
3~Yf/~sC, j2 ~T4 LOVt' ;4/q/y - World Bank Documents & Reports
428
-~ -- ~T 3~Yf/~sC, j2 ~T4 LOVt' ;4/q/y job rvnr Public Disclosure Authorized Public Disclosure Authorized Public Disclosure Authorized Public Disclosure Authorized
-
Upload
khangminh22 -
Category
Documents
-
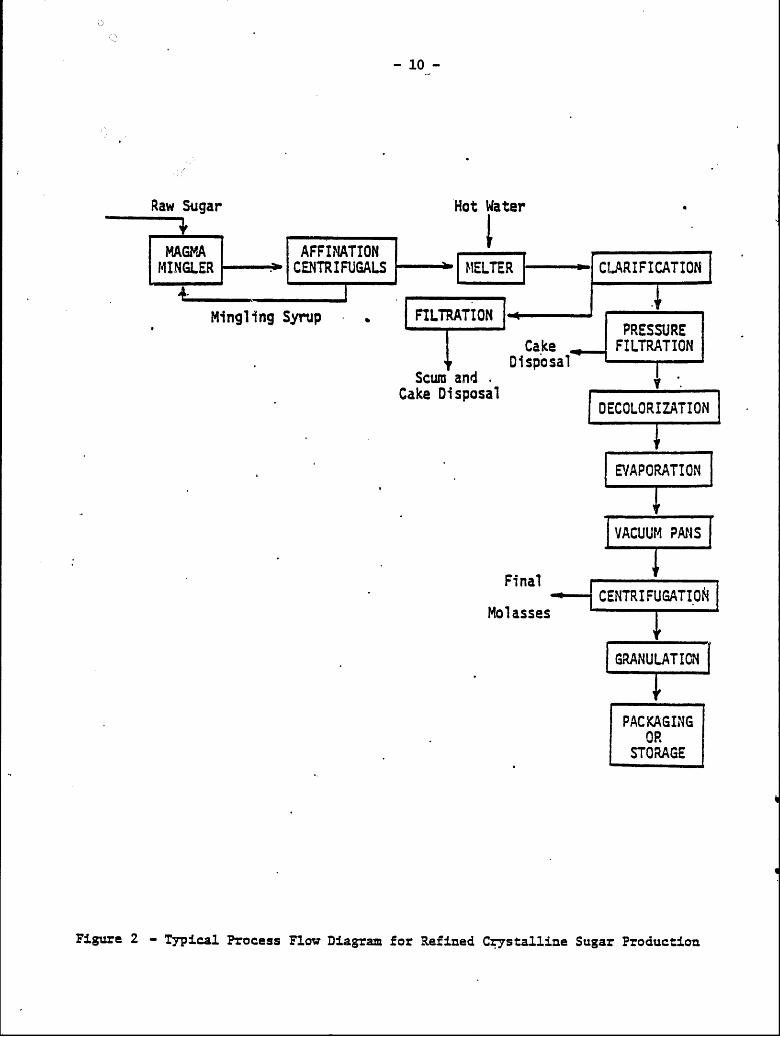
view
2 -
download
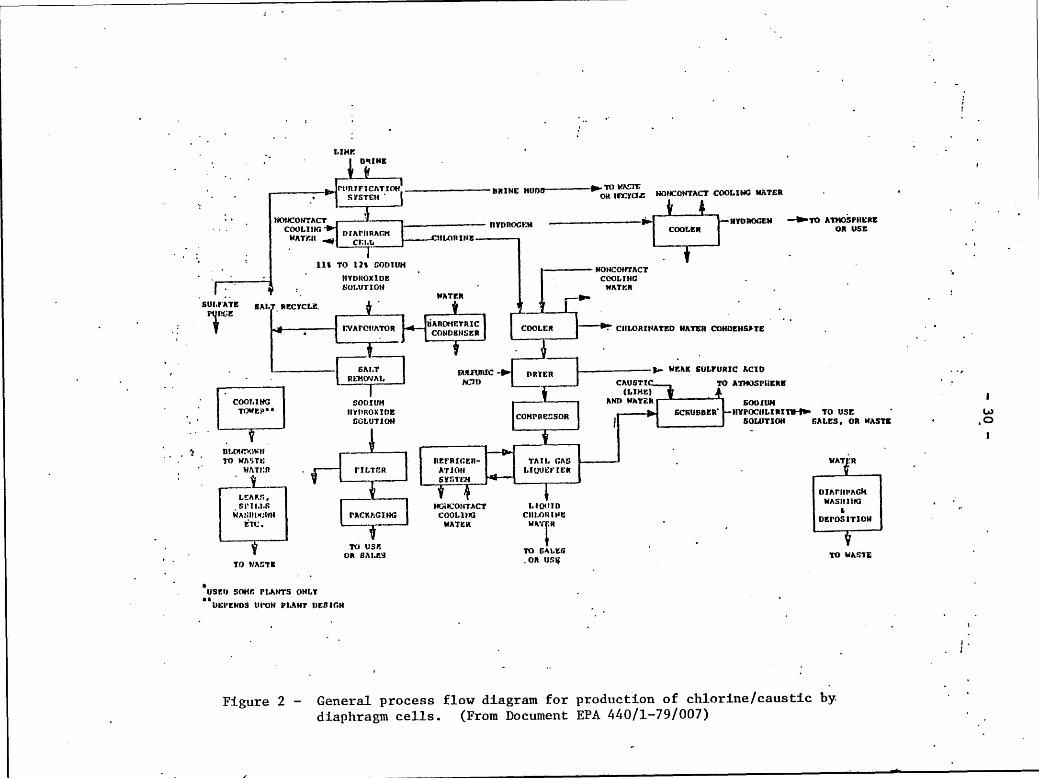
0
Transcript of 3~Yf/~sC, j2 ~T4 LOVt' ;4/q/y - World Bank Documents & Reports

-~ --~T
3~Yf/~sC, j2 ~T4 LOVt' ;4/q/y
job rvnr
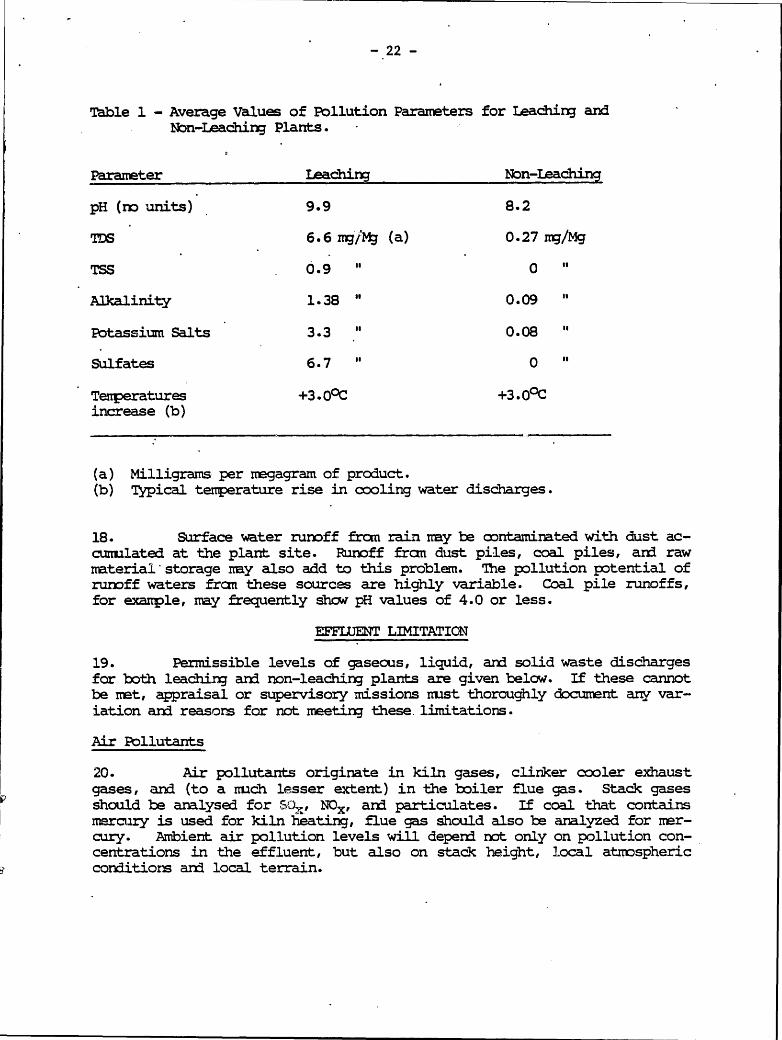
Pub
lic D
iscl
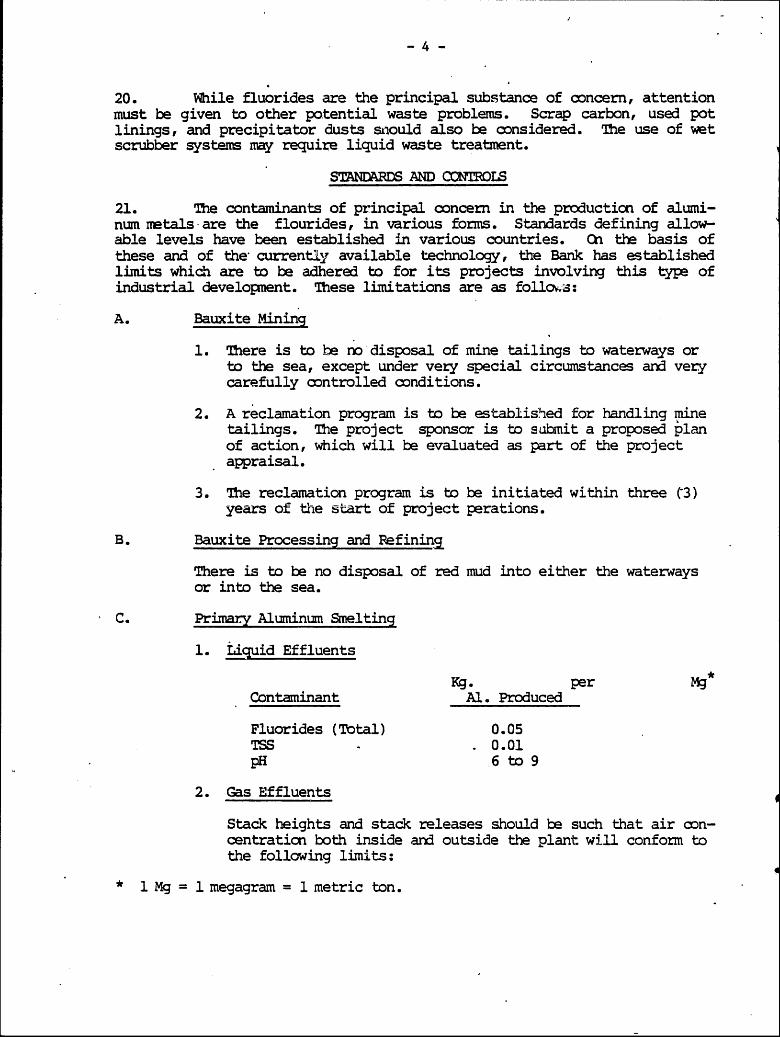
osur
e A
utho
rized
Pub
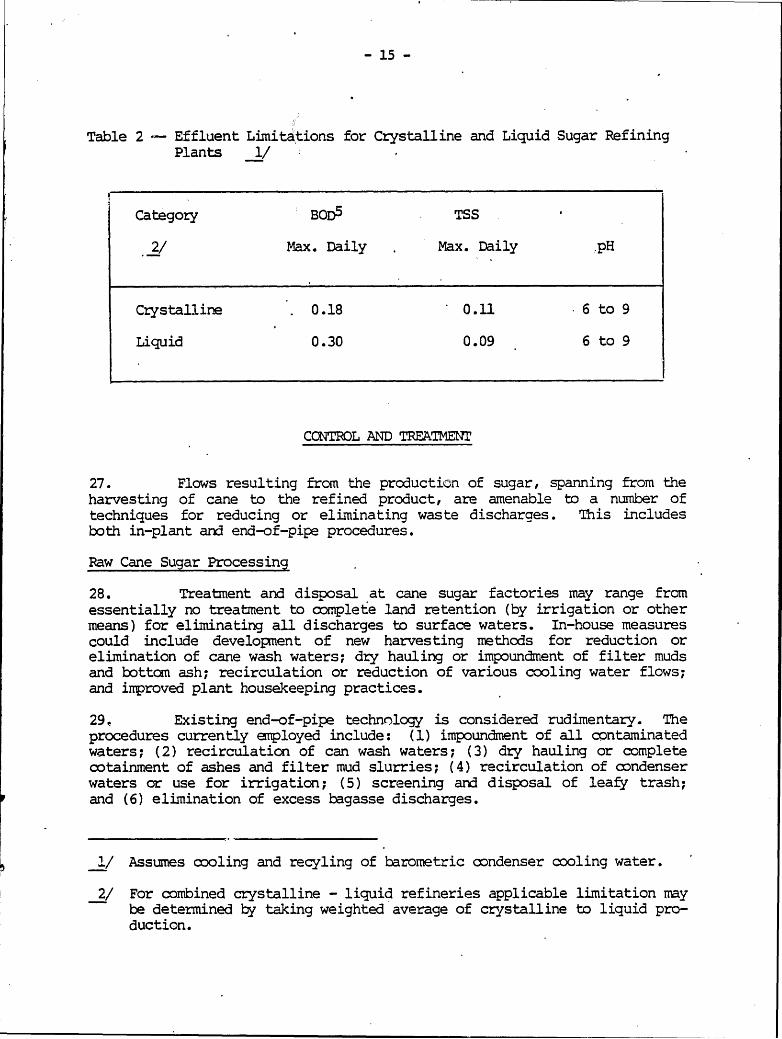
lic D
iscl
osur
e A
utho
rized
Pub
lic D
iscl
osur
e A
utho
rized
Pub
lic D
iscl
osur
e A
utho
rized

THE WORLD BANK
OFFICE OF ENVIRONMENTAL AFFAIRS
ENVIRONMENTAL GUIDELINES
JUNE 1983

T BLE OF CONTENTS
Page
FOREW AR . . . . . ... R* * * ** * * * * * ** * * * * * ** * * **.1
1. ALUMINUM INDUSTRY.............DT............................... 12. CANE SUGAR INDUSTRY.................. 73. CEMENT INDUSTRY.......DUS. 184. CHLOR-ALKALI INDUSTRY............. 275. DAIRY PRODUCTS INDUSTRYDUS........................... 396. DUST EMISSIONSISS................ . ....... ..6 467. EFFLUENTS, DISPOSAL OF INDUSTRIAL WASTES....................., 548. EFFLUENTS, LIQUID, LAND DISPOSAL & TREATMENT.................. 639. ELECTROSTATIC PRECIPITATORS (ESP'S)............................ 6510. ETHANOL PRODUCTIO.. ............. 6611. FERTILIZER MANUFATURING WASTES........ 7612. FISH AND SHELLFISH PROCESSING.......... 8613. FRUIT AND VEGETABLE PROCESSING................................. 9514. GEOTHERMAL DEVELOPMENT............ 10315. GLASS MAN UFACTURING................. 10516. IRON & STEEL INDUSTRY - GENERAL CONSIDERATIONS................. 11617. IRON & STEEL INDUSTRY - BLAST FURNACE.......................... 12418. IRON & STEEL INDUSTRY - BY-PRODUCT COKE OVENS.................. 13019. IRON & STEEL INDUSTRY - ORE PREPARATION, SINTERING AND........ 137
PELLETIZING
20. IRON & STEEL INDUSTRY - ROLLING AND FINISHING OPERATIONS....... 14321. IRON & STEEL INDUSTRY - STEEL MAKING PROCESS................... 15522. LEAD SAMPLING AND ANALYSES............. 16923. MEAT PROCESSING AND RENDERING........... 17724. MINING - STRIP SURFACE MINING OPERATIONS....................... 183
(SEDIMENT & EROSION CONTROL - LAND RECLAMATION)25. MINING - UNDERGROUND (COAL).................................... 18926. NITROGEN OXIDE EMISSIONS............. .......... ........s 19827. NITROGEN OXIDE SAMPLING AND ANALYSESNAY...... 20428. NOISE.21129. NON-FERROUS METALS INDUSTRY - ALUMINUM......................... 21930. NON-FERROUS METALS INDUSTRY - COPPER & NICKEL................8 22831. NON-FERROUS METALS INDUSTRY - LEAD & ZINC...................... 24032. NON-FERROUS METALS INDUSTRY - SILVER, TUNGSTEN................ 251
COLUMBIUM AND TANTALUM -33. OFFSHORE HYDROCARBON EXPLORATION AND PRODUCTION PROJECTS....... 26334. OIL PIPELINES................ 27535. OIL SHALE OPERATIONSERAT............. 28136. PALM OIL INDUSTRY.DUS........... 29537.* PESTICIDE MANUFACTURE - SAFETY AND ECOLOGY..................... 30338.* PESTICIDES - GUIDELINES FOR USE............................... 30639. PETROLEUM REFINING...FI............ 31240. PLATING AND ELECTROPLATING...................................o 323

Page
41. PLYWOOD MANUFACTURING.......................................... 33242. POULTRY PROCESSING............. 34143. PULP AND PAPER INDUSTRY....ST...4........................... 34844.* RODENTICIDESC.................................. ........ 36445. RUBBER PRODUCTION (CRUMB)...................................... 36746. SECONDARY ENVIRONMENTAL EFFECTS........... 37247. SLAUGHTERHOUSES I - INDUSTRIAL WASTE DISPOSAL.................. 37448. SLAUGHTERHOUSES II - DESIGN ARRANGEMENT..RG....3........ ..... 37949. SULFUR DIOXIDE EMISSIONS - GENERAL POLLUTION SO2*************** 38550. SULFUR DIOXIDE SAMPLING AND ANALYSESNA.LYSES. ................ 39251. LEATEER TANNING AND FINISING........... * 39952. TEA AND COFFEE PRODUCTION.O.D.TO............................ 40853. TEXTILE AND SYNTHETIC FIBER INDUSTRIES....oUTRI....ES....... . 41354. WOOL SCOURING.. ................ 421
* Denotes Environmental and Occupational Health and Safety.

FOREWORD JUNE 1983
INDUSTRIAL WASTE CONTROL GUIDELINES
As an integral part of its appraisal and supervision functions,the World Bank is required. to evaluate the adequacy and effectiveness of
pollution cottrol measures for projects involving industrial operations.
These evaluations are concerned not only with effects on environment, but
with effects on the occupational health and safety of industrial workers as
well.
To assist Bank's missions, the Office of Environmental Affairshas developed a series of guidelines covering industries and pollutants
most frequently, or considered most likely, to be encountered in the Bank
lending programs.
Each industry, or major pollutant, which may be. common to a num-
ber of industries, is treated separately. Guidelines are designed to pre-
sent only an overview of a particular industry or pollutant rather than ex-
haustive coverage.
Each guideline covers a number of aspects, including: environmen-
tal factors, permissible pollutant levels, and principal control methods.
If applicable, the guideline includes a discussion of gaseous, liquid and
solid waste aspects of the same industry or pollutant.
Application of these guidelines must be adjusted to each specific
situation. Permissible pollutant levels given, are considered to be a-
chievable at reasonable costs by existing treatment and control technolo-
gy. Where these performance levels cannot be achieved, the appraisal and/
or supervisory mission should. fully document deviations and reasons for
these deviations, be they technical, regulatory or other. Where local reg-
ulations regarding permissible pollutant levels differ from those presented
in these guidelines, the stricter regulations should prevail.
Individual guidelines will be revised periodically by the Office
of Environmental Affairs as sufficient new knowledge becomes available to
warrant changes. Additional guidelines covering specific industries will
be written as required. While these guidelines were prepared primarily for
use by Bank staff, their use. by others is wecomed and encouraged. Further
information concerning environmental acitivities of the World Bank are
available by writing to:
Office of Environmental AffairsThe World Bank
1818 H Street, N.W.Washington, D.C. 20433
U.S.A.
iii

-1-
THE WORLD BANK JULY 1982
OFFICE OF ENVIONMENAL AFFAIRS
GUIDELINES
ALUMINUM INUSTRY WASTES
1. Aluminum is considered to be the most abundant metal in the
earth's crust. The aluminum industry is international in scope, and its
maiufacture, fabrication, and use are currently worldwide. The wastes re-
sulting frcn the industry's operations are of significant proportions, and
hence their effects must be considered in environmental impact assessments.
MANUFACTURING PRCESS
2. The basic material used in the manufacture of aluminum metal -is
bauxite ore. Major sources of the mineral are South America, the Caribbean
and Australia. Specific sources include Jamaica, Haiti, Costa Rica, Suri-
nam, Guyana, French Guiana, Brazil, Ghana, Guinea, Sierra Leone, Cameroon,
Sumatra, Java and Borneo.
3. The most camonly used method for the production of aluminum me-
tal frcn bauxite ore is the Bayer Process, followed by the Hall-Heroult
Process. Thus, aluminum production may be considered a two-step process.
4. In the Bayer Process the bauxite is digested with hot, strong al-
kali solution (generally sodium hydroxide) to form a solution of sodium a-
luminate, and a nud residue (commonly referred to as "red mud"). The solu-
tion is then cooled and the mud residue removed by settling and/or filtra-
tion. The hydrated aluminum is calcined to produce alumina (A1 2 03 ), fol-
lowing carbon dioxide injection.
5. The alumina is then reduced electrolytically by the Hall-Heroult
Process., to produce aluminum, involving the electrolysis of alumina dissol-
ved in a fused salt electrolyte consisting of cryolite (Na3 Al F6 ) with
minor additions of other fluoride salts. The process is carried out in a
cell (pot) - consisting of a carbon anode, a cathode, and the electrolyte
- contained in a carbon-lined steel box. This is followed by alloying and
casting into ingots. The ingots are then shaped for final use by casting,
rolling, forging and/or extrusion.
6. The industry is currently investigating the possibility of pro-
ducing alumina fran alumina-bearing raw materials, as an alternative to the
Bayer Process. Recycling is also a source of aluminum metal, with material
coming mainly fran new scrap, aluminum cans, and discarded automobile bo-
dies.

-2-
ENVI01MENTAL ASPECTS
A - BAUXITE MINING
7. The major environmental concerns in bauxite mining operations are
land reclamation, runoff water control, dust control and infrastructure im-
pacts.
8. It is generally accepted that in cases of mining and related
operations the land should be restored to an equal or more useful state
than existed before the start of such operations. Reclamation measures and
costs should be carefully asseissed and included in the projected mining
costs.
9. Rainwater runoff control can be both difficult and costly under
certain conditions. Runoff waters should be carefully considered in terms
of suspended solids, pH, dissolved solids, and metals. Dust problems may
arise fran the mining, handling, and shipping of bauxite ore. ore opera-
tions can also generate unwanted noise from blasting and the use of heavy
excavation and transportation equipment. Infrastructure needs can include
access roads and facilities, personnel housing, and community services.
B - BAUXITE PROCESSING AND REFINING
10. In the processing of bauxite to produce aluminum, the principal
environmental concerns include: (1) disposal of the bauxite residue (red
mud); (2) dirt losses; (3) emissions from fuel burning; (4) waste liquid
and slurry streams, other than bauxite residue; (5) noise; and (6) infra-
structure impacts.
11. The amount of bauxite residue can vary from a half to one ton dry
weight pez ton of alumina produced; depending upon the type of bauxite and
the manner in which it is processed. The mud normally contains 20 to 30
percent of solids. While the chemical caposition can vary widely, a re-
presentative sample will generally range as follows:
Component % (Dry Basis)
Fe2O3 30-60
A1 203 10-20
Si02 3-20
Na2O 2-10
CaO 2-8
TiO2 Trace-10
Loss On ignition 10-15
pH 12-12.5 (Sol. Fraction)

-3-
12. While a number of disposal methods for these residues have beeninvestigated, some form of dumping is currently considered to be the bestmethod, including (1) land impoundment; (2) ocean dumping by ships, barges,,or pipelines; and (3) seashore reclamation.
13. Land impoundment in a diked impervious area is most frequentlyused, and is the method to be generally employed for Bank-supported pro-jects. Care must be taken to avoid contamination of ground waters. Thesettling ponds can remove 30 to 60 percent of the solids. In sane cases,water fram the impoundment area can be returned to the process as make-upwater.
14. Sea disposal is practiced in a number of areas. 'At some sites inthe Mediterranean, the residue -is discharged via pipelines into underwatercanyons at depths of over 2,000 meters. In Japan sea dumping is permitted,but only to areas and by methods specified by government regulations, withdisposal areas being located over 300 kilometers from shore. Use ofbauxite residue for seashore reclamation is permitted in Japan on a limitedbasis, but has been found to be very costly.
15. For Bank-sponsored projects sea disposal may be used in specialcases only, under carefully controlled conditions, and with the assurancethat there will be no harmful effects on sea life.
16. The handling of bauxite from its transportation source throughstorage and processing can generate significant fugitive dust emissions, ascan the handling of aluminum from processing to shipping. Although bothbauxite and aluminum are inert materials, their escape into the atmospherecan create a nuisance problem. Exhaust gases from aluminum calcination mayalso be a source of undesirable dust emissions. Abandoned bauxite impound-ment areas can also lead to appreciable dust generation if allowed to be-come entirely dry.
17. Fuel burning for steam generation and aluminum calcination canproduce emissions of sulfur dioxide and oxides of nitrogen. Stacks forthese facilities should be designed to meet applicable ambient air qualitystandards.
18. Infrastructure effects may extend some distance from the plantsite itself. Consideration should be given to access roads, bauxite un-loading and aluminum shipping facilities, water supplies, power needs,housing for the work force, and community facilities.
C - ALUMINA REDUCTION
19. The emissions resulting fran the primary reduction process areboth gaseous and particulate in character. The gaseous portions consistmainly of hydrogen fluoride (HF), with traces of other fluoride compounds.The particulate material is chemically ill defined, but does contain sub-stantial quantities of fluoride. The proportion of gaseous to par'iculatefluorides will vary considerably, depending upon the type of cell beingoperated.
-4-
20. While fluorides are the principal substance of concern, attentionmust be given to other potential waste problems. Scrap carbon, used potlinings, and precipitator dusts snould also be considered. The use of wetscrubber systems may require liquid waste treatment.
STANDARDS AND CONTROLS
21. The contaminants of principal concern in the production of alumi-num mtals-are the flourides, in various forms. Standards defining allow-able levels have been established in various countries. On the basis ofthese and of the currently available technology, the Bank has establishedlimits which are to be adhered to for its projects involving this type ofindustrial development. These limitations are as followS:
A. Bauxite Mining
1. There is to be no disposal of mine tailings to waterways orto the sea, except under very special circumstances and verycarefully controlled conditions.
2. A reclamation program is to be established for handling minetailings. The project sponsor is to submit a proposed planof action, which will be evaluated as part of the projectappraisal.
3. The reclamation program is to be initiated within three (3)years of the start of project perations.
B. Bauxite Processing and Refining
There is to be no disposal of red mud into either the waterwaysor into the sea.
C. Primary Aluminum Smelting
1. Liquid Effluents
Kg. per Mg*Contaminant Al. Produced
Fluorides (Total) 0.05TSS - . 0.01pH 6 to 9
2. Gas Effluents
Stack heights and stack releases should be such that air con-centration both inside and outside the plant will conform tothe following limits:
* 1Mg= 1 megagram = 1 metric ton.
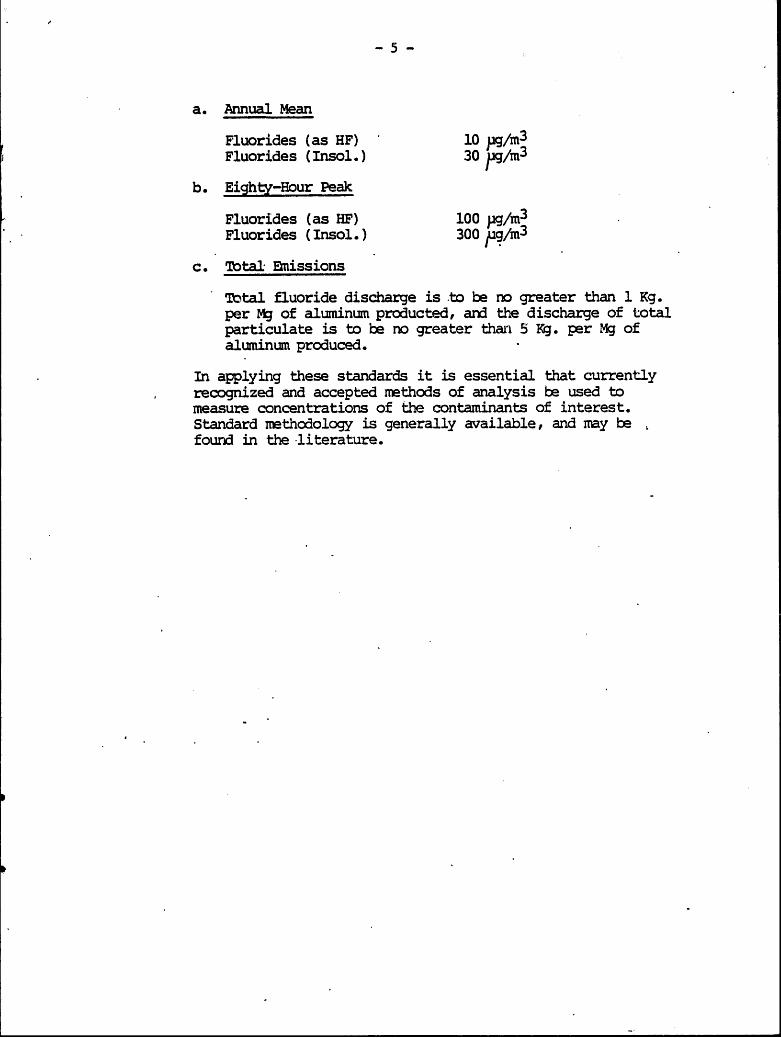
-5-
a. Annual Mean
Fluorides (as HF) 10 pg/n3
Fluorides (Insol.) 30 Pjg/n3
b. Eighty-Hour Peak
Fluorides (as HF) 100 pq/r 3
Fluorides (Insol.) 300 ugn/m3
c. Total Enissions
Total fluoride discharge is to be no greater than 1 Kg.per Mg of aluminum producted, and the discharge of totalparticulate is to be no greater than 5 Kg. per Mg ofaluminun produced.
In applying these standards it is essential that currentlyrecognized and accepted methods of analysis be used tomeasure concentrations of the contaminants of interest.Standard methodology is generally available, and ray befound in the literature.

-6-
BIBLIOGRAPHY
1. "The Aluminum Industry and the Environment." UNEP Industry SectorSeminars, Aluminum Meeting, Paris, 6 to 8 October 1975. Papers andDocuments. (1975).
2. "Environmental Aspects of the Alminum Industry-An Overview." UNEP'Industry Programme. Paris (May 1977).
3. "Environmental Recommendations for Siting and Operation of New PrimaryAluminum Industry Facilities.". International Primary AluminumInstitute. London (1977).
4. "Environmental Considerations of Selected Energy Conserving Man-ufacturing Process Options." Alumina/Aluminum Report. U.S. En-vironmental Protection Agency. Doc. EPA 600/7-76-034 h. Wash-ington (December 1976).
5. "Air Pollution Control in the Primary Aluminum Industry." Sing-master & Breyer. New York (1973).
6. "Development Document for Proposed Effluent Limitations Guidelinesand New Source Performance Standards for the Bauxite Refining Sub-category of the Aluminum Segment of the Nonferrous Metals Manufactur-ing Point Source Category." U.S. Environmental Protection Agency.Doc, EPA 440/1-74/019-c (March 1974).
7. "Development Document for Proposed Effluent Limitations Guidelinesand New Source Performance Standards for the Primary Aluminum Smelt-ing Subcategory of the Nonferrous Metals Manufacturing Point SourceCategory." Doc. EPA -440/1-74-019-d (March 1974).
8. "Development Document for Effluent Limitations Guidelines and NewSource Performance Standards for the Secondary Aluminum Smelting Sub-category of the Aluminum Segment of the Nonferrous Metals Manufactur-ing Point Source Category." Doc. EPA-440/1-74-019-e (March 1974).
9. Bauxite, Alumina and the Environment (ISSN. 0378-9993. UNEP, Industryand Environment Office. July/ August/Septem.ber, 1981.. Vol. 4 No. 317 Rue Margueritte, 75017, Paris, France.

-7-
THE WORLD BANK July 1982
OFFICE OF ENVIRONMENTAL AFFAIRS
GUIDELINES
CANE SUGAR INDUSTRY
1. Cn the basis of general manufacturing practices, cane sugarproduction falls into one or the other of two groupings - raw cane sugarprocessing and canie sugar refining. These represent separate major stepsin the process and are frequently carried out at separate locations. Forthe purposes of these guidelines each grouping will be discussed separatelyunder each of the principal headings. Although in a few cases raw cane andrefined sugar are produced in the same plant, the two types are, treatedseparately since physically separate production facilities are generallyutilized. ,There are substantial differences in the processes, as well asin the quality and quantity of waste effluentz.
2. In each case organics al,d solids are the pollutant ofsignificance. Pollution loadings are generally expressed in terms ofbiochemical oxygen demand (BOD5 ) and total suspended solids (TSS). Thehydrogen ion concentration (ph) is also important in measuring pollutionaleffects of these wastes.
MANUFACTURING PROCESSES
Raw Cane Sugar Processing
3. Sugar cane is a giant perennial grass, containing varying amountsof sucrose in fhe juice of the mature plant. The exact sucroseconcentration depends upon the variety of cane, agricultural practices, andother factors. The harvested cane will typically contain 15 percent fiberand 85 percent juice, by weight. In turn, the juice will average 80percent water, 12 percent sucrose, and 8 percent invert sugars andimpurities.
4. The harvesting and loading of sugar cane on transport vehiclesmay be accomplished either manually or mechanically, depending upon theavailability antd cost of labor. The methods used will appreciably affectthe amounts of dirt, trash and mud entering a mill. High loads of thesematerials are undesirable from both the processing and waste water handlingviewpoints, and are generally. higher where mechanical harvesting andloading are utilized.
5. The manufacturing process consists of cane washing and cleaning,milling or extraction of the juice from the stalk, clarification,filtration, evaporation and crystallization. Washing is generally employedwhen mechanical harvesting and loading are used. After cleaning, the caneis cut into chips, shredded and fed into a series of mills for crushing andextraction of 40 to 50 percent of the juice. The cane fiber from the finalmill, known as "bagasse", is usually fed to a boiler and used to producesteam.
-8-
6. The juice from the mills contains large amounts of impurities.Screening removes the coarser shreds, which are returned to the mills.Lime, heat and a small amount of phosphate are used to remove much of theremaining impurities through precipitation, settling and decantation incontinuous clariliers. Following clarification the juice is divided intothe clarified and precipitated mud portions. Rotary vacuum or other typesof filters are used to thicken the precipitated materials and recover apart of the juice. The liquid from the clarification system is about 85percent water and 15 percent soluble solids. Before crystallization, thesolution is reduced by evaporation to obtain a syrup containing about 60percent soluble solids.
7. The -concentrated juice from the evaporation is crystalllized,gently agitated and discharged to high-speed centrifuges to separate thecrystal from the syrup. Crystals remaining in the centrifuge are washedwith hot water to remove remaining syrup and the crystalline sugar trans-ferred to storage for subsequent shipping of futher processing.
8. A typical process flow diagram is presente,. in Figure 1.
Cane Sugar Refining
9. The raw material for refining consists of the crystalline sugarproduced by the raw cane factories. The raw sugar contains a film of mo-lasses, as well as various impurities such a bagasse particles, organics,inorganic salts and microorganisms. The refining process involves the re-moval of most of this film and the associated impurities. The steps gener-ally followed include affination and melting, clarification, decoloriza-tion, evaporation, crystallization and finishing. A typical process flowdiagram is presented in Figure 2. Processes will vary in detail from refi-nery to refinery. Such differences are particularly evident in ccolora-tion methods, where the mediun may consist of bone char, granular activatedcarbon, powered -activated carbon, vegetable carbon, ion-exchange resins orother materials.
10. In some cases a refinery may produce liquid sugar only, or bothliquid and crystalline sugar. For liquid sugar the affination, decoloriza-tion, and evaporation steps are usually the same. After evaporation, thesugar solution is filtered, cooled and stored in the liquid form .for laterdistribution. A typical process for liquid sugar refining is presented inFigure 3.
SOURCES AND CHARACTERISTICS OF WASTES
Raw Cane Sugar Processing
11. In raw cane sugar processing, water is used for cane washing,cooling of vapors from barometric condensers, slurrying of filter cakes,boiler bottom ash and boiler fly ash, boiler makeup, maceration, floor washand clean up and miscellaneous cooling.
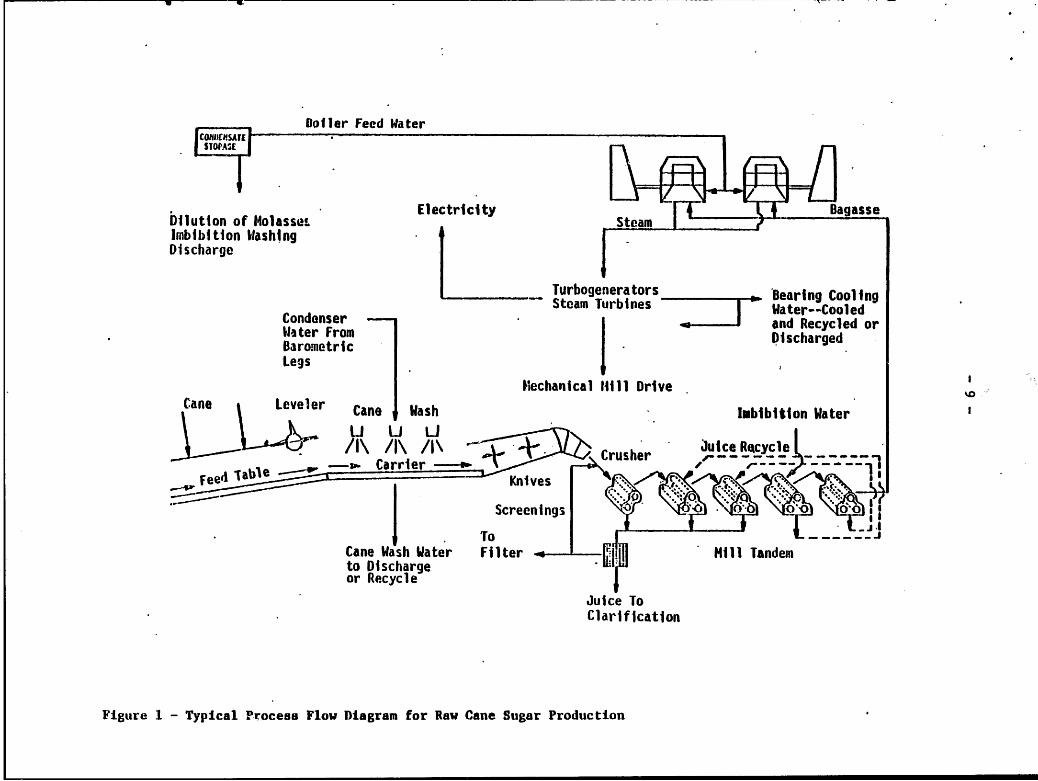
Botler Feed WaterCOMPIENISATE
SITO.SE
Dilution of Molassei Electricity Steam BagasseImbibition WashingDischarge
Turbogenerators Bearing CoolingSteam Turbines Water--CooledCondenser -. and Recycled orWater From DischargedBarometricLegs
Mechanical 14111 DriveCane Leveler Cane Wash Imbibition Water
/ / /.\ Juice RtcycleCrirCrusher ,----- ---
F Knives .:.-
Screenings a o c d
Cane Wash Water Filterto Dischargeor Recycle
Juice ToClarification
Figure 1 - Typical Process Flow Diagram for Raw Cane Sugar Production
- 10 -
Raw Sugar Hot Water
MAGMA 7AFFINATION.MINGLER CENTRIFUGALS MELTER CLARIFICATION
Mingling Syrup FILTRATION~ONPRESSURE .
Cake FILTRATIONDisposal
Scum and . I -Cake Disposal
DECOLORIZATION
EVAPO
VACUUM PANS
Final*--- CENTRIFUGATION
Molasses
GRANULATION
PACKAGING. OR
STORAGE
Figure 2 - Typical Process Flow Diagram for Refined Crystalline Sugar Production

Raw Sugar
AFFINATION
Steam1Water
MELTING Wae
SWEET WATER
CL.ARIFICATN
FILTRATION
GRANULAR CARBON
ION EXCHANGE
Water
EVAPOKEIO ¡y. HOT WATEREVORAT ION
Carbon
FILTRATION
Diatomaceous Earth
INVE RSION
Refined Sugar
Figure 3. - Typical Process Flow Diagram for Refined Liquid Sugar Production

- 12 -
12. Water use will vary considerably between plants, due to differ-ences in water conservation and recirculation practices. The quantititesof waste water generated in a plant may not correspond to the total waterintake because of moisture content of -sugar cane, amounting to 70 to 75percent; a portion of the fresh water added in the process enters into thefilter cake and bagasse; and a portion of the fresh water is lost throughevaporation.
13. Waste water production will be affected by (1) the condition ofthe cane upon arrival at the factory in terms of the mud and trash content;(2) harvesting technique, whether by hand, mechanically, or a combinaitonof the two; (3) the availability of land for waste water treatment of dis-posal; (4) length of processing season; (5) climatic variations; (6) sizeof plant; (7) nature of soil; (8) process variations; (9) nature of watersupplies.
14. The-character of the total waste water discharges will depend notonly upon the characteristics of the component streams, but also upon theextent of in-plant waste reduction practices. The principal sources arethe filer mud, barometric condenser cooling waters, and cane wash water.Some pollution is added by numerous small streams originating in the pro-cess. In general, purely hazardous.or toxic pollutants (such as heavy met-als and pesticides) will not be found in wastes discharged from cane sugarfactories.
15. While a number of parameters may be considered in evaluating theeffects of these wastes, it has been found that three are of principal sig-nificance: (1) BOD5 , for measuring the organic oxygen-consuming materials;(2) TSS for measuring the loading of suspended materials which could inter-fere with water supply andd other legitimate stream use; and (3) pH for as-sessing the acidity of alkalinity of the wastes.
Cane Sugar Refining
16. . As in the case of raw cane sugar plants, water use will varywidely due to differences in processes, water reuse, conservation tech-niques, and other aspects. Water supplies are usually taken from two sour-ces. One will be a low quality water, generally from a nearby surface sup-ply, for condenser cooling. The other will be a high quality water, suchas from a municipal source, for process, washing and related purposes.Water intake for a crystalline refinery is about double that for a liquidsugar refinery.
17. Waste water discharges may originate from condensers, filterbackwash, truck and equipment washing, floor drains, boiler fed blowdown,and miscellaneous cooling.
18. Although waste water volumes and quality from refineries willvary widely, the sources may be generally grouped as follows:

- 13 -
(1) Crystalline refinery using bone- char for decolorization -principally char wash water and barometric condenser cooling
water.
(2) Crystalline refinery using carb.n for decolorization -
principally barometric condenser cooling water, process
waste, ion-exchange regeneration solution, and carbonslurries.
(3) Liquid refinery utilizing affination and remelt - similar to
a carbon crystalline refinery but with a lower barometriccondenser cooling water flow.
(4) Liquid refinery not using affination, remelt and vacuum pans
- similar to number' (3) but with a lower barometric
condenser cooling water flow.
(5) Combination crystalline and liquid refiner, by separateprocess-discharge is a combination of numbers (2) and (3).
19. The parameters of principal pollutional significance for cane
sugar refining wastes are BOD5 , TSS and pH. On an individual basis, chemi-
cal oxygen demand (COD), temperature, sucrose, alkalinity, total coliforms,
fecal coliforms, total dissolved solids, and nutrients may be of signifi-
cance. Based on available evidence cane sugar refining wastes are not
known to contain hazardous or toxic substances.
EFFLUENT LIMITATIONS
20. As has been previously stated, for both raw sugar processing and
cane sugar refining plants, the BOD5 , TSS and pH are the pollution para-
meters of principal concern, and should therefore receive principal consid-
eration by appraisal and supervision missions. The effluent limitations.presented below are considered to be economically achievable- by the use of
best available technology for.new plants.
Raw Sugar Cane Processing
21. The quality and quantity of plant discharges will be influenced
by several factors. Such factors include raw materials, harvesting tech-
niques, length of grinding season, climatic 'variations, growing cycle, to-
pography, precipitation, irrigation prctices, and other relevant aspects.
22. Generally the most significant factor influencing operations andwaste water characteristics will be the mud, dirt, and trash content of the
cane upon arrival at the factory. Harvesting techniques--whether mechan-
ical, hand, or a combination of the two-will determine the amounts of
these materials entering the plant.. The levels of undesirable materialswill affect processing operations in terms of : the presence or absence of
cane washing and the quality of spent cane wash water; the efficiency of
sucrose production; and the amounts, of filter muds and bagasse produced.Factories processing hand harvested cane generally do not utilize cane
washing, and thus should more readily produce a high quality effluent.

-14-
23. Table 1. lists the permissible effluent concentrations formaximum daily average discharges, expressed in terms of kilograms ofpollutant per megagram of field cane.* Field cane is defined as the canecrop as harvested, including field trash and other extraneous materials.
24. As an approximation for relating pollutant discarges to output offinished product, experience indicates that on the average 1 megagram netcane will produce 75 kg. of raw cane sugar. Field cane may contain fromzero to as high as 50 percent field trash* and extraneous materials,depending upon the location, harvesting methods, and other local factors.Net cane is defined as field cane minus the weight of extraneous materials.
Table 1. - Effluent Limitations for Raw Sugar Can Procesing Plants.
Harvesting BOD5 TSSMethod Max. Daily Max. Daily pH
Mech. or com-bined hand/mech. 0.20 0.48 6 - 9
Hand 0 0 6 - 9
Cane Sugar Refining
25. For purposes of applying effluent standardds, cane sugarrefineries are grouped according .to whether producing crystalline or liquidsugar. Current limitations to be applied to Bank projects are given inTable 2, expressed as kilograms of pollutant per megagram of melted sugar.
26 As an approximation for relating pollutant discharges to finishedproduct, experience has shown that on the average 100 kg of raw cane sugarwill yield about 93 kg of crystalline sugar, at 960 Brix. Degrees Brix isdefined as the percentage of sucrose, by weight, in a pure sugar solution.
* 1 megagram = 1 metric ton1 Mg = 1 MT
15-
Table 2 Effluent Limitations for Crystalline and Liquid Sugar RefiningPlants 1/
Category BOD5 TSS
2/ Max. Daily Max. Daily ,pH
Crystalline 0.18 0.11 6 to 9
Liquid 0.30 0.09 6 to 9
CONTROL AND TREATMENT
27. Flows resulting from the production of sugar, spanning from the
harvesting of cane to the refined product, are amenable to a number of
techniques for reducing or eliminating waste discharges. This includes
both in-plant and end-of-pipe procedures.
Raw Cane Sugar Processing
28. Treatment and disposal at cane sugar factories may range from
essentially no treatment to complete land retention (by irrigation or other
means) for eliminating all discharges to surface waters. In-house measures
could include development of new harvesting methods for reduction or
elimination of cane wash waters; dry hauling or impoundment of filter muds
and bottom ash; recirculation or reduction of various cooling water flows;
and improved plant housekeeping practices.
29, Existing end-of-pipe technology is considered rudimentary. The
procedures currently employed include: (1) impoundment of all contaminated
waters; (2) recirculation of can wash waters; (3) dry hauling or complete
cotainment of ashes and filter mud slurries; (4) recirculation of condenser
waters or use for irrigation; (5) screening and disposal of leafy trash;
and (6) elimination of excess bagasse discharges.
1/ Assumes cooling and recyling of barometric condenser cooling water.
2/ For combined crystalline - liquid refineries applicable limitation may
be determined by taking weighted average of crystalline to liquid pro-
duction.

30. A number of potential end-of-pipe technologies are currently un-der investigation, including: (1) biological treatment (stablization ponds,activated sludge and others); (2) the use of tube settlers and other meansfor removing solids without the use of coagulants; (3) modification of canewashing systems to reduce soil loadings in the waste waters; and (4) theuse of polymers to accelerate settling of waste water discharges.
Cane Sugar Refining
31. Current technology for the control and treatment of cane sugarrefining waste waters consists principally of process control (i.e. recyc-ling and reuse of water, prevention of sucrose entrainment in barometriccondenser cooling water, and recovery of sweet waters), impoundment (landretention), and disposal of process waters to municipal sewerage systems.In-plant control measures are important in the total pollution control ef-fort. A principal purpose of these measures is to prevent sugar losses,which may be looked upon as profit losses by the refiner and as organicpollutant contributions by the environmentalist.
32. In addition to reducing sugar losses, other measures would in-clude effective dry-handling techniques for sludges and filter cakes, maxi-mum recovery and reuse of various process streams, and improved housekeep-ing.
33. A number of end-of-pipe techniques are available, ranging frompreliminary to advance waste treatment systems. These would include (1)flow equalization; (2) chemical treatment (pH adjustment, chlorination);(3) primary treatment (settling, sedimentation, and clarification); (4) bi-ological treatment (activated sludge, trickling filters, stabilizationponds and lagoons); (5) advance waste treatment (carbon adsorption, micro-screening, reverse osmosis); and (6) ultimate disposal (evaporation la-goons, spray irrigation).
.34. When land disposal of waste water is practiced, contamination ofground water resources must be prevented, whether.such disposal is by see-page beds or by deep well injection.

- 17 -
BIBLIOGRAPHY
1. Made, G.P. "Cane Sugar Handbook". 10th Ed. John Wiley & Sons, NewYork, (1977).
2. "Development Document for Interim Final Effluent Limitations Guidelinesand Proposed New Source Performance Standards for the Raw Cane SugarProcessing Segment of the Sugar Processing Point Source -Category",U. S. Environmental Protection Agency, Doc. EPA 440/1-75/044 (February1975).
3. "Development Document for Effluent Limitations Guidelines and NewSource Performance Standards for the Cane Sugar Refining Segment of theSugar Processing Point Source Category". U. S. Environmental ProtectionAgency. Doc. EPA 440/1-74/002-c (March 1974).
4. "Sugar Manual". Hawaii Sugar Planters Association. Honolulu (1972).
5. "A System Approach to Effluent Abatement by Hawaii's Sugar Cane In-dustry". In Proceedings Fourth National Symposium on Food ProcessingWastes. Doc. EPA 660/2-73-031, U. S. Environmental Protection Agency.Washington, (December 1973).
6. "Consumptive Use of Water by Sugar Cane in Hawaii", University ofHawaii, Water Resources Research Center, Technical Report No. 37(1978)
7. Biaggi, N. "The Sugar Industry-in Puerto Rico and Its Relation to theIndustrial Waste Problem". J. Water Pollution Control Federation. 40,8 (August 1968).
8. Miller, J. R. "Treatment of Effluent from Raw Sugar Factories". Inproceedings of the International Society of Sugar Cane Technologists,(1969).

- 18 -
THE WORLD BANK MARCH 1983
OFFICE OF ENVIROtMNTAL AFFAIRS
CEMENANUFACTURING
GUIDELINES FOR DISPOSAL OF WASTE
1. Cement manufacturing plants vary widely in volume and conposit-
ion of pollutants discharged. Differences arise fran process variations,
in-plant practices, bousekeeping, and other factors.
2. Three basic steps are normally utilized in cement manufacture:
(1) raw material grinding and blending, (2) clinker, production, and (3)
finish grinding.
3. Paw materials include lime (calcium oxide), silica, aluminum, and
iron. Litne, the largest single ingredient normally canes fran limestone,cement rock, oyster shell, marl, or chalk - all of these sources consist
prinarily of calcium carbonate. Other raw materials are introduced as
sand, clay, shale, iron ore, and blast furnace slag. These materials may
be added initially, with feed. to the process, or further in the process se-
quence such as in the clinker grinding stage.
4. Two types of processes are available, naninally termed "wet" or
"dry". In the wet process, raw materials are ground, mixed with water and
the slurry fed to the kiln. With the dry process raw materials are dried
before or during grinding. Dry ground materials are fed to the kiln.
5. The kiln is a long cylindrically shaped oven, internally lined
with refractory brick. It rotates slowly on a axis slightly inclined fran
the horizontal. The slight axis inclination allows kiln contents to drop
forward as the kiln rotates. High temp erature combustion gas produced at
the lower end of the kiln flows upward, counter current to solid material
noving down the kiln. Coal, gas, or oil my be used to generate this con-
bustion gas. Most kilns are equipped to fire more than one type fuel. As
material moves down the kiln, its temperature increases to about 14008 C,
at which point it fuses to form hard, small pieces termed "clinker". Upon
leaving the kiln, clinker. is rapidly air cooled, combined with a small
amount of gypsum* and ground into fine powder. Ground cement is further
and shipped to market either in bulk or bags.
* Gypsum level of the final cement product, regulates cement setting time
at the site of its use.

-19-
6. Flow sheets for typical wet and dry manufacturing processes are
shown in Figure 1.
7. Cement plants are categorized as "leaching" and "non-leaching".Kiln dust leaching systems are used in leaching plants to avoid loss of
high alkali dusts. Dry dust is mixed with water to rake a slurry about 10%
solids. In the slurry, alkali frxn the dust dissolves into the water.
phase. The slurry then flows to a clarifier. Clarifier underflow, - con-
taining 40 to 60 % solids returns to the kiln, while overflow is discharg-
ed. Clarifier overflow is the nost severe source of water pollution for
the cement industry. An alternative for reducing this problem is to use
low alkali raw materials.
SOURCES OF WASTE
8. Cement manufacture can result in pollution of air, water, and
land resources.
Air
9. Air pollution can originate at several operations in cement manu-
facture. These sources and their associated emissions are as follows:
Sources Enissions
Raw Materials - Particulates (dust)Grinding, Handling
Kiln Operations Particulates (dust), OD,and Clinker Cooling SOxr NOx, Hydrocarbons,
Aldehydes, Ketones
Product Grinding, Particulates (dust)Handling, Packaging,Shipping
10. A major source of particulate natter (or dust) at nost cement
plants is the kiln. Kiln rotation and high-velocity flow of combustion
gases entrain large quantities of dust (as much as 10 to 20 % of the kilnfeed) out the feed inlet of the kiln.
Water
11. Highest levels of water pollution occur when water is allowed tocontact collected kiln dusts. Three nost significant sources where this
contact may occur are: (1) the leaching operation (most important) which
renoves soluble alkali and recovers solid insoluble portions for reuse, and

- 20 -
Raw Materials
. Crushing
Wet Process Dry Process
Proportioningand ixin ofProporticning
.din-Water and Mixing ofRaw Materials Itaw Materialsin Slurry Tanki
Grinding Water .Grinding
Homogenizing Homogenizingand Blending UandBlending
Evaporation
[-Ki.Lln * DUST Ki ln
Clinker CoolerClne
i-inishGrinding and _
GypsumAddition
Cement Cooler
StorageBaggingShipping
Figure 1 - Flow Sheer for Typical Wet and Dry Cement Manufacturing Processes.

-21-
discharges overflow (leachate) as waste, (2) disposal of enti:e wet dustslurry with no recovezy or reuse (slurry is fed to a pond, solids settleand overflow is discharged), and (3) aqueous effluents frcn wet scrubbersare used to wash dusts from kiln gas emissions.
12. Process cooling is the major use for water in dry process cementmanufacture (drying equipment and air COmpressor operation, and cooling ofkiln bearings, burner pipes, etc.). Therefore, dry process water effluentsshould not normally be contaminated unless poor water management is prac-ticed. Slurry water used to feed raw materials into the kiln for the wetprocess evaporates (dissipates in the air as vapor) so it does not become awater effluent discharge.
13. Auxiliary activities such as electric power generation (with asteam boiler), slurry tank cleaning, washing of bulk bauling trucks, cool-ing tower blow-down, and raw material washing are wastewater sources, butnormally of minor significance.
Land
14. Kiln dust, raw materials, clinker, coal, and other substancesare frequently stored in piles on plant property. Unless proper measuresare taken, rainfall may pe iate through these piles, dissolve (or leach)soluble pollutants and carry hem with the sutface runoff waters. Alsowater polluted in this manner can migrate through the subsurface layers be-neath the material storage piles and contaminate groundwater sources.
CHARACTERIZATION OF WASTES
15. Dust renoved from kiln gases is primarily a mixture of raw ma-terial, and clinker particles. These gases also contain alkalies (from theraw materials) and fuel which volatilized in the kiln. While raw materialalkalies are insoluble in their natural state, high kiln temperatures,chemically modifies the alkali conponent of its mineralogical matrix sothat alkali becomes both volatile at high temperatures and water soluble atlcw temperatures.
16. Plants which produce low alkali cement and use high alkali rawmaterials do not recyle dust to the kiln. Disposal of this dust is a seri-ous plant problem. In. addition to dust, cement plant emissions also con-tain significant quantities of CO, SOx, (sulfur oxides)' and NOx, (nitrogenoxides), as well as lesser quantities of hydrocarbons, aldehydes, and ke-tones.
17. The seven most significant parameters for evaluating water pollu-tion of cement industry effluents are: pH, total dissolved solids, totalsuspended solids, alkalinity, potassium, sulfate, and temperature. Averagevalues for these parameters which are in water effluents created by scrub-bing kiln dusts are shown in Table 1.
- 22 -
Table 1 - Average Values of Pollution Parameters for Leaching andNon-Leaching Plants.
Paraneter Leaching Non-leaching
pH (m units) 9.9 8.2
TDS 6.6 ng/M4 (a) 0.27 ng/Mg
TSS 0.9 " 0 t
Alkalinity 1.38 " 0.09 "
Potassium Salts 3.3 " 0.08 "
Sulfates 6.7 " 0
Tenperatures +3.00 C +3. 0 C
increase (b)
(a) Milligrams per regagram of product.(b) Typical temperature rise in cooling water discharges.
18. Surface water runoff fran rain ay be contaminated with dust ac-
cunulated at the plant site. Runoff fran dust piles, coal piles, and raw
material 'storage ay also add to this problem. The pollution potential of
runoff waters fron these sources are highly variable. Coal pile runoffs,
for example, may frequently show pH values of 4.0 or less.
EFFLUENT LIMITATION
19. Permissible levels of gaseous, liquid, and solid waste discharges
for both leaching and non-leaching plants are given below. If these cannot
be net, appraisal or supervisory missions nust thoroughly document any var-
iation and reasons for not meeting these. limitations.
Air Pollutants
20. Air pollutants originate in kiln gases, clinker cooler exhaust
gases, and (to a nuch lesser extent) in the boiler flue gas. Stack gases
should be analysed for 507, Nx, and particulates. If coal that contains
mercury is used for kiln heating, flue gas should also be analyzed for mer-
cury. Ambient air pollution levels will depend not only on pollution con-
centrations in the effluent, but also on stack height, local atmospheric
conditions and local terrain.
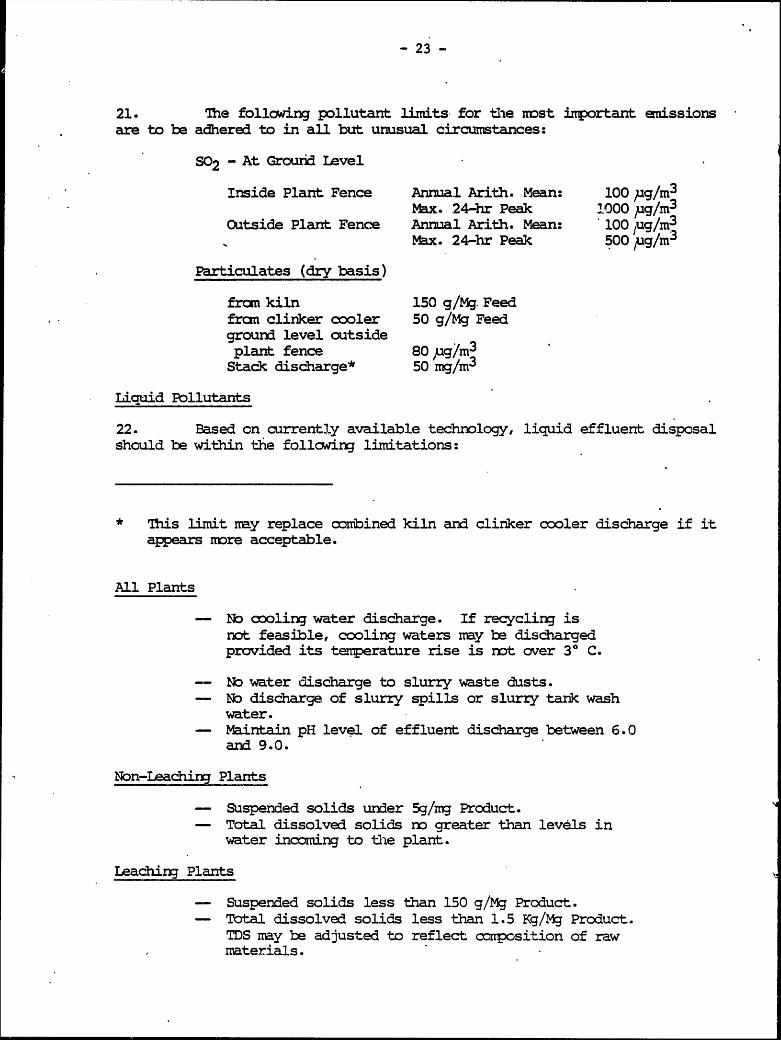
- 23 -
21. The following pollutant limits for the most important emissionsare to be adhered to in all but unusual circumstances:
SO2 - At Grourid .Level
Inside Plant Fence Annual Arith. Mean: 100 ug/m3
Mtx. 24-hr Peak 1000 pg/m3
Outside Plant Fence Annual Arith. Mean: 100/ ug/m3
Max. 24-hr Peak 500 ug/m3
Particulates (dry basis)
fran kiln 150 g/Mg. Feedfran clinker cooler 50 g/Mg Feedground level outsideplant fence 80 pg/m3
Stack discharge* 50 mg/m3
Liquid Pollutants
22. Based on currently available technology, liquid effluent disposalshould be within the following limitations:
* This limit may replace combined kiln and clinker cooler discharge if itappears more acceptable.
All Plants
- No cooling water discharge. If recycling isnot feasible, cooling waters way be dischargedprovided its temperature rise is not over 3* C.
-- No water discharge to slurry waste dusts.- No discharge of slurry spills or slurry tank wash
water.- Maintain pH level of effluent discharge between 6.0
and 9.0.
Non-Leaching Plants
- Suspended solids under 5g/mg Product.- Total dissolved solids no greater than levels in
water incoming to the plant.
Leaching Plants
- Suspended solids less than 150 g/Mg Product.- Total dissolved solids less than 1.5 Kg/Mg Product.
TDS may be adjusted to reflect composition of rawmaterials.

-24-
Material Storage Piles
No rainfall allowed to percolate through piles and
runoff in uncontrolled fashion.
Equipent Washing, Road Washing, Etc.
- Not over 150. g/Mg Product during equipmentcleaning operations, or during periods ofrainfall.
Solid Wastes/Material Storage
23. Kiln dust, coal, and other materials piles should be so arranged
as to avoid any arbitrary rainfall runoff. Where such runoff cannot be
avoided, the effluent should be channelled, centrally collected, and sub-
jected to sedimentation and any other necessary measures for reducing or
eliminating pollution. . Also, if any rainwaters can migrate under storage
piles to contaminate a groundwater resource, storage areas may have to be
lined.
CONTROL AND TREMMENT OF WASTES
24. Kiln operation is the major source of dust and gaseous pollu-
tants. Larger dust particles can be renoved by cyclones or other mechani-
cal devices. Small dust particules can be renoved by electrostatic precip-
itators, bag filters, or wet scrubbers. In most cases, collected dust is
recycled to the process for reuse as raw material. Dusts from other sec-
tions of cement production are generally renoved through local exhaust sys-
tems combined with some form of mechanical collection.
25. Both wet process and dry process plants achieve essentially com-
plete waste water reuse with available technology, except in certain dust
contact operations. In all wet process plants, except those leaching col-
lected dust, effluents fran ancillary operations (plant clean-up, truck
washing, cooling, etc.) can be used to prepare slurry feed to the kiln.
This water evaporates in the kiln, any organic matter is burned off, any
nonvolatile inorganic material remains with the product, thus, no water ef-
fluent is produced. Cooling towers or ponds may be necessary to recycle
excess water.
26. Use of waste waters for feeding the kiln is not possible in dry
process plants. Here, however,, virtually ccmplete recycling of liquid ef-
fluents is possible if cooling towers or ponds are used. The only dis-
charge is normally a small volume of cooling tower "blow-down" or bleed
water that is required to prevent buildup of dissolved solids in the
recirculating water. In some cases, these small volumes can be
evaporated. Cooling streams can be segregated and steps taken to prevent
dust entry into cooling water systems.

-25-
27. For leaching plants, the water is necessarily exposed to contam-i-nants and recycling is generally rot feasible. Principal pollution param-eters of leaching basin -effluents are pH, alkalinity, suspended solids, andtotal dissolved solids (primarily potassium and sulfate). Treatment is ef-fected by neutralization and carbonation. Although removal of dissolvedsolids is generally not practiced for leachate streams, results indicatethat evaporation, precipitation, ion exchange, reverse osmosis, and elec-trodialysis, individually or in combination, can be quite effective.
28. Laboratory analyses for any liquid effluent should include pH.total dissolved solids, total suspended solids, alkalinity, potassium,salts, sulfate, and temperature rise.
29. Solid naterials, including wastes, are generally stored in pileson plant property. These can be contained or treated .(diking, latex spray-ing, etc.) to prevent rain runoff into adjacent waters. Diked areas shouldbe of sufficiennt size to contain an average 24-hour rainfall.
ENERGY CONSIDERATIONS
30. Application of these guidelines and control mechanism shouldensure optimm utilization of raw materials and result in some reduction ofenergy requirements. Major factors in minimizing energy consumption willbe the plant design and operation.
31. Fuel requirements of a cement plant should vary from 6.23 to 6.91gigajoules per negagram of product* for the wet process and from 3.14 to4.0 gigajoules/megagram of product for the dry process. Fuel consumptionfor new plants should be at the lower limit, and it should fall below theupper limit for existing plants. Conformance to these limits shouldminimize any impact on the environment. Where fuel consumption for a newplant is estimated to be at or near the higher value, the reasons must befully explained by the appraisal mission.
* One gigajoule = one billion joules.One gigajoule/megagram = 238.9 calories/gm

- 26 -
BIBLIOGPAPHY
1. "Information Sources on the Cement and Concrete Industry". UNIDO
Guides to Information Sources, No. 2. United Nations Industrial
Development Organization. New York (1977).
2. "Emission Measurement Techniques for Particulate Matter from Power
Plants, Cement Manufacturing and the Iron and Steel Industry". Or-
ganization for Ecoinmic Cooperation and Development. Paris (1975).
3. Development Document for Effluent Limitations, Guidelines and New
Source Performance Standards for the Cement Manufacturing Point Source
Category". U.S. Environmental Protection Agency. Doc. No. EPA/440/1-
74-005-a.
4. "Papadakis, M. and M. Venuat. "Industrie de la Chaux, du Ciment, et du
Platre", from Collection "Les Industries, Leurs Productions, Leurs
Nuisances". Industrie-2. DUNOD. Paris (1970).

- 27 -
THE WORLD BANK FEBRUARY 1983
OFFICE OF ENVIROMNTAL AFFAIRS
CHLOR-ALKALI PLNTS
(CHLORINE AND CAUSTIC SODA)
1. Chlorine and caustic soda. (NaOH) production constitute important
segments of the inorganic diemicals industry. The largest world producersof chlorine include Canada, France, the Federal Republic of Germany, Italy,the United Kingdom, and the United States. Annual production by_individualcountries for 1979 varied fron 0.87 to 11 million metric tons.
2. Except for the United Kingdom the sare countries, along with Ro-
Mmnia and Russia, are the largest world producers of caustic soda. For
1979, the annual production varied from 0.7 to 11.3 million metric tons inthe individual countries,. as 100 percent NaOH.
3., Chlorine and and its co-product, caustic soda, are used in large
quantities in the production of plastics, organic and inorganic chemicals,
in the pulp and paper industry, in water supply and wastewater treatment,and in several other industrial processes.
MANUFATUING PPCESSES:
4. Chlorine and caustic soda are produced alrcst entirely frcm theelectrolysis of a sodium or potassium chloride solution (brines) by one oftwo major processes - the mercury cell or the diaphragm cell. These two
processes differ in cell design and in the quality and quantity of wastes- generated. Other processes, such as the membrane process, have been devel-
oped through the pilot plant stage but operating data are not currentlyavailable. To avoid any discharges of nercury to the environment, new
World Bank projects involving chlor-alkali plants should not utilize themercury cell process.
5. In the purification of the brine, the sodium chloride solution
(brine or salt dissolved in water) is treated with sodium carbonate and
sodium hydroxide to precipitate inpurities such as calcium, magnesium, and
iron. The precipitated hydroxides and carbonates are then settled in aclarifier and the underflow, referred to as brine nud, goes to a lagoon or
to filtration.
6. Brine muds from mercury cell plants usually contain small amcunts
of mercury, because of recycling of the spent brine from the cells. Before
transfer to the cells, treated brine is evaporated if necessary to rexmvethe excess water and -then pH-adjusted. Spent or depleted brine from the
cells is acidified and dechlorinated (using vacuum and/or air stripping)before being saturated with salt and recycled.

-28-
Mercury Cell Process
7. The mercury cell consists of two sections: the electrolyzer andthe decomposer or denuder. A general process flow diagram is shown in Fig-ure 1. The electrolyzer consists of an elongated steel trough slightly in-clined fran the horizontal. Mercury flows in a thin layer at the bottom,acting as the cathode of the cell, and the brine flows concurrently on topof the mercury. Parallel graphite or metal anode plates are suspended frcmthe cover of the cell. Electric current flowing through the cell decom-poses the brine, liberating chlorine at the anode and sodium metal at thecathode. The metallic sodium forms -an amalgam with the mercury. The amal-gam from the electrolyzer flows to a denuder. The spent brine is recycledto the brine purification process.
8. In the denuder, the sodium-mercury amalgam is the anode and thecathode is iron or graphite. De-mineralized water is added, and this re-acts with the amalgam to fotm hydrogen and caustic soda. The mercury isreturned to the electrolyzer. The hydrogen gas can be vented or cooled byrefrigeration to remove water vapor before sale or before use as a fuel.
9. The chlorine from the cell is cooled to remove water and otherimpurities. The condensate is usually steam stripped and then either re-turned to the brine system or discharged as a waste. The chlorine gas,after cooling, is further dried by scrubbing with sulfuric acid. The di-luted acid is regenerated for reuse, sold, or used for pH control. Thechlorine gas is then compressed and liquified.
10. The liquefying procedure results in a residual mixture of noncon-densable gases known as tail or sniff gases. This residue is usuallyscrubbed with caustic or lime, generating a hypochlorite solution, whida isdeconposed, used on site, sold, or discharged as a waste.
11. The caustic soda formed at the denuder has a concentration of 50percent NaOH. Sane of the impurities present in the solution can be re-moved or reduced by the addition of certain chemicals, followed by filtra-tion of the caustic. In most cases the caustic is sent to storage or evap-orated if a more concentrated product is required.
Diaphragm Cell Process
12. The process flow diagram for the diaphragm cell process is pre-sented in Figure 2. In this process, the treated brine solution is elec-trolyzed to form chlorine, hydrogen and sodium hydroxide. The cell con-tains an asbestos diaphragm separating the anode frcm the cathode. Chlo-rine is liberated at the anode, while hydrogen and hydroxyl ions are pro-duced at the cathode. The negatively charged hydroxyl ions (anions) willreact with the positively charged sodium ions (cations) to form caustic.In the past graphite, with lead to provide the electrical contact and sup-port, was generally used for the anode. ' In recent years the graphiteanodes have been replaced by titanium anodes, having a platinum or ruth-enium oxide coating. The advantages of the metal anodes include increased

,
"
1 �
i �' "
�
.
. . . � 11vnnOCeu
' , '
. � � п �;
� � . С 111,0 IUf. �.
Р U а l Г 1 С ПMERL'URY
UM;NVeCa _
i GM �C ;
�DN11K
' � " JU1111�cAN ,. DENIIIEMLIEED
� CELL � ( П F.f:oHP0. � B1tj M11TER COOLER
i
' �
' PU П IflCAT10N � ._..._,,.. Н Е а с 11 � ^ 'Q I Л н о ' 0 J1'1f1QS1'11CflE
.
5 о � :; с� и >.и м Ча + с о и rn с т F1 ь ren) � J
1 К11 � :QК ? Л С ТUa USC
� � S1;STEH и У D П О К IU С 6A1.Jf Г loN Е � 1 � 1 �
'�
� с ооь ll ю илтСR 1b илтеа�
� I 1
'
1 .
. .
�ссю l. и. а со носыsn п �
, � � ,
� SC П UODINC Ч А S Т� � � � j � j$TE
, . П П 1 И С ' ' и q Т Е а Yl4TT.R '� 01 SOO1Ut � p л CRACINC а Р. С У с 1, С C004iNG
. H11US . ' 11YDa01I10C - � � ER
�
� � ; �, so ьurloи ' го sAь es
' ' f ' К Л С К И д S SULUTION �
, � �, А 7f Ю � P11ERC
, ' то и л s т С � м с к vл в н н г � >< с ь С г� с к и ns п� . .
� л n и а к с ,; с ы г. г [ ст еа с л и s т l с ( г,I н Е 1 ,
' , � " END Ч д т Е R BLlM1 D01 П 1 ,
' . � � Е о 1 IU5 �+ _ -i в Т О 1tIEa15 . � .
� � ' . ьлнйе i ьь
. ,
� -- -- �5
. .
11Q1K: П UTACT � RFTORT 1 �
� � ( с о гп л с т � 1 � 7. - - Т �
CooLI1> с и А Т Е а. R
�
,
.. �
6111.FURIC U
'
Л CID aFCYC1.C0 а {-- М Е П С U К У ' � " "' -" � L_-SO4ID9 -. �jp1V и 115 т С е�
70 CCLL 7AIL CAS в 60111UH (0 Р С 111 С П 1 И )
. . � '
g , N
� "
NYi'oCUlA П 1TB � -, , � р
, , С D
а 60GUт 10N
�0 К
L[QU1D 10 U6E, Sf ьLCS (
� о r С lk1Р ь1 Е &SOa � 1� tQUL'F9ER 1tLO К IN б ' � " � 5R6C9 О Р И А 6 Т Е �
. � � G о я use
, ' . С а1` КODUCT
, � �
, R
, � .
.
' �
PCFRICI:!tATlU11
� и f. Л К SULfUa1c 1 Ч У й Т � N � � �
� CO11DE11SATC ACiU
� � . 1
' ' � � исi г�со ит лсх � ' �
то илs те а а acusC с 0аьл l с � ,
. ' илrt, а
. . , .USCO А Т 8l} И С Р L Л F Г Г !! О Н Ь С
-'
.
�
�
�
' �
� �
1
.
.
�.
(
�
� �
�
.
�
�
.
.
? Figure i- Ge п eral process diagram for production of chlorine/caustic Ъ у mercury ce11s.
; (From i,o � ument Е Р А 440%1-79/007} . �
�
�
1!
�
.
. ' �
� . � . . : . �� � ,
, LIHC ' �.' � 09[ Ч 6 �
�. � �t
� PUR1FlC Л T1( � г B111NE М о П D-""-'-' М 'mkti'''Jt �� � � SYSTEH � о К 1 ч +� у ( у Е Ж lHC0i1't лС ? C004ING и г1 т Е А � �
� � � Н О ИС О Н : л С Т П YDROGEN -- � "' Н УО АО С Е и ; т 0 A тNOSPHERL , �� CtlULI1N: UI Л MIRACM COOLER OR U5c .Ч л т Г 11 .,,} CEl.L
l1U1p1HE
' � 11t т о 1 h saOlu м� � , Чоиса гп лс т,� � и чО Чох l0 е ссо ы нс .. � � Л ULUTION � MATY.R � �. .. � М л Т С 11
� ''
BUL ГAT[ gA1. RECYCI. � , �.1К �Е
� � � 1:VA Г Q1lЛ Т О R gAПOHETRIC COOLER . C111ANINATLD Ч л т В R CONDEHS1гTE � , ' '. CANDBN5c8 �
, - . .
GALT � ( � д гl С - ORYER 1 � и L А К 6U4Г URiC ACID ..,. , ' � � et �мо v ль�н ." о с ли s т l ro лт�и s РИсив'
(LIHEj �
' COOLINC SOOIUM 11N0 и А Т � R 6f Ю IUH� � ` т и ея " HrnnoxtOE co м raessoa s сЧивеСа ' пУРас и w Rlre �1 в то usE ' w, �
s � ьurloH � бow т ioN 6ALCS. oR и А 9 Т [ �
, О. �
- �
� . . � , ui � +r. к1MN � ' .
'. то илчтг: пеен l с сп- тл l � сл s . иАт
��н� ' Ч ЛТ 1: П � FILTCR А т 1 о N LIOUEFIБ II � �' � Б У S т Е Н
<, � л F9, Ornrunл c � lsr1 � .1s Ни к :огп лс т u1an0 и л si и и с ,
к л ;ciuMsnl РАс кис тис с ооь l гю с Игм гl Че �С Т С , и л Т С В Ч � ' �R � OCPOSlT]OH
. TU U51. � � �� о П 8 �1LЕ у 1'0 6A4BG у ' о и л ;7 �Е �+ � Т О H Л STk . о 11 USif
� USCO S ОН Г. PLANTB ONLY .н
'UE1' с Ч 09 lU' о Н Р 1 � NT 11EBIGN ,
. � ' . . 1
� ' 1.�
� . i� .. �
.
Figure 2- General process flow dlagram for production of chl � rine/caustic by '`, diaphragm ce11s. (From Document Е Р А 440/1-79/007) � ,

31
power efficiencies, longer anode life,, and a reduction in potential pollu-
tant load of lead and chlorinated organics. Cathodes are generally made
of m.ital - In the Hooker "S" cell, for example, the cathode is made of
crimped steel wire directly covered with asbestos. When in use, the cath-
ode unit is conpletely submergered. The asbestos covering then functions
as the diaphragn. separating the anode fran the cathode.
13. The chlorine gas is processed in the same way as in the mercury
cell process, and produces the same residuals. The hydrogen gas can be
vented or cooled to remove the water vapor, and either marketed or used as
a, fuel -
14. The resulting caustic (or sodium hydroxide) has a concentration
of about 14 percent NaOH and a sodium chlori.de content running as high as
17 percent. The caustic is usually filtered to remove sorm of the impuri-
ties and then evaporated to 50 percent NaOH in rmltipl!-- effect evaporat-
ors. The vapor resulting from the last of the evaporators is condensed in
barometric condensers,, by contact with cooling water, or in surface conden-
sers using non-contact cooling water. Sodium chloride remains as a solid
salt,, and this is returned to the brine system. Further purification of
the caustic is sometimes necessary for certain applications (such as rayon
production). Extraction or adsorption techniques are effective in removing
small amounts of impurities.
TAMSTE SOURCES AND CHAPACTERISITICS
Ai-r Emissions
15. Er issions from miercury and diaphragm cell plazits include chlori ne
gas, carbcn dioxide, carbcn monoxide, and hydrogen. Gaseous chlorine is
present in the gas from liquefaction, from vents in tank cars and tax0% con-
tainers during loading and unloading, and frcm storage taxLks and process
transfer tanks. Othe-- emissions include miercury vapor from mercury cathode
cells and chlorine from compressor seals, header seals, and the air blowing
of depleted brine in mercury cell plants.
Liquid Effluents - Mercury Cell Process
16. Brine mud,, produced from purification of the brine.. usually con-
tains magnesium, calcium, iron and other trace metals such as titanium,
molybdenum, chromium, vanadium, and tungsten. Calcium and iron are removed
as oxides. Small amounts of mercury also are found in the nud, frcm the
recycling of the unconverted brine to the purification unit after dechlori-
nation.
17. Ce" room wastes include leaks, spills, area wash down, and cell
wash waters. The volume depends tTm housekeeping practices, and my vary
from 0.01 to 1.5 cubic meters per metric tcn of chlorine produced. This is
the major stream requiring treatment because-of the high levels of mercury
present. If graphite anodes are used.. the wastes may also contain lead and
chlorinated organics.

-32-
18. Condensation from the cell gas is contaminated with chlorine. Inmost cases the condensates are recycled to the process after chlorine re-covery. Both contact and non-contact water are utilized for chlorine cool-ing and for removal of water vapor. Concentrated sulfuric. acid is used inthe. dryer to remove residual water from the chlorine gas after first stagecooling. The acid is used until it is reduced in concentration to 50 to 70percent. Then it is regenerated, used for pH control in a treatmentsystem, or marketed.
19. The tail gas containing the uncondensed chlorine gas from theliquefaction stage, along with some air and other gases, is scrubbed withsodium/calcium hydroxide to form sodium/calcium hypochlorite solution.Additional hypochlorite solution is produced when the equipment is purgedfor maintenance. The hypochlorite can be used on site in another process,sold, or treated before discharge. Tail gas scrubber discharges will varyfrom 0.04 to 0.58 cubic meters per metric ton of chlorine produced.
20. The 50 percent caustic produced at the denuder is filtered to re-move salt and other inpurities. The filters are backwashed periodically asneeded. The backwash water can be discharged to treatment, or filteredwith the filtrate which is recycled to the brine system. The filteredsolids may either be *disposed of to land or reprocessed for recovery ofmercury.
21. Ccoling of the hydrogen results in a condensate, which can eitherbe sent to treatment facilities or to mercury recovery and returned to thedenuder.
22. In summary, the total waste flow from mercury cell plants is re-ported to average 2.1 cubic meters per metric ton of chlorine produced.This does not include brine nud waters, which are reused instead of dis-charged and hence do not affect total flow.
23. The pollution parameters of importance in the mercury cell plantsare total suspended solids (TSS), mercury, and hydrogen ion concentrations(pH). Other toxic metals which nay be present, besides mercury, includearsenic, antimony, cadmium, chromium, copper, lead, nickel, silver,thallium and zinc. The principal sources of these metals are considered tobe the raw salt or brine and the corrosion reactions between chlorine andthe materials in the process equipment. Other than mercury, the levels ofthe other toxic metals found in the wastes are not considered to besignificant.
Liquid Effluents - Diaphragm Cell Process
24. Brine purification produces the brine mid as a waste, consistingof precipitated hydroxides and carbonates of calcium, magnesium, iron, andother metals . The muds are filtered or settled in lagoons, with thefiltrate or overfklow either discharged or recycled to the brine systems.The filtrate volume will average about 0.42 cubic meter per metric ton ofchlorine produced.
- 33 -
25. Cell room wastes include leaks, spills, area washdown and cell
wash waters. The cell wash waters contain high levels of asbestos. Where
graphite anodes are used in the cells, the wastes may also contain signifi-
cant quantities of lead. Waste flows from cell roon operations will vary
widely, and will average about 0.38 cubic meters per metric ton of chlorine
produced fram metal anode plants. Graphite anode plants will average 1.2
cubic neters per metric ton of chlorine produced.
26. Condensation fram the indirect cooling of cell gas is contami-
nated with chlorine. The chlorine is removed and/or recovered frcm the
liquid stream before discharge or recycle. Flows will average 0.49 cubic
meter for metal anode plants and 0.78 cubic meter per metric ton of chlo-
rine produced for graphite anode plant.
27. Concentrated sulfuric acid is used to dry the chlorine gas after
the first cooling stage. When the concentration is, reduced to 50 to 70
percent, the spent acid is regenerated, sold, or used for pH control, as is
the case-in mercury cell plants.
28. Uncondensed chlorine gas from the liquefaction stage is scrubbed
with sodium or calcium hydroxide to produce the corresponding hypochlo-
rite. The hypochlorite can be used in other processes, sold, or discharged
with or without treatment. Waste flows from this source average 0.17 for
metal anode plants and 0.11 for graphite anode plants, in terms of cubic
meters per metric ton of chlorine produced.
29. Backwashing of filters used to clarify the caustic product ray
produce significant quantities of wastewaters. These are wholly or par-
tially recycled to the process. Caustic filter badkwashing is necessary to
remove sodium sulfate at graphite anode plants, since the accumulation of
sulfate ions can interfere with cell performance.
30. Hydrogen gas cooling produces a stream which is usually dis-
charged. The volume of flow is very small and not considered to be of sig-
nificance.
31. . Where vapors from caustic evaporators are water-cooled, a signif-
icant amount of wastewater can be generated in "once through" installa-
tions. Recirculation of the cooling water will greatly reduce this dis-
charge, but will require a cooling step and a blowdown discharge. Average
wastewater flows from the individual units in the diaphragm cell process
are given in Table 1. The total plant flow in any specific case will de-
pend upon the practices (such as recirculation, by-product recovery, etc.)
employed at the particular plant.
32. The pollution parameters of significance include total suspended
solids (TSS), hydrogen-ion concentration (pH), chromium, copper, lead, nic-
kel and zinc. Asbestos, used for the diaphragm separating the anode from
the cathode, is a major toxic pollutant also fourd in these process waste-
waters. However, due to the lack of a standardized analytical procedure
there is as yet no general agreement on acceptable limitations. As a roughapproximation, a concentration of 300,000 fibers per liter is considered to
be an acceptable limit at this time. Other toxic metals may also be pre-
sent in these wastes but the levels are generally not considered to be of
significance.

-34-
Table 1. Average Wastewater Flows fran Diaphgram Cell Plants.
Fla-m3 per Metric Ton ChlorineSource
Metal Anode Graphite AnodePlant Plant
Cell room wastes and cell wash 0.38. 1.2
Chlorine Condensate. 0.49 0.78
Spent Sulfuric Acid 0.01 NA*
Tail Gas Scrubber 0.17 0.11
Caustic Filter Wash NA* 5.4
Brine Filter Backwash NA* 0.45
Caustic Cooling Blowdown 0.86 NA*
Brine Mud 0.42 NA*
* NA = Not Available

- 35 -
Solid Wastes
33. The major sources of solid wastes in chlorine plants, for both
the diaphragm and mercury cell processes, are the brine muds. The solids
concentration in the filter backwashing can vary from 2 to 20 percent, and
range in volume from 0.04 to 1.5 cubic meters per metric ton of chlorine
produced. Solids are also present in the caustic filter washdown and the
cell room wastes. In a diaphragm cell plant, the waters will contain sig-
nificant quantities of asbestos, originating from washdowns and cell repair
or cleaning. Total mercury loss from mercury cell operations averages 7.5
grams of Hg per ton of chlorine liquefied. Some portion of this can be ex-
pected to be present in the solid wastes discharged fran the plant.
EFFLUET LIMITATIONS
Air Emissions
34. Air emissions, when discharged to the atmosphere should be main-
tained within the following limitations:
Carbon Monoxide (CO)
Max. 8-hr. Aver. 10 jug/m3Max. 1-hr. Aver. 40 pg/rm3
Carbon Dioxide (C 9 )20 mg/m3
Chlorine Gas (as Cl-)
Max. 30-idi. Aver. 0.3 mg/m3
Max. 24-hr. Aver. 0.1 ng/m3
Sodium Hydroxide (Na OH)
Max. 15 minutes 4 mg/m3
Mercury (Hg)
Per ton of chlorine produced: 3 grams
Liquid Effluents
35. Liquid effluents from plants using the mercury cell process, are
to be usintained within the following limits:
Max. Max.24 hr. Aver. 30 day Aver.
Kg per Metric Ton of Chlorine Product.
TSS 0.64 0.32Mercury 2.8 x 10⁻⁴ 1.4 x 10⁻⁴pH 6 to 9 units 6 to 9 units

- 36 -
36. For plants using the diaphragm cell process, effluents shouldmeet the following limitations:
Max. Max.24-hr. Aver. 30-day Aver.Kg. per Metric Ton of Chlorine Product.
TSS 1.1 0.51Chromium 2.3 x 10 8.8 x 10⁻⁴Copper 1.1 x 10⁻² 4.4 x 10⁻³Lead 2.6 x 10- 2 1.0 x 10⁻²Nickel 1.1 x 10⁻² 4.4 x 10⁻³Zinc 1.1 x 10⁻² 4.4 x 10⁻³pH 6 to 9 Units 6 to 9 Units
CONTROL AND TREAIMM OF WASTES'
Air Emissions
37. Airborne emissions can be kept within required air quality limi-tations through the use of cyclones, scrubbers, strippers, and other meth-ods. In manuy instances, the gases may be recovered and reused cr marketedas saleable products.
Liquid Effluents
38. Management and bousekeeping practices should receive first con-sideration in establishing measures for reducing or eliminating wastewaterdischarges, and these could include control of water usage, recovery ofuseful or saleable by-products, and process nodifications.
39. The brine treatment and cell roam areas should be equipped withfiberglass gratings to collect all spills and leaks. Mercury bearingwastes should receive sulfide precipitation, followed by pressure filtra-tion.. This will also renove the other heavy metals which may be present inthe stream. The precipitated mercury waste may be stored in a lined pond,transferred to a secure landfill, or processed for recovery of the mer-cury. The filtrate from the sulfide filtration is recycled back to theprocess. Where further treatment is needed the filtered effluent can bepassed through granular activated carbon beds for removal of residual metalsulfides and metallic mercury.
40. At diaphragm cell plants, the prevailing practice is either tocontrol asbestos wastes by settling or filtEering cell wash wastewaters orto neutralize and settle effluents before discharge. Recycling of treatedstreans is comon, although not always the case. Plants using graphite an-odes treat lead-bearing wastes by chemical precipitation and settling orfiltration before discharge.

- 37 -
41. The -control of toxic organic compounds varies greatly between
plants. For exariple, in a plant where the end use of the chlorine is the
manufacture of a chlorinated product, the bulk of the chlorinated organic
inpurities are not removed.
42. Where a more purified chlorine product is required, the organics
are accumulated in the reboiler of the chlorine scrubber. The residues are
batch-treated for separation and recovery of the organic phase materials,
which are then sold as feedstock for the manufacture of related products.
The aqueous phase may be stripped for removal of additional organics and
chlorine, and then recycled or discharged
43. The use of mtal rather than graphite anodes increases cell power
efficiency and greatly reduces the pollutant loading of lead and toxic or-
ganics.
44. By changing from contact to noncontact cooling of the vapors from
caustic soda concentration, or by recirculating barametric condenser water,
the amount of wastewater generated qan be considerably reduced.
45. Raw diaphragm materials are being developed, whidh can apprecia-
bly reduce pcwer consumption and rinimize or eliminate asbestos dischar-
ges. The rodified diaphragms include polymer rodified asbestos rretbranes,polymer merbranes and ion exchange membranes.
46. The use of high pressure and refrigeration for chlorine recovery
will reduce the chlorine content of tail gases. Before venting of the
tail gas to the atiosphere, the common practice is to scrub it with caustic
soda and produce a hypochlorite solution. The hypochlorite can be sold,
used on site, or discharged.
Solid Wastes
47. The solids contained in the brine muds, as well as those result-
ing from other parts of the plant cperations, should first be examined for
possible by-product recovery, either on site or elseWhere. When on site
disposal is required, these residues may be transferred to ponds, drying
beds, or durped in land fills. Since isuch residues may contain mercury or
other toxic substances, extreme care should be taken to avoid runoff or
drainage into surface waters or seepage into ground waters. Disposal
grounds may need to be sealed and provided with surrounding walls to pre-
vent both seepage and surface runoff.
ENERGY CONSIDERATIONS
48. In the electrolytic chlor-alkali production process the energy
requirements will be very large. The process requires an average of 21.6giga-joules of energy per metric ton of chlorine produced (1 giga-joule
equals 1 billion joules).
49. This energy will be in the fonn of electric power, which may
either be brought in from outside sources or generated on-site. Where
power is brought in from outside sources via a grid system, the available
- 38 -
energy varies from 30 to 45 percent of the energy content of the fuels used
to generate the electricity. If the power is generated at the chemical
plant site the available energy can be increased to a range of 60 to 80
percent by, for example, the use of pass-out steam for other factory opera-
tions such as distillation or drying.
50. The above energy requirements do not include the energy required
by the equipment used for treatment and disposal of plant wastes. These
requirements will vary according to the treatment and disposal techniques
adopted, and rust therefore be determined on a case-by-case basis.
BIBLICGRAPHY
1. UN Economic and Social Council. "Air Pollution Problems of the Inor-
ganic Chemicals Industry". Proceedings of Seminar held in Geneva,
Switzerland, 1-6 November 1976. Doc. ENV/SEM. 7/3, CHEM/SEM. 5/3. (22
July 1977).
2. Economic Cormission for Europe "Annual Review of the Chemical Industry
1979". Doc. ECE/CHEM/34. United Nations. New York (1980)
3. Jarrault, P. "Limitations des Emissions de Polluants et Qualite de
L'Air. Valeurs Reglementaires dans les Principaux Pays Industrial-
ises". Institut Francais de L'Energie. Paris (1978).
4. U.S. Environmental Protection Agency. "Compilation of Air Pollutant
Emission Factors". Second Edition. Doc. AP-42. Washington (March
1975).
5. U.S. Environmental Protection Agency "Development Document for Effluent
Limitations Guidelines and Standards for the Inorganic Chemicals Manu-
facturing Point Source Category" (Proposed). Document EPA440/1-79/007. Washington (June 1980).
6. U.S. Environmental Protecion Agency. "Treatability Studies for the In-
organic Chemicals Manufacturing Point Source Category". Document EPA
440/1-80/103. Washington (July 1980).
7. APHA, AWWrA, WPCF. "Standard Methods for the Examination of Water and
Wastewater". 15th Edition. American Public Health Association. New-
York (1980).
8. Shreve, R.N. "Selected Process Industries". McGraw-Hill Book Co. New
York (1950).
9. The Chemical Society. "Conservation of Resources". A Symposium held
at the University of Glasgow, 5th-9th, April, 1976. Special Publica-
tion No. 27. London (1976).
-39-
THE WORLD BANK FEBRUARY 1983
OFFICE OF ENVIROMENTAL AFFAIRS
GUIDEAINES
DAIRY PRODUCTS INDUSTRY
1. The dairy products industrial operations are difficult to treat
'because of wide variations between individual plants in raw material in-
.puts, processes used, varieties of products manufactured, volumes of wastes
generated as affected primarily by internal plant practice and other fact-
ors. These guidelines will present general information on typical plant
operations, which may then be applied and/or adapted to specific projects.
INDUSTRIAL PROCESSES
2. Dairy products plants may be categorized by specific product out-
put. Categories and products generally included in each category are shown
in Table 1.
3. Plants may perform a combination of these product operations, al-
though there are plants which have only one or two process categories.
Typical manufacturing processes for these products can be found in the sug-
gested references cited below.
4. For example, processing of fluid milk includes clarifying, cream
separation, pasteurizing, homogenizing and possibly deodorizing. For but-
ter production, a culture of bacteria is added to cream, the mixture is
"ripened" and agitated under oDntrolled temperatures until butter and but-
termilk are separated.
5. Cheese is produced through addition of a "starter" to whole milk
or skim milk under controlled temperature conditions. An acid or enzyme is
added to this mixture to form lactic acid which, in turn, results in curd
formation . Curd is separated, washed, and subjected to various additional
processes, depending upon the type of cheese being made.
SOURCES OF WASTES
6. Dairy industry effluents are. primarily all liquid. Main sources
of wastes result from:
a) Washing and cleaning of tank trucks, cans, piping
and other equipment.
b) Spills fram leaks, overflows, equipmentmalfunctions, careless bandling and other similarcauses.
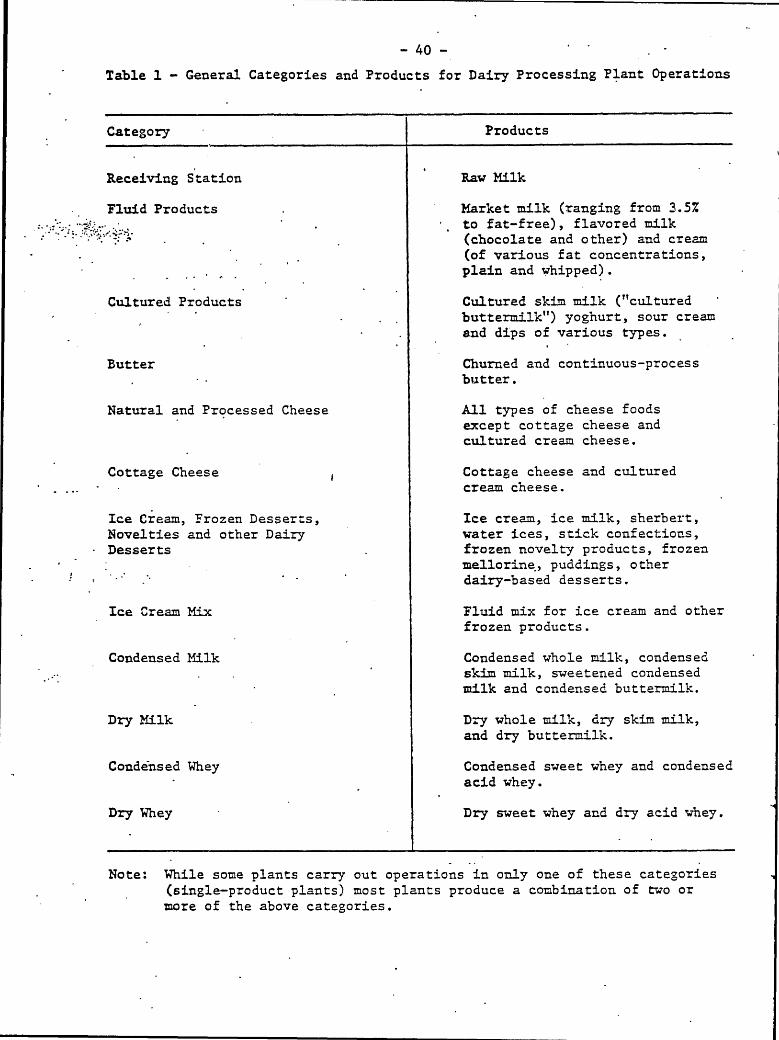
- 40 -
Table 1 - General Categories and Products for Dairy Processing Plant Operations
Category Products
Receiving Station Raw Milk
Fluid Products Market milk (ranging from 3.5%
to fat-free), flavored milk
.- .(chocolate and other) and cream
(of various fat concentrations,plain and whipped).
Cultured Products Cultured skim milk ("cultured
buttermilk") yoghurt, sour cream
and dips of various types.
Butter Churned and continuous-processbutter.
Natural and Processed Cheese All types of cheese foodsexcept cottage cheese and
cultured cream cheese.
Cottage Cheese Cottage cheese and culturedcream cheese.
Ice Cream, Frozen Desserts, Ice cream, ice milk, sherbert,
Novelties and other Dairy water ices, stick confections,
Desserts frozen novelty products, frozen
mellorine., puddings, otherdairy-based desserts.
Ice Cream Mix Fluid mix for ice cream and other
frozen products.
Condensed Milk Condensed whole milk, condensedskim milk, sweetened condensedmilk and condensed buttermilk.
Dry Milk Dry whole milk, dry skim milk,and dry buttermilk.
Condensed Whey Condensed sweet whey and condensed
acid whey.
Dry Whey Dry sweet whey and dry acid whey.
Note: While some plants carry out operations in only one of these categories
(single-product plants) most plants produce a combination of two or
more of the above categories.

-41-
c) Processing losses sudh as evaporator entrainmentbottle and case washer discharges, container breakage
and product change-over in filling machines.
d) Wastage of spoiled products, returned products, or
by-products such as whey.
e) Detergents and other compounds used in working and
sanitizing solutions that are discharged as wastes.
f) Entrainment of lubricants from conveyors, stackersand other equipment.
g) Routine operation of toilets, washrooms and eating
facilities.
h) Waste materials that may be contained in incomingraw water which ultimately goes to waste.
7. The greatest amount of waste originates from the first five sour-
ces listed above and is directly related to various dairy products handled
at the plant. Typical contributions of waste aterials to the total final
waste load, as estimated for a fluid milk plant in terms of 5-day biodhemi-
cal oxygen deinand (BOD 5 ), are shown in Table 2.
Table 2 - Estimated Waste Contribution, as BOD5 , By Source - Fluid Milk
Plant.
Waste Source (as BD5 ) Per6ent
Milk, milk products and otheredible products 94
Cleaning products 3
Sanitizers Very Small
Lubricants Very Small
Sanitary and domestic wastes 3
(employees)
Total 100-
-42-
CHARACTEPSTIC OF WASTES
8. Several water quality parameters may be used to assess the pollu-
tion potential of wastes from processing of dairy products. Three parame-
ters are considered most significant: 5-day biochemical oxygen demand
(BOD 5 ), total suspended solids (TSS), and hydrogen ion concentrations
(pH). Parameters of lesser significance include, chemical oxygen demand(COD), temperature, phosphorous as phosphates, nitrogen as ammonia and ni-
trates, and chlorides.
9. Wastes are largely organic in nature. The mijor pollution effect
is to decrease dissolved oxygen in receiving waters. The BOD 5 test is
most useful as a measure of this potential to decrease dissolved oxygen.
10. Suspended solids will adversely affect turbidity of receivingwaters, as well as causing a build-up of bottom deposits. This is particu-
larly objectionable when solids are organic in nature, as is the case for
dairy wastes. Bottom deposits of organic sludge may exert a heavy oxygendemand on receiving waters. Anaerobic decomposition may produce hydrogensulfide or other intermediate products which can cause noxious odor prob-leus and can be toxic to aquatic life.
11. A pH outside the acceptable range may have an adverse direct im-
pact on the receing waters or may have secondary effects such as increasingthe solubility of heavy metals. There may also be increased toxicity toaquatic life, inceased corrosiveness of water supplies, increased costs of
water treatment, rendering of waters unfit for certain processes such asfood and beverage canning or bottling, and other similar effects. Thoughindividual waste streams may exhibit unusually high or low pH values, thecombined discharge from a plant generally results in a final effluent with-in acceptable ranges of this parameter.
I EFFLUNT LIMITATIONS
12. Table 3 presents permissible levels of biochemical oxygen demand,total dissolved solids and pH. These levels are to be met by individualdischarges frcm the product category indicated. Loadings apply to single-
product plants only. Limitations for the final effluent of a multi-product
plant should be determined from these, using a weighted average based onthe contribution and reduction to be affected by each of the categoriesconprising plant operations.
13. Where a plant discharges to a municipal sewage collection andtreatment system, effluent limitations are governed by local regulations .Depending upon character and volume of the industrial wastes, sore pre-treatment may be required to render them acceptable to the municipal sys-tem.
14. In determining plant effluent loadings and applying these stand-ards, it is essential that currently well recognized and accepted labora-tory analytical techniques be utilized. Detailed procedures may be foundin the literature.
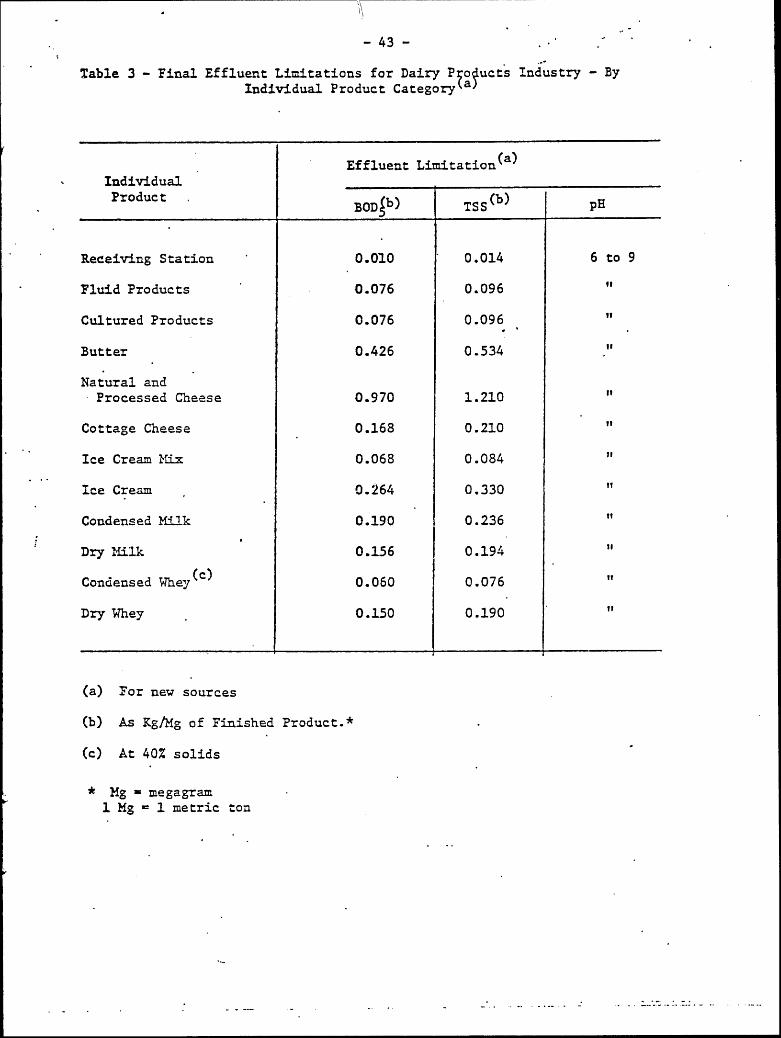
- 43 -
Table 3 - Final Effluent Limitations for Dairy P o ucts Industry - ByIndividual Product Category
Effluent Limitation(a)IndividualProduct BOD b) TSS(b) pH
Receiving Station 0.010 0.014 6 to 9
Fluid Products 0.076 0.096
Cultured Products 0.076 0.096
Butter 0.426 0.534
Natural andProcessed Cheese 0.970 1.210
Cottage Cheese 0.168 0.210
Ice Cream lix 0.068 0.084
Ice Cream 0.264 0.330
Condensed Milk 0.190 0.236
Dry 1ilk 0.156 0.194
Condensed Whey(c) 0.060 0.076
Dry Whey 0.150 0.190
(a) For new sources
(b) As Kg/Mg of Finished Product.*
(c) At 40% solids
* Mg - megagram1 Mg 1 metric ton
-44-
CONTROL AND TRFATMENT OF WASTES
15. Control and reduction of waste discharges can be achieved through(1) in-plant control and management; (2) end-of-pipe treatment; and (3)discharge to municipal systems. In nost cases a combination of two ofthese is utilized.
16. In-plant control and management techniques should always be ap-plied, regardless of final disposal of plant effluents. Final dischargeswill be reduced in strength and/or volumes, thus reducing loading on treat-ment systems.
17. Internal measures most commonly used include: (1) a ccmprehen-sive waste nonitoring system to provide a basis for effective waste manag-ment; (2) an equipment maintenance program to minimize product losses; (3)a product and process scheduling system to assure optimum equipment utili-zation; (4) a product quality control program to prevent loss of productsto waste streams; (5) development of uses for waste products; and (6) con-stant improvement of processes, equipment and systems.
18. The major concern in treatment of dairy wastes is to reduce theconcentration of oxygen-demanding materials, and thus make wastes generallyamenable to one form or another of biological treatment. More commonly ap-plied techniques include activated sludge, trickling filters, aeration la-goons, stabilization ponds, spray irrigation, ridge and furrow irrigation,and anaerobic digestion. In general practice, wastes are treated by a com-bination of these techniques, depending upon volumes, strengths, effluentstandards, and other conditions.
19. Probably the nost difficult problem in disposal of, dairy wastesis whey handling. In many cases, whey supply exceeds that which can bemarketed for useful purposes. Whey is difficult to treat by usual biologi-cal techniques. The most ccmnon methods for disposal include (1) livestockfeeding; (2) spray irrigation; (3) discharge to nu.Lnicipal systems wherefeasible; and (4) concentrating and drying.
20. Depending upon the volume and strength of the wastes and capabil-ity of the nunicipal treatment system, dairy wastes may be discharged topublic sewers. The dairy waste load may need to be equalized eitherthrough individual holding facilities or through incidental storage inmunicipal sewers, in order to av6id shock loads on the municipal treatmentplant. Effective in-plant control measures will reduce the strength andvolume of the effluents. Where the dairy waste constitutes a significantportion of the total volume reaching the nunicipal plant, the whey shouldbe segregated to avoid possibly upsetting the municipal treatment system.

-45-
BIBLIOGRAPHY
1. "Develonent Document for Effluent Linmitations Guidelines and New
Source Performance Standards for the Dairy Product Processing Point
Source Category". U.S. Environmental Protection Agency. Doc. EPA440/1-74-021-a. Washington. (May 1974).
2. Nemerow, N.L. "Liquid Waste of Industry - Theories, Practices, andTreatment". Addison-Wesley Publishing Conpany, Inc. Reading, Mass.(1971).
3. Finch, J. "Gdidelines for the Control of Industrial Wastes - Dairy
Wastes". World Health Organization. Doc. WHO/WD/71.7. Geneva (1971)
4. Jones, H.R. "Pollution Control in the Dairy Industry". Noyes Data
Corporation. Park Ridge, N.J. and London, England (1974).
- 46 -
THE WORLD BANK APRIL 1983
OFFICE OF ENVIRONMENTAL AFFAIRS
DUST EMISSIONS
GENERAL POLLUTION GUIDELINES
Introduction
1. Two series of dust guidelines are presented: one for the work-
place and one for the environment beyond the plant fence.
2. Dust concentration LeveLs inside industrial or agroindustrial
plants are threshold Limit vaLues (TLV) for workers exposed eight hours a
day, and forty hours per week. For this reason, a plant should be designed
and operated to provide actual dust Levels weLL below the TLV.
3. Concentration LeveLs given for environment (beyond pLant bound-
aries) couLd probably be exceeded a few times per year without experiencing
permanent adverse affects. .
4. The Office of Environmental Affairs (OEA) wiLL revise these
guideLines when additional knowLedge from inside- or outside the-Bank-Group
warrants changes.
Definition and Properties of Dust
5. Dust or particulate matter consists of fineLy divided soLids, so
smaLL in size as to be capable of remaining suspended by the atmosphere for
Long periods of time. The Lower size Limit for particuLates is the transi-
tion size to Larger gas moLecuLes (about 0.1 um or Less), whereas the upper
particuLate size Limit is about 500 pm. When the upper size Limit is ex-
ceeded, gravity wiLL remove a particLe from the air so rapidLy, that it
cannot constitute a breathing hazard. IndustriaL, agroindustriaL, trans-
portation and domestic activities aLL can release particulates into the
air. This dust may or may not be mixed with other gaseous or Liquid
contaminants.
6. The five main factors which infLuence the interaction between
dust and the human body are:
(a) PhysicaL characteristics (size, shape, hardness)
(b) ChemicaL composition(c) Concentration in the atmosphere
(d) Duration of exposure(e) IndividuaL susceptibi Lity
7. Size of dust particLe: Dust retention by human Lungs varies with
particLe size as shown by the foLLowing table (from the US Bureau of
Mines):
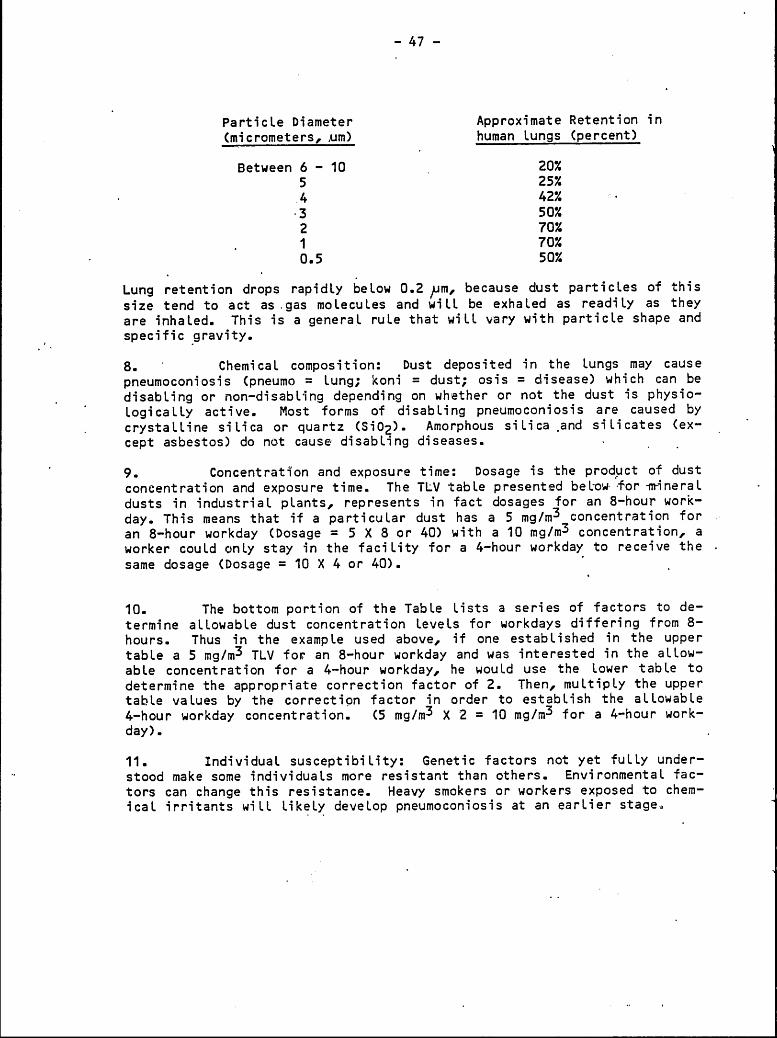
-47-
ParticLe Diameter Approximate Retention in
(micrometers, ,um) human Lungs (percent)
Between 6 - 10 20%5 25%
42%13 50%2 70%1 70%0.5 50%
Lung retention drops rapidLy beLow 0.2 pm, because dust particLes of this
size tend to act as .gas moLecuLes and wiLL be exhaLed as readiLy as they
are inhaLed. This is a general rule that wiLL vary with particle shape and
specific gravity.
8. Chemical composition: Dust deposited in the Lungs may cause
pneumoconiosis (pneumo = Lung; koni = dust; osis = disease) which can be
disabling or non-disabling depending on whether or not the dust is physio-
LogicaLLy active. Most forms of disabling pneumoconiosis are caused by
crystaLLine siLica or quartz (WO2). Amorphous siLica and siLicates (ex-
cept asbestos) do not cause disabling diseases.
9. Concentration and exposure time: Dosage is the product of dust
concentration and exposure time. The TLV table presented beLow- for -m-ineraL
dusts in industrial plants, represents in fact dosages for an 8-hour work-
day. This means that if a particuLar dust has a 5 mg/m 3 concentration for
an 8-hour workday (Dosage = 5 X 8 or 40) with a 10 mg/m3 concentration, aworker couLd onLy stay in the facility for a 4-hour workday to receive the
same dosage (Dosage = 10 X 4 or 40).
10. The bottom portion of the TabLe Lists a series of factors to de-
termine aLLowabLe dust concentration Levels for workdays differing from 8-
hours. Thus in the exampLe used above, if one established in the upper
table a 5 mg/m3 TLV for an 8-hour workday and was interested in the aLLow-
able concentration for a 4-hour workday, he wouLd use the Lower table to
determine the appropriate correction factor of 2. Then, multipLy the upper
table vaLues by the correction factor in order to estabLish the aLLowabLe
4-hour workday concentration. (5 mg/m3 X 2 = 10 mg/m 3 for a 4-hour work-day).
11. Individual susceptibiLity: Genetic factors not yet fuLLy under-
stood make some individuals more resistant than others. Environmental fac-
tors can change this resistance. Heavy smokers or workers exposed to chem-
ical irritants wiLL LikeLy deveLop pneumoconiosis at an earLier stage.
-48-
SampLing and Measuring Dust
12. AccurateLy determining dust concentrations in the air remains a
problem. One must remember that totaL dust is much Less important than re-
spirable dust. The sampLing instrument should thus dupLicate insofar as
possible, retention characteristics of the human Lung. A number of such
instruments have been developed. The best known are the British MRE (Mines
Research EstabLishment) and the American personal sampLer. Their retention
characteristics are compared with the human Lung in TabLe 1. There is a
good correLation between these two instruments. The MRE sampLer coLLects
1.88 times more than the personal sampLer. As these instruments wiLL coL-
* Lect onLy a few miLLigrams of dust over an eight hour period an accurate
and sensitive baLance is necessary to weigh the coLLected particLes. The
preceding discussion shows why it is imperative to provide the sampLing in-
strument name and its retention characteristics with any anaLytical
results.
OccupationaL GuideLines
13. Occupational guidelines given in the foLLowing table are extrac-
ted from Occupational Safety and Health Administration (US Department of
Labor) and from the bookLet "TLV" pubLished by the American Conference on
GovernmentaL IndustriaL Hygienists (1977). As discussed earlier, entries
* in this tabLe are TLV values for 8-hours exposure. ActuaLLy, any facility
shouLd be designed and operated to give LeveLs. weLL below .these vaLues (no
more than one-haLf the TLV is recommended).
14. When figures are presented in miLLions of particLes per cubic
foot (mppcf) they were determined by measurements on impinger sampLes
counted by Light field techniques.
VegetabLe Dust
15. If these dusts contain Less than 1% Si02 the inert dust TLV vaLue
applies. If they contain more than 1% Si02 the quartz TLV applies. Many
of these dusts produce aLLergic reactions either from their own antigen
content or from moLd or fungi dusts that grow during storage. Vegetable
dusts can create three kinds of hazards: respiratory effects, skin and eye
effects and fires and explosions.

- 49 -
Table 1.
10 0
i Pulmonary Deposition80-\
2 Personal Sampler (cyclone)
0 3 MRE Samplcr60 -2
40 -
20 -
0 2 4 6 8 l0o, 12Pace Dlameter (micrometers)
.Source: U.S. Burezu of Mi1nes. S=mpling an-d Evpluating Respirable Coal1Mine Dust:A Training Mý'anual. U.S. Bureau of Min',-es, nomainCircular No. 8503,Februar-y 19'il, p. 3. Adapted from Fig-ure 1.
OL..

- 50 -
TLV FOR DUSTS
Based on 8-Hour Workday
Substance mppcf mg/m_
,Silica (SiO7)
CrystaLLine QuartzRespirabLe *1,4 300 10
%SiO2 + 10 %Si02 + 2
Total Dust 30
%Si02 + 2
CristobaLite Use one haLf of the
Thidymite vaLues caLcuLated fortotaL dust
TripoLi (Respirable) *4 10+ 2%Si.02+2
Fused SiLica Use quartz formuLa
'Amorphous RespirabLe *4 1 (< 5/um)
(including diatomaceous earth)
TotaL 3 (aLL sizes)
SiLicates (< 1% quartz)
Asbestos (aLL forms) *3 2 fibers (> 5um)/ccGraphite (naturaL) 15Mica 20 --
MineraL WooL Fiber -- 10PerLite 30 --
PortLand Cement 30 --
Soapstone 20 --
TaLc (Non-Asbestiform) 20 --
TaLc (Fibrous) Use asbestos vaLue
TremoLite Use asbestos vaLue
CoaL Dusts
BituminousRespirabLe fraction <5% Si0 2 * 2.4RespirabLe fraction >5% 5i02 * 10
%Si02 + 2
Inert or Nuisance Dusts (2)
Respirable *4 15 5TotaL 50 15

- 51 -
TLV CORRECTION FACTORSFOR
WORKDAYS DIFFERING FROM 8 HOURS
Workday Hours TLV Correction Factor
1 8.02 4.04 2.08 (Base Case) 1.0
10 0.815 0.5320 0.4
Notes: (1) Both concentration and % 5i02 to be determined from dust
fraction passing a size selector with the foLLowing charac-
teristics.
Aerodynamic Diameter (pm) % Dust Passing
(unit density sphere) Through the SeLector
< 2 902.5 753.5 505.0 2510.0 0
(2) Should contain Less than 1.0% quartz; if quartz content is
greater use quartz formuLa.
(3) As determined by the membrane fiLter method, at 400-450 X mag-
nification (4 mm objective) with phase contrast iLLumination.
(4) Respirable dust as defined by the British MedicaL Research
CounciL criteria, and as sampLed by a device producingequivalent results (MRE sampLer).

- 52 -
EnvironmentaL Guidelines
16. The U.S. Department of Health, Education and Welfare estimates
adverse human heaLth effects begin when ambient Levels of dust exceed 80
pg/m3 , whereas adverse effects on materials and vegetation can begin with
'dust Levels as Low as 60 pg/m3 . These estimates formed the basis of the
foLLowing EPA dust guidelines (issued in July 1974).
(a) 75 pg/m3 -- annual geometric mean(b) 260 ,Pg/m3 -- maximum 24 hour concentration,
no more than once a year.
To make these guideLines easier to use, EPA. (at the same time) aLso pro-
vided a guideLine for stack discharges: 50 mg/m3 (dry). As a comparison,
the USSR guideline is 150 pg/m3 (maximum 24 hour concentration). The pre-
ceding figures are applicable to totaL inert dust (< 1% Si02 ) containing no
carcinogenic compounds. Large variations from one project to another exist
in terms of requirements for dust controL.
These variations are due to the physicaL and chemical characteristics of
dusts between projects,' climate (dry or rainy, calm or windy), and otherfactors of Location. Therefore it is difficuLt to offer universaL guide-
Lines for dust controL. As a ruLe, the foLLowing LeveLs should not be ex-
ceeded:
Stack Emissions:
When background LeveLs of dust are high, dustemissions from the stack shouLd not be greater
than 100 mg/m3
Ambient Levels:
AnnuaL geometric mean 100 ,ug/m3
Maximum 24-hour concentration 500/ug/m3
If the dust under consideration is affecting vegetation, the annuaL meanand 24-hour concentration figures shouLd be adjusted downwards.
SampLing and AnaLysis
17. OnLy anaLyticaL resuLts which give both sampLing method and meth-
od of analysis are meaningful. The most reLiable sample is "respirabLedust". If it is not possible to coLLect a "respirable dust" sampLe, thetotaL dust sampLe shouLd be evaLuated. Whatever sample type is selected,the name of the sampLing instrument and its retention characteristic should
be given. Weighing a sampLe (if possible) is the most accurate method of
anaLysis. Precautions shouLd be taken to weigh onLy dry dust from whichaLL moisture (humidity) has been removed. ParticLe counting is less accu-rate than weighing, but nonetheLess is acceptabLe for any siLcate exceptasbestos. If particle counting is the only avaiLabLe means for asbestos,it shouLd onLy be done for fibers Longer than 5 um.

-53-
Control
18. The appraisaL mission should receive assurances that the projectwiLL meet the guideLines and that necessary equipment and trained personneLwiLL be avaiLable to sampLe, analyze, and take any necessary correctivemeasures. FoLLow-up missions should check analysis results in comparisonto the guidelines. If results are higher than guideline va'Lues, mission
members shouLd ask for reasons and discuss possibLe corrective measures.
LegisLation
19. If existing Legislation in the project country incorporates duststandards or guidelines stricter than IBRD's guidelines, country standards
prevaiL.
20. If, on the other hand, existing LegisLation in the project coun-
try is Less restrictive than IBRD guidelines, the appraisaL mission shouldpresent reasons why it is expected that plant personneL and the neighboring
exposed popuLation and its environment wiLL be as weLL protected as if the
guideLines were foLLowed.

- 54 -
THE WORLD BANK CCTOBER 1982
OFFICE OF ENVIROIMENTAL AFFAIRS
GENERAL GUIDELINES
DISPOSAL OF INDUSTRIAL EFFUJENTS
1. These guidelines are intended for general application to disposal
of effluents and pollutants for most industrial sources. Although general
in nature, they should be applied to the total environment whether the ef-
fluents are in the gaseous, liquid or solid state. These guidelines may be
applied where particular data is not otherwise available, or as a supple-
ment for those specific industries where guidelines have been developed by
the Bank.
2. Polluticn may be defined as the addition, fram either natural or
man-made sources, of any foreign substances to the air, water or land in
such quantities as to render such medium unsuitable for specific or estab-
lished uses. An industry may frequently produce wastes that affect rore
than one of these media. Thus, the Appraisal or Supervision Mission must
consider the total range of disposal operations in order to properly evalu-
ate effluent treatment and control measures. Toxic properties are of prime
concern in evaluating effects of industrial pollution. Table 1 presents a
surmary of waste toxicity frcm a number of industries.
3. Pollution may also result fram noise and heat, which are measur-
able in term of intensity and effect but have no physical, chemical or bi-
ological composition.
4. This guide is concerned primarily with the effects of pollution
on the environment. However, consideration should also be given to the ef-
fects of specific contaminants on personnel at the industrial work place.
SOURCES AND CHARACTER OF WASTES
5. Effluents are frequently complex, heterogeneous mixtures of sev-
eral substances or materials. Gaseous effluents may include particulates
(solids) or aerosols (liquids); liquid effluents may include dissolved
solids or gases, as well as suspended solids; and solid wastes often con-
tain one or several liquids.
Gaseous Effluents
6. Airborne pollutants originating at stationary sources whether or
not diluted with air, are generally exhausted through a stack. From the
stack they will disperse into the atnsphere and eventually return to
ground level. Ground level concentrations may be estimated on the basis of
the stack height and diameter at stack muth, gas velocity or flow, and
temperature. For new installations some of this information will need to
be derived from performance at existing installations.

- 55 -
TABLE 1 - Some Hazardous Wastes Produced by Industry(a)
Toxic Waste ProducedIndustry
Solvents Metals Gases Org. Inorg.
Mining X X X
Textiles X X
Paper Prod. Etc. X X
Alkalai & Chlorine X
Cyclic Internediates X X X X X
Organic Chemicals X X X X X
Inorg. Chemicals X X X X
Plastics X X X
Drugs X X X
Soaps & Cleaners X
Paints, etc. X X X
Agri. Chemicals X X X
Explosives X X
Petr. & Coal Products X X X X X
Leather Tanning X X X
Asbestos Products X X
Blast Furn. & Steel X X X X
Non-Ferrous Metals X X
(a) Fran "A Study of Hazardous Waste Materials, Hazardous Effects andDisposal Methods", Vol. 1, Report PB 221-465. Booz-Allen AppliedResearch, Inc. Available from National Technical Information Service,Inc., Springfield, Va. (1973).

56-
7. Gaseous effluents most frequently result fran combustion proces-ses. They may also be either by-products of chemical reactions or suspend-ed particulates resulting fran mechanical operations such as grinding.Principal inpurities of combustion gases generally include sulfur dioxide(SO 2 ) particulates (flying ash or carbon), nitrogen oxides (NOx), carbondioxide (CO), and mercury compounds from combustion of certain coals.
8. Chemical products released to the atmosphere are too numerous tomention, and depend upon the particular industry considered. As examples,hydrofluoric acid and fluoride compounds evolve from production of bothaluminum and phosphoric acid; arsine a particularly lethal arsenic com-pound, (AsH3 ) can result from the burning of- pyrites or blends in a reduc-ing atmosphere.
9. Quarrying and mining operations can discharge dust or particulatematter into the atmosphere, as can plants producing steel, cement, and fer-tilizers. While dusts may create environmental problems, it is importantto note that they may also create serious occupational hazards if the workplace has been poorly designed or is not properly operated. The humanhealth problem is of primary importance in these situations.
Liquid Effluents
10. Apart from normal human wastes discharges, other liquid effluentsfrom industrial plants consist principally of cooling water and waste by-products dissolved or suspended in water originating from the process orother sources. In many cases the gaseous effluents are stripped of par-ticulate matter by wet scrubbers which, in turn, discharge to plant sewers.
11. Cooling water, as the nomenclature implies, is used to cool pro-cess materials. It is generally uncontaminated in flowing through theplant, except for an increase in temperature and for containing chromatesused to protect surfaces from corrosion. When cooling water is combinedwith other waste streams, the total effluent will contain these other con-taminants.
12. Liquid effluents will generally be at temperatures higher thanthose in receiving waters . Therefore, care must be exercised to keep thetemperature differences as small as possible to avoid harmful effects onaquatic plant and animal species living' in the receiving waters.
13. As a general guideline for Bank projects, effluent temperaturesshould not be more than 30 C higher than that of the receiving waters.Where the receiving water temperatures are at 28* C or less, the effluenttemperature may be a maximum of 50 C above that of the receiving waters.In cases where maintaining these differentials causes excessive increasesin project costs or undue harm to fisheries or other aquatic life, the max-im=u allowable temperature may be determined from the following equation:
Tmax = OT + URLT-OT3

-57 -
Where: Tmax = Maximum allowable stream temperature after mixing
OT = Optimum temperature for species affected
URLT = Ultimate recipient lethal temperature for species affected.
14. An important but frequently overlooked source of liquid pollutionis the. accidental or deliberate discharge of hazardous materials. Toxicmaterials have been known to reach adjacent waterways during plant start-upperiods because of accidents or inadequate preparation. Village wells andsurface supplies have been contaminated from careless disposal ofion-exchange unit backwash discharges. Where toxic materials are used orproduced in the industrial operations, measures for prevention ofaccidental spills should be established and fully described by appraisaland supervision missions.
Solid Wastes
15. Land may become polluted or rendered otherwise unsuitable forspecific uses through addition of waste materials. Among the more commonsubstances are (1) paper, cartons, plastics, and other packing materials;(2) rubble frcm demolition and other discarded building materials; (3)stripped soil, exposed erodable soil and tailings from mining operations;(4) slag heaps frcm smelting operations; (5) pulp, pits, culls, vines andother organic residuals from canning operations; and (6) organic sludgesfrom pulp and paper mills, textile plants and other industrial operations.
16. Land disposal may include spray irrigation, lard farming,sanitary landfull, deep well disposal and "secure" burial.
17. Proper location and operation of disposal sites are principalfactors in handling solid wastes. A general unsightliness, noxious odorcaused by deconposing organic residues, and breeding of disease carriers,can result fram improperly operated areas.
18. Dust may also create a problem at dump sites that are completelydry. These sites should be kept to a minimum or eliminated, depending upontheir composition and the environment surrounding the disposal site.
MANAGEMENT OF WASTES
19. Measurement of effluents, both as to quantity and quality isbasic to a waste management program. Acceptable and recognized techniquesare readily available for this purpose. The management program will in-volve sampling and analysis of effluents, flow measurements, application ofestablished standards, and control of discharges through treatment or othermeans. Standardized laboratory techniques should be utilized to assuredata acceptability.

- 58 -
Sampling and Analytical Procedures
20. Monitoring of air contaminants may be accomplished through emis-sion source testing or atmospheric monitoring. Industrial processes mayinvolve frequent cyclic changes. Therefore source monitoring must be care-fully timed so that measurements are nade when the process is operating intypical fashion. Fluctuations of peak loadings must be determined. Allwaste source variables should be defined so that samples will represent
typical process conditions.
21. Atmospheric monitoring requires establishment of an air monitor-ing network. Incation of the sampling stations should be based on the useto be made of the data, such as (1) source-oriented monitoring for enforce-ment purposes; (2) zones of highest projected pollution concentrations; (3)background data needs prior to industrial development* (4) high populationdensity areas; and (5) background data needs where industrial developmentis not imrninent.
22. Analytical methods for air contaminants are described in the lit-erature. Methods are generally classified as chemical or physical, andcover dustfall, suspended particulate matter, gaseous substances and organ-ic pollutants.
23. Wastewater sampling points should be such that flow conditions inthe discharge stream will have achieved a homogeneous mixture. The efflu-ent discharge velocity at the sampling point should be high enough toassure collecticn of a well-mixed representative sample.
24. Flow measurements are an integral part of any wastewater monitor-ing program. Selection of a method will depend upon the facilities avail-able, the degree of precision required, and the conditions under which thewastes are discharged (batch operations, operating periods, etc.). Theweight of contaminants discharged to a receiving stream can be calculatedfrom both the flow rate and the measured concentration of contaminants de-rived from the analytical data.
25. Techniques for the qualitative, analysis of wastewaters fall intofour categories; chemical, physical, biological and biochemical. Specificanalyses will depend upon the nature of the industrial operation and otherfactors determined on a case-by-case basis.
26. All significant waste streams, including single or conbinedflows, which are present or planned, should be described in terms of flowrate (volumetric) and their chemical, physical, and biological characteris-tics. If partial or full treatment of the waste stream is being or will beprovided, a full description should be furnished by the missions.

-59-
27. Solid wastes from industry often pose special problems such asnon-degradability (plastics) and toxicity (chemical residues). In estab-lishing disposal methods, solid wastes should be classified and rated as totheir effects such as (1) human toxicity; (2) groundwater contamination;(3) biodegradability; and (4) nobility. Chemical, physical, and biologicalmethods, as described above, are normally used to analyze air and watereffluents from solid waste disposal areas.
28. Quantities of solid wastes are measured in terms of both volume-and weight. Leachates are measured by collecting all drainage frcm thedisposal area, and passing it through a device for flow measurement andsample collection.
Units of Measurement
29. In order to permit conparison of data between projects it is es-sential that, insofar as possible, the same units be used in reporting en-vironmental data. With the rapid movement towards universal use of metricunits throughout the scientific and technical communities, Bank missionsshould confine themselves to that system.
30. More commonly-used metric units are as follows:
Gaseous Effluents: Micrograms per Normal cubic meter pg/3m3 (normal)*Milligrams per Normal cubic meter pg/m3 (norrmal)Grams per Normal cubic meter g/m3 (normal)
Liquid Effluents:Milligrams per liter rg/LMicrograms per liter pg/L
Solid Effluents: Milligrams per kilogram of mg/kgsolid waste (dry basis)
Flows: Liters per second L/sCubic meters per hour m3 /h
Pressure: Kilograms per square centimeter kg/cm2
Newtons per square centimeter N/cm2
Temperature: Degrees Centigrade *C
* Normal Conditions: O0 C, 101.3 kPa (760 mm Hg)kPa - kilo Pascals
- 60 -
Application of Standards
31. "Standards" are be defined as levels at which specific materialsmay be safely discharged to the environment. "Standards", "regulation",and "norm" are terms frequently applied very loosely in appraising aplant's performance. A strict definition may differ between countries, or*even between regions in the same country. Therefore, appraisal and super-vision missions should clearly define standards used in rating effluentdisposal performance. Data for both standards used and a plant's perform-ance should be expressed in units of contaminant per unit of production ofraw material input.
Effluent Controls
32. Reducticn of waste effluents to meet applicable discharge stand-
ards can be acconplished by in-plant measures (process changes, good house-keeping, etc.), treatment systems, or some combination.
33. Measures for reducing gaseous effluent contaminants include (1)
operational improvements; (2) increasing stack height; (3) removal of gasesby adsorption, absorption, catalytic conversion, or other methods; and (4)particulate removal systems such as filters, sedimentation, centrifugalseparators, electrostatic precipitators, wet scrubbers or other equipment.
34. Techniques applicable for liquid effluent disposal include in-plant measures and process changes, discharge to mnicipal treatmentsystems, or on-site treatment facilities designed to reduce specific con-taminants. 'When releasing liquid effluents, precautions nust be taken toavoid contamination of adjaceant aquifers, particularly in the case of
deep-well injection. Thorough tests, using tracer dyes or other nethods,should be conducted at each specific location where it is planned to usethis method.
35. Handling and disposal of solid wastes nust give attention to theland at the disposal site, as well as the effect of disposal methods on airand water resources. Sites should be designed and operated to prevent, orminimize or properly channel runoff. Runoff collection and settling havebeen effective for this purpose. Latex films covering waste piles have al-so been effective. Unprotected waste piles are subject to leaching whichmay result in acidic or alkaline effluents percolating to streams or aqui-fers used for water supply.
36. Appraisal missions should make certain that engineering designsfor the project have incorporated necessary treatment equipment and con-trols to achieve predetermined acceptable levels of effluent quality. Themission should also make certain that equipment cost is included in pro-ject funding, and is properly scheduled for procurement and delivery.Plans should also be developed for the training or employment of personnelto efficiently use the equipment. The sampling and analysis program shouldbe critically reviewed to assure comlete coverage of industrial opera-tions, including night shifts and weekends.

- 61 -
37. Supervision missions should ascertain that pollution controlequipment has been installed, that it is being efficiently operated, andthat adequate monitoring is being provided to assure continuing conformancewith control requirements.
38. In all cases, proposed or actual handling of waste materials andfinal effluents should be coupletely described. This is particularly im-portant with large projects involving several contractors. Where treatmentelements are being planned and designed by different organizations or agen-cies, it must be ascertained that these elements are compatible with each-other and will result in an overall system that.reduces plant discharges toacceptable levels.
ENERGY CONSIDERATIONS
39. Energy needs for the individual plant must be considered. Thefuel requirements for optimum operation of a plant have been determined fora number of industries: Fuel consumption for new plants should readilymeet the established levels or ranges. Failure to meet these limitationsshould be fully explained by the Bank's missions.
BIBLIOGRAPHY
1. "Environmental Considerations for the Industrial Development Sector".The World Bank, Washington. (August 1978).
2. "Treatment of Industrial Effluents". Ed. by A.G. Callely, C.F.Forster, and D.A. Stafford. John Wiley & Sons, New York. (1976).
3. Powers, P.W. "Hdw to Dispose of Toxic Substances and IndustrialWastes". Nayes Data Corporation. Park Ridge, N.J. and London.(1976).
4. "Land Application of Residual Materials". Selected Papers-EngineeringFoundation Conference, September 26 - October 1, 1976. Pub. byAmerican Society of Civil Engineers, New York. (1978).
5. "Manual on Urban Air Quality Management". European.Series No. 1.World Health Organization, Regional Office for Europe, Copenhagen.(1976)
6. Nemerow, N.L. "Liquid Wastes of Industry - Theories, Practices, andTreatment". Addison-Wesley Publishing Co., Reading, Massachusetts.(1971)
7. "Air Quality Control - Naional Issues, Standards and C-oals". NationalAssociaticn of Manufacturers, Washington. (1975)
8. "Analysis of Raw, Potable and Waste Water". U.K. Department of theEnvironment, HMSO, London. (1972)

- 62 -
9. "Standard Methods for the Examination of Water and Wastewater" 14th
Edition. American Public Health Association, New York. (1975)
10. "Standard Methods for the Water Quality Examination for the Member
Countries of the Council for Mutual Economic Assistance". Ministry of
Forestry and Water Management, in cooperation with the Hydraulic
Research Institute, Prague. (1976)
11. Martin, W. & Stern, A.C. "The Collection, Tabulation, Codification,
and Analysis of the World's Air Quality Management Standards". Vol.
I. ESE Publication No. 380. University North Carolina, Chapel Hill.
(October 1974)
12. "Water Quality Criteria - 1972". U.S. Ehvironmental ProtectionAgency, Washington. (March 1973)
13. "Quality Criteria for Water". U.S. Environmental Protection Agency,
Washington. (July 1976)

- 63 -
TE WORLD BANK AUGUST 1979
OFFICE OF ENVIRONMTAL AFFAIRS
1NDUSTRIAL LIQUID EFFLUENT
LAND DISPOSAL AND LAND TREATMET
1. When land is available and concentrations of toxicants are lowenough, land disposal is the simplest technical and the most economical wayto dispose of liquid effluents.
2. If the effluent is suitable, it can be used for land treatmentincluding irrigation and soil desalination.
Land DisDosal
3. In this technique, the affluent is spread on a piece of land fora few hours, then on a second piece for the same amount of time, and so onuntil it is possible to come back to the first when the water has beenabsorbed and the biological oxidation completed.
4. It is difficult to give figures in a general guideline. The arearequired depends on the type of soil, its thickness and on the characteristicsof the industrial wastes. It is advisable to err on the conservative side
. . when estimating the land necessary and this estimation should be.left tospecialists.
5. All agro industries liquid effluents (i.e. slaughter houses, dairies,sugar plants etc.) can probably be disposed of on land as most of the impuritiescan be subjected to biological oxidation.
6. The US EPA estimates that land disposal is 20% more economical thanthe usual techniques. When the effluent contains nitrogen and/or phosphorus,land disposal is an easy way to prevent eutrophication of a lake or a river.
Land Treatment
7. Certain industrial effluents can be beneficial if used on the land.A few industries produce water as a by-product (i.e. urea). When this wateris pure or, as in the case of urea, only slightly contaminated with beneficialproducts like ao and urea, it can be used in irrigation. Because of thecontinuous supply.'"I, crops can increase from one per year to two or three.
1/ The yearly plant turn around can be done during monsoon time and/orcrop harvesting.

-64-
8. Cooling water used in process industries can also be used for irrigationif chromates are replaced by phosphates as corrosion inhibitors and if the freechlorine is kept to a low value.
9. This raises the question of considering the industrial effluents oneby one instead of mid"ng them in,a pond or lagoon and then deciding on thetreatment. Some effluents can be used without treatment, others with somevery slight treatment and these two could then be disposed of on the land oreven used in irrigation, the rest mst be treated and discharged in a waterwayor in the sea.
10. The advantages of land treatment affects not only the economics ofthe project but also of the agriculture in the region. For this reason landtreatment should be considered as the first option in any industrial project.
BIBLIOGRAPHY
1. A History of Land Application as a Treatment Alternative.United States Environmental Protection Agency,April 1979- 430/9- 79-012,Washington D.C. 20460.
2. EPA Design Manual for Land Treatment (in preparation).
- 65 -
TEE WORLD BANK JANUARY 1981
OFFICE OF NVIRONMENTAL AFFAIRS
ELECTROSTATIC PRECIPITATORS (ESP's)
GIDELINES
1. Electrostatic Precipitators (ESP's) are one of the best ways to collectdust from gaseous effluents. Several industries use them extensively; amongthem, cement, mining, steel and non-ferrous metals. They act by ionizing thedust particles in the gas stream. The particle is then pulled towards an electrodeby the electrostatic field then removed from the electrode and collected.
ES? Design
2. The design takes into account the following factors:
gas flow and compositiondust concentration in raw gasdust concentration exit ES?
All other conditions being equal, the dust amount in the gas exit ESP will determinethe characteristics of the precipitators (electrode total surface).
3. If, instead of a 100 mg/m3 concentration we want 50 mg/m3 exit ESP, wewill have to practically double the electrode total surface and, at the same time,the equipment price.
4. From the preceding, it is easy to see that the most important technicalguarantee is the dust concentration exit ESP. Defining ESP performance by theratio of dust removed over total dust should be avoided as this depends on thedust concentration inlet equipment.
5. The US and West German standard is now 50 mg/Nm 3 in the stack.
World Bank Guidelines
6. The World Bank guideline will be 100 mg/m 3 in the stack. The concen-tration 150 mg/m3 can be accepted if the plant is in a rural area, and if dustconcentration at ground level is within World Bank guidelines inside the plantfence and 260 ,pg (microgram)/im3 maxim= outside the plant fence.
7. Up to 1980 the ESP for LDCs were designed usually for 300 mg/m3 . Thishas created problems particularly in conjunction with low level stacks. Thedecrease to 100 mg/m3 will also have the added benefit of decreasing the shutdown time and the maintenance cost on the extracting fan. At 300 mg/m3 in apower station using normal coal (10% ash), the fan has to be shut down every3 to 4 months to rebalance or replace some blades.
- 66 -
THE WORLD BANK APRIL 1983
OFFICE OF ENVIRONMENTAL AFFAIRS
ETHANOL PRODUCTION
ENVIRONMENTAL GUIDELINES
1. EthanoL, an organic chemicaL, is commonLy used as an industrial
soLvent, in medicine, and in the manufacture of alcohoLic beverages. It
can be used as a fueL, but is costLier than hydrocarbon fueLs.
2. - EthanoL (ethyL alcohol) can be produced by fermentation from any
of three main types of biomass raw stocks: (a) sugar bearing materiaLs
(such as sugarcane, moLasses, and sweet sorghum); (b) starches (such as
cassava, corn, babassu mesocarp, and potatoes); and (c) ceLLuLoses (such as
wood and agricuLturaL residues).
3. Production of ethanoL from these materials first requires con-
version of the carbohydrate into soLubLe sugars (except when sugar bearing
materiaLs are used), then fermentation of the sugars into ethanoL, and fin-
aLLy separation of ethanoL from water and other fermentation by-products by
distiLLation.
RAW MATERIALS
4. Sugarcane is considered to be the most suitable raw materiaL. It
not only requires the simpLest conversion method but its processing also
generates a waste product caLLed bagasse. Bagasse is generaLLy dried and
used as a fueL for generating steam and power needed for crushing, fermen-
tation, and distiLLation operations. One ton of sugarcane having an average
sugar content of 12.5 percent produces about 70 Liters of ethanoL by'direct
fermentation of the juice. Sugarcane gives one of the highest ethanoL
yieLds per hectare of crop Land, and is currently the most commonLy used
raw materiaL worLdwide.
5. Cane moLasses, a by-product resulting from the extraction of
sugar from cane and known as blackstrap moLasses, has been the most widely
used raw materiaL. Production of one ton of sugar yields 190 'Liters of mo-
Lasses, containing 50 to 55 percent fermentabLe sugar. A ton of moLasses
(consisting mainLy of sucrose, gLucose, and fructose) wiLL yieLd about 280
Liters of ethanoL. Sugar production from beets wiLL also yieLd moLasses
which couLd be used as a source for ethanoL.
6. Main starch materiaLs of interest as ethanoL sources are cassava
(aLso caLLed mandioca) and corn. Cassava is a root wideLy grown as a sub-
sistence crop in a number of developing countries. Under proper condit-
ions, cassava yieLds can reach 20 tons per hectare. One ton of cassava
yields about 180 Liters of ethanoL. Use of cassava produces no suitabLe
residuaL energy source.

- 67 -
7. HistoricaLLy, corn has been used principaLLy for fermentation in
whiskey production, and as a minor source of industriaL alcohoL. Consider-
able work is currently underway to produce ethanoL for use as a gasolinebLend. Corn yields average 6 tons per hectare, and a ton of corn yieLds
about 368 Liters of ethanoL. Corn-based ethanoL plants do not produce any
residuaL fueL suitabLe as an energy source.
8. Wood and agricultural crop residues are the principal ceLLuLosicmaterials used. EthanoL production from this source is more complex andLarger in scaLe than that from sugar and starches. No commerciaL scaLprocesses, suitable for use in deveLoping countries, are currently avaiL-abLe. Considerable development work is presentLy being carried out in many
countries, and this may become an important biomass source at some futuretime. Since this source is not commerciaLLy proven, it wiLL not be dis-cussed further in this document.
MANUFACTURING PROCESSES
9. In a plant using sugarcane as the raw material, cane is washed,crushed, and then fiLtered to separate ceLLuLose (or bagasse) from the sug-ar juice. The juice is concentrated and steriLized. This is foLLowed byyeast fermentation of the juice in a batch system. Yeast is removed bycentrifuging, treated (to grow additional yeast), and recycLed to the fer-mentation system. Bagasse is dried and burned to generate steam and powerto meet in-plant requirements.
10. ConventionaL ethanoL technoLogy uses batch fermentation with com-
mon strains of yeast to produce a solution containing 8 to 10 percent aLco-hoL after 24 to 72 hours fermenting. A concentration of 8 to 10 percentethanoL is the maximum achievabLe in batch systems.
11. Fermented mash (caLLed "beer") is sent to a stripping column.Here, two separate streams are made, the ethanoL product stream (with atrace of water) and a waste stream, caLLed stiLLage. The stiLLage con-tains most of the water and the fermentation soLids. It must be properLydiscarded to avoid environmentaL poLLution.
12. The stream containing the ethanoL is distiLLed in a muLtistagecoLumn to a concentration of about 94 percent ethanoL. Anhydrous ethanoL,having 99.8 percent purity, is produced in a third distiLLation coLumn, byadding benzene and further distiLLing. Benzene is separated from the aLco-
hoL and recycLed.
13. If the end product is to be hydrous or straight aLcohoL, contain-ing 94 percent ethanoL, the third distiLLation step is not used, thus redu-
cing steam requirements and eLiminating the need for benzene.
14. The basic process for other sugar materiaLs is the same as des-cribed above. The size of fermentation and distiLLation units might bedifferent, depending upon raw materiaLs used and resuLting materiaLs baL-ance. For these sugar materiaLs, fermentation takes 4 to 5 times Longerthan in the case of sugarcane.
- 68 -
15. Operations in a starch based ethanoL plant are aLso similar, ex-
cept that mash preparation is required prior to fermentation. Cassava
roots, (containing 25 to 30 percent starch) are frequently used. First,
they are washed, peeLed, and Liquified in a cooker. Liquified starch is
broken down into fermentable sugar by adding two enzymes: amyLase and gLuco
amyLase. Once fermentable sugar is formed, processing is identical to that
for sugarcane, beginning at the fermentation step.
16. Cassava roots contain essentiaLLy no ceLLuLose. No bagasse is
formed and energy r1equirements must be supLied from externaL sources.
17. Other starch bearing materials use practicaLLy the same process-
ing procedures as cassava, aLthough preparation faciLities must be designed
for the particular crop being used.
18. A process fLow diagram for sugarcane and starch-based pLants is
presented in Figure 1.
19. TechnoLogy for production of ethanoL from biomass has not changed
greatLy in recent years. However, with the increasing interest in the use
of aLcohoL as a fueL, severaL efforts are underway.
20. Continuous fermentation, though not yet commerciaLLy developed,
can yieLd Liquor with up to 12 percent alcohoL content. AdditionaL micro-
bioLogical research is in progress to improve yeast strains to yieLd higher
alcohoL concentrations during fermentation. This technoLogy is expected to
reduce energy requirements for distiLLation and simuLtaneousLy reduce stiL-
Lage volume as weLL.
21. Use of agriculturaL wastes for feedstock or fueL purposes and the
development of new or improved crops as raw materiaLs are aLso receiving
some attention. A major constraint in utiLizing cassava and corn is the
need for externaL fueL sources. Certain agriculturaL waste products couLd
be made suitable for fueL purposes by modifying current boiLer designs.
WASTE SOURCES AND CHARACTERISTICS
22. EthanoL production produces a number of waste products having an
impact on the environment. No extremely toxic waste streams are associated
with the biomass conversion technoLogies. OccasionaLLy some heavy metaLs
may be found, but this is rare.
23. Sources of air emissions for a particular ethanoL facility wiLL
depend upon the feedstock used. The utiLization of grains rather than sug-
ar feedstocks wiLL generate particuLate emissions during unLoading, Load-
ing, conveying, rough grinding, screening, cLeaning, and fine miLLing the
stock.
24. GeneraLLy, air emissions originate from fermenter vents as weLL
as the condenser vents on distiLLation coLumns. Fugitive voLatiLe organic
compound emissions aLso occur at valves, pumps, flanges, open-ended Lines,
and storage tanks, throughout the plant.

s CAssAA7 jE6P71 PASTE PiREPARATNON
AND SIOnAGE WAAER ENZYME51 EN21M1I*
WAILM VAPO LFACION AND
WAWLIE-~i R-- -- cnttN
- n]II L t INGS C14t1 1. i l
WATE 1At
PIIELIt101FAC1IIIN
STIEAM
FInMENTAT ION AND FI TRATION DISIULLATION
¥EAST
ANHIV0MOUS
PR[
I FMINtAM4hN
-EtitMcIAiIN ... t.L-
oIIct PriRnOU14s URAZIL
Figure 1. Process Flow Diagram Sugarcane and Starch Based Plants.

- 70 -
25. Carbon dioxide is produced during fermentation. Due to high re-
covery costs, the gas is usuaLLy vented to the atmosphere. Trace amounts
of ethanoL may occasionaLLy escape with the carbon dioxide. Trace amounts
of benzene may also escape from the dehydration/benzene recovery process,
in both the gaseous and Liquid wastes. Benzene discharges are not consid-
ered harmful so Long as they are Limited to trace amounts. Such dischar-
ges shouLd be regularly monitored since benzene is a known carcinogen and
is highLy explosive. Regular equipment maintenance and proper housekeeping
procedures wiLL generaLLy provide adequate controL.
26. FuseL oiLs produced as one of the fractions in the distiLLation
column, consist mainLy of amyL or isoamyL aLcohoLs and glyceroL. About 5
kilograms of fuseL oiLs are produced per 1000 Liters of ethanoL. This vaL-
uable by-product is either soLd to outside markets or bLended with the eth-
anoL as a fueL denaturant. (A denaturant is an additive which, once com-
bined, is very difficult to separate and makes the mixture unfit for human
consumption). MoLasses fermentation yields about 1.1 Liters of fuseL oiL
per 1000 kiLograms of feedstock. With corn the yieLd amounts to about 3
percent of the alcohoL produced.
27. StiLLage consists of non-fermentabLe materiaL, and can be removed
at various points in the production process. The most commonLy used meth-
od, resulting in minimum ethanoL Loss, is to withdraw it from the bottom of
the stiLL during or after distiLLation (thus the term stiLLage). This
waste can have a biochemical oxygen demand (BOD 5 ) as high as 40,000 mg/
Liter and contain about 10 percent of solid material. StiLLage contains
some fertilizer nutrients made up of about 1 percent nitrogen, 0.2 percent
phosphate, and 1.5 percent potash.
28. Yeast grows rapidly in the fermentation step, and the excess is
generaLLy recovered, purified, and recircuLated into the system. Yeast re-
covery wiLL amount to about 72 grams per Liter of ethanoL produced.
29. If steam and power for conventional sugarcane base operations are
generated from burning bagasse, particuLate emissions may resuLt. Were
sugarcane is not the biomass source, fossiL fueLs are generaLLy used and,
dependent upon the choice of fueL, emissions of suLfur oxides, nitrogen ox-
ides and particulates may result.
30. CooLing tower bLowdowns are another waste source. This stream
(having high concentrations of dissolved inorganic materiaL) wiLL be high
in soLids but Low in B0D 5. Feedstock pLant and equipment washes constitute
another signifiant waste stream, and can acount for up to 20 percent of the
totaL BOD5 Loading.
31. FLy ash, coaL dust, and grain dust are the primary soLid wastes
resulting from fermentation process using coaL as a source of fueL.

- 71 -
EFFLUENT LIMITATIONS
32. Many of the waste materials resulting from ethanoL productionyield valuable by-products, or are suitable for other uses. For other poL-Lutants,as discussed below, treatment methods are available for eLiminatingor reducing their discharges to the environment.
33. Where disposaL to the environment is unavoidable, effLuent dis-charge Levels are to be reduced to the foLLowing:
Air Emissions
SuLfur Dioxide (as S02): Ann. Arith. Mean 100 jag/m3
Max. 24-hr. Peak 1000lyg/m3
Nitrogen Oxides (as NO2): Ann. Arith. Mean 100 /g/m3
Particulates: Ann. Geom. Mean 75 ug/m3
Max. 24-hr. (once 260 ug/m3per year)
Benzene 1 ppm
Liquid Wastes
5-Day BOD : 30 to 60 mg/LSuspended SoLids : 30 to 60 mg/LpH : 6 to 9 Units
WASTE CONTROL TECHNOLOGY
34. Emissions from the various steps in the process can be reduced toacceptable LeveLs by use of conventional mechanicaL coLLectors or wetscrubbers. This wiLL remove or drasticaLLy reduce both the particuLatesand gases. A Liquid waste, containing the particuLates as suspendedsoLids, wiLL be produced and wiLL require disposal.
35. Carbon dioxide is recoverabLe, and it may be economicaL to do soif a market is readiLy avaiLaLbe. It can be used in the manufacture ofcarbonated beverages, fire extinguishers, dry-ice production, food process-ing, and the chemicaL industry. Some 70 to 80 percent of the carbon diox-ide is recoverable. The gas contains a few impurities (such as aLdehydesand aLcohoLs) and these do cause odors. They can be readiLy removed by ab-sorption or adsorption.
36. FuseL oiL is a combination of higher aLcohoLs, its compositiondepending upon the crop used to supply the sugar base. It can be used as afeedstock in chemicaL production and as a soLvent. It may aLso be burnedas a fueL. In Large scale fermentation it is removabLe in an extra column,fractioned, and marketed as a by-product. Removal is not practical in asmaLL scaLe pLant.
- 72 -
37. StiLLage constitutes by far the major Liquid waste requiring dis-
posaL. It is high in both BOD and suspended soLids (in the range of 30,000
to 40,0000 mg/Liter), and volumes wiLL be in the range of 10 to 15 times
the voLume of the ethanoL produced. The waste has found wide usage in many
countries as animaL feed, fertiLizer, and for crop irrigation.
38. Starch crop fermentation stiLLage contains non-fermentabLe solids
in suspension-and in solution. The waste can be applied directly to the
Land as a fertiLizer, but the amounts must be carefuLLy monitored, because
of their acidity and odor. The coarser solids can be separated, dried, and
bLended with the dried soLubLe materiaL. These are normaLLy referred to as
distiLLers dark grains (DDG) or, when combined with the dried soLubLe ma-
teriaL, as distiLLers dried grains with solids (DDGS). The nutritionaL
value of these products for animaLs wiLL vary according to the feedstock
and production process used.
39. StiLLage products from beverage distiLLeries are generaLLy aLL
used for animaL feed. The bourbon whiskey industry is the main source,
with corn being the principaL feedstock. Wheat and rye stiLLages are aLso
used for this purpose. In addition to suppLying protein and energy, such
feeds aLso act to stimuLate digestive processes in ruminants. DistiLLers
feeds have been found to be of benefit to chickens, turkeys, beef and dairy
cattLe, caLves, sheep, swine, and warm-water fish.
40. Residue from moLasses fermentation is aLso used as an animaL
feed, but mainLy for dairy cattLe. It is aLso used as an antidusting agent
in feed mixing and handLing. The residue contains potash salts, nitrogen
compounds, and phosphates and hence can be used as a fertiLizer. As a fer-
tiLizer, it can be applied directly to.the soiL as a Liquid, but costs and
Logistics tend to Limit its use to areas cLose to the fermentation faciLi-
ties. Excessive use can create a number of problems, such as proliferation
of insect pests.
41. Under normaL operations the stiLLage, after removaL, is separated
into solids and Liquids (thin stiLLage). After initiaL screening and pro-
cessing through a dewatering press the soLids wiLL stiLL contain about 65
percent water, and are known as wet stiLLage. This may be fed directLy to
Livestock. One head of cattle wiLL consume the stiLLage produced from pro-
duction of about 3.8 Liters of ethanoL. Further drying is necessary if
Long-distance transportation or Long-term storage is required. The dried
materiaL must be protected from insects and rodents.
42. The thin stiLLage of fermented grains aLso contains vaLuabLe pro-
teins and carbohydrates, but it is difficuLt to dry any further. It is
acidic and may be applied directly to the soiL through irrigation systems.
It may also be anaerobicaLLy fermented to produce methane.
43. Where stiLLage wastes are not used for by-product recovery or
other beneficiaL use, they shouLd not be dicharged to surface waters with-
out treatment. If volumes are smaLL in reLation to the capacity of an
availabLe pubLicLy owned sewage treatment plant, the wastes may be dis-
charged to pubLic sewers.

- 73 -
44. If Large volumes are to be handLed, then treatment should be pro-vided at the plant site. The nature of this waste is such that treatmentmethods normaLLy used for domestic sewage may be applied. Secondary treat-ment, such as activated sLudge or trickLing fiLters, may be used after someform of pretreatment to remove the high concentrations of organic materialsand solids. The BOD 5 and suspended soLids should be reduced to the 300mg/Liter range before secondary treatment. Again depending on voLumes,settLing ponds or Lagoons may aLso be used, particuLarLy if the operationis seasonal and based on the availabiLity of crops. Care must be taken toavoid damaging ground waters.
45. The Liquid waste from the wet scrubbers shouLd receive treatmentbefore discharge to the environment. Since the principal contaminant is inthe form of suspended solids, the discharge can go to settLing or evapora-tion ponds.
46. The principal solid wastes wiLL be the sLudges resuLting from in-plant waste treatment facilities and the settLed solids from any ponds op-erated at the site. Consideration should be given to possibLe recovery ofvaLuable by-products from the solids which are generated. Otherwise thesolids shouLd be removed and dumped on controLLed (such as diked) areas inthe plant. Means shouLd be provided for preventing rain runoff into nearbysurface or ground waters.
47. Ocean disposaL of wastes is to be avoided whenever possibLe.However, when no other options are available and it becomes a method ofLast resort, expert services shouLd be engaged to design the system. Thisis a highLy specialized field, in which onLy a few designers have had ex-tensive experience.
48. Initial planning for an ocean outfaLL should include a comprehen-sive survey of the proposed ocean discharge area to determine the foLLow-ing, as a minimum:
(a) Currents - direction, magnitude, frequency, variationwith depth, relation to tide, water dispLacements, etc.;
(b) Densities -.variation with depth, as determined from saLinityand temperature data and standard tabLes;
(c) Submarine topography, geoLogy, and bottom materiaLs;
(d) Marine bioLogy; and
(e) Turbidity, dissoLved oxygen, and other physicaL and chemi-caL characteristics.
49. The data derived from this survey shouLd be the basis for designof the outfaLL and diffusion system. Wastes discharged into the ocean aresubject to three stages of diffusion or mixing:

- 74 -
(a) InitiaL jet mixing, which is infLuenced by jet strength,
currents, and density differences;
(b) DeveLopment of a homogeneous diffusion field; and
(c) TurbuLent diffusion of the entire waste field due to
naturaL oceanic turbuLence.
50. The factors infLuencing these stages wiLL incLude:
(a) OutLet design. For optimum diLution the jets shouLd dis-
charge horizontaLLy with no initiaL upward veLocity;
(b) Number of outLets. A multipLe outLet diffuser wiLL dis-
charge over a Large area and provide more effective
diLution and dispersion. ALL other factors being equal,
the singLe outLet unit wiLL generaLLy require a Longerdistance and greater depths to the point of discharge;
(c) Diffuser velocity. The veLocity in aLL parts of thediffuser shouLd be sufficient to prevent deposition ofresiduaL particLes. For settled wastes a veLocity in therange of 0.61 to 1 meter per second is considered a minimum;
(d) FLow distribution. The outfLow between the variousdiffuser outLets shouLd be fairLy uniform. Where thismay be difficuLt, as in the case of a sLoping sea bottom,the distribution shouLd be fairLy uniform at Least for
the Low and medium flows anticipated; and
(e) Prevention of seawater intrusion. Seawater entering thepipe becomes stagnant, and wiLL tend to trap grit and other
settLeabLe materiaLs, causing reduction of hydrauLic capacity.
BIBLIOGRAPHY
1. PauL, J.K. (Ed.) "EthyL ALcohoL Production and Use as a Motor
FueL". Noyes Data Corporation. Park Ridge, New Jersey. (1979).
2. The WorLd Bank. "ALcohoL Production from Biomass in the Developing
Countries". Washington (November 1980).
3. "ALcohoL FueLs from Biomass". In "Energy TechnoLogies and the En-
vironment". U.S. Department of Energy. Doc. DOE/EP-0026. Washing-
ton (June 1981).
4. SeLtzer, Richard E. "Economic Impact of Effluent ReguLations on the
Rum Industry (Puerto Rico and U.S. Virgin Islands)". Prepared for
U.S. EnvironmentaL Protection Agency by Development PLanning and Re-
search Associates, Inc. Manhattan, Kansas 66502 (March 1979).

- 75 -
5. Houghton-ALico, Doann "ALcohoL FueLs-Policies, Production, and
PotentiaL". Westview Press. BouLder, CoLorado 80301. (1982).
6. "Study of Rum DistiLLery Waste Treatment and By-Product Recovery
Technologies". SCS Engineers. Long Beach, CaLfornia 90807. (1979).

- 76 -
CTHE WORLD BANK MARCH 1983
OFFICE OF ENVIRONMENTAL AFFAIRS
GUIDELINES
FERTILIZER MANUFACTURING WASTES
1. Fertilizer use has increased sharply in recent years. By 1973,total world consumption of N-P-K (nitrogen-phosphorous-potassium) fertiliz-ers bad reached 77 million metric tons, having doubled over the pzecedingeight years. Largest tonnage increases were in &eveloped countries ofEurope and North America, but greatest percentage increases were in lesserdeveloped regions of Asia, Africa and Latin America.
2. While formulation of fertilizers, as well as other manufacturingaspects will vary between plants and countries, there are many common pro-duction elements in which affect both discharge of waste effluents and sub-sequent environmental effects.
MANUFACTURING PROCESSES
3. Fertilizer plants produce two types of product - nonmixed (orstraight) and mixed. Nonmixed fertilizers contain only a single major nu-trient, while mixed fertilizers contain two or more primary nutrients. Forpurposes of these guidelines the industry will be further subdivided asfollows:
Nonmixed Fertilizers
Nitrogen Based
-Ammonia-- Urea --Amnium Nitrate
Phosphate Based
--Phosphoric Acid-- Normal Superphosphate--Triple Superphosphate
Mixed Fertilizers
Ammonium Phosphate and N-P-K's
4. Nitrogen fertilizer manufacture includes four basic process
plants: ammonia, urea, nitrate, and nitric acid.

- 77 -
5. Ammonia is the basic nitrogen fertilizer constituent, and is pro-duced by reaction of hydrogen with nitrogen. Urea, another major nitrogensource, is produced by reaction of ammonia with carbon dioxide to form am-monium carbamate, which in turn is dehydrated to form urea. Urea plantsusually share a common site with like-size ammonia plants, so that the lat-ter not only supplies ammonia but also high purity carbon dioxide needed toproduce urea.
6.' Amonium nitrate is produced by reaction of ammonia with nitricacid. The resulting- product is a. solution, which can be sold as a liquidor further processed into a dry product. In some cases the final dry formwill be prills (or pellets). In other cases the final product will becrystals.
7. Nitric acid is produced in many plants for use in ranufacturingnitrogen fertilizers such as ammonium nitrate. Nitric acid is generallymade by partial oxidation of amm onia with air, followed by further oxida-tion and absorption in water to produce a 55 to 65 percent solution.
8. Phosphate fertilizer facilities are usually separated geographic-ally from nitrogen facilities, and therefore are discussed separately inthese guidelines. The manufacturing process is comprised of eight separatecomponents: sulfuric acid production, phosphate rock grinding, wet processphosphoric acid production, phosphoric acid concentration, phosphoric acidclarification, and preparation of: normal superphosphate, triple superphos-phate, and armnonium phosphate, respectively.
9. The basic components are sulfuric acid production and wet processphosphoric acid production. Sulfuric acid is the essential raw materialin producing phosphoric acid and normal superphosphate. It is now usuallymanufactured by the Contact Process, using elemental sulfur, air, andwater.
10. Raw materials used in producing phosphoric acid are ground phos-phate rock, sulfuric acid, and water. Other acids, such as nitric and hy-drochloric, may also be used. The resulting phosphoric acid solution isconcentrated by evaporation, clarified for removal of precipitated solids(consisting mainly of iron and aluminum phosphates, soluble gypsum, andfluorosilicates) and then distributed to markets.
11. Normal superphosphate is produced by mixing 65,to 75 percent sul-furic acid, ground phosphate rock, and water. Following mixing and initialsettling of 1 to 4 hours, the mixture is transferred to storage for 3 to 8weeks to allow complete chemical reaction between the acid and the rock.The basic chemical reaction is as follows:
Ca3(PO4)2 + 2H2 S04 + 5H 2 0
2 CaSO4 .2H 2 0 +,Ca(H 2 PO4 ) 2 .H 2 0
(Normal Superphoshate)

- 78 -
12. Triple superphosphate (TSP) is produced by corrbining phosphate
rock, phosphoric acid, and water. Two types of TSP are manufactured, using
the same raw materials: Run-of-Pile (ROP) and Granular Triple Superphos-
phate (GTSP).
13. The ROPphate, except that phosphoric acid is used instead of sulfuric acid. Mix-
ing of the phosphoric acid and phosphate rock is done in a cone mixer.
This produces a slurry, which rapidly becomes plastic and solidifies. So-
lidified material passes through a rotary mechanical cutter, which breaks
it up and discharges to storage piles for curing. Following 2 to 4 weeks
of curing, the product (triple superphosphate) is taken from storage, sized
and Bhipped to markets. The solidification process may release obnoxious
gases which can create air pollution problems.
14. The GTSP process utilizes a lower concentration of phosphoric
acid, different proportions of the same ingredients, and other changes from
the ROP process. The product is a hard, uniform, pelletized granule made
in equipment which permits easy collection and treatment of dusts and nox-
ious fumes.
15. Aronium.phosphate fertilizers are produced in two major formula-
tions: ronoammnium phosphate (MAP) and diamnonium phosphates (DAP).
These vary in the amount of nitrogen and phosphate present. The two pri-
mary raw materials, in either case, are anrnia and wet process phosphoric
acid. Sulfuric acid is sometimes used in certain MAP formulations. The
final granular product is dried, cooled, and shipped. Small sized granules
are separated and used as recycle material.
16. Luring the past several years there has been a trend towards com-
pound fertilizers. While these have always been popular in the United
States, their use has grown considerably in Western Europe and Japan.
These coumpounds (sometimes referred to as mixed fertilizers) are produced
by mixing inorganic acids, various solutions, double nutrient fertilizers,
and certain types of straight fertilizers mixed in accordance with require-
ed N-P-K ratios. Another form of compound fertilizers, called blend ferti-
lizers, are produced by simple combination of granular dry straight and
inixed fertilizers, again, in accordance with the N-P-K ratio required,
SOURCES AND CHARACTERISTICS OF WASTES
17. Fertilizer industry wastes can affect air, water, and land re-
sources of an environment. Pollution problems arise from low process effi-
ciency, disposal of unwanted by-products, contaminants in flue dusts and
.gases, contaminants in process condensates, and accidental spills or
losses.
18. In production of nitrogen fertilizers, no air pollution results
from amnonia and urea manufacture. Overhead vapors from neutralizers in
the reaction of armonia with nitric acid to form crystal armoni=n nitrate
which ay lead to an air pollution problem. However it can frequently be
handled by cyclones or baghouses. Concentrator and prill tcwer exhausts
can contain ammonium nitrate particles and ray also result in an air pollu-
tion troblem.

-79-
19. Liquid wastes from the nitrogen fertilizer industry can originatefrom wastewater treatment plant effluents (filtration, clarification, soft-ening, deionization), closed loop cooling tower blowdown, boiler.blowdown,compressor -blowdown, process condensates, spills or leaks, and nonpointsource discharges. Nonpoint polluted water sources ay originate from air-borne armonia dissolving into falling rain or snow, or prill dusts or othermaterials lying on the plant grounds, dissolving into rainwater as it runsoff various surfaces in the vicinity of the fertilizer plant.
20. Since air pollution p-.blens for a nitrogen fertilizer complexare considered minor in nature, to air pollution parameters are applied.Major wastes are liquid in nature and are measured in terms of ammonia ni-trogen, organic nitrogen, nitrate nitrogen, and hydrogen-ion concentration(pH).
21. Phosphate fertilizer plants generate considerable amounts of dustin grinding phosphate rock. Fluorine (as SiF4 ) ay evolve in the acidula-tion process (changing phosphates in phosphate rock from an insoluble to asoluble state). Air pollution problems are caused by ROP production.While dust and obnoxious fumes result,from GTSP production these are read--ily collected and treated.
22. Liquid effluents include water treatment plant wastes, coolingtower and boiler blowdowns, make-up water, spills and leaks, surface run-off, and gypsum pond water. Cooling is- generally by indirect mans, andcooling waters are not contaminated. In the United States the majority ofphosphate fertilizer plants impound and recirculate all water which hasdirect contact with process gas or liquid streams. Uses include barometriccondensers, gypsum sluicing, gas scrubbing, and heat exchangers. This con-taminated water is normally not discharged from the plant complex.
23. Fluoride emissions are the principal air pollution concern inphosphate fertilizer plants. Hence this is the only air pollutant forwhich effluent limitations are provided in this guideline. Primary param-eters for liquid wastes are phosphorous, fluorides, suspended solids, andTpH.
24. For all fertilizer plants, solid materials may be found in stor-age piles, settled dust, and similar forms. As rain water falls upon thesedust sources, dusts may be swept into the rainwater runoff. This will in-crease both the dissolved and suspended solids levels in these runloffwaters.
EFLUENT LIMITATIONS
25. Effluent limitations are given below for nitrogen, phosphate, andmixed fertilizer plants. The permissible levels are based on best current-ly available demonstrated control technology.
26. For all plants, where applicable,' the ambient air quality levelsshould not exceed those given in Table 1, to assure public health protec-tion.

-80-
Nitrogen Fertilizer Plants
27. Except for ammonia, as given in Table 1, air emissions from ni-
trogen fertilizer plants are usually of minor inportance under proper op-
erating conditions. Therefore, no other limitations are included for gase-
ous effluents fran this type of plant. Limitations for liquid effluents
from nitrogen plants, as presented in Table 2. Where applicable, gaseous
nitric acid effluent limitations are the same as those for phosphate ferti-lizer plants, as shown in Table 3.
Table 1 - Arbient Air Quality Limitations a/
Pollutant Period Limitationug/m3 . b/
Particulates Ann. Geom. Mean 75
Max. 24-Hours 260
Sulfur Oxides:Inside plant fence Ann. Arith. Mean 100
Max. 24-Hour peak 1000Outside plant fence Ann. Arith. Mean 100
Max. 24-Hour peak 500
Carbon Mbnoxide Max. 8-Hour 10,000
Max. 1-Hour .40,000
Photochem. Oxidants Max. 1-Hour 160
Hydrocarbons Max. 3-Hour 160
Nitrogen Oxides Ann. Arith. Mean 100
Atmonia Max. 8-Hour 72,000
a/ From "Expert Group Meeting on Minimizing Pollution From Fertilizer
Plants". Helsinki, 26-31 August 1974. UUIDO. Vienna (1974).
b/ ug/m3 : Microgram/cubic reter.

- 81 -
Table 2 - Liquid Effluent Limitations for Nitrogen Fertilizer Plants
Liitation - Kg/MgType of Plant Parameter of Product
Daily Ratio
Anonia An=onia as N 0.11
Urea
Non-prilled Amnonia as N 0.065Prilled " 0.065Non-prilled Organic N as N 0.24Prilled 0.7
Armonium Nitrate
Non-prilled Aumnia as N 0.05Prilled " 0.10Non-prilled Nitrate as N 0.025Prilled 0.05
All Plants pH (no units) 6 to 9

-82-
Phosphate .fr>artilizer Plants
28. Limits on gaseous emissions from phosphate fertilizer plants are
presented in Table 3.
Iable 3 -- Gaseous Emission Limits for Phosphate Fertilizer Plants
Process Parameter. Limitation
Nitric Acid Nitrogen Oxides (NOx) 1.5 kg/Mg Product
Visible Emissions 10% Opacity a/
Sulfuric Acid Sulfur Dioxide (SO 2 ) 2.0 kg/Mg Productas 100% Acid
Acid Mist 0.075 kg/Mg Productas 100% Acid
Visible Emissions 10% Opacity a/
Wet Process Phos- Fluorides (as F) 10 gm/Mg Equiv. b/
phoric Acid I P2 05 Feed
Superphosphate Fluorides (as F) 5 gm/Mg Equiv.
P2 05 Feed
Triple Superphosphate- Fluorides (as F) 5 gm/Mg Equiv.
ROP and Granular P2 05 Feed
Visible Emissions 20% Opacity a1
Triple Superphosphate- Fluorides (as F) 0.25 gm/hr/M ton
Gran. Equiv. P2 05 Stored
Storage Facility
a/ "Opacity" is defined as the degree to which emissions reduce the
transmission of light and obscure the view of an object in the
background.
b/ g = gram1 megagram = 1 metric ton1 Mg = 1 metric ton
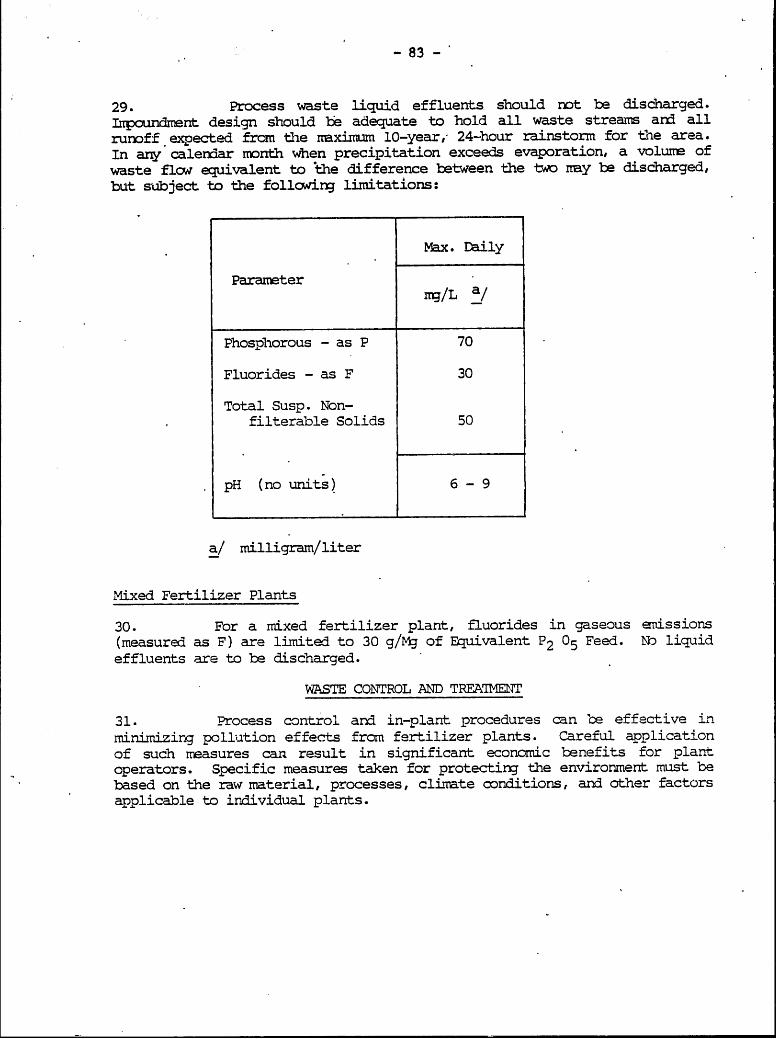
- 83 -
29. Process waste liquid effluents should not be discharged.Iupoundment design should be adequate to hold all waste streams and all
runoff expected frm the maximum 10-year, 24-hour rainstorm for the area.In any calendar month when precipitation exceeds evaporation, a volume of
waste flow equivalent to the difference between the two ny be discharged,but subject to the following limitations:
Max. ]Daily
Parameterng/L a/
Phosphorous - as P 70
Fluorides - as F 30
Total Susp. Non-filterable Solids 50
pH (no units) 6 - 9
a/ milligram/liter
Mixed Fertilizer Plants
30. For a mixed fertilizer plant, fluorides in gaseous emissions
(measured as F) are limited to 30 g/Mg of Equivalent P2 05 Feed. No liquid
effluents are to be discharged.
WASTE CONTROL AND TREATMENT
31. Process control and in-plant procedures can be effective in
minimizing pollution effects from fertilizer plants. Careful application
of such measures can result in significant economic benefits for plant
operators. Specific measures taken for protecting the environment must be
based on the raw material, processes, climate conditions, and other factors
applicable to individual plants.

- 84 -
32. For nitrogen fertilizer plants, ammonia stripping has been found
effective for removing ammonia in process condensates, and boiler and
cooling tower blowdowns at anmonia, urea, and ammonium nitrate plants. The
stripping medium may be -either air or steam, depending upon the use to be
made of the overhead vapors, local air pollution regulations, and other
factors. At urea plants hydrolysis has been used to convert urea in waste
streams back to amonia and carbon dioxide.
33. Recently a nmber of investigations have been nade into removing
nitrate from wastewater by the use of biological action in aerated ponds or
basins. Ion exchange units have also been used successfully to remove
amnonia and nitrates from waste waters. At ammonium nitrate plants
condensates contain anmonia, ammonium nitrate, and some oxides of nitrogen,and these all require treatment before discharge. These condensates have
been used as absorber feed in the nitric acid plant. Thus creating an
internal use of the waste stream which results in recovery of both ammonia
and nitrate. Oils and greases can also present problems in nitrogen
fertilizer complexes, but application of available technology can reduce
these pollutants to less than 25 mg/liter.
34. For phosphate fertilizer plants, technology exists for reducing
contaminants present in waste effluents. Air pollution of SO2 from sulfur-
ic acid plants can be reduced by use of the "double-contact" process or am-
monia scrubbing. Tail gas from nitric acid plants, containing oxides of
nitrogen (NOx), can be handled by extended absorption or catalytic reduct-
ion. In general, gaseous eniissions as a group can be reduced by the use of
absorber towers. They are either collected as dusts or water scrubbed.
35. Although there should be no discharge of liquid effluents from
phosphate fertilizer plants, rainfall conditions may be such as to require
treatment of discharges on certain occasions. Frequently reductions in
pollutant concentrations can be effected on separate process streams.
Critical points where neasures can be applied include: (1) cooling water
blowdown and accidental leakage from sulfuric acid coils; (2) drainage from
waste by-product gypsum piles; and (3) seepage from gypsum ponds.
36. Because of differences in production of N-P-K fertilizers, re-
sulting pollution problems will vary widely. Usually cyclones and filter
bags will reduce dust emissions in dry-process plants. In other cases
scrubbers will be the preferred alternative and these, in turn, will re-
quire further pollution control procedures for the resulting liquid ef flu-
ent.

- 85 -
BIBLIOGRAPHY
1. "Minimizing Pollution from Fertilizer Plants". Report of an ExpertGroup Meeting, Helsinki, 26-31 August 1974. UN Industrial DevelopmentOrganization. Vienna (1974).
2. Hignett, T.P., "Recent Developments in Fertilizer Production Technologyand Economics, with Special Reference to An=monia and Compound Fertiliz-ers". ASPAC Food and Fertilizer Technology Center. Taiwan (August1974).
3. Finneran, J.A. "Guide to Building an Ammnia Fertilizer Complex". UN
Industrial Development Organization. Vienna (1969).
4. "World Guide to Pollution Control in the Fertilizer Industry". British
Sulphur Corporation. London (1975).
5. "Development Document for Effluent Limitations Guidelines and New
Source Performance Standards for the Basic Fertilizer Chemicals Segment
of the Fertilizer Manufacturing Point Source Category". U.S. Environ-
mental Protection Agency. Washington. Doc. EPA-440/1-74-011-a (March1974).
6. "Development Document for Effluent Limitations Guidelines and NewSource Performance Standards for the Formulated Fertilizer Segment of
the Fertilizer Manufacturing Point Source Category". U.S. Environ-mental Protection Agency. Washington, Doc. EPA/1-75-042-a (January1975).
7. "Standards of Performance for New Stationary Sources". U.S.Environmental Protection Agency. Washington (August 1, 1976).

-86-
THE WORLD BANK OCTOBER 1982
OFFICE OF ENVIRONITAL AFFAIRS
GUIDEINES
FISH AND SHELLFISH PROCESSING
1. There is a wide variety of finfish and shellfish which could be
processed at projects involving Bark financing. Therefore, it is not pos-
sible to prepare a guideline covering all forms that may be encountered.This document will deal only with ocean fish and marine life, and will con-
fine itself to a representative group of species, thereby providing informa-tion considered typical of and applicable to processing, canning, and pre-
serving of fish and shellfish.
2. Specific species to which these guidelines may be applied in-
clude, but are not limited to, salmon, herring (sometimes as sardines in
the immature state), ocean perch, mackerel, halibut, cod, sole, tuna,
clams, oysters, scallops, crab and shrimp.
PROCESSING OPERATIONS
3. Harvesting utilizes a wide range of old and new technologies for
supplying the basic raw material. Techniques fall into one of four general
methods; netting, trapping, dredging, and line fishing. Airplane spotting
and other systems are sometimes used for locating the fish. Once harvestedand aboard the vessel, the catch is either taken directly to a processing
plant or is iced and frozen on board for later delivery.
4. At the receiving point, the catch is unloaded, weighed, and
transported by conveyor or suitable containers to the work area. It may be
processed imrediately or transferred to cold storage. Pre-processing pre-
pares the catch for the later cperations. It nay consist of washing of
dredged crabs, thawing of frozen fish, beheading shrimp at sea, and other
operations prior to butchering. Wastes from butchering and evisceration
are usually dry-captured or screened fran the waste stream and processed as
a fishery by-product.
5. Except for those portions intended for the fresh fish and seafood
markets, some form of cooking or pre-cooking is usually practiced in order
to prepare the caInndity for the picking and cleaning operation. Precook-
ing or blanching facilitates removal of skin, bone, shell, gills, and other
parts which nust be separated before marketing. In same cases steam con-
densate fram this operation is collected and further processed as a by-pro-
duct. For example, the condensate or stick water from the tuna precook.
Stick water is water which has been in close contact with the fish, and
contains large amounts of entrained organics.

- 87 -
6. End product is prepared in its final form by picking or cleaning
to separate edible fram non-edible portions. Non-edible portions resulting
fran this procedure are usually collected and saved for by-product process-
ing. The cleaning operation may be manual, mechanical, or a combination of
the two. With fresh fish or fresh shell-fish, the neat product is packed
into suitable containers and held under refrigeration until shipment . to
consumer outlets. If the final product is to be held for extended periods
before consunption, then freezing, canning, pasteurization, refrigeration,
or same combination of these is used for preservation to prevent spoilage.
7. Fish and shellfish, and their waste products, are frequently used
for production of such industrial cocodities as fish meal, concentrated
protein solubles, oils, liquid fertilizers, fish food pellets, kelp pro-
ducts, shell novelties and pearl essence. Se species are used primarily
for industrial purposes. Fbr example, menhaden and anchovy are utilized
extensively for preparation of fish meal, and added as- a protein supplement
in animal feeds; oils are used in shortening, margarine, lubricants, and
cosmetics; and fish solubles are used as liquid fertilizers.
SOURCES AND CHARACTERISTICS OF WASTES
8. Edible product yield is highly variable. In general, yields for
shellfish are in the 15 to 20 percent range while that for fish such as
tuna or salnon yield reach the range of 60 or more percent. Extensive
beneficial uses made of non-edible fish portions greatly reduces waste dis-
charge.
9. Wastewater parameters of major inportance in the canned and
preserved seafood processing industry are the 5-day, 200 C, biochemical
oxygen demand (BOD 5 ), total suspended solids (TSS), combined oils and
greases, and pH. Normally, these wastewaters contain no hazardous or
toxic materials (heavy metals, pesticides, etc.). Occasionally highly
concentrated sodium chloride (NaCl) solutions may be discharged. These can
interfere with biological treatment system unless pretreatment, such as
dilution or flow equalization, is provided prior to disposal.
SaLmon
10. Wastewater flow rates in a salmon processing plant will depend on
whether the butchering operation is carried out by machine or by hand.
Machine operations will result in higher flow rates, (BOD 5 , and TSS). Many
plants will enplay both machine and hand butchering, depending on the
species, quanity of catch to be processed and other factors.
11. In both fresh and frozen salmon processing, the principal source
of wastewater is the wash tank operation. Here eviscerated fish are
cleaned to renove adhering blood, tissues lining the body cavity
(mesantaries), sea lice, and visceral particles. A preliminary rinse of
the fish, as caught, is sometimes used to reduce the amount of slime
adhering to the carcass and to facilitate handling. Wash tank and
pre-rinse contribute about 90% of all wastewater flow. The remainder comes
from wash down of butchering tables and other work areas.

- 88 -
12. Wastewater flows fron salmon canning cperations are nuch higherthan preparing fresh or frozen salmnn products, particularly where butcher-
ing is done nechanically. Hand butchering and canning operation is essent-
ially the sane as the fresh/frozen operaticn except for wastes fran fish
cutting and can filling, which will also increase the amount of wastes into
the water.
13. Typical loadings to be anticipated fran these two types of opera-ticns are presented in Table 1.
Table 1 - Typical Effluent Loadings fran Salnon Processing
CannedParameter Fresh/
Frozen a . Mech. HandButchered a/ Butchered a/
Flow 3,750 L/Mg 19,800 I/Mg 5400 I/Mg
BOD5 2.0 kg/Mg 45.5 kg/Mg 3.4 kg/Mg
TSS 0.8 kg/Mg 24.5 kg/Mg 2.0 kg/Mg
Oils/Greases 0.18 kg/Mg 5.2 kg/Mg 7.8 kg/Mg
PH 6.6 6.5 7.0
a/ All loadings except pH, expressed as per negagram of product.1 Mg = 1 megagram = 1 metric ton; L = liter.
Tuna
14. Processing tuna requires several unit operations including re-
ceiving, thawing, butchering, precooling, cleaning, canning, retorting,
labeling and casing. Process and waste sources are shown schematically in
Figure 1. This cperation requires large volumes of both fresh water, (us-
ually fran nunicipal sources) and salt water pumped directly fran the ocean
or saline wells. Both nunicipal and saline waters normally come ito con-
tact with the tuna only in those stages preceding the precooking operation.
15. Typical waste flows and loadings discharged fran a tuna process-
ing plant are given in Table 2.

89
RAW FROZEN TUNAFROM BOATS
E PRODUCT FLOWRECEIVIN ------ WASTEWATER FLOW
FROZEN i *WASTE SQLIDSFLOWSTORAGE
(GLOOD. JUICES)THAWING --- *-
(VISCERA) BUTCHERING (BLOOD, JUICES, SMALL PARTICLES).... . S HWASHING -*
STICKWATER (OILS. SOLUBLE ORGANICS) (OILS, MEAT, BONE, ETC.)rPRECOOK 9
o. -------
LCO-(HEAD, FINS,.SKIN, DOPIE)
CEN (LIGHT MEAT)(RED MEAT)GTMET
IAN (VEGETABLE 0IL. MEATIPARTICLES)
I I1
CAN WASHER CAN WASHER
L(OILS, MEAT PARTICLES, SOAP) I
ETORT RETORT001. COOL
(CRGANICS,CETEROENT)L J .- _L. - ... - -
LASEL LABELI I a CASE
(SCRUBBER WATER WITH ENTRAINED ORGANICS)REDUCTiON P.ANT __ ---- J- J L * -
PRESS IL LIUOR1... . LIUORWASTEWATER
(CONDENSATE WITH ENTRAINED ORGANICS)
FISH CONCENTRATEO PET FOOD HUIANMEAL SQLUBLES CONSUMPTION DISCHARGE
Figure 1. Typical Tuna Processing, Waste Flows, and By-Product Usage.

-90-
Table 2 - pical Effluent loadings fram Tuna Processing
Parameter Loadings a/
Flow - L/Mg 22,300
BOD5 - kg/Mg 15
TSS - kg/Mg 11
Oils/Greases - kg/Mg 5.6
pH 6.8
a/ All loadings, except pH, expressed as per megagramof whole tuna processed.
Cn the average, 45 percent of the raw tuna intake results in food product,
54 percent (viscera, bead skin, fins, bone, red meat) in by-products, and
the remaiiing 1 percent goes to waste.
16. Conmercial shrinp collecticn is done by netting at distances of
same 100 km from shore. The harvest is taken directly to a processing plant
or a "mother" ship. If taken to a ship, the catch must be inediately iced
and reiced every 12 hours. Following peeling and preparation, shrimp are
processed and marketed as frozen, or as canned or breaded products.
17. Up to the late 1950's shrinp were hand peeled for retail market-
ing or further processing. Currently, peeling machines are used, thus in-
creasing plant capacities some 30 to 40 fold. Peeling machines are the
largest water users and also contribute to the largest waste load. Some 45
to 55 percent of the water entering a plant is used for this purpose.
18. Typical waste flows and pollutant loadings from shrinp processing
operations are given in Table 3.

-91-
Table 3 -Typical Effluent loadings fran Shrimp Processing
Parameter a/ Frozen Canned* Breaded
Flow m3/Mg 73.4 60.0 116
BOD5 kg/Mg 130. 120-. 84
TSS kg/Mg 210. 54. 93
Oils/Greases kg/Mg 17. 42. -
pH 7.7 7.4 7.8
a/ All loadings, except pH, expressed as per megagram ofraw shrimp input to plant.
EFFLUENT LIMITATIONS
19. Limitations for liquid effluents frcm fish processing plants aregiven in Table 4. Under normal cperations no gaseous effluents of any con-sequence are discharged. Solid wastes, generally removed by screening, areeither processed into saleable by-products or transferred to landfills orother facilities for final disposal.
20. Applicaticn of these limitations should be based on conditions ateach individual plant. ' These are average values only, based on currentlyavailable technology considered to be achievable under present day opera-ting conditions at existing plants.
21. Factors which will influence limitations applicale to any indi-vidual plant, are (a) nature of the end product; (b) mechanical versus handbutchering or peeling; (c) extent of processing performed on board ship,prior to transfer to the plant; (d) water quality requirements for receiv-ing waters; and (e) remoteness of plant location.

-92-
Table 4 - Liquid Effluent Limitations for Fish Processing Plants a/
Max. Daily kg/Mg Live Weight Processedcategory
BOD5
Tuna 2.2 2.2 0.27
Salmon 11. 2.8 2.8
Other Finfish 4.7 4.0 0.85
Crab 3.6 3.3 1.1
Shrimp 52. 22. 4.6
Other Shellfish 41. 41. 0.62
a/ In all cases pH should be 6 to 9.
b/ 0 + G = Oils and Greases.
CONTROL AND TREATME
22. Waste components of greatest concern are solids, oils and
greases. The current treatment trends are toward the use of screening and
air flotation, combined with effective in-plant measures, as the principal
means of reducing overall waste loadings.
23. In addition to in-plant control measures, wastes from all fish-
eries production operations under proper conditions are amenable to biolog-
ical treatment or discharge to municipal systems. With adequate operation-
al controls, no materials harmful to municipal waste treatment processes
need to be discharged.
24. Application of in-plant control techniques should be the first
step in handling of wastes. Basic techniques available are minimizing
water use, recovery of dissolved proteins in effluent solutions and recov-
ery of solid portions for use as edible products.

- 93 -
25. Water-saving can be accomplished through reducing the use offlumes for in-plant transport of products. Dry handling of product or useof pneumatic ducts requires a small fraction of the water used by flumes.Spring-loaded nozzles, which autcuatically shut off when released by theuser, should be utilized on butchering lines. Steam and water valves mistbe properly maintained to avoid leaks and prevent losses.
26. Fish, along with meat and fewl, are frequently cateogrized as"animal proteins" because they contain the high levels of amino acid re-quired for good nutrition. Protein content will vary from 8 to 10 percentfor oysters to over 25 percent for tuna. Several techniques are availablefor reclaiming protein from those portions not classified as "food pro-ducts. Proteins can be recovered in wet form and made into high qualityfrozen products. Whole fish or waste fish parts can be converted to fishmeal or flour for animal feed. Protein wastes can also be converted into ahigh grade flour for human consumption. Concentration and utilization offish proteins as food additives is finding increasing use in developingcountries. Salmon eggs, representing up to 5 percent of by weight of thefish and formerly discarded are nov being recovered for caviar in a numberof locations.
27. Seafood plants have previously been located near or over receiv-
ing waters considered to have had adequate waste assimilation capacity.Therefore, there was little or no application of waste treatment technologyto this industry. Despite the fact that these wastes are generallybiodegradable, they do not contain unacceptable levels of toxic substances,and are amenable to biological treatment in nunicipal systems undercontrolled conditions.
28. Screening is extensively employed, in various forms and degrees,for solids recovery. Solids so recovered have market value and, in addit-ion, recovery eliminates their discharge into receiving waters and nunici-pal sewers. Solids may also be renoved by sedimentation basins.
29. If by-product recovery is not practical, proper disposal ofsolids nust be considered. Where permitted and where land is available,private landfill may be a practical solution. Land application of unstabi-lized, putrescible solids as a rutrient source may be impractical becauseof nuisance conditions which could be created.
30. Another alternative is deep sea disposal. Such a method does notsubject the marine environment to the potential hazards of toxic substancesand pathogens normally associated with the dumping of human sewage sludges,nunicipal refuse, and industrial wastes. Tb minimize any detrimental ef-fect on the marine environment, waste solids should be ground before dispo-sal, should be discharged only to waters subject to strong tidal flushingaction, and at depths of not less than 13 to 15 meters.
31. Wastewaters from which the solids have been separated may be sub-
jected to either physical-chemical or biological treatment to further re-duce organic levels in the water prior to final disposal.
-94-
32. The most prcmisirg physical-chemical techniques currently being
investigated are chemical coagulation and air flotation. Economic corid-erations seriously limit current applicaticn of chemical oxidation, since
the high cost of supplying chlorine and ozone, the two nost promising oxi-
dants, -is a deterrent.
33. Air flotation, with addition of appropriate chemicals, is capable
of removing high concentrations of solids, grease, oil and dissolved organ-ics. Vacuum flotation, dispersed air flotation, and dissolved air flota-
ticn are systems most comlonly applied at present. In using these methods
it is important to add sufficient quantities of chemical coagulants to can-
pletely absorb the oils and greases present.
34. Most wastewaters have sufficient. nutrients present to make them
amenable to biological treatment. Activated sludge, high-rate trickling
filters, ponds, lagoons, and land disposal nay all .be applied under properconditions.
35. Selection of a treatment system requires analysis of total plant
operation and application of techniques specific for wastes to be treated.
BIBLIOGRAPHY
1. U.S. Environmental Protection Agency "Development Document for Effluent
Limitations Guidelines and New Source Performance Standards for the
Catfish, Crab, Shrimp, and Tuna Segment of the Canned and Preserved
Seafood Processing Point Source Category". Doc. EPA-440/1-74-020-a.Washington (June 1974).
2. U.S. Environmental Protection Agency "Develoment Document for Effluent
Limitations Guidelines and New Source Performance Standards for the
Fish Meal, Salmon, Bottom Fish, Clam, Oyster, Sardine, Scallop, Herr-
ing, and Abalone Segment of the Canned and Preserved Fish and Seafood
Processing Industry Point Source Category".Doc. EPA-440/1-75/041-a, Group I, Phase II. Washingtcn (September
.1975).
3. "Best Conventional Pollutant Control Technology-Reasonableness of Ex-
isting Effluent Limitations Guidelines". Federal Register, Vol. 43,
No. 164, pp. 37570-37607, and Vol. 43, No. 170, pp. 39062-39067. Wash-
ington (August 23 and August 31, 1978).

- 95 -
*9 5
THE WOD BANK OCTOBER 1980
OFFICE OF ENVrOPMENA AFAIRS
FRUIT AND VEGETABLE PROCESSING
IRDUSTRIAL WASTE DISPOSAL
1. Because of the wide variety of fruits and vegetables that areharvested and processed, in varylng degrees, discussions of industrialoperations covering each of the varieties for which effluent limitationsare given below is beyond the scope of this document. Therefore, thediscussions are Limited to the processing of apples, citrus, potatoes andtheir various by-products. However, effluent limitations are inclu.edfor many other fruits and vegetables normally processed in these plants.
InDUSTRIAL PROCESSES
2. Industrial operations covering apples, citrus fruits, and potatoesinvolve many of the procedures used in fruit and vegetable processing ingeneral. The series of steps outlined below for each of these groups maynot all occur at each plant. Therefore, it is necessary to have completeinformation on the final product to be prepared in order to assure properapplication of the affluent limitations.
3. In addition to apples marketed directly for consumption, thefruit is used mainly for preparation of sauce, juice and frozen or cannedslices. Other products, but in a lesser volume, include dehydrated applepieces, special apple rings, spiced whole apples, and baked apples. Appleprocessing usually involves storage, washing and sorting, peeling and coring,slicing, chopping, extracting juice, dehydration, deasrating, and cooking.
4. Control of the temperatures and relative humidity of storage areasis critical for maintaining quality. Apples received from the field orstorage must be washed to remove dirt and other residues, and then sortedto remove undersized, spoiled, or otherwise inferior fruit. Mechanicalpeeling is most commonly used, particularly where a sliced product is tobe produced.. The peal and core particles (along with inferior fruit)are used to make juice or vinegar stock. Steam and caustic pealing are alsoutilized.- After slicing, the slices are deaerated in a brine solution,under vacuum. The final step is freezing and packaging or cooking andcanning.

-96-
5. Oranges, rapefrait, lemons, tangerines (madrarins) and limesare the citrus fruits most frequently grown and barvested. The steps inthe processing include: receiving, storage and washing (to removeforeign materials, pesticides, etc.); extraction of raw juice; finishing(to separate pips and mbranA segments); and juice concentration. Whensegments are to be produced the fruit is mechanically peeled, subjectedto canstic treatment to remove adhering membrane particles, and manual-ly or mechanically segmented to produce sections. In many cases the peel-Ings are further processed for recovery of citrus oil.
6. The principal forms manufactured by the potato processingindustry are frosen products; chips; dehydrated potaroes; and canned,bash, stew, and soup products. The quality of the rav potatoes and thetypes of manufacturing process are the two principal factors in deternin-ing the quantity and characteristics of the waste ;enerated. Ideally, themost suitable potatoes should have a high solids content, low content ofreducing sugars, thin peals, and uniforn size and shape.
7. The bulk of the potato intake is placed in storage by theprocessor in order to provide adequate quantities of raw material for
. year-rocnd. operation. Storage facilities require high hiIdity levelsto prevent shrinkage. From storage, the potatoes go to rotary drums orcylindrical washers to remove soil particles and other foreign materials.Next, these vegetables are peeled (using abrasion or rubber studded rolls,or other means). As part of the peeling proccss the potatoes are electroni-cally inspected for eyes, blemishes, and remaining peel. These undesirable
. elements are then removed and the potatoes sliced or diced. Considerablestarch may be released in the slicing and subsequent washing operation.The crude starch is recovered and shipped alswhere for further refining.
8. After slicing or dicing, the pieces are blanched (using steam orhot water). prior to preparation of the final product.
... - =7OURCESfD CHATMSTICS 07 WASTES
9. Effluents from the fruit and vegetable processing industry can beboth solid and liquid in nature, and the process waste streams are generallya mixture of the two. Gaseous effluents are minor or non-existent, andhencs, will not be covered in this discussion. Odors related to anaerobicponds, which are sometimes used for waste treatment, may be significant inindividual situations.
10. The waste water parameters of major significance are the five-day biochemical oxygen demand (BD5 ), total suspended solids (TSS), andhydrogen-ion concentration (pI). Fecal coliforms may be of concern, althoughnot generally found in wastewaters from this industry. To avoid problemsin this regard, all sanitary wastes should be handled separately and shouldin no way come in contact with process wastewaters. This separation can beparticularly critical in situations where in-plant reuse of process waters ispracticed.

- 97 -Table 1: Characteristics of Typical Waste Effluents -
Pruit and Vegetable Processing a/
Flow 1300 TSS1,000 gaWron ib/ton lb/tonraw product b/ raw product c/ raw Oroduct c/
Min. Mean Max. Min. Mean Max. Min. Mean Max.
Apples 0.2 2.4 13 3.9 I8 44 0.4 4.5 21Apricots 2.5 5.6 14 18 40 80 5 9.9 19Asparagus 1.9 8.5 29 0.9 4.9 22 4.3 7.5 13Dry tmans 2.5 8.8 33 15 60 182 2.6 43 99Uma beans 2.4 7.7 22 9.3 48 175 4.6 39 231Snap beans 1.3 4.2 11.2 1.6 15 81 0.8 6.1 46
Beets 0.3 2.7 67 28 53 127 7.3 22 64
Broccoli 4.1 9.2 21 5.8 20 61 4.6 17 61Brussels sprouts 5.7 8.2 12 4.2 7.5 14 2.9 15 7952rries 1.8 3.5 9.1 11 19 40 1.4 7.1 22Carrots 1.2 3.3 7.1 17 30 53 4.5 17 53Cauliflower 12 17 24 5.5 16 36 2.8 7.8 22Cherries 1.2 3.9 14 21 38 78 1.0 2.0 3.8Citrus 0.3 3.0 9.3 0.9 9.6 26 0.7 3.7 14Corn 0.4 1.8 7.6 12 27 64 3.6 10 27Grapes 0.6 1.5 5.1 6.4 9.0 13 1.5 1.7 2.0Mushroomr 1.8 7.8 28 7.7 15 28 5.1 7.3 12Olives - 8.1 - - 27 - - 27 -
Onions 2.5 5.5 10 57 57 58 5.3 17 55Peaches . 1.4 3.0 6.3 17 35 70 3.4 8.6 21Pears 1.6 3.6 7.7 19 50 126 3.6 12 33Peas 1.9 5.4 14 16 38 87 3.8 11 38Peppers 0.9 4.6 16 5 32 50 1 58 170Pickles 1.4 3.5 11 26 42 75. 3.0 8.2 23Pimentos 5.8 6.9 8.2 39 55 76 4.1 5.8 8.1Pineapples 2.6 2.7 3.8 13 25 45 . 5.2 9.1 17Plums 0.6 2.3 8.7 6.5 10 14 0.6 2.1 4.3
Potato chips 1.2 1.6 2.2 17 25 38 22 32 48
Potatoes, sweet 0.4 2.2 9.7 39 93 217 40 57 117Potatoes, white 1.9 3.6 6.6 42 84 167 39 128 423Pumokin 0.4 2.9 11 9.2 32 87 2 67 12Saucrkraut 0.5 0.9 3.0 4.6 5.6 15 - 1.0 2.6Spinach 3.2 8.8 23 5.7 14 31 7 1.8 6.1 21Squash 1.1 6.0 22 20 - - 14 -
Tomatoes, peeled 1.3 2.2 3.7 6.3 9.3 14 5.8 12 26Tomatoes, product 1.1 1.6 2.4 2.2 4.7 9.7 5.6 10 19Turnips 2.4 7.3 18 - - -
a/ From suggested Reference No. 5q/ Multiply by 4.17 to convert to liters/agagram7/* Multiply by 0.500 to convert to kg/megagram
1 Mg - 1 megagram a 1 metric ton

- 98 -
31. Water is extensively used in all phases of industry, principallyas (b) a cleaning agent to remove dirt and other foreign material; (a)a heat transfer medium for heating and cooling; (c) a solvent for removalof undesirable ingredients from the product; (d) a carrier for the incorporationof additives into the product; and (e) a method of transporting and handlingthe product.
12. Wastewaters from the processin of individual products are commonto the industry as a whole, and are made up mainly of biodegradable organicmatter. Although the procedures used in processing the various commoditieshave many aspects in comon, there are variations which affect the quantityand strength of the affluents produced.
13. Wasteater characteristics will be affected by: (a) the conditionof the raw fruit or vegetable (such as freshly picked versus stored); (b)the peeling method Ccaustic peeling produces higher 30D5 and TSS than doesmechanical peeling, for example; () water usage, including the extent ofwater transport; (d) age and efficiency of equipment; Ce) the processingoperations for the commodity being produced; and (f) in-plant measuresand housekeeping practices.
14. Average flows and characteristics of waste effluents are presentedin Table 1. The data covers both screened and unscreened effluents, whichaccounts. for the wide variations between mInimu and marimr values.
FLUENT LIMITAIONS
15. Effluent limitations for wastes originating from the fruitand vegetable processing industry are presented in Tables 2, 3, and4, below.
Table 2. Liquid Effluent Limitations - Specialties a/.
Commndiry 30D 5 TSS
W Mg Raw Product
Baby Foods 0.84 1.15Chips - Corn 1.14 2.12Chips - Potato 1.68 3.03Chips - Tortilla 1.66 3.02Ethnic Foods 1.59 2.83Jams/Jellies 0.19 0.34Mayonnaise/Dress. 0.21 0.39 1Soups 2.77-k/ 4.93Tomato/Starch/Cheese 0.98 1.74Vegetables - Dehy. 1.78 3.18
a/ For plants processing approximately 1000 to 5000 magagrams per Year.
b/ Represents Kg per Megagrams raw ingredients.

- 99 -
Table 3. Liquid Effluent Limitations - Vegetable Processing at.
30D TSSComodity ---
K8/Mg Raw Product
Asparagus 0.28 0.50Beans - Dry 1.40 2.51Beans - Lima 1.75 3.12Beans - Snap 1.05 1.86Beets 0.68 1.24Troccoli 1.89 3.34Carrots 0.97 1.76Cauliflower 2.36 4.17Corn - Canned 0.45 0.84Corn - Frozen 0.99 1.83Mushrooms 1.19 2.12Onions - Canned 1.72 3.14
Onions/Garlic - Dehyd 1.16 2.07Peas 1.00 1.97Pickles-Fresh Pack 0.64 1.14Pickles - Process Pack 0.65 1.21Pickles - Salt Stations 0.08 0.16Pias=tos 2.00 3.84Potatoes Sweet/Whita 0.52 1.09Saurkraut - Canned 0.26 0.47Saurkraut - Cutting 0.05 0.09
Spinach 1.18 2.08Squash 0.30 0.53Tomatoes Q.90. 1.74
a/ For plants processing approximately 1000 to 5000 megagram per Year.

- 100 -
Table 4. Liquid Effluent Limitations - Fruit Products al.
BOD5 TSSCommodity
Kg/Mg Raw Product
Mpple Juice 0.20 0.20Apple Products 0.20 0.20Apricots 1.26 2.28
aberzries 0.1 0.33rries - Sweet 0.45 0.81
Eneies - Sour 1.10 2.01raies - Brined 0.76 1.44
itrus Products 0.14 0.20granberries 0.62 1.12
ied Fruit 0.72 1.34ape Juice - Canned 0.76 1.39
Prape Juice - Pressed 0.11 0.20plives 2.28 3.93Peaches 0.75 1.40Tears 0.86 1.58ineapples 1.48 2.60lums 0.28 0.50Raisins 0.20 0.38.Strawberries 0.62 1.10
a/ For plants processing approximately 1000 to 5000 megragram per Year.
16. In addition to the limitations given above, all effluentsshould maintain the MPN fecal coliform count below 400 per 100 mLand the pH at 6.0 to 9.5.
-- COML AM TEAfls
17. The wastes resulting from this industry are principally organicin nature. They are therefore amenable to biological treatment, either atthe point.of discharge or, with pretreatment, in a municipal sewage treat-ment system. In-plant procedures and housekeeping practices can be effectivein reducing the waste load to be ttaated or discharged to municipal plants.
18. A fruit or vegetable processing plant is completely dependentupon a supply of good quality water. The increasing use of pesticidesand other contaminants requires more effective washing following theharvesting procass. The use of mechanical harvesting techniques resultsin increased quantities of soil and dirt pickup and consequently requiresmore extensive washing. It has been demonstrated that when washing is doneat a site reoved from the processing facility ruch as adjacent to theharvesting area) total plant water usage can be reduced by as much as 8 to10 percent.

- 101 -
19. Where pealing is necessary, mechanical aeans are usually employed,using aither caustic or steam. Water sprays or rubber abrading are the twoprincipal methods of removing the peel. The use of the rubber abradingtechnique can reduce the total waste flow, BD5 , and TSS by as much as 50percent.
20. Water used in the sorting, triming, and grading operation canbe recirculated for a given period of time. Since it comes into contactwith the interior of the fruit or vegetable there is a tendency to buildup the concentration of soluble and suspended solids. When these solidsreach the point where the water must be replaced, the contaminated watercan be further concentrated by evaporation and used as vinegar stock.
21. Wastewater volumes can be reduced by substituting other methods(screw conveyers, air propulsion,. pump transport, etc.) in place of flumingto convey the products through the operation. The system substituted forfluming must be adapted to the product and the processing on an individualbasis. Other operations which should be carefully examined for economiesin water use include the blanching, container cooling, and clean-up. WAtarrecirculation, using cooling towers where necessary, can also be effectivein reducing effluent volumes. Flow equalization through the use of storagetanks to reduce large fluctuations in volumes will reduce overall treatmentneeds.
22. It is currently the general practice in this industry to separatethe solid waste from the liquid waste streams. This is usually done byphysical means such as screening (stationary, rotary, or vibrating), plainsedimentation, hydroclones, or flotation. For operations producing signifi-cant volumes of french fried products, traps may be necessary to reduce oiland grease discharges.
23. Waste effluents are readily treatable by biological methods,after the major volume of the suspended solids have been removed byscreening, sedimentation, or other primary treatment. Once this separationhas been accomplished most of the biodegradable material is in the solubleform, and may be treated by such systems as activated sludge, tricklingfilters, lagoons (anaerobic or aerated), rotating biological contactors,and others.
24. Land application of these effluents has been successfullyutilized. Its operation depends upon a number of factors, including:(1) infiltrative and percolative capacity of. the soil; (b) clogging:(c) quality changes in the soil; (d) travel of the sprayed effluentto springs and streams or, through faults, to ground water supplies;Ce) evaporation; and (f) transpiration through cover plant growth.
25. In evaluating the application of this method it is necessaryto consider: Ca) available land area; (b) soil characteristics; (e)available slope, to minimize ponding of water; (d) intervals requiredto rest the soil between applications; (e) nature and density of thecover crop; (f) and the characteristics7 of the wastes in terms of thecomponents which may affect the soil mantle.

- 102 -
BI3LIOGRAPEY
1. Jones, L. "Waste Disposal Control in the Fruit and Vegetable-ndustry". Noyes Data Corporation, Park Ridge, N.J. and London.
(1973).
2. Powers, P.W. "How To Dispose of Toxic Substances and IndustrialWastis". Noyes Data Corporation, Park Ridge, N.J. and London(1976).
3. "Treatment of Industrial Effluents". Ed. by A.G. Callely, C.F.Forster, and D. A. Stafford. Halstead Press (John Wiley & Sons),New York (1976). pp.245-257.
4. U1S,-. EaVroMental Protection Agency. "Development Document forEffluent Limitations Guidelines ate New Source Performance Standardsfor the Apple, Citrus, and Potato Processing Segment of the Cannedand Preserved Fruits and Vegetables Point Source Category". Doc.EPA-440/1-74-027-a. Washington (March 1974).
5. U.S. Environmental Protection Agency. "Pollution Abatement inthe Fruit and Vegetable Industry" Doc. EPA-625/3-77-0007(3 Volumes). Washington (July 1977).
- 103 -
THE WOELD ANK MA .1979
072M-E 07ENIROMMETAL AFFAInS
GEOTEEMAL DEVELOPMENT
GUDELIES
1. The environmental impact of geothermal development can be import-and and should be part of any World Bank study in this field.
2. The min points to consider are as. follows:
- Direct physical effects on habitat- Erosion- Surface water effects- Ground water effects- Air pollutio,- Noise- uman presence
3. The project should take into consideration the survival and wellbeing of the wildlife species including fish. This should be done from theexploration phase through the well-field development, the plant construction,the plant operation and finally, the field abandonment.
4. Erosion of the land can be caused by waer, by wind or by streamchamnels. Pronounced erosion can result from minor disturbances of the landsurface and/or the vegetation. Good planning, reasonable grading, and goodconstruction regulations will prevent significant erosion.
5. Geothermal development will reduce some stream flows (construction. period) or increase others. The quality of. the surface water will probably
be changed. .Significant alterations of the hydrology or drainage routes shouldbe avoided.
6. Changes in ground water level, quality and temperature will occur.These should be forecast to avoid any drastic impact. Reinjection should beconsidered especially if the effluent is highly polluted.
7. Although the air pollution should not Se a maj or problem it shouldbe considered in each phase especially if emission of radioactive vapors orvapor borne salts is possible.
8. Noise will be generated by several activities or pieces of equipmentand could interef ere with normal behavior of animals; breeding, rest, hiber-nation and migration patterns could be disrupted.

�

105
THE WORLD BANK JANUARY 1981
oma or EnzRoNMENTAL AFFAIRS
GLASS MANUFACTURING
GUIDELIM
1. The glass manufacturing industry may be divided into a number of seg-
ments descriptive of the products from specific processes. However, based on
the types of plants most, frequently encountered in World Bank projects, this
document will confine itself to those ?1ants producing flat glass, pressed and
blown glass (battles).
MANUFACTURING PROCESSES
Fl t Glass
2. Flat glass is produced by meltiag sand together with other inorganic
ingredients a-ad then forming the molten material into a flat sheet. The tech-
niques most frequently used are the float, plate, sheet, and rolled processi 2.
Although the raw materials and malting operations are basically the same, ei ch
process uses a different method for forming flat sheets from the molten glaski.
3. In the float process the glass is drawn across a molten tin bath. In
the plate process the rollers used to form the sheets will also control the
initial thickness, with the final thickness being achieved by grinding and polish-
ing. The glass is formed by a vertical drawing procedure in the sheet process.
Text=tzlng rolls serve to impart surface te=ures in the roUed process. The
priwry glass sheets may be further fabricated into related pToducts such as
orsq coated products, automotive and architectural glass, windshields, and
others.
4. Mm most common type of flat glass produced utilizes the soda-lime
method. Generally, about one-half of each batch consists of sand (silica).
Other major ingredients include soda ash Mai C03), limestone (Ca C03). dolomite
(Mg C03), and cul-Ilet. L%a cu-lat consists of the broken glass generated in the
manufactux-Ing or fabricAting processes. This is recycled with the raw materials
to improve the melting qualities of the batch.
The manufacturing steps include (a) batching - 1"Iming of raw materials;
(b) malting; (a) forming - to effect d1sne" ional control and surface texture,
based on, applying sheet, plate, rolled or float processes; (d) annealing - to
remove iaternal stresses; (e) grinding and polishing - to achieve flat and
parallel surfaces; (f) washing; and (g) cooling.
Pressed and Blown Glass
6., The pressed and blown glassware category covers the manufacture of glass
containers, machine pressed and blown glass, glass tubing, television picture
tubes, envelopes, inenndescent lamp envelopes, and hand pressed and hlown glass
products.
- 106
7. The soda-lime process is most commonly used for pressed and blownglass production, but the compositioz, differs from that used in the flat glasscategory. Sand comprises about'70 percent of the batch. Soda or soda ash com-prise 13 to 16 percent, with the remainder made up of cullet. Soda and, some-times, small quantities of potassium oxide are added as flaing agents. Calciumoxide (lime) and small amounts of aluminum and magnesium oxides are added toimprove chemical durability. Iron and other materials may be added as coloringagents.
8. The manufacturing consists of (a) raw material storage and mixing;(b) malting; (c) forming - including blowing, pressing, drawing, and casting;(d) cullet quenching; (a) annealing; and (f) finishing. The steps will varyfrom plant to plant, depending upon the final product.
SOURCES AND CHARACTERISTICS OF WASTES
9. Process wastewaters are considered to be those which have come intodirect contact with the glass, mainly including such sources as washing, quench-ing, grinding, and polishing. No process wastes are produced in the manufactureof sheet and rolled glass. Water is added to the raw materials for dust sup-pression, but the water is evaporated and discharged as a vapor.
Air Emissions
10. Although there are numerous unit operations used in glass manufactur-ing, most of the key processing steps responsible for generating the bulk ofatmospheric emissions are common throughout the industry.
11. Emissions from raw material handling and storage are generally dueto solid particles becoming airborne when materials are moved to storage, uponreceipt at the plant or when they are moved from storage to the process. Inthe glass malting operation pollutants arise from two sources: combustion of fueland vaporization of raw materials. Pollutants frequently encountered includeNO, SOz, CO, and hydrocarbons, depending upon the fuel utilized. It has beenestimated, for example, that a fuel oil containing 1 percent sulfur by weightwill yield approximately 600 mg/L of SO2 in the flue gas.
12. The second source of air pollutants from the melting process resultsfrom the vaporizat.on of raw materials in the glass melt. This consists mainlyof particulates which are vaporized from the molten glass surface and condenseat lower teperatures in the furnace checkerworks or in the stack. The chemicalcomposition of the particulates will depend upon the particular formulationused. Emission levels for uncontrolled glass melting furnaces are given inTable 1.
13. Based on current information, gaseous emissions from the final stepsof glassmaking, normally referred to as "forming and finishing" operations,are generally not significant enough to be of concern.

- 107 -
TABLE 1 - T"ical Gaseous Emission Levels from UncontrolledGlass Malting Furnaces a/
Plant Type Flat Con- Pressed & BlownGlass tainer Soda Non-
Glass Lime Soda-
Emission
Gas/Kg Glass pulled from furnace
Nitrogen Ozides 4.0 2.3 4.2Particulates 1.5 1.2 1.2 5Sulfur Oxides 1.5 1.4 2.7 3.0Carbon Monoxide 0.02 0.08 0.10Hydrocarbons 0.04 0.07 0.15Fluorides - - - 10Selenium - 0.002 -
a/ From Reference (6).Liquid Effluents
14. Pretreatment of water supplies is required in some cases, dependingupon raw water cualitv and intended water use. However, information on effin-ent characteristics of these auxiliary wastes is not readily available. Be-cause practices vary considerably each case should receive separate study andconsideration to determine the impact on overall waste discharges.
15. For the plate glass category significant pollution results from theproduction of plate glass, solid tempered automotive glass, and windshild fab-rication. The major parameters of pollutional significance include suspendedsolids, oil, hydrogen-ion concentration, pH, 5-day biochemical oxygen demand(30 5), total phosphorous, and temperature. Typical increases in concentrationsof tese parameters over process influent water levels are presented in Table 2.

-108
TABLE 2 - Increase in Concentrations Over Levels in ProcessInfluent Waters for Flat <jlass Plants (a)
Plata Float Solid Wind-Glass Glass Temp Shield (b)
Auto Fabric
lov(c) 45,900(d) 138 . 49 175<>
Susp. Solida -mg/L 15,000 15 100 25
01 -mg/L Trace 5 13 1,7C0
COD -mg/L 100 15 25 1,700
BOD5 -mg/L - 2 15 33
Total Phosph -mg/L 0 0 0 5
Dis: Solida -mg/L 175 100 100 LoV
pRaU) 9 8 7 7 - 8
Temperature -*C 2.8 (g) 8 19
(a) No sigificant process wastewater discharges from rolled and sheetglass operations.
(b) Typical process waters fron fabrication of windshields using ol autoclaves.
(c) Process water only, exclusive of cooling water.
(d) Liters per Metric Ton of production.
(e) Liters per square meter of area on one side.
(f) Represent absolute values.
(g) Moderate increase.

- 109 -
16. In glass container manufacturing the process water is used forcullet quenching and non-contact cooling of batch feeders, melting furnaces,forming machines and other auiliary equipment. Wastewater characteristicswhich should receive attention include flow, biochemical oxygen demand (BOD),total chemical oxygen demand (COD), total suspended solids (TSS), and oil.Typical increases in these parameters over and above the levels found in theincoming process water, are given in Table 3.
TABLE 3 - Increase in Concentrations Over Lavels in ProcessInfluent Waters for Glass Container and Machine PressedGlass Plants.
Glass MachineParameter Containers Pressed &
Blown
Flow-Liters/Met. Ton(a) 1540 2920
Temperature - OC. 6 8
PH(b) 7.5 7.8
BOD - mg/L (5-day, 20*C) 5 5
COD - mg/L 50 50
Susp. Solids - mg/L 24 25
Oil - mg/L 10 10
(a) Process water only, exclusive of cooling water.(b) Represent absolute values.
17. In machine pressed and blown glass manufacturing the raw materialsare first melted and then formed (by use of presses, or other techniques)into tableware, lenses, reflectors, headlamp parts, and other similar items.Water is used principally for non-contact cooling and gullet quenching. Waste-water characteristics which may be of significance include flow, temperature,hydrogen-ion concentration. '(pH), 5-day biochemical oxygen demand (30D 5 ), chem-ical oxygen demand (COD), total suspended solids (TSS), and oil. The loadingsof these pollutants added to the incoming process waters during the productionprocess are also presented in Table 3.
18. Wa.tewaters in the hand pressed and blown glass industry originatealmost entirely in the finishing steps. The finishing steps which requirewater and hence will produce wastewater discharges include (a) crackoff and

- 110 -
polishing; (b) grinding and polishing; (c) machine cutting; (d) alkali washing;(e) acid polishing; and (f) acid etching. Some plants may utilize only oneor two of these steps while other plants may employ several or all of the pro-casses. Some handmade glass plants also use machine forming presses.
19. Waste water parameters which should be considered include flows,total suspended solids (TSS), fluorides (7), lead (Pb), hydrogen-ion concentra-tion (pH), and temperature. The increases in these parameters in the incomingprocess waters are shown in Table 4.
TABLE 4 - Increase in Concentrations Over Levels in Process InfluentWaters for Hand Blown and Pressed Glass Plants.
Parameter Flow Temp pH TSS F Pbc. (b) Mg/Liter
(a)Poess
Crackoff/Polish, 9,920 2.8 3.2 36 194 0.96
Grinding/Polish. 3,460 2.8 - 4350 - 0.43
Machine Cutting. 10,880 1.6 10.0 2580 100. -
Alkali Washing 4,795 57 11.2 17 - -
Acid Polishing 5,380 46 2.2 220 1980 31
Acid Etching 36,530 33 4.0 8 462 7.9
(a) Process water only, exclusive of cooling waters.(b) Represent absolute values.
Solid Wastes
20. There are no significant solid waste disposal problems associatedwith the basic glass production process. The waste or broken glass, calledcullet, is normally segregated and added to the raw material batches, as al-ready discussed above. Some sludges and other solids will result from systemstreating glass industry wastes.

. - 111 -
EFFLU T LITATIONS
21. Ambient air quality at ground levels in the vicinity of glass man-ufacturing plants should be maintained at or below the concentrations givenin Table 5. These concentrations should be considered as World Bank guidelines.
TABLE 5 Allowable Ambient Air Quality Concentrations at GroundLevel.
Pollutant Averaging AllowableTime Concentra-
tions
Nitrogen Dioxide Ann,. Arith. 100;ug/m3
Particulates Ann. Geom. 75,ug/m3
Sulfur Oxides (a) (a)
Sulfur Oxides (a) (a)
Carbon Monoxide 8-Hour 10 mg/23
Carbon Monoxide 1-Hour 40 mg/=3
Hydrocarbons 3-Hour 16041ug/m3
(a) Inside plant fenceAnn. Arith. mean: 100 pg/a3
Ma.24-hr. peak: 1000 pg/m3
Outside plant fenceAm. Arith mean: 100 g/m3Max. 24-hr. peak 500 zg/m3
22. Effluent limitations for glass plants, based on the application ofcurrently available technology are shown in Tables 6 and 7. These Tablesshould be considered as World Bank guidelines.

-112-
TABLE 6 - Effluent Limitations for Wastewater Discharges fromFlat Glass Plants (a)
t FSolid Wind-Plate FloatT.I Sel
Parameter Glass Glass Autom. Fabric.
)c) dd)
pH 6 -'9 6 -9 6 - 9 6 - 9
Total Susp. Solids 2.76 2.0 1.95 4.4
Oil 0.7 0.64 1.76
COD 0.90 2.0 - 4.9
BOD (5-day, 200C) - - 0.73
Total Phosph. - 0.05 - 0.98
(a) No wastewater discharges from sheet and rolled glassplants.
(b) Kg/Metric Ton.(c) Sm/Metric Ton.(d) gm/Square meter of area on one side.
TABLE 7 - Effluent Limitations for Wastewater Discharges from Containerand Blown/Pressed GlassPlants.
ParameterOil Susp. PH Floo- Lead
Process Solids ride(a) (a) ()(b)
Glass Containers 30 70 6-9 - -
Mach. Blown/Press - - - - -
Hand Blown/Press(c)
-Leaded & EF Ac Fin. - 10 6 - 9 13 0.1
-Non Lead. EF Ac Fin - 10 6 - 9 13 -
-Non EF Ac. Fin - 10 6-9 -
(a) Average -.̂ daily values for 30 consecutive days as g/Mfetric TonFurnace pull.
(b) Average of daily values for 30 consecutive days as mg/Liter.(c) For plants which melt raw materials, discharge over 190 liters per
day and produce type of glassware shown.

- 113 -
WASTE CONTROL AND TREATMET
Gaseous Emissions
23. For control. of particulates from raw materials handling operations,it is the general practice to enclose the unloading and conveying areas andto vent through fabric filters. The chemical composition of the fugitivedusts will be the same as the raw materials, since no chemical reactionsoccur during storage and handling.
24. Control of gaseous emissions arising from fuel sources can be con-trolled by changing to fuels having a lower content of certain pollutants,such as sulfur. Electric "boosting" also has been effective for this purpose.In this technique electric current is dissipated through the molten glass,supplying part of the required heat and reducing the amount of fossil fuelsneeded to maintain proper malting temperatures. Boosting is most commonlyused in container glass plants. All-electric melters, which have been de-veloped primarily to improve melting efficiency and product control, haveresulted in lowering gaseous emissions from the melting operation.. Construc-tion is less expensive for all-electric melters as compared to that for fossilfuel furnaces.
25. Several process modifications can be used to lower emissions. Theseinclude (a) reducing the amounts of materials in the fuel, which vaporize atfurnace temperatures; (b) increasing the fraction of recycled glass in thefurnace fuels; (a) installing sensing and control equipment on the furnace;(d) modifying the burner design and firing patterns; and (e) utilizing electricboosting, as discussed above.
26. Particulates in the glass melting furnace exhaust can be collectedby discharging through fabric filters. Fabric filter systems have the advant-age of high collection efficiency, low pressure drop across the system and lowenergy requirements. Venturi (vat) scrubbers and electrostatic precipitatorsare also used for removal of particulates.
27. Sulfur oxides are the gases of principal concern in melting furnaceexhausts. It has been demonstrated that wet scrubbers provide good controlfor both sulfur oxides and particulates. Electrostatic precipitators will re-
move varying amounts of these pollutants. It has been reported that treatingthe exhaust streams with an alkaline spray converts gaseous sulfur oxides to
solids which can then be collected as particulates. Fluorides, where present,are reduced by electric boosting. Electrostatic precipitators have proven
effective in capturing arsenic in the particulate form.
Liquid Wastes
28. The major constituents requiring treatment in wastewaters from pri-
mary flat glass and automotive glass fabrication are suspended solids and oil.In all cases, in-plant modifications should receive first consideration. No
process wastewaters are produced by the sheet and rolled glass subcategories,
since these are essentially dry operations and water is used only for dust

-114-
control in each batch.
29. For plate glass manufacturing plants, lagoon treatment with theaddition of polyelectrolyte to the incoming wastewater, has resulted invery high suspended solids removals. System efficiency can be improved invarious ways such as by using a two-stage lagoon arrangement, applying sandfiltration to the lagoon effluent, recycling of effluents for other plantuses, and other similar techniques.
30. Phosphorous is the pollutant of principal concern in float glassmanufacturing, when detergents are used. Wastewater phosphorous loadingscan be eliminated by discontinuing the detergent wash. All effluent dischargescan be eliminated by recycling the washwater to the batch and cooling tower.Dissolved solids removal may be required if the water is recycled for washing.
31. Suspended solids and oils are most commonly removed by coagulation-sedimentation and filtration at plants producing solid tempered automobilewindow glass. A solids contact coagulation-sedimentation system, with sludgedewatering by centrifuge, is employed. A further decrease in suspended solidsand oil can be accomplished by filtering the settled effluent through a dia-tomaceous earth filter containing a medium especially treated for oil removal.These measures will also effect a reduction in BOD and COD levels.
32. Oil is the major contaminant which must be removed from windshieldlamination wastewaters. Most of the oil can be removed by centrifuging, plainflotation using an American Petroleum Institute (API) separator, or by dis-solved air flotation. Suspended solids and residual oil can be removed byfiltration through oil absorptive media.
33. The pollutants of.principals concern in the pressed and blown glassindustry are oil, fluoride, ammonia, lead and suspended solids. In currentpractice oil is reduced by using gravity separators such as belt skimers andAPI separators. Treatment for removal of fluoride and lead is accomplishedby the addition of lime, rapid mizing, flocculation, and sedimentation of theremelting reaction products. Treatment for amonia removal is presently notpracticed.in this industry. Amnia removal by stream stripping can be usedfor control of high amonia discharges. It has been reported that severalplants are able to recycle non-contact and cullet quench waters.
Solid Wastes
34. Control systems for air pollution control will generate solids.These presently have little or no economic value and are not considered tobe an attractive source of chemicals. Generally, these solids are best disposedof by recycling back into the glass melting process or through landfilling.
35. Treatment of liquid wastes results in the production of various solids,such as sludges and spent diatomaceous earth. These should be dewatered tothe degree feasible and then disposed of to landfill. The lagoons used forsuspended solids removal can also serve as solids disposal sites in some cases.

- 115 -
BIBLIOGRAPHY
1. "Information Sources on the Glass Industry". UNIDO Guides to InformationSources-No. 16. United Nations. New York (1975).
2. United Nations Industrial Development Organization. "Glass and GlassMaking". United Nations, Now York (1977).
3. The World Bank "Environmental Considerations for the Industrial DevelopmentSector". Washington (August 1978).
4. U.S. Environmental Protection Agency. "Development Document for Proposed
Effluent Limitations Guidelines and New Source Performance Standards for
the Flat Glass Segment of the Glass Manufacturing Point Source Category".
Doc. EPA 440/1-73/001-a. Washington (October 1973).
5. U.S. Environmental Protection Agency. "Development Document for Proposed
Effluent Limitations Guidelines and New Source Performance Standards for
the Pressed and Blown Glass segment of the Glass Manufacturing Point Source
Category". Doc. EPA 440/1-75/034-a, Group I, Phase II. Washington (January1975).
6. U.S. Environmental Protection Agency. "Glass Manufacturing Plants. Back-
ground Information: Proposed Standards of Performance". Doc. EPA 450/3-79-
005-a. Washington (June 1979).

- 116 -
TE WO=LD BANK : :NA= 1980
OMFCE O ENVTIMTAL AFFAZRS
EFFLUENT GUIDELINES
M0W AND STME IUSTRY
GENERAL CONSIDEATIONS
1. Zron and steel production utilizes a highly complux system, in which
raw matarials consisting of iron are, coke, and Limestone are converted through
a series of processes into steel of various compositions, sizes, and shapes as
required by market demands.
2. Basically the conversion process may be broken down into five major
segments: (a) ore preparation, slntering, and pelletizing; (b) cake production;
(c) blast furnace operations (pig iron production); (d) steel production; and
(e) rolling and finishing operations.
3. For each of these segments a document has been prepared--to cover the
manufacturing process, waste sources and charactewistics, eff, ,ent limitations
based on the best practicable treatment technology currentQy available, and cou-
trol and treatment of wastes.
4. This document presents a broad simplified summary of the processes
carried out in an integrated iron and steel plant, as well as a discussion of
noise considerations, sampling and analytical aspects. These are applicable
to all segments of the industry, and hence are included in this general section.
Figure 1 presents a process flow diagram for the iron and steel industry.
THE INUSTM
5. Iron-bearing materials consisting primarily of iron ozides, to which
coke and limestone have been added, are reduced to molten iron (pig iron) in a
blast furnace. The iron absorbs carbon from the coke in this step and results
in cast iron, containing 3 to 4 percent carbon. Since modern steel contains
less than 1 percent of carbon, the excess carbon mst be removed to convert
the casr iron into steel.
6. This removal is accomplished through controlled oxidation of mixtures
of molten pig iron, melted iron, and steel scrap in steelmakIng furnaces to
produce carbon steels. Various elements (such as chromium, manganese, and
molybdena, alone or in combination) may be added to the molten steel to produce
alloy steels.
7. The molten steel, after reaching the desired composition, is poured
into molds where it solidifies to form ingats. After removal from the molds
the ingots are reheated to a uniform temperature and rolled into shapes known
as blooms, billets, and slabs. These shapes are referred to as semifinished
steel.

У.
� , �
� � О д r оЕ иО АЕ f1 иEt [1 и г [ и P1 А гl г ' � �С р А � � liONE f и Е � P � i � Ni
1и i0ri� б Е [N1V[ � OMf Г 1 Ч Е 1 �о vЕ и �
orro[иr,
� 11 и i Е А � �
1 � .
А 1 � t ю иl о .iYE[L
. cRA eof � Afr1N � , .� � 1
� о �� и га [ьи р� ,1 � �
.. ,4 л ` .
'
�� с Ч IiAt
�
.
� �
. fTONE � LA1r ! ' �� �
tUBMAC��
� � А �1 �
� С � 1 � А ! д �! ' � i г� !°.' tqAP и Р Е и � CASi fi[El ' Н
or гп � � � fw д nЕА и ти 1и ТЕ А Ч [ouiE1 v� OVEN� 1 д о И � ! '� � � � А О
� ,� . � , wс �и и l и �
о ц А q ' ..i
� , � � .
�
� f и 1l и � .� � cA� t 51 � � 4 ' � � i �E � EciNOпES Рди о ц t Т i� с ц А � ,, '' с 11 Е Ч 1 С А l !N
,, д EeuVEAr к дАР Е 1.[с i д l с � 1QU1o . .� flur F и ди есЕ Tt Е 4 ,
' l дои � � � .с о , � � � � , .П 1lT1LlAi10N
� 1 д oDUCt1 � �[ � � ц
� . � � . .
Fi.g, 1-- Р r л с е е е F1 о и Diagrap! - Iron а n Л S � ael Indaetry (From U.5. � Р А А о с . 440/1-79f024a �Vo1. I � Oct. 1979) ' ' . � �
1
а' � '.
, .
!

118
a. The semifinished steel is tien further processed in ozo or more ofseveral ways such as hot rolling, cold rolling, forging,, extrudingg dravinggor other moms to produce tht finished products needed to fill market demand'Barss plates,, structural shapes, rails,, wire, tubular shapes, and coated pro-
ducts axe among the,forms most frequently produced.
NOISE
9. In a typical integrated iron and steel works, noise results from
(a) production and processing operations; (b) handling and transport of raw
materials, semi-finished and finished products; and (c) aerodynamic and hyd=-
dynamic -tources. Efforts to limit noise in steelworks should bo Adayed at
lowering exposure to noise in the working enviroument to an acceptable leveland removing'noise problems in nearby residential areas. These two are fre--
quently complementary with the solution to the in-works problem often providing
a suitable answer to the comounity situation. a general rule, the problem
should be resolved as close to the source'as poss I ible in order to assure bestresults.
10. Typical peak noise levels are as follows:
Production and Processina Operations.
Ore crushing, 5 meter distance 98 dBA (continuous)Loading scrip pans., 25 ineter distince 105 dBA (intermittent)Electric arc furnace (malt down period)6 meter distance 109 dBA (semi-continuous)
fandling and Transport of Raw Materials, Semi-finished andFinished Products,
Conveyor discharge point,, 5 meter distance 85 dBA (continuous)Slab m:LU roller tables, 5 meter distance 95 dBA (intermittent)
Aerodynamic and Hydrodynamic Sources:
Valves and dampers, blast furnace coldblast, 1 meter distance 96 dBA (continuous)
Bl,a,st furnace hot stove operation,10-mater distance-- 91 dBA (continuous)
3.1 * A number of measures may be taken to reduce noise levels, in addition
to maz:Lm= possible reduction at the source. Quieter machines can be substi-
tutad, and where this is not possible the noise area should be isolated and
acoustically sealed. To protect neighborhoods it may be necessary to acousti-
cally treat entire buildings., 'Noise controls should be incorporated in the de-
sign of new plants or units.

-119-
12. Conveyor belts and systems, in place of road or railway haulings,will greatly reduce noise emissions. Emissions in the handling and transferof semi-finished or finished products can be offensive. Rolling mill finish-ing departments, for example, represent a major source. For light productsthe handling equipment can be modified for control purposes, but this is notalways possible for the larger and heavier products. The shape, weight, speedof transport, and similar aspects should receive consideration.
13. As production units increase in size, the quantities of process andby-product gases and liquid which must be transported will also increase.Aerodynamic and hydrodynamic noises originate in the integrated collection anddistribution systems used to handle these materials. Noises are caused byturbulence (due to high velocities) and pressure fluctuations. Levels can bedecreased by-careful piping design, covering pipes with layers of insulation,isolating and correcting vibration sources, using low noise valves and ventila-tors, and other similar measures. Noise barriers, screens, and earth moundsare also effective in reducing noise in many cases.
14. To avoid possible hearing damage weighted sound levels per 24-hourperiod should be kept below 70 dBA with a maximum of 90 dBA. (See "Noise"Guideline, Office of Environmental Affairs, The World Bank, January 1979).
SAMPLING AND ANALYTICAL PROCEDURES,
15. A major element of any program for management of the ehuironment isthe basic information on the source, nature, levels, and the concentrationsresulting in the medium to which discharged, following mixing and adsorption.
Air Pollution*
16. There are two general applications in monitoring air contaminants-emission source testing and atmospheric monitoring. In both cases the locationof monitoring devices, the .type of equipment, the duration of sampling, andpollutant discrimination are of paramount importance in quantitatively appraisingair quality. Furthermore, these considerations require an intimate knowledgeof the emission source(s), background pollution, meteorology and topography ofthe area under study, and other pertinent factors.
17. Source testing requires a relatively elaborate set of measurementsto establish a starting or final contaminant condition. Because industrialprocesses involve frequent cyclic changes, the timing of source testing ormonitoring must be planned accordingly. Process operations shold be carefullyreviewed so that individual polluting substances and classes of pollutants canbe identified. Fluctuations of peak loadings must be determined and thus pre-dictions of process peculiarities, such as equipment-caused effluent and tempera-ture variations, are possible. All the variables of source testing must beaccounted for so that the final pollutant analysis will be representative ofthe entire source process. A review of the various combinations of devices andtechniques and their inherent limitations in current literature is required.This will aFsure the application of the optimum sampling method for a generalrange of factors, such as greatest reliability, minimum cost, minimization of

- 120
required personnAl skills, ease of access and duration of sampling for eachspecific sampling situation.
18. Monitoring of the atmosphere requires the establishment of an airmonitoring network to supply the aerometric data necessary to supprrt air pol-lution prevention, control and abatement activities. At the same time, itshould conasume the minimum amount of financial and manpower resouzces. Thefirst step in establishing an air monitoring network is to determine the useof the aerometric data, collection devices available, the limitations of thesampling procedures and equipment, what pollutants must be monitored, locationof pollutant monitors, and the duration of monitoring. The very nature of theair pollution problem varies widely from area to area, depending upon thepeculiarities of meteorology, topography, source characteristics, and legal andadministrative situations.
19. The decision as to which pollutants must be monitored depends on thedata needs as defined by the source inventory. In most cases, it is necessaryto set priorities because of resource limitations. Pollutants to be monitoredshould be selected on the basis of their (a) representing a definite hazard;(b) possibility of becoming hazardous to the public health and welfare at sometime in the near future; and*(c) being controlled by existing or proposed standards.
20. Generally, the methods of analysis for sootfall,*dustfall, suspendedparticulate matter, gaseous pollutants and organic pollutants fall within thechemical, physical or biological category. Among the physical mthods are spec-trophotometry, thermal conductivity, chromatographic analysis, mass spectrometry,and gravimetric methods. Biological methods are applied in the preparation ofbacterial cultures of organic contaminants and monitoring of respiration rateto correlate with quantities of organic pollutants. There are many variationsto these methods. The most recent literature should be carefully reviewed andevaluated for application to -the problem at hand.
Water Pollution
21. The composition of industrial wastewaters varies widely, and no trulysatisfactory classification system has yet been devised. Hence, the importanceof industrial wastewater monitoring cannot be overstressed. Flows are measuredto determine the quantity of wastewater being discharged. The combination offlow rate data with analytical data obtained from laboratory analysis permitsthe calculation of weight of contaminants being discharged into the receivingstream. The next logical step after the amount of contaminants is known is todetermine what effect these contaminants have on the receiving body of waterand then finally establish some acceptable level of contaminant discharge. Mon-itoring of wastewater also facilitates locating major sou,ces of wastes.
22. The location of a sampling station should be selected such that theflow conditions will have achieved, as closely as possible, a homogenous mixture.The velocity of flow at the sampling point should, at all times, be sufficientto prevent the deposition of solids, thus assuring the collection of a wellmixed representative sample. Homogenous flow conditions normally exist afterchanneling all flow at a weir, Parshall flume or hydraulic pump. A free-fallingdischarge from a pipe is also an excellent sampling location. A sampling point

- 121 -
of approximately one-third the wastewater depth from the bottom and as near tothe center of flow as possible is recomended for monitoring flows in seversand channels. Types of equipment for the monitoring of industrial wastewatercontaminants vary from manual to automatic type devices. The selection of theappropriate sampling .equipment is dependent mainly upon the type of sample de-sired, either "grab" or "composite".
23. The quantity of sample to be collected varies with the extent of lab-oratory analysis to be performed. A sample volume between two and three litersis normally sufficient for a fairly complete analysis. The total number of sampleswill depend upon the objectives of the monitoring program. The use of a fewstrategic locations and enough samples to define the results in terms of statis-tical significance is usually much more reliable than using many stations witionly a few samples from each.
24-. Techniques and methods for the qualitative analysis of wastewater con-taminnts may be divided into four basic categories: chemical, physical, biologicaland biochemical. Detailed procedures are found in the literature, and should becarefully reviewed for application to the problem at hand.
Solid Wastes
25. The production and composition of solid wasti hasochanged substantiallyin recent years because of changing patterns of living, population shifts, andother reasons. Where once solid wastes were mostly domestic, they are now pro-duced in substantial quantities by industry as well. Solid wastes from industrymay pose special problems such as nondegradability (plastics) and toxicity (chem-ical residues). Because of the increased importance of solid wastes from theindustrial sector, monitoring and analytical methods have been developed for con-trol purposes.
26. The environmental and other impacts on the land disposal site and itsenvirons should be monitored and complete records maintained at all times. Datato be kept for each disposal site should include:
- Quantitative measurements of the solid wastes handled;- Description of solid waste materials received, identified
by source of material;- Major operational problems, complaints or difficulties;- Vector (a carrier that is capable of transmitting a pathogen
from one organism to another) control efforts;- Dust and litter control efforts; and
Quantitative and qualitative evaluation of the environmentalimpact of the land disposal site with regard to the effective-ness of gas and leachata control, including data from leachatesampling and analyses, gas sampling and analyses, ground audsurface water quality sampling and analyses upstream and down-s9ream of the site.

122
27. Upon completa Uilling of the site, a detalled description (IncludInga plan)should be recorded with the a=ea's Land- recordIng authority. The ,description should include general types and låcation of watas, depth of fiLL,and other nformation of interest to potential futura users or owners of theland. -
28. Special attantion should be given to the disposal of hazardousmaterials to landfill areas. Because it is somatimes difficult to classifywastas an hazardous or non-hazardous a rough classification may be made byevaluating cach one in. tecm of (a) human toxicity, (b) groundwater co=tamin2atripotential, (c) discase transmission potntial, and (d) bicdegradab1litry.
BILOGRAFET
1. "Eironmentä-Z-Control in the Iron and Stael Industry," liternatcnalIron and Steel Tnstituta, Brussels (1978).
2. "The Maklng, Shaping aäd Treating of Steel.", Ed. by .E. McCanon.NIuth Edition. Unitad States Steel Corporation. PIttsburgh (1971).
3. Ensel, C.S. and Vaughn, W.J. "Staml Production: Processes, Productsand Residuals." Mfsources for' the Futur'. The Johns Hopkns UniversityPress, BaltImorm and London (1976).
4. Vnitad Nations Developmnt OrganIzat±on, Development and Transfer ofTecnology Series No. 11 "Technologlcal Profiles of the Iron and SteelIndustry." UnItad Nations, Nw York (1978).
5. U.S. Enviro=nmtal ProtectIon Agency "Draft Development Doc ants forProposed Effluent LImItatIons Guidellnes and Standards for the Ironand Stael Tdustry." Dec. EPA 440/1-79/024a. Washtngton.. (October1979), as follo~s:
Vol. i - GeneralVol. II - y-product Coka M=Cng and Beehve Coka Yakn SubcategnresVal. II - Sinterng and Z1ast Furnaca Subtcatgoras•Vol. IV - Zasic Ox7en Furnacm and Open Ecalth Furnaca- Subcategories.Vol. 7 - EAcrc Arc Furnaca, Degassjng, and ConCmous Cast±ng
Subcategories.V01. VI - Pipe and Tube and Cold Rollng Subcategor±es.Vol. VT- Sulfuri Ac.d P±ckl g, Hydrochloric AcId Pickling, and
Combination Acid ?±-kl<"st Subearagory.
6. U.S. Environental Protecton Agncy. "Water Quali1y Critar±a." Doc.EPA-R3-73-033, Washington (March 1973).

- 123 -
7. Jarrault, P. "Limitation des Emissions de Polluants et Qualite de L'Ati -Valeurs Reglementaires dans les Principaux Pays Industrialises."Institut Francais de 1'Energie. Paris (1978).
8. U. S. Federal Register. "Interim Effluent Limitations and Guidelines,and Proposed Performance and Pretreatment Standards - ElectroplatingPoint Source Category." V.40 No. 80. Washington (April 24, 1975).
9. U. S. Environmental Protection Agency "Guidelines for Lowest AchievableEmission Rates from 18 Major Stationary Sources of Particulates, NitrogenOxides, Sulfur Dioxide, or Volatile Organic Compounds." Dec. EPA-450/3-79-024, Washington (April 1979).
10. J. X. Campbell, R. R. Willis "Protection Against Noise," J. Iron andSteel Institute, Vol. 211, Pt. 5, p. 346 (May 1973).
11. J. M. Campbell, R. R. Willis "A Practical Approach to Engineering Noise,"Proc. Metals. Soc. Conf. on Engineering Aspects of Pollution Controlin the Metals Industries, 17-29 Nov. 1974. P. 184.
12.. APHA, AWWA, WPCF. "StAndard Methods for theZz.nxamination of Water andWastewater." 14th Edition. American PublicHealth Association. NewYork (1975).
13. United Kingdom Department of the Environment, "Analysis of Raw, Potableand Wasta Waters." H. M. Stationery Office, London (1972).
14. U. S. Environmental Protection Agency. "Industrial Guide for Air PollutionControl." Doc. EPA-625/6-78/004. Washington (June 1978)
15. U. S. Environmental Protection Agency. "Hardbook for Monitoring IndustrialWastewaters." Washington (August 1973).
16. "Environmental Considerations for the Industrial Development Sector". TheWorld Bank. Washington (August 1978).

- 124 -
TEE WORLD BANK MARCH 1980
OFFICE OF ENVIRONMNZAL AFFAIRS
EFLUENT GUIDELINES
IRON AND STEEL INDUS2-Y
BLAST' FURNACE AND DIRECT REDUCTION PROCESSES
1. Iron and steel production utilizes a highly complex system, in whichiron are and other raw materials are subjected to a series of processes to con-vert them into finished steel products.
2. The series of conversion processes may be divided into five majorsegments: (a) are preparation, sintering and pelletizing; (b) by-product cokeproduction; (c) pig iron production; (d) steel production; and (e) rolling andfinishing operations.
3. This document is one of a series which has been prepared on the in-
dividual segments. Each one presents information as needed for assessing theenvironmental effects of the gaseous, liquid, and solid wastes produced by theoperation. In each case the document discusses the manufacturing processes,waste sources and character, effluent limitations based on best practicabletreatment technology currently available, and applicable waste treatment methods.A bibliography is also included.
BLAST FURNACES
Manufacturing Process
4. Pig iron (containing over 90 percent iron), is the product resultingfrom reactions of a mixture of iron-bearing materials, coke, and limestone ina blast furnace. These furnaces are large cylindrical structures, some 30 metersin height. Heated air is blown into the lower part of the unit to promote cokecombustion. The iron oxide reacts with the hot carbon monoxide from the burningcoke, while the limestone reacts with the impurities in the iron-bearing materialand coke to forn molten iron and slag. Materials are charged into the top of thefurnace, where the reactions begin. As these melt and decrease in volume thecharge passes to the bottom of the furnace, where molten iron and slag exist.The molten slag floats on top of the iron and is drawn off through an openingin the upper part of the furnace. The molten iron is drawn off through an openingat the bottom of the furnace (below the slag discharge opening), formed into ingotsand cooled for subsequent processing.
-125-
5. The combustion process produces gases, which are a valuable heatsource. They are discharged through the top of the furnace, cleaned to re-move large quantities of solids and other pollutants, and then recycled.
Waste Sources and Characteristics
6. Blast furnace operations produce wastes in the gaseous, liquid, andsolid states. Air pollutants are produced by three different segments of theoperation: blast furnace gas, cast house emissions, and slag handling and-processing.
T. Blast furnace gas is a relatively pollution-free fuel when strippedof its dust burden. Large production,units are frequently connected to combinedpower and furnace blowing units. For certain other uses, the calorific valueof this gas is increased by mizing it with coke oven gas. The gas must be cleanedof dust to a high degree before being used as a fuel. Cleaning or scrubbing isdone by a wet process, producing a liquid waste which may contain toxic substances.Under normal operations, air pollution from blast furnace gas production is notconsidered significant.
8. 16olten metal and slag are discharged from the furnace and cause fumeemissions as the result of exposure to air and oxidation. Further emissionsarise from vaporization of alkaline oxides from slag, and sometimes from com-bustion of tars and resins in impregnated refractory clays. Emission of sulfurdioxide from molten slag may also be a problem. Manganese fumes in ferromanganeseoperations constitute a potential health hazard.
9. Coarse aggregate is prepared by pouring the molten slag into a slagpit in layers, either adjacent to or at a distance from the furnace. Waterspraying is frequently used to accelerate the cooling process, and this canresult in a hydrogen sulfide odor. A condensation chimney is often used to scrubnoxious vapors. Materials from slag pits are further processed to produce aggre-gate of specific size ranges. Effective dust control measures can reduce thissource to insignificant levels.
10. Blast furnace wastewaters-originate primarily from top gas cleaning.Water is also used for cooling the furnace, but this is a non-contact operationand therefore of little or no significance from the pollution standpoint. Thewastewaters contain large quantities of particulate matter and quantities ofcyanide, phenol, and amonia. Other pollutants include heavy metals and certainorganics originating in the raw materials or formed during the combustion process.
31. Wastewater flows and characteristics will vary, according to the rawmaterials, the iron making process used, and the gas scrubbing process applied.Ranges of flows and concentrations that are typically found are presented inTable 1.
12. Solid wastes include blast furnace slag, dry dust and moist filter cake,cast house fumes, refractory wastes, and ladle skull (the metal shell which solidi-fies on the sides and bottoms of the ladle). The slag is processed and used as abuilding material, raw material for blast furnace cement, and other similar purposes

- 126
Cast house dusts are collected on filter extraction systems and fed to thesinter plant. Used refractory material and ladle skulls are generally dumpedon site.
Table 1. - Wastewater Flows and Characteristics for a Typical BlastFurnace Operation
Paranter* Concentrations
Flow - L/Ms (a) 4600 - 12,900
Ammonia N - zg/L (b) 10 - 17
Cyanide mg/L (b) 1 - 54
Phenols ag/L (b) 0.05 - 2.9
Fluoride mg/L (b) 1.4 - 6.5
Sulfide mg/L (b) 2.0 - 54
Suspended Solids mg/L 354 - 7040
pH - Units 6.4 - 10.2
(a) LIMg = Liters per megagran of iron produced.
(b). mg/L = milligrams per liter of effluent
Effluent Limitations
13. Gas cleaning and recovery will normally reduce atmospheric dischargesto concentrations well below acceptable levels. In all cases, ambient airquality should be maintained below .the following levels outside the plant fence:
Sulfur Dioxide
Inside plant fence Annual Arith. mean: 100'Ag/m3Max. 24-hr peak 1000 pg/=3
Outside plant fence Ann-al Arith. mean: 100 ,ug/m3
Max. 24-hr peak 5001,ug/m3
* Mg a megagram 1 metric tonL a Liter

- 127 -
Hydrogen Sulfide
Average 24-hour 8 ug/m 3
Particulate Matter
Annual Gea. Mean 75,u/m3
Max. 24-hour, not over once a year 260 'ug/m3
(a) /a/ 3 * MicrogramoR notr zbic meter of air sampled
14. Limitations for blast furnace wastewater effluents, based on bestpracticable treatment technology currently available, are presented in Table 2.
Table 2.- Effluent Limitations for Blast Furnace (Pig Iron)Wastewater Discharges.
fLimitationParameter (per Mg Product) (a)
Flow (b) 520 Liters
Susp. Solids 26 Grams
Sulfide 3.1 Grams
Fluoride 21 Grams
Phenols 2.1 Grams
Cyanide 7.8 Grams
Amnia - N 65 Grams
pR 6.0 - 9.0 Units
(a) Per megagram of iron produced.
(b) Excluding all non-contact cooling water
- 128
Control and Treatment of Wastes
15. Because blast furnace gas is recycled and reused, it undergoes avery high degree of cleaning. The cleaning process frequently involves upto three stages - dry collection in a "dust catcher", high energy scrubbingand vat electrostatic precipitation. Excessive emissions from the cast houseoperations can be avoided by maintaining sufficient ventilation. In the slaghandling procedure, the miing of molten slag with water is in itself effec-tive in controlling much of the air pollution discharged. A condensationchimney is effective for removing any residual gases and materials.
16. Treatment of blast furnace wastewaters is concerned mainly with theremoval of suspended solids. Other constitutents, such as cyanides, phenols,oils and greases, metals, and others are also of concern. These wastes originatemostly from the cleaning of gases resulting from combustion of the raw materialsin the furnace. They are removed through the top of the furnace (and frequentlyreferred to as "top" gases) for subsequent cleaning and use elsewhere in theplant.
17. Treatment in most cases consists of thickener/clarifiers for removingthe suspended solids. Sludge is removed continuously from the bottom of thethickener and pumped to vacuum filters, for dewatering. The filtrate is returnedto the thickener influent. Various flocculating agents such as polymers, areoften used to enhance solids. removal. The clarified effluent can be used forcooling purposes. Solids removal, by itself, has only a minor effect on thechemical composition of the wastewater. Chlorination can be useful as a meansof destroying cyanides and phenols. Bio-oxidation systems have also been success-ful in destroying cyanides.
18. Both organic and inorganic toxic pollutants have been found in blastfurnace effluents, and hence should receive attention. Depending upon the in-dividual or combination of pollutants involved, varying degrees of removal canbe achieved by the application of filtration (as part of the suspended solidsremoval procedure), activated carbon, and carbon adsorption.
19. Disposal of solids, filter cake, sludges, and other similar materialswhich cannot be recycled is to controlled landfill. Slurries from the gas scrub-bers frequently contain significant amounts of lead, zinc, and alkalis and hencecannot be recycled. without receiving additional treatment.
DIECT EDUCTION PROCESS
20. In recent years, particularly in countries having adequate suppliesof both high grade iron ore and energy resources, a number of methods for thedirect reduction of ore have been developed. This has been particularly truein countries seeking to establish a local iron and steel industry. The processpermits development of smaller production units, with capacities in the orderof 1,000 tons of sponge iron per day.

- 129 -
21. Basically the process utilizes the reaction between either a gaseousreducing agent or a solid fuel and the ore. The lump ore and/or pellets arecharged to a vertical shaft or fluidized bed to produce matallized productscontaining a minimm of 90 percent iron. This sponge iron can be readily maltadin an electric arc furnace. The main advantages of the process relate solelyto the size and flexibility of the operation. The direct reduction/electricfurnace steelmakIng procedure is much more energy-intensive than the more con-ventional blast furnace/basic oxygen furnace procedure.
22. Dusts contained in the off-gases from these plants are usually re-moved by vet scrubbing. Cleaned gases are either used to provide heat for gasreforming or, in some instances, to preheat the feed material. The resultingslurry is filtered, pressed, and recycled. The clarified effluent can be usedfor cooling. Wmere pelletizing is used, the fines resulting from the screeningof the pellets are fed back to the process.
23. Effluent limitations for gaseous and liquid effluents are the sameas those given in paragraph 13 and 14, above.
BIBLIOGRAPHY
1. "Environmental Control in the Iron and Steel Industry", International Ironand Steel Institute, Brussels (1978).
2. United Nations Development Organization, Development and Transfer of Tech-nology Series No. 11 "Technological Profiles of the Iron and Steel Industry".United Nations, New York (1978).
3. U.S. Environmental Protection Agency "Draft Development Documents for Pro-posed Effluent Limitations Guidelines and Standards for the Iron and SteelIndustry." Doc. EPA 440/1-79/024a. Washington. (October 1979): Vol. Ill-Sintering and Blast Furnace Sub-categories.
4. Jarrault, P. "Limitation des Esmissions de Polluants at Qualite de L'Air -Valeurs Raglementaires dans leas Principaux Pays Industrialises." InstitutFrancais de l"Energie. Paris (1978).
5. U. S. Environmental Protection Agency "Guidelines for Lowest AchievableEmission Rates from 18 Major Stationary Sources of Particulate, NitrogenOxides, Sulfur Dioxide, or Volatile Organic Compounds." Dec. EPA-450/3-79-024. Washington (April 1979).
6. U. S. Environmental Protection Agency. "Industrial Guide for Air PollutionControl." Doc. EPA-625/6-78/004. Washington (June 1978).
7. U.S. Environmental Protection Agency. "Water Quality Criteria." Doc. EPA-R3-73-033. Washington (March 1973)
8. APEA, AWA, WPC7. "Standard Methods for the Examination of Water and Waste-water." 14th Edition. American Public Health Association. New York (1975).
9. U.S. Environmental Protection Agency. "Handbook for Monitoring IndustrialWastewaters." Washington (August 1973).

- 130 -
TEE VORLD BANK MARCE 1980
OFFICE OF MNVIRNMNTAL AFFAIRS
IRON AND STEEL InDUSTT
iTPRODUCT CO OVENS
EFFLVENT GUIDELINES
1. Iron and steel production utilizes a highly complex system,in which iron ore and other raw materials are subjected to a series ofprocesses to convert them into finished steel products.
2. The series of conversion processes may be divided into fivemajor segments: (a) ore preparation, sintering and pelletizing; (b)byproduct coke production; (c) pig iron production; (d) steel pro-duction; and (e) rolling and finishing operations.
3. This document is one of a series which has been preparedon the individual segments. Each one presents information needed forassessing the environmental effects of the gaseous, liquid, and solidwastes produced by the operation. In each case the document discussesthe manufacturing processes, waste sources and character, effluentlimitations based on best practicable treament technology currentlyavailable, and applicable waste treatment methods. A bibliography isalso included.
MANUFACTURING PROCESS
4. Two types of ovens have been traditionally used to producemetallurgical coke: beehive and byproduct recovery. The byproductrecovery types, discussed in this document, are the most extensivelyused at this time. In the United States, for example, less than 1%of the metallurgical coke produced in 1977 came from beehive ovens.
5. The byproduct recovery process not only results in a suitablehigh-quality coke, but also makes possible the recovery of valuablebyproducts from the distillation reaction. Crude coal tars, crudelight oils, ammonium sulfate, and naphthalines are the principal by-products recovered. Other products, such as creosote oils, phosphates,crasols and elemental sulfur, are also recovered in some cases.

-131-
6. A byproduct recovery coke plant consists of batteries ofovens in which blends of high, medium, and low volatile bituminousgrades of selected coals are heated. The heating occurs out ofcontact with air in order to drive off volatile components withoutburning them. The volatiles.are drawn off and recovered, while theresidue remaining after 12 to 24 hours of heating constitutes thecoke product.
7. When ready, the coke is pushed from the oven and quenched(or cooled) before going to storage or use. Two methods are in use -dry quenching and wet quenching. Dry quenching is used in some plantsin Russia, England, Prance, and Switzerland. Wet quenching, the mostwidely used method, is accomplished by discharging the hot coke fromthe ovens to the quenching car. The car is then moved to the quenchingstation by locomotive, and water sprayed on the mass while still inthe car, to cool it. The coke is then transferred elsewhere forstorage or use.
WASTE SOURCES AND CHARACTERISTICS
8. As previously stated, the byproduct process yields a varietyof useful materials, which are either reused in the mill operation orprofitably marketed elsewhere. Utilization of these byproducts keepsthen out of the waste streams and hence signiflcantly reduces thewaste load which might otherwise be discharged from a coke plant.There are, however, several other potential sources of gaseous,particulate, and aquaeous emissions which are not removed as part ofthe recovery process and can have an adverse effect on the environment.
9. Waste gas can originate in the coal preheater units utilizedat many plants. Gravity charging of ovens can result in emissions oftoxic and flammable gases, as well as fumes and dusts.
10. Major liquid wastes usually include excess amonia liquor,final cooler wastewater, light oil recovery wastes from the benzolplant, barometric condenser wastes from the ammonia sulfate crystal-lizer, desulfurizer wastes, and contaminated waters from air emissionscrubbers at charging, gushing, quenching, preheating, or screeningstations. The largest volumes of water are from indirect (noncontact)cooling operations. These are nomlally not contaminated, except fromleaks in coils, tubes, or other equipment.
11. Typical wastewater flows from byproduct coke oven operationsare presented in Table 1.
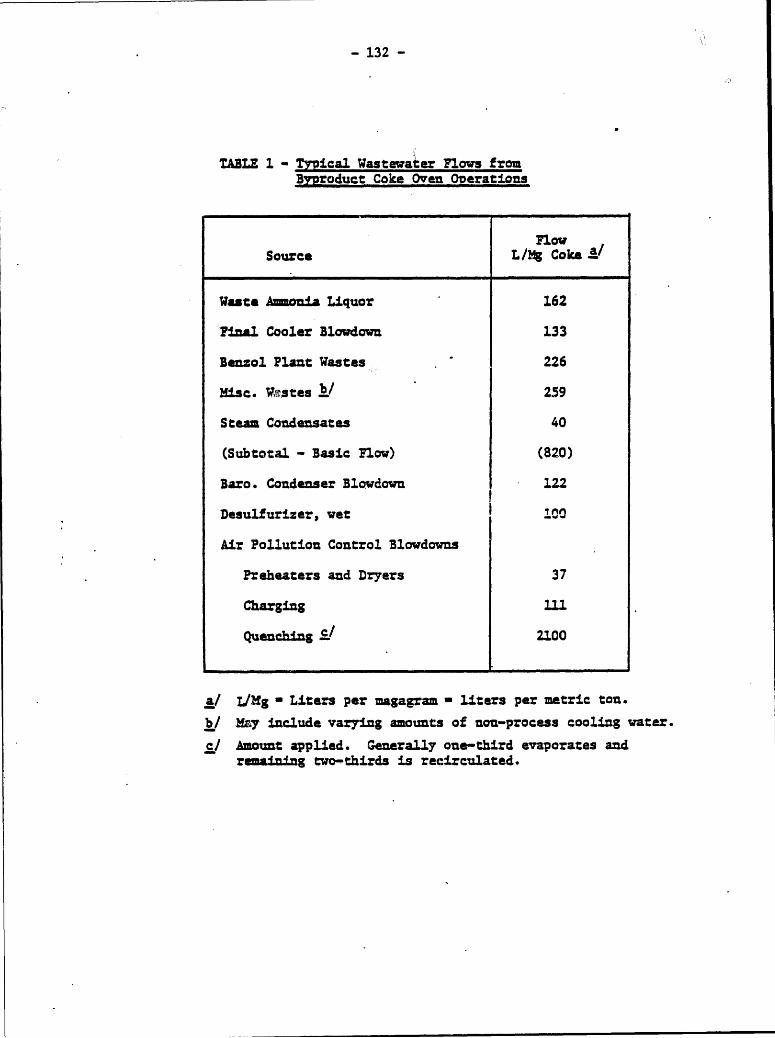
-132-
TABLE 1 - Typical Wastewater Flows fromByproduct Coke Oven Overations
FlowSource L/Mg Coke.!/
Waste Amonia Liquor 162
Final Cooler Blowdown 133
Benzol Plant Wastes,. 226
Misc. Westes 259
Steam Condensates 40
(Subtotal - Basic Flow) (820)
Baro. Condenser Blowdown 122
Desulfurizer, wet 1c
Air Pollution Control Blowdowns
Preheaters and Dryers 37
Charging 111
Quenching 1/ 2100
a/ L/Mg * Liters per magagram = liters per metric ton.
i Mzy include varying amounts of non-process cooling water.
/ Amount applied. Generally one-third evaporates andremaining two-thirds is recirculated.

-133-
12. Parameters considered of major significance in coke plantwastewaters include: total suspended solids, oils and greases,ammonia -N, total cyanides, phenolic compoTnds, sulfides, thiocyanates,and pH. In addition, coking will also produce a large number of bothorganic and inorganic pollutants, which may need to be eliminated fromwaste streams if concentrations are too high. Over 50 such pollutantshave been identified at existing plaqts.
13. Available data on raw waste quality in coke plants show widevariations, and hence are not presented here. Each plant will need tobe evaluated according to its own individual circumstances and merits.
14. Byproduct coke making also produces a number of toxicpollutants, both organic and inorganic. Some 30 organic substancesare considered of major significance, including acrylonitrile, ethyl-benzene, naphthalene, phenol, fluorine, pyrene, toluene, and ylane.Of the inorganics, antimony, arsenic, cyanides, selenia, silver, andzinc are considered to be the most significant.
15. The use of lime to raise pd levels prior to ammonia strippingproduces a sludge in the form of unreacted calcium hydroxide, alongwith precipitated calcium carbonates and sulfates. Other sludgesinclude coal or coke fines. Another source of solid wastes may occurwhere recovered byproducts are not sufficiently pure for further use orfor resale or reuse.
EFFLUENT LIMTATIONS
16. Coke making may result in discharge of gaseous ammonia,hydrogen sulfide, and hydrogen cyanide to the atmosphere if collectors,ductwork, and piping are not carefully monitored and controlled.Particulates may also escape to the atmosphere. With effective controls,little or none of these substances should be discharged. Odors can be
4 a problen if not carefully controlled.
170 On the basis of best practicable control technology now avail-able, wastewaters from byproduct coke plants should be maintained at orbelow the levels given in Table 2.
18. The use of lime to raise pH levels prior to ammonia strippingproduces significant quantities of sludge. Disposal of these sludgesto landfill sites should be such as to prevent escape to the environment.

- 134 -
TABLE 2 - Effluent Limitations for ByproductCoke Plant Operations
LimitationParameter (Per Mg Coke)
Total. Cyanide 22 gram
Phenolic Compounds 1.5
Ammonia - NH3 91
Oil and Grease 11
Suspended Solids 37-94
PH 6.0-9.0 (units)
Flow a/ 730-940 liters
a/ Excludes non-contact cooling water.
CONTROL AND TREATMENT OF WASTES
19. Because the byproducts from coke making can be profitablyrecovered and marketed or reused, pollution control is largely achievedthrough the recovery processes. Gases and dusts which are not other-wise recovered as useful byproducts are effectively removed by dustcollecting devices,, sprays, or a combination of the two. Disposal iseither to recycling or to landfills.
20. Odors can be minimized or eliminated by restricting vaporlosses to the atmosphere through leaking vent pipes, storage vessels,and liquor seals. Burning of coke oven gas can produce significantemissions of sulfur gas, unless the sulfur component is removed beforeburning. Desulfurization is most often accomplished either throughabsorption/desorption or absorption/oxidation. Removal efficiencieswill range from 80 to 99 percent.
21. Following application of various byproduct recovery measures,there still remains a residual discharge of contaminated wastewater

- 135 -
which must be treated before release. The three most frequentlyapplied methods are physical/chemical, biological, and incineration/evaporation technologies. Flow minamization should be a first stepin all cases.
22. A physical/chemical system would include a fixed leg onthe ammonia still to strip additional amonia from the wastewater,through addition of lime slurry and additional steam. This step isAollowed by carbon adsorption to remove the organic components.Prior to carbon adsorption the wastes can be oxidized with suchchemicals as chlorine, chlorine dioxide, sodian hypochlorite, ozone,or peroxides to destroy the organics. Where these chemicals areused, the carbon colum acts mainly as a final polish.
23. In a biological or bio-axidation system, the wastewatersfrom the fixed leg to the ammonia still, which have a high pE, arefirst neutralized with acid and then flow into a single-stageactivated sludge bio-oxidation system or pond. Aeration is providedby mechanical agitation or by use of large blowers. Depending uponthe pollutants to be removed one or two additional stages may berequired to remove phenols, cyanide and ammonia (oxidized to nitrates)-and provide denitrification in a final stage. Effluents from thesestages are subjected to sedimentation, step aeration, and pf adjust-ment before discharge.
24. Incineration/evaporation is not widely used, and is bestapplied in situations where the impact on air pollution would notbe significant. In this method, the total raw waste load is distilledand evaporated in a controlled combustion system. Coke oven gas -andcrude coal tar are the only byproducts recovered.
25. The use of lime to raise pH levels prior to ammonia strippingproduces large quantities of sludge in the form of unreacted hydroxide,along with precipitated calcian carbonates and sulfates. Disposal canbe to landfill but care must be taken to prevent the sludges from redis-solving and reaching streams as runoff. Lesser amounts of sludge formwhen caustic soda is used as the alkali, but this will cause an increasein the. dissolved solids levels. Other sludges will contain coal orcoke fines, and these can be readily recycled back to the process.
26. All sludges should be recycled to the process insofar aspossible. Controlled landfill is the disposal method of choice forall solid wastes that cannot be recycled to the system, including thosebyproducts which are not of suitable quality for marketing purposes.

- 136 -
BIBLIOGRAPEY
1. Russel, C.S. and Vaughn,W.J. "Steel Production: Processes, Productsand Residuals." Resources for the Future. The Johns HopkinsUniversity Press, Baltimore and London (1976).
2. United Nations Development Organization. Development and Transferof Technology Series No. 11 "Technological Profiles of the Iron andSteel Industry." United Nations, New York (1978).
3. U.S. Environmental Protection Agency. "Draft Development Documents forProposed Effluent Lim1taL.is Guidelines and Standards for the Ironand Steel Industry." Doc. EPA 440/1-79/024a. Washington. (October1979: Vol. II - Byproduct Coke Making and Beehive Coke Making Sub-categories.
4. Jarrault, P. "Limitation des Emissions de Polluants at Qualite deL'Air - Valeurs Reglementaires dans les Principaux Pays Industrialises."Institut Francais de 1'Energie. Paris (1978).
5. U.S. Environmental Protection Agency."Guidelines for Lowest AchievableEmission Rates from 18 Major Stationary Sources of Particulate, Nitro-gen Oxides, Sulfur Dioxide, or Volatile Organic Compounds."Dec. EPA-450/3-79-024 Washington (April 1979).
6. U.S. Environmental Protection Agency."Industrial Guide for AirPollution Control." Doc. EPA-625/6-78/004. Washington (June 1978).
7. U.S. Environmental Protection Agency. "Water Quality Criteria."Doc. EPA-R3-73-033, Washington (March 1973).
8. APRA, AWA, WPCF. "Standard Methods for the Exanination of Water andWastewater." 14th Edition. American Public Health Association. NewYork (1975).
9. U.S. Environmental Protection Agency. "Handbook for MonitoringIndustrial Wastewaters." Washington (August 1973).

- 137
THE WORLD BANK APRI 1980
OFFICE OF ENVIRONMENTAL AFFAIRS
120N AND STEEL INDUSTRY
ORE PREPARATION, SINTERING, AND PELETIZING
. ETSLDET GUDELINES-
1. Iron and steel production utilizes a highly complex system, in whichiron are and other raw materials are subjected to a series of processes toconvert them into finished steel products.
2. The series of conversion processes may be divided into five majorsegments: (a) ore preparation, sintering and pelletizing; (b) by-productcoke production; (c) pig iron production; (d) steel production; and (e) roll-ing and finishing operations.
3. This document is one of a series which has been prepared on the in-dividual segments. Each one presents information as needed for assessing theenvironmental rfects of the gaseous, liquid, and solid wastes produced by theoperation. Ineach case the. document discusses the manufacturing processes,waste sources and character, effluent limitations based on best practicabletreatment technology currently available, and applicable waste treatment methods.A bibliography is also included.
ORE PREPARATION-
Manufacturing Process
4. Higher grades of ore are becoming rapidly depleted throughout theworld, due to selective mining of one type or another. During the mining ofhigh-grade ores the low-grade ores which may be present as overburden and cappingwill ai with the material of good grade, particularly when large-scale mechani-cal mining methods are used. To assure an acceptable and consistent ore havingthe desired composition for iron smelting, the run-of-the-mine ore is givenspecial preparation, often referred to as "beneficiation."
5. Various beneficiation techniques are applied to suit the specific ore,depending upon the mineralogical and petralogical characteristics of the material.Techniques used include wet screening, gravity treatment, magnetic separation,froth flotation, reduction roasting, thickening, and drying. The combination oftechniques used depends upon the cost economics, the required quality of the endproduct, and the possibilities of recycling waste products.
Waste Sources and Characteristics
6. Raw materials are delivered by water, rail, or highway, and normallyrequire handling within the mill, as 'well as stockpiling and blending. Within

138 -
the works area, raw materials such as oies are usually transported by convey-or belts. Spray installations are used for reducing dust losses, since a highsurface moisture content is necessary to avoid wind-borne losses of fine mate-rials. Where no spray facilities axe used, studies have shown losses fromwind-borne drift to be in the order of 0.35 grams per ton of material stored.With adequate controls, waste production from this segment of the operationshould be relatively minor.
SINTEPING AND PELLETIZING
Manufacturing Process
7. The benefication process produces large proportions of fines, some-times up to 50 percent by weight of the ore mined. In the case of magnetiteores, the entire quantity of concentrate is in the form of fines. Whateverthe source, the fines require sintering or pelletizing before utilization formaking iron.
8. Sintering produces a useful agglomerate from the mined ore and awide variety of wastes, such as coke breeze, mill scale, flue dust,blue dust,limestone, and dolomite fines. The process has great flexibility in the agglo-meration of raw materials having different physical properties and mineralogicalcomposition.
9. Pelletizing, another of the agglomeration processes, is most fre-quently utilized where the ore particles are in a very fine form either as abeneficiated product or as a naturally-occurring mineral like blue dust. Theprocess is carried out in two steps - balling and induration.
10. The purpose of "balling" is to increase the particle size of the dust.After wet or dry grinding of the ore, dewatering, and partial drying, "green"pellets are formed by the addition of a suitable binder. Bentonite, .limestone,or hydrated lime are commonly used for this purpose. In order to produce pel-lets of suitable quality it is necessary to carefully control the type of grind,the size to which the are is ground, the schedule of drying and preheating, andpreheating, and the cooling cycles.
11. The induration process involves the drying of the green pellets,pre-heating to proper temperatures, firing at the required temperatures, and soak-ing for a definite period to create iron oxide or a slag bond formation betweengrains. This is followed by regulated cooling of the final product.
12. A recent development has been the use of cold induration processes, inwhich special types of cements (containing no sulfur) are used with the pell-etizing feed before balling. The green balls, sometimes coated with iron con-centrate fines to prevent cluster formation, are allowed to cure and hardenfor periods of up to 5 weeks.
- 139 -
Waste Sources and Characteristics
13. Although sintering plants are generally fitted with high chimneysto assure adequate dispersion of waste gases, use of high-sulfur raw mate-rials can cause problems from sulfur dioxide combining with other contribu-tions from nearby sources. Dusts or particulate matter can also be majorproblems. Other gaseous pollutants, such as hydrogen fluoride and nitrogenoxide do not cause problems in most countries, although. Japan is experiencingsome problems as a direct result of the potential for photochemical pollution.A typical sinter vlant wasta gas will contain 0.2 to 1.0 g/m3 (normal)*of SO2 lessthan 0.4. gjm 3 (normal) of NO., and less than 0.01 g/z3 (normal) of F
14. The firing process employed in pellet plants may produce gaseousemissions of sulfur dioxide and nitrogen oxides. When using ores with highfluorine content, gaseous fluorine compounds may be emitted. Both sulfurdioxide and nitrogen emissions depend upon the types of burner and fuel used,and will normally not constitute a serious problem.
15. Wastewater generated during the sintering and pelletizing operationresult mainly from the scrubbing of gases and dusts producted during theprocess. Wastewaters are also generated from7the cooling, crushing, andscreening of the final product. Newer plants generally use "dry" dust collec-
.tion equipment and hence have no flows from this source. The pollutants inthe effluent reflect the variety of process fuel materials, such as iron andsteelmaking flue dusts, ores, mill scale, coke, limestone, slag fines, andothers. Oils and gases are also present, prieuz.,-zlly carried by the scrapand mill scale used in the operation.
16. The average concentrations found in typical untreated effluents fromsintering plants are shown in Table 1.
Effluent Limitations
17. Where effective Sas scrubbing is ued to remove gases and dusts onlyminor amounts of air pollutants are discharged. In all situations ambientlevels of gaseous effluents, outside the plant fence, should be maintainedwithin the following limits:
Sulfur Dioxide
Inside plant fence Annual Arith. mean: 100 ug/m3Max. 24-hr peak 1000 Pg/m3
Outside plant fnca Annual Arith. mean: 100 pg/m3Max. 24-hr peak 500 ug/m3
Nitrogen Dioxide
Annual Arithmetic Mean 100 )u/'m3 (normal)
Particulate Matter
Annual Geometric Mean 75 ug/m,3 (normal)Max. 24-hour, not more thanonce a year 260 Pg/
* Normal Conditions: 0C, 101.3 kPa (760 mn Rg)
-l140
TABLE 1. Sintering Plant Wastewater Flows and Characteristics
Parameter Average
Flow - L/MS (a) 6100
Oil and Grease - mg/L (b) 245
Suspended Solids - mg/L 6100
PH 6-12
Fluatide - mg/t 17
Sulfide - mg/L 56
(a) L/1% - Liters per magagram sinter produced(b) mg/L 1l.grams per liter of effluent.
18. Effluent limitations, based on best practicable technology currentlyavailable, should be maintained as shown in Table 2.
TABLE 2. Effluent Limitations for Wastewaters from Sintering Plants
Parameter Mtation (a)(Per MN( Product)
Oils and Greases 4.2 grams
Suspended Solid 21 grams
pH 6.0 - 9.0 (units)
Flow (b) 416 liters
(a) Per Metric Ton of sinter produced(b) Excluding non-contact cooling water(*) 1 Mg * 1 megagram = 1 metric ton

- 141 -
19. Various toxie pollutants, depending upon the raw materials used,are also generally present. These include cyanides, zinc, copper, nickel,lead, silver and others. Limitations for these substances should be asfollows:
Cyanides: 0.01 ag/L(a) Nickel: 1 mg/LZinc: 1 ag/L Lead: 0.1 mg/LCopper: 3. mg/L Silver: 0.1 mg/L
(a) mg/L * Milligrams per liter.of effluent
20. Solid wastes are produced from the gas and dust scrubbers and othersources. These solids are primarily metallic oxides, mostly iron, and are
.recycled to the sIntering process.
Control and Treatment of Wastes
21. uGas and dusts are effectively removed from exhaust streams by meansof wet scrubbers or by dry methods, such as electrostatic precipitation. Theremoved solids are either recycled to the sintering or pelletizing processesor transferred to a waste recovery operation elsewhere.
22. Wastewaters result mainly from the vet scrubbing and cooling ofgases, dusts, and other materials involved in the sintering processes. Whiletreatment facilities are concerned mainly with solids removal, a side effectis to remove other pollutants as well. Thickeners and clarifiers or settlinglagoons are used for suspended solids removal. Skimmers are effective foroil and grease removal.
23. While suspended solids removal will remove some of the toxic pollu-tants, higher degrees of treatment are usually required for this purpose.Advanced treatment technologies known to be effective for both organic and in-organic toxic pollutants include alkaline chlorination, sulfide precipitation,filtration, and activated carbon treatment.
24 Solid wastes generated from the treatment of gaseous and liquideffluents are generally recycled into the systems.
BIBLIOGRAPHY
1. United Nations Development Organization, Development and Transfer ofTechnology Series No. 11 "Technological Profiles of the Iron and SteelIndustry." United Nations, New York (1978).
- 142
2. U.S. Environmental Protection Agency "Draft Development Documents forProposed Effluent Limitations Guidelines and Standards for the Ironand Steel Industry." Doc. EPA 440/1-79/024a. Washington. (October1979): Vol. III - Sintering and Blast Furnace Subcategories. -
3. Jarrault, P. "Limitation des Emissions de Polluants at Qualite deL'Air = Valeura Realamentaires dans les Principaux Pays Industrialises."Institut Francais de 1"Energia. Paris (1978).
4. U.S. Environmental Protection Agency "Guidelines for Lowest AchievableEmission Rates from 18 Major Stationary Sources of Particulate, NitrogenOxides, Sulfur Dioxide, or Volatile Organic Compounds." Doc. EPA-450/3-79-024 Washington (April 1979).
5. U.S. Environmental Protection Agency. "Industrial Guide for Air PollutionControl." Doc. EPA-425/6-78/004. Washington (June 1978).
6. U.S. Environmental Protection Agency. "Water Quality Criteria." Doc.EPA-R3-73-033, Washington (March 1973).
7. U.S. Environmental Protection Agency. "Handbook for Monitoring IndustrialWastewa trs." Washington (August 1973).
8. APEA, AWWA, WPCF. "Standard Methods for the Examination of Water andWastewater." 14th Edition. American Public Health Association. New York(1975).

- 143
TIE WORLD AK OCTOBER 1980
OFFICE OF ENVONIENTAL AFFAIRS
IRON AND STEEL IDUSTRY
ROLLING AND FINISHING OPERATIONS
EFFLUENT GU IDIES
1. Iron and steel production utilizes a highly complex system, in whichiron ore and other raw materials are subjected to a series of processes toconvert them into finished.steel products.
2. The series of conversion processes may be divided into five majorsegments: (a) ore preparation, sintering and pelletizing; (b) by-productcoke production; (c) pig iron production; (d) steel production; and (e) rollingand finishing operations.
3. This document is one of a series which has been prepared on the in-dividual segments. Each one presents information as needed for assessing theenvironmental effects of the gaseous, liquid, and solid wastes produced by theoperation. In each case the document discusses the manufacturing processes,wasta sources and charactir, UA.Zluant limitations based on best practicabletreatment technology currently available, and applicable waste treatment methods.A bibliography is also included.
MAUFACTURING PROCESS
3. Steel finishing consists of the processing of the steel from thefurnaces into the range of shapes and sizes required to supply specific marketneeds. Because of the wide variety of possible products, the array of technologyand. equipment required for any particular product, the different operatingpractices utilized by individual plants, and other similar factors,this is prob-ably the most complez operation in steel making. Some of the typical operationsare discussed below.
4. Conventional casting involves the pouring of ingots, subsequent reheat-ing in soaking pits, followed by rolling of semifinished shapes from the ingots.A considerable amount of the original malt, averaging some 14 percent, is lostduring all this handling. Losses result from pouring, unmolding, rolling, trim-Lng, and surface preparation (scarfing). This scrap is generally recycled tothe steel furnaces.
5. In continuous casting the molten metal is poured into a trough, andthen flows to water-cooled molds to form the desired shape. From the mold, thecontinuous pieces having the required cross-sections are drawn by rollers, cooledby direct water sprays, and cut into pieces of the desired lengths. Scrap pro-duction is far less (under 4 percent) in this process than in conventional casting.

144
6. Not-rolling strip mills convert heated slabs into thin steel strips,which are either cut into lengths (sheet) or rolled onto cares (coil). Aplate mill converts heated slabs into thicker plates (over 6 m), and functionsessentially the se as a strip mill.
7. While some products are sold as they come from the hot-rolling mill,a large portion of the hot-mill production is subject to further processing inthe cold mill. In this process, sheet and strip steel products are reduced inthickness by being passed through various cold rolling configurations. As pre-paration for cold rolling,the surface of the strip is cleaned of scale formed inthe hot mill and during storage. This is usually done by passing the stripsthrough baths of dilute hydrochloric or sulfuric acid to discolve the scale, aprocess designated as "pickling". Since cold steel has lower plasticity, ascompared with hot steel, rolling speeds are slower to achieve the same thickness.Cold rolling can produce thinner strips and a finer surface quality.
8. During cold rolling the steel becomes quite hard and unsuitable formost uses. Therefore, the strip is subjected to an annealing process to restoreits ductility -and to effect other changes in the mechanical properties to renderthe material suitable for specific uses.
9. For certain uses it is necessary to apply coatings to the steel inorder to provide corrosion protection, wear resistance, antifriction properties,lubricity, heat and light reflectivity, and other effects. The process involvesthe application of a thin layer of a metallic or non-metallic element to thesurface. Metallic elements most frequently used include tin, zinc, chromium,and aluminum. Non-metallic coatings include oxides, sulfides, phosphates, sili-cateas, simple complex organic compounds (alkyd resins and varnishes), and mis-cellaneous inorganic coatings (vitrous enamel, etc.). The most important stepin the process is the careful preparation of the surface of the steel prior toapplication of the coating.
10. A naber of methods are in cmmon use for applying coatings. Theseinclude the hot-dip process, metal spraying, metal cementation, fusion welding,and metal cladding. Most metal coatings are applied by the hot-dip method, ex-cept for tin which is now generally applied by an electrolytic process.
1. The electroplating process is one in which a basic ferrous or non-ferrous material is coated by electrodeposition of a metal, such as tin. Threesteps are involved: (a) cleaning, to remove oil, grease, and dirt from the sur-face to be coated; (b) electroplating, in which metal ions in acid, alkaline,or neutral solution are reduced on cathodic surfaces (in this case the surfacebeing platad); and (c) post-treatment, in which additional coatings of anothermaterial may be applied for special uses. Continuous electroplating of coilsteel represents the largest application of electroplating worldwide, in termsof tonnage produced.

- 145 -
WASTE SOURCES AND CA2ACTE!ISTICS
12. The most likely sources of air pollutants in the rolling and finish-ing operations are the reheating furnaces, soaking pits, scarfing machines,acid recovery plants, galvanizing lines, and organic coating lines. Currentcontrol practices provide sufficient reduction, so that these sources are notconsidered significant. -
13. Oil firing of reheating furnaces and oil pits can produce unaccept-able sulftr gases in the 4nmedate environment. Coke oven gas, natural gas,and other alternate fuels are coming into widespread use, thus eliminating thisproblem. Automatic scarfing produces some iron oxide fumes, but this is con-trolled by means of irrigated precipitators. Spentpickling acids are generallyrecovered by heating, but effective gas scrubbing prevents fuma acid emissions.Fumes from the salt fluxes used in hot-dip galvanizing lines are controlled byextraction and ventilation. Solvent fmias from organic coating lines can becontrolled with properly designed ventilating systems.
14. The primary waste constitutents from the hot-rolling processes in apipe and tube mill are scale, oils and greases. Scale is formed as the hotsteel surface oxidizes, and is continuously scaled'and chipped away. Scale par-ticles are mainly metallic iron, farrous oxide, and ferric oxide. Oils andgreases originate from oil spills, equipment line leaks and breaks, drippingof lubricants, and equipment washdowns. Copper, chromium, lead, zinc, and otherheavy metals may be found in wastewaters when these are used in the rolling pro-cass, but levels are usually not significant. Typical wastewater characterisitcsare presented in Table 1.
15. *Wastewaters from a cold-rolling pipe and tube mill generate a finescale (primarily ferric oxide), as well as both soluble and insoluble oils andgreases. Wastewater sources include flushing of the product, welders and rolls,and the cold drawing and pickling waste waters. Levels of toxic pollutants arebelow those for hot-rolling mills, and hence are considered to be of little orno significance. Typical wastewater characteristics are shown in Table 1.
TABLE 1. Wastewater Characteristics for Hot and Cold Pipe and Tube Mills
Parameter Rot Tube Cold TubeKill Ml
Suspended solids - mg/L 500-700 1000
Oils/Greases - mg/L 50-100 100-200
pH 6.0-9.0 6.0-9.0

- 146 -
16. The roling process generates heat. Oil solutions are added directlyto the product to reduce the heat buildup and to provide lubrication for theproduct beng rolled. Three types of oil application systems are in use today-designated as recirculated, direct application and combination. The recirculatedsystem is moat widely used at the present time. Due maIAly to the use of the oilsolutions, high concentrations of various pollutants are discharged. The mostcommon of these are suspended solids, oils and greases. Toxic metals and organicpollutants are also present and anst be removed before discharge of the effluent.
17. The major water use in a cold rolling mil operation is for coolingthe rolls and materials being rolled. A water-oil emulsion is sprayed directlyon the materials and rolls as the material enters the rolls. A flooded lubri-cation system supplies both the lubrication and cooling operations. Recycleand recovery systems are commonly used, in order to control pollution and reducethe quantities of fresh oils which anst be supplied. Characteristics of typicalcold-rolling mill discharges are present in Table 2.
TABLE 2. Characteristics of Typical Effluents,from Cold-Rolling Mills
aa
Direct'FParameter Recirculated Application Combination
Flow - L/Mg 165 1772 1359
Suspended Solids Mg/L 1235 160 624
Oil/Grease - mg/L 22640 1861 1009
Diss. Iron -mg/L 140 22 7.8
pH 6.9 7.2 6.4
18. Acid pickling is the'process of chemically removing oxides and scalefrom the surface of a metal by means of inorganic acid solutions. The processmay be.carried out using one acid alone or in combination. Sulfuric acid orhydrochloric acid are now most frequently used, depending upon the type ofmaterial to be pickled. The process encompasses three operations; pickling,rinsing, and fume scrubbing. Wastewater can originate from the rinsing and fumescrubbing steps. Spent pickle liquor is a third source, but while this islowest in volue it is highest in contaminant levels. Typical characteristicsof wastewater from combination acid pickling operations are show in Table 3.
* 1 L/Mg 1 liter per megagram n 1 liter per metric ton

TABLE 3. Characteristics of Typical Effluents from Acid Pickling Operations
Sulfuric Acid Hydrochloric Acid
ParameterParameter Pickle Rinse Spent Fume Pickle Rinse Spent Fume
Liquor Scrubber Liquor Scrubber
Batch Cont. Batch Cont.
Flow - Liters/Mg 960 1020 83 0 a 390 465 300 6Dies. Iron - mg/L 375 520 41,000 1190 190 1690 52,300 402Tot. Susp. Sol. mg/L 180 44 1,890 93 0 60 740 490Oil/Grease mg/L 24 12 14 34 3 30 52 780pH (Units) 2 - 6 2 -5 1 2 - 3 < 2 1 - 4 <1 <
Arsenic mag/L 0.39 0.01 0.18 0.10 --- 0.11 0.01 0.07Cadmium mg/L 1.1 0.02 0.46 0.20 -- 0.003 0.12 <0.07Total Chromium mg/L 5.1 <0.001 30 3.2 --- 0.57 13 0.19Copper mg/L 0.45 0.14 3.0 2.3 --- 0.72 11 0.21Cyanides mg/L 0.01 0.01 0.006 0.002 --- --- (0.01 <0.01
Lead mg/L 0.14 0.04 1.6 1.5 --- 0.28 310 < 0.26Nickel mg/L 0.64 0.24 21 1.9 --- 0,78 10 0.23Silver mg/L 0.01 <0.01 0,29 --- --- -- 0.20 < 0.10Zinc mgL 16 0.10 2.8 1.2 -- 0.49 15 0.15Antimony Mg/L --- --- - -- --- -- 0.19 0.86 0.18
Selenium mg/L --- --- --- --- -- --- 0;04 < 0.01Thallium mgAL --- ---- --- -- -- 0.18 < 0.05
a/ All flows returned to rinse tank

- 148
19. Wastewaters generated by hot coating processes, now most widely usedexcept for tin coating, fall into three categories: (a) continuouly run rinsewaters (rinses following cleaning operations, flows from fume scrubbing systems,final rinse flows, etc.); (b) intermittent discharges (spent and flux baths,chemical treatment solutions, etc.); and (c) noncontact cooling waters.
20. Wastewater from plating processes originates in the cleani=g, surfacepreparation, plating and related operations. Constituents include the basicmaterial being finished and applied,-as well as the components in the process-ing solutions. The predominant wastewater constituents are the metal cations(such as copper, nickel, chromium, zinc, lead, tin, etc.) and the anions occur-ring in the cleaning, pickling, or processing baths (such as phosphates, chlor-ides, and various metal complexing agents).
21. Steel scrap, millscale, scarfing residues, refractory material,andused oils and greases are the principal solid or semi-solid waste substancesfrom the rolling and milling operations. Most of these are recovered or re-cycled back into the steel-making process. Scrap metal is used as feedstock,while mill scale (about 90% Fe203) can be recycled to the sinter plant. Re-fractory wastes are separated, with re-usable material going back into the plantand the non-usable portions going to a dump. Used oils and greases are eitherincinerated or mixed with inert materials prior to disposal to special-dumps.Spent pickling acids from both sulfuric and hydrochloric processes may be re-generated.
EFFLUENT LIMITATIONS
22. Effluent limitations for specific elements of rolling and finishingoperations, except for electroplating, are presented in Table 4. Materials con-sumed or processed do not provide a basis for applying effluent guidelines,in the case of electroplating processes. For this purpose, limitations arebased on the surface area (square meters) of materials plated, for each opera-tion (cleaning, plating, etc.) carried out as part of the plating process.Limiting values are presented in Table 5, for a number of substances found inthese wastes, depending upon the process being used.
CONTROL AND TREATMENT OF WASTES
23. Discharges of gases, particulates, and fumes can be reduced or elim-inated by use of scrubber and other collecting devices, and these normally*donot constitute a problem.- When dry collecting devices ard used to isolatethese materials they may be either recycled into the process, if appropriate,or taken to landfill disposal. When wet methods are.used the materials aresubject to whatever treatment is provided for the wastewaters.

- 149 -
TABLE 4. Effluent Limitations for Steel Rolling and Finishing- Mill Wastewaters
Per Mg Steel Processed
Waste Source Susp. Oil Diss.Flow Solids Grease Fe PHLiters Grams
.ipe & Tube Mill
Rot Iolling 6700 67 100
Cold Rolling (Water) .(No wastewater discharges)
Cold Rolling (Oils) (No wastewater discharges)
Cold Rolling Mill
Racirculated 104 3 0.14 0.10 6-9
Dir. Application 1668 104 42 4 6-9
Combination 1043 26 10 1 6-9
Pickling
S04 - Satch- (N wastewater discharges)
S04 - Batchb .2500 125 25 3 6-9
S04 - coNInuoua/ (No wastewater discharges)
S04 - Continuous 1042 52 10 1 6-9
RCI - Batch & Cont.S! (d) 200 40 4 6-9
RCI - Batch & Cont.- () 18 35 4 6-9.
Eat Coatingsl/ 5000 250 75 - 6-9
a/ Concentrates + rinses, acid recovery
+ " , acid ne ntralization.
g/ Liquor regen. + rinse neut. + fume scrubbing.
/ Flow = 4047 L for batch, 2774 L for continuous.
ef Neut. liquor & rinses +' fume scrubbing.
2/ Flow M 3524 L for batch, 2252 L for continuous
With fume scrubbing.

-150'-
ZALE 5. Effluent Limitations for Electroplating Plants
mg/ 2 / Operation a/
ParameterNon-Water Water SupplySupply Sources andSources Fish Life
Copper 80 75Nickel 80 4Total Cr 80 15Hexavalent Cr 8 1.5Zinc 80 -Total CN 80 1.5Fluoride 3200 30Cadmium 48 2.9Lead 80 4.4Iron 160 45Tin 160Phosphorous 160 -Total Suspended Solids 3200pH (units) 6.0 - 9.5 -Flow (liters) 145 -
a/ aImum of average daily values in any 30-day period.Yxaimun daily value not to exceed 2 times 30-day average.
24. Treatment technologies are currently available for meeting thewastewater guidelines given in this document. In many cases the treatmentis similar, and therefore consideration should be given to combining thewastewater flows for treatment at a common site, when two or more of theoperations are carried out at the same time. Treatment processes whicheither alone or in combination, depending upon the waste characteristicsand ultimate disposal, will achieve the limitations given in Tables 4 and5 are as follows:

- 151 -
Pipe and Tube Mill a) Primary sedimentation in a scale pit, equippedEat Rolling with oil skimming devices, followed by floccu-
lation with polymer and additional sedimenta-tion in a high rate thickener.
b) Solids dewatering with vacuum filtration.
c) Filtration of entire flow prior to dischargeor recycle.
d) Recycle through a cooling tower.
Pipe and Tube Mill a) Primary sedimentation in a scale pit equippedCold Rolling (Water) with oil skimming devices.
b) Flocculation with polymer and additional sed-imentation in a high rate thickener.
c) Solids dewatering by vacuum filtration. Com-plete recycling following filtration.
Pipe and Tube Mill a) Primary sedimentation in a scale pit equippedCold Rolling (Oil) with oil skimming devices.
b) Flat bed filtration, followed by complete re-cycle of all solutions.
c) Spent soluble oil solutions and oil skimmings- removed to outside reclamation or disposal.
Cold Rolling DMil a) Reuse of rolling solutions.Recirculated
b) Treatment of minimm blowdown via oil separa-tio;n, equalization, chemical treatment floccu-lation, air flotation, surface skimming and.etended settling.
Cold Rolling Mill a) Treatment of solutions via oil separation,Direct Application equalization, chemical treatment, floccula-
tion, air flotation, surface skilming,andlong-term settling.
Cold Rolling Mill a) Maximum degree of reuse practical.Combination
b) Treatment of Blowdown from recirculationsystem and water from direct applicationstands via oil separation, equalization,chemical treatment, flocculation, air flo-tation, surface skimming, and extended settling.
- 152 -
Pickling - So4 a) On-site acid recovery.Batch - Acid Recovery
b) Reclaim usable sulfuric acid, and solidferrous sulfate heptahydrate for outsideresale.
Pickling - SO4 a) Equalize acid and alkaline wastes; blendBatch - Acid Neut. mix, and aerate.
b) Lima neutralization, with polymer addition.
c) Extended settling (one day retention).
Pickling - SO4 a) On-site acid recovery.Cont. - Acid Recovery
b) Reclaim usable sulfuric acid, and alsosolid ferrous sulfate haptahydrate foroutside resale.
Pickling - SO4 a) Equalize acid and alkallie wastes; blend,Cont. - Acid Neut. mix and aerate.
b) Lime neutralization, with polymer addition.
c) Extended settling (one day retention).
Pickling - ECI a) Spent pickle liquor regeneration.Liquor Regen.
b) Recycle of fume scrubber water with mini-mum blowdown to treatment.
.) Absorber vent scrubber once-through totreatment with rinsewater via neutraliza-tion, polymer addition and settling orclarification.
d) pE neutralization.
Pickling - EC1 a) Equalize acid and alkaline wastes; blend,Liquor Neut. aix, and aerate.
b) Treat with lime or caustic soda, add polymer.
c) Sedimentation via thickener; vacuu filtra-tion of underflow.
d) pH neutralization.
- 153 -
Hot Coatings a) Separate collection, equalization, blend-ing, and settling.
b) Lime and polymer addition.
c) One day settling and continuous oil skimdng.
Electroplating a) Chemical treatment providing for cyanidedestruction.
b) Reduction of hezavalent chaots to trivalentform.
c) Neutralization and coprecipitation of heavymetals as hydroxides or hydrated oxides.
d) Settling and clarification to remove suspendedsolids.
BIBLIOGRAPHY
1. "Environmental Control in the Iron and Steel Industry," InternationalIron and Steel Institute, Brussels (1978).
2. "The Making, Shaping and Treatingof Steel." Ed. by H. E. McGannon.Ninth Edition. United States Steel Corporation. Pittsburgh (1971).
3. Jarrault, P. "Limitation des Emissions de Polluants at Qualite de L'Air -Valeurs Reglementaires dans les Principaux Pays Industrialises."Institut Francais de 1'Energie. Paris (1978).
4. U. S. Environmental Protection Agency "Guidelines for Lowest AchievableEmission Rates from 18 Major Stationary Sources of Particulate, NitrogenOxides, Sulfur Dioxide, or Volatile Organic Compounds." Dec. EPA-450/3-79-024 Washington (April 1979).
5. T. S. Environmental Protection Agency "Draft Development Document forProposed Effluent Limitations Guidelines and Standards for the Iron andSteel Industry." Doc. EPA-440/1-79/024a. Washington, (October 1979):
Vol. VIII - Sulfuric Acid Pickling, Hydrochloric Acid Pickling,and Combination Acid Pickling Subcategory.
6. U. S. Federal Register. "Interim Effluent Limitations and Guidelines,and Proposed Performance and Pratreatment Standards - ElectroplatingPoint Source Category." V.40 No. 80. Washington (April 24, 1975).

- 154
7. U. S. Environmental Protection Agency. "Development Document forInterim Final Effluent LimItations Guidelines and Standards for theMetal Finishing Segment of the Electroplating Point Source Category."Doc. EPA.-440/1-75/040-a. Washington. (April 1975).
8. U. S. Environmental Protection Agency. "Water Quality Criteria." Doc.EPA-R3-73-033, Washington (March 1973).
9. APEA, AWA, WPCF. "Standard Methods for the famination of Water andWastewater." 14th Edition. American Public Health Association. NewYork (1975).
10. United Kingdom Department of the Environment, "Analysis of Ra,Potable,and Waste Waters." H. M. Stationary Office, London (1972).
11. U. S. Environmental Protection Agency. "Handbook for Monitoring Indus-trial Wastewaters." Washington (August 1973).

*15*
THE WORLD ANK OCTOBER 1980
OFFICE OF ENVI30NMrAL AFFAIES
IRON AND STEEL IDUSTRY
STEIMAIG PROCESSES
EFLUENT GUELINES
1. Iron and steel production utilizes a highly complex system, inwhich iron ora and other raw materials are subjected to a series of pro-cesses to convert them into finished steel products.
2. The series of conversion processes may be divided into fivemajor segments: (a) ore preparation, stntering and pelletizing;(b) by-product coke production; (c) pig iron production; (d) steel pro-duction; and (e) rolling and finishing operations.
3. This. document is one of a series which has been prepared on theindividual segments. Each one presents information needed for assessingthe enviromental effects of the gaseous, liquid, and solid wastes producedby the operation. In each case the document discusses the manufacturingprocesses, waste sources and character, effluent limitations based on"best practicable treatment technology currently available and applicablewaste treatment methods. A bibliography is also included.
4. The basic difference between iron and steel is in the relativeamounts of impurities -n the two metals. The molten iron is saturatedwith carbon, and also contains undesirable amounts of silicon, manganese,phosphorous, and sulfur. These are removed in the steel-making process.However, in order to impart certain desirable properties to the steel,other elements are added in controlled proportions as part of the steel-making cycle. These are categorized as "residual alloy elements," andare confined mainly to tin, copper, nickel, chromium, and molybdenum.
5. At the present time steel is produced mainly in three principalfurnace types or processes - the open hearth furnace, basic oxygenfurnace, and electric arc furnace.

156 -
OPEN EATE FUENACE
Manufacturins Process
6. The open hearth furnace consists of a shallow rectangular basinor hearth, enclosed by refractory lined walls and roof, into which thecharge is placed. The charge may consist of all liquid iron, liquid ironand. liquid steel, solid steel (scrap) and liquid iron, or some other similarcombination of iron and scrap steel. The charge is heated by a gas flamelocated at the ends of each furnace. Fuels coummnly used include naturalgas, coke oven gas, fuel oil, coal tar, or some combination of these.The choice of fuel will influence the sulfur dioxide generation per tonof steel.
7. There are two principal types of open hearth furnaces - theacid and the basic. The furnace is termed an "acid" furnace where thebasiu refractory material consists of silicon sand. Where the basin isLined with dolomite or magnesite the furnace is a "basic" unit. The basicfurnace has the ability to remove phosphorous and sulfur from iron and itsores. The acid furnace, on the other hand, requires a minimn amount ofthese substanes to operate and can use only selected raw materials. Atthe and of the heating period the furnace is tapped, at a temperature ofapproximately 1650C, and the molten steel poured into moldings to formingots, castings, or other shapes for subsequent processing.
Waste Sources and Characteristics
8. Waste products from the open hearth process include slag; oxidesof iron emitted as. micron dust; waste gases composed of air, carbon dioxideand water vapor; oxide of sulfur and nitrogen, and oxides of zinc (ifgalvanized steel scrap is used). Fluorides may be emitted, both in thegaseous and particulate states. Most of the particulate emissions consistof iron oxides (predominantly (Fe.03) generated at an average rate of 12.5 kgper NT of steel produced.
9. In addition to these primary.sources, the secondary sources shouldalso receive attention. These include the hot metal transfer station, thehot metal mizer, the fumes caused by charging of scrap and hot metal, andthe fumes emitted during tapping of the vessel. The dusts emitted at thesepoints are largely fine grain iron oxides, and can be recycled to the sinterplant either directly or after some form of treatment.
10. The quantity of particulates will vary according to the gascleaning systems used. A semi-wet system cools he hot gases before entry
- 157 -
into the dry precipitators, which remove the particulates from the gasstream. However, a small portion of the particulate matter does escapeinto the wastewater systems. On the other hand, the wet scrubber systemis specifically designed to remove the particulates from the gas stream,and thus results .in larger concentrations of suspended matter. The gasscrubber systems essentially prevent the discharge of gaseous and particulatematerials to the atmosphere.
L1. Characteristics of a typical raw wastewater from an open hearthfurnace are presented in Table 1. This table also includes certaincomponents considered, to be toxic and therefore of significance.
12. Solid wastes originating from the open hearth operation includeslag, scrap, slurries, dusts, and refractory materials. The largestquantity of these wastes is slag, the amount of which will depend upon thequality of steel being produced and the ratio of scrap to pig iron inthe charged materials. Typically, slag quantities can vary from 70 to170 kg perHg of liquid'steel.* Slags can be used in blast furnace sinter,in construction, and for fertilizers, and hence do not normally constitutea waste problem.
Effluent Limitations
13. Open hearth furnaces are generally equipped with a cleaningsystem, which can efficiently cool and scrub the hot gases that areproduced. The entrained gases will contain one or more of the following:sulfur dioxide, nitrogen oxides, zinc oxide, ferric oxide, fluorides, andparticulates. Where the cleaning system is effective, discharges tothe atmosphere would be very minor. Where gaseous effluents are dischargedto the environment, ambient air quality at ground level should be maintainedat or below the following concentrations:
S02:
Inside Plant fence Annual Arith. mean 100 ug/m 3
Max. 24-br peak 1000 /3Outside plant fence Annual Arith. mean 100 g/m3
Max. 24-hr peak 500 JUg/m 3
3N0 Ann. Arith Mean 100 g/m
Fluorides (as El) Ann. Arith Mean 10 38-hr Peak 100'Ug/M
3Particulates: Ann. Geom. Mean 75 jug'aqMax. 24-hr 260 )g/m
14. Effluent Limitations for open-hearth furnace wastewaters, basedon application of best practicable control technology presently available,are given in Table 2. These include only suspended solids and pR. Althoughother pollutants are of concern, effluent limitations are still under de-velopment. Treatment methods discussed below will normally reduce theseother substances to acceptable levels.
* 1 kg/Mg = 1 Kilogram per megagram - 1 Xg/metric ton.

- 158 -
ZABLE 1.- Typical Raw Wastewater Characteristics Open Hearth Furnace
Semi-vat WetParameter System System
Flow -L/f(a)
Applied 4670 8100
Discharge 288 807
Susp. Solids - Mg/L(b) 500 1100
Fluoride 260 110
Nitrate - 10 320
Zinc - 0.60 200
Chromii * 0.08 -
Copper - 0.08 2.0
Cyandes - 0.04 -
Nickel - 0.05
Lead- - 0.60
pE - Units 2.0 -3.0 3.0 - 7.0
(a) L/Mg = Liters per megagram of steel produced
(b) agI* Milligrams per liter of discharge
TABLE 2 - Effluent Limitations for 0aen Hearth Furnace Wastewaters
Per Mg Steel Prod.Semi-wet Wet
Parameter System System
Suspended Solids - & 15 23
Flow - liters A 293 460
pH - units 6.0 - 9.0 6.0 - 9.0
a/ Excluding all non-contact cooling water

- 159 -
Control and Treatment of Wastes
15. Thres types of gas cleaning systems are in general usefor cleaning and scrubbing the hot gases from open hearthfurnaces - the dry system,.the.sai-wet system, and the vet system.
16.. By maintaining an exact balance between the water suppliedfor cooling the gases and the water evaporated no wastewater is produced.This is called the dry system. Cooling of .the hot gases takes place ' inan. evaporation chamber, located at the top of the open hearth building.
17. In the semi-wat system, an excess of water is supplied to thecooling chamber (spark box), thus producing an effluent discharge. Theparticulata matter collected in both the dry and semi-dry systems ilcollected as a dry dust, but some plants slurry this dust and convey itto thickeners.
18. In the wet gas scrubber system, the hot gases containing theparticulates are conveyed to Venturi scrubbers for cooling and cleaning.Particulate matter is removed as a result of the pressure drop acrossthe throat of the scrubber. Water is supplied to the scrubber to entrapparticulates and cool the gases. The wastewater resulting from thissystem is generally discharged to a treatment facility.
19. The basic type of equipment applied to wastewaters from thegas cleaning and fume collection systems are clarifiers or thickeners forprimary sedimentation. These systems are the major source of wastewaters.Clarifiers may be used ahead of the thickeners to remove the heavier solids.Because open-hearth effluents are acidic, provisions should be made toneutralize them. Either lime or caustic are effective for the purpose.Lime, polymer, or other chemicals are added to the clarifiers to aid insettlement of solids and removal of toxic metals. Clarifier sludges aredwatered in vacuum filters; the overflow is normally recycled. Wherethe overflow is discharged to a stream, it should receive further treatment,such as lagoon settling, prior to release.
20.* The presence of fluorides, heavy metals, and nitrates .willrequire advance levels of treatment. Line precipitation has been effectivein removing heavy metals and fluorides. Both carbonate and hydroxide aresuitable. However, the carbonate is preferable since it results in amore dense precipitate, improves solids separation, and yields lowersludge volumes. Nitrates may be removed by anaerobic biological processes,as employed in conventional sewage treatment plants. Nitrate concentrationscan be reduced to 10 mg/ .
- 160 -
21. Slags, which constitute the largest byproduct from steel making,have several possible uses. They can be recycled into the sinter mix andfed into the blast furnaces. Large lump size slags havn found use inreinforcement of river and canal banks, road building, or as railway trackballast. Slags containing high levels of P205 (usually over 15 percent)can be ground and used as fertilizer. Process scrap resulting fromsteel pouring can be readily recycled.
22. Fue cleaning dusts and slurries, depending upon their composition,are devatered and fed back to the sinter plant. Metallic components fromrefractory wastes are separated and reused. The residue is innocuous andconvey4d to landfill. Kill scale, if virtually oil-free, can be recycledto the sinter plant. Where the oil content is high, the scale should bedumped and precautions taken to prevent oil pollution due -to runoff.
BASIC OXYGEN FURNACE
Manufacturing Process
23. The basic oxygen furnace for steelmaking is a relatively recentdevelopment, having been first introduced in the 1950's. The process is -now most universally used, both for new installations and for replacementsof older facilities.
24. The Basic Oxygen Furnace (BOF) process produces steel in apear-shaped, refractory-lined open-mouth furnace using a mixture of hotiron (at 13700C), cold steel scrap, and fluxes. Fluxes such as burntlime (CaO) are used to produce a slag which floats on the molten steelsurface and collects impurities during steel production. Pure oxygen isinjected to the surface at supersonic velocities (Mach 2), through a water-cooled copper-tipped lance for approximately 25 minutes. The lance islowered through the open furnace mouth and positioned about 1.5 metersabove the surface of the bath. The high velocity of the oxygen results inviolent. agitation and intimate mixing with the molten iron.
25. PaPid oxidation of the dissolved carbon, silicon, manganese,phosphorous, and iron occurs. The carbon in the steel bath combines withthe oxygen to produce C02 and CO gases which are released from the furnace.The silicon, manganese, phosphorous, etc. oxidize into the slag. Fluaropar(Ca2) is added to the bath mixture to maintain a fluid slag. Burnt limeis added to aid in the production of a floating slag.
26. A BOF installation is generally equipped with two units, althoughthree or more may be found in a few instances. In a dual furnace facility

- 161
one furnace is operating while the other is in either the furnace reheator brick relining mode. Some plants practice "swing" blowing, where onefurnace is being blown withoxygen while the other furnace is being chargedwith raw materials.
Wasta Sourcas and Characteristics
27. The vaste products:from the basic oxygen steelmaking processinclude, heat, airborne fluxes, slag, carbon monoxide and dioxide gases,and,oxides of iron emitted as micron dusts. Also,when the hot iron ispoured into ladles or the furnace, submicron iron oxide fumes are releasedand some of the carbon is precipitated out as graphite. Fumes and smokeare also released when steel is poured into holding ladles from the furnace.Basic oxygen furnaces are equipped with some type cf air pollution gascleaning systems for containing, cooling and cleaning the. large volumesof hot gases and submicron fumes that are released.
28. During the oxygen blowing cycle, the primary gas constituentemitted is carbon monoxide(CO). The CO will burn outside the furnace ifallowed to come in contact with air, but combustion can be retarded bypreventing contact of the CO with the outside air. This is referred toas "suppressed combustion."
29. Because the CO gas will burn when in contact with air, electro-static precipitators cannot be used due to arcing in the electric platesand the potential of an explosion. Suppressed combustion systems alwaysutilize wet-type scrubber systems, since there is always some air leakageinto the cleaning systems. An open hood mounted above the furnace mouthconveys gases and fumes to the air pollution cleaning systems.
30. Four principal types of gas cleaning systems are currently inuse: dry, semi-wet, wet open combustion, and wet suppressed combustion.The wet suppressed combustion systems are the most widely used today.
31. In a dry precipitator system, an exact balance is maintainedbetween water applied to cool the gases and that evaporated in the coolingprocess. No effluent is discharged in this case. Particulate matter iscollected as dry dust. In the semi-wet method an excess of water issupplied to a chamber (spark box) to cool the furnace gases, thus producinga liquid discharge. The particulate matter is also collected as a dry dust.
32. The wet gas cleaning systems involve the use of quenchers andhigh-energy Venturi scrubbers. The hot gases, containing large amounts of
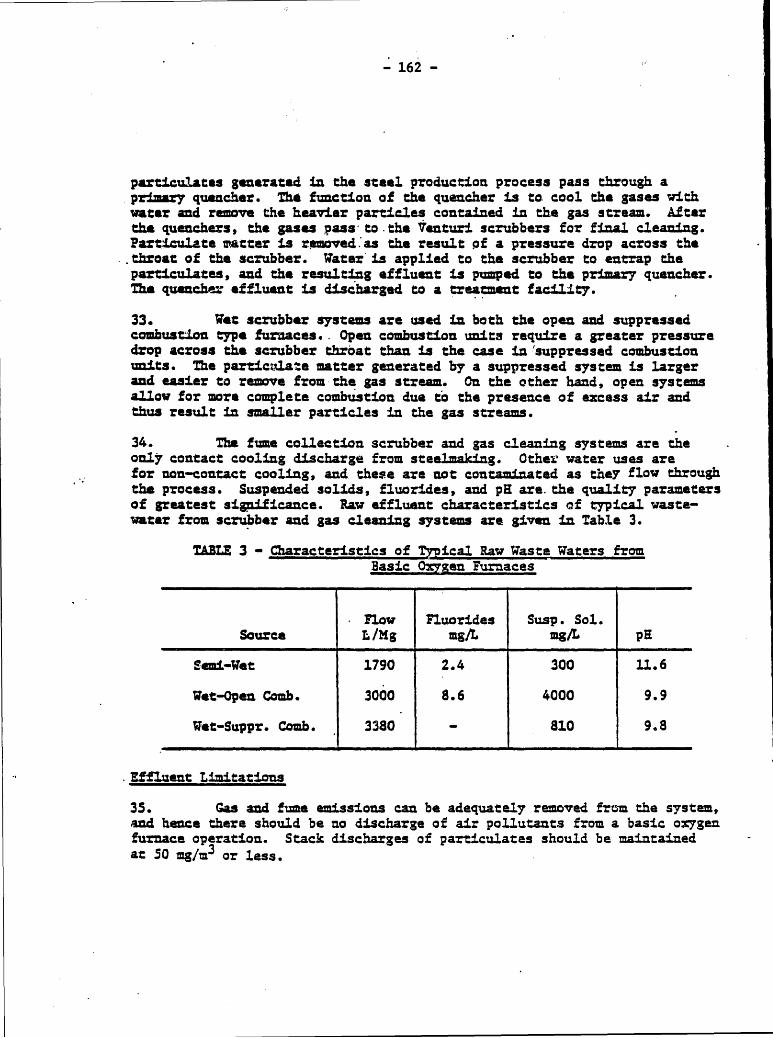
162 -
particulates generated in the steel production process pass through aprimary quencher. The function of the quencher is to cool the gases withwater and remove the heavier particles contained in the gas stream. Afterthe quenchers, the gases pass to the Venturi scrubbers for final cleaning.Particulate matter is removed. as the result of a pressure drop across the
.throat of the scrubber. Water is applied to the scrubber to entrap theparticulates, and the resulting effluent is pumped to the primary quencher.The quencher effluent is discharged to a treament facility.
33. Wet scrubber systems are used in both the open and suppressedcombustion type furnaces.. Open combustion units require a greater pressuredrop across the scrubber throat than is the case in.'suppressed combustionunits. The particulate matter generated by a suppressed system is largerand easier to remove from the gas stream. On the other hand, open systemsallow for more complete combustion due to the presence of excess air andthus result in smaller particles in the gas streams.
34. The fume collection scrubber and gas cleaning systems are theonly contact cooling discharge from steelmaking. Othew water uses arefor non-contact cooling, and these are not contaminated as they flow throughthe process. Suspended solids, tuorides, and pH are.the quality parametersof greatest significance. Raw effluent characteristics of typical waste-water from scrubber and gas cleaning systems are given in Table 3.
TABLE 3 - Characteristics of Typical Raw Waste Waters fromBasic Oygen Furnaces
Flow Fluorides Susp. Sol.Source L/Mg mg/L mg/L pH
Semi-Wet 1790 2.4 300 11.6
Wet-Open Comb. 3000 8.6 4000 9.9
Wet-Suppr. Comb. 3380 810 9.8
Effluent Limitations
35. Gas and fume emissions can be adequately removed from the system,and hence there should be no discharge of air pollutants from a basic oxygenfurnace operation. Stack discharges of particulates should be maintainedat 50 mg/n3 or less.

163
36. Effluent limitations for wastewaters are presented in Table 4.These limitations are based on application of best practicable treatmentcurrently available.
TABLE 4 - Effluent Limitations - Basic Oxygen Furnace Wastewaters
Flow Fluoride Susp.1. 1 Sol. g
Per Magagram Produced PgIISemi-Wet (No wastewater Discharges)
Wet-Open Comb. 630 - 31 6-9
Wet-Suppr. Comb. 210 - 5 6-9
Control and Treatment of Wastes
37. Fuae and gas cleaning systems discussed above, normally used withbasic oxygen furnaces, are effective in controlling and essentially eliminatingair emissions from the operation.
38. Liquid wastes from a semi-wet system undergo primary dedientationin a thickener, to which coagulant aids are usually added. The thickenersludge is dewatered by a vacuum filter, and the filter cake disposed of tolandfill or other appropriate means. The filtrate from the vacuu units isreturned to the thickener. The thickener overflow is completely recycledto the process, thus resulting in.zero discharge of effluent.
39. Liquid wastes.from a wet-open combustion system undergo solidsseparation in a clarifier, as a first step. Wastewater is then pumped to athikener for sedimentation, where coagulant acids may be added. The under-flow (or sludge) from the thickener is dawatered in vacuum filters, and thefilter cake conveyed to landfill disposal. The filtrate is returned to thethickener. About 85 percent of the thickener overflow is recycled to theprocess. The remainder is acid neutralized and discharged. Makeup wateris added to the recycle systems to compensate for blowdown and evaporationlosses.
40. Wastewaters from a wet-suppressed combustion system are firstsubjected to primary treatment in a clarifier to separate the solids. Itthen flows to a thickener, to-which a coagulant has been added. Thickenersludge goes to the vacuum filters, from which the cake goes to landfill

164-
disposal and the filtrate is returned to the thickener. Some 95 percent ofthe thickener overflow is recycled to the process. The remaining 5 percentundergoes further clarification. The sludge from this unit goes to the vacuumfilters, while the affluent is acid neutralized and discharged.
41. Fluoride levels are not significantly affected by the treatmentmethods discussed above. The levels generally found are higher than would beacceptable for a receiving water used for public water supplies. Therefore,existing fluoride levels should be considered in terms of the use to be madeof the receiving waters. Fluoride reduction can be achieved through applica-tion of lima reduction methods.
42. Disposal of sludges, filter cakes, and other solids may be tolandfill or to process recycling via the sintering plants. For landfill dis-posal the sludge is often dried to a higher solids content to reduce thevolume. In some cases the presence of zinc in the sludges may make them un-suitable for the sinters, since they could cause damage in the blast furnaceoperations.
ELECTRIC ARC FURNACES
Manufacturing Process
43. The electric arc furnace receives iron from the blast furnace, alongwith scrap metals and fluming materials to produce steel. Until recently, thisprocess was used primarily for production of alloy steels, but it is now usedto produce a wide range of carbon and specialty steel compositions.
44. High quality and alloy steels are produced in refractory-lined cylin-drical furnaces, utilizing a cold steel scrap charge and flazes. Sometimes alower grade of steel will be produced in the open hearth or basic oxygen fur-nace and charged to the electric unit. This is known as duplexing.
45. The heAt for the furnace is provided by passing an electric currentthrough the scrap or steel bath, by means of three triangularly spaced cylin-drical carbon electrodes inserted through the furnace roof. The electrodesare consumable and oxidize during the process. Furnaces range in charge capa-city from about 20 to nearly 400 metric tons. Diameters range from 2 to 9meters; heat cycle time is 4 to 5 hours.
46. Production of some high-quality steels requires the use of twodifferent slags for the same heat, referred to as oxidizing and reducing slags.The first slag is removed from the furnace and new fluxes added for the secondslag. The heat cycle generally consists of charging, meltdown, moltan metalperiod, oxidizing, refining, and topping (or pouring). Pure oxygen is some-times lanced across the batch to speed up the oxidation cycle which, in turn,will reduce the consumption of electrical power.

- 165
47. Within the past decade a new process, called the Argon Oxygen De-carbonization (AOD) process has been used in conjunction with electric arefurnaces. When the electric furnace is used in conjunction with the AOD, theelectric are unit functions as a carbon steel scrap smelter. The bat metalcharge is then transferred to the AOD unit for final refining. This elimi-nates the double slag process required when electric are furnaces are produc-ing stainless and alloy steels. The AOD process allows for better controlof the alloy steel composition.
Waste Sources and Characteristics
48. Waste products discharged from the electric are furnace processinclude smoke, slag, carbon dioxide and monozide gases, and oxides of ironemitted as submicron fumes. Other contaminants, such as zinc oxides fromgalvanized scrap, will also be discharged depending upon the type and qualityof scrap used. Scrap containing large quantities of oil will yield heavyreddish-black smoke as the oils are burned off at the start of the meltdowncycle. Nitrogen.oxide and ozone are discharged from the arcing of the elec-trades.
49. Gases and particulate matter can be effectively removed by varioustypes of gas cleaning systems, which will limit or aliminate the dischargeof these contanants. Three types of gas cleaning systems are most widelyused: dry, semi-wet, and wet. Some. of the gas cleaning and resulting opera-tions, however, will result in a contaminated wastewater discharge.
50. Dry gas cleaning systems.are generally of two types: baghouses andelectrostatic precipitators. A baghouse consists of a series of cloth orfiberglass bags which filter the water-cooled furnace gases. The furnacegases are first quenched by water sprays in a spray chamber and are then in-troduced to the baghouse. The bags are periodically shaken free of the dustwhich is then collected in hoppers located at the bottom of the baghousestructure. The dry dust thus collected is removed and landfilled. Anotherdry method of gas cleaning is the electrostatic precipitator, which involvesthe use of electrically.charged metal plates to capture the charged particu-late matter entrained in the gas stream. As for the baghouse method, thegases mst be water cooled prior to precipitator cleaning. Cooling of thefurnace gases is accomplished in an evaporation chamber to which water isapplied. The dust captured by the electrostatic precipitator is collectedin a hopper and conveyed to landfill. Neither of these two gas cleaning systemsresult in an aqueous discharge and therefore do not require any water pollutioncontrol equipment.
51. The semi-vet system also involves the use of electrostatic precip-itators but results in an aqueous discharge. This system water-cools thefurnace gases in a spark box chamber which is about one-third the size of theevaporation chamber used for a dry system. Water is oversupplied to thespark box to ensure adequate cooling and thus results in an effluent from thesystem.
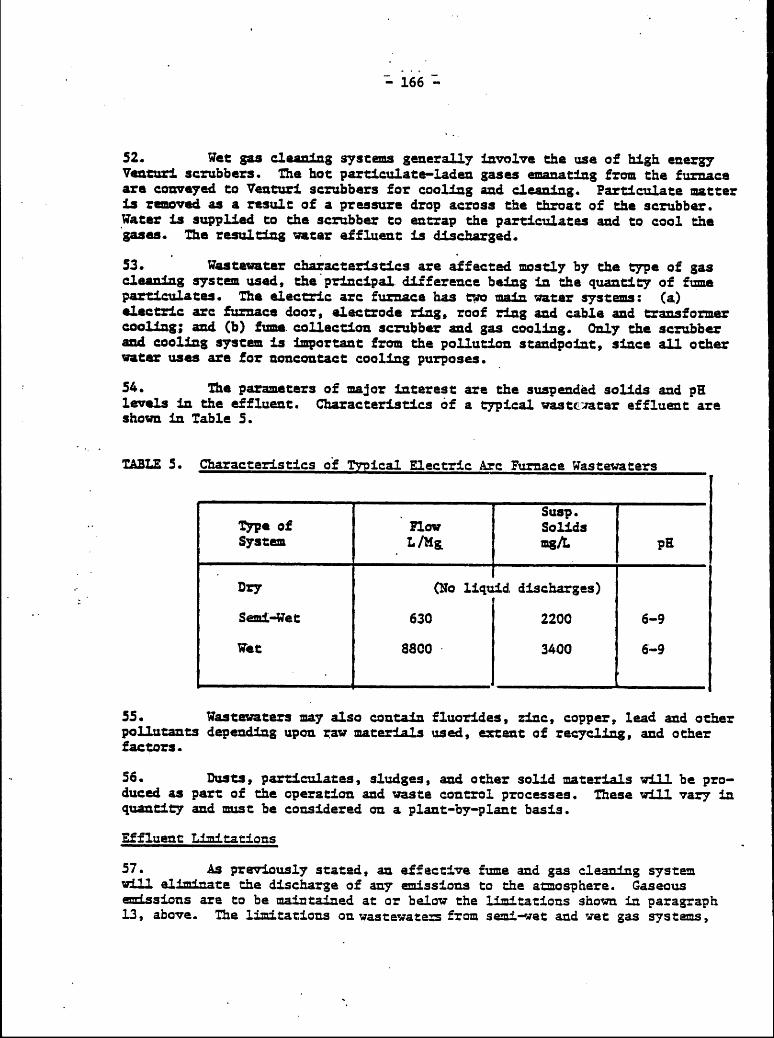
166 -
52. Wet gas cleaning systems generally involve the use of high energyVenturi scrubbers. The hot particulate-laden gases emanating from the furnaceare conveyed to Venturi scrubbers for cooling and cleaning. Particulate matteris removed as a result of a pressure drop across the throat of the scrubber.Water is supplied to the scrubber to entrap the particulates and to cool thegases. The resulting water effluent is discharged.
53. Wastewatar characteristics are affected mostly by the type of gascleaning system used, the principal difference being in the quantity of fumeparticulates. The electric are furnace has two main water systems: (a)electric are furnace door, electrode ring, roof ring and cable and transformercooling; and (b) fume collection scrubber and gas cooling. Only the scrubberand cooling system is important from the pollution standpoint, since all otherwater uses are for noncontact cooling purposes.
54. The parameters of major interest are the suspended solids and pHlevels in the effluent. Characteristics of a typical wastciater effluent areshown in Table 5.
TABLE 5. Characteristics of Typical Electric Arc Furnace Wastewaters
Susp.Type of Flow SolidsSystem L /M& mg/L PH
Dry (No liquid discharges)
Semi-Wet 630 2200 6-9
Vet 8800 3400 6-9
55. Wastewaters may also contain fluorides, zinc, copper, lead and otherpollutants depending upon raw materials used, extent of recycling, and otherfactors.
56. Dusts, particulates, sludges, and other solid materials will be pro-duced as part of the operation and waste control processes. These will vary inquantity and must be considered on a plant-by-plant basis.
Effluent Limitations
57. As previously stated, an effective fume and gas cleaning systemwill eliminate the discharge of any emissions to the atmosphere. Gaseousemissions are to be maintained at or below the limitations shown in paragraph13, above. The limitations on wastewates from semi-wet and wet gas systems,

- 167 -
based on using best practicable treatment currently available, are shown inTable 6.
TABLE 6. Effluent Limitations - Electric Are Furnace Operations
Suspended SolidsSource AMs at PI
Semi-wet System (No wastewater discharges)
Wet System 26 50 6-9
Control and Treatment of Wastes
58. Gas cleaning systems, as described above, will adequately controlor prevent the discharge of gaseous and particulate emissions to the atmos-phere. Where semi-wet or wet systems are used the materials are transferredto the liquid mediun and therefore require treatment of the resulting waste-waters.
59. The treatment components required for discharges from the two gascleaning systems are essentially the same. The basic treatment uses a clari-fier or thickener for primary sedimentation, following a classifier or otherprimary solids separation device to remove the heavier solids. The thickenerunderflow (or.sludge) is dewatered in vacuum filters. Filtrate from thevacutm unit is returned to the thickener. Chemical flucculation can be usedto aid in the settlement of solids and the removal of toxic metals and fluoride.Tn the semi-wet system the thickener overflow is completely recycled. In thewet gas system a part of the thickener overflow is discharged to receivingwaters.
60. Additional levels of treatment may be required, where significantquantities of inorganic toxic pollutants and fluorides are present. Severalmethods have been successful in controlling these substances. These methodsinclude lime and polymer flocculation, Lime precipitation, and precipitationwith sulfide compounds. The use of sulfide compounds has been more useful inreducing effluent metal concentrations than in the case of lime flocculation.
61. Significant quantities of sludge are generated from sedimentationof gas cleaning system wastes. These may be disposed of to landfill or to thesintering plant, following drying to a fairly high solids content. The presenceof zinc in the sludge may make it unsuitable for recycling to the sinter plantwithout dezincing. The dusts collected in the dry system baghouse may betransferred to a landfill site for disposal.

- 168 -
BIBLIOGRAPHY
1. "Environmental Control in the Iron and Steel Industry," InternationalIron and Steel Institute, Brussels (1978).
2. "The Making, Shaping and Treating of Steel". Ed. by H.E. MaGannon.Ninth Edition. United States Steel Corporation. Pittsburgh (1971).
3. Eussel, C.S. and Vaughn, W.J. "Steel Production: Processes, Productsand Residuals". Resources for the Future. The Johns Hopkins UniversityPress, Baltimore and London (1976).
4. United Nations Development Organization, Development and Transfer ofTechnology Series No. 11 "Technological Profiles of the Iron and SteelIndustry". United Nations, New York (1978).
5. U.S. Environmental Protection Agency "Draft Development Documents forProposed Effluent Limitations Guidelines and Standards for the Iron andSteel Industry". Doc. EPA 440/1-79/024a. Washington. (October 1979):
Vol. IV - Basic Oxygen Furnace and Open aarth Furnace Subcategories.Vol. V - Electric Are Furnace, Degassing, and Continuous Casting
Subscategories.
6. U.S. Environmatnal Protection Agency "Guidelines for Lowest AchievableEmission Rates from 18 Major Stationary Sources of Paxticulate, NitrogenOxides, Sulfur Dioxide, or Volatile Organic Compounds". Dec. EPA-450/3-79-024 Washington (April 1979).
7. U.S. Environmental Protection Agency. "Industrial Guide for Air PollutionControl". Doc. EPA-625/6-78/004. Washington (June 1978).
8. Jarrault, P. "Limitation des Emissions de Polluants et Qualite de L'Air -Valeurs Reglementaires dans les Principaux Pays Industrialises". InstitutFrancais de 1'Energie. Paris (1978).
9. APHA, ANWA, WPCF. "Standard Methods for the Examination of Water andWastewater". 14th Edition. American Public Health Association. New York(1975).
10. United Kingdom Department of the Environment, "Analysis of Raw, Potable,and Wasta Waters". H.M. Stationery Office, London (1972).
11. U.S. Environmental Protection Agency. "Handbook for Monitoring IndustrialWastewaters". Washington (August 1973).
12. U.S. Environmental Protection Agency. "Water Quality Criteria". Doc. EPA-R3-73-033, Washington (March 19/3).
-169-
THE WORLD BANK SEPTEMBER 1982
OFFICE OF ENVIRNMTAL AFFIPS
LEAD SAMPLING AND ANALYSES
1. This document covers the sanpling and analyses for determininginorganic lead concentrations in the gaseous and liquid wastes from indus-trial operations as well as other sources discharging to the environment.For gaseous and particulate discharges, both stationary and ambient sourceswill be discussed.
2. Stationary sources consist mainly of primary and secondary leadsmelters. Primary plants are those producing lead from lead sulfide oreconcentrates by pyrametallurgical processes. Secondary plants are thoseproducing lead from scrap materials, such as nanufacturers of storage bat-tery conponents. Ambient source monitoring measures the discharges reach-ing the environment from these installations, as well as discharges fromautomobile exiausts and other similar sources. -
STATIONARY SOURCE AIR MONITORIG
.Sampln
3. Stack sanpling ports are used for this purpose. These are to belocated at least eight stack diameters "downstream" of any bends, constric-tions, - abatement equipment, or other flow disturbances. If this is notpossible, then the sampling location should be at least two stack diameters"upstream" of any flow disturbances. Where these criteria cannot be met astack extension beyond the discharge and nay be required. Ports should beinstalled flush with the stack wall, and extend outward frcm the exteriorwall for between 5 and 20 centimeters, unless additional extension isrequired for installation of gate valves or other appurtenances.
4. If the sun of the stack inside diameter plus one port length isless than 3 meters, two ports should be installed on diameters 90 degreesapart. If the sum is greater than 3 meters, then four ports should be in-stalled on diameters 90 degrees apart.
5. Because particulates exhibit inertial effects and are not uni-formly distributed within a stack, the sarpling procedure is more complexthan for gaseous pollutants. Samples are taken at several traverse pointsalong the stack diameters (or cross-secticn). For a rectangular cross sec-tion the equivalent diameter is to be determined from the equation
De 2
where De = the equivalent diameter, L = the length, and W = the width ofthe cross-section.

6. When the eight and two-diameter criteria can T:e met, the minimumnumber of traverse points should be (a) twelve, for circular or rectangularstacks with diameters (or equivalent diameters) greater than 0.61 meter;(b) eight, for circular stacks having diameters between 0.30 and 0.61meter; and (c) nine, for rectangular stacks having equivalent diameters be-tween 0.30 and 0.61 meter.
7. The stack sampling train for determining inorganic lead whenusing the atomic absorption spectropbotometer procedure is shown schemati-cally in Figure 1. It is important in the sampling of particulates thatsamples, be withdrawn isokinetically, i.e. the linear velocity of the gasentering the nozzle should be equal to the velocity of the undisturbed gasstream at the .sample point.
8. The filter holder uses a glass fiber filter. A temperature of120 + 14* C is to is to be maintained by a suitable heating system sur-rounding the filter holder. The very fine particles and the vapor fractionwhich pass through the filter are trapped by the impingers.
9. The sanpling period is to be at least one hour's duration, andlonger if required to extend over a conplete project cycle. The miniwmvolume should be in the range of 0.85 to 0.9 dry standard .,cubic meter(dscm) per hour.
10. When using the dithizone analytical procedure, a different sanp-ling train is used. This is shown schematically in Figure 2. The trainconsists of a 0.45 micron membrane filter, or equivalent, (to capturelarger particles) followed by a sanpling tube containing activated carbon(to capture particles smaller than 0.45 microns). Generally, a total sam-ple of not over 150 to 200 cubic meters is collected
Analyses
11. The preferred methods of analysis for stack samples is "Method12", as designated by the U.S. Ehvironmental Protection Agency. In thismethod the particulate and gaseous lead emissions (consisting mainly oflead oxides) are withdrawn fra the source and collected on a filter and indilute nitric acid. The collected samples are digested in acid solutionand analyzed by atomic absorption spectrophotenetry, using an air acetelyneflame. Ch the basis of tests on samples with concentrations ranging ftcrn0.61 to 123.3 mg Pb/m3 , the within-laboratory precision of the method var-ies frmi 0.2 to 9.5 percent.
12. High concentrations of copper may interfere with the Pb analysisat the 217.0 rinm line of the instrument. This interference can be avoidedby analyzing the sample at the 283.3 rm line. (nm = nanameter = 10-9meter)
13. Where atamic absorption spectrophotanetry cannot be used, due tounavailability of equipnent or for other reasons, the colorimetric dithi-zone method, as published by ASTM, may be used. The method measures par-ticulate lead concentrations ranging from 0.01 to 10.0 micrograms per cubicmeter. It will also measure the vaporous lead, captured on the activatedcarbcn column, at concentrations below 0.5 microgram per cubic meter.

IEMPE RATURE SENSOR
ROBEM - HEAlf0 AREA TiE RMOMETER
4 ) EMPERATUIE . THERMOMETER
FROB ,/~ ALLVALVETO1uB STOR . \ -FILTER HOLDER TIEMMTR CHK
PROBE STAC*K
VACUUM*0* LINE
REVERSE-TYPE1e_* 1PITOT TUBE I
.PITOTMANOMETR IMPINGERS ICE BATH
r BY-PASS VALVEORI1FICE..
VACUUMGAUGE
MAIN VALVETHERMOMETERS
ORY GAS METER AIR-TIGHTPUMP
Figure 1 Inorganic Lead Sampling Train (From U. S. Federal Register,
p. 16576, April 16, 1982).
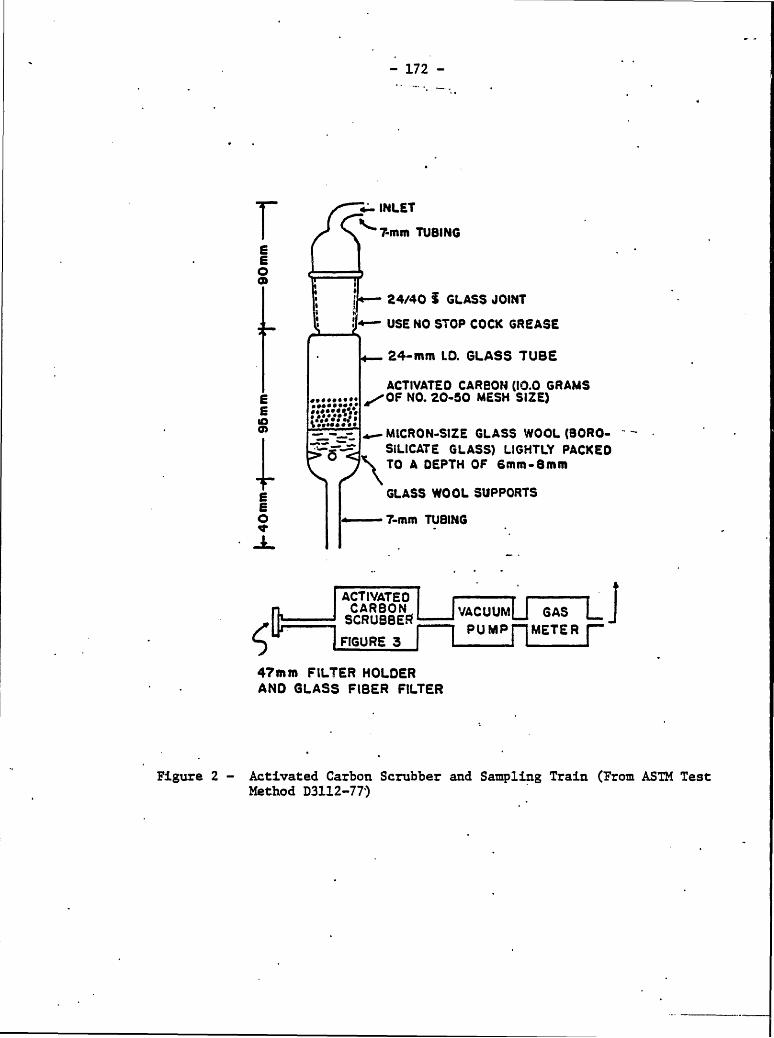
- 172 -
INLETY 7-mm TUBING
E
0
24/40 i GLASS JOINT
.- USE NO STOP COCK GREASE
24-mm ID. GLASS TUBE
ACTIVATED CARBON (10.0 GRAMS..... OF NO. 20-50 MESH SIZE)
MICRON-SIZE GLASS WOOL (901R0-SILICATE GLASS) LIGHTLY PACKEDTO A DEPTH OF 6mm-8mm
GLASS WOOL SUPPORTS5o - 7-mm TUBING
ACTIVATEDCARBON VACUUM GAS
SCRUBE-q PUMPF""METERFIGURE 3
47mm FILTER HOLDERAND GLASS FIBER FILTER
Figure 2 - Activated Carbon Scrubber and Sampling Train (From ASTM TestMethod D3112-77)
- 173-
14. For the dithizcne nethod, the filter sample is digested with ni-tric and perchloric acid, and the dissolved lead then determined colorim-itrically. For the carbon column portion of the samples, the lead is sep-arated from the activated carbn with hychuxochloric and nitric acids, filt-ered, and the lead in the filtrate determined colorimetrically.
15. In the presence of weak amnoniacal-cyanide solution (pH 8.5 to9.5) dithizone gives colored complexes with bismuth, stannous tin, nono-valent thallium, and indium. In strong arnoiacal-citrate-cyanide solu-tions (at pH of about 11.0), the dithizonates of these ions are unstableand are only partly extracted with chloroform-dithizone solution. Themethod has been found to be without interference from 20 micrograms ofbisnuth, 20 of novalent thallium, 100 of stannous tin, and 200 microgramsof trivalent indium. The ASIM procedure includes various steps to reducethe effects of these and other interfering ions.
AMBIENT AIR MONITORING
Sanpling
16. When the atanic absorption spectrophotaneter is to be used forthe analyses, ambient air sanples are best collected with a high-volume airsampler. This. type of sampler utilizes a vacuum-like device to draw largevolumes of air through a fiber glass filter on which particulates are col-lected for measurement and analysis. The sampler nust be capable of pass-ing envircomental air through a 406.5 cm2 portion of a clean glass fiberfilter at a rate of at least 1.70 m/;nin. The notor must be capableof 24-hour continuous ' operation, which is usually the nornal samplingperiod.
17. The glass-fiber filters should have a collection efficiency ofat least 99 percent for particles 0.1 to 100 microns in size. If otherfilter naterials are used, care must be taken to use filters that containvery low background concentrations of the pollutant being investigated,which in this case would be lead.
18. The total air flow through the sanpler is based on rotameterreadings taken ,at the beginning and end of the sanpling period. , The pro-cedure assumes that the decrease in flow is linear with time and that the24-hour rate as recorded is a representative average of' the entire samplingperiod.
19. While the high-volume sampler does not entrap all of the vaporfraction it is considered that the portion not entrapped is widely dis-.persed and highly diluted by the time the plume reaches the ground. Ambi-ent sanpling, for the nost part, is done outside the plant fence. There-fore, it is generally assumed that the particulates collected by the samp-ler contain essentially all of the lead present in the ambient air.
20. When the dithizone analytical method is to be used, the samplingtrain shown in Figure 2, and briefly described above, is to be used.

- 174 -
Analyses
21. The U.S. Ehvironmental Protection Agency procedure designated as"Reference Method for the Determination of Lead in Suspended ParticulateMatter Collected from Ambient Air" is * the method of choice for determiningthe lead-content of sanples collected a the high-volume glass-fiberfilter.
22. Lead in the particulate uatter collected by the fiber-glass fil-ter is solubilized by extraction with nitric acid (HNO 3 ) facilitated byheat, or by a mixture of HNO 3 and hydrochloric acid (HCl) facilitated byultrasonication, which will extract metals other than lead fron* the partic-ulate natter.
23. The lead content is determined by atomic absorption spectrophoto-metry, using an acetylene flame, the 283.3 or 217.0 rm lead absorptionline, and the optinm instrumental operating conditions recomnended by thenanufacturer.
24. The typical range of the method is 0.07 to 7.5 micrograms Pb/m3 ,assuming an upper linear range of analysis of 15 micrograms/ml and an airvolune of 2400 m3. .
25. Both chemical and light scattering interferences are possiblewith this method. Most analysts report an absence of chemical interfer-ences. Where interferences do occur, the published method includes thesteps necessary to reduce or eliminate both types of interferences.
26. When the USEPA method cannot be used due to lack of proper in-strumentatian or for other reasons, then the ASIM dithizone method may beused. The procedure is briefly described above.
WASTEWATER MONITORING
Sampling
27. Wastewater sample collections should be Iased on the actual pro-cess operations. Conposition of the effluents will vary either with timeor flow. Ccrposite samples, consisting of portions collected at intervalsover a 12 to 24-hour period, are considered to be most representative, al-though grab or spot samples nay be collected for special purposes.
28. Where the conposition varies according to time, the sanplesshould be of equal volume. Where the samples vary according to the flow,the sample size should be in proportion to the flow. For situations whensamples must be collected at frequent intervals over long periods, the useof autenatic samplers is recomended. I
29. Preliminary sampling throughout the plant, to include all import-.ant sources of the pollutant, will indicate the location and mininun numberof sanpling stations. It is important to know the lead content of individ-ual waste streams within the plant, as well as in the final effluent.Since flows nust also be determined, it is considered best to combine theflow measurement station with the sampling station whenever possible.
175 - -
30. Sampling stations should be located so that (a) the flow of thewaste streans is known or can be determined; (b) the staticn is easily ac-cessible, with no safety hazards for personnel; and (c) the wastewater isthoroughly mixed. When flumes are used for measuring flows, the sample isusually well-mixed. If weirs are used to measure flows, the, waste streamray not necessarily be well-mixed, since solids tend to settle behind thebarrier while floating naterial passes over the weir.
31. The total volume of sanple to be collected will depend upon theanalytical procedure to be used. The volume should be sufficient to allowfor repeating the analysis, supplying samples to other laboratories forcheck purposes where indicated, and similar. factors. Care should be takento properly preserve the sanples during the -sampling period and in trans-porting to the laboratory, so that the composition does not change betweencollecticn and analysis.
Analyses
32. Atcmic absorption spectrcphotanetry is the method of choice forroutinely determining lead in waste waters, as is the case with air-borneefflueits. The method is rapid, sensitive, and specific for the particularmetal involved. The procedure is described in detail in the- -FifteenthEdition of "Standards Methods for the Examination of Water and Wastewater" .
33. Where the atcmic absorption spectrophotometer is not available,lead concentrations may be determined by the dithizone method, also des-cribed in "Standard Methods". In this procedure, an acidified sample oflead is mixed with. anmniacal citrate-cyanide reducing solution and extrac-ted with dithizcne in chloroform, to form a cherry-red lead dithizanate.The color of the mixed solution is then measured colorimetrically. Theprocedure may be subjected to interference from bisnuth, stannous tin, andmonovalent thallium. Modifications are provided to avoid interference fromthese elements, particularly excessive quantities of bisnuth or tin.
BIBLIOGRAPHY
1. U.S. Code of Federal Regulations, Title 40, Sub-Chapter C, Part 60,Sutpart L, "Standards of Performance for Secondary Lead Smelters" andSubpart R, "Standards of Performance for Primary Lead Smelters".Office of the Federal Register, GSA, Washington, (July 1, 1981)
2. U.S. Federal Register. "Standards of Performance for New StationerySources; lead-Acid Battery Manufacture" . Vol. 47,. No. 74, pp 16564-16579. Washington. (April 16, 1982).
3. American Society for Testing and Materials (AS7M). "Standard TestMethod for Lead in the Atmosphere by Colorimetric Dithizone Pro-cedure". ANSI/ASTM D-3112-77. Philadelphia (1977).
4. U.S. Code of Federal Regulations, Title 40, Subchapter C, Part 50."National Primary and Secondary Ambient Air Quality Standards". Officeof the Federal Register,. GSA, Washington (July 1, 1981).
176 -
5. American Public Health Association. "Standard Methods for the Exami-naticn of Water and Waste water ". 15th Edition. New York (1980).
6. "Treatment of Industrial Effluents". Edited by A.G. Callely, C.F.Forster, and D.A. Stafford. Halsted Press Division of John Wiley &Sons, Inc. New York (1976).

- 177 -
THE WORD BAK OCTOBER 1980
OFFICE OF ENVRO TAL AND EEALTH AFFAIRS
HEA PROCESSING AND RENDERING
TDUSTRIAL WASTE DISPOSAL
1. Meat processing plants are those whose operations are confinedto dressing and curing of carcasses, to preparing specialty and other- products,and to cannig, following slaughter of the animals . The raw input generallyconsists of carcasses of cows and bogs. Processing operations may be carriedout in conjunction with a slaughterhouse or at a separate location. Slaughter-houses will not be covered in these guidelines since they are the subject of aseparate document.
2. A rendering plant is one which converts the inedible and discardedremains of the anima (such as fats, bones, heads, blood, and offal) into use-ful by-products such as lard, tallow, oils and proteinaceous solids. Renderingmay be done on-site as an adjunct to processing operations or off-site as anindependent operation.
IDUSTRIAL PROCESSES
3. Meat processing produces a number of products which may be generallygroaped as follows:
- Meat cuts and related products (such as steaks, chops,roast and hamburgers) for hotels, restaurants and privateconsumers;
- am-s and bacon, requiring curing in pickling solutionsfollowed by cooking and smoking, cooling, and slicing orother preparation prior to packaging and marketing;
- Comminuted meat products, requiring substantial size re-dntion and izing. The final product will be in a casingor container, such as sausages or sausage meat; and
- Canned products such as hams, sandwich spread and petfoods.
4. Most plants will produce a mix of these, although some do confinethemselves to one specialty only.
5. Plant waste waters usually discharge through catch basins, greasetraps, or flotation units. While there is a waste reduction benefit, the basicpurpose of this procedure is to separate the greases for later by-product recovery,rather than to provide waste treatant per se.
- 178 -
6. In the rendering operation, the bulk material, (offal, bones, trim-mings, etc.) are dumped into a pit and then conveyed to a grinder, when grind-ing is necessary. The raw mixture is next heated or cooked to melt the tallowor grease and permit separation from the proteinaccous materials. The protein-aceous material, also known as "cracklings", is normally screened and ground toproduce a meat and bone product. Both edible and inedible by-2rodnet resultfoa the r aendring operation, depending upon the composition and freshness ofthe raw materials and on the procedures used.
SOURCES AND CEARACTE OF WASTES
7. Liquid wastes, carrying various amounts of solids are the majorconcern in this industry. Solid wastes, resulting mainly from screening andhousekeeping, may also be of concern but this will depend upon the degree ofseparation and by-product recovery practiced at the individual plant. Otherthan odor problems, gaseous wastes are not significant. The purely hazardoustypes of components, such as heavy metals and pesticides, are not normallyfound in meat processing effluents.
8.* The most important parameters applicable to liquid effluents are5-day biochemical oyxgen demand (30D5 ), total suspended solids (TSS), oils andgreases (0 + G), hydrogen-ion concentration (pR), and facal coliform organisms.In addition, phosphorous may be of concern in meat processing while ammnia maybe of signifiaance in rendering operations.
9. Odors can originate from both point and non-point sources. Theygenerally result from bacterial activity on organic matter, the heating ofanimal materials, and the handling of warm animal residues.
10. The processing of carcasses and remains adds to the waste loadingsas follows:
- Preparation of meat materials. Large volumes of highlycontaminated waste are generated in thawing raw materialsby water immersion. The breaking, cutting, trizming, andboning of meats for further processing generates very littleflow and waste load. Waste loads originate primarily fromcleaning the equipment used for grinding, mixing, blending,and emulsifying the processed materials into other products.Additional wastes are generated from extrusion, stuffing,or molding operations related to forming or containeriza-tion of the product zixture prior to cooking.
- Pickling or curing operation. This involves use of a solu-tion for pickling hams, bacon and other products. Wastesresult from the nature of the process and the washing downof floor areas.
- Product cooking. Products are generally cooked in ovens(smakahouses) or in wet cookers using live steam or hotwater. Wastes are generated principally from the spray-ing applied to drench the products after cooking and fromequipment cleaning.

- 179 -
-- ag nii. Large volumes of water are generated in thecanning operation. Plants using automated canning lineswill discharge less water and wastes from this source.
11. In the rendering industry the major waste sources are from rawmaterials receiving, condensing cooker vapors, plant cleanup, and truck andbarrel washing. These mainly contain organic matter and suspended solids,along with various inorganic substances. The waste materials found in theefflunnts include blood, meat and fatty tissue, body fluids, hair, dirt, manure,bide curing solutions, tallow and grease, meal products, and caustic or alkalinedetergents.
12. Typical raw waste characteristics for various types of operationsare shown in Table 1.
Table 1. Typical Raw Waste Characteristics - Meat Processing and Rendering.
Flow BoD3 TSS 0 + G a/Type of Plant (Liters)
Per Megagraz of Final Product (TP)
Small Processor b/ 3,330 1.1 0.80 0.49
Meat Cutting 600 0.52 0.64 0.12
Sausage andLunch Meats 9,600 2.6 3.5 1.2
lam Processing 10,600 5.5 3.3 2.4
Meat Canning 11,200 12. 4.5 2.1
Per Megagram Raw Material Input (3M)
Rendering c/ 3,260 2.2 1.1 0.72
a/ 0 + G - Oils and Greases
b/ Total production = less than 2,700 Xg/day
c/ Following in-plant materials recovery using catch basins, skimmers, etc.
* 1 magagram = 1 metric ton

- 180 -
Table 2. Daily Magdxman Effluent Limitations - Meat Processing andRendering Plants
Type of Plant -a/ BOD TSS Oils + Greases
Per Mega5ram of Final Product (FP)
Small Processor b/ (No discharge allowable) c/
Meat Cutting 0.02 0.02 0101
Sausage andLunch Meat 0.28 0.38 0.20
Ram Processing 0.32 0.42 0.22
Meat Caming 0.34 0.44 0.26
Per Megagram law Material Input (EM)
endering Plant d/ 0.14 0.20 0.10
a/ For all plants: pH = 6 to 9; Facal Coliform MN 400/100 ml.
/ Total Production = less than 2,700 kg/day.
c/ May be discharged to munIcipal system with adequate pretreatment.
j/ For plants where hide curing is carried out, the following additiveadjustments are to be made:
OD5 = 6.2 I (no. of bides)(Kg Of EM)
TSS * 12.6 X (no. of hides)(Kg of RM)

181 -
CONTROL AND TEATMENT OF WASTES
13. As has already been stated, the principal and usually only air pol-lution problem connected with the maat processing and rendering industries isthat of odors, particularly in the rendering operations. Other possible sourcesare the smokabouse operation and the dryers. Air scrubbers are most commonlyused. for odor control. To avoid increasing the liquid waste loading the scrubberwater may be recycled if the air is not too heavily loaded with smoke and greaseparticles.
14. Liquid waste discharges to receiving waters can be reduced in volumean4 concentration through effective water management, in-plant waste controls,process modifications, and by the use of treatment systems. The wastes may alsobe released to micipal systems provided that certain pretreatment measuresare taken prior to discharge from the industry.
15. In-plant control techniques include the use of screening, skimming,or settling (alone or in combination) to reduce the discharge of solids. Be-cause these solids, to a large degree, can be processed into saleable by-productsthis treatnt step is routinely employed in most plants. Excess solids can behauled to a landfill. Where possible, steps should be taken to prevent usefulmaterials from reaching the floor in order to reduce general cleanup operations.This conserves water and reduces effluent flows. Catch basins can be employedfor separation of greases and other solids. Dissolved air flotation systemshave also been effective in removing grease and finely suspended solids.
16. Biological systems can generally be effective for treating these wastes,particularly where in-plant "primary" treatment for recovery of useful solids isbeing utilized. Secondary treatment, such as anaerobic processes, aerobic lagoons,the activated sludge process, and high-rate trickling filtration are the techniquesmost frequently used.
17. If treatment beyond "secondary" is required the effluent may be sub-jected to slow sand filtration, microstraining, spray-irrigation, ion-exchange,or 'other tartiany systems.
SUGGESTED REFERENCES
1. "Information Sources on the Meat Processing Industry",-N IndustrialDevelopment Organization. Doc. UNO/LI3/SER.Dl/Rev.1 New York (1976)
2. Jones, Rarold R. "Pollution Control in Meat, Poultry, and SeafoodProcessing". Noyes Data Corporation., Park Ridge, N.J., and London (1974).
3. Lavie, Albert, "'The Meat Fandbook", AVI Publishing Co. Westport, Conn.C1963).
4. U.S. Environmental Protection Agency-Development Documents forEffluent Limitations Guidelines and New Source Performance Standardsfor the. Meat Products and Rendering Processing Point Source Category,as follows:

-182-
(a) Doc. EPA-440/1-74/031, Processor Segment (August 197Cb) Doc. EPA-440/1-74/031-d, Group 1. Phase I, Renderer
Segment (January 1975)
5. U.S. Environmental Protection Agency I'Upgradig Meat PackingFacilities to Reduce Pollution", EPA Technology Transfer SeminarPublication. 3 Vols. Washington (October 1973).
-183-
THE WORLD BANK JULY 1982
OFFICE OF ENVIRCRENTAL AFFAIRS
GUIDELINES
STRIP (SURFACE MINING OPERATIONS)SEDINT AND EROSION CONTROL (LAND RECLAMATION)
1. Ctrol of erosion and sedimentation has assumed a new imPortancein view of world-wide industrial . expansicn and increased energy needs.Greater reliance is being placed on coal as a major energy source. . Manymineral ores and coal supplies are readily accessible through strip (orsurface) mining cperations. Therefore measures are necessary to protectthe environment from uncontrolled soil movement ar4 offsite damage thatcould result from such perations.
2. Measures are also necessary to ensure the safety of workers andothers who are required to be at or near the site. On March 24, 1981, 19persons were buried alive when their bcmes, located at the edge of an cpencast tin mine, were destroyed by a landslide. The ground an which thehomes were standing slipped 60 meters downhill into an excavation. This
tragic event occurred at Puchong, Selangor State, Malaysia.
3. Each Bark appraisal report should include a complete and detailedproposal, with a timetable, for controlling erosion and sedimentation whichcould result from projects. The plan should provide for initiating landreclamation and other necessary measures in the early project stages, andin no case later than three (3) years following the start of mining opera-ticns.
4. These guidelines present basic concepts and sources of sedimentpollutin, principles, of control, and the planning needed for effectivecontrol measures.
CONCEPTS AND. COURCES OF SEDIMENT POLI=TION
5. Surface mining, like any large-scale earth-imving cperation, cangenerate- large volumes of sediment. If the sediment can be containedwithin the mining site, then no problems are created. However, if thesediments are not contained but are allowed to reach adjacent waterways, asis most frequently the case, then they become pollutants.
6. As pollutants, the sediments can have a number of detrimental ef-fects, such as:
-Reducing storage capacity in reservoirs;-Filling lakes and ponds;-Clogging stream channels;-Destroying aquatic babitats;-Increasing water treatments costs; and-Acting as carriers of other pollutants (such as plant
nutrients, insecticides, heavy metals and diseas organisms).

- 184 -
7. The najor sources of sediment pollution are those 'land-disturbingactivities associated with mining, construction, agriculture, and fores-try. It has been reported that active surface mining and constructionoperations cause the highest rates of erosion.
8. The major sources of sediment in surface mining operations arethe areas being cleared, grubbed (removal of stumps and roots), and scalped(renoval of vegetation cover); roadways; spoil pits; and active miningareas.
9. Soil losses from clearing, grubbing and scalping operations arecaused by:
-Failing to install perimeter control measures prior tostart up of operations;
-Exposing soils or steep slopes;-- Clearing too far above the unexcavated face of the over-
burden;-Clearing and grubbing too far ahead of the open cut;-Improperly placing or protecting the salvaged or stock-
piled materials; and-Creating a surface that impedes infiltration or concen-
trates surface runoff, such as leaving bulldozer cleatmarks that run up and down a slope.
10. Roadways are often the major source of. sediment, and may functionas conduits for sediment washing down from other areas into the naturaldrainage systems. This includes the roadways within the mining area itselfas well as the access roads outside the actual mine. site.
11. IMng access roads can adversely disrupt the natural drainage sys-tems by intercepting, concentrating and diverting runoff. This will resultin severe soil losses from roadway surfaces, ditches, cut slopes and safetybens.
12. Accelerated onsite and offsite erosicn will occur after the mineceases operations if steps are not taken to permanently stabilize exposedsurfaces with vegetaticn and to otherwise lessen disruptian of the normaldrainage patterns.
13. In area strip mining operaticns, carried cut in level or gentlyrolling topography, the spoil accumulating belcw the outcrop line has thegreatest potential for causing offsite sediment damage. Water pumped fromthe pit during rainfall can also contribute significant quantities of sedi-ment and other contaminants.
14. Contour strip mining, carried cut in steep or rountainous terrainhas a much greater potential for sediment damage. Since contour mines havea narrcw, linear configuration nore of the- spoil area tends to dischargedirectly into the natural drainage systems. Another contributing factor isthat the receiving waterway is generally closer to the sediment source andseparated by relatively steep terrain. Additionally, the mine sitereceives erosive runoff from undisturbed areas above it.
- 185
15. Mountain-top renoval raining bas, in recent years, been an alter-native to strip mining. The nost critical areas at this type of operationare the spoil slopes around the perimeter, mine roadway exits, and valleyfills. The fills are highly susceptible to piping (subsurface removal ofsoil) and to landslides. Another serious problem can be the soil lossesfran the face of the slope due to rainfall and runoff. Chemical and acidpollution can also cause serious problems.
16. Certain reclamation practices contribute significantly to en-vironmental damage if not properly carried out. Configuraticn of the grad-ed areas, the pattern of reestablished drainageways, revegetation measures,tillage practices, and followup maintenance will all influence the longterm soil losses and offsite damages.
PRINCIPLES OF EROSION AND SEDIMT TRANSPORT
17. As applied to mining operations the nost important types of eros-ion are those caused by a stornwater runoff. Three basic types are ofmajor significance:
-Sheet erosion - resulting from rain striking a baresoil surface, and displacing soil particles;
-Rill and uly erosion - removal of soil by water throughsmall, well-defined channels; and
-Stream channel erosion - scouring of the stream channelby sediment reaching the stream frcn land surfaces.
18. The erosion potential of any area is determined by climate (pre-cipitation, teuperature and wind);- vegetative cover; soil characteristics(structure, texture, organic matter, moisture, and permeability); and to-pography. %hile these factors must be considered separately, it is theircambined effects which determine the total erosicn potential.
19. Sediment transportaticn and depositicn are influenced by the flowpatterns of the water and the nature of the particles being transported.As velocity and turbulence increase, more sediment is transported. Small,light particles such as fine sand, silt and clay are easily transported.Ccnversely, coarser and heavier particles are more readily deposited.
CONTROL TEHNOIGY
20. Stornwater runoff, which is the basic cause of soil erosicn, canbe controlled through applications of proper vegetative and structual prac-tices, and constructicn measures that control the location, volume, and ve-locity of runoff. To this should be combined a suitable program of schedc-hing mining operations to minimize problems related to seasonal climaticfluctations.
21. Control nay be accomplished through one or more of the following:
-Reduction and detention of 'the runoff;-Intercepticn and diversicn of the runoff; and-Proper handling and disposal of concentrated flow.

-186-
22. Soil stabilization is another means of preventing soil erosion.Stabilizatin measures may be either vegetative or non-vegetative, short.term or long term, or a combination of these. Vegetative stabilizationutilizes different types of vegetatici to protect the soil frcn erosion.Non-vegetative stabilization erploys a nultitude of measures that depend onmaterials other than vegetaticn to prevent erosion. Frequently the twotypes are used together.
23. Mulching and chemical stabilization are the two major types ofshort term measures applied. Mulching, with organic materials such asstraw, bay, wood chips, wood fiber or other products, is most often used.Chemical stabilizers serve to coat and penetrate the soil surface and bindthe soil particles together. These are nost. effective for dry, highly per-meable spoil or inplace soils subject to sheet flow.
24. Mulching and channel stabilizaticn are most frequently used forlong term stabilization. However, mulching in this case involves the useof fiber glass, plastics, or other non-biodegradable material to protectseed beds during the germination and early plant development periods. Ingeneral, structual channel stabilizaticn involves the use of stone riprap(broken rock) or other durable material to stabilize ditches and otherwaterways. Stone surfacing is sometimes used to stabilize highly toxicsurfaces or excessively wet seepage areas cn slopes.
25. Sediment is the product of erosion and hence must be contained,and every effort should be made to control sediments at, or as close to,the source as possible. The procedures used successfully for trapping(such as sandbags and straw bales), settling basins and chemical coagula-ticn.
26. All erosion control and sediment containment fAcilities must re-ceive proper maintenance during their design life in order to perform ef-fectively. They should be located in a highly visible area so as not to beoverlooked. They must also be readily accessible to personnel and equip-ment for regular inspections, and for the performance of routine and emer-gency repairs.
27. Once the mining operaticn is finished, all sediment controlstructures should be disosed of in such a way as to present both the struc-tures and the accumulated sediments fran beconing nuisances and contribu-ting to envircrental deterioration.
EFUENT LIMITATIONS
28. Runoff and drainage from surface mining operations should not ex-ceed the following limitations prior to discharge into surface waters:
Total Suspended Solids: 30 - 100 rg/LTotal Iron 4 - 7 mg/LpH 6 - 9Alkalinity Greater than aciditySoluble Toxicants None

- 187 -
CONTROL PIANNING
29. An erosion and sediment control plan serves as the basis for cp-erating the mine and at the same time minimizing or eliminating environmen-tal damage.
30. Preparation of a control plan requires five basic steps:
-Identification of legal and technical requirements;-- Collecticn and evaluaticn of site information;-Development of a control strategy;-Interdisciplinary review of the feasibility of the
preliminary plan; and-Revision and finalizaticn of the control plan
31. Table 1 presents a list of the major components which should beconsidered in formulating an erosion and sediment control master plan.This should be made an integral part of the overall mining, operation.
IAND RECIAMATION
32. Surface mine reclamaticn shall be performed in such a mannerthat the lands are returned to conditions capable of supporting prior landuses or uses that are equal to or better than prior land use. The operatormust backfill and grade to cover all acid and toxic materials. Highwallsand spoil piles mst be eliminated and the approximate original contour re-stored. All surface areas nst be stablized and protected in order to con-trol slides, erosion, subsidence and accompanying water pollution. Water
* inpcundnents, retention facilities, dams, or settling ponds shall be ade-quate for intended land use. These faclities cannot produce significantadverse effects to adjacent water resources. Cperators nust use best prac-ticable coumercially available technology to minimize, control, or preventdisturbances to surface or underground water quality, quantity, or flow.Mining wastes and rubbish must be properly disposed of so as to minimize,control, or prevent water pollution.
33. It is inportant .that land reclamation be started as soon as pos-sible and at the latest 3 years after the opening of the mine. The BankMission should receive concrete and detailed proposals on the reclamationprogram and On the means necessary to achieve it.
BIBLIOGRAPHY
1. Grim, E.C. and R.D. Hill. "Envircnmental Protection in Surface Miningof Coal". U.S. Environmental Protection Agency - Technology Series,Doc. EPA-670/2-74-093. Washingtcn (October 1974).
2. U.S. Envircomental Protection Agency "Erosion and Sediment Control".(2 Vols.) Doc. EPA-625/3-76-006. Washington (October 1976).
3. "Guidelines for Reclamation and Revegetation, Surface-Mined Coal Areasin Southwest Virginia". Virginia Polytechnic Institute and StateUniversity, Extension Division. Blacksburg, Virginia (February 1973).

-188 -
Zable 1. Components to be Considered for Prepatat:a.n of Erosion and Sedlment
Contro ?l ans a/
Sackground information: TSchedul of acivities-continued
1. General: Mining operations-conrin*'
.ocation of project 2. Overburdan handling:
EUnt of arma to be af fecdType of mining operation
Method of overburden handling
Evidence of comptianc~ with State's legal Handling of fim cut
rMquirments Pian view of overbuden storage
2. Sitt invemory: Stornwater handling in overburden
stog armas
Topography Tonporary sabiliation rmeasures•
Geologic analyss - Permanent stalilization meaures
Soi analysisi c analysis
Hydrologic analysi Reiamato opermionr:
Vegetaive analyuisLand usa analys
1. H.andling of toxic material:
Method of handling toxic material
Equipmem to be used
Schedule of activies 2. Spoil rehandling and grading:
Site preparation: Typical cross section of regrading
1. Accs mads Euipment to be usedMethod of spreading tosoii or upper
Plan view (location) hor~an material on the regradd
Typiclrssuection are, including aroximateProf iles thicinms of the final ~rfacing
Maintenance requirements Und schedule nmtrialMehod of drainage contol for the
2. Orainage and hent ibmrol srcmre: finl regraded mec
Plan view (location . .. 3. Rugetada 7
Typil crom sionsDetnilm (where needed) . Method to be usd
Design computatons (where needed) SUrface preparadon
Maintnance requirwnu and w*hedule Type of vegestionP~dl~ appication (method and
3. CW~ring and grubbing: . rWW' . , Seasonal ruegetation schedule and
Plan views of lienks of ares to be ciaed r=m
Ducripio of procedure Mulch application (method and mte)
V.xhinesy to be und Maintenance reument and sched-
Mehod of diposing of timber, brudand . ue
idemificeaion of crt~l r ruquinng 4. Mine abandonmenu
Meshod for disposul and stliationof drainge stuctures noto.
Maing op.rdons: ee abov. partcicuary uediment
bjaaficften
. Seiping:•. Medud for smbiånsi ad/or aln
donment of hiulroad '
Method of se~iping tpsoAi meriad Auignnt of mponsii-y for any
Equipentu to be us~ psnnenen t u rci keft bwhind
Plan viw of tassoö norage m . Maintnance progid sceduie
Tmorary s Sge d ~twe sabiliaton of '6 for aW PrLbZonnt_truc 1urs 't
-i USEL "EroionP and S n Control". Do. EP-2/s.600. (cte 1976)
189
THE WOILD BANK FERUARY 1981
OFFICE OF ENVIRONMENTAL AFFAIRS
UNDERGROUND COAL MINING
EFFLUENT GUIDELINES
1. Many of the world's mineral resources are extracted from the earththrough underground mining operations. The principal ones include coal, andto a lesser degree, copper, lead, zinc, molybdenum, uranium, and others.This document will be confined to the environmental effects of undergroundcoal production and its associated operations.
NIG PROCESSES
2. Underground mining is a highly complex operation, involving basic-ally working beneath a thick overburden, connected to the outside by shaftsand passageways which are sometimes hundreds of meters long. Major problemswhich are not found or are of lesser importance in surface mining includeroof supports, ventilation, lighting, drainage, methane release, equipmentaccess and coal conveyance.
3. Once a main access portal has been established, parallel entriesare driven into the coal deposit to provide corridors for haulage, ventilation,power and other operational needs. Cross-corridors then reach to the sides ofthe mine, leaving pillars in a checkerboard fashion to support the roof andoverburden. The deeper the mine, the larger the pillars must be relative tothe mined out areas. Where large pillars are required for support duringoperations it may be desirable to mine the pillars as the equipment retreatsback toward the main tunnel. The roof must then be supported by other meansor allowed to collapse.
4. Equipment used in underground mining ranges from relatively simpleto highly automated machinery. Many small mines still rely primarily on handlabor. Coal is blasted from the face of the seam and loaded into shuttle cars,using mechanical techniques in most cases. This involves undercutting, drill-ing, blasting and loading. Shuttle cars, filled by portable conveyor belts,take the coal either to an underground transfer point or directly out of themine.
5. These operations produze.large amounts of dust and liberate methanetrapped in the coal, requiring that exposed areas be kept essentially free ofparticulates or open flames to prevent coal dust or methane explosions. Machinesare usually connected to a watar supply to provide a spray for dust control.Frequent methane testing is required at the seam face to avoid danger to theworkers.

- 190 -
6. Continuous machines are employed in many locations. Basicallya rotating head digs into the coal and loosens it while arms scoop it ontoa conveyor belt for loading into a shuttle car.
7. Longwall mining has been used in Europe for many years and isnow gaining popularity in other regions. Corridors about 100 to 200 metersapart are driven into the coal and interconnected. The longwall of the in-terconnection is then mined in slices. The roof is held up by steel supportswhile the cutter makes a pass across the face. The roof supports are advancedwith the shearing machine to make a new pass, while the roof in the mined outarea collapses behind the supports.
8. For most uses, the mined coal must be processed to meet consumerneeds in terms of size, moisture, mineral concentrations, heat content andother properties. This may be done by either physical or chemical procedures,and usually takes place at the mine site.
9. Physical coal cleaning involves crushing, grinding, sizing, solidsseparation, washing and flotation in various combinations. These techniquesremove portions of the sulfur and ash contents. Although the sulfur existsin the coal in both the organic and inorganic forms, physical cleaning iseffective'anly in reducing the inorganic portion. Because of partial ashremoval, the procedure also 4acreases the per kilogram heat content.
10. Chemical coal cleaning or desulfurization involves treating coalwith a reagent capable of converting the sulfur to a soluble or volatileform. Leaching solutions such as nitric acid, hydrofluoric acid, :hlorine,ammonia, and organic solvents have been reported to be successful. Eowever,this cleaning procedure is still in the experimental stage and is not currentlybeing applied commercially.
SOURCES AND CHARACTERISTICS OF WASTES
11. Coal mining operations and equipment choices vary widely, and aregenerally selected on the basis of local geology and other natural conditions.The specific environmental effects will depend upon the mining techniquesutilized and the existing geological or geochemical characteristics.
Air Emissions
12. Air pollutants from coal mining operations are not considered tobe significant. Dusts originate from drilling and blasting procedures, butthese are generally controlled by water sprays at the working face. Methaneis controlled through effective ventilation with air in order to reduce thegas concentrations to levels below the flamable or toxic limits, and thusavoids the possibility of underground explosions. The methane problem increaseswith greater depths because the methane has less opportunity to diffuse tothe surface over geologic time. It has been estimated that at mining levelsmethane is produced at an average rate of 5 cubic meters per ton of coal mined.

- 191
Liquid Effluents
13. The principal environmental pollutant resulting from undergroundcoal. mining operations is acid mine drainage. The acidity results whennaturally occurring pyrite (FeS2)in the coal seam and wastes is ozidized inthe presence of air and water to form sulfuric acid (32 SO4 ) and iron sul-fates (7e S04 and Fe 2 (SO 4 ) 3. This very acidic (pH 2 to 3) effluent mustbe treated for pH and dissolved iron before release to water courses. Atthe low pH values heavy metals (such as iron, manganese, cadmium, copper,zinc, and. lead) are more soluble and can create serious water pollution prob-lses. Continuous acid discharges will seriously affect aquatic ecosystems.Acid waters containing heavy concentrations of dissolved heavy metals willsupport only a limited water flora, such as acid-tolerant molds and algae,and will not support fish. Acid waters are not suitable for human consumptionnor for most industrial uses.
14. The amount and rate of acid formation and the quality of water dis-charged will depend upon the amount and type of pyrite in the oterburden andin the coal, time of exposure, characteristics of the overbutdenl and amountof available water. It has been estimated that in the Appalachian bituminouscoal mining regions of the eastern United States an average of 1200 liters ofacid mine water is discharged for each metric ton of coal mined.
15. Water is supplied to coal mines primarily for suppressing dust (con-tinuouj, mining and conveyor belt operation) and for equipment cooling. Rainwater can enter mine areas through infiltration. Hence, continuous water re-moval is required to assure continuity and efficiency of the mining process.
16. In coal preparation the water is deliberately introduced into theunit process operations which include vet screening, tables, cyclones, gravityseparation and heavy media separation. Water is also used for dust control,equipment cooling, and transporting coal in the washing process.
17. The parameters of principal concern in underground coal mining opera-tions and for coal preparation plants include hydrogen ion concentrations (P),total suspended solids (TSS), total iron, and total manganese. Average levelsof these parameters found in typical underground mining and coal preparationplants are given in Table 1.
Solid Wastes
18. Solid wastes are generated both during underground mining and duringthe preparation process. The solid waste from underground mines (commonly re-ferred to as "gob") results from the digging required to reach the coal seams.Normally this material is transported to the surface and dumped in piles onthe land. Its composition in general corresponds to the overburden found inthe mining area.
- 192 '
Table 1. Average Quality of Raw Effluents From Acid Mine Drainageand Coal Preparation
Parameter Acid CoalDrainage Preparation
Total Susp. Sol. - mg/L 158 218,000
Total Manganese - mg/L 4.9 8.4
Total Iron - mg/L 135 733
pH - Units 5.7 7.0
Ls. Pefuse from the coal extraction and preparation, consisting ofsolid wastes and other impurities, is also generally disposed of by dumping,on nearby land areas.
20. The waste piles are unsightly, causing degradation of local prop-erty values and destruction of esthetics. The refuse contains flanmablematerial readily susceptible to spontaneous combustion and difficult to quench.This burning produces particulate matter and fumes high in sulfur dioxide.Acid mine drainage and siltation can also result from runoff from the piles.Siltation is influenced by the steepness, compaction, drainage controlstructures, and cover material of the pile.
WASTE DISCHARGE LIMTATIONS
Air Emissions
21. Dust and methane-gas are the principal air pollutants of concernin underground mining. Particulates should be controlled by water sprays.Methane gases should be controlled by efficient ventilation systems bringingoutside air to the working areas.
22. Coal preparation plants can be sources of discharges of particulatematter to the atmosphere. Pneumatic cleaning and thermal drying are the chiefsources. Particulates should be limited to:
Ann. Geom. Mean 75 ag/m3Max. 24-hours 260 ag/m3
(outside the mine fence at ground level)
193,
Liauid Effluents
23. Liquid effluents from subsurface mining add coal preparation opera-tios should conform to the limitations shown in Table 2.
Table 2 - Effluent Limitations for Acid Mine Draina2eand Coal Prevaration
Parameter TAimtation
Total Susp. Sol. - mg/L 70
c Total Manganese - mg/L 4
Total Iron - mg/L 6
pH Units 6 to 9
CONTROL AND TREATHET OF WASTES
Air Emissions
24. Dust control in the mines is effected by continuous spraying of theworking face. The methane is diluted with air to less-than-flammable limitsto avoid the possibility of underground explosions. In some instances themethane can be drained from the coal seam before mining. Such an operationrecovers the gas for use as a fuel and at the same time reduces the danger ofmine explosions.
25. Particulate matter from coal preparation originates from crushing,pneumatic cleaning and thermal drying. These emissions can be effectively con-trolled by use of baghouses or other dust collection devices.
Liauid Effluents
26. The acidity in the acid mine drainage may be controlled through pH.adjustment and chemical precipitation. Hydrated lime (Ca (OH)2) is mostcomonly used for this purpose, and can be introduced as an aquaeous slurryor as a dry powder. In large installations calcined lime (CaO) (also termed"slaked" or "quick" lime) or limestone (Ca C03 ) may be more economical touse. Caustic soda (Na OH) or soda ash (Na 2 CO 3 ) can also be used, but aremuch more expensive.
- 194 -
27. Control of the pff will also result in a reduction of the iron andmanganese levels in the effluent, by causing oxidation which converts theferrous iron to ferric iron and thus precipitates it out of solution. Theupward adjustment of the pH causes a solubility decrease and precipitationof the heavy metals in the effluent. The precipitates can then be removedby settling.
28. The effectiveness of neutralization and settling in controlling theeffluent is governed by the reagents used, the influent and effluent pH,temperature, volume of flow and the presence of any side reactions, includingmetal chelation and mixed-metal hydroxide complaxing.. (Chelation is a chemicalreaction in which a central metallic ion is captured in a complex within aring containing several atoms).
29. Oxidation of certain components common to coal mine wastewates (suchas ferrous ions) to easily removed compounds can also be accomplished by aeration,either mechanical or simple cascading flow. The resulting sludge and othersolids are readily settled in settling basir,.
30. Wastewater from coal preparation plants may be satisfactorily treatedby settling. If the settling pond capacity is limited it may be necessary touse a coagulant. The overflow from the ponds is generally suitable for recyc-ling through the preparation systems, resulting in little or no discharge tosurface waters. Where sufficient land area is available two or more ponds areused on an intermittent basis. As a pond is filled with settled solids, it istaken out of service for removal and disposal of the sludge.
Solid Wastes
31. Refuse from the mining operation may be left underground but in mostcases it is brought to the surface and dumped nearby. Refuse from the coalcleaning is generally collected and also dumped near the site.
32. Steps should be taken to assure that leachate and surface runofffrom the piles does not cause harm to surface waters or groundwater supplies.Leaching,which should be monitored, can be minimized or prevented by carefulcomposition and layering of the refuse material. Leaching water will be treatedif need be.
33. Sludges from the settling ponds can be dredged and conveyed to arefuse pile and sludge lagoon. Where sufficient pond capacity is provided, thesludge may be allowed to dry in the lagoon. This will reduce the volume andfacilitate removal and final. disposal.
COAL SLRRY PIPELINES
34. Although it is not being widely applied at this time, coal slurrypipeline technology has already proven to be a commercially successful alterna-tive for transportation of coal. Because use of this technology is expanding,

- 195 -
it is considered advisable to outline the possible environmental effects. Guide-lines on use of pipelines for transportation of petroleum and its derivativeshave been prepared by the Bank's Office of Environmental Affairs.
35. The major risks of environmental damage occur during the constructionphases of slurry pipelines. The environmental effects and measures that canbe taken to minimize these effects are shown in Table 3. Coal pipelines may ex-tend for distances of as much as 500 to 2000 kilometers. The facilities areusually buried underground and hence cause no permanent esthetic damage.
Table 3 - Environmental Effects of Coal Pineline Construction-
Activity Environmental Effects Mitigation Measures
(1) Clearing and Destroys wildlife habitat Revegetate quicklygrading Encourages runoff and Slow runoff
erosion Leave screeningDegrades esthetics vegetation
(2) Ditching Potential runoff from Close ditch as soon asspoil pile possibleCovering top soil may Separate top soil andproduce rock rubble set aside
Haul to appropriatedisposal site
(3) -Rauling and Increased truck Limit haul hours andStringing Pipe traffic route
(4) Welding Pipe None None
(5) Coating Pipe Accidental spill of Normal care in operationcoating materials . and availability of
cleanup materials
(6) Backfill Extra top soil or Use existing or properlyditch "padding" soil sited borrow pitsmay be needed
(7) Clean-up Erosion of right-of- Adequate revegetationway program
Restore drainagepatternsMonitoring of recovery
(8) Testing System Requires large volumes Careful selection ofof water water source and discharge
a/ From EPA Document EPA - 600/7-77-013 (See Bibliography)

-196-
36. The risk of spills from such facilities is considered to be negligible.The control and prevention of corrosion are well developed technologies becauseof extensive use of these underground systems to transport petroleum, naturalgas, and other resources.
37. Operational impacts are affected jy the coal preparation, pumpingstations, and dewatering facilities. Problems are associated with preparationof the coal slurry, inter-basin transfer of large quantities of water required,and discharge or disposal of the separated water at the destination.
38. Since preparation of the slurry is generally done at the site of coalpreparation, as previously discussed, the handling of wastes is genrally includedin the measures otherwise taken at the site. To prevent settling and possibleobstruction in the system, ponds are provided at intervals for emptying the linein case of a system breakdown or other interruption.
39. At the discharge end, the coal slurry goes into agitated tank storage,from which it is conveyed to the dewatering systems. Dewatering is done bynatural settling, vacuum filtration, or by centrifuge. Additional thermaldrying is required before use of the coal. The finely ground coal still remain-ing in the water is generally removed by chemical flocculation. The reclaimedwater may be used for cooling or other purposes.
BIBLIOGRAPH!
1. Lajzerowic, J. "Environmental Factors and t:ae Requirements for Controlof Effluents", in "Economica of Mineral Engineering". Inter-regionalSeminar organized by the United Nations in cooperation with the Govern-ment of Turkey, held at Ankara, April 1976. Mining Journal Books Ltd.London (1976).
2. Lajzerowicz, J. "Institutional Aspects Related to Coal Development inCanada". Presented at United Nations Symposium on World Coal Prospects,Katowice, Poland, October 15-23, 1979.
3. Alexanderson, G. and Klevebring, B.-I. "World Resources: Energy, Metals,Minerals". Walter de Gruyter. Berlin and New York (1978).
4. "The Direct Use of Coal-Prospects and Problems of Production and Combustion".Office of Technology Assessment, Congress of the United States. Washington(1979).
5. U. S. Environmental Protection Agency". Monitoring Environmental Impactsof the Coal and Oil Shale Industries: Research and Development Needs".Doc. EPA-600/7-77-015. Washington (February 1977).

- 197 -
6. U. S. Environmental Protection Agency. "Development Document for ProposedEffluent Limitations Guidelines, New Source Performance Standards, and Pre-treatment Standards for the Coal Mining Point Source Category". PreliminaryContractor' sDraft. Washington (January 1980).
7. "Standards of Performance for New Sources - Coal Mining Point Source Category".U.S. Federal Register, V.44, 9'. pp 2536-2592. Washington. (January 12, 1979).
8. "World Glossary of Mining, Processing, and Geological Terms". Ed. by R.S.M.Wyllie and G. 0. Argall, Jr. Miller Freeman Publications. San Francisco(1975).
9. Powers, Philip W. "How to Dispose of Toxic Substances and Industrial Wastes".Noyes Data Corporation. Park Ridge, New Jersey and London (1976).
10. "Pollution Control Objectives for the Mining, Smelting, and Related Industriesof British Columbia". British Columbia Ministry of Environment, PollutionControl Board. Victoria (1979).
- 198
THE WORLD BANK NOVEMBER 1982
CEICE OF ENVIRONMENTAL AFFAIRS
NITFCGEN OXIDE EMISSIONSGUIDELTIES
1. Oxides of nitrogen present in ths atmosphere originate fran bothnatural and nan-made sources. Natural souxces include lightning, volcaniceruptions, and bacterial acticn in the soil. . Although these natural emis-sians far exceed those generated from nan-made activities they are not c-sidered significant. They are distributed over the entire earth, and theresulting air concentrations are practically negligible. The backgroundconcentration of nitrogen dioxide in land areas generally ranges between0.41 and 9.4 micrograms per cubic meter.
2. This document will concern itself with those axides of nitrogendischarged fran man-made sources. They include nitric oxide (NO) and ni-trogen dioxide (N02). At the point of discharge the predominant form isnitric oxide, but this is readily converted to nitrogen dioxide throughchemical reactions in the atmosphere.
SOURCES AND EFFECrS
3. The principal source of nan-made emissions is the acbustion offossil fuels. In this context fossil fuels include coal, oil and its de-rivatives, and natural gas. The predoninant oxide of nitrogen emitted bycmbustion processes is nitric oxide, with small amounts of nitrogen diox-ide. Enissions originate fran both stationary and nobile sources. Specif-ically, emissions originate fran transporaticn (principally autaobile ex-bausts); fuel arnbustion for power generation and industrial production;and certain non-carbustion sources. Hane abusticn of fuels may also makesignificant contributions in sane locations. Other industrial sources in-clude fertilizers, glass, ircn ore preparaticn (sintering and pelletizing)plants, and petroleum refineries.
4. Stationary combustion sources will generally account for 50 per-cent or more of the total nitrogen oxide emissions. For example, the pro-portians are estimated to be 60 percent in Japan, 59 percent in the Nether-lands, 82 percent in the United Kingdom, but only 44 percent in the UnitedStates. Hane combustion of fuels is said to contribute between 5 and 6percent of the emissions in the United Kingdan and the United States.
5. Transportaticn sources include personal autaobiles, buses,trucks, railroad vehicles, aircraft, and ships cn inland waterways. Gaso-line powered vehicles are by far the largest contributors among these. Ofthe total emissions, transportation facilities contribute approximately 40percent in Japan, 41 percent in the Netherlands, 18 percent in the UnitedKingdom, and 51 percent in the United States.

- 199 -
small portion of the* total nitrogen oxide emitted, they can be significantin. certain local situations. The manufacture of nitric acid is the nostinportant of these. Other exanples include electroplating and processesusing concentrated nitric acid, such as the manufacture of explosives orthe producticn of sulfuric acid by means of the chamber process.
7. Oxides of nitrogen formed in conbusticn processes are usually dueeither to thermal fixation of abmspheric nitrogen in the cmbustion air(resulting in "thermal NOx") or to the conversion of chemically boundnitrogen in the fuel (resulting in "fuel NOx"). For natural gas and dis-tillate oil firing, nearly all NO% emissions -result fran thermal fixation.For residual oil and coal, the contribution fran fuel-bound nitrogen can besignificant, and even be predominant under certain operating conditions.
8. When a mixture of oxygen and nitrogen (such as air) is heatedabove 1600* C, oxides of nitrogen will result. Noral combustion tempera-tures in car engines are well above this level. As a result, over 0.3 per-cent of the exhaust can consist of a mixture of NO and NO 2 . Enissions arelowest at lower engine speeds. The character of the emissions will dependupon the operating characteristics of the engine, such as toerature, du-ration of the cwbusticn cycle, air/fuel ratio, etc. Diesel engines alsoare emission sources but to a much lesser degree because of the lower com-busticn temperatures in the cylinders. Gas turbines and other similar en-gines are also less significant as sources.
9. Autcmobile exhausts will al]o release unburned hydrocarbons intothe atmosphere. While hydrocarbons are not in themselves generally haium-ful, they can form photochemical oxidants ocamonly known as smog when re-leased in the presence of oxides of nitrogen and exposed to sunlight. Pho-tochemical smogs can occur anywhere, but they have been nost severe in LosAngeles, California, where they are a year-round phenanenon due to frequenttemperature inversions.
10. Ozone is the rain constituent of photochemical oxidants and canhave severe effects on the respiratory system. Smog can irritate the lungsand seriously aggravate asthma or other respiratory diseases. Coughing,eye irritaticn, headaches, and throat pain are conmonly experienced duringexposure to smog.
U. The nitrogen oxides fran man-made sources can also exist as pri-mazy pollutants in areas not subject to formaticn of smog. Such exposureis believed to increase the risks of acute respiratory disease and suscept-ibility to chronic respiratory infection. Nitrogen dioxide (NO2 ) contri-butes to heart, lung, liver, and kidney damage, and can be fatal at highconcentrations.
12. Nitrogen oxides are also toxid to vegetation. Although manyplants can metabolize low concentrations of NOx' the higher concentrationswill reduce growth and the fertility of seeds.
- 200 -
13. Nitrogen oxides can also affect the environment by contritutingsignificantly to the acid rain problem. Through cotmlex atmiospheric reac-ticns, these oxides can be converted to nitric acid, which is then depos-ited with rain or snow. In the United States acid precipitation, nuch ofwhich is due to nitric acid, has reduced or destroyed cumiercially and re-creationally important species of fish in several areas.
FMISSIC SAMPLIG AND ANALYSES
14. The unit of mearuement used to denote the ambient concentrationsof nitrogen oxides in the atmosphere, after emission from either stationaryor mobile sources, is expressed as weight per- unit volume of air or, spe-cifically, as micrograms of nitrogen dioxide (N02) per cubic meter (g/m3)*This unit is to be used in all World Bank project reports.
15. Plant emissions, prior to reaching the atmosphere may be express-ed in terms of plant input or output. Examples of these limitations, asapplid to fossil fuel and nitric acid plants, are given below.
16. Sampling and analytical procedures for determining nitrogen ox-ides are covered in a separate guideline issued by the Office of Environ-mental Affairs.
ACCEPTABLE STANDARDS
17. Two types of standards are generally used - ambient and emis-sicns. Ambient standards express the allowable concentration of a contami-nant in the air (in this case) surrounding the industrial site, followingdischarge and mixing.. Ambient levels are essential for detenning poss-ible environmental damage and for evaluating adverse physical, health, andother effects upon the surrounding area and its inhabitants.
18. Eission standards express the allowable concentrations of a con-taminant at the point of discharge, before any mixing with the surroundingmedium (air). Emission levels are necessary for identifying specific pol-lution sources and designing remedial works.
19. For all Bank projects ambient air concentrations of nitrogen ox-ides, expressed as NO2 , should not exceed the following:
Annual J.ith. Mean: 100g/m3(0. 05 ppn)
20. For guidance purposes, emission levels for stationary source dis-charges, before mixing with the atmosphere, should be maintained as fol-lows:
(a) For fuel fired steam generators, as Nanograms(10-9 gram) per Joule of beat input:Gaseous fossil fuel 86Liquid fossil fuel 130Solid fossil fuel 300Lignite fossil fuel 260
-201-
(b) Nitric acid plants:
1.5 Kg N02/metric ion acid produced.
21. In special situations, strict adherence to these standards may bedifficult for a number of reasons. Where this occurs, Bank missions shouldvery thoroughly document such cases, with sufficient information to allow ajudgement to be made. Examples of situations where these standards couldnot be. met, with acceptable nodifications, include:
- Expansion of existing plants - The Annual ArithmieticMean and the maximum 24-hour peak resulting fromthe ambination of the old units with the new onesshould be no greater than the values existing priorto operation of new units. In addition, the new unitsby themselves should meet established standards.
More simply, emission plumes fran new and existingsources should not mix to the extent that combinedambient concentrations exceed maximu ambient concen-trations obtained from the existing source aione. Thismay be accomplished by (a) increasing the stack heightof the new source, (b) changing the stack location ofthe new source, or (c) reducing the new source emissionlevels. Furthermore, if plume mixing is not a problemthe new source units should, by themselves, meet theabove standards.
- Revamping of existing plants - Every effort shouldbe made to decrease existing pollution levels andprovide measures which will minimize concentrationswithout placing unreasonable economic burdens on the
* industry.
- Inversions - When the NOx source location is in a valleyor surrounded by nountains, inversion layers which mayoccur during certain seasons of the year could trap thestack emissions. These same emissions can drcp back toground level, stagnate there, and damage crops sensitiveto both SO2 and Tx. In World Bank financed pro-jects it may be impossible to change the site loca-tion (i.e. in the case of an expansion of anexisting plant) . To protect hman and plant lifein such cases, the peak concentration should bedecreased fran 500 pg/m3 during any 24-hour perioddown to 350 pg/m 3 d ing 4 hours, unless it can beshown that the effluent will not be trapped by theinversicn layer.

-202-
CONTR TECHNOIGY
22. EnissicL control measures must be designed for each ind-iviAualplant, particularly since the system nust be capable of reducing norre thanone polludant in nost situations.
23. The most commcn method currently used to reduce NOX emissionsfrom autcnobile exhausts (which are the major sources) is the catalyticccnverter. The method utilizes a catalyst instead of high tboperatures toachieve sinultaneous oxidation of the runinaing fuel, and reduction of NOxto N2 . The catalyst achieves the double goal of decreasing concentrationsof both NOx and hydrocarbons cn a metal catalyst deposited on ceramic na-terial.
24. Mobile source emissions are also reduce t.hrough changes in com-bustion chamber design (such as lower compression ratios), spark retar-daticn (including both basic timing and a "slower" advance curve), and ex-haust gas recirculation.
25. The NOz emissions fram oil-fired canbustion systems can be re-duced by mixing water with the oil before it is sprayed into the burners.Water decreases the canbustion temperatures, and can reduce NOx emissionsfrcm light-weight oils by as much as 15 percent. Energy-wise, however, themethod is considered to be costly.
26. xnissions fran stationary sources, such as utility and industrial.canbustion installations, can be reduced by a number of methods. Amongthese, staged coabustion, low excess air cperation, and flue gas recircula-tion are widely used..
27. Staged canibustion is effective for control of both thermal andf-Uel nitrogen oxides. The method cansists of initially providing less .thanthe amount cE air (02) required for cnplete coabustion. After a time de-lay more air is added in one or nore steps or stages. The method is appli-cable to a wide range of fuels and facilities, frcm pulverized coal burnersto small scale industrial boilers. Addition of this method to existingcoal-buring installations has resulted in a 30 to 50 percent reduction ofT0x emissions.
2S. In the low excess air method, the principal mechanism is also thelack of available oxygen for canbining with either thermal activated orcracked fuel activated nitrogen atos. This method can be conbined withthe staged canbusticn process, and can reduce nitrogen oxide enissions by40 to 70 percent, without seriously increasing carbon nonoxide enissions.
29. Flue gas recirculation has been effective in controlling thenralnitrogen oxides. 'The recirculaticn of exhaust gases to the flame regionsreduces peak temperatures and oxygen availability, thus reducing nitricoxide formation. This method is more difficult to aply, since it requiresincreased operation controls and greater capital investment.
- 203 -
30. A number of methods are under further study for stationary sourceemissions. These include burner design changes, water/steam injection, wetscrubbing with aqueous ammonia, and fluid bed combustion.
BIBIOCGRAPHY
1. World Health Organization "Oxides of Nitrogen". Environmental HealthCriteria 4. Geneva, (1977).
2. Organizaticn for Economic Cooperation and.Developnent. "PhotochemicalSnog-Contribution of Volatile Organic Ccmpounds". Paris (1982).
3. U.S. Environmental Protection Agency. "Technology Assessment Reportfor Industrial Boiler Applications - N0X Combusticn Modification".Document EPA-600/7-79-178f. Washington (December 1979).
4. Diamant, R.M.E. "The Prevention of Pollution". Pitman Publishing.Landon (1974).
5. U.S. Envircrnental Protection Agency. "Research Summary-ControllingNitrogen Oxides". Document EPA-600/8-80-004. Washington (February1980).
6. Jarrault, P. "Limitations des Emissions de Polluants et Qualite deL'Air. Valeurs Reglementaires dans les Principaux Pays Industri-alises". Institut Francais de L' Energie. Paris (1978).
7. World Health Organizastion. "Air Quality Criteria and Guides forUrban Air Pollutants" WHO Technical Report Series No. 506. Geneva(1972).
8. U.S. Code of Federal Regulations, Title 40, Sub-Chapter C, Part 60,Subpart D "Standards of Performance for Fossil-Fuel Fired Steam Gen-erators for Which Construction is Canenced After August 17, 1971".Office of the Federal Register, GSA. Washington (July 1, 1981).
9. U.S. Code of Federal Regulations, Title 40, Sub-chapter C, Part 50.."National Primary and Secondary Ambient Air Quality Standards". Officeof the Federal Register, GSA, Washington (July 1, 1981).
10. Organization for Eco=anic Cooperation and Development. tM hotochemicalOxidant Air Pollution". Paris (1975).
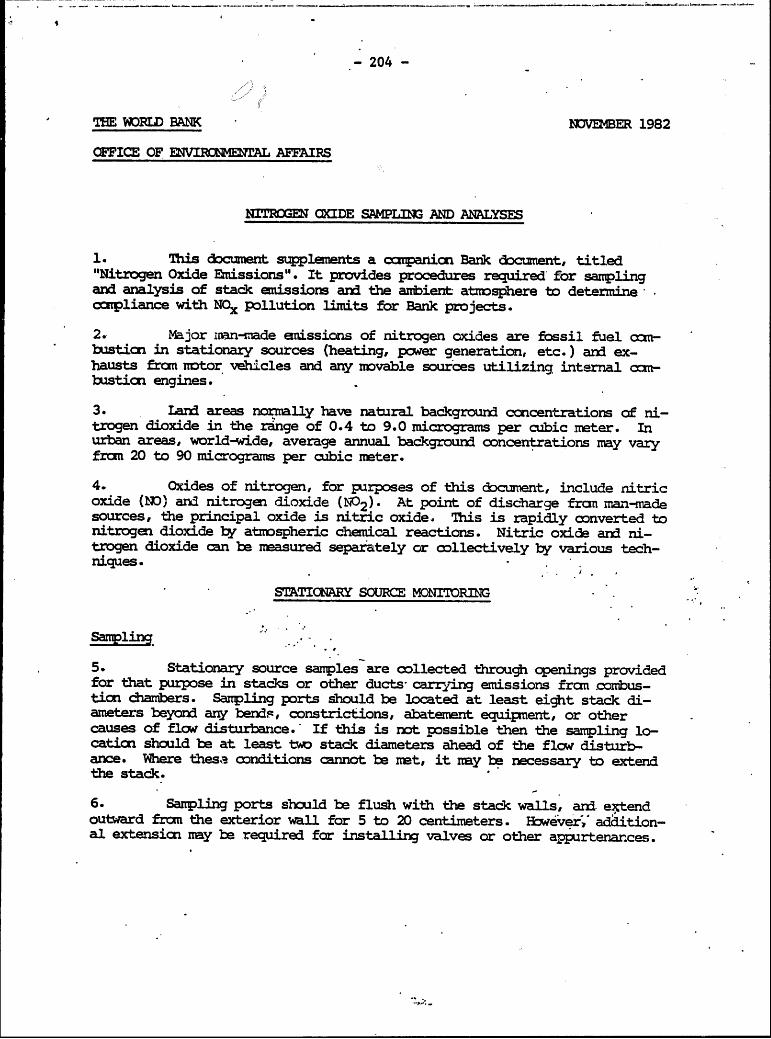
- 204 -
THE WDRLD BANK NOVEMBER 1982
OFFICE OF ENVIROMENTAL AFFAIRS
NITROGEN CIDE SAMPLING AND ANALYSES
1. This document supplements a ctrpanion Bank document, titled"Nitrogen Oxide Emissions". It provides procedures required for samplingand analysis of stack emissions and the ambient atnosphere to determinecapliance with NCx pollution limits for Bank projects.
2. Major man--made emissions of nitrogen oxides are fossil fuel com-busticn in stationary sources (heating, power generation, etc.) and ex-hausts from notor vehicles and any novable sources utilizing internal cmn-bustion engines.
3. Land areas normally have natural background concentrations of ni-trogen dioxide in the range of 0.4 to 9.0 micrograms per cubic meter. Inurban areas, world-wide, average annual background concentrations may varyfron 20 to 90 micrograms per cubic meter.
4. Oxides of nitrogen, for purposes of this document, include nitricoxide (NOJ) and nitrogen dioxide (NO 2 ). At point of discharge fran man-madesources, the principal oxide is nitric oxide. This is rapidly converted tonitrogen dioxide by atmospheric chemical reactions. Nitric oxide and ni-trogen dioxide can be measured separately or collectively by various tech-niques.
STATIONARY SOURCE MONITORING
5. Stationary source samples are collected through openings providedfor that purpose in stacks or other ducts- carrying emissions fran combus-tion chambers. Sampling ports should be located at least eight stack di-ameters beyond any bendS, constrictions, abatement equipment, or othercauses of flow disturbance. If this is not possible then the sampling lo-cation should be at least two stack diameters ahead of the flow disturb-ance. Nhere these anditions cannot be net, it nay be necessary to extendthe stack.
6. Sampling ports should be flush with the stack walls, and. extendoutward fron the exterior wall for 5 to 20 centimeters. However, addition-al extension may be required for installing valves or other appurtenances.

- 205 -
7. The sampling apparatus is shown schematically in Figure 1. Thesampling probe may be placed at any locaticn across the stack diameter, anda grab sample collected in an evacuated flask containing a dilute sulfuricacid-hydrogen. peroxide solution. This solution reacts with the nitrogenoxides. The volumetric flow rate and moisture content of exhaust gasstream nust be determined for calculating the total mass emission rate.
8. Each grab sample is obtained rapidly (15 to 30 seconds) and fourgrab samples constitute a run. A minimum of three runs should be taken, ora total of 12 grab samples. An interval of 15 minutes .should elapse be-tween each grab sample.
9. Since a grab sample collects a relatively small amount of materi-al over a relatively short period of time, the result obtained will be es-sentially an instantaneous measure of the nitrogen oxides. It will be rep-resentative of the emissions only if the gas stream is well mixed and theconcentration is constant with time. Multiple samples are .therefore neces-sary.
Analyses
10. Nitrogen oxide levels are determined by the EPA procedure desig-nated as "Method 7". Nitrogen oxides (except for nitrous axide-N 2 0) aremeasured coloranetrically using the Phenoldisulfonic Acid Procedure. Themethod is applicable for measurement of nitrogen oxides (as NO2 ) from sta-tionary sources in the range of 2 to 400 milligrams per dry standard cubicmeter, without having to dilute the sample.
11. A similar method has been developed by the American Society orTesting and Materials, designated as Method ANSI/ASIM-D-1608-77. This meth-od is applicable to concentrations ranging fran 4 to several thousand mill-igrams per dry standard cubic meter.
AMBIE AIR MONITORIN
Sampling
12. The number of sampling points required for an ambient air moni-toring network will depend upon program objectives, effluent requirements,meteorological conditions, topography, and other related factors. For asmall source, particularly if. cne wind direction . predominates, only twosites are required. One site would be for monitoring source effects whilethe other would provide upwind or background concentrations. Where winddirections are variable several sampling points are required.
13. It is desirable to place collecticn. devices in areas most likelyto receive the highest ground-level concentrations of pollutants. Plumetrajectory frcm emission source to the point of ground-level impact may bepredicted roughly fra a knowledge of predominant wind directions. A con-venient tool for performing such an analysis is the "wind rose"; a chartwhich plots wind directions and percentage of time, annually, that wind isblowing frca that, direction. Where more precise information is requiredfor site selection, computerized atmospheric dispersion models may be nec-essary.
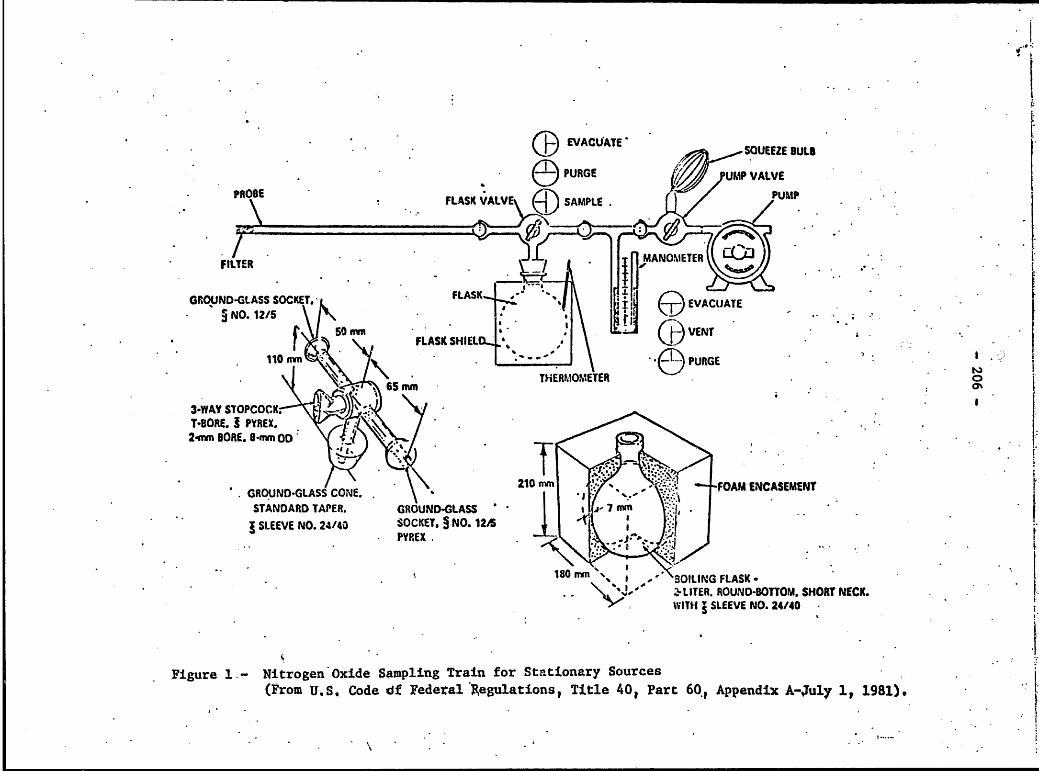
EVACUATEYY j....SQUEEZE BUL8e PURGE UMP VALVE
PROBEFLASK VALV SAMPLE PUMP
est a .MANOMETER
GROUND-GLASS SOCKET. FLASK EVACUATENO. 12/5 ,
50 mm *.VENTFLASK SHIELD , .*
110 MM . PURGETHERMOMETERo
65mm or
3*WAY STOPCOCK.RBRE. -PYREX.
2-nvn BORE. 0-mim OD
210 mm FO4AM ENCASEMENTGROUND-GLASS CONE. OMCSE
STANDARD TAPER. GROUND-GLASS 7 (M
SLEEVE NO. 24/40 SOCKET. NO. 125tPYREX...
180 m SOILING FLASK*.- LITER. ROUND-BOTTOM. SHORT NECK.WITH SLEEVE NO. 24/40
Figure 1.- Nitrogen*Oxide Sampling Train for Stationary Sources
(From U.S. Code df Federal Regulations, Title 40, Part 60 Appendix A-July 1, 1981).

- 207
14. The principal factors in selecting the sampling locations aretopography and meteorology. Other considerations include:
(a) Location of the sampling site, relative topollutant source, accessibility, andoperation.
(b) Sanple delivery to laboratory facilities.
(c) Proper handling of samples to prevent deteriora-ticn or conversion that would produce inaccurateresults.
(d) Availability of suitable analytical proceduresand instrumentation for generating acceptablequantitative and qualitative data.
(e) legal restrictions (such as effluent limitations)affecting the discharges fran existing sources.
15. Preferably, ambient levels should be monitored continuously.Con-tinuous samples nay be obtained by a variety of instrument techniques andare particularly suitable for averaging over long time periods. Non-auto-natic (or dynamic) samples may be used When continuous types of equipmentare not available.
16. A typical continuous monitoring device consists of an inlet sec-ticn, gas pretreatment section, detector, photamultiplier, spectrometer,and readout device. Depending upcn conditions of the gas to be analyzed,pretreatment could include pressure adjustment, particulates removal (usu-ally by filter), moisture renoval (usually with silica gel column) and tem-perature adjustment (usually by condenser).
17. Basic COmLpcnents for a dynamic sampling unit (shown in Figures 2and 3): include inlet, fritted bubbler, drying tube, temperature gauge, drytest meter, pump, and anameter.
Analyses
18. The chemiluminescent method, adopted by the U.S. EavironmentalProtection Agency, ard cited in the Bibliography, is the preferred analyti-cal method for determining nitrogen dioxide levels in ambient air samples.This is an autcmated continuous method Widh records a measurement everyfew seconds, and readily permits determination of specific time averagelevels. The method is applicable to measurements in the range of zero toabout 2,000 milligrams per cubic meter.

[

209
19. Chemiluminescence analyzers wil-I respond to otber nitrogen con-taining compounds,, such as peroxyacetyl nitrate. A±mospheric concentra-tions of these potential interferences are generally 1cW relative to NO2,,and bence valid NO measurements imy be * Where levels of inter-fering substances ?S ch as sulfur dioxide and ozone levels) are suspectedof being high. then an alternate method should be used.
20. Nitrogen dioxide levels may be determined manually by the Griess-Saltzman Method,, adopted by the American Society for Testing and Materials,,and cited in the Bibliography. The sanpling train shown in Figures 2 and 3should be used for this purpose. Sampling periods should be 'between 15 and30 minutes, at a flow rate of about 0.4 liter/per minute. The method isapplicable for levels in the range of 4 to 10,000 microgram per cubicmeter.
22. In the Griess-Saltzman Methodt N02 is absorbed in an azo-dye-forming reagent. A red violet color is produced witl 15 minutes, and itsintensity measured spectrometrically at 550 nanometers.
23. A ten-fold ratio of sulfur dioxide to nitrogen dioxide producesno effect. A 30-fold ratio slowly bleaches the color to a slight degree.Addition of acetone to the reagent retards fading, and permits reading thecolor intensity within 4 to 5 hours instead of 45 minutes required withoutaontone. A 5-fold ratio of ozone to nitrogen dioxide will cause a smallinterference, with the maxinal effect occurring within 3 hours. Other ni-trogen oxides and other gases that may be present in polluted air could al-so interfere with the accuracy of the manual method.
BIBLIOGRAPHY
1. World Health Organization "Oxides of Nitrogen". Environmental HealthCriteria 4. World Health Organization. Geneva (1977).
2. U.S. Code of Fedeal Regulations, Title 40,, Part 60, Appendix A,, Method7. "Determination of Nitrogen Oxide Emissionss from Stationary sources".office of the Federal Register. Washington (July 1, 1981).
3. U.S. Environmerrtal Protection Agency. "Handbook-Industrial Guide toAir Pollution Control". Document EPA-625/6-78-004. Washington (June1978).
4. American Society for Testing and Materials. "Standard Test Method forOxides of Nitrogen in Gaseous Cmbustion Products (Phenol-DisulfcnicAcid Procedures)". Method ANSI/ASTM D-'1608-77. Philadelphia (1977).
S. Organization for Economic Cooperation and Develolxrent. PhotochemicalOxidant Air Pollution,", Paris (1975).
- 210 -
6. U.S. Code of Federal Regulations, Title 40, Part 50, Appendix F."Measurement Principle and Calibration Procedure for the Measurementof Nitrogen Dioxide in the Atmosphere (Gas Phase Chemiluminescence) ".
Office of the Federal Register. Washingtcn (July 1, 1982).
7. American Society for Testing and Materials. "Standard Test Method forNitrogen Dioxide Content of the Atmosphere (Griess-Saltzman Reacticn)".Method ANSI/ASTM D-1607-76. Philadelphia (1976).
- 211 -
TE WOELD BANK OCTOBER 1980
OFFICE OF ENVIRONMENAL AFFAIRS
NOISE
1. Bank missions will be concerned with noise and its environasntalaffects in various types of projects. Among these are highway and railwayprojects, airports, agricultural enterprises (from .9peration of farm machinery),and industrial installations.
BASIC CONCEPTS
2. Noise may be described as sound without agreeable musical quality,or as "unwanted sound". Generally, noise is produced when an object or sur-face vibrates rapidly enough to generate a pressure wave or disturbance inthe surrounding medium. From the standpoint of environmental effects themedium of greatest concern is air, although sound may also be transmittedthrough liquids and solids.
3. Sound is transmitted by wave motion. It propagates as the resultof the elastic interactions between the molecular components of the mediumthrough which it travels. The speed of sound, therefore, depends upon the massof molecules (density) and their elastic reactions (pressure). The human earresponds to the pressure fluctuations set up in the surrounding medium. Air-borne sound travels at a speed of 344 meters per second at a temperature of 200 C.In seawater sound travels at the rate of about 1490 meters per second.
4. The decibel (dB) is used to measure the relative pressure of differ-ent sounds. The decibel is equal to 20 times the logarLthm of the ratio ofsound pressure to a reference pressure of 20 #Pa*, or.,
Sound pressure level (dB) a log1 0 Measured PressureReference Pressure
Thus, a sound with 10 times the pressure of another is considered to be 20 dBlouder, and each succeeding 10-fold increase adds another 20 dB to the soundlevel. Relative sound pressure levels for various degrees of "loudness" arepresented in Table 1.
5. The quality of sound (or noise) is measured by flow of energy perunit area. Frequency is a measure of the number of complete vibrations occur-ing per second, and is measured in "hertz" (z). Thus, 1 Ez equals 1 cycleper second. Normally, the human ear cannot detect sounds above 15,000 Ez(ultrasound). The lower limit of human detection depends more on the quantity-of sound. At 65 Ez the human ear does not normally detect sounds below 60 dB.
*.1 Pascal = 10 dyne per square centimeter.

-212
Table 1. Relative Sound Pressure Levels for Various Sources of Noise a/.
Relative SoundPtessude Lavels
Appar=nt EdsB .ø .o PascalsLoud~s
0 dB
Deafening Jet aircraft 140 10,000900 200Threshold of feeling 130 3,162,000
Very loud Elevated train, thunder 120 1,000,000 20Subway train, rtveter 110 316,200Noisy Ind. Plant 100 100,000 2Loud street noise 90 31,620Noisy office 80 10,000 0.2
Loud Av. St-eet noise 70 3,162Av. office 60 1,000 0.02
Moderate Mod. restaurant clatter 50 316Private offica 40 100 0.002
Fa-nt Rustling leaves 20 10 0.0002
Very faint. Normal breathing 10 3Theshold audibility 0 1 0.00002
From '"So nd Control Costruction" U. S. Gypsu Ca.
EASUREET OF NIZSZ
6. The basic goal in quantifying sound is to determine the time andlocation variations of noise in the environent throughout a com=uity andto assure that the data can be used as a measure of the effects of environ-mental noise en people.

- 213 -
7. The Sound Level Meter (SLM) is the basic instrument for measuringsound or noise. While such instruments are available from a number of manu-facturers, all meters to be used for this purpose must meet the AmericanNational Standards Institute (ANSI) specification S1.4-1971, or the latestANSI issuances. Both Type 1 (Precision) and Type 2 (General Purpose) metersare acceptable. The Type 2 meter has broader performance tolerances,and isusually less bulky, lightex, and less expensive than.the Type 1.
8. A sound. level meter electronically weighs the amplitude of the vari-ous frequencies in accordance with a person's hearing sensitivity and sums theresulting weighted spectrum into a single number. "The typical meter containsthree different response weighting networks: A, to match the response of theear to sound of low intensity; 3, to match response to sound of moderate in-tensity; and C,to match response to sound of high intensity. The A scale ismost commonly used, since it most closely approximates the human perceptionof sound. The weighted sound level unit, at the A setting is commonly designatedas dB (A).
9. The SLM A-setting measures the sound level at a frequency of 1,000Rz. Where frequency readings differ from the standard of 1,000 Hz, then acorrection muist be made to convert "flat" response readings to the A levels.The term "flat'response designates the uniform response of an instrument overa wide frequency range, up to 20 K Hz.
Table 2. Corrections from "Flat" Resonse Levels to A Levels.
Octave Band Center CorrectionFrequency (Ez) (d)
31.5 - 39.563 - 26
125 - 16250 - 8.5500 - 3.0
1000 0
2000 + 1.04000 + 1.08000 - 1.0
16000 - 6.5

- 214 -
EFFECTS OF NOISE
10. A universal effect of noise is its interference with the understand-ing of speech. This is one aspect of "masking" - an interaction of two acousticstimli whereby one of then changes the perceived quality of the other, shifts itsapparent location or loudness, or makes speech completely inaudible. Variousfactors enter into the degree of speech interference, such as speech, age, andhearing of individuals. Children have less precise speech than do adults, whileolder persons are more susceptible to interference from background noise.
11. Noise can elicit a variety of physiological responses, but no clearevidence exists to indicate that continued activation of these responses leadsto permanent health effects. Sounds of sufficient intensity can cause pain tothe auditory nervous system. It can be presumed that noise exposure can causegeneral personal stress, either by itself or in combination with other stresssources. Noise exposure to moderate intensities that may be found in the environ-ment does have some effect on the cardiovascular system, but no definite permanentaffects on the circulatory systems have been demonstrated. Moderate noise levelshave been known to cause vasoconstriction of the periphe-al areas of the body andpupillary dilation, but there is no evidence that these effects can lead to harm-ful consequences over a period of time.
12. Continuous noise levels above 90 dB (A) have detrimental effects onhuman performance, especially in so-called "noise-sensitive" functions, such asvigilance tasks, information gathering, and analytical processes. Noise levelsbelow 90 dB (A) can be disruptive, particularly if they have predominantl highfrequency components, and are intermittent, unexpected and uncontrollable.
13. Frequencies below 16 Hz are referred to as infrasonic, and include suchsources as earthquakes, wind, thunder, and distant jet aircraft. Man-made infra-sound occurs at higher intensity levels than those found in nature. Effectsassociated with infrasound resemble mild stress reactions and bizarre auditorysensations, such as pulsating and fluttering. Ultrasonic frequencies are thoseabove 20,000 Rz, and are produced by a variety of jet engines and industrialequipment. Above 105 dB, the effects of high intensity ultrasounds resemblethose observed during stress situations.
14. ' Noise has the same general effects on wildlife and other anials asit does on humans Noise of sufficient intensity can disrupt normal patternsof animal existence. Exploratory behavior can be curtailed, avoidance behaviorcan limit access to*food and shelter, and breeding habits can be disrupted.Hearing loss and the masking of auditory signals can complicate an animal'sabilities to recognize its young, detect and locate prey and evade predators.Physiological effects of noise exposure-such as changes in blood pressure andchemistry, hormone balance, and reproductivity-have been demonstrated in labora-tory animals and, to some extent, in farm animals.
15. Secondary effects of noise on the health and welfare of man includethree general types: sonic boom effects, noise induced vibration and sonicfatigue. Saund can also cause buildings to vibrate, and this can have a directeffect on humans.. Some booms of sufficient intensity not only can break windows,
- 215 -
but they can also damage building structures. However, sonic booms can be con-trolled to levels which are innocuous in relation to buildings and structures.Noise induced vibrations near rocket launch sites can also cause window break-age. Construction activities may have similar effects. Sonic fatigue is alsoa problem where material is used near intense sound sources, but such problemscan be avoided by proper design and this type of fatigue does not usually causeenvironmental problems.
NOISE CONTROL TECENIQUES
16. Noise control techniques fall into two general catetories: controlat the source and control of.the path of sound. Within the urban environmentnoises originate principally from aircraft and airport operations, industrialoperations, construction activities and highway traffic.
17. Aircraft related noises mainly,.affect the populations living nearairports or in the flight paths of low flying airplanes. Although many newtypes of jet-powered ships introduced since 1972 emit less noise than earliermodels, noise continues to be the most serious constraint currently facing air-port operations.
18. A number of techniques may be applied, alone or in combination, tothe reduction of aircraft noises and their affects. The principal ones include:
- Operational measures designed to limit the productionof noise by aircraft. This could involve special take-off and landing procedures, restrictions on the total noisyaircraft traffic, banning of night traffic, diversion ofpart of the traffic to other regional airports, and appli-cation of local airport noise regulations.
- Measures aimed at changing the land use in areas exposedto heavy noise. This requires close coordination of airportplanning with regional and local land use policy. Such an ap-
* proach is most easily implemented in the case of new airportsin areas not yet intensely developed. Eowever, even around
. existing airports it is possible to re-z=ne the heavily im-* pacted areas over a period of time and minimize noise exposures
for private dwIellings, schools, hospitals and recreation areas.
- Measures aimed at reducing the impact of noise at the pointof receiption. This will require sound-proofing of privateresidences, hotels, offices and other structures. Suchmeasures should be taken as a last resort, since they donothing to eliminate the source of the noise or to improvethe outdoor environment.
19. Noises resulting from industrial operations are generally confinedwithin the plant structure. Machinery and equipment are the main sources, andthe effects are felt mostly by the individual workers. Controls may be accom-plished through measures at the source (relocation, vibration, vibration control,

- 216
etc.); installation of acoustical shields, enclosures, or other barriers tointerrupt the path of the sound; or through limiting the duration of the ex-posure by the receiver. The first two of these measures will help reduce thenoise levels in the environment outside the plant.
20. While construction operations are not permanent, large projects arecarried out over relatively long time periods, and measures are frequently re-quired to reduce noise emissions. Construction noises can originate from suchsources as crane and hoisting equipment, air compressors, concrete mixers,tractor and bulldozing equipment and materials delivery vehicles.
21. Noise control at construction sites will require an analysis of eachindividual situation to determine which measures should be applied. The gen-eral measures which can be effective include*
- Assurance that the manufacturer has designed, built andequipped the unit to conform with existing noise controlregulations.
- Adequate operation and maintenance of equipment.
- Limiting the time of day during which equipment maybe operated.
- Limiting the places or zones in which equipment maybe used.
22. The effect of vehicle noise on populations is usually dependent upontraffic concentrations rather than on any one individual vehicle. Althoughtrucks are normally fewer in number, they tend to contribute the largest shareof the noise. Motorcycle traffic can also be a significant contributor. Forhighway vehicles, noises originate from the exhaust systems, engines, specialfeatures (such as loading machinery on solid waste carriers and other heavy dutytrucks), and other individual characteristics.
23. Noise abatement measures are similar to those for construction equip-ment, as given in paragraph 21. Additional controls may be imposed throughlicending and inspection procedures, and through driver education on operationalprocedures.
ACCEPTABLE NOISE LITATIONS
24. There are considerable variations in the recommended allowable noiselevels emitted by the many individual sources existing in the environment. Thelimitations presented in Table 3 reprasent the net effect of cumulative contribu-tions from all sources. The levels &Lven are considered adequate for protectingthe health and welfare of the general public in the specific environmental situ-ation. The term "public health and welfare" denotes personal comfort and well-being as well as the absence of hearing damage or other clinical symptom.

- 217 - .
Table 3. Yearly Average Equivalent Sound Levels Reguired for Protectionof Public Health and Welfare 17
Indoor To Protect Qutdoor To ProtectActivity Hearing Loss Aamst Activity Huarinc Loss Against
Measure Inter- Considera- Both Ef- Inter- Considera- Both Ef-
2/ ference tion fcts (b) frence tion ct (b)
Residential with Out- Ldn 45 45 S5 55
side Space and FarmResiderces Leq(24) 70
Residential with No Ldn 45 45outvide Space .0
c(24) 70
Commercial Leq(24) (a) 70 70(c) (a) 70 70(c)
Inside Tr4nsportation Leq(24) (a) 70 (a)
Industrial Le(24)(d) (a) 70 70(c) (a) 70 70(c)
Hospitals Ldn 45 45 55 55
Leq24) 70 70
Educ2ticonal Leq(24) 45 45 S $5
Leq(24)(d) 70 70
Recreational Areas Le9124) (a) 70 70(c) (a) 70 70(c)
Farm Land and Leq(24) (a) 70 70(c)
General Unpopulated ILand
Code:
a. Since different types of activities appear to be associated with different levels. identifi-cation of a maximum level for activity interference may be difficult except in those
* circumst2nces where spexch cuniaiUOn is, %x.;itica! activity.
bt, Basud on lowest level.c. Bused only on hicaring loss.d. An L.q(8)I of 75 dB may be identified in these situations so long as the exposurc over
the remaining 16 hiours pvr day ii low enough to result in a negligibiecLzontribution to
the 244hout averie, i.e.. no greater than an Lq of 60 d3.
/ From Ref. 4
/ L = Day-night average A - weighted equivalent sound level, witha 10-decibel weighting applied to night time levels.
L eq (24) - Equivalent A-weighted sound level over 24 hours.
- 218 -
BI3LIOGRAPET
1. Peterson, A.P.G. and E.E. Gross, Jr. "Eandbook of Noise Measurement"General RadIo Inc. Concord, Mass. (1974).
2. U.S. Department of Commerce/National Bureau of Standards. "Quieting:A Practical Guide to Noise Control", NBS Handbook 119. Washington (1976)
3. U.S. Environmental Protection Agency. "Public Health and Welfare Criteriafor Noise". Doe. 550/9-73-002. Washington (July 27, 1973).
4. U.S. Enviromenta1 Protection Agency. "Information on Levels of Environ-mental Noise Requisite to Protect Public Health and Welfare with an Ade-.quate Margin of Safety". Doc. 550/9-74-004. Washington (March 1974).
5. United States Gypsum, "Sound Control Construction-Principles and Performance2nd Ed. Chicago (1972).
6. United Anto Workers, "Noise Control-A Worker's Manual". Detroit (February.1978).
7. U.S. Federal Register, "Noise Emission Standards for Construction Equipment-New Wheel and Crawler Tractors". Vol. 42, No. 132, pp. 35804-35820. Wash-ington. (July 11, 1977).
8. "Transportation Noises", A Symposium on Acceptability Criteria. Ed. byJames D. Chalupnik. University of Washington Press. Seattle and London(1970).
9. "Airports and the Environment". Organization for Economic Cooperation andDevelopment. Paris (1975).
10. U. S. Enviromental Protection Agency. "Fundamentals of Noise: Measurement,Rating Schemes, and Standards". Doc. NTID 300.15. Washington (December 31,
.1971).
-219-
THE WORLD BANK FEBRUARY 1983
OFFICE OF ENVIIMENTAL AFFAIRS
1CtT-FERROUS METALS INDUSTR
ATI4INE4 PRODUCTION
ENVIRONMENI'A GUIDEf.INS
1. The non-ferrous metals category includes a large umber of metal-lic elements, but only a few are of concern to World Bark operations atthis time. Those nost freqently encountered in Bank activities are cover-ed in four separate documents in the series, as follows: (a) alumirm; (b)lead and zinc; (c) copper and nickel; and (d) silver, tungsten, columbium,and tantallum. This document will concern itself with alumirmm production.
2. Both primary and secondary aluminum will be discussed, the class-ification being based upon the raw materials used in the production. Norm-ally, the primary metal is produced fron the raw ore, while the secondarymetal is produced fra manufacturing scrap, discarded consumer items, andother residues containing economiically recoverable quantities. The manu-facturing process and waste sources are shcwn in Figures 1 and 2.
.. 3. Aluminum is considered to be the nost abundant metal in theearth's crust. The aluminum industzy is international in scope, and its
m anufacture, fabrication, and use are currently worldwide. The wastes re-sulting fron the industry's operations are of significant proportions, andhence their effects must be considered in environmental inpact assessments.
.NUFACIURIN PROCESSES
4. The basic material used in the manufacture of aluminum metal isbauxite ore. Major sources of the mineral are South America, the Caribbeanand Australia. Specific sources include Jamaica, aiti, Costa Rica, Suri-nam, Guyana, French Guiana, Brazil, Ghana, Guinea, Sierra Leone, Cameroon,
. Sumatra, Java and Borneo.
5. The nost CaIonly used method for the production of aluminum met-al fran bauxite ore is the Bayer Process, follcwed by the Hall-Heroult Pro-cess. Thus, aluminum production my be considered a two-step process.
6. In the Bayer Process the bauxite is digested with a bot, strongalkali solution (generally sodium hydroxide) to form a sodium aluminatesolution and an undissolved residue MUmnonly called "red mad". The red midis separated by filtration and reworked for recovery of additional alum-ina. The sodium aluminate solution is hydrolyzed to aluminum hydroxide bycooling and dilution, and the hydroxide then induced to crystallize byseeding with alumina crystals. The precipitate (which is the aluminum by-droxide) is separated fran the liquor, clarified in tray thickeners, washedwith hot water, and filtered. As the final step the hyudroxide is calcined
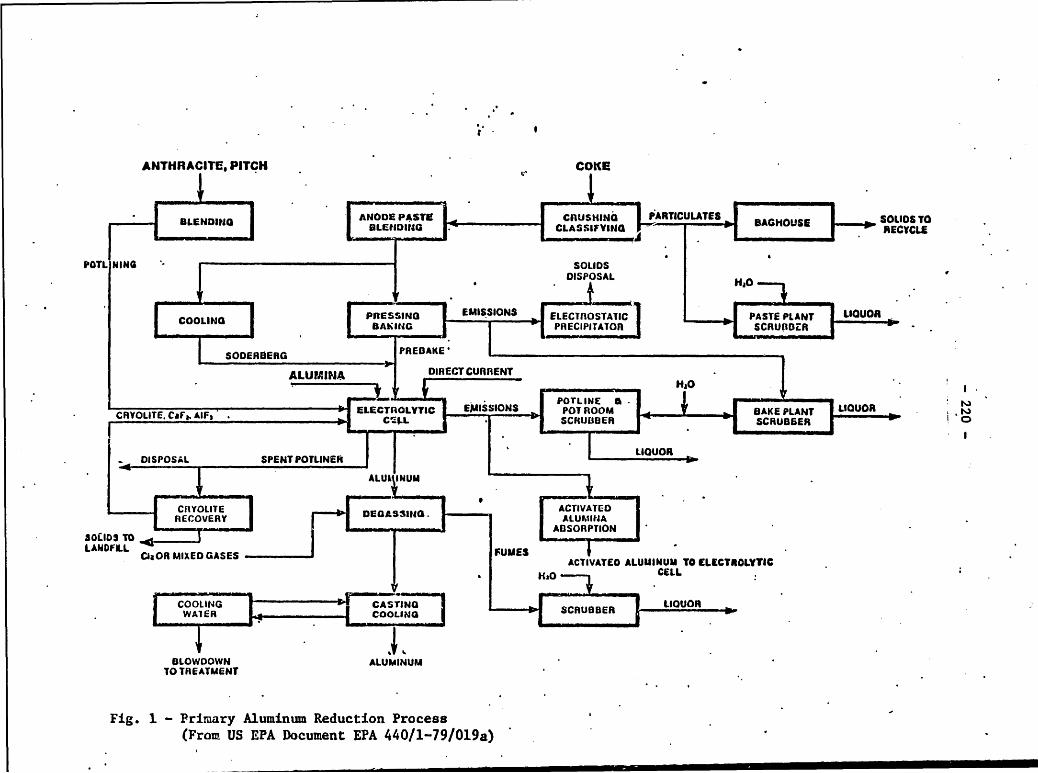
ANTHRACITE, PITCH COKE
BLENDING ADE PSTE EBLENDIENDG14 CLSIYN ___ECTCL______________
POTL NING SOLIDSDISPOSAL
COOLING PRESSING EMISSIONS ELECTROSTATIC PASTE PLANT LIOUORBAKING PRECIPITATOR SCRUBDER
SODERIIERG
ALUMINA DIRECT CURRENT40.
* ~ POTLINE &---ECRYOLITE. Caf. MF, . LECTROLYTIC EMISSIONS POT ROOM KE PLANT LIOUOR
DISPOSAL SPENT POTLINER LIOUOR
ALUiNUM
CRYOLITE EA31GACITDR CEyRY DEGASSIdU. -- VA DI CO :LE Y AUMINJAT- - - - ---- ABSORPTIONSOEIDS TO .4*I1TI WLANDFLL CIaOR MIXED GASES IFUMES
ACTIVATED ALUMINUM TO ELECTROLYTIC*aO CELL
COOINGCASIN LIQUORE WAER COOLINGSCRUBBER
BLOWDOWN ALUMINUMTO TREATMENT
Fig. 1 - Primary Aluminum Reduction Process(From US EPA Document EPA 440/1-79/019a)
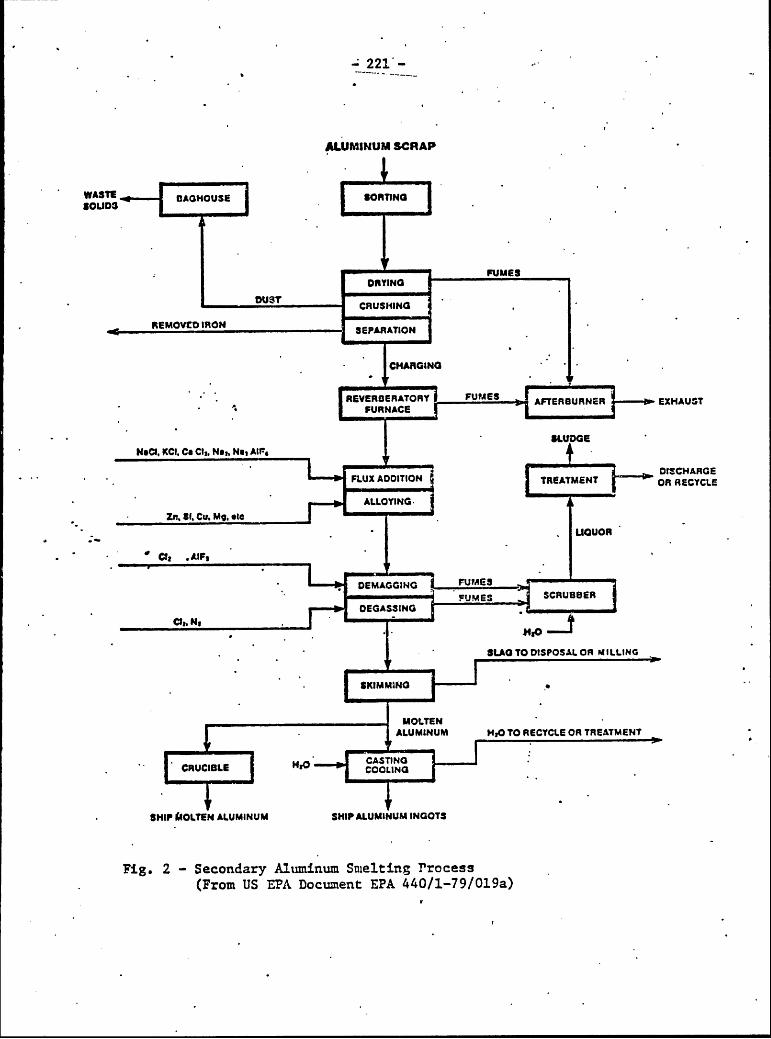
-221-
ALUMINUM SCRAP
WASTE -- AGHOUSE SORTINGSOUD3
DRYINGFUMES
ADUST CRUSHING
,REMOVED IRON SEPARATION
.CHARGING3
SREVERBERATORY FUMAES AFTERBURNER EXHAUST* FURNACE
SLUDGE
NoCS, KCI. Ca Cit. Not, Na, AP&
DISCHARGEFLUX ADDITION TREATMENT OR RECYCLE
AALLOYING,TS
Zin. 81. Cu, Mg.*n
DEMAGGING ruMAES7FUMES ,SCRUSSER
DEGAS31NG
.St.AG TO DISPOSAL OR MILLING
MOLTENALUMINUM M2O TO RECYCLE OR TREATMENT
II CASTING4CRUCIBLE Ha COOLING
S SHIP (OLTE ALUMINUM SHIP ALUMINUM INGOTS
Fig. 2 -Secondary Aluminum Smelting Process(From US EPA Documient EPA 440/1-79/019a)

--- 222
in rotary kilns, at tenperatures up to 1800*C to produce alumina 4Al 2 03),cooled, and shipped to reduction plants.
7. The alumina is then reduced electrolytically by the Hall-HeroultProcess, to produce aluminum. This invlves the electrolysis of aluminadissolved in a fused salt electrolyte consisting of cryolite (Na3Al F6 ),*with minor additions of other fluoride salts. The process is carried outin a cell (pot) - consisting of a carbon anode, a cathode, and the elec-trolyte - contained in a carbon-lined steel box. This is followed by al-laying and casting into ingots. The ingots are then shaped for final useby casting, rolling, forging and/or extrusion.
8. For secondary alumim production, the raw materials include newclippings; forgings and other solids; borings and turnings; residues; oldcastings and sheets; and high iron scrap.
9. The smelting process for secondary aluminum generally consists ofsix steps: charging scrap into the furnace, addition of fluxing agents,addition of alloying agents, mixing, demagging (magnesium removal) or de-gassing, and skinmiig. Sae plants also process residues to recover a highaluminum fraction for smelting and a low aluminum fraction for use by steelmanufacturers as ingot topping. High-iron scrap undergoes presmeltingtreatment for iron removal.
WASTE SOURCES AND CHARACTERISTICS
* 10. The irjor environmental concerns in bauxite mining operations are:Aand erosion, runoff water control, and dust control. In the processing ofbauxite to produce aluminum the principal environmental concerns include:(a) disposal of bauxite residue (red mud); (b) dirt losses (c) emissionsfran fuel burning; and (d) waste liquid and slurry streams.
Air Enissions
11. In the primary aluminum industry, gaseous emissions originatefron the potlines, potroom, paste plant, anode bake plant, and thedegassing operation. Most plants effectively collect and renove thevarious emissions and therefore very little escapes to the atmosphere. Inthe secondary aluminm category, emissions originate in the deagging(nagnesium reroval) operations and fron processing of furnace residues.These also are effectively collected and removed.
12. The emissions, in both primary and secondary plants, will containdusts, fluorides, sulfur compounds, fuel combustion products, certain or-ganic pollutants, phenols, cyanides (in cryclite recovery) and organic car-bon in varying amounts.
Liquid Wastes
13. The conventional water pollution parameters (biochemical oxygendenand, chemical oxygen demand, total organic carbon, oils and greases,etc.) have limited values in the non-ferrous metals industry. High concen-trations of metals, a characteristic of the wastes, will inhibit biologicalactivity and render these tests ineffective and of limited value.

223 -
14. In primary aluminum production the significant parameters are to-tal fluorides, total suspended solids, and pH. For secondary productionthese are also significant, but to them nust be added amonia nitrogen,aluminum, and copper.
15. Process wastewater in primary aluminum production originates franthe wet scrubbers used for air pollution control in the potline, potrooan,paste plant, anode bake plant, and the degassing operation. Other wastestream originate from the cryolite recovery, ingot cooling, and cathodemaking. For secondary aluminum operations the wastewater results fron de-
Wagging, wet milling of residues, and contact cooling.
Solid Wastes
16. Solid wastes include bauxite residues (red nud), residues franair pollution control devices (precipitators and scrubbers), and the watersused to cool the ingots and castings. The cathodes, consisting of carbonliners which hold the molten aluminum, are replaced periodically and re-quire disposal. Spent cathodes will have a significant fluoride content,and water runoff fron storage areas used for the spent units will. containfluorides. Scrubbers, furnaces, and ingot cooling are the principal solidwaste sources in secondary aluminum production.
E FN LIMITATIONS
-. AIR EMISSIONS
- 17. Control measures should be such that there will be very minor orno emissions to the atmosphere. The dusts and gases are usually collectedfor recycling and byproduct recovery, or for discharge with the wastewaterstreams.
18. Where gaseous emissions are discharged to the atmosphere, thefollowing limitations are to be observed:
Sulfur Dioxide (SO 9 )
Inside Plant Fence Ann. Arith Mean 100 pg/m3Max. 24-hour Peak 1000 pg/m3
Outside Plant Fence Ann. Arith Mean 100 ig/m3
Max. 24-hour Peak 500 3g/m3
fluorides (as HF) Ann. Arith Mean 10 jg/m3
Max. 8-hour Peak 100 pg/m3
Particulates Ann. Gecn. Mean 75 pg/m3Max. 24-hour Peak 60 pg/m3
Liquid Effluents
19. Discharge limitations, based on the best practicable controltechnology currently available, are as follows:

224 -
Primary Aluninum - Srelting
Max. 24-hour
Fluorides (total) 0.05 Ng/Mg* AluminumTSS 0.10 " "pH 6 to 9 units
Secondary Aluminum - Smelting
Max. 24-hour
-Fluorides (total) 0.4 NG/Mg * AlumimmTSS 1.5 " "NH3 (as N) 0.01 " " -Al 1.0 " "CU 0.003 ""
PH 6 to 9 units
* 1 Mg = 1 Megagram = 1 Metric ton.
Solid Wastes
Bauxite Minin
(a) There is to te no disposal of mine tailings to waterways orto the sea, except urxer very special circumstances and verycarefully controlled conditions.
(b) A reclamation program is to be established for handling minetailings. The project sponsor is to submit a proposed planof action, which will be. evaluated as part' of the projectappraisal.
(c) The reclamation program is to be initiated within three (3)years of the start of project perations.
Bauxite Processing and Refining
There is to be no disposal of red nud into either the waterwaysor into the sea.
CONTROL AND TREA'IMEN OF WASTES
Air Muissions
20. The industry makes extensive use of both wet and dry methods forcontrol of particulates ard gases. Liquid effluents fran the wet systemsare discharged with the wastewater, except, where there is byproduct recov-ery or utilization. Dry systems are preferable to wet systems, since re-movals are just as effective and liquid waste flows are reduced.

-225-
Liquid Effluents
21. In-plant controls should be carefully considered as the firststep in reducing wastewater loadings and volumes. In-plant measuresinclude improvemnt of bousekeeping practices, byproduct recovery,wastewater recycling (with or without treatment), and others.
22. Technology applicable to primary aluminum wastes includes treat-ment of wet scrubber water and other fluoride-containing effluents to pre-cipitate the fluorides. This is followed by settling of the precipitateand recycling of the clarified liquid to the wet scrubbers. Pecycling willcontrol the volume of wastewater discharged.
23. Wastewaters containing fluorides will originate fran the potline,potrooms, anode bake plant, used cathode disposal, used cathode storagearea, and storm water runoff. Precipitation of these. effluents may be ac-conplished by addition of cryolite or lime. Holding ponds or lagoonsshould be provided for settling of that portion of the flow. not recycled.
24. In secondary aluminum production, wastewaters originate fran met-al cooling, fume scrubbing, and residue milling. Metal cooling flows maybe reduced or eliminated through air cooling of ingots or recycling. Fumescrubber wastewaters may be recycled after pH adjustment and settling. Ef-fluents fran residue milling should be given three or four-stage settling,pi adjustment, and total impoundment.
Solid Wastes
. While a nmiber of disposal methods for bauxite residues have beeninvestigated, scme forM of dumping is currently considered to be the bestmethod, including (a) land impoundment; (b) ocean dumping by ships, barges,or pipelines; and (c) seashore reclamation.
26. Land impoundment in a diked impevious area is most frequentlyused, and is the method to be generally employed for Bank-supported pro-jects. Care must Ie taken to avoid contamination of ground waters. Thesettling ponds can remove 30 to 60 percent of the solids. In scme cases,water from the inPoundment area can be returned to the process as make-upwater.
27. Sea disposal is practiced in a number of areas. At scme sites inthe Mediterranean, the residue is discharged via pipelines into underwatercanycns at depths of over 2,000 meters. In Japan sea dumping is permitted,but only to areas and by methods specified by government regulations, withdisposal areas being located over 300 kilometers fra shore. Use of baux-ite residue fcv seashore reclamation is permitted in Japan cn a limitedbasis, but ms -teen found to be very costly. For Bank-sponsored projectssea disposal may be used in special cases only, under carefully controlledconditions, and with the assurance that there will be no harmful effects onsea life.

-226-
28. Sludges fra settling or other treatment of waste streams aretransferred to contractors or reprocessors for recovery of metals. Dryingbeds, lagoons, landfills, or incineration are also used. Gravity thicken-ing, vacuum, filtration, or other conditioning may be applied ahead of ulti-mate disposal.
29. Particulate matter frn dry scrubbers is burned, dumped on land,or recycled for byproduct recovery.
BIBLIOGRAPHY
1. "The Aluminium Industry and the Environment." UNEP Industry SectorSeminars, Aluminium Meeting, Paris, 6 to 8 October, 1975. Papers andDocuments. (1975)
2. "Environmental Aspects of the Aluminium Industry - An Overview." UNEPIndustry Progranme. Paris (May 1977)
3. "Environmental Recommendations for Siting and Operation of New PrimaryAluminium Industry Facilities." International Primary Aluminium Insti-tute. London (1977)
4. "Air Pollution Control in the PriTary Aluminum Industry." Singmaster &.. Breyey. New York (1973)
. 5. U.S. Environmental Protection Agency. "Environmental Considerations ofSelected Energy Conserving Manufacturing Process Options." Alumina/Aluminum Report. Doc. EPA 600/7-76-034 h. Washington (Decerber 1976)
6. U.S. Enviromental Protection Agency. "Development Document for Pro-osed Effluent Limitations Guidelines and New Source Performance Stand-ards for the Bauxite Refining Subcategory of the Aluminum Segment ofthe Nonferrous Metals Manufacturing Point Source Category." Doc. EPA440/1-74-019-c. (March 1974)
7. U.S. Environmental Protection Agency. "Development Document for Pro-posed Effluent Limitations Guidelines and New -Source Performance Stand-ards for the Primary Aluminum Smelting Subcategory of the NonferrousMetals Manufacturing Point Source Category." Doc. EPA-440/1-74-019-d.(March 1974)
8. U.S. Environmental Protection Agency. "Development Document for Ef-fluent Limitations Guidelines and New Source Performance Standards forthe Secondary Aluminum Smelting Subcategory of the Aluminum Segment ofthe Nonferrous Metals Manufacturing Point Source Category." Doc.EPA-440/l/74-019-e. (March 1974)
9. U.S. Environmental Protection Agency. ,"Development Document for Ef-fluent Limitations Guidelines and Standards for the Nonferrous MetalsManufacturing Point Source Category." Doc. EPA-440/1-79/019-a.(September 1979)
- 227-
10. "Standard Methods for the Examination of Water and Wastewater." 15thEdition. American Public Health Association. New York (1980)
11. "Code of Federal Regulations - Protection of Environment, " Title 40,Parts 400 to 424, U.S. Government Printing Office. Washington (July 1,1981)
12. Atkins, M.H. and J.F. Lowe. "The Econanics of Pollution Control in theNon-Ferrous Metals Industry." Pergamon Press. , Oxford (1979)
13. Boodson, K. "Non-Ferrous Metals - A Biographical Guide. " Macdonald &Co. (Publishers) Ltd. London (1972)
- 228 -
THE WORLD BANK MARCH 1983
OFFICE OF ENVIRONMENTAL -AFFAIRS
NON-FERROUS MEnUS INDUSTM
COPPER AND NICKEL PRODU)CTION
ENVIF4ENTAL GUID S
1. he non-ferrous metals category includes a large number of metal-
lic elements, but only a few are of concern to World Bank operations at
this time. Those most frequently encountered in Bank activities are cov-
ered in four separate documents in this series, as follows: (a) aluminum;
(b) lead and zinc; (c) copper and nickel, and (d) silver, tungsten, colum-
bium, and tantalum. This document will cover the production of primary andsecondary copper, and primary nickel.
MANUFACTURI1G PROCESSES
COPPER
2. shelting is the first step in the production of prinary copperfrom the are. One of two main process schemes is generally used: roast-
ing, smelting, and converting; or simply smelting and converting. Roasting
is used where nmerous types of ores are processed, in order to reduce the
content of sulfur and other impurities in the feed stock. Ore concentrates
of uniform consistency frequently do rot require the roasting step.
3.. Selting is carried out in either a reverberatory furnace or an
electric furnace. 7he smelting and refining processes are illustrated in
Figures 1 and 2. The end product is a nolten copper-iron-sulfide material
called matte. The matte goes to a converter, while the slag containing the
inpurities is skimned- off as waste material fbr .disposal.
4. In the converting step, the iron-sulfide co=ponent of the matte
is oxidized to sulfur dioxide and iron oxide. The sulfur dioxide is
carried off in the exhaust air streams. The iron oxide further reacts with
silicate (added as a fluxing agent) to form iron-silicate slag. This slag
contains significant amounts of copper and is thus recycled to the smelting
step. The product from the converter units is called blister copper.
5. Blister copper, which contains various impurities, -is cast into
anodes and sent to electrolytic refining for purification. A small percen-
tage of plants use fire refining to produce refined copper. Insoluble
slimes are generated during the electrolytic process. These may contain
economically significant amounts of copper, selenium, tellurium, lead, sil-
ver, and other precious metals. - The slimes are usually treated off site,
but nay be treated on site, for byproduct recovery. .

-229-
COPPER CONCENTRATES
GREEN FEED
STEAM TO ROASTING SOLIDS TO DISPOSAL
POWER PLANTEMIS ON CALINEGANGUE
SOLIDS TO WAS LEAT EMISSIONS SMELTING AG GRANULATION I -- WATER
SMELTINGEMISSIONS MATTEy
Ir7 WASTEWATER
ELECTROSTATIC' COVERTING SLAGPRECIPITATOR
AIR
SO.
SULFUrIC OLISTER
BLOWDOWN ACID PLANT SLAG COPPER
G FIRE NING AIR
inr oCARBON
WATER WASTEWATER
- R CASTING WS
COOUiNG
ANODE OR FIRE REFINEDCOPPER TO ELECTRO&YSIS
OR MARK T
Figure 1. Primary Copper Smelting and Fire Refining Processes.
(From U.S. EPA Document EPA 440/1-79/019a)

- 230 -
BLISTER COPPER POLE
INTERMACIATE OnADE COPPERAT00UFURNACE
ELECOLYELEATHOLYT
ECLEREUS CO
ORLDCSROL SLMEROB-PODCTSEOVR
H1 AODES .
ELECROVNNIG LECTROLYTEEATE
COD USECPZDomn
ELECTROLYTE AsH, FUMES VENTTO ATMOSPHERE
SVAPORATOR MELTING SCRUBBER LIOUOR
'FURNACE
CENTRIFUGEBLACK ACID HCRU
IH2, CAKE .. (
.
DRYERCASTING WASTEWATER
DRYERCOOLING
NISO4* ALTERNATE USE COPPER-OR DISPOSAL PRODUCTS.
Figure 2. Primary-Copper Electrolytic Refining Process.
-(Pronm-U. S*. .EPA.Do.cwment 440 /1-79 /019a)

- 231 -
6. Industrial copper-bearing scrap, discarded consumer items, andresidues fran melting and refining are the basic raw materials used in sec-ondary copper production. The manufacturing process consists of pretreat-ment of scrap, smeltingi and refining. The processing depends upon the rawmaterials used and the desired end product. The process is illustrated inFigure 3.
NICKEL
7. The nickel extraction industry may be divided into two major seg-ments, based on the composition of the raw ore. Those ores which are minedunderground are mainly sulfide ores. The nickel minerals are concentratedby physical methods, and the concentrates then smelted by pyrometallurgicalmethods.
8. Nickel oxide ores (also known as laterite -ores) cam fron openpit mines, at or near the surface at naxium depths of sone .30 meters. Thenickel deposits fron open mines cannot be concentrated by physical means.The metal is extracted either in a chemical form by leaching or as ferro-nickel by smelting.
9. Nickel sulfide concentrates Ure smelted with a flux to produce acopper-nickel-iron matte. The resulting furnace matte is treated to renoveiron slag and part of the sulfur as sulfur dioxide gas, and to produce asulfur-deficient copper-nickel matte.
10. The copper-nickel matte is slowly cooled to form copper and nick-el sulfide crystals, plus a nickel-copper alloy containing significantquantities of precious- metals4 The crystal nass is pulverized to separatethe conponents fran each other. The nickel-copper alloy in the pulverizedmixture is extracted magnetically and then refined electrolytically. Thenickel-copper sulfide minerals are separated by flotation.
11. In one type of process the nickel sulfide concentrate is treatedby selective leaching with amonia, under pressure, and the solution thenheated to precipitate the copper. Nickel and cobalt are recovered separ-ately, as metal powders, by hydrogen reductioh of the purified solution.
12. The carbonyl process can be also used to recover nickel fran thenickel-sulfide concentrate. The sulfide is roasted to produce nickel ox-ide, and this is reduced with water gas to form crude sponge nickel. Thesponge is then treated with carbon monoxide to form nickel carbonyl. Heatis applied to the carbonyl to decampose the Ni (CO) 4 mixture and producenickel pellets or nickel powder. Iron sulfide concentrate, the residuefron the carbonyl process, is further treated to recover nickel oxide as amarketable product.
13. Nickel oxide laterite ore, after drying and screening, is pro-cessed by smelting with coke, limestone, and gypsum to form an iron-nickelmatte. The matte is then treated in the same way that mattes with similarconposition are smelted and refined in the processing of sulfide ores. .
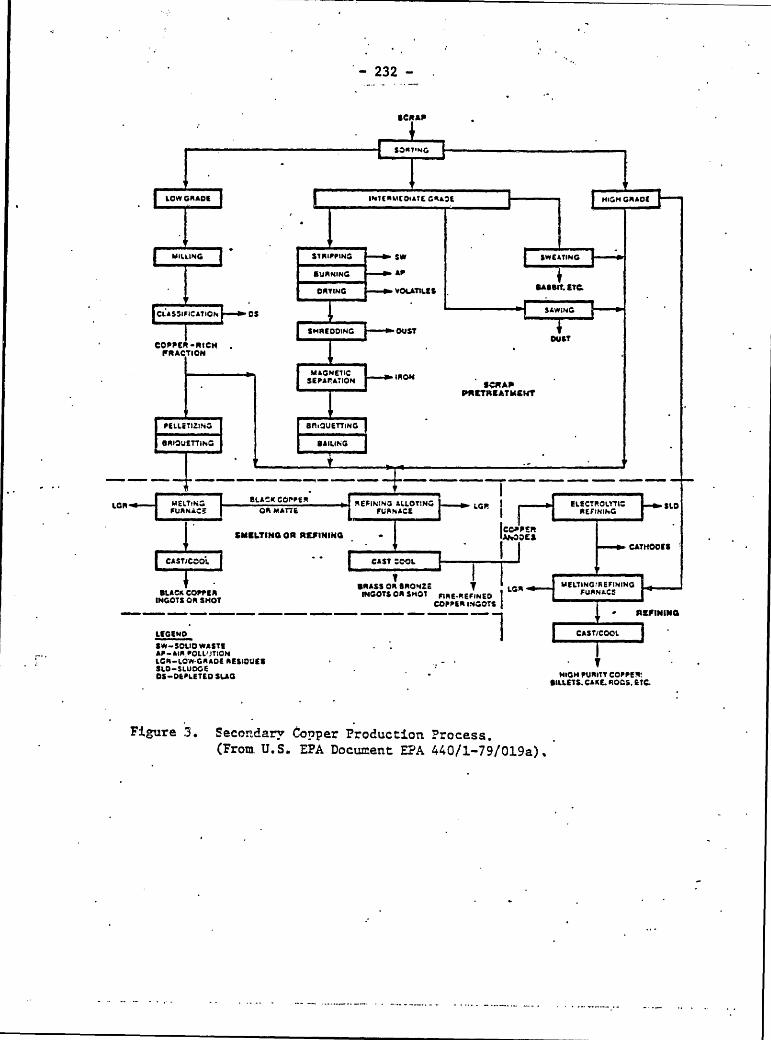
�
233
14. Another metbod of processing laterite ores is to smelt them with
coke and limestone,, or other carbon reductant,, to produce ferronickel. The
ferronickel 'is refined by depbosphorization, and removal of the silicon and
cbromium as a slag. M6 refined product is marketed.
is. Cxide ores may also be processed by leaching with ammonia or with
asulfu.:-ic acid. Ammonia will produce nickel oxide,, which can be
marketed or further refined by the methods used for sulfide ores. In sul-
furic acid leaching the nickel and cobalt are precipitated as sulfides by
hydrogei, lvilfide. Mie crude sulfide is leached in a weak acid solution to
redissolve the nickel and cobalt,, then . ralized with ammonia and pro-
cessed for recovery & nickel arxi cobalt powders.
MASTE SOURCES AND CHAPJC=ST'-rC-S
COPPER
Air Emissions
16. Emissions fran the copper smelting and refining cperations i i
nate in the roasting, smelting, and converting processes. Sulfur dioxide
and partaculates are the principal pollutants. In some.plants these gases
pass through a boiler for beat recovery and then through a low-velocity
flue device to settle cut the heavier particulates. The smaller particles
are usually removed by electrostatic precipitators or by baghou-ses.
17. Mere gases are not burned in a boiler, the sulfur dioxide is re-
covered as liquid S02 or as sulfuric acid. Gases are preconditioned by
electrostatic precipitators or scrubbing towers to remove the particulates
and prevent the buildup of soluble salts such as metallic sulfates and
hiorides. In secondary copper production, sone emissions result from
burning,, drying,, and shredding of the raw stock,, but these are n::)t consid-
ered to be significant.
Uquid Effluents
18. Wastewater from smelting in primary copper production originates
frcrn the acid plant blowdown, contact cooling, and slag granulation. In
the refining facilities the effluents consist of waste electrolyte and cat-
bode wash,, anode wash,, and contact cooling waters. Sources within a secon-
dary copper plant include slag millirig and classification, smelter air pol-
lution control,, contact cooling, electrolyte, and slag granulation.
Solid Wastes
19. Solids are produced mainly frau air scrubbers and precipitators,
furnaces (as slag), and scrap pretreatment in the case of secondary copper.

- 234 -
NICKL
Air EInissions
20. Enissions fran the processing of nickel sulfide ore concentrates
contain significant amounts of both particulates and gases. These origi-
nate nainly fran the roasters, smelters, and converters as well as from
power generation facilities which nay be part of the production facility.
The character of the particulates depends upon the source. Gases will in-
clude one or nore of the following: Sulfur oxides, nitrogen oxides, carbon
nonoxide, and water vapor. Sam nicKeA oxide is carried to the atnesphere
fran roasting of precipitated nickel carbonate to remove carbon dioxide.
Nornally there will be no visible emissions from a well-operated nickel
electrolytic refining operation.
21. Emissions from processing of nickel oxide ores will also contain
significant amounts of particulates and gases. Sources and con1position are
similar to the emissions from nickel sulfide ore processing, but levels
will differ. In furnaces which produce ferronickel, for example# sulfur
oxides are a nuch lesser problem . Annmnia and sulfuric acid leaching
operations are generally carried out in closed systems and hence contribute
no emissions to the atmosphere.
Liquid Effluents
22. The najor sources of liquid effluents will be the waters used for
cooling at various points in the process. This woud include the converter
natte, furnace natte, converter slag, driers, reduction kilns, pelletizers,
and wet scrubbers, where used for emissions control. Power generation
facilities, if operated as part of the installation, may also be a source
of cooling water.
23. Significant paraneters governing discharges to adjacent waters
will be terperature and total suspended solids. Oils and greases sbould
also be considered in case of equipnent leakages, spills from oil storage
facilities, or other possible sources.
Solid Wastes
24. Solid wastes will originate periodically fran emission control
devices, settlings in cooling pits, and sludges from waste treatment facil-
ities.
EFFIDENT LIMITATIONS
Air Emissions
25. Wet or dry systems for renoval of particulates, combined with
collection of the gases for recycling or product recovery, will nrnally
provide sufficient control to drastically reduce or eliminate discharges to
the atmosphere. Where discharges are nade to the environment then emission
levels, for both copper and nickel production, are to be maintained at or
below the following levels:
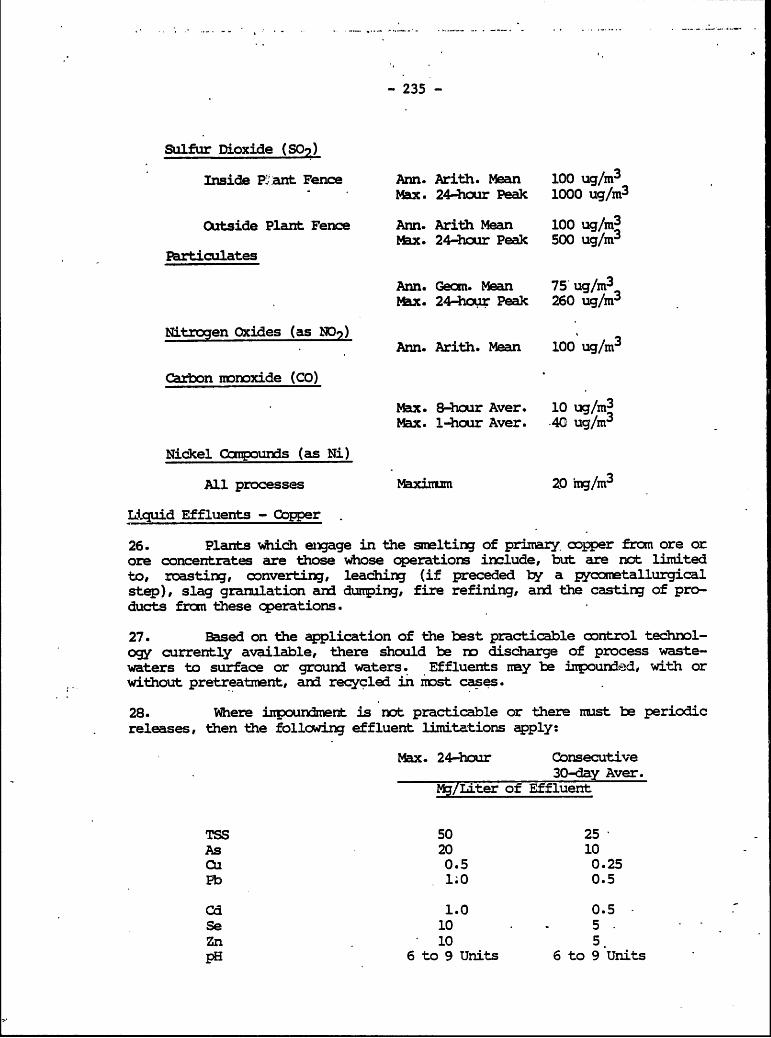
- 235 -
Sulfur Dioxide (SO9
Inside P:ant Fence Ann. Arith. Mean 100 ug/m3
Max. 24-hour Peak 1000 ug/m3
Outside Plant Fence Ann. Arith Mean 100 ug/m3
Max. 24-hour Peak 500 ug/mParticulates
Ann. Geom. Mean 75 ug/m3
Max. 24-hour Peak 260 ug/m3
Nitrogen Oxides (as N07)Ann. Arith. Mean 100 ug/m3
Carbon monoxide (CO)
Max. 8-hour Aver. 10 ug/m3
Max. 1-hour Aver. .40 ug/m3
Nickel Ccmpounds (as Ni)
All processes Maxim= 20 mg/m3
Liquid Effluents - Copper
26. Plants which engage in the smelting of primary copper froa ore orore concentrates are those whose operations include, but are not limitedto, roasting, converting, leaching (if preceded by a pycometallurgicalstep), slag granulation ar dumping, fire refining, and the casting of pro-ducts frcn these operations.
27. Based on the application of the best practicable control technol-ogy currently available, there should be no discharge of process waste-waters to surface or ground waters. Effluents may be impounded, with orwithout pretreatment, and recycled in n'st cases.
28. Where inpoundment is not practicable or there rmst be periodicreleases, then the following effluent limitations apply:
Max. 24-hour Consecutive30-day Aver.
Mg/Liter of Effluent
TSS 50 25 -As 20 10CU 0.5 0.25Pb 1.0 0.5
Cd 1.0 0.5Se 10 - 5.Zn . 10 5,
pH 6 to 9 Units 6 to 9 Units

- 236 -
29. Plants engaged in the elecrolytic refining of copper are thosewhose cperations include, but are rxt limited to, anode casting (performedat refineries which are - not located onsite with a smelter), product cast-ing, and by-product recovery.
30. On the basis of best practicable control technology currentlyavailable, wastewater effluents frca such plants should not exceed thefollowing limitations:
Max. 24-hour Consecutive__37 - 30-da y Aver.
7EMetric Ton of Product
TSS 0.10 0.05Cu 1.7x10- 3 0.8x10⁻³Cd 6x10- 5 3x10⁻⁵Pb 6x10- 4 2.6x10⁻⁴Zn 1.2x10- 3 0.3x10⁻³
31. Plants engaged in secondary copper production are those which re-cover, reprocess, and remelt new and used copper scrap and residues to pro-duce copper metal and copper alloys. There should be no discharge ofliquid effluent fram this source. Wastewaters may be impiounded and in manycases. recycled, either with or without pretreatment.
32. Where inpoundment is not practicable, or periodic releases arenecessary, then discharges should meet the following limitations:
Max 24-hour Consecutive30-day Aver.
Mg/Liter of Effluent
TSs 50 25Cu 0.5 0.5Zn 10 5Oil & Grease 20 10pH 6 to 9 Units 6to 9 Units
Liquid Effluents - Nickel
33. Based on best practicable control technology currently available,wastewater discharges from primary nickel production may be impounded andrecyled in many cases, with or without pretreatment. Where irpoundment isnot possible then discharges are to meet the following limiations, based onresults achieved at Canadian plants:

-237-
Consecutive30-day Aver.Mg/Liter
TSS 15Co 0.2Ni 0.5Fe 0.5pH 6 to 9 Units
CONTROL AND TREATMENT OF WASTES
34. As a first step in developing measures for control of emissions,wastewaters, and other sources of wastes, a critical analysis should be
made of plant operations to determine what internal measures can be taken
to reduce discharges to the environment. This includes, utilization or
recycling of waste products, process changes, isolation of highlyconcentrated waste streams for separate treatment, inproved housekeepingprocedures, control of water use, and other similar measures.
Air missions
35. Gaseous and particulate emissions can be controlled by wet or dry
scrubbers, cyclone filters,, electrostatic precipitators, or other devices.
Discharges from wet systexs are added to other liquid process wastes and
receive the same treatment. Dry systems 'e preferable where possible,.
since they are generally as effective and b not add to the volume of
wastewaters. The collected dusts and particulates are nore readily'
disposable or reusable in the dry state. Tall chimneys (with heights in
the 75 to 125 meter range) may be needed in addition to the scrubbers or
other emission systems.
Liquid Effluents
36. Scrubber waters fran prinary copper smelters can be treated by
settling, coibining the supernatant with the cooling water, applying
chemical precipitation, and recycling. Contact cooling waters fram. primary
copper refineries way be recycled. Acid plant blowdown waters should
receive chemical precipitation and filtration, and the filtrate recycled.
37. Slag mill wastewaters in a secondary copper plant can be settled,
and the supernatant cobined with the contact cooling water for treatment
by chemical precipitation. The supernatant may receive further filtration,
stored and recycled, thus resulting in zero discharge.
38. Oil leakages, in both copper and nickel production facilities,
from nachinery, fuel storage, or other sources can be controlled by
* installing oil trapping and recovery systems. A dike system nay be
advisable for the oil unloading and storage areas.
- 238 -
39. Most of the liquid discharges in nickel production will come from
cooling the mattes and slag casts. These streams will be high in suspendedsolids and contain varying degrees of nickel, cobalt, iron, and other
inpurities. The wastewaters should be settled in ponds or tanks, and thesupernatant cooled and reused within the plant. Depending upon the
suspended solids contents, the supernatant waters may require filtration orother additional treatment before reuse or discharge to surface waters.
40. Where waters are discharged to nearby surface waters temperaturesnust be reduced in order to avoid interference with other uses of thereceiving waters. Discharge temperatures should be about 300C or lower.
Solid Wastes
41. Solid wastes nay contain reusable naterials, and this should be
the first consideration in developing disposal measures. Sludges, if not
sold for reprocessing, may be discharged on-site to drying beds, lagoons,landfills, or similar facilities. Dried sludges, dry particulates, andother siMilar residues can be piled on land or used for landfill. Care
should be taken at dunp sites to avoid contaminating ground waters and to
prevent the pollution of surface waters by runoff.
BIBLIOGRAPHY
1. National Academy of Sciences. "Medical and Biologic Effects of pollu-tants - Nickel." Washington (1975)
2. Canada Department of Mines and Resources, Mineral Resources Division."Nickel-Canada and the World. " Mineral Report 16. Ottawa (1968)
3. United Nations Industrial Development Organization. "Non-Ferrous
Metals - A Survey of Their Production and Potential in the DevelopingCountries." Vienna (1972)
4. Jarrault, P. "Limitation des Emissions de Polluants et Qualite de
L'Air." Institut Francais de L'Energie. Paris (1978)
5. U.S. Environmental Protection Agency. "Guidance for Lowest Achievable
Enission Rates from 18 Major Stationary Sources of Particulate,Nitrogen Oxides, Sulfur Dioxide, or Volatile Oreganic Ccmpounds."Document EPA 450/3/79-024. Washington (April 1979)
6. U.S. Environmental Protection Agency. "Development Document forEffluent Limitations Guidelines and Standards for the Nonferrous Metals
Manufacturing Point Source Category." Doc. EPA-440/1-79/019-a.Washington (Septenber 1979).

- 239 -
7. Atkins, M.H. and J.F. Lowe, "The Economics of Pollution Control in the
Non-Ferrous Metals Industry." Pergarnon Press. Oxford (1979).
8. Powers, P.W. "How to Dispose of Toxic Substances and IndustrialWastes." Noyes Data Corporation. Park Ridge, NJ. and London (1976)
9. "Standard Methods for the Examination of Water and Wastewater. " 15thEdition. American Public Health Association. New York (1980).
10. Nevala, E.C., H.R. Butler, and H.J. Koehler. "Aquaeous Effluent Treat-
ment at the Sudbury Processing Ccaplex of INO Limited." Presented at
24th Industrial Waste Conference, Toronto, Ontario, May 29 to June 1,.1977.
11. U. S. Code of Federal Regulations. Title 40, "Protection of Environ-
ment". Chapter 1, Part 42, "Nonferrous Metals Manufacturing Point
Source Category". Washington. Washington (July 1, 1981).

- 240 -
THE WORLD BANK FEBRUAY 1983
OFFICE OF ENVIFNMENTAL -AFFAIBS
NON-FERIUS MEIS INDUSTRY
LEAD AND ZINC PROCTION
ENVII01MENTAL GUIDELINES
1. 'fe non-ferrous metals category includes a large number of
metals, but only a few are of concern to World Bank cperations at this
time. Those most frequently encountered in Bank operations are covered in
four separate documents in this series, as follows: (a) aluminum,; (b) lead
and zinc; (c) copper and nickel; and (d) silver, tungsten, columbium, and
tantalum. This document will be confined to the production of primary and
secondary lead, and primary zinc.
MANFACTURING PROCESSES
IiAD
2. Galena, cerusite, and anglesite are the pri %ipal mineral ores
used in the primary lead industry. The manufacturing process includes both
refining and smelting. Usually both operations are czrried out at the same
locations, but are independent of each other. The manufacturing process is
shcn in Figure 1.
3. The smelting process consists of blending the ore concentrates
with. recycled products and fluxes. The blend is pelletized and fed to a
sintering machine. From the machine, the sinter passes through a breaker
for breaking and sizing. Oversized particles are charged to the blast fur-
nace and the small particles returned to the sinter feed operations.
4. The blast furnace is the primary reduction unit of the smelter
process. Three molten layers are usually formed in this unit. The top
layer consists of a slag containing silicate of iron, calcium, magnesium,
trace impurities, and sanetimes significant quantities of lead and zinc.
The middle layer (which does not always form) is carposed of copper and
iron sulfide, along with some precious metals. The botton layer aprises
the lead bullion which goes to the refining process.
5. Hard lead (sometimes referred to as antimonial lead) is the
principal product of the primary lead industry. The initial step in the
refining process is usually called "dross decopperizing" and serves to re-
nove the copper. The dross (or skimned slag) is treated in a reverberatory
furnace to separate the lead. The copper matte from the decopperizing goes
to a copper smelter. The separated lead is further processed to remoave the
antimony, gold, silver, bismuth, zinc, and any other inpurities which may
be present.

�

242
6. The principal raw materials used in the secondary lead industry
are storage battery plates and lead residues. Scme use is also made of
solder, babbit (an allcy used to line machine bearings), cable coverings,
and others. The lead is produced by dbarging the scrap materials to a re-
yerberatory furnace (to produce soft lead) or to a blast furnmace (to pro-
duce bard lead). The soft lead my be further refined to produce lead Ox-
ide. The. bard lead may'either be shipped without additional processing or
further processO the site to fill specific needs. A flow diagram for
the secondary V ,,-,) , --int mewny smelting process is presented in Figure 2.
ZIW
7. The two major sources of raw material cr prod ction of primary
zinc are the zinc concentrate recovered as a co I product fka, lead and cop-
per ores and the zinc ores frcm mining cperations. The,prolytic and elec-
trolytic processes are the two methods in general use for primary zinc pro-
duction.
8. In the pyrolytic process, sbown =1 Figure I the concentrates are
roasted after drying and blending to remove sulfur as sulfur dioxide, as
well as to remow varying amoun:tz of other volatile impurities such as mer-
ct=y, lead,, and calcium. The roasted concentrate (calcine) is blended with
coke, moisture, and sometimes silica sand, and thenpelletized. The pellets
are sintered and crushed, and then fed to a reduction furnace. Most of the
cadmium and lead is removed during sintering.
9. The zinc contained in the sinter is reduced to zinc oxide or
metallic zinc in a vertical retort furnace or- an electrothermic furnace.
In either case, the resulting zinc vapor is condensed and cast into in-
gots. The uncondensed zinc axid carbon monoxide are passed through a wet
scrubber. The exhausted carbon monoxide is used as a fuel, and the zinc is
removed f=aL the scnibber water for reprocessing.
10. In the electrolytic process,, presented in Figure 4,, the roasting
is fol1cwed by leaching of the calcine with spent electrolyte (H2SO4) todissolve the'*zinc and cadmium. The solids (-gangue) are sepaiated by sedi-
mentation and filtration,, and sold to other processors for recovery of the
le&d and copper.
11. The zinc solution is further purified by adding zinc dust (and
scmeti:mes scrap iron) in stages. These steps first precipitate copper and
other bpurities and then cadmium. The pure solution is filtered, cooled
and then passed to electrolytic cells,, where the zinc is deposited on alum-
2i= cathodes. The ptnIfied zinc is stripped fran the cathode, melted, and
cast into various shapes for marketing.
12. The solids fran the filtration step are usually processed on site
to recover the cadmium, if they are rich in cadmium, and the residues sent
elsewhore to other processors for recovery of other metals. Cadmium-rich
solids are leached with sulfuric acid to dissolve the cadmium, and then
treated with zinc dust and other reagents to precipitate a cadmium sponge.
The sponge is then further processed to produce cadmium met al, which is
cast into shapes (usually small spheres) suitable for electrciplating.
WASTE BATTERIES
LEAD RESIDUES
HSO, RATTERY wH0 + ELECTROLYTECRACKING TO TREATMENT.
5 CASINGS TO DISPOSAL
SCRAPIRON
EMISSIONS SLAG LEMISSIONSWSEREVERBERATORV LA BLAST hWASTE
BAGHOUSE ER ORY A SBAUS - S
SOFT LEADLIOUOR TO RECYCLE
UBBER ANTIMONIAL SCRUBBER-10.FSCRLEAD
LIOUOR TO RECYCLE .EMISSIONS
- A*.CwL -REMELT BARTON ,I REMELT
KETTLK OXIDATION KETTLE
REFINED LEAD LEAD OXIDE ANTIMONIAL LEAD LEAD ALLOY
Figure 2- Secondary Lead/Antimony Smelting Process.
(From USEPA Document EPA 440/1-79/019a)
- 244 -
ZINC CONCENTRATES
WATER
SLUDGE DUST CONCENTRA1TECOLLECTION DRYING
WATER GaS"
WASTEWATERtSTO TREATMENT
ON40ASS RCOLLECTION PA .
CALCINE CADMIUM+ PLANT
LAD SINTERING COLDEC0N AS
21NC*RICHRESIDUE CADMIUM PLANT
(RomESIDU DcmetEA-4/-7/1
COKE . mBLUE POWDERREDUCTION ZINC OXIDE
RESIDUE . FURNACE CO. PLANT USETREATMENT
FERROSILICON
25CPOOR WATER CAS OLGW ER WN
RESIDUE TOLEAD REFINERY
$ LAD
. BLOCKS
OTHSER.. . . SHAPES.
Figure 3- Pyrolitic Zinc Production Process
(From US-4-7A Document EPA-440/1-79/019a)

-245 -
ZINC CONCENTRATES
STORAGEWAEGS
PRELEACHPLANT
ROASTER DI H.SO.
. CALCINECLASSIFIER DUST
BALL MILL
UNDERFLOW ZINC SOLUTION FROM
CADMIUM PLANT
, LEACHING
SOLIDS TOCOPPER OR T
. LEAD THICKENERSREFINERY FILTERS
SOLIDSTOZCADMM SOLUCON ZINC DUST
PLANT IPURIFICATION
ELECTRLYSISSPENT CELL ACID
ELCOLYSIS
.. . .CATHODEMELTING
ZINC OXIDE FURNACE
COOLING TOWERWATER CASTING BLOWOOWN
. .SLAB
BLOCKS
OTHERSHAPES
Figure 4- Electrolytic Zinc Reduction Process
(From USEPA Docurent EPA-440/1-7S/019a)

- 246 -
WASTE SOURCES AND CHARACTERISTICS
LEAD
Air Missions
13. The smelting process in primary lead production generates gaseous
emissions of sulfur oxides, arsenic, antimony, and cadmium in the sintering
of the ore blends. A highly concentrated SOx stream produced during the
initial phase of the operation may or may not go to a sulfuric acid plant.
Particulates are removed by flue, baghouse, or wet scrubbers for recycling
to sintering machines.
14. In the refining process, sare fumes are produced, mainly by the
softening furnace. Established air pollution control devices are used to
renove these emissions, and no significant quantities are normally dis-
charged to the atmosphere.
15. Secondary lead, produced nostly from discarded storage battery
plates, generates gaseous emissions fran both reverberatory and blast
furnaces, and the remelt kettles. These are renoved by baghouses or scrub-
bers. Water fran the scrubbers is generally recycled.
Liquid Effluents
16. Liquid wastes in primary read smelting originate fran sintering
air pollution control units, acid- plant blowdowns, blast furnace emission
control devices, zinc fuming control units, slag granulation, and dross re-
verberatory furnace emission control devices. Wastewater. in the refining
process can originate from wet scrubbers, but this water is usually re-
cycled and no discharge results. Cooling of the castings is usually a non-
contact operation and the water is normally recycled.
17. For secondary lead plants the waste streams include battery acid,
raw cooling,' and washdown fran the battery -cracking. Furnace and kettle
air pollution control devices and contact cooling contribute wastewater in
the smelting process. Battery acid streams are strongly acidic and contain
significant levels of suspended solids, as well as several metals such as
antimony, arsenic, cadmium, lead, and zinc. Metal cooling is usually ac-
complished by non-contact methods.
Solid Wastes
18. Solid wastes originate fram air pollution control devices, prepa-
xation of feeds, furnace operations, and other sources. A significant por-
tion of these residues are reused in the process.
- 247 -
ZINM
Air missions -
19. missions originate fron the drying process in pyrolite zinc pro-duction, fran which they are renoved by wet scrubbers and discharged withthe wastewater. The roaster. units renove sulfur as sulfur dioxide, aswell as other volatile inpurities such as arsenic, lead, and cadmium. Theexhaust gases pass through a dust collection system before transfer to anacid plant for conversion to sulfuric acid. The waste solids are latertreated to recover cadmium.
20. The blending and pelletizing of the ore concentrate also producesa dust, which is collected and treated to recover cadmium and lead. Thereduction of the zinc contained in the sinter to zinc oxide or metalliczinc produces uncondensed zinc and carbon monoxide. These -are passedthrough a wet scrubber, with the carbon monoxide being used as a fuel andthe zinc recovered for reprocessing.
21. The roasting furnaces in electrolytic refineries renove sulfur assulfur dioxide fron the ore concentrates, and this goes to a sulfuric acidplant. These emissions ay also contain other inpurities. such as mercury,lead, and cadmium. Calcine dust fron the roasters is *separated fron thesulfur dioxide in the dust collectors and returned to the process.
Liquid Effluents
22. IsWstewater flows in prinary zinc production originate fra thewet scrubbers which collect emissions fron the concentrate, roasting, sint-ering, and leaching units. Other effluents are discharged from the acidplant blowdown, reduction furnace, preleaching, anode/cathode washing, andcontact cooling. Depending upon the source, the waste streams will containvarying concentrations of lead, arsenic, cadmium, zinc, and other pollut-ants. Toxic heavy metals should be renoved by neutralization before dis-charge.
Solid Wastes
23.. In general, the dusts and other solids resulting from zinc pro-duction contain significant quantities of other netals, such as lead andcopper. These residues are sold to other processors for recovery ofvaluable corponents.
24. Cadmium byproduct recovery, nearly always practiced at primaryzinc plants, does not generate any significant quantities of solid wastes.
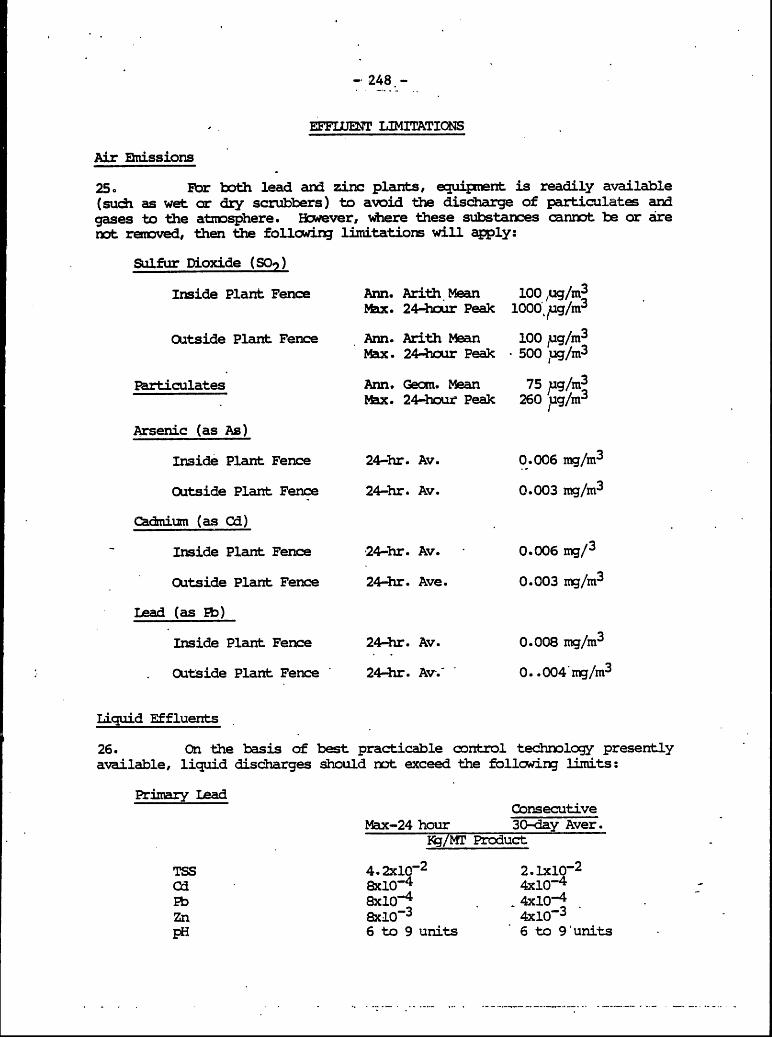
- 248 -
- EFFLUET -IMtTATIONS
Air Emissions
25. For both lead and zinc plants, equipmnt is readily available(sudh as wet or dzy scrubbers) to avoid the discharge of particulates andgases to the atmosphere. However, where these substances cannot be or arenot removed, then the following limitations will apply:
Sulfur Dioxide (SO,)
Inside Plant Fence Ann. Arith Mean 100 ,ug/m3Max. 24-hour Peak 1000 ug/m3
Outside Plant Fence Ann. Arith Mean 100 ,ug/m3Max. 24-hour Peak 500 ug/m3
Particulates Ann. Geon. Mean 75 ag/m3Max. 24-hour Peak 260 ug/m3
Arsenic (as As)
Inside Plant Fence 24-hr. Av. 0.006 mg/m3
Outside Plant Fence 24-hr. Av. 0.003 mg/m3
Camium (as Cd)
Inside Plant Fence 24-hr. Av. 0.006 mg/3
Outside Plant Fence 24-hr. Ave. 0.003 mg/n3
Lead (as Pb)
Inside Plant Fence 24-hr. Av. 0.008 mg/m3
Outside Plant Fence 24-hr. Av-. 0..004 mg/m3
Liquid Effluents
26. On the basis of best practicable control technology presentlyavailable, liquid discharges should not exceed the following limits:
Primary LeadConsecutive
Max-24 hour 30-day Aver.K44g/MT Product
TSS 4.2x10- 2 2.1x10 2
Cd Sx0-4 4x10⁻⁴
Pb 8xl0-4 4x10⁻⁴Zn 8x10⁻³ 4x10⁻³pH 6 to 9 units 6 to 9'units

-249-
Secondary Lead (Battery Cracking)
TSS - 5x10⁻² 2.5x1 -2Cd 4x10- 5 2x10~Pb 1x10 3 0.5x10⁻³As 1X10⁴ 0.5x10⁻⁴
pH 6 to 9 units 6 to 9 units
ConsecutiveMax-24 hour 30-day Aver.
Eq/Mr Metal Product
Primary Zinc
TSS 0.42 0.21As 1.6xlQ-3 8x04Cd .S860-1 4x10⁻⁴
Se 0.08 0.04Zn 0.08 0.04
pH 6 to 9 units 6 to 9 unitsCONTROL AND TREMT OF WASTES
Air Eissions
27. Both the lead and zinc industries nake extensive use of wet and
dry methods for renoval of particulates and gases. Liquid effluents franthe wet systems are bandled with the wastewaters and receive the same
treatment. Dry systens are preferable, since removal efficiencies are high
and wastewater volumes are reduced. Current trends are toward dry system
for new plants and replacements.
Liquid Effluents
28. The initial step in disposing of wastewaters is to critically ex-
amine housekeeping practices. Inrplant measures such as process changes,
nonitoring of water use, byproduct recovery, and recycling can make signif-
icant reductions in the anunt of liquid effluents that nust be treated and
discharged.
29. Except for acid plant blowdown water, zero discharge by recycling
is achievable in a primary lead plant. Acid plant blowdown waters ay be
treated by chemical precipitation and filtration.
30. Wastes from secondary lead production fran battery. cracking can
be treated by using lime for pH adjustment, followed by flocculation, pre-
cipitation, and settling.
31. Waste streams from primary zinc production can be treated by
chemical precipitation, using alumina, and filtration. Cooling waters nay
be cmbined with other streams and receive the same treatment. Generally,
all effluents can be collected, after- treatment, and recycled.
250 -
Solid Wastes
32. Sludge disposal is a problem in these industries, since the waste
streams my carry large concentrations of metals. Sludges are frequently-removed by contractors for off-site disposal or sold to reprocessors for
recovery of metals. Drying beds, lagoons, landfills, incineration, or acmbination of these can be effectively used for on-site disposal.
33. Particulate matter frcm dry scrubbers may be burned, placed in a
landfill or reprocessed for byproduct recovery.
BIBLIOGRAPHY
1. United Nations Industrial Development Organization. "Non-ferrous
Metals - A Survey of Their Production and Potential in the DevelopingCountries." Vienna (1972)
2. Atkins, M.H. and J.P. Lowe, "The Economics of Pollution Control in the
Non-Ferrous Metals Industry." Perganon Press. Oxford (1979)
3. Boodson, K. "Non-Ferrous Metals - A Biographical Guide." Macdonald &
Co. (Publishers) Ltd. London (1972)
4. Powers, P.W. "How to Dispose of Toxic Substances and Industrial
Wasted". Noyes Data Corporation. Park Ridge, NJ. and London (1976)
5. "Standard Methods for the Examination of Water and Wastewater." 15th
Edition. American Public Health Association. New York (1980)
6. "Chemical Engineers Handbook." Ed. by Robert H. Perry and Cecil H.
Chilton. Fifth Edition. McGraw-Hill Book Co. New York (1973)
7. U.S. Environmental Protection Agency. "Develoment Document for Ef-
fluent Limitations Guidelines and Standards for the Nonferrous Metals
Manufacturing Point Source Category." Dc. EPA-440/1-79/019-a. (Sep-
tember 1979)

- 251 -
THE WOLD BANK MARCH 1983
OFFICE OF ENVIIUNENTAL -AFFAIRS
NCN-FERROUS METALS INDUSTRYSILVER, TUNGSTEN, CO4MIMM AND
TANTALIM PROUCTIONhENVIOMETAL GUIDELINES
1. The non-ferrous metals category includes a large' number of metal-lic elements, but only a few are of concern to World Bank operations atthis time. Those nost frequently encountered in Bank projects are covered
in four separate documents in this series, as follows: (a) aluminum; (b)lead and zinc; (c) copper and nickel; and (d) silver tungsten, columbium,and tantalum. This document will cover the production of (a) secondary sil-ver from photographic and non-photographic wastes; (b) primary tungstensalts (anmonium paratungstate-APT) and metal; and (c) primary columbium and
tantalum salts and metals.
MANUFACTURING POCESSESSECONDARY SILVER
2. The principal sources of raw materials are photographic wastes,
plating and sterling ware wastes, electrical components, and miscellaneoussources. Photographic wastes are the largest single source. Typical pro-duction processes are shown in Figures 1 and 2. -
3. r In the recovery of silver frn photographic natprials, the filmis chopped into small pieces, followed by separation of the silver from the
films by nitric acid stripping. Then follows sedimentation, decantation
and filtration. The plastic residue is disposed of as solid waste, while
the liquid portion is mixed with chemicals to precipitate the silver.Spent photographic solutions may also be added at this point for recovery
. of the silver. The supernatant is decanted and sent to treatment. The
sludge is thickened, filtered or centrifuged, .dried, roasted, and cast into
ingots (also known as Dore plates). The ingots nay be further refined on
site or shipped elsewhere. The roasting furnace slag is crushed and class-
ified, the silver concentrate is returned as furnace feed, and the tailingsgo to landfill.
4. Cyanide solutions fran the plating and sterlingware industries
are treated with sodium hypochlorite to precipitate the silver and oxidize
the cyanide. Following initial settling more sodium hypochlorite and lime
are added, and the solution resettled. The resulting silver-chloride pre-cipitate is washed and dried for further processing or sold as a final pro-duct.

-252-
PHOTOGRAPHIC FILM SCRAP
DUSTGRANULATION BAGHOUSE
STRIPPING NITRIC ACID
WASTE FILM SEDIMETATIONTO LANDFILL & FILTRATION
PRECIPITATION REAGENTS
RECOVER ED DUST* SILVER-FREE PRECIPITATION W EPOTAPHIC
WATER WASTE PHOTOGRAPHICSOLUTIONS
SILVER-FREE SILVER SLUDGE.WATER FILTRATION
SILVER-BEARING PHOTOGRAPHICFILM ASH
CASTING
O ELECTROLYSIS SLIMESE ROLYSIS TO Au & Pt RECOVERY
MELTING&CASTING.
SILVER INGOTS
Figure 1. Silver Refining From Photographic Wastes
* (from US EPA Document EPA 440/l-79/019a)

��
254
5. 'When electrical caLpcnents scrap is not suitable for electrolyticrefining, it must be further processed to recover the silver. The scrapis firsit melted in a reverbatory furnace to produce lead bullicn, coppermatte,, and slag. The lead bullicn is melted to produce litharge and preci-ous metals layers. The litharge goes to a lead refinery and the preciousmetals layer is cast into anodes for electrolytic- refining. The ccppermatte is processed to separate the silver, which is cast as ingots. Theslag is smelted in a blast furnace to separate the lead and ccpper por-ticns. Blast furnace slag is discarded as waste. This procedure is shownin Figure 2.
PRmARY TUNGSTEN..
6. A number of processes are available for producing' tungsten salts
and metal- Ferberite (FeM4) and scheelite (CaM4) are the two cres mostwidely used to produce ammonium paratungstate (APT) and tungsten metal pow-der. Typically,, tungstate (W04) is purified from concentrates and convert-ed to tungstic acid (H2WO4) through a series of filtraticn'and precipita-tim reacticns. Further processing produces the intermediate product des-ignated'as APT. The APT is dried,, sifted, and converted to oxides which,in* turn,, are finally reduced to tungsten metal powder - The powder iseventually used to produce the metal,. or comb3ned with carbcn or othermetals to make carbides cr metal alloys. The production process is shownin Figure 3.
PRnvMEY COLUMBIUM AM TANVUM
7. Columblum. is th-we more pcpular name for nibbium. uhich is element41 in the periodic system. Tantalum, (nunber 73 in the periodic system) andcolumbium generally occur together in nature as the minerals tantalite andcolumbite, respectively.
8. Raw materials . for the production of primary columbiLun and tanta-lum salts are ore concentrates and slags. The slags used are generallythose resulting from. tin production. Mwee types of plants are encount-ered: producers of metals and salts -fran concentrate and slags; producersof purified salts aily fraL concentrates and slags; and producers of metalsfran purified salts. The salts of these two elements are produced first inthe process. r1he salts are then subjected to aluminothermic,, sodium, orother reducticn 3n order to produce the two individual metals. Productionprocesses are illustrated in Figure 4.
%A= SOURCES AND CHARAC=STICSSEXX)NDARY SILVER
Air Emissions
9. In the producticn of silver from film, dusts andparticulates originate in the film chcpping cperat!.-.,-t. Particles are alsoreleased when the film is incinerated. The dusts are collected and return-ed to the process for recovery of the silver. Roasting furnaces also causeemissions butthese are readily controlled by the use of wet scrubbers.

255-..
GROUNDCONCENTRATE.
DIGESTION 4NaOH
SETTLEWASTE SOLIDS E
FLILTER
NaaWO&
PRECIPITATIONNaCI & caCI,
DECANTATION
CaWO SLURRY
. . HCI
WASTE SCRUBBER WATER - CaCI2 SOLUTION-o TO WASTE
HaWO4 SLURRY
. NH40HDISSOLVINGNH0
WASTE SCRUBBER WATER 0 - WASTE SOLIDS
NH 4 WO4
~~DRYIGJWASTE SCRUBBER WATER
APT
REDUCTION 1TO
WASTE SCRUBBER WATER METALS
TUNGSTEN POWDER
Figure 3. Primary Tungsten Production Process
(From US EPA Document 440/1-79/019al

-256-
DIGESTIONAIR SCRUBBER WASTES OFB GANGUE CONCENTRATE
Cb/Ta BEARING. SOLUTION
AIR SCRUBBER WASTES EXTRACTIONFLOOR WASHING WITHRAFFINATE I-WASTES MIBK .
Cb/To IN WATER
NH 3KCI NH
To Cb VTO WASTE PRECIPITATION PRECIPITATION TO NH 3TREATMENT Ik &T STRIPPRNGFILTRATION FILTRATIONI
AIR To CbAI*RWAER SALT SALT SCRUBBER
TI WAT RINRaN TO NHTREATMENT SDRYING DTRIRNNG
SCRUBBER aRINSE 4-F REDUCTION REDUCTIONWATER L
To METAL Cb METAL
Figure 4. Primary Columlium and Tantalum Production Process(From US EPA Document EPA 440/1-79/019a)

- 257
10. Secondary silver production from non-photographic materials re-sults in emissions fron the leaching and stripping of the scrap materials.These will contain significant levels of acids, cyanides (if used in theprocess), and metals. Smelting furnaces will also produce emissions ofparticulates and fumes. Wet or dry dust-fume collectors isolate thematerials for return to the process or to waste.
Liquid Effluents
11. Liquid waste sources in the processing fran photographic films
and other photographic wastes include leaching and stripping, precipitationand filtration, roasting furnaces, electrolysis units (for recovery ofother metals) and contact cooling. Wastewater fran the. leaching processwill be strongly acidic or caustic, depending upon the leachate used. This
effluent nay also contain significant quantities of chromium, copper, lead,and zinc as well as scue organic pollutants which are used in the manufac-
ture of the film.
12. Waste effluents also result fran the precipitation of silver fron
the leaching and stripping solution. These are similar to the leaching
wastewaters, but will also reflect the omposition of the chemical addition
used. Iron, zinc, and soda ash are among the chemicals used for precipita-
ting the silver. The precipitate is dried, roasted, cast, and cooled.
Direct contact cooling water is discharged. ..
13. In silver production fron non-photographic materials, a highlyacidic wastewater results fran the control of emissions in the stripping
units. This effluent may also contain significant quantities of cyanides
(if used in the stripping process) and other metals. The filtrate fran the
precipitation of the silver in the stripping solution is also discharged as
wastewater. Wet scrubbers used to collect furnace emissions are another
liquid effluent source. In those plants using electrolytic refining, the
spent electrolyte, wastewater, and wet scrubber systems contribute to the
final effluent. Contact cooling is a final scurce of waste flows in the
plants.
Solid Wastes ..
14. Solid wastes generated in these processes include the plastic
portion of the film remaining after stripping, solids fron wet and dry
scrubbers (when not recycled to the system) and sludge residues fron which
silver has been renoved.
PRIMARY TUNGSEN
Air Emissions
15. Principal emission sources in tungsten production are the leach-
ing, dissolving, drying, and reduction units. Wet scrubbers are usually
installed for this purpose, and discharges to the atnsphere are insignifi-
cant.
-258-
Liquid Effluents
16. Wstewaters originate fron precipitation and filtration, leach-ing, and the wet scrubbers, in the conversion of ore concentrates to amnan-ium paratungstate (APT). The wastewater streams reflect the conposition ofthe ore concentrate and the processing steps used prior to leaching. Theyare typically strongly acidic, very high in chlorides, and ay contain sig-nificant levels of such metals as arsenic, lead, and zinc. Scrubber efflu-ents from the drying nay contain high concentrations of amnonia, and may besubjected to amnania recovery before discharge.
17. 7he reducticn units, which convert the salt into the metal, willproduce wastewaters from the wet scrubbers. Wtile this effluent ay behigh in anmenia, it usually is not treated for annonia recovery.
Solid Wastes
18. A gangue, or residue, results fran the fusion reaction in thefornation of soluble sodium tungstate from the cre concentrates. Thesewaste solids are usually transferred to landfills, but in sane cases theresidue is sold for nolybdenum recovery.
PRIMARY COUMBIUM AND TANIALUM
Air Enissions
19. Air emissians from the production of columbium and tantalum saltsand metals originate frcn the treatment with methyl isobutyl ketone (MIBK)or other organic solvent, the salt drying units,,. and the reduction of saltsto the pure metal.
Liquid Effluents
20. The most significant wastewater sources are the digestion, sol-
vent extraction, and precipitation processes required for extraction ofthe salts fram the concentrates and slags. The processing involves the useof acids, amnania, and organic solvents. All of these are present in thefinal effluent. Production of the metals fron the salts results in waste-water fra the leaching operation (following reduction) and from wet airpollution control devices.
Solid Wastes
21. Treatment of the wastewaters and quench waters results in produc-
tin of sludges, for which disposal must be provided.
EFFUT LIMITATIONS
Air Emissions
22. In general, particulates and gases emitted fran the production ofthe metals covered IW this document are readily controlled and eliminated

- 259 -
by the use of wet or dry scrubbers. Where any of the emissions are dis-charged to the atmosphere, then the following limitations are to be observ-ed in all cases:
Sulfur Dioxide (s0')
Inside Plant Fence Ann. Arith. Mean 100 pg/m3
Max. 24-hour Peak 1000 pg/m3
Outside Plant Fence Ann. Arith. Mean 100 UG/r 3
Max. 24-hour Peak 500 pg/rn3
Fluorides (as HF) Ann. Arith Mean 10 ug/m3Max. 8-bour Peak 100 pg/m3
Particulates Ann. Geom. Mean 75 pg/m3Max. 24-hour Peak 260 pg/m3
Liquid Effluents
23. On the basis of best practicable technology currently available,
liquid discharges are to be maintained within the following limitations:
Secondary Silver -
Photographic
Max 24-hour
ig/MT Metal Prod.
TSS 0.60Cr lx10-3CU . 6x10⁻⁴Pb 2x10⁻⁴Zn 1x10⁻²
- 4x10⁻⁴
pH 6 to 9 units
Secondary Silver -
Non-photographic
TSS 0.30Cu 3x10⁻²Zn 0.10-Ag 3x10⁻³pH 6 to 9 units

- 260 -
Max. 24-hour
Ng/MT APT Prod.
Primary Tungsten -Ore to Salt -
TSS 1NH3 -N 1Cr 2x10- 3cu 6x10 3
Pb 4x10⁻³Ag 4x10⁻³
pH 6 to 9 units
Primry Tungsten -Salt to Metal
Max. 24-hour
Kg/Mr Metal Prod.
TSS 9x10⁻²
NH3 -N 4x10⁻²Cr .4x10-4Cu 6x10⁻⁵Pb 2x10⁻²Ag 6xl0-5pH 6 to 9 units
Primary Columbium and Tantalum -Ore to Salt
ConsecutiveMax. 24-hour 30-Day Aver.
K/MT of Purified Salt
Fluoride (total) 11.8 5.9
TSS 8.4 4.2NH3-N 10 20
pH 6 to 9 units 6 to 9 units
Primary Columbium and Tantalum -Salt to Metal
ConsecutiveMax. 24 hour 30-day Aver.
MT of Metal
Fluoride (total) 8.4 4.2
TSS 6.0 3.0pH 6 to 9 units - 6 to 9.units
- 261 -
CONTROL AND TREMIMENT OF WASTES
Air Enissions
24. The producticn facilities discussed in this document generallycontrol and eliminate air emissions through the use of dry or liquid scrib-bers. Gases are frequently utilized in the plant, either as a fuel or as a.comp~czent of another product. Particulates are discharged with the waste-water streams, where wet collecticn methods are used, or else are utilizedfor other purposes within the plant. If dry collection systems are utiliz-ed then the particulates are dumped on land if they have no recovery value.Liquid Effluents
25. Housekeeping practices should be critically examined and improved
as a first step in the control of liquid effluents. Process changes, moni-
toring of water use, by-product recovery, and recycling are among the meas-
ures that can significantly reduce the volume of wastes requiring treatmentand disposal.
26. Whstewaters from secondary silver processing from both photogra-phic and non-photographic wastes can be treated by steam stripping of the
high ammcniia streams, and applying chemical precipitation -and filtration to
the ombined stream. Treated effluents may he recycled at discharged.
27. In the productici of primary tungsten metal, both in the ore to
salt phase and in the salt to metal phase, high amnonia streams can be
stripped to remtve and possibly recover the amnonia. The residual can be
conbined with other streams and receive chemical precipitation and filtra-
tion. The resulting effluent may be recycled or discharged.
28. - In the wastewaters frcm the producticn of the salt fron the ore
concentrate, steam stripping provides a high degree of amonia removal and
recovery. Lime precipitation is effective in renoving the fluoride ions and
results in the precipitation of metals dissolved in the waste streams.
Suspended solids are removed by sedimentaticn.
29. Effluents frcm the producticn of the metal frm the purified salt
can be treated by lime precipitation to renove the fluoride ion and dis-solved metals. Sedimentation renoves the suspended solids.Solid Wastes
30. Sludge disposal is a problem in these industries. These wastestreams may contain large quantities of one or more heavy metals, and these
are nost cirnonly renoved from liquid effluents by chemical precipitation.Consequently, the sludges contain large concentrations of the .metals.
31. Sludges are disposed of by contractors or are sold to reprocess-ors. They may also be transferred to drying beds, lagoons, landfills, orincineration.

-262-
32. Other solid wastes, such as wet scrubber residuals, are added tothe waste streans receive the same treatment and disposal and hence add tothe sludge loads. Particulate natter from dry scrubbers is burned, dunpedcn land, or is recycled for by-product recovery.
BIBLIOGRAPH
1. United Nations Industrial Develcpnent Organizaticn. "Non-Ferrous Met-als - A Survey of Their Production and Potential in the DevelopingCountries." Vienna (1972)
2. Atkins, M.H. and J.F. Lowe, "The Econcmics of Polutic Control in theNon-Ferrous Metals Industry." Pergamon Press. Oxford (1979).
3. Boodscn, K. "Non-Ferrous Metals - A Biographical Guide." Macdonald &Co. (Publishers) Ltd. London (1972)
4. Powers, P.W. - "How to Dispose of Toxic Substances and' IndustrialWastes." Noyes Data Corporation, Park Ridge, N.J., and London (1976).
5. "Standard Methods for the Examination of Water and Wastewater." 15thEdition. American Public Health Association. New York (1980).
6. "Chemical Engineers Handbook." Ed. by Robert H. Parry and Cecil H.Chiltcn. Fifth Edition. McGraw Hill Book Co., New York (1973).
7. U.S. Environmental Protection Agency. "Development Document for Efflu-ent Limitations Guidelines and Standards for the Nonferrous Metals Man-ufacturing Paint Source Category." Doc. EPA-440/1-79/019a. Washing-ton, (September 1979).
- 263 -
The World Bank November, 1981
Office of Environmental Affairs
ENVIRONMENTAL RECONNAISSANCE OF OFFSHORE HYDROCARBON EXPLORATION
AND PRODUCTION PROJECTS
1. Background
The objective of an environmental reconnaissance to be carried out in con-
nection with a proposed offshore energy project is to determine, in a
general way, the possible impact of the project, its presence and opera-
tion, on the environment, worker health and safety and the social well-
being of peoples to be affected by the.project and to make recommendations
to eliminate or mitigate adverse effects of the project.
The reconnaissance-type study should include; but not necessarily
be limited to, the following considerations.
(a) Biota
The nature and extent of the biotic community resident in or
transiting the area likely to come under the influence of the project;
e.g., shellfish beds, benthic organisms, offshore fishery, spawning
grounds, finfish nursery area, etc., during the exploration, construction,and operation phases. Especial attention should be paid to those members
of the biota forming part of the food chain for economically important
species, ecologically unique life forms or endangered species. The poten-
tial adverse impact on lishery, marine mammal, bird and other natural
faunal/floral resources, including their presence, abundance, area depend-
ence, and distribution should be carefully noted.
(b) Facility Integrity
The potential, and possibly dangerous, effects of environmental
phenomena on the structural and operational integrity of the facility, in-
cluding those related to unusual but recorded weather, wind, swell, seismic
and related conditions.
(c) Waste Handling
The proposed plans for liquid, gaseous and solid wastes manage-
ment, transportation and disposal, taking into consideration the likely
dangers posed to the ecological systems, public health, environmental
amenities and aesthetics.
(d) Contingency Plans for Blowouts, Spills and Fires
The appropriateness and adequacy of contingency plans, equipment,
supplies, personnel, and response-time to cope with blowouts, major spills,
fire, structural failure and/or other major emergencies. These should be
noted with regard to the probable diseconomies and environmental damage.
- 264 -
(e) Occupational Health and Safety
The plans, regulations, codes, practices and their monitoring and
enforcement relating to the protection, safety and health of the workers.
Offshore facilities pose special problems of prevention, control, treat-
ment, and evacuation.
(f) Scenic,.Touristic and Aesthetic-Considerations
The scenic and aesthetic qualities of the area likely to be
affected by the project's presence and operation, including visual and
acoustic considerations. Present and potential tourtsm values that may be
prejudiced should receive consideration.
(g) Project-associated Environmental Impacts
Activities associated with the project, including transportation
and shipping, may generate problems; e.g., ships' wastes, bilge discharges,
spills during transfers, collisions, and touristic detraction.
(h) Onshore Facilities and Activities
The adequacy, relevance, timing and funding of plans and prac-
tices designed to cope with induced onshore development associated with
the offshore scheme. Likely social and. important environmental conse-
quences should be identified, with particular reference to industrial and
port-related developments.
(i) Existing Laws, Regulations and Codes Governing Offshore
Projects
Identification of existing national and/or applicable local juris'-
dictional laws, regulations, codes, ordinances relating to offshore energy
exploration and production operations.
(j) Future Expanded or Associated Offshore Development
If the project is one of several being planned or presently
existent in the area or field being developed, a general assessment of the
combined impact is important; i.e., aggregate impacts may have consequences
differing in nature or magnitude from those identified with each incre-
mental project. When-a hydrocarbon field is expected to be exploited, the
area of which may be large or configured in a manner to suggest an extended
impact zone, a coastal zone management plan should be considered to ensure
orderly and environmentally sound development.

- 265
(k) Report of Findings and Recommendations
A full report of the reconnaissance findings should be prepared
to include appropriate detailed information on the anticipated environ-
mental, worker health and safety, and social consequences of the proposed
project; the nature, scope, and. timing of any additional studies required;
the nature, dimensions, timing, and severity of important problems should
be highlighted, along with recommendations as to how they might be preven-
ted or mitigated.
In preparing the report and detailing the measures to be taken,
appropriate utilization should be made of the General Environmental Guide-
lines for Offshore Hydrocarbon Exploration and Production Projects which
follow.

-266-
The World Bank November, 1981
Office of Environmental Affairs
General Environmental Guidelinesfor
Offshore Hydrocarbon Exploration and Production Projects
1. Background
In considering the environmental implications of offshore energy
projects, the general policies of the Bank relating to the environment pro-
vide useful guidance (see Bibliography Nos. 1 and 2).
However, the unique nature of offshore energy development re-
quires its own specific guidelines. -In this endeavor the Bank has relied
heavily on guidelines and regulations in force in the Commonwealth of
Australia and Canada; and, practices recommended by the American Petroleum
Institute, the Intergovernmental Maritime Consultative Organization, the
Norwegian Petroleum Directorate, and others. These concern themselves with
exploration, production, transportation, sensitive environments, special
circumstances, environmental damages and legal liability, and related
matters (see Bibliography Nos. 3-7). These materials have been included to
address the spectrum of considerations and requirements seen as necessary
to the Bank's financing of such type projects.
2. Procedure
Borrowers and/or their engineering consulting firm(s) 'serving
them must satisfy the Bank that their approach to protecting the environ-
ment and its biota, accident prevention, blowout prevention, contingency
preparedness, wastes management, worker health and safety, meet these, or
equivalent, requirements and/or is adequate under anticipated prevailing
and worst recorded offshore conditions.
3. Rigid standards, rules, regulations are not promulgated herein
and are otherwise judged unwise and impractical given the varied project
environments to be encountered world-wide. What is sought is a practical,
eminently doable approach to the environmental dimensions of offshore
energy activities tailored to the specifics of the total milieu; i.e.,
environmental, economic, political, and social.
4. It must be emphasized and highlighted, however, that blowout
prevention. (BOP) constitutes the highest priority in any setting. De-
tailed technical BOP recommendations are, therefore, included in the
guidelines. Experience has shown that accidents will occur even when these
precautions are practiced. It is realistic to expect a blowout frequency
of 'roughly one in twenty-five even with the best prevention. In recog-
nition of this, the Borrower must satisfy the Bank as to the adequacy of
its contingency plans and preparedness for dealing with these situations.
- 267
5. The Bank recognizes that some of its member countries are poorly
equipped to plan, oversee and enforce a program of coastal zone protec-
tion.. It is prepared, therefore, to assist governments in this regard
while assuming, inter alia, environmental oversight responsibility for
projects it is financing in the coastal waters of such countries. In -this
regard, the Bank will, in cooperation with governments and in keeping with
its project supervision activities, carry out a monitoring of those envi-
ronmental, health and worker safety considerations incorporated into the
project. Technical assistance will also be provided where appropriate.
6. Project Design Checklist and Related Bibliography
The brief design checklist and related bibiiography* (which fol-
low) include those major considerations to be addressed in Bank-financed
offshore energy projects. The task is that of demonstrating to the Bank's
satisfaction that offshore energy projects proposed for financing will not
present unacceptable risks to the environment. The Borrower will be expec-
ted to recommend environmental protection and management measures that rep-
resent a balanced consideration of the benefits and risks entailed.
The checklist is intended to serve principally as a guide to the
essential elements of the environmental provisions.
Environmental Checklist
Waste management program (at site, in transport, on shore);
1) Of solids2) Liquids3) Gases
The resources and environment at risk:
1) At site2) In transport3) On shore4) In emergencies
Environmental threats to projects:
1) Weather-related2) Fouling3) Geological (drilling, completions)4) Other
*NOTE: All documents listed in the bibliography are available in the
Bank"s Energy Department Library.

- 268 -
Emergency preparedness:
1) Available emergency equipment and finance (see para. 4)
2) Trained personnel3) Response time4). Worker safety5) Medical facilities.
Other
1) Relevant national legislation and institutions
2) Monitoring and enforcement
3) Costs, benefits and social impact
.~..,.....*.

-269-
BIBLIOGRAPHY
(All documents listed are available from World Bank Energy Library.)
1. a) Environment and Development, 1979. World Bank. 33 pages.
b) Environmental, Health and Human Ecologic Considerations in
Economic Development Projects, 1974. World Bank. 142 pages.
c) Industry: Environmental Control, 1978. World Bank. 128 pages.
2. International Bank for Reconstruction and Development (IBRD),
International Development Association (IDA), International Finance
Corporation (IFC).
3. General Regulations (see Annex, page 1 for details)
Exploration:
i) Marine Operations, Directions as to, - Commonwealth of
Australia, State of Victoria. Schedule 1. 23 pages.
ii) Drilling Operations, Directions as to, -- Commonwealth of
Australia, State of Victoria. Schedule 1. 16 pages.
Production:
iii) Petroleum Production, Directions as to, - Commonwealth of
Australia, State of Victoria. Schedule 1. 8 pages.
(In arctic/antarctic environments use Canada Oil and Gas
Production and Conservation Regulations, 1979. 359 pages.)
Transportation:
iv) Recommended Practice for Design, Construction, Operation
and Maintenance of Offshore Hydrocarbon Pipelines. American
Petroleum Institute (API), RP 1111. 22 pages.
v) International Convention for the Prevention of Pollution
from Ships, 1978. Inter-Governmental Maritime Consultative
Organization (IMCO). 171 pages.
4. Supplementary Regulations (see Annex, pages 1 and 2 for details)
Exploration:
vi) Recommended Practice for Blowout Prevention Systems. API,
RP 53. 58 pages.

-270
vii) Testing of Drilling Fluids. API, RP 13B. 35 pages.
viii) Oil, Gas, and S-Leases in the Outer Continental Shelf Area.
US Geological Survey (USGS), OCS Order #2, Section 5.
10 pages.
ix) Recommended Practice for Safe Drilling of Wells Containing H2S
API, RP 49. 11 pages.
Production:
x) Recommended Practice for Planning, Designing and Constructing
Fixed Offshore Platforms. API, RP 2A. 86 pages..
xi) Recommended,Practice for Production Facilities on Offshore
Structures. API, RP 2G..15 pages.
xii) Recommended Practice for Design, Installation, and Operation
of Subsurface Safety Valve Systems. API, RP 14B. 27 pages.
xiii) Recomended Practice for Analysis, Design, Installation and
Testing of Basic Surface Safety Systems Offshore Production
Platforms. API, RP 14C. 85 pages.
xiv) Outer Continental Shelf. US Geological Survey, Order No.11
(Sec. 1OA-10D). 1 page. Order No. 7 (Sec. 4).
5. Sensitive Environments (see Annex, page 2 for details)
Exploration:
xv) International Conventidn for the Prevention of Pbllution from
Ships, 1973. IMCO (Sec. 10-12). 5 pages.
xvi) Oil and Gas Production and Conservation Regulations, 1979.
Canada. 359 pages.
6. Special Circumstances (see Annex, page 2 for details)
xvii) The Onshore Impacts of Offshore Oil and Natural Gas Develop-
ment In the West African Region, 1981. UNEP. 50 pages.
xviii) World Directory of National Parks and Other Protected Areas,
1977. IUCN. 2 volumes.
(Note: For working conditions and working environment
in the petroleum industry - offshore - see
Bibliography No.7, xzviii.)
- 271 -
7. Additional bibliographic information related to offshore energy devel-
opment activities:
xix) Provisional Regulations for Diving on the Norwegian
Continental Shelf, 1978. Norwegian Petroleum Directorate
(NPD). 39 pages.
xx) Provisional Regulations Concerning Littering and Pollution
Caused by Petroleum Activities on the Norwegian Continental
Shelf, 1980. NPD. 8 pages.
xxi) Guidelines for the Inspection of Primary and Secondary
Structures of Productinn - and Shipment Installations and
Underwater Pipeline Systems, 1978. NPD. 17 pages.
xxii) Development Document for Interim Final Effluent Limitations
Guidelines and Proposed New Source Performance Standards for
the Oil and Gas Extraction Point Source Category, 1976.
US Environmental Protection Agency.
xxiii) Study of Offshore Mining and Drilling Carried Out Within the
Limits of National Jurisdiction - Safety Measures to Prevent
Pollution, 1980. UNEP Working Group of Experts on Environ-
mental Law. 55 pages.
xxiv) Guidelines for Preparing Outer Continental Shelf Environ-
mental Reports, 1980. US Geological Survey.
xxv) Guidelines for Preparation of an Environmental Impact
Statement, 1980. Canada. 28 pages.
xxvi) Drilling Mud Toxicity:' Laboratory and Real-World Tests,
1978. Ocean Resources Engineering. 5 pages.
S zxxvii) Programmatic Environmental Impact Statement: US Lake Erie
Natural Gas Resource Development. US Army Corp of Engineers
and EPA. 282 pages.
xxviii) Working Conditions and Working Environment in the
Petroleum Industry, Including Offshore Activites, 1980. ILO,
Geneva. 116 pages.
xxix) Guidelines on Means for Ensuring the Provision and Main-
tenance of Adequate Reception Facilities in Ports, 1976.
IMCO. 16 pages.

- 272 -
xxx) Reports from Working Groups I and II and III under the 1978
Hague Conference of Safety and Pollution Safeguards in the
Development of N-W European Offshore Mineral Resources, 1980.
IMCO. 40, 130, and 60 pages, respectively.
xxxi) Study of Offshore Mining and Drilling Within the Limits of
National Jurisdiction - Liability to Pay for - Compensation
for Environmental Damage - Conclusions, 1980. UNEP Working
Group of Experts on Environmental Law.

- 273 -
ANNEXPage 1
i. Marine Operations: These regulations concern issues relevant
mainly to mobile platforms, anchoring, construction, certification, fixed
equipment, general requirements, stairways, lighting conditions, life-
jackets, evacuation facilities platform, population densities, fires,
safety provisions, rescue crafts, helicopter landing decks. Schedule 1 is
a regulatory document concerned with application for consent to "Designated
Authority." For Bank purposes the authority in question will occasionally
be the Bank itself.
ii. Drilling Operations: These regulations similarly consider chn-
sent requirements for equipment to comply with ceTtain standards, (well,
casing, blowout preventers, etc.). They also consider abandonment of
wells, inflammable and toxic gases, and production tests.
iii. Petroleum Production: These regulations consider requirements
for production equipment and recovery of petroleum, pressure valves, con-
trol mechanisms, safety devices, flaring, accidents, toxic gases, pollu-
tion, (waste oil, oil sludge, emulsion disposal, petroleum effluent dis-
charge limitations).
(Oil and Gas Production and Conservation Regulations. This 'very
detailed document covers, inter alia, drilling program approvals, equipment
standards, operator safety, medical facilities, firefighting, alarm systems
blowout prevention, casing, operational manuals, contingency plans, inspec-
tions, safety zones, safety valves, monitoring, waste materials, personnel
training, records, abandonment.)
iv. Recommended Practice for Design, Construction, Operation and Main-
tenance of Offshore Hydrocarbon Pipelines: A technical document covering
design, safety systems, inspection and testing, operation and maintenance,
corrosion control.
v. Internatignal Convention for the Prevention of Pollution from
Ships: (70 countries). A regulatory, technical, and administrative
protocol covering, inter alia, regulations for prevention of pollution by
oil, by sewage, by garbage, by hazardous substances.
vi. Recommended Practice for Blowout Prevention Systems: A tech-
nical document of recommended practices for blowout prevention equipment
systems.The document covers, inter alia, diverter systems, preventer stack
arrangements, choke main folds, kill liner, closing units, auxilliary
equipment, testing, sealing, blowout preventer modifications for hydrogen
sulfide gas environments, pipe stripping. All of the above are considered
for both surface and subsea installations.
vii - ix. These documents consider safe practices related to title texts.

- 274
ANNEXPage 2
xiii. Considers practices related to H2S.
x. Recommended Practice for Planning, Designing and Constructing
Fixed Offshore Platforms: A document covering planning, design criteria,
welding, fabrication, installation, inspection, and surveys.
xi. Recommended Practice for Production Facilities on Offshore
Structures: A document covering codes, rules, regulations, design con-
siderations, production equipment arrangements, and fire protection.
xii. Recommended Practice for Design, Installation, and Operation
of Subsurface Safety Valve Systems: A set of technical recommendations
covering design, installation, operation, testing, and maintenance of sub-
surface safety valve systems.
xiii. Recommended Practice for Analysis, Design, Installation and
Testing of Basic Surface Safety Systems on Offshore Production Platforms:
A comprehensive, technical coverage of basic surface safety system on off-
shore production platforms.
xiv. US Geological Survey: No. 11 cousiders Flaring and Venting
of Grs; No. 7, Spill Control and Removal. General and non-technical recom-
mendations.
xv. International Convention for the Prevention of Pollution from
Ships: (70 countries). A regulatory, technical, and administr4tive
protocol covering, inter alia, regulations for prevention of pollution by
oil, by zewage, by garbage, by hazardous substances.
zvi. Petroleum Production: These regulations consider requirements
for production equipment and recovery of petroleum, pressure valves, con-
trol mechanists, safety devices, flaring, accidents, toxic gases, pollu-
tf , (waste oil, oil sludge, emulsion disposal, petroleum effluent dis-
charge limitations).
xvii. Onshore Impacts: , Summary of Conference on Cooperation in the
Production and Development of the Marine and Coastal Environment of the
West Afri-can Region. Non-technical.
xviii. World 'Directory: Includes legislation and administration,
country by country, as known by the IUCN, 1977.
Office of Environmental Affairs
1981

- 275
TE WORLD BANK JUNE 1980
OFFICE OF ENIRONMNTAL AFFAIRS
OIL PIPELINES
1. A wide variety of commodities and resources (gaseous, liqui. andsolid) are presently transported by pipeline, over distances varying fzom afew. meters to several bundred kilometers.. This document will confine itselfto pipelines designed for the bulk transportation of oil products over longdistances, as opposed to piping necessary in the local handling, industrialprocessing, and marketing of crude oil and its by-products.
2. Pipelines are used for transport both between crude product andprocessing installations entirely on land, as well as between offshore wellsand onshore transfer or processing facilities. In Europe, for example, trans-portation of crude oil has been mainly between ocean terminals and inland re-fineries, which are usually near the centers of consumption. In the UnitedStates pipelines have been used primarily to transport crude oil from pro-duction fields to refinery centers. Pipelines constitute an important ele-ment in the transfer of crude oils, both in terms of economics and time, asopposed to transfer by tankers. The development of supertankers has changedthe economics of pipeline versus tanker transport.
3. Both crude oil and nearly all finished petroleum products can betransported by pipelines. Heavy fuel oils (residual fuel), used widely byindustry and power stations, generally cannot be pipelined except at consid-erabl. extra cost and over limited distances. All the lighter products canbe handled through a pipeline. A single line, by transferring batches incorrect and properly scheduled sequences can be used to supply a large partof the variety of oil requirements of a specific area. Pipelines to date havethe best safety record among the various methods used to transport crude oil.
PIPELINE CONSTRUCTION AND OPERATION
Pipelines do not have the flexibility of tankers. They are permanentfixtures and, once installed, cannot be rerouted even if conditions change ora different means of transport becomes more advantageous. Therefore, they areinitially designed and constructed on the basis of the ultimate estimated capa-city. The construction of a pipeline must be based on broad forecasts as tothe flow of oil over a specific route for many years in the future.
5. Offshore pipelines, located in waters as deep as 350 to 450 meters,are frequently used to transfer oil from ocean production sites to onshorestorage, handling, or processing facilities. Pipe sizes will range up to 90cm or more in diameter, depending upon water depth as well as the flows to becarried.
- 276 -
6. Ocean pipelines are usually installed in one of three ways: (a)
sections are assembled and joined onshore, and towed out to sea as assembly
proceeds; (b) sections are joined at or near shore, towed out to sea as units,
and sunk at the proper location. Sections are joined by divers after being
put in place at the sea bottom; and (c) pipe sections 15 to 30 meters in length,
depending upon diameter, are taken to sea on "derick-lay" barges, welded to-
gether on the barge, section by section, floated out along the end of the barge,
and then allowed to sink to the bottom. Regardless of the laying technique
used, all pipe ends are joined together by welding at some stage of the instal-
lation.
7. Where depths permit the pipeline rests in previously prepared trenches
on the sea bottom, and these are back-filled after the pipe is in place. In
other situations, the line rests on the bottom but care must be taken to assure
that it lies flat and avoids laying on large boulders or other obstructions.
The pipe must be weighted to minimize or eliminate shifting after it is set in
place. This can be accomplished by providing a heavy concrete outer coating
on the pipe, some 10 cm. in thickness, before it is set in place; anchoring to
cement filled bags; attached to the seabed by means of drill-in expandable rock
anchors; or other similar techniques.
8. Laying pipes on land is considerably less complicated than in the
case of marine installations. Once the route is established and rights-of-waycleared, the pipe is laid in trenches, specially prepared according to the soil
conditions, topography and other factors. Sections of pipe are laid in the
trench, and welded end-to-end at the site.
9. Pumping is required for transport of the petroleum over long distances.
Centrifugal pumps, provided with variable speed drives, are most frequently used.
Where only one product is to be moved at all times constant speed units are suit-
able. Pump design selections, and location are based on a number of factors such
as viscosity of prod=cts to be transported, topography, distances, pressure
gradients, and other characteristics. Power for pumping facilities is from
diesel fuels and usually generated at the site, since locations are generally
remote from population centers.
10. Once installed, pipelines can operate with relatively little attention.
Constant inspection and maintenance must be provided, however. The major costs
are those for installation, including construction, burial, materials and pump-
ing equipment. Total operating costs, including direct operations and capital
charges, will average about 10 percent of the total capital costs.
SOURCES OF POLLTON
11. The p-incipal source of pipeline pollution is from leaks which can
result from a number of causes. Assuming a "zero percent loss" at time of in-
stallation leaks can arise from corrosion, damage from eztarnal forces or
factors, and carelessness.
12. Pipe corrosion may occur both externally and internally. With modern
techniques, this is no longer considered to be a significant problem. Cathodic
protection enables advance detection of weak points.

- 277 -
13. Damage from external forces is considered potentially to be the mostserious source; particularly when lines pass through or near large industrialor building sites. Lines in areas subject to operation of heavy agriculturalequipment may also suffer damage. Ships anchors catching on lines laid inshallow waters are another potential source of damage. Leaking pumps andvalves can also contribute pollution.
14. Carelessness is generally the result of human errots, and is thecause of spills in connecting to or delivery from the pipelines.
15. In the case of pipelines on land, soil erosion and discharge of sedi-ment to surface waters can occur during the trenching required as part of theconstruction phase. The construction of necessary access roads and landingstrips are also potential sources of sediment from runoff.
POLLTION CONTROL MASRES
16. Pipeline pollution can be prevented or minimized by various means,both before and after operations are started. During the construction phases(a) all materials should be carefully inspected for manufacturing defects; (b)all welded joints should receive careful inspection; (c) hydrostatic tests,at pressures above normal working pressures,should be made; (d) corrosion con-trol technology should be applied; and (e) alarm systems, capable of providingadvance or- inediate warnings of failures or breakdowns, should be included.After the line is operating, an effective inspection and maintenance programwill be required.
17. Hydrostatic tests are made on each pipe length to detect the presenceof wall cracks, pinholes, or -other defects which might cause leakage. Weldingedges and pipe surfaces are inspected by visual and ultrasonic methods formaterial defects before welding. When completed,all welded joints should beinspected by I-ray techniques. Pressure relief valves are included in thesystem to provide for a rise in the internal pressure due to a temperature rise,or other occurrence which might cause a blockage.
18. Protection against external corrosion may be provided by coating withsuch materials as asphaltic mixtures, coal-tar enamels, or epoxy compounds.Pipelines should be electrically insulated from platforms and. land- structures.These measures protect against the loss of metal that could endanger thestrength and safety of the lines. Internal corrosion may be controlled byaddition of corrosion inhibitors to the materials passing through the- lines.
19. Cathodic protection methods can also be used to minimize or eliminateexternal corrosion in land-based lines. The sacrificial-anode method, mostoften used, depends upon making the metal to be protected (the pipeline, inthis case) the cathode in the electrolyte involved. The soil functions as theelectrolyte. Zinc, magnesium, or aliminum are used as the metal anode andprovide the extra (or sacrifical) metal which can be "sacrificed" in thecorrosion process. The metal anode "bracelets" are attached to the steel pipe,

- 278 -
at distances of 100 to 200 or more meters, and are generally of sufficientsize to last for the projected life of the pipeline.
20. Inspections along the length of pipelines, for land installations,are necessary to detect major leaks or losses. Helicopters are well suitedfor this purpose, particularly in marsh or sparcely populated areas. Theinspection should cover not only possible leaks but also irregularities whichmight endanger the line such as places where the pipeline has been exposed,conditions of river banks intersected by the line, damages to com=unicationslines adjacent to or part of the pipeline operation, and extraneous work under-way near the pipeline.
21. In the case of pipelines running through the ocean and other waters,measures to control pollution should include:
(a) Providing all pipelines leaving a structure andreceiving production from the structure with a high-low pressure sensor to shut off the wells.
(b) Providing all pipelines delivering products, toeither offshore or onshore production facilities,with a shut-off valve at or near the receiving facility,connected to an automatic, or remote shut-off system.
(c) Providing sensors and automatic shut-off valves or deviceson all pipelines crossing a structure, to avoid uncon-trolled flow at the structure.
(d) Equipping all oil pu=mps with automatic high-low pressureshut-off devicesi
(e) Providing a metering system to give continuous comparisonbetween input and output on all lines, and thus detectany line leaks.
(f) Providing protective coatings, cathodic protection, orother measures to avoid loss of metal and weakening ofthe pipe.
(g) Assuring that all pipelines are installed and maintainedso as to be compatible with trawler operations.
() Installing and maintaining pipelines to assure protectionagainst water currents, storm scouring, soft bottoms, andother environmental influences.
(i) Inspecting the ocean surface above the pipeline at leastonce per week for indications of leakage. Aircraft, float-ing craft, or similar means may be used for this purpose.

- 279 -
(j) Conducting an external inspection of all lines byside scan sonar or other acceptable means, at leastonce per year, to identify exposed portions of thepipeline. Exposed sections are then inspected indetail by photographic or-other means to determineif any hazards exist to the line or to other usersof the area.
22. An acceptable, fully detailed system for operation, inspection andmaintenance of the installation should be established before the start ofoperations. Once operations begin accurate records of all inspections, events,unusual incidents, actions taken, etc. should be maintained as part of theoverall records system. Good operation and maintenance constitute the mosteffective method for controlling pollution from oil pipeline installations.
STANDARDS AND REGULATIONS
23. National standards and codes of practice exist or are under consid-eration in many countries thrcughout the world. Generally these cover minimustandards and requirements to assure design, construction, operation and main-tenance of pipelines according to internationally accepted and proven engineer-ing safety practices. While these standards may or may not have legal status,they are widely recognized and are sponsored by reputable engineering or standardsorganizations.
24. Standards promulgated by the United Kingdom Institute of Petroleun,the American Petroleum Instituite, and the USA Standards Institute have receivedwide acceptance. The Economic Commission for Europe (ECE), Organization forEconomic Cooperation and Development (OECD), and other international agencieshave also promulgated codes and standards dealing with oil pipelines.
BIBLIOGRAPE!
1. Organization for Economic Cooperation and Development "Pipelines- The UnitedStates and Europe - Their Legal and Regulatory Aspects", Paris (1969).
2. Abrahamson, Bernhard J. and Joseph L. Steckler "Strategic Aspects of SeaborneOil", International Studies Series No. 02-017, Vol. 2. Sage Publications,Beverly Hills/London (1973).
3. Hubbard, Michael. "The Economics of Transporting Oil to and within Europe".Maclaren & Sons Ltd. London (April 1967).
4. "Pipeline Design and Construction". Manual Compiled from 1976 issues of Oiland Gas Journal. Petroleun Publishing Co. Tulsa (1977).
5. Economic Commission for Europe "Proceedings of the Seminar on the Protectionof Ground and Surface Waters Against Pollution by Crude Oil and Oil Products".Geneva, 1-5 December 1969. 2 Vol. United Nations. New York (1970).

- 280 -
6. U.S. Department of the Interior, Geological Survey. "OCS Orders 1 through14 Governing Oil, Gas, and Sulphur Leases in the Outer Continental Shelf andthe Gulf of Mexico Area". Washington (January 1977).
7. U.S. Department of the Interior, Geological Survey. "Notice to Lessees andOperators of Federal Oil and Gas Leases in the Outer Continental Shelf PacificArea". Washington (June 1, 1971).

- 281'-
THE WORLD BANK JANUARY 1982
ENVIRONMENTAL CONSIDERATIONS IN OIL SHALE PROJECTS.
BACKGROUND INFORMATION
Introduction:
1. Shale oil production will combine a number of processing opera-
tions on one site: mining, ore preparation, retorting, gas treatment,
refining, and solid waste management. The scale of operation will be mas-
sive. Consequently, the rates at which point source and fugitive pollu-
tants are generated will require strict control. Potentially applicable
control technologies employed in related industries-such as petroleum
production, stone crushing, cement manufacture, and electric power opera-
tion--may not be directly transferable to shale oil production because of
process mixes and integration.
General Overview of Environmental Problems
2. The environmentally problematic effluents and wastes from oil
shale operations have not been thoroughly characterized. In some cases,
adequate sampling and analysis methods have not been developed, validated,and standardized. In a commercial operation the byproducts of retorting
will usually be processed in some further way before their characteristics
as potential pollutants can be identified and control technology devel-
oped. Site and process-dependent pollutants, particularly trace organics
and inorganics, may have the greatest potential impact on health and wel-
fare. Finally, rufining shale oil into end use products may result in in-
creased emissions of toxic compounds.
3. Control technologies for treatment of off-gases are generally
believed to be adequate, but they need to be demonstrated for key pollu-
tants in off-gas streams. Additional studies are needed, however, to
characterize off-gases from both in situ and surface retorting processes
because of the potential for release of toxic trace elements.
4. It will be especially important to control particulates from
mining and handling operations by use of suppression systems. Water
sprays, along with wetting agents and organic binders, need to be eval-
uated for use at the points of emission as well as on haulways and ore
piles. In-mine localized particulate removal by modular wet scrubbers,
electrostatic precipitators, or baghouses needs to be evaluated. For ex-
ample, whether electrostatic precipitators can be used to control partic-
lates from mining and crushing operations will depend on characteristics
of the dust. Raw oil shale dust resistivity has not been adequately in-
vestigated. Additional studies are needed, especially with respect to
fine particulate control.

-282-
5. Because of the absence of a full scale oil shale industry, the
adequacy of control technologies for handling oil shale wastewaters is
still questionable. Some oil shale developers contemplate using retort
water to moisten retorted shale for dust control and to aid compaction. If
the retort wastewater is used in this manner, the hazardous and toxic
constituents might migrate to local surface and ground water supplies.
6. Modified in situ oil shale processing will generate more waste-
water than can be consumed by process reuse. Subsurface injection or sur-
face discharge may be necessary. Wastewater constituents may include haz-
ardous organics (polycyclic materials, phenolics, amines) and inorganics
(arsenic, molybdenum, vanadium, boron, among others). Control techinques
must be developed, therefore, to ensure effective removal of these constit-
uents before wastewater disposal.
7. Little is known about the movement of ground water into and
through abandoned chambers of modified in situ operations. To date, only
speculations have been made about the leaching of such chambers by ground
water. Consequently, laboratory studies should be conducted to determine
probable leaching rates and concentrations of organic and inorganic con-
stituents. These studies should be supplemented by field monitoring of ex-
isting and near-future in situ retorting operations.
8. The disposal of solid wastes resulting from oil shale mining and
processing is a major environmental concern. Retorted shale could present
problems of surface and ground water degradation if pile stability and im-
permeability are not maintained. All research and monitoring programs to
date have dealt with relatively small quantities of retorted shale. Poten-
tial problems, such as mass stabilizations of shale piles and maintenance
of an impervious layer below plant root zones, can likely be identified and
solutions found only by creation of a large pile from commerical scale pro-
cessing.
SPECIFIC. ENVIRONMENTAL IMPACTS
Atmospheric Emissions
9. Atmospheric emissions will arise from several activities or op-
erations during oil shale processing. -The major source of S0 2 , oxides of
nitrogen (NOx), and carbon monoxide (CO) will be fuel combustion for pro-
cess heat; S02 will also be emitted in the tail gases of sulfur recovery
operations. The use of fuel oils in mobile equipment and explosives will
result in emissions of CO and NOx. Hydrocarbons will be present both in
combustion emissions and in product storage tank vapors. Emissions of par-
ticulate matter will result from blasting, raw and spent shale handling and
disposal, raw and spent shale dust in process gas streams, fuel combustion,
and other site activities that generate fugitive dust.
10. Potentially hazardous substances may be emitted during the ex-
traction and processing of oil shale. Silica (quartz) may be present in
dust derived from oil shale and associated rocks and in fugitive dust.
Particulate emissions from fuel combustion and fugitive dust from spent
shale handling and disposal may contain polycyclic organic material (POM)

-283-
and. certain trace metals. Gaseous ammonia (NH3), hydrogen sulfide (H2S),
and volatile organics may be released during moisturizing and subsequent
cooling of retorted shale. Catalyst materials may release particulate
matter containing trace metals to the atmosphere during regeneration, hand-
ling, and final disposal.
11. Pyrolysis of essentially any type of organic material produces
some POM, and oil shale is no exception. In general, POM compounds have
low volatility and are associated with solids or high boiling liquids, or
with particulates. Although POM is known to be present in carbonaceous re-
torted shales, its biological availability and potential hazard in this
form are not well known. POM compounds could be released to the atmosphere
during shale retorting, during handling and disposal of retorted shales, or
during combustion of shale-derived oils.
12. Temperature and oxidation-reduction conditions during retorting
are not severe enough to volatilize most metallic and heavy elements. With
notable exceptions such as arsenic, mercury, and possibly antimony, most
trace elements (for example, nickel, vanadium, and molybdenum) will proba-
bly remain with the spent shale or be found as components of raw and spent
shale solids entrained in retort gases and in raw shale oil. Arsenic in
raw shale apparently forms a range of volatile oil-soluble compounds (per-
haps organic .arsines) during retorting. It appears in raw shale oil and in
all condensible oil fractions. If not removed during upgrading, arsenic
will be present in shale oil combustion products. If nickel is present and
process conditions favorable, nickel carbonyl, a highly toxic gaseous com-
pound can be formed.
13. Actual emissions of nonvolatile trace elements will be in approx-
imate proportion to raw and retorted shale particulate emissions from oil
shale extraction and retorting. These emissions may not be different in
nature or magnitude from those associated with the extraction and process-
ing of other ftel and nonfuel minerals (coal, limestone, phosphate rock,
and so forth). Further, the dolomitic or alkaline nature of some oil shale
immobilizes many elements as relatively inert oxide, carbonate, or silicate
salts. Trace element mass emission rates give no simple indication of bio-
availability-'chemical reactivity, or physical properties.
14. Metals (nickel, cobalt, molybdenum, chromium, iron, zinc) and
their compounds are used as catalysts for hydrotreatment, dearsenation,
sulfur recovery, and trace sulfur removal. Particulate matter containing
catalyst metals could be emitted either during on-site regeneration or dur-
ing handling and disposal. Catalyst use is, of course, not unique to shale
oil processing, and most information and experience in preventing hazardous
emissions can be borrowed from the petroleum and related industries.
15. The refining of crude shale oil will produce a number of potent-
ially adverse environmental effects, primarily as a result of atmospheric
emissions. Data have not been developed on the quality and quantity of
these emissions.
- 284 -
Water Quality:
16. Water is necessary to the development of an oil shale industry.Water will be needed- for dust control during mining and crushing, for gas
cleaning and air pollution control, for cooling, and for moisturizing re-torted shale. Upgrading crude shale oil, on-site power generation, and re-
vegetating disturbed land and retorted shale disposal areas will also con-
sume large quantities of raw water. The water needs per unit of net pro-duct will necessarily depend on the mining, retorting, and upgrading
methods used. In general, in situ methods are expected to consume less
water than conventional mining and retorting.
17. Most major developers in the United States have indicated that
they intend to discharge no wastewaters directly to surface streams. Sur-
face retorting process waters would be reused, and perhaps ultimately ap-plied to retorted shale. Effects of extraction and processing activities
on local hydrology and water quality are therefore likely to be indirect or
incidental. The water pollution implications of mine dewatering, of creat-
ing large retorted shale disposal piles, and of abandoning in-ground re-
torts have not been determined; these actions could create major environ-mental impacts.
18. Because of the low concentration of compounds in discharge
waters, no acute or chronic effects on aquatic biota in surface waters may
result; however, compounds of low solubility may be bioaccumulated by some
aquatic organisms and become toxic to other aquatic organisms, birds, and
man. Oil shale process waters contain single-ring and polynuclear aroma--
tics that contain suspected carcinogens. If process waters are discharged
into the aquatic environment, sediments may accumulate these compounds and
later release them slowly. More information is needed on the degradation
of these compounds and on their potential for bioaccumulation in aquatic
organisms. Effects of extraction and processig activities on existingwater quality in the oil shale region will vary with the geography and the
season.
19. Aqueous wastes from oil shale processing can be categorized
broadly as originating from direct or indirect sources. Wastewaters from
direct sources are those generated by unit operations or processes, includ-
ing:
-Retorting--Upgrading-Some air emission control and gas cleaning processes
-Cooling and boiler water blowdowns--Water Treatment-Mine Dewatering-- Sanitary Disposal
20. Wastewaters from indirect sources include:
--Leachate from retorted shale disposal areas-Runoff and erosion resulting from construction and site use
-Runoff resulting from mining and transport activities
-285-
21. Some water vapor will condense with crude shale oil during
separation of the oil from retort gases. The condensate can partially
separate from crude shale oil during storage, or it can appear in aqueous
waste streams of shale oil upgrading operations. Water vapor remaining in
retort gases after oil separation can be condensed during cooling or gas
cleaning or it.. can appear in the flue gas stream for retort gas
combustion. Water separated from crude shale oil will contain ammonia,
carbonate and bicarbonate, sodium, sulfate, chloride, and dissolved or
suspended organic compounds (phenolics, amines, organic acids,
hydrocarbons, and mercaptans). Smaller quantities of calcium, magnesium,
sulfides, and trace elements may also be present, along with suspended
shale fines. Water condensed from retort gases will contain primarily
ammonia and carbonates, with traces of organic substances and
sulfur-containing compounds.
22. The quality of the wastewaters from upgrading operations will
vary with the level of on-site upgrading or refining.- In general, a full-
scale refining operation may include any of the following wastewater
streams: oily cooling water, process water, and wash water. These waste-
waters will contain high concentrations of ammonia, bicarbonates, sulfides,
phenols, total dissolved solids, oil, and grease.
23. Wastewaters from some air emissions control and gas-cleaning
systems will contain shale dust particulate matter, hydrocarbons, hydrogen
sulfide, ammonia, phenols, organic acids, and amines. Thiosulfate and thi-
ocyanate may also be present in these wastewaters.
24. Because of evaporative losses, a constant buildup of dissolved
solids in cooling water will necessitate discharge of part of this recircu-
lated water as blowdown from cooling water systems. Similarly, part of the
boiler water will have to be discharged as blowdown to minimize boiler
scaling. Both the cooling water and the boiler blowdown water will dontain
high concentrations of dissolved solids and substances such as hexavalent
chromium used for corrosion control.
25. Raw water treatment systems will have to supply water of good
quality for processing operations, cooling towers, steam generation, and
other miscellaneous uses. Water treatment wastes will usually consist of
chemical sludges, backwash water from filtration systems, and blowdown from
zeolite softening systems. Most of the waste will be lime sludge high in
hardness and dissolved salts.
26. Aquifers encountered during mining must be dewatered. Unless
ground water is prevented from entering the mine, however, dewatering could
produce large quantities of low-quality water; quality and quantity will
vary with location and processing technique. During full-scale surface re-
torting, most of this water will be used in wetting and compacting retorted
shale. Major constituents of mine water are sodium, carbonate, bicarbo-
nate, chlorides, fluorides, and boron. Reinjecting this water into the
aquifer may increase ground water salinity.
27. Sanitary wastewaters from operational facilities will include
domestic sewage from kitchens, bathrooms, and laundries. Because these
wastewaters contain unstable organic matter and enteric micro-organisms,
they will require treatment before disposal.

- 286 -
28. Perhaps 45 to 50 percent of the water needed for an oil shale
plant will be used to moisturize retorted shale. Much of this water could
possibly be supplied by mine water and process wastewaters. Because of the
large quantities of water used and the exposure of retorted shale to rain
and snowfall, indirect water pollution may result from leaching or runoff
from retorted shale piles. Some of the water applied to retorted shale is
expected to be bound to the shale in the form of simple hydrates. The sus-
pended and dissolved constituents of wastewaters applied to retorted shale
may affect the solubility of potential contaminants in the shale. Experi-ments in the laboratory and with small plots indicate that inorganic salts
(sulfate and salts of sodium, magnesium, and chlorine) may be leached from
retorted shales. Small quantities of organic substances and trace elements
are also water soluble.
29. Construction, mining, and site use may increase sediment and dis-
solved solids loading in surface runoff and receiving. streams. This indi-
rect source of potential water pollution is not unique to oil shale extrac-
tion and processing, but may require careful control because of the magni-
tude of site activities. Collection and impoundment of runoff will likelybe necessary.
Solid Waste
30. The solid wastes resulting from oil shale processing present one
of the major environmental problems associated with commercial develop-ment. Shale-derived solid wastes will include fines from raw shale crush-
ing and conveying, mined raw shale waste, and processed (or retorted)shale. Together these wastes constitute most of the process solids requir-
ing disposal. Other solid wastes will depend primarily on the pollution
controls employed and on the extent to which crude shale oil upgrading is
carried out in conjunction with retorting. These wastes may include shale
oil coke, treatment sludges, and spent catalysts.
31. Disposal of surface retorted shale will involve transport and
surface emplacement of large quantities of solids on a scale only rarelyattained to date in the :,ining industry. The spent shale will contain po-tentially leachable salts and, in some cases, a carbonaceous residue from
retorting. If shale oil is upgraded in conjunction with retorting, a dis-
posal pile might also contain spent catalysts, sludges, atsenic-ladensolids, and other plant wastes.
32. In light of the foregoing, it would appear that potential hazards
exist relating to:
-Pile stability--Airborne particulates, odors, and organic vapors
-Leachates, organic and inorganic, caused by precipitationand ground water movement
-Transfer of possible hazardous organics or trace elements
to the biosphere-Translocations of toxic substances to vegetation

- 287'-
33. Mass movement of disposal piles could adversely affect water
quality. Sediment and salts could be added to local surface waters, or to
catchment structures. Changes in pile drainage systems caused by slumping,
and so forth, may encourage infiltration.
34. Vegetation may be difficult* to maintain on a destabilized pile
surface; as a result, surface wind and water erosion may increase.
35. Because no large disposal piles have been constructed to date,
little is known about pile stability in real situations. Further, most of
the work to date has dealt with carbonaceous shales; decarbonized shales,
from which the organic content has been burned off, are likely to differ
significantly in stability and leaching properties.
36. To control fugitive dusts, and to provide moisture for compaction
and stabilizing the disposal piles, retorted shale will be wetted before
transport and disposal. It is not known whether wetting will be sufficient
to minimize particulate emissions at the scale of operations contemplated
at each site. The characteristics of the spent shale and the micrometeor-
ology at a given site are among the pertinent variables.
37. Runoff from, and infiltration into, disposal piles may result in
water pollution. It is planned to route natural drainage at each disposal
site around the pile or through the pile in conduits. Provisions must be
made to drain side gullies, if present, and to protect ground waters from
leachate contamination. It is not clear whether the absorptive properties
of the individual spent shales and the catchment basins planned by most
developers are sufficient to ensure environmental protection against water
quality degradation.
38. The surface of a disposal pile is subject to natural eros.ion by
wind and water. In principle, it is possible to protect or stabilize pile
surfaces by means other than vegetation; the large areas involved in com-
mercial shale oil operations, however, may make vegetation the preferred or
economic alternative. Moreover, successful vegetation can create a biotic
habitat similar to or consistent with that of surrounding areas.
39. True and modified in situ retorting will leave the retorted shale
below the ground. There, the retorted shale may create high potential for
ground water pollution. Subsidence that may occur could fracture overlying
aquifers and result in water movement between aquifers and reduction of
ground water quality. Substantial quantities of raw mined oil shale
brought to the surface by modified in situ mining may be permanently dis-
posed of as raw shale or may be surface retorted. In either case, leach-
ates may affect surface and ground water quality.
PUBLIC HEALTH
40. Waste streams associated with shale oil processing, crude shale
oils, and upgraded or refined shale oil products may contain carcinogens or
other hazardous trace substances from which industrial workers and the gen-
eral population should be protected.

- 288 -
41. Various known and suspected carcinogens belonging to the POM
class have been identified in crude shale oil and shale oil products, in-cluding benzo(a)pyrene (BAP). Other carcinogenic compounds in the POM
class have been tentatively identified in shale products including 3-meth-
ylcholanthrene and an isomeric mixture of dimethylbenz(a)-anthracenes. In
general, P0M compounds have high boiling points, about 570oF (3000C), andare found in the higher boiling distillates or residues of shale oils, in-cluding shale oil coke and carbonaceous residues associated with processedshale.
42. Some of the controversy about the carcinogenicity of shale-de-rived materials arises from using BaP content as an indicator of activity.Levels of BaP in shale oils are usually in the same range as levels- in
petroleum oils havings a similar boiling point, suggesting that shale oilpresents no more hazard than petroleum. Experimental tests with crude
shale oil and various distillate fractions have shown, however, that thecarcinogenic potency of these oil shale products measured by nonhuman bio-assay techniques cannot be attributed to BaP alone. Other carcinogenic orco-carcinogenic compounds may be present. Conversely, high measured levels
of BaP in a material do not necessarily indicate biological availability.
43. In general, little is known about the hazards of shale-relatedwaste streams; retorting and refining operations conducted to date have
been limited in scope and size, and have been aimed primarily at demonstra-
ting technology rather than determining effluent quantities and proper-ties. Preliminary biological studies of the oil shale industry have notdemonstrated unmanageable problems of toxicity. Studies now in progresswill further delineate potential toxic profiles gind possibly confirm pro-visional data now available. Continued research is needed to expand exist-
ing data and to develop data on various refinery cuts, including residual
oil, emission products from retorting and refining, and emission productsfrom combustion of fuels for power production. Data are also needed 'on the
health hazards that may be associated with the contamination of stream est-
uaries or undergrond water by various leachates from shale oil technolo-gies. Although results thus far are encouraging, it would be prudent toreserve judgdment on the potential toxicity of oil shale development andshale oil production and use until the data base is extended to other para-meters and until other investigators confirm the results.
ASSOCIATED EFFECTS
Radioactivity
44. Some radioactivity will be released to the atmosphere during oil
shale mining and processing. Radioactive elements will be contained in
dust emissions, fine particulate emissions, process water discharges, andleachate from spent shale disposal piles. Some radon gas will be releaseddirectly.
Noise
45. Noise will be created during oil shale development by processingplant construction and operation, community expansion, mining, and waterreservoir operation, and by construction and operation of pipelines,

- 289 -
transmission lines, roads, and railways. Because oil shale development
sites are, characteristically, a reasonable distance from population cen-
ters, the impacts of noise are expected to be negligible.
Social and Economic
46. Social and economic impacts of development are expected to be
fairly severe because many oil shale sites are remote and sparsely populat-
ed. Population centers in the oil shale area are basically rural. The in-
troduction of nil shale development will significantly increase the numbers
of people who use the towns, creating higher demands on local municipalservices such as fire and police protection, schools, hospitals and health
care, and on local utilities such as electricity, water, and sewage treat-
ment.
ARCHEOLOGICAL, HISTORIC, SCENIC AND OTHER VALUES
POLLUTION CONTROL TECHNOLOGY
47. In planning for an oil shale operation, cAre should be taken in
the initial stages to determine if the site contains any historical, arche-
ologic, geologic, religious, paleontologic, biologic anV/or cultural values
that should be considered in the site preparation. Often a reconaissance
will serve to uncover evidences of such values resulting in a subsequent
decision with the proper authorities regarding their disposition.
Air Emission Controls
48. Particulate matter and dust emission sources will include raw
shale mining, blasting, conveying, crushing, and screening. Dust from
spent shale will result from transfer, conveying, and disposal operations.
Particulate and dust emissions will vary about threefold, depending on
mining and processing techniques and the richness of the shale. Open-pit
mines will generate large quantities of dust simply as a result of the
large quantities of shale and overburden to be handled. In situ retort op-
erations will release much less particulate matter: however, rubblizing
from in situ operations,may be a greater source of dust than conventional
underground mining.
49. Water spray has potential for suppressing dust at open conveyors,
crushers, or transfer points. Continous sprays would be needed, but at
properly adjusted rates so that no runoff would result. Without-additives,
water spray efficiency would be adequate (above 80 percent) for particles 5
micrometers and larger: however, efficiency drops to 43 percent for 3 mi-
crometer particles and to 25 percent for 1 micrometer particles.Adding
steam to the spray increases performance to 68 percent for 3-micrometer
particles and to .40 percent for 1-micrometer particles. A more common
method of increasing performance is addition of a wetting agent to reduce
the surface tension of droplets on the particles. Overall mass effic-
iencies on the order of 95 percent can be achieved.
50. Water spray may be effective in controlling open-pit mining
dusts. Chemical binders may also be applicable to these dusts, as well as
to storage piles unprotected from wind erosion. Moisturizing techniques
may be used to reduce dust emissions from spent shale handling.
-290-
51. A wide selection of control equipment is available for removal of
fine particulate matter from gas streams and other closed operations. The
performance efficiencies of baghouses, electrostatic precipitators, and
scrubbers are all very high, even for fine particulate matter. The largequantities of particulate matter collected will probably be water slurried,then used to moisturize the spent shale.
52. Oil shale retorting will yield large quantities of low-Btu off-
gas. Hydrogen sulfide and ammonia are the main constitutents to be removed
from gas streams before the gas is used as fuel. The presence of other
sulfur contaminants, such as carbonyl sulfide.or carban disulfide is sus-
pected but has not been confirmed by experimental work. The presence and
concentrations of these constituents will affect the selection of desulfur-
ization schemes.
53. Over 99 percent of the ammonia and a small percentage of the
hydrogen sulfide will separate in the condensate from the vapor product
cooling unit following the retort.
54. Sulfur emissions associated with oil shale operations will origi-
nate from retort off-gases (either burned for fuel or flared), tail gases
from sulfur recovery operations, and the combustion of the produced shale
oil. These emissions, primarily H2S and SO 2 , must be removed before the
gas streams are released to the atmosphere. As an alternative, combustion-
generated sulfur emissions can be controlled by the use of clean (desulfur-
ized) fuels.
55. Over the years, the petroleum, chemical, and gas industries have
used various processes for concentrating and removing hydrogen sulfide from
gas strams, and new processes are under development. The choice of -an H2Sremoval process depends on gas stream characteristics and economics. Re-
tort off-gases and shale oil refinery gases contain sulfur dioxide, but in
small quantities that may not need treatment; however, if a Claus unit is
used for H2S removal then the resultant tail gas will be rich in SO 2 andwill need treatment. A number of SO2 removal processes could conceivably
be used.
56. If the retorting and refining gases are desulfurized, it is un-
likely that further sulfur emissions control would be necessary to produce
clean gases for use as fuel in process heaters and boilers. Trace amountsof ammonia in the gas would be converted to oxides of nitrogen on combust-
ion; however, these quantities would be only a few parts per million com-
pared to quantities of thermally generated NOx. Thermally generated NOxcan best be controlled by demonstrated combustion modification techniques.If crude shale oil is used as process fuel, control of both SO2 and NOxemissions could be necessary. Full hydrotreating would be more cost effec-tive than flue gas treating, if on-site refining is included in the shale
oil facility.
57. Hydrocarbon emissions will result from direct preheating of raw
shale, and will need control. Thermal incineration is probably the method
of choice.

- 291 -
58. Hydrocarbons and carbon monoxide resulting from incomplete com-
bustion will be emitted by the boilers, furnaces, heaters, and diesel
equipment associated with oil shale development. With proper maintenance,
emissions from these sources are not considered large; however, high back-
ground levels have been reported in some areas, and any additional contri-
butions from process operations will be a cause for environmental concern.
Hydrocarbon and carbon monoxide emissions can be held to a low level by
proper design, operation, and maintenance of external and internal com-
bustion equipment.
Wastewater Treatment
59. The quantity and quality of water ava1lable, methods of water
use, and disposal criteria will dictate the pretreatment, internal con-
ditioning, and wastewater treatment necessary at each oil shale processing
site. Wastewaters from oil shale processing will contain dissolved and
suspended solids, oil, trace elements and metals, trace organics, toxics
(carcinogens), dissolved gases, and sanitary wastes.
60. Individual waste streams have not been characterized adequately
to make firm treatment or control technology judgmpnts regard'ing which unit
processes should be applied to which waste streams. Nonetheless, so-me
ideal processing schemes have been envisioned and discussed. The size of
the treatment unit will depend on the wastewater volume to be treated at a
specific site and on the concentrations of pollutants to be removed. The
basic operating approach will be to concentrate the pollutants for ultimate
disposal or containment so that clean water can be recycled or discharged.
61. Wastewaters that contain dissolved solids (more than 1,000 milli-
grams per liter) and suspended solids, and that are essentially free of oil
and trace organics, can be collected and flow-equalized in large holding
lagoons before treatment. Oily wastewaters (more than 10 milligrams of oil
per liter) from all wastewater sources should be collected and processed by
separators or similar equipment before receiving further treatment. Waste-
waters contaminated with trace elements and metals should be essentially
free of oil and dissolved solids to allow them do be treated separately.
Trace organie wastewater volumes are not expected to be large, but these
wastewaters will contain highly diverse types of organic pollutants. Toxic
wastewater volumes are expected to be small, but advanced treatment and
control will be needed for the concentrates collected. Specific controls
and treatment will be necessary for wastewaters from scrubbers that absorb
common oil shale process gases-such as hydrogen sulfide, ammonia, and car-
bon dioxide-before the water is reused or discharged. Sewage and water
treatment plant releases should be considered for separate treatments and
disposal.
62. The amounts and qualities of water to be expected from mine de-
watering are not known, and they will depend on the site. In contrast to
some earlier characterizations of surface retorting operations as large
water consumers, true and modified in situ developments may produce a sur-
plus of water that will have to be treated and discharged or reinjected in-
to aquifers.

-292-
Solid Waste Controls
63. A commercial oil shale industry will produce tremendous quanti-
ties of spent oil shale, as well as smaller amounts of overburden, lean
shales, raw shale fines, and chemical solids. Modified in situ operations
may also produce large amounts of raw shale waste. For -ining, handling,
and disposal of overburden, techniques used in the surface mining of other
minerals should usually be applicable to surface mining of oil shale.
These techniques include disturbing the minimum area necessary, using water
sprays and chemical binders to control dust, conserving soil, and usingarid area vegetation methods.
64. Except in a true in situ oil shale operation, some raw or spent
shale will have to be disposed of onthc surface, either in disposal piles
or as canyon fill. Any surface disposal of spent or raw oil shale will
probably produce some leachate, which may adversely affect surface and
ground water quality. It will likely be necessary to provide for collect-
ion, treatment, and reuse of this leachate.
65. Process-generated solid wastes-such as spent catalysts, lime
sludges, coke,- and other solids from water and wastewater treatment sys-
tems--may contain toxic substances. Disposal of these wastes by burying
them in the spent shale pile would be likely to increase the levels of tox-
ic pollutants in the spent shale leachate. It may be possible to dispose
of some process wastes along with the spent shale if it is demonstrated
that the wastes do not themselves produce a leachate or promote production
of additional pollutants in the spent shale leachate. A preferred method
of handling potentially toxic spent catalysts would be to return them to
the manufacturer for regeneration and subsequent reuse,
66. It may be possible to dispose of surface-retorted spent shale by
returning it to the mine, backfilling either with dry spent shale or with a
spent shale slurry. Because of the potential for chronic leaching, it is
recommended that spent shale not be returned to a wet mine; leachate prob-
lems would be more easily controlled on the surface than in a subsurface
environment.- Returning dry spent shale to a dry mine, however, would cre-
ate support, decrease subsidence potential, and reduce surface spent shale
storage by about 60 percent. In any case, mine disposal of *spent shale
should not be considered viable until it has been critically investigated
to ensure that leachates will not degrade ground or surface waters.
67. Leachate will contain water-soluble organic and inorganic
solids. Because of its expected poor quality, leachate from surface dis-
posal piles will probably be collected behind dams constructed for the pur-
pose and located slightly downstream of the toe of the pile. An imperme-
able base should underlie the pile, and drains should be included to pick
up the leachate and discharge it at the collection point. For modified in
situ oil shale operations, it will probably be necessary to minimize water
flow through the retorts and collect and treat as necessary any leachate.
Most of the ions present in leachate are also present in various flue gas
desulfurization process liquids; therefore, it could be possible to use the
leachate on site for removal of sulfur dioxide from flue gas streams of
surface retorts. The leachate problem could also be reduced by leaching

- 293 -
the soluble minerals from the raw shale feed before retorting and passing
the retorted shale through a spent shale burner to remove residual carbon
and organics.
68. Modified in situ retorting, conventional underground mining, and
possibly true in situ retorting may pose fracturing and subsidence problems
unless subsidence control technology is provided. For conventional under-
ground mining, some control technology exists that could probably be modi-
fied and applied to the specific hydrologic and geologic environment of a
particular underground oil shale mine. Backfilling mine voids with spent
shale could provide additional support'though ground water pollution could
be a concern. Special attention would be needed to avoid long-term prob-
lems from weakening of pillar strength by spalling and weathering. For
modified and perhaps true in situ retorting, the key to controlling subsi-
dence or fracturing of surrounding strata will probably lie in learning to
control rubblization and in developing a technology that wl provide pill-
ars adequately sized and appropriately spaced to support overlying strata.
Other Controls
69. Other process controls include those necessary to reduce storage
tank emissions, biological sludges, tank bottom sludges, and separator
sludges. Floating-roof tanks and internal floating covers reduce both
diurnal breathing losses and filling losses associated with fixed-roof
tanks. Thp technology is well developed, having been used in the petroleum
and chemical industries. Internal floating covers are preferable in.sites
having high wind, rainfall, or snowfall because they are protected from the
weather.
70. Refineries limit or reduce sludges and other solid wastes primar-
ily through source control techniques involve identifying and monitoring
sourqges of oil, water, and other contaminants and then implementing inplant
operating procedures to introduce less water into drains, to recover oil
and water from solid wastes, to decrease the amount of contaminants in oily
drainage, and to reduce the oil content of separator solid waste.
SAMPLING, ANALYSIS AND MONITORING
71. One p.oblem facing developers is sampling and analysis of product
and waste streams associated with producing oil from oil shale. The
methods that have historically been used to analyze air and water samples
have been applied to oil shale effluents, but without the straightforward
results expecte.. Extraordinary interferences and matrix effects appar-
ently make some methods ineffective. Many workers in the field are add-
ressing the problem of standardization of methods for collecting, shipping,
storing, and analyzing samples. Interlaboratory studies on many different
types of environmental samples will be needed to validate those methods
best suited for consistent analysis of oil shale pollutants.
72. Effective monitoring through sampling and analysis is expected to
provide:-A baseline evaluation of conditions before development
--A record of changes from baseline conditions
-A continuing check of compliance with environmental
regulations and laws
- 294 -
-- Predictive capability for timely notice ofdeveloping problems
-A check on the effectiveness of mitigating procedures
73. A monitoring program shou].i include sampling of point source ef-
fluents at and around the facility, non-point source effluents resultingfrom activity at the mining, processing, and disposal sites, and accidental
discharges. Monitoring should begin with a baseline survey.
74. An air-monitoring program should include on-site gas and particu-
late analyses and a network of meteorological and air quality measurement
stations remote from the processing site.
75. Surface water monitoring should incorporate biological monitoring
as well as physical and chemical analyses. Changes in aquatic biota may
indicate subtle changes in water quality characteristics before they are
detected by physical-chemical analyses for specific pollutants or by indi-
cator parameters such as dissolved oxygen, pH, and hardness. Water moni-
toring should be done both upstream and downstream; wet and dry surface
streams and springs and observation wells should be monitored to detect
ground water changes.
76. In a water-monitoring program, non-point-sources will probably
receive greater attention than point sources beause of the difficulty ofmonitoring pollutants emanating from shale pile, construction sites, access
roads, unlined catchments, and evaportation ponds. Adding to this problem
will be the possible discharge of saline ground waters. Moreover, site ac-
tivities may result in reduced water flows and, therefore, may affect al-
ready limited supplies of water for agriculture, livestock watering, andother beneficial uses.
77. In addition to spent shale, disposal sites will probably contain
raw shale fines, spent catalysts, sludges, and process wastewaters. Sur-
face erosion and leaching of soluble salts and organic compounds will
necessitate extensive disposal site monitoring, particularly of
revegetation trenches, of the alluvium, and at the toe of the pile where
pollution is most likely. The spent shale monitoring program particularlyshould be designed to identify environmental problems in time for
corrective measures to be taken.
NOTE: It is the intention of the Office of EnvironmentalAffairs to make available two guidelines dealing withmining and retorting. These forthcoming guidelineswill supplement those presently dealing with certainenvironmental problems also associated with oil shale;
namely, Sulfur Dioxide, Dust, Noise, Effluent Disposal,
Strip Mining, Underground Mining, Coke Oven Industry(retorting), and, Secondary Environmental Effects.

295 -
THE WORLD BANK AUGUST 1982
OFFICE OF ENVIMEAL AFFAIRS
PALM OIL INDJSTEd'
GUIDELINES
1. The oil palm is found in a wild, seni-wild, and cultivated state
in several equatorial tropical areas, but principally in Southeast Asia,
Africa, Central America, and the Caribbean. By 1976 Malaysia had increased
its oil palm plantings to the point where it had become the world's leading
producer of palm oil.
2. The fruit of the oil palm is a mne-seeded fruit (drupe) whose
outer pulp (mesocarp) provides the palm oil of Commerce. A hard-shellednut within the mesocarp contains the palm kernel, from which are prodhced
palm kernel oil (similar in composition to cocoanut oil) and palm ketnel
cake (useful as a protein source for livestock feed).
3. Both palm oil and palm kernel oil are used primarily in the manu-
facture of margarine, cooking fat, and soap. 'Ib a lesser extent they are
also used for producing candles, glycerine, mayonnaise, bakery goods, and
other edible and non-edible products.
INDUSTRIA 4 PROCESSES
4. The fruit of the oil palm grows in clusters, called fresh fruitbunches (F.F.B.), in which form it is harvested fran the tree. Some loose
fruit is trapped between the leaf and the stem, and is collected with thebunches. The bunches and loose fruit are transferred as quickly as poss-ible to the factory for processing. Since maximum factory efficiency is
achieved by maintaining a constant input of raw material, the fruit is
sanetimes placed in storage prior to processing.
5. In a typical operation the fruit is accurately weighted upon re-ceipt and then either temporarily stored or transferred to processing. Thefruit is processed as quickly as possible in order to minimize oil qualitydegradation. The initial processing step is sterilization, usually bysteam injection, done to loosen the fruit in the bunches, and facilitatethe stripping as well as other operations which follow.
6. After sterilizaticn the fruit is fed to strippers to separate itfrom the leaves. The fruit falls through the slats of the strippers to a
conveyor, and to the digesters.* The empty fruit bunches are removed fromthe strippers for separate disposal. The bunches contain significantquantities of nutrients.

296
7. The purpose of digestion is to release oils fron the pericarpcells, raise the temperature of the mass to facilitate subsequent pressing,and drain away free oil to reduce the volume of material to be pressed.The pericarp cells are the main oil-containing tissue in oil palm fruit.The digester is provided with rotating knives or beater arms, which serveto stir and pulp the fruit into a mash. The wet mash is then drawn off forthe crude oil extraction.
8. Oil is extracted either by centrifuging or by squeezing the di-gested pulp. Centrifuging has been used mostly in factories having a lowoutput. Ram presses (manually or hydraulically operated) and screw pressesare most frequently used for the larger plants. Solvent extraction hasbeen attempted, but to date its use has been limited to extraction of oilsfrcm palm kernels.
0
9. The liquid drained from the digesters and extractors is the crudeoil product, and consists of a mixture of oil, water and cell debris. Themixture is passed through vibrating fine screens to remove particles offiber and shell ends and, after heating, goes to the clarifiers. * Thescreenings are returned to the digesters.
10. Static clarification is the method most frequently used to purifythe oil. In this process, the oil and water mixtures go through a funnelto the bottom of a drum, one-fourth filled with hot water. Clean oil risesto the top and overflows, while the dirt tends to fall to the bottom. Cen-trifuging is used to remove oil fran the settled dirt. The purified oilis then run through a high-speed- centrifuge to remove the bulk of the re-maining water and impurities. Fran the purification system the oil passesto storage tanks.
11. The residues from the extraction presses, containing the wholeand broken nuts and shells, is dried and passed through an air stream toseparate the lighter fibers. The nuts are further dried to shrink the ker-nel within the shell, allow easier separation after cracking, and reducethe amount of broken kernels. After drying, the nuts are passed through anut cracker and then to a screen for separating the uncracked nuts from thekernels and shell fragments. The shell and kernel are then separated, by ahydrocyclone. The kernels are dried, bagged and stored for subsequent pro-cessing. The separated shell material may either be burned or used as fillmaterial.
12. Generally, palm kernel oil is not produced at the site producingthe crude palm oil. The conditions for release of kernel oils are differ-ent from those of palm oil but are similar to those of copra and hard oil-bearing seeds. The kernels must be crushed to a very fine meal before theoil can be extracted under pressure. Steam cooking releases the oil stillfurther, and it is then extracted by hydraulic batch presses, continuousscrew presses, or by solvents.
13. A typical system for the production palm oil and kernels is shownin Figure 1.
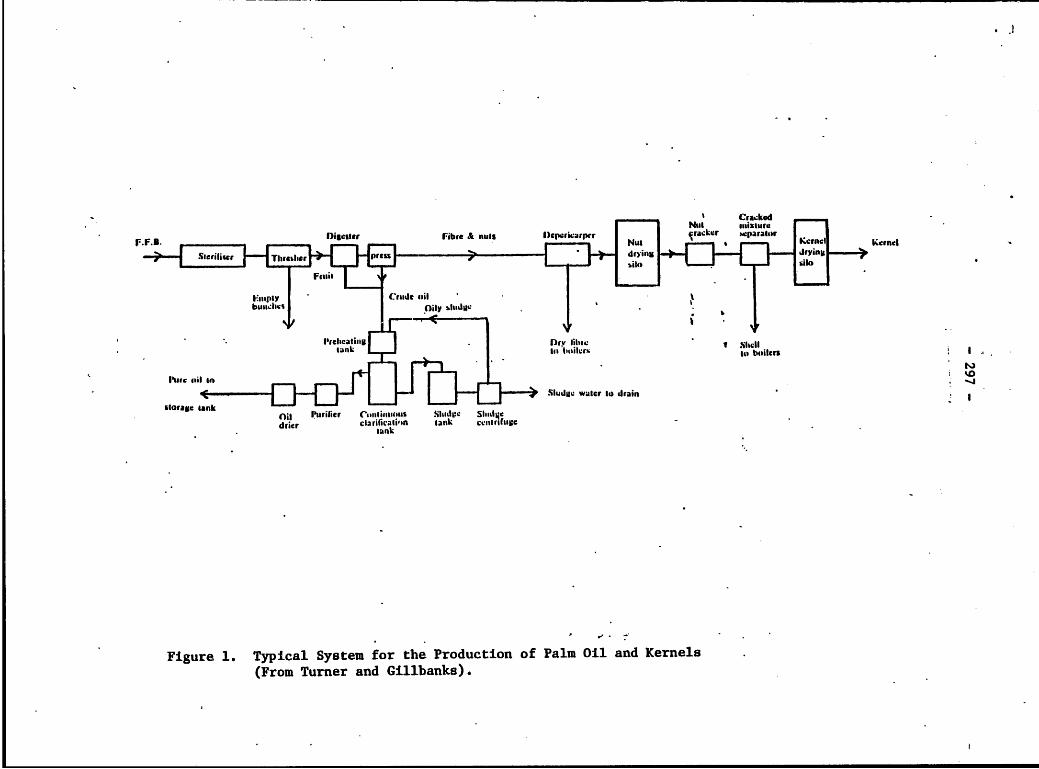
CrackedNut rnixture
Figurei.gTypicalSystem fr h P utio ofpamilr aNd K ra eparator
S (riliser Firbr dinG s
FEmPty Crude oil'bunJhus oily Sludge
Parcheatiu8 o Dry lihlt$&:ettank lto ilers to twilers
Puas (bil io
SlUdgle water to drain
Storag tankOil Paurifier C61n1inuo1us Shidve Stud414drier clarification lank c.nitrtuse
. tank
Figure 1. Typical System for the Production of Palm Oil and Kernels.
(From Turner and Gillbanks) .

-298-
WASTE SOURCES AND CHARACTERISTICS
14. Wastes originating from palm oil processing Nperations are gener-ally limited to solids and liquids. The solid materials are readily amen-able to separation and disposal.
15. The empty bunches, following the stripping operation, create amajor disposal problem. They contain quantities of recoverable nutrientswhich are lost if the material is merely dumped. Dumping also creates con-ditions favorable for fly breeding, giving rise to nuisances. Use of theempty bunches for mulching has been found to be unecomonical. Separatedshells are another solid waste for which provision must be made for dispos-al. Uncontrolled incineration of these residues, where utilized, couldcreate air pollution problems.
16. Liquid wastes originate principally from (a) the sterilizdrs,where the fresh fruit bunches are heated under high pressure steam, and (b)the oil clarification step, in which the oil is separated from the sludgecoming from the digester.
17. The most significant pollution parameters for palm oil processingwastes are 5-day biochemical oxygen demand (BOD5 ), chemical oxygen demand(COD), total suspended solids (TSS) , and hydrogen-ion concentration (pH).Other parameters may also be of significance at individual plants. Charac-teristics of a typical palm oil mill waste effluent are presented in Table1.
EFFLUENT LIMITATIONS
18. The work done towards establishing effluent limitations for thewastes fran this industry has been very limited, and much of it has beeninconclusive. Considerable further development is needed on the chemistryand other characteristics of palm oil effluer.s under a variety of condi-tions.
19. It has been observed that waste effluents from palm oil process-ing are very similar in characteristics and behavior to effluents from theproduction of olive oil and by-product cake or meal from raw olives. Thelimitations and handling of wastes related to palm oil processing are basedto sae extent on accepted practices in the olive oil industry.
20. It is feasible to achieve 100 percent reduction of pollutant andwaste effluent discharges to surface waters by onei of the following meth-ods:

- 299
Table 1. Typical Palm Oil Mill Waste Effluent
Parameter Average Range
pH 3.7 3.5-4.5
BOD5 - mg/L* 25,000 20,000-35,000
COD - mg/L 45,000 30,000-60,000
NH3N - mg/L 30 20-60
Org.N - mg/L 600 500-800
NO3 - mg/L 30 20-60
Tot. Sol. - mg/L 35,000 30,000-40,00b
Susp. Sol. - mg/L 25,000 20,000-30,000
Ash - mg/L 4,500 4,000-5,000
Oil/Grease - mg/t 7,000 5,000-10,000
Starch - mg/L 2,000
Protein - mg/L 3,000 --
Tot. Sugar - mg/L 1,000
Flow - kg/kg. FFB 0.6
Empty Bunches - kg per
kg FFB Processed 0.25
a/ From Sinnappa.
* mg/L = milligram per liter

- 300 -
- spray irrigation- land application- evaporation ponds- discharge to municipal systems
21. Where the above methods cannot be applied, the wastes are amen-able to biological treatment. However, because of the high strengths ofthe raw effluents, treatment efficiencies in the order of 99 percent orbetter will usually be required to avoid damages to the environment. Ef-ficiencies of 95 to 97 percent are the levels generally economicallyachievable, and in many cases these may not be adquate.
CONTROL AND TREATMENT OF WASTES
0
22. As previously stated, the empty bunches present a disposal prob-lem. Because they contain significant quantities of useful nutrients it isgenerally economical to institute by-product recovery measures. Currently,the most effective disposal method is slow burning by incineration, whichreduces the bulk and produces an ash which can be used as a source of pot-ash fertilizer.
23. The shells that have been separated fram the kernels are col-lected and may be used either as fuel for steam generation or as roadfill. When used alone, this residue is not satisfactory for boiler fuelsince it contains silica which volatilizes and forms a glassy coating onthe fire bars and refractory lining. Consideration has been given to theuse of the shells as a filler for plastics, but no significant market ex-ists at this time for this purpose.
24. The sludges originating in the sterilizer condensate and the cla-rification proccess have a high oil and solids content, and cause verystrong and disagreeable odors. A common method of handling these is bymeans of a series of sludge pits. Water and dirt sink to the bottom of thepits, while the oil floats to the top. The oil is recovered by skimning,and used for soap manufacture in some countries. The sludge settling inthe pits may be used as a fertizlizer, or the water and sludge mixturedisposed of by spray irrigation.
25. Where spray irrigation is applied to disposal of the effluen..,pumping distances should be less than one kilometer. Land requirementswill be about 200 square meters per cubic meter of effluent per day.
26. For land application the terrain should be terraced and graded tolevel. Waste effluents are then discharged to one terrace at a time, to adepth of about 8 am. As a terrace dries it is plowed in preparation forthe next application. Care should be taken to avoid contamination of freshwater aquifers.

-301-
27. Evaporation ponds are operated in series for maximum effective-ness, and should be- lined to prevent percolation to ground waters. Onepond at a time should be filled completely, to a depth of about 0.6 meter.The next pond in the series is then filled, while evaporation is takingplace in the filled units. Enough ponds should be provided to permithandling the plant's. total annual discharge. The number of ponds requiredwill depend upon the annual waste volume, the annual net evaporation rate,and other local factors. The ponds are to be dredged periodically toremove the accumulated sludge.
28. The experience of several years in the Malaysian palm oil indus-try shows that liquid effluents are amenable to biological treatment. Theanaerobic treatment is done in two steps: in the first, called the acidifi-cation phase where despite the name, the pH increases fra 4.8 to 6.0 andthe BOD drops to 6000 mg/L; in the methanogenic phase the pH goes first to7.3 and then to 7.9. After this phase, the BOD falls below 200 mg/L.
29. This can be followed by aerobic oxidation where the BOD falls,be-low 100 mg/L and the pH reaches 8.5. If ponds are used, the total rdten-tion time for the effluent is between'55 and 60 days.
30. To prevent'deposition of hard sludge on the bottom of the methan-ogenic ponds, the liquor is desludged on sand beds and the cake used asfertilizer on the estate.
31. Ponds can be replaced by agitated tanks consuming more energy butallowing for the recovery of methane gas. Odors are not a nuisance if foamis kept on top of the methanogenic ponds.
Effluent Limitations
32.. Limitations for liquid effluent frau palm oil pressing plants areshown below:
pH 6 to 9BOD below 100 mg/LCOD below 1000 mg/LTSS below 500 mg/L
BIBLIOGRAPHY
1. United Nations Industrial Development Organization "Technical and Eco-nomic Aspects of the Oil Palm Fruit Processing Industry," Sales No.E74.II-B.10. United Nations, New York (1974).
2. "The Oil Palm". Papers presented at Conference held in London, May3-6, 1965. Ministry of Overseas Development-Tropical Products Insti-tite, London (1965).
302-
3. Turner, P.D., and R.A. Gillbanks, "Oil Palm Cultivation and Manage-ment." The Incorporated Society of Planters, Malaysia (1974).
4. Hartley, C.S.W., "The Oil Palm." Liongmans, Gram and Company, Ltd.London, (1967).
5. Ahmad, A.A.B., and F.L.C. Ming, "Palm Oil Processing Effluent Treat-ment -- Foreseeable Technological Problems." Malaysia Factories andMachinery Department, Doc. 628-54/634-614, Kuala Lumpur (1975).
6. Sinnappa, S. "Treatment Studies of Palm Oil Mill Waste Effluent." De-partment of Chemistry, Malaysia (1977).
7. U. S. Environmental Protection Agency. "Draft Development DocumentEffluent Limitation Guidelines and New Source Performance Standardsfor the Miscellaneous Foods and Beverages Point Source Categories".Prepared by Environmental Science and Engineering, Inc., Gainesville,Florida (February 1975).
8. BUKIT Kraiong Palm Oil Mill, Highlands and Lowlands BHD, the Enginoer-ing Department, Barlow Boustead Estates Agency SDN, BHD, Malaysia Bio-logical treatment of palm oil mill effluent by ponding, using a 2 phaseanaerobic digestion and facultative oxidation.
9. Division of Environment, Ministry of Science, Technology and Environ-ment, Kuala Lumpur, Malaysia. Effluent standards for palm oil industry(1982).

- 303 -
THE WORLD BANK OClMBER 1982
OFICE OF ENIFCMTA AFFAIRS
SAFETY AND OCCUPATIONAL HEALTH
PESTICIDE MANUFACTURE
1. 'This guideline will address safety of personnel working in theplant as well as health hazards inside the plant.
Plant Safety:
2. Tbxic organic chemicals and highly volatile solvents are used inthe nanufacture of pesticides. Danger of fire and explosion is always pre-sent; accidents can happen if process conditioas change, leaks develcp orstatic electricity builds up on eq:ipnent, or storage vessels.
3. Major explosions followed by fire can occur at the plant as thefollowing exaples show. A control thernaneter not in the liquid phase ofa distillation vessel recorded erroneously low tenperatures and thus causedoverheating. The reaction reached explosive speed, and the vessel blew up.No injuries were reported and the equipment damage was around US$300, 000.The instrumentation equipnant was then changed and the problemn disappeared.
4. Process conditions were changed in a distillation vessel to in-crease capacity. The reaction reached explosive velocity and the distilla-tion reactor blew up. This tine, on operatot was killed and damagesanounted to US$500,000. Sweeping changes were made and the process con-ditions were brought back into a safer zene. The vessel was put in a con-crete bunker and provided with a high pressure diaphragm which will rupturebefore the vessel does. Alarns and trips were also added to forewarn theoperators of changes and to shut off the process, if necessary, before thedanger point is reached.
5. A ocpany was producing Malathion at a higher temperature than isnormally accepted. At this high temperture, sane of the reagents were un-stable, and an explosion resulted. Seven operators were wounded and burn-ed-three died later on. The equigent damage amounted to US$800,000.Malathia production was then discontinued.
6. Toxic or dangerous materials in the form of gases, solids andliquids, are handled by erployees. Included are raw materials, in-processmaterials, finished products and effluents. Among the nost toxic gases aresulfur dioxide, chlorine and phosgene. The nost dangerous liquid (and to acertain extent vapor) is mercury. Every finished product, whether solid orliquid, is toxic to a certain degree.
7. In order to decrease ndnor accidents and avoid a serious one,standing orders for safety should be issued, and the Safety Officer shouldmake sure these regulations are implemented. The Safety Department' s mainduties should be:
- 304 -.
Fire protection and naintenance of fire-fighting equipnent.Accident prevention.Evaluation of hazardous, toxic and flamable materials.
8. Materials should be segregated in three classes, according totheir flability:
Class A - Flash point */ below 6.670C.Class B - Flash point between 6.67 and 21.10C.Class C - Flash point above 21. 1cC.
9. Toxic substances should also be divided into three classesaccording to their LD 50 **/
Class A - LD 50 less than 100Class B - ID 50 between 100 and 800Class C - LD 50 over 800
10. According to their class, materials should be stored in threeareas;
a) in the open-non-flamnable or low flarnable productsor low toxicity,
b) in closed warehouses-products of medium toxicity orflamnability..
c) in trenches or in buried storage tanks-products ofhigh toxicity of flaurability.
11. Every employee should receive instructions in safety and accidentprevention and be aware of the dangers involved in handling toxic pro-ducts. Prevention measures should b- backed up by fire-fighting andtoxicity fighting measures and equipnent. The water fire loop should havea sufficient number of hydrants and should deliver a flow of at least 150m 3/h at a pressure of four to six kilos fran a tank cotaining at least 500m3 . In case of power failure, a generator connected to an emergencyelectrical pump should make the fire loop independent frn the outsidepower supply. Every operator should be trained in fire-fighting and firstaid. Special teams should receive additional fire-fighting training. Theconpany fire-fighting brigade should train with the town fire-fightingbrigade on a regular basis. Besides the water fire loop, there should beportable fire extinguishers (chemical powder or CO2 ) distributed in theplant and inspected regularlarly.
*/ The flash point is the mininun temperture at which the vapor of aliquid will ignite under certain test conditions.
*/ Ib 50 represents the lethal dose for 50% of the test animals.Measured as 100 mg/kg of animal body weight will cause 50% of the testanimals to die. The smaller the value for ILD 50 the more toxic thematerial (less material will cause 50% of the animals to die) .

-305-
12. Each enployee should receive a gas nask. Air packs (portablebreathing equinant with a reserve of air or oxygen) should be available ineach unit. A doctor should be an duty and all cases of allergy or poison-ing reported to him. Special measures should be taken for mercury pollu-tion or any other toxicant. In sane units every employee should have urineand blood tests taken every six months to detect and cure any poisoning.
13. A record of lost time by accident should be kept. The recordshould also include frequency and severity indexes for- each accident.
14. The safety engineer should be well experienced and enthusiastic.Every piece of safety equinnt should be -in excellent condition. Thesafety engineer should supervise the fire chief and be assisted in his workby one or more safety technicians.
Plant Surroundings:
15. Plant wastes can be classified as liquid effluents or gas pollu-tants. Liquid effluents contain raw materials and intermediate or finishedproducts which, if toxic, can create serious safety and polluticn prob-lems. Mbst inportant are toxicant losses. The oxpany should avoid dis-charging in the environment any toxic waste effluent, regardless of its.biodegradability.
16. Several gas pollutants are released by the different- processes.Among the most inportant in a pesticide plant are sulfur dioxide, chlorine,hydrochloric acid and nrcaptans. These pollutants should be scrubbed be-fore being discharged into the atmosphere.
BIBLIOGRAPHY
1. United Nations Development Prograrne. ".Environmental Operations Guide-lines", with Attachnents 1101 through 1106. Document G3300-1/TL., NewYork (28 May 1981).

- 306 -
THE WORLD BANK FEBRUARY 1983
OFFICE OF ENVIRONMENTAL AFFAIRS
PESTICIDES
GUIDELINES FOR USE
1. A pesticides component is now very often incorporated in Bank
agricultural projects. As a consequence, this Office has received several
requests for advice an the toxicity and the use of certain pesticides.
2. In some cases, the answer given was not complete because the name
mentioned was a trade name unknown in the US. To prevent this, sponsors
should be asked to supply the chemical name and the- common name generallyused in the pesticides trade. For instance, if the sponsor decides to use
RAVYCN, there is -o way here to identify the naterial. The sponsor should
give the generally accepted commn name CARBARYL, the chemical name
1-naphtyl methyl carbamate, and if possible the chemical formula.
0
0-C-NHCH3
or even the US trade name. In this case SEVIN.
Choice of Presticide
3. The criteria for choosing pesticides should be based on the fol-
lawing factors:
BiodegradabilityToxicity to Manmals and FishRisks of ApplicationPrice
4. Biodegradability should be the most important criteria as stable
chemicals will accumulate, and this accumulation can be magnified into the
food chain. This is why chlorinated hydrocarbons which are very stable,
chemically speaking, should be avoided and why the US Ehvironmental Pro-
tection Agency banned the following products: DDT, Aldrin Chlordane and
Heptachlor.
5. Using these products in Bank projects should be avoided if at all
possible. If they are absolutely required, the detailed reason should be
given; price differential is not a sufficient reason.

- 307
6. Depending on when the chemical is used and where it will end up,toxicity for naimals and/or fish should then be taken into account.
7. Tbxicity figures show the relative toxicity of the product tolaboratory animals (white rats unless otherwise specified). LD5 0 is thedose that kills balf of the experimental animals in any test expressed inmilligrams of the chemical per kilogram of animal weight. The higher theLD5 0 value, the lower the toxicity. Toxicity can be oral (mouth inges-tion), dermal (skin absorption), or inhalatin dusts. Special measuresshould be taken when bandling products with high dermal. toxicity.
8. Risks of application depend in part cn the toxicity but also onthe physical properties of the material and the way it is applied. Theproduct can be sold as a concentrate, a soluti on, an emulsifiable concen-trate, a wettable powder, or a dust. It is for instance safer to apply asolution on the ground than a dust, but it may not be always possible to doso. Aerial spraying is potentially the most damaging.
9. Price as an element of choice between two pesticides should onlybe considered after the other criteria have been decided.
Application of Pesticides
10. . Even the safest among pesticides will probably involve some
health risks. To avoid any serious accident, the appraisal mission shouldmake sure that the people *ging to handle or be in contact with the product(dealers - foriulators - applicators - farmers) have been properly trainedin its use and known about the hazards of handling it. The product shouldbe shipped in adequate containers with labels, clearly identifiable, show-ing bcw to use it, how to avoid any problems, and bow to give first aid incase of an emergency.
11. The use of casual (migrant) workers for applying pesticides iswidespread but should be avoided for the following reasons: These workersdo not have the knowledge or the experience necessary for safe applicationand they will have a tendency to disregard the safety rules.
12. If these workers must be employed, they must be educated andtrained, keeping in mind that their schooling is most of the time inade-quate or nonexistant. Secondly, they must work under experienced super-visors doing nothing but supervising the pesticide application.
13. Disposal of containers should not be overlooked. In 1967, 16people died in Mexico from eating flour and sugar stored in Parathiondrums.
14. Conmon transportation of pesticides and food in the same vehicleshould be forbidden. In Colombia 63 people died and 165 became seriouslyill from eating flour contaminated with Parathion during transport bytruck.

ANNEX 1 - Page 1
- 308 - From US EPA
INSECTICIDES
SUBSTITUTE FOR
PRODUCT DDT Aldrin Dieldrin Chlordane Heptachlor
Phorate o o o
Demeton o
lethyl parathion (%
Parathion a o o o
Guthion oAldicarb o
Azodrin o
Diazionon o o o 0
Dimethoate o
Fenthion o
Methomyl o
Crotoxyphos o
Chlorpyrifos o o o a
Bux o 0 o
Carbofuran o o o a
Counter o o o
Dasanit o o 0 0
Disulfoton 6 o0 0
Dyfonate 0 o o o
Landrin o o o
Trichlorfon o o o o
Dacthal o
Aspon o a o o
. Siduron o
Ethion o o o o
Propoxur 0 o o o o o
Acephate o o o
Methoxychlor 0 0 0
Endosulfan o o o o o
May 1976

�

310 -
15. For additional details see UNIDO's book ".Industrial Productionand Fo=lation of Pesticides in Developing Countries" - 2 volumes - UN -New York, 1972.
16. Amex 1 contains the EPA tables which show equivalent acceptablesubstitutes for banned pesticides.
17. The following pesticides should not be used: DDT, Aldrin, Diel-drin, Chlordane, Hepdachlor, 2,4,5T (2,4,5 Trichlorophenoxyacetic Acid),EBDC (Ethylenebisdithiocarbamate). all rmrcury conpounds, all arsenic com-pounds, MIREX (Dechlorane). and DBCP (Dibromchloro Propane).
18. The product Phosvel (leptcphos) an organo phosphate made, but notsold in the United Stdats should also be banned for its long range ef-fects. Chronic neurological disorders,, paralysis,, and sometimes death areassociated with this chemical believed to eat away myelin,, the sheathingaround the nerves. The pesticide EDB (Ethylene Dibrcrnide) is a proven car-cinogen.
19. The following pesticides are suspect of long-range d=nic ef-fects and should be avoided: endrin, toxaphene,, strobane,, 1080,, strychnine,kepone,, lindane, ca&aium, DECP, BHC,, d-Imethoate, diallates, triallates,chlorobenzilate,, ethylene oxide,, EPN,, carbaiyl, aramite,, PCP,, creosote,,chloranil,, monourea,, benomyl, DDVP, chloroform, (SST) DFF, piperonyl butox-ide, rotenone, perthane, safrole, promide and inerphos.
20. The use of DBCP and EDB should be restricted. to cases where nosubstitutes exist for the considered application. The use of MIPMC shouldbe restricted to compounds where it is mixed with products enhancing itsphotodegradability.
21. In view of the added potential damages to the environment and ofthe Bank's official policy favoring "Intermediate Technologies ", aerialspraying of pesticides should be discouraged whenever it can be replaced byground spraying -
22. Ultra low volume application (ULV) ULV techniques with quanti-ties habitually below 5 liters per hectare are ncw well proven and shouldbe promoted in Bank projects either for aerial or ground spraying. Tb beeffective this technique requires proven equipmnt,, strict control of thespray drcplets diameter (usually in the order of 30 um), and experiencedsupervision to take into account the weather conditions. The main pesti-cides nanufacturers will supply teennical bulletins or. ULV and also trainedsupervisors.
ADDENDUM
1. The pesticide MIREX (Dechlorane) has been forbidden by the EPP. and thesame Organization has suspended the use of the pesticide DBCP (Dibro-mochloro, Propane)

�
312
THE WORLD BANK OCTOBER 1980
OFFICE OF MY AFFAIRS
ryTimEm RZFnMG
The petroleum. Industry is a compl" combination Of inter-dependent
operations, which-can be divided Into three major divistops: productiong re-
fining, and marketing. This document.will be concerned only with refining,
and thus cover only those operations necessary to convert the crude oil into
consumer products, prior to marketing.-
REFINERY PROCESSING
2. The production of consumer products from crude oil involves several
separate processes which are fundamental to refinery operations. Each of these
produces- wastes that are identifiable and must be disposed of under controlled
conditions to avoid environmental damages. The principal processes are discussed
below,
3. Crude and product storase Crude oil is stored in order to provide
constant*supplies of feedstocks for primary fractionation runs of ec*nomical
duration, Intermediate products are stored to equalAze flows within the re-
finery. Finished products are stored to-await shipment, for mixing and blend-
ing on or off'the premises, and to lessen the effects of changes in product de-
mands. Storage is prov ded in steel tanks, permitting sufficient detention for
settling of water and suspended solids. The settled water layers are drawn off
periodically.
4. Crude desaltinz, This removes inorganic salts and some of the sus-
pended solids from the crude oilt. in order to minimIze mechanical plugging and,
corrosion in procese,equipment. Salts are separated by water washing in the
presence of chem1cals-specific.to the type of salts present and,the characterfs-
tics of tho'crude oll.
5. Crude oil fractionation. This is the basic refining process, by which
crude petroleum is separated into intermediate fractions of specified boiling
point ranges. Topping (sometimes called prefractionation or skimming) is the
first step in the process, and serves to separate the economical quantities of
the very light distillates from the-crude oil.
6. Cracking. Thermal cracking breaks down heavy oil fractions into lower
molecular weight fractions, such as heating oils. Catalytic cracking also
.breaks down heavy fractions into lower molecular weight fractions but utilizes
a catalyst and runs at lower temperatures and pressures than in thermal cracking.
Hydrocracking converts hydrocarbon feedstocks (including distillates, gas oils,
and'residues) into gasoline, high-quality middle distillates, LPG, or low-sulfur
residual fuel. HydrocrackIng consists basically of catalytic cracking in the
presence of hydrogen.

- 313 -
7. Hydrocarbon processing. Several operations are included in this
category. Polymerization converts olefin feedstocks into higher-octane
polymer gasoline, propane and butane. Alkylation converts normally gaseous
hydrocarbons into high octane alkylates for use as gasoline blending compon-ents. Isomerization is also used for converting light gasoline stocks into
higher-octane isomers to produce higher octane motor fuel, as well as to
convert isobutane from normal butane for use as fuel-stock in the alkylation
process. Reforming converts low octane naphtha, heavy gasoline, and naphthene-
rich stocks to high octane gasoline blending stock.
8. Solvent refining. Used primarily to obtain lube oil fractions or
aromatics from feedstocks containing mixtures of hydrocarbons and undesirable
materials such as unstable acidic, sulfur, organomtallic, napthenic, and/or
nitrogen compounds. Refined oils, high-octane blending components, and high-
purity aromatics are produced. Dewazing which is also a solvent process, isused to remove wax from lube oil stocks to produce lubricants with low pour
points and to recover wax for further processing.
9. Hydrotreating. Saturates olefins and removes sulfur, nitrogen, and
oxygen compounds and other contaminants from either straight run or cracked
petroleum fractions to produce materials having low sulfur, nitrogen, and olefin
contents and improved stability. The process occurs in the presence of hydrogen.
10. Grease manufacture. Blends various alkali earth metal hydroxides and
fatty acids for soap manufacture with lube oils, wazes and other materials to
produce lubricating greases.
11. Deasphalting. Separates asphalts or resins from viscous hydrocar-
bon fractions, segregates heavy or medium neutral fractions by propdne extrac-
tion, and/or removes paraffinic catalytic cracking stock from distillation
residues. The resulting products are deasphalted or decarbonized oil, asphalt,
and heavy fuel blending stocks.
12. Wax manufacture. Takes high-oil-content wax fractions directly from
crude factionation and/or waxes from dewazing of lube oils and converts them
to paraffin and microocrystalline waxes of low-oil-content, high melting point,and other characteristics required for high-quality waxes.
13. Product finishing. Drying and sweetening are used to remove_sulfur
compounds, including hydrogen sulfide and mercaptans, and to improve color,
odor, oxidation stability, and inhibitor response to produce materials suit-
able for blending, shipping or further processing. Lubricating oil finishing
takes petroleum fractions that have been solvent extracted and dewaxed, and
converts them to finished. lube oils ready for blending and ccmpounding. Blending
and packaging are the final steps in preparation of the petroleum products
which muat meet those specifications required by industries, retailers, and
consmers.
- 314 -
14. Hydrogen production. Produces the hydrogen needed for refiningoperations, such as hydrotreating and hydrocracking, and for petrochemicalfeedxtocks. The piimary r materials are natural gas; refinery gas, propane,
..butanes and others.
15. General Utilities. Certain utility facilities, such as supplies ofsteam and cooling water, generally serve several processes. Boiler feed wateris prepared and.steam generated at a single location. -Non-contact steam, usedfor surface heating, is circulated through a closed loop, from which neededquantities are made available for specific process.purposes. The condensateis. recycled to the boiler house, with a certain portion being discharged asblowdown. Steam is used principally for: non-contact process heating; powergeneration in turbines, compressors, and process pumps; and as a diluent, strip-ping-madium, or vacuum source with steam jet ejectors.
16. A petroleum refinery consists of a complex combination of inter-dependent operations concerned with separation of crude molecular constitu-ents, molecular cracking, molecular rebuilding, and solvent finishing. Onlythe major processes have been identified above, since the intermediate andfinished products are too numerous and too variable in coposition to covrin this document. Not -all of these operations are necessarily caried out ,tone refinery. The products of one or more of these operations are frequentlytransferred to other plants. for further processing into markatable commodities.
-- SOURCES AND CHARACTERISTICS OF WASTES
17. The principal environmental problems in oil refinery operations aredue to both enissions and effluents.
Gaseous Emissions
18. The air pollutants emitted by refineries are affected by crude oilcapacity, air pollution control measures being utilized, general level of main-tenance and hosuekeeping, and the specific processes being carried out. Table1 presents the principal potential sources of various contaminants.
19. 0 Sulfur oxides, nitrogen oxides, hydrocarbons, carbon monoxide,andodor.are the emissions of greatest concern. Particulates, aldehydes, amonia,
- and organic acids may also be present but are usually of lesser importance.
Liquid Wastes
20. Refineries vary in complexity from small installations employingperhaps single atmospheric fractionation, to the, very large integrated facili-ties producing a broad spectrum of petroleum and petrochemical commoditiesfrom a wide variety of feedstocks. Basic refinery operations may be groupedinto five categories on the basis of the effects on raw waste water loadings.

- 315
Table 1. Potential Sources of Oil Refinery Enissions a/
jission PrIncipal Potential Sources
Sulfur Oxides Boilers, process haters, catalytic cracking unit
regenerators, H2 S flares, decoking operations.
Hydrocarbons Storage tanks, wastewater separators, catalyst
regenerators, pumps and valves, cooling towers,
volatile hydrocarbon handling equipment, process
heaters, compressor engines.
Nitrogen Ozides Process heaters, compressor engines, catalyst
regenerators, flares.
Particulate Matter Regenerators, boilers, decoking, incinerators.
Lldehydes Catalyst regenerators
Ammonia Catalyst regenerators
Odors Treating units, drains, tank vents, wastewater
separators
Carbon Monoxide Catalyst regenerators, decoking, compressor engines,
incinerators
/ See Raf. 1.
21. The categories used are patterned after the American PetroleumInstitute (API) classification system. These categories and the rafineryoperations included in each are as follows:
- Topping: Topping, catalytic reforming, asphaltproduction, or lube oil manufacturing,but no cracking or thermal operations.

- 316 -
- Cracking: Topping and cracking
- Petrochemicals: Topping, cracking and petrochemicalsoperations (first generation and isomeriza-
- . tion products or second generation products).
- Lube: Topping, cracking and inhe oil manufactur-ing processes.
- Itegrated: Topping, cracking, lube oil maufacturingprocesses, and petrochemicals operations.
22. The pollution parameters of major significance in this industryare as follows:
- 5-day Biochemical Oxygen Demand (30D 5 )
- Chemical Oxygen Demand (COD)
- Total Organic Carbon (TOC)
-- Total Suspended Solids (TSS)
- Oils and Greases (O/G)
-- Phenolic Compounds
- Ammonia Nitrogen (NE 3 -N)
- Sulfides
- Total Chromiun (Tot.Cr.)
- Heavalent Chromium (Cr+)
- Hydrogen Ion Concentration (pR)
23. The waste water flows and characteristics of refinery effluents canvary considerably according to the type of operations. Table 2 lists themedian (50% of occurrences less than or equal to the values shown) raw wasteflows and loadings, representing the oil separator effluents for each of theprocessing categories cited above. In general, all wastewaters from process-ing units discharge to large basins or ponds (API separators) which functionas oil and water separators. The oil is usually recovered as a valuable by-product. Rexavalent chromium is present in r±Inery effluents, due to theaddition of chromates to cooling waters in order to inhibit corrosion.

... .. . .. . . . . -317 - .
Table 2. Mad-ian Waste Flows and Loadings for Petroleum RefineryOperations, Following Oil/Water Separation. -a/
Process Category
Paramster Topping Cracking Patro- Lube Inte-ChJ. grated.
Net xg per 1000 z3 of Peedstock b/
30D5 3.4 73 172 217 197
COD 37. 217 463 543 329
TOC 8.0 41 149 109 139
TSS 12. 18 49 72 58
O/G 8.3 31 53 120 75
PhenOls . 0.03 4.0 7.7 8.3 3.8
NE3 - N 1.2 28 34 24 20
Sulfides 0.05 0.94 0.86 0.01 2.0
Tot. CR 0.01 0.25 0.23 0.05 0.49
Cr+ 0.007 0.15 0.13 0.02 0.30
flow C 67 93 109 117 235
/ Prom EPA Doe. 44011-74-014a.
b/ Feedstock a Crude oil and/or naturil gas liquids throughput.
/ As m3 per 1000 a3 of feedstock.
EFFLUT LIMITATIONS
Gaseous Emissions
24. Limitations for gaseous emissions from specific refinery processing

.. .. ... ... .. -318 -..
operations are given in Table 3. For processing operations not covered in theselimitations, acceptable ambient air quality standards applicable to the specificpollutant are to be applied.
Table 3. Performance Limitations for PetroleumRefinerr Emissions
Parameter Source mitations
Sulfur Fuel gas combustion Shall not burn any gas contain-Oxides davices ing over 230 mg H2S per dry m3
at standard conditions
SulfurOxides Sulfur recovery Not over 0.025% SO2 by volum at
plant zero oxygen on a dry basis,withreduction control system andincineration
Not over 0.030% sulfur compoundsand 0.0010% H2 S by volume atzero oxygen on a dry basis, withreduction control system but noincineration
Hydrocarbons Storage vessels with No discharge to atmosphere.capacity of over Equip with floating roof and vapor.150 Mg (40,000 recovery system if true vaporGallons) pressure is 10.4 to 76. kPa
Equip with vapor recovery system iftrue vapor pressure is over76 kPa
Particulate Catalyst regenerator Not over 1 kg/1000 Kg coke burnoffMatter
Carbon Catalyst regenerator Not over 0.050% by volumeMonoxide
Opacity a/ All emissions Not over 30% except for 3 minutesin any 1 hour
a/. "Opacity" is the degree to which emissions reduce the transmission oflight and obscure the view of an object in the background.
* 1. magagram = 1 metric ton, 1 a Hg - 133.3 PaMg = segagra,. 1*a = kilo Pascal

- - -.. .. * . *.. . . .. ... . -319 -.
Liquid Effluents
25. Table 4 presents the permissible mazinim daily discharge of variouspollutants in patroleum refinery effluents. These limitations are based on
-- the application of best demonstrated end-of-pipe technology currently avail-able, the use of API (or equivalent)oil and water separators in the plant,segregation of non-contact wasta waters from process waste waters, and effc-tive in-plant process control and housekeeping measures.
ConOL AND TREANT OF WASTES
26. The gaseous emissions and the liquid effluents are of equal import-ance in the refinery operations ani the discharges must be controlled in orderto avoid environmental damage. A combination of process control, in-planthousekeeping, and treatment technology can usually be effective in achievingreduction of these discharges to acceptable levels.
Gaseous Effluents
27. .It is difficult to categorize emission sources on the basis of re-finery operations, since many of them are common throughout the plant. Forpurposes of emissions control the refinery should be considered as an inte-grated systems of storage facilities, process heaters, cooling equipment,pamps, valves and other units and operations.
28. Hydrocarbon emissions originate principally from storage facilities,valves, pumps, compressors, waste water separators, and loading facilities.These emissions can, in most instances be collected by vapor recovery systemsor ventilating systems and eliminated by burning. Disposal is most frequentlythrough elevated flares, using steam ejection. Flares aist be so located asto avoid proximity to combustible materials, tanks and processing equipment.
29. Other measures for reducing emission discharges include high affi-ciency dust removal equipment on catalytic cracking units, waste heat boilerson catalyst regenerators, smokeless flares, and sulfu= recovery systems. Im-proved housekeeping, coupled with maintenance and employee education can alsocontribute significantly.
Liquid Effluents
30. Technology for control and reduction of effluent loadings falls in-to three categorias: in-plant control, at source pretreatent, and end-of-pipetechnology.
31. Two types of in-plant measures can greatly reduce the volume offinal effluents. The first of these utilizes the .reuse of water from one pro-cess to another, such as using blowdowns from higher pressure boilers as feedto low pressure boilers or using treated effluent as makeup water wheneverpossible. The second approach is to utilize recycle systems that use watermore than once for the same purpose, such as using steam condensate as boilerfeed water or using cooling towers.

Table 4. Liquid Effluent Limitations for Petroleum Refinery Wastes.
Maximum Daily .ischarge - Kg per 1000 m3 of Feadstock a b
ProcessauCategory BOD5 COD TOC TSS 0/0 PHEN. N1 3-N SUL- TOTAL CR+6
FIDES CR
Topping 6.3 32 8.2. 4.0 1.9 0.04 1.3 0.04 0.10 0.002
Cracking 8.7 61 11. 5.8 2.6 0.06 8.6 0.05 0.14 0.002
Petrochemicals 12 69 15. 7.7 3.5 0.08 11 0.06 0.19 0.003
. Lube 18 126 24. 12. 5.6 0.12 11 0.10 0.31 0.005
. Integrated 22 152 29. 14. 6.7 0.14 11 0.12 0.37 0.006
Runoff c/ 0.03 0.19 0.03 0.02 0.01 -- -- -- - - 0
Ballast d/ 0.03 0.24 0.03 0.02 0.01 -- -- - -- -
a/ Feedatock - Crude oil and/or natural gas liquids throughput.
b/ For all effluents p1t - 6 to 9.
c/ Applies only to process area runoff treated in main treatment system. All runoff from tank fields and non-process
areas shall not exceed 35 mg/1 of TOC or 15 mg/1 of 0/C when discharged.
dl Applies only to ballast waters treated at refinery.

-.. - 321 -..
32. Good housekeeping will further reduce waste flows. Examples areminimizing waste when sampling product lines, using vacuum trucks or drycleaning methods to clean up oil spills, applying effective maintenance and
-Aspection in order to keep .tha refinery equipment as leakproof as possible,and providing individual disposal for waste streams (such as spent cleaningsolutions) having special characteristics.
33. Process modification, in most cases applicable to both existingand new installations, could include: -
- Substitution of improved catalysts having longer lifeand requiring less regeneration.
- eplacement of barometric condensers with surface con-densers or air fan coolers to reduce a major oil-wateremulsion source.
* Subesitucon of air fan coolers for water cooling to re-. duca blowdown discharges.
- Installation of hydrocracking and hydratreating processesdesigned to generate the lowest possible waste loadings.
- Provision of automatic monitoring equipment, such as forTOC, to assure early detection of process upsets and avoidingexceasive discharges to severs.
- aximum use of improved drying, sweetening, and finishingprocedures to minimize volumes of spent caustics, filtersolids and other materials requiring disposal.
34. Major at-source pretreatment measures include stripping of sourwaters, neutralization and oxidation of spent caustics, ballast water separa-tion, and slop oil recovery. Gravity separators remove the major portion ofthe free oil found In refinery waste waters. Most of these oils can be re-processed, and hence the separtor is considered an integral part of the re-finety operation.
35. End-of-pipe control technology relies most heavily on a combina-tion of flow equalization and biological treatment methods. Equalization,which elimnates surges in flows and loadings, is particularly importantfor a biological treatment system since, for eample, sudden discharges con-taining high concentrations of certain materials can upset or completely kill
- the organisms in the system.
36. Among the biological techniques most commonly applied are dissolvedair flotation, oxidation ponds, aerated lagoons, trickling filters, activatedsludge, physical-chemical methods, granular media filters, and activated car-bon. These may be applied singly or in combination, depending upon the volumeand characteristics of the wastes to be treated, availability of land areas andother factors.

.. . . .. - 322- -
37. The most frequently used methods for disposal of chromium bearingwastes are by reduction of the hexavalent to the trivalent form (with sulfurdioxide, sulfites, ferrous sulfate, or other reducing Agents), followed byneutralization and precipitation of the reduced chromium with alkali.
38. Sludges produced from biological treatment may be disposed of byland-filling, land farming or incineration.
B7LIOGRAPHT
1. Jones, Harold R. "Pollution Control in the Petroleum Industry". Noyes'Data Corporation. Park Ridge, N. J. and London (1973).
2. Powers, Philip W. "How to Dispose of Toxic Substances and IndustrialWastes". Noyes Data Corporation. Park Ridge, N. J. and London (1976).
3. U. S.* Environmental Protection Agency. "Development.Document for EffluentLimitations Guidelines and New Source Performance Standards for the PetroleumRefining Point Source Category". Doc. EPA-440/1-74-014-a (April 1974).
4. UN Environment Programme "Seminar on Environmental Conservation in thePetroleum Industry - 29 March to 1 April, 1977". Doc. UNEM/lss.5/10(Final). United Nations. New Tork (June 10, 1977).
5. U. S. Federal Register, US Government Printing Office, Washington, asfollows:
(a) Vol. 39 (39FR9308), March 8, 1974(b) Vol. 40 (40FR46250), October 6, 1975(c) Vol. 41 (41FR36600), August 30, 1976(d) Vol. 41 (41FR43866), October 4, 1976(e) Vol. 43 (43MR10866), March 15, 1978(f) Vol. 43 (43F21616), May 18, 1978

- 323 -
TE WORLD BANK OCTOBER 1980
OFFICE OF ENVIRONMENTAL AFFAIS
PLATING AND ELECTROPLATING,.
FLUET GUIDELINES
Process Description
1. Electroplating applies a surface coating by electrodeposition on ametal surface. Copper, nickel, chromium, zinc, tin, lead, cadmium, ironaluminum or combinations thereof can be used as coating. Precious metals asgold, silver, palladium, platinum, rhodium or combinations can also be usedas. coating. Chemical plating on metals or plastics can also be done and gene-rally a plant. applies both processes.
2. A plating line is a sequence of ,tanks in which one or more coatingsare applied. It may be broken down in 3 steps; preparation of the surface forcoating, application of the coating and finally post treatment.
3. The pretreatment. involves cleaning, descaling and degreasing. CIeaningC.amoves oil, grease and dirt; it can be done by solvents, alkalis, emulsions,ultrasounds or acids. Salt bath descaling is used to get rid of hard to removeoxides from stainless steels or other alloys. A typical electroplating pretreat-ment is shown in Annex 1 and a typical chemical plating pretreatment in Annex 2.
Wastes Characteristics
4. Annez 3 shows the pollutants occurrence in the U. S. plating industryin general and per section (common metals - precious metals - chemical plating -anodizing - coating - milling and etching - printed circuit boards).
5. All the pollutants mentioned in Annex 3 are commonly present insignificant amounts and require some control in the effluent discharge. Thisconttol can be achieved by currently available technology.
Waste Removal
Reduction of Hexavalent Chromium
6. Because of its high toxicity hexavalent chromium has to be reducedto the trivalent state. This is done with any reducing agent but SO 2 is mostsafonly used at a pH between 2 and 3. The reaction will take two to threehouT and sulfuric acid may have to be added to keep the right pH.
Oxidation of Cyanides
7. Any oxidation agent will do the job. Chlorine, hypochorites andhydrogen peroxide are the most commonly used but oxygen in air is also effectiveif there is room for an aerated pond. Cyanates being much less toxic than

- 324 -
cyanides, there is no need to go to complete oxidation to nitrogen as long asall the cyanides have disappeared.
Metals Removal
8. This is done by pH adjustment. Lime addition to the waste water willincrease the pH and promote precipitation of metal hydroxides. The maximuprecipitation corresponds to a wall defined pH changing for each metal. Theluxlym solubility for Cr is 0.012 mg/L at pH 8.5. .. Below and above this pf thesolubilityincreases. At pH 10.5, nickel solubility is 0.001 mg/L but at thesme 10.5 chromium solubility is back up to 1 mg/L. The precipitation of metalhydroxides may consequently have to be done-in several stages.
9. The solubility figures given above are for pure solutions of the metal.Other factors can increase or decrease the solubility, among them, temperature,other salts concentration, common ions, etc.
10. In industrial practice, the precipitation of metal hydroxides ispromoted by adding inorganic coagulants or polyelectrolytes flocculants in aclarification tank or pond or both.
11. The sludge collected from clarification is first dewatared and theneither buried in a landfill, incinerated or hauled away.
Results of Treatment
12. Although there are more sophisticated treatments that can replaceor be added to the operations described, these can achieve the following resultsfor the main pollutants:
Pollutant Residual (mRiT-)
Copper 0.5Nickel 0.03Cr Total 0.1Cr exavalent 0.01Zinc 1.2Cyanide 0.01Cadmium 0 . 02Lead 0.03
13. These figures should be considered as World Bank guidelines for theplating industry not forgetting that effluent pH should always be between 6and 9.
Costs of Treatment
14. Anna 4, 5 and 6 taken from the EPA publication Electroplating (seebibliography) gives the investment ana operating costs for clarification,chromium reduction, and cyanide oxidation.
* mg/L - milligran per liter

- 325 -
BI3LIOGRAPET
For more information consult EPA 440/1-78/085 - Electroplating.Point source category. Publisher: United States Envirozzantal ProtectionAgency - February, 1978.

ANNEX I
PARTSA SOLVENT ALKALINE Hc1
DEGREASE CLEAN RINSE CLEAN RINSE(SOAK)
ANODIC AOI
ALAINE- RINSE HCL CLEAN RINSE NLKADINECLEAN CLEAN
ELECTROPLATERINSE ACID DIP HRINSE . a
FIGURE 3-7 TYPICAL ELECTROPLATING PRETREATMENTSEQUENCE

ANNEX II
. *
PARTSVAPOR . ALKALINE COLD RINSE ACIDDEGREASE CLEAN CLEAN
* ~
ALKALINE*COLD RINSE ALEAN COLD RINSE ACIDCLEAN .CLEAN
NICKEL STRIKE TO ELECTROLESS PLATINGHOT RINSE (ELECTROPLATE) RINSE
FIGURE 3-9 TYPICAL ELECTROLESS PLATING ON METALS*PRETREATMENT SEQUENCE
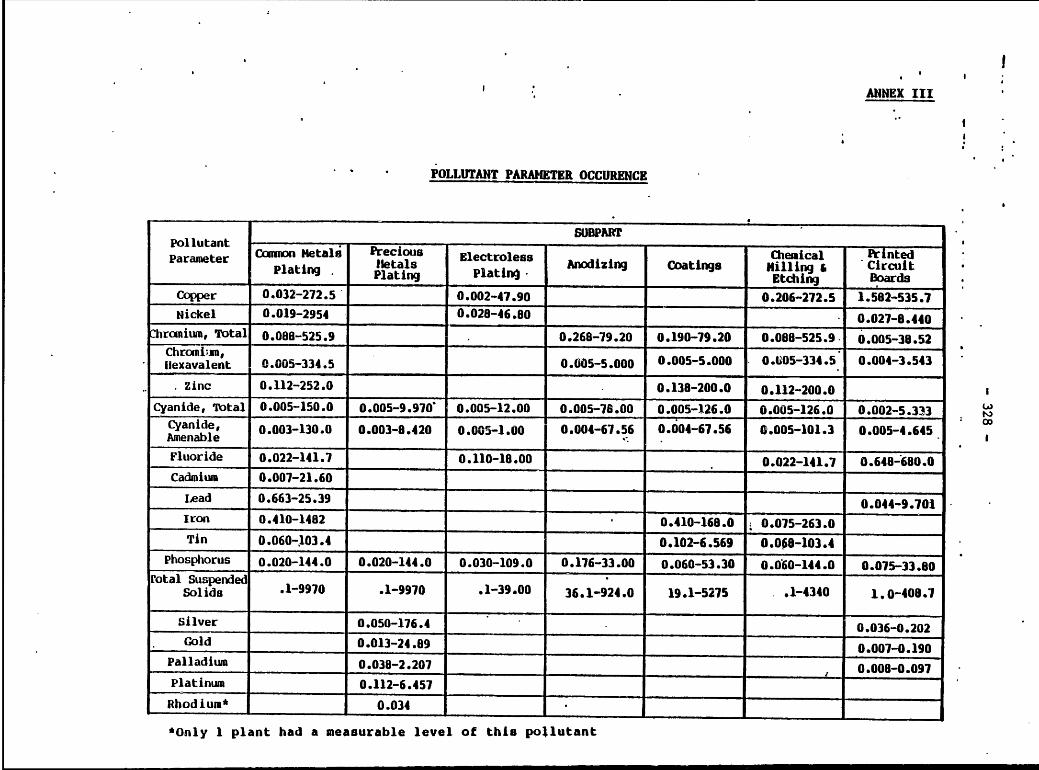
. -ANNEX III
POLLUTANT PARAMETER OCCURENCE
SUBPARPollutant .Parameter Common Metali Precious Electroless Chemical .Printed
Plating a eetals ltins Anodizing Coatings Hilling -CircuitPlating Plating Etching Boards
Copper 0.032-272.5 0.002-47.90 0.206-272.5 1.582-535.7Nickel 0.019-2954 0.028-46.80 0.027-8.440
Chromium, Total 0.088-525.9 . 0.268-79.20 0.190-79.20 0.088-525.9. 0.005-38.52Chromi n,lexavalent 0.005-334.5 0.0055.000 0.005-5.000 0.605-334.5 0.004-3.543
zinc 0.112-252.0 0.138-200.0 0.112-200.0 ICyanide, Total 0.005-150.0 0.005-9.970' 0.005-12.00 0.005-78.00 0.005-126.0 0.005-126.0 0.002-5.333
Cyanide,00Cyanide, 0.003-130.0 0.003-8.420 0.05- 1.00 0.004-67.56 0.004-67.56 0.005-101.3 0.005-4.645Amenable
Fluoride 0.022-141.7 0.110-18.00 0.022-141.7 0.648-680.0Cadmium 0.007-21.60
Lead 0.663-25.39 0.044-9.701Iron 0.410-1482 0.410-168.0 0.075-263.0Tin 0.060-103.4 0.102-6.569 0.008-103.4
Phosphorus 0.020-144.0 0.020-144.0 0.030-109.0 0.176-33.00 0.060-53.30 0.060-144.0 0.075-33.80rotal Suspended
Solids .1-9970 .1-9970 .1-39.00 36.1-924.0 19.1-5275 .1-4340 1.0-408.7
Silver 0.050-176.4 0.036-0.202Gold 0.013-24.89 0.007-0.190
Palladium 0.038-2.207 , 0.008-0.097Platinum 0.112-6.457
Rhodium* 0.034 -
*Only 1 plant had a measurable level of this pollutant

- 329 -
CLARIFICATION-CONTINUOUS TREATMENT SETLlNG TANX
Flow Rate(Liters/Er) 37,850 75,700 157,708
Investment 571,363 $91,575 $130,102Annual Costs: .
Capital Costs 4,552 5,842 8,301
Depreciation 14,273 18,315 26,020
Operation & MaintenanceCosts (Excluding Energy& Power Costs) 2,506 2,565 3,851
Energy & Power Costs 36 72 150
Total Annual Cost $21,367 $26,794 S 38,322
TABLE 8-7
CLARIFICATION-BATCH TREATMENT SET LING TANX
Flow Rate(Liters/Er) 1,893 3,785 18,925
Investment S25,551 S28, 529 $38,032
Annual Costs:
Capital Costs 1, 63 0 1,820 2,427
Depreciation S,110 5,706 7,606
operation & MaintenanceCosts (Excluding Energy& Power Costs) 2,334 2,341 2,394
Energy & Power Costs 41 81 811
Total Annual Cost S 9,155 S 9,948 S13,238
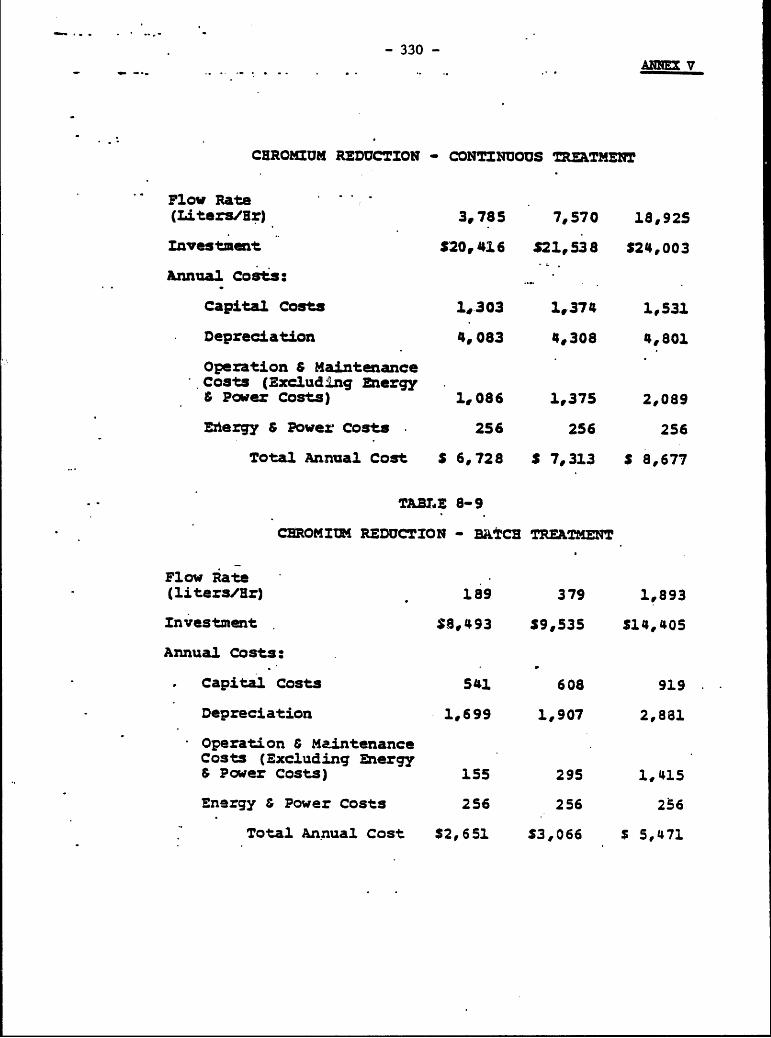
- 330 -ANNE V
CHROMIUM REDUCTION * CONT1UOUS TREATMENT
Flow Rate(Liters/Br) 3,785 7,570 18,925
Investment $20,416 $21,538 $24,003
Annual Costs:
Capital Costs 1,303 1,374 1,531
Depreciation 4,083 4,308 4,801
Operation S MaintenanceCosts (Excluding Energy& Power Costs) 1,086 1,375 2,089
Ehergy & Power Costs 256 256 256
Total Annual Cost S 6,728 S 7,313 S 8,677
TABLE 8-9
CBROMIUM REDUCTION - BATCE TREATMENT
Flow Rate(liters/Br) 189 379 1,893
Investment SS,493 S9,535 S14,405
Annual Costs:
Capital Costs 541 608 919
Depreciation 1,699 1,907 2,881
Operation S MaintenanceCosts (Excluding Energy& Power Costs) 155 295 1,415
Energy & Power Costs 256 256 256
Total Annual Cost $2,651 S3,066 S 5,471

-331 -
CYANIDE OXIDATION - CONTINUOUS TREATMENT
Flow Rate(Liters/E) 3,785 5,678 7,570Investment $47,808 $51,875 $55,556Annual Costs:
Capital Costs 3,050 3,310 3,544Depreciation 9,561 10,395 11,11Operation & MaintenanceCosts (Excluding Energy& Power Costs) 2,218 2,750 3,563Energy & Power Costs 90 135 180
Total Annual Cost $14,920 $16,570 $18,098
TABLE 8-11.
CYANIDE OXIDATION - BATCE TREATMENT.
Flow Rate(Liters/Hr)
189 757 1,893Investment $10,325 513,258 $17,069Annual Costs:
Capital Costs 659 846 1,089Depreciation 2,065 2,652 3,414Operation & MaintenanceCosts (Excluding Energy& Power Costs) 464 1,854 4,636Energy & Power Costs 5 18 45
Total Annual Cost S 3,192 S 5,370 S 9,184
- 332 -
THE WORLD BANK FEBRUARY 1982OFFICE OF ENVIRONMINTAL AFFAIRS
PLIWOOD MANUFACTURING
ENVIROCMETIAL GUIDELINES
1. Plywood consists of several layers of wood (6r veneer) joined to-gether by means of an adhes.ive. The material has many uses. It can bedesigned and engineered for both construction and decorative purposes, andin various shapes (flat, curved, or bent). Hardwood plywood is generallyused for decorative purposes and has a facing layer of wood from deciduousor broad leaf trees. Softwood plywood is generally -used for constructionand structural purposes, with the facing layers being from coniferous orneedle-bearing trees.
MANUFACTURING PROCESS
2. The operations required for converting logs into veneer and theninto plywood are nainly mechanical. The process flow diagram for a typicalveneer and plywood mill is presented in Figure 1.
3. Logs are delivered to the plant either with or without the bark,and cut to proper lengths. Where barking is required the hark is renovedby any one of several wet or dry processes. The machines most comonly usedinclude drum, ring, bag, hydraulic, and cutterhead barkers.
4. The nost important operation in the process is the cutting of theveneer, since the appearance of a plywood panel is greatly dependent uponthe nanner in which the wood layers are prepared. Prior to cutting, thelog is heated or "conditioned" to improve the cutting properties, particu-larly in the case of hardwoods. When conditioning occurs prior to debark-ing then bark, renoval is greatly facilitated. With the increasing use ofring and cutterhead barkers, whose cperations are not aided by prior beat-ing, the conditioning more comnonly occurs between the barking and veneer-ing operations.
5. Twe basic methods are used to beat the logs: (a) directing steamonto the logs in a steam vat (or steam tunnel) or (b) heating the logs in avat full of hot water, in turn beated either directly by live steam or in-directly by steam coils.
6. The cutting of veneers may be accomp).ished by (a) rotary cutting,(b) slicing, (c) stay log cutting, or (d) sawn veneering. Rotary cuttingis the nost widely used method at the present time. In this method a logor ("bolt") of wood is centered and turned on a lathe against a )nife ex-tending across the length of the unit. A thin sheet of veneer is peeledfrom the log as it turns. Log lengths will vary from about 0.6 to 2.4 m,although lengths of up to nearly 5 m are not uncomn. Rotary cut veneersgenerally vary from 1.3 to 3.6 mm in thickness.

LIQUID WASTE .
"GREEN END" STEAM DRIER WASH
OVERFLOW FROM CONDENSATE AND DELUGE I EXHAUST
LOG POND WATER :GASES
LOG STORAGE(LOG POND LOG LOG VENEER VENEER GLUE WASH
COLD DECK DEBARKING STEAMING LATHE DRIER "WATER
OR 80TH)Hr
. . GLUE
GASES PREPARATION
SOLIDS Lo
BARK GLUE RECYCLE
LIQUIDS
VENEER GLUE RESSIN FINISHINGPREPARATION LINE
I Ir
I II*. I UNUSABLE I TRIM AND
I I VENEER AND I SANDERI TRIMMINGS I DUST
I II
SOLID WASTE IS BURNED IN BOILERCHIPPED FOR REUSE OR SOLD
Figure 1 - Process Flow Diagram for Veneer and Plywood Production.
(From EPA Publication EPA-440/1-74-023-a)

- 334 -
7. Freshly cut veneers are usually dried to a moisture content ofless than 10 percent since, if not dried, they would be unsuitable forglueing. In addition, the undried materials are also susceptible to attackby molds, bluestain and wood-destroying fungi, Several drying methods arein use, the most comnra being a long chamber, equipped with fans and heat-ing coils, through which the sheets are transported under controlled temp-eratures and humidity conditions.
8. . Following the drying operatin the stock is prepared for glue-ing. Preparation includes grading and matching, redrying, dry-clipping,jointing, taping and slicing, and inspection. Except for jointing andsplicing, which generally requires an adhesive, these steps are completelymechanical.
9. Adhesives may be divided into three principal categories:
(a) Protein-contains various combinations ofwater, dried blood, soya flour, lime, sodiumsilicate, caustic soda, and formaldehyde.
(b) Urea-formaldehyde resin-contains various com-binations of water, defoamer, wheat flour, and
(c) Phenol-formaldehyde-contains various combina-tions of water, furafil, wheat flour, phonolicformaldehyde resin, caustic soda, and soda ash.
10. The phenol-formaldehyde mixture is used almost exclusively forexclusively for exterior applications, while the other two are used chieflyfor interior applications. Current information indicates that urea-baseglues. are the most widely used.
11. Most plants mix their own glues.. Applicaticn to the veneers is usu-ally by means of power driven rollers which spread the adhesive on thesheets. More recently sprays and curtain-coaters have been coming intowider usage. After glueing, the sheets are subjected to pressure of up to17 or 18 atmospheres, to insure proper alignment and full contact betweenthe glue and wood layers.
12. Following the pressing, a series of finishing steps are applied,depending upon the plant and the final product desired. Such steps include(a) redrying, (b) trimming, (c) sanding, (d) coating, (e) sorting, (f)molding, and (g) storing.
WASTE SOURCES AND CHARACTERISTICS
13. Veneer and plywood production operations will produce wastes of agaseous, liquid, and solid nature.

- 335 -
Gaseous Enissions-
14. Formaldehyde is the principal conponent of concern in the glueswhich are nost widely used today. There is little free formaldehyde in theresin mixtures. The high cure terperatures used will generally volatilizeany residual free formaldehyde.
15. Volatile organic com7pounds may be emitted by evaporaticn of or-ganic solvents used in conventional coatings currently applied. Coatingsare used primarily at hardwood plywood plants but, in nost cases, only asmall percentage of the total production is coated.
Liquid Effluents
16. The parameters of major significance in the production of veneersand plywood are 5-day biochemical oxygen demand (BODS) and total suspendedsolids (TSS). Other pollutants may be present but are considered to be ofminor significance. The processing method, raw materials used,. and thechemicals added are the principal considerations in identifying the import-ant parameters.
17. In the log barking operation BOD5 and TSS are both of concern.The TSS concentrations from drum barkers are slightly higher than for hy-draulic barkers, but the BOD5 values are significantly higher in the drumbarker. The higher values are due to the longer contact time between thebark and the water, as well as because of the grinding acticn Aich occursin the water. BOD5 values are also affected by the species of wood barked
and by the time of the year in wtch the log is cut. Drum barking watersare often recycled. The ranges of BOD5 and TSS values in log barkingwaters are as follows:
BOD5 TSS
Hydraulic 56-250 520-2360Drm 48-990 2020-2880
18. As previously stated, log conditioning is accomplished either bysteam vats (or tunnel systems) or by hot water vats. The only waste waterfrom the steam vats is the steam condensate, which carries with it leach-ates fram the . logs and wood particles. The magnitude of flows will varywith the number and size of the vats. Typical values for wastewaters fromsteam vats are as follcws:
Waste Volume: 1.6-3.1 L/sec. 1/BOD5: 470-3100 mg/LTSS: 74-2940 mg/LpH: 4-6 Units
1/ For a plant with annual producticn of 9.31 million Sq. M. Plywood,9.53 m thick.

- 336 -
19. Hot water vats, because of the method of heating (steam, beatingcoils, etc) do not have a constant discharge, and are generally emptiedonly periodically. The water and solids that build up in the closed systemare replaced with clean water. In many cases the wastewater is settled andthen recyled back into the vats. The characteristics of these waters varywidely, as indicated by the following typical analysis:
BOD5 : 330-4700mg/LTSS : 70-2500 mg/LPH : 4.4-6.9 Units
20. Veneer dryers accumulate wood particles, which are renovedeither by flushing with water or blowing out with air. Volatile hydrocar-bons will also ccndense cn the surface of the dryers to form an organicdeposit called "pitch". It is necessary to remove these deposits period-ically, in order to avoid excessive buildup. A high pH detergent is ap-plied to dissolve nost of the pitch, followed by a water. rinse. The natureand volume of the dryer wash waters depend upcn the amount of water used,the anount of any scraping prior to application of the detergent and therinse, condition and operating patterns of the dryer, and the species ofwood being dried.
21. The water released by the veneer in the drying process is conver-ted to steam and vented to the atnesphere. The liquid discharge frcm thedryer includes spent wash water and the water from the deluge system whenthat system is used to extinguish fires that sometimes start inside theunit. Same plants take advantage of fires to clean the dryers. Water isalso used occasionally to flood the bottam of the units in order (accordingto sci claims) to lessen the insidence of fires and reduce air pollutionproblems. For veneer dryer washing purposes a typical plant will ,dischargeabout 17.5 liters per metric ton of production. Dryers are generally wash-ed once in every 80 hours of operation.
22. Many plants recycle all wash, fire, and flood waters fran thedryers because the operation causes substantial evaporation of water.Thus, fresh water can be used to clean the dryers and still operate as aclosed system.
23. Waste water in the glue operation originates from washing of themixers, glue hold tanks and the glue spreaders. Discharge fron the gluewashing operations averages about 45 liters per metric ton of product.
24. A typical combined veneer and plywood mill requires a certainamount of cooling water to dissipate heat fran the air compressors, as wellas the lathes and presses. This is normally "pass-through" water and doesnot require any special handling before discharge to the environment. Thedischarge should be nonitored, however, to assure that temperatures do notreach unacceptable levels.
- 337 -
Solid Wastes
25. Solid wastes generated in the production process include (a)bark, (b) wood particles from the veneer dryers, (c) organic "pitch" frcmcleaning of the veneer driers, (d) wood trimmings from cutting veneers andplywood sheets to size and (e) wood dust fran the sanding and finishing op-erations. It is difficult to quantify these materials since they are de-pendent a the practices and products at each particular plant.
EFUJE=I LIMITATIONS
Gaseous Emissions
26. Gaseous emissions are not considered significant in plywoodplants, except where coatings are applied as part of the production pro-cess. Volatile organic conpounds are discharged fron the coating lines.The nature of these emissions depends upcn the organic solvent used. Theseare normally multiconponent mixtures which may contain various combinationsof nethyl ethyl ketcne, methyl isobutyl ketone, toluene, xylene, butyleacetates, propanol, and others.
27. Emissions levels of volatile organic conpounds (VOC) should bekept at or below the following concentrations:
Printed interior wall 2.9 kg VOC per 100 m2
panels of bardwood plywood coated surface
Natural finish hardwood 5.8 kg VOC per 100 m2plywood panels coated surface
Liquid Effluents
28. Liquid effluent limitations are presented in Table 1. Theselimits are considered achievable on the basis of best practicabletechnology currently available.
CONTROL AND TREA'IMENT OF WASTES
Gaseous Emissions
29. Measures for reducticn of volatile organic compounds fran coatingoperations includes the use of low solvent, ultra-violet curable coatings;use of wasterborne coatings; and incineration.
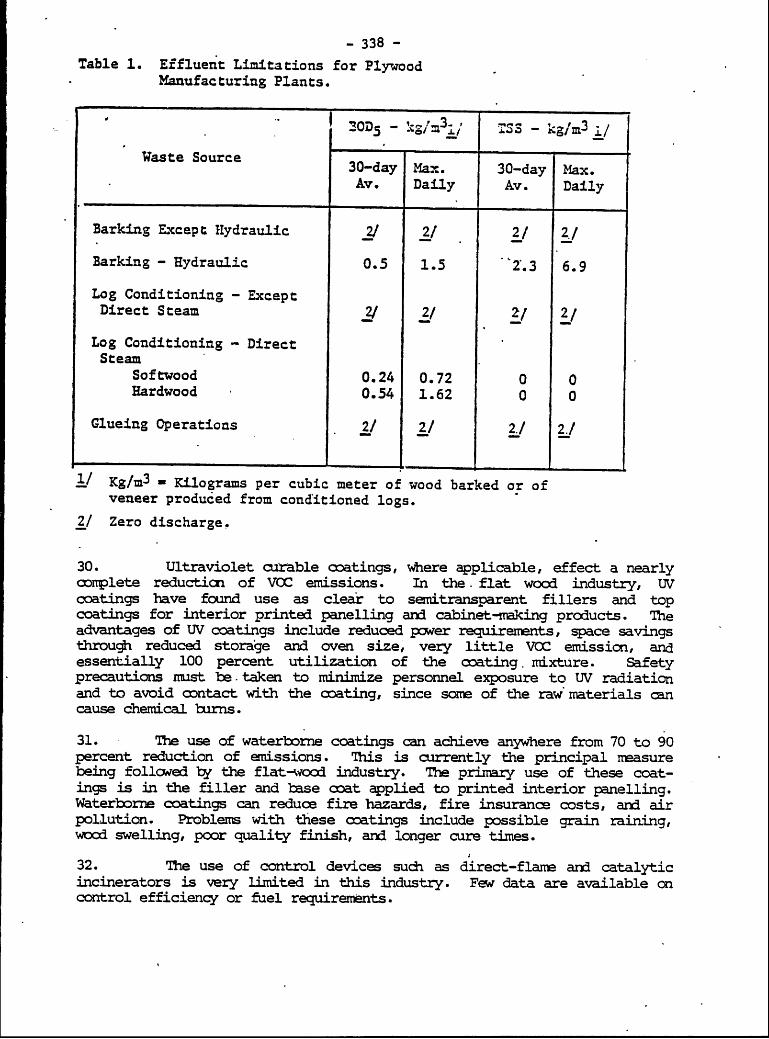
- 338 -
Table 1. Effluent Limitations for PlywoodManufacturing Plants.
330D5 - kg/m/ SS - kgm3
Waste Source 30-day Max. 30-day Max.Av. Daily Av. Daily
Barking Except Hydraulic 2/ 2/ 2/ 2/
Barking - Hydraulic 0.5 1.5 2.3 6.9
Log Conditioning - ExceptDirect Steam 2/ 2/ 2/ 2/
Log Conditioning - DirectSteam
Softwood 0.24 0.72 0 0Hardwood 0.54 1.62 0 0
Glueing Operations 2/ 2/ 2./ 2.1
.1 Kg/m3 . Kilograms per cubic meter of wood barked or ofveneer produced from conditioned logs.
2/ Zero discharge.
30. Ultraviolet curable coatings, where applicable, effect a nearlycomplete reduction of VOC emissions. In the . flat wood industry, UVcoatings have found use as clear to semitransparent fillers and topcoatings for interior printed panelling and cabinet-raking products. Theadvantages of UV coatings include reduced power requirements, space savingsthrough reduced storage and oven size, very little VOC emission, andessentially 100 percent utilization of the coating. mixture. Safetyprecautions must be. taken to minilize personnel exposure to UV radiationand to avoid contact with the coating, since some of the raw materials cancause chemical birns.
31. The use of waterborne coatings can achieve anywhere from 70 to 90percent reduction of emissions. This is currently the principal neasurebeing followed by the flat-wood industry. The primary use of these coat-ings is in the filler and base coat applied to printed interior panelling.Waterborne coatings can reduce fire hazards, fire insurance costs, and airpollution. Problems with these coatings include possible grain raining,wood swelling, poor quality finish, and longer cure times.
32. The use of control devices sudh as direct-flame and catalyticincinerators is very limited in this industry. Few data are available oncontrol efficiency or fuel requirements.

- 339 -
Liquid Effluents
33. Where debarking is by a dry process, the bark chips are shreddedand burned as fuel. For wet drum and bag barkers, the chips are pressed toremove the water and sent to the boiler for use as fuel. The water can berecycled.
34. Bark from the hydraulic type of unit is separated, pressed to re-move the water, and used as boiler fuel. The amount of water resultingfrom the process is more than can be used in other plant unit operations,and hence must be -otherwise handled. Treatment follows- the practices wide-ly utilized in the pulp industry, i.e. the use of circular heavy-duty typeclarifiers or thickeners. The clarifier effluent is dewatered, by vacuumfilters or other means, and then subjected to biological treatment which isnormally 85 to 95 percent effective. The filter cake, containing up to 30percent moisture, is disposed of cn land or sold for use as a mulch.
35. The major effort in the veneer production segment of this indus-try has been directed towards reducing waste water volumes by reuse andccnservation, and by containment of those waste waters that cannot be re-used. Waste water from log conditioning is probably the largest and mostdifficult source to handle in a veneer mill.
36. Hot water vats, when heated indirectly through coils, will nothave a continuous discharge. Any discharge results from spillage when logsare placed into or 'taken out of the units. The wastewater fron theseoperations can be clarified by settling in tanks or ponds and then reusedfor nakeup. The resulting sludge is transferred to a landfill. Some de-creased pH in the vats may occur over time. If this happens, lime orsodium hydroxide should be added for corrosicn control.
37. Wastewater from steam vats must be discharged because of the dif-ficulty of reusing the contaminated condensate. In same instances modifi-cation can be made to allow conversicn of steam vats to hot water spraytunnels which then function in a manner similar to hot water vats.
38. Either the use of hot water sprays or the use of modified steam-ing would allow mills that use steam vats to operate in a manner similar tothose that use hot water vats (in which there is no steam impingement) .All of these are closed systems, requiring only solids removal and periodic"flush-outs". The relatively small volume of water produced from the"flush-outs" can be contained in evaporation ponds or used for irrigation.
39. In cases where effluents from either hot water or steam vats mustbe treated then biological methods, such as ordinary or aerated lagoons,have been both practicable and effective. It has been reported that BOD5reductions of 85 to 90 percent are readily achievable.
40. Waste discharges from cleaning of veneer dryers can he reducedthrough various modifications in the procedure. One mill reports a signif-icant reduction by manually scraping the dryer and blowing it out with airprior to the application of water. Installation of water meters or valvedhoses prcmotes water conservation and results in significant reductions.The volume of wastes fram this source is small enough to be handled by con-tainment or by use for irrigation or similar purposes.

- 340 -
41. T(Bchnology is currently available to eliminate the discharge ofall wastes from the glueing operations. Recycling systems are acceptedtechnology in the industiy, and are applicable for protein, urea, and phe-nol types of glues. Hcwever, mills that use several types of glues mustihave individual recycle systems to separate the different wash waters,since attempts at mixing the wastewater frcm different types of glues havenot been successful. Various inplant operational and equipment modifica-tions can reduce the volume of glue wash water.
42. In addition to recycling the plant may also contain and/orevaporate the glue washwater, spray the liquid on the .bark that goes intothe boiler as fuel, or use a combination of these techniques.
Solid Wastes
43. Along with the bark chips previously mentioned, solid wastes alsoinclude veneer dryer scrapings, unusable veneer and triumings, and trim andsander dusts fron the finishing opertions. These wastes may be burned forfuel, dunped on land, or sold for other uses elsewhere.
BIBLIOGRAPHY
1. U.S. Ehvironmental Protection Agency. "Developmnent Docurent forEffluent Limitations Guidelines and New Source Performance Standardsfor the Plywood, Hardwood, and Wood Preserving Segment of the TimberProducts Point Source Category". Doc. EPA-440/1-74-023-a. Washington,(April 1974).
2. U.S. Environmental Protection Agency. "Guidance for Lcwest AchievableEmission Rates from 18 Major Stationary Sources of Particulate,Nitrogen Oxides, Sulfur Dioxide, or Volatile Organic Compounds".Doc. EPA-450/3-79-024. Washington (April 1979).
3. Nestler, F.H. and Max Nestler. "The Formaldehyde Problem in Wood-BasedProducts-An Annotated Bibliography". U.S. Forest Service GeneralTechnical Report FPL-8. Washington (1977).
4. Blomquist, R.F., "Formaldehyde Emissions Are No Problem With WoodProducts Bonded With Phenolic Resins". American Plywood Associa-ticn, Tacoma, Washington 98411. (August 6, 1981).
5. Baker, William A., Ed. "Technical Literature Index". American PlywoodAssociation, 'acoma, Washington 98411. (September 1980).

THE WORLD BAg - 341 - OCTOBEI 1980
OFFICE OF E3YFNMENTA ARIS
POULTRY PROCESSING PLATS
InDUSTRIAL WASTE DISPOSAL
1. Poultry processing operations cover young and mature chickens,turkeys, ducks, geese, various other birds, and small game such as rabbits.The final product may consist of whole carcasses, pairts, cooked or cannedmeats, and specialties such as rolls and patties. Plants may produce oneor a combination of several of these items.
IDUSTEIAL PROCESSES
2. Live birds are taken to processing plants in coops, which are firsttransferred to the hanging area. The birds are removed from the coops and sus-spended by the feet from an overhead conveyor line. This is followed by slaught-ering, most commonly done by severing the jugular vein or by debraining. Thedead bird then travels through an enclosed area, known as the "blood tunnel",for draining and recovery of free-flowing blood. Recovery may be either from thefloor of the tunnel or from troughs installed for the purpose.
3. After. the blood tnnel the birds are scalded and mechanically de-feathered. Remaining pin feathers are next removed, either by hand or by waxstripping. The defeathered carcass goes to the evisceration room, where thefeet are cut off, the peritoneal cavity opened, and the viscera removed. Thevisceral parts are separated into edible and non-edible portions. The non-edible portions are added to the offal disposal system. Next, the head andneck are removed, the carcass thoroughly washed and then inspected. The finalstep is chilling or freezing, and packing either for marketing or for furtherprocessing.
4. Additional processing can involve thawing, cutting and boning, dicing,grinding and chopping, batter and breading, miIng and blending, stuffing,canning, final product preparation, packaging and shipping in various combina-tions.
5. Product flows for basic and further processing plants are shown inFigures 1 and 2, respectively.
SOURCES AND CEARACTER OF WASTES
6. Liquid wastes carrying varying amounts of solids are the major con-cern in this industry. Solid wastes, resulting mainly from housekeeping andscreening of effluents may also be of concern but this will depend upon in-plant practices and degree of solids separation. Gaseous wastes are generallyof no significance. The purely hazardous types of waste components, such asheavy metals and pesticides are not normally found in the effluents.

- 342 -
.PROCESSES WASTS1PRODUCT FLOW SY-PRODUCT FLOW LIQUID SOLID
BIRDS*
RECEIVING
AREA1KILLINGS BLOOD
RECOVERY
tNOIL
- -tm1
SCALDINGN
PICKING * im mmm m-m..mma , I rROEING
SEISCEAA N SOLIDGTREATMEN HAASTIN
PRCSPRTRO m ~ ~ DICAG
SCARCASSl WASH1Pi ALTERNATE S0LISS FLOW
AS SOLIDS.7ASTE(INCLUDES DRY CLEANUP)
CHILLING ... INSDI3BE,RINDKRING
PACKING - -- -
i. PLN. 2)IPREESWTE IM.800 SLUDGE
TWEAMEN WAWASTE
PLAN polr DrciPOSa ts
Figure 1 - T7pical Process Flow and Wasta Sources Ao. olr rcesn lns(7rom Raf . 2)

- 343 -
WASTER WATER,PROCESS AND MATERIAL FLOW RELATIVE FLOW*
~ J_RECIV-G m - - M m .
THAWING - - -MED LGE
SM - PERIODICCUT-UP - - - - -- - ..OPERATIONS
SM - PERIODICBONING
COOKING - - - - - MED - LGE
DICING* SM - MED PERIODICGRINDINIG, - - -BATTER ANDBREADINGII
MIXIiG, SM - MED PERIODICBLENDING
COOKING SM - MED* -------- m- ------- m
STUFFING - - ------ - --
CANNING MED - LGEEG'COOKING qm m I MED - LGE
V SMSTORAGE ----- **
IPREPAAIN
FREEZING & V SM PERIODICPACKAGING
I MATERIAL ORC01. PRODUCT FLOWSTORAGEWATWTE
*v SM VERY SMALL WASTE WATERSM -SMALLMED * MEDIUM TREATMENTLGE -LARGE
Figure 2. Typical Process Flow and Waste Sources for Further ProcessingPoultr7 Plant. (From Ref. 2)
- 344 -
7. The most significant parameters applicable to the liquid effluentsare the 5-day biochemical oxygen demand (30D 5 ) total suspend solids (TSS),oils and greases (0 + G), hydrogen-ion concentration (pH), and facal coliformorganisms. Amonia levels may occasionally be of concern.
8. All of the steps in the poultry plant processing contribute to thewaste loadings. These contributions include blood, offal, feathers, meat andfatty tissues, materials lost in processing, preservatives and caustic oralkaline detergents. In mst plants, raw wastes are subjected to "primary"treatment by discharge through catch basins, skiing tanka, air flotationsystems, or other devices. The basic purpose of this procedure is not wastetreatment per sa, but the recovery of by-products which can be profitablyseparated and marketed.
9. The strongest single pollutant is blood, generated in the killingarea. Feathers, dirt and manure will also be added at this point. Thosematerials not removed by drains or dry scraping are flushed to the sever duringcleaning. Overflows from the scalding and defeathering operations w.ll alsocontribute these same materials.
10. The evisceration process and subsequent washing generate a largevolume of waste water. The carcass and giblet washing, worker hand washers,side-pan washers and viscera flow-away water, and clean up operations, all con-tribute to this flow. Waste waters from the evisceration procedures will con-tain tissue and fat solids, gut, grease, blood and intestinal bacteria.
11. Another waste source is the carcass and gizzard chilling operation.This is made up of chiller overflows, dumping of chiller water at the and ofeach day, and equipment clean-up. The chiller wastes contain greases,meat andfat particles and blood.
12. Feathers and offal are discharged to flumes and recovered by screen-ing. The flume water and the water retained by these materials and drainingthrough the equipment eventually 'ecome a part of the total plant effluent.
13. The operations designated as "further" processing use waters to thawfrozen materials, to cook the poultry and finished products, to cool the freshlycooked products, and to clean the equipment. The birds and products come intodirect contact in some of these processes and thus contribute waste components.
14. Some plants have on-site rendering facilities to produce feed gradematerials from the feathers, offal, blood and other by-products. Generally,however, these by-products are taken off-site for .endering purposes. Renderingoperations are discussed in greater detail in the guideline titled "Meat Process-ing and Rendering Industry".
15. Waste water effluent streams for typical poultry processing plants areshown in Figures 1 and 2. Typical raw waste flows and characteristics are shownin Table 1. These data are for effluents following the application of in-plant"primary" treatment for by-product recovery.
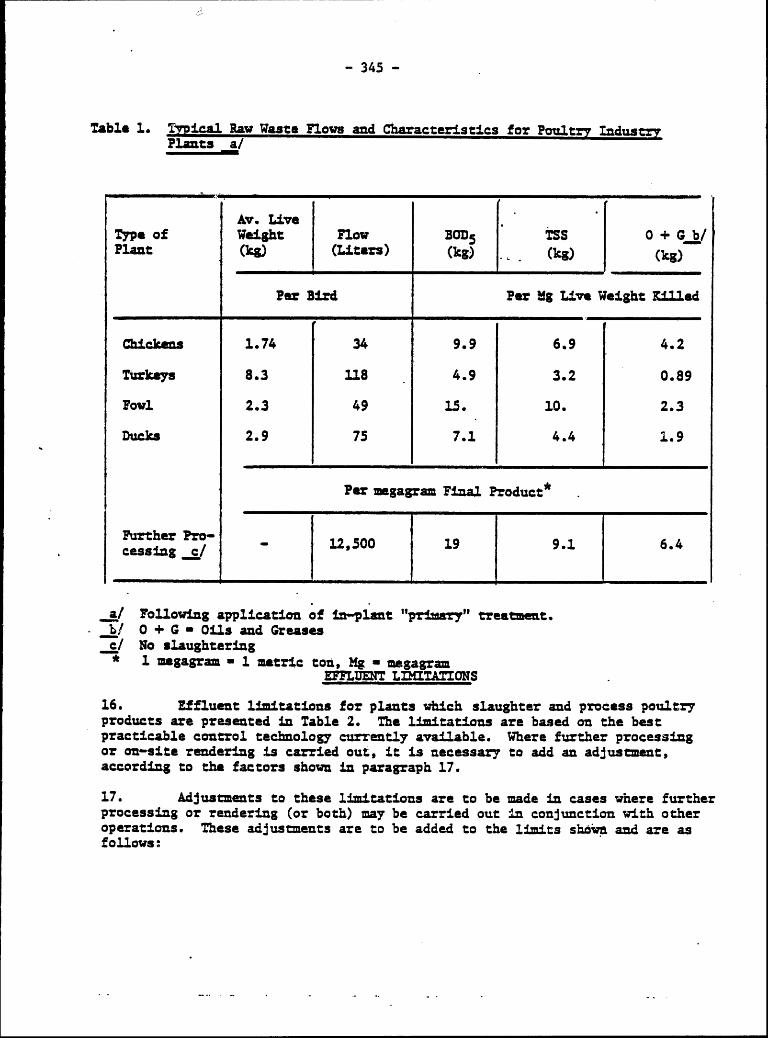
- 345 -
Table 1. Typical Raw Waste Flows and Characteristics for Poultry IndustryPlants a/
Av. LiveType of Weight Flow 30D5 TSS 0 + G b/Plant (kg) (Liters) (kg) (kg) (kg)
Per Bird Per Mg Live Weight KIlled
Chickens 1.74 34 9.9 6.9 4.2
Turkeys 8.3 118 4.9 3.2 0.89
Fowl 2.3 49 15. 10. 2.3
Ducks 2.9 75 7.1 4.4 1.9
Per megagram Final Product *
Further Pro - 12,500 19 9.1 6.4cassing C/
al Following application of in-plant "priary" treatment.b/ 0 + G = Oils and GreasesC/ No slaughtering* 1 magagram , 1 metric ton, Mg M megagram
EFFLUENT LITAIONS
16. Effluent limitations for plants which slaughter and process poultryproducts are presented in Table 2. The limitations are based on the bestpracticable control technology currently available. Where further processingor on-site rendering is carried out, it is necessary to add an adjustment,according to the factors shown in paragraph 17.
17. Adjustments to these limitations are to be made in cases where furtherprocessing or rendering (or both) may be carried out in conjunction with otheroperations. These adjustments are to be added to the limits shown and are asfollows:

�

347
CMqTRM AND :A7MMT_OF WASTES
is. Waste loads discharged by, the poult%-7 industr7 ma7 be reduced toacceptable levels through a combination of tachniques including fficientwater management, in-plantwasta controls, process control, and varrIng da-grees of biological treatment. Wastes may also be released to ymmeipal systems-provided that pretreatment measures are applied.
19. In-plant measures Include (a) monitoring flows and waste strengthsin all major water use areas; (b) control and reduction-of water flows at majoroutlets through use of properly, sized nozzles and pressure regulation; (a)confining bleeding procedures and recou ring all possible collectable bloodfor rendering; (d) shutting off unnecess=7 water flown during work breaks;(e) rousing water for makeup purposes whenever possible; (f) applying d%-7 offalbandling in place of fluming; (g) close monitoring of screening and handlingsyste= for offal and feathers to prevent discharge of these materials; (h)using dry cleanup prior to washdown of all floors and tables; and (i) trainingall employe,-m in appl7ing good water management practices.
20. B7-prodUct racovery of offal and feathers, when fluming is utilized,.is accomplished by the use of screens. These may be rotary,, tibrating orstatic t7pes, Vibrating and rotar7 screens are most frequentI7 used in thepoultry Industry. They can be useful not only for materials recovery but alsofor providing at least primar7 trea"mmmt for all plant wastes when screeningopenings are sufficiently fine. Grease and solids may also be re:moved by theuse of catch basins or air flotation systa=.
21. Several biological systems may be used for treatment of these wastes,followIng the application of in-plant primar7 treatment. Anaerobic processes,aerobic lagoons, and activated sludge s7stems are commonly used. The system,used must be adaptad to the individual plant on the basis of waste water vol=a,waste loads, equipment used, required waste load reduction, sludge disposal,odor problems and other factors,
22. Where a maxim= degree of treatment is required, chemical precipitation,sand filters, and microstralners have been effective.- A no discharge conditioncan be achieved through the use of spray or flood irrigation where sufficientareas of relatively flat land are availabla.
BIBLIOGPAM
1. Jones. Harold R. "Pollution Control in Maat, Poultr7s and SeafoodProcessing". Noyes Data Corporation. Park Ridge, N.J. and London(1974).
2. U.S. Enviranmmmtal Protection Agenay "Development Document for ProposedEffluent TAm4tations Guidelines and New Source Performance Standardsfor. the Poultx7 Segment of the Meat Product and Ran daring Process PointSource Categor7". Doc. EPA-440/1-73/031-6, Group 1, Phase II. Washing-ton (April 1975).
3. U.S. Envirortmental Protection Agency "Upgrading Poultry ProcessingFacilities to Reduce Pollution". EPA Technology Transfer Semd"ar Pub-lications. 3 Vols. Washington (JuI7 1973).
- 348 -
THE WORLD BANK JANUARY 1981
OFFICE 07 ENVIROMENTAL AFFAIRS
PULP AND PAPER INDUSTRY
EFFLUENT GUIDELINES
1. Paper is produced from raw materials containing cellulose fibers,which is the basic required component. While the greatest portion of thefibers are produced from wood, some are produced from recycled paper and fromnen-wood sources.
2. Several methods are used for pulping wood. In some processes it iscooked with chemicals under controlled conditions of temperature, pressure,time and liquor composition, with different chemicals and combinations ofchemicals being utilized. In other methods wood is reduced to a fibrousstate by machanical or by a combination of mechanical and chemical means.
3. To prepare the paper stock the pulp is resuspended in water, followedby refiners to refine the individual fibers into the state required to producethe strength needed in the paper product. The degree of fiber refining isgoverned by the type of pulp and the and paper product desired.
MANUFACTURING PROCESSES
4. Wood may be received at the pulp mill in any one of several differ-ent forms, including logs, chips, sawdust and other sawmill residues.
Wood Preparation
5. In the case of logs the bark is first removed, and this may,be doneeither by friction with other logs (in barking drums), by mechanical tools, orby water jets (hydraulic debarking). The barking drums may be operated eitherwith or without water, but better debarking is achieved and wood losses arelower when water is used. The clean logs are then chipped to produce woodfragments of suitable size (about 30 x 30 x 4 m). The chips are screened toseparate those which are either too small or too large, and transferred tostorage bins or chip piles for later use.
6. Fibers constitute the basic raw material in the manufacture of paper.These are composed mainly of cellulose, and may be derived from either woodor non-wood sources. The fibers represent some 50 percent of the dry weightof the fiber source, with the other major components consisting of hemi-callu-loses and lignina. The last two substances serve to cement the fibers together.Fibers are separated from the wood by means of the pulping operations, usingmechanical pulping, chemical pulping, or a combination of both. On a world-wide basis, approximately one-third of the paper production is from mechanicalpulps and two-thirds is from chemical pulps.

- 349 -
7. World-wide it is estimated that 5 percent of new pulp coms from
non-wood fibrous materials. Non-wood materials used for pulp, papers and
paper board production include agricultural residues (bagasse, cereals),
natural plants (such as bamboo and esparto grass) and cultivated fiber crops
(such as jute, flas, sisal and cotton fibers). The most widely used of these
are wheat straw, rice strawt bamboo and bagasse. The processes used for pro-
ducing non-wood materials are generally similar to those used in the wood-based
segments of the industry.
Pulp Preparation
8. Mechanical pulp is also known as groundwood pulp, since mechanical
action, in the form of large rotating grindstones, is used to process the
whole logs. The type of wood most readily or economically available usually
determines the groundwood process to be applied. Softwood generally does not
require pretreatment and has therefore been the usual raw material for the stone
groundwood process, as well as for some of the other processes. The high
energy requirements for grinding untreated hardwood may be offset by using pro-
ceases which incorporate pretreatment. Sawmill residues are also a source of
raw materials for processes which utilize wood chips.
9. The principal mechanical pulping processes include stone groundwood,
refiner groundwood, thermo-mechanical, cold soda, and chemical groundwood. The
process selected is based on the raw material supplied, type of fiber desired,
and strength of paper needed for specific uses.
10. In chemical pulping wood, the raw material is cooked in batch or
continuous digesters (large pressure vessels) with solutions of various chem-
icals. Digestion (or cooking) proceeds to the point at which non-cellulosic
constitutents are dissolved and the fibers can be liberated by "blowing" (i.e.
ejecting the chips) from the digester.
11. The principal chemical methods include acid sulfite, kraft and soda.
Softwoods are the primary raw materials of the sulfite process, while both
soft and hardwoods are used in kraft and soda pulping.
12. While the mechanical pulps have many desirable qualities for the manu-
facture of low cost. paper (where opacity is important), they normally do not
have sufficient brightness for the better grades. Brightness will also vary
with the characteristics of the wood raw material. Bleaching is therefore
necessary to satisfy the demands of better end paper products where mechanical
pulps are used for their production.
Pulp Bleaching
13. The most con bleaching agents for stone and refiner groundwoodsare hydro-sulfites and peroxides, used either individually or in sequence.Zinc hydrosulfita, sodium and potassium borohydride, hydrogen peroxide and sodium
peroxide are the specific chemicals particularly used. The same chemicals may
also be used for cold soda and chemi-groundwood pulps.
- 350 -
14. For chemical pulps the most frequently employed bleaching chemicals
are chlorine, calcim or sodium hypochlorite, and chlorine dioxide. Alkalies
such as caustic soda and calcium hydroxide are used to extract chlorinated re-
action products.
15. Oxygen bleaching of chemical pulps is a new process developed in
recent. years, and is currently used in a limited number of mills world-wide.
It is said to achieve a brightness and strength equivalent to that obtained
by more costly uthods. It has also been reported as being less susceptibleto brightness reversion.
16. Displacement bleaching, barely beyond the pilot plant stage, hasrecently been installed in two U.S. plants. In this process, chemicals are
displaced through a pulp mat rather than being conventionally mixed into the
pulp. Very rapid bleaching occurs, due to high reaction rates.
17. A variety of waste papers are deinked to produce a variety of pulps.Before waste paper can be used for this purpose it must be carefully classi-
fied into different groups, only some of which can be deinked, since (a) not
all. waste papers are suitable for deinking and (b) specific types of waste
papers are suitable only for specific types of reclaimed pulps.
18. Where the pulp is to be used away from the production site it is
dried for market purposes.. The pulp is reduced to a thick mat, on eithera Fburdrinier machine or a cylinder mold, subjected to mechanical pressure
in a series of presses, and then dried to air-dry consistency (about 10%moisture content). Wet market pulp, with a moisture content of 50 percent is
also produced in some cases. The process is the same as that for the dry pulp,
except that the final drying step is omitted.
19. Unbleached kraft and neutral sulfite semi-chemical (NSSC) pulps are
also produced in some plants. The unbleached pulps are mainly used for liner-
board (used as the smooth-surface facing in corrugated board), wrapping paper,
grocery bags, and shipping sacks. Semi-chemical pulps are used mostly as the
corrugating medium in corrugated board.
20. The paper mill may be close to or at a distance from the pulp mill.
An integrated paper mill is one that is located near a pulp mill, and the pulp
is transferred as a slurry directly to the paper-making process. The non-inta-
grated mill is usually located at some distance from the pulp mill and receives
the pulp in a dry or semi-dry form. The paper stock is prepared by resuspend-
ing the dry or semi-dry pulp in water to a consistency of 4 to 6 percent.
Stock Preparation
21. The stock is mechanically treated in the refiners to "brush" or cut
the individual fibers. This step produces the properties needed to give the
required strength to the paper. In cases where good formation is desired,

- 351 -
such as for fine papers, the stock is also pumped through a jordan, whichfurther cuts the fibers to the necessary length with a minimum of brushing.The amount of cutting and brushing varies with the type of pulp used and therequirements of the and paper product.
22. Chemical additives may be used for various purposes, either beforeor after stock preparation. For example, resin is used for sizing, whichprevents blotting of ink. Clay, calcium carbonate, and.titanius oxide aresome of the substances added as fillers where opacity and brightness of thepapers are important. A wide variety of other additives such as wat strengthresins, dyestuffs, and starches may be used, depending on end-use requirements.
Paper Production
23. The final paper or board product is formed on either a Fourdrinier,a cylinder machine, or a twin-wire machine. The Fourdrinier has a flat sheet-forming surface while the cylinder machine utilizes a cylindrical-shaped mold.The Fourdrinier is most widely used at the present time.
24. . In the Fourdriniar operation the dilute pulp flows onto a wire screen,on which the water drains off and the sheet is formed. A suction pick-up rolltransfaers the sheet from the wire to presses, which enhances the density andsmoothness and removes additional water. It then passes through a series ofheated hollow metal cylinders for final drying.
25. In the cylinder operation, revolving wire-mash cylinders rotate inone or more vats of dilute pulp, picking up fibers and depositing them on amoving belt. The pressing and drying procedures are the same as for the Four-drinier operation. The cylinder machine has the capability of producing heavieranlti-layered sheets, and therefore its principal use is in the manufacture ofpaperboard.
26. In the twin-wire operation the paper stock passes between two wirewebs. Water drains simultaneously from each side of the stock, resulting information of the sheet.
WASTE SOURCES AND CEARACTERISTICS
27. Pulp and paper production affects the environment in several ways,since gaseous, liquid, and solid wastes are produced from various parts of theoperations. The greatest environmental impact comes from the bleaching andpulping of chemical pulp. Mechanical pulping operations usually have lessimpact on the environment. The environmental impacts can be greatly reduced byrecycling and reusing most of the process waters and many of the chemicals backinto the process.
Air Emissions
28. The principal emissions of concern at kraft pulp mills are sulfurdioxide, total reduced sulfur (TRS) compounds and particulate matter. Hydrogen

- 352 -
sulfide, methyl mercaptans, dimethyl sulfide, and dimethyl disulfide as agroup contitute the TRS compounds. The most noticeable characteristics ofthe TRS group is its highly odorous nature.
29. The TRS group originates mainly in the sulfate cooking process -generally in the digester systems, the brown stock washers, the multiple effectevaporators, the black liquor oxidation systems, the recovery furnace, thesmelt-dissolving.tank, the lime kiln, and the condensate stripper systems.Sulfur dioxide originates from the sulfite process as well as from the neutralsulfite and bisulfite processes. Some sulfur dioxide is formed in the recoveryboiler of the sulfate process, as well as from burning coal or fuel oil inthe power plant. Principal sources are the recovery furnace, lime kiln, smeltdissolving tanks, and the power plant. Principal sources of the particulatematter are the recovery furnaces, the smelt dissolving tank, and the lime kiln.Fly ash particles consist mainly of carbonates and sulfates.
30. Chlorine emissions can occur, but are mostly of the "diffuse" type.This means that they are not located at any particular point source, but orig-inate as fumes from tank vents, wash filters, severs, and other similar sources.The gases are mainly chlorine or chlorine dioxide. Generally concentrations arenot significant, but provisions should be made for detecting and handling lethalconcentrations, should they develop. Hydrogen sulfide can collect in the stockchests. Good ventilation should be provided; work operations at that locationshould be carried out by at least two persons together in case of emergency.
Liauid Effluents
31. Water is a principal raw material in the manufacture of pulp andpaper, and is used extensively in each of the subprocesses. As it flows throughthe various process steps it is in contact with other raw materials and absorbsmany of the substances.
32. The parameters of principal importance for describing the degree ofcontamination in liquid effluents from pulp and paper mill operations include5-day biochemical oxygen demand (BD5); total suspended solids (TSS); color(not including groundwood, deinked, and non-integrated sub-categories); amonianitrogen (for amonia base sulfite and amnia base dissolving subcategoriesonly). In European practice chemical oxygen demand (COD) is also frequentlyused as a parameter. Typical flows, BOD 5 , and TSS for untreated wastes (theparameters of most importance in the Bank's activities) are shown in Table 1.
33. In the various chemical pulping procedures lignin and lignin deriva-tives enter into solutions from the wood during the cooking process. The spentcooking liquors containing these highly colored compounds are removed from thepulp in a washing sequence following the cooking process. The wash water ishighly colored. In spite or recovery procedates many mills continue to dischargewastes having a high degree of color.

�

354
34. Pulp and papermaking liquid wastes normally contain minor concentra-tions of aumonia, nitrogez4 and nitrogen compounds are often added to providenecessary biological treatment efficiencies in the plant waste treatment s7stem.In the same way, zinc compounds also normally occur in sub-lathal concentrationsand henca are of minor concern in pulp YnI11 waste dischn gas. Zinc concentrationsin excess of 5 mg/L in waters used for public supply can cause =desirable tasteswhich persist through conventional water treatment systems.
Solid Wastes
35. The characteristics of solid wastes from pulp and paper milI operationswiU very considerably from ane, mill to another@ For the average mill the dis-t%-ibution of total solid wastes will be as follows:
Wastmatar- sludges 45 percentAsh 25 percentBackv wood waste 15 percentPaper, trash 10 percentMiscellaneous 5 percent
Approximately 75 percent of the solid wastes will be organic in mature. Totalsolid waste generation for a typical kraft mill producing 200 tons of pulp perday, and typical paper z-111 producing 100 tons/day, are presented in Table 2.
Table 2 Solid*Wastas Generated in Typical Pulo and Paper Mill Operations a/
Blaachea NewsprintWaste Principal Kraft Pulp.Source, Constituents Mill Pner Mill
Log pond, wood Stones, mud, 500'ream bark
Boiler ash Ash, sand 1200
Knots, screen Wood slivers, 300rejects pulping Chem.
Racausticizing Lima, metals,rejects carbon 1300
Wastewater Fiber, sand, 1400 1200sludges fine clays
Paper, trash Varied 100 30
a/ From Reference No. 4b Producing 200 tons/da-7c/ Producing 100 tons/day

- 355 -
EFFLUENT LIITATIONS
36. Limitationa for air emissions discharged from pulp and paper milloperations ara sh~w in Table 3.
Table 3 - Gastous Emission Limitations - Pulp and Paper Mills
SourC al Particulate SulfuT-a Matter Dioxide
%c/kg ADP-N (Ament)
Bacovery Furnace System 0.075
LAmæ Ei 0.0125
Smalt Tank 0.0125
Bron Stock Washer 0.005
BLack Liquor Oxid. 0.005
*Condensate Stripper 0.005
Digester System_ 0.005
Mult. Eff. Evaporator 0.005
AU Sources 100 l 100_d/
al TRS m Total Raduced Sulfur Compounds, measured as H2Sbi/ ADP Air Driad ?upr/ Annual Arith. Mean, max. 24-hours = 1000 pg/Nm3
d/ Annual Geom. Mian, Max. 24-hours a 500 p/Nn3
37. Liquid effluent guidelines for bleached kraft, groundwood sulfite,soda, de±nk and non-intagrated paper m4il, unblaached kraft and semichemical
pulp mills arm presented in Table 4. In all cases, the limitations ara based
cn the best practicable control technology considered to be widely available.

- 356 -
Table 4 - Liquid Effluent Limitations - Pulp and Paper Mills(See Appendix A for descriptions of Waste Sources)
Waste SourceA/ BODO I TSS ZINC
Kg/XT produced/Day-
Bleached Kraft Pulp Mills
Dissolving Pulp 13.0 15.6Zfarket Pulp 7.1 10.3Finepaper Pulp 4.7 7.4 -BCT-- Pulp 6.4 10.3 -
Sulfite Pulp Mills
Papergrade Pulp 15.2 21.2 -Dissolving Pulp 22.7 26.2 -
Soda Pulp Mills 5.8 8.3 -
Groundwood Pulp Mills
Chemi-mech. Pulp 3.5 5.9 0.13Therm-Mech. Pulp 2.6 4.4 0.10Fine.7aper Pulp 3.8 6.4 0.14HN- Pulp 4.2 7.0 0.15
Deink Paper Mills 7.0 12.6 -
Non-Integrated Paper Mills
Fine Paper 4.2 4.2Tissue Paper a/4.7 4.7Tissue Paper (FWP)- 4.7 4.7 -
Unbleached Kraft Pulp Mills 2.8 6.0 -
NSSC - Amonia Pulps -- 4.0 5.0 -
NSSC - Sadium Pulps 4.4 5.5 -
Unbleached Kraft - NSSC Pulps 4.0 6.2
a/ In all cases pH = 6.0 to 9.0b/ Maximum of average daily values in any 30-day period. Mansmum daily
value not to exceed 2 times 30-day average.q/ BCT a Pulp used to manufacture paperboard, coarse papers, and tissue
papers.

- 357
d/ CM Pulp used to manufacture, coarse, molded fiber and newsprintpapers.
/ FnP - From vasta paper.f/ NSSC * Neutral sulfite semi-chemical process.
CONTROL AND TREAMENT OF WASTES
38. Although there are variations in equipment and technology betweenindividual mills manufacturing the sam types of products, such differencesdo not significantly change the characteristics of the wastes produced ineach situation. Currently available control technology will not usually re-quire major changes in production processes. Changes in piping, modificationof existing equipment, and other relatively minor changes will generally permitapplication of existing control technology.
Gaseous Wastes
39. Except in an occasional situation (such as unfavorable topography oradverse climatological conditions) sulfur dioxide is not a problem for kraftmills. Adequate control is possible by proper operations, especially of theliquor recovery furnace. Appropriate selection of auiliary fuels will alsobe a major factor in resolving discharges of the pollutant. Where dischargeconcentrations are too high fuel degulfurization, flue gas removal, processmodification, or some combination of these may be required.
40. The TES gases (can cause unpleasant odors from kraft mill operations.These gases (also referred to as non-condensible) originate in various parts ofthe mill, especially from the digestor evaporators and the foul condensatestripping. These are commonly collected in headers, scrubbed with an alkalisolution to remove a portion of the sulfur, and then burned. Incineration mostfrequently takes place in the lime kiln, where the TRS is converted to sulfurdioxide which, in turn, is largely recovered by adsorption on the lime dustand in the liquid in the kiln exhaust scrubber.
41. Particulates originatz in various elements of the mill operation,such as the recovery furnace, power boilers, lime kiln, exhaust, and others.Control and removal is best achieved by the use of scrubbers, electrostaticprecipitation and other similar means.
Liquid Wastes
42. Liquid wastes can be reduced in both volume and concentrations by acombination of in-plant control measures and end-of-the-pipe treatment.
43. In-plant measures include effective pulp washing, chemical and fiberrecovery, treatment and reuse of selected waste streams, collection of spills,and prevention of accidental discharges. Continuous monitoring of mill sewersshould be conducted, including the outfall, in order to receive rapid warning

- 358 -
of accidental spills. Storage basins, prior to treatment, will serve to absorbshock discharges and provide a more constant loading on the treatment facilities.Waste loadings from wet barking can be materially reduced by recycling the bark-ing water. These and other similar operating and housekeeping measures are veryeffective.
44. Eternal effluent treatment includes neutralization, primary treatmentto remove the settleable solids, and biological (or secondary) treatment to re-duce the effluent BD5 .
45. Large pieces of assorted materials, such as knots and rocks, are dis-charged into the sewers from process operations. Large items such as tools andhard hats may also occasionally be discharged to the sewers by accident. Screensare required at strategic locations withIn the mill to remove these materials.Screens may utilize mechanical or manual cleaning, depending upon the loadingseapected.
46. Bleached kraft pulp mill effluents are highly acidic, while effluentsfrom mechanical pulp mills and most paper mills are mildly acidic. Where the pHin the effluent requires only a small adjustment then a liquid alkali such ascaustic soda, or an acid, such as hydrochloric, can be used for neutralization.Where wastes are highly acidic some form of lime is used for this purpose.
47. Settleable solids are removed in a clarifier, usually a circular tankin which the particles are allowed to settle to the bottom. In some cases slowstirring is used to cause an agglomeration of particles. Conditioning chemicalsare sometimes added to enhance flocculation. At some mills settling basins,either following or in place of clarifiers, are used. These function entirelyby gravity, and have a detention time of up to 8 hours. The sludges collectedat the bottom of these units is withdrawn at regular intervals and handled byvarious disposal methods.
48. Biological treatment is now required for effluents from new mills inmany industrialized countries. Such treatment facilities are also being in-stalled at many older mills . This type of treatment accomplishes several purposes:it reduces the acute tozicity of the effluent and usually renders it non-toxicto fish; it reduces the potential of the wastes to cause taste, foaming, odors,and tainting of fish flesh; and generally creates an effluent suitable for dis-charge to most surface waters.
49. Where sufficient land is available for the purpose, aerated lagoonsare most often used to provide extended detention of pulp and paper mill effluents.This system will consist of one or more lagoons equipped with aerating devicesand providing a detention period of several days. As a rough guide, one cubicmeter of lagoon capacity will be required for each 30 grams of BOD5 in the in-fluent. As an average, the system will provide a 90% reduction in BOD , with atotal detention period of about 10 days. The activated sludge process a; alsoeffective but because of the higher capital and operating costs, its use isually limited to situations where sufficient land is not available. The activatedsludge process also requiroes a high degree of operator attention and skills.Other methods, such as oxidation ditches and trickling filters, have also beeneffective.
- 359 -
Solid Wastes
50. The largest volume of solid wastes is generated by the wastewatertreatment process. Land disposal, by lagooning or dumping, has been used ex-tensively in the past. This method is being used less and less because of odorsfrom decomposition of the materials, potential pollution of both surface andground watars, and the elimination of affected lands from future use. However,with the application of proper sanitary landfill measures this method shouldcreate few or no environmental problems.
51. Devatering and incineration of sludges are now receiving wider usage.Vaccum filtration produces a filter cake containing 20 to 30 percent solids.Chemical conditioning with ferric chloride, alum, or polyelectrolytes will greatlyaid poorly filterable sludges. Although costs are high, three types of incinera-tion are being practiced: burning in a specially designed incinerator, burning inthe bark boiler, and burning in a power boiler utilizing fossil fuels.
52. Many of the solid wastes can be utilized for useful purposes. Becausethey are organic in nature they can be used as a fuel, for agricultural, or otherpurposes. Fibrous sludges and barks are suitable for manufacturing wallboard androofing papers. It has been demonstrated that crop yields have significantly im-proved when fibrous sludges have been applied as a mulch. Ash from bark burningboilers is rich in plant nutrients, particularly potash. It can be used as asoil conditioner, particularly for acid soils. There are several other ways inwhich solid wastes can serve a useful purpose. It is often advantageous to en-list the cooperation of various goverment agencies, local industries, and othersin developing by-product recovery and utilization measures.
BIBLIOGRAPHY
1. United Nations Environmental Program. "Effluent and Emission Control inthe Pulp and Paper Industry". 2 Parts. Paris (1979)
2. U.S. Environmental Protection Agency. "Development Document for AdvancedNotice of Proposed or Promulgated Rule Making for Effluent LimitationsGuidelines and New Source Performance Standards for the Bleached Kraft,Groundwood, Sulfita, Soda, Deink, and Non-Integrated Paper Mills Segementsof the Pulp, Paper, and Paperboard Mills Point Source Catagory". Doc.EPA 440/1-75/047, Group I, Phase II. Washington (August 1975).
3. U.S. Environmental Protection Agency. "Standards Support and EnvironmentalImpact Statement - Vol. I: Prosposed Standards of Performance for Kraft PulpMills". Doc. EPA 450/2-76-014-a. Washington (September 1976).
4. U.S. Environmatnal Protection Agency. "Standards Support and EnvironmentalImpact Statament - Vol. II: Promulgated Standards of Performance for KraftPulp Mills". Doc. EPA 450/2-76-014-6. Washington (December 1977).
- 360 -
5. Beak Consultants Limited "Environmental Considerations for the Pulp andPaper Industzy". File K4386 (Draft). Vancouver, B.C. (September 1979).
6. U.S. Environmental Protection Agency. "Development Document for EffluentLimitations Guidelines and New Source Performance Standards for the Un-bleached Kraft and Semichemical Pulp Segment of the Pulp, Paper, and PaperBoard Mills Point Source Category". Doc. EPA-440/1-74-025-a. Washington(May 1974)*.
7. APHA, AWA, WPCF "Standard Methods for the Ezamination of Water and Waste-water". 14th Edition. American Public Health Association. New York(1975).
8. U.S. Environmental Protection Agency. "Guidelines for Lowest AchievableEmission Rates from 18 Major Stationary Sources of Particulate, NitrogenOxides, Sulfur Dioxide, or Volatile Organic Compounds". Doc. EPA 450/3-79-024. Washington (April 1979).
9. U.S. Environmental Protection Agency. "Water Quality Criteria". Doc. EPA23-73-033. Washington (March 1973).
10. Powers, Philip W. "Row to Dispose of Toxic Substances and IndustrialWastes". Noyes Data Corporation. Park Ridge, N.J. and London (1976).
11. Wasser, Abwasser, Abasserreinigung in der Papierindustrie, em. Prof. Dr.-Ing. W. Brecht und Dr.-Ing. H. L. Dalpke, Guatter-Staib Verlag, Postfach180, D-7950 Biberach/RiB 1, West Germany. (December 1980).

- 361 -
APPENDIZ A
PRINCIPAL GRADES OF FULP AND PAPER PRODUCTION
FROM WOOD CELLULOSE FIBERS (*)
1. BLEACE KRAFT: DISSOLVING PULP means the production of a highlybleached pulp by a process utilizing a highly alkaline sodium hydroxide andsodium sulfide cooking liquor. Included in the manufacturing process is a"pre-cook" operation termed prehydrolysis. The highly bleached and purifieddissolving pulp is used principally for the manufacture of rayon and otherproducts requiring the virtual absence of lignin and a very high alphacellulose content.
2. BLEACHED KRAFT: MAREET PULP means the production of bleachedpulp by a "full-cook" process utilizing a highly alkaline sodium hydroxideand sodium sulfide cooking liquor. Included in this subcategory are millsproducing papergrade market pulp as the only product.
3. BLEACHED KRAFT: FINE PAPERS means the production of bleachedpulp by a "full-cook" process utilizing a highly alkaline sodium hydroxideand sodium sulfide cooking liquor. This pulp is used to manufacture finepapers.
4. BRLVAD KRAFT: B.C.T. PAPERS means the production .of bleachedpulp, by a "full-cook" process utilizing a highly alkaline sodium hydroxideand sodium sulfide cooking liquor. This pulp is used to manufacture avariety of papers with clays and fillers contents less than eight percent.Included in this subcategory are mills producing paperboard (B), coarse (C)papers, and tissue (T) papers.
5. PAPERGRADE SULFITE means the production of pulp, usually bleached,by a "full-cook" process using an acidic cooking liquor of bisulfites ofcalcium, magnesium, ammonia, or sodium containing an excess of free sulphurdioxide. This pulp is used to manufacture a variety of paper products suchas tissues and fine papers.
6. DISSOLVING SULFITE means the production of highly bleached andpurified pulp by a "full-cook" process using very strong solutions of bi-sulfites of calcium, magnesium, amonia, or sodium containing an excess offree sulphur dioxide. This pulp is used principally for the manufacture ofrayo and other products requiring the virtual absence of lignin and a veryhigh alpha cellulose content.
7. SODA means the production of bleached pulp by a "full-cook"process utilizing a highly alkaline sodium hydroxide cooking liquor. Thispulp is used principally to manufacture a wide variety of papers such asprinting and writing papers.
(*) Adapted from References (1) and (5) of Bibliography.

- 362 -
8. GROUNDWOOD: CMI-MCHANICAL means the production of pulp, withor without brightening, utilizing a chemical cooking liquor to partiallycook the wood followed by mechanical defibration by refining at atmosphericpressure. This pulp is used to produce a variety of products includingfine papers, newsprint, and molded fiber products.
9. GROUNDUWOD: THEMO-MECHANICAL means the production of pulp, withor without brightening, by a brief cook utilizing steam, with or withoutthe addition of cooking chemicals such as sodium sulfite, followed bymechanical defibration by refiners which are under pressure. This pulp isused in a variety of products such as newsprint and tissue products.
10. GROUNDWOOD: FINE PAPERS means the production of pulp, with orwithout brightening, utilizing only mechanical defibration by either stonegrinders or refiners.
11. GROUNDWOOD: C.M.N. PAPERS means the production of pulp, with orwithout brightening, utilizing only mechanical defibration by either stonegrinders or refiners. This pulp is used to manufacture coarse (C) papers,molded (M) fiber products, and newsprint (N).
12. DEINK means the production of secondary pulp, sometimes brightenedor bleached from recycled waste papers in which an alkaline treatment maybe utilized to remove contaminants such as ink and coating pigments. Thepulp is used, frequently in combination with chemical pulp, to manufacturea wide variety of papers such as printing, tissue, and newsprint.
13. NON-nMTEGRATMD FINE PAPER means the manufacture of fine papersfrom wood pulp or deinked pulp prepared at another site. Fine papers arerelatively high in price, and include grades such as printing, writing, andtechnical.
14. NON-InTEGRATED TISSUE PAPER means the manufacture of tissue papersfrom wood pulp or deinked pulp prepared at another site. Tissue papersinclude grades such as facial and toilet papers, paper diapers, and papertowels.
15. NON-NTEGRATED TISSUE PAPERS (FROM WASTE PAPER) means the manu-facture of tissue papers from recycled waste papers. Tissue papers includegrades such as facial and toilet papers, paper diapers, and paper towels.
16. UNBLEACEED MAST means the production of pulp without bleachingby a "full-cook" process, utilizing a highly alkaline sodium hydroxide andsodium sulfide cooking liquor. This pulp is used principally to manufacturelinerboard, the smooth facing of "corrugated boxes," but is also utilizedfor other products such as grocery bags and cement sacks.
- 363
17. SODIM BASE NEUTRAL SULfITE SEMI-CEMCAL means the productionof pulp without bleaching utilizing a neutral sulfite cooking liquorhaving a sodium base. Mechanical fiberizing follows the cooking stage,and the principal product made from this pulp is the corrugating mediumor inner layer in the corrugated box "sandwich."
18. AMONIA BASE NEUTRAL SULFITE SEMI-CEMICAL means the productionof pulp without bleaching, using a neutral sulfite cooking liquor havingan aimonia base. Mechanical fiberizing follows the cooking stage, andthe pulp is used to manufacture essentially the same products as issodium base NSSC.
19. UNBLEACEED IRAPT-NSSC (CROSS RECOVE) means the production ofunbleached kraft and sodium base NSSC pulps in the same mill wherein thespent NSSC liquor is recovered within the inbleached kraft recovery process.The products made are the same as outlined above for the unbleached kraftand NSSC subcategories, respectively.
- 364 -
THE WORLD BANK OCTOBER 1980
OFFICE OF ENVIRO1M1TAL AFFAIPS
RODNTICIDES
GUIDELINES FOR USE
1. Several World Bank projects include transporting, storing and pro-cassing food grain. Minimizing losses due to pests, mainly rodents, is a majorconsideration.
2. Rodenticides are being used whose toxicity to mammals, including man,varies widely. This guideline describes the main rodenticides being used andgives the important characteristics of each product.
Choice of Rodenticide
3. The basis of choice for pesticide use should also be applied here.Biodegradability and toxicity are the two most important criteria.
4. The rodenticides have been separated into three different classes.
In Class I the products whose use require only normalprecautions.
In Class II the products whose use should be discouragedor severely controlled.
In Class III the products whose use should be banned.
Class I Normal Precautions
5. This class includes the anticoagulants, and the following rodenticides:Red Squill, Norbormide and Zinc Phosphide.
6. The anticoagulants are the safest of all rodenticides. Unfortunatelythe rapid spread of resistance to them among rats and mice has made necessarythe use of other types. The anticoagulants should be the first choice in areaswhere rodents are not yet resistant to them.
7. Red Squill, known also as Dethdiet (powder) or Rodine (liquid extract),is the powdered bulb of Urginea Maritima, a perenial growing in the Mediterra-nean area. It is extremely irritating to the skin and causes vomiting in mostmamals (but not rats). Despite reported cases of cattle, sheep and chickenpoisoning, the possible hazards to man are quite remote. Red Squill being anatural product, its potency is not uniform.
8. Norbormide has a good efficacy against rats with a low toxicity to

- 365 -
other maals. The other name is Raticata.
9. Zinc Phosphide (Zn 3 P2 ). This gray powder with high melting pointis widely used. Stable when dry, but decomposes slowly in moist air. Reactsviolently with acids to form inflammable phosphine gas (PR3 ) giving off thecharacteristic garlic-Like odor. While highly toxic to domestic fowl, thisproduct has a good safety record.
Class II - Severe Control
10. These products should only be applied by trained operators under theconditions specified by the manufacturer. This class includes the followingproducts:- sodium fluoroacetate, fluoroacatamide and strychnine.
11. Sodium fluoroacatate (CH2 FCOONa). Odorless, tasteless and fastacting, this chemical is extremely toxic to warm-blooded animals. It actschiefly on the heart with secondary affect on the central nervous system. Thepossession, transport and sale of this compound are strictly regulated in theUS. Its use should be restricted to areas (i.e. locked warehouses and sewers)to which access by unauthorized persons or by animals can be prevented complete-ly. The acute oral LD50 (rat) is 0.22 mg/kg. One trade name is 1080.
12. Fluoroacetamide (FE2 C - CO - NE2). It is a highly toxic materialand all precautions that apply to sodium luoroacetate should also apply toit. Its acute oral LD50 (rat) is 15 mg/kg. Trade names are:
1081FussolFluorakil 100
13. Strychnine. This alkaloia is extracted from the seeds of nux vomica.Mainly used as strychnine sulfate in poison baits for jackrabbits, coyotes andwolves. It is only moderately successful in rodent control but can be quitehazardous to human beings and domestic animals. The LD50 for man is 30 - 60 mg/kg.
Class III - Banned Usage
14. The products in this class should be banned because they are toodangerous for man and/or the environment. They include arsenic trioxide,phosphorous, thallium sulfate, naphtylurea (ANT) and gophacide.
15. Arsenic trioxide. This chemical has been used for many centuries andis very effective against rodents. It is also dangerous to man as a toxicantand a carcinogen.
16. Phosphorous. White phosphorous is sold in many LDCs in a 1 - 2% pastaformUlation as a cockroach poison and a rodenticide. This has led to poisoning,especially in children eating the formulation. A dose of 15 mg is highly toxicand one of 50 mg is nearly always fatal.

- 366 -
17.. Thallium sulfate. It is highly toxic to rodents but also to man anduseful animals that can be poisoned if they eat other animals already poisonedby thsiu. It is rapidly absorbed through the skin and the gastrointestinaltract and its elimination from the system is very slow. There have been agrowing number of accidental poisonings coming from its use in householdpesticidal baits. In the US, only government agencies can use it.
18. Naphytylthiourea (AMTM). A 2% impurity of this product is 2-naphtylamine, itself a known carcinogen.
19. Gophacide. This organic phosphate is highly toxic to rats and othermammaels with ready absorption through the skin as an increased hazard. Taxi-cological studies have also shown that gophacide may have delayed neurotoxiceffects.
New Anti-Coagulant
20. On December 5, 1979, the US EPA announced that it had approved a newpoison that kills rats immune to the lethal effects of WARFARIN or other anti-coagulants. The new toxin made by ICI Americas, Wilmington, Delaware is usedin 4 different baits to control rats and mice and-is called "TALON". This pro-duct should be kept away from children.

- 367 -
TEE WORD RAN JANUARY 1981
OFFICE OF ENVIRONMETAL AFFAIRS
CRMIB RUBBER PRODUCTION
EFFLUENT GuIDEL S
1. Solid rubber, for the fabrication of various products, is producedboth as a natural material extracted from plant life, and synthetically fromthe chemical reaction of specific materials. This document will confine it-self to natural rubber only, since this is the type usually produced incountries to which Bank projects are directed.
2. Although many variaties of plants are known to contain naturalrubber, only a few of these are considered to be of commerical significance.Today, the major portion of the worlds supply of natural rubber comes from asingle species of tree - the Hevea brasiliensis. Although native to theAmazon Basin, it is now cultivated in tropical regions throughout the world.
3. The most favorable rubber growing areas are located within a rangeof 10* to 15* latitude on either side of the equator, where rainfall is heavyand evenly distributed, and the temperatures range from 200 to 32* C. Thelargest producers of natural rubber, as of 1976, were Malaysia, Indonesiaand Thailand. Other significant producers included Sri Lanka, India, Liberia,Nigeria, Brazil, Cameroon, Ivory Coast, Cambodia and Burma. These countrieswere producing about 95% of the world supply.
PRODUCTION PROCESSES
4. Natural rubber is marketed in a variety of forms and grades, ofwhich the chief forms are categorized as latez, crude dry rubber, and crepe.The major share of production is for crude dry rubber.
5. Latex is obtained from the tree by cutting into the latex vesselsin the bark, using a procedure called "tapping". A spout is inserted at theend of the cut (which slopes downward), and the latex flows through the spoutand into a cup attached to the tree. A small amount of preservative (sodiumsulfite) is usually placed in the cup to prevent coagulation. Three to fourhours after tapping, the later is collected in buckets and carried to a re-caiving station.
6. At the receiving station the later is strained to remove particlesof bark, dirt and other foreign matter and then transfarred to the factoryby tank trucks or other means. More preservative is added to assure that thematerial will arrive at the factory in a well-preserved liquid condition.Sodiun sulfite is generally used to preserve latex destined for dry rubberproduction.
- 368 -
7. In recent years new developments have been made in preparing, pack-ing, and grading natural rubber. The tendency has been towards small compressed,neatly wrapped bales marketed on the basis of technical specifications in onlya few grades.
8. The material received at the factory is treated by coagulation inorder to separate the rubber. Acetic and formic acids are the reagents mostcommonly used for this purpose. The latex coagulates into thick curds at thispoint. The solid forms of rubber are produced by various processes in whichthe rubber coagulum is reduced to small particles, washed thoroughly and driedas a crumb, either in hot air tunnels. or extrustion driers.
9. In many of the plants the coagulum is mechanically reduced to smallparticles by a rotary knife cutter or similar chopping or shredding device.The chopped granules are dried in deep bed trays by a forced air draft, atfairly high temperatures. Following drying the granules are compressed intobales and wrapped in plastic for marketing.
10. The Rubber Research Insitute of Malaysia has developed a mechano-chemical granulation process for the production of crumb rubber. The processuses conventional equipment but combines this with the application of a verysmall amount of castor oil(0.4 to 0.7 percent) as a crumbing agent. The re-sulting crumb is easily dried in hot air circulating driers. The product ismarketed as "Reveacrumb".
11. Crumb rubber is generally marketed in bales weighing about 35 kilo-grams. Crumb rubber is also frequently referred to as "technically specifiedrubber" and as block rubber.
WASTE SOURCES AND .CARACTERISTICS
12. Large quantities of water are used for washing, cleaning, and dilu-tion purposes in rubber processing operations. Some H2 S odors may be emittedfrom stabilization ponds used to treat the effluent, but under normal conditionsthere are no gaseous emissions of any significance.
13. Liquid effluents consitute the most important source of pollutionfrom natural block (crumb) rubber production. The most important parametersare biochemical oxygen demand (BOD), chemical oxygen demand (COD) total sus-pended solids (TSS), total solids (TS), ammonia nitrogen (NE3 - N), and hydro-gen-ion concentrations (pH). The quality of effluent from a typical plantis given in Table 1.

- 369 -
ABLE 1 - Characteristics 'of a Typical Waste from Natural Block(Crumb) Rubber Production
Parameter Concentration inEffluent
30D(a) 1,140 Mg/L
COD 1,620.Mg/L
Total Susp Sol. 230 Mg/L
Total Solids 995 mg/L
N33-9- 55 Mg/L
pH 6.3
Flow (b) 54 L/T Produced
(a) 3 day - 30' C.(b) Estimambased. on Malaysia experience, covering 86Z
block rubber and 14% latex concentrate production.
EFFLENT LIMITATIONS
14. Liquid effluents discharged from block rubber plants should conform
to the limitations given in Table 2, below.
TABLE 2 - Effluent Limitations for Natural Block (Crumb) Rubber Plants
Parameter I Limitation
BOD (5-day, 20C) 100 Mg/L
COD 225 Mg/L
Total Susp. Sol. 100 Mg/L
NE3-N 15-20 Mg/L
pH 6 - 9

- 370 -
CONTROL AND TEEATMNT OF WASTES
15. As shown above, wastewater from rubber processing contains organicmatter and nitrogenous materials at sufficiently high levels to cause pollu-tion if discharged to receiving waters without prior treatment. Measures toreduce effluent concentrations include a combination of internal measuresbefore treatment, followed by treatment systems.
16. Internal measures prior to treatment could include, but not belimited to:
a) Application of good housekeeping practices.
b) Use of rubber and/or settling trays to recoverlost rubber particles and reduce solid matterin the effluent.
c) Proper miming and combining of all effluents toassure maximm dilution prior to treatment.
17. Simple biological treatment, such as aerobic-anaerobic pond systemshave been found effective in treating these effluents. Such systems have beenfound to remove 80 to 95% of the BOD, 80 to 85% of the COD, 80 to 95% of thesuspended solids, and 40 to F0% of the ammonia nitrogen. Such a system re-quires a large land space and hence may not be practical for factories situ-ated in urban areas.
18. Land disposal of effluent has also been used successfully, especiallywhere the land is planted with mature rubber or oil palm trees. While thistechnique has not been extensively used thus far it has been found to have thefollowing advantages:
a) Increases the yield of both rubber and oil palmin the range of 11 to 19%.
b) Results in cost savings for fertilizers whichmight otherwise be required.
c) Supplies moisture to the land, from the waterin the effluent, during periods of low precipitation.
d) Eliminates direct discharge of effluents intowaterways.
19. Rotating bio-disc systems have also been used successfully for thispurpose. Average reductions of 78% in BOD, 67% in COD, 93% in ammonia nitrogen,and 75% in total nitrogen have been achieved by this method.
20. Experimental work is now underway on the use of water hyacinth(Eichhornia crassipes) to remove a major part of the pollutant in blockrubber/concentrate effluents.

- 371 -
21. Other experimental work-is underway to produce methane from anaerobictreatment of the effluent.
BIBLIOGRAPHY
1. "Summary of Proceedings of the Twenty-Fourth Assembly". InternationalRubber Study Group. Jakarta, 28-31 October 1975.(Printed by Bell, Logan& Carswall, Ltd., Belfast)
2. Polhanus, Loren G. "Rubber-Botany, Production and Utilization". LeonardHill (Books) Ltd., London and Interscience Publishers, Inc., New York (1962).
3. "Rubber and Energy Crisis". The Economist Intelligence fUait, Ltd., London(1974).
4. "The Vanderbilt Rubber Handbook". G. G. Winspear, ad. R.T. Vanderbilt Co.,Inc. New York (1968).
5. "Rubber Technology". M. Morton, ad. Second Edition. Van Hastrand ReinholdCompany. Now York (1973).
6. Sittig, Marshall. "Pollution Control in the Plastics and Rubber Industry".Noyes Data Corporation. London and Park Ridge, New Jersey. (1975).
7. Rubber Research Institute of Malaysia. "Annual Report - 1978" pp. 201-203.Kala Lumpur (1979).
8. Rubber Research Insituts of Malaysia "Annual Report - 1975" pp. 158-159.Kuala Lumpur (1976).
9. "Treatment of Effluents from Rubber Processing Factories". InternationalRubber Conference. Kuala Lumpur (1975).
10. "Land-Disposal of Rubber Factory Effluent: Its Effects on Soil Propertiesand Performance of Rubber and Oil Palm". Proceedings of the Rubber ResearchInstitute of Malaysia Planters' Conference, 15-17 October 1979. pp 436-457.Kuala Lumpur (1979).
11. "Technology and Standards for Treatment of SMR Block Rubber Effluent". Pro-cedings of the Rubber Research Institute of Malaysia Planters Conference,17-19 October 1977. pp. 201-214.Kuala Lumpur (1977).

- 372 -
TE WORLD BAMK OCTOBER 1980
0FICE OF ENV AFFAIRS
SECONDAEY ENVIONTAL EFFECTS OF IDUSTRIAL PROJECTS
1. When.the Bank is financing a project in the-heavy industry or in alabor intensive industry, secondary effects on the eaviroumnt will be im-portant and mst be trYan into account.
2. These effects are the consequences of a population inflax in thetown or the region and they include water and power distribution, sewagecollection and treatment, bousing, schools and roads.
3. In developed countries, the ratio between employment in the newplant and new employment in the region is usually one to seven, or one toeight. Although the conditions are different in LDC's, the sam ratio canbe applied. If satellite industries, like mechanical repair shops for in-stance are less likely to be created, the necessity of additional serviceslike banking or schools is apparent.
4. As an example, a steel plant employing a little less than 1000people was built close to a town of 6000. Five years after start up, thetown population had jumped to 42,000, with appalling results for the environ-meant and the,quality of life.
5. Urban Development Planning or Financing is the field of specializetdepartments in the Bank. They should be consulted on problems likely to arise.The goal of this guideline is only to draw the attention on the potential fortrouble and to suggest economical solutions in certain areas, thus preventingthe expansion of urban slum.
6. In the forecasts for water and power consumptions, not only theplant requirements but also the town future uses should be taken into consid-eration. A common water intake and pumping station or a common power linewhenever possible, will usually prove more economical for both parties.
7. Sewage collection and treatmnt should receive special attention.In the case of the steel plant mentioned above, the town bad no treatmntwhatsoever with direct discharge into a river estuary. The assimilative capacityof the estuary was sufficient at the time but totally inadequate for a town of42000. The steel plant did not help by discharging untreated industrialsevage into the same river. After a few woaths the river was dead, the beachesclose to the estuary became unhealthy and their access bad to be forbidden.Finally,commercial fishing in the bay stopped.for lack of fish.
8. A pretreatment of the industrial effluent followed by treatment ina sewage plant common to both the town and the plant has advantages .for bothparties. Usually both the costs for iLdustrial wastes eontrol and for municipalsewage treatment are decremsed when this solution is adopted.

- 373 -
9. Dom tc and industrial garbage diUposal has created problms inthe stecl plant project. The disposal should be addreassed in the plarningstages and a gultable dump arta identified.
10. FinalUy, adequata housiug, schools, as vall as road and transporta-tion should be provided.
ii. F=ancing of these additlonaL expenes i, agad complicate thesituation. The industrial projact caot a"a be saddled with costs forirovlng the general Infragtructure of the tow or the region. On the otherhand, the town may not havs the necesary rusources to face important expend-±iures.
i9

- 374 -
TI WOLD BANK OCTOBER 1980
OFFICE OF ENT AIOMTAL AFFAIRS
SLAUGRTERBOUSES
PART I - INDUSTRIAL WASTE DISPOSAL
1. Slaughterhouses generally limit their operations to killing ofcattle and hogs, and processing of carcasses for consa=r markets or prepa-ration of a variety of products. Sheep, lamb and calves are generallyhandled in the sme manner. Such a facility may be a simple installationlimited to k1iling and marketing of carcasses only, or it may be part of alarge meat processing installation.
2. This guideline will be confined to slaughtering operations forlarge animals only. Separate guidelines have been prepared to cover meatprocessing and rendering and to cover the poultry industry.
INDUSTIAL PROCESS
3. For a simple slaughterhouse operation, the steps generally involvedinc:ude holding in stockyards or pens, killing, blood removal, hide removalor hog dehairing, evisceration, triaing, and cutting for market. Simpleslaughterhouses are small .to medinm in size, with small installations havinga live weight kill (LRK) of under 45 magagrams per dat -while medium installa-tions may range as high as 350 magagrams LWK per day.*
4. A complex slaughterhouse is one which carries out at least three by-product operations such as paunch and viscera handling, blood processing, hideor hair processing and rendering. Most complex slaughterhouses are mediu tolarge in size, and will normally have a LK above 350 megagrams per day. Aprocess flow diagram is shown in Figure 1.
SOURCES AND CHARACTER OF WASTES
5. Liquid wastes, carrying varying amounts of solids,are the major con-cern in this industry. Volumes of solid wastes, produced mainly from screeningand housekeeping, will depend upon the degree of separation and by-product re-covery practiced at each individual plant. Other than odor problems, gaseouswastes are not significant. The purely hazardous types of waste components,such as heavy metals and pesticides, are not normally found in the effluents.
6. The most significant pollution parameters are the 5-day biochemicaloxygen demand (BOD 5 ) total suspended solids (TSS), oils and greases (0 + G),hydrogen-ion concentration (pH), and fecal coliform orgaanisms.
7. Odors originate from various sources, and generally result from bac-terial activity on organic matter. Putrescible substances result from unloading
* 1 Mg I 1 megagram - 1 metric ton

�

376..........
and ~~cm. 01 "JZ;Tgcm, m~= ~21.rng and storage,9 blood callect:i= andstoraza,9. and ~raca pilan of solid trash or &artaga.
8. Tha glaugåter-läg operaticu in the larzact sinxlc llqu:Ld vactain tha maat Ind=t=yq and bload is the major c=t=:Lbut:Lon. Cattla. for ex låtcantaln ap ta 23 kg o£ blood per, anå=l, acud only 70 parcent, is t7pically re-=verad for furthar p=cass:L=g. Tha- stmumh cantentst when vashad outg co=tituta=otbaz, scurca. Howv~m&* tUs matudål U often Inolatad and aith procasgadar ha~4 ta landf-11 2 g end tb= docc not cout=ibut to the v»ta effluent. Otherpol-at:t= sou=cen stzachtaz-lag opara~ Includa ca=ss wash-Ing. alon& withVUGGra. =d offal procaccing. la som plants hidas are =catad by a=scula dipplzggprudnaång spant a=*=-fc solutions which- e= pt~at a spcc-(--kl d:Uposal prablem.
9. R~ w~ta ~ etazej for a typ:Lml. slaughterhousc, operation, arepresentad In Table. la
Table 1. Týmlcal Uv *asta Cha.,actax-lat:Lan - Slauzhtarho«a Opc=atlmg&o
Flow BOD TSS O+G alTypa, of (Uters)
Per magagram Liva Välght Killed
51=pla. plant 5,330 6.0 5.6 2.1
complaz Planzi: 79383 11 9.6 5.9
0 Ollå and Graauo
UPLUM. LMTA=ONS
10. Efflumt 11+m<t^ýtjop for slaughtarho7~ vastes, based tad=logyC=&eatly knewn to be availablet ara presentad, i= Table 2.
Table 2. Mazim~ Daily Llquid Mfluent TA"<tacjcmu Slaughtarh=na Operations
Type at BOD5 TSS 0+<; al PRPlant ). UU1 (kg)
Simpla pla=Rýc/ 0.1. 0.20 0.06 6 - 9
cofflax P121M 0.21 0.25 0.08 6 - 9
al 0 + 0 m OUs and Graasesb/ Per mega¥& Live We±ght Ulled
MFN Yccal Coliform count less th= 4.00 per 100 mL. (m:Lllil«tters).

- 377 -
11. For installations where the kill is less than 50 head of cattle (orthe equivalent weight in other animals) then these limitations need not beapplied. The appraisal or supervision mission should, however, be certainthat adequate precautions are taken to avoid irreversible damage to the en-vironment and the creation of any occupational health problems.
I CONTROL AND TREATMENT OF WASTES_
12. Odors are the only significant air pollution problm connected withthis industry, and these can be controlled by air scrubbers. Scrubber watersay be recycled in most cases.
13. Liquid waste discharges can be reduced in volume and concentrationthrough effective water management, in-plant waste controls, process modifi-cations, and by the use of treament systems. The wastes may also be releasedto municipal sewers provided that certain pretreatment measures are taken priorto discharge. These measures will depend upon local regulations and the degreeof treatment provided by local facilities.
14. In-plant control techniques include the use of screening, skimming,or settling (alone or in combination) to reduce the discharge of solids. Be-cause these solids, to a large degree, can be processed into saleable by-pro,-ducts, this primary etraent is routinely employed in most plants. Excesssolids can be hauled to a landfill. Where possible, measures should be takento prevent useful materials (such as blood, paunch manure, pieces of tissue,etc.) from reaching the floor, in order to reduce general cleanup operations.This conserves water and reduces effluent volumes. Catch basins should be usedfor separation of greases and other solids.
15. Biological systems can generally be used to treat slaughterhousewastes, particularly where in-plant primary treatment for recovery of usefulsolids is being applied. Secondary treatment, such as anaerobic processes,aerobic lagoons, activated sludge and high-rate trickling filtration are thetechniques most frequently used. If additional treatment is required, theeffluent may be subjected to slow sand filtration, aicrostraining, spray-irrigation, ion-exchange or other tertiary treatment systems.
16. Where arsenic dipping is used for treating bides, then measures willbe required to protect the health of workers and to prevent spills outside theplant. .Special measures nst be taken for the safe disposal of spent arsenicsolutions.
BIBLIOGRAPHY
1. "Information Sources on the Miit Processing Industry". UN Industrial De-velopment Organization. Doc. UNID0/LIB/SER.D.1/Rev. 1. New York (1976).
2. Jones, arold R. "Pollution Control in Meat, Poultry and Seafood Process-ing". Noyes Data Corporation. Park Ridge, N.J., and London (1974).

- 378 -
3. Lv, Albert. "The Meat Handbook". AVI Publishing Co., Westport,Con. (1963).
4. U. S. Eviroanntal pratection Agency - "Developm~nt Docuent for Ef-fluent Lmitations Guidelines and New Source Perforzmance Standarda forthe Red Mast Processing Segent of the Meat Product and Rendering Pro-cessing Polnt Source Category". Doc. EPA-440/1-74-012-a. Washington(February 1974).
5. U. S. Envronntal Protection Agency - "Upgrading Meat Packing Facl-Ities to Raduce Polluta". EPA Techology Transfer Sinar Publica-tion. (3 Vals.) Washington (October 1973).
6. Mbodla, S.P. and .?. Greenfild - "Treatment of Abattoir Effluent byTrckling Fltration". J. Water pollution Control Federati. V.50,pp 2741-2751. Wash~ngton (December 1978).
1

- 379 -
THM LD W AO BA OCTOBER 1980
OFFICE OF ENVIRO N ATAIRS
SLAUGEHOUSES
PART II -. PLANT DESIGN AND EQUIPHMT
1* most slaughterhouses conform to certain basic design principles,irrespective of minor variations in layout and equipment. The modest through-put of some slaughterhouses calls for a simple structure, but regardless ofsize it must be suitably equipped to function efficiently and economicallyunder good sanitary conditions. Knowledge of local conditions, consumer habitsand butchers' interests anst all be considered in the. final planning. Opera-tional. problems can be avoided if basic requirements are considered equallyapplicable to both small and large installations.
2. A fir specializing in slaughterhouse design, construction and opera-tions should be engaged to prepare necessary layouts and drawings, togetherwith the construction and engineering specifications required for tender docu-mants. The designs should be prepared in close collaboration with the Nationaland local health authorities. Following competitive bidding, a contract forthe construction of the slaugherhouses can be awarded. The award may be As aturakey if this is deemed to be most advantageous for the client. The contractshould include not only the construction of buildings but also the supply ofall plant and machinery, and the engineering supervision required to initiateoperations. Ancillary facilities, utility services, administration offices andstaff amenities should also be included in the design and construction.
3. A contract for the construction of one small slaughterhouse unit wouldprobably be of interest to local contractors only, as would the supplying of thenecessary equipment and materials. However, a contract for several units wouldbe of international interest and would receive much wider attention. Many largefirms manufacturing slaughterhouse equipment and machinery can provide a widerange of services through design offices staffed by specialists to cover allphases of the planning. Competitive proposals should be obtained from such firms.
LOCATION AND SITING
4. A slaughterhouse should be sited in a strategic location for live-stock procurement either from the local market or from supplies delivered bytransport. The availability of good commuications and transportation is alsoassential for providing easy access to consumer markets. The location shouldbe away from built-up areas or those zoned for future residential development.Labor and technical services, adequate power and water supplies, and easy meansof effluent disposal should also be readily available.
- 380 -
5. The site area for a small slaughterhouse should be not less than3 hectares for any size plant, however, it is desirable to appropriate asmach land as possible in the beginning to provide for (a) possible futureexpansion, (b) the holding of excess livestock in an emergency and (c) readymeans for disposal of effluent, particularly paunch contents and other solidwastes. There is little advantage to locating an installation adjacent toa receiving body, of water from the standpoint of waste disposal. Wasteaffluents are subject to specified limitations, as discussed in Part I ofthis G41ide-le in order to protect receiving water quality.
PLANT BUTDNS
6. The slaughterhouse should be designed and constructed to meet thesanitary standards established by the National and local Public Health, Vet-arinary, and other authorities involved. The main building should be a singlestory structure of simple design to contain separate slaughter sections forcattle and for hogs, including provisions for an efficient meat inspectionservice. Carcasses from slaughter floors aire to be carried on rails to ahanging hall which is also part of the main building. A small partitionedarea is to be provided to serve as a detention bay for holding doubtful car-casses awaiting further mination by meat inspectors.
7. If the receiving market is limited to purchasing fresh meat only,and shipment is made on an "as killed" basis, then chill room and refrig-aration plants need not be included in the investment cost. However, it isdesirable that provision be made for chIlling carcasses, in case of marketingor other changes in the future. Therefore, space should be provided in thehanging room area to install a chill room unit. Loading facilities for carcassesand one for offal and other "dry" wastes should adjoin the carcass hanging hall.A section of the main building, nant to the slaughter floors, is to b* partitionedoff for cleaning and washing the hides.
8. All slaughterhouse building walls are to be finished on the insidewith a flat, washable surface. Floors should be of concrete with a minimslope of l.5% to standard drains and should be surfaced with non-slip, impact-resistant materials. Ample ventilation is required throughout the building andall openings to the outside mast be screened. Working and inspection areas mastbe provided with adequate illumination.
9. If all intestines, lungs, blood and remains are sold for off-site useand consumption, very little remains for conversion as by-products apart fromany condened carcasses. However, it is necessary to provide for whatever asMtbe stored or otherwise handled and a separate building is considered best forthis purpose. A structure having high walls, a smooth impervious interior finish,and a solid concrete floor with suitable drainage leading to the catch basinshould be provided. The same building can also accommodate a small maintenanceworkshop, the boiler, and laundering facilities for the industrial clothing. Awell ventilated building will be required for the salting and storage of hides.The administration offices, change rooms, showers and toilets require separate

- 381 -
buildings suitably finished and equipped. This builng should be simple andutilitarian.
10. To "iniIn.ze fly nuisance and insect infestation, anImal receivingand holding aras for livestock awaiting sluaghter should be located well awayfrom the slaughterhouse. The two are to be connected by a race or crush. Thelivestock pens will have a roof for shade, and concrete floors with drains lo-cated outside the enclosures. The pens should be surrounded by curbs to pre-vent the spread of manure and liquids beyond the holding area. If the pensare to be washed down, a manuri ttap wil be -re4iiied- to recoveir solids. A drink-ing troughiiii piped iiiply of water shiiild b placedin eachjlding pen.A small quarantine enclosure is required for isolating sick. animals.
PLANT OPERATIONS AND EQUIPMENT
11. Complex and costly machinery is not required to process the modestthroughput of small plants, and significant savings can be achieved by localprocurement of many equipment items. For example, hanging sails and support-ing steelwork can be fabricated without difficulty. Guillotine doors, work-ing platforms, paunching tables, offal tanks, paunch and hide tanks can allbe constructed locally.
12. All. equipment in contact with edible products should be stainlesssteel, while working platforms and other heavy equipment should be galvanized.Tubular legs are considered best for all tables, platforms, and tank stands.Angle irons which collect dirt are to be avoided and wood should not be usedfor any purpose in the production areas. Wash basins and knife sterilizersmust be strategically located in the slaughter and dressing sections.
13. A strict routine of preventive maintenance mast be established andfollowed. Equipment manufacturers are to supply details on the routine main-tenance required for the items which they furnish, including a list of recom-manded spare units and parts to be acquired. Where several slaughterhouses areto be constructed in a region, consideration should be given to standardizingparts and equipment, and to the establishment of a central workshop and spareparts inventory for replacing or repairing large items 3uch as hoists, electricsaws, and motors. In case of a mnechanical breakdown at any of the regional in-stallations, the spare item could be readily supplied from the central storesand installed. At the same tim the faulty item would be brought back to thecentral workshop for repair and overhaul. Eash slaughterhouse should be re-sponsible for minor day-to-day maintenance and repairs, and should carry thespare parts and equipment needed for this purpose.
14. For the cattle slaughter floor, a simple bed system of flaying (skinremoval) is desirable, using mobile dressing trolleys. Back flaying will befrom an elevated position using a manual hoist. A small daily slaughter ofless than 20 animals does not justify electric stunning equipment, electrichoists or mechanical flaying machines. The hog section usually has a largerthroughput and will be equipped with electric stunning apparatus, mechanicalscalding tanks and de-hairing machines.

- 382 -
15. Where only small amounts of inedible materials are available forprocessing, the high cost of purchasing or operating pressure cookars, can-trifuges, or ezpellers is not warranted. Instead, any necessary renderingcan be carried out by cooking in locally made tanks fitted with open andclosed steam coils. A small grinding machIn* should be included in the equip-ment initially provided.
16. A conical tripe washer, tables, and washing tanks should be providedfor cleaning intestines and tripe where the quantities of these by-productsare too snall to justify the cost of a mechanied plant. In addition, forsmall plants, all anmals- passing *through the slaughtering will be numbered sothat the viscera will reach the offal cleaning room in the same sequence as theslaughtering. In small plants, viscera cleaning will be carried out by thebutchers and their crews until such time as other provisions can be made. Tomaintain good sanitary conditions in the plant and in the meat delivery vans,as well as for identification purposes, the butchers are to be provided withplastic bags to hold the cleaned intestines.
17. Steam will be required to heat water for the de-hairing of pigs, toclean the slaughterhouse and plant, to render inedible products, and to sterilizeutensils such as knives and cleavers. For these purposes, an oil-fired boilerusing diesel fuel oil should be installed. The boiler would be supplied withall necessary valves, gauges, pump and electrical connections .for automaticoperation and control.
18. The slaughterhouse production crews should be provided with protect-ive clothing. To maintain the garments in a clean condition, a washing machineand dryer are to be included in the initial equipment installation.
WATR SUPPLY
19. A slaughterhouse must have an adequate supply of water available ata suitable pressure throughout the plant and, in addition, a sufficient supplyof hot water during working hours. If a constant and ample mcmicipal supply isnot available then a study of water supply sources must be included as part ofthe site selection and approval process. Provision should be made in the invest-ment cost estimates for a ground supply, with the required pumps and piping. Forestimating purposes, water usage will amount to 1,200 liters per animal unit, asa miIum. A head tank, with a capacity of at least 25,000 liters should alsobe provided.
20. Only supplies which meet the bacterial standards for drinking watershould be used. The supply should show no coliform bacteria in 100 mL of sample.Natural waters will often meet this standard, depending upon the source. Sincesuch quality is readily attainable by effective treatment, a chlorinated supplywill be suitable. Surface water is likely to be heavily polluted and containhigh amounts of organic matter. Full treatment, (including sedimentation, fil-tration, and chlorination) is necessary before use. However, it is unlikelythat supplies from deep wells would require this degree of treatment.

- 383 -
21. The plant water supply should be chlorinated, as a minmn of treat-nt, regardless of source. Chlorine dosage should be sufficient to provide
a residual of at least 0.5 mg/L after a 20-minute contact period. Automaticchlorine dosing facilities should be included in the list of equipment to beinstalled if the supply is not othervise treated.
EFFLET - DISPOSAL
22. For waste disposal purposes, traps should be located at strategicpoints in the drainage system to separate large solids -from the affluent.Ideally, the site plan should be arranged so that the land falls away from the"dirty" side of the buildings, (the stock pens, slaughter floor and offal clean-ing sections) to open land below. For a small plant, such a situation landsitself to a simple gravity system of effluent disposal-first through a catchbasin to trap fats and solids, then through filter beds and finally to irriga-tion of crops.
23. Slaughterhouse drains should lead directly to one or more catchbasins suitably located away from the premises. A conv=tonal over/undergravity flow type basin, with four or five chambers is suitable. Pumps andpiping or other means will be required for periodic draining of the basins.Since most of the offal, organs, and other remains are converted to useful by-products, there should be little material present in the effluent which mightcreate difficulties with an excess of fatty materials.
24. Effluent characteristics, discharge limitations, and currently avail-able treatment technology are discussed in Part I, of this Guideline.
IPERSONAL HYGIE AND WASEDOWN FACILITIES
25. In order to determine what facilities need to be provided to assureacceptable personal hygiene and plant washdown procedures, it is essential thatsuch procedures be established during the planning stages. Suggested measuresfor avoiding contamination of the plant's output are presented below to identifythe provisions which should be made for this purpose.
26. Each slaughterhouse unit should be provided with a separate nearbybuilding, housing personnel hygiene facilities such as showers, wash basins,clothes lockers, toilets and first-aid facilities. Each person reporting forduty should be required to wash hands, preferably in a sodium hypochloritesolution. The individual would then be issued clean coveralls, apron and capand leave whatever personal clothing that is not necessary for work in thelockers situated in the locker room. Provisions should be made for all per-sonnel to wash hands after using the toilets and before returning to the workarea. Before entering the slaughterhouse, it is desirable that each personwalk through a shallow beth containing a 01sinfectant solution. Hand washingshould be required again after entering the slaughter room.

- 384 -
27. Prior to' commncement of the day's operations, each section of thesluaghterhouse is to be washed down with hot water. During each shift, floorsshould be frequently cleared of waste and washed down thoroughly with hot water,followed by spraying with a bactericidal solution. Particular attention shouldbe given to drains.
28. Any trays or containers used in processing should be left in an in-verted position after washing. All knives, sharpening steels, cleavers, andother utensils should be staris!ed in boiling water at the and of the day'swork and again before resuming work the next day. All waste traps should becleaned daily. At least twice each week catch basins should be completelyemptied of both liquid and solid contents, and thoroughly cleaned. Livestockpens and slaugherhouse surromdings anst be cleaned daily and sprayed with in-secticides. A constant watch should be kept for possible breeding places forflies or other insects.
- 385 -
TIE WRLD BANK NOVEMBER 1982
OFFICE OF ENVI101MENTAL AFFAIRS
SULFUR DICKIDE EMISSIONS
GUIDELNES
1. Man-made emissions of sulfur dioxide originate fr3n a variety ofsources discharging to the atmosphere. The major source is from the
-bustion of fossil fuels sudt as coal and oil. Smne 90 to 95 percent ofpollution-related sulfur oxide emissions are in the form of sulfur diox-ide. Another source of sulfur dioxide is auto exhaust gases, although itaccounts for a relatively small portion of such discharges to the at-nosphere. This guideline will concern itself with staticnary sources only,particularly those resulting fran cabustion of fuels containing sulfur.
2. Sulfur dioxide oxidizes in the atmosphere to form sulfates, aparticulate form of sulfur capounds. These corpounds may have adverse ef-fects on human bealth and property, depending upon particle sizes, the par-ticulate form of sulfur present, dispersion as affected by weather condit-ions, and the presence of other pollutants which nay magnify the effects.
SOURCES AND EFFECTS
3. Sulfur dioxide, has a sharp and choking odor, and is consideredto be one of the most dangerous gases to man. It is one of several. formsin which sulfur circulates globally. The sulfur cycle also includeshydrogen sulfide gas, sulfuric acid aerosol, and several sulfate salts: inaerosol form. For purposes of this discussion, an aerosol is defined as asuspension of liquid droplets or solid particles in a gas.
4. The concentration of populations into large metropolitan areas,with the resulting energy needs and industrial activity, causes the eniss-ions to accunulate over these areas and disperse slowly. A US study, madein 1968, showed nationwide distribution of sulfur oide enission sources tobe as follows:
Fuel canbustion 73.5%Coal 60.5%Residual fuel oil 11.8%Distillate fuel oil 1.2%
Industrial Processes 22.0%Transportation 2.4%Coal Refuse 1.8%Solid Waste Disposal 0.3%
- 386 -
5. Electric power plants, the bulk of which utilize coal and oils asfuel, are the leading sources of sulfur dioxide emissions, as shown above.Except for transportation sources (which include motor vehicles, vessels,and railroads); over 97% of the nan-made sources are statioiary. The de-gree of sulfur dioxide producticn fran any individual source depends notonly on the amount, but also on the type of fuel burned.
6. Sulfur, in a free or avirbined state, occurs in practically allfossil fuels. When freed to the atIosphere, usually by ccmbustion, thesulfur or its _ap,ounds react with the avygen presentu in the air to formoxides. These can conbine with moisture to form sulfurous acid, followedby formation of sulfuric acid, as follows:
502 +.320 H2 S03
S02 + 1/202-... S03
503 + 20 .... ; 2S0 4
7. Acids formed in the atmosphere fall with rain and can affectcrops and plants, and surface waters (particularly lakes). Sume lichens,for example, store acid in their roots then die, and they are scaetimesused as indicators of sulfur dioxide fallout.
8. Sulfur dioxide emissions, through the formation of acids andother salts in the atmosphere, can cause damages to human health and prop-erty. High levels of sulfate concentrations will aggravate asti"La, lungand heart disease. Sulfur dioxide in the presence of photochemical oxi-dants and by-products such as sulfuric acid and bydrogen sulfide has beenshown to affect the respiratory tract. It is also widely believed thatlong term exposure to sulfates nay increase the likelihood of respiratoryillness such as bronchitis, emphysena and asthma. This effect is more pro-bable when high acentrations of particulates are present.
9. Sensitive vegetation can be severely damaged by low levels ofsulfur dioxide, levels even lower than those said to cause distress to lungdiseased patients. Such effects result from the synergistic action ofsulfur dioxide with low levels of ozane or nitrogen oxide which may bepresent. Wheat, barley, oats, white pine, cotton, alfalfa, buckwheat,sugar beets, and other crp plants have been reported killed by relativelylow levels of sulfur dioxide fallout. Studies nade in the USSR during thepast decade showed that pine trees growing in an atmosphere having SO2 can-centrations of 500 ug/m3 had a growth loss of 48 percent in comparison withpine trees growing in an atmosphere free of 902*
10. Sulfur oxides and their acid by-products will attack any exposednatal surface, including steel rail tracks. Reactions will also occur onother substances such as brick, stonework and even granite, (such asstatues and nnnts). Plastics, rubber, paper, and many other similarmaterials will became discolored and brittle when exposed. Buildings,bridges, steel girders, automobiles and highways are all affected byexcessive emissions.

- 387 -
EMISSION SAMPLIN AND MEASUREMEN
11. Although several units have been used in the past to express theconcentrations of sulfur dioxide in the air, the unit in most caomcn usetoday is in terns of weight per unit volume of air-micrograms of S02 percubic neter of air (p ). This unit should be used by the Bank's staffin their reports dealing with this pollutant. Where analytical results aregiven in parts per million (ppm) of 502, the data can be converted to.g/m3 as follows:
1 ppn S02 = 2620 pg/m3
It is inportant to note that this conversion factor applies to SO2 only,and will not apply to any other substance having a different molecularweight.
12. Because industrial operations may involve frequo't cyclicchanges, the timing of testing or nonitoring nust be properly roxrdinated.Individual polluting substances should be identified and flVIctuations ofpeak loadings determined in advance. All the variables associated withsource testing should be considered so that the sanpling and analytical re-sults will be representative of the entire source process.
13. Procedures for the collection and analysis of both stationary andanbient source sanples, for determining sulfr dioxide levels, are contain-ed in the guideline titled "Sulfur Dioxide Sampling and Analyses ", avail-ble frcm the Bank's Office of Environmental Affairs.
ACCEPTABLE STANDARDS
14. Standards are generally of two types - emission and ambient.Enission standards apply to allowable concentrations at the source, such asstacks, ventilating systens and other discharge points. Ambient standardsapply to the allowable concentrations of a cntaminant in the.air surround-ing an industrial area or community. mission levels are necessary foridentification of specific pollution sources and design of remedial works.Ambient levels are essential for determining possible environmental danagesand for avoiding adverse physical, health and other effects upon the sur-rounding area and its inhabitants. The standards presented below representthe concentrations of SO2 which nay be permitted in the area surroundingthe emissicn source.

- 388 -
15. For all Bank projects ambient air concentrations of sulfu- aidesshould not exceed the following for new plants:
Inside plant fence Annual Arith. mean: 100 pg/m3Max. 24-hr. peak 1000 pg/m3
Outside plant fence Annual Arith. mean: 100 pg/m3Max. 24-hr. peak . 500 pg/m3
16. In special situations strict adherence to these standards may bedifficult. All such cases are to be carefully documented by the Bank miss-ions. Factors which may affect the ability to meet these standards in-clude:
- Expansion of existing plant - The annual arith-metic mean and the Max. 24-br peak resulting frCmthe aotbination of the old units with the new anesshould be no greater than the values obtained forthe old units alone.
More simply, enission plumes fran new and existingsources should not mix to the extent that canbinedambient coIcentrations exceed naximum ambient concen-trations obtained fran the existing source alone. 7-ismay be acceplished by (a) increasing the stack heightof the new source, (b) changir the stack location ofthe new source, or (c) reducing new source eissionlevels. Furthermore, if plume mixing is not a problen,the new source units should by themselves meet the abovestandards.
- Pevamping of existing plants - Every effort shouldbe made to decrease existing pollution levels andprovide measures which will minimize concentrationswithout placing unreasonable econanic burdens cn theindustry.
- Inversions - When the S02 source locationis in a valley or. surrounded by nountains,inversicn layers which may occur during certainseasons of the year, could trap the stackemissions. These enissions can drcp back toground level, stagnate there, and damagecrops sensitive to So2 and NOx In sone pro-jects, it may be irpossible to dange the sitelocation (i.e. in case of an expansion of anexisting plant). In this case, to protect crops,the peak concentraticn will be decreased from500 pg/m3 during 24 hours down to 350 pg/m3 during4 hours, unless it can be shcwn that the effluentwill not be trapped by the inversion layer.
- 389 -
- Non-ferrous metal smelters - Substitutions offlash or electric furnaces may be necessary tomeet guideline requirements.
17. The existing US national ambient air quality standards are givenbelow for acuparisan with the above figures.
- P a - based on bealth effects cn Lmans
Annual arith. mean: 80 pg/n3
Max. 24-br. - once yearly: 365 pg/m3
- Secor - based cn envirconmental effects
Annual arith. mean: 60 pg/m3Max. 24-4r. - once yearly: 260 Ug/m3Max. 3-hr. - once yearly: 1300 'g/m3
CCNI'ROL TECHNILGY
18. Technology to be applied 'for control of emissions must bedesigned for each individual case since, in most instances, the system usedmust be capable of rernving or reducing more than one pollutant at the sametime.
19. Since SO2 emissions are due principally to the content of sulfurand its acmpounds in the coal and oil used for fuel, the first measure tobe considered is the substituticn of low sulfur fuels cr natural gas. Anyincrease in fuel costs should be balanced against the cost of treating thegaseous wastes.
20. Enissions my be reduced through process changes. In-plant meas-ures could include changing raw materials, modifying process cperations, orrecovering and reusing materials otherwise being wasted through the stack.Raising the point of discharge above the ground, by increasing the stackheight, will reduce contaminant concentrations at ground level.
21. When measures such as those outlined above cannot be applied,chemical or physical processes should be utilized. Sulfur dioxide may berenoved by adsorption, absorption, or a chemical process such as catalyticconversion. In sane of these processes, the S02 can be removed and serveas the raw material for sulfuric acid production.
22. One of the prcuising methods for flue gas desulfurization utiliz-es the reaction of magnesium oxide with SO2 to form magnesium sulfite. The
-magnesium sulfite solids are separated by centrifuging, dried to remove themoisture, and then calcined to regenerate the magnesium oxide for recy-cling, and generate concentrated SO2 to be used for sulfuric acid produc-ticn.
- 390 -
23. Limestone scrubbers have been used successfully for desulfuriza-ticn of flue gases. Injection of lime or magnesium into the fuel ccnbust-ion damber has also been effective in reducing sulfur dioxide emissions.Hwever, it should be noted that these processes produce caIzium sulfatewastes, which can present a disposal problem. They are therefore recom-mended in areas where land is both available and inexpensive.
24. Amnania subbing system have been in successful operaticn insulfuric acid plants since the idd 1930's. The nain drawback has been thedisposal of the ammonium sulfate by-product. Any World Bank financed sul-furic acid plant where the sponsor insists cn a single absorption designshould be equipped with amania scrubbing.
BIBLIOGRAPHY
1. U.S. Environmental Protection Agency. "Health Effects of Air Pollu-ticn". Washingtcn (June 1976).
2. "Envircnmental Considerations for the Industrial Developnent Sector".The World Bank. Washington. (August 1978).
3. Pasztor, L., Selmeczi, J. G., and Labovitz. C. "Stack Gas Desulfuri-zation Residue Management". Presented at National Conference on Man-agement and Disposal of Residues frmzl Treatment of Industrial Waste-waters. Washington (February 3-5, 1975).
4. U.S. Envircnrental Protection Agency. "Capsule Report-Flue Gas Desul-furization and Sulfuric Acid Production Via Magnesia Scrubbing". Doc.EPA-625/2-75-007. Washington, (1975).
5. "Air Quality Criteria and Guides for Urban Air Pollutants". Report ofa WEW Expert Carmittee. WHO Technical Report Series No. 506. WorldHealth Organization. Geneva (1972).
6. Andrews, W.A. Moore, D.K., and LePoy, A.C. "A Guide to the Study ofEnvironental Pollution". Prentice-Hall, Inc. Englewood Cliffs, NewJersey (1971).
7. "Manual on Urban Air Quality Management". European Series No. 1 WorldHealth Organization, Regional Office for Europe. Copenhagen (1976).
8. Ismerov, N.F. "Control of Air Pollution in the USSR". Public HealthPaper No. 54. World Health Organization. Geneva (1973).
9. Proceedings - "Seminar cn Desulfurization .of Fuels and CcnibustionGases". UN Econcmic Comnissicn for Europe, Held in Geneva, 16-20November 1970. Doc. SI/ECE/AIR POLL/l. United Nations, New York.(1971).

- 391 -
10. Proceedings - "Seminar cn Control of missions fram the Non-Ferrous.Metallurgical Industries". TN Econornic Conmissicn for Europe. Held in
Dubrovnik, 19-24 November 1973. Doc. B'E/ENV/5. United Nations, NewYork (1974).
11. U.S. Enviramnental Protection Agency. "Performance Test Methods".Doc. EPA 340/2-78-011. Washington, D. C. (1978).
- 392 -
THE WORLD BANK 2DCMBER 1982
OFFICE OF ENVIRONMENTAL AFFAIRS
SULFUR DICKIDE SAMPLIN ANM ANALYSES
1. This document supplements an earlier Bank document, titled "Sul-fur Dioxide Enissions", by providing specific details cn the collection andanalysis of samples. Both docments sbould be reviewed and the guidelinesapplied as requjred in situations involving sulfur dioxide enissions, andrelated oxides.
2. When released to the atmosphere, sulfur or its cmpounds will re-act with the oxygen in the air to form mainly sulfur dioxide. When exposedto moisture the dioxide can undergo the following reactions:,
$02 + E20 R2 SO3
SO2 + 1/202-w S03
SO 3 + H20 - H"2 S04
3. Two types of monitoring will be required in connection with in-dustrial operations: The first is stationary source or stack emissiontesting, to determine emission concentrations at the source. The secondtype is ambient nonitoring, which measures the pollutant concentrations inthe areas surrounding a plant.
STTINARY SOURCE MONITORIN
Sampling
4. Stack sampling ports should be provided, and located at leasteight stack diameters "downstream" of any bends, constrictions, abatementequipent, or other flow disturbances. 'If this is not possible then thesampling location should be at least two stack diameters "upstream" of thestack exit or other flow disturbance. Where these criteria cannot be met astack extension may be required. Ports should be installed flush with theinterior stack wall, and extend outward fromn the exterior stack wall forbetween 5 and 20 centimeters, unless additional length is needed forinstallation of gate valves or other appurtenances.
5. If the sum of the stack inside diameter plus one port length isless than 3 meters, tuo ports should be installed on diameters, 90 degreesapart. If this sun is greater than 3 meters, then four ports should be in-stalled on diameters 90 degrees apart.

- 393 -
6. For SO2, a gas sample is taken at a single sanpling point located
at the center of the stack, or no closer to the inside wall than 1 meter,for large-diameter stacks. The gas saMple must te drawn at a continuousrate through a sampling train simnlar to that shown in Figure 1. It may be
advisable to conduct a series of exploratory tests across a stack to deter-mine whether the gas which is beirg measured is uniform in concentraticn orstratified.
7. As the gas passes through the sampling apparatus, the sulfuricacid mist and sulfur trioxide are separated and the. sulfur dioxide is re-moved by a chemical reaction with a hydrogen peroxide solution. Upcn acn-
pletiam of the. sanple the H2 S04 mist and the S03 are discarded. The col-lected material, containing the S02, is recovered for analysis at the lab-oratory.
8. The mnininum sampling time is 20 minutes per sample. NoT separatesamples constitute a "run". Three runs are normally taken, giving six sep-arate portions. An interval of at least 30 minutes should elapse between
each sample. Longer sampling times may be required if larger samples areneeded. It is iMportant that constant process operations, preferably at
maximum levels, be n aintained during the duration of the sampling periods.
9. Current technology for continuous monitoring of stack gases is ina state of flux. Most units are subject to interference fram pollutantsother than that being analyzed. The units are also subject to electronicinstability.
Analyses
10. Sulfur dioxide concentraticn in stack samples may be measured bythe barium-thorin (x) titration method, currently designated as a referencemethod by the U.S. Environmental Protection Agency. p-e minimn detectable
limit by this method has been determined to be 3.4 milligrams of S02 Pecubic meter (mg/m3 ).
11. Tests have shown that S02 concentrations as high as 80 mg/m3 canbe efficiently collected in two midget inpingers, each containing 15 milli-liters of 32 percent hydrogen perioxide, at a rate of one liter per minute
for 20 minutes. Based cn theoretical calculations, the upper concentrationlimit in a 20-liter sanple vould be about 93,300 mg/m3 . The barium-thorinmethod is also applicable in these ranges.
12. Same laboratories specify a sampling method that collects sulfu-
ric acid, sulfur trioxide, and sulfur dioxide. The analysis then givestotal sulfur oxides. This method usually yields values from one to fivepercent higher than those obtained by the barium-thorin method, in which
the sulfur trioxide and sulfuric acid are discarded.
(x) The Thorin indicator is 1 - (o - arsencphenylazo)- 2 naphtol 3, 6 disulfonic acid, disodium salt,

1.0 CM(0.75 IN.) PROBE
, PITOT TUBE
THERMOMETERSTACK WALL
PROBE (END PACKED MIDGET BUBBLER N TUBEWITH QUARTZ OR GLASS WOOL IMPINGERSPYREX WOOL)
TYPE-S PITOT TUBE j -iI .
PITOT MANOMETER _ _-E_o
ICE BATH,"
THERMOMETERNEEDIE VALVE
RATE METER
DRY *GAS METER
SURGETANK
F'igure 1. Sulfur Dioxide Sampling Train (From Reference EPA-625/6-78-004).

- 395 -
AMBIEI= AIR MONITORIG
Sampling Site Selection
13. The number of points to be included in an ambient air nonitoringnetwork will depend largely cn the data required to meet the stated programobjectives. For a small source, where mne wind direction predominates,monitors are usually operated at two sites: one to monitor the effects ofthe source and the other to provide upwind or background concentrations.Where wind directions are variable or other similar emissicn sources areoperating nearby, additional sampling points will be required to identifythe concentrations that are attributable to specific sources.
14. The principal factors in setting up the sampling locations are
topograpy and meteorology. Other considerations include:
(a) Tocation of the tampling site, in terim ofthe pollutant source, accessibility, and opera-tion.
(b) Delivery of samples to the location of labora-tory facilities.
(c) Handling of sample to prevent deterioraticn orconversion of pollutant to a form that wouldproduce an inaccurate result. Samp.e tempera-tures, between the collection point and the lab-oratory, should be kept under 29* C.
(d) Availability of suitable analytical proceduresand instrumentation for generating acceptablequantitative and qualitative data.
(e) legal restrictions (such as effluent limitations)affecting the discharges from existing sources.
15. It is desirable to place the collection devices in the areas nost
likely to receive the highest ground-level concentrations of pollutants.The path of pollution fra the emission source to the point of ground-levelimpact may be predicted roughly frcn a knowledge of preclminant wind di-
rections. A convenient tool for performing such an analysis is the "windrose", a chart which plots the wind directions and the percentage of the
time, annually, that the wind is blowing fra that direction. here more
precise informaticn is required for site selecticn, caputerized atmosphe-
ric dispersion nodels ay be necessary.
Sample Collection
16. Ambient sulfur dioxide levels ay be nonitored by two priicipal
techniques: (a) the dynamic sampler, which utilizes a bubbler train and
provides 24-hour analyses and (b) the continuous sampler which utilizes va-
rious instrument techniques and provides variable tine averages. Static
samplers, such as the sulfation plates, are very crude and imprecise, and
are no longer considered useful for this purpose.

-396 -
17. The dynamic and continuous sairpling units usually consist of a
system incorporating several acupments, as shiown in Figure 2. A typicaldynamic collectian system would include an inlet secticn, absorptin sec-ticn, flow regulation device, and a pump, as the prine never.
18. A typical continuous nonitoring device would consist of an inletsection, gas pretreatment section, detector, photonultiplier, spectreter,and readout device. Depending upon the conditions of the gas to be =oni-tored, the pretreatnent section could include pressure adjustment, removalof particulates (usually a filter), reinval of noisture (usually a silicagel colun) and tenperature adjustnnt (usually a condenser).
AnalMses
19. The U.S. Envircr%nental Protection Agency, after examinaticn of
the various nethods used world-wide, has adopted the pararosaniline nethodfor determination of sulfur dioxide in the atmosphere. In this method thesulfur dioxide is absorbed in a solution of potassium tetrachlorrrercu-rate. A couplex is then forned, which is stable to strcng oxidants. Theccuplex is reacted with pararosaniline and fornaldehyde to form paraosani-line methyl sulfonic acid. .The absorbance of the solution is then measur-ed spectrophotanetrically. This is the method to be used in conectionwith World Bank projects. The method is applicable to the measuremert ofsulfur dioxide in ambient air, using sanpling periods of up to 24 hours.
20. Concentraticns of sulfur dioxide in the range of 25 to 1050 mic-
rogran per cubic meter (ug/m3 ) can be measured by this method. Concentra-
tions below 25 ug/m3 can be measured by sanpling larger volumes of air, butonly if the absorption efficiency of the particular system is first deter-mined. High cocentrations ney be analyzed by using smaller. gas sanples, a
larger collecticn volume, or a suitable aliquot of the collected sam-ple.
BIBLIOGRAPHY
1. UN Eoonmic and Social Council, EE. "Draft Report cn Effects of Sul-fur Coupounds on Soil, Groundwater, and Vegetation". DL,.. ENV/IEB/WG.1/R.5. New York (28 June 1982).
2. "Pollution Engineering Practice Handbook". Edited by P.N. Cheremini-soff and R.A. Young. Ann Arbor Science Publishers, Ann Arbor, Michi-gan (1976).
3. UN Econcaic and Social Council, ECE, :Cooperative Prograne for Mni-toring and Evaluaticn of Lcng-Range Transmissicn of Air Pollutants inEurope (EMEP) ". Doc. ENV/IEB/R.12. ew York (5 August 1981).
4. U.S. Environmental Protection Agency . "Handbook-Industrial Guide for
Air Pollution Control". Document EPA-625/6-78-004. Washington (June1978).

�

398
5. U.S., Environmental Protection Agency. "Handbook-Continuous Air Pollu-tion Source Monitoring S stems% Document EPA 625/6-79-005. Washing-ton, D. C. (June 1979).
6. U.S. Code of Federal Regulations, Title 40#, Subchapter C0, Part 50,, Ap-pendix A. "Reference Method for Determinaticn of Sulfur Dioxide in theAtmosphere (Pararosaniline Method)". Office of the Federal Register,GSA. Washington. -(July 2# 1981).
7w Ball, R.J. and Andersonsp G.E. "Cptimm Site Exposure Criteria for S02Monitoring". USEPA Publication No. EPA-470/3-77-0-1-3. Research Tri-&wle Park, N. C. (April 1977).

- 399 -
TE WORLD BANK OCTOBER 1980
OMCE or ENVIRONMENTAL AFFAIRS
LEATER TARING AND FINISHING
1. Tanning is the process by which animal skins are converted intoleather. The skin consists of three layers: flesh, derma or corium and epi-dermis. The epidermal and corium layers constitute the leather making portion,consisting ainly of the protein collagen. Basically,-leather is formed bythe reaction of collagen fibers with tannin, chromiu, alut or other tanningagents.
2. Waste production in the leather tanning and finishing industry willbe affected by the manufacturing process used to convert various types ofanimal skins to the tanned and finished leather. In terms of the waste loads,four general processes are used in this industry: beamhouse; tanhouse; retan,color and fatliquor; and finishing. The principal chemicals employed in theseprocesses include lime, sodium sulfide and sulfhydrate, basic chromium sulfate,vegetable compounds, mineral acids and sodium chloride.
3. This document will deal with the processing of cattle hides, sheepskins and pig skins. These are the raw materials of principal concern in Bankprojects, and will serve as typical examples for illustrating waste produC.tionand control in this industry.
INDUSTRIAL PROCESSES
Cattle Ride Tannerv
4. The beamhouse process provides for receiving the hides and for theinitial cleaning and preparation for the other operations. Nearly all hidesas received will have been trimed and graded, and salted or brined at themeat packing plant prior to shipment to the tannery. They are normally re-ceived and stored at the tannery in packs of 1.5 to 2 meters high. The moisturecontent in the hides, as received, is maintained during storage.
5. The first step in the processing is to unfold and trim each hide,and cut it in half along the backbone, the step being frequently referred toas halving or siding. The trimmings are collected for shipment to glv' orother by-product manufacturing plants.
6. The sides (or whole hide, in some instances) are transferred to vats,drums, or hide processors for washing and soaking to restore moisture. Thisserves to remove dirt, salt, blood, manure and non-fibrous proteins from theskins.
7. The skins are next transferred to a flashing machine, in which theyare carried through rolls and across rotating spiral blades to remove any fleshstill clinging. Most hides are fleshed at the packing house or in a separatefacility. Fleshings are normally recovered and sold for rendering or conver-sion to glue. With 1roper handling this operation contributes very little liquidor solid waste.

- 400 -
8. The final beahouse operation is the removal of hair. This is doneby chemical loosening, followed by either machine pulling or chemically dis-solving the hair. Machine rewoval is practiced where the hair is to be re-covered. Removal is accomplished in vats, drums or hide processors with alime slurry. "Sharpeners", such as sodium sulfide and sodium sulfhydrate,are added in varying strengths depending upon whether or not the hair is tobe saved. The uhairing process is one of the principal waste sources intannery operations.
9. The basic tanning is accomplished in the tanhouse process. Thefirst step is the "bating", which prepares the stock for tanning. The hidesare placed in a solution of amcnium salts and enzymes in order to de-limethe skins, reduce smelling, peptize fibers and remove the protein degradationproducts. Bating is followed by "pickling", frequently done in the same con-tainers. A brine and acid solution is used to bring the hides to an acid con-dition for subsequent tanning. This treatment also prevents precipitation ofchromium salts in the chrome tanning procedure.
10. Nearly all cattle hides are either chrome or vegetable tanned. Ina few instances alum or other tanning materials are used. For heavy leatherssuch as sole, mechanical, and saddle leathers, vegetable tanning is used, ina solution containing vegetable tanners or other plant extracts. Shoe upperleathers are usually tanned in a bath containing chromium sulfate. The tannedhide is then split to produce a grainside piece of essentially constant thick-ness and a flesh side layer.
11. The retan, color and fatliquor operations constitute the third majorstep. Retaning is done principally to impart different characteristics tothe finished leather. Chrome, vegetable, or synthetic tanning agents may beused for this purpose. BleachinS with sodium bicarbonate and sulfuric acidcommonly follows the tanning in producing sole leather. Coloring is done inthe same drums as the retanning, using natural dyes or synthetic products.The fatliquoring operation adds oils to the leather in order to replace thenatural. oils lost in the beamhouse and tanhouse procedures.
12. After the vet processes the hides are subject to the finishing stepssuch as drying, staking or tacking, and plating prior to marketing. Stakingor tacking involves stretching the hide to make it more pliable and avoidshrinkage. T1e plating operation "presses" the hide in order to give it asmoother surface.
Sheep Ski.Ln Tannery
13. Sheep skin tanneries generally omit the beamhouse process but do in-clude a degreasing operation. Thus, the three major processes are the tanhouse;retan, color and fatliquor; and the finishing.
- 401 -
14. The tanhouse process includes receiving, storage, flashing, degreas-ing, tanning and refleshing. After flashing, the skins are placed in drums,washed, and soaked. A solvent or detergent is then added to remove the grease,which is recovered as a by-product from those skins where the wool has beenremoved. Grease recovery is not normally practiced when the wool (shearlings)is still attached to the skin. The solvent is recovered and reused.
15. Sheep skins may be either chrome or vegetable tanned, with chromebeing most frequently used. Where skins are received in the pickled conditionthere are no Iiming or bating operations. In some cases tanning is followedby refleshing, which results in a small amount of solid wastes.
16. Skins to be dyed are immersed in drums containing a dye (usuallysynthetic) solution. Some bleaching may be done prior to coloring of shear-lings. Fatliquoring follows the dyeing, and is usually carried out in thesas containers.
17. The finishing process, following the color and fatliquor operations,includes drying, skiving, (removal .of the skin's thin surface layer), staking,carding, clipping, sanding (use of abrasives or wheels to produce a specifictexture), and buffing.
Pig Skin Tannery
18. Pig skin tannery operations are similar to those for sheep skins.There are essentially no beamhouse operations, but degraasing is generallyrequired in the tanhouse processing. The skins are received at the tanneryin a fresh frozen or brined and refrigerated state. Refrigerated storageis provided if they are to be held before tanning.
19. Degreasing is practiced by many of these tanneries. After washingand soaking in warm water a solvent is added to remove the grease. The re-sulting solution-of solvent, grease, and water is pumped to large tanks, wheresome separation is achieved by decanting. The solvent is recovered for reuse.Grease is recovered by decanting or skimming from the top of the holding tanks.
20. LIming (to remove embedded hair), bating, and pickling follows thedegreasing. Tanning is done next, using either chrome or vegetable compounds.Pig skins are generally fully tanned at this point, thus eliminating the needfor retanning. After tanning, the skins are tumble dried, split, and shavedor skived to produce the desired thickness. The splits (small pieces of non-uniform thickness) are sold for fertilizer production.
21. From the tanhouse, the skins go to the coloring and fatliquoringoperations. The drying, coating, staking, and sanding operations follow nextto complete the process. These are principally dry operations and are con-sidered as minor sources of wastes.
- 402 -
WASTE SOURCES AND CEARACTERSTICS
22. Wastes from taMery operations will contain a number of constitu-ents, of varying quontities and significance according to the raw materials,processes and final prcducts. Materials which can appear in tannery wastesinclude hair, hide scraps, pieces of flash, blood, manure, dirt, salt, lime,soluble proteins, sulfides, amines, chromina salts, tannin, soda ash, sugarsand starches, oils, fats, greases, surface agents, mineral acids, dyes andsolvents.
23. Waste const1tuents, when present, may be discharged in the gaseous,liquid, or solid state. The liquid wastes are of major significance. How-ever, gaseous and solid materials re important in certain individual opera-tions, and consideration should be given to their disposal.
24. The anst important parameters for defining the characteristics ofthe liquid wastes are: 5-day biochemical oxygen demand (30D 5 ); total Kjeldahl(ammonia plus organic) nitrogen (TKN); total suspended solids (TSS); chromium(Cr); oils and greases (O/G); sulfides; hydrogen-ion concentration (p); andfecal coliform organisms.
25. Particulate matter and hydrogen sulfide are the two potential gaseousdischarges of significance. The principal sources of hydrogen sulfide are thereactions involving sulfide wastes from unhairing operations. The removal ofnitrogen from the wastes by amania stripping, when required, creates anotherpotential air pollution problem. Emissions from tannery boilers can also bea source of gaseous discharges, and fly ash emissions generally occur whencoal is used as a fuel. Sulfur dioxide will be found in boiler stack gaseswhen high sulfur coals or heavy fuel ails are burned. -
26. Solid wastes include flashings, hair hide triamings, sanding dusts,sludges, greases and general plant wastes. Most plants recover flashings andraw hide trimmings for sale to rendering plants or conversion into glue. Wherehair is recovered, it is sold as a by-product.
27. In terms of liquid wastes, certain operations are common to nearlyall tanneries. These include: washing and soaking; degreasing (for sheep andpig skins); unhairing; bating, pickling; tanning (including bleaching for somevegetable tanning); retanning; coloring; fatliquoring and finishing. Theprincipal waste constituents contributed by each of these various operationsare presented in Table 1.
28. Not all plants utilize all of the operations indicated in Table 1.Based on the combinations most frequently encountered in the industry, tan-neries may be categorized by primary processes, as shown in Table 2. The colorand fatliquor processes are not included since their wastes are normally ofvery low strength, even though highly variable in volume.

- 403 -
Table 1. Principal Liquid Waste Constituents Contributed By Specific Operations.
Operation Waste Constituents
Washing and 30D 5 , TSSSoaking
Degreasing 30 5 , TSS, O/G
Unhairing OD5 , TSS, pH, Sulfides,Nitrogens
Bating Ammonia nitrogen
Pickling Acids, salts
Taying Chromina, vegetable tarmins
Retanning, Coloring, Color, OilFatliquoring
Finishing Essentially none
29. Average raw waste water characteristics based on the categories givenin Table 2, are presented in Table 3 for the more important pollution parameters.
EFFLUENT LMITATIONS
30. The collection and disposal of gaseous and solid wastes should providefor essentially no discharge of such materials to the environment. The sourcesand methods of handling these substances are discussed below.
31. Limitations on liquid effluent discharges to surface waters are pre-sented in Table 4. These are based on the best technology currently availableand considered to be economically feasible.
32. Liquid effluent quality requirements for industries discharging tomunicipal sewers can be less stringent than those discharging to a water course.However, wastes discharged to mnicipal facilities usually will require somedegree of pretreatment, depending upon the volume and strength of the wastes,degree of mnicipal treatment and local regulations.

- 404 -
Table 2. Plant Categories By Primary Processes. /
Primary Process .
CategoryBeahouse Teing Fnishing
A Pup Bair Chrofe yes
B Save Bair Chrom Yes
C Save Eair Vegetable Yes
D Mair Previously Previously YesRemoved Tanned
B Hair Previcusly Chrom YesRemoved erRätalned
F Pulp or Save Cbrome or NoHair No Tanning
/ From EPA Doc. 440/1-74-016-a
CONTROL AND TREATnT OF WASTES
33. While thure are variations in individual operations between plants,available control and treatment techniques are generally applicable to mostsituations. Control of wastes is accompliahed through a combination of in-plant mmasures, disposal to micipal facilities, or discharge to the air,water and land environments.
Gaseous Wastes
34. Gasecus emissions of hydrogen sulf:de, principally from the unhair-ing procedures, may be controlled by oxidation of the sulfides with a catalystprior to discharge to the main plant sewers. This not only avoids potentialair pollution and odor problems but also protects the safety of workers exposedto the waste streams. Removal of nitrogen through biological systems ratherthan by amonia stripping avoids potential problems created by venting ammoniafrom highly concentrated wastes.

- 405 -
Table 3. Average Tannery Raw Wastewater Characteristics -Kg per Meaaaram of Raw Hides Processed. a/ b/
Parameter, Category
A 3 C D - .E F
Flow 53 63 50 20 63 28
BOD5 95 69 67 37 67 110
7EN 17 13 9.2 3.7 6.0 16
TSS 140 145 135 47 88 110
Tot. Cr 4.3 4.9 0.2 2.6 1.2 4.4
0/G 19 43 33 7.9 24 6.6
Sulfides 0.5 0.8 1.2 2.1 4.5 3.7
PH 1.0- 4.0- 2.0- 3.4- 1.5- 9.2-13.0 12.6 13.0 11.2 12.5 10.4
a/ From EPA Doe. 440/1-74-016-a.b/ Except flow and pH. Flow = m /*g Raw Hides Processed.
1 megagram = 1 metric con
35. In addition to process sources, air pollution problems can alsoresult from operation of the tannery boilers. Wet scrubbers or electro-static precipitators can remove over 98 percent of the fly ash from coalfired facilities. Sulfur dioxide emissions can be greatly reduced by burn-ing coal and fuel oils having a low sulfur content. Gas scrubbers capableof removing sulfur dioxide from boiler flue gases are currently under de-velopment.
Liauid Wastes
36. The use of hide processors (essentially concrete mixers), in placeof vats, paddles, or drums, will greatly reduce water consumption in appli-cable vet processing operations. Other in-plant measures to reduce wasteflow include: employee awareness and application of water-saving measures,changing continuous rinses to batch rinses; using meters or timers to limitindividual flows, and use of wash or rinse waters for process solution makeup.

- 406 -
Table 4. Daily Mazlm± Effluent L±mitations - Leather Tanneries.
Consttuent . Plant Category ./ A 3 C D E F
30D5 2.8- 3.2 2.6 1.0 3.2 1.4
TSS 3.0 3.6 2.8 1.2 3.6 1.6
0/G 1.1 1.3 1.0 0.48 1.3 0.68
Sulfides 0.010 0.012 0.010 0.004 0.012 0.006
Tot. Cr 0.10 0.12 0.10 0.04 0.12 0.06
0.54 0.64 0.50 0.20 0.62 0.28
pa 6.0 to 9.0
Facal Col. Not over 400 per 100 mL
/ All limitations, except pH and Fecal Coliforms, expressed as kg/MSagram of Raw Hdes Processed.
37. Tan liquor dlscharges can be reduced through recyclng in vegetabletanneries ar rause in retanning operations. - Chrome tanning solutions can beregenerated and resed by settlIng the spent lquor, and adding chromiu salts,sulfuric acid, and sod:ium chloride to restore the proper concentration. Un-hairing solutions are also ameable to "regeneration" and rause. Final dis-posal of chrome liquors should be given special attention, since chrome inits varlous valence states is hazadous to man, aquatic life, and vegetation.The chrome can be precipitated, in clarifiers or equall=at:on basins, as chro-miu hydrozide at a pR of 8.5 to 10.5. Disposal of chrome sludges is discussedbelov, in paragraph 41.
38. Pretratmaent may be required for seer safety and mantenance, pro-tection of biological treatment syst=s, meeting final effluent dischargellmitations, ar conforming with sludge disposal criteria. The followingmethods, alene ar in combination, may be applied for this purpose: screening,flov equalization, sedlmentation, coagulation, pE adjustment, and separatesludge dispod,

- 407 -
39. For plants discharging waste7 directly to surface waters, on-sitetreatment should be provided in order to maset effluent limitations. Biologicalsystems are most effective. The specific system to be used should be designedfor the volume and characteristics of the wastes discharged. Trickling filtersaerobic and anaerobic lagoons, and activated sludge systems have been effective
40. Additional treatment may be required in certain cases. When thereare high concentrations of nitrogen compounds, nitrogen removal may be necessarMicroscreening, carbon adsorption (using fixed beds of activated carbon), colorremoval, ion exchange, and reverse osmosis are effective in providing additionatreatment where necessary. .
Solid Wastes
41. Sanitary landfills are best suited for disposal of those solidwastes which are not recovered as valuable by-products. Incineration andhigh temperature treatment are not recommended for sludges or other wastescontainnrg chrome, to avoid oxidation of the chrome from the trivalent tothe hezavalent state. These sludges should be spread on land until suchtime as their impact upon the environment is better understood.
42. Proper selection o t site for use as a landfill is of primary im-portance in avoiding environmental damages. Site selection factors shouldinclude: sufficient area; reasonable haul distance; distance from expstingor planned residential, co=marcial and recreational areas; soil ccn"tion=and rock formations; access to transportation networks; location oZ uxiatiuigflood plains; and potential fire hazards.
BIBLIOGRAPHY
1. "Development Document for Effluent Limitations Guidelines and New SourcePerformance Standards for the Leather Tanning and Finishing Industry".U.S. Environmental Protection Agency. Document EPA-440/1-74-016-a. Wash-ington (March 1974).
2. Villa, J.A. "The Interrelationship Between Parameters of the Leather In-dustry". UN Industrial Development Organization. United Nations. New York(1973).
3. "Information Sources on the Leather and Leather Goods Industry". UN Indus-trial Development Organization, Guides to Information Sources No. 3. UnitedNations. New York (1972).
4. "International Glossary of Leather Terms". International Council of Tanners.London (1967).
5. Harris, D. "Dictionary of Terms Used in the Rides, Skins, and Leather Trade"Agriculture Handbook No. 465. U.S. Dept. Agriculture. (April 1974).

- 408 -
TE WOMLD BANK OCTOBER 1980
OFFICE OF IVIRONMTAL AFAIRS
GU IES
TEA AND COFFEE PRODUCTION
L. Tea can, be grown under a wide range of climatic conditions, fromMditarranean to tropical. Developing countries in South Asia and East Africaaccount for about 97% of world tea production and exports. During the period1971-1973 India accounted for 39.2%, Sri Lanka 18.6%, Japan 8.2%, and otherAsian countries for 18.9% of world production. In the same period Kenya accountedfor 4.31, Malavi and Uganda for 1.8% each, and other African countries for 4.2%of the total world production. Latin America accounted for 3Z of the total, ofwhich Argentina was responsible for 2.4%. Total world production during thisperiod was over 3.5 million metric tons.
2. Latin American has been the dominant world coffee producer during thelast 100 years. During the period 1968-1972-Souh America accounted for 43.3%,*7-with Brazil in the lead at 26.4% ardColombia&-uevat 12.1%. North and.-CentralAmerica and the Caribbean area acdunted-fgAJk of world production,, with .Mezico, Guatemala and EL Salvador bEig-1e leading producers. During this sameperiod 30.2% of the world productioncam from Africa, with Ethiopia, Angoia-tndUganda in the lead. The remaining production of about 8% came from Asia, withthe major portion coming from Indonesia. Over 65 million bags were produced.
MANUFACTURING PROCESS
Tea Production
3. Tea is processed by two principal methods, to yield either green orblack tea. Of these, black tea is the more important in the world market.Because tea is hygroscopic-readily absorbing moisture from the air-it cannotbe stored for any extended periods in most of the producing countiies.
46' The first stage in black tea manufacturing is called "withering".This consists of spreading the tea leaves in thin layers on trays or "tats",made of tightly stretched jute or wire netting. The density of spreads isusually one kilogram of tea per 2 to 3m2 of tray area. Banks of tats arearranged in layers, 12 to 15 cn apart, to allow for free access of air. Wither-ing takes 18 to 24 hours.
5. In place of the withering tats some factories are using perforatedrevolving drs, through which hot air is blown to dry the tea leaves. Eachdrum can hold up to nearly 700 kg of leaf. Both space and time required toachieve the proper wither are reduced by this method.

�

41o
the =roastad coffee of Where the coff ae farms are large., as ir Bra-zil, hulling and subsequent grading by size and removal of defective beans takesplace an the farms. In other areass as in Africag this is commonl7 done in can-tral plants to which the farmers sell the dried cherries.
13. The vat process is used in the countries with mild climates and, al-though move complicatadg yields a, much better qua 14 t7 product. The cherry isfir3t washed to float off any stalks and "light" cherries, and then pulped to re-move the flesh of the cherry. The. beans are then fermented and washed to-removethe silver skin.' They are next thoroughly dried while still in their parchmentcovering, usually by sung but sometimes by hot air. Finally, the parchment isremoved by machine , and the grasn.caffee graded and picked over for defect3.The arrangements for these processes vary tu cLiff arent countries 9 blut the stepsare essentially the sama everywhere.
14. Gre= coffee beans are normally roasted in rvmlv#% metal cylinders,directly or ind-1 ectly heated by gas or fuel oil. The mor*'c9znmn method is 0batch roasting, in lots of 230 to 635 kgi at.tamperaturat increasing from 200 Cto 220 0 C over a cycle lasting from 8 to 18 minutes. The continuous roastingmethod utilizes a temperature of 260'OC, with a contact time of about 5 minutes.
15. Either wet or dry methods are used to cool the roasted beans. In thewet process water is sprayed over the ha, beans while still 1z the roaster. Thewater is partially, evaporated and piriia_"'7 absorbed into the bean. Th drvroasting the beans'ara cooled by-a3t's#d_'By contact with the cooling apparatus.,Th order to preserve the arc= the roasitiRd coffee should be cooled rapidly so-.that the oil in which the arama lies is not lost through the surface of the bean.
WAST.0 SOURCES AND STICS
16. Under efficient operating conditions relatively, small voltmes of wastesoriginate from the production of tea and coffee. Purely hazardous pollutants arenot normally found in those wastes. Provisions must be made for disposal of humanwastes originating at the plant, for which the 5-day biochemical ox7gen demand(BODs)v total suspended solids (TSS), and colifo= organism would be of signi-ficance. Acceptable methods, using biological systems, are readily available forthis purpose. The human wastes can also be discharged to a mtralcipal treatmentsystem without an7 pretreatment, if isolated and kept separate from, any otherplant wastes. Wastes ma7 also originata from, plant cleanup operations.
Tea Production
17. Sam gaseous wastes may result from tea production. Hot air from thedrying operation is generally exhausted to the atmosphere, at a temperat=a of500 to 550C, as it leaves the dr7ars. It may also contain some leaf particlas,but this should be relatively mu"org since it represents a loss of product andhence a loss of profit for the plant. At=spheric discharge of combustion pro-ducts may be signi-ficant where coal or oil fired boilers are used as sources ofheat. Sullur dioxide and particle emissions may be of concern.

- 411 -
18. There are essentially no liquid wastes from the processing of tea.Some liquid wastes wil.U result from cleaning operations. Daily washing of far-mentation surfaces, once or more daily, is essential to avoid bacterial conta-mination which can cause tainted and soft teas. Rollers also require frequentcleaning. Plain water is generally adequate for washing purposes, but disin-factants are used in some plants. Washup wastes may contain some suspendedsolids.
Coffee Production
19. Wastes from the vet processing of cherries is generally the major pro-cass liquid flow from coffee production. This will contain pieces of stalks andother trash. Although cooling of the beans following the roasting operationdoes not normally produce any wastes, a few plants are reported to have wet stackscrubbers which generate small quantities of waste weter. Some housekeeping ope-rations may also generate liquid wastes.
20. Solid wastes are generated from a number of sources. Skins, bulls andother trash result from separation of the beans from the cherries in the dryprocess. Parchment removal, following fermentation, will produce some wastes.Cleaning of roasting equipment is normally a dry operation and can produce somewaste residues.
EFFLUENT LIMITATIONS
21. Gaseous emissions, from gas or oil fuel combustion, will produce sulfurdioxide and particulates. Permissablls limits are as follows:
SO2 at Ground Level
Inside plant fance Annual Arith. mean: 100 ug/m3Max. 24-hr peak 1000 g/m
Outside plant fence Annual Arith. mean: 100 gg/m3Max. 24-hr peak 500 )g/m3
Particulates at Ground Level
Ann. Geom. Mean: 75JIg/a3K . 24-br: 260,pg/=3
22. It is feasible to achieve essentially total el-mination of liquid wastedischarges to surface waters through such means as land application, ponding andlagooning, discharge to municipal treatment, or some combination of these.
23. Solid waste materials may be deposited on controlled land fills, eitherwithin or outside the plant grounds.
CONTROL AND TREATMENT OF WASTES
24. Gaseous emissions may be controlled by means of proper stack design,wet stack scrubbers, or a combination of the two. Substitution of other fuelsfor coal or oils, where possible, will also reduce these emissions.
- 412 -
25. Liquid wastes from the vet processing of cherries to separate thecoffee beans contain broken stalks and other trash. This effluent may bescreened to separate the solids. General housekeeping wastes will originate fromboth tea and coffee processizg. A third possible source may be the effluent fromthe wat stack scrubbers, where these are used. These effluents may all be com-bined and disposed of by spray irrigation, lagoons, or evaporation ponds. Dis-charge to a iicipal treatment system may be possible, either with or withoutpretreatment. Human wastes should be kept separate from process wastes, and dis-posal made to either imIcipal or private on-plant facilities.
26. Solid materials are best disposed of by depositing on land, in control-led areas either within or outside the plant grounds. Where necessary, suspend-ed materials should be separated from the liquid carrier by screening, settling,or other means. Selection of a land site for disposal of solid wastes should con-sider such factors as sufficient area; reasonable haul distances; distance fromexisting or planned residential, commercial and recreational areas; naturaldrainage and runoff patterns; and soil conditions.
BIBLIOGRAPHT
1. Singh, S., deVries, J., Hulley, J.C.L., and Young, P. "Coffee, Tea, tndCocoa - Market Prospects and Development Lending". World Bank OccaslonalPapers, No. 22. The World Bank. Washington (1977).
2. Eden, T. "Tea". 2nd Ed. Longman, Green and Co. Ltd. London (1965).
3. Earler, C.R. "Tea Manufacture". Oxford University Press. London (1963).
4. Rowe, J.W.. "The World's Coffee". H.M.S. Office. London (1963).
5. Saarer, A.E. "Modern Coffee Production". Leonard Hill Books Ltd., London(1962).
6. U.S. Environmental Protection Agency. "Draft Development Document forEffluent Limitation Guidelines and New Source Performance Standards forthe Miscellaneous Foods and Beverages Point Source Categories". Preparedby Environmental Science and Engineering, Inc., Gainesville, Florida(February 1975).

- 413 - CO 18TEE WOD BAN41 OCTOBER 1980
OFFICE OF EV ENTAL AFFAfIS
T E AND SYNTETIC FIBER IDUSTRIES
1. The basic raw materials in the textile industr'. are wool, cottonand man-ends fibers, with the moat important man-made fibers being rayon,acetate, nylon, acrylic, polyester, polypropylene and glass fiber.
2. With the exeception of silk, the natural fibers are available instaple (or short fiber) form. The man-made fibers are available as eitherstaple or continuous filament forms. Mn the staple form, the elements arespun iapo yarn. Both forms, in turn, are woven or knitted into fabrics. Inmost cakes fabrics are dyed and treated to impart shrink resistance, creaseresistance, and other characteristics, and then delivered to manufacturersfor production of textile commodities. .Fabrics may also be sold as grey,bleached or printed goods.
3. Both dry and vet processes are used to transform fibers into fabricsand thence into final products. Dry processing includes spinning, weaving,knitting, bonding and laminating. The major vet processes-from which efflu-ent disposal problems arise-include scouring, desizing, mercerizing, bleach-ing, dyeing and finishing.
MAWNUFACTURING PROCESSES
Wool Fibers and Fabrics
4. The initial treatment given to raw wool after shearing is a scouringor washing in order to free it fromn natural grease, soluble salts (from theperspiration of sheep), and sand and dirt which are always present. Scouringmay be accomplished either with detergents or solvents, with the detergentsbeing most commonly used. The process is carried out (usually) in a series. ofopen bowls (or baths). The first ones contain sodiu carbonate and a littlesoap or ionic detergent. The next bowls contain a small quantity of ionic de-targent, and the final bowl contains only water. Essentially, the first bowlsprovide the detergent or alkali solvent and accomplish the scouring, while thelast bowls perform the rinsing. Solvents such as carbon tetrachloride, petroleumether, or kerosene are also sometimes used to remove the grease and other im-parities.
5. The next step is the carbonizing, to remove cellulosic impuritiespresent as vegetable burrs and seeds or as vegetable fibers in the form ofloose wool. The process consists of impregnating the material with a dilutesolution of a mineral acid (generally sulfuric), drying, baking, and subject-ing the wool to mechanical action to remove the degraded cellulose as dust.

- 414 -
After carbonization, the wool is thoroughly rinsed and neutralized with sodiucarbonate, and the materials rinsed again before the fulling and dyeing opera-tions.
6. The fulling process shrinks and thickens the goods, as required bythe final use to be made of the material. Either alkali or acid fulling arecommonly employed. The alkali method utilizes soap or detergent, sodim car-bonate, and sequestering agents. In the acid process the wool is impregnatedwith an aquasous sulfuric acid solution. After either method the goods arewashed to remove the fulling chemicas. Wool is dyed either as yarn or aswoven piece goods, with dye formulations varying according to the final useof the goods. One of three classes of dyes are generally used: acid, metallic,or mordant (chrome) dyes. The use of mordant dyes is diminishing.
Cotton Fibers and Fabrics
7. Raw cotton is received in bales, opened, cleaned, mixed and thoroughlyseparated. It is next carded, a process in which the fibers are separated andaligned in a thin web, and than converted into a continuous untwisted strandcalled a "sliver". In some cases it is necessary to comb the sliver to removeshort fibers and tangles, and to place the fibers in parallel to each other.Several strands of sliver are then combined into a single strand and drawnin order to improve sliver uniformity. The sliver is then further reduced insize and wound around a bobbin to form a "roving". The roving is transferredto a spinning frame to produce a yarn of specified twist and strength. Theyarn from several bobbins is wound onto a large spool and fed to a "warper".Several warper beams are wound together, fed through sizing machines, and thenwound on a loom beam for use in the weaving operation.
8. Prior to weaving, the finished yarn is strengthened by "slashing".This requires coating the warp yarns with "sizing" A stiffen or strengthenthem to minmaze yarn abrasions during the weaving operation. Starch, starchsubstitutes, polyvinyl alcohol, carboxy methyl cellulose, gelatin glue, andgums are among the sizing agents generally used. After slashing, the yarnsare woven into fabrics. Excess sizing is removed from the woven fabrics, andthe fabric rinsed clean. Desizing is followed by scouring or "kiering" (boilout), using hot alkaline detergents or soap solutions to remove cotton wax andother non-callulosic components. The scoured goods receive a final rinse toremove residual detergents or soaps.
9. After scouring, the material is bleached to remove the natural yellow-ish color of the cotton fiber and to render it white. Sodiu hypochlorite andhydrogen peroxide are the two most commonly used bleaching agents. In some in-stances the bleaching is done after desizing. Fabrics in the =nbleached andundyed state are sometimes referred to as "greige" or "gray goods".
10. Bleaching is followed by mercerizing, which-gives a brighter luster,increases dye affinity, and improves the tensile strength of the fabric. Withthe increasing use of cotton-polyester blends, fewer cotton fabrics are being

- 415 -
mercerized. The,dyeing or printing process follows the mercerizing, eitherin batch process machines, for small volumes, or by continuous dyers forlarge volumes.
Synthetic Fibers and Fabrics
11. Synthetic textile fibers may be grouped under two broad categories:cellulosic and non-cellulosic. Rayon and cellulose acetate-are the two majorcellulosic fibers; nylon, polyester, acrylics, and modacrylics are the majornon-cellulosic fibers. The synthetics are produced entirely by chemical treat-ment and processing of raw materials such as wood pulp, cotton fibers, petroleumderivatives, and other substances. The fibers so produced have an almost un-limited range of uses.
12. Synthetic fibers are produced as continuous filaments or in stapleform. The filament yarns are generally used to produce 100 percent syntheticgoods, while the staple forms are used to produce blends of synthetics or com-binations of man-made and natural fibers. Since the manufacturing process canbe closely controlled, synthetic materials are essentially free of chemical im-purities. Therefore, only light scouring and little or no bleaching is requiredprior to dyeing. The yarns are sometimes dyed before use in a final product,unless the material is to be piece dyed, printed, or used as produced.
SOURCES AND CEARACTERISTICS OF WASTES
13. Many of the operations for producing yarns and fabrics are commonto the industry as a whole and the characteristics of the wastes are similar.Basically, the fibers are converted to yarns, the yarns are converted to fabricsand eventually to final products. The fabrics, after manufacturing, are sub-jected to several wet processes known as finishing. Waste effluents are pro-duced in varying degrees from the bleaching, mercerizing, dyeing, printingand finishing operations.
14. Normally, air-borne wastes do not present problems in the productionof textiles and synthetic fibers. Air contamination may result from combustionof fuels used for steam generation. Flue gas discharges contain carbon monox-ide and sulfur dioxide, depending upon the type and quality of fuel used. En-vironmental contamination can usually be controlled by discharging through astack of adequate height. Data on the concentrations of possible air-bornecontamints existing at ground level should be determined in the generalplant area prior to the start of indutrial operation.
15. Fibers and dusts may originate from various in-plant sources, par-ticularly the spinning and weaving operations. The sources of such substancesshould be equipped with filters or other devices to prevent their discharge tothe atmosphere, both within and outside the plant.
16. In many textile production operations, particularly for syntheticfibers, a finish is applied to improve the running characteristics during theprocessing. Synthetic fibers are frequently subjected to heat treatment in
- 416 -
order to improve certain desirable properties. Such treatment volatalizesthe finish into a mixture of volatile oils and waxes. The mixture escapesas a gas and this effect is commonly referred to as "smoking". If dischargedto the atmosphere the fimes may be irritating to workers and may condense onmachinery. The condensation causes housekeeping problems, potential flamableconditions and-sometimes degradation of the quality of the product.
17. The principal parameters used to characterize liquid textile indus-try wastes are the flow, 5-day biochemical oxygen demand (30D5), chemicaloxygen demand (COD), total suspended solids (TSS), oils and greases (0 + G),chromium, phenols and sulfides.
18. In order to facilitate definition of effluent characteristi. andlimitations, manufacturing operations can be categorized according to the pro-cess being utilized as part of the production of a textile and its final con-sumer product. An individual plant will carry out one or more of these opera-tions concurrently, but only in rare cases will all of these operations becarried out at one plant at the same time. Therefore, total effluent dischargeallowances may be determined by taking the sum of the permissible effluent load-ings applicable to the individual process categories which are being carriedout at the individual plant.
19* Bence, the liquid wastes from this industry may be categorizedas follows: - -- - - --
- Raw wool scouring -- nit fabric finishing- Wool finishing Carpet mills- Dry processing - Stock and yarn dyeing and finishing- Woven fabric finishing - Comission finishing
Raw Wool Scourin.
20. Liquid wastes from raw wool scouring differ from all other categoriesof wastes in that they contain significant quantities of oil and grease, evenafter in-process recovery. Sulfur, phenols, and other organic substances appearintermittently in the effluents, and originate from the sheep urine, faces,blood, tars, branding fluids and insecticides used in sheep dips. The scouringbowls separate the heavier dirt and grit from the wool, and this residue settlesto the bottom, from which it can be removed for disposal.
21. Wool finishing wastes are distinguished from other textile finish-ing effluents because of the wide variety of process chemicals used, the 30D 5loading, and the higher water usage per unit of product. The heaviest flowsappear in the rinsing applied after fulling. Orthophenols, phenols, diphenolsor benzoic acid derivatives will be present in significant quantities in thewastes from mills working on polyesters and other blends. The finished fabricreceives a wash (or "heavy scour") prior to the dyeing, to remove all foreignmaterials either introduced by or remaining from previous processing procedures.

- 417 -
Other finishing stages contributing liquid wastes in varying degrees includethe carbonizing, fulling, crabbing (applied to give rectilinear alignment tothe fabric), final cleaning and dyeing.
Dry Processing
22. These wastes originate at mills producing greige goods from cottonstocks, and consist principally of the residues in sizing boxes and water usedfor cleanup. Starches and polyvinyl alcohols are the most commonly used sizingmaterials. Cobling waters are generally separated and are not included in theflows fro this source. Typically, over 90% of the effluent from a dry process-ing Mil is sanitary waste.
23. The carpet backing industry produces an unusual waste, because of theuse of foamed and unfoamad latex backing. The 1 tax, which is not solublein water, is used in a highly dispersed form and may cause suspended solidsand COD problems from equipment washdowns.
Woven Fabric Finishing
24. The wastes resulting from the finishing of woven goods originatefrom removal of foreign materials during the finishing process and from thevarious chemicals used for this purpose. Enzymatic removal of starches indesizing produces an effluent containing dissolved and suspended solids, fatsand waxes, at a pH of 6 to 8. Effluents from eulfuric acid removal of starchescontain dissolved and suspended solids, oils, and greases at a pH of 1 to 2.Mercerizing, bleaching, dyeing, and printing--which also constitute a part ofthe finishing process-contribite minor to significant waste loads. Suchwastes may contain NaOR, HC10, EC102 , Na2 SO 3 , and other constitutents, depend-ing upon the process chemicals used.
Knit Fabric Finishing
250 The principal differences in wat process operations between knit andwoven fabrics are that knit yarns are treated with lubricants rather thanstarches or polymer sizes, and that mercerizing is not applied to knit goods.Otherwise, the wastes generated from compdrable unit operations performed oncottons, synthetics and blends are similar to those resulting from woven fabricfinishing. Lubricating finishes applied to knitting yarns generally contain abase of mineral oil, vegetable oil, synthetic esther type oil or wax. Thefinishes may also contain antistatic agents, antioxidants, bacteriostats andcorrosion inhibitors. Knitting oils are readily soluble in water and are re-moved from the goods by washing prior to dyeing.
Carpet Mills
26. Carpet industry wastes are similar in character to those from knitfabric finishing operations. When polyester is dyed disposal of the carriers(auziliary chemicals) presents a problem. Most wool used for carpets is dyedin the yarn form, thus minimizing chromiu use. Where carpets are printed ordyed continuously, the thickeners (used to give the print paste the viscosityrequired for the method of printing and the pattern to be printed) contributeto a high 30D5 load.

- 418 -
Yar- DYeâz and Finishing
27. Vastes firo yar processiag will d4pend principally cn whather natu-ral fibers, blends or synthetics are processed. Whn only syathetics are be-icg handlad, low levais of datergents, soda ash, sodium phosphata, and bleachesare discharged, and these vill have a,low BOD5 . Scouring, blesching and mer-carIzicg of cotton. gentrate BOD5 and color, because of fiber impuri:ties, andhigh dissolved solide because of the merceriizng. '
Commission Fnishinc
28. This type of plant vill frequently have a high hydraulic loadingand a lesa treatable vaste than encountered la other operations. "Proble"type materials, generally in batches, are processed and severalproceasses may be carried out in sequence or smultaneously. Operations do notreadily permit vater recycling and reuse. The characteristics of the affluentsare subject to vide fluctuations because of the constantly changing mix of pro-cesses and products.
rEFLUNT LIMITATIONS
.29. Effluent limitations for various textile proceass operations, basedou the best treatmont technology currently avallable, are presented in Table 1.These are for plants carrying out the indicated processing on a continuous basis.For plants carrying out commission finIshing the lizitations are double thoseshown.
Table 1. Daily Maxi= Effluent Limitations - Textile Plants.
TOTALBOD5 TSS COD CEO- PEL SULFIDE
PROESS a/
XgtMegagram Final Product
Vool Scouring of c/ 10 32 138 - 0.10 0.20
Wool pinishing 22 35 .163 0.14 0.14 0.28
Dry Processing d/ 1.4 1.4 2.8 - - -
Woven Fabric 6.6 18 60 0.10 0.10 0.20Finishing
Knit FabricFinishing 5.02 22 60 0.10 0.10 0.20
Carpet Mills e/ 7.8 il 70 0.04 0.04 0.08
Stock & YarnDyeing-Fin. 6.8 17 85 0.12 0.12 0.24
M

- 419 -
a1 For those plants identified as "Commission Finishing" multiplyeffluent limitation by 2.
b/ Limitations expressed as kg/Mie'raw wool.
a/ Oil and Grease limitation is 7.2 kg/Bg raw wool.
d/ Fecal coliform MPN Limitations a 400 per 100 mL. (For all processes)
a/ Limitations expressed as kg/Mg primary backed carpet.
Note: pH limitation for all effluents is 6 to 9.
CONTROL AND TREAMET OF WASTES
30. Wastes from textile production may be reduced in both volume andstrength through in-plant measures, through the application of end-of-pipe-technology, or through a combination of the two. In-process control requiresaltering the process requirements that. generate contamants and controllingwater use in both process and non-process operations.
31. An effective water management program is a major factor in reducingwaterborne pollutants. Measures would include the use of liquid level con-trols, flow meters and regulators, adequate hot water capacity, an effectiveleak and spill prevention program, strict attention to housekeeping procedures,and use of better hand and machine working methods. The more extensive use ofsoluble sizers and desizers has been suggested as a means of reducing liquidB0D5 and COD waste loads, though their feasibility has not been fully demon-strated. Reducing water consumption for individual processes, strict controlof dyeing operations, and selective process automation and instrumentation willall contribute to in-plant waste reduction. Chromium wastes, originating fromthe dyeing and finishing operations, may be eliminated by substituting for thechromium dyes. If treatment is necessary the chromium may be removed by coagu-lation with alum.
32. Since a large proportion of the biodegradable material in textilewastes is in the soluble form the effluents are readily susceptible to bio-logical treatment. Activated sludge systems (including extended aeration),trickling filters, anaerobic lagoons, anaerobic contact systems, aerobic lagoons,and rotating biological contactors have all been successfully applied to thetreatment of these effluents.
33. Where very high removals are required to meet effluent standards, oneof the advancedtreatment technologies may be applied. These have achievedvarying degrees of success. Processes which have been used or considered forthis purpose include phase change (distillation, freezing), physical separation(filtration, reverse osmosis, ultrafiltration, electrodialysis), sorptionsystems (activated carbon, ion exchange, absorption resins), and chemicalclarification. Eash situation must be carefully analyzed and evaluated on itsown merits before applying any specific advance waste treatment technique.
* 1 Mg a 1 megagram = 1 metric ton
- 420 -
3'LIOGRAPHY
1. Powers, Philip W. "How to Dispose of Toxic Substances and IndustrialWastes". Noyes Data Corporation. Park Ridge, N. J. and London (1976).
2. U. S. Environmental Protection Agency - "Development Document forEffluant Limitations Guidelines and New Source Performance Standardsfor the Textile Wlls Point Source Category". Doc. EPA-440/1-74-022a.Washington (June 1974).
3. U. S. Evironmntal Protection Agency - "Economic Analysis of Pretreat-mant Standards for the Textile Industry". Doc. EPA-440/1-77-009. Wash-ington (July 1977).
4. Sbaskaran, T.R. "Guidelines for the Control of Industrial Wastes -Cotton Textile Wastes". Doc. WHO/WD/73.16. World Health Organization.Geneva (1973).
5. Isaac, P.C.G. and Ruscombe-King, N.J. "Guidelines for Control of Indus-trial Wastes - Woollen Textile Wastes". Doc. WHO/WD/75.17. World HealthOrgawation. Geneva (1975).
6. Linton, George E. "Natural and Manmade Fibers". Duell, Sloan and Pearce,New York (1966).
7. Kastens, Anita S. "Synthetic Fiber Markets to 1970". Noyes DevelopmentCorporation, Pearl River, N. Y.
8. "Tairchild's Dictionary of Textiles". Ed. by Isabel 3. Wingate. FairchildPublications, Inc. New York (1967).

- 421 -
THE WORLD BANK OCTOBER 1980
OFFICE OF ENVIRONMENTAL AFFAIRS
WOOL SCOURING
. EFFLUENT GUIDELINES AND PROCESS -
1. Wool scouring is the first wet process that the raw fibers receive.It removes all the natural and acquired impurities from the fibers. Two methodsexist; detergent scouring and solvent scouring. The first process is usedalmost exclusively because solvent scouring is too costly.
2. Two types of detergent scouring are used; the soap alkali processand the neutral detergent process. In the soap alkali, a soap or a detergentis added to a milk alkali such as sodium carbonate at a pH 9.5 to 10.5. Thebath is heated to 550 C and requires an average of 80 liters of water per megagranof wool fiberA* Part of that water is recycled. In the neutral detergentprocess, nonionic detergents are added to water at a pH 6.5 to 7.5 and at atemperature from 550 to 700 C.
3. The process is carried out in a series of 4 open bowls called "scour-ing train". The first two bowls contain the detergent or soap alkali andperform the "scour". The last two rinse the fibers clean; then the wool isdried.
4. For every,kilo of scoured woolen fiber, one to 1.5 kilos of wasteimpurities are produced. Therefore, wool scouring is one of the strongestindustrial wastes in terms of BOD.
5. A general flow sheet is given in ANNEX.
6. The grease wool contains 25 to 75% non-wool materials consisting ofwool grease and other excretions and secretions of the sheep, such as urine,feces, sweat and blood, as well as dirt. Additional products such as pestici-des and dyes may be present. This impurity variability causes the same vari-ability in raw waste loads.
Waste Chaacteristics
7. The raw waste contains significant quantities of oil and grease whosedifficult -biodegradability constitutes a special.problem. Therefore, a greasereco2ery ste' is important to decrease pollution.
8. Sulfvr is brought in with the wool as well as phenolic and otherorganic materials.
9. In centrifuging, the top low density stream contains concentratedgrease, the medium density stream is recycled upstream, and the heavy densitybottom (dirt and grit) is sent to the treatment plant. 60% of the grease isrecovered; the rest goes with the dirt and grime.
* 1 Mg = 1 megagram = 1 metric ton
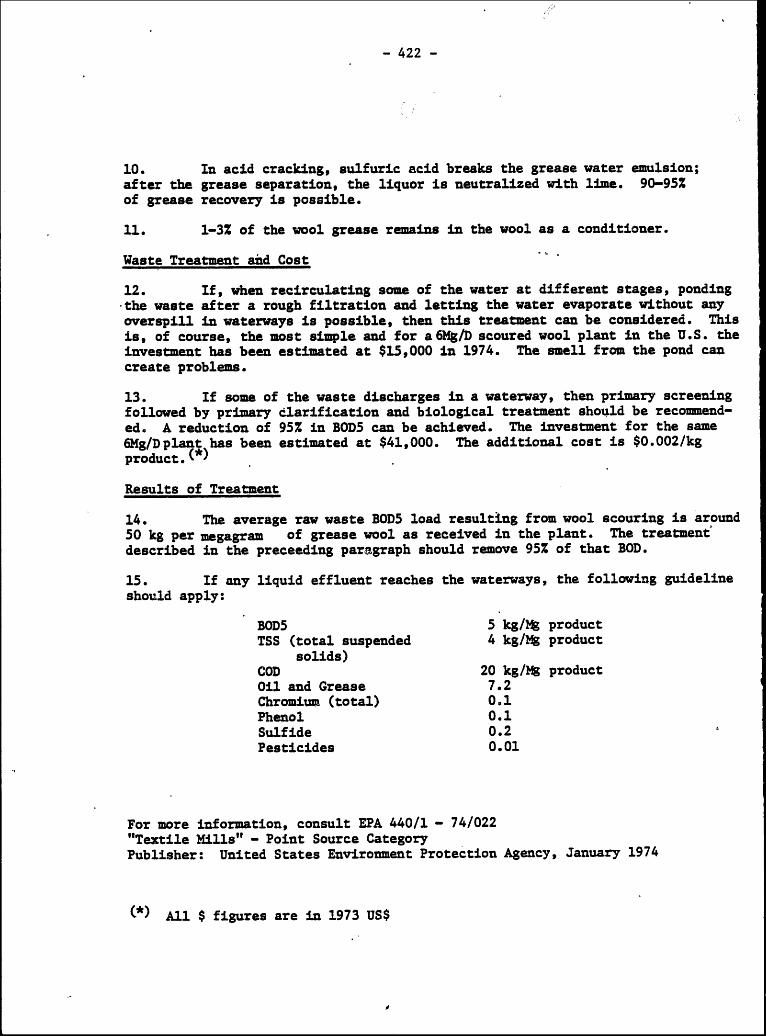
- 422 -
10. In acid cracking, sulfuric acid breaks the grease water emulsion;after the grease separation, the liquor is neutralized with lime. 90-95%of grease recovery is possible.
11. 1-3% of the wool grease remains in the wool as a conditioner.
Waste Treatment and Cost
12. If, when recirculating some of the water at different stages, ponding-the waste after a rough filtration and letting the water evaporate without anyoverspill in waterways is possible, then this treatment can be considered. Thisis, of course, the most simple and for a6Mg/D scoured wool plant in the U.S. theinvestment has been estimated at $15,000 in 1974. The small from the pond cancreate problems.
13. If some of the waste discharges in a waterway, then primary screeningfollowed by primary clarification and biological treatment should be recommend-ed. A reduction of 95% in BOD5 can be achieved. The investment for the same6Mg/Dplant has been estimated at $41,000. The additional cost is $0.002/kgproduct.M
Results of Treatment
14. The average raw waste BOD5 load resulting from wool scouring is around50 kg per magagram of grease wool as received in the plant. The treatmentdescribed in the preceeding paragraph should remove 95% of that BOD.
15. If any liquid effluent reaches the waterways, the following guidelineshould apply:
BOD5 5 kg/Mg productTSS (total suspended 4 kg/Mg product
solids)COD 20 kg/Mg productOil and Grease 7.2Chromium (total) 0.1Phenol 0.1Sulfide 0.2Pesticides 0.01
For more information, consult EPA 440/1 - 74/022"Textile Mills" - Point Source CategoryPublisher: United States Environment Protection Agency, January 1974
0) All $ figures are in 1973 US$

ANN5A A
SoapDetergent Water RouseSoda Ash Water
Wool Topwater Reuse
RwU Sorting and Scouuand wash Ory Sach Top MakingS
Waste Blendinge Wesuiaan me Idaa.IMy 93
-boFibersFor Wool
SW Scour LW H3SO4 YarLiquor
AcidSeaao- Crack Seaao
*lqid WasteRe *Pry
[lid oidWat SW LW centrifuge L
LW
SOUIGG: "Chemical!Physical and Biological Treatment of Wool Processing Wastes," by Hatch, at al. 28t Annual Purdue ladustrialWaste Conference, West Lafayette, Iadiana, I May 1973.
Figure 1 Subcstegory la Wlool Scouring


![FYdgYdcYf]k Yf\ FYdgYj]f]k - Samagra](https://static.fdokumen.com/doc/165x107/631f358f13819e2fbb0fa1db/fydgydcyfk-yf-fydgyjfk-samagra.jpg)