Environmental Fate, Aquatic Toxicology and Risk Assessment ...
Upload
independentCategory
view
0download
0
3D-MEDNEs: An Alternative “in Silico” Technique for ChemicalResearch in Toxicology. 2. Quantitative Proteome-Toxicity
Relationships (QPTR) based on Mass Spectrum Spiral Entropy
Maykel Cruz-Monteagudo,†,‡ Humberto González-Díaz,*,⊥ Fernanda Borges,†
Elena Rosa Dominguez,‡ and M. Natália D.S. Cordeiro§
Physico-Chemical Molecular Research Unit, Department of Organic Chemistry, Faculty of Pharmacy, UniVersityof Porto, 4150-047 Porto, Portugal, Applied Chemistry Research Center, Faculty of Chemistry and Pharmacy,
Central UniVersity of Las Villas (UCLV), Santa Clara 54830, Cuba, Unit of Bioinformatics & ConnectiVityAnalysis (UBICA), Institute of Industrial Pharmacy, and Department of Organic Chemistry, Faculty of
Pharmacy, UniVersity of Santiago de Compostela, 15782 Santiago de Compostela, Spain, and REQUIMTE,Department of Chemistry, Faculty of Sciences, UniVersity of Porto, 4169-007, Porto, Portugal
ReceiVed August 20, 2007
Low range mass spectra (MS) characterization of serum proteome offers the best chance of discoveringproteome-(early drug-induced cardiac toxicity) relationships, called here Pro-EDICToRs. However, dueto the thousands of proteins involved, finding the single disease-related protein could be a hard task. Thesearch for a model based on general MS patterns becomes a more realistic choice. In our previous work(González-Díaz, H., et al. Chem. Res. Toxicol. 2003, 16, 1318–1327), we introduced the molecular structureinformation indices called 3D-Markovian electronic delocalization entropies (3D-MEDNEs). In thisprevious work, quantitative structure-toxicity relationship (QSTR) techniques allowed us to link 3D-MEDNEs with blood toxicological properties of drugs. In this second part, we extend 3D-MEDNEs tonumerically encode biologically relevant information present in MS of the serum proteome for the firsttime. Using the same idea behind QSTR techniques, we can seek now by analogy a quantitativeproteome-toxicity relationship (QPTR). The new QPTR models link MS 3D-MEDNEs with drug-inducedtoxicological properties from blood proteome information. We first generalized Randic’s spiral graphand lattice networks of protein sequences to represent the MS of 62 serum proteome samples with morethan 370 100 intensity (Ii) signals with m/z bandwidth above 700–12000 each. Next, we calculated the3D-MEDNEs for each MS using the software MARCH-INSIDE. After that, we developed several QPTRmodels using different machine learning and MS representation algorithms to classify samples as controlor positive Pro-EDICToRs samples. The best QPTR proposed showed accuracy values ranging from 83.8%to 87.1% and leave-one-out (LOO) predictive ability of 77.4–85.5%. This work demonstrated that the ideabehind classic drug QSTR models may be extended to construct QPTRs with proteome MS data.
Introduction
The ability to predict the toxic effects of potential new drugsis crucial to prioritizing compound pipelines and eliminatingcostly failures in drug development. The inability to accuratelypredict toxicity early in drug development cost the pharmaceuti-cal industry $8 billion in 2003, approximately one-third the costof all drug failures. Indeed, predictive toxicology and “omics”technologies are of growing interest to government regulators,who have called for more predictive toxicology and toxicoge-nomics or toxicoproteomics approaches to be used in assessingdrug safety. Predictive toxicology is still in its early stages,characterized by the use of gene or protein expression profilesto gain a basic understanding of whether a compound has a“clean” or “messy” profile. The tremendous advantages of theseapproaches, as well as pressure from the FDA to improvetoxicology testing in drug development, indicate that advance-
ments in predictive toxicology will play an increasing andaccelerating role in drug development (1).
Specifically, cardiotoxicity is a serious adverse effect ofchemotherapy ranging from relatively benign arrhythmias topotentially lethal conditions (2, 3), where the extent and severityof the necrosis can be monitored by the levels of bioactivemarkers (4). However, the number of new biomarkers reachingroutine clinical use remains unacceptably low (5, 6).
At the same time, body fluids are a protein-rich informationreservoir that contains the traces of what the blood hasencountered on its constant perfusion and percolation throughoutthe body (7). In this sense, the blood proteome is changingconstantly as a consequence of the perfusion of the organundergoing drug-induced damage, and this process then addsto, subtracts from, or modifies the circulating proteome (8, 9).So, a blood proteome represents a potential target for thedetection of proteome-(early drug-induced cardiac toxicity)relationships called here Pro-EDICToRs (7). Thus, due to theoptimal performance in the low mass range exhibited by massspectra (MS), the use of this method applied to proteomics mayoffer the best chance for the study of Pro-EDICToRs typephenomena. However, due to the thousands of intact and cleavedproteins in the human serum proteome, finding the single
* To whom correspondence should be addressed. Tel: +34-981-563100.Fax: +34-981 594912. E-mail: [email protected] or [email protected].
† Physico-Chemical Molecular Research Unit, University of Porto.‡ UCLV.⊥ University of Santiago de Compostela.§ REQUIMTE, University of Porto.
Chem. Res. Toxicol. 2008, 21, 619–632 619
10.1021/tx700296t CCC: $40.75 2008 American Chemical SocietyPublished on Web 02/08/2008

disease-related protein could be like searching for a needle ina haystack, requiring the separation and identification of eachprotein biomarker. In addition, most commonly used toxicitybiomarkers appear only when significant organ damage hasoccurred. For these reasons, to identify patterns by using theoverall serum proteome MS information instead of directlyidentify a single marker candidate represents a more attractiveand realistic choice for this purpose (10, 11).
In this sense, Petricoin et al. successfully identified patternsof low molecular weight biomarkers as ion peak features withinthe spectra and used these patterns as the diagnostic end pointitself for the early detection of drug-induced cardiac toxicities(12) and ovarian (13) and prostate cancer (14). In any case, asreferred above the detection of single biomarker signals is oftena hard-to-manage problem due to the very large amount ofinformation that serum proteome MS contain. In addition,diseases and toxicity phenomena are often multifactorial, andconsequently predictions based only on a few proteomics
biomarkers may be overfitted due to nonrepresentative dataselection. In this sense, one could expect that a predictive modelbased on information about multiple-biomarker patterns shouldbe a more realistic alternative. We can call a model makingthis kind of prediction a quantitative proteome-toxicity rela-tionship (QPTR) model in close resemblance to the more classicquantitative structure–activity relationship (QSAR); quantitativestructure–property relationship (QSPR), and quantitativestructure-toxicity relationship (QSTR) models (15–39).
Using the concept of entropy to encode information aboutMS patterns may be one way to tackle the QPTR problem. Oneof the pioneer works on the use of Shannon’s entropy to encodemolecular structure in QSAR studies was published by Kier in1980 (40, 41). In this work, the author states that a drugmolecule is considered to be an information source. Quantifica-
Figure 1. Schematic representation of the MS spiral graph-based studyof Pro-EDICToRs.
Figure 2. MARCH-INSIDE interface view of a serum proteome MSspiral graph.
Figure 3. Process of generation of a serum proteome mass spectrumspiral graph.
Figure 4. MARCH-INSIDE interface view of a serum proteome MSCartesian 2D-lattice-like graph.
Table 1. Results for the LDA-Based QPTR Model onTraining and LOO Cross Validation
training parameter (%) LOO CV
class NCT CT 83.87 accuracy 77.42 class NCT CT
NCT 28 0 70.59 sensitivity 67.65 NCT 25 3CT 10 24 100 specificity 89.29 CT 11 23
620 Chem. Res. Toxicol., Vol. 21, No. 3, 2008 Cruz-Monteagudo et al.

tion of the information content using Shannon’s equation givesnegative entropy values, also known as molecular negentropy(40, 41). Many other authors have used Shannon’s entropyparameters to encode small molecule structure (17, 41–48).These concepts have been extended to describing protein(49, 50), DNA sequences (51) or protein–protein interactionnetworks (52). More recently, the information properties of
organic molecules have been the subject of in depth researchby Graham et al. (53–58).
Our group has introduced an approach to study the informa-tion content of different molecular systems in terms of entropymeasures derived with a Markov model (MM). In general, ourapproach begins with the classic description of a complex systemby means of a graph or network. This graph is composed ofnodes (the parts of the system) and edges expressing some kindof relationships between pairs of nodes (59–62). After that, weconstruct the Markov matrix of the system. The elements ofthis matrix are the probabilities of direct interaction betweenthe parts of the system. On the basis of Markov chain theoryand Chapman-Kolmogorov equations, we can obtain theprobabilities of interactions between parts of the system notdirectly connected, computing the natural powers of the Markovmatrix (63). The method is very flexible, depending mainly onthe assignation of the roles for system, parts of the system(nodes), and relationships between parts (edges). This techniquedescribes the system by using different numerical parametersderived from the Markov matrix. Between the numericalparameters, we can calculate to describe information of thesystem; we can find spectral moments, potentials, couplingnumbers, average atomic physico-chemical properties, andothers (64–67). In a recent review, we exposed the details ofthe method making a revision of other connectivity or topologi-cal graph theoretic methods used in chemistry, toxicology,medicine, and bioinformatics (68). From the parameters usedby our group, the Shannon’s entropy of the different powers ofthe Markov matrix can be considered between the most usedones. The entropies calculated by us included systems such assmall molecules of drugs and toxic substances, RNA secondarystructures, protein sequences, and viral surfaces (69–75). Thenature of this technique is topologically based mainly on thecharacterization of the connectivity of the system by numericalparameters. However, it is possibly to incorporate 3D informa-tion without difficulty (76–78). This approach was referred tofrom the first works (more entered on the use of spectralmoments) as the Markovian chemicals in silico design (MARCH-INSIDE) technique (79–81). In any case, applications exceededthe first theoretic definition and were confirmed many times byexperimental outcomes in medicinal chemistry, molecularbiology, and toxicology (67, 73–75, 82–90).
The application of graph theory to MS was first proposed byBartels for peptide sequencing (91). The basic idea consists intransforming a MS into a graph called a “spectrum graph”.Basically, each peak in the experimental MS is represented asa vertex (or several vertices) in the spectrum graph, and adirected edge is established between two vertices if the massdifference of the two vertices equals the mass of one or severalamino acids (peptide loss) (91). An alternative approach basedon graph theory is representing a collection of several MS as anetwork or graph considering that each MS as a whole is a nodeof the network (92–95). In the previous case, the MS of eachprotein is represented as a network (the nodes are fragmentationpeptides), and in this last case, the MS of many proteins arerepresented as a network (the nodes are the total MS of aprotein). In any case, no serious steps have been given tointegrate proteome MS graphs or networks with QSAR/QSTRtechniques to seek QPTR models based on MS informationencoded by entropy indices. In the first paper of this series, wereported a new class of entropy parameters called the 3D-Markovian electronic delocalization negentropies (3D-MEDNEs).The 3D-MEDNEs are Shannon’s entropy type indices for a MMwith experimentally demonstrated applications in QSTR studies
Figure 5. LDA model receiver operating characteristic (ROC) curve.
Figure 6. (A) Scatter plot of standardized residual vs sample ordernumber and (B) histogram of residuals.
Proteome MS Spiral Graph Detection of Toxicity Chem. Res. Toxicol., Vol. 21, No. 3, 2008 621

(96). In the present work, we decided for the first time to extendthese indices to identify Pro-EDICToRs type patterns bygenerating a QPTR model. This QPTR model is based on aMS graph theoretical approach instead of directly identifyingpatterns within the high-throughput MS. In the first instance,we propose an alternative graph theoretical representation tothe classic proteome spectrum graph that is more compact andsuitable to manage. The new proteome spectrum graph isconstructed here based on the four-color spiral maps introducedby Randi∫ et al. for DNA sequence representation (97) Next,we calculate the new 3D-MEDNEs now referred as 3D-Markovian electronic dissociation negentropies (pointing to thenature of MS processes). These MS-spiral 3D-MEDNEs (θk)are then used as inputs to derive QPTR models as an alternativemethod for Pro-EDICToRs study in 62 drug-induced cardiotox-icity and control serum proteome MS samples. A graphicrepresentation of the approach proposed in this work for theearly detection of drug-induced cardiac toxicities is shown inFigure 1.
Materials and Methods
Mass Spectrometry Study Details. Although the full detailsregarding the mass spectrometry method used to generate theraw data files used in the present work have been previouslyreported by Petricoin et al. (12), we offer here an overview aboutthe mass spectrometry study for a better understanding. Underthe assumption that the low molecular weight range of theserum/plasma proteome contains important diagnostic informa-tion, the search for low mass serum/plasma biomarkers isfocused on the lower molecular mass region (within the rangeof molecules with m/z values ) 700-12000). To conduct thissearch, the most common analytical platform is comprised of aprotein chip biomarker system-II (PBS-II, a low-resolution time-of-flight (TOF) mass spectrometer). Herein samples are ionizedby surface-enhanced laser desorption/ionization (SELDI), aprotein chip array-based chromatographic retention technologythat allows for direct mass spectrometric analysis of analytesretained on the array. The proteins adhered to the chromato-graphic surface of the chip are treated with acid (so that theycan become ionized) and then dried down onto the surface. Thebait region containing individual captured serum protein samples,dried down on a row of spots, is inserted into a vacuum chamberand a laser beam is fired at each spot. The laser energy desorbsthe ionized proteins, which fly down the vacuum tube towardan oppositely charged electrode. The mass to charge value ofeach ion is estimated from the time it takes for the launchedion to reach the electrode; small ions travel faster. Therefore,the spectrum provides a “time of flight” (TOF) signature of ionsordered by size.
The high-resolution mass spectrometer used to generate theraw data files was a hybrid quadrupole time-of-flight massspectrometer (QSPIRAL pulsar I, Applied Biosystems Inc.,Framingham, MA) fitted with a ProteinChip array interface(Ciphergen Biosystems Inc.) and externally calibrated twice aday using a mixture of known peptides. This high-resolutionmass spectrometer possesses higher sensitivities and specificitiesas a result of the increased number of peaks seen and the muchbetter between and within machine reproducibility (98).
Serum Proteome MS Data Set. We used tab-delimited datafiles containing mass/charge (m/z) and peak intensity (I) valuesexported from serum rat proteome high-resolution MS reportedby Petricoin et al. (12) for the generation of the serum proteomeMS spiral graphs. According to these authors, the data files weregenerated by first exporting the raw data file generated from
Tab
le2.
Des
crip
tive
Stat
isti
csfo
rR
esid
ual
Ana
lysi
san
dN
orm
alit
yT
ests
dist
ribu
tion
stat
istic
sra
wde
scri
ptor
s,s θ k
stan
dard
s θ kde
scri
ptor
sor
thog
onal
desc
ript
ors
O(s θ k
)
test
stat
istic
ssy
mbo
lva
lue
vars
NC
TC
TQ
PTR
vars
NC
TC
TQ
PTR
vars
NC
TC
TQ
PTR
norm
alca
ses
N62
b 0-
2299
-23
68-
69.2
b 0-
1.2
-0.
90.
3b 0
-1.
25-
0.91
0.34
norm
alm
ean
M0.
28θ 1
3865
639
409
752.
6s θ 1
*-
22.6
18.6
41.3
O(s θ 1
*)0.
37-
0.31
-0.
68no
rmal
skew
ness
S-
0.60
θ 3-
1660
90-
1688
62-
2772
.6s θ 3
*89
.0-
73.3
-16
2.4
O(s θ 3
*)5.
66-
4.66
-10
.32
norm
alku
rtos
isK
0.81
θ 553
3686
5440
4210
355.
9s θ 5
*-
341.
128
0.9
622.
1O
(s θ 5*)
21.2
-17
.4-
38.6
K.-
S.a
diff
eren
ceK
.S.D
.0.
17θ 6
-48
6931
-49
8177
-11
245.
8s θ 6
*37
4.1
-30
8.1
-68
2.1
O(s θ 6
*)40
.3-
33.2
-73
.4K
.-S.
erro
rp-
leve
l<
0.1
θ 881
361
8563
342
71.9
s θ 8*
-14
3.8
118.
426
2.2
O(s θ 8
*)-
74.8
61.6
136.
4L
illie
fors
erro
rp l
-lev
el<
0.01
θ 10
2001
683
-13
18.2
s θ 10*
44.8
-36
.8-
81.7
O(s θ 1
0*)
44.8
-36
.9-
81.7
Sh.-
W.b
fitSh
.W.
0.96
Sh.-
W.b
erro
rp-
leve
l0.
43
aK
olm
ogor
ov–S
mir
nov
test
for
norm
aldi
stri
butio
nfit
.b
Shap
iro-
Wilk
test
for
norm
aldi
stri
butio
nfit
.
622 Chem. Res. Toxicol., Vol. 21, No. 3, 2008 Cruz-Monteagudo et al.
the QSPIRAL mass spectrometer into tab-delimited files thatgenerated approximately 350 000 data points per spectrum. Thebinning process condenses the number of data points to 7105points per sample. The high-resolution MS is binned using afunction of 400 ppm (ppm) such that all data files possessidentical m/z values (e.g., the m/z bin sizes linearly increasefrom 0.28 at m/z 700 to 4.75 at m/z 12 000) (12).
Using the spontaneously hypertensive rat (SHR) model, inwhich animals were challenged with doxorubicin or withmitoxantone with or without dexrazoxane (a routinely usedcardioprotectant), we analyzed over 200 samples collected andstored frozen over a 4-year period (N ) 203). This study systemhas both well-known pathological and serum biomarker endpoints (cardiac lesion histological changes and serum cardiactroponin concentrations, respectively) that have been usedrecently to measure effects of therapeutic compounds on cardiacdamage. Since the cardiac toxicity profile of 141 out of 203samples analyzed was reported as unknown or with no definitiveinformation about their cardiotoxic profile, only 62 samples wereused in this work (99–102):•Definitive positive (34 samples with overt cardiotoxicity). Tab-delimited data files exported from serum proteome high-resolution spectra belonging to sera from spontaneously hyper-tensive rat (SHR) model animals with overt cardiotoxicity (cTnTg 0.15 ng/mL and histologic lesion scores g1.0). Also includedas positive were rats with lower cTnT levels (g0.08 ng/mL)but also with mild apparent pathologic changes as determinedby histologic lesion scoring.•Definitive negative (28 samples without cardiotoxicity). Tab-delimited data files exported from serum proteome high-resolution spectra belonging to sera obtained from control SHRanimals prior to treatment or following only 1–3 treatments withsaline alone and whose cTnT ) 0.
Statistical Analysis. Using the MARCH-INSIDE methodol-ogy, as defined previously, we can attempt to develop a simplelinear QPTR to predict cardiotoxicity risk (ct) with the generalformula:
ct ) b0 + b1gθ1 + b2
gθ2 + ··· + bkgθk ) b0 +
∑ bkgθk (1)
Here, gθk values play the role of the independent or predictivevariables. The subindex k is the order of the entropy and thesuperindex g refers to the type of MS graph representation; i.e.g ) s for spiral MS graphs and g ) l for lattice-like graphs. Inthe cases that we do not specify g, we refer to g ) s by default.We selected linear discriminant analysis (LDA) (103) to fit thediscriminant function. The QPTR model classifies the rat’sserum proteome MS into two general groups, namely, car-diotoxic risk (ct ) 1 for positive samples) and no cardiotoxicrisk (nct ) -1 for negative samples). In eq 1, bk represents thecoefficients of the classification function, determined by theleast-squares method as implemented in the LDA module ofthe STATISTICA 6.0 software package (104). Best subsetmethod was used for variable selection (105–107). The statisticalsignificance of the LDA model was determined by Fisher’s testby examining Fisher ratio (F) and the respective p-level (p). Atthe same time, the square Mahalanobis’s distance (D2) betweenthe centroids of each one of the two groups (ct and nct groups)was examined to test discriminatory power of the functiondeveloped (108). All the variables included in the model werestandardized in order to bring it into the same scale. Subse-quently, a standardized linear discriminant equation that allows
comparison of their coefficients is obtained (109). We alsoinspected the percentage of good classification, cases/variablesratios (F parameter), and number of variables to be explored toavoid overfitting or chance correlation (105, 106). The QPTRmodel was trained by using the 62 samples available. To testthe predictive ability of the model, we used a leave-one-out(LOO) cross validation technique.
Results and Discussion
Definition of Serum Proteome MS Spiral Graphs. For thegeneration of the MS spiral graphs, we used high-dimensionaldata produced by high-throughput MS binned data files derivedfrom raw data files (more than 300 000 intensity signals).Although the binned process reduces efficiently the number ofdata points, it is still hard to manage it for graph generation.Hence, the number of data points in the binned data files wascondensed to 36 by including in each new data point theaveraged m/z and I values of 200 consecutive data points. Eachnew data point condenses now the information encoded on 200binned MS data points (12). Due to the number of data pointsin the binned data files, the last data point was generated byusing the last 205. Considering the successive transformationsapplied to the raw data (binning and averaging processes), allthe averaged m/z and I values were replaced by their respectivestandardized values. The values were standardized in order tobring all of them (regardless of their distributions and originalunits of measurement) to compatible units from a distributionwith a mean of 0 and a standard deviation of 1. Standardizationalso makes the results entirely independent of the ranges ofvalues or the units of measurements. Finally and for graphrepresentation, the averaged and standardized m/z and I valueswere multiplied in order to obtain one list of 36 successive datapoints (DP) values for the relationship ⟨Ij⟩ ) (m/z)I, which canbe used in generating a MS graph by using a spiral representa-tion.
Since the values of m/z and I were standardized, the meanvalue of ⟨I⟩ for each sample is around 0.5. Consequently, a cutoffvalue of 0.5 is used to classify each one of the 36 data pointsor MS regions (spiral graph nodes) according to ⟨Ij⟩. Thenecessity of these three coordinates (x, y) in the 2D space and⟨Ij⟩, which can be seen as the third coordinate z, indentify thepresent method as a 3D approach. Next, the spiral graph isobtained in an analogy to the spiral graphs introduced by Randi∫et al. for DNA sequence representation. Specifically, in thiswork, we represented the data points of the MS as a squarespiral with nodes labeled differently; that is if the average ⟨Ij⟩< 0.5, then the node is labeled with the letter C; otherwise islabeled with P. The spiral begins with the first MS data point(MS lower m/z region) and finishes in the last data point forthe MS higher m/z region (97).
If one connects the adjacent nodes (placed at Euclideandistance equal to 1) with the same label, then one obtains theMS spiral graphs shown in Figure 2. Only vertical connections(in ordinates) and horizontal connections (in abscises direction)are allowed. Diagonal connections are not allowed becauseEuclidean distance for those nodes is different from 1 andconsequently they are not considered adjacent. As result thedifferent labeling of nodes confers to each MS spiral graph aparticular topology allowing their numerical (topological orconnectivity) characterization depending on the set of valueson the 3D space (2D coordinates and ⟨Ij⟩) for each sample. Agraphic representation of the process of generation of a serumproteome mass spectrum spiral graph from a mass spectrum
Proteome MS Spiral Graph Detection of Toxicity Chem. Res. Toxicol., Vol. 21, No. 3, 2008 623
data file is shown in Figure 3. Here, DP/⟨I⟩ represents the listof the 36 successive data points (DP) values for the relationship⟨Ij⟩ ) (m/z)I used in generating a MS graph. This figure canalso serve to understand the same process for the Cartesian 2Dgraphs further described.
MS Spiral Graph Entropy Measures (sθk). We used aMarkov model (MM) to codify information about serumproteome MS regions. Specifically, in this work, we introducedthe entropy measures (sθk) as numerical indices of the informa-tion content in the serum proteome MS spiral graph. The sθk
values were calculated with the software MARCH-INSIDE 3.0(110). This new version is the result of extending the so-calledMARCH-INSIDE 2.0 (Markovian chemicals in silico design)approach to work with MS networks renaming it from now onas the Markov chains invariants for simulation and designapproach. We retain the same acronym but change the namemaking it more general. The new MARCH-INSIDE approachis used here for the first time to codify the disorder degreeinduced by the pool of proteins at specific regions for a MSand has been applied previously to the study of proteins(64–66, 69, 70, 77, 78, 111–115). Here, the classic Markovmatrix MARCH-INSIDE approach (115) has been adapted tocharacterize the new spiral graphs. The method uses essentiallytwo matrix magnitudes:(a) The matrix 1Π (see eq 2). This matrix is built up as a squarematrix (n × n). The matrix 1Π contains the probabilities 1pij toreach a node ni moving throughout a walk of length k ) 1 froma node nj. In order to increase the simplicity of calculations,we used the discrete forms of the 3D coordinates (Rij for x andy and oj for ⟨Ij>),
1p(Rij, oj) )Rijoj
∑l ) 1
n
Rilol
(2)
where Rij ) 1 if and only if the two nodes ni and nj are neighborsplaced at topological distance k ) 1 in the spiral graphs, Rij )
0 otherwise. This clearly determines that Rij is the discrete formof the Euclidean distance Dij(x,y) between the two nodes withcoordinates x and y in a 2D Cartesian space. On the other hand,the parameter oj ) 1 if the relationship Ijm/zj > 0.5 for the MSregion j represented by the node nj, otherwise oj ) 0.5. Theparameter oj and the Ijm/zj are then the discrete and thecontinuous forms, respectively, for the third dimension (z) ofthe present probabilities. That is to say, the 1pij are 3Dparameters depending on the Cartesian coordinates (x, y) andon the spectral intensity weighted mass-charge values Ijm/zj
or their discrete form oj. Consequently, the new entropiesderived from 1pij (see below) are also 3D parameters.(b) The zero-order absolute initial probabilities vector Aπ0 (seeeq 3). This vector lists the absolute initial probabilities Apk(j)to reach a node ni from a randomly selected node nj,
Ap0(j) ) 1N
(3)
where N represents the number of nodes (spectral regions) inthe spiral graph. Due to the particularities of the graphrepresentation used here Apk(j) only depends on the total numberof data points or spectral regions on the graph. Consequently,all the nodes in the graph have the same and constant value ofApk.
Because the elements of the matrices kΠ (which are the knatural powers of the matrix 1Π) depend on the adjacencyrelationships between the nodes on the graph, the use of Markovchains (MCH) theory thus allows calculation of the spectralproteomic stochastic entropies (sθk) for any node nj that onecan reach in the spiral graph by moving from any node ni
throughout the entire graph using walks of length k:
sθk ) Sh · (1Π)k · Aπk ) Sh · Aπk )
- kB∑j ) 1
nApk(j)log Apk(j) (4)
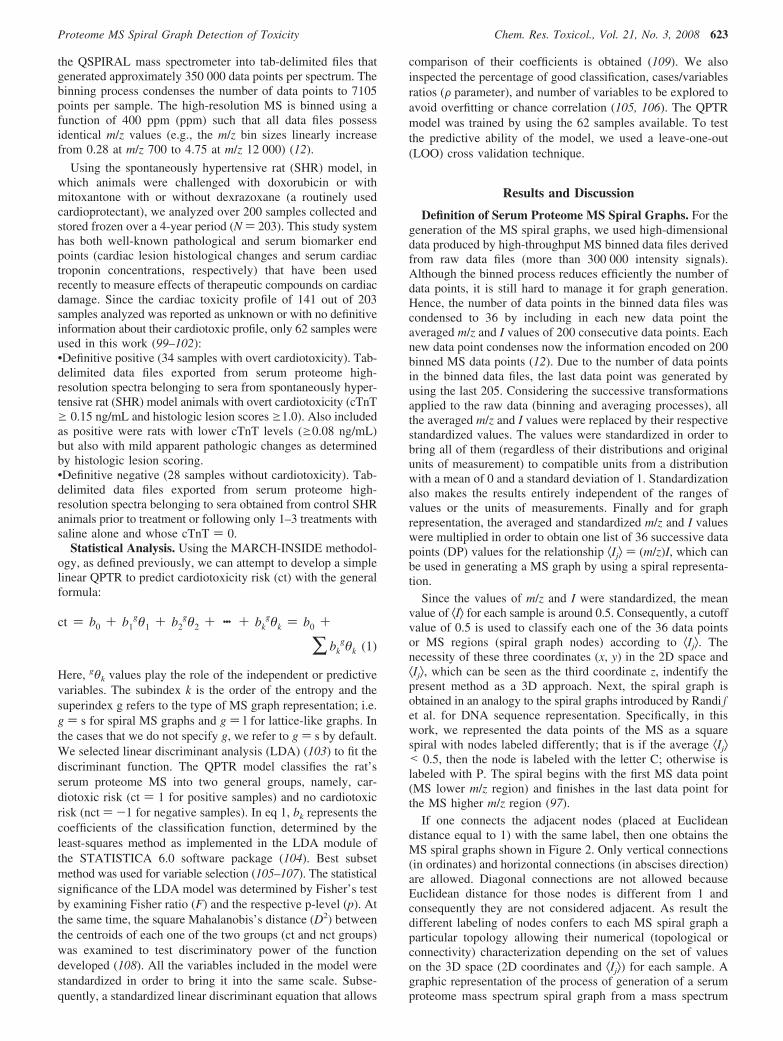
Figure 7. Scatter plots of square standardized residual vs the respective θk included in the QPTR model.
624 Chem. Res. Toxicol., Vol. 21, No. 3, 2008 Cruz-Monteagudo et al.

where Aπkis the vector listing the absolute probabilities Apk(j)to reach a node j moving throughout a walk of length k withrespect to any node in the spectral graph. The operator Shappliesthe -kBx log x function to each element Apk(j) of the vector
Aπk, resembling Shannon’s entropy-like magnitudes. Shannonentropies are of major importance to encode biologically relevantinformation not only for small-sized drugs but for large systemslike proteins too. In this equation, kB is the Boltzmann’s
Table 3. Machine Learning Classification Algorithms Based on MS Spiral Graph sθk Indices
ML parameters
ML schemea training LOO cv
short name rule/tree/function accuracy sensitivity specificity accuracy sensitivity specificity
LDA ct ) 41.39sθ1 - 162.4sθ3 + 622.05sθ5
- 682.15sθ6 + 262.24sθ8 - 81.7sθ10
- 0.34
83.87 70.59 100 77.42 67.65 89.29
Func.Log. ct × 10-4 ) 0.3sθ1 - 1.3sθ3 +4.9sθ5
- 5.9sθ6 + 3.9sθ8 - 1.9sθ10 - 0.387.1 76.5 100 85.5 73.5 100
Bayes Net 54.8 100 0C.Naive.Bayes 72.6 61.8 85.7 72.6 61.8 85.7Naïve.Bayes 62.9 38.2 92.9Naïve.Bayes.M. 54.8 100 0Naïve.Bayes.S. 62.9 38.2 92.9Naïve.Bayes.U. 62.9 38.2 92.9ML.Perceptron 71.0 85.3 53.6RBF.Network 71.0 85.3 53.6Simple.Log. ct )11.3 + 38.1sθ1 - 42.95sθ10 75.8 70.6 82.1 61.3 67.6 53.6SMO ct ) 0.16sθ1 + 0.52sθ3 + 0.67sθ5 +
0.71sθ6 + 0.72sθ8 + 0.74sθ10 - 3.0453.2 94.1 0.36
Perceptron 54.8 100 0Lazy.IB1 64.5 100 21.4IBk 87.1 76.5 100 72.6 67.6 78.6KSpiral 79.0 70.6 89.3 71.0 61.8 82.1LWL 75.8 70.6 82.1 61.3 61.8 60.7Ada.Boost.M1 74.2 91.2 53.6Att.Sel.Class. if sθ1 e 1.82 ct or if sθ1 > 1.82 if sθ1
e 1.89 nct else ct74.2 67.6 82.1 61.3 64.7 57.1
Bagging 79.0 70.6 89.3 59.7 64.7 53.6Class.Via.Reg. 75.8 70.6 82.1 58.1 79.4 32.1CV.Param.Sel. 54.8 100 0Decorate 79.0 70.6 89.3 72.6 64.7 82.1Filt.Classif. 54.8 100 0Grading 54.8 100 0Log.Boost 82.3 76.5 89.3 67.7 67.6 67.9M.Boost.AB 71.0 79.4 60.7 64.5 73.5 53.6Multi.C.Classif. ct × 10-4 ) 0.3sθ1 - 0.1sθ3 + 0.5sθ5
- 0.6sθ6 + 0.4sθ8 - 0.2sθ10 - 252.687.1 76.5 100 85.5 73.5 100
MultiScheme 54.8 100 0Ord.Classif. if sθ1 e 1.82 ct or if sθ1 > 1.82 sθ1 e
1.89 nct else ct74.2 67.6 82.1 61.3 67.6 53.6
Inc.Log.Boost 54.8 100 0R&.Comm 87.1 76.5 100 72.6 67.6 78.6Stacking 54.8 100 0StackingC 54.8 100 0Thresh.Sel. ct × 10-4 ) 0.3sθ1 – 1.3sθ3 + 4.9sθ5
- 5.9sθ6 + 3.9sθ8 – 1.9sθ10 - 252.687.1 76.5 100 72.6 70.6 75.0
Vote 54.8 100 0ADTree 82.3 76.5 89.3 71.0 61.8 82.1Decis.Stump 71.0 85.3 53.6J48 if sθ1 e 1.82 ct or if sθ1 > 1.82 if sθ1
e 1.89 nct or if sθ1 > 1.89 ct74.2 67.6 82.1 61.3 67.6 53.6
LMT ct )11.3 + 38.1•sθ1 - 42.95• sθ10 75.8 70.6 82.1 59.7 64.7 53.6NB Tree 71.0 79.4 60.7 64.5 70.6 57.1R&.Forest 87.1 76.5 100 69.4 70.6 67.9REPTree 75.8 67.6 85.7 56.5 61.8 50.0Hyper.Pipes 56.5 100 0.36VFI 46.8 0.59 96.4Conj.Rule if sθ10 > 1.95 and sθ1 e 1.92 nct 72.6 91.2 50.0Decis.Tab. if sθ10 e 1.95 nct else ct 54.8 100 0Jrip 71.0 85.3 53.6Nnge 87.1 76.5 100 62.9 73.5 50.0OneR if sθ8 < 1.90 ct or <1.91 nct or sθ8<
1.92 ct or sθ8< 1.96 nct sθ8 g 1.96 ct77.4 70.6 85.7 67.7 61.8 75.0
PART if sθ1 > 1.82 & sθ1 e 1.89 and sθ10 >1.95 nct else ct
72.6 91.2 50.0
Ridor ct except if sθ10 > 1.95 and sθ1 e 1.92nct except if sθ5 e 1.91 and sθ1 >1.84 nct
77.4 73.5 82.1 64.5 64.7 64.3
ZeroR 54.8 100 0
a For the details about all these schemes, see ref 136.
Proteome MS Spiral Graph Detection of Toxicity Chem. Res. Toxicol., Vol. 21, No. 3, 2008 625

constant, which is used as a physical unit scaling value. TheMS θk entropies encode in a stochastic manner the disorderdegree induced by the pool of proteins registered at specificspectral regions (nodes placed at different distances in the spiralreticule). As can be noted in eq 4 the sθk can be written usinga MM as the product of Aπ0 and the natural powers of the matrix1ΠbasedontheChapman-Kolgomorovequations(42,43,49,116).
Definition of Serum Proteome Cartesian 2D-Lattice-likeMass Spectrum Graphs. A second graph theoretical representa-tion is developed in order to test another source of graphrepresentation and at the same time the influence of the degreeof compression over the performance in detecting Pro-EDIC-ToRs of classifiers using numerical indices derived from thistype of representation. Hence, the number of data points in the
binned data files was condensed now to 71 by including in eachnew data point the averaged m/z and I values of 100 consecutivedata points. Each new data point condenses now the informationencoded on 100 binned data points producing a less condensedsource of spectral information. As with spiral graphs, the lastdata point was generated by using the last 105.
All the averaged m/z and I values were replaced by theirrespective standardized values generating a new averaged andstandardized data file consisting of 71 data points, which is nowsuitable for graph generation. Like for the spiral graphs, a cutoff value of 0.5 is chosen for both m/z and I values related toeach averaged data point. This cut off value is used to codifyeach data point according to their respective average m/z and Ivalues allowing their representation as a node on a Cartesian
Table 4. Comparing Spiral vs Lattice-like Graphs with Different Classification Techniques
parameters
training LOO cv
technique/(scheme)a rule/tree/function accuracy sensitivity specificity accuracy sensitivity specificity
Spiral-Like MS Graph Representation (sθk)sθk-LDA ct ) 41.39sθ1 - 162.4sθ3 +
622.05sθ5 - 682.15sθ6 +262.24sθ8 - 81.7sθ10 - 0.34
83.87 70.59 100 77.42 67.65 89.29
sθk-MLC (logistic function)b ct ) 2883.4sθ1 - 12705.1sθ3 +49845.7sθ5 - 58993.7sθ6 +38608.6sθ8 - 19449.5sθ10 -252.6
87.1 76.5 100 85.5 73.5 100
sθk-PLS 59.68 55.88 64.29 59.68 55.88 64.29PLS LV-LDA ct ) 7492PLS LV1 +233PLS LV2
+ 4PLS LV3 - 95274.19 67.65 82.14 64.71 72.58 82.14
PLS LV-MLC (random tree) b PLS LV3 < 0.08 | PLSL V2 <-0.04 | | PLS LV2 < -0.08 | | |PLS LV3 < -0.29: NCT (1/0) | | |PLS LV3 g -0.29: CT (4/0) | |PLS LV2 g -0.08: NCT (2/0) |PLS LV2 g -0.04 | | PLS LV3 <0.06 | | | PLS LV1 < 0.13: CT(10/0) | | | PLS LV1 g 0.13 | | | |PLS LV2 < -0.04: CT (6/0) | | | |PLS LV2 g -0.04 | | | | | PLSLV3 < -0.18: CT (2/0) | | | | |PLS LV3 g -0.18: NCT (1/0) | |PLS LV3 g 0.06 | | | PLS LV1 <0.11: NCT (1/0) | | | PLS LV1 g0.11: CT (2/0) PLS LV3 g 0.08 |PLS LV2 < -0.04: NCT (17/3) |PLS LV2 g -0.04 | | PLS LV3 <0.13 | | | PLS LV3 < 0.09: NCT(13/5) | | | PLS LV3 g 0.09: CT(2/0) | | PLS LV3 g 0.13: NCT(1/0)
87.1 76.5 100 72.58 67.6 78.6
PCA factor-LDA ct ) 0.59PCA factor1 - 0.93PCAfactor2 + 0.24
74.19 67.65 82.14 72.58 64.71 82.14
PCA factor-MLC (lazy Kspiral)b 87.1 76.5 100 77.41 70.6 85.7
Cartesian 2D-Lattice-like MS Graph Representation (lθk)lθk-LDA ct ) -80173lθ4 + 111184lθ6 +
169228lθ8 - 228212lθ9 +28087lθ10 - 43
58.06 32.35 89.29 53.22 29.41 85.71
lθk-MLC (lazy IBk)b 71.0 100 35.7 62.9 94.1 25lθk-PLS 56.45 35.29 82.14 53.23 29.41 82.14PLS LV-LDA ct ) 361PLS LV1 +11PLS LV2 +
4PLS LV3 - 4654.83 32.35 82.14 54.84 32.25 82.14
PLS LV-MLC (OneR)b if -0.0541 e PLS LV2 < 0.1676;then class ) nct otherwise; thenclass ) ct
66.13 94.1 32.1 64.52 94.1 28.6
PCA factor-LDA ct ) 0.30PCA factor1 - 0.37PCAfactor2 + 0.20
53.23 32.35 78.57 53.23 32.35 78.57
PCA factor-MLC (OneR)b if -0.4402 e PCA factor1 <1.2853 then class ) nct otherwise;then class ) ct
66.13 94.1 32.1 64.52 94.1 28.6
a Linear discriminant analysis (LDA), partial least squares (PLS), partial least squares latent variable (PLS LV), principal components analysis factor(PCA Factor), machine learning classifier (MLC). b For details about these classification schemes, see ref 136.
626 Chem. Res. Toxicol., Vol. 21, No. 3, 2008 Cruz-Monteagudo et al.

2D space. Each data point in the averaged data file is placed ina Cartesian 2D space with the first data point at the (0, 0)coordinate. The coordinates of the successive data points arecalculated as follows in a similar manner to that for DNA spaces(117):(a) increases in +1 (abscissas) if the absolute m/z value is <0.5and the absolute I value is >0.5 for a data point (rightwardstep);(b) decreases in -1 (abscissas) if the absolute m/z value is >0.5and the absolute I value is <0.5 for a data point (leftward step);(c) increases in +1 (ordinates) if the absolute m/z and I valuesare >0.5 for a data point (rightward step, upward step);(d) Decreases in -1 (ordinates) if the absolute m/z and I valuesare <0.5 for a data point (downward step). Once we appliedthe above-mentioned transformations, we obtained a SP spec-trum graph in a Cartesian coordinates 2D space, where eachnode encodes information related to m/z and I values of acondensed spectral region. The Figure 4 illustrates the appear-ance of Cartesian 2D-lattice-like MS graphs obtained withinthe graphical interface of MARCH-INSIDE software (110).
MS Cartesian 2D-Lattice-like Graph Entropy Measures(lθk). In this study, the stochastic matrix of the classic MARCH-INSIDE approach used for small molecules, RNAs, and proteinshas been adapted to characterize the new Cartesian 2D-lattice-like graphs. Here we use essentially the lattice-like analoguesofthesameclassicthreematrixmagnitudes(67,76–78,82,114,118–121):the matrix 1Π (see 1). This matrix is now also built up as asquare matrix (n × n). Note that the number of nodes (n) in thegraph may be equal to or smaller than the number of data pointsin the MS averaged data files. The matrix 1Π contains theprobabilities 1pij to reach a node ni with n coincident spectraldata points (dpi) moving throughout a walk of length k ) 1from a node nj with n overlapping spectral data points (dpj):
1pIj )Rijdpj
∑G ) 1
n
RijdpG
(5)
Ap0(j) )dpj
∑G ) 1
n
dpG
(6)
where, Rij represents the adjacency relationships between nodes(if nj is adjacent to ni then Rij ) 1; otherwise Rij ) 0). The restof the magnitudes are defined in analogy to the spiral graphsthat we have described above. The use of MM theory thus allowscalculation of the MS Cartesian 2D-lattice-like graph entropymeasures (lθk) for any node nj that one can reach in the Cartesian2D graph by moving from any node ni throughout the entiregraph using walks of length k. Considering that the lθk valuesare information average values, we also determine them as thesum of two-term products. The first term is the absoluteprobability of reaching node nj by moving from any node ni
throughout walks of length k and the second is the logarithmof these probabilities (see eq7) (49, 122).
lθk ) Sh · (1Π)k · Aπ0 ) Sh · Aπk )
- kB∑j ) 1
nApk(j) log Apk(j) (7)
MS Spiral Graph Quantitative Proteome-ToxicityRelationship (QPTR) Models. In the present work, we areproposing the use of graph theory combined with high-
throughput MS to study Pro-EDICToRs in toxicoproteomics.To illustrate the potentialities of this approach on the earlydetection of drug-induced cardiac toxicities, we decided todevelop a QPTR based on θk, used here as numerical indicesof the serum proteome MS spiral graph. The best QPTRequation found using LDA was
ct ) 41.39sθ1 - 162.4sθ3 + 622.05sθ5 - 682.15sθ6 +
262.24sθ8 - 81.7sθ10 - 0.34 N ) 62
F ) 7.04 D2 ) 3.0 U ) 0.56 p ) 0.00001F ) 4.43 (8)
where F is the Fisher ratio, p is the probability of error acceptingoverall significance of the model, F is the ratio between thenumber of cases and adjustable parameters, D2 is the Mahal-anobis’s distance, and U is the Wilk’s statistic. This QPTRmodel demonstrated an accuracy of 83.87% in classifying MScoming from rat serum with overt cardiotoxicity (ct ) 1) and“non-cardiotoxic sample MS” (ct ) 0). Specifically, 24 out of34 CT samples and the totality of the 28 NCT samples wereclassified correctly. See Table 1 for details. There is apparentlya high difference between the value of the coefficients in theQPTR (we used standardized coefficients). However, we founda notable reduction of these coefficients with respect to the rawcoefficients (see also Table 1). These results illustrate the highutility of using the standard coefficients here (109).
The statistical significance of the model was evaluatedthrough a Fisher’s test p < 0.05 being an indication of thestatistical significance of the QPTR model. Parsimony was testedwith F; a value higher than 4 does not offer any reason toconsider the overfitting a drawback of the model. Here we have4.43. Additionally, the high values of D2 and U statistics denoteddiscriminatory power expressed through the relation betweenthe intra- and interclass variability and the separation betweenthe centroids of each group, respectively. In addition, thereceiver operating characteristic curve (ROC curve) (123, 124)obtained indicates that the model is not a random but astatistically significant classifier (see Figure 5). As was men-tioned in the in Statistical Analysis section, the predictive abilityof the model was assessed by using a LOO cross validation(cv) technique (125). The proposed model was able to classifycorrectly 48 out of 62 samples (global internal predictability )77.42%). In particular, 23 out of 34 CTR samples (sensitivity) 67.65%) and 25 out of 28 NCTR samples (specificity )89.29%) were classified correctly.
It is also necessary to find out whether the basic assumptionsof LDA are fulfilled (106, 108) because in the case of severeviolations, the reliability of the model’s predictions could becompromised. LDA presupposes a linear additive relationshipbetween the predictive variables (sθk) and the response variable(ct). Indeed, this is the simplest functional form to adopt withno prior information. Visual inspection of the distribution ofthe standardized residuals for all samples (standardized residualsvs cases; see section A in Figure 6) supports this choice becauseno systematic pattern is found (108).
Inspecting normality of residuals, we found that the residualsexhibit adequate values of skewness and kurtosis (108), whichis a sign normal distribution fitting. Nevertheless, the hypothesisof multivariate normality of residuals cannot be confirmed sincethe results of applying the Kolmogorov–Smirnov test do notreject this hypothesis. Interestingly, Shapiro-Wilks and Lillie-fors tests provide opposite results suggesting the existence ofonly slight deviations from the normal distribution (statisticvalues in Table 2). This can be noted through the frequency
Proteome MS Spiral Graph Detection of Toxicity Chem. Res. Toxicol., Vol. 21, No. 3, 2008 627

histogram shown in Figure 6, panel B. In addition, because theterm related to the error represented by residuals is not includedin the LDA equation; the mean must be 0. Actually, the residualmean value for our model is close to the assumed value of 0(see Table 2).
The next important parametric assumption of LDA washomocedasticity (i.e., homogeneity of variance of the variables),which was checked by visual inspection of the plot of squarestandardized residuals for each predictor variable (108). Theplots in Figure 7 reveal an adequate scatter on the points withoutany consistent pattern, which validates the assumption ofhomocedasticity.
Finally, we find that the main violation of our QPTR modelrelies on the colinearity exhibited by sθk. The regressioncoefficients (bk) are measures of the change in the expected valueof the response variable (ct) when the given predictor (sθk) isincreased by one unit while all other predictor variables are heldconstant. Unfortunately, we found correlation between more thanone pairs of sθk higher than 0.7. Consequently, the interpretationgiven for bk is not fully applicable if colinearity exists. However,the fact that some or all predictor variables are correlated amongthemselves does not, in general, inhibit the model’s ability toobtain good inferences about the mean responses or predictionsof new observations (126). One way to solve this problem(colinearity) is the transformation of the input parameters sθk
into a new set of orthogonal parameters O(sθk) prior toperforming the LDA. In many orthogonalization methods suchas partial least squares (PLS) (127, 128) and principal compo-nents analysis (PCA) (111, 129–131), the new orthogonal inputsare dependent on all the original parameters sθk (see Table 2and Table 4 of the next section). It may become an importantinconvenience due to the higher difficulty for the interpretationof the new coefficients in terms of the original inputs sθk. Theorthogonalization method introduced by Randi∫ is simpler inthis sense. Randi∫’s method performs orthogonalization in sucha way that we can easily relate each O(sθk) with the cor-respondent O(sθk) (96, 132–134). In Table 2, we depict thevariation of the coefficients in the QPTR model along with thetransformation of the raw input sθk parameters first into standardsθk* parameters and finally into orthogonal and standard O(sθk*)values.
In conclusion, showing that the QPTR model is not a randomclassifier, is accurate, has satisfactory parsimony, robustness,and predictability, and fulfills the main LDA assumptions, wecan state that this model could be used in the study of Pro-EDICToRs. However, the deviations from normality and thecolinearity detected justify the application of nonparametricalmethods to seek improved QPTR models. In this sense, wedecided to test other nonparametric classifiers implemented inthe software WEKA (135, 136), which have a long history inchemical and life sciences applications (137, 138).
As shown in Table 3, with the exception of two QPTR models(a logistic function and a multiclass classifier) no significantlysuperior classification schemes were found (136). In the caseof the two algorithms above-mentioned, their training sensitivityand specificity values are superior with respect to the LDAmodel by 5.9% and 3.2%, respectively. On the LOO cv, thesemachine learning algorithms performed better compared withthe LDA model too. Specifically, the accuracy, sensitivity, andspecificity values were superior by 8.1%, 5.9%, and 10.7%,respectively, evidencing a superior predictive ability. Eventhough, the same sθk were included in both classes of QPTRmodels, we recommend the use of the last one rather than theLDA QPTR model. We take into consideration the enhanced
performance shown by machine learning methods. In addition,the non-parametrical nature of these methods supports thischoice considering the nonperfect normality and presence ofcolinearity between the sθk included in the models (107, 119).
Comparing MS Spiral Graph QPTR with OtherModels. Next, in order to check the advantage of using the spiralgraph as descriptors source versus other possibilities, we carriedout a comparative study of the performance in detecting Pro-EDICToRs of different classifiers resulting from the combinationof several modeling techniques with several sources of inputvariables derived from two different MS graph representations.For this purpose, we used the SP MS Cartesian 2D-lattice-likegraphs as a source of descriptors. Both set of descriptors (spiralgraph-based entropies sθk and Cartesian 2D-lattice-like graph-based entropies lθk) were used as inputs to several modelingtechniques including LDA, PLS, PLS combined with LDA(PLS-LDA), PCA combined with LDA (PCA-LDA), and theclassification schemes implemented on the WEKA software. InPLS and PCA, the new orthogonal variables derived from theoriginal gθk values are called latent variables (LVi) or factors(Fi), respectively. The three PLS LVi generated during the PLSmodeling as well as the two main PCA Fi were used for LDAand WEKA machine learning modeling. All the machinelearning classifiers implemented on the WEKA software(82, 139, 140) were tested by using all the possible sources ofdescriptors (sθk,
lθk,sθk- or lθk-based PLS latent variables, and
sθk- or lθk-based PCA factors). Only the best performingmachine learning classifier based on each source of descriptorsis reported in Table 4.
As can be observed in Table 4, none of the modelingtechniques applied to the set of Cartesian 2D graph-basedentropies exhibited promising results. Among the spiral graphssθk, there was no modeling technique able to overcome thepredictive ability of the sθk-based LDA and logistic functionclassifiers. In any case, all the sθk-based classifiers performedsignificantly better than the lθk-based ones. Based on theseresults, we can conclude that less-condensed graph representa-tions do not lead to improved results in detecting Pro-EDICToRs. However, the level of graph degeneracy of eachrepresentation can be a factor influencing the success in detectingPro-EDICToRs suggesting a lower degeneracy of the spiralgraphs (141–153).
Finally, we have demonstrated above the usefulness of spiralgraphs and sθk for the derivation of accurate QPTRs. In thissense, other graph representations (the Cartesian 2D-lattice-likegraphs) have been used as source of numerical indices (lθk
indices), and parametric and nonparametric alternatives havebeen checked. Hence, on the basis of these findings, we canconclude that the presented spiral graph representation of theserum proteome mass spectrum and the numerical indices (sθk)derived from this representation have captured important featuresfor the early detection of drug-induced cardiac toxicities fromserum proteome mass spectra.
Acknowledgment. The authors thank the PortugueseFundação para a Ciência e a Tecnologia (FCT) (SFRH/BD/30698/2006) for financial support. H.G.-D. acknowledgesresearch position with a tenure track contract at the Universityof Santiago the Compostela funded by Program Isidro PargaPondal of the “Xunta de Galicia”.
Supporting Information Available: A summary of thequantitative proteome-toxicity relationship (QPTR) approachbased on spiral entropy of mass spectra, the computed valuesof the six predictor variables included in the QPTR model for
628 Chem. Res. Toxicol., Vol. 21, No. 3, 2008 Cruz-Monteagudo et al.
the 62 samples used, as well as their respective observed andpredicted classifications according to the LDA model, and theposterior probabilities to be classified as CT or NCT accordingto the LDA model. This material is available free of charge viathe Internet at http://pubs.acs.org.
References
(1) Seifert, M. H. J., Wolf, K., and Vitt, D. (2003) Virtual high-throughputin silico screening. Drug DiscoVery Today: Biosilico 1, 143–149.
(2) van Dalen, E. C., van den Brug, M., Caron, H. N., and Kremer, L. C.(2006) Anthracycline-induced cardiotoxicity: comparison of recom-mendations for monitoring cardiac function during therapy inpaediatric oncology trials. Eur. J. Cancer 42, 3199–3205.
(3) Jones, R. L., and Ewer, M. S. (2006) Cardiac and cardiovasculartoxicity of nonanthracycline anticancer drugs. Exp. ReV. AnticancerTher. 6, 1249–1269.
(4) Urbanova, D., Urban, L., Carter, A., Maasova, D., and Mladosievi-cova, B. (2006) Cardiac troponins--biochemical markers of cardiactoxicity after cytostatic therapy. Neoplasma 53, 183–190.
(5) Ward, J. B., Jr., and Henderson, R. E. (1996) Identification of needsin biomarker research. EnViron. Health Perspect. 104, 895–900.
(6) Anderson, N. L., and Anderson, N. G. (2002) The human plasmaproteome: history, character, and diagnostic prospects. Mol. Cell.Proteomics 1, 845–867.
(7) Hu, S., Loo, J. A., and Wong, D. T. (2006) Human body fluidproteome analysis. Proteomics 6, 6326–6353.
(8) Mehta, A. I., Ross, S., Lowenthal, M. S., Fusaro, V., Fishman, D. A.,Petricoin, E. F., 3rd, and Liotta, L. A. (2003) Biomarker amplificationby serum carrier protein binding. Dis. Markers 19, 1–10.
(9) Liotta, L. A., Ferrari, M., and Petricoin, E. (2003) Clinical proteomics:written in blood. Nature 425, 905–905.
(10) Kantor, A. B. (2002) Comprehensive phenotyping and biologicalmarker discovery. Dis. Markers 18, 91–97.
(11) McDonald, W. H., and Yates, J. R., 3rd (2002) Shotgun proteomicsand biomarker discovery. Dis. Markers 18, 99–105.
(12) Petricoin, E. F., Rajapaske, V., Herman, E. H., Arekani, A. M., Ross,S., Johann, D., Knapton, A., Zhang, J., Hitt, B. A., Conrads, T. P.,Veenstra, T. D., Liotta, L. A., and Sistare, F. D. (2004) Toxicopro-teomics: serum proteomic pattern diagnostics for early detection ofdrug induced cardiac toxicities and cardioprotection. Toxicol. Pathol.32, 122–130.
(13) Petricoin, E. F., Ardekani, A. M., Hitt, B. A., Levine, P. J., Fusaro,V. A., Steinberg, S. M., Mills, G. B., Simone, C., Fishman, D. A.,Kohn, E. C., and Liotta, L. A. (2002) Use of proteomic patterns inserum to identify ovarian cancer. Lancet 359, 572–577.
(14) Petricoin, E. F., 3rd, Ornstein, D. K., Paweletz, C. P., Ardekani, A.,Hackett, P. S., Hitt, B. A., Velassco, A., Trucco, C., Wiegand, L.,Wood, K., Simone, C. B., Levine, P. J., Linehan, W. M., Emmert-Buck, M. R., Steinberg, S. M., Kohn, E. C., and Liotta, L. A. (2002)Serum proteomic patterns for detection of prostate cancer. J. Natl.Cancer Inst. 94, 1576–1578.
(15) Katritzky, A. R., Fara, D. C., Petrukhin, R. O., Tatham, D. B., Maran,U., Lomaka, A., and Karelson, M. (2002) The present utility andfuture potential for medicinal chemistry of QSAR/QSPR with wholemolecule descriptors. Curr. Top. Med. Chem. 2, 1333–1356.
(16) Katritzky, A. R., Petrukhin, R., Tatham, D., Basak, S., Benfenati,E., Karelson, M., and Maran, U. (2001) Interpretation of quantitativestructure-property and -activity relationships. J. Chem. Inf. Comput.Sci. 41, 679–685.
(17) Katritzky, A. R., Perumal, S., Petrukhin, R., and Kleinpeter, E. (2001)Codessa-based theoretical QSPR model for hydantoin HPLC-RTlipophilicities. J. Chem. Inf. Comput. Sci. 41, 569–574.
(18) Katritzky, A. R., and Gordeeva, E. V. (1993) Traditional topologicalindices vs electronic, geometrical, and combined molecular descrip-tors in QSAR/QSPR research. J. Chem. Inf. Comput. Sci. 33, 835–857.
(19) Estrada, E., and Uriarte, E. (2001) Recent advances on the role oftopological indices in drug discovery research. Curr. Med. Chem. 8,1573–1588.
(20) Moridani, M. Y., Siraki, A., Chevaldina, T., Scobie, H., and O’Brien,P. J. (2004) Quantitative structure toxicity relationships for catecholsin isolated rat hepatocytes. Chem. Biol. Interact. 147, 297–307.
(21) Serra, J. R., Jurs, P. C., and Kaiser, K. L. (2001) Linear regressionand computational neural network prediction of tetrahymena acutetoxicity for aromatic compounds from molecular structure. Chem.Res. Toxicol. 14, 1535–1545.
(22) Gombar, V. K., Enslein, K., and Blake, B. W. (1995) Assessment ofdevelopmental toxicity potential of chemicals by quantitative structure-toxicity relationship models. Chemosphere 31, 2499–2510.
(23) Siraki, A. G., Chevaldina, T., Moridani, M. Y., and O’Brien, P. J.(2004) Quantitative structure-toxicity relationships by acceleratedcytotoxicity mechanism screening. Curr. Opin. Drug DiscoVery DeV.7, 118–125.
(24) Moudgal, C. J., Venkatapathy, R., Choudhury, H., Bruce, R. M., andLipscomb, J. C. (2003) Application of QSTRs in the selection of asurrogate toxicity value for a chemical of concern. EnViron. Sci.Technol. 37, 5228–5235.
(25) Enslein, K., Gombar, V. K., Blake, B. W., Maibach, H. I., Hostynek,J. J., Sigman, C. C., and Bagheri, D. (1997) A quantitative structure-toxicity relationships model for the dermal sensitization guinea pigmaximization assay. Food Chem. Toxicol. 35, 1091–1098.
(26) Roy, K., and Ghosh, G. (2004) QSTR with extended topochemicalatom indices. 2. Fish toxicity of substituted benzenes. J. Chem. Inf.Comput. Sci. 44, 559–567.
(27) Basak, S. C., and Mills, D. (2001) Prediction of mutagenicity utilizinga hierarchical QSAR approach. SAR QSAR EnViron. Res. 12, 481–496.
(28) Saiz-Urra, L., Gonzalez, M. P., and Teijeira, M. (2006) QSAR studiesabout cytotoxicity of benzophenazines with dual inhibition towardboth topoisomerases I and II: 3D-MoRSE descriptors and statisticalconsiderations about variable selection. Bioorg. Med. Chem. 14,7347–7358.
(29) Saiz-Urra, L., Gonzalez, M. P., Fall, Y., and Gomez, G. (2007)Quantitative structure-activity relationship studies of HIV-1 integraseinhibition. 1. GETAWAY descriptors. Eur. J. Med. Chem. 42, 64–70.
(30) Saiz-Urra, L., Gonzalez, M. P., Collado, I. G., and Hernandez-Galan,R. (2007) Quantitative structure-activity relationship studies for theprediction of antifungal activity of N-arylbenzenesulfonamides againstBotrytis cinerea. J. Mol. Graphics Modell. 25, 680–690.
(31) Morales, A. H., Cabrera Perez, M. A., and Gonzalez, M. P. (2006)A radial-distribution-function approach for predicting rodent carci-nogenicity. J. Mol. Model. 12, 769–780.
(32) Gonzalez, M. P., Teran, C., Teijeira, M., Besada, P., and Gonzalez-Moa, M. J. (2005) BCUT descriptors to predicting affinity towardA3 adenosine receptors. Bioorg. Med. Chem. Lett. 15, 3491–3495.
(33) Gonzalez, M. P., Teran, C., and Teijeira, M. (2006) A topologicalfunction based on spectral moments for predicting affinity towardA3 adenosine receptors. Bioorg. Med. Chem. Lett. 16, 1291–1296.
(34) Gonzalez, M. P., Puente, M., Fall, Y., and Gomez, G. (2006) In silicostudies using Radial Distribution Function approach for predictingaffinity of 1 alpha,25-dihydroxyvitamin D(3) analogues for VitaminD receptor. Steroids 71, 510–527.
(35) González, M. P., Morales, A. H., and González-Díaz, H. (2004) ATOPS-MODE approach to predict permeability coefficients. Polymer45, 2073–2079.
(36) Gonzalez, M. P., and Moldes del Carmen Teran, M. (2004) A TOPS-MODE approach to predict adenosine kinase inhibition. Bioorg. Med.Chem. Lett. 14, 3077–3079.
(37) Gonzalez, M. P., Helguera, A. M., and Collado, I. G. (2006) Atopological substructural molecular design to predict soil sorptioncoefficients for pesticides. Mol. DiVersity 10, 109–118.
(38) Gonzalez, M. P., Helguera, A. M., and Cabrera, M. A. (2005)Quantitative structure-activity relationship to predict toxicologicalproperties of benzene derivative compounds. Bioorg. Med. Chem.13, 1775–1781.
(39) Fernandez, M., Caballero, J., Helguera, A. M., Castro, E. A., andGonzalez, M. P. (2005) Quantitative structure-activity relationshipto predict differential inhibition of aldose reductase by flavonoidcompounds. Bioorg. Med. Chem. 13, 3269–3277.
(40) Kier, L. B. (1980) Use of molecular negentropy to encode structuregoverning biological activity. J. Pharm. Sci. 69, 807–810.
(41) Agrawal, V. K., and Khadikar, P. V. (2003) Modelling of carbonicanhydrase inhibitory activity of sulfonamides using molecular negent-ropy. Bioorg. Med. Chem. Lett. 13, 447–453.
(42) Stahura, F. L., Godden, J. W., and Bajorath, J. (2002) DifferentialShannon entropy analysis identifies molecular property descriptorsthat predict aqueous solubility of synthetic compounds with highaccuracy in binary QSAR calculations. J. Chem. Inf. Comput. Sci.42, 550–558.
(43) Stahura, F. L., Godden, J. W., Xue, L., and Bajorath, J. (2000)Distinguishing between natural products and synthetic molecules bydescriptor Shannon entropy analysis and binary QSAR calculations.J. Chem. Inf. Comput. Sci. 40, 1245–1252.
(44) Roy, K., and Saha, A. (2003) Comparative QSPR studies withmolecular connectivity, molecular negentropy and TAU indices. PartI: Molecular thermochemical properties of diverse functional acycliccompounds. J. Mol. Model. (Online) 9, 259–270.
(45) Agrawal, V. K., Bano, S., and Khadikar, P. V. (2003) QSAR analysisof antibacterial activity of some 4-aminodiphenylsulfone derivatives.Acta Microbiol. Immunol. Hung. 50, 385–393.
Proteome MS Spiral Graph Detection of Toxicity Chem. Res. Toxicol., Vol. 21, No. 3, 2008 629
(46) Agrawal, V. K., Karmarkar, S., and Khadikar, P. V. (2001) QSARstudy on binding affinity of PATs (rodenticides) to the [3H]-mepyramine-labelled H1 receptor in rat and guinea pig brain. SARQSAR EnViron. Res. 12, 529–545.
(47) Agrawal, V. K., and Khadikar, P. V. (2001) QSAR studies on acylatedhistamine derivatives. Bioorg. Med. Chem. 9, 2787–2792.
(48) Katritzky, A. R., Lomaka, A., Petrukhin, R., Jain, R., Karelson, M.,Visser, A. E., and Rogers, R. D. (2002) QSPR correlation of themelting point for pyridinium bromides, potential ionic liquids.J. Chem. Inf. Comput. Sci. 42, 71–74.
(49) Strait, B. J., and Dewey, T. G. (1996) The Shannon informationentropy of protein sequences. Biophys. J. 71, 148–155.
(50) Dima, R. I., and Thirumalai, D. (2004) Proteins associated withdiseases show enhanced sequence correlation between chargedresidues. Bioinformatics 20, 2345–2354.
(51) Loewenstern, D., and Yianilos, P. N. (1999) Significantly lowerentropy estimates for natural DNA sequences. J. Comput. Biol. 6,125–142.
(52) Manke, T., Demetrius, L., and Vingron, M. (2005) Lethality andentropy of protein interaction networks. Genome Inf. Ser. 16, 159–163.
(53) Graham, D. J., and Schacht, D. (2000) Base information content inorganic molecular formulae. J. Chem. Inf. Comput. Sci. 40, 942.
(54) Graham, D. J. (2002) Information content in organic molecules:structure considerations on the basis of integer statistics. J. Chem.Inf. Comput. Sci. 42, 215.
(55) Graham, D. J., Malarkey, C., and Schulmerich, M. V. (2004)Information content in organic molecules: Quantification and statisti-cal structure via Brownian processing. J. Chem. Inf. Comput. Sci.44, 1601–1611.
(56) Graham, D. J., and Schulmerich, M. V. (2004) Information contentin organic molecules: reaction pathway analysis via brownianprocessing. J. Chem. Inf. Comput. Sci. 44, 1612–1622.
(57) Graham, D. J. (2005) Information content and organic molecules:Aggregation states and solvent effects. J Chem Inf Model 45, 1223–1236.
(58) Graham, D. J. (2007) Information content in organic molecules:Brownian processing at low levels. J Chem Inf Model 47, 376–389.
(59) Gan, H. H., Pasquali, S., and Schlick, T. (2003) Exploring therepertoire of RNA secondary motifs using graph theory; implicationsfor RNA design. Nucleic Acids Res. 31, 2926–2943.
(60) Chou, K. C. (1990) Applications of graph theory to enzyme kineticsand protein folding kinetics. Steady and non-steady-state systems.Biophys. Chem. 35, 1–24.
(61) Mason, O., and Verwoerd, M. (2007) Graph theory and networks inBiology. IET Syst. Biol. 1, 89–119.
(62) Harary, F., and Hage, P. (1995) Eccentricity and centrality innetworks. Social Networks 17, 57–63.
(63) Freund, J. A., and Poschel, T. (2000) Stochastic Processes in Physics,Chemistry, and Biology; Lecture Notes in Physics 557; Springer-Verlag, Berlin, Germany.
(64) González-Díaz, H., Uriarte, E., and Ramos de Armas, R. (2005)Predicting stability of Arc repressor mutants with protein stochasticmoments. Bioorg. Med. Chem. 13, 323–331.
(65) Gonzalez-Diaz, H., Molina, R., and Uriarte, E. (2005) Recognitionof stable protein mutants with 3D stochastic average electrostaticpotentials. FEBS Lett. 579, 4297–4301.
(66) Aguero-Chapin, G., Gonzalez-Diaz, H., Molina, R., Varona-Santos,J., Uriarte, E., and Gonzalez-Diaz, Y. (2006) Novel 2D maps andcoupling numbers for protein sequences. The first QSAR study ofpolygalacturonases; isolation and prediction of a novel sequence fromPsidium guajaVa L. FEBS Lett. 580, 723–730.
(67) Santana, L., Uriarte, E., Gonzalez-Diaz, H., Zagotto, G., Soto-Otero,R., and Mendez-Alvarez, E. (2006) A QSAR model for in silicoscreening of MAO-A inhibitors. Prediction, synthesis, and biologicalassay of novel coumarins. J. Med. Chem. 49, 1149–1156.
(68) González-Díaz, H., Vilar, S., Santana, L., and Uriarte, E. (2007)Medicinal chemistry and bioinformatics - Current trends in drugsdiscovery with networks topological indices. Curr. Top. Med. Chem.7, 1025–1039.
(69) González-Díaz, H., and Uriarte, E. (2005) Biopolymer stochasticmoments. I. Modeling human rhinovirus cellular recognition withprotein surface electrostatic moments. Biopolymers 77, 296–303.
(70) González-Díaz, H., Molina, R., and Uriarte, E. (2004) Markov entropybackbone electrostatic descriptors for predicting proteins biologicalactivity. Bioorg. Med. Chem. Lett. 14, 4691–4695.
(71) Ramos de Armas, R., González-Díaz, H., Molina, R., Perez Gonzalez,M., and Uriarte, E. (2004) Stochastic-based descriptors studyingpeptides biological properties: modeling the bitter tasting thresholdof dipeptides. Bioorg. Med. Chem. 12, 4815–4822.
(72) González-Díaz, H., de Armas, R. R., and Molina, R. (2003)Markovian negentropies in bioinformatics. 1. A picture of footprints
after the interaction of the HIV-1 Psi-RNA packaging region withdrugs. Bioinformatics 19, 2079–2087.
(73) González-Díaz, H., Vina, D., Santana, L., de Clercq, E., and Uriarte,E. (2006) Stochastic entropy QSAR for the in silico discovery ofanticancer compounds: Prediction, synthesis, and in vitro assay ofnew purine carbanucleosides. Bioorg. Med. Chem. 14, 1095–1107.
(74) Cruz-Monteagudo, M., and González-Díaz, H. (2005) Unified drug-target interaction thermodynamic Markov model using stochasticentropies to predict multiple drugs side effects. Eur. J. Med. Chem.40, 1030–1041.
(75) González-Díaz, H., Aguero, G., Cabrera, M. A., Molina, R., Santana,L., Uriarte, E., Delogu, G., and Castanedo, N. (2005) Unified Markovthermodynamics based on stochastic forms to classify drugs consider-ing molecular structure, partition system, and biological species:Distribution of the antimicrobial G1 on rat tissues. Bioorg. Med.Chem. Lett. 15, 551–557.
(76) González-Díaz, H., Saíz-Urra, L., Molina, R., and Uriarte, E. (2005)Stochastic molecular descriptors for polymers. 2. Spherical truncationof electrostatic interactions on entropy based polymers 3D-QSAR.Polymer 46, 2791–2798.
(77) Gonzalez-Diaz, H., Perez-Castillo, Y., Podda, G., and Uriarte, E.(2007) Computational chemistry comparison of stable/nonstableprotein mutants classification models based on 3D and topologicalindices. J. Comput. Chem. 28, 1990–1995.
(78) Gonzalez-Diaz, H., Saiz-Urra, L., Molina, R., Santana, L., and Uriarte,E. (2007) A model for the recognition of protein kinases based onthe entropy of 3D van der Waals interactions. J. Proteome Res. 6,904–908.
(79) González-Díaz, H., Olazabal, E., Castanedo, N., Sanchez, I. H.,Morales, A., Serrano, H. S., Gonzalez, J., and de Armas, R. R. (2002)Markovian chemicals “in silico” design (MARCH-INSIDE), apromising approach for computer aided molecular design II: Experi-mental and theoretical assessment of a novel method for virtualscreening of fasciolicides. J. Mol. Model. 8, 237–245.
(80) González-Díaz, H., Gia, O., Uriarte, E., Hernadez, I., Ramos, R.,Chaviano, M., Seijo, S., Castillo, J. A., Morales, L., Santana, L.,Akpaloo, D., Molina, E., Cruz, M., Torres, L. A., and Cabrera, M. A.(2003) Markovian chemicals “in silico” design (MARCH-INSIDE),a promising approach for computer-aided molecular design I:Discovery of anticancer compounds. J. Mol. Model. 9, 395–407.
(81) González-Díaz, H., Torres-Gomez, L. A., Guevara, Y., Almeida,M. S., Molina, R., Castanedo, N., Santana, L., and Uriarte, E. (2005)Markovian chemicals “in silico” design (MARCH-INSIDE), apromising approach for computer-aided molecular design III: 2.5Dindices for the discovery of antibacterials. J. Mol. Model. 11, 116–123.
(82) González-Díaz, H., Agüero-Chapin, G., Varona, J., Molina, R.,Delogu, G., Santana, L., Uriarte, E., and Gianni, P. (2007) 2D-RNA-coupling numbers: A new computational chemistry approach to linksecondary structuretopology with biological function. J. Comput.Chem. 28, 1049–1056.
(83) González-Díaz, H., Bastida, I., Castanedo, N., Nasco, O., Olazabal,E., Morales, A., Serrano, H. S., and de Armas, R. R. (2004) Simplestochastic fingerprints towards mathematical modelling in biologyand medicine. 1. The treatment of coccidiosis. Bull. Math. Biol. 66,1285–1311.
(84) Cruz-Monteagudo, M., González-Díaz, H., and Uriarte, E. (2006)Simple stochastic fingerprints towards mathematical modeling inbiology and medicine 2. Unifying Markov model for drugs sideeffects. Bull. Math. Biol. 68, 1527–1554.
(85) González-Díaz, H., Cruz-Monteagudo, M., Vina, D., Santana, L.,Uriarte, E., and De Clercq, E. (2005) QSAR for anti-RNA-virusactivity, synthesis, and assay of anti-RSV carbonucleosides given aunified representation of spectral moments, quadratic, and topologicindices. Bioorg. Med. Chem. Lett. 15, 1651–1657.
(86) González-Díaz, H., Aguero-Chapin, G., Varona-Santos, J., Molina,R., de la Riva, G., and Uriarte, E. (2005) 2D RNA-QSAR: AssigningACC oxidase family membership with stochastic molecular descrip-tors; isolation and prediction of a sequence from Psidium guajaVaL. Bioorg. Med. Chem. Lett. 15, 2932–2937.
(87) Gonzalez-Diaz, H., Tenorio, E., Castanedo, N., Santana, L., andUriarte, E. (2005) 3D QSAR Markov model for drug-inducedeosinophilia--theoretical prediction and preliminary experimentalassay of the antimicrobial drug G1. Bioorg. Med. Chem. 13, 1523–1530.
(88) González-Díaz, H., Olazábal, E., Santana, L., Uriarte, E., andCastañedo, N. (2007) QSAR study of anticoccidial activity for diversechemical compounds: prediction and experimental assay of trans-2-(2-nitrovinyl)furan. Bioorg. Med. Chem. 15, 962–968.
(89) González-Díaz, H., Cruz-Monteagudo, M., Molina, R., Tenorio, E.,and Uriarte, E. (2005) Predicting multiple drugs side effects with ageneral drug-target interaction thermodynamic Markov model.Bioorg. Med. Chem. 13, 1119–1129.
630 Chem. Res. Toxicol., Vol. 21, No. 3, 2008 Cruz-Monteagudo et al.

(90) Gia, O., Marciani Magno, S., González-Díaz, H., Quezada, E.,Santana, L., Uriarte, E., and Dalla Via, L. (2005) Design, synthesisand photobiological properties of 3,4-cyclopentenepsoralens. Bioorg.Med. Chem. 13, 809–817.
(91) Bartels, C. (1990) Fast algorithm for peptide sequencing by massspectroscopy. Biomed. EnViron. Mass Spectrom. 19, 363–368.
(92) Bandeira, N. (2007) Spectral networks: A new approach to de novodiscovery of protein sequences and posttranslational modifications.Biotechniques 42, 691.
(93) Bandeira, N., Clauser, K. R., and Pevzner, P. A. (2007) Shotgunprotein sequencing: Assembly of peptide tandem mass spectra frommixtures of modified proteins. Mol. Cell. Proteomics 6, 1123–1134.
(94) Bandeira, N., Tsur, D., Frank, A., and Pevzner, P. A. (2007) Proteinidentification by spectral networks analysis. Proc. Natl. Acad. Sci.U.S.A. 104, 6140–6145.
(95) Bandeira, N., Tang, H., Bafna, V., and Pevzner, P. (2004) Shotgunprotein sequencing by tandem mass spectra assembly. Anal. Chem.76, 7221–7233.
(96) González-Díaz, H., Marrero, Y., Hernandez, I., Bastida, I., Tenorio,E., Nasco, O., Uriarte, E., Castanedo, N., Cabrera, M. A., Aguila,E., Marrero, O., Morales, A., and Perez, M. (2003) 3D-MEDNEs:An alternative “in silico” technique for chemical research intoxicology. 1. Prediction of chemically induced agranulocytosis.Chem. Res. Toxicol. 16, 1318–1327.
(97) Randic, M., Lers, N., Plavsic, D., Basak, S. C., and Balaban, A. T.(2005) Four-color map representation of DNA or RNA sequencesand their numerical characterization. Chem. Phys. Lett. 407, 205–208.
(98) Conrads, T. P., Zhou, M., Petricoin, E. F., Liotta, L. A., and Veenstra,T. D. (2003) Cancer diagnosis using proteomic patterns. Exp. ReV.Mol. Diagn. 3, 411–420.
(99) Lambertenghi-Deliliers, G., Zanon, P. L., Pozzoli, E. F., and Bellini,O. (1976) Myocardial injury induced by a single dose of adriamycin:An electron microscopic study. Tumori 62, 517–528.
(100) Zhang, J., Herman, E. H., and Ferrans, V. J. (1993) Dendritic cellsin the hearts of spontaneously hypertensive rats treated with doxo-rubicin with or without ICRF-187. Am. J. Pathol. 142, 1916–1926.
(101) Herman, E. H., Zhang, J., Rifai, N., Lipshultz, S. E., Hasinoff, B. B.,Chadwick, D. P., Knapton, A., Chai, J., and Ferrans, V. J. (2001)The use of serum levels of cardiac troponin T to compare theprotective activity of dexrazoxane against doxorubicin- and mitox-antrone-induced cardiotoxicity. Cancer Chemother. Pharmacol. 48,297–304.
(102) Zhang, J., Herman, E. H., Knapton, A., Chadwick, D. P., Whitehurst,V. E., Koerner, J. E., Papoian, T., Ferrans, V. J., and Sistare, F. D.(2002) SK&F 95654-induced acute cardiovascular toxicity in Spra-gue-Dawley rats--histopathologic, electron microscopic, and immu-nohistochemical studies. Toxicol. Pathol. 30, 28–40.
(103) Van Waterbeemd, H. (1995) Discriminant analysis for activityprediction, In Chemometric Methods in Molecular Design, (VanWaterbeemd, H., Ed.) pp 265–282, Wiley-VCH, New York.
(104) (2001)ATISTICA, Statsoft Inc.(105) Kowalski, R. B., and Wold, S. (1982) Pattern recognition in chemistry,
In Handbook of Statistics, (Krishnaiah, P. R., and Kanal, L. N., Eds.)pp 673–697, North Holland Publishing Company, Amsterdam.
(106) Van Waterbeemd, H. (1995) Chemometric Methods in MolecularDesign, Vol. 2, Wiley-VCH, New York.
(107) Cruz-Monteagudo, M., Gonzalez-Diaz, H., Aguero-Chapin, G.,Santana, L., Borges, F., Dominguez, E. R., Podda, G., and Uriarte,E. (2007) Computational chemistry development of a unified freeenergy Markov model for the distribution of 1300 chemicals to 38different environmental or biological systems. J. Comput. Chem. 28,1909–1923.
(108) Stewart, J. and Gill, L. (1998) Econometrics, 2nd ed., Prentice Hall,London.
(109) Kutner, M. H., Nachtsheim, C. J., Neter, J. and Li, W. (2005)Standardized multiple regression model, Applied Linear StatisticalModels pp 271–277, McGraw Hill, New York.
(110) González-Díaz, H., Molina-Ruiz, R. and Hernandez, I. (2007)MARCH-INSIDE, version 3.0 (MARkov CHains INvariants for SImulationand DEsign), MARCH-INSIDE, version 3.0 (MARkov CHainsINvariants for SImulation and DEsign). Main author informationrequesting contact e-mail: [email protected].
(111) Saiz-Urra, L., González-Díaz, H., and Uriarte, E. (2005) ProteinsMarkovian 3D-QSAR with spherically-truncated average electrostaticpotentials. Bioorg. Med. Chem. 13, 3641–3647.
(112) González-Díaz, H., and Uriarte, E. (2005) Proteins QSAR withMarkov average electrostatic potentials. Bioorg. Med. Chem. Lett.15, 5088–5094.
(113) Gonzalez-Diaz, H., Sanchez-Gonzalez, A., and Gonzalez-Diaz, Y.(2006) 3D-QSAR study for DNA cleavage proteins with a potentialanti-tumor ATCUN-like motif. J. Inorg. Biochem. 100, 1290–1297.
(114) Gonzalez-Diaz, H., Saiz-Urra, L., Molina, R., Gonzalez-Diaz, Y.,and Sanchez-Gonzalez, A. (2007) Computational chemistry approachto protein kinase recognition using 3D stochastic van der Waalsspectral moments. J. Comput. Chem. 28, 1042–1048.
(115) Ramos de Armas, R., González-Díaz, H., Molina, R., and Uriarte,E. (2004) Markovian backbone negentropies: Molecular descriptorsfor protein research. I. Predicting protein stability in Arc repressormutants. Proteins 56, 715–723.
(116) Radestock, S., Bohm, M., and Gohlke, H. (2005) Improving bindingmode predictions by docking into protein-specifically adaptedpotential fields. J. Med. Chem. 48, 5466–5479.
(117) Randic, M. (2004) Graphical representations of DNA as 2-D map.Chem. Phys. Lett. 386, 468–471.
(118) Gonzalez-Diaz, H., Perez-Bello, A., Uriarte, E., and Gonzalez-Diaz,Y. (2006) QSAR study for mycobacterial promoters with lowsequence homology. Bioorg. Med. Chem. Lett. 16, 547–553.
(119) González-Díaz, H., Pérez-Bello, A., Cruz-Monteagudo, M., González-Díaz, Y., Santana, L., and Uriarte, E. (2007) Chemometrics for QSARwith low sequence homology: Mycobacterial promoter sequencesrecognition with 2D-RNA entropies. Chemom. Intell. Lab. Syst. 85,20–26.
(120) Gonzalez-Diaz, H., Vina, D., Santana, L., de Clercq, E., and Uriarte,E. (2006) Stochastic entropy QSAR for the in silico discovery ofanticancer compounds: Prediction, synthesis, and in vitro assay ofnew purine carbanucleosides. Bioorg. Med. Chem. 14, 1095–1107.
(121) González-Díaz, H., Pérez-Bello, A., and Uriarte, E. (2005) Stochasticmolecular descriptors for polymers. 3. Markov electrostatic momentsas polymer 2D-folding descriptors: RNA-QSAR for mycobacterialpromoters. Polymer 46, 6461–6473.
(122) Gromiha, M. M., Oobatake, M., Kono, H., Uedaira, H., and Sarai,A. (1999) Role of structural and sequence information in theprediction of protein stability changes: Comparison between buriedand partially buried mutations. Protein Eng. 12, 549–555.
(123) Zweig, M. H. (1994) Apolipoproteins and lipids in coronary arterydisease. Analysis of diagnostic accuracy using receiver operatingcharacteristic plots and areas. Arch. Pathol. Lab. Med. 118, 141–144.
(124) Zweig, M. H., Broste, S. K., and Reinhart, R. A. (1992) ROC curveanalysis:An example showing the relationships among serum lipidand apolipoprotein concentrations in identifying patients withcoronary artery disease. Clin. Chem. 38, 1425–1428.
(125) Morales, A. H., Perez, M. A., Combes, R. D., and Gonzalez, M. P.(2006) Quantitative structure activity relationship for the computa-tional prediction of nitrocompounds carcinogenicity. Toxicology 220,51–62.
(126) Kutner, M. H., Nachtsheim, C. J., Neter, J. and Li, W. (2005)Multicollinearity and its effects, In Applied Linear Statistical Models,pp 278–289, McGraw Hill, New York.
(127) Prusis, P., Lundstedt, T., and Wikberg, J. E. (2002) Proteo-chemometrics analysis of MSH peptide binding to melanocortinreceptors. Protein Eng. 15, 305–311.
(128) Devillers, J., Chezeau, A., and Thybaud, E. (2002) PLS-QSAR ofthe adult and developmental toxicity of chemicals to Hydra attenuata.SAR QSAR EnViron. Res. 13, 705–712.
(129) Taraviras, S. L., Ivanciuc, O., and Cabrol-Bass, D. (2000) Identifica-tion of groupings of graph theoretical molecular descriptors using ahybrid cluster analysis approach. J. Chem. Inf. Comput. Sci. 40, 1128–1146.
(130) Mei, H., Liao, Z. H., Zhou, Y., and Li, S. Z. (2005) A new set ofamino acid descriptors and its application in peptide QSARs.Biopolymers 80, 775–786.
(131) Jacobs, M. N. (2004) In silico tools to aid risk assessment of endocrinedisrupting chemicals. Toxicology 205, 43–53.
(132) Randi∫, M. (1991) Orthogonal molecular descriptors. New J. Chem.15, 517–525.
(133) Randi∫, M. (1991) Resolution of ambiguities in structure-propertystudies by use of orthogonal descriptors. J. Chem. Inf. Comput. Sci.31, 311–370.
(134) Randi∫, M. (1993) Fitting of non linear regressions by orthogonalizedpower series. J. Comput. Chem. 14, 363–370.
(135) (2002) Waikato Environment for Knowledge Analysis (WEKA),University of Waikato, New Zealand.
(136) Witten, I. H. and Frank, E. (2005) Data Mining: Practical MachineLearning Tools and Techniques, 2nd ed, San Francisco, CA.
(137) Frank, E., Hall, M., Trigg, L., Holmes, G., and Witten, I. H. (2004)Data mining in bioinformatics using Weka. Bioinformatics 20, 2479–2481.
(138) Nascimento, D. G., Rates, B., Santos, D. M., Verano-Braga, T.,Barbosa-Silva, A., Dutra, A. A., Biondi, I., Martin-Eauclaire, M. F.,De Lima, M. E., and Pimenta, A. M. (2006) Moving pieces in ataxonomic puzzle: Venom 2D-LC/MS and data clustering analysesto infer phylogenetic relationships in some scorpions from theButhidae family (Scorpiones). Toxicon 47, 628–639.
Proteome MS Spiral Graph Detection of Toxicity Chem. Res. Toxicol., Vol. 21, No. 3, 2008 631

(139) Pillai, S., Good, B., Richman, D., and Corbeil, J. (2003) A newperspective on V3 phenotype prediction. AIDS Res. Hum. RetroVi-ruses 19, 145–149.
(140) Witten, I. H. and Frank, E. (2000) Data Mining: Practical MachineLearning Tools and Techniques with JaVa Implementations, pp265–320Morgan Kaufmann, San Francisco, CA.
(141) Liao, B. (2005) A 2D graphical representation of DNA sequence.Chem. Phys. Lett. 401, 196–199.
(142) Liao, B., Tan, M., and Ding, K. (2005) Application of 2-D graphicalrepresentation of DNA sequence. Chem. Phys. Lett. 414, 296–300.
(143) Liao, B., Tan, M., and Ding, K. (2005) A 4D representation of DNAsequences and its application. Chem. Phys. Lett. 402, 380–383.
(144) Randi∫, M., Vracko, M., Zupan, J., and Novic, M. (2003) Compact2-D graphical representation of DNA. Chem. Phys. Lett. 373, 558–562.
(145) Randi∫, M., Lers, N., Plavsi∫, D., Basak, S., and Balaban, A. T.(2005) Four-color map representation of DNA or RNA sequencesand their numerical characterization. Chem. Phys. Lett. 407, 205–208.
(146) Liu, Y., Guo, X., Xu, J., Pan, L., and Wang, S. (2002) Some noteson 2-D graphical representation of DNA sequence. J. Chem. Inf.Comput. Sci. 42, 529–533.
(147) Randi∫, M. (2000) Condensed representation of DNA primarysequences. J. Chem. Inf. Comput. Sci. 40, 50–56.
(148) Randi∫, M., and Balaban, A. T. (2003) On a four-dimensionalrepresentation of DNA primary sequences. J. Chem. Inf. Comput.Sci. 43, 532–539.
(149) Randi∫, M., Vracko, M., Nandy, A., and Basak, S. C. (2000) On3-D graphical representation of dna primary sequences and theirnumerical characterization. J. Chem. Inf. Comput. Sci. 40, 1235–1244.
(150) Zupan, J., and Randi∫, M. (2005) Algorithm for coding DNAsequences into “spectrum-like” and “zigzag” representations. J. Chem.Inf. Model. 45, 309–313.
(151) Liao, B., and Wang, T. M. (2004) New 2D graphical representationof DNA sequences. J. Comput. Chem. 25, 1364–1368.
(152) Randi∫, M. (2004) 2-D graphical representation of proteins basedon virtual genetic code. SAR QSAR EnViron. Res. 15, 147–157.
(153) Randi∫, M., and Zupan, J. (2004) Highly compact 2D graphicalrepresentation of DNA sequences. SAR QSAR EnViron. Res. 15,191–205.
TX700296T
632 Chem. Res. Toxicol., Vol. 21, No. 3, 2008 Cruz-Monteagudo et al.
Copyright © 2022 FDOKUMEN