Chemically Enhanced Water Removal in Papermaking
174
e University of Maine DigitalCommons@UMaine Electronic eses and Dissertations Fogler Library 5-2012 Chemically Enhanced Water Removal in Papermaking James John Beaupré Follow this and additional works at: hp://digitalcommons.library.umaine.edu/etd Part of the Chemical Engineering Commons is Open-Access Dissertation is brought to you for free and open access by DigitalCommons@UMaine. It has been accepted for inclusion in Electronic eses and Dissertations by an authorized administrator of DigitalCommons@UMaine. Recommended Citation Beaupré, James John, "Chemically Enhanced Water Removal in Papermaking" (2012). Electronic eses and Dissertations. 1764. hp://digitalcommons.library.umaine.edu/etd/1764
-
Upload
khangminh22 -
Category
Documents
-
view
1 -
download
0
Transcript of Chemically Enhanced Water Removal in Papermaking
The University of MaineDigitalCommons@UMaine
Electronic Theses and Dissertations Fogler Library
5-2012
Chemically Enhanced Water Removal inPapermakingJames John Beaupré
Follow this and additional works at: http://digitalcommons.library.umaine.edu/etd
Part of the Chemical Engineering Commons
This Open-Access Dissertation is brought to you for free and open access by DigitalCommons@UMaine. It has been accepted for inclusion inElectronic Theses and Dissertations by an authorized administrator of DigitalCommons@UMaine.
Recommended CitationBeaupré, James John, "Chemically Enhanced Water Removal in Papermaking" (2012). Electronic Theses and Dissertations. 1764.http://digitalcommons.library.umaine.edu/etd/1764
CHEMICALLY ENHANCED WATER REMOVAL IN PAPERMAKING
By
James John Beaupré
B.Sc. University of Maine, 2007
A DISSERTATION
Submitted in Partial Fulfillment of the
Requirements for the Degree of
Doctor of Philosophy
(in Chemical Engineering)
The Graduate School
The University of Maine
May 2012
Advisory Committee:
David J. Neivandt, Associate Professor of Chemical and Biological Engineering,
Advisor
Douglas W. Bousfield, Professor of Chemical and Biological Engineering
Joseph M. Genco, Professor of Chemical and Biological Engineering
Adriaan R.P. van Heiningen, Professor of Chemical and Biological Engineering
Kenneth P. Kehrer, General Manager of Global Innovation
Armstrong World Industries
ii
THESIS ACCEPTANCE STATEMENT
On behalf of the Graduate Committee for James John Beaupré, I affirm that this
manuscript is the final and accepted thesis. Signatures of all committee members
are on file with the graduate school at the University of Maine, 42 Stodder Hall,
Orono, Maine.
David J. Neivandt, Date
Associate Professor of Chemical and Biological Engineering
LIBRARY RIGHTS STATEMENT
In presenting this thesis in partial fulfillment of the requirements for an advanced
degree at The University of Maine, I agree that the Library shall make it freely
available for inspection. I further agree that permission for "fair use" copying of this
thesis for scholarly purposes may be granted by the Librarian. It is understood that
any copying or publication of this thesis for financial gain shall not be allowed
without my written permission.
Signature
CHEMICALLY ENHANCED WATER REMOVAL IN PAPERMAKING
By James John Beaupré
Thesis Advisor: Dr. David J. Neivandt
An Abstract of the Dissertation Presented in Partial Fulfillment of the Requirements for the
Degree of Doctor of Philosophy (in Chemical Engineering)
May 2012
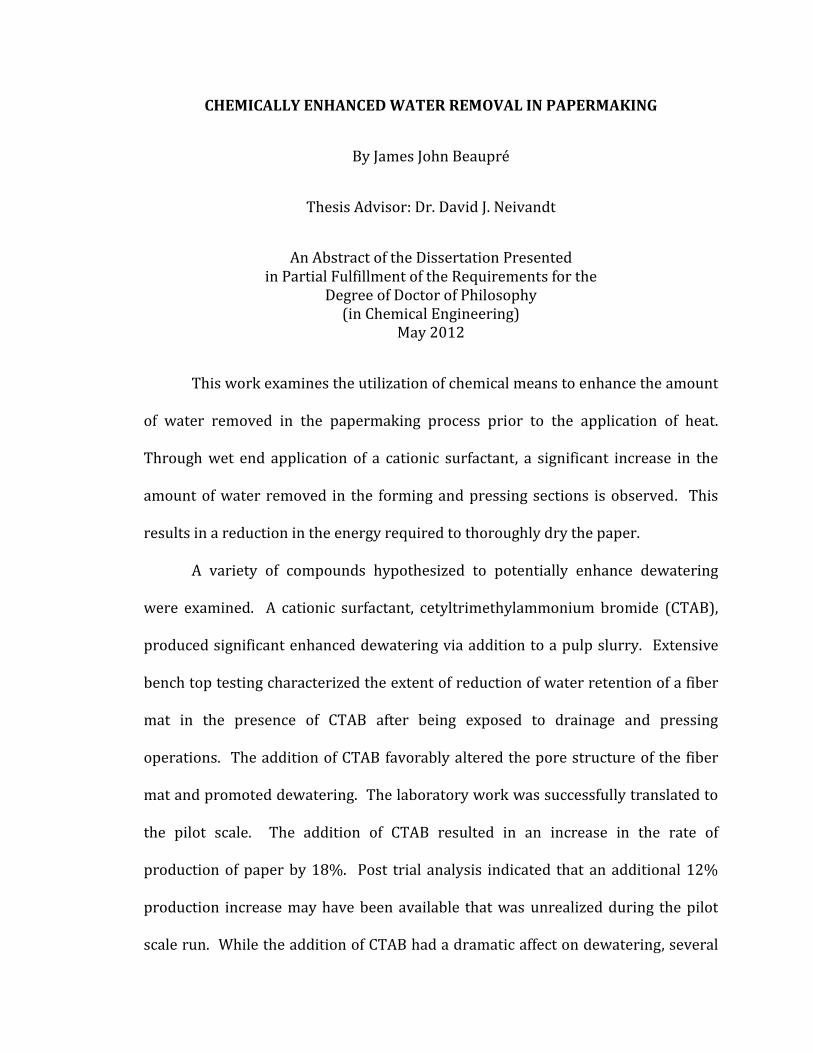
This work examines the utilization of chemical means to enhance the amount
of water removed in the papermaking process prior to the application of heat.
Through wet end application of a cationic surfactant, a significant increase in the
amount of water removed in the forming and pressing sections is observed. This
results in a reduction in the energy required to thoroughly dry the paper.
A variety of compounds hypothesized to potentially enhance dewatering
were examined. A cationic surfactant, cetyltrimethylammonium bromide (CTAB),
produced significant enhanced dewatering via addition to a pulp slurry. Extensive
bench top testing characterized the extent of reduction of water retention of a fiber
mat in the presence of CTAB after being exposed to drainage and pressing
operations. The addition of CTAB favorably altered the pore structure of the fiber
mat and promoted dewatering. The laboratory work was successfully translated to
the pilot scale. The addition of CTAB resulted in an increase in the rate of
production of paper by 18%. Post trial analysis indicated that an additional 12%
production increase may have been available that was unrealized during the pilot
scale run. While the addition of CTAB had a dramatic affect on dewatering, several
potentially negative effects were identified. Specifically, the fiber surface was
shown to be charge reversed from negative to positive, the surface tension of the
slurry was significantly reduced, the fiber sheet was considerably thicker, and the
sheet strength was reduced by the addition of CTAB. Efforts to mitigate the negative
effects observed in both the laboratory and pilot scale testing determined that the
addition of an anionic clay reversed the bulking, charge, and surface tension effects,
however it failed to recover the strength loss.
In conclusion, the work demonstrated that the addition of the cationic
surfactant CTAB to a pulp slurry results in significant chemically enhanced water
removal. The technology is expected to have direct application in niche markets
which do not base product quality on strength or bulking. Additional
implementation of the technology may be possible with further evaluation.
iii
ACKNOWLEDGMENTS
First and foremost I would like to offer my greatest thanks to my advisor, Dr.
David Neivandt, for the wonderful experience I have had in the five years of my
graduate experience. His patience, willingness to take the extra minute to chat,
drive for perfection, willingness to allow experiences outside the laboratory, guiding
development of my lateral thinking, and the expectation that I would perform better
was truly the fiber that tied my entire work together. Without his guidance and
belief in me, this work would not exist.
I would also like to express my deepest gratitude to Dr. Kenneth Kehrer, of
Armstrong World Industries, for providing the catalyst which allowed for the work
to be performed. Also, I would like to thank Dr. Kehrer for every one of the 13
meetings in which he and Dr. Neivandt would leave my head spinning. Without that
prodding, I doubt I would have advanced as rapidly as I did. I would like to thank
my committee namely Dr. Joseph Genco, Dr. Douglas Bousfield, and Dr. Adriaan Van
Heiningen; their words of wisdom and willingness to see me whenever I knocked
upon their door truly provided external insight when it was needed most.
I wish to thank the entire staff of the Process Development Center; Mark
Paradis, Pros Bennett, Mike Bilodeau, Keith Hodgins, Jon Spender, Donna Johnson,
and Josh O’Keefe. Whenever I had a question, needed to learn a new test, or broke
something, one of you could always be found for assistance. I would also like to
offer my thanks to Anthony Raymond and Evelyn Fairman for their assistance in
performing WRVs, I know they were long, repetitive, and tedious, but the data you
collected formed a large part of this body of work.
iv
I would like to acknowledge Armstrong World Industries for funding the core
of this work, as well as the Pulp and Paper Foundation for funding my
undergraduate studies as well as my first year as a graduate student. I also express
my thanks to the Maine Economic Improvement Fund for funding a final year of my
graduate career to write this dissertation. Ideas are great, but without funding they
sit and it is through the support of the previously mentioned organizations that
science takes a leap forward.
I would like to express gratitude to the entire University of Maine
Department of Chemical and Biological Engineering, to the faculty who taught me,
Nick and Amos who could fix anything, and to Kelly Leadbetter, Angel Hildreth, and
Cathy Dunn (who supports everyone) for putting up with my request and needs for
nine years. I would also like to thank the “burrito crew”; Dave, Alex, Sarah, Adam,
Ed and Tyrone for their friendship, good times, support, and most of all the Verve
burritos.
In ending I would like to express thanks to my family; John, Marilyn, and
Sharon, for their love, support, and their ability to always know what to say. I also
would like to also thank my in-laws; Joe, Julie, and Angie, for welcoming me into
their home and family with open arms.
Finally, Danielle, I would like to thank my loving wife for putting up with
everything I do and providing the words of encouragement that motivated me when
nothing else seemed to matter. This work is dedicated to her, as without her none of
this would matter.
v
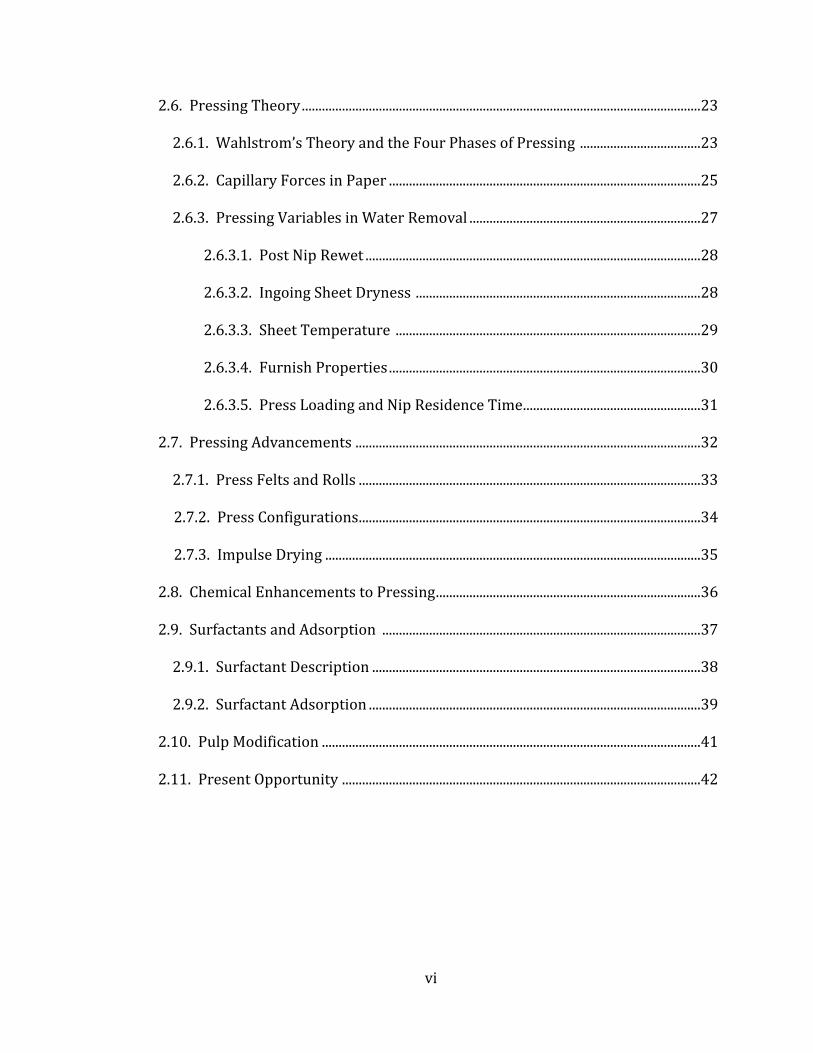
TABLE OF CONTENTS
ACKNOWLEDGMENTS ......................................................................................................................... iii
LIST OF FIGURES .....................................................................................................................................x
Chapter
1. INTRODUCTION AND BACKGROUND ....................................................................................... 1
1.1. Description of the Problem .................................................................................................. 1
1.2. Components of the Paper Machine ................................................................................... 2
1.3. Cellulose and Fiber Structure .............................................................................................. 5
1.3.1. Ultra Structure of the Cell Wall ................................................................................... 5
1.3.2. Distribution of Lignin and Cellulose ......................................................................... 6
1.4. Wood Pulping Properties ....................................................................................................... 7
1.5. Sheet Solids Limitations ......................................................................................................... 9
2. LITERATURE REVIEW ..................................................................................................................11
2.1. Distribution of Water in Cellulose and Cellulose Fiber Mats .................................11
2.2. Drainage and Formation ......................................................................................................12
2.3. Components of the Forming Section ...............................................................................14
2.3.1. Forming Fabrics ..............................................................................................................14
2.3.2. Former Types ...................................................................................................................17
2.3.2.1. Fourdrinier Former ...........................................................................................17
2.3.2.2. Twin-wire Formers ...........................................................................................18
2.4. Drainage Theory ......................................................................................................................21
2.5. Fundamentals of Pressing ..................................................................................................22
vi
2.6. Pressing Theory .......................................................................................................................23
2.6.1. Wahlstrom’s Theory and the Four Phases of Pressing ....................................23
2.6.2. Capillary Forces in Paper .............................................................................................25
2.6.3. Pressing Variables in Water Removal .....................................................................27
2.6.3.1. Post Nip Rewet ....................................................................................................28
2.6.3.2. Ingoing Sheet Dryness .....................................................................................28
2.6.3.3. Sheet Temperature ...........................................................................................29
2.6.3.4. Furnish Properties .............................................................................................30
2.6.3.5. Press Loading and Nip Residence Time .....................................................31
2.7. Pressing Advancements .......................................................................................................32
2.7.1. Press Felts and Rolls ......................................................................................................33
2.7.2. Press Configurations ......................................................................................................34
2.7.3. Impulse Drying ................................................................................................................35
2.8. Chemical Enhancements to Pressing ...............................................................................36
2.9. Surfactants and Adsorption ...............................................................................................37
2.9.1. Surfactant Description ..................................................................................................38
2.9.2. Surfactant Adsorption ...................................................................................................39
2.10. Pulp Modification .................................................................................................................41
2.11. Present Opportunity ...........................................................................................................42
vii
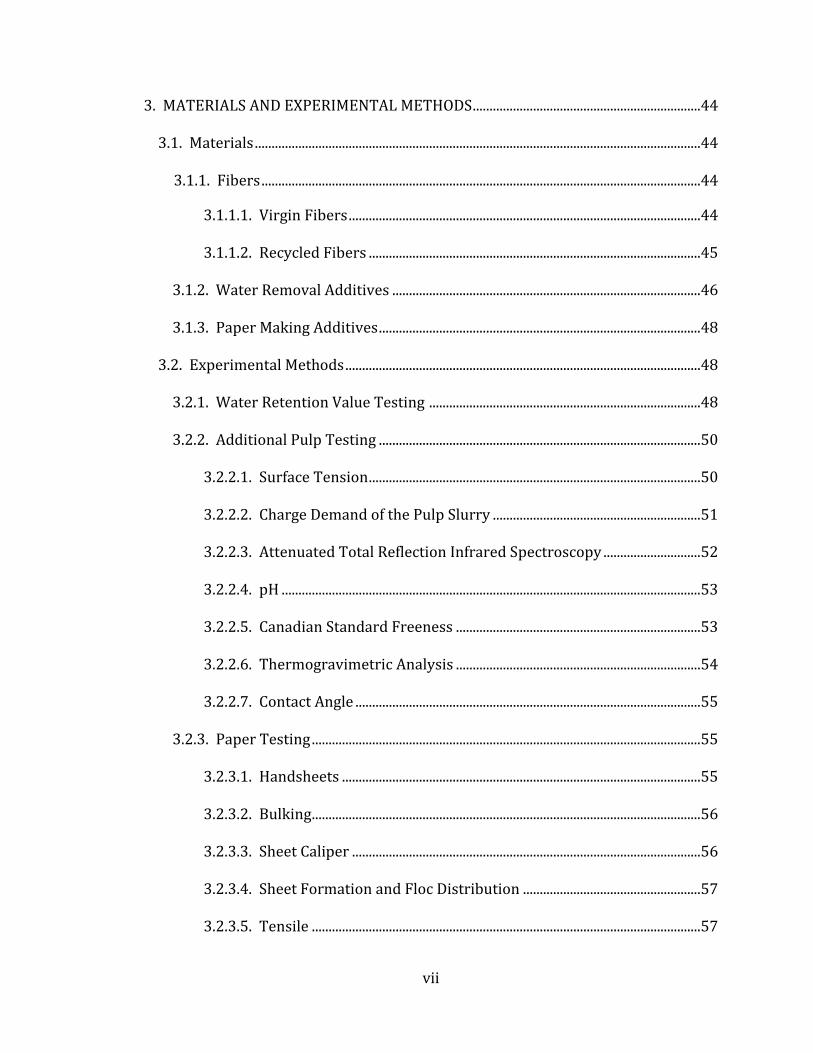
3. MATERIALS AND EXPERIMENTAL METHODS ....................................................................44
3.1. Materials .....................................................................................................................................44
3.1.1. Fibers ...................................................................................................................................44
3.1.1.1. Virgin Fibers .........................................................................................................44
3.1.1.2. Recycled Fibers ...................................................................................................45
3.1.2. Water Removal Additives ............................................................................................46
3.1.3. Paper Making Additives ................................................................................................48
3.2. Experimental Methods ..........................................................................................................48
3.2.1. Water Retention Value Testing .................................................................................48
3.2.2. Additional Pulp Testing ................................................................................................50
3.2.2.1. Surface Tension ...................................................................................................50
3.2.2.2. Charge Demand of the Pulp Slurry ..............................................................51
3.2.2.3. Attenuated Total Reflection Infrared Spectroscopy .............................52
3.2.2.4. pH .............................................................................................................................53
3.2.2.5. Canadian Standard Freeness .........................................................................53
3.2.2.6. Thermogravimetric Analysis .........................................................................54
3.2.2.7. Contact Angle .......................................................................................................55
3.2.3. Paper Testing ....................................................................................................................55
3.2.3.1. Handsheets ...........................................................................................................55
3.2.3.2. Bulking ....................................................................................................................56
3.2.3.3. Sheet Caliper ........................................................................................................56
3.2.3.4. Sheet Formation and Floc Distribution .....................................................57
3.2.3.5. Tensile ....................................................................................................................57
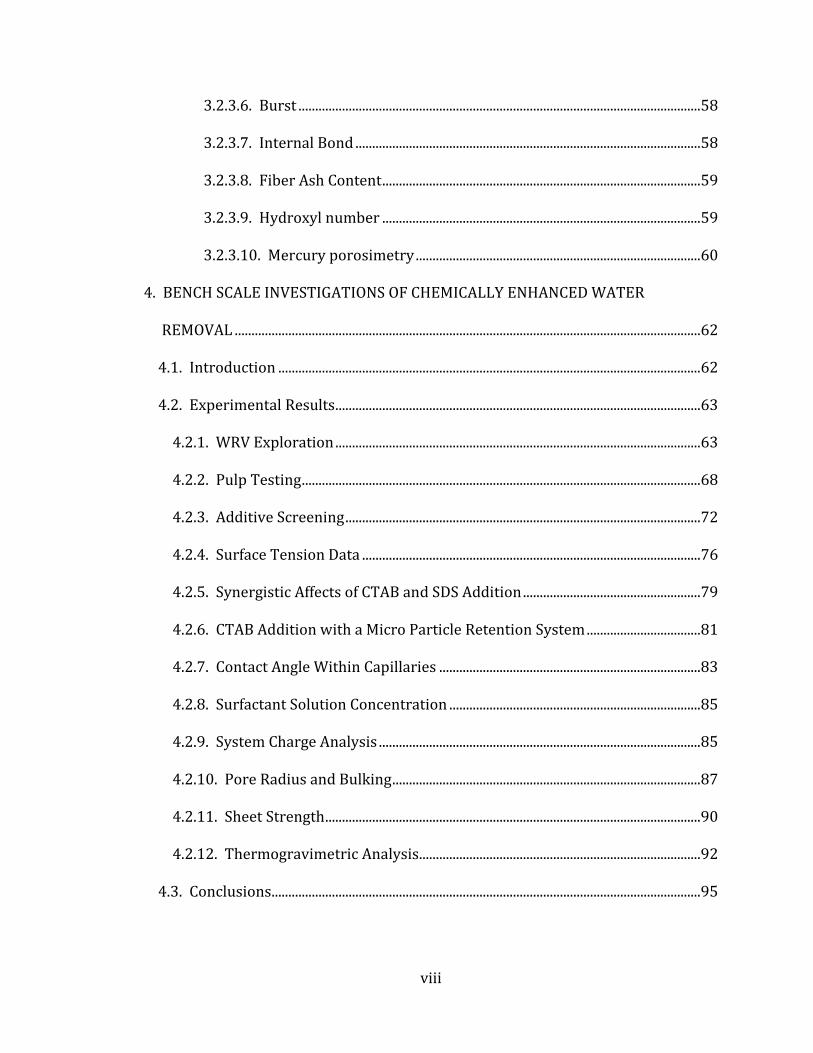
viii
3.2.3.6. Burst ........................................................................................................................58
3.2.3.7. Internal Bond .......................................................................................................58
3.2.3.8. Fiber Ash Content ...............................................................................................59
3.2.3.9. Hydroxyl number ...............................................................................................59
3.2.3.10. Mercury porosimetry .....................................................................................60
4. BENCH SCALE INVESTIGATIONS OF CHEMICALLY ENHANCED WATER
REMOVAL ...........................................................................................................................................62
4.1. Introduction ..............................................................................................................................62
4.2. Experimental Results .............................................................................................................63
4.2.1. WRV Exploration .............................................................................................................63
4.2.2. Pulp Testing .......................................................................................................................68
4.2.3. Additive Screening ..........................................................................................................72
4.2.4. Surface Tension Data .....................................................................................................76
4.2.5. Synergistic Affects of CTAB and SDS Addition .....................................................79
4.2.6. CTAB Addition with a Micro Particle Retention System ..................................81
4.2.7. Contact Angle Within Capillaries ..............................................................................83
4.2.8. Surfactant Solution Concentration ...........................................................................85
4.2.9. System Charge Analysis ................................................................................................85
4.2.10. Pore Radius and Bulking ............................................................................................87
4.2.11. Sheet Strength ................................................................................................................90
4.2.12. Thermogravimetric Analysis....................................................................................92
4.3. Conclusions ................................................................................................................................95
ix
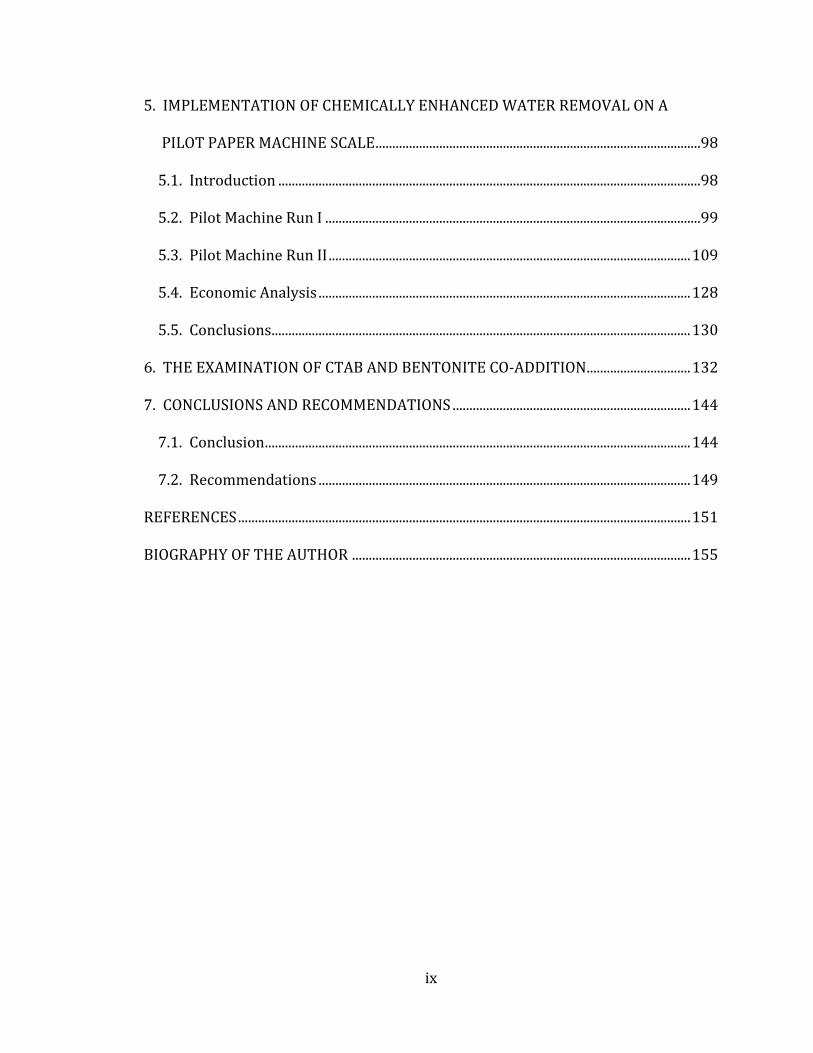
5. IMPLEMENTATION OF CHEMICALLY ENHANCED WATER REMOVAL ON A
PILOT PAPER MACHINE SCALE .................................................................................................98
5.1. Introduction ..............................................................................................................................98
5.2. Pilot Machine Run I ................................................................................................................99
5.3. Pilot Machine Run II ............................................................................................................ 109
5.4. Economic Analysis ............................................................................................................... 128
5.5. Conclusions ............................................................................................................................. 130
6. THE EXAMINATION OF CTAB AND BENTONITE CO-ADDITION ............................... 132
7. CONCLUSIONS AND RECOMMENDATIONS ....................................................................... 144
7.1. Conclusion ............................................................................................................................... 144
7.2. Recommendations ............................................................................................................... 149
REFERENCES ....................................................................................................................................... 151
BIOGRAPHY OF THE AUTHOR ..................................................................................................... 155
x
LIST OF FIGURES
Figure 1.1 Example of a Fourdrinier paper machine. ........................................................ 3
Figure 1.2 Structure of a woody cell depicting the middle lamella, primary
wall, the three layers of the secondary wall, and the warty layer ........... 6
Figure 1.3 Cellulose structure depicting β-D-glucopyranose chain unit. ................... 7
Figure 2.1 The structure of a modern headbox. ................................................................12
Figure 2.2 Single-layer forming fabric. ..................................................................................15
Figure 2.3 Examples of the forming fabric cross-sections .............................................16
Figure 2.4 An example of a Fourdrinier former .................................................................17
Figure 2.5 An example of a hybrid former ...........................................................................19
Figure 2.6 An example of a gap former .................................................................................19
Figure 2.7 Jet from the headbox between the two forming fabrics of a gap
former and initial dewatering ............................................................................20
Figure 2.8 The four phases within the press nip as defined by Wahlstrom ...........24
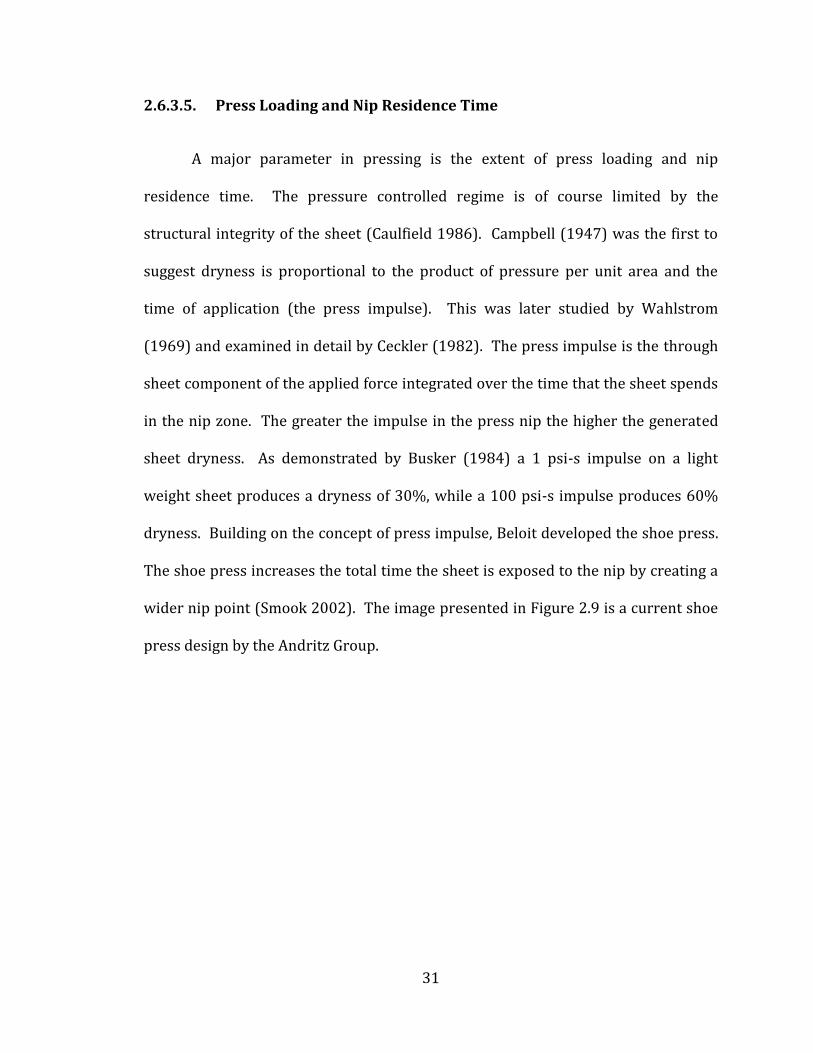
Figure 2.9 Modern shoe press, the X-Nip by Andritz .......................................................32
Figure 2.10 Straight through press section ............................................................................34
Figure 2.11 Three-nip no-draw press section arrangement ...........................................35
Figure 2.12 Adsorption of cationic surfactants on cellulose fibers ..............................40
Figure 2.13 Adsorption isotherm of C12, C14, C16, and C18 cationic
surfactants onto cellulose .....................................................................................41
Figure 3.1 The chemical structure of cetyltrimethylammonium bromide ..............46
Figure 3.2 The chemical structure of octadecyltrimethylammonium
bromide ........................................................................................................................47
xi
Figure 3.3 The chemical structure of sodium dodecyl sulfate .....................................47
Figure 3.4 Dryness out of the press section versus the water retention value .....49
Figure 4.1 WRV versus CTAB dosage for unprinted paper ...........................................64
Figure 4.2 Hypothetical paper machine with mass balance .........................................65
Figure 4.3 WRV versus CTAB dosage for recycled newsprint......................................67
Figure 4.4 WRV versus CTAB dosages for varied pulp times of unprinted
paper .............................................................................................................................68
Figure 4.5 WRV of recycled directory as a function of CTAB dosage ........................69
Figure 4.6 WRV of sulphite fibers as a function of CTAB dosage ................................70
Figure 4.7 WRV of Sappi Co-pulp as a function of CTAB dosage. ................................70
Figure 4.8 WRV of C1S broke as a function of CTAB dosage .........................................71
Figure 4.9 WRV of NBSK as a function of CTAB dosage ..................................................71
Figure 4.10 WRV of unbleached brown recycled fiber as a function of CTAB
dosage ...........................................................................................................................72
Figure 4.11 WRV versus dosage of CTAB, SDS, Trition X-100, Percol 182,
Aerosil 380, and lignosulfonic acid ...................................................................74
Figure 4.12 WRV versus dosages of OTAB, Cetrimide, and CTAB .................................76
Figure 4.13 Surface tension versus dosage of CTAB, SDS, Trition X-100,
Percol 182, Aerosil 380, and lignosulfonic acid ...........................................77
Figure 4.14 WRV versus surface tension of CTAB, SDS, and Trition X-100 ...............78
Figure 4.15 WRV and surface tension data for CTAB enhancement with SDS
single and sequential addition ............................................................................80
xii
Figure 4.16 WRV comparison of 1wt% CTAB addition with the Telioform
system ...........................................................................................................................82
Figure 4.17 Surface tension comparison of 1wt% CTAB addition with the
Telioform system .....................................................................................................83
Figure 4.18 Glass capillaries with lower ends immersed in 1mM CTAB
solution and 18.2 MΩ-cm water .........................................................................84
Figure 4.19 Streaming potential and total charge data for control pulps and
1wt% CTAB dosed pulp .........................................................................................86
Figure 4.20 WRV pad thickness for a control, the addition of 0.35wt%,
0.7wt%, and 1wt% CTAB and 1wt% SDS .......................................................87
Figure 4.21 Mercury porosimetry data plotting log differential volume versus
log pore diameter of WRV pads ........................................................................89
Figure 4.22 Tensile index of handsheets comprising of a control condition
and the addition of 0.35wt%, 0.7wt%, and 1wt% CTAB ..........................90
Figure 4.23 Hydroxyl number of a control condition and the addition of 1wt%
CTAB ..............................................................................................................................91
Figure 4.24 TGA trace of control pulp and 1wt% CTAB dosed pulp ............................93
Figure 4.25 TGA trace of control WRV centrifuged pads and 1wt% CTAB
dosed centrifuged pads ..........................................................................................94
Figure 5.1 WRV of a control condition and the addition of 0.35wt%,
0.7wt%, and 1wt% CTAB ................................................................................... 100
Figure 5.2 Illustration of couch, 2nd press, and reel sample points on the
pilot paper machine. ............................................................................................ 101
xiii
Figure 5.3 Sheet solids versus CTAB dosage off the couch roll for recycled
directory pulp ......................................................................................................... 102
Figure 5.4 Sheet solids versus CTAB dosage off the 2nd press for recycled
directory pulp ......................................................................................................... 102
Figure 5.5 Sheet solids versus CTAB dosage off the reel for recycled
directory pulp ......................................................................................................... 103
Figure 5.6 Headbox charge versus CTAB dosage for recycled directory
pulp ............................................................................................................................. 104
Figure 5.7 Surface tension versus CTAB dosage of headbox samples for
recycled directory pulp ....................................................................................... 105
Figure 5.8 Sheet tensile versus CTAB dosage for recycled directory pulp. .......... 106
Figure 5.9 Sheet burst versus CTAB dosage for recycled directory pulp ............. 107
Figure 5.10 Sheet caliper versus CTAB dosage for recycled directory pulp .......... 108
Figure 5.11 Sheet cumulative pore volume versus CTAB dosage for recycled
directory pulp ......................................................................................................... 109
Figure 5.12 Sheet solids off the couch roll ........................................................................... 112
Figure 5.13 Sheet solids off the 2nd press ........................................................................... 112
Figure 5.14 Sheet solids off the reel ....................................................................................... 113
Figure 5.15 Tray solids for the control, Telioform, Telioform/CTAB, and
CTAB conditions .................................................................................................... 114
Figure 5.16 Schematic of CTAB addition points for machine chest, refined,
and disintegrated trial conditions. ................................................................. 115
xiv
Figure 5.17 Sheet solids off the couch roll for CTAB addition point
conditions ................................................................................................................. 116
Figure 5.18 Sheet solids off the 2nd press for CTAB addition point
conditions ................................................................................................................ 116
Figure 5.19 Sheet solids off the reel for CTAB addition point conditions .............. 117
Figure 5.20 Headbox charge and streaming potential versus trial
conditions ................................................................................................................. 118
Figure 5.21 Plot of measured surface tensions at each pulp condition ................... 119
Figure 5.22 Headbox charge and streaming potential versus trial condition
post trial .................................................................................................................... 120
Figure 5.23 Trial WRV data employing head box samples .......................................... 121
Figure 5.24 Sheet tensile for each trial condition in the machine direction .......... 122
Figure 5.25 Sheet tensile for each trial condition in the cross machine
direction .................................................................................................................... 123
Figure 5.26 Sheet z-directional strength for each trial condition .............................. 124
Figure 5.27 Sheet thickness for each trial condition ....................................................... 125
Figure 5.28 Log differential pore volume for each trial condition ............................. 126
Figure 5.29 Kajaani Formation Index of paper samples for all trial
conditions ................................................................................................................. 127
Figure 5.30 Floc Distribution results of paper samples for all trial
conditions ................................................................................................................. 127
Figure 5.31 Production and profit analysis model ........................................................... 129
xv
Figure 6.1 WRV of control conditions, the addition of 1wt% CTAB, and
subsequent addition of 4wt% bentonite ...................................................... 133
Figure 6.2 Surface tension of control conditions, the addition of 1wt%
CTAB, and subsequent addition 4wt% bentonite..................................... 134
Figure 6.3 WRV Pad thickness of control conditions, the addition of 1wt%
CTAB, and subsequent addition of 4wt% bentonite................................ 135
Figure 6.4 Mercury porosimetry of control conditions, the addition of
1wt% CTAB, and subsequent addition of 4wt% bentonite .................. 136
Figure 6.5 Tensile of control conditions, the addition of 1wt% CTAB, and
subsequent addition of 4wt% bentonite. ..................................................... 137
Figure 6.6 Sheet ash of control conditions, the addition of 1wt% CTAB,
and subsequent addition of 4wt% bentonite ............................................. 138
Figure 6.7 Kajaani formation indices of control conditions, the addition of
1wt% CTAB, and subsequent addition of 4wt% bentonite. ................. 139
Figure 6.8 Floc distribution of control conditions, the addition of 1wt%
CTAB, and subsequent addition of 4wt% bentonite................................ 139
Figure 6.9 Streaming potential and total charge of control conditions, the
addition of 1wt% CTAB, and subsequent addition of 4wt%
bentonite .................................................................................................................. 141
Figure 6.10 Hydroxyl number of a control condition, the addition of 1wt%
CTAB, and subsequent addition of 4wt% bentonite................................ 142
1
CHAPTER 1
INTRODUCTION AND BACKGROUND
1.1. Description of the Problem
Over the past 200 years papermaking has gone from an art to a science with
many technological improvements aimed at making better paper less expensive and
more efficiently. Due to the nature of the papermaking process, the largest
improvements in dewatering have been mechanical, such as increases in the size of
machines for greater production and the implementation of new machine designs.
In the past twenty years the North American papermaking industry has
encountered a great deal of competition from growing papermaking industries in
South America, Asia, and Europe where significant amounts of capital have been
invested in building larger, faster machines. These new high speed machines leave
aging paper manufacturing facilities in a highly competitive environment while
facing high labor and energy costs and using significantly older, slower machines. In
order to survive, papermakers have leveraged their ingenuity to develop unique
types of paper to carve out niche markets and apply as much efficiency to the
current installed machines as possible. However this has not been enough to make
up for the lack of ability to compete with the newer production methods and newer
machines worldwide which allow for lower cost production.
The formation of a sheet of paper from a pulp slurry comprised of wood
fibers requires three steps to produce a finished sheet of paper. These steps are; the
2
removal of water by wet end drainage, pressing, and drying, each step attributes a
higher cost to the process, respectively. There has been much work conducted in
exploring mechanical means of increasing removal of water prior to applying heat in
order to reduce the amount of energy required for the drying process. Less water
left in the sheet translates into decreased energy expenditure, or a greater level of
production with the equivalent energy cost. However, very little attention has been
paid to chemical enhancements in drainage, pressing, and drying. As paper
machines age and speed requirements increase, machines tend to become “dryer
limited.” When a machine is dryer limited, its rate of production is limited by the
rate at which water can be removed by the application of heat. It is generally
impractical and economically unfeasible to install the capital equipment needed to
overcome this limitation. Therefore, improvements in increasing water removal
efficiency prior to heat application are at the forefront of development.
1.2. Components of the Paper Machine
The formation of a sheet of paper from a pulp slurry requires three unit
operations to produce a finished product. These three operations are; forming
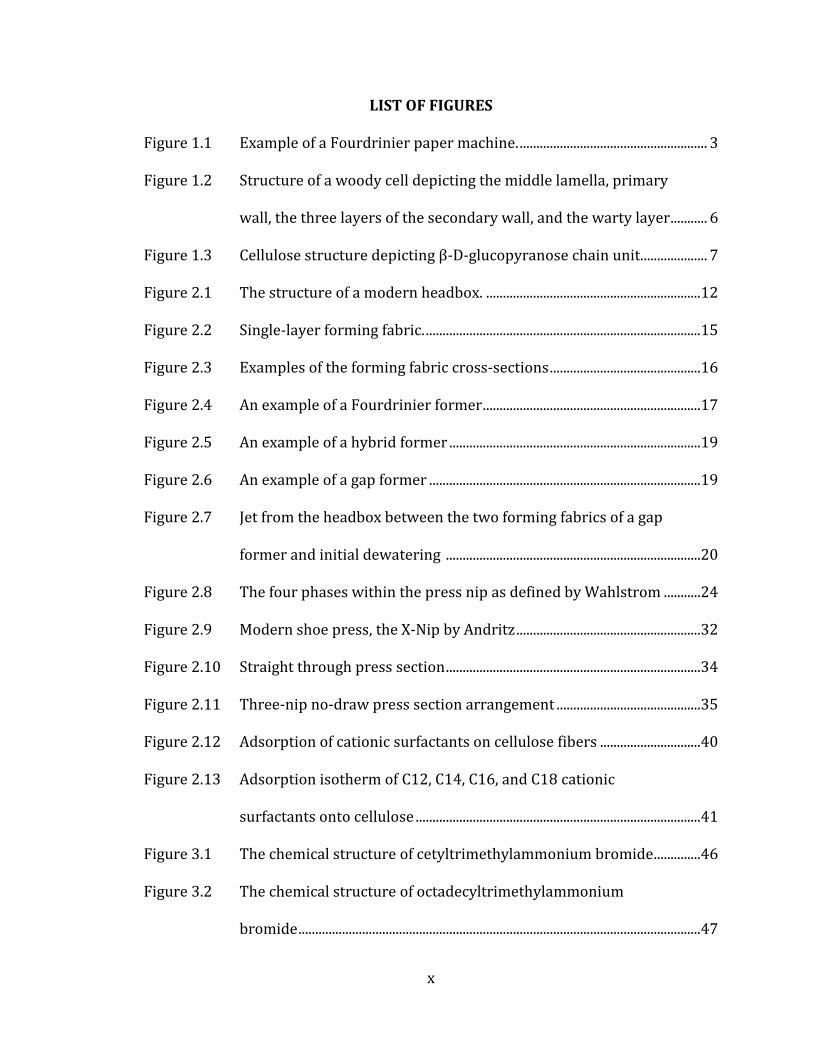
operations, pressing operations, and drying operations as shown in Figure 1.1.
3
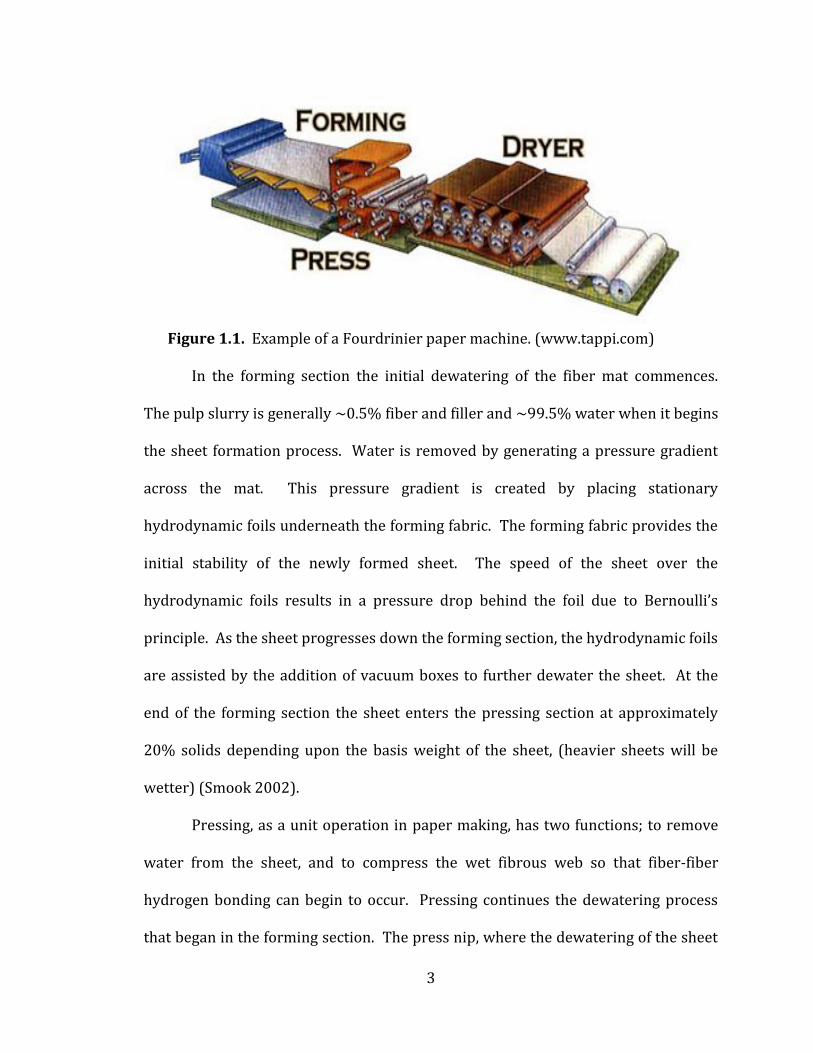
Figure 1.1. Example of a Fourdrinier paper machine. (www.tappi.com)
In the forming section the initial dewatering of the fiber mat commences.
The pulp slurry is generally ~0.5% fiber and filler and ~99.5% water when it begins
the sheet formation process. Water is removed by generating a pressure gradient
across the mat. This pressure gradient is created by placing stationary
hydrodynamic foils underneath the forming fabric. The forming fabric provides the
initial stability of the newly formed sheet. The speed of the sheet over the
hydrodynamic foils results in a pressure drop behind the foil due to Bernoulli’s
principle. As the sheet progresses down the forming section, the hydrodynamic foils
are assisted by the addition of vacuum boxes to further dewater the sheet. At the
end of the forming section the sheet enters the pressing section at approximately
20% solids depending upon the basis weight of the sheet, (heavier sheets will be
wetter) (Smook 2002).
Pressing, as a unit operation in paper making, has two functions; to remove
water from the sheet, and to compress the wet fibrous web so that fiber-fiber
hydrogen bonding can begin to occur. Pressing continues the dewatering process
that began in the forming section. The press nip, where the dewatering of the sheet
4
occurs due to a pressure pulse, is located between two press rolls. Of these two rolls,
one is covered with rubber and the second is either a steel or composite covered
roll. The sheet is transferred from the forming section fabric to the press section
felts which serve two purposes; to provide support for the sheet which cannot yet
support its own weight, and to assist in carrying excess water from the sheet. The
sheet leaves the press section at approximately 40% - 50% solids (Smook 2002).
Smook (2002) states that the dryer section of a paper machine is the most
expensive portion of the machine to build in terms of the capital cost of the
equipment, and installation. Further, the dryer section has the greatest operational
cost due to the high energy consumption required to evaporate the remaining water
from the sheet. The moisture content of the final product is generally accepted to be
~5%. Smook concludes that due to the overall cost of the dryer section,
improvements to increase the evaporation rate and reduce energy usage are well
justified. Often the drying operation receives less attention and opportunities to
improve this section’s efficiency are overlooked. The sheet enters the dryer section
at typically 50% to 60% moisture and passes over steam heated rolls to apply
energy for drying. Drying may also be accomplished by steam heat in dryer cans,
infrared dryers, natural gas dryers or a combination of two of these methods. Dryer
felts in two tier steam dryers are used to initially aid in supporting the sheet and,
later, in the dryer section to hold the sheet tightly to the steam heated rolls to
maximize heat transfer.
5
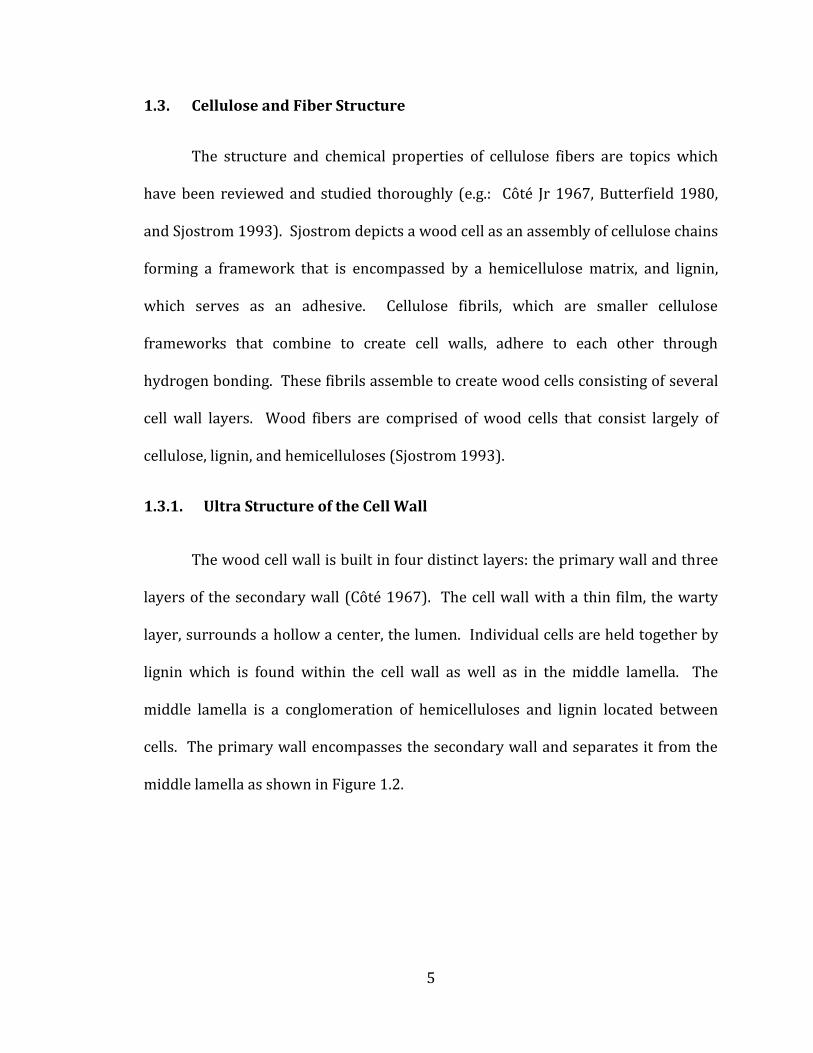
1.3. Cellulose and Fiber Structure
The structure and chemical properties of cellulose fibers are topics which
have been reviewed and studied thoroughly (e.g.: Côté Jr 1967, Butterfield 1980,
and Sjostrom 1993). Sjostrom depicts a wood cell as an assembly of cellulose chains
forming a framework that is encompassed by a hemicellulose matrix, and lignin,
which serves as an adhesive. Cellulose fibrils, which are smaller cellulose
frameworks that combine to create cell walls, adhere to each other through
hydrogen bonding. These fibrils assemble to create wood cells consisting of several
cell wall layers. Wood fibers are comprised of wood cells that consist largely of
cellulose, lignin, and hemicelluloses (Sjostrom 1993).
1.3.1. Ultra Structure of the Cell Wall
The wood cell wall is built in four distinct layers: the primary wall and three
layers of the secondary wall (Côté 1967). The cell wall with a thin film, the warty
layer, surrounds a hollow a center, the lumen. Individual cells are held together by
lignin which is found within the cell wall as well as in the middle lamella. The
middle lamella is a conglomeration of hemicelluloses and lignin located between
cells. The primary wall encompasses the secondary wall and separates it from the
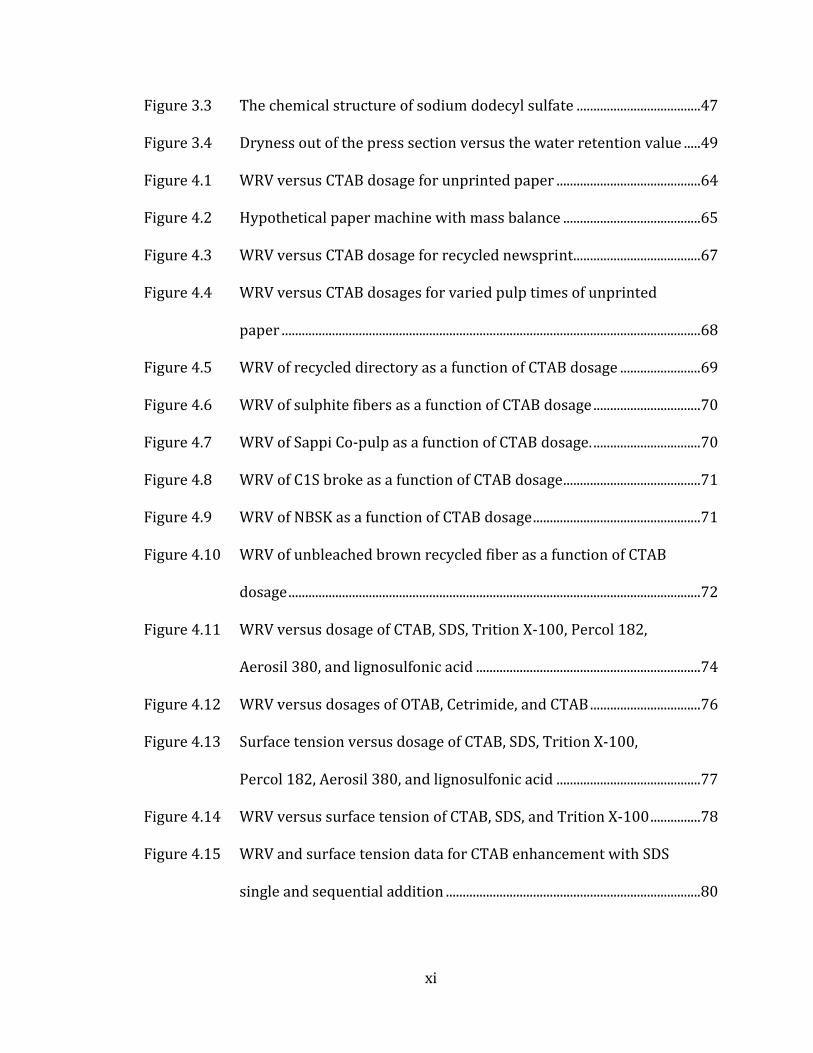
middle lamella as shown in Figure 1.2.

6
Figure 1.2: Structure of a woody cell depicting the middle lamella (ML), primary wall (P), the three layers of the secondary wall (S1, S2, and S3), and the warty layer (W). (Côté 1967)
The secondary layer makes up the majority of the cell wall. To enter the
lumen, which is the empty cavity at the center of the fiber, molecules must travel, by
diffusion, through the cell wall or through larger holes that connect the outside of
the cell to the interior (pits) (Sjostrom 1993). Pits allow for the transport of water
in the radial direction of the tree structure by connecting adjacent cells to each other
through the middle lamellae. As the cell is being pulped in the papermaking
process, the pits allow for the impregnation of the fiber with various additives used
in the papermaking industry. In most pulping processes the middle lamella is
destroyed and carried out by the pulping liquors from the resulting wood pulp.
1.3.2. Distribution of Lignin and Cellulose
When examining wood fiber on a molecular scale the most abundant
constituent is cellulose comprising 50 to 70wt% of the total fiber content. Lignin
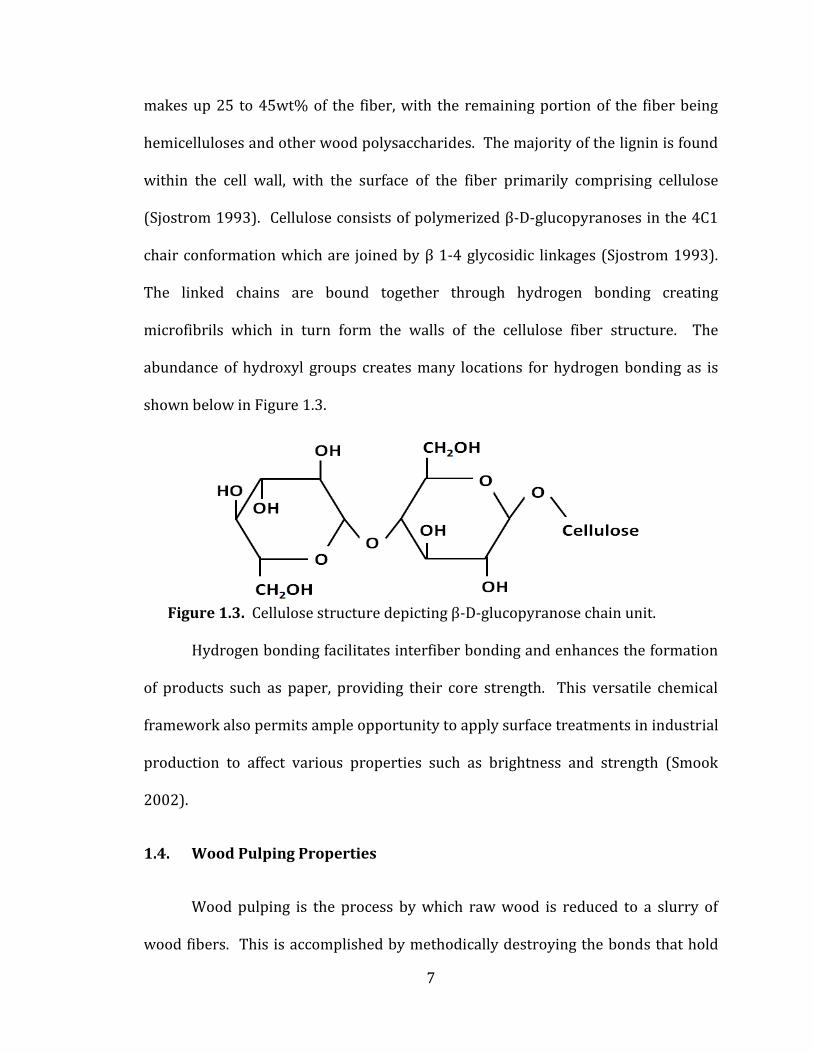
7
makes up 25 to 45wt% of the fiber, with the remaining portion of the fiber being
hemicelluloses and other wood polysaccharides. The majority of the lignin is found
within the cell wall, with the surface of the fiber primarily comprising cellulose
(Sjostrom 1993). Cellulose consists of polymerized β-D-glucopyranoses in the 4C1
chair conformation which are joined by β 1-4 glycosidic linkages (Sjostrom 1993).
The linked chains are bound together through hydrogen bonding creating
microfibrils which in turn form the walls of the cellulose fiber structure. The
abundance of hydroxyl groups creates many locations for hydrogen bonding as is
shown below in Figure 1.3.
Figure 1.3. Cellulose structure depicting β-D-glucopyranose chain unit.
Hydrogen bonding facilitates interfiber bonding and enhances the formation
of products such as paper, providing their core strength. This versatile chemical
framework also permits ample opportunity to apply surface treatments in industrial
production to affect various properties such as brightness and strength (Smook
2002).
1.4. Wood Pulping Properties
Wood pulping is the process by which raw wood is reduced to a slurry of
wood fibers. This is accomplished by methodically destroying the bonds that hold
8
the wood together, which may be achieved by chemical means, mechanical means,
or a combination of the two (Smook 2002). Wood pulp is generally comprised of the
three major components carried over from the cellulose fibers, namely: cellulose,
lignin, and hemicelluloses. Pulping processes generally form an abundance of
carboxylic acid groups on the cellulose chains resulting in a negative surface charge.
Different methods of pulping produce different quality pulps that contain varying
proportions of the three wood cell components. Chemical pulps make up the largest
proportion of pulp production in North America, the most common type is a wood
pulp produced by the kraft pulping process. Chemical pulping dissolves the middle
lamella that holds the wood cells together. This represents a drawback in the
chemical pulping process, as the chemistry that dissolves the bonds holding the cells
together also dissolves and reacts away portions of the cellulose fiber, leading to
lower pulp yields. The majority of lignin left in the chemical pulping processes is
found within the cell walls. This residual lignin does not affect the ability of the fiber
surface to hydrogen bond with adjacent fibers. A greater number of hydrogen
bonds between adjacent fibers produce a stronger final product for kraft pulps,
compared to mechanical pulping methods. Mechanical pulping produces a pulp that
has a higher lignin content than chemical pulps due to the fact that mechanical
pulping physically ruptures bonds between wood cells to create a fibrous mass. The
lignin is left mostly intact in portions of the middle lamella on the resulting fibers.
This residual lignin is then partially bleached and washed off (Gullichsen 1999).
Pulps with larger amounts of residual lignin tend to form weaker products due to
9
non-uniformity in hydrogen bond distribution and are thus considered lower
quality pulps (Smook 2002).
1.5. Sheet Solids Limitations
Paper machine furnishes are blended with pulps from various sources to
optimize the running conditions of each machine and to meet specifications of the
given type of paper being produced. However, as paper machines age and speed
requirements increase, the machines tend to become “dryer limited” regardless of
the machine furnish. When a machine is dryer limited, its rate of production is
limited by the rate at which water can be removed in the dryer section. Further
speed increases would produce a sheet that would have higher than acceptable
moisture levels. It is impractical and economically unfeasible to install a longer
dryer section to overcome this limitation. Therefore, improvements in increasing
water removal efficiency are typically concentrated on the forming section and
press section. Advancements in these two sections to date have been solely
mechanical. Theoretically, a higher dryness coming from the forming section into
the press section should generate a higher dryness exiting the press section.
However in reality most machines cannot realize this enhancement due to the level
of pressing required to remove the remaining water from the sheet. That is, the
pressures generally required to remove water in the press section to a level greater
than a given value results in crushing of the sheet, thereby damaging the final
product. As such increased amounts of dewatering in the forming section do not
generally translate to increased solids exiting the press section; rather the sheet is
10
pressed to the maximum value possible without structural damage. It is this
pressure that governs the water removal rate, and hence the exiting solids content.
However, methodologies have been developed that result in higher solids exiting the
press section by mechanical means other than increasing the pressure applied to the
sheet.
11
CHAPTER 2
LITERATURE REVIEW
2.1. Distribution of Water in Cellulose and Cellulose Fiber Mats
Previous work has shown that water in a pulp slurry exists in the vicinity of
cellulose fibers as unbound water, freezing-bound water, and nonfreezing-bound
water (Park 2007). The unbound water is water that is removed in the
papermaking process by dewatering the sheet via free drainage, pressure, and heat;
such water has a freezing temperature consistent with that of bulk water (0°C). The
bound water, both freezing and nonfreezing, neighbors the fiber surface. The
nonfreezing-bound water is defined as the few layers of water adjacent to the fiber
surface that due to the strong interfacial interaction are unable to undergo the
conformational rearrangements necessary to freeze; that is, these water molecules
have no freezing temperature. The freezing-bound water is water which is bound to
the nonfreezing-bound water and is adjacent to the bulk fluid (Park 2007).
Freezing-bound water has a depressed freezing point due to its proximity to the
nonfreezing-bound water (Park 2007). Further work by Park et al. (2007), has
compartmentalized these types of water by differential scanning calorimetery and
thermogravimetric analysis into two categories, easy-to-remove water and hard-to-
remove water. Easy-to-remove water is considered free water and contains nearly
all of the available unbound water (~75% of the unbound water). Hard-to-remove
water includes trapped unbound water within the fiber walls (~25% of the total
12
unbound water) as well as all of the freezing and nonfreezing-bound waters (Park
2007). Park et al. (2007) have shown that that hard-to-remove water accounts for
30 to 60% of the total water remaining in the sheet after pressing.
2.2. Drainage and Formation
In order to understand the complete dewatering phenomenon, it must be
analyzed from the beginning of the papermaking process. Stock preparation stage is
the first stage of the papermaking process, this portion of the process is also known
as the wet end. In stock preparation, wood fibers are mixed with water, fillers, and
additives. From stock preparation the pulp slurry is transported to the headbox of a
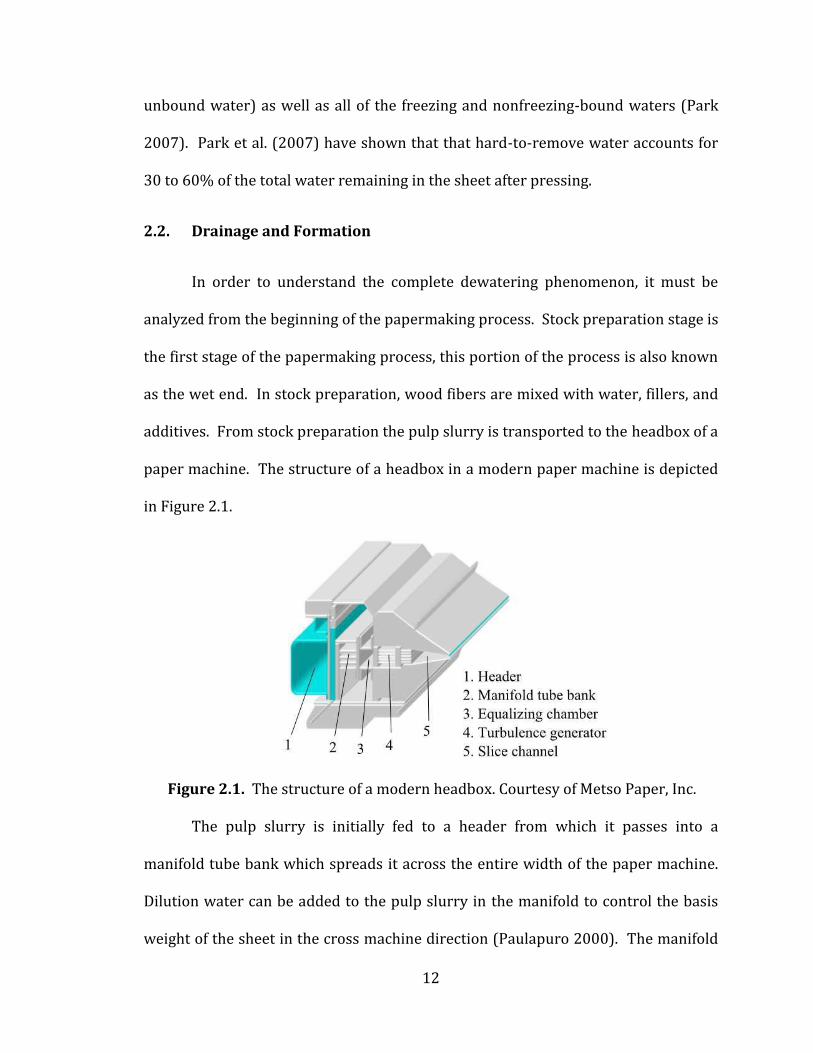
paper machine. The structure of a headbox in a modern paper machine is depicted
in Figure 2.1.
Figure 2.1. The structure of a modern headbox. Courtesy of Metso Paper, Inc.
The pulp slurry is initially fed to a header from which it passes into a
manifold tube bank which spreads it across the entire width of the paper machine.
Dilution water can be added to the pulp slurry in the manifold to control the basis
weight of the sheet in the cross machine direction (Paulapuro 2000). The manifold

13
then feeds the pulp slurry to an equalizing chamber from which it continues to
another set of pipes called a turbulence generator and subsequently to a slice
channel. The slice channel terminates at a slice opening from which the pulp slurry
is delivered to the forming section. Elastic plates (i.e. vanes) can be used in the slice
channel to reduce large scale fluctuations in sheet structure and to maintain
turbulence to improve sheet formation (Paulapuro 2000). Older machines, or
machines which produce special paper grades, may have variants to the headbox
structure presented in Figure 2.1.
The major task of the headbox is to produce the right type of jet for the
forming section. Jet quality is determined by an even mass distribution in the cross
machine direction; sufficient turbulence generation for the breakup of small fiber
aggregates (flocs), and production of stable jets by pressure regulation. Jets leaving
the slice opening have fiber a concentration that is governed by the paper grade, and
is typically in the range of between 0.5 to 1.0wt% (Smook 2002).
From the headbox the pulp slurry is sprayed onto the forming section of the
machine, which consists of a continuously moving fabric known as a forming fabric
(or wire). Dewatering of the pulp slurry is the main task of the forming fabric. A
secondary task of the forming fabric is to transport the developed sheet of fibers
along the forming section of the process. In modern gap formers the forming
section consists of two forming fabrics overlaying each other, the fiber pulp slurry is
sprayed between them. The traditional Fourdrinier former consists of a single
fabric onto which the pulp slurry is sprayed. Consequently in a Fourdrinier former
dewatering occurs only in one direction through the forming fabric (Paulapuro
14
2000) as opposed to in two directions for a gap former. The majority of the free
water removal that occurs in the making of a sheet of paper transpires within the
forming section. When the pulp slurry leaves the forming section it has a solids
concentration of 15 to 25 wt% depending on the paper grade (Smook 2002).
Dewatering can be enhanced by applying a vacuum on the opposite side of
the forming fabric. Vacuum can be generated inside the forming roll, by the use of
separate suction boxes, or zones. However, the most common means of amplifying
vacuum is to employ blades in contact with the forming fabric. The dewatering
components will be discussed in greater detail in Section 2.3. The forming
phenomenon has a major influence on how evenly the fibers are distributed within
the finished paper sheet. In the forming section, the accumulated fibers form an
initial sheet which is called the wet web. Relative fiber position and orientation do
not change extensively from the wet web structure to that of the finished sheet and
thus sheet formation depends greatly on initial dewatering. Since formation is a
significant measure of paper quality; it is obvious that control and manipulation of
the forming section is critical to the papermaking process. Additionally, the greater
the extent of water removal in the formation process, the less water need be
removed in the more energy intensive processes of pressing and drying.
2.3. Components of the Forming Section
2.3.1. Forming Fabrics
Forming fabrics are a planar, continuous plastic woven mesh (Paulapuro
2000) that act both as a smooth support base for the fiber pulp slurry, and as a
15
filtration medium. The fibers that deposit upon or in between the forming fabrics
create the wet web. Thus, the forming fabrics have a major effect on the finished
product.
Commonly used fabric structures are so called single-layer (SL), double-layer
(DL), triple-layer (TL), triple-weft (TW) and self support binding (SSB) structures
(Smook 2002). These names refer to the number of fabric filament layers and their
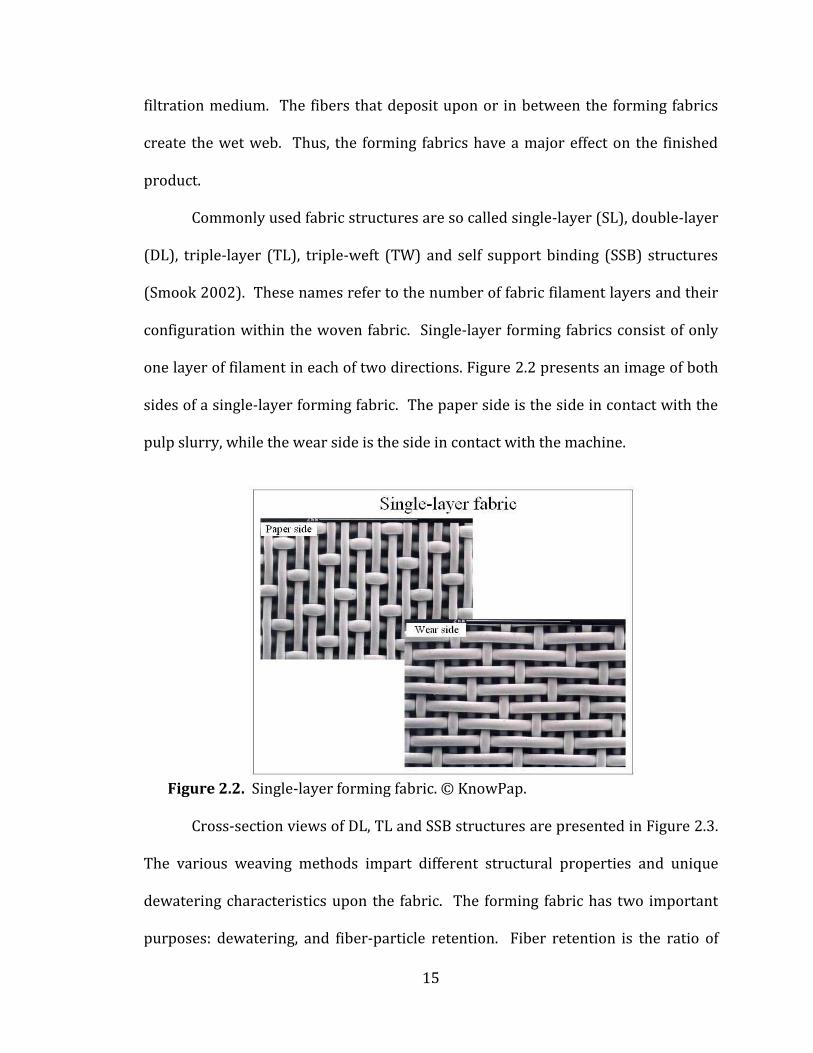
configuration within the woven fabric. Single-layer forming fabrics consist of only
one layer of filament in each of two directions. Figure 2.2 presents an image of both
sides of a single-layer forming fabric. The paper side is the side in contact with the
pulp slurry, while the wear side is the side in contact with the machine.
Figure 2.2. Single-layer forming fabric. © KnowPap.
Cross-section views of DL, TL and SSB structures are presented in Figure 2.3.
The various weaving methods impart different structural properties and unique
dewatering characteristics upon the fabric. The forming fabric has two important
purposes: dewatering, and fiber-particle retention. Fiber retention is the ratio of
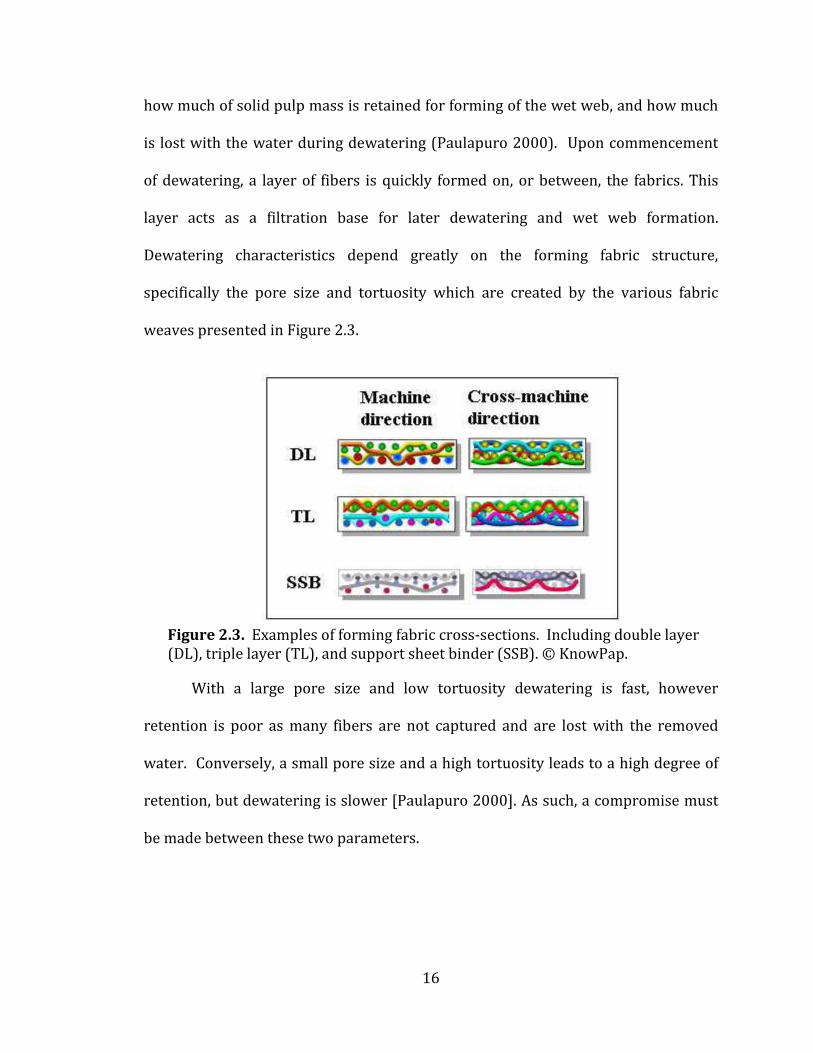
16
how much of solid pulp mass is retained for forming of the wet web, and how much
is lost with the water during dewatering (Paulapuro 2000). Upon commencement
of dewatering, a layer of fibers is quickly formed on, or between, the fabrics. This
layer acts as a filtration base for later dewatering and wet web formation.
Dewatering characteristics depend greatly on the forming fabric structure,
specifically the pore size and tortuosity which are created by the various fabric
weaves presented in Figure 2.3.
Figure 2.3. Examples of forming fabric cross-sections. Including double layer (DL), triple layer (TL), and support sheet binder (SSB). © KnowPap.
With a large pore size and low tortuosity dewatering is fast, however
retention is poor as many fibers are not captured and are lost with the removed
water. Conversely, a small pore size and a high tortuosity leads to a high degree of
retention, but dewatering is slower [Paulapuro 2000]. As such, a compromise must
be made between these two parameters.
17
2.3.2. Former Types
2.3.2.1. Fourdrinier Former
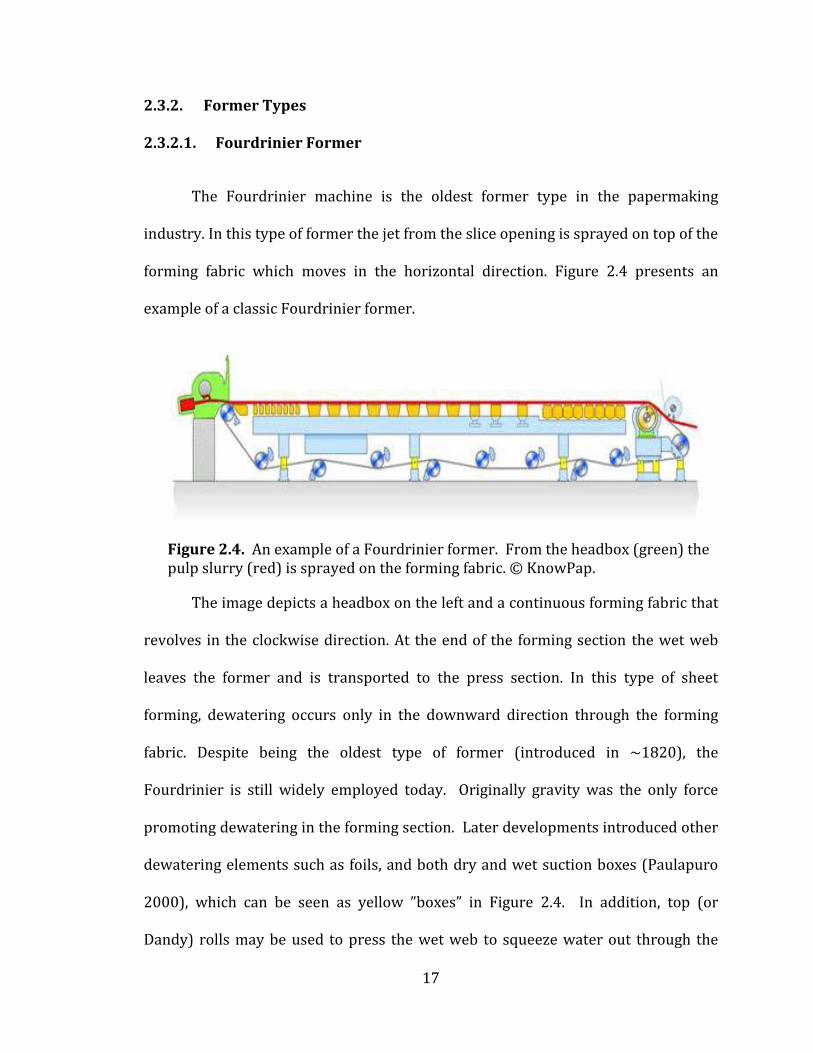
The Fourdrinier machine is the oldest former type in the papermaking
industry. In this type of former the jet from the slice opening is sprayed on top of the
forming fabric which moves in the horizontal direction. Figure 2.4 presents an
example of a classic Fourdrinier former.
Figure 2.4. An example of a Fourdrinier former. From the headbox (green) the pulp slurry (red) is sprayed on the forming fabric. © KnowPap.
The image depicts a headbox on the left and a continuous forming fabric that
revolves in the clockwise direction. At the end of the forming section the wet web
leaves the former and is transported to the press section. In this type of sheet
forming, dewatering occurs only in the downward direction through the forming
fabric. Despite being the oldest type of former (introduced in ~1820), the
Fourdrinier is still widely employed today. Originally gravity was the only force
promoting dewatering in the forming section. Later developments introduced other
dewatering elements such as foils, and both dry and wet suction boxes (Paulapuro
2000), which can be seen as yellow ”boxes” in Figure 2.4. In addition, top (or
Dandy) rolls may be used to press the wet web to squeeze water out through the
18
fabric. Fourdrinier formers have the advantage of gentle dewatering and a long
dewatering time, which are required for some special paper grades. The major issue
with Fourdrinier formers is that the one-sided dewatering leads to the web
becoming “two sided” that is, having differing sheet characteristics on the two sides.
2.3.2.2. Twin-wire formers
The ever present tendency toward higher productivity goals leads to a
constant drive for higher machine speeds. The Fourdrinier former configuration,
however, produces unstable dewatering at higher running speeds. The industry
solution to the problem was to introduce a second forming fabric, such that one is
present on both sides of the wet web to stabilize the dewatering (Paulapuro 2000).
In addition to improved stability, dewatering times became shorter since water was
removed in two directions. The first twin-wire formers were developed in the early
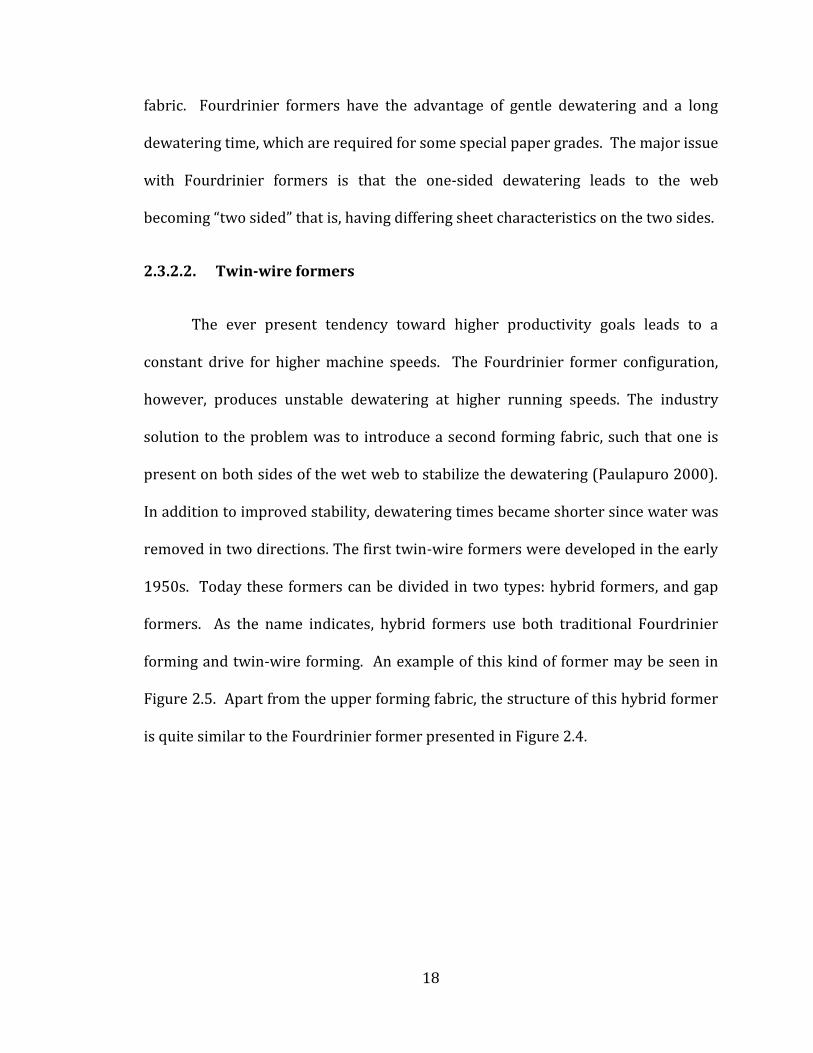
1950s. Today these formers can be divided in two types: hybrid formers, and gap
formers. As the name indicates, hybrid formers use both traditional Fourdrinier
forming and twin-wire forming. An example of this kind of former may be seen in
Figure 2.5. Apart from the upper forming fabric, the structure of this hybrid former
is quite similar to the Fourdrinier former presented in Figure 2.4.
19
Figure 2.5. An example of a hybrid former. © KnowPap.
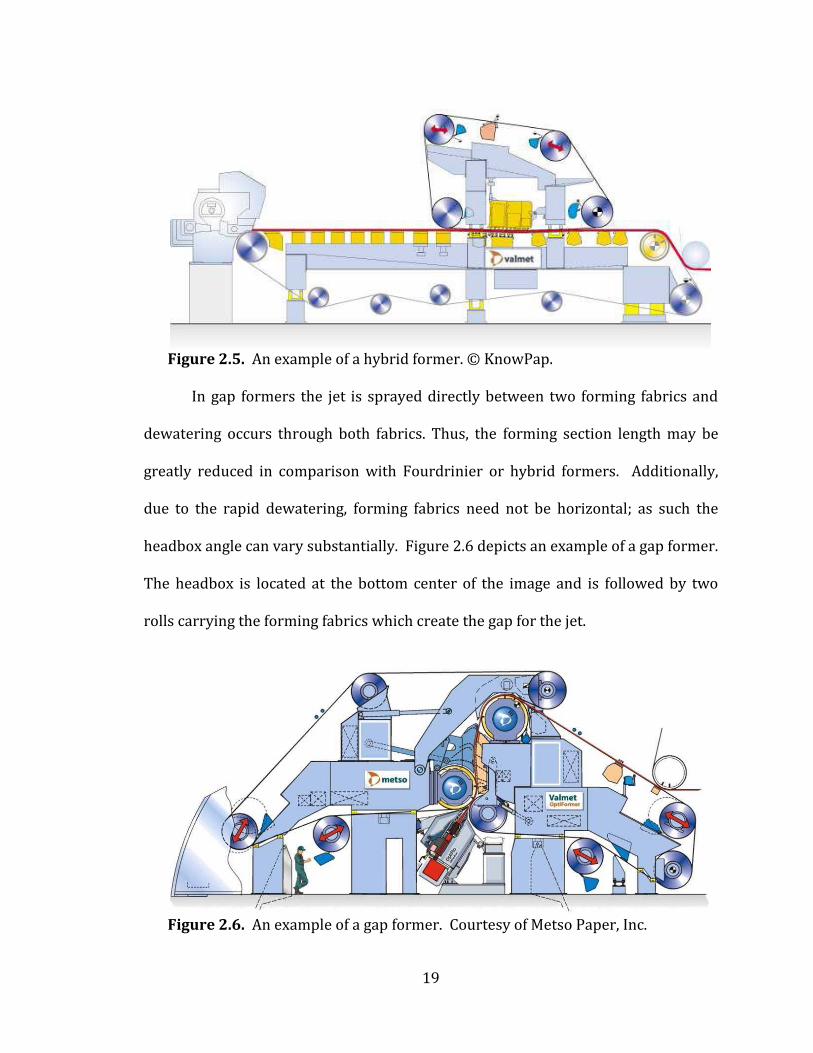
In gap formers the jet is sprayed directly between two forming fabrics and
dewatering occurs through both fabrics. Thus, the forming section length may be
greatly reduced in comparison with Fourdrinier or hybrid formers. Additionally,
due to the rapid dewatering, forming fabrics need not be horizontal; as such the
headbox angle can vary substantially. Figure 2.6 depicts an example of a gap former.
The headbox is located at the bottom center of the image and is followed by two
rolls carrying the forming fabrics which create the gap for the jet.
Figure 2.6. An example of a gap former. Courtesy of Metso Paper, Inc.
20
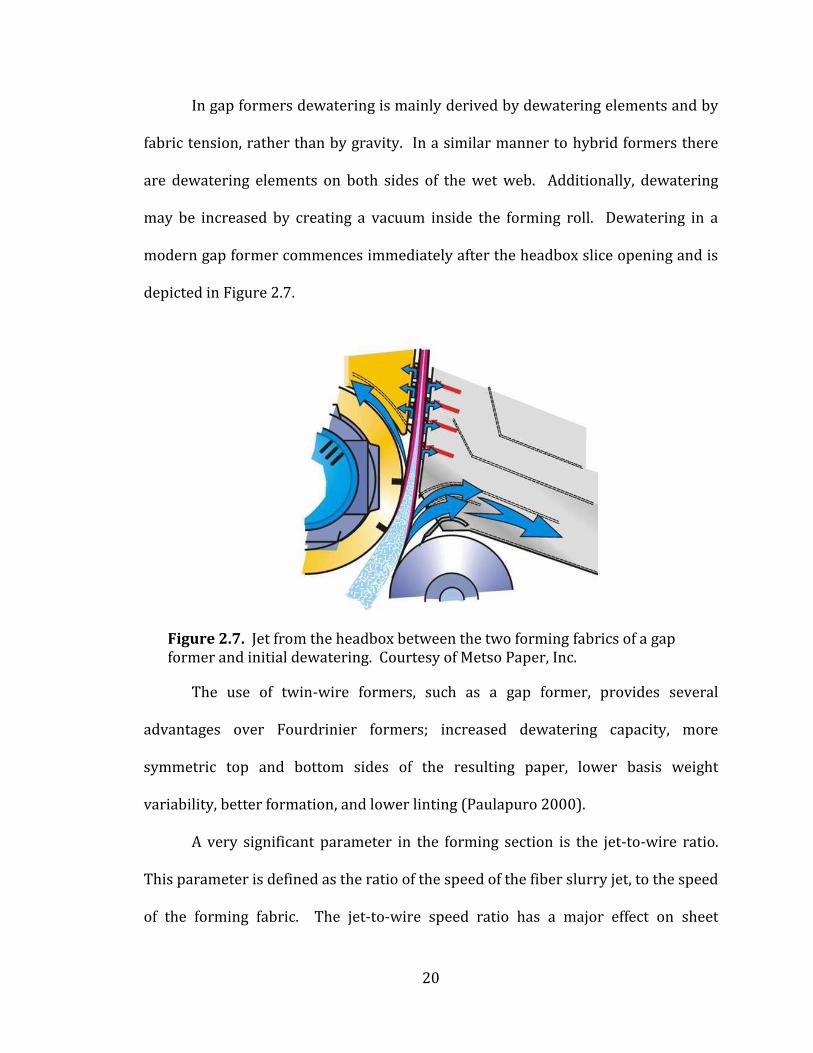
In gap formers dewatering is mainly derived by dewatering elements and by
fabric tension, rather than by gravity. In a similar manner to hybrid formers there
are dewatering elements on both sides of the wet web. Additionally, dewatering
may be increased by creating a vacuum inside the forming roll. Dewatering in a
modern gap former commences immediately after the headbox slice opening and is
depicted in Figure 2.7.
Figure 2.7. Jet from the headbox between the two forming fabrics of a gap former and initial dewatering. Courtesy of Metso Paper, Inc.
The use of twin-wire formers, such as a gap former, provides several
advantages over Fourdrinier formers; increased dewatering capacity, more
symmetric top and bottom sides of the resulting paper, lower basis weight
variability, better formation, and lower linting (Paulapuro 2000).
A very significant parameter in the forming section is the jet-to-wire ratio.
This parameter is defined as the ratio of the speed of the fiber slurry jet, to the speed
of the forming fabric. The jet-to-wire speed ratio has a major effect on sheet
21
formation, for example it controls the fiber orientation anisotropy. The preferred
jet-to-wire ratio depends on the paper grade produced, and the forming fabric type.
Typically the jet-to-wire ratio has a value close to 1, but is varied to optimize sheet
properties. (Smook 2002)
2.4. Drainage Theory
The primary process occurring in the forming section of a paper machine is
drainage. The fundamentals of papermaking drainage may be examined from a
theoretical perspective. During drainage, controlled filtration of a fiber slurry leads
to the formation of a sheet. Filtration typically commences at a consistency in the
range of 0.5 to 1.0 wt% fiber. As the papermaking process has evolved over the past
century, researchers have continually attempted to model the process, and the rate
of drainage, in order to enhance product quality, as well as to increase production
rates. Today the most commonly accepted expression to describe the flow though
the newly formed sheet in a Fourdrinier machine utilizes the Kozeny-Carman form
of Darcy’s Law:
(Equation 2.1)
Where ΔP is the pressure drop across the thickness of the sheet, L is the sheet
thickness, μ is the viscosity of the fluid, ε is the porosity of the bed, k is the
resistance coefficient, ν is the superficial velocity, and S is the specific surface area.
This model predicts that as a sheet becomes thicker it requires a larger pressure
gradient to produce the equivalent level of dewatering, similarly a thinner sheet
22
requires a lower pressure gradient. The porosity of the sheet also has a dramatic
effect on the required pressure difference as it is inversely proportional and is a
linear factor. A small increase in the porosity leads to a large decrease in the
required pressure gradient for water removal.
2.5. Fundamentals of Pressing
Pressing operations represent the final opportunity to maximize the dryness
of the sheet before entering the energy intensive dryer section. Pressing occurs in
two regimes as described by Wahlstrom (1969); pressure controlled, and flow
controlled pressing. In pressure controlled pressing the resistance to flow between
the fibers of the sheet is insignificant. The dryness of the sheet is dictated solely by
the flow of water exiting the fiber wall. Operation in the pressure controlled regime
is preferred in industrial settings. Ceckler (1982) described pressure controlled
pressing as a flow phenomenon with the press impulse being the major driving
force. The amount of water that is removed is proportional to the basis weight of
the sheet at the maximum operational pressure. A greater dryness can be achieved
by increasing the pressure applied to the sheet, however, above the maximum
operational pressure the structural integrity of the sheet is overcome and the sheet
is crushed, creating a lower quality product. Pressure controlled pressing applies to
single felted presses with basis weights up to 100 g/m2 and to double felted presses
with basis weights up to 150 g/m2 (Wahlstrom 2001). The pressure controlled
region can be extended to heavier sheets at higher speeds with modern shoe
presses.
23
Conversely, flow controlled pressing is defined by conditions where the rate
of water removal is constant at a given set of pressing parameters. This is a sign of
poor operational pressing conditions (Smook 2002). In the flow controlled pressing
regime water removal follows Darcy’s law, as dryness is a function of the press
impulse with no independent effect of pressure or time (Ceckler 1982). This
condition arises when the water that is being pressed from the sheet is removed at a
slower rate than it is created, defeating the purpose of applying a greater pressure.
To overcome the limitation, the rate at which water is carried away from the
pressing zone must be increased in order achieve a greater dryness out of the press
and to revert to the pressure controlled regime.
2.6. Pressing Theory
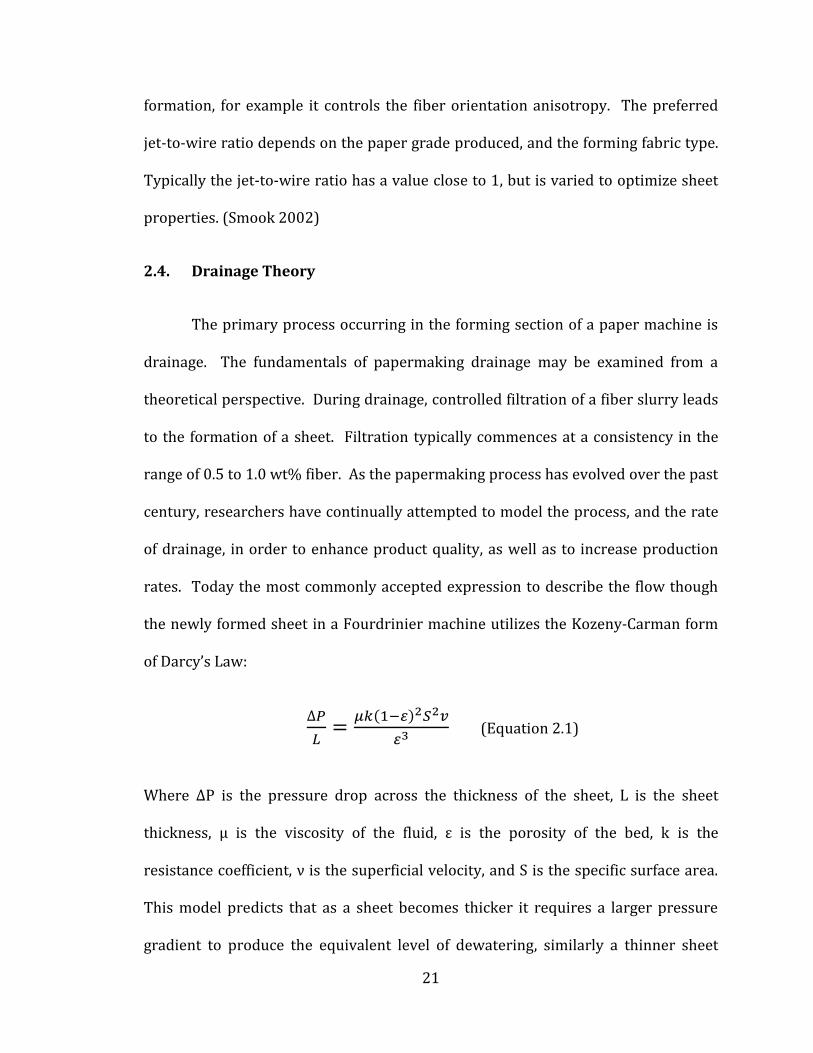
2.6.1. Wahlstrom’s Theory and the Four Phases of Pressing
The current understanding of pressing phenomena stems from the work of
Wahlstrom (1960, 1969). Wahlstrom defines the pressing phenomena in
papermaking as being comprised of two components for the flow of water; the flow
of water between fibers, and the flow of water from fiber walls. Others have
established sections of water removal in the press; however Wahlstrom (1969) has
become the accepted standard for modern pressing theory. There are four
identifiable phases of water removal in the press nip which Wahlstrom defines as
shown in Figure 2.8.
24
Figure 2.8. The four phases within the press nip as defined by Wahlstrom. (Smook 2002)
The first phase begins at the entrance of the press nip where the pressure
curve commences, and ends when the paper has become saturated. In this phase
the sheet and the press felt are compressed; removing air from both, however no
hydraulic pressure is generated for water removal which leads to no change in the
dryness of the sheet. This is due to the fact that the transfer of water out of the
sheet can only occur through capillary forces or evaporation. The second phase
continues from the point of saturation to the mid-nip point where the maximum
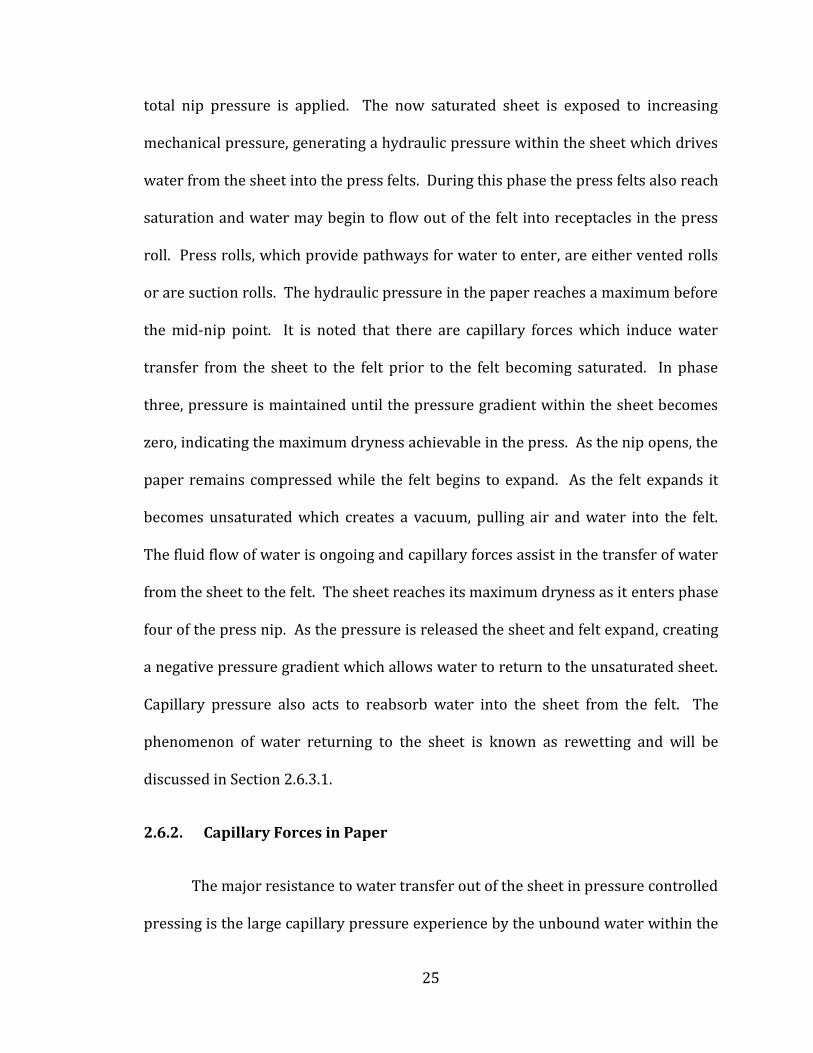
25
total nip pressure is applied. The now saturated sheet is exposed to increasing
mechanical pressure, generating a hydraulic pressure within the sheet which drives
water from the sheet into the press felts. During this phase the press felts also reach
saturation and water may begin to flow out of the felt into receptacles in the press
roll. Press rolls, which provide pathways for water to enter, are either vented rolls
or are suction rolls. The hydraulic pressure in the paper reaches a maximum before
the mid-nip point. It is noted that there are capillary forces which induce water
transfer from the sheet to the felt prior to the felt becoming saturated. In phase
three, pressure is maintained until the pressure gradient within the sheet becomes
zero, indicating the maximum dryness achievable in the press. As the nip opens, the
paper remains compressed while the felt begins to expand. As the felt expands it
becomes unsaturated which creates a vacuum, pulling air and water into the felt.
The fluid flow of water is ongoing and capillary forces assist in the transfer of water
from the sheet to the felt. The sheet reaches its maximum dryness as it enters phase
four of the press nip. As the pressure is released the sheet and felt expand, creating
a negative pressure gradient which allows water to return to the unsaturated sheet.
Capillary pressure also acts to reabsorb water into the sheet from the felt. The
phenomenon of water returning to the sheet is known as rewetting and will be
discussed in Section 2.6.3.1.
2.6.2. Capillary Forces in Paper
The major resistance to water transfer out of the sheet in pressure controlled
pressing is the large capillary pressure experience by the unbound water within the
26
fiber walls (Wahlstrom 1960). In addition, the sheet itself introduces another
mechanism of trapping unbound water within the newly formed voids between
fibers which were nonexistent prior to individual fibers forming the sheet. With the
knowledge that the fiber wall can retain 1 to 4 kg of water per kg of fiber exiting the
press section (Wahlstrom 1981), it is clear that an understanding of the factors that
govern water removal from capillaries (and voids modeled as capillaries) is critical
in order to maximize the dryness achievable exiting a press.
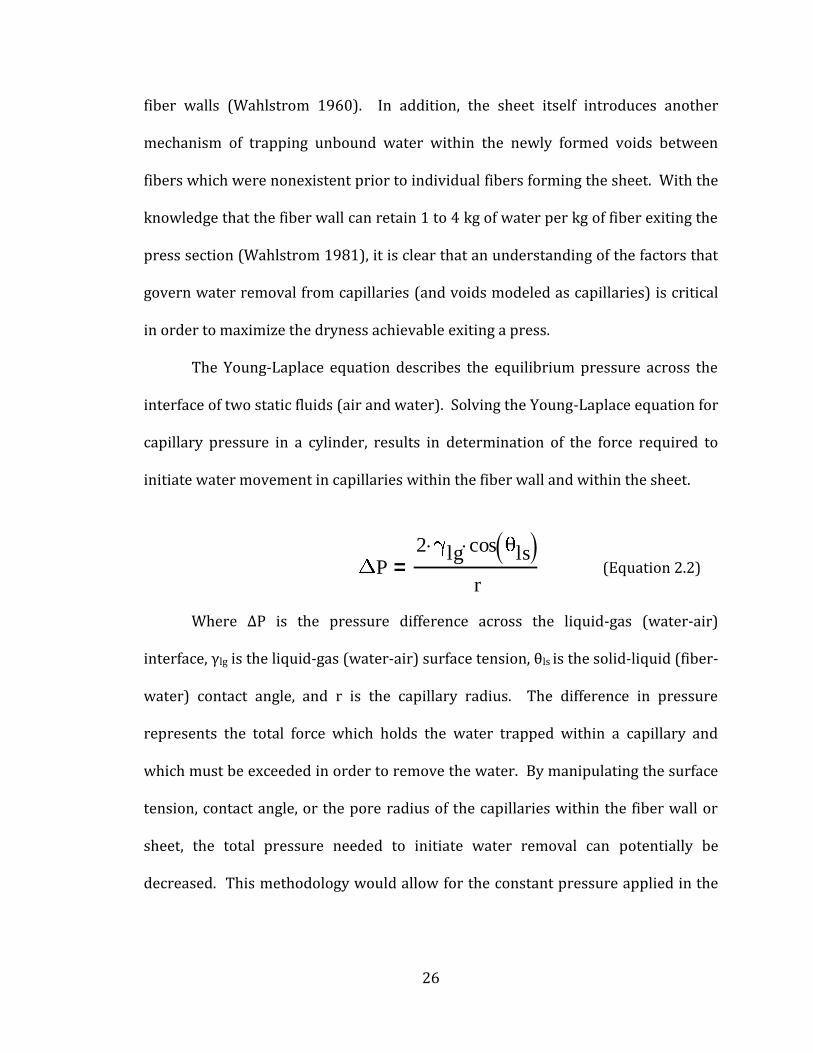
The Young-Laplace equation describes the equilibrium pressure across the
interface of two static fluids (air and water). Solving the Young-Laplace equation for
capillary pressure in a cylinder, results in determination of the force required to
initiate water movement in capillaries within the fiber wall and within the sheet.
(Equation 2.2)
Where ΔP is the pressure difference across the liquid-gas (water-air)
interface, γlg is the liquid-gas (water-air) surface tension, θls is the solid-liquid (fiber-
water) contact angle, and r is the capillary radius. The difference in pressure
represents the total force which holds the water trapped within a capillary and
which must be exceeded in order to remove the water. By manipulating the surface
tension, contact angle, or the pore radius of the capillaries within the fiber wall or
sheet, the total pressure needed to initiate water removal can potentially be
decreased. This methodology would allow for the constant pressure applied in the
P2 lg cos ls( )
r=
27
pressure controlled pressing regime to be more efficient at removing unbound
water, leaving only the remaining bound water to be removed by other means.
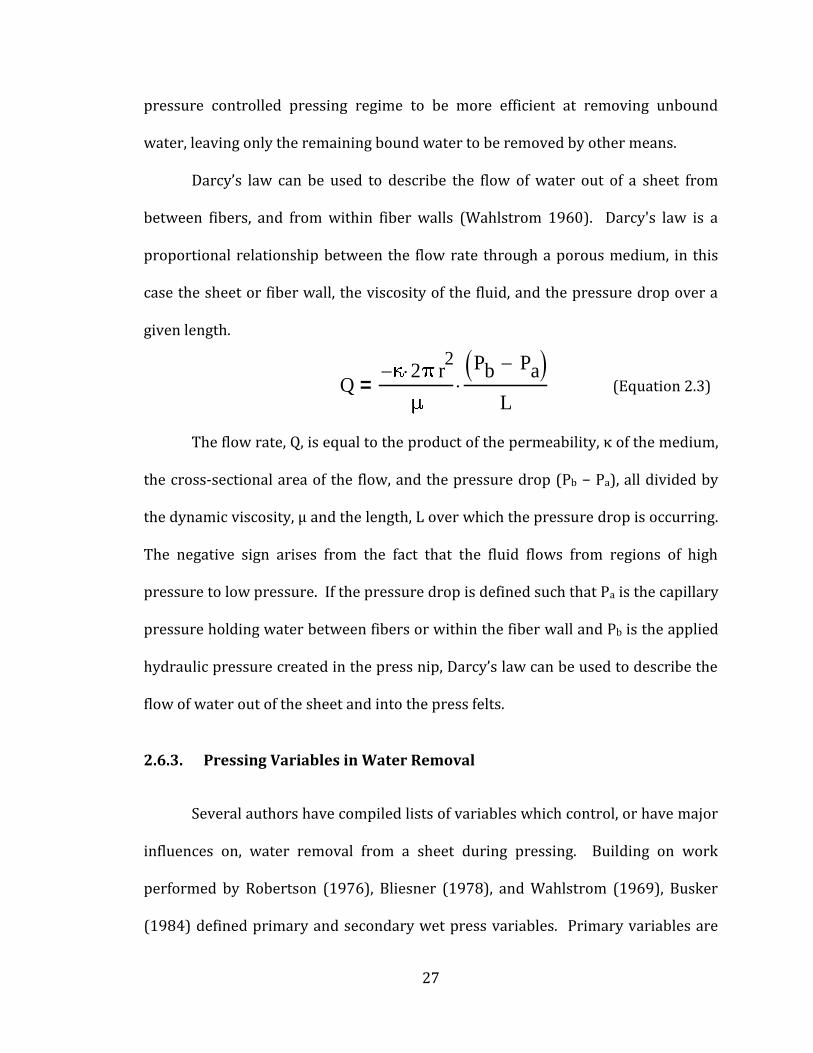
Darcy’s law can be used to describe the flow of water out of a sheet from
between fibers, and from within fiber walls (Wahlstrom 1960). Darcy's law is a
proportional relationship between the flow rate through a porous medium, in this
case the sheet or fiber wall, the viscosity of the fluid, and the pressure drop over a
given length.
(Equation 2.3)
The flow rate, Q, is equal to the product of the permeability, κ of the medium,
the cross-sectional area of the flow, and the pressure drop (Pb − Pa), all divided by
the dynamic viscosity, μ and the length, L over which the pressure drop is occurring.
The negative sign arises from the fact that the fluid flows from regions of high
pressure to low pressure. If the pressure drop is defined such that Pa is the capillary
pressure holding water between fibers or within the fiber wall and Pb is the applied
hydraulic pressure created in the press nip, Darcy’s law can be used to describe the
flow of water out of the sheet and into the press felts.
2.6.3. Pressing Variables in Water Removal
Several authors have compiled lists of variables which control, or have major
influences on, water removal from a sheet during pressing. Building on work
performed by Robertson (1976), Bliesner (1978), and Wahlstrom (1969), Busker
(1984) defined primary and secondary wet press variables. Primary variables are
Q- 2 r
2 Pb Pa-( )L
=
28
those which influence the dryness of the sheet leaving the press section by greater
than 2%, while secondary variables are those that have effects of 2% or less on the
dryness exiting the press section. The present review focuses on the primary
variables where the largest gains can potentially be made.
2.6.3.1. Post Nip Rewet
A major variable mentioned in Section 2.6.1 previously is post-nip rewet of
the sheet. Post-nip rewet occurs during extended contact between the felt and the
sheet after the maximum nip pressure point. Even with the rate of water transfer
being very low in this scenario, Busker (1984) states that post-nip rewet can
account for up to 5% of dryness loss exiting the press nip. Thorne (1981)
previously demonstrated decreasing dryness through rewet by measuring 7 to 37
g/m2 of water uptake in a 300 Canadian standard freeness (CSF) sheet at contact
times of 39 ms to 628 ms. Light weight sheets are more susceptible to rewet due the
high ratio of sheet surface area to basis weight, which allows for a greater fraction of
the total capillaries within the sheet to be exposed to the excess water within the
felt. Comparatively heavy weight sheets such as linerboard can lose as little as 2%
dryness due to rewet (Busker 1984).
2.6.3.2. Ingoing Sheet Dryness
The ingoing sheet dryness is known to have a large effect on the outgoing
sheet dryness as reported by Smart (1975). At the typical 35 to 40% sheet dryness
level out of the press, a near linear relationship is observed where an approximately

29
2% dryer sheet entering the press leads to a 1% dryer sheet exiting the press. From
this general relationship, ratios in the range of 2:1 to 3:1 dryness in to dryness out
are used to approximate gains in industry (Busker 1980). The in-going sheet
dryness determines the water load at the nip and is usually an uncontrolled
variable. However, sheet basis weight can control the amount of water carried
through the presses, where heavier sheets retain more water. Busker (1980)
showed that a change in basis weight from 60 to 163 g/m2 corresponded to a
change in sheet dryness from 44% to 37% at constant pressing.
2.6.3.3. Sheet Temperature
During pressing the sheet temperature has a significant effect on water
removal. The addition of steam boxes and other heating elements, such as infrared
heat sources, to press sections have contributed to recent improvements in pressing
operations (Smook 2002). By raising the temperature of the sheet and the
associated water, the viscosity of water within the sheet decreases allowing for
easier removal in the press section as predicted by Darcy’s Law (Equation 2.3).
Wahlstrom (1991) states that for each 10°C increase in sheet temperature, a 1%
increase in sheet dryness results experimentally, which is comparable to predictions
by Darcy’s Law (Equation 2.3). Anderson and Back (1981) demonstrated a change
in dryness out of the press from 38% to 48% for a sheet temperature change of 5°C
to 90°C. However, due to the high partial pressure of steam at 80 to 85°C, it is
uneconomical to further increase heating in the press section. Similarly, Busker
(1984) presented an increase in dryness out of the press of 0.6 to 1.1% for every

30
11°C rise in sheet temperature by applying steam to the sheet prior to the nip point.
The application of steam to the sheet is currently achieved by placing steam boxes at
the entrance of the nip. Recently, the introduction of the heated press roll, which
aids in flashing off some water and also lowering water viscosity, has resulted in
improved water removal (Smook 2002).
2.6.3.4. Furnish Properties
The furnish properties of the slurry employed to form a sheet provide
another major variable in pressing. The amount of refining of the stock provides a
controllable parameter of sheet dryness; whereby a sheet with higher refining
shows a higher wetness as described by Busker (1984). A bleached kraft sheet
demonstrated an increase of 15% wetness when refined from a Canadian Standard
Freeness of 720 to 200. The pulp type also affects water retention as kraft fibers
retain less water than ground wood fibers (Caulfield 1982).
Recalling that the capillary forces present in-between fibers and within fiber
walls dictate the pressure required to remove water during pressing, manipulating
the surface tension, contact angle, or the pore radius of the fibers or sheet with
additives in the furnish may provide an increase in dryness out of the press;
however, literature is lacking in this area. To further demonstrate that the industry
has possibly ignored this aspect of pressing, Busker (1984) states that “[additives]
are not apt to be the most productive areas of research and development for large
gains.”
31
2.6.3.5. Press Loading and Nip Residence Time
A major parameter in pressing is the extent of press loading and nip
residence time. The pressure controlled regime is of course limited by the
structural integrity of the sheet (Caulfield 1986). Campbell (1947) was the first to
suggest dryness is proportional to the product of pressure per unit area and the
time of application (the press impulse). This was later studied by Wahlstrom
(1969) and examined in detail by Ceckler (1982). The press impulse is the through
sheet component of the applied force integrated over the time that the sheet spends
in the nip zone. The greater the impulse in the press nip the higher the generated
sheet dryness. As demonstrated by Busker (1984) a 1 psi-s impulse on a light
weight sheet produces a dryness of 30%, while a 100 psi-s impulse produces 60%
dryness. Building on the concept of press impulse, Beloit developed the shoe press.
The shoe press increases the total time the sheet is exposed to the nip by creating a
wider nip point (Smook 2002). The image presented in Figure 2.9 is a current shoe
press design by the Andritz Group.
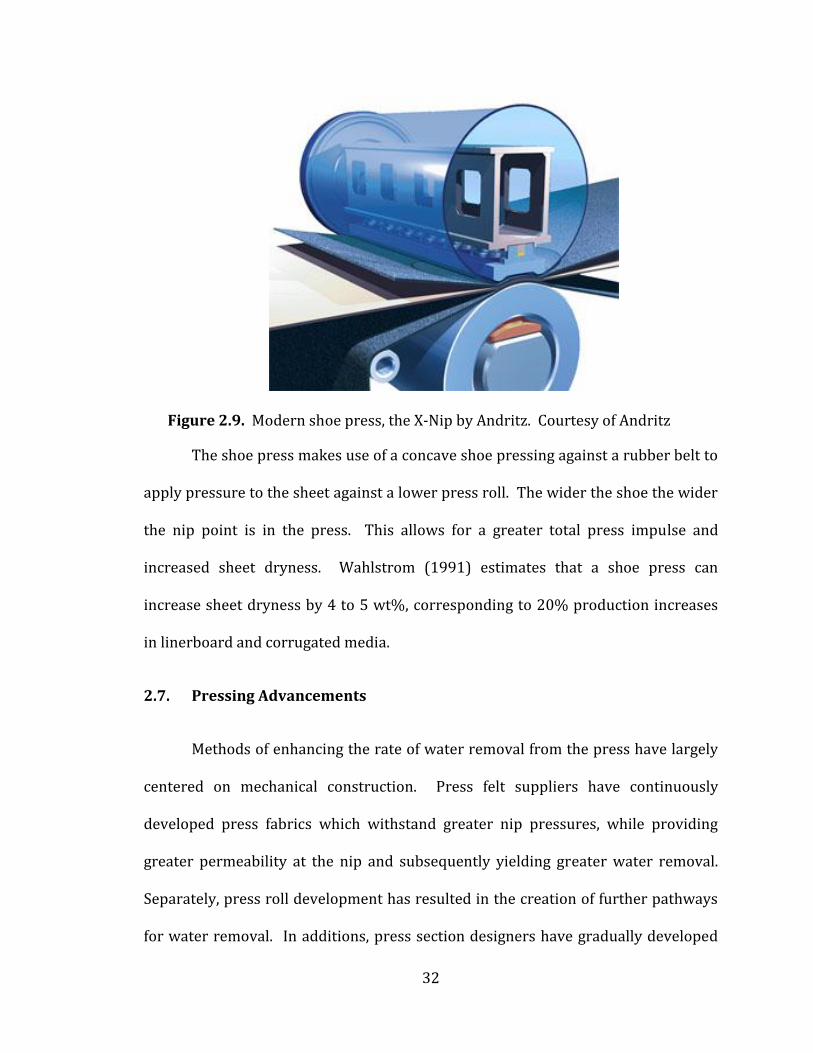
32
Figure 2.9. Modern shoe press, the X-Nip by Andritz. Courtesy of Andritz
The shoe press makes use of a concave shoe pressing against a rubber belt to
apply pressure to the sheet against a lower press roll. The wider the shoe the wider
the nip point is in the press. This allows for a greater total press impulse and
increased sheet dryness. Wahlstrom (1991) estimates that a shoe press can
increase sheet dryness by 4 to 5 wt%, corresponding to 20% production increases
in linerboard and corrugated media.
2.7. Pressing Advancements
Methods of enhancing the rate of water removal from the press have largely
centered on mechanical construction. Press felt suppliers have continuously
developed press fabrics which withstand greater nip pressures, while providing
greater permeability at the nip and subsequently yielding greater water removal.
Separately, press roll development has resulted in the creation of further pathways
for water removal. In additions, press section designers have gradually developed
33
press sections with a greater number of nip points and larger residence times within
the nips. Recent research has also been conducted in impulse drying to further
enhance water removal.
2.7.1. Press Felts and Rolls
New designs for press felts and press rolls have made great strides in
enhancing the efficiency of water removal in the press section. The ideal press felt is
one that can resist high compression resulting from high press impulses, and be able
to handle large water capacities. Ideally this would be done while providing a low
resistance to flow into the press felt and a uniform pressure across the web. Varying
weave patterns and construction materials have been employed to meet the
minimum of these needs to date; however, suppliers are continually attempting to
design better press fabrics. Synthetic felt construction materials have taken over
where wire meshes and cotton felts once were the norm (Wahlstrom 2001).
Historically the development of the press roll has concentrated on optimizing
the surface (specifically to provide better release of the wet sheet). Traditionally,
press rolls were polished granite, however, due to failures of granite rolls at high
speeds and the inability of granite to take the temperature shock which comes with
the addition of steam boxes, modern press sections are commonly equipped with
composite type rolls (Smook 2002). The new generation rolls have a steel core with
a composite cover to mimic the properties of granite rolls. Using grooved and
drilled rolls gives the water other means of exit from the nip. Suction rolls have also
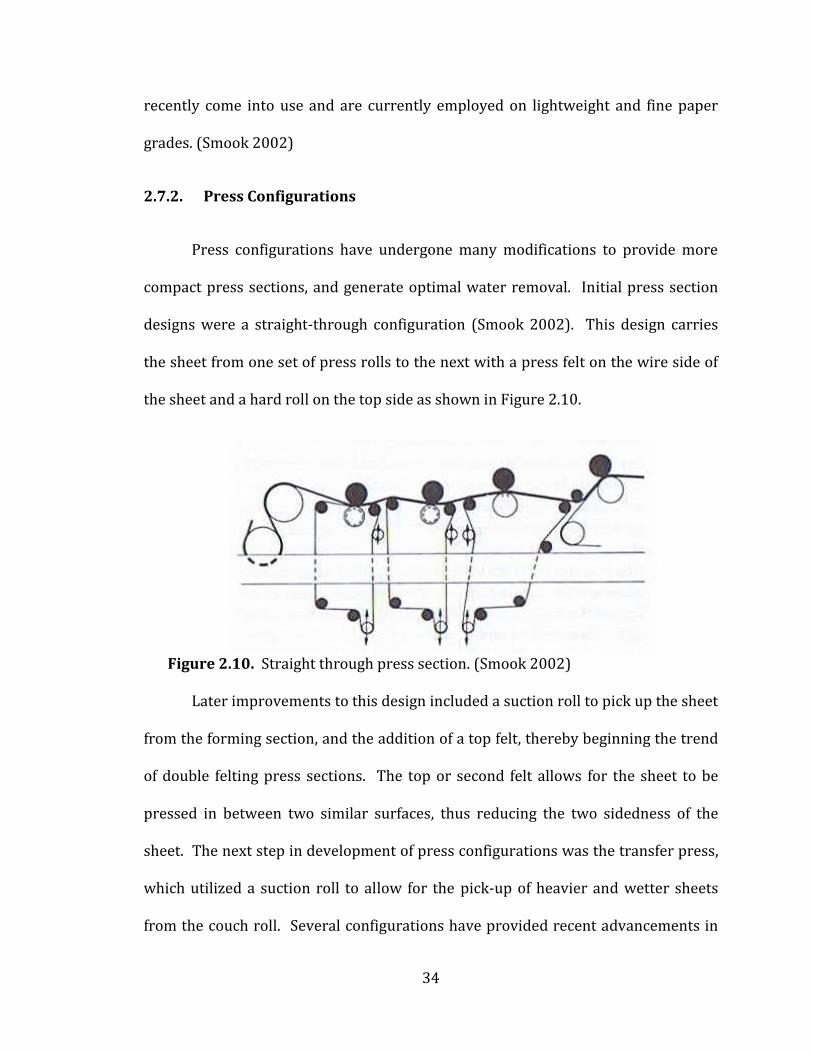
34
recently come into use and are currently employed on lightweight and fine paper
grades. (Smook 2002)
2.7.2. Press Configurations
Press configurations have undergone many modifications to provide more
compact press sections, and generate optimal water removal. Initial press section
designs were a straight-through configuration (Smook 2002). This design carries
the sheet from one set of press rolls to the next with a press felt on the wire side of
the sheet and a hard roll on the top side as shown in Figure 2.10.
Figure 2.10. Straight through press section. (Smook 2002)
Later improvements to this design included a suction roll to pick up the sheet
from the forming section, and the addition of a top felt, thereby beginning the trend
of double felting press sections. The top or second felt allows for the sheet to be
pressed in between two similar surfaces, thus reducing the two sidedness of the
sheet. The next step in development of press configurations was the transfer press,
which utilized a suction roll to allow for the pick-up of heavier and wetter sheets
from the couch roll. Several configurations have provided recent advancements in
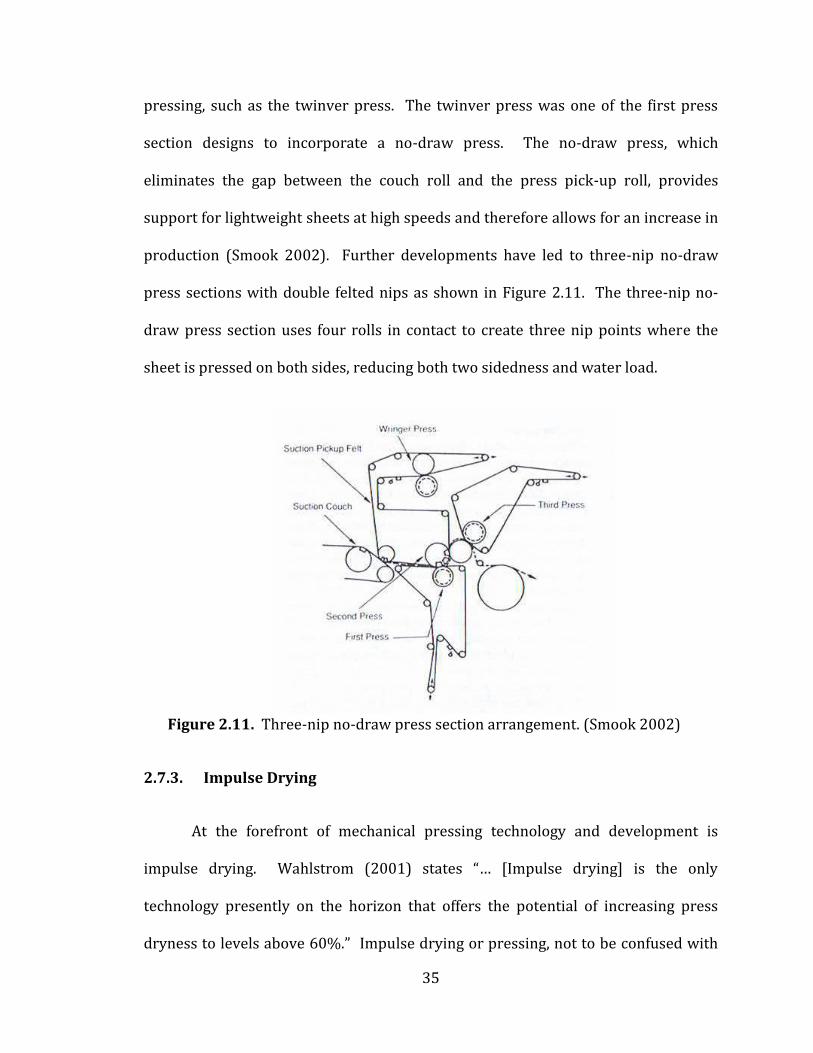
35
pressing, such as the twinver press. The twinver press was one of the first press
section designs to incorporate a no-draw press. The no-draw press, which
eliminates the gap between the couch roll and the press pick-up roll, provides
support for lightweight sheets at high speeds and therefore allows for an increase in
production (Smook 2002). Further developments have led to three-nip no-draw
press sections with double felted nips as shown in Figure 2.11. The three-nip no-
draw press section uses four rolls in contact to create three nip points where the
sheet is pressed on both sides, reducing both two sidedness and water load.
Figure 2.11. Three-nip no-draw press section arrangement. (Smook 2002)
2.7.3. Impulse Drying
At the forefront of mechanical pressing technology and development is
impulse drying. Wahlstrom (2001) states “… [Impulse drying] is the only
technology presently on the horizon that offers the potential of increasing press
dryness to levels above 60%.” Impulse drying or pressing, not to be confused with
36
the press impulse, is performed by pressing the sheet against a heated roll. The roll
is heated to between 200°C and 400°C, which generates steam in the expanding
section of the nip point. This steam forces water held within the sheet out
(Wahlstrom 2001). For generation of steam, the press impulse must not be too
short. Due to the large press impulse required, stemming from the extended
residence time necessary to induce the generation of steam, this technology is
currently applied largely to shoe press configurations. Work performed by Lucisano
(2003) and furthered by Backstrom (2009) has shown that impulse technology can
improve dewatering, mechanical properties of the sheet, and printability of the
sheet. Backstrom (2009) determined that impulse pressing can possibly increase
paper machine production by up to 40% if it is dryer section limited.
2.8. Chemical Enhancements to Pressing
Little work has been reported examining if and how pressing can be
enhanced by means other than mechanical. Stratton (1982) utilized various cationic
wet end polymers to demonstrate that increases of 1-2% solids of out of a press
section were possible with varying dosage levels. The study focused solely on the
use of polymers in wet pressing. Higher polymer doses resulted in larger solids
increases. High charge density polymers were found to be more effective than low
charge density polymers (Stratton 1982). At the time, Stratton stated that the
mechanism for the effect had not been determined.
Wegner (1987) studied the effects of cationic polyacrylamide on water
removal in the forming, pressing, and drying sections. Wegner observed that while
37
an increase in drainage was evident, the sheet behavior during wet-press
dewatering was unaffected. It was noted, however, that wet pressing with a cationic
polyacrylamide could compensate for higher moisture levels entering the press
while maintaining the solids content exiting the press (Wegner 1987).
Work performed by Springer (1991) demonstrated that chemical additives
had an indirect influence on wet pressing. Chemical additives affecting drainage
prior to the press resulted in higher solids into the press section and ultimately
higher solids exiting the press (Springer 1991). Additional research showed that for
sheets entering the press at equal moistures, the additives had no effect on the
outgoing solids content. Springer (1991) postulated that if an additive was to have
any effect on press enhancement, the additive must be able to penetrate the fiber
structure and influence its water holding capacity. Given the findings of Springer
(1991), it is evident that a thorough understanding of cellulose fiber structure and
the factors that may affect water holding capacity are required. Combining this
understanding with the effect of a potential chemical additive may yield a
mechanism for water removal, further discussion is provided in Section 2.11.
2.9. Surfactants and Adsorption
In examining the potential of chemical additives to enhance dewatering it is
noted that the pulping process generates several types of bonding sites on the wood
fiber that may potentially be used for surface modification. In addition to the native
hydroxyl sites that cellulose exhibits, there are many carboxylic acid groups which
form on the surface of the fibers during pulping. These groups can dissociate,
38
thereby forming sites for electrostatic interactions. These electrostatic sites may be
targeted for surface modification, specifically by surfactants or charged polymers.
2.9.1. Surfactants
Surface active agents, or surfactants, are organic compounds that are
amphiphilic, i.e. they contain both hydrophobic groups, known as tails, and
hydrophilic groups, known as heads (Moore 1972). Due to their amphiphilic nature,
they are typically soluble in both organic solvents and water. The type of head
group is used to classify surfactants into four categories: anionic, cationic, non-ionic
and zwitterionic (amphoteric) (Moore 1972). Their amphiphilic nature leads to a
driving force for surfactants to migrate and adsorb, or self-assemble, at interfaces,
e.g. liquid/gas, liquid/liquid and solid/liquid. At the liquid-gas interface (e.g.
water/air), surfactants act to reduce the surface tension. Similarly, they can reduce
the interfacial tension between two liquids by adsorbing at the liquid/liquid
interface. Liquid/solid interfaces may also be modified by adsorption of surfactants,
leading, for example, to changes in surface energy, and the contact angle of liquids
on the modified surface. Above a threshold concentration, surfactants assemble in
bulk solution forming aggregates known as micelles. The concentration at which
surfactants form micelles is referred to as the critical micelle concentration (CMC).
When micelles assemble in water, the hydrophobic tails of the surfactant create an
inner core and the hydrophilic head groups form an outer shell that maintains
favorable contact with water creating a minimum in the free energy (Moore 1972).
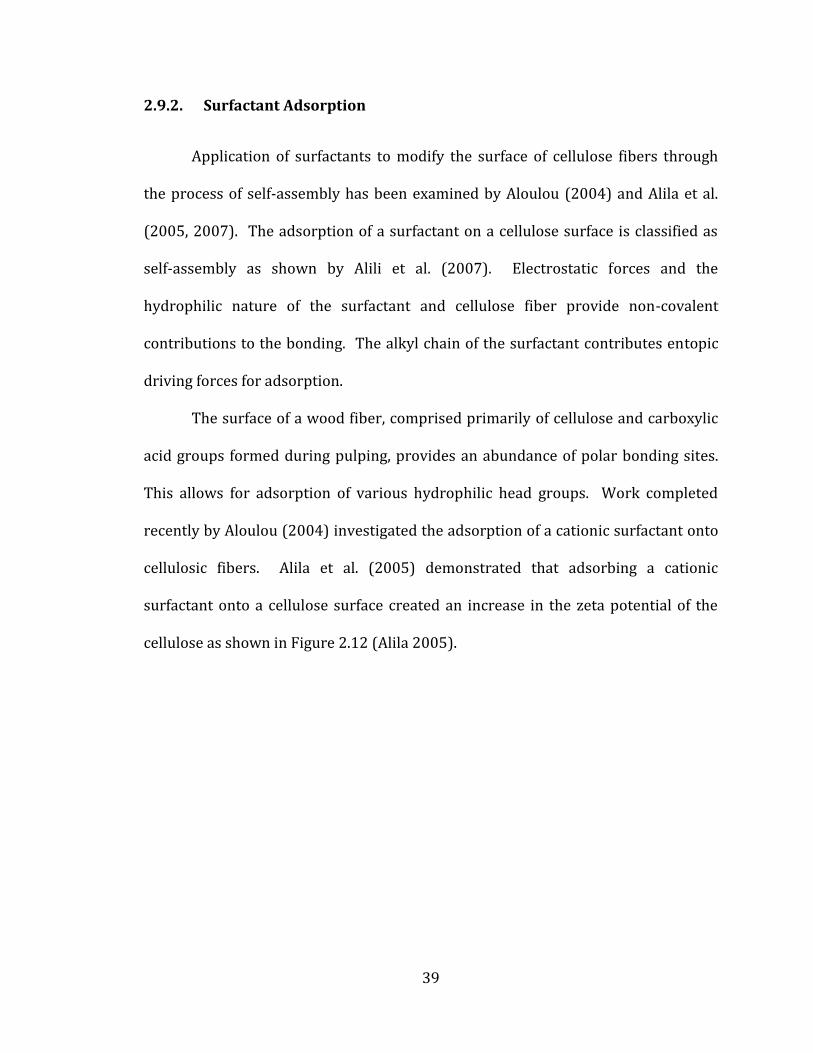
39
2.9.2. Surfactant Adsorption
Application of surfactants to modify the surface of cellulose fibers through
the process of self-assembly has been examined by Aloulou (2004) and Alila et al.
(2005, 2007). The adsorption of a surfactant on a cellulose surface is classified as
self-assembly as shown by Alili et al. (2007). Electrostatic forces and the
hydrophilic nature of the surfactant and cellulose fiber provide non-covalent
contributions to the bonding. The alkyl chain of the surfactant contributes entopic
driving forces for adsorption.
The surface of a wood fiber, comprised primarily of cellulose and carboxylic
acid groups formed during pulping, provides an abundance of polar bonding sites.
This allows for adsorption of various hydrophilic head groups. Work completed
recently by Aloulou (2004) investigated the adsorption of a cationic surfactant onto
cellulosic fibers. Alila et al. (2005) demonstrated that adsorbing a cationic
surfactant onto a cellulose surface created an increase in the zeta potential of the
cellulose as shown in Figure 2.12 (Alila 2005).

40
Figure 2.12. Adsorption of cationic surfactants on cellulose fibers. Zeta potential versus solution concentration (Alila 2005).
The zeta potential is the electric potential of the interfacial double layer at
the slipping plane, versus a point in the bulk fluid away from the colloidal interface
(Moore 1979). That is, zeta potential is the potential difference between the
dispersion medium and the stationary layer of fluid attached to the surface. The
dispersion medium in a pulp slurry is the water surrounding the cellulose fibers and
the stationary layer of fluid is considered to be the bound water on the fiber. The
change in surface energy of the cellulose fiber likely leads to changes in the behavior
of cellulose surface interactions (e.g. fiber-fiber, fiber-water, etc.).
In addition, Alila et al. (2005) measured adsorption isotherms of cationic
surfactants with varying alkyl chain lengths on cellulose surfaces to determine the
dependence of adsorption on the chain length. Surfactant alkyl chain lengths of C12,
C14, C16, and C18 were employed for adsorption onto model cellulose surfaces. Figure
41
2.13 reprinted from Alila et al. (2005) demonstrates that increasing surfactant chain
length leads to a shift of adsorption toward lower concentrations and to a
continuous increase in the maximum adsorbed amount of surfactant (Alila 2005).
This trend is attributed to the entropic driving force derived from the hydrophobic
surfactant tails.
Figure 2.13. Adsorption isotherm of C12, C14, C16, and C18 cationic surfactants onto cellulose. (Alila 2005)
2.10. Pulp Modification
Chemical modification of pulps to enhance pulp strength, color, and water
holding capacity, specifically for recycled pulps, has been a topic of much research
(Wistara 1999, Smook 2002) due to the present trend of reusing and recycling
paper. It is well known that the strength, color, and water holding capacity of
recycled pulp are far inferior to virgin pulps and any improvement in the
performance of those pulps would allow the use of a low cost raw material. A study
42
by Wistara and Young demonstrated that while some properties of a recycled pulp
can be improved by chemical treatments, other aspects of the pulp are negatively
affected (Wistara 1999). Specifically, the relationship between the ability of the
pulp to hold water, and the tensile strength of the paper was examined. Wistara and
Young treated recycled pulp with butylamine and ammonia and found that the
treated pulps had lower hydroxyl contents. The water holding capacity decreased
after the treatment; however paper made from the pulps demonstrated a decrease
in tensile strength. Wistara and Young hypothesized that the reduction in the
number of hydrogen bonding sites (hydroxyl groups) was responsible for the
decrease in fiber-fiber bonding strength, as evidenced by the lower tensile, and for
the decrease in water holding capacity due to a reduction in hydrophilicity of the
fiber surfaces (Wistara 1999).
2.11. Present Opportunity
Decreasing the water load entering the drying section of a paper machine,
and/or decreasing the energy required to evaporate the residual water, is expected
to result in significant energy, and hence fiscal savings. The vast majority of efforts
made to increase the amount of water removed in the forming and pressing
operations to date have focused on mechanical methods. Specifically, most work
has centered on new forming section designs, wire construction, means of extending
pressure impulse, improving felt and roll design, and introducing new press section
configurations. An alternative and little explored methodology is to reduce the
hydraulic force required to overcome the capillary force holding water within the
43
fiber walls and between fibers through the reduction of the capillary force itself.
Additionally, the concept of modifying the energetics of water bonding to cellulose
to reduce the thermal energy required to evaporate bound water has not been
pursued. The fundamental parameters that govern water removal from capillaries
within fiber walls and between fibers are known. Specifically, the relevant
parameters are given by the Young-Laplace equation and are the water/air surface
tension, the cellulose/water contact angle, and the pore radius. Surfactants are
known to adsorb on cellulose (cationic surfactants in particular) and hence affect
the surface energy and consequently the contact angle. Additionally, surfactants
modify the water/air surface tension. Thus at least two of the relevant parameters
may be positively modified though judicious application of surfactants.
Consequently the present work investigates, from both a fundamental and an
applied perspective, the effect of surfactant addition on the dewatering of paper in
the forming and press sections, and the energetics of residual water removal in the
dryer section.
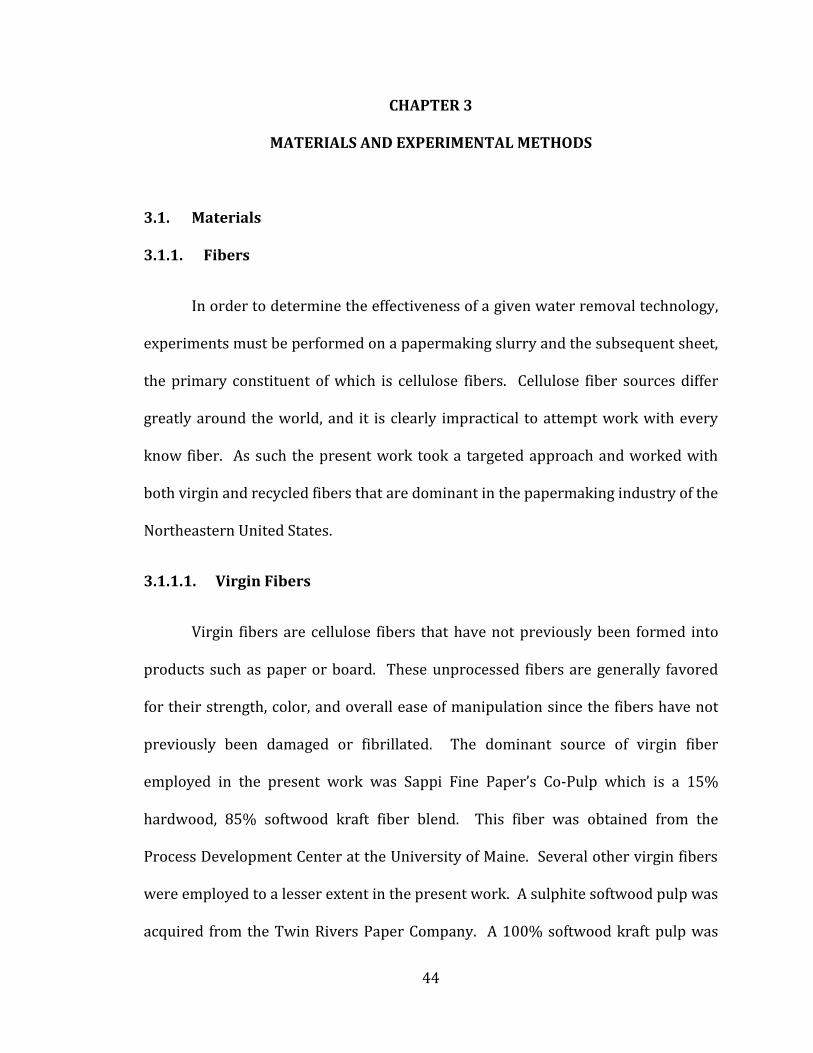
44
CHAPTER 3
MATERIALS AND EXPERIMENTAL METHODS
3.1. Materials
3.1.1. Fibers
In order to determine the effectiveness of a given water removal technology,
experiments must be performed on a papermaking slurry and the subsequent sheet,
the primary constituent of which is cellulose fibers. Cellulose fiber sources differ
greatly around the world, and it is clearly impractical to attempt work with every
know fiber. As such the present work took a targeted approach and worked with
both virgin and recycled fibers that are dominant in the papermaking industry of the
Northeastern United States.
3.1.1.1. Virgin Fibers
Virgin fibers are cellulose fibers that have not previously been formed into
products such as paper or board. These unprocessed fibers are generally favored
for their strength, color, and overall ease of manipulation since the fibers have not
previously been damaged or fibrillated. The dominant source of virgin fiber
employed in the present work was Sappi Fine Paper’s Co-Pulp which is a 15%
hardwood, 85% softwood kraft fiber blend. This fiber was obtained from the
Process Development Center at the University of Maine. Several other virgin fibers
were employed to a lesser extent in the present work. A sulphite softwood pulp was
acquired from the Twin Rivers Paper Company. A 100% softwood kraft pulp was

45
acquired from Fibrek, as well as an unbleached kraft fiber pulp. These pulps were
received in dry lap form and were rehydrated to 4 wt% consistency in a two liter
TAPPI disintegrator for seven minutes prior to use to mimic the hydro pulping stage
of the paper making wet end process.
3.1.1.2. Recycled Fibers
Recycled fibers are cellulose fibers that have been re-pulped or re-
disintegrated from an existing cellulose containing product such as paper or board.
Papermakers differentiate between fibers that are recycled from post consumer
products; including but not limited to newspaper, corrugated cardboard, paper
board, and coated paper; and fiber recycled onsite at the mill due to manufacturing
issues. The later is referred to as broke fiber and is simply re-disintegrated prior to
use. Post consumer fiber is initially processed at fiber recycling facilities to remove
inks, glues, and additional contaminates, before being utilized in the papermaking
process.
In the present work, recycled newsprint and directory fiber was supplied by
Armstrong World Industries. The fiber was received in sheet form and required
bench top disintegration prior to use; the pulps were not deinked or otherwise
treated prior to testing. Recycled brown fiber (post consumer) was acquired from
Fibrek, which had been fully processed and re-pulped.
Broke fiber was obtained from multiple sources. Single side coated broke
was supplied by the Twin Rivers Paper Company to enable simulation of filler and
fines in the papermaking process. Directory broke was acquired from the former
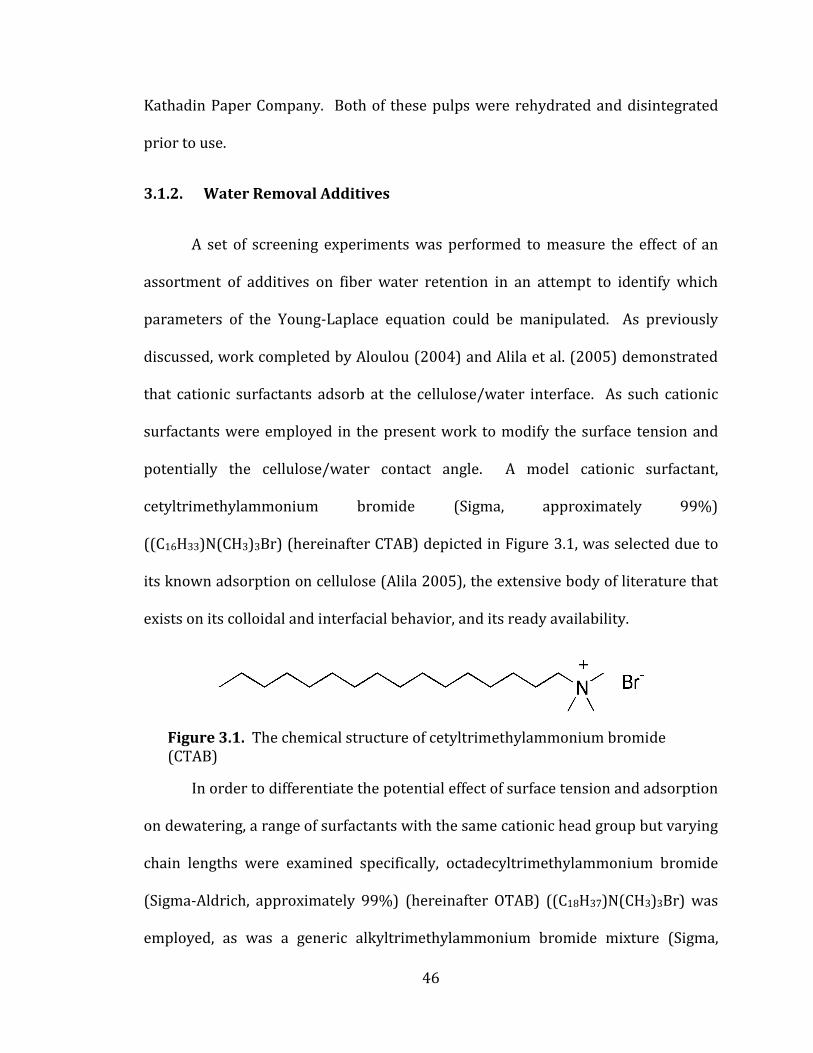
46
Kathadin Paper Company. Both of these pulps were rehydrated and disintegrated
prior to use.
3.1.2. Water Removal Additives
A set of screening experiments was performed to measure the effect of an
assortment of additives on fiber water retention in an attempt to identify which
parameters of the Young-Laplace equation could be manipulated. As previously
discussed, work completed by Aloulou (2004) and Alila et al. (2005) demonstrated
that cationic surfactants adsorb at the cellulose/water interface. As such cationic
surfactants were employed in the present work to modify the surface tension and
potentially the cellulose/water contact angle. A model cationic surfactant,
cetyltrimethylammonium bromide (Sigma, approximately 99%)
((C16H33)N(CH3)3Br) (hereinafter CTAB) depicted in Figure 3.1, was selected due to
its known adsorption on cellulose (Alila 2005), the extensive body of literature that
exists on its colloidal and interfacial behavior, and its ready availability.
Figure 3.1. The chemical structure of cetyltrimethylammonium bromide (CTAB)
In order to differentiate the potential effect of surface tension and adsorption
on dewatering, a range of surfactants with the same cationic head group but varying
chain lengths were examined specifically, octadecyltrimethylammonium bromide
(Sigma-Aldrich, approximately 99%) (hereinafter OTAB) ((C18H37)N(CH3)3Br) was
employed, as was a generic alkyltrimethylammonium bromide mixture (Sigma,
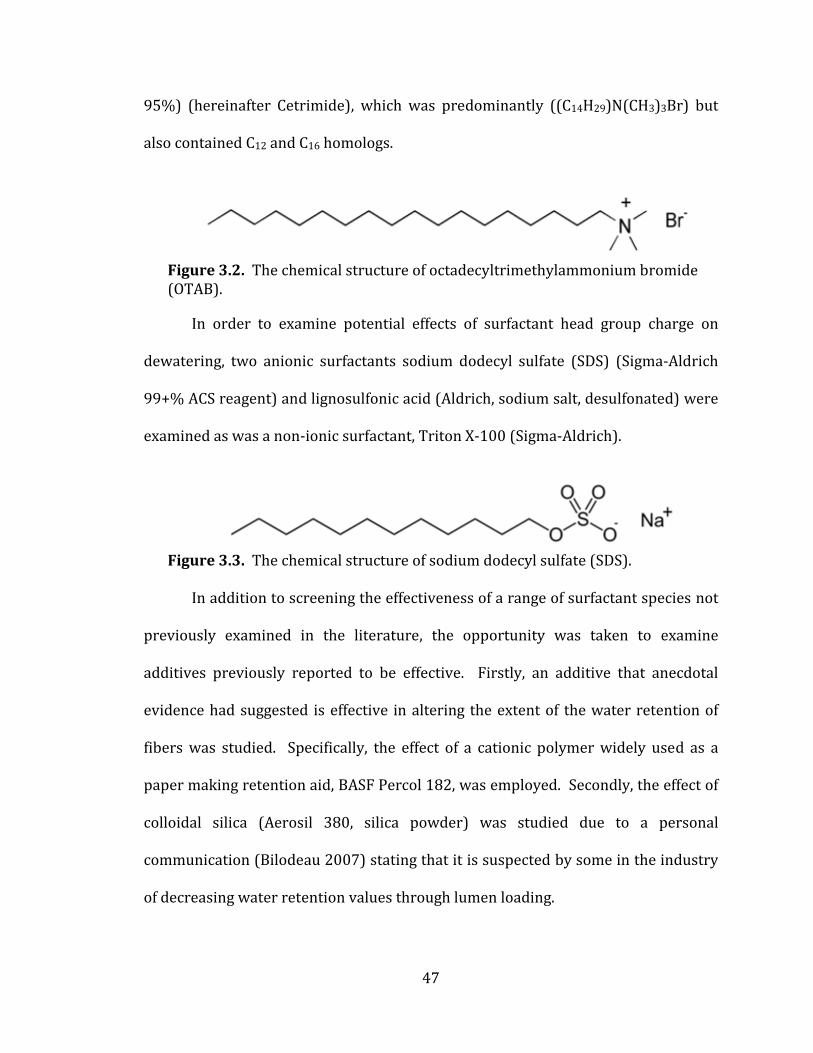
47
95%) (hereinafter Cetrimide), which was predominantly ((C14H29)N(CH3)3Br) but
also contained C12 and C16 homologs.
Figure 3.2. The chemical structure of octadecyltrimethylammonium bromide (OTAB).
In order to examine potential effects of surfactant head group charge on
dewatering, two anionic surfactants sodium dodecyl sulfate (SDS) (Sigma-Aldrich
99+% ACS reagent) and lignosulfonic acid (Aldrich, sodium salt, desulfonated) were
examined as was a non-ionic surfactant, Triton X-100 (Sigma-Aldrich).
Figure 3.3. The chemical structure of sodium dodecyl sulfate (SDS).
In addition to screening the effectiveness of a range of surfactant species not
previously examined in the literature, the opportunity was taken to examine
additives previously reported to be effective. Firstly, an additive that anecdotal
evidence had suggested is effective in altering the extent of the water retention of
fibers was studied. Specifically, the effect of a cationic polymer widely used as a
paper making retention aid, BASF Percol 182, was employed. Secondly, the effect of
colloidal silica (Aerosil 380, silica powder) was studied due to a personal
communication (Bilodeau 2007) stating that it is suspected by some in the industry
of decreasing water retention values through lumen loading.

48
3.1.3. Paper Making Additives
In an effort to as closely as possible duplicate the wet end chemistries of the
papermaking process, industrially employed wet end chemicals were sourced.
Specifically, BASF’s Telioform system was employed as it is the industrial standard
in wet end systems. The Telioform system affects retention, drainage, and
formation, thereby allowing a single system implementation to mimic a wide range
of papermaking chemical additive functions.
The Telioform system is a dual microparticle system comprising two
microparticles; BASF Telioform M306 (an anionic micropolymer) and BASF
Hydrocol 2D6 (bentonite). The specific bentonite employed in the Telioform system
is the sodium montmorillonite form of the smectite trioctahedral swelling clays.
The bentonite has a plate-like structure that is positively charged on the edges and
negatively charged on the flat surfaces. Also included in the Telioform system are
BASF Percol E22S, a cationic microemulsion retention aid, and BASF Alcofix 189, a
cationic low molecular weight polyamine retention aid.
3.2. Experimental Methods
3.2.1. Water Retention Value Testing
The water retention value (WRV) is a laboratory scale comparative measure
of water content in a paper mat after the press section of a paper machine (TAPPI
UM 256). The WRV is the most widely employed pulp quality measurement
examined in wet pressing studies (Wahlstrom 2001). The WRV test is employed to
simulate how much water remains after the pressing operation and hence how
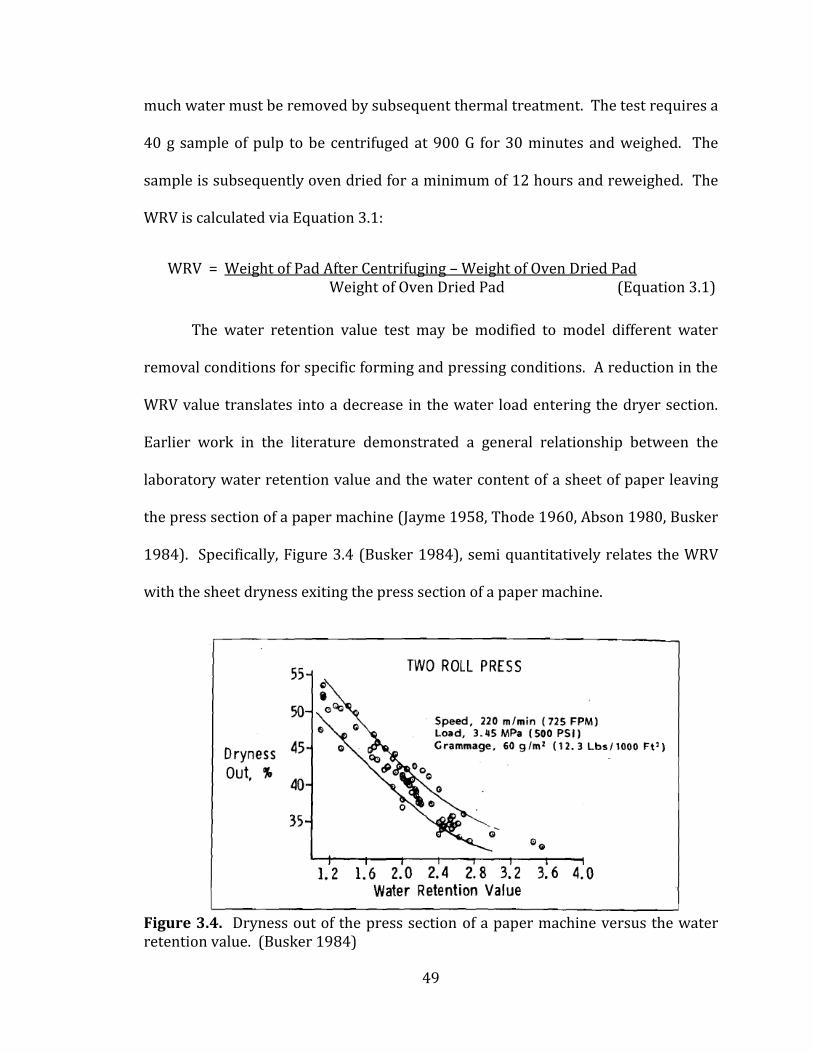
49
much water must be removed by subsequent thermal treatment. The test requires a
40 g sample of pulp to be centrifuged at 900 G for 30 minutes and weighed. The
sample is subsequently oven dried for a minimum of 12 hours and reweighed. The
WRV is calculated via Equation 3.1:
WRV = Weight of Pad After Centrifuging – Weight of Oven Dried Pad Weight of Oven Dried Pad (Equation 3.1)
The water retention value test may be modified to model different water
removal conditions for specific forming and pressing conditions. A reduction in the
WRV value translates into a decrease in the water load entering the dryer section.
Earlier work in the literature demonstrated a general relationship between the
laboratory water retention value and the water content of a sheet of paper leaving
the press section of a paper machine (Jayme 1958, Thode 1960, Abson 1980, Busker
1984). Specifically, Figure 3.4 (Busker 1984), semi quantitatively relates the WRV
with the sheet dryness exiting the press section of a paper machine.
Figure 3.4. Dryness out of the press section of a paper machine versus the water retention value. (Busker 1984)
50
In the present work the TAPPI UM 256 water retention value test was
utilized to determine the effect of chemical addition at varying dosages on sheet
dewatering. Fiber (40 grams) was disintegrated for seven minutes in one liter of tap
water (~50 - 60°C) in a TAPPI disintegrator to form a 4 wt% pulp slurry. Samples
were then centrifuged in a Fisher Scientific Marathon 10K centrifuge at 900 G for 30
minutes in a brass open bottom crucible with a brass mesh supporting the fiber mat
to mimic the forming and pressing section of a two press Fourdrinier machine.
Samples were subsequently weighed on an Ohaus Explorer analytical balance
(model E04130) and placed in Fisher Scientific Isotemp Standard Oven at 105°C
overnight to remove all retained water prior to recording the final dried fiber
weight.
3.2.2. Additional Pulp Testing
3.2.2.1. Surface Tension
Surface tension testing was performed to evaluate the potential effects of
each additive as a function of system dosage. A KSV Instruments Sigma 70 surface
tensiometer equipped with a platinum-iridium du Noüy ring was employed. Surface
tension was calculated from measurements of ten surface oscillations.
Measurements were recorded in DOS based software and were reported in dynes.
Samples were prepared by using an Eppendorf model 5804R centrifuge to separate
the fiber from the supernatant via centrifuging at 5000 rpm for 10 minutes in 60 mL
Nalgene centrifuge tubes. The supernatant was tested in 10 cm standard dishes.
51
The du Noüy ring was cleaned in between samples by rinsing with distilled water
and flaming to remove any remaining organics.
3.2.2.2. Charge Demand of the Pulp Slurry
The most common technique employed in the paper industry for measuring
the charge of particulate suspensions is the streaming potential measurement in
conjunction with polyelectrolyte titration. In this technique, a piston moves the
slurry of interest back and forth through a narrow gap at a proprietary frequency.
The motion produces an AC current between two electrodes contained in the
measuring cell wall. Charged material adsorbed to the cell wall will be separated
from its counter-ions by the flow of the slurry to create a streaming current which is
reported as the streaming potential value. When this measurement is used in
conjunction with polyelectrolyte titration, it is possible to determine the charge
demand of the pulp suspensions by titrating the solution to a neutral charge with
the appropriate cationic or anionic polyelectrolyte. An inherent assumption of the
method is that the oppositely-charged polyelectrolyte forms a one-to-one charge
complex with the charged particles of the system. The quantity of polyelectrolyte
consumed at the point of charge reversal is referred to as the charge demand of the
suspension. (Scott 1996). In the present work these measurements were performed
with a Mütek Particle Charge Detector PCD-03. The two titrants used were cationic
0.001N poly-DADMAC by BTG, and anionic 0.001N PVSK also by BTG. All testing
was performed with a 10 mL sample of pulp supernatant, in triplicate.
52
3.2.2.3. Attenuated Total Reflection Infrared Spectroscopy
Infrared spectroscopy is a powerful tool for the analysis of the molecular
composition of a given material. Many sampling configurations exist for infrared
spectroscopy, however, for bulk materials that absorb strongly in the infrared
spectral region, options are limited. One technique that has found great utility in the
measurement of strongly absorbing materials is Attenuated Total Reflection FT-IR
(ATR-IR). The technique passes an infrared beam through an internal reflection
element (IRE) with a higher refractive index than the sample medium, the beam is
aligned such that it has an incident angle at the IRE/medium interface that is greater
than the critical angle. Upon reflection from the interface an evanescent wave is
generated that penetrates into the optically rarer medium for a distance of
approximately the wavelength of the incident beam. (Harrick 1967) If the medium
is IR adsorbing in the wavelength range of the evanescent (and incident) beam, then
the reflected beam is attenuated accordingly. Measurement of the intensity of the
reflected beam thereby provides an infrared absorbance spectrum of the interfacial
region of the medium (Neivandt 1998).
ATR-IR was employed in the present work to determine the solution
concentration of the cationic surfactant CTAB in pulp supernatant by integration of
the area of the resonances assigned to CTAB in the C-H stretching region (2000 –
3000 cm-1). Due to the cationic nature of CTAB and its tendency to adsorb on
anionic surfaces such silicon IREs, the solution pH was decreased to be below the
isoelectric point of the metal oxide form of silicon (pH 2.0) to avoid the deposition of
CTAB on the IRE. The supernatant of the pulp was isolated from the fibers via
53
centrifugation as described in Section 3.2.2.1. Supernatant pH was lowered by the
addition of 4 N hydrochloric acid. Attenuated total reflection infrared (ATR-IR)
spectroscopy measurements were performed using an ABB Inc. FTLA2000-104
spectrometer with a twin mirror reflection accessory and flow cell equipped with a
Si internal reflection element by Harrick Scientific.
3.2.2.4. pH
In the papermaking industry the machine wet end falls into two distinct pH
categories, acid machines operating at a pH of ~4 – 5, and alkaline machines
operating at a pH of ~7 – 8. Throughout the present work pulp pH was monitored
to asses any potential impact on the normal operating conditions of the industry.
The pH was monitored with a Corning Pinnacle 545 pH meter equipped with a
plastic bodied refillable electrode.
3.2.2.5. Canadian Standard Freeness
The degree of pulp refining is known to affect the water holding capacity of a
fiber (Busker 1984). A fiber which has been refined to a greater level will hold more
water since refining pulp increases the fiber surface area due to fibrillation of the
exterior of the fiber (Smook 2002). The degree of refining may be monitored by
examining the rate of water drainage from a pulp slurry sample and correlating this
with the surface area of fibers within the slurry, this is known as a freeness
measurement. The Canadian Standard Freeness test, TAPPI method T-227, is one
such method and is commonly used to evaluate pulps in the paper industry. In the
present work a Green’s Slowness Tester wall model by the Star Brass Manufacturing
54
Company was employed to measure the Canadian standard freeness (CSF). The
tester is comprised of a drainage chamber and a rate measuring funnel which allows
water to exit via gravity while collecting a fiber mat on a screen. The “freed” water
is collected in a 1000 mL graduated cylinder; where the volume collected is
reported as the CSF in mL. A pulp with little surface area will drain water rapidly
through the screen, and result in a large volume (700 mL or more) of water
collected. However, if the same pulp was subjected to refining, the increased surface
area of the fibers would cause water to drain much more slowly and the total
volume of water collected would be greatly reduced (e.g. 100 – 200 mL). In the
present work, this method was employed to prepare pulps for a pilot machine trial
which had nearly identical drainage rates.
3.2.2.6. Thermogravimetric Analysis
To complement work investigating water removed in the forming and press
sections, the energetics of water removed in the drying section was studied. To
explore the rate of water removal by heat application, a TA Instruments 2950 TGA
was employed to perform thermogravimetric analysis of pulp samples. The furnace
of the instrument was electronically heated to the target temperature of 110°C, from
which point the experiment was run isothermally. Dry nitrogen gas was used to
sweep volatiles removed from the sample at a flow rate of 35 mL/min. Platinum
sample pans, which held approximately 100 mg of sample, were employed. The
experiment was run until the weight change of the sample over ten seconds was
55
negligible. Data was collected via a computer and analyzed with the TGA 2950
software package.
3.2.2.7. Contact Angle
A contact angle device was designed and built to facilitate imaging of the
water contact angle within a glass capillary, and to measure the height of the water
column within the capillary. By use of complementary surface tension data, a
comparison between measured capillary forces and those predicted by the Young-
Laplace equation was possible. The instrument allowed for images to be taken and
for the head pressure of the capillary to be varied. A Cannon Rebel Xsi DSLR camera
with a macro lens combination provided 12x optical magnification which permitted
the use of Image J software to measure the resultant contact angles. Glass capillaries
(0.75mm internal diameter) were cleaned using a 20wt% Contrad 70 detergent
solution, followed by nitric acid to remove organic contaminants. Capillaries were
imaged in situ by placing the lower end of the capillaries vertically in troughs
containing solutions of 18.2 MΩ-cm water and 1mM, CTAB side-by-side.
3.2.3. Paper Testing
3.2.3.1. Handsheets
Handsheets are bench scale formed sheets of paper which allow physical
testing to be performed on a representation of a full scale commercial sheet.
Handsheets were formed using a modified version of TAPPI Method T205 Forming
Handsheets for Physical Testing of Pulp. Utilizing 4wt% consistency pulp prepared
in the TAPPI Disintegrator for seven minutes, 150 gm/m2 handsheets were
56
produced as recommended by Appendix B in T205 to mimic paperboard sheets.
The choice to make paperboard type handsheets was made in order to find a middle
ground between fine paper production and the production of ceiling tiles. The
sheets were formed in a Herman Manufacturing Company handsheet mold and
pressed in a Herman Manufacturing Company handsheet press. The resulting
sheets were air dried and stored in a controlled temperature and humidity room
over night before testing was performed. The room was set to TAPPI T402
conditioning specifications of 50.0% ± 2.0% relative humidity and 23.0°C ± 1.0°C.
3.2.3.2. Bulking
A visual increase in WRV pad thickness apparent under certain experimental
conditions prompted the measurement of the thickness of the relevant pads.
Measurements were performed utilizing a Pittsburg 6” digital caliper. Three pads
per sample condition were measured twice to generate statically valid thicknesses
of the WRV pads.
3.2.3.3. Sheet Caliper
Sheet caliper was measured since it is a critical property that many
manufactures utlize to sell their products. In addition sheet caliper was monitored
to determine if the bulking trend observed in the WRV pads translated to sheets
formed by other processes. Utilizing TAPPI Method T-411 and a TMI dead weight
caliper, the sheet caliper of both handsheets and pilot trial produced paper was
measured.
57
3.2.3.4. Sheet Formation and Floc Distribution
The Kajaani formation tester utilizes light transmittance to characterize
sheet uniformity, a commonly examined parameter in papermaking quality control.
A high Kajaani value is indicative of the following sheet characteristics: improved
formation, increased density, heavier basis weight, and decreased filler content for a
specific basis weight. Generally, the higher the Kajaani value, the lower the sheet
porosity, as the sheet has become “closed.” An additional forming parameter
commonly reported is the floc distribution in units of flocs/cm2; the larger the floc
distribution number the smaller the average floc size. In the present work a
standard Kajaani formation tester with Valmet Automation formation analyzer V 1.2
software was employed.
3.2.3.5. Tensile
The tensile strength of paper is dictated by factors such as fiber strength,
fiber length, and the extent of fiber-fiber bonding. Tensile strength is a commonly
employed parameter used for quality control purposes since it is easily measured
and is an excellent indication of the serviceability of many papers. In addition,
tensile strength may be used as an indicator of potential resistance to web breaking
of papers, such as printing papers, during printing on a web fed press or other web
fed converting operation. In the present work the tensile strength of handsheet and
pilot trial sheet samples was evaluated via TAPPI Method T-494 utilizing a constant-
rate-elongation testing machine which applied an elongation rate of 25 mm/minute.
Specifically, an Instron 5564 was employed to measure machine direction and cross
58
machine direction sheet tensile. Samples were prepared by cutting 25mm wide
strips approximately 220mm long utilizing a TMI tensile sample cutter. A total of 10
samples were run for each condition to generate a statistically relevant average.
3.2.3.6. Burst
A measure of physical sheet strength that complements tensile
measurements is burst strength. TAPPI method T-403 states that the bursting
strength of a sheet is the maximum hydrostatic pressure required to rupture the
sheet when a controlled and constantly increasing pressure is applied through a
rubber diaphragm to a circular area, 30.5 mm (1.20 in.) in diameter. A Lorentzen
and Wettre Burst-O-Matic was employed in the present work to perform the burst
test. Samples were tested in six locations across a given sheet to provide
statistically meaningful data.
3.2.3.7. Internal Bond
A measure of the internal bond strength of a sheet is known as the I-Bond or
Scott bond test. TAPPI method T-569 Internal bond strength (Scott type), defines
the test as a measure of the energy required to rapidly delaminate a sheet-type
specimen. “Z” directional rupture is initiated by the impact of a pendulum having
both a controlled mass and a controlled velocity that exceeds 6000 times the
velocity of tensile strength and other dead-weight testers. A TMI I-Bond Monitor /
Internal Bond 80-01 tester was employed along with a TMI I-Bond preparation
station.
59
3.2.3.8. Fiber Ash Content
The ash content of WRV pads was determined by employing TAPPI method
T-211 Ash in wood, pulp, paper and paperboard: combustion at 525°C. T-211 ash
test were performed by oven drying a fiber sample in a Fisher Scientific Isotemp
Standard Oven at 105°C for 20 minutes, prior to placing the sample in a ceramic
crucible. An initial weight was recorded on an Ohaus Explorer analytical balance
(model E04130) and the sample placed in a Thermolyne 62700 Furnace at 525°C for
two hours. The resulting chars were weighed and divided by the initial weight to
determine the ash content of the sample.
3.2.3.9. Hydroxyl number
Hydroxyl number determination was performed on paper samples that were
oven dried at 105±2°C to ensure complete moisture removal. Dry paper sheets of
1.50±0.05g were analyzed according to Method A of ASTM D4274-05 Standard
(ASTM 2005). The standard method, primarily used for determining hydroxyl
numbers of polyols, was adapted with a slight modification: instead of the specified
20mL of acetylation reagent mixture, 50mL was employed. The stock acetylation
reagent mixture was comprised of 127mL of acetic anhydride and 1000mL of
pyridine. This modification was made due to the need for a sufficient quantity of the
acetylation reagent to ensure reaction of all available hydroxyl groups on the fiber.
The acetylation reagent was added to the fiber sample in a 98±2°C water bath. The
reaction was allowed to proceed for two hours after which the number of hydroxyl
groups that had reacted was quantified from the concentration of acetic acid,
60
generated as a side product of reaction. The concentration of acetic acid was
determined by titration with sodium hydroxide. The hydroxyl number in mg KOH/g
sample was subsequently calculated via:
The Hydroxyl Number: [(B-A) × N × 56.1] / W
Where, A is the volume (ml) of sodium hydroxide solution required for the
titration (after the phenolphthalein reaction) of the liquefied sample; B is the
volume (ml) of sodium hydroxide solution required for titration of the blank
(control) solution; N is the normality of the sodium hydroxide solution; and W is the
weight of the fiber sample. Results are reported in the ASTM accepted standard of
mg of potassium hydroxide, which is why the molar mass of potassium hydroxide
(56.1) is included in the equation. Three samples from each condition were tested
to provide a statistical average hydroxyl number.
3.2.3.10. Mercury porosimetry
Mercury porosimetry is a technique commonly used to characterize the
porosity and pore structure of materials via application of various levels of pressure
to a sample immersed in liquid mercury. Pore size may be determined with
knowledge of the external pressure required to force the mercury into a pore
against the opposing force of the mercury's surface tension. A force balance
equation known as the Washburn equation may be computed for a material having
cylindrical pores:

61
Where PL is the pressure applied liquid mercury for intrusion, PG is the
pressure within the sample prior to the intrusion of mercury (as the measurement
commences at a vacuum this value is generally 0.5 psia), σ is the surface tension of
mercury, θ is the contact angle of mercury (the contact angle of mercury with most
solids is between 135° and 142°, so an average of 140° is employed) and DP is the
pore diameter. In the present work porosimetry was employed to examine changes
in the pore structure of WRV pads, and paper samples as a result of additive
addition. Samples were prepared by cutting a portion of WRV pads or paper sheets
weighing 0.200 g ± 0.002 g and placing them in 5cc penetrometer. Measurements
were performed with Micromeritics Autopore IV instrument over a pressure range
of 0.50 psia to 25,000 psia. Duplicates were run to confirm results.
62
CHAPTER 4
BENCH SCALE INVESTIGATIONS OF CHEMICALLY ENHANCED WATER
REMOVAL
4.1. Introduction
Decreasing the water load entering the drying section of a paper machine,
and/or decreasing the energy required to evaporate the residual water, is expected
to result in significant energy and hence fiscal savings. As described in Chapter 2
the vast majority of efforts made to increase the amount of water removed in the
forming and pressing operations to date have focused on mechanical methods.
Specifically, most work has centered on examining means of extending the pressure
impulse, improving fabric and roll design, and introducing new machine
configurations. An alternative and little explored methodology is to reduce the
hydraulic force required to overcome the capillary force holding water within the
fiber walls and between fibers, through reduction of the magnitude of the capillary
force itself. Additionally, the concept of modifying the energetics of water bonding
to cellulose to reduce the thermal energy required to evaporate bound water has
not been pursued.
The fundamental parameters that govern water removal from capillaries
within fiber walls and between fibers are known and were reviewed in Section 2.6.2.
Specifically, the relevant parameters are given by the Young-Laplace equation and
are; the water/air surface tension, the cellulose/water contact angle, and the pore
radius. Surfactants are known to adsorb onto cellulose (cationic surfactants in

63
particular) and hence affect the surface energy, and consequently the contact angle.
Additionally, surfactants modify the water/air surface tension. Thus, at least two of
the relevant parameters may be positively modified though judicious application of
surfactants. Consequently the present work aimed to investigate, from both a
fundamental and an applied perspective, the effect of surfactant addition on the
dewatering of paper in the formation and press sections, and the energetics of
residual water removal in the dryer section. Bench top testing was employed to
provide a platform for the rapid screening of additives, as well as to examine the
physical properties of the resulting paper.
4.2. Experimental Results
4.2.1. WRV Exploration
Utilizing the TAPPI UM 256 water retention value test, the effect of
cetyltrimethylammonium bromide (CTAB) addition at varying dosages was
observed by pulping 40 grams of fiber in one liter of tap water (~50 - 60°C) in a
TAPPI disintegrator to form a 4 wt% pulp slurry. CTAB was added as a dry powder
to the water at the commencement of the disintegration (here in after referred to as
pulping) process, prior to the addition of fiber. Figure 4.1 presents a plot of WRV vs.
dosage of CTAB (g/g of paper) for a 7 minute pulping duration employing unprinted
recycled paper. The following dosages of CTAB were tested: 0 g (control); 0.35 wt%
, 0.70 wt% , 1.0 wt% , 1.75 wt% , and 3.5 wt% on a dry fiber basis. Each data point
represents an average of six separate WRV samples and the error bars represent
95% confidence intervals based on six data points at each CTAB dosage.
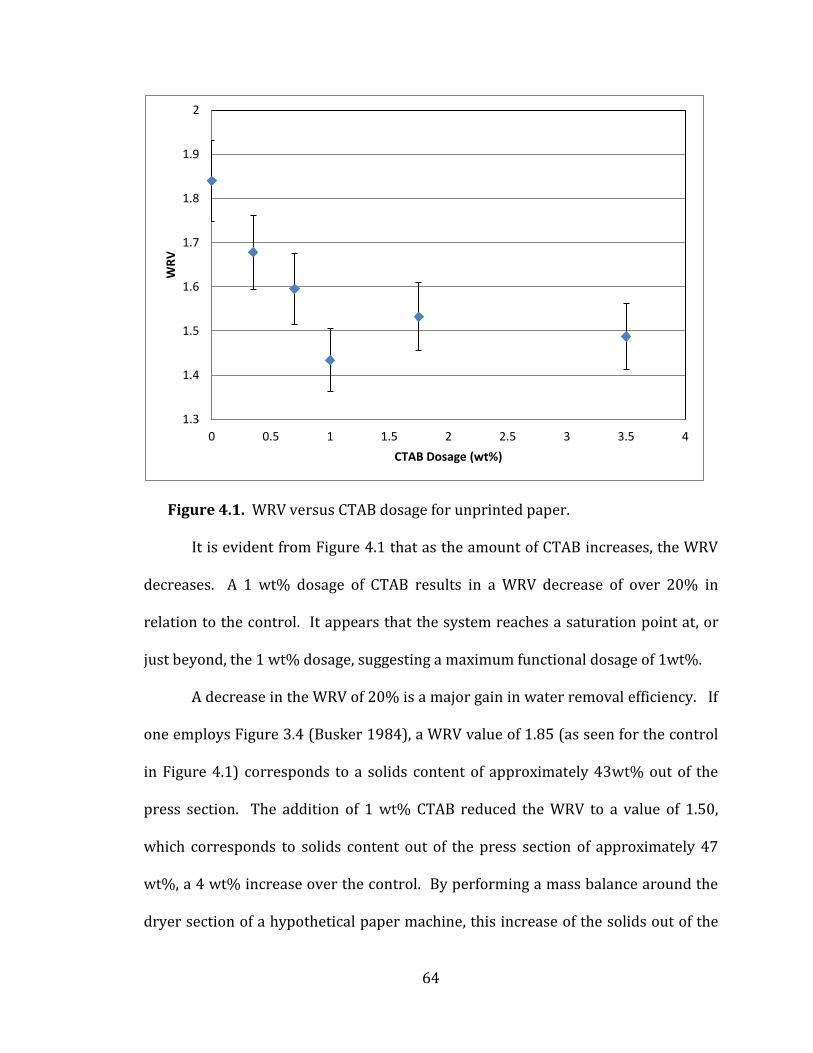
64
Figure 4.1. WRV versus CTAB dosage for unprinted paper.
It is evident from Figure 4.1 that as the amount of CTAB increases, the WRV
decreases. A 1 wt% dosage of CTAB results in a WRV decrease of over 20% in
relation to the control. It appears that the system reaches a saturation point at, or
just beyond, the 1 wt% dosage, suggesting a maximum functional dosage of 1wt%.
A decrease in the WRV of 20% is a major gain in water removal efficiency. If
one employs Figure 3.4 (Busker 1984), a WRV value of 1.85 (as seen for the control
in Figure 4.1) corresponds to a solids content of approximately 43wt% out of the
press section. The addition of 1 wt% CTAB reduced the WRV to a value of 1.50,
which corresponds to solids content out of the press section of approximately 47
wt%, a 4 wt% increase over the control. By performing a mass balance around the
dryer section of a hypothetical paper machine, this increase of the solids out of the
1.3
1.4
1.5
1.6
1.7
1.8
1.9
2
0 0.5 1 1.5 2 2.5 3 3.5 4
WR
V
CTAB Dosage (wt%)
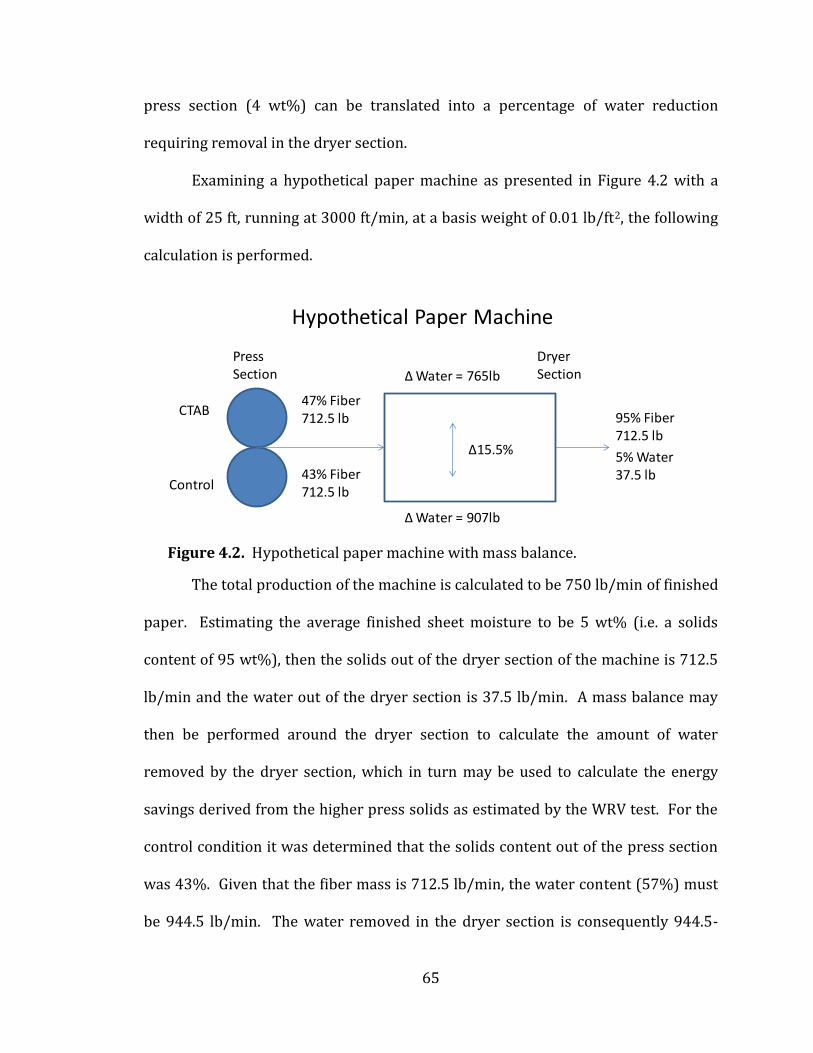
65
press section (4 wt%) can be translated into a percentage of water reduction
requiring removal in the dryer section.
Examining a hypothetical paper machine as presented in Figure 4.2 with a
width of 25 ft, running at 3000 ft/min, at a basis weight of 0.01 lb/ft2, the following
calculation is performed.
Figure 4.2. Hypothetical paper machine with mass balance.
The total production of the machine is calculated to be 750 lb/min of finished
paper. Estimating the average finished sheet moisture to be 5 wt% (i.e. a solids
content of 95 wt%), then the solids out of the dryer section of the machine is 712.5
lb/min and the water out of the dryer section is 37.5 lb/min. A mass balance may
then be performed around the dryer section to calculate the amount of water
removed by the dryer section, which in turn may be used to calculate the energy
savings derived from the higher press solids as estimated by the WRV test. For the
control condition it was determined that the solids content out of the press section
was 43%. Given that the fiber mass is 712.5 lb/min, the water content (57%) must
be 944.5 lb/min. The water removed in the dryer section is consequently 944.5-
Δ15.5%
Control43% Fiber712.5 lb
47% Fiber712.5 lb
Press Section
DryerSection
CTAB
Δ Water = 765lb
Δ Water = 907lb
5% Water37.5 lb
95% Fiber712.5 lb
Hypothetical Paper Machine

66
37.5 lb/min, which is 907 lb/min. For 1 wt% addition of CTAB it was determined
that the solids content out of the press section was 47%. Given that the fiber mass is
712.5 lb/min, the water content (53%) must be 802.4 lb/min. The water removed
in the dryer section is consequently 802.4-37.5 lb/min, which is 765 lb/min. The
percentage difference in water removed in the dryer section between the control
and the CTAB addition case is 907-765 lb/min, which is 142 lb/min, or 15.5%. The
corresponding energy savings is determined employing the heat of vaporization of
water (970 BTU/lb) to be 137,740 BTU/min. It should be noted that if the machine
was running at its maximum dryer capacity, the reduction of water load in the dryer
section of 15.5% could be employed to enable a total production increase of 15.5%.
This conclusion derives from the assumption that the unused dryer capacity could
be utilized if the machine speed was increased proportionately, thereby increasing
the water load in the dryer section to match the control water load.
From the above calculations it may be seen that the difference observed in
the WRV value (1.8-1.4=0.4) may be multiplied by a factor of 10 to derive the
difference in solids out of the press section in weight percent (0.4x10=4) which may
in turn be related to the approximate percentage difference in water removed in the
dryer section by multiplying by a factor of 4 (4x4=16).
Figure 4.3 presents WRV data obtained from a comparable experiment to
that presented in Figure 4.1, with the exception that printed paper was employed,
and a lower dosage range of CTAB was utilized.
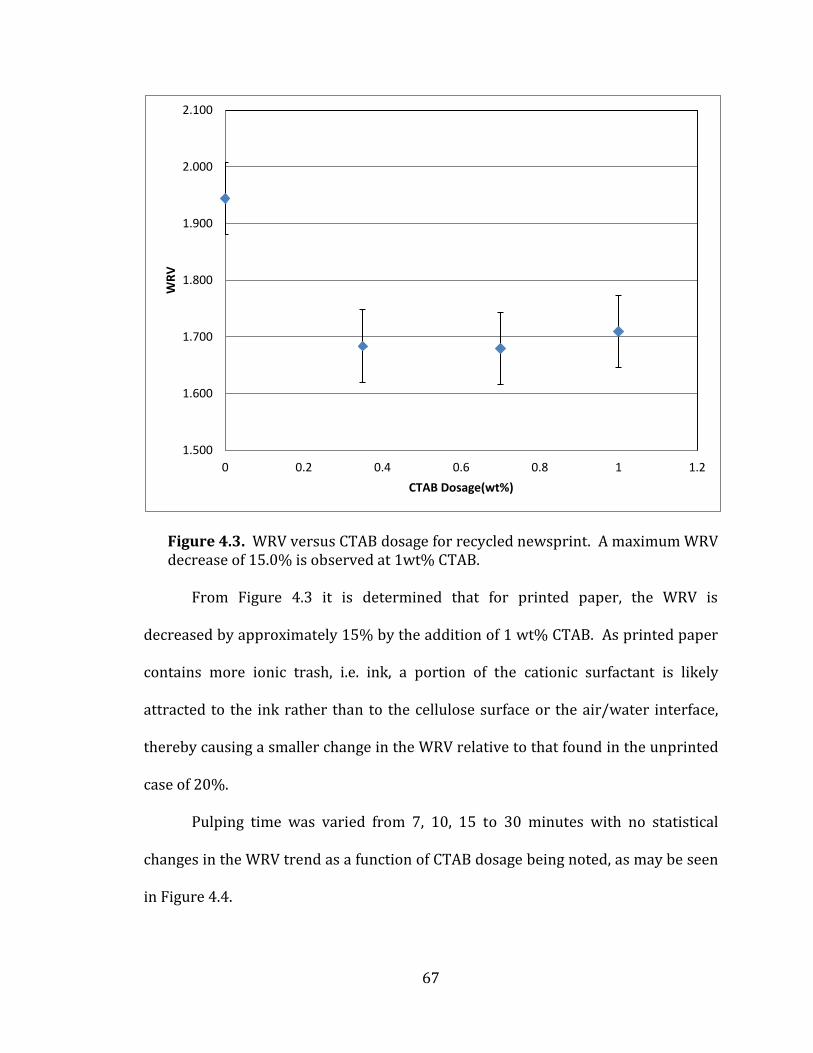
67
Figure 4.3. WRV versus CTAB dosage for recycled newsprint. A maximum WRV decrease of 15.0% is observed at 1wt% CTAB.
From Figure 4.3 it is determined that for printed paper, the WRV is
decreased by approximately 15% by the addition of 1 wt% CTAB. As printed paper
contains more ionic trash, i.e. ink, a portion of the cationic surfactant is likely
attracted to the ink rather than to the cellulose surface or the air/water interface,
thereby causing a smaller change in the WRV relative to that found in the unprinted
case of 20%.
Pulping time was varied from 7, 10, 15 to 30 minutes with no statistical
changes in the WRV trend as a function of CTAB dosage being noted, as may be seen
in Figure 4.4.
1.500
1.600
1.700
1.800
1.900
2.000
2.100
0 0.2 0.4 0.6 0.8 1 1.2
WR
V
CTAB Dosage(wt%)

68
Figure 4.4. WRV versus CTAB dosages for varied pulp times of unprinted paper.
4.2.2. Pulp Testing
In order to determine the breadth of applicability the apparent water
retention effect of CTAB would have on the paper industry, several types of pulps
were evaluated via the WRV test at CTAB of dosages of 0.35 wt%, 0.70 wt%, and 1.0
wt% in a 7 minute pulping time. Specifically, experiments were performed on;
recycled directory, sulphite fibers, Sappi Co-pulp, single side coated (C1S) broke,
non-bleached softwood kraft (NBSK) and brown recycled fiber pulps, and are
presented in Figures 4.5 – 4.10 respectively. The data indicates that regardless of
the pulp type or source, a trend of a reduction in the WRV with increased CTAB
dosage is observed. Control WRV values for the pulps ranged from 1.65 to 2.05
1.3
1.4
1.5
1.6
1.7
1.8
1.9
2
0 0.2 0.4 0.6 0.8 1 1.2
WR
V
CTAB Dosage (wt%)
7 min
10 min
15 min
30 min
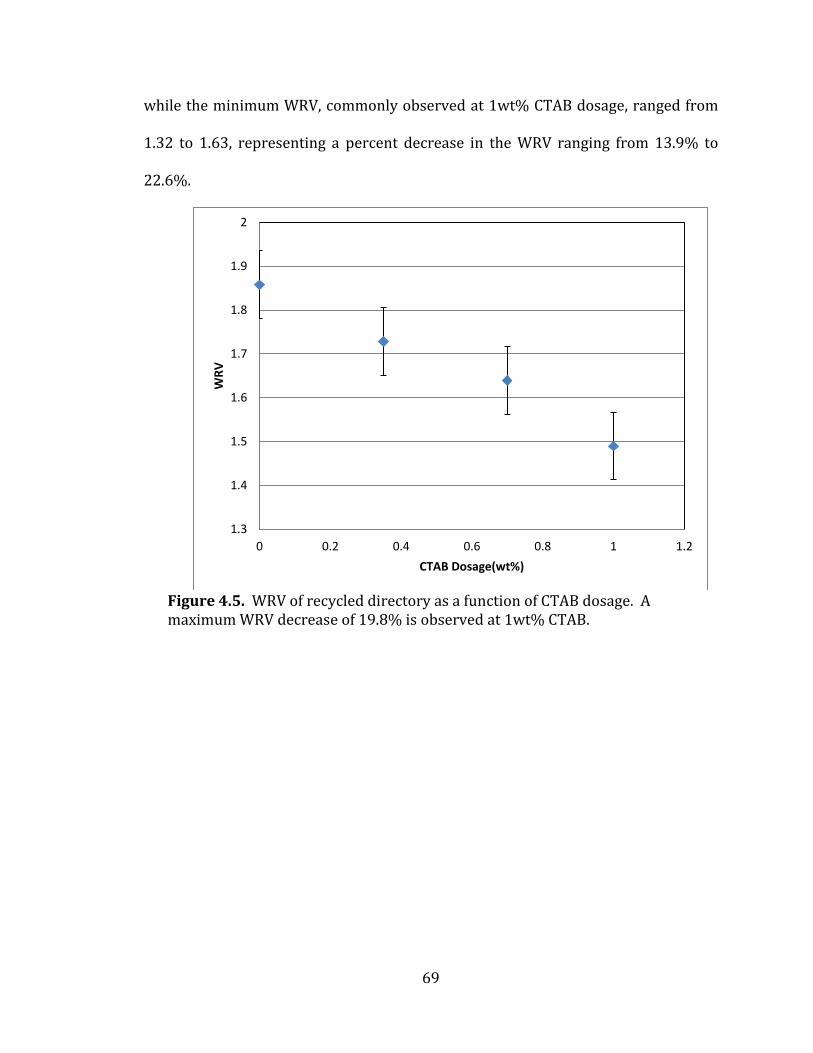
69
while the minimum WRV, commonly observed at 1wt% CTAB dosage, ranged from
1.32 to 1.63, representing a percent decrease in the WRV ranging from 13.9% to
22.6%.
Figure 4.5. WRV of recycled directory as a function of CTAB dosage. A maximum WRV decrease of 19.8% is observed at 1wt% CTAB.
1.3
1.4
1.5
1.6
1.7
1.8
1.9
2
0 0.2 0.4 0.6 0.8 1 1.2
WR
V
CTAB Dosage(wt%)
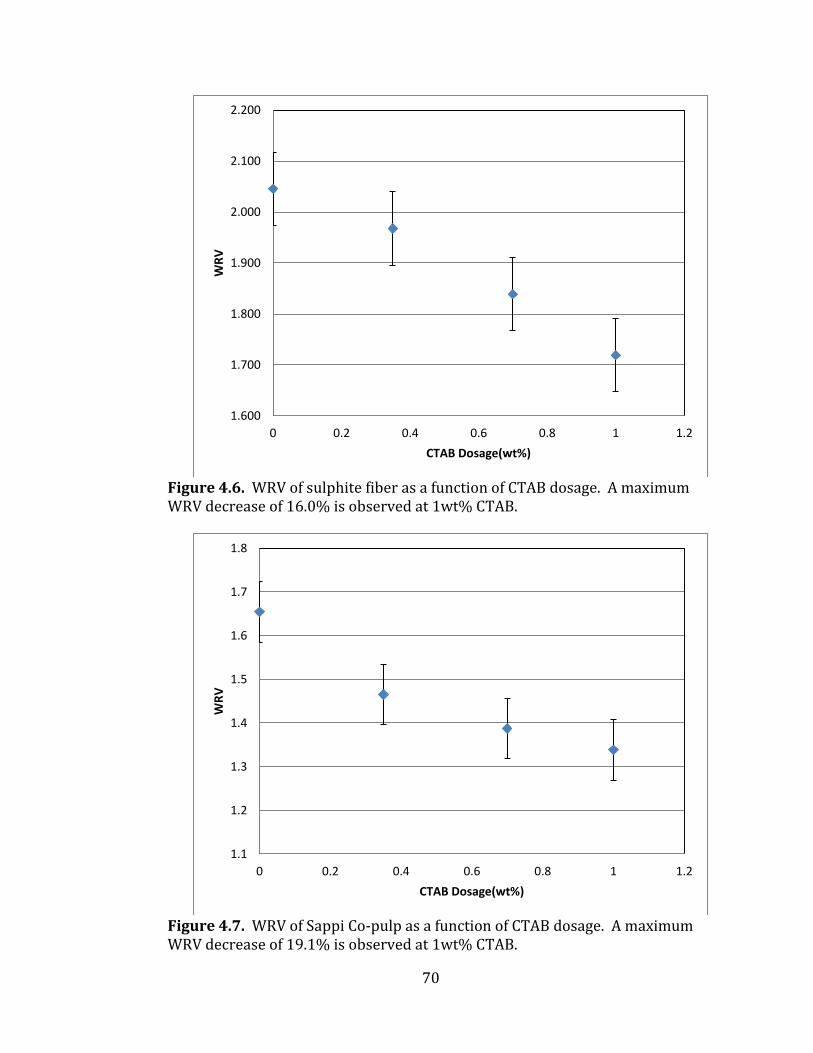
70
Figure 4.6. WRV of sulphite fiber as a function of CTAB dosage. A maximum WRV decrease of 16.0% is observed at 1wt% CTAB.
Figure 4.7. WRV of Sappi Co-pulp as a function of CTAB dosage. A maximum WRV decrease of 19.1% is observed at 1wt% CTAB.
1.600
1.700
1.800
1.900
2.000
2.100
2.200
0 0.2 0.4 0.6 0.8 1 1.2
WR
V
CTAB Dosage(wt%)
1.1
1.2
1.3
1.4
1.5
1.6
1.7
1.8
0 0.2 0.4 0.6 0.8 1 1.2
WR
V
CTAB Dosage(wt%)
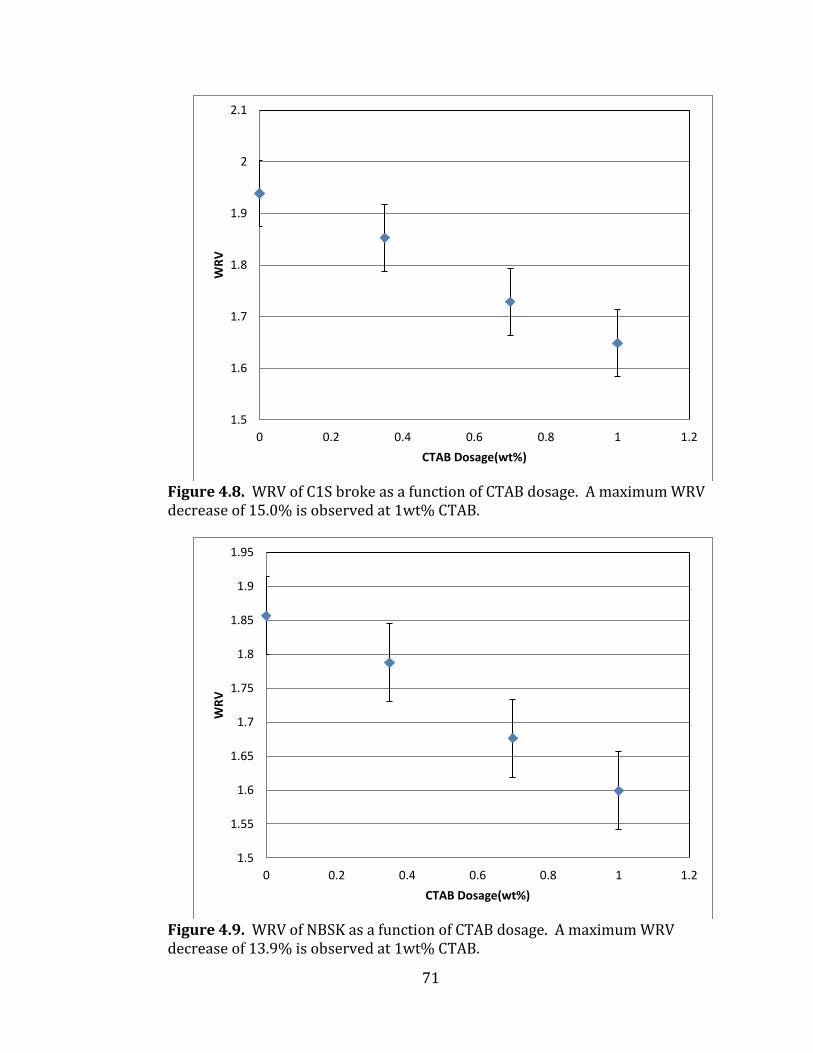
71
Figure 4.8. WRV of C1S broke as a function of CTAB dosage. A maximum WRV decrease of 15.0% is observed at 1wt% CTAB.
Figure 4.9. WRV of NBSK as a function of CTAB dosage. A maximum WRV decrease of 13.9% is observed at 1wt% CTAB.
1.5
1.6
1.7
1.8
1.9
2
2.1
0 0.2 0.4 0.6 0.8 1 1.2
WR
V
CTAB Dosage(wt%)
1.5
1.55
1.6
1.65
1.7
1.75
1.8
1.85
1.9
1.95
0 0.2 0.4 0.6 0.8 1 1.2
WR
V
CTAB Dosage(wt%)
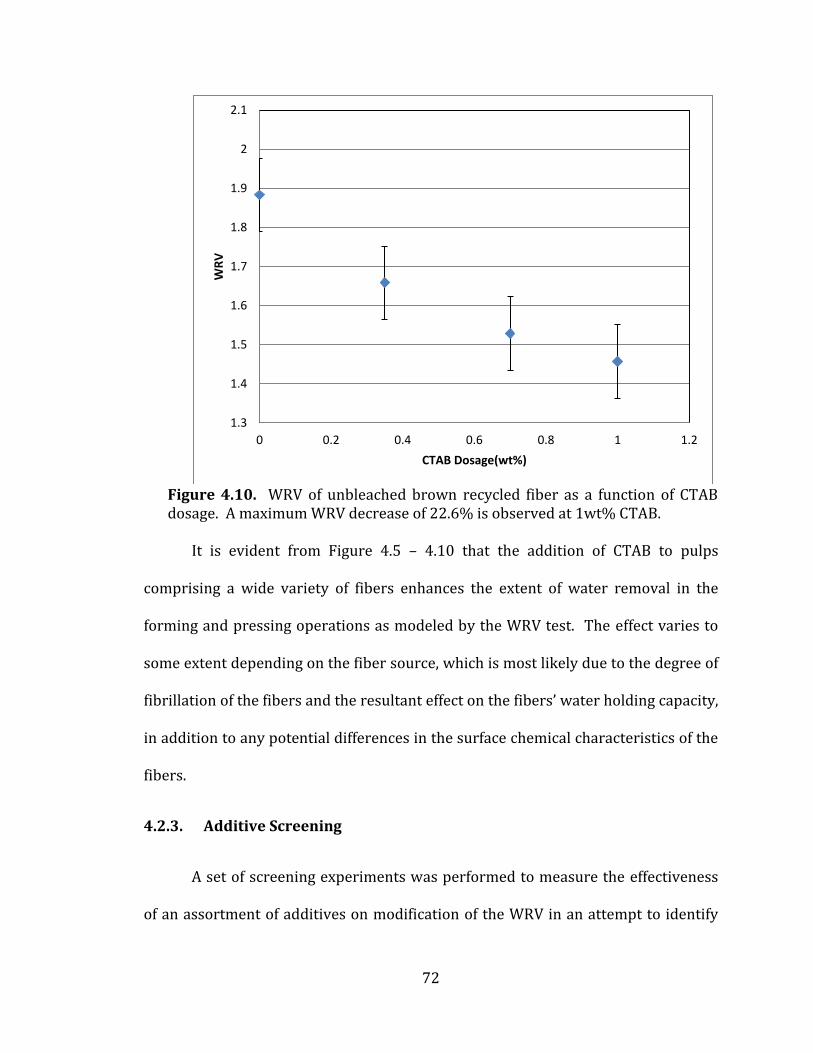
72
Figure 4.10. WRV of unbleached brown recycled fiber as a function of CTAB dosage. A maximum WRV decrease of 22.6% is observed at 1wt% CTAB.
It is evident from Figure 4.5 – 4.10 that the addition of CTAB to pulps
comprising a wide variety of fibers enhances the extent of water removal in the
forming and pressing operations as modeled by the WRV test. The effect varies to
some extent depending on the fiber source, which is most likely due to the degree of
fibrillation of the fibers and the resultant effect on the fibers’ water holding capacity,
in addition to any potential differences in the surface chemical characteristics of the
fibers.
4.2.3. Additive Screening
A set of screening experiments was performed to measure the effectiveness
of an assortment of additives on modification of the WRV in an attempt to identify
1.3
1.4
1.5
1.6
1.7
1.8
1.9
2
2.1
0 0.2 0.4 0.6 0.8 1 1.2
WR
V
CTAB Dosage(wt%)
73
which parameters of the Young-Laplace equation were being manipulated by CTAB.
Since CTAB is known to affect surface tension, a selection of other surfactants of
differing head group charges and varying chain lengths was employed to evaluate
what correlation, if any existed between WRV and surface tension. Since CTAB is a
cationic surfactant, sodium dodecyl sulfate (SDS) and lignosulfonic acid, both
anionic surfactants, and Triton X-100, a non-ionic surfactant, were included in the
screening list.
In addition to probing a potential surface tension correlation, the
opportunity was taken to examine additives previously described in literature as
having effects on surface tension and/or WRV values, as well as an additive that
anecdotal evidence had suggested affects the WRV. Specifically, the effect of a
cationic polymer widely used as a retention aid, Percol 182, was examined to
determine if the charged, cationic nature, of CTAB alone was the cause of the
decreased WRV. Secondly, the effect of colloidal silica (Aerosil 380) was studied due
to personal communications (Bilodeau 2007) stating that it is suspected of
decreasing WRV values through lumen loading.
The additives were introduced into the water employed to create a 4 wt%
pulp slurry of recycled unprinted fiber. The slurries were prepared by pulping
approximately 40 grams of recycled fiber in one liter of warm tap water in a TAPPI
disintegrator for seven minutes. Additives were employed at three levels; 0.35 wt%,
0.7 wt% and 1.0 wt%. WRV tests were performed immediately upon completion of
pulping; a correlated surface tension measurement was made at the same time.
Two additional surface tension measurements were made at sequential ten minute
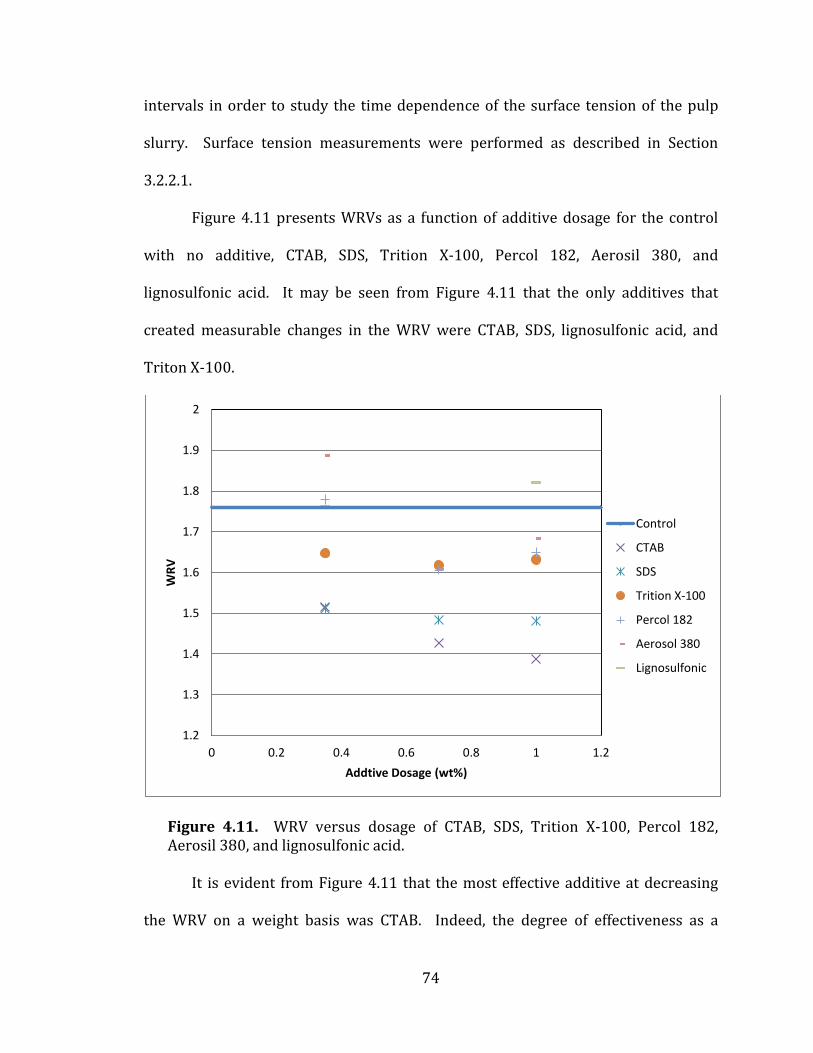
74
intervals in order to study the time dependence of the surface tension of the pulp
slurry. Surface tension measurements were performed as described in Section
3.2.2.1.
Figure 4.11 presents WRVs as a function of additive dosage for the control
with no additive, CTAB, SDS, Trition X-100, Percol 182, Aerosil 380, and
lignosulfonic acid. It may be seen from Figure 4.11 that the only additives that
created measurable changes in the WRV were CTAB, SDS, lignosulfonic acid, and
Triton X-100.
Figure 4.11. WRV versus dosage of CTAB, SDS, Trition X-100, Percol 182, Aerosil 380, and lignosulfonic acid.
It is evident from Figure 4.11 that the most effective additive at decreasing
the WRV on a weight basis was CTAB. Indeed, the degree of effectiveness as a
1.2
1.3
1.4
1.5
1.6
1.7
1.8
1.9
2
0 0.2 0.4 0.6 0.8 1 1.2
WR
V
Addtive Dosage (wt%)
Control 2
CTAB
SDS
Trition X-100
Percol 182
Aerosol 380
Lignosulfonic
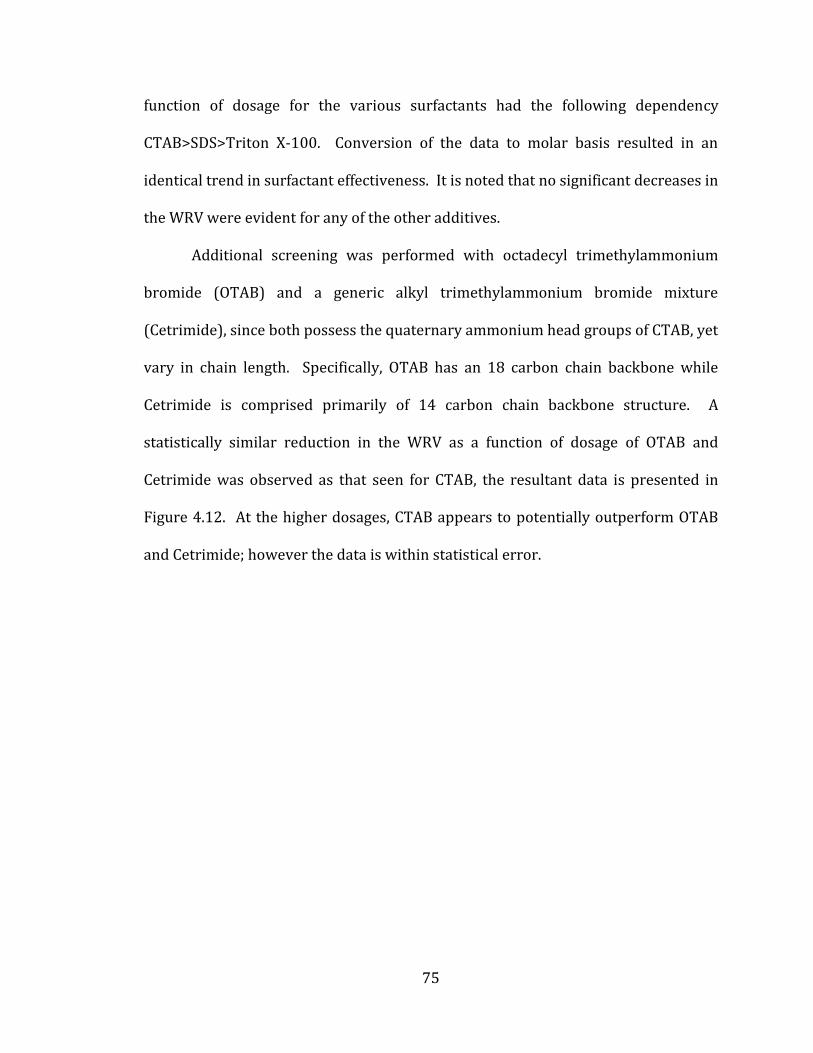
75
function of dosage for the various surfactants had the following dependency
CTAB>SDS>Triton X-100. Conversion of the data to molar basis resulted in an
identical trend in surfactant effectiveness. It is noted that no significant decreases in
the WRV were evident for any of the other additives.
Additional screening was performed with octadecyl trimethylammonium
bromide (OTAB) and a generic alkyl trimethylammonium bromide mixture
(Cetrimide), since both possess the quaternary ammonium head groups of CTAB, yet
vary in chain length. Specifically, OTAB has an 18 carbon chain backbone while
Cetrimide is comprised primarily of 14 carbon chain backbone structure. A
statistically similar reduction in the WRV as a function of dosage of OTAB and
Cetrimide was observed as that seen for CTAB, the resultant data is presented in
Figure 4.12. At the higher dosages, CTAB appears to potentially outperform OTAB
and Cetrimide; however the data is within statistical error.
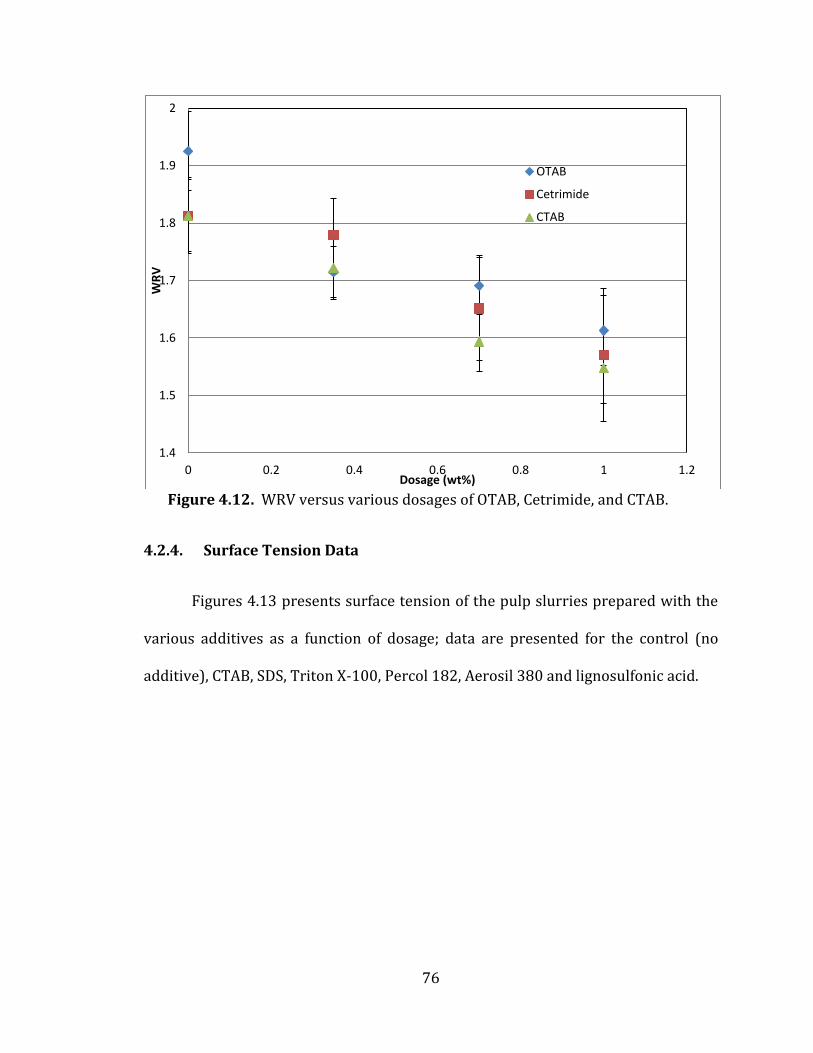
76
Figure 4.12. WRV versus various dosages of OTAB, Cetrimide, and CTAB.
4.2.4. Surface Tension Data
Figures 4.13 presents surface tension of the pulp slurries prepared with the
various additives as a function of dosage; data are presented for the control (no
additive), CTAB, SDS, Triton X-100, Percol 182, Aerosil 380 and lignosulfonic acid.
1.4
1.5
1.6
1.7
1.8
1.9
2
0 0.2 0.4 0.6 0.8 1 1.2
WR
V
Dosage (wt%)
OTAB
Cetrimide
CTAB
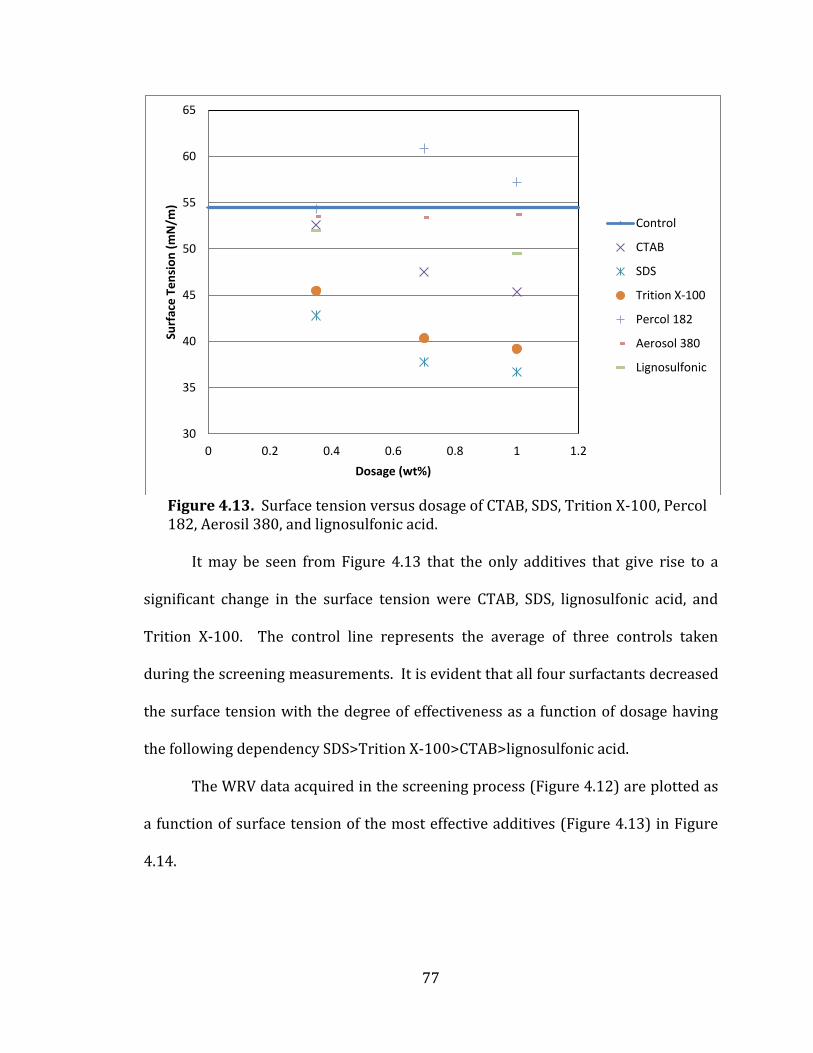
77
Figure 4.13. Surface tension versus dosage of CTAB, SDS, Trition X-100, Percol 182, Aerosil 380, and lignosulfonic acid.
It may be seen from Figure 4.13 that the only additives that give rise to a
significant change in the surface tension were CTAB, SDS, lignosulfonic acid, and
Trition X-100. The control line represents the average of three controls taken
during the screening measurements. It is evident that all four surfactants decreased
the surface tension with the degree of effectiveness as a function of dosage having
the following dependency SDS>Trition X-100>CTAB>lignosulfonic acid.
The WRV data acquired in the screening process (Figure 4.12) are plotted as
a function of surface tension of the most effective additives (Figure 4.13) in Figure
4.14.
30
35
40
45
50
55
60
65
0 0.2 0.4 0.6 0.8 1 1.2
Surf
ace
Te
nsi
on
(m
N/m
)
Dosage (wt%)
Control 1
CTAB
SDS
Trition X-100
Percol 182
Aerosol 380
Lignosulfonic
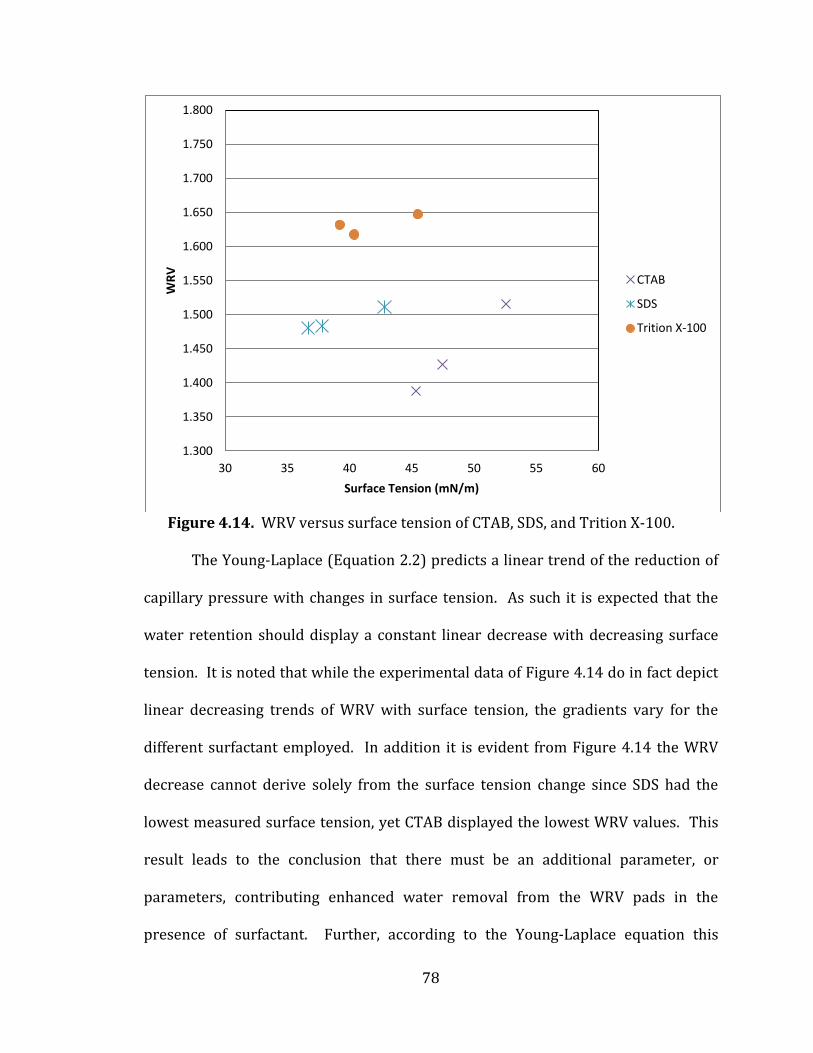
78
Figure 4.14. WRV versus surface tension of CTAB, SDS, and Trition X-100.
The Young-Laplace (Equation 2.2) predicts a linear trend of the reduction of
capillary pressure with changes in surface tension. As such it is expected that the
water retention should display a constant linear decrease with decreasing surface
tension. It is noted that while the experimental data of Figure 4.14 do in fact depict
linear decreasing trends of WRV with surface tension, the gradients vary for the
different surfactant employed. In addition it is evident from Figure 4.14 the WRV
decrease cannot derive solely from the surface tension change since SDS had the
lowest measured surface tension, yet CTAB displayed the lowest WRV values. This
result leads to the conclusion that there must be an additional parameter, or
parameters, contributing enhanced water removal from the WRV pads in the
presence of surfactant. Further, according to the Young-Laplace equation this
1.300
1.350
1.400
1.450
1.500
1.550
1.600
1.650
1.700
1.750
1.800
30 35 40 45 50 55 60
WR
V
Surface Tension (mN/m)
CTAB
SDS
Trition X-100
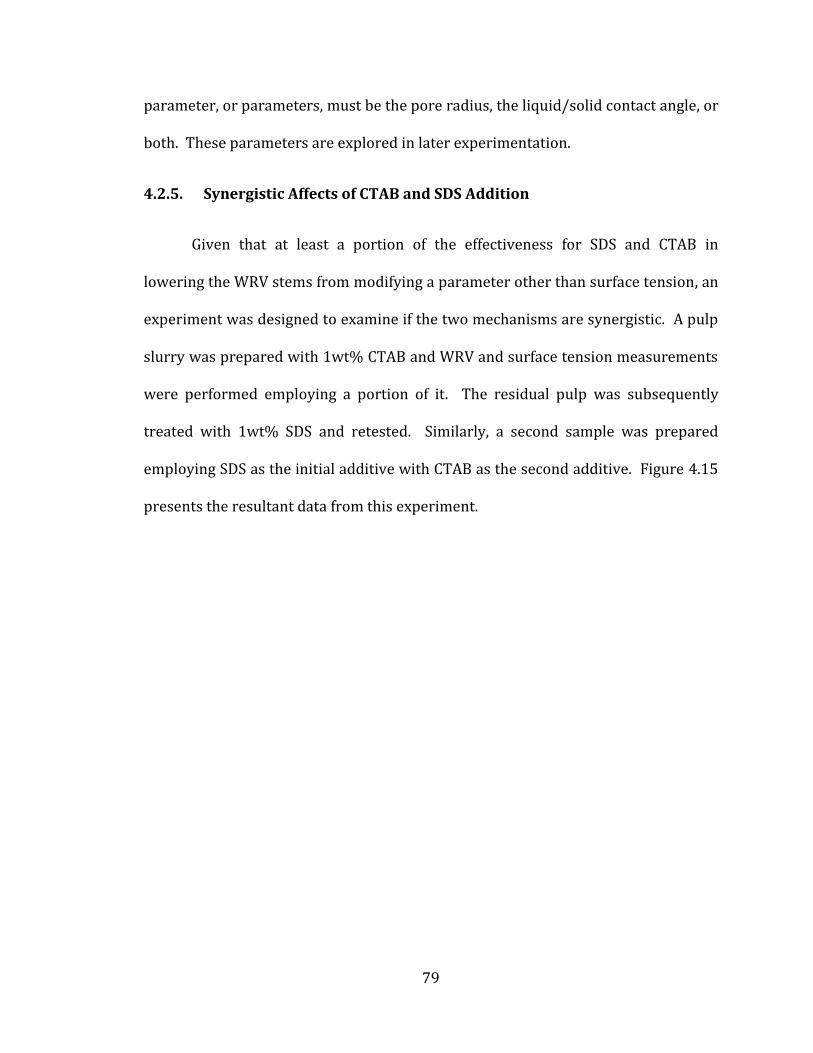
79
parameter, or parameters, must be the pore radius, the liquid/solid contact angle, or
both. These parameters are explored in later experimentation.
4.2.5. Synergistic Affects of CTAB and SDS Addition
Given that at least a portion of the effectiveness for SDS and CTAB in
lowering the WRV stems from modifying a parameter other than surface tension, an
experiment was designed to examine if the two mechanisms are synergistic. A pulp
slurry was prepared with 1wt% CTAB and WRV and surface tension measurements
were performed employing a portion of it. The residual pulp was subsequently
treated with 1wt% SDS and retested. Similarly, a second sample was prepared
employing SDS as the initial additive with CTAB as the second additive. Figure 4.15
presents the resultant data from this experiment.
80
Figure 4.15. WRV (left axis) and surface tension (right axis) data for CTAB and SDS single and sequential addition.
Investigation of Figure 4.15 reveals that the reduction in the WRV obtained
by each additive individually is increased when the second additive is incorporated.
It is noted that while each initial additive lowers the surface tension, the second
additive has a limited effect on the surface tension, yet it significantly decreases the
WRV. The effect of CTAB and SDS are indeed synergistic, confirming that there are
two mechanisms which enhance the water removal process. Further, the data of
Figure 4.15 suggest that water removal may potentially be improved even in
systems which already have low surface tensions by the addition of CTAB. It is also
noted that the order of surfactant addition is important for the synergistic effect.
Presumably this fact arises due to the system favoring SDS at the air/water interface
30
35
40
45
50
55
60
65
70
75
80
1
1.2
1.4
1.6
1.8
2
0 1 2 3 4 5 6
WR
V
Condition
WRV Surface Tension
Control SDS 1wt% CTAB 1wt% CTAB 1wt% SDS 1wt% w/ SDS 1wt% w/ CTAB 1wt%
Surf
ace
Te
nsi
on
(m
N/m
)
81
(as evidenced by SDS decreasing surface tension more effectively then CTAB)
resulting in additional CTAB adsorption on the fiber surface or presence in solution.
4.2.6. CTAB Addition with a Micro Particle Retention System
Many different wet-end chemistries are used in papermaking. In order to
determine how CTAB addition would affect a commercial system, the addition of
CTAB was compared with, and used in conjunction with, an industry leading
retention and drainage microparticle system. BASF’s Telioform system was selected
upon the recommendation of several practitioners in the field (Paradis 2008). The
Telioform system is comprised of BASF Percol E22S, BASF Hydrocol 2D6, BASF
Alcofix 189, and BASF Telioform M306. A control system with recycled directory
pulp was tested (control in Figures 4.16 and 4.17), followed by a 1 wt% addition of
CTAB while pulping (CTAB). A batch of pulp was prepared and the Telioform
system added under a high shear mixing environment (Telioform). The Telioform
system addition was repeated with a batch of pulp previously treated with 1 wt%
CTAB (CTAB w/ Telioform). Finally a pulp was prepared via addition of the
Telioform system followed by the addition of 1 wt% CTAB (Telioform w/ CTAB).
Figure 4.16 presents WRV data resulting from the measurements, while Figure 4.17
presents corresponding surface tension data.
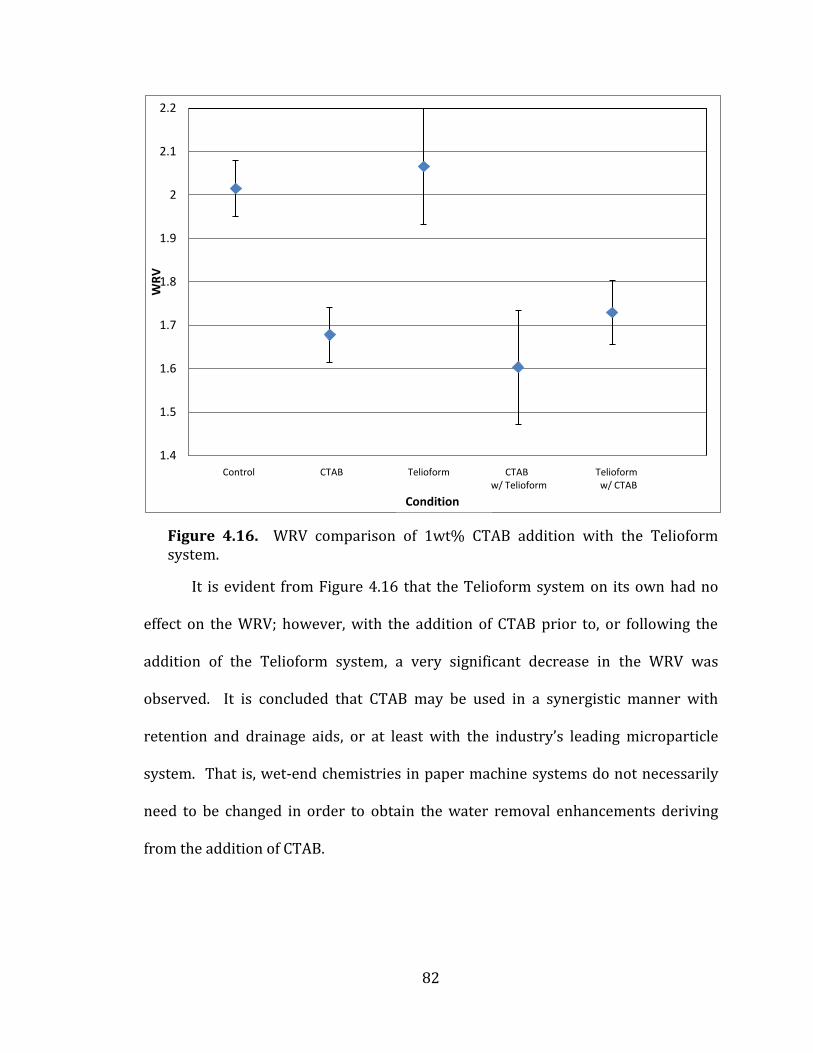
82
Figure 4.16. WRV comparison of 1wt% CTAB addition with the Telioform system.
It is evident from Figure 4.16 that the Telioform system on its own had no
effect on the WRV; however, with the addition of CTAB prior to, or following the
addition of the Telioform system, a very significant decrease in the WRV was
observed. It is concluded that CTAB may be used in a synergistic manner with
retention and drainage aids, or at least with the industry’s leading microparticle
system. That is, wet-end chemistries in paper machine systems do not necessarily
need to be changed in order to obtain the water removal enhancements deriving
from the addition of CTAB.
1.4
1.5
1.6
1.7
1.8
1.9
2
2.1
2.2
0.5 1.5 2.5 3.5 4.5 5.5
WR
V
Condition
Control CTAB Telioform CTAB Telioform w/ Telioform w/ CTAB
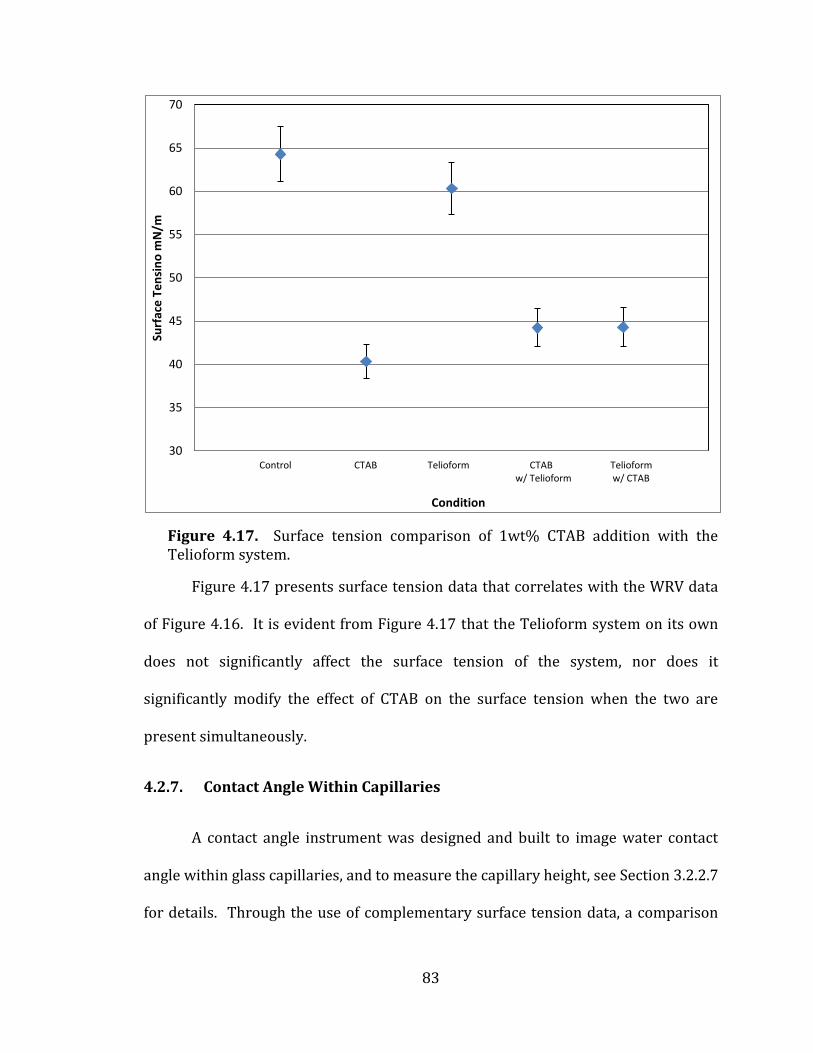
83
Figure 4.17. Surface tension comparison of 1wt% CTAB addition with the Telioform system.
Figure 4.17 presents surface tension data that correlates with the WRV data
of Figure 4.16. It is evident from Figure 4.17 that the Telioform system on its own
does not significantly affect the surface tension of the system, nor does it
significantly modify the effect of CTAB on the surface tension when the two are
present simultaneously.
4.2.7. Contact Angle Within Capillaries
A contact angle instrument was designed and built to image water contact
angle within glass capillaries, and to measure the capillary height, see Section 3.2.2.7
for details. Through the use of complementary surface tension data, a comparison
30
35
40
45
50
55
60
65
70
0 1 2 3 4 5 6
Surf
ace
Te
nsi
no
mN
/m
Condition
Control CTAB Telioform CTAB Telioform w/ Telioform w/ CTAB
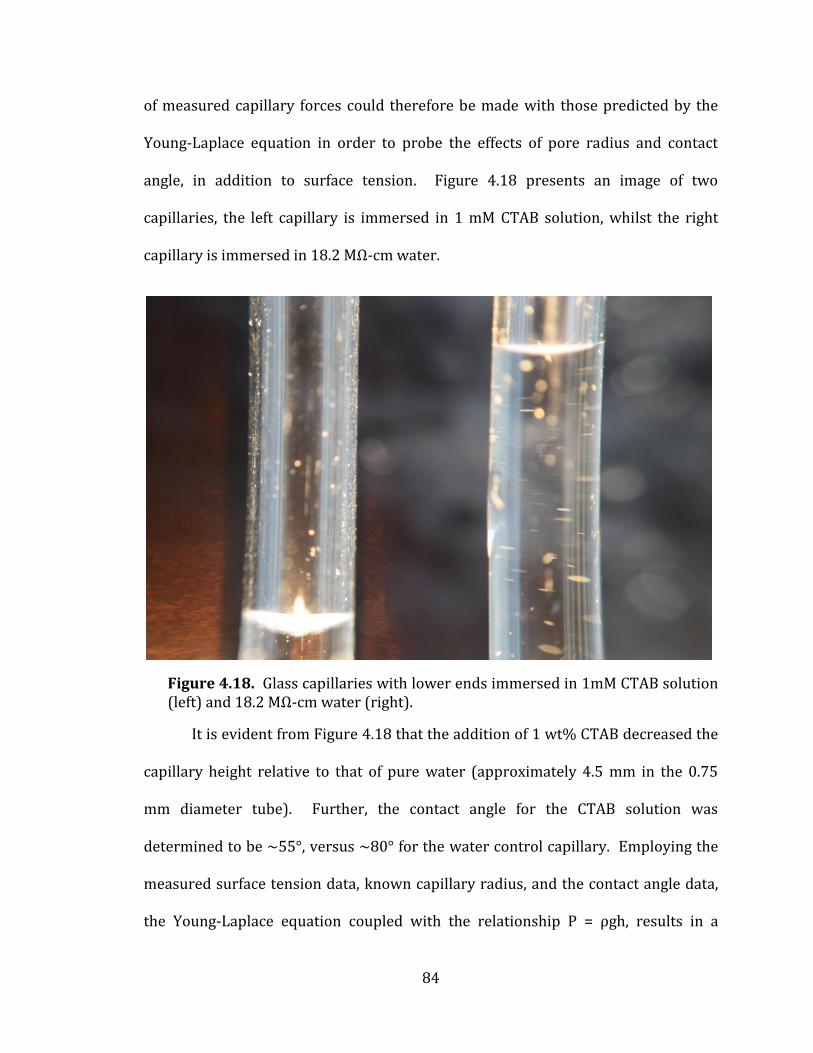
84
of measured capillary forces could therefore be made with those predicted by the
Young-Laplace equation in order to probe the effects of pore radius and contact
angle, in addition to surface tension. Figure 4.18 presents an image of two
capillaries, the left capillary is immersed in 1 mM CTAB solution, whilst the right
capillary is immersed in 18.2 MΩ-cm water.
Figure 4.18. Glass capillaries with lower ends immersed in 1mM CTAB solution (left) and 18.2 MΩ-cm water (right).
It is evident from Figure 4.18 that the addition of 1 wt% CTAB decreased the
capillary height relative to that of pure water (approximately 4.5 mm in the 0.75
mm diameter tube). Further, the contact angle for the CTAB solution was
determined to be ~55°, versus ~80° for the water control capillary. Employing the
measured surface tension data, known capillary radius, and the contact angle data,
the Young-Laplace equation coupled with the relationship P = ρgh, results in a
85
predicted capillary height difference of 4.9 mm. The actual capillary height
difference (4.5 mm) agrees within ~10%; with the error largely attributable to
experimental uncertainty. The accurate prediction of capillary height based upon
measured surface tension and contact angle implies that the effect that CTAB
exhibits in enhancing water removal is at least partially dependent upon these
parameters and by inference that the pore radius should be important according to
the Young-Laplace equation.
4.2.8. Surfactant Solution Concentration
Quantification of the concentration of CTAB in the solution phase of pulp
slurries (that is not at the air/water interface, on the fiber surface, or within the
fiber) was made through solution depletion attenuated total reflection infrared
spectroscopy (ATR-IR, see Section 3.2.2.3.). The ATR-IR data revealed that at 1wt%
addition of CTAB to a wide variety of pulps, less than 1% of the surfactant was
present in solution. It follows therefore that greater than 99% of the surfactant was
adsorbed onto or into the fiber, or was resident at the air/water interface. Since
Figure 4.14 indicates that surface tension alone does not fully govern the WRV, this
finding directs the search for the second mechanism of water removal to the fiber
itself and to the modification of the fiber by CTAB.
4.2.9. System Charge Analysis
Given that the ATR-IR data revealed that the vast majority of CTAB added to
the pulp was resident on, or within, the fiber the streaming potential and total
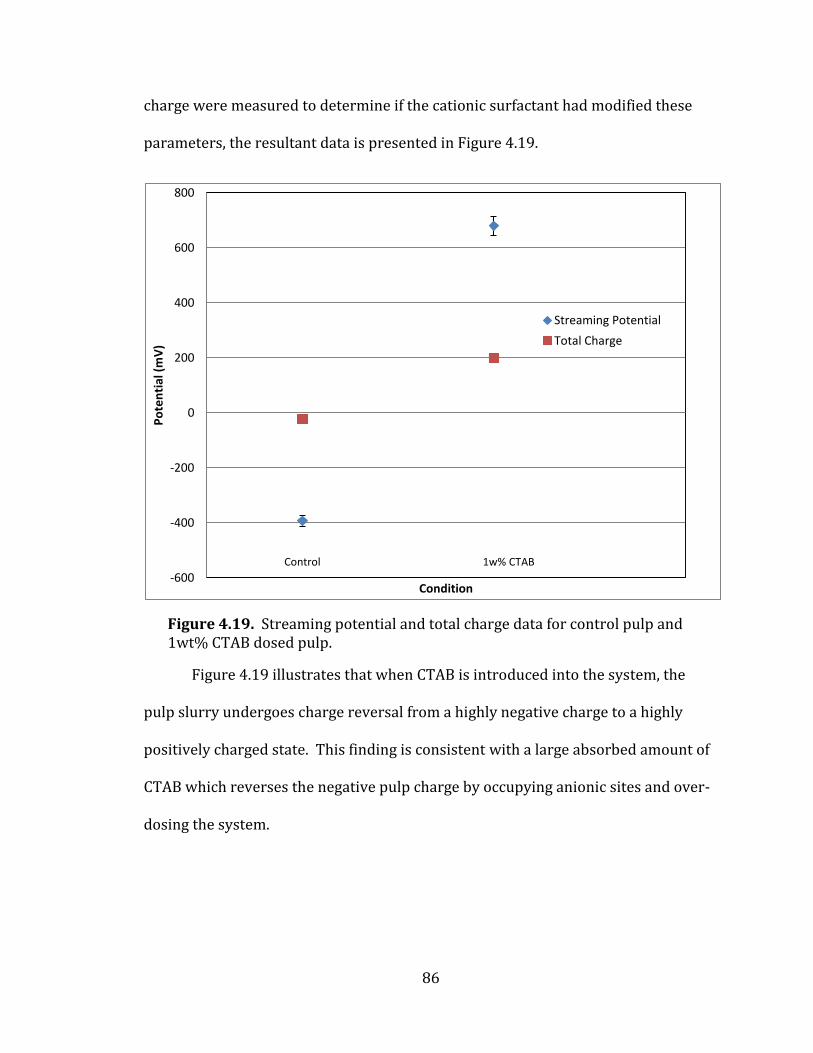
86
charge were measured to determine if the cationic surfactant had modified these
parameters, the resultant data is presented in Figure 4.19.
Figure 4.19. Streaming potential and total charge data for control pulp and 1wt% CTAB dosed pulp.
Figure 4.19 illustrates that when CTAB is introduced into the system, the
pulp slurry undergoes charge reversal from a highly negative charge to a highly
positively charged state. This finding is consistent with a large absorbed amount of
CTAB which reverses the negative pulp charge by occupying anionic sites and over-
dosing the system.
-600
-400
-200
0
200
400
600
800
Po
ten
tial
(m
V)
Condition
Streaming Potential
Total Charge
Control 1w% CTAB
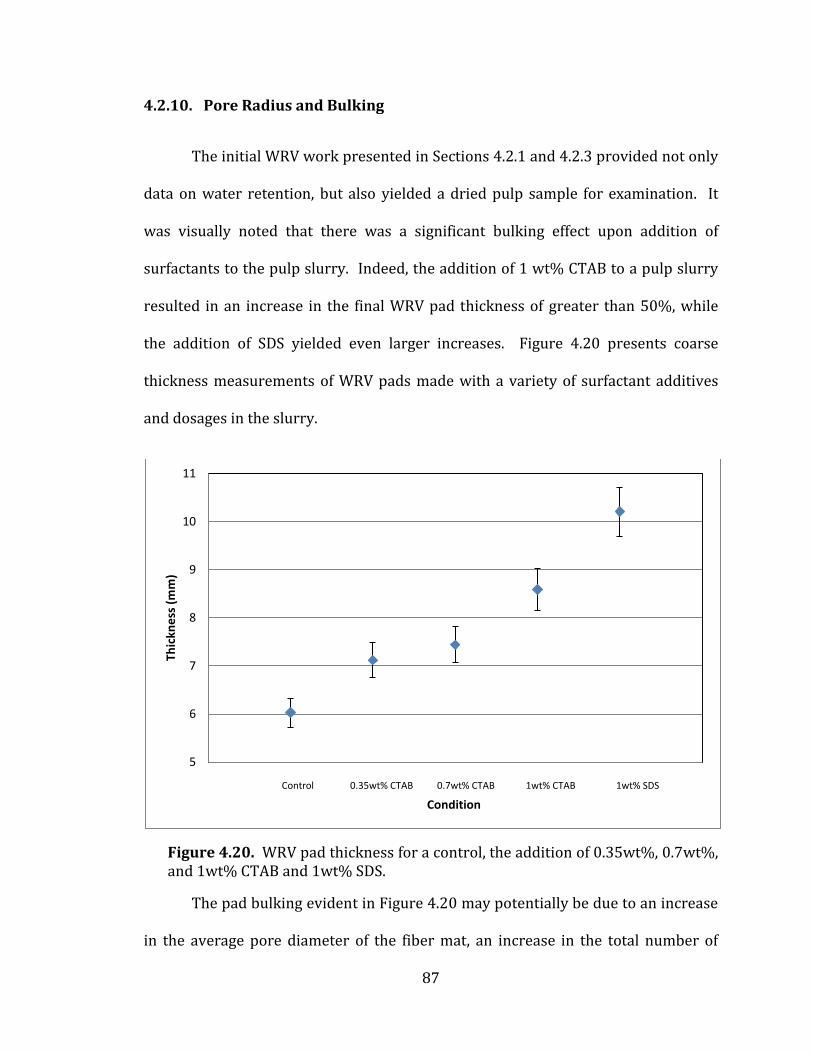
87
4.2.10. Pore Radius and Bulking
The initial WRV work presented in Sections 4.2.1 and 4.2.3 provided not only
data on water retention, but also yielded a dried pulp sample for examination. It
was visually noted that there was a significant bulking effect upon addition of
surfactants to the pulp slurry. Indeed, the addition of 1 wt% CTAB to a pulp slurry
resulted in an increase in the final WRV pad thickness of greater than 50%, while
the addition of SDS yielded even larger increases. Figure 4.20 presents coarse
thickness measurements of WRV pads made with a variety of surfactant additives
and dosages in the slurry.
Figure 4.20. WRV pad thickness for a control, the addition of 0.35wt%, 0.7wt%, and 1wt% CTAB and 1wt% SDS.
The pad bulking evident in Figure 4.20 may potentially be due to an increase
in the average pore diameter of the fiber mat, an increase in the total number of
5
6
7
8
9
10
11
0 1 2 3 4 5 6
Thic
kne
ss (
mm
)
Condition
Control 0.35wt% CTAB 0.7wt% CTAB 1wt% CTAB 1wt% SDS
88
pores, or both. The expansion was not evident in measurements of pad thickness in
the wet state; yet it was clearly evident in the dried samples. This increase in the
pore diameter and/or number of pores is attributed to electrostatic repulsion of the
CTAB coated fibers. Specifically, if the force experience by two pulp fibers that are
catatonically charged via adsorbed CTAB is modeled using Coulomb’s Law, the
origin of the expansion upon drying becomes evident. Coulomb’s Law is defined
such that q1 and q2 are two point charges, ε0 is the relative permittivity of the bulk
media, and r is the distance between them.
If one sets q1 and q2 as constant values and substitutes the assigned values
for the permittivity of air (~1 F/m) and water (~80 F/m), it is evident that the
electrostatic repulsion causing fiber separation is 80 fold in the dried state (in air)
relative to the wet state (in water), resulting in a thicker dried pad.
In order to quantify the pore structure of the dried pad, mercury porosimetry
was employed. Figure 4.21 presents a plot of Log Differential Volume vs. Log of
Pore Diameter for WRV pads created from slurries containing various CTAB dosages
during a 7 minute pulp time of recycled fiber.

89
Figure 4.21. Mercury porosimetry data plotting log differential volume versus log pore diameter of WRV pads. A control condition and the addition of 0.35wt%, 0.7wt%, and 1wt% CTAB.
Figure 4.21 indicates that an increase in CTAB dosage increases the total
number of pores in the resultant pad (as evidenced by the increase in total volume
of pores of a given size), in addition to inducing a slight shift to larger pore sizes.
The increase in both the number of pores and the shift to larger pore sizes is
consistent with the observed bulking. Although only a small portion of the bulking
observed in the dry state is expected in the wet state, an increase in the pore size
and volume is nonetheless predicted and would be expected, according to the
Young-Laplace equation, to enhance the water removal rate. It should be noted that
0.00E+00
2.00E-01
4.00E-01
6.00E-01
8.00E-01
1.00E+00
1.20E+00
0.1 1 10
Log
Dif
fere
nti
al V
olu
me
of
Me
cury
in P
ore
s (m
l/g
of
sam
ple
)
Log Pore Diameter (μm)
Control 0.35% CTAB 0.7% CTAB 1.0% CTAB
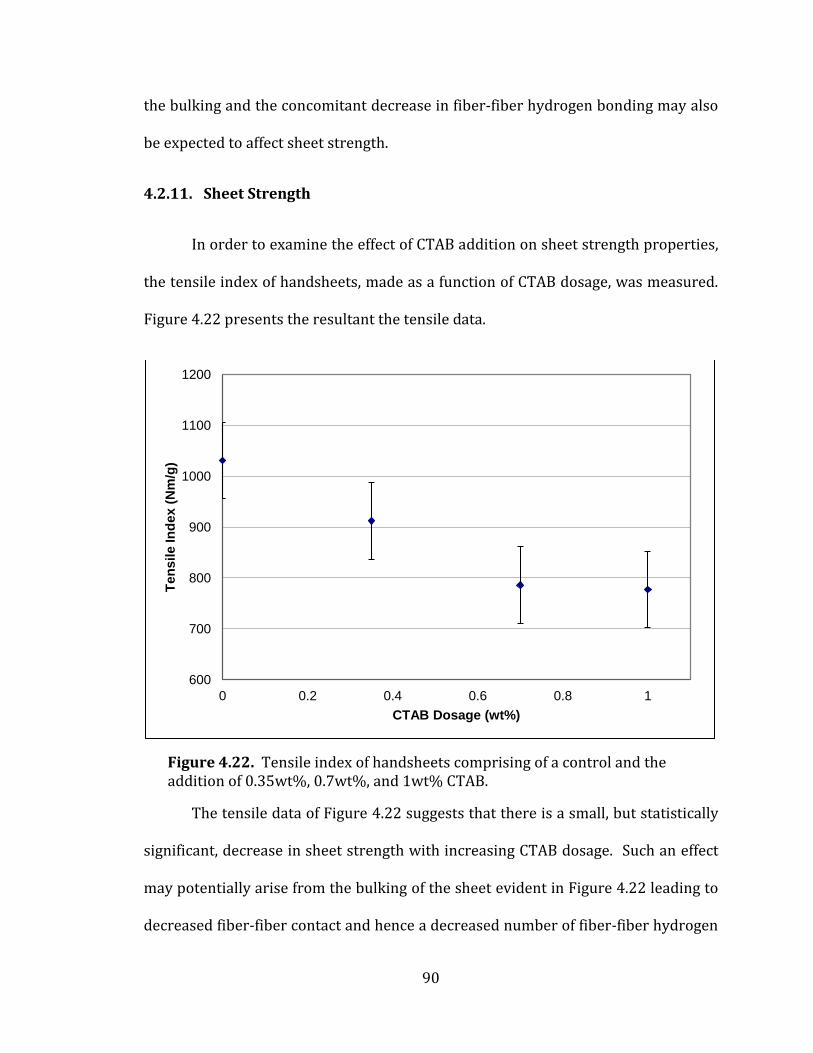
90
the bulking and the concomitant decrease in fiber-fiber hydrogen bonding may also
be expected to affect sheet strength.
4.2.11. Sheet Strength
In order to examine the effect of CTAB addition on sheet strength properties,
the tensile index of handsheets, made as a function of CTAB dosage, was measured.
Figure 4.22 presents the resultant the tensile data.
Figure 4.22. Tensile index of handsheets comprising of a control and the addition of 0.35wt%, 0.7wt%, and 1wt% CTAB.
The tensile data of Figure 4.22 suggests that there is a small, but statistically
significant, decrease in sheet strength with increasing CTAB dosage. Such an effect
may potentially arise from the bulking of the sheet evident in Figure 4.22 leading to
decreased fiber-fiber contact and hence a decreased number of fiber-fiber hydrogen
600
700
800
900
1000
1100
1200
0 0.2 0.4 0.6 0.8 1
Ten
sile In
dex (
Nm
/g)
CTAB Dosage (wt%)
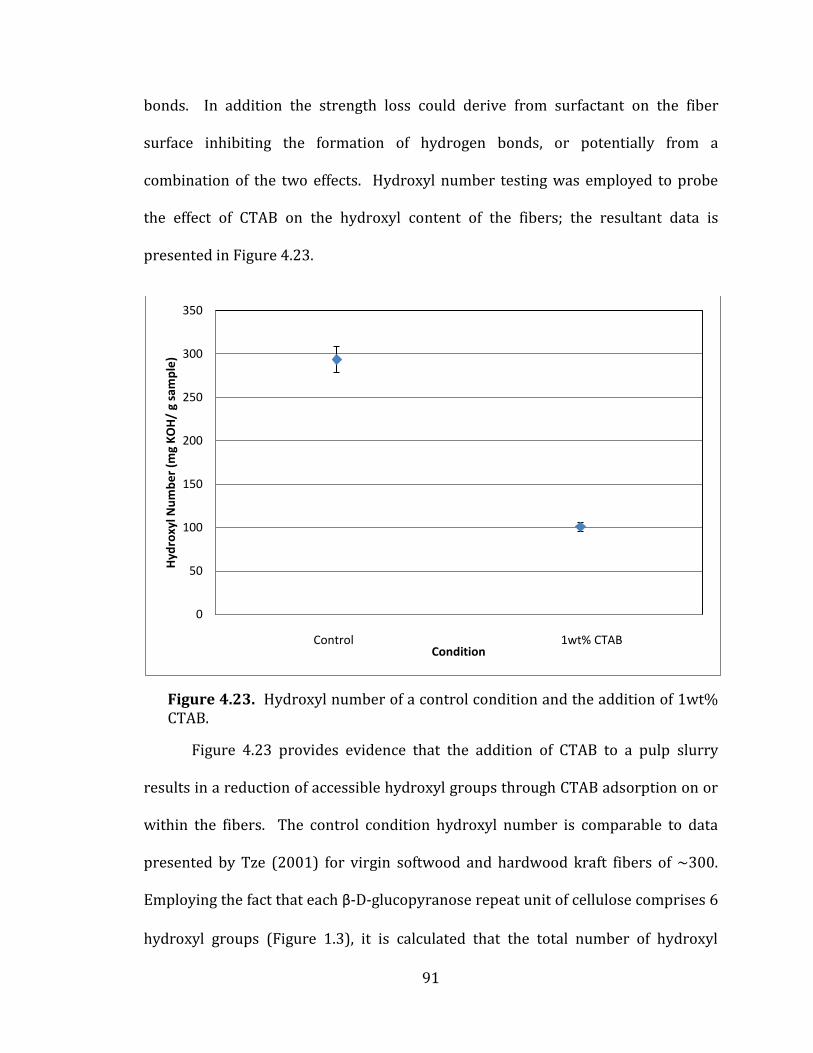
91
bonds. In addition the strength loss could derive from surfactant on the fiber
surface inhibiting the formation of hydrogen bonds, or potentially from a
combination of the two effects. Hydroxyl number testing was employed to probe
the effect of CTAB on the hydroxyl content of the fibers; the resultant data is
presented in Figure 4.23.
Figure 4.23. Hydroxyl number of a control condition and the addition of 1wt% CTAB.
Figure 4.23 provides evidence that the addition of CTAB to a pulp slurry
results in a reduction of accessible hydroxyl groups through CTAB adsorption on or
within the fibers. The control condition hydroxyl number is comparable to data
presented by Tze (2001) for virgin softwood and hardwood kraft fibers of ~300.
Employing the fact that each β-D-glucopyranose repeat unit of cellulose comprises 6
hydroxyl groups (Figure 1.3), it is calculated that the total number of hydroxyl
0
50
100
150
200
250
300
350
0 0.5 1 1.5 2 2.5 3 3.5 4
Hyd
roxy
l Nu
mb
er
(mg
KO
H/
g sa
mp
le)
Condition Control 1wt% CTAB
92
groups in the 40 grams of fiber utilized in pulp preparation is ~4.46 x 10²³. At 1
wt% addition to such a pulp slurry, a total of ~8.78 x 1025 molecules of CTAB are
present in the system. As such there are more than sufficient CTAB molecules to
occupy all the hydroxyl groups of the fiber. In addition, "Wood Chemistry:
Fundamentals and Applications" by Sjostrom (1993) states that ~30% of the
hydroxyl groups of cellulose are inaccessible (i.e. within the wood fiber wall), which
correlates with the ~40% of available hydroxyls of Figure 4.23 that were not
occupied by CTAB. These data are consistent with a reduction in the ability of the
fibers to form the extensive hydrogen bonding network necessary for sheet strength
to occur.
4.2.12. Thermogravimetric Analysis
Since a portion of the mechanism appears to derive from an effect at the fiber
surface, and/or within the fiber itself, it was hypothesized that the energetics of
bound water removal may be affected. As such, thermogravimetric analysis (TGA)
was employed to probe this possibility. Figure 4.20 presents a TGA curve of percent
weight loss of a 4wt% pulp sample as a function of heating time at a temperature of
110°C for both a control pulp and a 1wt% CTAB dosed pulp. The temperature of
110°C was chosen as most industrial paper machine operate dryer sections at
temperatures of 110°C to 120°C (Smook 2002).
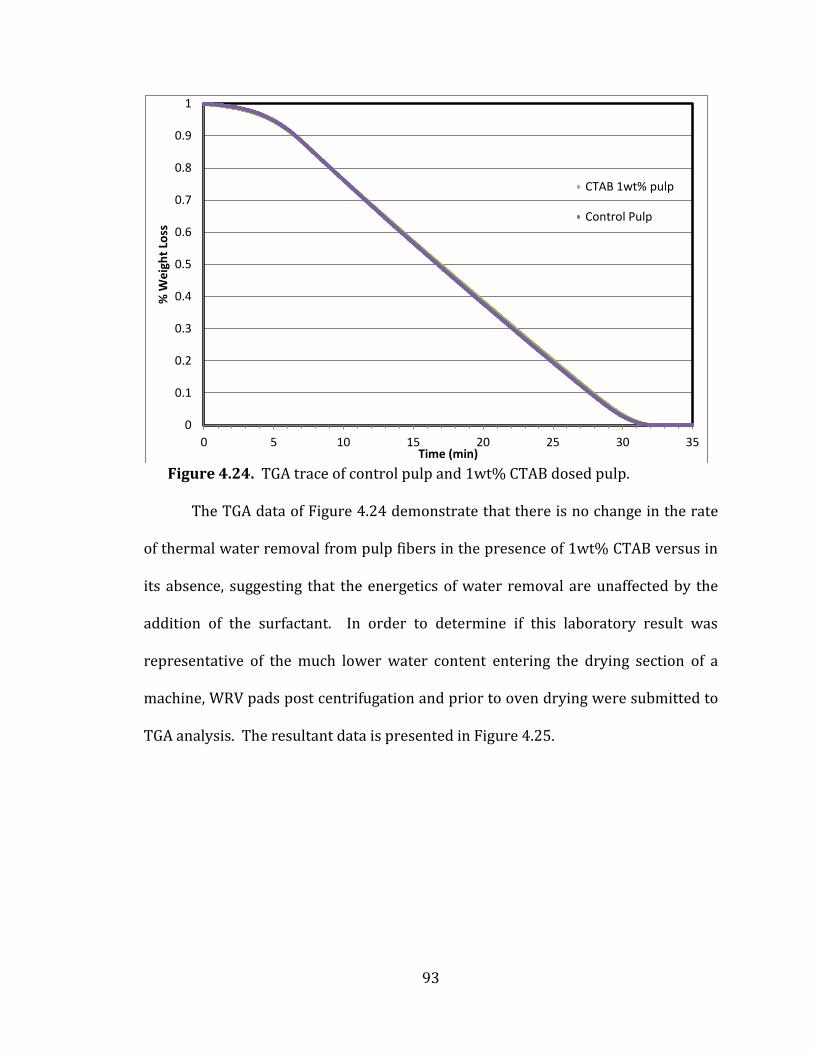
93
Figure 4.24. TGA trace of control pulp and 1wt% CTAB dosed pulp.
The TGA data of Figure 4.24 demonstrate that there is no change in the rate
of thermal water removal from pulp fibers in the presence of 1wt% CTAB versus in
its absence, suggesting that the energetics of water removal are unaffected by the
addition of the surfactant. In order to determine if this laboratory result was
representative of the much lower water content entering the drying section of a
machine, WRV pads post centrifugation and prior to oven drying were submitted to
TGA analysis. The resultant data is presented in Figure 4.25.
0
0.1
0.2
0.3
0.4
0.5
0.6
0.7
0.8
0.9
1
0 5 10 15 20 25 30 35
% W
eig
ht
Loss
Time (min)
CTAB 1wt% pulp
Control Pulp
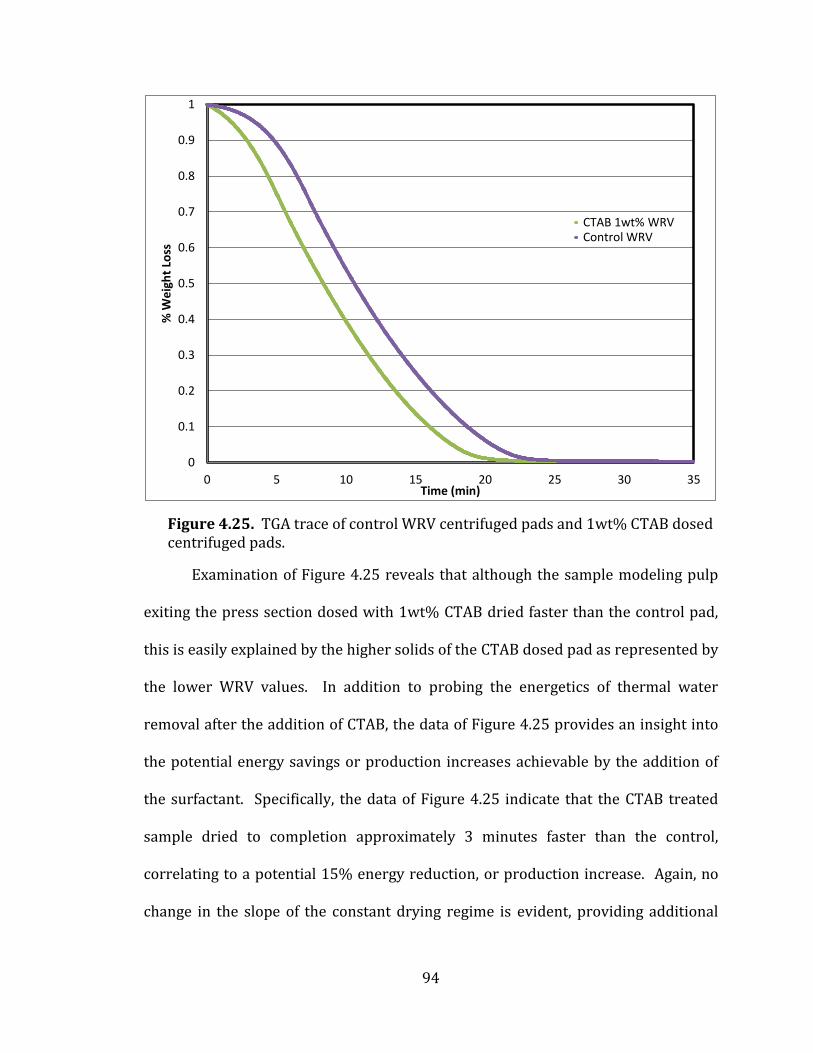
94
Figure 4.25. TGA trace of control WRV centrifuged pads and 1wt% CTAB dosed centrifuged pads.
Examination of Figure 4.25 reveals that although the sample modeling pulp
exiting the press section dosed with 1wt% CTAB dried faster than the control pad,
this is easily explained by the higher solids of the CTAB dosed pad as represented by
the lower WRV values. In addition to probing the energetics of thermal water
removal after the addition of CTAB, the data of Figure 4.25 provides an insight into
the potential energy savings or production increases achievable by the addition of
the surfactant. Specifically, the data of Figure 4.25 indicate that the CTAB treated
sample dried to completion approximately 3 minutes faster than the control,
correlating to a potential 15% energy reduction, or production increase. Again, no
change in the slope of the constant drying regime is evident, providing additional
0
0.1
0.2
0.3
0.4
0.5
0.6
0.7
0.8
0.9
1
0 5 10 15 20 25 30 35
% W
eig
ht
Loss
Time (min)
CTAB 1wt% WRV Control WRV
95
evidence that the mechanism by which CTAB is affecting the forming and pressing
sections is not related to the energetics of water removed in the dryer section.
4.3. Conclusions
The present work has developed and characterized a novel approach to the
dewatering of a cellulose fiber mat. A significant void in the literature, and
subsequent opportunity, were identified; specifically, the potential to apply
chemical means to enhance water removal. The data of Chapter 4 demonstrates
that the addition of cetyltrimethylammonium bromide (CTAB), a cationic surfactant,
to a pulp slurry significantly decreases the amount of water retained in the pulp
after drainage and pressing (examined by the water retention value test (WRV)).
Drainage was progressively increased with increasing dosage of CTAB up to a
plateau at a dosage level of 1wt% on a dry fiber basis. The effectiveness of CTAB
was demonstrated for pulps comprising a wide range of fiber types employed in
papermaking in the Northeastern United States. Employing the relationship
between WRV and the solids exiting the press section of a paper machine developed
by Busker (1984), the CTAB WRV results suggest a potential 4% improvement in
press solids. A mass balance around a hypothetical paper machine indicates that the
4% press solids correlates with a 16% increase in production rate. In order to
evaluate if the effect observed with CTAB was attributable solely to the cationic
surfactant, a slew of additives were screened with WRV testing. While some
additives demonstrated a performance enhancement in dewatering, none
approached the effectiveness of CTAB. The screening work demonstrated that the
96
reduction in surface tension induced by surfactant addition was partially, but not
wholly, responsible for the reduction in the WRV. Given that water removed in the
forming and pressing operations is governed by flow through a porous medium
(cellulose fiber mat) attention was turned to parameters affecting removal of water
from capillaries. Specifically, investigation of the Young-Laplace equation led to
examination of the effect of CTAB on the contact angle of water at the solid/liquid
interface. Measurements within capillaries demonstrated that the addition of CTAB
significantly increased the contact angle, which in turn decreased the water column
height, a finding that would improve water removal in a fibrous mat. Evaluation of
the solution concentration of CTAB revealed that vast majority of the surfactant was
resident either at the air/water interface, or on or within the fibers. Measurement
of the streaming potential and total charge of a CTAB dosed pulp slurry revealed
that CTAB was adsorbed on the cellulose fiber via observation that the previously
anionic fiber system was charged reversed to a cationic system.
Visual observations of WRV pads and handsheets made from CTAB dosed
pulps revealed that they were significantly thicker relative to controls. An
examination of the pore structure of the WRV pads was therefore undertaken.
Mercury porosimetry revealed that with the addition of CTAB, the pore structure of
the fiber mat shifted to larger pore radii with a concomitant increase in the number
of pores. The Young-Laplace equation indicates pore radius has an inverse
relationship with capillary pressure. As such, the increase in pore radii observed in
the presence of CTAB results in an enhanced rate of water removal due to a
reduction in the force holding water within fiber capillaries. The strength of CTAB
97
dosed sheets was found to be significantly decreased relative to control sheets; a
fact at least partially attributable to decreased fiber-fiber hydrogen bonding arising
from the bulking. In addition, determination of the number of available surface
hydroxyl groups on fibers revealed that in the presence of CTAB approximately 60%
of the groups were masked by the surfactant. This effect would be expected to
decrease the extent of fiber-fiber hydrogen bonding, thereby contributing to the loss
of sheet strength.
98
CHAPTER 5
IMPLEMENTATION OF CHEMICALLY ENHANCED WATER REMOVAL ON A PILOT
PAPER MACHINE
5.1. Introduction
In order to determine if the laboratory observations detailed in Chapter 4
could be scaled up, a pilot trial was designed to examine the performance of the
technology on the machine scale. The University of Maine’s Process Development
Center (PDC) has a suite of unit operations which are available for pilot testing of
papermaking processes for research and development purposes. In relation to the
present work, the PDC has stock preparation capabilities (fiber disintegration and
pulp refining) and a pilot paper machine.
The fiber employed in the pilot trials was received in one of two forms; final
product rolls (recycled directory fiber and broke), or dry lap sheets (virgin fiber).
Prior to use the fiber required rehydration (in accordance with industrial practices
and as replicated by the TAPPI disintegrator in the laboratory scale work of Chapter
4). A pilot scale hydro-pulper was employed to accomplish fiber rehydration
resulting in a pulp slurry which was reconstituted to approximately 4wt%
consistency. Once pulp slurries were prepared they were passed through a 13 inch
double disc refiner operating at approximately 1100 rpm. The refining imparted 0.8
J/m of energy into the fiber slurry, resulting in fiber fibrillation in order to promote
bonding and sheet strength. However, it should be noted that refining and the
resultant fibrillation of fibers increases their water holding capability. The stock
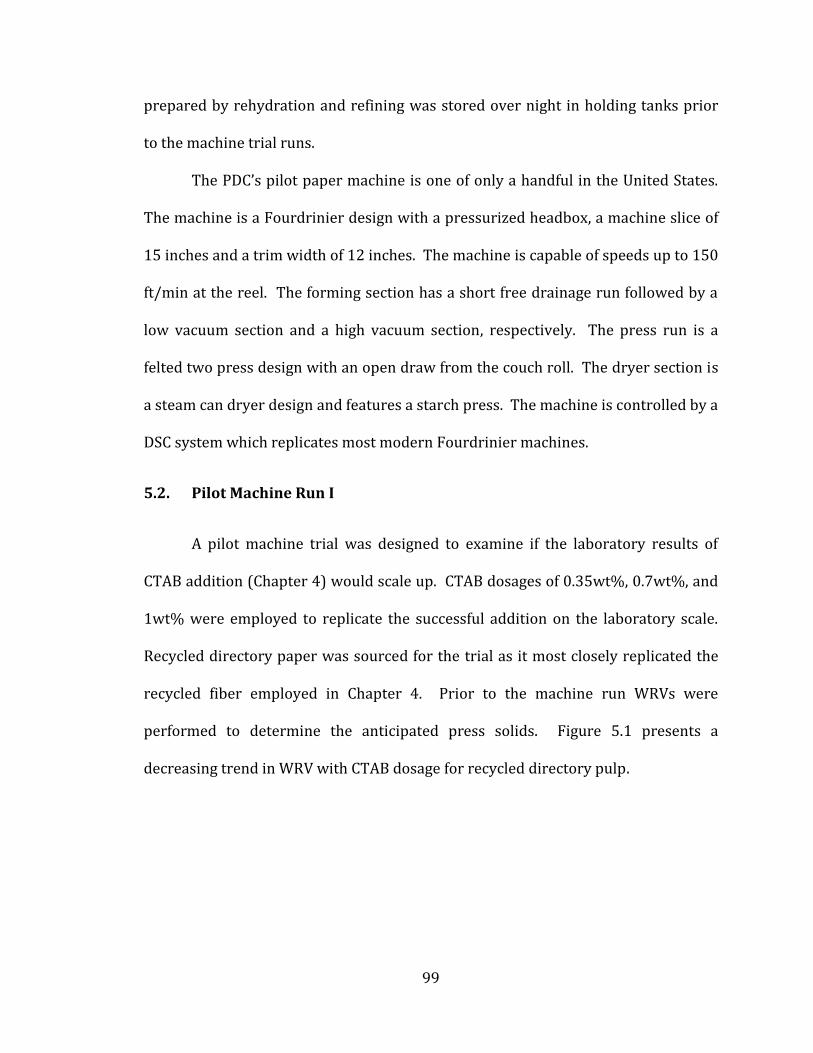
99
prepared by rehydration and refining was stored over night in holding tanks prior
to the machine trial runs.
The PDC’s pilot paper machine is one of only a handful in the United States.
The machine is a Fourdrinier design with a pressurized headbox, a machine slice of
15 inches and a trim width of 12 inches. The machine is capable of speeds up to 150
ft/min at the reel. The forming section has a short free drainage run followed by a
low vacuum section and a high vacuum section, respectively. The press run is a
felted two press design with an open draw from the couch roll. The dryer section is
a steam can dryer design and features a starch press. The machine is controlled by a
DSC system which replicates most modern Fourdrinier machines.
5.2. Pilot Machine Run I
A pilot machine trial was designed to examine if the laboratory results of
CTAB addition (Chapter 4) would scale up. CTAB dosages of 0.35wt%, 0.7wt%, and
1wt% were employed to replicate the successful addition on the laboratory scale.
Recycled directory paper was sourced for the trial as it most closely replicated the
recycled fiber employed in Chapter 4. Prior to the machine run WRVs were
performed to determine the anticipated press solids. Figure 5.1 presents a
decreasing trend in WRV with CTAB dosage for recycled directory pulp.
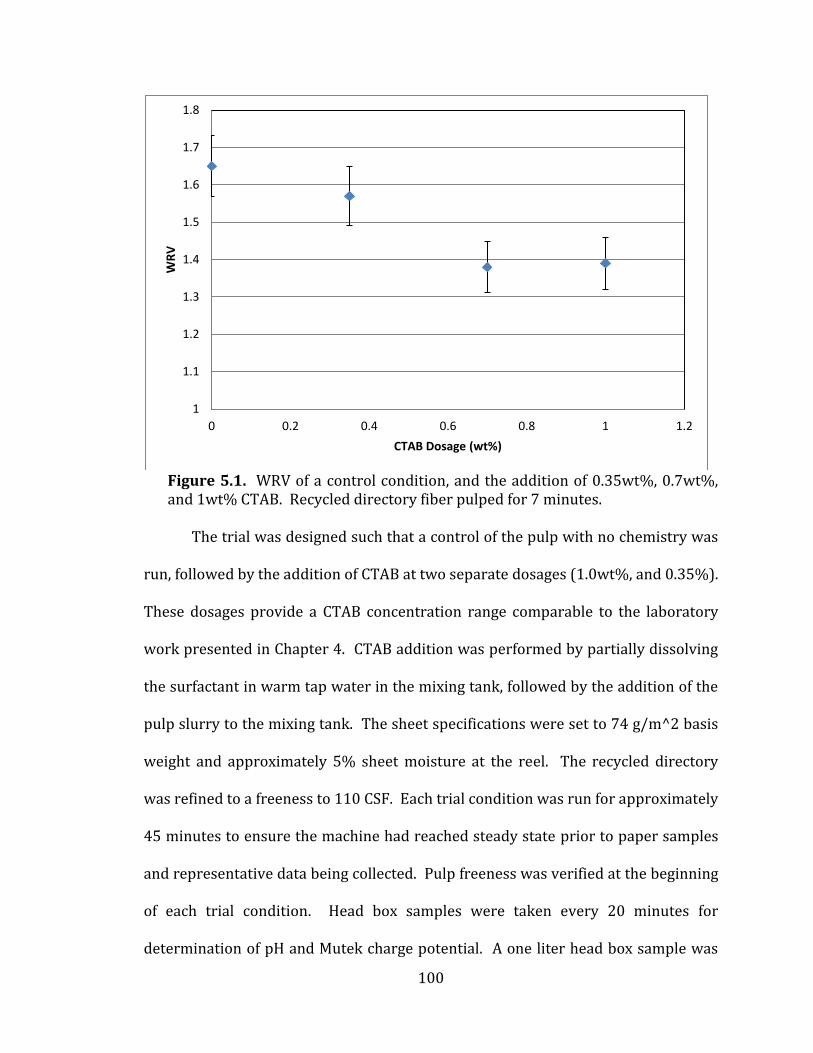
100
Figure 5.1. WRV of a control condition, and the addition of 0.35wt%, 0.7wt%, and 1wt% CTAB. Recycled directory fiber pulped for 7 minutes.
The trial was designed such that a control of the pulp with no chemistry was
run, followed by the addition of CTAB at two separate dosages (1.0wt%, and 0.35%).
These dosages provide a CTAB concentration range comparable to the laboratory
work presented in Chapter 4. CTAB addition was performed by partially dissolving
the surfactant in warm tap water in the mixing tank, followed by the addition of the
pulp slurry to the mixing tank. The sheet specifications were set to 74 g/m^2 basis
weight and approximately 5% sheet moisture at the reel. The recycled directory
was refined to a freeness to 110 CSF. Each trial condition was run for approximately
45 minutes to ensure the machine had reached steady state prior to paper samples
and representative data being collected. Pulp freeness was verified at the beginning
of each trial condition. Head box samples were taken every 20 minutes for
determination of pH and Mutek charge potential. A one liter head box sample was
1
1.1
1.2
1.3
1.4
1.5
1.6
1.7
1.8
0 0.2 0.4 0.6 0.8 1 1.2
WR
V
CTAB Dosage (wt%)
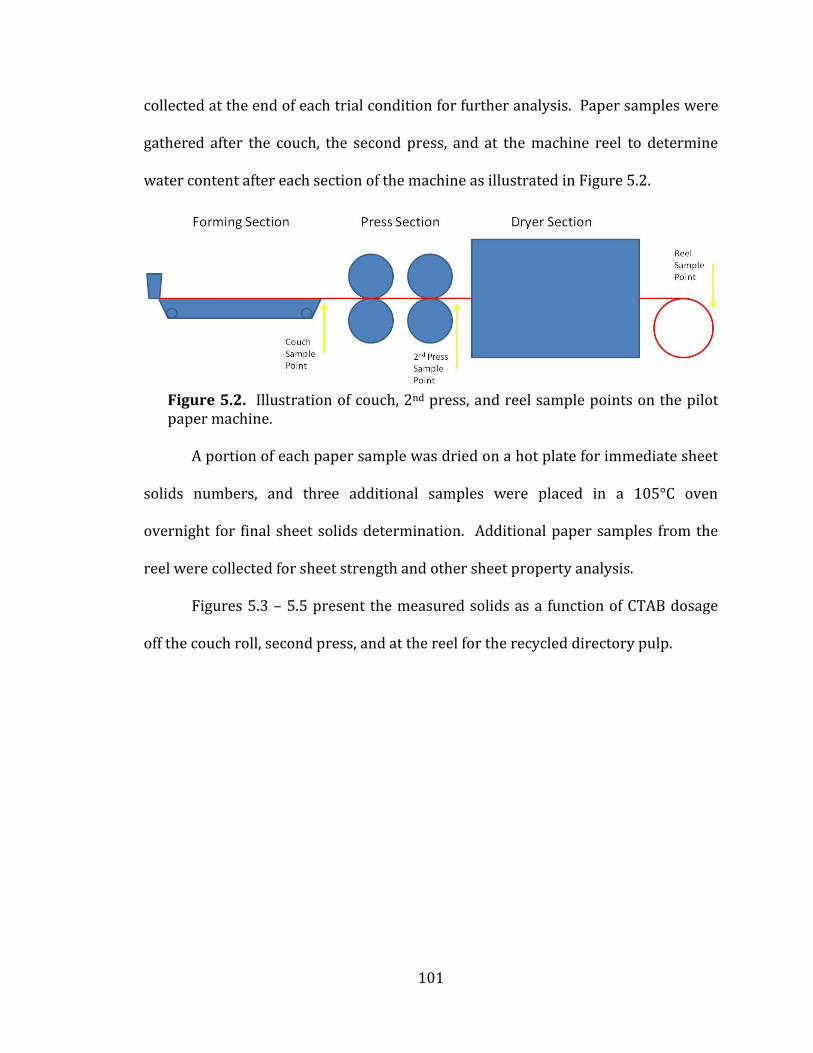
101
collected at the end of each trial condition for further analysis. Paper samples were
gathered after the couch, the second press, and at the machine reel to determine
water content after each section of the machine as illustrated in Figure 5.2.
Figure 5.2. Illustration of couch, 2nd press, and reel sample points on the pilot paper machine.
A portion of each paper sample was dried on a hot plate for immediate sheet
solids numbers, and three additional samples were placed in a 105°C oven
overnight for final sheet solids determination. Additional paper samples from the
reel were collected for sheet strength and other sheet property analysis.
Figures 5.3 – 5.5 present the measured solids as a function of CTAB dosage
off the couch roll, second press, and at the reel for the recycled directory pulp.
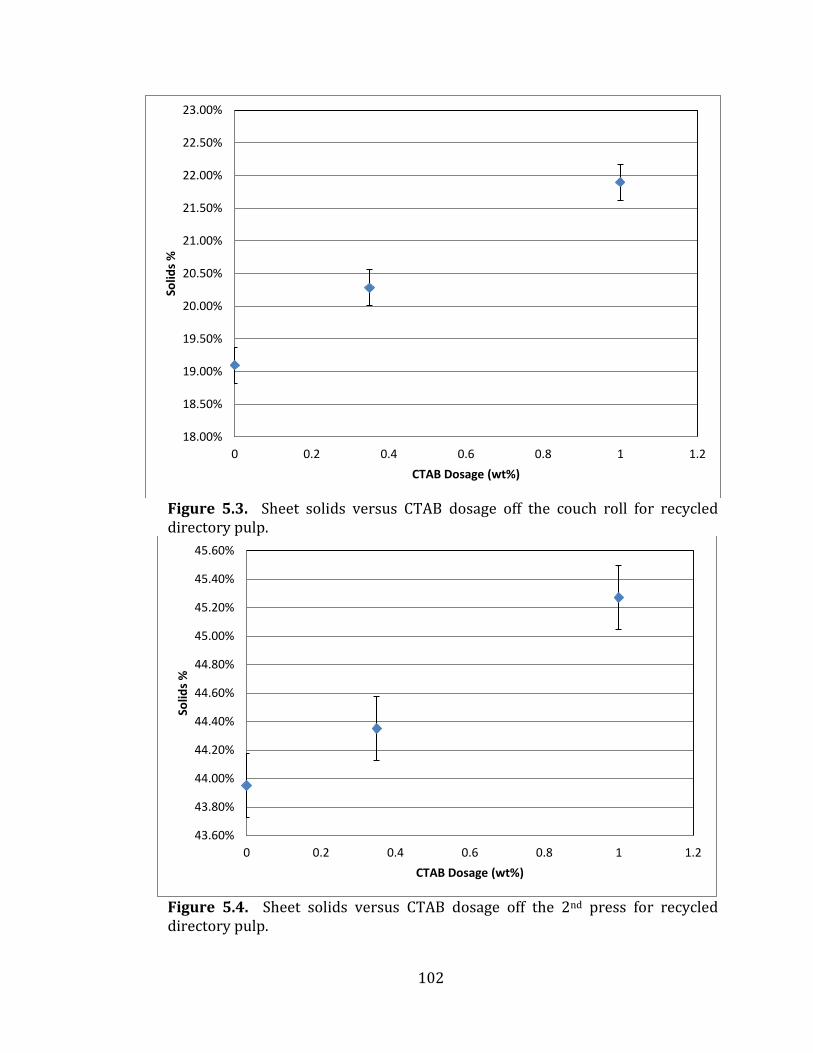
102
Figure 5.3. Sheet solids versus CTAB dosage off the couch roll for recycled directory pulp.
Figure 5.4. Sheet solids versus CTAB dosage off the 2nd press for recycled directory pulp.
18.00%
18.50%
19.00%
19.50%
20.00%
20.50%
21.00%
21.50%
22.00%
22.50%
23.00%
0 0.2 0.4 0.6 0.8 1 1.2
Solid
s %
CTAB Dosage (wt%)
43.60%
43.80%
44.00%
44.20%
44.40%
44.60%
44.80%
45.00%
45.20%
45.40%
45.60%
0 0.2 0.4 0.6 0.8 1 1.2
Solid
s %
CTAB Dosage (wt%)
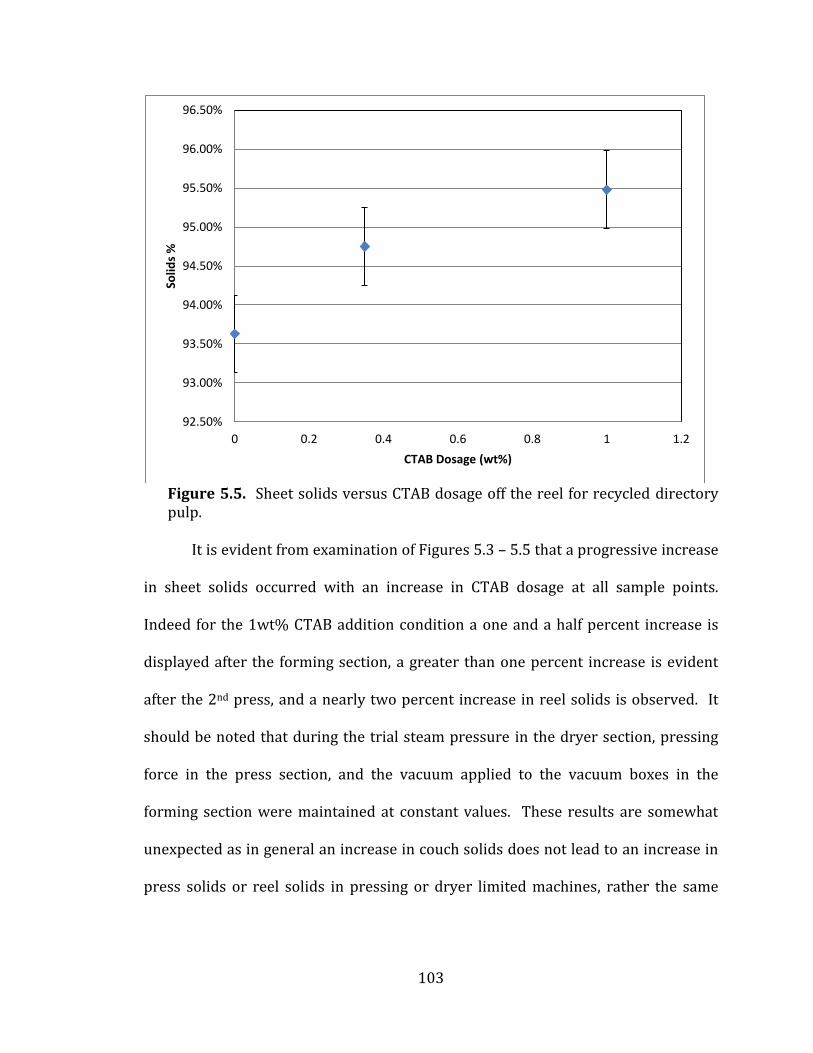
103
Figure 5.5. Sheet solids versus CTAB dosage off the reel for recycled directory pulp.
It is evident from examination of Figures 5.3 – 5.5 that a progressive increase
in sheet solids occurred with an increase in CTAB dosage at all sample points.
Indeed for the 1wt% CTAB addition condition a one and a half percent increase is
displayed after the forming section, a greater than one percent increase is evident
after the 2nd press, and a nearly two percent increase in reel solids is observed. It
should be noted that during the trial steam pressure in the dryer section, pressing
force in the press section, and the vacuum applied to the vacuum boxes in the
forming section were maintained at constant values. These results are somewhat
unexpected as in general an increase in couch solids does not lead to an increase in
press solids or reel solids in pressing or dryer limited machines, rather the same
92.50%
93.00%
93.50%
94.00%
94.50%
95.00%
95.50%
96.00%
96.50%
0 0.2 0.4 0.6 0.8 1 1.2
Solid
s %
CTAB Dosage (wt%)
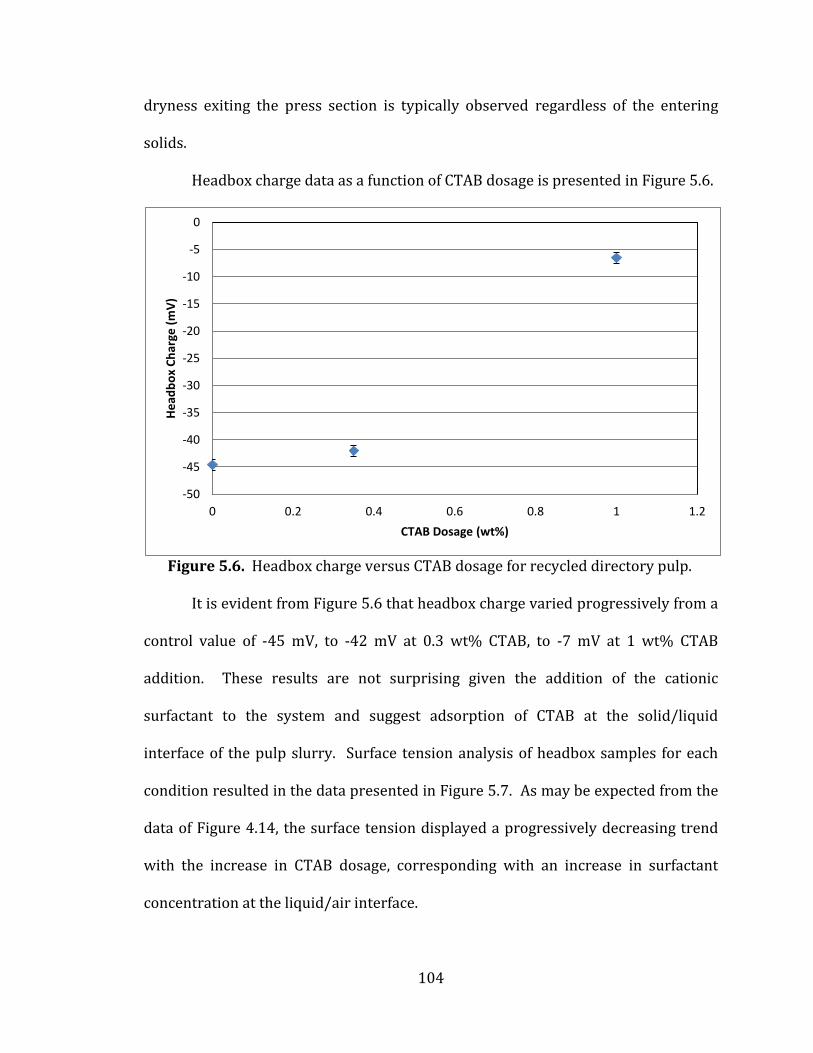
104
dryness exiting the press section is typically observed regardless of the entering
solids.
Headbox charge data as a function of CTAB dosage is presented in Figure 5.6.
Figure 5.6. Headbox charge versus CTAB dosage for recycled directory pulp.
It is evident from Figure 5.6 that headbox charge varied progressively from a
control value of -45 mV, to -42 mV at 0.3 wt% CTAB, to -7 mV at 1 wt% CTAB
addition. These results are not surprising given the addition of the cationic
surfactant to the system and suggest adsorption of CTAB at the solid/liquid
interface of the pulp slurry. Surface tension analysis of headbox samples for each
condition resulted in the data presented in Figure 5.7. As may be expected from the
data of Figure 4.14, the surface tension displayed a progressively decreasing trend
with the increase in CTAB dosage, corresponding with an increase in surfactant
concentration at the liquid/air interface.
-50
-45
-40
-35
-30
-25
-20
-15
-10
-5
0
0 0.2 0.4 0.6 0.8 1 1.2
He
adb
ox
Ch
arge
(m
V)
CTAB Dosage (wt%)
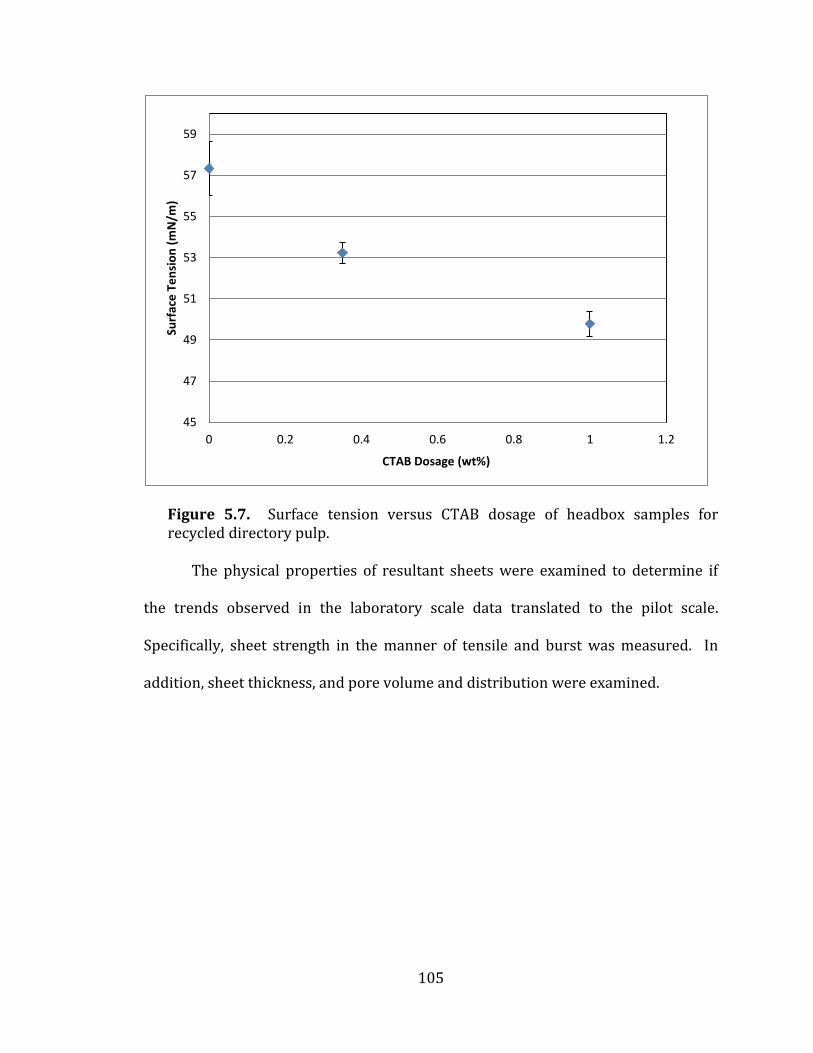
105
Figure 5.7. Surface tension versus CTAB dosage of headbox samples for recycled directory pulp.
The physical properties of resultant sheets were examined to determine if
the trends observed in the laboratory scale data translated to the pilot scale.
Specifically, sheet strength in the manner of tensile and burst was measured. In
addition, sheet thickness, and pore volume and distribution were examined.
45
47
49
51
53
55
57
59
0 0.2 0.4 0.6 0.8 1 1.2
Surf
ace
Te
nsi
on
(m
N/m
)
CTAB Dosage (wt%)

106
Figure 5.8. Sheet tensile versus CTAB dosage for recycled directory pulp.
Figure 5.8 presents a decrease in tensile strength of sheets as a function of
increased CTAB addition. Specifically, the data demonstrates that the sheet lost
nearly three lbf of strength at the highest dosage of CTAB (1 wt%). Consequently,
the sheet burst strength was examined, the results of which are presented in Figure
5.9. A comparable trend to that observed for sheet tensile is evident in the sheet
burst strength data.
10
11
12
13
14
15
16
17
18
19
20
0 0.2 0.4 0.6 0.8 1 1.2
Ten
sile
Fo
rce
(lb
f)
CTAB Dosage (wt%)
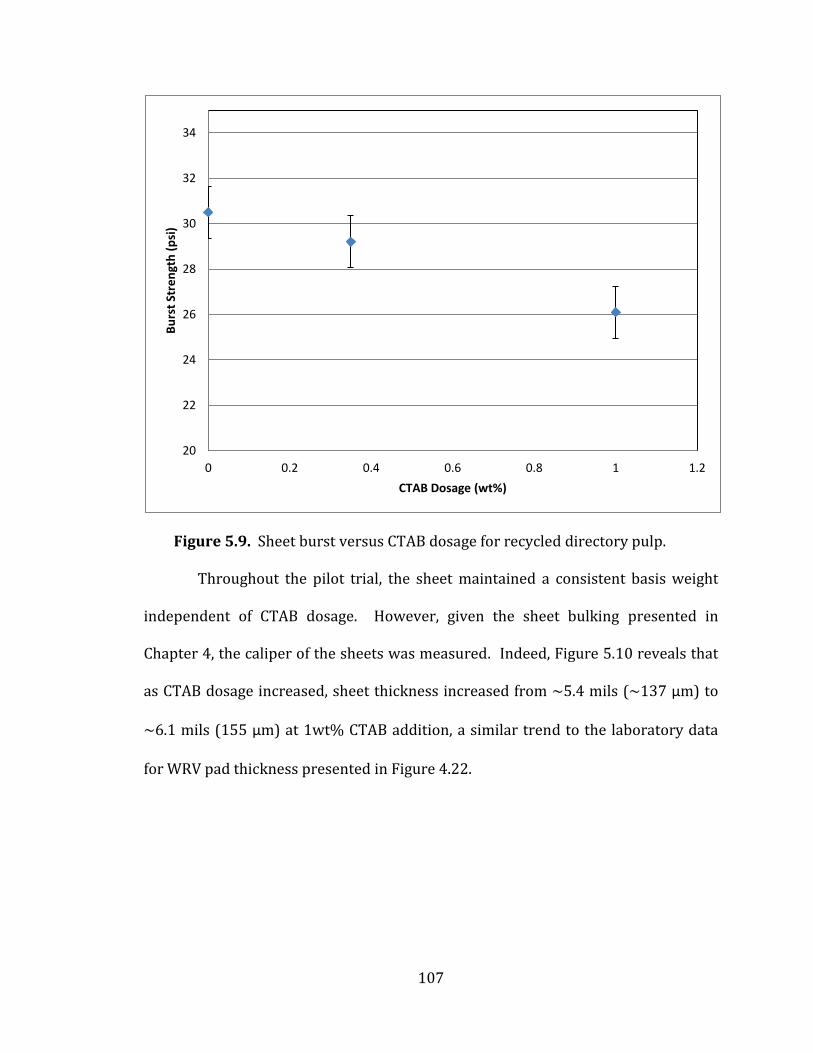
107
Figure 5.9. Sheet burst versus CTAB dosage for recycled directory pulp.
Throughout the pilot trial, the sheet maintained a consistent basis weight
independent of CTAB dosage. However, given the sheet bulking presented in
Chapter 4, the caliper of the sheets was measured. Indeed, Figure 5.10 reveals that
as CTAB dosage increased, sheet thickness increased from ~5.4 mils (~137 μm) to
~6.1 mils (155 μm) at 1wt% CTAB addition, a similar trend to the laboratory data
for WRV pad thickness presented in Figure 4.22.
20
22
24
26
28
30
32
34
0 0.2 0.4 0.6 0.8 1 1.2
Bu
rst
Stre
ngt
h (
psi
)
CTAB Dosage (wt%)
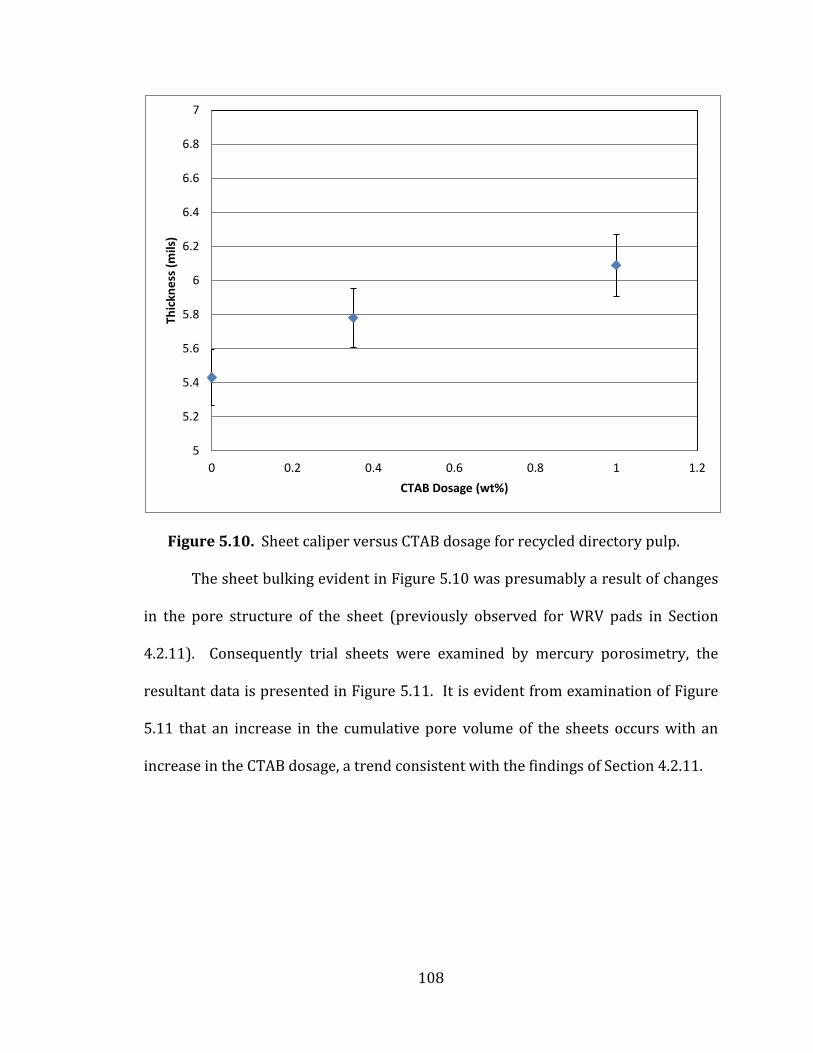
108
Figure 5.10. Sheet caliper versus CTAB dosage for recycled directory pulp.
The sheet bulking evident in Figure 5.10 was presumably a result of changes
in the pore structure of the sheet (previously observed for WRV pads in Section
4.2.11). Consequently trial sheets were examined by mercury porosimetry, the
resultant data is presented in Figure 5.11. It is evident from examination of Figure
5.11 that an increase in the cumulative pore volume of the sheets occurs with an
increase in the CTAB dosage, a trend consistent with the findings of Section 4.2.11.
5
5.2
5.4
5.6
5.8
6
6.2
6.4
6.6
6.8
7
0 0.2 0.4 0.6 0.8 1 1.2
Thic
kne
ss (
mils
)
CTAB Dosage (wt%)

109
Figure 5.12. Sheet cumulative pore volume versus CTAB dosage for recycled directory pulp.
The trial results demonstrate on the pilot scale that the addition of CTAB to a
pulp slurry enhances water removal in the paper making process. Indeed all trends
observed from the laboratory study (Chapter 4) were successfully scaled to the pilot
machine. Enhanced water removal was demonstrated in both forming and pressing
sections, the headbox charge was decreased, as was bond strength of the sheet. In
addition, the bulking and change in pore structure observed on the bench scale were
replicated on the pilot scale.
5.3. Pilot Machine Run II
A second pilot scale machine trial was designed and implemented to examine
two separate aspects of chemically enhanced water removal, scale up of the dual
0
0.2
0.4
0.6
0.8
1
1.2
1.4
1 10 100 1000 10000 100000 1000000
Cu
mu
lati
ve P
ore
Vo
lum
e (
mL/
g)
Log Pore Diameter (nm)
Trial 1.0wt% CTAB
Trial 0.35wt% CTAB
Trial Control Run
110
addition of CTAB and the Telioform system; and optimization of the addition points
of CTAB when used as the sole additive. The two day trial was structured such that
the scale up feasibility of CTAB and Telioform co-addition was performed the first
day, and examination of the effect of CTAB addition point was performed the second
day. Critically, the trial was configured to document enhanced dewatering through
quantification of production rate increases by running the machine in a dryer
limited state and manipulating speed whilst maintaining reel solids of ~95%. If
enhanced dewatering occurred in the forming and/or pressing section, the water
load into the dryer section would decrease and machine speed could be increased to
reinstate a dryer limited scenario. Such an eventuality would result in an increase
in production. As such, machine speed/production was employed to quantify the
effect of enhanced dewatering.
The sheet specifications were set to 89 g/m2 basis weight and approximately
5% sheet moisture at the reel. Pulp was refined to ~300 CSF and the freeness was
verified at the beginning of each trial condition. Head box samples were taken every
20 minutes for the determination of pH and Mutek streaming potential and total
charge. Additional head box samples were acquired at each solids sample point to
provide a correlated wet end sample for future testing. A one liter head box sample
was collected at the end of each trial condition for further laboratory analysis.
Paper samples were gathered after the couch, the second press, and at the machine
reel to determine water content at each section of the machine. A portion of each
paper sample was dried on a hot plate for immediate sheet solids numbers, and
three additional samples were collected and placed overnight in a 105°C oven for
111
final sheet solids content. Additional samples from the reel were acquired to
determine sheet strength and perform other sheet property analysis.
The furnish for the Telioform/CTAB slurry was comprised of 70% Sappi Co-
Pulp and 30% Twin Rivers Paper single side coated broke. The broke was included
in order to provide ash content to the sheet and better represent a commercial
furnish. In addition, the presence of ash in the sheet allowed the monitoring of the
retention efficiency of the Telioform system (drainage, forming, and retention aid).
Figures 5.12 – 5.14 present sheet solids as a function of trial conditions off the
couch, the 2nd press, and at the reel, respectively. The four conditions were a control
with no added chemistries, Telioform only addition, CTAB addition followed by
Telioform addition, and a CTAB addition only. CTAB addition was performed by
introducing the additive in the machine chest. The machine speeds at each
condition were as follows; control and CTAB only, 50 ft/min, and both Telioform
and Telioform/CTAB, 45 ft/min. When the Telioform system was employed
machine speeds had to be decreased in order to maintain the target sheet moisture
at the reel.
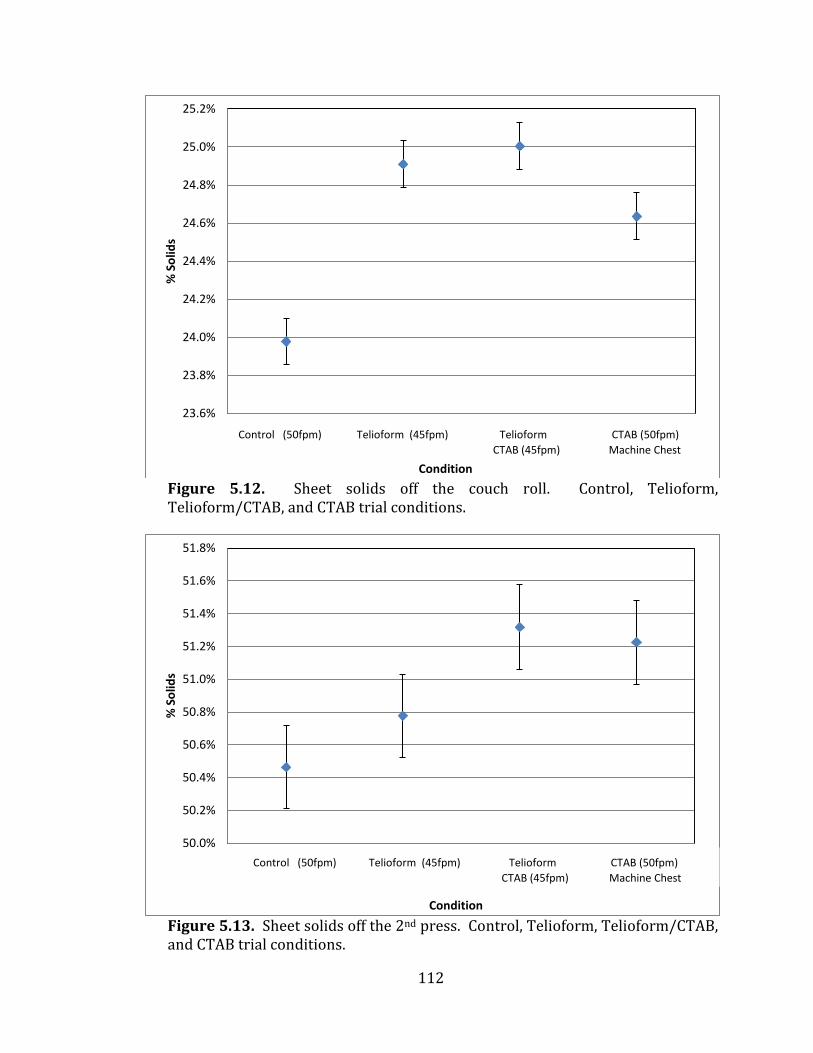
112
Figure 5.12. Sheet solids off the couch roll. Control, Telioform, Telioform/CTAB, and CTAB trial conditions.
Figure 5.13. Sheet solids off the 2nd press. Control, Telioform, Telioform/CTAB, and CTAB trial conditions.
23.6%
23.8%
24.0%
24.2%
24.4%
24.6%
24.8%
25.0%
25.2%
50 100 150 200 250 300 350 400 450
% S
olid
s
Condition
Control (50fpm) Telioform (45fpm) Telioform CTAB (50fpm)
CTAB (45fpm) Machine Chest
50.0%
50.2%
50.4%
50.6%
50.8%
51.0%
51.2%
51.4%
51.6%
51.8%
50 100 150 200 250 300 350 400 450
% S
olid
s
Condition
Control (50fpm) Telioform (45fpm) Telioform CTAB (50fpm)
CTAB (45fpm) Machine Chest

113
Figure 5.14. Sheet solids off the reel. Control, Telioform, Telioform/CTAB, and CTAB trial conditions.
It is evident from Figure 5.12 that for trial conditions of Telioform and
Telioform/CTAB, greater water retention in the sheet occurred in the forming and
pressing sections versus the control, as is indicated by the need to decrease machine
speed by 5 fpm to maintain reel solids. It is noted that this finding is contrary to
results seen in WRV testing presented in Figure 4.16 and is likely attributable to the
fact that addition of retention chemistry to the machine furnish increases the
retention of fines in the forming sheet resulting in greater water retention. The
laboratory scale results presented in Figure 4.16 were performed on recycled fibers
and did not included a coated broke component.
95.4%
95.6%
95.8%
96.0%
96.2%
96.4%
96.6%
96.8%
97.0%
97.2%
50 100 150 200 250 300 350 400 450
% S
olid
s
Condition
Control (50fpm) Telioform (45fpm) Telioform CTAB (50fpm)
CTAB (45fpm) Machine Chest
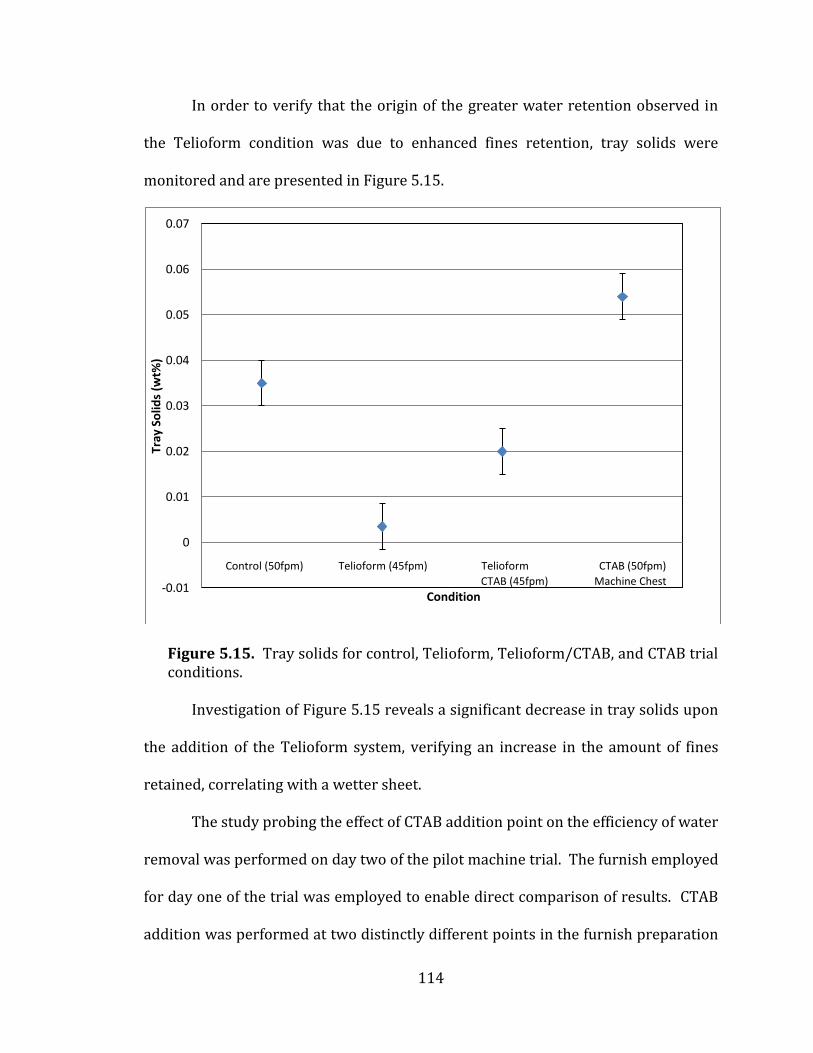
114
In order to verify that the origin of the greater water retention observed in
the Telioform condition was due to enhanced fines retention, tray solids were
monitored and are presented in Figure 5.15.
Figure 5.15. Tray solids for control, Telioform, Telioform/CTAB, and CTAB trial conditions.
Investigation of Figure 5.15 reveals a significant decrease in tray solids upon
the addition of the Telioform system, verifying an increase in the amount of fines
retained, correlating with a wetter sheet.
The study probing the effect of CTAB addition point on the efficiency of water
removal was performed on day two of the pilot machine trial. The furnish employed
for day one of the trial was employed to enable direct comparison of results. CTAB
addition was performed at two distinctly different points in the furnish preparation
-0.01
0
0.01
0.02
0.03
0.04
0.05
0.06
0.07
Tray
So
lids
(wt%
)
Condition
Control (50fpm) Telioform (45fpm) Telioform CTAB (50fpm)
CTAB (45fpm) Machine Chest
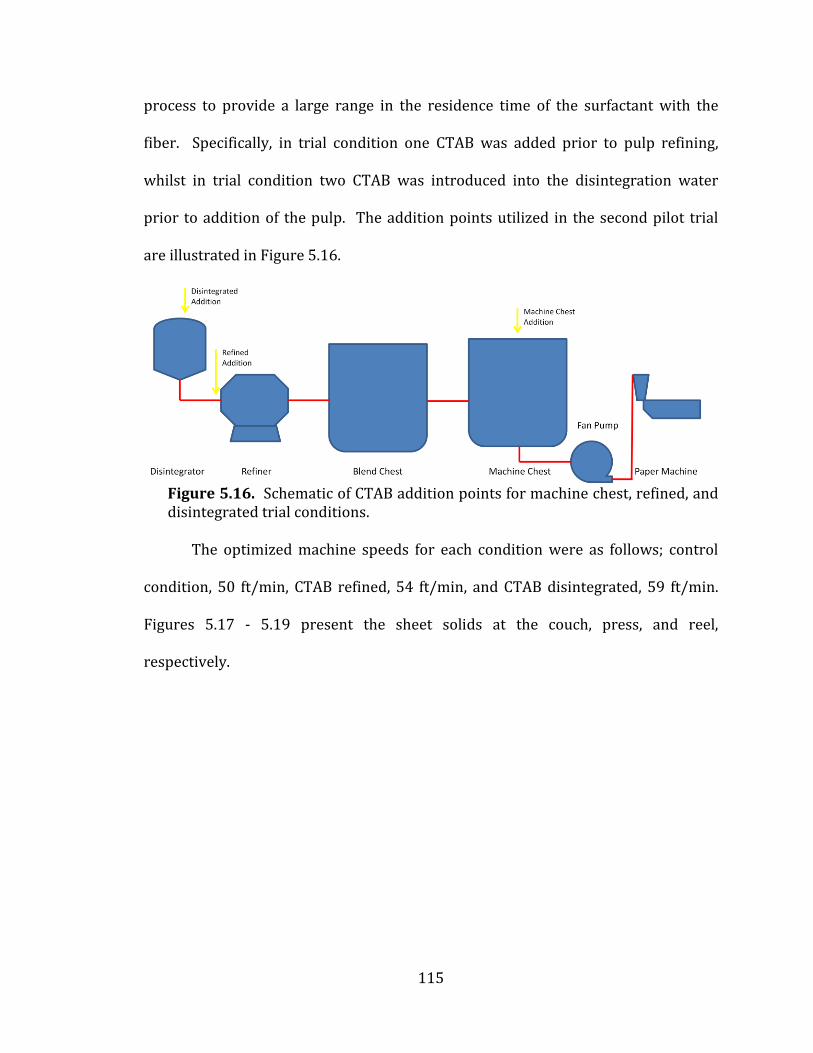
115
process to provide a large range in the residence time of the surfactant with the
fiber. Specifically, in trial condition one CTAB was added prior to pulp refining,
whilst in trial condition two CTAB was introduced into the disintegration water
prior to addition of the pulp. The addition points utilized in the second pilot trial
are illustrated in Figure 5.16.
Figure 5.16. Schematic of CTAB addition points for machine chest, refined, and disintegrated trial conditions.
The optimized machine speeds for each condition were as follows; control
condition, 50 ft/min, CTAB refined, 54 ft/min, and CTAB disintegrated, 59 ft/min.
Figures 5.17 - 5.19 present the sheet solids at the couch, press, and reel,
respectively.
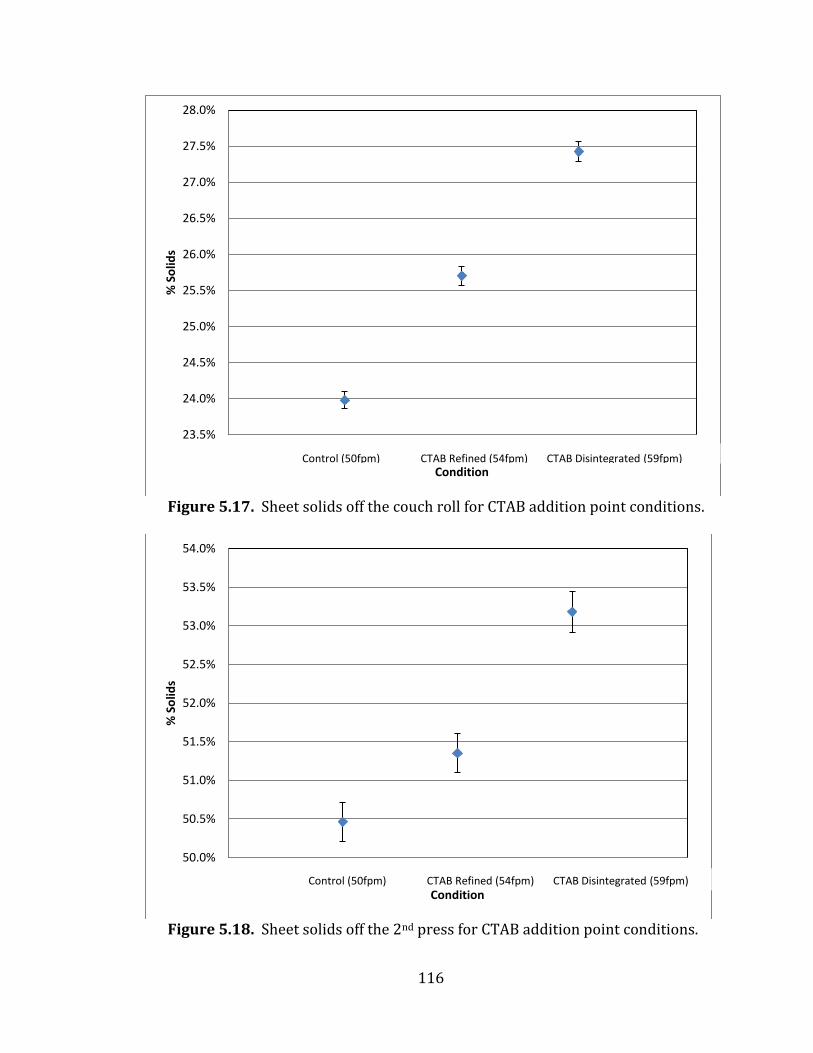
116
Figure 5.17. Sheet solids off the couch roll for CTAB addition point conditions.
Figure 5.18. Sheet solids off the 2nd press for CTAB addition point conditions.
23.5%
24.0%
24.5%
25.0%
25.5%
26.0%
26.5%
27.0%
27.5%
28.0%
0 50 100 150 200 250 300 350 400
% S
olid
s
Condition Control (50fpm) CTAB Refined (54fpm) CTAB Disintegrated (59fpm)
50.0%
50.5%
51.0%
51.5%
52.0%
52.5%
53.0%
53.5%
54.0%
0 50 100 150 200 250 300 350 400
% S
olid
s
Condition Control (50fpm) CTAB Refined (54fpm) CTAB Disintegrated (59fpm)
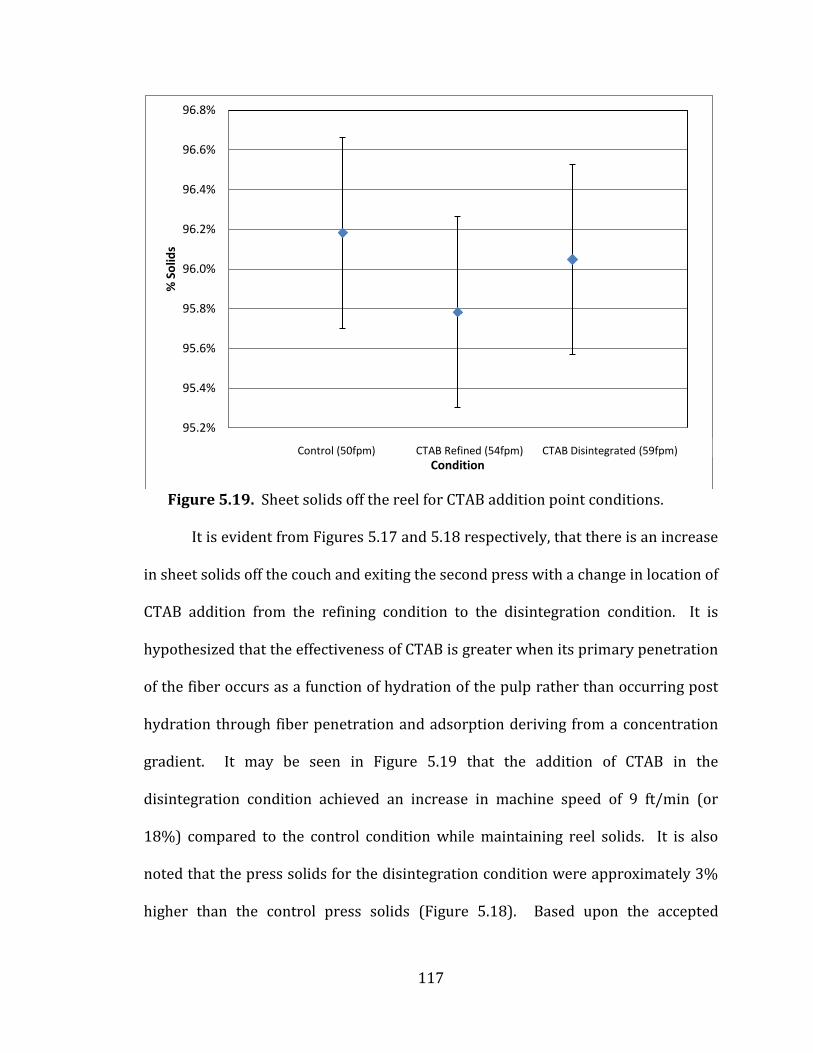
117
Figure 5.19. Sheet solids off the reel for CTAB addition point conditions.
It is evident from Figures 5.17 and 5.18 respectively, that there is an increase
in sheet solids off the couch and exiting the second press with a change in location of
CTAB addition from the refining condition to the disintegration condition. It is
hypothesized that the effectiveness of CTAB is greater when its primary penetration
of the fiber occurs as a function of hydration of the pulp rather than occurring post
hydration through fiber penetration and adsorption deriving from a concentration
gradient. It may be seen in Figure 5.19 that the addition of CTAB in the
disintegration condition achieved an increase in machine speed of 9 ft/min (or
18%) compared to the control condition while maintaining reel solids. It is also
noted that the press solids for the disintegration condition were approximately 3%
higher than the control press solids (Figure 5.18). Based upon the accepted
95.2%
95.4%
95.6%
95.8%
96.0%
96.2%
96.4%
96.6%
96.8%
0 50 100 150 200 250 300 350 400
% S
olid
s
Condition Control (50fpm) CTAB Refined (54fpm) CTAB Disintegrated (59fpm)
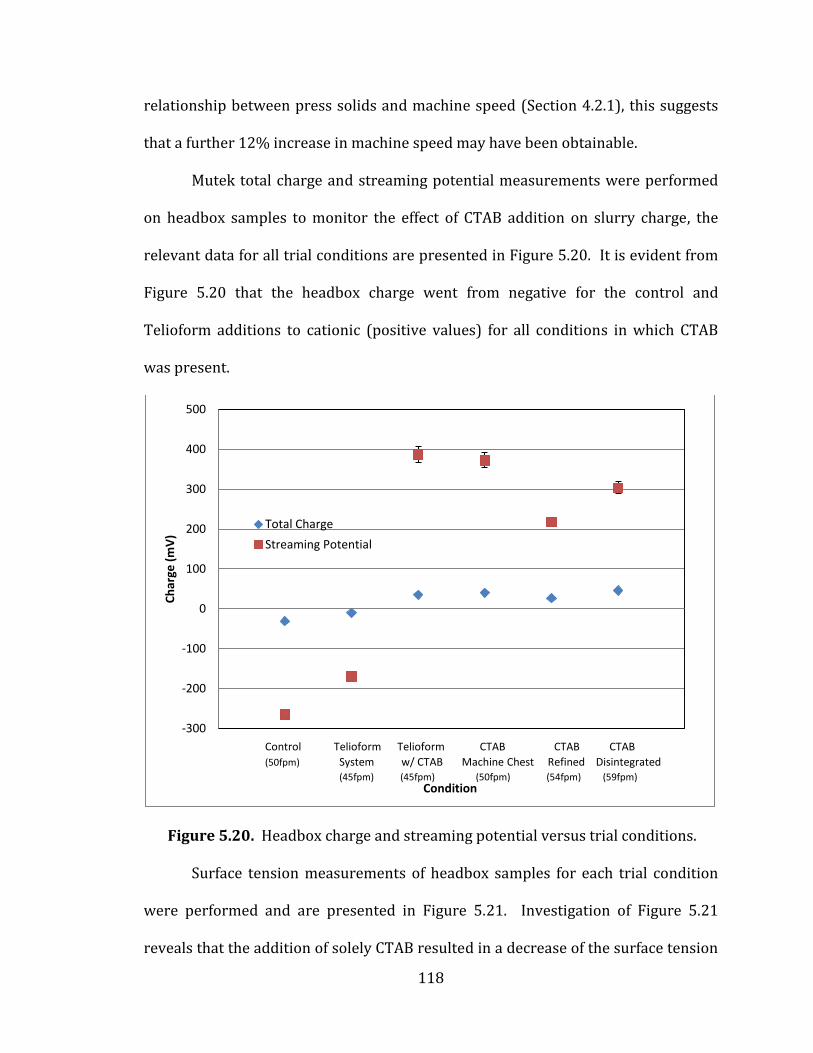
118
relationship between press solids and machine speed (Section 4.2.1), this suggests
that a further 12% increase in machine speed may have been obtainable.
Mutek total charge and streaming potential measurements were performed
on headbox samples to monitor the effect of CTAB addition on slurry charge, the
relevant data for all trial conditions are presented in Figure 5.20. It is evident from
Figure 5.20 that the headbox charge went from negative for the control and
Telioform additions to cationic (positive values) for all conditions in which CTAB
was present.
Figure 5.20. Headbox charge and streaming potential versus trial conditions.
Surface tension measurements of headbox samples for each trial condition
were performed and are presented in Figure 5.21. Investigation of Figure 5.21
reveals that the addition of solely CTAB resulted in a decrease of the surface tension
-300
-200
-100
0
100
200
300
400
500
Ch
arge
(m
V)
Condition
Total Charge
Streaming Potential
Control Telioform Telioform CTAB CTAB CTAB
(50fpm) System w/ CTAB Machine Chest Refined Disintegrated (45fpm) (45fpm) (50fpm) (54fpm) (59fpm)
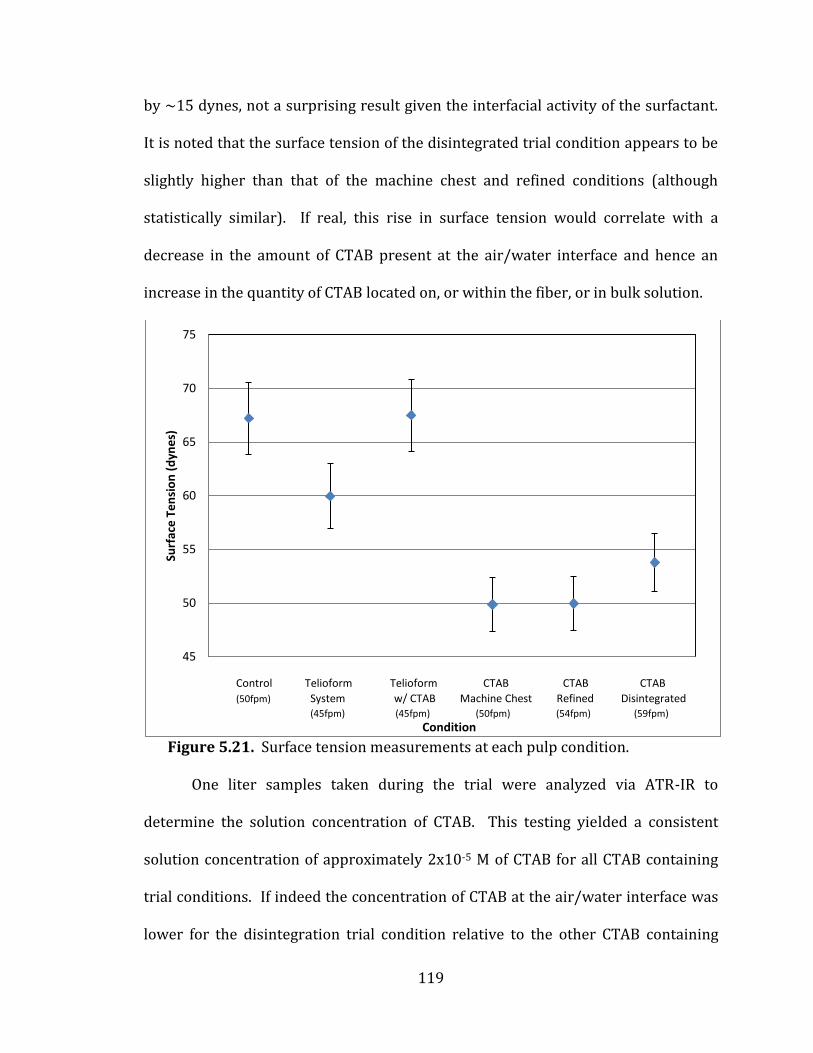
119
by ~15 dynes, not a surprising result given the interfacial activity of the surfactant.
It is noted that the surface tension of the disintegrated trial condition appears to be
slightly higher than that of the machine chest and refined conditions (although
statistically similar). If real, this rise in surface tension would correlate with a
decrease in the amount of CTAB present at the air/water interface and hence an
increase in the quantity of CTAB located on, or within the fiber, or in bulk solution.
Figure 5.21. Surface tension measurements at each pulp condition.
One liter samples taken during the trial were analyzed via ATR-IR to
determine the solution concentration of CTAB. This testing yielded a consistent
solution concentration of approximately 2x10⁻⁵ M of CTAB for all CTAB containing
trial conditions. If indeed the concentration of CTAB at the air/water interface was
lower for the disintegration trial condition relative to the other CTAB containing
45
50
55
60
65
70
75
50 150 250 350 450 550 650
Surf
ace
Te
nsi
on
(d
yne
s)
Condition
Control Telioform Telioform CTAB CTAB CTAB
(50fpm) System w/ CTAB Machine Chest Refined Disintegrated (45fpm) (45fpm) (50fpm) (54fpm) (59fpm)
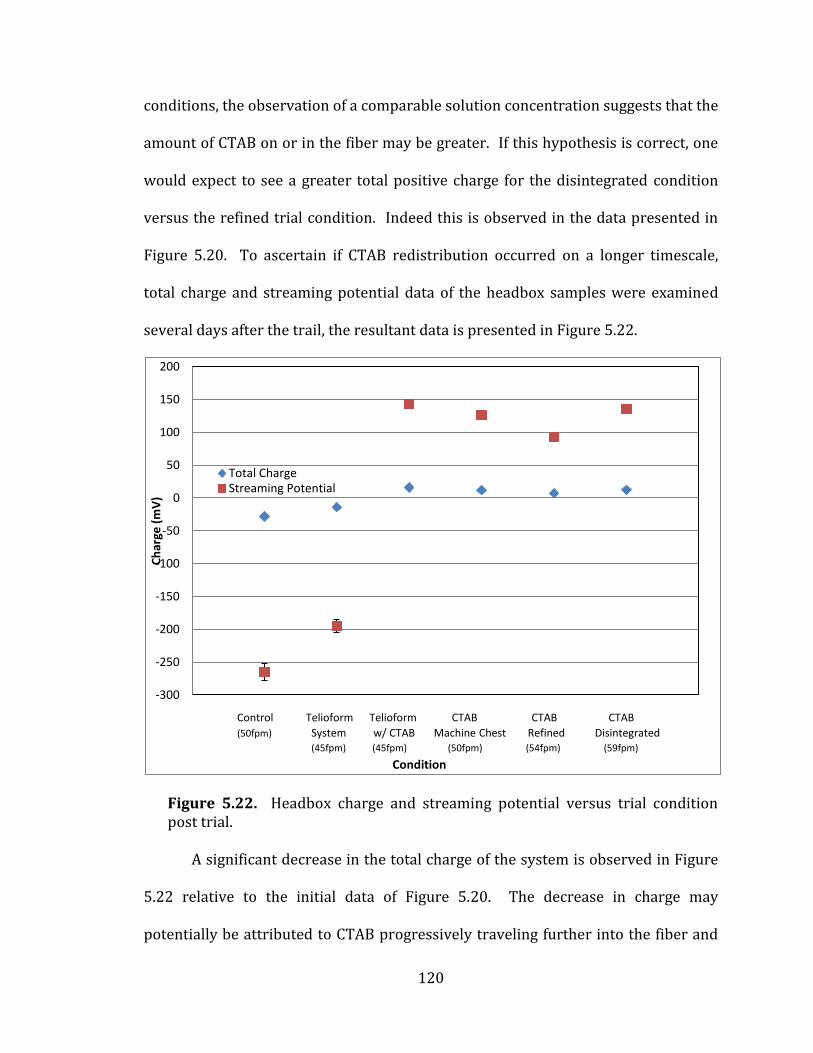
120
conditions, the observation of a comparable solution concentration suggests that the
amount of CTAB on or in the fiber may be greater. If this hypothesis is correct, one
would expect to see a greater total positive charge for the disintegrated condition
versus the refined trial condition. Indeed this is observed in the data presented in
Figure 5.20. To ascertain if CTAB redistribution occurred on a longer timescale,
total charge and streaming potential data of the headbox samples were examined
several days after the trail, the resultant data is presented in Figure 5.22.
Figure 5.22. Headbox charge and streaming potential versus trial condition post trial.
A significant decrease in the total charge of the system is observed in Figure
5.22 relative to the initial data of Figure 5.20. The decrease in charge may
potentially be attributed to CTAB progressively traveling further into the fiber and
-300
-250
-200
-150
-100
-50
0
50
100
150
200
Ch
arge
(m
V)
Condition
Total Charge Streaming Potential
Control Telioform Telioform CTAB CTAB CTAB
(50fpm) System w/ CTAB Machine Chest Refined Disintegrated (45fpm) (45fpm) (50fpm) (54fpm) (59fpm)
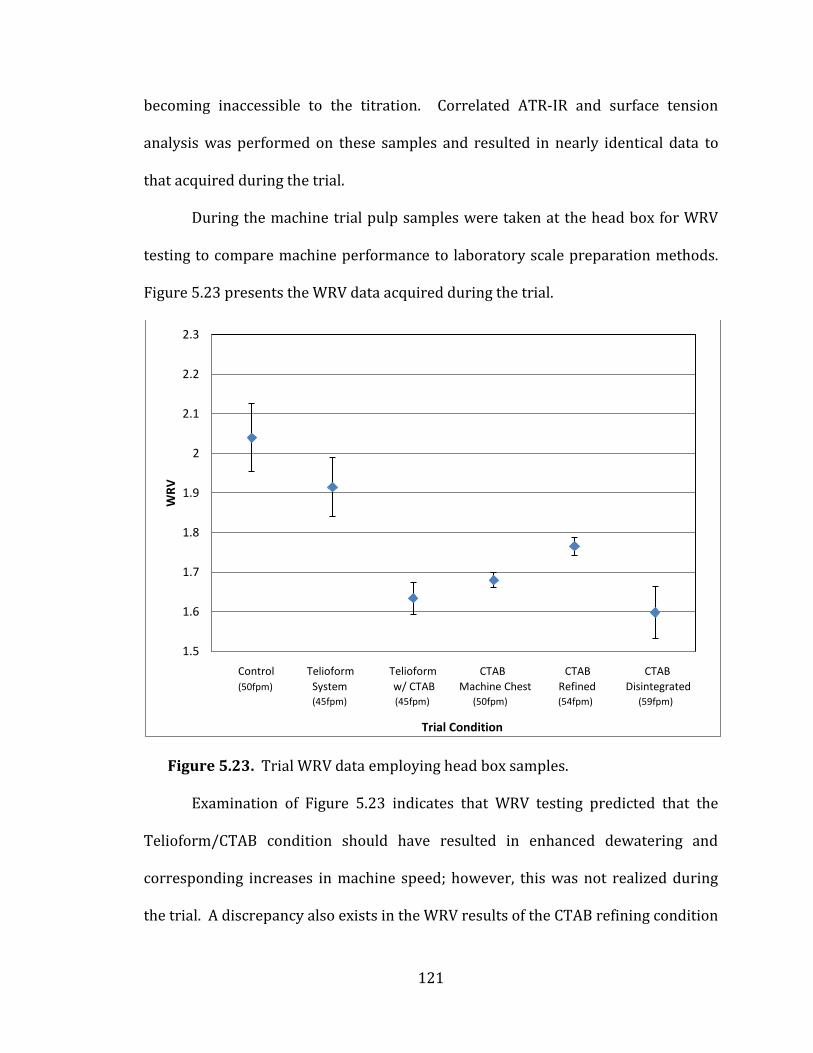
121
becoming inaccessible to the titration. Correlated ATR-IR and surface tension
analysis was performed on these samples and resulted in nearly identical data to
that acquired during the trial.
During the machine trial pulp samples were taken at the head box for WRV
testing to compare machine performance to laboratory scale preparation methods.
Figure 5.23 presents the WRV data acquired during the trial.
Figure 5.23. Trial WRV data employing head box samples.
Examination of Figure 5.23 indicates that WRV testing predicted that the
Telioform/CTAB condition should have resulted in enhanced dewatering and
corresponding increases in machine speed; however, this was not realized during
the trial. A discrepancy also exists in the WRV results of the CTAB refining condition
1.5
1.6
1.7
1.8
1.9
2
2.1
2.2
2.3
50 150 250 350 450 550 650
WR
V
Trial Condition
Control Telioform Telioform CTAB CTAB CTAB
(50fpm) System w/ CTAB Machine Chest Refined Disintegrated (45fpm) (45fpm) (50fpm) (54fpm) (59fpm)
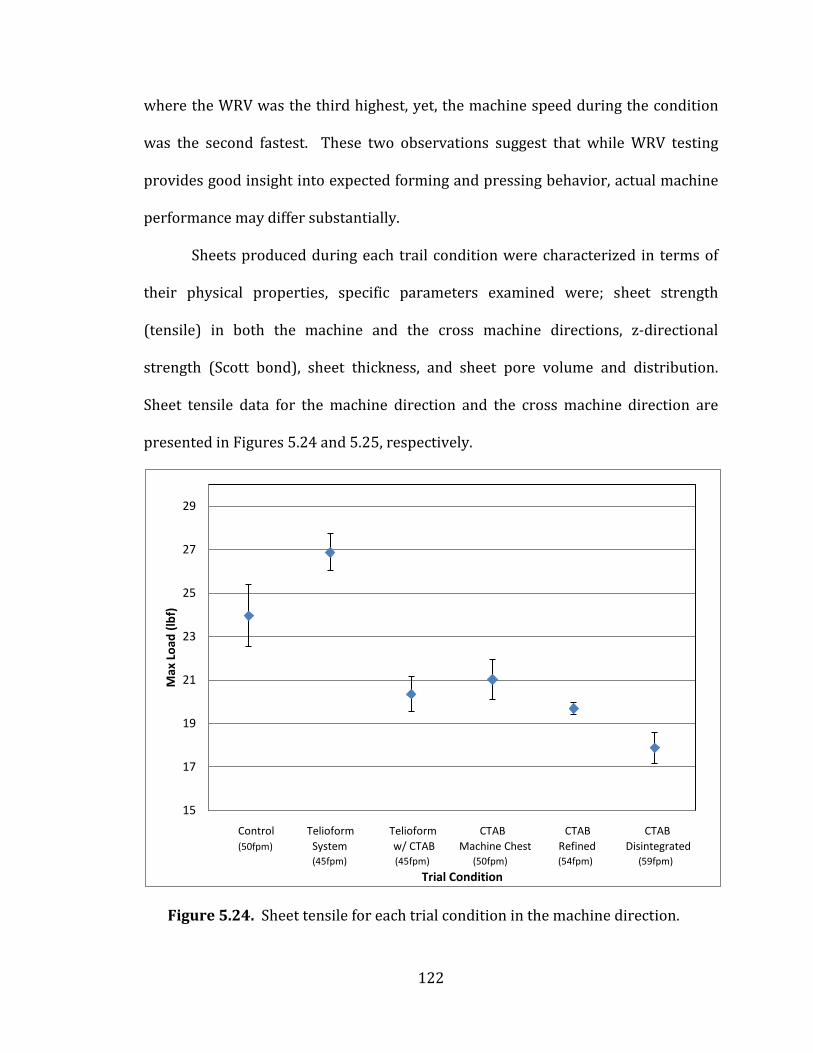
122
where the WRV was the third highest, yet, the machine speed during the condition
was the second fastest. These two observations suggest that while WRV testing
provides good insight into expected forming and pressing behavior, actual machine
performance may differ substantially.
Sheets produced during each trail condition were characterized in terms of
their physical properties, specific parameters examined were; sheet strength
(tensile) in both the machine and the cross machine directions, z-directional
strength (Scott bond), sheet thickness, and sheet pore volume and distribution.
Sheet tensile data for the machine direction and the cross machine direction are
presented in Figures 5.24 and 5.25, respectively.
Figure 5.24. Sheet tensile for each trial condition in the machine direction.
15
17
19
21
23
25
27
29
50 150 250 350 450 550 650
Max
Lo
ad (
lbf)
Trial Condition
Control Telioform Telioform CTAB CTAB CTAB
(50fpm) System w/ CTAB Machine Chest Refined Disintegrated (45fpm) (45fpm) (50fpm) (54fpm) (59fpm)
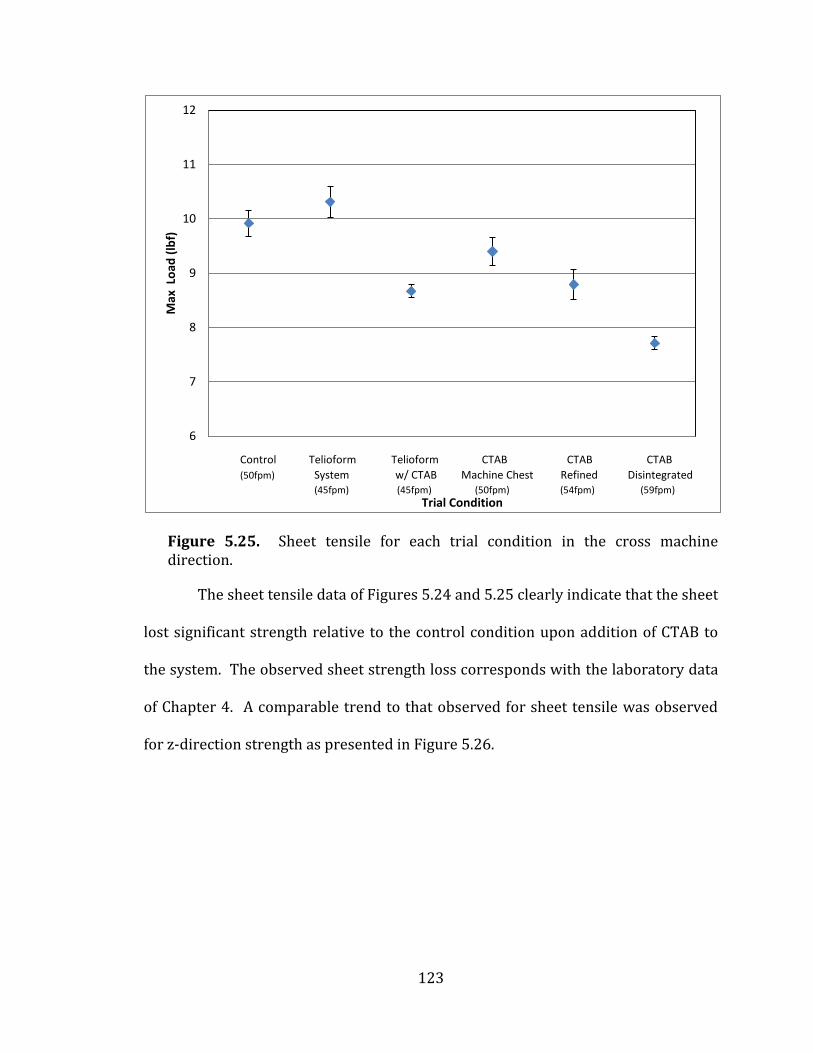
123
Figure 5.25. Sheet tensile for each trial condition in the cross machine direction.
The sheet tensile data of Figures 5.24 and 5.25 clearly indicate that the sheet
lost significant strength relative to the control condition upon addition of CTAB to
the system. The observed sheet strength loss corresponds with the laboratory data
of Chapter 4. A comparable trend to that observed for sheet tensile was observed
for z-direction strength as presented in Figure 5.26.
6
7
8
9
10
11
12
50 150 250 350 450 550 650
Max
Lo
ad (
lbf)
Trial Condition
Control Telioform Telioform CTAB CTAB CTAB
(50fpm) System w/ CTAB Machine Chest Refined Disintegrated (45fpm) (45fpm) (50fpm) (54fpm) (59fpm)
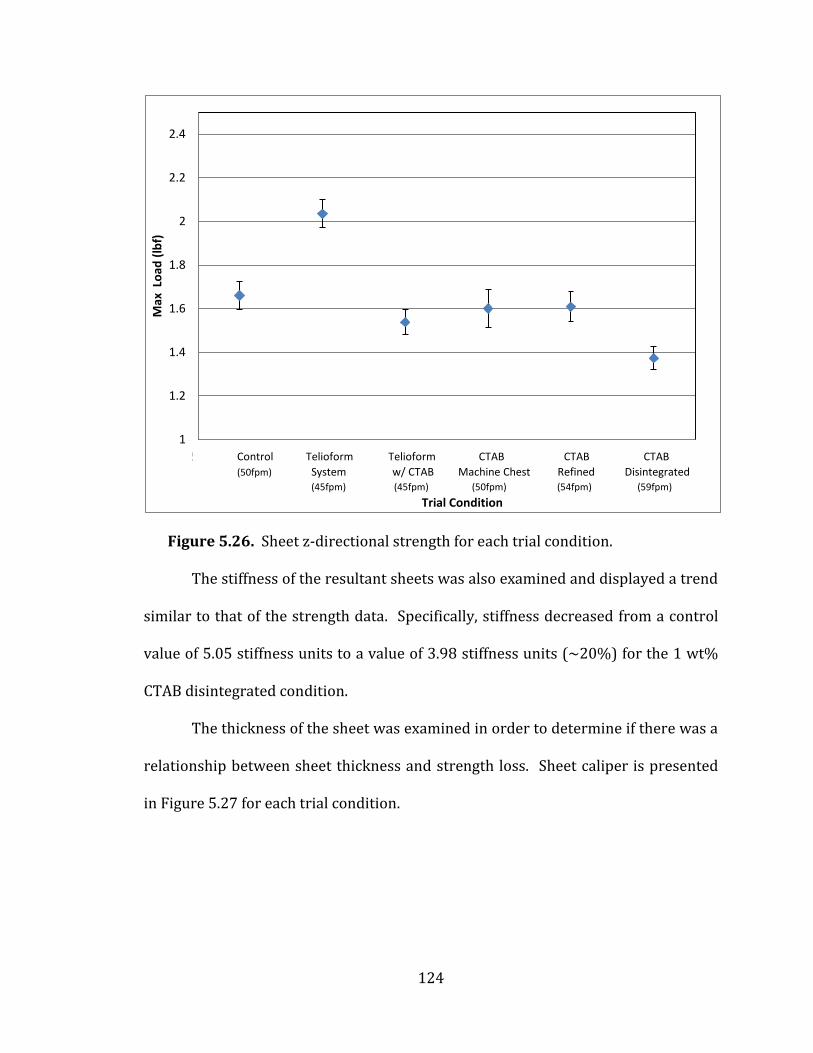
124
Figure 5.26. Sheet z-directional strength for each trial condition.
The stiffness of the resultant sheets was also examined and displayed a trend
similar to that of the strength data. Specifically, stiffness decreased from a control
value of 5.05 stiffness units to a value of 3.98 stiffness units (~20%) for the 1 wt%
CTAB disintegrated condition.
The thickness of the sheet was examined in order to determine if there was a
relationship between sheet thickness and strength loss. Sheet caliper is presented
in Figure 5.27 for each trial condition.
1
1.2
1.4
1.6
1.8
2
2.2
2.4
50 150 250 350 450 550 650
Max
Lo
ad (
lbf)
Trial Condition
Control Telioform Telioform CTAB CTAB CTAB
(50fpm) System w/ CTAB Machine Chest Refined Disintegrated (45fpm) (45fpm) (50fpm) (54fpm) (59fpm)
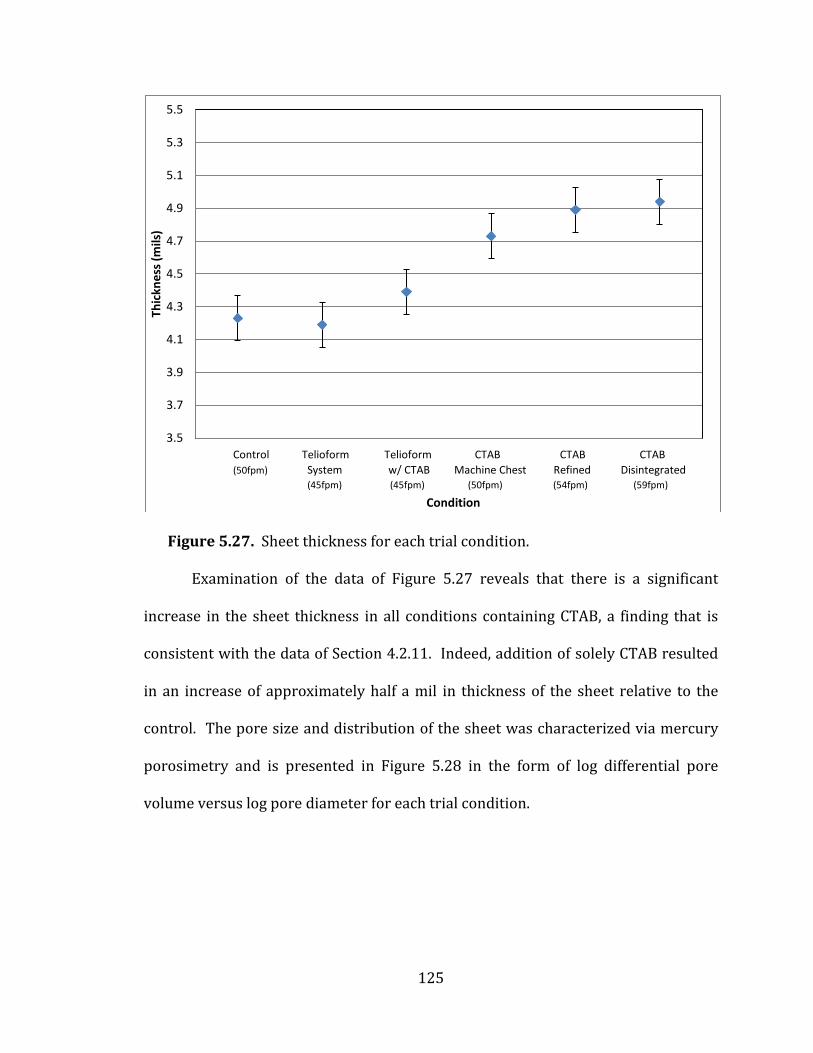
125
Figure 5.27. Sheet thickness for each trial condition.
Examination of the data of Figure 5.27 reveals that there is a significant
increase in the sheet thickness in all conditions containing CTAB, a finding that is
consistent with the data of Section 4.2.11. Indeed, addition of solely CTAB resulted
in an increase of approximately half a mil in thickness of the sheet relative to the
control. The pore size and distribution of the sheet was characterized via mercury
porosimetry and is presented in Figure 5.28 in the form of log differential pore
volume versus log pore diameter for each trial condition.
3.5
3.7
3.9
4.1
4.3
4.5
4.7
4.9
5.1
5.3
5.5
50 150 250 350 450 550 650
Thic
kne
ss (
mils
)
Condition
Control Telioform Telioform CTAB CTAB CTAB
(50fpm) System w/ CTAB Machine Chest Refined Disintegrated (45fpm) (45fpm) (50fpm) (54fpm) (59fpm)
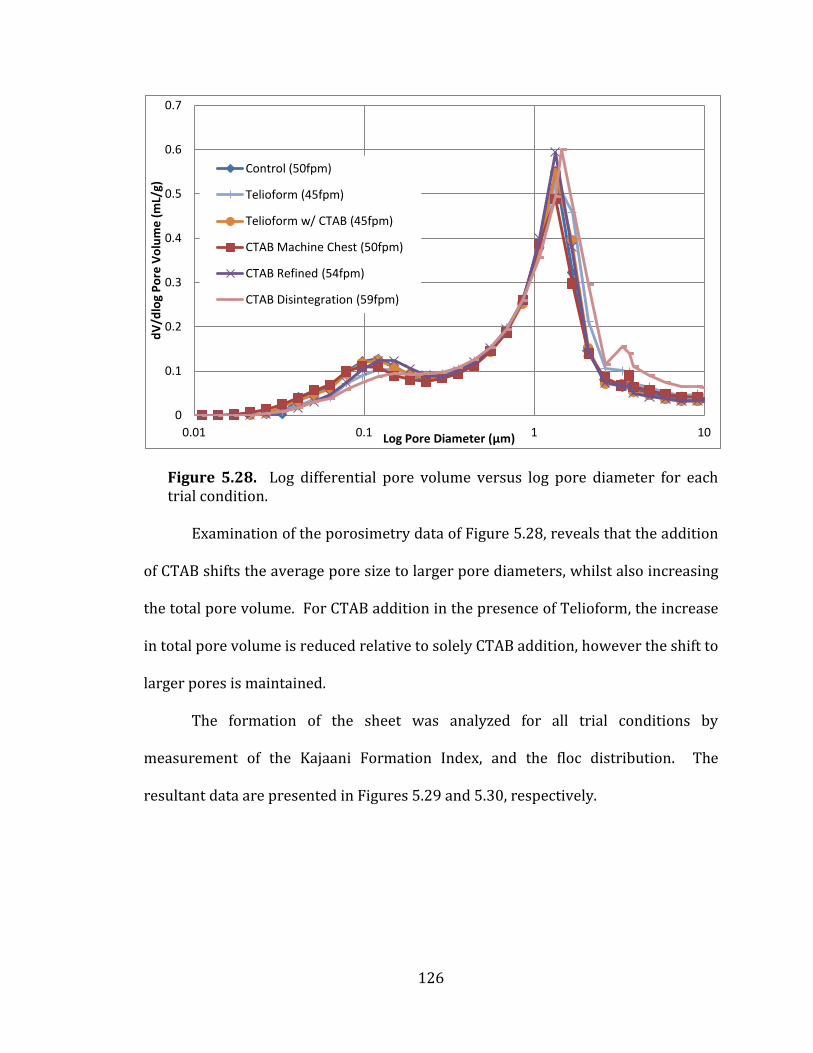
126
Figure 5.28. Log differential pore volume versus log pore diameter for each trial condition.
Examination of the porosimetry data of Figure 5.28, reveals that the addition
of CTAB shifts the average pore size to larger pore diameters, whilst also increasing
the total pore volume. For CTAB addition in the presence of Telioform, the increase
in total pore volume is reduced relative to solely CTAB addition, however the shift to
larger pores is maintained.
The formation of the sheet was analyzed for all trial conditions by
measurement of the Kajaani Formation Index, and the floc distribution. The
resultant data are presented in Figures 5.29 and 5.30, respectively.
0
0.1
0.2
0.3
0.4
0.5
0.6
0.7
0.01 0.1 1 10
dV
/dlo
g P
ore
Vo
lum
e (
mL/
g)
Log Pore Diameter (μm)
Control (50fpm)
Telioform (45fpm)
Telioform w/ CTAB (45fpm)
CTAB Machine Chest (50fpm)
CTAB Refined (54fpm)
CTAB Disintegration (59fpm)
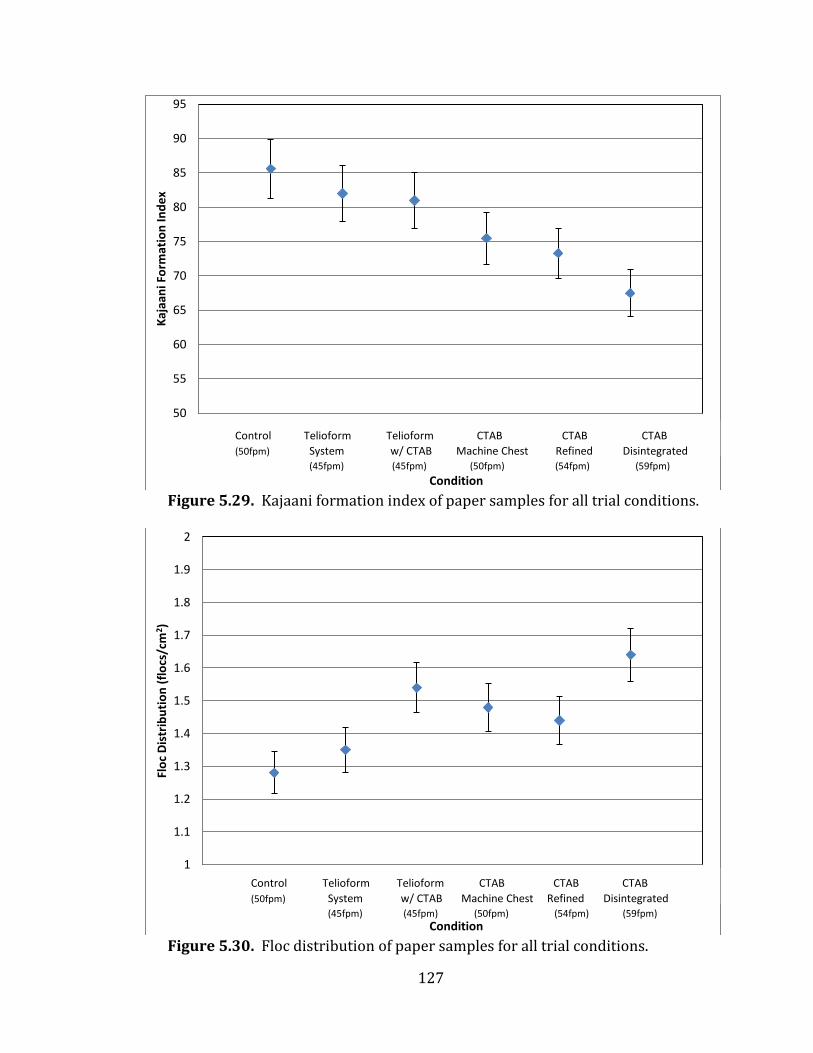
127
Figure 5.29. Kajaani formation index of paper samples for all trial conditions.
Figure 5.30. Floc distribution of paper samples for all trial conditions.
50
55
60
65
70
75
80
85
90
95
0 100 200 300 400 500 600 700
Kaj
aan
i Fo
rmat
ion
Ind
ex
Condition
Control Telioform Telioform CTAB CTAB CTAB
(50fpm) System w/ CTAB Machine Chest Refined Disintegrated (45fpm) (45fpm) (50fpm) (54fpm) (59fpm)
1
1.1
1.2
1.3
1.4
1.5
1.6
1.7
1.8
1.9
2
0 100 200 300 400 500 600 700
Flo
c D
istr
ibu
tio
n (
flo
cs/c
m2 )
Condition
Control Telioform Telioform CTAB CTAB CTAB
(50fpm) System w/ CTAB Machine Chest Refined Disintegrated (45fpm) (45fpm) (50fpm) (54fpm) (59fpm)
128
It is evident from examination of the data of Figure 5.29 that the addition of
CTAB significantly decreased the Kajaani Formation Index (KFI), and further, that
the lowest value correlates with the best dewatering condition (disintegration). The
decreasing KFI is interpreted as an opening up of the sheet due to the breaking up of
existing floc structures, or more likely, the prohibition of them from forming due to
electrostatic repulsion. The floc formation behavior is consistent with knowledge
that the fiber is positively charged through the adsorption of CTAB and hence
experiences electrostatic repulsion. The data of Figure 5.30 indicates that CTAB
addition generated a greater floc distribution, that is, a greater number of smaller
flocs per unit area, a finding consistent with the KFI data and the enhanced water
removal observed.
5.4. Economic Analysis
Within the papermaking industry it is generally accepted that dryer savings
may be translated into production increases, and given that most machines run
dryer limited the ability to create dryer savings would have broad applicability in
the industry (Bilodeau 2009). Translating the reduction of water into the dryer
section into increased dryer capacity (via a mass balance presented in Section 4.2.1)
demonstrates that an increase in press solids of 4% yields approximately a 15.5%
increase in dryer capacity (~1:4 ratio). Assuming an equivalent scaling from the
pilot machine to a full scale paper machine, the 18% dryer capacity increase
demonstrated in Section 5.3 would correlate with a production rate increase of
18%. By increasing the production of the machine by 18%, the fixed cost per ton of
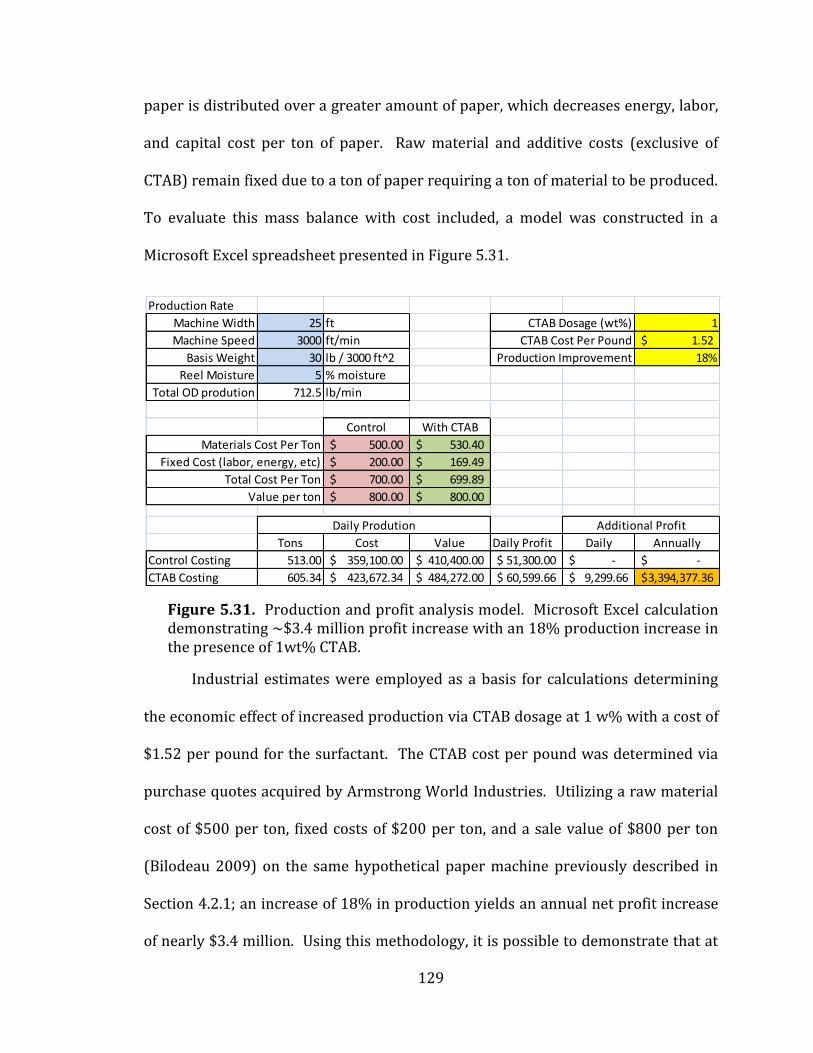
129
paper is distributed over a greater amount of paper, which decreases energy, labor,
and capital cost per ton of paper. Raw material and additive costs (exclusive of
CTAB) remain fixed due to a ton of paper requiring a ton of material to be produced.
To evaluate this mass balance with cost included, a model was constructed in a
Microsoft Excel spreadsheet presented in Figure 5.31.
Figure 5.31. Production and profit analysis model. Microsoft Excel calculation demonstrating ~$3.4 million profit increase with an 18% production increase in the presence of 1wt% CTAB.
Industrial estimates were employed as a basis for calculations determining
the economic effect of increased production via CTAB dosage at 1 w% with a cost of
$1.52 per pound for the surfactant. The CTAB cost per pound was determined via
purchase quotes acquired by Armstrong World Industries. Utilizing a raw material
cost of $500 per ton, fixed costs of $200 per ton, and a sale value of $800 per ton
(Bilodeau 2009) on the same hypothetical paper machine previously described in
Section 4.2.1; an increase of 18% in production yields an annual net profit increase
of nearly $3.4 million. Using this methodology, it is possible to demonstrate that at
Production Rate
Machine Width 25 ft 1
Machine Speed 3000 ft/min 1.52$
Basis Weight 30 lb / 3000 ft^2 18%
Reel Moisture 5 % moisture
Total OD prodution 712.5 lb/min
Control With CTAB
500.00$ 530.40$
200.00$ 169.49$
700.00$ 699.89$
800.00$ 800.00$
Tons Cost Value Daily Profit Daily Annually
Control Costing 513.00 359,100.00$ 410,400.00$ 51,300.00$ -$ -$
CTAB Costing 605.34 423,672.34$ 484,272.00$ 60,599.66$ 9,299.66$ 3,394,377.36$
CTAB Dosage (wt%)
CTAB Cost Per Pound
Production Improvement
Additional ProfitDaily Prodution
Materials Cost Per Ton
Fixed Cost (labor, energy, etc)
Total Cost Per Ton
Value per ton
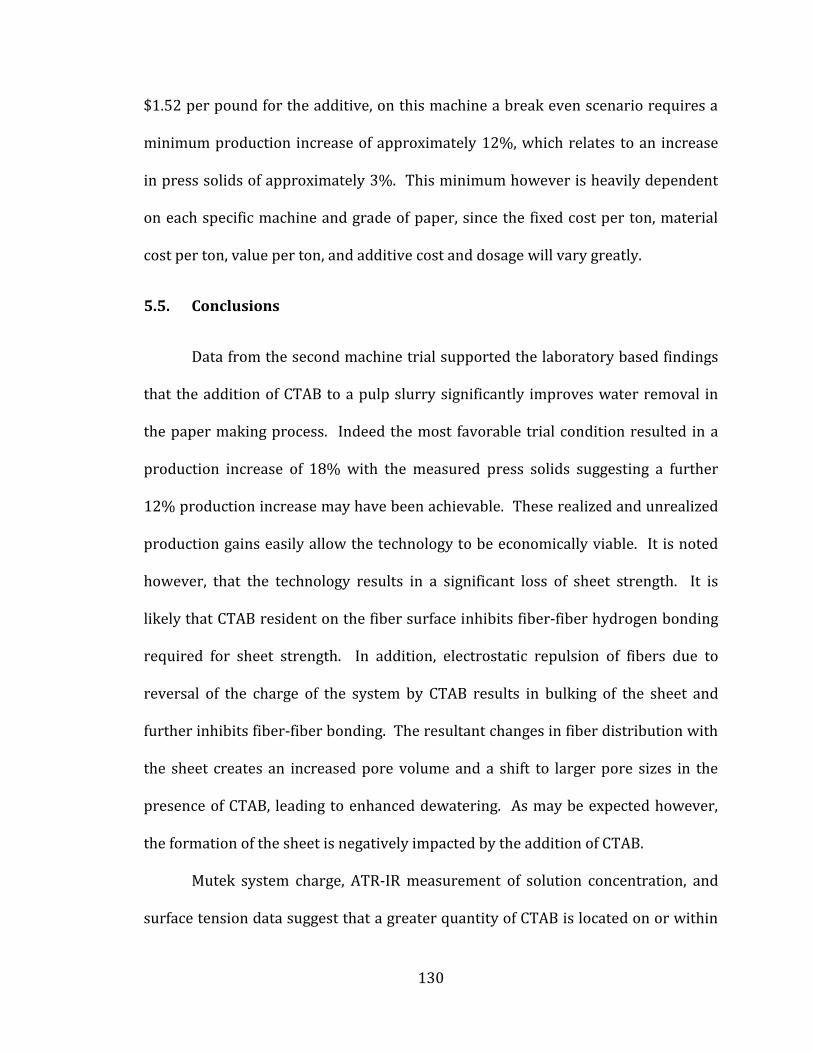
130
$1.52 per pound for the additive, on this machine a break even scenario requires a
minimum production increase of approximately 12%, which relates to an increase
in press solids of approximately 3%. This minimum however is heavily dependent
on each specific machine and grade of paper, since the fixed cost per ton, material
cost per ton, value per ton, and additive cost and dosage will vary greatly.
5.5. Conclusions
Data from the second machine trial supported the laboratory based findings
that the addition of CTAB to a pulp slurry significantly improves water removal in
the paper making process. Indeed the most favorable trial condition resulted in a
production increase of 18% with the measured press solids suggesting a further
12% production increase may have been achievable. These realized and unrealized
production gains easily allow the technology to be economically viable. It is noted
however, that the technology results in a significant loss of sheet strength. It is
likely that CTAB resident on the fiber surface inhibits fiber-fiber hydrogen bonding
required for sheet strength. In addition, electrostatic repulsion of fibers due to
reversal of the charge of the system by CTAB results in bulking of the sheet and
further inhibits fiber-fiber bonding. The resultant changes in fiber distribution with
the sheet creates an increased pore volume and a shift to larger pore sizes in the
presence of CTAB, leading to enhanced dewatering. As may be expected however,
the formation of the sheet is negatively impacted by the addition of CTAB.
Mutek system charge, ATR-IR measurement of solution concentration, and
surface tension data suggest that a greater quantity of CTAB is located on or within

131
the fiber when the surfactant is added in the disintegration step of slurry
preparation, as opposed to addition during refining or at the machine chest. As such
the most favorable addition for CTAB was observed during disintegration. These
results mirror those acquired in bench top experimentation and therefore represent
a successful translation of the technology to the pilot scale. It is noted however that
attempts to employ CTAB in conjunction with a commonly used formation, drainage,
and retention system (Telioform) were largely unsuccessful, and did not
demonstrate improvements seen on the bench scale. Examination of tray solids in
the Telioform conditions led to the conclusion that upon CTAB addition to the
system the retention chemistry was disrupted (tray solids increased in the presence
of CTAB illustrating a loss of retention). It was hypothesized that the shorter
residence times on the pilot machine, in comparison to the bench scale, CTAB
competed with the cationic component of the Telioform system in combining with
bentonite; leading to a hindering of both mechanisms.
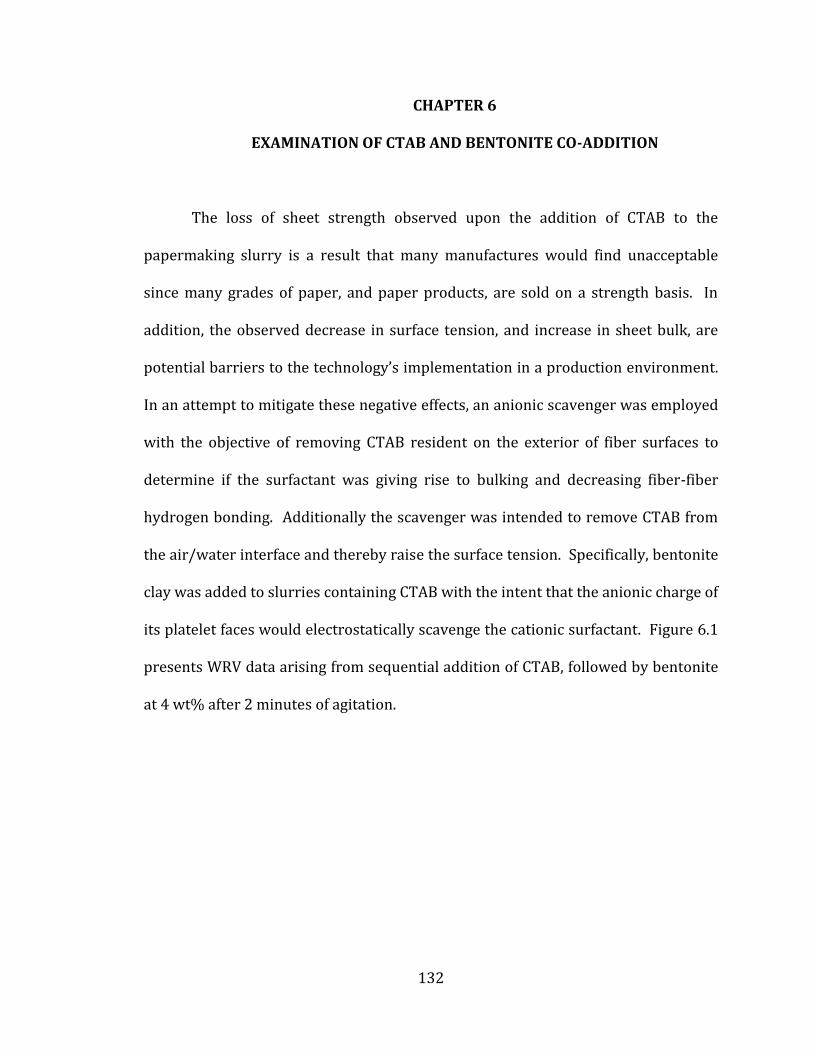
132
CHAPTER 6
EXAMINATION OF CTAB AND BENTONITE CO-ADDITION
The loss of sheet strength observed upon the addition of CTAB to the
papermaking slurry is a result that many manufactures would find unacceptable
since many grades of paper, and paper products, are sold on a strength basis. In
addition, the observed decrease in surface tension, and increase in sheet bulk, are
potential barriers to the technology’s implementation in a production environment.
In an attempt to mitigate these negative effects, an anionic scavenger was employed
with the objective of removing CTAB resident on the exterior of fiber surfaces to
determine if the surfactant was giving rise to bulking and decreasing fiber-fiber
hydrogen bonding. Additionally the scavenger was intended to remove CTAB from
the air/water interface and thereby raise the surface tension. Specifically, bentonite
clay was added to slurries containing CTAB with the intent that the anionic charge of
its platelet faces would electrostatically scavenge the cationic surfactant. Figure 6.1
presents WRV data arising from sequential addition of CTAB, followed by bentonite
at 4 wt% after 2 minutes of agitation.
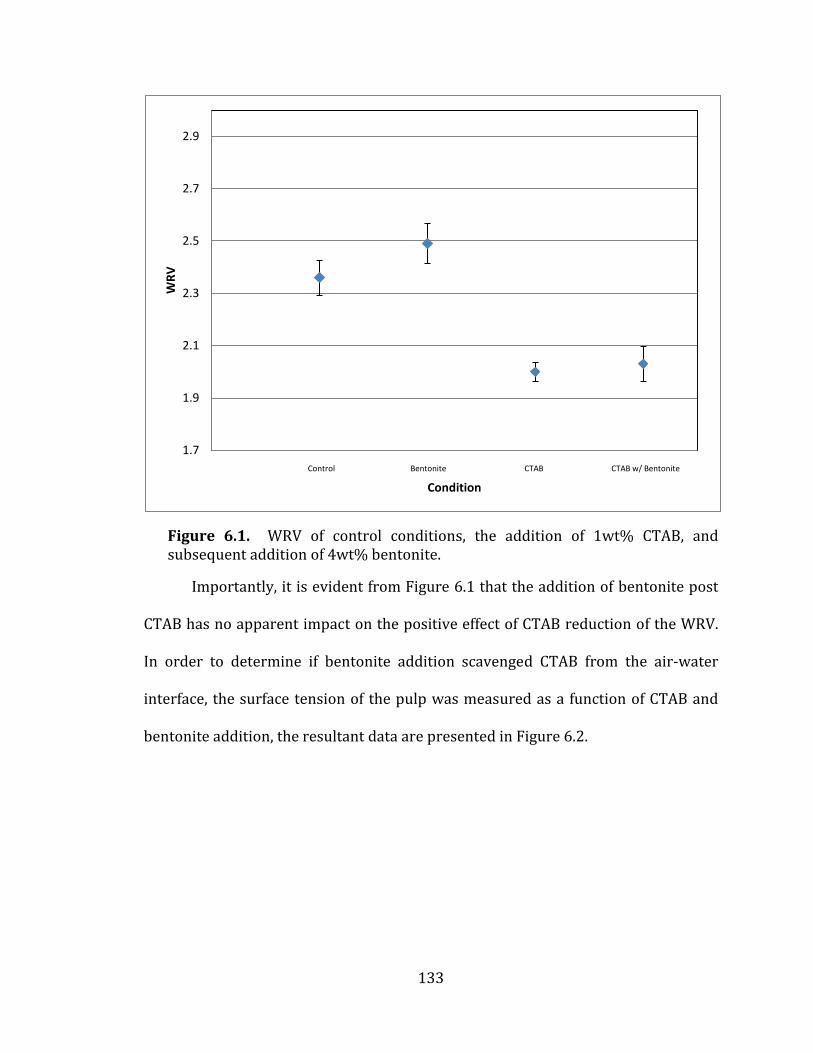
133
Figure 6.1. WRV of control conditions, the addition of 1wt% CTAB, and subsequent addition of 4wt% bentonite.
Importantly, it is evident from Figure 6.1 that the addition of bentonite post
CTAB has no apparent impact on the positive effect of CTAB reduction of the WRV.
In order to determine if bentonite addition scavenged CTAB from the air-water
interface, the surface tension of the pulp was measured as a function of CTAB and
bentonite addition, the resultant data are presented in Figure 6.2.
1.7
1.9
2.1
2.3
2.5
2.7
2.9
0 0.5 1 1.5 2 2.5 3 3.5 4 4.5
WR
V
Condition Control Bentonite CTAB CTAB w/ Bentonite
134
Figure 6.2. Surface tension of control conditions, the addition of 1wt% CTAB, and subsequent addition 4wt% bentonite.
Figure 6.2 illustrates that the decrease in surface tension arising from the
addition of CTAB may be reversed by the post addition of bentonite. Consequently
the data of Figure 6.2 demonstrates that in fact bentonite is capable of scavenging
CTAB, at least from the air-water interface.
The results of Figure 6.2 suggest that pad thickness may also be expected to
be modified by the sequential addition of CTAB and bentonite. An experiment
probing the potential effect was performed and the resultant data are presented in
Figure 6.3.
50
55
60
65
70
75
0 0.5 1 1.5 2 2.5 3 3.5 4 4.5
Surf
ace
Te
nsi
on
(m
N/m
)
Condition Control Bentonite CTAB CTAB w/ Bentonite
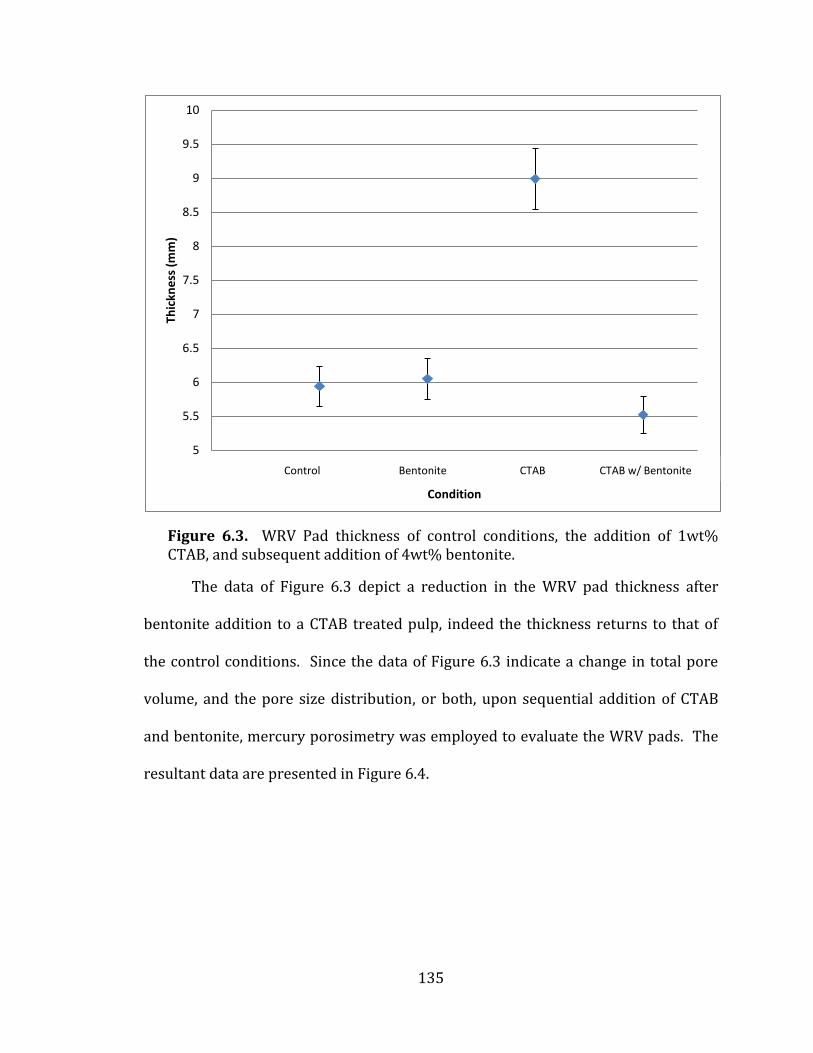
135
Figure 6.3. WRV Pad thickness of control conditions, the addition of 1wt% CTAB, and subsequent addition of 4wt% bentonite.
The data of Figure 6.3 depict a reduction in the WRV pad thickness after
bentonite addition to a CTAB treated pulp, indeed the thickness returns to that of
the control conditions. Since the data of Figure 6.3 indicate a change in total pore
volume, and the pore size distribution, or both, upon sequential addition of CTAB
and bentonite, mercury porosimetry was employed to evaluate the WRV pads. The
resultant data are presented in Figure 6.4.
5
5.5
6
6.5
7
7.5
8
8.5
9
9.5
10
0 0.5 1 1.5 2 2.5 3 3.5 4 4.5
Thic
kne
ss (
mm
)
Condition
Control Bentonite CTAB CTAB w/ Bentonite
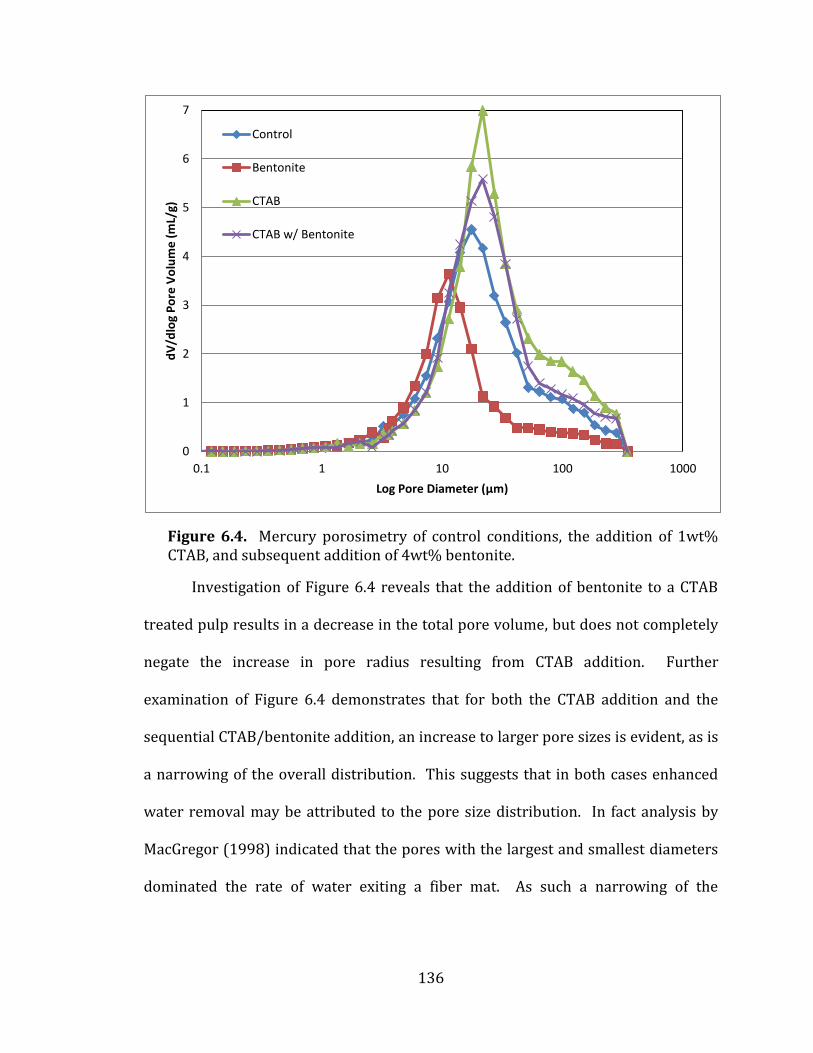
136
Figure 6.4. Mercury porosimetry of control conditions, the addition of 1wt% CTAB, and subsequent addition of 4wt% bentonite.
Investigation of Figure 6.4 reveals that the addition of bentonite to a CTAB
treated pulp results in a decrease in the total pore volume, but does not completely
negate the increase in pore radius resulting from CTAB addition. Further
examination of Figure 6.4 demonstrates that for both the CTAB addition and the
sequential CTAB/bentonite addition, an increase to larger pore sizes is evident, as is
a narrowing of the overall distribution. This suggests that in both cases enhanced
water removal may be attributed to the pore size distribution. In fact analysis by
MacGregor (1998) indicated that the pores with the largest and smallest diameters
dominated the rate of water exiting a fiber mat. As such a narrowing of the
0
1
2
3
4
5
6
7
0.1 1 10 100 1000
dV
/dlo
g P
ore
Vo
lum
e (
mL/
g)
Log Pore Diameter (μm)
Control
Bentonite
CTAB
CTAB w/ Bentonite
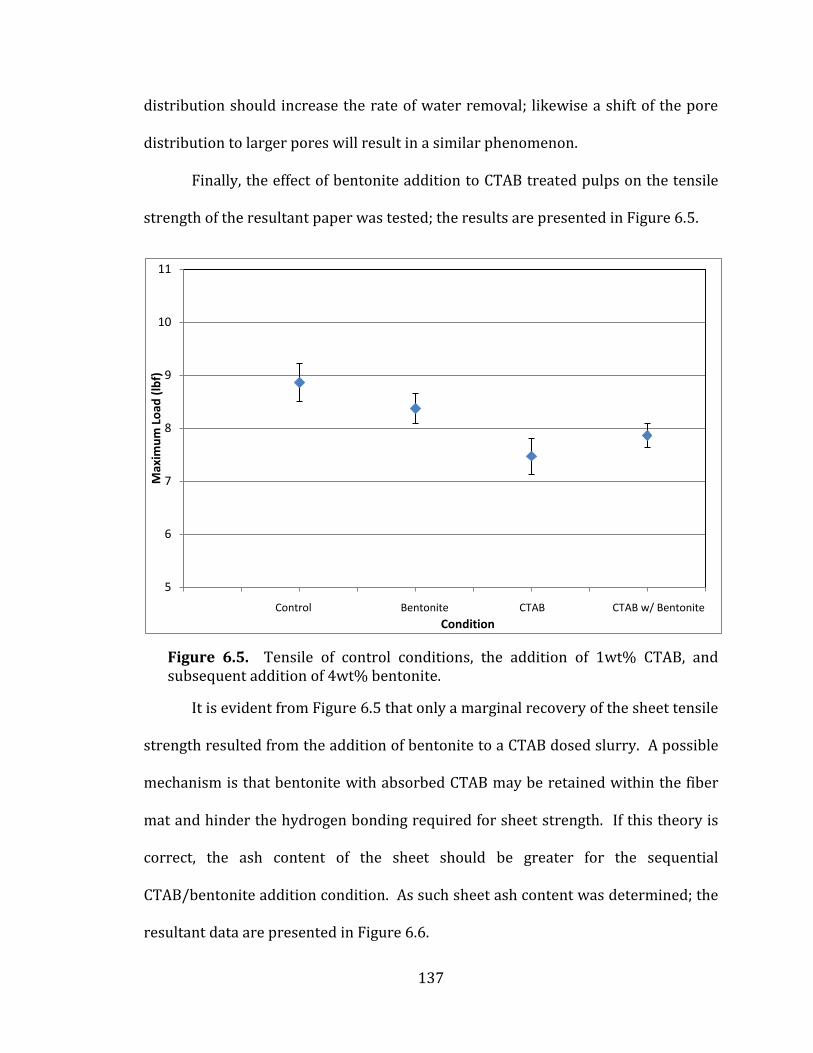
137
distribution should increase the rate of water removal; likewise a shift of the pore
distribution to larger pores will result in a similar phenomenon.
Finally, the effect of bentonite addition to CTAB treated pulps on the tensile
strength of the resultant paper was tested; the results are presented in Figure 6.5.
Figure 6.5. Tensile of control conditions, the addition of 1wt% CTAB, and subsequent addition of 4wt% bentonite.
It is evident from Figure 6.5 that only a marginal recovery of the sheet tensile
strength resulted from the addition of bentonite to a CTAB dosed slurry. A possible
mechanism is that bentonite with absorbed CTAB may be retained within the fiber
mat and hinder the hydrogen bonding required for sheet strength. If this theory is
correct, the ash content of the sheet should be greater for the sequential
CTAB/bentonite addition condition. As such sheet ash content was determined; the
resultant data are presented in Figure 6.6.
5
6
7
8
9
10
11
Max
imu
m L
oad
(lb
f)
Condition
Control Bentonite CTAB CTAB w/ Bentonite
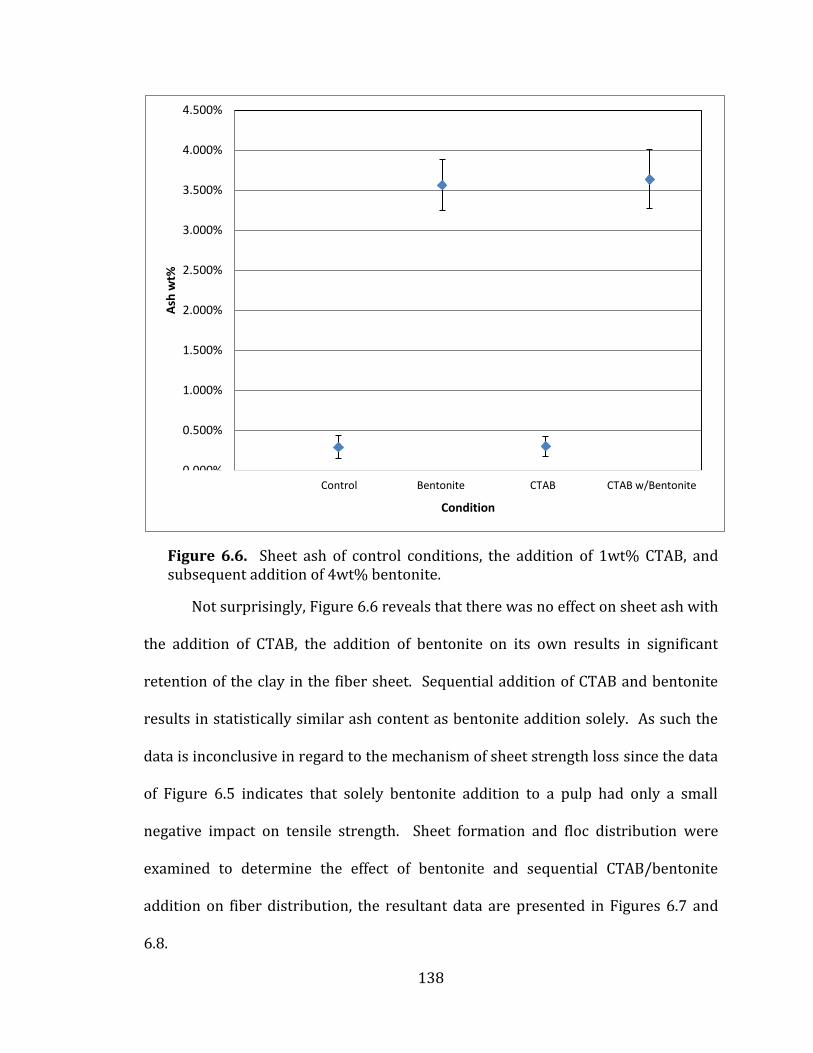
138
Figure 6.6. Sheet ash of control conditions, the addition of 1wt% CTAB, and subsequent addition of 4wt% bentonite.
Not surprisingly, Figure 6.6 reveals that there was no effect on sheet ash with
the addition of CTAB, the addition of bentonite on its own results in significant
retention of the clay in the fiber sheet. Sequential addition of CTAB and bentonite
results in statistically similar ash content as bentonite addition solely. As such the
data is inconclusive in regard to the mechanism of sheet strength loss since the data
of Figure 6.5 indicates that solely bentonite addition to a pulp had only a small
negative impact on tensile strength. Sheet formation and floc distribution were
examined to determine the effect of bentonite and sequential CTAB/bentonite
addition on fiber distribution, the resultant data are presented in Figures 6.7 and
6.8.
0.000%
0.500%
1.000%
1.500%
2.000%
2.500%
3.000%
3.500%
4.000%
4.500%
0 0.5 1 1.5 2 2.5 3 3.5 4 4.5
Ash
wt%
Condition
Control Bentonite CTAB CTAB w/Bentonite
139
Figure 6.7. Kajaani formation indices of control conditions, the addition of 1wt% CTAB, and subsequent addition of 4wt% bentonite.
Figure 6.8. Floc distribution of control conditions, the addition of 1wt% CTAB, and subsequent addition of 4wt% bentonite.
50
55
60
65
70
75
0 50 100 150 200 250 300 350 400 450
Kaj
aan
i Fo
rmat
ion
Ind
ex
Condition Control Bentonite Bentonite w/CTAB CTAB
1.3
1.4
1.5
1.6
1.7
1.8
1.9
0 50 100 150 200 250 300 350 400 450
Flo
c D
istr
ibu
tio
n (
flo
cs/c
m^2
)
Condition
Control Bentonite Bentonite w/ CTAB CTAB

140
From investigation of the data of Figures 6.7 and 6.8, it is hypothesized that
the addition of bentonite to a fiber system pretreated with CTAB results in bentonite
scavenging CTAB from the fiber and partially reversing the disruption of formation
of the sheet. The addition of bentonite to CTAB dosed pulps closes up the sheet, but
does not completely reverse the effect of CTAB generating smaller flocs and hence
enhanced dewatering. For bentonite to affect water removal as an ash or filler, 2-3
wt% of ash must be retained in the sheet (Scott 1996), a value attained in Figure 6.6.
However, as bentonite is largely anionic it actually holds water in the sheet, which
may be seen in Figure 6.1 for the addition of solely bentonite.
As was demonstrated in Figure 4.19, CTAB addition to pulp slurries results in
the localization of the surfactant on the fiber surface, a concomitant increase in the
streaming potential to positive values, and charge reversal of the system. In order
to determine if bentonite addition was effective at scavenging CTAB from the
surface of pulp fibers, streaming potential and total charge measurements were
performed on CTAB and bentonite dosed pulps, as presented in Figure 6.9.
141
Figure 6.9. Streaming potential and total charge of control conditions, the addition of 1wt% CTAB, and subsequent addition of 4wt% bentonite.
It is evident from Figure 6.9 that bentonite addition results in the return of
the system charge to the near neutral level observed prior to CTAB addition. In
addition, the streaming potential is returned to strongly negative values. This is a
significant result since paper machines typically run in the negative total system
charge regime, a range in which the sequential addition of CTAB and bentonite
results in, whilst still providing enhanced water removal. This finding suggest that
that indeed bentonite is effective at scavenging bound surfactant or alternatively its
contribution to the streaming potential and total charge of the system results in a
return of pre-CTAB conditions.
-1000
-800
-600
-400
-200
0
200
400
600
800
Po
ten
tial
(m
V)
Condition
Streaming Potential
Total Charge
Control Bentonite CTAB CTAB w/ Bentonite
142
In order determine whether CTAB is in fact removed from the fiber by the
addition of bentonite, the number of available hydroxyl groups on cellulose was
measured for each condition, the resultant data is presented in Figure 6.10.
Figure 6.10. Hydroxyl number of a control condition, the addition of 1wt% CTAB, and subsequent addition of 4wt% bentonite.
Investigation of Figure 6.10 reveals that the number of hydroxyl sites of
cellulose decreased from ~300 for the control to ~100 for 1 wt% addition of CTAB.
This finding indicates that CTAB occupies hydroxyl sites on or within the fiber, and
is consistent with the charge reversal of the system from an anionic state in the
control to a cationic state in the presence of CTAB (Figure 6.9). The addition of
bentonite recovers the hydroxyl number to that of the control condition,
consequently proving CTAB removal from on or within the fiber via scavenging. The
scavenging of the CTAB by bentonite must result in the formation of a
0
50
100
150
200
250
300
350
0 0.5 1 1.5 2 2.5 3 3.5 4
Hyd
roxy
l Nu
mb
er
(mg
KO
H/
g sa
mp
le)
Condition
Control CTAB CTAB w/ Bentonite
143
CTAB/bentonite complex which Figure 6.7 demonstrates is retained in the sheet.
The retained CTAB/bentonite complex affects formation by opening up the sheet
relative to the control sheet (lower KFI) as demonstrated by the data of Figure 6.7
and allows enhanced water removal. It is noted that in many ways the
microparticle/CTAB addition mimics the successful formation/drainage/retention
systems employed in the papermaking industry. Interestingly the data of Figure 6.4
indicates that the positive shift in pore size is not lost upon sequential addition of
bentonite to a CTAB treated slurry, which correlates with the formation data of
Figure 6.8. Therefore, it is concluded that the enhanced water removal mechanism
seen with the post addition of bentonite to a CTAB treated pulp is due to a shift in
pore size to larger diameters, whereas the enhanced water removal mechanism
when only CTAB is present is attributed to a shift in pore size to larger pores, as well
as an increase in the total pore volume.
An identical path of experimentation to that outlined for bentonite was also
completed utilizing an alternative anionic scavenging molecule, anionic
polyacrylamide (PAM). While similar trends to that of bentonite were observed,
overall results with the addition of PAM lacked statistical consistency and hence are
not presented.
144
CHAPTER 7
CONCLUSIONS AND RECOMMENDATIONS
7.1 Conclusions
The present work has developed and characterized a novel approach to the
dewatering of a cellulose fiber mat. A significant void in the literature, and
subsequent opportunity, were identified; specifically, the potential to apply
chemical means to enhance water removal. The data of Chapter 4 demonstrates
that the addition of cetyltrimethylammonium bromide (CTAB), a cationic surfactant,
to a pulp slurry significantly decreases the amount of water retained in the pulp
after drainage and pressing (examined by the water retention value test (WRV)).
Drainage was progressively increased with increasing dosage of CTAB up to a
plateau at a dosage level of 1wt% on a dry fiber basis. The effectiveness of CTAB
was demonstrated for pulps comprising a wide range of fiber types employed in
papermaking in the Northeastern United States. Employing the relationship
between WRV and the solids exiting the press section of a paper machine developed
by Busker (1984), the CTAB WRV results suggest a potential 4% improvement in
press solids. A mass balance around a hypothetical paper machine indicates that the
4% press solids correlates with a 16% increase in production rate. In order to
evaluate if the effect observed with CTAB was attributable solely to the cationic
surfactant, a slew of additives were screened with WRV testing. While some
additives demonstrated a performance enhancement in dewatering, none
approached the effectiveness of CTAB. The screening work demonstrated that the
145
reduction in surface tension induced by surfactant addition was partially, but not
wholly, responsible for the reduction in the WRV. Given that water removed in the
forming and pressing operations is governed by flow through a porous medium
(cellulose fiber mat) attention was turned to parameters affecting removal of water
from capillaries. Specifically, investigation of the Young-Laplace equation led to
examination of the effect of CTAB on the contact angle of water at the solid/liquid
interface. Measurements within capillaries demonstrated that the addition of CTAB
significantly increased the contact angle, which in turn decreased the water column
height, a finding that would improve water removal in a fibrous mat. Evaluation of
the solution concentration of CTAB revealed that vast majority of the surfactant was
resident either at the air/water interface, or on or within the fibers. Measurement
of the streaming potential and total charge of a CTAB dosed pulp slurry revealed
that CTAB was adsorbed on the cellulose fiber via observation that the previously
anionic fiber system was charged reversed to a cationic system.
Visual observations of WRV pads and handsheets made from CTAB dosed
pulps revealed that they were significantly thicker relative to controls. An
examination of the pore structure of the WRV pads was therefore undertaken.
Mercury porosimetry revealed that with the addition of CTAB, the pore structure of
the fiber mat shifted to larger pore radii with a concomitant increase in the number
of pores. The Young-Laplace equation indicates pore radius has an inverse
relationship with capillary pressure. As such, the increase in pore radii observed in
the presence of CTAB results in an enhanced rate of water removal due to a
reduction in the force holding water within fiber capillaries. The strength of CTAB
146
dosed sheets was found to be significantly decreased relative to control sheets; a
fact at least partially attributable to decreased fiber-fiber hydrogen bonding arising
from the bulking. In addition, determination of the number of available surface
hydroxyl groups on fibers revealed that in the presence of CTAB approximately 60%
of the groups were masked by the surfactant. This effect would be expected to
decrease the extent of fiber-fiber hydrogen bonding, thereby contributing to the loss
of sheet strength.
In order to determine if the laboratory observations could be scaled up, two
pilot trials were undertaken to examine the performance of the technology on the
machine scale. The University of Maine’s Process Development Center (PDC) pilot
testing facilities for papermaking process research and development were
employed for this purpose. The first trial demonstrated that the addition of CTAB to
a pulp slurry enhanced water removal in the paper making process. Indeed all
trends observed in the laboratory study (Chapter 4) were successfully scaled to the
pilot machine. Enhanced water removal was demonstrated in both forming and
pressing sections, the headbox charge was decreased, as was the bond strength of
the sheet. In addition, the bulking and change in pore structure observed on the
bench scale was replicated on the pilot scale.
The second pilot scale machine trial was designed and implemented to
examine two separate aspects of chemically enhanced water removal, scale up of the
dual addition of CTAB and the Telioform system; and optimization of the addition
points of CTAB when used as the sole additive. Critically, the trial was configured to
quantify enhanced dewatering through quantification of the production rate
147
increases via running the machine in a dryer limited state and manipulating speed
whilst maintaining reel solids. If enhanced dewatering occurred in the forming
and/or pressing section the water load into the dryer section would decrease and
machine speed could be increased to reinstate a dryer limited scenario, correlating
with an increase in production. Data from the second machine trial supported the
laboratory based findings that the addition of CTAB to a pulp slurry significantly
improves water removal in the paper making process. Indeed the most favorable
trial condition resulted in a production increase of 18%, with the measured press
solids suggesting a further 12% production increase may have been achievable.
These realized and unrealized production gains easily allow the technology to be
economically viable. It is noted however, that the technology results in a significant
loss of sheet strength. It is likely that CTAB resident on the fiber surface inhibits
fiber-fiber hydrogen bonding required for sheet strength. In addition, electrostatic
repulsion of fibers due to reversal of the charge of the system by CTAB results in
bulking of the sheet and further inhibits fiber-fiber bonding. The resultant changes
in fiber distribution within the sheet creates an increased pore volume and a shift to
larger pore sizes in the presence of CTAB, leading to enhanced dewatering. As may
be expected however, the formation of the sheet is negatively impacted by the
addition of CTAB.
Mutek system charge, ATR-IR measurement of solution concentration, and
surface tension data suggest that a greater quantity of CTAB is located on or within
the fiber when the surfactant is added in the disintegration step of slurry
preparation, as opposed to addition during refining or at the machine chest. As such
148
the most favorable addition for CTAB was observed during disintegration. These
results mirror those acquired in bench top experimentation and therefore represent
a successful translation of the technology to the pilot scale. It is noted however that
attempts to employ CTAB in conjunction with a commonly used formation, drainage,
and retention system (Telioform) were largely unsuccessful, and did not
demonstrate improvements seen on the bench scale. Examination of tray solids in
the Telioform conditions led to the conclusion that upon CTAB addition to the
system the retention chemistry was disrupted (tray solids increased in the presence
of CTAB illustrating a loss of retention). It was hypothesized that the shorter
residence times on the pilot machine, in comparison to the bench scale, CTAB
competed with the cationic component of the Telioform system in combining with
bentonite; leading to a hindering of both mechanisms.
The loss of sheet strength is a result that many manufactures would find
unacceptable since many grades of paper, and paper products, are sold on a strength
basis. In addition, the observed decrease in surface tension and increase in sheet
bulk are potential barriers to the technology’s implementation in a production
environment. In order to mitigate these negative effects, an anionic scavenger
(bentonite clay) was employed to attempt to remove CTAB resident on the exterior
of the fiber surfaces to determine if the surfactant was giving rise to bulking and
decreasing fiber-fiber hydrogen bonding. Indeed, the addition of bentonite yielded a
recovery of the surface tension, streaming potential and total charge, and a
reduction in bulking, whilst maintaining a reduction in the WRV. However, sheet
strength was not recovered to a level that would be deemed acceptable by the
149
industry. The scavenging of the CTAB by bentonite results in the formation of a
CTAB/bentonite complex which is retained in the sheet. The retained
CTAB/bentonite complex affects formation by opening up the sheet in relation to
the control (lower KFI) and allows enhanced water removal. Therefore, it is
concluded that the enhanced water removal mechanism seen with the post addition
of bentonite to a CTAB treated pulp is due to a shift in pore size to larger values,
whereas the enhanced water removal mechanism when only CTAB is present is
attributed to a shift in pore size to larger pores, as well as an increase in total pore
volume.
7.2 Recommendations
The technology developed in the present work likely has a niche application
within the pulp and paper industry. Direct application of the addition of CTAB to a
system to enhance water removal may be employed in situations where machines
are dryer or press limited, and the loss of formation and sheet strength are non-
factors in measurement of product quality. For paper grades where formation and
sheet strength are critical aspects of the paper product, additional work must be
performed in order to optimize the additive, or its mode of addition, to reduce the
negative impacts while maintaining gains in water removal. Further examination of
the two component addition should be explored with an emphasis on manipulating
known parameters to increase strength and to improve formation such as refining,
and the jet-to-wire ratio. It may also be possible to introduce a low cost strength
additive to the wet end to recover sheet strength and truly develop a multi-
150
component system. More generally the present work demonstrates that a wet end
cationic additive may be employed with comparative ease to manipulate the pore
structure of a sheet, opening up a host of possibilities.
151
REFERENCES
Abson D, Gilbert R D (1980) Observations on water retention values. Tappi
63(9):146-147
Alila S, Boufi S, Belgacem M N, Beneventi (2005) Adsorption of a cationic surfactant
onto cellulosic fibers I. surface charge effects. Langmuir 21:8106-8113
Alila S, Aloulou F, Beneventi, Boufi S (2007) Self-aggregation of cationic surfactants
onto oxidized cellulose fibers and coadsorption of organic compounds. Langmuir
23:3723-3731
Aloulou F, Boufi S, Belgacem N, Gandini A (2004) Adsorption of cationic surfactants
and subsequent adsolubilization of organic compounds onto cellulose fibers. Colloid
Polym Sci 283:344-350
Anderson L, Back E (1981) The effect of temperature up to 90 deg C on dewatering
of wet paper webs, evaluated in a press simulator. Proceedings Tappi Engineering
Conference 311-323
Bliesner W C (1978) Sheet water removal in a press: time to review the
fundamentals. Pulp and Pap 52:75-77
Backstrom M, Drotz M, Tubek-Lindblom A, Blohm E (2009) Improved product
quality and increased production capacity with impulse technology. Pulp and Pap
Canada 110:33-36
Busker L H (1980) Wet press water removal over a wide parameter range. Pap Tech
and Ind 21:91-96/109
Busker L H, Cronin D C (1984) The relative importance of wet press variables in
water removal. Pulp and Pap Can 85:87-101
Butterfield B G, Meylan B A (1980) Three-dimensional structure of wood an
ultrastructural approach. 2nd edn. Chapman and Hall, London
Campbell W B (1947) The physics of water removal. Pulp and Pap Mag of Canada
Convention Issue:103-122
Ceckler W H, Thompson E V (1982) The university of maine at orono wet pressing
project. University of Maine at Orono, Orono
152
Caulfield D F, Young T L, Wegner T H (1982) The role of web properties in water
removal by wet pressing. Tappi 65:65-69
Caulfield D F, Young T L, Wegner T H (1986) How web and press parameters
interact to control water removal in the wet press. Tappi J 69:90-93
Cole B J W (2009) Wood chemistry: a course in wood and biomaterial chemistry,
course notes. University of Maine, Orono
Côté Jr W A (1967) Wood ultrastructure. University of Washington Press, Syracuse
Gullichsen J, Fogelholm C J (1999) Paper science and technology: chemical pulping.
Fapet Oy, Helsinki
Harrick N J (1967) Internal reflection spectroscopy. Interscience Publishers, New
York, NY
Jayme G (1958) Properties of wood celluloses II determination and significance of
water retention values. Tappi 41(11):180A-183A
Lobosco V (2004) On the modeling of mechanical dewatering in papermaking.
Dissertation Royal Institute of Technology, Stockholm, Sweden
Lucisano M F C, Petrini J B, Martin A R (2003) The role of evaporative dewatering in
impulse drying. Tappi J 2(3):26-32
MacGregor M A (1998) Wet pressing and paper properties – a micromechanical
view. STFI Proceedings February 1998. Stockholm, Sweden
Moore W J (1972) Physical chemistry. 5th edn. Prentice-Hall Inc, Englewood Cliffs
Neivandt D J (1998) Co-adsorption of polyelectrolytes and surfactants at the
silica/solution interface. Dissertation University of Melbourne, Australia
Park S, Venditti R A, Jameel H, Pawlak J J (2007) Hard-to-remove water in cellulose
fibers characterized by high resolution thermogravimetric analysis. Tappi J 6(7):10-
16
Park S, Venditti R A, Jameel H, Pawlak J J (2006) Hard to remove water in cellulose
fibers characterized by high resolution thermogravimetric analysis. - methods
development. Cellulose 13:23-30
153
Paulapuro H, Gullichsen J (2000) Papermaking part 1, stock preparation and wet
end. Papermaking Science and Technology. Finnish Paper Engineers’ Association
and TAPPI, Helsinki, Finland
Robertson G J (1976) The evaluation and improvement of press section
performance, some practical aspects. Appita 30:62-67
Ruthven D (1984) Principles of adsorption and adsorption processes. J Wiley and
Sons, New York
Scott W E (1996) Principles of Wet End Chemistry, TAPPI Press, Atlanta, GA
Sjostrom E (1993) Wood chemistry: fundamentals and applications. 2nd edn.
Academic Press, San Diego
Smart F R (1975) Water removal performance on a grooved second press, part 1.
Pap Tech and Ind 16:172-178
Smook G (2002) Handbook for pulp and paper technologists. 3rd edn. Angus Wilde
Publications Inc, Vancouver
Springer A, Nabors L A, Bhatia O (1991) The influence of fiber, sheet structural
properties, and chemical additives on wet pressing. Tappi J 4(2):221-228
Stratton R A (1982) Use of polymers in wet pressing. Tappi Proceedings
Papermakers Conference 179-185
Tappi Useful Method 256: Water retention value
Thode E F, Bergomi Jr J G, Unson R E (1960) The application of a centrifugal water-
retention test to pulp evaluation. Tappi 43(5):505-512
Thorne J T (1981) The effect of capillary rewet on wet pressing operations.
Dissertation University of Maine at Orono
Tze W T, Gardner D J (2001) Contact angle and IGC measurements for probing
surface-chemical changes in the recycling of wood pulp fibers. J Adhesion Sci
Technology 15(2):223-241
Wahlstrom B P (1960) A long term study of water removal and moisture
distribution on a newsprint machine press section: part 1. Pulp and Pap Mag of
Canada 61:380-401
154
Wahlstrom B P (1969) Our present understanding of the fundamentals of pressing.
Pulp and Pap Mag Canada 70:349-369
Wahlstrom B P (1981) Opportunities in pressing: part 1. Tappi 64:75-78
Wahlstrom B P (1991) Pressing – the state of the art and future possibilities. Pap
Tech 18:227-236
Wahlstrom B P (2001) Wet pressing in the 20th century: evolution, understanding
and future. Pulp and Pap Canada 102:81-88
Wegner T H (1987) The effect of polymeric additive on papermaking. Tappi J 7:107-
111
Wistara N, Young R A (1999) Properties and treatments of pulps from recycled
paper. part I. physical and chemical properties of pulps. Cellulose 6:291-324
155
BIOGRAPHY OF THE AUTHOR
James John Beaupré was born in Caribou, Maine on February 3, 1985. He
graduated from Madawaska High School in June of 2003. He subsequently attended
the University of Maine where he received a B.S. degree in Chemical Engineering in
May of 2007. He began graduate studies at the University of Maine in 2007. James
is a candidate for the Doctor of Philosophy degree in Chemical Engineering from the
University of Maine in May, 2012.