Multidimensional tomographic imaging using volume holography
Upload
independentCategory
view
1download
0
Optics Communications 248 (2005) 41–50
www.elsevier.com/locate/optcom
3D image reconstruction of transparent microscopicobjects using digital holography
Francisco Palacios a,*, Jorge Ricardo a, Daniel Palacios b, Edison Goncalves c,Jose L. Valin d, Rodrigo De Souza c
a Physics Department, Faculty of Natural Science, University of Orient, Patricio Lumumba SN, Santiago de Cuba, Cubab Nuclear Physics Department, University Simon Bolivar, Caracas, Venezuela
c Engineering Mecatronic and Mechanic System Department, Polytechnical School, Sao Paulo University (USP), Brazild Mechanics Department, High Polytechnical Institute ‘‘Jose Antonio Echeverrıa’’, CP 1930, AP 6028, Havana, Cuba
Received 20 July 2004; received in revised form 26 November 2004; accepted 26 November 2004
Abstract
In this paper, we present the potentialities of the digital holography microscopy for 3D image reconstruction of
transparent microscopic objects. A method for object volume reconstruction based on the capture of only one off-axis
hologram is discussed. We show that this technique can be efficiently used for obtaining quantitative information from
the intensity and the phase distributions of the reconstructed field at different locations along the propagation direction.
The potential of the method has been exploited by applying the 3D image reconstruction procedure to etched nuclear
tracks induced in the widely used polymer detector CR-39. Nowadays, confocal microscopy and atomic force micros-
copy are applied to study nuclear track morphology in CR-39 detectors. The micro-holographic method developed in
this work, and applied to that particular study, constitutes a new alternative procedure that overcomes the previously
described at least in technological simplicity.
� 2004 Elsevier B.V. All rights reserved.
PACS: 07.05.Pj; 42.30.RxKeywords: 3D phase reconstruction; Phase unwrapping; Digital holography; Holographic contouring
0030-4018/$ - see front matter � 2004 Elsevier B.V. All rights reserv
doi:10.1016/j.optcom.2004.11.095
* Corresponding author. Tel.: +53 22 633011/2263; fax: 53 22
632689/2042.
E-mail address: [email protected] (F. Palacios).
1. Introduction
Digital holography has several features that
make it an interesting alternative to conventional
microscopy. These features include an improved
focal depth, possibility to generate 3D images,
and phase contrast images [1–3].
ed.

42 F. Palacios et al. / Optics Communications 248 (2005) 41–50
One popular version of the experimental set-up
in digital holography is the digital Fresnel hologra-
phy, which uses quasi-parallel beans [4] to record
with a CCD camera the intensity distribution of
the hologram. The digital hologram is multipliedby the reference wavefield in the hologram plane
and the diffracted field in the image plane is deter-
mined by the usual Fresnel–Kirchoff integral [5] to
calculate the intensity and the phase distribution
of the reconstructed real image. From the numer-
ical standpoint, the Fresnel–Kirchoff integral can
be represented in terms of an inverse discrete Fou-
rier transformation.Although Fourier transform holographic meth-
od needs only one hologram for obtaining the
phase value corresponding to all points of the
reconstructed phase field, must contouring method
uses two holograms to obtain the phase interfero-
gram and later, after unwrapping procedure, the
object shape. This is the case of the two-wave-
length contouring [6], two-source contouringmethod [7], etc. In general, the determination of
phase values by Fourier method, as is necessary
to use the arctan function for extracting the phase
[8], are wrapped onto the range �p to p rad, and
the process of phase unwrapping, i.e., restoration
of the unknown multiple of 2p to all pixels, must
be carry out before the parameter can be deduced
from the phase distribution.A wide variety of partial solution to the
unwrapping procedure is discussed in the litera-
ture [9,10]. However, the temporal phase
unwrapping is recognized as the best by its sim-
plicity and the fact that it is guarantee to pro-
duce a correct unwrapping of phase maps
containing physical boundaries of the object. In
temporal phase unwrapping [11] the 3D phasefield is generated making holograms capture dur-
ing the time and the phase unwrapping consider
at t direction for phase accumulation. In this
case the 2D unwrapping is not performed, only
along t-axis the unwrapping works, but many
holograms must be captured. This method when
applied for shape contouring or dynamic defor-
mation is fast compared with any other methodthat uses 2D unwrapping and the results are not
exposed to corrupting unwrapping mistake. In
this case the unwrapping procedure takes into
consideration the phase difference for obtaining
the phase image.
Interesting applications of digital holography
rely on the possibility of carrying out whole
reconstruction of the recorded wave front andconsequently, the determination of the phase
distribution at any arbitrary plane located be-
tween the object and the recording plane, and
along the object reconstructed image. Grilli
et al. [12] use the digital holography possibility
of reconstructing the image field at different
planes from the object to find the object beam
phase form and to show how the experimentalset-up affects this, but they do not found the
3D object shape.
In this work, we employ a variant of unwrap-
ping algorithm that shares the same basic princi-
ple with the temporal phase unwrapping
technique but uses as t-axis the reconstructed
depth in the image field. This is the principal
idea applied in this work for to obtain the 3Dphase image corresponding to a nuclear track in-
duced in the CR-39 detector as microscopic
object.
The organization of the paper is as follows. In
Section 2, the general principle of digital hologra-
phy is presented. The experimental set-up is
described in Section 3. The 3D image reconstruc-
tion algorithm is discussed in Section 4. The resultsand discussion are discussed in Section 5.
2. General principles of digital holography
Holography is a method that allows reconstruc-
tion of whole optical wave fields. The principle of
recording and reconstruction of holograms isshown in Fig. 1. The light coming from the object
under test and a reference wave interfere in the
hologram plane.
In classical holography the reconstruction is
carry out by illumination of the hologram intensity
with the reference wave. A virtual and a real image
of the object are reconstructed.
In digital holography this reconstruction pro-cess is performed by multiplication of the stored
digital hologram with the numerical description
of the reference wave and by the convolution of

Fig. 1. Recording of the hologram (a) and image reconstruction (b).
F. Palacios et al. / Optics Communications 248 (2005) 41–50 43
the result with the impulse response function. Thediffracted field in the image plane is given by the
Rayleigh–Sommerfeld diffraction formula
wðx0,y0Þ ¼ 1
ik
Z Zhðn,gÞrðn,gÞf ðx0,y0,n,gÞ
� cosH dx dy ð1Þ
with
f ðx0,y0,n,gÞ ¼ expðikqÞq
ð2Þ
and
q ¼ffiffiffiffiffiffiffiffiffiffiffiffiffiffiffiffiffiffiffiffiffiffiffiffiffiffiffiffiffiffiffiffiffiffiffiffiffiffiffiffiffiffiffiffiffiffiffiffiffiffiffid 02 þ ðn� x0Þ2 þ ðg� y 0Þ2
q, ð3Þ
where d 0 is the reconstruction distance, i.e., the dis-
tance backward measured from the hologram
plane n–g to the image plane, h(n,g) is the recordedhologram, r(n,g) represents the reference wave
field, k denotes the wave number and k is the wave-length of the laser source. Due to the small angles
between the hologram normal and the rays from
the hologram to the image points, the obliquity
factor cosH can normally be set cosH = 1.
Different approaches for solution of Eq. (1)
have been proposed [13]. The Fresnel approxima-
tion replaces the factor q by the distance d 0 in
the denominator of Eq. (2) and the square rootin the argument of the exponential function is re-
placed by the first terms of a binomial expansion.
This approximation is valid since the dimension
of the CCD chip is small in comparison to the dis-tance d 0 [13]. With these approximations Eq. (1)
takes the form:
wðx0,y0; d 0Þ ¼ exp½ipd 0kðm2 þ l2Þ�
�Z Z
hðn,gÞrðn,gÞgðn,gÞ
� exp½�2ipðnmþ glÞ� dn dg, ð4Þ
where the quadratic phase function g(n,g) is the
impulse response,
gðn,gÞ ¼ expði2pd 0=kÞikd 0 exp
ipd 0k
ðn2 þ g2Þ� �
ð5Þ
and the spatial frequencies are m ¼ x0
d 0k, l ¼ y0
d 0k.
The discrete finite form of Eq. (4) is obtainedthrough the pixel size (Dn,Dg) of the CCD array
[14], which is different from that (Dx 0,Dy 0) in the
image plane x 0–y 0 and related as follows:
Dx0 ¼ d 0kMDn
, Dy 0 ¼ d 0kNDg
,
where M and N are the pixels number of the CCDarray in x 0 and y 0 directions, respectively.
According to Eq. (4), the wavefield w(x 0,y 0,d 0) is
determined essentially by the 2D Fourier trans-
form of the quantity h(n,g)r(n,g)g(n,g). For rapid
numerical calculations a discrete formulation of
Eq. (4) involving a 2D fast Fourier transform algo-
rithm (FFT) as showed in:

Fig. 2. Experimental set-up.
44 F. Palacios et al. / Optics Communications 248 (2005) 41–50
wðm,n,d 0Þ ¼ expði2pd 0=kÞikd 0
� expipkd 0 ðm2Dx02þn2Dy02Þ
� �FFT
� IHðj,lÞrðj,lÞexpipkd 0 ðj2Dn2þ l2Dg2Þ
� �� �m,n
,
ð6Þ
where j, l, m, n are integers (�M/2 6 j, l 6M/2),
(�N/2 6 m, n 6 N/2) and IH is the digitalhologram.
In the formulation based on Eq. (6) the recon-
structed image is enlarged or contracted according
to the depth d 0. An alternative approach is useful
for keeping the size of the reconstructed image
constant [5]. In this formulation, the wavefield
w(x 0,y 0,d 0) can be calculated by,
wðx0,y 0,d 0Þ ¼ I�1fI½hðn,gÞrðn,gÞ�I½gðn,gÞ�g, ð7Þ
where I½gðn,gÞ� is the Fourier transform of the im-
pulse response, namely
I½gðn,gÞ� ¼Z 1
�1
Z 1
�1gðn,gÞ exp½�i2pðmnþ lgÞ� dn dg:
ð7aÞ
Taking into account the form of the impulse re-
sponse in Eq. (5) we have that its Fourier trans-
form is given by,
I½gðn,gÞ� ¼ expði2pd 0=kÞ exp½�ipkd 0ðm2 þ l2Þ�:ð8Þ
With this method the size of the reconstructed im-
age does not change, i.e., Dx 0 = Dn, Dy 0 = Dg and
is necessary one Fourier transform and one inverseFourier transform each to obtain one 2D recon-
structed image at a distance d 0. Although the com-
putational procedure is heavier in this case
compared to the Fresnel approximation approach
of Eq. (6), this method allows for easy comparison
of the reconstructed images at different distances d 0
since the size does not change with modifying the
reconstruction distance. Furthermore, in this casewe get an exact solution to the diffraction integral
as far as the sampling Nyquist theorem is not
violated.
3. Experimental set-up
Fig. 2 shows the experimental set-up used in
this work, corresponding to a digital holographic
microscope designed for transmission imagingwith transparent sample. The basic architecture is
that of a Mach-Zender interferometer. A linearly
polarized He–Ne laser (15 mW) is used as light
source. The expanded beam from the laser is di-
vided by the beam splitter (BS1) into reference
and object arms.
With the combinations of the dual polarizers P1
and P2 is adjusted the intensities in the referencearm and the object arm of the interferometer and
the same polarization state is also guaranteed for
both arms improving their interference.
The specimen M is illuminated by a plane wave
and a microscope objective (MO) that produces a
wave front called object wave O collects the trans-
mitted light. A condenser, not shown, is used to
intensify the light intensity of the objectillumination.
At the exit of the interferometer, the interfer-
ence between the object wave O and the reference
wave R creates the hologram intensity Ih(n,g). Theoff-axis geometry is considered, for this reason the
mirror E2, which reflects the reference wave is ori-
ented such that the reference wave reaches the
CCD camera with a small incidence angle with re-spect to the propagation direction of the object
wave.
A digital hologram is recorded by a standard
black and white CCD camera (PULNIX model
TM-9701) and transmitted to a computer by
means of a Frame Grabber card. The digital holo-
gram Ih(j,l) is an array of M · N = 640 · 480 8-bit-
F. Palacios et al. / Optics Communications 248 (2005) 41–50 45
encoded numbers that results from the 2D sam-
pling of Ih(j,l) by the CCD camera,
IHðj,lÞ ¼ Ihðn,gÞrectnLx
,gLy
� �
�XM=2
k¼�M=2
XN=2
l¼�N=2
dðn� jDn,g� lDgÞ, ð9Þ
where j,l are integers, Lx · Ly = 8.91 mm · 6.58
mm is the area of the sensitive chip, and
Dn = 11.6 lm, Dg = 13.6 lm defines the sampling
intervals in the hologram plane.
Holographic microscopy has been proposed in
various configurations [15], in this work we are
working with a geometry including a MO that
was proposed for the first time in 1966 by VanLig-ten and Osterberg [16]. In digital holography a
similar approach was used by Cuche et al. [17].
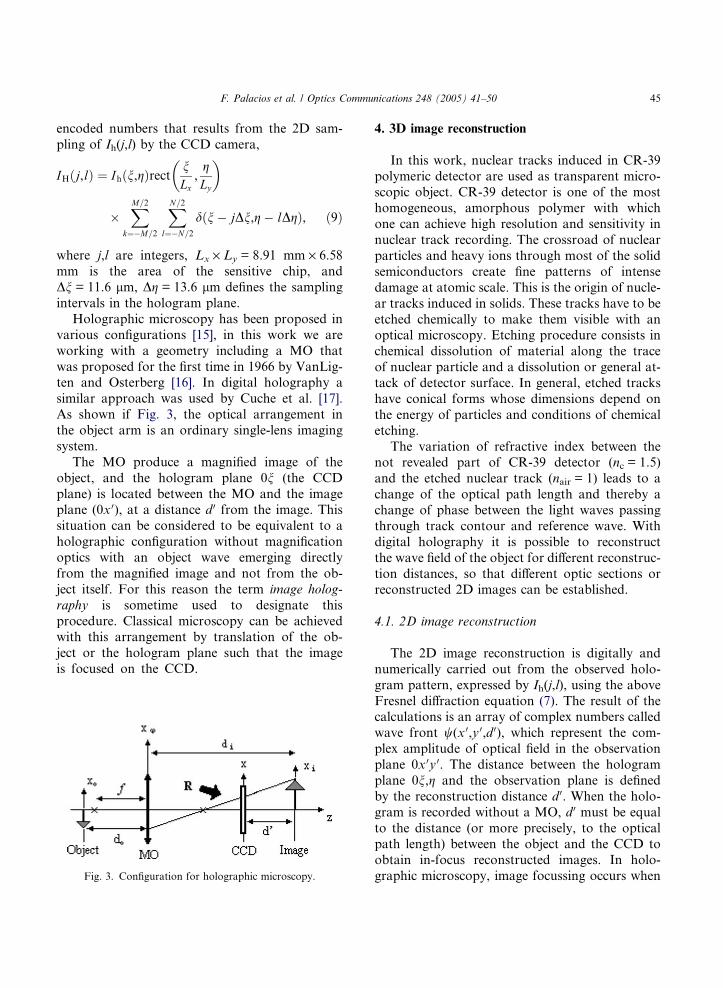
As shown if Fig. 3, the optical arrangement in
the object arm is an ordinary single-lens imaging
system.
The MO produce a magnified image of the
object, and the hologram plane 0n (the CCD
plane) is located between the MO and the imageplane (0x 0), at a distance d 0 from the image. This
situation can be considered to be equivalent to a
holographic configuration without magnification
optics with an object wave emerging directly
from the magnified image and not from the ob-
ject itself. For this reason the term image holog-
raphy is sometime used to designate this
procedure. Classical microscopy can be achievedwith this arrangement by translation of the ob-
ject or the hologram plane such that the image
is focused on the CCD.
Fig. 3. Configuration for holographic microscopy.
4. 3D image reconstruction
In this work, nuclear tracks induced in CR-39
polymeric detector are used as transparent micro-
scopic object. CR-39 detector is one of the mosthomogeneous, amorphous polymer with which
one can achieve high resolution and sensitivity in
nuclear track recording. The crossroad of nuclear
particles and heavy ions through most of the solid
semiconductors create fine patterns of intense
damage at atomic scale. This is the origin of nucle-
ar tracks induced in solids. These tracks have to be
etched chemically to make them visible with anoptical microscopy. Etching procedure consists in
chemical dissolution of material along the trace
of nuclear particle and a dissolution or general at-
tack of detector surface. In general, etched tracks
have conical forms whose dimensions depend on
the energy of particles and conditions of chemical
etching.
The variation of refractive index between thenot revealed part of CR-39 detector (nc = 1.5)
and the etched nuclear track (nair = 1) leads to a
change of the optical path length and thereby a
change of phase between the light waves passing
through track contour and reference wave. With
digital holography it is possible to reconstruct
the wave field of the object for different reconstruc-
tion distances, so that different optic sections orreconstructed 2D images can be established.
4.1. 2D image reconstruction
The 2D image reconstruction is digitally and
numerically carried out from the observed holo-
gram pattern, expressed by Ih(j,l), using the above
Fresnel diffraction equation (7). The result of thecalculations is an array of complex numbers called
wave front w(x 0,y 0,d 0), which represent the com-
plex amplitude of optical field in the observation
plane 0x 0y 0. The distance between the hologram
plane 0n,g and the observation plane is defined
by the reconstruction distance d 0. When the holo-
gram is recorded without a MO, d 0 must be equal
to the distance (or more precisely, to the opticalpath length) between the object and the CCD to
obtain in-focus reconstructed images. In holo-
graphic microscopy, image focussing occurs when

46 F. Palacios et al. / Optics Communications 248 (2005) 41–50
the reconstruction distance is equal to the distance
between the CCD and the image during the holo-
gram recording (d 0 in Fig. 3).
Since w(x 0,y 0,d 0) is an array of complex number,
we can obtain a 2D amplitude-contrast image bycalculating the intensity:
Iðx0,y0,d 0Þ ¼ Re½wðx0,y0,d 0Þ�2 þ Im½wðx0,y0,d 0Þ�2
ð11Þand a 2D phase-contrast image by calculating the
argument,
/ðx0,y 0,d 0Þ ¼ arctanIm½wðx0,y 0,d 0Þ�Re½wðx0,y 0,d 0Þ� : ð12Þ
For phase-contrast imaging the digital hologram
has to be multiplied by a digital reference wave
Rd [17], which must be a replica of experimental
reference wave R. In classical holography, thesame operation is performed optically when the
hologram is illuminated with the reference wave.
If we assume that a perfect plane wave is used as
reference for hologram recording, Rd is calculated
as follows:
Rdðj,lÞ ¼ AR exp i2pkðkxjDnþ kylDgÞ
� �, ð13Þ
where j and l are integers (�M/2 6 j 6 M/2), (�N/
2 6 l 6 N/2), AR is the amplitude, Dn and Dg are
the sampling intervals in the hologram plane,and kx, ky are the two components of the wave vec-
tor that must be adjusted such that the propaga-
tion direction of Rd matches as closely as
possible that of the experimental reference wave.
In practice a method to approximate Rd to R
consists in varying kx, ky until exist coincidence be-
tween the form and distribution of fringes of the
real part of Rd with the interference fringes ofthe hologram. A fine adjustment of kx and kycan be performed by removal all fringes of the
reconstructed phase distribution in some area of
the image where a constant phase is presumed.
4.2. 3D unwrapping algorithm
The proposed method of 3D reconstruction isbased on a similar procedure to that of temporal
unwrapping, where the t-axis is substituted by the
z-axis or rather in direction where varies the focus
of the reconstructed image. Starting from the recon-
struction of the2D phase-contrast image, the phase
at each pixel is measured as a function of the field
depth varying the reconstruction distance d 0.The phase values calculated by Eq. (12) lie auto-
matically in the range �p to +p; this means that
calculating the sequence of the complex map of
field w(x 0,y 0,d 0) for various reconstruction dis-
tances d 0 separated by a distance Dd 0 sufficiently
small, so that discontinuities do not exist between
two consecutive phase planes, the continuous
phase distribution can be obtained by computingthe finite sum of Eq. (12),
/ðx0,y0,d 0sÞ ¼
Xd 0sd 0¼d 0f
/ðx0,y 0,d 0Þ, ð14Þ
where d 0f and d 0
s are the distances from the CCD
to the bottom of nuclear tracks and to the upper
top of detector surface, respectively. These two
distances are measured regarding the magnified
image of the object and can be determined experi-
mentally using the intensity image reconstruction
and auto focus software techniques.
The first reconstructed phase field is carried outfor d 0 ¼ d 0
f , taking this like reference for the sum
of the successive phase maps. This way, the phase
maps calculated for values of d 0 increased they rep-
resent phase variations regarding that of reference,
and then the sum would give the integration of the
phase along direction where varies the focus.
Contrary to the traditional temporal unwrap-
ping, in this work the accumulation of phaseplanes / is used instead of the phase difference
D/ among adjacent planes because, in this case, di-
rectly with the phase values / the fringes of con-
tour of phase of the object are obtained for a
certain distance of reconstruction.
The simplicity of this algorithm resides in the
correct election of Dd 0 that guarantee the phase
difference between two consecutive planes shouldbe less that p/2 providing that discontinuities do
not exist between two consecutive phase planes.
Fig. 4(a) illustrates light crossroad through a
nuclear track induced in detector.
If light rays propagate along straight lines in a
transparent medium along the z-axis the change

Fig. 5. Scheme of the unwrapping path based on sum of 2D
phase planes algorithm in 3D space.
Fig. 4. (a) Light crossroad through a nuclear track induced in
CR-39 detector. (b) Object wave emerging directly from the
magnified image and not from the object itself.
F. Palacios et al. / Optics Communications 248 (2005) 41–50 47
of phase between two adjacent rays at MO,
which is maintained in the magnified image, is
given by:
D/i,iþ1 ¼ /i � /iþ1 ¼ kðdi � diþ1Þ, ð15Þ
where k denotes the wave vector (k = 2p/k), dI,dI + 1, the optical path lengths of the rays i andi + 1, respectively.
The ith phase changes can be expressed as
/i ¼2pkðdicnc þ nadiaÞ ð16Þ
and for (i + 1)th phase change,
/iþi ¼2pkðdðiþ1Þcnc þ dðiþ1ÞanaÞ: ð17Þ
Subtracting Eq. (17) from Eq. (16) and reorganiz-
ing the terms,
D/iþ1,i ¼2pkDdcðnc � 1Þ: ð18Þ
Considering D/ < p/2, then Ddc < k/2.To carry out previous analysis to the plane of
the magnified image of object, Fig. 4(b), it is nec-
essary to multiply Ddc by the axial magnify b of
the MO.
Dd 0 ¼ Ddcb,
where b = m2 [18]. In this work m = 90, so that fi-
nally Dd 0 < 2 mm.
As the reconstruction is carried out to the mag-
nified image of the object, corresponding to thefree-space of propagation, the reconstruction for-
mulas are valid, as well as the obtained phase
values.
Summarizing, Eq. 14 indicates a 3D phase
unwrapping algorithm when Dd 0 satisfy the previ-
ous condition. Fig. 5 illustrates graphically the
algorithm.
The values /i � 1 and /i,i � 1 represent the un-wrapped phase by calculating phase sum from
i = 1 to i � 1 and wrapped phase between i and
i � 1, respectively.
The distinctive feature of this method is that
only one hologram is needed to unwrap the whole
3D phase field, and the unwrapping procedure is
very simple in this condition.
5. Results and discussion
Fig. 6 shows a digital hologram of a selected
area of CR-39 detector recorded with the

Fig. 6. Digital hologram recorded by CCD camera.
Fig. 7. Sequence of a video clip presentation of the intensity
distribution, of a digitally reconstructed object wavefield,
obtained at different distances d 0 from the hologram plane
along z-axis direction.
48 F. Palacios et al. / Optics Communications 248 (2005) 41–50
experimental set-up presented in Fig. 2, the MO
magnification is m = 90 and numerical aperture
NA = 1.25.
The hologram appears as a pattern of interfer-
ence fringes. In this work, experimental conditions
were adjusted so that fringes of interference wereright and not curve, avoiding the necessity of
digital correction of the spherical aberration intro-
duced by MO. Another parameter that character-
izes the interference fringes constitutes its spacing,
which keeps close inverse relationship between ob-
ject and reference wavefield with incidence angle
on the CCD. There is an optimum spacing be-
tween interference fringes, for which maximumseparation among the terms that characterize the
reconstructed wavefield (zero order and unsharp
virtual image) is guaranteed, without requirements
of sampling imposed by the CCD resolution are
violated.
From the hologram, the reconstructed ampli-
tude-contrast images was determined for d 0 rang-
ing from 180 to 225 mm and with Dd 0 = 1 mm.The sequence of intensity distribution was com-
bined to obtain a clip video presented in Fig. 7.
The reconstructed wavefield contains only the real
image of the nuclear tracks without influence of
the other reconstructed terms because of the off-
axis geometry of the set-up (see Fig. 2).
The video clip shows that a point shaped inten-
sity pattern is obtained at the reconstruction dis-tances corresponding to the distance from the
hologramplane to focusing distance of each bottomtracks. This example shows that numerical recon-
struction of holograms provides an efficient method
for visualizing virtual focusing of microscopic sam-
ple, which constitutes the experimental counterpart
of traditional focusing of an optical microscope.
Quantitative analysis of geometrical shape and
its main parameters of sample rely on the ability
of digital holographic microscopy to provideinformation not only about intensity but also on
the phase distribution of the optical wavefield at
different planes from the recorded hologram.

F. Palacios et al. / Optics Communications 248 (2005) 41–50 49
Applying the 3D reconstruction method described
in Section 4.2 the continuous phase distribution
was obtained (Fig. 8).
Height distribution h(x,y) on the sample surface
is simply proportional to the reconstructed phasedistribution /(x,y) [19]:
hðx,yÞ ¼ k4p
/ðx,yÞ: ð19Þ
In [19] an experiment performed with a surface of
homogeneous optical properties demonstrated
that phase changes corresponding to optical path
less than 10 nm can be measured on the basis of
the reconstructed phase-contrast image.
As mentioned above, the reconstructed phase
distribution can be used for quantitative measure-
ments, as it is illustrated in Fig. 9. Dimensional
Fig. 8. Reconstructed continuous phase distribution corresponding t
Fig. 9. (a) 3D plot of the reconstructed surface of a nuclear track
volume parameters and the profile forms of the nu-
clear track can be estimated.
Etched nuclear tracks were obtained by irradia-
tion of CR-39 samples with 5.48 MeV a-particlesfrom 241Am. The detector was etched 4 h in 6 NNaOH solution at 70 �C.
By means of Eq. (19) the calculated phase distri-
bution values were converted to height measure-
ments to calculate the zi values in the graph.
Corresponding xi and yj values were calculated
as follows:
xi ¼iDnm
, i ¼ 0,1, . . . ,M ,
yj ¼iDgm
, j ¼ 0,1, . . . ,N ,
o the hologram presented in Fig. 6. (a) 2D, (b) 3D perspective.
. (b) Sagittal cut at the middle of the reconstructed surface.

50 F. Palacios et al. / Optics Communications 248 (2005) 41–50
where Dn and Dg are the sampling intervals in the
hologram plane, m is the MO magnification and
M,N are the pixels number of the CCD array in
x and y directions, respectively.
6. Conclusions
In this paper, we have proved the potentialities of
the digital holography microscopy for 3D image
reconstruction of transparent microscopic objects.
A method for object volume reconstruction based
on the capture of only one off-axis hologram wasdiscussed, showing that this technique can be effi-
ciently used for obtaining quantitative information
from the intensity and the phase distributions of the
reconstructed field at different locations along the
propagation direction. The proposed method was
applied to the 3D image reconstruction of etched
nuclear tracks induced in the widely used polymer
detector CR-39. The micro-holographic methoddeveloped in this work, applied to the study of nu-
clear tracks, constitutes a new alternative procedure
that overcomes the current techniques, such as con-
focal microscopy and atomic force microscopy, at
least in technological simplicity.
Acknowledgments
The present work was supported by the Brazil-
ian research agencies CAPES and FINEP.
References
[1] W. Xu, M.H. Jericho, I.A. Meinertzhagen, H.J. Kreuzer,
Cell Biol. 20 (2001) 301.
[2] S. Seebacher, W. Osten, T. Baumbach, W. Juptner, Opt.
Lasers Eng. 36 (2001) 103.
[3] C. Buraga-Lefebre, S. Coetmellec, D. Lebrun, C. Ozkul,
Opt. Lasers Eng. 33 (2000) 409.
[4] M. Jacquot, P. Sandoz, G. Tribillon, Opt. Commun. 190
(2001) 87.
[5] J.W. Goodman, Introduction to Fourier Optics, McGraw-
Hill, San Francisco, CA, 1968 (Chapter 5).
[6] B.P. Hildebrand, K.A. Haines, J. Op. Soc. Am. 57 (1967)
155.
[7] C. Quan, P.J. Bryanston-Cross, Opt. Lasers Tech. 22
(1990) 255.
[8] U. Schnars, W. Juptner, Appl. Opt. 33 (1994) 179.
[9] T.R. Judge, P.J. Bryanston-Cross, Opt. Lasers Eng. 21
(1994) 199.
[10] B. Gutmann, H. Weber, Appl. Opt. 26 (1999) 5577.
[11] H.O. Saldner, J.M. Huntley, Appl. Opt. 36 (1997) 2770.
[12] S. Grille, P. Ferraro, S. De Nicola, A. Finizio, G.
Pierattini, R. Meucci, Opt. Exp. 9 (2001) 294.
[13] T. Kreis, W. JuptnerSeries in Optical Metrology, vol. 3,
Akademie Verlag, 1997, p. 353.
[14] T. Kreis, W. Juptner, in: W. Juptner, W. Osten (Eds.),
Fringe �97: Automatic Processing of Fringe Pattern, Verlag
Series in Optical Metrology, vol. 3, Akademie Verlag,
Berlin, 1997, p. 353.
[15] R. Barer, V.E. Cosslett (Eds.), vol. 10, Academic Press,
London, 1987, p. 99.
[16] R.F. VanLigten, H. Osterberg, Nature 211 (1966) 282.
[17] E. Cuche, P. Marquet, C. Depeursinge, Appl. Opt. 38 (34)
(1999) 6994.
[18] R. Jurgen Meyer-Arendt, Introduction to Classical and
Modern Optics, second ed., Prentice-Hall, Englewood
Cliffs, NJ, 1984 (Chapter 1.3).
[19] U. Schnars, J. Opt. Soc. Am. A 11 (7) (1994) 2011.
Copyright © 2022 FDOKUMEN


![Microscopic and macroscopic creativity [Comment]](https://static.fdokumen.com/doc/165x107/63222cba63847156ac067f99/microscopic-and-macroscopic-creativity-comment.jpg)