39. Student housing at South African universities.pdf
293
i
-
Upload
khangminh22 -
Category
Documents
-
view
1 -
download
0
Transcript of 39. Student housing at South African universities.pdf
i
ii
REPORT ON THE
MINISTERIAL COMMITTEE
FOR THE REVIEW OF THE PROVISION OF
STUDENT HOUSING AT
SOUTH AFRICAN UNIVERSITIES
iii
Contact informationDepartment of Higher Education and Training
Physical Address:123 Schoeman Street
PRETORIA0001
Postal Address:Private Bag x174
Pretoria0001
WEBSITE ADDRESS: www.dhet.gov.za
TELEPHONE DETAILSCall Centre: 0800 872 222
Tel: 012 312 5911Fax: 012 321 6770
Email: [email protected]
RP83/2012ISBN: 978-0-621-40731-0
iv
Table of Contents
List of figures v
List of tables vii
Acronyms viii
Chairperson’s Introduction ix
Executive summary xii
1. Introduction 1
1.1 Analytical and interpretive framework 1
1.2 Methodology 3
1.3 Limitations of the report 5
1.4 Structure of the report 5
2. Student housing: A review of the literature 8
2.1 Student housing statistics 8
2.2 Models of student housing development 14
2.2.1 Public-private partnerships 14
2.2.2 Partnerships between cities and universities 16
2.2.3 Reuse of old buildings 17
2.3 Recent trends in student housing 17
2.3.1 Residential learning communities 17
2.3.2 Mixed student housing 18
2.3.3 Safety and security 19
2.3.4 Sustainable campus housing 19
2.3.5 The diversity of student housing needs 19
2.4 The contribution of residence life to student success 20
2.4.1 The first year experience and residence 21
2.4.2 Living-learning programmes and student outcomes 23
2.5 National student housing policies and regulatory frameworks 24
2.6 Financing of student accommodation and infrastructure 25
2.7 Conclusion 29
3. Residence student demographics 31
3.1 Number of residence students and residence capacities 31
3.2 Proportions of undergraduate and postgraduate students in residence 33
3.3 Gender 35
3.4 Race 36
3.5 Race and gender 37
3.6 Level of study 38
3.7 Time taken to graduate 40
3.8 Financial aid 41
3.9 Geographic origins 41
3.10 Comparing national, student and residence student populations in South Africa 46
4. Student housing infrastructure and facilities 49
4.1 Types of student housing 49
4.2 Room sizes 50
v
4.3 Catering 51
4.4 Recreational facilities 53
4.5 Access to computer and ICT facilities 55
4.6 Accommodation for students with disabilities 55
4.7 State of infrastructure and facilities 57
4.8 Quantifying the state of repair 64
4.9 Estimating the cost of repairs and improvements 65
5. Residence management and administration 66
5.1 Staff to student ratios 66
5.2 Staff remuneration and training 68
5.3 Security 69
5.4 Student residence leadership structures 71
5.5 Student support structures 71
5.6 Residence selection and admission policies 72
5.7 Residence academic admission criteria 73
5.8 Subletting 75
5.9 Corruption 75
5.10 Student protests related to accommodation 76
6. Private student accommodation 79
6.1 Types of private accommodation 79
6.2 Private accommodation providers 79
6.3 Students in private accommodation 80
6.4 Privately owned residence accommodation A 81
6.5 Privately owned residence accommodation B 86
6.6 Public-private partnership accommodation 91
7. Financing of student accommodation and housing at public universities 98
7.1 Separation of university and residence budgets 98
7.2 Residence management accounts 99
7.3 Levels of unpaid student debt 102
7.4 Comparison of residence fees 103
7.5 Financial exclusions from residence 106
7.6 Financial assistance to residence students 107
7.7 Third stream residence income generation 108
7.8 Funding of residence infrastructure development over the past decade 109
7.9 Lease and public-private partnership agreements 111
7.10 True ownership costs of new residences 111
7.11 Fair and reasonable residence fee 115
7.12 Institutional future planning 116
8. Analysis of findings 119
8.1 Overall assessment 120
8.2 Towards a typology of South African higher education campuses 121
8.3 Funding residence development 125
8.4 Critical issues 129
8.5 Access/equity/redress 130
8.6 Quality/standards 131
8.7 Cost/financing 132
vi
8.8 Learning/success 134
8.9 Inclusion/integration 135
8.10 Governance/management 136
9. Recommendations 138
9.1 Residence admissions and allocations policies 138
9.2 Minimum standards for student housing and accommodation 138
9.3 Private student housing and accommodation 139
9.4 Residence management and administration 139
9.5 Role of residences in the academic project 140
9.6 Financing of student housing and funding of student accommodation 141
9.7 Condition of residence infrastructure 143
9.8 Future planning 144
10. References 145
Appendix A: Terms of Reference 151
Appendix B: Research Questionnaire 154
Appendix C: Sample Institutional Profile 178
Appendix D: Proposed Minimum Standards Code 206
Appendix E: Minimum Standards Room Specification Manual 212
Appendix F: Budget Student Meal Plan 248
Appendix G: Financial Models for New Residences 258
Appendix H: Impact of Student Housing on Academic Success 260

vii
List of figures
Figure 1: Analytical and interpretive framework
Figure 2: Student type of residence per European country surveyed
Figure 3: Type of student housing per European country surveyed
Figure 4a: Proportions of undergraduate and postgraduate students in residence,2008
Figure 4b: Proportions of undergraduate and postgraduate students in residence,2009
Figure 4c: Proportions of undergraduate and postgraduate students in residence,2010
Figure 5a: Proportions of residence students by gender, 2008
Figure 5b: Proportions of residence students by gender, 2009
Figure 5c: Proportions of residence students by gender, 2010
Figure 6a: Proportions of residence students by race, 2008
Figure 6b: Proportions of residence students by race, 2009
Figure 6c: Proportions of residence students by race, 2010
Figure 7a: Residence student demographics by race and gender, 2008
Figure 7b: Residence student demographics by race and gender, 2009
Figure 7c: Residence student demographics by race and gender, 2010
Figure 8a: Residence students by level of study, 2008
Figure 8b: Residence students by level of study, 2009
Figure 8c: Residence students by level of study, 2010
Figure 9: Time taken to graduate, 2005 cohort
Figure 10: Numbers of residence students who received financial aid, 2008-2010
Figure 11a: Geographic origin of residence students, 2010
Figure 11b: Geographic origin of new first year students, 2010
Figure 11c: Geographic origin of new first year students with disabilities, 2010
Figure 11d: Geographic origin of senior undergraduate students, 2010
Figure 11e: Geographic origin of senior undergraduate students with disabilities,2010
Figure 11f: Geographic origin of postgraduate diploma and certificate students,2010
Figure 11g: Geographic origin of postgraduate diploma and certificate students withdisabilities, 2010
Figure 11h: Geographic origin of Honours, Masters and PhD students, 2010
Figure 11i: Geographic origin of Honours, Masters and PhD students withdisabilities, 2010
Figure 12: Comparison of national, student and residence student populations, 2010
Figure 13: Comparison of undergraduate students in relation to residence studentsand total enrolments, 2010
Figure 14: Student housing by type, 2010
Figure 15: City Edge PPP: comparative annual data
Figure 16: Prime interest rate, 1999-2011
Figure 17: City Edge PPP: comparative totals after 15 years
viii
Figure 18: Separation of university and residence budgets
Figure 19a: Total/national net residence budget surplus, 2008-2010
Figure 19b: Total/national net average residence budget surplus, 2008-2010
Figure 20: Net residence operations surplus/(deficit) for 2008-2010
Figure 21: Total levels of student debt for accommodation, 2006-2009
Figure 22: Levels of unpaid student housing debt, 2006-2009
Figure 23: Annual residence fee (without food), 2008-2010
Figure 24: Average % residence fee increase 2008-2010
Figure 25a: NSFAS residence funding recipients, 2008
Figure 25b: NSFAS residence funding recipients, 2009
Figure 25c: NSFAS residence funding recipients, 2010
Figure 26: Average annual gross third stream income, 2007-2009
Figure 27: Sources of funding for residence infrastructure development
Figure 28: Real cost of ownership - Scenario 1
Figure 29: Real cost of ownership - Scenario 2
ix
List of tables
Table 1: Number of students in university residences, 2008-2010
Table 2: Registered students and bed space per university and campus, 2010
Table 3: Population demographics and university enrolments in South Africa, 2010
Table 4: State of repair of infrastructure
Table 5: State of fixtures and fittings
Table 6: State of dining room facilities
Table 7: Staff to student ratios per university
Table 8: Residence academic admission criteria
Table 9: Incidents of housing-related student unrest and protest
Table 10: Reasons for student housing-related protests
Table 11: Private accommodation providers
Table 12: Net surplus/deficit for each university’s residential system, 2008-2010
Table 13: Weighted average residence fee, 2008-2010
Table 14: Funding of residence infrastructure development
Table 15: Per student estimates for the provision of accommodation which complieswith proposed minimum standards
Table 16: Master plans for provision of student housing
Table 17: Number of universities that requested financial assistance from DHET
Table 18: Backlog or bed shortage and number of beds needed
Table 19: Fifteen year infrastructure funding requirement for university residenceinfrastructure development
Table 20: Total cost of meeting the 80%/50% bed capacity target over ten andfifteen years
Table 21: Assessment of condition of infrastructure
Table 22: Components of quality
Table 23: Pros and cons of living on campus
Table 24: Governance and management
x
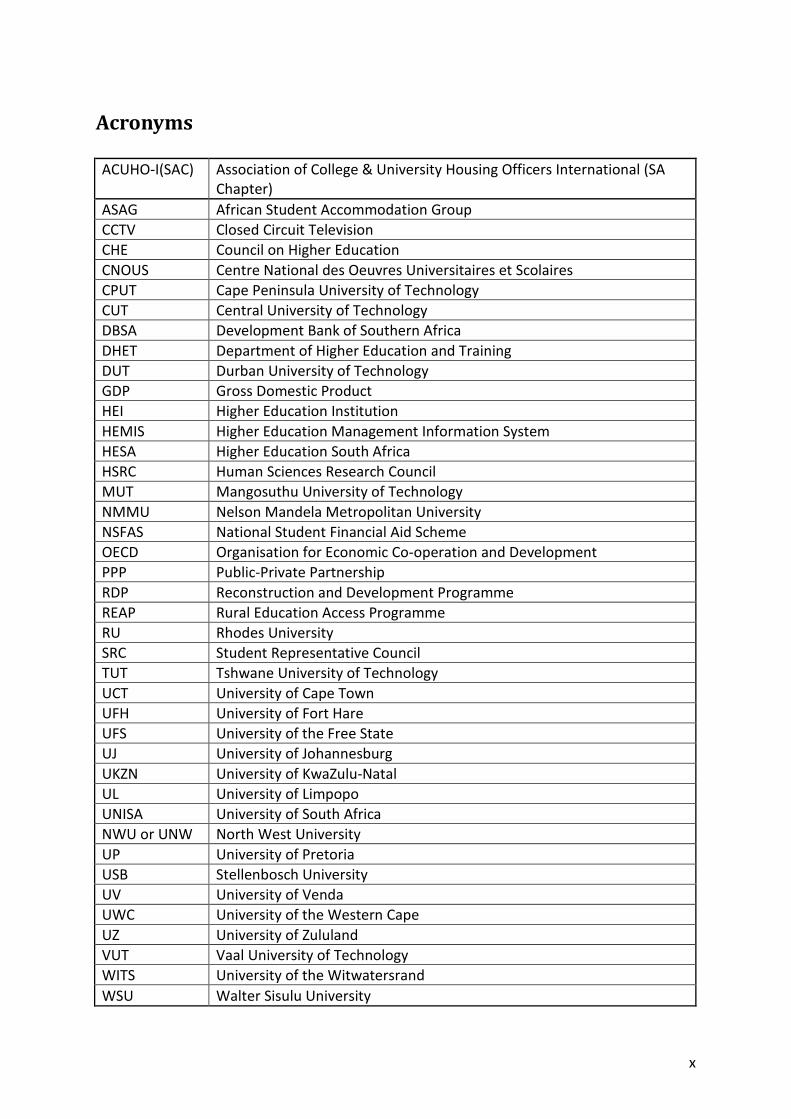
Acronyms
ACUHO-I(SAC) Association of College & University Housing Officers International (SAChapter)
ASAG African Student Accommodation Group
CCTV Closed Circuit Television
CHE Council on Higher Education
CNOUS Centre National des Oeuvres Universitaires et Scolaires
CPUT Cape Peninsula University of Technology
CUT Central University of Technology
DBSA Development Bank of Southern Africa
DHET Department of Higher Education and Training
DUT Durban University of Technology
GDP Gross Domestic Product
HEI Higher Education Institution
HEMIS Higher Education Management Information System
HESA Higher Education South Africa
HSRC Human Sciences Research Council
MUT Mangosuthu University of Technology
NMMU Nelson Mandela Metropolitan University
NSFAS National Student Financial Aid Scheme
OECD Organisation for Economic Co-operation and Development
PPP Public-Private Partnership
RDP Reconstruction and Development Programme
REAP Rural Education Access Programme
RU Rhodes University
SRC Student Representative Council
TUT Tshwane University of Technology
UCT University of Cape Town
UFH University of Fort Hare
UFS University of the Free State
UJ University of Johannesburg
UKZN University of KwaZulu-Natal
UL University of Limpopo
UNISA University of South Africa
NWU or UNW North West University
UP University of Pretoria
USB Stellenbosch University
UV University of Venda
UWC University of the Western Cape
UZ University of Zululand
VUT Vaal University of Technology
WITS University of the Witwatersrand
WSU Walter Sisulu University
xi
MINISTER’S FOREWORD
The provision of accessible, decent, safe and academically conducive studentaccommodation in South African Universities is of great importance to the quality of thehigher education system and the success of our students, especially those from a rural andpoor background. Many of our students, particularly those studying in our historically blackinstitutions, have been living in very poor conditions and this has often hampered theirability to succeed. We have also in the past witnessed boycotts and protests over theconditions in student residences. On taking office and visiting some of the institutions, itwas glaringly apparent to me that student housing was a major problem in our publicuniversity system and that something needed to be done.
I therefore appointed a Ministerial Committee in August 2010 to review the provision ofstudent accommodation at our universities and to benchmark South African universitiesagainst each other as well as against international institutions operating in similarenvironments. I requested the Committee to undertake research to determine the real needfor student accommodation across all our public universities, to assess the various modelsof provision already in the system and to make recommendations on how to improve thesituation.
The work of the Committee included an assessment of the various types of housingcurrently provided for university students, possibilities for the future, as well as potentialfunding models which could assist in alleviating the problem while simultaneously ensuringthat the provision is affordable and does not detrimentally affect the operating budgets ofour universities in the future. In undertaking these important tasks, the Committee engagedand consulted universities, student organisations, financial services organisations, HigherEducation South Africa (HESA) and other key stakeholders.
The report does indeed confirm that there are major backlogs in the provision of studentaccommodation, and that in some instances students are living in appalling conditions.Many of our institutions have not been able to make sufficient investments in maintainingtheir infrastructure, and far too few students are accommodated. It is clear that massiveinvestments are required to address the backlog that currently exists. This is primarily theresponsibility of the state and, where feasible the universities themselves.
Private providers could play an important role in filling the gap that exists in the provision ofaffordable student accommodation. However, the report indicates that the provision ofprivate student accommodation is unregulated, allowing widespread exploitation ofstudents and exposure of students to various types and levels of risks. The private sectorinvolvement must be seen as a response to the social need that exists. Private involvementin student housing projects can make a useful contribution but only if it is regulated toensure sure that students are provided with quality accommodation which is affordable,academically conducive and sustainable into the future.
Research evidence suggests that being housed in a safe, well-managed residence is bothsocially and academically beneficial for students, particularly those from poorerbackgrounds. It means that they do not have to spend hours commuting to and from the
xii
university and that they live in conditions that are conducive to academic study. This isparticularly important for first year students who are the most vulnerable group and needthe most assistance to succeed academically. Decent and affordable studentaccommodation thus allows students to focus their energies on their academic endeavours,thereby improving the chances of success.
The importance of well managed and administered student accommodation cannot be over-emphasised as data provides conclusive proof that the throughput of students in residencesis far better than those that reside off-campus and commute to universities. Furthermore,support in student residences plays an important role as it is far easier to access thesestudents and provide support necessary for academic success. Closely linked to affordablestudent accommodation is the need to ensure that all students are provided with balancedmeals of good nutritional value. There is evidence of hunger among students, somethingwhich we should never allow for both moral and academic reasons. The report makesrecommendations in this regard as well.
The report makes far reaching and comprehensive recommendations which include,amongst others, the setting of minimum standards for student housing andaccommodation, professionalisation of housing staff, and the setting of comprehensiveresidence admission and allocation policies. These recommendations have already beenvery useful for the Ministry particularly in guiding the resource allocations for the nextround of infrastructure funding. In immediately responding to the challenges outlined in thereport, special allocations have been made for student accommodation with focus beingrightly placed on historically disadvantaged institutions and campuses so that they canimprove their standards of student accommodation.
While the funds allocated thus far are inevitably still insufficient to address all the backlogshighlighted in the report, the department has already began exploring sources of fundingother than the fiscus. I expect to make some major announcements in this respect during2012.
I am very pleased with the outcome of the work of the committee and would like to thankProfessor Rensburg, all committee members, the researchers and departmental officialswho contributed to the development of this important report.
Dr B.E. Nzimande, MPMinister of Higher Education and TrainingFebruary 2012
xiii
Chairperson’s Introduction
On receiving the call from Minister Nzimande to chair a Ministerial Committee on StudentHousing, I pondered over the significance of such a study given the several other challengesthat confound our university system, ranging from the long-run per capita decline infunding, the imperative of more purposeful and strategic institutional differentiation tosupport institutional and national ambitions, through the contributions of the publicschooling system to students’ low success rates at universities as well as the nature of theformal and actual school curriculum, to the perennial governance and leadership crises, tomention only a few such matters.
Thus the questions arose: why establish such a Ministerial Committee, and what is thenational crisis that sparked Minister Nzimande into establishing it? The Committee began itsapproach to these challenging questions by seeking an answer to the next question – or is itthe prior one? – which is: why is planned student accommodation important?
As we are well aware, the university system that exists today emerged from an eclectic setof elite and historically disadvantaged institutions inherited from our apartheid past.Mergers of some universities with different historical funding arrangements, it was believed,would provide the opportunity to create from the bottom-up a more equitable system. Theestablishment of the Department of Higher Education and Training in 2009 added a newdimension to the transformative possibilities in higher education, such as the prospect ofproviding a single, seamless post school education and training system that will meet theaspirations of young people and adults. At the same time education and training initiativeswould be challenged to respond to national imperatives that include enhancing economicgrowth, addressing rural development and contributing to the development of a wellinformed and critical citizenry. Achieving these goals has been no easy task, and manyremain elusive. We know from various studies that participation, retention, throughput andgraduation rates are low, and postgraduate enrolment must increase.
It is now well documented that the last decade has seen an explosion in student enrolmentin our residential university system, with enrolment reaching 535 433 in 2010 (538 210 in2011) and expected to grow at a rate of about 2%. Strikingly, the number of beds availableat residential universities in 2010 totalled 107 598, or 20% of total enrolment. Researchsuggests that, internationally, about 50% of students live at home or with relatives;however, given the high levels of poverty in Africa and the unsuitability of the homeenvironment for academic endeavour for the majority of students, suitable studentaccommodation needs to be provided for up to 100% of students in some contexts. Theideal bed capacity target recommended by the Committee ranges from 50% to 80%. Thissituation translates by 2013 into a shortage of 207 800 beds. This is a fundamentalassumption that informs this work. The motivation is simple yet critical, if the universitysystem is to achieve one of its fundamental goals, i.e., in respect of under-graduateeducation to create the conditions that will enable dependent adolescents to become wiseadults – men and women of dignity and honour – who will be the country’s future leaders,whose discoveries and innovations will be the source of national prosperity in the coming
xiv
centuries, and whose personal ethics will be the standards both of government and ofcorporate South Africa.1
Importantly for the work of this Committee, a large proportion of this enrolment growth isaccounted for by young, black, low income, first generation university entrants, especiallyfemale entrants. Given the significant economic and social distributional value of universityeducation, this is an extremely positive development for South Africa. However, given thetwin factors of very slow growth in residential places in the university system over the lastdecade and the severely limited capacity of many parents and students to fully financeresidential accommodation and meals, much of the potential of this positive developmenthas been wasted since first year drop-out rates have remained stubbornly high, and it isincumbent upon us to explore and develop a fundamentally new approach to studentaccommodation that can remedy this situation. There is an additional rationale for this, too:spending one’s first year at university in a well-led, well-managed, well-governed and well-maintained residence improves one’s chance of graduating on time.
We have found that as a result of the exceedingly high demand for student housing, on-campus accommodation has been under pressure, often resulting in informal andunmanaged over-accommodation including ‘squatting’ and significant overuse and decay ofexisting infrastructure and utility services. Notwithstanding goodwill, much of the recentprovision of off-campus student accommodation has been unplanned and reactive, withcomplicated and even questionable lease agreements and public-private partnerships thatsee universities, not the private provider, carrying risk. Often, such accommodation is simplybad and located in the worst and most unsafe parts of downtown metropolitan areas or inrural areas at a distance from campuses. Often, too, students, whether in on- or off-campusaccommodation, go hungry or live on inadequate and unbalanced meals with very littlenutritional value.
On-campus student residences are frequently poorly governed and managed or even not atall governed and managed. Many staff in charge of accommodation have not had therequisite training to manage their responsibilities, resulting in incompetent practices orsimply inaction. Thus, instead of always providing our students with the best environments,on- or off-campus, within which they can flourish and achieve their, their families’ and ourambitions, we are simply reproducing the cycle of incompetence, lack of compassion andpoverty. As this report notes, residences located in university campuses are much morethan bricks and mortar. They are living social communities that can either advance ordetract from our shared university or societal goals. These communities also reflect andcontest the diverse range of social and economic class paradoxes that exist in our society,including racism and gender-based and sexual orientation related violence.
Given such instances of squatting and decay, one wonders why there is such reluctance toact and why this situation has so quickly become the norm. Is it because of indifference, orbecause officials turn a blind eye, or because executives have simply allowed themselves tobe bullied into inaction by some stakeholders? Whatever the reasons, we know that clear
1Lewis, H.R., Excellence without a Soul: How a Great University Forgot Education (New York: Public Affairs
Books, 2006), pp. 17-19.
xv
and deliberate action is urgently required so that we can provide the very bestcircumstances under which (especially undergraduate) students can flourish.
We have also found very good practices on all of these counts, some of which we record inthis report and which inform our advice to the Minister. These very good practicesdemonstrate the value of well-considered and planned approaches to the provision of on-and off-campus accommodation. This report thus provides critical support for arguments forthe success of South Africa’s higher education ambitions for its citizens and of the collectivenation-state. We intend for this report to stand out in eight aspects, viz.:
To make the case for student residences to be living and learning communities thatare critical to the success of the academic project;
To develop the idea of student villages in metropolitan areas as appropriateenvironments for students to flourish socially, intellectually and academically;
To establish the scale of the student accommodation quandary;
To offer a well-motivated and justifiable differentiated framework for redressing thisstudent accommodation quandary through establishing a typology of need based onrelative access to private sector led provision and historical disadvantage;
To provide government with a medium to long term financing framework within afifteen year timeframe, in order to intercede in this situation;
To provide ways in which the National Student Financial Aid Scheme loans can beimproved to address qualifying students’ dire states;
To provide minimum standards for student accommodation, whether on- or off-campus; and
To tackle poor student nutrition and hunger in our universities.
The dearth of research and knowledge in the field of student accommodation hampered theCommittee’s progress, and the establishment of a domestic centre of excellence in alldimensions of student accommodation is thus an urgent priority.
I wish to take this opportunity to acknowledge the contributions of members of theCommittee. First, for their insights and wisdom, I am grateful to senior officials in theDepartment of Higher Education and Training, viz., Kirti Menon, Brenda Swart, LeonardoCloete and, more recently, Shai Makgoba. I am also most indebted to our researchers, DrIain L’Ange and Michele Berger, for their detailed preparation and systematic approach tothe work; and I wish to thank Rhodes University and its Centre for Higher EducationResearch, Teaching and Learning (CHERTL) for seconding Dr L’Ange for this work. Finally, Iwish to express personal appreciation to Shireen Motala for her resolute stewardship of theresearch, and to my office staff, Thembeka Dlungwane, Annah Sekwele and, more recently,Thabo Mamabolo, for all of the fine logistical arrangements.
Professor Ihron RensburgChairperson: Ministerial Committee for the Review of the Provision of Student Housing
xvi
Executive summary
This report documents the findings of the review of the provision of student housing in thepublic university education system in South Africa undertaken by the Ministerial Committeeestablished in August 2010 by the Minister of Higher Education and Training. The scope ofthe review called for an assessment of the following specific aspects of student housing:
Demand for student accommodation at university and national levels.
Current mix of students in residences.
Benchmarked findings across universities in South Africa and worldwide.
Current and potential types of physical accommodation.
Models of securing physical accommodation.
Current levels of student payment for accommodation, including NSFAS provision.
Sources of finance available to universities.
Minimum standards for all residences.
True ownership cost of new accommodation buildings and its impact on futureoperational budgets.
Possible changes to funding frameworks.
Due to the complexity and the inter-relatedness of these aspects, an analytical andinterpretive framework was developed which identifies the key and fundamental elementspertaining to the provision of university student housing and accommodation in SouthAfrica today. The framework, which comprises of the following elements, also expresses theneed to keep these elements in equilibrium, or creative tension:
Access/equity/redress.
Quality/standards.
Cost/financing.
Learning/success.
Inclusion/integration.
Governance/management.
A number of methods of data collection were utilised. First, an extensive desktop review ofrelevant literature in the areas specified by the Minister was conducted. Second, acomprehensive questionnaire was developed in consultation with senior officials of theDepartment of Higher Education and Training (DHET), and distributed to the ViceChancellors of the twenty two universities with residences. Third, site visits to each campusof the twenty two universities were conducted, during which residences and relatedcomponents of the residential system were inspected. Interviews with a number of relevantstakeholders were also conducted during the site visits. A total of 49 campuses were visited.
The literature review reflects the fact that most literature on student housing derives fromEurope and North America and, to a lesser extent, Australia, with little research on studenthousing in developing country contexts, including South Africa. In Europe, most students live
xvii
at home, with relatives or on their own, rather than in residences; however, there aredistinct regional and national differences in each of these categories.
In most countries, the demand for student housing currently tends to outstrip supply, andpublic funding of higher education is under increasing pressure everywhere. Studenthousing models range from traditional university residences to public-private partnerships(PPPs), city-university partnerships and the reuse of old buildings; and recent trends includean emphasis on residential learning (or ‘living-learning’) communities, more mixed andflexible housing forms, a focus on safety and security, sustainable and green campusdevelopments, and greater consideration for the diversity of student housing needs.
While a large body of international research suggests that residence life can make asubstantial positive contribution to student success, these findings are neither conclusivenor necessarily generalisable to a developing world context. More rigorous and focusedresearch is needed in the South African context.
Nationally, the racial demographic profile of students in university provided accommodationis close to that of the national demographic. As might be expected, there are more femalethan male students accommodated. The number of university residence beds in 2010 was107 598, which accommodated 20% of the total number of full-time contact studentsenrolled at the twenty two universities with residences. However, only 5.3% of first yearstudents, those arguably in greatest need of accommodation, are in residences.
In 2010 some 71% of students housed in university residences received some form offinancial assistance. Regarding students’ geographic origins, the highest percentage ofstudents housed in residences in 2010 originated from KwaZulu-Natal, followed by theEastern Cape, and third highest were students from the Southern African DevelopmentCommunity (SADC).
While campuses are more or less evenly split between those with dining hall facilities andthose which are self-catering, poor nutrition and student hunger are issues at alluniversities. The maldistribution of NSFAS funding for student accommodation at a numberof universities is the direct cause of much suffering and hardship to students.
Residence staff-student ratios vary between 1:19 and 1:535, with staff remuneration andtraining varying just as widely.
Around a quarter of all infrastructure, fixtures, fittings and dining hall facilities are assessedby the universities concerned to be in an unsatisfactory or poor condition. Based onuniversity estimates, the value of the current national maintenance and refurbishmentbacklog is R2.5 billion. If the existing residence stock is to be modernised to render theresidences ‘fit-for-purpose’, then a further R1.9 billion is required.
In addition to these costs for maintenance, refurbishment and modernisation of existingresidence stock, it is estimated that the current residence bed shortage is approximately195 815. (This estimate is premised on the provision of residence accommodation for: 80%of full time contact student enrolments on campuses where off-campus accommodation is
xviii
unsuitable and/or unavailable, and for 50% of full time contact student enrolments oncampuses where limited off-campus accommodation is available and is suitable, all at a perbed construction cost of R240 000.) In these terms, the cost of overcoming this shortageover a period of ten years is estimated at R82.4 billion, or R109.6 billion over fifteen years.
Universities reported a total of 39 incidents of student-housing related protests, of varyingintensity and scope, during the past five years, several of which were sparked bydissatisfaction with residence maintenance and facilities.
The lack of sufficient and adequate on-campus housing is resulting in overcrowding,jeopardising students’ academic endeavours and creating significant health and safety risks.
The private sector is a significant contributor and stakeholder in the provision ofaccommodation to university students in South Africa, as is the case internationally. Leavingaside those students who live at home or in their own accommodation, it is estimated thatthe number of student beds currently made available by both small and large scale privateproviders in South Africa is close to 10% of the total full-time contact enrolment atuniversities in 2010.
However, the conditions under which students are being housed in some university-leasedbuildings can only be described as squalid. Private student housing in the country appears tobe completely unregulated.
The few existing partnerships between universities and private student housing developersoffer high quality but also relatively expensive accommodation. Until now most universitieshave been using their own funds to finance residence infrastructure development, butvariations on such public-private partnerships, perhaps involving multiple universities,existing state infrastructural development mechanisms and private sector funding, have thepotential to be more cost-effective.
South African universities generated an overall surplus from their residence operationstotalling R251.5 million from 2008 to 2010; this includes universities that recorded surpluses– four universities account for R316 million of the R450 million surplus – as well asuniversities that recorded losses – five universities account for R167 million of the R200million loss.
Total student residence debt has grown from approximately R67 million in 2006 toapproximately R85 million in 2009.
In 2010 the average residence fee without food was R13 283, and the average residence feeincluding meals was R30 924.
The challenges facing universities are enormous, making it all the more essential that eachinstitution develops a proper student housing and accommodation strategic plan. The focusneeds to shift to the development of strategies and mechanisms to increase access touniversity residences by poor working class and rural students and to develop sensitivesupport mechanisms for these students which empower and enable them to participate
xix
fully in the academic, social and cultural life of the university, so that they too receive aholistic educative university experience.
Summary of recommendations
Residence admissions and allocations policies
1. A comprehensive residence admissions and allocations policy needs to be developedby each university, and rigorously implemented, managed and monitored.
2. Strategies and mechanisms need to be developed to increase and support access touniversity residences by poor working class and rural students.
3. Strategies and mechanisms need to be established to allow all new first year contactstudents in need of accommodation to be allocated to a residence for their firstyear.
Minimum standards for student housing and accommodation
4. Minimum standards for the accommodation and housing of students must bedeveloped and made applicable to all providers of student housing, both public andprivate.
Private student housing and accommodation
5. Given the dire shortage of suitable student accommodation, public-privatepartnerships in the form of student villages, particularly in the metropolitan areas,should be explored further.
6. Mechanisms designed to foster and enhance cooperation between all stakeholdersinvolved in the provision of student housing and accommodation need to beestablished, under the auspices of the DHET.
Residence management and administration
7. Residence staff to resident student ratios should not normally exceed 1:150 in thecase of wardens, house parents, residence managers or the equivalent, and 1:100 inthe case of student sub-wardens or the equivalent.
8. All universities should establish a board, council or similar body which represents allresidences and oversees residence life.
9. Improving the professionalism, compensation and training of university housing staffis an urgent priority.
10.All complaints and allegations of maladministration, corruption and nepotism mustbe rigorously investigated by the DHET and strict action taken against offenders.
Role of residences in the academic project
11. Research needs to be conducted to explore ways in which the social and culturalmilieu in residence systems impacts upon the ability of black working class studentsto succeed academically.
xx
12.Research needs to be conducted to explore the broad and complex relationshipbetween student housing and academic success.
13.Residences must become an integral part of the academic project and promoted assites of academic endeavour.
Financing of student housing and funding of student accommodation
14.Residence bed capacities to accommodate 80% of full time contact studentenrolment on campuses where off-campus accommodation is unsuitable and/orunavailable, and 50% of full time contact student enrolment on campuses wherelimited off-campus accommodation is available and is suitable, should be targeted.
15.Once the state has indicated what proportion of this target it is able to fund, theprivate sector should be invited to meet the remaining bed capacity target, inaccord with minimum standards for the provision of student housing.
16.The complete separation of the residence budget and management accounts fromthe university budget and management accounts is needed.
17.Residence management accounts should be submitted on a quarterly basis to theUniversity Council, and annual financial reporting must be standardised.
18.A ‘wealth tax’ mechanism should be explored as a way of increasing residence accessto disadvantaged students.
19.An investigation into universities’ use of reserves for priorities such as studenthousing should be undertaken.
20.An annual fixed national NSFAS residence fee for student board and lodging whichmeets minimum standards (including a minimum of two balanced meals per day)should be set at R30 500 for 2011.
21.The current range of NSFAS funding for residence accommodation should beincreased.
22.Stricter guidelines should be developed for the administration of NSFAS funding,especially accommodation funding, by the universities.
23.The current system of infrastructure grants from the DHET should be maintained andstrengthened, with clear guidelines and funding allocation criteria.
24.Requests for funding for new residence development and residence refurbishmentmust be accompanied by a comprehensive assessment and cost estimate from aregistered quantity surveyor.
25.A differentiated or sliding residence infrastructure funding mechanism should bedeveloped to enable campuses with low bed capacities to receive a higherpercentage of the infrastructure funding ‘pie’ until they have caught up.
Condition of residence infrastructure
26.All universities are to conduct a professional quantity surveyor-led assessment oftheir residence infrastructure.
27.National minimum standards and service level agreement guidelines for themaintenance and refurbishment of residence infrastructure should be established.
28.Modular residence construction methodologies should be fully researched.
xxi
Future planning
29.All universities should develop a multi-year strategic plan (including a financial plan)for residence maintenance and refurbishment.
30.Those who are accountable for university student housing should be part of theplanning process. The Chief Housing Officer should report directly to a member ofthe senior management team of the university.
1
1. Introduction
This report documents the findings of the review of the provision of student housing in thepublic university education system in South Africa undertaken by the Ministerial Committeeestablished in August 2010 by the Minister of Higher Education and Training.
The terms of reference of the review, as specified by the Minister, are listed in summaryform below and in full detail at the end of this report (Appendix A). The Committee wasasked to specifically review the following aspects of student housing:
Demand for student accommodation at university and national levels.
Current mix of students in residences.
Benchmarked findings across universities in South Africa and worldwide.
Current and potential types of physical accommodation.
Models of securing physical accommodation.
Current levels of student payment for accommodation, including NSFAS provision.
Sources of finance available to universities.
Minimum standards for all residences.
True ownership cost of new accommodation buildings and its impact on futureoperational budgets.
Possible changes to funding frameworks.
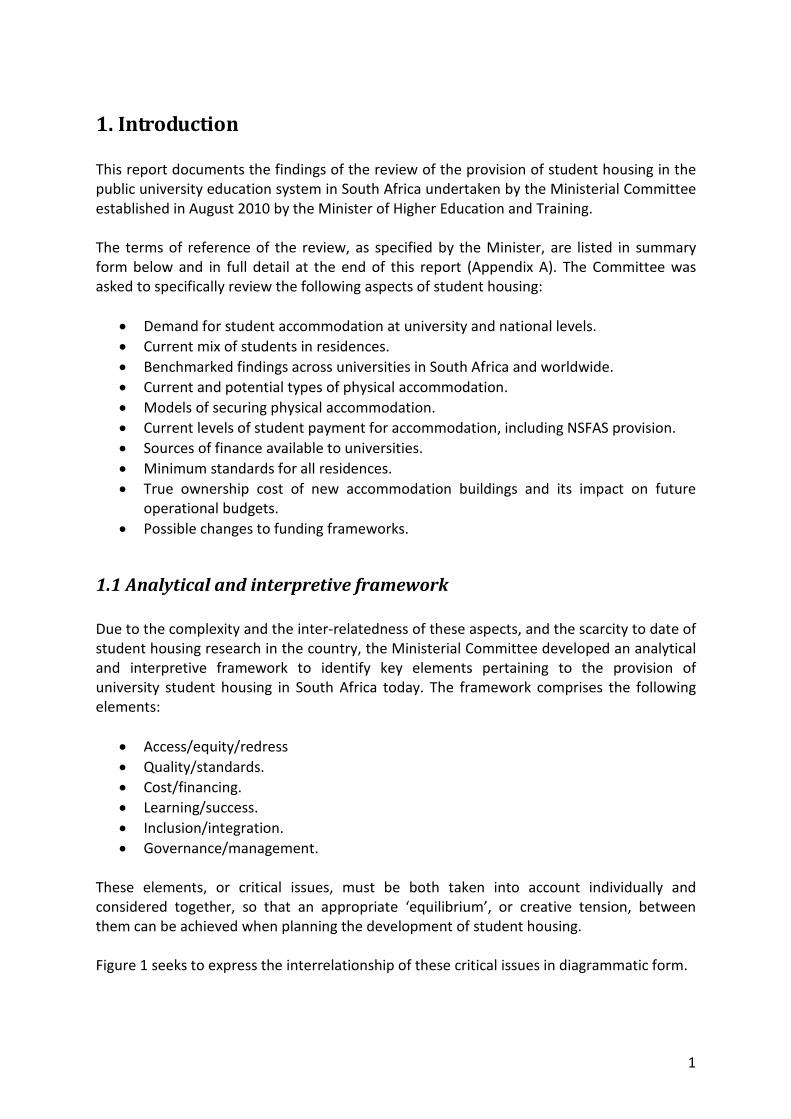
1.1 Analytical and interpretive framework
Due to the complexity and the inter-relatedness of these aspects, and the scarcity to date ofstudent housing research in the country, the Ministerial Committee developed an analyticaland interpretive framework to identify key elements pertaining to the provision ofuniversity student housing in South Africa today. The framework comprises the followingelements:
Access/equity/redress
Quality/standards.
Cost/financing.
Learning/success.
Inclusion/integration.
Governance/management.
These elements, or critical issues, must be both taken into account individually andconsidered together, so that an appropriate ‘equilibrium’, or creative tension, betweenthem can be achieved when planning the development of student housing.
Figure 1 seeks to express the interrelationship of these critical issues in diagrammatic form.
2
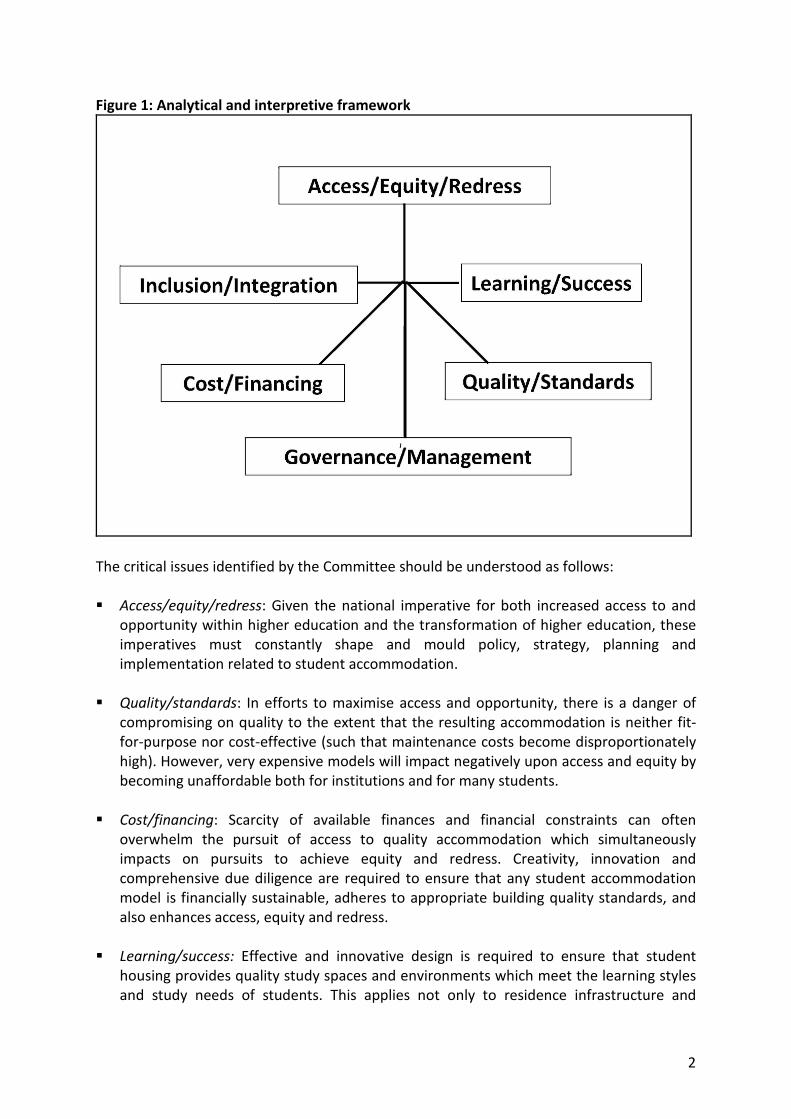
Figure 1: Analytical and interpretive framework
The critical issues identified by the Committee should be understood as follows:
Access/equity/redress: Given the national imperative for both increased access to andopportunity within higher education and the transformation of higher education, theseimperatives must constantly shape and mould policy, strategy, planning andimplementation related to student accommodation.
Quality/standards: In efforts to maximise access and opportunity, there is a danger ofcompromising on quality to the extent that the resulting accommodation is neither fit-for-purpose nor cost-effective (such that maintenance costs become disproportionatelyhigh). However, very expensive models will impact negatively upon access and equity bybecoming unaffordable both for institutions and for many students.
Cost/financing: Scarcity of available finances and financial constraints can oftenoverwhelm the pursuit of access to quality accommodation which simultaneouslyimpacts on pursuits to achieve equity and redress. Creativity, innovation andcomprehensive due diligence are required to ensure that any student accommodationmodel is financially sustainable, adheres to appropriate building quality standards, andalso enhances access, equity and redress.
Learning/success: Effective and innovative design is required to ensure that studenthousing provides quality study spaces and environments which meet the learning stylesand study needs of students. This applies not only to residence infrastructure and
3
architecture, but also to the establishment of effective and efficient residenceleadership, management and administrative structures and procedures. Excellentbuildings without effective leadership, management and administrative structures,programmes, codes and interventions which facilitate and provide supportive learningenvironments, actually constitute barriers to student learning and success.
Inclusion/integration: University residences are prime loci both for socialising andinteracting with peers from a variety of backgrounds and cultures, and for sustaining,developing and sharing academic skills and experiences. Sound residence managementand leadership structures are essential for the establishment and provision of learningenvironments capable of overcoming exclusionary and discriminatory discourses andpractices and promoting social justice and cooperation.
Governance/management: Good university and residence governance is central topersonal and institutional growth and innovation, and underpins policy formulation andimplementation. Management is in turn accountable for the implementation of thepolicies established by the governing structures of the university. Sound and precisepolicies are meaningless without concomitant service delivery, and good managementflounders in a vacuum without sound policy.
1.2 Methodology
The following methodologies were utilised in undertaking the review and compiling thisreport. First, a desktop review of literature relating to student housing in South Africa andinternationally was conducted.
Second, a comprehensive questionnaire was developed by the Ministerial Committee inconsultation with senior officials from the Department of Higher Education and Training(DHET). The questionnaire (Appendix B) was distributed to the Vice Chancellors of thetwenty two South African universities with residences. The questionnaire requested inputfrom each university relating to the following key aspects of student accommodation:
A. Institutional and housing student dataB. Student housing models and infrastructureC. Private student housingD. Residence management and administrationE. Academic indicatorsF. Financing of student housingG. Condition of residence infrastructureH. Future planning
The data requested in the questionnaire consisted in the main of quantitative anddescriptive data, aimed at providing the Committee with an understanding of the currentstudent housing situation across the country.
4
Third, site visits to each campus of these universities were undertaken by the Committee, insome instances accompanied by officials from the DHET, in order to verify and clarifyinformation provided in the questionnaire and to gather further information of a qualitativenature. The Chief Financial Officers and Chief Housing Officers from all universities werebriefed in advance, and preliminary input was obtained. A total of 49 campuses werevisited, between February and May 2011. During these site visits relevant stakeholders wereinterviewed and residences and other components of the residential system wereinspected. Interviews were conducted with the following individuals, where available, ateach university:
The Vice Chancellor or Deputy Vice Chancellor responsible for student housing.
The Chief Housing Officer.
The SRC President and the SRC Residence Counsellor.
Representatives from residence management staff.
Representatives from elected student House Committee structures.
Site visits were made both to on-campus university-owned residences and to off-campusuniversity-managed or -leased residences. The residences inspected by the Committee werepre-selected by the relevant university’s officials according to the categories (a) bestresidence, (b) ‘average’ residence, and (c) worst residence, from the perspective ofresidences’ overall condition. These selections were verified with the student stakeholders,and where these differed from the university’s selection, inspections of residencesidentified by students were also undertaken. The following areas of each residence wereviewed:
A single student room.
A double or multiple student room.
An ablution facility.
A common area.
Cooking areas (if applicable).
Dining hall facilities (where such are provided).
Particular attention was also paid to the grounds and environs of the residences, the stateof housekeeping and security of the various buildings, and the ‘fitness-for-purpose’ of thebuildings from a university student housing perspective.
In addition, all universities were given a second opportunity to submit additional, updatedor amended data to the Committee during July 2011, and several universities tookadvantage of this opportunity.
Fourth, site visits were made to a sample of the accommodation facilities, and interviewswere conducted with representatives, of the following providers of private studentaccommodation:
South Point (Johannesburg).
African Student Accommodation Group (ASAG) (Cape Town).
Urban Nest (Pretoria).
5
Kamdar (Durban).
Real People (East London).
Input regarding each private provider’s accommodation model was invited, including theirviews of the future of private student accommodation in South Africa.
In addition, input was obtained from, and/or interviews were conducted with:
The Public Private Partnership (PPP) Unit of National Treasury.
The Director of Business Development in the PPP Unit.
Representatives of the Association of College and University Housing Officers.
Representatives from the Development Bank of Southern Africa.
The South African Union of Students.
1.3 Limitations of the report
The time-frames established for the completion of the report were very tight.Unfortunately, several institutions were unable to meet the deadlines for submission ofcompleted questionnaires, which reduced the time available for analysis and interpretation.While most institutions availed themselves of extended deadlines to submit additional,amended or updated data, three universities were unable to do so. In some instances,certain categories of data were not available or were not submitted, and some data provedto be unusable.
1.4 Structure of the report
The following chapter, Chapter 2, reviews the available literature on university studenthousing. It examines, inter alia, student housing statistics; models of student housingdevelopment; recent trends in student housing; the relationship between being in residenceand academic success; national student housing policies and regulatory frameworks; andthe financing of student accommodation and infrastructure. Most of this literature derivesfrom a developed country, specifically North American and European, context; hardly anystudent housing research has been undertaken in developing country contexts, includingSouth Africa.
Chapter 3 presents the latest data on residence student demographics, including thenumber of students in residence, residence bed capacities and the proportions ofundergraduate and postgraduate students in residence, and breaks down the residencestudent population by gender, race, level of study and geographic origins. It alsoinvestigates how long residence students take to graduate and how many are receivingfinancial aid.
Chapter 4 deals with student housing infrastructure and facilities. After identifying the maintypes of student housing, it examines residence room sizes, recreational facilities, access tocomputer and ICT facilities, and the availability of accommodation for students with
6
disabilities. It pays particular attention to the question of self-catering versus dining hallprovision, and raises the issue of student hunger. The current state of infrastructure andfacilities across all university campuses can at best be said to be average, and the chapterends by quantifying the state of repair and estimating the cost of repairs and improvements.
Chapter 5 focuses on residence management and administration, including staff to studentratios, staff remuneration and training, security, student residence leadership structuresand student support structures. The chapter also discusses residence selection andadmission policies, especially academic admission criteria, and also makes reference to therelationship between student academic success rates and the provision of housing. Theissues of subletting and corruption are raised, and the nature, causes and extent of studentprotests related to accommodation are probed.
Chapter 6 investigates private student accommodation. While data on the number ofstudents living at home or in private accommodation is scarce, most private accommodationcan be divided into one of three types. These types – two different kinds of privately ownedresidence accommodation together with public-private partnership (PPP) forms ofaccommodation – are examined in detail, with regard to their location, distance fromcampus, suitability, state of repair, lease or partnership arrangements, cost, provision offood and social cohesion.
Chapter 7 examines the financing of student accommodation and housing at publicuniversities. It draws on data provided by universities with regard to whether theiruniversity and residence budgets are separate and whether they are producing a residencebudget surplus, as well as their levels of unpaid student debt, residence fees, financialexclusions from residence, financial assistance to residence students, third stream residenceincome generation, funding of residence infrastructure development over the past decade,and lease and public-private partnership agreements. The chapter ends by analyzing thetrue ownership costs of new residences, what might constitute a fair and reasonableresidence fee, and the extent of institutional future planning.
Chapter 8 provides an analysis of the findings in the previous chapters. It offers a typologyof South African higher education campuses, based upon the capacity of the areasurrounding each campus to provide suitable accommodation to students. This typology isused to illustrate the magnitude of the shortage of residence beds at South Africanuniversities, and to assess different ways in which the backlogs and the developmentrequired might be addressed. The overall findings are then analysed in the light of each ofthe categories of the analytical and interpretive framework discussed above, namely,access/equity/redress, quality/standards, cost/financing, learning/success,inclusion/integration, and governance/management.
Finally, Chapter 9 lists the Committee’s recommendations. The recommendations aredivided into eight sections, including:
Residence admissions and allocations policies;
Minimum standards for student housing and accommodation;
Private student housing and accommodation;
7
Residence management and administration;
Role of residences in the academic project;
Financing of student housing and funding of student accommodation;
Condition of residence infrastructure; and
Future planning.
A set of eight Appendices contain (A) the terms of reference for this report, (B) the researchquestionnaire sent to all universities, (C) a sample institutional profile, (D) a proposedMinimum Standards Code for Student Housing and Accommodation in South Africa, (E) aproposed Minimum Standards for Student Housing room specification manual, (F) a budgetstudent meal plan, (G) financial models for new residences and (H) a preliminary analysis ofthe impact of student housing on academic success.
8
2. Student housing: A review of the literature
The following review of the literature summarises the results of a search for recent peer-reviewed research pertaining to the following aspects of student housing around the world:
Student housing statistics, including where most students live whilestudying and the pros and cons thereof;
Models of student housing development, from public-privatepartnerships through collaborations between cities and universities to therenovation or reuse of existing buildings;
Recent trends in student housing, including residential learningcommunities, mixed housing, safety and security, sustainable and greenhousing and accommodating the diversity of student housing needs;
The contribution of residence life to academic success, with particularreference to the nature of the first year student experience and the ideaof living-learning programmes;
National student housing policies and regulatory frameworks; and
Financing of student accommodation and infrastructure.
This chapter draws primarily on literature on student housing in Europe and North Americaand, to a lesser extent, Australia. There is almost no research on student housing indeveloping country contexts. The little South African literature that makes any mention ofstudent housing issues (viz., DHET, 2010; DoE, 2008; Jones, Coetzee, Bailey & Wickham,2008; Moja, 2008; Radder & Han, 2009; Sebokedi, 2009; Swartz, 2010) is highlighted atrelevant points in the discussion below. The specific findings of the Ministerial Committee’sreview of the provision of student accommodation at South African universities arepresented in Chapters 3 through 7 of this report.
2.1 Student housing statistics
National-level data drawn from several European countries constitutes an instructive andcomparative starting point for an investigation of student housing issues, characteristics andtrends. The Eurostudent reports of 2005 and 2011 provide a number of indicators relevantto student housing, including where most students live while studying, and the influencethat student age, the supply, cost and funding of accommodation, the size of the studylocation and students’ socio-economic backgrounds have on students’ choice of housing,among other details.
The Eurostudent report of 2005 (Eurostudent, 2005), which surveyed Austria, Finland,France, Germany, Ireland, Italy, Latvia, Portugal, Spain, the Netherlands and the UnitedKingdom (England and Wales), offers a snapshot of where most European students livewhile studying: with their parents or relatives, in halls of residence, or in their own lodgings.
9
71
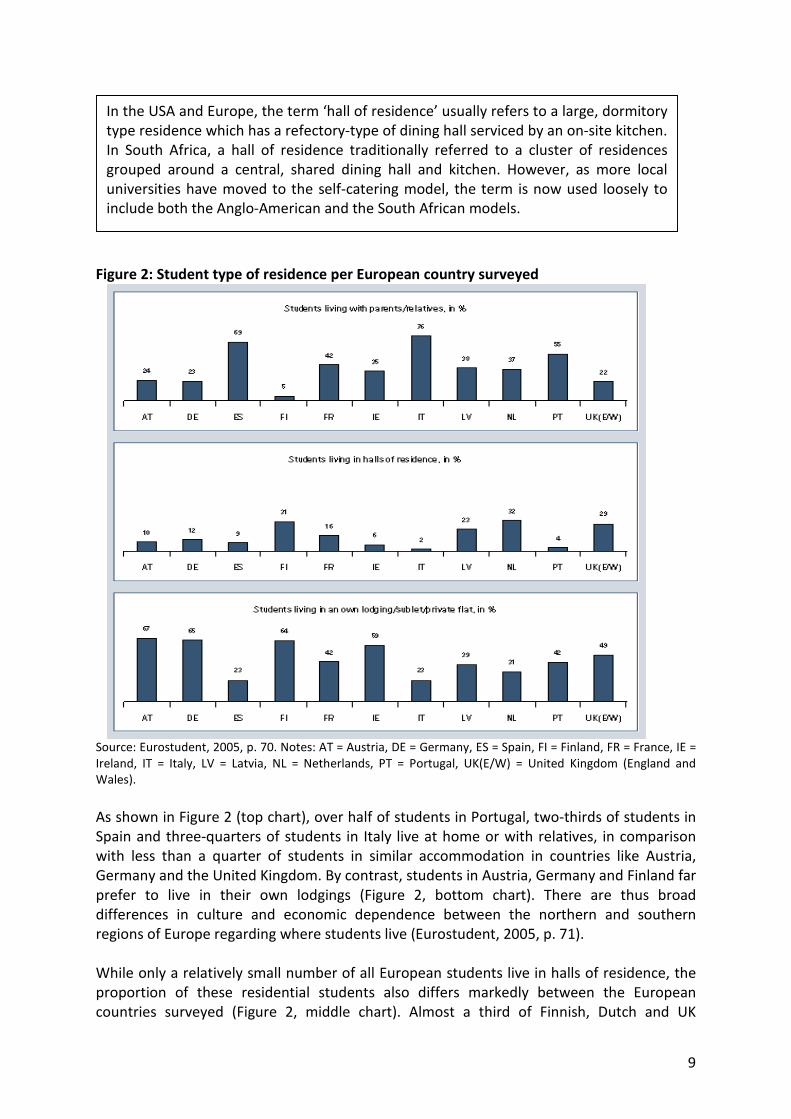
Figure 2: Student type of residence per European country surveyed
Source: Eurostudent, 2005, p. 70. Notes: AT = Austria, DE = Germany, ES = Spain, FI = Finland, FR = France, IE =Ireland, IT = Italy, LV = Latvia, NL = Netherlands, PT = Portugal, UK(E/W) = United Kingdom (England andWales).
As shown in Figure 2 (top chart), over half of students in Portugal, two-thirds of students inSpain and three-quarters of students in Italy live at home or with relatives, in comparisonwith less than a quarter of students in similar accommodation in countries like Austria,Germany and the United Kingdom. By contrast, students in Austria, Germany and Finland farprefer to live in their own lodgings (Figure 2, bottom chart). There are thus broaddifferences in culture and economic dependence between the northern and southernregions of Europe regarding where students live (Eurostudent, 2005, p. 71).
While only a relatively small number of all European students live in halls of residence, theproportion of these residential students also differs markedly between the Europeancountries surveyed (Figure 2, middle chart). Almost a third of Finnish, Dutch and UK
In the USA and Europe, the term ‘hall of residence’ usually refers to a large, dormitorytype residence which has a refectory-type of dining hall serviced by an on-site kitchen.In South Africa, a hall of residence traditionally referred to a cluster of residencesgrouped around a central, shared dining hall and kitchen. However, as more localuniversities have moved to the self-catering model, the term is now used loosely toinclude both the Anglo-American and the South African models.
10
students live in halls of residence, as well as almost a quarter of Latvian students, incomparison with fewer than 10% of students in such accommodation in Spain, Ireland, Italyand Portugal.
The most recent Eurostudent report (Eurostudent, 2011), which added Croatia, the CzechRepublic, Denmark, Estonia, Lithuania, Malta, Norway, Poland, Romania, Slovakia, Slovenia,Sweden, Switzerland and Turkey to the survey, found that, “in most countries, living withparents is the dominant form of housing of all students” (Eurostudent, 2011, p. 167; see alsoFigure 3, below).
Other Eurostudent (2011) findings are that student age, the supply of student halls, the sizeof the study location and student socio-economic background significantly influence wherestudents live:
Older students are more likely to live away from their parents’ home. Also, olderstudents more frequently live with a partner/children, and less frequently live with(an)other person/s.
Student halls are usually the cheapest (and usually subsidised) form of studentaccommodation outside of parents’ homes.
The size of the study location, i.e., the urban area where the university is located,partially influences choice of housing type in that students at universities located inbig cities are more likely to live with their parents than students in small cities; this ispartly due to the relatively higher cost of living and accommodation in bigger urbanareas.
Most students from poor socio-economic backgrounds do not live at home, are likelyto be living with a partner and/or children, and are slightly less likely than higherincome students to be living in a hall of residence (Eurostudent, 2011, p. 167ff).
Most students are satisfied with their form of accommodation, particularly but not onlythose students living with their parents. However, living in halls of residence had the lowestaverage level of satisfaction, suggesting that the main reason for students choosing thisform of housing may be due to its lower cost (Eurostudent, 2011, p. 167, 182). On average, aEuropean student travels for almost half an hour from their home to their university,regardless of their chosen accommodation.
The Eurostudent report (2011) emphasises that, first, student housing is a significantvariable in students’ academic life, and that, second, funding for such accommodation playsa key role in the selection of student housing:
Adequate accommodation is – together with sufficient funding – a main frameworkcondition for the ‘smooth operation’ of studies. Financial concerns with accommodationas part of students’ living expenses may have a negative impact on equity of access tohigher education, especially for those potential students from families with lowerincome. For instance, students may have to make a choice between remaining with theirparents and studying in the university nearest to this address or choosing an alternativestudy location, but having to work during studies to cover the expenses for rent(Eurostudent, 2011, p. 168).
11
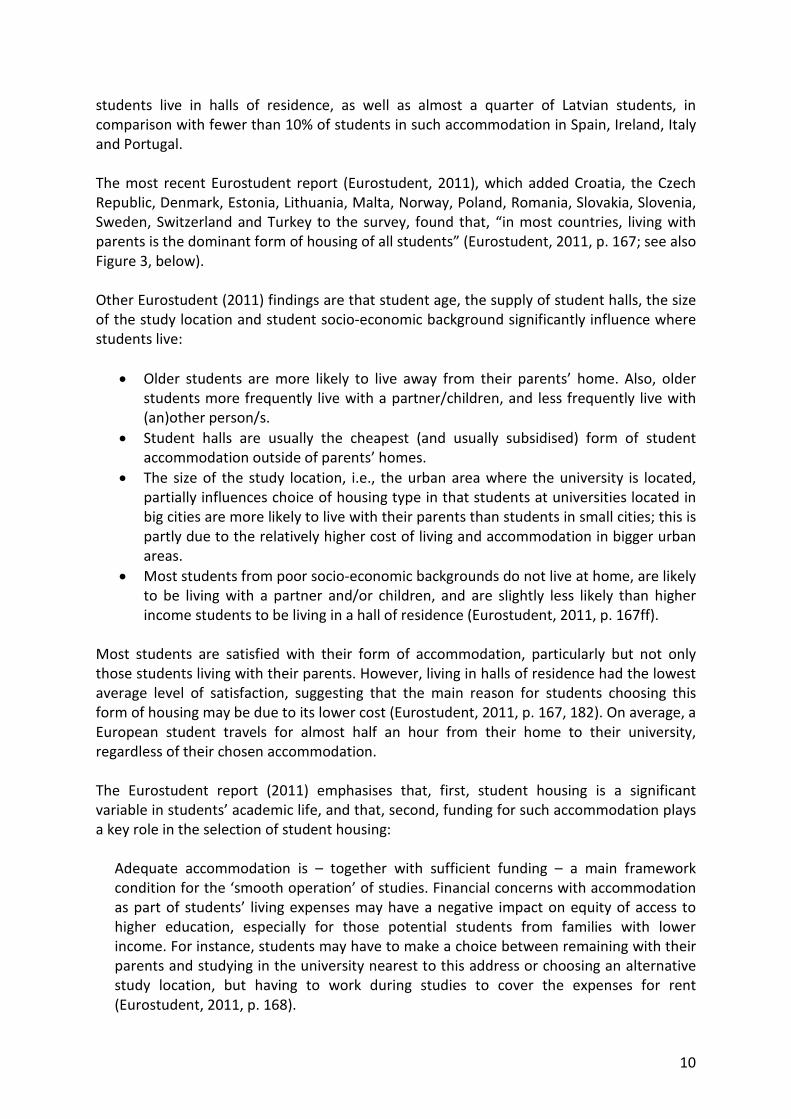
Figure 3: Type of student housing per European country surveyed
Source: Eurostudent, 2011, p. 172. Notes: AT = Austria, CH = Switzerland, CZ = Czech Republic, DE = Germany,DK = Denmark, EE = Estonia, ES = Spain, E_W = England and Wales, FI = Finland, FR = France, HR = Croatia, IE =Ireland, IT = Italy, LI = Lithuania, LV = Latvia, MT = Malta, NL = Netherlands, NO = Norway, PL = Poland, PT =Portugal, RO = Romania, SE = Sweden, SK = Slovakia, SL = Slovenia, TR = Turkey.
The Eurostudent report (2011, p. 168) differentiates between four categories of housing forstudents (Figure 3, above):
living with parents, or
not living with parents, and living alone, or living with partner and/or children, or living with (an)other person/s not mentioned above.
In the southern European countries of Malta, Italy and Spain, and also Poland, half or moreof all students live with their parents, while living with a partner and/or children is mostcommon amongst students in the Scandinavian countries.
There are several positive aspects of living in a residence on or near campus, as opposed toliving on one’s own, with one’s parents or more generally at a distance from the university:
Living in student halls enhances the integration and orientation of students, who mightotherwise feel lost in big cities or big universities, or in academia in general. Living withfellow peers may be stimulating for intellectual development, be it in the context ofrespective studies or beyond. This stimulation might be enforced by extra-curricularservices and offerings provided by the residence hall owner or management, or therelated higher education institution. When living in student halls, it is likely that studentssee studying at a higher education institution as their main occupation in this period of
12
their life, which as a consequence may have a positive effect on their duration of studyand grades (Eurostudent, 2011, p. 170).
On the other hand, the Eurostudent report (2011) noted a range of drawbacks with regardto various forms of student housing. For instance, living in a student hall of residence is saidto be good for academic study, but the quality of the housing may not be very high(Eurostudent, 2011, pp. 168-9).
The quality of student residences and of services related to student housing is also ofconcern in the (little) South African research in the field. For instance, a recent survey(Radder & Han, 2009) of 430 Nelson Mandela Metropolitan University (NMMU) residentialstudents residing in on-campus student housing found that across four dimensions withregard to the service quality of the housing – interaction, empathy, general amenities androom amenities – students believed that the service quality of on-campus residences wasrelatively low. Students were least satisfied with room amenities (being particularlyconcerned with bathroom facilities and lack of soundproofing between rooms) and mostsatisfied with general amenities (mainly parking). With regard to interaction, residencemanagers were viewed as unreliable service providers who failed to keep promises; and interms of empathy, it was felt that service staff did not sufficiently understand students’specific needs (Radder & Han, 2009, p. 115). Separately, a small study of the quality of thestudent housing registration and placement process at CPUT also found inefficiencies anddelays, a lack of inter-departmental communication and a “lack of monitoring, planning, andthe absence of quality control points” (Sebokedi, 2009, p. 12).
Students’ personal predilections, as in the form of preferences for a certain level of qualityof room amenities, can overdetermine what kind of housing students choose. Youth andstudents are often at the forefront of the latest social trends, as well as being directlytargeted by advertisers of anything new or up to date, and their expectations, or at leasttheir aspirations, are correspondingly high. In this light, where they have a choice, allstudents in all locations are increasingly swayed by the quality and availability of housingservices and amenities. For instance, both on- and off-campus students at the University ofBritish Columbia emphasised the importance of proximity to shops and services (Knight &Parr, 2010, p. 16).
Other categories of student housing also have their advantages and their disadvantages:living with one’s parents may be “comfortable and cheap”, but may also be more restrictivein terms of personal liberty than living in one’s own lodgings (Eurostudent, 2011, pp. 168-9).The same may apply to living in a residence on campus, however: in the United States, theNational Multi Housing Council (NMHC) is reported as saying that many students mayactually prefer living off campus because of the space, cost and freedom from universityrules (NMHC, 2007, cited in Piotrowicz, 2009). In a survey conducted at a large Canadianuniversity, however, over two-fifths (43%) of off-campus students would live on campus ifthey could (Knight & Parr, 2010, p. 20), with the majority saying that their housing distancefrom campus meant they could not participate sufficiently in campus life. In partialconfirmation, more than three-quarters of the on-campus students placed particularemphasis on the academic and social benefits of on-campus living (Knight & Parr, 2010, p.8).
13
There are other trade-offs. While greater personal freedom is assured when one lives alone,one might also have to find employment in order to support one’s choice of housing(Eurostudent, 2011, pp. 168-9), which thus reiterates how financial issues often weighheaviest on where and in what kinds of accommodation students end up living in.
Clearly, as the Eurostudent report (2011) concluded, there is no single type of housing whichis best for all students. Conversely, there is no single kind of student for whom any kind ofhousing would be appropriate, but students with varying socio-economic backgrounds, age,gender, geographic locations, study interests and preferences.
It is also apparent that demand for student housing – and for specific types of housing –tends to outstrip supply in most of the countries surveyed here, although the extent of thesupply varies widely. Most universities in Western Europe lack sufficient accommodation tohouse their students, “with very few accommodating more than 10%” (King Sturge, 2008, p.2). The recent (31 August to 2 September 2011) second Australian Student Housing Summitfocused on the growing demand for, and the shortage of, student housing in Australia. Usingdata from Universities Australia, it is estimated that there is only one bed available for every20 students enrolled in Australian higher education institutions (Informa Australia, 2011). InCanada in 2007, student bed-space across all universities averaged at 16.8% (Knight & Parr,2010, p. 25). The greatest student housing capacity was at the University of BritishColumbia, one of the largest Canadian universities by fulltime student headcount: it hadbed-space for 28% of its fulltime students, while the least bed-space was 7.4%, at theUniversity of Calgary (Knight & Parr, 2010, p. 25). In the United States in 2003, a survey of118 public and private four-year colleges and universities, servicing 10% of all US students atthe time, found that they were able to provide housing for an average of 23.5% of theirstudents (i.e., for 20.6% of public and 38.6% of private college students) (Abramson, 2003,p. 22). At the University of California, Los Angeles, 52% of the student population iscurrently housed within one mile of campus, though not all this housing is university- owned(UCLA, 2011, p. 5).
As the terms of reference for this Report (Appendix A) indicate, the correspondingpercentage in South Africa is just under 19%, i.e., there is enough student accommodationto house almost one-fifth of the country’s total student population. Whether such provisionof student housing places can be said to be adequate or inadequate is partly what theremainder of this Report seeks to establish.
In South Africa, universities are under great pressure to open the doors of learningand culture to all and to make further education available and accessible, in linewith the Constitution and the Bill of Rights (Republic of South Africa, 1996). Muchinternational literature emphasises that a student’s accommodation is a key factorin making possible successful educative outcomes; hence, one of the purposes ofthis Report is to investigate the main characteristics of and current trends in thefield of student housing in South Africa.
14
2.2 Models of student housing development
Historically, the English and German university traditions have had the greatest influence onmodern day student housing trends. Originally, students at the earliest medieval universitiessourced their own accommodation through rentals free from university control. The firstresidential colleges were established in Paris, in response to the need to provideaccommodation to poorer students, and were soon duplicated at Oxford and Cambridge(Rashdall, 1895, p. 479). The English system differed from the original French structuresprimarily in that the heads of colleges were more likely to be appointed administrators thanfellow teachers, but otherwise student housing continued to evolve along the same lines,involving the construction of student and faculty housing alongside academic facilities sothat students and faculty could share knowledge and experience (Han, 2004, pp. 17-18). Inthis regard, pastoral care was part of the university obligation to students, as universitiesacted in loco parentis (Macintyre, 2003, p. 110). The medieval German system shared manycharacteristics with the French and English ones, but the consequences of the Reformationand, especially, the early nineteenth century Humboldtian reforms, placed greater emphasison the university being purely a place for academic exchange, such that it became theresponsibility of the student to source his or her own accommodation (Han, 2004, p. 21).
The growing demand during the 1960s for a university education, coupled with the assertionof the rights of youth and students, exposed the weaknesses in the established approachesto student housing. The shortage of accommodation compelled many universities tointroduce systems like Cambridge University’s “licensed lodgings”, so as to provide bed andbreakfast services to students (Hughes & Davis, 2002). The conservative traditions ofauthority imposed in formal halls of residence came to be seen as inappropriate andoutdated (Macintyre, 2003, p. 110). Students were also becoming more demanding of thetype and quality of accommodation they expected, and the universities themselves began toput a lot of emphasis on accommodation as a key selling point in their advertising to attractprospective students. As a result, new universities that were established during this timetended to follow “one of three models: non-collegiate dormitory residences, small-scaleresidences with shared facilities, or reliance on the private housing market in thesurrounding areas” (Macintyre, 2003, p. 110).
Apart from the traditional model whereby universities finance and build their own newstudent housing facilities, since the 1990s three other models of student housing havebecome common in America and Europe.
2.2.1 Public-private partnerships
Public-private partnerships (PPPs) with regard to student housing development typicallyinvolve the transfer to a private provider of housing-related functions such as “land control,project ownership, property management and operation, design and construction, projectfinancing, and residence life programs” (Han, 2004, p. 30). A PPP may be defined as:
15
a contract where the university makes a fee for service payment for the delivery ofcertain infrastructure and related services over the long term. The private provider istypically contractually responsible for the financing, the construction and themaintenance of the new housing infrastructure, and also assumes responsibility for itscondition and performance (Paxton, 2008).
Distinctions can be made within public-private contractual arrangements as well. Auniversity may contract for the private provision of goods or services while retainingownership and management of the process, or it may entirely privatize or outsource theoperation but in the process lose control (Bekurs, 2007). The key differences between PPPsand traditional procurement models are said to be the following: PPPs “replace traditionalprocurement contracts with long term contracts”, “interchange upfront milestone paymentswith ongoing performance-based payments” and “impose pre-agreed output-basedspecifications rather than input specifications typical of construction procurement” (Paxton,2008).
In a context where student enrolments are growing and public funding of higher educationis not keeping pace or even declining, PPPs are particularly useful when a university cannotafford to build its own student housing, or prefers not to take on the risks and futuremaintenance costs of doing so. An indirect advantage of a PPP for a university is that it caninstead focus its own resources on what it does best, namely, higher education (Paxton,2008). Private developers, being potentially more up to date with and attuned to moderntrends and tastes, may be better suited to meet student needs, while the financing optionsprovided by a joint venture can also “increase the total investment capacity … [and]preserve the debt capacity and tax-exempt advantage of the university” (Han, 2004, p. 31).By taking more risks, private developers in turn are usually guaranteed good returns(Macintyre, 2003).
In the United States, public-private partnerships for the provision of studentaccommodation are becoming a more common occurrence, though the trend began nearlytwenty years ago (Johnson, 2010). Similarly, Australian universities are increasinglyexploring public-private partnerships as the preferred means of funding, building andoperating student accommodation projects (Paxton, 2008). Across Europe, from the UnitedKingdom to Finland, a range of partnerships between universities and the private sector arebeing supplemented by purely entrepreneurial developments which in many cases havecreated new housing markets from scratch (Macintyre, 2003).
While the PPP model is attractive to the extent to which it can quickly deliver much neededstudent housing, it has its detractors. Hughes and Davis (2002) argue that privateparticipation in the construction of student housing blurs the commercial and educationalprovisions of accommodation and creates contexts where student housing does notconstitute part of the experience of being a university student. Steakley (2005) cautions thatdevelopers are primarily interested in costs and that universities have to keep a watchfuleye on development as they are in these partnerships for the long haul and need to do thebest they can to maximise return on investment. The PPP model is also not suitable for alluniversity accommodation projects, since it reduces the university’s direct control and mayrequire significant lead and planning time (Paxton, 2008). It follows that a robust analysis
16
and due diligence of the university’s specific context and needs is vital if the PPP model is tobe adopted for the provision of student housing.
2.2.2 Partnerships between cities and universities
Universities play an important role in a city’s intellectual, cultural and economic life.Because of the high rentals that university students are likely to pay if there is demand foraccommodation, they end up taking spaces that could be occupied by neighbourhoodfamilies and an artificial inflation of housing prices is created which can have a negativeeffect on the local housing market (Macintyre, 2003, p. 112; Han, 2004, p. 32). In this regard,it becomes crucial for the city and its higher education institutions to work together toaddress housing concerns. A good case of this practice is the city of Boston, which since1990 has added 16 324 beds for undergraduate and graduate students, resulting in thefreeing of 4 100 housing units for use by the city’s residents (Han, 2004, p. 32). The City ofBoston Redevelopment Authority works closely with universities and colleges to developand update their institutional master plans which address issues of demographics, land use,transportation and urban design, among others. This way, the city assists the universities inmaking certain of their long term plans, at the same time protecting the city’s housing stockby reducing the number of students who occupy residential property (Han, 2004, p. 32).
Moreover, if the issue of student housing is not addressed by local authorities, or ifpermitted to be driven haphazardly either by private student initiatives or by university ordeveloper property speculation, numerous socio-economic problems may arise. Well-planned student housing has the potential to revitalize neglected city areas (Macintyre,2003, p. 117) but, when poorly integrated into existing patterns and demographics, studenthousing initiatives can have a negative impact on the economic, physical, cultural and sociallives of communities (Smith, 2008). Regarding the economic impact, such ‘studentification’(a phenomenon where large numbers of students move to traditionally non-studentneighbourhoods) may contribute to (real or imagined) rises in house prices, throughspeculative buying for renting purposes. This has the impact of pricing out first time homebuyers and promotes a large number of transient people in localities because of the highrental market. Considering physical space, student rental properties can present a problemof low maintenance standards, as the owner is not there to contribute to maintenanceespecially where facilities like gutters are shared. This may lead to deterioratinginfrastructure, declining property values and potential ghettoisation of an area (Macintyre,2003, p. 116). In relation to cultural impact, the transient nature of student occupation leadsto less community involvement and cohesion. This transient lifestyle defeats the purpose ofbuilding sustainable communities being espoused by the English government. Students are
Student residence public-private partnerships are regarded with a great deal ofsuspicion by many student housing officials in South Africa. At the root of thissuspicion is the perception that such partnerships are both expensive andunreliable. Many universities have had poor experiences with the private sector inleasing buildings for student accommodation; and some partnerships, such as oneat the University of the Witwatersrand (The Junction), are reported to havecollapsed. Using guidelines formulated by the PPP Unit of the National Treasury, anexisting student housing PPP is evaluated in this report.
17
also perceived to have a ‘work hard, play hard’ attitude that affects relations withneighbours because of increased noise levels (Smith, 2008).
2.2.3 Reuse of old buildings
A university may consider renovating some of its other properties in order to make themsuitable for student housing. Usually, buildings targeted for this are within walking distanceof the university, which makes them very convenient for student housing (Han, 2004, p. 33).It is also cheaper to finance renovations than to build new buildings. However, manyconsiderations must be taken into account when deciding to reuse or renovate.Construction has to take cognisance of zoning laws. Abandoned buildings may be officebuildings and the local council or municipality will have to approve their conversion intostudent accommodation if in a business district. Furthermore, there may be restrictions onnoise, as these are different for residential and office areas (Remøy and Van der Voordt,2007).
2.3 Recent trends in student housing
Growing demand for student accommodation worldwide is spurring new innovations andinitiatives in the field. These include an emphasis on residential learning (or ‘living-learning’)communities, more mixed and flexible housing forms, a focus on safety and security,sustainable and green campus developments, and greater consideration for the diversity ofstudent housing needs.
2.3.1 Residential learning communities
Residential learning communities try to integrate the academic and accommodationexperiences. Also known as ‘residential colleges’ or ‘living-learning communities’ (on whichmore in the next section of this chapter), they are touted as improving retention, asstudents in such communities are reported to spend more time talking about theiracademics and studying outside the classroom. They are often associated with, but are
The development of partnerships between universities and local municipalitiesshould be seen as a critical aspect of any attempt to address the studenthousing backlog in South Africa. The need for such partnerships is illustrated inthe Eastern Cape, where the development of on-campus student housing hasbeen constrained on both the Rhodes and the Fort Hare (Alice) campuses due tomunicipal infrastructural incapacity. Such partnerships would be especiallywelcome where there is a lack of adequate public transport between studentaccommodation and university campuses.
This model of ‘brownfields’ student housing development has beenembraced by the private sector in South Africa. Its merits and demerits areexplored in detail in the report.
18
distinct from, ‘green’ or sustainable housing (see University of Cape Town & StellenboschUniversity, 2010, and below in this section). However, because they tend to be premised onhomogeneity (either course-based or level-based), critics of the trend argue that itundermines principles of diversity (Angelo & Rivard, 2003). This may a short-sightedobservation, though, since diversity can be achieved through other variables: for example,students studying physics are similar only by course of study but are diverse in other ways.Furthermore, the actual physical architecture of residential housing, commonly rangingfrom corridor to cluster to pod constructions, must be considered, since this too can haveintegrating or individualizing effects and may or may not contribute to a sense ofcommunity (Devlin et al, 2008).
In South Africa, residential learning communities exist in various, largely embryonic, formsat several universities, and certain prominent aspects of these, at the Universities ofStellenbosch and the Free State, are discussed in Chapter 5. The only literature whichalludes to residential learning communities in South Africa, however, appears to be apresentation made by the Vice Chancellor of Nelson Mandela Metropolitan University,Derek Swartz, at the 2010 national conference of the South African Chapter of theAssociation of College and University Housing Officers International (Swartz, 2010). Swartzargued that student residences are of strategic importance because they are ideal locationsfor both teaching and learning and social and recreational life, not least because they cancreate a sense of community. He suggested that student residences have, or ought to have,four key functions:
A pedagogical function – residences are places of teaching and learning,induction and orientation;
A cultural function – clubs and societies are strongest in student residences; A social function – having fun is key to student life; and A leadership function – residences are a training ground for student
leadership (Swartz, 2010).
Apart from this presentation, the Stakeholder Summit on Higher Education Transformation(DHET, 2010) also makes mention of residential learning communities, in the form of callingfor the establishment of living-learning communities.
2.3.2 Mixed student housing
Mixed housing in its simplest form accommodates the needs of both single and marriedstudents. Apartments with two or four bedrooms which can either house married studentsalong with their families or can be shared by a group of single students are beingconstructed on some campuses. However, mixed housing comes with its own problems,especially when married and single students share such spaces, since their different needsmay prove incompatible. In addition, the fact that student demand for housing rises andfalls at different times of the year has encouraged some universities to develop moreflexible models, like the ‘double as a single’ and the ‘expanded housing’ models, to cater forfluctuating demand and thus maximize revenue (Ryan, 2003). In this regard, someuniversities lease hotel rooms or alternate accommodation to meet the temporary demandby students. While high student enrolment can lead to pressures for accommodation,
19
planning for residency should also consider off-campus markets as these might be used forpurposes of holiday accommodation and for conferences out of term time, should auniversity find itself struggling to occupy its rooms. The off-campus market can also helpalleviate university residency challenges if they build affordable and comfortable housing forstudents (Ryan, 2003).
2.3.3 Safety and security
Safety and security is a major issue for students and parents, and universities areincreasingly responding to this by improving access control and installing video cameras thatmonitor exits, lobbies, elevators and laundry rooms. Technology is important, but a humanpresence is sometimes essential: for example, at Boston University, although students gainaccess to the building by swiping their student cards, a security guard is stationed in thelobby to watch out for tailgating (Angelo & Rivard, 2003).
2.3.4 Sustainable campus housing
Sustainability and the development of green campuses are some of the ways in whichuniversities and colleges are responding to the environmental challenge. In 2009, therewere “87 self-described and self-reported sustainable campus housing initiatives in UnitedStates colleges and universities”, though of these two-thirds were private institutions(Torres-Antonini & Dunkel, 2009, p. 14). Green residences are residence halls that“maximise energy, water and materials use and … minimise and ultimately eliminatenegative impacts on human health and the environment throughout their life cycle” (USGreen Building Council Research Committee, quoted in Torres-Antonini & Dunkel, 2009, p.14).
In addition to using renewable sources of materials for construction, green campuses alsopromote sustainability, living-learning communities and hubs. The design features ofsustainable residential buildings – through the use of reclaimed or renewable sourcematerials, compact fluorescent lamps and solar panels, efficient water managementsystems, the provision of spaces for communal meals, facilities for recycling waste, orstorage space for bicycles and other forms of alternative transportation – can deliverdesired energy and resource efficiencies alongside environmental edification (Torres-Antonini & Park, 2009, p. 32). In South Africa, the Universities of Cape Town andStellenbosch are implementing sustainable living-learning communities by promoting paperrecycling and energy saving initiatives and educating around environmental issues(University of Cape Town & Stellenbosch University, 2010).
2.3.5 The diversity of student housing needs
In a context where there is a shortage of student housing, it is important to establishstudent needs so that future provision of housing can consider these needs in constructingaccommodation suitable for students. Thomsen and Eikemo (2010) found that only 13.6% ofthe Trondheim, Norway, student population of 29 000 had access to rented institutionally-owned accommodation, while 78.2% rented from the private market. These students’ needsvaried depending on the context, but additional broad parameters influenced their personal
20
satisfaction with housing. Apart from the need to take into account the fact that studentaccommodation is temporary, and that students in a transient housing situation expectdifferent things to that of students in a permanent one, such additional parameters include“personal factors at different phases of life, social and cultural background, financialsituation, and expectations, but also … the architectural characteristics of a building or adwelling” (Thomsen & Eikemo, 2010, p. 274). Today’s students also have high expectationsfor up-to-date service delivery and facilities that provide value. Individuals responsible forstudent housing programmes must offer students safe and fully functioning facilities withmodern amenities and programmes, all at reasonable cost (Ryan, 2003).
Leaving aside individual students’ personal preferences, the diversity of student housingneeds is especially pertinent in the context of issues of racial integration in studentresidences, and allocating accommodation in ways that take cognisance of sexualorientation. In the USA, several universities have tried to deal with these kinds of admissionsissues by allocating accommodation to students of colour and to international studentsthrough a lottery system; but some universities have since abandoned this system, arguingthat it is itself discriminatory (Hardi, 2000). In South Africa, Moja (2008) has argued thatsegregationist practices still exist in the allocation of student housing, under the guise ofusing ‘culture’ as a basis of this allocation on campuses that have a predominantly whitestudent body. This is supported by the Report of the Ministerial Committee onTransformation and Social Cohesion and the Elimination of Discrimination in Public HigherEducation Institutions (DoE, 2008), which found that admission policies in residences arecreating de facto segregation and discrimination in the allocation of housing to students andthe employment of staff in residences.
Most universities worldwide have also implemented policies on mixed gender studenthousing, but the issue of access to housing by transgender couples is as yet unresolved.While a married woman or man can obtain couple accommodation relatively easily, same-sex and transgender couples have had to resort to lawsuits in the United States in an effortto be treated fairly (Wright, 2001). Moreover, where policy enables such access to coupleaccommodation, institutions still have the responsibility of guaranteeing the safety of thesecouples from homophobic students. Nevertheless, at last count in the United States at least,more than 50 campuses offered gender-neutral housing (Alexander, 2010).
2.4 The contribution of residence life to student success
The issue of the relationship between student housing and academic success has beenmentioned more than once in this chapter. The recent trend towards ‘sustainable living-learning communities’, discussed in the previous section, is considered important preciselybecause such forms of accommodation are seen, in part, as encouraging and enablingstudents to persevere with and complete their studies. The Eurostudent report, too, asnoted above, deemed that students living in halls of residence are likely to see studying astheir main occupation, and this in turn, it is believed, “may have a positive effect on theirduration of study and grades” (Eurostudent, 2011, p. 170).
21
Much research related to on-campus student housing and its impact on student persistenceand performance emanates from the United States. This body of research indicates thatliving in on-campus housing at a four-year college or university has a positive impact onstudent retention, performance and adjustment (Pascarella & Terenzini, 2005). Living on-campus, studies have found, correlates positively with improved academic performance,student persistence and higher levels of student involvement in on-campus andextracurricular activities (Lowther & Langley, 2005). According to the Higher Education2Research Institute at the University of California at Los Angeles, living in on-campushousing during a student’s first year increases their chance of finishing college by 12%(Pascarella & Terenzini, 2005). Since this has been found to apply even when differing levelsof academic ability are taken into account, students defined as high risk, or with loweracademic credentials, may especially benefit from living in on-campus housing (Pascarella &Terenzini, 2005). Furthermore, regardless of race or gender, dormitory residents have beenfound to be more likely than commuters to obtain a degree, to report higher levels of socialinteraction, and to have higher levels of self-confidence and satisfaction with their collegeexperience (Thompson, 1993).
Forms of accommodation that are stable and of good quality are also associated withacademic achievement and retention (Macintyre, 2003, p. 111). Studies have identifiedloneliness, housing problems and an inability to bond with the community as particularobstacles to student success and retention (Catt, 1998); and students who have been able toestablish bonds in their new environment adjust better to university life than students whoare isolated and not as successful at establishing new friendships (Enochs, 2006). On-campus housing environments have been likened to families, in terms of rules, boundaries,a sense of community and an atmosphere of care and concern for other students. Studentsliving in on-campus housing, compared to those living off-campus, report a higher level ofinvolvement in campus life and more friendships on campus (Barthelemy & Fine, 1995).
2.4.1 The first year experience and residence
A student’s experiences during his or her first year at university are seen as particularlyimportant. In the context of growing and increasingly diverse student populations, changinggender and ethnic profiles, mounting financial pressures and greater government, industryand parental demands that universities improve quality, retention and through-put rates,the nature of the first year student experience has seldom been out of the researchspotlight. In South Africa, the first year experience is particularly relevant given the vast gapbetween the general quality of schooling and the expectations of universities, the need toredress decades of apartheid inequalities, inequities and inefficiencies, and the desire toremain internationally competitive.
International research on this topic indicates that the first year of study at a university is themost critical in terms of persistence. In the United States approximately 15% to 19% of eachfirst year class is lost during or at the end of the first year. Reasons for this vary, but the lackof a strong connection to academic and social support services is believed to be a strongcontributor (Lowther & Langley, 2005). Shapiro and Levine (1999) found a higher rate ofretention among first year students living in residence halls and that these students weremore likely to report satisfaction with their first year experience, more likely to contact
22
professors, more likely to act in leadership capacities, and less likely to suffer declines inacademic self-esteem compared to those living off-campus. Conversely, first year studentswho struggle academically are frequently isolated, both socially and academically (Light,2001). Catt (1998) found that first year students who attend community colleges that do notoffer on-campus housing have less academic success than those living in on-campus housingat community colleges, in part because, unlike commuter students, students in on-campushousing can participate easily in campus activities and clubs. Apart from the ordinarystudent, student leaders living on-campus are naturally more available to members of theirorganisations, faculty sponsors, administrators and other interested parties (Catt, 1998).
On the other hand, in their comprehensive review of the literature on what they moreaccurately term the “multiplicity of first-year experiences”, Harvey, Drew and Smith (2006,p. iv) also investigated the last twenty years’ worth of international research on the impactof residence on the experience of first year students. Their assessment of the collectivefindings of this body of research is less sanguine and more tentative. First, while students inon-campus housing are more likely to remain at, persevere through and successfullycomplete their university studies than other students, such students have historically alsobeen more economically and socially privileged (Harvey, Drew & Smith, 2006, pp. 58-9).Controlling for such differences, “there is ambiguous evidence about whether living inresidences actually enhances grades” (Harvey, Drew & Smith, 2006, p. iii).
Second, several studies in the United States have found no significant or direct differencesbetween living on or off campus, but only slight and indirect positive effects in the form of“the extent of [on-campus] students’ interaction with faculty and peers” (Harvey, Drew &Smith, 2006, p. 59). To paraphrase one set of such findings (Pascarella, cited in Harvey, Drew& Smith, 2006, p. 59), among the slight advantages enjoyed by resident students, asopposed to students who commute, are that they:
Participate in more on-campus activities;
Interact more frequently and informally with academic staff and peers;
Are more satisfied and more positive about their campus environment;
Are more likely to persist and graduate;
Show improved psychosocial development; and
Attach more importance to aesthetic, cultural, and intellectual values,liberalism and secularism.
Third, research undertaken in Canada found, in contrast to much of the US literature, thatstudents living with their parents obtained higher marks and had higher rates of classroominvolvement than students living on campus; while research from the Netherlandsconcluded that on-campus students had more personal problems and spent less time ontheir studies. Coupled with this, an Australian study observed that the positive outlook andbeliefs of students were more important to their first year experience than their actual on-campus circumstances (Harvey, Drew & Smith, 2006, p. 60).
Thus, in the light of these ‘ambiguous’ results, Harvey, Drew and Smith conclude that “thebeneficial effects of residential living seem to be dependent on the context and may be
23
more beneficial in small institutions”, noting at the same time that the most, though notoverwhelming, benefits arise “where students live and learn together” (2006, p. iii, 61).
Another, more recent Australian study (Groen, 2009) has pointed out that much researchsuggesting that on-campus students get higher marks and demonstrate “higher gains inpersonal and social competence than their commuter student counterparts” has beenlimited to an American context and has not yet been shown to be generalisable (Groen,2009, p. 4). Finding that “there is no clear cut pattern of which accommodation style fostersa more positive first year experience overall”, Groen argues that “what is important is thatstudents are individually matched to an arrangement that fosters their experience and thiswill change depending on a variety of individual factors and how well the student can copewith influences such as distractions or increased travel times” (Groen, 2009, p. 16).
2.4.2 Living-learning programmes and student outcomes
Research on the almost bewildering variety and complexity of living-learning programmes athigher education institutions in North America is still in its infancy (Inkelas & Soldner, 2011).At the simplest level, the concept of a living-learning programme is not far removed fromthe earliest and most traditional forms of student housing, in which residential andacademic buildings existed in close proximity, if not in the same building. The emergence ofthe concept has been traced to some of the early US colonial colleges, including Harvard,William and Mary, and Princeton, where buildings were constructed containing not onlylecture halls but also dining rooms, a kitchen, a library, and sleeping quarters for studentsand their tutors, and as a result these buildings were concerned not only with learningsubjects but with the entire academic experience (Inkelas & Soldner, 2011). Since tutorslived in residence with students to oversee their learning and development, these buildingswere unlike most modern university residences, which are often little more than hostels orbuildings to house heads on pillows.
The general view of living-learning programmes today is that they are intended “to makepossible the integration of the social, cultural, physical, spiritual, and intellectual growth ofstudents in such a way that each complements the others” (Adams, cited in Inkelas &Soldner, 2011, p. 30). This view correlates with transformative and constructivistunderstandings of quality education which view the student as an active participant in aprocess of ‘adding value’ to his or her educative experience: “a transformative approach toquality [education] is about enhancing and empowering students, which requires a focus onthe total learning experience – all aspects of students’ experience that impact upon theirlearning” (Harvey & Knight, 2006, p. 39). This focus on an all-round academic experience isalso common in the South African literature on academic development which, while it doesnot appear to explicitly address the concept of living-learning, occasionally makes referenceto student housing-related issues. As far back as the early 1990s, for example, Mahatey andKwenaite (1992) were reporting on an initiative at the University of the Western Cape whichinvolved appointing senior students as residence assistants responsible for improving notonly students’ social lives but also their academic lives.
Similarly, international research also indicates that university environments which have thestrongest impact on cognitive development and persistence are typically the result of
24
purposeful, programmatic efforts to integrate students’ intellectual and social lives duringtheir university years (Pascarella & Terenzini, 1991). Since student development and change,it is argued, consist less of individual deterministic experiences than of a collage ofinterrelated experiences over time, the critical question is how a university can ‘shape itsintellectual and interpersonal environments to invite increased student involvement’(Pascarella & Terenzini, 1991, p. 611):
The more one’s social experience reflects and reinforces one’s academic experience,the greater will be the possibility for intellectual development. Put another way, themore complete the integration between a student’s academic life and social lifeduring college, the greater the likelihood of his or her general cognitive andintellectual growth (Pascarella & Terenzini, 1991, p. 159).
There is much plain common sense, as well as potential, inherent in the living-learningconcept. However, Inkelas and Soldner (2011) caution that, while the propaganda on living-learning programmes makes them appear like the ideal undergraduate educationalintervention, there is little agreement about what living-learning programmes should do,little insight as to how they should be run, and little evidence that they are always effectivein the goals and objectives they are ostensibly created to achieve. Few practical definitionsof living-learning programmes and concepts yet exist, a void in understanding which hascreated “a somewhat Wild West scenario” (Inkelas & Soldner, 2011, p. 30). In a personalcommunication with the Ministerial Committee, Professor Karen Inkelas added that “living-learning programs are not well-studied” and current definitions are “vague and misleadingat best”. She pointed out that “staffing and physical space research/assessment on living-learning programs are nearly non-existent”, and called for “living-learning professionals toband together and create a definitive definition of living-learning programs” (Inkelas,personal communication, 2 December 2010).
2.5 National student housing policies and regulatory frameworks
Policy and regulatory frameworks for student housing exist in most developed countries. Abrief overview of the policies and frameworks of just three countries – France, the UnitedStates of America and the United Kingdom – are presented here, as much to highlight thealmost complete lack of such policies and frameworks in South Africa as to stimulatethinking around the development of appropriate and relevant guidelines and regulation inthis country.
In France, the Centre National des Oeuvres Universitaires et Scolaires (CNOUS, 2009) heads anetwork that manages student social services, from housing to food to managing studentfinancial aid. In the United States, while student housing regulation is fragmentary and lacksany apparent over-arching policy framework or support structure at either the federal orstate levels, the National Association of Housing Co-operatives (NAHC), which workstogether with Canada through the North American Students Cooperation (NASCO),facilitates the provision of affordable housing through a network of local and regionalcooperatives (ICA, 2007). In the United Kingdom, the Housing Act of 2004 (United Kingdom,2004) exempts higher education institutions from having to license houses of multiple

25
occupants provided they sign up to the Universities United Kingdom (UUK) Code of Practicefor University Managed Student Accommodation, which sets standards for health andsafety, repair and maintenance, environmental quality, landlord and tenant relationships,health and wellbeing, anti-social behaviour and disciplinary procedures, and codeadministration and compliance.
By contrast, in South Africa there is as yet very little national policy and regulation in thefield of student housing. South African legislation and policies on higher education, forinstance, the Higher Education Act (Act no. 101 of 1997, as amended by the HigherEducation Amendment Acts 55 of 1999, 54 of 2000 and 23 of 2001) and the National Planfor Higher Education in South Africa (DoE, 2001), do not include regulations on studenthousing.
Perhaps the first instance when student housing became a significant part of national highereducation policy discourse was in April 2010, at the Stakeholder Summit on HigherEducation Transformation (DHET, 2010). The Summit criticized the poor physical quality ofstudent accommodation both on- and off-campus, raised concerns about the poornutritional quality of residence food and the use of food allowance funds, and called for anintegration of residential life into the core business of universities as well as theincorporation of residence life into the academic project of universities through theestablishment of living-learning communities. The outcome of the summit was a Declarationcontaining fifteen recommendations, including an undertaking to develop mechanisms topromote student-centred and caring universities (which would include, inter alia,improvements in student services such as accommodation and catering) (DHET, 2010).
There are also no clear and coherent regulations governing the provision of student housingin South Africa, at either local/municipal, regional or national levels. This dearth of policyand regulation should be of particular concern since, as some international literature hasshown, a lack of planning and oversight can lead to serious unintended and negativeconsequences (see Macintyre, 2003, and Smith, 2008, above). At the institutional level,while all South African universities which have campus accommodation have operationalpolicies and protocols in place, only two institutions appear to have documented minimumstandards for the provision of student accommodation, viz., the University of Johannesburgand Rhodes University, and these are not comprehensive in terms of either accommodationinfrastructure norms or governance and management norms and standards.
Given the relative lack of regulations governing the provision of student housing in SouthAfrica, a proposed Minimum Standards Code for Student Housing and Accommodation inSouth Africa is attached to this report as Appendix D.
2.6 Financing of student accommodation and infrastructure
Over the past few decades, public funding of higher education has been under severe andincreasing pressure all over the world, as governments and citizens alike demand improvedaccountability, efficiency and outcomes even while expecting mass participation (Macintyre,2003). Coupled with growing student enrolments, this situation is unlikely to change in the
26
near future, forcing universities to make hard choices between where and how they utilisetheir otherwise limited resources.
“In most countries some form of public financing of higher education is experienced” (DeVilliers & Steyn, 2005, p. 3), and South Africa is no exception. Arguing in favour of increasedpublic spending on education, and specifically higher education, De Villiers and Steyn (2005)compared public expenditure on higher education in South Africa with that in othercountries.
Total expenditure on higher education per student, both private and public, differssubstantially among countries. In OECD countries, for example, this varied between $4000 in Greece in 2003 to $20 000 in the USA. Also, if higher educational expenditure asa percentage of the GDP is used as a yardstick, America spends the highest percentageon education. Although extra funds per se do not guarantee greater efficiency andquality, it does seem as though America’s higher education is more successful if it iscompared with the systems in other developed countries (De Villiers and Steyn, 2005,pp. 3-4).
In South Africa, by comparison, the impact of relatively lower public spending on highereducation as well as the escalating cost of higher education has contributed to the fact that“student debt [has] increased substantially over the years …, increasing by 79% over theperiod 2001-2003”. At the same time, “student debt [was] written off by 102% from 2000-2003”, without taking into account “institutions for which no data is available … [but] wherelarge debts could be expected” (De Villiers & Steyn, 2005, p. 9).
The National Student Financial Aid Scheme (NSFAS) was introduced specifically to assiststudents from poverty-stricken backgrounds, whose desire for higher education but lack ofmeans was translating either into complete exclusion from university or into a ballooning ofstudent debt. The exponential growth in the NSFAS budget over the years has neverthelessbeen unable to keep pace with the ever-increasing demand for financial aid (DoE, 2009b, p.2). While thousands of students have benefited from the scheme, it has been argued thatone consequence of the channelling by the state of additional funds into NSFAS is thatuniversities have been left with an even smaller percentage of the education budget: while“this policy [i.e., NSFAS] … helps to decrease student debt it doesn’t pay for expenditure ofHE [higher education] institutions”; moreover, “only a very small percentage of studentsbenefit from [the] scheme” (De Villiers & Steyn, 2005, p.10, emphasis added).
These findings and conclusions are mirrored in the REAP Report (Jones, Coetzee, Bailey &Wickham, 2008):
An analysis conducted by the HSRC and the CHE into South Africa’s university drop-outrate, cited inadequate financial resources as the main reason for students droppingout of university (80% of respondents), and that this was a significantly greater factorfor African and Coloured students than for White or Indian students. Financialconstraints were found to manifest particularly in students having difficulty affordingregistration fees, accommodation, meals, books (including materials and equipment)and travel costs. Related financial factors, such as lack of a quiet space to study, living
27
far from campus and pressure from their families to leave their studies in order tosupport them financially, also contributed significantly to student drop-out (Jones etal., 2008, p. 22).
Regarding the role of NSFAS in addressing these financial constraints and barriers toaccessing higher education, the REAP report acknowledges that NSFAS is the single largestprovider of financial aid to students in state higher education institutions in South Africa andis therefore critically important in providing financial access to higher education for largenumbers of financially needy students who would otherwise not be able to afford it (Joneset al., 2008). The report also contends, however, that this contribution “can never beenough to meet the full scope of the need”, which thus makes it the responsibility of theindividual institutions to determine the size of the awards according to their studentpopulation profile. The report finds that although institutions make financial aid allocationsaccording to prescribed means tests, they have the discretion to allocate funds according todifferent line items such as accommodation and registration fees. This, according to thereport, has given rise to wide variations in financial aid practices among institutions,depending on the numbers and economic profile of their student populations that requiresuch assistance, and that awards are more comprehensive in some institutions than inothers.
Several instances are cited to support this finding:
The NSFAS loan may cover the registration fee at some universities, but not at allinstitutions. It was also found to cover residence fees at four of the institutions in thesample, but not for first-year students, who are most at-risk of dropping out, at oneinstitution. Generally, nonresidential accommodation was not covered by the loan,which resulted in an added financial burden for those who applied late, when theresidences were already fully booked. Furthermore, although the NSFAS loan doesmake some allowance for the purchase of textbooks, this is not always sufficient,which is problematic for those students who cannot make up the shortfall. There werealso complaints that the NSFAS living allowance was not only insufficient, but that itwas sometimes paid out very late by financial aid departments, even as late as the endof the term, which caused students much personal hardship. Students are expected tomake up these shortfalls in financial aid one way or another, but many cases wereencountered of students who could not (Jones et al., 2008, p. 31).
This is well illustrated by a first year NSFAS-supported student, as follows:
You have to survive with whatever you have and wait until the next deposit thatyou’re going to get from home. NSFAS is only tuition and books so the food moneycomes from home. For someone like me it’s very tough because money is a seriousissue for me. I can’t ask for money. Even when I’ve run out it’s hard for me to pick upthe phone and say; “Hey guys, I’ve got no food.” So I just sit and wait and wait andwait until the day comes. Even if it means starving, I have a serious problem when itcomes to asking for money. I don’t think it’s pride. For instance, at home, my motheris the only person working. So, whatever decisions I make, I first think; “Eish, thispoor woman, she’s already got enough on her plate.” So the least I can do is just be
28
patient and wait for her. When she’s fine she’ll give me whatever it is (Jones et al.,2008, p. 31).
Apart from inadequate access to funding, reflections such as these raise issues of food andnutrition. The nutrition of students did not form part of the terms of reference of theMinisterial Committee; however, during the site visits it soon became apparent that the lackof adequate food is a serious problem for many students at a number of South Africanuniversities (see also DHET, 2010). There is no doubt that nutritional status can havesignificant and sometimes profound effects on human mental performance (Rogers & Lloyd1994, p. 443; Dani, Burrill & Demmig-Adams, 2005, p. 263; Lien, 2006, p. 425), thatmalnutrition, even with no clinical signs, affects intelligence (Quendler, 2002; Taras, 2005),and hence that adequate nutrition is vital for academic performance and success.
Leaving aside the large gap between NSFAS funding and student need in South Africa today,the allocation and use of such funding, together with the variations in financial aid practicesamong institutions, particularly in relation to student accommodation, need furtherinvestigation.
Furthermore, provision of financial support for student accommodation needs is only oneaspect of the complex student housing equation; university residences and other forms ofon- and off-campus accommodation must also be maintained, staffed and managed. Atmany US colleges and universities, as in South Africa, the challenges of ageing studenthousing infrastructure, the evolution of residential life programmes, the cost of and needfor professional residence staff, and the financial implications of technology in the residenceenvironment (Ryan 2003), are compounded by increasing student expectations for livingoptions and cumbersome financial structures, all of which prevent an aggressive approachto renovation or new construction (Stoner and Cavins, 2003). Traditional funding optionsare no longer viable for many institutions, and additional options are needed to address thegaps between what is required of university housing facilities, what is desired by students,and what is affordable for the university and the student resident.
Alternative sources of funding could include: increasing residence fees or room rent;revision of residence budgets and programmes to reduce costs; the privatisation ofresidence halls and operations; addressing the funding gap through federal, state ormunicipal assistance, state initiatives and tax-exempt corporate models; leveraging special
The financial challenges and difficulties described by the REAP report (Jones et al.,2008) are, if anything, understated. The hardships confronting many studentswere encountered and observed by the Ministerial Committee, and are recountedin several sections of the report. The REAP report also expresses one of severaltensions relating to the provision of student housing identified by the researchers,viz., the ongoing contestation as to whether NSFAS loan allocations should belarger, and cater more comprehensively for fewer students, or whether theyshould be smaller and offer wider access. This tension is explored in the fundingand financing section of this report.
29
events such as the hosting of major sporting events; and sponsorship by corporate orprivate donors (Stoner and Cavins, 2003).
A coalition of funding sources must be compiled in order to secure the needed fundsfor projects envisioned for the future. Upgrading or constructing new facilities tomeet future expectations will cost significantly more than can be legitimatelyattached to amortisation schedules from revenue bonds. Consortia of fundingcoupled with private gifts … have merit. Further, folding total project costs into therevenue bond model can no longer be considered the sole answer to funding. Therent cannot possibly be increased enough to cover project budgets envisioned forthe future … It will become necessary to finance educational programs and academicenrichments within residential facilities from sources other than rental income(Stoner & Cavins, 2003, p. 26).
Similarly, La Roche, Flanigan and Copeland (2010) find that millennial students in the UnitedStates have significantly higher expectations for student housing than their parents did andare willing to pay an additional fee for certain amenities. They recommend that “given thecurrent economic situation, universities may find it expedient to join forces with their priorcompetitors, private developers, and share in the lucrative revenue stream provided bystudent housing” (La Roche, Flanigan and Copeland, 2010, p. 274).
2.7 Conclusion
While many if not most students continue to live in their parents’ homes while studying, thesupply of adequate housing, on or off university campuses, for those who cannot or choosenot to stay at home, cannot keep up with the demand. Hence the traditional, historicalpatterns of student housing are being supplemented with a range of other models,prominent among them being various forms of public-private partnerships, and at the sametime greater attention is being given to satisfying the varying and not alwayscomplementary needs and demands of universities, parents and governments as well asstudents. The phrase ‘mix and match’ could be said to sum up many of the several recenttrends in student housing, but quality and fitness for purpose remain all-important.
With regard to the contribution of residence life to student success, a substantial body ofresearch suggests that students who live in on-campus housing perform at a higher levelacademically, and are more satisfied with their overall college experience, than their off-campus counterparts, even when differing levels of academic ability are taken into account.However, the findings are not conclusive, being tempered by research, from the USA as wellas from other countries, which suggests that the influence of on-campus student housing onstudent engagement and academic life may be, at most, slight and indirect. All thesefindings, whether promising or questionable, await further research into the extent to whichthey are generalisable to other parts of the world, especially developing world contexts.
In South Africa, issues of access, equity and redress are especially important, as are those ofquality and cost, among other student housing concerns. How to comprehensively andadequately finance student accommodation and infrastructure, and whether to draw on
30
public coffers or private sources or both, is a challenge that will exercise the minds ofgovernment policymakers and university managers, both here and around the world, fordecades to come. In order to address this challenge, much more up to date information isrequired; unfortunately, there is a scarcity of research in South Africa, and in developingcountries more generally, about these and all aspects of student housing (a state of affairspartly reflective of a lack of national policy and regulation in the field). There is also a lack ofresearch, worldwide, into exactly which factors, initiatives, programmes and interventionsactually contribute to the positive impact of residence accommodation and life upon theacademic and the educative experience of students.
In particular, more rigorous and focused research into the relationship between studenthousing and academic success in South Africa, into first year experiences, and into therelevance and applicability of the concept of living-learning communities, is needed, notleast because, given poor student performance, retention and through-put rates in thecountry, even slight and indirect advantages are worth exploring further, and fosteringwhere possible.
While there appears to be growing consensus amongst American studenthousing professionals that living in residence significantly advantages a studentat university, the generalisation of these findings to other countries needs to befurther researched. Among other things, this report seeks to establish whetherany preliminary indicator trends with regard to the academic success of studentsin residence relative to commuter students can be identified at South Africanuniversities. However, more coordination between universities and furtherresearch is needed in this area.
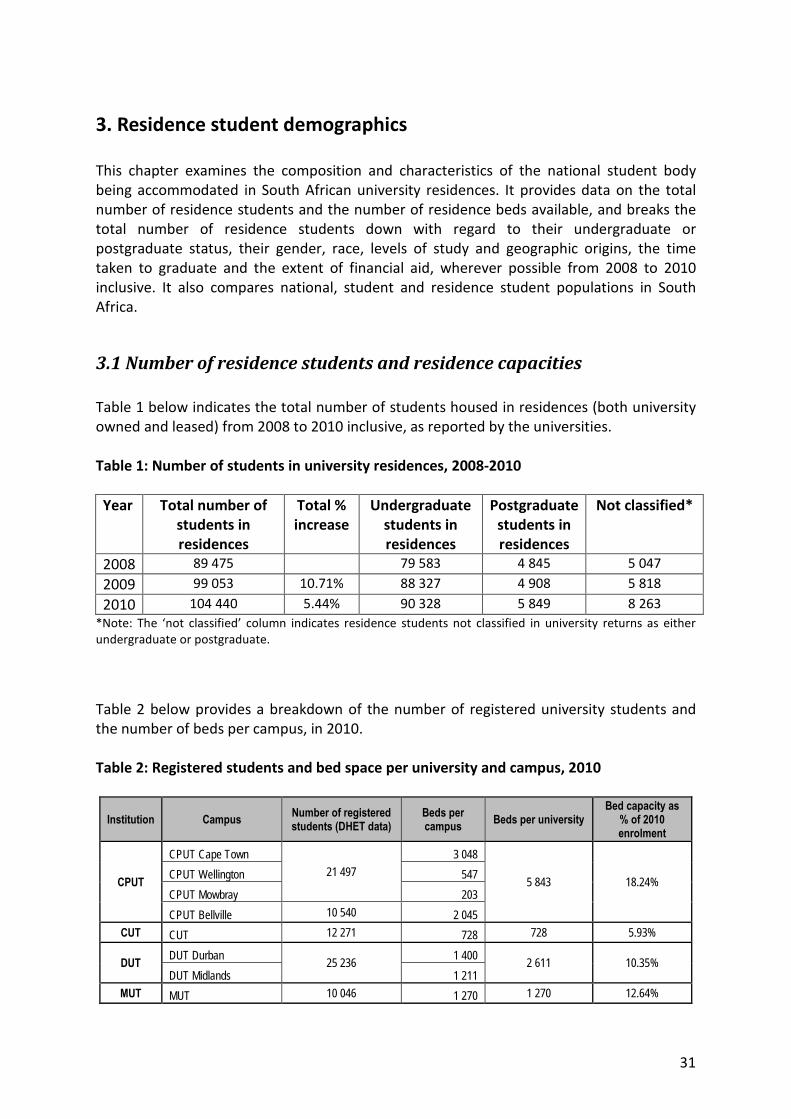
31
3. Residence student demographics
This chapter examines the composition and characteristics of the national student bodybeing accommodated in South African university residences. It provides data on the totalnumber of residence students and the number of residence beds available, and breaks thetotal number of residence students down with regard to their undergraduate orpostgraduate status, their gender, race, levels of study and geographic origins, the timetaken to graduate and the extent of financial aid, wherever possible from 2008 to 2010inclusive. It also compares national, student and residence student populations in SouthAfrica.
3.1 Number of residence students and residence capacities
Table 1 below indicates the total number of students housed in residences (both universityowned and leased) from 2008 to 2010 inclusive, as reported by the universities.
Table 1: Number of students in university residences, 2008-2010
Year Total number ofstudents inresidences
Total %increase
Undergraduatestudents inresidences
Postgraduatestudents inresidences
Not classified*
2008 89 475 79 583 4 845 5 047
2009 99 053 10.71% 88 327 4 908 5 818
2010 104 440 5.44% 90 328 5 849 8 263
*Note: The ‘not classified’ column indicates residence students not classified in university returns as eitherundergraduate or postgraduate.
Table 2 below provides a breakdown of the number of registered university students andthe number of beds per campus, in 2010.
Table 2: Registered students and bed space per university and campus, 2010
Institution CampusNumber of registeredstudents (DHET data)
Beds percampus
Beds per universityBed capacity as
% of 2010enrolment
CPUT
CPUT Cape Town
21 497
3 048
5 843 18.24%CPUT Wellington 547
CPUT Mowbray 203
CPUT Bellville 10 540 2 045
CUT CUT 12 271 728 728 5.93%
DUTDUT Durban
25 2361 400
2 611 10.35%DUT Midlands 1 211
MUT MUT 10 046 1 270 1 270 12.64%
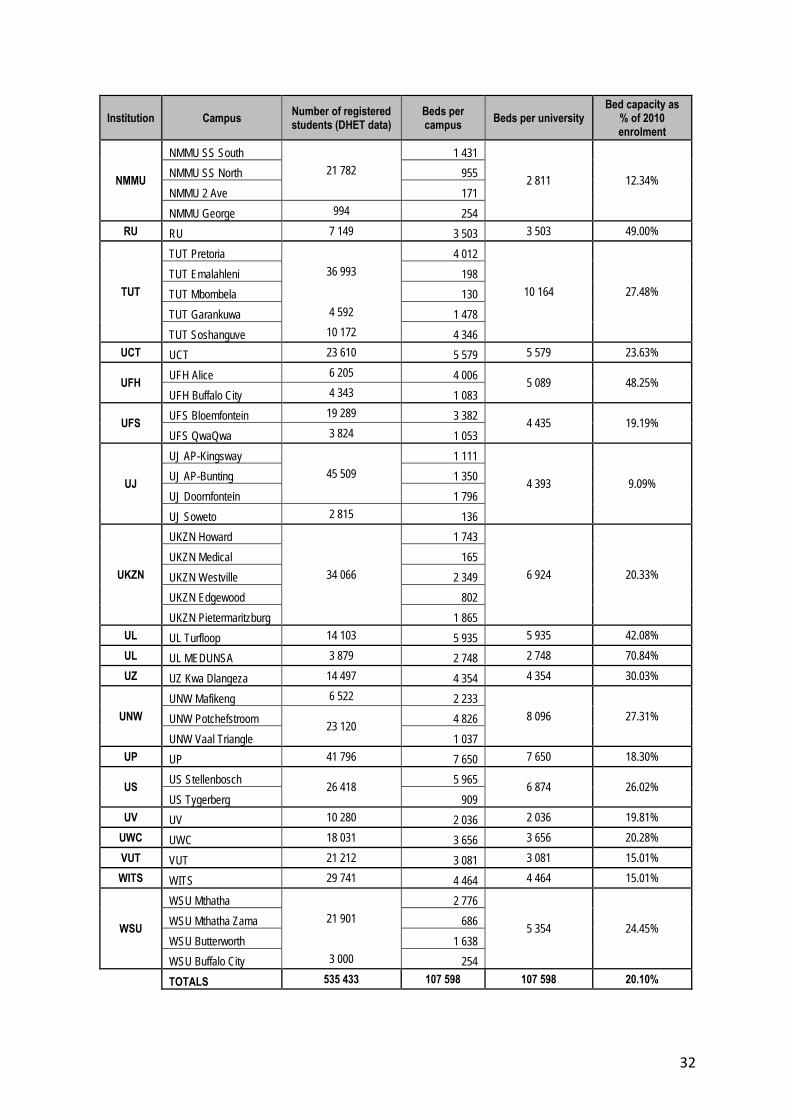
32
Institution CampusNumber of registeredstudents (DHET data)
Beds percampus
Beds per universityBed capacity as
% of 2010enrolment
NMMU
NMMU SS South
21 782
1 431
2 811 12.34%NMMU SS North 955
NMMU 2 Ave 171
NMMU George 994 254
RU RU 7 149 3 503 3 503 49.00%
TUT
TUT Pretoria
36 993
4 012
10 164 27.48%
TUT Emalahleni 198
TUT Mbombela 130
TUT Garankuwa 4 592 1 478
TUT Soshanguve 10 172 4 346
UCT UCT 23 610 5 579 5 579 23.63%
UFHUFH Alice 6 205 4 006
5 089 48.25%UFH Buffalo City 4 343 1 083
UFSUFS Bloemfontein 19 289 3 382
4 435 19.19%UFS QwaQwa 3 824 1 053
UJ
UJ AP-Kingsway
45 509
1 111
4 393 9.09%UJ AP-Bunting 1 350
UJ Doornfontein 1 796
UJ Soweto 2 815 136
UKZN
UKZN Howard
34 066
1 743
6 924 20.33%
UKZN Medical 165
UKZN Westville 2 349
UKZN Edgewood 802
UKZN Pietermaritzburg 1 865
UL UL Turfloop 14 103 5 935 5 935 42.08%
UL UL MEDUNSA 3 879 2 748 2 748 70.84%
UZ UZ Kwa Dlangeza 14 497 4 354 4 354 30.03%
UNW
UNW Mafikeng 6 522 2 233
8 096 27.31%UNW Potchefstroom23 120
4 826
UNW Vaal Triangle 1 037
UP UP 41 796 7 650 7 650 18.30%
USUS Stellenbosch
26 4185 965
6 874 26.02%US Tygerberg 909
UV UV 10 280 2 036 2 036 19.81%
UWC UWC 18 031 3 656 3 656 20.28%
VUT VUT 21 212 3 081 3 081 15.01%
WITS WITS 29 741 4 464 4 464 15.01%
WSU
WSU Mthatha
21 901
2 776
5 354 24.45%WSU Mthatha Zama 686
WSU Butterworth 1 638
WSU Buffalo City 3 000 254
TOTALS 535 433 107 598 107 598 20.10%
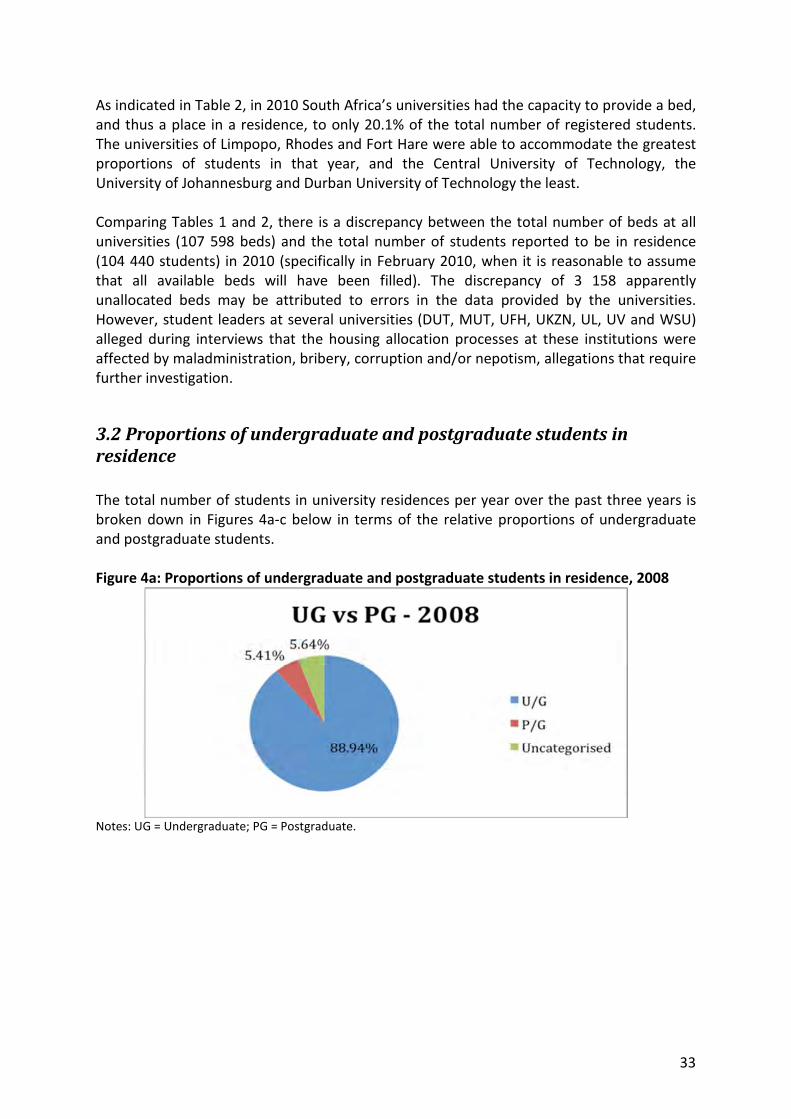
33
As indicated in Table 2, in 2010 South Africa’s universities had the capacity to provide a bed,and thus a place in a residence, to only 20.1% of the total number of registered students.The universities of Limpopo, Rhodes and Fort Hare were able to accommodate the greatestproportions of students in that year, and the Central University of Technology, theUniversity of Johannesburg and Durban University of Technology the least.
Comparing Tables 1 and 2, there is a discrepancy between the total number of beds at alluniversities (107 598 beds) and the total number of students reported to be in residence(104 440 students) in 2010 (specifically in February 2010, when it is reasonable to assumethat all available beds will have been filled). The discrepancy of 3 158 apparentlyunallocated beds may be attributed to errors in the data provided by the universities.However, student leaders at several universities (DUT, MUT, UFH, UKZN, UL, UV and WSU)alleged during interviews that the housing allocation processes at these institutions wereaffected by maladministration, bribery, corruption and/or nepotism, allegations that requirefurther investigation.
3.2 Proportions of undergraduate and postgraduate students inresidence
The total number of students in university residences per year over the past three years isbroken down in Figures 4a-c below in terms of the relative proportions of undergraduateand postgraduate students.
Figure 4a: Proportions of undergraduate and postgraduate students in residence, 2008
Notes: UG = Undergraduate; PG = Postgraduate.
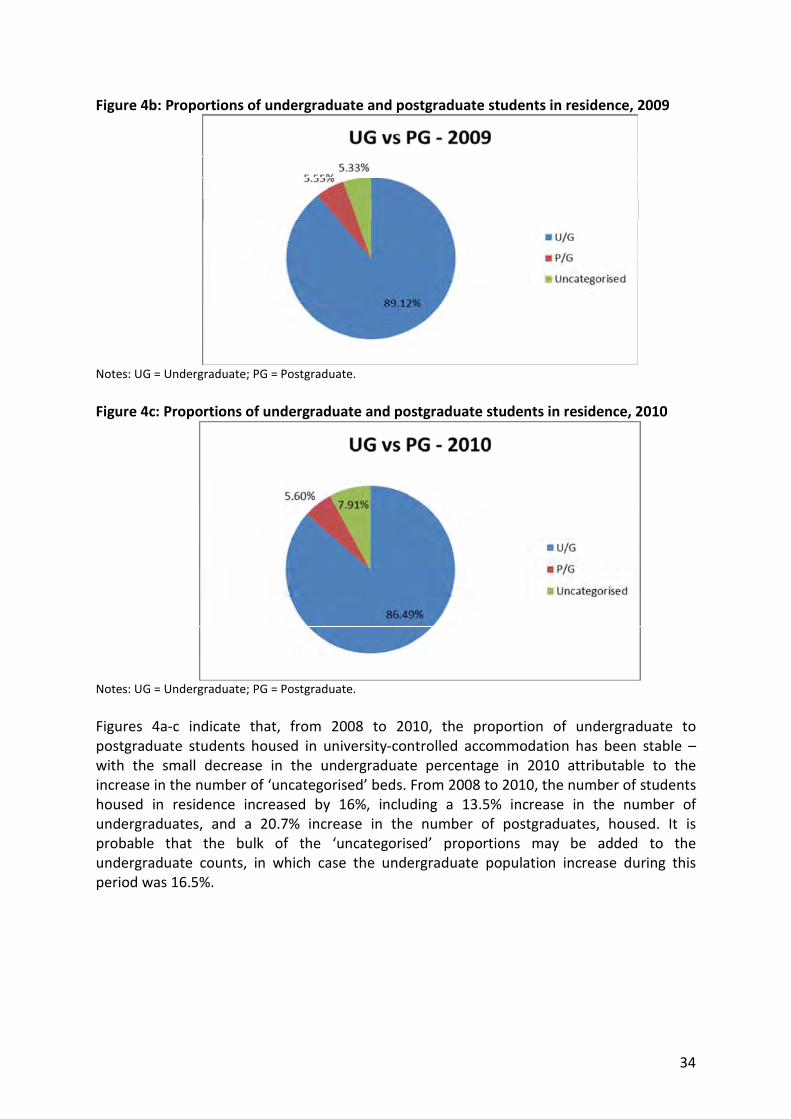
34
Figure 4b: Proportions of undergraduate and postgraduate students in residence, 2009
Notes: UG = Undergraduate; PG = Postgraduate.
Figure 4c: Proportions of undergraduate and postgraduate students in residence, 2010
Notes: UG = Undergraduate; PG = Postgraduate.
Figures 4a-c indicate that, from 2008 to 2010, the proportion of undergraduate topostgraduate students housed in university-controlled accommodation has been stable –with the small decrease in the undergraduate percentage in 2010 attributable to theincrease in the number of ‘uncategorised’ beds. From 2008 to 2010, the number of studentshoused in residence increased by 16%, including a 13.5% increase in the number ofundergraduates, and a 20.7% increase in the number of postgraduates, housed. It isprobable that the bulk of the ‘uncategorised’ proportions may be added to theundergraduate counts, in which case the undergraduate population increase during thisperiod was 16.5%.
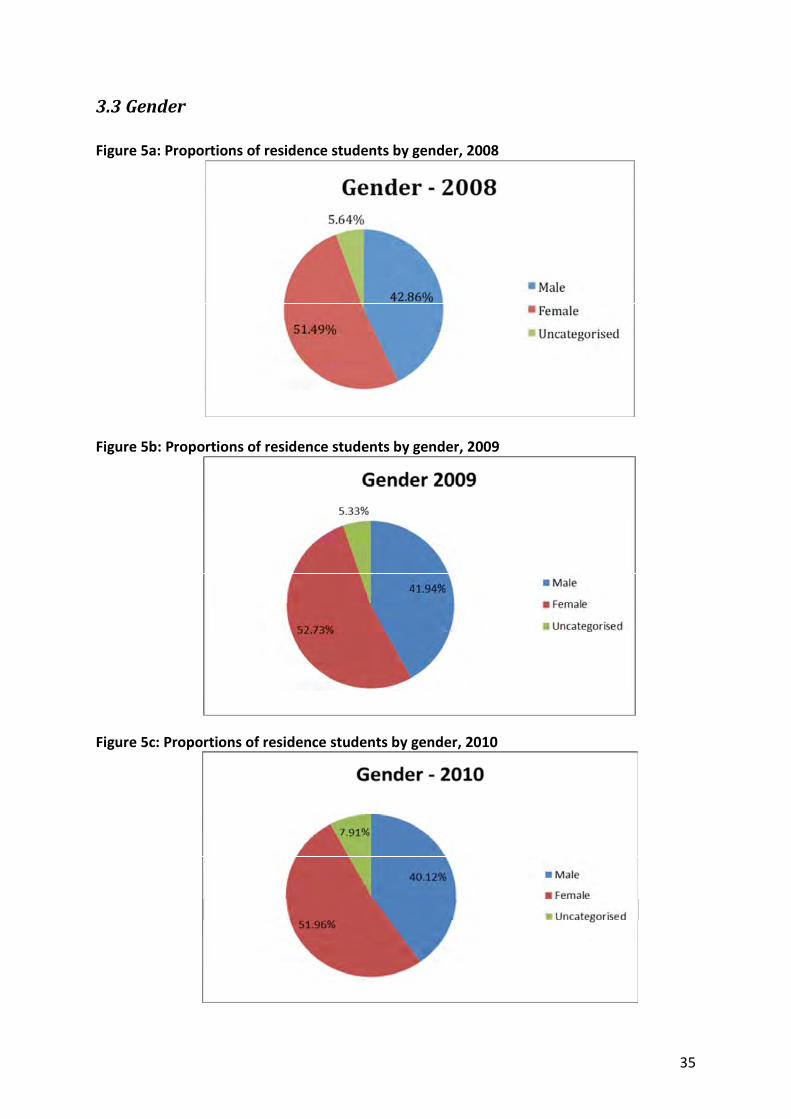
35
3.3 Gender
Figure 5a: Proportions of residence students by gender, 2008
Figure 5b: Proportions of residence students by gender, 2009
Figure 5c: Proportions of residence students by gender, 2010
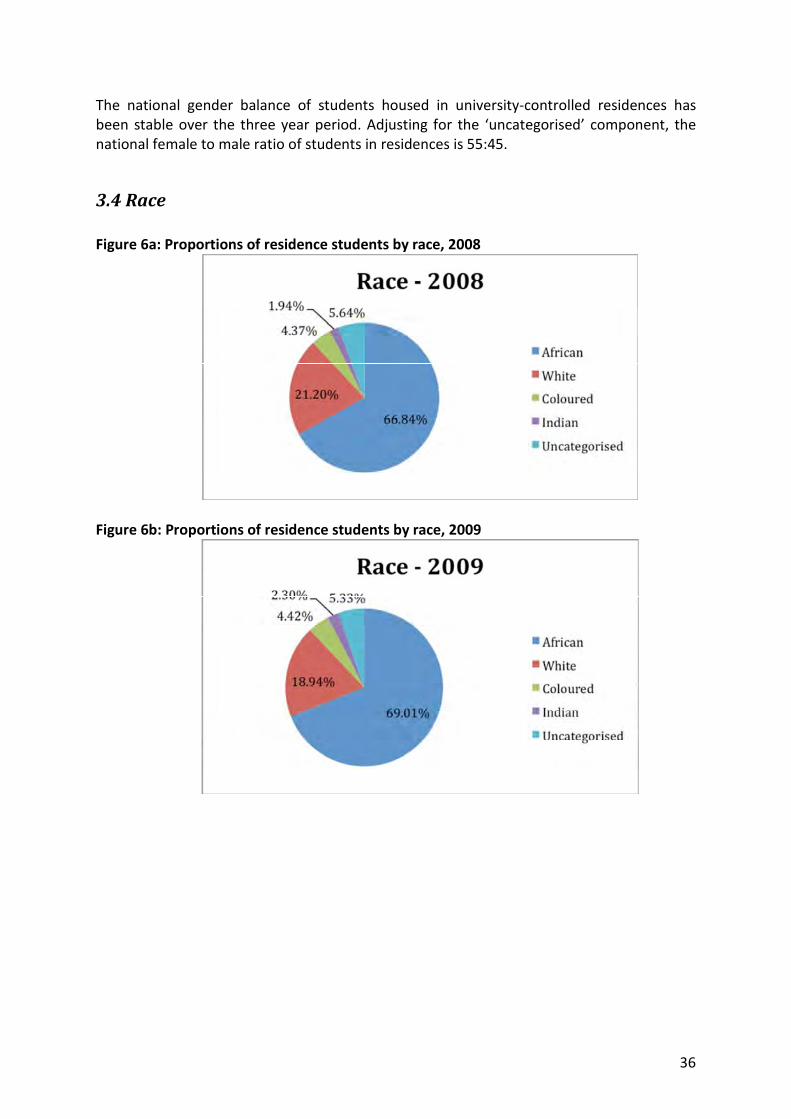
36
The national gender balance of students housed in university-controlled residences hasbeen stable over the three year period. Adjusting for the ‘uncategorised’ component, thenational female to male ratio of students in residences is 55:45.
3.4 Race
Figure 6a: Proportions of residence students by race, 2008
Figure 6b: Proportions of residence students by race, 2009
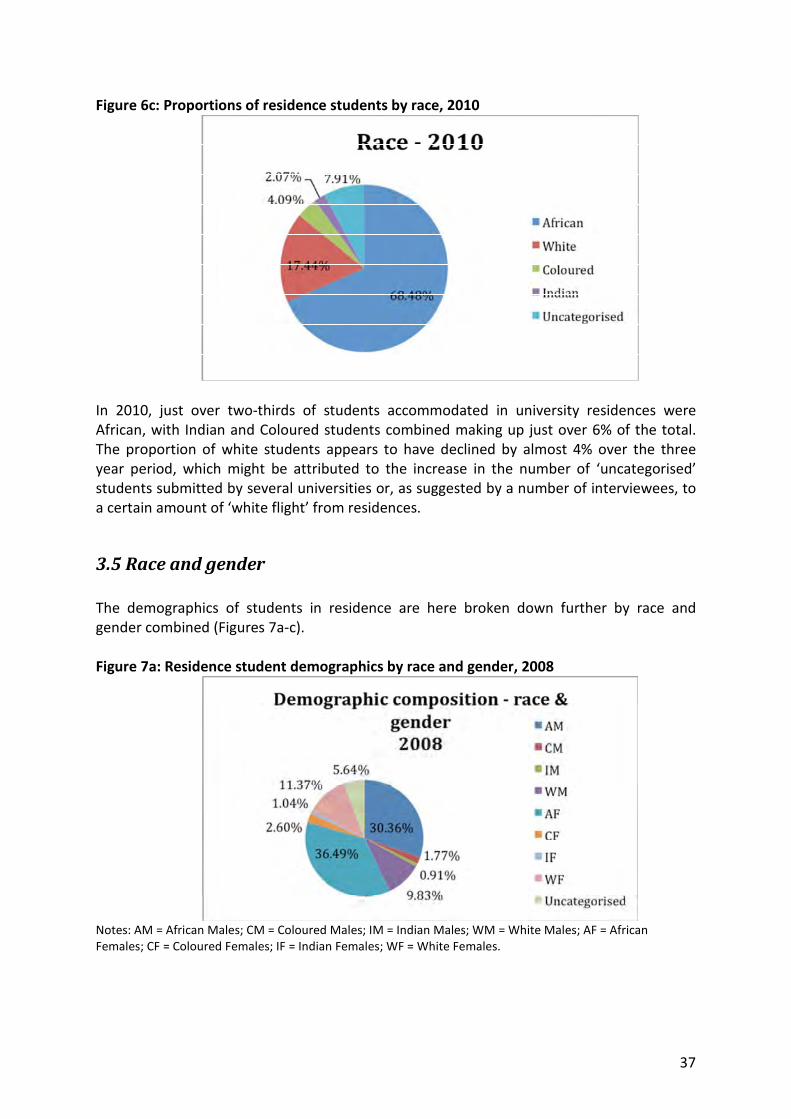
37
Figure 6c: Proportions of residence students by race, 2010
In 2010, just over two-thirds of students accommodated in university residences wereAfrican, with Indian and Coloured students combined making up just over 6% of the total.The proportion of white students appears to have declined by almost 4% over the threeyear period, which might be attributed to the increase in the number of ‘uncategorised’students submitted by several universities or, as suggested by a number of interviewees, toa certain amount of ‘white flight’ from residences.
3.5 Race and gender
The demographics of students in residence are here broken down further by race andgender combined (Figures 7a-c).
Figure 7a: Residence student demographics by race and gender, 2008
Notes: AM = African Males; CM = Coloured Males; IM = Indian Males; WM = White Males; AF = AfricanFemales; CF = Coloured Females; IF = Indian Females; WF = White Females.
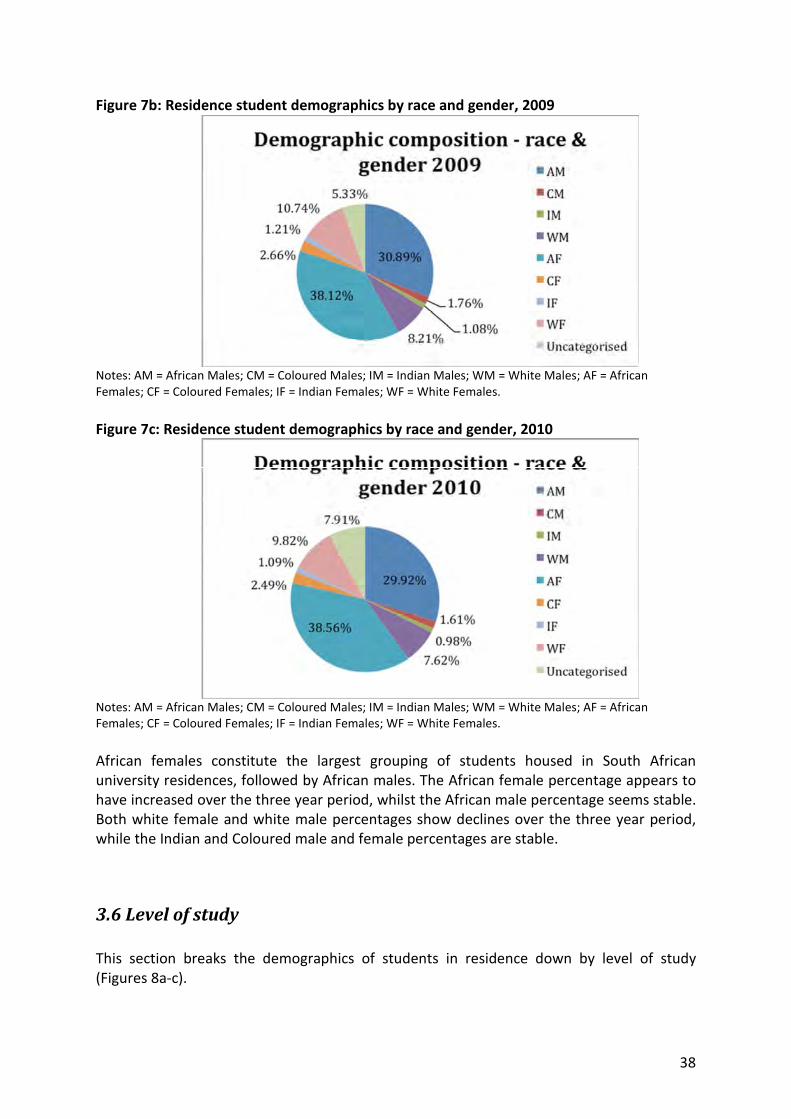
38
Figure 7b: Residence student demographics by race and gender, 2009
Notes: AM = African Males; CM = Coloured Males; IM = Indian Males; WM = White Males; AF = AfricanFemales; CF = Coloured Females; IF = Indian Females; WF = White Females.
Figure 7c: Residence student demographics by race and gender, 2010
Notes: AM = African Males; CM = Coloured Males; IM = Indian Males; WM = White Males; AF = AfricanFemales; CF = Coloured Females; IF = Indian Females; WF = White Females.
African females constitute the largest grouping of students housed in South Africanuniversity residences, followed by African males. The African female percentage appears tohave increased over the three year period, whilst the African male percentage seems stable.Both white female and white male percentages show declines over the three year period,while the Indian and Coloured male and female percentages are stable.
3.6 Level of study
This section breaks the demographics of students in residence down by level of study(Figures 8a-c).
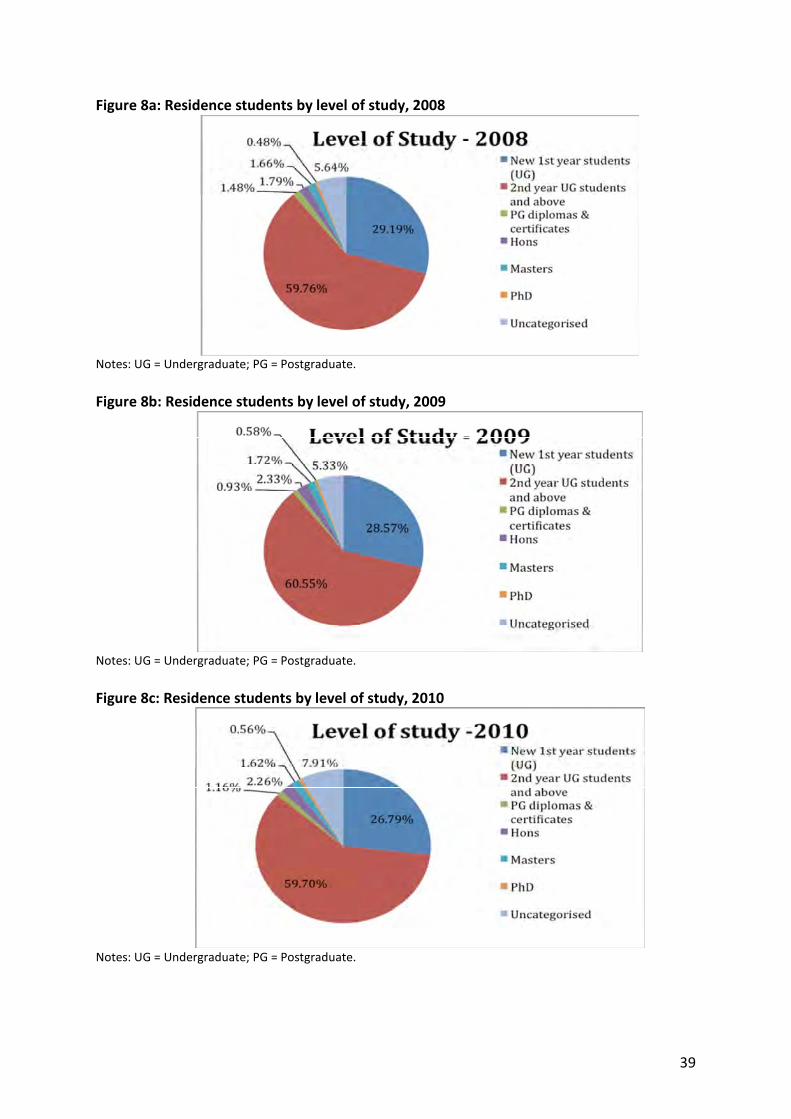
39
Figure 8a: Residence students by level of study, 2008
Notes: UG = Undergraduate; PG = Postgraduate.
Figure 8b: Residence students by level of study, 2009
Notes: UG = Undergraduate; PG = Postgraduate.
Figure 8c: Residence students by level of study, 2010
Notes: UG = Undergraduate; PG = Postgraduate.
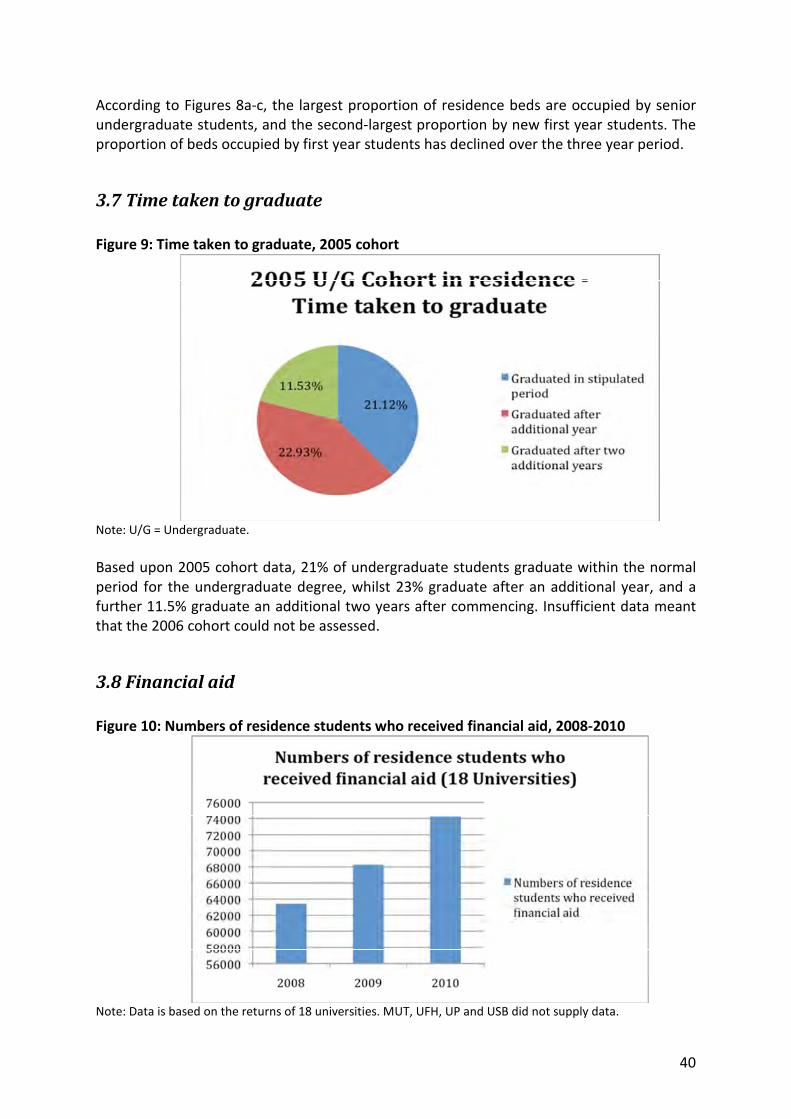
40
According to Figures 8a-c, the largest proportion of residence beds are occupied by seniorundergraduate students, and the second-largest proportion by new first year students. Theproportion of beds occupied by first year students has declined over the three year period.
3.7 Time taken to graduate
Figure 9: Time taken to graduate, 2005 cohort
Note: U/G = Undergraduate.
Based upon 2005 cohort data, 21% of undergraduate students graduate within the normalperiod for the undergraduate degree, whilst 23% graduate after an additional year, and afurther 11.5% graduate an additional two years after commencing. Insufficient data meantthat the 2006 cohort could not be assessed.
3.8 Financial aid
Figure 10: Numbers of residence students who received financial aid, 2008-2010
Note: Data is based on the returns of 18 universities. MUT, UFH, UP and USB did not supply data.
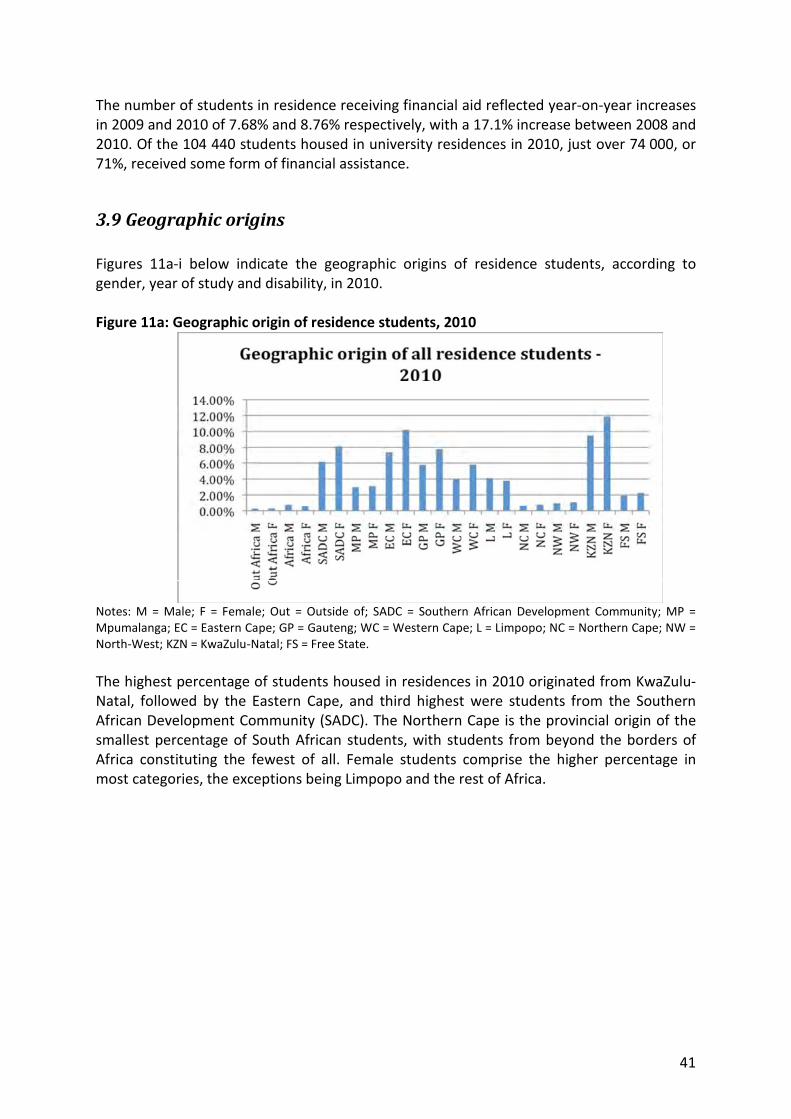
41
The number of students in residence receiving financial aid reflected year-on-year increasesin 2009 and 2010 of 7.68% and 8.76% respectively, with a 17.1% increase between 2008 and2010. Of the 104 440 students housed in university residences in 2010, just over 74 000, or71%, received some form of financial assistance.
3.9 Geographic origins
Figures 11a-i below indicate the geographic origins of residence students, according togender, year of study and disability, in 2010.
Figure 11a: Geographic origin of residence students, 2010
Notes: M = Male; F = Female; Out = Outside of; SADC = Southern African Development Community; MP =Mpumalanga; EC = Eastern Cape; GP = Gauteng; WC = Western Cape; L = Limpopo; NC = Northern Cape; NW =North-West; KZN = KwaZulu-Natal; FS = Free State.
The highest percentage of students housed in residences in 2010 originated from KwaZulu-Natal, followed by the Eastern Cape, and third highest were students from the SouthernAfrican Development Community (SADC). The Northern Cape is the provincial origin of thesmallest percentage of South African students, with students from beyond the borders ofAfrica constituting the fewest of all. Female students comprise the higher percentage inmost categories, the exceptions being Limpopo and the rest of Africa.
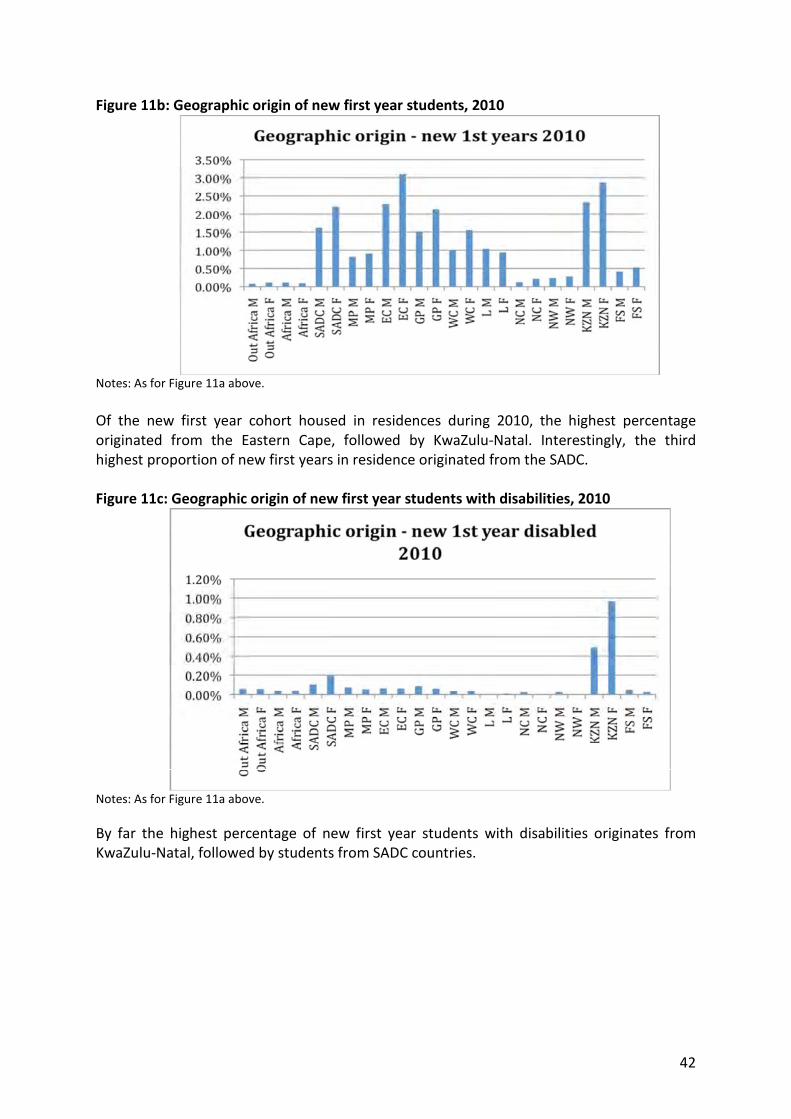
42
Figure 11b: Geographic origin of new first year students, 2010
Notes: As for Figure 11a above.
Of the new first year cohort housed in residences during 2010, the highest percentageoriginated from the Eastern Cape, followed by KwaZulu-Natal. Interestingly, the thirdhighest proportion of new first years in residence originated from the SADC.
Figure 11c: Geographic origin of new first year students with disabilities, 2010
Notes: As for Figure 11a above.
By far the highest percentage of new first year students with disabilities originates fromKwaZulu-Natal, followed by students from SADC countries.
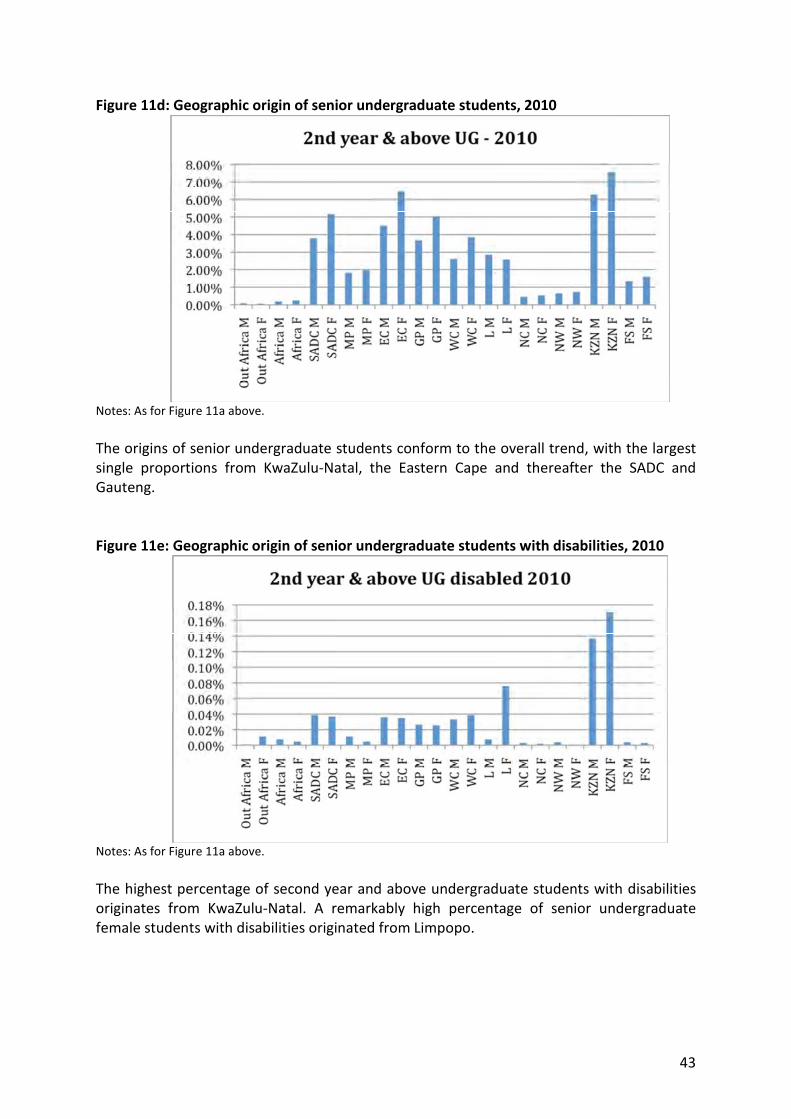
43
Figure 11d: Geographic origin of senior undergraduate students, 2010
Notes: As for Figure 11a above.
The origins of senior undergraduate students conform to the overall trend, with the largestsingle proportions from KwaZulu-Natal, the Eastern Cape and thereafter the SADC andGauteng.
Figure 11e: Geographic origin of senior undergraduate students with disabilities, 2010
Notes: As for Figure 11a above.
The highest percentage of second year and above undergraduate students with disabilitiesoriginates from KwaZulu-Natal. A remarkably high percentage of senior undergraduatefemale students with disabilities originated from Limpopo.
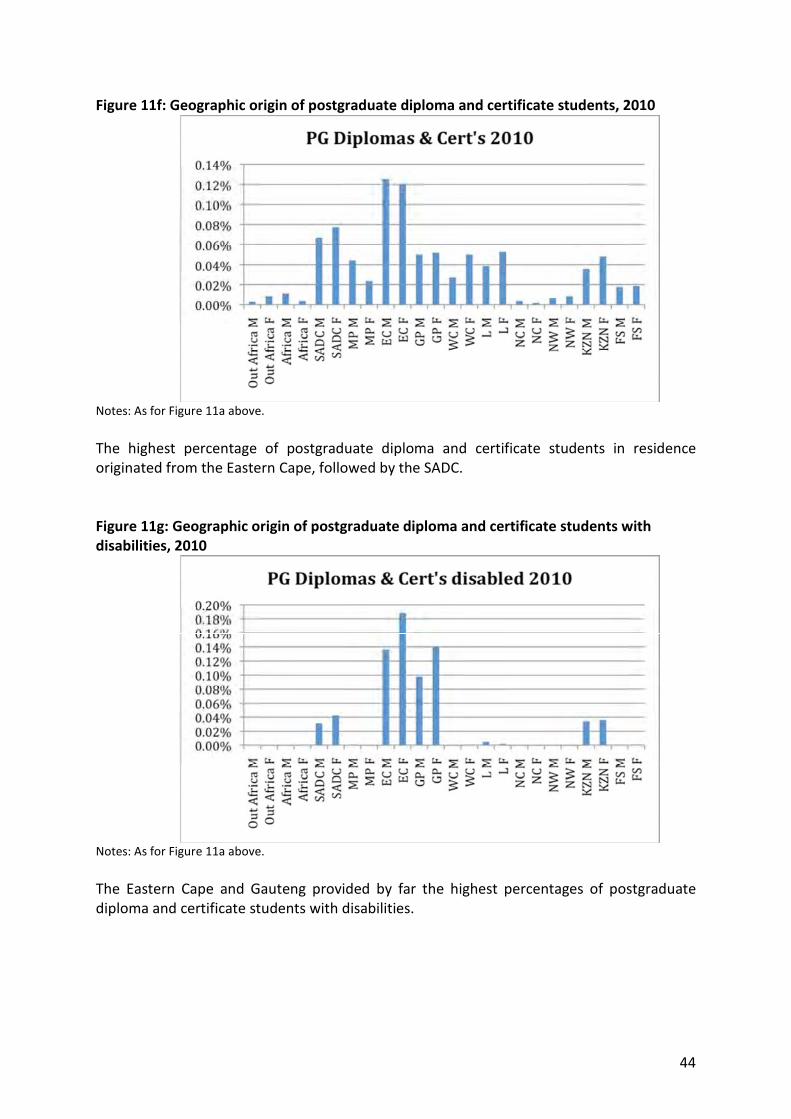
44
Figure 11f: Geographic origin of postgraduate diploma and certificate students, 2010
Notes: As for Figure 11a above.
The highest percentage of postgraduate diploma and certificate students in residenceoriginated from the Eastern Cape, followed by the SADC.
Figure 11g: Geographic origin of postgraduate diploma and certificate students withdisabilities, 2010
Notes: As for Figure 11a above.
The Eastern Cape and Gauteng provided by far the highest percentages of postgraduatediploma and certificate students with disabilities.
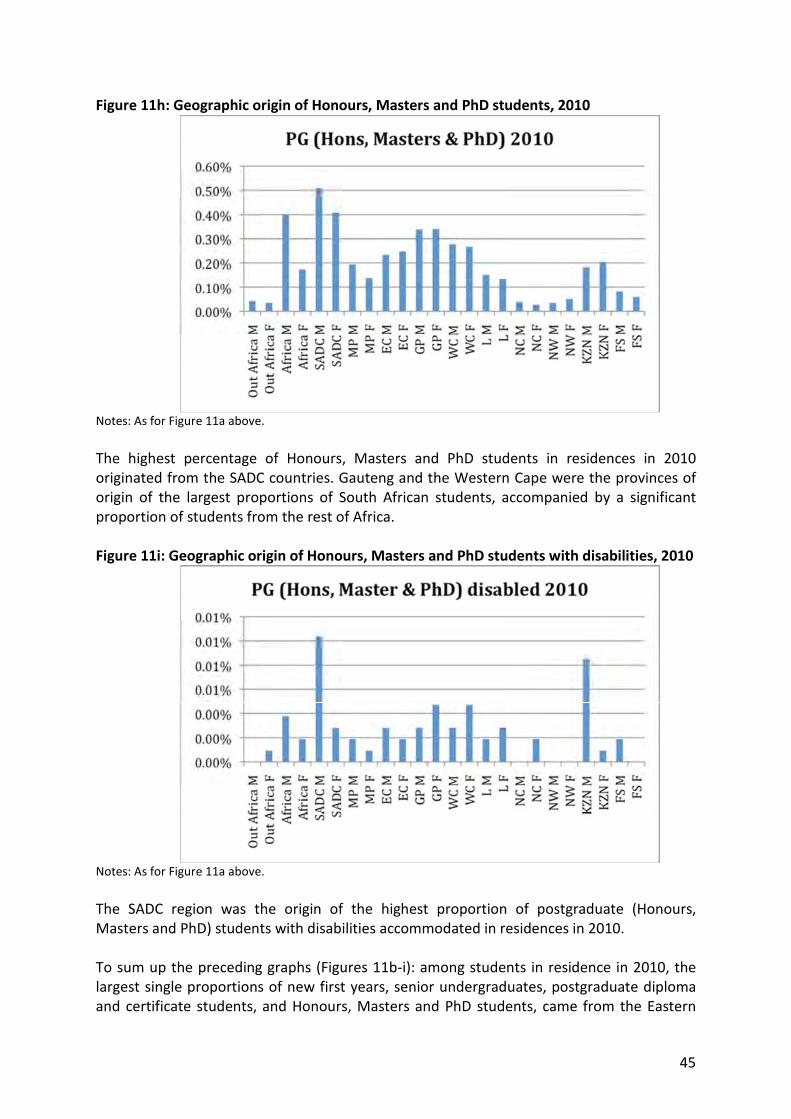
45
Figure 11h: Geographic origin of Honours, Masters and PhD students, 2010
Notes: As for Figure 11a above.
The highest percentage of Honours, Masters and PhD students in residences in 2010originated from the SADC countries. Gauteng and the Western Cape were the provinces oforigin of the largest proportions of South African students, accompanied by a significantproportion of students from the rest of Africa.
Figure 11i: Geographic origin of Honours, Masters and PhD students with disabilities, 2010
Notes: As for Figure 11a above.
The SADC region was the origin of the highest proportion of postgraduate (Honours,Masters and PhD) students with disabilities accommodated in residences in 2010.
To sum up the preceding graphs (Figures 11b-i): among students in residence in 2010, thelargest single proportions of new first years, senior undergraduates, postgraduate diplomaand certificate students, and Honours, Masters and PhD students, came from the Eastern
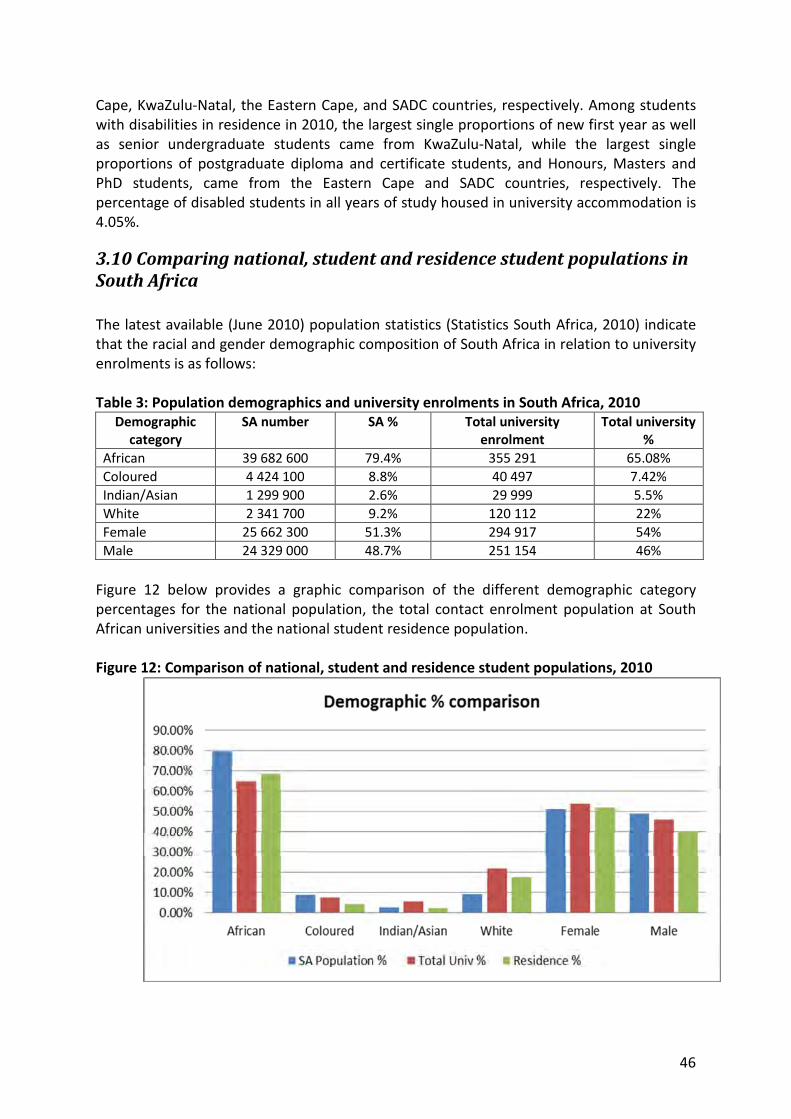
46
Cape, KwaZulu-Natal, the Eastern Cape, and SADC countries, respectively. Among studentswith disabilities in residence in 2010, the largest single proportions of new first year as wellas senior undergraduate students came from KwaZulu-Natal, while the largest singleproportions of postgraduate diploma and certificate students, and Honours, Masters andPhD students, came from the Eastern Cape and SADC countries, respectively. Thepercentage of disabled students in all years of study housed in university accommodation is4.05%.
3.10 Comparing national, student and residence student populations inSouth Africa
The latest available (June 2010) population statistics (Statistics South Africa, 2010) indicatethat the racial and gender demographic composition of South Africa in relation to universityenrolments is as follows:
Table 3: Population demographics and university enrolments in South Africa, 2010Demographic
categorySA number SA % Total university
enrolmentTotal university
%
African 39 682 600 79.4% 355 291 65.08%
Coloured 4 424 100 8.8% 40 497 7.42%
Indian/Asian 1 299 900 2.6% 29 999 5.5%
White 2 341 700 9.2% 120 112 22%
Female 25 662 300 51.3% 294 917 54%
Male 24 329 000 48.7% 251 154 46%
Figure 12 below provides a graphic comparison of the different demographic categorypercentages for the national population, the total contact enrolment population at SouthAfrican universities and the national student residence population.
Figure 12: Comparison of national, student and residence student populations, 2010
47
According to the data provided by the universities, the percentage of female studentshoused in university accommodation in 2010 matched that of the national percentage, butthe percentage of male students in residence was some 8% below the national percentage.This is due to a combination of several factors:
More female students choose to live in residence for safety reasons.
There are more female than male students in higher education.
More male students move out of residence accommodation earlier than femalestudents.
In 2010 the percentage of African students housed in university accommodation was 11%below the national population percentage, but 3.5% above the national universityenrolment percentage. The percentage of white students in university accommodation was8.2% above the national population percentage, but 4.2% below the national universityenrolment percentage. Both the Coloured and Indian in residence percentages are slightlybelow both the national percentage as well as the national university enrolmentpercentages. The white percentage is particularly interesting due to concerns expressed atseveral of universities about ‘white flight’ from the residences, and the desire of theresidence leadership (both staff and students) at these institutions to have residences whichare more reflective of the national demographic profile.
Figure 13 below provides a comparison of:
The number of new first year contact students as a percentage of the totalcontact enrolment at South African universities.
The number of second year and above contact students as a percentage ofthe total contact enrolment at South African universities.
The number of new first year students in residence as a percentage of thetotal contact enrolment at South African universities.
The total number of second year and above students in residence as apercentage of the total contact enrolment at South African universities.
The total number of students housed in residence as a percentage of thetotal contact enrolment at South African universities.
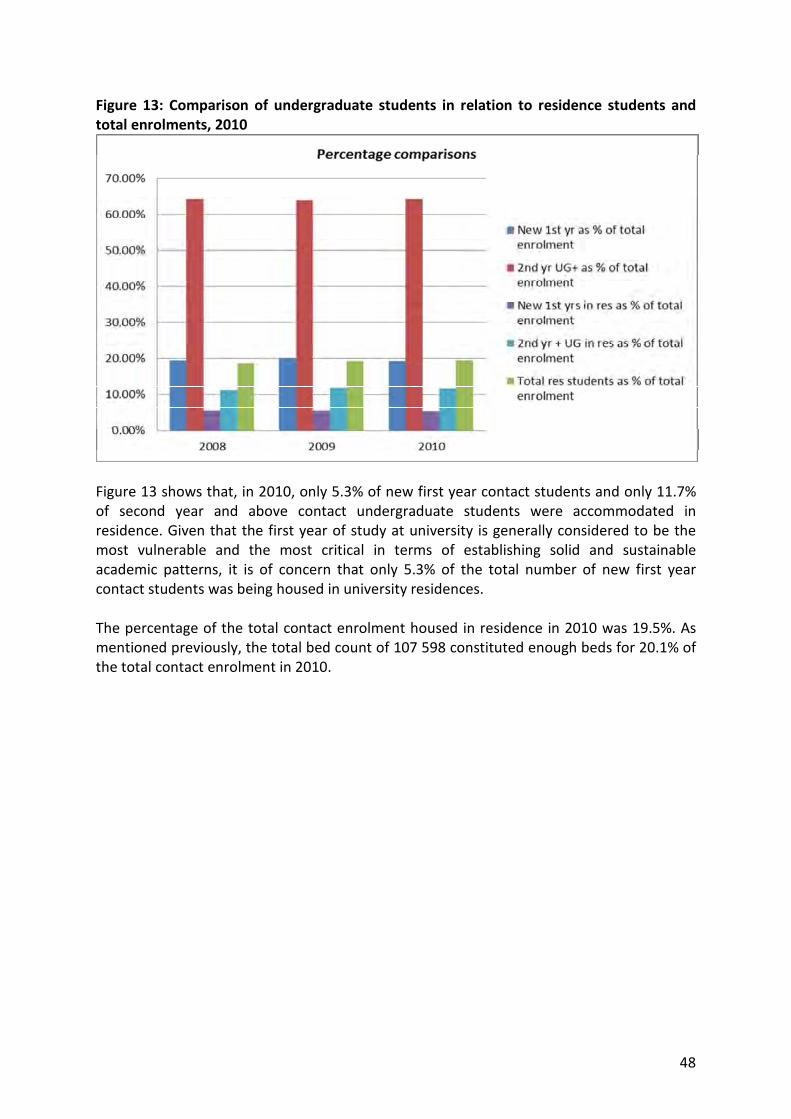
48
Figure 13: Comparison of undergraduate students in relation to residence students andtotal enrolments, 2010
Figure 13 shows that, in 2010, only 5.3% of new first year contact students and only 11.7%of second year and above contact undergraduate students were accommodated inresidence. Given that the first year of study at university is generally considered to be themost vulnerable and the most critical in terms of establishing solid and sustainableacademic patterns, it is of concern that only 5.3% of the total number of new first yearcontact students was being housed in university residences.
The percentage of the total contact enrolment housed in residence in 2010 was 19.5%. Asmentioned previously, the total bed count of 107 598 constituted enough beds for 20.1% ofthe total contact enrolment in 2010.
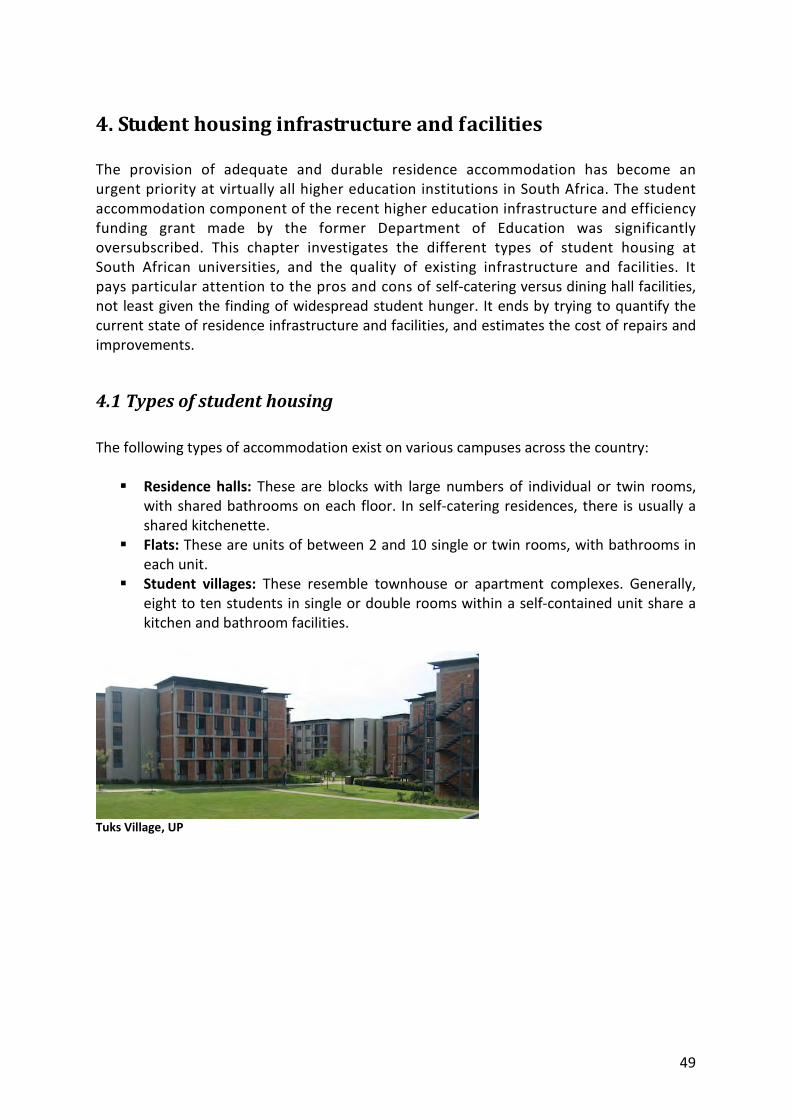
49
4. Student housing infrastructure and facilities
The provision of adequate and durable residence accommodation has become anurgent priority at virtually all higher education institutions in South Africa. The studentaccommodation component of the recent higher education infrastructure and efficiencyfunding grant made by the former Department of Education was significantlyoversubscribed. This chapter investigates the different types of student housing atSouth African universities, and the quality of existing infrastructure and facilities. Itpays particular attention to the pros and cons of self-catering versus dining hall facilities,not least given the finding of widespread student hunger. It ends by trying to quantify thecurrent state of residence infrastructure and facilities, and estimates the cost of repairs andimprovements.
4.1 Types of student housing
The following types of accommodation exist on various campuses across the country:
Residence halls: These are blocks with large numbers of individual or twin rooms,with shared bathrooms on each floor. In self-catering residences, there is usually ashared kitchenette.
Flats: These are units of between 2 and 10 single or twin rooms, with bathrooms ineach unit.
Student villages: These resemble townhouse or apartment complexes. Generally,eight to ten students in single or double rooms within a self-contained unit share akitchen and bathroom facilities.
Tuks Village, UP
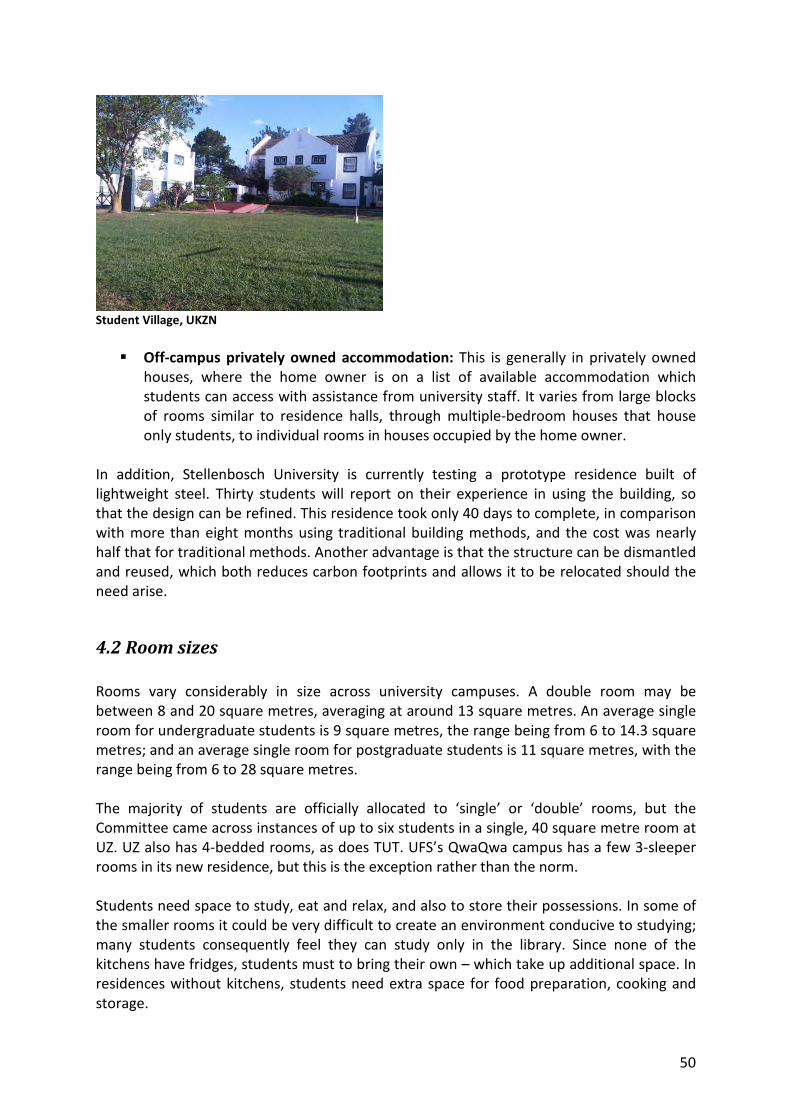
50
Student Village, UKZN
Off-campus privately owned accommodation: This is generally in privately ownedhouses, where the home owner is on a list of available accommodation whichstudents can access with assistance from university staff. It varies from large blocksof rooms similar to residence halls, through multiple-bedroom houses that houseonly students, to individual rooms in houses occupied by the home owner.
In addition, Stellenbosch University is currently testing a prototype residence built oflightweight steel. Thirty students will report on their experience in using the building, sothat the design can be refined. This residence took only 40 days to complete, in comparisonwith more than eight months using traditional building methods, and the cost was nearlyhalf that for traditional methods. Another advantage is that the structure can be dismantledand reused, which both reduces carbon footprints and allows it to be relocated should theneed arise.
4.2 Room sizes
Rooms vary considerably in size across university campuses. A double room may bebetween 8 and 20 square metres, averaging at around 13 square metres. An average singleroom for undergraduate students is 9 square metres, the range being from 6 to 14.3 squaremetres; and an average single room for postgraduate students is 11 square metres, with therange being from 6 to 28 square metres.
The majority of students are officially allocated to ‘single’ or ‘double’ rooms, but theCommittee came across instances of up to six students in a single, 40 square metre room atUZ. UZ also has 4-bedded rooms, as does TUT. UFS’s QwaQwa campus has a few 3-sleeperrooms in its new residence, but this is the exception rather than the norm.
Students need space to study, eat and relax, and also to store their possessions. In some ofthe smaller rooms it could be very difficult to create an environment conducive to studying;many students consequently feel they can study only in the library. Since none of thekitchens have fridges, students must to bring their own – which take up additional space. Inresidences without kitchens, students need extra space for food preparation, cooking andstorage.
51
4.3 Catering
In all university accommodation, there is a mix of self-catering and dining hall provision,where meals are included in the cost of the accommodation, or where students pay permeal that they consume. Forty-one per cent of campuses have dining halls; 40% are self-catering and 19% have both options available.
Mixed views were expressed with regard to self-catering versus catered meals. Self-cateringis viewed as being the cheaper and more flexible option, but many student intervieweeslamented that preparing meals is time-consuming. In addition, student as well asmanagement interviewees admitted that students either will not eat for extended periodsor will eat ‘junk food’. A common view was that students would rather spend money onitems other than food, or else send money home to support their families. Wits seeks toensure that residence students receive adequate nutrition by requiring them to book atleast 8 meals a week. At RU, meal costs are incorporated into the residence fee: allresidence students are pre-booked for meals at the beginning of the year and may onlyunbook a maximum of 30% of meals per annum for a refund. Cooking in rooms at both Witsand RU is strictly forbidden.
Many kitchens observed during site visits were poorly furnished and equipped and, in somecases, as the University of Limpopo, had no stoves, with students expected to bring theirown. On the UL Turfloop campus, except in newly refurbished buildings, students cook intheir rooms because there are no kitchen facilities. Even on other campuses which do havekitchen facilities, some students still prefer to cook in their rooms, despite no provision forcooking or for storage of food and cooking utensils. Thus, desks are being used not only forstudying but also for cooking; and dishes are being washed in bathroom sinks, causingregular blockages. Self-catering residences seldom have sufficient storage space in studentrooms for food and cooking utensils; besides, students indicated that theft is a problem,hence their preference to store food and equipment in their rooms even when storage isprovided in kitchens.
Food and nutrition are issues at all universities. During the site visits the Committee becameaware of large numbers of students (both residential and non-residential) who are hungry.There is a general concern among residence managers and student leaders alike thatstudents are not eating well, and that financial pressures are such that students go hungryor consistently eat poor quality or inadequately balanced diets (pap and milk was observedbeing prepared in many self-catering units). Stakeholders at UJ were of the opinion that‘some don’t eat because they can’t afford food. There are students who need meal cards tomake sure they eat. A cafeteria would be good; the university should subsidise food to someextent. Some students don’t eat for days’. Considered by university managers to be aparticularly serious problem among first year students and those with bursaries, hunger andpoor nutrition are believed to affect attendance, concentration during lectures andacademic performance, and to lead to high drop out rates.
52
Campus health staff at UV indicated that students regularly faint on campus, and whenbrought to the health care centre are often found to be suffering from malnutrition. Theyrelated cases of students attempting to live on just one portion of fruit juice concentrateand water per day, in the mistaken belief that the high sugar content will sustain them. AtMUT the prevalence of students begging for food has reached such proportions that a‘Students Against Hunger’ society has been formed under the patronage of the ViceChancellor, who has a box outside his office for the collection of food donations. Similarly,UFS’s Bloemfontein campus has started a campaign called ‘No Student Hungry’, anindependent project run from the Rector’s office. The university’s bursary programme alsoallocates R25 a day for meals for needy students, who must give back through volunteering.The community around the university is involved in this campaign through sponsorships,thus creating a sense of ownership.
NWU’s Potchefstroom campus has an annual fundraising event where the primarias sit in acage for three days and only take liquids, to raise money for residences to buy food,medicine or bus tickets home for needy students. Canned foods are also collected for needystudents. At CPUT’s Wellington campus a warden was encountered providing, at her ownexpense, two-minute noodles to students whose NSFAS funding for food had not beenreceived two months into the academic year. Similar stories were encountered at UWC,DUT, UZ and WSU. Random interviews with students encountered in the residences duringthe site visit to WSU during May 2011 (i.e., four months into the academic year) revealedthat they still had not received funding for food. At UFH the Deputy Vice Chancellorindicated that funds once allocated to sports clubs and cultural societies is now being usedto provide food to students.
Stakeholders cautioned that students do not want to be branded as being in need, and poorstudents may adopt numerous strategies and lifestyles in order not to reveal their plight. Inso doing they comply with dominant social discourses which pretend not to see or refuse toacknowledge widespread poverty. The title of a recent paper on student poverty in SouthAfrica refers to these strategies in quoting a poor student who said,
You know as a student, I cannot just show in public that I am poor, I am struggling … I domy washing, I keep myself clean … at least when you see me, you don’t know I am poor(Firfirey & Carolissen, 2010).
This is a mirror of findings in the REAP report (Jones et al., 2008, p. 31), which, as indicatedabove, similarly quoted a student who had run out of food saying how difficult it was forhim to ask for money from his equally-poor parents, such that he preferred to starve whilepatiently waiting for financial or other assistance.
No student interviewed during the site visits admitted to being hungry, but severalrecounted stories about fellow students who were starving, stories which were thenconfirmed by student leaders and student support staff. Given the stigma of poverty, theCommittee is of the view that these stories are merely the tip of the iceberg that is studenthunger. It is an indictment on all who live in this country that some of the greatest talents ofthe next generation, and many of its future leaders, are being suffered to live and learnunder such appalling conditions. It is not only that the country’s potential is being
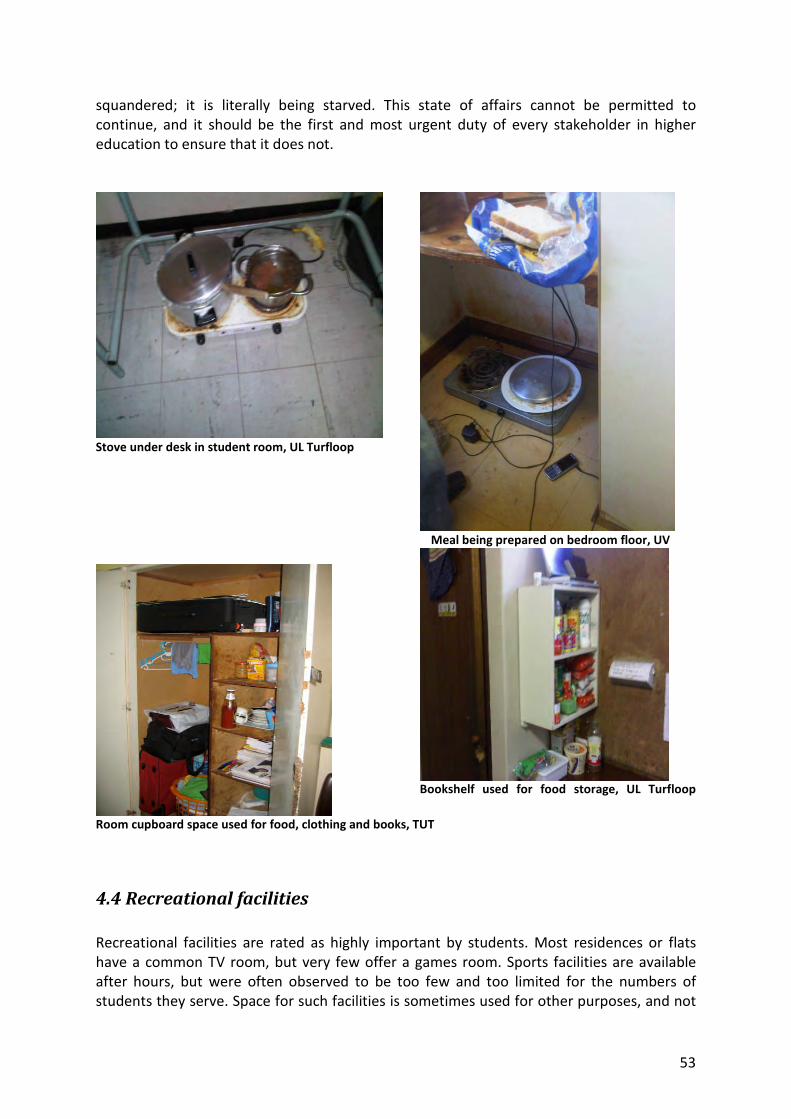
53
squandered; it is literally being starved. This state of affairs cannot be permitted tocontinue, and it should be the first and most urgent duty of every stakeholder in highereducation to ensure that it does not.
Stove under desk in student room, UL Turfloop
Meal being prepared on bedroom floor, UV
Bookshelf used for food storage, UL Turfloop
Room cupboard space used for food, clothing and books, TUT
4.4 Recreational facilities
Recreational facilities are rated as highly important by students. Most residences or flatshave a common TV room, but very few offer a games room. Sports facilities are availableafter hours, but were often observed to be too few and too limited for the numbers ofstudents they serve. Space for such facilities is sometimes used for other purposes, and not
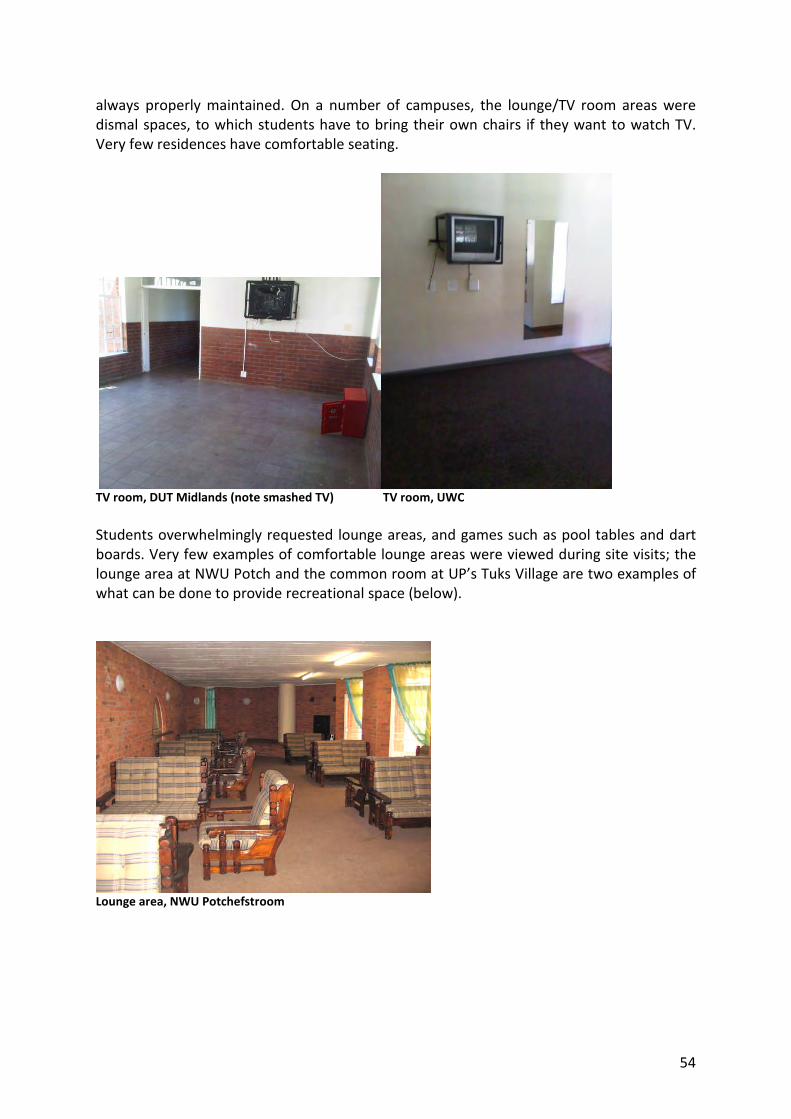
54
always properly maintained. On a number of campuses, the lounge/TV room areas weredismal spaces, to which students have to bring their own chairs if they want to watch TV.Very few residences have comfortable seating.
TV room, DUT Midlands (note smashed TV) TV room, UWC
Students overwhelmingly requested lounge areas, and games such as pool tables and dartboards. Very few examples of comfortable lounge areas were viewed during site visits; thelounge area at NWU Potch and the common room at UP’s Tuks Village are two examples ofwhat can be done to provide recreational space (below).
Lounge area, NWU Potchefstroom
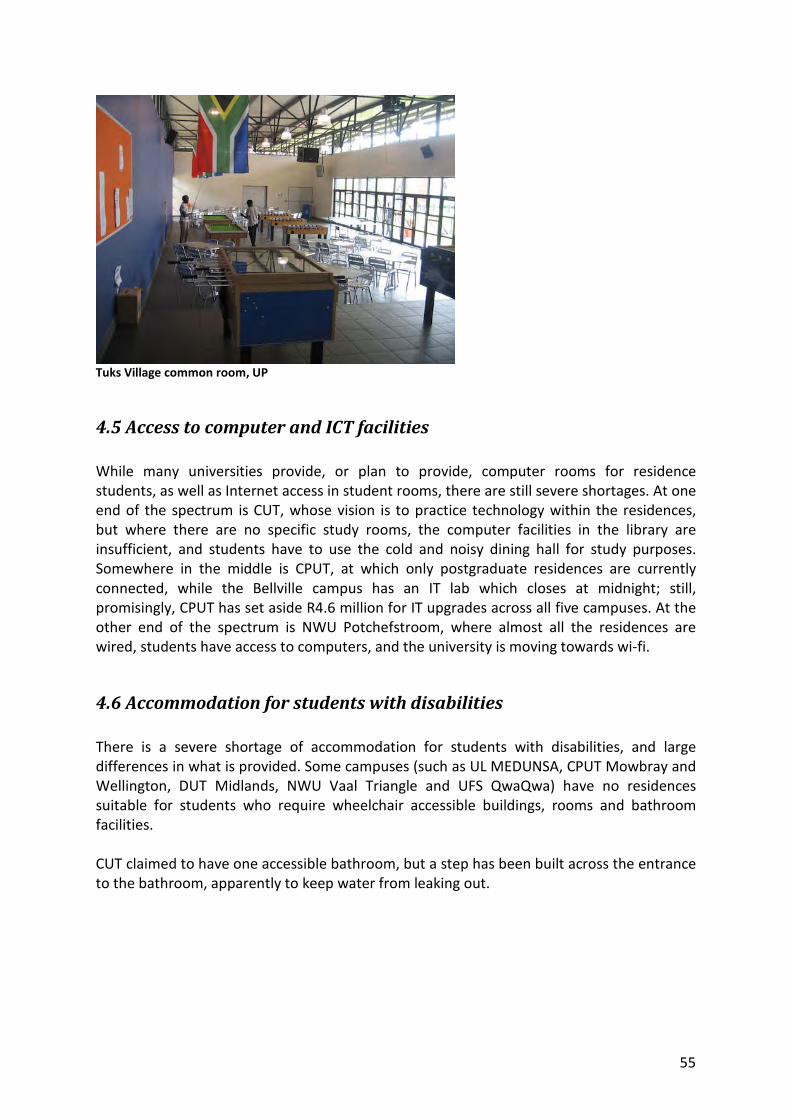
55
Tuks Village common room, UP
4.5 Access to computer and ICT facilities
While many universities provide, or plan to provide, computer rooms for residencestudents, as well as Internet access in student rooms, there are still severe shortages. At oneend of the spectrum is CUT, whose vision is to practice technology within the residences,but where there are no specific study rooms, the computer facilities in the library areinsufficient, and students have to use the cold and noisy dining hall for study purposes.Somewhere in the middle is CPUT, at which only postgraduate residences are currentlyconnected, while the Bellville campus has an IT lab which closes at midnight; still,promisingly, CPUT has set aside R4.6 million for IT upgrades across all five campuses. At theother end of the spectrum is NWU Potchefstroom, where almost all the residences arewired, students have access to computers, and the university is moving towards wi-fi.
4.6 Accommodation for students with disabilities
There is a severe shortage of accommodation for students with disabilities, and largedifferences in what is provided. Some campuses (such as UL MEDUNSA, CPUT Mowbray andWellington, DUT Midlands, NWU Vaal Triangle and UFS QwaQwa) have no residencessuitable for students who require wheelchair accessible buildings, rooms and bathroomfacilities.
CUT claimed to have one accessible bathroom, but a step has been built across the entranceto the bathroom, apparently to keep water from leaking out.

56
Adapted shower for students with disabilities, CUT
Step blocking access to bathroom for students with disabilities, CUT
Some residence buildings have adapted bathrooms and others have adapted kitchens andlaundry facilities (such as NWU Mafikeng). While NMMU has no specific adaptations on itsGeorge campus, it reports that all residence computer laboratories have magnificationsoftware for mobility, visual, hearing and learning impaired students, and students are ableto borrow digital recording equipment to tape their lectures for later playback. Manyuniversities offer adapted transport for students with disabilities. No universities havespecific residence policies regarding accommodating students with disabilities, but mosthave special units on campus that assist such students and with whom the residences canliaise. Some universities indicated that students with disabilities are given priority forresidence spaces.
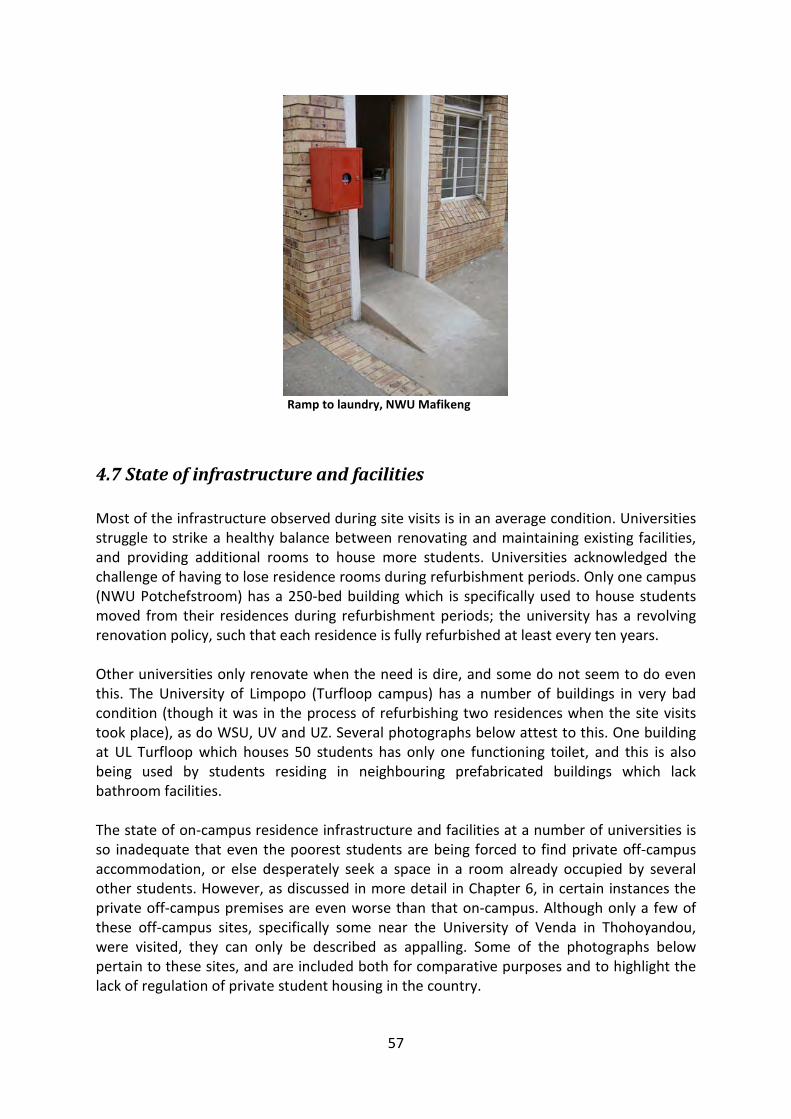
57
Ramp to laundry, NWU Mafikeng
4.7 State of infrastructure and facilities
Most of the infrastructure observed during site visits is in an average condition. Universitiesstruggle to strike a healthy balance between renovating and maintaining existing facilities,and providing additional rooms to house more students. Universities acknowledged thechallenge of having to lose residence rooms during refurbishment periods. Only one campus(NWU Potchefstroom) has a 250-bed building which is specifically used to house studentsmoved from their residences during refurbishment periods; the university has a revolvingrenovation policy, such that each residence is fully refurbished at least every ten years.
Other universities only renovate when the need is dire, and some do not seem to do eventhis. The University of Limpopo (Turfloop campus) has a number of buildings in very badcondition (though it was in the process of refurbishing two residences when the site visitstook place), as do WSU, UV and UZ. Several photographs below attest to this. One buildingat UL Turfloop which houses 50 students has only one functioning toilet, and this is alsobeing used by students residing in neighbouring prefabricated buildings which lackbathroom facilities.
The state of on-campus residence infrastructure and facilities at a number of universities isso inadequate that even the poorest students are being forced to find private off-campusaccommodation, or else desperately seek a space in a room already occupied by severalother students. However, as discussed in more detail in Chapter 6, in certain instances theprivate off-campus premises are even worse than that on-campus. Although only a few ofthese off-campus sites, specifically some near the University of Venda in Thohoyandou,were visited, they can only be described as appalling. Some of the photographs belowpertain to these sites, and are included both for comparative purposes and to highlight thelack of regulation of private student housing in the country.
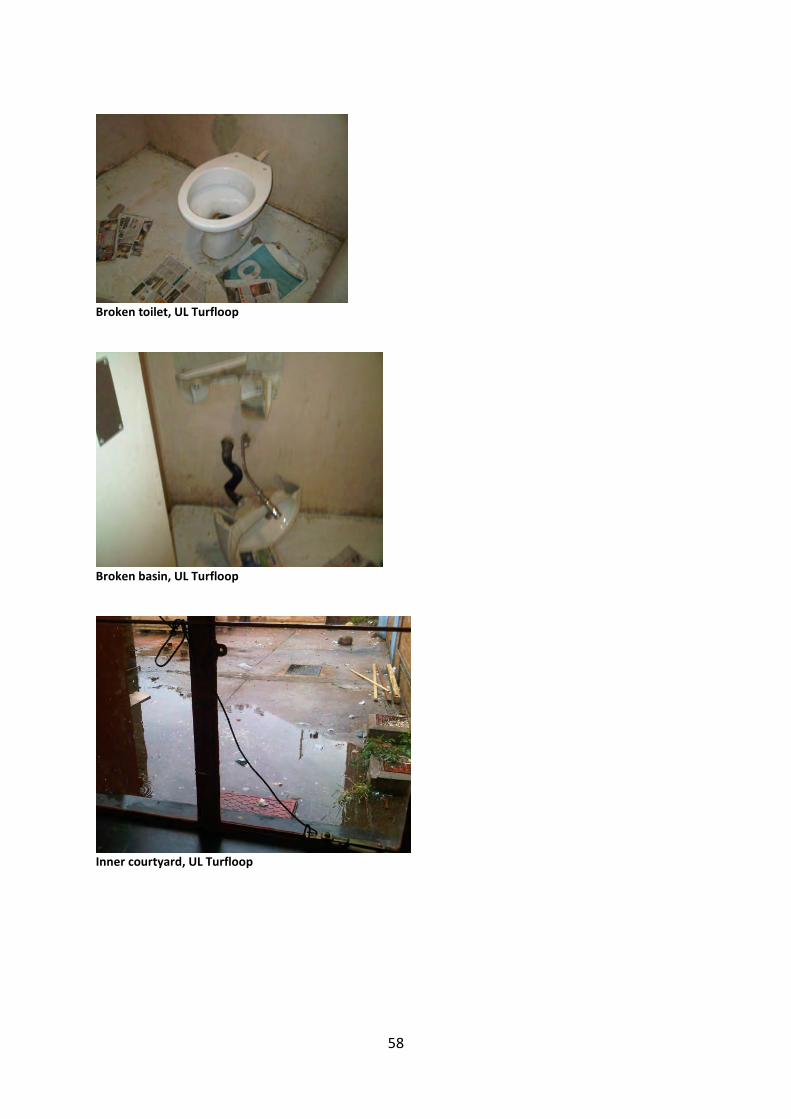
58
Broken toilet, UL Turfloop
Broken basin, UL Turfloop
Inner courtyard, UL Turfloop
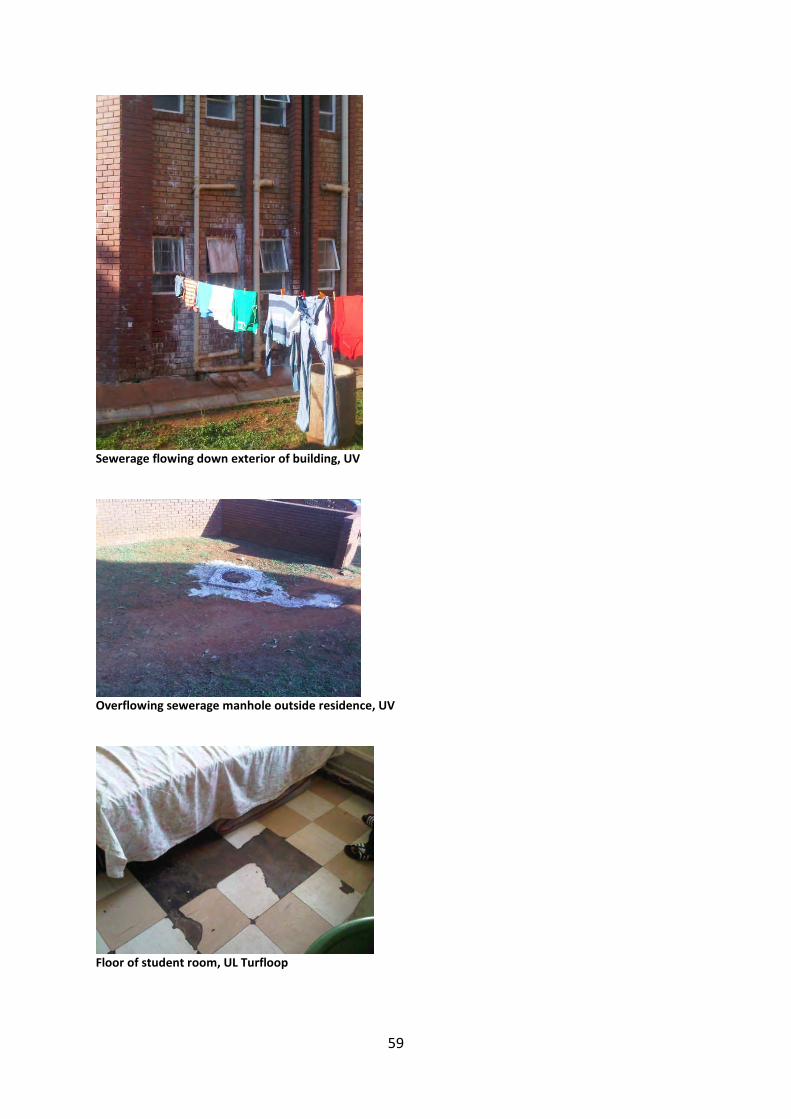
59
Sewerage flowing down exterior of building, UV
Overflowing sewerage manhole outside residence, UV
Floor of student room, UL Turfloop
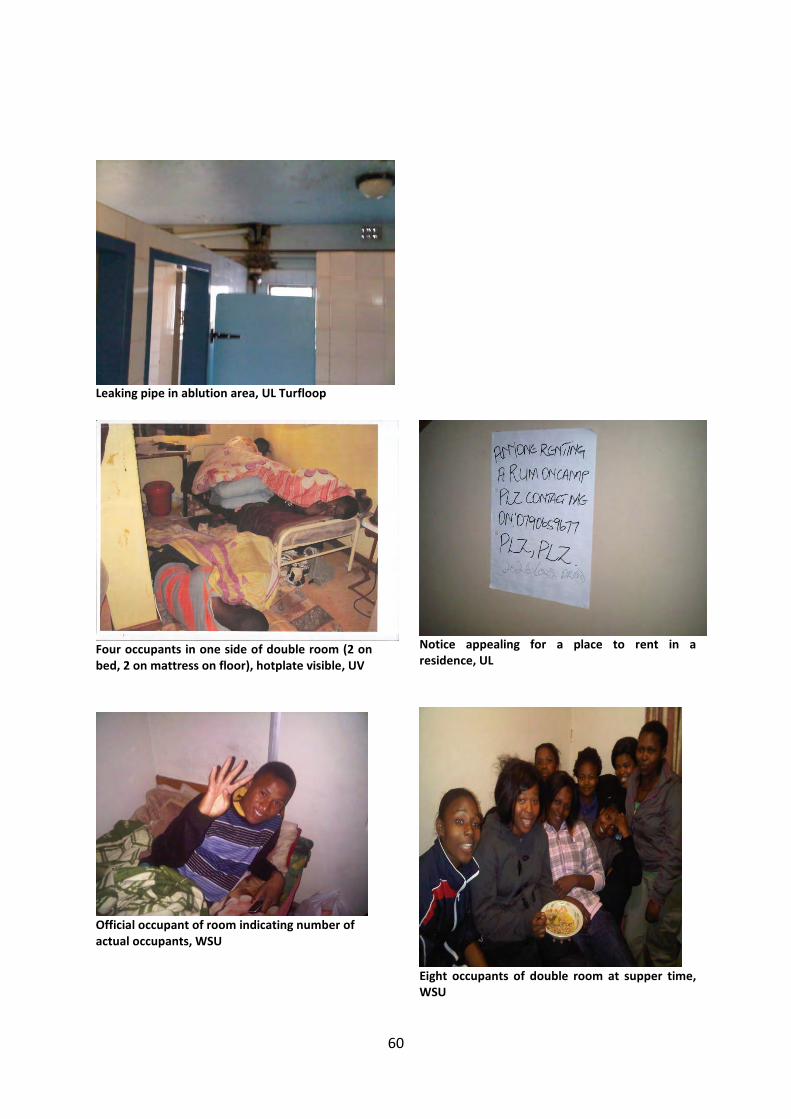
60
Leaking pipe in ablution area, UL Turfloop
Four occupants in one side of double room (2 onbed, 2 on mattress on floor), hotplate visible, UV
Official occupant of room indicating number ofactual occupants, WSU
Notice appealing for a place to rent in aresidence, UL
Eight occupants of double room at supper time,WSU
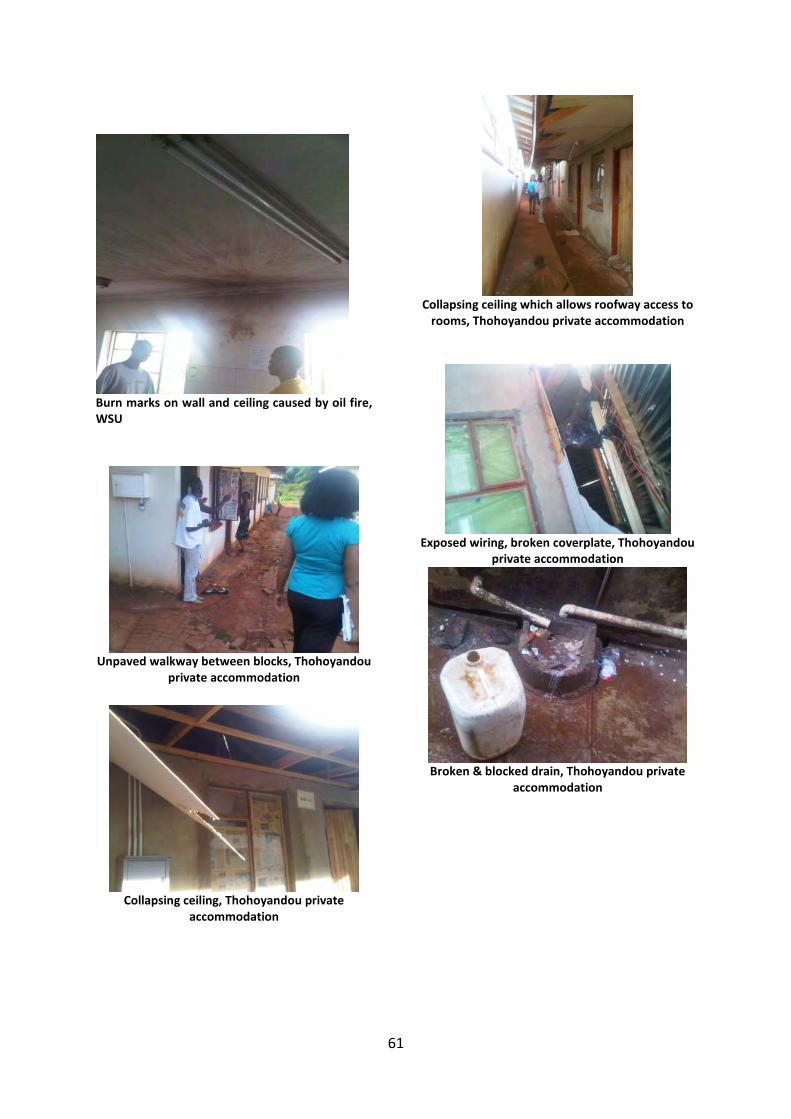
61
Burn marks on wall and ceiling caused by oil fire,WSU
Unpaved walkway between blocks, Thohoyandouprivate accommodation
Collapsing ceiling, Thohoyandou privateaccommodation
Collapsing ceiling which allows roofway access torooms, Thohoyandou private accommodation
Exposed wiring, broken coverplate, Thohoyandouprivate accommodation
Broken & blocked drain, Thohoyandou privateaccommodation
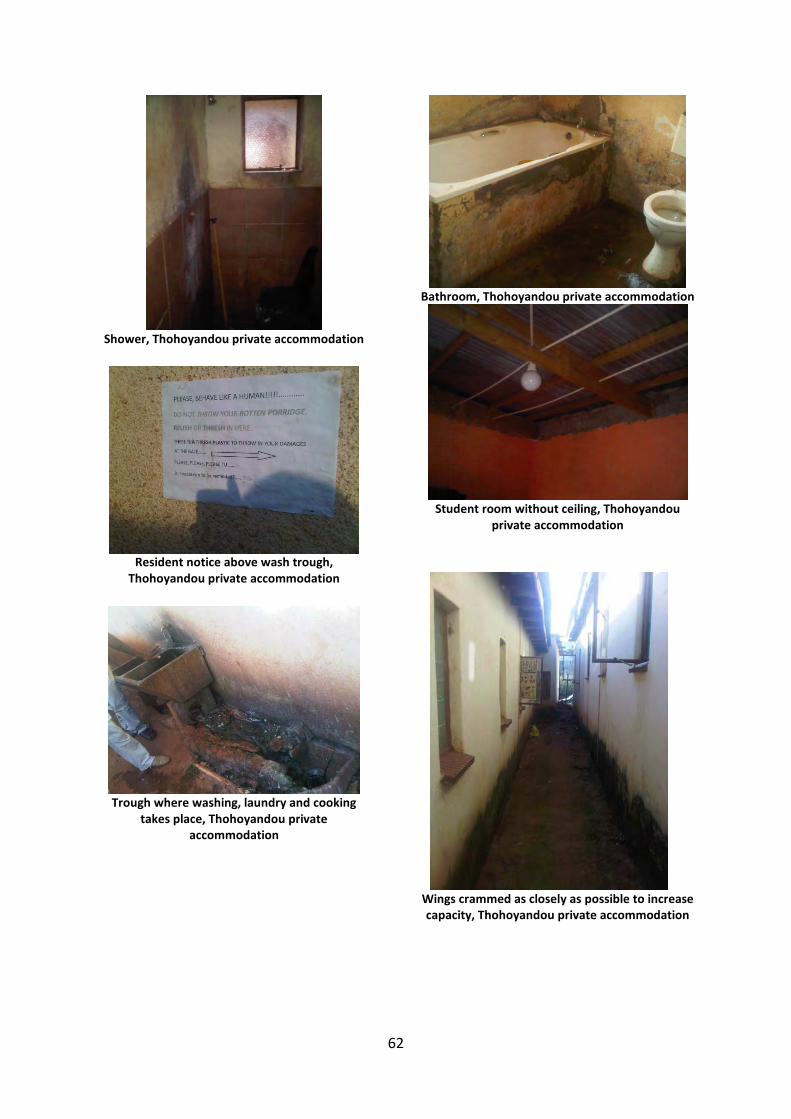
62
Shower, Thohoyandou private accommodation
Resident notice above wash trough,Thohoyandou private accommodation
Trough where washing, laundry and cookingtakes place, Thohoyandou private
accommodation
Bathroom, Thohoyandou private accommodation
Student room without ceiling, Thohoyandouprivate accommodation
Wings crammed as closely as possible to increasecapacity, Thohoyandou private accommodation
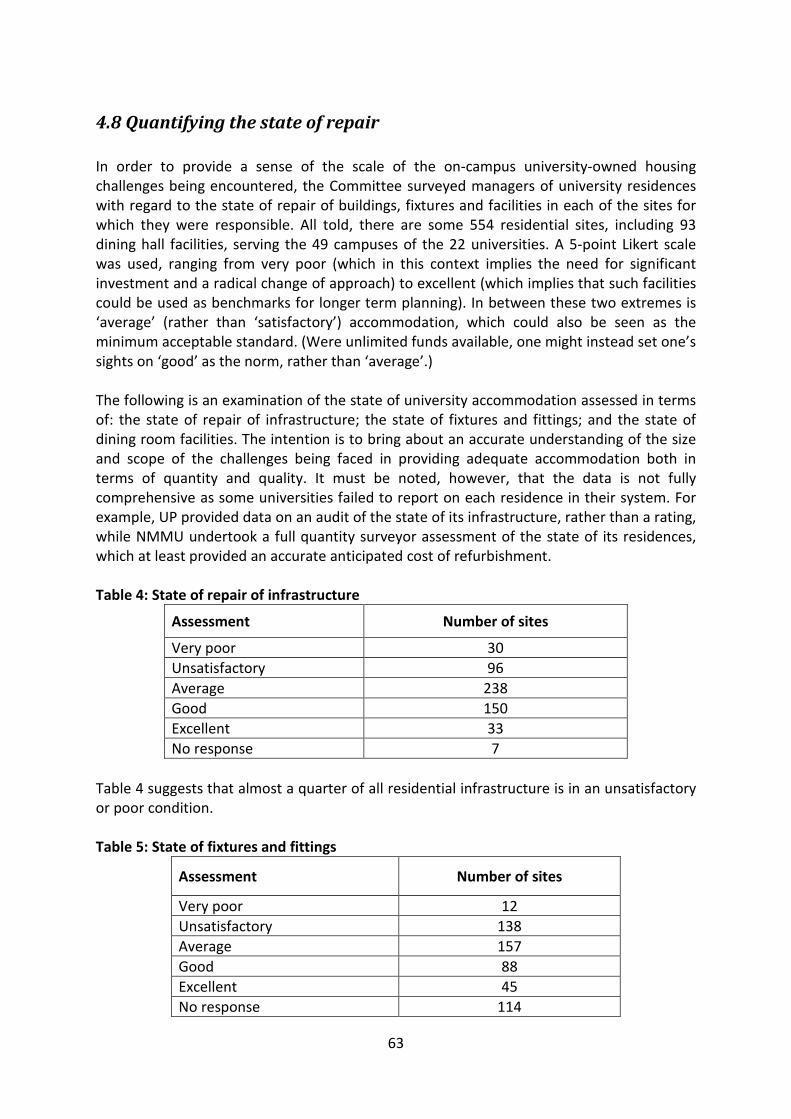
63
4.8 Quantifying the state of repair
In order to provide a sense of the scale of the on-campus university-owned housingchallenges being encountered, the Committee surveyed managers of university residenceswith regard to the state of repair of buildings, fixtures and facilities in each of the sites forwhich they were responsible. All told, there are some 554 residential sites, including 93dining hall facilities, serving the 49 campuses of the 22 universities. A 5-point Likert scalewas used, ranging from very poor (which in this context implies the need for significantinvestment and a radical change of approach) to excellent (which implies that such facilitiescould be used as benchmarks for longer term planning). In between these two extremes is‘average’ (rather than ‘satisfactory’) accommodation, which could also be seen as theminimum acceptable standard. (Were unlimited funds available, one might instead set one’ssights on ‘good’ as the norm, rather than ‘average’.)
The following is an examination of the state of university accommodation assessed in termsof: the state of repair of infrastructure; the state of fixtures and fittings; and the state ofdining room facilities. The intention is to bring about an accurate understanding of the sizeand scope of the challenges being faced in providing adequate accommodation both interms of quantity and quality. It must be noted, however, that the data is not fullycomprehensive as some universities failed to report on each residence in their system. Forexample, UP provided data on an audit of the state of its infrastructure, rather than a rating,while NMMU undertook a full quantity surveyor assessment of the state of its residences,which at least provided an accurate anticipated cost of refurbishment.
Table 4: State of repair of infrastructure
Assessment Number of sites
Very poor 30
Unsatisfactory 96
Average 238
Good 150
Excellent 33
No response 7
Table 4 suggests that almost a quarter of all residential infrastructure is in an unsatisfactoryor poor condition.
Table 5: State of fixtures and fittings
Assessment Number of sites
Very poor 12
Unsatisfactory 138
Average 157
Good 88
Excellent 45
No response 114
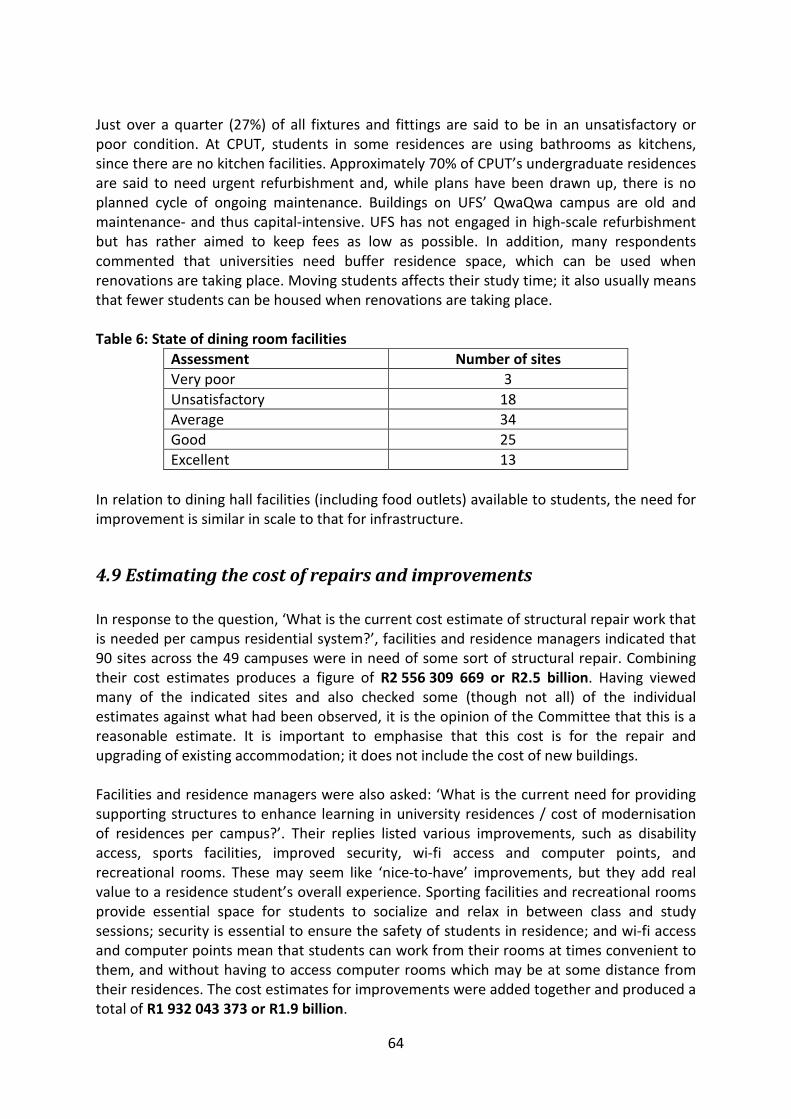
64
Just over a quarter (27%) of all fixtures and fittings are said to be in an unsatisfactory orpoor condition. At CPUT, students in some residences are using bathrooms as kitchens,since there are no kitchen facilities. Approximately 70% of CPUT’s undergraduate residencesare said to need urgent refurbishment and, while plans have been drawn up, there is noplanned cycle of ongoing maintenance. Buildings on UFS’ QwaQwa campus are old andmaintenance- and thus capital-intensive. UFS has not engaged in high-scale refurbishmentbut has rather aimed to keep fees as low as possible. In addition, many respondentscommented that universities need buffer residence space, which can be used whenrenovations are taking place. Moving students affects their study time; it also usually meansthat fewer students can be housed when renovations are taking place.
Table 6: State of dining room facilities
Assessment Number of sites
Very poor 3
Unsatisfactory 18
Average 34
Good 25
Excellent 13
In relation to dining hall facilities (including food outlets) available to students, the need forimprovement is similar in scale to that for infrastructure.
4.9 Estimating the cost of repairs and improvements
In response to the question, ‘What is the current cost estimate of structural repair work thatis needed per campus residential system?’, facilities and residence managers indicated that90 sites across the 49 campuses were in need of some sort of structural repair. Combiningtheir cost estimates produces a figure of R2 556 309 669 or R2.5 billion. Having viewedmany of the indicated sites and also checked some (though not all) of the individualestimates against what had been observed, it is the opinion of the Committee that this is areasonable estimate. It is important to emphasise that this cost is for the repair andupgrading of existing accommodation; it does not include the cost of new buildings.
Facilities and residence managers were also asked: ‘What is the current need for providingsupporting structures to enhance learning in university residences / cost of modernisationof residences per campus?’. Their replies listed various improvements, such as disabilityaccess, sports facilities, improved security, wi-fi access and computer points, andrecreational rooms. These may seem like ‘nice-to-have’ improvements, but they add realvalue to a residence student’s overall experience. Sporting facilities and recreational roomsprovide essential space for students to socialize and relax in between class and studysessions; security is essential to ensure the safety of students in residence; and wi-fi accessand computer points mean that students can work from their rooms at times convenient tothem, and without having to access computer rooms which may be at some distance fromtheir residences. The cost estimates for improvements were added together and produced atotal of R1 932 043 373 or R1.9 billion.
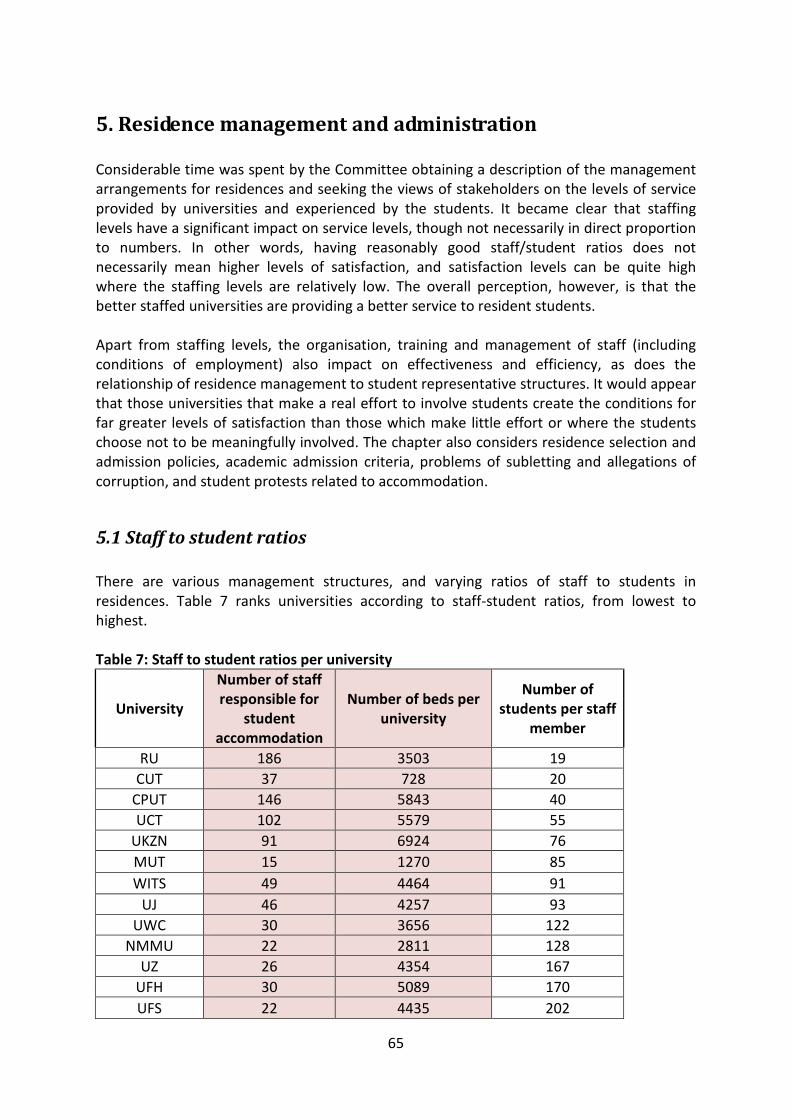
65
5. Residence management and administration
Considerable time was spent by the Committee obtaining a description of the managementarrangements for residences and seeking the views of stakeholders on the levels of serviceprovided by universities and experienced by the students. It became clear that staffinglevels have a significant impact on service levels, though not necessarily in direct proportionto numbers. In other words, having reasonably good staff/student ratios does notnecessarily mean higher levels of satisfaction, and satisfaction levels can be quite highwhere the staffing levels are relatively low. The overall perception, however, is that thebetter staffed universities are providing a better service to resident students.
Apart from staffing levels, the organisation, training and management of staff (includingconditions of employment) also impact on effectiveness and efficiency, as does therelationship of residence management to student representative structures. It would appearthat those universities that make a real effort to involve students create the conditions forfar greater levels of satisfaction than those which make little effort or where the studentschoose not to be meaningfully involved. The chapter also considers residence selection andadmission policies, academic admission criteria, problems of subletting and allegations ofcorruption, and student protests related to accommodation.
5.1 Staff to student ratios
There are various management structures, and varying ratios of staff to students inresidences. Table 7 ranks universities according to staff-student ratios, from lowest tohighest.
Table 7: Staff to student ratios per university
University
Number of staffresponsible for
studentaccommodation
Number of beds peruniversity
Number ofstudents per staff
member
RU 186 3503 19
CUT 37 728 20
CPUT 146 5843 40
UCT 102 5579 55
UKZN 91 6924 76
MUT 15 1270 85
WITS 49 4464 91
UJ 46 4257 93
UWC 30 3656 122
NMMU 22 2811 128
UZ 26 4354 167
UFH 30 5089 170
UFS 22 4435 202
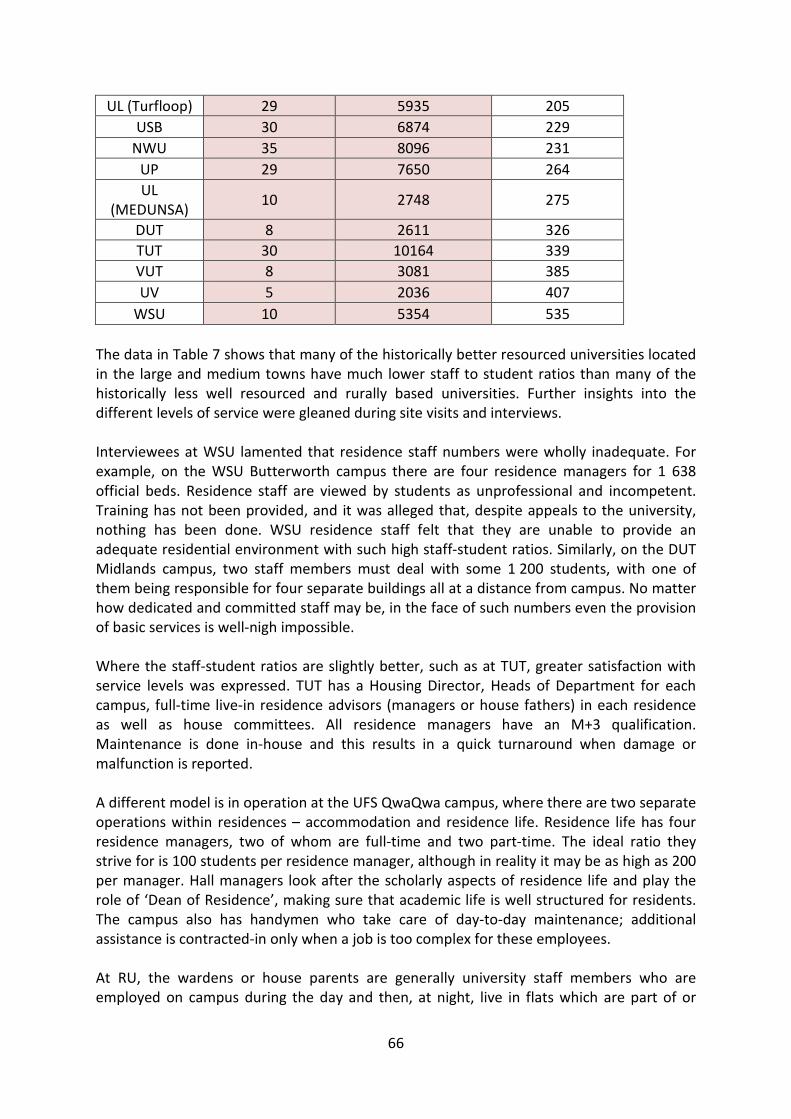
66
UL (Turfloop) 29 5935 205
USB 30 6874 229
NWU 35 8096 231
UP 29 7650 264
UL(MEDUNSA)
10 2748 275
DUT 8 2611 326
TUT 30 10164 339
VUT 8 3081 385
UV 5 2036 407
WSU 10 5354 535
The data in Table 7 shows that many of the historically better resourced universities locatedin the large and medium towns have much lower staff to student ratios than many of thehistorically less well resourced and rurally based universities. Further insights into thedifferent levels of service were gleaned during site visits and interviews.
Interviewees at WSU lamented that residence staff numbers were wholly inadequate. Forexample, on the WSU Butterworth campus there are four residence managers for 1 638official beds. Residence staff are viewed by students as unprofessional and incompetent.Training has not been provided, and it was alleged that, despite appeals to the university,nothing has been done. WSU residence staff felt that they are unable to provide anadequate residential environment with such high staff-student ratios. Similarly, on the DUTMidlands campus, two staff members must deal with some 1 200 students, with one ofthem being responsible for four separate buildings all at a distance from campus. No matterhow dedicated and committed staff may be, in the face of such numbers even the provisionof basic services is well-nigh impossible.
Where the staff-student ratios are slightly better, such as at TUT, greater satisfaction withservice levels was expressed. TUT has a Housing Director, Heads of Department for eachcampus, full-time live-in residence advisors (managers or house fathers) in each residenceas well as house committees. All residence managers have an M+3 qualification.Maintenance is done in-house and this results in a quick turnaround when damage ormalfunction is reported.
A different model is in operation at the UFS QwaQwa campus, where there are two separateoperations within residences – accommodation and residence life. Residence life has fourresidence managers, two of whom are full-time and two part-time. The ideal ratio theystrive for is 100 students per residence manager, although in reality it may be as high as 200per manager. Hall managers look after the scholarly aspects of residence life and play therole of ‘Dean of Residence’, making sure that academic life is well structured for residents.The campus also has handymen who take care of day-to-day maintenance; additionalassistance is contracted-in only when a job is too complex for these employees.
At RU, the wardens or house parents are generally university staff members who areemployed on campus during the day and then, at night, live in flats which are part of or
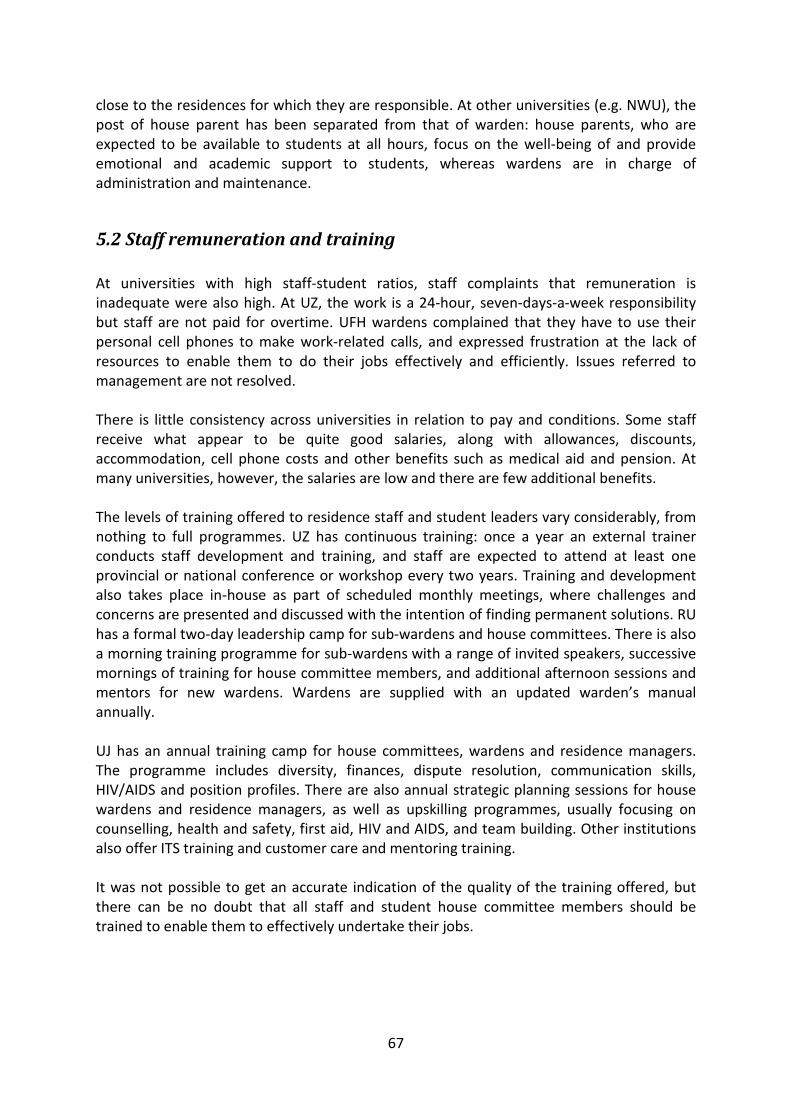
67
close to the residences for which they are responsible. At other universities (e.g. NWU), thepost of house parent has been separated from that of warden: house parents, who areexpected to be available to students at all hours, focus on the well-being of and provideemotional and academic support to students, whereas wardens are in charge ofadministration and maintenance.
5.2 Staff remuneration and training
At universities with high staff-student ratios, staff complaints that remuneration isinadequate were also high. At UZ, the work is a 24-hour, seven-days-a-week responsibilitybut staff are not paid for overtime. UFH wardens complained that they have to use theirpersonal cell phones to make work-related calls, and expressed frustration at the lack ofresources to enable them to do their jobs effectively and efficiently. Issues referred tomanagement are not resolved.
There is little consistency across universities in relation to pay and conditions. Some staffreceive what appear to be quite good salaries, along with allowances, discounts,accommodation, cell phone costs and other benefits such as medical aid and pension. Atmany universities, however, the salaries are low and there are few additional benefits.
The levels of training offered to residence staff and student leaders vary considerably, fromnothing to full programmes. UZ has continuous training: once a year an external trainerconducts staff development and training, and staff are expected to attend at least oneprovincial or national conference or workshop every two years. Training and developmentalso takes place in-house as part of scheduled monthly meetings, where challenges andconcerns are presented and discussed with the intention of finding permanent solutions. RUhas a formal two-day leadership camp for sub-wardens and house committees. There is alsoa morning training programme for sub-wardens with a range of invited speakers, successivemornings of training for house committee members, and additional afternoon sessions andmentors for new wardens. Wardens are supplied with an updated warden’s manualannually.
UJ has an annual training camp for house committees, wardens and residence managers.The programme includes diversity, finances, dispute resolution, communication skills,HIV/AIDS and position profiles. There are also annual strategic planning sessions for housewardens and residence managers, as well as upskilling programmes, usually focusing oncounselling, health and safety, first aid, HIV and AIDS, and team building. Other institutionsalso offer ITS training and customer care and mentoring training.
It was not possible to get an accurate indication of the quality of the training offered, butthere can be no doubt that all staff and student house committee members should betrained to enable them to effectively undertake their jobs.
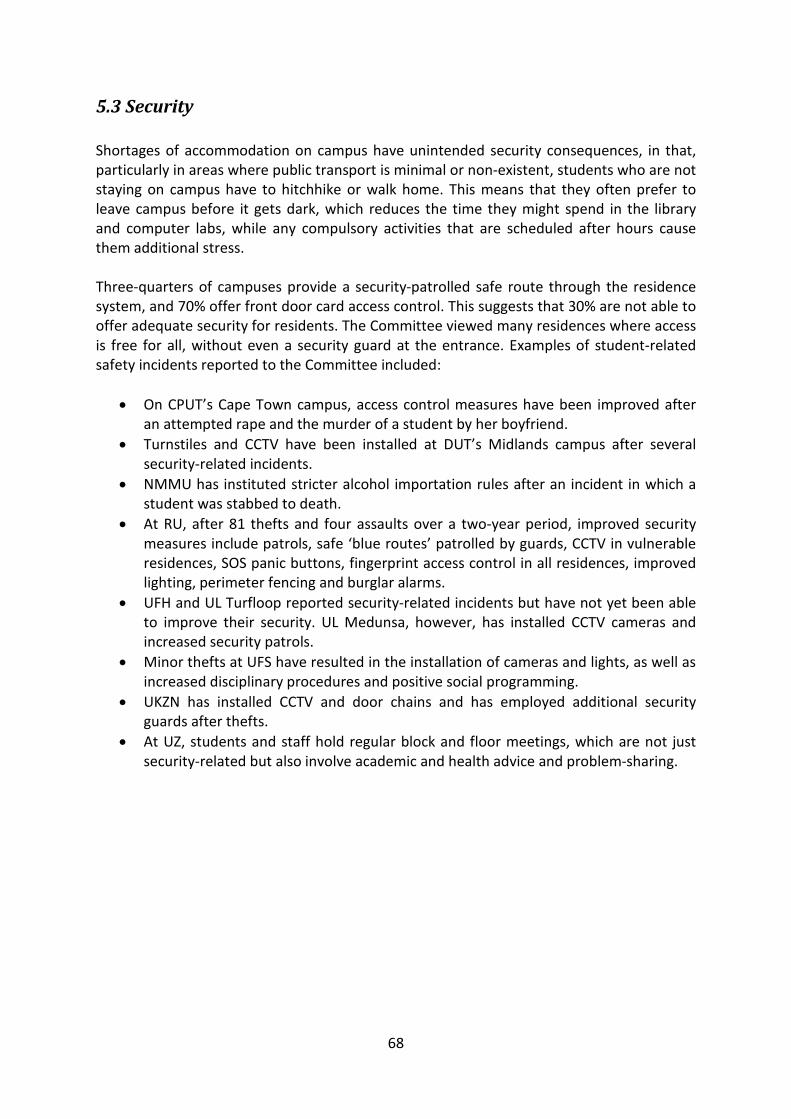
68
5.3 Security
Shortages of accommodation on campus have unintended security consequences, in that,particularly in areas where public transport is minimal or non-existent, students who are notstaying on campus have to hitchhike or walk home. This means that they often prefer toleave campus before it gets dark, which reduces the time they might spend in the libraryand computer labs, while any compulsory activities that are scheduled after hours causethem additional stress.
Three-quarters of campuses provide a security-patrolled safe route through the residencesystem, and 70% offer front door card access control. This suggests that 30% are not able tooffer adequate security for residents. The Committee viewed many residences where accessis free for all, without even a security guard at the entrance. Examples of student-relatedsafety incidents reported to the Committee included:
On CPUT’s Cape Town campus, access control measures have been improved afteran attempted rape and the murder of a student by her boyfriend.
Turnstiles and CCTV have been installed at DUT’s Midlands campus after severalsecurity-related incidents.
NMMU has instituted stricter alcohol importation rules after an incident in which astudent was stabbed to death.
At RU, after 81 thefts and four assaults over a two-year period, improved securitymeasures include patrols, safe ‘blue routes’ patrolled by guards, CCTV in vulnerableresidences, SOS panic buttons, fingerprint access control in all residences, improvedlighting, perimeter fencing and burglar alarms.
UFH and UL Turfloop reported security-related incidents but have not yet been ableto improve their security. UL Medunsa, however, has installed CCTV cameras andincreased security patrols.
Minor thefts at UFS have resulted in the installation of cameras and lights, as well asincreased disciplinary procedures and positive social programming.
UKZN has installed CCTV and door chains and has employed additional securityguards after thefts.
At UZ, students and staff hold regular block and floor meetings, which are not justsecurity-related but also involve academic and health advice and problem-sharing.
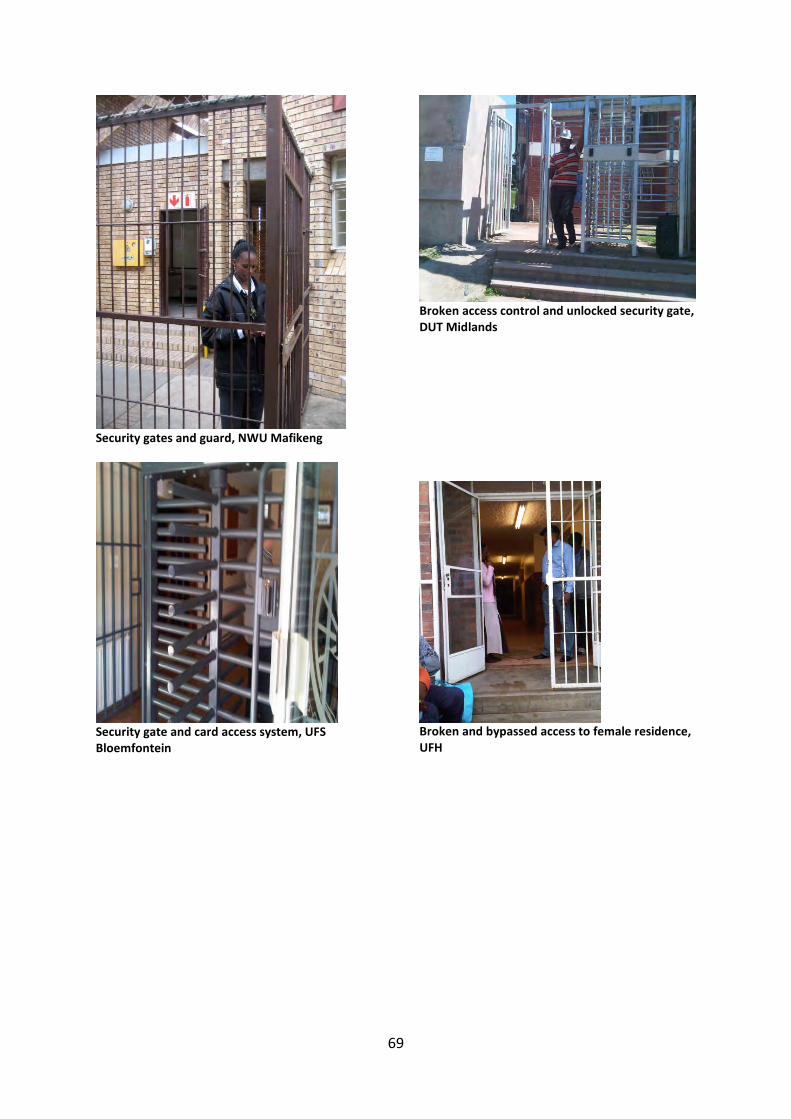
69
Security gates and guard, NWU Mafikeng
Security gate and card access system, UFSBloemfontein
Broken access control and unlocked security gate,DUT Midlands
Broken and bypassed access to female residence,UFH
70
5.4 Student residence leadership structures
Students play an important role in running the residences, with most residences havinghouse committees comprised of elected student representatives. However, not manyuniversities have an All Residence Council (as does Wits), Board of Residences (as at RU) orsimilar body representing all residences and which meets regularly with the HousingDirector of the institution. Such structures facilitate communication between residencesand the institution’s management, and provide a forum where issues and grievances can bedebated and discussed. Nevertheless, it appears that all SRCs have a housing portfolio,though the student occupying this position is not necessarily a residence student or amember of a house committee; in such cases, it is not clear that the student can adequatelyrepresent the interests of the residence system.
In most cases, house committee members are elected by the student body in the residence;in some cases they are first vetted by university residence management and then put up forelection by students. Most student house committee members receive some form of in-kindremuneration, most typically a bigger room.
At universities with higher staff-student ratios, student house committees tend to pick upthe duties and responsibilities that might normally be associated with a sub-wardenposition. This can impact on these students’ own academic work, a problem raised by CPUTstudents. At RU, house wardens are assisted by sub-wardens who are senior studentsappointed by the university, with an employment contract and a monthly allowance. Atother universities, sub-warden positions are filled voluntarily, with students encouraged toapply in return for benefits such as free accommodation. All institutions, however, providesub-wardens with some form of remuneration, whether a residence fee rebate, free boardand lodging, an honorarium, allowance or stipend, or in some instances hourlyremuneration. House committee members, on the other hand, may not receive anyremuneration at all (such as at CPUT and MUT), or else receive an honorarium (CUT), aresidence fee rebate or a stipend (NMMU), or simply first choice of a room.
5.5 Student support structures
There is a range of support structures operating in university residence systems and oncampuses more broadly. Most institutions indicated that they provide a variety of residenceprogrammes aimed especially but not exclusively at first year students, including mentoring,tutoring, peer education, orientation, counselling, health and wellness programmes,leadership development, career guidance, relationship guidance, drug awareness, diversitymanagement, HIV/AIDS education, citizenship education, financial management and conflictmanagement.
Two of the more comprehensive of these programmes are those offered by Stellenboschand Free State universities. Stellenbosch University has implemented a mentor systemwithin its residential system which functions on the basis of a peer counselling model.
71
Mentors aim to integrate the institutional, academic and social components of student lifeby encouraging personal development and independence amongst first year students,helping them to align their social and academic programmes and creating space fordiscussion. Mentors are involved with prospective students before they enter the university,by assisting with academic, residence and other enquiries, and on arrival mentors facilitateconversations regarding students’ experiences and goals and help them find their wayaround campus and through registration. Mentors help with the formation of informal studygroups and academic networks, and liaise between first years, residence heads andacademic support structures. Each mentor is allocated seven first year students, and isexpected to meet weekly with each mentee and hold group sessions once every two weeks,around prescribed co-curricular topics including the school-university transition anddiversity. Mentors, who are carefully selected and provided with training, are also keptinformed of mentees’ academic performance so that they can provide support.
At Free State University, the goal of residence life, according to a residence handbook, is toinspire each student to reach his or her own potential. Towards this end, living-learningprogrammes, the clustering of residence, value-driven management and a peer educators’programme mediate the residence environment for first year students so that they have atransformative learning experience. Each peer educator is responsible for 12 first yearstudents, and must facilitate eight group sessions with these students during the year, aswell as meeting individually with students once a month. They provide academic advice andact as mediators between individual students and the residence environment.
5.6 Residence selection and admission policies
A variety of residence selection and admission policies exist at South African universities. Alluniversities indicated that a selection and admission policy is in place, though studentrepresentatives from the majority of universities expressed concern that these policies werenot always properly or fairly implemented. The policies range from a ‘first-come, first-served’ approach to more complex procedures which regulate admission into residence onthe basis of some or all of the following criteria:
Academic performance (Matriculation results in the case of a new first yearstudent, and the previous year’s results in the case of a returning student);
Distance between a student’s home and campus;
Equity considerations; and/or
Financial status.
Room allocation policies were also said to be in place, but the extent to which roomallocations are actually regulated and monitored appears to vary widely. The Committeefound that, at many universities, the process is transparent, carefully regulated andmonitored to ensure equity and diversity; at some universities, however, junior residencestaff or students are in charge of how rooms are allocated, without oversight by seniormanagement, while at one institution it was alleged that room allocations are performed byone of the outsourced security guards.
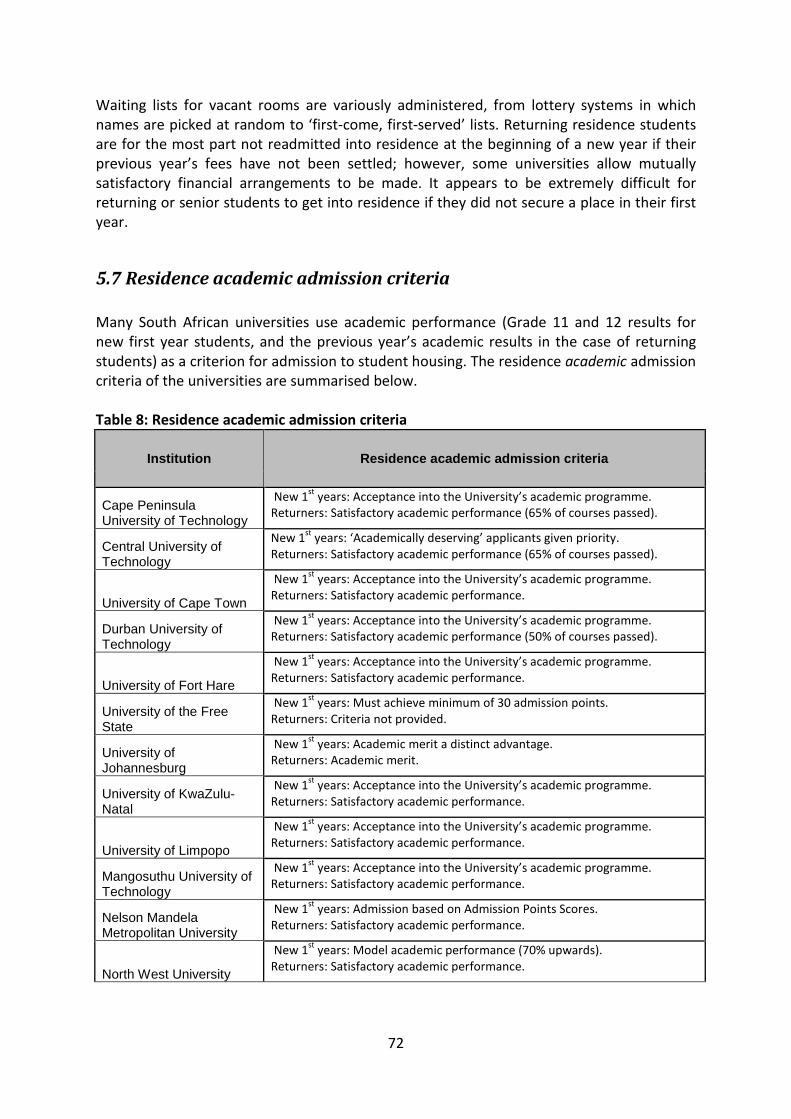
72
Waiting lists for vacant rooms are variously administered, from lottery systems in whichnames are picked at random to ‘first-come, first-served’ lists. Returning residence studentsare for the most part not readmitted into residence at the beginning of a new year if theirprevious year’s fees have not been settled; however, some universities allow mutuallysatisfactory financial arrangements to be made. It appears to be extremely difficult forreturning or senior students to get into residence if they did not secure a place in their firstyear.
5.7 Residence academic admission criteria
Many South African universities use academic performance (Grade 11 and 12 results fornew first year students, and the previous year’s academic results in the case of returningstudents) as a criterion for admission to student housing. The residence academic admissioncriteria of the universities are summarised below.
Table 8: Residence academic admission criteria
Institution Residence academic admission criteria
Cape PeninsulaUniversity of Technology
New 1st
years: Acceptance into the University’s academic programme.Returners: Satisfactory academic performance (65% of courses passed).
Central University ofTechnology
New 1st
years: ‘Academically deserving’ applicants given priority.Returners: Satisfactory academic performance (65% of courses passed).
University of Cape Town
New 1st
years: Acceptance into the University’s academic programme.Returners: Satisfactory academic performance.
Durban University ofTechnology
New 1st
years: Acceptance into the University’s academic programme.Returners: Satisfactory academic performance (50% of courses passed).
University of Fort Hare
New 1st
years: Acceptance into the University’s academic programme.Returners: Satisfactory academic performance.
University of the FreeState
New 1st
years: Must achieve minimum of 30 admission points.Returners: Criteria not provided.
University ofJohannesburg
New 1st
years: Academic merit a distinct advantage.Returners: Academic merit.
University of KwaZulu-Natal
New 1st
years: Acceptance into the University’s academic programme.Returners: Satisfactory academic performance.
University of Limpopo
New 1st
years: Acceptance into the University’s academic programme.Returners: Satisfactory academic performance.
Mangosuthu University ofTechnology
New 1st
years: Acceptance into the University’s academic programme.Returners: Satisfactory academic performance.
Nelson MandelaMetropolitan University
New 1st
years: Admission based on Admission Points Scores.Returners: Satisfactory academic performance.
North West University
New 1st
years: Model academic performance (70% upwards).Returners: Satisfactory academic performance.
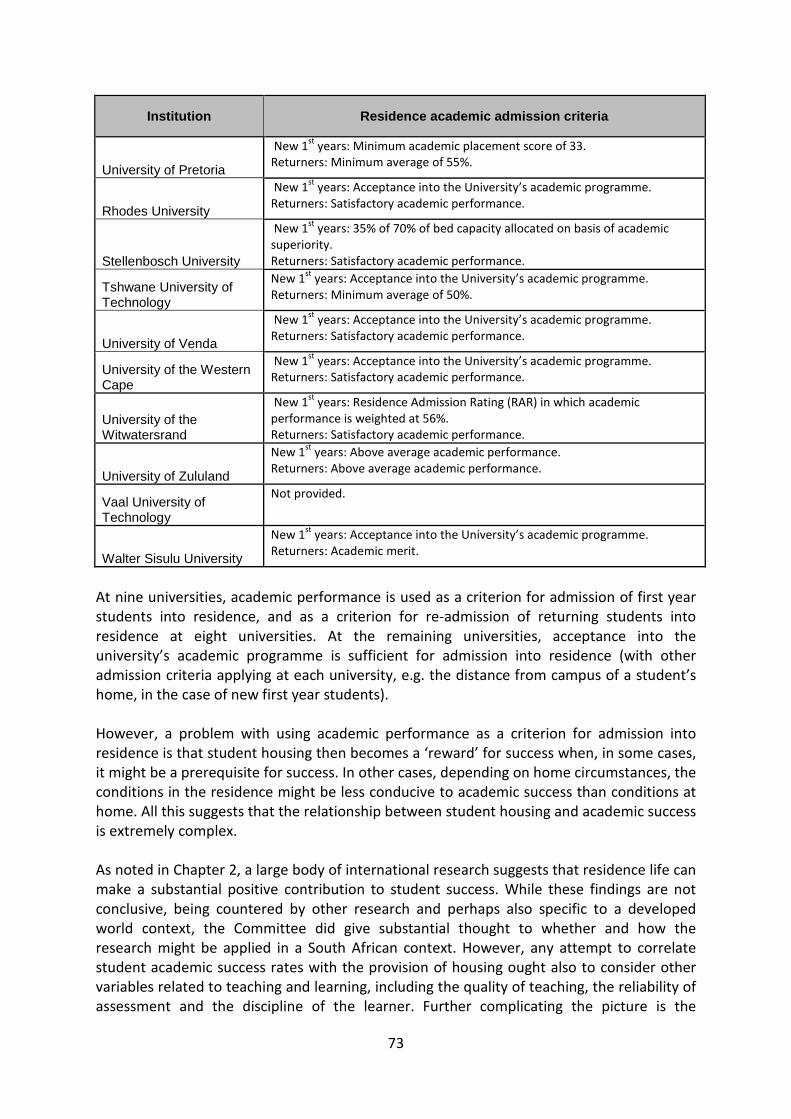
73
Institution Residence academic admission criteria
University of Pretoria
New 1st
years: Minimum academic placement score of 33.Returners: Minimum average of 55%.
Rhodes University
New 1st
years: Acceptance into the University’s academic programme.Returners: Satisfactory academic performance.
Stellenbosch University
New 1st
years: 35% of 70% of bed capacity allocated on basis of academicsuperiority.Returners: Satisfactory academic performance.
Tshwane University ofTechnology
New 1st
years: Acceptance into the University’s academic programme.Returners: Minimum average of 50%.
University of Venda
New 1st
years: Acceptance into the University’s academic programme.Returners: Satisfactory academic performance.
University of the WesternCape
New 1st
years: Acceptance into the University’s academic programme.Returners: Satisfactory academic performance.
University of theWitwatersrand
New 1st
years: Residence Admission Rating (RAR) in which academicperformance is weighted at 56%.Returners: Satisfactory academic performance.
University of Zululand
New 1st
years: Above average academic performance.Returners: Above average academic performance.
Vaal University ofTechnology
Not provided.
Walter Sisulu University
New 1st
years: Acceptance into the University’s academic programme.Returners: Academic merit.
At nine universities, academic performance is used as a criterion for admission of first yearstudents into residence, and as a criterion for re-admission of returning students intoresidence at eight universities. At the remaining universities, acceptance into theuniversity’s academic programme is sufficient for admission into residence (with otheradmission criteria applying at each university, e.g. the distance from campus of a student’shome, in the case of new first year students).
However, a problem with using academic performance as a criterion for admission intoresidence is that student housing then becomes a ‘reward’ for success when, in some cases,it might be a prerequisite for success. In other cases, depending on home circumstances, theconditions in the residence might be less conducive to academic success than conditions athome. All this suggests that the relationship between student housing and academic successis extremely complex.
As noted in Chapter 2, a large body of international research suggests that residence life canmake a substantial positive contribution to student success. While these findings are notconclusive, being countered by other research and perhaps also specific to a developedworld context, the Committee did give substantial thought to whether and how theresearch might be applied in a South African context. However, any attempt to correlatestudent academic success rates with the provision of housing ought also to consider othervariables related to teaching and learning, including the quality of teaching, the reliability ofassessment and the discipline of the learner. Further complicating the picture is the
74
relevance and validity of various potential indicators of success. One measure of whetherthere is a difference in academic success between students living in residence and thoseliving outside of the university residence system would be the number of courses, credits orsubjects passed and failed over a defined period. Another indicator could be the time takenby students in residence and students living outside of residence to successfully completean academic qualification. A third measure might be the graduation rate, or the number ofgraduates as a percentage of the number of enrolments, albeit that the graduation rate ismore a measure of size and intake versus outputs than a true measure of success. Note, too,that a student who starts their academic career in residence may not complete in residenceand so measuring their success over a period of years may also not be a true reflection ofthe impact of access to student housing.
Bearing in mind these caveats and considerations, a preliminary and purely exploratoryanalysis of the percentage of courses, credits or subjects passed per year by students livingin residence in comparison with students living off campus was undertaken on the basis ofdata supplied by a number of universities (see Appendix H). Unfortunately, the dataprovided was not comprehensive; in addition, the data was averaged, which necessitateseven greater caution. On the basis of this data and preliminary analysis, it appears that theaverage percentage of courses/subjects/credits passed by first year students in residence isslightly higher than that for students not housed in residence. However, no firm conclusionscan be drawn at this stage. Moreover, the finding is not mirrored in average cohortgraduation rates; it emerges only at a small number of universities. There also appears to beno difference between the pass rates of students in residence and those outside residenceat institutions which have residence academic admission criteria. Much more detailedresearch, including more complete and accurate data, with regard to the relationshipbetween student academic success rates and the provision of housing, is required.
5.8 Subletting
Sub-letting, also referred to as squatting, is prevalent to varying degrees at manyuniversities, being driven by the lack of available or affordable accommodation. Alluniversities prohibit the practice, but subletting often goes undetected, given the lack ofsecurity measures at many residences. This means that entry is fairly easy for non-residents.
Several universities commented that subletting is a problem but that they are not able tomonitor it or provide accurate statistics (UFH), and that it is less significant where properaccess controls are in place and 24-hour security is provided (CPUT). UL Turfloopacknowledged a very high subletting rate, due to a lack of proper access control, as did UZand WSU, due to a huge shortage of student rooms and the distance from the nearest town.Wits, which does not believe subletting to be a problem, noted that preventing itnecessitates considerable effort and vigilance on the part of staff.
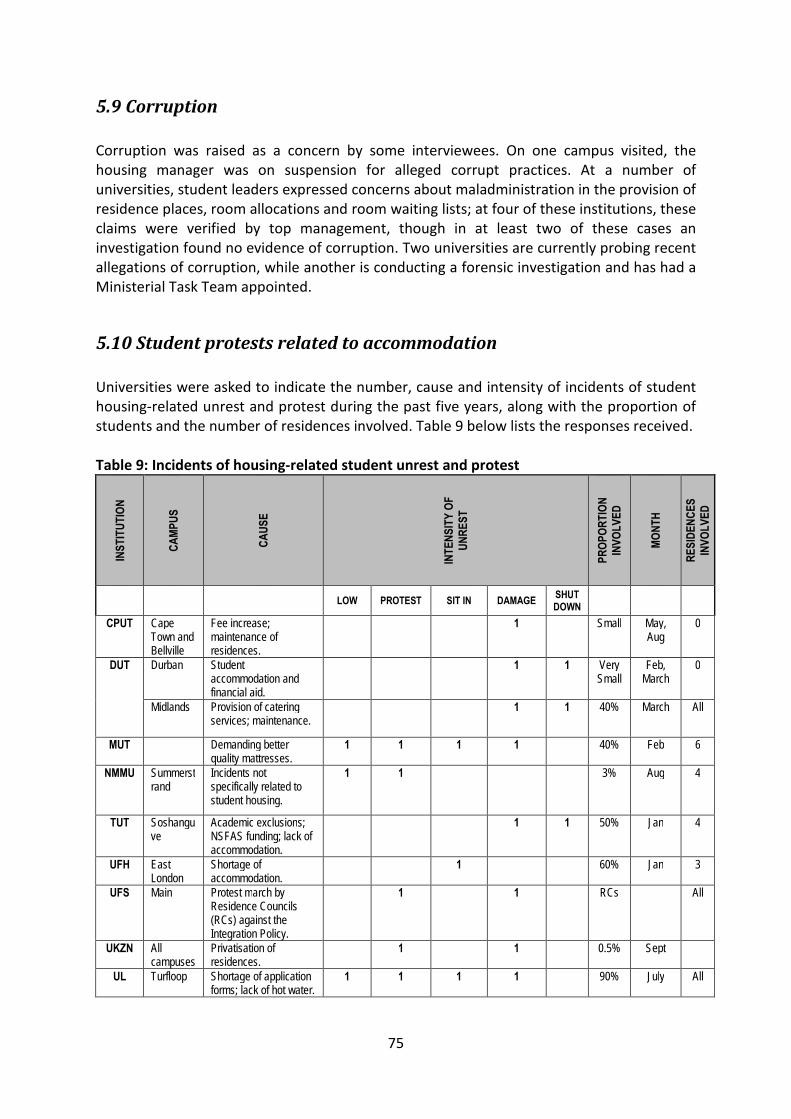
75
5.9 Corruption
Corruption was raised as a concern by some interviewees. On one campus visited, thehousing manager was on suspension for alleged corrupt practices. At a number ofuniversities, student leaders expressed concerns about maladministration in the provision ofresidence places, room allocations and room waiting lists; at four of these institutions, theseclaims were verified by top management, though in at least two of these cases aninvestigation found no evidence of corruption. Two universities are currently probing recentallegations of corruption, while another is conducting a forensic investigation and has had aMinisterial Task Team appointed.
5.10 Student protests related to accommodation
Universities were asked to indicate the number, cause and intensity of incidents of studenthousing-related unrest and protest during the past five years, along with the proportion ofstudents and the number of residences involved. Table 9 below lists the responses received.
Table 9: Incidents of housing-related student unrest and protest
INS
TIT
UT
ION
CA
MP
US
CA
US
E
INT
EN
SIT
YO
FU
NR
ES
T
PR
OP
OR
TIO
NIN
VO
LV
ED
MO
NT
H
RE
SID
EN
CE
SIN
VO
LV
ED
LOW PROTEST SIT IN DAMAGESHUTDOWN
CPUT CapeTown andBellville
Fee increase;maintenance ofresidences.
1 Small May,Aug
0
DUT Durban Studentaccommodation andfinancial aid.
1 1 VerySmall
Feb,March
0
Midlands Provision of cateringservices; maintenance.
1 1 40% March All
MUT Demanding betterquality mattresses.
1 1 1 1 40% Feb 6
NMMU Summerstrand
Incidents notspecifically related tostudent housing.
1 1 3% Aug 4
TUT Soshanguve
Academic exclusions;NSFAS funding; lack ofaccommodation.
1 1 50% Jan 4
UFH EastLondon
Shortage ofaccommodation.
1 60% Jan 3
UFS Main Protest march byResidence Councils(RCs) against theIntegration Policy.
1 1 RCs All
UKZN Allcampuses
Privatisation ofresidences.
1 1 0.5% Sept
UL Turfloop Shortage of applicationforms; lack of hot water.
1 1 1 1 90% July All
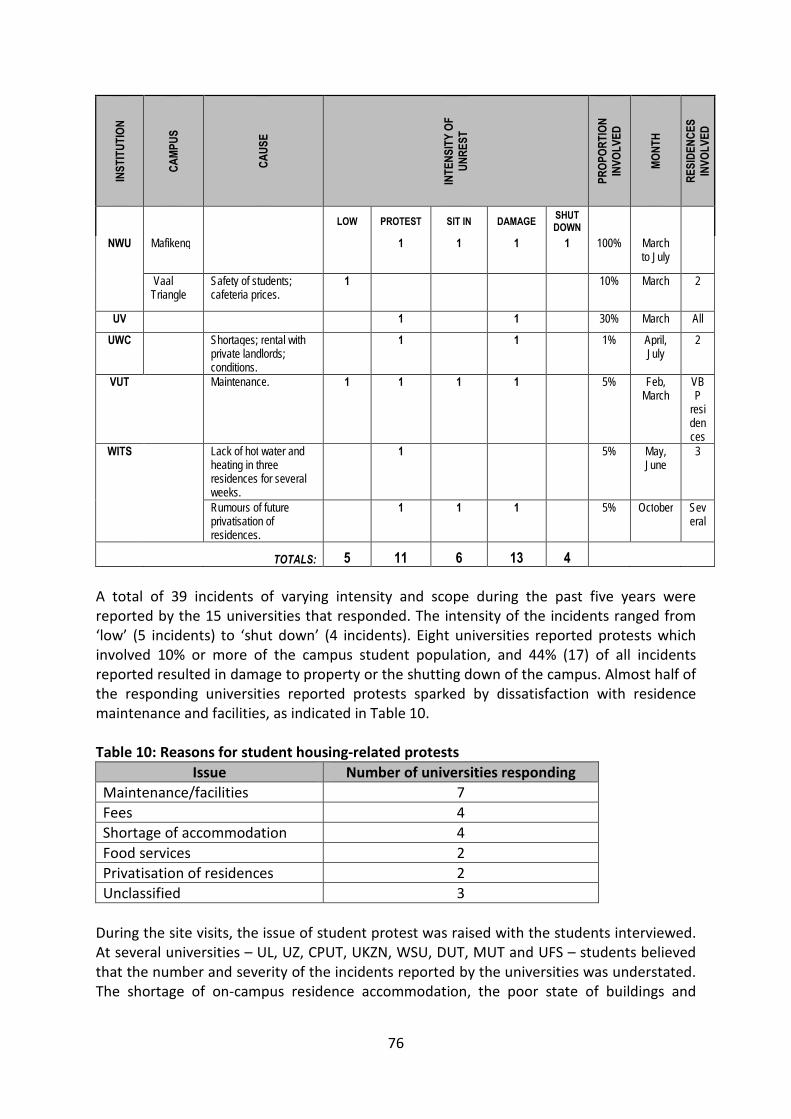
76
INS
TIT
UT
ION
CA
MP
US
CA
US
E
INT
EN
SIT
YO
FU
NR
ES
T
PR
OP
OR
TIO
NIN
VO
LV
ED
MO
NT
H
RE
SID
EN
CE
SIN
VO
LV
ED
LOW PROTEST SIT IN DAMAGESHUTDOWN
NWU Mafikeng 1 1 1 1 100% Marchto July
VaalTriangle
Safety of students;cafeteria prices.
1 10% March 2
UV 1 1 30% March All
UWC Shortages; rental withprivate landlords;conditions.
1 1 1% April,July
2
VUT Maintenance. 1 1 1 1 5% Feb,March
VBP
residences
WITS Lack of hot water andheating in threeresidences for severalweeks.
1 5% May,June
3
Rumours of futureprivatisation ofresidences.
1 1 1 5% October Several
TOTALS: 5 11 6 13 4
A total of 39 incidents of varying intensity and scope during the past five years werereported by the 15 universities that responded. The intensity of the incidents ranged from‘low’ (5 incidents) to ‘shut down’ (4 incidents). Eight universities reported protests whichinvolved 10% or more of the campus student population, and 44% (17) of all incidentsreported resulted in damage to property or the shutting down of the campus. Almost half ofthe responding universities reported protests sparked by dissatisfaction with residencemaintenance and facilities, as indicated in Table 10.
Table 10: Reasons for student housing-related protests
Issue Number of universities responding
Maintenance/facilities 7
Fees 4
Shortage of accommodation 4
Food services 2
Privatisation of residences 2
Unclassified 3
During the site visits, the issue of student protest was raised with the students interviewed.At several universities – UL, UZ, CPUT, UKZN, WSU, DUT, MUT and UFS – students believedthat the number and severity of the incidents reported by the universities was understated.The shortage of on-campus residence accommodation, the poor state of buildings and

77
facilities, the shortage of NSFAS funding, the lack or poor quality of food andmaladministration were what students judged to be the main causes of the protests.
It is worth emphasising that university managers and student leaders agree that somestudent protests have been related to food services and/or the lack or poor quality of food.These concerns, as well as the problem of nutrition and the distressing issue of studenthunger, have been discussed above in relation to catering. Of even greater import for bothuniversity managers and student leaders, it appears, and one of the key reasons for studentdissatisfaction and protest, is the simple shortage of accommodation. The lack of sufficientand adequate on-campus housing was raised by students at every historically disadvantageduniversity. Due to this lack, large numbers of students are forced to find accommodation offcampus, which may or may not be suitable or affordable; alternatively, the problems ofsubletting (squatting) and overcrowding in residences are compounded.
While the Committee was unable to visit many ‘digs’ types of student accommodation, theywere appalled at the conditions found at three separate private facilities in Thohoyandouwhich housed students from the University of Venda. The conditions in some of thesefacilities were so atrocious that even the accompanying university officials refused to enter.The stench of blocked drains and malfunctioning sewerage systems was indescribable. Thestudents’ rooms were minute, barely big enough for a bed which consequently must beused also as a desk, a cooking space and a social space. The supply of electricity was at thewhim of the landlord, who would arbitrarily cut off power to save on expenses. Their onlypositive aspect was that they were within walking distance of the UV campus. At othercampuses, QwaQwa for example, distances of 10-15km from campus were mentioned. The(photographed) notice exhorting fellow students to “behave like a human”, which wouldhave been ironic if the situation were not so serious, resonated with the words of thestudent leadership at a completely different university, DUT: “If we are treated like animals,are they surprised when we respond like animals?”.
The on-campus residence situation at a number of universities is not much better than thatdescribed above, off-campus. While outlawed on all campuses, subletting (i.e., unauthorisedaccommodation in university residences, or ‘squatting’) is widespread at a number ofinstitutions. At several campuses visited, rooms designed for one occupant areaccommodating four students, and double rooms designed for two students are occupiedby eight students.
The resulting overcrowding not only jeopardises and hampers students’ academicendeavours, but creates significant health and safety risks. In the event of an emergency therisks posed to student lives and the liability of university and facility management would beserious. Students related stories of theft, assault, rape, prostitution and harassment.Student residents, student leaders and university officials alike acknowledged the extremeand varied dangers of such overcrowding, but pointed out that the alternative is for theextra occupants to sleep in hovels or on the streets. Indeed, stakeholders at WSU spokeabout the ‘plastic people’, or students who, having been unable to secure any form ofaccommodation, lead a nomadic existence, storing their possessions in plastic sheets duringthe day and retrieving them at night before searching out open lecture venues, toilets andsheds on campus where they sleep.

78
6. Private student accommodation
Due to the serious shortage of residence accommodation for university students in SouthAfrica, the private sector is a potentially key role player in the provision of student housing.International research indicates that the majority of university students are accommodatedin private student housing. This chapter provides an overview of private accommodationnationally, and explores the extent and the suitability of such accommodation.
6.1 Types of private accommodation
The several types of private student accommodation in South Africa may be categorised asfollows:
i. Home accommodation, where students reside with family members orguardians;
ii. Single flat/apartment accommodation, where individual students enter intoa lease agreement with a landlord for a studio or one-bedroomed apartmenttypically within the landlord’s own house or garden or within a block of flats;
iii. ‘Digs’ accommodation, where students jointly or severally rent a house forcommune type accommodation;
iv. Privately-owned residence accommodation A, where a building is leased bya university for a certain period at a fixed rental, and where the universityassumes the risk for occupancy levels while ownership remains with thelandlord (e.g. the Lonsdale Hotel leased by MUT, Sikelela leased by CPUT, andSeaboard 1 and 2 leased by DUT);
v. Privately-owned residence accommodation B, where students from severalinstitutions enter into fixed-period lease contracts with a landlord whoretains the risk for occupancy levels (e.g. South Point and Urban Nest); and
vi. Public-private partnership (PPP) accommodation, where a developerestablishes a residence and leases it for a fixed period at a predeterminedescalating rate to a university, at the end of which period the residencebecomes the property of the university (e.g. the Cape Edge PPP betweenCPUT and African Student Accommodation Group).
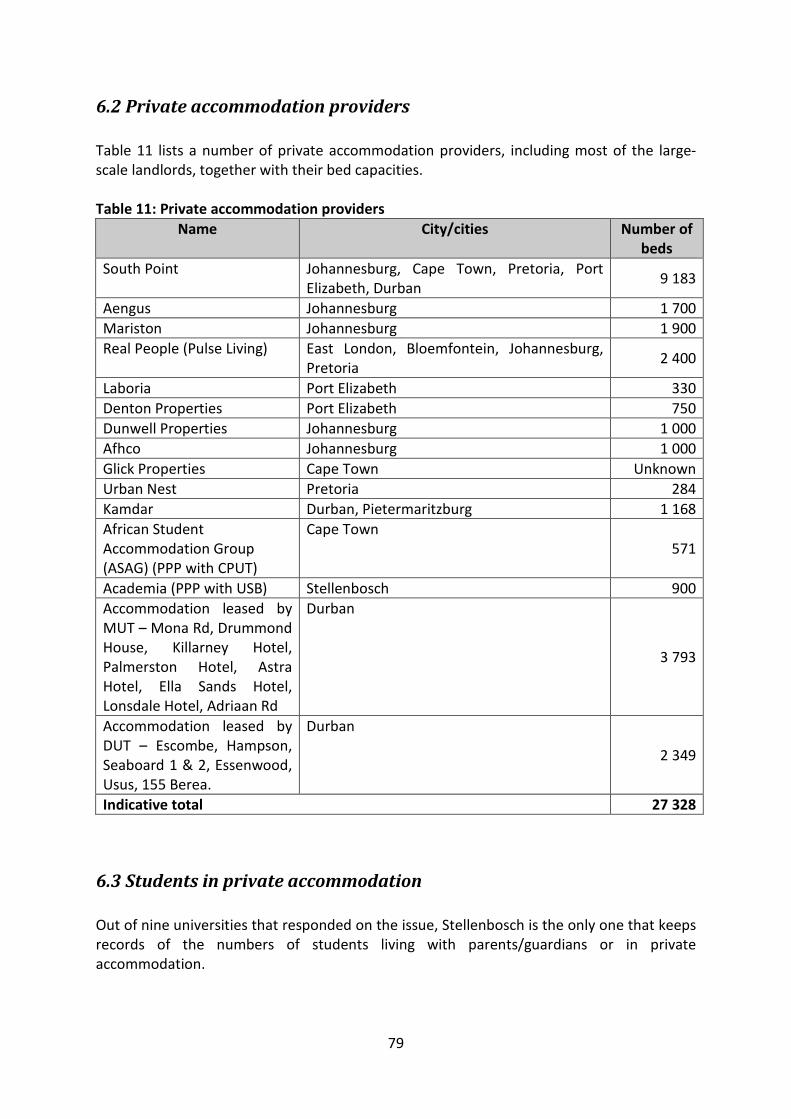
79
6.2 Private accommodation providers
Table 11 lists a number of private accommodation providers, including most of the large-scale landlords, together with their bed capacities.
Table 11: Private accommodation providers
Name City/cities Number ofbeds
South Point Johannesburg, Cape Town, Pretoria, PortElizabeth, Durban
9 183
Aengus Johannesburg 1 700
Mariston Johannesburg 1 900
Real People (Pulse Living) East London, Bloemfontein, Johannesburg,Pretoria
2 400
Laboria Port Elizabeth 330
Denton Properties Port Elizabeth 750
Dunwell Properties Johannesburg 1 000
Afhco Johannesburg 1 000
Glick Properties Cape Town Unknown
Urban Nest Pretoria 284
Kamdar Durban, Pietermaritzburg 1 168
African StudentAccommodation Group(ASAG) (PPP with CPUT)
Cape Town571
Academia (PPP with USB) Stellenbosch 900
Accommodation leased byMUT – Mona Rd, DrummondHouse, Killarney Hotel,Palmerston Hotel, AstraHotel, Ella Sands Hotel,Lonsdale Hotel, Adriaan Rd
Durban
3 793
Accommodation leased byDUT – Escombe, Hampson,Seaboard 1 & 2, Essenwood,Usus, 155 Berea.
Durban
2 349
Indicative total 27 328
6.3 Students in private accommodation
Out of nine universities that responded on the issue, Stellenbosch is the only one that keepsrecords of the numbers of students living with parents/guardians or in privateaccommodation.
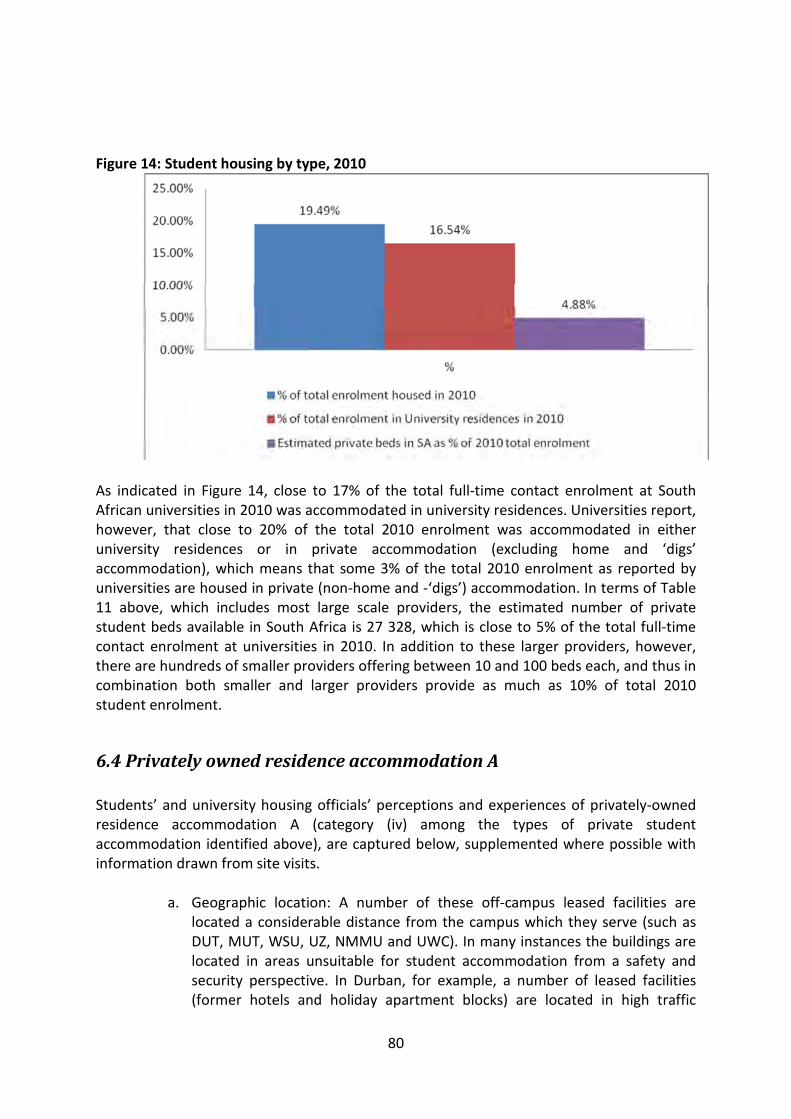
80
Figure 14: Student housing by type, 2010
As indicated in Figure 14, close to 17% of the total full-time contact enrolment at SouthAfrican universities in 2010 was accommodated in university residences. Universities report,however, that close to 20% of the total 2010 enrolment was accommodated in eitheruniversity residences or in private accommodation (excluding home and ‘digs’accommodation), which means that some 3% of the total 2010 enrolment as reported byuniversities are housed in private (non-home and -‘digs’) accommodation. In terms of Table11 above, which includes most large scale providers, the estimated number of privatestudent beds available in South Africa is 27 328, which is close to 5% of the total full-timecontact enrolment at universities in 2010. In addition to these larger providers, however,there are hundreds of smaller providers offering between 10 and 100 beds each, and thus incombination both smaller and larger providers provide as much as 10% of total 2010student enrolment.
6.4 Privately owned residence accommodation A
Students’ and university housing officials’ perceptions and experiences of privately-ownedresidence accommodation A (category (iv) among the types of private studentaccommodation identified above), are captured below, supplemented where possible withinformation drawn from site visits.
a. Geographic location: A number of these off-campus leased facilities arelocated a considerable distance from the campus which they serve (such asDUT, MUT, WSU, UZ, NMMU and UWC). In many instances the buildings arelocated in areas unsuitable for student accommodation from a safety andsecurity perspective. In Durban, for example, a number of leased facilities(former hotels and holiday apartment blocks) are located in high traffic
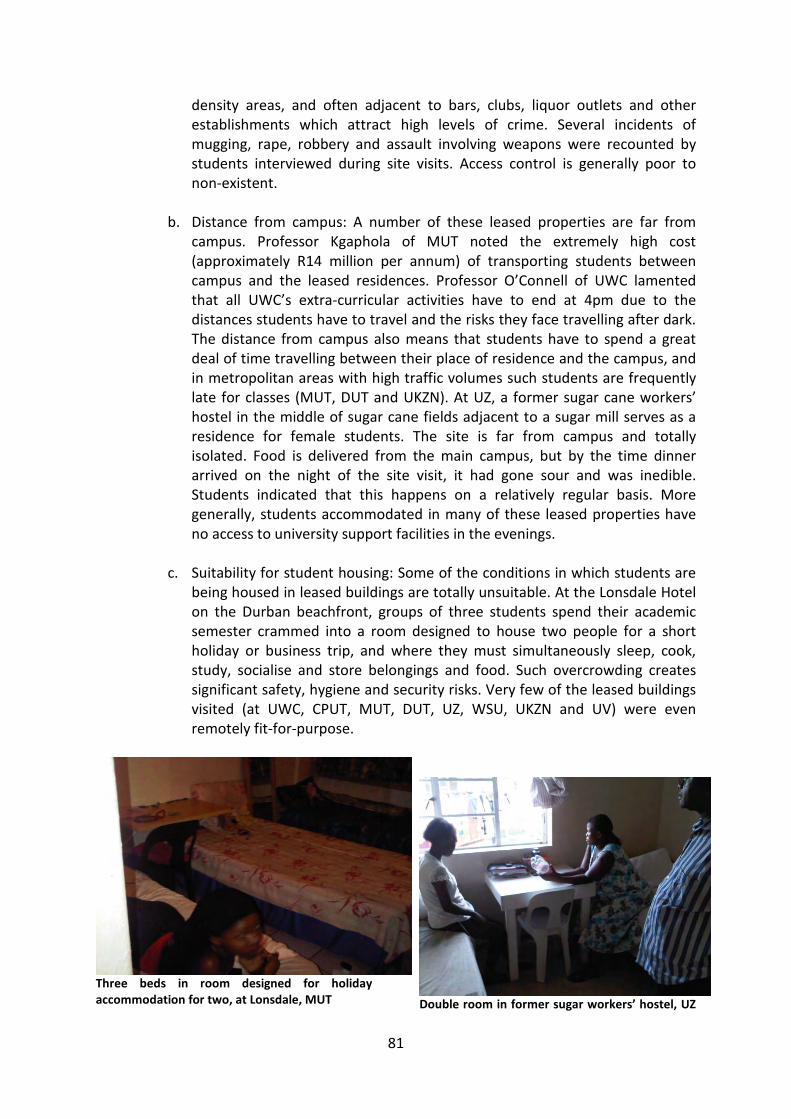
81
density areas, and often adjacent to bars, clubs, liquor outlets and otherestablishments which attract high levels of crime. Several incidents ofmugging, rape, robbery and assault involving weapons were recounted bystudents interviewed during site visits. Access control is generally poor tonon-existent.
b. Distance from campus: A number of these leased properties are far fromcampus. Professor Kgaphola of MUT noted the extremely high cost(approximately R14 million per annum) of transporting students betweencampus and the leased residences. Professor O’Connell of UWC lamentedthat all UWC’s extra-curricular activities have to end at 4pm due to thedistances students have to travel and the risks they face travelling after dark.The distance from campus also means that students have to spend a greatdeal of time travelling between their place of residence and the campus, andin metropolitan areas with high traffic volumes such students are frequentlylate for classes (MUT, DUT and UKZN). At UZ, a former sugar cane workers’hostel in the middle of sugar cane fields adjacent to a sugar mill serves as aresidence for female students. The site is far from campus and totallyisolated. Food is delivered from the main campus, but by the time dinnerarrived on the night of the site visit, it had gone sour and was inedible.Students indicated that this happens on a relatively regular basis. Moregenerally, students accommodated in many of these leased properties haveno access to university support facilities in the evenings.
c. Suitability for student housing: Some of the conditions in which students arebeing housed in leased buildings are totally unsuitable. At the Lonsdale Hotelon the Durban beachfront, groups of three students spend their academicsemester crammed into a room designed to house two people for a shortholiday or business trip, and where they must simultaneously sleep, cook,study, socialise and store belongings and food. Such overcrowding createssignificant safety, hygiene and security risks. Very few of the leased buildingsvisited (at UWC, CPUT, MUT, DUT, UZ, WSU, UKZN and UV) were evenremotely fit-for-purpose.
Three beds in room designed for holidayaccommodation for two, at Lonsdale, MUT Double room in former sugar workers’ hostel, UZ
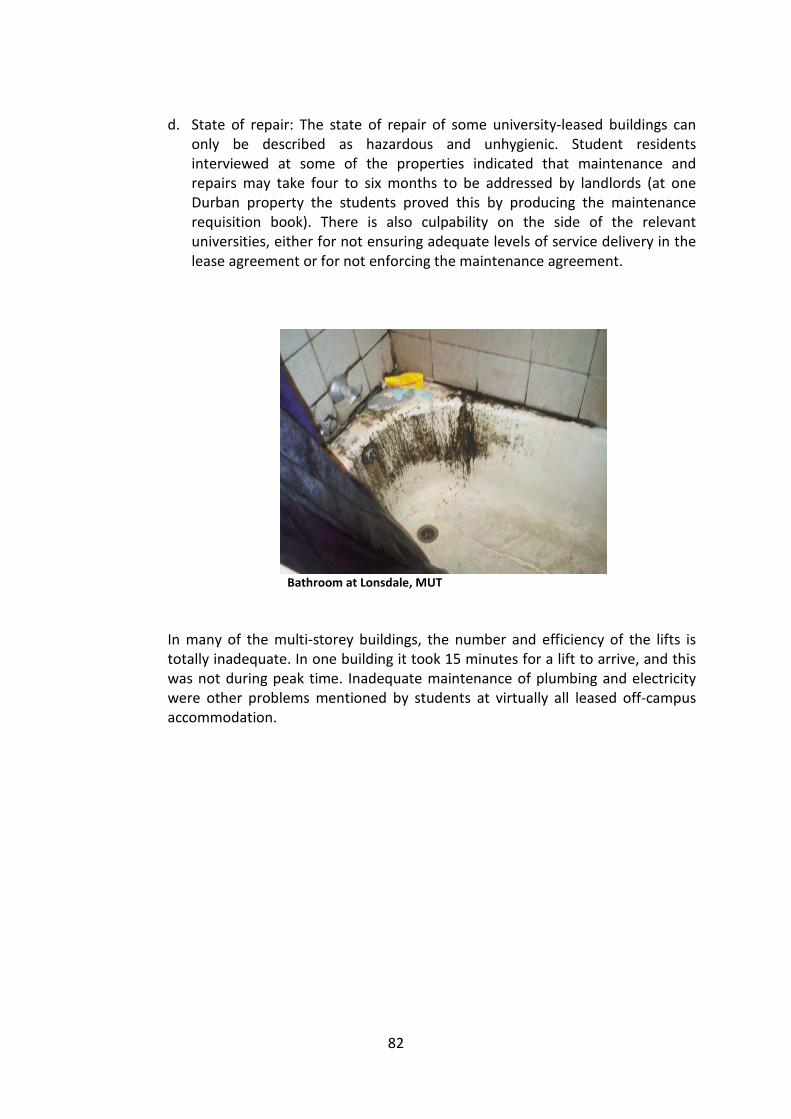
82
d. State of repair: The state of repair of some university-leased buildings canonly be described as hazardous and unhygienic. Student residentsinterviewed at some of the properties indicated that maintenance andrepairs may take four to six months to be addressed by landlords (at oneDurban property the students proved this by producing the maintenancerequisition book). There is also culpability on the side of the relevantuniversities, either for not ensuring adequate levels of service delivery in thelease agreement or for not enforcing the maintenance agreement.
Bathroom at Lonsdale, MUT
In many of the multi-storey buildings, the number and efficiency of the lifts istotally inadequate. In one building it took 15 minutes for a lift to arrive, and thiswas not during peak time. Inadequate maintenance of plumbing and electricitywere other problems mentioned by students at virtually all leased off-campusaccommodation.
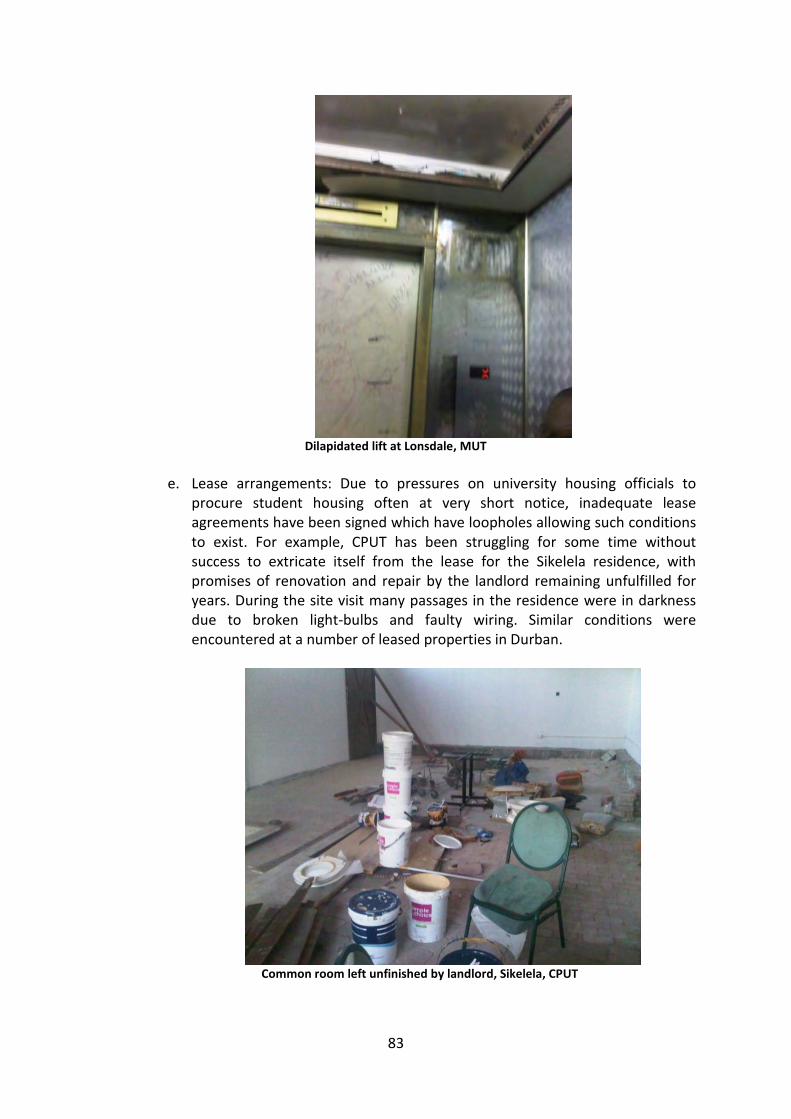
83
Dilapidated lift at Lonsdale, MUT
e. Lease arrangements: Due to pressures on university housing officials toprocure student housing often at very short notice, inadequate leaseagreements have been signed which have loopholes allowing such conditionsto exist. For example, CPUT has been struggling for some time withoutsuccess to extricate itself from the lease for the Sikelela residence, withpromises of renovation and repair by the landlord remaining unfulfilled foryears. During the site visit many passages in the residence were in darknessdue to broken light-bulbs and faulty wiring. Similar conditions wereencountered at a number of leased properties in Durban.
Common room left unfinished by landlord, Sikelela, CPUT
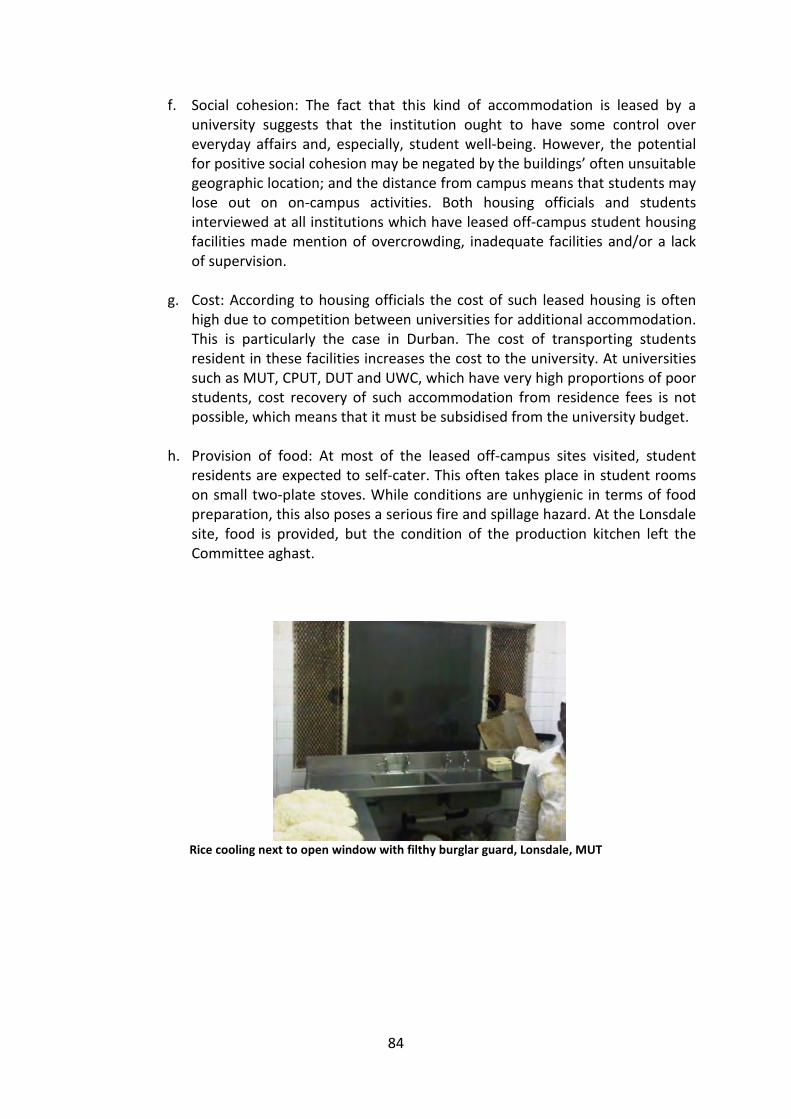
84
f. Social cohesion: The fact that this kind of accommodation is leased by auniversity suggests that the institution ought to have some control overeveryday affairs and, especially, student well-being. However, the potentialfor positive social cohesion may be negated by the buildings’ often unsuitablegeographic location; and the distance from campus means that students maylose out on on-campus activities. Both housing officials and studentsinterviewed at all institutions which have leased off-campus student housingfacilities made mention of overcrowding, inadequate facilities and/or a lackof supervision.
g. Cost: According to housing officials the cost of such leased housing is oftenhigh due to competition between universities for additional accommodation.This is particularly the case in Durban. The cost of transporting studentsresident in these facilities increases the cost to the university. At universitiessuch as MUT, CPUT, DUT and UWC, which have very high proportions of poorstudents, cost recovery of such accommodation from residence fees is notpossible, which means that it must be subsidised from the university budget.
h. Provision of food: At most of the leased off-campus sites visited, studentresidents are expected to self-cater. This often takes place in student roomson small two-plate stoves. While conditions are unhygienic in terms of foodpreparation, this also poses a serious fire and spillage hazard. At the Lonsdalesite, food is provided, but the condition of the production kitchen left theCommittee aghast.
Rice cooling next to open window with filthy burglar guard, Lonsdale, MUT
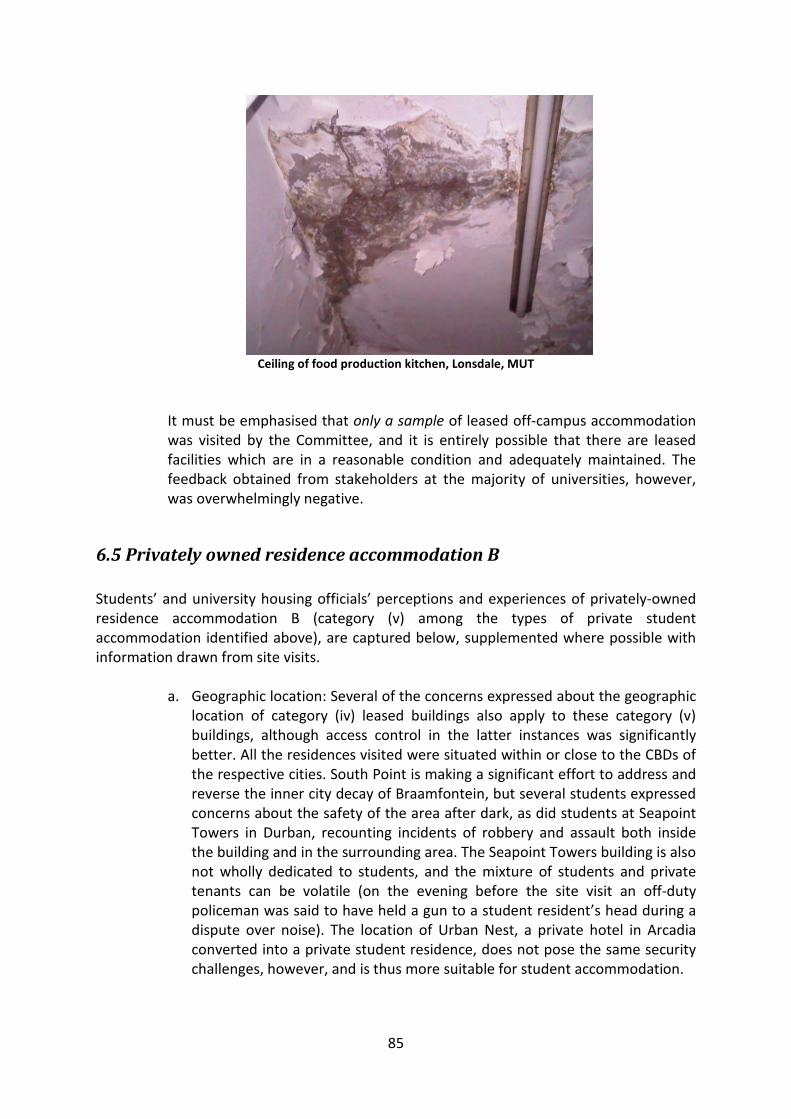
85
Ceiling of food production kitchen, Lonsdale, MUT
It must be emphasised that only a sample of leased off-campus accommodationwas visited by the Committee, and it is entirely possible that there are leasedfacilities which are in a reasonable condition and adequately maintained. Thefeedback obtained from stakeholders at the majority of universities, however,was overwhelmingly negative.
6.5 Privately owned residence accommodation B
Students’ and university housing officials’ perceptions and experiences of privately-ownedresidence accommodation B (category (v) among the types of private studentaccommodation identified above), are captured below, supplemented where possible withinformation drawn from site visits.
a. Geographic location: Several of the concerns expressed about the geographiclocation of category (iv) leased buildings also apply to these category (v)buildings, although access control in the latter instances was significantlybetter. All the residences visited were situated within or close to the CBDs ofthe respective cities. South Point is making a significant effort to address andreverse the inner city decay of Braamfontein, but several students expressedconcerns about the safety of the area after dark, as did students at SeapointTowers in Durban, recounting incidents of robbery and assault both insidethe building and in the surrounding area. The Seapoint Towers building is alsonot wholly dedicated to students, and the mixture of students and privatetenants can be volatile (on the evening before the site visit an off-dutypoliceman was said to have held a gun to a student resident’s head during adispute over noise). The location of Urban Nest, a private hotel in Arcadiaconverted into a private student residence, does not pose the same securitychallenges, however, and is thus more suitable for student accommodation.
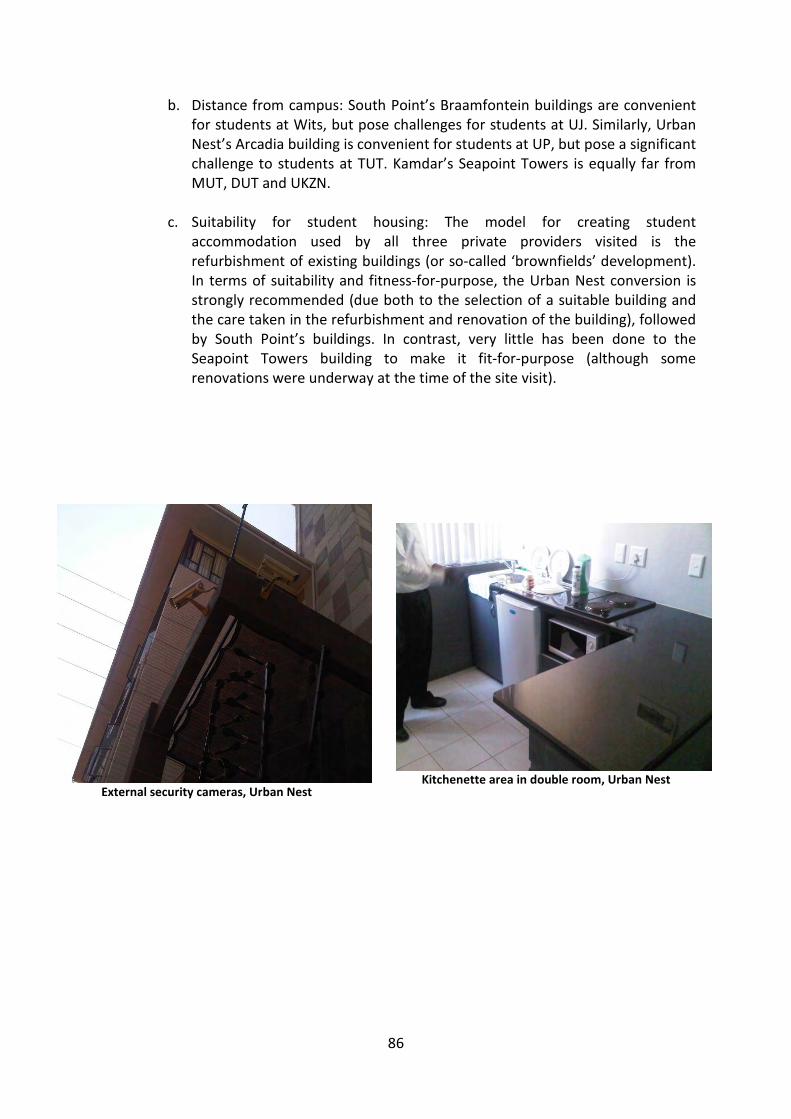
86
b. Distance from campus: South Point’s Braamfontein buildings are convenientfor students at Wits, but pose challenges for students at UJ. Similarly, UrbanNest’s Arcadia building is convenient for students at UP, but pose a significantchallenge to students at TUT. Kamdar’s Seapoint Towers is equally far fromMUT, DUT and UKZN.
c. Suitability for student housing: The model for creating studentaccommodation used by all three private providers visited is therefurbishment of existing buildings (or so-called ‘brownfields’ development).In terms of suitability and fitness-for-purpose, the Urban Nest conversion isstrongly recommended (due both to the selection of a suitable building andthe care taken in the refurbishment and renovation of the building), followedby South Point’s buildings. In contrast, very little has been done to theSeapoint Towers building to make it fit-for-purpose (although somerenovations were underway at the time of the site visit).
External security cameras, Urban NestKitchenette area in double room, Urban Nest
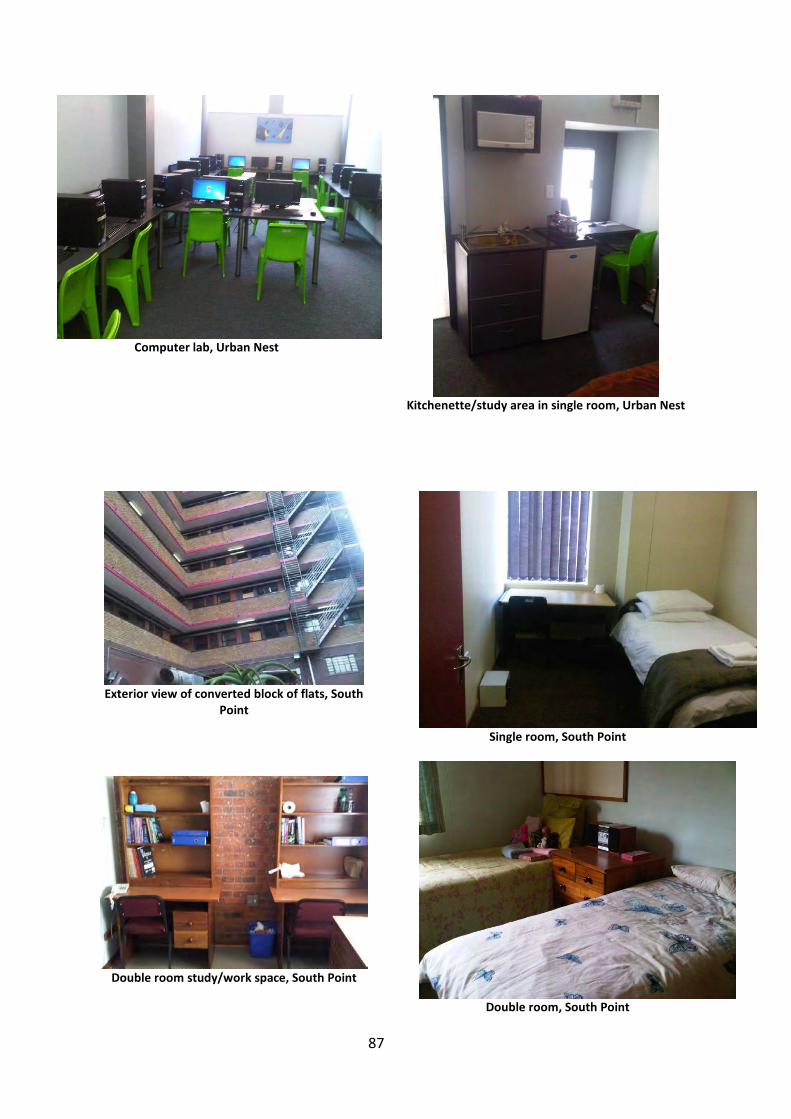
87
Computer lab, Urban Nest
Kitchenette/study area in single room, Urban Nest
Exterior view of converted block of flats, SouthPoint
Double room study/work space, South Point
Single room, South Point
Double room, South Point
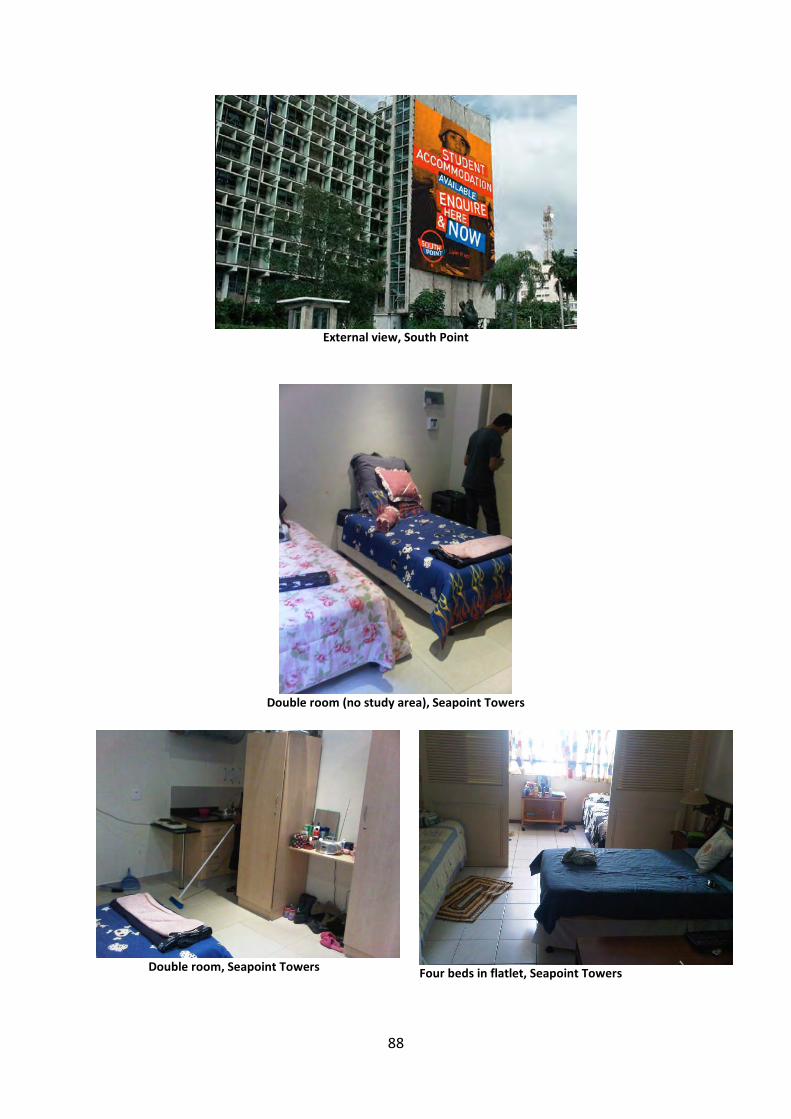
88
External view, South Point
Double room (no study area), Seapoint Towers
Double room, Seapoint Towers Four beds in flatlet, Seapoint Towers
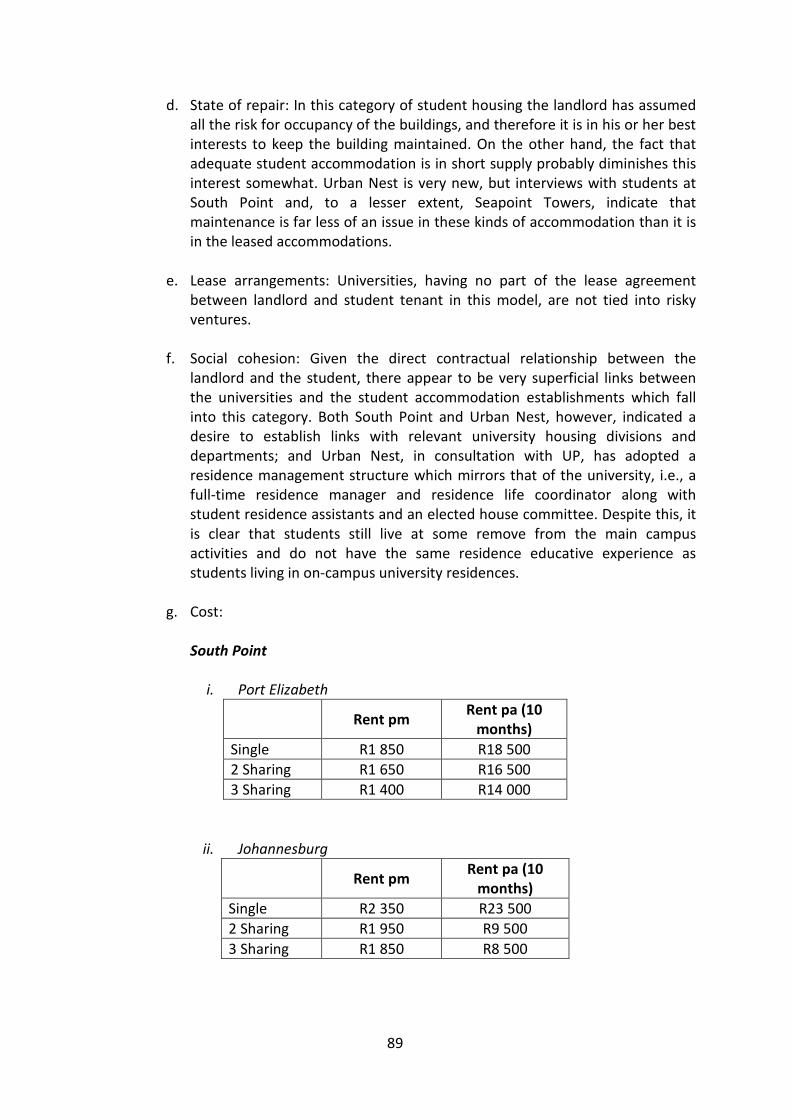
89
d. State of repair: In this category of student housing the landlord has assumedall the risk for occupancy of the buildings, and therefore it is in his or her bestinterests to keep the building maintained. On the other hand, the fact thatadequate student accommodation is in short supply probably diminishes thisinterest somewhat. Urban Nest is very new, but interviews with students atSouth Point and, to a lesser extent, Seapoint Towers, indicate thatmaintenance is far less of an issue in these kinds of accommodation than it isin the leased accommodations.
e. Lease arrangements: Universities, having no part of the lease agreementbetween landlord and student tenant in this model, are not tied into riskyventures.
f. Social cohesion: Given the direct contractual relationship between thelandlord and the student, there appear to be very superficial links betweenthe universities and the student accommodation establishments which fallinto this category. Both South Point and Urban Nest, however, indicated adesire to establish links with relevant university housing divisions anddepartments; and Urban Nest, in consultation with UP, has adopted aresidence management structure which mirrors that of the university, i.e., afull-time residence manager and residence life coordinator along withstudent residence assistants and an elected house committee. Despite this, itis clear that students still live at some remove from the main campusactivities and do not have the same residence educative experience asstudents living in on-campus university residences.
g. Cost:
South Point
i. Port Elizabeth
Rent pmRent pa (10
months)
Single R1 850 R18 500
2 Sharing R1 650 R16 500
3 Sharing R1 400 R14 000
ii. Johannesburg
Rent pmRent pa (10
months)
Single R2 350 R23 500
2 Sharing R1 950 R9 500
3 Sharing R1 850 R8 500
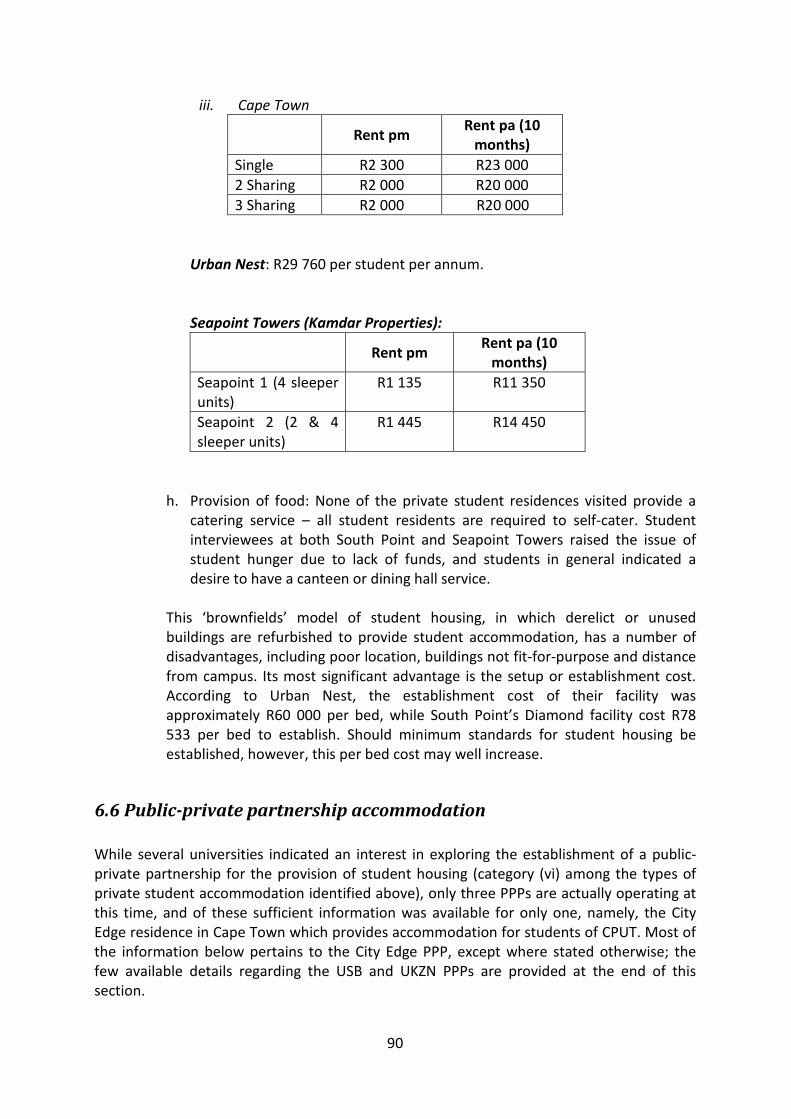
90
iii. Cape Town
Rent pmRent pa (10
months)
Single R2 300 R23 000
2 Sharing R2 000 R20 000
3 Sharing R2 000 R20 000
Urban Nest: R29 760 per student per annum.
Seapoint Towers (Kamdar Properties):
Rent pmRent pa (10
months)
Seapoint 1 (4 sleeperunits)
R1 135 R11 350
Seapoint 2 (2 & 4sleeper units)
R1 445 R14 450
h. Provision of food: None of the private student residences visited provide acatering service – all student residents are required to self-cater. Studentinterviewees at both South Point and Seapoint Towers raised the issue ofstudent hunger due to lack of funds, and students in general indicated adesire to have a canteen or dining hall service.
This ‘brownfields’ model of student housing, in which derelict or unusedbuildings are refurbished to provide student accommodation, has a number ofdisadvantages, including poor location, buildings not fit-for-purpose and distancefrom campus. Its most significant advantage is the setup or establishment cost.According to Urban Nest, the establishment cost of their facility wasapproximately R60 000 per bed, while South Point’s Diamond facility cost R78533 per bed to establish. Should minimum standards for student housing beestablished, however, this per bed cost may well increase.
6.6 Public-private partnership accommodation
While several universities indicated an interest in exploring the establishment of a public-private partnership for the provision of student housing (category (vi) among the types ofprivate student accommodation identified above), only three PPPs are actually operating atthis time, and of these sufficient information was available for only one, namely, the CityEdge residence in Cape Town which provides accommodation for students of CPUT. Most ofthe information below pertains to the City Edge PPP, except where stated otherwise; thefew available details regarding the USB and UKZN PPPs are provided at the end of thissection.
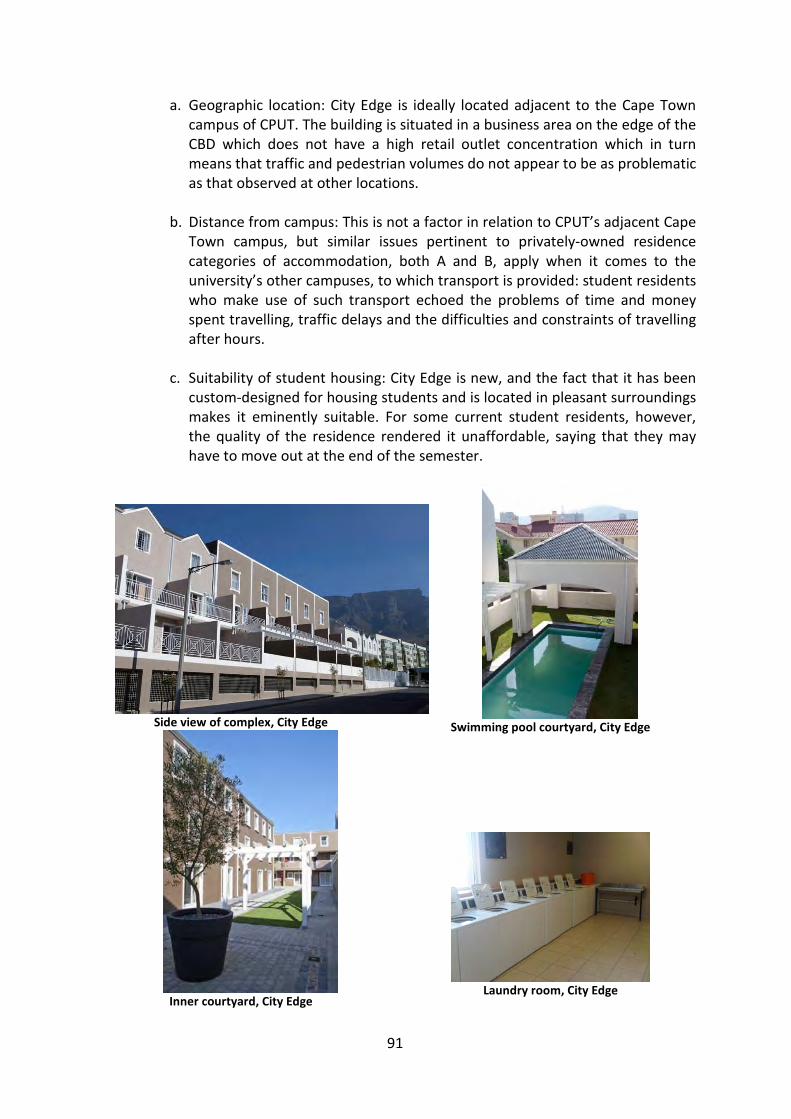
91
a. Geographic location: City Edge is ideally located adjacent to the Cape Towncampus of CPUT. The building is situated in a business area on the edge of theCBD which does not have a high retail outlet concentration which in turnmeans that traffic and pedestrian volumes do not appear to be as problematicas that observed at other locations.
b. Distance from campus: This is not a factor in relation to CPUT’s adjacent CapeTown campus, but similar issues pertinent to privately-owned residencecategories of accommodation, both A and B, apply when it comes to theuniversity’s other campuses, to which transport is provided: student residentswho make use of such transport echoed the problems of time and moneyspent travelling, traffic delays and the difficulties and constraints of travellingafter hours.
c. Suitability of student housing: City Edge is new, and the fact that it has beencustom-designed for housing students and is located in pleasant surroundingsmakes it eminently suitable. For some current student residents, however,the quality of the residence rendered it unaffordable, saying that they mayhave to move out at the end of the semester.
Side view of complex, City Edge
Inner courtyard, City Edge
Swimming pool courtyard, City Edge
Laundry room, City Edge
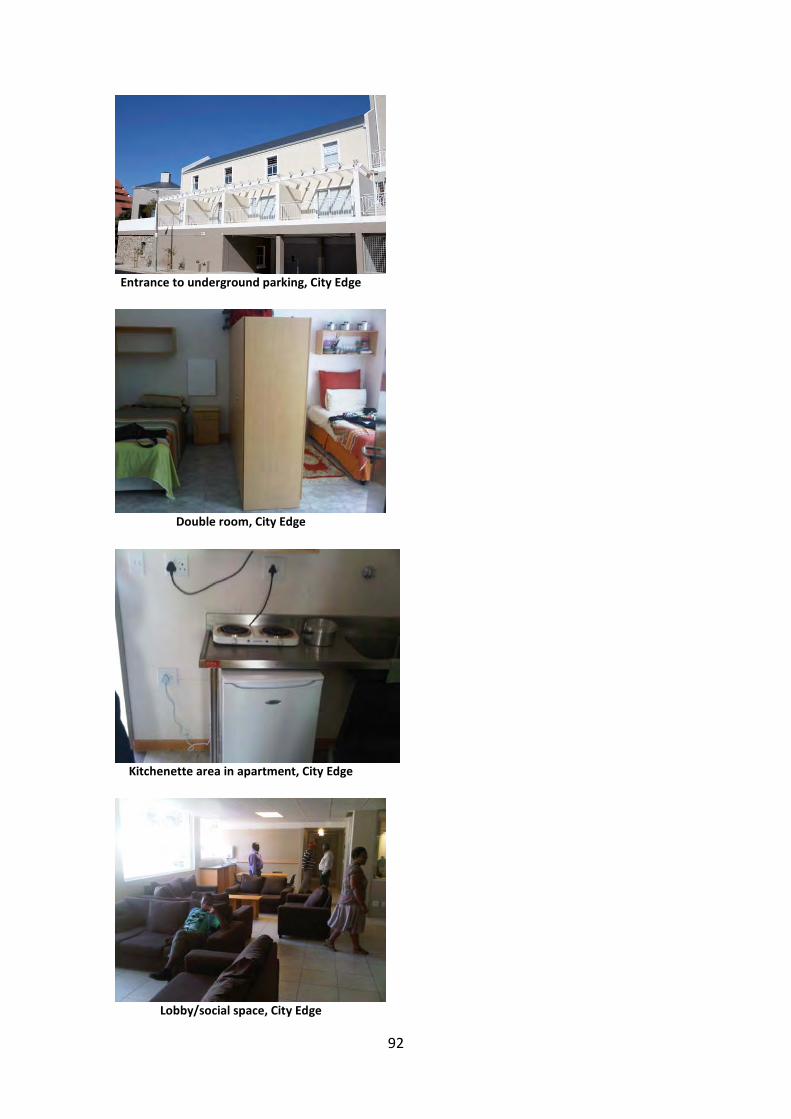
92
Entrance to underground parking, City Edge
Double room, City Edge
Kitchenette area in apartment, City Edge
Lobby/social space, City Edge
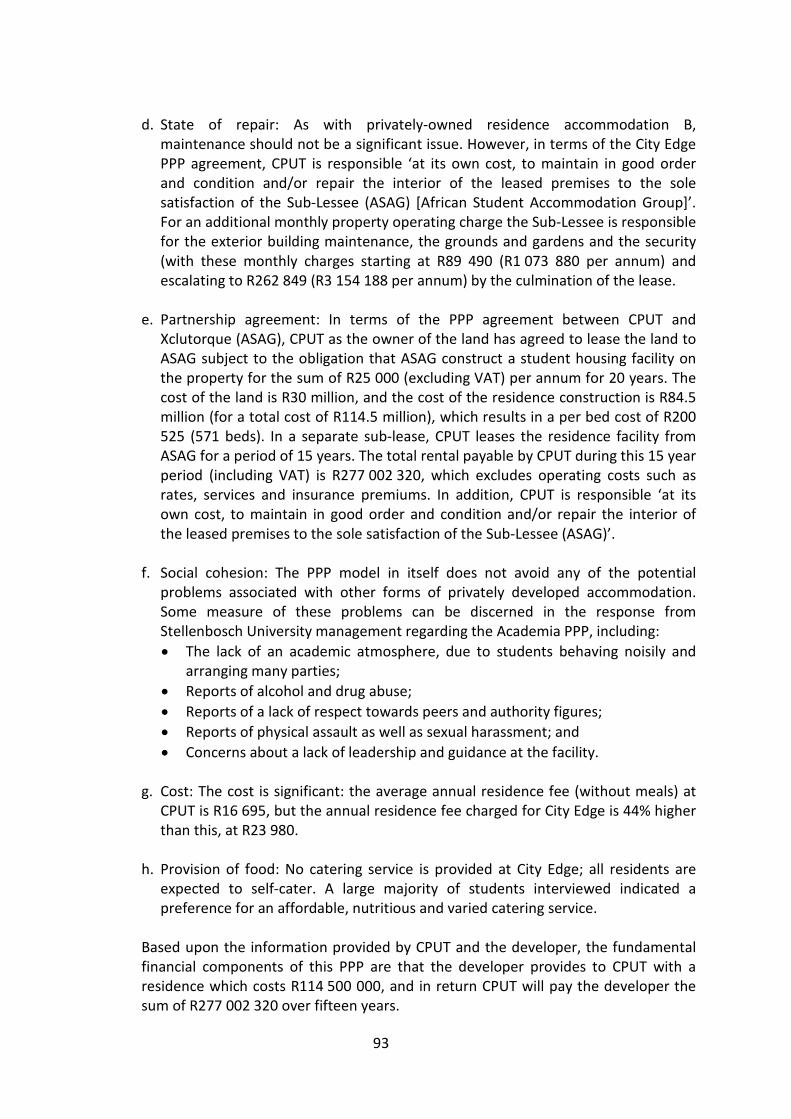
93
d. State of repair: As with privately-owned residence accommodation B,maintenance should not be a significant issue. However, in terms of the City EdgePPP agreement, CPUT is responsible ‘at its own cost, to maintain in good orderand condition and/or repair the interior of the leased premises to the solesatisfaction of the Sub-Lessee (ASAG) [African Student Accommodation Group]’.For an additional monthly property operating charge the Sub-Lessee is responsiblefor the exterior building maintenance, the grounds and gardens and the security(with these monthly charges starting at R89 490 (R1 073 880 per annum) andescalating to R262 849 (R3 154 188 per annum) by the culmination of the lease.
e. Partnership agreement: In terms of the PPP agreement between CPUT andXclutorque (ASAG), CPUT as the owner of the land has agreed to lease the land toASAG subject to the obligation that ASAG construct a student housing facility onthe property for the sum of R25 000 (excluding VAT) per annum for 20 years. Thecost of the land is R30 million, and the cost of the residence construction is R84.5million (for a total cost of R114.5 million), which results in a per bed cost of R200525 (571 beds). In a separate sub-lease, CPUT leases the residence facility fromASAG for a period of 15 years. The total rental payable by CPUT during this 15 yearperiod (including VAT) is R277 002 320, which excludes operating costs such asrates, services and insurance premiums. In addition, CPUT is responsible ‘at itsown cost, to maintain in good order and condition and/or repair the interior ofthe leased premises to the sole satisfaction of the Sub-Lessee (ASAG)’.
f. Social cohesion: The PPP model in itself does not avoid any of the potentialproblems associated with other forms of privately developed accommodation.Some measure of these problems can be discerned in the response fromStellenbosch University management regarding the Academia PPP, including:
The lack of an academic atmosphere, due to students behaving noisily andarranging many parties;
Reports of alcohol and drug abuse;
Reports of a lack of respect towards peers and authority figures;
Reports of physical assault as well as sexual harassment; and
Concerns about a lack of leadership and guidance at the facility.
g. Cost: The cost is significant: the average annual residence fee (without meals) atCPUT is R16 695, but the annual residence fee charged for City Edge is 44% higherthan this, at R23 980.
h. Provision of food: No catering service is provided at City Edge; all residents areexpected to self-cater. A large majority of students interviewed indicated apreference for an affordable, nutritious and varied catering service.
Based upon the information provided by CPUT and the developer, the fundamentalfinancial components of this PPP are that the developer provides to CPUT with aresidence which costs R114 500 000, and in return CPUT will pay the developer thesum of R277 002 320 over fifteen years.
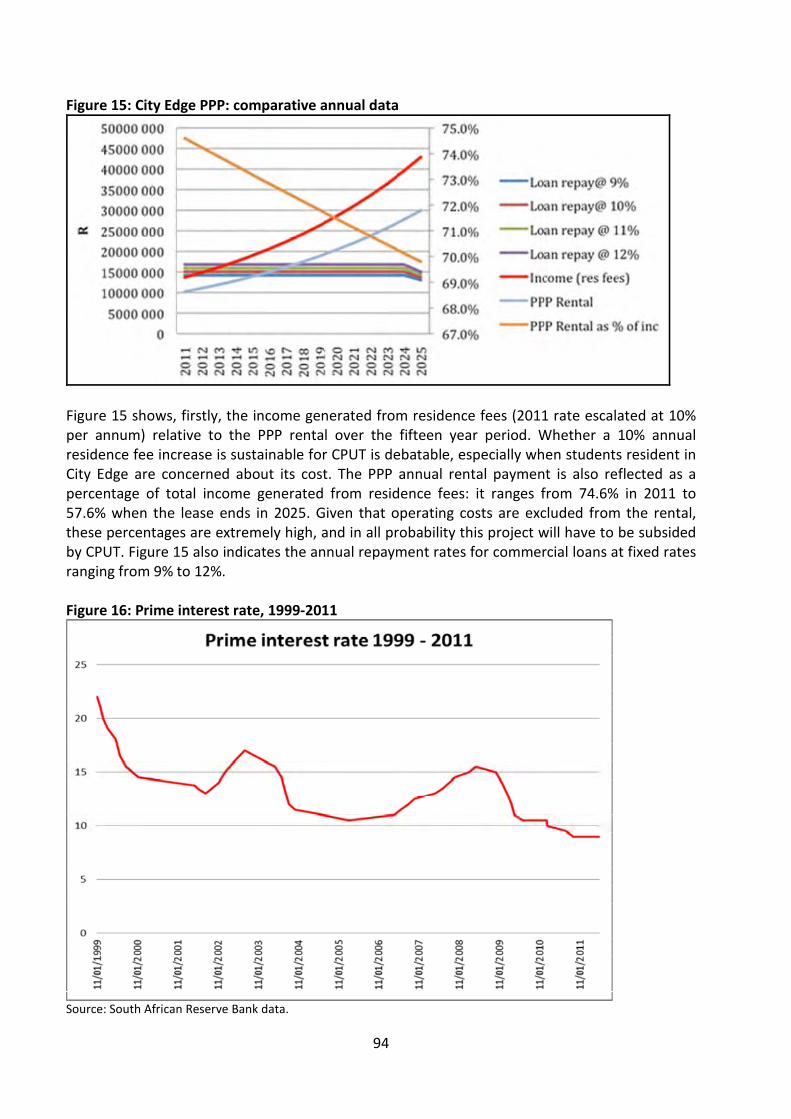
94
Figure 15: City Edge PPP: comparative annual data
Figure 15 shows, firstly, the income generated from residence fees (2011 rate escalated at 10%per annum) relative to the PPP rental over the fifteen year period. Whether a 10% annualresidence fee increase is sustainable for CPUT is debatable, especially when students resident inCity Edge are concerned about its cost. The PPP annual rental payment is also reflected as apercentage of total income generated from residence fees: it ranges from 74.6% in 2011 to57.6% when the lease ends in 2025. Given that operating costs are excluded from the rental,these percentages are extremely high, and in all probability this project will have to be subsidedby CPUT. Figure 15 also indicates the annual repayment rates for commercial loans at fixed ratesranging from 9% to 12%.
Figure 16: Prime interest rate, 1999-2011
Source: South African Reserve Bank data.
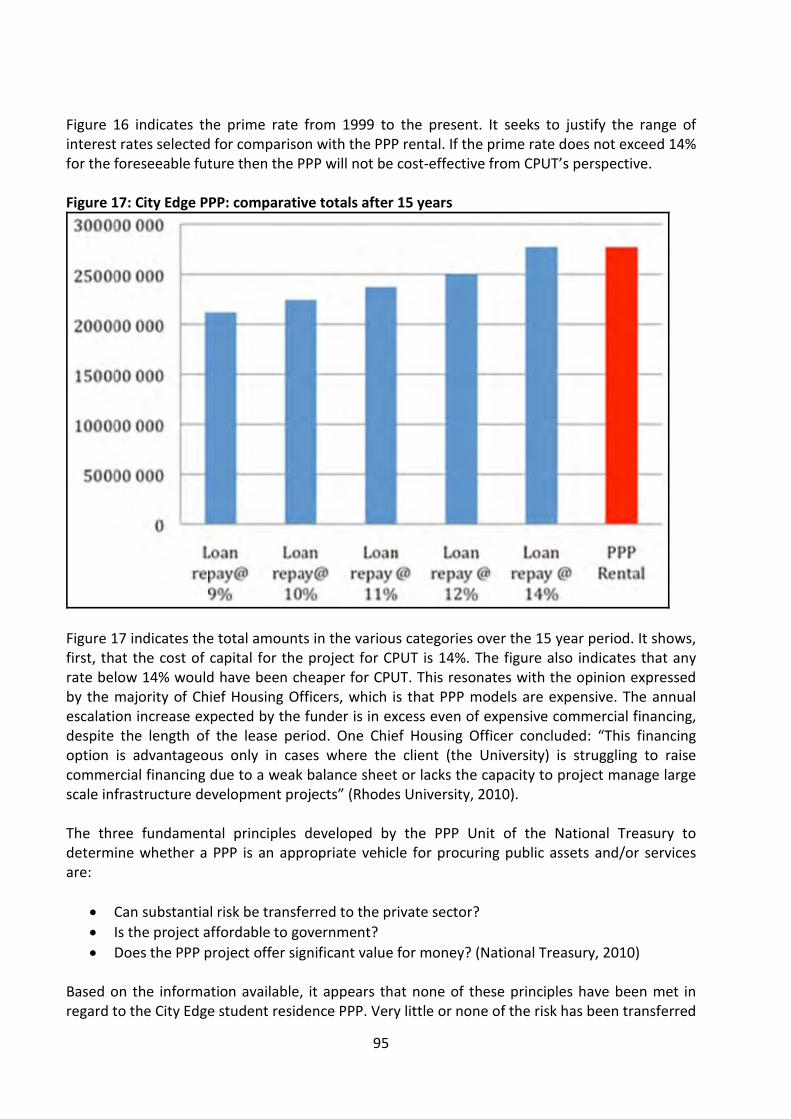
95
Figure 16 indicates the prime rate from 1999 to the present. It seeks to justify the range ofinterest rates selected for comparison with the PPP rental. If the prime rate does not exceed 14%for the foreseeable future then the PPP will not be cost-effective from CPUT’s perspective.
Figure 17: City Edge PPP: comparative totals after 15 years
Figure 17 indicates the total amounts in the various categories over the 15 year period. It shows,first, that the cost of capital for the project for CPUT is 14%. The figure also indicates that anyrate below 14% would have been cheaper for CPUT. This resonates with the opinion expressedby the majority of Chief Housing Officers, which is that PPP models are expensive. The annualescalation increase expected by the funder is in excess even of expensive commercial financing,despite the length of the lease period. One Chief Housing Officer concluded: “This financingoption is advantageous only in cases where the client (the University) is struggling to raisecommercial financing due to a weak balance sheet or lacks the capacity to project manage largescale infrastructure development projects” (Rhodes University, 2010).
The three fundamental principles developed by the PPP Unit of the National Treasury todetermine whether a PPP is an appropriate vehicle for procuring public assets and/or servicesare:
Can substantial risk be transferred to the private sector?
Is the project affordable to government?
Does the PPP project offer significant value for money? (National Treasury, 2010)
Based on the information available, it appears that none of these principles have been met inregard to the City Edge student residence PPP. Very little or none of the risk has been transferred
96
to the private party; based upon the current residence fee structure and the cost of the leaseagreement, the project seems to be expensive to both students and the university; and, finally,given that many student residents, who hail from poverty-stricken backgrounds, are burdenedby the comparatively high cost of being accommodated in the facility, the value for moneyoffered by the project is debatable.
About the two other PPPs for student accommodation that exist in South Africa – one being theAcademia PPP between Stellenbosch University and an undisclosed private provider, and theother being between UKZN and an equally undisclosed private partner – little additionalinformation could be gathered. In the case of the Academia PPP, it appears that much of the riskhas indeed been transferred to the private party. An assessment of whether the PPP isaffordable and offers significant value for money was not possible, although as mentionedabove, a lack of social cohesion is of concern. Academia provides accommodation not only toStellenbosch students but also to Boland College and UNISA students, and the partnershipagreement also allows the private partner to offer accommodation to non-students in the eventof vacancies. In the second case, UKZN submitted the following criticisms of its PPP:transportation costs; inadequate facilities; and configuration of rooms.
It is clear that student accommodation has been identified by private developers as a relativelylow risk, profitable business, thanks to both the massive demand for student accommodationand the lack of any regulatory framework for the housing of students. While it must beacknowledged that there are some private providers who are providing value-for-moneyaccommodation to students, there are also many private providers, both small- and large-scale,whose opportunism and greed are subjecting students to poor living conditions. Despite this, thescope of the student housing shortage requires that serious thought be given to ways ofexploiting the possible benefits of various kinds of privately-owned or public-private partnershipaccommodation, while simultaneously ensuring that such initiatives adhere to minimumstandards for the provision of student housing.
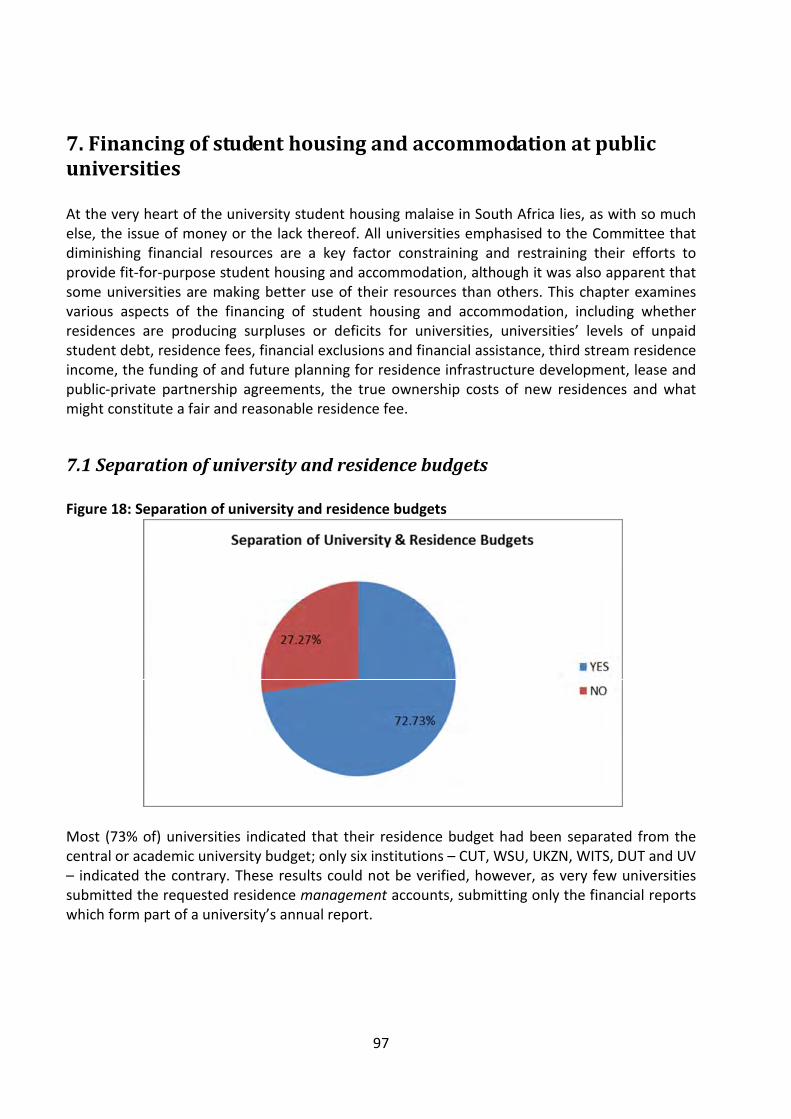
97
7. Financing of student housing and accommodation at publicuniversities
At the very heart of the university student housing malaise in South Africa lies, as with so muchelse, the issue of money or the lack thereof. All universities emphasised to the Committee thatdiminishing financial resources are a key factor constraining and restraining their efforts toprovide fit-for-purpose student housing and accommodation, although it was also apparent thatsome universities are making better use of their resources than others. This chapter examinesvarious aspects of the financing of student housing and accommodation, including whetherresidences are producing surpluses or deficits for universities, universities’ levels of unpaidstudent debt, residence fees, financial exclusions and financial assistance, third stream residenceincome, the funding of and future planning for residence infrastructure development, lease andpublic-private partnership agreements, the true ownership costs of new residences and whatmight constitute a fair and reasonable residence fee.
7.1 Separation of university and residence budgets
Figure 18: Separation of university and residence budgets
Most (73% of) universities indicated that their residence budget had been separated from thecentral or academic university budget; only six institutions – CUT, WSU, UKZN, WITS, DUT and UV– indicated the contrary. These results could not be verified, however, as very few universitiessubmitted the requested residence management accounts, submitting only the financial reportswhich form part of a university’s annual report.
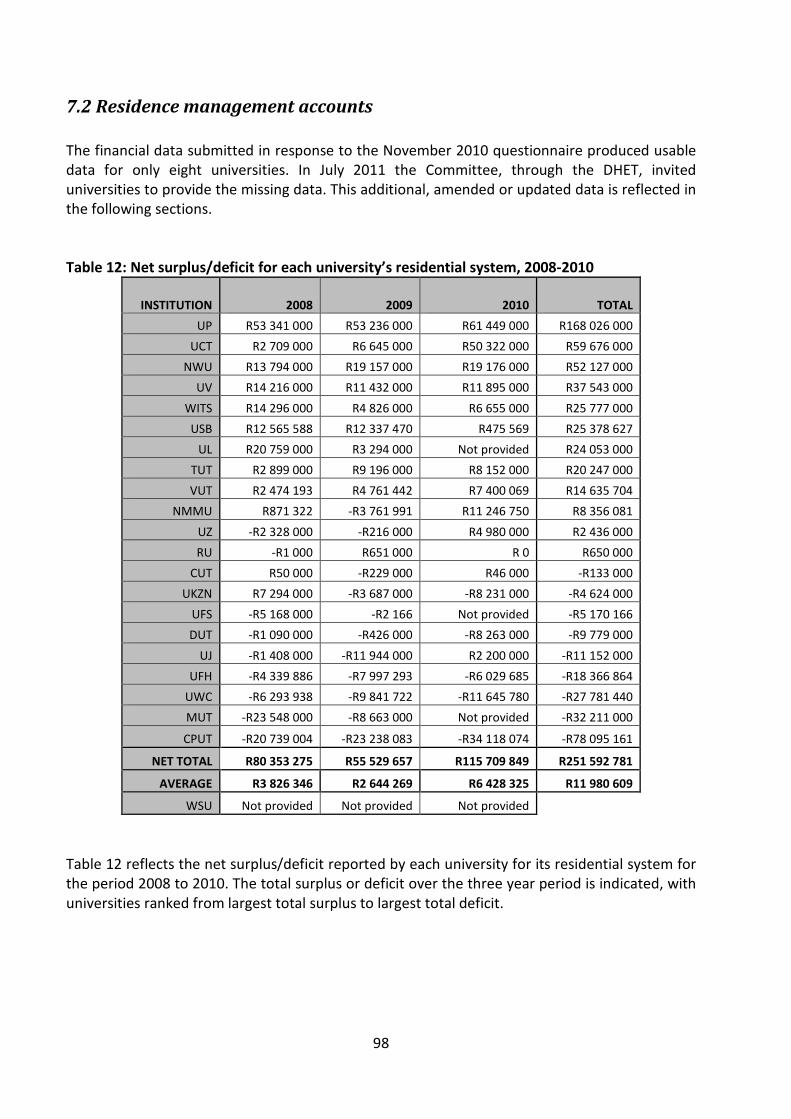
98
7.2 Residence management accounts
The financial data submitted in response to the November 2010 questionnaire produced usabledata for only eight universities. In July 2011 the Committee, through the DHET, inviteduniversities to provide the missing data. This additional, amended or updated data is reflected inthe following sections.
Table 12: Net surplus/deficit for each university’s residential system, 2008-2010
INSTITUTION 2008 2009 2010 TOTAL
UP R53 341 000 R53 236 000 R61 449 000 R168 026 000
UCT R2 709 000 R6 645 000 R50 322 000 R59 676 000
NWU R13 794 000 R19 157 000 R19 176 000 R52 127 000
UV R14 216 000 R11 432 000 R11 895 000 R37 543 000
WITS R14 296 000 R4 826 000 R6 655 000 R25 777 000
USB R12 565 588 R12 337 470 R475 569 R25 378 627
UL R20 759 000 R3 294 000 Not provided R24 053 000
TUT R2 899 000 R9 196 000 R8 152 000 R20 247 000
VUT R2 474 193 R4 761 442 R7 400 069 R14 635 704
NMMU R871 322 -R3 761 991 R11 246 750 R8 356 081
UZ -R2 328 000 -R216 000 R4 980 000 R2 436 000
RU -R1 000 R651 000 R 0 R650 000
CUT R50 000 -R229 000 R46 000 -R133 000
UKZN R7 294 000 -R3 687 000 -R8 231 000 -R4 624 000
UFS -R5 168 000 -R2 166 Not provided -R5 170 166
DUT -R1 090 000 -R426 000 -R8 263 000 -R9 779 000
UJ -R1 408 000 -R11 944 000 R2 200 000 -R11 152 000
UFH -R4 339 886 -R7 997 293 -R6 029 685 -R18 366 864
UWC -R6 293 938 -R9 841 722 -R11 645 780 -R27 781 440
MUT -R23 548 000 -R8 663 000 Not provided -R32 211 000
CPUT -R20 739 004 -R23 238 083 -R34 118 074 -R78 095 161
NET TOTAL R80 353 275 R55 529 657 R115 709 849 R251 592 781
AVERAGE R3 826 346 R2 644 269 R6 428 325 R11 980 609
WSU Not provided Not provided Not provided
Table 12 reflects the net surplus/deficit reported by each university for its residential system forthe period 2008 to 2010. The total surplus or deficit over the three year period is indicated, withuniversities ranked from largest total surplus to largest total deficit.
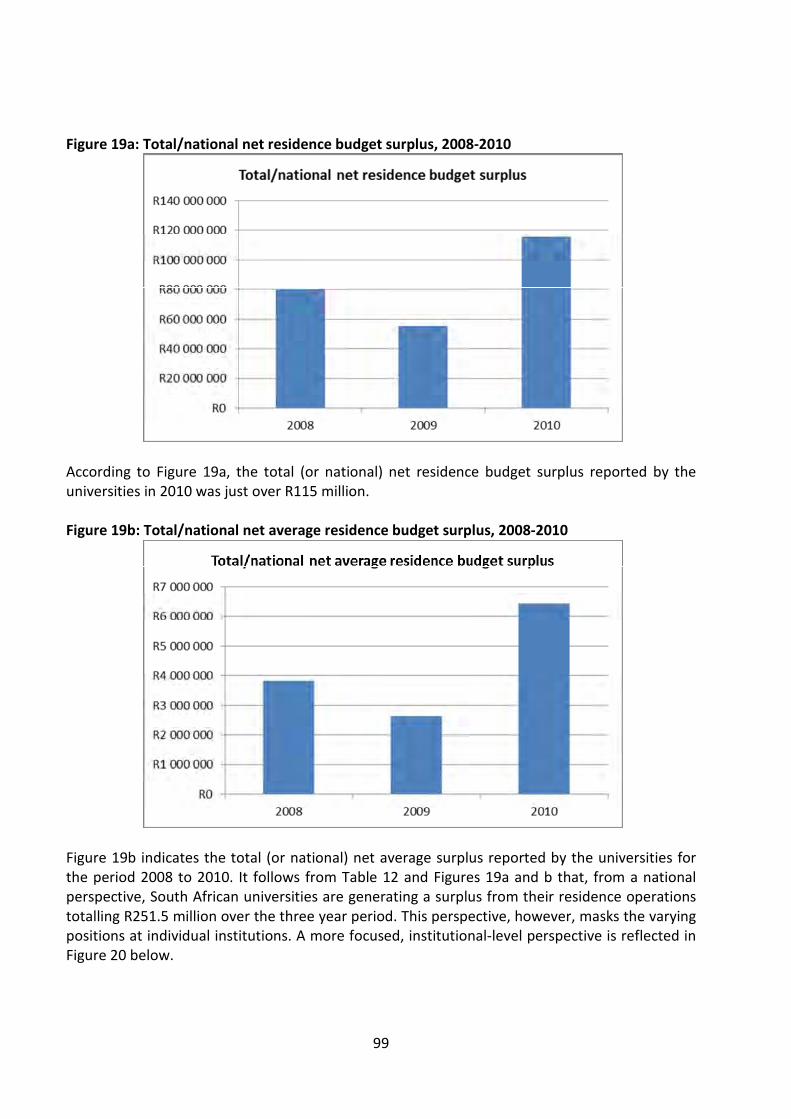
99
Figure 19a: Total/national net residence budget surplus, 2008-2010
According to Figure 19a, the total (or national) net residence budget surplus reported by theuniversities in 2010 was just over R115 million.
Figure 19b: Total/national net average residence budget surplus, 2008-2010
Figure 19b indicates the total (or national) net average surplus reported by the universities forthe period 2008 to 2010. It follows from Table 12 and Figures 19a and b that, from a nationalperspective, South African universities are generating a surplus from their residence operationstotalling R251.5 million over the three year period. This perspective, however, masks the varyingpositions at individual institutions. A more focused, institutional-level perspective is reflected inFigure 20 below.
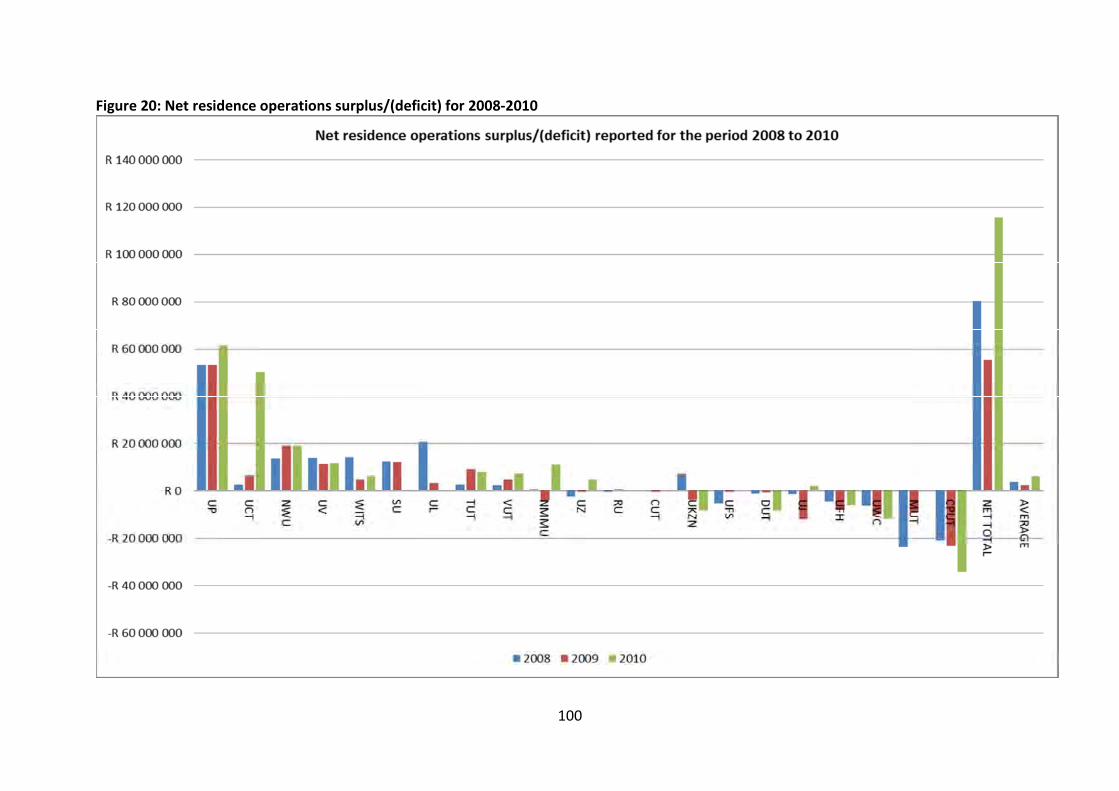
100
Figure 20: Net residence operations surplus/(deficit) for 2008-2010
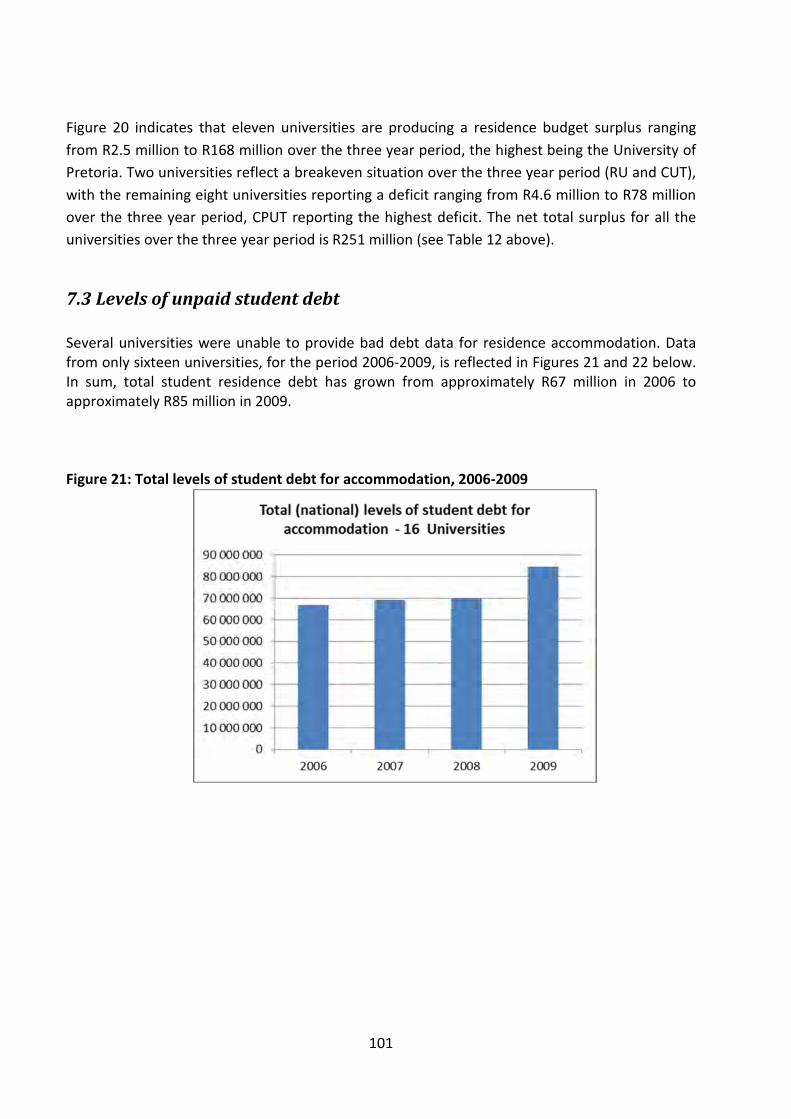
101
Figure 20 indicates that eleven universities are producing a residence budget surplus ranging
from R2.5 million to R168 million over the three year period, the highest being the University of
Pretoria. Two universities reflect a breakeven situation over the three year period (RU and CUT),
with the remaining eight universities reporting a deficit ranging from R4.6 million to R78 million
over the three year period, CPUT reporting the highest deficit. The net total surplus for all the
universities over the three year period is R251 million (see Table 12 above).
7.3 Levels of unpaid student debt
Several universities were unable to provide bad debt data for residence accommodation. Datafrom only sixteen universities, for the period 2006-2009, is reflected in Figures 21 and 22 below.In sum, total student residence debt has grown from approximately R67 million in 2006 toapproximately R85 million in 2009.
Figure 21: Total levels of student debt for accommodation, 2006-2009
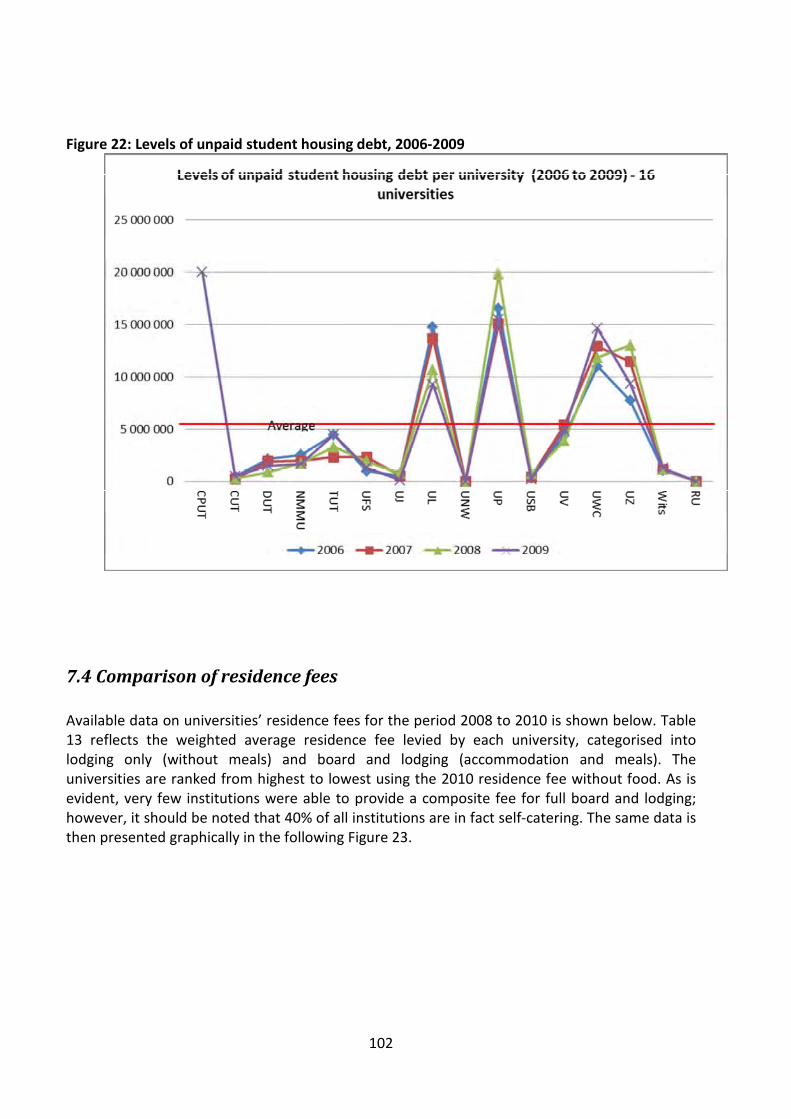
102
Figure 22: Levels of unpaid student housing debt, 2006-2009
7.4 Comparison of residence fees
Available data on universities’ residence fees for the period 2008 to 2010 is shown below. Table13 reflects the weighted average residence fee levied by each university, categorised intolodging only (without meals) and board and lodging (accommodation and meals). Theuniversities are ranked from highest to lowest using the 2010 residence fee without food. As isevident, very few institutions were able to provide a composite fee for full board and lodging;however, it should be noted that 40% of all institutions are in fact self-catering. The same data isthen presented graphically in the following Figure 23.
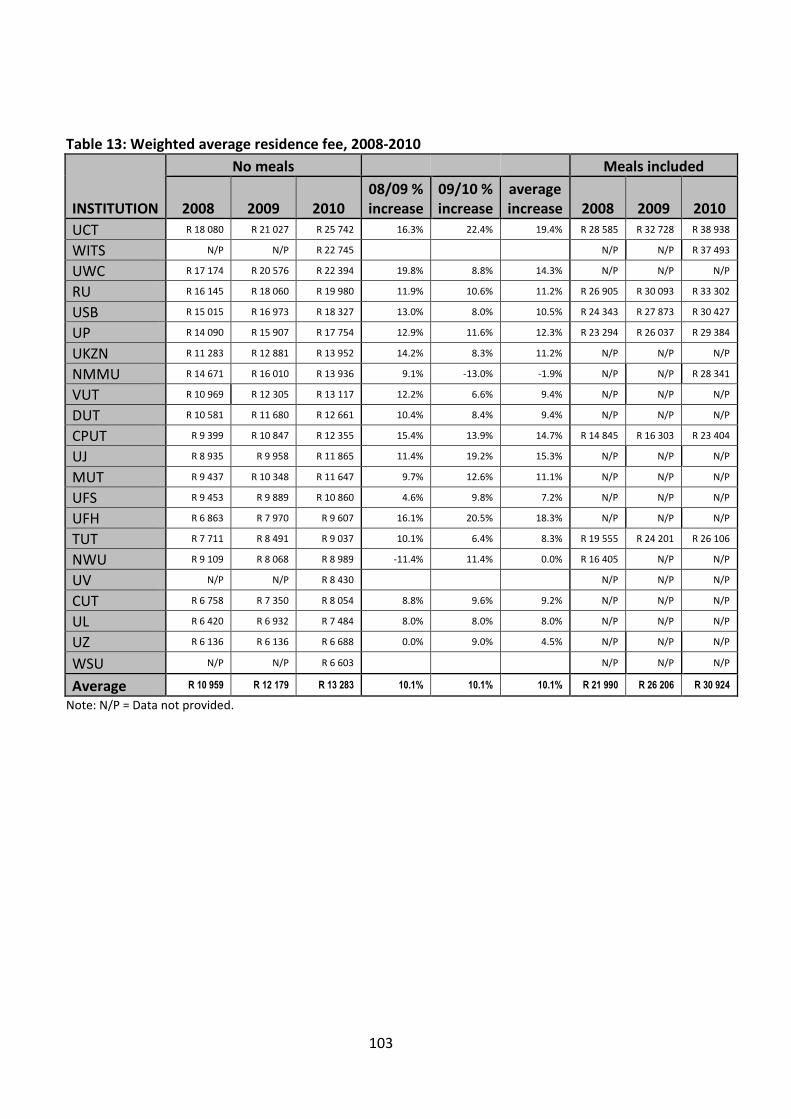
103
Table 13: Weighted average residence fee, 2008-2010
INSTITUTION
No meals Meals included
2008 2009 201008/09 %increase
09/10 %increase
averageincrease 2008 2009 2010
UCT R 18 080 R 21 027 R 25 742 16.3% 22.4% 19.4% R 28 585 R 32 728 R 38 938
WITS N/P N/P R 22 745 N/P N/P R 37 493
UWC R 17 174 R 20 576 R 22 394 19.8% 8.8% 14.3% N/P N/P N/P
RU R 16 145 R 18 060 R 19 980 11.9% 10.6% 11.2% R 26 905 R 30 093 R 33 302
USB R 15 015 R 16 973 R 18 327 13.0% 8.0% 10.5% R 24 343 R 27 873 R 30 427
UP R 14 090 R 15 907 R 17 754 12.9% 11.6% 12.3% R 23 294 R 26 037 R 29 384
UKZN R 11 283 R 12 881 R 13 952 14.2% 8.3% 11.2% N/P N/P N/P
NMMU R 14 671 R 16 010 R 13 936 9.1% -13.0% -1.9% N/P N/P R 28 341
VUT R 10 969 R 12 305 R 13 117 12.2% 6.6% 9.4% N/P N/P N/P
DUT R 10 581 R 11 680 R 12 661 10.4% 8.4% 9.4% N/P N/P N/P
CPUT R 9 399 R 10 847 R 12 355 15.4% 13.9% 14.7% R 14 845 R 16 303 R 23 404
UJ R 8 935 R 9 958 R 11 865 11.4% 19.2% 15.3% N/P N/P N/P
MUT R 9 437 R 10 348 R 11 647 9.7% 12.6% 11.1% N/P N/P N/P
UFS R 9 453 R 9 889 R 10 860 4.6% 9.8% 7.2% N/P N/P N/P
UFH R 6 863 R 7 970 R 9 607 16.1% 20.5% 18.3% N/P N/P N/P
TUT R 7 711 R 8 491 R 9 037 10.1% 6.4% 8.3% R 19 555 R 24 201 R 26 106
NWU R 9 109 R 8 068 R 8 989 -11.4% 11.4% 0.0% R 16 405 N/P N/P
UV N/P N/P R 8 430 N/P N/P N/P
CUT R 6 758 R 7 350 R 8 054 8.8% 9.6% 9.2% N/P N/P N/P
UL R 6 420 R 6 932 R 7 484 8.0% 8.0% 8.0% N/P N/P N/P
UZ R 6 136 R 6 136 R 6 688 0.0% 9.0% 4.5% N/P N/P N/P
WSU N/P N/P R 6 603 N/P N/P N/P
Average R 10 959 R 12 179 R 13 283 10.1% 10.1% 10.1% R 21 990 R 26 206 R 30 924
Note: N/P = Data not provided.
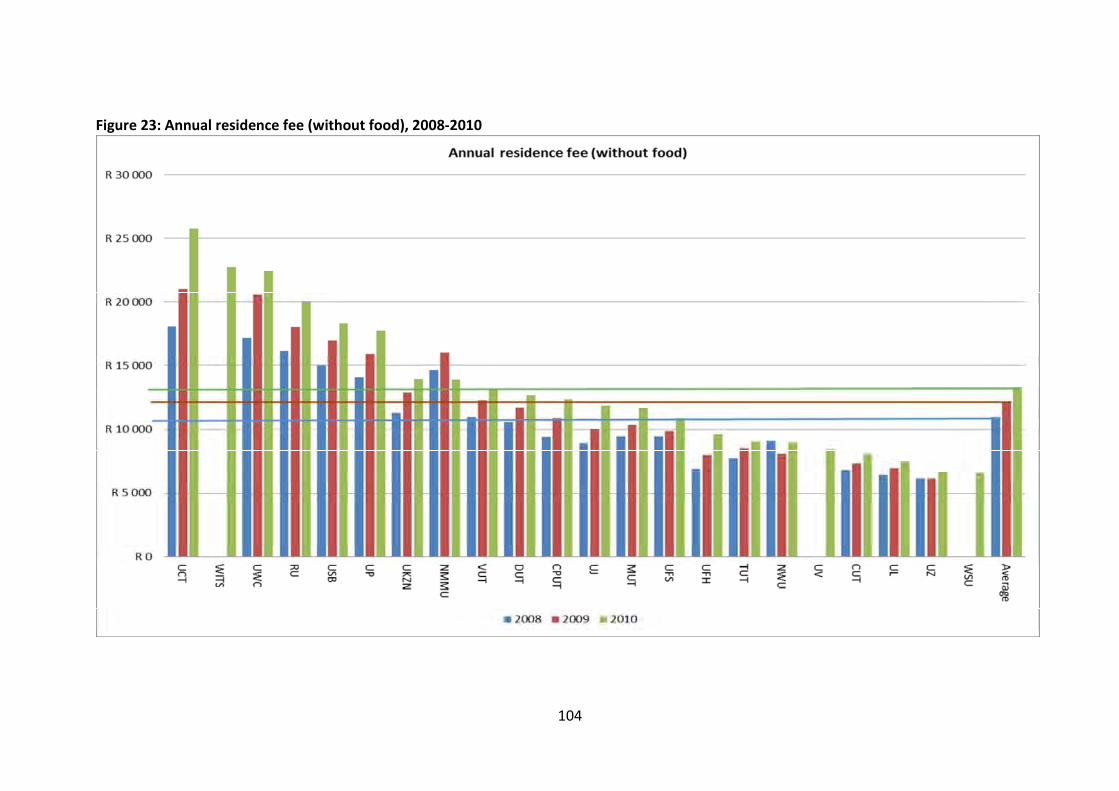
104
Figure 23: Annual residence fee (without food), 2008-2010
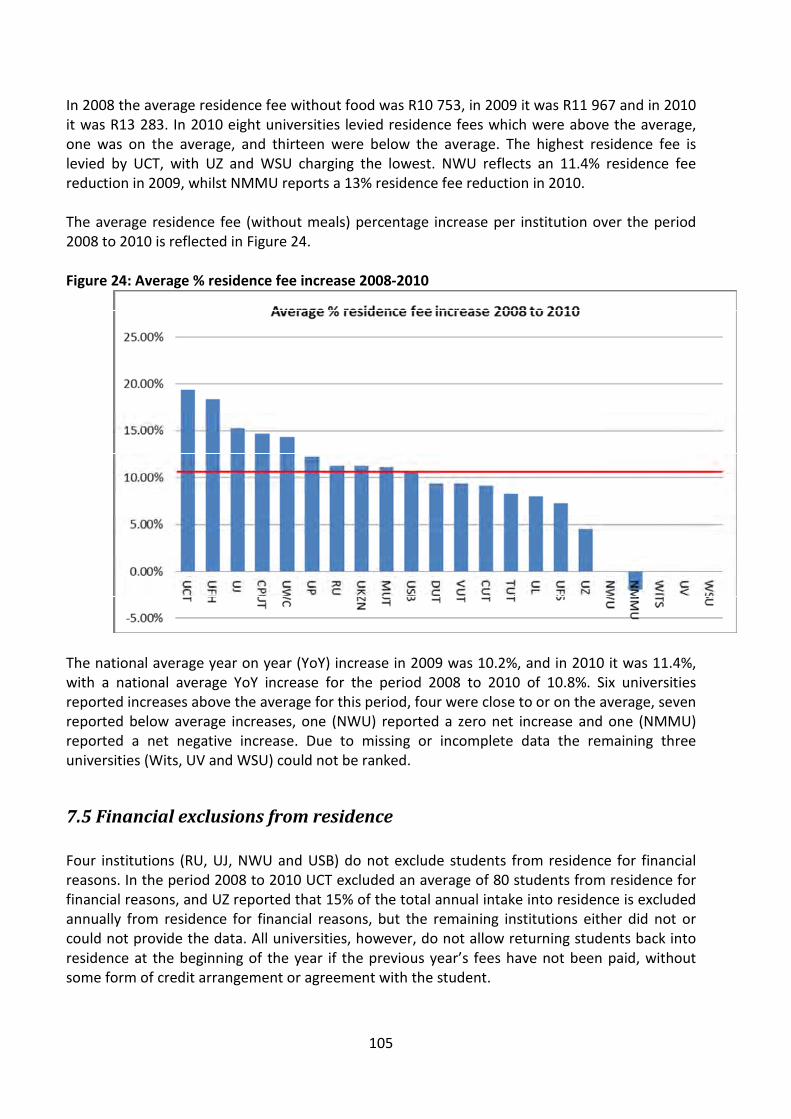
105
In 2008 the average residence fee without food was R10 753, in 2009 it was R11 967 and in 2010it was R13 283. In 2010 eight universities levied residence fees which were above the average,one was on the average, and thirteen were below the average. The highest residence fee islevied by UCT, with UZ and WSU charging the lowest. NWU reflects an 11.4% residence feereduction in 2009, whilst NMMU reports a 13% residence fee reduction in 2010.
The average residence fee (without meals) percentage increase per institution over the period2008 to 2010 is reflected in Figure 24.
Figure 24: Average % residence fee increase 2008-2010
The national average year on year (YoY) increase in 2009 was 10.2%, and in 2010 it was 11.4%,with a national average YoY increase for the period 2008 to 2010 of 10.8%. Six universitiesreported increases above the average for this period, four were close to or on the average, sevenreported below average increases, one (NWU) reported a zero net increase and one (NMMU)reported a net negative increase. Due to missing or incomplete data the remaining threeuniversities (Wits, UV and WSU) could not be ranked.
7.5 Financial exclusions from residence
Four institutions (RU, UJ, NWU and USB) do not exclude students from residence for financialreasons. In the period 2008 to 2010 UCT excluded an average of 80 students from residence forfinancial reasons, and UZ reported that 15% of the total annual intake into residence is excludedannually from residence for financial reasons, but the remaining institutions either did not orcould not provide the data. All universities, however, do not allow returning students back intoresidence at the beginning of the year if the previous year’s fees have not been paid, withoutsome form of credit arrangement or agreement with the student.
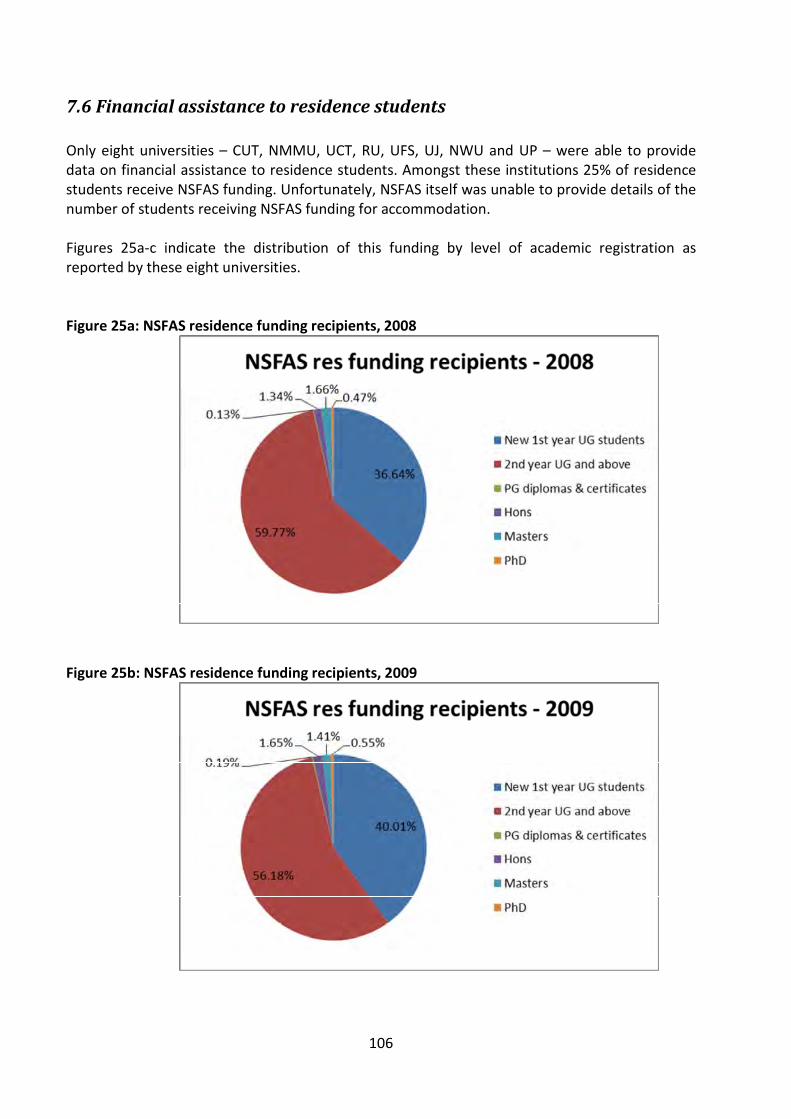
106
7.6 Financial assistance to residence students
Only eight universities – CUT, NMMU, UCT, RU, UFS, UJ, NWU and UP – were able to providedata on financial assistance to residence students. Amongst these institutions 25% of residencestudents receive NSFAS funding. Unfortunately, NSFAS itself was unable to provide details of thenumber of students receiving NSFAS funding for accommodation.
Figures 25a-c indicate the distribution of this funding by level of academic registration asreported by these eight universities.
Figure 25a: NSFAS residence funding recipients, 2008
Figure 25b: NSFAS residence funding recipients, 2009
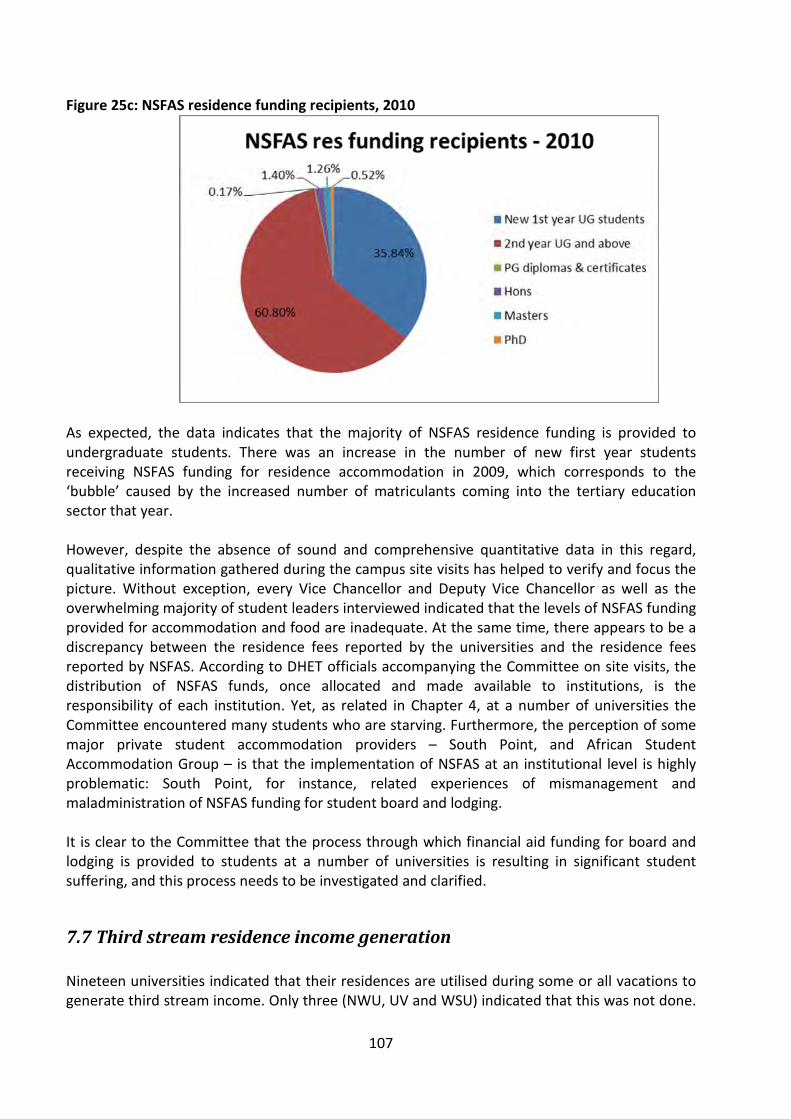
107
Figure 25c: NSFAS residence funding recipients, 2010
As expected, the data indicates that the majority of NSFAS residence funding is provided toundergraduate students. There was an increase in the number of new first year studentsreceiving NSFAS funding for residence accommodation in 2009, which corresponds to the‘bubble’ caused by the increased number of matriculants coming into the tertiary educationsector that year.
However, despite the absence of sound and comprehensive quantitative data in this regard,qualitative information gathered during the campus site visits has helped to verify and focus thepicture. Without exception, every Vice Chancellor and Deputy Vice Chancellor as well as theoverwhelming majority of student leaders interviewed indicated that the levels of NSFAS fundingprovided for accommodation and food are inadequate. At the same time, there appears to be adiscrepancy between the residence fees reported by the universities and the residence feesreported by NSFAS. According to DHET officials accompanying the Committee on site visits, thedistribution of NSFAS funds, once allocated and made available to institutions, is theresponsibility of each institution. Yet, as related in Chapter 4, at a number of universities theCommittee encountered many students who are starving. Furthermore, the perception of somemajor private student accommodation providers – South Point, and African StudentAccommodation Group – is that the implementation of NSFAS at an institutional level is highlyproblematic: South Point, for instance, related experiences of mismanagement andmaladministration of NSFAS funding for student board and lodging.
It is clear to the Committee that the process through which financial aid funding for board andlodging is provided to students at a number of universities is resulting in significant studentsuffering, and this process needs to be investigated and clarified.
7.7 Third stream residence income generation
Nineteen universities indicated that their residences are utilised during some or all vacations togenerate third stream income. Only three (NWU, UV and WSU) indicated that this was not done.
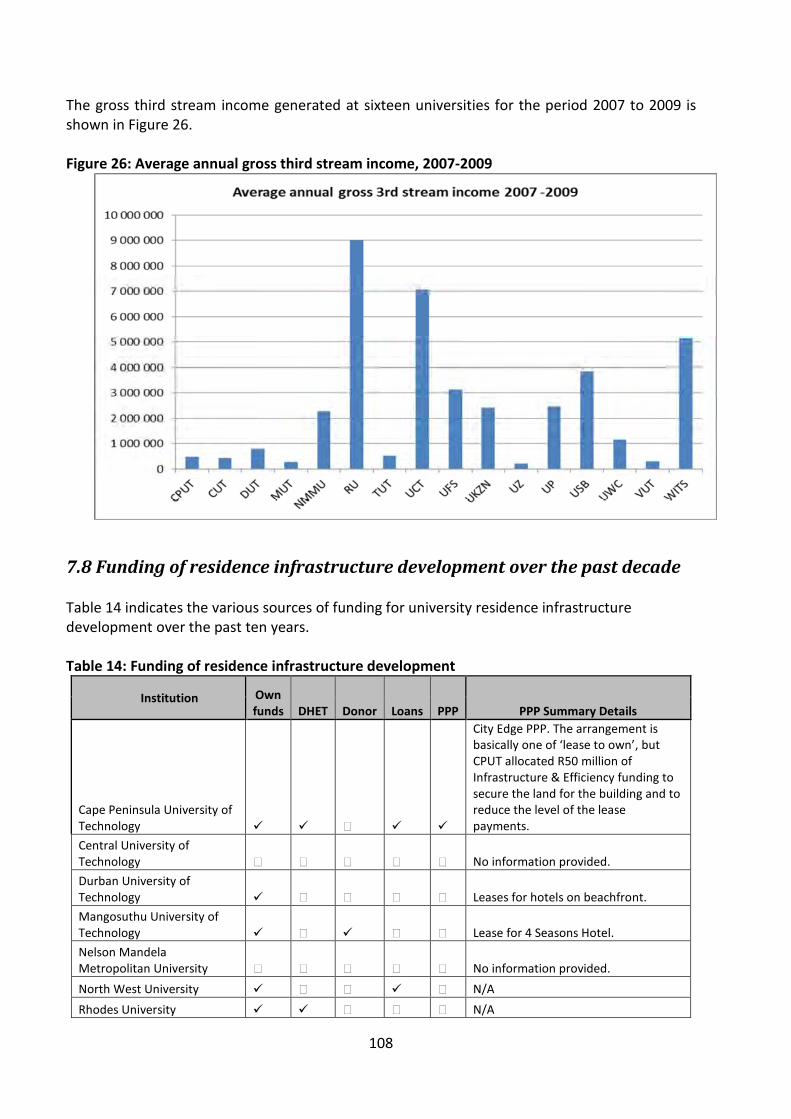
108
The gross third stream income generated at sixteen universities for the period 2007 to 2009 isshown in Figure 26.
Figure 26: Average annual gross third stream income, 2007-2009
7.8 Funding of residence infrastructure development over the past decade
Table 14 indicates the various sources of funding for university residence infrastructuredevelopment over the past ten years.
Table 14: Funding of residence infrastructure development
Institution Ownfunds DHET Donor Loans PPP PPP Summary Details
Cape Peninsula University ofTechnology
City Edge PPP. The arrangement isbasically one of ‘lease to own’, butCPUT allocated R50 million ofInfrastructure & Efficiency funding tosecure the land for the building and toreduce the level of the leasepayments.
Central University ofTechnology No information provided.
Durban University ofTechnology Leases for hotels on beachfront.
Mangosuthu University ofTechnology Lease for 4 Seasons Hotel.
Nelson MandelaMetropolitan University No information provided.
North West University N/A
Rhodes University N/A
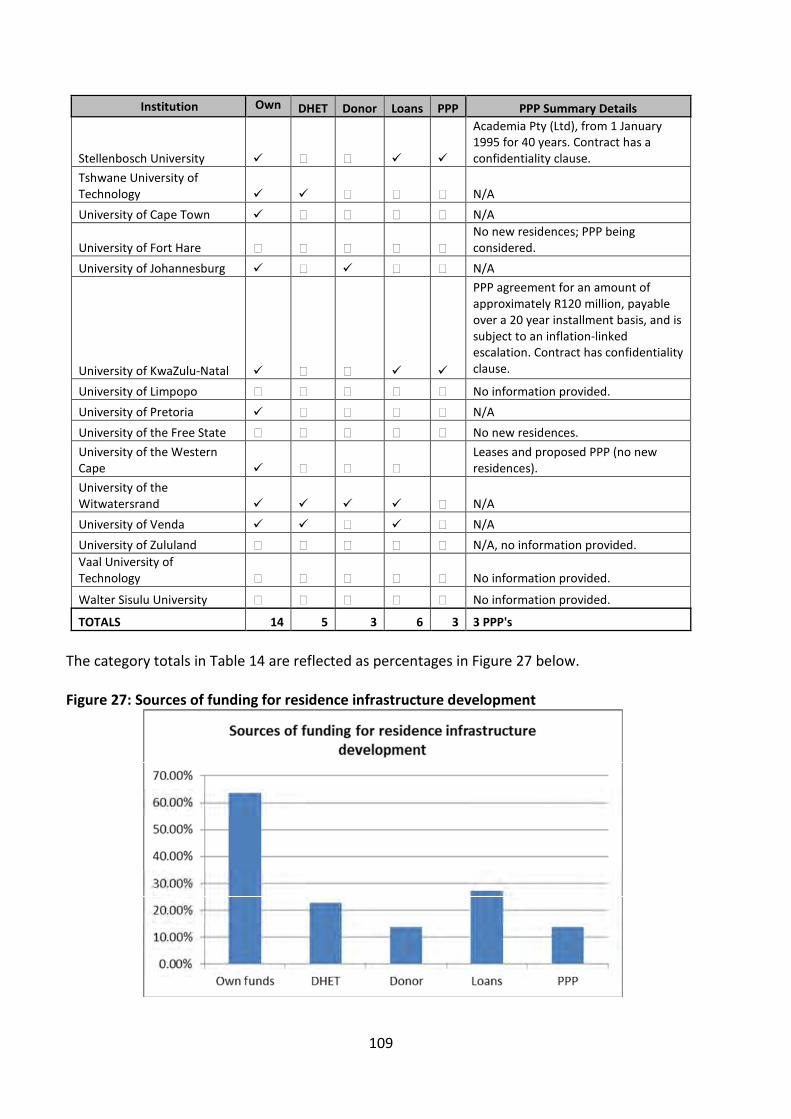
109
Institution Ownfunds
DHET Donor Loans PPP PPP Summary Details
Stellenbosch University
Academia Pty (Ltd), from 1 January1995 for 40 years. Contract has aconfidentiality clause.
Tshwane University ofTechnology N/A
University of Cape Town N/A
University of Fort Hare
No new residences; PPP beingconsidered.
University of Johannesburg N/A
University of KwaZulu-Natal
PPP agreement for an amount ofapproximately R120 million, payableover a 20 year installment basis, and issubject to an inflation-linkedescalation. Contract has confidentialityclause.
University of Limpopo No information provided.
University of Pretoria N/A
University of the Free State No new residences.
University of the WesternCape
Leases and proposed PPP (no newresidences).
University of theWitwatersrand N/A
University of Venda N/A
University of Zululand N/A, no information provided.
Vaal University ofTechnology No information provided.
Walter Sisulu University No information provided.
TOTALS 14 5 3 6 3 3 PPP's
The category totals in Table 14 are reflected as percentages in Figure 27 below.
Figure 27: Sources of funding for residence infrastructure development
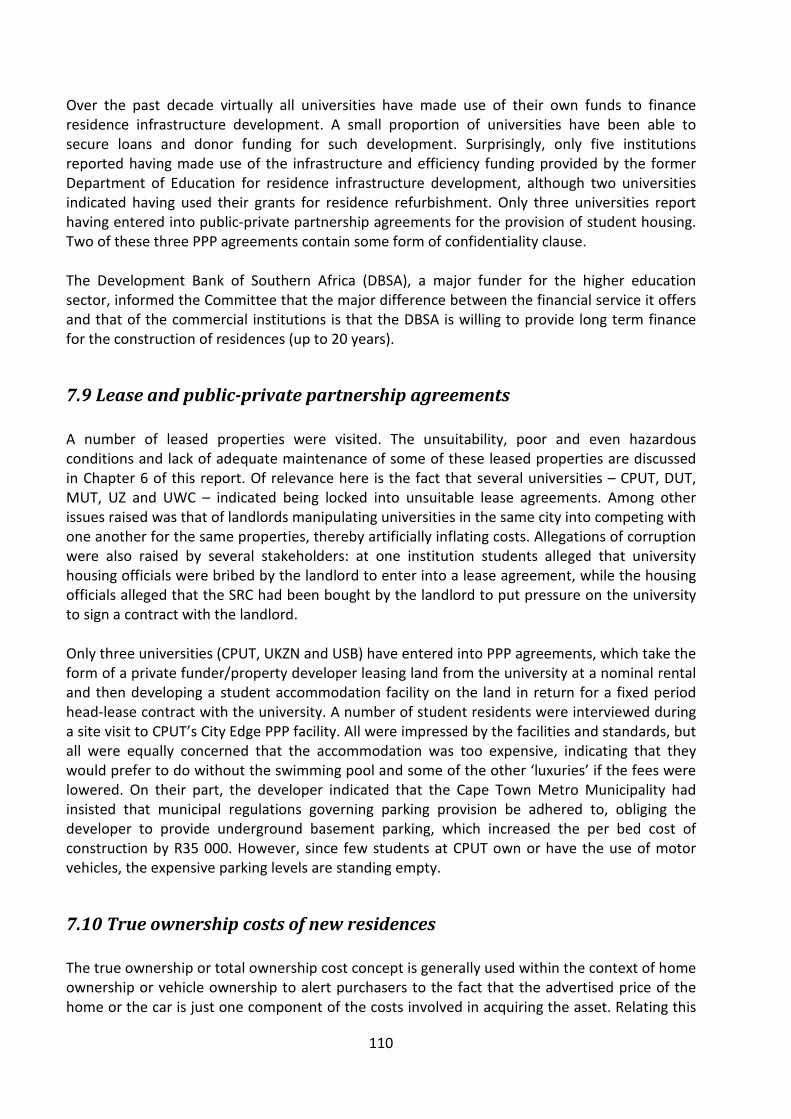
110
Over the past decade virtually all universities have made use of their own funds to financeresidence infrastructure development. A small proportion of universities have been able tosecure loans and donor funding for such development. Surprisingly, only five institutionsreported having made use of the infrastructure and efficiency funding provided by the formerDepartment of Education for residence infrastructure development, although two universitiesindicated having used their grants for residence refurbishment. Only three universities reporthaving entered into public-private partnership agreements for the provision of student housing.Two of these three PPP agreements contain some form of confidentiality clause.
The Development Bank of Southern Africa (DBSA), a major funder for the higher educationsector, informed the Committee that the major difference between the financial service it offersand that of the commercial institutions is that the DBSA is willing to provide long term financefor the construction of residences (up to 20 years).
7.9 Lease and public-private partnership agreements
A number of leased properties were visited. The unsuitability, poor and even hazardousconditions and lack of adequate maintenance of some of these leased properties are discussedin Chapter 6 of this report. Of relevance here is the fact that several universities – CPUT, DUT,MUT, UZ and UWC – indicated being locked into unsuitable lease agreements. Among otherissues raised was that of landlords manipulating universities in the same city into competing withone another for the same properties, thereby artificially inflating costs. Allegations of corruptionwere also raised by several stakeholders: at one institution students alleged that universityhousing officials were bribed by the landlord to enter into a lease agreement, while the housingofficials alleged that the SRC had been bought by the landlord to put pressure on the universityto sign a contract with the landlord.
Only three universities (CPUT, UKZN and USB) have entered into PPP agreements, which take theform of a private funder/property developer leasing land from the university at a nominal rentaland then developing a student accommodation facility on the land in return for a fixed periodhead-lease contract with the university. A number of student residents were interviewed duringa site visit to CPUT’s City Edge PPP facility. All were impressed by the facilities and standards, butall were equally concerned that the accommodation was too expensive, indicating that theywould prefer to do without the swimming pool and some of the other ‘luxuries’ if the fees werelowered. On their part, the developer indicated that the Cape Town Metro Municipality hadinsisted that municipal regulations governing parking provision be adhered to, obliging thedeveloper to provide underground basement parking, which increased the per bed cost ofconstruction by R35 000. However, since few students at CPUT own or have the use of motorvehicles, the expensive parking levels are standing empty.
7.10 True ownership costs of new residences
The true ownership or total ownership cost concept is generally used within the context of homeownership or vehicle ownership to alert purchasers to the fact that the advertised price of thehome or the car is just one component of the costs involved in acquiring the asset. Relating this

111
concept to the ownership of a university residence, the true ownership costs may be categorisedas follows:
1. Setup costs, referring to the total cost of constructing the residence which is incurredonce, and usually covered by some form of borrowing (from reserves, or a commercialloan). These costs include:
Feasibility and due diligence study costs (including Environmental Impact Assessmentcosts);
Professional fees of consultants (project manager, architect, consulting engineers,legal fees, etc.);
Procurement costs;
Construction costs (contractor, sub-contractors, materials, etc.);
Furniture and equipment costs; and
Contingency provision.
2. Recurring costs, referring to the annual operating expenditure required to keep theresidence functional into the future. The list of costs below is a composite of themanagement account reports received (large budget cost items have been identified asseparate line items, whilst smaller budget expense items have been grouped under thecategory general operating expenses):
Staffing costs (permanent, contract and casual and student subwarden remuneration;training expenses);
Food purchases (if catering is provided);
Loan costs (fixed asset capital redemption and interest repayment for residencecapital infrastructure projects);
Security costs (including access control and CCTV costs);
Cleaning materials;
Furniture and equipment renewals;
Insurance;
Services costs (rates, power and water, sanitation);
Maintenance and renovation costs (the facilities management industry standardprovision is 1%-3.5% of the replacement value of the fixed asset(s) to be budgetedper annum);
Refurbishment reserve cost (major refurbishment of fixed assets over and aboveroutine maintenance and renovation, approximately 1% of replacement value of fixedasset(s) per annum to be placed in refurbishment reserve);
Student support costs (hall grants, subscription costs, etc.);
Student financial aid (approximately 5% of total income from residences allocated forfinancial aid residence packages); and
General operating expenses (telephones, stationery, vehicle costs, insurance,transport, etc.).
3. Post-project costs, referring to once-off large item costs which arise after the completionof a budgeted project, such as the conversion from a token-based access control systemto a biometric access control system, as well as unplanned projects which may arise in
112
response to an emergency or crisis situation, such as a sudden spate of thefts requiringthe installation of cameras and panic buttons in a particular area.
A case study of an actual residence project at Rhodes University is presented below to illustratethe real costs of ownership of residences and the short to medium term impact upon theresidence budget. The project encompassed the construction of three new residences, providingan additional 261 beds, which was completed at the beginning of 2011. Two financial scenariosare provided under Appendix G.
Scenario 1 is based upon the following actual costs and assumptions:
The cost of the project was R62 275 000. The cost excludes land acquisition costs, butincludes construction costs, all furnishing and fittings (student rooms are fully furnishedand include soft furnishings and bed linen), heat pumps in place of hot water boilers,motion-control sensors to control lighting in common areas, wireless and fibre-opticnetwork points in each room, six common rooms fitted with flat screen TVs and DSTV,three kitchenettes, six laundry areas fitted with washing machines and tumble driers, sixbox rooms, biometric access control, electronic fire-monitoring system, rain-waterharvesting and on-site water storage to mitigate short period water outages, andlandscaping. All 261 student rooms are single rooms in a dormitory configuration. Three3-bedroomed wardens’ flats are included.
The cost per bed of the residences is thus R238 602 (2010 actual cost).
Factored into the model is the additional proportional cost (R7 830 000) of providingkitchen and dining hall facilities for 261 students.
The staff costs include the additional costs of a hall administrator, three cleaners, onehousekeeper and 12 food services staff (on two shifts) at RU remuneration rates (thelowest paid worker at RU received R71 175 per annum cost-to-company in 2011).
Income in the model is derived solely from residence fee income in the first year (avacancy provision of 2.25% is included), and from the second year third stream incomebased on historical income performance is included.
The residence fee in 2011 is R35 700, including three meals per day and bed linenlaundry.
Operating costs are based upon an assessment of the past ten years’ actual expenditure.
Capital replacements are factored into the model after five years, and maintenance andprovision for refurbishment after seven years at 2% of cost of construction.
Residence fees and operating costs are escalated annually at the current tertiaryeducation inflation rate of 8.5% provided in the latest Statistics South Africa data.
In order to establish the true ownership cost it is assumed that the entire project cost hasbeen financed through a 100% loan to be repaid over ten years at a fixed interest rate of9%.
The scenario indicates that the total net deficit during the ten year loan repayment period isR98.112 million, which will take a further eight years after repayment to recoup. The additionalcost to the institution is thus the R86.8 million deficit over ten years which would need to befunded from either:
113
Cross-subsidisation from existing paid-off residences;
Residence reserves, which may incur an opportunity cost depending upon the strategicplans of the student housing division;
Institution reserves or bank overdraft, both of which come at a further cost;
Increasing residence fees; or
Any combination of the above.
This effect or impact is represented in Figure 28 below, in which the large net deficit for the tenyear loan period is evident (red graph).
Figure 28: Real cost of ownership - Scenario 1
Needless to say, the cost is higher if the cost of acquiring land is to be factored into the model,and if a floating interest rate loan is secured and interest rates increase. The cost to the studentsin this model is a residence fee of R35 700 per annum including food.
However, were the residences to be funded by a government grant (such as an infrastructureand efficiency funding grant), the scenario would change significantly. The impact of this secondscenario (Scenario 2; see also spreadsheet B in Appendix G) is illustrated below.
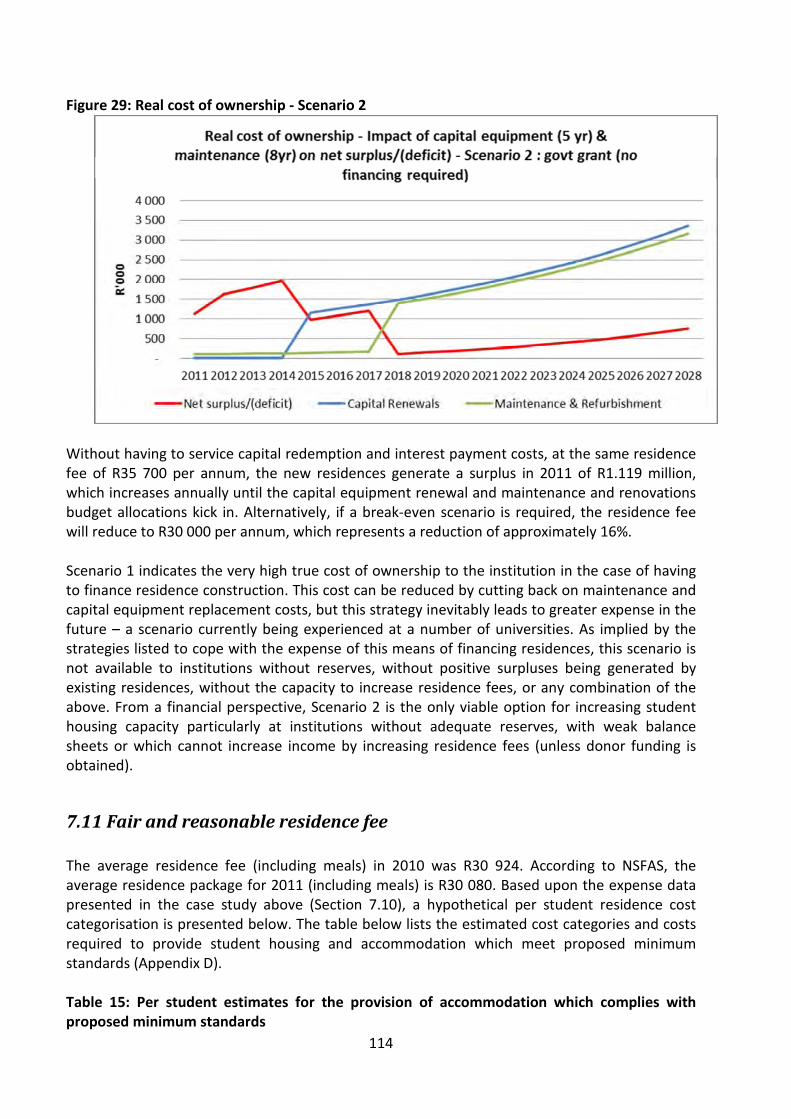
114
Figure 29: Real cost of ownership - Scenario 2
Without having to service capital redemption and interest payment costs, at the same residencefee of R35 700 per annum, the new residences generate a surplus in 2011 of R1.119 million,which increases annually until the capital equipment renewal and maintenance and renovationsbudget allocations kick in. Alternatively, if a break-even scenario is required, the residence feewill reduce to R30 000 per annum, which represents a reduction of approximately 16%.
Scenario 1 indicates the very high true cost of ownership to the institution in the case of havingto finance residence construction. This cost can be reduced by cutting back on maintenance andcapital equipment replacement costs, but this strategy inevitably leads to greater expense in thefuture – a scenario currently being experienced at a number of universities. As implied by thestrategies listed to cope with the expense of this means of financing residences, this scenario isnot available to institutions without reserves, without positive surpluses being generated byexisting residences, without the capacity to increase residence fees, or any combination of theabove. From a financial perspective, Scenario 2 is the only viable option for increasing studenthousing capacity particularly at institutions without adequate reserves, with weak balancesheets or which cannot increase income by increasing residence fees (unless donor funding isobtained).
7.11 Fair and reasonable residence fee
The average residence fee (including meals) in 2010 was R30 924. According to NSFAS, theaverage residence package for 2011 (including meals) is R30 080. Based upon the expense datapresented in the case study above (Section 7.10), a hypothetical per student residence costcategorisation is presented below. The table below lists the estimated cost categories and costsrequired to provide student housing and accommodation which meet proposed minimumstandards (Appendix D).
Table 15: Per student estimates for the provision of accommodation which complies withproposed minimum standards
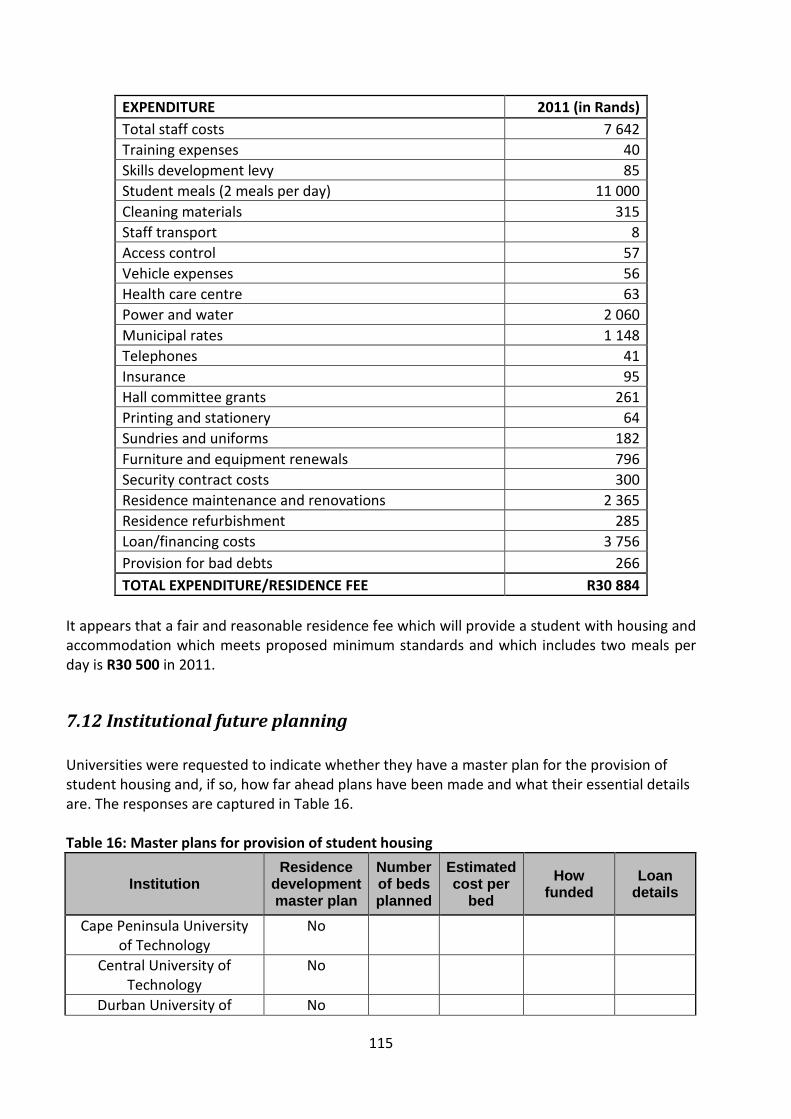
115
EXPENDITURE 2011 (in Rands)
Total staff costs 7 642
Training expenses 40
Skills development levy 85
Student meals (2 meals per day) 11 000
Cleaning materials 315
Staff transport 8
Access control 57
Vehicle expenses 56
Health care centre 63
Power and water 2 060
Municipal rates 1 148
Telephones 41
Insurance 95
Hall committee grants 261
Printing and stationery 64
Sundries and uniforms 182
Furniture and equipment renewals 796
Security contract costs 300
Residence maintenance and renovations 2 365
Residence refurbishment 285
Loan/financing costs 3 756
Provision for bad debts 266
TOTAL EXPENDITURE/RESIDENCE FEE R30 884
It appears that a fair and reasonable residence fee which will provide a student with housing andaccommodation which meets proposed minimum standards and which includes two meals perday is R30 500 in 2011.
7.12 Institutional future planning
Universities were requested to indicate whether they have a master plan for the provision ofstudent housing and, if so, how far ahead plans have been made and what their essential detailsare. The responses are captured in Table 16.
Table 16: Master plans for provision of student housing
InstitutionResidence
developmentmaster plan
Numberof bedsplanned
Estimatedcost per
bed
Howfunded
Loandetails
Cape Peninsula Universityof Technology
No
Central University ofTechnology
No
Durban University of No
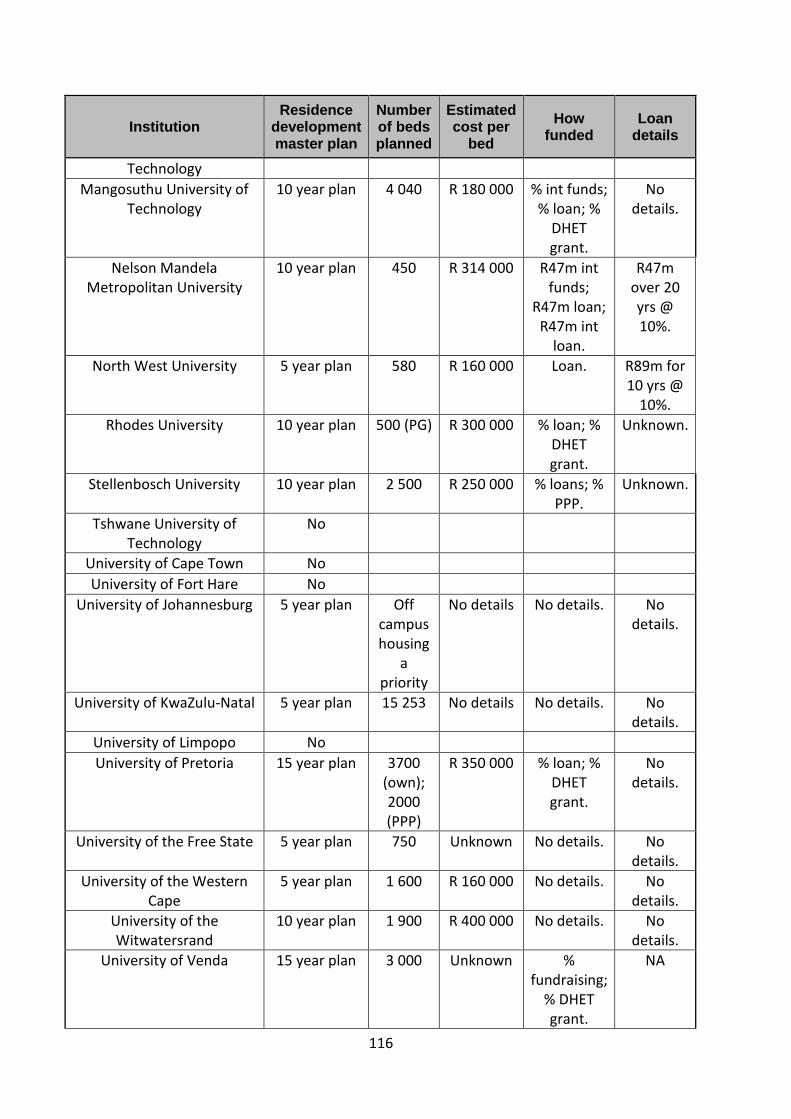
116
InstitutionResidence
developmentmaster plan
Numberof bedsplanned
Estimatedcost per
bed
Howfunded
Loandetails
Technology
Mangosuthu University ofTechnology
10 year plan 4 040 R 180 000 % int funds;% loan; %
DHETgrant.
Nodetails.
Nelson MandelaMetropolitan University
10 year plan 450 R 314 000 R47m intfunds;
R47m loan;R47m int
loan.
R47mover 20yrs @10%.
North West University 5 year plan 580 R 160 000 Loan. R89m for10 yrs @
10%.
Rhodes University 10 year plan 500 (PG) R 300 000 % loan; %DHETgrant.
Unknown.
Stellenbosch University 10 year plan 2 500 R 250 000 % loans; %PPP.
Unknown.
Tshwane University ofTechnology
No
University of Cape Town No
University of Fort Hare No
University of Johannesburg 5 year plan Offcampushousing
apriority
No details No details. Nodetails.
University of KwaZulu-Natal 5 year plan 15 253 No details No details. Nodetails.
University of Limpopo No
University of Pretoria 15 year plan 3700(own);2000(PPP)
R 350 000 % loan; %DHETgrant.
Nodetails.
University of the Free State 5 year plan 750 Unknown No details. Nodetails.
University of the WesternCape
5 year plan 1 600 R 160 000 No details. Nodetails.
University of theWitwatersrand
10 year plan 1 900 R 400 000 No details. Nodetails.
University of Venda 15 year plan 3 000 Unknown %fundraising;
% DHETgrant.
NA
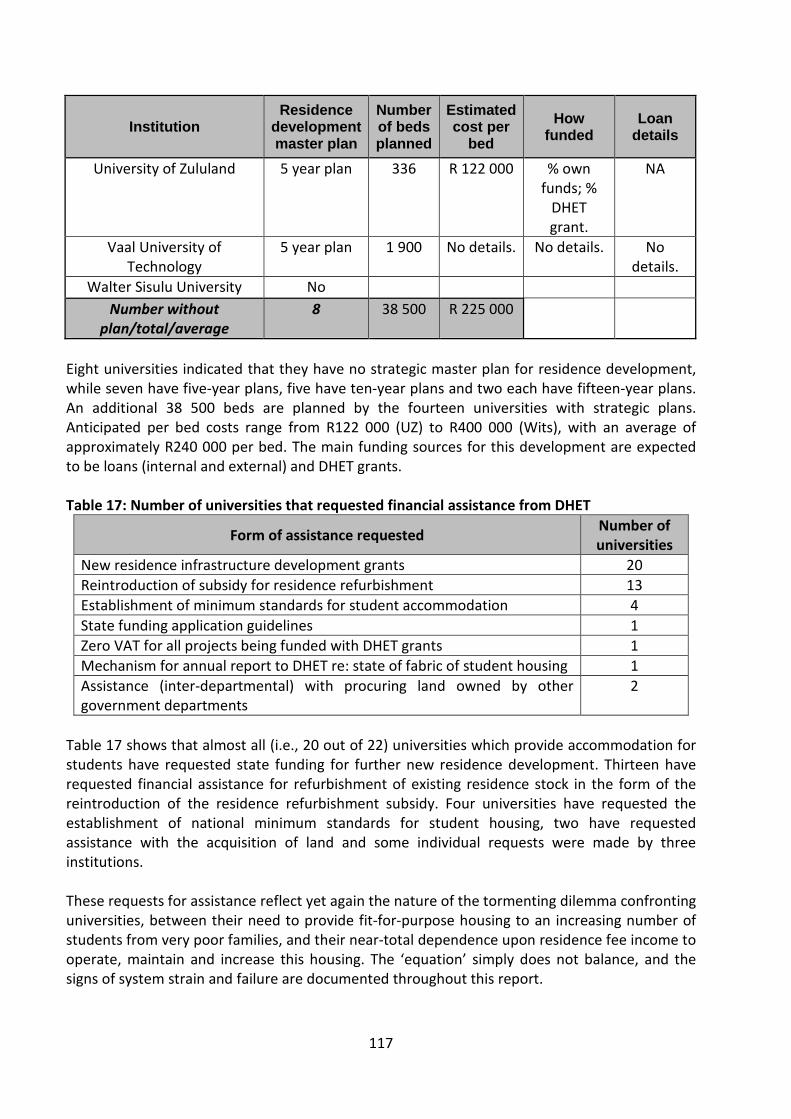
117
InstitutionResidence
developmentmaster plan
Numberof bedsplanned
Estimatedcost per
bed
Howfunded
Loandetails
University of Zululand 5 year plan 336 R 122 000 % ownfunds; %
DHETgrant.
NA
Vaal University ofTechnology
5 year plan 1 900 No details. No details. Nodetails.
Walter Sisulu University No
Number withoutplan/total/average
8 38 500 R 225 000
Eight universities indicated that they have no strategic master plan for residence development,while seven have five-year plans, five have ten-year plans and two each have fifteen-year plans.An additional 38 500 beds are planned by the fourteen universities with strategic plans.Anticipated per bed costs range from R122 000 (UZ) to R400 000 (Wits), with an average ofapproximately R240 000 per bed. The main funding sources for this development are expectedto be loans (internal and external) and DHET grants.
Table 17: Number of universities that requested financial assistance from DHET
Form of assistance requestedNumber ofuniversities
New residence infrastructure development grants 20
Reintroduction of subsidy for residence refurbishment 13
Establishment of minimum standards for student accommodation 4
State funding application guidelines 1
Zero VAT for all projects being funded with DHET grants 1
Mechanism for annual report to DHET re: state of fabric of student housing 1
Assistance (inter-departmental) with procuring land owned by othergovernment departments
2
Table 17 shows that almost all (i.e., 20 out of 22) universities which provide accommodation forstudents have requested state funding for further new residence development. Thirteen haverequested financial assistance for refurbishment of existing residence stock in the form of thereintroduction of the residence refurbishment subsidy. Four universities have requested theestablishment of national minimum standards for student housing, two have requestedassistance with the acquisition of land and some individual requests were made by threeinstitutions.
These requests for assistance reflect yet again the nature of the tormenting dilemma confrontinguniversities, between their need to provide fit-for-purpose housing to an increasing number ofstudents from very poor families, and their near-total dependence upon residence fee income tooperate, maintain and increase this housing. The ‘equation’ simply does not balance, and thesigns of system strain and failure are documented throughout this report.
118
8. Analysis of findings
The university system that exists today is one that has evolved from a set of higher educationinstitutions inherited from the apartheid era. The white community was served by a smallnumber of elite universities and a few technikons, but the institutions serving the blackcommunity were significantly less well resourced both in terms of capital investment andfunding per student. Because these universities were serving a predominantly poor section ofthe population, limited additional income could be generated from fees or donations andcorporate sponsorship was minimal.
Since political liberation in 1994, the question of economic liberation has become the critical‘make-or-break’ issue for South Africa as it struggles with the reality and consequences of beingone of the most economically inequitable countries in the world. In this struggle, highereducation is a crucial component in the strategy to address the issues of poverty and theattainment of a normalised economy. In order to produce the skilled human capital required forrealising these objectives, it is vital that access to higher education is increased dramatically, andall South African universities are under great pressure to ‘throw open the doors of learning’.However, increased access to the academic programmes of universities has given rise tosignificant and potentially explosive incongruities in relation to current national student housingcapacity.
The Vice Chancellor of the University of the Western Cape expressed the awfulness of thedilemma faced at several universities:
The scale of the problem is desperate. We [UWC] have thrown open the doors of learning fornineteen thousand students, but we only have place for three thousand two hundred. Locallandlords demand high rentals, but NSFAS funding is totally inadequate; and thisaccommodation is often appalling. We can’t have any campus programmes after four in theafternoon because of the dangers our students, many of whom are from the poorest of thepoor communities of Khayelitsha and beyond, face while travelling. The nearest cinema isfifteen kilometres from campus. The past continues to linger with us (Professor BrianO’Connell, site visit interview, 17 March 2011).
This view was echoed by both university and student leadership at almost all universities visited.
The process of transforming this system and achieving greater equity was never going to be aneasy or a short term task. The restructuring of universities and technikons, especially by mergingcampuses with differing historical funding arrangements, has provided an opportunity to createa more even funding environment. But, while it has been relatively easy to introduce moreequitable funding of students, and even (through NSFAS) some level of redress, it has been muchmore difficult to address the imbalance in inherited resources. The historically advantageduniversities remain advantaged in many respects. They have higher levels of corporatesponsorship and higher levels of income from research, they attract more affluent students andthey have better quality and better maintained infrastructure. Where previously advantagedinstitutions have inherited campuses that were previously disadvantaged, they have had toinvest substantial levels of commitment, resources and expenditure, but this challenge pales in
119
significance in relation to that facing historically disadvantaged universities with universally poorinfrastructure and maintenance levels.
All universities, however, regardless of the current state of their infrastructure and resources,face a difficult future in respect of accommodation. It is expected that a continuously increasingproportion of school leavers will enroll in university courses. An increasingly large majority ofstudents will be coming from poor urban townships and rural areas rather than from middleclass suburbs. This will increase demand for student accommodation, and for additional trainedstaff to manage the accommodation.
It is important to understand university residences as being much more than bricks and mortar.They are social structures located in learning institutions that in turn are embedded in a varietyof South African communities. These communities bring with them into the universities andresidences the complete range of socio-economic problems that exist in society. There remainlimited understandings between individuals and communities from different racial groups, not tomention gender, impacting upon the ability of universities to create mixed living spaces. Thereare huge differences between the expectations of affluent or middle class students and those ofpoorer students from families with little experience of post-school education.
Universities are part of our communities and share all the problems and possibilities of society,and it is in this context that some very difficult choices will have to be made with regard to theprovision of student housing.
8.1 Overall assessment
The data which this report has gathered paints a very challenging national picture:
1. There are 107 598 beds available for the approximately 535 000 learners currentlyenrolled in the country’s 22 residential universities.
2. There is a relatively clear pattern of reasonable to excellent student accommodationbeing provided at the historically advantaged campuses, and reasonable to deplorableaccommodation being provided at the historically disadvantaged campuses (with somenotable exceptions, including the QwaQwa campus of UFS, and the Mafikeng campus ofNWU).
3. The demographic profile of students in residence closely approximates the nationaldemographic profile.
4. There is a paucity of research on student housing in South Africa and more generally in adeveloping country context.
5. Various models of student accommodation exist, ranging from traditional dormitory typeresidences to student villages.
120
6. Various models for acquiring student residences have been identified, ranging fromowner-build to public-private partnerships.
7. A constant theme emerging from the financial analysis is the implacable dialecticbetween the need to keep residence fees as low as possible and the need to providestudent housing and accommodation which meets minimum acceptable standards. Thisdialectic is particularly relentless at institutions which draw students from the poorestcommunities in South Africa.
8. The maldistribution of NSFAS funding for student accommodation at a number ofuniversities is the direct cause of much suffering and hardship to students at thoseinstitutions. Many students experience hunger on a daily basis.
From a policy perspective, there is a need to break down the large scale problem that is studenthousing into a set of more manageable challenges. The analysis below is intended to assist in theestablishment of meaningful targets for the short, medium and longer term.
8.2 Towards a typology of South African higher education campuses
The different campuses of some universities, let alone the universities themselves, have verydifferent contexts and needs. The following campus typology is proposed for the purpose ofquantifying the national shortage of beds. It must be emphasised that this typology and thetargets suggested here are illustrative and represent, in the Committee’s view, the idealsituation.
Type 1 campuses are those where off-campus accommodation is unsuitable and/orunavailable (e.g. UL Turfloop, UV, UWC, UFH Alice). These campuses are located inimpoverished areas with a severe shortage of suitable accommodation for the area’sresidents, let alone students. Consequently, such campuses ideally need to be able toaccommodate a minimum of 80% of total student enrolment in on-campusaccommodation in the short to medium timeframe, and 100% in the long term.
Type 2 campuses are those where limited off-campus accommodation is available and issuitable (e.g. RU, USB). Such campuses ideally should be able to accommodate aminimum of 50% of total student enrolment in on-campus accommodation.
Type 3 campuses are those where limited off-campus accommodation is available and issuitable, and where land for on-campus accommodation is restricted (e.g. UJ, Wits, UCT).On these campuses, ideally, PPP student accommodation villages, involving partnershipbetween universities, metropolitan councils and private providers, should be encouragedand supported in the short to medium term.
Various options are available for determining the targets and thus the residence bed backlog.Using the campus typology proposed above, targets for calculating the 2010 shortage could beset as follows:
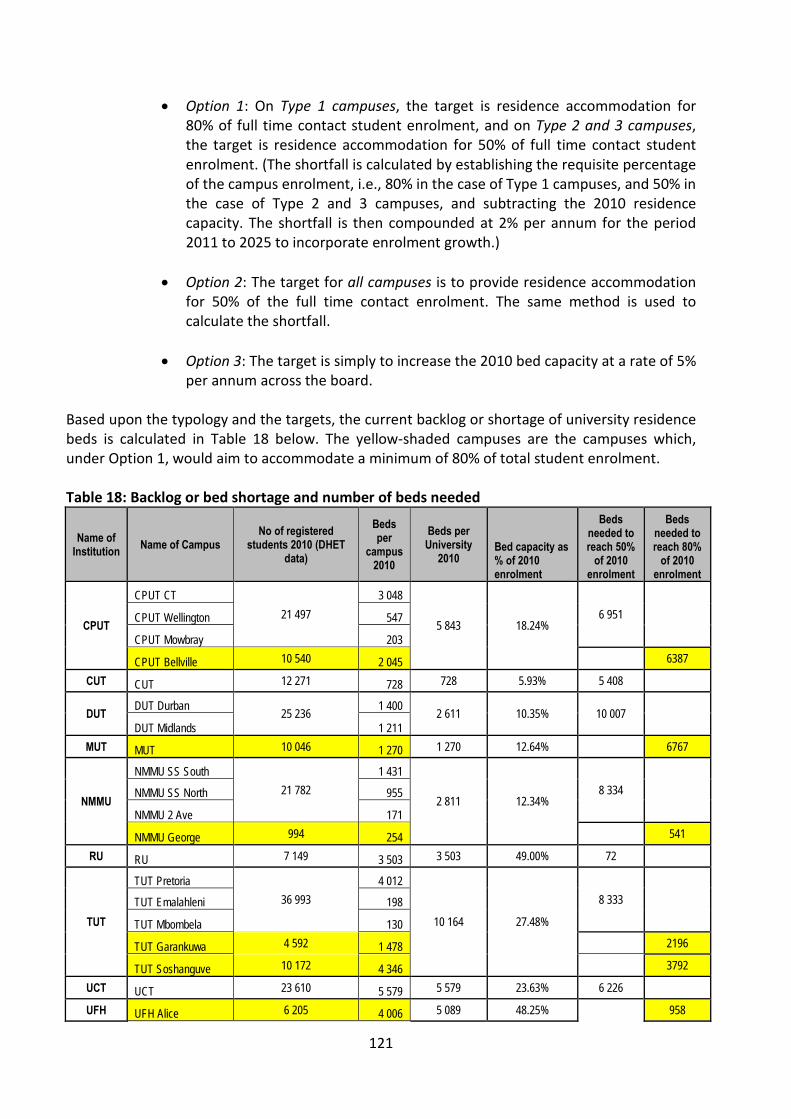
121
Option 1: On Type 1 campuses, the target is residence accommodation for80% of full time contact student enrolment, and on Type 2 and 3 campuses,the target is residence accommodation for 50% of full time contact studentenrolment. (The shortfall is calculated by establishing the requisite percentageof the campus enrolment, i.e., 80% in the case of Type 1 campuses, and 50% inthe case of Type 2 and 3 campuses, and subtracting the 2010 residencecapacity. The shortfall is then compounded at 2% per annum for the period2011 to 2025 to incorporate enrolment growth.)
Option 2: The target for all campuses is to provide residence accommodationfor 50% of the full time contact enrolment. The same method is used tocalculate the shortfall.
Option 3: The target is simply to increase the 2010 bed capacity at a rate of 5%per annum across the board.
Based upon the typology and the targets, the current backlog or shortage of university residencebeds is calculated in Table 18 below. The yellow-shaded campuses are the campuses which,under Option 1, would aim to accommodate a minimum of 80% of total student enrolment.
Table 18: Backlog or bed shortage and number of beds needed
Name ofInstitution
Name of CampusNo of registered
students 2010 (DHETdata)
Bedsper
campus2010
Beds perUniversity
2010Bed capacity as% of 2010enrolment
Bedsneeded toreach 50%
of 2010enrolment
Bedsneeded toreach 80%
of 2010enrolment
CPUT
CPUT CT
21 497
3 048
5 843 18.24%6 951CPUT Wellington 547
CPUT Mowbray 203
CPUT Bellville 10 540 2 045 6387
CUT CUT 12 271 728 728 5.93% 5 408
DUTDUT Durban
25 2361 400
2 611 10.35% 10 007DUT Midlands 1 211
MUT MUT 10 046 1 270 1 270 12.64% 6767
NMMU
NMMU SS South
21 782
1 431
2 811 12.34%8 334NMMU SS North 955
NMMU 2 Ave 171
NMMU George 994 254 541
RU RU 7 149 3 503 3 503 49.00% 72
TUT
TUT Pretoria
36 993
4 012
10 164 27.48%
8 333TUT Emalahleni 198
TUT Mbombela 130
TUT Garankuwa 4 592 1 478 2196
TUT Soshanguve 10 172 4 346 3792
UCT UCT 23 610 5 579 5 579 23.63% 6 226
UFH UFH Alice 6 205 4 006 5 089 48.25% 958
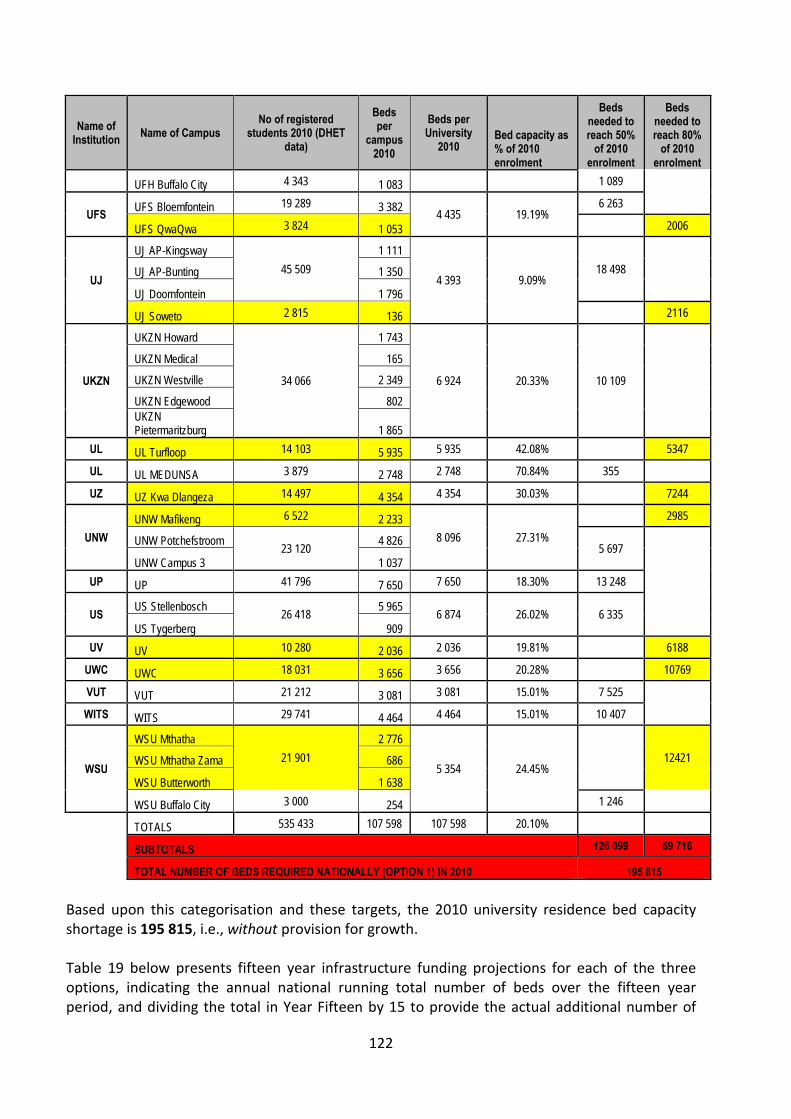
122
Name ofInstitution
Name of CampusNo of registered
students 2010 (DHETdata)
Bedsper
campus2010
Beds perUniversity
2010Bed capacity as% of 2010enrolment
Bedsneeded toreach 50%
of 2010enrolment
Bedsneeded toreach 80%
of 2010enrolment
UFH Buffalo City 4 343 1 083 1 089
UFSUFS Bloemfontein 19 289 3 382
4 435 19.19%6 263
UFS QwaQwa 3 824 1 053 2006
UJ
UJ AP-Kingsway
45 509
1 111
4 393 9.09%18 498UJ AP-Bunting 1 350
UJ Doornfontein 1 796
UJ Soweto 2 815 136 2116
UKZN
UKZN Howard
34 066
1 743
6 924 20.33% 10 109
UKZN Medical 165
UKZN Westville 2 349
UKZN Edgewood 802
UKZNPietermaritzburg 1 865
UL UL Turfloop 14 103 5 935 5 935 42.08% 5347
UL UL MEDUNSA 3 879 2 748 2 748 70.84% 355
UZ UZ Kwa Dlangeza 14 497 4 354 4 354 30.03% 7244
UNW
UNW Mafikeng 6 522 2 233
8 096 27.31%
2985
UNW Potchefstroom23 120
4 8265 697
UNW Campus 3 1 037
UP UP 41 796 7 650 7 650 18.30% 13 248
USUS Stellenbosch
26 4185 965
6 874 26.02% 6 335US Tygerberg 909
UV UV 10 280 2 036 2 036 19.81% 6188
UWC UWC 18 031 3 656 3 656 20.28% 10769
VUT VUT 21 212 3 081 3 081 15.01% 7 525
WITS WITS 29 741 4 464 4 464 15.01% 10 407
WSU
WSU Mthatha
21 901
2 776
5 354 24.45%12421WSU Mthatha Zama 686
WSU Butterworth 1 638
WSU Buffalo City 3 000 254 1 246
TOTALS 535 433 107 598 107 598 20.10%
SUBTOTALS 126 099 69 716
TOTAL NUMBER OF BEDS REQUIRED NATIONALLY (OPTION 1) IN 2010 195 815
Based upon this categorisation and these targets, the 2010 university residence bed capacityshortage is 195 815, i.e., without provision for growth.
Table 19 below presents fifteen year infrastructure funding projections for each of the threeoptions, indicating the annual national running total number of beds over the fifteen yearperiod, and dividing the total in Year Fifteen by 15 to provide the actual additional number of
123
beds required to meet the target by 2025. The 2010 per bed construction cost in 2010 iscompounded annually at a rate of 10%; and the annual cost over the fifteen year period iscalculated. Note that the number of beds for which infrastructure funding will be required willdecrease if, in addition, private and PPP initiatives are established.

124
Table 19: Fifteen year infrastructure funding requirement for university residence infrastructure development
OPTION 1 2010 2011 2012 2013 2014 2015 2016 2017 2018 2019 2020 2021 2022 2023 2024 2025
capacity target 195815 199731 203726 207800 211956 216195 220519 224930 229428 234017 238697 243471 248341 253307 258373 263541
Annual target ov er 15 y ears 17569 17569 17569 17569 17569 17569 17569 17569 17569 17569 17569 17569 17569 17569 17569
Construction cost per bedR 240 000 R 264 000 R 290 400 R 319 440 R 351 384 R 386 522 R 425 175 R 467 692 R 514 461 R 565 907 R 622 498 R 684 748 R 753 223 R 828 545 R 911 400 R 1 002 540
Annual Infrastructure grant req R 4 638 320 535 R 5 102 152 589 R 5 612 367 847 R 6 173 604 632 R 6 790 965 095 R 7 470 061 605 R 8 217 067 766 R 9 038 774 542 R 9 942 651 996 R 10 936 917 196 R 12 030 608 915 R 13 233 669 807 R 14 557 036 788 R 16 012 740 467 R 17 614 014 513
Infrastructure grant (5 year intervals) R 28 317 410 699 R 45 605 473 105 R 73 448 070 490
Total res infrastructure development grant over 15 year period: R 147 370 954 294
OPTION 2 2010 2011 2012 2013 2014 2015 2016 2017 2018 2019 2020 2021 2022 2023 2024 2025
capacity target 160119 163321 166587 169919 173317 176784 180319 183926 187604 191356 195184 199087 203069 207130 211273 215498
Annual target ov er 15 y ears 14367 14367 14367 14367 14367 14367 14367 14367 14367 14367 14367 14367 14367 14367 14367
Construction cost per bedR 240 000 R 264 000 R 290 400 R 319 440 R 351 384 R 386 522 R 425 175 R 467 692 R 514 461 R 565 907 R 622 498 R 684 748 R 753 223 R 828 545 R 911 400 R 1 002 540
Infrastructure grant R 3 792 888 000 R 4 172 176 800 R 4 589 394 480 R 5 048 333 928 R 5 553 167 321 R 6 108 484 053 R 6 719 332 458 R 7 391 265 704 R 8 130 392 274 R 8 943 431 502 R 9 837 774 652 R 10 821 552 117 R 11 903 707 329 R 13 094 078 062 R 14 403 485 868
Infrastructure grant (5 year intervals) R 23 155 960 529 R 37 292 905 991 R 60 060 598 028
Total res infrastructure development grant over 15 year period: R 120 509 464 548
OPTION 3 2010 2011 2012 2013 2014 2015 2016 2017 2018 2019 2020 2021 2022 2023 2024 2025
capacity target 107598 112978 118627 124558 130786 137325 144192 151401 158971 166920 175266 184029 193231 202892 213037 223689
Annual target ov er 15 y ears 14913 14913 14913 14913 14913 14913 14913 14913 14913 14913 14913 14913 14913 14913 14913
Construction cost per bedR 240 000 R 264 000 R 290 400 R 319 440 R 351 384 R 386 522 R 425 175 R 467 692 R 514 461 R 565 907 R 622 498 R 684 748 R 753 223 R 828 545 R 911 400 R 1 002 540
Infrastructure grant R 3 937 032 000 R 4 330 735 200 R 4 763 808 720 R 5 240 189 592 R 5 764 208 551 R 6 340 629 406 R 6 974 692 347 R 7 672 161 582 R 8 439 377 740 R 9 283 315 514 R 10 211 647 065 R 11 232 811 772 R 12 356 092 949 R 13 591 702 244 R 14 950 872 468
Infrastructure grant (5 year intervals) R 24 035 974 063 R 38 710 176 589 R 62 343 126 498
Total res infrastructure development grant over 15 year period: R 125 089 277 149
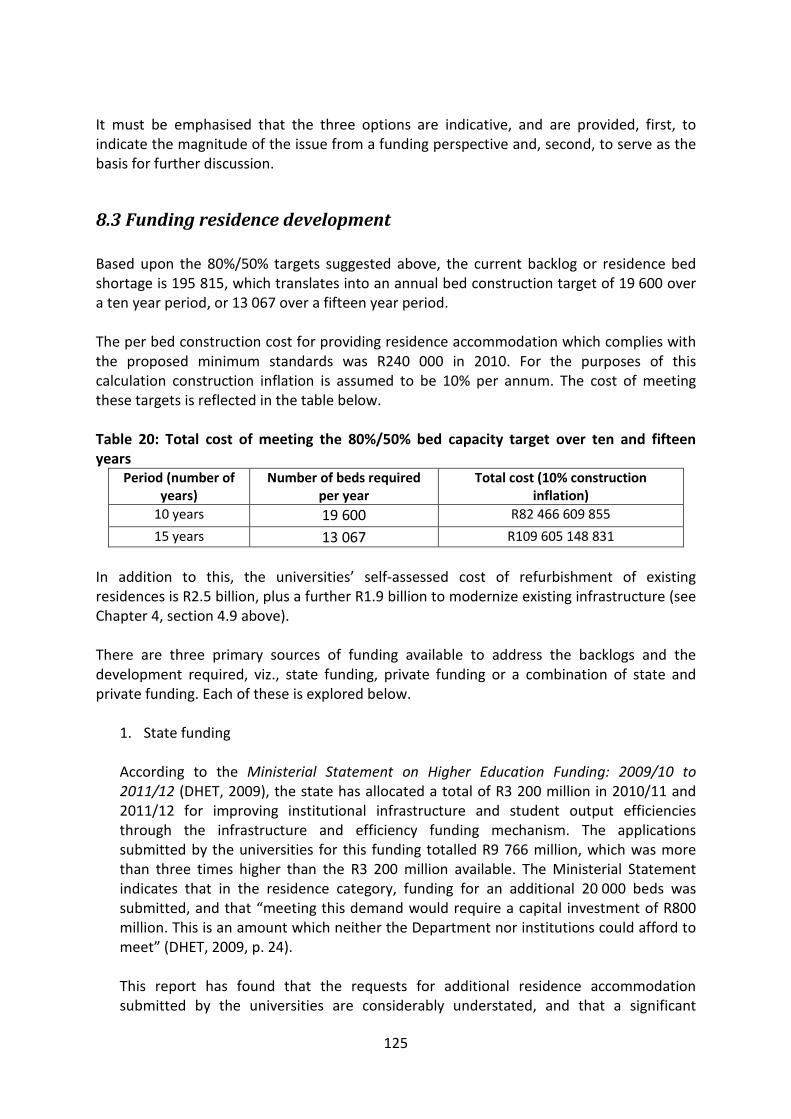
125
It must be emphasised that the three options are indicative, and are provided, first, toindicate the magnitude of the issue from a funding perspective and, second, to serve as thebasis for further discussion.
8.3 Funding residence development
Based upon the 80%/50% targets suggested above, the current backlog or residence bedshortage is 195 815, which translates into an annual bed construction target of 19 600 overa ten year period, or 13 067 over a fifteen year period.
The per bed construction cost for providing residence accommodation which complies withthe proposed minimum standards was R240 000 in 2010. For the purposes of thiscalculation construction inflation is assumed to be 10% per annum. The cost of meetingthese targets is reflected in the table below.
Table 20: Total cost of meeting the 80%/50% bed capacity target over ten and fifteenyears
Period (number ofyears)
Number of beds requiredper year
Total cost (10% constructioninflation)
10 years 19 600 R82 466 609 855
15 years 13 067 R109 605 148 831
In addition to this, the universities’ self-assessed cost of refurbishment of existingresidences is R2.5 billion, plus a further R1.9 billion to modernize existing infrastructure (seeChapter 4, section 4.9 above).
There are three primary sources of funding available to address the backlogs and thedevelopment required, viz., state funding, private funding or a combination of state andprivate funding. Each of these is explored below.
1. State funding
According to the Ministerial Statement on Higher Education Funding: 2009/10 to2011/12 (DHET, 2009), the state has allocated a total of R3 200 million in 2010/11 and2011/12 for improving institutional infrastructure and student output efficienciesthrough the infrastructure and efficiency funding mechanism. The applicationssubmitted by the universities for this funding totalled R9 766 million, which was morethan three times higher than the R3 200 million available. The Ministerial Statementindicates that in the residence category, funding for an additional 20 000 beds wassubmitted, and that “meeting this demand would require a capital investment of R800million. This is an amount which neither the Department nor institutions could afford tomeet” (DHET, 2009, p. 24).
This report has found that the requests for additional residence accommodationsubmitted by the universities are considerably understated, and that a significant
126
investment is required by the state to address the residence maintenance andrefurbishment backlogs as well as a proportion of the additional residence bed capacityrequired.
In order to address the inadequacy of student housing and accommodation, and also tomake a significant improvement to the efficiency of the higher education sector,government needs to considerably increase the funding for student housingrefurbishment and development without any adverse impact on academic funding. Inother words, new or additional funding is required, rather than a transfer of existingfunding allocations.
However, it is acknowledged that the magnitude of the requirement surpasses thecapacity of the state alone. It is clear that the participation of the private sector isessential in addressing the need for additional student housing capacity.
2. Private funding
Despite its shortcomings, private student housing is here to stay. The main problem withprivate residence provision in South Africa is the complete lack of regulation, which hasgiven rise to the exploitation and endangerment of students as described elsewhere inthis report. The promulgation of a Minimum Standards Code (Appendix D) will go a longway towards addressing this problem, particularly if adherence is monitored by theuniversities through a private student accommodation accreditation program andstructure, such as that developed and implemented by the University of Johannesburg.
3. Combined state and private funding
In the traditional PPP model, as mentioned earlier, a private developer or funder leasesland from a university for a nominal fee, and builds a student residence (for and inconsultation with the university) using private funds. Depending upon the PPP contract,the private provider invoices either the university or the students for theaccommodation provided. The ownership of the residence reverts to the university aftera certain period (usually 20 to 30 years).
However, there are many possible combinations of state and private funding, and thePPP model is eminently flexible. It follows that current residence backlogs and futureresidence developments can also be addressed by utilizing state infrastructural fundingmechanisms as spurs to stimulate greater and simultaneously more regulated and fit forpurpose private sector funding. What will stimulate such residence development, bothpurely private and in the form of PPPs? First, the standard maximum NSFAS residence orstudent accommodation funding package should be set at a fair and reasonableresidence fee (as described in 7.11). This is the sum which will be allocated to studentsassigned into student housing which meets proposed minimum standards. Currently,NSFAS accommodation funding is allocated to students based upon the residence feesset by each university, which in 2011 range from R6 603 (WSU) to R25 742 (UCT) withoutfood. Second, in 2010 the universities indicated that 21.5% of students living inresidence in 2010 received NSFAS funding for accommodation. It is proposed that this
127
percentage should be increased to 40% on Type 2 and 3 campuses, and 70% on Type 1campuses. This will require an additional R2.3 billion per annum for NSFAS funding forstudent accommodation (calculated using the Committee’s 2011 standardised residencefee of R30 500 and the number of residence students who received NSFASaccommodation funding in 2010 as indicated by the universities).
This standardizing of the NSFAS accommodation package and the increase in thenumber of beneficiaries of the NSFAS residence funding package nationally will vastlyincrease the market demand for private student housing. Furthermore, going into thefuture, the growth in student numbers is not going to come from the wealthy segment,but from poor communities. These students will require NSFAS funding. This will furtherincrease the number of students ‘in the market’ for student accommodation (which, ofcourse, must comply with the proposed minimum standards). The Committee is of theview that there will be no shortage of private providers lining up to provide studenthousing.
It must be emphasized that none of these models can be construed to be privatization ofstudent accommodation, since in the true sense of the word privatization is the sale of anexisting state asset.
The advantages and benefits of stimulating the provision of private student housing throughthe NSFAS mechanism are as follows:
a. It makes use of an existing and established funding mechanism;b. This ‘subsidization’ of student housing is differentiated on the basis of degree of
need (as opposed to pure subsidisation which is a blanket mechanism which wouldbenefit rich and poor alike);
c. A national social development mechanism can be used to leverage access to privatecapital;
d. The responsibility for innovative and creative ways of providing a significantproportion of the additional student accommodation required is passed onto theprivate sector, while a code of minimum standards protects the public (in this case,students);
e. It relieves some of the burden on universities with poor balance sheets and high riskprofiles (from a financing perspective) as a higher percentage of infrastructure andefficiency funding can be allocated to such institutions (provided their capacity toutilise the funding effectively and efficiently has been established);
f. It uses state funding to, first, invest in and support the national human resourcedevelopment strategy and, second, stimulate economic growth, and, given the sheervolumes involved, it may well attract foreign investment; and
g. The state retains ultimate control through NSFAS funding (which is analogous tostate control of the market via the repo rate mechanism).
A large number of permutations and combinations are possible in the establishment of anykind of public-private partnership, depending upon sector, type and context, and theimposition of too many or too restrictive a set of guidelines may stifle innovation and
128
creativity. However, based on National Treasury’s PPP requirements, the followingprinciples should guide any public-private provision of student accommodation.
1. Substantial technical and/or operational and/or financial risk must be transferred to theprivate provider:
Financial risk refers to the provision of capital for the project and the responsibilityfor attracting students into the residence offered. Risk is not transferred if thepartner university is required to ‘lease-back’ the residence. Risk is transferred whenthe private partner assumes the risk of attracting students into the residenceprovided. At most, the university and the private party could elect to share the risk insome proportion, in the unlikely event of a decline in student numbers impactingupon the pricing of the project.
Technical risk refers to the design and construction of the residence infrastructure inaccordance with minimum standards and the particular requirements of the partneruniversity (such as architectural style, positioning, etc.). Technical risk, which shouldbe transferred to the private party, includes routine maintenance and refurbishmentsuch that the infrastructure is handed over to the partner university at the end of theproject term in the same condition as at the beginning of the project.
Operational risk refers to the operations required to run and manage the residence.Unlike financial and technical risk, and certain other operational responsibilitieswhere the private sector might provide greater efficiencies (e.g. security),universities are more expert as far as the governance, management, administrationand support of students is concerned, and thus operational risk should remain theresponsibility of the partner university.
2. The unitary payment, or the charges payable to the private partner by the university inconnection with the performance of its obligations included in the project deliverablescalculated in terms of the payment mechanism (which may be either the responsibility ofthe relevant university, or the DHET through subsidies, or a combination thereof), must beaffordable. The onus is upon the private party to ensure the provision of studentaccommodation which meets minimum standards. The use of university owned land forsuch projects will also render the PPP more affordable than a purely private development.
3. Public-private provision must be value for money. Value for money is achieved whenstudents are provided with accommodation which meets minimum standards for the entirelifespan of the project within the standard national residence fee; and the infrastructure ishanded back to the partner university in new condition at the end of the project.
4. Inter-departmental and agency collaboration and cooperation is essential for the successof any form of public-private provision. Too many government departments and localauthorities operate in silos, and unless their functions are coordinated promisingpartnerships can be scuttled by overly-burdensome and restrictive regulations (such as theparking garages at the City Edge PPP, discussed in Section 7.9, or where affordable and
129
reliable public transport arrangements are required between the accommodation and theuniversity campus).
5. In order to mitigate their own risk, a private party might seek to obtain the right to fillvacant rooms or units with non-students. Given the specific conditions and requirements ofacademic life, this mixing of students with other tenants is highly undesirable. An alternativemight be to design a residence in such a way that wings or sections can be completelyclosed off from one another, and have completely separate access points.
6. Project duration should not exceed twenty years without good reason. If necessary, theproject can be extended or renewed by mutual agreement.
7. The success or failure of all such projects depends precisely on the fact that they arepartnerships. As with any partnership, the “onus is on both parties to make the projectviable through a genuine spirit of co-operation that engenders trust” (National Treasury,2010, p. 23). Where universities additionally draw on the advice and support of the DHET,assisted by the PPP Unit of National Treasury, the likelihood of successful partnerships canbe increased.
8.4 Critical issues
With regard to the critical issues identified in the analytical and interpretive frameworkinforming this report, it can be said that none of these critical issues for the provision ofstudent housing is currently being adequately addressed.
1. Access/equity/redress: Throwing open the doors of learning without providing theminimum support required to ensure a reasonable chance of success is not onlyirresponsible but also dehumanising, and is negating the very intention of increasingaccess to higher education.
2. Learning/success: Academic learning and success are being severely constrained andhampered by the overcrowding caused by the shortage of student housing.
3. Inclusion/integration: By impeding the educative and academic aspirations ofstudents, the current state of student housing provision hampers and preventsstudents from inclusion and integration into the workplace and thereby constrainsparticipation in the economy of the country.
4. Quality/standards: Basic health and safety norms and standards are being violatedevery day by the current poor quality of student housing provision.
5. Governance/management: Due to sheer pressure of numbers and the strain oninfrastructure, facilities and amenities, student housing management structures andmechanisms are being sorely tested on all campuses; in some instances managementstructures and mechanisms have entirely failed.
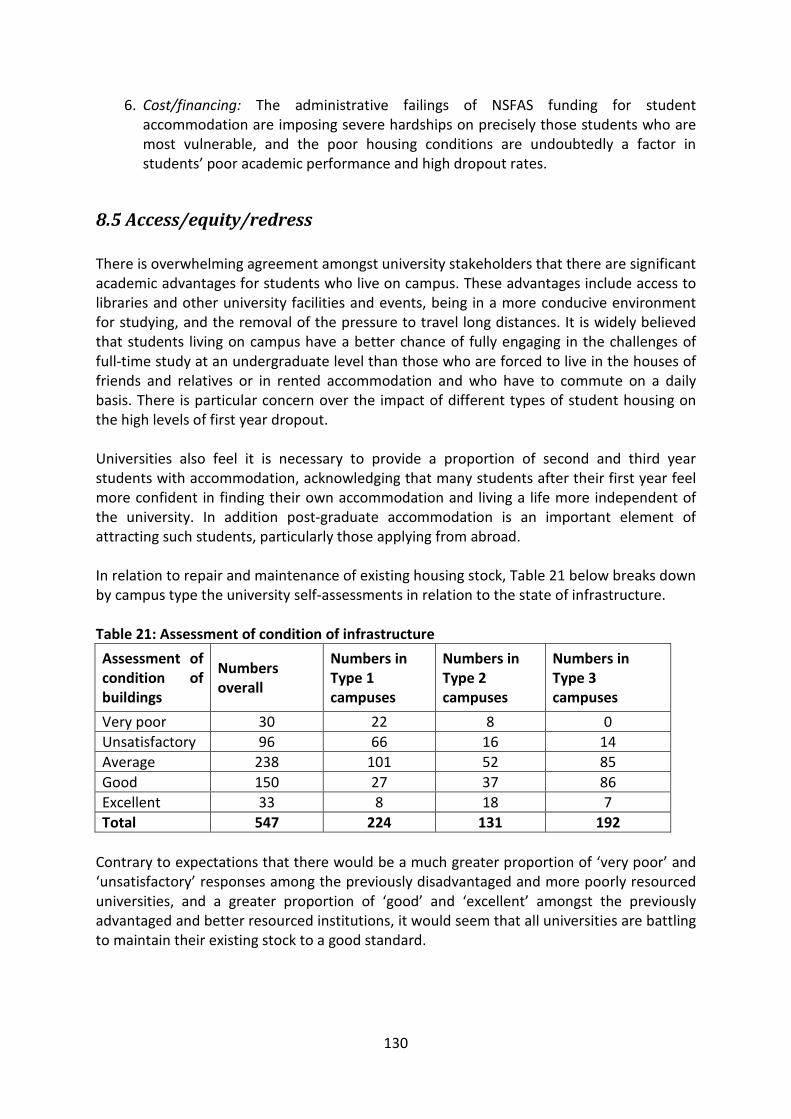
130
6. Cost/financing: The administrative failings of NSFAS funding for studentaccommodation are imposing severe hardships on precisely those students who aremost vulnerable, and the poor housing conditions are undoubtedly a factor instudents’ poor academic performance and high dropout rates.
8.5 Access/equity/redress
There is overwhelming agreement amongst university stakeholders that there are significantacademic advantages for students who live on campus. These advantages include access tolibraries and other university facilities and events, being in a more conducive environmentfor studying, and the removal of the pressure to travel long distances. It is widely believedthat students living on campus have a better chance of fully engaging in the challenges offull-time study at an undergraduate level than those who are forced to live in the houses offriends and relatives or in rented accommodation and who have to commute on a dailybasis. There is particular concern over the impact of different types of student housing onthe high levels of first year dropout.
Universities also feel it is necessary to provide a proportion of second and third yearstudents with accommodation, acknowledging that many students after their first year feelmore confident in finding their own accommodation and living a life more independent ofthe university. In addition post-graduate accommodation is an important element ofattracting such students, particularly those applying from abroad.
In relation to repair and maintenance of existing housing stock, Table 21 below breaks downby campus type the university self-assessments in relation to the state of infrastructure.
Table 21: Assessment of condition of infrastructure
Assessment ofcondition ofbuildings
Numbersoverall
Numbers inType 1campuses
Numbers inType 2campuses
Numbers inType 3campuses
Very poor 30 22 8 0
Unsatisfactory 96 66 16 14
Average 238 101 52 85
Good 150 27 37 86
Excellent 33 8 18 7
Total 547 224 131 192
Contrary to expectations that there would be a much greater proportion of ‘very poor’ and‘unsatisfactory’ responses among the previously disadvantaged and more poorly resourceduniversities, and a greater proportion of ‘good’ and ‘excellent’ amongst the previouslyadvantaged and better resourced institutions, it would seem that all universities are battlingto maintain their existing stock to a good standard.
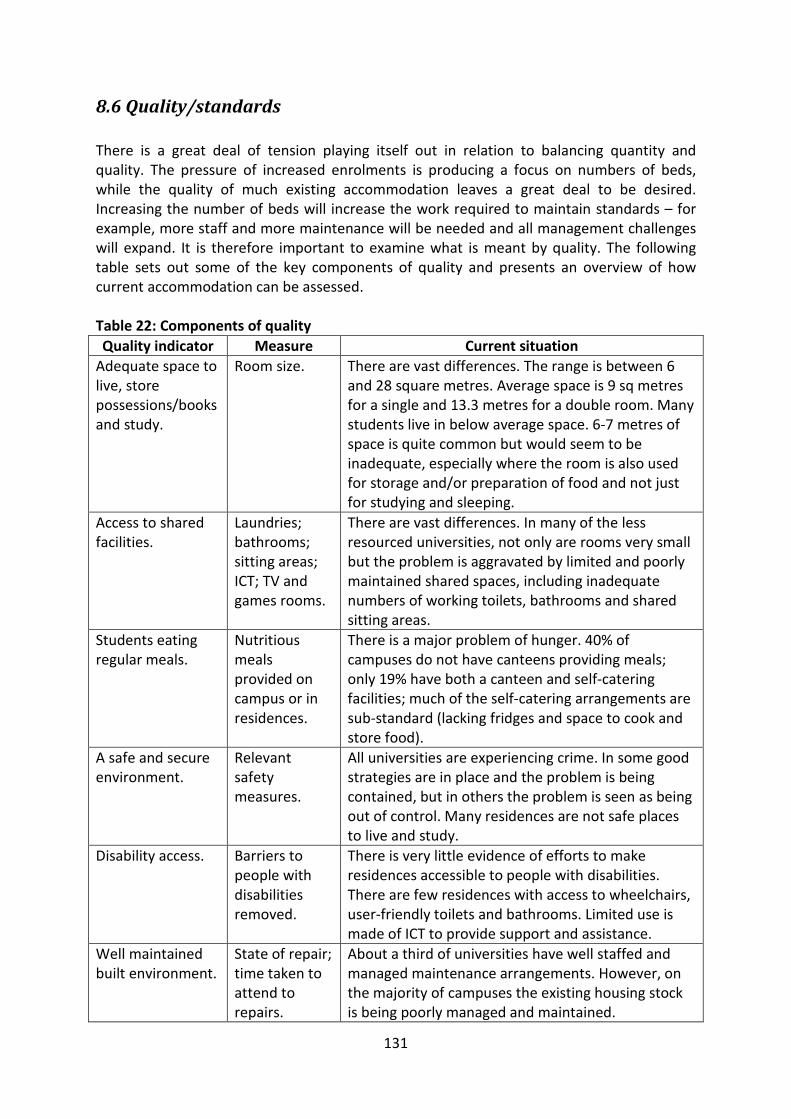
131
8.6 Quality/standards
There is a great deal of tension playing itself out in relation to balancing quantity andquality. The pressure of increased enrolments is producing a focus on numbers of beds,while the quality of much existing accommodation leaves a great deal to be desired.Increasing the number of beds will increase the work required to maintain standards – forexample, more staff and more maintenance will be needed and all management challengeswill expand. It is therefore important to examine what is meant by quality. The followingtable sets out some of the key components of quality and presents an overview of howcurrent accommodation can be assessed.
Table 22: Components of quality
Quality indicator Measure Current situation
Adequate space tolive, storepossessions/booksand study.
Room size. There are vast differences. The range is between 6and 28 square metres. Average space is 9 sq metresfor a single and 13.3 metres for a double room. Manystudents live in below average space. 6-7 metres ofspace is quite common but would seem to beinadequate, especially where the room is also usedfor storage and/or preparation of food and not justfor studying and sleeping.
Access to sharedfacilities.
Laundries;bathrooms;sitting areas;ICT; TV andgames rooms.
There are vast differences. In many of the lessresourced universities, not only are rooms very smallbut the problem is aggravated by limited and poorlymaintained shared spaces, including inadequatenumbers of working toilets, bathrooms and sharedsitting areas.
Students eatingregular meals.
Nutritiousmealsprovided oncampus or inresidences.
There is a major problem of hunger. 40% ofcampuses do not have canteens providing meals;only 19% have both a canteen and self-cateringfacilities; much of the self-catering arrangements aresub-standard (lacking fridges and space to cook andstore food).
A safe and secureenvironment.
Relevantsafetymeasures.
All universities are experiencing crime. In some goodstrategies are in place and the problem is beingcontained, but in others the problem is seen as beingout of control. Many residences are not safe placesto live and study.
Disability access. Barriers topeople withdisabilitiesremoved.
There is very little evidence of efforts to makeresidences accessible to people with disabilities.There are few residences with access to wheelchairs,user-friendly toilets and bathrooms. Limited use ismade of ICT to provide support and assistance.
Well maintainedbuilt environment.
State of repair;time taken toattend torepairs.
About a third of universities have well staffed andmanaged maintenance arrangements. However, onthe majority of campuses the existing housing stockis being poorly managed and maintained.
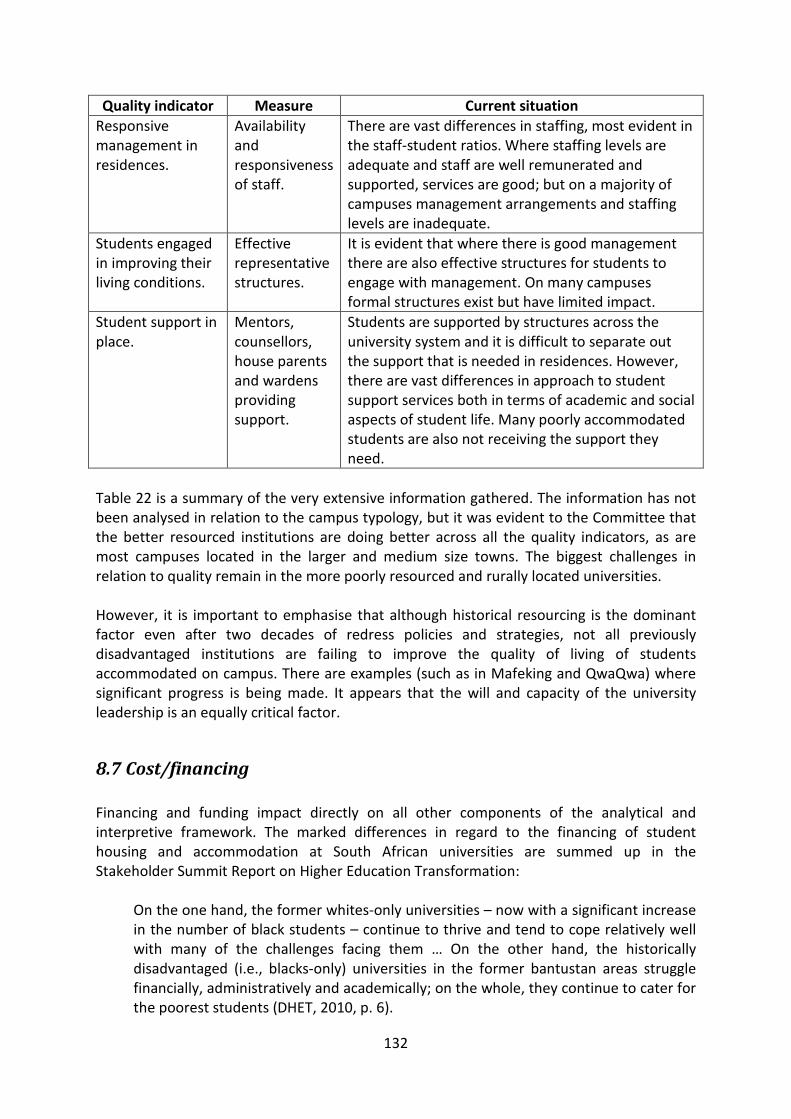
132
Quality indicator Measure Current situation
Responsivemanagement inresidences.
Availabilityandresponsivenessof staff.
There are vast differences in staffing, most evident inthe staff-student ratios. Where staffing levels areadequate and staff are well remunerated andsupported, services are good; but on a majority ofcampuses management arrangements and staffinglevels are inadequate.
Students engagedin improving theirliving conditions.
Effectiverepresentativestructures.
It is evident that where there is good managementthere are also effective structures for students toengage with management. On many campusesformal structures exist but have limited impact.
Student support inplace.
Mentors,counsellors,house parentsand wardensprovidingsupport.
Students are supported by structures across theuniversity system and it is difficult to separate outthe support that is needed in residences. However,there are vast differences in approach to studentsupport services both in terms of academic and socialaspects of student life. Many poorly accommodatedstudents are also not receiving the support theyneed.
Table 22 is a summary of the very extensive information gathered. The information has notbeen analysed in relation to the campus typology, but it was evident to the Committee thatthe better resourced institutions are doing better across all the quality indicators, as aremost campuses located in the larger and medium size towns. The biggest challenges inrelation to quality remain in the more poorly resourced and rurally located universities.
However, it is important to emphasise that although historical resourcing is the dominantfactor even after two decades of redress policies and strategies, not all previouslydisadvantaged institutions are failing to improve the quality of living of studentsaccommodated on campus. There are examples (such as in Mafeking and QwaQwa) wheresignificant progress is being made. It appears that the will and capacity of the universityleadership is an equally critical factor.
8.7 Cost/financing
Financing and funding impact directly on all other components of the analytical andinterpretive framework. The marked differences in regard to the financing of studenthousing and accommodation at South African universities are summed up in theStakeholder Summit Report on Higher Education Transformation:
On the one hand, the former whites-only universities – now with a significant increasein the number of black students – continue to thrive and tend to cope relatively wellwith many of the challenges facing them … On the other hand, the historicallydisadvantaged (i.e., blacks-only) universities in the former bantustan areas strugglefinancially, administratively and academically; on the whole, they continue to cater forthe poorest students (DHET, 2010, p. 6).
133
The issue of finance and access to funding (or lack thereof) is fundamental for theestablishment and provision of residences which can provide both the safe and secure livingenvironment and the social and cultural milieu required to support the academic project.
In order to provide access to increasing numbers of poor students, many universities (butpredominantly those previously disadvantaged) have kept their residence fees as low aspossible. The direct result is that the residences do not generate sufficient income to meetoperational costs. This in turn impacts negatively upon the ability to construct new buildingsto meet the increasing demand and on the ability to refurbish and maintain ageing anddeteriorating infrastructure. This inability in turn gives rise to attitudes of defeatism,fatalism and frustration among university and especially residence management staff, whomust also cope with increasing levels of responsibility due to staff cost cutbacks. This furtherreduces or demolishes the capacity of the system to provide the basic safe and secureenvironment and the supportive social and cultural milieu required to enhance the learningand the academic success of the residents, and provides fertile ground formaladministration and corruption. The effect of all this on students who are already battlingwith the dehumanising and alienating effects of poverty is devastating and, it is suggested,contributes significantly to the high dropout rate of students from university. The lack offunding thus creates a downward spiral of decay in which the components of the analyticaland interpretive framework start working against one another instead of remaining in acreative and productive tension.
There is another funding issue which along with low residence fees initiates and contributesto this spiral of decay, and that is the ongoing contestation as to whether NSFAS loanallocations should be higher and cater more comprehensively for fewer students, orwhether they should be lower and offer broader access. Since poverty is multi-dimensionaland includes not only inadequate income but also inadequate social and psychological well-being, including perceptions of powerlessness and negative feelings about the self (Firfirey& Carolissen, 2010), it is important for the NSFAS funding framework to ensure that fundingis sufficient to empower the recipients to participate fully and freely in the academic, socialand cultural milieu of the residence and the university more broadly. In turn this means thatNSFAS funding should at minimum include the costs of registration fees, full board (or atleast two balanced and nutritious meals per day) and lodging costs, books, equipment,travel costs and personal effects.
This raises the issue of the real cost of providing student accommodation and what is a fairand reasonable residence fee. Due to the number of variables involved, and the fact thatmany of these variables are dependent upon context, it is not possible to provide adefinitive answer or a ‘one-size-fits-all’ response. Nevertheless, the case study presentedabove indicates that a reasonable residence fee must cover full board and lodging andprovide for the provision of secure, maintained residences with a sound managementstructure.
The need to keep residence fees as low as possible must therefore be balanced or kept intension with the other five components of the analytical and interpretive framework ifstudents, and poor working class and rural students in particular, are to be provided with

134
safe, well-maintained and well-managed residence accommodation. In addition, such feesmust be commensurate with the provision of accommodation which meets minimumstandards.
8.8 Learning/success
The link between student housing and academic outcomes is a complex and unresolvedmatter, as shown in both the international literature and the empirical evidence presentedin this report. Much more rigorous, focused and context-specific research into this link isneeded, especially in South Africa. Nevertheless, there was overwhelming support fromstudents and managers for the assertion that accommodation impacts upon a student’sacademic performance. Those students who come from reasonably well off families,particularly where the parents themselves have been university educated, and who remainat home for the duration of their studies, are not the main concern, nor are they a usefulbenchmark for the majority of students who come from generally poor backgrounds.
In relation to the majority of students, the Committee believes that a number of advantagescan be claimed for living on campus, and a number of disadvantages to living off-campus(Table 23).
Table 23: Pros and cons of living on campus
Factor impactingon studies
Benefits of living on campus Problems with living at home orwith relatives
Travel time andcost to get to andfrom classes.
Less time and money is spenton travel, and more onstudying.
In many cases travel takes timewhich could be spent studying.
Living spaceconducive tostudying.
Students have their own space(however limited) and accessto library and internet.
Often students living off campusexperience problems of finding spaceto study; they may have no localaccess to libraries or internet.
Safety. Although safety is a challengeon campuses there are effortsto create a safe environment.
The travel arrangements for gettingback to townships at night can bedangerous (taxis and long walks totaxi ranks).
Building a supportnetwork.
Particularly in the first year,study groups, mentoring andsocial activities are important.
Very often students find it hard tobuild support networks when theylive away from the university.
Statistics of the number of university students not successfully completing their studies arevery worrying. A very large number of first year students do not make it to the second year,and although dropout rates reduce in later years they remain high. There are obviouslymany factors involved, including previous education history, financial difficulties and thesheer level of effort required to keep up with academic programmes. Nevertheless, theCommittee is convinced that the provision of decent standard accommodation, particularlyfor first year students, could play a significant role in helping to reduce dropout rates andcreate conditions for students to succeed in their studies.
135
8.9 Inclusion/integration
Inclusion and integration are a challenge, particularly for the previously advantageduniversities. Generally, the historically disadvantaged universities remain places where blackstudents study, whereas the former white universities have become racially mixed and havebeen challenged to transform. In some universities, the challenges has been the bringingtogether of formerly white with formerly black campuses. Generally, this has been achievedby putting in place a common set of standards and management arrangements.
Although there are examples of serious problems in relation to inclusion and integration,these were not issues raised by students or other university stakeholders as being critical tothe accommodation challenge. Rather, there is a general perception that black studentscontinue to get a worse deal than white students which, if all 107 598 places are considered,is valid to the extent that the conditions that white students used to experience remain to agreat extent as they were. However, there are complaints that standards have fallen, andthat more and more white students no longer seek accommodation on campus. While theremay have been a slight drop in standards as available resources are spread more thinly toaccommodate increasing numbers of students, in general the standards provided by theformer white universities remain high, and the number of white students accommodatedhas remained at the same level or declined only slightly.
On the other hand, the former black universities have had to work hard at improvingconditions, but in many cases they have not succeeded and standards remain low. So thereremains a sense of exclusion, which is expressed in terms of protests and also in terms ofdropout rates, generally attributed to financial difficulties but in practice the result of acombination of factors, one of which is likely to be accommodation. The sense theCommittee got when visiting residences in many of the former black universities was thatexclusion is stark and current – even among those who have accommodation. Theconditions are such that they could legitimately be given the label ‘squalid’. Even thoughmany such students may feel that they are amongst the more privileged of people in theircommunities (because they are some of the few that have access to higher education), theymust feel that they have been provided access on a very different basis to white and middleclass students.
The Committee came across radically different expectations among stakeholders ondifferent campuses. At many of the former white universities there are expectations inrelation to things like space, common facilities, repairs and maintenance, and security.Expectations are high amongst the students themselves, the management of the residences,and the leadership within the university. There is a strong culture of pride in and ownershipof one’s residence. By contrast, at some (but not, by any means, at all) of the historicallydisadvantaged universities it would seem that low expectations are the norm amongststudents, residence management and university leadership. Some staff at some of theseinstitutions felt that they were being completely ignored and that they had so manystudents to look after that they could do little or nothing to raise standards. At someuniversities there seemed to be a complete disinterest in the problems of the students in
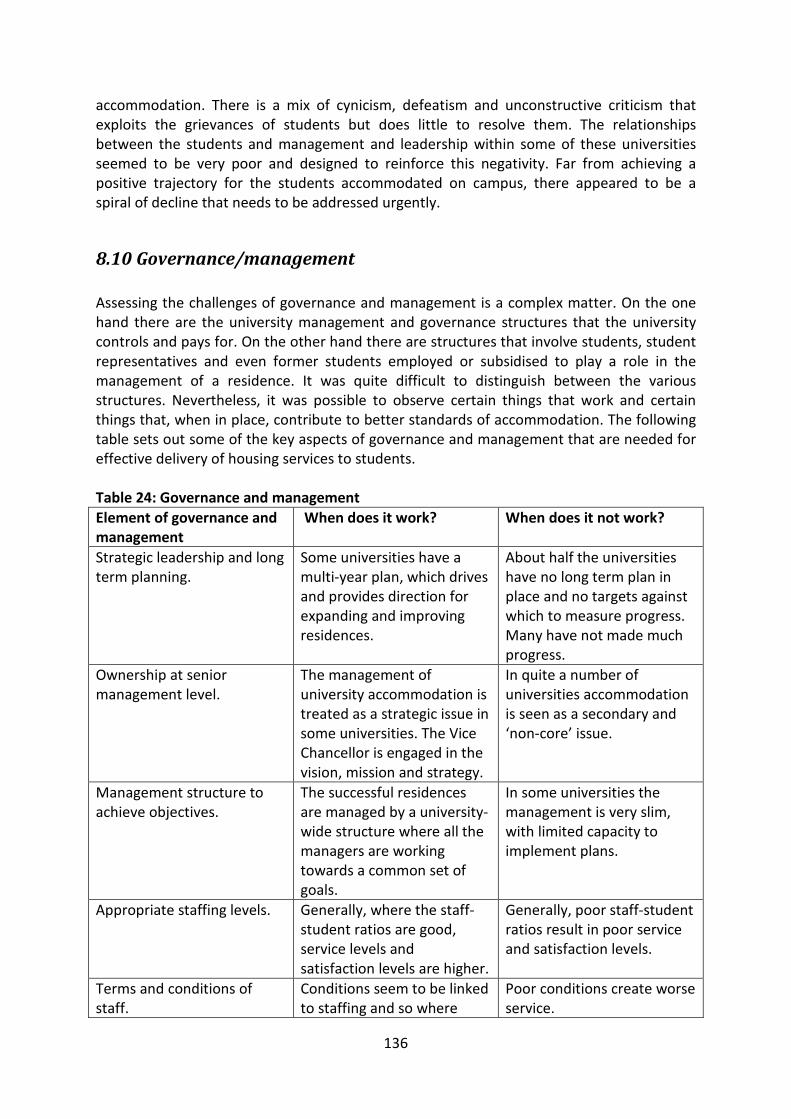
136
accommodation. There is a mix of cynicism, defeatism and unconstructive criticism thatexploits the grievances of students but does little to resolve them. The relationshipsbetween the students and management and leadership within some of these universitiesseemed to be very poor and designed to reinforce this negativity. Far from achieving apositive trajectory for the students accommodated on campus, there appeared to be aspiral of decline that needs to be addressed urgently.
8.10 Governance/management
Assessing the challenges of governance and management is a complex matter. On the onehand there are the university management and governance structures that the universitycontrols and pays for. On the other hand there are structures that involve students, studentrepresentatives and even former students employed or subsidised to play a role in themanagement of a residence. It was quite difficult to distinguish between the variousstructures. Nevertheless, it was possible to observe certain things that work and certainthings that, when in place, contribute to better standards of accommodation. The followingtable sets out some of the key aspects of governance and management that are needed foreffective delivery of housing services to students.
Table 24: Governance and management
Element of governance andmanagement
When does it work? When does it not work?
Strategic leadership and longterm planning.
Some universities have amulti-year plan, which drivesand provides direction forexpanding and improvingresidences.
About half the universitieshave no long term plan inplace and no targets againstwhich to measure progress.Many have not made muchprogress.
Ownership at seniormanagement level.
The management ofuniversity accommodation istreated as a strategic issue insome universities. The ViceChancellor is engaged in thevision, mission and strategy.
In quite a number ofuniversities accommodationis seen as a secondary and‘non-core’ issue.
Management structure toachieve objectives.
The successful residencesare managed by a university-wide structure where all themanagers are workingtowards a common set ofgoals.
In some universities themanagement is very slim,with limited capacity toimplement plans.
Appropriate staffing levels. Generally, where the staff-student ratios are good,service levels andsatisfaction levels are higher.
Generally, poor staff-studentratios result in poor serviceand satisfaction levels.
Terms and conditions ofstaff.
Conditions seem to be linkedto staffing and so where
Poor conditions create worseservice.
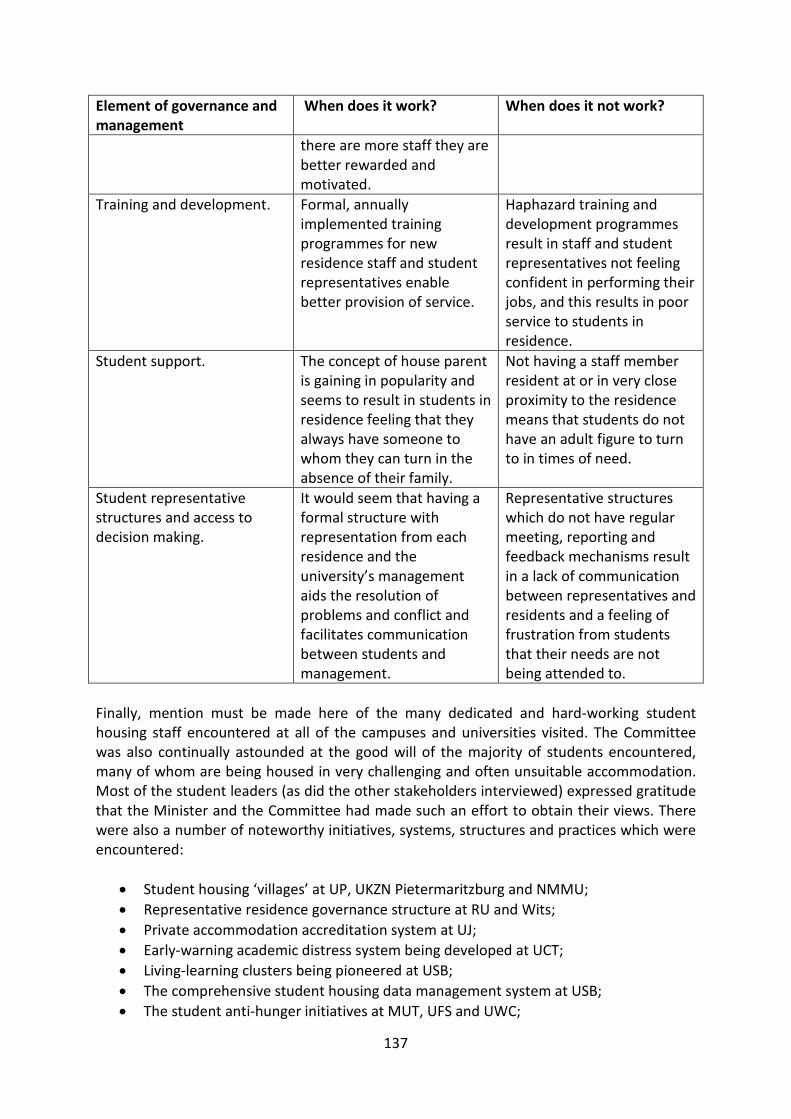
137
Element of governance andmanagement
When does it work? When does it not work?
there are more staff they arebetter rewarded andmotivated.
Training and development. Formal, annuallyimplemented trainingprogrammes for newresidence staff and studentrepresentatives enablebetter provision of service.
Haphazard training anddevelopment programmesresult in staff and studentrepresentatives not feelingconfident in performing theirjobs, and this results in poorservice to students inresidence.
Student support. The concept of house parentis gaining in popularity andseems to result in students inresidence feeling that theyalways have someone towhom they can turn in theabsence of their family.
Not having a staff memberresident at or in very closeproximity to the residencemeans that students do nothave an adult figure to turnto in times of need.
Student representativestructures and access todecision making.
It would seem that having aformal structure withrepresentation from eachresidence and theuniversity’s managementaids the resolution ofproblems and conflict andfacilitates communicationbetween students andmanagement.
Representative structureswhich do not have regularmeeting, reporting andfeedback mechanisms resultin a lack of communicationbetween representatives andresidents and a feeling offrustration from studentsthat their needs are notbeing attended to.
Finally, mention must be made here of the many dedicated and hard-working studenthousing staff encountered at all of the campuses and universities visited. The Committeewas also continually astounded at the good will of the majority of students encountered,many of whom are being housed in very challenging and often unsuitable accommodation.Most of the student leaders (as did the other stakeholders interviewed) expressed gratitudethat the Minister and the Committee had made such an effort to obtain their views. Therewere also a number of noteworthy initiatives, systems, structures and practices which wereencountered:
Student housing ‘villages’ at UP, UKZN Pietermaritzburg and NMMU;
Representative residence governance structure at RU and Wits;
Private accommodation accreditation system at UJ;
Early-warning academic distress system being developed at UCT;
Living-learning clusters being pioneered at USB;
The comprehensive student housing data management system at USB;
The student anti-hunger initiatives at MUT, UFS and UWC;
138
The student meal system at RU; and
The impressive student housing setups at the QwaQwa campus of UFS and theMafikeng campus of NWU.
139
9. Recommendations
On the basis of the literature review, the questionnaire and other data collected, the sitevisits and interviews and the analysis thereof, the following recommendations are made.
9.1 Residence admissions and allocations policies
While it has been established that the demographic profile of students in universityresidences nationally is close to matching the national demographic profile of South Africa,there are campuses which are still working towards achieving this. Hence it is recommendedthat:
a. A comprehensive residence admissions and allocations policy must bedeveloped by all universities in consultation with all relevant stakeholders.Accountability for the implementation of this policy should reside at seniormanagement level.
b. The allocation of students into residences and rooms must be strictlymanaged, controlled and monitored by university housing staff in accordancewith the residence admissions and allocations policy mentioned above.
c. Waiting lists for residence vacancies must be managed and administered byrelevant university administrative staff in accordance with the residenceadmissions and allocations policy.
More broadly, strategies and mechanisms to increase access to university residences bypoor working class and rural students, and to develop sensitive support mechanisms forthese students which empower and enable them to participate fully in the academic, socialand cultural life of the university, need to be developed.
Furthermore, given that in 2010 only 5.3% of new first year contact students wereaccommodated in university residences, it is recommended that strategies and mechanismsneed to be established by all universities to allow all new first year contact students in needof accommodation to be allocated into residence for their first year. This recommendationhas been factored into the campus bed targets established by the Committee and into itsrecommendations for government infrastructure funding.
9.2 Minimum standards for student housing and accommodation
It is recommended the Minimum Standards Code for the Accommodation and Housing ofStudents in South Africa should either be a) made statutory, or b) advisory and incentivisedby providing grants to universities for student accommodation linked to the incremental
140
implementation of this code. The proposed Minimum Standards Code is presented inAppendix D.
9.3 Private student housing and accommodation
The research has indicated that the provision of private student accommodation iscompletely unregulated in South Africa, allowing widespread exploitation of students andexposure of students to various types and levels of risk. The private sector is however acritical stakeholder in addressing the student accommodation backlogs identified. TheCommittee therefore recommends that:
a. The Minimum Standards Code for the Accommodation and Housing ofStudents in South Africa must be applicable to all providers of studenthousing (both public and private) where such housing accommodates ten ormore students.
b. Given the dire shortage of suitable student accommodation, it isrecommended that the PPP model be further explored, particularly in themetropolitan areas, for the provision of student villages which will provide fit-for-purpose accommodation to students from several universities and highereducation institutions. It is also recommended that the PPP Unit of NationalTreasury should be involved throughout the process, from feasibility studiesthrough to procurement and project completion.
c. In order to foster and further enhance cooperation between the variousstakeholders involved in the provision of student housing andaccommodation, i.e., universities, municipalities or metropolitan councils,private providers and relevant government departments, it is recommendedthat all policy, regulatory and standards-related work arising from this reportshould be incorporated within the work of the appropriate DHET directorate.These may include but are not limited to: determining the appropriate mix ofstate, university and privately funded housing provision; developing andstandardising PPP agreements; facilitating access to sources of funding andfinancing for residence development; brokering relationships with funders;assisting and monitoring universities’ efforts to attain their student housingand accommodation targets and goals; and providing advisory andmanagement support. The DHET should also be the custodian of theproposed Minimum Standards Code for the Accommodation and Housing ofStudents.
9.4 Residence management and administration
Sound, robust, efficient and effective governance, management and administration arecritical for the provision of student accommodation which is fit-for-purpose and which
141
supports the academic project of the university. To this end, the followingrecommendations are made:
a. Residence staff to resident student ratios should not normally exceed 1:150 inthe case of wardens, house parents, residence managers or the equivalent, and1:100 in the case of student sub-wardens or the equivalent.
b. All universities should establish a board, council or similar body whichrepresents all residences, meets regularly with the university’s housing officials,provides a forum where issues and grievances can be debated and discussed,and generally oversees residence life.
c. The professionalisation of housing staff is an urgent priority. To this end it isrecommended that members of the academic staff should be sought forappointment as (in addition to their academic work) wardens, house parents orresidence managers. Wardens must be compensated adequately, e.g., paymentin kind such as full board and lodging for themselves and their families insuitable accommodation close to or attached to the residence for which they areresponsible, or an appropriate stipend. Adequate training must be provided towarden staff (e.g. crisis counselling, first aid, health and safety, emergencyprocedures, etc.). Mechanisms and measures for developing staff, andaddressing incapacity and incompetence, must be established.
d. All complaints and allegations of maladministration, corruption and nepotismmust be rigorously investigated by the DHET and strict action taken againstoffenders.
9.5 Role of residences in the academic project
The research indicates that whilst there is a complex relationship between student housingand academic success, there is preliminary evidence to suggest that being housed in a safe,well-managed residence does advantage students, particularly those from poorerbackgrounds. It is therefore recommended that:
a. In-depth qualitative (and preferably ethnographic) research is needed to explorenuanced ways in which the social and cultural milieu in residence systemsimpact upon the ability of black working class students to succeed academically;
b. More nuanced and in-depth research is needed to explore the impact of studenthousing on success in the context of other factors such as the extent to whichteaching supports students learning, the preparedness (and, indeed, willingness)of academic staff to teach well and the extent to which the generalarrangements for teaching and learning support students’ success;
142
c. In the meantime universities must encourage the development of initiatives andmechanisms to make residences an integral part of the academic project andencourage and promote them to become sites of academic endeavour; and
d. Structured support programs and mechanisms for first year students inresidence must be developed and enhanced, drawing on best practice modelsalready in operation at some universities.
9.6 Financing of student housing and funding of studentaccommodation
The recommendations made in this section refer to the financing of student housinginfrastructure development and maintenance, and the funding required by students tosecure accommodation in university student housing.
a. Targets based on typology: It is recommended that the bed capacity targetsbe established using the campus typology proposed in Chapter 8 above, asfollows:Type 1 campuses: Target is residence accommodation for 80% of full timecontact student enrolment at such campuses.Type 2 and 3 campuses: Target is residence accommodation for 50% of fulltime contact student enrolment at such campuses.Once the State has indicated what proportion of this target it is able to fund,the private sector should be invited to meet the remaining bed capacitytarget, in accord with minimum standards for the provision of studenthousing.
b. Complete separation of the residence budget and management accounts fromthe university budget and management accounts: As mentioned above, mostuniversities indicated that their residence budgets and accounts have beenseparated from the university budget but few were able to provide theCommittee with a set of management accounts. It is recommended thatresidential operations budgets be separated from the university budget. Thiswill allow greater and more effective management, transparency,accountability and control of residence income and expenditure.
c. Quarterly submission of residence management accounts to the UniversityCouncil: It is recommended that, in the interests of good governance, theresidence management accounts be submitted quarterly to the UniversityCouncil for scrutiny and approval.
d. Standardisation of annual financial reporting: The Committee encounteredgreat difficulties obtaining meaningful data from the universities forcomparative research purposes. It is recommended that a standardised orcommon residence management accounting system be developed andimplemented to allow meaningful comparative analysis for the purposes of
143
policy formulation, research and decision-making. This should include theestablishment of a common ‘dashboard’ of financial data (such as variousratios) which will be collected by the DHET for research purposes.
e. Robin Hood principle: At some universities a ‘wealth tax’ mechanism has beenincorporated into the residence budget through the introduction of afinancial aid expense item comprising 5% of the total income generated. It isrecommended that this mechanism be explored at other universities as a wayof increasing access to disadvantaged students.
f. Universities with ‘vast’ reserves: During several site visits the issue of someuniversities sitting on ‘vast’ reserves accumulated in the apartheid era wasraised, and the view was expressed that it would be appropriate for thesereserves to be taken into account when considering applications forinfrastructure funding grants. It is recommended that the issue of suchreserves be investigated by the HESA Funding Strategy Group, and that anappropriate guideline be established for the accumulation and use ofreserves by universities.
g. Fair residence fee: It is recommended that an annual fixed national NSFASresidence fee be established (R30 500 for 2011) for student accommodation(board and lodging) which meets minimum standards.
h. Increasing the range of NSFAS funding for accommodation: It isrecommended that the current range of NSFAS funding to 21.5% of studentsin residence be increased to 40% on Type 2 and Type 3 campuses and to 70%on Type 1 campuses.
i. NSFAS funding guidelines: It is recommended that stricter guidelines bedeveloped for the administration of NSFAS funding by the universities,including the requirement that funding for student housing should be madeavailable to student recipients by no later than the end of the second week ofthe first term. It is also recommended that a ‘dashboard’ of NSFAS studenthousing funding indicators be developed, and that this ‘dashboard’ must bepresented to University Councils quarterly.
j. NSFAS accommodation funding restrictions: It is recommended that NSFASfunding for student accommodation be set at a minimum level which allowsthe recipient full board (a minimum of two balanced meals per day) andlodging. The recipient may be allowed to ‘unbook’ a maximum of 20% ofmeals which may be credited to the relevant student’s accounts; in otherwords, 80% of the boarding/meal funding may only be used for meals.
k. Residence infrastructure grants: Several universities requested thereintroduction of the DHET residence maintenance subsidy. The Committee isof the opinion that the current system of infrastructure grants from the DHET
144
is a fairer and more effective funding mechanism. The Committee, however,recommends that:
1. The DHET must develop a set of clear guidelines for this funding.2. The DHET must establish and document a clear set of funding allocation
criteria.3. Requests for funding for new residence development and residence
refurbishment must be accompanied by a comprehensive reportassessing the scope of the project as well as a professional cost estimatefrom a registered quantity surveyor (QS), and further that such projectscompleted using DHET funding shall be subject to assessment andevaluation by an independent building professional team (QS, architect,relevant consulting engineers, etc.) appointed by the Department.
4. The costs of the professional report and estimate should be met by theDHET.
5. The 2010 residence bed capacity ranges from 6% to 70.84%. Althoughthe greatest need for increased bed capacity is on the campuses whichhave a low bed capacity, the campuses at the higher end of the bedcapacity scale cannot be left out of the funding allocation while theother campuses catch up, as this will prejudice the enrolment plans ofthose universities. A differentiated or sliding residence infrastructurefunding mechanism is therefore recommended, in which campuses withlow bed capacities receive a higher percentage of the infrastructurefunding ‘pie’ until they have caught up.
9.7 Condition of residence infrastructure
Residence maintenance and refurbishment backlogs are enormous across the studenthousing sector. The Committee has had to rely mainly on universities’ own cost estimates ofthe monetary value of this backlog. In order to further assess the quantum of themaintenance and refurbishment backlog, it is recommended that:
a. All universities are to have a professional quantity surveyor (QS)-ledassessment of their residence infrastructure, so as to obtain aprofessional and independent assessment of the scope of maintenanceand refurbishment needed to bring the residences to minimumstandards, and an accurate costing for such maintenance andrefurbishment. This assessment should be funded by the DHET as amandatory component of the infrastructure grants.
b. National minimum standards and service level agreement guidelines forthe maintenance and refurbishment of residence infrastructure shouldbe established in consultation with all relevant stakeholders.
c. Modular residence construction methodologies being explored at someuniversities should be fully researched, since this has the potential to
145
significantly reduce the cost of meeting the national backlog if found tobe viable, sustainable and suitable.
9.8 Future planning
In as much as the residences need to become an integral part of the academic project ofuniversities, so too do residences need to be integrated into the strategic plans andobjectives of universities. It is recommended that all universities should be required todevelop a multi-year strategic plan (including a financial plan) for residence maintenanceand refurbishment, residence development (in accordance with the university’s enrolmentplan) as well as a plan to integrate and incorporate the residences into the academic projectof the university. These plans should be updated on an annual basis taking account offeedback provided by the DHET.
At several universities the student housing directorate or department is not involved instrategic planning of new residences or the maintenance and refurbishment of residences. Itis recommended that those who are accountable for university student housing should bepart of the planning process. It is further recommended that the Chief Housing Officershould report directly to a member of the senior management team of the university.
10. References
Alexander, T. (2010). New policies accommodate transgender students. Chronicle of HigherEducation, 56(39).
Angelo, J. & Rivard, N. (2003). If you build it, they will come: 6 trends to build by, fromcampus innovators in higher ed housing. Accessed 21 January 2011http://www.universitybusiness.com.
Barthelemy, K. & Fine, J. (1995). The relationship between residence hall climate andadjustment in college students. College Student Journal, 29, 465-475.
Bekurs, G. (2007). Outsourcing student housing in American community colleges: Problemsand prospects. Community College Journal of Research and Practice, 31(8), 621-636.
Catt, S. (1998). Adjustment problems of freshmen attending distant, non-residentialcommunity colleges. PhD dissertation, University of Pittsburg.
CNOUS (2009). Centre National des Oeuvres Universitaires et Scolaires. Accessed 21 January2011 http://www.cnous.fr/doc/plaq_instit_ang.pdf.
Dani, J., Burrill, C. & Demmig-Adams, B. (2005). The remarkable role of nutrition in learningand behaviour. Nutrition and Food Science, 35(4), 258-263.

146
Devlin, A., Donovan, S., Nicolov, A., Nold, O. & Zandan, G. (2008). Residence hallarchitecture and sense of community. Environment and Behavior, 40(4), 487-521.
De Villiers, A. & Steyn, A. (2005). The changing face of higher education finance, with specialreference to South Africa. Paper presented at the Economics Society of South Africaconference, Durban, 7-9 September.
DHET (2009). Ministerial Statement on Higher Education Funding: 2009/10 to 2011/12.Pretoria: Department of Higher Education and Training.
DHET (2010). Report on the Stakeholder Summit on Higher Education Transformation.Pretoria: Department of Higher Education and Training.
DoE (2001). National Plan for Higher Education in South Africa. Pretoria: Department ofEducation.
DoE (2008). Report of the Ministerial Committee on Transformation and Social Cohesion andthe Elimination of Discrimination in Public Higher Education Institution. Pretoria:Department of Education.
DoE (2009a). Ministerial Statement on Higher Education Funding: 2006/7 to 2008/9.Pretoria: Department of Education.
DoE (2009b). Report of the Ministerial Committee on the Review of the National StudentFinancial Aid Scheme. Pretoria: Department of Education.
Enochs, W. (2006). Social adjustment of college freshmen: The importance of gender andliving environment. College Student Journal, 40(1), 63-73.
Eurostudent (2005). Social and Economic Conditions of Student Life in Europe 2005.Hannover: Hochschul-Informations-System. Accessed 21 January 2011http://www.eurostudent.eu/results/reports.
Eurostudent (2011). Social and Economic Conditions of Student Life in Europe: Synopsis ofIndicators. Eurostudent IV 2008-2011. Hannover: Hochschul-Informations-System. Accessed21 January 2011 http://www.eurostudent.eu/results/reports.
Firfirey, N. & Carolissen, R. (2010). ‘I keep myself clean . . . at least when you see me, youdon’t know I am poor’: Student experiences of poverty in South Africa. South African Journalof Higher Education 24(6), 985-1000.
Groen, T. (2009). The perceived influence of student accommodation arrangements on thefirst year experience. Unpublished paper, University of Western Australia.
Han, J. (2004). House, home, and community: Good models for graduate student housing.Masters dissertation, Massachusetts Institute of Technology.
147
Hardi, J. (2000). No housing preference for minority students. Chronicle of Higher Education,46(29).
Harvey, L., Drew, S. & Smith, M. (2006). The first-year experience: a review of literature forthe Higher Education Academy. Sheffield: Sheffield Hallam University.
Harvey, L. & Knight, P. (2006). Transforming higher education. Bristol: Open University Press.
Hughes, D. & Davis, M. (2002). Student housing: a cautionary tale of one city. Journal ofSocial Welfare and Family Law, 24(2), 135-155.
ICA (2007). Housing Co-operatives in the USA. August. Accessed 21 January 2011http://www.ica.coop/al-housing/attachments/Housing%20Cooperatives%20in%20USA%20-%20FINAL.pdf.
Inkelas, K. & Soldner, M. (2011). Undergraduate Living-Learning Programs and StudentOutcomes, in J. Smart & M. Paulsen (eds) Higher Education: Handbook of Theory andResearch, Vol 26. New York: Springer.
Informa Australia (2011). Student Housing Summit 2011. Sydney, 31 August-2 September.Accessed 18 July 2011 http://www.informa.com.au/conferences/education/student-housing-summit.
Johnson, E. (2010). Public private partnerships for university housing development. Accessed21 January 2011 http://dlmplanners.com/perspectives/2010/01/public-private-partnerships-for-university-housing-development.html.
Jones, B., Coetzee, G., Bailey, T. & Wickham, S. (2008). Factors that facilitate success fordisadvantaged higher education students - An investigation into approaches used by REAP,NSFAS and selected higher education institutions. Athlone: Rural Education AccessProgramme.
King Sturge (2008). Student Accommodation in Western Europe. London: King Sturge LLP.Accessed 21 January 2011http://www.coralportfolio.com/_resources/fund1/documents/King_Sturge_Western_Europe_Student_Accommodation_Market_2009.pdf.
La Roche, C., Flanigan, M. & Copeland, P. (2010). Student housing: Trends, preferences andneeds. Contemporary Issues in Education Research, 3(10), 45-50.
Lewis, H. (2006). Excellence without a Soul: How a Great University Forgot Education. NewYork: Public Affairs.
Lien, L. (2006). Is breakfast consumption related to mental distress and academicperformance in adolescents? Public Health Nutrition, 10(4), 422-428.
148
Light, R. (2001). Making the most of college: students speak their minds. Cambridge, MA:Harvard University Press.
Lowther, S. & Langley, J. (2005). First year retention: Is it housing or affiliation that matters?Paper presented at the Alabama Association for Institutional Research conference, April.
Mahatey, N. & Kwenaite, N. (1992). The residence assistantship programme: Towards aholistic approach to student development. Proceedings of the 7th Conference of the SouthAfrican Association for Academic Development. Port Elizabeth: Port Elizabeth Technikon.
Marginson, S. & Considine, M. (2000). The enterprise university: Power, governance andreinvention in Australia. Cambridge: Cambridge University Press.
Macintyre, C. (2003). New models of student housing and their impact on localcommunities. Journal of Higher Education Policy and Management, 25(2), 109-118.
Ministry of Education (2001). National plan for higher education. Pretoria: Ministry ofEducation.
Moja, T. (2008). Racism, an event or a way of life on campuses? University World News:Africa Edition, 18-21.
National Commission on Higher Education (1996). Report: A framework for transformation.Pretoria: Human Sciences Research Council.
National Treasury (2010). Introducing public private partnerships in South Africa. Pretoria:National Treasury.
Pascarella, E. & Terenzini, P. (1991). How college affects students: Findings and insights fromtwenty years of research. San Francisco: Jossey-Bass.
Pascarella, E. & Terenzini, P. (2005). How college affects students: A third decade ofresearch. Vol 2. San Francisco: Jossey-Bass.
Paxton, P. (2008). Using PPPs for university student accommodation projects. Accessed 21January 2011 http://www.mondaq.in/australia/article.asp?article_id=69138.
Piotrowicz, K. (2009). On and Off Campus Student Housing: A Course developed forResidential Property Management Undergraduate and Graduate Students. MA thesisproject, Ball State University.
Quendler, S. (2002). Link between nutrition, physical activity, and academic achievement.Atlanta: ILSI Center for Health Promotion.
Radder, L. & Han, X. (2009). Service Quality of On-Campus Student Housing: A South AfricanExperience. International Business & Economics Research Journal, 8(11), 107-119.
149
Rashdall, H. (1895). The Universities of Europe in the Middle Ages. Vol.1. Oxford: Clarendon.
Remøy, H. & Van der Voordt, T. (2007). A new life: conversion of vacant office buildings intohousing. Facilities, 25(3/4), 88-103.
Republic of South Africa (1996). Constitution of the Republic of South Africa, Act no 108 of1996. Pretoria: Government Printers.
Republic of South Africa (1997). Higher Education Act No. 101 of 1997. GovernmentGazette No. 18515, Notice 1655. Pretoria: Government Printers.
Rhodes University (2010). Rhodes University Council Meeting Minutes, March 2010. RhodesUniversity.
Rogers, P. & Lloyd, H. (1994). Nutrition and mental performance. Proceedings of theNutrition Society, 53, 443-456.
Ryan, M. (2003). Contemporary issues in student housing finance. New Directions forStudent Services, 103, 59-71.
Sebokedi, Z. (2009). Student housing registration and placement inefficiencies at a SouthAfrican University. Masters thesis, Cape Peninsula University of Technology.
Shapiro, N. & Levine, J. (1999). Creating learning communities: A practical guide to winningsupport, organizing for change and implementing programs. San Francisco: Jossey-Bass.
Smith, D. (2008). The politics of studentification and '(un)balanced' urban populations in theUnited Kingdom: an update. Working paper, Nottingham Action Group. Accessed 21 January2011http://www.nottinghamaction.org.uk/_downloads/Politics%20of%20Studentification.pdf.
Statistics South Africa (2010). Stats Online. Accessed 21 January 2011http://www.statssa.gov.za/keyindicators/keyindicators.asp.
Steakley, L. (2005). More students and less capital funding push innovative housing.Engineering News-Record, 255(1).
Stoner, K. & Cavins, K. (2003). New options for financing residence hall renovation andconstruction. New Directions For Student Services, 101, Spring.
Swartz, D. (2010). Presentation to the National Conference of the South African Chapter ofthe Association of College and University Housing Officers International. UnpublishedPowerPoint presentation, Durban.
Taras, H. (2005). Nutrition and student performance at school. Journal of School Health,75(6), 199.
150
Thompson, J. (1993). The effects of on-campus residence on first-time college students.NASPA Journal 31(1), 41-47.
Thomsen, J. & Eikemo, T. A. (2010). Aspects of student housing satisfaction: a quantitativestudy. Journal of Housing and the Built Environment, 25, 273-293.
Torres-Antonini, M. & Dunkel, N. (2009). Green residence halls are here: Current trends insustainable campus housing. The Journal of College and University Student Housing, 36(1),10-23.
Torres-Antonini, M. & Park, N. (2009). Sustainable student campus housing in the U.S.International Journal of Spatial Design and Research, 8(10), 29-38.
UCLA (2011). UCLA Student Housing Master Plan 2010-2020. 2011 Update. Los Angeles:University of California, Los Angeles. Accessed 21 January 2011http://www.housing.ucla.edu/SHMP/SHMP-2017-3.pdf.
United Kingdom (2004). Housing Act 2004. Accessed 21 January 2011http://www.legislation.gov.uk/ukpga/2004/34/contents.
Universities UK (2006). Code of Practice for the Management of Student Housing. Accessed21 January 2011 http://www.lsbu.ac.uk/accommodation/pdfs/codePracticeManStu.pdf.
University of Cape Town & Stellenbosch University (2010). Sustainability in residences: TheUCT and Stellenbosch experiences. Presentation at the Student Housing African Summit,Durban, 1 June.
Wright, E. (2001). GLBT students battle for equal access to student housing. Lesbian News,27(4).
151
Appendix A
MINISTRY OF HIGHER EDUCATION AND TRAININGMINISTERIAL COMMITTEE FOR THE REVIEW OF THE PROVISION OF STUDENT
HOUSING
I, Bonginkosi Emmanuel Nzimande, MP, Minister of Higher Education and Training, inaccordance with Treasury Regulation 20 [issued in terms of the Public Finance ManagementAct, 1999 (Act No 1 of 1999)], hereby establish the committee set out in the schedule heretoto review the provision of student housing in the public university education system.
Ministry of Higher Education and TrainingTerms of Reference for the Review of the Provision of Student Housing
Background
Education White Paper 3: A Programme for the Transformation of Higher Education (1997)provided the policy framework for the transformation of higher education over the pastdecade. The policies have been informed by the need to ensure:
Improved access to higher education, particularly for students from poor andpreviously marginalised communities;
Responsiveness of higher education to the economic and social developmentpriorities of the country;
Capacity in the higher education system for high level research and innovation;
Enhanced quality of academic programme provision and the quality of student life;and
Redress of historical inequalities.
In the Ministerial Statement on Higher Education Funding: 2009/10 to 2011/12 dated 10November 2009 the Minister announced that a review will be undertaken to assess thesystem's need for additional student housing, the time frames for meeting these needs andexamine different ways in which expansions of student housing could be financed.
Problem Statement
Universities’ applications for the infrastructure and output efficiency grant for 2010/11 to2011/12 indicated that all contact universities are experiencing severe pressures on theirstudent housing resources. The applications received from universities were for a total 20000 new student residence places to be provided for 2010/11 to 2011/12. The current
152
provision of student housing places is approximately 100 000 student residence places for acontact student population of 530 000, an average provision of 18.8%. This is a nationalaverage, with some universities providing in excess of this percentage while others providehousing far below this percentage.
It is purported that this lack of supply of student housing is the cause, in the first instance ofmuch of the campus unrest apparent in recent times. In the second instance, the lack ofsupply is deemed to be a primary cause for the poor performance by many students as aresult of living conditions purportedly not conducive for studying; this having a detrimentalimpact on the throughput rate at universities.
Different factors have influenced the supply of new student accommodation or theupgrading and maintaining of existing accommodation. In the last two years a larger portionof the infrastructure funding provided by the department has been earmarked for studentaccommodation. The maintenance and ownership costs that increase as the residence ages,poor collection of student revenue in some universities has had financial implications foruniversity budgets, in some instances creating unsustainable financial pressure.
In the declaration of the Higher Education Stakeholder Summit on Transformation held on22 and 23 April 2010, the poor conditions under which students learn and live arerecognised.
Overall Purpose of the Review
To assess the current provision of student accommodation and benchmark the SouthAfrican universities against each other as well as against international institutions operatingin a similar environment. Furthermore, to determine the real need and assess the variousmodels of provision of student housing, the various types of housing that can be providedand the potential funding models which may assist in alleviating the problem but ensuringthat the provision thereof does not detrimentally affect the operating budgets of theuniversities in future.
Specific Terms of Reference
The scope of the review is to:
Assess the real demand for student accommodation at an individual university levelas well as at a national level, including the current state of student accommodationfacilities.
Determine the current mix of students in residences i.e. senior, junior, race, gender,disability etc in relation to the institutional policies.
Benchmark the results of findings across universities in South Africa as well asworldwide with specific emphasis on countries with similar demographics as SouthAfrica.
Identify the different types of physical accommodation currently being provided anddetermine whether there are any other forms of physical accommodation suitablefor the South African environment, including related facilities.
153
Examine the various models of securing physical accommodation e.g. outrightpurchase, lease, public private partnerships (PPP), build own and transfer (BOT),private providers etc.
Assess the current level of student payment for accommodation, including provisionfor student housing in NSFAS allocations.
Explore the sources of finance available to universities.
Develop in consultation with the sector the minimum standards of all residences.
Undertake an analysis of the true ownership cost of new accommodation buildingsand determine the impact thereof on operational budgets a few years after theproposed acquisition.
Propose possible changes to the funding framework to obviate the financingproblems created by the provision of more accommodation and owning additionalbuildings.
Provide a report to the Minister in which information on the above issues have beendocumented with recommendations that are appropriate to the current and futureprovision of student housing in universities. It is expected that the report will have short-term, medium-term and long-term proposals.
Review Process and Committee
The committee will be chaired by Professor Ihron Rensburg, Vice-Chancellor of theUniversity of Johannesburg and will not comprise of a full complement of members for theduration of the committee's work. The committee will comprise of the chairperson andofficials from the Department of Higher Education and Training (DHET), Ms K Menon and MsSwart. The committee will source different technical expertise to assist with the scope of itswork; in addition, a lead report writer to work under direction by Professor Rensburg is tobe commissioned to undertake the work.
In the course of its work, the committee and expertise sourced by the committee mayconsult key stakeholders, including but not limited to universities, national studentorganisations, NSFAS, financial services organisations, HESA and the Council on HigherEducation. The committee should draw on studies undertaken in South Africa and oninternational best practice and may commission work in consultation with the DHET.
154
Appendix B
MINISTERIAL COMMITTEE FOR THE REVIEW OF THE PROVISIONOF STUDENT HOUSING AT SOUTH AFRICAN UNIVERSITIES
RESEARCH QUESTIONNAIRE(To be completed electronically)
PurposeThe Minister of Higher Education and Training has established a Ministerial Committee toreview the provision of student housing at South African Universities. The MinisterialCommittee is chaired by Prof I Rensburg, Vice Chancellor of the University of Johannesburg.Dr Iain L’Ange, Director of Residential Operations at Rhodes University has been appointedas the principal researcher for the project.
The aim of this questionnaire is to collect part of the information and data required toproduce a report to the Minister which analyses the student housing situation atUniversities and provides recommendations that are appropriate to the current and futureprovision of student housing at Universities with short, medium and long-term proposals.
Questionnaire return dateDue to the tight timeframes set for the project it would be greatly appreciated if thecompleted questionnaire could be returned to Dr Iain L’Ange (at i.l’[email protected]) as anemail attachment by no later than 03 December 2010. The electronic version of thequestionnaire should be requested by sending an email to i.l’[email protected] [email protected] .
How to complete the questionnaireThe questionnaire comprises the following sections:
A. Institutional and housing student dataB. Student housing models and infrastructureC. Private student housingD. Residence management and administrationE. Academic indicatorsF. Financing of student housingG. Condition of residence infrastructureH. Future planning
155
Quantitative data responses:Tables have been provided for quantitative data requests. Respondents are requested toavoid changing the format of the tables. However, if additional rows are required, theseshould be added. As much of the quantitative data is required per campus, multi-campusrespondents are requested to complete a questionnaire for your largest campus in which allquestions are answered, and then a separate questionnaire for each campus (completingONLY the questions indicated). Please remember to insert the name of the relevant campusin the space provided at the top of each table.
Qualitative responses:Text boxes have been provided for qualitative responses. As the size of the box will increaseproportionately to the contents, the size of the box provided is NOT an indication of thelength of the response requested. Please use as much space as you require to answer thequestion comprehensively. Multi-campus respondents are requested to complete aquestionnaire for your largest campus in which all questions are answered, and then aseparate questionnaire for each campus (completing ONLY the questions indicated). Pleaseremember to insert the name of the relevant campus in the space provided at the top ofeach table.
Supportive documentation:In a number of cases, supportive documentation is requested (policy documents,organograms, etc.). As far as possible, please send such documentation electronically. If thisis not possible, please mark each document clearly to indicate which section and question itrelates to in the questionnaire (e.g., D1), and post to Dr Iain L’Ange, Rhodes University, POBox 94, Grahamstown, 6140.
Process Please answer each question as comprehensively as possible. Any queries about the completion of the questionnaire may be directed to Dr Iain
L’Ange (046 603 8188 (O); 046 603 8962 (fax); i.l’[email protected]). Please return the completed questionnaire to Dr Iain L’Ange (at i.l’[email protected]) as
an email attachment by no later than 03 December 2010. Follow up campus site visits will be scheduled where indicated once the
questionnaires have been returned and scrutinised. The data gathered will be collated and analyzed by the research team and the results
will be used to produce a report which analyses and profiles the university studenthousing situation in South Africa.
Thank you for your assistance
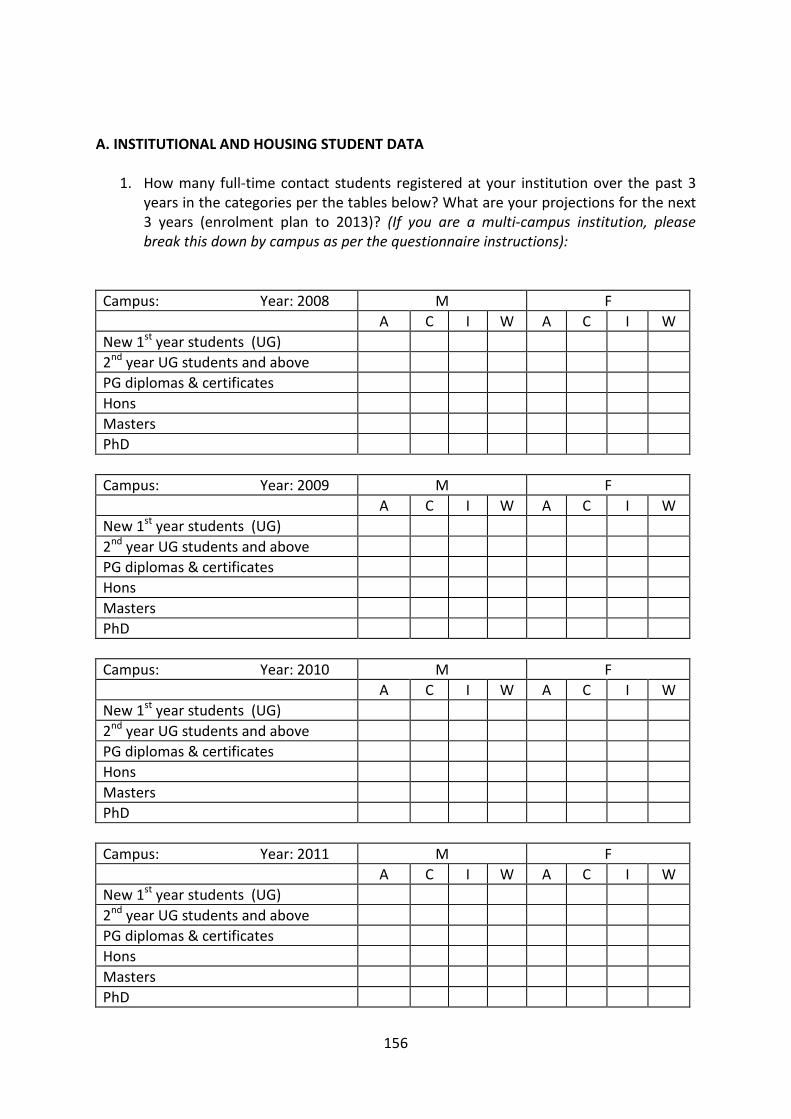
156
A. INSTITUTIONAL AND HOUSING STUDENT DATA
1. How many full-time contact students registered at your institution over the past 3years in the categories per the tables below? What are your projections for the next3 years (enrolment plan to 2013)? (If you are a multi-campus institution, pleasebreak this down by campus as per the questionnaire instructions):
Campus: Year: 2008 M F
A C I W A C I W
New 1st year students (UG)
2nd year UG students and above
PG diplomas & certificates
Hons
Masters
PhD
Campus: Year: 2009 M F
A C I W A C I W
New 1st year students (UG)
2nd year UG students and above
PG diplomas & certificates
Hons
Masters
PhD
Campus: Year: 2010 M F
A C I W A C I W
New 1st year students (UG)
2nd year UG students and above
PG diplomas & certificates
Hons
Masters
PhD
Campus: Year: 2011 M F
A C I W A C I W
New 1st year students (UG)
2nd year UG students and above
PG diplomas & certificates
Hons
Masters
PhD
157
Campus: Year: 2012 M F
A C I W A C I W
New 1st year students (UG)
2nd year UG students and above
PG diplomas & certificates
Hons
Masters
PhD
Campus: Year: 2013 M F
A C I W A C I W
New 1st year students (UG)
2nd year UG students and above
PG diplomas & certificates
Hons
Masters
PhD
2. Please indicate the number of students housed in residence in the followingcategories for the past 3 years (in February, in June and in November) (If you are amulti-campus institution, please break this down by campus as per the questionnaireinstructions):
Campus: Year: 2008-Feb M F
A C I W A C I W
New 1st year students (UG)
2nd year UG students and above
PG diplomas & certificates
Hons
Masters
PhD
Campus: Year: 2008 - Jun M F
A C I W A C I W
New 1st year students (UG)
2nd year UG students and above
PG diplomas & certificates
Hons
Masters
PhD
158
Campus: Year: 2008 - Nov M F
A C I W A C I W
New 1st year students (UG)
2nd year UG students and above
PG diplomas & certificates
Hons
Masters
PhD
Campus: Year: 2009 - Feb M F
A C I W A C I W
New 1st year students (UG)
2nd year UG students and above
PG diplomas & certificates
Hons
Masters
PhD
Campus: Year: 2009 - Jun M F
A C I W A C I W
New 1st year students (UG)
2nd year UG students and above
PG diplomas & certificates
Hons
Masters
PhD
Campus: Year: 2009 - Nov M F
A C I W A C I W
New 1st year students (UG)
2nd year UG students and above
PG diplomas & certificates
Hons
Masters
PhD
Campus: Year: 2010 - Feb M F
A C I W A C I W
New 1st year students (UG)
2nd year UG students and above
PG diplomas & certificates
Hons
159
Masters
PhD
Campus: Year: 2010 - Jun M F
A C I W A C I W
New 1st year students (UG)
2nd year UG students and above
PG diplomas & certificates
Hons
Masters
PhD
Campus: Year: 2010 - Nov M F
A C I W A C I W
New 1st year students (UG)
2nd year UG students and above
PG diplomas & certificates
Hons
Masters
PhD
3. Please indicate the numbers of students who received any financial aid and werehoused in residence in the following categories for the past 3 years (If you are amulti-campus institution, please break this down by campus as per the questionnaireinstructions):
Campus: Year: 2008 M F
A C I W A C I W
New 1st year students (UG)
2nd year UG students and above
PG diplomas & certificates
Hons
Masters
PhD
Campus: Year: 2009 M F
A C I W A C I W
New 1st year students (UG)
2nd year UG students and above
PG diplomas & certificates
Hons
Masters
PhD
160
Campus: Year: 2010 M F
A C I W A C I W
New 1st year students (UG)
2nd year UG students and above
PG diplomas & certificates
Hons
Masters
PhD
4. Please indicate how many registered students your institution was unable to place inresidences due to lack of capacity over the past three years in the followingcategories (If you are a multi-campus institution, please break this down by campusas per the questionnaire instructions):
Campus: Year: 2008 M F
A C I W A C I W
New 1st year students (UG)
2nd year UG students and above
PG diplomas & certificates
Hons
Masters
PhD
Campus: Year: 2009 M F
A C I W A C I W
New 1st year students (UG)
2nd year UG students and above
PG diplomas & certificates
Hons
Masters
PhD
Campus: Year: 2010 M F
A C I W A C I W
New 1st year students (UG)
2nd year UG students and above
PG diplomas & certificates
Hons
Masters
PhD
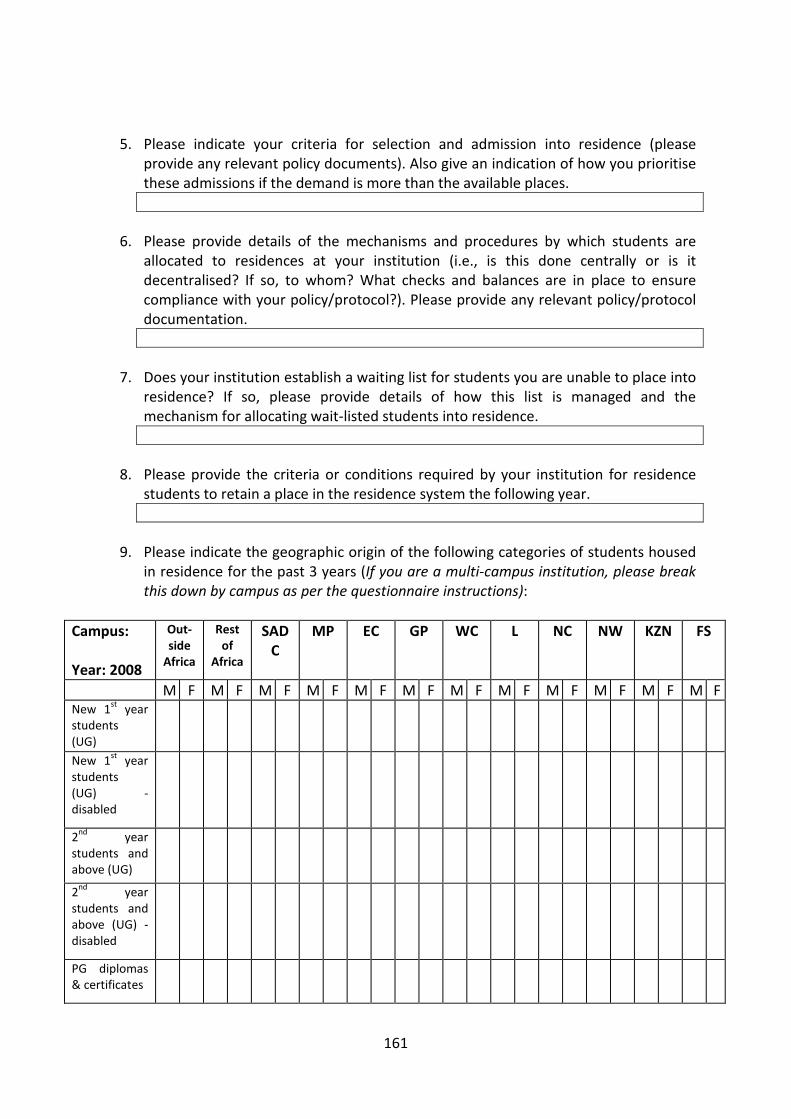
161
5. Please indicate your criteria for selection and admission into residence (pleaseprovide any relevant policy documents). Also give an indication of how you prioritisethese admissions if the demand is more than the available places.
6. Please provide details of the mechanisms and procedures by which students areallocated to residences at your institution (i.e., is this done centrally or is itdecentralised? If so, to whom? What checks and balances are in place to ensurecompliance with your policy/protocol?). Please provide any relevant policy/protocoldocumentation.
7. Does your institution establish a waiting list for students you are unable to place intoresidence? If so, please provide details of how this list is managed and themechanism for allocating wait-listed students into residence.
8. Please provide the criteria or conditions required by your institution for residencestudents to retain a place in the residence system the following year.
9. Please indicate the geographic origin of the following categories of students housedin residence for the past 3 years (If you are a multi-campus institution, please breakthis down by campus as per the questionnaire instructions):
Campus:
Year: 2008
Out-side
Africa
Restof
Africa
SADC
MP EC GP WC L NC NW KZN FS
M F M F M F M F M F M F M F M F M F M F M F M FNew 1
styear
students(UG)
New 1st
yearstudents(UG) -disabled
2nd
yearstudents andabove (UG)
2nd
yearstudents andabove (UG) -disabled
PG diplomas& certificates
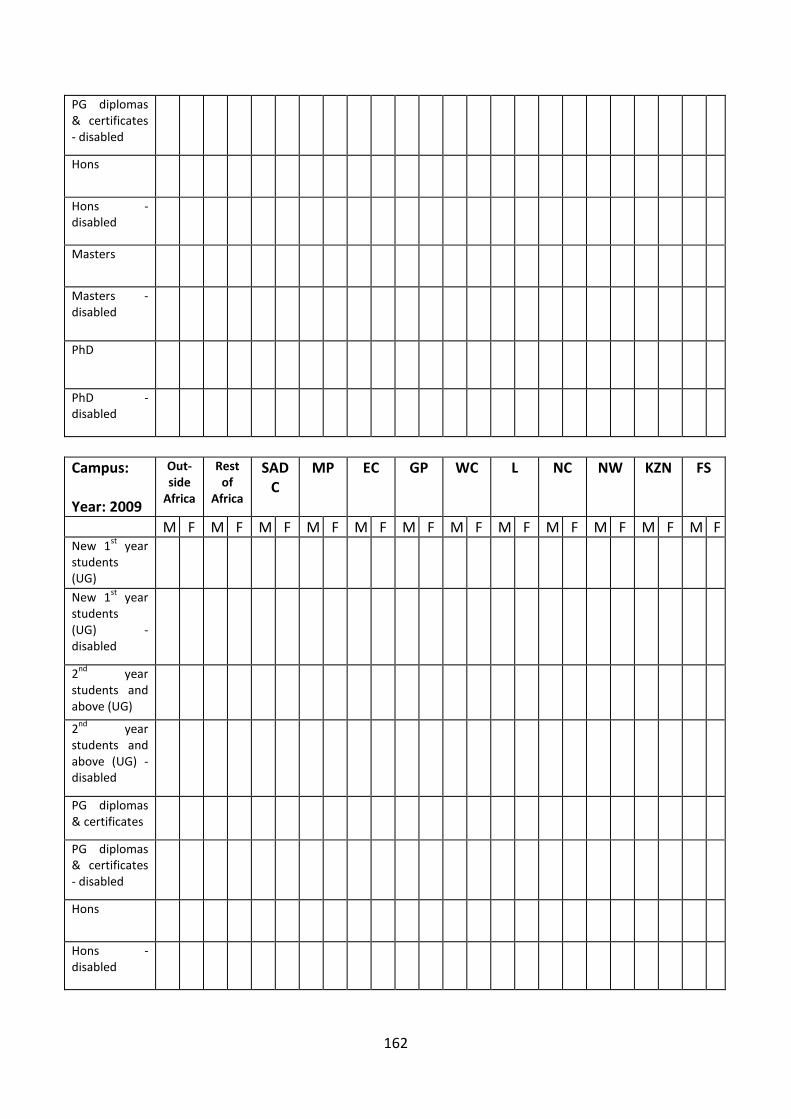
162
PG diplomas& certificates- disabled
Hons
Hons -disabled
Masters
Masters -disabled
PhD
PhD -disabled
Campus:
Year: 2009
Out-side
Africa
Restof
Africa
SADC
MP EC GP WC L NC NW KZN FS
M F M F M F M F M F M F M F M F M F M F M F M FNew 1
styear
students(UG)
New 1st
yearstudents(UG) -disabled
2nd
yearstudents andabove (UG)
2nd
yearstudents andabove (UG) -disabled
PG diplomas& certificates
PG diplomas& certificates- disabled
Hons
Hons -disabled
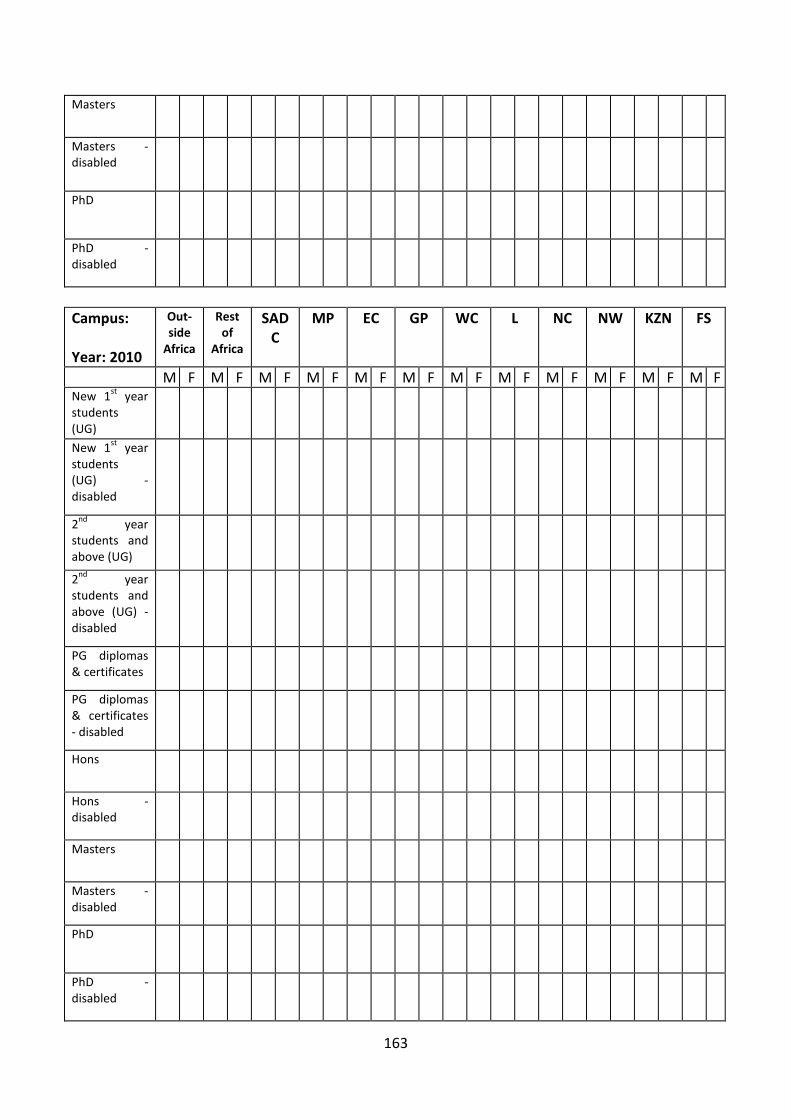
163
Masters
Masters -disabled
PhD
PhD -disabled
Campus:
Year: 2010
Out-side
Africa
Restof
Africa
SADC
MP EC GP WC L NC NW KZN FS
M F M F M F M F M F M F M F M F M F M F M F M FNew 1
styear
students(UG)
New 1st
yearstudents(UG) -disabled
2nd
yearstudents andabove (UG)
2nd
yearstudents andabove (UG) -disabled
PG diplomas& certificates
PG diplomas& certificates- disabled
Hons
Hons -disabled
Masters
Masters -disabled
PhD
PhD -disabled
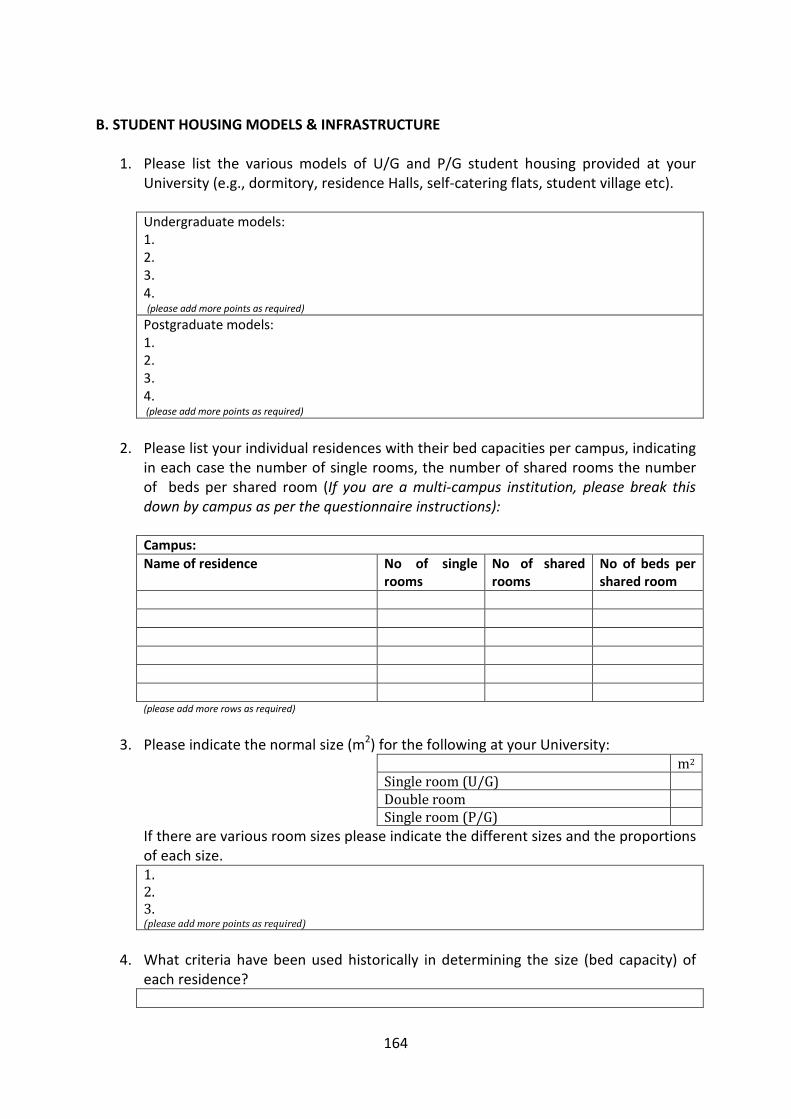
164
B. STUDENT HOUSING MODELS & INFRASTRUCTURE
1. Please list the various models of U/G and P/G student housing provided at yourUniversity (e.g., dormitory, residence Halls, self-catering flats, student village etc).
Undergraduate models:1.2.3.4.(please add more points as required)
Postgraduate models:1.2.3.4.(please add more points as required)
2. Please list your individual residences with their bed capacities per campus, indicatingin each case the number of single rooms, the number of shared rooms the numberof beds per shared room (If you are a multi-campus institution, please break thisdown by campus as per the questionnaire instructions):
Campus:
Name of residence No of singlerooms
No of sharedrooms
No of beds pershared room
(please add more rows as required)
3. Please indicate the normal size (m2) for the following at your University:m2
Single room (U/G)Double roomSingle room (P/G)
If there are various room sizes please indicate the different sizes and the proportionsof each size.1.2.3.(please add more points as required)
4. What criteria have been used historically in determining the size (bed capacity) ofeach residence?
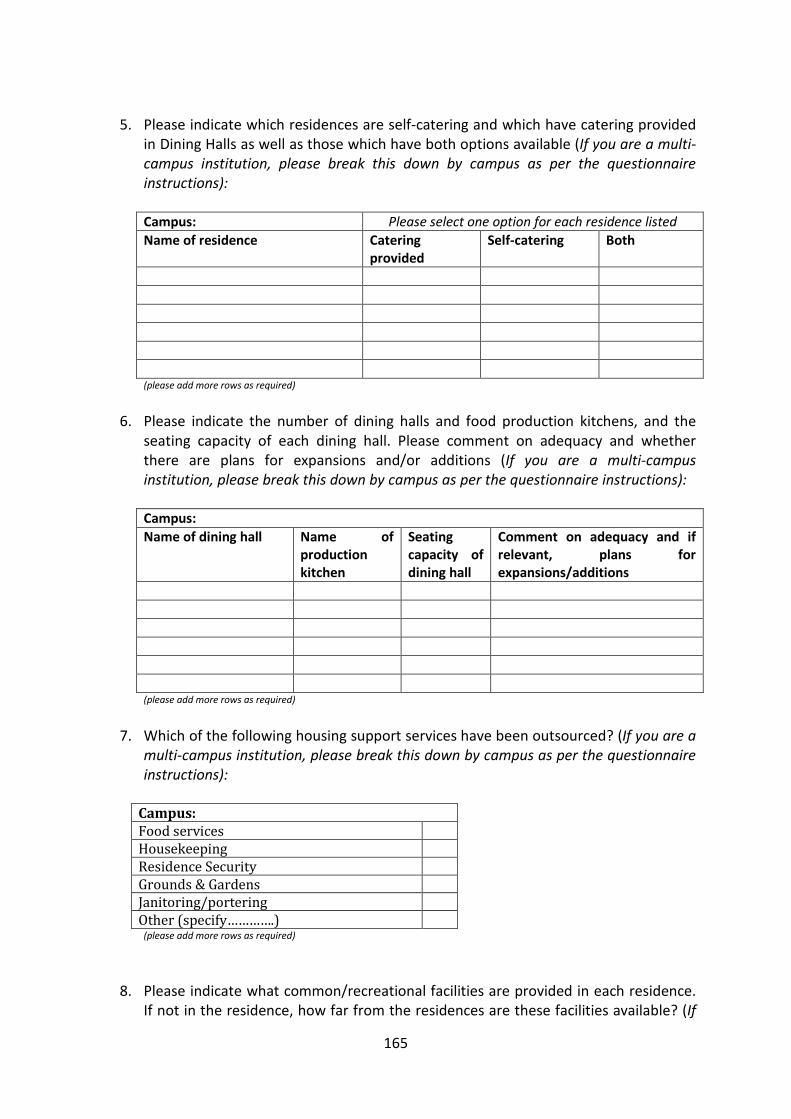
165
5. Please indicate which residences are self-catering and which have catering providedin Dining Halls as well as those which have both options available (If you are a multi-campus institution, please break this down by campus as per the questionnaireinstructions):
Campus: Please select one option for each residence listed
Name of residence Cateringprovided
Self-catering Both
(please add more rows as required)
6. Please indicate the number of dining halls and food production kitchens, and theseating capacity of each dining hall. Please comment on adequacy and whetherthere are plans for expansions and/or additions (If you are a multi-campusinstitution, please break this down by campus as per the questionnaire instructions):
Campus:
Name of dining hall Name ofproductionkitchen
Seatingcapacity ofdining hall
Comment on adequacy and ifrelevant, plans forexpansions/additions
(please add more rows as required)
7. Which of the following housing support services have been outsourced? (If you are amulti-campus institution, please break this down by campus as per the questionnaireinstructions):
Campus:Food servicesHousekeepingResidence SecurityGrounds & GardensJanitoring/porteringOther (specify………….)
(please add more rows as required)
8. Please indicate what common/recreational facilities are provided in each residence.If not in the residence, how far from the residences are these facilities available? (If
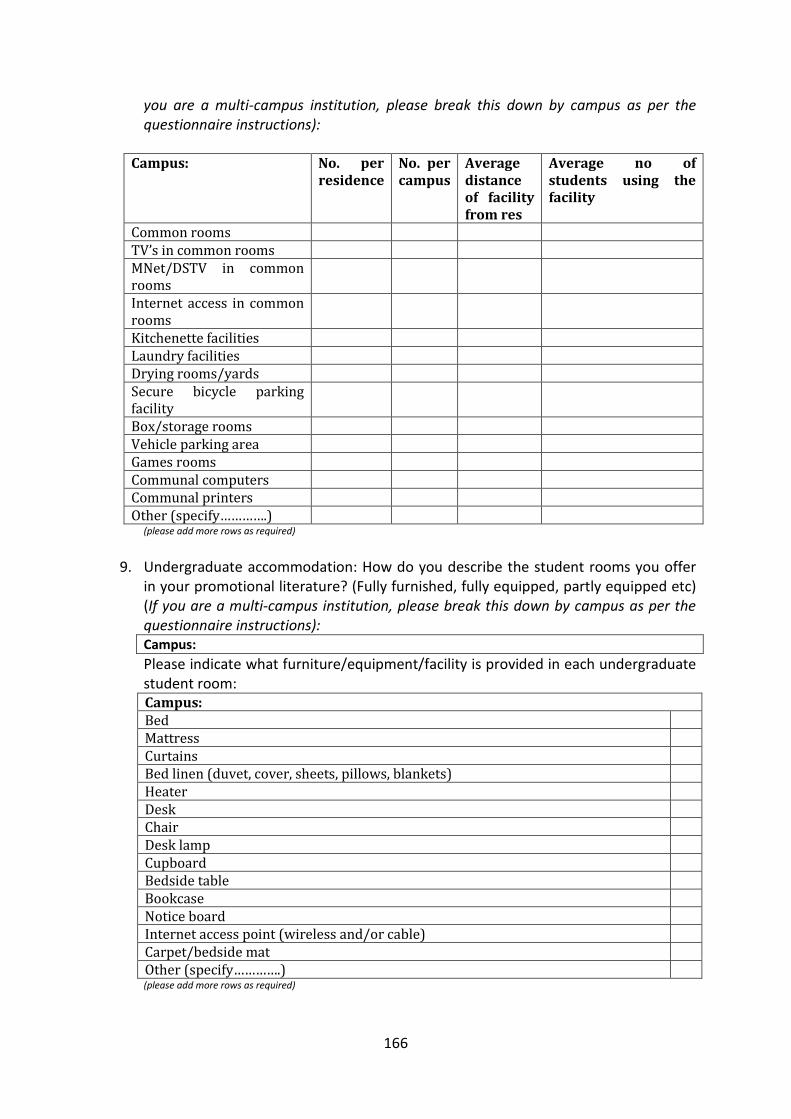
166
you are a multi-campus institution, please break this down by campus as per thequestionnaire instructions):
Campus: No. perresidence
No. percampus
Averagedistanceof facilityfrom res
Average no ofstudents using thefacility
Common roomsTV’s in common roomsMNet/DSTV in commonroomsInternet access in commonroomsKitchenette facilitiesLaundry facilitiesDrying rooms/yardsSecure bicycle parkingfacilityBox/storage roomsVehicle parking areaGames roomsCommunal computersCommunal printersOther (specify………….)
(please add more rows as required)
9. Undergraduate accommodation: How do you describe the student rooms you offerin your promotional literature? (Fully furnished, fully equipped, partly equipped etc)(If you are a multi-campus institution, please break this down by campus as per thequestionnaire instructions):Campus:
Please indicate what furniture/equipment/facility is provided in each undergraduatestudent room:Campus:BedMattressCurtainsBed linen (duvet, cover, sheets, pillows, blankets)HeaterDeskChairDesk lampCupboardBedside tableBookcaseNotice boardInternet access point (wireless and/or cable)Carpet/bedside matOther (specify………….)(please add more rows as required)
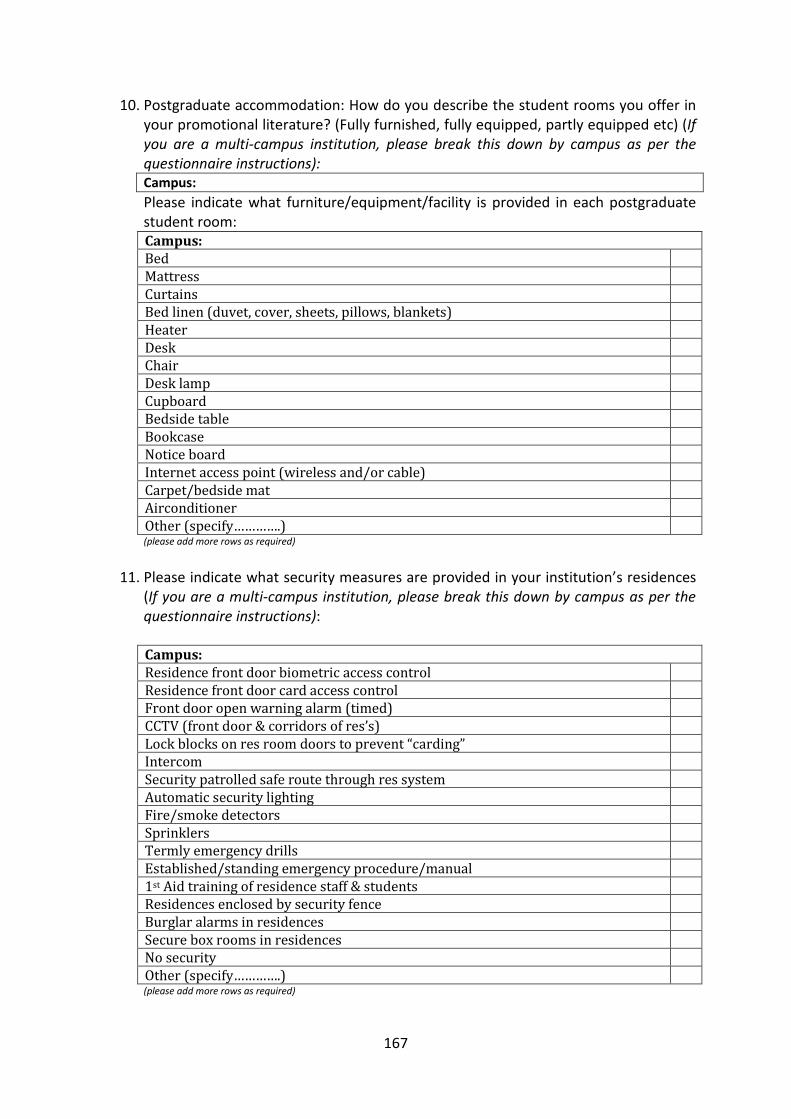
167
10. Postgraduate accommodation: How do you describe the student rooms you offer inyour promotional literature? (Fully furnished, fully equipped, partly equipped etc) (Ifyou are a multi-campus institution, please break this down by campus as per thequestionnaire instructions):Campus:
Please indicate what furniture/equipment/facility is provided in each postgraduatestudent room:Campus:BedMattressCurtainsBed linen (duvet, cover, sheets, pillows, blankets)HeaterDeskChairDesk lampCupboardBedside tableBookcaseNotice boardInternet access point (wireless and/or cable)Carpet/bedside matAirconditionerOther (specify………….)(please add more rows as required)
11. Please indicate what security measures are provided in your institution’s residences(If you are a multi-campus institution, please break this down by campus as per thequestionnaire instructions):
Campus:Residence front door biometric access controlResidence front door card access controlFront door open warning alarm (timed)CCTV (front door & corridors of res’s)Lock blocks on res room doors to prevent “carding”IntercomSecurity patrolled safe route through res systemAutomatic security lightingFire/smoke detectorsSprinklersTermly emergency drillsEstablished/standing emergency procedure/manual1st Aid training of residence staff & studentsResidences enclosed by security fenceBurglar alarms in residencesSecure box rooms in residencesNo securityOther (specify………….)(please add more rows as required)
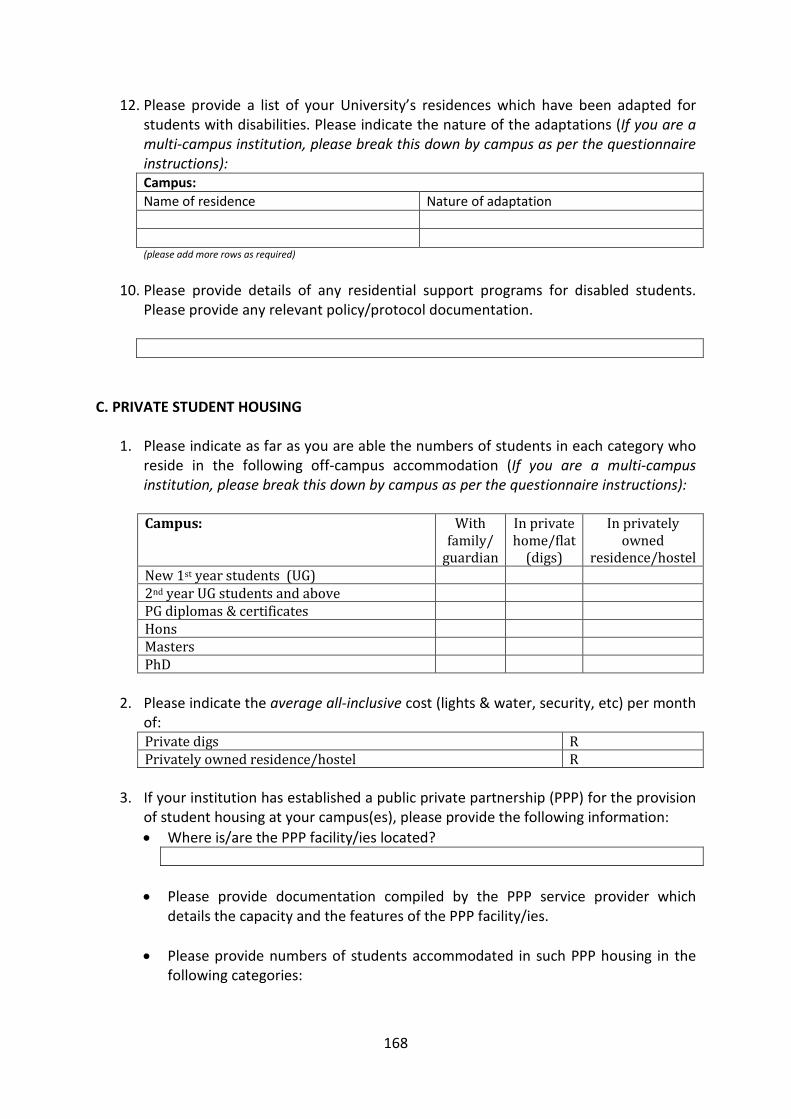
168
12. Please provide a list of your University’s residences which have been adapted forstudents with disabilities. Please indicate the nature of the adaptations (If you are amulti-campus institution, please break this down by campus as per the questionnaireinstructions):Campus:
Name of residence Nature of adaptation
(please add more rows as required)
10. Please provide details of any residential support programs for disabled students.Please provide any relevant policy/protocol documentation.
C. PRIVATE STUDENT HOUSING
1. Please indicate as far as you are able the numbers of students in each category whoreside in the following off-campus accommodation (If you are a multi-campusinstitution, please break this down by campus as per the questionnaire instructions):
Campus: Withfamily/
guardian
In privatehome/flat
(digs)
In privatelyowned
residence/hostelNew 1st year students (UG)2nd year UG students and abovePG diplomas & certificatesHonsMastersPhD
2. Please indicate the average all-inclusive cost (lights & water, security, etc) per monthof:Private digs RPrivately owned residence/hostel R
3. If your institution has established a public private partnership (PPP) for the provisionof student housing at your campus(es), please provide the following information:
Where is/are the PPP facility/ies located?
Please provide documentation compiled by the PPP service provider whichdetails the capacity and the features of the PPP facility/ies.
Please provide numbers of students accommodated in such PPP housing in thefollowing categories:
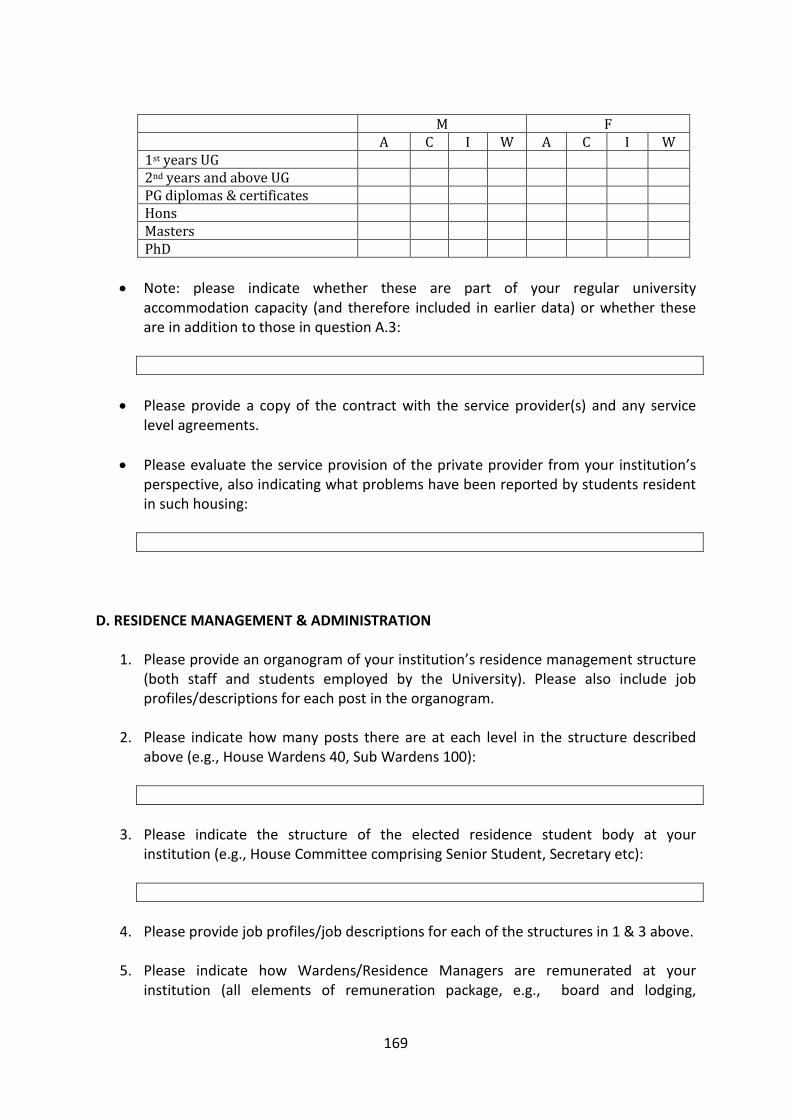
169
M FA C I W A C I W
1st years UG2nd years and above UGPG diplomas & certificatesHonsMastersPhD
Note: please indicate whether these are part of your regular universityaccommodation capacity (and therefore included in earlier data) or whether theseare in addition to those in question A.3:
Please provide a copy of the contract with the service provider(s) and any servicelevel agreements.
Please evaluate the service provision of the private provider from your institution’sperspective, also indicating what problems have been reported by students residentin such housing:
D. RESIDENCE MANAGEMENT & ADMINISTRATION
1. Please provide an organogram of your institution’s residence management structure(both staff and students employed by the University). Please also include jobprofiles/descriptions for each post in the organogram.
2. Please indicate how many posts there are at each level in the structure describedabove (e.g., House Wardens 40, Sub Wardens 100):
3. Please indicate the structure of the elected residence student body at yourinstitution (e.g., House Committee comprising Senior Student, Secretary etc):
4. Please provide job profiles/job descriptions for each of the structures in 1 & 3 above.
5. Please indicate how Wardens/Residence Managers are remunerated at yourinstitution (all elements of remuneration package, e.g., board and lodging,

170
allowances, salary etc). Please distinguish between full time and part timeWardens/Residence Managers.Full-timea.b.c.(please add more rows as required)
Part-timea.b.c.(please add more rows as required)
6. Please indicate how student Sub-Wardens/Residence Student Assistants areremunerated at your institution (all elements of remuneration package, e.g., boardand lodging, allowances, salary, fee rebates etc).
7. Please indicate how elected residence House Committee members are remuneratedat your institution (all elements of remuneration package, e.g., board and lodging,allowances, salary, fee rebates etc).
8. Please provide details of the training provided to Wardens/Residence Managers,Sub-Wardens/Residence Student Assistants, and House Committees (e.g., bookletcontaining program and training material outline, courses).
9. Has your institution experienced any student housing related unrest during the pastfive years? If yes, please provide the following estimates per incident (Please copyand past addition tables as required):Cause of incident:Campus:a. How intensive was the unrest?Select one option
1. Low intensity/scale2. Protest meeting/march3.Sit-in/disruption of program4. Damage to property, SAPF involved5. Shut down of res/campus required
b. What proportion of the campus student population was involved?c. In which month did this incident/unrest occur?d. How many residences were the root cause of the unrest?
10. How many incidents of student housing-related unrest occurred over the past fiveyears per campus at your University?
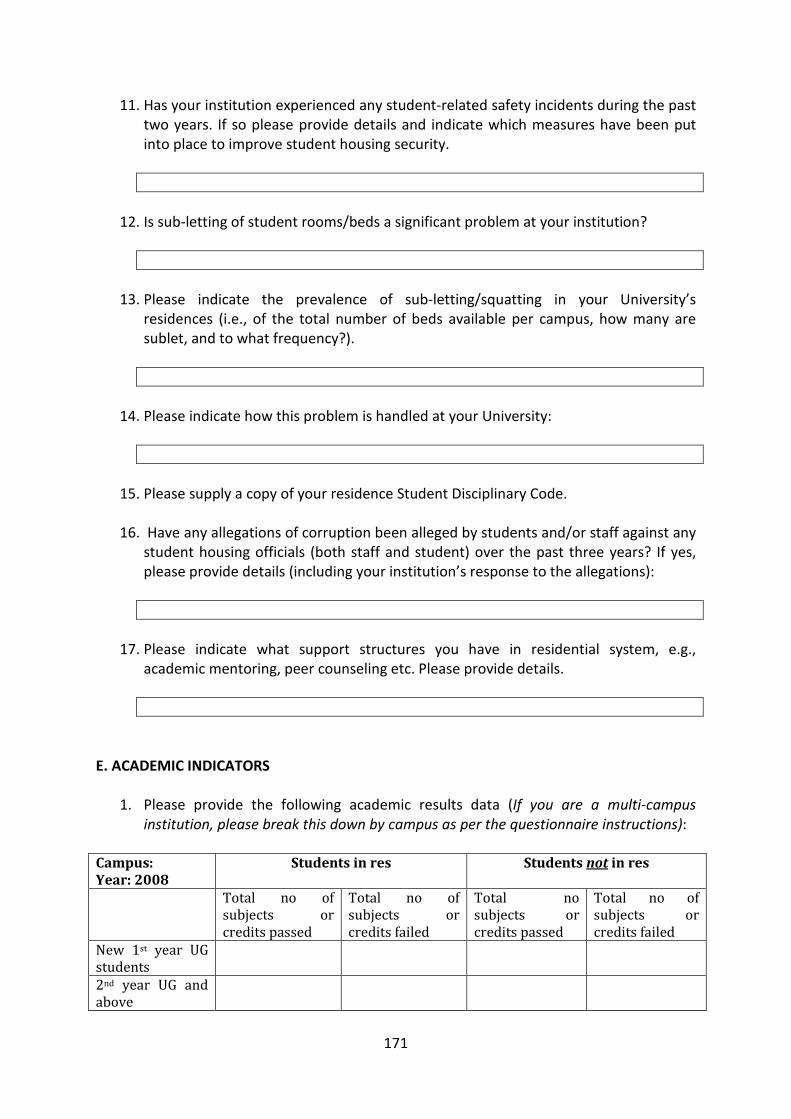
171
11. Has your institution experienced any student-related safety incidents during the pasttwo years. If so please provide details and indicate which measures have been putinto place to improve student housing security.
12. Is sub-letting of student rooms/beds a significant problem at your institution?
13. Please indicate the prevalence of sub-letting/squatting in your University’sresidences (i.e., of the total number of beds available per campus, how many aresublet, and to what frequency?).
14. Please indicate how this problem is handled at your University:
15. Please supply a copy of your residence Student Disciplinary Code.
16. Have any allegations of corruption been alleged by students and/or staff against anystudent housing officials (both staff and student) over the past three years? If yes,please provide details (including your institution’s response to the allegations):
17. Please indicate what support structures you have in residential system, e.g.,academic mentoring, peer counseling etc. Please provide details.
E. ACADEMIC INDICATORS
1. Please provide the following academic results data (If you are a multi-campusinstitution, please break this down by campus as per the questionnaire instructions):
Campus:Year: 2008
Students in res Students not in res
Total no ofsubjects orcredits passed
Total no ofsubjects orcredits failed
Total nosubjects orcredits passed
Total no ofsubjects orcredits failed
New 1st year UGstudents2nd year UG andabove
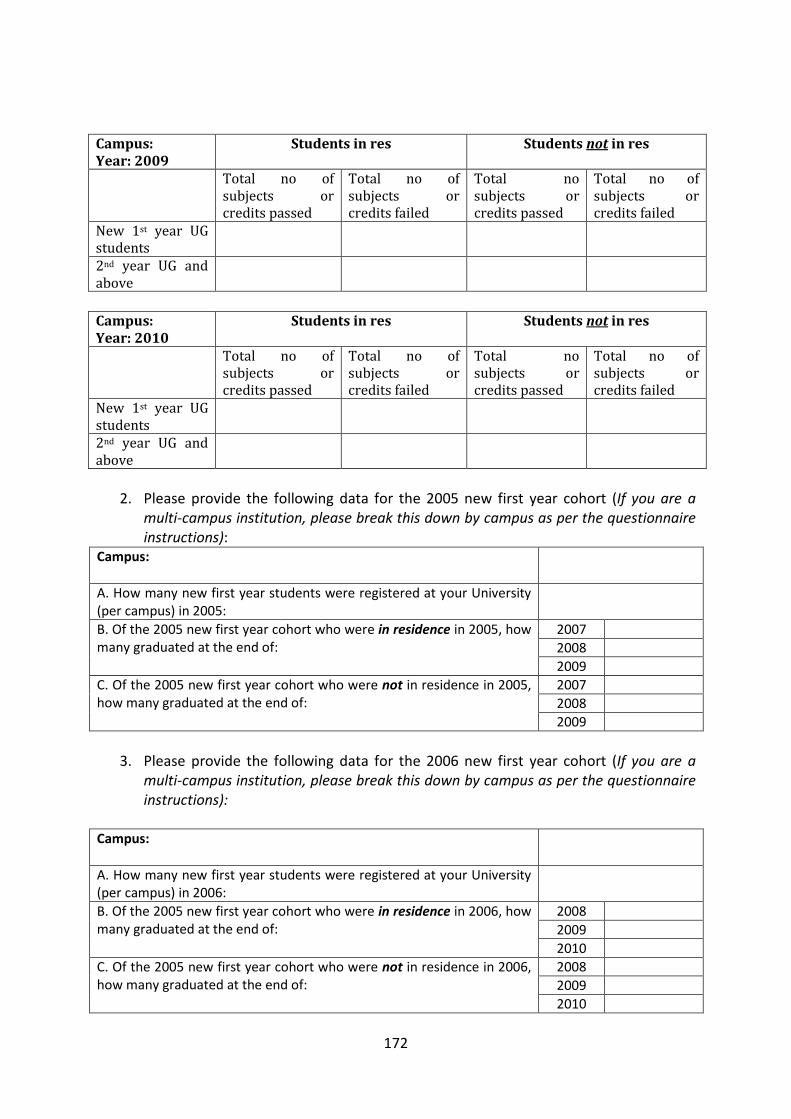
172
Campus:Year: 2009
Students in res Students not in res
Total no ofsubjects orcredits passed
Total no ofsubjects orcredits failed
Total nosubjects orcredits passed
Total no ofsubjects orcredits failed
New 1st year UGstudents2nd year UG andabove
Campus:Year: 2010
Students in res Students not in res
Total no ofsubjects orcredits passed
Total no ofsubjects orcredits failed
Total nosubjects orcredits passed
Total no ofsubjects orcredits failed
New 1st year UGstudents2nd year UG andabove
2. Please provide the following data for the 2005 new first year cohort (If you are amulti-campus institution, please break this down by campus as per the questionnaireinstructions):
Campus:
A. How many new first year students were registered at your University(per campus) in 2005:
B. Of the 2005 new first year cohort who were in residence in 2005, howmany graduated at the end of:
2007
2008
2009
C. Of the 2005 new first year cohort who were not in residence in 2005,how many graduated at the end of:
2007
2008
2009
3. Please provide the following data for the 2006 new first year cohort (If you are amulti-campus institution, please break this down by campus as per the questionnaireinstructions):
Campus:
A. How many new first year students were registered at your University(per campus) in 2006:
B. Of the 2005 new first year cohort who were in residence in 2006, howmany graduated at the end of:
2008
2009
2010
C. Of the 2005 new first year cohort who were not in residence in 2006,how many graduated at the end of:
2008
2009
2010
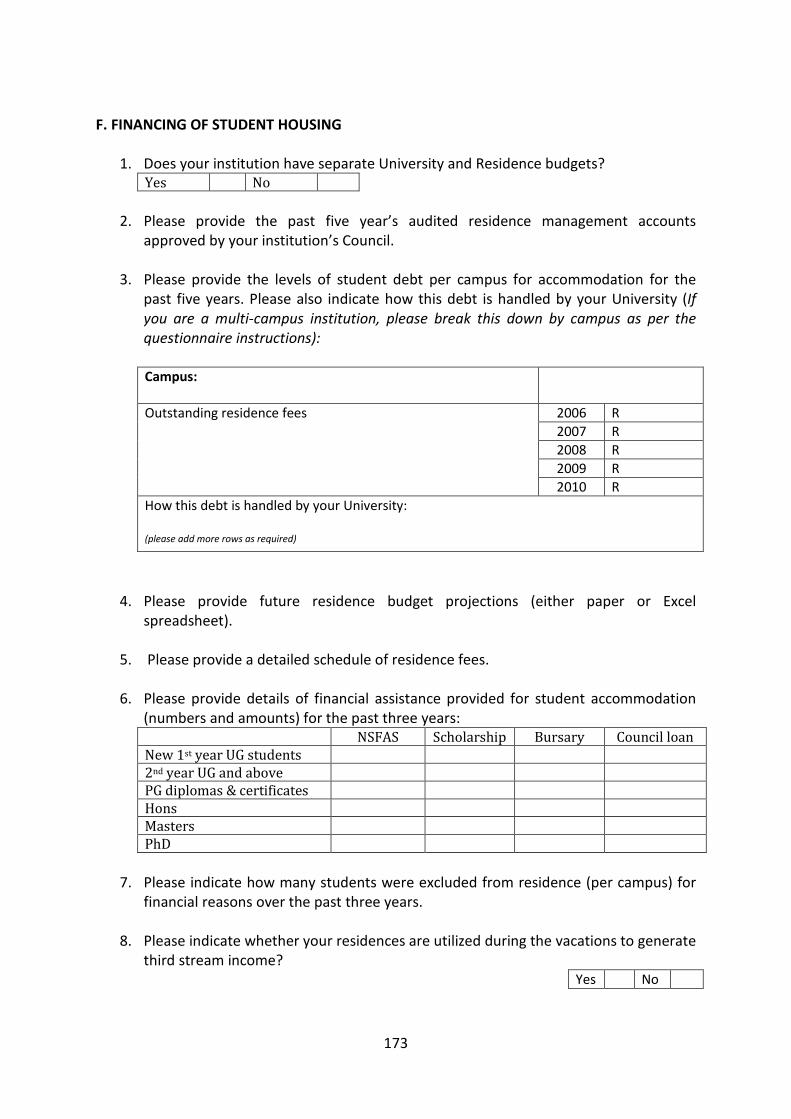
173
F. FINANCING OF STUDENT HOUSING
1. Does your institution have separate University and Residence budgets?Yes No
2. Please provide the past five year’s audited residence management accountsapproved by your institution’s Council.
3. Please provide the levels of student debt per campus for accommodation for thepast five years. Please also indicate how this debt is handled by your University (Ifyou are a multi-campus institution, please break this down by campus as per thequestionnaire instructions):
Campus:
Outstanding residence fees 2006 R
2007 R
2008 R
2009 R
2010 R
How this debt is handled by your University:
(please add more rows as required)
4. Please provide future residence budget projections (either paper or Excelspreadsheet).
5. Please provide a detailed schedule of residence fees.
6. Please provide details of financial assistance provided for student accommodation(numbers and amounts) for the past three years:
NSFAS Scholarship Bursary Council loanNew 1st year UG students2nd year UG and abovePG diplomas & certificatesHonsMastersPhD
7. Please indicate how many students were excluded from residence (per campus) forfinancial reasons over the past three years.
8. Please indicate whether your residences are utilized during the vacations to generatethird stream income?
Yes No
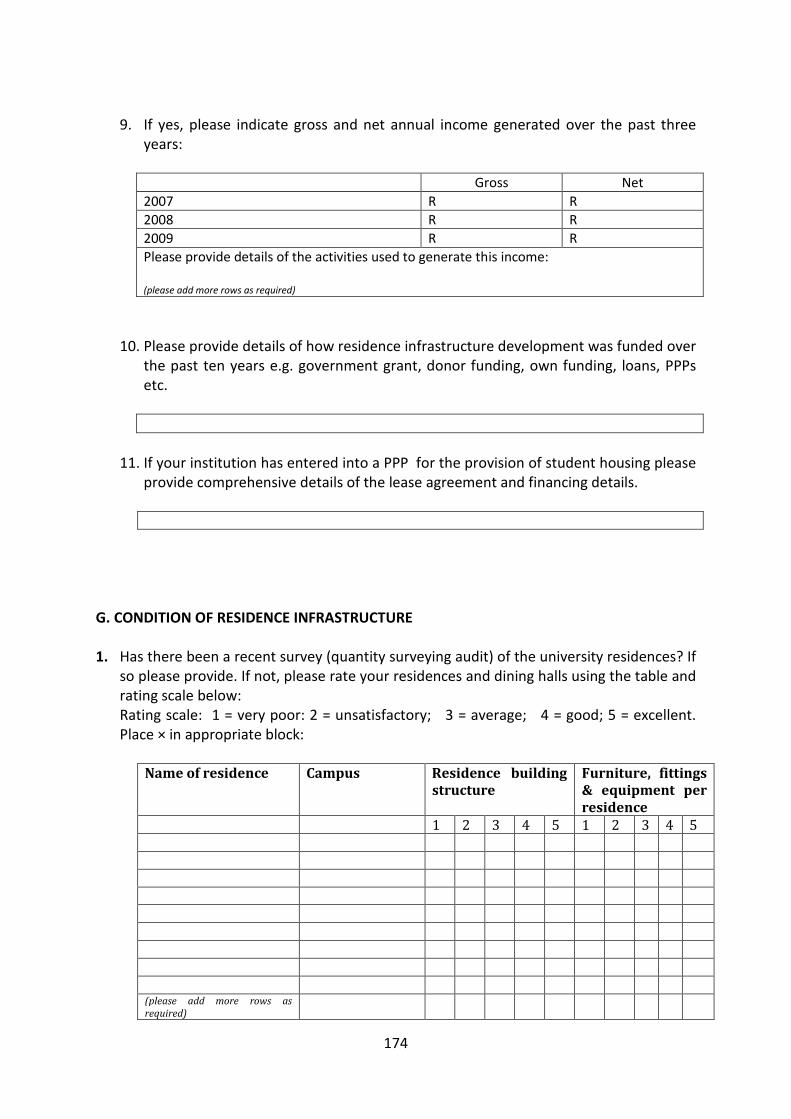
174
9. If yes, please indicate gross and net annual income generated over the past threeyears:
Gross Net
2007 R R
2008 R R
2009 R R
Please provide details of the activities used to generate this income:
(please add more rows as required)
10. Please provide details of how residence infrastructure development was funded overthe past ten years e.g. government grant, donor funding, own funding, loans, PPPsetc.
11. If your institution has entered into a PPP for the provision of student housing pleaseprovide comprehensive details of the lease agreement and financing details.
G. CONDITION OF RESIDENCE INFRASTRUCTURE
1. Has there been a recent survey (quantity surveying audit) of the university residences? Ifso please provide. If not, please rate your residences and dining halls using the table andrating scale below:Rating scale: 1 = very poor: 2 = unsatisfactory; 3 = average; 4 = good; 5 = excellent.Place × in appropriate block:
Name of residence Campus Residence buildingstructure
Furniture, fittings& equipment perresidence
1 2 3 4 5 1 2 3 4 5
(please add more rows asrequired)
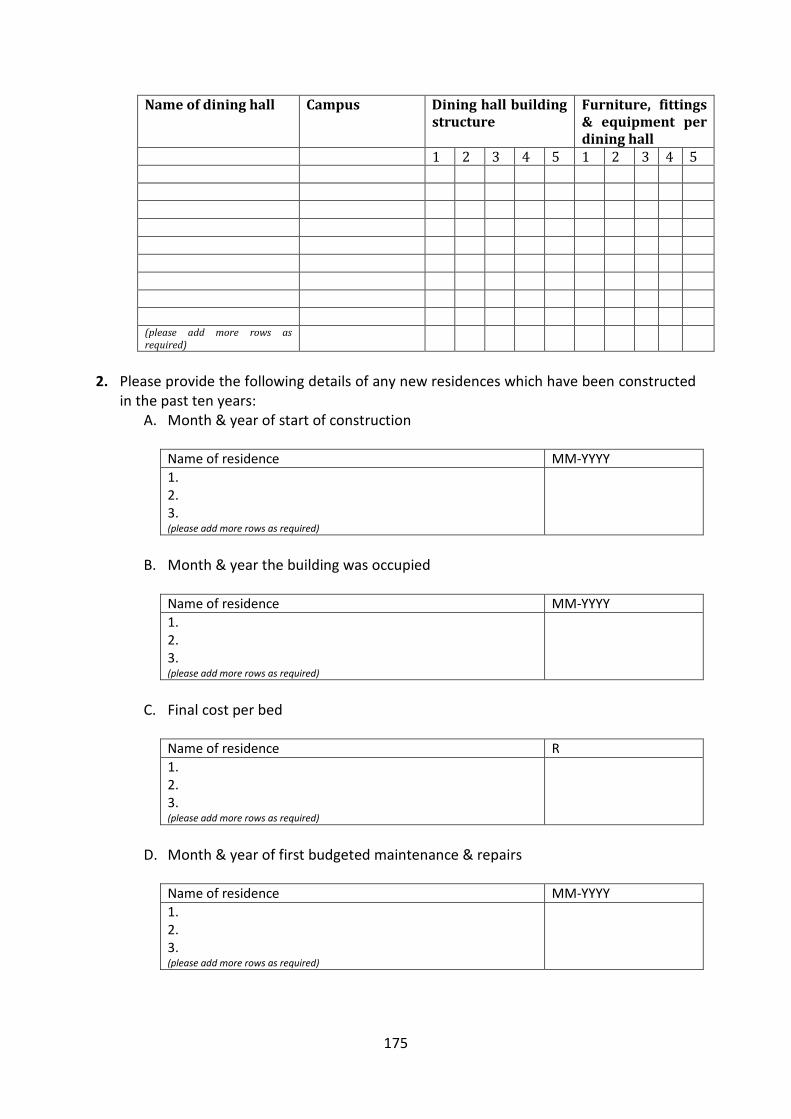
175
Name of dining hall Campus Dining hall buildingstructure
Furniture, fittings& equipment perdining hall
1 2 3 4 5 1 2 3 4 5
(please add more rows asrequired)
2. Please provide the following details of any new residences which have been constructedin the past ten years:
A. Month & year of start of construction
Name of residence MM-YYYY
1.2.3.(please add more rows as required)
B. Month & year the building was occupied
Name of residence MM-YYYY
1.2.3.(please add more rows as required)
C. Final cost per bed
Name of residence R
1.2.3.(please add more rows as required)
D. Month & year of first budgeted maintenance & repairs
Name of residence MM-YYYY
1.2.3.(please add more rows as required)
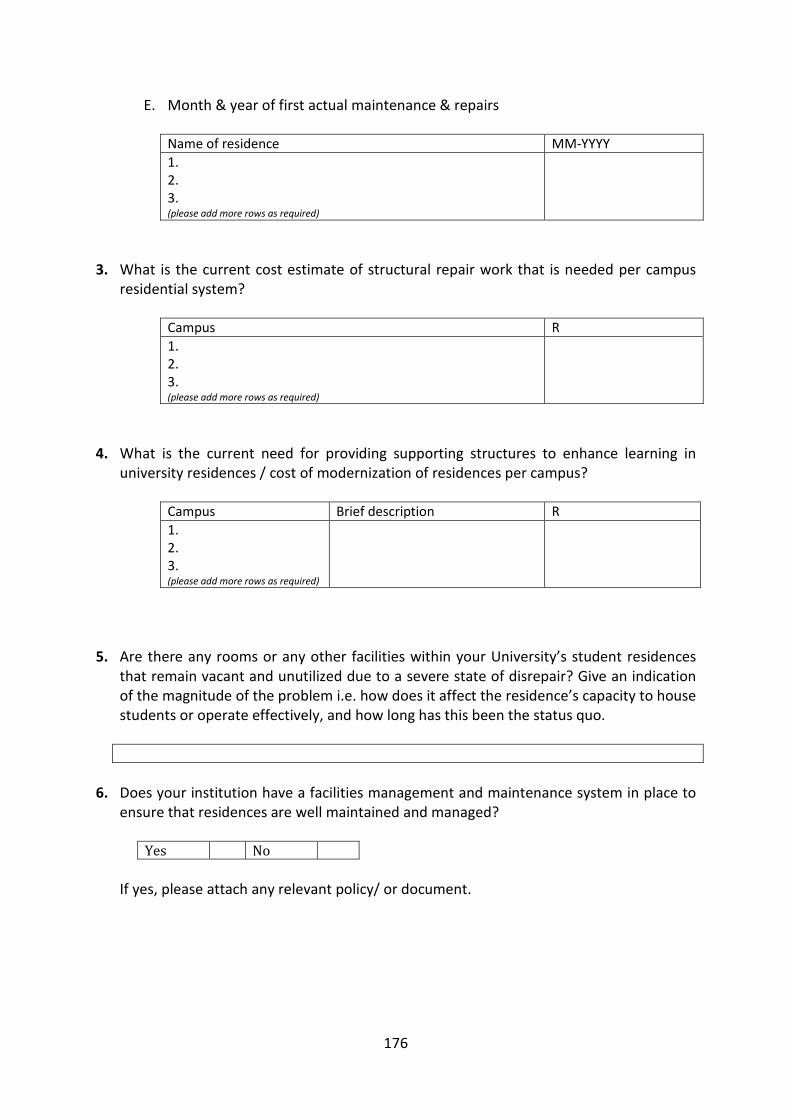
176
E. Month & year of first actual maintenance & repairs
Name of residence MM-YYYY
1.2.3.(please add more rows as required)
3. What is the current cost estimate of structural repair work that is needed per campusresidential system?
Campus R
1.2.3.(please add more rows as required)
4. What is the current need for providing supporting structures to enhance learning inuniversity residences / cost of modernization of residences per campus?
Campus Brief description R
1.2.3.(please add more rows as required)
5. Are there any rooms or any other facilities within your University’s student residencesthat remain vacant and unutilized due to a severe state of disrepair? Give an indicationof the magnitude of the problem i.e. how does it affect the residence’s capacity to housestudents or operate effectively, and how long has this been the status quo.
6. Does your institution have a facilities management and maintenance system in place toensure that residences are well maintained and managed?
Yes No
If yes, please attach any relevant policy/ or document.
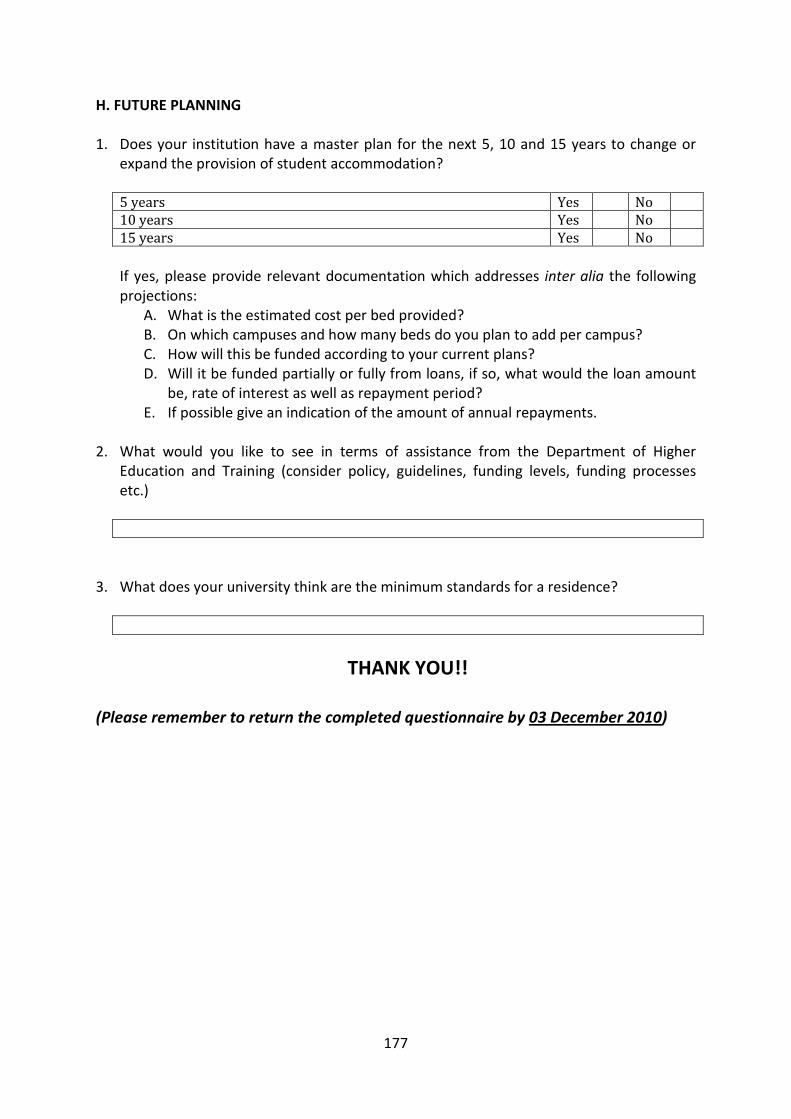
177
H. FUTURE PLANNING
1. Does your institution have a master plan for the next 5, 10 and 15 years to change orexpand the provision of student accommodation?
5 years Yes No10 years Yes No15 years Yes No
If yes, please provide relevant documentation which addresses inter alia the followingprojections:
A. What is the estimated cost per bed provided?B. On which campuses and how many beds do you plan to add per campus?C. How will this be funded according to your current plans?D. Will it be funded partially or fully from loans, if so, what would the loan amount
be, rate of interest as well as repayment period?E. If possible give an indication of the amount of annual repayments.
2. What would you like to see in terms of assistance from the Department of HigherEducation and Training (consider policy, guidelines, funding levels, funding processesetc.)
3. What does your university think are the minimum standards for a residence?
THANK YOU!!
(Please remember to return the completed questionnaire by 03 December 2010)
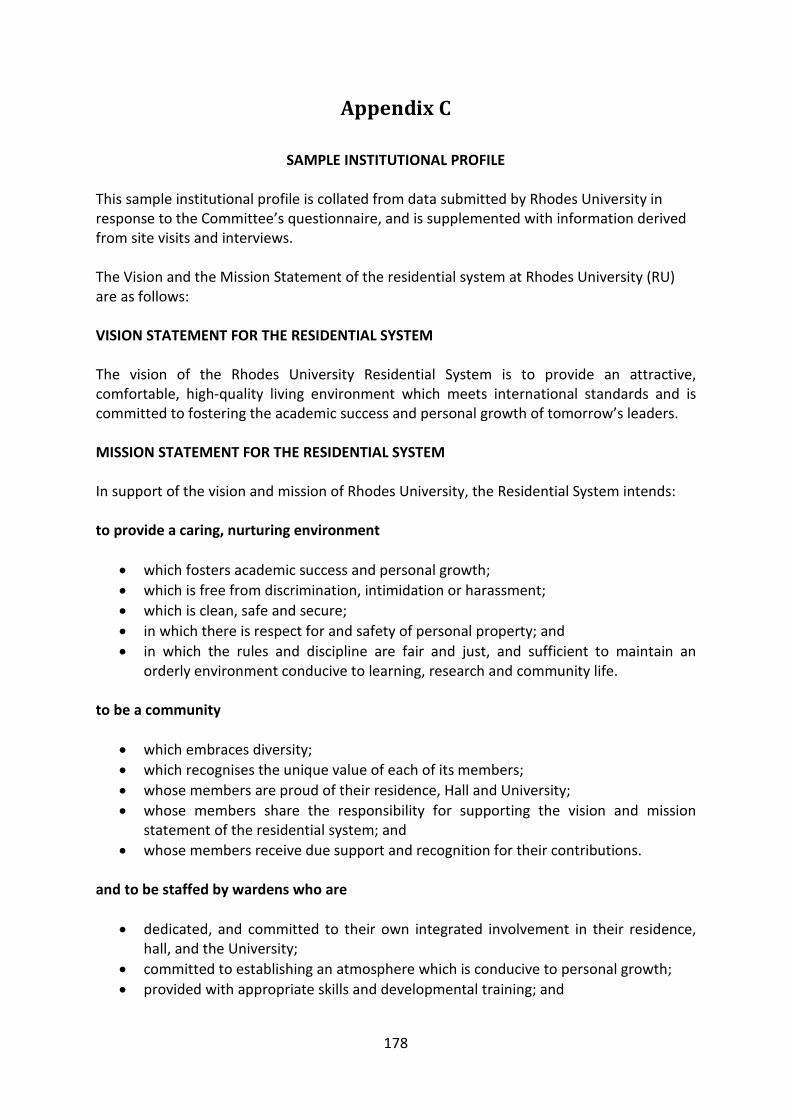
178
Appendix C
SAMPLE INSTITUTIONAL PROFILE
This sample institutional profile is collated from data submitted by Rhodes University inresponse to the Committee’s questionnaire, and is supplemented with information derivedfrom site visits and interviews.
The Vision and the Mission Statement of the residential system at Rhodes University (RU)are as follows:
VISION STATEMENT FOR THE RESIDENTIAL SYSTEM
The vision of the Rhodes University Residential System is to provide an attractive,comfortable, high-quality living environment which meets international standards and iscommitted to fostering the academic success and personal growth of tomorrow’s leaders.
MISSION STATEMENT FOR THE RESIDENTIAL SYSTEM
In support of the vision and mission of Rhodes University, the Residential System intends:
to provide a caring, nurturing environment
which fosters academic success and personal growth;
which is free from discrimination, intimidation or harassment;
which is clean, safe and secure;
in which there is respect for and safety of personal property; and
in which the rules and discipline are fair and just, and sufficient to maintain anorderly environment conducive to learning, research and community life.
to be a community
which embraces diversity;
which recognises the unique value of each of its members;
whose members are proud of their residence, Hall and University;
whose members share the responsibility for supporting the vision and missionstatement of the residential system; and
whose members receive due support and recognition for their contributions.
and to be staffed by wardens who are
dedicated, and committed to their own integrated involvement in their residence,hall, and the University;
committed to establishing an atmosphere which is conducive to personal growth;
provided with appropriate skills and developmental training; and
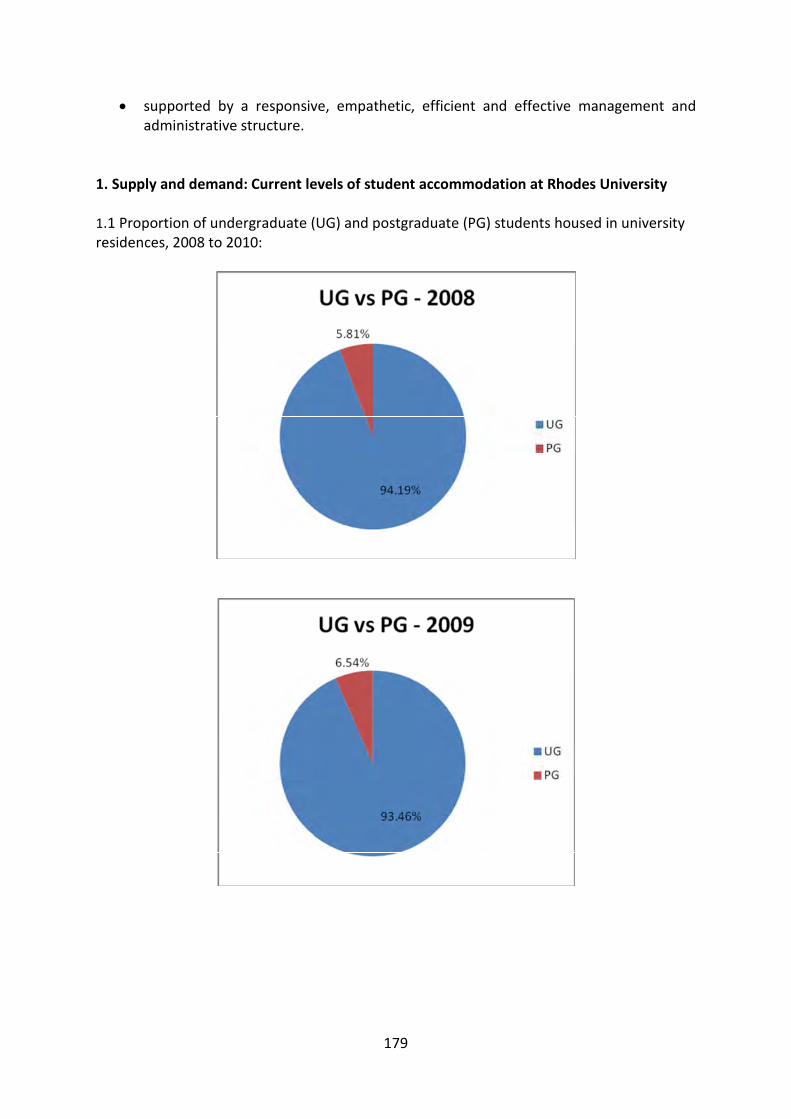
179
supported by a responsive, empathetic, efficient and effective management andadministrative structure.
1. Supply and demand: Current levels of student accommodation at Rhodes University
1.1 Proportion of undergraduate (UG) and postgraduate (PG) students housed in universityresidences, 2008 to 2010:
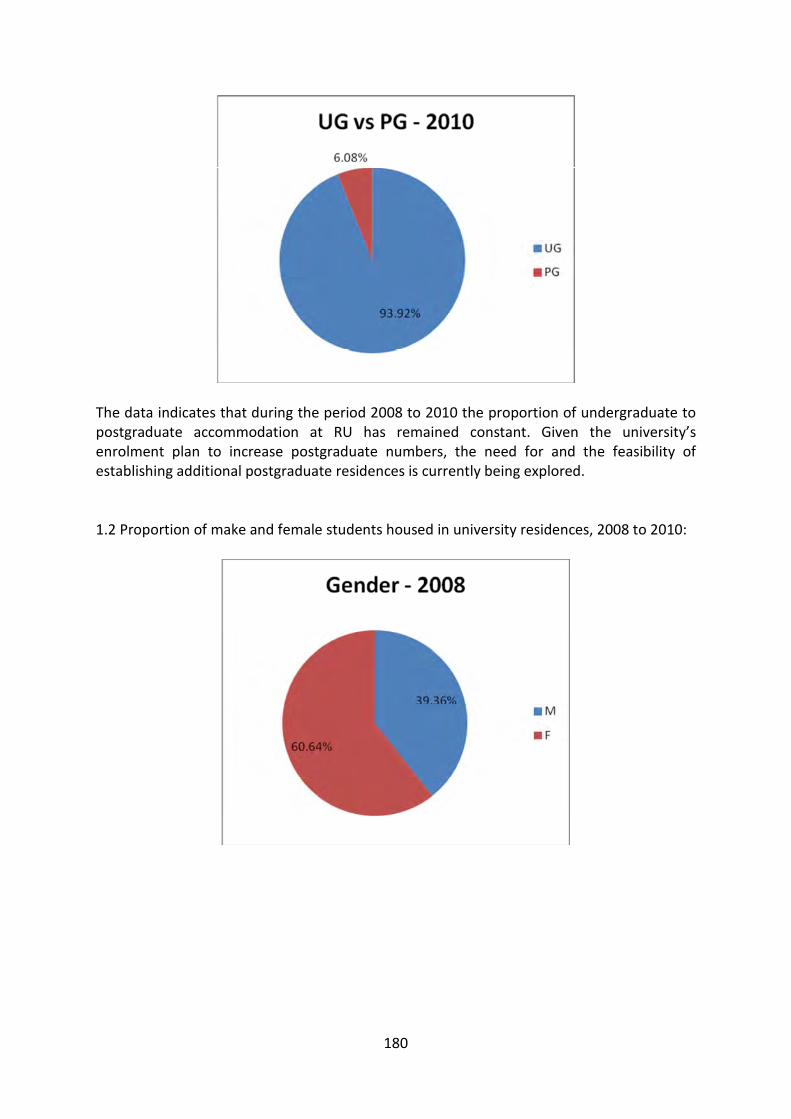
180
The data indicates that during the period 2008 to 2010 the proportion of undergraduate topostgraduate accommodation at RU has remained constant. Given the university’senrolment plan to increase postgraduate numbers, the need for and the feasibility ofestablishing additional postgraduate residences is currently being explored.
1.2 Proportion of make and female students housed in university residences, 2008 to 2010:
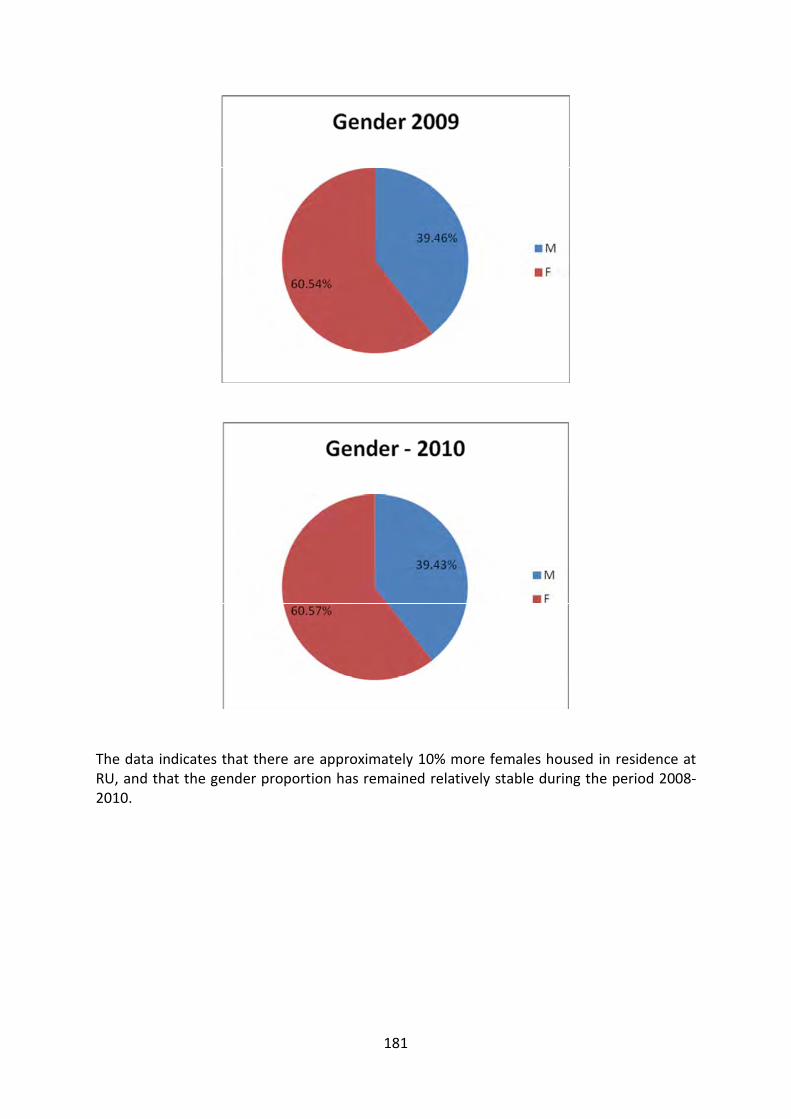
181
The data indicates that there are approximately 10% more females housed in residence atRU, and that the gender proportion has remained relatively stable during the period 2008-2010.
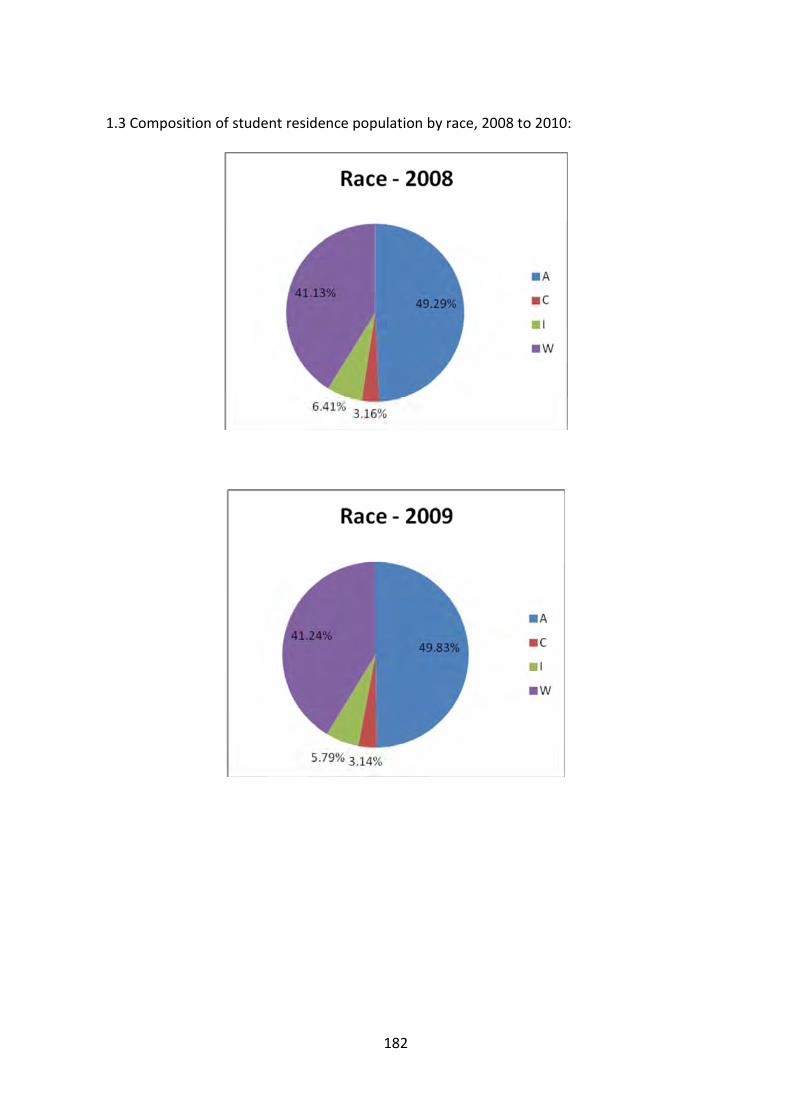
182
1.3 Composition of student residence population by race, 2008 to 2010:
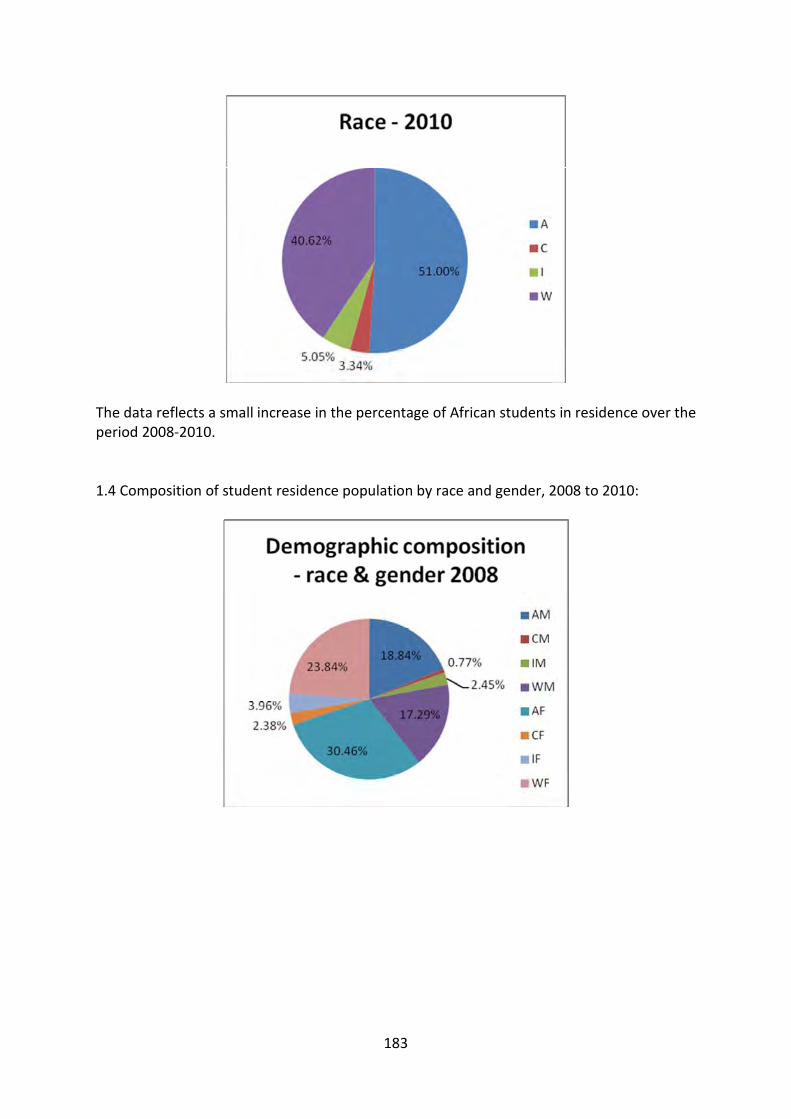
183
The data reflects a small increase in the percentage of African students in residence over theperiod 2008-2010.
1.4 Composition of student residence population by race and gender, 2008 to 2010:
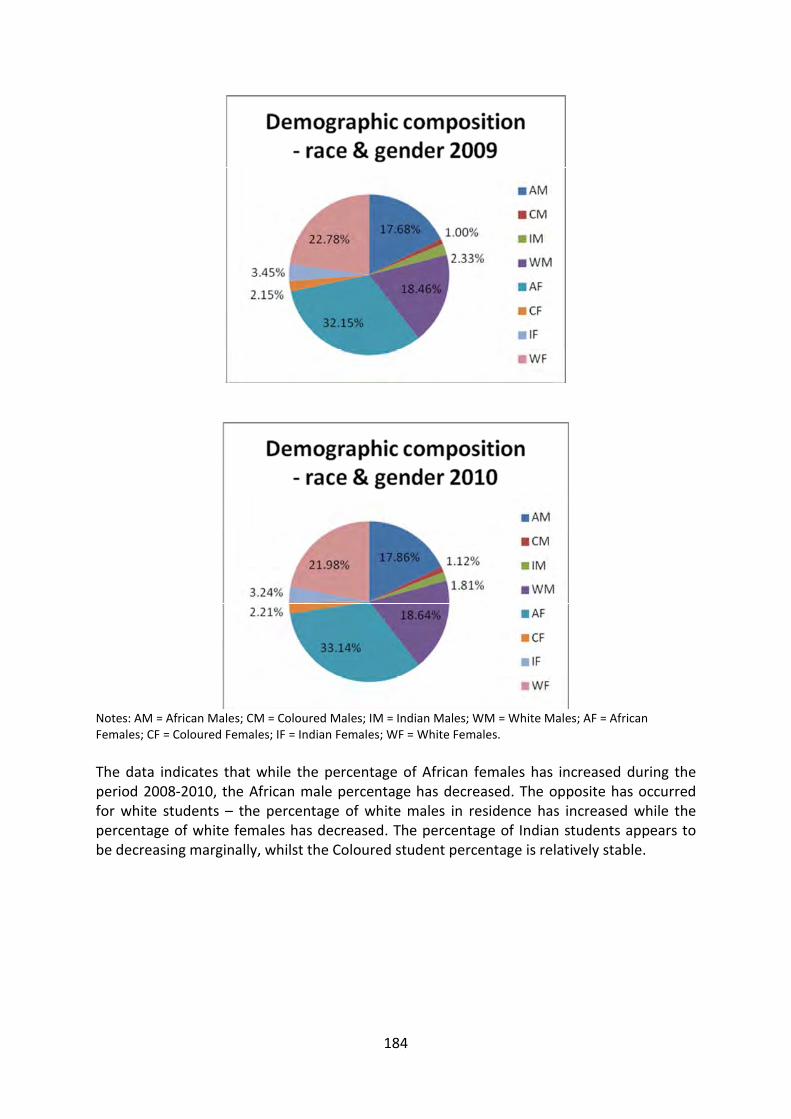
184
Notes: AM = African Males; CM = Coloured Males; IM = Indian Males; WM = White Males; AF = AfricanFemales; CF = Coloured Females; IF = Indian Females; WF = White Females.
The data indicates that while the percentage of African females has increased during theperiod 2008-2010, the African male percentage has decreased. The opposite has occurredfor white students – the percentage of white males in residence has increased while thepercentage of white females has decreased. The percentage of Indian students appears tobe decreasing marginally, whilst the Coloured student percentage is relatively stable.
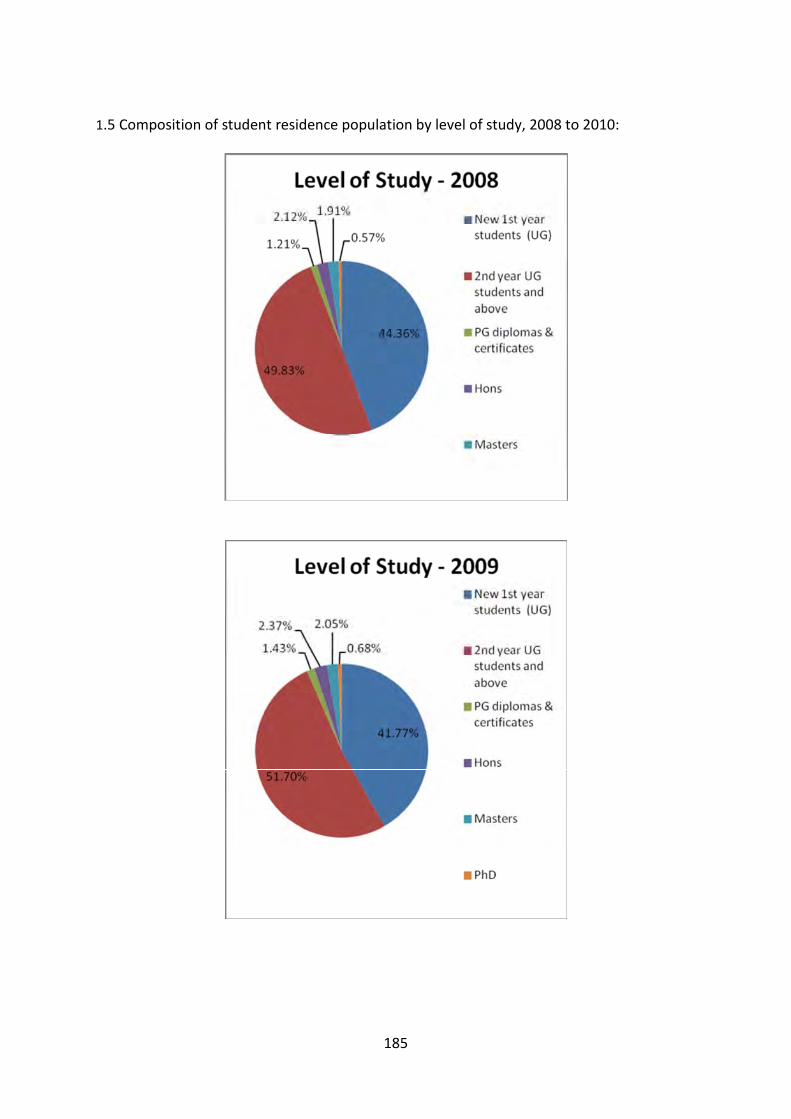
185
1.5 Composition of student residence population by level of study, 2008 to 2010:
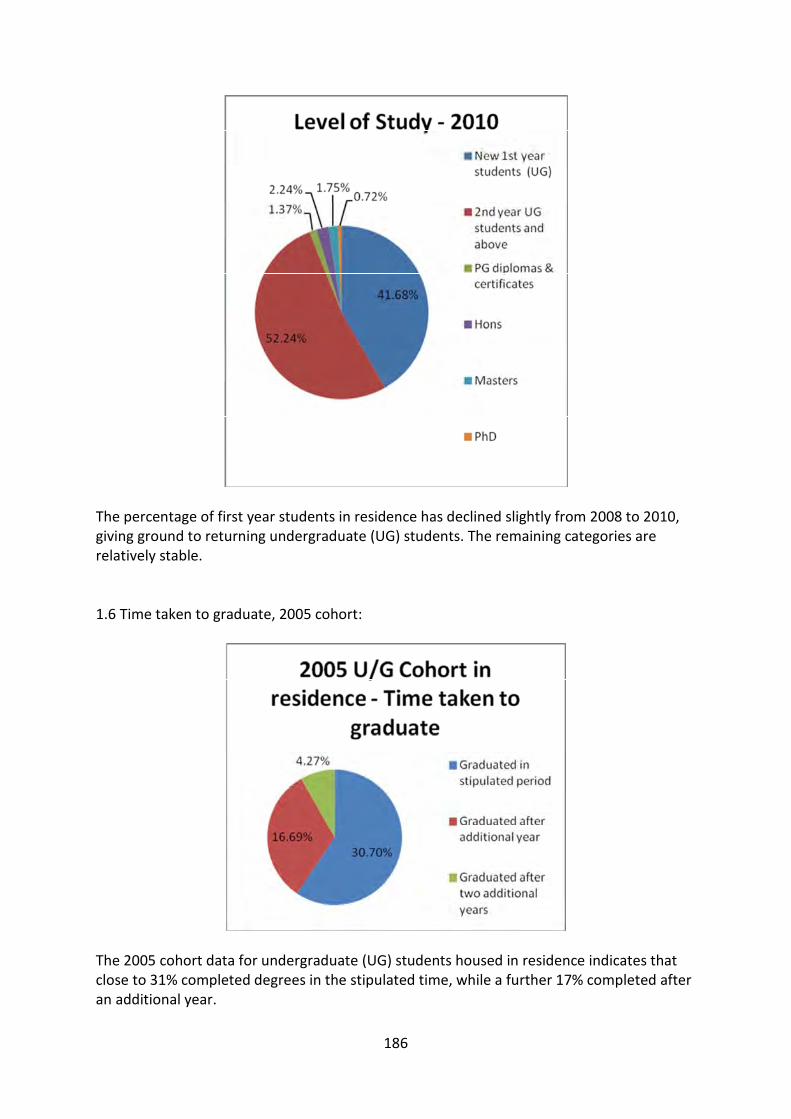
186
The percentage of first year students in residence has declined slightly from 2008 to 2010,giving ground to returning undergraduate (UG) students. The remaining categories arerelatively stable.
1.6 Time taken to graduate, 2005 cohort:
The 2005 cohort data for undergraduate (UG) students housed in residence indicates thatclose to 31% completed degrees in the stipulated time, while a further 17% completed afteran additional year.
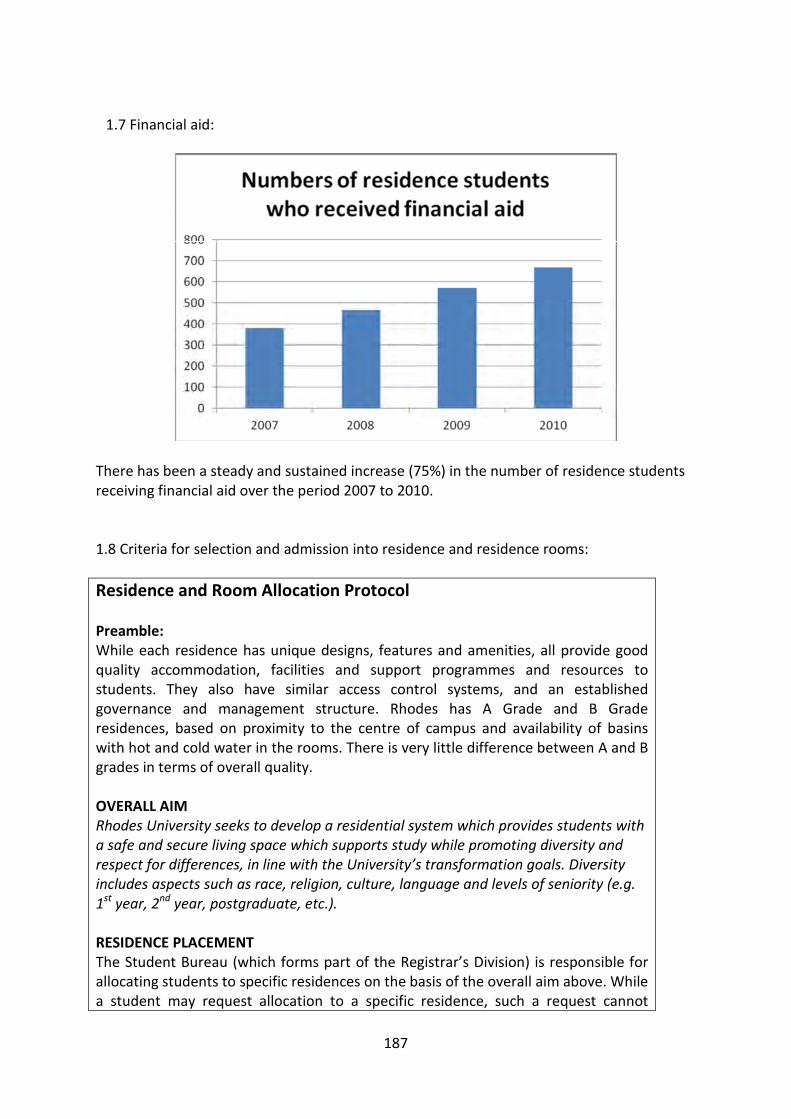
187
1.7 Financial aid:
There has been a steady and sustained increase (75%) in the number of residence studentsreceiving financial aid over the period 2007 to 2010.
1.8 Criteria for selection and admission into residence and residence rooms:
Residence and Room Allocation Protocol
Preamble:While each residence has unique designs, features and amenities, all provide goodquality accommodation, facilities and support programmes and resources tostudents. They also have similar access control systems, and an establishedgovernance and management structure. Rhodes has A Grade and B Graderesidences, based on proximity to the centre of campus and availability of basinswith hot and cold water in the rooms. There is very little difference between A and Bgrades in terms of overall quality.
OVERALL AIMRhodes University seeks to develop a residential system which provides students witha safe and secure living space which supports study while promoting diversity andrespect for differences, in line with the University’s transformation goals. Diversityincludes aspects such as race, religion, culture, language and levels of seniority (e.g.1st year, 2nd year, postgraduate, etc.).
RESIDENCE PLACEMENTThe Student Bureau (which forms part of the Registrar’s Division) is responsible forallocating students to specific residences on the basis of the overall aim above. Whilea student may request allocation to a specific residence, such a request cannot
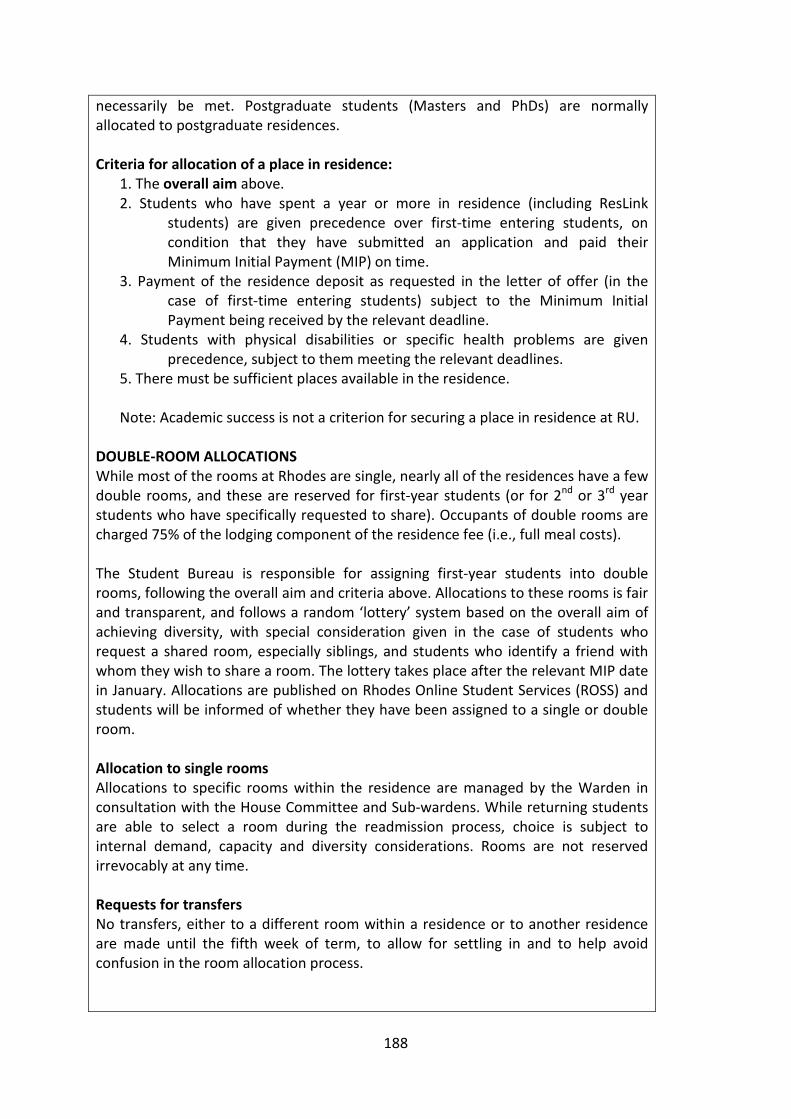
188
necessarily be met. Postgraduate students (Masters and PhDs) are normallyallocated to postgraduate residences.
Criteria for allocation of a place in residence:1. The overall aim above.2. Students who have spent a year or more in residence (including ResLink
students) are given precedence over first-time entering students, oncondition that they have submitted an application and paid theirMinimum Initial Payment (MIP) on time.
3. Payment of the residence deposit as requested in the letter of offer (in thecase of first-time entering students) subject to the Minimum InitialPayment being received by the relevant deadline.
4. Students with physical disabilities or specific health problems are givenprecedence, subject to them meeting the relevant deadlines.
5. There must be sufficient places available in the residence.
Note: Academic success is not a criterion for securing a place in residence at RU.
DOUBLE-ROOM ALLOCATIONSWhile most of the rooms at Rhodes are single, nearly all of the residences have a fewdouble rooms, and these are reserved for first-year students (or for 2nd or 3rd yearstudents who have specifically requested to share). Occupants of double rooms arecharged 75% of the lodging component of the residence fee (i.e., full meal costs).
The Student Bureau is responsible for assigning first-year students into doublerooms, following the overall aim and criteria above. Allocations to these rooms is fairand transparent, and follows a random ‘lottery’ system based on the overall aim ofachieving diversity, with special consideration given in the case of students whorequest a shared room, especially siblings, and students who identify a friend withwhom they wish to share a room. The lottery takes place after the relevant MIP datein January. Allocations are published on Rhodes Online Student Services (ROSS) andstudents will be informed of whether they have been assigned to a single or doubleroom.
Allocation to single roomsAllocations to specific rooms within the residence are managed by the Warden inconsultation with the House Committee and Sub-wardens. While returning studentsare able to select a room during the readmission process, choice is subject tointernal demand, capacity and diversity considerations. Rooms are not reservedirrevocably at any time.
Requests for transfersNo transfers, either to a different room within a residence or to another residenceare made until the fifth week of term, to allow for settling in and to help avoidconfusion in the room allocation process.
189
a. Transfer to a different room in the same residence• In the event of a single-room vacancy arising in any residence, preference will
be given to students in double rooms within that residence, and thereafter tostudents from other residences. Such students will be required to pay thesingle-room fee pro rata.
• Once a student has moved out of a double room, the remaining student willenjoy the benefit of the double room at 25% discount of the lodging fee, andwill not be required to move out in favour of a more senior student.
• In the event of a vacancy in a double room arising during the year, the StudentBureau may assign a short-listed student waiting for a place in residence tothis room.
• If a double room falls vacant entirely, a student requesting to move into theroom alone will be charged the single-room fee.
• Any room-swaps within a residence (from double to double or single to singlerooms) must be made in consultation with the Warden and HouseCommittee, and will normally only be made if the parties concerned mutuallyagree to such a change.
• The Warden should inform the Student Bureau of any changes from doublerooms to single rooms and single to double rooms.
b. Transfer to a different residence within the same Hall• Students wishing to move to a different residence in their Hall must apply to
the Hall Warden.• Any intra-hall transfers will normally only be made if the parties concerned
mutually agree to such a change, and must be approved by the Wardens ofthe two residences concerned.
• The Student Bureau must be informed of any changes in writing.
c. Transfer to a different residence in a different Hall• Students wishing to move to a different residence should apply through the
Student Bureau in conjunction with the relevant Hall Wardens, using the‘Departures and Transfer’ form from the Student Bureau.
• At the start of each year requests for transfers will only be considered afterMarch, during the year when vacancies open up and in October/Novemberwhen residence bookings are done.
• Requests for transfers at any time during the year must be approved by theWardens of the two residences concerned.
• In June some rooms are vacated by international students, and these will beallocated by the Student Bureau in consultation with the relevant Warden.
Withdrawal from residence• Wardens must complete the ‘Departures and Transfer’ form which should be
forwarded to the Student Bureau.• Students are required to inform the University in writing if they are
withdrawing from a residence or from the University.• The fees liability of students who withdraw from a residence during the
academic year is set out in the University Calendar.

190
Cancellation of offersThe University will cancel the offer made to any new or returning applicant
• who has not either paid the MIP or obtained MIP clearance;• who is academically excluded; or• who is not fully registered by the end of the second week of lectures.
The University has embarked upon a residence construction strategy to ensurethat every first year student will have a place in residence in addition toproviding sufficient accommodation for returning students. At the beginning of2011 the University will be able to provide residence accommodation for 65% offull-time contact undergraduates, and its enrolment plan aims to accommodateall first year students in residence without adverse impact upon returningstudents seeking residence accommodation.
1.9 Allocation of rooms:
Sub-wardens and House Committees are responsible for the allocation of students intoresidence rooms in accordance with the overall aim of the Residence and Room AllocationProtocol described above. The Hall and relevant House Wardens are responsible for ensuringthat the aim is realised, and are held accountable by the Board of Residences (which is a sub-committee of the Student Services Council). The senior official responsible for ensuringcompliance with the policy is the Dean of Students.
1.10 Waiting lists for rooms:
A waiting list is established and maintained by the Manager of the Student Bureau on a strict‘first come, first served’ basis, diversity being the only factor which overrides this principle.As vacancies occur the wait-listed student at top of the list is offered the place.
1.11 Retention of place in residence:
To retain their place in a residence a student must submit their application form by the duedate and avoid academic exclusion.
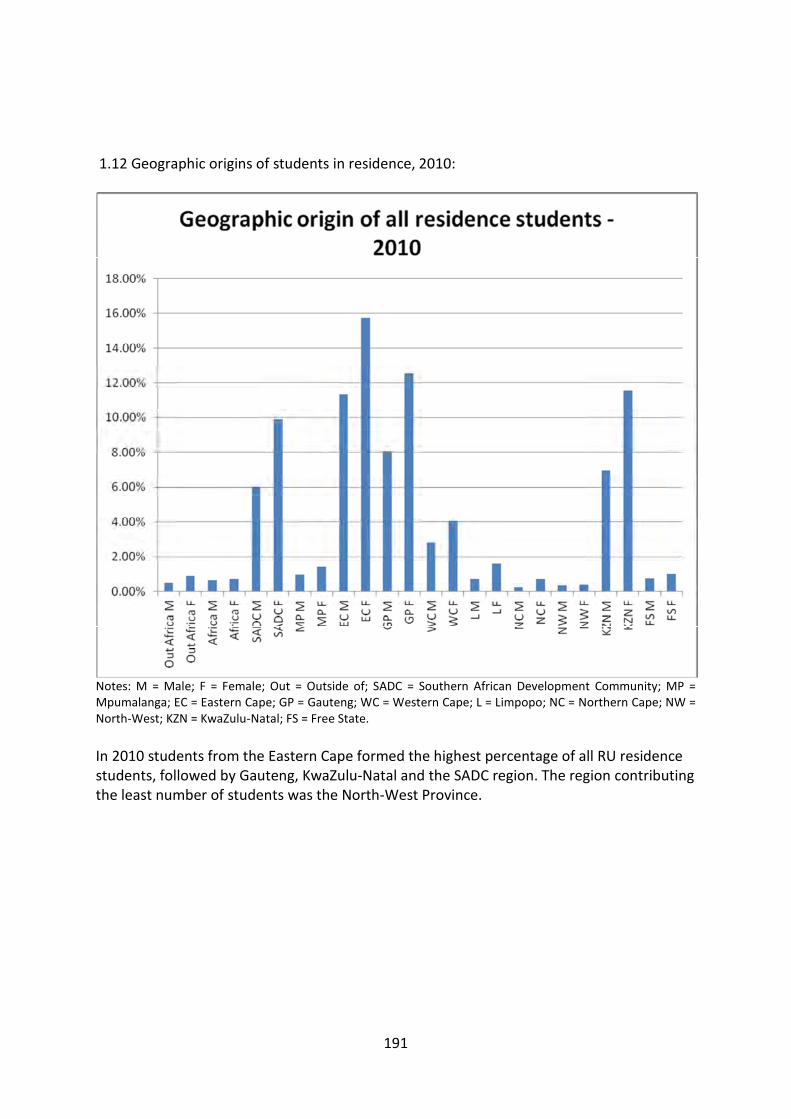
191
1.12 Geographic origins of students in residence, 2010:
Notes: M = Male; F = Female; Out = Outside of; SADC = Southern African Development Community; MP =Mpumalanga; EC = Eastern Cape; GP = Gauteng; WC = Western Cape; L = Limpopo; NC = Northern Cape; NW =North-West; KZN = KwaZulu-Natal; FS = Free State.
In 2010 students from the Eastern Cape formed the highest percentage of all RU residencestudents, followed by Gauteng, KwaZulu-Natal and the SADC region. The region contributingthe least number of students was the North-West Province.
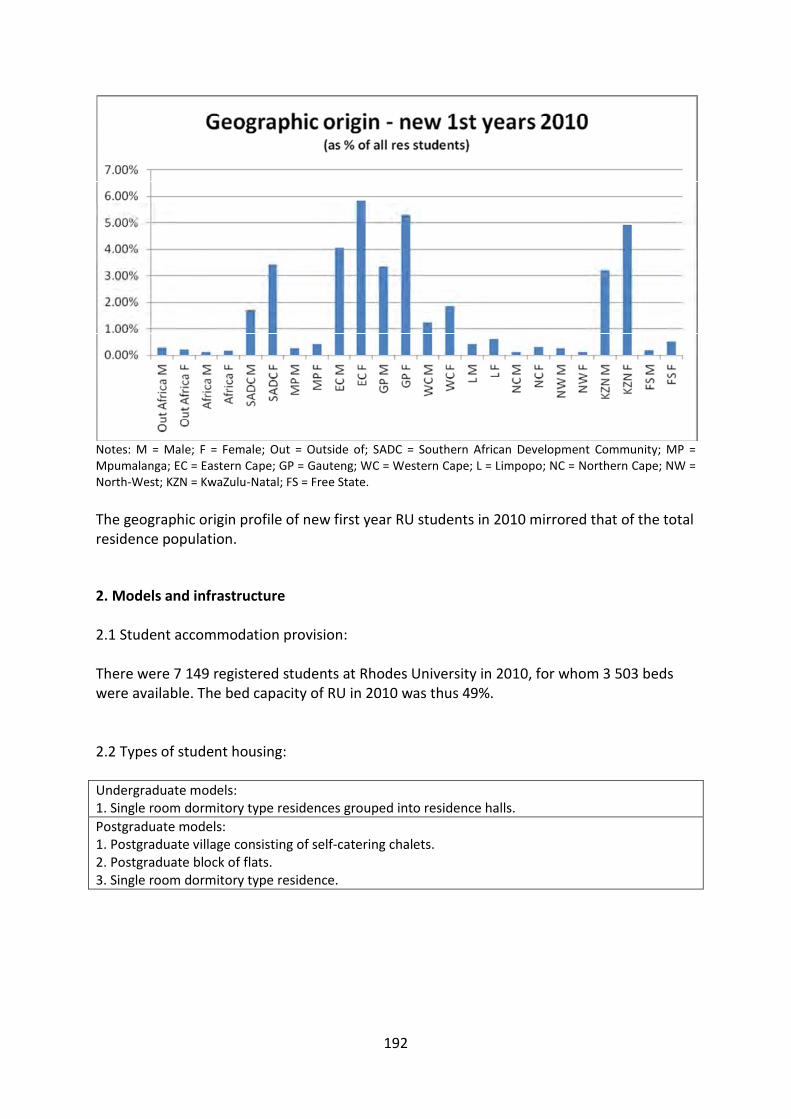
192
Notes: M = Male; F = Female; Out = Outside of; SADC = Southern African Development Community; MP =Mpumalanga; EC = Eastern Cape; GP = Gauteng; WC = Western Cape; L = Limpopo; NC = Northern Cape; NW =North-West; KZN = KwaZulu-Natal; FS = Free State.
The geographic origin profile of new first year RU students in 2010 mirrored that of the totalresidence population.
2. Models and infrastructure
2.1 Student accommodation provision:
There were 7 149 registered students at Rhodes University in 2010, for whom 3 503 bedswere available. The bed capacity of RU in 2010 was thus 49%.
2.2 Types of student housing:
Undergraduate models:1. Single room dormitory type residences grouped into residence halls.
Postgraduate models:1. Postgraduate village consisting of self-catering chalets.2. Postgraduate block of flats.3. Single room dormitory type residence.
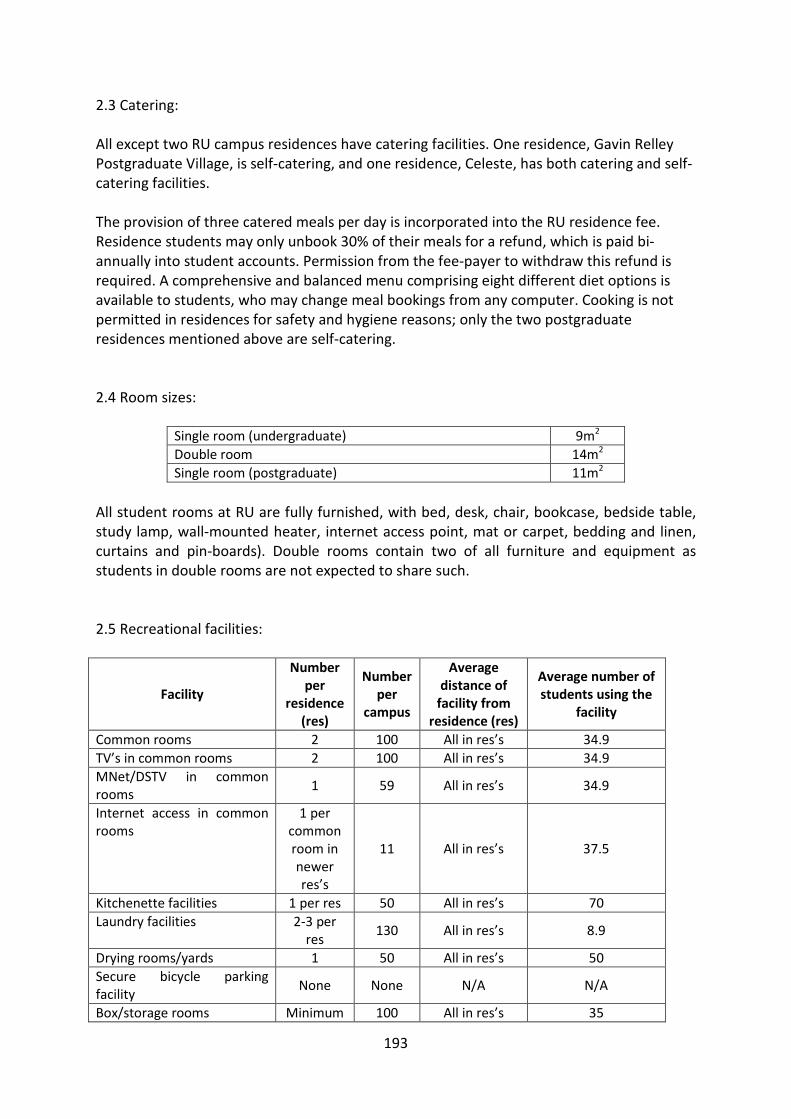
193
2.3 Catering:
All except two RU campus residences have catering facilities. One residence, Gavin RelleyPostgraduate Village, is self-catering, and one residence, Celeste, has both catering and self-catering facilities.
The provision of three catered meals per day is incorporated into the RU residence fee.Residence students may only unbook 30% of their meals for a refund, which is paid bi-annually into student accounts. Permission from the fee-payer to withdraw this refund isrequired. A comprehensive and balanced menu comprising eight different diet options isavailable to students, who may change meal bookings from any computer. Cooking is notpermitted in residences for safety and hygiene reasons; only the two postgraduateresidences mentioned above are self-catering.
2.4 Room sizes:
Single room (undergraduate) 9m2
Double room 14m2
Single room (postgraduate) 11m2
All student rooms at RU are fully furnished, with bed, desk, chair, bookcase, bedside table,study lamp, wall-mounted heater, internet access point, mat or carpet, bedding and linen,curtains and pin-boards). Double rooms contain two of all furniture and equipment asstudents in double rooms are not expected to share such.
2.5 Recreational facilities:
Facility
Numberper
residence(res)
Numberper
campus
Averagedistance of
facility fromresidence (res)
Average number ofstudents using the
facility
Common rooms 2 100 All in res’s 34.9
TV’s in common rooms 2 100 All in res’s 34.9
MNet/DSTV in commonrooms
1 59 All in res’s 34.9
Internet access in commonrooms
1 percommonroom innewerres’s
11 All in res’s 37.5
Kitchenette facilities 1 per res 50 All in res’s 70
Laundry facilities 2-3 perres
130 All in res’s 8.9
Drying rooms/yards 1 50 All in res’s 50
Secure bicycle parkingfacility
None None N/A N/A
Box/storage rooms Minimum 100 All in res’s 35
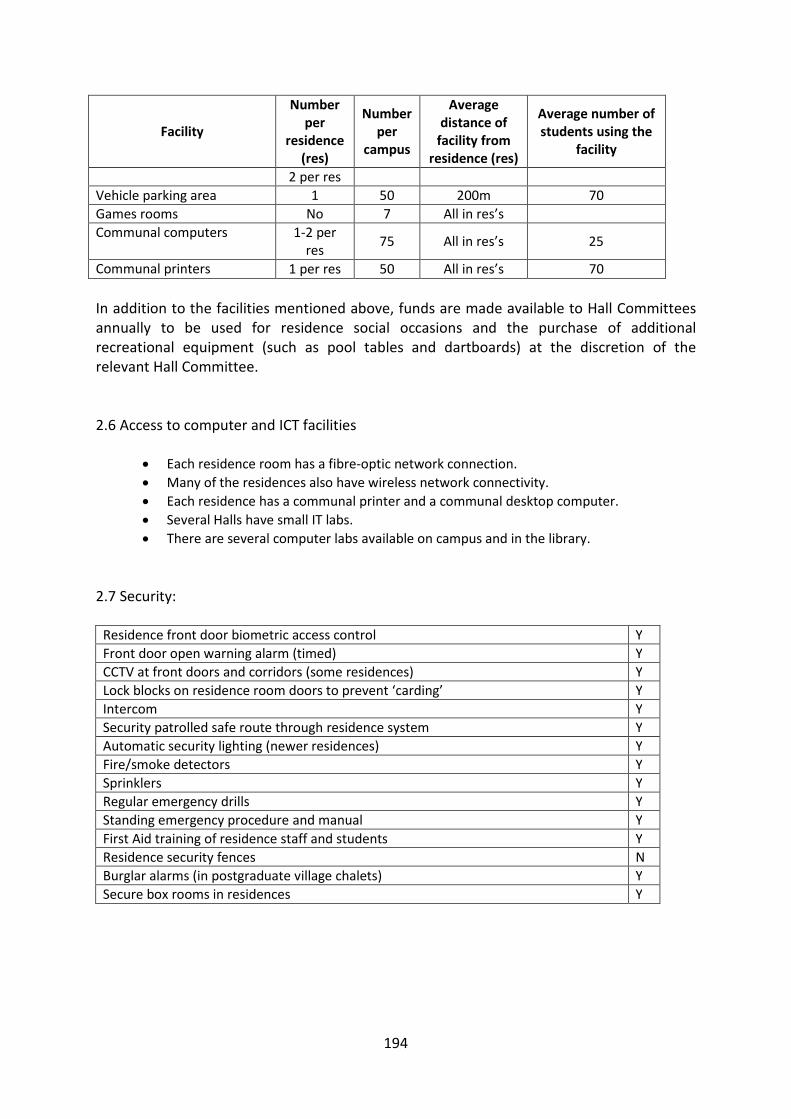
194
Facility
Numberper
residence(res)
Numberper
campus
Averagedistance of
facility fromresidence (res)
Average number ofstudents using the
facility
2 per res
Vehicle parking area 1 50 200m 70
Games rooms No 7 All in res’s
Communal computers 1-2 perres
75 All in res’s 25
Communal printers 1 per res 50 All in res’s 70
In addition to the facilities mentioned above, funds are made available to Hall Committeesannually to be used for residence social occasions and the purchase of additionalrecreational equipment (such as pool tables and dartboards) at the discretion of therelevant Hall Committee.
2.6 Access to computer and ICT facilities
Each residence room has a fibre-optic network connection.
Many of the residences also have wireless network connectivity.
Each residence has a communal printer and a communal desktop computer.
Several Halls have small IT labs.
There are several computer labs available on campus and in the library.
2.7 Security:
Residence front door biometric access control Y
Front door open warning alarm (timed) Y
CCTV at front doors and corridors (some residences) Y
Lock blocks on residence room doors to prevent ‘carding’ Y
Intercom Y
Security patrolled safe route through residence system Y
Automatic security lighting (newer residences) Y
Fire/smoke detectors Y
Sprinklers Y
Regular emergency drills Y
Standing emergency procedure and manual Y
First Aid training of residence staff and students Y
Residence security fences N
Burglar alarms (in postgraduate village chalets) Y
Secure box rooms in residences Y
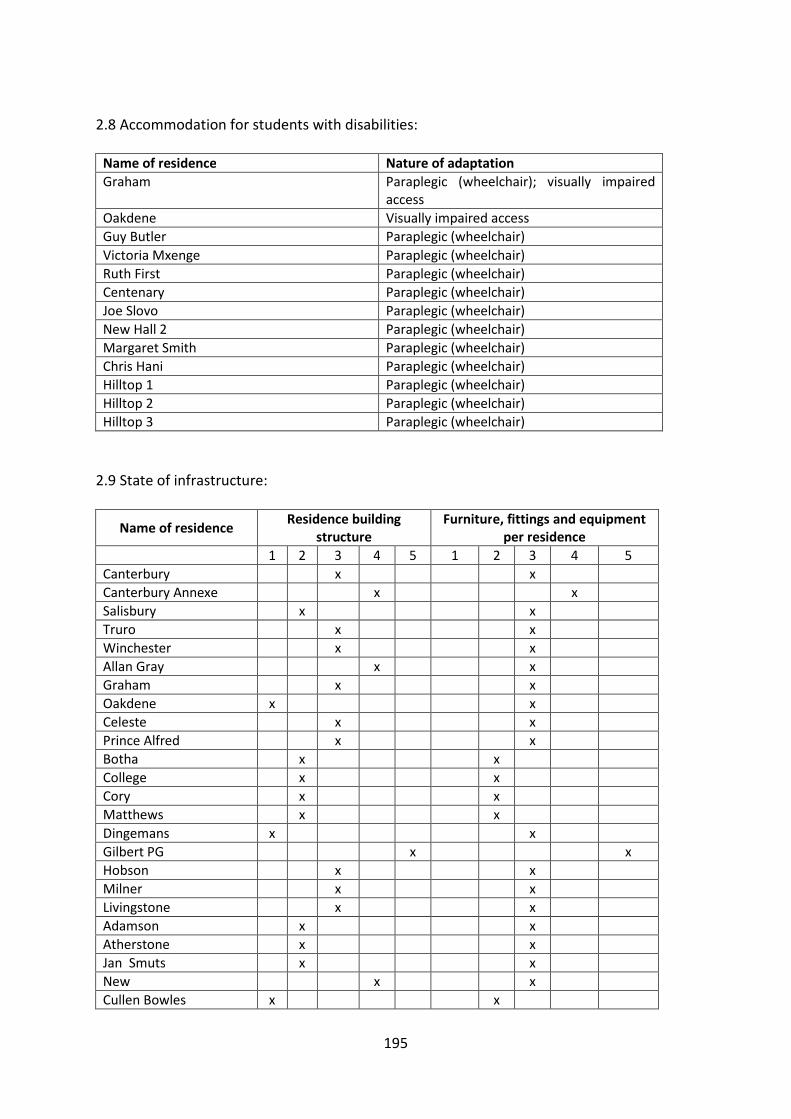
195
2.8 Accommodation for students with disabilities:
Name of residence Nature of adaptation
Graham Paraplegic (wheelchair); visually impairedaccess
Oakdene Visually impaired access
Guy Butler Paraplegic (wheelchair)
Victoria Mxenge Paraplegic (wheelchair)
Ruth First Paraplegic (wheelchair)
Centenary Paraplegic (wheelchair)
Joe Slovo Paraplegic (wheelchair)
New Hall 2 Paraplegic (wheelchair)
Margaret Smith Paraplegic (wheelchair)
Chris Hani Paraplegic (wheelchair)
Hilltop 1 Paraplegic (wheelchair)
Hilltop 2 Paraplegic (wheelchair)
Hilltop 3 Paraplegic (wheelchair)
2.9 State of infrastructure:
Name of residenceResidence building
structureFurniture, fittings and equipment
per residence
1 2 3 4 5 1 2 3 4 5
Canterbury x x
Canterbury Annexe x x
Salisbury x x
Truro x x
Winchester x x
Allan Gray x x
Graham x x
Oakdene x x
Celeste x x
Prince Alfred x x
Botha x x
College x x
Cory x x
Matthews x x
Dingemans x x
Gilbert PG x x
Hobson x x
Milner x x
Livingstone x x
Adamson x x
Atherstone x x
Jan Smuts x x
New x x
Cullen Bowles x x
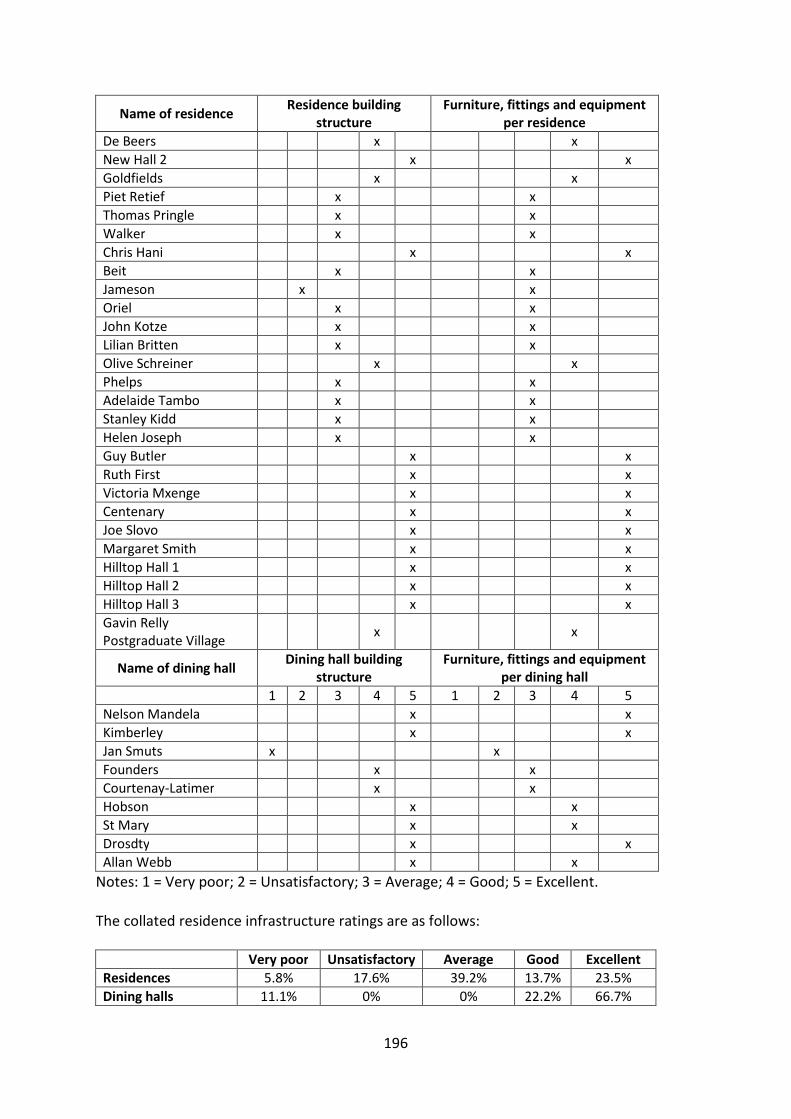
196
Name of residenceResidence building
structureFurniture, fittings and equipment
per residence
De Beers x x
New Hall 2 x x
Goldfields x x
Piet Retief x x
Thomas Pringle x x
Walker x x
Chris Hani x x
Beit x x
Jameson x x
Oriel x x
John Kotze x x
Lilian Britten x x
Olive Schreiner x x
Phelps x x
Adelaide Tambo x x
Stanley Kidd x x
Helen Joseph x x
Guy Butler x x
Ruth First x x
Victoria Mxenge x x
Centenary x x
Joe Slovo x x
Margaret Smith x x
Hilltop Hall 1 x x
Hilltop Hall 2 x x
Hilltop Hall 3 x x
Gavin RellyPostgraduate Village
x x
Name of dining hallDining hall building
structureFurniture, fittings and equipment
per dining hall
1 2 3 4 5 1 2 3 4 5
Nelson Mandela x x
Kimberley x x
Jan Smuts x x
Founders x x
Courtenay-Latimer x x
Hobson x x
St Mary x x
Drosdty x x
Allan Webb x x
Notes: 1 = Very poor; 2 = Unsatisfactory; 3 = Average; 4 = Good; 5 = Excellent.
The collated residence infrastructure ratings are as follows:
Very poor Unsatisfactory Average Good Excellent
Residences 5.8% 17.6% 39.2% 13.7% 23.5%
Dining halls 11.1% 0% 0% 22.2% 66.7%
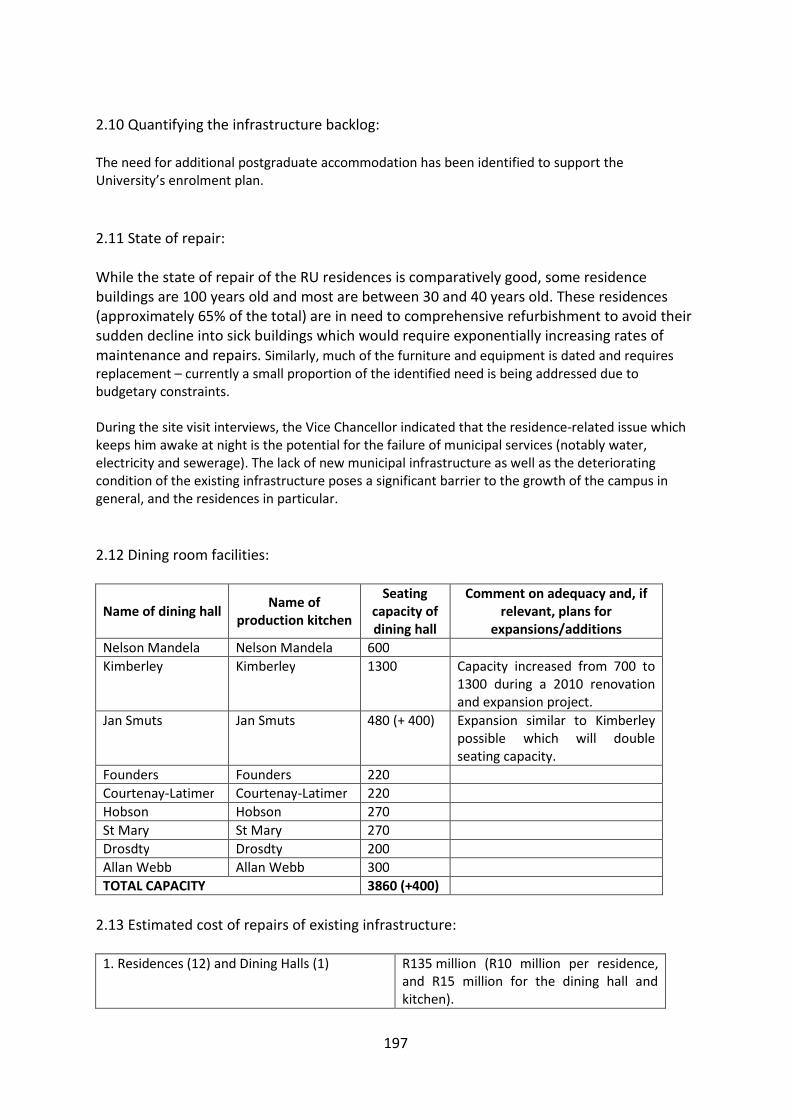
197
2.10 Quantifying the infrastructure backlog:
The need for additional postgraduate accommodation has been identified to support theUniversity’s enrolment plan.
2.11 State of repair:
While the state of repair of the RU residences is comparatively good, some residencebuildings are 100 years old and most are between 30 and 40 years old. These residences(approximately 65% of the total) are in need to comprehensive refurbishment to avoid theirsudden decline into sick buildings which would require exponentially increasing rates ofmaintenance and repairs. Similarly, much of the furniture and equipment is dated and requiresreplacement – currently a small proportion of the identified need is being addressed due tobudgetary constraints.
During the site visit interviews, the Vice Chancellor indicated that the residence-related issue whichkeeps him awake at night is the potential for the failure of municipal services (notably water,electricity and sewerage). The lack of new municipal infrastructure as well as the deterioratingcondition of the existing infrastructure poses a significant barrier to the growth of the campus ingeneral, and the residences in particular.
2.12 Dining room facilities:
Name of dining hallName of
production kitchen
Seatingcapacity ofdining hall
Comment on adequacy and, ifrelevant, plans for
expansions/additions
Nelson Mandela Nelson Mandela 600
Kimberley Kimberley 1300 Capacity increased from 700 to1300 during a 2010 renovationand expansion project.
Jan Smuts Jan Smuts 480 (+ 400) Expansion similar to Kimberleypossible which will doubleseating capacity.
Founders Founders 220
Courtenay-Latimer Courtenay-Latimer 220
Hobson Hobson 270
St Mary St Mary 270
Drosdty Drosdty 200
Allan Webb Allan Webb 300
TOTAL CAPACITY 3860 (+400)
2.13 Estimated cost of repairs of existing infrastructure:
1. Residences (12) and Dining Halls (1) R135 million (R10 million per residence,and R15 million for the dining hall andkitchen).
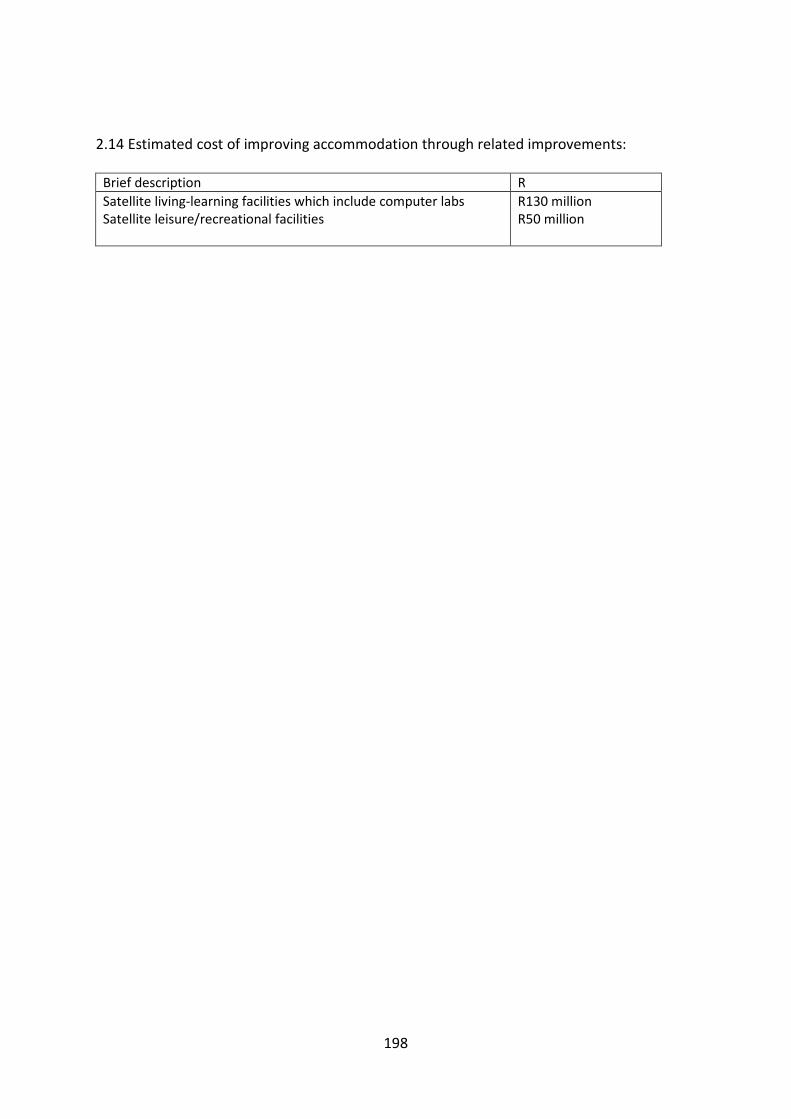
198
2.14 Estimated cost of improving accommodation through related improvements:
Brief description R
Satellite living-learning facilities which include computer labsSatellite leisure/recreational facilities
R130 millionR50 million

199
Exterior of Cullen Bowles residence
Newer residence: ablution area
Newer residence: student room
Exterior of Cullen Bowles residence (waterdamage)
Cullen Bowles residence: ablution area
Cullen Bowles residence: student room
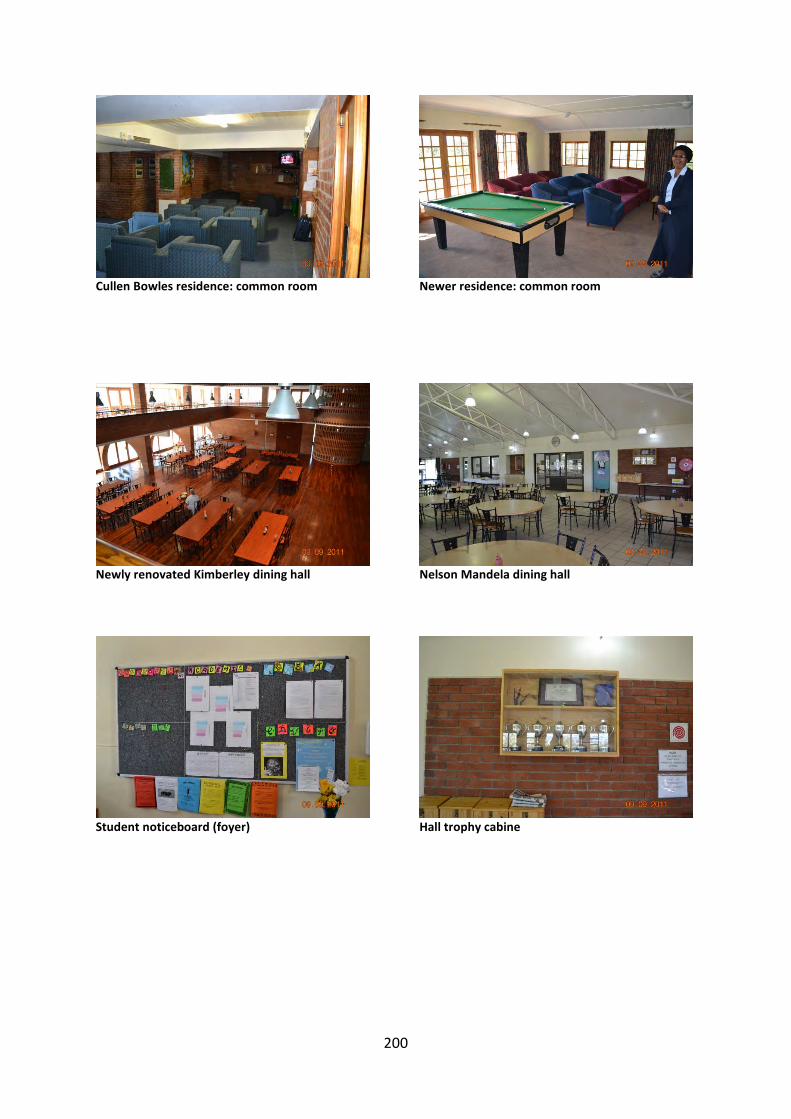
200
Cullen Bowles residence: common room
Newly renovated Kimberley dining hall
Student noticeboard (foyer)
Newer residence: common room
Nelson Mandela dining hall
Hall trophy cabine
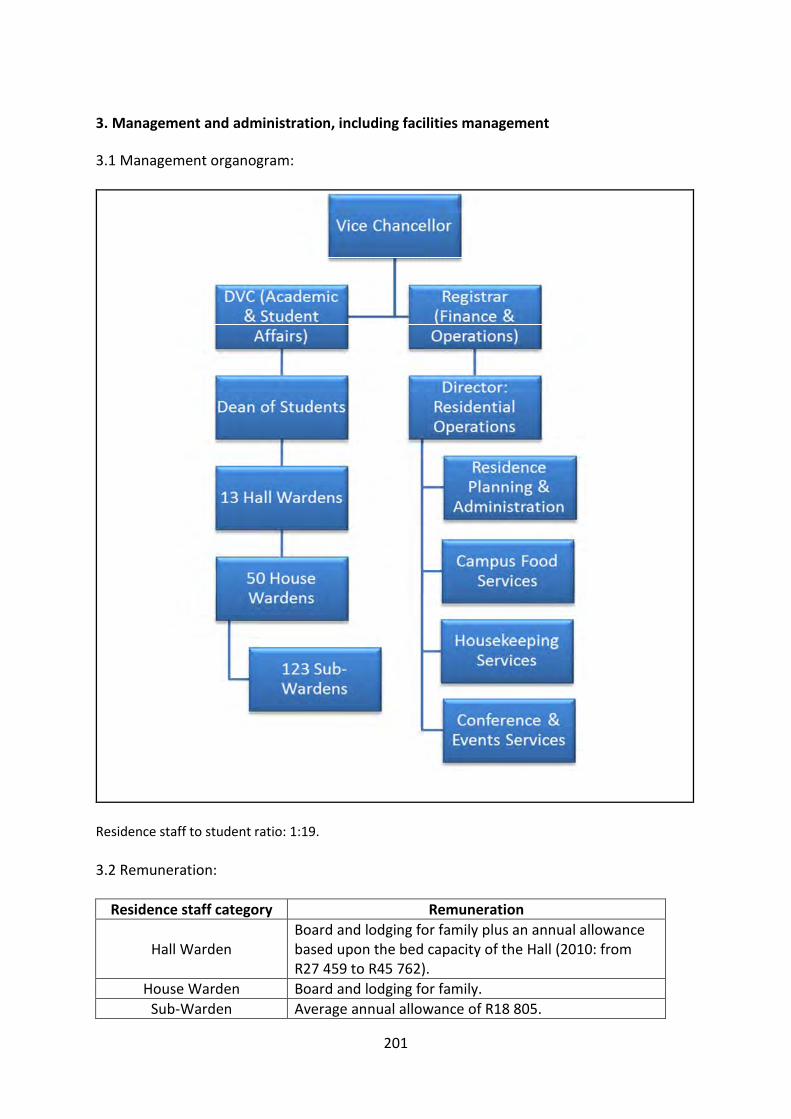
201
3. Management and administration, including facilities management
3.1 Management organogram:
Residence staff to student ratio: 1:19.
3.2 Remuneration:
Residence staff category Remuneration
Hall WardenBoard and lodging for family plus an annual allowancebased upon the bed capacity of the Hall (2010: fromR27 459 to R45 762).
House Warden Board and lodging for family.
Sub-Warden Average annual allowance of R18 805.
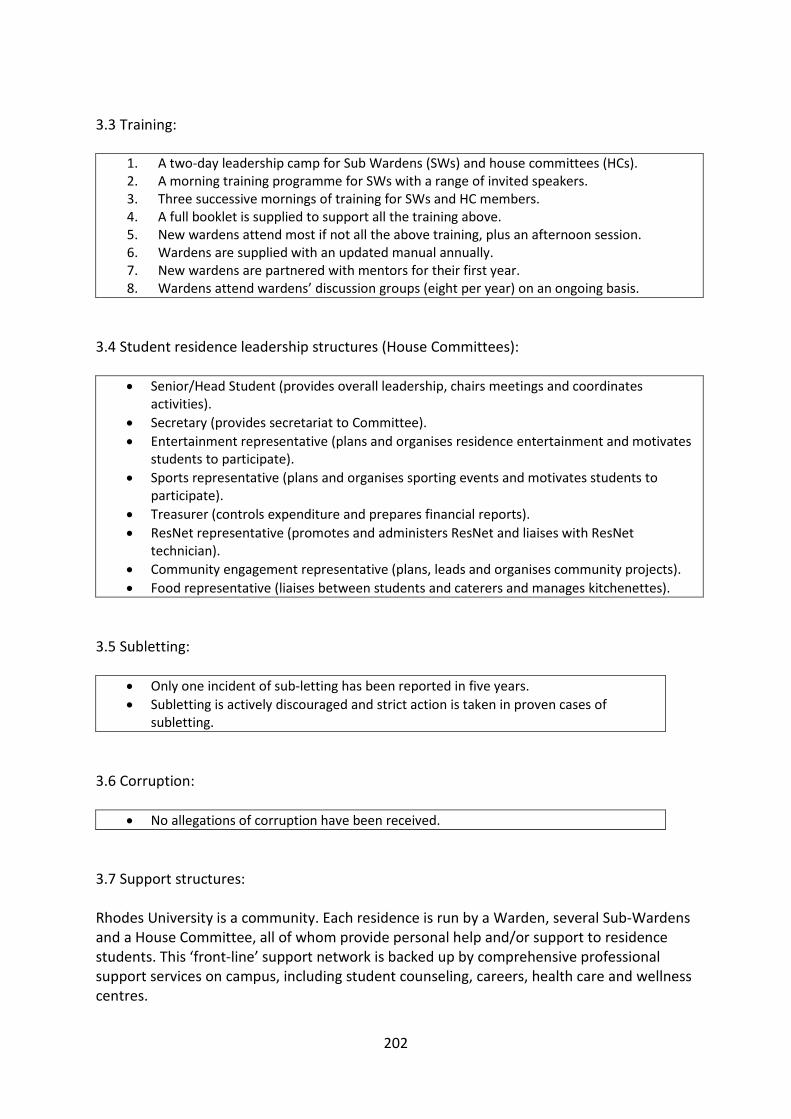
202
3.3 Training:
1. A two-day leadership camp for Sub Wardens (SWs) and house committees (HCs).2. A morning training programme for SWs with a range of invited speakers.3. Three successive mornings of training for SWs and HC members.4. A full booklet is supplied to support all the training above.5. New wardens attend most if not all the above training, plus an afternoon session.6. Wardens are supplied with an updated manual annually.7. New wardens are partnered with mentors for their first year.8. Wardens attend wardens’ discussion groups (eight per year) on an ongoing basis.
3.4 Student residence leadership structures (House Committees):
Senior/Head Student (provides overall leadership, chairs meetings and coordinatesactivities).
Secretary (provides secretariat to Committee).
Entertainment representative (plans and organises residence entertainment and motivatesstudents to participate).
Sports representative (plans and organises sporting events and motivates students toparticipate).
Treasurer (controls expenditure and prepares financial reports).
ResNet representative (promotes and administers ResNet and liaises with ResNettechnician).
Community engagement representative (plans, leads and organises community projects).
Food representative (liaises between students and caterers and manages kitchenettes).
3.5 Subletting:
Only one incident of sub-letting has been reported in five years.
Subletting is actively discouraged and strict action is taken in proven cases ofsubletting.
3.6 Corruption:
No allegations of corruption have been received.
3.7 Support structures:
Rhodes University is a community. Each residence is run by a Warden, several Sub-Wardensand a House Committee, all of whom provide personal help and/or support to residencestudents. This ‘front-line’ support network is backed up by comprehensive professionalsupport services on campus, including student counseling, careers, health care and wellnesscentres.
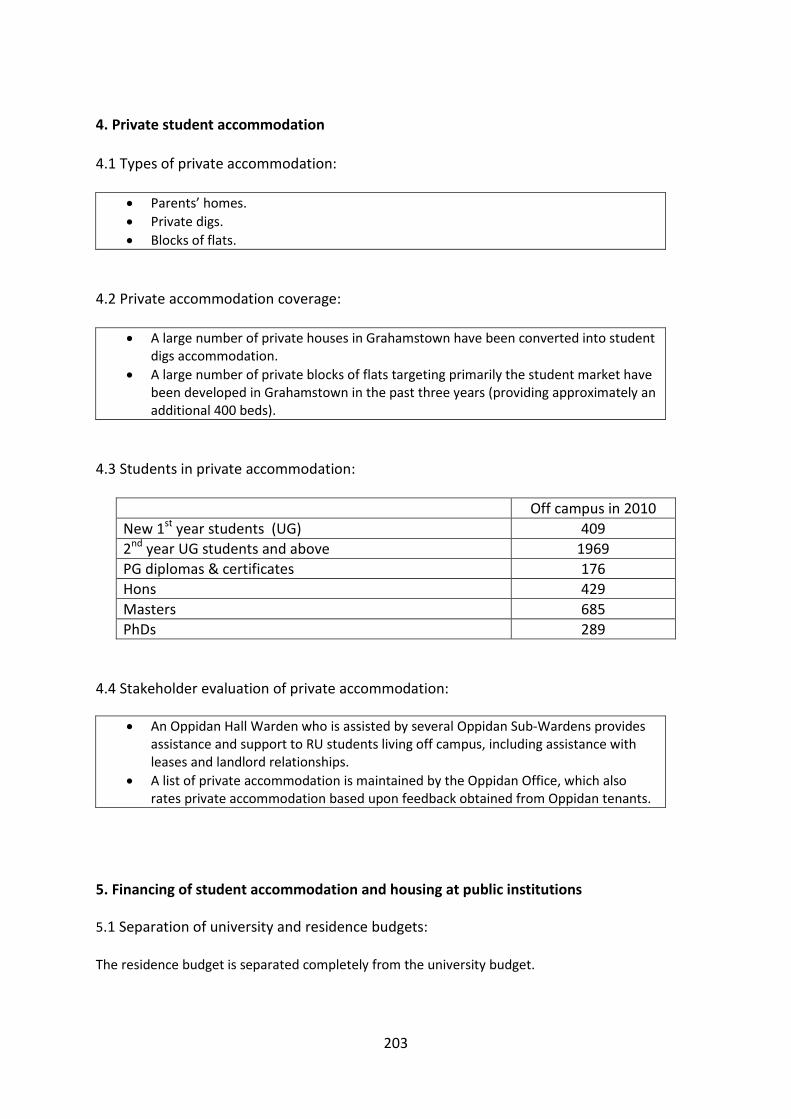
203
4. Private student accommodation
4.1 Types of private accommodation:
Parents’ homes.
Private digs.
Blocks of flats.
4.2 Private accommodation coverage:
A large number of private houses in Grahamstown have been converted into studentdigs accommodation.
A large number of private blocks of flats targeting primarily the student market havebeen developed in Grahamstown in the past three years (providing approximately anadditional 400 beds).
4.3 Students in private accommodation:
Off campus in 2010
New 1st year students (UG) 409
2nd year UG students and above 1969
PG diplomas & certificates 176
Hons 429
Masters 685
PhDs 289
4.4 Stakeholder evaluation of private accommodation:
An Oppidan Hall Warden who is assisted by several Oppidan Sub-Wardens providesassistance and support to RU students living off campus, including assistance withleases and landlord relationships.
A list of private accommodation is maintained by the Oppidan Office, which alsorates private accommodation based upon feedback obtained from Oppidan tenants.
5. Financing of student accommodation and housing at public institutions
5.1 Separation of university and residence budgets:
The residence budget is separated completely from the university budget.
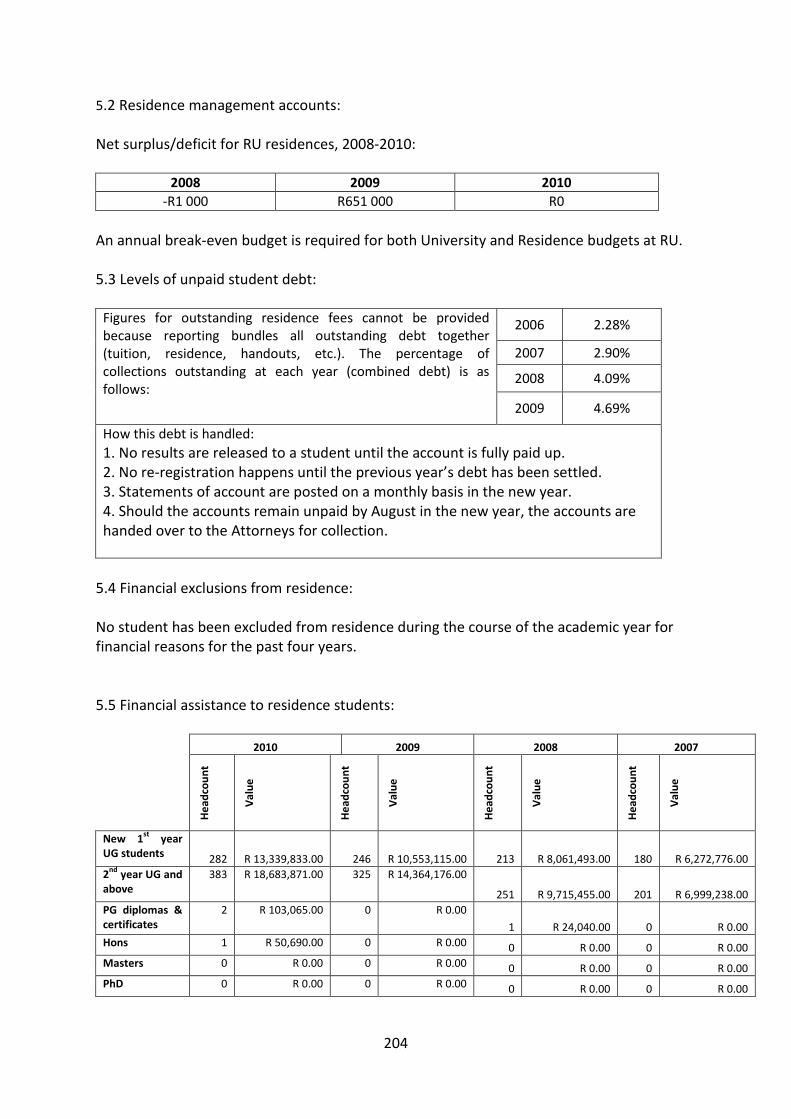
204
5.2 Residence management accounts:
Net surplus/deficit for RU residences, 2008-2010:
2008 2009 2010
-R1 000 R651 000 R0
An annual break-even budget is required for both University and Residence budgets at RU.
5.3 Levels of unpaid student debt:
Figures for outstanding residence fees cannot be providedbecause reporting bundles all outstanding debt together(tuition, residence, handouts, etc.). The percentage ofcollections outstanding at each year (combined debt) is asfollows:
2006 2.28%
2007 2.90%
2008 4.09%
2009 4.69%
How this debt is handled:
1. No results are released to a student until the account is fully paid up.2. No re-registration happens until the previous year’s debt has been settled.3. Statements of account are posted on a monthly basis in the new year.4. Should the accounts remain unpaid by August in the new year, the accounts arehanded over to the Attorneys for collection.
5.4 Financial exclusions from residence:
No student has been excluded from residence during the course of the academic year forfinancial reasons for the past four years.
5.5 Financial assistance to residence students:
2010 2009 2008 2007
He
adco
un
t
Val
ue
He
adco
un
t
Val
ue
He
adco
un
t
Val
ue
He
adco
un
t
Val
ue
New 1st
yearUG students 282 R 13,339,833.00 246 R 10,553,115.00 213 R 8,061,493.00 180 R 6,272,776.00
2nd
year UG andabove
383 R 18,683,871.00 325 R 14,364,176.00
251 R 9,715,455.00 201 R 6,999,238.00
PG diplomas &certificates
2 R 103,065.00 0 R 0.00
1 R 24,040.00 0 R 0.00
Hons 1 R 50,690.00 0 R 0.00 0 R 0.00 0 R 0.00
Masters 0 R 0.00 0 R 0.00 0 R 0.00 0 R 0.00
PhD 0 R 0.00 0 R 0.00 0 R 0.00 0 R 0.00
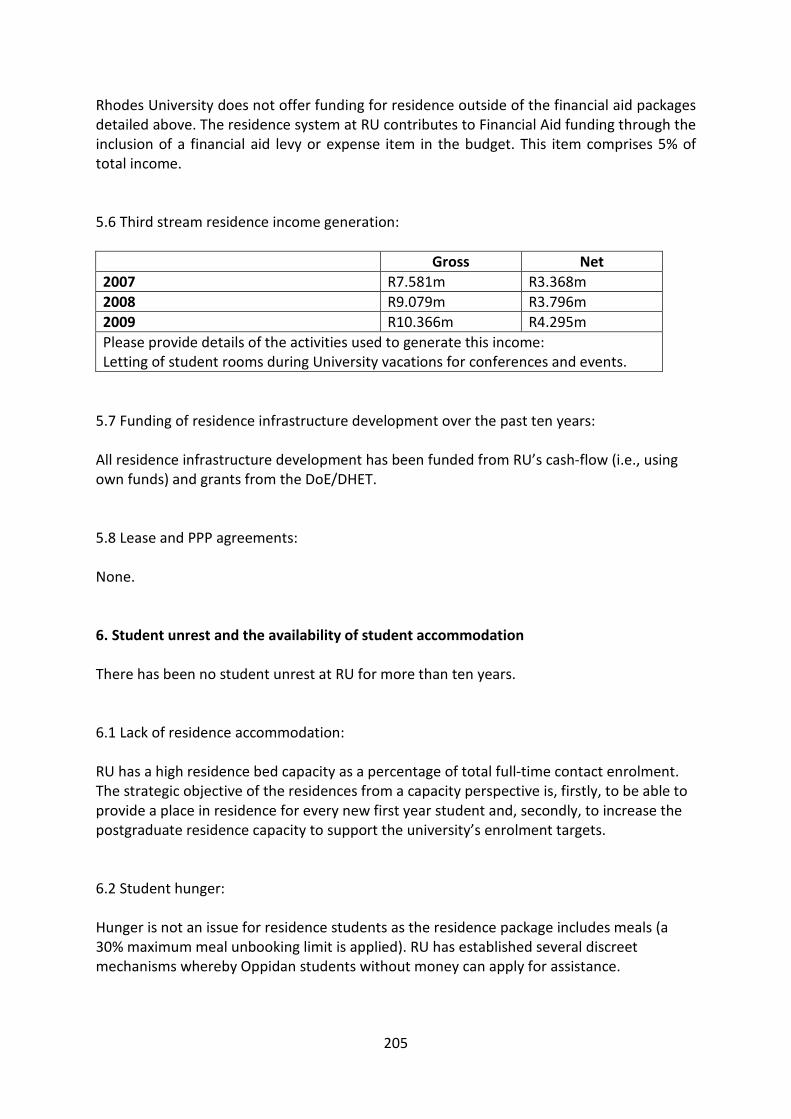
205
Rhodes University does not offer funding for residence outside of the financial aid packagesdetailed above. The residence system at RU contributes to Financial Aid funding through theinclusion of a financial aid levy or expense item in the budget. This item comprises 5% oftotal income.
5.6 Third stream residence income generation:
Gross Net
2007 R7.581m R3.368m
2008 R9.079m R3.796m
2009 R10.366m R4.295m
Please provide details of the activities used to generate this income:Letting of student rooms during University vacations for conferences and events.
5.7 Funding of residence infrastructure development over the past ten years:
All residence infrastructure development has been funded from RU’s cash-flow (i.e., usingown funds) and grants from the DoE/DHET.
5.8 Lease and PPP agreements:
None.
6. Student unrest and the availability of student accommodation
There has been no student unrest at RU for more than ten years.
6.1 Lack of residence accommodation:
RU has a high residence bed capacity as a percentage of total full-time contact enrolment.The strategic objective of the residences from a capacity perspective is, firstly, to be able toprovide a place in residence for every new first year student and, secondly, to increase thepostgraduate residence capacity to support the university’s enrolment targets.
6.2 Student hunger:
Hunger is not an issue for residence students as the residence package includes meals (a30% maximum meal unbooking limit is applied). RU has established several discreetmechanisms whereby Oppidan students without money can apply for assistance.
206
7. Institutional student housing plans for the future
Student housing development strategy must support the enrolment strategy of theUniversity. Currently RU has decided to cap undergraduate growth, and to increasepostgraduate numbers. The need for and the feasibility of establishing a furtherpostgraduate residence is being explored.
207
Appendix D
PROPOSED MINIMUM STANDARDS CODE FOR THE ACCOMMODATION AND HOUSING OFSTUDENTS IN SOUTH AFRICA
1. INTRODUCTION
1.1 This Code in no way absolves or releases any student accommodation provider from anylocal, provincial and national legislation which applies to any aspect of the housing andaccommodation of students.
1.2 This Code provides minimum standards for the provision of student housing andaccommodation in South Africa and must be read and interpreted in conjunction with therelevant university’s student accommodation and support rules, regulations, proceduresand policies.
1.3 The Ministerial Committee for the Review of the Provision of Student Housing hasestablished that the accommodation of students is much more than the provision of beds.The accommodation of students is also about the establishment of living socialcommunities. This responsibility is shared by both university and private accommodationproviders. This Code strongly encourages significant levels of cooperation and collaborationbetween university residence and housing structures and private accommodation providers.
1.4 This Code applies to universities and to private residences which accommodate ten ormore students.
1.5 Private student accommodation providers who elect to operate outside the parametersof this Code shall not receive accreditation and may not accommodate any National StudentFinancial Aid Scheme (NSFAS)-funded student.
2. PHYSICAL INFRASTRUCTURE
2.1 University residences (on and off campus)
The following minimum standards should be applied to all new residence buildings. Therefurbishment of existing residences should aim to bring existing residence buildings to thisstandard as soon as possible. The standards expressed here are a summary of the standardsexpressed in the Minimum Standards for Student Housing room specification manual(appended to this Code).
208
2.1.1 Siting of residences
The siting or location of student housing can have a profound impact upon access, equityand redress. In order to ensure equitable access to the academic facilities and supportservices of the university/campus, the following minimum standards are recommended:
The accommodation facility should preferably be situated within the campus securityperimeter, thereby affording residents the freedom to make full use of theacademic, social, cultural and sporting programs of the university without restrictionor hindrance.
Should on-campus locations be unavailable, then sites should be identified which areno more than 30 minutes travel from the campus. Affordable and secure transportrunning at regular intervals from early morning to late night should be provided.Such sites should be carefully selected with the safety, security and well-being ofstudents in mind.
2.1.2 Design of residences
The following minimum design standards are applicable:
o Single rooms should be no smaller than 9m2, and double rooms should be nosmaller than 14m2.
o Rooms should be furnished and fitted as per the specifications detailed in theMinimum Standards for Student Housing room specification manual.
o Dormitory/hall type residence buildings should not exceed the followingablution facilities ratios:
Wash basins – 1 per 4 student residents. Shower cubicles – 1 per 7 student residents. Lavatories – 1 per 5 student residents. Shower and lavatory cubicles shall be designed in such a way that
individual privacy is provided (i.e., no communal showers or toilets).o The following minimum social spaces should be provided:
Large common/meeting room – 1m2 per student resident. Smaller TV/meeting room – 0.5m2 per student resident.
o Cooking inside student rooms shall not be permitted. Suitable food storage,preparation and kitchen space shall be provided, which shall be equipped inthe following ratios which may not be exceeded:
Stove – 1 per 6 student residents. Cold storage – 0.75m3 lockable storage space per student. Sink – 1 per 15 student residents. Lockable cupboards – 1 per student resident. Microwave oven – 1 per 15 student residents. Countertop space – sufficient for 15 students’ simultaneous usage.
209
Further kitchen standards are detailed in section 3 iv below.
o Wireless and/or fibre optic cable internet access is required in all studentrooms and social spaces.
2.2 Private student accommodation
The same minimum standards are applicable to private student housing.
3. HEALTH AND SAFETY
All providers of student housing shall comply with all of the legislative requirements(national, regional and municipal) regulating health and safety at all times. Additionalrequirements pertinent to the provision of student housing are listed below, and certificatesof compliance should be obtained from the relevant authority on an annual basis withregard to the following services:
i. Fire safety, prevention and detection mechanisms and procedures.ii. Electricity and gas installations.
iii. Security staff, mechanisms and procedures.
In any building used to accommodate students, each student room aswell as the building itself must be secure.
iv. Self-catering facilities
Unless adequately equipped kitchenettes are provided, cooking shallnot be permitted in any student room. ‘Adequate’ here refers tosufficient preparation, storage, cold storage, cooking andwashing/cleaning space and facilities.
Food preparation and cooking areas shall be provided which complywith the norms specified in 2.1.2 above.
Monthly hygiene audits of all communal self-catering facilities andareas should be carried out in addition to annual municipal hygieneinspections.
v. Ablution areas and sanitation
All ablution areas should be cleaned at least once daily using cleaningindustry standard chemicals and products.
Shower doors or curtains must be fitted to shower cubicles to ensureprivacy.
210
4. FURNISHINGS AND FITTINGS
The furnishings and fittings required for each room type or area within a student housingfacility are detailed in the Minimum Standards for Student Housing room specificationmanual. Such furnishings and fittings should be maintained in sound and working order, andshould be replaced as soon as possible when broken beyond repair. Appropriate, fair andadequate mechanisms for determining responsibility for damage and/or breakage toproperty should be established by the relevant authority (student housing officials atuniversities; or landlord or agent in the case of private residences).
5. CONSTRUCTION, REPAIRS AND MAINTENANCE
Any and all construction, repairs and maintenance must comply at all times with all relevantlegislation, and must be carried out by appropriately qualified staff or contractors. Thefollowing additional requirements pertinent to the provision of student housing are listedbelow:
In the case of new buildings and/or refurbishment of existing buildings which havebeen funded by the Department of Higher Education and Training (DHET), the DHETshall inspect such buildings after completion to satisfy itself that the buildings are fit-for-purpose, provide value for money, and comply with relevant legislation.
Reasonable response times for emergency, urgent and routine repairs should beestablished after consultation with all stakeholders, and should be incorporated intoa service level agreement.
Any construction, maintenance or repairs must be carried out with minimumdisruption to the academic program and requirements of student residents, and withdue regard for their safety and security.
Areas surrounding residence buildings must be kept clear of refuse and litter.
6. STUDENT WELLBEING AND SUPPORT
Both university and private providers of student accommodation must ensure that there isadequate provision for the medical and psychological well-being of student residents duringwork hours, and that emergency support is available after hours.
7. STUDENT HOUSING GOVERNANCE AND MANAGEMENT
Governance of student housing and accommodation
A Board of Residences, All-Residence Council or similar body should be established atall universities to govern residence life on behalf of the Senate and the Council of theUniversity. The Board of Residences (or equivalent) may be a sub-committee of the
211
Student Services Council where such exists. The Board should be composed of equalnumbers of university staff and residential students, and should be chaired by asenior official of the university. The Board should meet quarterly, and its minutesmust be presented to Senate and Council. Membership of the Board or Councilshould include university staff and student representatives from off-campus studentaccommodation units housing ten or more students.
Staffing levels
Residence staff to resident student ratios should not normally exceed 1:150 in thecase of wardens, house parents, residence managers or the equivalent, and 1:100 inthe case of student sub-wardens or the equivalent.
Professional development of student housing staff
Adequate training must be provided by both universities and privateaccommodation providers to student housing staff at all levels. Such training mustencompass safety and health, emergency procedures, basic counselling and conflictresolution. The ongoing professional development of student housing staff must beencouraged by both universities and private accommodation providers.Collaboration and cooperation between university student housing divisions andprivate accommodation providers is strongly encouraged.
Policies, procedures, protocols and agreements
All providers of student housing should have clear and comprehensivedocumentation providing information about the nature of the accommodationavailable, the fee or rental (indicating clearly what is included in the rate as well asall terms and conditions), the rules and regulations, the management structure, thecomplaints procedure, maintenance/repairs requisition procedure, etc. Privateproviders shall establish clear and comprehensive standard lease agreements afterconsultation with relevant university officials and student representatives.
Student discipline
Universities are responsible for the discipline of students resident in universityowned or rented housing. Providers of private student accommodation must consultand collaborate with their ‘feeder’ universities in establishing suitable disciplinarycodes and mechanisms.
212
8. COMPLIANCE WITH STUDENT HOUSING AND ACCOMMODATION MINIMUMSTANDARDS
The Department of Higher Education and Training will be the custodian of this Code, and willprovide a consultative, facilitative and supportive service to the universities in attainingtheir student housing and accommodation targets and goals.
NSFAS-funded students may only be accommodated in housing which meets the minimumstandards requirements set out in this Code. Responsibility for accrediting private studenthousing and accommodation will be the responsibility of the ‘feeder’ University throughwhich the NSFAS funding allocation is made.
213
Appendix E
MINIMUM STANDARDS FOR STUDENT HOUSING ROOM SPECIFICATION MANUAL
ROOM DATA SHEETS
Room no 1 Bedroom Single
Room no 2 Bedroom Double
Room no 3 Common Room Large
Room no 4 Common Room Small
Room no 5 Study
Room no 6 Passage
Room no 7 Utility Area
Room no 8 Foyer
Room no 9 Staircase
Room no 10 Guest Toilet
Room no 11 Telephone Booth
Room no 12 Kitchenette
Room no 13 Ablutions
Room no 14 Laundry
Room no 15 Cleaners Store
Room no 16 House Store
Room no 17 Box Room
Room no 18 Linen Room
Room no 19 Electrical Duct
Room no 20 Boiler Room
Room no 21 Plumbing Duct
Room no 22 Hub Room
Room no 23 Grounds
Room no 24.01 Warden Kitchen
Room no 24.02 Warden Dining Area
Room no 24.03 Warden Lounge
Room no 24.04 Warden Bedroom 1
Room no 24.05 Warden Bedroom 2
Room no 24.06 Warden Bedroom 3
Room no 24.07 Warden Bathroom 1
Room no 24.08 Warden Bathroom 2
Room no 24.09 Warden Office
Room no 24.10 Warden Garage
Room no 24.11 Warden General
Room no 25 Residence General
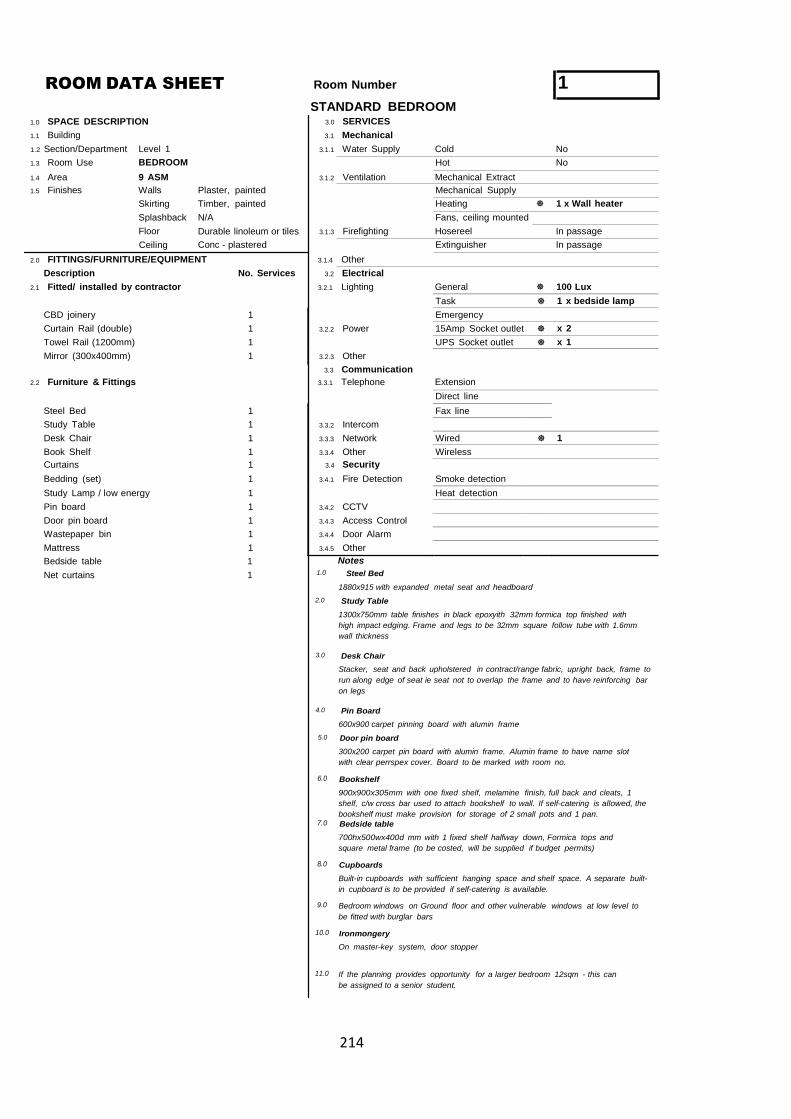
214
ROOM DATA SHEET
1.0 SPACE DESCRIPTION
Room Number 1STANDARD BEDROOM
3.0 SERVICES
1.1 Building 3.1 Mechanical
1.2 Section/Department
1.3 Room Use
1.4 Area
Level 1
BEDROOM
9 ASM
3.1.1 Water Supply Cold No
Hot No
3.1.2 Ventilation Mechanical Extract
1.5 Finishes Walls
Skirting
Splashback
Floor
Ceiling
Plaster, painted
Timber, painted
N/A
Durable linoleum or tiles
Conc - plastered
Mechanical Supply
Heating 1 x Wall heater
Fans, ceiling mounted
3.1.3 Firefighting Hosereel In passage
Extinguisher In passage
2.0 FITTINGS/FURNITURE/EQUIPMENT 3.1.4 Other
Description No. Services 3.2 Electrical
2.1 Fitted/ installed by contractor 3.2.1 Lighting General 100 Lux
Task 1 x bedside lamp
CBD joinery 1 Emergency
Curtain Rail (double) 1 3.2.2 Power 15Amp Socket outlet x 2
Towel Rail (1200mm) 1 UPS Socket outlet x 1
Mirror (300x400mm) 1 3.2.3 Other
3.3 Communication
2.2 Furniture & Fittings 3.3.1 Telephone Extension
Direct line
Steel Bed 1 Fax line
Study Table 1 3.3.2 Intercom
Desk Chair 1 3.3.3 Network Wired 1
Book Shelf 1 3.3.4 Other Wireless
Curtains 1 3.4 Security
Bedding (set) 1 3.4.1 Fire Detection Smoke detection
Study Lamp / low energy 1 Heat detection
Pin board 1 3.4.2 CCTV
Door pin board 1 3.4.3 Access Control
Wastepaper bin 1 3.4.4 Door Alarm
Mattress 1 3.4.5 Other
Bedside table 1 Notes
Net curtains 1 1.0 Steel Bed
1880x915 with expanded metal seat and headboard
2.0 Study Table
1300x750mm table finishes in black epoxyith 32mm formica top finished with
high impact edging. Frame and legs to be 32mm square follow tube with 1.6mm
wall thickness
3.0 Desk Chair
Stacker, seat and back upholstered in contract/range fabric, upright back, frame to
run along edge of seat ie seat not to overlap the frame and to have reinforcing bar
on legs
4.0 Pin Board
600x900 carpet pinning board with alumin frame
5.0 Door pin board
300x200 carpet pin board with alumin frame. Alumin frame to have name slot
with clear perrspex cover. Board to be marked with room no.
6.0 Bookshelf
900x900x305mm with one fixed shelf, melamine finish, full back and cleats, 1
shelf, c/w cross bar used to attach bookshelf to wall. If self-catering is allowed, the
bookshelf must make provision for storage of 2 small pots and 1 pan.7.0 Bedside table
700hx500wx400d mm with 1 fixed shelf halfway down, Formica tops and
square metal frame (to be costed, will be supplied if budget permits)
8.0 Cupboards
Built-in cupboards with sufficient hanging space and shelf space. A separate built-
in cupboard is to be provided if self-catering is available.
9.0 Bedroom windows on Ground floor and other vulnerable windows at low level to
be fitted with burglar bars
10.0 Ironmongery
On master-key system, door stopper
11.0 If the planning provides opportunity for a larger bedroom 12sqm - this can
be assigned to a senior student.
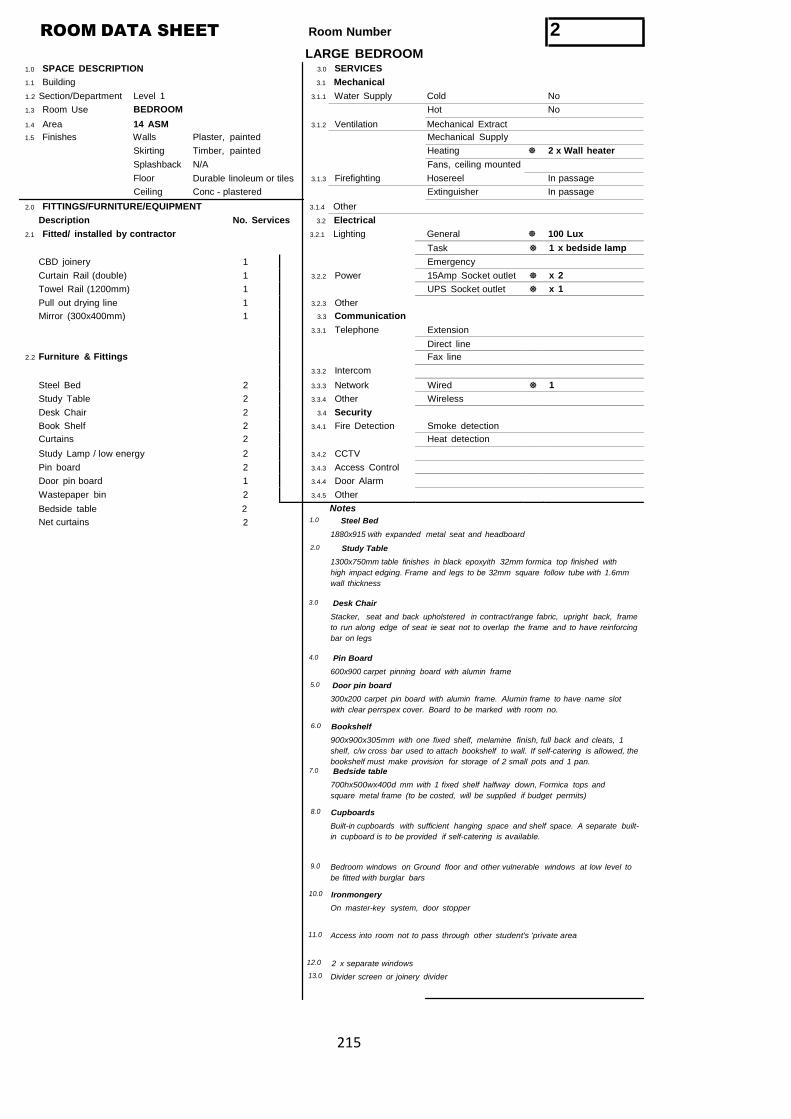
215
Task 1 x bedside lamp
CBD joinery 1 Emergency
Curtain Rail (double) 1 3.2.2 Power 15Amp Socket outlet x 2
Towel Rail (1200mm) 1 UPS Socket outlet x 1
Pull out drying line 1 3.2.3 Other
Mirror (300x400mm) 1 3.3 Communication
3.3.1 Telephone Extension
Direct line
Furniture & Fittings Fax line
3.3.2 Intercom
Steel Bed 2 3.3.3 Network Wired 1
Study Table 2 3.3.4 Other Wireless
Desk Chair 2 3.4 Security
Book Shelf 2 3.4.1 Fire Detection Smoke detection
Curtains 2 Heat detection
Study Lamp / low energy 2 3.4.2 CCTV
Pin board 2 3.4.3 Access Control
Door pin board 1 3.4.4 Door Alarm
Wastepaper bin 2 3.4.5 Other
ROOM DATA SHEET
1.0 SPACE DESCRIPTION
Room Number 2LARGE BEDROOM
3.0 SERVICES
1.1 Building 3.1 Mechanical
1.2 Section/Department
1.3 Room Use
1.4 Area
Level 1
BEDROOM
14 ASM
3.1.1 Water Supply Cold No
Hot No
3.1.2 Ventilation Mechanical Extract
1.5 Finishes Walls
Skirting
Splashback
Floor
Ceiling
Plaster, painted
Timber, painted
N/A
Durable linoleum or tiles
Conc - plastered
Mechanical Supply
Heating 2 x Wall heater
Fans, ceiling mounted
3.1.3 Firefighting Hosereel In passage
Extinguisher In passage
2.0 FITTINGS/FURNITURE/EQUIPMENT 3.1.4 Other
Description No. Services 3.2 Electrical
2.1 Fitted/ installed by contractor 3.2.1 Lighting General 100 Lux
2.2
Bedside table 2 Notes
Net curtains 2 1.0 Steel Bed
1880x915 with expanded metal seat and headboard
2.0 Study Table
1300x750mm table finishes in black epoxyith 32mm formica top finished with
high impact edging. Frame and legs to be 32mm square follow tube with 1.6mm
wall thickness
3.0 Desk Chair
Stacker, seat and back upholstered in contract/range fabric, upright back, frame
to run along edge of seat ie seat not to overlap the frame and to have reinforcing
bar on legs
4.0 Pin Board
600x900 carpet pinning board with alumin frame
5.0 Door pin board
300x200 carpet pin board with alumin frame. Alumin frame to have name slot
with clear perrspex cover. Board to be marked with room no.
6.0 Bookshelf
900x900x305mm with one fixed shelf, melamine finish, full back and cleats, 1
shelf, c/w cross bar used to attach bookshelf to wall. If self-catering is allowed, the
bookshelf must make provision for storage of 2 small pots and 1 pan.7.0 Bedside table
700hx500wx400d mm with 1 fixed shelf halfway down, Formica tops and
square metal frame (to be costed, will be supplied if budget permits)
8.0 Cupboards
Built-in cupboards with sufficient hanging space and shelf space. A separate built-
in cupboard is to be provided if self-catering is available.
9.0 Bedroom windows on Ground floor and other vulnerable windows at low level to
be fitted with burglar bars
10.0 Ironmongery
On master-key system, door stopper
11.0 Access into room not to pass through other student's 'private area
12.0 2 x separate windows
13.0 Divider screen or joinery divider
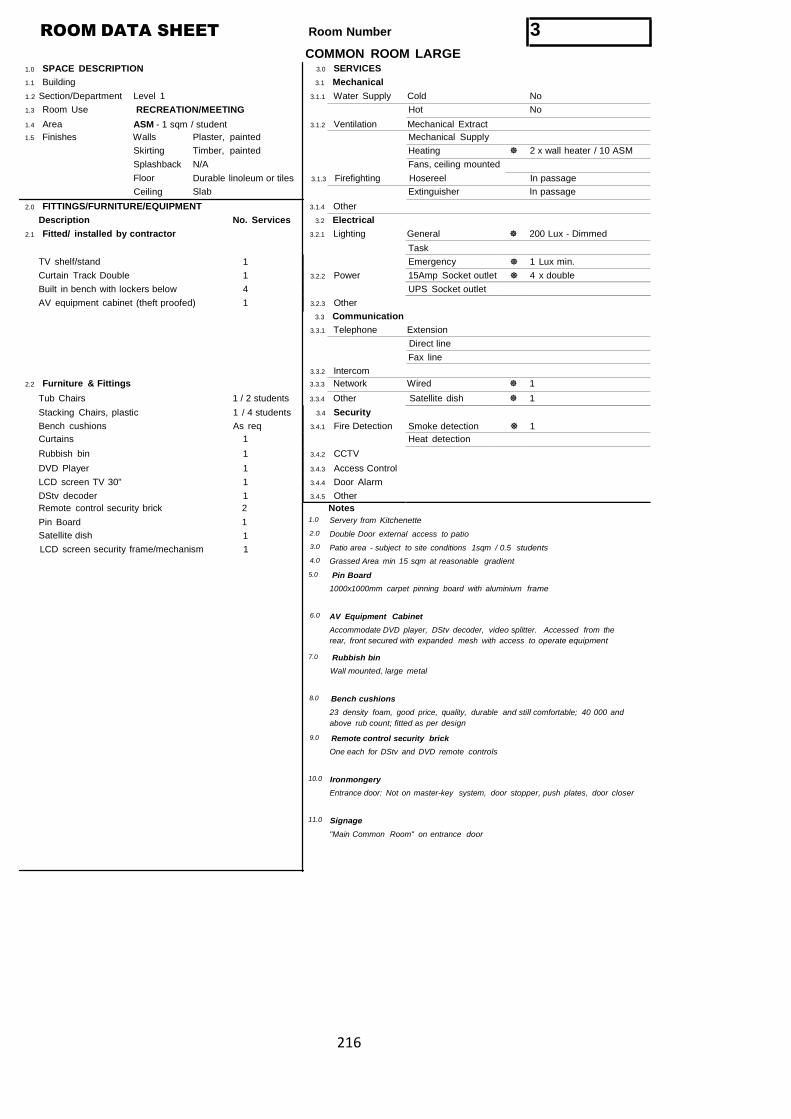
216
ROOM DATA SHEET
1.0 SPACE DESCRIPTION
Room Number 3COMMON ROOM LARGE
3.0 SERVICES
1.1 Building 3.1 Mechanical
1.2 Section/Department
1.3 Room Use
1.4 Area
Level 1
RECREATION/MEETING
ASM - 1 sqm / student
3.1.1 Water Supply Cold No
Hot No
3.1.2 Ventilation Mechanical Extract
1.5 Finishes Walls
Skirting
Splashback
Floor
Ceiling
Plaster, painted
Timber, painted
N/A
Durable linoleum or tiles
Slab
Mechanical Supply
Heating 2 x wall heater / 10 ASM
Fans, ceiling mounted
3.1.3 Firefighting Hosereel In passage
Extinguisher In passage
2.0 FITTINGS/FURNITURE/EQUIPMENT 3.1.4 Other
Description No. Services 3.2 Electrical
2.1 Fitted/ installed by contractor 3.2.1 Lighting General 200 Lux - Dimmed
Task
TV shelf/stand 1 Emergency 1 Lux min.
Curtain Track Double 1 3.2.2 Power 15Amp Socket outlet 4 x double
Built in bench with lockers below 4 UPS Socket outlet
AV equipment cabinet (theft proofed) 1 3.2.3 Other
3.3 Communication
3.3.1 Telephone Extension
Direct line
Fax line
3.3.2 Intercom
2.2 Furniture & Fittings 3.3.3 Network Wired 1
Tub Chairs 1 / 2 students 3.3.4 Other Satellite dish 1
Stacking Chairs, plastic
Bench cushions
1 / 4 students
As req
3.4 Security
3.4.1 Fire Detection Smoke detection 1
Curtains 1 Heat detection
Rubbish bin 1 3.4.2 CCTV
DVD Player 1 3.4.3 Access Control
LCD screen TV 30" 1 3.4.4 Door Alarm
DStv decoder 1 3.4.5 Other
Remote control security brick 2 Notes
Pin Board 1 1.0 Servery from Kitchenette
Satellite dish 1 2.0 Double Door external access to patio
LCD screen security frame/mechanism 1 3.0
4.0
Patio area - subject to site conditions 1sqm / 0.5 students
Grassed Area min 15 sqm at reasonable gradient
5.0 Pin Board
1000x1000mm carpet pinning board with aluminium frame
6.0 AV Equipment Cabinet
Accommodate DVD player, DStv decoder, video splitter. Accessed from the
rear, front secured with expanded mesh with access to operate equipment
7.0 Rubbish bin
Wall mounted, large metal
8.0 Bench cushions
23 density foam, good price, quality, durable and still comfortable; 40 000 and
above rub count; fitted as per design
9.0 Remote control security brick
One each for DStv and DVD remote controls
10.0 Ironmongery
Entrance door: Not on master-key system, door stopper, push plates, door closer
11.0 Signage
"Main Common Room" on entrance door
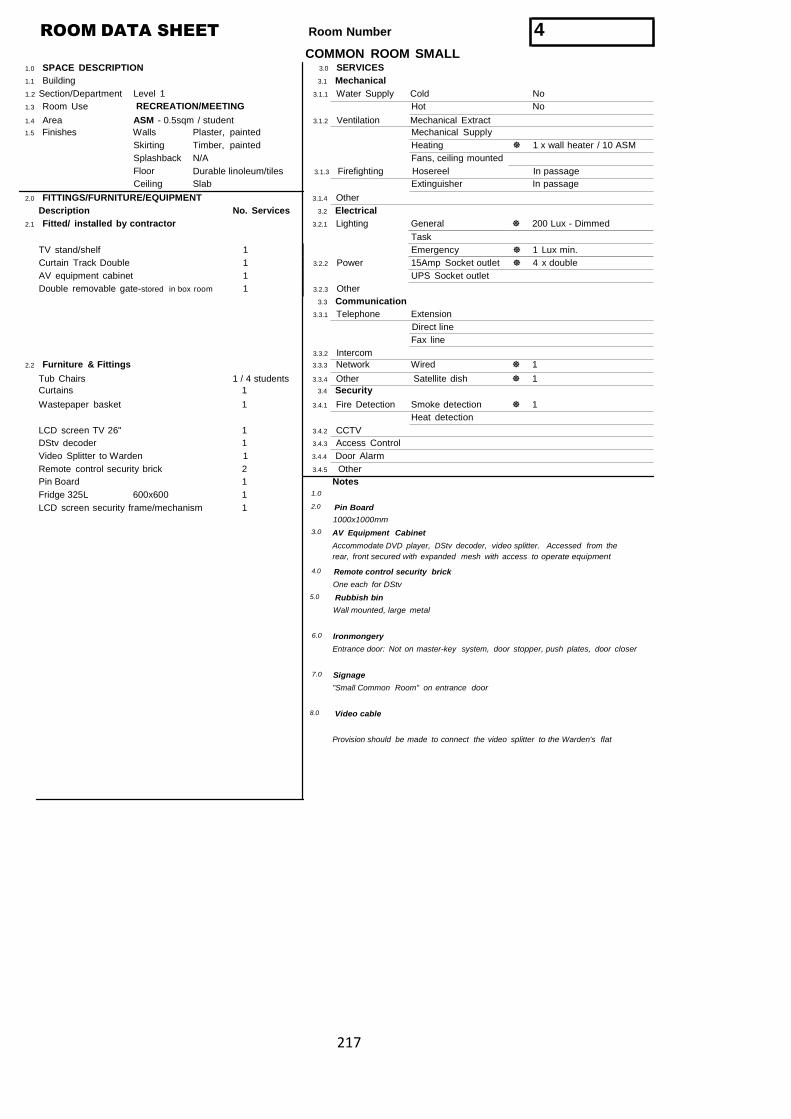
217
ROOM DATA SHEET
1.0 SPACE DESCRIPTION
Room Number 4COMMON ROOM SMALL
3.0 SERVICES
1.1 Building 3.1 Mechanical
1.2 Section/Department
1.3 Room Use
1.4 Area
Level 1
RECREATION/MEETING
ASM - 0.5sqm / student
3.1.1 Water Supply Cold No
Hot No
3.1.2 Ventilation Mechanical Extract
1.5 Finishes Walls
Skirting
Splashback
Floor
Ceiling
Plaster, painted
Timber, painted
N/A
Durable linoleum/tiles
Slab
Mechanical Supply
Heating 1 x wall heater / 10 ASM
Fans, ceiling mounted
3.1.3 Firefighting Hosereel In passage
Extinguisher In passage
2.0 FITTINGS/FURNITURE/EQUIPMENT 3.1.4 Other
Description No. Services 3.2 Electrical
2.1 Fitted/ installed by contractor 3.2.1 Lighting General 200 Lux - Dimmed
Task
TV stand/shelf 1 Emergency 1 Lux min.
Curtain Track Double 1 3.2.2 Power 15Amp Socket outlet 4 x double
AV equipment cabinet 1 UPS Socket outlet
Double removable gate-stored in box room 1 3.2.3 Other
3.3 Communication
3.3.1 Telephone Extension
Direct line
Fax line
3.3.2 Intercom
2.2 Furniture & Fittings 3.3.3 Network Wired 1
Tub Chairs 1 / 4 students 3.3.4 Other Satellite dish 1
Curtains 1 3.4 Security
Wastepaper basket 1 3.4.1 Fire Detection Smoke detection 1
Heat detection
LCD screen TV 26" 1 3.4.2 CCTV
DStv decoder 1 3.4.3 Access Control
Video Splitter to Warden 1 3.4.4 Door Alarm
Remote control security brick 2 3.4.5 Other
Pin Board 1 Notes
Fridge 325L 600x600 1 1.0
LCD screen security frame/mechanism 1 2.0 Pin Board
1000x1000mm
3.0 AV Equipment Cabinet
Accommodate DVD player, DStv decoder, video splitter. Accessed from the
rear, front secured with expanded mesh with access to operate equipment
4.0 Remote control security brick
One each for DStv
5.0 Rubbish bin
Wall mounted, large metal
6.0 Ironmongery
Entrance door: Not on master-key system, door stopper, push plates, door closer
7.0 Signage
"Small Common Room" on entrance door
8.0 Video cable
Provision should be made to connect the video splitter to the Warden's flat
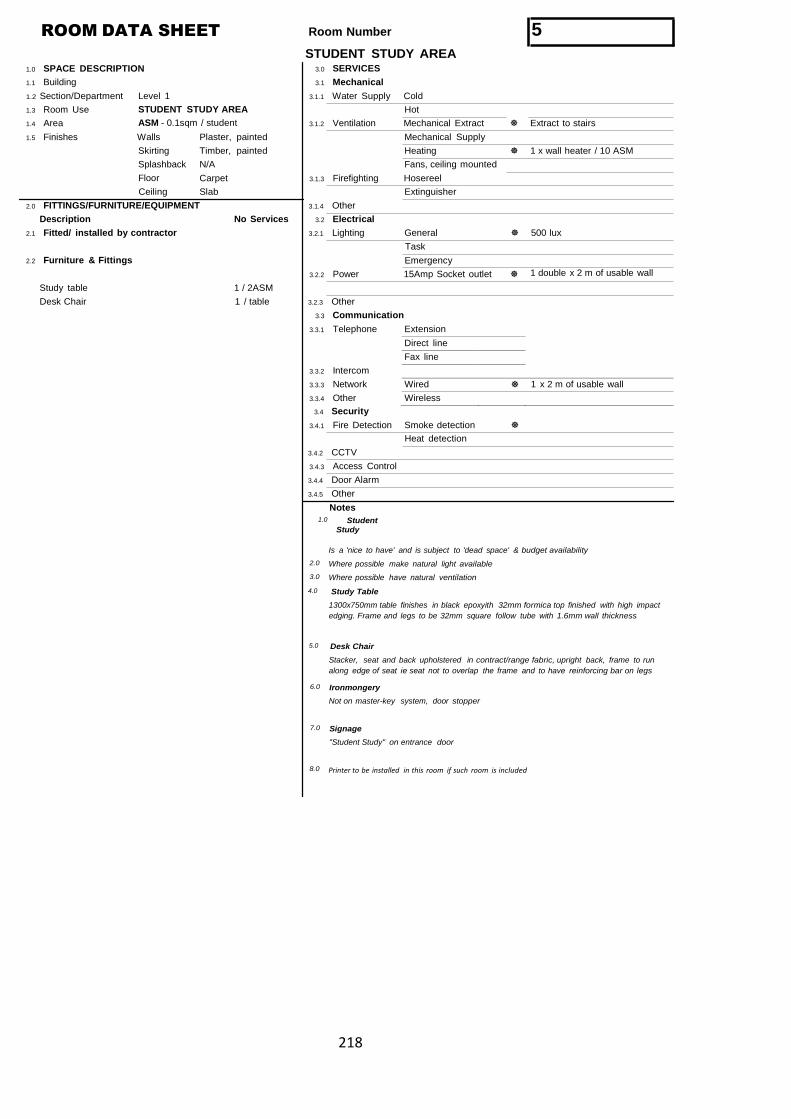
218
ROOM DATA SHEET
1.0 SPACE DESCRIPTION
Room Number 5STUDENT STUDY AREA
3.0 SERVICES
1.1 Building 3.1 Mechanical
1.2 Section/Department
1.3 Room Use
1.4 Area
Level 1
STUDENT STUDY AREA
ASM - 0.1sqm / student
3.1.1 Water Supply Cold
Hot
3.1.2 Ventilation Mechanical Extract Extract to stairs
1.5 Finishes Walls
Skirting
Splashback
Floor
Ceiling
Plaster, painted
Timber, painted
N/A
Carpet
Slab
Mechanical Supply
Heating 1 x wall heater / 10 ASM
Fans, ceiling mounted
3.1.3 Firefighting Hosereel
Extinguisher
2.0 FITTINGS/FURNITURE/EQUIPMENT 3.1.4 Other
Description No Services 3.2 Electrical
2.1 Fitted/ installed by contractor 3.2.1 Lighting General 500 lux
Task
2.2 Furniture & Fittings
Study table 1 / 2ASM
Emergency
3.2.2 Power 15Amp Socket outlet 1 double x 2 m of usable wall
Desk Chair 1 / table 3.2.3 Other
3.3 Communication
3.3.1 Telephone Extension
Direct line
Fax line
3.3.2 Intercom
3.3.3 Network Wired 1 x 2 m of usable wall
3.3.4 Other Wireless
3.4 Security
3.4.1 Fire Detection Smoke detection
Heat detection
3.4.2 CCTV
3.4.3 Access Control
3.4.4 Door Alarm
3.4.5 Other
Notes1.0 Student
Study
2.0
3.0
Is a 'nice to have' and is subject to 'dead space' & budget availability
Where possible make natural light available
Where possible have natural ventilation
4.0 Study Table
1300x750mm table finishes in black epoxyith 32mm formica top finished with high impact
edging. Frame and legs to be 32mm square follow tube with 1.6mm wall thickness
5.0 Desk Chair
Stacker, seat and back upholstered in contract/range fabric, upright back, frame to run
along edge of seat ie seat not to overlap the frame and to have reinforcing bar on legs
6.0 Ironmongery
Not on master-key system, door stopper
7.0 Signage
"Student Study" on entrance door
8.0 Printer to be installed in this room if such room is included
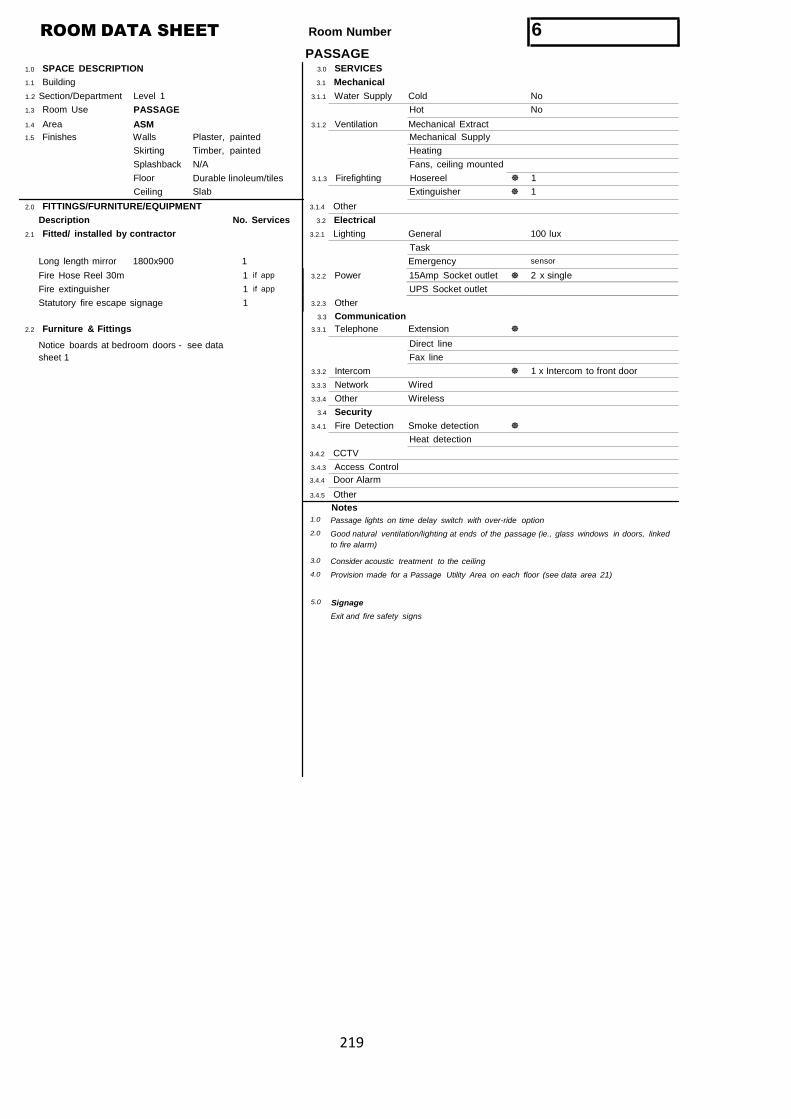
219
ROOM DATA SHEET
1.0 SPACE DESCRIPTION
Room Number 6PASSAGE
3.0 SERVICES
1.1 Building 3.1 Mechanical
1.2 Section/Department
1.3 Room Use
1.4 Area
Level 1
PASSAGE
ASM
3.1.1 Water Supply Cold No
Hot No
3.1.2 Ventilation Mechanical Extract
1.5 Finishes Walls
Skirting
Splashback
Floor
Ceiling
Plaster, painted
Timber, painted
N/A
Durable linoleum/tiles
Slab
Mechanical Supply
Heating
Fans, ceiling mounted
3.1.3 Firefighting Hosereel 1
Extinguisher 1
2.0 FITTINGS/FURNITURE/EQUIPMENT 3.1.4 Other
Description No. Services 3.2 Electrical
2.1 Fitted/ installed by contractor 3.2.1 Lighting General 100 lux
Task
Long length mirror 1800x900 1 Emergency sensor
Fire Hose Reel 30m 1 if app 3.2.2 Power 15Amp Socket outlet 2 x single
Fire extinguisher 1 if app UPS Socket outlet
Statutory fire escape signage 1 3.2.3 Other
2.2 Furniture & Fittings
Notice boards at bedroom doors - see data
sheet 1
3.3 Communication
3.3.1 Telephone Extension
Direct line
Fax line
3.3.2 Intercom 1 x Intercom to front door
3.3.3 Network Wired
3.3.4 Other Wireless
3.4 Security
3.4.1 Fire Detection Smoke detection
Heat detection
3.4.2 CCTV
3.4.3 Access Control
3.4.4 Door Alarm
3.4.5 Other
Notes1.0
2.0
3.0
4.0
Passage lights on time delay switch with over-ride option
Good natural ventilation/lighting at ends of the passage (ie., glass windows in doors, linked
to fire alarm)
Consider acoustic treatment to the ceiling
Provision made for a Passage Utility Area on each floor (see data area 21)
5.0 Signage
Exit and fire safety signs
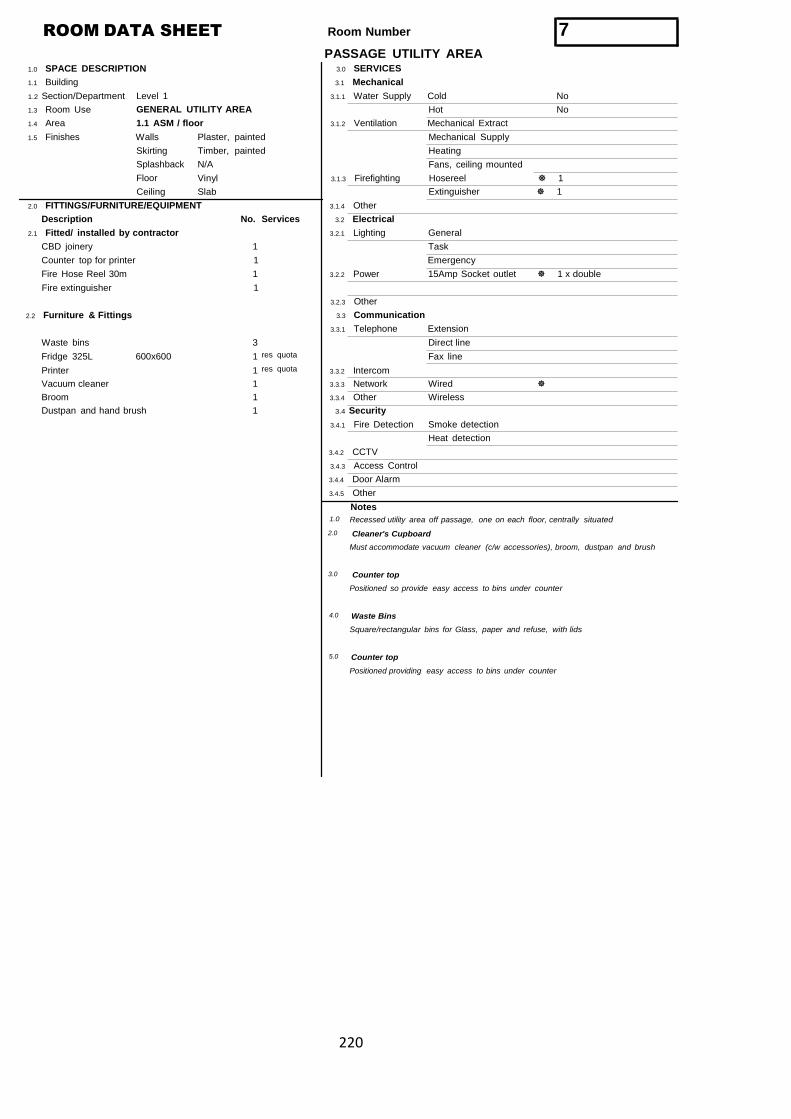
220
ROOM DATA SHEET
1.0 SPACE DESCRIPTION
Room Number 7PASSAGE UTILITY AREA
3.0 SERVICES
1.1 Building 3.1 Mechanical
1.2 Section/Department
1.3 Room Use
1.4 Area
Level 1
GENERAL UTILITY AREA
1.1 ASM / floor
3.1.1 Water Supply Cold No
Hot No
3.1.2 Ventilation Mechanical Extract
1.5 Finishes Walls
Skirting
Splashback
Floor
Ceiling
Plaster, painted
Timber, painted
N/A
Vinyl
Slab
Mechanical Supply
Heating
Fans, ceiling mounted
3.1.3 Firefighting Hosereel 1
Extinguisher 1
2.0 FITTINGS/FURNITURE/EQUIPMENT 3.1.4 Other
Description No. Services 3.2 Electrical
2.1 Fitted/ installed by contractor 3.2.1 Lighting General
CBD joinery 1 Task
Counter top for printer 1 Emergency
Fire Hose Reel 30m 1 3.2.2 Power 15Amp Socket outlet 1 x double
Fire extinguisher
2.2 Furniture & Fittings
1
3.2.3 Other
3.3 Communication
3.3.1 Telephone Extension
Waste bins 3 Direct line
Fridge 325L 600x600 1 res quota Fax line
Printer 1 res quota 3.3.2 Intercom
Vacuum cleaner 1 3.3.3 Network Wired
Broom 1 3.3.4 Other Wireless
Dustpan and hand brush 1 3.4 Security
3.4.1 Fire Detection Smoke detection
Heat detection
3.4.2 CCTV
3.4.3 Access Control
3.4.4 Door Alarm
3.4.5 Other
Notes1.0 Recessed utility area off passage, one on each floor, centrally situated
2.0 Cleaner's Cupboard
Must accommodate vacuum cleaner (c/w accessories), broom, dustpan and brush
3.0 Counter top
Positioned so provide easy access to bins under counter
4.0 Waste Bins
Square/rectangular bins for Glass, paper and refuse, with lids
5.0 Counter top
Positioned providing easy access to bins under counter
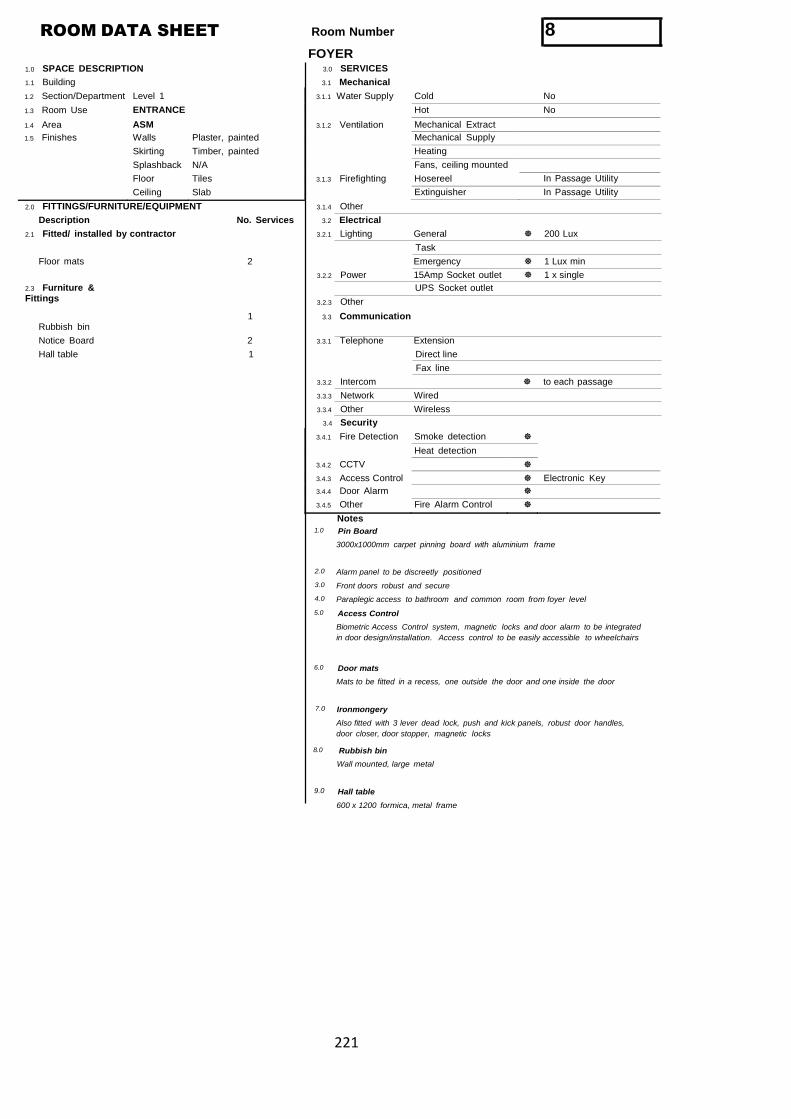
221
ROOM DATA SHEET
1.0 SPACE DESCRIPTION
Room Number 8FOYER
3.0 SERVICES
1.1 Building 3.1 Mechanical
1.2 Section/Department Level 1 3.1.1 Water Supply Cold No
1.3 Room Use ENTRANCE Hot No
1.4 Area ASM 3.1.2 Ventilation Mechanical Extract
1.5 Finishes Walls Plaster, painted Mechanical Supply
Skirting Timber, painted Heating
Splashback N/A Fans, ceiling mounted
Floor Tiles 3.1.3 Firefighting Hosereel In Passage Utility
Ceiling Slab Extinguisher In Passage Utility
2.0 FITTINGS/FURNITURE/EQUIPMENT 3.1.4 Other
Description No. Services 3.2 Electrical
2.1 Fitted/ installed by contractor 3.2.1 Lighting General 200 Lux
Task
Floor mats 2 Emergency 1 Lux min
3.2.2 Power 15Amp Socket outlet 1 x single
2.3 Furniture &Fittings
Rubbish bin
3.2.3 Other
1 3.3 Communication
UPS Socket outlet
Notice Board 2 3.3.1 Telephone Extension
Hall table 1 Direct line
Fax line
3.3.2 Intercom to each passage
3.3.3 Network Wired
3.3.4 Other Wireless
3.4 Security
3.4.1 Fire Detection Smoke detection
Heat detection
3.4.2 CCTV
3.4.3 Access Control Electronic Key
3.4.4 Door Alarm
3.4.5 Other Fire Alarm Control
Notes1.0 Pin Board
3000x1000mm carpet pinning board with aluminium frame
2.0
3.0
4.0
Alarm panel to be discreetly positioned
Front doors robust and secure
Paraplegic access to bathroom and common room from foyer level
5.0 Access Control
Biometric Access Control system, magnetic locks and door alarm to be integrated
in door design/installation. Access control to be easily accessible to wheelchairs
6.0 Door mats
Mats to be fitted in a recess, one outside the door and one inside the door
7.0 Ironmongery
Also fitted with 3 lever dead lock, push and kick panels, robust door handles,
door closer, door stopper, magnetic locks
8.0 Rubbish bin
Wall mounted, large metal
9.0 Hall table
600 x 1200 formica, metal frame
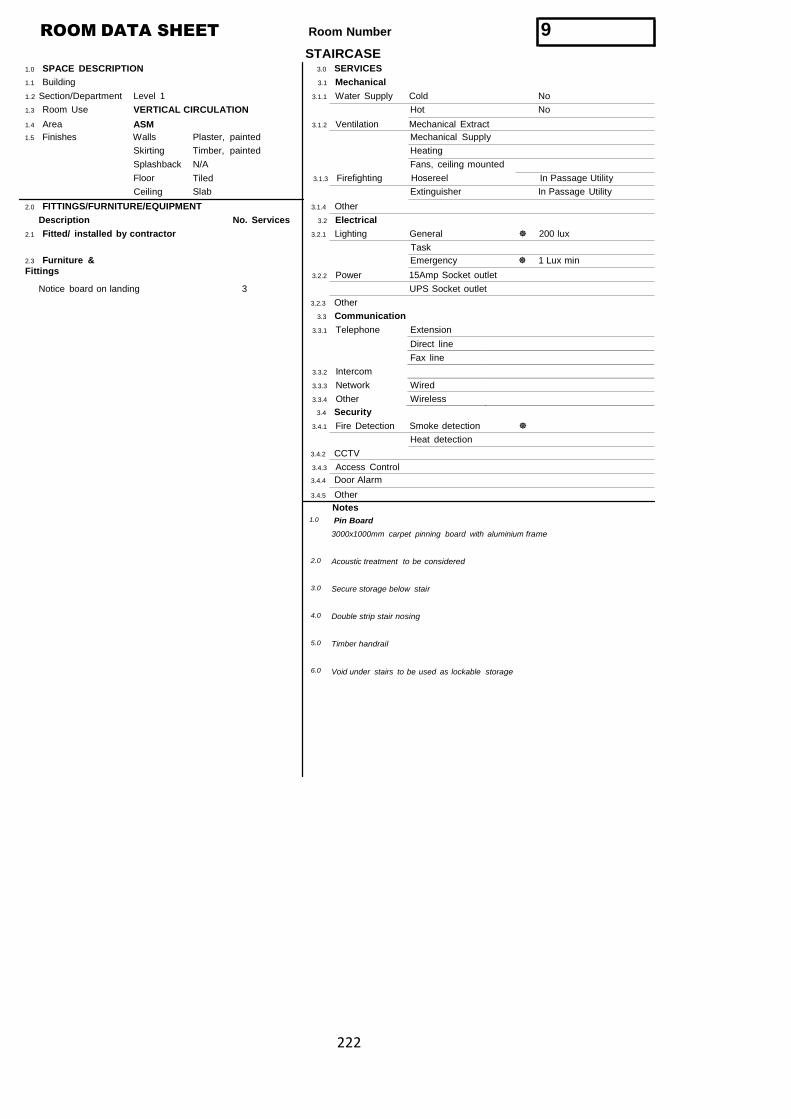
222
ROOM DATA SHEET
1.0 SPACE DESCRIPTION
Room Number 9STAIRCASE
3.0 SERVICES
1.1 Building 3.1 Mechanical
1.2 Section/Department
1.3 Room Use
1.4 Area
Level 1
VERTICAL CIRCULATION
ASM
3.1.1 Water Supply Cold No
Hot No
3.1.2 Ventilation Mechanical Extract
1.5 Finishes Walls
Skirting
Splashback
Floor
Ceiling
Plaster, painted
Timber, painted
N/A
Tiled
Slab
Mechanical Supply
Heating
Fans, ceiling mounted
3.1.3 Firefighting Hosereel In Passage Utility
Extinguisher In Passage Utility
2.0 FITTINGS/FURNITURE/EQUIPMENT 3.1.4 Other
Description No. Services 3.2 Electrical
2.1 Fitted/ installed by contractor 3.2.1 Lighting General 200 lux
Task
2.3 Furniture &Fittings
Emergency 1 Lux min
3.2.2 Power 15Amp Socket outlet
Notice board on landing 3 UPS Socket outlet
3.2.3 Other
3.3 Communication
3.3.1 Telephone Extension
Direct line
Fax line
3.3.2 Intercom
3.3.3 Network Wired
3.3.4 Other Wireless
3.4 Security
3.4.1 Fire Detection Smoke detection
Heat detection
3.4.2 CCTV
3.4.3 Access Control
3.4.4 Door Alarm
3.4.5 Other
Notes1.0 Pin Board
3000x1000mm carpet pinning board with aluminium frame
2.0
3.0
4.0
5.0
6.0
Acoustic treatment to be considered
Secure storage below stair
Double strip stair nosing
Timber handrail
Void under stairs to be used as lockable storage
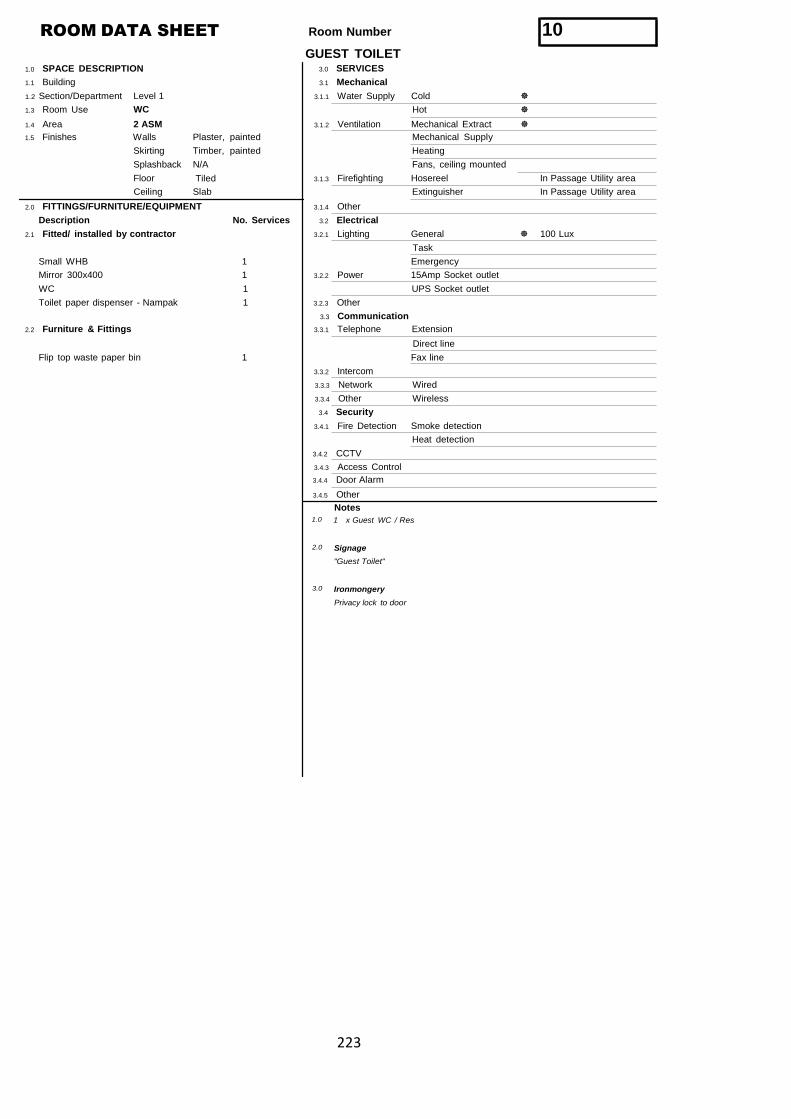
223
ROOM DATA SHEET
1.0 SPACE DESCRIPTION
Room Number 10GUEST TOILET
3.0 SERVICES
1.1 Building 3.1 Mechanical
1.2 Section/Department
1.3 Room Use
1.4 Area
Level 1
WC
2 ASM
3.1.1 Water Supply Cold
Hot
3.1.2 Ventilation Mechanical Extract
1.5 Finishes Walls
Skirting
Splashback
Floor
Ceiling
Plaster, painted
Timber, painted
N/A
Tiled
Slab
Mechanical Supply
Heating
Fans, ceiling mounted
3.1.3 Firefighting Hosereel In Passage Utility area
Extinguisher In Passage Utility area
2.0 FITTINGS/FURNITURE/EQUIPMENT 3.1.4 Other
Description No. Services 3.2 Electrical
2.1 Fitted/ installed by contractor 3.2.1 Lighting General 100 Lux
Task
Small WHB 1 Emergency
Mirror 300x400 1 3.2.2 Power 15Amp Socket outlet
WC
Toilet paper dispenser - Nampak
2.2 Furniture & Fittings
1 UPS Socket outlet
1 3.2.3 Other
3.3 Communication
3.3.1 Telephone Extension
Direct line
Flip top waste paper bin 1 Fax line
3.3.2 Intercom
3.3.3 Network Wired
3.3.4 Other Wireless
3.4 Security
3.4.1 Fire Detection Smoke detection
Heat detection
3.4.2 CCTV
3.4.3 Access Control
3.4.4 Door Alarm
3.4.5 Other
Notes1.0 1 x Guest WC / Res
2.0 Signage
"Guest Toilet"
3.0 Ironmongery
Privacy lock to door
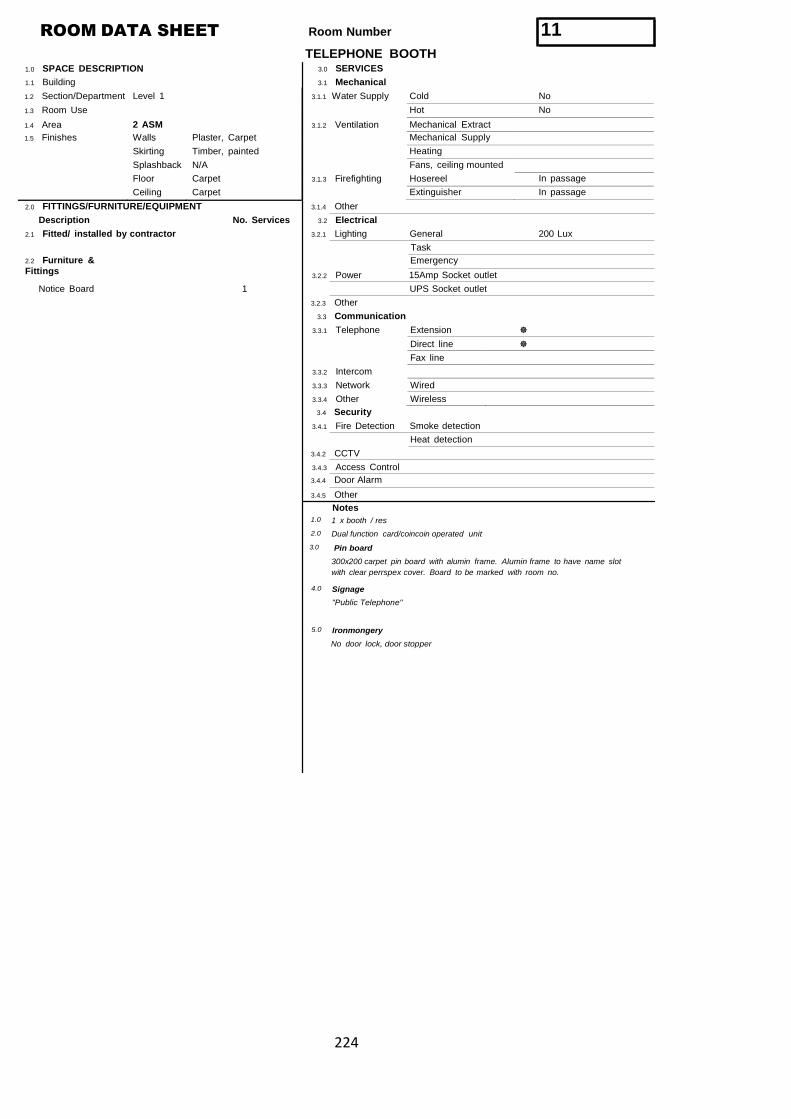
224
ROOM DATA SHEET
1.0 SPACE DESCRIPTION
Room Number 11TELEPHONE BOOTH
3.0 SERVICES
1.1 Building 3.1 Mechanical
1.2 Section/Department Level 1 3.1.1 Water Supply Cold No
1.3 Room Use Hot No
1.4 Area 2 ASM 3.1.2 Ventilation Mechanical Extract
1.5 Finishes Walls Plaster, Carpet Mechanical Supply
Skirting Timber, painted Heating
Splashback N/A Fans, ceiling mounted
Floor Carpet 3.1.3 Firefighting Hosereel In passage
Ceiling Carpet Extinguisher In passage
2.0 FITTINGS/FURNITURE/EQUIPMENT 3.1.4 Other
Description No. Services 3.2 Electrical
2.1 Fitted/ installed by contractor 3.2.1 Lighting General 200 Lux
Task
2.2 Furniture &Fittings
Emergency
3.2.2 Power 15Amp Socket outlet
Notice Board 1 UPS Socket outlet
3.2.3 Other
3.3 Communication
3.3.1 Telephone Extension
Direct line
Fax line
3.3.2 Intercom
3.3.3 Network Wired
3.3.4 Other Wireless
3.4 Security
3.4.1 Fire Detection Smoke detection
Heat detection
3.4.2 CCTV
3.4.3 Access Control
3.4.4 Door Alarm
3.4.5 Other
Notes1.0
2.0
1 x booth / res
Dual function card/coincoin operated unit
3.0 Pin board
300x200 carpet pin board with alumin frame. Alumin frame to have name slot
with clear perrspex cover. Board to be marked with room no.
4.0 Signage
"Public Telephone"
5.0 Ironmongery
No door lock, door stopper
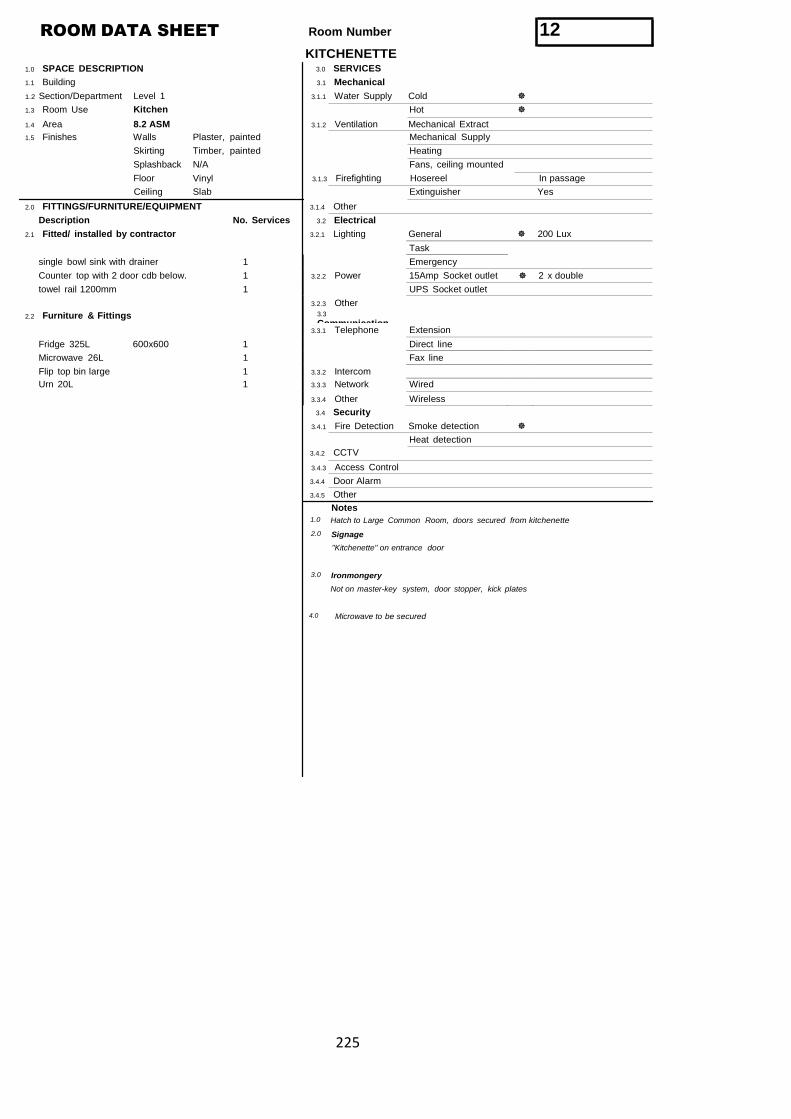
225
ROOM DATA SHEET
1.0 SPACE DESCRIPTION
Room Number 12KITCHENETTE
3.0 SERVICES
1.1 Building 3.1 Mechanical
1.2 Section/Department
1.3 Room Use
1.4 Area
Level 1
Kitchen
8.2 ASM
3.1.1 Water Supply Cold
Hot
3.1.2 Ventilation Mechanical Extract
1.5 Finishes Walls
Skirting
Splashback
Floor
Ceiling
Plaster, painted
Timber, painted
N/A
Vinyl
Slab
Mechanical Supply
Heating
Fans, ceiling mounted
3.1.3 Firefighting Hosereel In passage
Extinguisher Yes
2.0 FITTINGS/FURNITURE/EQUIPMENT 3.1.4 Other
Description No. Services 3.2 Electrical
2.1 Fitted/ installed by contractor 3.2.1 Lighting General 200 Lux
Task
single bowl sink with drainer 1 Emergency
Counter top with 2 door cdb below. 1 3.2.2 Power 15Amp Socket outlet 2 x double
towel rail 1200mm 1 UPS Socket outlet
2.2 Furniture & Fittings
3.2.3 Other3.3
Communication3.3.1 Telephone Extension
Fridge 325L 600x600 1 Direct line
Microwave 26L 1 Fax line
Flip top bin large 1 3.3.2 Intercom
Urn 20L 1 3.3.3 Network Wired
3.3.4 Other Wireless
3.4 Security
3.4.1 Fire Detection Smoke detection
Heat detection
3.4.2 CCTV
3.4.3 Access Control
3.4.4 Door Alarm
3.4.5 Other
Notes1.0 Hatch to Large Common Room, doors secured from kitchenette
2.0 Signage
"Kitchenette" on entrance door
3.0 Ironmongery
Not on master-key system, door stopper, kick plates
4.0 Microwave to be secured
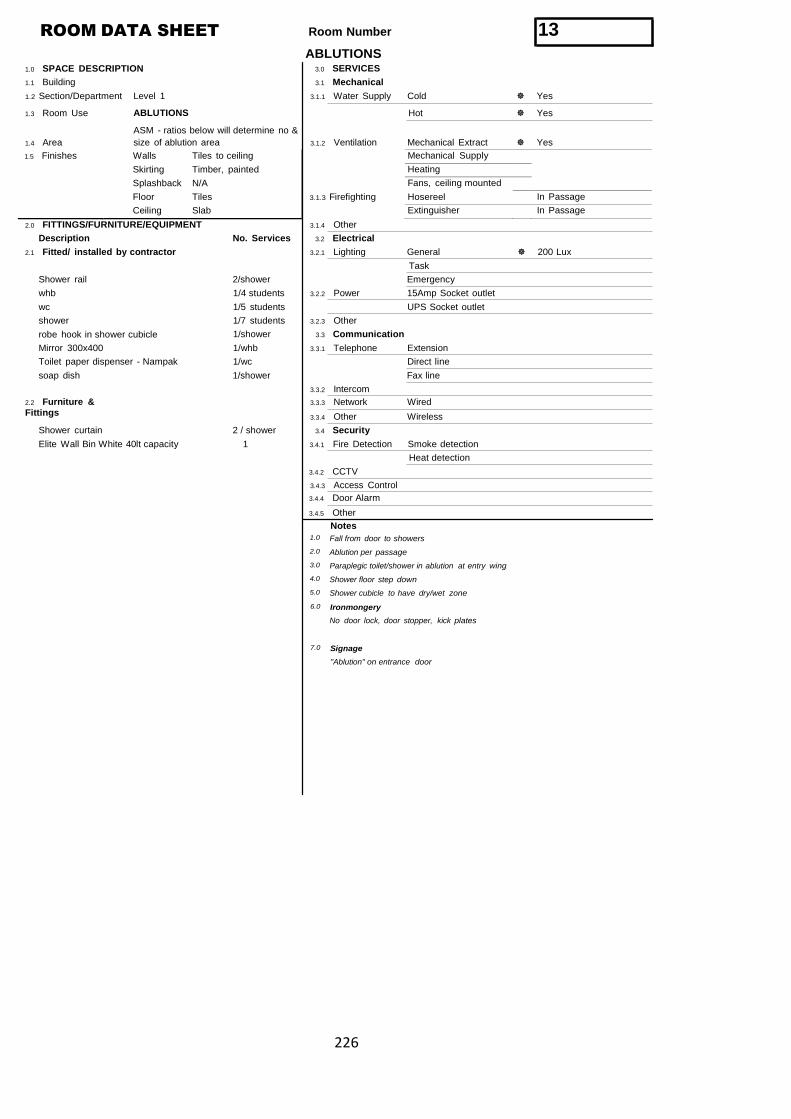
226
ROOM DATA SHEET
1.0 SPACE DESCRIPTION
Room Number 13ABLUTIONS
3.0 SERVICES
1.1 Building 3.1 Mechanical
1.2 Section/Department
1.3 Room Use
1.4 Area
Level 1
ABLUTIONS
ASM - ratios below will determine no &
size of ablution area
3.1.1 Water Supply Cold Yes
Hot Yes
3.1.2 Ventilation Mechanical Extract Yes
1.5 Finishes Walls Tiles to ceiling Mechanical Supply
Skirting Timber, painted Heating
Splashback N/A Fans, ceiling mounted
Floor Tiles 3.1.3 Firefighting Hosereel In Passage
Ceiling Slab Extinguisher In Passage
2.0 FITTINGS/FURNITURE/EQUIPMENT 3.1.4 Other
Description No. Services 3.2 Electrical
2.1 Fitted/ installed by contractor 3.2.1 Lighting General 200 Lux
Task
Shower rail 2/shower Emergency
whb 1/4 students 3.2.2 Power 15Amp Socket outlet
wc
shower
robe hook in shower cubicle
Mirror 300x400
Toilet paper dispenser - Nampak
1/5 students UPS Socket outlet
1/7 students 3.2.3 Other
1/shower 3.3 Communication
1/whb 3.3.1 Telephone Extension
1/wc Direct line
soap dish 1/shower Fax line
3.3.2 Intercom
2.2 Furniture &Fittings
3.3.3 Network Wired
3.3.4 Other Wireless
Shower curtain 2 / shower 3.4 Security
Elite Wall Bin White 40lt capacity 1 3.4.1 Fire Detection Smoke detection
Heat detection
3.4.2 CCTV
3.4.3 Access Control
3.4.4 Door Alarm
3.4.5 Other
Notes1.0
2.0
3.0
4.0
5.0
Fall from door to showers
Ablution per passage
Paraplegic toilet/shower in ablution at entry wing
Shower floor step down
Shower cubicle to have dry/wet zone
6.0 Ironmongery
No door lock, door stopper, kick plates
7.0 Signage
"Ablution" on entrance door
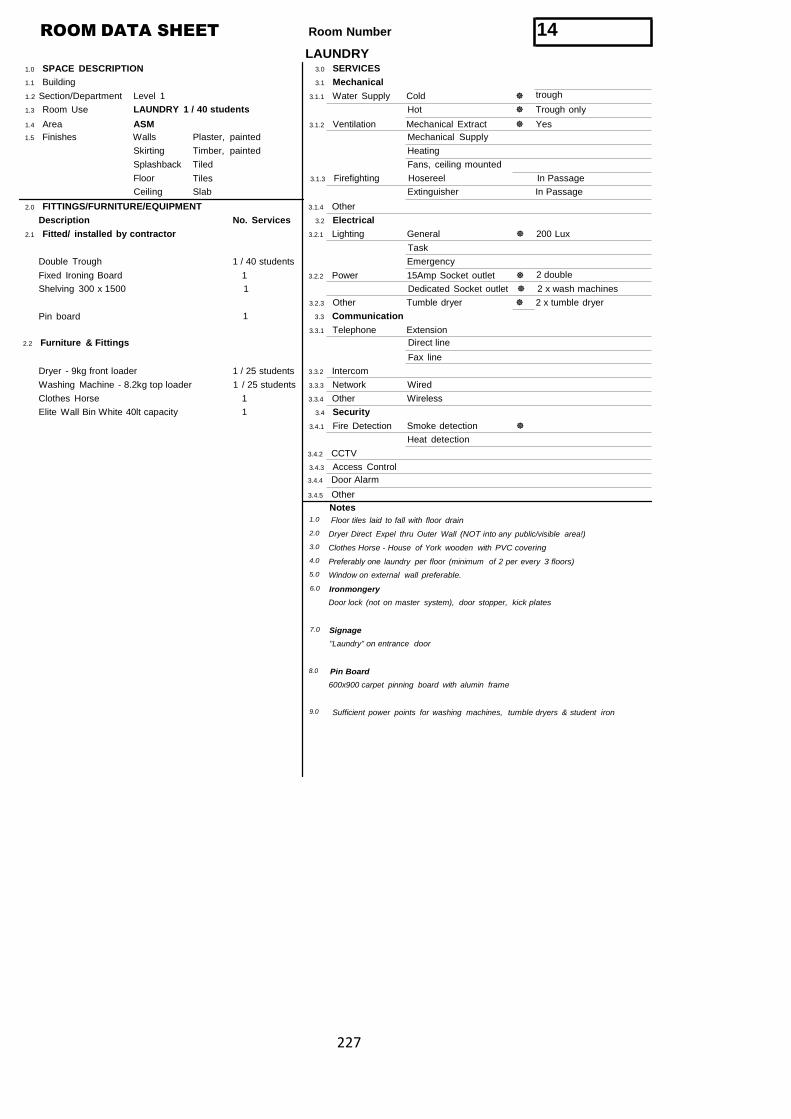
227
ROOM DATA SHEET
1.0 SPACE DESCRIPTION
Room Number 14LAUNDRY
3.0 SERVICES
1.1 Building 3.1 Mechanical
1.2 Section/Department
1.3 Room Use
1.4 Area
Level 1
LAUNDRY 1 / 40 students
ASM
3.1.1 Water Supply Cold trough
Hot Trough only
3.1.2 Ventilation Mechanical Extract Yes
1.5 Finishes Walls
Skirting
Splashback
Floor
Ceiling
Plaster, painted
Timber, painted
Tiled
Tiles
Slab
Mechanical Supply
Heating
Fans, ceiling mounted
3.1.3 Firefighting Hosereel In Passage
Extinguisher In Passage
2.0 FITTINGS/FURNITURE/EQUIPMENT 3.1.4 Other
Description No. Services 3.2 Electrical
2.1 Fitted/ installed by contractor 3.2.1 Lighting General 200 Lux
Task
Double Trough 1 / 40 students Emergency
Fixed Ironing Board 1 3.2.2 Power 15Amp Socket outlet 2 double
Shelving 300 x 1500
Pin board
2.2 Furniture & Fittings
1 Dedicated Socket outlet 2 x wash machines
3.2.3 Other Tumble dryer 2 x tumble dryer
1 3.3 Communication
3.3.1 Telephone Extension
Direct line
Fax line
Dryer - 9kg front loader 1 / 25 students 3.3.2 Intercom
Washing Machine - 8.2kg top loader 1 / 25 students 3.3.3 Network Wired
Clothes Horse 1 3.3.4 Other Wireless
Elite Wall Bin White 40lt capacity 1 3.4 Security
3.4.1 Fire Detection Smoke detection
Heat detection
3.4.2 CCTV
3.4.3 Access Control
3.4.4 Door Alarm
3.4.5 Other
Notes1.0
2.0
3.0
4.0
5.0
Floor tiles laid to fall with floor drain
Dryer Direct Expel thru Outer Wall (NOT into any public/visible area!)
Clothes Horse - House of York wooden with PVC covering
Preferably one laundry per floor (minimum of 2 per every 3 floors)
Window on external wall preferable.
6.0 Ironmongery
Door lock (not on master system), door stopper, kick plates
7.0 Signage
"Laundry" on entrance door
8.0 Pin Board
600x900 carpet pinning board with alumin frame
9.0 Sufficient power points for washing machines, tumble dryers & student iron
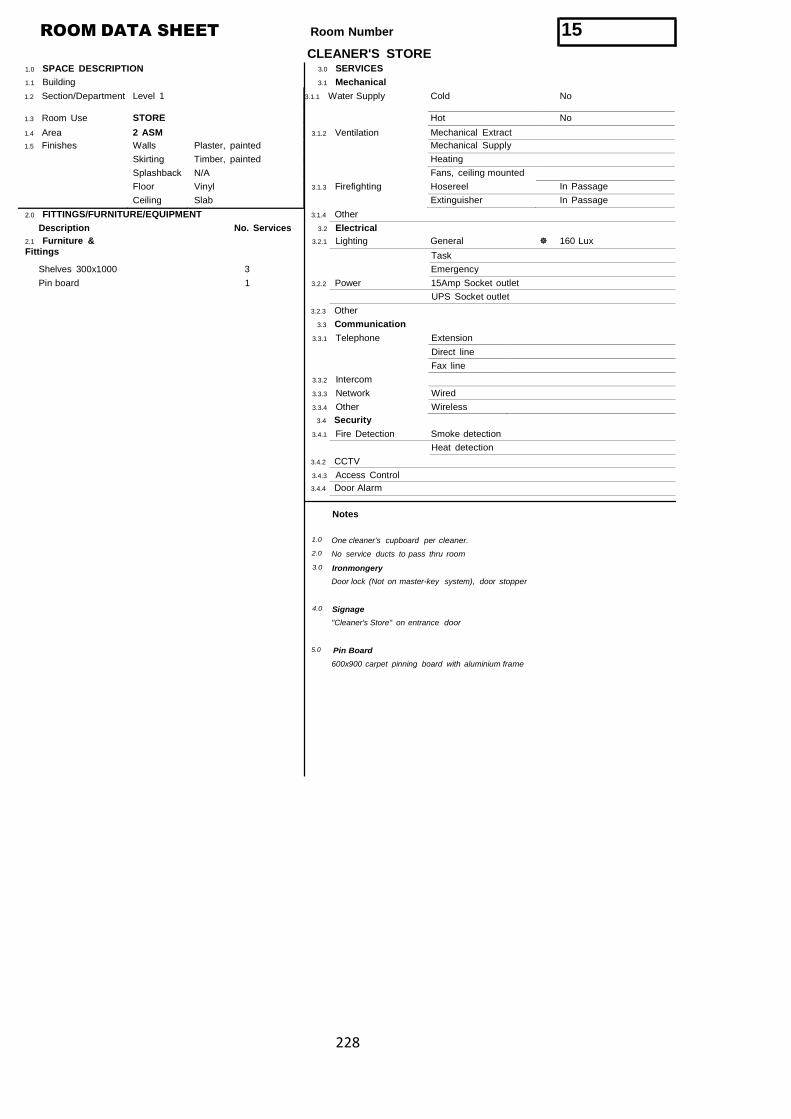
228
ROOM DATA SHEET
1.0 SPACE DESCRIPTION
Room Number 15CLEANER'S STORE
3.0 SERVICES
1.1 Building 3.1 Mechanical
1.2 Section/Department Level 1 3.1.1 Water Supply Cold No
1.3 Room Use STORE Hot No
1.4 Area 2 ASM 3.1.2 Ventilation Mechanical Extract
1.5 Finishes Walls Plaster, painted Mechanical Supply
Skirting Timber, painted Heating
Splashback N/A Fans, ceiling mounted
Floor Vinyl 3.1.3 Firefighting Hosereel In Passage
Ceiling Slab Extinguisher In Passage
2.0 FITTINGS/FURNITURE/EQUIPMENT 3.1.4 Other
Description No. Services 3.2 Electrical
2.1 Furniture &Fittings
3.2.1 Lighting General 160 Lux
Task
Shelves 300x1000 3 Emergency
Pin board 1 3.2.2 Power 15Amp Socket outlet
UPS Socket outlet
3.2.3 Other
3.3 Communication
3.3.1 Telephone Extension
Direct line
Fax line
3.3.2 Intercom
3.3.3 Network Wired
3.3.4 Other Wireless
3.4 Security
3.4.1 Fire Detection Smoke detection
Heat detection
3.4.2 CCTV
3.4.3 Access Control
3.4.4 Door Alarm
Notes
1.0
2.0
One cleaner's cupboard per cleaner.
No service ducts to pass thru room
3.0 Ironmongery
Door lock (Not on master-key system), door stopper
4.0 Signage
"Cleaner's Store" on entrance door
5.0 Pin Board
600x900 carpet pinning board with aluminium frame
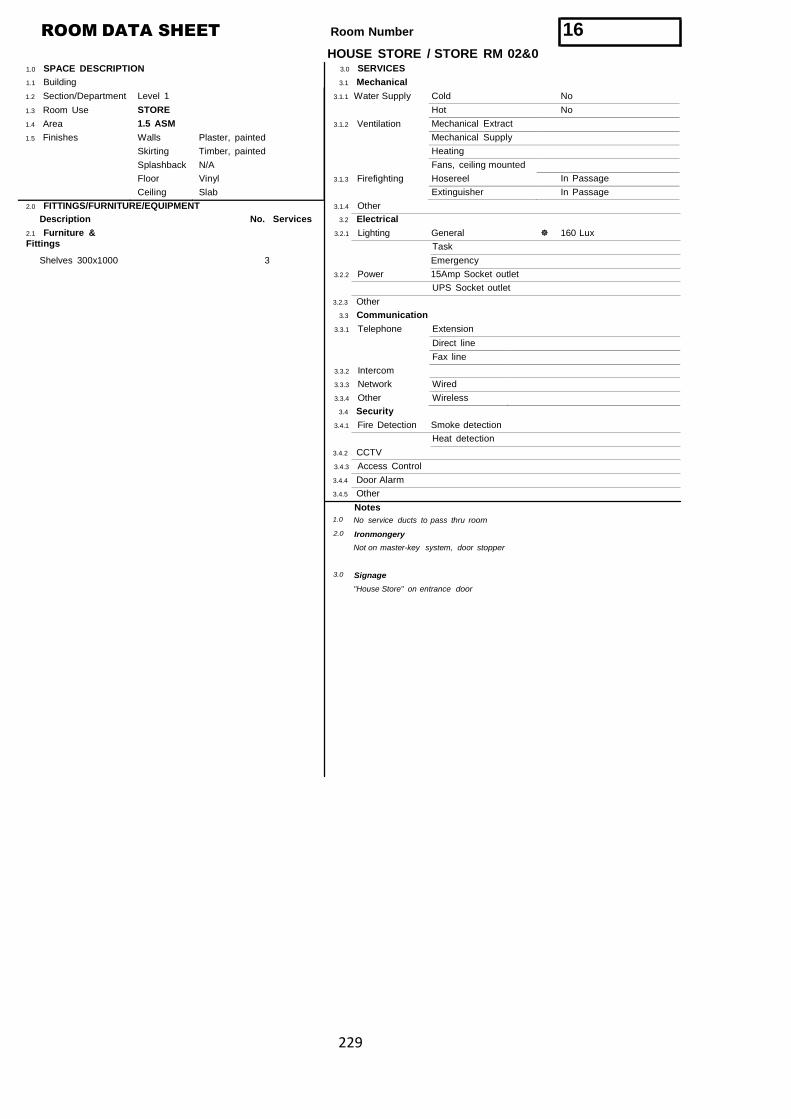
229
ROOM DATA SHEET
1.0 SPACE DESCRIPTION
Room Number 16HOUSE STORE / STORE RM 02&0
3.0 SERVICES
1.1 Building 3.1 Mechanical
1.2 Section/Department Level 1 3.1.1 Water Supply Cold No
1.3 Room Use STORE Hot No
1.4 Area 1.5 ASM 3.1.2 Ventilation Mechanical Extract
1.5 Finishes Walls Plaster, painted Mechanical Supply
Skirting Timber, painted Heating
Splashback N/A Fans, ceiling mounted
Floor Vinyl 3.1.3 Firefighting Hosereel In Passage
Ceiling Slab Extinguisher In Passage
2.0 FITTINGS/FURNITURE/EQUIPMENT 3.1.4 Other
Description No. Services 3.2 Electrical
2.1 Furniture &Fittings
3.2.1 Lighting General 160 Lux
Task
Shelves 300x1000 3 Emergency
3.2.2 Power 15Amp Socket outlet
UPS Socket outlet
3.2.3 Other
3.3 Communication
3.3.1 Telephone Extension
Direct line
Fax line
3.3.2 Intercom
3.3.3 Network Wired
3.3.4 Other Wireless
3.4 Security
3.4.1 Fire Detection Smoke detection
Heat detection
3.4.2 CCTV
3.4.3 Access Control
3.4.4 Door Alarm
3.4.5 Other
Notes1.0 No service ducts to pass thru room
2.0 Ironmongery
Not on master-key system, door stopper
3.0 Signage
"House Store" on entrance door
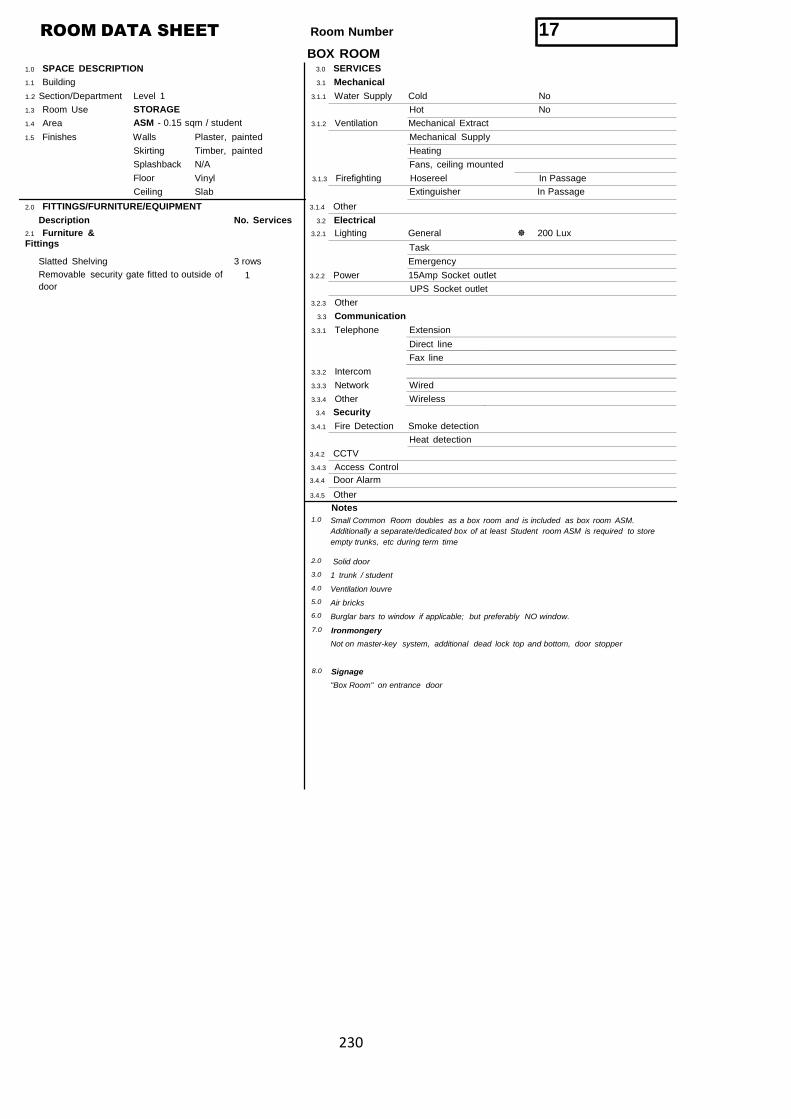
230
ROOM DATA SHEET
1.0 SPACE DESCRIPTION
Room Number 17BOX ROOM
3.0 SERVICES
1.1 Building 3.1 Mechanical
1.2 Section/Department
1.3 Room Use
1.4 Area
Level 1
STORAGE
ASM - 0.15 sqm / student
3.1.1 Water Supply Cold No
Hot No
3.1.2 Ventilation Mechanical Extract
1.5 Finishes Walls
Skirting
Splashback
Floor
Ceiling
Plaster, painted
Timber, painted
N/A
Vinyl
Slab
Mechanical Supply
Heating
Fans, ceiling mounted
3.1.3 Firefighting Hosereel In Passage
Extinguisher In Passage
2.0 FITTINGS/FURNITURE/EQUIPMENT 3.1.4 Other
Description No. Services 3.2 Electrical
2.1 Furniture &Fittings
3.2.1 Lighting General 200 Lux
Task
Slatted Shelving 3 rows Emergency
Removable security gate fitted to outside of
door1 3.2.2 Power 15Amp Socket outlet
UPS Socket outlet
3.2.3 Other
3.3 Communication
3.3.1 Telephone Extension
Direct line
Fax line
3.3.2 Intercom
3.3.3 Network Wired
3.3.4 Other Wireless
3.4 Security
3.4.1 Fire Detection Smoke detection
Heat detection
3.4.2 CCTV
3.4.3 Access Control
3.4.4 Door Alarm
3.4.5 Other
Notes1.0
2.0
3.0
4.0
5.0
6.0
Small Common Room doubles as a box room and is included as box room ASM.
Additionally a separate/dedicated box of at least Student room ASM is required to store
empty trunks, etc during term time
Solid door
1 trunk / student
Ventilation louvre
Air bricks
Burglar bars to window if applicable; but preferably NO window.
7.0 Ironmongery
Not on master-key system, additional dead lock top and bottom, door stopper
8.0 Signage
"Box Room" on entrance door
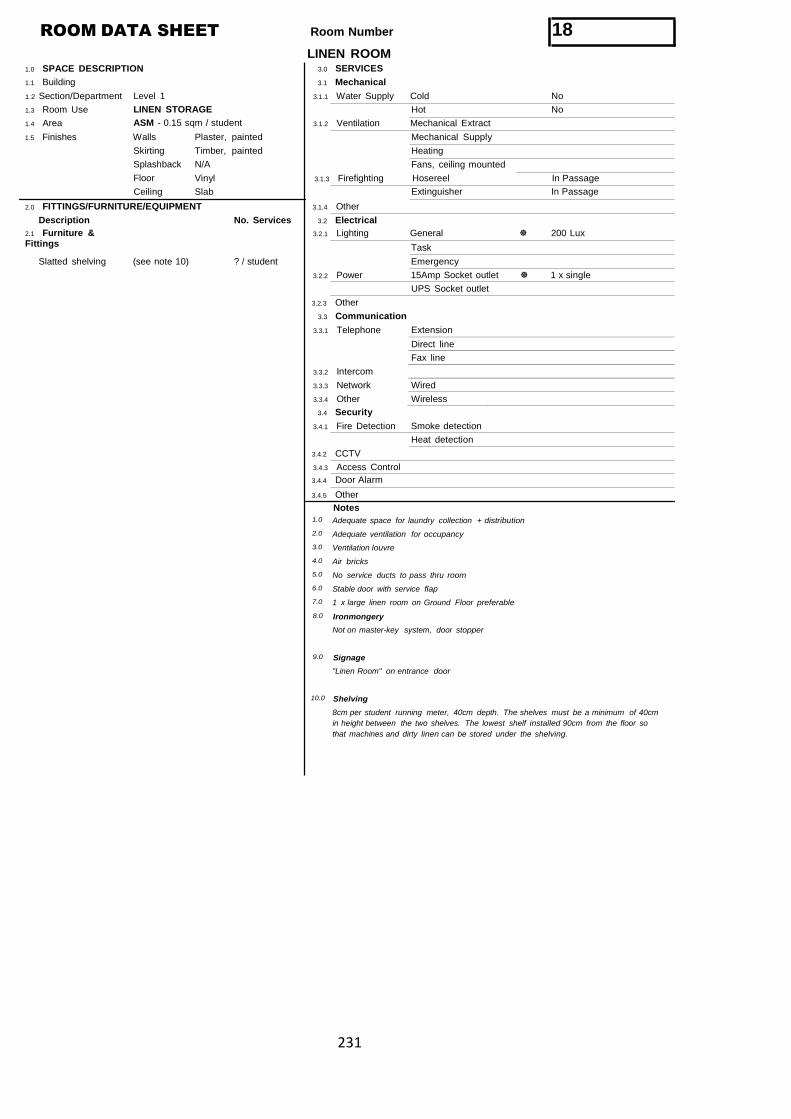
231
ROOM DATA SHEET
1.0 SPACE DESCRIPTION
Room Number 18LINEN ROOM
3.0 SERVICES
1.1 Building 3.1 Mechanical
1.2 Section/Department
1.3 Room Use
1.4 Area
Level 1
LINEN STORAGE
ASM - 0.15 sqm / student
3.1.1 Water Supply Cold No
Hot No
3.1.2 Ventilation Mechanical Extract
1.5 Finishes Walls
Skirting
Splashback
Floor
Ceiling
Plaster, painted
Timber, painted
N/A
Vinyl
Slab
Mechanical Supply
Heating
Fans, ceiling mounted
3.1.3 Firefighting Hosereel In Passage
Extinguisher In Passage
2.0 FITTINGS/FURNITURE/EQUIPMENT 3.1.4 Other
Description No. Services 3.2 Electrical
2.1 Furniture &Fittings
3.2.1 Lighting General 200 Lux
Task
Slatted shelving (see note 10) ? / student Emergency
3.2.2 Power 15Amp Socket outlet 1 x single
UPS Socket outlet
3.2.3 Other
3.3 Communication
3.3.1 Telephone Extension
Direct line
Fax line
3.3.2 Intercom
3.3.3 Network Wired
3.3.4 Other Wireless
3.4 Security
3.4.1 Fire Detection Smoke detection
Heat detection
3.4.2 CCTV
3.4.3 Access Control
3.4.4 Door Alarm
3.4.5 Other
Notes1.0
2.0
3.0
4.0
5.0
6.0
7.0
Adequate space for laundry collection + distribution
Adequate ventilation for occupancy
Ventilation louvre
Air bricks
No service ducts to pass thru room
Stable door with service flap
1 x large linen room on Ground Floor preferable
8.0 Ironmongery
Not on master-key system, door stopper
9.0 Signage
"Linen Room" on entrance door
10.0 Shelving
8cm per student running meter, 40cm depth. The shelves must be a minimum of 40cm
in height between the two shelves. The lowest shelf installed 90cm from the floor so
that machines and dirty linen can be stored under the shelving.
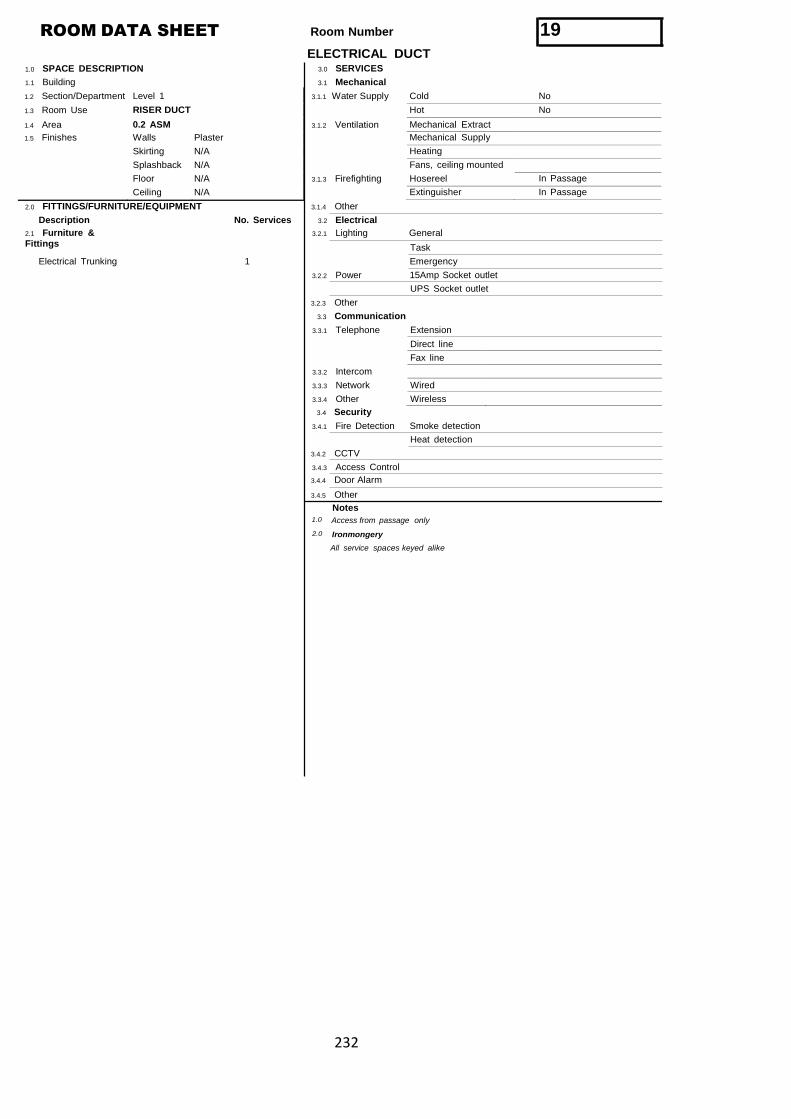
232
ROOM DATA SHEET
1.0 SPACE DESCRIPTION
Room Number 19ELECTRICAL DUCT
3.0 SERVICES
1.1 Building 3.1 Mechanical
1.2 Section/Department Level 1 3.1.1 Water Supply Cold No
1.3 Room Use RISER DUCT Hot No
1.4 Area 0.2 ASM 3.1.2 Ventilation Mechanical Extract
1.5 Finishes Walls Plaster Mechanical Supply
Skirting N/A Heating
Splashback N/A Fans, ceiling mounted
Floor N/A 3.1.3 Firefighting Hosereel In Passage
Ceiling N/A Extinguisher In Passage
2.0 FITTINGS/FURNITURE/EQUIPMENT 3.1.4 Other
Description No. Services 3.2 Electrical
2.1 Furniture &Fittings
3.2.1 Lighting General
Task
Electrical Trunking 1 Emergency
3.2.2 Power 15Amp Socket outlet
UPS Socket outlet
3.2.3 Other
3.3 Communication
3.3.1 Telephone Extension
Direct line
Fax line
3.3.2 Intercom
3.3.3 Network Wired
3.3.4 Other Wireless
3.4 Security
3.4.1 Fire Detection Smoke detection
Heat detection
3.4.2 CCTV
3.4.3 Access Control
3.4.4 Door Alarm
3.4.5 Other
Notes1.0 Access from passage only
2.0 Ironmongery
All service spaces keyed alike
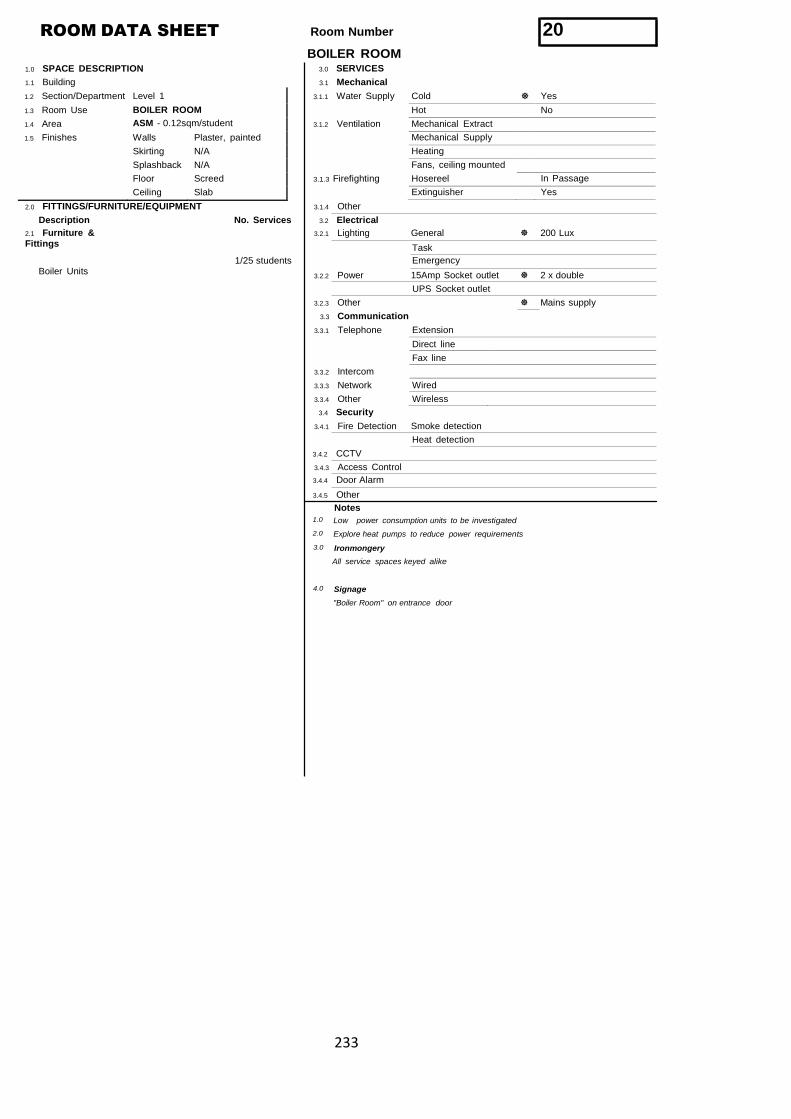
233
ROOM DATA SHEET
1.0 SPACE DESCRIPTION
Room Number 20BOILER ROOM
3.0 SERVICES
1.1 Building 3.1 Mechanical
1.2 Section/Department Level 1 3.1.1 Water Supply Cold Yes
1.3 Room Use BOILER ROOM Hot No
1.4 Area ASM - 0.12sqm/student 3.1.2 Ventilation Mechanical Extract
1.5 Finishes Walls Plaster, painted Mechanical Supply
Skirting N/A Heating
Splashback N/A Fans, ceiling mounted
Floor Screed 3.1.3 Firefighting Hosereel In Passage
Ceiling Slab Extinguisher Yes
2.0 FITTINGS/FURNITURE/EQUIPMENT 3.1.4 Other
Description No. Services 3.2 Electrical
2.1 Furniture &Fittings
Boiler Units1/25 students
3.2.1 Lighting General 200 Lux
Task
Emergency
3.2.2 Power 15Amp Socket outlet 2 x double
UPS Socket outlet
3.2.3 Other Mains supply
3.3 Communication
3.3.1 Telephone Extension
Direct line
Fax line
3.3.2 Intercom
3.3.3 Network Wired
3.3.4 Other Wireless
3.4 Security
3.4.1 Fire Detection Smoke detection
Heat detection
3.4.2 CCTV
3.4.3 Access Control
3.4.4 Door Alarm
3.4.5 Other
Notes1.0
2.0
Low power consumption units to be investigated
Explore heat pumps to reduce power requirements
3.0 Ironmongery
All service spaces keyed alike
4.0 Signage
"Boiler Room" on entrance door
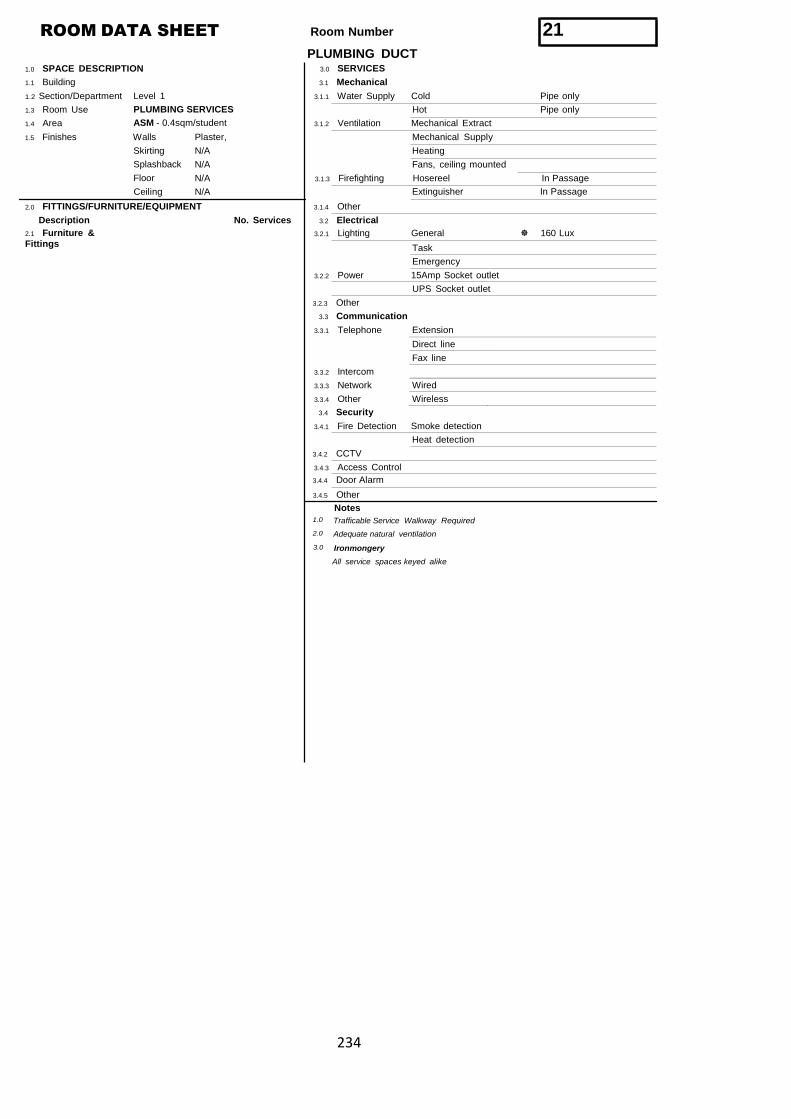
234
ROOM DATA SHEET
1.0 SPACE DESCRIPTION
Room Number 21PLUMBING DUCT
3.0 SERVICES
1.1 Building 3.1 Mechanical
1.2 Section/Department
1.3 Room Use
1.4 Area
Level 1
PLUMBING SERVICES
ASM - 0.4sqm/student
3.1.1 Water Supply Cold Pipe only
Hot Pipe only
3.1.2 Ventilation Mechanical Extract
1.5 Finishes Walls
Skirting
Splashback
Floor
Ceiling
Plaster,
N/A
N/A
N/A
N/A
Mechanical Supply
Heating
Fans, ceiling mounted
3.1.3 Firefighting Hosereel In Passage
Extinguisher In Passage
2.0 FITTINGS/FURNITURE/EQUIPMENT 3.1.4 Other
Description No. Services 3.2 Electrical
2.1 Furniture &Fittings
3.2.1 Lighting General 160 Lux
Task
Emergency
3.2.2 Power 15Amp Socket outlet
UPS Socket outlet
3.2.3 Other
3.3 Communication
3.3.1 Telephone Extension
Direct line
Fax line
3.3.2 Intercom
3.3.3 Network Wired
3.3.4 Other Wireless
3.4 Security
3.4.1 Fire Detection Smoke detection
Heat detection
3.4.2 CCTV
3.4.3 Access Control
3.4.4 Door Alarm
3.4.5 Other
Notes1.0
2.0
Trafficable Service Walkway Required
Adequate natural ventilation
3.0 Ironmongery
All service spaces keyed alike
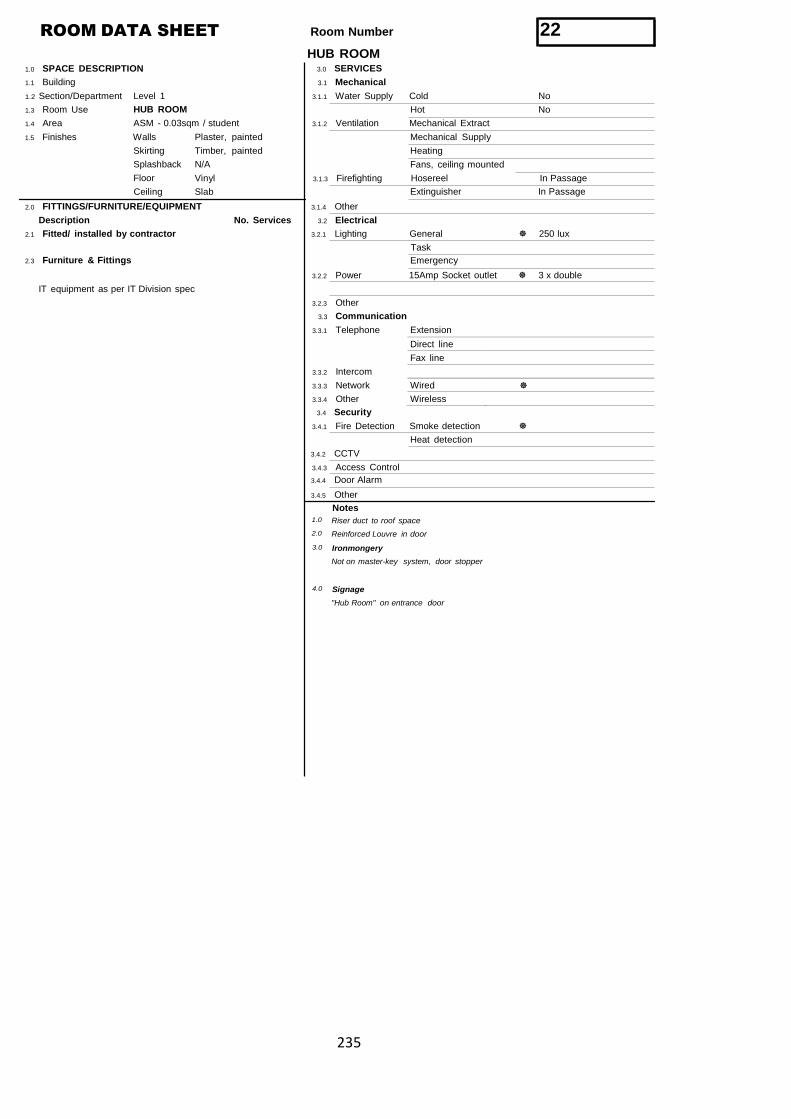
235
ROOM DATA SHEET
1.0 SPACE DESCRIPTION
Room Number 22HUB ROOM
3.0 SERVICES
1.1 Building 3.1 Mechanical
1.2 Section/Department
1.3 Room Use
1.4 Area
Level 1
HUB ROOM
ASM - 0.03sqm / student
3.1.1 Water Supply Cold No
Hot No
3.1.2 Ventilation Mechanical Extract
1.5 Finishes Walls
Skirting
Splashback
Floor
Ceiling
Plaster, painted
Timber, painted
N/A
Vinyl
Slab
Mechanical Supply
Heating
Fans, ceiling mounted
3.1.3 Firefighting Hosereel In Passage
Extinguisher In Passage
2.0 FITTINGS/FURNITURE/EQUIPMENT 3.1.4 Other
Description No. Services 3.2 Electrical
2.1 Fitted/ installed by contractor 3.2.1 Lighting General 250 lux
Task
2.3 Furniture & Fittings
IT equipment as per IT Division spec
Emergency
3.2.2 Power 15Amp Socket outlet 3 x double
3.2.3 Other
3.3 Communication
3.3.1 Telephone Extension
Direct line
Fax line
3.3.2 Intercom
3.3.3 Network Wired
3.3.4 Other Wireless
3.4 Security
3.4.1 Fire Detection Smoke detection
Heat detection
3.4.2 CCTV
3.4.3 Access Control
3.4.4 Door Alarm
3.4.5 Other
Notes1.0
2.0
Riser duct to roof space
Reinforced Louvre in door
3.0 Ironmongery
Not on master-key system, door stopper
4.0 Signage
"Hub Room" on entrance door
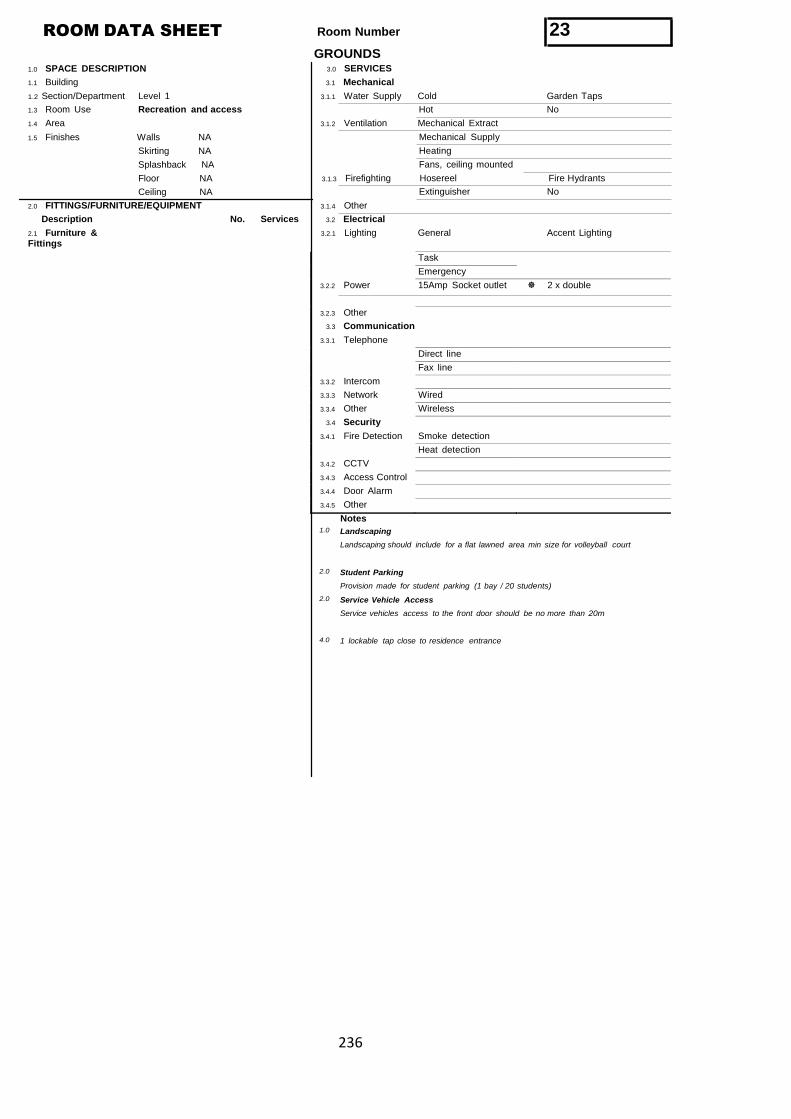
236
ROOM DATA SHEET
1.0 SPACE DESCRIPTION
Room Number 23GROUNDS
3.0 SERVICES
1.1 Building 3.1 Mechanical
1.2 Section/Department
1.3 Room Use
Level 1
Recreation and access
3.1.1 Water Supply Cold Garden Taps
Hot No
1.4 Area 3.1.2 Ventilation Mechanical Extract
1.5 Finishes Walls NA
Skirting NA
Splashback NA
Floor NA
Ceiling NA
Mechanical Supply
Heating
Fans, ceiling mounted
3.1.3 Firefighting Hosereel Fire Hydrants
Extinguisher No
2.0 FITTINGS/FURNITURE/EQUIPMENT 3.1.4 Other
Description No. Services 3.2 Electrical
2.1 Furniture &Fittings
3.2.1 Lighting General Accent Lighting
Task
Emergency
3.2.2 Power 15Amp Socket outlet 2 x double
3.2.3 Other
3.3 Communication
3.3.1 Telephone
Direct line
Fax line
3.3.2 Intercom
3.3.3 Network Wired
3.3.4 Other Wireless
3.4 Security
3.4.1 Fire Detection Smoke detection
Heat detection
3.4.2 CCTV
3.4.3 Access Control
3.4.4 Door Alarm
3.4.5 Other
1.0
2.0
2.0
4.0
Notes
Landscaping
Landscaping should include for a flat lawned area min size for volleyball court
Student Parking
Provision made for student parking (1 bay / 20 students)
Service Vehicle Access
Service vehicles access to the front door should be no more than 20m
1 lockable tap close to residence entrance
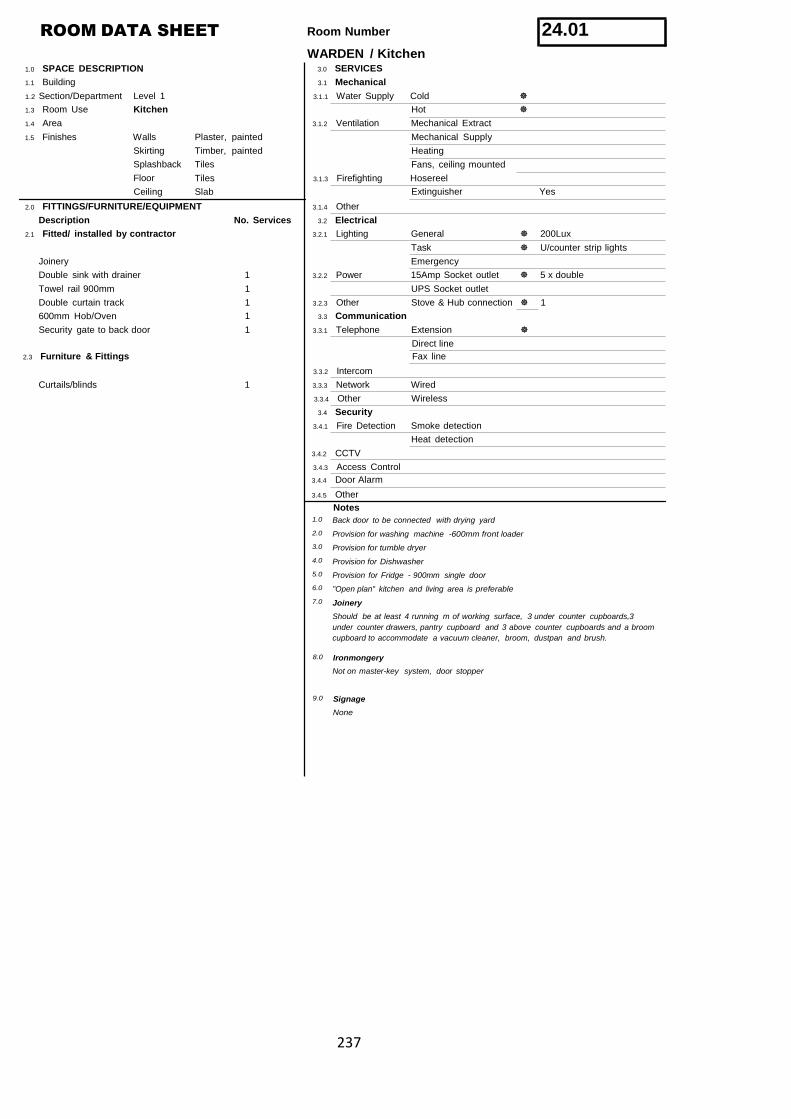
237
ROOM DATA SHEET
1.0 SPACE DESCRIPTION
Room Number
WARDEN / Kitchen3.0 SERVICES
24.01
1.1 Building 3.1 Mechanical
1.2 Section/Department
1.3 Room Use
Level 1
Kitchen
3.1.1 Water Supply Cold
Hot
1.4 Area 3.1.2 Ventilation Mechanical Extract
1.5 Finishes Walls
Skirting
Splashback
Floor
Ceiling
Plaster, painted
Timber, painted
Tiles
Tiles
Slab
Mechanical Supply
Heating
Fans, ceiling mounted
3.1.3 Firefighting Hosereel
Extinguisher Yes
2.0 FITTINGS/FURNITURE/EQUIPMENT 3.1.4 Other
Description No. Services 3.2 Electrical
2.1 Fitted/ installed by contractor 3.2.1 Lighting General 200Lux
Task U/counter strip lights
Joinery Emergency
Double sink with drainer 1 3.2.2 Power 15Amp Socket outlet 5 x double
Towel rail 900mm
Double curtain track
600mm Hob/Oven
Security gate to back door
2.3 Furniture & Fittings
1 UPS Socket outlet
1 3.2.3 Other Stove & Hub connection 1
1 3.3 Communication
1 3.3.1 Telephone Extension
Direct line
Fax line
3.3.2 Intercom
Curtails/blinds 1 3.3.3 Network Wired
3.3.4 Other Wireless
3.4 Security
3.4.1 Fire Detection Smoke detection
Heat detection
3.4.2 CCTV
3.4.3 Access Control
3.4.4 Door Alarm
3.4.5 Other
Notes1.0
2.0
3.0
4.0
5.0
6.0
7.0
Back door to be connected with drying yard
Provision for washing machine -600mm front loader
Provision for tumble dryer
Provision for Dishwasher
Provision for Fridge - 900mm single door
"Open plan" kitchen and living area is preferable
Joinery
Should be at least 4 running m of working surface, 3 under counter cupboards,3
under counter drawers, pantry cupboard and 3 above counter cupboards and a broom
cupboard to accommodate a vacuum cleaner, broom, dustpan and brush.
8.0 Ironmongery
Not on master-key system, door stopper
9.0 Signage
None
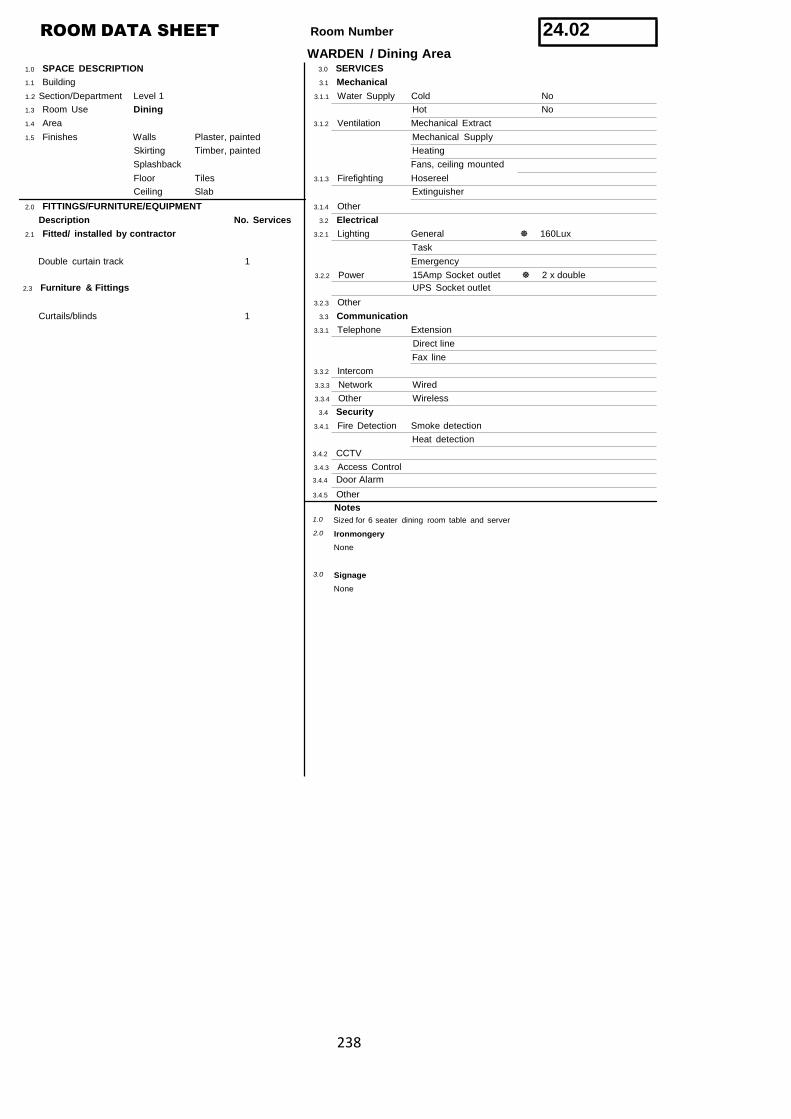
238
ROOM DATA SHEET
1.0 SPACE DESCRIPTION
Room Number
WARDEN / Dining Area3.0 SERVICES
24.02
1.1 Building 3.1 Mechanical
1.2 Section/Department
1.3 Room Use
Level 1
Dining
3.1.1 Water Supply Cold No
Hot No
1.4 Area 3.1.2 Ventilation Mechanical Extract
1.5 Finishes Walls
Skirting
Plaster, painted
Timber, painted
Mechanical Supply
Heating
Splashback Fans, ceiling mounted
Floor
Ceiling
Tiles
Slab
3.1.3 Firefighting Hosereel
Extinguisher
2.0 FITTINGS/FURNITURE/EQUIPMENT 3.1.4 Other
Description No. Services 3.2 Electrical
2.1 Fitted/ installed by contractor 3.2.1 Lighting General 160Lux
Task
Double curtain track
2.3 Furniture & Fittings
1 Emergency
3.2.2 Power 15Amp Socket outlet 2 x double
UPS Socket outlet
3.2.3 Other
Curtails/blinds 1 3.3 Communication
3.3.1 Telephone Extension
Direct line
Fax line
3.3.2 Intercom
3.3.3 Network Wired
3.3.4 Other Wireless
3.4 Security
3.4.1 Fire Detection Smoke detection
Heat detection
3.4.2 CCTV
3.4.3 Access Control
3.4.4 Door Alarm
3.4.5 Other
Notes1.0 Sized for 6 seater dining room table and server
2.0 Ironmongery
None
3.0 Signage
None

239
ROOM DATA SHEET
1.0 SPACE DESCRIPTION
Room Number
WARDEN / Lounge3.0 SERVICES
24.03
1.1 Building 3.1 Mechanical
1.2 Section/Department
1.3 Room Use
Level 1
Lounge
3.1.1 Water Supply Cold No
Hot No
1.4 Area 3.1.2 Ventilation Mechanical Extract
1.5 Finishes Walls
Skirting
Plaster, painted
Timber, painted
Mechanical Supply
Heating
Splashback Fans, ceiling mounted Intergrated with light point
Floor
Ceiling
Tiles
Slab
3.1.3 Firefighting Hosereel
Extinguisher
2.0 FITTINGS/FURNITURE/EQUIPMENT 3.1.4 Other
Description No. Services 3.2 Electrical
2.1 Fitted/ installed by contractor 3.2.1 Lighting General 160Lux
Task
Double curtain track 1 Emergency
Security gate to Double door 1 3.2.2 Power 15Amp Socket outlet 4 x double
UPS Socket outlet
2.3 Furniture &Fittings
3.2.3 Other
3.3 Communication
Curtails/blinds 1 3.3.1 Telephone Extension
Direct line
Fax line
3.3.2 Intercom
3.3.3 Network Wired
3.3.4 Other Wireless
Other Satellite DStv Linked with Small Com Room
3.4 Security
3.4.1 Fire Detection Smoke detection
Heat detection
3.4.2 CCTV
3.4.3 Access Control
3.4.4 Door Alarm
3.4.5 Other
Notes1.0
2.0
Sized for 6 x seats, TV unit, coffee table, 2 x occasional chairs
Double door to patio/garden
3.0 Ironmongery
Not on master-key system, door stoppers
4.0 Signage
None
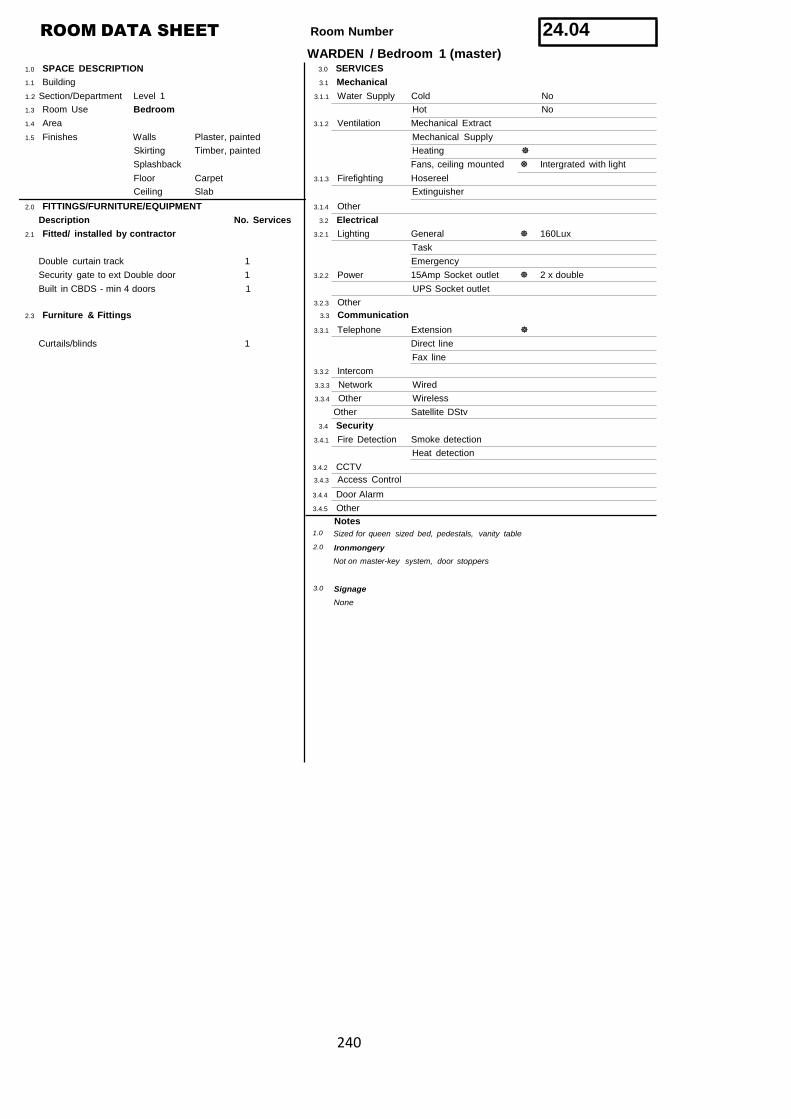
240
ROOM DATA SHEET
1.0 SPACE DESCRIPTION
Room Number
WARDEN / Bedroom 1 (master)3.0 SERVICES
24.04
1.1 Building 3.1 Mechanical
1.2 Section/Department
1.3 Room Use
Level 1
Bedroom
3.1.1 Water Supply Cold No
Hot No
1.4 Area 3.1.2 Ventilation Mechanical Extract
1.5 Finishes Walls
Skirting
Plaster, painted
Timber, painted
Mechanical Supply
Heating
Splashback Fans, ceiling mounted Intergrated with light
Floor
Ceiling
Carpet
Slab
3.1.3 Firefighting Hosereel
Extinguisher
2.0 FITTINGS/FURNITURE/EQUIPMENT 3.1.4 Other
Description No. Services 3.2 Electrical
2.1 Fitted/ installed by contractor 3.2.1 Lighting General 160Lux
Task
Double curtain track 1 Emergency
Security gate to ext Double door 1 3.2.2 Power 15Amp Socket outlet 2 x double
Built in CBDS - min 4 doors
2.3 Furniture & Fittings
1 UPS Socket outlet
3.2.3 Other
3.3 Communication
3.3.1 Telephone Extension
Curtails/blinds 1 Direct line
Fax line
3.3.2 Intercom
3.3.3 Network Wired
3.3.4 Other Wireless
Other Satellite DStv
3.4 Security
3.4.1 Fire Detection Smoke detection
Heat detection
3.4.2 CCTV
3.4.3 Access Control
3.4.4 Door Alarm
3.4.5 Other
Notes1.0 Sized for queen sized bed, pedestals, vanity table
2.0 Ironmongery
Not on master-key system, door stoppers
3.0 Signage
None
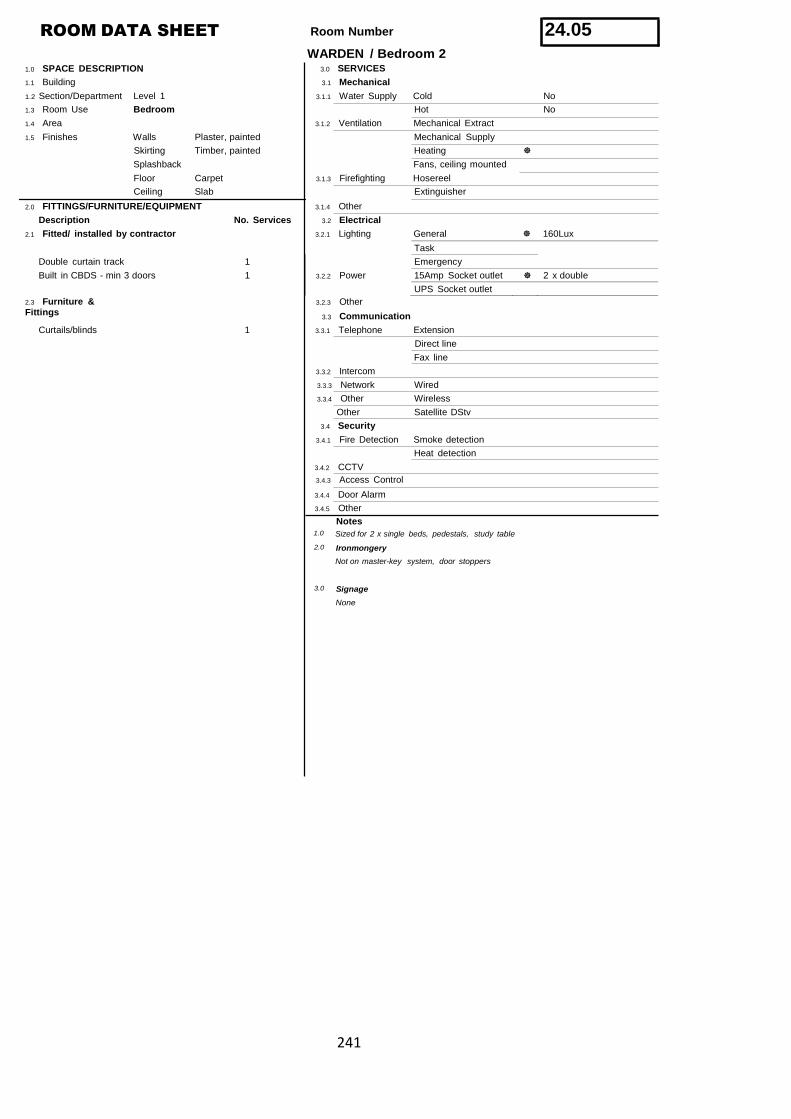
241
ROOM DATA SHEET
1.0 SPACE DESCRIPTION
Room Number
WARDEN / Bedroom 23.0 SERVICES
24.05
1.1 Building 3.1 Mechanical
1.2 Section/Department
1.3 Room Use
Level 1
Bedroom
3.1.1 Water Supply Cold No
Hot No
1.4 Area 3.1.2 Ventilation Mechanical Extract
1.5 Finishes Walls
Skirting
Plaster, painted
Timber, painted
Mechanical Supply
Heating
Splashback Fans, ceiling mounted
Floor
Ceiling
Carpet
Slab
3.1.3 Firefighting Hosereel
Extinguisher
2.0 FITTINGS/FURNITURE/EQUIPMENT 3.1.4 Other
Description No. Services 3.2 Electrical
2.1 Fitted/ installed by contractor 3.2.1 Lighting General 160Lux
Task
Double curtain track 1 Emergency
Built in CBDS - min 3 doors 1 3.2.2 Power 15Amp Socket outlet 2 x double
UPS Socket outlet
2.3 Furniture &Fittings
3.2.3 Other
3.3 Communication
Curtails/blinds 1 3.3.1 Telephone Extension
Direct line
Fax line
3.3.2 Intercom
3.3.3 Network Wired
3.3.4 Other Wireless
Other Satellite DStv
3.4 Security
3.4.1 Fire Detection Smoke detection
Heat detection
3.4.2 CCTV
3.4.3 Access Control
3.4.4 Door Alarm
3.4.5 Other
Notes1.0 Sized for 2 x single beds, pedestals, study table
2.0 Ironmongery
Not on master-key system, door stoppers
3.0 Signage
None
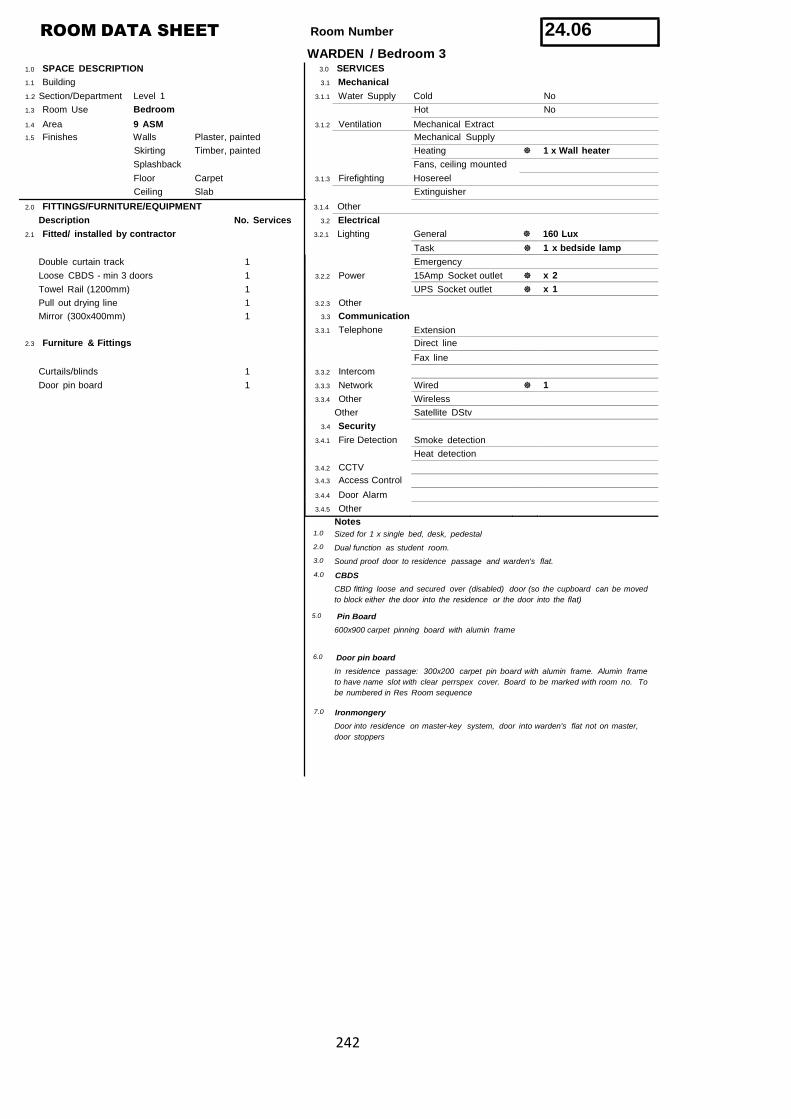
242
ROOM DATA SHEET
1.0 SPACE DESCRIPTION
Room Number
WARDEN / Bedroom 33.0 SERVICES
24.06
1.1 Building 3.1 Mechanical
1.2 Section/Department
1.3 Room Use
1.4 Area
Level 1
Bedroom
9 ASM
3.1.1 Water Supply Cold No
Hot No
3.1.2 Ventilation Mechanical Extract
1.5 Finishes Walls
Skirting
Plaster, painted
Timber, painted
Mechanical Supply
Heating 1 x Wall heater
Splashback Fans, ceiling mounted
Floor
Ceiling
Carpet
Slab
3.1.3 Firefighting Hosereel
Extinguisher
2.0 FITTINGS/FURNITURE/EQUIPMENT 3.1.4 Other
Description No. Services 3.2 Electrical
2.1 Fitted/ installed by contractor 3.2.1 Lighting General 160 Lux
Task 1 x bedside lamp
Double curtain track 1 Emergency
Loose CBDS - min 3 doors 1 3.2.2 Power 15Amp Socket outlet x 2
Towel Rail (1200mm) 1 UPS Socket outlet x 1
Pull out drying line 1 3.2.3 Other
Mirror (300x400mm) 1 3.3 Communication
3.3.1 Telephone Extension
2.3 Furniture & Fittings Direct line
Fax line
Curtails/blinds 1 3.3.2 Intercom
Door pin board 1 3.3.3 Network Wired 1
3.3.4 Other Wireless
Other Satellite DStv
3.4 Security
3.4.1 Fire Detection Smoke detection
Heat detection
3.4.2 CCTV
3.4.3 Access Control
3.4.4 Door Alarm
3.4.5 Other
1.0
2.0
3.0
Notes
Sized for 1 x single bed, desk, pedestal
Dual function as student room.
Sound proof door to residence passage and warden's flat.
4.0 CBDS
CBD fitting loose and secured over (disabled) door (so the cupboard can be moved
to block either the door into the residence or the door into the flat)
5.0 Pin Board
600x900 carpet pinning board with alumin frame
6.0 Door pin board
In residence passage: 300x200 carpet pin board with alumin frame. Alumin frame
to have name slot with clear perrspex cover. Board to be marked with room no. To
be numbered in Res Room sequence
7.0 Ironmongery
Door into residence on master-key system, door into warden's flat not on master,
door stoppers
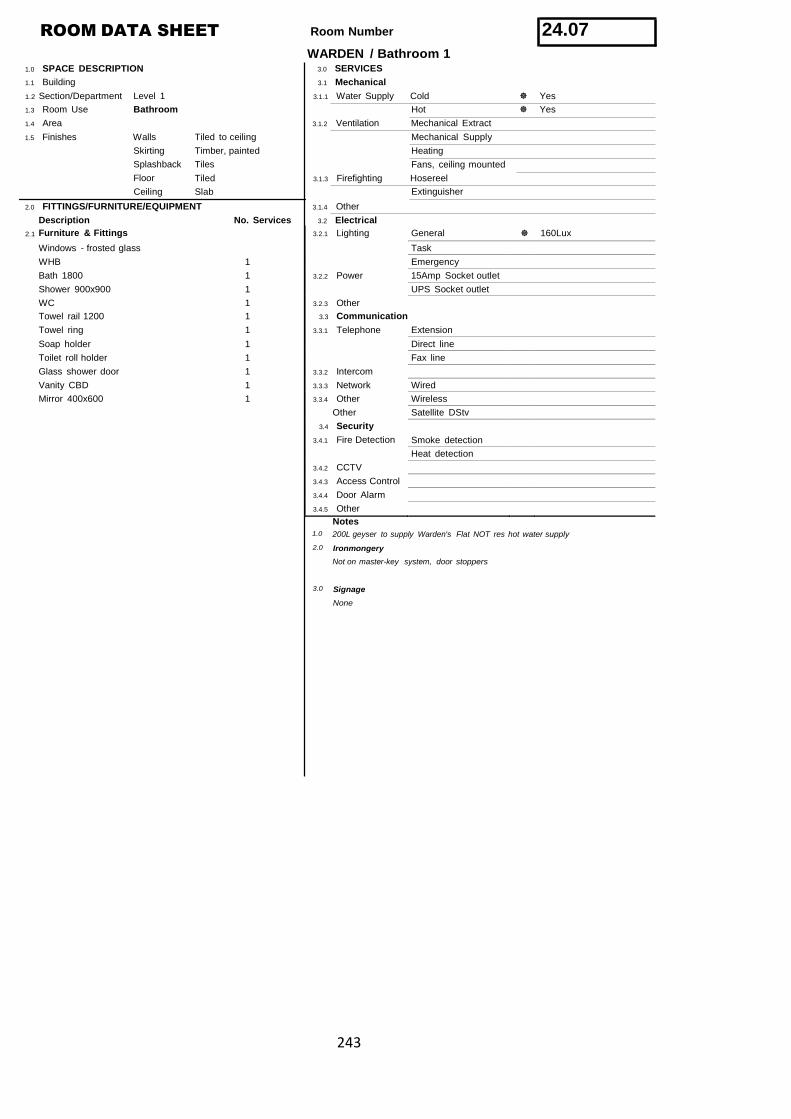
243
Furniture & Fittings 3.2.1 Lighting General 160Lux
Windows - frosted glass Task
WHB 1 Emergency
Bath 1800 1 3.2.2 Power 15Amp Socket outlet
Shower 900x900 1 UPS Socket outlet
WC 1 3.2.3 Other
Towel rail 1200 1 3.3 Communication
Towel ring 1 3.3.1 Telephone Extension
Soap holder 1 Direct line
Toilet roll holder 1 Fax line
Glass shower door 1 3.3.2 Intercom
Vanity CBD 1 3.3.3 Network Wired
Mirror 400x600 1 3.3.4 Other Wireless
Other Satellite DStv
3.4 Security
3.4.1 Fire Detection Smoke detection
Heat detection
3.4.2 CCTV
3.4.3 Access Control
3.4.4 Door Alarm
3.4.5 Other
ROOM DATA SHEET
1.0 SPACE DESCRIPTION
Room Number
WARDEN / Bathroom 13.0 SERVICES
24.07
1.1 Building 3.1 Mechanical
1.2 Section/Department
1.3 Room Use
Level 1
Bathroom
3.1.1 Water Supply Cold Yes
Hot Yes
1.4 Area 3.1.2 Ventilation Mechanical Extract
1.5 Finishes Walls
Skirting
Splashback
Floor
Ceiling
Tiled to ceiling
Timber, painted
Tiles
Tiled
Slab
Mechanical Supply
Heating
Fans, ceiling mounted
3.1.3 Firefighting Hosereel
Extinguisher
2.0 FITTINGS/FURNITURE/EQUIPMENT 3.1.4 Other
Description No. Services 3.2 Electrical
2.1
1.0
Notes
200L geyser to supply Warden's Flat NOT res hot water supply
2.0 Ironmongery
Not on master-key system, door stoppers
3.0 Signage
None
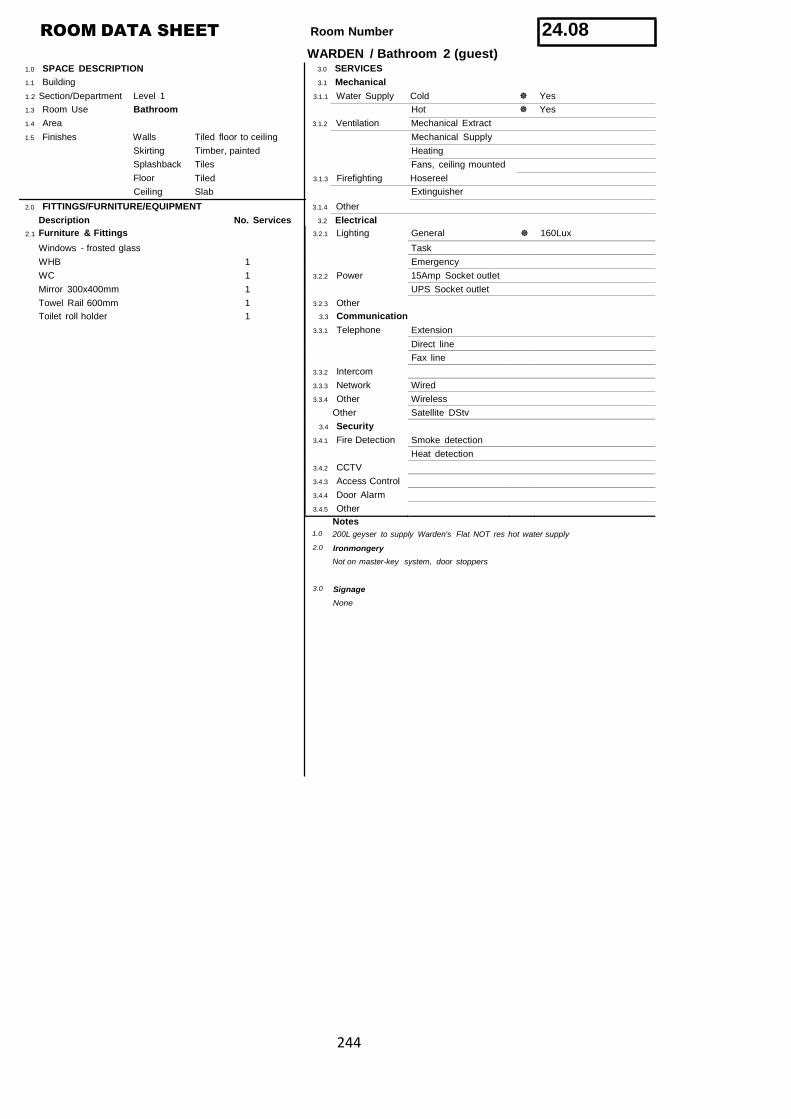
244
Furniture & Fittings 3.2.1 Lighting General 160Lux
Windows - frosted glass Task
WHB 1 Emergency
WC 1 3.2.2 Power 15Amp Socket outlet
Mirror 300x400mm 1 UPS Socket outlet
Towel Rail 600mm 1 3.2.3 Other
Toilet roll holder 1 3.3 Communication
3.3.1 Telephone Extension
Direct line
Fax line
3.3.2 Intercom
3.3.3 Network Wired
3.3.4 Other Wireless
Other Satellite DStv
3.4 Security
3.4.1 Fire Detection Smoke detection
Heat detection
3.4.2 CCTV
3.4.3 Access Control
3.4.4 Door Alarm
3.4.5 Other
ROOM DATA SHEET
1.0 SPACE DESCRIPTION
Room Number
WARDEN / Bathroom 2 (guest)3.0 SERVICES
24.08
1.1 Building 3.1 Mechanical
1.2 Section/Department
1.3 Room Use
Level 1
Bathroom
3.1.1 Water Supply Cold Yes
Hot Yes
1.4 Area 3.1.2 Ventilation Mechanical Extract
1.5 Finishes Walls
Skirting
Splashback
Floor
Ceiling
Tiled floor to ceiling
Timber, painted
Tiles
Tiled
Slab
Mechanical Supply
Heating
Fans, ceiling mounted
3.1.3 Firefighting Hosereel
Extinguisher
2.0 FITTINGS/FURNITURE/EQUIPMENT 3.1.4 Other
Description No. Services 3.2 Electrical
2.1
1.0
Notes
200L geyser to supply Warden's Flat NOT res hot water supply
2.0 Ironmongery
Not on master-key system, door stoppers
3.0 Signage
None
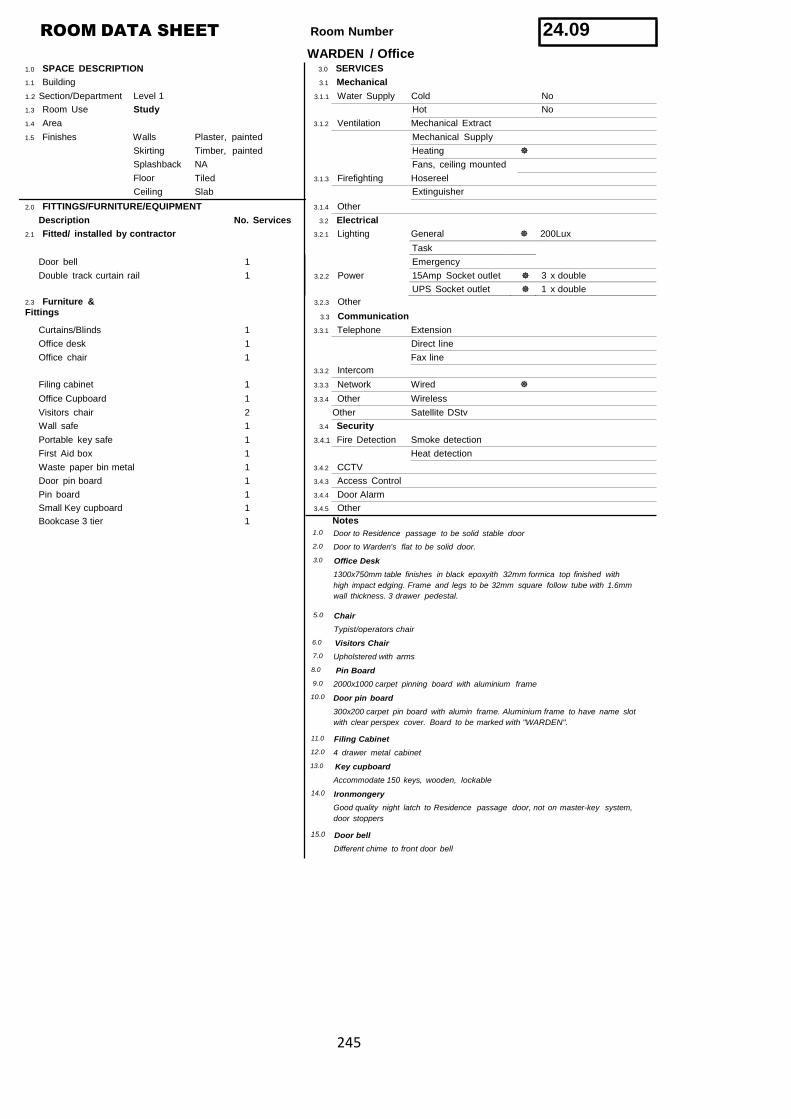
245
ROOM DATA SHEET
1.0 SPACE DESCRIPTION
Room Number
WARDEN / Office3.0 SERVICES
24.09
1.1 Building 3.1 Mechanical
1.2 Section/Department
1.3 Room Use
Level 1
Study
3.1.1 Water Supply Cold No
Hot No
1.4 Area 3.1.2 Ventilation Mechanical Extract
1.5 Finishes Walls
Skirting
Splashback
Floor
Ceiling
Plaster, painted
Timber, painted
NA
Tiled
Slab
Mechanical Supply
Heating
Fans, ceiling mounted
3.1.3 Firefighting Hosereel
Extinguisher
2.0 FITTINGS/FURNITURE/EQUIPMENT 3.1.4 Other
Description No. Services 3.2 Electrical
2.1 Fitted/ installed by contractor 3.2.1 Lighting General 200Lux
Task
Door bell 1 Emergency
Double track curtain rail 1 3.2.2 Power 15Amp Socket outlet 3 x double
UPS Socket outlet 1 x double
2.3 Furniture &Fittings
3.2.3 Other
3.3 Communication
Curtains/Blinds 1 3.3.1 Telephone Extension
Office desk 1 Direct line
Office chair 1 Fax line
3.3.2 Intercom
Filing cabinet 1 3.3.3 Network Wired
Office Cupboard 1 3.3.4 Other Wireless
Visitors chair 2 Other Satellite DStv
Wall safe 1 3.4 Security
Portable key safe 1 3.4.1 Fire Detection Smoke detection
First Aid box 1 Heat detection
Waste paper bin metal 1 3.4.2 CCTV
Door pin board 1 3.4.3 Access Control
Pin board 1 3.4.4 Door Alarm
Small Key cupboard 1 3.4.5 Other
Bookcase 3 tier 1 Notes1.0
2.0
Door to Residence passage to be solid stable door
Door to Warden's flat to be solid door.
3.0 Office Desk
1300x750mm table finishes in black epoxyith 32mm formica top finished with
high impact edging. Frame and legs to be 32mm square follow tube with 1.6mm
wall thickness. 3 drawer pedestal.
5.0 Chair
Typist/operators chair
6.0 Visitors Chair
7.0 Upholstered with arms
8.0 Pin Board
9.0
10.0
2000x1000 carpet pinning board with aluminium frame
Door pin board
300x200 carpet pin board with alumin frame. Aluminium frame to have name slot
with clear perspex cover. Board to be marked with "WARDEN".
11.0 Filing Cabinet
12.0 4 drawer metal cabinet
13.0 Key cupboard
Accommodate 150 keys, wooden, lockable
14.0 Ironmongery
Good quality night latch to Residence passage door, not on master-key system,
door stoppers
15.0 Door bell
Different chime to front door bell
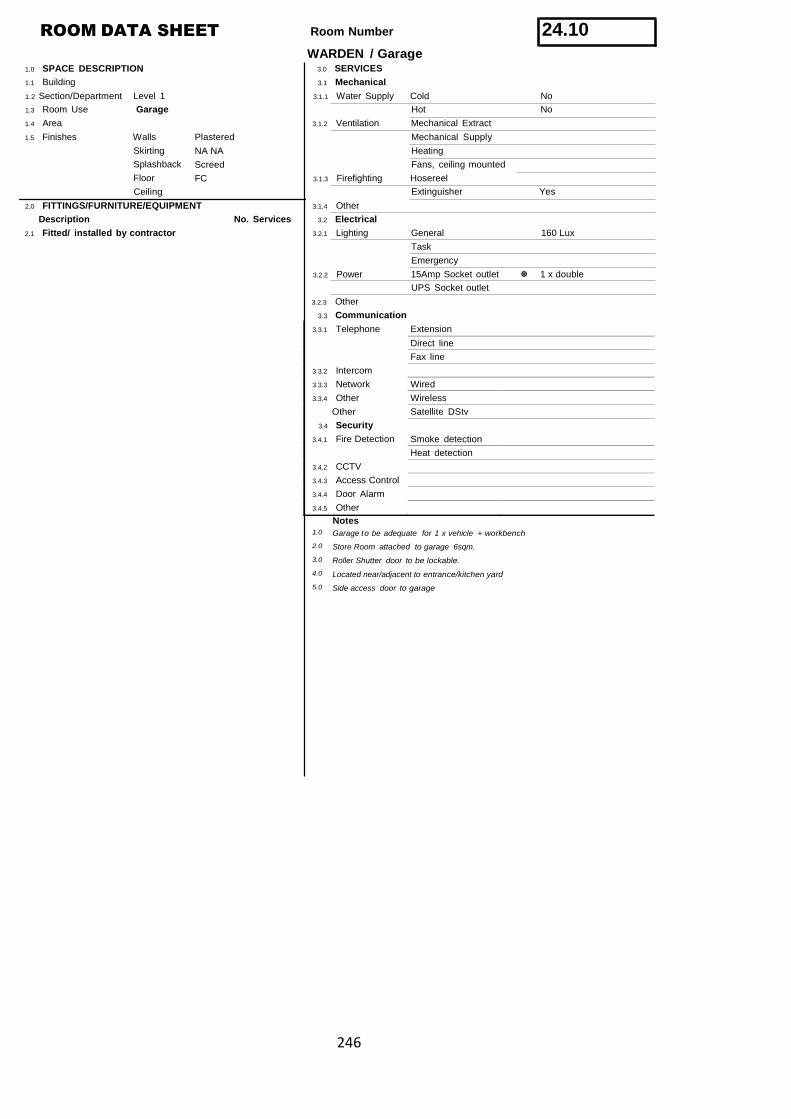
246
ROOM DATA SHEET
1.0 SPACE DESCRIPTION
Room Number
WARDEN / Garage3.0 SERVICES
24.10
1.1 Building 3.1 Mechanical
1.2 Section/Department
1.3 Room Use
Level 1
Garage
3.1.1 Water Supply Cold No
Hot No
1.4 Area 3.1.2 Ventilation Mechanical Extract
1.5 Finishes Walls
Skirting
Splashback
Floor
Ceiling
Plastered
NA NA
Screed
FC
Mechanical Supply
Heating
Fans, ceiling mounted
3.1.3 Firefighting Hosereel
Extinguisher Yes
2.0 FITTINGS/FURNITURE/EQUIPMENT 3.1.4 Other
Description No. Services 3.2 Electrical
2.1 Fitted/ installed by contractor 3.2.1 Lighting General 160 Lux
Task
Emergency
3.2.2 Power 15Amp Socket outlet 1 x double
UPS Socket outlet
3.2.3 Other
3.3 Communication
3.3.1 Telephone Extension
Direct line
Fax line
3.3.2 Intercom
3.3.3 Network Wired
3.3.4 Other Wireless
Other Satellite DStv
3.4 Security
3.4.1 Fire Detection Smoke detection
Heat detection
3.4.2 CCTV
3.4.3 Access Control
3.4.4 Door Alarm
3.4.5 Other
1.0
2.0
3.0
4.0
5.0
Notes
Garage to be adequate for 1 x vehicle + workbench
Store Room attached to garage 6sqm.
Roller Shutter door to be lockable.
Located near/adjacent to entrance/kitchen yard
Side access door to garage
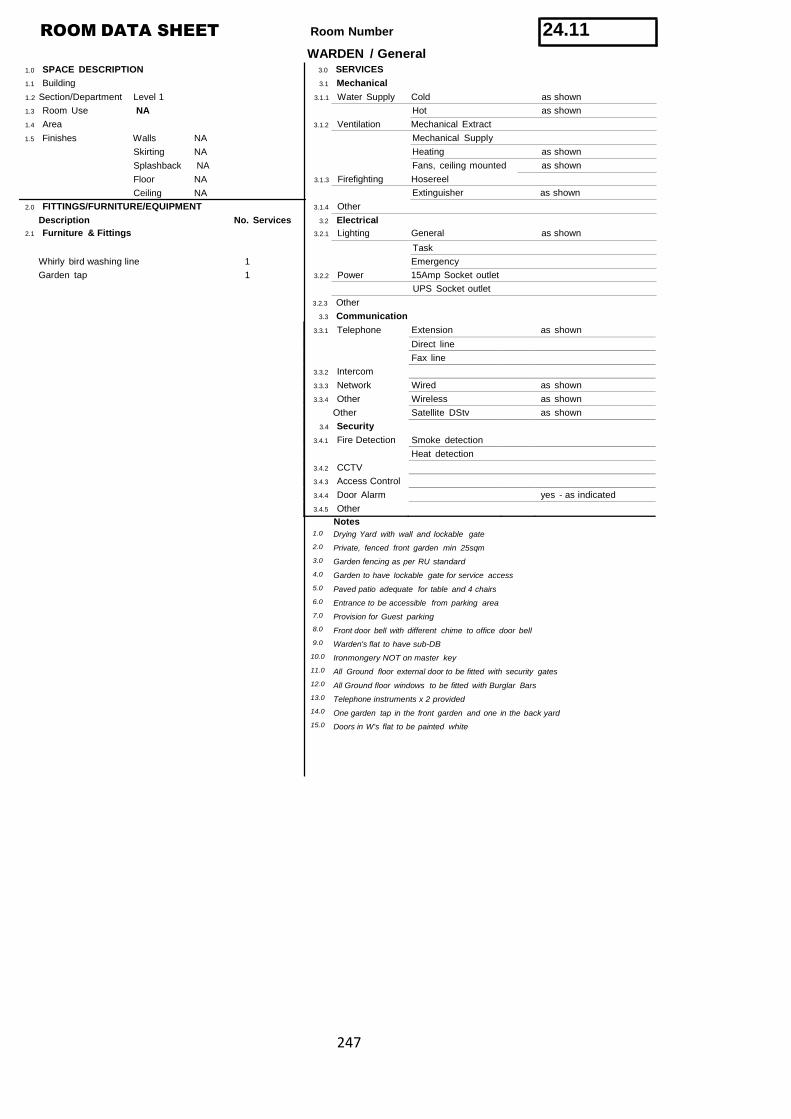
247
ROOM DATA SHEET
1.0 SPACE DESCRIPTION
Room Number
WARDEN / General3.0 SERVICES
24.11
1.1 Building 3.1 Mechanical
1.2 Section/Department
1.3 Room Use
Level 1
NA
3.1.1 Water Supply Cold as shown
Hot as shown
1.4 Area 3.1.2 Ventilation Mechanical Extract
1.5 Finishes Walls NA
Skirting NA
Splashback NA
Floor NA
Ceiling NA
Mechanical Supply
Heating as shown
Fans, ceiling mounted as shown
3.1.3 Firefighting Hosereel
Extinguisher as shown
2.0 FITTINGS/FURNITURE/EQUIPMENT 3.1.4 Other
Description No. Services 3.2 Electrical
2.1 Furniture & Fittings
Whirly bird washing line
Garden tap
3.2.1 Lighting General as shown
Task
1 Emergency
1 3.2.2 Power 15Amp Socket outlet
UPS Socket outlet
3.2.3 Other
3.3 Communication
3.3.1 Telephone Extension as shown
Direct line
Fax line
3.3.2 Intercom
3.3.3 Network Wired as shown
3.3.4 Other Wireless as shown
Other Satellite DStv as shown
3.4 Security
3.4.1 Fire Detection Smoke detection
Heat detection
3.4.2 CCTV
3.4.3 Access Control
3.4.4 Door Alarm yes - as indicated
3.4.5 Other
1.0
2.0
3.0
4.0
5.0
6.0
7.0
8.0
9.0
10.0
11.0
12.0
13.0
14.0
15.0
Notes
Drying Yard with wall and lockable gate
Private, fenced front garden min 25sqm
Garden fencing as per RU standard
Garden to have lockable gate for service access
Paved patio adequate for table and 4 chairs
Entrance to be accessible from parking area
Provision for Guest parking
Front door bell with different chime to office door bell
Warden's flat to have sub-DB
Ironmongery NOT on master key
All Ground floor external door to be fitted with security gates
All Ground floor windows to be fitted with Burglar Bars
Telephone instruments x 2 provided
One garden tap in the front garden and one in the back yard
Doors in W's flat to be painted white
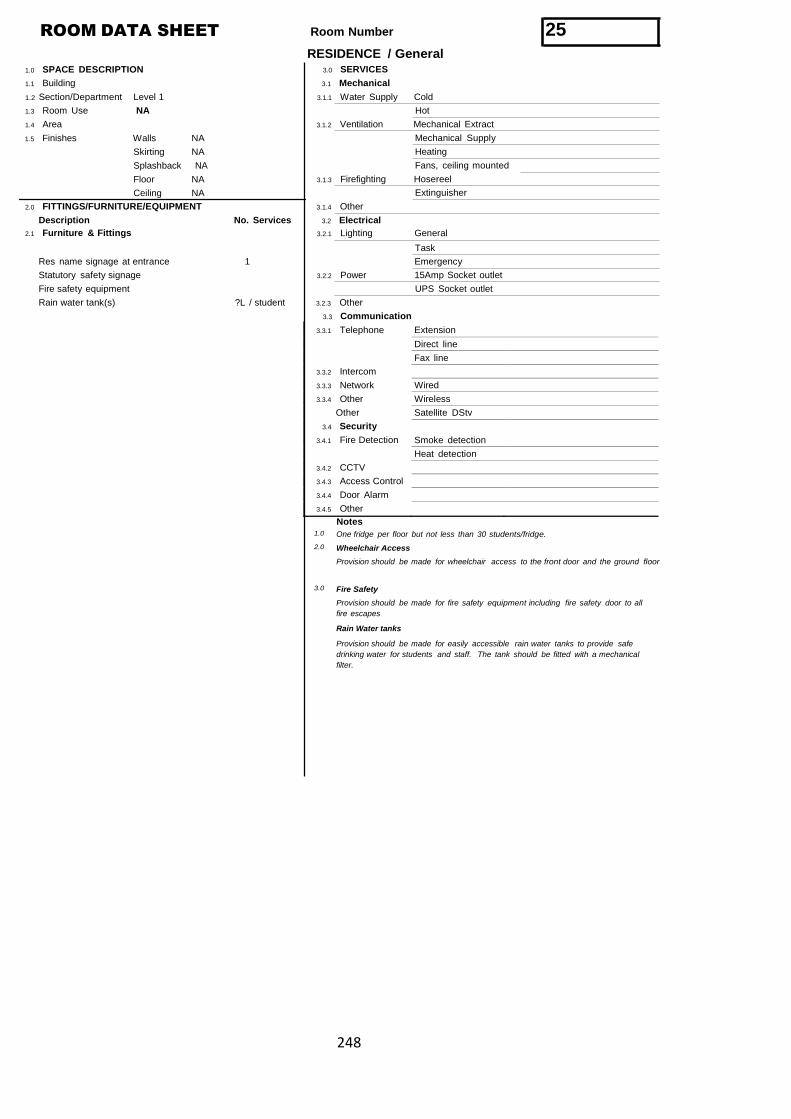
248
ROOM DATA SHEET
1.0 SPACE DESCRIPTION
Room Number 25RESIDENCE / General
3.0 SERVICES
1.1 Building 3.1 Mechanical
1.2 Section/Department
1.3 Room Use
Level 1
NA
3.1.1 Water Supply Cold
Hot
1.4 Area 3.1.2 Ventilation Mechanical Extract
1.5 Finishes Walls NA
Skirting NA
Splashback NA
Floor NA
Ceiling NA
Mechanical Supply
Heating
Fans, ceiling mounted
3.1.3 Firefighting Hosereel
Extinguisher
2.0 FITTINGS/FURNITURE/EQUIPMENT 3.1.4 Other
Description No. Services 3.2 Electrical
2.1 Furniture & Fittings
Res name signage at entrance
Statutory safety signage
Fire safety equipment
Rain water tank(s)
3.2.1 Lighting General
Task
1 Emergency
3.2.2 Power 15Amp Socket outlet
UPS Socket outlet
?L / student 3.2.3 Other
3.3 Communication
3.3.1 Telephone Extension
Direct line
Fax line
3.3.2 Intercom
3.3.3 Network Wired
3.3.4 Other Wireless
Other Satellite DStv
3.4 Security
3.4.1 Fire Detection Smoke detection
Heat detection
3.4.2 CCTV
3.4.3 Access Control
3.4.4 Door Alarm
3.4.5 Other
1.0
2.0
3.0
Notes
One fridge per floor but not less than 30 students/fridge.
Wheelchair Access
Provision should be made for wheelchair access to the front door and the ground floor
Fire Safety
Provision should be made for fire safety equipment including fire safety door to all
fire escapes
Rain Water tanks
Provision should be made for easily accessible rain water tanks to provide safe
drinking water for students and staff. The tank should be fitted with a mechanical
filter.
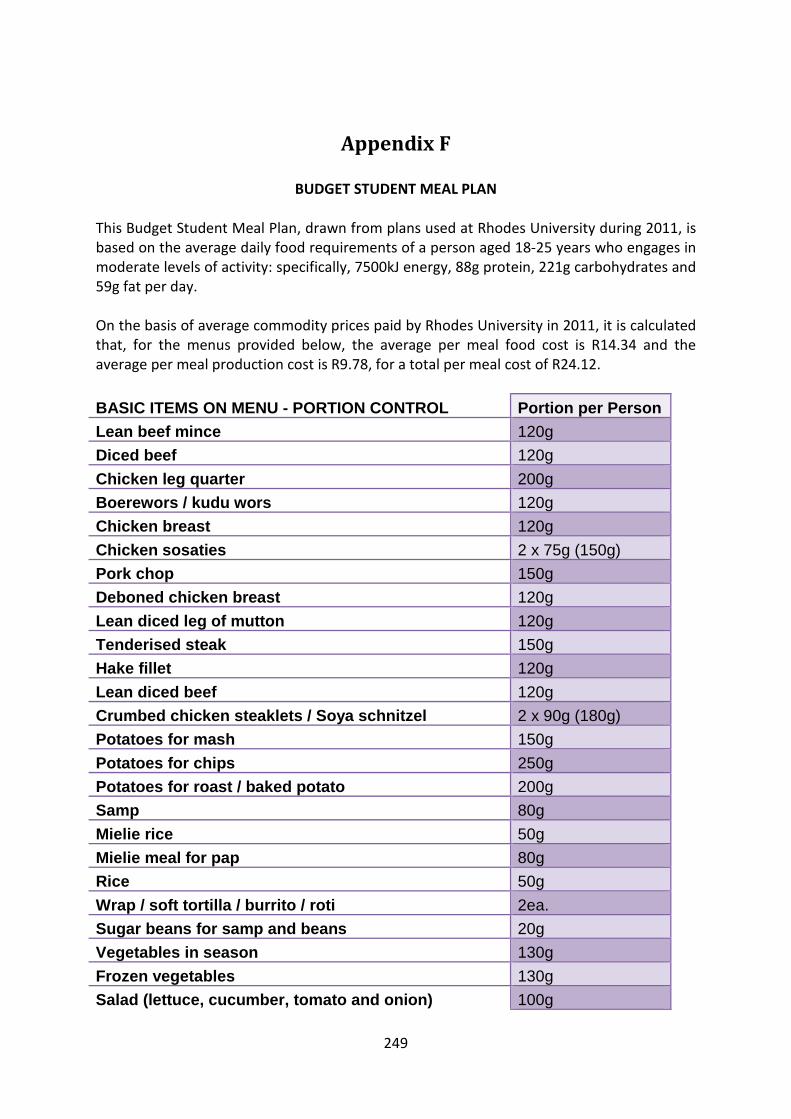
249
Appendix F
BUDGET STUDENT MEAL PLAN
This Budget Student Meal Plan, drawn from plans used at Rhodes University during 2011, isbased on the average daily food requirements of a person aged 18-25 years who engages inmoderate levels of activity: specifically, 7500kJ energy, 88g protein, 221g carbohydrates and59g fat per day.
On the basis of average commodity prices paid by Rhodes University in 2011, it is calculatedthat, for the menus provided below, the average per meal food cost is R14.34 and theaverage per meal production cost is R9.78, for a total per meal cost of R24.12.
BASIC ITEMS ON MENU - PORTION CONTROL Portion per Person
Lean beef mince 120g
Diced beef 120g
Chicken leg quarter 200g
Boerewors / kudu wors 120g
Chicken breast 120g
Chicken sosaties 2 x 75g (150g)
Pork chop 150g
Deboned chicken breast 120g
Lean diced leg of mutton 120g
Tenderised steak 150g
Hake fillet 120g
Lean diced beef 120g
Crumbed chicken steaklets / Soya schnitzel 2 x 90g (180g)
Potatoes for mash 150g
Potatoes for chips 250g
Potatoes for roast / baked potato 200g
Samp 80g
Mielie rice 50g
Mielie meal for pap 80g
Rice 50g
Wrap / soft tortilla / burrito / roti 2ea.
Sugar beans for samp and beans 20g
Vegetables in season 130g
Frozen vegetables 130g
Salad (lettuce, cucumber, tomato and onion) 100g
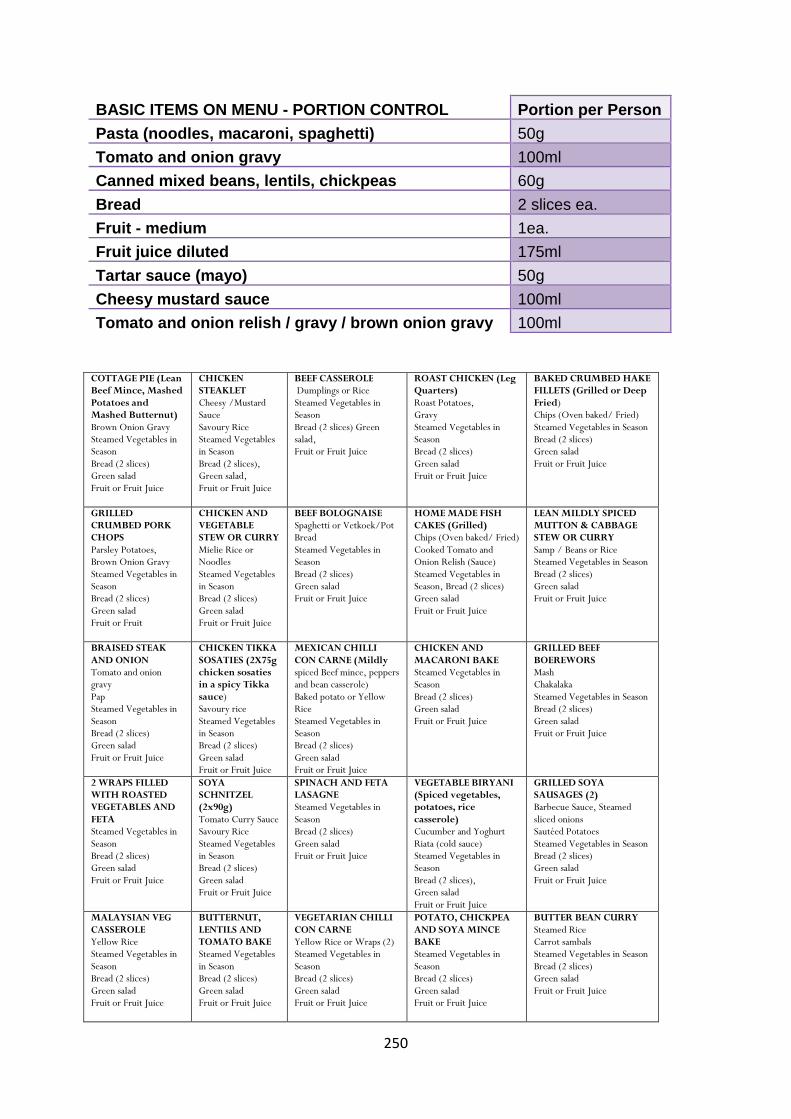
250
BASIC ITEMS ON MENU - PORTION CONTROL Portion per Person
Pasta (noodles, macaroni, spaghetti) 50g
Tomato and onion gravy 100ml
Canned mixed beans, lentils, chickpeas 60g
Bread 2 slices ea.
Fruit - medium 1ea.
Fruit juice diluted 175ml
Tartar sauce (mayo) 50g
Cheesy mustard sauce 100ml
Tomato and onion relish / gravy / brown onion gravy 100ml
COTTAGE PIE (LeanBeef Mince, MashedPotatoes andMashed Butternut)Brown Onion GravySteamed Vegetables inSeasonBread (2 slices)Green saladFruit or Fruit Juice
CHICKENSTEAKLETCheesy /MustardSauceSavoury RiceSteamed Vegetablesin SeasonBread (2 slices),Green salad,Fruit or Fruit Juice
BEEF CASSEROLEDumplings or RiceSteamed Vegetables inSeasonBread (2 slices) Greensalad,Fruit or Fruit Juice
ROAST CHICKEN (LegQuarters)Roast Potatoes,GravySteamed Vegetables inSeasonBread (2 slices)Green saladFruit or Fruit Juice
BAKED CRUMBED HAKEFILLETS (Grilled or DeepFried)Chips (Oven baked/ Fried)Steamed Vegetables in SeasonBread (2 slices)Green saladFruit or Fruit Juice
GRILLEDCRUMBED PORKCHOPSParsley Potatoes,Brown Onion GravySteamed Vegetables inSeasonBread (2 slices)Green saladFruit or Fruit
CHICKEN ANDVEGETABLESTEW OR CURRYMielie Rice orNoodlesSteamed Vegetablesin SeasonBread (2 slices)Green saladFruit or Fruit Juice
BEEF BOLOGNAISESpaghetti or Vetkoek/PotBreadSteamed Vegetables inSeasonBread (2 slices)Green saladFruit or Fruit Juice
HOME MADE FISHCAKES (Grilled)Chips (Oven baked/ Fried)Cooked Tomato andOnion Relish (Sauce)Steamed Vegetables inSeason, Bread (2 slices)Green saladFruit or Fruit Juice
LEAN MILDLY SPICEDMUTTON & CABBAGESTEW OR CURRYSamp / Beans or RiceSteamed Vegetables in SeasonBread (2 slices)Green saladFruit or Fruit Juice
BRAISED STEAKAND ONIONTomato and oniongravyPapSteamed Vegetables inSeasonBread (2 slices)Green saladFruit or Fruit Juice
CHICKEN TIKKASOSATIES (2X75gchicken sosatiesin a spicy Tikkasauce)Savoury riceSteamed Vegetablesin SeasonBread (2 slices)Green saladFruit or Fruit Juice
MEXICAN CHILLICON CARNE (Mildlyspiced Beef mince, peppersand bean casserole)Baked potato or YellowRiceSteamed Vegetables inSeasonBread (2 slices)Green saladFruit or Fruit Juice
CHICKEN ANDMACARONI BAKESteamed Vegetables inSeasonBread (2 slices)Green saladFruit or Fruit Juice
GRILLED BEEFBOEREWORSMashChakalakaSteamed Vegetables in SeasonBread (2 slices)Green saladFruit or Fruit Juice
2 WRAPS FILLEDWITH ROASTEDVEGETABLES ANDFETASteamed Vegetables inSeasonBread (2 slices)Green saladFruit or Fruit Juice
SOYASCHNITZEL(2x90g)Tomato Curry SauceSavoury RiceSteamed Vegetablesin SeasonBread (2 slices)Green saladFruit or Fruit Juice
SPINACH AND FETALASAGNESteamed Vegetables inSeasonBread (2 slices)Green saladFruit or Fruit Juice
VEGETABLE BIRYANI(Spiced vegetables,potatoes, ricecasserole)Cucumber and YoghurtRiata (cold sauce)Steamed Vegetables inSeasonBread (2 slices),Green saladFruit or Fruit Juice
GRILLED SOYASAUSAGES (2)Barbecue Sauce, Steamedsliced onionsSautéed PotatoesSteamed Vegetables in SeasonBread (2 slices)Green saladFruit or Fruit Juice
MALAYSIAN VEGCASSEROLEYellow RiceSteamed Vegetables inSeasonBread (2 slices)Green saladFruit or Fruit Juice
BUTTERNUT,LENTILS ANDTOMATO BAKESteamed Vegetablesin SeasonBread (2 slices)Green saladFruit or Fruit Juice
VEGETARIAN CHILLICON CARNEYellow Rice or Wraps (2)Steamed Vegetables inSeasonBread (2 slices)Green saladFruit or Fruit Juice
POTATO, CHICKPEAAND SOYA MINCEBAKESteamed Vegetables inSeasonBread (2 slices)Green saladFruit or Fruit Juice
BUTTER BEAN CURRYSteamed RiceCarrot sambalsSteamed Vegetables in SeasonBread (2 slices)Green saladFruit or Fruit Juice
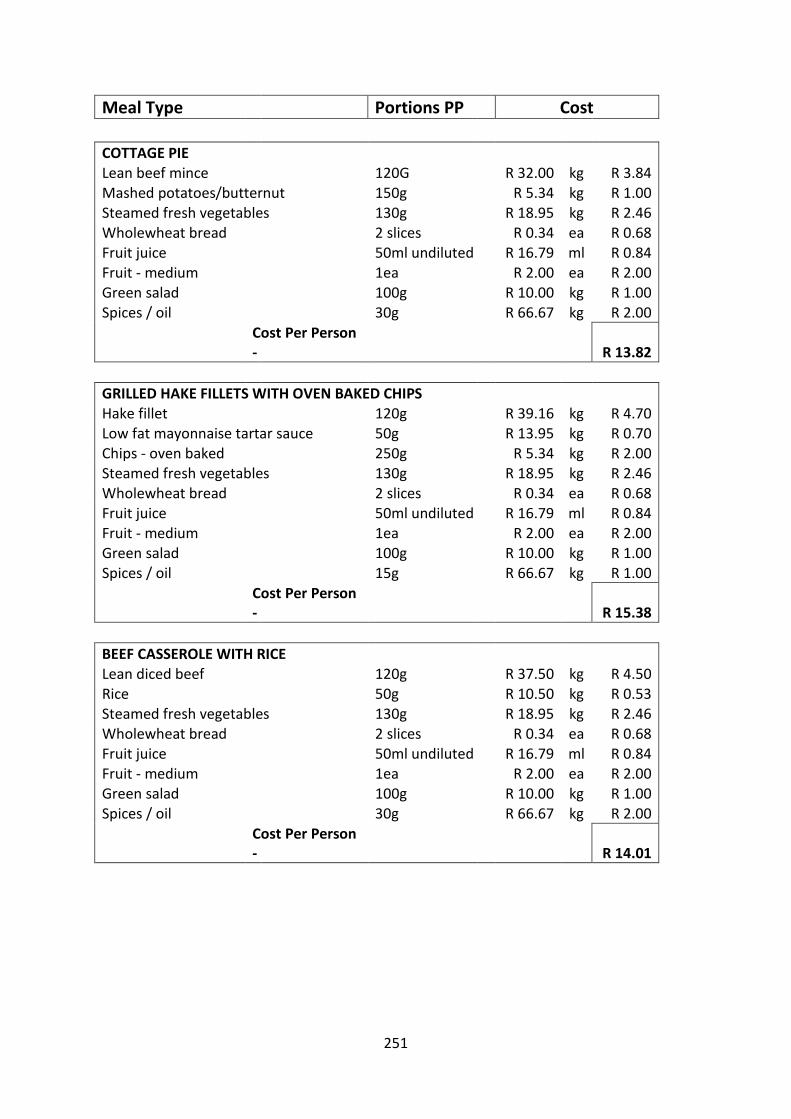
251
Meal Type Portions PP Cost
COTTAGE PIELean beef mince 120G R 32.00 kg R 3.84Mashed potatoes/butternut 150g R 5.34 kg R 1.00Steamed fresh vegetables 130g R 18.95 kg R 2.46Wholewheat bread 2 slices R 0.34 ea R 0.68Fruit juice 50ml undiluted R 16.79 ml R 0.84Fruit - medium 1ea R 2.00 ea R 2.00Green salad 100g R 10.00 kg R 1.00Spices / oil 30g R 66.67 kg R 2.00
Cost Per Person- R 13.82
GRILLED HAKE FILLETS WITH OVEN BAKED CHIPSHake fillet 120g R 39.16 kg R 4.70Low fat mayonnaise tartar sauce 50g R 13.95 kg R 0.70Chips - oven baked 250g R 5.34 kg R 2.00Steamed fresh vegetables 130g R 18.95 kg R 2.46Wholewheat bread 2 slices R 0.34 ea R 0.68Fruit juice 50ml undiluted R 16.79 ml R 0.84Fruit - medium 1ea R 2.00 ea R 2.00Green salad 100g R 10.00 kg R 1.00Spices / oil 15g R 66.67 kg R 1.00
Cost Per Person- R 15.38
BEEF CASSEROLE WITH RICELean diced beef 120g R 37.50 kg R 4.50Rice 50g R 10.50 kg R 0.53Steamed fresh vegetables 130g R 18.95 kg R 2.46Wholewheat bread 2 slices R 0.34 ea R 0.68Fruit juice 50ml undiluted R 16.79 ml R 0.84
Fruit - medium 1ea R 2.00 ea R 2.00Green salad 100g R 10.00 kg R 1.00Spices / oil 30g R 66.67 kg R 2.00
Cost Per Person- R 14.01
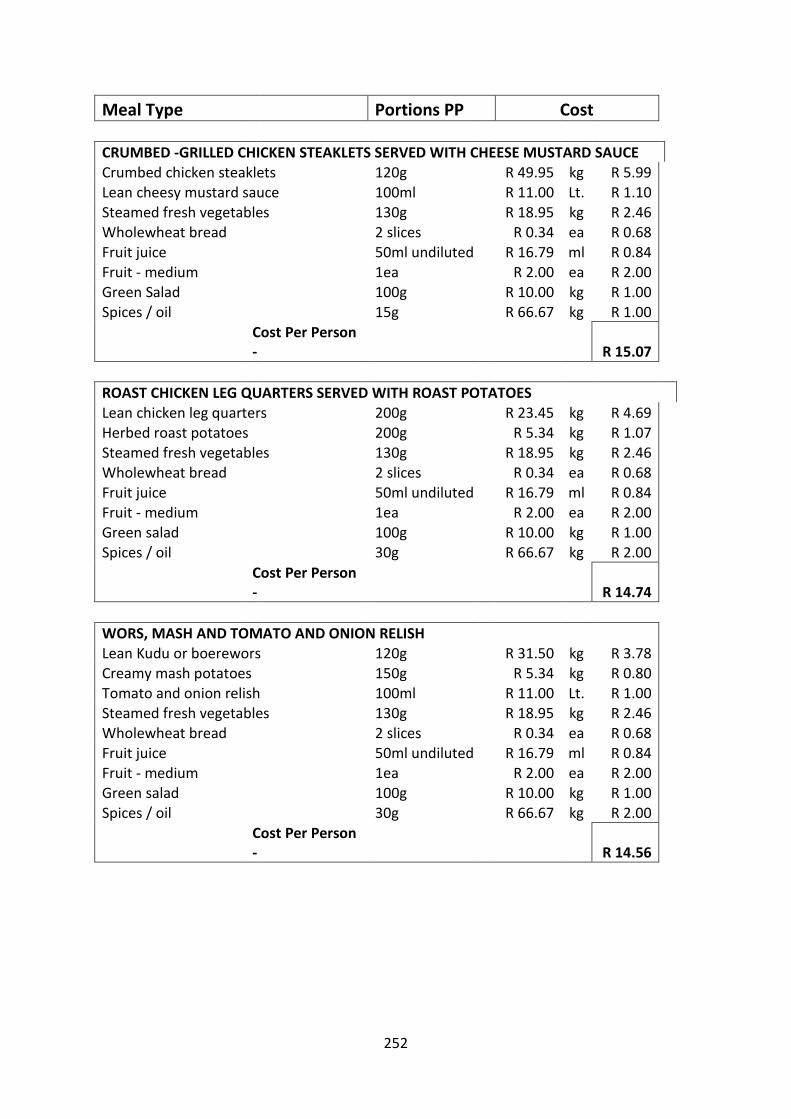
252
Meal Type Portions PP Cost
CRUMBED -GRILLED CHICKEN STEAKLETS SERVED WITH CHEESE MUSTARD SAUCECrumbed chicken steaklets 120g R 49.95 kg R 5.99Lean cheesy mustard sauce 100ml R 11.00 Lt. R 1.10Steamed fresh vegetables 130g R 18.95 kg R 2.46Wholewheat bread 2 slices R 0.34 ea R 0.68Fruit juice 50ml undiluted R 16.79 ml R 0.84Fruit - medium 1ea R 2.00 ea R 2.00Green Salad 100g R 10.00 kg R 1.00Spices / oil 15g R 66.67 kg R 1.00
Cost Per Person- R 15.07
ROAST CHICKEN LEG QUARTERS SERVED WITH ROAST POTATOESLean chicken leg quarters 200g R 23.45 kg R 4.69Herbed roast potatoes 200g R 5.34 kg R 1.07Steamed fresh vegetables 130g R 18.95 kg R 2.46Wholewheat bread 2 slices R 0.34 ea R 0.68Fruit juice 50ml undiluted R 16.79 ml R 0.84Fruit - medium 1ea R 2.00 ea R 2.00Green salad 100g R 10.00 kg R 1.00Spices / oil 30g R 66.67 kg R 2.00
Cost Per Person- R 14.74
WORS, MASH AND TOMATO AND ONION RELISHLean Kudu or boerewors 120g R 31.50 kg R 3.78Creamy mash potatoes 150g R 5.34 kg R 0.80Tomato and onion relish 100ml R 11.00 Lt. R 1.00Steamed fresh vegetables 130g R 18.95 kg R 2.46Wholewheat bread 2 slices R 0.34 ea R 0.68Fruit juice 50ml undiluted R 16.79 ml R 0.84Fruit - medium 1ea R 2.00 ea R 2.00Green salad 100g R 10.00 kg R 1.00Spices / oil 30g R 66.67 kg R 2.00
Cost Per Person- R 14.56
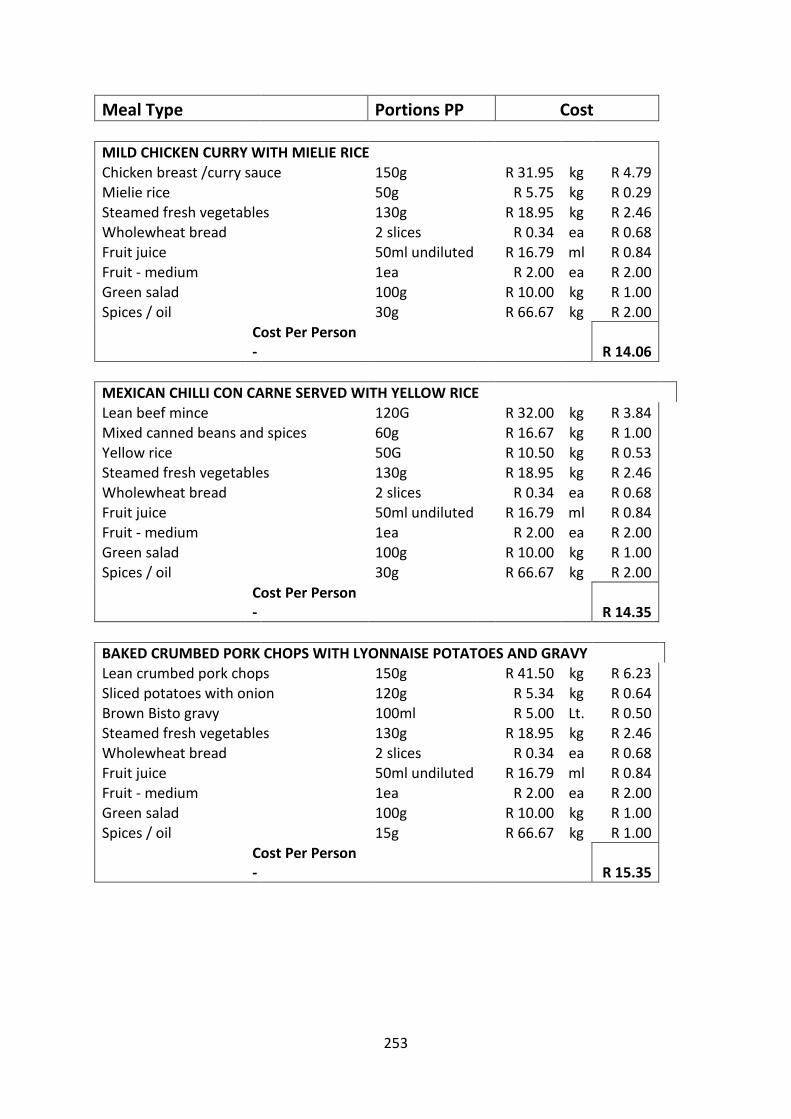
253
Meal Type Portions PP Cost
MILD CHICKEN CURRY WITH MIELIE RICEChicken breast /curry sauce 150g R 31.95 kg R 4.79Mielie rice 50g R 5.75 kg R 0.29Steamed fresh vegetables 130g R 18.95 kg R 2.46Wholewheat bread 2 slices R 0.34 ea R 0.68Fruit juice 50ml undiluted R 16.79 ml R 0.84Fruit - medium 1ea R 2.00 ea R 2.00Green salad 100g R 10.00 kg R 1.00Spices / oil 30g R 66.67 kg R 2.00
Cost Per Person- R 14.06
MEXICAN CHILLI CON CARNE SERVED WITH YELLOW RICELean beef mince 120G R 32.00 kg R 3.84Mixed canned beans and spices 60g R 16.67 kg R 1.00Yellow rice 50G R 10.50 kg R 0.53Steamed fresh vegetables 130g R 18.95 kg R 2.46Wholewheat bread 2 slices R 0.34 ea R 0.68Fruit juice 50ml undiluted R 16.79 ml R 0.84Fruit - medium 1ea R 2.00 ea R 2.00Green salad 100g R 10.00 kg R 1.00Spices / oil 30g R 66.67 kg R 2.00
Cost Per Person- R 14.35
BAKED CRUMBED PORK CHOPS WITH LYONNAISE POTATOES AND GRAVYLean crumbed pork chops 150g R 41.50 kg R 6.23Sliced potatoes with onion 120g R 5.34 kg R 0.64Brown Bisto gravy 100ml R 5.00 Lt. R 0.50Steamed fresh vegetables 130g R 18.95 kg R 2.46Wholewheat bread 2 slices R 0.34 ea R 0.68Fruit juice 50ml undiluted R 16.79 ml R 0.84Fruit - medium 1ea R 2.00 ea R 2.00Green salad 100g R 10.00 kg R 1.00Spices / oil 15g R 66.67 kg R 1.00
Cost Per Person- R 15.35
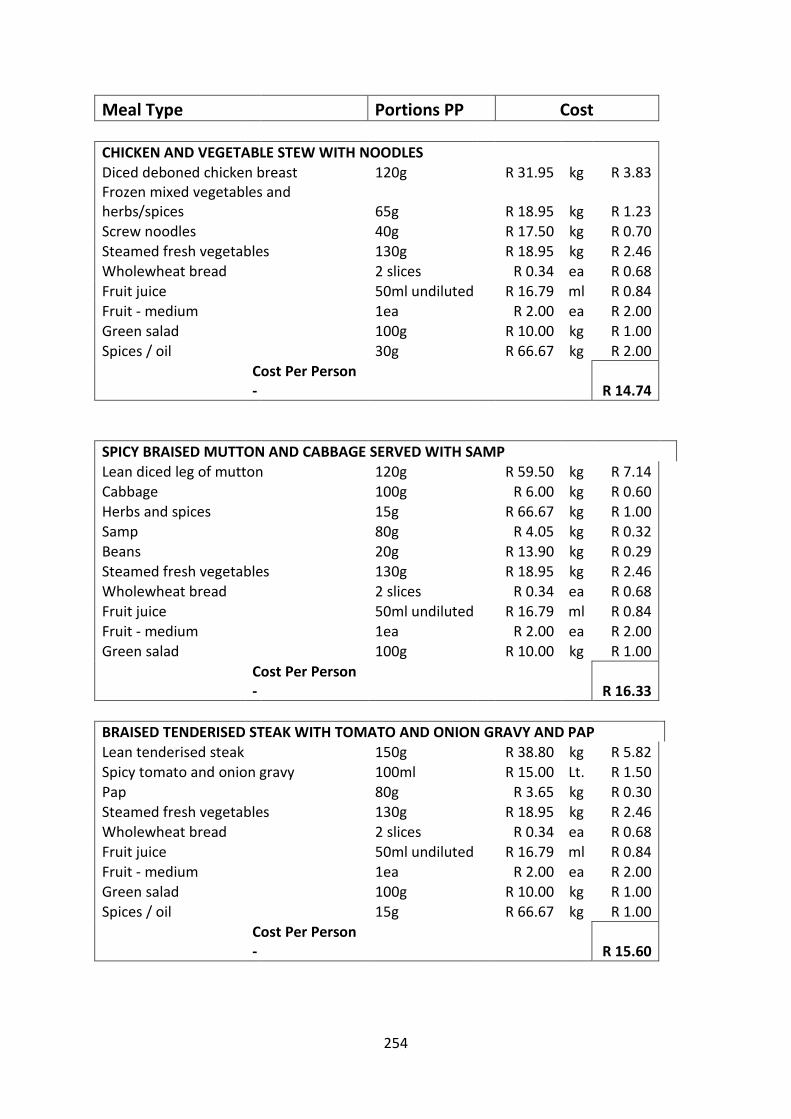
254
Meal Type Portions PP Cost
CHICKEN AND VEGETABLE STEW WITH NOODLESDiced deboned chicken breast 120g R 31.95 kg R 3.83Frozen mixed vegetables andherbs/spices 65g R 18.95 kg R 1.23Screw noodles 40g R 17.50 kg R 0.70Steamed fresh vegetables 130g R 18.95 kg R 2.46Wholewheat bread 2 slices R 0.34 ea R 0.68Fruit juice 50ml undiluted R 16.79 ml R 0.84Fruit - medium 1ea R 2.00 ea R 2.00Green salad 100g R 10.00 kg R 1.00Spices / oil 30g R 66.67 kg R 2.00
Cost Per Person- R 14.74
SPICY BRAISED MUTTON AND CABBAGE SERVED WITH SAMPLean diced leg of mutton 120g R 59.50 kg R 7.14Cabbage 100g R 6.00 kg R 0.60Herbs and spices 15g R 66.67 kg R 1.00Samp 80g R 4.05 kg R 0.32Beans 20g R 13.90 kg R 0.29Steamed fresh vegetables 130g R 18.95 kg R 2.46Wholewheat bread 2 slices R 0.34 ea R 0.68Fruit juice 50ml undiluted R 16.79 ml R 0.84Fruit - medium 1ea R 2.00 ea R 2.00Green salad 100g R 10.00 kg R 1.00
Cost Per Person- R 16.33
BRAISED TENDERISED STEAK WITH TOMATO AND ONION GRAVY AND PAPLean tenderised steak 150g R 38.80 kg R 5.82Spicy tomato and onion gravy 100ml R 15.00 Lt. R 1.50Pap 80g R 3.65 kg R 0.30Steamed fresh vegetables 130g R 18.95 kg R 2.46Wholewheat bread 2 slices R 0.34 ea R 0.68Fruit juice 50ml undiluted R 16.79 ml R 0.84Fruit - medium 1ea R 2.00 ea R 2.00Green salad 100g R 10.00 kg R 1.00Spices / oil 15g R 66.67 kg R 1.00
Cost Per Person- R 15.60
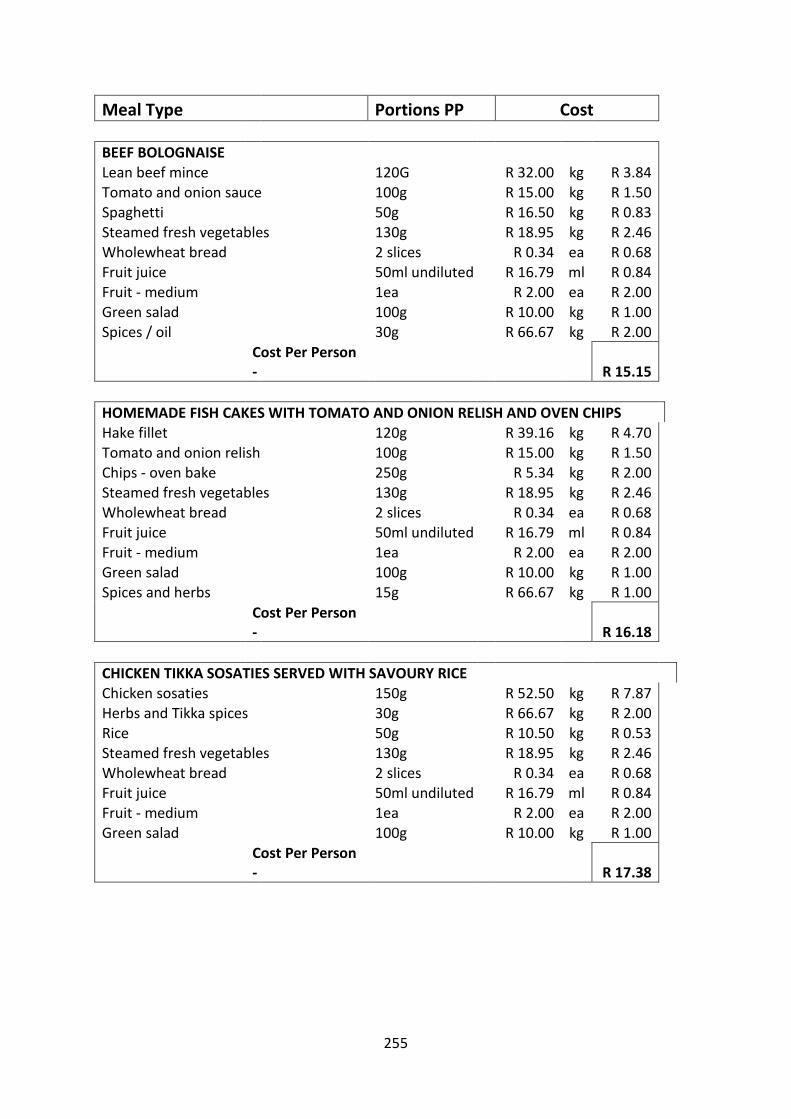
255
Meal Type Portions PP Cost
BEEF BOLOGNAISELean beef mince 120G R 32.00 kg R 3.84Tomato and onion sauce 100g R 15.00 kg R 1.50Spaghetti 50g R 16.50 kg R 0.83Steamed fresh vegetables 130g R 18.95 kg R 2.46Wholewheat bread 2 slices R 0.34 ea R 0.68Fruit juice 50ml undiluted R 16.79 ml R 0.84Fruit - medium 1ea R 2.00 ea R 2.00Green salad 100g R 10.00 kg R 1.00Spices / oil 30g R 66.67 kg R 2.00
Cost Per Person- R 15.15
HOMEMADE FISH CAKES WITH TOMATO AND ONION RELISH AND OVEN CHIPSHake fillet 120g R 39.16 kg R 4.70Tomato and onion relish 100g R 15.00 kg R 1.50Chips - oven bake 250g R 5.34 kg R 2.00Steamed fresh vegetables 130g R 18.95 kg R 2.46Wholewheat bread 2 slices R 0.34 ea R 0.68Fruit juice 50ml undiluted R 16.79 ml R 0.84Fruit - medium 1ea R 2.00 ea R 2.00Green salad 100g R 10.00 kg R 1.00Spices and herbs 15g R 66.67 kg R 1.00
Cost Per Person- R 16.18
CHICKEN TIKKA SOSATIES SERVED WITH SAVOURY RICEChicken sosaties 150g R 52.50 kg R 7.87Herbs and Tikka spices 30g R 66.67 kg R 2.00Rice 50g R 10.50 kg R 0.53Steamed fresh vegetables 130g R 18.95 kg R 2.46Wholewheat bread 2 slices R 0.34 ea R 0.68Fruit juice 50ml undiluted R 16.79 ml R 0.84Fruit - medium 1ea R 2.00 ea R 2.00Green salad 100g R 10.00 kg R 1.00
Cost Per Person- R 17.38
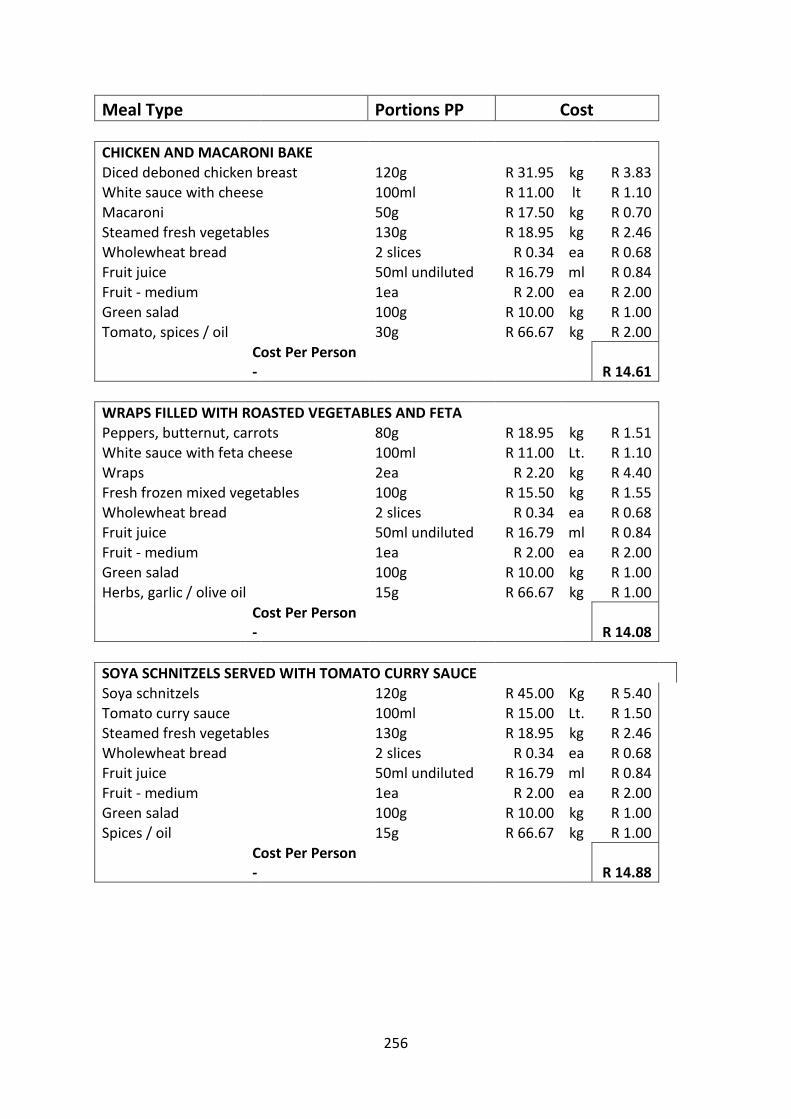
256
Meal Type Portions PP Cost
CHICKEN AND MACARONI BAKEDiced deboned chicken breast 120g R 31.95 kg R 3.83White sauce with cheese 100ml R 11.00 lt R 1.10Macaroni 50g R 17.50 kg R 0.70Steamed fresh vegetables 130g R 18.95 kg R 2.46Wholewheat bread 2 slices R 0.34 ea R 0.68Fruit juice 50ml undiluted R 16.79 ml R 0.84Fruit - medium 1ea R 2.00 ea R 2.00Green salad 100g R 10.00 kg R 1.00Tomato, spices / oil 30g R 66.67 kg R 2.00
Cost Per Person- R 14.61
WRAPS FILLED WITH ROASTED VEGETABLES AND FETAPeppers, butternut, carrots 80g R 18.95 kg R 1.51White sauce with feta cheese 100ml R 11.00 Lt. R 1.10Wraps 2ea R 2.20 kg R 4.40Fresh frozen mixed vegetables 100g R 15.50 kg R 1.55Wholewheat bread 2 slices R 0.34 ea R 0.68Fruit juice 50ml undiluted R 16.79 ml R 0.84Fruit - medium 1ea R 2.00 ea R 2.00Green salad 100g R 10.00 kg R 1.00Herbs, garlic / olive oil 15g R 66.67 kg R 1.00
Cost Per Person- R 14.08
SOYA SCHNITZELS SERVED WITH TOMATO CURRY SAUCESoya schnitzels 120g R 45.00 Kg R 5.40Tomato curry sauce 100ml R 15.00 Lt. R 1.50Steamed fresh vegetables 130g R 18.95 kg R 2.46Wholewheat bread 2 slices R 0.34 ea R 0.68Fruit juice 50ml undiluted R 16.79 ml R 0.84Fruit - medium 1ea R 2.00 ea R 2.00Green salad 100g R 10.00 kg R 1.00Spices / oil 15g R 66.67 kg R 1.00
Cost Per Person- R 14.88
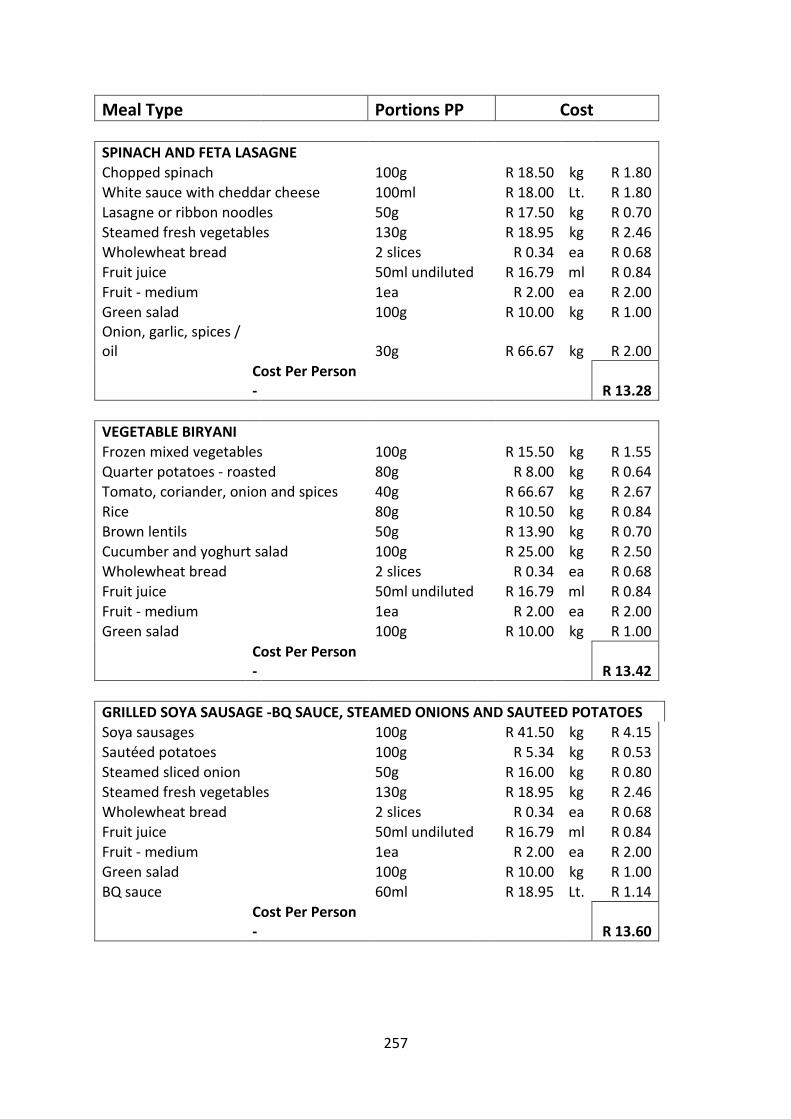
257
Meal Type Portions PP Cost
SPINACH AND FETA LASAGNEChopped spinach 100g R 18.50 kg R 1.80White sauce with cheddar cheese 100ml R 18.00 Lt. R 1.80Lasagne or ribbon noodles 50g R 17.50 kg R 0.70Steamed fresh vegetables 130g R 18.95 kg R 2.46Wholewheat bread 2 slices R 0.34 ea R 0.68Fruit juice 50ml undiluted R 16.79 ml R 0.84Fruit - medium 1ea R 2.00 ea R 2.00Green salad 100g R 10.00 kg R 1.00Onion, garlic, spices /oil 30g R 66.67 kg R 2.00
Cost Per Person- R 13.28
VEGETABLE BIRYANI
Frozen mixed vegetables 100g R 15.50 kg R 1.55Quarter potatoes - roasted 80g R 8.00 kg R 0.64Tomato, coriander, onion and spices 40g R 66.67 kg R 2.67Rice 80g R 10.50 kg R 0.84Brown lentils 50g R 13.90 kg R 0.70Cucumber and yoghurt salad 100g R 25.00 kg R 2.50Wholewheat bread 2 slices R 0.34 ea R 0.68Fruit juice 50ml undiluted R 16.79 ml R 0.84Fruit - medium 1ea R 2.00 ea R 2.00Green salad 100g R 10.00 kg R 1.00
Cost Per Person- R 13.42
GRILLED SOYA SAUSAGE -BQ SAUCE, STEAMED ONIONS AND SAUTEED POTATOESSoya sausages 100g R 41.50 kg R 4.15Sautéed potatoes 100g R 5.34 kg R 0.53Steamed sliced onion 50g R 16.00 kg R 0.80Steamed fresh vegetables 130g R 18.95 kg R 2.46Wholewheat bread 2 slices R 0.34 ea R 0.68Fruit juice 50ml undiluted R 16.79 ml R 0.84Fruit - medium 1ea R 2.00 ea R 2.00Green salad 100g R 10.00 kg R 1.00BQ sauce 60ml R 18.95 Lt. R 1.14
Cost Per Person- R 13.60

258
Meal Type Portions PP Cost
MALAYSIAN VEGETABLE CASSEROLEFrozen mixed vegetables 100g R 15.50 kg R 1.55Diced potatoes 80g R 8.00 kg R 0.64Tomato, coriander, onion and spices 40g R 66.67 kg R 2.67Yellow rice 50g R 10.50 kg R 0.53Chickpeas 50g R 13.90 kg R 0.70Wholewheat bread 2 slices R 0.34 ea R 0.68Fruit juice 50ml undiluted R 16.79 ml R 0.84Fruit - medium 1ea R 2.00 ea R 2.00Green salad 100g R 10.00 kg R 1.00
Cost Per Person- R 10.61
BUTTERNUT, LENTILS AND TOMATO BAKEButternut - sliced 100g R 15.50 kg R 1.55Tomato and onion gravy 100g R 15.00 kg R 1.50Mixed herbs, garlic, onion and spices 40g R 66.67 kg R 2.67Bread crumbs 20g R 10.50 kg R 0.21Brown Lentils - cooked 100g R 13.90 kg R 1.39White sauce with feta cheese 100ml R 11.00 Lt. R 1.10Wholewheat bread 2 slices R 0.34 ea R 0.68Fruit juice 50ml undiluted R 16.79 ml R 0.84Fruit - medium 1ea R 2.00 ea R 2.00Green salad 100g R 10.00 kg R 1.00
Cost Per Person- R 12.94
VEGETARIAN CHILLI CON CARNE SERVED WITH RICEImana savoury soya mince 80g R 18.95 kg R 1.51Mixed canned beans and spices 60g R 16.67 kg R 1.00Rice 50G R 10.50 kg R 0.53Steamed fresh vegetables 130g R 18.95 kg R 2.46Wholewheat bread 2 slices R 0.34 ea R 0.68Fruit juice 50ml undiluted R 16.79 ml R 0.84Fruit - medium 1ea R 2.00 ea R 2.00Green salad 100g R 10.00 kg R 1.00Tomato, herbs, spices /oil 30g R 66.67 kg R 2.00
Cost Per Person- R 12.02
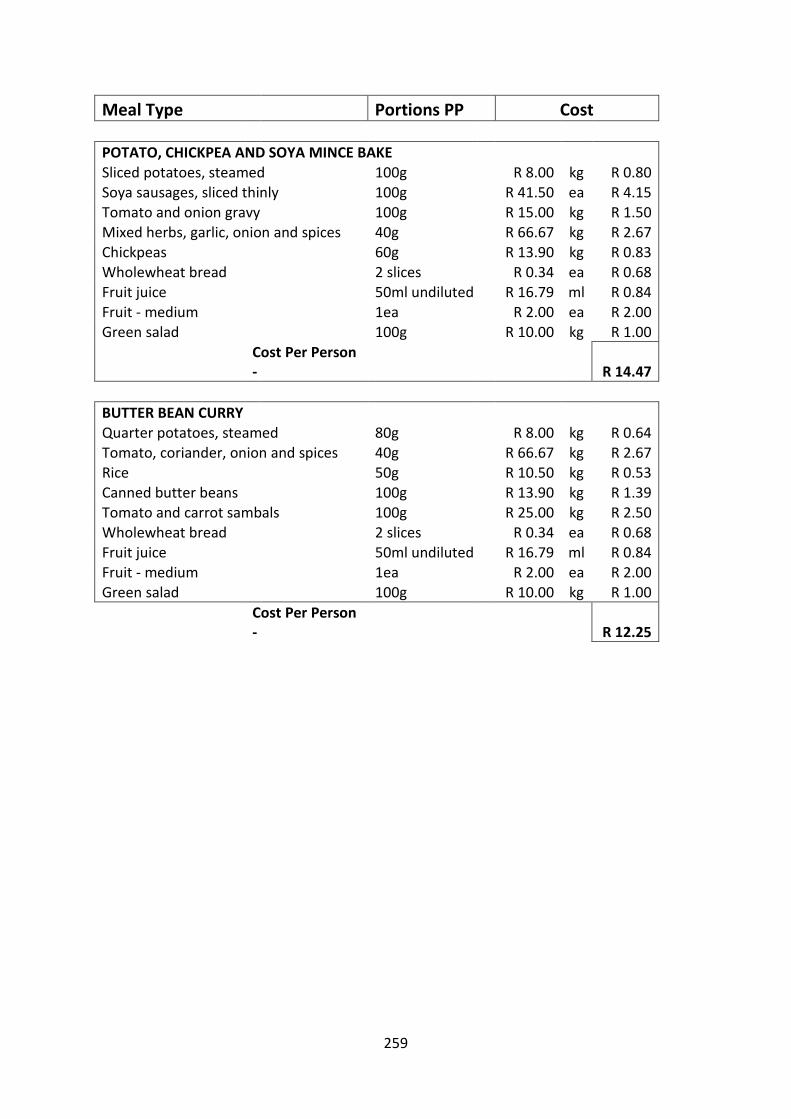
259
Meal Type Portions PP Cost
POTATO, CHICKPEA AND SOYA MINCE BAKESliced potatoes, steamed 100g R 8.00 kg R 0.80Soya sausages, sliced thinly 100g R 41.50 ea R 4.15Tomato and onion gravy 100g R 15.00 kg R 1.50Mixed herbs, garlic, onion and spices 40g R 66.67 kg R 2.67Chickpeas 60g R 13.90 kg R 0.83Wholewheat bread 2 slices R 0.34 ea R 0.68Fruit juice 50ml undiluted R 16.79 ml R 0.84Fruit - medium 1ea R 2.00 ea R 2.00Green salad 100g R 10.00 kg R 1.00
Cost Per Person- R 14.47
BUTTER BEAN CURRYQuarter potatoes, steamed 80g R 8.00 kg R 0.64Tomato, coriander, onion and spices 40g R 66.67 kg R 2.67Rice 50g R 10.50 kg R 0.53Canned butter beans 100g R 13.90 kg R 1.39Tomato and carrot sambals 100g R 25.00 kg R 2.50Wholewheat bread 2 slices R 0.34 ea R 0.68Fruit juice 50ml undiluted R 16.79 ml R 0.84Fruit - medium 1ea R 2.00 ea R 2.00Green salad 100g R 10.00 kg R 1.00
Cost Per Person- R 12.25
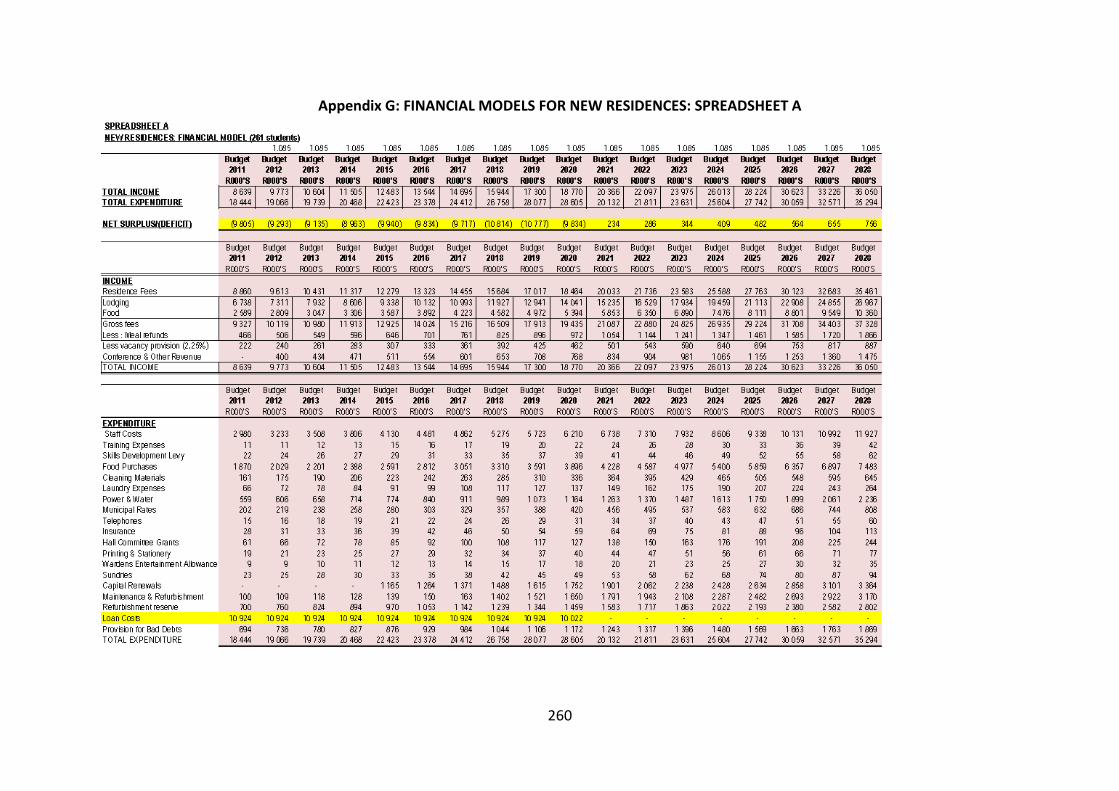
260
Appendix G: FINANCIAL MODELS FOR NEW RESIDENCES: SPREADSHEET A
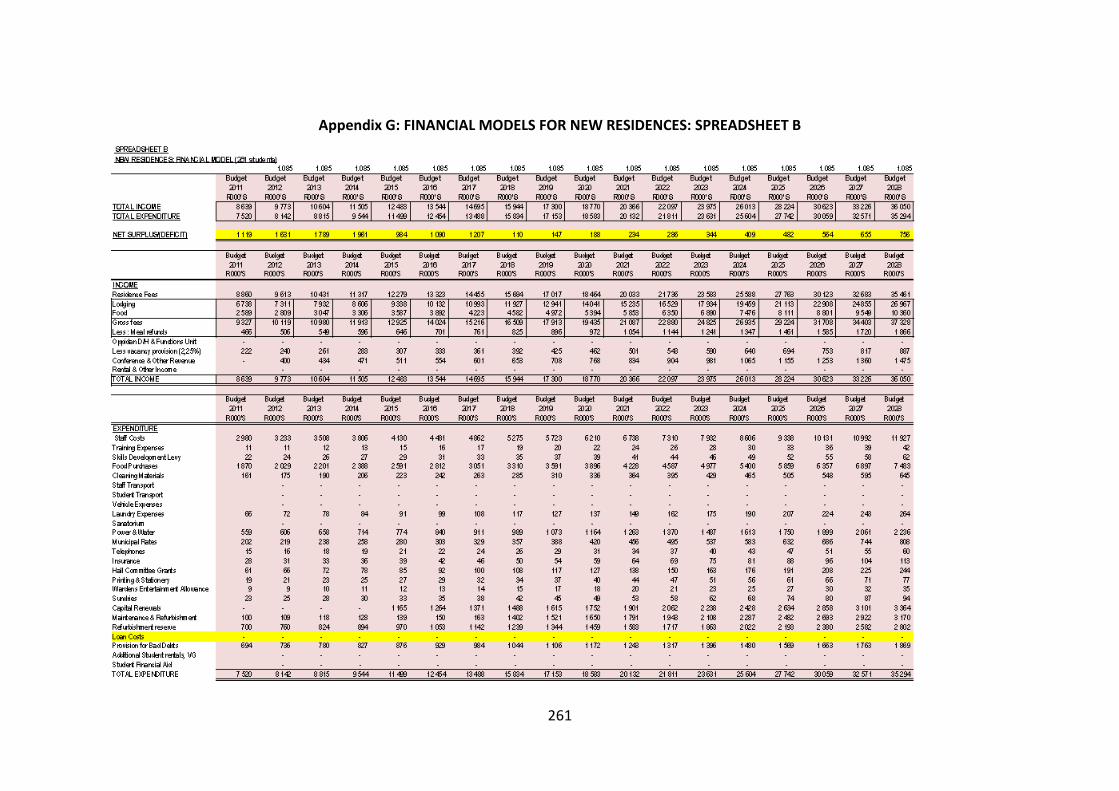
261
Appendix G: FINANCIAL MODELS FOR NEW RESIDENCES: SPREADSHEET B
262
Appendix H
PRELIMINARY ANALYSIS OF THE IMPACT OF STUDENT HOUSING ON ACADEMIC SUCCESS
(Note: the data on which the figures in this Appendix is based is not comprehensive, and all information should be treated with caution.)
In the following figures, the percentage of courses, credits or subjects passed per year by students living in residence is compared with thenumber of courses passed by students living off campus. Nineteen of the 22 universities with residences provided the necessary academicdata, but only twelve made their 2010 academic data available. The following campus codes are used in the accompanying figures:
Institution Campus Code Campus
CPUT 1 Cape Peninsula University of Technology - Cape Town
CPUT 2 Cape Peninsula University of Technology – Bellville
CPUT 3 Cape Peninsula University of Technology - Mowbray
CPUT 4 Cape Peninsula University of Technology - Wellington
CUT Central University of Technology – Bloemfontein
DUT 1 Durban University of Technology - Durban
DUT 2 Durban University of Technology - Midlands
MUT Mangosuthu University of Technology
NMMU 1 Nelson Mandela Metropolitan University - Summerstrand South
NMMU 2 Nelson Mandela Metropolitan University - Summerstrand North
NMMU 3 Nelson Mandela Metropolitan University - 2nd Ave
NMMU 4 Nelson Mandela Metropolitan University - George
RU Rhodes University
263
Institution Campus Code Campus
UCT University of Cape Town
UFH 1 University of Fort Hare - Alice
UFH 2 University of Fort Hare - East London
UFS 1 University of the Free State - Bloemfontein
UFS 2 University of the Free State - QwaQwa
UJ University of Johannesburg - Doornfontein
UKZN 1 University of KwaZulu-Natal - Edgewood
UKZN 2 University of KwaZulu-Natal - Howard
UKZN 3 University of KwaZulu-Natal - Medical
UKZN 4 University of KwaZulu-Natal - Pietermaritzburg
UKZN 5 University of KwaZulu-Natal - Westville
UL 1 University of Limpopo - Turfloop
UL 2 University of Limpopo - MEDUNSA
UNW North West University – Potchefstroom
UP University of Pretoria
USB Stellenbosch University
UV University of Venda
UWC University of the Western Cape
WITS University of the Witwatersrand
WSU1 Walter Sisulu University - Buffalo City
WSU2 Walter Sisulu University - Butterworth
WSU3 Walter Sisulu University - Zamukulungisa Mthatha
WSU4 Walter Sisulu University - NMD Mthatha

264
Credits/courses/subjects passed by % (first year), 2008
Credits/courses/subjects passed by % (first year), 2009
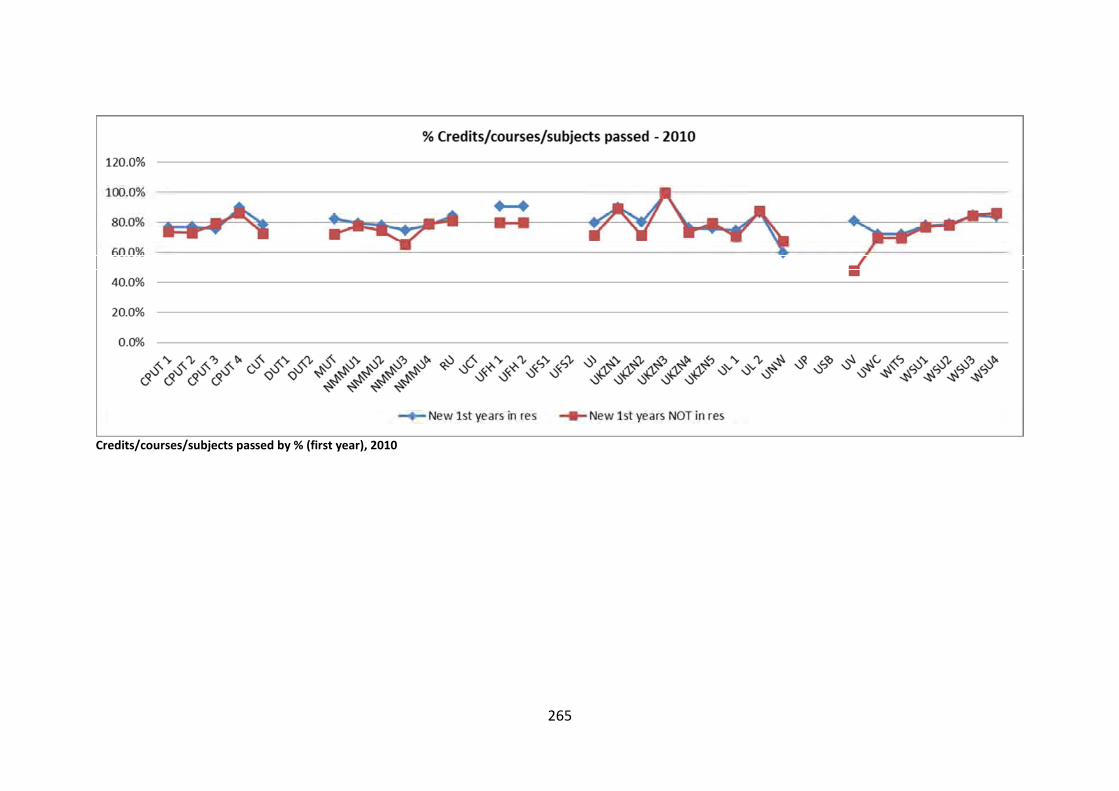
265
Credits/courses/subjects passed by % (first year), 2010
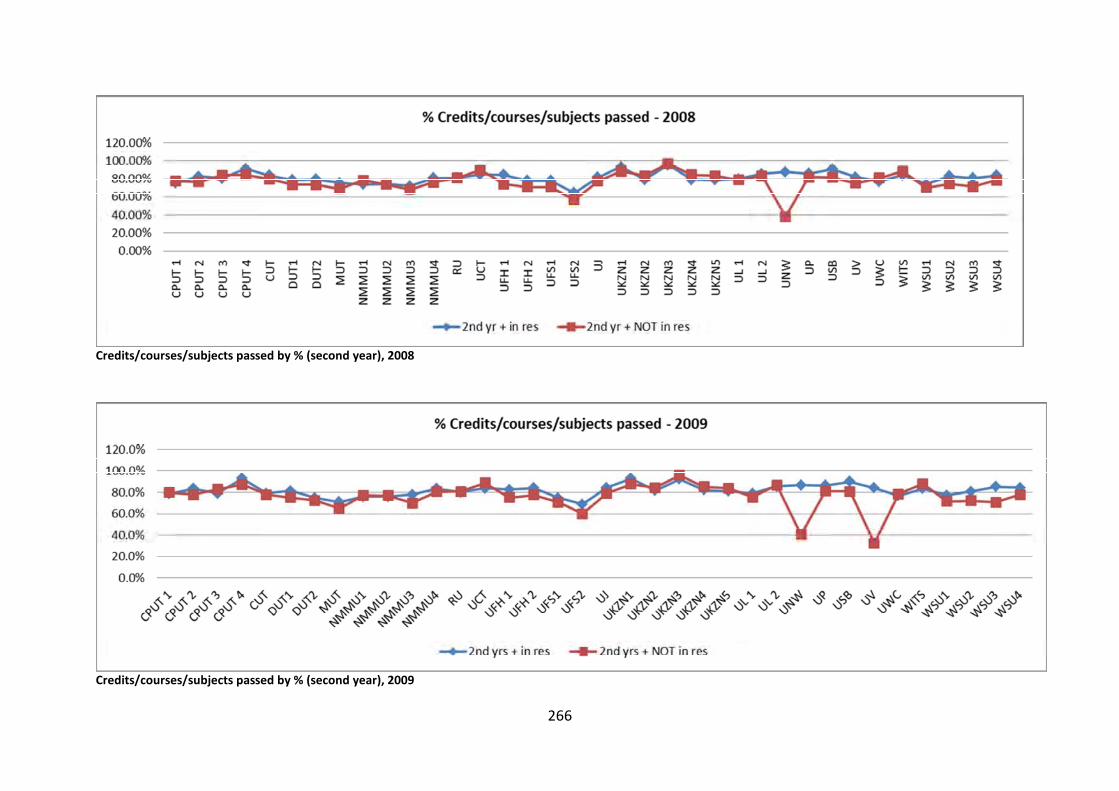
266
Credits/courses/subjects passed by % (second year), 2008
Credits/courses/subjects passed by % (second year), 2009
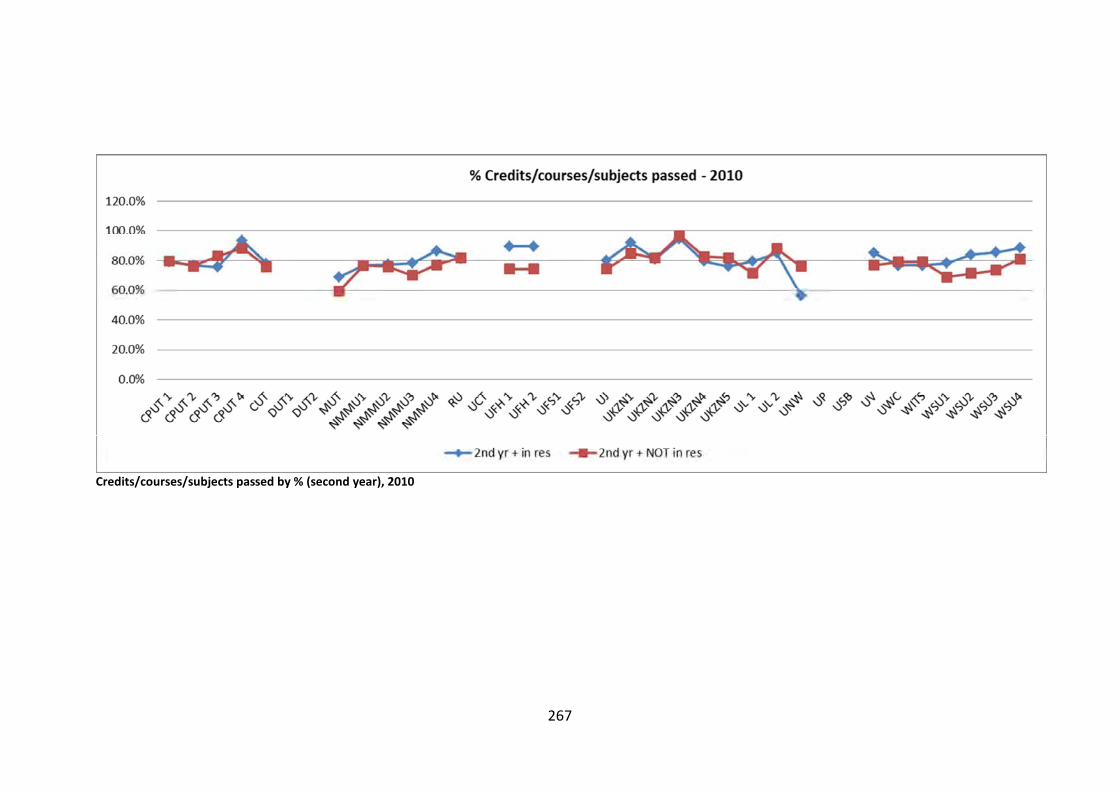
267
Credits/courses/subjects passed by % (second year), 2010
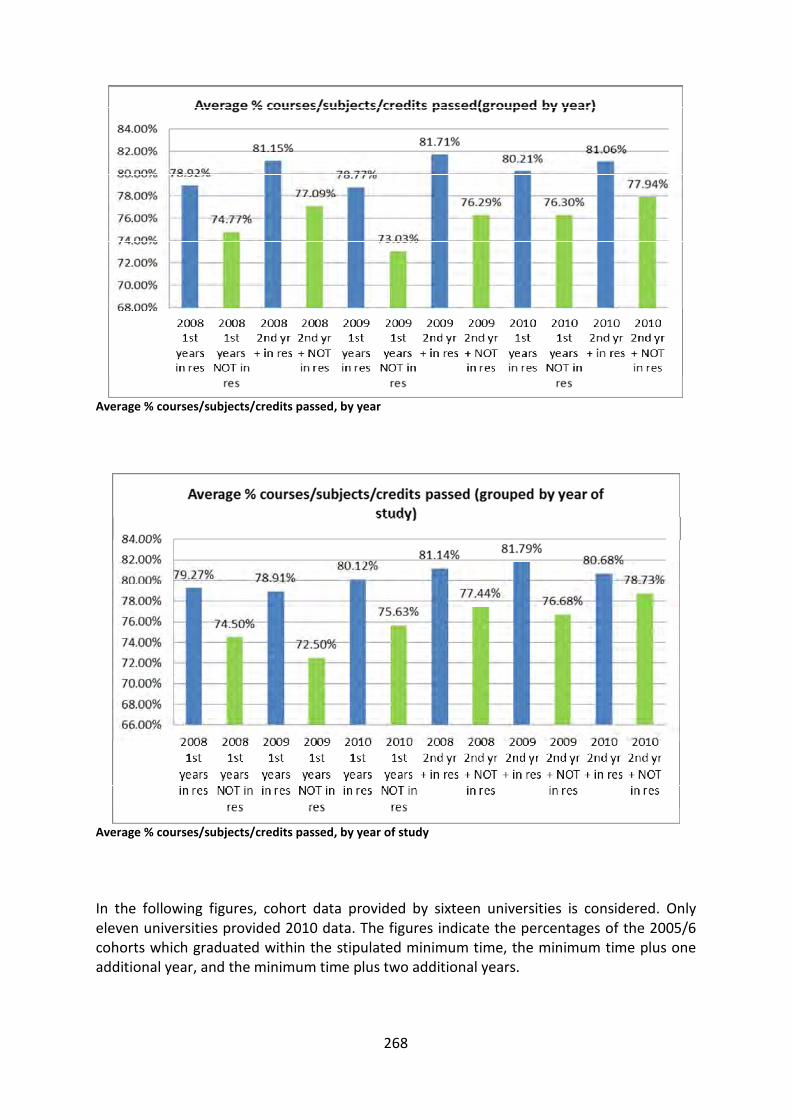
268
Average % courses/subjects/credits passed, by year
Average % courses/subjects/credits passed, by year of study
In the following figures, cohort data provided by sixteen universities is considered. Onlyeleven universities provided 2010 data. The figures indicate the percentages of the 2005/6cohorts which graduated within the stipulated minimum time, the minimum time plus oneadditional year, and the minimum time plus two additional years.
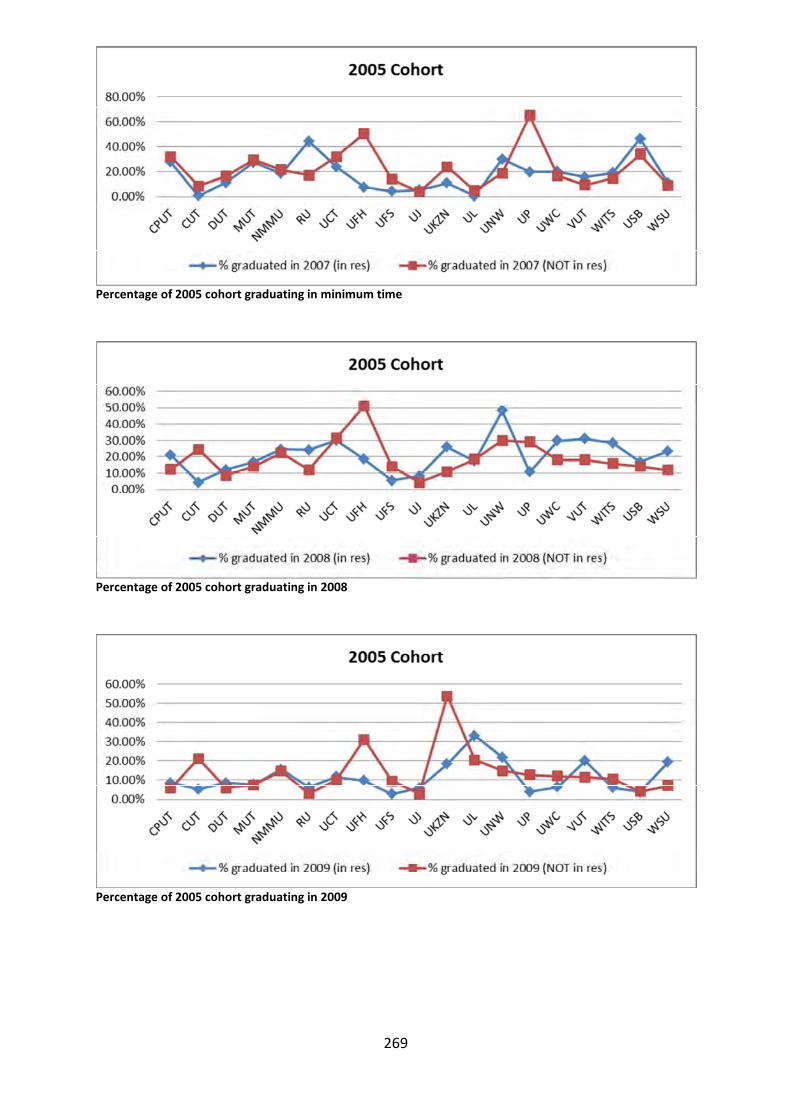
269
Percentage of 2005 cohort graduating in minimum time
Percentage of 2005 cohort graduating in 2008
Percentage of 2005 cohort graduating in 2009
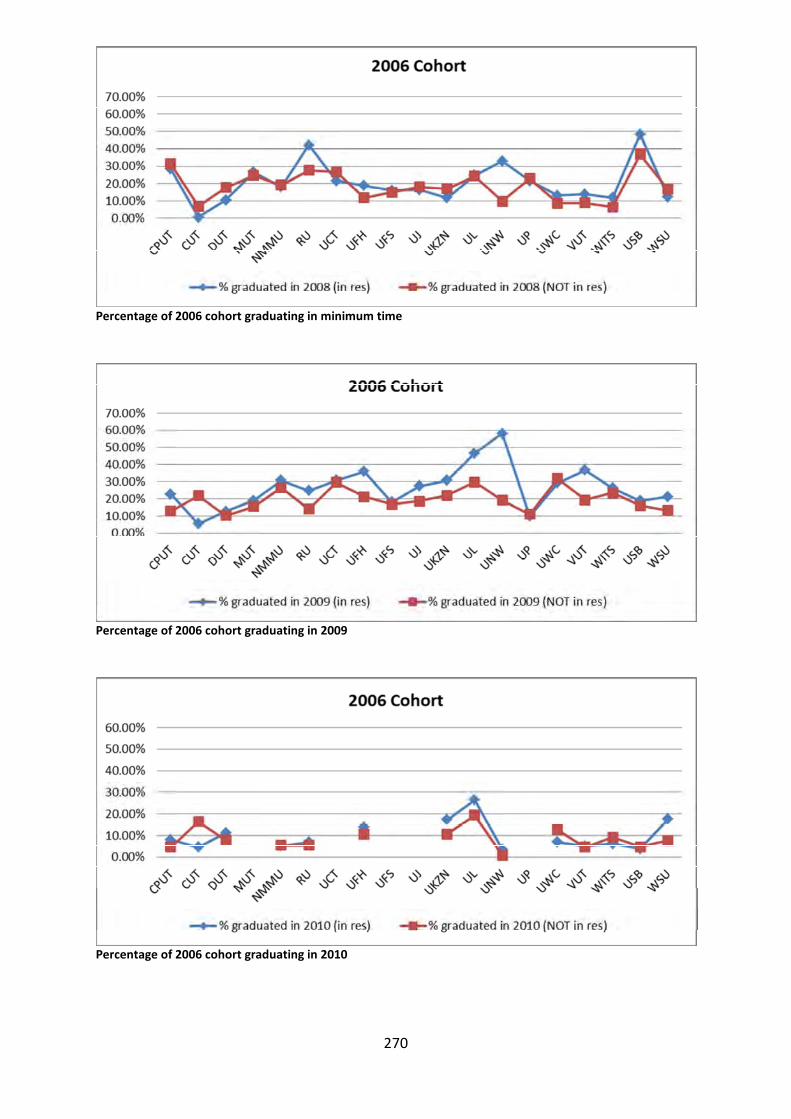
270
Percentage of 2006 cohort graduating in minimum time
Percentage of 2006 cohort graduating in 2009
Percentage of 2006 cohort graduating in 2010
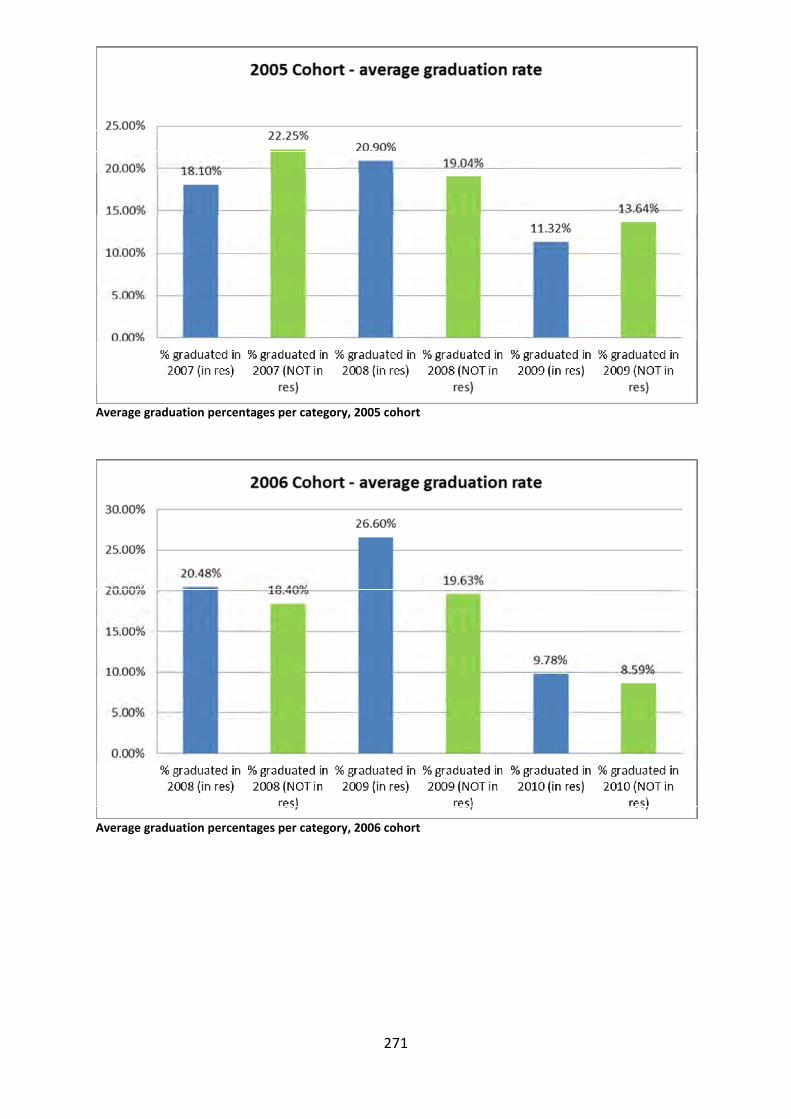
271
Average graduation percentages per category, 2005 cohort
Average graduation percentages per category, 2006 cohort
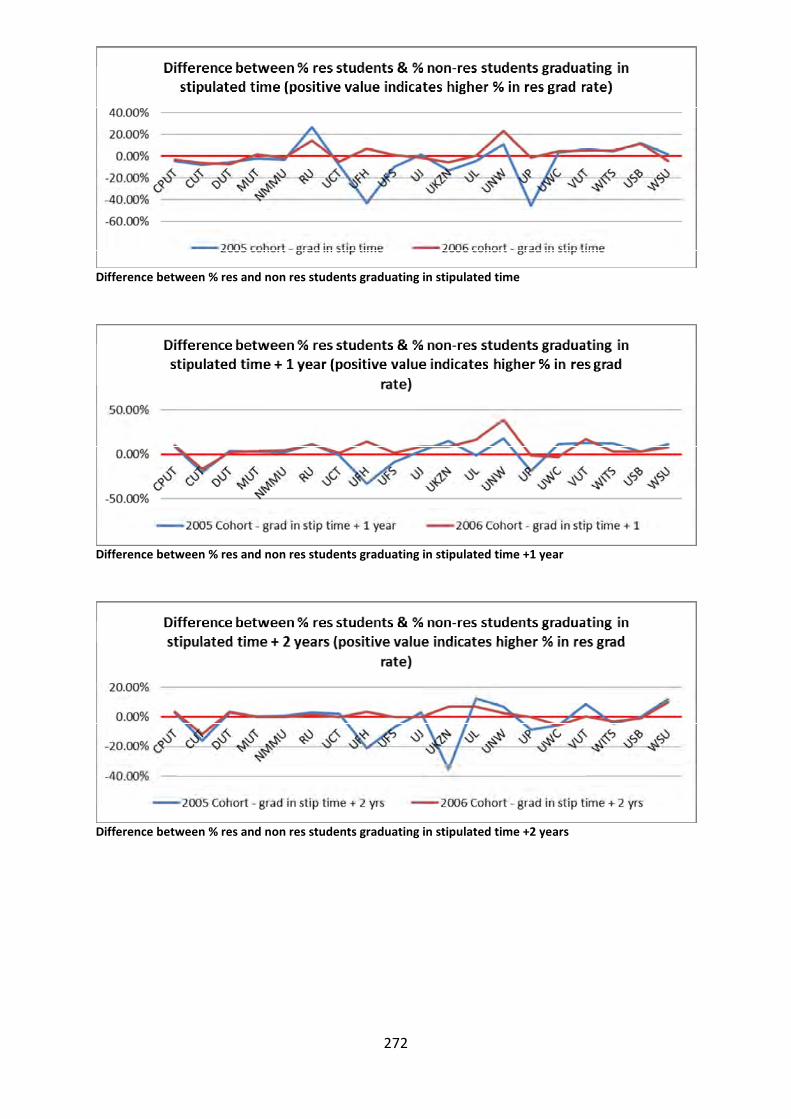
272
Difference between % res and non res students graduating in stipulated time
Difference between % res and non res students graduating in stipulated time +1 year
Difference between % res and non res students graduating in stipulated time +2 years