
Annual Report 1938-39 - Canada.ca
476
-
Upload
khangminh22 -
Category
Documents
-
view
0 -
download
0
Transcript of Annual Report 1938-39 - Canada.ca


DOMINION OF CANADA
(Seventy-second Annual Fisheries Report
of the Dominion)
FOR THE YEAR
1938-39
OTTAWA J. O. PATENAUDE, I.S.O.
PRINTER TO THE KING'S MOST EXCELLENT MAJESTY 1939


To His Excellency the Right Honourable Baron Tweedsmuir of Elsfreld, P.C.,
C.H., Governor General and Commander-in-Chief of the
Dominion of Canada.
MAY IT PLEASE YOUR EXCELLENCY :
I have the honour to submit herewith, for the information of Your Excel-lency and the Parliament of Canada, the Ninth Annual Report of the Depart-ment of Fisheries, being the Seventy-second Annual Fisheries Report for the Dominion.
I have the honour to be,
Your Excellency's most obedient servant,
J. E. MICHAUD, Minister of Fisheries.
DEPARTMENT OF FISHERIES, OTTAWA, April 6, 1939.
87275—lb

CONTENTS
DEPUTY MENISTER'S REPORT COVERING-- PAGE Results of Commercial Fishing Operations in the Calendar Year 1938 5 Foreign Trade in Fisheries Products 10 Assisting Fishermen by Direct Aid 12 Assisting Fishermen by Sales Promotion 12 Inspection of Fisheries Products 14 Fish Culture Work 14 Oyster Culture 15 Fishing Bounty 15 Returns from Pelagic Sealing Instructional Work Among Fishermen 17 Pacific Halibut Commission 18 Pacific Salmon Commission 19 North A.merican Council on Fishery Investigations 20
APPENDICES
1. Reports of the Chief Supervisors* of Fisheries 22
2. Report of the Fish Culture Branch of the Department 79
3. Report of the Fisheries Engineer 140
4. Report on Oyster Culture 148
5. Report on the Inspection of Fish and Technical Instruction to Fisbermen 163
6. Report on Canned Salmon Inspection 166
7. A Statement of Fisheries Revenue and Expenditure for the Fiscal Year 1938-39, and a Summary of Revenue and Expenditure According to Provinces for the period 1867 to 1938-39 179
8. A Statement Showing the Number of Fisheries Licences issued in 1938-39 186
9. A Statement Showing the Number of Lobster Fishing Licences issued each year since 1928 190
4

DEPUTY MINISTER'S REPORT
To the Hon. J. E. MicHAtd-o, M.P., Minister of Fisheries.
have the honour to submit the Ninth Annual Report of the Depart-ment of Fisheries, -which is the Seventy-second Annual Report on the fisheries of Canada and is for the fiscal year ended March 31, 1939. Among other sub-jects referred to in the report are the following:—
Results of Commercial Fishing Operations in the Calendar Year 1938. Foreign Trade in Fisheries Products. Direct Assistance to Fishermen. Assisting Fishermen by Sales Promotion. Fisheries Products' Inspection. Fish Culture. Progress in Oyster Farming. Fishing Bounty Payments. Pelagic Sealing Returns.
• Instructional Work Among Fishermen. Work of the Pacific Halibut Commission. 'Work of the Pacific Salmon Commission. Activities of the North American Council on Fishery Investigations.
The appendices include:—
Reports of the Chief Supervisors of Fisheries Report on the Department's Fish Culture Work Report on Oyster Culture Report on Canned Salmon Inspection Report of the Fisheries Engineer. Report on Fish Inspection and Technical Instruction to Fishermen A Statement of Fisheries Revenue and Expenditure for the Fiscal Year
1938-39, and a Summary of Revenue and Expenditure According to Provinces for the period 1867 to 1938-39.
A Statement Showing the Number of Fisheries Licenses issued in 1938-39 A Statement Showing the Number of Lobster Fishing Licenses issued each
year since 1928.
REVIEW OF FISHERIES RESULTS FOR THE CALENDAR YEAR 1938
Commercial landings of fish and shellfish by Canadian fishermen in 1938 showed some decrease from the total for 1937, but the marketed value of the year's production, $40,492,976, showed an increase of more than a million and a half, and was greater than the marketed value of any other year since 1930. Total catch from sea and freshwater fisheries was 10,741,150 hundredweights, or approximately 176,900 hundredweights less than in the year before. The
5

6 DEPARTMENT OF FISHERIES
decrease was in the landings from the sea fisheries, which amounted to 9,845,723 hundredweights as against 10,026,396 hundredweights in the preceding year. The landings from the inland or freshwater fisheries, 895,427 hundredweights, increased by between three and four thousand hundredweights. The landed value of the sea fisheries catch or, in other words, the value of the catch to the fishermen as landed, increased by more than $58,000, notwithstanding that the aggregate quantity of fish and shellfish taken during the year was smaller than the catch of 1937. On the other hand, in the case of the inland fisheries there was a decrease of slightly more than $422,000 in landed value, in spite of the fact that the catch had increased. On the marketed value side the increase was in the return from the sea fisheries—a gain of $1,790,101. The marketed value of the catch from the inland fisheries, $6,718,828, decreased by $273419. Five of the provinces (Manitoba, Alberta, Prince Edward Island, Quebec and British Columbia) had increases in marketed value to their credit, as will be seen from the table below. The great gain, however, over $2,517,000, was in British Columbia.
Major Fisheries.—Taking the Dominion as a whole, the salmon fishery again led in the marketed value of the year's catch. There was an increase of more than 42,500 hundredweights in the landings of salmon, and their marketed value, $14,992,500 roundly stated, was grea.ter by over $2,622,000 than the marketed value for 1937. The lobster fishery, second to the salmon fishery in point of marketed value return, yielded an increased catch as compared with the 1937 total, but a weakening of the prices in export markets had the effect of reducing marketed value by more than $840,000. The value of the lobster catch as marketed was $3,793,219. In the case of the cod fishery, there was an increase both in catch and marketed value. The landings by the cod fishermen, approximately 1,702,000 hundredweights, increased by nearly 178,400 hundred-weights, and their marketed value, $3,335,231, showed a gain of $195,000. The herring fishery was not as successful as in the preceding year, and both catch and marketed value decreased. Whitefish were again of first importance in the freshwater fisheries, although catch and value alike decreased. Total landings of whitefish -svere 154,244 hundredweights and their marketed value was $1,650,347 which meant a decrease of approximately 19,400 hundredweights on the one side and $237,500 on the other side. Other fish to show marketed value of more than one million dollars were as follows, some of them taken in the sea fisheries, others in freshwater operations: Halibut, $1,789,444; sardines, $1,393,- 129; haddock, $1,361,992; trout, $1,036,292; pickerel, $1,031,868.
Employment and Capital Investment.—Gear, equipment and plants in use in the fisheries during the year represented a total capital investment of $48,- 561,442, or $3,634,700, roundly stated, above the investment of 1937. The major part of the increase, nearly $3,629,000, was in the investment in the sea fisheries, and was accounted for by additional investment in canning and curing establishments. Total investment in boats, vessels, gear, etc., used in primary operations was less by $197,000 than it had been in. 1937, and totalled a little less than $26,599,000.
The total number of persons directly employed in fisheries operations during 1938 was 85,994, or 1,969 more than the number employed in the pre-ceding ye,ar. Of the total number, 57,034 were engaged in the primary oper-ations of the sea fisheries, 14,376 in primary freshwater operations and the remainder, 14,484, were at work in canning and curing establishments connected with the sea fisheries.
Marketed value of the 1938 production, by provinces, is shown in Table I below, as well as comparative figures for each of the three preceding years. Table II shows marketed value figures for the sea fisheries and freshwater fisheries, respectively, for 1938.

British Columbia Quebec* New Brunswick* Prince Edward Island Nova Scotia
Totals
1937
lbs.
495,419,500 71,596,600
137,790,700 27,525,000
270,307,800
1,002,639,600
1938
lbs.
456,286,400 86,507,800
127,173,100 29,420,400
285,184,500
984,572,300
REPORT OF THE DEPUTY MINISTE1?
TABLE I
MARKETED VALUE BY PROVINCES
— 1938 1937 1936 1935
S $ $ S
Nova Scotia 8,804,231 9,229,834 8,905,268 7,852,899 New Brunswick 3,996,064 4,447,688 4,399,735 3,949,615 Prince Edward Island 930,874 870,299 953,029 899,685 Quebec 1,957,279 1,892,036 2,108,404 1,947,259 Ontario 3,353,775 3,o15,666 3,209,422 2,852,007 Manitoba 1,811,124 1,796,012 1,667,371 1,258,335 Saskatchewan 468,646 527,199 367,025 252,059 Alberta 492,943 433,354 309,882 225,741 British Columbia 18,672,750 16,155,439 17,231,534 15,169,529 Yukon 5,290 8,767 13,385 20,725
Totals 40,492,976 38,976,294 39,165,055 34,427,854
TABLE II
— Sea Inland Total
S $ S
Nova Scotia 8,804,231 8,804,231 New Brunswick 3,971,599 24,465 3,996,064 Prince Edward Island 930,814 930,874 Quebec 1,394,694 552,585 1,957,279 Ontario 3,353,775 3,353,775 Manitoba 1,811,124 1,811,124 Saskatchewan 458,646 458,645 Alberta 492,943 492,943 British Columbia 18,672,750 18,672,750 Yukon 5,290 5,290
Totals 33,774,148 6,718,828 40,492,976
SEA FISHERIES RESULTS
Figures showing by provinces total commercial production of sea fish and shellfish during ea,ch of the calendar years 1938 and 1937 are given in the following table:
* Some reference to inland fisheries production in Quebec and New Brunswick will be found on page 10 and in the report of the Eastern Chief Supervisor, which begins on page 22.
Detailed references to the results of operations in various sea fisheries will be found in Appendix No. 1, which embodies the respective reports of the department's Chief Supervisor, Eastern Division, and Chief Supervisor, Western Division. It will be sufficient here to point out that production in most of the
7

8 IMPARTMENT OF FISHERIES
more important fisheries was greater in 1938 than it had been in 1937 though aggregate catch from the sea fisheries decreased. Total Atlantic coast landings of cod, for instance, amounted to 168,338,800 pounds, or approximately 17,- 400,000 poun.ds more than in 1937. Atlantic herring landings, 114,906,400 pounds, were about 7,160,000 pounds greater than in the preceding year. The haddock, lobster, mackerel and sardine fisheries each showed an increase in catch, with the totals for 1938 amounting to 39,358,900 pounds in the case of haddock, 31,438,500 pounds of lobsters, 28,556,500 pounds of mackerel and 184,450 barrels of sardines.
On the Pacific coast the catch of salmon was 173,466,400 pounds, as against 169,173,600 in 1937. The quantity of halibut landed in British Columbia by Canadian fishing vessels wa,s 12,024,700 pounds, an increase of 303,000 pounds in round figures. British Columbia's herring production, however, decreased quite sharply and amounted to slightly less than 132,892,000, as compared with 192,979,500 pounds in the preceding year. While the herring catch decreased, the landings of pilchards, like the landings of salmon and halibut, showed a gain. In 1937 the pilchard fishermen landed 96,148,500 pounds, but in 1938 their catch was 103,537,000. The combined landings from all of British Columbia's fisheries were less in 1938, however, than it had been in the previous year.
The Lobster Fishery.-The lobster fishery in the -three Maritime provinces and in the Magdalen Islands comes under the department's administration and a number of references to it will be found in the Eastern Chief Supervisor's report in Appendix No. 1. In the mainland areas of Quebec, however, admin-istration of all the fisheries is in provincial hands. The following table gives the figures of lobster catch, pack, shipments in shell, meat and tomalley for each of the four Atlantic provinces and for the Magdalen Islands, separately, for the years 1938, 19 7, 1936 and 1935:
CATCH
1938 1937 1936 1935
Marketed "-w`s" , , Marketed ,--, , Marketed ,, , Marketed
Cwts " Value Value ._,,w Ls. value ,,w Ls. Value
S S S S
Nova Scotia 155,405 2,282,169 158,961 2,757,880 145,091 2,570,274 176,836 2,732,872 New Brunswick 68,474 721,612 72,586 1,089,002 56,499 916,850 54,831 818,699 Prince Edward
Island 71,213 606,134 58,238 538,792 59,286 614,789 63,876 605,107 Quebec, including
Magdalen Ilds 19,293 183,304 20,165 247,755 22,397 281,515 24,426 222,064 (Magdalen Ilds) 17,181 155,917 17,304 199,527 19,696 251,426 21,707 193,765
*Totals 314,385 3,793,219 309,950 4,633,429 283,273 4,383,428 319,969 4,378,742
SHIPPED IN SHELL
Nova Scotia 82,530 1,423,138 89,904 1,816,015 73,158 1,535,573 90,840 1,652,082
New Brunswick 18,554 264,267 23,528 422,708 19,750 375,899 20,537 381,092
Prince Edward , Island 11,072 117,044 2,064 26,153 2,743 35,939 2,991 32,430
Quebec, including
Magdalen 'Ids 6,435 59,29 8,057 101,623 7,134 86,276 783 8,200
(Magdalen 'ids ) 4,839 38,485 6,058 64,148 5,842 72,668
*Totals 118,591 1,864,278 123,553 2,366,529 102,785 2,033,687 115,151 2,073,504

9 REPORT OF THE DEPUTY MINISTER
QTJANTITY C..A.NNED
1938 1937 1936 1935 -
Marketed Marketed Marketed Marketed Cases Cases Cases Cases Value Value Value Value
S S $ S
Nova Scotia 37,838 734,086 34,649 817,814 37,690 960,621 46,863 1,021,258 New Brunswick 23,060 403,473 26,957 624,128 20,428 512,055 18,275 404,260 Prince Edward
Island 24,625 474,397 20,952 497,846 22,345 563,286 25,170 556,596 Quebec, including
Magdalen Ilds 6,481 121,841 6,023 144,332 7,639 194,005 9,597 213,519 (Magdalen Ilds ) 6,223 115,843 5,623 134,448 6,927 177,714 8,656 193,615
*Totals 92,004 1,733,797 88,581 2,084,120 88,102 2,229,967 99,905 2,195,633
* Totals are for the four provinces.
TOIALLEY
1938 1937 1936 1935
Marketed Marketed Marketed Marketed Cases Cases Value Cases Value Cases Value C Value
S •
$ S S
Nova Scotia 3,684 33,873 3,588 37,250 3,668 35,512 3,528 33,560 New Brunswick 686 5,128 1,215 10,039 1,174 9,796 617 4,497 Prince Edward
Island 1,559 14,198 1,155 11,935 1,499 15,564 1,358 15,661 Quebec, including
Magdalen Ilds 119 1,094 174 1,080 128 1,234 36 345 (Magdalen Ilds ) 116 1,049 155 931 108 1,044 15 150
*Totals 6,048 54,293 6,132 60,304 6,469 62,106 5,539 54,063
LOBSTER MEAT
1938 1937 1936 1935 _
Marketed Marketed Marketed Marketed
Cwts • Value Cwts * Value Cwts* Value Cwts * Value
S S S S
Nova Scotia 1,131 91,072 1,149 86,771 535 38,568 510 25,972 New Brunswick 974 48,744 635 32,127 382 19,100 577 28,850 Prince Edward
Island 11 495 62 2,858 6 420 Quebec, including
Mtwd alen Ilcls... 12 540 12 720 (Magdalen Ilds.) 12 540
*Totals 2,128 140,851 1,853 122,476 917 57,668 1,093 55,242
* Totals are for the four provinces.
INLAND FISHERIES
Two of the areas in which freshwater fisheries are carried on, Alberta and Manitoba, showed increase in the value of fisheries production in 1938 as com-pared with 1937, but elsewhere there were decreases, with the net result that freshwater production as a whole was valued at only 86,718,828, or $273,400
less, in round figures, than in 1937. The major decrease, close to $262,000, was in Ontario, and here the reduction was due in much the largest part to the lessened success of the blue pickerel fishery. The catch of blue pickerel-it is only in Ontario that this particular species of fish is taken-was less by some 21,300 hundredweights than in the year before when it had totalled about
67275-2

1938 1937
Fresh and Frozen Fish Canned Fish Salted, Pickled and Smoked Fish Miscellaneous Fish Products Fish and Whale Oils
11,344,300 10,208,200 3,740,700 1,237,300
975,500
12,182,300 10,608,800 3,982,500 1,210,400
849,900
10 DEPARTMENT OF FISHERIES
94,500 hundredweights, roundly stated. The marketed value of the 1938 catch, slightly over $497,500, showed a decrease of $315,100.
The gain in Alberta was $59,600, and in Manitoba $15,100. In Saskatche-wan's fisheries there was a decrease of $58,500 in marketed value, while in the case of Quebec's freshwater fisheries, the reduction was $21,200. New Bruns-wick's inland output fell off by nearly $3,000, and in the Yukon Territory there was a decrease of close to $3,500. Round figures have been given here in all cases. The following table shows the catches of the principal varieties of fresh-water fish in 1938 and each of the three preceding years:
- 1938 1937 1936 1935
cwt. cwt. cwt. cwt.
Whitefish 154,244 173,675 144,603 147,456 . Pickerel 128,812 143,020 145,635 109,548
Tullibee 57,932 55,966 59,265 39,721 Trout 72,555 70,588 72,825 , 66,242 Pike 62,283 51,320 54,370 44,761 Herring 55,700 50,236 50,919 34,536 Perch 43,067 34,672 31,090 71,153 Blue pickerel 73,171 94,496 68,995 51,230
FOREIGN TRADE IN FISHERIES PRODUCTS
,Canada's most important single export market for fisheries products is in the United States and when general business was somewhat less brisk in that country in 1938 than it had been in 1937 Canadian fish sales across the border decreased quite substantially, and that tells the major part of the story, of a drop in the Dominion's foreign fisheries trade during the year. Total export trade, $27,506,000, roundly stated, was $1,327,000 below the 1937 total and of this reduction over $1,271,000 was in the business done with the United States. Import trade in fisheries produetprincipally trade in sardines from Norway and canned tuna and crabs from Japan and the United States-was approx-imately $190,000 greater than in 1937 or $2,962,000 but, even at that, it was only about a ninth as great as the export business.
Sales to Great Britain, the country second in importance among the export customers of the Canadian fishing industry, increased by about $170,000. In the case of trade with countries other than Britain and the United States the year brought a decrease of over $225,000.
Given in round figures, the value of the exports in 1937 and 1938, respect-ively, were as follows:
1938 1937
27,506,000 12,709,300 6,847,600 7,949,000
28,833,000 13,980,700 6,678,100 8,175,000
Total Sales Sales to the United States Sales to the United Kingdom Sales to Countries Other than the United States and the United Kingdom
Shown by classes of products, the trade for 1938 and the preceding year was as follows, with round figures used in all cases:

REPORT OF THE DEPUTY MINISTER 11
Much the greater part of the export business in fresh and frozen fish is done, of course, with the nearest market, the United States, but it is possible to -make deliveries to much more distant countries and halibut and salmon in the aggregate amount of more than 8,171,000 pounds, and valued at nearly $1,203,500, were shipped to the United Kingdom, in addition to some smaller sales to other overseas markets. The trade with the Old Country in frozen halibut, mainly from British Columbia, increased by 50 per cent in volume, as compared with the 1937 trade, and by something more than 50 per cent in value. In the year's " fresh and frozen " trade with the United States, live lobsters were the product of first importance, from the dollars-and-cents standpoint, with sales totalling nearly 10,688,000 pounds in quantity and $1,952,000 in value. Other large items entering into the business with thé United States in fresh and frozen products were whitefish, valued at approximately $1,514,900, smelts, $620,900, salmon, $574,150, halibut, $555,400, trout, $526,100, cod, $253,100 and haddock, $191,400.
.Canned salmon continued to hold first place, reckoning in value, not only among the exports in the canned fish group but among all kinds of fisheries exports. Shipments of this product (practically all of Canada's pack of canned salmon is put up in British Columbia) went to nearly forty different export markets and were valued in •all at about $7,128,000. Business was not quite as satisfa,ctory, however, as it had been in 1937, and that was the case also as regards the business in canned lobsters and canned sardines, Atlantic Coast products, which ranked next after salmon in export importance as rated in dollars. The major share of the external trade in canned lobsters was done with the United Kingdom, Sweden, the United States and France and in canned sardines with Australia and British South Africa although sardine sales were made to some twenty other countries. Britain purchased more Canadian lobster than in 1937, or .2,775,800 pounds as compared with 2,225,400, but ship-ments to the rest of the world decreased. Canned sardine trade was not quite as good as in 1937.
The decrease of approximately $241,000 in the value of the exports of salted, pickled and smoked fish was not an. occasion for much surprise, keeping in mind the unsettlement of conditions which has existed in many of the prin-cipal markets for these products in the past few years. The disturbed situation in the Far East was sufficient in itself to account for more than half of the net decrease when it resulted in a. sharp fall in the exports of drysalted herring from British Columbia to China and Japan. The reduction in the business in dried fish from the Atlantic Coast was about $63,000.
Bigger trade in pilchard oil was the main factor in raising total export business in oils above the 1937 figures. Exports of pilchard oil—all of Canada's pilchard oil comes from British Columbia— were more than twice as large as they had been in the preceding year, or 1,788,165 gallons; the value increase, though not proportionate to the rise in volume, reached the respectable sum of $85,300. Exports of cod liver oil increased both in volume and value. There was decrease in the quantity of whale oil shipped abroad but its value, close to $145,000, was less than $5,000 below the 1937 mark.
Fish meal is the principal commodity in the " -Miscellaneous Products " grciup but, as a matter of fact, it was oth-er products which lifted the 1938 export total for this group above the 1937 level. Canadian fish meal goes in largest part to two countries—the United States and the United Kingdom; in 1938 the British purchases increased substantially but the sales to the United States were well below the 1937 figures. All told, the business in meal decreased by $81,150. The decrease in the dollar return from the meal sales was offset, with a few thousand dollars left to the good, by improved business in bait fish, fish offal, and fish livers. It was the trade in fish livers which accounted in most part for the betterment. Over 20,300 hundredweights of livers, principally
87275-2h

12 DEPARTMENT OF FISHERIES
halibut livers, were shipped out of the country as against 7,100 hundredweights in 193-7 and they were valued at nearly $280,100 as against less than $215,000. Nearly all of the liver sales Were to the United States.
DIRECT ASSISTANCE TO FISHERMEN
Helping fishermen through joint federal-provincial action to re-establish themselves in the fishing industry, or better establish themselves, a plan 'adopted in 1936-37 and continued in the following year was again ,carried out in 1938-39. Grants, loans and the cost of some equipment aids, including emergent grants to enable fishermen in the Maritime Provinces to replace gear which had been destroyed in some exceptionally severe storms, totalled $471,106.20 during 1938-39. Of this total $369,443.57 was ,contributed from the funds of the Departnient of Fisheries. The remainder of the money was contributed, in varying shares, by co-operating provinces—Nova Scotia, New Brunswick, Prince Edward Island and Quebec—under respective agreements made by them with the department.
Leaving out of the reckoning those fishermen who were aided by means of the emergent "storm grants," 14,308 fishermen and 36 associations of fishermen in the Maritime Provinces and Quebec received direct financial assistance in the total amount of $386,424.38, and $295,732.98 of this total was contributed by the department,. Shown by provinces, the numbers of individual fishermen and associations receiving aid, and the aggregate sums they received, were as follows:—
NOVA SCOTIA Fishermen obtaining loans or other assistance.. .. Associations obtaining loans.. ..
Total amount of loans.. .'.. Contributed by department toward total..
NEW BRUNSWICK Fishermen obtaining loans or other assistance.. . 3,163 Association obtaining a loan.. .. 1
Total amount of loans and other aid.. .. 871,864 70 Contributed by department toward .. .. 47,909 80
PRINCE EDWARD ISLAND Fishermen receiving loans.. .. 1,212 Associations receiving loans.. .. 22
Total amount of loans and other aid.. .. 389,219 66 Contributed by department toward total.. .. .. 59,479 77
QUEBEC* Fishermen receiving loans or other assistance.. '8,883
Total amount of loans, etc.. .. .. $147,438 13 Contributed by department toward total.. .. 139,634 84
*The fishermen receiving aid in Quebec were men in the Magdalen islands and in Bonaventure, Gaspe, Matane and Saguenay counties.
It was in the Maritime Provinces that the great damage was done to fishing equipment by severe storms in the latter part of 1938 and it was there that the department granted some special financial aid for the specific purpose of assisting the fishermen to replace the gear that was destroyed. Each of the
• three provincial governments also contributed to replacement .costs. In New Brunswick the departmental contribution amounted to $4,404.36. In Prince Edward Island the department paid $19,206.23. In the .case of Nova Scotia, where the damage to gear was greatest, the department made a grant of $50,000.
ASSISTING FISHERMEN BY SALES PROMOTION
Continuing the plan first put into effect in 1936-37 and 'again followed in 1937-38, the department assisted the fishermen in 1938-39 by carrying on a nation-wide publicity campaign- designed to increase Canadian demand for
1,050 13
$70.614 24 48,808 57

13 REPORT OF THE DEPUTY MINISTER
Canadian fish products. At the same time, and with the same object in view, the department also continued to employ lecturer-demanstrators who, by cookery demonstrations and addresses, urged the merits of Canadian fish foods upon the attention of housewives and sought thereby to expand household purchases of the fish and shellfish which the fishermen have to sell. In the course of the fiscal year the two lecturer-demonstrators then employed held demonstrations and meetings at which thousands of women, in the aggregate,. were present. For the most part these employees were at work in Central Canada, where there is the greatest concentration of consuming population, but some demon-strations and meetings were ,held elsewhere. In general it is the department's palicy to carry on this particular branch of its activity in the inland parts of the Dominion rather than in the coastal districts where most of the people may naturally be expected to be already acquainted with the value of fish foods and the methods of preparing them for the table. The lecture-demonstration programs are highly regarded by the fishing industry and representations have been made to the department that they should be extended. Under these circumstances, and since the department is itself convinced of the usefulness of this work, steps are being taken to .add to the number of women employed as lecturer-demonstrators.
Except in points of detail, the publicity campaign of the year was much the same as those of the two preceding yea.rs, which .had been commended by the Canadian Fisheries. Association and representative people in the industry as being productive of very helpful results. Advertisements were published at frequent intervals in practically all classes of publications in all parts of the Dominion. They were so drafted as to emphasize the excellence of sea products und freshwater fish and the various forms in which the catches are marketed-fresh, frozen, canned, smoked, dried and pickled. In other words, they kept in mind the interests of the fishermen in all sections of the country and the interests of the producers of fresh and processed fish alike. Accompanying the publication of the advertisements there was large-scale distribution of a new fish cook-book, 100 Tempting Fish Recipes, which had been prepared by- the depart-ment's lecturer-demonstrators. An earlier booklet, Any Day a Fish Day, had already been distributed among Canadian women in large numbers. The demand for the later cook-book is significant of the widened interest in Canadian fish foods which has been created by the department's publicity campaigns.
Although the general plan followed in .connection with the 1938-39 cam-paign was much the same as those previously pursued there were two departures which might be noted as of some importance. One was the use of radio adver-tising, which was broadcast over more than thirty stations under arrangements made with the Canadian Broadcasting Corporation. The other was the extension of efforts by which written and pictorial material relative to the Dominion's fisheries and fish foods was made available .to different classes of Canadian publications. This latter action, in particular, proved to be of a good deal of value. It may be noted, as a matter of record, that the year's distribution of information regarding the fisheries and fish foods was more widespread than it had been at any time previously.
The parlianaentary appropriation from which the .costs of the publicity campaign were met had earmarked the funds for use in expanding the demand for the fishermen's products at home and ,abroad. Out of the sum voted, $150,000, the department transferred $15,000 to London for use in advertising canned salmon and lobster in the "Canada Calling " campaign which was undertaken in the interests of Canadian products generally. The renaainder of the appropriation, save for a small amount, was expended within the Dominion.

14 DEPARTMENT OF FISHERIES
FISHERIES PRODUCTS INSPECTION
Fish curing plants, canneries, various classes of fish products, and the con-tainers used in marketing certain of these products are inspected under the authority of the Fish Inspection Act and the Meat and Canned Foods Act. Inspections are made under the Fish Inspection Act in the case of certain pickled and smoked fish, and in the case of oysters and frozen smelts, while inspections relating to fish canneries and canned products are conducted under authority of part of the Meat and Canned Foods Act. Except in the case of canned salmon the inspection is performed as part of the work of the department's regular fishery inspectors, who are prepared for this particular part of their duty by special courses of study. Since practically all of Canada's output of canned salmon is packed in British Columbia inspection of this commodity is carried out by the Canned Salmon Inspection Laboratory, established by the depart-ment for this purpose at Vancouver in 1936. The laboratory is staffed by trained chemists.
A report giving details of the inspection work carried on during 1938 under the Fish Inspection Act will be found in Appendix No. 5, while detail as to the inspection of canned salmon is treated separately in Appendix No. 6.
During 1938 inspection of canned salmon nearly 1,619,700 cases-1,619,659 1f to be exact—were found eligible for certification as being of approved quality.
Approximately 24,500 cases measured up to Grade B standard or, in other words, they were sound, wholesome and fit for human food, though not fully up to certificate requirements. Out of all the great quantity of canned salmon in-spected less than 900 cases were found to be below Grade B standard and therefore subject to confiscation. Several thousand cases, about 6,800, eontained tips and tails or minced or flaked salmon and these products are not eligible for certification under the salmon inspection regulations.
Changes in the regulations under the Fish Inspection Act early in the year extended oyster inspection to "Cup Shaped Oysters", and the grading of frozen smelts was extended to the entire coast of New Brunswick. The latter extension was made after some experience with such inspection and grading on certain parts of the east coast of the province during the previous year. In 1938 there were 160,921 boxes of frozen smelts inspected and graded as compared with 7,481 boxes during 1937. During the year fifty-six permanent officers were engaged in the inspection work, assisted by thirty-eight temporary employees, with most of the latter employed in grading smelts in New Brunswick where satisfactory results were secured.
Details of the inspections under the Fish Inspection Act will be found in Appendix No. 5, as previously mentioned, and it is not necessary to go into them here.
FISH CULTURE
Fish culture work was carried on by the depa.rtment in 1938 in Nova Scotia, New Brunswick and Prince Edward Island, where the fisheries are under federal administration. Thirteen main hatcheries were in operation, one subsidiary hatchery, six rearing stations, eight salmon retaining ponds and several egg-collecting camps. Operations were concerned with the more important fresh water and anadromous food and game fishes such as Atlantic, sebago and ouana-niche salmon, and speckled, brown, rainbow and salmon trout. In addition over 1,000,000 sockeye salmon eggs were planted in Hillier creek, tributary to
addition,
lake, Vancouver Island, in continuation of the stocking effort, begun in 1937, to add these waters to the sockeye reproducing area of the Barkley Sound district. The total output for 1938 slightly exceeded 33,685,000.
A detailed report on fish culture operations during the calendar year 1938 is to be found in Appendix 2.

REPORT OF THE DEPUTY MINISTER 15
PROGRESS OF OYSTER FARMING
Growth of the department's oyster culture program in Prince Edward Island, and preliminary development of a similar program in some parts of Nova Scotia are indicated in detail in Appendix No. 4. It is only in Prince Edward Island and Nova Scotia, and on a small strip of the New Brunswick coast where beds were transferred to federal authority for investigational and experimental purposes several years, ago, that control of the oyster areas is in the hands of the department. In New Brunswick, apart from the one small section of coast, and in British Columbia, the Dominion's fourth oyster producing province, oyster areas are under the jurisdiction of the respective provincial governments.
Active development of commercial oyster culture has been under way since 1932 in Prince Edward Island where control of the oyster areas was transfered to federal authority in 1928 and where, following preliminary investigation, oyster planting was undertaken on a commercial scale by oyster "farmers" employing plans of operation suggested by the department. In 1932 the number of areas under cultivation was 26 and by 1938 it had increased to 594.
The Nova Scotia Government transferred the oyster areas in that province to Dominion control in 1936, and investigation work preparatory to an effort to increase production of oysters in the.se waters is now under way. Two areas are under active study and approval was given during the year to 30 applications for leases by persons wishing to undertake oyster farming in the Bras d'Or Lake region in Cape Breton. A similar number of leases issued by the provincial government before transfer of control are still in force. Approval was also given in 1938 to a smaller number of leases on the Gulf of St. Lawrence coast of the province. Additional applications have been received and are under examination.
A glance at some of the tables in Appendix No. 4 will show further progress made in Prince Edward Island during the year. As already stated, the total number of "oyster farms" in operation during 1938 wa.s 594 and they had an acreage of 2,130 acres. This represente,d an increase of 131 farms over the 1937 number and an increase in acreage of some 440 acres.
Though wisely paying more attention to the building up of stock on the beds than the pushing of immediate sales, nevertheless the farmers are gradually expanding their sales. In 1938 the "oyster farms" marketed 4,300 barrels of oysters compared to some 1,950 barrels in 1937. The careful building up of the stock is being undertaken in an effort to permit a much larger quantity of oysters being marketed a few years hence. In 1938 the oyster farmers planted 9,620 barrels of oysters on their "underwater farms", as against 5,175 barrels in the year preceding.
FISHING BOUNTY PAYMENTS
Payment of fishing bountfes under authority of "An Act to Encourage Development of Sea Fisheries and Building of Fishing -Vessels," reached a total for the year of $159,982.70. Owners of fishing boats and vessels and fishermen in Prince Edward Island received $14,991.05, in New Brunswick similar groups received $21,344.60, in Quebec, $41,784.10, and in Nova Scotia $81,862.95. In all the number of boat owners receiving bounty numbered 11,660, while the number of vessel owners was 734. Boat fishermen receiving the bounty num-bered in total 19,933, and vessel fishermen 3,707.
The basis of distribution for 1938 was as follows: (1) To owners of vessels entitled to receive bounty, $1 per registered ton, payment to the owner of any one vessel not to exceed $80; (2) to vessel fishermen entitled to receive bounty, $6 each; (3) to owners of boats measuring not less than I2-foot keel, $1 per boat; (4) to boat fishermen entitled to receive bounty, $5.55 each.

174 226 553
413 618 926 240
71 640
31 203 309 793 306 158
5
40
21 40 46
3
77
14 81 86 13 56
105
616
304 541 620
39
3,623
184 981
1,628 185 816
20
15
15 14 14 13
47
13 12 19 14 15
33
196
73 146 190
14
1,090
63 226 489
46 209
303 602 236
30 3
28 81
11 17 11 10
16 708
3 12
1
10 58 11
10 14 11
18 734 3,707 13,388
124 439
13 16
11 208 563 1,811 00
DEPARTMENT OF FISHERIES
The following table shows the distribution of bounty, by counties, in the four provinces affected:-
1938-39
16
Men Tons Men Aver- age
Tons
Total Amount Province and County Boats Amount Vessels Amount
5,666 482 9,642 20 2,775
6 165
9 15
69 2,781
96 158
16 640
25 27
1,283 195 3,104
183 793 350
1 4 1
11,660
458 2,278
107 542
3,385
1,326
39
51
12
6 79
10 11 165
43
Nova Scotia- Annapolis Antigonish Cape Breton Cumberland Digby Guysboro Halifax Inverness Kings Lunenburg Pictou Queens Richmond Shelburne Victoria Yarmouth
Totals
New Brunswick- Charlotte Gloucester Kent Northumberland Restigouche Saint John Westmoreland
Totals
Prince Edward Island- Kings Prince Queens
Totals
Quebec- Bonaventure Gaspe Matane Saguenay
Totals
Grand Totals
270 343 758
5 724
1,008 1,253
570 93
799 49
329 505
1,287 435 337
8,765
551 1,078
411 48
6 43
130
2,267
258 1,487
631
2,376
857 4,511
175 982
6,525
19,933
$ cts.
1,67250 2,129 65 6,006 80
32 75 4,431 20 6,212 40 7,880 15 3,403 50
587 15 5,074 45
302 95 2,028 95 3,111 75 7,935 85 2,720 25 2,028 35
55,558 65
3,361 05 6,713 65 2,517 05
296 40 36 30
265 65 802 50
13,992 60
1,614 90 9,221 35 3,979 80
14,816 05
5,251 20 27,516 55
1,078 25 6,127 10
39,973 10
124,340 40
cts.
303 00
1,804 30
742 00 1,417 00 1,760 00
123 00
10,163 00
562 00 2,337 00 4,562 00
461 00 2,070 00
26,304 30
165 00 6,621 00
246 00 320 00
7,352 00
28 00 130 00
17 00
175 00
38200 1,429 00
35,642 30
S cts.
1,975 50 2,129 65 7,811 10
32 75 5,173 20 7,629 40 9,640 15 3,526 50
587 15 15,237 45
302 95 2,590 95 5,448 75
12,497 85 3,181 25 4,098 35
81,862 95
3,526 05 13,334 65 2,763 05
616 40 36 30
265 65 802 50
21,344 60
1,642 90 9,351 35 3,996 SO
14,991 05
5,633 20 28,945 55
1,078 25 6,127 10
41,784 10
159,982 70
Nova.-A number of "Late" claims amounting in all to S5,193.50, which are included in this statement, are for the season of 1937. As the basis of distribution for 1937 difiered from that of 1938, a number of ihe figures in the "Amount" columns do not, therefore, balance with the number of claims paid.
PELAGIC SEALING RETURNS
Delivered to the Canadian authorities by the United States Government under the terms of the Pelagic Sealing Treaty of 19 1 1, Canada's share of the fur seal skins taken on the Pribilof Island rookeries in 1938 amounted to 8,755 skins. This represented a slight increase over the return to Canada in 1937, which totalled 8,277 skins. The Dominion's share of the skins from the Pribilof Island rookeries, as set by the treaty, is fifteen per• cent in number and value of the total annual take.
The Pribilof seal herds, reduced to less than 150,000 at the time when the treaty became effective, have shown an increase of ten fold and more under the

REPORT OF THE DEPUTY MINISTER
protection given them since 1911. In August, 1938, the herd total, as estimated by the United States authorities, reached nearly 1,900,000 seals.
In recent years the plan for the disposal of the Canadian share of the seal skins has provided for the marketing of the pelts in London. Previously, the Dominion did not concern itself directly with marketing, the sales of all Pribilof pelts being carried out by the United States authorities who paid Canada fifteen per cent of the amount received. The decision reached by the Dominion author-ities in 1933 to sell the Canadian share of the skins in London brought very satisfactory results at first. During the past two years, however, a new situa-tion has arisen in that the market in London has been less favourable, both as to price and demand for sealskins generally. In 1938-39 Canada sold 5,259 skins at the London fur auctions, securing a net return of $38,371.60, but that was less by $6,000, in round figures, than the net amount received in 1937-38. There was only a slight decrease, less than a hundred, in the number of skins sold, as compared with the figures for the preceding year, but the return per skin decreased quite sharply.
In addition to her share of the Pribilof Island skins, Canada is also entitled, under the Pelagic Sealing Treaty, to a ten per cent annual share of the pelts taken on Japanese and Russian rookeries. In 1938-39 Japan paid Canada $983.57 as the proceeds from the sale of 214 skins.
INSTRUCTIONAL -WORK AMONG FISHER -MEN
Continuation and extension of special work among the fishermen in a number of Atlantic Coast areas was a major part of the educational program carried on by the department during the past year. Conducted for the depart-ment by adult education specialists from St. Francis Xavier University, this work is designed to assist fishermen in studying their problems and in organ-izing for joint action to solve those problems. It is carried on in areas where, for one reason or another, there are local conditions which place the .fishermen in need of assistance of this kind.
The work was begun in some fishing communities in northeastern New Brunswick in 1936-7. Subsequently, it was extended to the Magdalen Islands, the only part of Quebec where the fisheries are under federal administration. In the course of 1938-9 it was extended also to Prince Edward Island districts as well as to Cape Breton Island and some other parts of Nova Scotia. Under the plan which is followed by adult education workers the fishermen are helped to organize and conduct study clubs, to form associations which usually affiliate with the United Maritime Fishermen—an organization of commercial fishermen of the Maritime Provinces and the Magdalen Islands—and, where they desire to do so, to establish co-opérative groups. Since the work was first undertaken a number of groups in the areas covered have taken up co-operative lobster canning and have also entered into some other co-opera-tive activities. _ •
The expense to the department in connection with this special educational work is the actual cost only. During 1938-9 the outlay was slightly less than $27,400. It is planned to continue the work during 1939-40. The question of giving financial assistance toward the development of broadly similar work in some British Columbia areas is receiving attention.
The past year also saw the continuation of instructional work among fishermen in certain branches of fish processing. Reference to this subject will be found in Appendix No. 5. The same appendix deals in some detail with educational courses for fishermen given by the Fisheries Research Board. All of the investigations and experiments carried on by the board are under: taken, of course, to serve the interests of the fishermen and the fishing industry generally; the research work of the past year is not dealt with here since it is reviewed in the board's own annual report.
17

18 DEPARTMENT OF FISHERIES
PACIFIC HALIBUT COMMISSION During the year the International Fisheries Commission continued its
investigation of the life history of the Pacific halibut and the observation and regulation of the halibut fishery, as provided in the treaty of January, 1937, between Canada and the United States. The investigations indicated that the stocks of halibut were continuing to increase as a result of regulation.
Regulations governing fishing in 1938 were similar to those issued in August of the preceding year, in most respects. They again provided for the closure of Area 2 by means of a last date of fishing and for the closure of Area 3 by a last date of clearance for fishing and a subsequent last date of fishing. They con-tinued the provision for the retention and landing of a limited proportion of halibut caught incidentally to fishing for other species with set lines in areas closed to halibut fishing. They changed the previous regulations by increasing the catch limits in Areas 2 and 3 by one million pounds each, to 22,700,000 and 25,300,000 pounds respectively, and by prohibiting the use of set nets for the capture of halibut.
The 1938 halibut fishing season opened on April 1, sixteen dayS later than in 1937. In spite of the later opening date and the increased quotas, the catch limits were attained and Area 2 was closed to halibut fishing upon the same date as in 1937 and Area 3 only ten days later than in the previous year. Areas 1 and 2 were closed to halibut fishing at midnight of July 28, with catches of approximately 706,000 and 22,923,000 pounds respectively. September 29 was set as the last date of clearance for Area 3, and the area was closed to fishing at midnight of October 29, with a catch taken of approximately 25,591,000 pounds. No halibut were landed from Area 4 which was closed at the same time as Area 3.
Permits for the retention and sale of a limited proportion of halibut caught incidentally to fishing for other species in Areas 1 and 2 after closure to halibut fishing were granted until October 17 and were valid until midnight of October 29. Under this provision of the regulations, designed to avoid wastage of halibut caught incidentally by the cod fishery, approximately 280 ,000 pounds of halibut were landed from Area 2.
Close contact with the fishing industry, which • has contributed greatly to the success of the commission, was maintained as in previous years. On December 9 at Seattle, the commission met with the Conference Board, com-posed of representatives of the fishing fleets in the different ports, to give the fishermen an opportunity of presenting their views on matters pertaining to the regulation of the fishery. During the year many fishermen also availed them-selves of the commission's standing invitation to visit its laboratory and to learn at first hand the results of the investigations and the scientific basis under-lying every action of the commission.
The scientific investigations of the commission were continued along the lines required for the fulfilment of the purposes of the treaty. Current biological and statistical data, which form a system of observation of changes occurring as a result of regulation and a necessary basis for the continued rational control of the fishery, were collected and analyzed. The collection of biological data at sea made the operation of a vessel necessary.
Improvement in the condition of the stocks of halibut was revealed by the investigations. The abundance of fish, as indicated by the catch in pounds per unit of gear fished, showed a further increase all along the coast. The average catch per unit of gear in Area 2, which includes the grounds off British Columbia, was 70 pounds, nine pounds or fifteen per cent greater than in 1937 and 35 pounds or 100 per cent g-reater than in 1930. West of Cape Spencer, Alaska, in Area 3, the catch per unit of gear was 115.5 pounds—three and one-half pounds or three per cent greater than in 1937 and 50 pounds or 77 per cent greater than in 1930, the last year of unrestricted fishing.

REPORT OF THE DEPUTY MINISTER 19
Sampling of the stocks of marketable halibut by means of market measure-ments was continued to determine the changes occurring in their composition as a result of regulation. Approximately 75,000 fish were measured from 73 repre-sentative trips landed at Seattle from different banks. Otoliths for the study of age composition were taken simultaneously. Analysis of the measurements failed to produce conclusive evidence of any further increase in the average size of the fish or in the proportion of larger and therefore of mature fish on the more depleted southern banks. The maximum proportion of larger sizes from the stock of young available at the time regulation began appears to have been reached and a further increase in the larger sizes may not occur until the increas-ing stock of young has had time to grovv up. The possibility of such an eventu-ality was foreseen by the commission and is to be regarded as a normal stage in the rebuilding of the spawning stocks on the southern grounds.
The work of following the effect of regulations upon the production of spawn in Area 2 was again given special attention. The halibut schooner Eagle was chartered and operated in the vicinity of Cape St. James spawning grounds as representative of Area 2 from December 26, 1937, to March 6, 1938, and from December 2, 1938, on into 1939. During the 1937-38 winter season, 309 quantitative net hauls were made at 114 stations in the neighbourhood of cape St. James. At 12 of the,se stations hydrographie samples and data were also taken to determine the exact conditions prevailing where the eggs and larvae were found. In the 1938-39 season, 66 net stations and 3 hydrographie stations were occupied before 'the end of the year.
Analysis of the catches of eggs and larvae during the 1937-38 spawning season indicated that the production of spawn was somewhat le,ss than in the winter of 1936-37, though still greater than in the 1935-36 season. Variation from year to year in the production of spawn by marine fishes is the rule and the failure of production in 1937-38 to equal that of 1936-37 is less significant than is the maintenance of the increase over 1935-36. Excepting 1938-39, about which information is not yet available, the trend of production of spawn has been definitely upward from 1934-35.
The investigations of the commission proved that the condition of the different stocks of 'halibut was still improving as a result of regulation. They continued to measure the changes takina place in the stocks and to explain them.
The personnel of the commission °during the year remained unchanged as follows:—
For Canada—Lewis W. Patmore, Prince Rupert, B.C., and A. J. Whitmore, Department of Fisheries, Ottawa.
For the United States—Edward W. Allen, Seattle, Wash., and Frank T. Bell, Washington, D.C.
Mr. Allen is the chairman of the commission and Mr. Patmore the secretary. Headquarters of the commission are at Seattle.
PACIFIC SOCKEYE SALMON COMMISSION
Established in 1937 following exchange of ratifications of the convention which had been signed by Canada and United States in 1930 for the protection, preservation and extension of the sockeye salmon fisheries of the Fraser River system, the International Pacific Salmon Fisheries Commission made substantial progress during 1938 in preliminary and experimental inve,stigational work. Charged with the duty of making "a thorough investigation into the natural history of the Fraser river sockeye salmon, hatchery methods, spawning ground conditions and other related matters," the commission was concerned in large part during the year with efforts to determine facts on which it eould base a permanent program. Branches of this endeavour included a study of the sockeye " races " or " runs " in order to secure data as to the times of passage
HMI

DEPARTMENT OF FISHERIES
of particular races through the commercial fishing grounds, the time spent en route to the river, and the time spent on the spawning grounds. The intensity of the fishery was also studied, as were the question as to the proportions of the catch taken by the several types of fishing gear and the further question as to the times of migration of the salmon to the various parts of the river system. Mapping of spawning grounds and an investigation preliminary to the study of the control of predatory fishes were likewise undertaken by the commission's staff.
Investigation and Surveys.—In the course of the year, 5,695 sockeye salmon were tagged at various points along the generally recognized migration route, including the entrance to Juan de Fuca straits, the mouth of the Fraser and Hell's Gate canyon. Of these tagged fish 2,295 were later recovered. The high percentage of recovery was most gratifying and the data made available by this particular branch of the year's investigations should prove a valuable nucleus.
Nearly 800,000 fish, or slightly more than half of the number of sockeye taken in the commercial fishing region of the convention waters, were examined by observers at canning plants which were located at points which are strategic in relation to the commission's work. Details as to age, size, sex, etc., were obtained so far as 10,000 of these salmon were concerned.
Field parties in the upper river spawning areas surveyed the important streams and made estimates of the number of spawning fish returning to them. Spawning grounds were mapped, obstacles and stream conditions observed and data (scales, measurements, etc.) were .collected for us è in distinguishing the various races.
At Cultus lake experiments were conducted in methods of estimating the number of spawning salmon present on the beds. The purpose of these experi-ments vvas to determine the possibility of devising and applying some relatively simple and .accurate means of estimating runs ta less .accessible points.
Sittings of the commission were held at Vancouver on September 22, 23 and 24, 1938. In the course of these sessions the initial meeting with the Advisory Commit -tee took place. The ,committee is composed of representatives of various salmon interests in the two countries. At the joint sitting the program of the commission and the work undertaken up to that time were discussed with the committee.
During the year Dr. W. A. Found, formerly Deputy -Minister of Fisheries for Canada, retired from the commission. His place as one of the Canadian representatives was taken by Mr. A. J. Whitmore, of the Department of Fisheries.
NORTH AMERICAN COUNCIL ON FISHERY INVESTIGATIONS
The principal fisheries of international importance on the North American side of the North Atlantic have been for some years under investigation by the several countries interested in them. These countries have representatives on the North American Council on Fishery Investigations which ha,s the function of correlating the investigations to mutual benefit and of making recommenda-tions to the governments of the countries.
The council held its 25th meeting in Boston on October 4, 5 and 6, 1938. France had expected to be represented, but conflict of dates of meetings made it impossible for Dr. Ed. Le Danois to attend. Newfoundland wa,s represented by Dr. W. F. Hampton, of the Fishery Research Laboratory. Members of the council representing the United States were the chairman, Dr. H. B. Bigelow, Director of the Woods Hole Oceanographic Institution, and Mr. Elmer Higgins, Chief of the Division of Scientific Enquiry in the Bureau of Fisheries. The three Canadian members were in attendance, namely, Dr. W. A. Found, Deputy Minister of Fisheries, Professor J. P. McMurrich (sin -ce deceased) of the Fisheries Research Board, and Dr. A. G. Huntsman, Consulting Director of the Fisheries Research Board, ,,vho has been secretary of the council for many
.?0

REPORT OF THE DEPUTY MINISTER 21
years. There were nine fishery in.ve-stigators as a-dvisers for the United States, and five advisers for Canada. The meeting was arranged to coincide with other fishery meetings at Boston to introduce a new feature, a general session to .which the members of the AdvisOry Cominittee of the United States Bureau of Fisheries were invited and at which were ,presented various .papers reviewing for the general fishery public the more striking results obtained in the .different investigations. At the close of the meeting new officers were elected. Dr. Huntsman as chairman and Mr. Higgins as secretary.
Some of the more important investigations reported were as follows:— Codfish.—The .codfish are in large quantity and more generally fished, and
hence of most general interest. They have been found to exist in more or less local populations showing quite .complicated movements. The populations intergrade in .character, and are distinguished .principally by the average numbers of vertebrae in the backbone, which are evidently determined by the temperatures to which the eggs are exposed at an early stage in -their develop-ment. Those fish found inshore in the summer .move for the most part merely somewhat offshore in the winter
' but some of them travel far, and chiefly north-
eastward, as from the .coast of Maine to eastern Nova Scotia or from outer Nova Scotia to Newfoundland. Those found in deeper water move farther offshore in the winter. Those on offshore banks show a somewhat regular, extended movement to Gaspé, the south .coast of Newfoundland and the Grand bank by late summer when the water is warmest, and to the outer banks off Halifax as far as Emerald bank in the late winter when the water is coldest. There are quite peculiar cod that spawn in autumn near Halifax, and the few of them that have been tagged showed a movement after spawning the reverse of the others, not at •all eastward, but -westward to the
e'oulf of Maine and bay of Fundy.
The inshore cod are fished more intensively,from ten to thirty per cent being recaught, but only from three to five per cent of the offshore fish are recaptured.
Hydrographic Conditions.—The hydrographic conditions which affect the fish off the Canadian coast are the result to a great extent of general oceanic movements. The United States Coast Guard studies in its Ice Patrol the Labrador Current and the Gulf Stream in the vicinity of the Grand banks, and the Woods Hole Oceanographic Institution, with the co-operation of the Bermuda Biological Station and the Fisheries Research Board of Canada, is studying the ocean circulation of which the powerful Gulf Stream is the most pronounced feature and very significant for our waters. Various factors made the waters off the Canadian coast only slightly above normal in temperature during the summer of 1938.
Salnion.—Comprehensive investigation of the movements of salmon has been effected during the last two years by the Quebec Salmon Commission with the co-operation of the Governments of Newfoundland and Canada. A total of 897 salmon were tagged on the three coasts of Newfoundland, 709 in the gulf of St. Lawrence from the Miramichi region to Seven Islands, and 300 in the bay of Fundy in the outflOw of the Saint John river. As in 1937, there was scattering from every point in both directions coastwise, but from Port-aux-Basques, Newfoundland, and from Seven Islands, Quebec, the salmon scattered widely, going both outwards and inwards and crossing to the south side of the gulf. In marked contrast the salmon of the Saint John outflow remained therein, with a single exception among the 172 recaptured.
.Lobsters.—For the first time the council reviewed lobster investigations in which both Canada and Newfoundland are now engaged. During their first four stages the young lobsters swim up in the water and are found to be moved about by wind currents. Ho w . far they may be carried and scattered remains to be determined.
J. J. COWIE, Acting Deputy Minister of Fisheries.

22 DEPA.RTMENT OF FISHERIES
APPENDIX No. 1
ANNUAL REPORTS OF CHIEF SUPERVISORS OF FISHERIES FOR THE YEAR 1938
REPORT OF MAJOR H. D. SUTHERLAND, CHIEF SUPERVISOR OF FISHERIES, EASTERN DIVISION
Total landings of all species of fish taken in the division during the year were greater than in 1937 by over 8,952,000 pounds, but owing to lower prices being received by the fishermen, particularly for lobsters, the landed value decreased by approximately $927,195. The market value of $14,091,504 reflects the lower prices and is $881,629 below that for the previous year. The increase in production was due to larger landings in Nova Scotia, Prince Edward Island and the Magdalen Islands, offset in part by a decrease in the New Brunswick catch. The varieties showing increases in catch in excess of 1,000,000 pounds were: cod, a gain of 9,710,800 pounds; sardines, 5,113,400 pounds; mackerel, 4,442,600 pounds; herring, 4,260,100 pounds; hake and cusk, 3,234,800 pounds; and alewives; 2,957,200 pounds. The largest single decrease was in the case of pollock, a drop of 13,851,000 pounds.
The total production from the sea fisheries was 465,034,800 pounds, as compared with 456,082,800 pounds with a landed value of $8,932,674 in 1937. The catch was 7,336,300 pounds less than in 1936 when 472,371,100 pounds were taken.
The approximate total quantities and marketed value of the fish and shell-fish produced in the division for the past six years were:—
Production MarketedValue
lbs.
1938 1937 1936 1935 1934 1933
465,034,800 14,091 504
455,000,000 14,945,696
472,000,000 14,764,797
119,000,000 13,081,989
422,000,000 12,786,565
390,000,000 10,205,397
THE LOBSTER FISHERY
A small increase in the catch of lobsters took place during the year; there had also been an increase in 1937. Landings in Cape Breton Island in 1938 were slightly higher than in 1937 and with a large increase in Prince Edward Island were sufficient to offset the decreases occurring in other districts, which, however, were not great. With such intensive fishing in areas where no size limit is enforced, any considerable increase in catch of this species is perhaps scarcely likely. The increased catch in the eastern district of New Brunswick in 1937 was not continued in 1938 in the newly defined areas, a small decrease being noted.
The total catch for the division was 31,227,300 pounds, with landed value of $2,844,320 as compared with 30,708,900 pounds and landed value of $3,719,234 in 1937. The number of fishermen engaging in lobster fishing during the year was 17,845, a decrease of 987 from the total for the preceding year.

REPORT OF THE DEPUTY MINISTER 23
A summary of the number of fishermen and the catch of lobsters for the past six years is shown below:—
Fishernaen Licensed
Catch Pounds
1938 1937 1936 1935 1934 1933
17,847 31,227,300
18,832 30,708,900
18,551 28,057,200
18,146 31,725,000
17,968 35,658,800
17,348 37,012,100
•The catch in Nova Scotia for the year was 355,600 pounds less than in 1937. The only increase in this province was in Cape Breton. In the eastern mainland district there was little difference from the previous year and on the western mainland small decreases occurred throughout, with the exception of Lunenburg .county. The lower catch in this latter section was due to the heavy loss of lobster gear when a storm on December 6-7 destroyed a large part of the traps and was followed by broken stormy weather during the remainder of the month.
The catch in New Brunswick shows a decrease of 411,200 pounds compared with that of 1937. Both the eastern section of the province and the Bay of Fundy .areas had decreased landings. Lower prices to the fishermen were a contributing cause to the smaller catch in the eastern part and the heavy loss of gear in the Bay of Fundy waters during early December 'caused a smaller catch in that area.
Landings in Prince Edward Island were the largest for the past three years, and show the substantial increase of 1,297,500 pounds over 1937, the amounts taken each year being:—
1938 7 121.300 pounds
Lobsters were taken in larger quantities in all sections of the island but particularly in west Prince -county in the vicinity of Alberton. The larger catch there is attributed to the suppression of the illegal fishing which was so prevalent in previous years. Some losses occurred in shipping market lobsters in the fall fishing period on the west coast, -owing to -warm weather at the opening of the season on August 10.
Little 'change occurred in the catch of the Magdalen Islands but it was slightly below that for 1937.
Prices paid for both canning and market lobsters to the fishermen were definitely below 1937 figures and .caused a decrease of $874,914 in the landed value for the division as a whole.
A total of 213 lobster canneries were operated in 1938, twenty-five less than in 1937. The total pack was 91,746 48-pound cases, compared withh 88,181 cases packed in 1937, an increase of 3,565.
(A statement of the catch, pack, shell shipments and meat produced is given on pages 8 and 9.)
THE COD FISHERY
Increased landings of cod were made in all parts of Nova Scotia, particu-larly in Cape Breton Island and the western mainland, the gain amounting to 9,847,300 pounds. There was a small increase in the amount taken by the bank fishermen and salted for drying but the major part of the increase was used fresh and marketed by the fish companies. Prices were below those paid in

Catch Number of Cases
1938 1937 1936 1935 1934 1933
36,881,800 31,768,400 49,273,600 37,499,800 38,231,000 26,022,400
349,887 423,043 393,854 338,436 288,091 180,597
1,
24 DEPARTMENT OF FISHERIES
1937, causing a decrease in the total landed value. Larger catches were made also in Prince Edward Island and the Magdalens, New Brunswick landings alone being lower than in 1937. The loss of the European market for Gaspé cure dried fish has not been overcome by securing un outlet elsewhere and has caused a serious decline in cod fishing in northern New Brunswick.
The total quantity of cod taken during the year was 141,358,300 pounds, compared to 131,647,500 pounds in 1937, and the landed value wa,s $1,712,723 as against $1,733,372 in 1937. Marketed value in 1938 was $3,108,919, com-pared with $2,719,585 in the year before.
THE SARDINE FISHERY
An increase in catch of 5,113,400 ,pounds was shown in the important sardine fishery although the landings were less than in the peak year, 1936. Prices obtained for the first of the catch were low, the American packers offering only $5 to $9 per hogshead. Later, when a scarcity became , evident, the prices increased sharply, going as ,high as $53 per hogshead for a choice run of fish. Landed value total increased by $130,342. There were 349,887 cases of sardines packed by the Canadian firms and as u high standard of 'production has been maintained these goods find a ready market.
The quantitie,s of sardines taken and the cases produced in the past six years were:—
THE HADDOCK FISHERY
There was a small increase, 515;600 pounds, in the total divisional catch of haddock. In Nova Scotia, where the major part of the production accurs, the landings decreased in Cape Breton Island and the eastern mainland but there was an increase in the western part of the province. The landed value was lower but by less than a thousand dollars, than in 1937. The catch in the Bay of Fundy area of New Brunswick increased greatly over the previous year, rising from 198,900 pounds in 1937 to 887,300 pounds in 1938; the catch for 1937, however, had been exceptionally low.
The total quantity of haddock taken in the division was 39,322,400 pounds with landed value of $634,976 compared with 38,806,800 pounds and landed value of $635,949 in 1937. Marketed values for the respective years. were $1.334,144 and $1,294,091.
THE HERRING FISHERY
Larger catches of herring were made in all districts except the Bay of Fundy area in New Brunswick, and in Prince Edward Island. The bulk of the catch was made up of spring fish used mainly for bait. Owing to the smaller supply of fish availabrle in southern New Brunswick the smoked herring pro-- ducers at Grand Manan did not process as large a quantity as in the previous year. Their pack was again disposed of by the Smoked Herring Board. Pro-duction of canned herring was slightly greater than in 1937 und the quantity of salt barrelled herring produced, most of it in Nova Scotia, was 'almost double

REPORT OF THE DEPUTY MINISTER 25
the preceding year's output. Landings of .herring in the division totalled 86,234,700 pounds. Their value, landed, was $410,147 as against $336,687 for the 81,974,600 pounds caught in 1937. Marketed value in 1938 was $1,155,460; in 1937 it was $906,224.
THE MACKEREL FISHERY
Mackerel landings show an increase of 4,442,600 pounds over 1937, the catch increasing quite sharply in Nova Scotia but decreasing in New Brunswick and Prince Edward Island. The catch consisted mainly of spring fish and was salted for 'southern markets. The catch of fat fall mackerel was about the same as in the previous year but prices paid to the fishermen were somewhat lower. The marketing of the fat mackerel as salted fillets is becoming more general each year and appears to be the form most acceptable to the trade.
The total catch for the division was 28,081,900 pounds, with landed value of $337,821, compared with 23,639,300 pounds and landed value of $378,931 in 1937. The marketed value in 1938 was $551,494 while in 1937 it was $629,755.
THE SMELT FISHERY
For the division as a whole the catch of smelts increased slightly over that of the previous year. With the exception of the eastern mainland of Nova Scotia, all districts Show increases, the largest being in the western Nova Scotia area.. On the east coast of New Brunswick the catch increased by 70,000 pounds but fell considerably short of the quantity taken there in 1936; prices to the fishermen there were somewhat lower than in 1937, owing to a fairly heavy carry-over from the previous year and mild weather for freezing early in the season. Standard grading of frozen smelts was made effective by regulation and .considerably improved marketing conditions on the east coast of New Brunswick.
The total smelt catch for the division was 6,064,700 pounds with landed value of $286,739; the 1937 figures were 5,871,500 pounds and $280,406. Marketed value in 1938 was $422,080 as against $394,326 in 1937.
THE SALMON FLSHERY
Commercial catch of salmon in the division was 164,600 pounds less than 1937, the only area to show an increase being Cape Breton Island. The area showing the greatest decline was the Bay of Fundy section of New Brunswick.
Total landings for the division were 1,864,800 pounds. The landed values were $265,301 and $284,233 and the marketed values $335,428 and 930,216 for 1938 and 1937 respectively.
THE HALIBUT FISHERY
Landings of halibut in the division were 3,968,300 pounds and their landed value $363,326, as against 3,168,600 pounds with a landed value of $292,354 in 1937, an increase in catch of 799,706 pounds and in value $70,972. Prices did not vary to any extent in the two years.
THE SCALLOP FISHERY
There was a big decrease in the number of boats engaged in the scallop fishery and the catch dropped accordingly. A total of 95,190 gallons equal to 47,595 barrels, were taken while in 1937 the fishermen had landed 183,695 gallons, equal to 91,848 barrels. Approximately half the boats did not fish during the last three months of the year and a number dropped out in the spring season. The sharp drop was caused by unsatisfactory market .conditions in the United States, where the major part of the catch has been sold in other years. American boats and vessels operated on the offshore scallop areas during the

26 DEPARTMENT OF FISHERIES
summer months and their catch depressed the price so much that the Canadian fishermen found that it did not pay to fish. This fishery, which is centered at Digby, Nova Scotia, has suffered a heavy loss from the causes noted.
The landed value of $123,008 for the 1938 catch, as compared to $278,894 in 1937, reflects the altered conditions. The marketed value was $139,359 dur-ing the past year, compared with $296,409 in 1937.
OTHER FISHERIES
The very large catch of pollock in 1937 was not repeated this year, the quantities taken being well below the earlier year's figures. The landings were 13,851,100 pounds less than last year, the decrease being mainly in New Bruns-wick's Bay of Fundy waters. Landed value was $57,098, compared with $99,122 in 1937, while marketed value was $115,017 in 1938 and $222,208 in 1937.
Landings of hake and cusk, vvhich are taken principally in western Nova Scotia., show an increase of 3,234,800 pounds reaching 26,072,300 pounds with landed value of $129,659. The market value decreased by $481 totalling $297,203.
The production of oysters from the public beds showed a further decrease this year. In the Bras d'Or Lakes area of Nova Scotia this drop amounted to 802 barrels, the eastern mainland showing a small increase. In Prince Edward Island increased quantities -%Vere taken in Prince county and northern Kings but these gains were offset by a large decrease in Queens county, making the provincial total 1,236 barrels below that of 1937. New Brunswick areas pro-duced 823 barrels more than in the previous year but some difficulty was experi-enced in marketing this catch owing to the different grades of oysters taken.
The total landings for the division were 21,497 barrels with a landed value of $91,438; the 1937 catch had been 22,355 barrels with landed value of $102,552. Marketed values were $138,167 in 1938 and $143,880 in 1937.
The catch of swordfish, which is made entirely in Nova Scotia, decreased by 409,100 pounds as a result of the virtual failure of this fishery in Northern Victoria county and much smaller catches being taken on the mainland than in 1937. In the western part of the province the catch declined by over 300,000 pounds; however, the large catch made there in 1937 was most unusual. Total landings of swordfish were 1,092,900 pounds, with landed value of $101,529 as against 1,502,000 pounds with a landed value of $170,198 in 1937. Marketing conditions were not as favourable in 1938 as in the year before and the value—$132,763 as compared with $238,165 in 1937—reflects the price decline.
NOVA S COTIA
Aggregate catch of fish in Nova Scotia during the year was 285,184,600 pounds, or approximately 14,876,800 pounds more than the amount taken in 1937. Landed value was lower, however, owing mainly to lower prices for lobsters. The marketed value decreased by approximately $425,603.
All districts in the province show increased landings, the greatest gains being in the cod, mackerel, herring and halibut fisheries. There was a sharp drop in the catch of scallops. The western mainland district had the largest general increase; the increase in the eastern mainland, though smaller than in the west, was due to some extent to a market for fresh fish being made available during the fall to the inshore fishermen through the operation of a collection service. With the increased catches a small rise in the level of prices would put the industry on a prosperous basis. In the case of the four fisheries showing the largest increases the gains were:—
Halibut ..
9,847,300 pounds
5,192,800 "
5,444,400 "
824,300 "

The catch of haddock shows a small decrease for the year, the result of small landings in the eastern mainland at Halifax. The greater part of the mackerel taken were spring fish. For the fat fall mackerel the prices to the fishermen were lower than in 1937, making the landed value below that for 1937 despite the increased catch. Herring show a larger landed value than in 1937 and the marketed value is in proportion to the increased catch. As already pointed out, the scallop fishery experienced a serious decline on account of low prices in the United States' markets, resulting from scallop fishing being carried on by American vessels during the summer months. The catch was little more than half as large as in the previous year and was marketed at low prices. Only about half of the boats operated in the fall fishing season.
The commercial catch of salmon shows a small increase for the year, thanks to larger quantities being taken in Cape Breton Island.
A decrease of 355,600 pounds in the lobster catch occurred oveing to smaller landings being made in the western mainland, where a heavy December storm destroyed a large part of the lobster gear shortly after it had been set. Pro-duction increased in the Cape Breton Island section -while on the eastern main-land the decrease was only about 7,000 pounds. The prices, both landed and marketed, were lower than for some time. Landings in the province in the past six years have been as follows:—
1938 •
15,540,500 pounds 1937 15,896,100 " 1936 14,509,100 " 1935 17, 683, 600 " 1934 18, 159, 000 " 1933 17,685,800 "
The record of total catches, landed and marketed values covering the chief species taken in Nova Scotia is shown in the following statement:—
1938
Total quantity of all fish landed lbs. 285,184,600 Landed value S 5,323,582 Marketed value $ 8,804,231
_ Lb Landed 'Marketed s. Value Value
$ S
Lobsters 15,540,500 1,770,722 2,282,169 Cod 119,243,800 1,507,424 2,501,847 Haddock 38,354,600 615,963 1,293,273 Halibut 3,954,400 362,203 499,175 Mackerel 22, 796, 000 274,545 447,561 Flerring 25,565,400 167,807 407,146 Scallops (gals.) 92,000 119,109 135,460 Swordfish 1,092,900 101,529 132,763 Flake and Cusk 16,587,000 85,999 214.205 Salmon 485,400 69,518 84,616 Pollock 8,189,200 43,695 93,761 Smelts 678,100 39,702 58,470 Soles 1,694,100 30,304 69,978 Alewives 3,872,300 25,499 35,294
1937
Total quantity of all fish landed lbs. 270,307,800 Landed value $ 6,015,179 hlarketed value S 9,229,834
REPORT OF THE DEPUTY MINISTER 27

DEPARTMENT OF FISHERIES
Landed Marketed Lbs. Value Value
$ 8
Lobsters 15,896,100 2,304,302 2,757,S80 Cod 109,396,500 1,526,374 2,404,452 Haddock 38,504,700 628,606 1,282,023 Halibut 3,130,100 290,215 392,335 Mackerel 17,603,200 302,723 465,803 Herring 20,121,400 129,522 342,426 Scallops (gals.) 180,855 274,760 291,225 Swordfish 1,502,000 170,198 238,165 Hake and Cusk 14,428,900 74,843 210,653 Salmon 464,700 70,304 79,389 Pollock 10,648,500 53,874 102,005 Smelts 687,200 40,246 56,842 Soles . 2,174,900 32,333 89,950 Alewives 2,907,800 16,450 23,169
NEW BRUNSWICK The total landings of fish in the province including the inland section were
127,727,600 pounds, which was a decrea-se as compared with the previous year of 10,608,800 pounds, due in a large measure to the greatly decreased catch of pollock. These fish were unusually plentiful in 1937 but did not make their appearance in the same a-bundance during the present year. Landings of this variety were 11,391 ;800 pounds -less than in 1937. The landings of ,cod, lobster, herring, clams and shad were also lower, offset by a large increase in the catch of sardines of 4,359,400 -pounds as well as an increase in aleveives and haddock. The gain in catch of lobsters last year was not -maintained as production was 411,200 pounds below that year. Landings in both the Bay of Fundy and eastern areas were lower with the price of bath -canning und market lobsters below 1937 figures. There was a further decrease in the catch of cod in the northern section where this fishery has .had so serious a decline owing to the lack of a market for the Gaspé cure. Efforts to produce pickle-cured cod for making boneless and to market some dried .cod in the United States have not yet been fruitful in any large way although some progre,ss is being made. A considerably larger catch of sardines was made in the Bay of Fundy waters and towards the end of the run sold ,at high prices to the American firms. The production of herring was lower in the Bay of Fundy area and due to high prices a smaller quantity was smoked at Grand Manan; larger quantities were
canned in various form.s at Black Harbour. The prices were higher and com-pen,sated for the decreased catch.
The total production for the province including the inland section was 127,727,600 pounds with landed value of $1,799,459 com-pared with 138,336,400 pounds with landed value of $1,910,610 in 1937. The respective marketed values were $3,996,064 and $4,447,688. The catch of the inland section was 1,115,100 pounds with a landed value of $37,271 compared with 1,158,000 pounds with landed value of $40,333 in 1937. Marketed values were-1938, $40,181; 1937, $43,141.
Better catches of 'haddock were made than in 1937, mainly by boats fishing from Wilson Beach and were sold at good prices at Eastport, Maine.
The salmon -catch was down slightly and prices remained at about the same level as for 1937.
There was a decrease of 1,305,000 pounds in the catch of clams in the Bay of Fundy area. About the same quantity was -canned locally and the decrea-se in the catch was due to market conditions for clams in the raw state. -
There was a small increase in the smelt catch of the eastern section but awing to lower prices to the fishermen the landed value decrea,sed. The market price received was less owing to there being u heavy carry over from the previous year's catch.
28

REPORT OF THE DEPUTY MINISTER 29
The total catches of the different varieties with their landed and marketed values for New Brunswick are shown in the following tabulations:-
1938 Total quantity of all kinds lbs. 127,727,600 Landed value S 1,799,459 Marketed value S 3,996,064
Landed Marketed - Lbs. Value Value
$ S
Lobsters 6,847,400 497,320 721,612 Sardines 36,127,800 336,826 1,389,195 Smelts 4,360,900 209,468 308,991 Herring 42,731,500 192,939 626,469 Salmon 1,421,000 204,045 258,994 Cod 10,268,300 103,548 167,322 Oysters 2,473,800 45,966 76,512 Clams 5,591,900 36,513 94,580 Alewives 6,095,700 34,311 76,230 Hake and Cusk 4,569,800 23,913 36,898 Shad 1,338,700 37,861 42,307
• Haddock 917,200 18,299 39,821 Pollock 1,944,200 13,403 21,256 Quahaugs 345,100 3,328 8,981
1937 Total quantity of all kinds lbs. 138,336,400 Lauded value 1,910,610 Marketed value 5 4,447,688
Landed Marketed Lbs. Value Value
S S
Lobsters 7,258,600 713,801 1,089,002 Sardines 31,768,400 210,254 1,525,602 Smelts 4,272,000 209,672 295,296 Salmon 1,624,100 224,892 261,740 Herring 45,276,500 151,245 443,739 Cod 11,598,700 118,111 172,369 Oysters 2,309,200 51,277 75,487 Clams 7,200,200 46,920 114,475 Pollock .3,336,000 45,248 120,203 Shad 1,363,300 38,286 44,738 Alewives 4,414,900 26,120 52,015 Hake and Cusk 4,584,900 19,328 54,005 Mackerel 1,012,700 16,045 36,211 Haddock 261,800 6,701 10,401 Quahaugs 194,600 2,017 4,176
PRINCE EDWARD ISLAND
The total landings of all kinds of fish in 1938 increased over 1937 by 1,895,400 pounds. The varieties having the largest increases -vvere lobsters, hake and cusk, and alewives. Smaller catches were made of herring and oysters than in 1937.
The lobster fishery w-hich showed a decreased -catch in 1937 in the decline from the peak of 1932 yielded a larger amount during the year of 1,297,500 pounds but owing to the lower prices obtained was not as remunerative to the fishermen by approximately $66,000; larger catches were made in all districts. In this connection the District Supervisor writes:-
" The co-operation on the part of the fishermen to personally protect the various fishing industries, evidence of which was noted in 1937, has

30 DEPARTMENT OF FISHERIES
• increased to a gratifying extent, and although there were odd attempts to fish illegally a marked improvement was noted throughout the season in this respect, the interest of the individual fisherman being an important contributory factor to the satisfactory results obtained." This attitude of co-operation appears to be securing results insofar as the
lobster fishery is concerned. There was not much change in the cod fishery which was about on a level
with 1937, the prices remaining un.changed from those obtained the previous year. The landings at Souris increased owing to two vessels fishing from that port until December 22. Landings of herring were below 1937, the bulk of the catch taken being from the spring run and used for lobster bait, the catch of fat herring was smaller due to rough weather preventing the fishermen from operating. The mackerel catch was slightly below the previous year. A con-siderable increase (317,700 pounds) was made in the landings of alewives due to a demand for them as fox feed. A quantity was taken in the herring nets during August and September which was pickled and used for food. The catch of smelts was higher than in 1937 but was considerably below 1936. Owing to the grading of all smelts marketed the landed and marketed values were increased.
A further decline occurred in the oyster fishing, the public beds in Orwell, Vernon and Seal rivers and in Pownal bay and its tributaries have became affected with what appears to be the same disease as that which was evident in East and West rivers in 1937, and the amounts taken from the areas has decreased. The total catch was 1,048,400 •pounds (5,242 barrels) as compared with 1,295,600 pounds (6,478 barrels) in 1937, a decrease of 247,200 pounds or 1,236 barrels. Increased landings were made in east and west Prince county and northern Kings, the decreases being in the areas noted in southern Queens county. The bulk of the shipments was from the leased area,s augmented by about 500 barrels taken in Bedeque bay which ,had been reconditioned by relaying them in approved areas. The increa.sed quantities from the leased areas are a tribute to the work of Dr. A. W. H. Needier, whose work in this regard has been invaluable. The depletion of the Queens county areas has been keenly felt by the fishermen there, who depended on it largely for a
The total landings of all species with landed and marketed values veere as shown below:-
1938 Total quantity of all fish landed lbs. 29,420,400 Landed value $ 649,074 Marketed value $ 930,874
____ Lbs. Landed Marketed
Value Value
S $ $
Lobsters 7,121,300 458,762 606,134 Cod 6,842,500 49,880 76,415 Smelts 960,800 34,125 50,725 Oysters 1,048,400 29,232 39,193 Herring 5,605,600 29,174 57,728 Hake and Cusk.. 4, 915, 500 19,747 46,100 Mackerel 1,055,900 16,146 25,003 Clams 694,200 3,471 16,072 Silversides 307,800 2,682 3,078 Alewives 484,000 2,520 4,890 Quahaugs 214,500 881 1,744
1937 Total quantity of all fish landed. lbs. 27,525,000 Landed value $ 713,632 Marketed value $ 870,299

REPORT OF THE DEPUTY MINISTER
- Lb Landed Marketed s . Value Value
$ S
Lobsters 5,823,800 524,847 538,792 Cod 6,750,400 49,868 88,900 Smelts 890,000 29,220 40,856 Oysters 1,295,600 32,402 44,020 Herring 6,492,800 35,752 66,964 Hake and Cusk 3,823,700 14,244 33,026 Mackerel 1,116,400 18,079 28,958 Clams 701,000 3,505 14,141 Silversides 137,000 1,298 1,341 Alewives 166,300 875 1,514 Quahaugs 187,400 937 3,825
MAGDALEN ISLANDS
The catch in the Magdalen Islands increased over the total for the previous year by 2,788,600 pounds, the gain being made principally in the cod and herring fisheries. Landed value, however, was lower than in 1937, a condition accounted for by the smaller prices paid for lobsters.
The lobster catch was only slightly below 1937, about 12,000 pounds below. Fewer fishermen were engaged and the number of traps decreased by approx-imately 35,000. Increased landings of cod were made in the southern district but fell off in the northern area owing to the closing of the plant operated by the Gorton Pew Company. A good catch of herring was made, 2,248,300 pounds in excess of 1937 landings. Increased quantities of herring were used to make smoked bloaters and 29,000 boxes more than in 1937 were produced. The catch of mackerel decreased by 465,500 pounds, smaller landings being made in both the northern and southern districts. The market price of spring and fall mackerel alike was much below that obtained in 1937.
The islands' total catch for the year and landed and marketed values were as detailed below:-
1938 Total quantity of all fish landed lbs. 22,702,200 Landed value $ 239,451 Marketed value S 360,335
_ Lbs. Landed Marketed
Value Value
S S
Lobsters 1,718,100 117,516 155,917 Cod 5,003,700 51,871 62,983 Mackerel 3,441,500 34,360 57,087 Herring 12,332,200 20,227 64,124 Smelts 64,900 3,411 3,894
- 1937 Total quantity of all fish landed lbs. 19,913,600 Landed value S 299,340 Marketed value $ 425,312
- Lbs. Landed Marketed
Value Value
$ s
Lobsters 1,730,400 176,284 199,527 Cod 3,901,900 45,106 53,864 Mackerel 3,907,000 42,084 98,783 Herring 10,083,900 20,168 53,095 Smelts 22,300 1,268 1,338
31

1938 1937
Margaree river North river St. Ann Baddeck river Grand river
488 349
26 41
312 309 42 40
441 17 48 24 20 64 54
114 40
100 80
174 220
DEPARTMENT OF FISHERIES
SPORT FLSHING
NOVA SCOTIA Angling generally in Nova Scotia was retarded to some extent by weather
conditions which caused unusually high water in the streams and lakes on the mainland and with a cold period in the Cape Breton section during the first six weeks of the open season, which is usually the best time for fishing in that area. The number of salmon taken was less than in 1937, a state of 'affairs attributed to the water levels in the streams being so high that either fish passed upstream to the headwaters where no angling was carried on or the excess water created unfavourable conditions for the fish to rise to the fly. Trout fishing was good in the mainland area and an average catch was made after the month of June in Cape Breton waters.
Angling in Cape Breton.—Angling in Cape Breton Island was definitely held back for the first six weeks of the season on account of cold weather but good fishing was obtained from July onward until the latter part of the season when rains raised the level of the water to such an extent that few fish were taken. During the summer frequent rains kept the streams at satisfactory height. Conditions on the Margaree river generally were good and more salmon were taken than in 1937, the month of September affording the best fishing. The number of salmon taken in the North river, Victoria county, was also greater than in the year before. The table below gives the number of Salmon taken by angling in 1938 and the preceding year:—
The catch of trout was about the same as for 1937. A sharp decrease in catch occurred at Lake Ainslie, Inverness county, where only 509 were taken as compared with 2,714 in 1937. In other parts of the island, particularly northern Victoria, increased catches were made.
Angling, Eastern Mainland.—The weather conditions general in the prov-ince were found in this district. There was a good supply of water in all the streams and lakes and in some it reached too high level for good angling. In two streams only were a greater number of salmon taken than in 1937—St. Mary river, Guysboro county, and Moser river, Halifax county. The largest decrease in numbers taken was in Ingram river, Halifax county. The table below gives the number of salmon taken in the various streams for the past two years:—
32
1938 1937
375 45 78 31 96 69 65
246 45
240 168 478 253
St. Mary river Liscornb river Ecum Secum river Gaspereau brook Isaacs and New Harbour rivers Salmon river, Port Dufferin Sheet Harbour rivers Tangier river Ship Harbour river Musquodoboit river Lawrencetown waters Ingram river Moser river

1938 1937
Lunenburg eountY - East river Middle river Gold river La Have river Petite river
Queens county- Medway river Mersey river
Shelburne county- Rosmvay river Clyde river
Yarmouth county-- Tusket river
Digby county-- Salmon river
Annapolis county- Lequille river Round Hill river Annapolis river Nietaux river
Kings county-Gaspereau river
59 28 27 50 73 91
125 344 60 238
312 613 278 637
2 18 30
20 60
38 43
19 19 100 99 78 139 37 253
14 48
33 REPORT OF THE DEPUTY MINISTER
• Trout fishing in all the lakes and streams compared favourably with that of other years and was better than in 1937. A number of trout marked before being liberated by the hatchery officers were taken in Sherbrooke lakes, Çuysboro county, and showed good growth and a high rate of survival.
Angling, Western Mainland.—There was a sharp decrease in the number of salmon taken by angling in the western part of Nova Scotia, a condition which was due at least in part to the almost continuous high water conditions that prevailed and allowed salmon to ascend to the upper portions of the river fairly early in the season. The decrease in catch was general in all the principal salmon angling streams but most noticeable in the Mersey and Medway, the heaviest producers of sport fish. Trout fishing was quite satisfactory, the best angling being at the headwaters of the principal rivers where higher water conditions caused more attractive angling.
The table below gives the comparative number of salmon taken by angling in the principal rivers in the past two years:—
Deep Sea Sport Fishing.—This sport continued to be an attraction for tourists and anglers during the summer months. Tuna sport fishing was very much in evidence in the coastal waters of Victoria, Lunenburg, Queens, Shel-burne and Yarmouth .counties, though the fish taken were some-what smaller in size than in other years and were rather less plentiful. Some very good fish were taken however, the largest at Shelburne weighing 864 pounds. Swordfish were not iaken in any quantity in Cape Breton waters, the weather being unfavourable for angling; the largest caught by angling weighed 295 pounds. Striped bass fishing afforded good sport at Annapolis Royal where consistent fishing was obtained during the season. Angling for pollock was not as good as in the preceding year, the fish not appearing at the surface or in the quantities that can be found on the coast as a general rule.
NEW BRUNSWICK
Bay of Fundy Area.—Angling for salmon is not at all extensive in this area, but few fish were taken in the Salmon and St. Croix rivers. Fishing for land-
87275-3

1937 1938
St. John River system Miramiehi River system
Salmon Grilse
1,146 238
8,253 9,549
Salmon Grilse
1,316 1,349
5,192 9,818
1
1 a
s]
1
a d
1
A
34 DEPARTMENT OF FISHERIES
locked salmon in Chamcook lakes showed an improvement and 176 fish, averag-ing 2-1 pounds each, were taken as compared with 132 averaging 2 pounds in the previous year. Black bass fishing in Wheaton lake was also satisfactory, fine catches of large bass being taken during the summer months.
De )) Sea Sport Fisking.—Pollock were the only deep sea fish taken by angling; the catch was about 3,000 pounds taken mainly off Charlotte county.
Eastern District.—Conditions throughout the district were better for angling than in 1937 as there were frequent rains and the water in the streams was maintained at a higher level throughout the season. There was lacking also the extreme heat without rain, prevalent in August and September the previous year, which had interfered much with trout angling. Salmon angling on the Restigouche river and its tributaries was slightly better than in 1937, the total landed being 2,910 fish as compared with 2,546. On the Jacquet river 132 salmon were taken as compared with 130 in the previous year. In the Bathurst area, including Tetagouche, Middle, Little and Nipisiquit rivers, 461 salmon were landed or 142 more than in 1937. The only river in Northumberland county where salmon angling is carried on successfully is the Tabusintac and in this stream during the months of September and October 83 salmon and 27 grilse were taken as compared with 242 in the year before. The main angling in this river, however, is for spring salmon taken on a barbless hooked fly. Of these 830 were caught and immediately released. The catch for the previous year was only 392 fish.
Trout angling was carried on under excellent conditions on the larger rivers and their branches in Restigouche, Gloucester and Northumberland counties. The numerous smaller streams there also produced satisfactory angling results, more favourable water and temperature conditions being contributing factors. The streams in this group included the Eel, Charlo, Louiston, Middle, Little, Tetagouohe, Nigado, Pokemouche
' Tracadie, Caraquet, Bartibogue, Bay du
Vin, Eskedelloc, des Caches, Burnt Church, Black and Napan rivers. In Kent and Westmorland counties similar conditions prevailed in the
principal trout fishing streams and much better trout fishing obtained than during the previous year.
Inland District.—Water and weather conditions were good and at no time did the water reach a low level during the angling season and the high water did not adversely affect angling on either side of the St. John or Miramichi.
The catch of salmon and grilse in the St. John river waters was below 1937 in number. In the Miramichi waters the number of salmon taken increased but there was a small decrease in the catch of grilse; the salmon increase was due to more fishing for black salmon, 356 permits being issued for angling with barbless hooks as against 237 in 1937. Angling for bright salmon was good during July and September.
On the Nashwaak river the catch was below 1937 total or 85 salmon and grilse compared with 132. Hartts Island pool, which last year did not give as good angling as usual, was again this year barren of fish. On the St. John river decreased numbers of fish were taken in the Hartland, Bristol and Bath pools.
On the Tobique river the catch was 806 salmon and 113 grilse; in 1937 the figures were 623 salmon and 595 grilse. Fewer salmon were taken in Salmon river than in the preceding year.
The total number of salmon and grilse taken by angling in the principal rivers -was:—

REPORT OF THE DEPUTY MINISTER 35
Of these numbers the southwest Miramichi produced 6,224 salmon and 6,661 grilse, the northwest Miramichi 1,871 salmon and 2,319 grilse.
Trout fishing was better than in 1937 the catch increasing by 2,500 pounds.
PRINCE EDWARD ISLAND
Àngling in the ponds and brooks of Prince Edward Island was good during the early part of the season but fell off as the water became warm. Angling for sea trout was good throughout the season. Large numbers of trout were seen on the spawning grounds after the close of the fishing season.
In West Prince county during the early part of the season very fair catches of trout were taken in all the brooks and ponds, but when the warm weather came fishing became poorer. Water conditions were good for trout and salmon and there was a good run of both these fish.
In Dunk river, East Prince county, very few trout came up during the fishing season but there was an abundance of small trout. In other streams in this district the catch was about the same as in 1937.
In Northern Queens county, good runs of sea trout were noticed throughout the season in the more important streams, and fishing was good in all the mill ponds. Angling conditions were exceptionally good at the head of Hillsboro river and very good in the early part of the season at Blooming point. Fishing for rainbow trout in Glenfinnan lake was very poor.
In Southern Queens there was a good run of sea trout in all the rivers. Fishing in the mill ponds was good in the early part of the season but fell off as the water became warm. Spawning conditions were favourable. There was fairly good fishing in McRae's, McPherson's, McLeod's ponds and water and spawning conditions were favourable in all of them. There was also good fish-ing in Montagne, Brudenell, Sturgeon, Murray and Belle rivers. Fishing in Vernon river was poor.
In Northern Kings water and angling conditions were favourable and there was good fishing in Fortune river, Big pond, More 11 river, Naufrage river, East lake and Black pond. The trout trap was not operated at Fortune river and it is difficult to make any comparison of the number of trout ascending to spawn at this place but a large number of adult female trout were taken well up stream during the closing days of the fishing s.eason. Salmon were not as plentiful at Morel' river as in 1937 only 443 being taken in the trap collecting salmon eggs; in 1937 the trap took 909. A record landing was made at Big pond during the latter part of May when a Charlottetown sportsman landed a trout weighing approximately eight and three-quarter pounds.
FISHERY PROTECTION SERVICE
The Fishery Protection vessels Arras and Arleta, the former under the command of Captain H. P. Cousins and the latter commanded by Captain R. I. Swansburg, were actively - engaged in fishery protection duties along the Atlantic coast of the division throughôut the year and rendered excellent service.
The Arras was employed from January 1 to January 20 as a mother ship with the winter fishing fleets operating from Canso, Petit de Grat, Arichat and vicinity and the services performed in this connection were very much appreciated by the fishermen of these places. Two men in a disabled Canso fishing boat were rescued on January 5 off Green island and the boat towed to port, and on the following day another disabled fishing boat was towed safely to Canso.
At the request of the Fisheries Research Board the Arras was lent to that board from January 22 to February 3 for the purpose of carrying out a hydro-graphic survey off the outer coast of Nova Scotia. From February 4 to the end of March the ship was engaged patrolling - between Halifax and cape Sable as a safeguard against infringements of the lobster fishing regulations, in protect-
87275-3/

36 DEPARTMENT OF FISHERIES
ing territorial waters from foreign vessels, and in breaking ice to release fishing vessels. From April 1 to April 13 patrol was carried on between Halifax and Canso. Ice was broken at Country harbour and Spanish bay for the benefit of the local fishermen. The Arras was laid up at Yarmouth for annual overhaul from April 18 to May 18 and patrol was then resumed between Yarmouth and Halifax.
As in former years the Arras was detailed for work with the fishing fleet on the Grand Banks during the summer months and left Halifax on June 14, arriving at Burin, Newfoundland, on June 17 where she found the Lunenburg fleet. While on the Grand Banks weather conditions, bait and ice reports, etc., were broadcast daily from the ship to the fleet and medical services, as required, were rendered by the ship% doctor to members of the crews of the fishing vessels. With reference to the work on the banks Captain Cousins commented as f
"During the summer season 27 Lunenburg fishing vessels operated on the Grand Banks. The ship's doctor gave medical treatment 426 times. The catch by the Lunenburg fleet averaged about 2,500 to 3,000 quintals of fish per vessel, this being the most successful catch for several years.
"There were 20 French and 30 Portuguese trawlers operating on the Grand Banks and coast of Greenland."
The Arras left Newfoundland waters on August 27 and returned to Nova Scotia where she resumed fishery protection duties along the coast. She also assisted at the Lunenburg County Exhibition at Bridgewater and the Lunenburg Fisheries Exhibition at Lunenburg. The Arras accompanied and acted as a mother ship to the racing fishing schooner Bluenose during the International Schooner Races held off Boston and Gloucester in the fall.
Returning to Halifax -the ship proceeded on November 11 to Canso to resume her duties as a mother ship with the winter fishing fleets working out of Canso, Petit de Grat and Arichat. During the year the ship spent 182 days at sea and steamed 10,802 miles.
The Anaux, from the opening of the year until February 8, was engaged on the southwestern coast of Nova Scotia in lobster protection work, particular attention being given to the enforcement of the size limit. Supervision was given to the movement of foreign vessels within territorial waters, while ice was broken by the ship at various points to release fishing vessels so that they might proceed to and from the fishing grounds. From February 9 to March 24 the ship was laid up at Lunenburg for annual overhaul.
On the completion of overhaul, the Anaux was detailed for work along the eastern coast of Nova Scotia where she was occupied until April 24 breaking ice where required as well as assisting in the enforcement of the lobster fishery regulations. As in former years the vessel was called upon to render assistance in connection with the protection of the lobster fishery in the Northumberland Strait area and was so engaged from April 25 to May 13. Finishing work in this area, the An eux proceeded to Cape Breton where she was employed for two weeks measuring and locating trap-net berths at Middle Head, Ingonish and Arichat. Patrol work followed from May 27 to July 1 along the eastern and southwestern coasts of Nova Scotia and then the ship resumed work in the Northumberland strait, returning thence to patrol the Atlantic coast of Nova Scotia from July 12 to August 3. From August 4 to October 3 she patrolled the waters of Northumberland strait, enforcing the lobster fishing regulations, giving particular attention to the protection of berried lobsters, as well as checking lobster fishermen for lobster fishing licences.
From October 4 to the end of the year the Anaux carried on general patrol duties along the Atlantic coast of Nova Scotia, supervising the operations of

J.
the scallop and lobster fishermen, and the enforcement of the lobster size limit regulations in lobster fishing district No. 4 after the opening of the lobster fishing season on December 1.
The Arleux is equipped with a fast motor boat, and this boat, working in conjunction with the mother ship, was a great factor in suppressing illegal lobster fishing. The motor boat alone covered 1,865 miles in patrol duties and was instrumental in assisting the crew of the Arleux to seize and destroy a con-siderable quantity of gear which vvas .illegally set. During the year the Arleux spent 191 days at sea and steamed 9,830 miles.
FISHERIES PATROL SERVICE
NOVA SCOTIA
In Cape Breton the chartered patrol boat Cabar Feidh was again employed in patrolling lobster fishing district 6A from May 16 to July 16. The boat covered 936 miles checking up on licences and searching boats for undersized lobsters. The services performed were very satisfactory.
Along the eastern shore of the province the patrol boat service during the year was carried on by the patrol boat Venning and the patrol boat Gilbert, both owned by the department, and the chartered boats ilfarmat, Daisy L. and Elsie.
The Venning commenced patrol work on May 30 and continued until laid up for overhauling on March 15, 1939. Owing to repairs not being completed this boat was late going on duty. She proceeded to Newcastle on June 9, remaining on duty in New Brunswick until August 2, when she returned to Nova Scotia waters. After some general patrol work she was detailed to work in checking illegal lobster fishing to the eastward of the boundary of the fall lobster season in District No. 8. When this had been completed the Venning returned to Halifax county and was employed in the open lobster season of District No. 4. A total of 7,590 miles was covered during the year.
The Gilbert was put in commission on April 14 and after being employ-ed in lobster fishing District No. 7 at the commencement of the lobster season left for bay Chaleur on May 21 and returned on July 19. She was then employed continuously on the boundary line between Districts Nos. 7 and 8 until October 6, after which she proceeded to Port Bickerton, Guysboro county, to act as mother ship to the fishing fleet at that place, laying up at Halifax on January 20, 1939. A total of 7,960 miles was covered on patrol work.
The chartered boat Mamie was engaged from May 3 to Octber 22. She was employed continuously in the strait section to oversee the operations of the nets and to check illegal lobster fishing from Malagash point to Mulgrave. A total of 4,902 miles was covered on patrol work.
The Daisy L. was on duty from August 8 to October 8 and covered 956 miles. The area covered was particularly at Malagash point, Wallace, Oak island and the shore of Cumberland county to McIvor's head.
The Elsie was engaged from August 8 to September 17 and covered a dis-tance of 1,246 miles on patrol. This boat was used mainly in the Lobster Fish-ing District No. 8 to oversee the operations of the fishermen.
The C.G.S. Arleux patrolled in the district during three periods: June 28 to July 16; August 3 and 4; and October 3 to 6. Mileage travelled by the ship 1,119 miles, patrol by the small boat 495 miles.
The guardian on Pictou island furnished a motor boat and the guardian at Tatamagouche bay .also, both of which gave effective service.
In the western district patrol boat service was rendered by the departmental owned boats Capelin and A. Halkett a-ssisted by chartered boats at Yarmouth, Clark's harbour, Woods harbour and Chester.
REPORT OF THE DEPUTY MINISTER 37

:
38 DEPARTMENT OF FISHERIES
The Capelin.patrolled generally, as formerly, the waters of the Nova Scotian coast fram Pubnico to the 'headwaters of the bay of Fundy. At the beginning of the year she was stationed at Westport, acting as a mother ship to the winter haddock fishing fleets operating in that vicinity and was also actively engaged in enforcing the lobster size limit regulations. The boat was laid up at Meteghan for annual overhaul from February 28 to May 2. TJpon going into commission again she patrolled the waters of St. Mary bay, checking boats to see that undersized •lobsters were returned to the water, and then made a general patrol to the headwaters of the bay of Fundy. Later a considerable period was spent in St. Mary bay and vicinity on lobster protection work Lobster smacks, boats and cars were searched throughout the sea,son for illegal fish. During the year twelve fishing boats and two schooners were assisted and towed to safety. Two men adrift in a dory during the storm of Demeber 5 were rescued and brought safely to Westport.
The Capelin patrolled 6,389 miles, destroyed 169 lobster traps, 125 buoys, 2,285 fathoms of rope illegally set and liberated 151 lobsters.
The A. Halkett at the opening of the year was engaged in checking up lobster fishermen's licences as well as enforcing the lobster size limit regulations and preventing the holding of berried lobsters. The boat was laid up for annual overhaul from February 28 to April 6. After going into commission she patrolled the waters of Mahone bay, enforcing the scallop fishery regulations, and worked week-ends in the estuary of the Medway river to prevent illegal salmon fishing. Assistance was rendered to the International Tuna Angling Committee at Liverpool during the latter part of August, and the boat gave assistance to the Bridgewater Exhibition Committee at Bridgewater and the Nova Scotia Fisherie,s Exhibition Committee at Lunenburg in September. A large number of lobster fishing boats were boarded and their catches inspected and •crates belonging to dealers and fishermen were overhauled to insure the enforcement of the lobster size limit regulations.
The A. Halkett patrolled during the season 4,964 miles, seized 74 lobster traps, 487 fathoms of rope and liberated 129 lobsters. Assistance was given to two schooners and several small boats.
The ,chartered boats working in the vicinity of Yarmouth, Clark harbour, Woods harbour and Chester gave satisfactory service and the work performed by them was instrumental in keeping down illegal lobster fishing.
NEW BRUNSWICK
In the Bay of Fundy section of the province the usual patrol boat service was carried on during the year. The Gannet Rock 11, a fine fast new boat, operated at Grand Manan during the •entire year, covering 6,537 miles. As a result of the effective work that was performed by this boat there was prac-tically no attempt at illegal lobster fishing at Grand Manan. The other regulations were also well observed as a result of this effective patrol.
The Thresher was in commission all the year and covered 10,707 miles. The Thresher is the general patrol boat for the whole Bay of Fundy district and was very helpful in attending to disabled motor fishing boats and in bringing doctors to needy sick persons on the islands and taking them to 'hospitals for medical treatment.
Two small chartered boats were also employed. One operated in Maces bay and the other at Grand Manan. The services rendered were satisfactory and they were instrumental in suppressing attempts at illegal lobster fishing.
Along the eastern shore of the province, four chartered boats, Gulf Rover, Gulf Racer, Gulf Ranger, and Gulf Raider, and the local patrol boat Brant, were used throughout the season. The Gulf Raider was employed for about a month at Prince Edward Island. In addition, the regular boats Gilbert and

Name of Boat Dates Employed Mileage
Gulf Ranger Brant Gulf Rover Gulf Raider Gulf Racer
April 26—November 12 April 26--November 23 April 27—November 12 May 25—November 11 May 23—November 30
9,777 miles 2,850 " 6,247 " 6,390 " 7,180 "
32,444 "
Venning were employed to assist in the salmon fishery patrol for about a month and a half each, the former on the Restigouche where she supervised the weekly closed period and assisted in towing salmon pontoons to the New Mills Pond, the other on the Miramichi salmon drift-line. Both boats gave valuable assistance in the administration of the salmon fishery. The C.G.S. Arleux also gave assistance on the protection of the Eel River lobster boundary line.
The locally employed boats were used in the administration of the salmon, lobster, oyster and smelt fisheries.
The following table shows the dates of service and the mileage of the chartered boats :—
PRINCE EDWARD ISLAND
Eight patrol boats were engaged during the past season in fisheries pro-tective work in this district and were allocated as follows: West Prince, 3; East Prince, 1; Queens, 3, and Kings, 1. Assistance was also given by C.G.S. Arleux and the patrol boat Gulf Raider at intervals during the season.
The chartered boats Langholm and Dolphin performed patrol service in Prince county from North tape to West point, the Dolphin operating between April 29 to May 31, when the Langholm wa,s chartered in the service, con-tinuing patrol operations up to and including November 20. A total mileage of 7,081 miles was covered by these two boats and the following seizures made: 483 traps, 4,865 fathoms of rope, and 391 pounds of lobsters. Very satisfactory results were obtained from this patrol service.
The 'chartered boat M.H.G. went on patrol in Cascumpec bay on July 12, continuing in the service until November 26. Some 3,154 miles were travelled and the following seizures made: 203 traps, 1,960 fathoms of rope, 273 pounds of lobsters, and one dory-. Patrolling the Cascumpec bay district, the boat produced satisfactory- results.
The chartered boat Girl Pat operated in the Richmond Bay district between August 1 and October 31, accomplishing satisfactorily a total mileage of 3,484 miles and seizing 78 traps and 450 fathoms of rope.
The chartered boat Beulah patrolled 1,851 miles, operating in the Malpeque-North Lake area between July 5 and October 4 and the following seizure„s were made during the period of operations: 461 traps, 4,905 fathoms of rope and 396 pounds of lobsters.
The •chartered boat Seabird operated satisfactorily in the Malpeque-North Lake area from August 1 to September 30, and patrolled some 1,591 miles. She seized 17 traps and 140 fathoms of rope.
The Capitol and Velox patrolled the Victoria-Georgetown district, the former being on duty from June 23 to July 24, on which date the newly-built govern-ment-owned Capitol took up her duties, .continuing in the service until November 2. From November 3 to 15 the crew of the Capitol were engaged in preparing the boat for and 'hauling it up into winter quarters. A total mileage of 7,355 miles was patrolled by the two boats and the following seizures were made: 211 traps, 1,942 fathoms of rope, 136 pounds of lobsters and one salmon gill-net and piece of herring net.
REPORT OF THE DEPUTY MINISTER 39

40 DEPARTMEiVT OF FISHERIES
The chartered boat B. and B. patrolled very satisfactorily .between Souris and Georgetown from August 1 to October 31, covering a total mileage of 2,655 miles and making the following seizures: 471 traps, 2,205 fathoms of rope and 1,775 pounds of lobsters.
The C.G.S. Arleux performed patrol duties of a most satisfactory nature in the traits of Northumberland, at intervals between April 27 and September 30. Ln the course of her patrol 59 traps and 16 berried lobsters were seized. Through the efforts of this boat and crew two prosecutions of persons in East Prince county for having berried lobsters were effected. The checking of licences and of spawn lobsters, important phases of lobster protective work, was succe,ssfully carried ,out by this boat.
The department-owned boat Gulf Raider patrolled the North Point bound-ary line in West Prince county from May 28 to June 14. In the prevention of illegal fishing between Districts No. 7 and 8 this boat's services were most effective.
MAGDALEN ISLANDS
The water patrol service in the Magdalens is provided by staunch motor boats owned and operated by the fisheries inspectors located on the islands,
,assisted by temporary employees. The lagoons fœmed by a se-ries of sand bars joining the various islands are lobster sanctuaries and require constant protec-tion during the close season. There is also the need of the northern inspector making patrols to Bryon island und Bird rocks in comiection with his official duties. Due to the efforts of these officers and their boats illegal fishing for lobsters has been practically eliminated during the past few years.
GULF AREA
An efficient water patrol service in the gulf area of this division is es,sen-tially needed, owing to the variety of conditions prevailing there in connection r-vith the fisheries. The greatest need is a protection of the lobster fisheries and th,e patrol boats named in this report are !primarily engaged in this work. The lobster fishing seasons in this area open and close at different times und this involves the protection of lobster boundary lin.es to prevent the running of lobsters from closed to open districts. Speedy patrol boats are required for this particular work and there is also the need of protecting the large water area that is closed to lobster fishing after the spring fishing seasons terminate. The patrol boats are also used in connection with salmon, oysters, smelt and other fisheries and •occasionally for the control and supervision of netting in certain areas.
LOBSTER PACK AND THE INSPECTION OF CANNERIES
During 1938 lice.nees to pack lobsters and tomalley were issued covering 215 .canneries. Of the number licensed, 213 canneries were actually operated, as compared with 239 in 1937, 256 in 1936 and 270 in 1935.
Comparative figures by provinces show the following distribution:—
Decrease Province 1938 1937 1936
1938-37 1938-36
Nova Scotia 63 72 76 9 13 New Brunswick 76 78 81 2 5 Prince Edward Island 65 74 84 9 19 Magdalen Islands 11 15 là 4 4
Totals 215 239 256 24 41

REPORT OF THE DEPUTY MINISTER 41
Lobster Pack.-During 1938 there was a total production of canned lobster within the Maritime Provinces and the Magdalen Islands amounting to 91,746 cases, as against 88,181 cases canned during 1937, on increase of 3,565 cases or 4 per cent.
Comparing the 1938 pack with previous years the following results are noted:-
Year Pack Increase or Percentage
Decrease Increase or Decrease
Cases Cases %
1938 91,746 1937 88,181 -I- 3,565 + 4.1 1936 87,390 + 4,356 + 4.8 1935 98,964 - 7,218 - 7.3 1934 114,679 - 22,933 - 19-1 1933 120,771 - 29,025 - 24-3 1932 164,981 - 73,235 - 44-4 1931 145,488 - 53,742 - 36 •9
Statistics for 1938 show increases in pack in Nova Scotia:, Prince Edward Island and the Magdalen Islands and a decrease in New Brunswick.-
Increase Province 1938 1937 or
Decrease
Cases Cases Cases
Nova Scotia 37,838 34,649 + 3,189 New Brunswick 23,060 26,957 - 3,897 Prince Edward Island 24,625 20,952 + 3,673 Magdalen Islands 6,223 5,623 + 600
91,746 88,181 ± 3,651
The pack for Nova Scotia in 1938 increased by 9.2 per cent as compared with 1937 output and the following increases and decreas.es when eompared with production for previous years:-
Percentage Year Pack Decrease of
Decrease
cases cases %
1936 37,690 -E 156 -E -4 1935 46,863 - 9,045 - 19.3 1934 50,553 - 12,715 - 25-1 1933 50,729 - 12,891 - 25.4
The New Brunswick pack when compared with 1937 shows a decrease of 3,897 cases or 14•4 per cent and for previous years the following increases and decreases may be noted:-
Increase • Year Pack or Percentage
Decrease
cases Cases %
1936 20,428 i- 2,632 -E 12.9 1935 18,275 i- 4,785 -1- 26 1934 23,815 - 755 - 3-2 1933 26,417 - 3,357 - 12.7 '
87275-4

Nova Scotia New Brunswick Prince Edward Island
Increase or I)ecrease
Percentage Increase or Decrease
Packed Province
1938 1937
-I- 41.9 - 13.3 -F 21 • 2
cases
760 16,728 3,429
cases
1,079 14,499 4,157
cases
319 - 2,229 1- 728
42 DEPARTMENT OF FISHERIES
The pack in Prince Edward Island shows an increase of 3,673 cases or 17-5 per cent. Compared with other years, the following increases end decreases may be noted:-
Increase Irear Pack Or Percentage
Decrease
cases cases %
1936 22,345 A- 2,280 -1- 10.2 1935 25,170 - 545 - 2.2 1934 30,214 - 5,589 - 18-5 1933 32,895 - 8,270 - 25.1
On the Magdalen Islands the pack for 1938 was 6,223 cases compared with 5,623 oases in 1937, an increase of 600 cases or 10-7 per cent. Compared with other years, the following decreases and percentages of decrease may be .noted:-
liear Pack Decrease Percentage
cases cases %
1936 6,927 703 10 • 1 1935 . 8,656 2,433 28-1 1934 10,097 3,874 38 • 3 1933 10,730 4,507 42 •
During the 1938 spring season 71,751 cases were canned as compared with 67,224 cases in the spring of 1937, an increase of 4,527 .cases or 6.7 per cent. Provincial figures covering spring pack show the following increases or decreases:-
Packed
1938 1937
Increase or Decrease
Percentage Increase or Decrease
Province
cases cases
36,767 8,638
20,469 6,223
34,018 10,051 17,531 5,623
Nova Scotia New Brunswick Prince Edward Island Magdalen Islands
cases
1- 2,749 - 1,413
2,938 1- 600
I- 8. - 14. A- 16 • 7 A- 10 • 7
During the fall season of 1938 the pack was 19,735 cases as compared with 20,917 cases in 1937, a decrease of 1,182 cases or 5.6 per cent. Provincial figures covering the fall pack show the following increases or decreases.

REPORT OF THE DEPUTY MINISTER 43
Cannery Inspection.—During 1938 careful attention was given to the inspec-tion of ,all canneries and 1,195 inspections were carried out by 36 inspecting officers, the average number of inspections being 10 per cannery.
Underweights.—Particular care was again given to " Underweights " and the fact that only 14 instances of suspected underweight cases were reported as against 16 in 1937, 24 in 1936 and 29 in 1935 can be taken as an indication of better cannery practice. Of the 14 lots of suspected underweights only 6 lots were adjudged underweight.
The following number of cases were marked "Underweight" during 1938 as compared with 1937:—
Province 1938 1937
Nova Scotia
New Brunswick
Prince Edward Island and Magdalen Islands
Totals
Nil cases 12 oz. pack Nil cases 12 oz. pack
19 cases 6 oz. pack 81 cases 6 oz. pack
5 cases 3 oz. pack Nil cases 3 oz. pack
Nil cases 12 oz. pack Nil eases 12 oz. pack
32 cases 6 oz. pack Nil cases 6 oz. pack
10 cases 3 oz. pack Nil cases 3 oz. pack
Nil cases 12 oz. pack 7 cases 12 oz. pack
150 cases 6 oz. pack 80 cases 6 oz. pack
65 cases 3 oz. pack 11 cases 3 oz. pack
Nil cases 12 oz pack. 201 cases 6 oz. pack 80 cases 3 oz. pack
7 cases 12 oz. pack 161 cases 6 oz. pack 11 cases 3 oz. pack
There was one instance in 1938 in which a canner allowed lobster meat to remain on the tables too long before canning. This lot was 'held by the inspect-ing officer for further examination and was subsequently found to be unfit for human consumption.
Cannery Grading.—During the year all canneries were graded by the fisheries inspectors and a general improvement in canneries was noted. This seemed to indicate a greater willingness on the part of canners to co-operate with our officers towards producing a better pack. Four canneries in New Brunswick were closed after failing to attain the minimum grading marks required by the regulations.
INSPECTIONS UNDER THE FISH INSPECTION ACT
The regulations under the Fish Inspection Act were revised early in the year and extended to .cover the inspection of pickled mackerel fillets, pickled headless and pickled trimmed herring. Later in the year provision was also made by regulation to eover the inspection of "Select Cup-shaped " oysters and to extend the inspection and grading of frozen smelts to the entire coast of New Brunswick. The latter measure was taken after some experience with such grading and inspection on certain parts of the east coast during the previous year.
81275-41

1938 1937
Educational visits Inspections of premises Empty containers inspected Pickled alewives inspected Pickled herring inspected
Headless herring inspected
Pickled mackerel inspected
Pickled mackerel fillets inspected
Hard cured smoked round herring inspected Oysters inspected
Frozen smelts inspected Dried fish inspected, pounds
4,595 6,328
311,205 11,970 17,814 x 11,032 y
78 f 10,854 p
795 x 12 y
54,126 x 197 y 43 f
439 p 8,148 s
6y 129 p
221,231 b 21,156 x 2,530 xx
194 y 160,921 z 839,600
3,797 3,943
348,005 11,242 6,278 x 5,867 y
24f 6,791 p
41,263 x 327 y
130 p
226,555 b 17,119 x 2,487 xx
7,481 z 2,648,750
44 DEPARTMENT OF . FISHERIES
The comparison of work performed under the Fish Inspection Act for the, past two years is as follows:—
(x—barrels). (y—hall-barrels). (f—quarter-barrels). (p—pails). (b-18 pound boxes). (xx-11-11 or 1 bushel boxes). (z—I5 or 10 pound boxes).
Of the above containers and fishing .products listed the supervisor who is in charge of pickled fish inspection reported that 967 empty containers veere reconditioned and 10 7082 rejected and that the following products were recon-ditioned as required by the regulations:—
Alewives Herring
64 pails Headless herring 8 barrels Mackerel fillets 50 pails Mackerel 1,443 barrels, 3 half-barrels Oysters 162 barrels, 164 boxes Hard cured smoked round herring 9,000 boxes
Reinspections as provided by the regulations were conducted with the following re,sults:—
lifackere/.—Sixty-one barrels below quality and short in weight; 38 barrels below quality; 6 barrels below quality and ungraded; 12 barrels -ungraded; 21 barrels stencilled " Tropics "; 28 barrels short in weight; 29 barrels original inspections confirmed.
Mackerel Fillets.—Ten barrels ungraded.
Herring.—Thirty barrels below quality; 57 barrels mixed quality and ungraded; 11 barrels ungraded; 47 barrels marked "Dark Fat."
Inspections under the regulation's made under the Fish Inspection Act are carried out by the permanent fishery officers of the division with such temporary assistance as may be needed in the heaviest producing districts. During the year fifty-six permanent officers were engaged in this work assisted by thirty-eight temporary employees. Most of the latter were used in connection with the grading of frozen smelts in New Brunswick, with satisfactory results. The smelt fishermen and dealers, generally, realized that in order to compete successfully in export markets the product must be standardized and while the
60 barrels 796 barrels 189 half-barrels

Quantity Value
Fish meal Cod oil Medicinal oil Common oil Herring oil Halibut livers KelP meal Seaweed meal Herring scales
3,138 tons $ 379,529 30,099 gallons 14,954 40,784 gallons 21,258 24,436 gallons 14,204 92,243 gallons 24,482 17,220 lbs. 5,166
291 tons 1,685 22 tons 1,100 261 tons 771
REPORT OF THE DEPUTY MINISTER 45
smelt inspection regulations applied only to the grading of fish for size and the marking of containers this was a sound basis for standardization and encourage-ment to the producers to pack a uniform product. Satisfactory results were also achieved in connection with the grading of oysters às well as the inspection of oysters for size and standard containers.
ILLEGAL FISHING
Reference is made in the 1937 .annual report for the division to the extremely difficult illegal lobster fishing situation that was dealt with in that year in the gulf area, particularly the parts adjoining the boundaries of the late lobster fishing season, and gratification is expressed that it could at that time be said with confidence that conditions with respect to illegal fishing had very greatly improved. This improvement continued during the past year and the're was much more evidence of co-operation between the fishermen and the protective forces than in the past. The supervisors of fisheries who are respon,sible for these areas report as follows:—
" So long as the severe economic conditions prevail there will always be the problem of illegal fishing but due to the organization and educa-tional work being carried on in the fishing communities it is easier to obtain the support of the right thinking fishermen to the enforcement of the regulations than it was in the past. Salmon, smelts, lobsters and oysters are always saleable and there is therefore great inducement to illegal fishing, but thiS has be-en kept at a minimum, due to the more effective :protective work. Viewing the situation as a whole, fishing regula-tions were satisfactorily observed during the past season. Attempted violations have been successfully frustrated at the outset by co-operation on the part of the land and water forces and during the entire year the regulations were well enforced." The co-ordination of land and water protective forces in the areas where
in the past the most difficulty was experienced with illegal fishing has been most effective. The prosecutions and confiscations, by provinces, in 1938 were as follows:—
Nova Scotia Prosecutions Confiscations
New Brunswick
115 37381 352
Prince Edward Island 42 80 Magdalen Islands nil 1
238 806
REDUCTION OF FISH WASTE AND COARSE FISH
During the year twenty firms in the division produced fish meal and oil. Of the,se, thirteen were located in Nova Scotia and seven on the Bay of Fundy coast of New Brunswick. Returns from these firms indicate that the following quantities of fish meal and oil were produced":—
* The figures include the production of firms but do not represent the total quantity of oil produced in the division.

$ cts
5,267 50 1,505 00 4,180 00
46 DEPARTMENT OF FISHERIES
Loss OF LIFE
it is regretted to report a loss of nineteen fishermen during the year. Of these seventeen were from Nova Scotia ports and two from Charlotte eounty, New Brunswick.
Loss OF GEAR
The estimated value of fishing equipment destroyed in the division by accident and storms during the year was over $375,000. The severest losses were in the 'southwestern part of Nova Scotia in iobster traps, boats and gear, destroyed in the heavy December storm previously mentioned, and on the east coast 6f New Brunswick and in Prince Edward Island where a similar storm did much damage in the latter part of November. No part of the division, however, escaped the damage caused by storms which were frequent throughout the fishing seasons.
SEAL BOUNTY
Bounty on hair seals at the rate of $2.50 per snout which rate was authorized in 1937, was continued during the past year. The number of these animals, which are so destructive to important shore fisheries, on which bounty was paid increased by 344 when a greater number of seals were being killed in the Magdalen Islands.
The comparative results for the division for the past two fiscal years is as follows:—
1938-39 1937-38
Bounty Number
2,336 642 869
10,952 50 3,847
Nova Scotia New Brunswick Prince Edward Island and Magdalen Islands
Totals for division
Number
2,107 602
1,672
4,381
Bornty
$ cts.
5,840 00 1,605 00 2,172 50
9,617 50
COLLECTION SERVICE
The bait collection service operated in the Canso area for the past few years was continued from July 25th to September 29th, except from August 6 to August 14 when bait was not required. A total of 20,730 pounds of bait was collected and distributed to the fishermen.
One of the outstanding developments of the year in the eastern part of the province was the operation of a collection service for late caught fresh line fish under joint arrangements between the Maritime National Fish Limited and the United Maritime Fishermen assisted by the department and by the Govern-ment of Nova Scotia.
Notwithsta,nding most unfavourable weather conditions and the late appear-ance of dogfish on the inshore fishing grounds, as well as lack of needed storage of bait and ice at the ports of call, the venture ras regarded as quite successful and a real benefit to many.of the shore fishermen. The service commenced on October 1 and continued until January 15. Two staunch collecting smacks were used throughout the season with another smaller boat for local collections as required. The ports of call were Petit de Grat, Canso, Dover, Port Felix, Larry's river, Charlos cove, New harbour, Coddles harbour, Drum head, Port Bickerton and Marie Joseph. The fish were delivered at the Maritime National fish plant at Halifax, the locals of the United Maritime Fishermen taking care

REPORT OF THE DEPUTY MINISTER 47
of the buying and loading arrangements at the outports and the company sup-plying the boxes and sending ice and bait down shore to the fishing ports. A total of 1,478,943 pounds of fish were carried during the collecting period.
This service greatly stimulated interest in fall and early winter inshore fishing and encouraged fishermen to equip themselves with better boats and gear in order to continue fishing operations at a time when they would otherwise be idle.
FISHING FLEETS The Lunenburg salt fishing fleet made the three regular trips to the banks
and total landings were somewhat greater than in 1937 which was the highest catch for quite a few years. Twenty-eight vessels in all engaged in this method of fishing as compared with twenty-five vessels. Following is a comparison of the catches of the three trips to the banks:—
1938 1937
Frozen baiting Spring Summer
14 vessels— 8,500 qtls. 24 " 26,500 " 28 " 72,800 "
13 vessels— 6,900 qt1s. 24 " 28,500 " 29 " 869,000 "
107,850 " 104,450 "
Prices were little changed from those paid in 1937 but one of the most discouraging features of the salt fish industry was that weather conditions during the spring and summer were unfavourable for drying fish. Continual rains made.drying most difficult and tended to increase spoilage and adversely affect the quality of fish.
Fresh Fishing.—Two new vessels of the modern type for fresh fishing were added to the fleet, the Lillah M. Boutillier and the Teresa H. Connors. These vessels were built at Lunenburg and are owned and operated by the Maritime National Fish Limited, Halifax.
The larger heavy powered vessels mostly hailing from Lunenburg continued in the fresh fishing industry during the winter months following a period of unemployment which terminated on January 19th when the majority of the fresh fishing fleet returned to the banks. Many of the vessels engaged in salt fishing during the spring and summer and some of them again turned to fresh fishing during the fall. October was a month of very heavy production and marketing conditions, due to low prices and high inventories, were unfavourable and continued so until the end of the year. Severe weather conditions tended to improve the situation somewhat during December but as the year closed the outlook for the fresh fish industry was still difficult.
The last report for the division referred to the unsatisfactory condition of the formerly large and important cod fishing fleets of Lameque and Caraquet in Gloucester county, New Brunswick. It is regrettable to report no improve-ment in this regard and that only 140 vessels operated in the codfishing fleets from these ports during the year although a few years ago the fleet was over 240 sail. The loss of important markets, as a result of world conditions, is responsible for the decline in this industry which produced the high quality Gaspe cured codfish. Many of the vessels during the past year were obliged to sell their fares in the green state for heavy salting.
EDUCATIONAL WoRK Reports received from the fishery officers indicate the wide extent to which
educational work is being carried on among the fishermen and dealers and the variety of conditions that are found along the coasts of this division. Such

48 DEPARTMENT OF FISHERIES
work includes instruction in methods of preparing, curing, grading and packing fishery products, sterilization and sanitation of fishing premises and the care and ha.ndling of live lobsters and fresh caught fish.
On the east coast of New Brunswick rapid progress has been made during the past few years in adult education in fishing communities. Under arrange-ments made by the department with the Extension Branch of St. Francis Xavier University this work has been extended widely in the three provinces and is resulting in the formation of numerous study groups, various organizations of fishermen and so on and is providing a firm foundation for sound co-operative activity. Many such groups have been most active and enthusiastic in taking advantage of the facilities provided for the inspection and grading of fishery products, such as canned lobsters, oysters, frozen smelts and some varieties of cured fish. The application of inspection requirements looking to the standard-ization of product by means of proper grading, packaging and marking is much simplified and made much more effective when it is possible to deal with trained groups of producers and packers who in their own interests understand and are fully prepared to meet market requirements.
DEPARTMENTAL STAFF
During the year there were a number of changes in the permanent staff and it is with great regret that the death of W. E. Joy, inspector for the Grand Manan area, on September 21 is reported. A. G. MacLeod, supervisor of fish-eries in Cape Breton, took his retirement leave on October 26 and three of the older inspectors of the division were retired during the year. These were Inspector R. S. Smith, of Pugwash, N.S. on December 31, due to illness, and Inspector J. G. D'Entremont, of Middle West Pubnico, N.S., on October 11, and Inspector M. W. Williston, of Bay du Vin, N.B., on November 28, on reaching retiring age. Miss L. A. Ingraham, of the Pictou office, and Miss M. A. Await, of the headqua.rters office, resigned from the service on December 31 and August 31, respectively.
New appointments to the service included those of Inspector H. J. Robichaud, Newcastle, N.B., on June 16 and Inspector Arthur J. Caissie, at Shediac, N.B., on June 9. Five seasonal inspectors were also employed in certain areas for fish inspection work.
The classification of those employed in the administrative services of the division during 1938 was as follows:—
Chief and district supervisors 10 Inspectors and clerical staff 82 Fishery guardians 617 Patrol and Protection Service 100
809
ANNUAL REPORT OF CHIEF SUPERVISOR OF FISHERIES (MAJOR J. A. MOTHERWELL) WESTERN DIVISION (BRITISH
COLUMBIA) FOR 1938
Thirty-eight salmon canneries operated in British Columbia during the year. This number compares with seventy-six in the years 1926 and 1927 and ninety-four in 1917. The recent tendency has been to concentrate canning opera-tions at some central point rather than have separate establishments scattered all along the coast, et a high cost in the way of separate overhead. With improved facilities for the transportation of fish long distances, canning com-panies have faund it desirable to close some of their plants and carry their salmon as far as 250 miles to a central point.
The early run of spring salmon off the shores of British Columbia was not up to expectations. On the other hand, there was an unusually large run of echoes.

Rivers Inlet.. Smiths Inlet..
No. of Sockeye per Case Canned*
12.24 13.17 12.50 10.50 13.95 14.68 10.89
REPORT OF THE DEPUTY MINISTER 49
The trollers' catches of cohoes would have been considerably greater than they were had it not been that for some unknown reason the fish did not take the trollers' bait so readily as in other years; this condition, in fact, is reported to have obtained all along the Pacific coast during 1938, from Alaska to the Columbia river. The gillnetters, however, had an unusually good season in mho fishing.
The sockeye run to the Alberni Canal district, which has been restored through the efforts of the department in the way of conservation and fish cul-ture, is being maintained at a very satisfactory point. The department% efforts towards rehabilitation have been -outstanding in this area.
In the annual report for the year 1937 'particulars were given regarding the number of sockeye salmon in the principal gillnet areas required to produce one standard oase of 48 one-pound tall cans. The figures for the year under review are given as follows:—
*Averages are based on the pack of sockeye in each of the districts mentioned, regardless of n-here caught.
It will be observed that the individual fish in 1938 running to the Smiths Inlet and the Fraser River districts were considerably larger than those of the preceding year.
CANNED SALMON
With a total pack of all varieties of canned salmon reaching 1,707,830 cases the year 1938 produced the second largest pack of canned salmon since the record-making season of 1930.
The following are the five-year averages of total packs of ail varieties dur-ing the past fifteen years:—
Cases 1,786,186 1,330,365 1,641,996
SOCKEYE
There was an unusually large pack of sockeye, the total reaching 447,453 cases, which considerably exceeds the average for the past fifteen years and com-pares with 383,515 cases, the average for the immediately preceding five years, as shown by the following statement:—
1924-1028.. .
Naas River Area.—The total of 21,746 cases of sockeye for the Naas area is considered a good average pack for the area and compares very favourably with the pack of 10,173 cases in the five-year cycle year of 1933, although short of the total of 36,242 cases in the four-year cycle of 1934.
Skeena River Area.—The total pack of sockeye from the Skeena River run, amounting to 46,988 cases, shows a definite increase over the five-year cycle year of 1933 when 27,693 cases were packed. It is little short, however, of the four-year cycle year of 1934 when 54,558 cases were packed.
Cases 322,162 318,582 383,515

50 DEPARTMENT OF FISHERIES
It must be remembered that in recent years the fishing on the Skeena has been materially curtailed as a result of moving the fishing boundary seven miles downstream and 'changing the opening date for sockeye fishing from June 20 to the last week-end of the month. Considering these restrictions, the pack of 1938 can be considered as reasonably satisfactory and would appear to be encouraging for the future.
Rivers and Smiths Inlets.—The total of 122,093 cases of sockeye .packed in the year under review compares with 119,548 cases in the five-year cycle year, 1933, and 89,575 cases in the four-year cycle year, 1934. The total is quite encouraging and it is felt that Rivers and Smiths inlets, under present regu-lations, should never have a failure.
Fraser River ilrea.—The total sockeye pack for the year was the largest .since 1914, or 169,430 cases, compared with 133,159 cases in the brood year, 1934. Very little of the 1938 pack was from the early run, which proceeds to the higher reaches of the' Fraser River watershed. The largest runs were of the later fish proceeding to the Shuswap larea, although the supplies to the Pemberton and Pitt systems were good.
An outstanding feature of this year's pack from Fraser River sockeye was the unusually large hsize of the individual fish. The average number of fish to the case, in the pack produced from the run proceeding to the Fraser waters, was only 10-33. On the lother hand, the average for the total pack put up in the Fraser district from sockeye from all sources was 10 •89 fish; in other words, the Fraser sockeye were much larger than the salmon brought in from other localities such as Nitinat, Rivers inlet, etc., for processing in the Fraser area.
Statement No. 15 shows the pack of sockeye salmon oaught en route to the Fraser river, via Juan de Fuca straits, Puget sound, which is in United States territory, the gulf of Georgia and the Fraser itself.
It will .be observed that the five salmon traps permitted in the Sooke area accounted for 1.2 per cent of the total run of sockeye to the Fraser river.
COHOES
Coho pack showed considerable increase over that of .any previous year and amounted to 273,706 eases. The run was unusually large in numbers and also in the size of the individual fish.
It will be remembered that in 1937 the supply of cohoes all along the Pacific coast was short but just the reverse condition obtained in 1938. In view of the unusually large size of the individual fish in 1938 there may be some merit in the suggestion that a larger percentage of the cohoes remained another year on the feeding grounds before seeking the spawning streams.
The following statement shows the five-year average pack of cohoes during the past fifteen years:—
1924-192S 155,746 cases
1929-1933 139,478 "
1934-1938 202,413 "
PINKS
The total of 400,876 cases of pinks was disappointing. One reason for the small total was the disappointing size of the catch in the Massett Inlet area. Whilst the streams in the section were fairly well seeded the fish apparently were difficult to catch, but in any event the size of the run was considerably smaller than anticipated.
It is interesting to note that the Fisheries Research Board of Canada is con-tinuing the investigation of the habits of the pink salmon run in the Massett district, and it is hoped that in the near future there will be information avail-

REPORT OF THE DEPUTY MINISTER 51
able to show whether there is anything in the contention that in certain years the pink salmon run is diverted from the Massett area to southeastern Alaska streams.
The two-year average packs of pinks during the past fourteen years have been as follows:-
1925-1926 609,196
1927-1928 519,989
1929-1930 794,953
1931-1932 215,355
1933-1934 483,961
1935-1936 553,249
1937-1938 493,226
cHums The quantity of chums packed was satisfactory, totalling 541,812 cases,
which is considerably in excess of the five-year average for the 15-year period, 1924-38, as shown by the following statement:
1924-1928
1929-1933
1934-1938
CANNED SALMON INSPECTION
The following statements give the results of the year's inspection of canned salmon at the departmental inspection laboratory situated in Vancouver:-
Number of inspections made 3,017 Total number of eases inspected - 1,651,863t Total number of cases below certificate standard 32,204 Total number of cases available for certificates 1,619,6594
DETAILS OF CANNED SALMON INSPECTION ACCORDING TO SPECIES
Number Number
Number of Cases of Cases Species of Cases below Eligible
Inspected Certificate for
Standard Certificates
Sockeye 44.1, 5001, 20, 3041 424,196 Springs 13,871-1, 13,8711 Steelheads 730 730 Bluebacks 27,404 164 27,240 Coho 237,9781 1,0171 236,961 Pinks 420,393 8,583 411,810 Churns 506,986 2,135 504,851
Totals 1, 651, 8631 32,204 1,619,659k
PARTICULARS OF NON-CERTIFIED CANNED SALMON ACCORDING TO SPECIES
Below Tips Species Grade Grade B and Minced Flaked Totals
B Tails
Sockeye 15,446 4,0831 302 473 20,3041 Springs Steelbeads Bluebacks 121 561 18 77 164 Cohn 190 6681 76 83 1,0171 Pinks 37 6,837 1,709 8,583 Chums 650 1,485 2,135
Totals 8891 24,493 5,8861 379 556 32,204
A more detailed account of the operations at the Laboratory is contained in the annual report of the Chief Chemist, Mr. F. Charnley. (Appendix No. 6).
The inspection fees collected at the rate of one-half cent per ca.,e totalled $8,219.43.
cases CC
Cé
Ct
CC
CC
CC
661,145 cases 296,497 " 501,937 "

52 DEPARTMENT OF FISHERIES
CANNED SALMON-FRENCH QUOTA
The quota for the calendar year of 1938 allotted by the French authorities to Canada 'totalled 31,250 inetric quintals, as follows:-
First quarter 8,125 quintals Second quarters 8,125 " Third quarters 7,500 Fourth quarter 7,500 "
In previous years 'certificates of origin have been issued at this office but commencing with the year 1938 other arrangements were made.
DRYSALTED SALMON
Under the operations of the British Columbia Salt Fish Board whkh controls all drysalt salmon, a total of 69,209 .hundredweight was processed and marketed in the Orient. This shows a very considerable reductio n over previous years and is accounted for by the difficult conditions obtaining generally .at the present time in the Orient.
The following statement shows the pack of drysalt salmon by species, since 1925:-
_ Sockeye Cohoes Pinks Chums Totals sWprhinitegs
cwts. cwts. cwts. cwts. cwts. owts.
1925 4,580 2,137 131,737 138,454 1926 139,858 139,858 1927 81,170 81,170 1928 48 170,205 170,253 1929 77,362 77,362 1930 1,291 114,932 116,223 1931 520 9,743 4 40,371 336,055 386,693 1932 8,142 119,147 127,289 1933 89 7,469 75,317 82,875 1934 2 90,979 90,981 1935 4 1,354 34 6,173 139,076 146,641 1936 2,780 76 150,637 153,493 1937 1,292 107,691 108,983 1938 12 69,197 69,209
POWER BOATS IN SALMON GILLNET FISHING
Statement No. 14 shows an increase of 320 power boats used, compared with the season of 1937, in salmon gillnet fishing in District No. 2. This is the highest total since power boats were permitted.
SALMON TIKFN By INDIANS IN THE FRASER RIVER WATERSHED FOR PURPOSE OF
THEIR OWN FOOD REQUIREMENTS
The following are the particulars of the catches of salmon taken by Indians for their own food purposes, under special free permits, in the Fraser River watershed:-
Fraser River Sockeye Springs Coho Chums Steelhead Total
Prince George subdistrict... 2,198 350 2,548 Quesnel subdistrict 475 50 525 Kamloops subdistrict 9,395 1,335 764 11,494 Hope subdistrict 2,590 2,250 630 230 310 6,010 Squamish subdistrict 2,000 1,150 1,050 600 250 5,050 North Vancouver subdis-
trict 285 330 615 Chilliwack subdistrict 8,400 2,870 4,905 6,650 2,110 24,935 Lower Mainland sub-
district 380 160 1,695 2,170 305 4,710
Totals 25,438 8,165 9,329 9,980 2,975 55,887

REPORT OF THE DEPUTY MINISTER 53
SALMON-BRINE CURED
A new development worthy of note was the brine curing of 68,949 chum salmon at one plant in Barclay sound. After curing, the fish were packed in barrels containing 900 pounds each, and shipped to the Japanese market.
SALVAGING OF SALMON FRY
Owing largely to deforestation, a number of the smaller salmon streams dry up each year in the summertime, resulting in considerable quantities of salmon fry being stranded in the upper reaches. As these conditions are observed by the fishery officers the fry are conveyed to areas from which they can safely reach the salt water. In this way many thousands are saved. The following is a statement of the work which has been done during the year:-
Area Method Coho Chums Springs Steelhead Total
No. No. No. No. No. District No. I-
Squamish .Netting 12,000 '10,000 } 47, 000 Squamish Ditching 14,000 11,000
Chilliwack Netting 600 } 17, 600 Chilliwack Ditching 7,100 0,500
North Vancouver Netting 992 992
District No. 3- Nanaimo 1`;:etting 735,500 12,600 3,400 } 1,411,500 Nanaimo Ditching ' 644,500 12,200 3,300
Cowichan Netting . 630,600 331,000 75,000 } 2, 086, 600 Cowichan Ditching 635,000 335,000 80, 000
Victoria Netting 9,600 1,650 1,800 } 30,050 Victoria Ditching 12,350 1,450 3,200
Nitinat Netting 91,000 56,000 23,000 } 220,000 Nitinat • Ditching 27,000 20,500 2,500
Pt. Renfrew Netting 153,000 } 203, 000 Pt. Renfrew Ditching 50,000
Ladysmith Netting 17,000 Ladysmith Ditching 28, 000
} 45, 000
Courtenay Netting 63,300 } 75, 300 Courtenay Ditching 12,000
Totals 3,143,942 779,000 . 21,000 102,200 4, 137, 042
SALMON CUL'r U RE
In an attempt to develop a run of sockeye salmon to Maggie lake, which is situated in Barclay sound, on the west coast of Vancouver Island, 1,050,000 sockeye eggs were collected at Anderson lake and " eyed " at the ,old hatchery building. After a normal loss of 16,641 the remaining 1,033,359 eggs were successfully planted in Hillier creek, tributary to Maggie lake.
No salmon had heretofore frequented the lake, a condition which was due, no doubt, to the fact that there was an impassable fall in the outlet stream. In 1937 the department built a fishway in this obstruction and there is now every reason to believe that any fish wishing to ascend to Maggie lake will be able to do so.
HALIBUT
Landings of halibut at British Columbia ports by Canadian and United States vessels, as shown by the following statement, totalled 193,488 hundred-

DEPARTMEN7' OF FISHERIES
weights, which is 6,063 hundredweights greater than the total for the previous year and constitutes the largest total in British Columbia since 1930. Landings were larger •at Vancouver, New Westminster, Butedale and Vancouver Island points. Of the 1938 total 120,247 hundredweights were from Canadian vessels and 73,241 hundredweights from United States .craft. The statement follows:-
Vancouver Vancouver
Prince Year and New Pr Rupert I3utedale Island Totals
Westminster points
cwts. cwts. cwts. cwts. cwts.
1930 11,387 293,617 978 2,814 308,796 1931 8,498 167,757 3,627 2,123 182,005 1932 11,883 148,615 6,677 1,672 168,847 1933 13,436 144,065 10,431 2,440 170,372 1934 16,113 150,476 13,297 2,716 182,602 1935 22,351 129,586 15,713 3,493 171,143 1936 20,777 131,830 11,522 3,992 168,121 1937 23,334 147,638 12,676 3,777 187,425 1938 28,155 141,691 17,776 5,866 193,488
LIVER PRODUCTION
There was an increa,se of 714 per cent or 1,267 hundredweights in the landings of halibut livers, over the total for 1937. The average value, however, showed a reduction of $2 per hundredweight, that is, $50.97 compared with the 1937 price of $52.97.
The following statement gives halibut liver production figures for 1933-38 period:-
Average
Marketed Value Cwts. Value perOmt.
S S cts.
1933 2,293 45,995 20 06 1934 . 1,562 36,439 23 33 1935 1,812 80,513 44 43 1936 1,916 96,311 50 27 1937 1,782 94,405 52 97 1938 3,049 155,420 50 97
COD LIVERS
There was as increase during the year in the quantity of cod livers landed by Canadian vessels, although the average price shows some reduction.
The statement following reviews tod liver returns for the past six years:-
Year Cwts. Marketed Average
Value Value per Cwt.
$ $ cts.
1933 385 7,781 20 21 1934 825 16,772 20 33 1935 1,127 43,367 38 48 1936 1,430 59,654 41 72 1937 1,017 40,238 39 57 1938 1,403 49,368 35 19
54

REPORT OF THE DEPUTY MINISTER 55
GRAYFISH LIVERS
• During the year there was a considerable increase in the landings of grayfish livers, although towards the end of the year market conditions were not altogether satisfactory. The average price was $6.37 per hundredweight compared with $6.15 per hundredweight in the previous season, as shown by the following statement:—
Marketed Average Year Value owts.
Value per Cwt.
8 8 cts.
1937 1,739 10,702 6 15 1038. 7,894 50,277 6 37
SHRIMPS
Although .there are substantial quantities of shrimps available along the coast of British Columbia the market conditions have been such in recent years that there has been only partial exploitation of the re-sources. It is possible that in the near future conditions may change to such a degree as to lead to a larger annual harvest being taken.
Shrimp landings for the past seven years are shown in the following statement:—
Year Marketed Fresh Canned
cwts. cases 1932 1933 1934 1935 1936 1937 1938
1,109 209
1,247 35
933 336
1,545 483
646 25
652 222
864 460
HERRING
Catches of herring on the west coast of Vancouver Island were disappointing, apart from Quatsino, where a good run appeared. It was only in this area that the full quota of 5,000 tons could be s_afely permitted.
The quota system in District No. 3 was again enforced during 1938 and appears to have functioned satisfactorily.
Prospecting by seiners in the northern area, that is, District No. 2, resulted is no new particularly large concentrations of herring being found, save in Prince Rupert harbour. Fairly good showings of herring were observed in some parts of the district but the fish were not sufficiently numerous to justify seining. For some reason or other herring did not show in large quantities in Cousins inlet up to the end of the year.
HERRING—DRYSALTED
From Statement No. 8 it will be observed that the pack of drysalted herring during the year was only 149,700 hundredweights—the smallest out-put for many years. The decrease was due, not to lack of fish, but entirely to the chaotic conditions obtaining in China, which made marketing arrange-ments -very difficult. The drysalting operations were again entirely under the control of the British Columbia Salt Fish Board.

cwts.
"Year Marketed Fresh Canned
1928 1929 1930 1931 1932 1933 1934 1935 1936 1937 1938
5,878 5,496 4,459 4,968 2,952 3,766 3,187 4,336 4,347 4,948 4,337
cases
671 295 204 251 999
1,267 1,322 1,312 1,546 2,157
56 DEPARTMENT OF FISHERIES
PILCHARDS
Due to the erratic movements of the fish, the success of each season's pilchard fishery operations is always speculative. In some sea,sons the pilchards are to be found within a few miles of the processing plante; in others, the operators have to send their boats to the extra-territorial waters off the State of Washington. During the first part of the 1938 season pilchard did not occur off British Columbia shores and were only available in the vicinity of Destruc-tion island, some fifty miles ,south of cape Flattery. As the season advanced, however, the fish came in off British Columbia, reasonably close to the Cana-dian plants, and this condition permitted the processing of a fairly satisfactory quantity at reasonable cost.
It will be observed from Statement No. 9 that the pack of canned pilchards is the largest since 1939.
CLAMS
There was a considerable increa,se in the quanthy of clams marketed, both fresh and canned clams, as shown by the following statement. This increase was due largely to the working of the razor clam beds along the north coast of the Queen Charlotte Islands:—
Marketed Fresh
Year Canned
cwts. 1934 1935 1936 1937 1938
6,332 15,716 26,530 27,018
- 37,103
5,815 10,209 12,579 12,587 22,155
CRA13S
The demand for British Columbia canned crabs continues to increase, as can easily be understood by anyone who is familiar with the .high quality of this particular pack.
The following statement shows the disposition of the crab catch during the past eleven years: 7-
WHALES
Whilst apparently there was no shortage of whales, weather cOnditions were again quite bad in 1938, particularly from the standpoint of prevalence of fog. The whaling company employed during the season 130 men a.t, their two stations situated at Naden harbour and Rose harbour, respectively. Six whaling boats were used.

REPORT OF THE DEPUTY IIIINISTE1? 57
The provisions of the international agreement in respect of whaling were closely observed.
Statement No. 11 shOws the whale catch since 1922.
• FISH MEAL AND OIL
Generally speaking, a fairly satisfactory season was enjoyed in the produc-tion of fish meal and oil. An increase in the production of oil was noted in the case of pilchards and while the output of herring oil showed reduction from that of the previous •season, it was the second largest in the history of the industry. This was due largely to the fact that during the past two years new sources of herring supply have been found in the northern areas.
FUR SEAL SKINS
Fur seal skins taken during the year, 1,367, show a reduction of approxi-mately fifty per cent as compared with the take of the previous year. The decrease was due to several causes, the principal being weakness of demand which resulted in the low price of $2.25, difficult weather conditions during the migration of the fur seals past the British Columbia coast were another ad-verse factor.
Statement No. 12 shows the number of fur seals taken since 1912.
DESTRUCTION OF SEA LIONS
While the main sea lion hunt was again carried on by C.G.S. Givenchy, the practic,e of ha-ving other fishery vessels destroy lions as opportunity occurred was also followed. Some lions were destroyed both by C.G.S. Iklalaspina and F.P.L. Vanidis. The following statement shows the total number destroyed by the three boats during the year:—
-Where Destroyed Adults Pups Totals _ . Entrance Island 62 62 Nanoose Bay 95 95 Thormanby Island 64 64 Long Beach Rocks 270 270 Raphael Point Rock 3 3 Langara Island 72 72 Solander Rocks 66 66 North Danger Rocks 122 122 Banilla Rocks 68 68 -Virgin Rocks 21 4 .25 East Haycock Island 605 256 861 West Haycock Island 354 513 867 Pearl Rocks 27 2 29 White Cliff Island 88 88 Butterworth Rocks 38 38
Totals 1,955 775 2,730
It will be noted that the largest numbers of lions were destroyed at the East and West Haycock isla.nds where operations were first undertaken in 1937. Only a few were killed at the Virgin and Pearl rocks where previously great numbers had usually congregated. Early operaeons by the Givenchy had greatly curbed the size of the herds at these points.
An experiment was carried on during the year by a commercial firm with a view to ascertaining the suitability of sea lion hides for making leather gloves. In this expeiiment some 346 lions, in addition to the number shown in the fore-

8 ets.
42,128 103,427 00 Total
Flair Seals Fiscal Year
Rate Number Amount
1914-1915 .1915.1916 1916-1917 1917-1918 1927-1928 19284929 1929-1930 1930-1931 1931-1932 1932-1933 1933-1934 1936-1937 19374938 1938-1939
3 50 1 00 1 00 1 00 3 50 3 50 2 50 2 50 2 50 2 00 1 50 1 50 2 50 2 50
2,237 749 785 748 567
3,209 5,944 6,308 6,084 4,300
400 1,933 4,295 4,569
S cts.
7,829 50 749 00 785 00 748 00
1,984 50 11,231 50 14,860 00 15,770 00 15,210 00 8,600 00
600 00 2,899 50
10,737 50 11,422 50
58 DEPARTMENT OF FISHERIES
going statement were lç_illed at East Haycock island, and their hides tanned. The success, or ,otherwise, of this expeniment has not yet been fully determined as information regarding the reaction of the market to the finished product is not yet available.
A census of the sea lion population of the British Columbia . coast was undertaken during the year and it is estimated that the number frequenting the various ,areas is 14,833. It is to be kept dearly in mind, that owing to the roving propensities of these mammals, the number should only be accepted as an estimate.
HAIR SEALS
The total amount paid out in British Columbia from April 1, 1938, to December, 31, 1938, in bounties on hair seals was $8,835. The following state-ment shows the amounts paid as hair seal bounties in British Columbia since 1914-15.
ENGINEERING WORK
In Appendix No. 3 of this report will be found reference to the work which engaged the attention of the engineering branch of the department's British Columbia Service during the year.
VIOLATIONS
There was a total of 258 prosecutions for violation of the fishery regulations during the year,. with resultant revenue of $10,158.32, as shown by the following statement:-
District District District No.1 No.2 No.3 Total
Prosecutions 92 83 83 258 Fines 8 2,527 00 $ 2,675 00 S 1,828 00 S 7,030 00 Sales 8 488 41 S 2,193 76 $ 446 15 $ 3,128 32
Total Fines and Sales 8 3,015 41 $ 4,868 76 $ 2,274 15 5 10,158 32

1938 Total Number
Departmentally owned- Malaspina and Givenchy (steam) District No. 1 (gas and Diesel) District No. 2 (gas and Diesel) District No. 3 (gas and Diesel)
Chartered boats-- District No. 1 (gas and Diesel) District No. 2 (gas and Diesel) District No. 3 (gas and Diesel) District No. 1 (row) District No. 2 (row) District No. 3 (row)
118
2 5
10 4
3 28 54
4 8
85
12
Base Minutes Hours
30 _ 303
Alert Bay Nanaimo Swanson Bay Vancouver
97 45
153 7
55 00 10 25
REPORT OF THE DEPUTY MINISTER 59
PATROL SERVICE
There were 21 departmentally owned power craft, including two steam vessels, 85 chartered gasoline boats and 12 row boats, employed in the patrol service in 1938, in addition to seaplanes, as shown by the following statement:—
Aerial patrol covered 303 hours, 30 minutes, as shown below:—
(A statement showing the flying time in preceding years will be found in the chief supervisor's report in the annual departmental report for 1937-38.)
The 'planes used during the season iust closed were two Bellanca "Pacemaker" cabin seaplanes, one Waco cabin seaplane, and one Boeing "Totem" flying boat. The two Bellancas were the regular equipment but were relieved from time to time by the other two.
NEW PATROL BOATS
In an effort to handle patrol service in rivers as efficiently as possible, and at a reduced cost, an effort is being made to replace the larger and more expensive patrol boats by small, two-man boats having greater speed and more shallow draft. In this way much more territory can be covered and, with the shallow draft, it is possible to cover portions of the Fraser river, for instance, where, in the past, protection has not proved sufficient.
During the year one boat of the smaller type was built by the department's staff at Poplar Island plant at New Westminster. The hull of this craft is of the Fraser River fishing boat type. It is 33 feet in length and of 7-foot beam, and its draft 30 inches. The boat is powered with an 8-cylinder marine engine, equipped with Joe's reverse gears. This season's experience has shown that this type of boat justifies expectations.
After having been employed in the fisheries protection service in British Columbia for many years, the steam vessel Givenchy, built in Montreal in 1918 as a minesweeper, has outlived lier usefulness and it lias been decided to take

60 DEPARTMENT OF FISHERIES
her out of commission at the end of the fiscal year and to replace her by a new boat. The Givenchy has been used in protecting the three mile limit, preventing misuse of Canadian harbours by foreign boats, protecting the halibut fisheries, protecting the fur seal herd in its annual migration to the Pribiloff Islands, and in other work connected with the fisheries. The new vessel, now under construc-tion under a contract placed with a shipbuilding firm at New Westminster, will have an overall length of 107 feet 6 inches, 18-foot beam and its moulded depth will be 11 feet 3 inches. The vessel has been designed by a British Columbia architect who has had many years' experience in designing boats suited to con-ditions obtaining on the coast of the province. She will be equipped with a 320 H.P. full diesel engine and will have a guaranteed cruising speed of twelve knots. The wood being used in her construction is yellow cedar and Douglas fir, with the usual percentage of white oak and Australian red gumwood. The new vessel is expected to go in commission about the end of the fiscal year.
With a view to a further increase in the efficiency of the protection service in open waters, a second boat is also being constructed for the department, this one at Vancouver. This vessel, like the other, is expected to be available for service by the end of the fiscal year. The boat will be 87 feet in length, 15 feet 6 inches in beam, with a moulded depth of 10 feet, and will be equipped with a full diesel engine of 180 H.P. The engines for both of the new vessels are of Vancouver manufacture.
DEPARTMENTAL STAFF
Those employed during the year in the several capacities were as follows:— Supervisors, inspectors and clerical staff .. . . . . 57 General, (inspection of spawning grounds, etc.) .. 20
Patrolmen and boat crews.. 206 Fish culture
. 3
Removal of obstructions 36
368
SPORT FISHING---TIDAL WATERS
Sport fishing in tidal waters, by means of trolling and fly casting, was very successful during the year. The blueback fishing was satisfactory, although not uniformly successful; for instance, the small man operating with a rowboat, and those fishing with small gas boats, with light gear, were not so successful as those who operated with heavier gear in deeper water. It has been suggested that the unusually dry warm summer resulted in the fish seeking greater depth and thus being unavailable to sportsmen who fish near the surface as a rule.
There was a remarkable increase in the size of the individual fish, both in the case of bluebacks and cohoes.

1,821
2,416
3,093
2,987
2,630
3,115
3,115
3,033
2,880
3,099
3,107
3,511
3,162
3,453
4,225
4,750
5,637
5,179
65
76
76
62
63
59
35
44
49
49
43
46
32
38
5,609
6,061
4,893
5,359
6,113
6,826
6,216
6,620
6,095
7,125
371
343
228
157
555
399
238
296
293
287
291
300
329
445
37
41
46
22
24
21
21
30
31
O
o 9
9
9
19
6
7
7
7
7
7
7
8
8
8
7
5
5
cases 4,419
4,177
8,819
2,328
3,156
6,650
4,727
14,133
1,849
1,644
3,114
2,527
1,788
2,322
cases 10,675
19,445
20,820
6,073
22,246
42,033
25,296
28,505
21,763
29,556
15,319
33,718
19,236
27,417
cases 1,996
2,165
1,462
865
cases 188,505
162,449
161,148
150,684
174,198
148,561
76,879
160,466
137,289
195,874
216,173
212,343
113,972
273,706
672
1,656
1,326
1,168
1,459
1,282
596
1,068
844
1,035
cases 29,938
23,736
16,129
5:526
7,926
11,970
4,894
14,974
5,953
12,859
8,619
10,834
3,420
2,933
STATEMENT No. 1
ANNUAL CANNED SALMON PRODUCTION IN Bninsu COLUMBIA
Number of salmon licences issued
Year
Sockeye
Num-ber of can
nones oper-ated
G.N. Troll P.S. D.S. T.N. Red Spring
Pink Spring
White Spring
Blue- back
Pack canned
Steel- head Coho Pink Chum Totals
1925
1926 '
1927
1928
1929
1930
1931
• 1932
1933
1934 •
1935
1936
1937
1938
cases 392,643
336,995
308,032
203,541
281,306
477,678
291,464
284,355
258,107
377,882
350,444
415,024
325,774
447,453
cases 39,142
41,276
34,029
11,002
8,295
20,184
17,526
46,953
12,464
15,281
10,187
16,493
10,963
10,276
cases 445,400
772,993
247,617
792,362
477,969
1,111,937
206,995
223,716
532,558
435,364
514,966
591,532
585,576
400,876
cases 607,904
701,962
562,109
863,257
424,982
401,114
55,997
306,761
293,630
513,184
409,604
597,487
447,602
541,812
cases 1,720,622
2,065,198
1,360,449
2,035,636
1,400,750
2,221,783
685,104
1,081,031
1,265,072
1,582,926
1,529,022
1,881,026
1,509,175
1,707,830
o
o •.1
■■•■
tl
Norn.-Licences issued include transfers from one district to another, except in the case of purse seines after 1929.
ffeemnnIeK 11201M1Ifierglalefià

PACK OF CANNED SALMON ON THE NAAS RIVER-1925 To 1938 STATEMENT No. 2 cn
Num- Number of salmon licences Pack canned
ber of issued Year can-
neries Red Pink White Blue- Steel-
oper- G.N. Troll P.S. D.S. T.N. Sockeya Sig Spring Spring back head C0110 Pink Churn Totals ated
cases cases cases cases cases cases cases cases cases cases *1925 3 210 20,351 5,441 387 538 470 8,188 35,880 23,497 94,752 t1925 18,945 4,067 387 392 457 7,726 34,530 22,504 89,008 *1926 4 316 15,929 4,616 751 597 375 4,274 43,891 15,392 85,825 f1926 15,929 4,616 751 597 . 375 4,274 50,815 15,392 92,749
*1927 4 302 11,986 3,221 511 213 96 3,845 16,609 3,307 39,788 t1927 11,986 3,221 511 213 96 3,845 16,609 3,307 39,788 *1928 3 263 5,558 1,471 68 615 36 18,002 95,998 4,591 126,339 f1928 5,540 1,471 68 307 36 10,734 83,183 3,538 104,877
*1929 3 240 16,347 256 57 96 1,195 10,507 1,261 29,719 1. 1929 16,077 256 57 96 1,145 10,342 1,212 29,185 *1930 3 282 26,500 1,772 283 176 137 5,555 90,163 4,330 128,916 '1'1930 26,405 1,722 283 176 84 961 79,976 3,853 113,460
*1931 1 235 16,929 1,010 323 106 8,943 5,178 660 33,149 f1931 9,146 1,010 323 106 443 3,575 392 14,995 *1932 3 278 15,138 5,848 264 468 23 33,495 51,920 15,070 122,226 f1932 14,154 3,676 264 468 40 7,955 44,629 14,515 85,671
*1933 3 297 10,173 1,014 227 214 114 19,016 57,406 2,778 00,942 1'1933 9,757 885 227 184 40 3,251 44,306 1,775 60,434 *1934 3 335 36,242 533 126 145 311 26,698 37,698 5,558 107,311 11934 28,701 383 126 145 311 9,935 32,965 2,648 75,214
*1935 3 310 12,712 94 298 108 143 21,810 25,508 17,481 78,214 f1935 12,245 86 298 168 143 5,125 21,443 12,681 52,189 *1936 3 349 28,562 1,622 229 316 496 11,842 72,022 20,196 135,285 f1936 24,137 520 188 237 496 8,439 60,582 16,504 111,103
*1937 2 321 17,590 773 245 232 46 12,336 7,876 10,530 49,628 f1937 11,630 773 245 232 46 316 5,688 6,002 24,939 *1938 2 309 21,746 458 189 125 188 20,485 61,660 15,135 119,986 f1938 14,795 13 165 125 188 3,986 ' 29,843 6,804 55,919
* rack of fish caught at Naas river regardless where canned. f Pack of Naas river regardless where caught.
NoTE.-Licences issued, except 1925, include transfers from other districts.
S'ffI
ME
S'I
d dO
‘L
N2
-NIU
Vc1
3e
eiagieteileià

ew.w.
EMISWERBIEMI ;itikkAef7,
PACK OF CANNED SALMON ON TUE SKEENA RIVER-1925 TO 1938 STATENIENT No. 3
Num- Number of salmon licences Pack canned
ber of issued Year can-
neries Red Pink White Blue- Steel- ooper- G.N. Troll P.S. D.S. T.N. Sockey S'pring Spring e - C ho Pink Chum Totals
ated Spring back head
cases cases cases cases cases cases cases cases cases cases #1925 13 1,067 77,785 17,811 1,657 2,457 700 38,029 127,226 10,687 276,352 $1925 81,149 19,185 1,657 2,603 713 39,168 130,083 74,308 348,866 $1926 15 1,129 82,307 17,896 966 1,750 764 30,153 170,586 46,382 350,804 #1926 82,357 17,896 966 1,750 764 30,209 210,064 63,527 407,533
$1927 13 1,195 83,988 13,595 3,567 1,600 046 25,209 38,903 9,656 177,173 #1927 83,984 14,856 3,567 1,609 580 25,623 38,761 18,659 187,639 $1928 11 1,208 34,524 4,121 988 397 231 18,751 191,812 11,792 262,616 11928 34,559 5,043 988 354 241 30,194 209,579 17,751 298,709
$1929 11 1,143 77,714 3,795 441 383 13 37,138 94,846 3,625 217,955 #1929 78,014 3,795 441 383 13 37,456 95,305 4,835 220,242 $1930 11 1,202 130,952 6,589 1,047 322 GO 24,191 214,266 3,327 380,754 #1930 132,372 6,674 1,047 324 58 29,203 275,642 5,057 450,377
$1931 8 1,076 107,936 7,040 2,284 534 768 20,146 41,264 3,893 183,865 #1931 93,020 7,040 2,284 534 768 10,737 44,807 3,610 162,809 #1932 10 1,119 59,916 16,378 9,419 2,472 404 48,312 58,261 38,549 233,711 #1932 52,624 14,268 9,419 2,472 365 20,549 32,519 28,756 160,972
#1933 10 1,218 30,506 2,626 444 227 267 39,896 95,783 15,714 185,463 t1933 27,693 6,805 444 828 201 21,366 79,932 10,970 148,239 #1934 9 1,164 70,654 6,844 592 860 114 54,470 125,163 24,388 283,085 $1934 54,558 6,809 592 860 131 21,298 27,628 6,242 118,118
#1935 9 1,053 64,140 3,443 429 188 12 45,512 09,412 31,807 244,943 #1935 52,879 3,422 429 188 14 23,498 81,868 8,122 170,420 #1936 8 970 97,823 4,883 455 435 33 55,198 178,299 36,892 374,018 #1936 81,900 3,781 414 356 33 32,142 92,997 15,343 227,026
#1937 7 850 55,811 3,788 382 315 21 34,502 72,455 37,431 204,705 11937 41,023 3,704 382 315 21 14,573 57,623 10,027 127,668 #1938 6 1,049 73,508 3,361 1,165 259 42 100,658 146,676 34,785 360,454 #1938 46,988 2,916 1,141 259 42 38,542 69,299 14,668 173,855
# Pack of fish caug tt at Skeena river regardless where canned. # Pack at Skeena river regardless where caught.
Nom-Licences issued include transfers from other districts.
RE
PO
RT
OF
T
HE
D
EP
UT
Y M
IN
IST
ER
01

PACK OF C.A.NNED SALMON FROM FISH CAUG-HT AT nivEns INLET AND SMITHS INLET-1925 TO 1938 STATEMENT No. 4
Nam- Number of salmon licences Pack canned
ber of issued Year can-
neries ink White Blue- Steel-
oper- G.N. Troll P.S. D.S. T.N. Sockeye IIed P . head Ccdio Pink Chum TcrUds
ated , Spruig Sprrng Spring back
cases cases cases cases cases cases cases cases cases cases 1925 11 1,127 201,186 344 311 116 10 4,887 7,675 11,501 226,030 1925 170,581 215 311 57 4, 868 8,625 11,477 196,132 1926 12 1,483 89,866 535 249 160 27 10,348 8,493 14,690 124,368 1926 74,629 473 189 142 11 7,448 18,503 11,751 108,146
1927 13 1,842 101,053 463 530 321 19 5,475 1,383 5,027 114,271 1927 87,145 322 530 321 17 4,980 1,402 3,617 98,384 1928 11 1,541 93,361 458 443 157 13 9,761 3,130 9,200 116,523 1928 88,876 156 443 152 13 1,098 16,703 3,626 111,066
1929 13 1,577 79,548 546 215 127 47 8,270 3,112 6,536 98,401 1929 77,669 140 239 107 41 3,239 1,340 1,091 88,866 1930 12 1,833 150,398 614 383 229 182 6,760 17,476 18,372 194,414 1930 141,684 275 383 215 208 2,084 34,638 2,135 181,622
1931 5 1,433 92,872 218 61 183 69 5,536 2,296 544 101,779 1931 80,732 200 82 165 68 6,683 3,724 562 92,216 1932 10 1,754 86,110 405 236 145 56 11,871 4,305 5,516 108,644 1982 85,358 128 236 148 49 7,335 4,631 1,109 98,989
1933 11 1,962 119,548 606 108 243 153 9,078 11,658 8,932 150,226 1933 114,045 454 108 241 169 8,514 25,054 9,518 158,103 1934 11 2,318 89,575 532 82 129 121 11,862 2,928 14,375 119,604 1934 82,828 390 82 128 122 8,793 9,769 16,444 118,556
1935 8 2,023 166,686 138 352 155 63 9,576 8,966 19,563 205,499 1935 129,531 94 806 146 49 917 6,045 1,128 144,216 1936 8 2,210 59,138 317 132 162 60 7,432 6,407 13,158 86,896 1936 42,803 315 131 148 54 7,683 17,254 10,921 79,309
1937 6 1;875 108,170 377 396 235 75 6,374 7,973 18,894 142,494 1937 91,399 335 453 233 76 5,331 18,873 21,931 138,631 1938 6 2,261 122,093 744 18 359 169 17,527 10,827 15,832 167,732
• 1938 86,4110 716 136 351 99 14,284 12,447 17,102 131,625
NOTE.-Figures shown in roman are packs from fish caught at Rivers inlet or Smiths inlet. Figures shown in italics are actual packs irrespective of where fish taken and not including fish shipped out for canning in other districts. Licences issued include transfers from other districts.
CS)
SWIU
11H
S1Id d
O ‘L
NZ
NIZ
IVcI
da

Num-ber of can-
neries oper-ated
10
10 10 8 9
8 7 8
10
1 1
10
11
10
Sockeye
cases 31,523
83,589 57,085 26,530 60,407
107,896 54,688 83,447 53,481
145,579 133,159 76,415 57,212
165,651 164,408 103,137 66,583
217,882 169,430
Red Spring
Cases 7,335
11,774 6,553 1,173 2,984
8,300 5,970
19,994 5,701
5,495 4,713 5,181 4,205
7,128 6,680 3,877 3,622
4,592 3,754
Pink Spring
cases 873
1,030 1,351
248 912
3,066 1,185 3,622
426
263 173 326 212
461 310 226
84
413 32
wilfte Spring
cases
20,130 10,493 3,661 5,977
9,761 3,187
11,020 4,554
11,072 10,760 6,783 4,984
8,426 8,142 1,940 1,738
1,532 508
Year
G.N.
Number of salmon licences issued
Troll P.S. D.S. T.N.
Pack canned
Blue- back
Steel- head Coho Pink Chum Totals
1925
1026 1927 1928 1929
1930 1931 1932 1933
1934* 1934t 1935* 1935t
1936* ' 1936t 1937* 1937t
1938* 1938t
969
1,063 1,249 1,303 1,473
1,523 1,358 1,446 1,685
1,803
1,663
1,784
2,082
2,319
50
59 111 109 113
115 154 166 110
98
124
118
190
190
64
105
108
58
112
22,566 1,607 7,701
350
20,647
19,065 1,354
21,923
Cases 5,107
14,036 10,621
705 11,960
27,857 14,697 16,558 13,299
cases 45
39 37
53
22 4
23
6
15 15
72 13
cases cases cases cases 36,717 99,800 66,111 272,993
21,787 32,256 88,493 273,134
24,079 102,535 67,259 280,013
27,061 2,881 193,106 255,455
40,540 158,290 144,208 425,331
25,535 30,754 68,946 282,137
13,468 21,534 948 115,681
28,685 9,813 45,100 218,262
25,715 143,058 77,330 323,564
30,751 35,847 219,331 470,904
10,991 342 103,081 264,826
63,933 182,528 72,353 415,220
24,600 111,328 8,227 211,118
51,243 23,842 188,538 465,942
22,572 2 30,663 232,777
25,618 252,416 119,254 525,548
11,242 87,897 20,934 193,469
54,314 29,862 181,444 512,034
28,687 63 49,835 252,322
RE
PO
RT
OF
THE
DE
PU
TY
MIN
IST
ER
PACK OF CANNED SALMON IN THE FRASER RIVER DISTRICT-1925 TO 1938 STATEMENT No. 5
* Represents actua pack, regardless where caught. t Represents pack of Fraser fish, regardless where canned.
NOTE.-Licences issued include transfers from other districts.
NoTE.-1936t pack of Sockeye on Fraser, 164,408 cases, does not include 16,611 cases Sockeye caught on Fraser and exported and canned in Puget Sound canneries.

66 DEPARTMENT OF FISHERIES •
STATEMENT No. 6
PACK OF CANNED SALMON OF PUGET SOUND, U.S.A., FROM 1925 TO 1938
Number Steel- Year of canneries Spring Sockeye Coho Chum Pink head Total
operated
cases cases cases cases cases cases cases
1925 23 28,268 106,064 171,587 41,635 555,848 141 903,543 1926 14 27,763 44,569 120,846 112,411 2,125 63 307,777 1927 21 43,443 96,343 133,528 37,414 585,506 216 896,450 1928 12 24,628 61,044 92,770 145,735 5,816 265 330,258
1929 21 32,600 111,855 101,363 150,867 727,748 280 1,124,713 1930 13 29,378 352,194 122,691 64,234 3,712 397 572,606 1931 18 28,066 83,728 76,025 55,189 705,580 293 948,881 1932 10 23,964 78,319 60,740 146,151 1,677 60 310,911
1933 19 20,869 125,738 44,568 37,039 543,340 222 771,776 1934 20 14,398 352,579 69,254 73,337 3,606 513,174 1935 14 9,737 54,677 71,985 15,604 377,445 529,448 1936 9 6,328 59,505 29,1911 80,831 1,345 177,201
1937 14 8,968 60,259 32,559 17,417 327,833 447,036 1938 13 2,7871 134,651 9,8201 7,8521 193 155,3041
STATEMENT No. 7
STATEMENT OF HALIBUT LANDINGS-BRITISFI COLUMBIA-1913 TO 1938
(Includes landings in United States bottoms) Cwt. Cwt.
19 1 3 223,465 1926 315,095 1914 214,411 1927 271,354 1915 194,896 1928 302,820 1916 123,062 1929 304,364 1917 113,529 1930 254,796 1918 186,229 1931 182,005 1919 210,777 1932 168,847 1920 238,770 1933 170,372 1921 325,868 1934 182,602 1922 293,184 1935 171,143 1923 334,667 1936 168,121 1924 331,382 1937 187,425 1925 318,240 1938 193,488
STATEMENT No. 8
STATEMENT OF DRY SALT HERRING PACKS, 1918-1938-BRITISFI COLUMBIA
3
Year District District District No. Total
No. 1 No.2 East Coast West Coast
cwt. cwt. cwt. ewt. cwt.
1918 20,000 109,900 42,710 172,610 1919 4,000 43,000 208,058 255,058 1920 807 1 176,640 334,720 512,168 1921 249 231,240 248,482 479,971 1922 297,871 224,897 522,768 1923 8,935 250,420 484,681 744,036 1924 305,266 548,277 853,543 1925 4,120 591,162 487,892 1,083,174 1926 11,134 4,192 596,114 327,207 938,647 1927 24,380 7,600 542,385 473,825 1,048,190 1928 46,995 748,032 277,161 1,072,188 1929 78,800 5,160 691,673 140,751 916,384 1930 19,114 546,342 :240,517 805,973 1931 668,506 119,721 788,227 1932 219,398 50,022 269,420 1933 448,944 64,080 513,024 1934 310,026 104,600 414,626 1935 280,290 22,420 302,710 1936 357,337 26,000 383,337 1937 203,401 203,401 1938 . 149,700 149,700

REPORT OF THE DEPUTY MINISTER 67
STATEMENT NO. 9
CANNED PILCHARD PACK-BRITISH COLUMBIA-1917 TO 1938
Cases Cases 1917 1,090 1928 65,097 1918 63,693 1929 98,821 1919 63,065 1930 55,166 1920 91,929 1931 17,336 1921 16,091 1932 4,622 1922 19,186 1933 2,946 1923 17,195 1934 35,437 1924 14,898 1935 27,184 1925 37,182 1936 35,007 1926 26,731 1937 40,975 1927 58,501 1938 69,473
STATEMENT No. 10
PRODUCTION FISH OIL AND MEAL-BRITISH COLUMBIA, 1920-1938
From Pilchards From Herring From Whales From Other Sources*
Year Meal Whale- Meal and Oil Meal Oil bone and Fertilizer Oil and Oil
fertilizer meal fertilizer
tons gals, tons gals, tons tons gals. tons gals.
1920. 503 1,035 604,070 466 55,669 1921. 489 44,700 1922. 326 230 283,314 911 75,461 1923. 485 910 706,514 823 180,318 1924. 292 926 645,657 1,709 241,376 1925.... 2,083 495,653 347 835 556,939 2,468 354,853 1926.... 8,481 1,898,721 310 13,700 340 666 468,206 1,752 217,150 1927.... 12,169 2,673,876 1,838 170,450 345 651 437,967 2,512 375,130 1928.... 14,500 3,995,806 831 68,411 376 754 571,914 3,658 411,207 1929.... 15,826 2,856,579 932 34,924 416 779 712,597 3,671 461,915 1930.... 13,934 3,204,058 915 60,373 273 581 525,533 2,420 182,636 1931.... 14,200 2,551,914 3,904 110,810 1,747 241,682 1932.... 8,842 1,315,864 6,195 186,173 413 45,517 1933.... 1,108 275,879 4,078 316,213 249 223 509,310 1,596 187,566 1934.... 7,626 1,635,123 2,570 104,710 340 631 813,724 2,458 337,025 1935.... 8,681 1,649,392 5,262 306,767 211 354 426,772 2,147 247,437 1936.... 8,715 1,217,097 10,985 782,499 332 687 763,740 3,148 335,969 1937.... 8,483 1,707,276 14,427 1,283,658 268 527 662,355 2,720 294,54E 1938.... 8,891 2,195,850 9,624 929,158 273 490 543,378 2,491 228,157
* Salmon and halibut offal and gray fish.
STATEMEX'T NO. 11
NUMBER OF WHALES LANDED-BRITISH COLUMBIA, 1922,1938*
Species 1922 1923 1924 1925 1926 1927 1928 1929 1930 1933 1934 1935 1936 1937 1938
Sperm 38 94 83 76 80 82 83 146 147 190 265 175 311 265 252 Sulphur 4 62 56 29 14 10 47 16 10 1 6 3 1 4 Fin 94 166 125 135 124 138 140 168 62 17 71 20 48 44 50 Hump 50 78 47 40 25 21 21 9 12 14 1 14 7 4 Sei 1 53 100 68 25 7 13 67 89 1 2 Right 2 1 Bottlenose 2 1 3 1 1
Totals 187 455 414 351 269 258 305 407 320 209 350 202 378 317 310
* No whaling plants operated 1931 and 1932.
87275-5h

-68 DEPARTMENT OF FISHERIES
STATEMENT No. 12
STATEMENT OF FUR SEAL SKINS TAKEN AND LANDED, BRITISF1 COLUMBIA, 1912-1938
Year District District Total
No.2 No.3
No. No. No. 1912 205 205 1913 285 119 404 1914 95 257 352 1915 39 400 439 1916 21 138 159 1917 14 204 218 1918 78 10 88 1919 53 17 70 1920 502 556 1,058 1921 270 2,079 2,349 1922 291 639 930 1923 678 3,746 4,424 1924 370 1,862 2,232 1925 810 3,655 4,465 1926 655 2,169 2,824 1927 188 1,288 1,476 1928 465 1,625 2,090 1929 1,119 2,264 3,383 1930 195 2,102 2,297 1931 76 1,387 1,463 1932 88 1,699 1,787 1933 237 1,747 1,984 1934 98 158 256 1935 63 778 841 1936 1,888 1,888 1937 2,671 2,671 1938 1,367 1,367
STATEMENT No. 13
STATEMENT OF LICENCES ISSUED FOR SALMON CANNERLES AND SALMON FISHING GEAR (NOT INCLUDING LICENCES TO CAPTAINS AND ASSISTANTS ON SALMON SEINE-BOATS OR
ASSISTANTS ON SALMON GILL-NET BOATS.) BRITISH COLUMBIA-1927-1938
Kind of Licence 1927 1928 1929 1930 1931 1932 1933 1934 1935 1936 1937 1938
District No. 1- Salmon cannery. 10 10 9 11 7 8 10 11 10 11 10 10 Salmon trolling 111 109 113 115 154 166 110 98 124 118 190 190 Salmon gill-net 1,249 1,303 1,473 1,523 1,358 1,446 1,685 1,803 1,663 1,784 2082, 2,319
District No. 5- Salmon cannery. 48 47 45 26 21 28 29 31 26 27 20 22 Salmon trap-net Salmon purse-seine 244 158 153 152 71 53 55 109 102 99 82 WO Salmon drag-seine 16 9 9 - 9 9 9 11 9 9 9 9 9 Salmon trolling 938 864 738 891 884 875 882 937 930 964 916 958 Salmon gill-net:-
Lowe inlet 29 59 67 58 74 76 80 Nass river 302 263 246 282 235 278 297 335 310 349 321 309 Skeena river 1,198 1,208 1,143 1,202 1,076 1,119 1,218 1,164 1,053 970 856 1,049 Rivers Inlet 1,273 1,117 1,149 1,449 1,144 1,461 1,603 1,899 1,699 1,802 1,490 1,796 Smiths Inlet 570 424 428 384 289 293 359 419 324 408 385 465 Bella Coola 195 173 236 f 359 240 238 228 285 268 265 { 261 1 242 Kimsquit 104 80 194 1 Butedale 108 58 56 71 51 55 43 48 41 57 18 80 Namu 180 77 116 142 108 100 107 141 129 146 137 159 QUeen Charlotte islands 42 22 3 6 5 4 2 19 24 4 53
Total, salmon gill-net, District No. 2 - 3,972 3,422 3,571 3,895 3,148 3,577 3,916 4,377 3,882 4,095 3,548 4,233
District No. 3- Salmon cannery 18 19 17 17 7 8 10 7 7 8 7 6 Salmon trap-net 7 7 7 7 7 7 8 8 8 7 5 5 Salmon purse-seine... 308 239 218 191 157 104 183 187 191 188 209 200 Salmon drag-seine 30 13 13 12 12 21 20 Salmon-trolling 2,045 2,014 1,779 2,109 2,077 1,992 1,888 2,064 2,053 2,429 2,056 2,305 Salmon gill-net 422 454 565 643 387 336 512 646 673 741 466 573
Whole Province- Salmon cannery 76 76 71 54 35 44 49 49 43 46 37 38 Salmon trap-net 7 7 7 7 7 7 8 8 8 7 5 5 Salmon purse-seine. 552 397 371 243 228 157 236 296 293 287 291 300 Salmon drag-seine 46 22 22 21 21 30 31 9 9 9 9 9 Salmon trilling 3,094 2,987 2,630 3,115 3,115 3,033 2,880 3,099 3,107 3,511 3,162 3,453 Salmon gill-net 5,643 5,179 5,609 6,061 4,893 5,359 6,113 6,826 6,218 6,620 6,096 7,125
Narc.-During the season 1928 F. Millerd's cannery at Vancoiiver, the Cassiar cannery on the Skeena and the Massett Cannery, Masset inlet, operated without licences, and are not included in the number of es.nnery licences shown above.
Commencing with year 1930 salmon cannery licences shown above were issued by the Provincial Fisheries Department

69: REPORT OF THE DEPUTY MINISTER
STATEMENT No. 14
STATEMENT OF POWER BOATS OPERATED IN DISTRICT No. 2, BRITISFI COLUMBIA, IN CONNECTION WITH SALMON GILL-NET OPERATIONS
- 1924 1925 1926 1927 1928 1929 1930 1931 1932 1933 1934 1935 1936 1937 1938
Naas river 3 9 35 21 37 34 119 142 179 233 268 243 327 278 287 Skeena river 18 64 133 162 216 263 472 603 660 668 732 804 842 824 817 Bella Coale and
Kimsquit 1 12 49 47 9011.03 70 1 124 94 89 101 156 150 139 161 169 Central area 8 28 87 13f 73 f 68 Ill 165 234 161 252 244 323 Rivers inlet.. 54 110 254 248 479 435 712 682 776 901 1,233 1,164 1,287 1,122 1,294 Smiths inlet 9 39 131 110 204 135 231 176 175 219 299 28" 302 128 387 Queen Charlotte
Islands 10 24
85 242 630 675 1,049 1,010 1,658 1,765 1,990 2,287 2,922 2,807 3,173 2,957 3,277
STATEMENT No. 15
PACK OF SOCKEYE SALMON FROM RUNS TO FRASER RIVER, 1925-1938
Canadian Fraser Traps in Puget Total
Year River Juan de Sound Cases Pack Fuca Pack
* Straits
1925 31,523 3,862 106,064 141,449 1926 83,589 2,091 44,569 130,249 1927 57,085 4,337 96,343 157,765 1928 26,530 2,769 61,044 90,343 1929 60,407 3,480 111,856 175,743 1930 93,416 5,334 352,194 450,944 1931 38,507 2,440 83,728 124,675 1932 61,769 4,000 78,319 144,088 1933 43,745 8,721 125,738 178,204 1934 133,159 6,117 352,579 491,855 1935 57,212 5,610 54,677 117,499 1936 164,408 3,837 59,505 227,75C 1937 66,583 6,152 60,259 132,994 1938 169,430 3,784 139,173 312,38î
* For the years 1925 to 1929 inclusive, figures represent sockeye pack at Fraser River canneries, re-gardless where caught. From 1930 onwards, figures represent pack of Fraser River sockeye, regardless where canned.

12 3 7
STATEMENT No. 16
STATEMENT OF FISHERY LICENCES ISSUED, BRITISH COLUMBIA—WHOLE PROVINCE, 1938
Issued Transfers Operating Variety of Licence
Jap Can- Total White bd. aP Total White Ind. Others Jap Can- Total
White Ind. Others R.S. celled ' R.S. R.S. celled '
Salmon trap-net 5 5 5 5 Salmon drag-seine 9 9 9 9 Salmon purse-seine 238 62 1 301 238 62 1 301 Salmon gill-net 3,285 1,492 . 910 44 78 5,809 977 322 17 1,316 4,262 1,814 910 61 78 7,125 Salmon trolling 2,742 475 155 2 11 3,385 88 68 2,810 475 155 2 11 3,453 Asst. Salmon gill-net . .. 49 141 314 1 43 548 49 141 314 1 43 548 Capt. salmon seine 81 96 177 81 96 177 Asst. salmon seine 1,041 721 1 1,763 1,041 721 1 1,763 Cod 245 22 151 2 15 435 245 .22 151 2 15 435 Crab 89 15 1 1 1 107 89 15 1 1 1 107 Grayfish 189 20 297 2 488 169 20 297 2 488 Miscellaneous fishery... 50 2 33 5 3 93 50 2 33 5 3 93 Smelt 34 18 2 54 34 18 2 54 Small dragger 33 10 43 33 10 43 Herring pound permits.. 7 7 7 7 Herring purse-seine...... 40 2 2 44 40 2 2 44 Herring gill-net 22 4 ' 26 22 4 26 Capt. herring seine 21 2 5 28 21 2 5 28 Asst. herring reine 251 72 76 399 251 72 76 399 Pilchard purse-seine..... 29 29 29 29 Capt. pilchard seine..... 20 a 23 20 3 23 Asst. pilchard seine 167 10 177 167 10 177 Capt. halibut boat for
bait 10 10 10 10
Totals 8,628 3,144 1,976 57 155 13,960 1,045 322 17 1,384 9,673 3,466 1,976 74 155 15,344
LICENCES ISSUED BY PROVINCIAL FISHERIES DEPARTMENT
Angling Permits 37 (2 cancelled) Salmon Cannery 38 Herring Cannery 2 Anglers Day Permits 56 Salmon Dry Saltery 7 Herring Dry Saltery Indian Permits 1,694 (1 etuicelled) Tierced Salmon Plants 6 Herring Reduction..
Cold Storage Plants 8 Pilchard Cannery... Miscellaneous Plants 14 Pilchard Reduction. Whale Reduction 2 Commercial Fishery Licenses for non-tidal
waters 139
3
SW
IUM
S'Id 1
O
d1■
1214
1U
VCI3
T
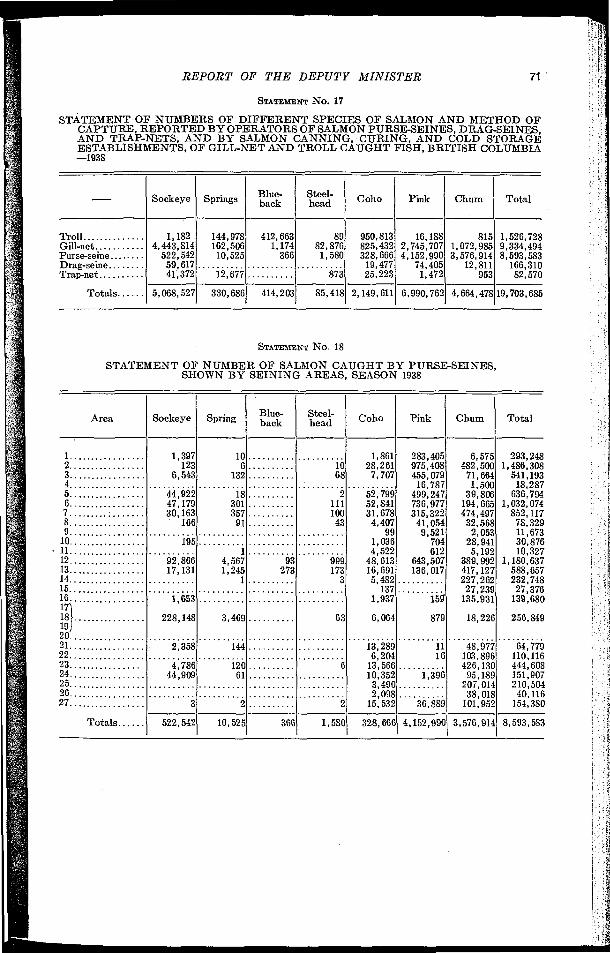
REPORT OF THE DEPUTY MINISTER 71
STATEMENT No. 17
STATEMENT OF NUMBERS OF DIFFERENT SPECIES OF SALMON AND METHOD OF CAPTURE, REPORTED BY OPERATORS OF SALMON PURSE-SEINES, DRAG-SEINES, AND TRAP-NETS, AND BY SALMON CANNING, CURING, AND COLD STORAGE ESTABLISHMENTS, OF GILL-NET AND TROLL CAUGHT FISH, BRITISH COLUMBIA -1938
13lue- Steel- ---- Sockeye Springs back head Coho Pink Chum Total
Troll 1,182 144,978 412,663 89 950,813 16,188 815 1,526,728 Gill-net 4,443,814 162,506 1,174 82,876 825,432 2,745,707 1,072,985 9,334,494 Purse-seine 522,542 10,525 366 1,580 328,666 4,152,990 3,576,914 8,593,583 Drag-seine 59,617 19,477 74,405 12,811 166,310 Tra.p-net 41,372 12,677 873 25,223 1,472 953 82,570
Totals 5,068,527 330,686 414,203 85,418 2,149,611 6,990,762 4,664,47819,703,685
SvernmEicr No. 18
STATEMENT OF NUMBER OF SALMON CAUGHT BY PURSE-SEINES, SHOWN BY SEINING AREAS, SEASON 1938
Blue- Steel- Area Sockeye Spring back head Coho Pink Chum Total
1 1,397 10 1,861 283,405 6,575 293,248 2 123 6 10 28,261 975,408 482,500 1,486,308 3 6,543 132 68 7,707 455,079 71,664 541,193 4 16,787 1,500 18,287 5 44,922 18 2 52,799 499,247 39,806 636,794 6 47,179 301 111 52,841 736,977 194,665 1,032,074 7 30,163 357 100 31,678 315,322 474,497 852,117 8 166 91 43 4,407 41,054 32,568 78,329 9 99 9,521 2,053 11,673
10 195 1,036 704 28,941 30,876 11 1 4,522 612 5,192 10,327 12 92,866 4,567 93 999 48,613 643,507 389,992 1,180,637 13 17,131 1,245 273 173 16,691 136,017 417,127 588,657 14 1 3 5,489 227,262 232,748 15 137 27,239 27,376 16 1,653 1,937 159 135,931 139,680 171 18 228,148 3,469 63 6,064 879 18,226 256,849 19 20 21 2,358 144 13,289 11 48,977 64,779 22 6,204 16 103,896 110,116 23 4,786 120 6 13,566 426,130 444,608 24 44,909 61 10,352 1,396 95,189 151,907 25 3,490 201,014 210,504 26 2,098 38,018 40,116 27 3 2 2 15,532 36,889 101,952 154,380
Totals 522,542 10,525 366 1,580 328,666 4,152,990 3,576,914 8,593,583

72 DEPARTMENT OF FISHERIES
STATEMENT No. 19
STATEMENT SHOWING PACKS OF CANNED SALMON, 1932-1938, WITH QUANTITIES GRADED SECOND QUALITY AND PERCENTAGES
- Steel- Blue-
SockeYe Springs head back Coho Pinks Chain Total
1932 Pack, cases 284,355 76,060 1,168 28,505 160,466 223,716 306,761 1,081,031 Grade B, cases 3,355 1,234 164 333 119 3,083 8,288 Per cent 1-179 1-622 -575 -207 -053 1-005 -766 1933 Pack, cases 258,107 20,266 1,459 21,763 137,289 532,558 293,630 1,265,072 Grade B, cases 494 10 873 15,149 887 17,413 Per cent -191 -045 -635 2-844 -302 1-376 1934 Pack, cases 377,882 29,784 1,282 29,556 195,874 435,364 513,184 1,582,926 Grade B, cases 21,620 139 5 962 4,085 1,127 27,938 Per cent 5-721 .466 -390 -491 -938 -219 1-764 1935 Pack, cases 350,444 21,920 596 15,319 216,173 514,966 409,604 1,529,022 Grade B, cases - 3,435 659 3,840 20,528 5,601 34,063 Per cent -980 3.006 1-776 3-986 1-367 2-227 1936 Pack, cases 415,024 29,854 1,068 33,718 212,343 591,532 597,487 1,881,026 Grade B, cases 13,725 483 29 5,265 19,502 Per cent 3-307 -227 -005 -881 1-036 1937 Pack, cases 325,774 16,171 844 19,236 113,972 585,576 447,602 1,509,175 Grade B, cases 65 68 27,282 3,212 30,627 Per cent -019 -059 4-659 -717 2-029 1938 Pack, cases 447,453 15,531 1,035 27,417 273,906 400,876 541,812 1,707,830 Grade B, cases 15,446 564 666 1,413 1,250 18,8311 Per cent 3.451 -206. -243 -352 -230 1-102
GENERAL SPAWNING REPORT-1938
This year's migration to the salmon spawning grounds continues to justify the expectation that under present conservation measures, properly enforced, the supply of salmon in this province should always be maintained.
Conditions vary from year to year in the way of intensive fishing, freshets, obstructions in streams, fishermen's strikes, weather conditions, etc., each having its effect on escapement, but each situation is being promptly met by any neces-sary measures.
During the season under review, while there was the usual toll of spawning fish by numerous enemies, such as trout, and ducks, eagles, and other bird life, there was also a large toll taken by bears and wolves. Conditions in this respect are particularly difficult in the short shallow streams in the Queen Charlotte Islands, where the bears are undoubtedly on the increase, resulting in some spawn-ing streams being entirely denuded of spawning fish. During the past fall the situation has been aggravated by the depreda.tions of wolves which are reported as being greatly on the increase. It is suggested that the usual food of the wolves is not so plentiful as heretofore and that they are now dependent more on salmon. It is a fact that during the past fall the inspecting officers have found many cases where wolve,s have destroyed large quantities of spawning salmon. This does not, however, apply to the Queen Charlotte Islands district, where there are no wolves.
The outstanding feature in the salmon runs of this season was the unusually large run of big cohoes. These large quantities were found practically all along the coast, although the trollers found difficulty in taking as large a percentage of the run as might have been expected. For some reason or other, possibly due to the presence of more desirable food, the cohoes did not take the fisher-men's lure as readily as in other seasons.
A detailed report covering the several areas follows:- Queen Charlotte Islands.-There was the usual small supply of sockeye in
the Massett Inlet and Copper River area, but the run is so small as to be unim-portant commercially. A average seeding occurred. The coho seeding was a satisfactory one.

REPORT OF THE DEPUTY MINISTER 73
In the case of pinks the supply on the spawning grounds was found to be adequate, generally speaking, with exceptionally heavy supplies on some of the spawning grounds along the southeast shores of the islands.
The supply on the Yakoun was good, notwithstanding that the catch was light. This also applies to the streams of Naden harbour. In the other streams in the Massett Inlet area, however, the supply was found to be light.
In the case of churns, a good seeding was observed in the Cumshewa dis-trict, but in other areas the spawning was only fair. By means of extra pro-tective measures a fair percentage of the run was permitted to escape to the spawning grounds.
Naas Area.—The usual inspection was made of the Meziaden portion of the watershed, to which the largest proportion of the sockeye salmon to the Naas proceeds.
It was found that the seeding by the early run of sockeye was heavy, being -very similar to that of the preceding year, better than that of 1933, but not quite as large as the heavy run in 1934. The later run was also heavy, being better than the late run reported in 1933, but similar to the good seeding of 1934, and much heavier than that of 1937. Generally speaking, the seeding of this area was heavy.
There was an unusually large run of coho salmon but the inspection in the Meziaden district was too early to observe just what the actual spawning had been on that portion of the watershed. However, the local inspector reports " a very unusual run of cohoes in the Naas area this season, nobody living here having seen anythin.g like it."
There is no doubt that the spawning grounds, which are mostly inaccessible from the standpoint of inspection, are well supplied. The individual fish were also reported to be unusually large. There was a satisfactory supply of pinks found on the spawning grounds although not quite as heavy as the seeding of 1936, the brood year. The run was late, which accounts for the seines not tak-ing larger quantities. The spawning of chums was also very good throughout the area.
At Meziaden lake the fishway was found to be functioning quite satis-factorily and the salmon had no difficulty in passing through.
The spring salmon seeding was not quite up to expectations.
Skeena Area.—The measures taken in recent years at this stream in the way of conservation by means of moving the boundary nearer to the mouth of the river, and the shortening of the fishing season, coupled with a voluntary reduc-tion in the number of fishing boats operated by the canners, would appear to be bringing the desired results in the way of adequate spawning.
The sockeye escapements to the most important areas, such as Babine and Lakelse, have been gratifying during the season under review.
On the upper Babine river the conditions were found to be fairly satis-factory, although on the lower river they were not quite so good. Taking these two areas together the spawning was found to be equal to that of 1934.
Fulton river, Pierre creek, Fifteen Mile creek, and Morrison creek, which are the principal sockeye spawning areas in Babine Lake district, were fairly heavily supplied with sockeye, and sqawning conditions generally were found to be good.
In the case of cohoes, generally speaking the seeding was quite satisfactory. This also applies to the spring variety.
The inspecting officer sums up as follows: " Babine spawning beds, in comparison with other years, have been adequately seeded by a medium to heavy run of sockeye, a heavy run of springs, a heavy run of cohoes, and a heavy run of pinks. The, only exception to this would be Pierre creek and Lower Babine river in regard to sockeye."
87275-6

74 DEPARTMENT OF FISHERIES
At the Morris Lake watershed a reasonably good inspection was made this fall and apparently at the proper time. A medium heavy run of sockeye was observed on the spawning grounds, with quite a heavy , run of springs, the latter being large individually.
In the Lakelse Lake area, the principal spawning grounds for sockeye are Williams, Schullabuchan and Granite creeks. The supply found this year was excellent and better than that of the brood year of 1934. There was a fair seeding of springs and a satisfactory supply of pink salmon.
Lowe Inlet Area.—The seeding of sockeye is reported at most of the streams in this subdistrict as heavy, and a considerable increase over the cycle year. There was an unexpected increase in the supply of cohoes found and the seeding is considered ample.
In the case of pinks the southern portion of the area was rather poorly seeded but a comparatively good escapement occurred, due to early closing of fishing. In the northern portion of the area, however, the pink run was quite heavy to all streams. Good supplies of chums were found in most of the spawn-ing beds in the district, with a few exceptions. On the whole, however, the seeding might have been better.
Butedale Area.—The weather was unusually dry this fall which made conditions in many of the small streams difficult, and required extra precautions in the way of prohibition of fishing to assure of sufficient supplies being made available to the spawning grounds.
The sockeye supply, however, is reported as larger than usual, with the escapement showing an increase over that of 1934. The escapement of cohoes was much heavier than the average of recent years.
The springs are never a big factor in the spawning of the Butedale area, but the supply was hardly up to normal.
In the case of pinks the seeding was reasonably satisfactory and it is expected that it may result in a satisfactory return two years hence.
The supply of chums was found to be entirely satisfactory. Bella Bella Area.—The sockeye seeding in this area was found to be satis-
factory, largely due to the measures taken for the purpose of conservation. There was a heavy escapement of cohoes, the fish being individually large. This was an "off" year for the pink variety, but despite this fact the seeding was found to be quite heavy.
An abundance of chum salmon was found on the spawning grounds, in fact both early and late runs were very numerous.
Bella Coola Area.—This year's spawning took place under generally favour-able conditions. Up to date of inspection no freshets had occurred and the prospects for reasonably satisfactory results were good. Encouraging supplies of sockeye were found, being equal to the seeding of the brood year. Cohoes, springs and chums were also well represented on the spawning grounds and showed an increase in comparison with recent years. The pinks,. on the con-trary, were scarce, the .seeding being much below that of the brood year of 1936.
Rivers Inlet Area.—The sockeye seeding is reported as being better than usual and the writer is of the opinion that under present regulations, properly enforced, there would appear to be no reason why these conditions should not always obtain.
Rivers inlet is not, considered a good fall salmon area although the coho supply was found to be somewhat better than usual, the run of pinks rather poor. This also applie,s to the chums.
Smiths Inlet Area.—This area is also primarily a sockeye district and the escapement in the year under review is reported as being most encouraging. With the present, regulations at this point well enforced there would appear to be no reason why the supply should not also always be maintained.

REPORT OF THE DEPUTY MINISTER 75
The run of cohoes was somewhat better than average, and the escapement of .chums was quite good to the small portion of the .area utilized by this va.riety.
FRASER RIVER WATERSHED
Prince George Area.—The e.scapement of sockeye, though not large, was a little better than the average of recent years. This applies particularly to the streams tributary to Stuart lake.
In the Francois Lake system the returns this year were encouraging, com-pared with those of recent seasons.
The number of spring salmon appearing on the spawning grounds was fairly heavy, comparatively.
Quesnel Area.—A few sockeye only were observed in the Bowron Lake system, and none at all in the Horsefly or Mitchell rivers, tributary to Quesnel lake.
In the Chileotin system, however, the escapement showed an increase of 100 per cent .over that of the brood year of 1934. This, no doubt, was partly the result of the arrangements made whereby Indians were not permitted to take any sockeye whatever on their way to the Chilco Lake spawning grounds.
Kamloops Area.—It will be remembered that this cycle has been increasing during recent years and in 1934 there was a most satisfactory seeding of the sockeye ,spawning grounds of the Shuswap district. This year there was again a large increase, in fact the return was surprisingly large, notwithstanding the excellent seeding of 1934. The numbers were estimated at four or five times as great as in the brood year.
Adams and Little rivers are the chief spawning areas and the gravel beds of these streams were literally 'covered with spawning sockeye. In the Adams river particularly, in addition to the distribution along the entire bed, there were large masses along both banks of the stream and many deep holes were practically full of spawning sockeye.
Although the fish-ways at the outlet of Adams lake leave something to be desired, yet that on the left hand side functioned reasonably well, re,sulting in a considerable escapement to the lake. A resident at the dam informed the writer that she had counted as many as 700 sockeye per hour .passing through this fishway at times.
At the mouth of Adams river, at the time of inspection, there were large quantitie-s of sockeye milling about in the lake, waiting to go up stream. At Scotch creek, which .had received practically no sockeye for some seasons past, there was observed a mass of sockeye which later reached the spawning beds. This river has had the best seeding for a good many years.
The physical condition of the salmon was excellent. The fish were, with few exceptions, unscarred and vigorous, which seemed to show that the con-ditions at Hell's Gate had -presented no difficulties.
In the north branch of the Thompson river a normal run of so-ckeye was observed at Raft river, but none at Barriere river. Spring and coho salmon, however, were observed in fair numbers,
Pemberton Area.—It will be remembered that for many years previous to 1936 very few sockeye were observed in the Anderson-Seton Lake system. In 1936, however, there was an encouraging rettum and in 1937 quite a large run appeared. This year, however, there was only a matter of a few hundred observed and these were mostly in Gates .creek .at the head of the system.
In the Birkenhead river the run of sockeye was quite good, the run being at least equal to that of the brood year. A heavy run of cohoes also reached this watershed.
87275-6à

76 DEPARTMENT OF FISHERIES
The coho run to the Squamish river and tributaries was the heavie,st in years .and the spawning beds were well seeded. The supply of .chums was also found to be very satisfactory. This also applies to the spring variety.
Hope Area.—The sockeye spawning grounds in this area are limited but a good run was ,observed to pass freely through Hell's Gate, the water conditions at that point being quite suitable practically all season. There was no con-gestion of salmon observed at the gate as is often the case. Only a few sockeye appeared in Kawkawa lake.
The coho supply on the spa-wning grounds is reported as being heavier than that of any recent year and the chum salmon spawning was also quite satisfactory.
Chilliwack Area.—Only a moderate number of sockeye reached the spawn-ing grounds of Chilliwack lake and its tributaries. The run to Cultus lake, by actual count, was in the vicinity of 6,000. The coho spawning was the heavie,st in years and the .chum supply wa,s also satisfactory.
The spring salmon run was normal.
Harrison Lake Area.—The sockeye spawning is considered satisfactory, compared with that of recent, years. Quite a good seeding was observed at Morris creek, which is the principal spawning ground of the area. Springs appeared in satisfactory quantities in the usual spawning grounds of the main channel of Harrison river. Cohoes and chums were found to be numerous also on the spawning grounds.
Pitt River Area.—The spawning conditions of sockeye in this area were found to be normal. This also applies to springs. A heavy run of cohoes appeared in the tributaries of the Upper Pitt river.
Lower Fraser Area.—In the Serpentine and Nicomekl rivers -there was found the largest supply of .coho salmon seen in several years and this applie,s to other streams in the lower part of the Fraser River system.
In the case of ,chums the seeding was not so satisfactory, .apart from the Cultus Lake area. During the fishing season additional .closed time was arranged to permit a larger portion of the run to escape the nets. It is expected that the resultant spawning will prove reasonably satisfactory.
North Vancouver Area.—There was a heavy seeding of cohoes and chums in the streams tributary to Burrard inlet. It was an " off " year for pink salmon but a few were observed in Indian river.
Alert Bay Area.—The sockeye spawning was unusually good, due no doubt largely to a strike of fishermen which resulted in fishing operations not commencing until June 26, practically a month later than usual.
The whole Nimpkish area was splendidly supplied with spawning sockeye. Normal supplies were also observed in McKenzie sound, Glendale cove, and Thompson Sound spawning grounds.
The supply of springs wa -s, generally speaking, normal, with heavy runs to the Nimpkish and Adams rivers.
The run of pink salmon to Knight Inlet streams was also reported as heavy, particularly at Glendale cove. The spawning grounds of Wakeman river, Thompson sound, Bond sound, and other mainland streams were dis-appointing, and the supply to Adams river, Keough and Klucksevi rivers was not equal to the brood year of 1936.
The coho supply was, generally speaking, very satisfactory. The mainland streams were well seeded but the streams on Vancouver Island were not so well supplied, with the exception of Quatsi river, where there was a heavy run. The size of the individuals, is also commented upon by the inspecting officer.

REPORT OF THE DEPUTY MINISTER 77
Practically all the rivers in the area were well supplied with chums. This includes Seymour inlet where some doubt had been expressed as to the escapement.
Quathiaski Area.—The sockeye seeding at Hayden bay was found to be a considerable increase ,over that of the brood year, and in fact this is the fourth year in succession in which increases have been observed. The Phillips Arm run compared favourably with that of four years previously.
The escapement of springs to the streams used by this variety, and par-ticularly to Phillips and Campbell rivers, is reported as being very satisfactory. The number of cohues on the spawning beds was greater than for many years. The inspecting officer remarks also on the large size of the individual fish of this variety.
The pink run,• while late, was found to be present in numbers comparing favourably with the brood year of two years previously. The chum escapement was better than for several seasons.
Comas Area.—The pink seeding .at Oyster river is reported as very satis-factory, being an improvement of 100 per cent over the brood year of 1936. The other pink streams, however, showed a disappointing seeding, particularly at Puntledge river. The brood year also was poor and was no doubt the result of the disastrous flood in. 1934.
The coho seeding is reported generally as extremely satisfactory, exceeding anything anticipated. The only exception was the Puntledge river where the return is reported as being below normal. In the Tsoleum river, a tributary of the Puntledge, however, a good supply was observed.
A good run of chums was observed on the spawning grounds, the Little Qualicum river showing the heaviest return of any stream. in the district. The closure of fishing in the waters adjacent to the Comox peninsula permitted a good supply of chums to reach the spawning areas of Puntledge river. A satisfac-tory supply also reached the spawning grounds of Oyster river. The spring salmon spawning in Puntledge river compared favourably with that of 1937. The spawning of steelhead, particularly in Puntledge, Tsoleum and Oyster rivers, is reported as good, but the Big Qualicum supply was not quite so satisfactory.
Pender Ilarbour Area.—Saginaw lake is the only sockeye spawning ground of •any importance in the ,area and it was found that the sockeye spawning was better than in recent years. The supplies of springs, to the spawning grounds in the Pender Harbour area were normal.
A good stipply of cohues was observed. In the case of chums, notwithstanding the heavy catches made by the fisher-
men, the escapement to the streams at the head of Jemis inlet was exception-ally heavy. This being an "off" year For pinks, only a light seeding occurred.
Nanaimo Area.—This is not a sockeye area. The springs, however, were found in much larger numbers on the spawning beds than in the previous year, although the run then was considered good.
The coho supply was heavier than in re-cent years, the escapement to the Nanaimo River watershed being greater than observed for many years, and in the Chemainus watershed the number was greater than usual. The fish in this area also were observed to be unusually large individually.
Pinks do not frequent the Nanaimo • rea in any material numbers. The spawning areas, however, were well supplied with chums.
Ladysmith Area.—The information .given under the Nanaimo heading applies also to the Ladysmith area.
Cowichan Area.—The supply of spring salmon on the spawning grounds was lighter than that of the corresponding cycle, and due to the unusually low

78 DEPARTMENT OF FISHERIES
water special precautions were necessary to see that a reasonable quantity escaped the commercial fishermen and the fishing by Indians for their own food purposes.
There was a good supply of cohoes on the spawn,ing grounds and a heavy seeding of chums.
Victoria Area.--An increase in the number of spawning cohoes was observed, compared with other years, and the size of the individuals was greater. An average spawning of chums occurred.
The inspecting officer reports American merganser ducks as particularly numerous on the spawning beds. Over seventy of these birds were shot. Some of the stomachs are reported as being gorged with salmon eggs and all of those examined contained some eggs.
Alberni Area.--The sockeye supply to Hobarton lake is reported as dis-appointing. An average number of spawners was found in the Anderson lake system, and in the Sproat Lake-Great Central Lake areas the seeding was found to be very gaod, the run being estimated to exceed that of the brood year.
Some changes were made at the fishway at Stamp falls which made the passage of salmon much easier. There was no difficulty experienced at Sproat Falls.
There was a heavy spavening of cohoes in practically all the rivers of any importance in the area, an exceptionally heavy spawning occurring in the creeks of the Somass River system.
The seeding of the spawning grounds by spring salmon was reported generally as being good.
The supply of chmns was found to be very heavy, notwithstanding the lower average catches by the commercial fishermen.
Clayoquot Area.—A good spawning of sockeye occured in Megin river, but the run to the main spawning grounds of this species, that is, Kennedy lake, is reported to have exceeded expectations and was far heavier than that of the brood year.
The coho supply was found to be the largest for twenty years, all the streams being 'heavily seeded.
The supply of chum spawners was good.
Nootka Area.—This is not an important sockeye area but the escapement was normal, with the exception of Burnam river where there was a slight decrease in numbers. The spawning of spring salmon was much the some as usual. The coho supply was an average one.
The chief run of salmon is the chum variety and, although the runs were not as great as hoped for, the seeding of the spawning grounds is reported to be satisfactory.
Kyuquot Area.--A very good run of springs was found on the spawning grounds and an exceptionally good supply of cohoes, the individual fish being also greater in size than usual. There was also a good supply of deums observed.
Quatsino Area.--This is not an important sockeye area but there was a heavy run of springs to Marble creek, which contains seventy-five per cent of the spring spawning area district.
The coho supply was above the average and the size of the individual fish larger than usual.
The pink supply in the Rupert Arm area is reported as being very heavy. This is the most important pink area of the district. The supplies to the other spawning grounds were light.
The churn supply was quite satisfactory, the escapement being above average.

REPORT OF THE DEPUTY MINISTER 79
APPENDIX No. 2
FISH CULTURE ANNUAL REPORT J. A. RODD, DIRECTOR
Fish cultural operatians of the Department of Fisheries were confined to those provinces in which it administered the fisheries, namely, Nova Scotia, New Brunswick and Prince Edward Island. In addition over 1,000,000 sackeye salmon •eyed eggs were planted in Hillier .creek, tributary to Maggie lake, Vancouver Island, in continuation of the stockine effort, resumed in 1937, to add these waters to the sockeye reproducing areas or the Barkley Sound district.
The transfer of the game fish hatcheries previously operated by this department, to the Province of British Columbia, under the authority of the Order in Council (P.C. 2532) of October 12, 1937, is reflected in the distribution statements embodied in this report, which show a considerable decrease as compared with distributions for 1937. In 1938, however, 95 per cent of the output was reared to various stages of development beyond the fry stage in comparison with 53 per cent in 1937.
The total output from the hatcheries operated by this department in 1938 was 33,685,297 . , The numbers of each species distributed were:— ST.ATEMENT BY SPECIES OF THE FISH AND FISH EGGS DISTRIBUTED FROM THE
HATCHERIES DURING THE YEAR ENDED DECEMBER 31, 1938
Year- Total Species Eyed Fry Advanced Finger- lings and Dis-
Eggs Fry lirgs Older tributien
Salmo salar-Atlantic salmon 280,000 5,453,400 15,853,103 53,807 21,640,310 Salmo salar ouananiche-Ouananiche
salmon 1,612 1,612 Salmo salar sebago-Sebago salmon 42,239 26,320 68,559 Salmo irideus-Rainbow trout 158,133 7,235 165,368 Salmo fario-Hybrid brown trout
(Brown trout-Atlantic salmon) 1,885 1,885 Oncorhynchus nerka-Sockeye salmon. 1,033,359 1,033,359 Salvelinus fontinalis-Speckled trout. 309,000 634,000 9,449,134 37,495 10,479,629 Cristivomer namaycush-Salmon trout 120,000 174,575 294,575
Totals 1,033,359 589,000 6,257,400 25,677,184 123,354 33,685,297
The following classificatien of green eggs, eyed eggs, fry, advanced fry, No. 1 fingerlings, etc., applies to all statements and references in this report:—
Green Eggs.—Eggs until they are " eyed." Eyed Eggs.—Eggs showing the eyes of the developing fish. Fry.—Fish from date of hatch until free-swimming with the food sac fully absorbed. (No
fry are distributed until the sac is fully absorbed.) Advanced Fry.—Fry that are feeding systematically. No. 1 Fingeriings.—Fish that are feeding from two to eight weeks. No. 2 Fingerlings.—Fish that are feeding from eight to fourteen weeks. No. 3 Fin ger/ings.—Fish that are feeding from fourteen to twenty weeks. No. 4 Fingerlings.—Fish that are feeding from twenty to twenty-six weeks. No. 5 Fingerlings.—Fish that arè feeding from twenty-six weeks to one year from date
of hatch.
Inspections were continued with a view to locating waters where fish eggs might be obtained in sufficient quantities , to warrant the establishing of collecting camps and also with a view to locating sites where the fish cultural service might be extended advantageously to districts that are not readily accessible from existing hatcheries.
Experiments with equipment, methods and foods of various kinds were continued at several hatcheries. The experiments and the investigations in relation to fish cultural problems that were made by the Fisheries Research Board of Canada are referred to in the board's report for 1938.
Thirteen main hatcheries, one subsidiary hatchery, six rearing stations, eight salmon-retaining ponds and several egg-collecting stations were operated in 1938. The output from these establishments was as fbllows:—

THE FOLLOWING TABLE SHOWS THE HATCHERIES OPERATED, THEIR LOCATION, DATE OF ESTABLISHMENT, THE SPECIES AND THE NUMBER OF EACH SPECIES DISTRIB1TTED FROM EACH HATCHERY DURING 1938
Fingerlings Year- Total Total
Estab- Hatchery Location Species Eyed Fry Advanced linge distri- distri-
lished eggs fry and bution by bution bY No. 1 No. 2 No. 3 No. 4 No. 5 lder species hatcheries
1929 Antigonish St. Andrews, N.S Atlantic sahnon. 450,000 980,000 69,304 1,499,304 ... „ ... Rainbow trout.. 24,694 971 25,665 . . . .. .... Speckled trout.. 1,576,000 167,106 9,000 2,000 3,518 1,757,624 3,282,503
1876 Bedford Bedford, N.S Atlantic salmon.. 45,000 735,125 780,125 Speckled trout.. 198,000 353,600 551,600 1,331,725
1937.. Cobequid Jackson, N.S Atlantic salmon.. 180,000 820,000 848,600 1,848,600 Speckled trout.. 590,000 130,168 21,783 741,951 2,590,551
1938 Coldbrook (f).... Coldbrook, N.S Speckled trout.. 108,000 108,000 108,000
1936 Grand Lake (f)... Wellington Station, N.S . Atlantic salmon 478,624 28,807 507,431 507,431
1937 Kejimkujik (f)... Now Grafton, N.S Atlantic salmon 20,000 33,000 42,000 95,000 Speckled trout 3,000 66,628 69,628 164,628
1912 Lindloff St. Peters, N.S Atlantic salmon.. 410,206 419,206 Rainbow trout 22,249 22,249 Speckled trout 151,000 33,486 184,486 625,941
1902 Margaree N.E. Margaree, N.S . Atlantic salmon.. 1,360,000 945,000 255,000 199,000 68,650 2,827,650 Speckled trout.. 1,206,585 295,000 259,000 230,000 155,190 4,706 2,150,481 4,978,131
1935 Mersey river, No. 3 Develop-
ment (f) Liverpool, N.S Atlantic salmon.. 64,600 64,600 64,60C
1913 Middleton Middleton, Annapolis Atlantic salmon 50,000 425,000 8,350 483,350 Co., N.S. Salmon trout 120,000 174,575 204,575
Speckled trout 146,000 292,000 274,275 712,275 1,490,20C
1933 Nictaux Falls (4 ) . Nictaux Falls, N.S...... Atlantic salmon 80,000 275,000 145,000 201,400 701,400 701,405
1929 Yarmouth South Ohio, N.S Atlantic salmon 100,000 225,000 130,000 60,000 200 118,800 10,000 25,000 659.000 Rainbow trout 200 18,500 5,000 23,700 Speckled trout 250,000 118,000 315,000 73,950 32,000 43,300 18,437 850,687 1,533,387
1928 Florenceville...... Florenceville, N.B Atlantic ealmon.. 645,000 428,000 384,211 1,957,211 Speckled trout 20,000 576,500 17,000 950 6,251 620,701 2,077,912
1880 Grand Falla Grand Falls, N.B Atlantic salmon.. 75,000 1,137,000 825,000 908,403 2,445,403 Speckled trout 20,000 85,000 30,000 715,000 388,986 1,238,486 3,683,885
1874 Miramichi South Esk., N.B Atlantic salmon.. 2,067,000 1,198,600 548,350 3,813,950 Speckled trout 40,000 66,000 14,800 2,566 41 123,407 3,937,35 1
1874 Restigouche Flatlands, Nil Atlantic salmon 2,501,668 29,788 2,531,956 Speckled trout.. 4,000 69,801 73,801 2,605.25 1
1914 Saint John Saint John, N.B Atlantic salmon., 275,000 647,112 1,512 023,624 Brown trout . 1,885 1,885
• hybrids. Ouananiche 1,612 1,612
salmon. Rainbow trout.. 1,264 1,264 Sebago salmon. 92,239 26,320 68,559 Speckled trout 35,000 195,000 471,500 3,500 8,750 4,542 718,292 1,715,23 1
1938 Cardigan (f) Cardigan, P.E.I Rainbow trout.. 12,000 38,000 42,490 92,490 Speckled trout 209,500 160,770 370.270 462,765
DE
PA
RT
MEN
T O
F F
ISHE
RIE
S

56,400 28,000
526,600 155,624 790,940
1,033,359
Nova Scotia- Atlantic salmon Rainbow trout Salmon trout Speckled trout
New Brunswick- Atlantic salmon Brown trout hybrids Ouananiche salmon Rainbow trout Sebago salmon Speckled trout
Prince Edward Island- Atlantic salmon Rainbow trout Speckled trout
British Columb,a- Sockeye salmon
RE
PO
RT
OF
THE
D
EP
UT
Y M
INIS
TE
R,
go
1,033,359 24,316
1905 Kelly's Pond....
1911 Anderson lake (a)
Southport, PET
Anderson lake, Kildonan,
Vancouver Island, B.C.
Atlantic salmon... Speckled trout.... Sockeye salmon(c )
583,000 207,940
1,033,359
1,033,359 589,000 6,257,400 16,370,890 5,072,165 3,169,051 856,588 208,490 128,354 33,685,297 33,685,297
(a ) Subsidiary hatchery. (f) Rearing station. (d) Pond and rearing station combined. (e) Autumn collection, 1938.
The eggs, fry and fingerlings included in this distribution, with the exceptions indicated, were from collections in the autumn of 1937 and the spring of 1938.
HATCHERY OUTPUT, BY PROVINCES, OF EYED EGGS, FRY , FINGERLINGS, YEARLINGS AND OLDER FISH DURING 1938
Fingerlings Total Total Eyed F Advanced Yearlings distri. distri- ry and eggs fry No. 1 No. 2 No, 3 No. 4 No. 5 der bution by bution by
species province
280,000 2,080,000 3,983,725 1,396,510 904,174 187,450 10,000 53,807 9,885,506
46,943 200 18,500 5,971 71,614
120,000 174,575 204,575
250,000 316,000 4,188,185 1,035,274 674,494 438,628 198,490 26,661 7,127,732
530,000 3,416,000 8,346,485 2,478,727 1,668,868 644,578 208,490 86,439 17,379,587 17,379,587
2,417,000 6,129,380 1,831,138 794,126 11,171,644
1,885 1,885 1,612 1,612 1,264 1,264
42,239 26,320 68,559
59,000 340,000 1,212,801 750,300 302,002 8,750 10,834 2,773,687
59,000 2,757,000 7,342,181 2,581,438 1,228,367 8,750 41,915 14,018,651 14,018,651
56,400 526,600 583,000
12,000 38,000 42,490 92,490
28,000 165,624 233,816 160,770 578,210
84,400 682,224 12,000 271,816 203,260 1,253,700 1,253,700
1,033,359 1,033,359 1,033,359
33,685,297

82 DEPARTMENT OF FISHERIES
Six thousand, three hundred and fifty-eight Atlantic salmon were obtained for fish cultural purposes and retained at the various ponds ope,rated by this department in the Maritime provinces. Of these 4,210 were purchased from com-mercial fishermen and 2,148 were taken in the departmental traps. The following is the average weight in pounds of salmon secured in 1938 from various sources: In Nova Scotia: Margaree harbour, Inverness county, 10-6; Nictaux river, Annapolis county, 6.4; River Philip, Cumberland county, 12; Sackville river, Halifax county, 12. In New Brunswick: Miramichi river, Northumberland county, 8-3; New Mills, Restigouche county, 14; St. John harbour, St. John county, 11. And in Prince Edward Island, More11 river, Kings county, 8. The average weight of the Sackville River salmon was more than double the average weight of those impounded in 1937 and 27,753,500 Atlantic salmon eggs were collected from all ponds.
The production of speckled trout eggs at the Maritime Province hatcheries reached a new high this year with over 17,124,000 ova secured—an increase of more than 1,320,000 over last year. This increase is largely due to expansion of rearing facilities and of accommodation for brood fish. Noticeable increases over the previous year were made from the Antigonish, Florenceville and St. John hatchery ponds. The possibilities of McRae lake in the Lindloff Hatchery district were prospected and 126,000 eggs secured.
Five hundred thousand salmon trout eyed eggs were obtained from the Department of Game and Fisheries for Ontario for an equal number of speckled trout eyed eggs.
Anderson Lake hatchery, Vancouver Island, was opened up in October to continue the stocking of Maggie lake with sockeye salmon and over 1,000,000 eyed eggs were planted under favourable conditions on December 10 and 11, 1938.
In continuation of the experiment in regard to the influence of environment versus heredity on Atlantic salmon referred to in previous reports, some 189,000 fingerlings, the progeny of "early" fish taken at New Mills, Chaleur bay, were distributed in the St. John river and its tributaries from the Grand Falls hatchery.
Over 566,000 Atlantic salmon fingerlings including some 69,000 yearlings and some two-year fish have been distributed to date in waters of the Maritime provinces having two fins missing, viz., the adipose and one pectoral or one ventral. A fair proportion of the New Mills stock distributed in the St. John river are included in this number.
The recapture of these marked salmon will add to present data in regard to the "homing" theory, sea movements or migrations and the influence of heredity versus environment in relation to the Atlantic salmon of Canadian streams. One dollar will be paid for scales and scars left by the removal of the fins from each recaptured marked salmon together with particulars as to its length, weight, date and place of recapture.
The closed circulatory system was again te,sted at Restigouche hatchery, 110,000 Atlantic salmon semi-eyed eggs being placed in the experimental troughs on December 12,1937. The previous season's plan was modified slightly in as much as the sa.nd was removed from the filter when the eggs began to hatch and varying amounts of fresh water were added up to five gallons per minute. Dur-ing the experiment the temperature of the water in the closed system ranged from 3 to 13 degrees higher than it was in the remainder , of the hatchery. The eggs in the closed system hatched between January 11 and February 12 while the remainder hatched between April 30 and May 21.
The experiment was not a success as the percentage loss in the eggs in the experimental group was higher than it was in the remainder, and the loss of fry due to blue sac and gill disease in the former was so heavy that the experiment was abandoned on May 3.

REPORT OF THE DEPUTY MINISTER 83
Copper sulphate treatment of lakes for the purpose of eliminating undesir-able fish, which .has been referred to in recent annual reports, was extended to Trefry's lake, Yarmouth county, Nova Scotia, in 1938. Trefry's lake has an area of 53-26 acres, a maximum sounded depth of 43 feet and an estimated average depth of 13-5 feet. It contained an estimated volume of 31,084,000 cubic feet of water. Treatment took place on Au-gust 6 under the direction of Dr. M. W. Smith, of the Atlantic Biological Station. The species composition of fish killed, the numbers, and the numbers and pounds of fish per acre were as follows:—
Species Number Number Weight Pounds Average
in lake per acre in lake, pounds per acre weight,
gm.
Ameinrus nebulosus (Catfish or bulllmad) 776 15 77-0 1-5 45-0 Anguilla rostrata (Eel) 3,262 61 140.3 2-6 19.5 Fundulus diaphanus (Killifish) 8,738 164 69-5 1-3 3-6 Morone americana (White perch) 11,761 221 456-6 8-6 17-6 Notemigonus crysoleucas (Golden shiner) 841 16 51-6 1-0 27.85 Osmerus mordez (Sraelt) 4,424 83 21-7 0-4 2-2 Perce jlavescens (Yellow perch) 1,360 26 71-6 1-3 • 23-9 Pomolobus pseudoharengus (Gaspereau) 4,346 82 51-2 1-0 5-4 Pungitius pungitius (Stickleback) 9
Totals 35,517 668 939-5 17-7
Lake Jesse, also in Yarmouth county, was treated in August, 1934, stocked with speckled trout in 1936 and 1937, closed to angling for three years and will be opened ,on April 15, 1939. Arrangements are being made to obtain an accurate census of the numbers and species of fish that may be caught for some weeks after the Lake is opened.
Tedford and Boar's Back lakes which were also treated in August, 1936, were stocked with speckled trout fry on an acreage basis during the past season.
Two thousand five imndred coarse fish, mostly white and yellow perch, were trapped and destroyed at lake Am-is and close to the same number at the Milo lakes, Yarmouth county, Nova Scotia. The traps were supplied by the department and were operated under the general direction of the superintendent of the Yarmouth hatchery. The Lake Annis trap (one) was tended by the owner-manager and those at the boys' camp " Mooswa." The (three) traps at the lakes, were tended by the members of the Milo Aquatic Club of Yarmouth.
As available information indicates that runs of sockeye salmon have ne.ver occurred in the streams of the easterly coast of Vancouver Island south of Sey-mour Narrows, a survey of the Nanaimo River system, with a view to acertain-ing whether or not a sockeye run could be established there, was undertaken in 1932. As far as could .be determined from a short summer investigation, physical conditions were found to be reasonably suitable for sockeye salmon production, but there were two adverse biological factors in an apparent paucity of plankton and a large trout population. Following this survey an experimental planting of eyed sockeye salmon eggs from the Rivers Inlet hatchery was made in March, 1933. These eggs were collected in the autumn of 1932.
In 1936, the fourth year after the eggs were taken, a gill-net was operated hi the lower section of the river during July, August and September. Only three male 'sockeye were taken. Observations were continued in 1937 and 22 sockeye were caught. All were :identified by their scales as five-year fish which had spent two years in fresh water. In addition to those th:at were caught and examined, the fishery guardian saw over 30 sockeye on July 30 and over 100 in August in a pool about five miles above the mouth of the river. Similar operations were carried on during the run of 1938 and 6 sockeye were taken. These were

84 DEPARTMENT OF FISHERIES
identified by their scales as six-year fish. As the six specimens obtained were sufficient for .examination no further effort was made to secure more salmon.
The appearance of sockeye in the Nanaimo river where they were not known to have occurred previously, in three consecutive years and of the saine age each year would seem to be due to the planting of the eggs that were collected at Rivers Inlet in 1932.
The Supervisor of Fisheries for Eastern Nova Scotia reported that, generally speaking, the streams of the easterly part of Halifax county were affording better sport since they have .been stocked with salmon fry. Quite a number of salmon were ,also reported in the Middle river, Gloucester county, whem very few have been reported for the past twenty ,,-.ears. Middle river has been systematically stocked from the Restigouche hatchery since 1933. Trout angling in the streams and ponds of Prince Edward Island is .also said to have .been good. An eight and three-quarter pound sea trout, reported to be the largest e-ver taken in Prince Edward Island, was landed in May at Big Pond, Kings County.
Thirty-nine per cent of the sebago salmon that were taken during the col-lection of such .eggs in 1938 at the Chamcook lakes, New Brunswick, had two fins missing, having been marked in this way before they were distributed a few years previously. Twenty-four per cent of the catch during similar operations during 1937, and thirty-nine per cent in 1936, bore the hatchery mark. These percentages indicate the importance of hatchery reared fish in maintaining sebago salmon angling in these waters.
Repre,sentative series of the fish produced .at the Maritime Province hatch-eries were exhibited at various exhibitions Or contributed to display.s made by provincial governments or by fish and game protective associations. These are referred to in the reports of the hatcheries that produced the fish.
The Canadian. National, the Cana.dian Pacific and the Dominion Atlantic Railway companies continued their generous assistance and co-operation by furnishing free transportation for shipments of game fish and game fish eggs with their attendants. The ,extent of this co-operation is indicated in the fol-lowing summary:
Total Number Railway
Mileage baggage Number of cases Nurn- mileage of car permits Or cans ber of on trip per- passes Passages Full Ernpty Total Full Empty Total mits
C.N.R 344 4 2,217 1,207 3,424 61 37 98 25 C.P.R 2,014 12 923 799 1,722 36 34 70 14 D.A.R 254 4 127 24 151 16 10 26 3
2,642 20 3,267 2,030 5,297 113 81 194 42
Narc.—Number of passages refers to transportation one way—a return trip counting as two pasaages. Number of permits refers to one way passages for cases or cans.
The interest - displayed in fish cultural operations by the general public has been most encouraging. The provincial fish and game protective associa-tions co-operated as opportunity offered and local fish and game clubs, angling and protective associations have co-operated with and assisted hatchery staffs in distributing the season's output, particularly in waters in which these organizations are interested. The Fredericton branch of the New Brunswick Fish and Game Protective Association purchased a truck for this purpose last year. Among others that rendered valued and appreciated co-operation are the F,ish and Game Protective Association, Madawaska county, and the associations of the Grand Falls, Yarmouth, Middleton, Coldbrook and Cobequid districts.

REPORT OF THE DEPUTY MINISTER 85
Prophylactic and sanitary measures to prevent the outbreak of disease were conducted on quite an extensive scale at all hatcheries and rearing ponds. Valuable and much-iappreciated advice and -co-operation were extended whole-heartedly by Doctors A. H. Leim, M. W. Smith and R. H. M'Gonigle (Patholo-gist), as well as by other members of the staffs of the Fisheries Research Board in the Maritime Provinces, all of which are referred to in the report of the board.
Several -vacancies in the .hatchery staffs. at the beginning of the year were filled by the Civil Service Commission and several much-needed positions were created and filled also by the commission. Consequently, the fish cultural staff in the Maritime Provinces is in a much better position than it ever has been in regard to personnel.
The most important additions were the appointment of two assistants (District Supervisors of Fish Culture, Grade I), in the persons of Messrs. F. A. Tingley and A. P. Hills, to Mr. James Catt, District Supervisor of Fish Culture, Grade 2, for the Maritime Provinces. In addition to general inspec-tions of fish cultural activities, these appointee,s will be employed in stream and lake surveys during the summer months. They have become fairly well acquainted with , the situation •in regard to fish cultural activities and require-ments in the Maritime Provinces. During July and August, they were stationed at the Atlantic Biological Station where they gained experience in laboratory technique, the copper sulphate treatment and survey of lakes under the super-vision of the director and the scientific staff of the station. From September to December they were in the field engaged in general fish culture work. They then returned to the station where for over three months they received further instruction in chemistry, physics, fish anatomy, embryology, lironology, pathology, etc.
Expansion during the year .consisted of a hatchery and superintendent's dwelling on the Mario river, New Brunswick, at the site selected last year, a superintendent's dwelling at Grand lake, Nova Scotia, and a hatchery and superintendent's dwelling at Lindloff, Nova Scotia, details of which are given in the respective references to these establishments.
Collections, transfers and distributions are given to the nearest thousand in the summaries of operation at the respective establishments.
ANTIGONISH HATCHERY
K. G. Shillington, Superintendent
Production and receipt of eggs during the year were: Hatchery ponds, speckled trout eggs 8,955,000 and rainbow trout eggs 287,000; from Kelly's Pond hatchery 300,000 and Bedford hatchery 1,340,000 Atlantic salmon eyed eggs. Transfers and distributions were: Speckled trout eyed eggs to Bedford hatchery 750,000, to Cobequid hatchery 1,000,000, to Kelly's Pond hatchery 550,000 and to Department of Game and Fisheries, Toronto (exchange for salmon trout eyed eggs) 500,000; and rainbow trout eyed eggs to Lindloff hatchery 45,000. Distributions of advanced fry, fingerlings and older fish were: Atlantic salmon 1,499,000, speckled trout 1,758,000, and rainbow trout 26,000. Of the above 2,739 speckled trout were marked by the removal of the adipose and the right pectoral fins.
Feeding tests, which had as control rations 100 per cent beef liver and 100 per cent sardines (young .herring), were carried on with six groups of speckled trout of the same age and observations were cohtinued until the eggs produced by .each group of trout were completely hatched. The 'highest average yield of eggs was from one group that received liver only while the highest percentage hatch was in the eggs produced by the group that was fed on fish. The other rations tested were plucks and fish, 50 per cent each; liver and fish,

86 DEPARTMENT OF FISHERIES
50 per cent each; pigs' lungs, 90 per cent, and gaspereaux roe, 10 per cent; and liver, plucks, fish and roe in equal proportions. The smallest average yield of eggs was from the group that was fed lungs and roe and the highest percentage loss in egg,s was from the group that was fed on liver only.
An additional 20-inch diameter intake pipe was laid and an improved screen was devised for the pond outlets. These screens have round iron bars at the bottom and are boarded in at the top. The draw of the water at the bottom of the screen facilitates the removal of debris and the cleaning of the ponds.
BEDFORD HATCHERY AND SAC KVLLLE RIVER SALMON RETAINING POND
George Hea,tley, Superintendent - The number of Atlantic salmon caught and eggs collected at the Sackville
pond were considerably smaller than the numbers taken during 1937 and 1936, although the salmon taken were of greater average weight than those of previous years. A considerable percentage of the salmon captured at this point have been rather small. These small fish did not appear with the larger fish this year, their non-appearance at the usual time being attributed to their intermittent and casual ascent during the late summer and early auturan, before trapping for hatchery purposes began. One hundred and two salmon only were secured for the pond compared with 248 in 1937 and 329 in 1936. Three hundred and seventy-three thousand eggs of unusually good quality were taken ,and laid down in the Bedford hatchery. Collection and receipt of eggs at the Bedford hatchery were: from Sackville river pond 373,000 and from River Philip pond 2,384,000 Atlantic salmon eggs, and from the Antigonish hatchery 750,000 speckled trout eyed eggs. Transfers were: to Antigonish hatchery 1,340,000 Atlantic salmon eyed eggs, to Grand Lake rearing ponds 21,000 sebago salmon eyed eggs, to Dalhousie University 12,000 Atlantic salmon eggs and to Grand Lake rearing ponds 518,000 Atlantic salmon fry and finger-lings. Distributions of advanced fry and fingerlings were: Atlantic salmon 780,000 and speckled trout 552,000.
COBEQUID HATCHERY AND RIVER PHILIP SALMON-RETAINING POND
J. W. Heatley, Superintendent
Collections of eggs were: Speckled trout from Hart lake 181,000 and hatchery ponds 6,000; Atlantic salmon from River Philip 3,568,000. One million speckled trout eyed eggs were received from the Antigonish hatchery and 10,000 speckled trout No. 3 and No. 4 fingerlings were transferred to the Grand Lake rearing ponds. Distributions were: 1,849,000 Atlantic salmon and 742,000 speckled trout. Sixteen thousand speckled trout fingerlings were marked ny the removal of the adipose and right ventral fins.
The collection of speckled trout eggs at Hart lake was disappointing in view of the experience of the previous years. - Reports indicated that quite a la:rge number of trout were taken by anglers in this lake during the summer which may account for the comparatively small size of the fish that were caught for hatchery purpo,ses •and for the fact that only 18 of the 811 that were marked in 1937 were observed by the egg-collecting staff. Marking was continued and the right ventral fin was removed from all the Hart lake trout-570 in number—that were handled during 1938. The 6,000 eggs were from trout that were caught in Poison lake and River Philip and transferred to the hatchery ponds in November, 1938.
A large run of Atlantic salmon occurred in River Philip. Assistant C. Sayer was in charge of operations. The first fish entered the hatchery trap on September 21 and 1,520 were impounded by November 1, ,after which the fences

REPORT OF THE DEPUTY MINISTER 87
were opened and the balance of the run permitted to ascend. A considerable number were observed pa,ssing over the dam after the fences were removed and 158 of those impounded were liberated unstripped tas sufficient eggs to meet requirements, namely 5,952,000, had been secured; 2,384,000 were laid down at the Bedford hatchery and 3,568,000 at the Cobequid hatchery. Five hundred stripped salmon were marked by attaching a nunabered tag to their dorsal fin.
In December electric power became available and was installed. The Cobequid power plant was dismantled and transferred to the new Lindloff hatchery. The circular rearing ponds continued to leak and several kinds of water-proofing materials were tested.
COLDBROOK READING PONDS
E. Barrett, Superintendent
The Coldbrook rearing ponds, which were opened in 1938, received 350,000 speckled and 15,000 salmon trout No. 1 fingerlings from the Middleton hatchery. Considerable loss. was experienced during the season and distributions, which were completed before the end of September, consisted of 108,000 specked trout of an average length of 4.1 inches. The property was enclosed and the grounds further improved.
GRAND LAKE REARING PONDS
J. M. Butler, Superintendent
Most of the two-year old sebago salmon reared in the ponds were immature, and the .eggs obtained from them, as well as from older pond fish, were of poor quality. Traps were ,again operated at Waverley run and Rawdon river. Very few sebago made their appearance, only 45 being taken at both places, of which 14 were females. Their average weight was three pounds and the collection
,amounted to only 13,000 eggs. Twenty-one thousand sebago salmon eyed eggs and 518,000 Atlantic salmon
fry and fingerlings were received from the Bedford hatchery, and 10,000 speckled trout fingerlings from the Cobequid hatchery. The latter group will be carried at Grand lake through the winter and distributed next spring. A repre,senta-tive series of the sebago salmon of different age,s available from the hatchery ponds were supplied the University of Toronto for study in connection with the investigation of the landlocked salmon of the Maritime Provinces, particularly as to their having heritable characteis different from those of the sea salmon.
A dwelling of bungalow type, thirty feet square, with full basement, ver-andah across the front and summer kitchen, was built for the Superintendent. It provides a living mom, dining room, kitchen, bathroom and five bedrooms.
Considerable repairs were made to the ponds; the whole series was enclosed by a mink-proof fence, and the grounds generally were improved.
Distributions for the season amounted to 507,000 Atlantic salmon.
KEJIMKUJIK REARING PONDS
F. F. Annis, Superintendent
The Kejimkujik rearing ponds were opened on April 26, some fifteen days earlier than was the case last year. They received from the Yarmouth hatchery 250,000 speckled trout advanced fry and 100,000 Atlantic salmon advanced fry, the last on May 26. The trout made satisfactory growth until July 22 when they were attacked .by fin disease which they appear to have contracted from fish in the water supply above the ponds. Further trouble was caused by the high temperature combined with the low oxygen content of the water and

8B DEPARTMENT OF FISHERIES
heavy losses in the trout continued until lower water temperatures occurred on August 21. As compared with the trout, the salmon did well. They were not affected by disease and they made satisfactory growth.
DistributionS, which were .completed on September 27, were: Atlantic salmon 95,000 and speckled trout 70,000.
Considerable improvement was made to the grounds.
LINDLOFF HATCHERY
Wrn. T. Owens, Superintendent The following eyed eggs were received: 200,000 speckled trout from the
Margaree, 600,000 Atlantic salmon from the Miramichi and 45,000 rainbow trout from the Antigonish hatcherie,s. Slightly over 126,000 speckled trout ova were collected at McRae lake, which is an increase over the collection of the previous year, and 1,050,000 Atlantic salmon eggs were received from the Margaree salrnon retaining pond. All Tspecies made good growth and the sur-vival of speckled trout compared favourably with previous years. Distribu-tions were: Atlantic salmon 419,000, rainbow trout 22,000 and speckled trout 184,000. Of these 10,000 ,salmon and 1,000 speckled trout were marked by the removal of the adipose and left pectoral fins.
- In December 361 speckled trout were eaught in a nearby brook and placed in the hatchery ponds with the idea, of developing this local strain as the nucleus of a brood stock.
A hatchery, 25 feet by 65 feet over all, embodying a hatching room, 25 feet by 52 feet 5 inches, equipped with 30 troughs 16 feet long, office, feed room and coal room, was built as well as a superintendent's dwelling of a semi-bungalow type, 30 feet square, with a verandah extending across the front, full ba,sement, living room, dining room, kitchen, bathroom, five bedroom's and summer kitchen.
Increased numbers of salmon smolt and parr were reported in Grand river as well as improved Tangling for trout in the east and west branches of the Tillard river.
MARGAREE HATCHERY
W. D. Turnbull, Superintendent Over 3,000,000 speckled trout eggs were obtained from hatchery stock and
4,362,000 Atlantic ,salmon eggs were received from the Margaree salmon retain-ing pond. Two hundred thousand speckled trout eyed eggs, were transferred to the Lindloff hatchery and distributions were: Atlantic salmon 2,828,000 and speckled trout 2,150,000. Eleven thousand seven hundred and ninety-nine Atlantic salmon fingerlings and 4,530 speckled trout of various ages were marked by the removal of the adipose and right pectoral fins. Several feeding experi-ments were made. One gToup of yearling speckled trout were not given any artificial food from December 20 to April 15 following. This group lost 16 per cent of their original weight while another group of the same number and age, retained under similar conditions, which were fed in the usuel way, increased their weight by 26 per cent during the same period. The grounds and rearing pond facilities were further improved. Low lying land was filled in, and a gaso-line tank and pump installed. Angling in the waters stocked from this hatchery is reported to be improving, particularly in the Maxgaree river and lake O'Law.
MARGAREE SALMON RETAINING ROND
J. P. Chiasson, Superintendent In accordance with the usual practice, salmon for the M,argaree salmo -n
retaining pond were purchased from the Margaree Harbour Salmon Fisheries Association whose net was operated intermittently for fish cultural purposes from September 19 to October 19.

REPORT OF THE DEPUTY MINISTEI? 89
In the interest of the anglers in the river above, :the association's net was not set until September 19. It was operated for three days, September 19 to 21 inclusive, during which 30 salmon were caught, all of which were placed in the
salmon retaining pond. During the next four days from September 22 to 25 inclusive, the net was lifted and the river was open to the ascent of fish. During the next four days, September 26 to 29 inclusive, the net was fished and 117 salmon were caught all of which were placed in the retaining pond. Ninety-seven caught from September 30 to October 2 inclusive were tagged and liberated above the net. During the remainder of the season the net was fished continu-ously but half of the salmon taken each day were liberated above the net and the remainder were placed in the pond.
One hundred and twenty . salmon were caught on October 3, half of which, or 60, were tagged and liberated. Three hundred and fourteen were caught on October 4, half of which, 157 were liberated, 43 of them being tagged. In all, 200 salmon caught from September 30 to October 4 inclusive were tagged and liberated above the net on October 3 and 4. During the whole of the season 758 salmon were impounded and 644 were liberated. One thousand four hundred and two salmon passed through the association's net, vehich is the largest number on record in any year since the net was first operated in 1909.
Altogether only 11 or 51 per cent of the 200 tagged salmon were recaptured up to the end of the angling season on October 15. Three of these fish were found in the retaining pond during stripping operations. The remainder, eight or four per cent, were taken by anglers. Three of those that were tagged on October 3 were taken two days later on October 5, two in McDaniel's pool six miles distant and one in Thornbush pool seven and one-half miles distant. One tagged on October 3 was taken in Thornbush pool three days later. One tagged on October 4 was taken in 11cDaniel's pool four dayts later. One tagged on October 3 was taken in Hut pool seven and one-quarter miles distant five days later. Two tagged on October 3 were taken in McDaniel's pool one of them six days later and the other ten days later.
Of the eight recaptured by anglers, seven were tagged on October 3 and one only on October 4. The distance that they travelled from the time they were tagged until they were recaptured ranged from six to seven and one-half miles. Those that were tagged and recaptured by anglers happen to have been liberated as a sharp freshet was subsiding. The freshet, as recorded at Frizzleton, was on October 1 and 2 and dropped abruptly on October 3. The salmon were liberated on (1) the morning of October 3 (2) the afternoon of October 3 and (3) on October 4. Of the first group six (six per cent) were taken by anglers, three on October 5 and one on October 6, six and seven and one-half miles up the river but none were caught at a greater distance although taken as late as October 13. Of the second group one fish (1 -6 per cent) was taken by angling and of the third group also one fish (2.3 per cent) but neither of these was as far up the river as those referred to previously. The availability to the anglers of the salmon that were liberated on October 3 and 4 would seem to have been due to the tagging and liberation having been so closely related to the freshet at Frizzleton which no doubt tended to bring these salmon up the river. All of these fish were marked during their autumn ascent to the spawning grounds and the small percentage of recaptures made by anglers, namely four per cent, is an indication of the effect that this net was late in the season on the angling in the river above.
Ten salmOn were lost during the operating period, September 19 to Decem-ber 5. All eggs taken were transferred, 4,362,000 to the Margaree and 1,050,000 to the Lindloff hatcheries.

90 DEPARTMENT OF FISHERIES
MERSEY RIVER IlEARING POND
T. K. Lydon, Offleer-in-Charge
The lower pool in the fishway at No. 3 Development, Mersey river, was fitted up and used experimentally as a rearing pond for salmon. The pool was securely screened against the entry of eels, none of which were observed in the pool during or at the end of the season.
Ninety thousand Atlantic salmon No. 1 fingerlings were transferred from the Middleton hatchery and placed in this pool between July 8 and 11. The growth during the 83 days that the salmon were in the pool was quite satisfactory, some of those distributed on September 29 being five inches long. The total produc-tion of 64,600 fingerlings was distributed in the Mersey River system.
MIDDLETON HATCHERY, STEVENS PONDS, NICTAUX SAL.MON POND AND REARING STATION
F. M. Millett, Superintendent
While a larger number of speckled trout were caught at Sand lake, they were of smaller size than were those taken during the last two seasons and they were also in poor condition. The collection of eggs was consequently smaller, amounting to 81,000. Five hundred thousand salmon trout (eyed) eggs (an exchange) were received from the Department of Game and Fisheries, Toronto, Ontario; 101,000 Atlantic salmon eggs from the Nictaux pond and 1,100,000 (eyed) from the Miramichi hatchery. One million three hundred and twenty-seven thousand speckled trout (eyed) eggs were purchased from the Brookdale Trout Company.
In so far as the hatching, rearing and distribution of trout and salmon are concerned, the Middleton hatchery, Stevens ponds and Nictaux rearing station are operated more or less as one unit. The ponds and rearing station receive their annual supplies of fry and eggs from or through the Middleton hatchery. The collection of salmon eggs at the Nictaux pond was quite disappointing. The expected number of salmon did not appear, the total number impounded being 83 only, and the total collection of eggs slightly under 101,000. Thirty-seven of the salmon were marked by tags attached to their dorsal fins.
The Nova Scotia Light and Power Company, Limited, who operate a power station on the Nicta.ux river, immediately below the rearing station, co-operated closely with the department in facilitating the safe descent of salmon smolt by closing down their power plant from May 24 to July 1. No. 1 fingerlings to the extent of 350,000 speckled trout and 15,000 salmon trout were transferred to the Coldbrook ponds and 90,000 Atlantic salmon to the Mersey River rearing station.
Distributions from the Middleton hatchery were: 483,000 Atlantic salmon, 294,000 salmon trout and 712,000 speckled trout, and from the Nictaux rearing station 701,000 Atlantic salmon, advanced fry and fingerlings. Three thousand salmon fingerlings from the Nictaux rearing station and 7,000 from the Middleton hatchery were marked by the removal of the adipose and left ventral fins and distributed in the Gaspereau river.
YARMOUTH HATCHERY
H. V. Gates, Superintendent
Larger than usual losses in speckled trout fingerlings were caused by high water temperatures that prevailed during the greater part of the summer. The selected stock developed at the hatchery recovered more quickly and were much larger at the end of the season than those hatched from eggs from other sources.

REPORT OF THE DEPUTY MINISTER 91
One hundred and forty-seven thousand speckled trout eggs and 33,000 rainbow trout eggs were obtained from the fish in the hatchery ponds, and 720,000 speckled trout (eyed) eggs were purchased from the Brookdale Trout Company. Two hundred and fifty thousand speckled trout and 100,000 Atlantic salmon (advanced fry) were transferred to the Kejimkujik rearing ponds. Distributions were: 659,000 Atlantic salmon, 24,000 rainbow trout and 851,000 speckled trout, made up of fry, fingerlings and older fish. The Fisheries Research Board received 10,000 speckled trout No. 1 fingerlings. One thousand three hundred and thirty-nine speckled trout—one and two years old—were marked by the removal of the adipose and right ventral fins. Representative series of the fish at the hatchery were contributed to displays made at the Nova Scotia Fisheries Exhibition, Lunenburg, and lat the Yarmouth county and the Munici-pality of Clare exhibitions.
FLORENCEVELLE HATCHERY
George Sutherland, Superintendent
Although the production of speckled trout eggs from the hatchery ponds was not as large as was expected—considering the number of fish that were handled—it amounted to 2,796,000, which is approximately 400,000 larger than the collection of 1937. One million two hundred and fifty-eight thousand Atlantic salmon eggs (green) were received from the St. John salmon retaining pond; 1,000,000 (eyed) from the Miramichi and 30,000 (eyed) from the Restigouche hatcheries. Speckled trout eggs (eyed) were transferred; viz., 400,000 to Grand Falls, 100,000 to Restigouche and 200,000 to Miramichi. One million four hundred and fifty-seven thousand Atlantic salmon and. 621,000 speckled trout advanced fry, fingerlings, yearlings and older fish were dis-tributed in the lakes and streams of the district. Six thousand two hundred and fifty-one speckled trout yearlings and older fish were marked by the removal of the adipose and left pectoral fins. Representative series of the fish at the hatchery were contributed to the displays made respectively by the Fredericton and Carleton branches of the New Brunswick Fish and Game Protective Associa-tion at the Fredericton and 'Woodstock exhibitions. Nutritional tests were carried on in relation to the yield and quality of the eggs produced by trout fed in different ways. Minor repairs, as necessary, were made to the buildings.
GRAND FALLS HATCHERY
W. A. McCluskey, Superintendent
The number of speckled trout eggs obtained from Fraser's pond, Three brooks, was disappointing in comparison with numbers obtained during the two preceding years. This decrease is attributed to the younger average age and smaller size of the trout that were available. The collection amounted to 659,000 eggs, as compared with over 1,166,000 in 1937 and 1,720,000 in 1936. One million five hundred and seven thousand Atlantic salmon (green) eggs were received from the St. John pond and 221,000 (eyed) from the Restigouche hatchery; 400,000 speckled trout (eyed) eggs from the Florenceville hatchery and 100,000 speckled trout (eyed) eggs, as a present for purposes of comparison, from the American Fish Culture Company, and 500,000 speckled trout (eyed) were purchased from the Brookdale Trout Company of Massachusetts. Two million four hundred and forty-five thousand Atlantic salmon and 1,238,000 speckled trout were distributed. Forty-two thousand salmon (Restigouche stock) and 2,000 speckled trout were marked by the removal of the adipose and right pectoral fins. Several diets were tested in the feeding of speckled trout fingerlings.

92 DEPARTMENT OF FISHERIES
MIRAMICHI HATCHERY AND MIRAMICHI SALMON-RETAINING POND
Frank Burgess, Superintendent
This hatchery and pond are operated more or less as a unit under the same staff. One thousand eight hundred and twenty-six salmon, purchased by tender from the late summer and early autumn run, were impounded between September 9 and October 1. They did extremely well during retention, suffering a loss of only eleven fish. The production of 8,565,000 eggs was eyed at the Miramichi hatchery. The following transfers from eggs laid down the fall of 1937 were made: to Florenceville hatchery 1,000,000, Lindloff hatchery 600,000, Middleton (Nictaux Falls) hatchery 1,100,000. Two hundred thousand speckled trout eyed eggs were received from Florenceville. Three million eight hundred and fourteen thousand Atlantic salmon and 123,000 speckled trout were dilstributed. Fourteen thousand nine hundred and forty Atlantic salmon fingerlings were marked by the removal of the adipose and right ventral fins. Some feeding tests were also carried on, and the grounds and surroundings were further improved.
NEW MILLS SALMON RETAINING POND
William White, Superintendent
Four hundred and thirteen salmon of the early run were purchased from the commercial fishermen of the district and delivered between May 21 and July 22. Throughout the whole of the season a loss of only three salmon occurred. Over 1,821,000 eggs were produced and laid down in the newly constructed hatchery, at the mouth of the Charlo river.
RESTIGOUCHE HATCHERY, FLATLANDS, CHARLO HATCHERY, CHARLO
R. O. Barrett, Superintendent
The original salmon hatchery on the Restigouche river, established in 1874, was one of the first fish-breeding establishments operated by the Dominion Government in the Maritime Provinces. Operations were first carried on at Deeside and were later moved to Flatlands. As the Flatlands hatchery was of limited capacity, and the site and water supply did not permit of an expansion of the hatching and rearing facilities, it was closed at the end of the 1938 dis-tribution season, and all suitable equipment was moved to the new hatchery, just completed, at the mouth of the Charlo river. The hatchery at Flatlands during 1938 received 1,328,000 Atlantic salmon eyed eggs from Kelly's pond and 100,000 speckled trout eyed eggs from the Florenceville hatchery. Two hundred and twenty-one thousand Atlantic salmon eyed eggs were transferred to Grand Falls and 30,000 to the Florenceville hatchery. Two million five hundred and thirty-one thousand Atlantic salmon and 74,000 speckled trout fry and finger-lings were distributed.
The Charlo hatchery, at the mouth of the river of the same name, in Restigouche county, New Brunswick, was opened on October 22, when it received its first Atlantic salmon eggs. In all 1,821,000 were received from the New Mills pond. This new plant consists of a main hatchery, 37 feet 8 inches by 63 feet, which includes a hatching-room, coal-room, office and toilet with storage space overhead for equipment; an auxilliary hatchery, 28 feet 8 inches by 68 feet 6,1, inches, including a hatching-room, storeroom and coal-room with storage space overhead; a building 21 feet by 65 feet, containing a double garage, ice-house, workroom, feed-room, cold storage with storage space above; and a superintendent's dwelling of the bungalow type, 30 feet square, with full base-ment, living-room, dining-room, kitchen, bathroom and five bedrooms, a verandah across the front and a summer kitchen at the rear. The hatching-room in the

REPORT OF THE DEPUTY MINISTER 93
main hatchery is 37 feet 8 inches by 51 feet 2 inches, and is equipped with forty hatching troughs, 20 feet long 10-i inches wide and 61,- inches deep, and sixteen floor troughs, 20 feet 61- inches 1ong,.24 inches wide and 9 to 12 inches deep. The auxiliary hatching-room is 28 feet 8 inches by 61 feet 5 inches, and is equipped with twenty-one hatching troughs, 20 feet long, 201- inches wide and 10 inche,s deep. The water supply is taken from Char lo falls, on the south branch of the Char lo river, where a concrete headworks is provided. From this point a pipe 18 inches in diameter conveys the water some 1,720 feet to the hatcheries, adjacent to which an extensive system of rearing ponds is contemplated. The drains for sixteen circular ponds were completed in 1938. Light is supplied to all buildings by a thirty-two volt electric light plant with a 1,500 watt generator and 240 ampere hour storage batteries.
ST. JOHN HATCHERY, ST. JOHN SALMON RETAINING POND, AND CHA.MCOOK LAKES
EGG COLLECTING STATION
J. D. Nichol, Superintendent
The collection of speckled trout eggs from the hatchery ponds this season was slightly over 1,803,000, being nearly 200,000 larger than the collection of 1937. This collection was supplemented by a present of 10,000 speclded trout eyed eggs (special stock) from the American Fish Culture Company, 1,204,000 Atlantic salmon eggs ftrom the St. John pond, and 113,000 sebago s,almon eggs from the Chamcook lakes. Distributions were: 924,000 Atlantic salmon, 69,000 sebago salmon and 718,000 speckled trout and sroall groups of brown trout hybrids, ouananiche and rainbow trout, yearlings and older fish. Atlantic salmon eggs and fingerlings were supplied Dr. A. G. Huntsman and the Fisheries Research Board as required. Representative series of the fish at the hatchery were forwarded the Bureau of Information and Tourist Travel for the display made by the Province of New Brunswick at the Sportsmen's Shows at Boston and New York. This fish display was in charge of Assistant Wm. T. Owens, of the St. John hatchery. Similar series were supplied the St. John branch and Moncton branch of the New Brunswick Fish and Game Protective Association for displays made by them respectively at the St. John and Moncton exhibitions. Twenty-two thousand six hundred and twelve sebago and ouananiche salmon, 1,264 rainbow trout and 9,542 speckled trout were marked by the removal of the adipose and one other fin. Feeding tests were carried on with speckled trout with a view to finding a diet best suited towards a large production of eggs of good quality. The St. John salmon pond was in charge of Assistants T. K. Lydon and N. J. Lamb. One thousand two hundred and thirteen salmon were ,purchased from the commercial weir fisher-men of St. John harbour for this pond. Low water and high temperatures contributed to a heavy loss in these fish during the summer months. Three million nine hundred and sixty-nine thousand eggs were produced and allotted, as follows: Florenceville 1,258,000, Grand Falls 1,507,000, and St. John 1,204,000. Numbered tags were affixed to the dorsal fins of 657 salmon which were liberated in St. John harbour at the close of the season.
The 'collection of eggs at the Chamcook lakes was in charge of Assistant T. K. Lydon. One hundred and seventy-one sebago salmon, i.e., 98 males and 73 females, were taken. Sixty-seven of these fish, or 39.1 per cent of the number taken, had two fins missing, .having been marked in this way when they were distributed. The numbers of marked sebago salmon in these lakes are referred to elsewhere in this report. A fairly representative series of the sebago salmon of these waters was supplied Mr. D. G. Wilder, University of Toronto, for study in regard to the question of the landlocked salmon of the Maritime Provinces having heritable characters different from those of the sea salmon. Feeding tests were carried on with a view to finding a diet conducive to a large production of speckled trout eggs of good quality.

94 DEPARTMENT OF FISHERIES
KELLY'S POND HATCHERY AND MORELL RIVER SALMON RETAINING POND
F. C. Hayley, Superintendent
The collection of speckled trout eggs was smaller than it was in the previous year; 65,000 were obtained from York pond, 186,000 from -Watts pond and smaller numbers from Andrews and the hatchery ponds. The first three men-tioned ponds are privately owned. The eggs as collected there were laid down in the Kelly's pond hatchery and only those that reached the eyed stage were paid for. Five hundred and fifty thousand speckled trout eyed eggs were received from the Antigonish hatchery and 100,000 rainbow trout, eggs, also eyed, from the Cape Cod Trout Company. One million five hundred and fifty-nine thousand Atlantic salmon (green) eggs were received from the More11 pond. Transfers of Atlantic salmon eyed eggs collected in 1937 were: 1,328,000 to the Restigouche hatchery and 300,000 to Antigonish hatchery; 501,000 speckled trout and 95,000 rainbow trout advanced fry 'and fingerlings were transferred to the Cardigan ponds. Five hundred and eighty-three thousand Atlantic salmon and 208,000 speckled trout advanced fry and fingerlings were distributed. Twenty-four thousand three hundred and sixteen speckled trout fingerlings were marked by the removal of the adipose and left pectoral fins and distributed in Vessey brook, tributary to Winter river. Operations ai, the More11 pond were at first in charge of J. J. Hayley and were taken over by Superintendent Tait when the Cardigan ponds were closed for the sea,son. The first salmon were caught on October 10 and betwecn that date and November 14 four hundred and forty-three were impounded. The loss during retention was only one salmon. The total collection of 1,559,000 eggs was placed in the Kelly's pond 'hatchery.
CARDIGAN REARING PONDS
A. Tait, Superintendent
The Cardigan rearing ponds, which were built in 1937, were ready for operation towards the end of May and received 95,000 rainbow trout and 501,000 speckled trout advanced fry and fingerlings from the Kelly's Pond hatchery. The opera.tions for the initial season were very satisfactory. Dis-tributions which were completed on October 25 consisted of 92,000 rainbow trout and 370,000 speckled trout fingerlings. The property was enclosed and general improvement thereof was begun.

STATEMENT BY SPECIES, OF LOCAL COLLECTION AND DISPOSAL OF EGGS DURING 1938
First and Number Disposal- Species Collection area at Number Totals last eggs collected Establishment
Atlantic salmon Margaree pond, N.S Nov. 11-Dec. 5.. 5,412,000 Lindloff 1,050,000 Margaree 4,362,000
Niciaux pond, N.S Nov. 7-17 100,956 Middleton 100,956 River Philip, N.S Nov. 7-18 5,951,850 Bedford 2,384,250
Cobequid 3,567,600 Sackville river, N.S Nov. 3-10 373,500 Bedford 373,500 Miramichi pond, N.I3 Oct. 18-Nov. 11 8,564,973 Miramichi 8,564,973 New Mills pond, N.B Oct. 21-Nov. 11 1,821,633 Cheri° 1,821,633 St. John pond, N.B Oct. 26-Nov. 9.. 3,969,105 Florenceville 1,258,145
. Grand Falls 1,506,890 St. John 1,204,070
Morell river, P.E.I Nov. 8-22 1,559,500 Kelly's pond 1,559,500 27,753,517 Sebago salmon Chamcook lakes, N.B Nov. 8-18 113,274 St. John 113,274
Grand lake, N.S. Nov 8-Dec, 10.. 13,000 Grand lake 13,000 Grand lake rearing ponds, N.S. Nov. 8-30 48,400 Grand lake 48,400 174,674
Duananiche salmon Grand lake rearing ponds, N.S Nov. 8-19 3,800 Grand lake 3,800 3,800 Rainbow trout Antigonish hatchery ponds, N.S Mar. 19-Apr. 25. 286,700 Antigonish 286,700
Yarmouth hatchery ponds, N S Mar. 26-Apr. 24. 33,000 Yarmouth 33,000 319,700 3ockeye salmon Anderson lake, B.0 Oct. 25-29 1,050,000 Anderson lake 1,050,000 1,050,000 3peckled trout Antigonish hatchery ponds, N.S Nov. 1-Dec. 20. 7,924,060
(b) 1,030,500 Antigonish 8,954,560 Margaree hatchery ponds, N.S Oct. 16-Nov. 21.. 2,381,647
(b) 642,918 Margaree 3,024,565 Hart lake, Colchester and Cumberland Cos., N.S. Nov. 2-7 181,124 Cobequid 181,124 Poison lake and River Philip, Cumberland Co., •
N.S Week Dec. 3 6,000 Cobequ id 6,000 McRae lake, Richmond Co., N.S Oct. 4-17 126,534 Lindloff 126,534 Sand lake, Annapolis Co., N.S Nov. 7-17 81,180 Middleton 81,180 Yarmouth hatchery ponds, N.S Nov. 3-24 90,000
(b) 57,000 Yarmouth 147,000 Florenceville hatchery ponds, N.B Oct. 7-Dec. 24.. 2,539,464
(b) 256,900 Florenceville 2,796,364 St. John hatchery ponds, N.B Oct. 24-Dec. 5.. 1,343,684
(b) 459,730 St. John 1,803,414 Kelly's pond hatchery pond, P.E.I. Dec. 13 4,000 Kelly's pond 4,000 17,124,741
46,426,432
UJIS
IAT
IIII A
I12
claïl SRI ,1
0 IU
0c 1
311.
(b) Eggs from yearling fish.

EYED EGGS PURCHASED IN 1938
Number
Species Month laid down Purchased from Laid down in hatchery Total byreceived species
Rainbow trout April Cape Cod Trout Company, Wareham, Mass Kelly's pond 100,000 100,000
Speckled trout December 1938, January 1939 Brookdale Trout Company, Kingston, Mass Middleton 1,327,435
December Brookdale Trout Company, Kingston, Mass Yarmouth 720, 000
• December Brookdale Trout Company, Kingston, Mass Grand Falls 500,000
October, November . Donald Fraser, Plaster Rock, N.B Grand Falls 459,770
November, December Harold Watts, York, P.E I Kelly's pond 255,348 3, 262, 553
3,362,553
Summary of eggs received: Eggs collected, 46,426,432; Eggs purchased 3,362,553; total 49,788,985.
EXCHANGED OR DONATED EYED EGGS RECEIVED 1938
From Department of Game and Fisheries, Toronto, Ontario, in exchange for speckled trout:—
Salmon trout from Wiarton hatchery, laid down at Middleton hatchery 500,000
.=1 •
From American Fish Culture Company, Carolina, Rhode Island, donated:—
Speckled trout, laid down at Grand Falls hatchery 100,000
Speckled trout, laid down at St. John hatchery 10,000

Number tagged Type of tag Period of tagging Where liberated
Nova Scotia- Margaree pond
Nictaux Falls pond River Philip pond
New Brunswick-- St. John pond
Aluminum
37 Aluminum... 500 Aluminum...
Aluminum..
October 3, 4
November 11, 17. November 8-14...
Margaree river, im-iately above Salmon Fisheries Association net.
Nictaux river. River Philip.
200
657 . November 5-15... .1 St. John Harbour.
' 97 REPORT OF THE DEPUTY MINISTER
In the interest of economy and convenience in the distribution of fry the folloveing transfers of eyed eggs were made in 1938:—
• Species From To Number Date received
Atlantic salmon (a) Bedford Antigonish 1,340,000 March 10, 16 (a) Middleton Nictaux Falls. 680,075 April 1 (a) Miramichi Lindloff 600,000 April 1
• (a) Miramichi Nictaux Falls 1,100, 000 APril 2 (a) Miramichi Florenceville 1, 000, 000 March 24 (a) Restigouche Florenceville 30,186 March 16 (a) Restigouche Grand Falls 221,364 March 16 (a) Kelly's Pond Antigonish 300,000 February 26 (a) Kelly's Pond Restigouche 1,328,000 February 4
Rainbow trout (b) Antigonish Lindloff 45,000 May 29
Sebago salmon (a) Bedford Grand Lake 21,390 April 22
Speckled trout (a) Antigonish Bedford 750,000 March 5 (a) Antigonish Cobequid 1, 000, Goo April 1 (a) Antigonish Kelly's Pond 550,000 March 4 (a) Margaree Lindloff 200,000 March 12 (a) Florenceville Grand Falls 400,000 March 9 (a) Florenceville Miramichi 200,000 March 18 (a) Florenceville Restigouche 100,000 March 17
(a) 1937 fall collection. (b) 1938 collection.
TAGGING AND MARRING OF FISH
The tagging of Atlantic salmon taken for fish cultural purposes, wh. ich was commenced in 1913, was continued on a somewhat larger-than-usual scale in 1938 at the several salmon retaining ponds in the Maritime Provinces. The adipose and one ventral or one pectoral fin was removed from 191,902 Atlantic and sebago salmon, ouananiche, rainbow and speckled trout before they were distributed. The object of the tagging is to add to present information in regard to the movements of the fish, frequency in spawning and the extent to which early salmon of any season return to fresh water as early fish or vice versa. The marking or fin clipping was practised for the purpose of gaining further information on the movements, growth and survival of hatchery product. Special reference is made to the tagging and liberation of fish from the net operated by the Margaree Harbour Salmon Fisheriee Association under " Margaree salmon retaining pond." The extent of the tagging is given in detail in the following statement:— ADULT ATLANTIC SALMON, TAGGED BY AFFIXING TAGS TO THE DORSAL FIN, 1938
87275-7

.98 DEPARTMENT OF FISHERIES
. . (1y The- recaptures of tagged - Atlantic salmon reported during 1938, (2) of all tagging done and of_ all - recaptures of tagged sa-lm-on reported sine tagging was initiated in 1913 to December 31, 1938, are as follows:—
TABLE 'No. 1
RECAPTURES, 1938—ATLANTIC SALMON
MARGAREE RIVER, N.S.
Weight Length 1. Where liberated Number Condition Sex Date 2. Where caught
F7814 7 31 Kelt F Nov. 25, 1936 Margaree Pond, N.S. 20f Clean F July 27, 1938 McArras Brook, Antigonish
county, N.S.
F7827 14 37 Kelt....... F Nov. 25, 1936 Margaree Pond, N.S. 24 41 Clean F July 21, 1938 One and one-half miles north of
Margaree Harbour, N.S.
F7838 15 38 Kelt F Nov. 25, 1936 Margaree Pond, N.S. (z) (u) 22 41 Clean . F 1938 (a) Margaree Pond, N.S.
. . F7843 7 31 Kelt F Nov. 25, 1936 Margaree Pond, N.S.
(v) 30 - ...:-.-..... Clean F July 25, 1938 Broad Cove Chapel, - Inverness county, N.S.
F7866 10 34 Kelt 1' Dec. 1, 1936 Margaree Pond, N.S. (z) (u) 21 41 Clean F 1938 (a) Margaree Pond, N.S.
F7885 14 38 - Keli F Dec. 1, 1936 Margaree Pond, N.S. 21 41 Clean F July 30, 1938 West of Point Cross brook out-
let, Inverness county, N.S. -
F7888 17 37 Kelt Dec. 1, 1936 Margaree Pond, N.S. 32 44 Clean F June 6, 1938 Pigeon Island, two miles frian
Lead Cove, Newfoundland. . -
-_•JE7965 :10 ''33:. Kelt . M Dec. 10, 1936 Margaree Pond, N.S. 27 - 40 , Clean M Aug. 6, 1938 One hundred yards west oi
Ferguson's ponds outlet, Pictou county, N.S.
- -- - (f)K131 . ... ... -.. . ..... .... Clean Oct. 3, 1938 Margaree Salmon Fisheries As- .
- sociation net, Margaree Har- bour, N.S.
18 ...... . _Clean-- . F Oct. 5, 1938 Thornbush pool, Margaree river, .
. N.S.
. . . (..f)K204 -- Clean. Oct: 3, 1938 Margaree Salmon Fisheries As-
sociation net, Margaree Har-bour, N.S.
- Clean Oct. 6, 1938 Thornbush pool, Margaree river,
N.S.
(j)K210 . .... .. : ... Clean...... M Oct. 3, 1938 Margaree Salmon Fisheries As- sociation net, Margaree Har.
- boar, N.S. - 7 Clean M Oct. 5, 1938 McDaniel pool, Margaree river,
N.S. ..
(f)K216 Clean M Oct. 3, 1938 Margaree Salmon Fisheries As sociation net, Margaree Har bour, N.S.
16i Clean M Oct. 5, 1938 McDaniel pool, Margaree river, N.S.
(f)K238 Clean Oct. 3, 1938 Margaree Salmon Fisheries As sociation net, Margaree liar« bour, M.S. _
9} Clean Oct. 13, 1938 McDaniel pool, Margaree river N.S.

99 REPORT OF THE DEPUTY MINISTER
TABLE No. 1—Continued
RECAPTURES, 1938--ATLANTIC SALMON—Continued
MARGAREE RIVER, N.S.
Number Weight Length Condition Ses Date 1. Where liberated 2. Where .ght
(1)1(239 Clean Oct. 3, 1938 Margaree Salmon Fisheries As- sociation net, Margaree Har-bour, N.S.
10 to 12 Clean Oct. 8, 1938 Hut pool, Margaree river, N.S.
(1)1(261 Clean M Oct. 3, 1938 Margaree Salmon Fisheries As-sociation net, Margaree Har-bour, N.S.
(z) (u) 7 30 Clean M 1938 (e) Margaree Pond, N.S.
(1)1(266 Clean...... M Oct. 4, 1938 Margaree Salmon Fisheries As-sociation net, Margaree Har-bour, N.S.
(z) (u) 7 30 Clean...... M 1938 (e) Margaree Pond, N.S.•
(1)1(272 Clean F Oct. 4, 1938 Margaree Salmon Fisheries As-sociation net, Margaree Har-bour, N.S.
10 Clean...... F Oct. 8, 1938 McDaniel pool, Margaree river, N.S.
• (1)1(280 Clean...... M Oct. 3, 1938 Margaree Salmon Fisheries As'
sociation net, Margaree Har-bour, N.S.
10 Clean M Oct. 9, 1938 McDaniel pool, Margaree river N.S.
(f )K285 Clean F Oct. 3, 1938 Margaree Salmon Fisheries As sociation net, Margaree Har bour, N.S.
(z) (u) 6 29 Clean F 1938 (e) Margaree Pond, N.S.
NICTAUX RIVER, N.S.
F6209 5 261 Kelt F Nov. 5, 1936 Nictaux Pond, N.S. 101 311 Clean F May 20, 1938 Nictaux river, halfway Irons
mouth and Rogers bridge, N.S.
F7034 6 284 Kelt F Nov. 9, 1936 Nictaux Pond, N.S. 114 32 Kelt F Apr. 22, 1938 Nictaux river, at Rogers bridge,.
N.S.
1001 7 29 Kelt M Nov. 15, 1937 Nictaux Pond, N.S. 7 30 Clean M June 7, 1938 Bay of Fundy, ten miles off
Point Lepreau, N.B.
1007 3 25 Kelt M Nov. 15, 1937 Nictaux Pond, N.S. 54 251 Clean M June 28, 1938 Placentia Roads, Newfoundland_
1012 4 27 Kelt F Nov. 16, 1937 Nictaux Pond, N.S. Kelt F Apr. 19, 1938 Nictaux river, Stevens pool, N.S._
1059 7 31 Kelt M Nov. 16, 1937 Nictaux Pond, N.S. Kelt M May 10, 1938 Annapolis river, at Lawrence-
town, N.S.
1063 6 291 Kelt M Nov. 16, 1937 Nictaux Pond, N.S. 74 Kelt M Apr. 19, 1938 Nictaux river, at Rogers bridge„
N.S.
1084 7 31 Kelt F Nov. 17, 1937 Nictaux Pond, N.S. (oa)6 32 Clean . F July 8, 1938 Garnish, Fortune bay, New-
- foundland.
87275-7;

100 DEPARTMENT OF FISHERIES
TABLE No. 1—Continued
RECAPTURES, 1938—ATLANTIC SALMON—Continued
RIVER PHILIP, N.S.
Number Weight Length 1. Where liberated Condition Sex Date (lbs.) (ins.) 2. Where caught
82 (d) Oct. 13, 1937 River Philip Pond, N.S.
61 Kelt Apr. 17, 1938 River Philip, at Oxford Junction, N.S.
F2567 17 37 Kelt F Nov. 10, 1936 River Philip Pond, N.S.
(aa)25 Clean F 1938 St. Anthony, Labrador.
F4869 7 29 Kelt F Nov. 12, 1936 River Philip Pond, N.S.
18 32 Clean F July 10, 1938 One mile east of Coal point, Big Island, Pictou county, N.S.
F4883 15 37 Kelt F Nov. 12, 1936 River Philip Pond, N.S.
(z) 21 41 Clean F 1938 (c) River Philip Pond, N.S.
Sacr.vrim RIVER, N.S.
F7042 4 23 Kelt M. Nov. 3, 1936 Sackville Pond, N.S. 141 32 Clean M June 11, 1938 One and one-quarter miles south
of Herring Cove Light House, Halifax county, N.S.
F7043 8 304 Kelt F Nov. 3 1936 Sackville Pond, N.S. (z) (u) 104 35 Clean F 1938 (b) Sackville Pond, N.S.
:2047 3 24 Kelt F Nov. 8, 1937 Sackville Pond, N.S. Kelt F May 5, 1938 Moirs Mill pond, at Bedford,
N.S.
:2116 3 23 Kelt M Nov. 12, 1937 Sackville Pond, N.S. Kelt M Apr. 30, 1938 Sackville river, near Sunnyside,
N.S.
2141 7 314 Kelt M Nov. 19, 1937 Sackville Pond, N.S. (z)(u)10 34 Clean M 1938 (b) Sackville Pond, N.S.
MIRAMICHI RIVER, N.B.
F1892 *12 34 Kelt F Oct. 28, 1937 Mirarnichi Pond, N.B. ' Kelt F May 28, 1938 Miramichi river, one-quarter
mile west of Nappan river,N.B
F1895 14 31 Kelt M Oct. 28, 1937 Miramichi Pond, N.B.
Kelt M May 22, 1938 Southwest Miramichi river near Doaktown, N.B.
44 (d) Sept. 17, 1937 Miramichi Pond, NH. 23 Kelt May 22, 1938 Miramichi river, at ColgatE
camp at Big Hole, Curventon N.B.
50 8 291. Kelt Oct. 24, 1937 Miramichi Pond, N.B.
10 Clean F Aug. 3, 1938 Miuramichi river, in Nappan bay. N.B.
101 34 Kelt F Oct. 27, 1937 Miramichi Pond, N.B.
Kelt F May 21, 1938 Northwest Miramichi river, al Exmoor, N.B.
108 30 Kelt F Oct. 27, 1937 Miramichi Pond, N.B. 30 Kelt F May 26, 1938 Northwest Miramichi river, one .. . _ _
-quarter mile -above hatchery Semth "Eck N Ti

REPORT OF THE DEPUTY 111INLSTER
TABLE No. 1-Continued
RECAPTITRES, 1938-ATLANTIC SALMON-Continued ,
MIRAISICEU RIVER, N.B.--Continueel
Number Weight Length 1. Where liberated Condition Sex Date 2. Where caught
502 9 30 Kelt F Oct. 30, 1937 Miramichi Pond, N.B. 31 Kelt F May 27, 1938 Miramichi river, at Bartibog
Bridge, N.B.
506 16 36 Kelt F Oct. 30, 1937 Miramichi Pond, N.B. 19 37 Kelt F June 2, 1938 Miramichi river, at Derby Junc-
tion, N.B.
508 10 30 Kelt F Oct. 30, 1937 Miramichi Pond, N.B. . 31 Kelt F May 20, 1938 • Mirarnichi river, at Chatham,
N.B.
512 11 311 Kelt M Nov. 1, 1937 Miramichi Pond, N.B. 33i Kelt M May 27, 1938 Miramichi 'river (north side) at
Chatham, N.B.
518 81- 29 Kelt F Oct. 30, 1937 Miramichi Pond, N.B. Kelt F May 24, 1938 Northwest Miramichi river
(south side), at Northwest Bridge, N.B.
541 9 Het F Nov. 1, 1937 Miramichi Pond, N.B. 291 . Kelt F May 25, 1938 Mirarnichi river, at Bartibog
Bridge, N.B.
556 9i 28 Kelt F Nov. 1, 1937 Miramichi Pond, N.B. Kelt F May 19, 1938 Northwest Miramichi river, at
Exmoor, N.B.
566 9 291 Kelt F Nov. I, 1937 Miramichi Pond, N.B. Kelt F May 9, 1938 Little Southwest Miramichi
river, at Silliker, N.B.
567 171 371 Kelt F Nov. 1, 1937 Miramichi Pond, N.B. Kelt F May 21, 1938 Northwest Miramichi river, at
Exmoor, N.B.
588 16 351 Kelt F Nov. 1, 1937 Miramichi Pond, N.B. Kelt F May 22, 1938 Northwest Miramichi river, at
Exmoor, N.B.
607 6 23 Kelt M Nov. 2, 1937 Miramichi Pond, N.B. 25 Clean M June 24, 1938 Black Duck Cove, St. Barbe dis-
trict, Newfoundland.
629 101 311 Kelt F Nov. 2, 1937 Miramichi Pond, N.B. Kelt F May 14, 1938 Little Southwest Miramichi
river, two miles above Red Bank, N.B.
643 91 30 Kelt F Nov. 4, 1937 Miramichi Pond, N.B. 30 Kelt F May 10, 1938 Northwest M irara ichi river, N.B.
645 10 301 Kelt F Nov. 4, 1937 Miramichi Pond, N.B. 31 Kelt F May 25, 1938 Northwest Mirarnichi river, foui
miles above hatchery, Soutt Esk, N.B.
648 91 301 Kelt F Nov. 4, 1937 Miramichi Pond, N.B. Kelt F May 25, 1938 Miramichi river, at Loggieville
N.B.
651 8i 291 Kelt F Nov. 5, 1937 Miramichi Pond, N.B. Kelt F Apr. 27, 1938 Northwest Mirarnichi river,N.E
661 16 38 Kelt F Nov. 5, 1937 Miramichi Pond, N.B. 39 Kelt F May 24, 1938 Miramichi river, off West Point
tine,. T.nrrrrimrilla 1\7 13_
toi

DEPARTMENT OF FISHERIES
TABLE No. 1-Continued
REC.APTURES, 1938-ATLANTIC SALMON-Continued
MIRAMICRI RIVER, N.B.-Continued
Weight Length 1. Where liberated Condition ex Date Number S D 2. Where caught
667 91 30 Kelt F Nov. 5, 1937 Miramichi Pond, N.B.
Kelt F May 10, 1938 NorthwestMiramichi river, N.B .
673 9 29; Kelt F Nov. 5, 1937 Miramichi Pond, N.B. Kelt F May 23, 1938 Little Southwest Miramichi
river, three-quarter mile above Red Bank bridge, N.B.
688 174 38 Kelt F Nov. 5, 1937 Miramichi Pond, N.B.
Kelt F June 1, 1938 Northwest Miramichi river, lit South Esk, N.B.
697 9 - 30 Kelt F Nov. 5, 1937 Miramichi Pond, N.B.
Kelt F May 23, 1938 Northwest Miramichi river, at South Esk, N.B.
699 161 38 Relt F Nov. 5, 1937 Miramichi Pond, N.B.
Kelt F May 24, 1938 Miramichi river, at Bartibog bridge, N.B.
731 12 32 Kelt M Nov. 8, 1937 Miramichi Pond, N.B.
Kelt M Apr. 27, 1938 Little Southwest Miramichi river, at Lyttleton, N.B.
785 11 311 Kelt M Nov. 6, 1937 Miramichi Pond, N.B.
Kelt M May 27, 1938 Northwest Miramichi river, at South Esk, N.B.
797 10 291 Kelt M Nov. 6, 1937 Miramichi Pond, N.B. , 29.1 Kelt M May 25, 1938 Miramichi river, near mouth of
Nappan river, N.B.
817 11 311 Kelt M Nov. 6, 1937 Miramichi Pond, N.B. Kelt M May 20, 1938 Northwest Miramichi river, one-
quarter mile above hatchery, South Esk, N.B.
821 13 331 Kelt M Nov. 6, 1937 Miramichi Pond, N.B. Kelt M May 15, 1938 Northxvest Miramichi river, one
mile from mouth of Millstream, N.B.
870 121 321 Kelt M Nov. 5, 1937 Miramichi Pond, N.13.
Kelt M May 9, 1938 Southwest Miramichi river, at Renous bridge, N.B.
.879 131 32 Kelt M Nov. 5, 1937 Miramichi Pond, N.B.
Kelt M May 25, 1938 Miramichi river, at Lower New- castle, N.B.
.898 81 29 Kelt F Nov. 5, 1937 Miramichi Pond, N.B.
Kelt F June 2, 1938 Miramichi river, at Loggieville, N.B.
900 18 38} Kelt F Nov. 5, 1937 Miramichi Pond, N.B.
Kelt F May 23, 1938 Northxvest Miramichi river, at Exmoor, N.B.
904 11 301 Kelt F Oct. 30, 1937 Miramichi Pond, N.B.
Kelt F May 27, 1938 Northwest Miramichi river, at Cassilis, N.B.
919 17 361 Kelt F Oct. 29, 1937 Miramichi Pond, N.B.
Clean F Aug. 29, 1938 Miramichi river, one mile below Loggieville wharf, N.B.
935 81 29 Kelt F Oct. 29, 1937 Miramichi Pond, N.B.
Kelt F May 27, 1938 Northwest Miramichi river, one and one-half mile above hatch- et., r qr.11+11 rob- l'S 1=1
102

REPORT OF THE DEPUTY MINISTER
TABLE No. 1—Conduded
RECAPTURES, 1938—ATLANTIC SALMON—Coaduded
MIRAMICRI RIVER, N.B.—CC/SC/tided
Number Weight Length Condition Sex Date 1. 'Where liberated 2. Where caught
963 81 30 Kelt F Oct. 29, 1937 Miramichi Pond, N.B. Kelt F May 25, 1938 Northwest Miramichi river, one
quarter mile above hatchery, South Esk., N.B.
969 9 29 Kelt F Oct. 29, 1937 Miramichi Pond, N.B. Kelt F May 3, 1938 Little Southwest Miramichi
river, at Silliker, N.B.
988 16 35 Kelt F Oct. 29, 1937 Miramichi Pond, N.B. 201 39 Clean F Oct. 13, 1938 Cain river, N.B.
992 81 29 Kelt F Oct. 29, 1937 Miramichi Pond, N.B. Kelt F May 25, 1938 Miramichi river, at Loggieville,
N.B.
993 15 351 Kelt F Oct. 29, 1937 Miramichi Pond, N.B. Kelt F May 27, 1938 Miramichi river, at Oyster river,
N.B.
996 101. 31 Kelt F Oct. 29, 1937 Miramichi Pond, N.B. Kelt F May 23, 1938 Miramichi river, below Oyster
river, N.B.
NEW MILLS POND, N.B.
99 71 30 Kelt F Oct. 29, 1937 New Mills Pond, N.B. 30 Kelt F May 19, 1938 Restigouche river, at Flatlands,
N.B.
1156 111 34 Kelt M Oct. 30, 1937 New Mills Pond, N.B. Kelt M May 23, 1938 Bay Chaleur, at Point la Nim,
N.B.
1166 71 31 Kelt F Oct. 30, 1937 New Mills Pond, N.B. _ (r) 8 Kelt F Apr. 29, 1938 Nipisiguit river, one mile from
mouth, N.B.
1175 11 34 Kelt 111 Oct. 30, 1937 New Mills Pond, N.B. 111 Kelt M May 31, 1938 Bay Chaleur, at Miguasha West,
Que.
1177 91 32 Kelt M Oct. 30, 1937 New Mills Pond, N.B. Kelt M May 25, 1938 Bay Chaleur, at Miguasha West,
Que.
1200 111 34 Kelt M Nov. 2, 1937 New Mills Pond, N.B. _ Kelt M May 27, 1938 McLeod Siding, N.B.
(aa) Weight when dressed. (a) Caught for second time for fish cultural purposes, Sept. 19-Oct. 19, 1938. (b) Caught for second time for fish cultural purposes, Sept. 1-Oct. 10, 1938. (c) Caught for second time for fish cultural purposes, Sept. 21-Nov. 1, 1938. (d) Tagged and liberated without weighing or measuring. (e) Salmon caught tagged and liberated above the Margaree Salmon Fisheries Association net
October 3 and 4; recaptured and placed in the Margaree salmon pond prior to October 19, 1938. (f) Salmon tagged and liberated. in Margaree river immediately above the Margaree Salmon Fish-
eries Association net. (u) Liberated with same tag attached. (v) Weight estimated. (z) Weight after stripped.
103

First year
Second year
0
(b) 2 1 5 7
(b) 6 1 5 0
(b) 2 0 1 0
(b) 2 (b) 7
o 0 O
- 1 O
(P)3 2 0 0 6
(b)24 (b)12 (b) 8
0 0
5
5 (a) 2
0 1
(I)
(a)
(a) (a)
1
130
(m)9 (m)4 (n) 9
0 0 1 o 0
44
4 4 0 2 0 1 3 0
3,776
261 165 140 76
0 92
124 37
14
0
1 1 O 0 -O
0 0 0 0 0
19
(P)
(P)
1929 1930 1925
1913 1914 1915 1916 1917 1918 1919 1920 1921 1921 1922 1922: 1923 1923 1924 1925 1926 1927 1928 1929 1930 1931 1932 1933 1934 1935 1936 1937 1938
1931 1932 1933 1934 1935 1936 1937 1938
1924
1929 1930 1931 1932 1933 1934 1935 1936 1937 1938
104 = DEPARTMENT OF FISHERIES
TABLE No. 2
STATEMENT OF ATLANTIC SALMON TAGG-ED (TAGS ATTACHED TO DORSAL FIN) AT THE SEVERAL POINTS EACH YEAR, FROM 1913 TO 1938, INCLUSIVE, THE NUMBER OF RECAPTTJRES OF CLEAN FISH OF EACH SEASON'S TAGGING AT THE SEVERAL POINTS THAT HAVE BEEN REPORTED AND THE APPROXIMATE PERIOD THAT ELAPSED BETWEEN TAGGING AND RECAPTURE.
Year Nurnher of Tags attached
Year after tagging during which clean fish were recaptured
Fourth year
Place where tagging was done . Third year
Fifth Year
0 0 O
Allen's lake, N S
Port Maitland, N.S
21 . 218
(Spring) 25
0 2 3
Margaree pond, N.S
264
• 98 150 119 200
99 99 84
105 (Spring) 18 (Fall) 103 (SPring) 30 (Fall) 98 (Spring) 20 (Fall) 99
99 0 0 0
•100 0
486 0 0
166 536 641 193
33 200
-0-
(h)
Nictaus pond, N.S
River Philip and Wallace river, N.S.
River Philip pond, N.S.
19
24 29
200 44
500
895
2 1,482

REPORT OF THE DEPUTY MINISTER 105
TABLE NO. 2— Contznued
Year alter tagging during which Number clean fish were recaptured
Year of Tags attached First Second Third Fourth Fifth
year year year year year
1932 97 (. i) 3 2
1933 150 (j) 4 (k) 7
1934 54 1 0
1935 0 0 0
1936 97 (5) 6 (k) 2
1937 239 (j) 1 0
1938 0 0 0
637 15 11
1913 250 0 3
1914 97 1 (c) 3
1915 119 1 (c) 3 -
1916 297 0 (c) 1
1917 149 0 (c) 1
1918 149 0 (c) 4
1919 100 0 0
1920 188 1 (c) 1
1921 161 0 0
1922 149 0 (c) 4
1923 150 0 0
1924 195 (q) 1 2
1925 0 0 0
1926 0 0 0
1927 0 0 0
1928 100 0 0
1929 0 0 0
1930 0 0 0
1931 0 0 0
1932 0 0 0
1933 0 0 0
1934 0 0 0
1935 0 0 0
1936 0 0 0
1937 617 4 0
1938 0 0 0 • 1927 (Spring) 20 0 0
2,741 8 22
• 1928 (Spring) 17 0 0
1928 (Fall) 8 0 0
1929 (Spring) 2 0 0
1930 (Spring) 5 0 0
32 0 0
1921 (Spring) 228 2 0
• 1919 172 0 5 • 1920 19 0 1 • 1927 100 1 1
1928 100 0 0
1929 0 0 0
1930 100 0 1
719 3 8
• 1913 49 0 1
1914 24 0 0 • 1914 76 0 0
1915 67 0 3
1916 100 0 1
1917 50 0 1
1918 0 0 0
1919 98 0 2
1920 0 0 0
1921 100 0 0
1922 99 0 0
1923 100 0 2
1924 99 0 1
1925 • 0 0 0
1926 0 0 0
Place where tagging was done
Sackville pond, N.S
Miramichi pond, N.B
Caine river, N.B
Tabusintac river, N.B....
Restigouche and Upsalquitch rivers, N.B.
Kedgwick river, N.B Little Main river, N.B. Matapedia river, N.B
Tide Head pond (Restigouche), N.B.
New Mills pond, N.B
87275-8

106 DEPARTMENT OF FISHERIES
TABLE No. 2—Continued
Nipisiguit river, N.B
Saint John pond, N.B
Morell river, P.E.I
Year after tagging during which
Number clean fish were recaptured
Year of Tags
attached First Second Third Fourth Fifth
year year year year year
1927 0 0
1928 0 0
1929 0 0
1930 409 1
1931 0 0
1932 0 0
1933 0 0
1934 0 0
1935 0 0
1936 0 0
1937 169 0
1938 0 0
1,440 1 1
1924 231 1 (r) 2 O O 0
1925 169 1 3 0 0 0
1926 118 0 1 0 0 0
1927 64 0 0 0 0 0
582 2 6 0 0 0
1913 50 0 1
1914 100 0 2 ..
1915 _70 (d) 2 1
1916 196 0 5
1917 100 0 1
1918 100 0 0
1919 100 1 0 .
1920 96 0 1
1921 104 0 0
1922 os 1 0
1923 100 1 1
1924 100 0 1
1925 0 0 0
1926 0 0 0
1927 0 0 0 -
1928 0 0 0
' 1929 0 0 0
1930 806 5 13
1931 0 0 0
1932 0 0 0
1933 0 0 0
1934 2 0 0
1935 0 0 0
- 1936 0 0 0
1937 20 0 0
1938 658 0 0
2,701 10 26
1918 44 0 0 0
1919 48 0 1 0:
1920 0 0 0 0
1921 49 (s) 1 0 0
1922 78 0 0 0
1923 48 0 1 0
1924 39 0 0 0
1925 0 0 0 0
1926 0 0 0 • 0
1927 0 0 0 0
1928 0 0 0 0
1929 137 (t) 5 1 0
1930 273 (t) 2 (v )10 0
1931 0 0 0 0
1932 0 0 0 0
1933 0 0 0 0
1934 0 0 0 0
1935 0 0 0 0
1936 0 0 0 0
1937 34 0 0 0
1938 0 0 0 0
750 8 13 0 0
Place where tagging was done

REPORT OF THE DEPUTY MINISTER
TABLE No. 2— Concluded
Year after tagging during which Nrumber clean fish were recaptured
Place where tagging was done Year of Tags attached First Second Third Fourth Fifth
year year year year year
Tadoussac pond, Que 1913 37 0 0 0 0 0 1914 99 0 3 0 0 0 1915 69 6 0 0 0 0 1916 98 0 1 0 0 a 1917 60 0 3 0 0 0 1918 0 0 0 0 0 0 1919 50 0 0 0 0 0 1920 126 0 0 0 0 0 1921 102 1 1 o o o .
' 641 7 8 0 0 0
York pond, Que 1917 25 0 (e) 1 0 0 0 1918 50 0 0 0 0 0 1919 150 0 1 0 0 0
York river, Que 1921 100 0 0 0 0 0
s 325 0 2 0 0 0
Allen's lake and Port Maitland, N.S 264 5 0 0 0 0 Margaree pond, N.S 3,776 44 130 3 0 1 Nictaux pond, N.S 895 14 19 1 0 R River Philip, Wallace river and River Philip
pond, N.S 1,482 2 9 o 0 0 Sackville pond, N.S 637 15 11 0 1 o Miramichi pond and Calas river, N.B 2,741 8 22 0 3 0 Tabusintac river, N.B 32 0 0 0 0 0 Restigouche, Upsalquitch, Kedgwick, Little
Main and Matapedia rivers, N.B 719 3 8 0 o o Tide Head and New Mills ponds, N.B 1,440 1 16 0 0 0 Nipisiguit river, N.B 582 2 6 0 0 0 Saint John pond, N.B 2,701 10 26 0 0 0 Morell river, P.E.I 750 8 13 0 0 0 Tadoussac pond, Que 641 7 8 0 0 0 York pond and river, Que 325 0 2 0 0 0
16,985 119 270 4 4 1
Total clean recaptures 398
(a) Five of these were stripped and liberated at pond the second time, viz., one, 1914 and 1915; one, 1930 and 1931; two, 1934 and 1935, and one, 1935 and 1936.
(b) Thirt,een of these were stripped and liberated at pond the second tirne, viz., one, 1913 and 1915; two, 1918 and 1920; one, 1921 and 1923; one, 1923 and 1925; one, 1924 and 1926; three, 1934 and 1936; two, 1935 and 1937, and two, 1936 and 1938.
(e) Twelve of these were stripped and liberated at pond the second time, viz., one, 1914 and 1916; one, 1915 and 1917; one, 1916 and 1918; one, 1917 and 1919; four, 1918 and 1920; one, 1920 and 1922, and three, 1922 and 1924.
(d) One of these was stripped and liberated at pond the second time, viz., 1915 and 1916. (e) Stripped and liberated at pond the second time, viz.
' 1917 and 1919.
(f) Tagged in spring 1921 and captured in net operated in Margaree river, stripped and liberated at pond, fall 1922.
(g) Four of these were caught the second t'une for fish cultural purposes, viz., 1930 and 1932. (h) Stripped and liberated at pond the second time, viz., 1934 and 1937. (5) Eight of these were stripped and liberated at pond the second time, viz., one, 1932 and 1933; two,
1933 and 1934; four, 1936 and 1937, and one, 1937 and 1938. (k) Five of these were stripped and liberated at pond the second time, viz., four, 1933 and 1935, and
one, 1936 and 1938. (m) Two of these were stripped and liberated at pond the second time, viz., one, 1931 and 1933, and
one, 1932 and 1934. (n) Eight of these were caught the second time for fish cultural purposes, viz., 1933 and 1935. One
died in pond and others lost their tags during summer. (p) Five of these were stripped and liberated at pond the second time, viz., four, 1929 and 1931, and
one, 1936 and 1938. (g) Stripped and liberated at pond the second time, viz., 1924 and 1925. (r) One of these was stripped and liberated at pond the second time, viz., 1924 and 1926. (s) Stripped and liberated at Morell pond, 1921, and caught at Margaree pond, stripped and liberated,
fall 1922. (1) Three of these were stripped and liberated at pond the second time, viz., two, 1929 and 1930, and
one, 1930 and 1931. (v) One of these was stripped and liberated at pond the second time, viz., 1930 and 1932. 87275--3à
107

108- • DEPARTMENT OF FISHERIES
Per cent Allen's lake and Port Maitland, N.S 1-89 Margaree river, N.S 4 • 71 Nictaux river, N.S 3-87 River Philip and Wallace river, N.S •74 Sackville river, N.S 4 • 23
- Miramichi and Cains - -vers N.B 1-20 Tabusintac river, N.Bri nil Restigouche river and tributaries and New Mills, 'N.B 1-29 Nipisiguit river, N.B 1•37 St. John river, N.B 1.33 Morell river, P.E.I 2-80 Saguenay river, Tadoussac, P.Q 2-34 York river, Pai 0 • 61
The summary of all tagging, from 1913 to 1938 inclusive, with returns there-from, shows that 119 fish—or 29 • 9 per cent of the total number recaptured-- were taken within one year; 270 salmon, or 67-8 per cent, within the second year; and four, or one per cent, in the third year; four or one per cent in the fourth year, and one salmon, or •3 per cent in the fifth year, after they were tagged and liberated. The fifth-year fish was from the Margaree river.
As is to be expected, only a few of the salmon tagged in 1937,-and none of those tagged in 1938, were reported up to the end of 1938.
The recapture of Atlantic salmon tagged in connection with Canadian Fish Cultural Operations referred to above is analysed in " Sea Movements of Canadian Atlantic Salmon Kelt" (Huntsman, A. G., 1938).
The marking of fish by fin clipping has been extended to hatchery product generally as indicated by table No. 3.
The recapture of clean salmon (table No. 2) that •had been reported to December 31, 1938, constitutes 2-34 per cent of the total number (almost entirely kelts) that were tagged and liberated. The percentage of recaptures of salmon that were tagged in the various districts varies considerably, ranging from nil from the Tabusintac river to 4-71 per cent from the Margaree river. The failure of returns from the Tabusintac may be partly due to the small number, 32, that were tagged there.
The respective percentages are as follows:—

TADLE No. 3—FISH MARKED BY FIN CLIPPING, 1938
Number — Species Age Distributed Nature of mark—Removal of
Nova Scotia- Antigonish hatchery 300 Speckled trout. Yearlings... Dec. 12—Coco° Coffre lake Adipose and right pectoral
300 " .... " .... Dec. 12—Copper lake, Antigonish county
250 " " .... " .... Dec. 9—Dewar dam-Barney river " "
200 II fi it .... Dec. 14—McDonald dam-East river «
150 " " .... Dec. 16—Mountain Meadow pond-West river " "
173 " " .... Dec. 16—Stewart dam tributary to Little Harbour " "
200 " " .... Two years.. Dec. 13—McLean or James river lake " "
389 if ,“ .... " .. Dec. 9—South river
300 " " .... " .. Dee. 13—West river, Antigonish county « < <
200 " « .... Three years. Dec. 3—Brierly brook lake « "
277 " " .... " Dec. 16—Stewart dam tributary to Little Harbour " Cobequid hatchery 2,000 " " Fingerlings. Aug. 11—Gleason brook-Portapique river Adipose and right ventral.
2000, " " .... " .. July 30—Isaac lake
2000, " " " Aug. 13—Maccan river, south branch " "
2,000 " " .... " .. July 30—Newfound lake
2,000 " " " .. Aug. 16—River Philip " "
2,000 " . " .. Aug. 23—Simpson lake id ll
2000, « " .... " .. Aug. 15—Tillie creek «
2,000 " « .... " .. Aug. 22—Wallace river « «
570 " " ....' Wild Nov. 21—Hart lake Right ventral Lindloff hatcherY 10,000 Atlantic salmon. • Fingerlings . Aug. 29—Grand river Adipose and left pectoral
1,000 Speckled trout « Aug. 25—Pottie lake (Madame island) 41
Margaree hatchery L 11,799 Atlantic salmon.... " .. Oct. 24, 25—Northcast Margarce river, Murray pool.. Adipose and right pectoral
200 ' Speckled trout....' " .. Dec. 23—Hatchery or Ingram brook "
682 " " ....• Yearlings.... Nov. 26—Lake O'Law " "
197 " if ....: Two years.. May 13—Lake O'Law " "
100 ' " 4 f .... " .. Nov. 21—Lake O'Law " "
200 " " .... " .. Nov. 26—Lake O'Law, upper « "
519 : " " .... Three years. May 13, 14—Lake O'Law " "
375 ' " .« .... .Dec. 13—Plaster pond " "
140 ' " " .... " Dec. 17—Lake O'Law "
160 ' " " ...., Four years.. May 13, 14—Lake O'Law " «
730 . " " .... " .. Nov. 2I—Lake O'Law " "
550 • " " .... " .. Dec. 16—Plaster pond "
680 " " ....- Five years.. May 12—Lake O'Law " "
Middleton hatchery 7,000 Atlantic salmon. Fingerlings . Sept. 12—Gaspereau river Adipose and left ventral Nictaur Falls rearin
station 3,000 " « " Sept. I2—Gaspereau river
Yarmouth hatchery 6,000 Atlantic salmon. Yearlings. Apr. 12, 1937—Clyde river Adipose and right ventral
4,000 " " ... " .... Apr. 20, 1937—Mersey river « - "
600 Speckled. trout..... " .... Dec. 8—Gardener brook " «
739 " " „.. TWO years.. pec.8—Gardenerbfge„,,„„„ " "
RE
PO
RT
OF
THE
DE
PU
TY
MIN
IST
ER
0

0 TABLE No. 3—FISH 11..41%1 .V5 IS'Y FIN CÉÏÉFING, 1938—Continued
Number — Species Age Distributed Nature of mark—Removal of marked
New Brunswick- Floreneeville hatchery.... 500 a a .... Yearlings.... June 16—Brown lake Adipose and left pectoral
400 . it . . . . " .... June 16—Hagerman brook-St. John river a
309 ie . . . . . " .... June 15—Hardwood brook-St. John river a "
500 . . . . .. " .... July 21—Kingsley brook-Nashwaaksis river a
600 "<‘ " July 26—Limekiln brook-Nashwaak river
.... a
500 a a .... June 15—Pokiok river a
500 a .... a .... July 29—Tinkettlo brook-Nashwaak river a a
391 . " .. • . Three years. June 14, July 18—Bull creek-St. John river a a
250 ‘‘ June 9, 10—Cranberry lake 4(
"
' 240 ‘i i‘ June 21, 22—Cross creek-Nashwaak river a a
180 4t a June 18—Second Eel river lake a a
600 it. . . • June 3, 8, 11, 13—Nashwaak river ‘‘ a
360 a " .... (I June 4, 7, 17—Nashwaaksis river it
180 a .... a June 18—Shogomoc river a a
200 a a Five ‘years.. May 16, 18—Big Guisiguit river a
200 a a .... ' .. May 16, 19—Little Guisiguit river a a
100 . . . . . . " .. May 17—Gallivan brook-St. John river a
100 a a " .. May 18—McLeary brook-Lakeville pond . If
150 a a .... " .. May 17, 19—River de Chute a Grand Falls hatchery (a) 7,000 Atlantic salmon. Fingerlings . Sept. 30—St. John river, at Kilburn ferry Adipose and right pectoral
(a) 5,000 a ... di Sept. 30—St. John river, at lower Perth it
(a) 5,000 a <‘ ... . Sept. 30—Salmon river, at Boat Landing a a (a) 5,000 a a ... a Sept. 19—Salmon river headwaters a a (a) 5,000 a .
.. . a Sept. 28—Hayley brook-Tobique river a ,<
(a) 5,000 it it l< Sept. 26—Tobique river, Millers bogan " a (a) 5,000 a " Sept. 29—Tobique river, at Plaster rock a a (a) 5,000 a a ... a Sept. 27—Tobique river, Waters bogan a "
2,000 Speckled trout di Sept. 29—Private pond, Power creek, Mr. Zeno Martin a a Miramichi hatchery 4,000 Atlantic salmon . it Aug. 19—Northwest Miramichi river Adipose and right ventral
2,000 a a ... a Aug. 11—Sevogle river-Northwest Miramichi river
5,500 a a ‘‘ Aug. 13, 22—Southwest Miramichi river a a
3,440 . It .. . " Aug. 23—Renoue river-Southwest Miramichi river
St. John hatchery 545 Rainbow trout. Yearlings. Sept. 30—Crooked creek Adipose and right ventral
719 a " .... Two years... Oct. 3, 5—Crooked creek • 12,000 Sebago salmon.... Fingerlings.. Sept. 24—Chamcook lake Anal
10,000 . if .. . . Yearlings.... Sept. 23—Chamcook lake Adipose and left pectoral
1,612 Ouananiche Two years Sept. 28—Chamcook lake Adipose and right pectoral
5,000 Speckled trout.... Fingerlings.. July 18—Red Rock lake Adipose and right ventral
2,700 a " .... Yearlings.... Dec. 7—Loch Lomond .
566 " ii . .
4t .... Dee. 7—Lilv lake-Rockwood Park a a
DE
PA
RT
ME
NT
O
F
FISH
ER
IES

Total
Prince Edward Island-Kelly's Pond hatchery....
CC
CC . .
de f! • . • .
1,000 267
9
24,316
191,002
Adipose and left pectoral
CC
Two xears..
Five years....
Fingerlings..
Dec. 7—Loch Lomond Dec. 7—Lily lake-Rockwood Park Dec. 7—Lily lake-Rockwood Park
Aug, 22, 23—Vessay brook-Winter river
(a) Restigouche stock.
The percentage of marked trout that have been reported from different districts varies greatly in relation to the number that were marked. In some districts the anglers and residents do not seem to be interested to a sufficient extent to go to the trouble of reporting the capture of marked fish to the department, or to the neare,st fishery officer.
The numbers of marked fish reported from 1935 to 1938, inclusive, are as follows:—
Zig‘
LSIN
IAT
211
11(1
3"a F
ILL
JO
‘L
2-10d
F2I

Where recaptured Number Species Date Distributed from Fins miSsing
Lake Edward dam, tributary to Gardener brook Gardener brook Whitehouse Mill—Salmon river Hick's Falls—Carleton river Lake Skinner Chan-mook lakes Kejimkujik lake Beaver lalco Ping Fong lake Campbell lake—River John Cooee Coffre lake Copper lake Donahue lake James River lake or McLean lake Long lake—East River St. Mary, Sherbrook lake Simon lake S uth River lake Stewart dam on tributary to Little Hax:bour West river Antigonish Harbour Chamcook lakes Copper lake Cutler lake Dobson lake Donahue lake.. Grant lake James River lake or McLean lake Long lake—East River St. Mary Sherbrook lake Simon lake South River lake Stewart dam on tributary to Little Harbour Trout lake Grand lake Hart lake Chamcook lakes Chamcook lakes Chameook lakes Ping Fong lake
Speckled trout
if
di
Sebago salmon Speckled trout.
(a) ‘‘
te
CC
CC
le
CC
et
• ee Sebago salmon ; Specicled trout
CC
di
fe
11
ef
41
IC
et
ee Sebago salmon Speckled trout Sebago salmon
CC
(a) Speckled trout.
April 19, 1936 Spring, 1936 April 25, 1930 Spring, 1936 Spring, 1936 Oct. 21-Nov. 13, 1936 April and May, 1937 April 1-May 31, 1937
Ce
Angling season, 1937 le
CC
CC
CC
de te
if If
fl it
ff
ft
it
Cf Ce
Oct. 23-Nov. 1, 1937 Angling season, 1938
et
te (C
If
if if
de
if
Ct IC
ef
et Cf
(1 (4
May-Sept., 1938 Oct. 19-Nov. 11, 1938 ,)une 3, 1938 Oct. 25-Nov. 16, 1938 Oct. 25, 26, 1938 May 30, 1938
Yarmouth hatchery ... ee ee ee ee ee
St. John hatchery Yarmouth hatchery ... St. ,John hatchery.. ee ee Antigonish hatchery
ee ee ee ee
ee ee ee
St. John hatchery.. . Antigonish hatchery .. ee
ee
CC;
CC
f C
et
Grand Lake ponds: .... Cobequid hatchery.... St. John hatchery ....
et et '
if it
(a)
ei
de
4/ if
di if
44 it
f f I<
tt f
20 several
8 several several
40 several
36 21 24
458 87
178 228
31 231
23 32
113 16
6 26
198 400 125 224
36 332
46 187 150 37
700 40 22 18
1 65 2 1
e t
de
Adipose and right ventral
if
if
ef 44
Adipose and right pectoral Adipose and right ventral Right pectoral
Adipose and right pectoral el
te tt
if
fi
CC fi
tt CI
it et
if
CC 4i
ft
if
CC
IC
it 41
If
i it f
if it
if
Adipose and right ventral Adipose Adipose and right pectoral ee Adipose and right ventral Right pectoral
ti
4'
RECAPTURES OF FISH WITH FINS MISSING
(a) Wild stock from Raiidon brook.

REPORT OF THE DEPUTY MINISTER 113
-• The 20 speckled trout listed under lake Edward were caught on April 19, 1936, in Gardener brook, one mile upstream from the point of liberation, five days later. The eight caught at Whitehouse Mill, Salmon river, were dis-tributed in lake Ellenwood and •wère caught three miles upstream from the point of distribution within a period of 10 clays. Those caught in Hick's falls, Carleton river, were distributed in lake Skinner in November, 1935, and had travelled downstream from ten to twelve miles before they were taken the following spring. Lake Skinner bas no outlet which these fish could ascend and this condition may ex-plain their movement downstream, which is the reverse of most recaptures.
With the exception of the sebago salmon caught on June 3, 1938, all the others listed were taken during egg collecting operations at the Chamcook lake,s. Three more marked sebagos were reported by anglers, and the suber-visor of fisheries for the district also reports that angling conditions were reasonably satisfactory and about 90 per cent of the fish taken bore the hatchery marks.
The Kejimkujik trout had travelled considerable distance from the point of liberation, 'crossed the lake, descended the Mersey river and were taken in the latter's tributaries.
The recaptures at Beaver and Ping Pong lakes afford additional proof that stunted races of speckled trout attain normal growth if they are transferred to a more suitable habitat where normal quantities of natural food are available.
The trout planted in these lakes came originally from Rairdon brook where they averaged 0-8 ounce in weight and five inches in length. They-were retained and fed at St. John hatchery for a year, increasing in weight to 3-7 ounces and in length to 9+ inches. They were then marked and distributed in Beaver and Ping Pong lakes. The 36 recapture,s in 1937 in' Beaver lake showed a good g-rowth ranging up to 11 inches in length. Two had descended to Mispec river and were taken 24 miles from point of liberation. Others were taken in the lake 1+ miles from point of liberation so that the maximum range of spread was 3..î- miles. The 21 recaptured in 1937 in Ping Pong lake ranged up to 12 inches in length and the largest was three-quarters of a pound in weight. One taken in 1938 weighed 154- ounces. This lake has no outlet and the fish are evenly distributed over its entire area.

- 114 DEPARTMENT OF FISHERIES
The recaptures of marked trout reported from the Antigonish area up to the close of the angling sea,son in 1938 represents 16-5 per cent of the number marked and distributed from that 'hatchery from 1935 to 1937 inclusive. The respective percentage recaptures of the marked fish distributed in the several lakes and streams in this district varies considerably, as shown in the following summary:—
Number
Water marked Number Percentage fish recaptured recaptured
distributed
Campbell lake—River John 900 24 2.7 Cooee Coffre lake 1,000 458 45.8 Copper lake 900 285 31.7 Cutler lake 500 400 80-0 Dobson lake 468 125 26 •7 Donahue lake 1,500 402 26-8 Grant lake 200 36 18.0 James River lake or McLean lake 1,000 560 56.0 Long lake—East river St. Mary 3,504 77 2.2 Sherbrook lake 1,700 418 24. 6 Simon lake , 690 173 25.1 South River lake 1,816 69 3-8 Stewart dam on tributary to Little harbour 1,625 813 50.0 Trout lake 200 40 20-0 West river 2,800 22 -8
Of the Cooee Coffre lake group caught in 1937 seventy-six were taken in Sand lake, 87 in Pan Handle lake, 16 in Cole Harbour river and the balance in the lake where they were distributed.
Of the Sherbrook Lake group caught during the angling season of 1937, twenty-five were taken in the lake outlet, one in St. Mary's river and a nuraber in Thud lake, three miles above Sherbrook lake. Those caught in 1938 were taken in the lake and in the outlet stream.
From those caught during the 'angling season of 1938 in the Dobson Lake group nineteen were taken one mile below the lake; in the Donahue Lake group twelve were taken one-quarter mile below the lake; in the McLean Lake group fourteen were taken below McLean lake; and in the Trout Lake group twenty were taken one-quarter to one-half mile below Trout lake—the balance in all cases being taken in the lakes where they were planted.
The eighteen marked trout from Hart lake were taken during egg-collecting operations and had been marked during a similar operation the previous year. The percentage recaptured in this instance was quite small, but angling had been carried on rather extensively during the intervening year.
The first distribution of marked Atlantic salmon from the Florenceville hatchery was made in 1935. These were from the spawning of 1933. Two salmon 3,vere reported with fins missing in June and July, 1938. The examina-tion of the scales showed two years of parr life and two years in the sea.

MIS
IN
IIII
Ad
Ild
ffe W
Hd d
O ‘
LU
Od
ffU
NOVE SCOTIA
ANTIGONISH HATCHERY
Atlantic salmon Rainbow trout Speckled trout
- Advanced
Fingerlings Fingerling" Year- Fingerlings ).'"ear- Two ' Three fry No. 1 No. 2 Ne ' 2 lings No. 1 No. 2 No. 3 No. 4 lings years years
1 Co- r Meadow river. 70,000 y brook 20,000 Y brook lake 200 r lake 30,000 300 )y river. 80,000 river. 40,000 25,000
,aie brook 15,000 nv Green river 75,000 in lake or James river
25,000 200 lake 25,000
1 brook-South river. ' 25,000 s river 40,000 25,000 river 40,000 9,304 073 195 river lake 55,000 lake 25,000 field brook-Glenr oy r 5,000 .iver 115,000 25,000 300 igh Co.- larbour lake 25,000 3,606 Coffre lake 40,000 300 ry Harbour river 80,000 70,000 lake 20,000
Ln lake 15,000 3,500 Lue lake 40,000 lake 10,000 Island lake 10,000 Secum river 39,000 raid lake 10,000 oro lake 10,000
■orough river 30,000 35,000 25,000 Hill lake 45,000 Harbour lake 30,000 lake 40,000
r lake 4,000 ake-Salmon river 20,000 ake-East river St. Mary 1,700 w lake 10.000
Antigonisl Beave Brierl, Brierl, Coppe Glenn James Maryi Meadc Mee:
lake North Polsor Right South South South Spring
rive. West
Guysborol Cole I Cooee Count,
Cutler Dobsc Donal Doyle Eight Ecum Fitzge Goldb Guysh Hazel Indian Jellow Lawlo Long 1 Long 11 Nano.

Guysborough ( Nickerson East River West Rivei Salmon riv Seal Herb( Sherbrook Square lak Smelt lake Tracadie ri
Pietou Co.- Barney riv Big brook-Brora. lake Calder lak Big Caribç Little Cari Chisholm Chisholm
Mary. Dewar dal East river French riv French riv Fraser's oi
Harbour Little Flar Maple lid« McLella.n I McDonald Middle rie Mountain :
river., Six Mile tn Stewart
Little H West bran , West river
ANTIGONISH HATCHERY-Concluded ,rsti
Atlantic minion Rainbow trout Speckled trout
Fingerlings Fingerlings Advanced Fingerling. Year- ' Year- Two Three
fry No. 1 No. 2 No. 2 lings No. 1 ' No. 2 No. 3 No. 4 lings years years
)o--Concluded lake 10,000 . St. Mary ' 125,000 250,000 r St. Mary ...... . . .. 125,000 ; 195,000 60,000 ..... .... .... ...... er ' 100,000 30,000 25,000 1
, iur lake . 10,000 lake 52,000 e. 20,000
24,694 ' 971 , iver 1 60,000 :
er 40,000 60,000 -East river.. ■ 20,000
- ...... ...., 50,000 .... ...... . ...... .... e 40,000 ni river 6,000 •bou river 18,000 lake-East river. 50,000 lake-West river St.
40,000 n-Barney river ' 10,000 250
50,000 er 55,000 er, branch 25,000 15,000 • Horse pond-Little
300 bour lake 50,000
.
10,000 brook 35,000 dam-East river 200
'or 20,000 Meadow pond-West
150 rook 42,000 lam tributary to arbour - 173 27'i ch brook 20,000 ' 90,000 50,000
45(Innn OR0.000 69.304 24.694 971 1,576,000 167,106 0,000 2,000 1,373 1,473 On
S'ff
lUff
lIS'
Ll 1
0LL
Nffi
lT‘
Lal
YclA
l
3,282,593 Total distribution

Atlantic Salmon
Advanced Fingerlings fry No. 1
Speckled trout
Advanced fry
Fingerlings No. 1
Experimental pond (Job's) Wittenberg Colchester Co.-
Otter brook Pembroke river Stewiacke river, south branch
Halifax Co.- Big Salmon river Brown lake-Musquodoboit river Chezzetcook river Conrod lake Governor brook-Nine Mile river Halfway river Little Sheldrake lake McGrath lake Moser river Musquodoboit river, upper Oyster ponds Upper Petpeswick-Long Bridge or Bridge End
lake Porter lake Quoddy river Sackville river Salmon river (Port Dufferin) Ship Harbour lake Taylor brook Little West river-Sheet Harbour West River Sheet Harbour
Hants Co.- Cameron lake
• Coxcomb lake Five Mile lake Kennetcook river
Lunenburg Co.- Corkum lake Gold river Middle river
• Mill lake-Canaan river Mill lake-Hubbard river
• Spectacle lake •Seffernsville lake Spondo lake brook
45,000
33,000
20,000 30,000 33,000
13,600 33,000 30,000
45,000 735,125 198,000 353,600
42,000
42,000
21,000
42,000
42,000 30,000
20,000 21,000 42,550 30,000 40,575 42,000 21,000 42,000
40,000 . •
133,000 84,000
33,000
33,000
33,000
33,000
33,000 33,000
2,000
33,000
33,000
30,000
33,000
30,000
REPORT OF THE DEPUTY MINISTER 117
BEDFORD HATCHERY
Total distribution 1,331,725

118 DEPARTMENT OF FISHERIES
COBEQUID ELA.TCHERY •
Atlantic salmon Speclded trout
_ F Advanced Finger- Fingerlings
ry lings fry No. 1 No. 1 No. 2 No. 3
Westmorland Co.- Chapman pond brook 7,500 Lac St. Emile 1,000 Little Shemogue river 7,500
Colchester Co.- Bass river, at Five Islands 15,000 Debert river 100,000 East river, at Five Islands 15,000 Economy river 120,000 40,000 Economy lake 15,000 Folly river 60,000 40,000 Folly lake 15,000 8,000 Gamble lake 10,000 Little Gamble lake 3,000 Great Village river 60,000 40,000 Hart lake 20,000 Irving lake 10,000 Long lake-French river 10,000 McCallum lake 10,000 Moose lake 5,000 Newton lake 15,000 North river, near Truro 110,000 Portapique river 60,000 40,000 Salmon river 60,000 105,000 Shatter lake 10,000 Silica lake or Bass River lake 15,000 Simpson lake 30,000 4,000 Truro Reservoir, Leper brook 8,000 Waughs river 10,000 Whirley Wha lake 10,000
Cumberland Co.- Amherst Pumping Station pond. 10,000 Black river 15,000 Blair lake 10,000 Currie pond 10,000 East river-Maccan river 10,000 Fountain lake 25,000 Fox river 5,000 French river 20,000 Gilbert lake 20,000 1,000 Gleason brook-Portapique river. 10,000 2,000 Halfway river lake 20,000 Harrison lake 8,168 Isaac lake 20,000 2,000 Little lake-Newfound lake 5,000 McAloney lake 15,000 1,000 Maccan river 60,000 50,000 20,000 Maccan river, south branch 20,000 2,000 Maccan river, west branch 20,000 Mountain brook 10,000 Newfound lake 20,000 2,000 Parrsboro Aboiteau 15,000 1,000 Polly brook 5,000 Pugwash river 20,000 Ramshead river 5,000 River Philip 60,000 135,000 303,600 8,000 River Philip, east branch 15,000 1,783 River Philip, west branch 15,000 Shinimikas river 100,000 Sugarloaf brook 15,000 Sutherland lake 10,000 7,000 Tidnish river 40,000 10,000 Tillie creek 5,000 5,000 Vickery lake 10,000 Wallace river 60,000 135,000 - 50,000 20,000 2,000 Wallace river, west branch 20,000
Pictou Co.- River John 15,000
180,000 820,000 848,600 590,000 130,168 21, 783
Total distribution 2,590,551

25,000 39,000 9,624
52,000 13, 000 39.000 13,000 24,000 26,000 12,000 24,000 12, 000 24,000 37,000
26,000 13,000 13,000
39,000 38,000
REPORT OF THE DEPUTY MINISTER 119
COLDBROOK REARING PONDS Speckled trout
Fingerlings Kings Co.- No. 4
Annapolis river 5,000 Aylesford lake 32,000 Canard iiver 3,000 Cornwallis river 5,500 Gaspereau lake 15,000 Habitant river 3,000 Hardwood lake 5,000 Kinsman •brook 500 Lake Paul 5.000 Lake Torment 20,000 Mack lake 2,000 Murphy lake 5,000 Nimchin Page lake 3,000 Parker brook 500 Thomas Clark brook 500 Trout river 3,000
108,000
Total distribution 108,000
GRAND LAKE REARING PONDS
Atlantic salmon
Fingerlings No. 3 Yearlings
Halifax Co.- Big Salmon river Chezzetcook river Grand lake Ingram river Musquodoboit river Nine Mile river Partridge run-Echo lake Quoddy river Sackville river
- Salmon river (Jeddore Harbour) Salmon river (Port Dufferin) Ship Harbour river Little West river-Sheet Harbour West river-Sheet Harbour
Hants Co.- Kennetcook river Pembroke river Stewiacke river
Lunenburg Co.- Gold river Middle river
5,500
2,000
6,807
1,500 3,500
4,000 5,500
28,807 478,624
Total distribution 507,431

Atlantic saLmon Fingerlings
Speckled trout Fingerlings
No. 1 No. 2 No. 3 No. 3 No. 4
Annapolis Co.- Cashman brook Little river Fairy lake Maitland river Mount Tom brook Roger brook West river
Queens Co.- Grafton lake Kejimkujik lake Medway river Menchan lake Mill pond--Medway river
20,000 33,000 42,000
3,000
20,000 33,000 42,000 3,000 66,628
3,000 9,000 3,000 3,000 6,000 6,000
12,000
2,128 15,000
4,000 3,500
fèri DEPARTMENT OF FISHERIES
KEJIMKUJIK REARING PONDS
Total distribution 164,628
LINDLOFF HATCHERY
Atlantic Rainbow
salmon trout Speckled trout
-- Fingerlings Fingerlings Fingerlings
No. 2 No. 2 No. 2 No. 3
Cape Breton Co.- Enon lake (via Munroe lake) 11,125 Gaspereau river 55,470 Lever lake 11,124 Salmon river 162,838
Richmond Co.- Black river 20,000 Ferguson lake 20,000 Grand river 200,898 Grand lake (Madame island) 30,000 Mary Ann's lake 3,000 McIsaac lake 20,000 Pottie lake (Madame island) 18,486 Saint Esprit lake 15,000 Seaview lake 18,000 Shaw lake (Madame island) 15,000 Thompson lake 5,000 Tillard river, east 20,000
, 419,206 22,249 151,000 33,486
Total distribution 625,941

MARGAREE HATCHERY
Atlantic salmon Speckled trout .
Two Three Pour Five - Ad- Fingerlings Fingerlings Year- years years years years
vanced linge fry No. 1 No, 2 No. 3 No. 4 No. 1 No. 2 No. 3 No. 4 No. 6
Cape Breton Co.- Bell lake 15,000 Black brook-Mira river 5,000 ' Brown lake 15,000 ' Canoe lake 10,000 10,000 Catalogne lake • 20,000 • Chain lakes-Mira river 10,000 10,000 . English lake 5,000 Ferguson lake 10,000 . Forester lake 10,000 10,000 Giovanetti lake 10,000 . Gillis lake 30,000 Grand lake-Indian bay 20,000 , . Hardy lake 20,000 Jackson lake ' 20,000 Redo lake 10,000 . McCormack lake 20,000 McDonald or Widow lake • 10,000 McInnes lake 10,000 McIntyre lake 15,000 McPherson lake 10,000 MeVicar lake ' 10,000 Meadow brook-Sydney river 20,000 Scotch or Scott lake 20,000 Stewart lake , 10,000 • Trout brook-Mira river 5,000
Dnlem lake (Boularderie island) 20,000 Inverness Co.-
Captain John's brook 5,000 Cheticam
river 150,000 35,000 p Flat brook ' 6,000 Gallant river 05,000 30,000 5,000 Gillis brook 20,000 Glen brook-River Denys 10,000 Graham river 0,000 Grand Etang brook ' 10,000 Horton lake 10,000 Little Judique river 5,000 . Northeast Mabou river 00,000 Southwest Mabou river 50 000 ' Northeast Margaree river-
Between Black Rock and Ward's pool 60,000
Big brook 90,000 7,000 ' Big Intercale bridge 200,000 65,000 30,000 4,050 Black Rock pool 50,000 30,000 Cranton bridge 160.000 4.000
RE
PO
RT
OF
T
HE
D
EP
UT
Y M
IN
ISTE
R

MARGAREE HATCFIERY-Continusd
Atlantic salmon Speckled trout
Two Three Four Five - Ad- Fingerlings Fingerlings Year- years years years years
vanced linge fry No. 1 No. 2 No. 3 No. 4 No. 1 No. 2 No. 3 No. 4 No. 5
,
Inverness Co-Conciuded Northeast Margaree river-C,onciuded
Doyle's bridge - 60,000 Egypt brook 90,000 3,000 Forest Glen brook 30,000 5,000 Hart pool 4,000 Hatchery or Ingram brook 20,000 , 5,200 102 274 Ingraham bridge 80,000 Island brooks 50,000 Lake O'Law brook 91,211 7,000
Lake O'Law 10,000 42.315 682 297 656 890 680 Fortune brook. 30,000 McKinnon brook 30,000
Lake O'Law, upper 10,000 26,000 200 Levis brook 77,289 5,000 McDaniel pool 50,000 . . MeDermid pool 100,000 McDonald brook 30,000 McLean pool 40,000 McLeod brook 30,000 Murphy brook 17,167. 3,000 Murray brook 30,000 3,000 Murray pool 30,000 20,000 Old bridge pool 24,000 Rock pool 30,000 8,000 Ross bridge 200,000 4,000 Stewart brook 8,000 Stewart brook, above 60,000 15,000 8,000 Stewart brook, below 100,000 8,000 Tingley crossing 100,000 30,000 Ward's pool 50,000 30,000 Watson brook 15,000
McColl brook 10,000 McDonnell brook-tributary to Mar-
garce Harbour 20,000 McPherson brook-River Denys 10,000 Mull river 75,000 Plaster pond 375 550 Plateau brook 30,000 Skye brook 20,000 Southwest Margaree river 100,000
Captain Allan's brook 50,000 McDonnell brook 50,000 McFarland's bridge 200,000 Matheson Glen brook 50,000 Salt brook 20,000
Cfr.+111 nrn a hrnnIr 40.000
Sg
laIN
IISLi J
O I
NZ
IVIZ
IVd
Fig

80,000
100,000
75,000
75,000
150,000
30,000
80,000
30,000
65,000
85,000 50,018
30,000
15,000
15,000
30,000
20,000
6,000 6,000
20,000 20,000
20,000
MERSEY RIVER POND Atlantic salmon
Fingerlings No. 3
Victoria Co.- Baddeck bay brook Baddeek river-
Farquar Angus or McDonald brook Forks Gillis brook North branch Peter brook
Barasois river Big Harbour brook Giffin lake Morrison lake Middle river
Beaver brook Cold brook Indian brook McDonald brook McLennan's bridge
North river Church river Tarbot lake
South Gut brook Washabuck river
1,360,000
Total distribution 4,978,131
045,000 255,000
75,000
190,000 88,850 1,208,585 205,000 259,000 230,000 155,100
3,675
682 599 1,305 1,440 680
RE
PO
RT
OF
THE
DE
PUT
Y M
INIS
TE
R
Queens Co.- Mersey river 34,100 Lower Great brook 11,300 Upper Great brook 19,200
Total distribution 64,600
I%) Cal

124. DEPARTMENT OF FISHERIES
MIDDLETON HATCHERY
Atlantic salmon Salmon trout Speckled trout Fingerlings
- Advanced F nggers - Fingerlings
No. 1 No. 2 No. 3 -fry No. 1 No. 1 No. 2 No. 3
Annapolis Co.- Annie Morehouse lake 10,000 Bailey lake 10.000 Bear river 20,000 Beaver lake-Bear river 10,000 Bogart lake • 10,000 Crisp brook 5,000 Elliott lake . 10,000 Fed lake 8,000 Foster lake 7,000 . Gibson lake 10,000 Lake Jolly 15,000 Lamb brook 10,000 Lequille river 50,000 Lily lake 6,000 3,000 Little river-Annapolis river 7,000 Long lake-Bear river 10,000 Long lake-North Mountain 10,000 Lower Sixty lake 10,000 McGill lake 15,000 10,000 Milford lake 25,000 Millbury lake 5,000 Morton brook 10,000 Nictaux river 1,350 10,000 North lake--Round Hill river. 10,000 Paradise lake 10,000 Parker brook 10,000 Rumsey lake 15,000 Round Hill river 45,000 Sand lake 11,000 Sandy Bottom lake 15,000 Shannon lake 20,000 • Simpson lake 10,000 Slocorab brook 5,000 Todd lake 10,000 - Trout lake 10,000 Walker lake 10,000 Waterloo lake 12,000 Young lake 5,000 Zwicker lake 10,000
Digby Co.- Barnes lake 10,000 Mallett lake 10,000 Porter or Mistake lake 8,000
Hants Co.- Avon river, south branch 20,000 Falls lake stillwater 10,000 Halfway river 6,275 Lebreau brook 5,000 Mockingigh lake 12,000 Murphy lake 10,000 Panuke lake 15,000 Zwicker lake 10,000
Rings Co.- Gaspereau river 15,000 7,000
Lunenburg Co.- Butler lake 10,000 Canoe lake, north • 7,000 Canoe lake, south 7,000 Card lake 25,000 Feener lake • 7,000 Franey lake 10,000 Gold river 50,000 45,000 Holbert lake 10,000 . Indian lake 10,000 Larlave river 50,000 Lake William 20,000 Lewis lake 10,000 Middle river 45,000 Petite river 45,000 Sherbrooke lake 120,000 174,575 Smith lake 8,000 Vaughan lake 10,000 Wentzell lake 7,000 West lake 8,000 Whetstone lake 15,000 Whitney lake 10,000 Wiles Stillwater-La Have river. 8,000
Queens Co.- Little Winford or Long lake-
Medway river 10,000 Maligeak lake 15,000 Medway river 90,000 Mersey river, headwaters 20,000
50,000 425,000 8,350 120,000 174,575 146,000 292,00 274,275
1,490,200 Total distribution

50,000
200,000
25,000
25,000 80,000
15,090
25,000
20,000
178,400
3,000
REPORT OF THE DEPUTY MINISTER
NICTAUX FALLS REARING STATION
Atlantic salmon
125
Advanced fry No. 1
Fingerlings
No. 3 No. 2
Annapolis Co.— Annapolis river Fales river Nictans, river
Hante Co— Avon river, 'west branch
Kings Co.— Cornwallis river Gaspereau river
Lunenburg Co.— LaHave river
Queens Co.— Medway river
80,000
80,000 275,000 145,000 201,400
Total distribution 701,400

DEPARTMENT OF FISHERIES
YARMOIITH
Atlantic Salmon
No. — _ - Advanced Fingerlings Year-
' Y Fry No. 1 No. 2 No. « 3 No. 4 No. 5 lings
Annapolis Co.— '
1 Whalen lake
Digby Co.—
2 Babine Meadows
3 Bear river, west branch
4 Belliveau Cove river
5 Boar Back lake
6 Carrying Road lake
7 Dean brook
8 Doucette brook
9 Grosses Coques river
10 Haines lake
11 Harris lake
12 Mallett lake
13 Meadow brook—Carleton river
14 Meteghan river, east branch
15 Meteghan river, west branch
16 Payson's Meadow
17 Porter or Mistake lake
18 Riviere a Margo-Meteghan river..
19 Salmon river 100,000 30,000 40,000 54,800 8,000
20 Salmon river, heaclwaters
21 Seven Pence Ha'Penny river
22 Silver river
23 Sissiboo river
24 Sullivan Flowage
25 Thibault lake
26 Wentworth lake
Kings Co.—
27 Sunken lake
Lunenburg Co.-
25 Blystner lake
29 Feener's brook 200
30 Wall lake
31 Wiles lake
Queens Co.—
32 Christopher brook
33 Fifteen Mile brook
34 Medway river 55,000 15,000 10,000 6,000
35 Medway river, headwaters
36 Mersey river 5,000
37 Tupper lake
Shelburne Co.—
38 Baker's Flats pond
39 Birchtown brook
40 Clyde river 120,000 50,000 34,000 6,000
41 Deception brook
42 East river
43 Lake George
44 Granite Village brook
45 Pugg lake
46 Tigney brook
Yarmouth Co.—
47 Argyle river
48 Burrell brook
49 Carleton river
50 Coldstream river
51 East branch—Tusket river
52 Ellenwood lake
53 Gardener brook
54 Little river—Tusket river
55 Big Meadow brook
56 Mood brook—Salmon river
57 Reynard bridge—Carleton river
58 Salmon river 75,000 35,000 15,000
59 Tedford lake
60 Tusket river
100.000 225,000 130,060 50,000 200 118,800 10,000 25,000
126

REPORT OF THE DEPUTY MINISTER
H_ATCHERY
Rainbow Trout Speckled Trout
Fingerlings Year- F Advanced Fingerlings Year- Two Three No ' No. 3 No. 4 linge
ry Fry No. 1 No. 3 No. 4 No. 5 line Years Yeare
5,000 1
25,000 2 5,000 3
25,000 4 42,000 s
3,000 6 25,000 7
15,000 8 25,000 9
2,500 10 2,600 11
2,500 12 20,000 7,000 13 50,000 1,000 14
50,000 15 20,000 16
3,000 17
10,000 1,700 18
19 25,000 20
3,000 21 35,000 22
4,000 23 13,000 24
2,000 25
20,000 26
5,000 27
4,0C)0 28
200 60 30 829 4,000 . 30
200 2,500 31
5,000 32
6,000 33
34 4,000 35
36
7,500 37
3,000 38 3,000 39
40 3,000 41 2,000 42 1,000 43 2,000 44
6,000 2,500 45 • 2,000 46
30,000 47 15,000 48
100,000 49
15,000 5,000 50 20,000 51
5,000 52 8,600 739 53
15,000 54 20,000 55 15,000 56
10,000 57
58 56,000 59
50,000 3,750 60
200 18,500 5,000 250,000 118,000 315,000 73,950 32,000 43,300 17,660 769 8
127
Total distribution 1,533,387

CO NEW BRUNSWICK
FLORENCEVILLE HATCHERY
Atlantic salmon Speckled trout
Fingerlings Ad- Fingerlings vanced Year- Three Five
No. 1 No. 2 >To. 3 iry No. 1 No. 2 No. 3 lings years years
New Brunswick Fish and Game Protective Association- Fredericton branch 500 250 Carleton branch 500
Carleton Co.i- Becaguimec river 135,000 34,442 Big Guisiguit river 30,000 201
Little Guisiguit river 20,000 30,000 201 Big Presquile river 75,000 36,000 Little Presquile river 24,000 20,000 Big Shiktahawk river 40,000 5,000 . Little Shiktahawk river 24,769 Bogan brook-Southwest Miramichi river 10,000 Bull creek-Saint John river 35,000 6,000 301
Burpee brook-Presquile river 6,000 Carr lake 10,000 Clearwater brook-Southwest Miramichi river 15,000 Colton brook-Shiktahawk river 5,000 Debec brook-Saint John river 6,000 Dingee brook-Saint John river 1,500 Elliot brdok-Southwest Miramichi river 25,000 Gallivan brook-Saint John river 7,000 10 1
Gibson creek, north branch-Saint John river 5,000 Hagerma4i brook-Saint John river 15,000 400
Hardwodd brook-Saint John river 6,000 300
McLearylbrook-Lakeville pond 15,000 10(
Mallory 1?rook-Saint John river 10,000
Maynes brook-Little Presquile river 15,000
Medmmekeag river 75,000 58,000 34,000 Mile brodk-Saint John river 1,000 Southweit Miramichi river, north branch 75,000 24,000 70,000 SouthweSt Miramichi river, south branch 75,000 60,000 36,000 Monquart river 60,000 5,000 Priest brhok-Monquart river 5,000
River deiChute 40,000 15(
sir,,nenn 1-,rnnle-SnlIthwAst, Mirfunichi river 10.000
't;1-1

250 240
180
600 360
180
York Co.- .. Artificial lake-Keswick river t. Brown lake
Conn brook-Shogomoc river Cranberry lake Cross creek-Nashwaak river Davidson lake Second Eel river lake Keswick river Kingsley brook-Nashwaaksis river Limekiln brook-Nashwaak river Long creek-Saint John river McBean brook-Nashwaak river McCullum brook-Nashwaak river Mactaquac river Manzer Mill stream-Nashwaak river Middle brook-Nashwaak river Nackawic river Nashwaak river Mashwaaksis river Pidgeon brook-Nashwaak river Pokiok river Risteen lake Shogomoc river. Skiff lake Taffa lake Tay creek Tinkettle brook-Nashwaak river
645,000
50,000
36,000
30,000
36,000 66,000
58,000
428,000
52,000
18,000
18,000 48,000
18,000
384,211 20,000
5,000
15,000 35,000 25,000
5,000 5,000 5,000
10,000 5,000
10,000 5,000
65,000 5,000
50,000 15,000 40,000
20,000 15,000 10,000
576,500 17,000 950
700 500
500 600
500
3,300
500
2,201 750
2,077,912
21W
ISIN
IN A
iLI
MA
T M
I d
O L
LUOM
I
Total distribution
2

_ 130 DEPARTMENT OF FISHERIES
GRAND FALLS HATCHERY
Atlantic salmon Speckled trout
Ad- Fingerlings Ad- Fingerlings
vanced Fry vanced
fry No. 1 No. 2 No. 3 fry No. 1 No. 2 No. 3
Salmon river-Victoria Co.- Salmon river (over 10 miles) 50,000 Salmon river flats 30,000 20,000 Salmon river, headwaters 15,000 84,000 Salmon river, mouth of 20,000 Salmon river, at Estey camp. 15,000 55,000 Salmon river, at Guimont lodge. 18,000 40,000 Salmon river, at Mignault lodge. 20,000 Salmon river, at Pow-er's camp.. 18,000 60,000 Aubin crossing 20,000 20,000 Big bogan 18,000 20,000 Boat Landing 35,000 18,681 Cote Mill 15,000 60,000 Covered bridge 18,000 40,000 Cyr flats 15,000 45,000 Danish Mill 15,000 Davis Mill 15,000 20,000 Iron bridge 25 , 000 Little Salmon river 45,000 35,000 Mersereau lake 5,000 Outlet brook 5,000 Sutherland brook 50,000 Watson flats 25,000
St. John river-Victoria Co.- Andover 20,000 Andover bar 40,000 Andover, lower 25,000 Andover, upper 20,000 Argossy 20,000 20,000 Aroostook 25,000 Aroostook bar 50,000 Aroostook Junction 20,000 Boutout brook 10,000 3,000
Cliff ordvale 15,000 Coronation 15,000 Costigan point 30,000 Dee point 25,000 Four Falls brook 15,000 7,00{ Gallagher flats 20,000 40,000 Hatchery brook, above falls 4,480
Hitchcock flats 25,000 35,000 Inman 15,000 lumen brook 5,000
Inman flats 55,000 • Kilburn ferry 25,000 15,000 20,000
Limestone 30,000 Lower Basin 20,000 15,000 McLaughlin flats 30,000 Morrill 25,000 75,000 15,722 Muniac river, mouth of 25,000 25,000 Muniao, UPPer 40,000 Ortonville 25,000 35,000 Perth 25,000 25,000 Perth, lower 25,000 50,000 35,000 20,000 Perth, upper 20,000 Pokiok brook 65,000 25,001
Sullivan flats 20,000 Undine 5,000 Watson flats 10,000 Tobique river (over 10 miles) 25,000 Tobique river, mouth of 35,000 Arthurette 15,000 Arthurette bridge 20,000 Bear brook 10,000 Grear flats 20,000 '
Haley brook 20,000 Millers 20,000 Millers bogan 20,000 Plaster Rock 20,000 Red Rapids 15,000 20,000 Riley brook 35,000 Two brooks 20,000 Waters bogan 20,000 111,./....... A...te,
20.000

REPORT OF THE DEPUTY MINISTER
GRAND FALLS HATCHERY-Continued
Atlantic salmon Speckled trout
- Ad- Fingerlings Ad- Fingerlings vanced Fry vanced
fry No. 1 No. 2 No. 3 fry No. 1 No. 2 No. 3
Madawaska Co.- Baker brook 35,000 Baker lake 80,000 Grand river 45,000
Beaver brook 10,000 Big Fork 25,000 Black brook 15,000 Harrison brook 7,000 Mud brook 10,000 Violette brook 12,000 Yellow brook 11,000
Green river 140,000 Iroquois river 80,000 37,00f Ledges pond 10,000 10,000 Little river 25,000 15,000 20,008
Michaud rocks 30,098 Nine Mile brook 20,008 Private pond, Power creek, Mr
Zeno Martin 2,001 Quisibis river 60,000 Siegas river 45,000 Trout river 125,000 25,008 Unique lake 80,000 50,008
Lake Rond, Temiscouata Co., Que. 10,001
75,000 1,137,000 825,000 408,403 20,000 85,000 30,000 715,000 388,48E
Total distribution 3,663,889
131
87275-9i

132 DEPARTMENT OF FISHERIES
MIRAMICHI HATCHERY
Atlantic salmon Speclded trout -
Ad.- Fingerlings Ad- Fingerlings year-
vanced vanced
Fry No. 1 No. 2 Fry No. 1 No. 2 No. 3 lings
Black river-Kent Co 3,000 Black river-Northumberland Co 5,000 2,566 41 Buctouehe river 4,000 500 Burnt Church river 5,000 Caraquet river 5,000 Cocagne river 4,000 500 Elmtree river 5,000 Grand AMouane river 4,000 Green brook-Bartibog river 5,000 Kowhibouguac river 4,000 500
McGinnis brook 4,000 500 Little river-Nipisiguit bay 5,000 Little Southwest Miraraichi river.. 450,000 392,000 50,000 • McKee Mills river 4,000 500 Middle river 39,000 Millstream-Nquateut bay 5,000 Nappan river 5,000 Nigadu river 5,000 Northwest Miramichi river 1,035,000 64,000 125,000
Millstream 101,000 Sevogje river 200,000 Stewart brook 23,350 Trout brook 32,000
Pabineau lake 4,000 Pokemouche river 5,000 Richibucto river, Coal branch.. 4,000 500 River dus Caches 5,000 St. Nicholas river 4,000 500 Salmon river 4,000 500 Scoudouc river 3,800 Southwest Miramichi river 178,500 100,000
Barnaby river 101,000 Cain river 90,000 172,900 Renoue river 101,000 45,000 50,000
Dungarvon river 56,000 82,500 Taxis river 85,200
Fabusintac river 49,000 74,500 Eskedelloc brook 5,000
retagouche river 45,000 72,000 Fracaclie river 5,000 Little Tracaclie river 5,000
2,067,000 1,198,600 548,350 40,000 66,000 14,800 2,566 41
Total distribution 3,937,357

69,801 4,000 29,788 2,501,668
Atlantic salmon Fingerlings
No. 1
Speckled trout
No. 2 Fry Fingerling,s No. 1
Charlo river, north branch Christopher brook
Black brook Eel river Jacquet river Loch Lomond Middle river Nipisiguit river Restigouche river
Kedgreick river Little Main river
• Matapedia river Upsalquitch river
Walker brook
90,000
50,000 352,496 767,477 160,096 138,569 543,030 400,000
23,801 18, 000 5,000
18,000
29,788
4,000
5, 000
REPORT OF THE DEPUTY - MINISTER
RESTIGOTJCHE HATCHERY
Total distribution 2,605,257
133

DEPARTMENT OF FISHERIES
ST. JOHN
Atlantic salmon Brown Sebago salmon No. — trout
Ad- Fingerlings hybrid Finger- Year- vanced yearlings lings lings
fry No. 1 No. 3 No. 3
1 Atlantic Biological Station, St. Andrews, New , Brunswick
Albert Co.— 2 Crooked creek 3 Little river 4 Mechanic lake 5 Point Wolfe river 6 Pollett river 7 Prosser brook-Little river 8 Sodom lake 9 Turtle creek-Petitcodiac river
10 West river Charlotte Co.—
11 Bartlett brook 12 Burns brook-Digdeguash river 13 Chamcook lake 42,239 26,320 14 Clarence stream-Magaguadavic river 15 Craig brook-Digdeguash river 16 Digdeguash river 17 Disappointment or Mistake lake 18 Doak brook-St. Croix river 19 Duck lake 20 Big Eel brook 21 Little Eel brook 22 Gibson lake 23 Green Brown brook-Kanus river 24 Half Moon lake 25 Kerr lake 26 Lake Utopia 27 Lepreau river 28 Linton stream-Magaguadavic river 100,000 29 McClary brook-St. Croix river 30 McDougall lake 31 Magaguadavic river 200,000 32 Murchie brook-St. Croix river 33 New river 34 Red Rock lake 35 St. Patrick lake 36 Seal Cove brook 37 Stein lake 38 Welch lake
Kent Co.- 38 Molus river
Kings Co.— 40 Anagance river 41 Ben lake 42 Chisholm lake 43 Hammond river 44 Hatfield brook-Belleisle river 45 Jack lake 46 Kennebecasis river, headwaters 47 Kennebecasis river, south branch 48 McLeod brook 49 Pichette lake 50 Price brook 51 Ray lake 52 Robinhood lalce 53 Salt Springs brook-Hammond river 54 Smith creek-Kennebecasis river 55 Studholm brook or Millstream 56 Trout creek-Kennebecasis river 100,000 57 'Wetmore dam-Kennebecasis river
Queens Co.— 58 Canaan river, north forks 59 Lake stream waters-Salmon river 60 Salmon river 75,000 61 Snowshoe lake
St. John Co.— 62 Beaver brook-Mispek river.. 63 Big Salmon river 70,000 64 Black lake 65 Black river 100,000 17,112 1,512 66 Boaz lake 67 Brandy brook-Mispek river 68 Dolan lake 69 Eagle lake 70 Germain brook-Hammond river 71 Graham lake 72 Grassy lake 73 Hanford brook 74 Hanson river 75 Henry lake 75 lionav lake
134

1
4 5 6 7 8 9 0 1 2 3 4 5 6 7
O
2
4 5 6 7 8 9 6 1 2
5
135 REPORT OF THE DEPUTY MINISTER
HATCHERY
Ouana- Rainbow trout Speckled trout
niche No.
Two Year- Two Ad- Fingerlings Year- Two Five . , ced
"ars 'jugs Years 2rY 1% No. 1 No. 2 No. 4 Hags years years
11,500 1
545 719 2
5,000 3
1,500 4
5,000 5
10,000 6
5,000 7
5,000 8
5,000 9
10,000 10
10,000 11
5,000 12
1,612 12 15,000 10,000 14
10,000 15 25,000 16 20,000 17
5,000 16
750 15
2,000 2(
2,000 21
5,000 21
5,000 21
750 21
5,000 21 30,000 5,000 21
10,000 21 2!
5,000 2!
10,000 31 3:
5,000 3:
10,000 3:
5,000 3.
5,000 3i
2,000 31
10,000 3'
5,000 31
10,000 3'
10,000 4.
500 4 10,000 4
25,000 4.
500 4
500 4
10,000 4
10,000 4
1,000 4 10,000 4
5,000 5
5,000 5
5,000 5
500 5
10,000 5
5,000 5 5
15,000 5
5,000 t
5,000 t E
3,000 E
3,000 E E
5,000 1 1
1,000 1
4,000 1
5,000 1
1,000 1 10,000 1
2,000 1
3,000 1 10,000 1
10,000 1 15,000
.
3,000 .
1
a 5
8

136 DEPARTMENT OF FISHERIES .
ST. JOHN HATCHERY
Atlantic salmon Brown Sebago salmon No. — trout
Ad- Fingerlings hybrid Finger- -,
vanced yearlings lings li - fry No. 1 No. 3 No. 3 m„e8
77 Himter lake 78 Lily lake-Rockwood Park 79 Little river 1,885 80 Loch Lomond 81 Loch Lomond, third lake 82 McDonald lake 83 Milligan lake 84 Moose creek 85 Musquash river, west branch 86 Sadler lake 87 Southern lake 88 Stephenson's brook pond-Loch Lomond 89 Stoker brook-Mispek river 90 Treadwell lake 91 Tyne Mouth creek 75,000 92 Wilmot brook-Loch Lomond
Sunbury Co.— 93 Brisley brook 94 Burpee brook-French lake 95 Mersereau brook 96 Oromocto river 75,000 97 Otter brook 98 Rockwell stream 99 Shin creek
100 Three Tree creek Westmorland Co.—
101 Hayward brook-Anagance river 102 Memramcook river 103 North river 104 Petitcodiac river 100,000 105 Tait brook-Memramcook river
York Co.— 106 Baker brook 107 Davis brook-Magaguadave river 108 Lake George 109 Harvey lake 110 Little McAdam streara Ill Magaguadavic river 112 Mink lake 113 Mink stream 114 Trout brook, upper 115 Spring brook (James VaiD-Magaguadavic river. 10,000 116 Spring brook (Lemuel Vail)-Magaguadavic river
275,000 647,112 1,512 1,885 42,239 26,320
Total distribution • 1 715,236

REPORT OF THE DEPUTY MINISTER
--Continued
Chum.- Rainbow trout Speckled trout
niche
Two Year- Two Ad- Fingerlings Year- Two Flve 1‘113.
years Fry vanced Hugs years line years years fry No.1 No.2 No.4
2,000 77
2,000 566 267 9 78
79
10,000 500 2,700 1,000 80
4,000 81
1,000 82
10,000 83 20,000 10,000 84
750 85
1,000 86
10,000 87
5,000 88
3,000 89 10,000 90
91
10,000 1,000 92
5,000 93
5,000 94
5,000 95
96
10,000 97
5,000 98
10,000 99
10,000 100 -
5,000 101
4,000 102
10,000 103
104
5,000 105
5,000 106
3,000 107
6,000 108
9,000 109
3,000 110
3,000 111
3,000 112
3,000 113
3,000 114
115
3,000 116
1,612 545 719 35,000 195,000 471,500 3,500 8,750 3,266 1,267 9
137
87275--10

DEPARTMENT OF FISHERIES
PRINCE EDWARD ISLAND
CARDIGAN REARING PONDS
Rainbow trout Speckled trout - Fingerlings Fingerlings
No. 2 No. 3 No. 4 No. 3 No. 4
Kings Co.- Bear river 5,000
. Big brook-Fortune river 10,000 Big pond 10,000 Brudenell river 5,000 Coogan stream-Morell river 10,000 Crane's pond-Morell river 5,000 Dingwell stream-Fortune river 6,000 Fitzpatrick's pond-Seal river 5,000 Goose river 3,000 Hay river 5,000 Head of Cardigan river 770 Leslie's pond-Souris river 1,000 McAuley brook-Morell river 3,000 McCaskil river 3,000 McDonald's pond-North lake 3,000 McInnis pond-Souris river 3,000 McKinnon strearn-Morell river 5,000 McLeod's pond-Midgell river 5,000 McPherson's pond-Montague river 5,000 McRae's pond-Montague river 5,000 Molyneaux pond-Sturgeon river 5,000 Montague Electric pond 6,000 Montague river 5,000 Mooney's pond-Morell river 5,000 Munn brook-Brudenell river 2,000 North lake 5,000 Poole's pond-Montague river 3,000 Priest pond 3,000 Quigley's pond 5,000 Webster's pond-Marie river 5,000
Prince Co.- Bain creek 5,000 Barbara Weit river 2,000 Barlow pond-Grand river 3,000 Beaton stream-Percival river 4,000 Bell's stream (Cape Traverse) 3,000 Brae river 4,000 Conroy's pond 5,000 Currie's pond-Little Piurre Jacques river 4,500 Doyle stream 5,000 Dunk river 8,000 Gard's pond-Mill river 4,500 Gordon's pond-Kildare river 5,000 Playwood's pond-Tignish river 5,000 Kane's stream-Mill river 5,000 Leard's pond-Trout river tributary to Lot 10
river 4,500 McArthur's pond-Fœdey river 4,000 McAusland's pond-Mill river 5,000 McWilliam's pond-Big Pierre Jacques river. 4,500 Marchbank's pond-Tyne river 3,000 Rix's pond-Kildare river 5,000 Round pond 5,000 Sheep river 5,000 Tuplin's pond-Indian river 5,000 Wilmot river 4,000 Wright Leard's pond-Dunk river 5,000
Queens Co.- Ballem stream 3,000 Beer's pond-Clyde river 5,000 Belle river 6,000 Black river 3,000 Brander's pond 4,000 Cousin's pond 5,000 Crooked creek 5,000 Dixon's pond-Sable river 6,000 Glenfuman lake 23,000 36,490 Holmes' pond-Sable river 3,000 Hope river 6,000 Lake Verde 4,000 Lanes brook-Vernon river 2,000
138

Rainbow trout Fingerlings
Speckled trout Fingerlings
No. 2 No. 3 No. 4 No. 3 No. 4
Queens Co.-Concluded Leard's pond-Pisquid river McLeod's pond-Belle river McLeod's pond-Murray river McPherson's pond-Flat river McPherson's pond-Pinette river Parson's pond-Glynde river Pisquid or O'Keefes lake Rackham's pond-Wheatley river Simpson's pond-Hope river Stevenson's Pond West river
12,000 15,000 6,000
12,000 38,000 42,490 209,500 160,770
8,000
6,000 6,000 8,000
6,000 5,000 5,000 7,500
2000, 5,000
5,000
REPORT OF THE DEPUTY MINISTER
CARDIGAN REARING PONDS-Continued
Total distribution 462,760
KELLY'S POND HATCHERY
Atlantic salmon Speckled troat
Ad- Finger- Ad- Fingerlings vanced lings vanced
fry No. 1 fry No. 1 No. 3
Kings Co.- Big pond 10,000 Coogan stream-Morell river 10,000 Goose river 10,000 Hooper's pond 10,000 Leard's, below Mills-Morell river 56,400 53,200 McKinnon brook-Morell river 10,000 Mooney's bridge-Morell river 53,200 Morell river 226,080 Naufrage river 53,000 Quigley's stream-St. Peters bay 34,920 Quigley's pond 7,823 Red bridge-Morell river 53,000 Schooner pond 53,200 Warren's pond-Head of East river 10,000
Prince Co.- . Dunk river 18,000 Tryon river 9,600
Queens Co.- Andrews pond-East river 6,852 Callaghan's pond-East river 10,000 Clark's stream-East river 10,000 Coles pond-North river 7,260 Crapaud river 9,600 Gates pond-North river 7,260 Graham's pond-Hunter river 5,000 FIardy's pond-Wint,er river 10,000 Pleasant Grove-Winter river 9,860 Raekham's pond-Wheatley river 5,000 Vessey brook-Winter river 24,31( Winter river 7,369
56,400 526,600 28,000 155,624 24,31(
Total distribution 790,940
139
BRITISH COLUMBIA
ANDERSON LAKE HATCHERY
Hillier creek-Maggie lake.. .. Total distribution.. ..
87275-10à
Sockeye salmon Eyed eggs
1,033,359 1,033.359

DEPARTMENT OF FISHERIES
APPENDIX No. 3
ENGINEERING BRANCH
REPORT BY CHARLES BRUCE, A.M.E.I.C., CHIEF ENGINEER
The Engineering Branch is responsible for all works of a technical nature which come under the department in the Maritime Provinces and British Colum-bia where the fisheries are administered by the federal government, and the branch also undertakes the design and supervision of construction of bait freezers and of fishways which may be built by the owners of dams under the require-ments of the Fisheries Act.
When such action is requested, the branch assists and co-operates with fish and game associations by conducting surveys and providing designs for the establishment by them of hatcheries and rearing ponds. It is also responsible for the administration, under the deputy minister, of leasing of areas for oyster farming in the Maritime Provinces and furnishes technical advice to the Fisheries Research Board in matters of an engineering nature.
All work of the branch in British Columbia is undertaken under the direct supervision of Resident Engineer John McHugh, with headquarters at Van-couver, B.C.
BUILDING FISHWAYS AND CLEARING RIVERS
Due in some measure to almost continuous high water conditions' no serious
obstructions to the ascent of fish in Maritime Province streams required attention during the open water season of 1938.
The abandonment of artificial fish cultural work for the propagation of salmon in Pacific Coast waters has caused attention to be focused more than ever on the preservation, improvement and development of natural spawning grounds which lie in the great numbers of streams draining the British Columbia coast line and are in many instances located at places difficult of access.
Works in this regard involve the removal of obstructions to the ascent of fish which may have accumulated as a result of land slides, forest rubbish which is carried down the streams during freshets, large trees growing along the 'banks which may be undermined by high water and fall into the streams, and in some instances materials either placed or carried into the streams as a result of logging operations. Wherever possible such operations are closely watched and the loggers are required to remedy the conditions they bring about, but it is quite possible that the damage may not occur until long after they have removed from the locality.
Continual attention is given to the extension of spawning areas by the improvement of conditions for ascending fish past natural barriers such as falls and rapids, thus affording access to new spawning grounds which were not previously available. It is necessary before such work is undertaken to explore the stream bed above the barrier to determine whether suitable gravel beds exist of sufficient extent to give returns commensurate of the contemplated improvements.
Following is a detailed statement of works coming under this heading, during the year 1938.
190

141 REPORT OF THE DEPUTY MINISTER
NOVA SCOTIA
Tusket River, Yarmouth County.—Adjustments were made to the fishway in the power dam and a complete instrumental survey was completed from svhieh designs for a proposed alternative fishway at the generating station were prepared.
Salmon River, Yarmouth County.—Inspection of several dams for the purpose of determining if fishways should be installed. As the lower dams on the river are opened up in the spring, it was decided that conditions for the ascent of fish were satisfactory.
Medway River, Queens County.—Inspection of the conditions for the ascent of salmon at South Brookfield and a survey of the power canal at Charleston to provide a means for descending fish.
Petite Riviere, Lunenburg County.—Interview with the town authorities of Bridgewater in connection with the provision of a fishway in a dam which they propose to build, for hydro-electric purposes, on this river and inspection of the site.
LaHave River, liunenburg County.—Inspection, survey and estimate for repairs to the fishway in the Wentzell Lake dam.
East River, Lunenburg County.—The river bed below a small power development was channelled to confine the flow of water and thus improve conditions for the ascent of salmon.
Branch Brook, Lunenburg County.—Several years ago a number of obstruc-tions were removed from the lower reaches of this stream and, as this had resulted in an appreciable increase in the numbers of fish which ascended, it was considered desirable to continue the work throughout the upper reaches of the stream.
Nictaux River, Annapolis County.—As large numbers of salmon smolt were being destroyed in passing through the turbines of the Nictaux Falls power development, a rack and sluice to divert them to the river were installed.
Gaspereau River, Kings County.—Large numbers of young gaspereau were destroyed, during the previous year, in passing through the turbines of the Black River power development which operates partly with water furnished through a diversion canal from the Gaspereau river. As a possible means of overcoming this harmful condition, the river was blocked to prevent the parent fish from ascending to the lakes from which the canal runs. While the fish spawned in the head pond of the Whiterock power development, examinations indicated that the returns were not likely to be satisfactory. It was accordingly deemed desirable to provide a method of screening the canal, if this were at all practicable, and again permit the parent fish to ascend to their natural spawning grounds in the lakes. An instrumental survey of a proposed location for screens was completed but the operating company is convinced that the maintenance of such screens would not be feasible. Further attention will be given the matter during the coming season when it is hoped that a satisfactory solution may be reached.
Mersey River, Queens County.—The fishway for the Nova Scotia Power Commission's new development on the Mersey river at Cowie falls, designs for which were made by the Engineering Branch during the previous year, waS completed by the commission during 1938. The dam at this plant is over forty feet high and the fishway has proved efficient for the ascent of salmon.
Tangier River, Halifax County.—A further inspection and survey were made in connection with the provision of a means for the ascent of fish past the power

142 DEPARTMENT OF FISHERIES
dam on this river. The mining company which owns the dam .has been inactive for the past two or three years and the dam has fallen into such a poor state of repair that a fishway would not be feasible. The trustees of the company requested that action to have an opening made in the dam be deferred until the prospects of a sale of the property were determined and this was acceded to.
Ingrams Brook, Inverness County.—Information was obtained and designs prepared for a fishway in the dam on this stream, which affords_a water supply for the Margaree hatchery.
North River, Victoria County.—Four situations on this river, where falls make it difficult for salmon to ascend, were surveyed and plans of remedial works were prepared. The work will be undertaken during the coming year.
Osier River, Halifax County.—An inspection of the situation at a dam where the owner had been required to install a fishway was made, and modifi-cations to the prescribed fishway were agreed upon with the owner.
NEW BRUNSWICK
At the request of the State of Maine Fish and Game association, an engineer inspected a fishway .at the Arostook River power development, and advised the association regarding repairs and modifications to make this fishway effective.
A request from this association that the possibilities of providing a means for the ascent of salmon over Grand falls on the St. John river be looked into was also met by a general inspection of the situation. The total fall at this point is over eighty feet and it is questionable, even if an efficient fishway could be provided, whether the returns would be commensurate with the cost of construction.
Inspections were also made of the dam on the Meduxenekeag river at Wood-stock, of the Robertson Lake dam and of the old stone dam near the mouth of the Mispec River.
BRITISH COLUMBIA
Obstructions consisting of logs, roots and debris washed or carried into the stream beds by freshets, which effectively barred the passage of salmon to their spawning grounds were removed from the following streams:—Atnarko river, Blood creek, Brown creek, Chicken creek, Clark creek, Coal creek, Cooks creek, Dena river, Elk creek, Gates creek, Grassy Bay creek, Hobarton river, Johnstone river, Lawson creek, Nameless river, Nanaimo river, Open Bay creek, Salmon river, Springer creek, Stark creek, Stowe creek, Sucker creek, Vine river, Waterloo creek.
In addition, minor obstructions were removed at various places by the local fishery officers and boat crews in the course of their inspection or patrol duties.
Sedgewick Bay Creek.—A low fall, which proved a barrier to ascending fish, was overcome by partly breaking it down and by introducing a step, by placing and anchoring a large log across the stream bed, from bank to bank.
Maggie River Fishway.—Work on this fishway which had not been completed in the previous year was continued. Two cross walls which had .been damaged were repaired and a relief pass, together with a by-pass, both at the head of the falls, were opened up. Maggie river is subject to extreme freshets, and it will probably be found necessary ,after further study to provide gates in the two relief channels to permit of regulating the flow through the fishway under the various water conditions that obtain.
During the past year 235 coho salmon were counted through this fishway, and it is possible that larger numbers passed through, as their movements could not be observed owing to the deluge of spray enveloping the entire falls

REPORT OF THE DEPUTY MINISTER 143
during high water stages. It is hoped that further examination and study of additional requirements at this situation can be made during the coming year.
Ingram River Fishway.—Following a decision to proceed with a fishway over the falls at the mouth of this river, which drains into Ellerslie channel, an examination was made to complete data for the preparation of the necessary plans and specifications. Due to the lateness of the season when this was completed and the isolated location of the work, it was considered desirable to postpone the 'actual construction until the coming suramer.
Stamp Falls Fishway.—The flow of water leading to this fishway has during the past few years become restricted because of the outer rock walls crumbling away and allowing some of the water to escape before reaching the inlet to the fishway. Particularly at low stages, this shortage of water was gradually rendering the fishway ineffective. Three distinct gaps totalling 100 feet in length, through which water escaped, were closed with concrete walls suitably reinforced and anchored, and it was found on their completion the flow through the fishway was increased three times. The fishway is now functioning satisfactorily.
Puntledge River Fishway.—The District Engineer of Public Works at New Westminster collaborated with an engineer of this branch with a view to a solution of the problem of providing an efficient fishway in the impounding dam on that river. An inspection of the situation was made and the difficulties that have been experienced discussed on the ground. This matter is still receiving attention.
Great Central Lake Fishway.—An inspection was made of the conditions at this fishway, where, due to waste through the dam, the flow through it is restricted. Remedial measures which would involve considerable expense were suggested, but the logging company which operates this dam did not feel in a position to carry them out. The company has given assurance that it will take the necessary action to insure un adequate flow through the fishway by more temporary means.
Lang or Wolfshonn Creek Fishway.—At the request of the Provincial Game Commission, an engineer of the branch inspected the situation at this creek, where a diversion weir was obstructing the movement of trout between Duck and Haslam lakes. After procuring the necessary data, a design and specification for a fishway were prepared, which it is expected will largely solve their problem.
Examinations were also made, and reports with estimates prepared covering the removal of obstructions in Captains Cove, Twin, Pierre and Tachek creeks, the latter three being tributary to Babine lake on the Skeena River system, and an engineer attended two public hearings arranged by the Provincial Lands Department in connection with objections by the local residents of Roberts creek to the baoming of logs on the foreshore adjoining this summer resort. The conclusion in this matter was that salmon would be properly protected under the provisions of the Fisheries Act and that the objection to booming was not one for consideration by the department.
FISH CULTURAL ESTABLISHMENTS
In addition to the usual repairs and upkeep of the various establishments the following works were undertaken:—
NOVA SCOTIA
Alntigonish Hatchery.—Due to extensions in the rearing pond facilities at this hatchery and the probability that a sub-hatchery would be established

144 DEPARTMENT OF FISHERIES
there in the near future, it was necessary to increase the water supply from the dam on South river. A survey was made and a 20-inch wood stave pipe line some 1,100 feet long, with connections to the various rearing and brood ponds, was laid and repairs to the existing 20-inch pipe line were completed.
' Lind loff Hatehery.—Following the decision to establish a permanent hatch-ery to replace the existing sub-hatchery at this place, plans and specifications for a hatchery building and dwelling were prepared. The hatchery measures 25 feet by 65 feet with an ell 10 feet 10 inches by 15 feet 8 inches, providing a hatching room 25 feet by 52 feet 5 inches, office, feed room, coal room and storage space in the entire attic. The hatching room is equipped with a supply trough and thirty hatching troughs each 16 feet long, 101 inches wide and 61 inches deep. The water supply is brought into the hatchery by a 6-inch wood stave pipe from the flume which supplies the rearing ponds at this establishment. The dwelling measures 30 feet square one and one-half story, with full basement, living room, dining room, kitchen, bathroom, four bedrooms and summer kitchen. An electric lighting plant provides lighting for both buildings with an extension to the garage and icehouse, and the domestic water supply for the dwelling is furnished by an electric pump and automatic pressure system and a septic tank provides for the disposal of sewage. The buildings were erected by contract under the supervision of the Engineering Branch.
Grand Lake Rearing Ponds.—A dwelling similar to that described for the Lindloff hatchery was built at this establishment by contract under engineering supervision. Electric power was available and the building is wired for lighting. The domestic water supply is obtained from a well with an electrically operated pump, and a septic tank affords disposal for sewage.
Mersey River Rearing Ponds.—Instrumental surveys were made for the establishment of a rearing pond system on the Mersey river, covering three possible sites: Lower Great brook, a site at No. 2 Power Development and one at No. 3 Power Development; plans and estimates of construction costs were prepared.
River Phillip Salmon Pond.—A complete survey of the facilities at this pond was made, including the establishment of boundaries of land which the department would require, provided it is decided to continue operations at this point.
General Inspections.—General inspections were made at Bedford hatchery, Cobequid hatchery, Coldbrook rearing ponds and Kejimkujik rearing ponds, and in Prince Edward Island the Cardigan rearing ponds were inspected and report on additional work to be done there submitted.
NEW BRUNSWICK
Charlo Hatchery.—Complete plans and specifications for a hatchery estab-lishment on the South branch of the Charlo river were prepared and the con-struction of the buildings was completed by contract under engineering super-vision. These include a dvvelling, similar to that described for the Lindloff hatchery in Nova Scotia, a main hatchery building, a sub-hatchery building and another building.
The main hatchery, which measures 37 feet 8 inches by 63 feet, contains the hatching room, measuring 37 feet 8 inches by 51 feet 2 inches, office, coal room
' toilet and storage space. The hatching room is fitted with sixteen con-
crete floor troughs each 20 feet 6 inches long, 2 feet wide and from 9 to 12 inches deep, and forty hatching troughs 20 feet long, 104- inches wide and 61 inches . deep.

REPORT OF THE DEPUTY MINISTER
The sub-hatchery, which measures 28 feet 8 inches by 68 feet 6 inches, contains a hatching room, measuring 28 feet 8 inches by 61 feet 5 inches, work-room, coal room and storage space. A gravel floor with plank walks in the passages between the troughs is provided in the hatching room with the purpose in view of installing concrete floor tanks if these are required at any future time. The room is equipped with twenty hatching troughs each 20 feet long, 201 inches wide and 10 inches deep.
The additional building, which measures 21 feet by 65 feet, contains a double garage, work room, feed room, icehouse, and a cold storage room for holding fish food, in which ice and salt is used for refrigeration. The electric lighting plant for all the buildings is installed in the work room, and power for operating a food grinder, used in preparing fish food, is also obtained from this plant.
In addition to the work completed by contract, as above outlined, the department undertook the installation of the water supply under the direct supervision of an engineer. This included the construction of a concrete dam and headworks at the crest of Charlo falls and laying approximately 1,800 feet of 18-inch diameter wood sta-ve pipe, with connections to the hatchery buildings and for rearing ponds which will be constructed as the needs of the plant demand. For a considerable distance the pipe line runs along a steep side hill which necessitated benching and blasting and for distances of 75 and 235 feet, respect-ively, where the ground surface was much below the gradient line, it is carried on trestle work. Considerable work was also done in clearing wooded land on the site where rearing ponds will be built, and this area was cleaned of all roots and the main drains for the future construction of ponds were installed.
This hatchery replaces the old Restigouche hatchery at Flatlands, N.B., and was placed in operation during the year.
FISHERIES RESEARCH BOARD
Survey of Upper Skeena Watershed.—An engineer accompanied Doctors Clements and Pritchard in an examination of the spawning grounds in the upper waters of this river for the purpose of considering the possibility of construction counting fences for salmon in the various tributaries which included the Lakelse system, Babine, Bulkley, Morice, Kispior, Telkwa, Copper and Kitsumgalum rivers. A great deal of information regarding conditions on these rivers was assembled, which will be of value both from the standpoints of feasibility and cost, should it later be decided to proceed with such works.
Cowichoen Lake Rearing Ponds.—Six new rearing ponds were constructed at Cowichan Lake hatchery which is operated by the Fisheries Research Board. The ponds each measure forty feet long, six feet wide and three feet deep.
OYSTER LEASING
The leasing of areas for oyster farming in Prince Edward Island was con-. • tinned and 198 leases were completed. The total number of leases in effect .at the end of the year was 482, covering 1,388 acres, and in addition 1,106 applica-tions were before the department. Action on an application includes investi-gation of the area it covers in order that the applicant may be advised regarding the possibilities for cultivating oysters and a survey to define the boundaries. Due to the great accumulation of applications and to the fact that leasing in Nova Scotia vsas becoming active, it was necessary during the year to engage an additional surveyor, and his appointment lias greatly assisted in disposing of applications which had accumulated beyond the capacity of the then personnel to cope with. Surveys of this nature can only be undertaken, in many instances,
145

146 DEPARTMENT OF FISHERIES
during fine and reasonably calm weather in summer and in fine weather in winter. A total of 444 surveys for leases was completed during the year, including 352 surveys for new leases and 63 re-surveys made at the request of lessees the boundaries of whose areas had been lost. In Nova Scotia 24 surveys of new areas and 5 surveys of old provincial leases were completed.
In addition to surveys for leases the following work was completed: (1) Triangulation and stadia survey of Wolf inlet and the preparation of a plan with grid to facilitate the location of leases; (2) similar survey of Brae bay and location of boundaries of area reserved for quahaug fishing; (3) survey of north boundary of area in Trout river, Malpeque bay, which was closed to fishing for direct marketing of oysters due to pollution; (4) re-survey of the department's reserved experimental area on the Cooper bed, Malpeque bay; (5) re-surveys of the public picking areas in Bideford river, Malpeque Bay area; (6) surveys for the location of additional mud-digging areas off Bentinck cove and off Princeton and Indian river, Malpeque Bay area; (7) survey and estab-lishment of beacons on grid lines of the Sedgewick Cove area, Bedeque bay, to facilitate the location of lease boundaries; (8) survey of an area reserved for experimental purposes in connection with oyster cultural work at Stony point, Bras d'Or Lakes area, and of an additional reserved area at Malagash.
A detailed report of oyster culture work under the department will be found in Appendix No. 4.
MISCELLANEOUS
Cold Storage Plants.—During the year an agreement was entered into with R. EIendsbee and Company, of Half Island Cove, N.S., under which the department subsidize,d the conversion of a building on their property into a cold storage plant for bait and fresh fish. Plans and specifications for the plant were reviewed and approved. Construction work was commenced but will not be completed until the coming year.
The question of the design of a standard plan for bait-holding plants for fishermen's organizations was taken up in consultation with the Chief Super-visor of Fisheries at Halifax and, as a result, plans and specification of such a plant were prepared. The plans provide for various sizes of icehouse and trawl tub room with a view to meeting the requirements at different places, should the fishermen's organizations find that such plants are necessary.
Marine Ways, Poplar Island and North Arm, B.C.—During the early weeks of the year, the spring freshets in the Fraser river caused further demoli-tion of the Poplar Island bridge and as a consequence the power service to the Poplar Island Marine station became disrupted. It was necessary to dispense with the bridge across the North arm as a means of carrying the power line and to build in its place two pile driven piers or dolphins to carry the wires across the river at a height where they would not interfere with navigation. The work was completed by contract under engineering supervision. Since that time the Department of Public Works has completed plans for a new marine station on the mainland side of the North arm, after various consultations with the Engineering Branch, and work has now commenced on the construction.
Bonneville, Rock Island and Grand Coulee Dams, Washington, U.S.A.—In company with the Deputy Commissioner of Fisheries for British Columbia and the Chief Supervisor of Fisheries, an engineer of the department visited the above projects in Washington state. All three projects are on the Columbia river and are causing concern to the fishing industry which fears for the future well being of the river in so far as that industry is concerned. Salmon are using and passing through the fish ladders in the Bonneville and Rock Island dams and ascending

REPORT OF THE DEPUTY MINISTER
the river to the Grand Coulee dam, which will, when completed, be 550 feet high and present an obstruction considered impracticable to overcome. Instead, very elaborate means are being provided to spawn artificially those salmon which pass the Bonneville and Rock Island dams and develop fry which will be planted at suitable points in tributary streams. The full effect of these high works upon the fisheries of the Columbia river will not be definitely known until at least one and possibly more complete cycles have been completed. In the meantime, there is a big educational value in following the situation as it develops from year to year and, in view of possible future harnessing of the larger rivers in British Columbia for power purposes, it is advisable to keep in touch with conditions on the Columbia river until a conclusive decision has been reached with respect to the effect of high dams in salmon streams.
Fisheries Station, Schooner Passage, Rivers Inlet, B.C.—The float at this station, together with all the mooring piles, was renewed by the Department of Public Works on data furnished by the Engineering Branch.
147

DEPARTMENT OF FISHERIES
APPENDIX No. 4
REPORT ON OYSTER CULTURE WORK UNDER THE DEPARTMENT OF FISHERIES FOR THE YEAR 1938-1939
BY A. W. H. NEEDLER, PH.D., FISHERIES RESEARCH BOARD OF CANADA
In the fiscal year 1938-39 oyster culture work was carried on by the Department of Fisheries in Prince Edward Island and Nova Scotia. Work under the present program has been in progress in Prince Edward Island since 1928. In Nova Scotia some preliminary investigations were commenced in 1934 but intensive work was not started until 1936.
The Dominion Government by an agreement with the province of Prince Edward Island in 1928 obtained jurisdiction over the province's oyster areas and undertook to develop its oyster industry. As the most important step in that direction the establishment of oyster farming was planned in those suitable areas which did not support a public fishery. Experimental oyster farming was commenced by the department in 1928 and scientific investigations by the Fisheries Research Board (then the Biological Board of Canada) in 1929, and these have been continued in close co-operation. The leasing of oyster ground was started in 1931 and development of oyster farming has been rapid, especially in the Malpeque Bay region. For a more detailed review of the earlier course of the program reference may be made to appendices of earlier annual reports of the department.
In 1936 the Dominion Government entered into an agreement with the province of Nova Scotia similar to that made with Prince Edward Island in 1928. Jurisdiction over the oyster areas of the province was transferred to the Dominion which undertook development of the industry. Intensive investi-gations of the conditions for oyster culture were commenced in 1936 in the two important regions—the Bras d'Or lakes of Cape Breton and the gulf of St. Lawrence coast of the mainland. The work in Nova Scotia is still at an early stage and ground was first offered for lease in February, 1938.
The greatest development of oyster farming has been in the Malpeque Bay region and investigations and experimental farming in co-operation with the Fisheries Research Board have centred at the Prince Edward Island Biological Station at Ellerslie. General headquarters for the work as a whole have been maintained there and much of the information and experience gained in Prince Edward Island is applicable in Nova Scotia. Intensive work is in progress in the Bras d'Or lakes near Orangedale and on the Northumberland Strait coast at Wallace and Malagash to study the special problems of those regions. While the work is, for convenience, reported !below separately for the two provinces, it is made one by the common value of the results of investigations, by common planning and by the use of personnel and other resources in common.
While the general prospects for the oyster farming industry are good it must be remembered that it is still in an early stage of development. There has been a great increase in the effort to grow oysters and a corresponding increase in the yield. Even in the Malpeque Bay region, however, where the develop-ment started first, more money is being spent than is being received for the oysters sold. The industry can hardly be considered to have reached maturity until the total receipts exceed the total expenditures. With increasing produc-tion marketing is becoming more important. The final establishment of a stable industry depends on the continued development of economical methods of culture and of adequate markets and marketing methods.
148

REPORT OF THE DEPUTY MINISTER
PRINCE EDWARD ISLAND
In 1938-39 there was a further increase in oyster farming in Prince Edward Island especially in the Malpeque-Cascumpeque region. The oyster mortality in the Charlottetown region continued te spread with the result that the public fishery in tributaries of Hillsborough bay has been almost entirely destroyed. Supervision of the industry from the public health standpoint has been extended and progress has been made in the development of procedures for handling oysters produced in polluted areas. Investigations on methods of production have been continued. Some attention has been given to improvement of grading in order to develop more stable marketing. These aspects of the development in 1938-39 are reported in greater detail below.
On November 25 a particularly heavy storm occurred which caused some damage to equipment for oyster farming and even to oyster stocks. The full extent of the damage will not be known until more thorough examination of the grounds is possible early in 1939.
1. Development of Leased Areas.-Table I which follows summarizes the development of oyster farming in Prince Edward Island in 1938. It is com-piled from individual statements obtained from all oyster farmers and while complete returns are not always obtainable and the figures are, therefore, some-times less than the truth it gives a reliable conservative approximation.
TABLE I.-SUMMARIZING THE DEVELOPMENT OF AREAS UNDER CULTIVATION IN PRINCE EDWARD ISLAND TO 1938
Number Shells Card- A -
Used for board
of Al.eas pproxi Oysters Oys
mate ters Spat Rcgion Year under Total Planted Sold Spat Col- Col-
Ctdti- Area lectors
vation leceon used
(acres) (labl.) (bbl.) (b a.)
Malpeque-Cascumpeque, 1932 26 110 254 0 1,500 0 includâng Darnley and New 1933 47 203 935 181 1,600 0 London Entys. 1934 85 388 1,516 434 1,050 1,254
1935 101 453 1,303 979 645 3,350 1936 202 862 3,342 1,093 1,011 13,600 1937 336 1,314 3,192 1,948 25,000 55,600 1938 457 1,729 5,968 3,451 3,000 98,000
Rustic° to Savagebays 1933 9 41 428 50 400 o 1934 13 63 595 92 2,650 o 1935 26 1161 750 145 4,300 0 1936 29 128 38 1 930 440 1937 31 137 21 0 25 0 1938 31 137 15 o 38 0
North Lake t,o Pinette river 1935 11 16 136 0 Some 0 1936 12 18 53 3 Some 0 1937 16 291- 22 o 25 0 1938 22 50 46 61 4 0
Hulecpuebayarea 1937 65 179 1,934 0 0 0 1938 69 184 3,594 788 0 0
Brae Harbour and Wolfe inlet . 1937 15 30 6 0 0 0 1938 15 30 4 0 0 0
Total 1932 26 110 254 0 1,500 0 1933 56 244 1,363 231 2,000 0 1934 98 451 2,111 526 3,700 1,254 1935 138 5851 2,189 1,124 5,000 3,350 1936 243 1,008 3,433 1,097 1,900 14,040 1937 463 1,6891 5,175 1,948 25,000 55,600 1938 594 2,130 9,627 4,300 3,042 98,000
149

DEPARTMENT OF FISHERIES
The:total oyster farming activity ,again shows a great increase over 1937. This has been principally in the Malpeque-Cascumpeque region. The mortality of oysters in the Charlottetown region has continued to hinder development of oyster farming in the eastern part of the Province. The development in the Bedeque Bay area has been associated with the closure of the bay inside Indian and Phelan points to direct marketing and the re-laying of oysters for purification. Some delay in development in certain areas has been caused by the need for investigation of local conditions from a public health standpoint. Reserves for quahaug fishing were set aside in Brae harbour but development there and in Wolfe inlet has been delayed further awaiting re,sults of the examination of the situation there as regards pollution. Interest in oyster farming is general in the province but there has been as yet little substantial development except in the Malpeque-Cascumpeque and Bedeque Bay regions.
2. Malpeque-Cascumpeque Region.—Conditions continued promising in this region where oyster farming first became established and where the benefits of experimental farming and other activities of the Department have been felt most directly. Additional information on the industry in this region is given in Table II.
It is impossible to give adequate figures for many aspects of the develop-ment, such as, for example, cleaning and hardening of ground, removal of mussels or starfish, separation of clusters, spat collection through cleaning g,round at the proper time, tran_sfers of oysters from producing and growing grounds to maturing grounds, etc. In these ways much effective work is being done for which no- details are given in Table II although it is included in the figures for the totals of work and materials used in development.
TABLE IL-OYSTER FARMING IN THE MALPEQUE-CASCUMPEQUE REGION IN 1935, 1936, 1937 AND 1938
— 1935 1936 1937 1938
Number of areas under cultivation 101 202 336 457 Barrels of oysters planted 1,303 3,342 3,192 5,968 Barrels of oysters sold 979 1,093 1,948 3,451 Carboard spat collectors used 3,350 13,600 55,600 98,000 Wages paid for development of areas 82,137 86,077 $11,532 816,371 Money spent for materials used in development 81,665 $ 7,351 814,305 827,484 Days' work by lessees 1,126 3,321 4,300 7,022 Value of time spent by lessees at $1.75 per day 81, 971 8 5,812 $ 7,525 812,289 Estimated total value of work and materiais used in
development 85,773 819,240 $33,362 856,144
The total expenditure in 1938 was over $56,000, an increase of over 60 per cent over 1937. The yield also increased more than 60 per cent but the value of the oysters produced is still much less than the total expenditure. Some oyster farmers have reached the stage where receipts are greater than expen-ditures. The industry as a whole, however, is still expanding and spending for the future.
There has been a great increase in the use of natural grounds for the rearing of spat obtained on cardboard collectors. This promises some reduction in the cost of small oysters for planting purposes. Two kinds of. ground have been used for this purpose. The successful experiments by the department in 1937 have led to the extensive use of gravel flats about Little Curtain island by various oyster farmers. In spite of losses due to shifting of bottom and of oysters in heavy storms these operations have been profitable. The expense is low and the product of good quality. There has also been an increase in the
150

REPORT OF THE DEPUTY MINISTER
use of the narrow shore zone of firm bottom in sheltered creeks. There is danger there that smothering may produce losses or poor shape. Good results can, however, be obtained by careful selection of ground.
There has been a great increase in the use of floating trays for rearing separate spat and it is expected to continue. This, combined with the increased use of the shores of sheltered creeks for rearing small oysters during open water, has created a need for the leasing of sheltered creeks. It is desirable to assure oyster farmers that they will be able to use the same mooring grounds or shores from year to year so that they can make economical arrangements for the work-. It has, therefore, become the policy of the department to issue leases in sheltered creeks but to avoid monopoly of the rather limited area where conditions are suitable leases in these situations are being issued for a term of five years only.
There has been a great increase in the use of concrete-coated egg-case fillers for the collection of spat in the Malpeque-Cascurapeque region. In 1938 about 98,000 of these collectors were used by oyster farmers as compared with about 55,000 in 1937. This is concrete evidence of a fundamental increase in production by the industry. A further increase is expected associated with increased rearing both on trays and on natural bottoms. The latter uses great quantities of spat to allow for losses. The Malpeque-Cascumpeque region is now the principal source of stock for the re-establishment of the industry in areas affected by the oyster mortality and this is another factor which will tend t,o increase spat collection.
In 1938 the Fisheries Research Board, in co-operation with the depart-ment, made predictions of the settlement of oyster spat in several areas. Accurate knowledge of the time when spat settles increases the efficiency of spat collection a great deal. It is expected that the prediction of " sets" will be continued from year to year and extended to new areas. It is hoped that in this way profitable spat collection will be established in areas not now used for that purpose.
A bounty was paid on starfish again in 1938 as a continuation of the 1937 experiment. As the rate of twenty-five cents per gallon paid in 1937 did not appear adequate it was increased in 1938 to fifty cents per gallon. This led to a great increase in the mopping of starfish and the amount originally set aside for this purpose was quickly exhausted.
TABLE Ill.—PRODUCTION OF OYSTERS IN THE 11I.ALPEQUE-CASCUMPEQUE REGION
From the From
Year Depart- Private Total
ment's Areas Areas
bbls. bbls. bbls.
1933 327 181 508 1934 422 434 856 1935 332 979 1,311 1936 454 1,093 1,547 1937 401 1,948 2,349 1938 437 3,451 3,888
The bounty was paid on 1,705 gallons, containing probably over a million and a half starfish. The bounty has served a useful educational purpose in demonstrating to the industry the effectiveness of mopping.
Starfish remain one of the most serious obstacles to oyster farming in this region and continued effort is needed on the part of the industry to combat them. As mentioned below, it is possible that the use of quicklime may provide a more effective substitute for mopping.
151

152 DEPARTMENT OF FISHERIES
3. Mortality of Oysters.—The continuation of the mortality of oysters in various areas in Prince Edward Island is a very serious feature for the whole oyster industry. There has been no recurrence of the mortality in the Malpeque-Cascumpeque region where a very serious mortality occurred years ago. There is, however, constant danger of spread of the mortality to new localities. In Prince Edward Island, Bedeque bay is the only considerable oyster producing area in which the mortality is not known to have occurred and it may have been there at about the same time as in the Malpeque region. The mortality may not be confined in the future to Prince Edward Island and if carried to the mainland may destroy the existing oyster industry in Nova Scotia and New Brunswick.
A similar mortality destroyed the oyster industry in the Malpeque-Cascumpeque region commencing in 1915 and spreading progressively through-out that region for a number of years. The present mortality was first noticed in Hillsborough (East) river and in certain neighbouring north shore bays in 1936 although it possibly occurred on a small scale in 1935. Hillsborough river, formerly supporting a public fishery of some thousands of barrels, produced no commercial catches in 1936. The mortality was of the same order in Brackley bay and occurred also in Tracadie, Savage and Rustico bays. In 1937 it destroyed most of the oysters in Elliott (West) and York (North) rivers, tributaries of Charlottetown harbour not seriously affected in 1936. In Pownal bay and in Vernon, Orwell and Pinette rivers the mortality appeared late in 1937 and reached varying proportions estimated at from 10 to 35 per cent. In 1938 the mortality continued in the Charlottetown region and, as predicted in the annual report of the department for 1937, completed the destruction of the fishery in tributaries of Hillsborough bay.
The mortality has made its appearance in some other areas in the province of less importance. There is evidence that it occurred in Enmore and Percival rivers in 1933. It will probably be introduced into all oyster areas in Prince Edward Island.
No causative micro-organism or "germ" has been found to which the mortality can definitely be attributed. The manner in which the mortality has spread is, however, conclusive evidence that it is caused by a contagious disease affecting oysters. Both in the Malpeque-Cascumpeque region and in the Charlottetown region an epidemic occurred which spread progressively for a number of years in which there were no apparent unusual conditions.
In 1938 there has been further evidence of the resistance of the present Malpeque stock to the disease. No serious mortality has occurred in the Malpeque-Cascumpeque region for twelve years or more. Oysters introduced into that region in 1928 and 1929, however, died with the usual symptoms of the mortality in the summer following their introduction. Malpeque stock in the immediate vicinity was not affected. Malpeque oysters transferred to Brackley bay in 1937 have survived to date and giàwn well although the mortality has continued there among the native oysters. Malpeque oysters introduced early in 1938 into a tributary of Hillsborough bay veere not affected that summer. Malpeque spat were reared on trays in Enmore river in 1938 with spat produced in Enmore river. Although the latter showed a serious mortality with the usual symptoms the Malpeque spat were unaffected and grew more rapidly. Other minor experiments have confirmed these results.
It appears, then, that all of these mortalities have probably been caused by the same disease. Each new appearance of the disease can be explained by a known transfer of gear or oysters from an area where the disease was known to have occurred to the newly affected area. In each case the mortality has been associated with the same symptoms and occurred at the same time of year with its peak in the late summer or early autumn. The present Malpeque stock, which is bred from the few survivors of the mortality over twenty years ago, is apparently resistant to the disease.

REPORT OF THE DEPUTY MINISTER
The above considerations are very, important in determining the most promising policy. Because the Malpeque stock is apparently resistant there is some prospect of re-establishing oyster stocks in the affected areas by the intro-duction of oysters from the Malpeque area. Because the disease is apparently easily transferred from place to place it is unwise to build up local oyster farming industries with limited stocks -which have not been exposed to the disease. There would always be danger of the introduction of the disease which might destroy the results of a great deal of effect. It seems, therefore, the best policy to use Malpeque stock in developing oyster farming in new areas and in attempts to re-establish the industry in areas affected by the disease. In Bedeque bay only, where large stocks are now present which may be susceptible to the disease, does it seem wise to prohibit the introduction of Malpeque oysters.
The development in Malpeque bay is thus given a special importance. It provides the only sound prospect for development elsewhere in the province. This has been noted above in connection with spat collection. If the disease should appear in Nova Scotia or New Brunswick the Prince Edward Island oyster industry will in the same way be of importance to the whole Maritime industry as a source of resistant stock.
4. Bede que Bay.—In 1936 the Department of Pensions and National Health conducted examinations leading to the conclusion that Bedeque bay inside Indian and Phelan points (Summerside harbour) is so contaminated as to make oysters unsafe to use as a raw food. This area was, therefore, closed to direct marketing of oysters early in 1937. Grounds for the re-laying of oysters for purification were sought in neighbouring coves.
Salutation, Sedgewick and Sunbury coves offered some suitable grounds but a decision regarding their freedom from pollution was not received frora the Department of Pensions and National Health until late in the summer. Time was, therefore, too short to complete all of the many applications for leases in time for the autumn fishing season. Many areas were surveyed, however, and over 1,900 barrels of oysters from the pollirted part of Bedeque bay were planted on them as shown in Table I.
In 1938 regulations were altered to provide for a more satisfactory policy in re-laying oysters for purification in this region. An attempt was made to assure proper purification of the polluted oysters and to conserve the producing stock in the polluted area. Although developed for this region the same prin-ciples are applicable elsewhere where pollution occurs.
The picking of small oysters in shallow areas exposed to winter mortality was permitted in June only. The season for this was separated from that for the fishing of marketable oysters in order to make possible the prevention of fishing small oysters from deeper grounds. The danger of picked oysters being marketed directly is less than in the case of oysters of marketable size so that June seemed a suitable month for this purpose although the marketing of oysters from leased areas is permissible then.
The fishing of oysters of marketable size in the polluted area for re-laying was permitted in July when marketing is illegal even from leased areas. All oysters taken from the polluted area were to be re-laid on approved grounds. The July season for re-laying assures that the oysters will be on grounds approved for purification for at least the whole month of August. The re-laid oysters can then be marketed from the first of September.
Such a policy of controlled relaying for purification is necessary to supply the outlet for oysters, growing in areas closed to direct marketing on account of pollution. The only alternative would be the removal of the source of pollu-tion by sewage disposal. To do this satisfactorily would be so expensive that it would seldom be warranted economically in the case of a town as large as Summerside.
153

154 DEPARTMENT OF FISHERIES
The leasing of oyster grounds in this region and the operations in 1938 are summarized in Table L The re-laying met with varied succe-ss. Re-laying on tidal flats in Salutation cove produced good survival and rapid growth but marketing or transfer to deeper ground is necessary for winter. The re-laying on deeper grounds met with good success in many cases. In some instances losses were caused by shifting of bottom, by damage of oysters during the transfer, by failure to separate clusters and other deficiencies in methods. It is expected that experience both in the nature of the re-laying grounds and in methods of handling will lead to the development of more satisfactory re-laying.
5. Experimental Farming.—The Department of Fisheries in 1938 continued experimental farming in close co-operation with the Fisheries Research Board. The scientific investigation by the board have been designed to develop oyster culture methods and to provide a sound !basis of knowledge for the administration and development of the industry. The department has carried out larger scale trials on methods based on scientific investigations.
The great development of oyster farming is shown elsewhere in this report and the industry is still expanding. Our knowledge of the oysters and the con-ditions affecting their grow-th and reproduction must be made to keep pace with the growing and changing industry. The development and demonstration of further improvements on oyster culture methods must be continued and these are the aims of the experimental farming.
The industry has shown to a high degree the co-operation necessary to make the results of this work successful. It has shown an eagerness to try out new methods and enterprising oyster fàrmers have developed improvements in application and in practical technique.
FIeadquarters for all experimental oyster farming by the department and the board are maintained at Ellerslie where areas have been set aside for that purpose on a -tributary of Malpeque Bay and where the board has established the Prince Edward Island Biological Station. The special needs of other localities are, however, borne in mind. Many of the results obtained at this central experi-mental farm are applicable elsewhere with minor variations but investigations, demonstrations or operations for the provision of stock are carried out else-where to meet special local needs. Thus, in 1938 intensive investigations were continued at Orangedale and at Malagash, Nova Scotia, where a general attack is being made on the special problems of the Bras d'Or lakes and the Gulf of St. Lawrence coast of Nova Scotia (see below). Investigations and experiments were carried on in the Charlottetown region in connection with the oyster mortality. It is pointed out, however, that the extension of intensive work to outlying areas is limited by the expense and by the availability of trained personnel neces,sary for proper supervision.
6. Results of Investigations and Experiments.—The results of experiments to develop improvements in oyster culture methods are reported in detail elsewhere. Space permits only a brief mention of the salient features of this work in 1938.
The prediction of "sets " has been mentioned above. With the assistance of two permanent seasonal inspectors it was possible to obtain in many places temperature observations, samples of oysters to observe spawning and tows with No. 18 bolting silk nets to obtain larvae. On this basis predictions of "sets " were made in fourteen places in the Malpeque-Cascumpeque and Bedeque regions. This work in 1938 extended our knowledge of the occurrence of oyster larvae. It confirmed the reliability of the information on growth of larvae which was used as a basis for the predictions and which had been developed in its final form by Dr. J. C. Medcof in• 1937. It is expected that this important work will be expanded in the future.

REPORT OF THE DEPUTY MINISTER 155
Experiments in 1938 showed that " sets " of spat increased with depth down to at least twelve feet and clearly demonstrated the reduction of " sets " on clusters which are severely crowded. It, therefore, appears advisable to reduce crowding by suspending the bundles of collectors in more than one tier whenever practicable. The angle at which collectors were suspended with relation to the position of the float had no evident effect on the " set."
Experience in 1938 indicated that floating trays with board bottoms and wire ends were not quite as satisfactory as wire-bottomed trays for the rearing of oysters. Spat grew satisfactorily in the board-bottomed trays when small but as they became larger and more crowded the growth became uneven and slower than in wire-bottomed trays. This was apparently especially true where the currents were very weak.
Investigations were continued on the seasons and depths at which ship-worms settle and on the protection of wood. Continued experience with its use indicated that, while the mixture of tar-copper oleate and a solvent gives satis-factory protection if a thick coat is maintained over the entire surface, its durbility is less than white or copper paint. It, has shown itself sufficiently good to warrant continued use as a cheap preservative but it is planned to experiment with the addition of other ingredients to improve the durability.
Preliminary experhnents in the use of quicklime for killing starfish con-firmed reports of United States investigators that it is effective at a concentra-tion of 480 pounds per acre. In shallow tanks this concentration killed about 90 per cent of the starfish in the first five days, after which the lime appeared to be no longer harmful. Oysters, lobsters, crabs, shrimps, cunners and various other species showed no serious ill effects. Small flounders were killed. Further experiments are planned to determine the effect of operations on a commercial scale on animals and plants which might be of direct or indirect value.
7. Provision of Planting Stock.—In 1938 sales of 193 barrels of small oysters were made to lessees for stocking purposes. The demand has been so great that the department is unable to satisfy any considerable proportion of it. The policy bas, therefore, been adopted of limiting the sale of planting stock to any individual or group to ten barrels. This increases the usefulness of the oysters the department can supply in enabling those entering the industry to make experimental plantings.
During the year 3,368 cardboard spat collectors bearing spat were sold. The sales by the department now constitute a very small proportion of the production. It seems desirable, however, to continue the production of limited quantities of spat for sale in order to assure at least a limited supply for outside areas and for those just entering the industry.
The policy of issuing permits to lessees to pick oysters for stocking purposes in the shallow shore zone where winter mortality is high was continued in 1938. This policy has led to the transfer of large quantities of oysters into deeper water thereby saving them from the winter killing which might otherwise have destroyed a large proportion. Its relative importance as a source of planting stock is, however, continually decreasing. The large numbers of leased areas and of those interested in picking are making proper supervision a difficult problem. This is especially true in warm weather when picking by hand is possible at a considerable depth. To improve the situation in this regard a change of the season for picking from the summer to the autumn is under consideration. This would also have the advantage of saving some oysters too small to pick during the summer but growing to a considerable size by the late autumn.
8. Revenue.—Table IV summarizes the revenue from experimental farming and provision of planting stock in 1938. All of this revenue is from the Malpeque-Cascumpeque region except for $8.40 from the sale of collectors bearing spat at Orangedale and $57.32 from the sale of oysters which had been transferred from the Bras d'Or lakes to St. Anne bay (see below).

156 DEPARTMENT OF FISHERIES
In addition to the sales of small oysters and spat mentioned above marketable oysters produced in the expeximents or demonstrations are sold. In 1938 the department sold 4371- barrels of marketable oysters at an average price of $9.14 as compared with 400-7 at an average price of $8.40 per barrel in 1937. The total revenue from oyster culture operations, exclusive of rentals on leased areas and royalities, was $5,199 in 1938. The addition of rentals and royalties makes the total revenue from the department's oyster culture operations in 1938 $6,957.27, of which all but $65.72 was from Prince Edward Island.
TABLE W.—REVENUE FROM OYSTER CULTURE, 1938-39
1938-39 I 1937-38
Sale of 3,368 cardboard spat collectors bearing spat at $0.15 Sale of 3,464 cardboard spat collectors bearing spat at $0.05 Sale of .wire containers for spat collection Sale of 42 bbls. crooked oysters for planting at $3.00 Sale of 193 bbls. small oysters for planting at $3.00 Sale of 169 barrels small oyst,ers for planting at $2.50 Sale of market oysters from experimental farm:
150 bbLs. ordinary at $7.50 (7.00 in 1937-38) 55 bbls. ordinary at $7.00 53 bbls. medium at $10.00 (9.00 in 1937-38) 74 bbls. medium at $9.00 (9.25 in 1937-38) 500 bbls. select at $12.50 (11.05 in 1937-38) 551 bbls. select at 812.05
Sale of 13 bbls. oysters from St. Ann bay, N.S Rent of starfish mops Fees for resurvey of boundaries of leases Royalty on oysters taken from leases in 1937 Rentals on leases
505 20 246 00 178 20
36 20 36 80 126 00
579 00 422 50
1,125 00 1,432 90
385 00
530 00 531 00
666 00 434 75
625 00 994 50
668 78
57 32 2 00
21 50 900
13 45
1,744 82 753 31
Total 6,957 27 5,166 96
Field Day for the Prince Edward Island Oyster Growers Association.—For the third consecutive year a field day was held at the Biological Station at Ellerslie on August 10 in co-operation with the Prince Edward Island Oyster Growers Association. In spite of heavy rain up to the middle of the day there was a large attendance. Great interest was again shown in exhibits illustrating various aspects of the industry.
The marketing of oysters was specially featured. The association was fortunate in having an address from F. W. Walsh, of the Marketing Board of the Province of Nova Scotia, on marketing and its relation to grading and to organization of producers.
The field day appears still to be effective in creating interest in oyster culture and disseminating information. A repetition is planned by the asso-ciation in 1939.
• The Prince Edward Island Oyster Growers Association has continued to be of great assistance in expressing collective opinions on behalf of the industry.
B. NOVA SCOTIA
The present oyster areas of Nova Scotia fall naturally into two distinct divisions—the Bras d'Or lakes of Cape Breton and the Gulf of St. Lawrence coast. Oysters might possibly be grown elsewhere but prospects for profitable oyster culture are believed to be much better in these two regions than anywhere else in the province.
The conditions in the two regions are widely different from each other and from those of the north shore bays of Prince Edward Island where investigations have been centred in the past. There has been very little effort to cultivate

REPORT OF THE DEPUTY MINISTER 157
oysters anywhere in Nova Scotia and there is little experience on which to base plans for future development. Intensive investigations are, therefore, still necessary to adapt cultural methods to special conditions in the two regions.
As the agreement between the Dominion Government and the government of Nova Scotia was not completed until 1936 the present oyster culture program is still in a very early stage of development in the province. There has as yet been hardly any establishment of actual private oyster farming.
1. Bras d'Or Lakes.—A preliminary survey of the oyster areas of the Bras d'Or lakes was made in 1934 and some minor supplementary investigations were carried on in 1935. Intensive investigations were commenced in 1936 and are still in progress. Dr. J. C. 1V1adcof, a scientist appointed to the staff of the Fisheries Research Board in 1938, was occupied with investigations in this region during that year.
The work in 1938 was concerned with the special problems of the region regarding both production and marketing. Ground was also offered for lease in February, 1938, and the consideration of applications involved a gre,at deal of work.
The general prospects for profitable oyster culture in the Bras d'Or lakes are not very good unless the marketing of oysters from that region can be improved. The difficulties of the situation are given in greater detail below.
Problems of Production.--Spat collection with the methods developed in the Malpeque Bay area was successful in 1938 for the third consecutive year. Experi-ments in 1938 included the use of brush as well as of concrete-coated card-board collectors with good results. The region abounds in well-sheltered inlets where conditions appear excellent for spat production and this fundamental step in the production of oysters appears to offer little difficulty.
The rearing of small oysters is, however, not so satisfactory. Relatively slow growth occurred again in floating trays. On trays near the bottom in deeper water growth was somewhat better but still much slower than in the Malpeque Bay region, for example. In view of these results and of the natural production of small oysters the value of intensive rearing in this region seems very doubtful.
There is a considerable natural production of small oysters in very shallow water along the shore, much of which results from the settlement of spat on eel-grass. These oysters grew as well or better than on the experimental trays. They can be exploited as a source of planting stock by a policy of issuing permits for picking oysters for planting purposes similar to that which has given good results in the Malpeque-Cascumpeque region. Both survival and eventual quality might be improved if these oysters were planted on suitable grounds. The development of a policy of this kind is under consideration for 1939.
Observations suggest that a relatively scarce food supply is an important factor in making growth slow in this region. Microscopic plants are not present in as great abundance as in many other regions. This is evident not only from examination of samples taken for that purpose but also in the clearness of the water and the relatively slight fouling of surfaces. The latter may be respon-sible for the unusual numbers of spat attaching themselves to eel-grass. If a poor food supply is responsible for the slow growth in the region no practical solution of the difficulty can be expected.
The relatively slow growth of oysters in the Bras d'Or lakes is an adverse factor of some importance. It tends to make production slow and to reduce the production per acre. This reduces the intensity of fishing which areas in the region can support without depletion.
Problems of Marketing.—The most serious and immediate problem of the industry is to improve marketing rather than production. The oysters now realize low prices and command only an uncertain market. This is discouraging

158 DEPARTMENT OF FISHERIES
th the development of oyster farming. At the present time the oysters are all shipped in the shell and the difficulties will be aggravated by increased production of high quality shell oysters elsewhere. General improvement will be possible only if quality can be improved or if other outlets can be developed to provide a more reliable market.
The poor quality of the oysters of this region consists in their freshness, their relatively weak shells and the darkness of the edge of the mantle. The two former are apparently associated with the low salinities. The weakness of the shell creates difficulties in shipment and no method of improving the oysters in this regard is in prospect. The freshness and the dark mantle both make the oysters less acceptable to the Canadian shell trade. They may possibly be overcome by transfer to saltier waters.
A preliminary trial transfer of oysters from near Orangedale to Port Hood island in 1935 gave promising results and a transfer on a larger scale was made in 1937 to St. Ann harbour where the water is as salty as in areas producing oysters of the highest quality. In the latter experiment the saltiness was improved quickly and there was some reduction in the darkness of the mantle edge after the oysters had remained on the new grounds for about a year.
The only real proof of the value of such a transfer would be a demonstrated increase in the market value of the oysters. In 1938 trial shipments to the Montreal market were made in co-operation with the Nova Scotia Marketing Board and the Bluemantle Oyster Producers Association at Orangedale. The results were indecisive but slightly higher prices were obtained and a somewhat better reception observed than in the case of oysters marketed directly from the Orangedale vicinity.
Some improvement in the marketing of Bras d'Or Lakes oysters may be produced by better grading. In common with most of the Canadian oyster industry there is much room for improvement in this regard. By careful grad-ing and packing the Bluemantle Oyster Producers Association was able to obtain prices above the average for the region. While an effort should be made in this direction it is not believed that it will be sufficient by itself to remove the marketing difficulties of the Bras d'Or Lakes oyster industry.
The possibility of developing other outlets should be considered more care-fully than in the past. The profitable shipment of shelled oysters or of canned oysters both depend on a low price before preparation. Prices are already low in the Bras d'Or lakes and while such outlets might not increase the prices obtainable for oysters in the shell it would in itself be desirable to develop reliable outlets.
Leasing of Oyster Grouncl.—The region now supports a public fishery con-centrated in the vicinity of Denys basin and the western part of St. Patrick channel. Scattered through the same area, which presents the best prospects for the industry, are a number of leases formerly issued by the Provincial gov-ernment. Although conditions for intensive oyster farming are not very encouraging it can probably both increase the production and improve the average quality. It is only through oyster farming that any sustained expansion of the industry can be made if the marketing difficulties are overcome.
In the autumn of 1936 a visit was made to the Bras d'Or lakes by the writer in company with Chief Supervisor Sutherland and Dr. M. Cumming, repre-senting the provincial govermnent, to formulate a policy for the region. On the basis of findings at that time and the results of previous investigations, the leasing of grounds was advocated to encourage the production of goad quality oysters and it was proposed that certain areas shoukl be set aside which would not be leased so that the interests of the public fishery would be protected. It was realized that oysters occur 80 generally in the Bras d'Or lakes that it would be impossible to encourage oyster culture without leasing grounds on which some oysters are present. To enable this the agreement betveeen the two goy-

REPORT OF THE DEPUTY MINISTER
ernments was amended slightly in the autumn of 1937. In February, 1938, it was advertised that applications for leases would be considered. Areas have been set aside which are not to be leased, selected to include grounds suitable for the public fishery. As improvement of quality is so important the policy has been adopted of leasing only areas including suitably firm bottom. In order to assure as many as possible an opportunity of engaging in oyster farm-ing the area of an individual lease has been limited to three acres. Most of the suitable grounds occur in the shore zone and no lease is permitted to extend more than 1,200 feet along the shore.
Up to the end of the fiscal year 1938-39 over 105 applications have been received in this region and about 28 of these have been examin,ed and approved. There are in addition about 29 leases issued by the provincial government and still in force.
The development of details of policy and lack of personnel has delayed action on many applications but it is expected that better progress will be made next year as additional assistance has now been pro-vided for this purpose.
2. Gulf of St. Lawrence Coast.—A preliminary survey of this region was made in 1936 and intensive investigations of the special problems were com-menced in 1937 in the Wallace-Tatamagouche area whieh is the most impor-tant producing area of the region and offers typical conditions for study. These investigations have been continued in 1938 and are still in progress. Further general survey of conditions in other parts of the region is required and will be carried out as opportunity permits. The region as a whole produces a smaller quantity but higher quality of oysters th•an the Bras d'Or Lakes region. Its problems, therefore, concern production rather than marketing. It differs both from the Bras d'Or lakes and the north coast of Prince Edward Island in its large tides and in the number of large streams tributary to oyster producing inlets. The large tides make tidal flats of great importance both in the natural production and in the potentialities of the region for oyster culture.
• Investigations in. 1938.—Facilities for investigations were improved at
Malagash in 1938. A small lot of land was purchased and a small building erected to hou.se equipment. A permanent foreman was also appointed.
Only moderate success was achieved in spat collection. "Sets" on experi-mental collectors on floats in a branch of Wallace bay were not heavy. Col-lectors exposed on the flats at Malagash obtained an original "set" of commercial value but the survival was poor, owing in part at least to shifting of the bottom and temporary burial of collectors. It is hoped that the provision of good shelter inside the dyke mentioned below will overcome this difficulty.
Experiments were continued in the use of tidal flats for oyster culture. A dyke was constructed in 1937 of boards nailed to uprights driven into the bottom and banked on either side with mud, gravel and stone. It retained up to eighteen inehes of water over about half an acre. The dyke survived the winter of 1937-38 without serious damage.
Experimental plantings of oysters were made inside the dyke and at various levels along the flats outside. Losses of from five to ten per cent, attributable in part at least to damage before planting, occurred on mud flats both outside and inside the dyke. Much higher mortalities occurred on firm bars exposed at low tide. Survival on ground exposed at low tide is apparently poorer on hard than on soft bottoms. There was a better survival on level than on sloping bottom and a better survival on firm bottom inside the dyke than on firm bottom at the same level outside. These results suggest that the retention of very shallow water reduces winter mortality. The effective use of the dyke for the retention of oysters over winter remains, however, to be demonstrated.
Other possible advantage,s of retaining water in such a dyke were indicated by the investigations in 1938. The growth inside the dyke was relatively rapid.
159

160 DEPARTMENT OF FISHERIES
When the additiorual shelter of a boom was provided little or no shifting oc-curred on bottom within the dyke. The rapid growth and protection from shifting are promising for the rearing of small oysters. As mentioned above, the dyke may prove of value in the collection of spat. The good shelter would make it pos-sible to expose collectors on hardened bottom within the dyke without wrap-ping in wire netting. If worth while "sets" con be obtained in this manner a cheaper method of spat production than the exposure of cardboard collectors by suspending them in bundles from floats will be assured.
There is, at the present time, a great natural production of spat and small oysters on bars exposed at low tide in Malagash basin. If left on the bars heavy losses ,occur and the remaining oysters become clustered and of poor shape. These bars do, however, provide a great potential source of planting stock and an experimental transfer of such oysters was made in 1937 and in 1938 to firm sandy bottom outside Malagash basin at depths sufficient to escape ice. The transferred oysters have survived well and it is believed that high quality oysters could be matured in this way. It is proposed to adopt a policy of issuing permits to oyster farmers to pick oysters on the bars for planting. Oysters occur in similar situations in other parts of the region and may be exploited in the same way.
Leasing on the Gulf of St. Lawrence Coast.—Since ground was offered for lease in February, 1938, about 27 applications have been received in this region. Of these about 16 have been examined and approved.
In this region no leases are being issued of areas now producing oysters in commercial quantities. Some applications have been refused on this 'basis at Caribou harbour, Malagash basin and Wallace bay and river. The definition of the areas which can be properly considered to be producing oysters in com-mercial quantities has involved delay in action on other applications.
The .areas for -which applications have been received in this region vary greatly in nature but most of those which are being proceeded with include ground deep enough to escape ice. There appears to be a good prospect for the development of such areas in this region. It will depend, however, on the develop-ment of spat collection and rearing methods and, especially in the immediate future, on the adoption of administrative policies exploiting the natural produc-tion of small oyster,s in situations where they do not lead to commercial pro-duction without transfer.
C. NEW BRUNSWICK
In view of unsatisfactory conditions in Shediac bay as regards public health no further work was done there in 1938. The work by the Biological Board and the Department of Fisheries in this area in 1932 and 1933 has served to bring some of the special problems to light, especially the erratic local production of spat and to provide a basis for further attack on them when conditions permit development there. The exploitation of the oysters requires the discovery of suitably situated unpolluted areas on which oysters could be relaid for Puri-fication or on which planting stock obtained in Shediac bay could be matured. Shediac bay is the only New Brunswick area over which the Dominion has jurisdiction on the basis of an agreement similar to those with the provinces of Prince Edward Island and Nova Scotia.
• D. GENERAL
1. Inspection and Marketing.—The importance of improving the grading of oysters to the development of the Canadian oyster industry can hardly be over-estimated. Hitherto there have been no recognized grades with any uniformity from place to place. Very few of the producers Or dealers have attempted systematic g,rading and even in the best cases there is room for improvement.

161 REPORT OF THE DEPUTY MINISTER
Thorough and stable grading is essential to the improvement of marketing and the establishment of stable prices. The need for effort in this direction will increase as the development of oyster farming leads to an increased production.
In 1938 with the co-operation of the Prince Edward Island Oyster Growers Association a first grade called "No. 1 Select Cup-Shaped" was defined and regulations have been passed pro -viding for inspection by the department's officers of oysters voluntarily submitted for qualification for this grade. Only those oysters which conform to the definition of the grade can be labelled as "No. 1 Select Cup-Shaped."
Oysters of this grade are defined as: (a) " No. 1 Select Cup-Shaped" oysters are 'oysters the length of each of whàeh shall not exe,eed one and one-half times its greatest width; provided that any barrel, half-barrel or box of such oysters may contain not more than ten per cent of oysters, the length of each of which may be up to one and three-quarter times its total width, but in neither case shall the length be less than three inches across the widest diameter of the shell. (b) No barrel, half-barrel or box of oysters shall be marked "No. 1 Select Cup-Shaped" unless it is marked with the minimum number of oysters con-tained therein and until it has been inspected by a properly authorized inspeetor and found by him to comply with paragraph (a) of this section. Such officer shall then mark the container with the words "No. 1 Select Cup-Shaped, Inspected for Grade."
Similar provision for one or more inferior grades is under consideration. It is to be hoped that the industry will take full advantage of this endeavour to establish standard grades.
2. Public Hea/th.—The relation between the oyster industry and public health is worthy of general 'attention because of its great importance to admin-istrative policy and to operations by oyster producers.
Public health supervision of all food industries is a policy of long standing in our society. In the case of the oyster industry it is necessary in order to protect not only the public health but the industry itself. Ex-perienee in other countries has shown that outbreaks of typhoid or other diseases if attributed to oysters have a disastrous effect on the market. It thus becomes necessary to decide what areas are so dangerously polluted that the oysters in them cannot safely be used and to prevent the direct marketing of such oysters without purification.
In Canada decisions regarding the pollution of areas are made by the Department of Pensions and National Health. The standards on which areas are classified as dangerously polluted or not have been based to a large extent on those in use in the United States. A decision in each individual case is based on a survey of sources of pollution and on actual bacteriological examination of the waters under consideration. It should be understood that pollution represents a potential as well as an actual danger. It provides a means for the spread of cliseas.es if they should occur in the -communities from which the pollution comes.
After the Department of Pensions and National Health has decided that any area is dangerously polluted the prevention of the direct marketing of oysters from that area and the supervision of the re-laying of oysters for puri- fication is ,carried out by the Department of Fisheries. The oysters must, of course, be re-laid on areas 'approved by the Department of Pensions and National Health and for a period which that department regard's as sufficient.
The proper public health supervision of the oyster industry has only been attempted of recent years and adequate supervision is still in the course of development. This causes unavoidable difficulties as it has sot yet been possible to carry out the necessary investigations in all our oyster areas. Further deci-
87275-11

162 DEPARTMENT OF FISHERIES
sions are, therefore, to be expected and may seriously affect the industry. The situation will be improved when the ground has been covered more adequately and more thorough knowledge .of the dangerously polluted areas is available.
In the meantime, vigilance is necessary to avoid as much as possible eco-nomic losses which may be caused by the exploitation of .areas which may later be fotmd to be dangerously polluted. In many cases it might be economioally possible to purify the oysters by relaying in relatively pure waters. In other oases the added expense might be too much for profitable operations. Vigi-lance is also required on the part of all concerned to prevent increases in pollu-tion. These might in some cases even accompany the development of the indus-try itself. It must be understood that if pollution increases new areas may at any time become dangerously polluted.
The difficulties of the public health supervision of the oyster industry are great but are not insoluble. They can be overcome with the least damage to the industry only by the fullest possible co-operation between the two departments and the industry itself.

REPORT OF THE DEPUTY MINISTER 163
APPENDIX No. 5
REPORT OF INSPECTION OF FISH AND PACKAGES AND TECHNICAL INSTRUCTION TO FISHERMEN
By J. J. COWIE, Director
INSPECTION OF SALTED HERRLNG, MACKEREL, ETC.
This inspection is conducted under authority of the Fish Inspection Act. During the year under review inspections of fish and containers were per-formed by those of our regular fishery officers who are qualified and authorized to do so with the assistance of three qualified temporaries. .
Atlantic Coast During the year 1938 over 6,000 inspections were made of fish-curing places
and curing_ utensils with a view to seeing that curing operations were carried on under proper sanitary conditions. •
There were, in round figures, 311,000 empty containers inspected and marked during the year. Of that number 900 were reconditioned and 10,000 rejected for rise as fish barrels. Of fish packed in containers for market there were . inspected 11,000 containers of alewives, 39,000 of herring, 800 of headless her-ring, and also 54,000 containers of mackerel and 8,000 of mackerel fillets. There were 221,000 boxes of smoked round herring inspected. Of oysters there were 23,000 containers inspected.
In September, 1937, an Order in Council was passed providing for the inspection of frozen smelts in the counties of Gloucester and Restigouche, New Brunswick. The result of the inspection was such that at the end of the sea,son there was a call for the extension of the inspection system to the whole prov-ince of New Brunswick. Authority was therefore procured in 1938 to apply the inspection to the whole province. A number of specially qualified tem-porary inspectors were employed during the winter fishing sea,son to carry out the extended inspection. Last year there were inspected 7,000 boxes, whereas this year 160,000 were inspected.
Under an arrangement with the Department of Pensions and National Health our fishery officers in the western part of Nova Scotia supervised the shucking, packing and shipment of scallops.
Pacific Coast Those of the officers on the Pacific Coast who are qualified and authorized
to do so carried on the inspection of dry salted herring during the winter herring fishing season. The fish are packed in 400-pound boxes and after inspection are shipped to the Orient. With the existing conditions in the Far East the business in this commodity remains limited. The quantity packed for this trade during the year under review was 149,700 hundredweights.
INSPECTION OF CANNERIES AND CANNED FISH
An inspection of all fish and shellfish canneries and the process of canning is conducted under the Meat and Canned Food Act by the fishery officers who are qualified.
87275-11à

164 DEPARTMENT OF FISHERIES
During the year there were operated in Nova Scotia, New Brunswick, Prince Edward Island and the Magdalen: Islands 213 lobster canneries, 21 clam canneries and 10 other canneries where sardines and other fish are canned.
Particular attention was given to the weight of lobster meat packed in the cans. Two hundred and eighty-one cases of lobsters were marked "Under--weight."
During the year all lobster canneries were graded in accordance with the grading scheme. A great improvement generally is noticeable in the standard of canneries operating, which is reflected in the production of better-quality pack.
Pacific Coast On the Pacific Coast, as on the Atlantic Coast, qualified fishery officers
inspected all fish and shellfish canneries and reported regularly during the season on the sanitary condition of such. During the year there were operated 38 salmon. canneries, 4 clam canneries and 2 other fish canneries.
An inspection of all salmon canned in British Columbia is 'carried on at Vancouver by a staff consisting of a chief chemist and two laboratory assistants. The inspection is conducted at a laboratory equipped and maintained by the department for that purpose. During the year the total nu-mber of cases of canned salmon inspected was 1,651,863. Of that number 32,204 cases were found to be below the standard and were marked "Grade B." A fee at the rate of one-half cent a case is charged for this inspection; consequently, the
, industry practically pays for this service.
Atlantic Coast Instruction to fishermen in the curing of cod in pickle for making boneless
fish and in the curing of cod in the Gaspe style was continued during the year.
Cod Cwing in Pickle.—The work of instruction in pickle curing was carried on in Nova Scotia, Prince Edward Island and on the north shore of New Bruns-wick.
It has to be pa,rticularly noted that as a result of this work a firm at Petit Rocher, Gloucester county, New Brunswick, has developed this business to such an extent that there were twelve to fifteen fairly large boats operating where previously no fishing was carried on.
Gaspé Cod Curing.—Instruction in this style of curing was continued at the Magdalen Islands and the county of Gloucester, New Brunswick.
The instructors visited the beaches and landing places and demonstrated to the fishermen the proper method of splitting, washing and salting the fish. The drying was also supervised as well as the packing and grading of the fish for market.
EDUCATIONAL COURSES FOR FISHERMEN
The fisheries Research Board arranged to give a short course of instruc-tion to fishermen at the Atlantic Fisheries Experimental station, Halifax, Nova Scotia. The period of the course was from April 1 to 21, 1938. Twenty-five fishermen attended. These were drawn from New Brunswick, Prince Edward Island and Nova Scotia. The instruction was mainly of a practical nature and consisted of instruction in the preparation of pickle-cured and boneless cod, the preparation of pickled mackerel and herring, navigation and motor engines.
INSTRUCTION IN FISH CURING

REPORT OF THE DEPUTY MINISTER
The practical demonstrations were supplemented by lectures designed to give the fishermen an idea of the underlying principles of the practical pro-cedures. Lectures also were given dealing with the habits of fish in the sea in relation to its capture.
Those who gave instruction were: Science, Doctors Beatty, Hess, Johnston and Mr. R. A. McKenzie, of the Research Board's staff; the curing of herring and mackerel, Mr. Robert Gray, of the department; pickle-cured .cod and bone-less fish, Mr. George Earl (since deceased) of the department; navigation, Cap-tain O'Hara, of the School of Navigation, Halifax; motor engines, Mr. R.. H. Davison, of Halifax.
The board also arranged to conduct a course of instruction for fishermen at its Fisheries Experimental station at Grand river on the Gaspé coast in the spring of 1938. This course ran from May 4 to 28. Twenty-one fishermen attended the 'course. These came mostly from the Gaspé coast and some from the French-speaking districts of New Brunswick.
• The instruction given was similar to that given at Halifax—the curing of mackerel and herring and the piclde-curing of cod and the making of boneless fish. Instruction was also given in navigation and in the operation of motor engines and the smoking of fish. Lectures were given on marine biology, refrigeration and the use of byLproducts, also in bacteriology in relation to canning.
165

166 DEPARTMENT OF FISHERIES
APPENDIX No. 6
REPORT ON CANNED SALMON INSPECTION AND RESEARCH
By F. CHARNLEY,
Chief Chemist, Canned Salmon Inspection Laboratory, Department of Fi,sheries
During 1938 the vs.-ork of the Canned Salmon Inspection Laboratory has been continued along the line,s indicated in the two previous annual reports. The routine inspection of parcels of canned salmon submitted for examination and tabulation of the resulting data have furnished additional data regarding the quality of British Columbia canned salmon. The results derived from the 1937 examinations are now complete and, together with those of the 1936 season, provide the first two sets in the collection of annual data -required for a study of the annual variation in quality in British Columbia canned salmon.
With the exception of minor changes in procedure, no substantial altera-tions have been made during 1938 in the method of carrying out the routine examinations. This apparent lack of progress in the • routine work of the laboratory, however, is in sharp contrast with the rapid advances that have been made in certain of the investigations that have been carried out at the labora-tory during the past year. The succe,ssful determination of the firmness research, for example, has provided a scientifically sound scale of firmne,ss for canned salmon which greatly increases the value of this character, since it will now be possible to combine this characteristic effectively with other fundamental quality characteristics of canned salmon to give a reliable index of quality. Such an index, in turn, will greatly simplify the work of establishing a scientifically sound grading plan for the various varieties of canned salmon. The results obtained at the laboratory during the past year thus represent a very consider-able advance beyond any previous work.
QUALITY OF CANNED SALM03%,": PACKED DURING 1937
As mentioned in last year's annual report, a quality characteristic of a given manufactured product consisting of a number of similar units can only be accurately specified by means of a distribution function. When the distribu-tion function is normal, that is, when it is symmetrical around the mean and fulfils certain other conditions, the quality characteristic can be specified by the .arithmetic mean or average and the standard deviation. Even if the dis-tribution varies widely from the normal type, the mean and standard deviation summarize fairly satisfactorily the essentials of the distribution. When con-sidering data pertaining to the various quality characteristics of canned salmon it . is essential, therefore, to note both the mean and standard deviation of the individual characteristics.
Another point vvhich should be noted when considering the summaries of the distributions given in this report is that certain of these quality character-istics differ widely in nature from the remaining characteristics. The characters vacuum and net weight, for example, differ from the remaining (fundamental) characters of canned salmon in that they are not affected by seasonal variation. The variation in the,se characters is entirely a consequence of variations intro-duced during processing. Hence, in thes.e instances, the salmon canner and the manufacturer of the salmon cans may be held directly responsible for any excessive variation in quality.

167 REPORT OF THE DEPUTY MINISTER
In the case of the fundamental characteristics of canned salmon, however, such as firmness, colour, etc., the variation is largely beyond the control .of the canner and results mainly from the operation of factors which produce the seasonal trend in these characteristics. The means and standard deviations of the combined results of one year's examinations do not, therefore, give com-plete information regarding the quality of the season's pack. Such statistics represent the average over the whole season for the particular character in question and the total extent of the variation around that average. To give complete information regarding the average of the character it would be neces-sary to give the line of seasonal trend, and the true standard deviation of the character would be the standard deviation aroun.d the line of seasonal trend.
Table I shows that the vacuum occurring in samples packed during 1937 was similar to that found in samples packed during the preceding year. These data further confirm the fact that the average vacuum obtainable with the present cannery processes of filling and exhausting is dependent on the size and dimensions of the can in addition to other factors. When arranged in descending order of average vacuum the various can sizes follow the order: 1-pound tails, -,1,--pound flats, 1-pound flats and 3--pound flats. Similar data pertaining to the other species indicate that, as regards vacuum, the various varieties of canned salmon packed during 1937 received very similar treatment during filling and processing.
The data listed in table I emphasize again the conclusion reached in last year's annual report, namely, that this quality characteristic of British Columbia canned salmon could be still further improved. Certain lines along which improvements might be effected were indicated in the latter report and need not be repeated hem. It may be worth while to mention, however, that a con-siderable proportion of the rather surprising variation in vacuum in the 1937 pack probably arises through lack of sufficient control of the net weight Of the contents of the cans. Table II shows that there is a substantial variation in the net weight of canned sockeye salmon packed during the 1936 and 1937 seasons. In the case of the one-pound tall sockeye, for example, the data of table II show that during both these years there was a standard deviation in the net weight of this can size of nearly half an ounce. This wide variation in net -weight appears to be due to lack of uniformity in the filling procedures fol-lowed by the different canners, because these distributions vary widely from the normal type and are therefore probably composite distributions consisting of a number of component normal distributions.
The twenty-five percentiles of these two distributions show that 75 per cent of the one-pound tall samples examined during these two years contained more than 161 ounces, yet notwithstanding this excessive over-filling a number of the samples were under weight to the extent of 2 ounces, while the total range extended from about 14 ounces to 18-2 ounces in the case of the 1936 samples and 18-5 ounces in the case of the samples packed during 1937. The effort of the industry as regards net weight thus leaves much to be desired and probably accounts for a considerable proportion of the rather excessive varia-tion in vacuum in British Columbia canned salmon.
In contrast with the vacuum data, the summaries of the distributions of softness of samples packed during 1937 (table III) show a general improvement in this quality characteristic in comparison with the corresponding figures for 1936. In most cases, however, the decreases in average softness are small. On the other hand, the improvement is so uniform that it is difficult to discover a satisfactory explanation of the phenomenon.
Any one, or all, of several factors might have brought about this decrease in softness of the 1937 samples. The decrease -might, for example, be due to

168 DEPARTMENT OF FISHERIES
an improvement in the quality of the salmon per se. Improvements in filling practice or in processing might also have contributed towards increasing the average firmness of the 1937 samples, or the improved results might be due to changes in the testing procedure itself. Only one subjective element, however, is introduced in carrying out the penetrometer tests, and this results from the way in which the operator adjusts the sample-holder to the upper surface of the sample. In view of the simplicity of the operation it hardly seems probable that the examiner would vary this adjustment materially from year to year.
The effect of this subjective element, however, in carrying out the pene-trometer tests is being investigated. If variations in this adjustment are found to introduce substantial variations in average softness, these will be eliminated so that in future the distributions of softness (or firmness) will be rigidly comparable.
Table IV shows that, as regards the intensities of the red and -yellow colours of the flesh, the samples of canned salmon packed during 1937 were very similar to those packed during the preceding season. The distributions of intensities of the yellow colour of the flesh were, in fact, practically identical with those derived from the 1936 data. In the case of the red colour, however, the averages are throughout slightly lower than those of the previous year and, by virtue-of the general uniformity in the discrepancies, lead one to suspect that the latter are not necessarily the result of genuine changes in the intensities of the red colour of the flesh of the salmon packed during 1937, as compared with that packed during the preceding year, but may have arisen partly through changes in the procedure 'followed in carrying out the colour determinations. During 1936 the colour measurements earried out at the inspection laboratory were conducted in the presence of ordinary daylight, that is, ordinary skylight and sunlight, while during subsequent years these measurements have all been made with a Standard daylight lamp as the light source. The 1937 data. may not therefore be strictly comparable with the 1936 data, since sunlight and summer daylight contain a higher proportion of the red constituents than the north skylight reproduc,ed by the standard lamp. The 1937 colour data will, of course, b-e accurately comparable with tho,se of succeeding years, as, for example, the 1938 data, but, until the latter are available, it would not appear safe to infer that there was any substantial annual variation in this quality characteristic of British Columbia canned salmon.
Summaries of the distributions of total free oil in samples of twelve cans olrawn from parcels !packed during the 1937 season are shown in table V. For purposes of comparison the averages listed in table V are shown again in table VI below the corresponding averages derived from the 1936 data. As will be seen from table VI, an outstanding feature of the 1937 pack is the pronounced change in the amount of free oil in the 1937 samples as compared with the corresponding samples packed during 1936. In some instances the annual variation in this quality ,characteristic is of the order of 75 per cent. In the case of one-pound tall pink salmon, for example, table VI shows that the average free oil in samples of 12 one-pound tall can s of this series varied from 28-6 c.• . in 1936 to 49-0 c.c. in 1937, and in the latter year approached the average free oil in the one-pound tall sockeye salmon. The relative increase in the free oil content of the one-pound tall pink salmon in 1937 was therefore approximately 71 per cent. In addition, the total range in this character increased nearly 100 per cent in the 1937 data as compared with the 1936 data and the total range in this char-acteristic for one-pound tall pink salmon was considerably larger than the range covered by the corresponding sockeye data.
Analogous changes in this characteristic appear in the other varieties of canned salmon, although to a considerably less extent. In all cases, however, there is evidence of a substantial annual variation in the free oil content of canned salmon.

REPORT OF THE DEPUTY MINISTER 169
The data of table VII show that, for the most part, there were only slight variations in average total free aqueous liquor in S amp les of twelve cans drawn from parcels ,packed during 1937 as compared with the corresponding figures of the previous year. In the case of the one-pound tall sockeye salmon there appears to have been a slight increase in the average of this characteristic during 1937. Similar increases in the average of this quality characteristic are shown in one-pound tall samples of blueback, coho and .pink salmon, while spring and chum show slight decreases in the amount of free aqueous liquid.
The 1937 averages for free oil and free aqueous liquor listed under "one-half-pound fiats" are not, of course, comparable with the 1936 data owing to the reduction that was made in this can size at the beginning of the 1937 season.
The results shown in table VIII confirm the conclusion drawn in the annual report of the previous year regarding this .quality characteristic of British Columbia canned salmon, namely, that there was a pronounced improvement in freshness in the 1937 pack relative to the 1936 pack, and definitely prove that it is -economically feasible to pack salrnon of a high grade of quality as regards freshness. The high standard of freshness achieved during 1937, unfortunately, does not appear to have been maintained during 1938. Complete figures for 1938 are not yet available, but the data that have been tabulated to date indicate that, in zeneral, the industry has failed to maintain the gratifyingly high standard attained in the previous year.
In 1938 a further revision of the format of the combined application and laboratory report form of examination was undertaken, but owing to the fact that fundamental changes in the grading procedure are impending, especially in the case of grade A canned salmon, the proposed alterations in the routine report have been postponed. In addition to certain alterations in the columns appearing on the present form, the revised form included a brief explanatien of the various quality characteristics of canned salmon that are dealt with in the routine examinations. These explanatory remarks, however, apply equally 'well to the present forms, hence it appears worth while to include them here pending the appearance of the revised form. The explanatory remarks are as follows:
BRIEF EXPLANATIO.N OF QUALITY CHARACTERISTICS RECORDED IN LABORATORY REPORT OF EXAMINATION
(1) Can. No.—The numbers listed in this column refer to the individual cans in the sample. The data recorded on the line opposite any can number therefore refer to that particular can. For example, the code mark recorded opposite can No. 2 is the code mark found in this can. Similarly, the number in column 3 opposite can No. 2 gives the net weight of this can, etc.
(2) Code.—This refers to the mark embossed on the end of the can. By means of certain letters, figures and special marks the code mark shows the species of the salmon, the cannery where the salmon was packed and the date on which it was packed.
(3) Net TVeight.—The number given in this column shows the weight in tenths of an ounce above or below the required gross weight of the can, that is, the legal weight of 16, 8 or 4 ounces, as the case may be, plus the average weight of the can.
(4) Vacuum.—The vacuum is expressed in inches of mercury at sea level and ordinary room temperature. For example, a vacuum of nine inches in a can of salmon shows that the pressure in the can is less than the atmospheric pressure by an amount equal to the pressure exerted by a column of mercurY nine inches in height.
87275-12

170 DEPARTMENT OF FISHERIES
(5) Softness.—This characteristic is expre,ssed in terms of depth of pene-tration of millimeters recorded by the Armstrong penetrometer under certain standard conditions. For practical purposes the softne-ss of the sample may be taken as roughly equal to the depth of penetration; 25-4 millimeters= 1 inch.
(6) Volume of Liquid.—The nuraber in this column gives the volume in cubic centimeters of aqueous or watery liquid recovered from the sample after the latter has been allowed to drain for five or ten minutes; 16-4 cubic centi-meters = 1 cubic inch.
(7) Volume of Oil.—The numbers recorded in this column show the volume in cubic centimeters of the free oil separated out from the total liquid after the latter has been allowed to settle. The sum of the numbers in columns 6 and 7 gives the volume of the total drained liquids (oil and aqueous liquid). The volumes given in this and the preceding column usually refer to the free aqueous liquid or free oil in a sample of 12 cans.
(8) Colour of F/esh.—Columns 8 (a) and 8 (b) gives the red, and yellow colours, respectively, of the flesh. The intensity of colour is expre,ssed in Lovibond colour units.
(9) Odour.—The odour is estimated subjectively by the examiner and is described by means of the following letters: A = Good; B = Better than Average; C = Average; D:= Poorer than Average; E = Poor; S = Stale; T = Tainted.
(10) to (14).—To indicate the presence in the sample of the characteris-tics recorded in these columns a vertical mark (1) or a check mark (V) is employed in the line opposite the corresponding can number. For example a series of l's or check marks opposite can No's. 1 to 12 in column 12 (Water-
marks) would indicate that the contents of every can in the sample of 12 contained watermarks.
Tgatermarks are various discolourations, usually pink and orange dis-colourations, that are found on the skin of salmon which has reached an advanced stage in the spawning migration. Reddening of the Flesh refers to the bacterial reddening that is often found along the ventral portion of the fish, around the fins
' etc. The presence of this reddening usually indicates
very stale or tainted salmon. Poor Filling indicates unsatisfactory filling of the can. Ordinarily, if the can contains more than three pieces of salmon, or if it is cross-filled, it may be regarded as a poorly filled can. Similarly, the sample .has been given Poor Cleaning, if there are evidences of viscera in the sample or blood along the vertebral column. Bruises and Pugh Marks . are undesirable, not only from the standpoint of the appearance of the sample, but also frora the fact that they usually form easy means of entrance for bacterial agencies into the uncooked salmon.
LECTURES ON INSPECTION METHODS
During the past year the industry has shown increased interest in the procedures followed by the laboratory in carrying out the routine examinations. In addition to the visits that were made by individual persons connected with the industry and by other individuals, the production managers, members of the scientific staffs, superintendents, cannery managers, etc., of two large com-panie,s visited the laboratory in February, 1938, for the purpose of observing the methods of inspecting canned salmon that are being followed here. The first of these groups visited the laboratory on February 16 and the second on

171 REPORT OF THE DEPUTY MINISTER
February 23. On both occasions the laboratory,- gave a demonstration and dis-cussion of the routine methods of inspecting canned salmon that are being applied. The visitors expressed considerable interest in the work that is being done by the laboratory.
RESEARCH WORK
The investigations carried out at the inspection laboratory during 193 8 have been directed largely towards utilizing more effectively the results of the routine examinations recorded on the laboratory reports of examination. Hitherto, no attempt has been made by the laboratory to combine the individual quality characteristics of canned salmon. The individual characteristics such as vacuum, softness, colour, etc., of the sample under examination have been shown in the form of average or total scores derived from some convenient sample size. Owing to the comparatively wide range in average quality of the present grade A salmon, however, it has become increasingly apparent that it would be advantageous to the injustry to classify further the present grade A salmon into two, or possibly three, subgrades.
The problem of setting up a scientifically sound grading plan for this purpose, unfortunately, is not an easy one. One of the reasons for this is that such a plan must meet satisfactorily a wide variety- of requirements. Some of the more important of these are:—
(a) The plan must be practical and therefore as simple as possible. Some method must therefore be found of combining effectively the various individual quality characteristics of canned salmon to give an index of quality.
(b) The plan should readily allow alterations in the weightings of the individual characteristics, that is, it should permit changes in the weights without undue calculations or additional tabulations.
(c) The plan should take into account the seasonal trend in average quality as indicated by the individual quality characteristics.
(d) The plan should take into consideration produCer and consumer risks and effective levels.
(e) The plan should fulfil its primary function satisfactorily, that is, it should separate satisfactorily the superior from the inferior grade A salmon.
(f) The plan should also be readily adaptable to various sample sizes.
Owing to limitations of space and the highly technical character of the subject it is not possible to give in this report a detailed discussion of the fore-going grading problem. This problem, however, raises questions that are of intimate concern to the industry. Also, a knowledge of certain aspects of it leads to the clearer perception of the bearing of the firmness research on the problem of grading. It appears almost imperative, therefore, to include here a brief account of the essential ideas involved.
For the purpose of illustrating these ideas it will suffice to consider the simple case of a single normally distributed chara.cter of constant. standard deviation, that is, a character whose variability around the mean remains unchanged. The distribution of the average (arithmetic mean) of a given sample, say 12, will therefore be normal. Also, as the average quality of the characteristic changes, the distribution of the average of samples of 12 will merely move horizontally to the right or left, as shown in figure 1. In the latter figure, X, is the average of the distribution of averages of samples drawn from quality X. Similarly, X, is the average of the distribution of average
87275-12h

172 DEPARTMENT OF FISHERIES
of samples drawn from quality X,. If Xe and X, are each three standard deviations from XL, then under the above conditions the probability of drawing a sample of 12 from the quality Xe having an average equal to or greater than X L is 0-00135.
FR
EQ
UE
NC
Y
Xe IX
AVERAGE OF SAMPLE
FIG. 1.—Producer's and consumer's effective levels corresponding to given producer's and consumer's and acceptance limit XL for the average of the sample.
Consequently, if XL is the acceptance limit for averages of 12, that is, if the examiner rejects the parcel whenever the average quality in samples of 12 is XL or lower, then owing to sampling fluctuations the consumer will be called upon to accept a certain proportion of parcels of lower average quality than XL. The lowest average quality of such parcels, and the proportion of such parcels, that he will be required to accept, however, are accurately specified by the average, Xe and the probability, Pe=0 • 00135, that is, by the con-sumer's effective level and consumer's risk. In this instance, the consumer would, in the long run, be a.sked to accept only about 13 out of every 10,000 of the parcels submitted for examination whose average quality was Xe or lower.
Similar reasoning evidently applie,s to the producer's risk and effective level. If, for example, the producer wishes to ensure that, in the long run, less than about 13 out of every 10,000 of the parcels he submits for examination will be rejected, then he will need to keep the quality of hi s product at the level X, or higher under the preceding conditions of sampling and inspection.
•From the preceding definitions of producer's and consumer's risks, it is evident that the limits bounding any given grade of quality X1 to X2 are in reality intervals or regions or uncertainty. In grading grade A canned salmon into two sub-grades or classes, for example, the limits defining one of these sub-grades, say A2, would be somewhat as shown in figure 2, under the above con-ditions of sampling and inspection. If the limits of grade A2 quality are L1 and L2 and the salmon canner wishes to ensure that certain parcels of his pack will pa,ss as grade Al, then he would need to see that the quality of these parcels

REPORT OF THE DEPUTY MINISTEI?
was equal to or greater than L, under the above conditions: Similarly, the consumer would be called upon to accept as grade A2 quality a certain pro-portion of parcels that were actually of grade B quality, but the lower limit of quality of such parcels would be L e, corresponding to a sample of size 12 and the above consumer's risk.
FIG. 2.—Effect of sampling fluctuations on the limits bounding any given grade of quality.
Owing to the effect of natural causes, however, the total range of grade A quality is fixed. Hence, if the sample size n is fixed. it may happen that it is not possible to classify grade A salmon into more than, say, two sub-classes or grades. The reason for this will be readily apparent on considering figures 3 and 4. Figure 3 illustrates the situation resulting from narrowing the interval of grade A2 quality so that the limits L 1 and L2 are 6S (6 standard deviations) apart. In figure 4 the interval corresponding to A2 quality has been reduced to one-half this distance.
In all instances, of course, there is overlapping in adjacent grades. By bringing the limits L1 and L2 closer together, as in figures 3 and 4, this over-lapping is considerably increased. In figure 3, however, there is still good segregation into distinct grades in the sense that it is possible to specify two values of average quality, say L e and L0, which do not appear simultaneously in the adjacent grades greater than the proportion of times given by the con-sumer's or producer's risk, providing the grades in which these two values of average quality appear have intervals that are not less than 6S, that is, pro-viding that each of the intervals of the grades Al and B in figure 3, for example, are not less than 6S. In the case of figure 4, it is not possible to specify such average qualities, if the grading intervals are all equal. Furthermore, in figure 4 there is overlapping in three adjacent grades, and if the grading interval A2 is further reduced, the proportion of times that the quality L1 will be graded B under these circumstances will steadily become greater than 0.00135.
173
Lp A 1 Fro, 3.—Diagram illustrating a sound practical grading plan.

174 DEPARTMENT OF FISHERIES
Al L, Az Lp
4.—Diagram shelving minimum requirements in a practical grading plan.
The purpose of grading, however, is to separate the good from the bad or the superior from the inferior. A. grading plan that occasionally assigns the same quality to three adjacent grades cannot be said to fulfil this function satisfactorily. Hence, it would appear that the grading plan illustrated in figure 4 represents the minimum requirements for practical grading purposes. For the latter purpose, the distance between the acceptance limits L1 and L2 should be at least 3S, •and in a really satisfactory grading plan this distance should be equal to or greater than 6S.
In the present stage of the grading investigation the best practical estimate of the standard deviation of a given quality characteristic for a given area appears to be the standard deviation st around the line of seasonal trend. In the case of the fundamental characteristics of canned salmon, however, the value of the standard deviation in quality, that is, the value of st , is not within the control of the salmon canner or examiner. Also, under the preceding conditions, the standard deviation of the average depends upon st and the size of sample inspected by the examiner. Consequently, -under the above conditions the fineness of the grading ultimately depends upon the size of sample taken for examination.
Hitherto, the main difficulty encountered in applying the foregoing ideas to the grading of canned salmon has been to combine the individual character-istics effectively to give an index of quality. In order to set up an index of quality that is practical and reliable, and, at the same time, is capable of interpretation along the lines indicated above, it is essential that the individual quality characteristics be norraally distributed. No difficulty would be experi-enced in combining satisfactorily the fundamental characteristics red and yellow colours of the flesh, total free oil and free aqueous liquid in samples of twelve, because these distributions, particularly around the line of seasonal trend, are closely normal and might safely be considered normal for all practical purposes. The distributions of softness (or firmness), however, vary widely from normal. Hence, it has not hitherto been practically feasible to include the latter quality characteristic in any proposed index of quality.
The importance of the firmness research that has been carried out at the laboratory during the past year lies in the fact that it has led to a normally distributed measure of this quality characteristic. The resulting measure of firmness can thus be readily combined with other quality characteristics of canned salmon. In addition, it will be possible in future, as a result of this work, to express the tolerances for firmness defining grade B salmon in the form of a coefficient of variation. As shown in last year's annual report, these

175 REPORT OF THE DEPUTY MINISTER
toleranoes have previously been specified by the average of this character for the sample under examination and the rather unsatisfactory statistic fraction defective p. In future it will be possible to take into consideration accurately both the average and variability in this characteristic vilen differentiating between grade A and grade B salmon.
Work on the problem of incipient deterioration has been continued during the past year, but owing to the pressing nature of the grading investigation and closely relating problems only a limited amount of time was available for this work. No further investigation of seasonal or other changes in the pH of the aqueous liquid in canned salmon was carried out during the past year. Similarly, owing to lack of time, it was not possible to investigate further the extent of the reliability, if a.ny, of the trimethylamine test in determining the amount of incipient deterioration in canned salmon. The limited time available for this research was employed in investigating the surface tension method of measuring acid values mentioned in last year's annual report. This work is being continued with a view to improving the reliability and rapidity of this method of measuring acid values and with the object of studying the possibilities of other means of determining the amount of hydrolysis in salmon oils.
During the past year difficulties were encountered in several instances in positively identifying species. The characteristics red and yellow colours of the flesh, total free oil, total free aqueous liquid, firmness, texture of the flesh tissue and odour are at present employed for this purpose. In view of the close similarities existing among certain of the species, however, and the serious overlapping in ranges of the individual characteristics which results from these similarities, it is occasionally almost impossible to 'establish positive identifica-tion of the species. In the coming year, therefore, it is the intention to collect data showing the ex-tent of the differenc,es in the unsaturations of the oils derived from the various species. These data, it is hoped, -will make available a further characteristic on which to base the identification of the species.
The following publication appeared during 1938 and reports in part the investigation dealing with the measurement of firmness of canned salmon. Charnley, F. and R. S.. Bolton—The Measurement of Firmness of Canned Salmon and Other
Semi-Rigid Bodies by the Dynamic Pen etrometer 3f ethod. I. Experiments with a Multiple-Needle Penetrometer.—J. Fish. Res. Bd. Can. 4 (3) 1938.
TABLE I.—SUMMARY OF VACUUM MEASUREMENTS ON SAMPLES OF CANNED SOCKEYE SALMON INSPECTED BETWEEN JUNE 1, 1937 AND MAY 31, 1938
1-1b. tails i-lb. flats 1-1b. flats 1-1b. flats
Number of cans examined 1,395 6,818 1,672 192 Average vacuum (inches) 9-57 7.01 5.40 5.68 Standard deviation (inches) 3 41 3.01 3-05 2'60 Standard deviation of average of 12 cans 0.90 0.87 0.88 0-75 Range pos. press. pos. press. pos. press. pos. press.
to 20 in. to 18 in. to 15 in. to 12 in.
Percentiles (inches): 25% 7.52 4.98 3 •31 3.92 50% 9-72 7.10 5.18 5.70 75% 11 •71 9.16 7.50 7.39
Vacuum is expressed in inches of mercury. Atmospheric pressure at sea level=29.9 inches of mercury.

1936-37 1937-38
1-1b. Talls 1-1b. Flats 1-lb. Tails 1-1b. Flats
SI2
P: 25% 50% 75%
2,605 16.75 0.48 0.14
13.95-18-15
16-48 16-78 17.07
7,442 8-66 0.29 0-08
7.1-9-9
8.47 8.65 8.85
1,394 16.86 0 •46 0-13
13.95-18-45
16.38 16-85 17.16
6,832 8-47 0-27 0-08
6-7-9-5
8-29 8-46 8-64
176 DEPA.RTMENT OF FISHERIES
TABLE II.-SUMMARY OF DISTRIBUTIONS OF NET WEIGHT OF CANNED SOCKEYE SALMON
N=Total number of tins examined; M =Average net weight (arithmetic mean) in ounces; S = Standard deviation of distribution of single tins; Si2-= Standard deviation of average of 12 tins; R= Range in ounces; P=-Percentiles.
TABLE III.-SUMMARY OF DISTRIBUTIONS OF SOFTNESS (TEXTURE) OF SAMPLES OF CANNED SALMON DRAWN FROM PARCELS INSPECTED BETWEEN JUNE 1, 1937 AND MAY 31,1938.
ONE-Pourm TALLs
Sockeye Blueback Coho Spring Pink Chum Steelhead
(x) ig 1,185 696 3,264 754 7,273 7,666 42 M 7-52 8.57 7.91 9-93 8-91 7.65 8.60 S 1.68 1.82 1-68 3-25 2-90 1-74 2-02 S12 0-48 0-53 0-48 0-94 0.84 0.50 0-58 it 4-16 5-16 4-20 5-26 4-5-40-5 4-25 6-15
I': 25% 6-28 7.29 6-74 7-66 6.93 6.46 7-15 50% 7-24 8-24 7-64 9.17 8-64 7-38 8.28 75% 8-48 9-47 8-84 11-57 10.13 8-52 9.44
ONE-HALF FOUND FLATS
N 5,257 437 2,525 971 4,297 2,654 164 11 7-53 8-68 8-39 10.06 9-54 8.22 8 •48 S 1-52 1.60 1-72 3-20 2.87 2-07 2.15 S12 0-44 0.46 0-50 0.92 0.83 0-60 0-62 11 4-24 5-14 5-20 5-32 5-40 4-24 5-17
13 : 25% 6.46 7-59 7-16 7-88 7.71 6-77 7-00 50% 7.32 8-42 8-19 9-42 8.98 7.83 8-09 75% 8-36 9-42 9-30 11.30 10.64 9.26 9.50
N=Total number of tins examined; M=Average softness (arithmetic mean) in scale units; S= Standard deviation of distribution of single tins; SD = Standard deviation of average of 12 tins; R= Range in scale units; P=Percentiles.
(x)=Immature Coho.

REPORT OF THE DEPUTY MINISTER
TABLE IV..--SUMMARY OF DISTRIBUTIONS OF COLOUR OF SAMPLES OF CANNED SAL- MON DRAWN FROM PARCELS INSPECTED BETWEEN JUNE 1, 1937 AND MAY 31,1938.
RED
- Sockeye Blueback Coho Spring Pink Chum Steelhead
N 3,121 373 1,966 558 4,988 4,153 74 M 6-29 5-54 4-73 4.12 3-09 2.53 3.55 S 0.80 0-64 0.71 1-41 0-66 0-61 0 •54 S6 0•33 0-26 0-29 0-58 0-27 0-25 0-22 R. 2.0-9-5 3-5-7-0 1.0-7.5 1.0-8.5 1-0-5.0 1-0-4.5 2.5-5.0
I': 25% 5-78 5.07 4.32 2.98 2-71 20-6 3-26 50% 6.29 5.50 4-77 4-40 . 3 •16 2•54 3.58 75% 6.80 6.00 5.16 5-16 3.56 3-00 4-03
YELLow
• N 3,121 373 1,966 558 4,985 4,151 74 M 4.18 3.50 3-25 3-11 2.67 2-61 2.81 S 0.70 0-58 0-50 0-78 0•41 0-41 0.34 S6 0.29 0•24 0.21 0-32 0-17 0-17 0-14 It 2 •0-7-0 2.5-5.0 2-0-5-0 1-0-6.0 1-5-4-0 1-5-4.0 2.0-3.5
, I':
25% 3-68 3.05 2-89 2.54 2-38 2-34 2-56 50% 4.21 3-47 3-19 3-02 2-66 2.60 2-87 75% 4.64 3-92 3.58 3.60 2 •99 2.92 3-08
N=Total number of cans examined; M =Average colour (arithmetic mean) in Lovibond colour units; S=Standard deviation of distribution of single cans; S6= Standard deviation of average of 6 cans; R=Ti,ange in Lovibond colour units; P=Percentiles.
TABLE V.-SUMM.A.RY OF DISTRIBUTIONS OF TOTAL FREE OIL IN SAMPLES OF 12 CANS DRAWN FROM PARCELS OF CANNED SALMON INSPECTED BETWEEN JUNE 1, 1937 AND MAY 31,1938.
ONE-POUND TALLS
---- Sockeye Blueback Coho Spring Pink Chum Steelhead
N 116 61 297 46 952 955 2 M 53.8 31.8 34-7 102.3 49.0 10-4 162-5 S12 31- 9 16.4 21-7 55.6 31-9 8-8 R 0-167.5 2-5-82.5 0-105.0 17-5-277.5 0-207.5 0-67-5 120-205
I': 25% 30.6 19.9 17.9 62.5 21.7 3-3 50% 50.8 27-2 29.9 97-5 45.2 8-7 75% 74-5 40.9 49.0 135-8 71.3 14.9
ONE-HALF POUND FLATS
N 659 39 221 67 488 262 4 M 39.6 15-0 18-0 60.0 25-8 7.7 57-5 Si, 22-1 7.8 10-4 26-6 15-8 5-2 It 0-137.5 2.5-47.5 0-82-5 9.5-139-5 0-87.5 0-32-5 50-70
P: 25% 24.5 9-9 10.5 41.3 13.6 3-1 50% 36-4 13.5 17.0 55.8 23.8 7-6 75% 49-0 17-2 22.7 78-9 35.8 10-8
N=Number of samples of 12 examined; M=Average volume of free oil in 12 cans (c.c.); S12=Standard deviation of free oil in 12 cans; R= Range in volume of free oil in 12 cans (Cc); P= Percentiles. 16-4 c.c. (cubic centirneters)=-1 cubic inch.
177

659 393-1 47-7
227-602
39 473.1
37 • 0 402-562
221 441-2 46-8
322-672
67 400-1 58-0
242-567
488 460-2 69.4
227-717
262 463-2
60-8 317-667
4 367-5
320-410 SI2
P: 25% 50% 75%
359.8 389.2 428.0
441.9 475.5 498.6
411-4 441.1 468-1
366-7 401-4 435-5
417-8 455-6 497-7
420 • 1 453-0 505-7
DEPARTMENT OF FISHERIES
TABLE VI—COMPARISON OF AVERAGE TOTAL FREE OIL (C.C.) IN SAMPLES OF 12 ONE- POUND TALL CANS INSPECTED DURING THE 1936 AND 1937 SEASONS
_ Sockeye Bluebook Coho Spring Pink Chum
1936 84-8 26-3 39-7 97.0 28•6 8-0 1937 53-8 31 • 8 34.7 102 • 3 49 • 0 10.4
TABLE VIL—SUMMARY OF DISTRIBUTIONS OF TOTAL FREE AQUEOUS LIQUOR IN SAMPLES OF 12 CANS DRAWN FROM PARCELS OF CANNED SALMON INSPECTED BETWEEN JUNE 1, 1937 AND MAY 31, 1938.
ONE-POUND TALLS
_
Sockeye Bluebook Coho Spring Pink Chum Steelhead
•
N 116 61 297 46 952 955 2 M 881-6 1,018.1 944 • 2 858-6 1,041.1 1,014-3 925-0 Su 104.6 63-8 90-8 132-8 172-4 105.8 R 587-1,147 867-1,192 602-1,252 577-1,177 557-1,597 727-1,427 900-950
I): 25% 809.7 971-8 887-4 783.8 917-0 942-2 50% 876-9 1,015-0 946.9 843-8 996-3 1,005 • 1 75% 947-5 1,048-8 996.4 922.5 1,142 • 7 1,077-2
ONE-HALF-POUND FLATS
N Number of samples of 12 examined; M = Average volume of free aqueous liquor in 12 cans (c.c.); = Standard deviation of free aqueous liquor in 12 cans; R = Range in volume of free aqueous
liquor in 12 cans (c.c.); P = Percentiles; 16-4 c.c. (cubic centimetres) = 1 cubic inch.
TABLE VIII.—FRESHNESS OF SAMPLES OF CANNED SALMON DRAWN FROM PARCELS PACKED BETWEEN JUNE 1, 1937 AND MAY 31, 1938.
— Steel-
Sockeye Bluebook Coho Spring Pink Chum head
Nc 277,068 18,164 112,492 15,869 561,500 442,275 838 Nt 9,790 1,497 8,040 2,045 19,488 17,016 224 Q 33 2 45 6 142 70 1 S 5 15 1 12 4 T %Q 0-337 0.134 0.560 0.293 0-729 0.411 0-446 %S 0-051 0.186 0.049 0.062 0.024 %T
Ne -= Number of cases represented by samples; Nt = Number of tins examined (i-lb. flats and 1-lb. tails combined); Q Number of questionable tins; S = Number of stale tins; T = Number of tainted tins; %Q = Percentage questionable tins; %S = Percentage stale tins; %T = Percentage tainted tins.
178

REPORT OF THE DEPUTY MINISTER 179
APPENDIX No. 7
SUMMARY OF EXPENDITURE AND REVENUE BY PROVINCES, OF THE FISHERIES SERVICE 1867-1938-39, UNDER THE DOMINION GOVERNMENT
Expenditure Revenue
8 cts. 8 ct,s.
Nova Scotia Prince Edward Island New Brunswick Quebec Ontario Manitoba and Northwest Territories Manitoba Northwest Territories Alberta Saskatchewan British Columbia Yukon Hudson Bay District
8,086,320 52 465,389 10
1,421,371 24 149,268 63
5,781,983 28 675,798 84
2,788,460 01 343,304 70
3,590,830 13 520,245 81
23,414 29 4,779 25
1,764,559 68 334,589 81
58,258 58 9,785 23
518,428 96 226,736 41
576,342 37 101,945 16
17,279,370 92 2,937,810 80
29,343 94 15,667 75 821 83
85,786,143 32
Cruisers Nova Scotia, Prince Edward Island, New Brunswick Expenditure, General Fishing Bounty
341,918,683 92
6,407,799 56 5,914,288 49 9,028,122 76
363,268,894 73

• S cts.
1, 000, 000 00
79 80
81 82 84 83 87
88 85 86
Supp. 510 Supp. 511
Statute Supp. 512
Supp. 490
Statute Statute
2,568,443 72
13,663 40
7,567 54
180 DEPARTNIENT OF FISHERIES
FINANCIAL STATEMENT
1938-39
Vote No. Appropriation .Am ount Expenditure
78
{
Salaries and Disbursements of FisherY Officers and Guardians
Fisheries Patrol Service Fisheries Protection Service
cts.
524,350 21 244,625 96 197,272 39
Building Fishways and Clearing Rivers Development of Deep Sea Fisheries and the Demand for
Fish Fish Culture Oyster Culture International Fisheries Commission (FIalibut) Fisheries Research Board of Canada To provide for payment of a bounty for the destruction of
harbour seaLs International Pacific Salmon Fisheries Commission Grant to United Fishermen's Association Grants to Fisheries Exhibitions:-
Nova Scotia Exhibition, Lunenburg Pictou Lobster Carnival
To provide for the replacement of Fisheries service vessels To enable aiding Fishermen, Groups of Fishermen and
others to establish or bett,er establish themselves in the industry
Miscellaneous Civil Service Gratuities To aid in expanding the sale of the products of the Cana-
dian fishermen in foreign and donaestic markets For the purposes of the purchase and shipment of dried fish
to the International Commission for the assistance of Child Refugees in Spain
Fishing Bounty Exchequer Court Award-re W. E. Kelly
9,000 00
62,000 00 240,740 00 24,000 00 25,000 00
240,000 00
30,000 00 25,000 00 3,000 00
1,800 00 500 00
150,000 00
500,000 00 760 00
135,000 00
10,000 00 159,982 70
4,243 15
966,248 56 3,968 80
54,059 29 233,408 21 22,115 32 24,171 42
239,877 49
22,375 00 20,979 67 3, 000 00
1,800 00 500 00
140,873 10
399,590 34 760 00
133,031 01
9,779 10 159,982 70
4,243 15
77 Statute
Departmental Administration ..... Minister's Salary and Car Allowance
2,621,025 85 124,800 00 12,000 00
2,440,768 16 115,675 56 12,000 00
2,757,825 85 Pacific Halibut Treaty Special Account (Finance De-
partment) Pacifie Salmon Treaty Special Account (Finance De-
partment)
2,589,674 66
* Balance due by United States Government on account of divisible expenditure for Fiscal Year 1938-39.
FISHERIES
STATEMENT OF REVENUE RECEIVED DURING TEE FISCAL YEAR 1938-39
Class Total Gen.Acct. N.S. P.E.I. N.B. Que. Ont. B.C. Yukon
9 cts. $ etc. 9 cts. $ cts. 9 etc. $ etc. 9 cts. 9 etc. $ etc.
Fisheries Revenue 52,281 15 11,356,00 2,820 77 10,542 25 264 50 2 00 26,815 63 480 00 Fines and Forfeitures... 11,602 19 662 30 222 80 331 79 10,385 30 Casual Revenue 8,884 92 516 68 2,630 30 5,207 40 51 90 42 40 436 24 Fish Culture Revenue... 408 50 50 00 358 50 Modus Vivendi 245 00 74 00 171 00 Pelagic sealing Revenue 39,355 17 39,355 17 Premium, Discount and
Exchange 1 43 30 113
112,778 36 39,871 85 14,722 60 8,30127 11,284 44 305 90 2 00 37,809 30 480 00

REPORT OF THE DEPUTY MINISTER
SALARIES AND DISBURSEMENTS OF FISHERY OFFICERS EXPENDITURE 1938-39 AND SUMMARY
Nova Scotia- Head Office $ 24,880 13 District No. 1 42,946 11 District No. 9 55,478 58 District No. 3 61,033 97
184,338 79
Prince Edward Island — District No. 1 28,883 03 District No. 2 (Mag'n. Island, Que.) 6,425 37
35,308 40
New Brunswick— District No. 1 28,042 81 District No. 2 64,335 06 District No. 3 37,878 44
130,256 31
General East 11,876 16
British Columbia— Head Office 28,203 72 District No. 1 32,802 01 District No. 9 37,867 72 District No. 3 44,185 26
Canned Salmon Inspection 12,471 27
General West 7,040 57 162,570 55
8 524,350 21
SummArer
Nova Scotia 5100,59546
Prince Edward Island 29,863 35
New Brunswick 134,677 38
Quebec 6,643 47
British Columbia 162,570 55 5 524,350 21
181

182 DEPARTMENT OF FISHERIES
FISFIERIES PATROL SERVICE—EXPENDITURE 1938-39 AND SUMM..A.RY
Nova Scotia- District No. 1—
Chartered Boats $ 974 30
District No. 2— Departmental Boats 11,446 79 Chartered Boats 4,290 84 General 132 28
District No. 3-- Departmental Boats 11,273 76 Chartered Boats 1,208 50 General 974 68
$ 30,301 15
Prince Edward Island— District No. 1—
Departmental Boats 3,582 78 Chartered Boats 8,865 30
12,448 08
New Brunswick— District No. 1—
Departmental Boats 10,484 50
District No. 2— • Departmental Boats 1,676 73 Chartered Boats 15,844 75 General 26 04
28,032 02
British Columbia— District No. 1—
Departmental Boats 18,913 33 Chartered Boats 863 42 General 105 02
District No. 2— Departmental Boats 39,822 15 Chartered Boats 29,502 60 Speed Boats 147 57
District No. 3— Departmental Boats 27,114 90 Charte Boats 28,827 84
Digby Island 6,056 09 Poplar Island 2,764 58 Air Service 19,727 21
173,844 71
$ 244,625 96
SUMMARY
Nova Scotia S 30,301 15 Prince Edward Island 12,448 08 New Brunswick 28,032 02 British Columbia 173,844 71
$ 244,625 96
FISHERIES PROTECTION SERVICE EXPENDITURE SUMMARY FOR 1938-39
East Coast 8 86,014 02 West Coast 111,258 37
$ 197,272 30

REPORT OF THE DEPUTY MINISTER
FISH CULTURE EXPENDITURE 1938-39 AND SUMMARY
Con- Mainte- Total Total - struction nance and by by
Operation Hatcheries Provinces
S cts. S cts. $ cts. $ CS. NOVA ScarrA
Administration 12,570 71 12,570 71 Antigonish 13,978 68 13,978 68 Bedford 4,875 57 4,875 57 rlobequid 9,047 44 9,047 44 Coldbrook Ponds 2,926 65 2,926 65 Grand Lake Ponds 7,360 96 5,081 21 12,442 17 Lind loff 14,118 05 4,016 95 18,135 00 Margaree 8 00 11,283 93 11,291 93 " Nfargaree Ponds 2,762 14 2,762 14 Middleton 6,525 85 6,525 85 Nictaux Pond and Rearing Station 1,201 88 1,201 88 River Phillip Ponds 788 79 788 79 Sackville River Ponds 453 42 453 42 Yarmouth 6,878 23 6,878 23 Kejimkujik Pond 4,769 88 4,769 88 Mersey River Pond No. 3 961 15 961 15
21,487 01 88,122 48 109,609 49
PRINCE EDWARD ISLAND
Kelly Pond 4,044 83 4,044 83 Morrell River Pond 695 06 695 06 Cardigan Rearing Ponds 5,489 86 5,489 86
10,229 75 10,229 75
NEW BRUNSWICK
Florenceville 9,S7 54 9,597 54 Grand Falls 7,067 57 7,067 57 Miramichi 6,902 29 6,902 29 hfiramichi Pond 1,420 5;) 1,420 53 New Mills Pond 3,856 57 3,856 57 Charlo (New Hatchery, Restigouche County) 40,968 44 2,010 41 42,978 85 Restigouche 3,404 73 3,404 73 St. John 13,460 61 13,460 61 St. John Pond 6,482 84 6,482 84
40,968 44 54,203 09 95,171 53
Supervisors, Engineers and Staff-East 8,308 18 8,308 18
General Account-East- Chamcook Lake, N.B 135 54 135 54 Miscellaneous 9 09 8,462 61 8,471 70
9 09 8,598 15 8,607 24
BRITISH COLUMBIA
General Account- Nelson Hatchery 57 50 57 50 Anderson Lake HatcherY 693 50 693 50 Cultus Lake Hatchery 561 29 561 29 Miscellaneous 169 73 169 73 1,482 02
233,408 21
SUMMARY
Nova Scotia S 118,077 00 Prince Edward Island 10,965 45 New Brunswick 102,883 74 British Columbia 1,482 02
S 233,408 21
183

184 DEPARTMENT OF FISHERIES
CONSERVATION AND DEVELOPMENT OF DEEP-SEA FISHERIES EXPENDITURE 1938-39
.Aids in Expending Demands for Fish $10,405 85 Educational Work 13,959 23 Educational Work Through Extension Department of St. Francis
6,176 13 Xavier College . . Bait Collection Service, N.S 574 50 Destruction of Sea Lions, B.0 281 35 Transhipment of Fur Seal Skins, B.0 2,934 84 Fisheries Intelligence Bureau . 3,565 02 Advertising 3,396 60 Fish Collection Boat, N.S 4,439 99 Shrimp Investigation, P.E I 785 55 Miscellaneous 3,847 02 North American Council 356 40 Grant to Bluenose 2,500 00 London Conference re Salt Cod Fish 836 81
$54,059 29
FISHERIES RESEARCH BOARD OF CANADA EXPENDITURE 1938-39
St. Andrews Biological Station, N.B 54,284 58 Nanaimo Biological Station, BE 60,722 38 Gaspe Experinzental Station, Quebec 16.586 98 Halifax Experimental Station, N.S 42,376 89 Prince Rupert Experimental Station, B.0 41,440 44 General Account 24,466 22
$239,877 49

Alberta British Columbia
cts.
590 84
16 82
6,061 39
24,466 22
S eta.' $ cts. S cts.
162,570 55 524,350 21 173,844 71 244,625 96 111,258 37 197,272 39
3,619 48 3,968 80
167 00 4,887 28 54,059 29 1,482 02 233,408 21
22,115 32 24,171 42 24,171 42
102,162 82 239,877 49
11,422 50 22,375 00
20,079 67 20,979 67
3,000 00
1,800 00 eoo oo
137,606 80 140,878 10
465 70 .390,590 34
$ eta.
308 95
S ets.
3,123 62
129,031 01 4,000 00
9,779 10 400 00
81,862 95
133,031 01
9,776 10 760 00
159,982 70 4,243 15
167,00 754,471 32 2,440,768 16
115,675 56 12,000 00
*Special account Halibut (Finance Dept.)
'Special account Pacific Salmon Commission (Finance Dept )
2,568,443 72 13,663 40 7,567 54
2,589,674 66
RE
PO
RT
OF
THE
DE
PU
TY
MIN
ISTE
R
FISHERIES EX.PENDITURE 1938-39 BY PROVINCES
Prince Edward Island
29,973 65 12,448 08 6,951 81
2,391 28 11,009 70 16,702 23
4,18000
1,000 00
81,818 84
14,991 05 4,243 15
185,709 88
Now Brunswick
Saskat- chewan
Appropriation
Salaries and disbursements, fishery officers and guardians
Fisheries Patrol Service Fisheries Protection Service Building fishways and clearing rivers Development of the Deep Sea Fisheries and the
demand for fish Fish culture Oyster culture International Fisheries Commission (Halibut).- Fisheries Research Board of Canada To provide for the payment of a bounty for the
destruction of harbour seals International Pacific Salmon Fisheries Com-
mission Grant to United Maritime Fishermen's Associa-
tion Grants to Fisheries Exhibitions-'-
Nova Scotia Exhibition-Lunenburg Pictou Lobster Carnival
To provide for the replacement of fisheries service vessels
To enable aiding fishermen, groups of fishermen and others to establish or better establish themselves in the industry
To aid in expanding the sale of the products of the Canadian fishermen in foreign and domestic markets
For tho purposes of the purchase and shipment of dried fuih to the International Commission for the assistance of child refugees in Spain
Miscellaneous Civil Service gratuities Fishing bounty Exchequer Court award re W. E. Kelly
Departmental Administration Minister of Fisheries, salary and car allowance
General
S eta.
44,323 53
NOVA Scotia
696,539 70
190,301 53 30,301 15 77,048 28
328 13
18,005 18 118,325 43
5,378 90
110,712 46
42,376 89
5,267 80
1,000 00
1,800 00 500 00
3,271 30
eta. eta.
413,702 72
134,342 51 28,032 02
1,413 93 4 37
11,892 05 102,590 97
34 19
56,058 50
21,344 60
54,284 58
1,50500
1,000 00
S eta.
300 00
Quebec
$ eta.
7,161 97
6,631 70
212,799 59
140,634 84
41,784 10
16,580 98
132,154 63
Ontario Manitoba
590 84 308,95
Total
Nor,-.11alances duo Canada on divisible menses at the close of the fiscal year 1038 -39 by United States Government.

186 DEPARTMENT OF FISHERIES
APPENDIX No. 8
The following is a statement of the various kinds of licences issued by the supervisors in their respective districts, during the 1938-39 season:—
MAGDALEN ISLANDS, QUEBEC—Ammo SUPERVISOR J. J. LABABEE
Kind of Licences Number of Licences Issued
Lobster fishing 767 Certificates of identification—Nil Licences to can lobsters 11 Certificates under section 53—Nil Herring seine 18 Herring trap-net 23 (6 cod trap-nets) Smelt gill-net 104 (1 cancelled) Smelt bag-net or box-net
929 (1 cancelled)
PRINCE EDWARD ISLAND—Acallo SUPERVISOR J J LABABEE
Lobster fishing 2,521 Certificates of identification-47 Licences to can lobsters 66 (1 cancelled) Oyster fishery 70 Quahaug fishery 101 Certificates under section 53-5 Lobster pound Nil Trap-net fishing 4 Salmon trap-net or pound-net 1 Set salmon gill-net 5 Gaspereau gill-net permits 11 Permits to authorize fishing for oysters in certain contaminated areas 129 Scallop fishery Nil Smelt gill-net 151 Smelt bag-net or box-net 213
— 3,272 (1 cancelled)
NOVA SCOTIA—DISTRICT No. 1—SUPERVISOR A. G. Mawr,
Lobster fishing 2,899 Certificates of identification-5 Licences to can lobsters 24 Oyster fishery 181 Certificates under section 53-165 Trap-net fishing 38 Salmon trap-net, pound-net or weir 233 Special angling permits 174 Set salmon gill-net 57 Gaspereau fishing Nil Scallop fishery Nil Smelt bag-net or box-net 37 Smelt gill-net 122
— 3,765
NOVA SCOTIA—DISTRICT No. 2—SUPERVISOR E. D. FRASER
Lobster fishing 4,350 Certificates of identification-210 (5 cancelled) Licences to can lobsters 39 Oyster fishery 363 Quahaug fishery 42 Certificates under section 53-83 (1 cancelled) Lobster pound 5 Seine 122 Licences to a captain of a Canadian fishing vessel (using an otter or
other trawl) 3 Herring weir 19 Trap-net fishing 101
1

REPORT OF THE DEPUTY MINISTER 187
538 (1 cancelled) 264 108
8 38
E. D. NOVA SCOTIA—DISTRICT No. 2—SuPERvisoR
Kind of Licences
FRASER-CO ncluded
Number of Licences Issued Salmon drift-net 54 Salmon trap-net, pound-net or weir 178 Special angling permits 207 (5 complimentary) Set salmon gill-net 361 Smelt dip-net fishing permits 347 Shad gill-net or drift-net 84 Scallop fishery 3 Smelt bag-net or box-net 184 Smelt gill-net 184 Lobster pound certificates-198 Interim receipts—Nil
6,646 (5 complimentary)
NOVA SCOTIA—DISTRICT No. 3—SumvisoR H. H. MARSHALL
Lobster fishing 3,753 (1 cancelled) Certificates of identification-31 (1 oancelled) Licences to can lobsters Nil
_ Certificates under section 53-181 Lobster pound 8 Herring- weir 52 Trap-net fishing 4
167 Salmon drift-net 3 Salmon trap-net, pound-net or weir 34 Salmon net permits (Medway river)_ 23 Special angling permits 550 (1 cancelled) Set salmon gill-net 426 Shad gill-net or drift-net Nil Smelt dip-net fishing permits Nil Scallop fishery 111 Smelt bag-net or box-net 18 Smelt gill-net 53 Permit for scientific purposes 1 Lobster pound certificates-764 (2 cancelled)
5,199 (2 cancelled)
NEW BRUNSWICK—DISTRICT No. 1—SUPERVISOR J. F. CALDER
Lobster fishing 172 Certificates of identification-19 Lob,ster pound 5 Certificates under section 53-9 Herring weir Clara permits Salmon gill-net or drift-net Herring seine Shad gill-net or drift-net Scallop fishery- 9 Smelt gill-net 1 Smelt ag-net or box-net Nil Lobster pound certificates-1,519 Lease of Dark Harbour fishing privileges-1 Lease of Beals Eddy Pond fishery-1
1,143 (1 cancelled)
NEW BRUNSWICK—DISTRICT No. 2—SUPERVISOR A. L. BARRY
Lobster fishing 3,384 (4 cancelled and 11 free)
Certificates of identification-82 Licences to can lobsters 76 Oyster fishery I. 1,252 (3 free) Quahaug fishery 98 Certificates under section 53-233 Lobster pound 5 Herring weir Nil Gaspereau pound-net or trap-net 83 Salmon gill-net or drift-net 188 Salmon trap-net, pound-net or weir 384 Special angling permits (black salmon) 31 (3 cancelled) Tomcod trap-net 6 Shad gill-net or drift-net Nil

188 DEPARTMENT OF FISHERIES
NEW BRUNSWICK—DISTRICT No. 2—SUPERVISOR A. L. BARRy—Conduded
Kind of Licences Number of Licences Issued Permits, authorizing the catching of pickerel, suckers, chub, perch
and other coarse fish Bass fishery Smelt gill-net Smelt bag-net or
Lobster pound certificates-746
12,110 (8 cancelled and 60 free)
Nil 429
box-net 6,165 (1 cancelled and 46 free)
NEW BRUNSWICK—DISTRICT No. 3—SuPERvisoR L. H. PARKS
Sturgeon fishery 6 Salmon net permits (St. John river) 81 (2 cancelled) Gaspereau pound-net or trap-net 1 Salmon gill-net or drift-net 130 Salmon trap-net, pound-net or weir r 98 Special angling permits (black salmon) 976 Gaspereau gill-net 183 Shad dip-net fishing permits 99 Pickerel permits (net fishing) 2 Whitefish gill-net permits (Grand Lake-Chiputneticook System) 49 Shad gill-net or drift-net 206 Permits authorizing the catching of pickerel, suckers, chub, perch
and other coarse fish 84 Bass fishery 24 Smelt bag-net or box-net Nil Pickerel permits (hook and line) 132 Interim receipts-43
2,071 (2 cancelled)
PROVINCE OF BRITISH COLUMBIA—CHIEF SUPERVISOR J. A. MOTHERWELL
Special angling permits (seasonal) Anglers day permits for non-residents Indian permits Crab fishery Smelt or sardine fishery Miscellaneous Salmon fishery licences for gill-net or drift-net Salmon trolling Salmon trap-net Salmon purse-seine Salmon drag-seine Licences to a captain of a salmon purse-seine boat Grayfish fishery Licences to assist operators of sahnon (purse or drag) seines Licences to assistants in a boat used in -operating -a salmon gill-net
or drift-net Cod fishery Whaling Licences to captain of a Canadian halibut fishing boat, etc Small dragger Herring gill-net or drift-net Herring purse-seine Pilchard purse-seine Licences to a captain of a herring purse-seine boat Permit for scientific purposes Licences to a captain of a pilchard purse-seine boat Licences to assistant operators of herring purse-seine Licences to• assistant opera.tors of pilchard purse-seine Herring pound permits Pelagic sealing certificates-15 .
37 (2 cancelled) 56
1,694 (1 cancelled) 107 (1 cancelled) 54 (2 cancelled) 93 (3 cancelled)
5,809 (78 cancelled) 3,385 (11 cancelled)
5 301 (1 cancelled)
9 177 488
1,763 (1 cancelled)
548 (43 cancelled) 435 (15 cancelled)
6 10 43 26 44 29 28
1 23
399 177
7
15,754 (158 cancelled)
YUKON DISTRICT Special fishery
PACIFIC COAST
Licences to United States halibut fishing vessels
23
171

REPORT OF THE DEPUTY MINISTER
ATLANTIC COAST
Number of Licences Issued Licences to United States fishing vessels 72
NORTHWEST TERRITORIES
Reduction works Nil Walrus 23 (incomplete) Special angling (Hudson Bay and James Bay) Nil
23
HUDSON BAY AND JAMES BAY
Experimental commercial fishing permit (James Bay) 1 Permits for scientific purposes 4
5 -
Total 51,183 (173 cancelled) 5 complimentary
60 free)
189
Kind of Licences

190 DEPARTMENT OF FISHERIES
APPENDIX No. 9
COMPARATIVE STATEMENT OF LOBSTER FISHING- LICENCES FROM 1928
PRINCE EDWARD ISLAND AND MAGDALEN ISLANDS
Kings and
Magdalen Prince Kings Year Queens Queens Totals
Islands County County County (Southern portion)
1928 682 925 616 337 2,560 1929 659 857 509 271 '2,296 1930 644 922 573 285 2,424 1931 526 894 521 283 2,224 1932 526 1,409 308 402 398 3,043 1933 599 1,359 324 438 485 3,205 1934 825 1,190 483 459 542 3,499 1935 931 1,110 538 487 591 3,657 1936 984 972 580 536 609 3,681 1937 973 1,060 594 417 588 3,632 1938 767 1,035 539 396 551 3,288
NOVA SCOTIA-DISTRICT No. 1
Inverness Richmond Breton Cape
Year Victoria
County CaolltY CountY County Totals
1928 537 648 462 376 2,023 1929 501 636 435 329 1,901 1930 496 682 442 343 1,963 1931 473 745 458 367 2,043 1932 542 897 578 426 2,443 1933 656 1,092 773 534 3,055 1934 701 1,060 790 561 3,112 1935 738 1,026 691 503 2,958 1936 845 948 886 506 3,185 1937 796 1,028 784 473 3,081 1938 738 883 823 455 2,899
NOVA SCOTIA-DISTRICT No. 2
bilants,
Guys- Antig- aPietou aCum- eCol- _, es _ utei
Halifax Halifax Patrol boro nish and Col- berland Totals
Year anl Cum-
Offi ce Coal:Lb' Boat County COunty chester County berland County
1928.... 183 976 41 1,021 334 521 171 17 3,264
1929.... 153 767 435 1,047 283 358 221 7 3,271
1930.... 131 1,135 204 1,087 308 349 255 9 3,478
1931.... 142 1,200 170 1,139 273 352 299 15 3,590
1932.... 105 1,364 14 1,330 339 462 399 14 *4,029
1933.... 68 1,453 59 1,439 350 526 374 18 4,287
1934.... 20 1,342 24 1,489 425 589 431 22 4,342
1935.... 5 1,435 21 1,473 494 685 426 7 4,549
1936.... 1 1,460 1,563 506 732 420 10 4,698
1937.... Nil 1,429 Nil 1,524 567 654 306 18 4,498
1938.... Nil 1,345 Nil 1,495 461 655 380 14 4,350
a Northumberland Straits side. b Bay of Fundy side. *The 1932 rotal includes two licences issued by the District Supervisor.

REPORT OF THE DEPUTY MINISTER
NOVA SCOTIA-DISTRICT No. 3
Imnen- Shel- Irar- Anna- Year Queens borne Diglay Kings Totals
burg naouth polis
1928 563 329 966 827 470 25 119 3,299 1929 472 217 850 792 463 27 120 2,941 1930 504 250 854 768 483 28 135 3,022 1931 590 296 1,016 770 430 128 3,230 1932 491 290 965 673 312 148 2,879 1933 525 262 1,112 720 415 21 141 3,196 1934 481 287 1,014 705 354 24 114 2,979 1935 562 307 1,10b 758 370 21 85 3,203 1936 550 304 1,058 831 368 23 90 3,224 1937 692 398 1,190 972 384 37 113 3,786 1938 617 298 1,128 1,135 438 32 104 3,752
NEW BRUNSWICK-DISTRICT No. 1
Albert and Year Charlode Saint John West- Totals
morland
1928 433 86 1 520 1929 360 53 1 414 1930 288 57 2 347 1931 281 45 4 330 1932 380 101 2 483 1933 271 99 1 371 1934 *299 94 1 394 1935 *362 87 1 450 1936 408 85 1 494 1937 380 81 2 462 1938 95 71 6 172
NEW BRUNSWICK-DISTRICT No. 2
Northurn- Itesti- Gloucester Kent West- Year berland gouche County County morland. Totals
County County County
1928 297 50 517 501 249 *1,981 1929 289 43 406 583 188 *1,834 1930 319 46 794 638 327 2,124 1931 300 54 647 765 326 2,192 1932 394 67 933 997 435 2,826 1933 407 77 1,041 989 720 3,234 1934 512 74 1,064 1,087 905 3,642 1935 509 80 986 1,035 719 3,325 1936 503 73 1,091 1,033 619 3,261 1937 526 60 1,084 1,008 696 3,774 1938 523 54 1,084 1,015 708 3,384
* The 1928 total includes 367 licences issued by the District Supervisor, the 1929 total 325 licences, the 1934, 3 licences, and 1935 1 licence, so issued.
NOTE.--Cancelled licences are not included in the figures in this appendix.
191

eee-lee •
11,1 r
fee..
CANADA — DEPARTMENT OF TRADE AND COMMERCE
DOMINION BUREAU OF STATISTICS FISHERIES, FURS AND DAIRY STATISTICS BRANCH
Dominion Statistician: R. H. Coats, LL.D., F.R.S.C., F.S.S. (Hon.) Chief, Fisheries, Furs and Dairy Statistics Branch: F. A. Brown.
FISHERIES STATISTICS OF CANADA
1938
(Prepared in collaboration with Dominion and Provincial Fisheries Departments)
Published by Authority of the Hon. W. D. Euler, M.P., Minister of Trade and Commerce
OTTAWA J. 0. PATENAUDE, I.S.O.
PRINTER TO THE KING'S MOST EXCELLENT MAJESTY 1940

TABLE OF CONTENTS PAGE
Historical Note on The Fisheries of Canada 4 Review of the Fisheries, 1938 10
Introduction and Summary Quantity and Value of the Chief Commercial Fishes, 1934-1938 13 Quantity and Value of All Fish Caught and Marketed, 1937 and 1938 14
Capital Equipment and Employees, 1936-1938—
In Primary Operations- Capital 20 Employees 20
In Fish Canning and Curing Establishments— Capital 20 Employees 21
Details of Fish Canning and Curing Establishments, 1936-1938— Employees and Salaries and Wages 23 Wage-earners by Months 24 Cost of Afaterials Used 24 Value of Production 25
Review by Provinces— Total Value of the Fisheries, 1934-1938 26 Quantity and Value of the Chief Commercial Fishes, 1934-1938 26 Quantity and Value of All Fish Caught and Marketed, 1938 29 Total Value for Counties and Districts of Sea Fish Caught and Marketed, 1936-1938 37 Proportion of Catch of Sea Fish taken offshore, 1938 38 Capital Equipment, 1938 44 Employees, 1938 46
Fishing Bounty 48 Foreign Trade 49 Historical Review 49 Table for Conversion of Weights of Fish 55
General Tables L Fish Caught and Marketed, 1938 56
Prince Edward Island, 56; Nova Scotia, 60; New Brunwick, 92; Quebec, 106; Ontario, 118; Manitoba, 120; Saskatchewan, 122; Alberta, 126; Yukon, 127; British Columbia, 128.
II. Agencies of Production, 1938—Capital Equipment, Employees, etc 14
Part 1. In Primary Operations- Prince Edward Island, 140; Nova Scotia, 142; New Brunswick, 154; Quebec, 160; Ontario, 166; Manitoba, 168;
Saskatchewan, 170; Alberta, 172; Yukon, 172; British Columbia, 174.
Part 2. In Fish Canning and Curing Establishments— (a) General Summary of Statistics 180 (b) Capital 186 (e) Employees and Salaries and Wages 186 (d) Number of Wage-earners by Months 188 (e) Quantity and Value of Fuel Used 190 (f) Power Equipment 192 (g) Classification of Establishments According to Value of Product 194 (h) Classification of Establishments According to Number of Employees 195
III. Miscellaneous- (1) Classification of Vessels and Boats Used in the Sea Fisheries, According t,o Principal Kinds of Fish Taken,
1938 198 (2) (a) Quantities and Values of Fish and Fishery Products Imported into Canada, for Consumption, 1936, 1937
and 1938 212 (b) Quantities and Values of Fish and Fishery Products of Canadia' n origin, Exported from Cnaada, 1936,
1937 and 1938 213 (e) Quantitie,s of Fish and Fishery Products of Canadian Origin, exported from Canada, by Countries of
Destination, 1938 214 (d) Total Value of Exports of Fish and Fishery Products, of Canadian Origin, by Countries of Destination,
1937 and 1938 222 (3) Exporta of Dried Cod from Chief Exporting Countries, 1936, 1937 and 1938 222 4) Fishing Bounties, 1938 1 223 5) The Salmon Pack of British Columbia, by Districts and Species, 1938 223 6) The Salmon Pack of British Columbia, by Species, 1929 to 1938 224 7) The Lobster Pack of Canada, by Provinces, 1918 te 1938 224
(8) Steam Trawler Landings on the Atlantic Coast, 1935-1938 224 (9) Fisheries Production in Certain Areas Defined by the North American Council on Fishery Investigations
1938 225

FISHERIES STATISTICS
PREFACE
This Report is issued tinder an arrangement for statistical co-operation between the Dominion Bureau of Statistics and the Government departments having jurisdiction with regard to fisheries throughout Canada. These depart-ments comprise: the Dominion Fisheries Department which exercises julis-diction over the fisheries of the Maritime provinces, Yukon, British Columbia and the Magdalen Islands, and the Fisheries Branches of departments of Ontario, Quebec, Manitoba, Saskatchewan and Alberta which have jurisdiction over the fisheries of their respective provinces, excepting in the case of Quebec, the fisheries of the Magdalen Islands. The province of British Columbia has a Fisheries Branch, but it does not engage in independent statistical work.
Under the arrangement above referred to, the statistics of the catch, and of the products marketed in a fresh state or domestically prepared, are collected by the local fisheries officers, checked in the Department of Fisheries, and co-ordinated and compiled in the Dominion Bureau of Statistics. In the case of manufactured fish products, schedules in conformity with those of other sections of the Census of Industry are sent by the Bureau to the operators of canneries, fish-curing establishments, etc., the fisheries officers assisting in securing an expeditious and accurate return. The grateful acknowledgments of the Bureau are tendered to the officers of the provincial governments who co-operate in these arrangements.
R. H. COATS,
Dominion Statistician
DOMINION BUREAU OF STATISTICS,
OTTAWA, November 7, 1939.
3
89667-1f

4 FISHERIES STATISTICS
THE FISHERIES OF CANADA
The Early Fisheries.—Fishing is one of the earliest and most historic industries of Canada. Leaving aside inconclusive evidence in favour of authentic record, one must ascribe to John Cabot the honour of having discovered, in 1497, the cod banks of Newfoundland, when he first sighted the mainland of North America. He reported that the sea was so covered with fish that they could be caught "with baskets a stone being attached to make the basket sink in the water". Cape Breton, one of the oldest place-names in America, is a memorial of the early French fishermen —and the Spaniards and the Portuguese were but little behind. Fernandez de Navarette mentions all three as frequenters of the "Grand Banks" before 1502. The fishing was by hand lines over barrels made fast to the bulwarks to prevent fouling, the vessels remaining during fine weather, then returning to France with from 30,000 to 50,000 cod. Voyages along the coast soon showed the cod as plentiful inshore as on the outer banks, and it became common for a crew to anchor in a bay, erect a hut on shore, and make daily excursions to the fishing grounds—the product being salted and dried on land and at the end of the season shipped to France. Jacques Cartier, when he went up the St. Lawrence in 1534, found traces everywhere of these early "Captains Courageous" and of their rivalries in arms no less than in the capture of the teeming product which had tempted them so far from home. An establishment of the kind mentioned was founded at Tadoussac by Chauvin in 1599. Soon the fishermen began to stay all winter and thus to erect permanent fishing settle-ments. The first grant of the fisheries of Canada was made by the King of France to de Monts in 1603. Fishing, therefore, may well be regarded as the first industry to be systematically prosecuted by Europeans in what is to-day the Dominion of Canada. It has never since ceased to yield a perennial harvest.
The Canadian Fishing Grounds.—Canada's fishing grounds are perhaps the most extensive in the world. On the Atlantic, from Grand Manan to Labrador, the coast line, not including the lesser bays and indentations, measures over 5,000 miles. The bay of Fundy, 8,000 square miles in extent, the gulf of Si. Lawrence, fully ten times that size, and other ocean waters comprise not less than 200,000 square miles or over four-fifths of the area of the fishing grounds of the North Atlantic. In addition there are on the Atlantic seaboard 15,000 square miles of inshore waters controlled entirely by the Dominion. Large as are these areas they represent only a part of the fishing grounds of Canada. The Pacific coast of the Dominion measures 7,180 miles in length and is exceptionally well sheltered, whilst throughout the interior is a series of lakes which together contain more than half of the fresh water on the planet, Canada's share of the Great Lakes alone amounting to over 34,000 square miles, a total which of course does not include lake Winnipeg (9,457 square miles) lake Manitoba, and others of even greater area.
Still more important than the extent of the Canadian fishing grounds is the quality of their product. It is an axiom among authorities that food fishes improve in proportion to the purity and coldness of the waters in which they are taken. Judged by this standard, the Canadian salmon, cod, halibut, herring, mackerel and whitefish are the peers of any in the world. It is possible, therefore, to state that by far the most valuable fisheries of the western hemisphere, if not of the globe, belong to Canada.
It will'be seen from the foregoing that it is impossible to deal with the Canadian fisheries in the aggregate; they are those of a continent rather than of a country, and are of corresponding diversity. Omitting the Hudson Bay and peri-Arctic region, which extends from Ungava to Alaska, there are roughly the following divisions of the Canadian fisheries:

Giant Tuna Fish of 6S0 lb. at liubbards, N.S.
Courtery, Canadian Government 3folion Picture Bureau.
Feeding Time.—Provincial Government Trout Hatchery, Normandale, Norfolk County, Ontario.
Courtesy, Travel and Publicity Bureau of Ontario.

Part of the Vancouver Fishing Fleet at Dock in the Mountain- Walled Harbour.
Courtesy, Vancouver Island Tourist Association.
Testing vacuum in cans of salmon at the canned salmon inspection labora-tory conducted at Van-couver, B.C. by the Dominion Department of Fisheries. All British Columbia canned salmon must be submitted for inspection by this federal laboratory.

FISHERIES STATISTICS
1. ATLANTIC FISHEILIES.—These were the first Canadian fisheries in point of time and until 1918 they remained the most important for aggregate value of product. Cod, halibut, haddock, herring, mackerel, smelt, sardine, swordfish, salmon lobster and oyster fisheries are included. Conditions are fairly uniform throughout these fisheries, which are commonly divided into the inshore and deep-sea fisheries. The inshore or coastal fishery is carried on in small boats, usually motor driven, with crews of two or three men, and in a class of small vessels with crews of from four to seven men. The means of capture employed by boat fishermen are gill nets and hooks and lines, both hand lines and trawls; whilst from the shore are operated trap nets, haul seines and weirs. Haddock as well as cod is a staple product; during the spring and summer it is split and salted but the important season comes with the autumn, when the fish are shipped fresh or smoked. The deep-sea fisheries are worked by vessels of from 40 to 100 tons, carrying from twelve to twenty men operating mainly with trawl lines from dories, although some fishing is done directly from the vessels by means of hand lines. The fleets operate on the various fishing banks, such as Grand Bank, Middle Ground and Banquereau. The vessels, built in the home shipyards, remain at sea, sometimes for months at a time, and in the hands of sailors who have no superior, seldom come to grief. When they return, the fish, which have been split and salted on board, are taken on shore and washed and dried. The West Indies provide the chief market for this product; no cod fish in the world stands the tropical clinzate like that cured by the fishermen of the Maritime provinces. Steam trawling as it is carried on in the North Sea was introduced on the Atlantic coast of Canada a number of years ago. The trawlers operate practically the whole year and their catches are utilized entirely for the fresh fish trade. Under the Fisheries Act, trawlers must be registered as British ships in Canada, owned in Canada and licensed by the Minister of Fisheries, and their operations must be restricted to waters at least 12 miles from shore.
Lobstering operations, which commenced about 1870, provide a distinctive industry. In that year there were three lobster canneries on the Atlantic coast of Canada; in 1938 the canneries numbered 215 and gave work to nearly 5,000 people; 30,000,000 lobsters is a normal catch. In addition to the canned product, a large quantity of lobster is marketed in shell, the greater part of which is exported to the United States. The difficulty of enforcing regulations prohibiting the capture of undersized and spawning lobsters offers a constant problem in connection with the output, but with the co-operation of the fishernzen themselves the fishery may be maintained and the annual harvest show no decline. In New Beunswick the canning of sardines, which are young herrings and not a distinét type of fish; occupies the position of the leading fisheries industry. The oyster fishery, whose early abundance was for a number of years greatly dinzinished, is being brought back to its former position of importance through the development by the Government of oyster farming; favourable areas in Prince Edward Island and Nova Scotia waters have been seeded, and the work in connection with the oyster culture is being carried on under the direction of experts.
The fishing population of the Maritime provinces is a specialized and stable industrial class. The coast-wise fisheries are operated from April to November, or to January in sheltered districts; and although the larger vessels work all winter, several thousand men are available for a time each year for other employment. This they find about the small plots of land which the most of them own or occupy, in the lumber camps of New Brunswick, or in the collieries of Nova Scotia. A few from Lunenburg and other centres engage in the -West Indian trade. Apart from restric-tions of weather and close seasons, the prevailing method of paying the men on shares has a further tendency in years of low catches or prices to drive them into secondary occupations.
2. INLAND FISHERIES.—The Great Lakes and tributary waters of the St. Lawrence are a second great division of the Canadian fisheries. The value of the inland fisheries of Quebec lies chiefly in the output of the eel, pickerel, and sturgeon
5

6 FISHERIES STATISTICS
fisheries. In Ontario, whitefish, trout, blue pickerel, lake herring, perch, pickerel and tullibee are the most important commercial fishes, though pike, sturgeon and coarse fish yield a fair return. The season on the Great Lakes lasts from six to eight months, and though fishing through the ice is followed by many a large number depend on miscellaneous employment between the seasons. Moving westward, lake Winnipeg, lake Winnipegosis, lake Manitoba and the smaller lakes to the north and east furnish most of the fish products of Manitoba. Whitefish and pickerel are the chief products but pike, tullibee, goldeye and many other varieties are found. In Saskatchewan awl Alberta commercial fishing is confined to the regions north of the Saskatchewan river, where whitefish in large quantities are taken. The difficulties in connection with transportation have not yet been surmounted; some of the greatest lakes of the continent—Reindeer, Great Slave, Great Bear—and hundreds of smaller bodies of water are still beyond reach from a marketing point of view. The lakes of the west, however, repeating the part which the St. Lawrence played in the days of the French regime, and the cod banks in the history of New England, have assisted greatly in the settlement of the country by providing a much needed food supply for early arrivals.
3. PACIFIC FISHERIES.—In British Columbia there is an interior fishing region which corresponds in the main to the prairie section; in the early history of the province it is doubtful if the fur trade (which opened the door by way of the Rocky Mountains to later enterprise ) could have established its footing but for these fisheries. The great wealth of British Columbia, however, in this respect—the source from which she contributes approximately two-fifths of the marketed value of the fish products of Canada and has built up a trade which reaches to the ends of the earth-is in the estuarian salmon fisheries of the Fraser, the Skeena, the Naas, and other rivers of the Pacific slope. Every species of this king of food fishes known to the waters of the Pacific (which, however, is not the salmo salar or true salmon ) is to be found on the British Columbia coast—the sockeye, the spring, the cohoe, the pink and the chum salmon. Of these, the sockeye, though not taken in such great numbers as the pink and chum species, is by far the most important, owing to its prevailing deep red colour and excellent texture, which have created so keen a demand for it in British and foreign markets. On the Fraser river, which used to be the chief source of supply, but which has now yielded place to the northern waters, the yield varies to a considerable extent from year to year. The run begins late in July and is at its height in the opening weeks of August, while the northern rivers have a some-what earlier season. The spring or quinnat salmon is a much larger fish; it was the first s. pecies used in the United States for canning. The run begins early in the spring and continues until the end of July. The cohoes are smaller, running, like the sockeye, in schools, during September and October on the Fraser, and earlier on the northern streams. The chum salmon is canned and a considerable quantity also is salted for export to the Orient. The run of pink salmon comes about three or four weeks later than that of the sockeye.
Halibut abounds off Vancouver island and between the Queen Charlotte Islands and the mainland, and though the first endeavour to establish an industry was unsuccessful, by 1903 British Columbia supplied 10,000;000 pounds of 25 ,000 ,000 pounds taken on the whole Pacific coast north of California. The former figure has since, in many years, been trebled, although after 1930 the quantity was reduced owing to the restrictions imposed under the provisions of the Treaty signed by Canada and the United States for the conservation of this fishery. Herring is taken in large quantities by British Columbia fishermen and is used chiefly in the preparation of the dry-salted product and in the manufacture of oil and meal. The pilchard, which is of the herring family, and is reported for Canada on the Pacific coast only, occupies third place among the chief commercial fishes of British Columbia. There is a large annual output of canned pilchard, but the principal items of production of the fishery are oil• and• meal. There is also the whale fishery, which has two stations on the -Queen Charlotte Islands. The catch includes whales of m,any kinds-

FISHEMES STATISTICS 7
sulphur bottom, finback, humpback and sperm, the last mentioned predominating. Whale hunting is carried on in boats with Svend Foyn harpoon guns—a method which was introduced from Norway. Every scrap of the whale is used—oil, meal and fertiiizer are its more important products. Black and ling cod, flounders, Skate, soles, clams and oysters are also abundant in British Columbia waters.
A word might be added with regard to the Canadian fur-seal fisheries of the Pacific, whose historic headquarters were the city of Victoria. Early in, the present century the industry had, owing to the scarcity of the animals, been reduced to small proportions, and in 1911 a treaty was arranged between Great Britain, the United States, Japan and Russia, the terms of which prohibit pelagic or open-sea fishing. This treaty, still in effect, has for its object the conservation of the seals and it has resulted in greatly increasing the size of the herds. As compensation for the suspen-sion of her sealing rights Canada receives annually from the Governments of the United States, Japan and Russia a share of the proceeds of the sealing on the Pribal off Islands and other rookeries owned by the respeetive countries. The Indians of British Columbia are exempt from the provisions of the Treaty, but their hunting must be carried on from open boats, manned by not more than five persons each and without the use of firearms.
Game Fish.—The above is a purely industrial and commercial survey. Fishing for sport, however, lias its economic side in a country of such famous game fish as the salmon of the Restigouche and other rivers of the Maritime provinces, the black bass and speckled trout of the Quebec and Ontario highlands, the red trout of the Nipigon and the salmon and rainbow trout of British Columbia. A considerable public revenue is derived from the leasing of waters in sparsely settled districts to clubs and individuals for sporting purposes. Several hundreds of guides find employment here during the summer months. .
THE GOVERNMENT AND THE FISHERIES*
Upon the organization of the Dominion Government at Confederation, the administration of the Canadian fisheries was placed under the Department of Marine and Fisheries. Early in 1930 a Departnzent of Fisheries, in charge of its own Minister, was organized. This Department now adnzinisters ail the tidal fisheries (except those of the mainland portion of Quebec, which, by agreement, are under provincial administration), the non-tidal fisheries of Nova Scotia, and the fisheries of Yukon and the Northwest Territories. The non-tidal fisheries of New Brunswick, Prince Edward Island, Ontario, the Prairie Provinces, and British Columbia, and both the tidal and non-tidal fisheries of Quebec (except the fisheries of the Magdalen Islands) are administered by the respective provinces, although the Dominion Department does certain protective work in non-tidal waters of New Brunswick, Prince Edward Island, and British Columbia. The right of fisheries regulation for all the provinces, however, rests with the Dominion Government. See the Fisheries Act (22-23 Geo. V, c. 42). The expenditure of the Dominion on the fisheries in the fiscal year 1938-39, including civil government salaries, contingencies, etc., was 8 2,568,443 and the revenue 8112,778.
Conservation.—River and lake fisheries certainly, and sea fisheries probably, if left to themselves, conform to the econonzic law of dinzinishing returns. The Canadian 'Government, accordingly, has had for a main object the prevention of depletion by the enforcement of close seasons, the forbidding of obstructions and pollutions and the regulation of nets, gear, and fishing operations generally. In addition, an extensive system of fish culture has been organized; the Dominion, in .1938, operated 13 main hatcheries, 1 subsidiary hatchery, 6 rearing stations, 8 Salmon retaining ponds, and several• egg c011ecting stations at a cost of 8233,408, and distributed 33,685,000 trout and salmon eggs, fry, and older fish. Distributions were made in suitable selected waters. Investigations and experiments directed
• Revised under the direction of J. J. Cowie, Acting Deputy Minister, Department of Fisheries, Ottawa.

g FISHERIES STATISTICS
toward the establishment of commercial oyster farming have been successfully carried on since 1929 in Prince Edward Island by the Dominion Department of Fisheries and have more recently been extended to Nova Scotia. In each of these provinces control of the oyster areas was transferred to Federal authority by the Provincial Government. In the two other oyster producing provinces, New Brunswick and British Columbia, control of the areas is in provincial hands, saving on a small strip of the New Brunswick coast where areas have been transferred by the Provincial Government to the control of the Dominion Department of Fisheries in order that certain investigations might be carried on.
Direct Assistance.—On the Atlantic coast, where conditions attending fishing operations make such a service desirable, a system, has been established of broadcasting radio reports as to weather probabilities, bait and ice supplies and ice conditions. Systems of instruction in improved methods of fish handling, fish curing, etc. have been carried on for some years past by the Department of Fisheries.
Continuing the plan which had been followed for several years in connection with direct aid to needy fishermen, the sum of 8500,000 was made available in the appropriations of the Department of Fisheries for the fiscal year 1938-39. In co-operation with the governments of Nova Scotia New Brunswick, Prince Edward Island and Quebec, loans and grants were made during the year to 14,308 fishermen and 36 associations of fishermen. Joint aid funds were set up in each province by contributions from the Department and the Provincial Government, and from these funds assistance was given to fishermen in re-establishing themselves, total spendings from the departmental appropriation anzounting to 8369,443.
Nation-wide advertising of fish foods was again carried on by the Department of Fisheries during the year in order to assist the fishermen by expanding the demand for their product. Approximately 8150,000 was spent for this purpose during 1937-38. All of this sum save 815,000 was expended within Canada. An amount of 815,000 was transferred to the United Kingdonz for use in supple-menting the advertising of Canadian canned salmon and canned lobster in the "Canada Calling" campaign. In addition to the advertising in the Dominion, fish cookery lecturer-demonstrators were kept in the field by the Department as a further means of increasing the use of fish foods.
Scientific Research.—Under the direction of the Fisheries Research Board of Canada (formerly the Biological Board of Canada), stations for the conduct of research into the numerous complex problems occurring in connection with the fisheries are established at Halifax, N.S., St. Andrews, N.B., Grand Riviere, Que., and Nanaimo and Prince Rupert, B.0 . Another station, chiefly for oyster investiga-tion work, is conducted by the Board at Ellerslie, P.E.I., and a sub-station for salmon investigations at Cultus Lake, B.C. A permanent staff of scientists is employed by the Board. The life histories of edible fishes, the bacteriology of fresh and cured fish, improved methods of handlin,g and preparing fish, and numerous other practical problems have been taken up and scientific memoirs and reports issued.
International Problems.—Fisheries problems of international importance have arisen from time to time on both coasts of the Dominion, as well as in the Great Lakes area where problems are complicated by the number of State governements concerned. A major international problem has been the question of United States privileges in the Atlantic fisheries of Canada. An outline of the history of this question may be found on, pages 9 and 10 of Fisheries Statistics of Canada, 1935. Since 1933, under the former modus vivendi plan, which grew out of the unratified treaty of 1888, United States fishing vessels have again been permitted to enter Canadian ports to buy bait and other fishing supplies.

FISHERIES STATISTICS
Joint steps to deal with two important Pacific Coast fisheries problems have been taken in recent years by Canada and the United States—one problem the preservation of the halibut fishery of the Northern Pacific Ocean and Bering Sea, the other the protection, preservation and extension of the sockeye salmon fisheries in the Fraser River system.
The first treaty relating to the halibut fishery was signed on March 2, 1923. Under this treaty a closed season for halibut fishing in each year was provided for and an international commission was set up to conduct an investigation into the fishery and the life history of the halibut. A further convention, signed at Ottawa on May 9, 1930, and ratified by the respective Governments on May 9, 1931, provided for the regulation of the fishery by the commission through the division of the convention waters into fishing areas, changing of dates for closed seasons, and so on. A new convention was signed at Ottawa on January 29, 1937, extending the regu-latory powers of the commission. Steps taken by the international commission under the several conventions have resulted in steady improvement in the state of the halibut fishery in the waters concerned.
The sockeye Salmon Fisheries Convention was signed at Washington on May 26, 1930, but exchange of ratifications did not take place until July 28, 1937, although the Canadian Parliament had given approval to the treaty several years before that time. The convention waters include not only the Fraser River watershed in British Columbia but also certain Canadian, United States and international waters making up the Fraser approach and through which the Fraser River sockeye pass.
Under the sockeye treaty the International Pacific Salmon Fisheries Commission was set up in 1937, consisting of three nzenzbers appointed by Canada and a like number appointed by the United States. The commission which has established its headquarters at New Tifestminster, B.C., is empowered by the convention to make "a thorough investigation into the natural history of the Fraser River sockeye salmon, into the hatchery 'methods, spawning ground conditions, and other related matters," to conduct the sockeye salmon fish cultural opertions in treaty waters, and to recom-mend to the Governments "removing or overconzing obstructions to the ascent of sockeye salmon, that may now exist or nzay from time to time occur, in any of the waters covered by this convention. . ." Certain powers of regulation were also given the commission by the convention but one of the understandings on which the treaty was approved by the two countries was that "The commission shall not promulgate or enforce regulations until the scientific investigations provided for in the convention have been made covering two cycles of sockeye salnwn runs, or eight years."
Fishing Bounties.—By an Act of 1882 (45 Vict., c. 18 ) for the development of the sea fisheries and the encouragement of boat-building, provision was made for the distribution, annually, anzong fishermen and the owners of fishing boats and vessels on the Atlantic waters, of $150,000 in bounties, representing the interest on the amount of the Halifax Award. An Act of 1891 (54-55 Vict., c. 42 ) increased the amount to $160,000, the details of the expenditure to be settled each year by Order in Council.
THE MODERN INDUSTRY
The latter half of the nineteenth century saw the commencement of expansion in the commercial fishing industry of Canada. In 1844 the estimated value of the catch was only $125,000. It doubled in the following decade and by 1860 had passed the million mark. Ten years later it was six millions and this was again more than doubled in 1878. By 1900 it had reached a total of 21 millions and the growth continued with little interruption until 1918, when it reached the high record of 60 millions. Since then there have be,en decreases in value, but these are due to lower prices rather than to smaller catches. In 1938 the value was 840,492,976. It will be understood that the figures given represent the total value of the fish as marketed,
89807-2
9

FISHERIES STATISTICS
whether in, a fresh, dried, canned or otherwise prepared state. Meanwhile the number of employees has increased in like proportion, mounting in some years to over 90,000, while the capital investment has gone as high as 864,000,000. In 1938 the number of employees was 85,994, and the capital investment, 848,561,442.
Among the different kinds of fish, the cod of the Atlantic and the salmon of the Pacific, in the earlier years of the fishing industry, disputed the primacy, but since 1895 salmon has definitely taken the lead, and the heavy pack and high price of lobsters have, in more recent years, sent cod down to third place. For the salmon fishery the yearly average of production in the period 1929 to 1938 was 812,515,482; for the lobster fishery, 4,567,646; and for the cod fishery, 83,319,603. For salmon, the high record year in the period was 1930, with 817,731,891; and for the lobster and cod fisheries 1929, with 85,696,542 and 85,394,636 respectively. In earlier times the leadership among the provinces belonged to Nova Scotia, but British Columbia now occupies first place, with Nova Scotia second and New Brunswick third.
TRADE.—In vie.w of the immense quantity of fish taken annually by Canadian fishermen, the trade must depend to a large extent upon the foreign market as an outlet for the product. From 60 to 70 per cent of the yearly capture is an average export, of which the United States takes approximately one-half and the United Kingdom one-fourth. In the calendar year 1938, total exports amounted to 827,543,680 of which 812,713,819 went to the United States and 86,880,661 to the United Kingdom. Another grouping of the export statistics shows that 811,457,680 went to British Empire countries and 816,086,000 to foreign countries. The most important single export is canned salmon (to the United Kingdom and European markets), followed by fresh lobster, canned lobster, fresh salmon, fresh whitefish, and dried cod (to the West Indies, South America, etc.). For fresh fish the United States is the chief market. Canadian imports of fish in 1938 amounted to 83,036,227.
REVIEW OF THE FISHERIES FOR THE YEAR 1938
Commercial landings of fish and shellfish by Canadian fishermen in 1938 show some decrease from the total for 1937, but the marketed value of the year's 'production, $40,492,976, records an increase of more than a million and a half, and was greater than the marketed value of any other year since 1930. Total catch from sea and freshwater fisheries was 10,741,150 hundredweights, or approximately 176,900 hundredweights less than in the year before. The decrease was in the landings from the sea fisheries, which amounted to 9,845,723 hundredweights as against 10,026,396 hundredweights in the preceding year. The landings from the inland or freshwater fisheries, 895,427 hundredweights; increased by between three and four thousand hundredweights. The landed value of the sea fisheries catch or in other words, the value of the catch to the fishermen as landed, increased by more than $58,000, notwithstanding that the aggregate quantity of fish and shellfish taken during the year was smaller than the catch of 1937. On the other hand, in the case of the inland fisheries there was a decrease of $422,279 in landed value, in spite of the fact that the catch had increased. On the marketed value side the increase was in the return from the sea fisheries—a gain of $1,790,101. The marketed value of the catch from the inland fisheries, $6,718,828, decreased by $273,419. Five of the provinces (Manitoba, Alberta, Prince Edward Island, Quebec and British Columbia) had increases in marketed value to their credit. The great gain, however , over $2,517,000, was in British Columbia.
Major Fisheries.—Taking the Dominion as a whole, the salmon fishery again leads in the marketed value of the year's catch. There was an increaseS of more than 42,500 hundredweights in the landings of salmon, and their marketed
10

FISHERIES STATISTICS 11
value, $14,992,500 roundly stated, was greater by over $2,622,000 than the marketed value for 1937. The lobster fishery, second to the salmon fishery in point of marketed value return, yielded an increased catch as compared with the 1937 total, but a weakening of the prices in export markets had the effect of reducing the marketed value by more than $840,000. The value of the lobster catch as marketed was $3,793,219. In the case of the cod fishery, there was an increase both in catch and marketed value. The landings by the cod fisher-men, approximately 1,702,000 hundredweights, increased by nearly 178,400 hundredweights and their marketed value, $3,335,231, showed a gain of $195,000. The herring fishery was not as successful as in the preceding year, and both catch and marketed value decreased. Whitefish was again of first importance in the freshwater fisheries, although catch and value alike decreased. Total landings of whitefish were 154,244 hundredweights and their marketed value vvas $1,650,347 which means a decrease of approximately 19,400 hundredweights on the one side and $237,500 on the other side. Other fish to show marketed value of more than one million dollars were as follows, some of them taken in the sea fisheries, others in freshwater operations: Halibut, $1,789,444; sardines, $1,393,129; haddock, $1,361,992; trout, $1,036,292; pickerel, $1,031,868.
SEA FISHERIES R,ESULTS
Figures showing by provinces the total catch of sea fish and shellfish during each of the calendar years 1938 and 1937 are given in the following table:
1938 1937
lb. lb.
British Columbia 456, 286, 400 495, 419, 500 Quebec 86, 507, 800 71, 596, 600 New Brunswick 127, 173, 100 137, 790, 700 Prince Edward Island 29, 420, 400 27, 525, 000 Nova Scotia 285, 184, 600 270, 307, 800
Totals 984,572, 300 1, 002, 639,600
Production in most of the more important fisheries was greater in 1938 than it had been in 1937, though aggregate catch from the sea fisheries decreased. The total Atlantic coast landings of cod, for instance, amounted to 168,338,800 pounds, or approximately 17,400,000 pounds more than in 1937. Atlantic herring landings, 114,906,400 pounds, were about 7,160,000 pounds greater than in the preceding year. The haddock, lobster, mackerel and sardine fisheries each showed an increase in catch, with the totals for 1938 amounting to 39,358,900 pounds in the case of haddock, 31,438,500 pounds of lobsters, 28,556,500 pounds of mackerel and 184,450 barrels of sardines.
On the Pacific coast the catch of salmon was 173,466,400 pounds as against 169,173,600 in 1937. The quantity of halibut landed in British Columbia by Canadian fishing vessels was 12,024,700 pounds, an increase of 303,000 pounds in round figures. British Columbia's herring production, however, decreased quite sharply and amounted to slightly less than 132,892,000 pounds, as compared with 192,979,500 pounds in the preceding year. While the herring catch decreased, the landings of pilchards, like the landings of salmon and halibut, show a gain. In 1937 the pilchard fishermen landed 96,148,500 pounds, but in 1938 their catch was 103,537,000 pounds. The combined landings from all of British Columbia's fisheries was less in 1938, however, than it had been in the previous year.
89667-21

FISHERIES STATISTICS
INLAND FISHERIES
Two of the areas in which fresh-water fisheries are carried on, Alberta and Manitoba, show increases in the value of fisheries production in 1938 as compared with 1937, but elsewhere there were decreases, with the net result that fresh-water production as a whole was valued at only $6,718,828, or $273,400 less, in round figures, than in 1937. The major decrease, close to $262,000, was in Ontario, and here the reduction was due in much the largest part to the lessened success of the blue pickerel fishery. The catch of blue pickerel—it is only in Ontario that this particular species of fish is taken—was less by some 21,300 hundred-weights than in the year before when it had totalled about 94,500 hundredweights, roundly stated. The marketed value of the 1938 catch, slightly over $497,500, showed a decrease of $315,100.
The gain in Alberta was $59,600, and in Manitoba $15,100. In Saskat-chewan's fisheries there was a decrease of $58,500 in marketed value, while in the case of Quebec's fresh-water fisheries, the reduction was $21,200. New Brunswick's inland output fell off by nearly $3,000, and in the Yukon Territory there was a decrease of close to 83,500. Round figures have been given here in all cases.
NOTE.—The foregoing "Review of the Fisheries, 1938", à issued through the courtesy of the Deputy Minister of Fisheries, in whose Department it was prepared.

FISHERIES STATISTICS 13
FISHERIES STATISTICS OF CANADA, 1938
The total value of production of the fisheries of Canada for the year 1938 was $40,492,976, compared with $38,976,294 in 1937 and $39,165,055 in 1936. These totals represent the value of the product as marketed, whether sold for consumption fresh, domestically prepared or factory made. The following table shows the quantity caught and the value marketed of the chief commercial fishes (those valued at $100,000 or upwards) for the past five years, with a state-ment in the final column of the increase or decrease for 1938 compared with 1937.
1. Quantity (a) and Value (b) of the Chief Commercial Fishes, Canada, 1934 to 1938
Increaseor decrease
EindofFish 1934 1935 1936 1937 1938 1938 compared with 1937
inc. 4- dec. -
Salmon ent. 1,696,856 1,824,205 2,029,704 1,724,213 1,766,728 -F 42,515
8 12,875,257 12,540,307 13.867,513 12,370,219 14,992,544 4- 2,622,325 Lobsters cmt. 361,992 319,969 283,273 309.950 314,385 4- 4.435
$ 4.269,764 4,378,742 4,383,428 4,633,429 3,793,219 - 840,210 Gad cwt. 1,714,059 1,539,150 1,699,974 1,523,626 1,702,023 4- 178,397
S 3,327,507 2,758,140 3,331,750 3,140,230 3,335,23 4- 195,001 Herring cwt. 1.901,874 2,060,320 2,852,381 3,057,503 2.533,67 - 523,826
8 1,799,967 1,817,540 2,576,533 2,556,883 2,487,23 - 69,652 HaEbut cwt. 123,152 132,130 138,458 150,583 162,54 1- 11,957
8 1,134,307 1,285,587 1,441,310 1,598,190 1,789,444 4- 191,254 Vehitefmh cwt. 144,615 147,456 144,603 173,675 154,244 - 19,431
8 1,358,692 1,432,072 1,525,700 1,887,889 1,650,347 - 237,542 Sardines bbl. 191,549 187,666 247,238 159,481 184,450 4- 24,969
8 1,039,002 1,335,798 1,598,562 1,526,505 1,393,129 - 133,376 Haddock cwt. 356,068 368,426 403,010 388,823 393,589 4- 4,766
8 1,075,529 1,129,095 1,291,905 1,296,313 1,361,992 4- 65,679 Trout cwt. 58,977 66,325 72,973 70,588 72,873 -E 2,285
8 594,354 768,568 842.7.38 1.031,740 1,036,292 4- 4,552 Pickerel cat. 122,512 109,54 145,63 143,020 128,812 - 14,208
S 844,848 801,822 1,109,397 1,043,532 1,031,868 - 11,664 Pilchards cwt. 860,103 911,411 889,03 961,485 1,025,369 1- 73,884
s 549,910 670,328 667,313 902,619 867,007 - 35,612 Mackerel cwt. 190,818 160,495 227,638 239,163 285,565 -E 46,402
S 421,013 308,721 461.866 635,740 560,716 - 75,024 13luepickerel cwt. 24,321 51,230 68,995 94,496 73,171 -- 21,325
$ 116,741 302,259 614,055 812,665 497,564 - 315,101 Saugers cwt. 48,695 35,044 47,711 82,676 95,007 4- 12,331
$ 242,889 155,975 263,579 377,884 488,786 4- 110,902 Smelts cwt. 59,909 79,409 94,868 67,343 71,256 4- 3,913
S 557,538 588,333 655,656 444,473 486,485 4- 42,012 Perch cwt. 72,766 72,001 32,258 35,231 43,661 4- 8,430
S 384,889 401,034 268,653 277,220 335,56 4- 58,343 awns (c) cwt. 85,314 137,944 143.274 142,472 150,52 4- 8,056
5 111,885 173,626 192,910 240,184 285,56 -E 45,377 Tullibee cwt. 44,076 39,721 59,265 55,966 57,93 1- 1,966
S 204,984 225,808 276,464 284,288 283,83 - 452 Lhigcod cwt. 47,806 62,841 28,932 42,858 46,51 4- 3,658
S 281,644 326,029 392,147 275,817 283,51 4- 7,694 Hakeancicusk cwt. 246,179 189,756 228,047 229,225 261,89 4- 32,673
S 257,240 221,341 316,200 289,004 280,16 - 18,843 Pike cu. 37,195 44,761 54,370 51,320 62,283 1- 10,963
S 149,821 181,263 225,589 215.306 233,18 1- 17,876 Oysters bbl. 24,964 27,113 26,965 24,687 24,47 - 211
S 158,241 178,126 189,922 180,079 175,62 - 4,459 Eds cmt. 25,238 25,091 23,440 20,980 22,06 4- 1,084
S 159,674 162,370 153,495 144,277 157,19 -I- 12,921 Scallops gal. 89,890 133.225 170,7 62 183,755 95,686 - 88,069
S 168,415 207,641 334,424 296,529 140,509 - 156,020 Grayflsh cwt. 117,020 107,400 145,701 148,913 197,110 4- 48,197
S 64,715 58,079 86,783 81,238 136,660 4- 55,422 Swordfish cwt. 14,091 22,339 17,853 15,020 10,929 - 4,091
$ 176,640 264,09 230,798 238,165 132,763 - 105,402 Alewives cwt. 70,739 83,086 88,860 74,890 104,520 -F 29,620
$ 72,479 98,244 93,628 7u,698 116,414 1- 39,716 Pollock cwt. 85,037 82,048 126,345 239,845 101,334 - 138,511
5 95,024 82,745 114,200 222,208 115,017 - 107,191 Soles cwt 14,469 16,578 24,301 27,456 23,60 - 3,851
S 71,741 79,246 108,409 123,398 107,957 - 15,441
(c) Prior to 1935 clams and quahaugs were combined. (b) Value marketed. (a) Quantity caught.

FISHERIES STATISTICS
2. Quantity and Value of All Fish Caught and Marketed, Canada, 1937 and 1938
Sea Fisheries
Kind of Fish 1937 1938
Quantity Value Quantity Value
$ S Cod, caught and landed cwt. 1,523,626 2,079,924 1,702,023 2,135,065 Marketed-
Used fresh cwt. 113,616 305,571 102,668 264,890 Fresh fillets cwt. 85,630 675,881 94,118 797,583 Green-saited cwt. 150,736 430,046 179,215 515,304 Canned cases 4,458 16,320 563 2,477 Smoked cwt. 295 2,670 476 3,658 Smoked fillets cwt. 60,602 517,064 55,838 479,765 Dried cwt. 189,930 923,496 220,568 942,198 Boneless cwt. 23,166 192,114 31,140 252,081 Roe cwt. 46 460 - Livers cwt. - - 150 750 Liver meal ton 2 170 3 160 Liver oil, medicinal gal. 49,624 30,122 62,614 35,667 Oil gal. 122,822 46,316 109,120 40,698
Total value marketed - 3,140,230 - 3,335,231
Haddock, caught and landed cwt. 388,823 637,378 393,589 635,514 Marketed- T_Tsed fresh cwt. 98,956 374,008 106,473 385,893 Fresh fillets cwt. 70,756 660,039 67,635 653,370 Canned (includes chicken hadnies) cases 7,196 28,137 22,096 88,824 Smoked cwt. 20,379 171,911 24,548 201,360 Smoked fillets cwt. 6,752 55,998 2,460 20,006 Green-salted cwt. 467 981 1,170 2,252 Dried cwt. 1,327 4,602 1,695 4,860 Boneless cwt. 53 320 678 3,429 Roe ciel. 28 317 185 1,998
Total value marketed - 1,296,313 - 1,361,992
lake and Cusk, caught and landed cwt. 229,225 109,299 261,898 130,599 Marketed- Used fresh cwt 22,873 23,505 52,521 48,318 Fresh fillets cwt 6,335 39,963 3,751 22,468 Canned cases 12,522 53,278 9,119 37,492 Green-salted cwt 42,666 80,589 41,179 76,687 Smoked cwt . - - 96 480 Smoked hllets cwt. 4,611 29,388 3,254 21,463 Dried cwt. 21,470 65,264 23,046 62,701 Boneless cwt. 1,019 6,291 1,759 9,733 Oil gal. 1,750 726 2,937 819
Total value marketed - 299,004 - 280,161
'ollock, caught and landed cwt 239,845 99,122 101,334 57,098 Marketed- Used fresh cwt 14,242 16,359 12,429 25,097 Fresh fillets cwt 451 2,861 899 1,121 Green-salted cwt 39,298 71,604 11,344 24,264 Smoked cwt. - - 4 19 Dried cwt. 48,558 130,190 21,142 64,128 Boneless cwt. 7 35 23 138 Oil gal. 3,125 1,159 1,090 250
. Total value marketed - 222,208 - 115,017
'atflsh, caught and landed cwt. 3,913 1,885 4,336 1,631 Marketed-
Used fresh cwt. 628 2,499 1,134 3,306 Fresh fillets cwt. 1,095 9,038 1,072 7,859
Total value marketed - 11,537 - 11,165
'biting, caught and landed cwt. 17 42 20 58 Marketed fresh cwt. 17 50 20 62
Ulibut, caught and landed cwt. 150,583 1,231,715 162,510 1,220,359 Marketed- Used fresh cwt. 148,472 1,461,576 152,596 1,402,891 Fresh fillets curt. 663 16,575 6,983 127,209 Canned cases 175 1,312 128 822 Livers curt. 2,362 117,290 3,725 182,722 Liver oil gal. 843 168 750 18,750 Viscera oil gal. - - 815 57,050 Meal ton 42 1,269 - -
Total value marketed 1,598,190 - 1,789,444
14

2
FISHERIES STATISTICS
2. Quantity and Value of All Fish Caught and Marketed, Canada, 1937 and 1938-con.
Sea Fisheries
Kind of Fish 1937 1938
Quantity Value Quantity Value
$ 5
Flounders, Brill, Plaice, caught and landed cwt. 13,345 15,521 15,861 21,631 Marketed-
Used fresh cwt. 7,501 21,151 10,205 32,056 Fresh fillets cwt. 1,948 23,292 1,762 26,342
Total value marketed - 44,443 - 58,398
Skate, (a) caught and landed cwt. 18,344 6,115 31,155 9,214 Marketed fresn cwt. 2,176 10,330 5,131 7,254
Soles, caught and landed cwt. 27,456 60,796 23,602 68,662 Marketed-
Used fresh cwt. 12,585 65,874 8,299 43,240 Fresu fillets cv.t. 4,957 57,524 5,101 64,717
Total value marketed - 123,398 - 107,957
Herring, caught and landed cwt. 3,007,267 930,034 2,477,977 874,221 Marketed-
Used fresh cwt. 193,346 252,100 156,670 257,361 Canned (round) cases 76,739 292,712 79,878 317,372 Canned (kippered) cases 4,911 15,129 15,819 69,957 Smoked (round) cut. 28,792 10,104 27,764 72,751 Smoked (boneless) evn. 1,367 10,026 6,077 70,844 Kippered cwt. 6,655 49,847 8,545 71,392 Dry-salted cwt. 203,401 203,401 149,700 142,112 Pickled bbl. 24,318 109,622 3,489 150,772 Used as bait bbl. 215,755 383,831 200,921 349,252 Fertilizer bbl. 177,456 93,313 189,524 71,501 Oil gal. 1,313,337 291,241 1,028,376 154,111 Meal ton 14,427 460,139 11,073 420,271 Scales cwt. 4,194 12,511 2,936 8,039
Total value marketed - 2,263,976 - 2,185,761
Mackerel, caught and landed cwt 239,163 354,258 285,565 315,36: Marketed-
Used fresh cwt 67,010 188,978 62,312 133,511 Fresh fillets cwt. 1,777 22,522 263 1,52. Canned C2SeS SOS 3,696 634 2,59 1 Smoked cwt. 00 300 40 281 Pickled bbl. 39.381 262,764 43,265 208,4 Fillets (salted) bbl. 7,312 117,321 8,631 102,62 1 Used as bait bbl. 9,344 39,859 28,814 111,69 1
Total value marketed - 635,740 - 560,711
Sardines, caught and landed bbl. 159,431 2ll,132 181,450 340,761 Marketed-
Sold fresh and salted bbl. 74,873 67,688 115,624 195,441 Canned cases 423,043 1,455,517 349,557 1,197,68 1
Total value marketed - 1,526,505 - 1,393,12 1
Pilchards caught and landed cwt. 961,485 421,613 1,035,369 452,99' Markéted-
Used fresh cwt. 33 150 19 51 Canned 40,975 110,351 69,473 232,31 Used as bait bbr 1,045 1,090 310 621 Oil gal. 1,707,276 513,906 2,195,850 313,55 1 Meal ton 8,483 277,122 8,891 320,46
Total value marketed - 902,619 - 867,00
Alewives, caught and landed cwt. 73,851 41,600 103,426 60,52 Marketed-
Used fresh cwt. 37,864 29,613 52,129 48,02 Smoked out. 2,98 7 7,408 2,988 7,08 Salted bbl. 11,046 37,832 10,450 59,49
Total value marketed - 71,853 - 114,60
Bass, caught and landed cwt. 158 766 195 1,00 Marketed fresh • cwt. lIS 1,002 195 1,24
(a) Part used in iho production of flan meal and oil.
15

16 FISHERIES STATISTICS
2. Quantity and Value of All Fish Caught and Marketed, Canada, 1937 and 1938-con.
Sea Fisheries
Kind of Fish 1937 1938
Quantity Value Quantity Value
$ $ Perch, caught and landed cwt. 559 3,632 591 3,905
Marketed- Used fresh cwt. 559 3,772 . 549 3,982 Fresh fillet. cwt. _ - 15 90
Total value marketed - 3,772 - 4,072
Rosetish, caught and landed cwt. 970 807 4,779 3,137 Marketed-
Used fresh cwt. 706 1,412 4,357 8,714 Fresh fillets cwt. 88 1,094 141 705
Total value marketed - 2,506 - 9,419
Salmon, caught and landed cwt. 1,722,097 5,674,919 1,765,087 6,749,237 Marketed-
Used fresh cwt. 290,694 2,182,014 241,835 2,056,402 Canned cases 1,509,520 9,268,404 1,708,835 12,274,863 Smoked cwt. 88 2,217 116 2,150 Kippered cwt. 100 1,300 113 1,269 Dry-salted cwt. 108,983 314,853 69,209 179,282 Mild cured cwt. 26,238 440,403 19,684 355,554 Pickled cwt. 248 3,303 1,087 12,305 Roe cwt. 9,360 24,982 8,492 18,411 Used as bait cwt. 237 564 50 123 Oil gal. 169,239 41,590 114,797 22,142 Meal ton 1,845 58.838 1,229 46,148
Total value marketed - 12,338,468 - 14,968,649
Shad, caught and landed cwt. 12,393 32,907 14,810 39,928 Marketed-
Used fresh cwt. 12,164 41,332 13,673 46.479 Salted bbl. 76 632 379 3,680
Total value marketed - 41,964 - 50,159
Smelts, caught and landed cwt. 66,433 323,266 70,226 342,933
Marketed fresh cwt. 66,433 438,823 70,226 480,605
Sturgeon, caught and landed cwt. 152 1,973 251 3,215 Marketed fresh cwt. 152 2,046 251 3,625
['rout, caught and landed cwt. - - 318 1,908 Marketed, canned cases - - 460 2,902
3Iack cod, caught and landed cwt. 13,110 54,011 8,463 31,444 Marketed--
Used fresh cwt. 10,328 60,793 5,887 38,672 Smoked cwt. 1,633 21,912 1,288 16,854 Livers cwt. 298 12,546 397 14,521 Liver oil gal. - - 50 1,250
Total value marketed - 95,251 - 71,297
ing cod, caught and landed cwt. 42,858 238,186 46,516 208,508 Marketed-
Used fre,sh cwt. 42,750 254,172 46,480 248,895 Smoked cwt. 54 729 15 180 Livers cwt. 518 20,916 830 33,661 Liver oil gal. - 31 775
Total value marketed 275,817 - 283,511
lad and Rock cod, caught and landed cwt. 1,801 5,562 6,874 17,471 Marketed-
Used fresh. cwt. 1,801 7,554 6,806 19,242 Smoked cwt. - 34 408 Livers cwt. 11 422 26 436 Liver oil gal. 88 2,200
Total value marketed 7,976 - 22,286

4
8
3
9
o
7
3 1 2
1
1
7 4
1
0
78 51 97 93
19
FISHERIES STATISTICS
2. Quantity and Value of All Fish Caught and Marketed, Canada, 1937 and 1938-con.
17
Sea Fisheries
Kind of Fisn 1937 1938
Quantity Value Quantity Value
$ $
Tuna, caught and landed cwt. 8,978 21,990 5,331 19,212 Marketed-
Used fresh cwt. 8,496 35,558 5,331 22,081 Canned cases 995 5,970 - - Livers cwt 23 345 25 375
Total value marketed - 41,873 - 22,451
Oapelln, Launce and SLisersIdes, caught and landed cwt. 31,876 13,211 35,516 19,441 Marketed fresh cwt. 31.876 15,468 35,516 23,71
Eels, caught and landed cwt. 2,050 11,310 2,501 14,461 Marketed fresh cwt. 2,050 12,745 2,501 16,381
Orayfish, caught and landed cwt. 148,913 39,332 197,110 34,431 Marketed-
Used fresh cwt. 4,420 1,399 49,351 2,981 Livers cwt. 1,789 10,702 9,333 49,27 Oil gal. 134,274 31,017 133,010 20,60 Meal ton 1,068 38,120 1,874 63,80'
Total value marketed - 81,238 - 136,66
Octopus, caught and landed cwt. 202 866 223 92 Marketed fresh cwt. 202 923 223 1 , Or
Oulachons, caught and landed cwt. 120 300 209 71 Marketed fresh cwt. 120 337 209 76
Squid, caught and landed eu-t. 1,308 1,528 2,484 2,54 Used as bait cwt. 1,308 1,897 2,484 3,70
Swordfish, caught and landed cwt. 15,020 170,198 10,929 101,52 Marketed-
Used fresh cwt. 15,020 236,095 10,929 132,17 Livers eu-t. 138 2,070 39 58
Total value marketed - 238,165 132,71
Tom cod, caught and landed eu-t. 9,261 14,757 14,523 37,25 Marketed fresh cwt. 9,264 23,472 14,523 48, 4i
•
Mixed fish, caught and landed (a) cwt. 51,185 54,935 60,819 56,31 (Not including any kinds mentioned elsewhere)• Marketed fresh cwt. 10,110 50,170 10,499 50,1
Abalone, caught and landed bbl. 53 133 - Marketed, canned cases 53 477 - -
Clams, caught and landed cwt. 142,472 114,506 150,528 118,1 1 Marketed-
Used fresh cwt. 74,162 64,558 73,773 63, 0; Canned cases 35,908 168,359 43,292 203,51 Chowder cases 1,893 7,267 5,102 18,9;
Total value marketed - 240,184 - 285,5i
Crabs, caught and landed cwt. 8,696 31,767 9,675 25,3' Marketed-
Used fresh cwt. 5,446 27,352 5,942 21,6 Canned cases 1,564 25,296 2,173 33,7
Total value marketed - 52,648 55,3
Lobsters, caught and landed cwt. 309,950 3,749,618 314,385 2,864,0 Marketed-
In shell cwt. 123,553 2,366,529 118,591 1,864,2 Meat cwt. 1,858 122,476 2,128 140,8 Canned cases 88,581 2,084,120 92, 004 1, 733, 7 Tomalley cases 6,132 60,304 6,046 54,2
Total value marketed - 4,633,429 - 3,793,2
(a) Part used in the production of fish meal and oil.

1
FISHERIES STATISTICS
2. Quantity and Value of All Fish Caught and Marketed, Canada, 1937 and 1938-con.
Sea Fisheries
Bind of Fish 1937 1938
Quantity Value Quantity Value
$ $
Oysters, caught and landed bbl. 24,687 138,751 24,476 127,696 Marketed-
Used fresh bbl. 24,100 174,209 22,862 166,324 Canned cases 587 5,870 1,426 9,296
Total value marketed - 180,079 - 175,620
Quahaugs, caught and landed cwt. 4,564 3,401 6,514 4,617 Marketed-
TJsed fresh cwt. 1,932 1,310 3,112 3.079 Canned cases 1,316 7,907 1,485 8,984
Total value marketed - 9,217 - 12,063
Scallops, caught and landed gal 183,755 279,014 95,686 124,000 Marketed -
Shelled gal 183,695 296,409 95,190 139,359 Canned cases 15 120 115 1,150
Total value marketed - 296,529 - 140,509
Shrimps, caught and landed cwt. 1,212 13,911 1,501 15,333 Marketed-
Used fresh cwt. 6.52 9.670 864 12,431 Canned cases 222 5,760 460 6,554
Total value marketed - 15,430 - 18,955
Fougues and Sounds, pickled or dried cwt. 687 4,970 1,137 6,566
Winkles, caught and landed cwt. 632 1,169 296 591
Marketed fresh cwt. 632 1,169 296 597
Dulse, green cwt. 4,471 4,883 3,013 2,777 Marketed dried cwt. 677 10,460 453 5,171
Seaweed, green cwt. 4,800 530 11,158 1,584 Marketed-
Dried cwt. 60 45 385 3,610 Meal ton 127 5,080 107 6,920 Fertilizer ton 25 150 - -
Total value marketed - 5,275 - 10,530
Fur Seals, caught and landed no. 2,671 12,431 1,367 3,076
Skins marketed no. 2,671 12,431 1,367 3,076
flair Seals, caught and landed no. 17,794 34,299 22,831 49,562 Marketed-
Skins no. 17,794 30,443 22,831 37,115 Oit gal. 75,699 22,978 93,593 16,801
Total value marketed - 53,421 - 53,916
Selugas, caught and landed no. 423 6,345 2 15 Marketed-
Skins no. 423 2,130 2 20 Oil gal. 19,120 4,810 80 24
Total value marketed - 6,940 - 44
Vhales, caught and landed no. 317 220,251 310 164,074 Marketed-
Oil gal. 662,355 197,227 543,378 162,708 Bone meal ton 268 5,896 273 6,006 Fertilizer ton 527 17,128 512 15,360
Total value marketed - 220,251 - 184,074
liscellaneous fish products- Fish oil, n.e s gal. 4,050 1,479 9,480 2,218 Fish meal, n.e s ton 6,562 309,639 5,823 294,532 Fish fertilizer, n.e.s ton 159 1,272 192 1,251 Fish offal. ton 32,678 21,005 14,344 24,886 Fish skins and bones cwt. 21,421 24,690 18,635 21,273 Other products - 59, 723 - 102,215
Cotai Value of Sea Fish- Caught and landed - 17,508,929 - 17,567,670 Marketed - 31,984,047 - 33,774,148
18

FISHERIES STATISTICS
2. Quantity and Value of All Fish Caught and Marketed, Canada, 1937 and 1938-con.
Inland Fisheries
IHnd of Fish 1937 1938
Quantity Value Quantity Value
s 6
Alewives, caught and buded cwt. 1,036 1,845 1,091 1,809
Marketed fresh cwt. 1,036 1,845 1,094 1,809
Bass, caught and landed cwt. 390 4,260 484 4,995
Marketed fresh cwt. 390 4,260 484 4,995
Blue pickerel, caught and landed ou-t. 91,496 718,170 73,171 453,660
Marketed fresh ou-t. 94,496 812,665 73,171 497,564
Carp, caught and landed ou-t. 17,844 57,074 17,556 46,491
Marketed fresh cwt 17,844 62,508 17,556 51,853
Catfish, caught and landed ou-t. 11,519 76,856 10,976 60,623
Marketed fresh cwt 11,519 82,448 10,976 65,654
Eels, caught and landed cM. 18,930 130,783 19,563 110,292
Marketed fresh cwt. 18,930 131,532 19,563 140,818
Fresh Water Drum, caught and landed cwt. 200 561 106 211
Marketed fresh eu-t. 200 836 106 319
Goldeyes, caught and landed cwt. 5,535 31,050 4,530 33,874 Marketed-
TJsed fresh cwt. 2,066 14,243 968 7,366 Smoked eu-t. 2,168 44,609 2,282 53,380
Total value marketed - 58,852 - 60,746
Herring, caught and landed cwt. 50,236 218,114 55,700 207,401
Marketed fresh ou-t. 50,236 292,907 55,700 301,462
Ling, caught and landed cwt. 3,524 3,558 3,603 3,179
Marketed fresh cwt. 3,524 3,664 3,603 3,665
filaskinonge, caught and landed cwt. - - 555 5,740
Marketed fresh cwt. - - 535 5,740
Mind fish, caught and landed cwt. 47,960 241,386 52,118 306,081 (Graylings, bullheads, ouananiche, etc.)
Marketed fresh ou-t. 47,960 273,469 52,118 337,824
linnets, caught and landed eu-t. 20 20 3 3
Marketed fresh eu-t. 20 20 3 5
Perch, caught and landed cwt. 31,672 239,083 43,067 283,913
Marketed fresh cwt. 34,672 273,448 43,067 331,491
Pickerel , caught and landed cwt. 143,020 795,929 128,812 713,228
Mark.eted fresh cwt 143,020 1,043,532 128,812 1,031,863
Pike, caught and landed cwt. 51,320 161,124 62,283 173,335
Marketed fresh cwt 51,320 215,306 62,283 233,182
Salmon, caught and landed eu-t. 2,116 31,751 1,611 23,895
Marketed fresh cwt. 2,116 31,751 1,641 23,895
Saugers, caught and landed cwt 82,676 325,802 95,007 103,963
Marketed fresh cwt. 82,676 377,884 95,007 483,781
Shad, caught and landed eu-t. 5,132 23,621 4,680 20,763 Marketed-
Used fresh cwt 4,382 21,371 4,080 18,963 Salted bbl. 250 2,250 200 1,806
Total value marketed - 23,621 - 20,763
19

Riad of Fish 1938 1937
Inland Fisheries
Quantity Value Quantity Value
Smelts, caught and landed cwt. 910 Marketed fresh cwt. 910
Sturgeon, caught and landed cwt. 6,194 Marketed-
Used fresh cwt. 6,194 Caviar lb. 3,181
Total value marketed -
Suckers , caught and landed cwt. 13,693
Marketed fresh cwt. 13, 693
Tom cod, caught and lauded cwt. -
Marketed fresh cwt. -
Trout, caught and landed cwt. 70,588
Marketed fresh cwt. 70,588
Tullibee, caught and landed cwt. 55,966 Marketed-
Used fresh cwt. 53,015 Smoked cwt. 1,844
Total value marketed -
Whitefish, caught and landed cwt. 173,675 Marketed-
Used fresh cwt. 173,653 Smoked cwt. 14
Total value marketed
Total Value of Inland Fish- Caught and landed Marketed
Total Value of All Fish- Caught and landed Marketed
5,650 5,650
62,229
67,344 3,256
70,600
15,531 21,532
887,440 1,031,740
224,764
271,899 12,389
284,288
1,421,524
1,887,615 274
1,887,889
5,684,158 6,992,247
23,193,087 38,976,294
1,030 5,880
1,030 5,880
7,326 70,479
7,326 83,770
4,203 4,333
- 88,103
23,121 23,488
23,121 33,383
4,290 21,450
4,290 21,450
72,555 854,914
72,555 1,033,390
57,932 215,187
54,850 269,160
1,926 14,676
- 283,836
154,244 1,182,025
154,225 1,650,137
12 210
- 1,650,347
5,261,879 6,718,823
22,829,549 40,492,976
FISHERIES STATISTICS
2. Quantity and Value of All Fish Caught and Marketed, Canada, 1937 and 1938-concluded
Capital Equipment and Employees IN PRIMARY OPERATIONS
Capital.-The capital investment, represented by the vessels, boats, and gear used in the primary operations of catching and landing the fish, had a total value in 1938 of $26,598,944, of which 821,679,805, or 82 per cent, is credited to the sea fisheries, and $4,919,139, or 18 per cent, to the inland fisheries. Com -prised in the total are 41,319 vessels and boats, valued at $14,760,329, and nets, seines, traps and other gear to the value of 811,838,615. Compared with the preceding year, the capital investment of the se,a, fisheries shows a reduction of $203,132, while the value of the equipment used in the inland fisheries increased by $5,697, making a reduction for the equipment of both fisheries, combined, of $197,435.
Employees.-The number of men engaged in fishing during the year was 71,510, comprising 57,034 employed in the sea fisheries, and 14,476 in the inland fisheries. Compared with the preceding year the total number of fishermen shows an increase of 1,529.
IN FISH CANNING AND CURING Capital.-The capital investment of the canning and curing branch of
the fisheries industry rose from $18,130,385 in 1937 to $21,962,498 in 1938. The increase is attributable chiefly to the larger investment in the salmon can-neries. The relation which the capital of each classification bears to the total investment is shown by the following statement of percentages: salmon canneries,
20

21 FISHERIES STATISTICS
53 per cent; fish curing establishments, 24 per cent; sardine and other fish canneries, 10 per cent; lobster canneries, 6 per cent; reduction plants, 4 per cent; freezing plants, 2 per cent; and clam canneries, 1 per cent.
Employees.-The number of persons employed in the establishments during the year was 14,484, compared with 14,044 in the preceding year.
Tables 3 to 6, which follow, contain summaries of capital equipment and employees in the primary operations and in fish canning and curing establish-ments, for Canada as a whole: other tables of the introduction present the information by provinces, while statistics by counties and fishing sub-districts will be found in Part II of the report.
3. Capital Equipment-Primary Operations. Value of Fishing Vessels, Boats, Nets, Traps, Piers and Wharves, etc., Employed in the Canadian Fisheries, 1936, 1937 and 1938
Sea Fisheries
Equipment 1936 1937 1938
Number Value Number Value Number Value
$ $ $ Steam trawlers 3 68,750 3 75,000 3 69,000 Steam fishing vessels 6 150,000 6 150,000 6 150,000 Sailing, gasoline and diesel vessels 1,000 4,170,500 999 4,337,314 1,133 3,960,120 Gasoline and diesel boats 20,155 7,645,067 19,880 7,610,194 19,875 7,486,346 Sail and row boats 15,158 425,278 13,695 384,626 14,518 390,424 Packers, carrying boats and scows 585 1,676,335 456 690,274 425 882,274 Gill nets 71,594 929,595 69,410 855,658 69,584 857,589 Salmon drift nets 13,054 1,146,022 12,543 1,043,442 13,511 1,323,470 Salmon trap nets 949 367,260 959 391,480 987 397,490 Trap nets, other 551 264,860 5119 263,620 639 281,170 Smelt nets 17,289 372,074 15,725 357,650 15,974 366,638 Pound nets 62 8,680 51 7,650 49 7,350 Oulachon nets 18 540 27 810 28 840 Shrimp net,s 25 1,775 28 2,350 23 1975, Salmon purse seines 220 248,500 208 259,200 262 301,200 Salmon drag seines 9 5,800 21 10,750 9 5,350 Seines, other 843 213,575 882 257,675 888 241,425 Weirs 374 299,093 393 319,695 490 380,025 Skates of gear 2,833 52,975 3,654 66,044 3,034 58,475 Tubs of trawl 22,055 288,887 21,770 293,383 22,828 307,172 Small ctrag,gers 14 2,050 13 2,150 15 6,850 Hand lines 72,906 161,034 70,197 174,415 70,629 175,343 Crab traps 7,265 27,225 8,741 33,272 6,778 26,545 Eel traps 395 734 625 5,898 782 1,112 Lobster traps 2,134,762 2,321,774 2,210,517 2,580,096 2,094,070 2,315,970 Lobster pounds 54 69,830 52 67,280 33 65,275 Oyster rakes 1,605 6,423 1,873 5,803 1,879 5,852 Scallop drags 835 23,278 1,025 23,362 662 20,799 Quahaug rakes 184 628 170 583 277 896 Fishing piers and wharves 1,759 665,020 1,753 594,810 1,721 573,675 Freezers and ice houses 620 233,800 715 256,880 727 251,945 Small fish and smoke houses 8,161 701,633 7,405 699,358 7,443 699,473 Other gear - 35,986 - 62,215 - 67,737
Total value - 22,584,981 - 21,882,937 - 21,679,805
Inland Fisheries
Equipment 1936 1937 1938
Number Value Number Value Number Value
$ $ S Fish carriers 27 125,850 27 126,700 27 124,850 Tugs 99 653,450 91 609,633 101 085.010 Gasoline and diesel boats 1,682 888,723 1,575 900,418 1,629 903,126 Skiffs and canoes 3,608 119,972 3,753 109,871 3,602 109,179 Guinda - 1,547,136 - 1,791,202 - 1,793,774 Seines 168 21,533 344 26,986 317 23,319 Trap nets - - 1 700 1 800 Pound nets 1,152 542,628 1,094 555,927 1,112 534,580 Floop nets 1,116 24,929 1,136 27,283 1,462 30,969 Dip and roll nets 97 402 93 1,184 68 298 Nets, other - - 767 22,940 - - Lines 2,876 19,581 1,250 8,377 1.849 13,263 Weirs 919 125,950 6() 700 342 67,500 Eel traps 130 260 639 89,590 260 1,100 Spears 231 1,687 86 603 325 1,396 Fish wheels 9 765 10 850 8 680 Fishing piers and wharves 546 164,943 500 152,373 578 155,252 Freezers and ice houses 915 375,635 855 432,195 940 412,753 Small fish and smoke houses 196 60,125 157 55,910 195 61,290
Total value - 4,673,569 - 4,913,442 - 4,919,139

no.
75
5,201
46,788
594
3,140
DO.
79
5,843
47,161
649
3,302
DO.
8,994
132
4,238
DO.
8,384
102
5,990
57,034 55,798
8,689
128
5,366
no.
3,256
2,553
177
354
307
10
8
no.
2,077
2,305
120
403
2,309
214
346
no.
3,099
2,174
196
427
322
43
9
no.
5,176
4,479
316
DO.
1,789
2,714
138
443
no.
2,949
2,439
268
478
408
34
12
DO.
4,738
5,153
406
921
2,723
212
331
DO.
5,534
5,513
271
728
2,728
148
316
374
2,421
138
308
830
2,631
257
355
22 FISHERIES STATISTICS
4. Employees in Primary Operations, 1936, 1937 and 1938
Sea Fisheries Inland Fisheries
1936 1938 1937 1938 1936 1937
DO. no. Men employed-
On stearn trawlers
On vessels
On boats
On packers, carrying boats and scows
Fishing not in boats
Total
75
5,083
48,948
965
3,300
58,371 13,364 14,183 14,476
5. Capital Equipment (a)-Fish Canning and Curing Establishments, 1936, 1937 and 1938
1936 1937 1938
Establishments
Number Value Number Value Number Value
8 e $
Lobster canneries 304 1,606,073 277 1,660, 901 215 1,220,121
Salmon canneries 68 9,365, 076 72 8,399.825 102 11,615,322
Clam canneries 17 113,892 21 206,056 25 284,709
Sardine and other fish canneries 15 1,690,575 12 1,837,321 11 2,181,350
Fish curing establishments 188 4,606,602 178 4,500,166 172 5,333,983
Freezing plants 15 433,680 19 412,557 18 404,971
Reduction plants (b) 17 798,694 18 1,113,559 18 922,042
Total 624 18,614,592 597 18,130,385 561 21,962,498
(a) Comprises value of land, buildings, and machinery, products and supplies on hand, cash and accounts and bills receivable.
(b) Although most of the fish meal and oil is produced in establishments classified as "reduction plants", there are small quantities recorded among the products of fish curing establishments.
6. Employees in Fish Canning and Curing Establishments 1936, 1937 and 1938
1936 1938 1937
Male Female Total Male Female Total Male Female Total
DO. Persons employed in-
Lobster canneries
Salmon canneries._
Clam canneries
Sardine and other fish canneries
Fish curing establish-ments
Freezing plants
Reduction plants
Total 8,573
2,278
2,960
941
6,665 15,238 7,774 6,270 14,044
2,315
178
319
7,896 6,588 14,484

FISHERIES STATISTICS
Details of Fish Canning and Curing Establishments
Number of Establishments.—The returns of plants engaged in canning and curing operations are classified according to the principal item of production, and the statistics are given separately in the report for each group, except where there are less than three establishments in any one group. The total number of plants in operation in 1938 was 561, divided as follows: lobster canneries, 215.
' salmon canneries, 102; clam canneries, 25; sardine and other
fish canneries, 11; fish curing establishments, 172; freezing pants, 18; and reduc-tion plants, 18. The number of salmon canneries increased from 75 in 1937 to 102 in 1938, but the increase is almost entirely for canneries of small size in the province of Quebec, where the number rose from 33 to 62. The salmon canneries on the Pacific coast are all of large capacity and number 38, compared with 37 in 1937. The number of lobster canneries was 62 less than the number recorded in 1937. The total for all classifications shows a decrease of 36. The processing of fish is an industry that is confined to the provinces bordering on the sea, the plants being located on the shores of bays and estuaries where they are of easy accessibility to the fishermen in making delivery of their catches.
• Employees and Salaries and TVages.—A total of 14,484 employees is recorded by the establishments in the year 1938, an increase over the preceding year of 440. Comprised in the total are 642 salaried employees, 9,092 wage-earners, and 4,750 piece workers. The piece workers are credited chiefly to the salmon canneries of British Columbia, where a large part of the work is done under contra,ct, the contractor engaging and paying his own help and being himself paid according to the quantity of fish packed. Approximately 80 per cent of the number of factory workers recorded in the British Columbia salmon canneries are given under the classification of "piece worker". Following is the method used in arriving at the total number of employees: on the report of each establishment an addition is made of the number of wage-earners shown for each month, and the resulting total is divided by the number of months the plant was in operation during the year. For example, a cannery employs 12 persons in May, 14 in June, 12 in July, and 10 in August—a total of 48. This total is divided by the number of months in operation, viz., 4, and the result gives the number of wage-earners for the establishment as 12. To this number are added the number of salaried employees and the number of piece workers, which are recorded for the year or season and not by months. The final figure will be the number of employees credited to the establishment for the year, and the compilation of these totals provides the number of employees in the industry. Employment in the establishments is greatest during the summer months, with the peak in June. Work in many of the plants, especially the lobster canneries, is intermittent, depending largely on the volume of fish brought in for processing. When a large quantity is received, extra help is required, and employment is given to an additional number of persons, many of them women, for two or three days in the week. No distinction is made in the monthly statistics of employment between full time and part time employees.
The total salary and wage bill for the year was $4,227,955, recorded by classification of employment as follows: for salaried employees, $772,493; for wage-earners, $2,775,425; and for piece workers, 8680,037. Compared with the preceding year the total amount shows an increase of $185,390.
The following table gives the nu_mber of employees, by classification fo employment, and the payments to each group in 1938 and in each of the two preceding years.
23

no. no. no. no. no. no. DO.
1936 1937 1938 Month
Male Female Total Male Female Total Male Female Total
January February March April May June July August September October November December
1,509 1,483 1,564 2,957 5,636 5,996 4,877 4,576 4,471 4,200 3,453 2,342
149 158 147 419
3,078 2,638
989 1,407 1,201
876 385 240
Average 3,589 4,544 3,718 4,692 3,553 862 4,415 955 974
DO.
48 70 80
327 3,405 3,156 1,263
954 877 749 334 195
1,557 1,553 1,644 3,284 9,041 9,152 6,140 5,530 5,348 4,949 3,787 2,537
1,913 1,837 1,836 2,832 5,315 5,669 4,832 4,940 4,636 4,452 3,596 2,764
2,062 1,995 1,983 3,251 8,393 8,307 5,821 6,347 5,837 5,328 3,981 3,004
104 114 166 394
2,692 2,397
885 1,344 1,134
697 273 140
2,010 1,692 1,784 2,892 5,126 5,594 4,875 4,689 4,405 4,042 3,262 2,270
no.
2,114 1,806 1,950 3,286 7,818 7,991 5,760 6,033 5,539 4,739 3,535 2,410
24 FISHERIES STATISTICS
7. Employees in Fish Canning and Curing Establishments in 1936, 1937 and 1938 - Number and Salaries and Wages
Employees Employees Total of Year on on Piece-Workers and of Salaries
Salaries Wages and Wages
„ no. s no. s no. $ no. s 1936 558 734,678 10,073 2,544,903 4,607 724,269 15,238 4,003,850 1937 602 722,651 9,671 2,632,120 3,771 687,794 14,044 4,042,565 1938 642 772,493 9,092 2,775,425 4,750 680,037 14,484 4,227,955
Wage-earners by Months.-Employment in the industry as a whole is at its height in the months of May and June, being influenced by lobster canning operations, which are confined mainly to these two months. Work is found in the salmon canneries from May to October, while in many of the fish curing establishments and clam and sardine canneries, employment is given during the entire year. The following table presents the statistics of employment of wage-earners by months in the years 1936 to 1938.
8. Wage-earners in Fish Canning and Cur'ing Establishments-Number on Pay Roll each month, 1936, 1937 and 1938 (a)
(a) Exclusive of piece workers
Materials Used.-The quantity of fish absorbed by the plants during the year 1938 was 7,826,520 cwt., or 79 per cent of the total catch for the sea fisheries of the Dominion. This compares with a total of 7,431,030 cwt. used, and a relation to catch of 75 per cent, in the preceding year. The remainder of the catch is marketed directly by the fishermen, either as fresh or domestically prepared.
The quantities and values of the fish and other kinds of materials used will be found, for the years 1936 to 1938, in the following table.
9. Quantity and Value of Materials Used in Fish Canning and Curing Establishments, 1936, 1937 and 1938
1936 1937 1938 Materials
Quantity - Value Quantity Value Quantity Wile
$ s $
Fish cwt 7,786,296 11,916,080 7,431,030 12,179,219 7,826,520 12,589,724 Edibhpoils. gal. 178,208 137,144 182,171 133,998 217,308 104,043 Salt cwt 535,326 256,651 406,340 208,510 381,461 206,797 Containers - 3,672,437 - 3,353,174 - 3,728,643 Other materials - 477,626 - 443,880 - 452,893
Total - 16,459,938 - 16,318,781 - 17,082,060

1936 1937 1938
Description of
establishment Fish
marketed for con-
sumption fresh
Fish canned, cured or othernise prepared
Fish marketed for con-
sumption fresh
Fish canned, cured or othermise prepared
Fish marketed for con-
sumption fresh
Fish canned, cureior otherwise prepared
Total value
Total value
Total value
Lobster canneries Salmon canneries Clam canneries Sardine and other fish
canneries Fish curing establish-
ments Freezing plants Reduction plants
956,073 663,453
38
115,442
4,142,843 546,326
5,899
2,395,633 12,302,585
91,046
1,916,458
2,533,866 40,966
974,073
3,351,706 12,966,038
91,084
2,031,900
6,676,709 587,292 960,072
1,082,704 590,377
1,355
108,399
4,576,639 689,759
6,808
2,300,802 10,470,591
199,362
2,083,378
2,558,096 51,495
1,368,860
3,353,506 11,060,968
200,717
2,191,777
7,134,735 741,254
1,375,668
4,406,120 513,386
1,628
1,939,391 13,251,902
269,060
2,211,540
3,197,870 45,242
981,806
2,370,986 13,839,691
270,021
2,316,456
7,603,990 558,628 983,434
Total 6,430,174 20,251,627 24,684,801 7,056,041 19,032,584 26,088,625 6,052,397 21,896,811 27,949,208
437,567 587,789
961
104,916
FISHERIES STATISTICS 25
Production.-The output of the establishments in 1938 had a total value of $27,949,208, of which the amount of $21,896,811 is credited to the canned, cured or otherwise prepared product, and $6,052,397 to the fish marketed for consumption fresh. The total value shows an increase over the preceding year of $1,860,583, or 7 per cent. To the total value in 1938 the several classifica-tions contributed as follows: salmon canneries, 50 per cent; fish curing establish-ments, 27 per cent; lobster canneries, 8 per cent; sardine and other fish canneries, 8 per cent; reduction plants, 4 per cent; freezing plants, 2 per cent; and clam canneries, 1 per cent. British Columbia, with its large salmon canning industry, occupies first place among the provinces with respect to total value of output, and second is Nova Scotia, dependent mainly on its freezing plants and lobster canneries. The position of each province in relation to the total for the Dominion, is shown by the following statement of percentages: British Columbia, 64 per cent; Nova Scotia, 23 per cent; New Brunswick, 9 per cent; and Quebec and Prince Edward Island, each 2 per cent. The value of production of the establishments in 1938 represents 83 per cent of the total marketed value of the sea fisheries for the year. The remainder-17 per cent-is marketed by the fishermen, directly, either as domestically prepared or for consumption fresh.
The following table gives for each classification of establishment, the value of output, divided between that sold for consumption fresh and the prepared product, in the years 1936 to 1938.
10. Value of Production of Fish Canning and Curing Establishments, 1936, 1937 and 1938
General Tables.-A section of the general tabular matter of the report is devoted to the statistics of fish canning and curing establishments, and in this section information regarding capital, employees, salaries and wages, value of production, and other phases, which has been briefly summarized in the fore-going paragraphs, is given in detail, by provinces and by counties or districts.
Review of the Fisheries by Provinces
The following tables (11-17) show by provinces: the total value of the fisheries; the quantity caught and landed and the value marketed of the chief commercial fishes; the quantity and value of all fish caught and landed and marketed; the total values for counties or districts of sea fish caught and landed and marketed; the quantity of sea fish taken offshore; the capital equipment; and the number of employees.

1938 1936 1937 1935 1934
Increase or
decrease 1938
compared vdth 1937
Inc. ± Dec. -
Hind of Fish
26 FISHERIES STATISTICS
11. Value of the Fisheries by Provinces, 1934-1938, in Order of Value, 1938
Increase or
decrease Province 1934 1935 1936 1937 1938 1938
compared ndth 1937
Inc.1-Dec.-
$ î $ $ $ $
Brithila Columbia 15,234,335 15,169,529 17,231,634 16,155,439 18,672,750 A- 2,517,311 Manna Scotia 7,673,865 7,852,899 8,905,268 9,229,834 8,804,231 - 425,603 NewBrunswick 3,679,970 3,949,615 4,399,735 4,447,688 3,996,064 - 451,624 Ontario 2,218,550 2,852,007 3,209,422 3,615,666 3,353,775 - 261,891 Quebec 2,306,517 1,947,259 2,108,404 1,892,036 1,957,279 1- 65,243 Manitoba 1,465,358 1,258,335 1,667,371 1,796,012 1,811,124 1- 15,112 PrinceEdward Island 963,926 899,685 953,029 870,299 930,874 -1- 60,575 Alberta 245,405 225,741 309,882 433,354 492,943 1- 59,589 Saskatchewan 219,772 252,059 367,025 527,199 468,646 - 58,553 YulconTerritory 14,625 20,725 13,385 8,767 5,290 - 3,477
Total 34,022,323 34,427,851 39,165,055 38,976,294 40,492,976 -I- 1,516,682
12. Quantity (a) and Value (b) of the Chief Commercial Fishes by Provinces, 1934-1938
Prince Edward Island
Lobsters cwt, 76,582 63,876 59,286 58,238 71,213 1- 12,975
$ 674,186 605,107 614,789 538,792 606,134 -E 67,342
Cod cwt 46,423 45,451 62,120 67,504 68,425 -E 921
S 84,445 85,269 103,867 88,900 76,415 - 12,485
Herring cwt 48,525 31,525 56,498 64,928 56,056 - 8,872
$ 53,872 44,502 66,987 66,964 57,728 - 9,236
Sraelts cwt. 8,238 10,015 11,843 8,900 9,608 + 708
$ 40,360 49,560 53,896 40,856 50,725 A- 9,869
Flake ancicusk cwt. 15,448 18,739 25,597 38,237 49,155 1- 10,918
$ 17,817 16,657 25,365 33,026 46,100 1- 13,074
Nova Scotla
Cod cwt 1,006,673 924,391 1,079,328 1,093,965 1,192,438 -E 98,473
$ 2,068,566 1,809,273 2,341,724 2,404,452 2,496,631 1- 92,179
Inbsters ewt. 184,590 176,836 145,091 158,961 155,405 - 3,556
5 2,487,633 2,732,872 2,570,274 2,757,880 2,282,169 - 475,711
Haddock 41,506 356,342 391,848 385,047 383,546 -.1,501
s 1,042,361 1,104,133 1,263,161 1,282,023 1,320,345 1- 38,322
Halibut cwt 24,254 29,035 31,044 31,301 39,54 -E 8,243
$ 292,695 338,017 388,461 392,335 499,175 -I- . 106,840
Mackerel evrt 143,782 110,820 190,616 176,032 227,96 1- 51,928
$ 330,805 213,718 384,499 455,803 447,591 - ' 18,242
Herring cwt 194,678 219,009 226,704 201,214 255,654 1- 54,440
5 301,204 351,998 366,815 342,426 407,146 ÷ 64,720
Hake and cusk ce-t. 154,357 115,233 141,053 144,289 165,870 ± 21,581
s 173,081 162,585 243,374 210,653 195,34 - 15,304
Scallops gal. 73,136 126,371 163,305 180,855 •92,00 - -, 88,855
• s 137,656 196,808 322,537 291,225 135,46 - 155,765
Swordfish cwt 14,091 22,339 17,853 15,020 10,92 - 4,091
s 176,640 264,097 230,798 238,165 132,763 - 105,402 •
Pollock cwt. 61,889 49,990 75,210 106,485 81,89 - 24,593 • $ 71,339 53,732 79,511 102,005 93,76 - 8,244
(a) Quantity caught. (b) Value marketed.

Increase or
decrease Kind of Iqsh 1034 1935 1936 1937 1938 1938
conapared with 1937
Inc. HE Dec. -
New Brunswick
36,868 399,474
19,221 261,744
129,514 222,171
55,919 94,580
12,369 76,512
37,256 49,240
8,273 44,870
Quebec
Ontario
42,986 193,439
15,870 131,720
(a) Quantity caught. (b) Value marketed.
27 FISHERIES STATISTICS
12. Quan.tity (a) and Value (b) of the Chief Commercial Fishes by Provinces 1934-1938-con.
21,797 Sardines ... bbL
lobsters cmt.
Henring cwt.
Snaelts cwt.
Salmon ... cwt.
Cod cwt.
Clams cwt.
Oysters
Alewives cat.
191,155 1,038,189
187,499 1,335,279
246,368 1,597,192
158,842 1,525,602
180,639 1,389,195 - 136,407
- 4,112 - 367,390
- 25,450 -F 182,730
889 13,701
54,831 818,699
56,499 916,850
72,586 1,089,902
65,073 812,045
68,474 721,612
480,338 508,150
521.620 506,562
452,765 443,739
427,315 626,469
457,225 463,512
52,739 429,840
63,875 478,853
42,720 295,290
43,609 308,991
- 2,031 - 2,746
16,241 261,740
14,210 258,994
16,562 243,554
17,279 256,338
- 13,304 - 5,047
115,987 172,369
102,683 167,322
149,848 197,714
131,477 178,667
- 16,083 - 19,805
1- 823
1- 1,025
16,808
1- 24,215
72,002 114,475
59,464 70,251
62,462 71,614
8,371 47,294
11,54 75,48
9,109 58,508
44,149 52,015
60,957 76,230
48,969 64,894
61,809 66,606
48,003 51,327
HE 87,978 95,493
11- 51,444 - 8,830
231,864 431,557
319,842 527,050
Cod cart
Herrhag ctvt
Lobsters cwt.
Salmon cwt
Eels cwt
Mackerel cat.
Smelts cwt
Pickerel cat. î
Sturgeon cwt.
Pike cwt.
402,760 609,423
518,638 909,300
418,950 681,556
367,265 281,381
418,708 272,551
295,650 244,339
283,948 300,333
352,323 251,733
872 64,451
1,688
1- 40,739
1- 293 10,590
- 2,670 - 36,450
20,165 247,755
19,293 183,304
24,426 222,064
35,747 295,900
22,397 281,515
11,167 114,597
12,855 155,336
11,267 116,058
11,599 96,884
10,376 116,009
18,450 128,185
18,743 138,775
22,628 149,216
21,786 143,222
22,643 145,016
41,840 104,768
39,161 66,309
35,640 59,300
16,164 27,263
28,838 53,956
2,055 Jr . 13,453
- 105 - 7,420
1- 139 862
- SO 605
8,466 47,962
10,521 61,415
0,489 41,021
10,611 49,313
7,569 48,533
4,475 47,730
4,674 53,584
4,560 55,150
4,521 52,170
4,705 53,387
4,435 44,120
4,574 44,982
5,194 54,907
5,170 54,478
5,113 55,929
5,275 44,045
5,19 5,186 42,889
5,526 44,745
5,482 44,467 44,65
56(1 21,164
60,991 945,360
60,405 924,196
62,563 738,243
64,587 768,586
liout cat
Whitefish cwt.
Inuepickerel cat.
Herring cat
Perch cwt
Pickerel cwt
Tullibee cat
52,952 555,996
- 5,708 - 84,477
49,477 732,261
55,185 816,738
54,783 664,789
57,903 810,642
49,230 595,663
- 21,325 - 315,101
1- 5,494 1- 27,165
1- 9,277 -F 69,190
-E 1,765 1- 33,682
- 1,874 - 30,920
73,171 497,564
94,496 812,665
51,230 302,259
68,995 614,055
24,321 116,741
47,030 268,072
41,536 240,907
25,291 88,520
28,761 100,664
29,779 235,256
20,502 166,066
60,397 332,185
60,185 294,907
23,128 217,404
21,363 183,722
24,319 199,417
23,932 224,961
22,921 160,447
7,598 125,369
9,472 156,289
10,710 108,171
9,202 92,941
11,052 93,942

1936 1938 1937 1935 1934
Increase or
decrease 1938
compared with 1937
Inc. Dec. -
Içind of Fish
28 FISHERIES STATISTICS 12. Quantity (a) and Value (b) of the Chief Commercial Fishes by Provinces,
1934-1938-concluded
Manitoba
Pickerel cwt 88,448 72,183 105,054 104,095 90,662 - 13,433
s 553,504 498,958 757,243 715,187 695,264 - 19,923
Saugers csvt. 48,695 35,044 47,711 82,676 95,007 1- 12,331
5 242,889 155,975 263,579 377,884 488,786 1- 110,902
Whitefish cwt 48,968 37,878 21,275 32,301 30,081 - 2,220
$ 422,760 376,121 219,504 373,383 269,134 - 104,249
Tidlibee cwt 29,158 22,128 38,331 16,936 18,050 1- 1,114
s 102,453 95,939 160,930 69,204 89,918 i- 20,714
Pike cait 10,492 13,996 24,332 23,984 33,179 -1- 9,195
S 31,489 50,313 98,073 97,851 88,961 - 8,890
Goldeyes cwt. 3,253 3,283 5,845 5,462 4,490 - 972
$ 46,736 37,256 49,880 57,980 60,098 1-. 2,118
Perch cwt 6,108 4,533 9,340 7,829 6,641 - 1,188
$ 54,518 28,429 95,868 65,237 58,041 - 7,196
Saskatchewan
Wlfitefish csvt. 25,305 33,202 38,951 54,725 39,904 - 14,821
$ 162,323 187,949 251,012 352,080 270,185 - 81,895
Trout clvt. 4,861 2,759 6,348 7,559 10,149 -F. 2,590
$ 27,894 19,422 57,077 68,627 92,713 1- 24,086
Tullibee cvet. 1,752 2,216 4,240 15,028 17,385 -E 2,357
5 5,262 7,033 10,693 34,565 34,504 - 61
Pickerel cvrt 1,921 3,012 4,060 6,428 5,085 - 1,343
S 10,291 15,059 20,538 34,070 29,392 - 4,678
Alberta
Whitefish evet. 17,800 17,508 22,395 27,836 31,286 1- 3,450
S 148,364 146,113 207,322 312,627 350,467 -1- 37,840
Pike csvt. 7,687 9,762 8,634 6,352 8,047 1- 1,695
$ 19,040 17,487 18,900 20,494 42,794 + 22,300
Pickerel cwt. 9,465 5,316 7,984 6,462 5,252 - 1,210
$ 66,803 34,416 53,832 54,681 40,881 - 13,800
Tulfibee meet 2,114 4,667 7,492 14,530 14,899 -F 369
$ 3,327 14,665 11,900 24,230 34,045 1- 9,815
British Columbia
Salmon ... csvt. 1,659,900 1,789,431 1,995,499 1,691,736 1.734.664 -1- 42,928 . 5 12,402,042 12,099,275 13,387,344 11,907,905 14,491,285 -E 2,583,280
Halibut csvt. 97,681 101,927 105,918 117,212 120,247 1- 3,035
5 833,829 940,862 1,039,879 1,190,056 1,272,385 -E 82,329
Pilchards cwt. 860,103 911,411 889,037 961,485 1,085,269 .1- 73,884
$ 549,910 670,328 667,313 902,619 867,007 - 35,612
Iferrhig cwt. 820,362 1,008,507 1,620,625 1,929,795 1,328,913 - 600,882
5 628,982 580,031 1,142,397 1,181,466 855,265 - 326,201
Iàngcod cwt. 47,806 62,841 68,932 42,858 46,516 -1.- 3,658
$ 281,644 326,029 392,147 275,817 283,511 -1. 7,694
Clams esvt. 17,962 35,804 51,446 46,078 76,633 -1- 80,555
$ 33,402 61,886 88,422 95,371 162,508 1- 67,137
Grayfish cwt. 117,020 76,800 116,140 113,220 159,690 -1- 46,470
5 64,715 46,668 69,719 66,790 113,190 1- 46,400
Black cod csvt. 6,391 9,698 7,196 13,410 8,463 - 4,947
$ 44,057 65,862 53,497 95,251 71,297 - 23,954
Yukon Territory
Salmon cwt. 300 520 510 412 129 - 283
$ 6 , 000 10,400 10,200 6,438 2,073 - 4,365
Whitefish mt. Ice 80 99 83 98 1- 15
$ 2, 00e 1,600 1,980 1,401 1,647 -F. 246
Trout me. 170 200 49 40 102 -F. 62
$ 3,400 4,000 735 628 1,476 4- 848
(a) Quantity caught. b) Value marketed.

4
8 2
FISHERIES STATISTICS
13. Quantity and Value by Provinces of All Fish Caught and Marketed during the year 1938
Sea Fisheries
Prince Edward Nova Scotia New British Island Brunswick (a) Quebec (a) Columbia
Kind of Fish
Quan- Value Qum' Value Quan- Value Quan- Value Quail- Value tity tity tity tity tity
$ $. $ 6 8
Cod, caught and landed cwt. 68,425 49,880 1,192,438 1,507,421 102,683 103,548 319,842 429,008 18,63'5 45,205
Marketed- Used fresh cwt. 12,396 17,795 52,550 161,394 11,814 19,530 19,768 41,798 6,140 23,873 Fresh fillets cwt. - - 82,206 699,774 260 1,637 7,401 53,632 4,251 42,140 Green-salted cwt. 21,552 54,144 83,617 253,734 16,863 52,451 57,183 154,975 - - Canned cases - - 563 2,477 - - - - - - Smoked cwt. - - 371 2,608 - - - - 105 1,056 Smoked fillets cwt. - - 55,260 475,593 54 428 524 3,744 - - Dried cwt. 215 1,275 149,352 602,04' 18,243 90,819 52,758 248,059 - - Boneless cwt. 140 1,120 29,828 242,178 205 1,699 967 7,084 - - Livers cwt. - - - - - - - - 150 756 Liver meal ton - - 3 160 - - - - - - Liver oil, medicinal gal. 1,989 1,352 46,352 24,322 391 235 13,882 9,758 - - Oil gal. 2,888 729 76,153 31,846 1,605 323 28,474 7,800 - -
Total value marketed. - 76,415 - 2,496,631 - 167,322 - 527,050 - 67,811
Haddock, caught and landed cv.-t . 386 636 383,516 615,963 9,172 18,299 485 616 - -
Marketed- Used fresh cwt. 386 940 97,995 366,715 7,781 17,499 311 739 - - Fresh fillets cwt. - 67,583 653,039 52 33 - - - - Canned (includes
chicken haddies) • (b) cases - - 17,385 68,681 4,711 20,143 - - - -
Smoked cwt. - 24368 199,575 160 1,78 - - - - Smol4ed fillets cwt.- - 2,460 20,006 - - - - - - Green-salted cwt. - - 1,167 2,245 3 - -
Dried cwt. - - 1,609 4,657 28 5 - 58 147 - Boneless cwt. - - 678 3,429 - - - - - Roe cwt. - - 185 1,998 - - - - -
Total value marketed. - 940 - 1,320,345 - 39,82 - 886 - -
Hake and cusk, caught and landed cwt. 49,155 19,747 165,870 85,999 45,698 23,913 1,133 641 42 9
Marketed- Used fresh cwt. 11,189 12,060 22,575 21,799 18,217 13,469 498 866 42 10 Fresh fillets cwt. - - 3,489 20,840 202 1,358 60 240 - - Ca.nned cases - - 9,119 37,492 - - - - Green-salted cwt. 16,424 30,463 18,706 33,871 5,877 11,897 172 456 - - Smoked cwt. - - 96 450 - - - - Smoked fillets cwt. - - 3,084 20,063 170 1,360 10 4 - - Dried cwt. 1,146 3,497 18,945 51,131 2,928 7,965 27 10 - - Boneless cwt. 15 60 1,744 9,673 - - - - - - Hake oil gal. - - - - 2,937 819 - - - -
Total value marketed.. - 46,100 - 195,349 - 36,898 - 1,71 - 10
Pollock, caught and landed cwt. - - 81,892 43,695 19,412 13,403 - - - -
Marketed- Used fresh cwt. - - 9,982 23,092 2,447 2,005 - - - - Fresh fillets cwt. - - 93 516 806 603 - - - - Green-salted cwt. - - 9,175 18,685 2,169 5,579 - - - - Smoked cwt. - - 4 19 - - - - - Dried cwt. - - 17,729 51,189 3,413 12,939 - - - - Boneless cwt. - - 23 138 - - - - - Oil gal. - - 400 120 690 13 - - - -
Total value marketed. - - - 93,761 - 21,25 - - -
Catfish, caught and landed cwt. - - 9,336 1,631 - - - - - -
Marketed- Used fresh cwt - - 1,134 3 - ,306 - - - - - Fresh fillets cwt. - - 1,072 7,859 - - - - - -
Total value marketed. - - - - 11,165 - - - - -
Whiting, caught and landed cwt. - - - - - - - - 20 5
Marketed fresh cwt. - - - - - - - - 20 E
(a) See also Inland Fisher'es. (b) Chicken haddies contain cod, haddock and hake.
29

30 FISHERIES STATISTICS
13. Quantity and Value by Provinces of All Fish Caught and Marketed during the year 1938-con.
Sea Fisheries
Prince Edward New British
Nova Scotia Ouebec (a) Island Brunswick (a) - Columbia Kind of Fish
Quail" Value Quail' Value Qum" Value Quan- Value Quan. Value
tity tity tity tity tity
s s s s $
Halibut, caught and hnded cwt. _ - 39,544 362,203 76 808 2,673 16,681 120,247 840,667 Marketed- Used fresh cwt. - - 29,637 344,027 76 896 2,636 16,803 120,247 1,041,165 Fresh fillets ewt - - 6,983 127,209 - - - - - Canned cases - - 91 637 - - 37 185 - Livers cwt - - 676 27,302 - - - - 3,049 155,420 Liver oil gal. - - - - - - - - 750 18,750 Viscera oil gal. - - - - - - - 815 57,050
Total value marketed.. - - - 499,175 - 896 - 16,988 - 1,272,385
Flounders, Brill, Plaice, caught and landed cwt. 582 457 10,459 12,309 2,579 3,001 65 105 2,176 5,759
Marketed- Used fresh cwt. 582 582 4,803 20,126 2,579 4,456 65 125 2,176 6,767 Fresh fillets cwt. - - 1,762 26,342 - - - - -
Total value marketed.. - 582 - 46,468 - 4,456 - 125 - 6,787
Skate, caught and bnded cwt. - - (b)33,262 7,035 199 137 - 694 2,072
Marketed fresh cwt. - - 4,238 4,448 199 339 - 694 2,467
• Soles, caught and
landed cwt. - - 16,941 30,304 - - 107 107 6,554 38,251 Marketed-
Used fresh cwt. - - 2,802 13,417 - - 62 144 5,435 29,679 Fresh fillets cwt. - - 4,713 56,561 - 15 156 373 8,000
Total value marketed.. - - - 69,978 - - 300 - 37,679
Herring, caught and landed . cwt. 56,056 29,174 255,654 167,807 427,315 192,939 410,039 168,117 ,328,913 316,184
Marketed- Used fresh cwt. 4,686 5,085 62,108 105,086 35,437 32,291 49,584 83,591 34,855 61,318 Canned (round) cases 35 131 - - 56,487 241,336 - - 23,356 75,908 Canned (kippered) cases - 990 7,920 14,809 61,897 - - 20 140 Smoked (round).- cwt. - 426 1,353 8,880 24,821 18,406 46,178 52 405 Smoked (boneless). cwt. - - 3 44 6,074 70,800 - - - Kippered ewt - - 5,580 48,260 10 50 - - 2,955 23,083 Dry-salted ... cwt. - - - - - - 149,700 142,115 Fielded bbl. 643 3,011 20,992 92,280 3,076 17,429 9,758 37,762 20 296 Used as bail bbl. 24,563 49,426 61,273 133,053 48,869 79,710 46,899 43,500 19,317 43,564 Fertilizer bbl. 75 75 - - 98,111 43,301 91,338 28,130 - Oil gal. - - 7,020 500 92,198 15,225 - - 929,158 138,386 Meal ton - - 414 14,000 1,035 36,225 - - 9,624 370,052 Scales cwt. - - 1,550 4,650 1,386 3,384 - - -
Total value marketed.. - 57,728 - 407,146 - 626,469 - 239,161 - 855,265
Iackerel, caught and landed cwt 10,559 16,146 227,960 274,545 7,885 12,770 39,161 41,908 - -
Marketed- Used fresh evrt 5,715 16,771 45,230 88,705 7,546 20,696 3,821 7,339 - - Fresh fillets cwt - - 263 1,524 - - - - - Canned cases 436 1,888 65 271 130 423 3 18 - - Smoked .. cwt. - - 40 280 - - - - - - Pickled bbl. 180 1,470 34,426 170,164 66 699 8,596 36,144 - - Fillets (salted) bbl. 107 1,326 6,263 79,024 - - 2,261 22,278 - - Used as bait bbl. 1,775 3,550 26,749 107,593 25 25 265 530 - -
Total value marketed.. - 25,003 - 447,561 - 21,843 - 66,309 - -
ardines caught and landed bbl. - - 3,770 3,770 180,639 336,826 41 164 - -
Marketed- Sold fresh and salt-
ed bbl. - - 3,770 3,770 111,813 191,506 41 164 - - Canned cases - - - 349,887 1,197,689 - - - -
Total value marketed.. - - 3,770 - 1.389,195 - 184 - -
(a) See also Inland Fisheries. (b) Part used in the production of fish meal and oil.

FISHERLES STATISTICS
13. Quantity and Value by Provinces of All Fish Caught and Marketed during the year 1938-con.
Sea Fisheries
31
Prince Edward New British Island Nova Scotia Brunswick (a) Quebec (a) Columbia
Hind of Fish
Quan- Value Quail" Value Quail" Value Quan" Value Quan" Value tity tity tity tity tity
6 6 I I I
Pilchards, caught and landed cwt. - - - - - - - - 1,035,369 452,999
Marketed- Used fresh cat. - - - - - - - 19 50 Canned cases - - - - - - - 69,473 232,311 Used as bait bbl. - - - - - - - - 310 620 Oil gal. - - - - - - - - 2,195,850 313,559 Meal ton - - - - - - - - 8,891 320,467
Total value marketed.. - - - - - - - 867,007
Alewives, caught and landed cwt. 4,810 2,520 38,723 25,499 59,863 32,502 - - - -
Marketed- Used fresh cwt. 4,690 4,690 26,572 22,755 20,867 20,583 - - - - Smoked cwt. - 2,496 4,932 472 2,150 - - - - Salted bbl. 50 200 2,605 7,607 13,835 51,688 - - - -
Total value marketed.. - 4,890 - 35,294 - 74,421 - - - -
Bass, caught and landed csvt. - 163 930 - - - - 32 ri
Marketed fresh cwt. - - 163 1,15S - - - 32 SI
Perch, caught and landed ms-t. - - 5 10 - - 45 68 511 3,82:
Marketed- Used fresh cwt. - - 5 40 - - - 544 3,941 Fresh fillets cwt. - - - - - _ 15 90 - -
Total value marketed.. - - - 40 - - 90 - 3,941
Boselish, caught and landed cwt. - - 4,779 3,137 - - - - -
Marketed- - Used fresh cwt. - - 4,357 8,714 - - - - -
Fresh fillets cat. - - 141 705 - - - - Total value marketed.. - - - 9,419 - - - - -
Saloon, caught and landed cwt. 16 160 4,851 69,518 13,778 195,623 11,775 152,526 1,731,664 6,331,41
Marketed- Used fresh cwt. 16 240 4,664 81,806 14,710 250,572 9,691 133,268 212,754 1,590.51 Canned cases - - 271 2,81 - - 734 4,588 1,707,830 12,267,46 Smoked cwt. - - - - - - 90 1,800 26 35 Kippered cat. - - - - - - - 113 1,26 Dry-salted cat. - - - - - - - - 69,209 179,28 Mild cured cwt. - - - - - - - 19,684 355,55 Pickled cwt. - - - - - 285 2,280 802 10,02 Roe cwt. - - - - - - - 8,492 18,41 Used as bait ca t. - - - - - - - 50 12 Oil gal. - - - - - - - - 114,797 22,14 Neal ton - - - - - - - - 1,229 46,14
Total value marketed. - 240 - 84,616 - 250,572 - 141,936 - 14,491,28
Shad, caught and landed cart. - - 4,296 11,963 10,437 27,638 77 327 - -
Marketed- Used fresh cwt - - 3,387 15,244 10,209 30.764 77 471 - - Salted bbl. - - 303 2,360 76 1,320 - - -
Total value marketed. - - - 17,604 - 32,084 - 471 - -
Smelts, caught and landed cwt. 9,408 34,125 6,781 39,702 43,609 209,468 9,491 53,207 73; 6,43
Marketed fresh ca t. 9,608 50,725 6,417 58,470 44,567 308,991 8,897 55,535 737 6,88
Sturgeon, caught and landed cwt. - - - - - 64 • 612 187 2,60
Marketed friv1h. cwt. - - - - - - 64 612 187 3.01
4
2 8
(a) See also Inland Fisheries.

FISHERIES STATISTICS
13. Quantity and Value by Provinces of All Fish Caught and Marketed during the year 1938-con.
Sea Fisheries
Prince Edward New British Nova Scotia Quebec (a)
Island Brunswick (a) Columbia Kind of Fish
Qum' Value Quan" Value Quan" Value Quan- yaw, Quan- ' Value
tity tity tity tity ° tity
$ $ $ $ $
Trout, caught and landed cwt. - - - - - 318 1,908 - -
Marketed, canned cases - - - - - - 460 2,902 - -
Black cod, caught and landed cwt. - - - - - - - 8,463 34,411
Marketed- Tised fresh cwt. - - - - - - - - 5,887 38,672 Smoked cat. - - - - - - - 1,288 16,854 Livers cwt. - - - - - - - 397 14,521 Liver oil gal. - - - - - - - 50 1,250
Total value marketed.. - - - - - - - - 71,297
Ling cod, caught and landed cwt - - - - - - - 46,516 208,508
Marketed- Used fresh cwt. - - - - - - - 46,486 248,895 Smoked cwt - - - - - - - 15 ISO Livers cw-t, - - - - - - - - 830 33,661 Liver oil gal. - - - - - - 31 775
Total value marketed.. - - - - - - - - 283,511
Red and Rock cod,
caught and landed cwt. _ - - - - - - 6,874 17,474 Marketed-
Used fresh cwt - - - - - - - - 6,506 19,242 Smoked cwt. - - - - - - - 34 408 Livers cwt - - - - - - - 26 436 Liver oil.... ..... gal. _ - - - - - - 88 2,200
Total value marketed.. - - - - - - - - - 22,286
runa, caught and landed cwt. - - 5,331 19,212 - - - - - -
Marketed- Used fresh cwt. - - 5,331 22,081 - - - - - - Livers csvt. - - 25 375 - - - - - -
Total value marketed.. - - - 22,456 - - - - - -
Capelin, Launce and Silversides, caught and landed cwt. 3,078 2,682 - - 1,000 250 31,400 16,072 38 444
Marketed fresh cwt. 3,078 3,078 - - 1,000 250 31,400 19,960 38 444
Eels, caught and landed cwt. 214 806 1,711 9,079 208 952 368 3,e30 - -
Marketed fresh cwt. 214 919 1,711 10,784 208 1,047 368 3,630 - -
Grayfish, caught and landed cwt. - - 37,120 7,344 - - - - 159,690 27,087
Marketed- Used fresh cwt. - - 3,400 670 - - - - 45,951 2,310 Livers cwt. - - - - - - - 9,333 49,271 Oil gal. - - 19,650 1,800 - - - - 113,360 18,802 Meal ton - - 612 21,000 - - - - 1,262 42,807
Total value marketed.. - - - 23,470 - - - - - 113,190
Octopus, caught and landed cwt. - - - - - - - 223 927
Marketed fresh cwt. - - - - - - - 223 1,016
)ulachons, caught and landed cwt. - - - - - - - 209 716
Marketed fresh cwt. - - - - - - - - 209 760
;quid, caught and landed cwt. - - 2,216 2,285 - - 268 258 - -
Used as bait cwt. - - 2.216 2.446 - - 260 258 - -
(a) See also Inland Fisheries.
32
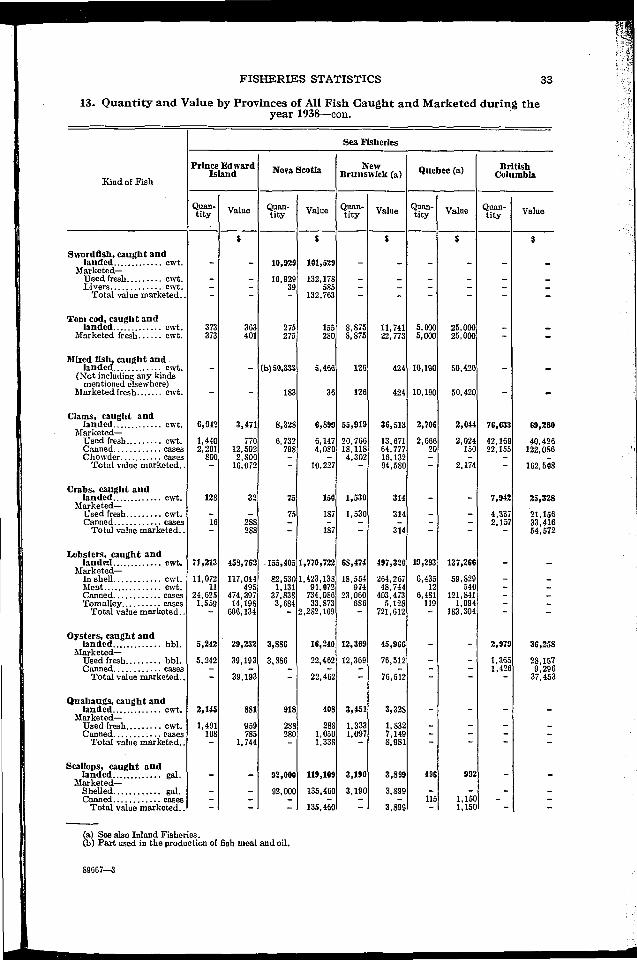
FISHERIES STATISTICS
13. Quantity and Value by Provinces of All Fish Caught and Marketed during the year 1938-con.
Sea Fisheries
Prince Edward New British Nova Scotia Quebec (a) Island Brunswick (a) Columbia Kind of Fish
(Ilan" Value Qum' Value Qum' Value Quan" Value Quail- Value tity tity tity tity tity
$ S S $ $
Swordfish, caught and landed cwt. - - 10,929 101,529 - - - - - -
Marketed- Used fresh cwt. - - 10,929 132,178 - - - - - - Livers cwt. - - 39 585 - - - - - -
Total value rnarketed.. - - - 132,763 - - - - - -
Tom cod, caught and landed cwt. 373 363 275 155 8,875 11,741 5,000 25,000 - -
Marketed fresh cwt. 373 401 275 280 8,875 22,773 5,000 25,000 - -
111hed fish, caught and landed cwt. - - (b)50,333 5,466 126 424 10,190 50,420 - ..,
(Not including any kinds mentioned elsewhere)
Marketed fresh cwt. - - 183 36 126 424 10,190 50,420 - -
Clams, caught and landed cwt. 6,912 3,471 8,328 6,899 55,919 36,513 2,706 2,011 76,633 69,260
Marketed- Used fresh cwt. 1,440 770 6,732 6,147 20,766 13,671 2,666 2,024 42,169 40,42E Canned cases 2,201 12,502 798 4,060 18.118 64,777 20 150 22,155 122,080 Chowder cases 800 2,800 - - 4,302 16,132 - - - -
Total value marketed.. - 16,072 - 10,227 - 94,580 - 2,174 - 162,50E
Crabs, caught and landed cwt. 128 32 75 150 1,530 314 - - 7,912 25,328
Marketed- Used fresh cwt. - - 75 187 1,530 314 - - 4,317 21,15E Canned cases 16 288 - - - - - - 2,157 33,41X
Total value marketed.. - 28S - 187 - 314 - - - 54,571
Lobsters, caught and landed cwt. 71,213 459,762 -153,405 1,770,722 68,171 197,320 19,293 137,266 - -
Marketed- In shell cwt. 11,072 117,044 82,530 1,423,138 18,554 264,267 6,435 59,829 - - Meat cwt. 11 495 1,131 91,072 974 48,744 12 540 - - Canned cases 24.621 474,397 37,838 714,086 23,060 403,473 6,481 121,841 - - Tomalley cases 1,559 14,198 3,684 33,873 656 5,128 119 1,094 - -
Total value marketed.. - 606,134 - 2,282,169 - 721,612 - 183,304 - -
Oysters, caught and landed bbl. 5,242 29,232 3,886 16,210 12,369 45,966 - - 2,979 36,258
Marketed- Used fresh bbl. 5,242 39,193 3,886 22,462 12,369 76,512 - - 1,365 28,151 Canned cases - - - - - - - 1,426 9,29(
Total value marketed.. - 39,193 - 22,462 - 76,512 - - - 37,45 1
Quahaugs, caught and landed cwt 2,145 881 918 408 3,451 3,328 - - - -
Marketed- Used fresh cwt. 1,491 959 285 288 1,333 1,832 - - - Canned cases 108 785 280 1,050 1,097 7,149 - - - -
Total value marketed.. - 1,744 - 1,338 - 8,981 - - - -
Scallops, caught and landed gal - - 92,000 119,109 3,190 3,899 496 992 - .-
Marketed- Shelled gal. - - 92,000 135,460 3,190 3,899 - - - - Canned cases - - - - - - 115 1,150 - -
Total value. marketed - - - 135.460 - 3.899 - 1.150 - -
(a) See also Inland Fisheries. (b) Part used in the production of fish meal and oil.
89667-3
33

FISHERIES STATISTICS
13. Quantity and Value by Provinces of All Fish Caught and Marketed during the year 1938-con.
Sea Fisheries
Prince Edward Nova Scoti New Qbec (a) British a Island Brunswick (a) ue Columbia Kind of Fish
Quail" Value Quan- Value Quail' Value Quark" Value Qum- Value tity tity tity tity tity
' s S $ $ S
Shrimps, caught and landed cwt. - - - - - - - 1,504 15,333
Marketed- Used fresh cwt. .- - - - - - - - 864 12,431 Canned cases - - - - - - - - 460 6,554
Total value marketed.. - - - - - - - - - 18,985
Tongues and sounds, - pickled or dried cwt. 147 322 933 5,836 57 408 - - -
Winkles, caught and landed cwt. - - 90 180 206 411 - - - -
Marketed fresh cwt. - - 90 ISO 206 417 - - -
Dube, green cwt. - - 700 550 2,313 2,227 - - - Marketed dried cwt. - - 140 980 313 4,191 - - -
Seaweed, green cwt. - - 4,655 810 6,503 774 - - - - Marketed-
Dried cwt. - - 105 810 280 2,800 - - - - Meal ton - - 95 6,500 12 420 - - - -
Total value marketed.. - - - 7,310 - 3,220 - - - -
Fur Seals, caught and landed no. - - - - - - 1,367 3,076 Skins marketed no. - - - - - - - 1,367 3,076
Hair Seals, caught and landed no. - - - - - - 22,831 49,562 - -
Marketed- Skins no. - - - - - - 22,831 37,115 - - Oil gal. - - - - - - 93,593 16,801 - -
Total value marketed.. - - - - - - 53,916 - -
Belugas, caught and landed no. - - - - 2 I.) - -
Marketed-
- - Skins DO. - - - - 2 20 - - Oil gal. -.- - - - - 80 24 - -
Total value marketed.. - - - - - - 44 - -
Whales, caught and landed no. - - - - - - - - 310 184,07 1
Marketed-
- - Oil gal. - - - - - - 543,378 162,701 Bone meal ton - - - - - - - - 273 6.006 Fertilizer ton - - - - - - - - 512 15,36(
Total value marketed.. - - - - - - - - - 184,074
Miscellaneous fish products-
- Fish oil, n.e s gal. - - 9,480 2,218 - - - - - Fish meal, n.e.s ton - - 5,697 289,563 126 4,969 - - - Fish fertilizer, n.e.s ton - - 95 475 97 776 - - - - Fish offal ton - - 14,324 24,806 20 80 - - - -
• Fish skins and bones cwt. - - 18,160 20,725 265 82 210 466 - - Other products - 100 - 4,662 - 52,501 - 133 - 104,811
Total Value of Sea Fish-
Caught and landed - 619,074 - 5,323,582 - 1,774,991 - 1,151,454 - 8,668,561 Marketed - 930,874 - 8,801,231 - 3,971,599 - 1,394,694 - 18,672,751
(a) See also Inland i .

FISHERIES STATISTICS
13. Quantity and Value by Provinces of All Fish Caught and Marketed during the year 1938-con.
Inland Fisheries
New
Brunswick (a) Quebec (a) Ontario Kind of Fish
Quan- Value Quan- Value Quail' Value
tity tity tity
S S S
Alewives, caught and landed cwt. 1,094 1,809 - - - - Marketed fresh cwt. 1,094 1,609 - - - -
Bass, caught and landed cwt. SO SOO 401 4,195 - - Marketed fresh cwt. 80 800 404 4,195 - -
Blue pickerel, caught and landed cwt. - - - 73,171 453,660 31arketed fresh cwt. - - - 73,171 497,564
Carp, caught and landed cwt. - - 6,835 35,770 10,721 10,721 Marketed fresh cwt. - - 6,835 35,770 10,721 16,083
Catfish, caught and landed cwt. - - 6,100 40,795 4,740 18,960 Marketed fresh cwt. - - 6,100 40,795 4,740 23,700
Eels, caught and landed cwt. 662 1,465 18,375 135,145 526 3,682 Marketed fresh cwt. 662 1,465 18,375 135,145 526 4, 208
liming, caught and landed cwt. - - 8,670 33,190 47,030 174,011 Marketed fresh cat. - - 8,670 33,390 47,030 268,072
0laskinonge, caught and landed cwt. - - 535 5,740 - - Marketed fresh cat. - - 535 5,740 - -
Hived fish, caught and landed cat. - - 13,320 67,935 30,911 228,763 (Grayling, bullheads, ouananiche, etc.) Mark-eted fresh cat. - - 13,320 67,935 30,914 259,678
Perch, caught and landed cat. 10 10 4,885 24,960 29,779 205,475 Marketed fresh cwt. 10 10 4,885 24,900 29,779 235,25E
Plckerel, caught and landed cat. 210 1,197 4,475 47,730 23,128 182,711 31arketed fresh cwt. 210 1,197 4,475 47,730 23,128 217,404
Pike, caught and landed eut. - - 5,195 44,650 10,038 30,114 Marketed fresh cwt. - - 5,195 44,650 10,038 40,152
Salmon, caught and landed cat. 432 8,422 1,09 13,400 - - Marketed fresh cwt. 432 8,422 1, OSO 13,400 - -
Shad, caught and landed cwt. 2,950 10,223 1,730 10,540 - - Marketed-
Used fresh cat. 2,350 8,423 1,730 10,540 - Salted bbl. 200 1,500 - - - -
Total value marketed - 10,223 - 10,540 - -
Smelts, caught and landed caft - - 1,030 5,880 - - Marketed fresh cwt. - - 1,030 5,880 - -
Sturgeon, caught and landed cwt. 36 380 4,510 41,370 1,577 5,520 Marketed-
Used fresh cwt. 36 360 4,510 44,370 1,577 5,993 Caviar lb. - - - - 3,841 3,841
Total value marketed - 360 - 44,370 - 9,834
Suckers, caught and landed cwt. 68 161 - - - - Marketed fresh cwt. 68 161 - - - -
Prout, caught and landed cwt. - - - - 60,405 803,387 Marketed fresh cwt. - - - - 60,405 924,196
Pom cod, caught and landed cwt. - - 4,290 21,450 - - Marketed fresh cwt. - - 4,290 21,450 - -
PuIllbee, caught and landed cwt. - - - - 7,595 110,171 Marketed fresh cwt. - - - - 7,598 125,369
Vhiteilsh, caught and landed cwt. 3 18 3,395 26,635 49,477 623,410 Marketed fresh cwt. 3 18 3,395 26,635 49,477 732,261
rota' Value of Inland Fish- Caught and lauded - 24,465 - 562,585 - 2,850,585 Marketed - 24,465 - 562,585 - 3,353,771
35
(a) See also Sea Fisheries.
89667-3;

36 FISHERIES STATISTICS
13. Quantity and Value by Provinces of All Fish Caught and Marketed during the year 1938-concluded
Inland Fisheries
Manitoba Saskatchewan Alberta Yukon Territory
Kind of Fish
Quan- Value Quan- Value Qtityuan- Value Quail' Value tity tity tity
$ $ $ $
Catfish, caught and landed cwt 136 868 - - - - -
Marketed fresh. cwt - 136 1,159 - - - - -
Fresh Water Drum, caught and landed cwt 106 211 - -- - - -
Marketed fresh vat 106 319 - -
- - -
Goldeyes, caught and landed cwt 4,490 33,551 40 323 - - - - Marketed-
Used fresh cwt 928 6,718 40 648 - - - - Smoked cwt 2,282 53,380 - - - - - -
Total value marketed - 60,098 - 648 - - - -
Ling, c,aught and landed cwt - - 3,603 3,179 - - - -
Marketed fresh cwt - - 3,603 3,665 - - - -
Mixed fish, caught and landed__ cwt. 296 1,757 - - 7,585 7,532 3 94 (Graylings, bullheads, ouananiche, etc.)
Marketed fresh cwt 296 2,305 - - 7,585 7,814 3 94
6Iullets, caught and landed cwt 3 3 - -- - - -
Marketed fresh cwt 3 5 - -
- - -
Perch, caught and landed cwt 6,641 46,508 81 405 1,671 6,555 - -
Marketed fresh cwt 6,641 58,041 81 609 1,671 12,615 - -
Pickerel, caught and landed cwt 90,662 447,231 5,085 13,939 5,252 20,420 - -
Marketed fresh. cwt 90,662 695,264 5,085 29,392 5,252 40,881 - -
Pike, caught and landed cwt 33,179 71,332 5,824 8,542 8,017 18,697 - -
Marketed fresh cwt 33,179 88,961 5,824 16,625 8,047 42,794 -
Salmon, caught and landed cvit - - - - - - 129 2,073
Marketed fresh cwt - - - - - - 129 2,072
Saugus, caught and landed cwt 95,007 408,963 - - - - - -
Marketed fresh cwt 95,007 488,786 - - - - - -
Sturgeon, caught and landed cwt. 689 13,073 514 7,156 - - - - Marketed-
Used fresh cwt 689 22,192 514 10,855 - - - - Caviar lb. 362 492 - - - - - -
Total value marketed - 22,684 - 10,855 - - - -
Suckers, caught and landed cwt 17,833 17,526 5,220 5,801 - - - -
Marketed fresh cwt 17,833 23,772 5,220 9,450 - - - -
Trout, caught and landed cwt 1,439 8,845 10,149 38,862 460 2,344 102 1,476
Marketed fresh cwt 1,439 10,678 10,149 92,713 460 4,327 102 1,47t
Tuilibee, caught and landed cwt 18,050 67,772 17,385 25,656 14,899 11,588 - - Marketed-
Used fresh cwt 14,968 75,242 17,385 54,504 14,899 34,045 - - Smoked cwt 1,926 14,676 - - - - - -
Total value marketed - 89,91 - 34,504 - 34,045 - -
Whitefish, caught and landed cwt. 30,081 189,445 39,904. 146,475 31,286 191,395 98 1,641 Marketed-
Used fresh cwt 30,062 268924 39,904 270,185 31,286 350,467 98 1,64 Smoked cwt 12 21 - - - - - -
Total value marketed - 269,13 - 270,185 - 350,467 - I,64
Total Value of Inland Fish- Caught and landed - 1,307,085 - 250,338 - 261,531 - 5,296 Marketed - 1,811,121 - 468,646 - 492,943 - 5,29(

FISHERIES STATISTICS
14. Total Value by Counties and Districts of Sea Fish Caught and Landed and Marketed during the years 1936, 1937 and 1938
Sea Fisheries
1936 1937 1938
Province and CountyorDistrict
Total value Total value Total value Total value Total value Total value
ofseafmh ofsea fish of sen fish ofsea fish ofsea fish ofsea fish
caught and.fish caught and fish caught and fish and products and products and products
landed marketed landed marketed landed amrireted.
$ $ $ $ $ 4
Canada Totals 17,051,514 32,951,501 17,508,929 31,984,047 17,567,670 33,774,148
Prince Edward Island -Totals 725,417 953,029 713,632 870,269 649,074 930,871
Kings 225,415 331,193 232,869 279,032 228,948 297,470 Queens 222,558 271,787 190,665 237,206 147,217 204,747 Prince 277,444 350,049 290,098 354,061 272,909 428,657
Nova Seotla-Totals 5,491,552 8,905,268 6,015,179 9,229,834 5,323,582 8,804,231
Richmond 160,540 157,588 147,523 173,219 117,063 152,894 Cape Breton 363,043 562,567 375,189 693,541 357,040 611,757 Victoria 170,831 234,617 174,886 193,884 147,057 177,067 Inverness 204,137 255,049 213,539 251,953 171,339 217,982 Cumberland 108,690 152,483 117,32' 149,740 83,870 134,985 Colchester 15,786 17,852 11,470 13,731 11,596 15,302 Pictou 209,494 377,798 170,96E 306,010 142,620 285,57C Antigonish 147,549 220,393 133,627 205,249 115,094 169,337 Guysborough 343,451 556,719 336,064 502,587 292,868 458,562 Halifax 851,096 1,876,663 984,801 2,031,817 917,334 2,0 85,512 Hanta ' 5,599 9,903 4,375 6,619 6,326 10.261 Lunenburg 844,857 1,230,646 1,032,489 1,323,844 947,476 1,256,502 Queens 154,552 233,379 132,677 225,805 123,325 195,942 Shellburne 883,018 1,534,286 940,833 1,552,027 865,715 1,503,801 Yarmouth 454,077 592,507 629,614 730,702 535,938 751,92 6 Digby 461,856 792,259 522,870 779,623 426,801 708,84 Annapolis 88,278 75,861 70,326 72,918 43,612 48,411 Kings 24,698 24,698 16,603 10,565 18,508 19,552
New Brunswick-Totals 2,070,423 4,370,404 1,883,173 4,420,251 1,774,994 3,971,59:
Charlotte 619,346 2,260,500 476,766 2,332,370 566,322 2,115,991 Saint John 129,215 206,706 139,051 207,264 128,244 213,471 Albert 701 701 273 273 699 692 Westmorland 222,818 419,186 208,431 521,126 232,541 366,051 Kent 330,414 395,124 328,519 398,058 204,383 357,22: Northumberland 317,992 443,047 321.088 394,257 292,702 406,04 1 Gloucester 366,137 512,968 350,264 475,454 293,551 426,75 1 Restigouche 83,800 132,170 58,781 91,449 56,552 85,354
Quebec-Totals 1,260,425 1,491,269 1,059,015 1,308,221 1,151,451 1,391,69:
I3onaventure 180,403 192,272 142,721 157,374 170,813 182,521 Gaspé 498,058 566,326 315,053 387,892 401,070 482,641 Magdalen Islands 293,488 423,458 299,340 425,312 239,451 360,33 1 Saguenay 142,705 155,143 138,032 172,462 176,245 197,21 liatane 13,202 21,501 14259 15,604 22,875 30,95: Rimouski 132,569 132,569 149,580 149,580 141,000 141,001
British Columbia--170tals 7,503,697 17,231,534 7,837,930 16,155,439 8,668,566 18,672,751
District No.1 1,662,094 4,697,869 1,391,133 4,930,201 2,259,195 6,225,7S District 1,7m2 3,431,128 8,048,426 3,590,318 7,087,808 3,831,676 8,991,47 1 District No.3 2,410,475 4,485,239 2,856,479 4,137,430 2,577,695 3,455,49'
37

FISHERIES STATISTICS
15. Proportion of Catch of Sea Fish taken Offshore (by steam trawlers and vessels of 40 tons or over, fishing on offshore grounds) 1938
Cod Haddock Hake and Cusk
Province and County or District
Quan- Quan- Total Quan- Quan- Total Quan- Quan- Total
tity tity quan- tity tity quart- tity tity ci uan-
taken taken tity taken taken tity taken taken tity
offshore inshore caught offshore inshore caught offshore inshore caught
cwt. cwt. cwt , cwt , cwt. cwt. cwt. cwt. cwt.
1 Canada-Totals 738,998 963,025 1,702,023 173,961 219,628 393,589 15,146 216,752 261,898
2 Prince Edward Island-Totals - 68,425 68,425- 386 386 - 49,155 49,155
3 Kings - 16,841 16,841 136 136 - 21,058 21,058 4 Queens - 22,331 22,331- 245 245 - 8,399 8,399 5 Prince - 29,253 29,253 - 5 5 - 19,698 19,698
• 6 Nova Scotia-Totals 738,998 453,410 1,192,133 173,961 209,585 383,516 15,146 150,724 165,870
7 Richmond - 14,921 14,921 - 21,299 21,299 - 318 318 8 Cape Breton - 84,572 84,572 - 11,494 11,404 - 2,285 2,281 9 Victoria - 13,421 13,421 - 29,218 29,218 - 277 277
10 Inverness - 11,309 11,309 - 754 754 - 6,330 6,339 11 Cumberland - 321 321 - - - 76 76 12 Colchester - 107 107- - - - - - 13 Pictou - 329 329 69 69 - 1,032 1,032 14 Antigonish - 610 610 55 55 - 3,145 3,145 15 Guysborough 1,293 56,019 57,312 34 5,959 5,993 9 1,700 1,709 16 Halifax 175,749 33, 343 209,092 128,432 9,839 138,271 989 615 1,604 17 Hanta - 106 106 - - - - - - 18 Lunenburg 457,720 21,440 479,160 19.200 5,060 24,260 3,840 2,000 5,840 19 Queens 9,798 23,219 33,017 3,852 4,578 8,430 2,248 3,814 6,062 20 Shelburne 87,847 115,144 202,791 22,398 46,685 69,083 7,140 15,929 23,066 21 Yarmouth 6,791 23,288 30,070 45 5,298 5,343 920 5,428 6,341 22 Digby - 44,696 44,696 - 65,714 65,714 - 96,715 96,711 23 Annapolis 7,688 7,688 - 3,464 3,464 - 11,032 11,031 24 Kings - 2,907 2,907 99 99 - 15 15
25 New Brunswick-Totals - 102,683 102,683 - 9,172 9,172 - 45,698 45,691
26 Charlotte - 22,614 22,634 - 3,335 8,335 - 26,009 26,002 27 Saint John - 4,116 4,116 547 547 - 2,738 2,731 28 Albert - 4 4- - - - - 29 Westmorland - 82 82 - - - - 30 Kent - 729 729 - - - 10,986 10,981 31 Northumberland - 522 522 - - - - - 32 Gloucester - 74,105 74,105 - 260 260 - 5,842 5,841 33 Hestigouche 491 491 - 30 30 - 123 121
34 Quebec-Totals - 319,812 319,812 - 485 485 - 1,133 1,131
35 Bonaventure - 29,951 29,951 - 194 194 - 1,053 1,05: 36 Gaspe 190,316 190,316 - 171 171 - 80 43( 37 Magdalen Islands - 50,037 50,037 120 120 - - - 38 Saguenay - 48,138 48,138 - - -
. - 39 Matane - 1,400 1,400 - - - - - 40 Rimouski - - _ - - - - -
41 British Columbia-Totais - 18,635 18,635 - - 42 41
42 District No. 1 - 11,717 11,717 - - - - 42 e 43 District No. 2 - - - - - -
6,918 6,918 - - - - 44 District No. 3 - -
38
2

FISHERIES STATISTICS
15. Proportion of Catch of Sea Fish taken Offshore (by steam trawlers and vessels of 40 tons or over, fishing on offshore grounds) 1938-con.
Pollock Catfish Halibut Flounders, Brill,Plaice
Quan- Quasi- Total Quasi- Quasi- Total Quasi- Quan- Total Quart- Quan- Total
tity tity quasi- tity tity quart- tity tity quasi- tity tity quan-
taken taken tity taken taken tity taken taken tity taken taken tity
offshore inshore caught offshore inshore caught offshore inshore caught offshore inshore caught
cwt. cmt. cmt. cmt. cwt. cmt. cmt. cmt. cut , cmt. cwt. cmt.
16,881 81,453 101,231 910 3,396 1,236 114,475 48,065 162,540 3,478 12,383 15,861 1
- - - - - - - - - - 582 3822
- - - - - - - - 3
- - - - - - - - 330 330 4
- - - - - - - - 252 252 5
16,881 65,011 81,592 910 3,396 1,336 28,249 11,295 39,541 3,178 6,981 10,159 6
- - - - - 31 31 - 28 287
- - - - - - 2,661 2,664 - 1,049 1,049 8
- - - - - - 114 144 - -8
- - - - - - - 14 14 - - 10
- 115 115 - - - 7 7 - 505 505 11
- - - - - - - - - 3 312
- - - - - - - - - -11
_ - - - - - - - - 200 200 14
- 693 693 - 3 3 45 629 874 4 213 21711 11,399 8,909 20,398 940 49 989 8,734 1,813 10,547 1,691 100 1,7911f 4 ... - - - - - - - - - - 17 [2,820 1,570 4,390 - - 8,210 660 8,870 1,100 10 1,11011 e- - 2,576 2,576 - - 123 645 76S 216 281 497 1 1 2,017 9,278 11,295 - 3,344 3,344 10,638 2,487 13.125 467 4,229 4,69621
645 12,100 12,745 - - 499 1,572 2,071 - - - 21
- 25,475 25,475 - - - 444 44 - 363 36322
- 2,825 2,825 - - - 153 153 - - - 23
- 1;470 1,470 - - - 32 3 - - - 21
- 19,442 19,112 - - - 76 7 - 2,579 2,37921
- 19,416 19,416 - - - - 50 5 - 250 28021
- 26 26 - - _ - - - - 3 321
- - - - - - - - - -21
- - - - - - - - - - - 2 1
- - - - - - - - - - 52 5231
- - - _ _ - - - - - -31
- - - - - - - 26 26 - 1,609 1,60931
- - _ _ _ - - - - 665 665 31
- - - - - 2,673 2,673 - 65 6a31
- - - - - - - - 45 4931
- - - - - - 273 273 - - -31
_ _ _ _ - - 63 63 - - - 31
- - - - - - 2,266 2,266 - 20 2031
_ _ _ _ - - 71 71 - - -31
_ _ _ - - - - - - -41
- - - - - 86,226 31,021 120,217 - 2,176 2,17641
- - - - - - 28,155 28,155 - 957 95741
_ _ - - - 86,226 - 86,226 - - - 4:
- - - - - - 5,866 5,866 - 1,219 1,2191
39

FISHERIES STATISTICS
15. Proportion of Catch of Sea Fish taken Offshore (by steam trawlers and vessels of 40 tons or over, fishing on offshore grounds) 1938-con.
Skate Soles Herring
ProvinceandCmndyorDistrict
Quan- Quan- Total Quan- Quan- Total Quan- Quan- Total
tity tity glum- thy tity quasi- tity thy quart-
taken taken fity taken taken tity taken taken tity
offshore inshore caught offshore in.shore caught offshore inshore caught
cat. cat. cwt. cwt. cwt. cat. cat. cwt. cat.
1 Canada-Totals 881 33,274 34,155 16,618 6,984 23,602 472,477,9302,477,977
2 Prince Edward Island-Totals - - - - - - 56,056 56,056
3 Kings - - - - - - - 9,951 9,951 4 Queens - - - - - - 12,756 12,756 5 Prince - - - - - - 33,249 33,349
6 Nova Scotia-Totals 881 32,381 33,262 16,618 323 16,941 47 255,607 255,654
7 Richmond - - - - - - - 3,568 3,568 8 Cape Breton - - - - - - - 4,491 4,491 9 Victoria - - - -- - 16,164 16,164
10 Inverness - - - _ - - 12,878 12,878 11 Cumberland. - - - - - - - 458 458 12 Ckgchester - - - - - - 137 137 13 Pictou - - - - - - - 1,036 1,036 14 Autigonish - - - - - - 10,405 10,405 15 Guysborough - - - 15 304 319 - 15,470 15,470 16 Halifax 881 5 886 16,603 19 16,622 47 36,879 36,926 17 Hanta - - - - - - 75 75 18 Lunenburg - - - - - - 50,315 50,315 19 Queens - - - - - - 15,266 15,266 20 Shelburne - 1,733 1,733 - - - 35,165 35,165 21 Yarmouth - - - - - - - 24,665 24,665 22 Ifigby - 27,650 27,650- - - - 13,800 13,800 23 Annapolis - 2,993 2,993- - - 13,059 13,059 24 Kings - - - - - - 1,776 1,776
25 bievrErtuismdcic-Irotals - 199 199- - - - 427,315 427,315
26 Charlotte - 199 199- - - 117,936 117,93E 27 Saint John - - - - - - 4,183 4,182 28 Albert - - - - - - - - - 29 Westmorland - - - - - - - 91,368 91,368 30 Kent - - - - - - - 71,426 71,426 21 Northumberland - - - - - - - 12,471 12,471 32 Gloucester - - - - - - 123,574 123,574 33 Resfi - gouche - - - - - - 6,357 6,351
34 Quebec--Totals - - - - 107 107 - 410,039 410,031
35 Bonaventure - - - - 107 107 - 153,437 153,431 36 Gaspe - - - - - 106,431 106,431 37 ItlagdahmIslands •- - - - - - 123,322 123,32 1 38 Saguenay - - - - - - 5,505 5,505 39 Blatane - - - - - - - 11,344 11,344 40 Rimouski - - - - - - 10,000 10,000
41 lffiltishColumbia-Totals - 694 694 - 6,551 6,554 - 432349131,328011
42 District No.1 591 591 - 4,374 4,374 - 12,170 12,17C 43 District:No.2 - - - 64 64 - 364,420 364,426 44 District No.3 - 103 103 - 2,116 2,116 - 952,323 952,322
40

FISHERIES STATISTICS
15. Proportion of Catch of Sea Fish taken Offshore (by steam trawlers and vessels of 40 tons or over, fishing on Offshore grounds) 1938-con.
Rosefish Black Cod Ling Cod Red and Rock Cod
Quantity Quantity Total Quantity Quantity Total Quantity Quantity Total Quantity Quantity Total
taken taken quantity taken taken quantity taken taken quantity taken taken quantity
offshore inshore caught offshore inshore caught offshore inshore caught offshore inshore caught
cwt. cwt. cwt. cwt. cwt. cwt. cwt. cwt. cwt. cwt. cwt. cwt.
4,779 - 4,779 3,443 5,020 8,463 116 46,400 46,516 75 6,799 6,874 1
- - - - - - - - - - -2
- - - - - - - - - - - - 3
- - - - - - - - - -4
- _ - - _ - _ - - -5
4,779 - 4,779 - - - - - - - - - 6
- - - _ _ _ _ - _ - 7
- - _ _ _ _ _ -9
- - - - - - - - - 10
- - - - - - - - - 11
- - - - - - - -12
- - - - - - - - - - 13
- - - - - - - - - - 14
- - - - - - - - - 15
4,779 - 4,779 - - - - - - - - 16
- - - _ _ _ _ _ _ _ - 17
- - - _ _ _ _ _ _ _ -18
- - - - - - - - - - 19
- - - - - - - - - -20
- - - - - - - - - - - 21
- - - - - - - - - - 22
- - - - - - - - - - 23
- - - _ _ _ - _ _ - _ - 24
- - - - - - - - - - 25
_ _ _ _ _ _ - _ - 26
- - - - - - - - - - - 27
- - - - - - - - - - - 20
_ _ _ _ _ _ _ _ _ - -21
_ _ _ _ _ _ _ _ _ - 3C
_ _ _ _ _ _ _ _ _ _ - 31
__ _ _ _ _ _ _ _ _ _ - 32
_ _ _ _ _ _ _ _ -31
_ - - - - - - - - 31
_ - - - - - - - - - 35
_ _ - - - - - - - - - Sc
_ - - - - - - - - -3
_ - - - - - - - - - 31
_ - - - - - - - - - Sc
_ - - - - - - - - - - 4(
- - 3,413 5,020 8,463 116 46,400 46,516 75 6,799 6,874 41
- - - 2,833 2,833 - 17,823 17,823 - 2,357 2,35741
- - 3,443 - 3,443 116 - 116 75 - 7541
- - - 2,187 2,187 - 28,577 28,577 - 4,442 4442 4
41
89867-4

42 FISHERIES STATISTICS
15. Proportion of Catch of Sea Fish taken Offshore (by steam trawlers and vessels of 40 tons or over, fishing on offshore grounds) 1938—con.
Swordfish Mixed Fish
Province and County or District
Quantity Quantity Total Quantity Quantity Total
taken taken quantity taken taken quantity
offshore inshore caught offshore inshore caught
cwt. cwt. cwt. cwt. cwt. cwt.
I Canada—Totals 742 10,187 10,929 44,291 16,355 60,649
2 Prince Edward Island—Totals - - - - - -
3 Kings - - - - - 4 Queens - - - - - - 5 Prince - - - - -
6 Nova Scotia—Totals 742 10,187 10,929 44,291 0,039 50,333
7 Richmond - 88 88 - 183 183 8 Cape Breton - 7,223 7,223 - - - 9 Victoria - 2,817 2,617 - - -
10 Inverness - - - - - 11 Cumberland - - - - - - 12 Colchester - - - - - - 13 Pictou - - - - - - 14 Antigonish - - - - - - 15 Guysborough - 99 99 - 4,200 4,200 16 Halifax - 30 30 44,294 1,656 45,950 17 Hants - - - - - 18 Lunenburg - 30 30 - - - 19 Queens - - - - - - 20 Shelburne - 100 100 - - - 21 Yarmouth 742 - 742 - - - 22 Digby - - - - - - 23 Annapolis - - - - - - 24 Kings - - - - - -
25 New Brunswick—Totals - - - _ 126 126
26 Charlotte _ _ - _ - _ 27 Saint John - - - - - - 28 Albert - - - - - 29 Westmorland - - - - - 30 Kent - - - - - - 31 Northumberland - - - - 126 126 32 Gloucester -- - _ - - 33 Restigouche _ _ _ - -
34 Quebec—Totals - - - - 10,190 10,190
35 Bonaventure - - - _ - - 38 Gaspe - - - - - - 37 Magdalen Islands - - - _ - - 38 Saguenay - - - _ 190 190 39 Matane - - - _ - - 40 Rimouski - - - - 10,000 10,000
41 British Columbia—Totals - - - - -
42 District No. 1 - - - - -
43 District No. 2 - - - - -
44 District No. 3 - - - - - -

FISHERIES STATISTICS 43
15. Proportion of Catch of Sea Fish taken Offshore (by steam trawlers and vessels of 40 tons or over, fishing on Offshore grounds) 1938-concluded
All other Whales kinds of Total (a)
Fish
Number Number Total Quantity Quantity Quantity Total taken taken number taken taken taken quantity offshore inshore caught inshore offshore inshore caught
no. no. RO. CR't. OWL CM,t. OWL
310 - 310 4,530,198 1,131,874 8,710,819 9,815,723 1
- - - 119,600 - 291,201 294,204 2 - _ - 36,311 _ 84,297 84,297 3 _ _ _ 31,052 - 75,113 75,113 4 _ _ _ 52,237 - 134,794 134,794 5
- - - 601,863 1,015,014 1,806,832 2,851,816 6 _ - - 35,259 - 75,695 75,695 7 - - - 26,439 - 140,221 140,221 8 - - - 20,002 - 61,843 81,843 9 - - - 40,835 - 72,129 72,129 10 - - - 14,678 - 16,360 16,360 11 - - - 4,606 - 4,853 4,853 12 - - - 21,213 - 23,679 23,679 13 - - - 14,857 - 29,272 29,272 14 - _ - 75,314 1,400 160,603 162,003 15 _ _ - 66,924 394,538 160,181 554,71916 - - - 7,575 - 7,756 7,75617 - - - 89,046 492,890 170,131 663.021 18 - - - 16,230 16,237 66,609 82,846 19 - - - 17,504 130,307 251,598 381,90520 _ - _ 32,224 9,642 104,575 114,21721 - - - 106,209 - 381,066 381,066 22 - - - 8,349 - 49,563 49,56323 - - - 4,399 - 10,698 10,69824
- - 664,411 - 1,271,731 1,271,73125
_ - 378,046 - 572,875 572,87526 _ _ _ 83,545 _ 95,158 95,15827 _ _ _ 72 _ 76 7628
- - 30,747 - 122,197 122,19729
- - 54,238 - 137,431 137,43130
- - 61,979 - 75,098 75,09831 , - - - 47,000 - 252,416 252,41632 _ - _ 8,814 _ 16,480 16,48033
- - - 120,514 - 865,078 865,07834
- - - 12,942 - 197,729 197,72935 - _ - 10,638 - 307,909 307,90936 - - - 53,480 - 227,022 227,02237 - - - 35,498 - 91,617 91,61738 - - - 1,786 - 14,601 14,60139 - - - 6,200 - 26,200 26,20040
310 - 310 3,023,750 89,860 4,473,001 4,562,86441
- - - 335,507 - 416,526 416,52642 310 - 310 888,952 89,860 1,253,436 1,343,29643 - - - 1,799,291 _ 2,803,042 2,803,04244
(a) Exclusive of belugas, seals, vagales, seaweed and dulse.
89607--41

44 FISHERIES STATISTICS
16. Summary by Provinces of Capital Equipment, 1938
Prince Edward Island Nova Scotia
In Primary Operations
No. Value No. Value
S 8
1 Steam trawlers - - 3 69,000 2 Sailing, gasoline and diesel vessels 11 6,400 526 1,371,320 3 Gasoline and diesel boats 1,673 377,400 5,907 1,540,795 4 Sail and row boats 722 8,220 4,755 100,804 5 Skiffs and canoes - - - - 6 Carrying smacks 8 3,000 106 134,850 7 Gill nets 3,114 24,062 38,775 403,568 8 Salmon drift nets - - 55 5,750 9 Salmon trap nets 1 600 509 128,290
10 Trap nets, other 4 860 376 197,330 11 Smelt nets 2,380 16,963 4,262 30,858 12 Pound nets - - - - 13 Hoop nets - - - _
14 Weirs - - 70 17,580 15 Seines - - 227 25,610 16 Skates of gear - - 1,190 16,270 17 Tubs of trawl 1,130 26,600 14,056 183,733 18 Hand lines 1,018 3,836 24,501 23,700 19 Crab traps 40 40 10 50 20 Eel traps - 771 1,074 21 Lobster traps 391,045 391,045 1,129,800 1,397,332 22 Lobster pounds - 14 13,530 23 Oyster rakes 339 1,017 367 1,292 24 Quahaug rakes 101 303 - 25 Scallop drags - - 501 17,706 26 Spears - - - 27 Fishing piers and wharves 37 34,200 1,038 374,985 28 Freezers and ice houses 27 5,875 229 59,880 29 Small fish and smoke houses 305 38,020 3,550 243,553 30 Other gear - - 2,325
31 Total value 918,441 - 6,361,185
Ontario Manitoba •
In Primary Operations
No. Value No. Value
.8 8
32 Steam vessels - - - - 33 Sailing, gasoline and diesel vessels _ - -
34 Gasoline and, diesel boats 1,038 656,926 214 156,960 35 Sail and row boats - - - 36 Skiffs and canoes 1 , 008 43,692 844 31,665 37 Packers, carrying boats and 'mows - 25 118,850 38 Tugs 99 672,484 - _ 39 Gill nets (a) 8, 251, 640 003,474 72,315 557,455 40 Salmon drift nets - - - - 41 Salmon trap nets - - - - 42 Trap nets, other - - - - 43 Salmon purse seines - - - - 44 Salmon drag seines - - - - 45 Seines, other 131 16,812 - - 46 Skates of ge,ar - - - - 47 Smelt nets - - - - 48 Pound nets 1,112 534,580 - - el Hoop nets 879 22,119 38 650 50 Dip and roll nets 64 292 4 6 51 Oulachon nets - - - 52 Shrimp nets - - - 53 Small draggers - - - 54 Hand lines 546 7,550 21 32 55 Crab traps - - - 56 Spears 119 , 984 - - 57 Fish wheels - - - 58 Fishing piers and wharves 399 107, 685 73 21,297 59 Freezers and ice houses 539 252,684 111 115,654 50 Small fish and smoke houses - 181 50,246 51 Other gear - - - -
62 Total value - 3,229,282 - 1,052,803
(a) For Ontario gill nets are shown in yards.

FISHERIES STATISTICS
16. Summary by Provinces of Capital Equipment, 1938-con.
New Brunswick Quebec
Sea Fisheries bland Fisheries Total Fisheries Sea Fisheries T.laud Fisheries Total Fisheries
No. Value No. Value No. Value No. Value No. Value No. Value
$ S S S S $
- - - - - - - - - - 1
293 240,300 - - - 293 240,300 47 24,200 - - 47 24.200 2
2,812 775,969 - - 2,812 775,969 2,943 874,985 201 28,405 3,144 903,390 3
4,852 124,977 - - 4,852 124,977 2,895 95,748 - - 2,895 95,748 4 - - 326 1,792 326 1,792 - - 1,23" 21,855 1,235 21,855 5
89 189,349 - - 89 189,349 13 7,200 - - 13 7,200 6
12,939 82,449 624 5,128 13,563 87,577 14,724 341,710 94 4,150 14,818 345,880 7
6,557 103,164 - - 6,557 103,164 - - - - - - 8
308 140,450 - - 308 140,450 164 53,150 - - 164 83,150 9
140 3,780 - - 140 3,780 119 79,200 - - 119 79,200 10
8,017 284,168 - - 8,017 284,168 1,264 31,799 - - 1,264 31,79911
49 7,350 - - 49 7,350 - - - - - - 12 - - - - - - - - 525 8,000 525 8,00013
370 357,445 - - 370 357,445 50 5,000 342 67,500 399 72,500 14
417 65,100 - - 417 65,100 200 31,915 186 6,507 386 38,429 15 - - - - - - - - - - -16
1,610 15,966 - - 1,610 15,966 5,832 80,873 - 5,832 80,873 17
9,366 7,644 - - 9,366 7,644 20,554 25,129 513 1,617 21,067 26,74 18 - - - - - - - - - -19
11 38 200 400 211 438 - 60 700 CO 70021
431,438 376,273 - - 431,438 376,273 141,697 151,320 - - 141,697 151,32021
17 51,395 - - 17 51,395 2 350 - 2 35022
1,173 3,543 - - 1,173 3,543 - - - - - 22
176 593 - - 176 593 - - - - - 24
157 3,063 - - 157 3,065 4 28 - 4 282E - - - - - - - - 206 412 206 412 21
361 105,090 - - 361 105,090 277 48,400 54 10,800 331 59,20021
140 88,715 - - 140 88,715 321 71,175 199 18,900 520 50,07521
1,171 254,790 . - - 1,171 254,790 2,375 132,210 1 400 2,376 132,6102E - 29,070 - - - 29,070 _ 34,860 - - - 34,86031
- 3,310,683 - 7,320 - 3,318,003 - 2,089,252 - 169,246 - 2,258,49831
Saskatchewan Alberta British Columbia Yukon
No. Value No. Value No. Value No. Value
S $ $ S
- - _ - 6 150,000 - - 3:
- - - 256 2,317,900 - - 32 40 17,235 126 30,000 6,540 3,917,197 12 3,6003f - - - - 1,294 60,675 - - 3E 42 1,700 137 8,12" _ - 10 3503 1 - - 2 6,000 209 547,875 - - 31 - - 2 12,526 - - - 31
11,1346 138,237 9,540 184,700 32 5,800 65 6303E - - - - 6,899 1,214,556 - - 4( - - - - 5 75,000 - - 41
1 800 - - - - - 4: - - - - 262 301,200 - - 4E
- - - 9 5,350 - -4J - - - - 44 118,800 _ - 4: - - - - 1,844 42,20" - - 41 - - - - 51 2,850 - - 41
- - - - - - 4E 20 200 - - - - - 4 1
- _ _ - - _ - 5( - - - - 28 840 _ - 51 - - - - 23 1,975 - -51 - - - - 15 6,850 _ - 5E
769 4,064 - - 14,290 115,034 _ - 5f
- - - 6,688 26,455 _ - 51 - - - - - _ - 5 1 - - - - - 8 66051 13 1,320 39 14,150 10 11,000 - - 5 1 25 2,870 63 ' 22,600 10 26,300 3 4551
1 1,500 10 9,100 42 50,900 2 5061
- - - - 1,452 _ - 61
167,926 - 287,201 - 9,000,244 - 5,355 61
45

No. Value
Prince Edward Island
In Fish Canning and Curing
Lobster canneries
Salmon canneries
Clam canneries
Sardine and other fish canneries
Fish curing establishments
Freezing plants
Reduction plants
Total 78 180,525
1
2
3
4
7
8
64
4
10
■•■
139,325
9,000
32,200
■••
46 FISHERIES STATISTICS
16. Summary by Provinces of Capital Equipment, 1938—con.
17. Summary by Provinces of Number of Employees, 1938
Prince Nova New Brunswick — Edward S
Island cotia
Sea Inland Total
No. No. No. No. No.
9 Men employed on vessels, boats, etc 3,309 18,548 13,713 417 14,130
10 Persons employed in fish canning and curing
establishments 1,234 3,325 2,652 - 2,652
11 Total 4,543 21,873 16,365 417 16,782

FISHERIES STATISTICS
16. Summary by Provinces of Capital Equipment, 1938--concluded
Nova Scotia New Brunswick Quebec British Columbia
No. Value No. Value No. Value No. Value
$ s $ 5
62 614,950 73 476,546 16 89,300 - - 1
2 1 62 38 11,597,913 2 26,528
51 12 1 - - 4 1 3
1,818,069 421,194 5 198,168 3 1 10,509 2 f 4
75 1 22 157,377 46 225,865 19 1 5
2,709,534 2,377,645 . 2 5 90,104 9 1 2 6
75,912 4 218,667 3 15,425 1 j 10 668,267 7
155 3,757,817 118 2,557,521 135 401,586 75 15,065,019 8
17. Summary by Provinces of Number of Employees, 1938
47
Saskat. British Yukon
Qtnbec Ontario Manitobachewan Alberta Columbia
Sea Inland Total
/go. /go. /go. /go. /go. /go. /go. No. /go.
11,150 1,634 12,684 4,170 3,819 1,547 2,954 10,314 35 9
1,170 - 1,170 - - _ - 6.10 - 10
12,320 1,531 13,854 1,170 3,819 1,547 2,954 16,417 35 11

48 FISHERIES STATISTICS
FISHING BOUNTY
Under the authority of "An Act to Encourage the Development of the Sea Fisheries and the Building of Fishing Vessels" the sum of $160,000 is appropriated annually by the Governor in Council. It is distributed under the name of Fishing Bounty by the Department of Fisheries amongst fishermen and fishing vessel and boat owners on the Atlantic coast, under regulations made from time to time by the Governor in Council.
For the year 1938, payment was made on the following basis:—
To owners of vessels entitled to receive bounty—$1 per registered ton; payment to the owner of any one vessel not to exceed $80.
To vessel fishermen entitled to receive bounty—$6.00 each.
To owners of boats measuring not less than 12 feet keel—$1 per boat.
To boat fishermen entitled to receive bounty—$5.55.
The total amount paid in 1938 was $159,982.70, allocated as follows:—
To 734 vessels and their crews $ 35,642.30
To 11,660 boats and their crews $ 124,340.40

FISHERIES STATISTICS 49
FOREIGN TRADE
Exports.—The total value of Canadian fish and fishery products exported during the calendar year 1938 was $27,543,680, compared with $28,902,152 in 1937 and $25,398,102 in 1936. The principal items in 1938, in order of value, were canned salmon ($7,128,194); fresh lobster (S1,952,697); canned lobster ($1,898,838); fresh and frozen whitefish (81,514, 870); and dried cod ($1,175,645). The total value of all fresh and frozen fish exported during the year was $11,344,363; of processed fish (canned, salted, smoked, etc.) $13,965,030; of fish oils $975,491; and of miscellaneous fishery products, $1,258,796. The chief countries of destination are the following: the United States ($12,713,819) ; the United Kingdom (86,880,661); Australia ($1,932,655); British West Indies (comprising Barbadoes, Jamaica, Trinidad and Tobago and other) ($946,528); France ($691,833); Germany ($687,844); British South Africa, ($621,345); and New Zealand ($522,680). Altogether there were 87 countries to which Canadian fish and fishery products went in 1938, and the list of exports includes 58 separate items.
Imports.—The value of the fish and fishery products imported for consump-tion was $3,036,227, compared with $2,877,131 in the preceding year and $2,918,251 in 1936. Fresh salmon from the United States, Newfoundland and Alaska; oysters from the United States; sardines from Norway, France, Italy and Portugal and cod liver oil from the United Kingdom, the United States, Newfoundland and Norway comprise the chief imports.
The following table gives values of exports and imports in the years 1926 to 1938.
VALUES OF EXPORTS AND IMPORTS OF FISH AND FISHERY PRODUCTS IN THE YEARS ENDING DECEMBER 31, 1926 TO 1938
Year Exporta Imports Year Exports Imports
$ S 8 $
1926 37,089,545 3,045,838 1933 20,223,610 1,694,325 1927 34,814,448 3,768,901 1934 22,497,135 2,121,762 1928 38,096,245 4,068,074 1935 24,859,486 2,597,856 1929 37,546,393 4,233,906 1936. 25,398,102 2,918,251 1930 31,869,350 3,446,601 1937 28,902,152 2,877,131 1931 25,848,585 2,653,894 1938 27,543,680 3,036,227 1932 18,752,107 1,862,337
HISTORICAL REVIEW
The five tables following will afford a review of the fishing industry of Canada for the past several years. In the case of production, returns are given, by provinces, back to 1870. In the case of the number and value of vessels, boats, etc., the review extends to 1880, and in the case of the number of employees to 1895.

FISHERIES STATISTICS
18. Historical Review-(a) Total Value of the Fisheries in the Respective Provinces of Canada, for the years 1870 and 1875 to 1938
Manitoba, Saskat-
Fence Total Nom New Mine' oilman Year Edward Scotia Brunswick Quebec Ontario Columbia Alberta' for Island Canada and
Yukon
$ î $ $ $ $ $ $
1870 Not know' 4,019,425 1,131,433 1,161,551 264,982 Nothmown Not known 6,577,391
1875 298,927 5,573,851 2,427,654 1,596,759 453,194 Notknown Not known 10,350,385 1876 494,967 6,029,050 1,953,389 2,097,668 437,229 104,697 Not known 11,117,000 1877 763,036 5,527,858 2,133,237 2,560,147 • 438,223 583,433 Notknown 12,005,934 1878 840,344 6,131,600 2,305,790 2,664,055 348,122 925,767 Not known 13,215,678 1879 1,402,301 5,752,937 2,554,722 2,820,395 367,133 631,766 Notltnown 13,529,254
1880 1,675,089 6,291,061 2,744,447 2,631,556 444,491 713,335 Notknown 14,499,979 1881 1,955,290 6,214,782 2,930,904 2,751,962 509,903 1,454,321 Notknomm 15,817,162 1882 1,855,687 7,131,418 3,192,339 1,976,516 825,457 1,842,675 Not known 16,824,092 1883 1,272,468 7,689,374 3,185,674 2,138,997 1,027,033 1,644,646 Not known 16,958,192 1884 1,085,619 8,763,779 3,730,454 1,694,561 1,133,724 1,358,267 Not known 17,766,404
1885 1,293,430 8,283,922 4,005,431 1,719,460 1,342,692 1,078,038 Not known 17,722,973 1886 1,141,991 8,415,362 4,180,227 1,741,382 1,435,998 1,577,348 186,980 18,679,288 1887 1,037,426 8,379,782 3,559,507 1,773,567 1,531,850 1,974,887 129,084 18,386,103 1888 876,862 7,817,030 2,941,863 1,860,012 1,839,869 1,902,195 180,677 17,418,508 1889 886,430 6,346,722 3,067,039 1,876,194 1,963,123 3,348,067 167,679 17,655,254
1890 1,041,109 6,636,444 2,699,055 1,615,119 2,009,637 3,481,432 232,104 17,714,900 1891 1,238,733 7,011,300 3,571,050 2,008,678 1,896,389 3,008,755 332,969 18,977,874 1892 1,179,856 6,340,724 3,203,922 2,236,732 2,042,198 2,849,483 1,088,254 18,941,169 1893 1,133,368 6,407,279 3,746,121 2,218,90" 1,694,930 4,443,963 1,042,093 20,686,659 1894 1,119,738 6,547,387 4,351,526 2,303,386 1,659,968 3,950,478 787,087 20,719,570
1895 976,838 6,213,131 4,403,158 1,867,920 1,584,473 4,401,354 752,466 20,199,338 1896.. 976,126 6,070,895 4,799,433 2,025,754 1,605.674 4,183,999 745,543 20,407,424 1897 954,949 8,090,346 3,934,13' 1,737,011 1,289,822 6,138,865 638,416 22,783,544 1898 1,070,202 7,226,034 3,849,357 1,761,440 1,433,632 3,713,101 613,355 10,667,121 1899 1,043,645 7,347,604 4,119,891 1,953,134 1,590,447 5,214,074 622,911 21,891,706
1900 1,059,193 7,809,152 3,769,742 1,989,279 1,333,294 4,878,820 718,159 21,557,639 1901 1,050,623 7,989,548 4,193,264 2,174,459 1,428,078 7,942,771 958,410 25,737,153 1902 887,024 7,351,753 3,912,514 2,059,175 1,265,706 5,284,824 1,198,437 21,959,433 1903 1,099,510 7,841,602 4,186,800 2,211,792 1,535,144 4,747,365 1,478,66' 23,100,878 1904 1,077,546 7,287,099 4,671,084 3,751,397 1,793,229 5,219,107 1,716,977 23,516,439
1905 998,922 8,259,085 4,847,900 2,003,716 1,703,963 9,850,216 1,811,570 29,479,562 1906 1,168,939 7,799,160 4,905,220 2,175,035 1,734,856 7,003,347 1,492,923 26,279,485 1907 1,492,695 7,632,330 5,300,564 2,047,390 1,935,025 6,122,923 968,422 25,499,349 1908 1,378,624 8,009,838 4,754,298 1,881,817 2,100,078 6,465,038 861,392 25,451,085 1909 1,197,557 8,081,111 4,676,315 1,808,437 2,177,813 10,314,755 1,373,181 29,629,169
1910 1,153,708 10,119,243 4,134,144 1,692,475 2,026,121 9,163,235 1,676,216 29,965,142 1911 1,196,396 9,367,550 4,886,157 1,868,136 2,205,436 13,677,125 1,467,072 34,667,872 1912 1,379,905 7,384,055 4,264,054 1,988,241 2,842,878 14,455,488 1,074,843 33,389,464 1913 1,280,447 8,297,626 4,308,707 1,850,427 2,674,685 13,891,398 904,458 33,207,748 1914 1,261,666 7,730,191 4,040,083 1,924,430 2,755,291 11,515,086 1,137,884 31,264,631
1915 933,682 9,166,851 4,737,145 2,076,851 3,341,182 14,538,32 ' 1,086,677 35,860,708 1916 1,344,179 10,092,902 5,656,859 2,991,624 2,658,993 14,637.346 1,826,475 39,208,378 1017 1,786,310 14,469,319 6,143,088 3,414,378 2,866,419 21,518.595 2,134,935 52,312,044 1918 1,148,201 15,143,066 6,298,990 4,577,973 3,175,111 27,282,223 2,634,180 60,259,744 1919 1,536,844 15,171,929 4,979,574 4,258,731 3,410,750 25,301,607 1,849,044 56,508,479
1920 1,708,723 12,742,659 4,423,745 2,592,382 3,336,412 22,329,161 2,108,257 49,241,339 1921 924,529 9,778,623 3,690,726 1,815,284 3,065,042 13,953,670 1,704,061 34,931,935 1922 1,612,599 10,209,258 4,685,660 2,089,414 2,858,122 18,849,658 1,495,499 41,800,210 1923 1,754,980 8,448,385 4,548,535 2,100,412 3,159,427 20,795,914 1,757,892 42,565,545 1924 1,201,772 5,777,251 5,383,809 2,283,314 3,557,687 21,257,567 2,072,935 44,534,235
1925 1,598,119 10,213,779 4,798,589 3,044,919 3,436,412 22,414,618 2,435,695 47,942,131 1926 1,358,934 12,505,922 5,325,478 3,110,964 3,152,193 27,367,109 3,540,033 56,360,633 1027 1,367,807 10,783,631 4,406,673 2,736,450 3,670,229 22,890,913 3,267,906 49,123,609 1928 1,196,681 11,881,095 5,001,641 2,996,614 4,030,753 26,562,727 3,580,562 55,050,973 1929 1,297,125 11,427,491 5,935,635 2,933,339 3,919,144 23,930,692 4,075,09" 53,518,521
1930 1,141,279 10,411,202 4,853,575 2,502,998 3,294,029 23,103,302 2,497,231 47,804,216 1931 1,078,901 7,986,711 4,169,811 1,952,894 2,477,131 11,108,873 1,742,985 30,517,306 1932 988,919 6,557,943 2,972,682 1,815,544 2,147,990 9,909,116 1,564,915 25,957,109 1933 842,345 6,010,601 3,000,045 2,128,471 2,089,842 12,001,471 1,424,171 27,496,946 1934 963,926 7,673,865 3,679,970 2,306,517 2,218,550 15,234,335 1,945,160 34,022,323
1935 899,685 7,852,899 3,949,615 1,947,259 2,852,007 15,169,529 1,756,060 34,427,854 1936 953,029 8,905,268 4,399,735 2,108,404 3,209,422 17;231,534 2,357,663 39,165,055 1937 870,299 9,229,834 4,447,688 1,892,036 3,615,666 16,155,439 2,765,332 38,976,294 1930 930,874 8,804,231 3,996,064 1,957,279 3,353,775 18,672,750 2,778,003 40,492,978
50
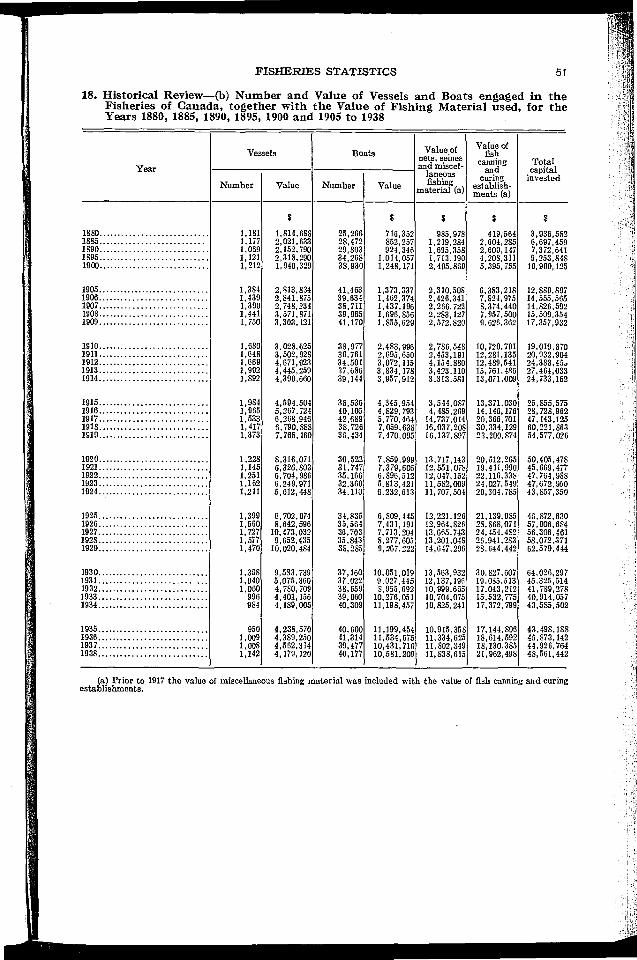
FISHERIES STATISTICS
18. Historical Review-(b) Number and Value of Vessels and Boats engaged in the Fisheries of Canada, together with the Value of Fishing Material used, for the Years 1880, 1885, 1890, 1895, 1900 and 1905 to 1938
flue o Value of Vessels Boats Va fish nets, seines and • mince canning Total
Year - and capital
hilaneous escturabiinisgh_ invested fis Number Value Number Value material
ng (a) ments (a)
$ $ $ $ 8
1880 1,181 1,814,688 25,266 716,352 985,978 419,564 3,936,582 1885 1,177 2,021,633 28,472 852,257 1,219,284 2,604,285 6,697,459 1890 1,069 2,152,790 29,803 924,346 1,695,358 2,600,147 7,372,641 1895 1,121 2,318,290 34,268 1,014,057 1,713,190 4,205,311 9,253,848 1900 1,212 1,940,329 38,930 1,248,171 2,405,860 5,395,765 10,990,125
1905 1,384 2,813,834 41,463 1,373,337 2,310,505 6,383,218 12,880,897 1906 1,439 2,841,875 39,634 1,402,374 2,426,341 7,824,975 14,555,5 85 1907 1,390 2,748,234 38,711 1,437,196 2,266,722 8,374,440 14,826,592 1908 1,441 3,571,871 39,965 1,696,856 2,283,127 7,957,500 15,509,354 1909 1,750 3,303,121 41,170 1,855,629 2,572,820 9,626,362 17,357,932
1910 1,680 3,028,625 38,977 2,483,996 2,786,548 10,720,701 19,019,870 1911 1,648 3,502,928 36,761 2,695,650 2,453,191 12,281,135 20,932,904 1912 1,669 4,671,923 34,501 3,072,115 4,154,880 12,489,541 24,388,45., 1913 1,992 4,445,259 37,686 3,834,178 3,423,110 15,761,486 27,464,033 1914 1,892 4,390,660 39,144 3,957,912 3,313,581 13,071,009 24,733,162
1915 1,984 4,594,504 38,536 4,345,954 3,544,087 13,371,030 25,855,575 1916 1,985 5,267,724 40,105 4,829,793 4,485,269 14,146,176 28,728,962 1917 1,533 6,268,946 42,689 5,770,464 14,737,014 20,366,701 47,143,125 1918 1,417 6,790,888 38,726 7,059,63S 16,037,208 30,334,129 60,221,863 1919 1,373 7,768,160 36,434 7,470,095 16,137,097 23,200,874 54,577,026
1920 1,228 8,316,071 30,522 7,859,999 13,717,143 20,512,265 50,405,478 1921 1,145 6,326,803 31,747 7,379,606 12,551,078 19,411,990 45,669,477 1922 1,251 6,704,986 35,166 6,896,512 12,047,152 22,116,338 47,764,988 1923 1,162 6,249,971 32,360 5,813,421 11,582,009 24,027,549 47,672,950 1924 1,211 5,612,448 34,110 6,232,613 11,707,504 20,304,785 43,857,350
1925 1,399 6,702,074 34,835 6,809,445 12,221,126 21,139,985 46,872,630 1926 1,560 8,642,596 35,564 7,431,191 12,964,826 28,868,071 57,906,684 1927 1,727 10,473,032 36,703 7,713,204 13,665,743 24,454,482 56,306,461 1928 1,577 9,652,435 35,843 8,277,605 13,201,048 26,941,283 58,072,371 1929 1,470 10,020,484 38,283 9,267,222 14,647,296 28,644,442 62,579,444
1930 1,368 9,583,739 37,160 10,051,019 13,563,932 30,827,607 64,026,297 1931 1,040 5,075,360 37,022 9.027,445 12,137,196 19,085,513 45,325,514 1932 1,060 4,780,709 38,659 8,965,692 10,999,665 17,043,212 41,789,278 1933 996 4,401,156 39,060 10,276,051 10,704,075 15,532,775 40,914,057 1934 984 4,189,005 40,309 11,198,457 10,825,241 17,372,799 43,585,502
1935 950 4,238,570 40,600 11,199,454 10,915,358 17,144,806 43,498,188 1936 1,009 4,389,250 41,314 11,534,675 11,334,625 18,614,592 45,873,142 1937 1,008 4,562,314 39,477 10,431,716 11,602,349 18,130,385 44,926,764 1938 1,142 4,179,120 40,177 10,581,209 11,838,615 21,962,498 48,561,442
(a) Prior to 1917 the value of miscellaneous fishing material was included with the value of fish canning and curing establishments.
51

FISHERIES STATISTICS
18. Historical Review-(c) Number of Persons Employed in the Fisheries Industry of Canada for the years 1895, 1900 and 1905 to 1938
Numberof Total
personsin Nuniber Number Nurnberof Total number Year fish canning of men of men men number ofpersons
andeuring in in fishing,not of wssels
in
establish- boats in fishermen fishing ments industry
1895 13,030 9,804 61,530 _ 71,334 84,364 1900 18,205 9,205 71,859 - 81,064 99,269
1905 14,037 9,366 73,505 - 82,871 96,908 1906 12,317 9,058 67,646 - 76,704 89,021 1907 11,442 8,089 63,165 - 71,254 82,696 1908 13,753 8,550 62,520 - 71,070 84,823 1909 21,694 7,931 60,732 - 68,663 90,357
1910 24,978 8,521 60,089 - 68,610 93,588 1911 25,206 9,056 56,870 _ 65,926 91,132 1912 23,327 9,076 56,005 - 65,081 88,408 1913 26,893 10,525 61,251 - 71,776 98,669 1914 24,559 9,400 60,554 - 69,954 94,513
1915 27,320 9,541 65,321 - 74,862 102,182 1916 25,680 9,192 60,432 - 69,624 95,304 1917 22,732 8,946 62,700 744 72,390 95,122 1918 18,554 8,668 58,110 1,738 68,516 87,070 1919 18,356 8,908 56,280 2,616 67,504 86,160
1920 18,499 7,918 47,418 1,861 57,197 75.6n6 1921 14,104 6,899 46,580 1,751 55,230 69,334 1922 16,577 7,503 »18,480 1,897 57,880 74,457 1923 15,447 6,694 44,482 2,341 53,517 68,964 1924 15,536 6,663 44,326 2,925 53,914 69,450
1925 16,272 7,566 47,531 3,176 58,273 74,545 1926 17,408 8,638 49,058 3,675 61,371 78,179 1927 16,697 8,851 48,800 5,764 63,415 80,112 1928 15,434 8,560 46,784 7,441 62,785 78,219 1929 16,367 7,979 48,247 7,857 64,083 80,450
• .
1930 15,722 7,545 48,691 7,600 63,836 79,558 1931 13,071 5,553 49,803 6,455 61,811 74,882 1932 13,724 5,170 52,959 6,355 64,484 78.208 1933 14,042 5,097 54,575 5,834 65,500 79,548 1934 14,802 4,905 57,782 5,947 68,634 83,436
1935 14,361 5,018 57,121 6,418 68,557 82,918 1936 15,238 5,158 59,030 7,538 71,735 86,973 1937 14,044 5,276 56,199 8,506 69,981 84,025 1938 14,484 5,922 56,288 9,292 71,510 85,994
(a) Not separately classified prior to 1917.
52

FISHERIES STATISTICS
18. Historical Review -(d) Total Capital Investment of the Fisheries Industry by Provinces, for the years 1880, 1885, 1890, 1895 and 1900 to 1938
Manitoba, Prince Nova New
fiasicat-
, British chewan Total Eclward for f3cotia Brunswick Quebec Crean.) Columbia Albert: Year Island Canada and
Yukon
$ S S S S S $ S
1880 106,011 2,225,493 490,714 756,796 177,543 182,0-5 Not known 3,938,562 1885 493,143 3,010,009 1,075,879 930,358 378,274 809,805 6,697,459 1890 348,320 3,243,310 1,184,745 521,544 563,443 1,511,279 Il 7,372,641 1895 479,639 3,139,968 1,710,347 804,703 831,505 2,085,435 202,251 9,253,848
1900 442,120 3,278,623 2,361,087 830,869 789,042 2,987,104 301,280 10,990,125 1901 425,589 3,319,334 2,233,825 954,661 750,921 3,360,082 446,888 11,491,300 1902 395,648 3,485,489 1,943,654 1,014,168 816,392 3,160,683 489,925 11,305,959 1903 464,792 3,937,428 2,005,391 1,124,848 846,368 3,236,102 606,525 12,241,454 1904 444,868 4,016,661 2,113,377 1,243,083 931,097 2,935,416 672,438 12,356,942
1905 417,951 4,361,897 2,182,059 1,138,875 960,700 3,158,145 661,270 12,860,697 1906 460,694 4,529,301 2,171,063 1,207,515 942,910 4,591,560 652,502 14,555,565 1907 488,905 4,469,041 2,332,455 1,134,315 1,099,403 4,767,863 534,610 14,826,592 1908 547,714 5,052,148 2,365,563 1,101,746 1,125,884 4,696,634 417,445 15,560,354 1909 566,828 5,014,909 2,346,467 1,097,767 1,147,075 6,823,852 359,034 17,357,932
1910 601,753 5,334,083 2,576,795 1,031,813 1,165,229 7,830,976 479,221 19,019,870 1911 641,731 5,645,276 2,894,795 1,215,532 1,170,365 8,903,000 462,205 20,932,904 1912 851,070 6,531,590 3,506,899 1,440,114 1,808,404 9,941,049 307,333 24,386,459 1913 948,667 7,110,210 3,600,547 1,445,871 1,506,581 12,489,613 362,544 27,464,033 1914 1,030,464 7,566,821 3,765,020 1,392,039 1,752,339 8,829,740 394,739 24,733,162
1915 1,024,268 7,899,112 3,958,714 1,464,373 1,860,732 9,141,915 506,461 25,855,575 1916 1,178,148 8,661,643 4,487,601 1.479,593 2,027,018 10,371,303 523,656 28,728,962 1917 1,770,949 11,702,311 5,733,071 3,263,218 2,331,182 21,690,345 626.049 47,143,125 1918 1,529,184 13,064.412 6,960,327 4,469,164 2,694,102 30,478,437 1,006.237 60,221,863 1919 1,528,541 13,971,628 5,676,652 3,767,293 3,039,662 25,373,497 1,017,733 54,577.026
1920 1,309,179 13,347,270 4,931,856 3,246,442 3,269,971 23,290,359 1,010,401 50,405,478 1921 970,798 12,265,465 4,436,076 2,735,617 3,151,715 21,135,723 974,083 45,669,477 1922 1,161,325 12,860,960 4,614,006 2,142,572 3,352,410 22,763,363 670,350 47,764,986 1923 1,278,481 12,188,808 4,574,617 2,267,511 2,807,368 23,577,986 976,177 47,672,950 1924 1,211,858 10,990,472 5,357,891 2,328,671 2,995,362 19,905,883 1,067,213 43,857,35 0
1925 1,237,972 11,674,790 5,247,448 2,708,239 3,235,510 21,6 14,584 1,094,087 46,872,630 1926 1,166,620 12,094,428 5,369,112 2,766,536 3,337,737 31,662,753 1,309,498 57,906,684 1927 1,117,473 11,469,249 5,526,968 2,406,274 3,257,190 31,117,986 1,409,301 56,306,461 1928 940,944 11,079,262 5,655,548 2.434,693 3,432,528 32,926,325 1,603,071 56,072,371 1929 905,125 11,252,655 5,886,719 2,800,987 3,47,380 36,236,067 1,998,491 62,579,444
1930 930,037 11,244,740 5,927,613 2,886,847 3,423,012 37,661,577 1,952,441 64,026,297 1931 939,212 10,207,805 6,099,993 2,639,960 3,137,642 20,750,316 1,550,386 45,325,514 1932 1,106,635 9,269,171 5,737,922 2,805,200 2,920,418 18,814,322 1,135,610 41,789,276 1933 1,093,767 8,212,828 5,186,356 2,840,551 2,877,909 19,576,822 1,125,624 40,914,057 1934 1,097,712 8,762,521 5,436,035 2,935,119 2,893,018 21,359,019 1,102,078 43,565,502
1935 1,090,709 8,991,261 5,487,035 2,956,043 2,986,500 20,771,125 1,215,515 43.498,188 1936 1,182,481 9,381,443 5,579,839 2,922,988 3,070,028 22,401,930 1,333,833 45,873,142 1937 1,150,632 9,775,114 5,684,342 2,553,340 3,277,567 21,046,644 1,439,125 44,926,764 1938 1,098,966 10,119,032 5,875,524 2,660,064 3,229,282 24,065,263 1,513,291 48,561,442
53

54 FISHERIES STATISTICS
18. Historical Review-(e) Total Number of Persons Employed in the Fisheries Industry of Canada, by Provinces, 1895 and 1900 to 1938
Manitoba,
Prince Sasirat- Total
Edward X°va New Britis chewart, Year Scotia Brunswick Quebec Ontario Columb
hia Alberta for
Islarul Canada and Yukon
no. no. no. 110. no. no. no. no.
1895 7,058 29,369 14,489 14,119 3,259 14,485 1,585 84,364
1900 8,178 31,569 18,079 16,231 2,502 21,294 1,326 99,269 1901 7,041 29,529 17,713 13,252 2,802 20,354 2,914 93,605 1902 6,576 28,546 17,305 13,977 2,885 18,563 3,512 91,364 1903 6,318 28,260 17,333 16,528 3,003 19,137 2,573 93,152 1904 6,706 28,860 18,342 14,498 3,125 15,236 4,559 91,326
1905 5,520 30,782 19,406 14,768 3,185 18,220 5,027 96,908 1906 5,788 27,864 19,502 13,316 3,085 15,535 3,931 89,021 1907 6,249 26,797 18,179 12,908 3,180 12,834 2,549 82,696 1908 5,899 28,227 21,419 12,321 3,263 11,768 1,926 84,823 1909 5,832 26,673 20,427 12,054 3,601 19,500 2,270 90,357
1910 7,975 26,568 22,660 12,052 3,767 17,108 3,458 93,588 1911 5,888 28,368 22,157 12,582 3,831 15,167 3,139 91,132 1912 5,703 26,538 21,675 11,386 3,604 15,628 3,874 88,408 1913 6,264 28,879 21,876 10,973 3,511 20,707 6,459 98,669 1914 5,832 29,364 22,034 11,012 4,076 18,328 3,867 94,513
1915 5,643 29,062 23,373 13,797 4,114 17,820 8,373 102,182 1916 6,235 28,682 21,799 12,158 3,592 18,355 4,483 95,304 1917 5,888 26,557 21,030 11,721 3,705 20,883 5,338 95,122 1918 5,684 25,368 15,712 12,180 3,918 20,157 4,051 87,070 1919 5,369 26,133 13,789 12,210 4,156 20,303 3,700 86,160
1920 4,793 23,574 11,325 10,460 3,693 18,881 2,970 75,696 1921 3,644 23,238 10,542 9,635 3,600 15,674 3,001 69,334 1022 4,204 23,977 12,130 11,127 4,003 15,813 3,203 74,457 1923 4,586 20,586 11,484 9,978 3,742 14,857 3,731 68,964 1924 4,205 19,192 11,119 10,023 4,267 16,180 4,464 69,450
1925 4,749 19,870 11,340 11,808 4,263 17,382 5,133 74,545 1926 4,480 20,191 11,438 12,010 4,145 20,598 5,017 78,779 1927 4,136 19,747 12,344 12,144 4,156 21,322 6,263 80,112 1928.. 3,607 19,595 13,075 12,121 4,128 18,994 6,699 78,219 1929 3,466 19,833 14,055 11,066 4,043 20,435 7,552 80,450
1930 3,495 19,150 14,316 12,233 4,074 19,347 6,943 79,558 1931 3,805 19,238 15,161 13,866 3,865 13,940 5,007 74,882 1932 4,568 20,086 15,957 14,691 3,816 14,822 4,268 78,208 1933 4,698 20,567 14,664 14,566 3,984 16,856 4,213 79,548 1934 4,474 22,078 15,397 15,091 4,125 17,926 4,345 83,436
1935 4,751 21,399 15,261 15,238 3,988 17,030 5,251 82,918 1936 4,427 22,023 16,527 15,102 4,280 17,989 6,625 86,973 1937 4,472 21,653 16,483 12,556 4,440 16,767 7,654 84,025 1938 4,543 21,873 16,782 13,854 4,170 16,417 8,355 85,994

FISHERIES STATISTICS 55
19. Table for Conversion of Weights of Fish
Fresh fish in this table in the case of cod, haddock, hake and cusk, pollock and halibut (Atlantic) means fish with the head on and the entrails removed. The weight of halibut on the Pacific cost is to be the weight minus head and entrails. In the case of swordfish and tuna, it means fish with the head, tail and entrails removed. In all other cases, fresh fish means fish as it comes from the water.
COD, HADDOCK, HAKE AND CUSK OR POLLOCK 300 lb. of fresh produce one cwt. of fresh fillets. 160 lb. of fresh produce one case of canned. 200 lb. of fresh produce one cwt. of green salted. 300 lb. of fresh produce one cwt. of smoked fillets. 200 lb. of fresh produce one cwt. of smoked. 300 lb. of fresh produce one cwt. (100 lb.) of dried. 400 lb. of fresh produce one cwt. of boneless.
HERRING 70 lb. of fresh produce one case of canned.
200 lb. of fresh produce one cwt. of smoked. 300 lb. of fresh produce one barrel of pickled. 200 lb. of fresh produce one barrel of hait (fresh or salted). 200 lb. of fresh produce one barrel of fertilizer. 125 lb. of fresh produce one cwt. of dry salted.
MACKEREL OR SHAD 70 lb. of fresh produce one case of canned. 300 lb. of fresh produce one barrel of pickled. 400 lb. of fresh produce one barrel of salt mackerel fillets.
SARDINES One barrel of fresh produces 4 to 5 cases canned.
(One case of 25 lb. equals 100 tins lb. each.)
PILCHARDS 70 lb. of fresh produce one case of canned. 200 lb. of fresh produce one barrel of bait.
ALEWIVES 200 lb. of fresh produce one cwt. of smoked. 275 lb. of fresh produce one barrel of pickled.
SALMON 84 lb. of fresh (Pacific) produce one 48-lb. case canned. 70 lb. of fresh (Atlantic) produce one 48-lb. case canned.
170 lb. of fresh produce one cwt. of smoked. 125 lb. of fresh produce one cwt. of dry salted. 150 lb. of fresh produce one cwt. of mild cured. 150 lb. of fresh produce one cwt. of pickled.
TUNA
100 lb. of fresh produce one case canned.
CLAMS Atlantic Coast-200 lb. of fresh produce one case of canned. (48 tins of 5 oz. of clam meat
each).
Pacific Coast- Razor clams-80-lb , of fresh produce one case of canned. (48 tins of 6 oz. of clam meat
each). Little neck, butter clams, etc.-150 lb. of fresh produce one case of canned. (48 tins of 6 oz.
of clam meat each).
CRABS
800 lb. of fresh produce one case of canned.
LOBSTERS
200 lb. of fresh produce one case of canned. (48 tins of 12 oz. of lobster meat each.) 500 lb. of fresh produce one cwt. of lobster meat.

56 FISHERIES STATISTICS
I. Fish Caught and Marketed, 1938-con.
Cod
Fishing Districts Marketed Caught
and landed
cwt.
Codliver oil, medi
cinal
Cod Used fresh
Green- salted Boneless Dried oil
gal. cwt. cwt. cwt. cwt.
Prince Edward Island
Totals for Province-
Quantity 68,425
Value $ 49,880
140 1,989 2,888
1,120 1,352 729
12,396 21,552 215 1
17,795 54,141 1,275 2
Kings County (a11)- Total quantity 16,841 Total value $ 16,665
20 1,150 888 160 597 229
278 4,189 15 3 75 556 11,310 4
Queens County (aII)- Total quantity 22,331 Total value $ 18,244
120 2,000 960 500
200 10,063 5,594 5 6 15,184 13,274 1,200
Prince County- East Prince 925 West Prince 28,328
375 275 839 1,680 11,494 8
839 2,055 11,769 Total quantity 29,253 Total value 8 14,971
9 •••
755 2,055 29,560 10
Mackerel •
Fishing Districts Marketed Caught and
landed Used as bait
Fillets (salted)
Used fresh Pickled Canned
bbl. bbl. bbl. cwt. cwt. cases
Prince Edward Island-con.
Totals for Province-
Quantity
Value
1,775 107 180 436 5,715 10,559 1
3,550 1,326 1,470 1,886 16,146 16,771 2
Kings County (a11)- Total quantity Total value 3
709 709 3 2,127 945 4
Queens County (a11)- Total quantity Total value
640 107 60 110 240 880
4,447 6,548 5 1,280 1,326 13,096 13,341 6
7 8
Prince County- East Prince West Prince
Total quantity Total value
35 46 15 330 55
185 332 1,100 374 2,970
1,135
376 70
1,646 590 559 3,302
2,270 1,303 2,105 10

FISHERIES STATISTICS
I. Fish Caught and Marketed, 1938-con.
Flounders, Haddock Hake and Cusk Brill, Herring
Plaice
Mar- Mar-
Marketed Marketed
caught keted keted
Caught Caught Caught and and and
and landed
Can-
landed Used landed 'Used Green- Bone- Used landed 'Used Pick- Used Eertil-
Dried ned
fresh fresh salted less fresh fresh (round) led as bait izer
cwt. cwt. cwt. cwt. cwt. cwt. cwt. cwt. cwt. cwt. cwt. cases bbl. bbl. bbl.
386 386 19,155 11,189 16,421 1,116 15 582 582 56,056 4,686 35 643 24,563 75 1
636 910 19,717 12,080 30,163 3,497 60 457 582 29,174 5,085 131 3,011 49,426 75 2
136 136 21,058 1,982 8,049 846 - - - 9,951 886 - 139 4,324 - 3 136 340 10,529 1,854 13,713 2,297 - - - 5,320 1,121 - 705 8,948 - 4
245 245 8,399 6,429 505 300 15 330 330 12,756 951 - 115 5,730 - 5 490 585 4,199 6,429 1,010 1,200 60 205 330 7,109 951 - 575 11,460 - 6
5 5 378 272 53 - 72 72 13,329 889 35 39 6,004 75 7 - - 19,320 2,506 7,817 - 180 180 20.020 1,960 - 350 8,505 - 8
5 5 19,698 2,778 7,870 - 252 252 33,349 2,849 35 389 14,509 75 9 10 15 5,019 3,797 15,740 - 252 252 16,745 3,013 131 1,731 29,018 75 10
Capelin,
Alewives Salmon Smelts Launce and Eels Silversides
'Marketed Marketed Marketed Marketed Caught Marketed Caught Caught Caught Caught and and and and and
landed Used landed Used landed Used landed Used landed Used fresh Salted fresh fresh fresh fresh
cwt. cwt. bbl. cwt. cwt. cwt. cwt. cwt. cwt. cwt. cwt.
4,840 4,690 50 16 16 9,608 9,608 3,078 3,078 214 214 1
2,520 4,690 200 160 210 34,125 50,725 2,682 3,078 806 919 2
- 16 16 1,040 1,040 2,056 2,056 18 18 3
- 160 240 3,514 5,200 1,963 2,056 54 54 4
4,400 4,250 50 - 2,826 2,826 680 680 90 90 5 2,300 4,250 200 - • - 7,643 14,130 450 680 180 270 6
440 440 - - - 3,057 3,057 192 192 41 41 î - - - - 2,685 2,685 150 150 65 65 ..
440 440 - - - 5,742 5,742 342 342 106 106 ç 220 440 - - - 22,968 31,395 269 342 572 595 16
57

FISHERIES STATISTICS
I. Fish Caught and Marketed, 1938—con.
Tom Cod Clams Crabs
Fishing Districts
Marketed Marketed Marketed Caught Caught Caught and Used and Used Chow- and
e Canned landed Canned landed fresh landd fresh der
cwt. cwt. cwt. cwt. cases cases cwt. cases
Prince Edward Island—Concluded
Totals for Province-
1 Quantity 373 373 6,912 1,410 2,201 800 128 16
2 Value $ 363 401 3,171 770 12,502 2,800 32 288
_Kings County (a11)— 3 Total quantity - - 2,248 746 1,001 - - - 4 Total value $ - - 1,124 373 8,102 - - -
Queens County (a11)— 5 Total quantity 20 20 2,850 450 400 800 128 16 6 Total value $ 10 20 1,425 275 1,600 2,800 32 288
• Prince County-
7 East Prince 56 56 1,844 244 800 - - - 8 West Prince 297 297 - - - - - -
9 Total quantity 353 353 1,844 244 800 - - - 10 Total value 8 353 381 922 122 2,800 - - -
58

FISHERIES STATISTICS
I. Fish Caught and Marketed, 1938-con.
Tongues
Lobsters Oysters Quahaugs and Sounds
Other Marketed Marketed Marketed Pickled products
Caught Caught Caught
and and and or
landed TJsed Meat Canned landed Used Used fresh ley fresh
Tomal- landed Canned dried fresh
cwt. cwt. cwt. cases cases bbl. bbl. cwt. cwt. reases cwt. 5
71,213 11,072 11 24,625 1,559 5,212 5,212 2,115 1,191 108 147 - l
458,762 117,044 495 474,397 14,198 29,232 39,193 881 959 785 322 100 5
28,093 1,800 - 10,366 841 106 106 1,919 1,34" 8
187,526 19,847 - 207,205 8,367 244 424 768 874 69 -
12,902 3,168 - 3,762 114 304 304 - - - 60 - :
90,314 34,579 - 71,308 1,144 1,520 2,018 - - - 300 100 1
10,052 1,096 - 1,479 156 4,451 4,451 66 24 21 - - '
20,166 5,008 11 7,018 348 381 381 160 122 - 87 - 7
30,218 6,104 11 10,497 504 4,832 4,832 226 146 21 87 - 1
180,922 62,618 495 195,884 4,687 27,468 36,751 113 85 89 22 - 1

Nova Scotia
1,192,438 52,550
1,507,424 161,891
13,658 12 1,263
14,921 12
12,138 15
1,773
6,585 580
76,214 3,086
84,572 3,666
90,333 11,611
3,880 276 5,032
4,509 427
13,421 703
15,078 753
9,185 813
2,124 474
11,309 1,287
9,685 1,705
82,206
699,774
Totals for Pr mince-
1 Quantity
2 Value 253,734
1,532 Richmond County-
Inverness county line to St. Peter's canal including Ile Madame... St. Peter's canal to Cape Breton county line
Total quantity Total value 4,213
463 7,209
717 16,306
Cape Breton County- 7 Richmond county line to White Point inclusive and head of East
Bay included 8 White Point to Bridgeport inclusive 9 Bridgeport and head of East Bay to Victoria county line
Total quantity Total value
812 1,060 1,243
Victoria County- 12 South of Path End inclusive
13 Path End to Green Cove inclusive 14 Green Cove to Inverness county line
Total quantity Totalvalue
1,718 Inverness County-
17 Victoria county line to Broad Cove 18 Broad Cove inclusive to Richmond county line
1,799 Total quantity Total value $
Cumberland County- 21 From New Brunswick line to Lewis Head 22 From Lewis Head to Colchester county line 23 Bay of Fundy shore
321 56 329 128
Total quantity Total value
Colchester County- 26 Northumberland Strait shore 27 Bay of Fundy shore
107 55 127 110
Total quantity Total value
88 58 241 216
Pistou County- 30 From Colchester county line to Pictou Harbour
31 Pictou Harbour including Pictou Island to Antigonish county line
329 274 308 764
Total quantity Total value....
610 200 725 400
Antigonish County (a11)- 34 Total quantity 35 Total value....
3 4
5 6
10 11
7,672 60,917
17,023 50,601
15 16
3,115 8,916
19 20
24 25
28 29
32 33
60 FISHERIES STATISTICS
I. Fish Caught and Marketed, 1938-con.
Marketed Fishing Districts
Used fresh
Fresh fillets
Green- salted

I. Fish Caught and Marketed, 1938-con.
4
Cod-concluded
Marketed
Smoked Cod liver Cod liver oil, Cod o Dried Boneless il Canned Smoked fillets meal medicinal
CUSCS CM't. OWL Mt. CVin. ton gal. gal.
563 331 55,260 149,352 29,828 3 46,352 76,153 1
2,477 2,608 475,593 602,045 242,178 160 24,322 31,846 2
- - - 1,617 156 - - 300 3
- - - 421 - - - - 4
_ _ _ 2,038 156 - - 300 5
- - 8,573 1,092 - - 60 E
- - - 591 - - - - 1
- - 43 711 230 -
- 196 4,859 292 61 - 3,706 - i
- 196 4,902 1,594 291 - 3,706 - 1(
- 1,176 39,314 7,336 2,328 - 2,224 - E
_ - 660 _ _ - - E
- _ 903 - _ _ - E
- - 514 - - - - 1,
_ _ - 2,077 _ _ - - 11
- - - 8,834 - - II
40 - 177 519 - 641E
- - 412 - - - 84811
40 - - 5S9 519 - - 1,489 11
176 - - 3,357 3,412 - - 36121
-
_ - 2'
- - - -
- 77 - 2,
_ -
- 77 _ _ _
_ 385 _ _
_ _
_ _ - - - - - - 2, _
- - - 10 - - - -3
_ _ _ 3 _ _ _ -3
- - - 13 - - - 3
_ _ 53 _ - 3
_ - - 97 _ _ - 3
- - 582 _ _ - 3

FISHERIES STATISTICS
L Fish Caught and Marketed, 1938-con.
Haddock
Fishing Districts Marketed
Caught-
and TIsed Fresh
landed Canned Smoked Smoked fresh fillets fillets
cwt. cwt. evrt. cases cwt. cwt. (a)
Nova Scotia-con.
Totals for Province-
1 Quantity 383,516 97,995 67,583 17,385 21,368 2,160
2 Value $ 615,963 366,715 653,039 68,681 199,575 20,006
Richmond County- 3 Inverness county line to St. Peter's canal including
Ile Madame 21,020 102 - 1,605 - - 4 St. Peter's canal to Cape Breton county line 279 129 - - - -
5 Total quantity 21,299 231 - 1,605 - - 6
Total value S 13,915 167 - 3,862 - -
Cape Breton County- 7 Richmond county lise to White Point inclusive and
head of East Bay included - - - - - 8 White Point to Bridgeport inclusive 420 355 13 - 13 - 9 Bridgeport and head of East Bay to Victoria county
line 11,074 6,128 5,312 - 1,076 129
10 Total quantity 11,494 6,483 5,325 - 1,089 129 11
Total value $ 18,092 25,532 53,145 - 7,439 1,033
Victoria County- 12 South of Path End inclusive - - - - - - 13 Path End to Green Cove inclusive 28,678 - - - - - 14 Green Cove to Inverness county line 540 526 - - -
15 Total quantity 29,218 526 - - - - 16
Total value $ 15,004 789 - - - -
Inverness County- - 17 Victoria county line to Broad Cove 367 70 - - -
18 Broad Cove inclusive to Richmond county line 387 111 - -
19 Total quantity 754 181 - - - - 20 Total value 952 362 - - - -
, Cumberland County-
21 From New Brunswick line to Lewis Head - - - - - - 22 From Lewis Head to Colchester county line ... - - - - - - 23 Bay of Fundy shore - - - - - -
24 Total quantity - - - - - - 25
Total value $ - - - - - -
Colchester County- 26 Northumberland Strait shore - - - - - - 27 Bay of Fundy shore - - - - - -
28 Total quantity - - - - - - 29
Total value $ - - - - - -
Pictou County- 30 From Colchester county line to Pictou Harbour 2 2 - - - - 31 Pictou Harbour including Pictou Island to Antigonish
county line 67 67 - - - -
12 Total quantity 69 69 - - - - 33
Total value $ 53 207 - - - -
Antigonish County (a11)- 14 Total quantity 55 55 - - - - 35 Total value 8 72 165 - - - -
(a) Including chicken huddles, which contain cod, haddock and hake.

FISHERIES STATISTICS
I. Fish Caught and Marketed, 1938-con.
Haddock-concluded llakeandCusk
Marketed Marketed Caught
Green- T, ....,, 13one- , and Um; d Fresh n 1 Green- ,..._, Srnoked Bone-
salted ''n''' less "°e landed fresh fillets "ane" salted 'fli°"'-' fillets lDrie d less
cwt. cwt. cwt. cwt. cut. cut. cut. cases cut. cwt. cwt. cut. cut.
1,167 1,609 678 185 105,870 22,575 3,489 9,119 18,700 96 3,084 18,915 1,744 1
2,245 4,657 3,429 1,998 85,999 21,799 20,840 37,492 33,871 480 20,063 51,131 9,673 2
- 266 - - 318 26 - - 70 - - 50 - 3 - 50 - - - - - - - - - - -4
- 316 - - 318 26 - - 70 - - 50 - 5 - 778 - - 159 26 - - 105 - - 100 - 6
_ - - - - 17 17 - - - - - _ -t
1"_ _ - 2,272 - - - 472 - 443 - -9
15- - - 2,2 89 17 - - 472 - 443 - - 1( 38 - - 809 17 - - 590 _ 2,134 - - 11
- -- - - 203 183 - - - - - - - E _ - 74 69 _ _ - _ - -1
- - _ - 277 252 - _ - - - - E _ - _ 84 127 _ _ - _ _ _ - 1(
- _ _ 828 - _ - 109 - 166 28E _ 30 - 5,511 6 _ _ 219 - - 1,689 - M
- 30- _ 6,339 6 _ _ 328 _ - 1,855 28 14 - 150 - 3,266 6 - - 820 - - 4,270 11221
_ - _ - 76 76 - - _ - - 2 _ _ _ - - _ _ _ - - _ _ - - - - - - - _ - _ - -2 - - _ - 76 76 - -
_ _ - -
_ _ _ 152 228 _ _ _ - _ -a
- - - - - - - - - - - - D - _
_ _
_ - _ - 27 17 _ _ _ - - 3 - 31
- - - - 1,005 90 - - - 236 - 147 - 3
- - - - - 1,032 107 - - 236 - 150 - 3: - - - - 533 304 - - 708 - 673 - 3:
- - - 3,145 150 - 990 - - 250 673 - - - 2,948 262 - - 2,425 - - 1,500 6033

FISHERIES STATISTICS
I. Fish Caught and Marketed, 1938—con.
• Pollock
Fishing Districts
Caught Marketed
and Used Fresh Green-
landed fresh fillets salted Dried Smoked
cwt. cwt. ewt, cwt. cwt. cwt.
Nova Scotia—con.
Totals for Province-
1 Quantity 81,892 9,982 93 9,175 17,729 4
2 Value 5 43,695 23,092 518 18,685 51,189 19
Richmond County-
3 Inverness county line to St. Peter's canal including Ile Madame - - - - - -
4 St. Peter's canal to Cape Breton county line - - - - - -
5 Total quantity - - - - - -
6 Total value s - - - - - -
Cape Breton County-
7 Richmond county line to White Point inclusive and head of East Bay included - - - - - -
8 White Point to Bridgeport inclusive - - - - - -
9 Bridgeport and head of East Bay to Victoria county
line - - - - - -
10 Total quantity - - - - - -
11 Total value s - - - - - -
Victoria County-
12 South of Path End inclusive - - - - - -
13 Path End to Green Cove inclusive - - - - - -
14 Green Cove to Inverness county line. - - - - - -
15 Total quantity - - - - - -
16 Total value s - - - - - -
Inverness County-
17 Victoria county line to Broad Cove - - - - - -
18 Broad Cove inclusive to Richmond county line - - - - - -
19 Total quantity - - - - -
10 Total value S - - - - - -
Cumberland County-
ll From New Brunswick line to Lewis Head - - - - - -
12 From Lewis Head to Colchester county line - - - - - -
:3 Bay of Fundy shore 115 49 - 11 15 -
?A Total quantity 115 49 - 11 15-1.5 Total value s 115 96 - 44 75 -
Colchester County-
!6 Northumberland Strait shore - - - - - -
17 Bay of Fundy shore - - - - - -
l8 Total quantity - .- - - - -
l0 Total value s - - - - - -
Pictou County-
SO From Colchester county line to Pictou Harbour - - - - - -
11 Pictou Harbour including Pictou Island to Antigonish county line - - - - - -
12 Total quantity - - - - - -
{3 Total value $ - - - - - -
Antigonish County (a11)—
i4 Total quantity - - - - - -
i5 Total value $ _ _ _ _ _ _
64

FISHERIES STATISTICS
I. Fish Caught and Marketed, 1938—con.
Pollock—con- eluded Catfish Halibut Flounders,Brill, Plaice
Marketed Marketed Marketed 3Iarketed Catet Caught Caught and Used Fresh and Used Fresh and Used Fresh 13one- Oil landed less fresh fillets lad fresh fillets Canned Livers landed fre sh fillets
cwt , gaL emit. eml. cwt. cwt. ent. ent. cases cmt. cwt. ent. cwt.
23 400 4,336 1,131 1,072 39,514 29,637 6,083 91 676 10,459 4,803 1,762 1 138 120 1,631 3,306 7,859 362,203 314,027 127,209 637 27,302 12,309 20,126 26,342 2
_ _ _ _ - _ _ _ _ 2S 28 -3 - - - - 31 31 - - - - - -4 - - - - 31 31 - - - 28 26 -5 - - - - 256 310 - - - 14 14 -6
- - - - 11 11 - - - - - -7 - - - - 226 226 - - - - - -8 - - - - - 2,427 2,008 - - - . 1,049 767 94 9 - - - - - 2,664 2,245 - - - 1,049 767 94 10 - - - - - 17,651 26,677 - - 798 2,579 1,40811
- - - - - - - - - - - -12 - - - - 104 - - - - - -13 - - - - 40 5 - - - - -14 - - - - 144 5 - - - - - -15 - - - - 664 50 - - - - - -16
- - - - 14 14 - - - - -17 - - - - - - - - - - - -18 - - - - 14 14 - - - - - -19 - - - - 96 140 - - - - - -20
_ _ _ _ - - _ _ _ 500 500 -21 _ _ _ _ _ _ _ _ _ _- -22 _ _ _ _ 7 7 _ _ _ 5 5 -23
_ _ _ _ 7 7 _ _ _ 505 505 -24 _ _ _ _ 42 63 - _ _ 510 1,515 - 25
- - - - - - - - - - - -26 _ _ _ _ _ _ _ _ 3 3 -2 _ _ _ _ _ _ _ _ _ 3 3 -26 _ - _ _ _ _ _ _ _ 6 9 -26
_ _ _ _ _ _ _ _ _ _ -36 _ _ _ _ _ _ _ _ _ _ _ -31
- - - - - _ _ _ 200 200 -B _ _ _ _ _ _ _ 100 150 -31
89667--5
65

FISHERIES STATISTICS
I. Fish Caught and Marketed, 1938—con.
Skate (a) Soles
Fishing Districts Marketed Marketed
Caught Caught
and Used and Used Fresh
landed fresh landed fresh fillets
cwt. cwt. cwt. cwt. cwt.
Nova Scotia—con.
Totals for Province-
1 Quantity 33,262 4,238 16,941 2,802 4,713
2 Value $ 7,035 4,448 30,304 13,417 56,561
Richmond County- 3 Inverness county line to St. Peter's canal including Ile Madame - - - - - 4 St. Peter's canal to Cape Breton county line - - - - -
5 Total quantity - - - - - 6 Total value $ - - - - -
Cape Breton County- 7 Richmond county line to White Point inclusive and head of East
Bay included - - - - - 8 White Point to Bridgeport inclusive - - - - - 9 Bridgeport and head of East Bay to Victoria county line _ _ _ _ _
10 Total quantity - - - - - 11 Total value $ - - - - -
Victoria County- 12 South of Path End inclusive - - - - - 13 Path End to Green Cove inclusive - - - - - 14 Green Cove to Inverness county line - - - - -
15 Total quantity - - - - - 16 Total value $ - - - - -
Inverness County- 17 Victoria county line to Broad Cove - - - - 18 Broad Cove inclusive to Richmond county line - - - - -
19 Total quantity - - - - - 20 Total value $ - - - - -
Cumberland County- 21 From New Brunswick line to Lewis Head - - - - 22 From Lewis Head to Colchester county line - - - - 23 Bay of Fundy shore - -
24 Total quantity - - - - - 25 Total value 5 - - - - -
Colchester County- 26 Northumberland Strait shore - - - - - 27 Bay of Fundy shore - - - -
28 Total quantity _ - - 29 Total value $ - - - - -
Pictou County- 30 From Colchester county line to Pictou Harbour - - - 31 Pictou Harbour including Pictou Island to Antigonish county
line - -
32 Total quantity - - 33 Total value $ - -
Antigonish County (a11)— 34 Total quantity - - - 35 Total value f - - -
(a) Part used in the production of fish oil and meal.
66

FISHERIES STATISTICS
I. Fish Caught and Marketed, I938-con.
Fferring
.Caught Marketed and Used Canned Smoked Smoked Used
landed Mppered Pickled ()il Meal Scales fresh (kippered) (round) (boneless) astutit
cwt. cwt. cases cmt. cwt. cwt. bbl. bbl. gal. ton cut.
255,654 62,108 990 426 3 5,580 20,992 61,273 7,020 414 1,550 1
167,807 105,086 7,920 1,353 41 48,260 92,280 133,053 590 14,000 4,650 2
3,176 - - - - 712 130 - - - 3
392 32 - - - 120 - - -4
3,568 32 - - - - 832 130 - - à
2,759 16 - - - - 4,992 260 - - 6
108 48_ _ _ _ 20 _ _ _ - 7
1,508 9- - - - 119 716 - - - 8
2,875 1,048_ - - 45 - 3,344 - - - 9
4,491 1,105- - - 45 139 4,060 - - - 1(
2,86 8 3,186- - - 450 715 8,535 - - - 11
14,345 151 - - - 43 5,060 - - - 11'
1,111 - - - - - - 80 - - - 12
708 _ _ _ _ _ _ 354 _ _ -14
16,164 151- - - - 43 5,494 - - - 11
8,316 113
- - - 217 8,241 - - - 11
7,200 7,200 _ _ _ _ _ _ - - 17
5,678 69- - - - 43 2,740 - - - 18
12,878 7,269_ _ _ _ 43 2,740 _ _ - 16
9,275 3,669- - - - 301 5,53 - - - 21
160 40- - - - - 60 - - -21 _ _ _ _ 2,150 _ - 2:
2i8 115- 11 _ _ 19 52 _ - 2 1
458 155- 11 - - 19 2,262 - - - 2
229 145- 33 - 95 3,899 - - - 2;
- - - - - - - 2 1
4 4- -
133 70 15 - - 3 12 - - - 21
137 74 - 15 - - 3 12 - - - 21
69 7S 45 - - 15 24 - - - 2:
314 159 - - - - 23 43 - - - 3(
722 83- - - - 41 257 - - - 31
1,036 242 - - - - 64 300 - - - 3:
748 454 - _ - 297 728 _ _ - 31
10,405 290 _ - - - 20 5,075 - _ - 3
10,805 580 - - - - 110 12,688 - - - 3;
89667--5f

FISHERIES STATISTICS
I. Fish Caught and Marketed, 1938—con.
Mackerel
Marketed
Nova Scotia—eon.
Richmond County-
St. Peter's canal to Cape Breton county
Cape Breton County-
snelusive and head of East Bay in-
White Point to Bridgeport inclusive... 7,741 373 - - - 2.092 - 407 Bridgeport and head of East Bay to
Victoria County-
Inverness County-

FISHERIES STATISTICS
I. Fish Caught and Marketed, 1938-con.
Sardines Alewives Bass Parch Flosefish
Mar- Mar-
Marketed Marketed Marketed Caught Caught Caught keted Caught keted Caught and and and and and
landed Soldfresh landed Used landed Used landed Used landed Used Fresh Skd Slt
and salted ha mo e a ed
sh ftash hash hash fi llets
bbl. bbl. er:t. eui. cwt. bbL ewt. ewt. mvt. ewt, cwt. ewt, cwt.
3,770 3,770 38,723 26,57 2 2,496 2,605 163 163 5 5 4,779 4,357 141 1
3,770 3,770 25,499 22,755 4,932 7,607 930 1,158 10 40 3,137 8,714 705 2
- - 148 58 - - - - - - - -3
- - - - - - - - - - - - 4
- - 148 58 - - - - - - - -5 _ _ 74 58 _ _ _ _ _ _ -€
_ - - 140 140 - - - - - - - - - I
- - 140 140 - - - - - - - - ll - - 84 157 - - - - - - - - 11
- - 5,000 4,101 - 327 - - - -
- - 1,790 1,790 - - - - - - - 1
- - 6,790 5,891 _ 327 - - - - - - 3,040 2,935 - 1,062 - - - - - 2
- 180 180 - - - - 7 _ - 2
- 200 200 - - - - - - - -2 - 599 100 50 145 - - - - - - 2
- - 979 480 50 145 - - - - - - 2 - - 399 335 38 435 - - - - - 2
_ _ .5 S - - --
_ _ _ _ -2 - - 1,034 1,030 2 - 28 2.8 _ - _ _
- - 1,042 1,038 2 - 28 28 - - - - _ _ 585 733 6 - 84 168 - - - - - 2
- - 2t 20 - - - _ _ -3
- - 21 20 - - - _ - - 10 22 - - _ _ _
- - 1,100 1,100 - - _ _ - - 975 1,250 - - - - - -

Salmon Shad
Fishing Districts Marketed Cauntit Marketed
Caught
and and U
landed Used sed
Canned landed Salted
fresh fresh
cwt. cwt. cases cwt. cwt. bbl.
Nova Scotia—con.
Totals for Province-
' Quantity 4,854 4,664 271 4,296 3,387 303
' Value 9 69,518 81,806 2,810 11,963 15,214 2,360
Richmond County- Inverness county line to St. Peter's canal including
Ile Madame 166 101 - 630 18 - St. Peter's canal to Cape Breton county lme 96 96 - - -
Total quantity 262 197 630 18 - Total value S 3,066 2,364 315 18 -
Cape Breton C,ounty- Richmond county line to White Point inclusive and
head of East Bay included - - - - - White Point to Bridgeport inclusive 337 279 105 57 - Bridgeport and head of East Bay to Victoria county
line 48 186 - 218 -
Total quantity 385 465 105 275 - Total value $ 4,865 7,675 - 105 1,060 -
Victoria County- South of Path End inclusive 519 439 - - - Path End to Green Cove inclusive 96 54 738 418 50
- Green Cove to Inverness county line 152 152 -
Total quantity 767 645 - M 418 50 Total value ç 9,474 11,098 - 553 41S 225
Inverness County- Victoria county line to Broad Cove 761 579 261 - - Broad Cove inclusive to Richmond county line 60 45 9 - -
Total quantity 821 624 270 - - Total value $ 10.172 10.02S 2.775 - -
Cumberland County- From New Brunswick line to Lewis Head - - - - From Lewis Head to Colchester county line 8 8 - - Bay of Fundy shore 4 4 - 867 567 100
Total quantity 12 12 867 567 100 Total value 175 260 3,503 2,833 1.200
Colchester County- Northumberland Strait shore - - - - - Bay of Fundy Shore 7 7 - 1,079 1,022 19
Total quantity 7 7 - 1,079 1,022 19 Total value S 111 146 - 4,140 5.688 190
Pictou County- From Colchester county line to Pictou Harbour.... 38 38 - - - Pictou Harbour including Pictou Island to Antigonish
county line 213 2 13 - - - -
Total quantity 251 251 - - - - Total value $ 3,360 4,425 - - - -
Antigonish County (a11)— Total quantity 465 461 - - - Total value S 7,333 9.681 - -
3
4
6
10 11
12 13 14
1 1
1 1
1 2
21 22 23
24 25
26 27
28 29
30 31
32 33
34 35
FISHERIES STATISTICS
I. Fish Caught and Marketed, 1938—eon.
70

FISHERIES STATISTICS
I. Fish. Caught and Marketed, 1938-con.
21 22 23
24 25
Smelts Tuna Eels Crayfish Squid
Caught Marketed Caught Marketed Caught Marketed Caught Marketed Caught Marketed
and and fresh fresh fresh
and and and , ,.,
landed Used landed Used Livers landed Used landed Used Oil Meal landed 'se' 9.9 fresh bait
cwt. cwt. cwt. cwt. cwt. cwt. cwt. cwt. cwt. gal. ton cwt. cwt.
6,781 6,417 5,331 5,331 25 1,711 1,711 37,420 3,400 19,650 612 2,216 2,216
39,702 58,470 19,212 22,081 375 9,079 10,784 7,344 670 1,800 21,000 2,285 3,416
660 121 22 22 - - - - - --
-
25 25 - - - - - - - - - 40 40
685 146 22 22 - - - - - 40 40
4,085 876 22 22 - - - - - - 40 50
39 39 - _ - - - - - - 30 30
75 75 _ - _ _ _ _ _ _ 20 20
96 152 _ - _ _ _ _ _ _ _
210 266 - - - - - - - - - 50 50
1,432 4,314 - - - - - - - - - 55 72
210 154 - - - 70 70 - - - - - -
210 154 - - - 70 70 - - - - -
1,450 1,386 - - - 210 420 - - - - - -
34 34 _ - _ _ _ _ _ _ _ 700 700
195 194 . - - - - - - - - 10 10
229 228 - - - - - - - - - 710 710
1,374 2,600 _ - _ - - - - _ _ 710 885
622 622 - - - - -- - - - - -
.753 345 - _ - _ _ _ _ - _ - - _ -
1.375 967 - - - - - - - - - _ _
5,S35 7,736 - - - - - - - - - - -
237 187 - - - 2 2 - - -- - -
12 12 - - - - - - - _ _ _ _
249 199 - - 2 2 - - - - - -
1,245 1,556 - - - 11 20 - - - - - -
388 50 - - - 7 7 _ _ - _ _
549 72 - - - 62 62 - _ _ _ _ _
937 122 - - - 69 69 - - _ _ _ _
4,646 976 - - - 390 566 - - _ _ _ -
302 143 - - - 120 120 600 600 - - 100 100
1,631 1,287 - - - 600 840 120 150 - _ 85 120

72 FISHERIES STATISTICS
I. Fish Caught and Marketed, 1938—con.
Swordfish Tom Cod Mixed Fish (a)
Fishing Districts
Caught Marketed Caught Marketed Caught Marketed and and and
landed Used Li vers landed Used landed Used fresh fresh fresh
cwt. cwt. ca-t. cwt. cat. cwt. cwt.
Nova Seotia—con.
Totals for Province-
1 Quantity 10,929 10,929 39 275 275 50,333 183
2 Value 6 101,529 132,178 585 155 280 5,466 36
Richmond County- 3 Inverness county line to St. Peter's canal including
Ile Madame 31 18 - - - 183 183 4 St. Peter's canal to Cape Breton county line. 57 57 - - - -
5 Total quantity 88 75 - - - 183 183 6 Total value S 690 675 - - - 36 36
Cape Breton County- 7 Richmond county line to White Point inclusive and
head of East Bay included 86 29 - - - - - 8 White Point to Bridgeport inclusive 6,057 5,186 - - - - - 9 Bridgeport and head of East Bay to Victoria county
line 1,080 1,766 - - - - -
10 Total quantity 7,223 6,981 - - - - - [1 Total value 6. 61,668 76,736 - - - - -
Victoria County- [2 South of Path End inclusive - - - - - [3 Path End to Green Cove inclusive 1,407 958 - - - - - 14 Green Cove to Inverness county line 1,210 929 - - - -
15 Total quantity 2,617 1,887- - - - - L6 Total value $ 21,263 28,305 - - - -
Inverness C,ounty- 17 Victoria county line to Broad Cove - - - - - - - 18 Broad Cove inclusive to Richmond county line - - - - -
[9 Total quantity - - - - - 30 Total value $ - - - - - - -
Cumberland County- /1 From New Brunswick line to Lewis Head - - - - - - 32 From Lewis Head to Colchester county line - - - - - - 33 Bay of Fundy shore - - - - - -
:4 Total quantity -- - - - - 35 Total value s — — — — — —
Colchester County- 36 Northumberland Strait shore - - - - - - - 37 Bay of Fundy shore - - - - - - -
38 Total quantity - - - - - - 39 Total value e — — — — — — -
Pictou County- 1 0 From Colchester county line to Pictou Harbour.... - - - - - - - II Pictou Harbour including Pictou Island to Antigon-
ish county line - - - - - - -
12 Total quantity - - - - - - - 33 Total value 6 - - - - - - -
Antigonish County (a11)— 14 Total quantity - - - 250 250 - - 15 Total value $ - - - 125 250 - -
(a) Part used in the production of fish meal and oil.

FISHERIES STATISTICS
I. Fish Caught and Marketed, 1938-con.
Clams Crabs Labsters Oysters
Marketed Marketed cieght Marketed Marketed
Caught 1:aught 1:aught
heed Used Canned heed Used ,„nle, In Meat Canned Te- . and used
fresh fresh '"'" shell malley 1anded fr'esh
cwt. cmt. cases cwt. cwt. cmi. cmt. cwt. cases cases bbL bbl.
8,328 6,732 798 75 75 155,405 82,530 1,131 37,838 3,681 3,886 3,886 1
6,899 6,147 4,080 150 1871,770,7221,123,138 91,072 731,086 33,873 16,210 22,482 2
- - - 2,778 2,171 - 1,133 36 47 47 2
- - - 3,708 1,751 - 451 52 30 • 30 4
- - - 6,486 3,922 - 1,584 88 77 77 f
- - - 55,970 51,293 - 34,868 587 261 291 f
- - - - - 1,865 506 - 744 52 - - ■
- - - - 8,714 4,735 - 1,626 123 - - i
- - - - - 4,593 2,312 - 1,108 142 29 29 9
- - - - - 15,172 7,554 - 3,478 317 29 291f
- - - - - 150,237 99,251 - 69,017 2,725 88 88 11
- - - - - 3,456 1,645 - 938 82 594 594 12
- - - - - 1,575 231 - 622 50 - - 13
- - - - - 3,383 269 - 1,607 91 - - IA
- - - - - 8,414 2,145 - 3,167 223 594 59411
- - - - - 67,448 33,842 - 63,370 2,124 2,105 2,67519
- - - - - 6,259 270 - 2,570 51 15 15 11
- - - - - 6,885 1,227 - 2,173 161 1,461 1,461 1E
- - - - - 13,144 1,497 - 4,743 212 1,476 1,476 19
- - - - - 91,935 15,462 - 90,186 1,779 5,820 8,11021
- - - - - 1,958 695 - 1,079 91 - - 21
- - - - - 7,868 267 - 3,734 632 717 71722
_ _ _ _ - 66 66 _ _ - - - 23
- - - - 9,872 1,028 - 4,813 723 717 71724
- - - - 67,643 12,489 - 89,055 6,552 3,585 5,01925
- - - - 468 150 - 77 6 280 2802E
250 - 1i5 - - - - - - - - -2
250 - 125 - - 468 150 - 77 6 280 2802E
125 - 500 - - 3,276 1,238 - 1,295 72 1,400 1,960 29
- - - - 10,074 5,859 230 7,784 804 310 310 36
45 45 - - 8,444 35 - 1,837 254 295 295 31
45 45 - - 18,518 5,894 230 9,621 1,058 605 60531
22 45 - - 129,626 68,525 11,89 180,293 10,123 2,435 3,645 32
27 27 - - 10,948 1,208 - 5,884 422 80 8034
45 60 - - 87,584 13,385 - 115,628 3,576 378 45031
73
89667--6

74 FISHERLES STATISTICS
I. Fish Caught and Marketed, 1938—con.
Tongues
Quahaugs Scallops and Sounds
Fishing Districts Marketed 3Iarkete
Caught Caught d Pickled and and Or
landed TJsed Canned landed Shelled dried fresh
cwt. cwt. cases gal. gal. cwt.
Nova Scotia—con.
Totals for Province-
1 Quantity , 918 288 280 92,000 92,000 933
2 Value 8 408 288 1,050 119,109 135,460 5,836
Richmond County- 3 Inverness county line to St. Peter's canal including
Ile Madame - - - - - - 4 St. Peter's canal to Cape Breton county line - - - - - -
5 Total quantity - - - - - 6 Total value c - - - - - -
Cape Breton County- 7 Richmond county line to White Point inclusive and
head of East Bay included - - - - - 8 White Point to Bridgeport inclusive - - - - - 9 Bridgeport and head of East Bay to Victoria county
line - - - - -
10 Total quantity . - - - - _ 11 Total value S - - - - -
Victoria County- - 12 South of Path End inclusive - - - - -
13 Path End to Green Cove inclusive - - - - 14 Green Cove to Inverness county line - - - - -
15 Total quantity - - - - 16 Total value S - - - -
Inverness County—
- - 17 Victoria county line to Broad Cove - - - 18 Broad Cove inclusive to Richmond county line - - - -
19 Total quantity - - - -
20 Total value S - - - -
Cumberland County— - 21 From New Brunswick line to Lewis Head - - - -
22 From Lewis Head to Colchester county line - - - - 23 Bay of Fundy shore - - - -
24 Total quantity - - - 25 Total value 8 - - - - -
Colchester County- 26 Northumberland Strait shore 918 288 280 - - 27 Bay of Fundy shore - - - -
28 Total quantity. 918 288 280 - - 29 Total value S 408 288 1,050 -
Pictou County—
- - 30 From Colchester county line to Pictou Harbour - - - - 31 Pictou Harbour including Pictou Island to Anti-
gonish county line - - - -
32 Total quantity - - -- 33 Total value $ - - - _ _ -
Antigonish County (a11)— 34 Total quantity - - - - _ 35 Total value s - - - - - _

FISHERIES STATISTICS
I. Fish Caught and Marketed, 1938--con.
Winkles Dulse Seaweed Miscellaneous
Mar- Mar- Fish
Caught keted keted Marketed Fish Fish Fish Other
and Green Green ell , meal, fertil- Fi.h - skins and
Dried Dried Meal ses. n.e.• tzer offal s. me.a. bones products
landed Used fresh
cwt. cwt. cwt. cwt , eut. cwt. ton gal. ton ton ton cwt. S
90 90 700 140 4,655 105 9.5 9,480 5,697 95, 14,324 18,160 -
180 180 550 980 SIO 810 6,500 2,218 289,563 4751 21,S0C 20,725 4.062
_ _ _ _ _ _ _ 16
- - - - - - - - - _ -
- - - - - - IS -
- - - - - - - - 72 -
- - - - - - - 266 - 1.330 1,093 - —
- - - - 266 - 1.330 1,093 -
- - - - - 10.640 - 1.330 1,566 -
- - - - _ _
1 i
_ _ _ _ _ _ _ _ _ _
_ _ _ _ - - - .53 _
_ _ _ _ _ _ _ 63 _
_ _
_ _ _
_ _ _
_
_ _ _ _ 455 65 _ _ _ _ _ 390 780 - _
89667-6;

1 2 3
4 5
6 7
10 11
12 13
14 15
16 17
18 19
20 21
22 23
24 25
26 27
28 29
30 31
13,355 46,638
2,343 8,487
89
5,578
1,424 3,662
4.665 14,534
9,290 4,065
44,696 46,392
7,688 7,720
2.907 4,360
4,571 6,348
3,964 3,980
330 495
1,323 8,920
361 2,166
5,667 18,733
650 1,950
76 FISHERIES STATISTICS
I. Fish Caught and Marketed, 1938-con.
3Iarketed Fishing Districts
Used fresh
Fresh fillets
Green- salted
cwt. cwt.
Nova Scotia-con.
Guysborough County- From Antigonish county line to Fox Island inclusive From Fox Island to Isaac's Harbour inclusive From Isaac's Harbour to Halifax county line
Total quantity Total value
Halifax County- From Guysborough county line to East Ship Harbour From West Ship Harbour to but not including Cole Harbour. Cole F1arbour to Pennant Point inclusive From Pennant Point to Lunenburg county line
Total quantity Total value
Hants County (a11)- Total quantity Total value....
Lunenburg County- From Halifax county line to and including Mahone Bay From 3Iahone Bay to Queens county line
Total quantity Total value
Queens County (a11)- Total quantity Total value....
Shelburne County- From Queens county line to but not including Shelburne town From and including Shelburne town to Yarmouth county line
Total quantity Total value
Yarmouth County (a11)- Total quantity Total value....
Digbv County- FrOm Yarmouth county line to the Sissiboo river The Sissiboo river inclusive to Annapolis county line, including
Digby Neck
Total quantity Total value
Annapolis County (ail)- Total quantity Total value....
Kings County (a11)- 32 Total quantity 33 Total value....
$
5,107 44,072
8,133
1,227 986 624
806 6,266 625 10,231
57,312 56,896 4,967
2.837
1,431 16,497
9,061 50,902
3,270
8,620 227
190,602 20,578
6,600 3,100 34,495
-
14,008 - 1,428
209,092 23,905
273,120 59,382
34,495 15,436
310,455 39,959
106 58 212 232
10,850 1,550
468,310 2,280
479,160 3,830
605.850 9,940
155,986 4,771
46,805 346
202.791 5,117
304,993 26,141
33,017 1.041
41,723 3,643
30,079 644
37,435 1,280
3,826 1,063
40,870 3,508
233,176
7,730
7,730 54,110
20,566
25,117
26,206
2,938
1,089
1,323

FISHERIES STATISTICS
I. Fish Caught and Marketed, 1938-eon.
Cod-concluded
Marketed
Smoked Cod liver Cod liver, oil, Cod oil Canned Smoked Dried Boneless fillets meal medicinal
cases civt. civt. cwt. cwt , ton gal, gal.
_ _ 675 - _ _ • - / _ _ _ 398 - _ _ 1,062 2 - - - 1,373 154 - _ 920 3 _ - 675 1,771 154 _ _ 1,952 4 _ _ 5,400 6,762 1,240 _ _ 600 5
- - - 1,090 - - - 120 6 _ - - 2,703 71 _ _ 700 7 - 133 15,560 401 2 - - 30,358 5 _ - - _ _ _ 2,000 9
- 133 15,560 4,194 73 - - 33,1781C - 1,064 140,040 19,060 588 - - 16,94411
- - 16 - - - 1: - - 128 - - - g
- - - 2,49 - - - B _ 15,140 130,885 2,710 - 18,40015
- 15,140 133,375 2,710 - 18,400 11 - 121,120 533,500 24,390 - 7,160 11
- 2,458 512 - - - - 1! - 19,664 1,664 - - - - li
- 42 13,321 2,210 3,395 3 21,072 90521 - 217 - 6,195 - _ 5,2352
- 42 13,538 2,210 9,590 3 21,072 6,140 2 - 368 . 128,737 8,142 78,770 160 10,831 1,692:
_ _ 25 _ 13,193 - - 2,5992 - - ISO - 105,093 - - 6452.
253 _ _ 75 558 _ - -2'
270 - 2,602 247 2,247 - 21,574 12,0652
523 - 2,602 322 2,805 - 21,574 12,0652 2,301 - 18,258 1,555 22,565 - 11,267 4,3872
_ _ 360 25 25 _ - - 3
_ _ _ 2,880 125 200 _ - 3
- - 442 319 - - - 3 - - 1,989 2,500 - - - 3

78 FISHERIES STATISTICS
I. Fish Caught and Marketed, 1938-con.
Haddock
Fishing Districts Marketed
Caught and
landed Used Fresh Canned Smoked Smoked
fresh fillets fillets
cwt. cwt. cwt. cases cwt. cwt.
Nova Scotia-con.
Guysborough County- 1 From Antigonish county line to Fox Island inclusive 825 2, 896 2,526 160 1,120 26 2 From Fox Island to Isaac's Flarbour inclusive 3.417 275 130 - 10 - 3 From Isaac's Harbour to Halifax county line 1,751 93 - - -
4 Total quantity 5.993 3,264 2,650 160 1,130 26 5 Total value S 9,375 8,946 16,456 720 8,480 20S
Halifax County- 0 From Guysborough county line to East Ship Har-
bour . - - - - - -
7 From West Ship Harbour to but not including Cole Harbour 390 55 - - -
8 Cole Harbour to Pennant Point inclusive 136.036 29, 794 38,082 - 4,241 1,091 9 From Pennant Point to Lunenburg county line 1,345 1,845 - - - -
10 Total quantity 138,271 31,694 38,082 - 4,241 1,091 11 Total value 257,327 146,286 374,156 - 56,275 10,580
liants County (all)- 12 Total quantity - - - - - - 13 Total value S - - - - - -
Lunenburg County- 14 From Halifax county line to and including Mahone
Bay 2,430 1,115 - - - - 15 From Mahone Bay to Queens county line 21,830 6,540 3,300 - 3,450 -
16 Total quantity 24,260 7,655 3,300 - 3,450 - 17 Total value $ 47,943 27,987 29,700 - 27,400
Queens County (a11)- 18 Total quantity 8.430 3,91 571 - 1,413 - 19 Total value $ 16,653 15,564 5,139 - 9,891
Shelburne C,ounty- 50 From Queens county line to but not including Shel-
burne town 49,547 9,863 9,730 - 7,838 294 51 From and including Shelburne town to Yarmouth
county line 19,536 4,792 1,744 71 229 -
22 Total quantity 69,083 14,655 11,474 71 8,067 294 23 Total value $ 132,216 71,945 120,796 355 58,806 3,885
Yarmouth County (a11)- Z4 Total quantity 5,343 4,740 72 - 74 - Z5 Total value 5 10,869 13,746 637 504 -
Dibgy County- :6 From Yarmouth county line to the Sissiboo river... 4,680 1,571 - 2,109 6 - 57 The Sissiboo river inclusive to Annapolis county
line, including Digby Neck 61,034 20,227 6,063 13,440 4,775 850
28 Total quantity 65,714 21,798 6,063 15,549 4,781 850 19 Total value $ 88,935 51,609 52,690 63,744 29,673 3,600
Annapolis County (all)- i0 Total quantity 3,464 2,654 40 - 123 70 il Total value $ 4,359 3,212 320 - 1,107 700
Kings County (all)- i2 Total quantity 99 99 - - - - 33 Total value 8 198 198 - - - -

1 2 3
4 5
6
8 9
0 1
2 3
4 5
16 17
18 19
0
21
22 23
24 25
26
27
28 29
30 31
32 33
FISI-IERIES STATISTICS
L Fish Caught and Marketed, 1938-con.
79
Haddock-concluded Hake and Cusk
Marketed Marketed
Caught and
Green- Bone- Used Fresh Green- Smoked Dried Bone-
Dried Roe landed
Canned Smoked salted less fresh fillets salted fillets less
cmt. emt. cut. cmt. cwt. cmt. cwt. cases cut. cwt. emt. cwt. cwt.
748 - - - 1,286 85 17 - 581 - - - - 97 22 - - 69 17 3 - 14 - - - - - - - - 354 32 - - so - - 52 -
845 22 - - 1,709 134 20 _ 655 _ - 52 - 1,406 48 - - 766 113 109 - 1,058 - - 135 -
- 112 - - 75 - - - - - - 25 - - 67 - - 1,359 493 224 - 95 - 27 - - - - - - 170 170 - - - - - - -
- 179 - - 1,604 663 224 - 95 - 27 25 - - 671 - - 792 1,280 1,540 - 215 - 189 90 -
_
215 295 - - 820 10 - - 165 - - 160 - 40 620 - 25 5,020 600 80 - 173 - - 900 270
255 915 - 25 5,840 610 so 338 - - 1,060 270 710 2,580 - 200 3,169 1,210 480 594 - - 2,730 1,620
- - - 6,062 166 384 - 1,198 - 189 14 - - - - 3,674 166 1,920 _ 1,791 - 1,134 28 -
- 87 - 160 13,802 281 920 - 3,419 - 21 1,547 -
- 661 - 9,267 985 727 - 1,676 96 - 228
87 661 160 23,069 1,266 1,647 - 5,095 96 21 1,547 228
266 3,341 1,798 14,877 2,913 11,054 - 10,891 480 190 4,025 1,140
48 10 8 - 6,348 1,552 - - 1,138 - 2 53 1,124 86 23 4 8 - 4,173 1,940 - _ 2,105 - 16 145 6,036
- - - - 2,480 3,677 - 1,158- - - - 27
4 50 9 - 94,235 11,208 1,124 7,961 6,866 - 2,392 11,937 -
4 50 9 - 96,715 14,885 1,124 9,119 6,866 - 2,392 11,937 27 5 141 40 - 46,164 12,138 5,657 37,492 10,732 - 16,340 32,553 162
- - - - 11,032 2,656 10 - 1,225 - 10 1,950 - - - - 4,418 1,060 50 _ 1,837 - GO 4,875 -
- - - 15 9 - - - - - 2 - - - - - 15 9 - - - - _ 7 -

80 FISHERIES STATISTICS
I. Fish Caught and Marketed, 1938-con.
Pollock .
Fishing Districts Marketed
Caught and
landed Used Fresh Green- Dried Smoked fresh fillets salted
cwt. cwt. cwt. cwt. cwt. cwt.
Nova Scotia-con.
Guysborough County- 1 From Antigonish county line to Fox Island inclusive - - - 12 - - 2 From Fox Island to Isaac's Harbour inclusi ve 669 21 - 231 36 - 3 From Isaac's Harbour to Halifax county line 24 - - 6 -
4 Total quantity 693 21 - 243 42 - 5 Total value 8 340 21 - 448 87 -
Halifax County- 6 FTOM Guysborough county line to East Ship Harbour 150 - - 50 7 From West Ship Harbour to but not including Cole
Harbour 1, 815 30 - 595 8 Cole Harbour to Pennturt Point inclusive 16,043 6,396 50 4,051 486 - 9 From Pennant Point to Lunenburg county line 2,300 - - 1,150 - -
10 Total quantity 20,308 6,426 50 5,201 1,131 - 11 Total value $ 10,610 18,939 300 10,819 4,246
Hants County (ail)- 12 Total quantity - - - - - 13 Total value S - - - - -
Lunenburg County- 14 From Halifax county line to and including Mahone
Bay 730 - - 350 10 - 15 From Mahone Bay to Queens county line 3,660 - - 80 1,167 -
16 Total quantity 4,390 - - 430 1,177 - 17 Total value S 2,451 - - 820 2,768 -
Queens County (all)- ' 18 Total quantity 2,570 - - 508 520 - 19 Total value $ 1.288 - - 566 1,040 -
Shelburne County- 20 From Queens county line to but not including Shel-
burne town 5,952 704 43 279 1,563 - 21 From and including Shelburne town to Yarmouth
county line 5,343 3 - 579 1,342 -
22 Total quantity 11,295 734 43 858 2,905 - 23 Total value $ 6,472 2,388 218 2,418 8,231 -
Yarmouth Pounty (all)- 24 Total quantity 12,745 11 - 62 4,201 4 25 Total value S 6,888 11 - 130 12,557 19
Digby County- . 26 From Yarmouth county line to the Sissiboo river... 2,099 1,465 - 3 223 - 27 The Sissiboo river inclusive to Annapolis county line,
including Digby Neck 23,376 - - 1,057 7,074 -
28 Total quantity 25,475 1,465 - 1,060 7,297 - 29 Total value $ 12,920 732 - 2,237 20,842 -
Annapolis'County (all)- 30 Total quantity 2,825 621 - 802 200 - 31 Total value 8 1,141 250 - 1,203 500 -
Kings County (all)- 32 Total quantity 1,470 655 - - 241 - 33 Total value 8 1,470 655 - - 843 -

FISHERIES STATISTICS
I. Fish Caught and Marketed, 1938-con.
Pollock--cone. Catfish Halibut Flounders, Brill,Plaice
Marketed Marketed Marketed Marketed Caught Caught Caught
and and and
bladed landed landed Used Fresh Bone- TJsed Fresh Used Fresh oil Canned Livers less fresh fillets fresh fillets fresh fillets
cwt. gal. cat. cwt. cat. oat. cat. cat. cases cat. cat. cat. cat.
- - - - - 52 147- - - 65 175 14 - - - - -194 SO - - - 152 - - _ 3 _ _ 428 358 _ _ _ - - -
- - 3 - - 674 585- - - 217 175 14 - 1 - - 5,226 5,346
- - 173 483 116 2
- - - - - 223 219 - - - - - -
- - _ _ _ 175 175 _ _ _ 100 100 _ - 989 758 78 9,969 1,093 6,983- 613 1,691 205 372 1 - 400 - - - 180 18 -
- - - -
- 400 959 758 78 10,547 1,667 6,983 - 613 1,791 305 372 1( - 120 507 1,515 458 110,068 21,402 127,209 - 25,376 1,891 1,020 4,0921]
- -
- - - - - 8,870 8,860 - - - 1,110 180 310 L
- - - - - 8,870 8,860 - _ - 1,110 180 3101 - - - - 89,720 104,600 - - - 1,110 720 3,7201
- - - - - 768 768 - - 497 497 - 1 - - - - - 7,130 7,290 - - 497 1,243 - 1
- - 2,369 376 994 11,006 10,750 - - - 4,325 1,571 9182
- - 975 - - 2,119 2,00" - 91 63 371 209 542
- - 3,344 376 994 13,125 12,755 - 91 63 4,696 1,780 9722 - - 1,123 1,791 7,401 105,313 149,261 - 637 1,926 6,820 12,003 17,0062
- - - - - 2,071 2,071 - - - - - - 2 - - - - - 20,367 22,020 - - - - - - 2
- - - - - 24 25 - - - 348 348 -2
- - - - - 420 419 - - - 15 15 - 2 - - - - _ 444 444 - - - 363 363 - 2 _ _ _ - - 3,732 5,132 - - _ 390 390 - 2
- - - - - 153 153 - - - - - - : - - - - - 1,416 1,416 - - - - -
23 - - - - 32 32 - - - - - - : 138 - - - - 320 320 - - - - - - :

82 FISHERIES STATISTICS
I. Fish Caught and Marketed, 1938—con.
Skate (a) Soles
Fishing Districts Marketed Marketed Caught Caught
and and landed landed Used Used Fresh
fresh fresh fillets
cwt. cwt. cwt. cwt. cwt.
Nova Scotia—con.
Guysborough County- 1 From Antigonish county line to Fox Island inclusive - - - - 2 From Fox Island to Isaac's Harbour inclusive - 227 169 5 3 From Isaac's Harbour to Halifax county line - 92 - -
4 Total quantity - 319 169 5 5 Total value S - - 373 254 65
Halifax County- 6 From Guysborough county line to East Ship Harbour - - - - - 7 From West Ship Harbour to but not including Cole Harbour - - - 8 Cole Harbour to Pennant Point inclusive 886 886 16,622 2,633 4,708 9 From Pennant Point to Lunenburg county fine - - - - -
10 Total quantity 886 886 16,622 2,633 4,708 11 Total value S 824 3,540 29,931 13,163 56,496
Hants County (a11)— 12 Total quantity - - - - - 13 Total value $ - - - - -
Lunenburg County- 14 From Halifax county line to and including Mahone Bay.. ...... - - - - - 15 From Mahone Bay to Queens county line - - - - -
16 Total quantity - - - - - 17 Total value S - - - - -
Queens County (a11)— 18 Total quantity - - _ _ - 19 Total value $ - - - - -
•
Shelburne County- 10 From Queens county line to but not including Shelburne town.. 1,422 48 - - - 11 From and including Shelburne town to Yarmouth county line.. 311 311 - - -
32 Total quantity 1,733 359 - - - :3 Total value $ 432 459 - - -
Yarmouth County (a11)— :4 Total quantity - - - - - :5 Total value S - - - - -
Digby County- :6 From Yarmouth county line to the Sissiboo river - - - - - :7 The Sissiboo river inclusive t,o Annapolis county lino, including
Digby Neck 27,650 - - - -
:8 Total quantity 27,650 - - - :9 Total value $ 5,530 - - - -
Annapolis County (all)— 10 Total quantity 2,993 2,993 - - - U Total value 3 449 449 - - -
Kings County (a11)— ,2 Total quantity - - - - - 3 Total value $ - - - - -
. (a) Part used in the production of fish oil and meal.

FISHERIES STATISTICS
I. Fish Caught and Marketed, 1938-con.
Herring
Marketed
Caught and
htnded Used Canned Smoked Smoked Kippered Pickled as Useait d (II Meal Scales fresh (kippered) (round) (bon?less) b
cwt. mvt. cases cwt. cmt. cwt. bbL bbL gal, ton cmt
5.275 553 - - - - 70 3,297 - - - 1
6.770 255 - - - - 591 4,206 7,090 414 - 2
3.425 - - - - - 245 1,345 - - - 3
15,470 SOS - - - 906 8,848 7,020 414 - 4
15,216 I,45S _ _ _ _ 4,676 22,638 500 14,000 - 5
5,420 - - - - - 400 2,110 - - - 6
7.200 95 _ - _ - 1,757 918 _ _ - 7
9,344 1,896 990 - - - 425 2,735 - - - S
14,962 2,862 _ - _ - 3,900 200 _ _ - £
36,926 4.853 890 - - - 6,452 5.963 - - - 16
28,759 9,706 7,920 - - - 27,977 15,734 - - 11
75 55 _ 10 _ - - - _ _
75 110 - 45 - - - - -
16,305 1.540 _ _ - - 4,355 850 _ - I.
34,010 1.630 - - - 1,670 6,09 5,100 - - 1,550 I:
50.315 3,170 _ _ - 1,670 10,435 5,950 _ 1,550 1 1
33,228 5,145 - - 16,700 44,240 14,100 - 4,650 E
15,266 12.960 - - - 408 841 - - - It
7,638 27.506 - - - 1,522 2,943 - - - 11
20,300 3,750 - 3 1,492 228 6,432 - - - 21
14,865 2,000 - - - 102 6,280 - - - 2:
35,165 5,780 - - 3 1,492 330 12,712 - _ -
20,355 20,492 - 44 14.650 1,559 27,487 - - - 2:
24,665 21,565 _ - - 37 568 96 _
11,837 29,230 - - 105 1,674 192 - - - 2;
8,310 - - - - 100 1,098 - - - 21
5,490 2,745 150 - 2,336 10 4,181 - -
13,800 2,745 150 - 2,336 110 5,279 - - - 2
8,546 2,705 - 750 - 16,352 360 8,052 _ _ - 21
13,059 778 - - - - 500 1,026 _ _ - 31
5,305 327 - - - - 2,250 1,026 - - - 3
1,776 76 - 240 - - 90 485 - - - 3
1,776 76 - 480 - - 450 970 - - - 3
83

84 FISHERIES STATISTICS
I. Fish Caught and Marketed, 1938-con.
Mackerel
Fishing Districts Marketed
Caught and
landed
Used ll
Fresh Fillets Used
fresh fiets Canned Smoked Pickled (eel e - t a) as bait
cwt. cwt. civt. cases cwt , bbl. bbl. bbl. Nova Scotia-con.
Guysborough County- 1 From Antigonish county line to Fox Island in-
clusive 3,194 866 - 15 - 574 896 184 2 From Fox Island to Isaac's Harbour inclusive 12,787 908 - - - 2,330 204 783 3 From Isaac's Harbour to Halifax county line 2,609 110 - - - 473 5 530
4 Total quantity 18,590 1,884 - 15 - 3,377 1,105 1,497 5 Total value. , $ 20,949 4,529 - 71 - 14,681 12,877 3,930
Halifax C,ounty- 6 From Guysborough county line to East Ship
Harbour 1,630 - _ - - - 400 - 215 7 From West Ship Harbour to but not including
Cole Harbour 1,920 150 - - - 590 - - 8 Cole Harbour to Pennant Point inclusive 8, 266 746 - - - 641 395 7,081 9 From Pennant Point to Lunenburg county line 40,200 960 - - - 9,700 - -
10 Total quantity 52,016 1,856 - - - 11,331 395 7,296 11 Total value $ 64,116 6,678 - - - 65,765 3,011 32,355
liants County (all)- 12 • Total quantity - - - - - - - - 13 Total value $ - - - - - - -
Lunenburg County- 14 From Halifax county line to and including Ma-
hone Bay 64,230 19,600 - - - 7,650 695 - là From Mahone Bay to Queens county line 14,400 1,450 - - 40 660 - 8,310
16 Total quantity 78,630 21,050 - - 40 8,310 695 8,310 17 Total value 5 92,125 23,950 - - 280 41,730 8,340 32,340
Queens County (ail)- 18 Total quantity 4,932 4,911 - - - 7 - - 19 Total value S 10,270 10,171 - - - 103 - -
Shelburne County- 20 From Queens county line to but not including
Shelburne town 15 306 247 - - 18 - 4,55 21 From and including Shelburne town to Yar-
mouth county line 1,056 - - - - - - 52S
22 Total quantity 1,071 306 247 - - 18 - 5,082 23 Total value S 1,623 1,259 1,404 - - 205 - 28,919
Yarmouth County (all)- 24 Total quantity 2,565 6,926 - - - - - - 25 Total value $ 5,067 19,010 - - - - - -
Digby County- 26 From Yarmouth county line t,o the Sissiboo
river 6,634 1,124 - - - - - 2,755 27 The Sissibooriverinclusive to Annapolis county
line, including Digby Neck 275 75 16 - - - - 116
28 Total quantity 6,909 1,199 16 - - - - 2,871 29 Total value 5 5,839 1,274 120 - - - - 5,800
Annapolis County (a11)- 30 Total quantity 6 6 - - - - - - 31 Total value $ 12 12 - - - - - -
Kings County (all)- 32 Total quantity 16 16 - - - - - - 33 Total value $ 80 80 - - - - - -

FISHERIES STATISTICS
I. Fish Caught and Marketed, 1938-con.
Sardines Alewives Bass Perch Rosefish
Mar- Mar- Mar- Marketed Marketed
keted keted keted
Caught Caught Caught Caught Caught
and and and and
S old and
landed landed landed landed Landed
fresh -used Used Used Used Fresh
and fresh Snacked Salted fresh fresh fresh fillets sahed
bbL bbL cwt. cwt. cwt. bbL cwt. cwt. cwt. cmt. cwt. cwt. cwt.
- 1,267 316 - 351 - - - - - - 1
- 158 146 - 30 - - - - - - - 2
- 1,425 462 - 381 - - - - - - 4
- 591 405 - 1,135 - - - - - - 5
- 490 460 - 11 - - - - - - 6
- 650 650 - - - - 5 5 _ _ -7
- 390 397 - - - - - - 4,779 4,357 141 8
- 300 300 - - - - - - -9
- 1,830 1,807 _ 11 _ _ 5 5 4,779 4.357 14 16
- 923 1,590 - 33 - 10 40 3,137 8,714 705 11
- 7.000 7,000 - - 72 72 - - - - - 12
- 3,145 5,215 - - 216 360 - - - - - 13
- 100 70 - 10 - - - - - -14
- - _ _ _ _ _ _ _ _ -15
- 100 70 - 10 - - - - - - 16
- 75 70 - 20 - - - - - -17
- 6,651 792 2,444 353 - - - - - 18
- 3,32 8 788 4,888 1,147 - - - - - 19
- 640 640 - - - - - - - -20
- 950 950 - - - - - - - -21
- 1.590 1.590 _ _ - - - - - - 22
- 1,172 1,667 - - - - - - - - 23
- 5,778 5,624 - 58 - - - - - - 24
- 6,968 7,030 - 145 - - - - - - 25
- - 100 100 - - - - - - _ -2G
3,770 3,770 10 10 - - - - - _ _ - 27
3.770 3,770 110 110 - - - - - - - - 2 8
3,770 3,770 110 110 - - - - - - - - 29
- - - - _ _ 63 63 _ _ _ _ -3G
_ - - - - - 630 630 _ _ _ _ -3!
- - 4,020 390 - 1,320 - - _ _ _ - 3f.;
- - 4,020 390 - 3,630 - - - - - 33
85

FISHERIES STATISTICS
I. Fish Caught and Marketed, 1938—con.
Salmon Shad
and and
Nova Scotia—eon.
Halifax County-
The Sissiboo river inclusive to Annapolis county

FISHERIES STATISTICS
I. Fish Caught and Marketed, 1938-con.
Smelts Tuna Elds Crayfish Sclui
Mar- Mar- Marketed Marketed Mar-
keted keted
Caught Caught Caught Caught Caught
and and and and and
landed Used landed Used Livers landed Used landed Used Oil Meal landed Used
fresh fresh fresh fresh asbait
mt. eat. cmt. emt. mt. cut. emt. emt. emt. gal. ton cwt. cv,d.
84 1,619 14 14 - - - 2,800 2.800 - - 1,102 1,080 1
10 9 - - - - - 34,020 - 19,650 612 126 148 2
92 82 - - _ _ _ _ _ _ _ -3
186 1,710 14 14 - - - 36,820 2.500 19,650 612 1,228 1.228 4
1,053 17,073 28 56 - - - 7,224 520 1,800 21,000 1,307 2,231 5
22 22 - - - - - - - - - - -6
555 555 - - - 158 158 - - - - - - 7
53 137 - - 25 - - - - - - - -8
- - 1,100 1,100 - - - - - - - - - 9
630 714 1,100 1,100 25 158 158 - - - - - - 16
4,188 6,585 1,840 4,400 375 945 1,580 - - - - - - 11
15 15 - - - 18 18 - - - - - 15
75 75 _ _ _ 108 110 - _ _ _ _ - 15:
103 103 2,750 2,750 - - - - - - - - 14
890 890 350 350 - 650 650 - - - - - 11
993 993 3,100 3,100 - 650 650 - - - - - 1(
6,360 6,400 12,600 12,600 - 3,250 3,250 - - - - - - 1 ■
32 32 140 140 - 450 450 - - - - 48 48 1:
336 336 140 420 - 3,150 3,516 - - - 48 4815
86 SG - - _ _ _ _ _ _ _ -SI
28 28 71 71 - - - - - - - - -2.
114 114 71 71 - - - - - - - - - 2:
1.160 1,160 162 162 - - - - - - - 2:
532 532 884 8S4 - 164 164 - - - - - 2.
4,027 5,305 4,420 4,421 - 332 332 - - - - - - 2;
57 57 _ - _ - - - - 40 402
57 57 . - - _ _
- - - - 40 402
680 680 _ _ - - - - - 40 402
- - - - - 10 10 -- - - - 3
- _ _ _ SO SO _ _ _ _ _ -3
25 25 - - - - _ _ _ _ -3
125 125 -, - - - - - - - - - 3

Swordfish Tom Cod Mixed Fish (a) '
Fishing Districts Marketed Marketed Marketed
Caught Caught Caught and and and
landed TIsed landed Used landed IJsed fresh Livers fresh fresh
cwt. cwt. cwt. cwt. cwt. cwt. cwt. Nova Scotia—con.
Guysborough County-
From Antigonish county line to Fox Island inclusive. - 127 - - - - - From Fox Island to Isaac's Harbour inclusive 7 - - - - 4.200 - From Isaac's Flarbour to Halifax county line 92 75 - - - - -
Total quantity 99 202 - - - 4.200 - Total value 1,087 2,602 - - - 840 -
Halifax County- From Guysborough county line to East Ship Har-
bour - - - _ - - _ From West Ship Ff arbour to but not including Cole
boar - - - - - - Cole Harbour to Pennant Point inclusive 30 012 - 32 - - 45.950 - From Pennant Point to Lunenburg county line - - - - - -
Total quantity 30 912 32 - - 45.950 - Total value 5 256 6,750 480 - - 4,590 -
Hanta County (a11)— Total quantity - - - - - - Total value e - - - - - - -
Lunenburg County— • From Halifax county line to and including Mahone
Bay - - _ _ _ - From Mahone Bay to Queens county line 30 30 _ _ _ -
Total quantity 30 30 - - - - - Total value 5 300 300 - - - -
Queens County (ail)— Total quantity - _ _ _ _ Total value e - - - - - - -
Shelburne County- From Queens county line to but not including Shel-
burne town 100 100 - - - - - From and including Shelburne town to Yarmouth
county line - - - - - - -
Total quantity 100 100 - - - - - Total value 8 1,859 1,859 - - - -
Yarmouth County (a11)— Total quantity 742 742 7 - - - - Total value $ 14,406 14,951 105 - _ _ _
Digby Comity- From Yarmouth county line to the Sissiboo river - - - - - - The Sissiboo river inclusive to Annapolis county line
including Digby Neck - - - 25 25 -
Total quantity - - - 25 25 - _ Total value S - - - 30 30 - _
Annapolis County (a11)— Total quantity _ _ - - - - -
Total value $ - - - - - -
Kings County (a11)— Total quantity - - - - - - - Total value S - - - - - - -
1 2 3
9
14
15
20
21
28 29
30 31
32 33
5
10 1 1
12 13
16 17
18 19
22 23
24 25
26 27
88 FISHERIES STATISTICS
I. Fish Caught and Marketed, 1938—con.
(a) Part used in the production of fish muai and oil.

FISHERIES STATISTICS
I. Fish Caught and Marketed, 1938-con.
Clams Crabs Lobsters Oysters
Marketed Marketed Marketed Marketed Caught Caught Caught Caught
and and and and landed Used Canne
landed Used landed In To- landed Used Meat Canned fresh fresh shell /Janney fresh
ewt. cwt. cases cwt. mt. cwt. cwt. cwt. cases cases bbl. bbl.
- - - - - 2,330 1,157 - 820 SS - - - - - - - 9,390 5,196 - 1,135 121 - - - - - - - 4,755 790 - 2,007 243 - -
- - - - - 16,475 7,143 - 3,962 452 - - - - - - - 164,795 108,995 - 80,429 4,645 - -
- - - - - 4,743 2,234 - 244 16 -
990 990 75 75 2,950 924 180 265 28 28 2 - - - - - 677 764 717 - 139 - - - - - - - 1,00" 1,005 - - - -
990 990 - 75 75 9,375 4,927 897 500 183 28 2811 495 495 - 150 187 112,321 75,902 78,900 9,915 1,690 168 224 1:
- _ - - _ 955 955 - - - - - - - 2,040 2,040 - - - - 1,
- - - 2,995 2,995 - - - - 1 - - - 40,570 40,570 - - - - - 1
2,100 1,670 215 - 1,703 1,703 - - - - 1
2,270 1,670 1,290 - 22,895 22,895 - - - - 1
496 496 - - 1,310 618 - - - - - 2
- - - - - 12,833 12,533 - - - - - 2
496 496 - - - 14,143 13,451 - - - - 496 496 - - - 266,335 287,362 - - - - - 2
210 210 - - - 22,018 23,426 3 - - - 173 173 - - - 407,590 485,850 217 - - -
290 290 458 - - 2,572 2,367 - - - - - l
3,830 2,914 - - - 2,5S8 2,759 1 _ -
4,120 3,204 458 - - 5,160 5,126 1 - - 3,207 3,142 2,290 - - 93,871 99,684 75 _ - - :
90 90 - - - 408 275 - - - - - : 66 66 - - - 6,906 4,675 _ _ _ _ - :
- - - - 86 86 - - - - - - - - 1,720 1,720 - - - -

90 FISHERIES STATISTICS
I. Fish Caught and Marketed, 1938—con.
Tongue,s
Quahaugs Scallops and Sounds
Fishing Districts Marketed Markete d
Caught Caught Pickled
and Used and Or
landed fresh Canned landed Shelled dried
cwt. cwt. cases gal. gal. cwt.
Nova Scotia--concluded
Guysborough County- 1 From Antigonish county line to Fox Island inclusive. - - _ _ _ 12 2 From Fox Island to Isaac's Harbour inclusive - - _ _ _ - 3 From Isaac's Harbour to Halifax county line - - - _ _ -
4 Total quantity - - - - - 12 5 Total value S - - - - - 42
Halifax County- 6 From Guysborough count y line to East Ship Har- .
bour - - - 17 17 12 7 From West Ship Harbour to but not including Cole
Harbour - - - - - - 8 Cole Harbour to Pennant Point inclusive - - - - 22,275 - 9 From Pennant Point to Lunenburg county line - - - - - -
10 Total quantity - - - 17 22,292 12 11 Total value S - - - 17 42.365 so
Hants County (a11)— 12 Total quantity - - - - - - 13 Total value S - - - - - -
Lunenburg County- 14 From Halifax county line to and including Mahone
Bay - - - 1.550 1.550 - 15 From Mahone Bay to Queens county line - - - 780 833 305
16 Total quantity - - - 2.330 2.383 305 17 Total value q; - - - 4.310 4.766 1,830
Queens County (a11)-- 18 Total quantity - - - - - - 19 Total value S - - - - _ -
Shelburne County- 10 From Queens county line to but not including Shel-
burne town - - - - 610 54 11 From and including Shelburne town to Yarmouth
county lino - - - - -
12 Total quantity - - - - 640 54 13 Total value 13 - - - - 1,212 483
Yarmouth County (a11)— 14 Total quantity - - - - - 1 15 Total value S - - - - - 4
Digby County- :6 From Yarmouth county line to the Sissiboo river - - - - - - 17 The Sissiboo river included to Annapolis county line
including Digby Neck - - - 82,090 59,577 549
18 Total quantity - - - 82,090 59,577 549 19 Total value $ - - - 105,550 78,440 3,417
Annapolis County (al)- 0 Total quantity. - - - 7,563 7,108 -
11 Total value $ - - - 9,232 8,677 -
Kings County (a11)— i2 Total quantity - - - - - - 13 Total value S - - - - - -

FISHERIES STATISTICS
I. Fish Caught and Marketed, 1938-con.
Winkles Dulse Seaweed Miscell aneous
Caught Marketed Marketed Marketed Ilsh Fish Fish Fish
Fi h skins Other and used
Green Green oil, meal, fertili, °jai and products landed fresh
Ihied Ihied Meal n.e.s. n.e.s. zer bones
cwt. cwt. cwt. cwt. cwt. cwt. ton gal. ton ton ton cwt. S
- - - - - - 3,120 - 509 - 168 1
- - - - - - - 731 - 1,1402
- - - - - 3,120 - 1,240 - - 4
- - - - - 780 - 2,481 - 1,308 5
- - - - - - 2,820 - 9,013 2,342 -
- I
_ _ _ _ _ _ _ 2,820 - 9.013 2,342 - 1(
_ _ _ _ _ - 143,955 - 17,021 3,513 - 11
_ _ _ _
_ _ _ _ - _ _ 580 95 _ 2,810 -L
- - - - - - - 580 95 - 2,810 - 11
- - - - - - - 26,100 475 - 2,475 - I'
- - - - - 3,796 167 - - -L
_ _ _ _ _ 759 7,515 _ _ - 11
- - - - - 1,164 - 1,753 3.640 3,2682'
_ _ _ - _ - - - - 1,713 -2
- - - - - 1,164 - 1,753 5,353
- - - - - 69,853 - 2,191 7,128 3,266 2:
- - - - 1,755 - - 40 5.580
- - - - _ - 446 _ _ 40 5,108 882
- - - - _ _ 809 - - 154 -2
90 90 100 20 4.000 - 95 _ 700 - 948 727
90 90 100 20 4.000 - 95 809 700- 948 881 - 2 180 180 100 140 400 - 6,500 233 31,500 - 1,743 740 - 2
- - 600 120 200 40 - - - - -3
- - 450 840 20 30 - _ _ _ - 3
_ - _ _ _ _ _ _ _ 30 -3 - - - - - - - - 60 - 3

92 FISHERIES STATISTICS
I. Fish Caught and Marketed, 1938-con.
Cod
Marketed
Fishing Districts Caught and
landed Used Fresh Green- Smoked fresh fillets salted fillets Dried
cwt. en-t. cwt. - cwt. cwt. cwt. New Brunswick-Sea Fisheries
Total Sea Fisheries for Province-
1 Quantity 102,683 11,814 260 16,863 51 18,213
2 Faille , S 103,548 19,530 1,837 52,451 428 90,519
Charlotte County- 3 From International boundary line to Public Wharf ,
Back Bay 1,050 245 64 250 4 83 4 From Public Wharf, Back Bay to Saint John county
line 4,081 675 - 1,526 117 5 West Isles and Deer Island 16 - - 8 - - 6 Campobello 3,681 1,100 - 818 - 7 Grand Manan Island 13,806 2,116 - 4,969 520
8 Total quantity 22,634 4,136 64 7,571 4 720 9 Total value S 20,772 4,721 329 23,087 28 2,533
Saint John County- 10 Saint John Harbour including Mispec and Saint John
river 1,104 133 112 - 50 - 11 The remaining portion of Saint John county 3,012 2,751 54 - - 33
12 Total quantity 4,116 2,889 166 - 50 33 13 Total value $ 5,379 3,661 1,328 - 400 132
Albert County (a11)- 14 Total quantity 4 4 - - - - 15 Total value c 12 12 - - - -
Westmèrland County- 16 Bay of Fundy watershed 82 82 - - - - 17 Northumberland Strait shore - - - - -
18 Total quantity 82 82 - - - - 19 Total value $ 201 201 - - - -
Kent County- 20 From Westmorland county line to Chockpish river. - - - - 21 From Chockpish river to Point Sapin 729 729 - - - 22 From Point Sapin to Northumberland county line - - - -
23 Total quantity 729 729 - - 24 Total value S 725 2,166 - - -
Northumberland Count y- 25 From Kent county line to Point-au-Car . 406 406 - - - 26 From Point-au-Car to lower end of Grand Down
Island - - - - - 27 From lower end of Grand Down Island to Gloucester
county line 116 84 - 16 - - 28 Northwest and southwest Miramichi rivers - - - - -
29 Total quantity 522 490 - 16 - - 30 Total value s 1,091 1,596 - 96 - -
Gloucester County- 31 From Northumberland county line to Shippegan
Gully inclusive 505 355 - - - 50 32 From Shippegan Gully to 13ass River 40,610 1,290 20 4,330 - 10,200 33 From Bass River inclusive to Restigouche county
line 6,655 1,228 10 1,330 - 579 34 Miscou and Shippegan Islands • 27,335 230 - 3,561 - 6.661
35 Total quantity 74,105 3,103 30 9,221 - 17,490 36 Total value 6 74,455 6,411 180 28,993 - SS,154
Restigouche County- 37 Total quantity 491 381 - 55 - - 38 Total value $ 913 762 - 275 - -

6
8
O 1 2
3 4
6
7
o
1 2
3 4
5 6
7 8
FISHERIES STATISTICS
I. Fish Caught and Marketed, 1938—con.
93
Cod—concluded Haddock
Marketed—concluded Marketed
Caught
Cod liver and Canned
landed Us Fresh (chicken Smoked Green- Dried Boneless °il 'Pledi- Cod oa fresh fillets haddies) sahed cold (a)
cut. gal. gal. cwt. cut. cut. cases cut. cwt. cwt.
205 391 1,605 9,172 7,781 52 4,711 180 3 28 1
1,699 235 323 18,299 17,499 331 20,143 1,785 7 56 2
SO 80 1,148 896 52 1,687 5 _ - 2
- - 586 427 - 392 - - - 4 - - 80 80 - - - - - 391 - 6,431 5,891 - 2,632 - - - f
5 590 9 - - - _ 3 2 1
85 391 670 8,335 7,294 52 4,711 5 3 28 f 619 235 150 16,535 16,557 331 20,143 35 7 56
120 - 350 - - - 175 - - h - - 135 197 197 - - - - - 1
120 - 135 547 197 - - 175 - - 1: 1,080 - 29 1,451 377 - - 1,750 - - 1:
- - - - - - - - - 1
- - - - - - - - 1
- - - - - - - - - - 2
- - - - - - - - - 2 - - - - - - - - - 2
- 2 - 2
- 2
_ - 5
_ - SOO - _ _ _ _ _ - :
- - - 260 260 - - - - :
- - 800 260 260 - - - - : - - 144 268 520 - _ _ - :
- - - 30 30 - - - - - : - - - 45 45 - - _ - :
4
(a) Chicken haddies contain cod, haddock and hake.

1 •1
1 1
1 19
20 21 22
25 26 27
28
31 32 33 34
35 36
37 35
23 24
29 30
FISHERIES STATISTICS
I. Fish Caught and Marketed, 1938-con.
94
10
11
12 13
Hake and Cusk
Fishing Districts
Caught Marketed
and Used Fresh Green- Smoked Hake
landed Dried
fresh fillets salted fillets oil
cwt. cwt. cwt. cwt. cwt. cwt. gal.
New Brunswick-Sea Fisheries-con.
Total Sea Fisheries for Province-
! Quantity 45,698 18,217 202 5,877 170 2,928 2,937
! Value $ 23,913 13,469 1,386 11,897 1,360 7,965 819
Charlotte County- I From International boundary line to Public Wharf, Back
Bay 158 G 13 146 - 25 - From Public Wharf, Back Bay, to Saint John county
line 13,420 8,571 - 1,332 - - SO1 West Isles and Deer Island - - - - - - Campobello 8,448 659 - 35 - 1,492 1,406 Grand Manan Island 3,983 - - 1,605 - 40 600
Total quantity 26,009 9,236 13 3,118 - 1,557 2,807 Total value 6 12,396 4,634 65 5,107 - 4,651 785
Saint John County- Saint John Harbour including Mispec and Saint John
river 882 - 124 - 170 - - The remaining portion of Saint John county 1,856 1,571 65 12 - 22 90
Total quantity 2,738 1,571 189 12 170 22 90 Total value $ 1,931 1,050 1,323 30 1,360 66 18
Albert County (a11)- Total quantity - - - - - - Total value $ - - - - - -
Westmorland County- Bay of Fundy watershed - - - - - - Northumberland Strait shore - - - - - -
Total quantity - - - - - - - Total value $ - - - - - -
Kent County- From Westmorland county line to Chockpish river 300 50 - 125 - - - From Chockpish river to Point Sapin 10,686 5,792 - 2,282 - 110 40 From Point Sapin to Northumberland county line - - - - - -
Total quantity 10,986 5,842 - 2,407 - 110 40 Total value $ 6,064 5,892 - 6,080 - 330 16
Northumberland County- From Kent county line to Point-au-Car - - - - - - From Point-au-Car to lower end of Grand Down Island - - - - - - - From lower end of Grand Down Island to Gloucester
county line - - - - - - - Northwest and Southwest Miramichi rivers - - - - - -
Total quantity - - _ - _ Total value $ - - - - - -
Gloucester County-
From Northumberland county line to Shippegan Gully. - - - - - - From Shippegan Gully to Bass River 2,360 360 - 340 - 440 - From Bass river included to Restigouche county line 1,055 1,055 - - - - - Miscou and Shippegan Islands 2,427 30 - - - 799 -
Total quantity 5,842 1,445 - 340 - 1,239 - Total value $ 3,346 1,709 - 680 - 2,918 -
Restigouche County (a11)- Total quantity 123 123 - - - - - Total value $ 176 184 - - - - -

FISHERIES STATISTICS 95
I. Fish Caught and Marketed, 1938--con.
Flounders, Brill, Pollock Halibut Plaice Skate
k d t Caught Caught M Caught M Marketed
Marketed arketed aree Caught an and and and Used Fresh Green- Used Used Used
landded Dried Oil landed la d landed fresh fillets salted fresh nde fresh fresh
cwt. cwt. cwt. cwt. cwt. gal. cwt. cwt. cwt. cwt. cwt. cwt.
19,442 2,447 806 2,169 3,413 690 76 76 2,579 2,579 199 199 1
13,403 2,005 603 5,579 12,939 130 808 896 3,001 4,156 137 339 2
1,690 601 - - 363 - - - 250 250 119 119 3
16 - - S - - - - - -4
636 90 _ _ 182 _ _ _ _ _ -
6,451 1,013 - 37 1,788 2 2 - - SO S C
10,623 717 80 6 2,124 1,080 6-90 48 48 - - - - 7
19,416 2,421 806 2,169 3 , 413 690 50 50 250 250 199 199 i
13.394 1,996 603 5,579 12,939 130 636 636 391 784 137 339 £
- - - - - - - - - - - 1(
26 26 _ _ _ _ _ _ 3 3 -1
26 26 _ _ _ _ _ _ 3 3 - lf
9 9 - - - - - - 6 6 - - 1
- - - - - - - _ - -
- - - - - - - - - -11
- - - _ - - - - - - - -11
- - - - - - - - - - - - 1(
_ _ _ _ _ _ - - 40 40 - -21
- - - - - - - 12 12 - -2] _ _
- - - - - - - - 52 52 - - 2!
- - - _ - - - - 58 131 - -2
_ _ _ _ _ _ _ _ _ _ -21 _
_ _ _ _ _ _ _ -2]
_ _ _
_ _ _ _ - _ _ - !
_ _ _ -. _ _ _ _ _ -31
_ 26 26 _ _ - 3
_ _ _ _ - - - - 1,609 1,609 - 3 _
- - _ _ - - 26 26 1,609 1,609 - 1
- - - - - - 172 260 1,511 2,800 - - 3(
_ _ _ _ _ - 665 665 _ - 3'
_ 3:
_ _ _ _ _ _ - _ 735 735 -

FISHERIES STATISTICS
I. Fish Caught and Marketed, 1938—con.
31 32 33 34
35 36
Herring
Fishing Districts
Charlotte county- From International boundary line to Public Wharf, Back Bay 2,235 1.255 - - -
Saint John County- Saint John Harbour including Mispec and Saint John river 400 400 - - -
Kent County-
Northumberland County-
From lower end of Grand Down Island to Gloucester county line 5,965 40 - - 2a
Gloucester County-

FISHERIES STATISTICS
I. Fish Caught and Marketed, 1938-con.
Herring--concluded Mackerel
Marketed Calet Marketed
and
Smoked Rip- .,,,, ,,,,, Used Ferti- OS Meal Scales lad d Used anned Pickled Used
n e fresh - astndt
(bonelem) pered "c"" asbait lizer C
crct. cwt. btd. bbL bbL gaL ton cwt. cwt. cwt. cases bbL bbL
6,074 10 3,076 48,869 98,111 92,198 1,035 1,386 7,885 7,546 130 66 25 1
70,800 50 17,429 79,710 43,301 15,225 36,225 3,384 12,770 20,696 423 699 25 2
10 2 - - - - - 165 165 - - -3
- - 560 - 48,195 1,035 516 60 60 - - - 4
- - 5,473 - - - 870 - - - - -5
- - - 50 - 44,003 - 284 284 - -6
6,074 - 110 3,155 - - - _ _ - - - 7
6,074 10 112 9,268 - 92,198 1,035 1,386 509 509 - - - 8
70,800 50 558 15,019 - 15,225 36,225 3,384 519 838 - - - 9
_ - - - - - - - _ - - 10
- - - 645 - - - - - - - - 11
_ _ - 645 - _ _ _ _ - _ _ - 12
- - 1,032 - - - - - - - -13
- - - - - - - - - - - - -14
- _ _ _ - _ - - - _ - 15
- - - - - - - - - - - - - 16
- - - 15,900 21,418 - - 656 656 - - - 17
_ - - 15,900 21,418 - _ 656 656 - - - 18
- - - 31,800 5,354 - - - 1,296 1,968 - - 19
- - 200 5,900 18,850 - - 20 20 - - - 20
- - 60 3,485 3,695 - - 616 616 - - - 21
- - 401,800 - - - - 52 28 - 8 -22
- - 300 11,185 22,545 - - - 688 664 - 8 - 23
- - 1,340 17,085 10,355 - - 740 2,010 - 16 - 24
' - - 91 3,100 - - - 469 385 28 - 25
_ _ _ _ - - - - - - - - 26
- - 25 900 2,000 - - 982 892 - 30 - 27
_ - _ _ _ _ - - - _ _ - 28
- - 116 4,000 2,000 - - 1,451 1,277 - 58 - 29
- - 345 8,300 1,500 - - 5,782 6,316 - 683 - 30
- - 40 1,700 12,800 - - 530 530 - - - 31
- - 425 1,990 19,120 - - - 2,437 2,387 _ - 2532
- - 450 1,924 11,250 - - - 1,484 1,393 130 - - 33
- - 1,511 2,000 6,400 - - 130 130 - - - 34
- - 2,426 7,614 49,570 - - - 4,581 4,440 130 _ 2535
- - 14,576 6,190 25,448 - - - 4,433 9,564 423 - 253E
- - 122 257 2,578 - - - - - _ - 31
- - 610 284 644 - - _ _ - _ - 38
97
89667--7

FISHERIES STATISTICS
I. Fish Caught and Marketed, 1938-con.
.- Sardines Alewives
M Fishing Districts arketed Marketed
Caught Caught and Sold and
landed fresh landed Used
and Canned fresh Smoked Salted salted
bbl. bbl. cases cwt. cwt. cwt. bbl. New Brunswick-Sea Fisherles-con.
Total Sea Fisheries for Province-
l Quantity 180,639 111,813 349,887 59,863 20,867 472 13,835
l Value 6 336,826 191,506 1,197,689 32,502 20,583 2,150 51,688
Charlotte County- ; From International boundary line to Public Wharf
Back Bay 21,890 5,743 - - - - - I From Public Wharf Back Bay to Saint John
county line 114,666 74,614 322,971 - - - 5 West Isles and Deer Island 16,360 9,481 - - - - 5 Campbello 1,733 - 26,916 - - - -
7 Grand Manan Island 9,383 7,756 - - - -
3 Total quantity 164,032 97,594 349,887 - - - - ) Total value $ 317,269 174,907 1,197,689 - - -
Saint John County- ) Saint John Hajbour including Mispec and Saint
John river 2,250 2,250 - 44,156 5,160 472 13,835 I The remaining portion of Saint John County 14,357 11,969 - - - -
I Total quantity 16,607 14,219 - 44,156 5,160 472 13,835 5 Total value 5 19,557 16,599 - 27,019 9,585 2,150 51,688
Albert County (a11)- I Total quantity - - - - - - 5 Total value .8 - - - - - -
Westmorland County- 5 Bay of Fundy watershed - - 97 97 - -
r Northumberland Strait shore - - 2,050 2,050 - -
I Total quantity - - 2,147 2,147 - I Total value .8 - - 553 708 - -
Kent County- From IVestmorland county line to Chockpish river - - 6,100 6,100 - - From Chockpish river to Point Sapin - - - - - - - From Point Sapin to Northumberland county line - - - - - - -
Total quantity - - - 6,100 6,100 - - Total value $ - - - 1,550 6,110 - -
Northumberland County- From Kent county line to Point-au-Car - - - - - - - From Point-au-Car to lower end of Grand Down
Island - - 400 400 - - From lower end of Grand Down Island to Glou-
cester county line - - - 1,060 1,060 - - Northwest and southwest Miramichi rivers - - 1,600 1,600 - -
Total quantity = - - 3,060 3,060 - - Total value $ - - 2,280 3,080 - -
Gloucester County- From Northumberland county line to Shippegan
Gully inclusive - - 4,400 4,400 - - From Shippegan Gully to Bass river - - - - - - From Bass River inclusive to Restigouche county
line - - - - - - Miscou and Shippegan Islands - - - - - -
Total quantity - - - 4,400 4,400 - - Total value S - - - 1,100 1,100 - -
Restigouche County (all)- Total quantity - - - - - - - Total value $ - - - - - - -

FISHERLES STATISTICS
I. Fish Caught and Marketed, l938-con.
Capelin, Launce Salmon Shad Smelts and Silversides Eels Tom Cod
Mar- Afar- Afar- Afar- Afar- Alarketed
keted keted keted keted keted
Caught Caught Caught Caught Cfvught Caught
and and ' and and and and
landed Used landed Used Salt d landed Used landed Used landed Used landed Used
fresh fresh e fresh fresh fresh fresh
cwt. cwt. cmd. cmt. bbL cmd. cwt. cut. cmt. cmd. cut. cwt. cwt.
13,778 14,710 10,437 10,209 76 43,609 44,567 1,000 1,000 208 208 8,875 8,875
195,623 250,572 27,638 30,764 1,320 209,468 308,991 250 250 952 1,047 11,741 22,773
2 80 - - - 72 72 - - - - - -
-
- - 310 310 - 1 10 - - - - _
_ _ - - - _
_ - _ -
- - 4 4 _ - -
_ - - - - _
2 80 310 310 - 86 86 - - - - - -
40 1,600 870 870 - 450 667 - - - - -
1,036 1,036 2,186 2,186 - - - - - - - - E
1,732 1,654 199 199 - - - - - - - - - 1'
2,768 2,690 2,385 2,385 - - - - - - - 1:
45,341 46,212 11,320 11,654 _ _ _ _ _ _ - 1:
I 1 39 39 - 3 3 - - -
30 30 195 195 - 15 15 - - -
4 4 1,269 1,041 76 - - _ _ _ _ - 1
- - - 2,828 3,090 - - - - - 1
4 4 1,269 1,041 76 2,828 3,090 - - - - - - 1
105 105 6,794 5,474 1,320 12,060 18,540 - - - -
- - - - 5,059 4,679 - - 5 5 75 752
442 442 1,110 1,110 - 3,022 2,913 - 27 27 982
85 85 - - - 197 197 - - - - - - 2
527 527 1,110 1,110 - 8,308 7,819 - - 32 32 75 1732
6;703 9,045 1,033 3,330 - 37,984 51,010 - - 133 160 100 3462
4,108 4,108 33 33 - 5,824 5,824 - - - - _ - 2
972 972 1,790 1,790 - 4,347 5,109 - - - - 6,221 6,1232
212 38 1 1 - 9,398 9,398 - - 91 91 - -
345 345 3,500 3,500 - - - - 35 35 - - 2
5,637 5,463 5,324 5,324 - 19,569 20,331 - 126 126 6,221 6.1232
71,634 89,528 7,426 9,241 - 103,481 159,789 - - 619 687 7,962 18,3692
516 690 - - - 2,010 1,358 - - 50 50 - - :
1,129 1,902 - - - 3,063 4,762 - _ - - - :
1,143 971 _ _ - 353 353 1,000 1,000 _ - 1,248 1,248:
- _ _ _ - 3,311 2,226 _ - - - - - :
2,788 3,263 _ _ - 8,737 8.699 1,000 1,000 50 50 1,248 1,248:
41,005 55,776 - - - 39,603 56,272 250 250 200 200 2,021 2,400:
2,051 2,682 - - - 4,078 4,539 - - - - 1,331 1,331.
30,765 48,276 - - - 15,875 22,695 - - - - 1,658 1,658
89667--7i

FISHERIES STATISTICS
I. Fish Caught and Marketed, 1938-on.
Mixed Fish Clams
Fishing Districts
Caught Marketed Caught Marketed and and
ded Used Canned Chowder
landed Used fresh 1-an fresh
cwt. cwt. cwt. cwt, cases cases New Brunswick-Sea Fisheries-con.
Total Sea Fisheries for Province-
1 Quantity 126 126 55,919 20,766 18,ll8 4,302
2 Value 3 424 424 36,513 13,671 61,777 16,132
Charlotte County- .3 From International boundary line to Public wharf,
Back Bay - - 19,200 6,543 3,857 54 4 From Public Wharf, Back Bay to Saint John county
line - - 20,262 2, 700 9,262 4,248 -5 West Isles and Deer Island - - 1,120 1,120 - - 6 Campobello - - 100 100 1,731 - 7 Grand Manan Island - - 2,144 2,144 - -
8 Total quantity - - 42,826 12,607 14,850 4,302 9 Total value 5 - - 28,004 8,197 53,180 16,132
Saint John County- 10 Saint John Harbour including Mispec and Saint John
river - _ _ _ _ _ 11 The remaining portion of Saint John county - - - - - -
12 Total quantity - - - - - - 13 Total value 5 - - - - - -
Albert County (a11)- 14 Total quantity - - - - - - 15 Total value $ - - - - - -
Westmorland County- 16 Bay of Fundy watershed - - - - - - 17 Northumberland Strait shore - - - - - -
18 Total quantity - - - - - 19 Total value 5 - - - -
Kent County- 20 From Westmorland county line to Chockpish river.. - - 37 37 120 - 21 From Chockpish river to Point Sapin - - 480 - 200 - 22 From Point Sapin to Northumberland county line - - - - - -
23 Total quantity - - 517 37 320 - 24 Total value $ - - 421 50 1,420 -
Northumberland C,ounty- 25 From Kent county line to Point-au-Car - - - - - - 26 From Point-au-Car to lower end of Grand Down
Island - - - - - - 27 From lower end of Grand Down Island to Gloucester
county line - - 1,823 116 - - 28 Northwest and southwest nrarnichi rivers 126 126 - - - -
29 Total quantity 126 126 1,823 116 - BO Total value $ 424 424 1,013 70 -
Gloucester County- 31 From Northumberland county line to Shippegan
Gully inclusive - - 3,484 1,530 2,441 - 32 From Shippegan Gully to Bass River - - 2,297 2,106 106 - 33 From Bass River inclusive to Restigouche county
line - - 2,749 2,749 - 34 Miscou and Shippegan Islands - - 1,323 721 401 -
35 Total quantity - - 9,853 7,106 2,948 -
36 Total value $ - - 5,575 3,854 10,177 -
Restigouche County (a11)- 37 Total quantity - - 900 900 - - 38 Total value 5 - - 1,500 1,500 - -
n
100

FISHERIES STATISTICS 101
I. Fish Caught and Marketed, 1938-con.
Crabs Lobsters Oysters Quahaugs
Marketed Marketed Marketed Marketed
Caught Caught Caught Caught
and and and Used In
landed Meat Canned Tomalley landed aese ledd
landed fresh shell ed iUrseescili Canned
cwt. cwt. cwt. cwt. cwt. cases cases bbl. bbl. cwt. cwt. cases
1,530 1,530 68,471 18,554 974 23,060 686 12,369 12,369 3,451 1,333 1,097 1
314 314 497,320 264,267 48,744 403,473 5,128 45,966 76,512 3,328 1,832 7,149 2
_ - 6 6 - _ _ - _ - -3
- - 505 505 - - - - - - -4
- - 49 49 - - - - - - -5
- - .53 53 - _ _ - - - 6
30 30 2,406 2,406 - - - - - - 7
30 30 3,019 3,019 - - - - - - - 8
14 14 51,178 54,486 - - - - - - - 9
- - 1.50 150 - - - - - - - 10
- - 676 676 - - - - - - 11
- - 826 826 - - - - - - -12
- - 12,960 13,184 - - - - - - 13
- - 29 29 - - - - - - -14
- - 497 447 _ - - - _ _ - 15
_ - - - - - - - - - -36
- - 23,207 9,084 974 5,803 170 318 318 152 37 17
- - 23,207 9,034 974 5,803 170 318 318 152 37 18
- - 185,656 129,551 48,744 101,258 1,358 2,521 2,862 190 340 19
- - 7,033 2,129 - 2,540 57 5,750 6,219 2,522 884 763 20
- - 10,234 1,034 - 4,604 66 1,050 813 - - 21
- - 3,492 388 - 1,552 - - - - - 22
- - 20,759 3,551 - 8,696 123 6,800 7,032 2,522 884 763 23
- - 102,657 42,596 - 143,505 820 24,574 42,192 2,482 1,326 5,324 24
- - 6,185 473 - 2,307 198 2,747 2,515 - - 25
- - - - - - 1,110 1,110 - - 26
1,500 1,500 2,208 - - 1,520 76 116 116 929 297 297 27
_ _ - - _ - - - - - 28
1,500 1,500 8,393 473 - 3,827 274 3,973 3,741 929 297 297 29
SOO 300 67,729 4,933 - 71,831 1,977 13,067 25,019 846 316 1,485 30
- - 2,701 - - 955 39 - _ _ - - 31
- - 2,875 951 - 1,099 24 1,270 1,270 - - - 32
- - 1,885 537 - 576 - - - - - - 32
- - 4,346 - - 1,836 56 s 8 _ _ - 39
- - 11,787 1,488 - 4,466 119 1,278 1,278 - - - 3 2
- - 73,515 17,810 - 81,083 973 5,804 6,439 - - - 3f
- - 454 84 - 268 - - -_ _ - Si
- - 3,178 1,260 - 5, 796 - - _ _ _ - 31

FISHERIES STATISTICS
I. Fish Caught and Marketed, 1938—con.
Tongues Scallops and Winkles
Sounds
Fishing Districts Marketed Marketed Caught Pickled Caught
and or and landed dried landed Used
Shelled fresh
gal. gal. cwt . cwt. cwt.
New Brunswick—Sea FLsheries—concluded
Total Sea Fisheries for Province-
1 Quantity 3,190 3,190 57 206 206
Value $ 3,899 3,899 408 411 417
Charlotte County- 3 From International boundary line to Public Wharf, Back Bay.. - - - 10 10 4 From Public Wharf, Back Bay to Saint John county line 350 350 22 - - 5 West Isles and Deer Island 1,970 1,970 - - - 6 Campobello - 29 - - 7 Grand Manan Island 870 870 - -
8 Total quantity 3,190 3,190 51 10 10 9 Total value $ 3,899 3,899 369 12 18
Saint John County- 10 Saint John Harbour including Mispec and Saint John river - - 11 The remaining portion of Saint John county - 6 196 196
12 Total quantity - 6 196 196 13 , . Total value i - 39 399 399
Albert County (all)— 14 Total quantity - - - - - 15 Total value S - - - - -
Westmorland County- 16 Bay of Fundy watershed - - - - - 17 - Northumberland Strait shore - - - - -
18 Total quantity - - - - - P Total value $ - - - - -
Kent County- 20 From Westmorland county line to Chockpish river - - - - - 21 From Chockpish river to Point Sapin - - - - - 22 From Point Sapin to Northumberland county line - - - - -
23 Total quantity - - - - 24 Total value $ - - - - -
Northumberland Coimty- 25 From Kent county line to Point-au-Car - - - - - 26 From Point-au-Car to lower end of Grand Down Island - - - - - 27 From lower end of Grand Down Island to Gloucester county line - - - - - 28 Northwest and southwest Miramichi rivers - - - - -
29 Total quantity - - - - - 30 Total value $ - - - - -
Gloucester Cotmty- 31 From Northumberland county line to Shippegan Gully inclusive - - - - - 32 From Shippegan Gully to Bass River - - - - - 33 From Bass River inclusive to Restigouche county line - - - - - 34 Miscou and Shippegan Islands - - - - -
35 Total quantity - - - - - 36 Total value S - - - - -
Restigouche County (a11)— 37 Total quantity - - - - - 38 Total value $ - - - - -
102

6 7 8
FISHERIES STATISTICS
O
I. Fish Caught and Marketed, 1938—con.
DuIse Seaweed Miscellaneous
Marketed 3farketed Fish Fish Fish Fish skins r
Green Green meal, fertilizer, offal and pOtheroducts n.e.s. n.e.s.
Dried Dried 3feal bones
cwt. . cwt. cwt. cwt. ton ton ton ton cwt. E
2,343 313 6,503 ZSO 12 126 97 20 265 -
2,227 4,191 774 2,800 420 4,9E9 776 80 82 52,50
- - 880- 12 - - 50 1,214
240 48 - - - - 7,667 _
- _ _ _ _ 44 97 _ _ -
1,963 245 5,623 280 - - 20 20 -
2,203 293 6,503 280 12 44 97 20 250 -
2,087 3,991 774 2.800 420 2,068 776 SO 67 8,911
- - - - - 82 - - - 43,494 li
140 20 - - - - - 15 - 1
140 20 - - - 82 - - 15
140 200 - - - 2,901 - - 15 43,494 1
_
- -
-
_
_ _ _ - _ _ _ - _ 9
-
_ _ _ _ _ _ _ _ _ 96
_ -

FISHERIES STATISTICS
I. Fish Caught and Marketed, 1938—con.
Fishing Districts Alewives Bass Eels
cwt. cwt. cwt.
New Brunswiek(a)—Inland FIsheries
Total Inland Fisheries for Province-
1 Quantity 1,094 80 662
2 Value caught and landed $ 1,809 800 1,465
3 Value marketed $ 1,809 800 1,465
4 Victoria CountY quantity 2 — 5 value $ 10 —
6 Carleton County quantity 32 17 7 value $ 84 85
8 York County quantity 600 30 9 value 6 1,118 150
10 Sunbury County quantity 135 — 11 value 3 252 —
12 Queens County quantity 195 1 290 13 value 3 219 1 580
14 rings County quantity 130 79 825 15 value 5 148 850
(a) The values given for the coimties are the marketed values.
104

FISHERIES STATISTICS 105
I. Fish Caught and Marketed, 1938—con.
Shad
Perch Pickerel Salmon Suckers Sturgeon Whitefish Caught Marketed
and landed Used
fresh Salted
cwt. cwt. cwt. cwt. cwt. bbl. cwt. cwt. cwt.
10 210 432 2,950 2,350 20 59 3 3 1
10 1,197 8,422 10,223 - - 161 360 18 2
10 1,197 8,422 - 8,423 1,800 161 36 18 3
- 3 _ 101 - _ _ - 4 - 60 - 606 - - _ - 5
- - 57 - 21 - - - ( - 1,425 - 105 - - - 1
- 22 156 - 2 - 5 - - 1
- 81 3,390 - 8 - 18 - - 4
- 100 42 - - 30 - - 1(
- 366 84 - 3 - 110 - - 1:
- 5 51 29 - 1,320 120 20 11 1!
5 432 475 - 4,560 1,080 20 110 1:
5 37 145 - 88 80 13 25 P
5 318 2,225 - 3,04 720 13 250 1 11
Novz.—In addition to the quantities shown in the above table, the fish taken by anglers in the inland waters of New Brunswick amounted to 1,735 cwt.
89887-8

FISHERIES STATISTICS
I. Fish Caught and Marketed, 1938-con.
Cod
Fishing Districts Marketed Caught
and
landed 'Used Fresh Green- Smoked Dried fresh fillets salted fillets
cwt. cwt. cwt. cwt. cwt. cwt.
Quebec-Sea Fisheries
Total Sea Fisheries for Province-
1 Quantity 319,812 19,768 7,401 57,183 524 52,758
2 Value $ 429,008 41,798 53,832 154,975 3,741 248,059
Bonaventure County- 3 From head of tidal waters to but not including
Miguasha Point - - - - 4 Miguasha Point included to Grand Cascapedia river
inclusive 255 255 - - - - 5 From but not including Grand Cascapedia river to
New Carlisle inclusive 4,423 2,445 72 590 - 194 6 Paspediac included to Gaspe county line 25,273 2,944 2,775 3,707 524 1,715
7 Total quantity 29,951 5,644 2,847 4,297 524 1,909 8 Total value $ 30,433 9,165 14,531 12,742 3,744 11,260
Gaspe County- 9 From Bonaventure county line to west side of Breche-
a-Manon river 50,966 413 - 12,048 - 8,819 10 From west side of Breche-a-Manon river to Mal Bay 54,874 158 - 13,123 - 9,490 11 Point St. Peter included to Cape Gaspe, including
Gaspe Bay 13,495 702 854 225 - 3,141 12 From Cape Gaspe to Little Fox river inclusive 33,171 1,100 507 731 - 9,696 13 From Little Cape to Fame Point inclusive 7,100 250 200 - - 2,083 14 From St. Helier to western boundary of Duchesnay
township 19,710 3,891 1,623 1,650 - 2,550 15 From western boundary of Duchesnay township to
Cape Chat 11,000 5,081 1,343 903 - 28
16 Total quantity 190,316 11,595 4,527 28,680 - 35,807 17 Total value i 293,151 26,200 39,112 75,148 - 190,888
Magdalen Islands- - 18 Southern subdistrict 44,267 - - 11,127 - 6,395 19 Northern subdistrict 5,770 - - 2,035 - 367
20 Total quantity 50,037 - - 13,162 - 6,762 21 Total value $ 51,871 - - 33,528 - 20,883
Saguenay County- 22 Tadoussac to but not including Bersimis - - - - - - 23 Bersimis included to but not including Godbout river 20 20 - - - - 24 Godbout river included to Pointe-a-Jambon inclusive 708 408 - 150 - 25 From but not including Pointe-a-Jambon to river
Pigou inclusive 2,056 952 - 552 - - 26 From but not including river Pigou to Havre St
Pierre inclusive 12,364 30 - 6,167 - - 27 From but not including Havre St. Pierre to but not
including Kegashka river 1,213 - - 464 - 95 28 Kegashka river included to but not including Mutton
Bay 4,632 - - 1,242 - 718 29 Mutton Bay included to Bonne Esperance inclusive.. 8,372 - - 1,972 - 1,476 30 From but not including Bonne Esperance to Blanc
Sablon inclusive 18,773 - - 397 - 5,993
31 Total quantity 48,138 1,410 - 10,949 - 8,280 32 Total value S 51,453 4,175 - 33,207 - 25,030
Matane County (a11)- 33 Total quantity 1,900 1,119 27 100 - - 39 Total value $ 2,100 2,258 189 350 - -
Rimouski County (a11)- 35 Total quantity - - - - - - 36 Total value 8 - - - - -
106

FISHERIES STATISTICS
I. Fish Caught and Marketed, 1938-con.
107
Cod-concluded Haddock Irakeand Cusk
Marketed-cone. Marketed Marketed
CAyi Caught
Bone- liveroil, Cod and Caught
landed Fse;11 rhied and
huided Used Fresh Green- Smoked less edi- oil fresh fillets salted fillets Dried ni
einal
cwt. gal. gal. cwt. cvet. cwt. cwt. cut. cwt. cwt. cwt. cwt.
967 13,882 28,474 485 311 58 1,133 498 60 172 10 27 1
7,084 9,758 7,800 616 739 147 811 866 240 456 40 108 2
- - 49 49 435 130 - 112 - 27 5 20 2,426 88 145 145 - 618 300 56 60 10 - 1 20 2,426 88 194 194 - 1,053 430 56 172 10 27 7 220 1,456 26 230 461 - 761 730 224 456 40 108 1
- - 4,255 - - - - - - - -I - 4,556 1,513 - - - - - - - - - 1( 90 - 540 120 66 18 80 68 4 - - - 11 - 5,400 838 - - - - - - - - 12 - 1,500 100 - - - - - - - -13 - - 1,400 51 51 - - - - - - -14 - - 640 - - - - - - - - -11 90 11,456 9,286 171 117 18 80 68 4 - - - 11
585 8,302 2,450 308 278 37 80 136 16 - - - 11
707 - 7,811 120 - 40 - - - - - 11 150 - 1,050 - - - _ - - - - - If
857 - 8,861 120 - 40 - - - - - - 2 6
6,279 - 2,293 78 - 110 - _ - _ _ - 21
- - - _ _ _ _ - - - - - 24
- - 3,200 - - - - - - _ _ - 21
- - 50 - - - - - - - - -21 - - 1,040 - _ _ _ - _ _ _ - 2 1 - - 1,949 _ - - - _ _ _ _ -26
- - 4,000 - - - - _ _ _ _ -3
- - 10,239 - - - - _ _ _ _ -3 _ - 3,031 _ _ _ _ _ _ _ _ - 35
• _ _
- _ _ _ _ _ _ _ - 31 _ - _ _ _ _ _ - 31

FISHERIES STATISTICS
I. Fish Caught and Marketed, 1938—con.
Flounders, BriLl,
Halibut Plaice
Fishing Districts Marketed Marketed
Ctsught Caught and and
landed Used landed Used
fresh Canned fresh
cwt. cwt. cases ewt. cwt.
Quebec Sea Fisheries—con.
Total Sea Fisheries for Province-
1 Quantity 2,673 2,636 37 65 65
2 Value 9 16,681 16,803 185 105 125
Bonaventure County- 3 From head of tidal waters to but not including Miguasha Point - - - - - 4 Miguasha Point included to Grand Cascapedia river inclusive.. - - - - - 5 From but not including Grand Cascapedia river to New Carlisle
inclusive - • - _ - _ 6 Paspebiac included to Gaspe county line - - - 45 45
7 Total quantity - - - 45 45 8 Total value $ - - - 45 45
Gaspe C,ounty- 0 From Bonaventure county line to west side of Breche-a-lfanon
river 34 34 - - - 10 From west side of Breche-a-Manon river to Mal Bay 30 30 - - - 11 Point St. Peter included to Cape Gaspe includnig Gaspe Bay 19 19 - - - 12 From Cape Gaspe to Little Fox river inclusive 40 40 - - - 13 From Little Cape to Fame Point inclusive - - - - - 14 From St. Helier to western boundary of Duchesnay township 130 130 - - - 15 From western boundary of Duchesnay township to Cape Chat 20 20 - - -
16 Total quantity 273 273 - - - 17 Total value $ 2,430 2,714 - - -
Magdalen Islands- 18 Southern sub-district. 43 43 - - 19 Northern sub-district 20 20 - - -
20 Total quantity 63 63 - - - 21 Total value $ 315 335 - - -
Saguenay County- 22 Tadoussac to but not including Bersimis - - - - - 23 Bersimis included to but not including Godbout river - - - 20 20 24 Godbout river included to Pointe-a-Jambon inclusive 521 521 - - - 25 From but not including Pointe-a-Jambon to river Pigou Inclusive 477 477 - - - 26 From but not including river Pigou to Havre St. Pierre inclusive 1,230 1,230 - - - 27 From but not including Havre St. Pierre to but not including
Kegashka river - - - - _ 28 Kegashka river included to but not including Mutton Bay 38 1 37 - - 29 Mutton Bay included to Bonne Esperance inclusive - - - - - BO From but not including Bonne Esperance to Blanc Sablon in-
clusive - - - - -
31 Tiotal quantity 2,266 2,229 37 20 20 32 Total value 5 12,871 12,689 185 60 60
Matane County (a11)— 33 Total quantity 71 71 - - - 34 Total value 5 1,065 1,065 - - -
Rimouski County (sil)- 35 Total quantity - - - - - 16 Total value 5 - - - - -
108

0
1 2
3.
5. 6.
FISHERLES STATISTICS
I. Fish Caught and Marketed, 1938-con.
109
Soles Herring
Marketed Marketed Caught Caught
and and landed Used Fresh landed Used Smoked Used
fresh fillets fresh (round) Pickled as bait Fertilizer
cwt. cwt. cwt. cwt. cwt. cwt. bbl. bbl. bbl.
107 62 15 410,039 49,584 18,406 9,758 46,899 91,338 1
107 144 156 168,117 83,591 46,178 37,762 43,500 28,130 2
- - - 8,271 - - 57 - 4,05 2 - - - 18,763 1,478 37 193 - 8,316 4
51 15 12 118,949 2,335 300 418 470 56,910 1 56 47 3 7,454 - 135 55 3,000 509 1
107 62 15 153,437 3,813 472 723 3,470 69,785 1 107 144 156 30,605 5,441 1,173 4,033 1,735 18,565 /
- - - 21,405 5,293 - 97 5,003 2,908 1 - - - 27,456 2,120 200 300 10,268 1,750 11 - - - 11,340 76 - 100 4,092 1,39011 - - - 10,000 500 195 300 3,857 2501; - - - 8,000 250 180 100 2,265 1,2401; - - - 13,770 1,760 1,550 320 1,975 2,0001 - - - 14,460 3,680 - 1,750 1,260 1,5051!
- - - 106,431 13,679 2,125 2,967 28,720 11,043 11 - - - 52,906 16,229 9,358 14,835 27,157 6,975 r
- - - 90,736 11,172 12,168 2,800 7,500 7,0001 _ - - 32,586 5,104 3,641 1,400 5,500 2,5001 1
- - - 123,322 16,276 15,809 4,200 13,000 9,5002 - - - 20,227 2,952 35,647 10,500 13,000 2,0252
- - - 117 117 - - - - 2 - - - 220 220 - - - - 2 - - - 736 436 - 50 75 - 2 - - - 527 437 - 30 - - 120 120 - - -2
- - - 1,128 - - - 564 -2 - - - 1,290 - - 350 120 - 2 - - - 542 - - 114 60 402
- - - 825 - - 278 - 3 - - - 5,505 1,330 - 822 819 403 - - - 5,869 2,183 - 3,468 1,074 803
- - - 11,344 4,486 - 1,046 890 9703 - _ _ 8,508 6,786 - 4,926 534 4853
- _ _ 10,000 10,000 _ - - - 3 - - - 50,000 50.000 - - - - 1
8 0
3 4 5.

FISHERIES STÀTISTICS
I. Fish Caught and Marketed, 1938-con.
Mackerel
Fishing Districts Marketed Caught laand
nded TJsed Canned Pickled Filletsted
Used as fresh sal bait
cwt. cwt. cases bbl. bbl. bbl.
Quebec-Sea Fisheries-con.
Total Sea Fisheries for Province-
1 Quantity 39,161 3,821 3 8,596 2,261 265
2 Value $ 41,908 7,339 18 36,144 22,278 530
' Bonaventure County- 3 From head of tidal waters to but not including
Miguasha Point - - - - - - 4 Miguasha Point included to Grand Cascapedia river
inclusive - - - - - - 5 Frorn but not including Grand Cascapedia river to
- New Carlisle inclusive 1,048 1,048 - - - 6 Paspebiac included to Gaspe county line 605 543 3 - - 30
7 Total quantity 1,653 1,591 3 - 30 8 Total value 5 1,653 2,709 18 - - 60
Gaspe County- 9 From Bonaventure county line to west side of Breche-
a-Manon river 277 197 - 26 - 10 From west side of Breche-a-Manon river to Mal Bay 310 310 - - - 11 Point St. Peter included to Cape Gaspe including
Gaspe Bay 84 84 - - - - 12 From Cape Gaspe to Little Fox river inclusive 900 900 - - - 13 From Little Cape to Fame Point inclusive - - - - - - 14 From St. Relier to western boundary of Duchesnay
township 895 157 - 246 - - 15 From western boundary of Duchesnay township to
Cape Chat 160 160 - -
16 Total quantity 2,626 1,808 - 246 26 - 17 Total value S 5,023 3,814 - 1,476 273 -
dalen Islands- 18 bouthern subdistrict 23,695 - - 6,095 1,235 235 19 Northern subdistrict 10,720 - - 2,240 1,000 -
20 Total quantity 34,415 - - 8,335 2,235 235 21 Total value $ 34,360 - - 34,612 22,005 470
Saguenay County- 22 Tadoussac to but not including Bersimis - - - - - - 23 Bersimis included to but not including Godbout river ,- - - - - 7 24 Godbout river included to Pointe-a-Jambon inclusive 102 102 - - - - 25 From but not including Pointe-a-Jambon to river
Pigou inclusive 242 242 - - - _
26 From but not including river Pigou to Havre St Pierre inclusive - - - - - _
27 From but not including Havre St. Pierre to but not including Kegashka river - - - - - -
28 Kegashka river included to but not including Mutton Bay 45 - - 15 - -
29 Mutton Bay included to Bonne Esperance inclusive - - - - - - 30 From but not including Bonne Esperance to Blanc
Sablon inclusive 78 78 - - - _
31 Total quantity 467 422 - 15 - - 32 Total value $ 872 816 - 56 - _
Matane County (aII)- 33 Total quantity - - - - - _
34 Total value $ - - - - - _
Rimouski C,ounty (all)- 35 Total quantity - - - - -
_
36 Total value 5 - - - - - _
110

FISHERIES STATISTICS
I. Fish Caught and Marketed, 1938—con.
Sardines Perch Salmon Shad
Marketed Marketed Marketed Marketed Caught Caught Caught Caught
and Sold and Fresh and and landed fresh and landed fillets landed Used Used
sahed fresh Canned Smoked Pickled landed fresh
bbL bbL cmt. cmt. cat. cmt. cases cmt. cmt. cmt. cmt.
41 41 45 15 11,775 9,691 734 90 285 77 77
164 164 63 90 152,526 133,268 4,588 1,800 2,280 327 471
- - - - 412 41 - - - - -
- - - - 2,965 2,033 - - - - -
_ _ _ - 36 36 _ _ _ - _
- - - 304 304 - - - - -
- - - - 3,717 2,785 - - - - - - - - - 65,697 51,981 - - - - -
- - - - 235 235 - - - - - - - - - 282 282 - - - 29 29
- - - - 656 656 - - - 48 48 - - 45 15 3 3 _ _ _ - _
_ - - 333 333 - _ - _ - -
- - - - 302 149 - 90 - - -
- - 45 15 1,811 1,656 _ 90 - 77 77
- 68 90 25,197 24,875 - 1,800 - 327 471
14 14 - 103 103 - - - - - 27 27 - 48 48 - - - _ _
-
- - 443 443 - - - - -
_ - - 340 340 - _ _ - _
_ - _ 365 365 - _ _ - _
- - - - 622 622 - - - - _
- - - - 733 14 428 - 240 - -
- - 1,875 1,596 306 _ 44 _ _ --
- - - 618 617 - - 1 _ _
41 41- - 5,147 4,148 734 _ 285 _ _ 164 164 - 45,132 39,012 4,553 - 2,280 - -
- - _ - - 300 300 _ -- _ - _ _ _ _
- - 4,500 5,400 _
_ _ SOO 800 - _ -- __
- - 12,000 12,000 _ _ - - -

FISHERIES STATISTICS
I. Fish Caught and Marketed, 1938—con.
Smelts Sturgeon Trout
Fishing Districts Marketed Marketed Marketed Caught Caught Caught and and and
landed Used landed lised landed fresh fresh Canned
cwt. cwt. cwt. cwt. cvrt. cases
Quebee—Sea Fisherles—con.
Total Sea Fisheries for Province-
1 Quantity 9,491 8,897 64 64 318 460
2 Value 8 53,207 55,535 612 612 1,908 2,902
Bonaventure County- 3 From head of tidal waters to but not including
Miguasha Point 2,894 2,894 - - - - 4 Miguasha Point included to Grand Cascapedia river
inclusive 1,298 704 - - - 5 From but not including Grand Cascapedia river to
New Carlisle inclusive 442 442 - - - - 6 Paspebiac included to Gaspe county line 1,107 1,107 - - -
7 Total quantity 5,741 5,147 - - - 8 Total value $ 31,061 27,302 - - -
Gaspe County— ' 9 From Bonaventure co unty line to west side of Breche- a-Manon river 530 530 -- - -
10 From west side of Breche-a-Manon river to Mal Bay 335 335 _ - - _ 11 Point St. Pet,er included to Cape Gaspe including
Gaspe Bay 449 449 - - - - 12 From Cape Gaspe to Little Fox river inclusive - _ _ _ _ 13 From Little Cape to Fame Point inclusive - _ _ _ 14 From St. Helier to western boundary of Duchesnay
township - _ _ _ _ 15 From western boundary of Duchesnay township to
Cape Chat - _ _ _
16 Total quantity 1,314 1,314 _ _ _ 17 Total value 5 9,820 13,228 _ _ -
Magdalen Islands— :8 Southern sub-district 199 199 - - - 19 Northern sub-district 450 450 - - -
:0 Total quantity 649 649 - - - :1 Total value 5 3,444 3,894 - - -
Saguenay County- n Tadoussac to but not including Bersimis 16 16 - - - :3 Bersimis included to but not including Godbout river 147 1 47 14 14 - - g Godbout river included to Po inte-a-Jambo n inclusive - - - - - :5 From but not including Pointe-a-Jambon to river
Pigou inclusive 138 138 - - - :6 Froro but not including river Pigou to Havre St
Pierre inclusive - - - - - - 7 From but not including. Havre St. Pierre to but not
including Kegashka river - - - - - - 5 Kegashka river included to but not including Mutton
Bay - - - - 23 46 9 Mutton Bay included to Bonne Eaperance mclusive - - - 295 414 0 From but not including Bonne .perance to Blanc
Sablon inclusive - - - - - -
il Total quantity 301 301 14 14 318 460 Total value $ 2,195 2,195 112 112 1,908 2,902
Matane County (a11)— 3 Total quantity 1,486 1,486 - - - - 4 Total value 5 6,687 8,916 - - - -
Rimouski County (a11)— 5 Total quantity - - 50 50 - - 6 Total value $ - - 500 500 - -

FISHERIES STATISTICS
I. Fish Caught and Marketed, 1938-con.
Capelin, I,aunce and Silversides Eels Squid Tom Cod Mixed Fish
Marketed Marketed Marketed Marketed Marketed Caught Caught Caught Caught Caught and and and and and
landed Used landed Used landed Used as landed Used landed Used fresh fresh bait fresh fresh
cwt. cwt. cwt. cwt. cwt. cwt. cwt. cwt. cwt. cwt.
31,400 31,400 368 368 258 268 5,000 5,000 10,190 10,190 1
16,072 19,960 3,630 3,630 258 2,58 25,000 25,000 50,420 50,420 2
- - - _ _ _ _ _ _ -3 - - _ _ _ _ _ _ -4
544 544 - - - - - - -5 100 100 - - - - - - - 6 644 644 - - - - - - - - ? 161 161 - - - - - - -8
2,280 2,280 - - - - - - - - 6 100 100 - - - - - - - - 1C
- _ _ _ _ _ _ _ _ - 11 _ _ _ _ 84 84 _ _ _ - 16
100 100 - - - - - - -1
2,480 2,480 - - 84 84 - - - - 1( 695 1,265 - - 84 84 - - - - 11
- - 5 5 - - - - - - 1£ - - - - - - - - - 1(
_ _ 5 5 _ - - - - - 2( _ 25 25 - - - - - 21
2,000 2,000 5 5 - - - - _ -21 160 160 8 8 - - - - 40 4021 570 570 - - 20 20 - - 150 150 2 ,
130 130 - - - - - - _ -21
21,910 21,910 - - - - - - _ - 21
1,350 1,350 - - - - - _ -
120 120 - - 30 30 - - - - 2. 376 376 - - 134 134 - - - - 2,
1,660 1,660 - - - - _ _ - - 31
28,276 28,276 13 13 184 184 - - 190 1803
15,216 18,534 105 105 174 174 - - 420 4203:
- - _ - _ _ - _ - - 3,
- - 350 350 - - 5,000 5,000 10,000 10,0003 _ _ 3,500 3,500 - - 25,000 25,000 50,000 50,0003
113
3
5
5
7
9
a 1 2
4
6

FISHERIES STATISTICS
I. Fish Caught and Marketed, 1938-con.
Clams Lobsters
Marketed Marketed Fishing Districts Caught Caught
and and
Used In Tomal-
landed Canned landed Meat Canned
fresh shell ley
cwt. cwt. cases cwt. cwt. cwt. cases ciases Quebec-Sea Fisheries-concluded
Total Sea Fliheries for Province-
1 Quantity 2,706 2,666 20 19,293 6,435 12 6,481 119
2 Value $ 2,014 2,024 150 137,266 59,829 510 121,841 1,094
Bonaventure County- 3 From head of tidal waters to but not including
Miguasha Point - - - 4 4 - - - 4 Miguasha Point included to Grand Cascapedia
river inclusive - - - 137 137 - - 5 From but not including Grand Cascapedia
river to New Carlisle inclusive 216 216 - 180 180 - - - 6 Paspebiac included to Gaspe county line - - - 650 484 - 83 I
7 Total quantity 216 216 - 971 805 - 83 1 8 Total value $ 162 162 - 9,898 11,730 - 1,915 15
Gaspe County- () From Bonaventure county line to west side of •
Breche-a-Manon river - - - 549 509 - 20 - I From west side of Breche-a-Manon river to
Mal Bay 790 790 - 390 80 - 155 2 1 Point St. Peter included to Cape Gaspe in•
eluding Gaspe Bay 270 270 - 122 122 - - - ) From Cape Gaspe to Little Fox riverinclusive - - - 80 80 - - 3 From Little Cape to Faine Point, inclusive - - - - - - - _ I From St. Helier to western boundary of Du-
chesnay township - - - - - - - - 5 From western boundary of Duchesnay town-
ship to Cape Chat - - - - - - -
Total quantity 1,060 1,060 - 1,141 791 - 175 2 Total value $ 1,127 1,127 - 9,852 9,614 - 4,083 30
Magdalen Islands- ( Southern subdistrict 880 880 - 5,503 133 12 3,012 58 I Northern subdistrict 350 310 20 11,678 4,706 - 3,211 58
I Total quantity. 1,230 1,190 20 17,181 4,839 12 6,223 116 Total value $ 615 595 150 117,516 38,485 540 115,843 1,049
Sagueany County- Tadoussac to but not including Bersimis - - - - - - - - Bersimis included to but not including Godbout
river - - - - - - - - Godbout river included to Pointe-a-Jambon
inclusive 120 120 - - - - - - From but not including Pointe-a- Jambon to
river Pigou inclusive - - - - - - - - From but not including river Pigou to Havre
St. Pierre inclusive - - - - - - - - From but not including Havre St. Pierre to but
not including Kegashka river - - - - - - - - Kegashka river included to but not including
Mutton Bay - - - - - - - - Mutton Bay included to Bonne Esperance
inclusive 80 80 - - - - _
From but not including Bonne Esperance to Blanc Sablon inclusive - - - - - _ -
Total quantity 200 200 - - - - - - Total value $ 190 140 - - - - -
Matane County (el )- Total quantity - - - - - - - Total value $- - - - - - - -
Rimouski County (a11)- Total quantity - - - - - - - Total value S - - - - - - -

I -
FISHERIES STATISTICS
I. Fish Caught and Marketed, 1938-con.
Scallops Flair Seals Belugas Misce llaneous
Marketed Marketed Marketed Fish
Caught Caught Other
Caught and skins and and
Canned lad Skins Oil land products
ed Skins Oil and bones
landed
gal. cases no. no. gal , no. no. gal. cwt. $
496 115 22,831 22,831 93,593 2 2 80 210 - 1
992 1,150 49,562 37,115 16,801 15 20 24 466 133 2
_ _
_
_ 4
_
_ _
- - - _ _ _ _ _ _ - 1(
- - - - _ - - - - - 11
_
_
_ - - - _ - - - - - 11
- - 5,083 5,083 12,195 - - 184 - 11
- - 3,500 3,500 7,300 - - - 26 - 11
- - 8,553 8,583 19,995 - - _ 210 - 21
- - 11,000 10,750 3,899 - - - 466 - 2:
- - 550 550 - - - - - - 21
- - 340 340 - - - _ _ - Z
- - 160 160 - - - - - -2
- - 15 15 - - - - - 2. -
- - 42 - 425 350 - _ _ - 21
- - 800 SOO 2,000 - - -
- 4,903 4,903 29,418 - - - - 21
- _
496 115 5,395 5,395 32,370 - - - - 133 2 ,
- - 1,660 1,660 9,960 - - _ _ - 31
496 115 14,248 14,248 79,098 _ - _
3 992 1,150 36,562 26,365 12,902 _ _ _ 1333:
_ _ - _ - 2 2 80 _ -a
- - - - - 15 20 24 -
115

FISHERIES STATISTICS
I. Fish Caught and Marketed, 1938-con.
Fishin' g Districts Bass Carp Catfish Eels Herring
cwt. cwt. cwt. cwt. cvrt. Quebec-biland Fisheries (a)
Total Inhnd Fisheries for Province-
1 Quantity 404 6,835 6,100 18,375 8,670
2 Value S 4,195 35,770 40,795 135,145 33,390
Below Quebec-
3 Bellechasse County quantity 75 125 - 2,850 -
4 value S 750 375 - 17,100 -
5 Charlevoix-Saguenay Counties quantity - - - 550 3,000
6 value 5 - - - 4,400 15,000
7 Kamouraska County quantity - - - 610 690
8 value 5 - - - 6,100 3,450
9 Montmorency County quantity 210 500 - 2.850 -
10 value 5 2,100 2,500 . - 14,250 -
11 Temiecouata C,ounty quantity - - - 290 4,980
12 value 5 - - - 2,900 14,940
13 Total quantity 285 625 - 7,150 8,670
14 Total value 5 2,850 2,875 - 44,750 33,394
Above Quebec-
15 Argenteuil County quantitY 10 90 160 60 -
16 value 5 120 540 1,440 540 -
17 Beauharnois County quantity 30 110 50 60 -
18 value $ 360 600 450 540 -
19 Berthier County quantity - 90 110 60 -
20 value $ - 360 770 420 -
21 Chambly CountY quantity - 180 160 - -
22 value $ - 900 480 - -
23 Champlain County quantity - - 70 100 -
24 value 5 - - 560 500 -
25 Chateauguay County quantity 15 650 300 15 -
26 'value $ 225 1,950 1,200 105 -
27 Hull County quantity - 100 120 10 -
28 value $ - 600 1,080 90 -
29 Huntingdon County quantity - - 60 20 -
30 value $ - - 600 180 -
31 Jacques Cartier County quantity - 15 120 20 -
32 value S - 150 1,200 200 -
33 Labelle County quantity - 490 45 10 -
34 value S - 2,450 225 120 -
35 Laprairie CountY quantity - 600 50 30 -
36 value S - 5,400 500 360 -
37 L'Assomption County quantity - 100 90 10 -
38 value $ - 500 1,800 150 -
39 Levis and Lotbiniere Counties quantity - - 255 6,000 -
40 value $ - - 765 42,009 -
41 Maskinonge County quantity - 400 510 120 -
42 value $ - 1,200 4,080 600 -
43 Misssisquoi County quantity 4 280 40 - -
44 value $ 20 1,120 800 - -
45 Montreal County quantity - 400 320 125 -
46 value 5 - 2,400 1,600 1,250 -
47 Nicolet County quantitY 10 390 510 410 -
48 value 5 50 1,950 2,550 3,280 -
49 Pontiac County quantity 10 90 90 80 -
50 value $ 150 450 900 800 -
51 Portneuf County quantity 10 80 25 380 -
52 value $ 100 400 125 2,800 -
53 Richelieu County quantity 20 510 1,000 1,650 -
54 value 5 200 2,550 5,000 16,500 -
55 St. Hyacinthe County quantity 10 55 65 45 -
56 value $ 120 275 585 450 -
57 St-Jean County quantity - 100 400 1,650 -
58 value $ - 500 2,000 16,500 -
59 Soulanges CountY quantity - 90 75 40 -
60 value $ - 450 375 400 -
61 Temislcamingue and Abitibi Counties quantity - - 15 - -
62 value $ - - 120 - -
63 Trois-Rivières County quantity - 180 250 100 -
64 value $ - 540 2,500 1,000 -
65 Vaudreuil County quantity - 500 595 50 -
66 value $ - 4,000 5,355 500 -
67 Verchères CountY quantity - 310 220 70 -
68 value $ - 1,550 1,760 560 -
69 Yamaska CountY quantity - 400 395 110 -
70 value $ - 2,000 1,975 550 -
71 Total quantity 119 6,210 6,100 11,225 -
72 Total value $ 1,345 32,895 40,795 90,395 -
116
(a) In the statistics for the inland fisheries of Quebec no distinction is made between value as caught and landed and value as marketed.

FISHERIES STATISTICS
L Fish Caught and Marketed, 1938-con.
Maeki- Mixed Tom nongé fish Perch Pickerel Pike Salmon Shad Smelts Sturgeon Whitefish Cod .
cwt. cwt. cwt. cwt. cwt. cwt. cwt. cwt. cwt. cwt. cwt.
535 13,320 4,885 4,475 5,195 1,080 1,730 1,030 4,510 4,290 3,395 1
5,710 67,935 24,960 47,730 44,650 13,400 10,510 5,880 44,370 21,450 26,635 2
- 125- - 75 - - 320 1,650 - 625 - 600 - - 1,920- 9,900 - 1,800 - - - 1,00 - 600 - 4,00 - 5 - 14,400 - _ - 12,000 - 3,500 - 20,000 - 6 - - - - - 40 55 110 200 29 - 7 - - - - - 800 550 1,100 3,200 1,45 - 8 - - - 45 - - 145 - 190 - 490 9 - - _ 675 _ - 1,16 - 1,900 - 2450 10 - 4,950 - - - 40 610 320 10 - - 11 - 19,800 - - - 600 3,050 1,280 150 - 12
- 6,875 120 - 1,080 1,130 1,030 2,050 4,290 490 13 - 34,825 - 1,275 - 13,400 6,680 5,830 15,150 21,450 2,450 14
10 - 190 15 55 - - - 10 - - 15 110 - 570 150 440 - - - 120 - 16
5 - 90 35 25 - - - 110 - -17 55 - 270 350 200 - - - 1,320 - - 18 - 210 210 90 115 - 30 - 40 - - 19 - 1,050 840 990 805 - 180 480 - - 20 - - 100 30 50 - 100 - 15 - -21 - - 400 600 500 - 800 - 180 - - 22 - 5,000 - 600 300 - - - 100 - 640 23 - 25,000 - 6,000 2,400 - - - 1,500 - 6,400 24
450 - 650 110 110 - - - 635 - - 25 4,500 - 2,600 1,100 770 - - - 6,350 - - 26
- 10 - 20 90 - - - - - 27 - 50 - 300 900 - - - - - - 28 - - 5 - 25 - - - 150 - - 29 - - 600 - 25 - - - 2,250 - - 30 15 40 10 3 - - - - - -31
225 - 400 200 35 - - - - - 32 - 90 12 - 70 - - - -
_ -33 - 900 1,800 - 1,05 - - - - - - 34 - 110 10 - 65 - - - - - - 35 - 550 52 - 78 - - - - _ - 36 10 - 80 20 25 - - - - - -37
250 - 1,200 300 375 - - - _ - 38 - 165 60 110 100 - 130 - 80 - 170 39 - 1,650 300 1,650 1,500 - 1,040 - 1,200 - 1,70040 - - 490 180 29 - - - 20 - - 41 - - 1,470 1,800 2,03 - - - 300 - - 42 - - 260 140 100 - - - - - 70 43 - - 1,040 2,520 500 - - - - - 700 44 - 170 - 80 22 - - - 90 - 75 45 - 1,020 - 1,600 2,25 - - - 1,800 - 750 46 - 280 420 180 18 - 230 - 225 - 400 47 - 840 1,260 2,160 1,800 - 1,150 - 2,250 - 3,600 48 15 - 50 40 40 - - - - - 60 49
300 - 400 800 480 - - - - - 300 56 - - 15 50 - - 15 - 25 - 120 51
- - 60 750 - 120 - 1,75 - 60022 10 - 310 220 820 - - 1 - 10053
100 - 2,170 2,200 6,550 - - - 100 - 500 54 10 - 45 30 - - - _ - - -51
100 - 225 450 - - - - - _ - 5E 10 - 520 100 320 - - -
_ - 51
100 - 2,600 1,500 3,200 - - - - _ - 5£ - - - 100 40 - - - 3 _ -56
- - - 1,500 320 - - 420 - - 66 - 210 - 1.550 1,625 - - - - - 950 61
- 1,050 - 12,400 12,940 - - - - _ 6,650 62
- - 190 55 80 - 95 - 22 - 30 65
- - 950 825 800 - 570 - 3,37 - 180 64
- 200 200 195 120 - - - 9 _ - 61
- 1,000 1,800 1,950 1,200 - - - 1,42 - - 6 1
- - 300 205 200 - - _ 8 - 195 61
- - 2,700 2,460 1,800 - - 96 - 1,950 61
- - 390 190 90 _ - - 29 - 95 65
- - 780 1,900 450 - - 3,44 - 855 71
535 6,445 4,885 4,355 5,195 600 2,460 - 2,905 71
5,740 33,110 24,960 46,455 44,650 - 3,860 - 29,220 - 24,185 71
117

FISHERIES STATISTICS
I. Fish Caught and Marketed, 1938-con.
ue Fishing Districts PBick
lerel Carp Catfish Eels Herring
cwt. cwt. cwt. cwt. cwt.
Ontario (a)
Totals for Province-
1 Quantity 73,171 10,721 4,740 526 47,030
2 Value caught and landed $ 453,660 10,721 18,960 3,682 174,011
3 Value marketed 5 497,564 16,083 23,700 4,208 268,072
4 Northern Inland waters-Lake of the Woods, lake Nipi- gon, lake Nipissing, Kenora and Rainy river dis- tricts quantity 826 16 84 - 24
5 value E 5,617 24 420 - 137
6 Lake Superior quantity 142 6 - - 18,555 7 value $ 966 9 - - 105,764
8 North Channel (Lake Huron) quantity - 8 - 17 9 value $ - 12 - - 97
10 Georgian Bay (Lake Huron) quantity - 446 77 - 473 11 value $ 669 385 - 2,696
12 Lake Huron (proper) quantity 20 37 29 - 1,867 13 value $ 136 56 145 - 10,642
14 Lake St. Clair, river St. Clair and Detroit river quantity 11 2,610 631 - - 15 value $ 75 3,915 3,155 - -
16 Lake Erie and Upper Niagara river quantity 71,577 3,739 783 - 13,745 17 value $ 486,724 5,609 3,915 - 78,347
18 Lake Ontario, Lower Niagara and St. Lawrence rivers quantity 595 1,442 1,912 423 12,306 19 value S 4,046 2,163 9,560 3,384 70,144
20 Southern Inland waters-Lake Simcoe, etc., including Ottawa river quantity - 2,417 1,224 103 43
21 value b - 3,626 6,120 824 245
(a) For the districts the values as marketed are given.
118

FISHERIES STATISTICS 119
I. Fish Caught and Marketed, 1938--con.
Mixed Perch Pickerel Pike Sturgeon Sturgeon Trout 'rullibee Whitefish Fish easier
cwt. cwt. cwt , cwt. eyvt. lb. cyd. cwt. cwt.
30,914 29,779 23,128 10,038 1,577 3,841 60,405 7,595 49,477 1
228,763 205,475 182,711 30,114 5,520 - 803,387 110,171 623,410 2
259,676 235,256 217,404 40,152 5,993 3,841 924,196 125,369 732,261 3
4,064 200 13,022 7,104 1,117 2,424 2,711 2,459 14,335 4
34,138 1,580 122,407 28,416 4,245 2,424 41,478 40,574 212,158 5
585 7 755 82 26 _ 16,678 619 3,117 6
4,914 55 7,097 328 99 - 255,173 10,214 46,132 7
2,271 65 535 855 66 37 6,261 9 1,857 8
19,076 514 5,029 3,420 251 37 95,793 149 27,484 9
1,071 45 1,246 431 21 87 14,269 777 11,962 10
8,996 356 11,712 1,724 SO 87 218,316 12,821 177,038 11
1,618 1,408 1,804 1 38 295 17.473 3,734 2,052 12
13,591 11,123 16,958 4 144 295 267,337 61,611 30,37013
2,355 295 477 215 91 117 - - 2 14
19,782 2,331 4,484 860 346 117 - - 30 15
13,731 25,955 5,095 202 165 860 - _ 10,018 16
115,340 205,045 47,893 SOS 627 860 - - 148,266 17
2,458 1,694 150 1,046 53 21 2,758 - 6,023 18
20,647 13,383 1,410 4,184 201 21 42,197 - 89,14019
'2,761 110 44 102 - - 255 - 11120
23,192 569 414 408 - - 3,902 - 1,64321

FISHERIES STATISTICS
I. Fish Caught and Marketed, 1938-con.
Goldeyes
Fresh Mixed Fishing Districts
Catfish water Marketed Fish Mullets Perch Drum Caught
and landed
Used Smoked fresh
cwt. cwt. cwt. cwt, cwt. cwt. cwt. cwt.
Manitoba (a)
Totals for Province-
1 Quantity 136 106 4,490 928 2,282 296 3 6,611
2 Value caught and landed $ 868 211 33,551 - - 1,757 3 46,508
3 Value marketed $ 1,159 319 - 6,718 53,380 2,305 5 58,011
SUMMER nSHING
4 Lake Winnipeg and Red River . quantity 136 106 - 736 - 152 466 5 value $ 1,159 319 - 5,231 - 1,216 - 3,000 6 Lake Winnipegosis quantity - - - 192 - - - 7 value $ -- - 1,487 - - - - 8 The Pas (Churchill river) quantity _ _ - - - _ - 9 value $ -- - - - - - -
10 The Pas (Athapapuskow lake) quantity - _ - - - - - - II value $ - - - - - -- - 12 The Pas (Cormorant and Moose lakes) quantity - - - - - - - - 13 value 5 - - - - - - - - 14 Shoal lake (Snowshoe Bay) quantity - - - - - - - - 15 value $ - - - - - - - - 16 Lake Sipiwesk and Nelson river quantity - - - - - - - 17 value 3 - - - - - - - - 18 Rupert's Land (Kautunigan) quantity - - - - - - - - 19 value $ - - - - -- - - 20 Lake of the Woods (Buffalo Bay) quantity - - - - _ 7 3 172 21 value $ .- - - - - 41 5 860
22 Total quantity 136 106 - 928 - 159 3 638 23 Total value marketed 5 1,159 319 - 6,718 _ 1,257 5 3,860
WINTER FISHING
24 Lake Winnipeg and Red river quantity - - - - 2,282 137 - 383 25 value 5 - - - - 53,380 1,048 - 2,714 26 Lakes Winnipegosis, Swan and Red
Deer quantity - - - - - - - 328 27 value 3 - - - - - - - 2,359 28 The Pas (Kississing and Risseynew
lakes) quantity - - - - - - - _ 29 value $ - - - - - - - - 30 The Pas (Rocky, Manistikwan, Egg,
Goose, Naosap and Athapapuskow lakes) quantity - - - - - - - -
31 value S - - - _ _ - - - 32 The Pas (Moose, William, Cedar and
Clearwater lakes) quantity - - - -- - - - 33 value $ - - - _ - - - - 34 The Pas (Herb, Little Herb, Kiski,
Setting, Landing, Halfway, Pakwa, Laundry, Wintering, Paint, Partridge, Crop, Sahomin, Ospawagan, Reed, Simonhouse and Cranberry lakes) quantity - - - - - - - -
35 value $ - - - - - - - - 36 Lake Manitoba and Whitemud river quantity - - - - - - - 5,189 37 value 6 - - - - - - - 48,438 33 Lake St. Martin quantity - - - - - - - 12 39 value $ - - - - - - - 72 40 Lake Waterhen quantity - - - - - - - 29 41 value $ - - - - - - - 292 42 Lake Dauphin quantity - - - - - - - 60 43 value - - - - - - - 300 14 Lake of the Woods (Buffalo Bay) quantity - - - - - - - 2 45 value - - - - - - - 8
46 Total quantity - - - - 2,282 137 - 6,003 47 Total value marketed $ - _ - - 53,380 1,048 - 54,181
(a) For the districts the values as marketed are given.
120

FISHERIES STATISTICS
L Fish Caught and Marketed, 1938-con.
ndlibee WIdtefish
Star-
Pickerel Pike Saugers Suckers Star- geon Trout
geon caviar Caught Marketed Caught Marketed
and and
landed Used d lande Used
fresh Smoked fresh Smoked
cmt. cwt. cwt. cwt. cwt. lb. cwt. cwt , cwt. cmt. cwt. cmt. cwt.
90,662 33,179 95,007 17,833 689 382 1,439 18,050 14,968 1,926 30,081 20,062 12 1
447,231 71,332 408,963 17,526 13,073 - 8,845 67,772 - - 189,445 - - 2
695,264 88,961 488,786 23,772 22,192 492 10,678 - 75,242 14,676 - 268,924 210 3
34,316 1.981 13,907 53 229 102 - - 4.376 - - 20,480 - 4
259,214 8,875 66,064 109 10,525 102 - - 11,764 - - 209,358 - 5
I 2 ,232 1,225 - 4 - - - - 4 - - 454 - d
94,288 4,075 - 4 - - - 2 - - 3.180 - /
- - - - 118 60 - - - - - - -1
- - - - 2,950 90 - - - - - -6
- - - - - - 170 - - - 190 -10
- - - - - - 1,360 - - _ _ 1,440 - 11
262 70 - - - - 111 - - _ - 1,385 - 12
2,140 - - - - - 828 - - - - 8,030 - 12
304 67 - - - - - - _ 433 -14
2,099 253 - - - - - - - - 4,240 - II
- - - - 300 200 - - - - - lf
- - - - 7,500 300 - - - - - - 1I
- - - - 17 - - - - - - -il
- - - - 592 - - - - - - - -11
82 26 439 - - - - 172 - - 2 - 21
492 104 1,985 - - - - - 346 - - 18 - 21
46,196 3,369 14,346 57 684 362 281 - 4,549 - - 22,944 - 2:
358,233 13,412 68,049 113 21,567 492 2,188 - 12,112 - - 226,266 - e
7,016 870 62,961 12 - - - 2,862 1,926 - - 1224
46,491 2,371 315,851 24 - - - 9,845 14,676 - - 21021
24,629 11,268 393 13,596 - - - - 546 - - 116 - 21
187,455 28,910 1,842 15,940 - - - - 1,274 - - 696 - 21
106 - - - - 7 53 73 - - 1,000 -21
584 - - - - - 392 49 - - 6,374 - 21
108 79 - 5 - - 370 2 - - 1,085 - 31
715 221 - 5 - - 3,134 10 - - 8,323 - 3
385 30 - - 25 - 441 - - - 1,445 - 1
2,720 60 - - • 625 - 3,259 - - - 10,174 - 3:
514 810 - 50 - - 294 - 269 _ - 3,431
1,938 1,835 - 50 - - 1,705 - 722 - - 16,709 - 3 1
10,404 15,338 17,276 3,704 - - - - 6,614 - - 27 - Ii
88,121 38,802 102,836 7.037 - - - - 51,064 - - 248 - 3 '
720 60 16 50 - - - _ _ - 10 - 31
5,760 120 SO 80 - - - - - - 110 - 31
195 652 13 34 - - - - g - - 4 - 4 1
908 1,118 122 36 - - - - 29 - - 24
394 696 - 324 - - - - 11 - - - - e
2,304 2,088 - 486 - - - - 88 - - - - e
5 7 2 1 - - - - 33 - - - _ ,
35 24 6 1 - - - - 49 - - - - 4.
44,466 29,810 80,661 17,776 25 - 1,158 - 10,419 1,926 - 7,118 1241
337,031 75,549 420,737 23,659 625 - 8,490 - 63,130 14,676 - 42,658 2104'
121

122 FISHERIES STATISTICS
I. Fish Caught and Marketed, 1938—con.
Fishing Districts Goldeyes Ling
1
2
3
cwt.
Saskatchewan(a)
Totals for Province-
Quantity
Value caught and landed
Value marketed
SUMMER FISHING
cwt.
40
323
618
3,603
3,179
3,665
2 2
4 5 6 7 8 10
19
Chitek lake...
Lac des ' Ilès...
Okemasis lake.
Montreal lake.
Candle lake...
Lac la Ronge..
Churchill river
Beaver lake...
-
-
-
-
-
-
-
30 30
4- 0 648
Saskatchewan river
Athabaska lake (b)
quantity value quantity value $ quantity value quantitY value quantitY value $ quantitY value 5 quantity value $ quantity value t quantity value quantity value
35
10 11 12 13 14 15 16 17 18 19 20 21 22 23 35
24 25
Total quantity Total value
40 77 648 86
26 27 28 29 30 31 32 33 34 35 36 37 38 39 40 41 42 43 44 45 46 47 48 49 50 51 521
54 55 56 57 58 59
WINTER FISHING
Jackfish lake
Murray lake
Turtle lake
Chitek, Birch, Brightsand and Eau Claire lakes
Makwa lake
Worthington and Peck lakes
Pierce and Lepin lakes
Lac de é Isles
Waterhen lake
Flotten lake
Greig, Kimball and Mistohay lakes
Keeley and Canoe lakes
Big Peter Pond and Little Peter Pond lakes
Churchill and Frobisher lakes
Deep river
Ile à la Crosse lake
Shagwenan lake.
quantity value $ quantity
value $ quantity
value $ quantity
value t quantity
value $ quantity
value t quantity
value $ quantity
value quantity
value quantity
value quantity
value quantity
value t quantity
valve quantity
value S quantity
value quantity
value t quantity
value $
.•■
164 164 240 240 248 248
6 6
200 200
8 8
18 21
5 5 8
17 28 28 15 15 12 12 3 6
3 6 4 8
(a) For the districts the values as marketed are given. (b) The fish caught in lake Athabaska is taken on the Saskatchewan side, but both Saskatchewan and Alberta own
boats and gear which are used in the fisheries of this lake.

FISHERIES STATISTICS
I. Fish Caught and Marketed, I938-con.
Perch Pickerel Pike Suckers Sturgeon Trout Tullibee Whitefish
cmt. cwt. cmt. emt. cwt. cmt, cwt. cmt.
81 5,085 5,824 5,220 514 10,119 17,385 39,904 1
405 13,939 8,542 5,801 7,156 38,862 25,656 146,475 2
609 29,392 16,625 9,450 10,855 92,713 34,504 270,185 3
_ 8 8 3 _ _ - 265 4 - 123 83 7 - - 4,236 5 - 5 8 - _ _ _ 207 6 _ 50 34 - _ _ 3,105 7 - 21 3 3 - - 377 8 _ 87 6 6 - - _ 1,509 9 _ 20 11 9 - _ _ 425 10 - 103 44 19 - - - 2,97111 - 12 47 - - - 16012 - - 76 286 - - 1,60513 - 10 30 50 - - - 200 14 - 60 120 50 - - 1,400 15 - - - - 176 - - - 16 - - - - 5,326 - - - 17 _ 6 30 40 58 _ 10618 - 37 90 80 - 403 - 742 19 - 4 12 24 - - - 1720 - 40 69 117 - _ _ 210 21 - 71 20 97 - 5,759 _ 31022 - 284 40 97 - 46,074 - 2,48223
- 145 134 273 176 5,817 _ 2,06724 - 784 562 662 5,326 46,477 - 18,26025
_ 0 1 7 - - - 1.98126
68 12 14 - - - 21,569 27
7 3 9 - - - 250 28 - 79 42 18 - - - 2,754 29
- 131 - - - 130 - - - 262 - - - 831 - - 26 26 - - 458 32 - - 162 63 - - 2,480 33 - 16 23 a _ - _ 3434 - 114 93 10 - - _ 201 35 - - 14 5 - - 11236 - - 56 10 - - - 89237 - 3 14 19 - 80 - 33538 - 24 48 3 - 1,100 - 3,76039 - 80 100 3 - - - 22040 - 700 300 9 - - - 3,10041 - 100 74 12 - - - 406 42 _ 740 368 125 _ - - 2,43843 - 38 31 2 - - - 15944 - 189 124 4 - - - 1,59145 - 10 84 7 - - - 8446 - 82 501 17 - - - 84647 - 257 404 242 - - 8 1,16448 - 832 1,230 242 - - 45 6,44049 - 494 861 185 - - 62 5,96950 - 2,467 1,723 185 - - 199 35,78351 - 42 630 220 - - 14 4,63552 - 169 1,260 220 - - 28 27,79853 - 7 111 9 _ _ - 88354 _ 28 222 9 _ _ - 5,30055 - 188 149 300 - - 4 1,17050 _ 939 447 300 - - 15 7,022 57 - 28 20 59 - 2 12 431 - 138 39 .59 - 37 50 2,590 59
123

53 54
3,526 3,579
124 FISHERIES STATISTICS
L Fish Caught and Marketed, 1938—con
Fishing Districts Goldeyes
cwt.
Saskatchewan (a)—Whtter Fishing--concluded
1 Snake, Sandfly and Besnard lakes quantity 2 value $ 3 Laplonge lake Quantity 4 value 5 5 Dore lake quantity 6 value $ 7 Needle lake quantity 8 value $ 9 Beaver and Green lakes quantity
10 value $ 11 Okemasis lake quantity 12 value 5 13 Dog, Lawrence, Elaine, Taggart, Wabeno and Hackett lakes quantity 14 value 5 15 Montreal, Swearing and Listen lakes quantity 16 value $ 17 East Trout, Little Bear and Big Sandy lakes quantity 18 value $ 19 Candle lake quantity 20 value $ 21 Lac la Ronge quantity 22 value $ 23 Barr and Trout lakes quantity 24 value $ 25 Reindeer and Woleston hikes and Churchill river quantity 26 value 5 27 Beaver (Ambit) lake quantity 28 value $ 29 Suggi lake quantity 30 value $ 31 Hunting, Dechambault and Jackson lakes quantity 32 value $ 33 Wildnest and Jans lakes quantity 34 value $ 35 Wood, Long, Miiond and Hidden lakes quantity 36 value $ 37 Mari lake quantity 38 value 5 39 Cumberland lake - quantity 40 value 5 41 Namew lake quantity 42 value $ 43 Long lake quantity 44 value $ 45 Katepwa and Echo lakes quantity 46 value 5 47 Athabaska lake (b) q uantity 48 value $ 49 Cold (Saskatchewan eide) lake quantity 50 value 5 51 Primrose lake quantity 52 value 5
62 62
141 141 812 842
564 584
22 22
38 38 47 47 4 4
32 32
Total quantity Total value
(a) For the districts the values as marketed are given. (b) The fish caught in lake Athabaska is taken on the Saskatchewan side, but both Saskatchewan and Alberta otm
boats and gear which are used in the fisheries of this lake.

Pickerel Pike Suckers Sturgeon Trout Tullibee Whitefish
cwt. cwt. cwt. cwt. cwt. cwt. cwt.
219 111 52 - 2 82 1,506
971 332 52 - 18 328 9,707
- 10 81 - 179 - 1,113
35 81 _ 1,176 - 6,680
966 1,343 228 - _ - 3,568
3,863 3,358 342 - - - 17,901
8 5 2 _ - - 65
32 20 4 _ _ 325
262 51 115 - - 2 163
879 166 190 - - 4 1,077
25 11 45 - - 5 187
158 43 110 - - 26 1,413
14 44 94 - - 7 491
56 126 132 - - 21 2,521
41 25 53 _ - - 652
206 98 76 - - - 3,790
27 55 58 - 43 - 435
122 172 106 - 31 4 - 2,235
40 169 132 - - - 236
332 1,111 397 - - - 2,06
178 94 258 - 2,617 - 1,58
872 376 516 - 31,398 - 11,05
- 26 18 - 9 - 43
- 92 18 - 1,12 - 2,64
8 16 24 295 193 - 24
30 41 24 4,674 2,31 - 2,33
46 48 40 - 74 - 2,01
186 73 40 - 444 - 9,06
138 117 92 - - - 74
552 351 92 - - - 4,47
20 113 35 - 50 44 1,14
80 310 44 - 600 110 5,10
6 14 15 _ - - 3
30 48 21 - - - 17
32 29 32 - 116 - 96
142 78 34 - 696 - 4,34
13 6 7 _ - 12
92 15 7 - - 36 2
- - - 43 - - -
- - - 855 - - -
118 140 110 - 116 - 40
472 280 110 - 696 - 1,62
231 33 160 - - 16,301 1,11
2,650 198 SOO - - 32,549 14,24
28 59 18 - - 792 10
284 349 54 - - 1,013 1,38
- 125 25 - 516 40 35
- 250 25 - 3,096 SO 1,75
4 1 4 - 250 - 65
30 4 8 - 3,217 - 7,67
1,240 500 1,850 - - - 1,36
10,000 1,510 3,800 - - - 13,74
4,940 5,690 4,947 338 4,332 17,385 37,837
28,608 16065 8,788 5,529 . 46,236 34,504 251,925
Perch
cwt.
-
-
-
-
-
-
-
-
-
-
58 461
23 148
81 609
1 2 3 4 5 6 7 8 9
10 11 12 13 14 15 16 17 18 19 20 21 22 23 24 25 26 27 28 29 30 31 32 33 34 35 36 37 38 39 40 41 42 43 44 45 46 47 48 49 50 51 52
53 54
FISIIERIES STATISTICS
I. Fish Caught and Marketed, 1938-con.
125

FISHERIES STATISTICS
I. Fish Caught and Marketed, 1938-con.
Fishing Districts Mixed Perch Pickerel Pike Trout Tulli- We-
Fish bee fish
cwt. cwt. cwt. cwt. un-t. cat. cwt. Alberta (a)
Totals for Province--
Quantity 7,585 1,671 5,252 8,047 460 14,899 31,286
Value caught and landed $ 7,532 6,555 20,420 18,697 2,314 11,588 194,395
Value marketed $ 7,814 12,615 40,881 42,794 4,327 34,045 350,467
SUMMER FISHING
Lesser Slave lake quantity 4,943 - 426 212 - 22 8,332 value $ 5,018 - 3,714 503 - 66 90,770
Lesser Slave lake district (Fawcett, Sturgeon and Mitsue lakes) quantity 93 23 10 233 40 147
value 5 184 182 80 1,265 240 1,470 Lac la Biche quantity 180 6 1,661 541 - 8,037 1,593
value 5 180 40 10,630 6,554 - 18,000 20,800 Lac la Biche district (Beaver, Buck, Elinor, Iron-
wood, Missm.vawi, Skeleton, Amisk, Bad, Corner, Ethel, Hope, Kinosiu and Windy lakes) quantity 19,5 194 55 317 280 540
value $ 195 1,105 402 1,230 621 5,525 Wahamun lake quantity 40 - - 30 - 400
value 5 40 - - 90 - 2,400 Wabamun lake district (Fickle and Shining Bank
lakes) quantity 1 - - 3 - 22 value $ 2 - - 16 - 318
Moose lake quantity - 70 87 26 56 53 value $ - 400 462 102 240 530
Moose lake district (Muriel lake) quantity - 2 - 41 - - value $ - 6 - 164 - -
Cold lake district (Marie and Tucker lakes) quantity 21 24 11 50 - 18 value $ 42 150 90 214 - 160
Pinehurst lake quantity 10 - 30 25 - 50 value $ 10 - 240 150 - 500
' Baptiste lake quantity 5 10 11 40 - value $ 5 80 110 240 -
Baptiste lake district (Lawrence lake) quantity 70 10 - 120 - - value 8 70 100 - 720 - -
Winniired lake quantity 200 - 282 55 - 283 value $ 200 - 1,300 55 - 2,830
Lac Ste Anne quantity 126 - 15 104 - 465 value 5 126 - 120 620 - 4,650
Lac Ste Anne district (Lac la Nonne and Lessard lake) quantity 10 20 40 20 10 30
value $ 10 200 400 160 200 300 Pigeon lake quantity 12 - 130 74 - 213
value $ 48 - 1,300 500 - 2,130 Pigeon lake district (Buck and Conjuring lakes) quantity 46 - 166 105 - 367
value 5 69 - 1,655 750 - - 3,674 tshmont lake district (Fork lake) quantity 5 7 - I - - -
value $ 20 70 - 10 - - -
Total quantity 5,957 366 2,924 1,957 - 8,485 12,513 Total value $ 6,219 2,333 20,503 13,103 - 19,607 136,057
WINTER FISHING
'..esser Slave lake quantity 67 - 216 444 - 13 2,524 value $ 67 - 1,729 1,776 - 26 26,804
1.esser Slave lake district (Fawcett, Lylich, Stur- geon, Little Whitefish, Utikuma, Utikumasis and Haig lakes) quantity 26 4 27 461 - 114 1,854
value $ 32 35 208 1,894 - 354 16,238 jailing lake quantity 145 644 144 - - 1,005
value $ 145 - 5,148 976 - - 10,046
Dolling lake district (Rock Island and Orloff lakes) . quantity 154 10 - 5 202 value $ 154 40 - 12 1,660
Vabamun lake quantity 63 203 - - 5,597 value $ 63 - 1,391 - - 82,631
Vabamun lake district ( Chip, Fickle, Isle, Maya- tan and Gregg lakes) quantity 29 20 5 216 - - 33
value $ 61 220 50 994 - - 510 gewell lake quantity 35 212 - - 338
value $ 35 - 2,319 - - 4,362 ■Tewell lake district (McGregor lake) quantity 211 387 - - -
value $ 211 - 3,100 - - - loose lake quantity 5 6 8 47 - 27 34
value $ 4 48 56 267 - 156 343
(a) For the districts the values as marketed are given.

FISHERIES STATISTICS
I. Fish Caught and Marketed, 1938-eon.
Fishing Districts Mi"d Perch Pickerel Pike Trout Tulli- White-
Fish bee fish
cwt. cwt. cwt. cwt. cwt. cwt. cwt.
Alberta (a)-Winter FIshing-concluded
Moose lake district (Keehewin and Muriel lakes) quantity 13 31 2 90 - 2 - value S 12 242 20 538 - 10 -
Cold lake quantity 6 - 3 8 189 - 967 value $ 6 - 22 48 2,344 - 8,718
Cold lake district (Bourque, Burnt, Ethel, Hilda, May, Marie, Tucker and Wolf lakes) quantity 135 88 136 192 - 44 361
value $ 135 800 1,190 805 - 176 3,699 Pinehurst lake quantity 8 - 126 40 - - 264
value $ 8 - 1,008 135 - - 2,680 Pinehurst lake district (Mosquito and Touchwood
lakes) quantity 56 - • 41 172 2 - 561 value $ 56 - 368 514 22 - 6,821
Lac la Biche quantity 139 - 245 380 - 5,980 90 value $ 139 - 3,030 1,596 - 12,330 940
Lac la Biche district (Amisk, Buffalo, Beaver, Bob- tail, Blackett, Burnt, Buck, Elinor, Frenchman, Hope, Hylo, Ironwood, Johnson, Kinnaird, Little Egg, Missawawi, Siebert, Skeleton and Square lakes) quantity 181 857 182 2,025 - Ill 246
value S 181 6,676 1,988 8,753 - 646 2,698 Winnifred lake quantity 148 - 491 376 - - 981
value $ 148 - 3,948 1,494 - - 8,506 Winnifred lake district (Gregoire, Ipiatik, Roberts
and Sterner lakes) quantity 102 - 42 99 - - 585 value $ 30 - 370 450 - - 5,890
Pigeon lake qwintity - - - - 1,790 value $ - - - - - 19,190
Pigeon lake district (Conjuring lake) quantity 24 - - 20 - - - value $ 24 - - 60 - -
Primrose lake quantity 17 - 60 67 - 169 value $ 17 - 440 34 - - 1,580
Peerless lake quantity - - 20 5 88 69 value $ - - 160 20 875 690
Peerless lake district (Graham lake) quantity - - 12 32 181 161 value $ - - 100 190 1,086 - 1,611
Baptiste lake district (Baptiste lake) quantity 9 23 31 6 - 22 - value 8 10 201 272 32 122
Lac Ste Anne quantity 10 - 8 7 - - 10 value $ 10 - 68 41 - 100
Lac Ste Anne district (Lac la Nonne, Lessard, Isogun and Bear lakes) quantity 43 - 13 109 - 65 45 8
value 5 45 - 101 482 544 4,598 Wahasca lake quantity - - 16 72 - 31 160
value $ - - 96 2S4 - 62 960 Ashmont lake district (F•rk, Goodfish, Little Hol-
low and Whitefish lakes) quantity - 276 - 256 - 314 value $ _ 2,060 - 1,092 - 3,135
Buffalo lake quantity 2 - - 10 - - value $ 2 - - 60 - -
• Total quantity 1,628 1,305 2,328 6,090 460 6,414 18,773 Total value $ 1,595 10,252 20,378 29,691 4,327 14,438 214,410
(a) For the districts, the values as marketed are given.
- Mixed Fish Salmon Trout Whitefish
cwt. cwt. cwt. cwt.
Yukon Territory
Totals-
Quantity 3 129 102 98
Value caught and landed 8 94 2,073 1,476 1,647
Value marketed 6 94 2,073 1,476 1,647
127

FISHERrES STATIS'rICS
I. Fish Caught and Marketed, 1938—con.,
1
1
1 2 2 2
2 2
2
2 2
2 3
Cod Hake and Cuak
Fishing Districts Marketed Marketed
Caught Caught and and
landed Used Fresh Smoked Livers landed Used
fresh fillets fresh
cwt. cwt. cwt. cwt. cwt. cwt. cwt.
British Columbia
'rotais for Province-
1 Quantity 18,635 6,140 4,251 105 150 92 42
2 Value $ 45,205 23,873 42,140 1,050 750 99 104
District No. 1—(Fraser River and Howe Sound)—
3 Total quantity 11,717 4,585 4,251 105 150 42 42 4 Total value $ 29,974 18,468 42,140 1,050 750 99 104
District No. 2—
5 Massett Inlet and northern Graham Island, Queen Charlotte Islands - - - - - - -
6 Southern Queen Charlotte Islands, mcludmg Sktdegate Inlet - - - - - - -
7 The Nues River - - - - - - - 8 Skeena River including Prince Rupert and the Upper
Skeena - - - - - - - 9 Grenville-Principe area - - - - - - - 0 Butedale including Gardiner canal - - - - - - - 1 Bella Bella and Fitzhugh Sound - - - - - - 2 Bella Cools, Dean and Burke Channels - - - - - - - 3 Rivers Inlet - - - - - - 4 Smiths Inlet - - - - - - -
5 Total quantity - - - - - - - 6 Total value 5 - - - - - - -
District No. 3—
7 Cape Scott to 'Puna Point, including all waters between Vancouver Island and the mainland - - - - - -
8 Tuna Point to Shelter Point including mainland waters opposite - - - - - - -
9 Shelter Point to French Creek 196 - - - - - - 9 Mainland waters from George Point to Gower Point - - - - - - - 1 French Creek to Shoal Harbour including Nanaimo 5,167 • - - - - - - 2 Shoal Harbour t,o Sambrio Point including Victoria 1,555 1,655 - - - - - 3 Sambrio Point to Pachena Point including Nitinat
Arm - - - - - - - t Barclay Sound and Port Alberni - - - - - - - 5 Wreck Bay to Estevan Point including Clayoquot
Sound - - - - - - - 6 Estevan Point to Tatchu Point =hiding Nootka
Sound - - - - - • - - 7 Tatchu Point to Cape Cook including Kyuquot Sound - - - - - - - 3 Cape Cook to Cape Scott including Quatsino Sound - - - - - - -
D Total quantity 6,918 1,555 - - - - -
D Total value 5 15,231 5,405 - - - - -

FISHERIES STATISTICS
I. Fish Caught and Marketed, 1938-con.
d, Waiting Halibut (a) Floune
PlaicersBrill, Skate
Caught Marketed Caught Marketed Caught Marketed Caught Marketed and and and and
landed *Used landed Used Liver Viscera landed Used landed Used
fresh fresh Livers oil oil fresh fresh
cwt. cwt. cwt. cwt. cwt. gal, gal. cwt. cwt. cwt. cwt.
20 20 120,247 120,247 3,019 750 815 2,176 2,176 691 691 1
58 62 810,667 1,011,165 155,420 18,750 57,050 5,759 6,767 2,072 2,167 2
20 20 28,155 28,155 408 - - 957 957 591 591 3 58 62 204,223 245,754 20,480 - - 2,864 3,872 1,773 2,111 4
- - 68,450 68,450 2,313 750 815 - - - _ _ _ - - 17,776 17,776 285 - - - - - - if - - _ _ _ _ - _ _ _ - 11
- - - - - - - - - - - 12 _ _ _ - _ - _ _ - - 14
- - 86,226 86,226 2,598 750 815 - - - - 12 - - 603,666 764,313 133,290 18,750 57,050 - - - - 12
_ _ 2,463 2,463 24 _ _ _ _ _ - 11
- - 12 12 - - - - - - - 11 - - - - - - - 460 460 10 10 19 _ _ - - _ _ _ _ _ _ - 20 - - 4 4 - - - - - - - 21 - - 1,085 1,085 - - - 459 459 93 9321 _ _ - - _ _ _ - _ _ -21 - - 985 985 - - _ 300 300 - - 29
- - 757 757 7 _ _ - - - 25
- , - _ - _ _ _ - - - - 26 - 526 528 12 - - - _ _ - 27 - - 32 32 - - - - - - - 2 5
- - 5, 866 5,866 43 - - 1,219 1,219 103 10325 - - 32,778 31,098 1,650 - - 2,895 2,895 299 356 30
(a) See footnote at page 138 for the landings of halibut at British Columbia ports by United States vessels.
129
89667-9

1
2
3 4
5
6
7 8
9 10 11 12 13 14
15 16
4,374 27,380
64
Caught and
landed Used fresh
cwt. cwt.
1,328,913 34,853
316,184 61,316
12,170 12,160 30,425 48,090
8,700
245,500
99,360
4,040 6,820
69
cases
140
20 140
364,420 82,412
cases
23,356
75,908
23,356 75,908
64 258
470
69 276
1 5
219
19,616
2,785
■•■
2,116 10,613
2,116 10,613
470
2,165
451 5
1,637
535,034
3,721
155,430
19,400
70,880
20,880
142,720
952,323 203,347
22,626 12,950
130 FISHERIES STATISTICS
I. Fish Caught and Marketed, 193 8-con.
Marketed
Herring
Caught and
landed
cwt .
38,251
6,551
Fishing Districts
• British Columbia-con.
Totals for Province-
Quantity
Value $
District No. 1-(Fraser River and Howe Sound)-
Total quantity Total value
District No. 2-
Massett Inlet and northern Graham Island, Queen Charlotte Islands
Southern Queen Charlotte Islands, including Skidegate Inlet
The Nana river Skeena river, including Prince Rupert and the
Upper Skeena Grenville-Principe area Bendale including Gardiner Canal Bella Bella and Fitzhugh Sound Bella Coda, Dean and Burke ChanneLs Rivers Inlet Smiths Inlet
Total quantity Total value
Soles
Marketed
Used Fresh fresh fillets
cwt. cwt.
5,435 373
29,679 8,000
3,255 373
18,808 8,000
64
64 258
Canned (round)
Canned (kippered)
District No. 3- 17 Cape Scott to Tuna Point including all waters
between Vancouver Island and the mainland 18 Tuna Point to Shelter Point including mainknd
waters opposite 19 Shelter Point to French Creek 20 Mainland waters from George Point to Gower
Point 21 French Creek to Shoal Harbour including Na-
naimo 22 Shoal Harbour to Sambrio Point including
Victoria 23 Sambrio Point to Pachena Point including Ni-
tinat Arm 24 Barclay Sound and Port Alberni 25 Wreck Bay to Estevan Point including Clayo-
quot Sound. 26 Estevan Point to Tatchu Point including Nootka
Sound 27 Tatchu Point to Cape Cook including Kyuquot
Sound 28 Cape Cook to Cape Scott including Quatsino
Sound
29 Total quantity 30 Total value
991 991
625 625
30 30

FISHERIES STATISTICS
I. Fish Caught and Marketed, 1938-con.
Herring-concluded Pilchards
Marketed Caught Marketed and
smoked Kip- Dry- ,,,,kinA Used Chl Meal landed Used 0.,„,„„,, Used oil Meal
Omund) pered sidted ''''''' asbait fresh "'""' as bait
cat. cwt. cat. bbL bbL gaL ton cwt. cat. cases bbL gal, ton
52 2,955 149,700 20 19,317 929,158 9,0211,035,369 19 69,473 3102,191,850 8,891 1
405 23,083 142,115 296 43,561 138,386 370,052 152,999 50 222,311 620 313,559 320,467 2
5 2,107 - 20 1755 247,532 1,776 9 9 - - - - 3
30 15,591 - 296 4,388 44.556 71,040 39 40 - - - - 4
23 45 - - 10,281 142,015 3,187 - _ - - - - k
_ _ _ - - - f
_ - _ - 206 27,520 172 _ _ _ _ - 11
- - - - - 16,891 98 - - - - 7,383 28E
_ - _ _ - E
23 45 - - 10,487 186.426 3,457 - - - - 7,383 2811
207 450 - - 20,974 29,200 134,904 - - - - 1,329 1.11211
- - - 1,082 - - - - - - - - 11
- - - 225 - - - -- - - -1:
- - _ _ - - _ _ _ - - 11
- 309 - _ 400 - - _ _ _ _ - V
- 50 149,700 - 830 27,580 301 - - - - - 2:
24 444 - - - - - _ - - -2
- - - _ - - _ _ _ _ _ _ -s
- - - - 2,828 252.941 1,727 341,753 10 19,304 310 634,926 2,9552
- - - - - - - 33,120 - - - - - Z
- - - - - 209,030 2,297 288,107 - 50,169 - 1,553,541 5,90821
- - - - - 5,649 66 312,400 - - -
- - - - 1,710 - - 59,980 - - -
24 803 149,700 - 7,075 495,200 4,3911,035,360 10 69,473 3102,188,467 8,863 2
168 7,042 142,115 - 18,202 64,630 164,108 452,960 10 232,311 620 312,230 319,3553
131
7
5
O
89667--9i
de

Bass Perch
Fishing Districts Caught Caught Marketed Marketed
and and landed Used landed Used
fresh fresh
cwt. cwt. cwt. cwt.
British Columbia--con.
Totals for Province-
1 Quantity 32 32 544 544
2 Value $ 72 86 3,827 3,942
District No. 1—(Fraser River and Howe Sound)—
3 Total quantity - - 386 386 4 Total value $ - - 3,186 3,301
District No. 2—
5 Massett Island and northern Graham Island, Queen Charlotte Islands. - - - -
6 Southern Queen Charlotte Islands, Including Skidegate Inlet - - - - 7 The Naas river - - - - 8 Skeena river including Prince Rupert and the Upper Skeena - - - - 9 Grenville-Principe area - - - -
10 Butedale including Gardiner Canal - - - - [1 Bella Bella and Fitzhugh Sound - - - - 12 Bella Cooks, Dean and Burke Channels - - - - 13 Rivers Inlet - - - - !4 Smiths Inlet - - - -
.5 Total quantitY - _ _ _
.6 Total value $ - - - -
District No. 3—
7 Cape Scott to Tuna Point, including all waters between Vancouver Island and the maialand - - - -
8 Tuna Point to Shelter Point, including romuland waters opposite - - 6 6 9 Shelter Point to French Creek - - - - 0 Makland waters from George Point to Gower Point - - - - :1 French Creek to Shoal Harbour including Nanaimo - - 82 82 !2 Shoal Harbour to Sambrio Point including Victoria 32 32 - - 3 Sambrio Point to Pachena Point including Nitinat Arm - - - - '4 Barclay Sound and Port Alberni - - 15 15 5 Wreck Bayto Estevan Point including Clayoquot Sound - - 55 55 !6 Estevan Point to Tatchu Point including Nootka Sound - - - - 7 Tatchu Point to Cape Cook, including Kynquot Sound - - - - 8 Cape Cook to Cape Scott, including Quatsino Sound - - - -
I/ Total quantity 32 32 158 158 0 Total value $ 72 86 641 641
2
2
132 FISHERIES STATISTICS
I. Fish Caught and Marketed, 1938—con.

FISHERIES STATISTICS
I. Fish Caught and Marketed, 1938-con.
Salmon
Caught Marketed
and
landed Used Dry- Mild
Canned Smoked KiPPered sal Pickled Roe Used as oil mee
fresh ted cured bait
cwt. cw-t. cases cwt. cwt. cwt. cwt. cwt. cwt. cwt. gal. ion
1,734,664 212,754 1,707,830 26 113 69,209 19,684 802 8,492 50 114,797 1,229 1
6,331,410 1,590,516 12,267,465 350 1,269 179,282 355,554 10,025 18,411 123 22,142 46,148 2
324,196 73,533 512,034 26 113 20,843 10,148 - 2,971 - 23,882 264 3
1,783,028 473,122 4,410,868 350 1,269 55,295 188,139 - 4,673 - 5,015 10,028 4
51,451 - 59,483 - - _ - - - - -
84,550 - 65,233 - - 7,000 - 483 - 2,903 57 f
116,731 - 55,919 - - _ - - - - - î
168,703 76,972 360,454 - - - 7,960 - - - 44,200 377 9
74,030 - - - - - - - - - - -c
95,535 5,299 102,555 - - - 1,576 - 28 - 7,840 95 IC
102,577 - 144,850 - - - - - 61 - 29,550 21211
38,408 - 32,581 - - - - - - - - 1
103,165 - 121,777 - - - - - - - - 12
37,867 9,848 - - - - - - - - 19
873,017 82,271 952,700 - - 7,000 9,536 - 1,379 - 84,493 761 U
2,927,373 692.070 6,562,976 - - 20,562 167,415 - 2,202 - 15,951 28,443 11
162,290 10,706 88,464 - - 11,086 - - 895 - - 11
67,197 150 16,500 - - - - - - - - lf
26,109 318 - - - - - - - - -Il
35,749 610 - - - 9,280 - - 700 - - 21
20,393 1,291 - - - - - - - - -2
9,680 9,483 8,254 - - - - - - - - 2:
19,443 - _
- - - - - - - - -21
106,971 12,428 62,596 - - 21,000 - 802 2,200 50 4,222 l292
27,295 9,355 - - - - - - - - - -21
21,955 855 67,282 - - - - - 347 - 2,200 75 21
23,519 10,060 - - - - - - - - - - 2:
16,850 1,694 - - - - - - - - - -21
537,451 56,950 243,096 - - 41,366 - 802 4,142 50 6,422 20421
1,621,009 425,324 1,293,621 - - 103,425 - 10,025 11,536 123 1,176 7,677 31
133

134 FISHERIES STATISTICS
L Fish Caught and Marketed, 1938—con.
Smelts Sturgeon Black Cod
Fishing Districts
arcaught Marketed Marketed .... II keted ‘...-aught ,....aught and and and
landed Used landed Used landed Used fresh fresh fresh
cwt. cwt. cwt. cwt. cwt. cwt.
British Columbia—con.
Totals for Province-
1 Quantity 737 737 187 187 8,463 5,887
2 Value $ 6,431 6,884 2,603 3,013 31,441 38,672
District No. 1—(Fraser River and Howe Sound)
3 Total quantity 698 698 184 184 2,833 1,865 4 Total value i 6,022 6,402 2,558 2,959 14,165 11,213
• District No. 2—
5 Massett Inlet and northern Graham Island, Queen Charlotte Islands - - - - - -
6 Southem Qneen Charlotte Islands, including Skide- gate Inlet _ _ - -
7 The Naas river - - - - 8 Skeena river including Prince Rupert and the
Upper Skeena 5 5 - - 2,444 2,036 9 Grenville-Principe area • - - • - - - -
10 Butedale including Gardiner Canal - - - - 999 999 11 Bella Bella and Fitzhugh Sound - - - - - 12 Bella C,00la, Dean and Burke Channels - - - - - - 13 Rivers Inlet - - - - - - 14 Smiths Inlet - - - - - -
15 Total quantity 5 à - - 3,443 3,035 16 Total value $ 25 50 - - 14,705 25,485
District No. 3--
17 Cape Scott to Tuna Point including all waters bet- ween Vancouver Island and the mainland - - - - - - -
18 Tuna Point to Sh,élter Point including mainland waters opposite - - - -
19 Shelter Point to Wench Creek - - - - - - 20 Mainland waters from George Point to Gower Point - - - - - - 21 French Creek to Shoal Harbour including Nanaimo 18 18 - - 987 987 22 Shoal Harbour tc> Sambrio Point, including Victoria 16 16 3 3 1,200 - 23 Sambrio Point to Pachena Point including Nitinat
Arm - - - - - - 24 Barclay Sound and Port Alberni - - - - - 25 Wreck Bay to Estevan Point including Clayoquot
Sound - - - - - - 26 Estevan Point to Tatchu Point includmg Nootka
Sound - - - - - - 27 Tatchu Point to Cape Cook including Iryuquo t Sound - - - - - - 28 Cape Cook to Cape Scott including Quatsmo Sound. - - - - - -
29 Total quantity 34 34 3 3 2,187 987 30 Total value 8 384 432 45 54 5,574 1,974

FISHERIES STATISTICS
I. Fish Caught and Marketed, 1938-eon.
Black Cod--concluded Ling Cod RedandRockCod
Nheketed 5farketed Marketed
Caught Caught and and
Liver landed S
Used rnokd Li Idver landed Skd Li Liver
e vers Used moevers
Smoked Livers on fresh oil fresh oil
cwt.. cwt. gaL cwt. cwt. cwt. cwt. gal. cmt. cwt. cwt. cwt. gal.
1,288 397 50 46,516 46,486 15 830 31 6,874 6,806 34 26 88 1
16,851 14,521 1,250 208,508 248,895 180 33,661 775 17,471 19,212 408 436 2,200 2
484 56 - 17,823 38,004 15 765 - 2,357 2,289 34 25 - 3
5,106 1,988 - 89,115 217,900 180 31,812 - 6,852 8,536 408 425 - 4
- 1
204 313 50 105 105 -7 31 26 2 _ _ 88 £
- _ - - _ _ 1
- 28 - -
11 1 - 4 - 49 4 - 1 - 11
204 341 50 116 11 - 11 31 75 7 _ 1 88 11
2.448 12,533 1,250 577 43 - 489 775 190 27 11 2,200 11
- - 148 - - - - - - - -
- - - 8,013 - - - - 365 36 - - - 11
_ _ _ 373 _ _ - 4 4 _ _ - 11
- - - 1,565 - - - - 1,414 1,41 - _ - D
- - - 10,112 - - - - 2,247 2,24 _ - - 2
600 - - 4,601 4,60 - - - 327 32 _ _ - 2:
- _ _ _ _ - _ _ - _ _ _1
- - - 2,173 2,173 - 25 - - - -
- - - 1.562 1,56 - 29 - 83 83 _ _ - 2
_ - - - - - - - - 2
- _ _ 7 - _ _ - - - - - 2
_ _ - 23 23 - - - 2 2 - - -2
600 - - 28,577 8,36 - 54 - 4,442 4,442 - _ - 2
9,300 - - 118,816 30,557 - 1,360 - 10,432 10,432 - _ - a
135
3
5
7
9 O

136 FISHERIES STATISTICS
I. Fish Caught and Marketed, 1938-con.
Grayfish
Caught and
landed
cwt.
159,690
27,087
Used fresh Livers
cwt.
Oil Meal
cwt. gal.
Fishing Districts Marketed
District No. 1-(Fraser River and Howe Sound)-
" 3 Total quantity 4 Total value.
District No. 2-
5 Massett Inlet and noraaern Graham Island, Queen Charlotte Islands
6 Southern Queen Charlotte Islands, including Skide- gate Inlet
7 The Naas River 8 Skeena River including Prince Rupert and the Upper
Skeena 9 Grenville-Principe area
10 Butedale including Gardiner canal 11 Bella Bella and Fitzhugh Sound 12 Bella Coola, Dean and Burke Channels 13 Rivers Inlet 14 Smiths Inlet
15 Total quantity 16 Total value
District No. 3-
17 Cape Scott to Tuna Point including all waters between Vancouver Island and the mainland
18 Tuna Point to Shelter Point including mainland waters opposite
19 Shelter Point to French Creek
20 Mainland waters from George Point to Gower Point
21 French Creek to Shoal FIarbour including Nanaimo
22 Shoal Harbour to Sambrio Point including Victoria 23 Sambrio Point to Pachena Point including Nitinat
Arm 24 Barclay Sound and Port Alberni 25 Wreck Bay to Estevan Point including Clayoquot
Sound 26 Estevan Point to Tatchu Point including Nootka
Sound 27 Tatchu Point to Cape Cook including Kyuquot
Sound 28 Cape Cook to Cape Scott including Quatsino Sound
29 Total quantity 30 Total value
15,339
40,118 30,612 73,621
159,690 27,087
9,333
49,271
985 6,145
865
123
ton
1,262
42,807
45,951
2,310
British Columbia-con.
Totals for Province-
1 Quantity
2 Value
113,360
18,802
1,260 42,785
2 22
577
683
15,339
30,612
45,951 2,310
7,360 36,802
51,703
61,657
113,360 18,802
988 6,324
1,893
5,467

FISHERLES STATISTICS
I. Fish Caught and Marketed, 1938-con.
Capelin, Launce and Silverside& Octopus Oulachons Clams
Marketed Marketed Marketed Marketed Caught Caught Caught Caught and and and and
landed Used landed Used landed Used landed Used ' fresh fresh fresh fresh Canned
cwt. cwt. cwt. cwt. cwt, cwt. cwt. cwt. cases
38 38 223 223 209 209 76,633 42,169 22,155 1 444 444 927 1,016 716 760 69,260 10,426 122,082 2
- 199 199 169 169 81 81 6,678 3
- 855 944 675 720 243 377 33,021 4
- _ - - _ - 9,550 4,762 2,39 1
- _ _ _ - :
14 _ 7 F
- _ - 4.
- - - - - - - - 14
- - - :
- - 2,51 2,510 - 11
- - - _
_ _ _ _ _ _ - 14
. -
_ _ _ _ _ 12,200 7,272 2,464 le
- - - - 10,671 6,605 25,73614
- - - 40 40 10,473 4,734 7 11
- 24 24 - 5,606 - - lf
- - - - 2,440 288 2,320 14 - - - - - - 288 288 -24 38 38 - - - - 24,669 8,630 - 21 - - - - - - 10,132 10,132 10,69324
- _ _ _ _ _ _ -21
- - - _ _ 2,102 2,102 - 24
- - - - - 8,628 8,628 - 21
- - - - - - - - 2 4
- - - - - - - 21
- - - - - 74 14 -24
38 38 24 24 40 40 64,352 34,816 13,013 24 444 444 72 72 40 40 58,346 33,444 63,3253(
137
89667--10

138 FISHERIES STATISTICS
I. Fish Caught and Marketed, 1938-con.
Crabs Oysters
Fishing Districts Marketed Marketed Caught and
landed
cwt.
Caught and
landed Used fresh
Used fresh Canned Canned
bbl. bbl. cwt. cases cases
British Columbia-concluded
Totals for Province-
Quantity
Value
7,942
2,979 1,365 1,426
36,258 28,157 9,296
4,337 2,157
25,328 21,156 33,416 2
District No. 1-(Fraser River and Howe Sound)-
Total quantity Total value
4,421 4,130 500
2,059 445 1,184
26,053 17,352 6,876 3
17,222 18,699 7,600 4
District No. 2-
Massett Inlet and northern Graham Island, Queen Charlotte Islands
Southern Queen Charlotte Islands, including Skide- gate Inlet
The Naas river Skeena river including Prince Rupert and the Upper
Skeena Grenville-Principe area Butedale including Gardiner Canal Bella Bella and Fitzhugh Sound Bella Coola, Dean and Burke Channels Rivera Inlet Smiths Inlet
5 3,004 1,502
6 ■•■
7 8
340 30 155 9
10 11 12 13 14
.•■•
i,344 1,657 Total quantity Total value
30 15 25,816 6,157 143 16
District No. 3-
17 Cape Scott to Tuna Point, including all waters between Vancouver Island and the mainland
18 Tuna Point t,o Shelter Point, including mainland waters opposite
19 Shelter Point to French Creek 20 Mainland waters from George Point to Gower Point. 21 French Creek to Shoal Harbour including Nanaimo.
22 Shoal Harbour t,o Sambrio Point including Victoria 23 Sambrio Point to Pachena Point including Nitinat
Arm 24 Barclay Sound and Port Alberni 25 Wreck Bay to Estevan Point including Clayoquot
Sound 26 Estevan Point to Tatchu Point including Nootka
Sound 27 Tatchu Point to Cape Cook including Kyuquot
Sound
28 Cape Cook to Cape Scott including Quatsino Sound
29 Total quantity 30 Total value
1 1
242
800 120
800 12 12 158
.1■1.
120 158
6 6 ■•■
242 920 920 177 177 2,420 10,805 10,205 1,949 2,314
Ncrrs.-Isn addition to the quantities shown in the statistical tables of the present report, there were landed at British Columbia ports by United States Vessels tile following:-
District No. 2.-Halibut, 73,302 cwt., halibut livers, 1,377 cwt.; halibut viscera, 1,968 cwt.: feack cod, 5,396 cwt.; black cod livers, 244 cwt.; ling cod, 20 cwt.; and ling cod livers. 3 owt.
3 g ie) (

FISHERIES STATISTICS
L Fish Caught and Marketed, 1938-concluded
Shrimps Fur Seals Whales
Other Caught Marketed Caught Marketed Caught Marketed products
and and and landed Used ldd
ane Bone
Canned Sldns landed Oil Fertilizer fresh meal
cwt. cwt. cases RO. RO. RO. gal. ton ton
1,504 864 460 1,367 1,367 310 543,378 273 512 - 1
15,333 12,431 6,554 3,076 3,076 184,074 162,708 6,006 15,360 104,819 2
1,026 606 350 _ _ _ _ _ _ - 3
12,385 9,318 5,040 - - - - - 59,024 4
100 - 50 - - 137 238,379 125 245 - 5
- 304,999 148 267 - f _
286 166 so - - -: - - 36,850 8 - - - 9
- - - - - - - - 5,24 11 - - - - - - - - _ - 11
- - - - - - - - - 19
386 166 110 - - 310 543,378 273 512 - 15
1,568 1,457 1,514 - - 184,074 162,708 6,006 15,360 42, 094 11
- - - -. _ - - - - - 17
- - _ - _ _ _ _ - 12 _ - - - - - - - - - 19
_ -21 _ _ - _ - - - - - - 21 92 92 - - - - - - - 3,67121
_ -21 - - - 784 784 - - - - 29
_ - _ 583 5 50 _ _ _ - 3021
- - _ - - _ _ _ - - 2 1
_ _ _ _ _ _ _ _ _ - 27 - - _ - - _ _ _ - 22
92 92 - 1,367 1,367 - - - - - 22
1,380 1,656 - 3,076 3,076 - - - 3,013(
Nei-E.-The following 1.9 in addition to the quantities shown for British Columbia in the statistical tables of the present report:
Estimated quantities of Esh of all kinds, including salmon, trout, cod, oulachons, bottom fish, shell fish, etc. consumed by Indians and others.
District No. 1.-18,240 cwt. District No. 2.-22,693 cWt. District No. 3.-21,995 cwt.
139
1
i
89667-10i

20 to 40 tons
10 to 20 tons
1
2
3
4
5
6
1
1
•■•
722
155
170
182
215
1,820
2,150 6 3,600 21
302
450
75,500
90,000
1
2
3
4
5
6
40
■••■
40 40
140 FISHERIES STATISTICS
II. Agencies of Production, 1938-Part I. In Primary Operations
Vessels Boats
Total men
No. Total Total value men
Fishing Districts Sailing, Gasoline
and Diesel Sail and Row
No.
Gasolke and Diesel
No. Value Value
no.
397 3,970
8,220
2,550
1,700
6
Prince Edward Island
Totals for Province
Kings County (all)-Totals
Queens County (a11)-Totals
Prince County-
Eastern Prince
Western Prince
Totals for County
10 6,400 36
4 2,800 15
1,673 377,400
609 137,500
312 74,400
752 3,600 21 165,500
3,260
1,204
629
494
933
1,427
no. no.
Fishing Gear
Hand Lines Lobster Traps Crab Traps Fishing Districts
No. Value No. Value No. Value
Prince Edward Island-concluded
Totals for Province
Kings County (all)-Totals
Queens County (a11)-Totals
Prince C,ounty-
Eastern Prince
Western Prince
Totals for County
1,918 3,836
581 1,162
400 800
87 174
850 1,700
937 1,874
391,015 391,045
168,770 168,770
82,600 82,600
42,550 42,550
97,125 97,125
139,675 139,675

FISHERIES STATISTICS 141
H. Agencies of Production, 1938-Part I. In Primary Operations-con.
Fkliing Gear
Carrying Smacks
Salmon Gill Nets Trap Nets, Smelt Nets Tubs of Trawl Trap Nets C/ther
No. Value Men No. Value No. Value No. Value No. Value No. Value
$ nO. $ $ $ $ $
8 3,000 13 3,114 24,062 1 600 4 860 2,380 16,963 1,330 26,600 1
4 1,400 7 663 5,810 1 600 2 SOO 338 2,464 176 3,520 2
3 1,300 4 780 6,240 - - - 330 2,760 138 2,760 3
1 300 2 411 2,542 - - - - 871 6,364 21 420 4
- - - 1,260 9,470 - - 2 60 841 5,375 995 19,900 5
1 300 2 1,671 12,012 - - 2 60 1,712 11,739 1,016 20,320 6
Fishing Gear-concluded
Fishing Piers Freezers and Small Fish
Oyster Rakes Quahaug Rakes and Wharves Ice Houses and Smoke Houses
No. Value No. Value No. Value No. Value No. Value
3 3 3 3 3
339 ' 1,017 101 303 37 34,200 27 5,875 395 18,020 1
8 24 82 246 4 30,800 1 4,575 78 5,850 1
20 60 - - 32 3,200 24 1,200 60 1,500 f
270 810 12 36 1 200 2 100 47 5,270
41 123 7 21 - - - 120 5,400 f
311 933 19 57 1 200 2 100 167 10,670 I

no. no. I no.
541 231 449
■•• 3 29
41
3 70
15 - 17
1 4 24
1 4 56
- _ 1 7 _ _ 8
_ 1 13
20 21
22
Nova Scotia
Totals for Province 69,000
142 FISHERIES STATISTICS
II. Agencies of Production, 1938—Part I. In Primary Operations—con.
Vessels
Steam Trawlers Sailing,
Gasoline and Diesel
40 tons 20 to 10 to
and 40 20
over tons tons
Fishing Districts
No. Value Tonnage
Richmond County-
2 Inverness county line to St. Peter's canal including Be Madame
$ St. Peter's r”nal to Cape Breton county line
Totals for County
Cape Breton County-
5 Richmond county lino to White Point, in-
clusive and head of East Bay included 6 White Point to Bridgeport inclusive 7 Bridgeport and head of East Bay to Vic-
toria county line
8 Totals for County
• Victoria County-
9 South of Path End inclusive 10 Path End to Green Cove inclusive 11 Green Cove to Inverness county line.
- 3
- 3
••••
Totals for County 12
Inverness County- 13 Victoria county line to Broad Cove.. 14 Broad Cove included to Richmond county
• line
Totals for County 15
Cumberland.County-
16 From New Brunswick line to Lewis Head 17 From Lewis Head to Colchester county
line 18 Bay of Fundy shore
19 Totals for County
Colchester County-
Northumberland Strait shore Bay of Fundy shore
Totals for Cowaty
Pictou County-
23 From Colchester county line t,o Pictou Harbour
24 Pictou Harbour including Pictou Island to Antigonish county line
25 Totals for County
28 Antigonish County (all)—Totals
3 463
Men
DO.
79

FISHERIES STATISTICS
H. Agencies of Production, 1938-Part I. In Priunary Operations--con.
Vessels-conc. Boats
Carrying Smacks Sailing, Alen
Gasoline and Sail and Row Gasoline and Diesel fishi ng without Diesel Total boats
men Total Total No. Value No. Value No. Value Men value men
$ no. $ $ no. $ no. no.
1,371,320 3,198 4,755 100,801 5,907 1,540,795 14,174 106 134,850 209 888 1
28,770 111 280 8,800 215 47,300 575 - - - 2
14,350 110 118 2,360 176 52,800 600 - - - 3
43,120 221 398 11,160 391 100,100 1,075 - - - 4
5,250 45 18 4,360 30 9,000 80 - - - - a
11,250 62 5 230 230 52,600 413 2 1,200 4 - f
34,200 158 58 1,164 64 11,200 191 - - - - 1
50,700 265 81 5,774 324 72,800 684 2 1,200 4 - F
- - 190 5,700 92 13,800 358 5 1,350 10 - 4
5,800 30 24 360 80 16,000 144 1 250 2 - 11
3,800 27 45 900 107 24,000 168 3 1,500 6 - 11
9,600 57 259 6,960 279 53,800 670 9 3,100 18 - 1:
1,800 17 54 1,200 220 69,000 571 3 2,700 6 - 1:
- - 130 2,600 109 32,905 428 6 2,100 9 8 1 4
1,800 17 184 3,800 389 101,905 999 9 4,800 15 8 1:
_ - 6 60 35 5,250 104 1 150 1 4211
- - go 900 202 30,300 370 3 1,200 5 601
- - 2 45 20 3,250 31 - - 11 1
- - 98 1,005 237 28,800 505 4 1,350 6 113 11
- - 10 100 21 4,200 31 - - - 252
- - 36 530 14 2,075 51 - - - 172
- - 46 630 35 6,275 82 - - - 422
- 60 500 201 40,200 345 11 38,500 26 372
- 35 700 112 22,400 228 4 1,200 8 122
- 85 1,200 313 62,600 573 15 39,700 34 492
- - 80 2,400 285 49,875 461 16 6,000 17 - 2
143
7 8
2
4
0 MIR1541i

16 17 18
19
23 24
25
5,750
144 FISHERIES STATISTICS
II. Agencies of Production, 1938-Part I. In Primary Operations-con.
Fishing Gear
Seines Gill Nets
No. Value
Salmon Drift Nets Fishing Districts
No. Value No. Value
Nova Scotia-con.
1 Totals for Province
Richmond C,ounty-
2 Inverness county line to St. Peter's canal including Ile Madame
3 St. Peter's canal to Cape Breton county line
4 Totals for County
38,775
1,900 22,800
1,270 8,890
3,170 31,690
230 1,610
1,143 19,983
870 8,700
2,243 30,293
390 5,850
238 3,570
250 3,750
878 13,170
630 7,560
491 5,892
1,121 13,452
80 800
20 200
162 1,615
262 2,615
1 10
46 394
47 404
15 150
310 2,480
325 2,630
1,000 10,000
403,568 227
3
3
25,610
2,000
2,000
-2 150
2 150
31 3,050
31 3,050
55
Cape Breton County-
5 Richmond county line to White Point inclusive and head of East Bay included
6 White Point to Bridgeport inclusive 7 Bridgeport and head of East Bay to Victoria county
line
Totals for County
Victoria County-
9 South of Path End inclusive 10 Path End to Green Cove inclusive 11 Green Cove to Inverness county line
12 Totals for County
8
Inverness County-
13 Victoria county line to Broad Cove 14 Broad Cove included to Richmond county line
15 Totals for County
umberland County-
From New Brunswick line to Lewis Head From Lewis Head to Colchester county line Bay of Fundy shore
Totals for COunty
Colchester County-
20 Northumberland Strait shore 21 Bay of Fundy shore
22 Totals for C,ounty
Pictou County-
From Colchester county line to Pictou Harbour... Pictou Harbour, including Pistou Island to Anti-
gonish county line
Totals for County
26 Antigonish County (a11)-Totals

UI
145 FISHERIES STATISTICS
II. Agencies of Production, 1938-Part I. In Primary Operations-con.
Fishing Gear-con.
Salmon Trap Tubs Skates Trap Nets, Smelt Nets Weirs of of Hand Lines Nets Other Trawl Gear
No. Value No. Value No. Value No. Value No. Value No. Value No. Value
$ $ I $ $ $ $
509 128,290 376 197,330 4,262 30,858 70 17,580 14,056 183,733 1,190 16,270 24,501 23,700 1
6 600 6 21,400 1,066 6,75 - - 400 7,200 - - 1,200 1,500 2 1 200 3 2,100 43 12 - - 30 240 - 1,020 816 3
7 800 9 23,500 1,109 6,879 - - 430 7,440 - - 2,220 2,316 4
- - - - 132 396 - - - - - - 143 100 5 11 1,650 - - 60 420 - - 190 1,710 - 490 490 6
12 6,000 8 7,500 80 445 - - 280 7,400 - - 623 934 7
23 7,650 8 7,500 272 1,261 - - 470 9,110 - - 1,256 1,524 8
70 4,970 5 4,000 10 400 - 140 1,400 - - 290 290 9 9 1,800 14 13,500 - - -- 50 400 - - 200 200 10
21 4,200 1 1.000 - - - 50 400 - - 300 300 11
101 10,970 20 18,500 10 400 - • 240 2,200 _ - 790 79012
88 30,000 - - 18 65 - - 510 5,000 - - 2,500 1,60013 21 4,200 - - 122 1,780 - 91 1,001 - - 288 576 14
109 34,200 - - 140 1,845 - - 601 6,001 _ - 2,788 2,17612
_ - - _ 572.650 - - - - - - -12 - - - - 683,400 - - - _ - - -1 - - - - - - 4 950 7 140 - - 58 58 11
- - - - 125 6,250 4 950 7 140 - - 58 5814
_ _ - _ 29 631 - _ - - - - 4 221 - - - - - - 9 520 8 49 - - - - 21
- - - - 29 631 9 520 8 49 - - 4 22',
4 1,000 - - 368 1,680 - - - - - - 12 62:
33 16,500 - - 800 2,900 - - 35 245 - - 100 502
37 17,500 - - 1,168 4,580 - - 35 245 - - 112 565
68 34,030 - - 666 2,664 - - 200 1,400 - _ 400 200 2

50 50
2
3
4
146 FISHERIES STATISTICS
II. Agencies of Production, 1938-Part I. In Primary Operations-con.
Fishing Gear-con.
Fishing Districts Crab Traps Eel Traps Lobster Traps
No. Value No. Value No. Value
5 $
771 1,074
Nova Scotia-con.
11Totals for Province 1,129,890 1,397,332
Richmond County-
Inverness county lino to St. Peter's canal, including Be Madame
St: Peter's canal to Cape Breton county line ......
Totals for County
Cape Breton C,ounty-
5 Richmond county line to White Point inclusive and Head of East Bay included
6 White Point to Bridgeport inclusive 7 Bridgeport and Head of East Bay to Victoria county
line
8 Totals for County
Victoria County-
9 South of Path End inclusive 10 Path End to Green Cove inclusive 11 Green Cove to Inverness county line
12 Totals for County
Inverness County-
13 Victoria comity line to Broad Cove 14 Broad Cove included to Richmond county
15 Totals for County
Cumberland County-
16 From New Brunswick line t,o Lewis Head 17 From Lewis Head to Colchester county Line. 18 Bay of Fundy shore
19 Totals for County
Colchester County-
20 Northumberland Strait shore 21 Bay of Fundy shore
22 Totals for County
Pictou County-
23 From Colchester county line to Pictou Harbour.. 24 Pictou Harbour, including Piston Island to Anti-
gonish county line
25 Totals for County
26 Antigonish County (a11)-Totala
■■■
20 60
38,800 36,800
27,000 27,000
63,800 63,800
15,000 15,000
37,000 46,250
12.300 21,450
64,300 82,700
17,400 17,400
8,000 8,000
10,500 10,500
35,900 35,900
36,400 36,400
35,124 47,686
71,524 84,086
8,750 8,760
54,300 54,300
451 451
63,501 63,501
10,000 10,000
10,000 10,000
87,500 87,500
39,200 39,200
126,700 126,700
90,000 90,000

147 FISHERIES STATISTICS
IL Agencies of Production, 1938-Part I. In Primary Operations-con.
Fishing Gear-concluded
Fishing Piers Freezers Small Fish
Lobster Pounds Oyster Rakes Scallop Drags and and and Other Wha.rves Ice Houses Smoke Houses Gear
No. Value . No. Value No. Value No. Value No. Value No. Value Value
-
S $ $ $ s $ s
11 13,530 367 1,292 501 17,706 1,036 374,985 229 59,880 3,550 243,553 2,325 1
- - - - - - 34 4,005 3 1,200 92 10,120 - 2
- - 15 60 _ - _ _ _ _ 150 6,000 - 2
- - 15 60 - - 34 4,005 3 1,200 242 16,120 - 9
- _ - - _ _ 15 6,000 - _ 25 1,000 - 1
- - _ - - 21 3,605 6 900 126 10,015 - I
- - _ _ - - - - - - 731,755 _
- - - - 36 9,605 6 900 224 12,770
- - 80 80 - - 6 600 10 1,000 105 3,150 -
- - - - - - 16 20,000 2 1,200 24 480 - 1
- - - - _ - 14 5,400 7 2,000 18 1,350 - 1
- - 80 80 - 36 26,000 19 4,200 147 4,980 - 1
- - - - - - 17 13,800 5 5,750 45 19,500 - 1
- - 67 167 - _ 4 850 - _ 30 4,350 - 1
- - 67 167 - 21 14,650 5 5,750 75 23,850 - 1
_ - - - - 2 200 - - 2 150 -1
- 80 480 - - - - - _
- _ _ - _ _ - _ 6 220 - 1
- - SO 480 - - 2 200 - _ 8 370 - 1
- - 10 80 - - - - - -
- - _ - - _ _ - - 6 85 75!
- - 10 80 - - - - - - 6 85 751
3 4,000 2e 200 - - 3 1,500 3 800 _ - - 1
- - 50 100 - - 1 25 20 2,000 3 240 - 1
4,000 70 300 _ _ 4 1,525 23 2,800 3 240 - 1
- - 40 120 - - - - 60 4,500 80 3,200
o
2
3 4
7 8
9
2
4
6

Totals for County 9
.1■1.
a 463
a 463
2
.•■
79
79
39
39
4 21 16
37
12
69,000
69,000
69
52
7
11
18
28
148 FISHERIES STATISTICS
II. Agencies of Production, 1938—Part I. In Prirnary Operations—con.
Vessels
Steam Trawlers
Fishing Districts Sailing, Gasoline and Diesel
NO. Tonnage Value Men 40 tons 20 to 10 to
and 40 20 over tons tons
1
2
3
4
Nova Scotla—con.
Guysborough County-
From Antigonish co unty line to Fox Island inclusive
From Fox Island to Isaac's Harbour in-clusive
From Isaac's Harbour to Halifax county line
Totals for County
Halifax County-
5 From Guysborough county line to East Ship Harbour
6 From West Ship Harbour to but not in-cluding Cole Harbour
7 Cole Harbour to Pennant Point inclusive 8 From Pennant Point to Lwienburg county
line
10 Hants County (MD—Totals
Lunenberg County-
11 From Halifax county line to and including Mahone Bay
12 From Mahone Bay to Queens county line
13 Totals for County
14 Queens County (a11)—Totals
Shelbourne County-
15 From Queens county line to but not in-cluding Shelburne town
16 From and including Shelburne town to Yarmouth county line
no. no. no. no.
2
1
23
15
39
6
3 7
36
52
10
64
Totals for County
18 Yarmouth County (all)—Totals
Digby CountY-
19 From Yarmouth countY line to the Sisei-boo river
20 The Sissiboo river included to Annapolis county line, including Digby Neck
21 Totals for County
22IAnnapolis County (all)—Totals
23 Kings County (a11)—Totals
17 11
1

FISHERLES STATISTICS
II. Agencies of Production, 1938-Part I. In Primary Operations-eon.
Vessels--concluded Boats
Carrying Smacks Men Sailing, Gaslin d o e an fishing Gasoline and Sail and Row Diesel without Diesel Total boats men
'rotal Total No. value No. Value No. Value Men value DIell
$ no. $ $ no. $ no. no.
800 4 285 7,125 137 27,400 422 10 22,400 18 75 1
35,000 129 550 11,000 300 90, 0e0 725 10 10,000 20 125 2
15,000 61 180 7,200 196 78,400 330 5 3,500 10 - 3
48,800 194 1,015 25,325 633 195,800 1,477 25 35,900 48 200 4
3,500 20 95 1,900 233 34,950 533 6 2,000 7 - :
1,100 11 128 2,560 132 17,940 540 - - - 100 1
9,400 44 155 3,400 158 47,400 465 1 1,500 3 - 1
20,650 305 310 3,100 210 32,000 560 _ _ 36 1
34,650 380 688 10,960 733 132,290 2,098 7 3,500 10 136 !
_ - 61 825 11 2,500 73 _ _ _ 4611
12,600 75 3 0e 6,00e 180 36,000 420 2 800 4 1251
810,000 1,020 50 1,000 275 68,75 450 - _ _
- 1
822,600 1.025 350 7,000 455 104,750 870 2 800 4 125 1
13,050 60 205 4,465 161 30,250 467 _ _ - - 1
105,000 237 265 3,50e 161 30,000 377 _ _ _ - 1
66,600 240 135 3,375 450 180,000 1,328 1 2,000 3 - 1
171,600 477 400 6,875 611 210,000 1,705 1 2,000 3 - 1
66,200 280 345 4,125 410 164,000 1,270 10 8,500 20 201
5,400 7 35 700 100 30,000 135 - - - 1201
59,000 61 130 2,700 315 141,000 615 7 28,000 30 - 1
64,400 68 215 3,400 415 171,000 750 7 28,000 30 120!
44,800 84 175 3,500 175 39,550 315 - _ _
- _ 70 1,40e 30 4,500 100 - _ - 30

10,747
82
7,690
874
1,527 2,521 5,825
80,464
1,150
15,000 43,200
8,740
7,576 35,023 29,125
162
12 150
17,160
2,160 15,000
20 2,050
6,100
2,194
58,200
27,940
50 5,000
1,087
626
11,240
9,520
1,713
443
20,760
7,575
80
400
800
3,600
750
700
480
200
4,400
2,200
12 1,450
2 500
150 FISHERLES STATISTICS
II. Agencies of Production, 1938-Part I. In Primary Operations-con.
Fishing Gear-con.
Fishing Districts Gill Nets
No. Value
Seines
No. Value
Salmon Ehet Nets
Value No.
$
Nova Scotia-con.
Guysborough C,ounty-
1 From Antigonish county line to Fox Island inclusive 2 From Fox Island to Isaac's Harbour inclusive 3 From Isaac's Harbour to Halifax county line
2,900 3,017 1,773
29,000 48,000 18,825
4 Totals for County
Halifax County-
5 From Guysborough county line to East Ship Harbour 6 From West Ship Harbour to but not including Cole
Harbour 7 Cole Harbour to Pennant Point inclusive 8 From Pennant Point to Lunenburg county hue.
9 Totals for Cotmty
10 Hanta Cotmty (all)-Totals
Lunenburg County-
11 Frqm Halifax county line to and including Mahone Bay
12 From Mahone Bay to Queens county line
13 Totals for County
141Queens C,ounty (all)-Totals
Shelburne County-
, 15 From Queens county line to but not including Shel-burne t,own
16 . From and including Shelburne town to Yarmouth county line
17 Totals for County
18 Yarmouth County (all)-TotaLs
Digby County-
19 Yarmouth county line to the Sissiboo river 20 The Sissiboo river included to the Annapolis county
line, including Digby Neck
21 Totals for County
22IAnnapolis County (all)-Totals
23 Kings County (a11)-Totals
3,600 2,500
95,825
50 5,000
5
7
80 800

1 "1
FISHERIES STATISTICS
II. Agencies of Production, 1938-Part L In Primary Operations-con.
Fishing Gear-con.
Salmon Trap Trap Nets, Smelt Nets Weirs Tubs of Trawl Skates of Gear Hand Lines Nets Other
No. Value No. Value No. Value No. Value No. Value No. Value No. Value
$ $ $ $ i 5 i
32 12,800 33 16,500 85 806 - - 525 5,250 - - 300 300 1 4 1,600 16 16,000 5 50 - - 1,000 10,000 - - 3,000 3,000 2 3 300 - - 125 625 - - 388 3,880 - - 522 522 3
39 14,700 49 32,500 215 1,481 - - 1,913 19,130 - - 3,822 3,822 4
- - - - 12 60 - - 50 40e - - 825 825 5
1 100 - - 35 660 - - 30 500 - - 1,000 1,000 6 26 1,560 11 3,080 30 180 - - 420 4,200 190 1,900 1,700 765 7 60 6,000 40 12,000 10 100 - - 700 2,100 64 320 1,200 600 8
87 7,660 51 15,080 87 1,000 - - 1,200 7,200 254 2,220 4,725 3,190 9
_ _ _ _ _ _ 4 460 _ _ _ 10 1010
10 250 200 60,000 170 510 - - 200 600 6 24 700 350 11 28 560 33 9,900 230 1,380 - - 2,400 48,060 160 3,200 1,500 2,25011
38 810 233 69,900 400 1,890 - - 2,600 48,600 166 3,224 2,200 2,60011
- - 3 1,350 10 200 - - 500 10,000 - - 1,156 1,15614
- - - - 8 75 2 1,000 1,700 28,000 400 5,000 350 350 11
- - - - 2 12 1 1,000 1,800 21,60e 250 3,750 600 900 1(
- - - - 10 87 3 2,000 3,500 49,600 650 8,750 950 1,2501
- - 3 29,000 5 90 4 1,200 152 1,368 84 1,176 1,910 1,91011
_ _ _ _ _ _ 8 3,200 200 1,000 _ 500 500E
- - - - 16 1,600 10 2,600 1,700 16, 0e0 36 900 800 800 21
- - - - 16 1,600 18 5,800 1,900 17,000 36 900 1,300 1,30021
- - - - - 7 1,400 230 3,750 _ 450 9902;
- - - - - 21 5,250 50 500 - 350 3502:
- -
151

FISHERIES STATISTICS
II. Agencies of Production, 1938—Part I. In Primary Operations—con.
No. Value No. Value No. Value
Nova Scotia—concluded
1 From Antigonish county line to Fox Island inclusive - - - - 16,600 16,600 2 FrOm Fox Island to Isaac's Harbour inclusive - - - - 87,000 87,000
Halifax County-
12 FromMahoneBaytoQueenscountyljne.............- - 400 400 28,000 28,000
9 From Yarmouth county line to the Sissiboo river - - - - 13,495 28,900

6
7
8
9
o
2
FISHERIES STATISTICS
II. Agencies of Production, 1938-Part I. In Primary Operations- con.
Fishing Gear-concluded
Fishing Piers Freezers Small Fish Lobster Pounds Oyster Rakes Scallop Drags and and and Other
Wharves Ice Houses Smoke Houses Gear
No. Value No. Value No. Value No. Value No. Value No. Value Value
$ $ $ $ $ $ $
- - - - - - 9 1,000 5 175 91 5,450 - 1
- - - - - - 100 10,000 9 4,500 150 14,000 - 2 _ _ _ _ 41 3,075 4 400 42 2,100 - 3
- - - - - 150 14,075 18 5,075 273 21,550 - 4
- - - - 3 15 82 8,200 10 1,000 200 12,000 - t
_ _ 5 5 - - 46 2,070 3 600 215 9,338 700 (
1 1,500 - - - - 83 11,205 - 122 12,200 - 1
- - - - - - 290 21,750 2 150 232 17,400 - t
1 1,500 5 5 3 15 501 43,225 15 1,750 769 50,938 700
_ _ - - _ _ _ 1 75 3 250 -II
- - - - 125 875 110 5,000 9 1,200 160 12,500 - 1
- _ - _ 60 300 14 70,000 4 3,200 340 34,000 - l'
- - - - 185 1,175 124 75,000 13 4,400 500 46,500 - 1:
- - - - - 35 21,000 4 12,600 270 11,750 - 1
- - - - - - 10 5,000 1 200 70 3,500 - 1
5 1,750 - - - - 12 1,200 4 666 140 7,000 - 1
5 1,750 - - - - 22 6,200 5 800 210 10,500 - 1
3 4,680 - - - - 30 120,000 10 8,830 230 19,500 1,5501
1 800 - - - - 3 1,500 5 200 110 2,200 - 1
1 SOO - - 145 14,500 28 28,000 12 5,000 200 6,000 - 2
2 1,600 - - 145 14,500 31 29,500 17 5,200 310 8,200 - 2
_ - _ _ 16 5 2,016 10 10,000 10 SOO 125 9,000 - 2
_ _ - - - - 20 1,000 75 3,750 - 5
153
6

154 FISHEREES STATISTICS
II. Agencies of Production, 1938—Part I. In Primary Operations—con.
Vessels
Sailing, Gasoline and Diesel Fishing Districts
20 to 40 10 t,o 20 Total value
Total men
New Brunswick—Sea FiSheries
1 Total Sea Fisheries for Province
- 1 800 _ - - - 7 11,800 - 1 1,500
4 24 56,100
Charlotte County-
From International boundary line to Public Wharf, Back Bay. • • • From Public Wharf, Back Bay, t,o Saint John county lino West Isles and Deer Island Campbello Grand Manan Island
2 3 4 5 6
7 Totals for County
Saint John County-
8 Saint John Harbour including Mispec and Saint John river 9 The remqining portion of Saint John county .
10 Totals for County
11 Albert County (all)—Totals
Westmorland County-
I2 Bay of Fundy watershed 13 Northumberland Strait shore
14 Totals for County
1 1,000 3 11 4,700 31 _ - _
12 5,700 34
15 16 17
18
Kent County-
From Westmorland county line to Chockpish river From Chockpish river to Point Sapin From Point Sapin to Northumberland county line.
Totals for C,mmty
75 43,000 150 2 800 4 1 900 2
- -
19 20 21 22
Northumberland County-
From Kent county line to Point-au-Car From Point-au-Car to lower end of Grand Down Island
From lower end of Grand Down Island to Gloucester county line Northwest and Southwest Miramichi rivers
781 44,700 156 Totals for County
- 13 11,000 38 60 33,200 - 4 2,700 22 25 72,000
24 25 26 27
46 418
14 200
601 1051 118,900 678 28
Gloucester County-
From Northumberland county line to Shippegan Gully inclusive From Shippegan Gully to Bass River Bass River included to Restigouche county line Miscou and Shippegan Islands
Totals for County
20 Restigouche C,ounty (a11)—Totals

FISHERIES STATISTICS 15,5
II. Agencies of Production, 1938-Part I In Primary Operations-con.
Boats
Carrying Smack and Scows Men Sail and ROW Gasoline and Diesel fishing
'without
Total boats men
No. Value No. Value No. Value Men
$ no. $ no. no.
4,852 124,977 2,812 775,969 10,386 89 189,349 171 2,207 1
133 2,660 46 9,200 236 8 9,850 16 65 2
190 4,750 59 13,570 299 25 125,509 50 65 3
378 19,600 162 108,950 303 9 13,60e 18 - 4
227 10,960 165 83,360 375 6 15,000 12 - 5
440 14,960 350 168,144 980 2 7,50e 5 45 6
1,368 52,930 782 383,224 2,193 50 170,859 101 175 7
196 8,800 80 24,000 262 - - - 262 8
82 2,050 116 39,440 190 3 2,90e 4 - 9
278 10,850 196 63,440 452 3 2,900 4 262 10
11 745 - - 12 - - - 311
s 220 9 890 23 _ _ _ 112
550 4,40e 354 53,100 1,308 7 9,175 14 24013
555 4,820 363 63,990 1,331 7 9,175 14 241 14
500 5,750 190 28,500 880 12 540 20 32516
100 3,00e 240 66,975 594 3 1,500 5 75 If
40 5,000 160 17,00e 400 4 1,600 8 - l'i
640 13,750 590 112,475 1,874 19 3,640 33 40011
150 8,000 lea 30,000 622 5 1,5Ce 10 180 li
165 1,019 5 1,250 170 _ _ _ 225 21
79 1,185 149 38,740 408 2 675 3 24621
139 1,390 6 900 149 - _ _ - 22
533 11,594 323 70,890 1,349 7 2,175 13 65121
220 10,000 90 22,000 710 - - - 6021
340 3,400 150 22,500 640 - - - 3021
310 11,500 100 15,50e 435 - - - 12521
397 1,588 193 28,950 1,180 _ _ - 1602i
1,267 26,488 533 88,950 2,965 - - - 37521
200 4,00e 25 3,000 210 3 600 6 100 21
.t

FISHERIES STATISTICS
II. Agencies of Production, 1938-Part I. In Primary Operations--con.
Fishing Gear-con.
Fishing Districts Gill Nets Seines Salmon Drift Nets
No. Value No. Value No. Value
$ $ $
New Brunswick--Sea Fisherles-con.
1 Total Sea Fisheries for Province 12,939 82,449 417 65,100 6,557 103,164
Charlotte County-
2 From International bowidary line to Public Wharf, Back Bay - - 69 6,900 - -
3 From Public Wharf, Back Bay to Saint John county line 25 250 100 15,000 - -
4 West Isles and Deer Island 2 60 95 14,400 - - 5 Campobello 10 300 60 9,000 - 6 Grand Marian Island 225 4,000 81 16,200 - -
7 Totals for County 262 4,610 405 61,500 -
Saint John County-
8 Saint John Harbour including Mispec and Saint John river 176 5,600 - - 218 4,400
9 The remaining portion of Saint John county 66 1,254 12 3,600 577 12,694
10 Totals for C,ounty 242 6.854 12 3,600 795 17,094
11 Albert County (a11)-Totals - - - - 6 228
Westmorland County-
12 Bay of Fundy watershed - - - - 23 1,140 13 Northumberland Strait shore 3,000 18,000 - - -
14 Totals for county 3,000 18,000 - - 23 1,140
Kent County-
15 From Westmorland county line to Chockpish river 2,000 5,500 - - 25 250 16 From Chockpish river to Point Sapin 800 2,400 - - 900 18,000 17 From Point Sapin to Northumberland county line 160 1,600 - - - -
18 Totals for County 2,960 0,500 - - 925 18,250
Northumberland County-
19 From Kent County line to Point-au-Car 600 7,000 - - 3,025 40,000 ZO From Point-au-Car to lower end of Grand Down
Island - - - - 2 600 .11 From lower end of Grand Down Island to Gloucester
county line 450 2,250 - - 216 4,752 22 Northwest and Southwest Miramichi rivers 115 1,150 - - -
13 Totals for County 1,165 10,400 - - 3,243 45,352
Gloucester County-
:4 From Northumberland county line to Shippegan Gully inclusive 1,225 7,250 - - 1,200 17,000
25 From Shippegan Gully to Bass River 1,500 10,500 - - 320 3,200 16 Bass River included to Restigouche county line._ 815 9,175 - - - - 17 Miscou and Shippegan Islands 1,620 4,860 - - 45 900
18 Totals for County 5,160 31,785 - - 1,565 21,100
19 Restigouche County (a11)-Totals 150 1,300 - - - -

FISHERIES STATISTICS
II. Agencies of Production, 1938-Part I. In Primary Operations-con.
Fishing Gear-con.
Salmon Trap Trap Nets, Smelt Nets Pound Nets Weirs Tubsolliami HandLines
Nets Other
MD. Value No. Value No. Value No. Value No. Value No. Value No. Value
$ $ $ $ $ $ $
308 140,450 140 3,780 8,017 281,168 49 7,350 370 357,445 1,610 15,966 9,366 7,644 1
- - - - 4 80 - - 65 39,000 24 240 60 60 5
- - - - _ - - - 100 50,000 225 2,250 75 75 2
- - - - - - - 75 75,000 10 80 350 350 4
- - - - 20 500 - - 28 28,000 605 4,853 1,500 1,500 2
- - - - - - - - 70 140,000 124 1,300 1,576 1,576 (
- - - - 24 580 - - 338 332,000 988 8,723 3,561 3,561 1
- - - -- - - - 17 13,200 60 480 - - E
- - - - - - - 12 12,000 132 1,113 - - 1
- - - - - - - 29 25,200 192 1,593 - - 1(
_ _ _ _ 1 12 - - 2 135 - - - - 11
- - - - - - 1 110 - - - -11
- - - 371 14,840 - - - - - - - 1E
- - - 371 14,840 - - 1 110 - - - 14
- 5 100 1,313 25,410 - - - - - 50 50 11
5 3,000 - 475 16,625 _ _ - - 35 300 250 250 1(
10 3,000 10 1,500 - - - - - - - 350 350 li
15 6,000 15 1,600 1,788 42,035 - - - - 35 300 650 6501E
26 4,000 15 350 1,083 75,810 - - - - - 650 65011
91 13,700 14 350 585 43,875 - - - - - - - 2 1
2 550 6 180 1,280 57,600 - - - - _ 110 11021
- _ _ _ _ 497,350 - _ - _ -L
119 18,250 35 880 2,948 177,285 49 7,350 - - - 760 7602E
- - 90 1,300 880 8,300 - - - - 50 400 800 600 24
23 9,200 - 675 12,550 - - - - 175 3,560 2,000 1,00022
44 44,000 - _ 51 2,000 - - - _ 50 250 385 160 21
_ _ _ _ 863 9,566 - - - - 120 1,200 1,150 863 Ti
67 53,200 90 1,300 2,469 32,416 - - - - 395 5,350 4,335 2,62321
107 63,000 - - 416 17,000 - - _ _ _ _ 60 50 21
157

158 FISHERIES STATISTICS
II. Agencies of Production, 1938-Part I. In Primary Operations-con.
2
4 .5 6
7
9
1
1
1
1
15 16 17
18
19 20
21
22
23
24
25 26 27
28
29
1
2 3 4 5 6 7
Fishing Gear-con.
Fishing Districts
Eel Traps Lobster Traps Lobster Pounds
No. Value No. Value No. Value
$ $ $ • New Brunswick-Sea Fisherles-concluded
Total Sea Fisheries for Province 11 38 431,438 376,273 17 51,395
Charlotte C,ounty- . From International boundary line to Public Wharf,
Back Bay - 60 90 1 200 From Public Wharf, Back Bay, to Saint John county
line - - 2,500 3,750 - - West Isles and Deer Island - 400 600 2 20,000 Campobello - 476 714 - - Grand Manan Island - 30,036 66,929 4 19,800
Totals for County - 33,472 72,083 7 40,000
Saint John County- Saint John Harbour 'including Mispec and Saint John
river - 460 805 • - The remaining portion of Saint John county - - 4,032 7,056 -
Totals for County - - 4,492 7,801 -
Albert County (alp-Totals - 116 155 -
Westmorland County- Bay of Fundy watershed - - - - Northumberland Strait shore - 54,148 27,074 3 6,000
Totals for County - - 54,148 27,074 3 6,000
Kent County- From Westmorland county line to Chockpish river - 38,260 38,260 1 200 From Chockpish river to Point Sapin - - 51,825 51,825 - From Point Sapin to Northumberland county line - 45,000 22,500 -
Totals for County - - 135,085 112,585 1 200
Northumberland County- From Kent county line to Point-au-Car - - 60,000 28,000 I 5,000 From Point-au-Car to lower end of Grand Down
Island - - - - - From lower end of Grand Down Island to Gloucester
county line - - 23,100 23,100 - Northwest and Southwest Miramichi rivers 3 6 - - -
Totals for County 3 6 83,100 51,100 1 5,000
Gloucester County- From Northumberland cotudy line to Shippegan
Gully inclusive - - 18,000 18,000 - From Shippegan Gully to Bass River - - 28,000 28,000 3 120 Bass River included to Restigouche county line.- - - 30,000 30,000 2 75 Miscou and Shippegan Islands 8 32 39,025 23,415 -
Totals for County 8 32 115,025 99,415 5 195
Restigouche County (all)-Totals - 6,000 6,000 - -
no.
1,792
24 184 684 300 350 250
Nom-In addition to the above, there were used by anglers in the inland waters of New Brunswick, 677 canoes, and 4,250 rods and lines.
New Brunswick-Inland Fisheries
Total Inland Fisheries for Province
Victoria County Carleton County York County Sunbury County Queens County Kings County
326
4 46
106 50 70 50
$
352
10 46
116 60 70 60

2
3 4 5 6
7
8 s
0
1
2 3
4
5 6
8
9
0
2
24 25 26 27
28
29
FISHERIES STATISTICS
II. Agencies of Production, 1938-Part I. In Primary Operations-con.
159
Fishing Gear--concluded
Fishing Piers Freezers Small Fish
Oyster Rakes Scallop Drags Quahaug Rakes and and and Other Wharves The Houses Smoke Rousee Gear
No. Value No. Value No. Value No. Value No. Value No. Value Value
6 6 6 6 î s 6
1,173 3,543 157 3,065 176 593 361 105,090 140 88,715 1,171 254,790 29,070
- - - - - 4 840 3 1,200 3 3,400 663
- - 4 60 - - 6 1,500 - - 16 4,800 5,015
- - 20 1,000 - - 75 6,500 3 1,200 53 6,500 15,453
- - 34 810 - 57 3,700 2 500 87 11,000 5,400
- 99 1,195 - 144 30,000 6 2,000 493 196,000 2,000
- - 157 3,065 - - 286 42,540 14 4,900 652 221,700 28,531
- - - - - - 43 21,300-
- 49 17,150 150
- - _ - - - 17 2,550 1 50 30 3,000 260
- - - - - - 60 23,850 1 50 79 20,150 410 1
- - - - - - - - - 4 200
20 100 - - - - - 6 4,000 60 240
20 100 - - - - - 6 4,000 64 440
450 1,600 - - 65 260 3 1,500 4 2,000 -
103 103 - - - - 4 30,000 1 500 6 800
60 200 - - - - 1 300 25,000 -
613 2,103 - - 65 260 8 31,800 7 7,500 6 800 -
250 750 _ _ _ _ 2 2,000 12 21,000 - _ _
106 318 - - - - - - 5 19,000 - - 75
24 72 - - 111 333 2 400 5 2,765 30 600 -
_ - _ _ _ - - 133,400 - - 54
380 1,140 - - 111 333 4 2,400 35 46,165 30 600 129
- - - - - - I 500 3 14,000 50 1,200 -
160 200 - - _ _ 2 4,000 35 1,750 200 6,000 _
_ - - - - - - - 34 4,000 70 3,500 -
_ - - _ _ _ 1 350 _ _ _
160 200 - - - - 3 4,500 73 20,100 320 10,700 -
_ - - - - - - 46,000 20 400 -
Men fishing Fishing Gear without boats Gill Nets Eel Traps
No. No. Value No. Value
6 6
65 624 5,128 200 400 I
_ 7 42 _ _ 2
- 46 368 - - 3
- 111 1,038 - - 4
- 85 680 _ _ 5
15 175 1,000 100 200 6
50 200 2,000 100 200 7

10 to 20 tons
47
8 4,000
191
26
24,200
31 7
4,000
15,500 3,500
26
131 29
19,000
1,200
160
5
5 1,200
160 FISHERIES STATISTICS
II. Agencies of Production, 1938—Part I. In Primary Operations—con.
Vessels
Ssiling, Gasoline and Diesel Fishing Districts
Total value
Quebec—Sea Fisheries
11Total Sea Fisheries for Province
Bonaventure C,ounty-
2 From head of tidal waters to but not including Miguasha Point 3 Miguasha Point included t,o Grand Cascapedia river inclusive 4 From but not including Grand Cascapedia river to New Carlisle inclusive. 5 Paspebiac included to Gaspe county line
6 Totals for County
Gaspe County-
7 From Bonaventure county line to west side of Breche-a-Manon river 8 From west side of Breche-a-Manon river to Mal Bay 9 Point St. Peter included to Cape Gaspe including Gaspe Bay
10 From Cape Gaspe to Little Fox river inclusive 11 From Little Cape to Fame Point inclusive 12 From St. Hélier to'western boundary of Duchesnay township 13 From western boundary of Duchesnay township to Cape Chat
14 Totals for CountY
Magdalen Islands-
15 Southérn subdistrict 16 Northern subdistrict
171 Totals
Saguenay County-
18 Tadoussac to but not including Bersimis 19 Bersimis included to but not including Godbout river 20 Godbout river included to Point-a-Jambon inclusive 21 From but not including Point-a-Jambon to river Pigou inclusive 22 From but sot including river Pigou to Havre St. Pierre inclusive
23 From but not including Havre St. Pierre to but nt including Kegashka river 24 ICegahka river included to but not including Mutton Bay 25 Mutton Bay included to Bonne Esperance inclusive 26 From but not including Bonne Esperance to Blanc Sablon inclusive
27 Totals for County
28 Matane County (a11)—Totals
29 Rimouski County (a11)—TotaLs
8
36
1
1
no.
Total men
no.

8
0
2
4
5 6
8 9
2
24 25 26
7
28
29
FISHERIES STATISTICS
II. Agencies of Production, 1938-Part I. In Primary Operations-con.
Boats '
Carrying Smacks Men
Sail and Flow Gasoline and Diesel fishing Nvithout
Total boats men
No. Value No. Value No. Value Men
$ S no. $ no. no.
2,895 95,748 2,913 874,985 10,726 13 7,200 26 207 j
20 600 6 1,800 5 - - - - 1
89 2,568 13 3,575 11 7 - _ - 18 1
440 13,200 27 8,100 63 - - - 18
296 7,250 88 35,200 57 - - - 50
845 23,618 134 48,675 1,376 - - - 86 ■
236 4,720 101 40,400 701 _ _ - 6
118 2,950 140 56,000 557 - - - 19
194 2,910 132 39,600 570 - - - 4
44 660 180 54,000 404 - - - 1
41 1,640 90 22,500 221 - - - - 1
130 3,900 432 120,960 994 - - - --
2 53 16,980 41 10,250 40 - - - -' 1
1,046 33,760 1,116 343,710 3,849 - - 121 1
370 12,950 540 162,000 2,20 8 3 1,200 6 - I
100 3,500 400 120,000 975 10 6,000 20 - 1
470 16,450 940 252,000 3,181 13 7,200 26 - 1
40 2,500 57 11,500 192 - - - -
22 770 15 7,500 84 - - - -
20 600 59 12,003 152 - -
73 2,190 42 5,250 176 _ _ _ -
55 4,200 81 16,000 518 - - _ _
- - 68 17,500 140 - - -
18 1,440 145 50,750 230 - - -
400 181 54,300 292 - - _
74 3,700 71 21,300 191 - - - -
310 15,800 719 196,100 1,975 - - _ _
164 4,920 24 3,000 285 - _ - _
ao 1,200 10 1,500 60 _ - _ _
161
88667-21

FISHEREES STATISTICS
H. Agencies of Production, 1938-Part I. In Primary Operations-con.
162
1
3
4
5
6
7
9
10 11 12
13
14
15 16
17
18 19 20 21
22
23
24
25 26
27
28
29
Fishing Gear
Fishing Districts Gill Nets Seines Salmon Trap Nets
No. Value No. Value No. Value
$ $ $
Quebec-Sea Fisheries-con.
Total Sea Fisheries for Province 11,321 311,710 200 31,915 164 53,150
Bonaventure County- .
From head of tidal waters to but not including Miguasha Point 16 160 -. - 20 6,000
Miguasha Point included to Grand Cascapedia river inclusive 90 900 25 3,750 25 25,000
From but not mcluding Grand Cascapedia river to New Carlisle inclusive 1,100 13,200 9 so° 2 1,850
Paspebiac included to Gaspe county line 1,200 24,000 - - 24 7,200
Totals for County 2,406 38,260 34 4,650 71 40,050
Gaspe C,ounty--
From Bonaventure county line to west side of Breche- a-Manon river.. 1,219 26,450 ' 30 3,000 - -
From west side of Breche-a-Manonnver to Mal Bay. 1,332 30,320 12 1,200 - - Point Pt. Peter includéd to Cape Gaspe including
Gaspe Bay . 35,750 17 1,700 - - Fro,m Cape Gaspe to Little Fox rver inclusive 491 14,800 - - - - From Little Cape to Fame Point inclusive 275 8,250 - - - - From St. Helier to western boundary of Duchesnay
township 1,038 27,450 - _ - - From western boundary of Duchesnay township to
Cape Chat 363 9,680 - _ - -
Totals for County 5,420 152,700 59 5,900 - -
• Magdalen Islands-
Southern subdistrict 3,942 59,130 18 9,000 - - Northern subdistrict 1,500 22,500 - - - -
Totals 5,442 81,630 18 9,000 - -
Saguenay County-
Tadou -.Pc to but not including Bersimis 25 1,000 - - 30 5,500 Bersimis included to but not including Go dbout river 20 700 - - 8 1,600 Godbout river included to Point-a-Jambon inclusive. 50 750 - - 40 1,500 From but not including Point-a-Jambon to river
Pigou inclusive 80 24,000 3 90 - - From but not including river Pigou to Havre St
Pierre inclusive 50 6,400 30 3,000 - - From but not including. Havre St. Pierre to but not
including Kegashka river 80 6,400 7 700 - - Kegasb,ka river included to but not including Mutton
Bay 240 7,200 16 3,200 - - Mutton Bay included to Bonne Esperance inclusive 306 7,020 10 2,000 - - From but not including Bonne Esperance t,o Blanc
Sablon inclusive 105 3,150 18 2,700 - -
Totals for County 956 56,620 84 11,690 78 8,600
Matane County (a11)-Totals 500 12,500 5 675 15 4,500
Rimouski County (all)-Totals - - - - -

5 6
7
8
o 1
2
4
27
28
29
163 FISHERIES STATISTICS
II. Agencies of Production, 1938-Part I. In Primary Operations-con.
Fishing Gear-eon.
l'rapNets,()ther Srnelt Nets Weirs Tubs of Trawl Hand Lines
No. Value No. Value No. Value No. Value No. Value
$ $ $ $ $
119 79,200 1,264 31,799 50 5,000 5,832 80,873 20,554 25,129 1
- - 217 21,700 - - - - - - 2
- _ - - _ _ 3 30 30 30 3
_ _ _ _ _ - 90 900 260 260 4
22 1,760 - - 1,608 16,080 775 775 5
- - 239 23,460 - - 1,701 17,010 1,065 1,065 E
- - - - - - 1,875 20,625 2,000 2,000 1
- - - - _ 590 6,490 1,480 1,480 f
- - 114 2,750 - - 60 720 1,700 1,700 !
- - - - - - 40 480 1,588 1,58811
- - - - - 25 313 1,000 1,0001:
_ - - - - 25 300 3,200 3,200 t
- - - - - - - - 630 630V
- - 114 2,750 - - 2,615 28,928 11,598 11,598 1
15 21,800 271 1,084 - - 1,200 27,600 3,700 7,4001
8 10,500 545 2,660 - - 25 675 400 600 1
23 32,300 816 3,744 - - 1,225 28,175 4,100 8,0001
ma gio MU
- - 5 225 - - - - - _
- - 10 1300 - - - - 18 18 ,
_ _ _ _ _ _ 80 1,200 300 300
- - SO 320 - - - - 300 300
_ _ _ - _ - _ - 760 1,140
- _ _ - _ _ 6 60 140 210
45 22,500 - - - _ 39 1,170 700 700
11 4,400 - - - - 31 930 723 723 '
40 20,000 - - - - 70 2,100 400 400
96 46,900 95 1,845 - - 226 5,460 3,341 3,791
- - - - - - 65 1,300 450 675
_ - _ _ 50 5,000 _ - - -
89667--11i

164 FISHERIES STATISTICS
II. Agencies of Production, 1938—Part I. In Primary Operations—con.
Fishing Gear—con.
Lobster Pounds Lobster Traps Fishing Districts
Value No. Value
Quebec—Sea Fisheries—concluded
151,320 Total Sea Fisheries for Province 1 141,693
18 982
1,470 7,500
9,970
12
Bonaventure County-
2 From head of tidal waters to but not including .Miguasha Point 3 Miguasha Point included to Grand Cascapedia river inclusive 4 From but not including Grand Cascapedia river to New Carlisle
inclusive 5 Paspebiac included to Gaspe county line
6 Totals for County.
655
980 5,000
6,647
7,650 9,900 1,350
150
5,100 6,600
900 150
Gaspe County-
7 From Bonaventure county line to west side of Breche-a-Manon river 8 From west side of Breche-a-Manon river to Mal Bay 9 Point St. Peter included to Cape Gaspe including Gaspe Bay
10 From Cape Gaspe to Little Fox river inclusive 11 From Little Cape to Fame Point inclusive 12 From St. Relier to western boundary of Duchesnay township 13 From western boundary of Duchesnay township to Cape Chat
14 Totals for County 12,750 19,050
52,100 52,100
Magdalen Islands-
15 Southern subdistrict. 16 Northern subdistrict 70,200 70,200
122,300 171 Totals 122,300
Saguenay County-
18 Tadoussac to but not including Bersimis
19 Bersimis included to but not including Godbout river 20 Godbout river included to Point-a-Jambon inclusive 21 From but noti ncluciing Point-a-Jambon to river Pigou inclusive 22 From but not including river Pigou to Havre St. Pierre inclusive 23 From but not including Havre St. Pierre to but not including
Negashka river 24 RegashIca river included to but not including Mutton Bay 25 Mutton Bay included to Bonne Esperanec inclusive 26 From but not including Bonne Esperance to Blanc Sablon inclusive
27 Totals for County
28 Matane County (a11)—Totals
29 Rimouski County (a1D—Totals

FishingPiers Freezers SmallFish Scallop Drags and and and Other
Wharves Icehouses Smokehouses Gear
No. Value N.D. Value No. Value No. Value Value
$ $ S $ $
4 28 277 48,400 321 71,175 2,375 132,210 31,860
_ _ _ - 3 145 106 3,180 - - - - - 15 600 17 485 -
- - - - 4 1,200 50 1,500 - - - - - 18 1,800 175 7,000 _
- - - - 40 3,745 348 12,165 -
_ _ 5 3,000 8 320 8 240 _
' - - 12 1,200 18 3,600 92 3.680 - - - - - 15 1,050 205 10,250 -
_ - - - - 200 6,000 - 1 - - - - - - 100 3,000 - 1 - - 6 3,000 20 2,000 210 4,200 - 1 _ - - - 10 1,350 85 2,550 -
_ _ 23 7,200 71 8,320 900 29,920 - 1
- 13 6,500 5 960 356 14.240 - 15 13,500 10 3,500 78 5,460
- - 28 20,000 15 4,460 434 19,700
_ _ _ - 70 12.600 - - - - - 10 1.200 - - - _ _ - 28 2.800 3 150 - _ _ 1 75 2 1,200 3 75 -
- 10 5,000 10 6,000 116 1,600 - _ _ 20 1,500 15 3,750 95 4,750 - - - 75 5.625 3 3,000 175 26,250 12,500
4 28 70 5,250 7 9,500 135 20,250 17,000 - - 50 3,750 3 4,600 104 15,600 5,360
4 2S 226 21,200 148 44,650 631 68,675 34,860
- - 44 8,500 62 1,750 - - - - - 3 1,500 - - -
1
28
29
2 3
4 5
6
7 8 o 0 1 2 3
4
5 6
7
18 19 20 21 22 23 24 25 26
27
FISHERIES STATISTICS
II. Agencies of Production, 1938-Part I. In Primary Operations-con.
Fishing Gear-concluded
165

1
2 3 4 5 6
7
Quebec-Inland Fisheries
Total Inland Fisheries for Province.
Below Quebec- Bellechasse County Charlevoix and Saguenay Counties Kamouraska County Montmorency County Temiscouata County
Totals 23 4,460
12
1 8 2
15 25
8 4
10 21
3
3 2
10
6 10
4 1 2 2
19
404
29 58 12 45
6 22
6 52 61 15 43
58 39 30
200 65 25
5 23 12
140
20
41 23 37
3,940
2,400
140 1,000
300 1,800 2,800
1,000 SOO
2000, 1,525
600
1,200 250 300
1,685
1,200 1,500
SOO 100
75 300
2,090
357
75 44 lo 20
4 25
4 21 30 15 30 10 58 38 20
120 69 20
3 13 12
100 40 20 20 30
9 18
43 3,525 1.130
Boats Fishing Gear
2
3 4 5 6 7
8
9
10
99
4 8
12 17 18
40
4,170
693 339 236 465 413
127
893
656
348
672,184 1,009 1,036
- 1 1171 3,973 14 2,910
43,692 666,926
11,500 262 9,633 149 67,055
51,500 58 3,485 108 44,530
74,700 58 4,030 62 38,865
120,810 130 6,262 140 109,561
141,074 40 1,685 130 96,564
65 3,385 45 12,736
272,900 126 5,987 173 187,935
- 152 5,252 215 106,770
2,510
64 300 212 447 437
1,080
8,251,6101 903,474
530,053 62,804
784,929 91,159
622,921 75,249
1,239,047 123,404
1,742,567 195,261
1,996,313 239,694
1,334,910 115,858
8001 45
Gasoline and
Diesel
166 FISHERIES STATISTICS
II. Agencies of Production, 1938-Part I. In Priraary Operations-con.
Boats Fishing Gear
Fishing Districts Skiffs and Canoes
85 1,200 5 900 68 72 1,260 4 900 76 40 400 - 40
110 1,100 4 640 120 50 500 10 1,500 100
21,855
Gaso hie and Diesel
S
28,405
Total men
NO.
1,534
Gill Nets
Value
4,150
Seines
Value
6,507
Above Quebec-- 8 Argenteuil County 9 Beauharnois County
10 Bert hier County 11 Chambly County 12 Champlain C,ounty 13 Chateauguay County 14 Hull County 15 Huntingdon County 16 Jacques Cartier County 17 Labelle County 18 Laprairie County 19 L'Assomption County 20 Levis and Lotbiniere Counties 21 Maskinonge C,ounty 22 Missisquoi County 23 Montreal County 24 Nicolet County 25 Pontiac CountY 26 Portneuf C,ounty 27 Richelieu County 28 St. Hyacinthe County 29 St. Jean C,ounty 30 Soulanges County 31 Temiscamingue and Abitibi Counties 32 Trois-Rivieres County 33 Vaudreuil County 34 Vercheres County 35 Yamaska County
1,125 1,100
300 1,000
160 1,200
200 400
1,200 150 300 100
2,320 380 300
3,000 1,235
200 60
130 120
1,000 400 200 200 300 135 180
4 12
14 700
5 250
7
-
175
8 200 1 25 5 125
26
-
2,090 51 1,275
6 150
4
-
100 6 150
38 190
8 40 1 25
36 Totals 878 17,395 178 24,465 184 6,407
Steam Tugs Total men Skiffs
and Canoes Fishing. Districts
Gill Nets
Ton- nage No. Value Value Value Yards 1 Value
Ontario
1 Totals for Province..
Northern Inland waters-Lake of the Woods, lake Nipigon, lake Nipissing, .Kenora and Rainy river districts
Lake Superior North Channel (Lake Huron).- Georgian Bay (Lake Huron) Lake Huron (proper) Lake St. Clair, river St. Clair
and Detroit river Lake Erie and Upper Niagara
river Lake Ontario, Lower Niagara and
St. Lawrence rivers Southern Inland waters-Lake
Simeoe, etc., including Ottawa ri ver

FISHERIES STATISTICS
II. Agencies of Production, 1938-Part I. In Prim.ary Operations-con.
Fishing Gear--concluded
Fishing Piers Freezers Small Fish Hoop Nets Lines Weirs Eel Traps Spears and and and
Wharves Ice Houses Smoke Houses
No. Value No. Value No. Value No. Value No. Value No. Value No. Value No. Value
$ $ $ $ $ $ s $
525 8,000 513 1,617 312 67,500 60 700 206 412 51 10,800 199 18,900 1 400 1
_ _ - - 57 28,500 - - - - - - 60 6000 - - 2
- - - - 73 14,600 60 700 - - - - 1 500 - - 3
- - - - 40 1,200 - - - - - - 6 600- -4
- _ _ - 120 12,000 - _ _ _ _ _ _ - _ - 5
- - - - 50 10,000 - - - - - - 20 2,000 - - 6
- - - - 340 66,300 60 700 - - - - 87 9,100 - - 7
_ - 29 87 - _ _ _ _ _ _ _ _ _ _ -8
- - 38 114 - - - - 15 30 - - - - - - 9
- - 12 36 - - - - 6 12 - - - - - - 10
- - 12 36 - - - - 20 40 - - 5 1,000 - - 11
4 40 2 6 1 200 - - - _ _ - _ _ _ - 12
- - 12 36 - - - - - - - - 2 200 - - 13
_ _ 6 18 - - - - - - - - - - - -14
- - 28 S4 - - - - 14 28 - - 6 200 - - 15
- - 46 138 - - - - 4 8- - - - - -16
_ - 15 75 - _ _ _ _ _ _ - - - - -17
3 30 6 18 - _ _ - 1 32 - - _ - _ - 18
- - 7 21 - - - - - - - - 2 100- -19
_ _ 2 6 - - - - -- 54 10,800 - - - - 20
56 280 2 6 - _ _ _ _ _ _ - 30 750 - - 21
- - 4 12 - - - - - - - - 4 140- -22
3 75 105 315 - - - - 35 70 - - - - - - 23
121 605 33 99 - - - - - - - - 6 28 - - 24
- - 30 90 - - - - - - - - 4 400- -25
- - 3 9 1 1,000 - - 1 2 - - - - - -26
26 130 12 36 - _ _ _ _ _ _ - 9 2,300 - - 27
_ _ 6 18 - _ _ _ _ _ _ - _ - - -28
- - 35 105 - - - - 67 134 - - 1 1,00 - - 29
3 75 12 84 - - - - 28 56 - - 23 500 1 40030
- - - - - - - - - - 6 1,600- -31
25 625 2 6 _ _ _ _ _ _ _ _ _ _ -32
- - 39 117 - - - - - - - - 4 12 - - 33
92 2,300 4 12 - - - - - - - - - - - - 34
192 3,840 11 33 - - - - - - - - 10 1,00 - - 35
525 8,000 513 1,617 2 1,200 - - 206 412 54 10,800 112 9,800 1 40036
Fishing Gear-concluded
Dip Piers Freezers Seines Pound Nets Hoop Nets and Lines Spears and and
Roll Nets Wharves Icehouses
No. Value No. Value No. Value No. Value No. Value No. Value No. Value No. Value
$ $ $ $ $ $ $ $
131 16,812 1,112 534,580 879 22,119 64 292 546 7,550 110 984 399 107,685 539 252,681 1
- - 45 14,710 63 2,135 - - 24 490 - - 113 2,1735 143 32,600 2
- - 57 27,650 - - - - - - - - 37 19,82 42 16,725 3 - 94 39,350 - - - - - - - - 37 14,180 47 14,245 4
5 770 82 72,545 48 720 - - 270 3,595 4 17 60 30,606 57 14,850 5
- - 114 74,350 - - - - 135 2,689 - - 31 7,160 55 23,505 6
32 4,017 102 10,425 3 450 1 1 36 241 - - 10 1,850 15 6,775 7
44 8,605 618 295,550 10 1,500 1 3 21 49 - - 76 25,075 104 131,660 8 5
4 85 - - 588 12,800 23 110 26 388 - - 29 6,320 38 9,510 9
45 2,935 - - 167 4,514 39 178 34 9 8 115 967 6 496 38 2,814 16
167

168 FISHERIES STATISTICS
II. Agencies of Production, 1938—Part I. In Primary Operations—con.
Fish Carriers
Fishing Districts Steam Diesel
No. Tonnage Value Men No. Tonnage Value Men
$ no. 3 no.
Manitoba
I Totals for Province 3 185 16,500 22 8 455 77,000 47
2 Lake Winnipeg and Red river 2 125 11,500 16 6 400 70,000 41
3 Lakes Winnipegosis, Swan and Red Deer 1 60 5,000 6 2 55 7,000 6
4 The Pas - - - - - - - -
5 Shoal lake (Snowshoe Bay) - - - - - - - -
6 Lake Manitoba and Whitemud river - - - - - - - -
7 Rupert's Land (Kautunigan) - - - - - - - -
8 Lake St. Martin - - - - - - - -
9 Lake Waterhen - - - - - - - -
10 Lake Dauphin - - - - - - - -
11 Lake Sipiwesk and Nelson river - - - - - - - -
12 Lake of the Woods (Buffalo Bay) - - - - - - - -
Fishing Gear
Fishing Districts Gill Nets Dip and Roll Nets Hoop Nets
No. Value No. Value No. Value
S 3 6
Manitoba
1 Totals for Province 72,335 557,455 4 6 38 650
2 Lake Winnipeg and Red river 31,545 316,056 - - 26 460
3 Lakes Winnipegosis, Swan and Red Deer 12,950 90,270 - - -
4 The Pas 2,333 19,999 - - -
5 Shoal lake (Snowshoe Bay) 40 600 - _ -
6 Lake Manitoba and Whitemud river.. . 23,190 117,950 4 6 10 150
7 Rupert's Land (Kautunigan) 36 360 - - - -
8 Lake St. Martin 255 1,278 - - -
9 Lake Waterhen 45 475 - - -
10 Lake Dauphin 1,800 9,000 - - -
II Lake Sipiwesk and Nelson river 76 570 - - -
[2 Lake of the Woods (Buffalo Bay) 65 900 - - 2 40

169 FISHERIES STATISTICS
II. Agencies of Production, 1938—Part I. In. Priraary Operations—con.
Fish Carriers—concluded Boats Men
fishing
Skiffs Gasoline without
Gasoline Barges and and Total boats
Canoes Diesel men
No. Tonnage Value lien No. Value Men 1.7o. Value No. Value No. No.
S no. $ no. $ $
10 149 22,050 25 4 3,300 4 811 31,665 211 156,960 1,622 2,099 1
5 100 8,500 15 - - - 770 28,280 169 126,750 1,404 661 2 _ - _ _ 3 3,000 3 14 450 37 28,100 145 386 3
3 35 8,500 7 1 300 1 25 1,530 4 1,110 32 138 4
1 10 4,600 2 - - - 10 500 - - 10 -5 - _ _ - _ - _ _ - - - 773 6 _ _ _ _ _ _ _ 6 300 - - 6 -7
- - - - - - - - - - 178 _ _ - _ _ _ _ - _ _ _ 39 _ _ - _ _ _ _ - _ _ _ 120 10
- - - - - - - 19 605 - _ 19 -11
1 4 450 1 - - - - - 4 1,000 6 112
Fishing Gear—concluded
Fishing Piers Freezers Small Fish Lines and and and
Wharves Ice Houses Smoke Houses
No. Value No. Value No. Value No. Value
$ s s s
21 32 73 21,297 111 115,654 181 50,210 1
21 32 55 13,500 SS 102,500 58 19,000 2
- - 12 7,297 11 11,554 25 14,040 3
_ _ - - 7 700 42 4,6004
- 2 300 2 600 2 200 1 _ _ _ _ _ — 36 9,500 f
_ _ - - _ - 1 5 I
_ _ _ - _ 3 900 1
- _ _ _ _ _ - 9 1,500 11
_ _ _ 1 150 1 2001:
- - 4 200 2 150 4 250 11
80667--12

FISHERIES STATISTICS
II. Agencies of Production, 1938—Part I. In Prim.ary Operations—con.
Boats Men fishing
without Gasoline
Total boats Fishing Districts Skiffs and Canoes and
Men Diesel
No. Value No. Value No. No.
$ i
Saskatchewan
1 Totals for Province 42 1,700 40 17,235 130 1,417
2 Jackfish lake - - - - 182
3 Murray lake - - - - 33
4 Turtle hike - - - - - 5
5 Chitek, Birch, Brightsand and Clearwater lakes 10 450 - 15 52
6 Makwa lake 8 400 4 600 24 32
7 Worthing,ton, Peck and Ministikwan lakes 10 450 2 300 20 28
8 Pierce and Lapine lakes - - - - 30
9 Lac des Iles - - - 29
10 Waterhen lake 2 60 1 200 8 46
11 Flottes lake - - - - 5
12 Greig, Kimble and Mistohey lakes - - - - 12
13 Keeley and Canoe lakes 2 30 - - 2 52
14 Big Pet,er Pond and Little Peter Pond lakes - - - - - 85
15 Churchill and Frobisher lakes - - - 47
16 Deep river - - - - - 9
17 Lac Ile à la Crosse - - - 47
18 Shagwenan - - - - 5
19 Snake, Sandfly, Besnard lakes - - - - 14
20 Lac la Plonge - - - - - 26
21 Dore lake - - - 69
22 Needle lake - - - - - 1
23 Lac Eau Claire, Beaver river and Green lake 2 60 - 2 12
24 Okemasis lake 2 50 2 600 3 5
25 Dog, Lawrence, Elaine, Taggart, Wabeno and
Hackett lakes - - - - 14
26 Swearing and Montreal lakes - - - - 10
27 East Trout, I.ittle Bear and Big Sandy lakes - - - e
28 Candle lake 3 140 2 235 6 13
29 Lac la Ronge - - 2 300 2 40
30 Barr, and Trout lakes - - - - - 4
31 Reindeer lake, Churchill river and Wolleston lake - 8 2,550 14 24
32 Beaver lake - - 3 1,150 3 31
33 Suggi lake - - - - - 20
34 Hunting, Deschambault and Jackson lakes - - - - 9
35 Wildnest and Jans lakes - - - - 3
36 Wood, Kikinagimak, Miron and Hidden lakes - - - - 11
37 Mari lake - - - - - 2
38 Cumberland lake - - - - 14
39 Namew lake - - - - 22
40 Long lake - - 195
41 Katepwa and Echo lakes - - - - 34
42 Saskatchewan river - - - - - 17
43 Lake Athabaska - - 12 10,500 17 28
44 Cold lake - - - - 25
95 Primrose lake 3 60 4 800 14 60
170

FISHERIES STATISTICS
II. Agencies of Production, 1938-Part I. In Priraary Operations-con.
Fishing Gear
Fishing Piers Freezers Small Fish Gill Nets Hoop Nets Trap Nets Lines and and and
Wharves Ice Houses Smoke Houses
No. Value No. Value No. Value No. Value No. Value No. Value No. Value
S S S $ g s
11,016 138,237 20 200 1 SOO 769 4,061 13 1,320 25 2,870 1 1,500 1
1,220 12,200 - - - - 120 590 - - - - - 2
99 1,860 - - - - 25 125 - - - - - 3
24 221 - - - - 3 15 - - - - -4
248 4,305 - - - - 27 112 - 2 40 - - 5
193 2,950 - - - - 8 64 - - 3 75 - - 6
156 2,510 - - - - 15 55 - - 2 160 - - 7
312 5,800 - - - - 22 17 - - - - - 8
174 2,610 - - - 15 12 - - - - - 9
276 3,978 - - - - 30 15 - 1 50 - - 10
30 467 - - - - 5 2 _ _ _ - -11
72 1,38 - - - 10 5 8 - - - - - 12
542 7,20 - _ _ 32 137 _ _ - - 13
912 11,57 - - - 45 213 - - - - - 14
387 6,02 - - - 48 240 - - - - - 15
981,225 - - - 6 30 - - - -16
358 4,33 - - - 19 91 - - - - - 17
63 81 - - 4 20 - - - - -18
115 1,33 - - 5 25 - - - - -19
318 3,735 - - - IS 77 - - - - - - 20
1,026 10,260 - _ 38 190 - - - - - - 21
4 60 - _ - 1 5 - - - - -22
72 700 - - - 9 51 - _ I 20 _ - 23
30 450 - - - 2 10 2 500 2 375 - - 24
SO 800 - - - 8 38 - - _ _ -25
80 845 - - - 4 29 - - - - -26
29 363 - - 5 55 - - _ _ -27
78 1,170 - - - 7 35 2 20 6 200 - - 28
281 4,395 - - - II 44 I 40 2 150 - - 29
38 580 - - - 2 10 - - - - -30
216 2,850 - - I SOO 1 5 2 125 3 500 - - 31
450 4,500 - - - - 14 70 2 75 1 100 - - 32
174 1,740 - _ _ _ 8 4 _ - _ - _ - 33
103 1,030 - - - - 6 3 - - - - - -34
27 360 - - - - 2 1 - _ _ _ - 35
165 1,800 - - - - 5 2 - _ _ _ -36
12 120 - - - - 1 5 _ _ _ _ -57
52 560 - - - - 1 5 _ _ _ -38
150 1,500 - - _ _ 13 SO _ _ _ _ - 39
1,030 8,24 - - - - 100 480 _ _ _ - - 40
151 1,200 - - - - 24 70 _ _ - - -41
48 480 20 200 - - _ _ _ _ - 42
330 6,600 - - - _ 9 45 2 500 2 1,200 1 1,50043
144 2,880 - - - - 10 100 - - _ - - 44
681 10,215 - - - - 31 310 2 60 _ - _ - 45
89667--121
171

172 FISHERIES STATISTICS
II. Agencies of Production, 1938—Part I. In Primary Operations—con.
Fish Carriers
Fishing Districts Gasoline Tugs Barges
No. Value No. Value Men Men
no. no.
4
4
Alberta Totals for Province
Lake Athabaska (a)
Lesser Slave lake
Lesser Slave lake district (Fawcett, Lylich, Stur-geon, Little Whitefish, Utikuma, Utik-umasis, Haig and Mitsue lakes)
Calling lake
Calling lake district (Rock Island and Orloff lakes)
Wabamun lake
Wabamun lake district (Chip, Fickle, Isle, Mayatan, Gregg and Shining Bank lakes)
Newell lake
Newell lake district (McGregor ] ake)
Moose lake
Moose lake district (Keehewin and Muriel lakes)._
Cold lake
Cold lake district (Bourque, Burnt, Ethel, Hilda, May, Marie, Tucker and Wolf lakes)
Pinehurst lake
Pinehurst lake district (Mosquito and Touchwood lakes)
Baptiste lake
Baptiste lake district (Lawrence lake)
Lac la Biche
12,526 10 2 1
2
3
4
2 6,000
12,526 2 . 6,000 10
5
6
7
8
O
10
11
12
13
14
15
16
17
18
19
20 Lac la Biche district (Amisk, Bad, Beaver, Buck, Blackett, Bobtail, Burnt, Buffalo, Corner, Elinor, Ethel, Frenchman, Hope, Hylo, Ironwood, John-son, Kinnaird, Kinosiu, Little Egg, Missawav,i, Skeleton, Siebert, Square and Windy lakes)
Winnifred lake
Winnifred lake district (Gregoire, Ipiatick and Roberts lakes)
Pigeon lake
Pigeon lake district (Buck and Conjuring lakes)
Primrose lake
Peerless lake
Peerless lake district (Graham lake)
Lac Ste Anne
Lac Ste Anne district (Lac la Nonne, Lessard, Isogun and Bear lakes)
Wabasca lake
Ashmont district (Fork, Goodfish, Little Hollow and Whitefish lakes)
Buffalo lake
21
22
23
24
25
20
27
28
29
30
31
32
Yukon Territory
33 Totals for Territory
tat The fish caught in lake Athabaska is taken on the Saskatchewan side, but both Saskatchewan and Alberta own boats and gear which are used in the fisheries of this lake.

FISHERIES STATISTICS
II. Agencies of Production, 1938-Part I. In Primary Operations--con.
Boats Fishing Gear Men
Skiffs Gasoline fishing Fishing Freezers Small Fish and and Total without Gill Nets Fish Wheels Piers and and Ice and Smoke
Canoes Diesel men boats Wharves Houses Houses
No. Value No. Value No. No. No. Value No. Value No. Value No. Value No. Value
$ $ $ $ $ $ $
137 8,125 126 30,000 541 2,399 9,540 184,700 - - 39 14,150 63 22,600 10 9,100 1
- - - - - - - - - - 2 400 1 4,000 1 3,0001
15 1,000 51 16,200 126 57 1,822 36,440 - - 18 12,000 5 10,000 4 2,000 1
6 700 3 700 17 102 648 12,912 - - 2 300 4 450 - -
- - - - - 49 294 5,880 - - - - - - - - /
- - - - - 9 54 1,080 - _ _ _ - _ _ - 1
36 1,400 4 SOO 95 1,344 1,419 28,780 - - - - 7 700 - - ■
2 150 - 3 7 60 1,080 - - - - 2 100 - - /
- - - - 45 45 900- - - - - - - -1
- - - - $ 48 960- - - - - - - - li
3 300 3 SOO 11 13 144 2,88 - - 1 150 3 300 1 100 1
1 100 - - 2 8 60 1,00 - - - - 1 100 - - 11
- - - - - 105 630 12,600 - - - - - - - - 1
4 300 - - 4 48 312 5,972 - - - - - - -
- - 1 200 2 22 144 2,880 - _ _ - 2 25 - - 1
- - - - - 20 120 2,340 - - - - - - - - 1
2 50 - - 3 1 20 246 - - - - - - - - 1
3 150 2 300 7 - 42 840 - - - - - - - - 1
26 1,300 21 4,000 103 66 1,454 29,080 - - 5 500 5 2,000 4 4,0001
19 1,275 9 1,500 48 105 938 13,976 - - 5 200 10 550 - - 2
- - 4 800 9 15 144 2,8 8 - _ _ - 3 900 - - i
- - - - - 16 96 1,92 - _ _ - - - - - 1
4 200 7 1,100 21 241 451 9,02 - - - - 5 1,000 - - 1
5 250 10 1,000 31 2 53 904 - - - - - - - - :
_ - - - - 9 45 900- - - - - - - - ■
_ _ - _ - 3 22 440- - - - - - - -I
- - - - - 4 24 480- - - - - - - - 1
8 800 8 2,000 53 59 224 4,480 - - 4 500 10 2,000 -
3 150 2 300 5 15 45 SO4 - - 2 100 4 200 -
_ _ _ _ - 2 12 240- - - - - _ _
- - 1 300 1 23 144 2,688 - - - - 1 50 - -
- - - - - 1 6 90- - - - - - - -
10 350 12 3,600 25 10 65 630 8 680 - - 3 45 2 50
173
3
6
7
8
0
1
2
4
6
7
8
0
1
32
33

6 600
3
3
.•■•
300
300
• ■■
•■•
150,000
75,000
75,000
■■.
66
33
33
■•■
174 FISHERIES STATISTICS
II. Agencies of Production, 1938—Part I. In Primary Operations—con.
Fishing Districts
no.
British Columbia
Totals for Province (a)
District No. 1—
2 Fraser River and Howe Sound
District No. 2— 3 Ma.sett Inlet and northern Graham Island, Queen Charlotte
Islands.
4 Southern Queen Charlotte Mends, including Skidegate Wet
5 The Naas River
6 Skeena river including Prince Rupert and the Upper Skeena
7 Grenville—Principe area.
8 Butedale including Gardiner canal
9 Bella Bella and Fitzhugh Sound
10 Bella Cools, Dean and Burke Chzumels
11 Rivers Inlet
12 Smiths Inlet
District No. 3—
13 Cape Scott to Tuna Point including all waters between Vancouver Island and the mainland
14 Tuna Point to Shelter Point including mainland waters opposite
15 Shelter Point to French Creek
16 Mainland waters from George Point to Gower Point
17 French Creek to Shoal Harbour including Nanaimo
18 Shoal Harbour to Sambrio Point including Victoria
19 Sambrio Point to Pachena Point including Nitinat Arm
20 Barclay Sound and Port Alberni
21 Wreck Bay to Estevan Point including Clayoquot Sound
22 Estevan Point to Tatchu Point including Nootka Sound
23 Tat,chu Point t,o Cape Cook includin' g Kyuquot Sound
24 Cape Cook t,o Cape Scott including Quataino Sound
(a) The province totals show the actual aggregate of the agencies of production in use. Figures for fishing districte show the agencies of production employed in each and as such agencies in some cases were engaged in several districts, ths total of the numbers shown in this table may exceed the provincial aggregate.

FISHERIES STATISTICS
II. Agencies of Production, 1938-Part I. In Primary Operations-con.
•
Vessels Boats Carrying boats, smacks
Gasoline and fish packers
Sailing, Gasoline and Diesel Sail and Row and Diesel Total
40 tons 20 to 10 to T tal Total men
and 40 20 Cilue men No. Value No. Wile No. Value Ilan
over tons tans
no. no. no. $ no. $ $ no. $ no.
20 109 127 2,317,900 1,403 1,294 60,675 6,540 3,917,197 8,615 209 547,875 230 1
12 89 43 1,338,200 873 45 4,050 2,485 1,251,500 2,791 62 136,700 68 2
- 10 7 108,500 102 46 1.150 301 275,100 433 25 281,500 87 3
- 14 15 198,000 172 4 100 91 92,680 143 23 215,500 73 4
- 16 6 169,000 142 14 345 394 234,632 474 34 236,340 84 5
2 14 26 462,000 242 10 1020 1,214 1,141,805 1,879 93 494,500 138 6
- 16 10 189,000 162 8 725 114 114,239 217 21 190,500 58 7
1 38 24 540,000 397 3 60 150 102,125 178 47 406,700 128 8
- 20 13 300,000 211 20 2,000 410 267,000 460 25 216,500 57 9
- 10 2 110,500 81 98 7,840 174 101,725 275 25 144,100 5410
1 13 3 187,500 109 433 21,650 1,339 628,870 1,878 62 356,500 12311
- 5 2 81,500 43 70 3,500 399 243,525 487 20 105,500 4612
- 71 65 1,016,250 890 78 3,590 737 379,625 903 84 495,600 215 13
- 12 40 310,000 313 211 6,330 228 91,200 445 4 18,100 8 14
- 41 26 510,000 395 75 2,250 120 84,000 201 8 4,000 16 15
- 3 10 76,500 60 45 900 115 81,300 242 12 20,000 8 18
1 10 28 326,000 332 62 1,900 135 56,000 204 28 14,800 - 17
- - 1 3,500 4 18 800 112 55,000 138 13 56,000 1018
- 9 12 183,000 135 26 460 65 36,000 116 7 18,000 2019
9 24 15 577,000 316 24 650 276 119,250 324 44 502,000 6820
12 16 12 366,000 204 - - 81 56,000 83 16 160,00e 4021
11 21 6 488,0E0 253 4 100 31 26,400 55 28 475,000 8922
s 18 5 456,000 216 - - 90 90,000 98 33 529,100 12423
15 15 11 468,500 184 64 3,200 61 54,600 74 2 4,500 424
175

176 FISHERIES STATISTICS
II. Agencies of Production, 1938—Part I. In Primary Operations—con.
Fishing Gear
Fishing Districts Gill Nets Seines
No. Value No. Value
$ $
British Columbia—con.
1 Totals for Province (a) 32 5,800 44 118,800
District No. 1—
2 Fraser River and Howe Sound 17 3,400 13 6,500
District No.2—
3 Massett Inlet and northern Graham Island, Queen Charlotte Islands - - 1 3,000
4 Southern Queen Charlotte Islands including Skidegate Inlet - - - -
5 The Nana river - - - -
6 Skeena river including Prince Rupert and the Upper Skeena - - 9 22,800
7 Grenville-Principe area _ _ - -
8 Butedale including Gardiner canal - 5 13,500
9 Bella Bella and Fitzhugh Sound - - - -
10 Bella C,00la, Dean and Burke Channels - 3 5,800
11 RiversInlet - 6 12,300
12 Smiths Inlet _ _ -
District No. 3—
13 Cape Scott to Tuna Point including all waters between Vancouver Island and the naainland - - 1 1,000
14 Tuna Point to Shelter Point including mainland waters opposite - - 2 300
15 Shelter Point to French Creek 15 3,000
16 MainLand waters from George Point to Gower Point - - - -
17 French Creek to Shoal Harbour including Nanaimo 12 1,900 8 40,000
18 Shoal Harbour to Sambrio Point including Victoria 1 200 1 200
19 Sambrio Point to Pachena Point including Nitinat Arm - - - -
20 Barclay Sound and Port Alberni - - 24 72,000
21 Wreck Bay to Estevan Point including Clayoquot Sound 5 750 13 28,500
22 Estevan Point to Tatchu Point including Nootka Sound - - 26 78,000
23 Tatchu Point to Cape Cook including Kyuquot Sound - - 27 50,400
24 Cape Cook to Cape Scott including Quatsino Sound - - 10 30,000
(a) The province totals show the actual aggregate of the agencies of production in use. Figures for fishing districts show the agencies of production employed in each and as such agencies in some cases were engaged in several districts, the total of the numbers shown in this table may exceed the provincial aggregate.

FISHERIES STATISTICS
II. Agencies of Production, 1938-Part I. In Primary Operations-con. 1
Fishing Gear--con.
Salmon Salmon Salmon Salmon Purse Seines Drag Seines DrittNets Trap Nets Snaeh Nets ChdadumiNets
No. Value No. Value No. Value No. Value No. Value NM. Value
6 6 6 $ 6 S
262 301,200 9 5,350 6,8991,214,556 5 75,000 51 2,850 28 840 1
112 168,000 - _ 2,422 423,850 - 47 2,350 28 840 2
22 29,100 _ - 26 1,300 _ _ _ _ _ - 3
35 47,800 - - 12 600 - - - - - - 4
30 40,500 - - 517 73,920 - - - - - - 5
- - - - 1,226 226,490 - - - - - - 6
38 53,100 7 4,150 79 13,955 - - - - - 7
61 92,200 2 1,200 63 9,805 - - - - - - s
37 60,900 - - 181 36,200 - - - - - - 9
9 15,500 - - 435 88,740 - - - - - - 10
13 22,400 - - 1,889 318,538 - - _ - - - 11
5 16,200 - - 465 78,193 - _ _ _ - 12
139 168,125 - - 307 46,050 - - - - - 13
52 78,000 - - 137 20,350 - - - - - 14
51 51,000 _ 10 2,000 _ - - _ _ - 15
18 18,500 _ 125 18,75 _ - - - - - 16
36 33,000 - - 1 15 - - 2 200 - - 17
1 1,000 - - - - 575,000 2 BOO - - 18
23 27,600 - - 35 5,25 - - - - - 19
34 44,100 - 9 7 19,400 _ - _ _ - 20
34 34,000 - - - - _ - - - _ - 21
20 15,200 - - _ _ - - - -22
4,600 _ _ - - _ - - _ _ - 23
12 8,900 - - 8 400 - - - - - - 24
177

178 FISHERIES STATISTICS
II. Agencies of Production, 1938—Part I. In Primary Operations—con.
Fishing Gear
Fishing Districts Shrimp Nets Skates of Gear Small Draggers
No. Value No. Value No. Value
s s $
British Columbia--concluded
1 Totals for Province (a) 23 1,975 1,811 42,205 15 6,850
District No. 1—
2 Fraser River and Howe Sound 21 1,575 260 2,900 13 6,500
District No. 2—
3 Massett Inlet and northern Graham Island, Queen Chaflotte Islands - - - - - -
4 Southern Queen Charlotte Islands including Skide- gate Inlet - 4 68 - -
5 The Naas river - - -
6 Skeena river including Prince Rupert and the Upper Skeena 2 400 1,584 39,529 -
7 Grenville-Principe area - - - -
8 Butedale including Gardiner canal - - -
9 Bella Bella and Fitzhugh Sound - - - - -
10 Bella Cools, Dean and Burke Channels - - - -
11 Rivera Inlet - - - - -
12 Smiths Inlet - - - -
District No. 3—
13 Cape Scutt to Tuna Point including all waters be- tween Vancouver Island and the mainland - - 90 1,620 -
14 Tuna Point to Shelter Point including mainland waters opposite - - - - -
15 Shelter Point to French Creek - - 208 2,080 8 1,600
16 Mainland waters from George Point t,o Gower Point - - 65 1,625 - -
17 French Creek to Shoal Harbour including Nanaimo. - - - - 9 1,200
18 Shoal Harbour to Sambrio Point including Victoria. - - 25 500 _ -
19 Sambrio Point to Pachena Point including Nitinat Arm _ - _ _ - -
20 Barclay Sound and Port Alberni - - 12 240 - -
21 \Vreck Bay t,o Estevan Point including Clayoquot Sound - - 12 600 - -
22 Estevan Point to Tatchu Point including Nootka Sound - - - - - -
23 Tatchu Point to Cape Cook including Kyuquot Sound - - - - - -
24 Cape Cook to Cape Scott inelvding Quataino Sound - - - -
(a) The province totals show the actual aggregate of the agencies of production in use. Figures for fishing districts show the agencies of production employed in each and as such agencies in some cases were engaged in several districts, the total of the numbers shown in this table may exceed the provincial aggregate.

179 FISHERIES STATISTICS
II. Agencies of Production, 1938-Part I. In Primary Operations-concluded
Fishing Gear-concluded
Fishing Pi us Freezers Small Fish Other Hand Lines Crab Traps and and and Gear
Wharves Ice Houses Smoke Houses
No. Value No. Value No. Value No. Value No. Value Value
$ 5 5 i 5 8
14,290 115,031 6,688 26,488 10 11,000 10 26,300 42 50,900 1,482 1
613 1,373 5,900 23,600 - - - - 22 31,900 32 2
2,206 19,854 170 850 - - -. - - - - 3
519 4,671 - - - -. - - - - -4
819 6,552 - - - - _ - - -6
2,871 25,831 355 1,065 - - - - - - 6
84 774 - - - - - - - - - 7
532 4,256 - - - - - - _ - - 8
3,869 26,16 - - - - - _ _ - 9
132 1,188 - - - _ _ - - - -10
408 3,672 _ - - _ _ _ - -11
408 3,672 - - - - _ - - - - 12
2,734 21,872 1 20 2 3,000 1 6,000 8 12,000 250 13
1,123 5,61 - - - - _ . - - - - 14
508 5,080 - - - - _ - - - -15
1,090 5,450 - - - 8 18,500 - - - 16
804 4,020 50 120 - - _ - - - 40017
500 2,500 200 200 1 1,000 - - - - 18
232 1,856 - - - - - _ - - -19
1,412 11,29 - - 1 1,000 - 9 4,500 - 20
2,100 21,000 _ - 6 6,000 _ - - - - 21
138 710 - _ - _ _ - _ _ - 22
450 6,750 - - - _ 1 1,800 - _ - 23
366 4,270 - - - _ - - 3 2,500 800 24
ZE1U3B

FISHERIES STATISTICS
II. Agencies of Production, 1938-Part 2. In Fish Canning and Curing (a) General Summary of Statistics
Province and County or District Establish- Capital Total Employees
and ments Salaries and Wages
no. S no. $
1 Canada-Totals 561 21,962,498 14,484 4,227,955
2 Lobster canneries 215 1,220,121 4,738 289,353
3 Salmon canneries 102 11,615,322 5,153 1,766,302
4 Clam canneries 25 284,709 406 58,262
5 Sardine and other fish canneries 11 2,181,350 921 425,538
6 Fish curing establishments 172 5,333,983 2,723 1,295,695
7 Freezing plants 18 404,971 212 85,046
8 Reduction plants (a) 18 922,042 331 307,759
9 Prince Edward Island-Totals 78 180,525 1,234 65,372
10 Lobster canneries 64 139,325 1,175 59,217
11 Clam canneries 4 9,000 25 912
12 Fish curing establishments 10 32,200 31 5,243
Kings County-
13 Lobster canneries 27 1 65,050 427 25,783 Clam canneries 2 f
14 Fish curing establishments 5 23,200 20 4,386
Queens County-
15 Lobster canneries 9 1 Clam cannery 1f 21,500 194 8,519
16 Fish curing establishments 5 9,000 11 857
Prince County-
17 Lobster canneries 281 61,775 582 25,827 Clam cannery. 1f
18 Nova-Scotia-Totals 155 3,757,847 3,325 1,119,587
19 Lobster canneries 62 514,950 1,685 136,770
20 Salmon canneries 2 1 Clam ctumeries 5 f 26,528 65 7,929
21 Other fish canneries 5 198,168 154 71,757
22 Fish curing establishments 75 1 Freezing plants 2f 2,799,534 1,367 854,750
23 Reduction plants 4 218,667 54 48,381
Richmond Comity-
24 Lobster canneries 4 21,723 105 8,444
Cape Breton County-
25 Lobster canneries 5 19,965 234 16,384
26 Fish curing establishments 4 301,247 117 65,441
Victoria County-
27 Lobster canneries 6 35,400 121 7,028
Inverness County-
28 Lobster canneries 9 1 Salmon canneries 2f 63,527 264 24,753
29 Fish curing establishments 3 4,750 25 3,265
Cumberland County-
30 Lobster canneries 12 27,000 203 11,344
ictou County (b)-
31 Lobster canneries 9 1 187,793 327 27,934 Clam cannery 1 I
Antigonish County-
32 Lobster canneries 5 19,675 196 15,793
Guysborough County-
33 Lobster canneries 10 147,587 241 26,181
34 Fish curing establishments 8 1 Reduction plant 1f 200,261 . 97 48,727
(a) Fish oil and meal are also found as by-products of canneries and fish curing establishments. (b) The statistics for Pictou County include one lobster cannery and one clam cannery in Colchester County.
180

FISHERIES STATISTICS
II. Agencies of Production, 1938-Part 2. In Fish Canning and Curing (a) General Summary of Statistics-con.
Value of Materials Used Value of Products Fuel and
Electricity Fish
Used Fish canned Fish Salt Containers Other Total Marketed cured or Total
Materials Fresh otherwise prepared
S $ s s s s $ $ $
407,631 12,589,724 206,797 3,728,603 556,936 17,082,060 6,052,397 21,896,811 27,919,208 1
34,092 1,564,538 14,955 218,695 7,386 1,805,574 437,597 1,939,391 2,376,988 2
135,443 5,467,035 16,817 2,598,759 53,145 8,165,756 587,789 13,251,902 13,839,691 3
10,287 92,176 1,149 31,456 12,522 137,303 961 269,060 270,021 4
62,820 553,312 20,429 491,430 314,211 1,379,382 104,916 2,211,540 2,316,456 5
81,361 4,289,416 150,376 368,636 110,800 4,919,228 4,406,120 3,197,870 7,603,990 6
8,163 363,221 2,395 3,471 603 369,690 513,386 45,242 558,628 7
72,465 260,026 676 16,156 28,269 305,127 1,628 981,806 983,434 S
9,997 381,494 6,193 66,095 800 454,582 57,867 549,409 607,276 9
9,491 351,494 908 64,024 214 416,640 55,875 501,425 557,30010
235 2,351 5 2,071 - 4,427 9,312 9,31 11
271 27,649 5,280 - 556 33,515 1,9.92 38,672 40,60412
4,272 152,976 613 27,480 52 181,121 21,381 224,717 .246,098 13
256 22,355 3,953 - 586 26,894 1,232 31,743 32,97514
938 54,055 33 9,56 - 63,687 4,606 77,360 81,966 15
15 5,294 1,327 - - 6,621 760 6,929 7,6S9 16
4,516 146,784 267 29,046 162 176,269 29,888 208,660 238,54817
106,753 3,512,211 73,184 433,101 130,259 4,149,095 2,962,340 3,509,170 6,471,51018
14,356 741,S74 10,984 86,405 6,536 845,799 228,271 873,825 1,102,09619
350 1S,339 1,216 4,167 100 23,822 2,569 32,378 34,94720
13,900 200,806 4,944 52,196 21,783 279,729 101,766 316,084 417,85021
58,274 2,545,261 56,340 283,903 78,538 2,964,042 2,620,106 2,093,132 4,721,23822
19,843 5,961 - 6,430 23,302 35,693 1,628 193,751 195,37923
467 31,552 460 4,708 - 36,720 10,463 41,655 52,11824
1,497 46,200 12 7,801 500 54,513 4,770 73,274 75,04425
5,323 165,979 4,944 16,540 6,782 194,245 261,293 105,157 366,45026
739 50,724 455 5,624 2 0e 57,003 7,191 70,765 77,95 27
1,450 119,835 4,383 10,490 300 135,008 19,190 155,801 174,991 28
78 9,338 1,700 886 50 11,974 325 16,170 16,49529
2,638 68,940 140 9,78 - 78,862 8,108 92,603 100,71 30
2,854 222,629 155 22,161 - 244,945 102,019 202,167 304,186 31
1.204 86,281 71 11,856 82 98,290 6,259 118,577 124,836 32
3,432 108,752 6,457 15,132 5,554 135,895 54,102 128,642 182,74433
22,688 90,003 3,806 7,220 260 101,309 82,520 89,002 171,52234
181

182 FISHERIES STATISTICS
II. Agencies of Production, 1938-Part 2. In Fish Canning and Curing (a) General Summary of Statistics-con.
E tabli- Total Employees ss h Province and County or District men Capital and Salaries and Wages
no. $ no. $
Nora Scotia--concluded
Halifax C,ounty- 1 Lobster canneries 2
Fish curing establishments 2 } 1,076,169 430 371,435 Reduction plants 2
Lunenburg C,ounty- 2 Fish curing establishments 4 349,993 186 97,676
Queens Cotmty- 3 Clam canneries 3 1,161 3 584 4 Fish curing establishments 4 116,232 50 33,452
- Shelburne County- 5 Other fish cannery 1 1
Fish curing establishments 18 J 591,236 342 204,404
Yarmouth C,ounty- 6 Fish curing establishments 16 1
Freezing plants 25 294,639 132 56,128
Digby County- 7 Clam cannery I
Other fish canneries 4 1 213,940 Iso 75,169 8 Fish curing establishments 16
Reduction plant 1 85,549 72 25,425
9 New Brunswick-Totals 118 2,557,521 2,652 456,463
10 Lobster canneries 73 476,546 1,509 66,962 11 Clam canneries 12 1
Sardine canneries: 3 11,816,069 850 325,373 12 Fish curing establishments 22 157,377 218 32,932 13 Freezing plants 5 90,104 65 21,411 14 Reduction plants .. 3 15,425 10 9,770
Charlotte CrountY- 15 Clam canneries 4 1
Sardine cannerie 31 1,813,219 755 323,806 16 Fish curing establishments là 1,
Reduction plants 21 74,675 128 15,562
Saint John CountY- 17 Fish curing establishments 4 1
Reduction plants 11 91,027 35 25,325
Westmorland County- 18 Lobster canneries 11 268.305 317 19,287 19 Fish curing establishments 3 7,100 65 1,795
Kent C,ounty- 20 Lobster canneries ... 18 55,770 512 20,064 21 Clam canneries 5 1,950 30 795 22 Freezing plants 3 27,530 19 9,411
Northumberland Count y- 23 Lobster canneries 8 1,
Clam cannery I f 60,447 259 12,717
Gloucester C,ountY (a)- 24 Lobster canneries 36 93,524 450 15,16S 25 Clam canneries 2 1
Freezing plants 2 f 63,974 82 12,49S
(a) The statistics for Gloucester C,ounty include Iwo lobster canneries in Restigouche C,ounty.

FISHERIES STATISTICS 183
II. Agencies of Production, 1938-Part 2. In Fish Canning and Curing (a) General Summary of Statistics-con.
Value of Materials Used Value of Products Fuel and
Electricity Fish Used sh Salt
Fish canned Fi Containers Other Total Marketed cured or Total Materials Fresh otherwise
prepared
$ $ S $ $ $ 8 S 8
6,813 970,564 2,957 117,390 56,120 1,147,031 996,419 957,249 1,953,668 1
11,500 . 303,235 5,748 44,129 562 353,674 218,714 308,134 526,84 8 2
- 324 _ 305 - 629 - 1,290 1,290 3
3,660 112,162 3,876 9,527 3,100 128,665 96,324 77,496 173,820 4
20,330 630,236 16,374 77,099 26,162 749,871 755,314 513,908 1,269,222 5
6,753 172,241 8,690 13,901 2,213 197,045 128,263 157,384 265,647 6
14,181 199,478 5,010 54,15 21,763 280,40 98,024 326,306 424,330 7
1,146 123,768 8,246 4,39 6,59 143,00 113,042 73,590 186,632 8
53,334 777,315 29,377 197,01 302,15 1,606,22 289,216 2,268,401 2,557,617 9
7,967 355,784 2,079 53,766 57 412,20 124,221 421,98 546,203 10
37,622 240,833 15,658 429,885 296,54 982,91 3,762 1,688,679 1,692,441 11
2,275 110,313 10,302 12,844 1,07 134,53 89,025 100,694 169,719 12
2,297 45,145 1,338 550 600 47,63 72,208 81 73,02413
3,173 25,270 - - 3,66 28,93 - 56,23 56,23014
37,413 236,882 15,658 425,058 296,54 974,13 3,762 1,672,94 1,676,706 15
1,708 54,331 4,537 2,075 1,073 62,016 37,453 58,28 95,742 16
3,431 79,231 5,366 10,364 3,660 98,641 51,572 93,385 144,95717
1,946 138,635 223 17,519 289 156,666 96,163 116,446 212,629 18
309 2,021 379 405 - 2,895 - 5,250 5,25019
1,803 102,293 657 18,509 130 121,589 5,988 142,839 148,82721
62 1,766 - 1,414 - 3,180 - 5,864 8,86421
289 18,922 1,33 550 600 21,410 29,182 816 29,99822
2,024 46,025 83 8,762 21 55,644 4,208 73,549 77,757 22
2,205 69,128 363 9,423 138 79,052 17,842 90,633 103,47524
2,144 26,111 - 2,968 - 31,079 43,026 8,384 51,41028

FISHERIES STATISTICS
II. Agencies of Production, 1938-Part 2. In Fish Canning and Curing (a) General Summary of Statistics-con.
Establish- Total Employees Province and County or District Capital and merits Salaries and Virages
no. S no. S
1 Quebec-Totals 135 401,586 1,170 120,755
2 Lobster canneries 16 89,300 369 26,384 3 Salmon canneries 62 1
Other fish cannery 1f 10,509 65 1,881 4 Fish curing establishments 46 225, 865 634 72,448 5 Freezing plants
Reduction plant } 75,912 .102 20,042
Bonaventure CountY- 6 Lobster canneries 3 17,550 10 1,925 7 Fish curing establishments 7 82,009 3 8 10,046 8 Freezing plants 5 12,049
• 20 3,826
Gaspe County (a) 9 Lobster canneries 2 .
Fish curing establishments 24 86,106 278 49,454 10 Freezing plants 4 63.863 82 18,216
Reduction plant 1
'Magdalen Islands-- 11 Lobster canneries 11 61,650 335 20,971 12 Fish curing establishments 12 62,850 340 16,244
Saguenay County- 13 Salmon canneries 62 1
Other fish cannery 1 } 15,509 67 2,073 Fieh curing establishments 3 J
14 British Columbia-Totals 75 15,065,019 6,103 2,465,773
15 Salmon canneries 38 11,597,913 5,065 1,761,340 16 Clam canneries
Other fish canneries 2 421,194 253 80,910 17 Fish curing establishments 19 2, 377, 645 526 377,623
Freezing plants 2 18 Reduction plants 10 668,267 259 245,900
District No. 1- 19 Salmon canneries 10
Other fish cannery 1 4, 275,829 1,370 632,020 20 Fish curing establishments 8
Freezing plant 1 407,693 124 98,986
District No. 2- 21 Salmon canneries 22
Clam canneries 2 5,665,071 3,120 874,374 22 Fish curing establishments 2
Freezing plant 1 1,530,371 157 195,630 23 Reduction plants 4 327,653 164 145,651
District No. 3- 24 Salmon canneries 6 1,724,887 690 270,590 25 Clam canneries 2 1
Other fish cannery 1 f 353,320 138 6.5,260 26 Fish curing establishments 9 439,581 245 83,007 27 Reduction plants 6 340,614 95 100,047
(a) The statistics for Gaspe County include one freezing plant in Matane County.
184

si
FISHERIES STATISTICS
H. Agencies of Production, 1938-Part 2. In Fish Canning and Curing (a) General Summary of Statistics-concluded
Value of Materials Used Value of Products Fuel and
Electricity Fish Used
° Fish canned
Fish Salt Containers matteing Total Marketed cured or Total
Fresh otherwise prepared
S s s $ $ $ $ $ s
7,242 349,471 29,767 33,554 10,185 422,977 142,678 464,806 607,484 1
2,278 115,386 984 14,498 58 130,926 29,230 142,159 171,389 2
948 3,110 - 2,740 5,850 _ 2,682 8,682 3
3,926 164,922 28,017 15,368 10,124 218,431 22,767 303,312 326,079 4
90 66,052 766 948 3 67,770 90,681 10,653 101,334 5
192 6,953 116 472 20 7,561 5,723 4,344 10,067 6
357 29,209 1,856 293 1,152 32,510 21,059 24,568 45,627 7
- 42,742 - 348 3 43,093 51,060 - 51,060 8
249 102,971 16,302 4,749 2,883 126,905 1,708 200,286 202,094 9
90 23,311 766 600 24,677 39,621 10,653 50,274 10
2,086 98,108 18 12,944 38 111,108 23,507 117,042 140,549 11
3,190 41,787 10,485 11,388 6,089 69,749 96,736 96,736 12
1,078 4,390 .224 2,760 - 7,374 - 11,077 11,077 13
220,305 7,569,173 67,976 2,698,806 113,211 10,449,196 2,600,296 15,105,025 17,705,321 14
137,526 5,449,526 15,667 2,594,689 83,045 8,142,927 585,438 13,224,996 13,810,434 15
20,939 197,558 905 35,897 8,410 242,770 131 452,271 452,502 16
22,451 1,693,294 50,728 58,494 20,479 1,822,995 2,014,727 702,604 2,717,331 17
49,389 228,795 676 9,726 1,307 240,504 - 725,054 725,054 18
44,934 2,124,726 5,264 912,417 29,761 3,072,168 351,312 4,741,976 5,092,28 19
818 453,718 4.998 22,630 7,534 488,880 389,253 250,499 639,752 20
57,706 2,759,107 8,269 1,279,532 37,882 4,084,890 232,857 6,775,836 7,008,693 21
19,865 1,075,821 4,101 12,917 393 1,093,232 1,563,603 142,825 1,706,428 22
24,670 61,424 - 5,563 182 67,169 335,469 335,469 23
25,820 577,528 2,047 409,803 15,402 1,004,780 1,40e 1,767,426 1,768,826 24
20,005 185,723 892 28,834 8,410 223,859 392,129 392,129 25
1,768 163,755 41,629 22,947 12,552 240,883 61,871 309,280 371,151 26
24,719 167,371 676 4,163 1,125 173,335 389,585 389,58527
185

Estab- Salaried Employees Province lish-
ments Male Female Total Salaries
no. no ' no. S Canada-Totals 561 552 90 772,493
Lobster canneries 215 60 10 23,499 Salmon canneries 102 188 IS 274,360 Clam canneries 25 14 2 12,635 Sardine and other fish canneries 11 43 13 82,187 Fish curing establishments 172 205 42 313,209 Freezing plants 18 12 1 20,225 Reduction plants 18 30 4 46,378
Prince Edward Island-Totals 78 7 - 2,335 Lobster canneries 61 5 - 1,365 Clam canneries 4 - - - Fish curing establishments 10 2 - 970
Nova Scotia-Totals 155 169 47 219,449 Lobster canneries 62 28 7 11,817 Salmon canneries 2 1 Clam canneries 5 f 5 1 2,529 Other fish carmerres 5 4 3 9,754 Fish curing establishments 75 1 Freezing plants 2 f 126 35 183,715 Reduction plants 4 6 1 11,634
New Brunswick-Totals 118 76 17 92,584 Lobster canneries 73 20 3 6,942 Clam carmeries 12 I Sardine canneries 3 f 39 10 69,709 Fish curing establishments 22 11 3 8,276 Freezing plants 5 3 1 3,620 Reduction plants 3 3 - 4,037
Quebec-Totals 135 84 2 17,952 Lobster canneries 16 7 - 3,375 Salmon canneries 62 l Other fish cannery 1 ( 54 ' 2 1,527 Fish curing establishments 46 22 - 12,975 Freezing plants 9 I Reduction plant 1f 1 - 75
British Columbia-Totals 75 216 21 410,173 Salmon canneries 38 133 16 272,233 Clam canneries 4 Other fish canneries 2 10 1 13,430 Fish curing establishments 19 Freezing plants 2 52 4 123,803 Reduction plants 10 21 3 30,707
2 3 4 5 6
8
9 10 11 12
13 14 15
16 17
18
19 20 21
22 23 24
25 26 27
28 29
30 31
32
33 34
186 FISHERIES STATISTICS
H. Agencies of Production, 1938-Part 2. In Fish Canning and Curing (b) Capital Invested
Land, Materials Cash and Estab- buildings, andproduots accounts Total.
Province lish- machinery on hand, and Capital mente and stocks in bills Invested
tools process,ete. receivable
no. $ $ $ 5
Canada-Totals 561 10,357,516 8,771,056 2,833,926 21,962,498
Lobster carmeries 215 852,082 132,602 235,437 1,220,121 Salmon canneries 102 4,165,501 6,407,279 1,042,542 11,615,322 Clara canneries 25 180,238 77,007 27,464 284,709 Sardine and other fish canneries 11 1,456,488 523,461 201,401 2,181,350 Fish curing establishments 172 2,841,688 1,292,752 1,199,543 5,333,983 Freezing plants 18 270,379 52,089 82,503 404,971 Reduction plants 18 591,140 285,866 45,036 922,042
Prince Edward Island-Totals 78 180,325 200 - 180,525 Lobster canneries 64 139,325 - - 139,325 Clam canneries 4 9,000 - - 9,000 Fish curing establishments 10 32,000 200 - 32,200
Nova-Scotia-Totals 155 2,060,839 986,501 710,507 3,757,847 Lobster canneries 62 329,077 49,1SS 136,685 514,950 Salmon canneries 2 1 Clam ctumeries 5 f 19,987 6,480 61 26,528 Other fish canneries 5 66,856 117,460 13,852 198,168 Fish curing establishments 75 I Freezing plants 2 f 1,466,669 779,373 ' 553,492 2,799,534 Reduction plants 4 178,250 34,000 6,417 218,667
II. Agencies of Production, 1938-Part 2. In Fish Canning and Curing (c) Employees and Salaries and Wages
BEM!

FISHERLES STATISTICS
II. Agencies of Production, 1938-Part 2. In Fish Canning and Curing (b) Capital Invested--concluded
Land, Meerials Cash and Estab- buildings, andproducts accounts Total
Province lish- nnwldnery onhand, and Capital iliels and stocks in bills Invested
tools process,etc, receivable
no. $ $ S s
New Brunswick-Totals 118 1,743,721 492,315 321,455 2,557,521
Lolostercanneries 73 323,580 74,914 78,052 476,546 Clarn.canneries 12 1 Sardine canneries 3 f 1,264,756 386,799 166,514 1,818,069 Fielicuringestabdishments 22 101,696 22,416 33,265 157,377 Freezing plants 5 44,345 3,135 42,624 90,104 Reduction plants 3 9,344 5,081 1,000 15,425
Quebec--Totals 135 317,250 44,105 40,231 401,586 Lobster canneries 16 60,100 8,500 20,700 89,300 Salmon canneries 62 1„ Other fish cannery 1 f 7,645 2,864 - 10,509 Fishcaringestablishments 46 212,567 11,510 1,788 225,865 Freezing plants 91 Itecbletion plant 1 f 36,938 21,231 17,743 75,912
British Columbia -Totals 75 6,055,381 7,217,905 1,761,733 15,065,019 Salmon canneries 38 4,151,356 6,404,015 1,042,542 11,597,913 Clam canneries 4 Other fish canneries 2 282,627 90,129 48,438 421,194 Fislacuring establishments 19 Freezing plants 2 1,230,764 510,074 636,807 2,377,645 Reduction plants 10 390,634 243,687 33,946 668,267
II. Agencies of Production, 1938-Part 2. In Fish Canning and Curing (c) Employees and Salaries and Wages-concluded
1Wage-earners Piece-Workers $
Male Female Total Wages Male Female Total Wages
no. no. 8 no. no. 8'
5,529 3,563 2,775,425 1,815 2,935 680,037 1
1,690 2,882 263,398 39 57 2,456 2
874 156 936,184 1,652 2,265 555,758 3
111 144 33,679 13 122 11,948 4
390 83 245,209 10 382 98,142 5
2,024 284 974,522 86 82 7,964 6
166 6 63,457 27 1,364 7
274 8 258,976 15 - 2,405 8
510 653 61,010 26 38 2,027 9
479 641 56,202 18 32 1,650 10
7 12 662 3 6 250 11
24 4,146 5 - 127 12
2,062 1,014 897,092 29 4 3,016 13
754 891 124,576 5 _ 377 14
33 22 5,320 - 4 ' 8015
104 43 62,003 - - - 16
1,133 57 669,129 16 - 1,90617
38 1 36,064 8 - 683 18
754 1,229 239,212 56 520 104,672 19
332 1,113 59,611 16 25 429 20
306 85 156,232 13 397 99,43221
76 30 21,209 27 71 3,44722
33 1 16,427 27 1,36423
7 - - 5,733 - - 24
652 106 101,103 26 - 1,70025
123 237 23,009 - - 26
7 2 354 - - - 27
424 162 57,773 26 - 1,70028
96 5 19,967 - - 29
1,551 261 1,457,008 1,678 2,373 568,59230
845 154 933,349 1,652 2,263 555,75831
73 05 57,152 7 97 10,32832
411 36 253.036 12 11 78433
222 6 213,471 . 7 - 1,72234
187

188 FISHERIES STATISTICS
II. Agencies of Production, 1938—Part 2. In Fish Canning and Curing (d) Number of Wage-earners by Months
January February March April Estab-
Province lish-
ments Fe- Fe- Fe- Male me Male Male Male male male male male
no. no. no. no. no. no. no. no. no.
1 Canada—Totals 561 2,010 104 1,692 114 1,784 166 2,892 394
2 Lobster canneries 215 85 - 20 - 11 - 339 181
3 Salmon canneries 102 233 24 194 16 219 24 S 07 51
4 Clam canneries 2.5 42 15 (II 50 92 70 52 81
5 Sardine and other fish canneries 11 250 27 200 24 245 13 310 20
6 Fish curing establishments 172 1,227 36 1,039 22 990 56 1,066 57
7 Freezing plants 18 49 2 46 2 40 2 43 2
8 Reduction plants 18 124 - 132 - 187 1 275 2
9 Prince Edward Island—Totals 78 - - - - - - 9 1
10 Lobster canneries 64 - - - - - - 9 1
11 Clam canneries 4 - - - - - - - - -
12 Fish curing establishments 10 - - - - - - - -
13 Nova Scotia—Totals 155 1,236 46 1,001 38 931 66 1,210 257
14 Lobster canneries 62 70 - 11 - S - 240 160
15 Salmon canneries U } Clam canneries - - - - 2 - 8 23
16 Other fish canneries 5 72 13 54 15 43 10 71 18
17 Fish curing establishments 75 l Freezing plants 2 f 1,073 33 914 23 857 56 894 56
18 Reduction plants 4 21 - 22 - 24 - 27 -
19 New Brunswick—Totals 118 192 17 181 20 233 16 379 33
20 Lobster canneries 73 12 - 6 - - - S7 20
21 Clam canneries 12 1,, Sardine canneries 3 f 133 16 132 19 192 15 234 12
22 Fish curing establishments 22 20 - 18 - 23 - 38 -
23 Freezing plants 5 22 1 20 1 13 1 15 1
24 Reduction plants 3 5 - 5 - 5 - 5 -
25 Quebec—Totals 135 5 - 5 - 5 - 15 -
26 Lobster canneries 16 3 - 3 - 3 - 3 -
27 Salmon canneries 6;2 l Other fish cannery f - - - - - - -
28 Fisk. curing establishments 46 I - I - I 9 -
29 Freezing plants 11 } Reduction plant 1 - 1 - I 3 -
30 British Columbia—Totals 75 577 11 503 56 612 81 1,219 103
31 Salmon canneries 38 233 24 194 16 219 24 807 51
32 Clam canneries 4 Other fish canneries 2 i 87 13 75 40 100 58 '49 48
33 Fish curing establishments 19 Freezing plants 2 159 4 131 - 135 1 150 2
34 Reduction plants 10 98 - 105 158 1 243 2

FISHERIES STATISTICS 189
II. Agencies of Production, 1938-Part 2. In Fish Canning and Curing (d) Number of Wage-earners by Months-concluded
May June July August Septeniber October November Deceniber
Male 1 Male Feie Male n
i , Male MaleEn'e. ale Feie Male Feie Male Male ale 21 no. no. no. no. no. no. no. no. no. no. no. no. no. no. no. no.
5,126 2,692 5,591 2,397 4,875 885 4,689 1,314 4,405 1,134 4,012 697 3,262 273 2,270 110 1
1,567 2,349 1,490 2,081 450 436 452 948 376 762 179 262 80 - 69 - 2
1,167 43 1,24 76 1,363 109 1,341 150 1,175 118 1,032 158 62 10 343 11 3
39 34 64 42 42 48 64 68 78 75 44 47 69 5 42 20 4
397 1 S 497 66 592 105 571 86 516 88 405 78 35 73 266 71 5
1,532 242 1,801 125 1,859 175 1,681 81 1,719 79 2,007 142 1,829 69 1,307 36 6
97 2 130 2 179 7 171 6 192 6 177 6 14 2 80 2 7
307 4 363 5 390 5 409 5 349 6 198 4 16 2 163 - 8
450 503 43 474 73 28 158 209 138 180 31 30 6 - - - 9
443 503 421 46 41 19 127 203 110 168 24 30 - - - - 10 - - 4 9 5 6 7 12 - - - - - -11
7 - 14 - 28 - 26 - 21 -. 7 - -12
2,036 1,121 2,10 98 1,691 316 1,315 126 1,351 108 1,181 95 1,430 48 1,169 2313
835 1,003 76 86 267 20S 80 37 74 29 74 21 66 - 36 - 14
27 21 1 1 18 17 20 2 30 - 6 - 29 - 16 - 15
118 16 15 4 163 50 147 39 140 37 104 18 92 10 66 16
1,007 8 1,10 4 1,186 41 1,051 4 1,048 41 1,19 55 1,211 37 1,031 2117
49 - à 60 - 34 - 59 1 4 1 32 1 20 - 18
510 59 617 531 528 98 753 SO 611 619 41 311 207 75 252 7 19
155 57 145 491 16 20 220 70 177 565 6 211 6 - 3 - 20
264 15 359 39 414 77 432 7 312 84 26 73 239 67 173 71 21
SO - 56 - 49 - 49 2 44 29 4 29 24 7 18 7 22
36 52 1 42 1 45 41 1 3 1 30 1 2 23
à - 5 - 7 - 7 - 7 - - 8 - -24
481 422 659 325 658 329 500 1 492 11 45 15 265 2 42 - 25
154 266 155 250 126 169 25 - 1 ' - 15 - 8 - 3 - 26
- - 1 - 4 - - 2 2 -
305 156 467 74 466 134 369 1 370 9 323 8 172 1 21 - 28
22 - 36 1 6 6 62 5 10 5 111 5 85 1 18 - 29
1,619 53 1,776 83 1,922 114 1,933 183 1,783 153 1,660 213 1,254 148 807 3630
1,156 43 1,239 7 1,346 109 1,319 148 1,14 118 972 158 598 102 327 1131
36 - 39 - 48 - 49 30 75 30 77 32 89 1 69 18 32
172 6 205 3 212 1 204 1 287 1 474 51 448 45 274 933
253 4 293 4 316 4 361 4 276 4 117 2 119 - 137 - 34

2 3 4 5 o 7 8
14 15
16 17
18
20 21
22 23 24
26 27
28 29
16,722 121,381
155
62 2 5 5
75 2 4
118
73 12 3
22 5 3
135
16 62
1 46
9
75
38 4 2
19 2
10
561
215 102 25 11
172 18 18
78
64 4
10
2,358 3,121 1,247 4,026 3,623
702 1,645
553
536 14
3
5,911
1,299
29 385
4,178 20
4,614
297
3,786
102 429
262
226
30
6
5,382
3,120
1,060
12 1,190 '
18,401 30,852 8,445
27,105 20,002 3,887
12,689
5,038
4,868 140 30
31,989
9,032
246 2,914
22,557 240
31,581
2,545
25,258
707 2,984
2,281
1,956
265
60
47,4E3
30,846
6,998
240 9,405
22
3
326
30
19 296
14 226
14 226
8
3
5
100
30
70
190 FISHERIES STATISTICS
II. Agencies of Production, 1938-Part 2. In Fish Canning and Curing (e) Fuel and Electricity
Province Estab-lish
ments
Biturainous C,oal Anthracite Coal
QuantitY Value Quantity Value
110.
Canada-Totals
Lobster canneries Salmon canneries Clam canneries Sardine and other fish carmeries Fish curing establishments__ Freezing Plants Reduction plants
91PrInce Edward Island-Totals
Lobster canneries Clam canneries Fish curing establishments
13 Nova Seotia-Totais
Lobster canneries Salmon nunneries Clam crumeries Other fish canneries Fish curing establishments Freezing plants Reduction plants
19INew Brunswick-Totals
Lobster canneries Clam canneries Sardine canneries Fish curing establishments Freezing plants Reduction plants
25 Quebec-Totals
Lobster canneries Salmon canneries Other fish cannery Fish curing establishments Freezing plants Reduction plant
30 British Colurnbia-Totals
31 Salmon canneries 32 Clam canneries
Other fish canneries 33 Fish curing establishments
Freezing plants 34 Reduction plants
ton ton
10 11 12

FISHERIES STATISTICS
II. Agencies of Production, 1938-Part 2. In Fish Canning and Curing Fuel and Electricity-concluded
Fuel Oil Gasoline CkuilOil and Wood Other Electricity Total
IMeselOil Fuel purchased value« fuel and
Qmantity Value Quantity Value Qmantity Value Quantity Value Value Qmseity Value titity
gal. s gal. s gal. $ cord $ $ Kw. H. g s
60,870 12,800 6,197 1,5353,325,781 151,127 10,157 39,916 8,6797,161,637 68,867 407,631 1
24,488 5,084 213 48 1,500 190 2,194 9,673 392 5,504 274 34,092 2
15,461 3,281 2,039 529 1,859,272 71,782 2,008 10,462 2,740 1,931,045 18,797 138,443 3
535 136 7 2 1,168 108 315 1,271 39 6,002 286 10,287 4
2,495 662 517 136 280,495 20,395 4,065 9,645 - 150,463 4,877 62,820 5
16,082 3,220 2,616 630 42,013 4,424 1,206 7,040 4,3174,937,464 40,923 01,301 6
50 15 - - 2,200 244 353 1,234 7 114,344 2,776 8,163 7
1,759 393 805 1901,139,136 56,984 16 91 1,184 16,815 934 72,465 8
2,915 896 - - 600 71 875 4,01 - 225 24 9,997 9
2,330 681 - - - 854 3,94 - - - b,491 1C
35 10 - - - - 21 75 - 158 10 23511
560 155 - - 600 71 - - - 67 15 2711:
29,978 5,852 391 105 367,628 23,178 2,813 9,328 3,5081,491,851 29,567 106,753 12
19,491 3,727 93 22 1,500 190 210 922 316 3,499 147 11,356 14.
359 93 7 2 - - 4 20 7 400 12 380 1 1
880 242 210 63 2,334 269 2,172 5,561 - 149,480 4,851 13,900 11
9,245 1,780 81 18 36,994 3,919 422 2,785 3,185 1,329,388 23,794 58,274 11
- - - - 326,800 18,800 5 40 - 9,084 763 19,813 1:
5,527 1,372 658 125 89,941 8,140 3,492 10,797 528 17,882 688 53,334 11
1,751 404 115 25 - - 1,108 4,700 76 2,005 127 7,96721
1,458 411 153 34 87,741 7,896 1,873 3,950 32 346 41 37,6222
2,208 464 390 66 - 165 936 420 7,608 319 2,275 2
50 15 -2,200 244 346 1,211 _ 19 30 2,2972
60 1 - - - - - 7,731 171 3,1732
2,459 578 1,530 382 350 54 612 3,863 7 644 77 7,2422,
913 212 5 1 _ 22 109 - - - 2,27821
- - 20 6 - - 200 94 - - - 948 2
1,541 366 1,505 375 350 54 383 2,78 - 644 77 3,9262
- - - _ - - I 23 7 - - 902'
19,966 4,152 3,618 9232,867,265 122,684 2,365 11,911 4,3365,651,035 38,510 230,3053'
15,241 3,224 2,039 529 1,859,272 71,782 1,828 9,620 2,7401,930,045 18,783 131,5203
518 99 134 33 191,588 12,338 290 1,210 - 6,479 261 20,9393
2,508 454 640 171 4,069 380 236 1,030 7123,713,911 19,4114 22,451 3
1,699 375 805 190 812,336 38,184 11 51 1,184 - - 49,359 3 ,
191
0
2

FISHERIES STATISTICS
II. Agencies of Production, 1938—Part 2. In Fish Canning and Curing (f) Power Equipraent
Ordinarily in use
Estab- Gas, Gasoline Province lish- Steam Engines and Water Wheels
ments and Diesel Engines Oil Engines and Turbines other than Turbines
Diesel
no. no. h.p. no. h.p. no. h.p. no. h.p.
1 Canada Totals 561 223 4,347 107 2,866 353 1,101 57 1,121
2 Lobster canneries 215 79 415 4 31 173 421 -
3 Salmon canneries 102 85 1,869 63 1,486 47 311 50 949
4 Clam canneries 25 6 85 4 53 10 32 -
5 Sardine and other fish canneries 11 18 570 8 455 11 55 1 20
6 Fish curing establishments 172 4 38 18 424 103 512 1 10
7 Freezing plants 18 1 15 1 15 2 10 -
8 Reduction plants 18 30 1,355 9 402 7 63 .5 142
9 Prince Edward Island—TotaLs 78 21 115 2 31 63 185 -
10 Lobster catmeries 64 24 115 - - 56 151 -
II. Clam canneries 4 - - - - 2 3 -
12 Fish curing establishments 10 - - 2 31 5 31 -
- 13 Nova Scotia—Totals 155 43 131 14 291 103 292 -
14 Lobster canneries 62 34 215 3 28 50 118 -
15 Salmon canneries 2 l Clam canneries 5 f 2 11 - - 3 13 -
16 Other fish cannreries 5 2 45 I 20 7 26 -
17 Fish curing establishments 75\ Freezing plants 2 I 4 38 10 246 43 135 -
18 Reduction plants 4 1 125 - - - - -
19 New Brunswick—Totals 118 33 535 6 291 81 349 - -
20 Lobster canneries 73 18 70 1 3 47 93 -
21 Clam canneries 12 l Sardine canneries 3 j 13 438 4 273 7 27 -
22 Fish curing establishments 22 - - - - 24 214 -
23 Freezing plants 5 1 15 1 15 2 10 - -
24 Reduction plants 3 1 15 - - 1 .5 -
25 Quebec—Totals 135 4 25 1 12 46 159 - -
26 Lobster canneries 16 3 15 - - 20 59 - -
27 Salmon canneries 62'1 Other fish cannery 1 J. - - - - - - -
28 Fish curing establishments 46 - - 1 12 25 93 - -
29 Freezing plants 9 1 Reduction plants 1 J 1 10 - - 1 7 - -
30 British Columbia—Totals 75 119 3,235 81 2,238 60 419 57 1,121
31 Salmon canneries 38 84 1,868 63 1,486 46 309 50 949
32 Clam canneries . 4 Other fish canneries 2 1 8 162 7 215 a 20 1 20
33 Fish curing establishments 19 Freezing plants 2 - - 5 135 6 39 1 10
34 Reduction plants 10 27 1,205 9 402 5 51 5 142
In reserve or idle
Estab- Gas, Gasoline Province lish- Steam Engines and Water Wheels
ments and Diesel Engines Oil Engines and Turbines other than Turbines
Diesel
no. no. h.p. no. h.p. no. h.p. no. h.p.
1 Canada—Totals 561 14 467 4 195 8 119 - -
2 Prince Edward Island—Totals 78 - - - -- - - 3 Nova Scotia—Totals 155 2 153 1 120 a 88 - - 4 New Brunswick—Totals 118 4 75 - 3 19 - - 5 Quebee—Totals 135 2 75 -- 1 2 - - 6 British Columbia—Totals 75 6 164 3 75 1 10 - -
192

FISHERIES STATISTICS
II. Agencies of Production, 1938-Part 2. In Fish Canning and Cur'ing (f) Power Equipment-concluded
Ordinarily in use-concluded
Electric Motors Total Electric Motors Total operated by Total
Primary operated by Power power generated Electric Boilers Power purchased power Equipment by primary Motors
power
no. h.p. no. h.p. no. h.p. no. h.p. RO. h.p. no. li.p.
740 9,738 310 3,456 1,050 13,197 88 959 398 4,418 278 12,825 I
256 367 4 8 260 875 1 1 5 9 160 3,508 2 245 4,615 106 1,100 351 5,715 7 60 113 1,160 53 5,102 3
20 170 11 61 31 231 - 11 61 10 393 4 38 1,100 14 182 52 1,282 67 680 81 862 15 890 5
126 984 164 1,916 290 2,900 3 18 167 1,934 15 520 6 4 40 à 112 9 152 - 5 112 3 355 7
51 1,962 G SO 57 2,042 10 200 16 280 22 2057, 8
86 331 2 3 SI 334 - 2 3 47 945 9
80 266 - - 80 266 - - - 44 80510 2 3 1 1 3 4 - 1 1 2 40 11 7 62 1 2 8 64 - 1 2 1 10 12
160 1,020 171 1,452 331 2,472 13 281 184 1,733 78 2,406 13
87 361 4 8 91 369 1 1 5 9 55 3,18714
5 24 - • - 5 24 - - - 3 4915 10 91 14 182 24 273 2 80 16 262 4 235 16
57 419 150 1,202 207 1,621 - - 150 1,202 14 675 17 1 125 3 60 4 185 10 200 13 260 2 25018
120 1,176 5 24 125 1,202 60 560 65 584 61 1,916 19
66 166 - - 66 166 - - 50 1,08620
24 738 - - 24 738 60 560 60 560 9 705 21 24 214 3 13 27 227 - - 3 13 - - 22
4 40 1 1 5 41 - - 1 1 1 75 23 2 20 1 10 3 30 - 1 10 1 50 24
51 196 1 1 52 197 1 5 2 6 12 420 25
23 74 - - 23 74 - - 11 330 26
- - - - - - - - - - -27 26 105 1 1 27 106 1 5 2 6 1 90 28
2 17 - - 2 17 - - _ _ -29
320 7,013 131 1,979 451 8,992 14 113 145 2,092 SO 7,13830
243 4,612 106 1,100 349 8,712 7 60 113 1,160 52 5,08831
19 417 10 60 29 47 7 5 40 15 100 8 268 32
12 184 13 809 25 993 2 13 15 822 1 25 33 46 1.800 2 10 43 1,81 - - 2 10 19 1,757 34
In reserve or dle-concluded
Electric Motors Total Electric 'Motors Total operated by Total
Primary operated by Power power generated Electric Boilers Power purchased power Equipment by primary Motors
Power
no. h.p. no. h.p. no. h.p. no. h.p. no. h.p. no. h.p.
26 781 8 49 34 830 5 40 13 89 6 426 1
6 361 8 49 14 410 _ - - 8 49 3 212 2
7 94 - 7 94 - - _ _ _ -
_ 4
3 77 _ 3 77 _ _ _ - _ - à
10 249 - 10 249 5 40 5 40 3 214 f
89667-13
193

194 FISHERIES STATISTICS
II. Agencies of Production, 1938—Part 2. In Fish Canning and Curing (g) Classification of Establishments According to Value of Production
Establishments having a production valued at
Province Estab- lish-
ments $5,000 to under
$10,000
$10,000 to under
$20,000
$20,000 to under
$50,000
$50,000 and over
tartini
Under $5,000
no.
Canada—Tot.als
Lobster canneries Salmon canneries Clam canneries Sardine and other fish canneries Fish curing establishments Freezing plants Reduction plants
Prince Edward Island—Totals
Lobster canneries Clam canneries Fish curing establishments
Nova Scotia—Totals
Lobster canneries Salmon. canneries Clam canneries Other fish canneries Fish curing establishments Freezing plants Reduction plants
New Brunswick—Totals
Lobster canneries Clam canneries Sardine canneries. Fish curing establishments Freezing plants Reduction plants
Quebec—Totals
Lobster canneries Salmon canneries Other fish cannery Fish curing establishments Freezing plants Reduction plant
no. no. 110. no. no.
96 96
54 58
1 1 1
37 29 1 7 2 1
BrItlsb Columbia—Totals
Salmon canneries Clam canneries Other fish canneries Fish curing establishments Freezing plants Reduction plants
20
20
. -
30
11
19
24
16
6
19
7
10
2
3
1
2
17
42
28
1
12 1
16
11
2 3
17
2
13
2
4
4
95
5
63 22
'3
1
75 2 4
118
73 12 3
22 5 3
135
16 62
1 46
75
38 4 2
19 2
10
52
20 1 3 1
20 3 4
5
4
1
26
10
1 1
13 1
10
4
2 2
4
2
7
1
4 2
561
215 102
25 11
172 18 18
78
64 4
10
155
62 2 5 5
}
236
77 63 18
2 67
6 3
36
23 4 9
38
8
5 1
23 1
41
9 • 12
1 1
81
6 38 2 7
19 1 8
19
5
3
10 1
4
1
3
58
38
3
10 7

IRO
FISHEREES STATISTICS
II. Agencies of Production, 1938—Part 2. In Fisb. Canning and Curing (h) Classification of Establishments According to Number of Employees
Establishments
Estab- Province lish-
ments Employing Employing Han%:Ing
fewer than five persons ..'
five persons and ove,- em (
puneesa) .
no. no. no. no.
Canada—Totals 561 91 403 67
Lobster canneries 215 8 207 - Salmon canneries 102 6 30 57 Clam canneries 25 4 18 3 Sardine and other fish canneries 11 2 9 - Fish curing establishments 172 65 101 6 Freezing plants 18 3 15 Reduction plants 18 3 14 1
-
Prince Edward Island—Totals 78 O 69 -
Lobster canneries 64 2 62 - Clam canneries 4 - 4 - Fish curing establishments 10 7 3 -
Nova Scotia—Totals 15 37 111 1
Lobster canneries 62 - 6 - Salmon canneries 2 1 Clam canneries 5 .1 1 3 2 Other fish canneries 5 1 4 - Fish curing establishments 75 1. Freezing plants 2 f 33 40 4 Reduction plants 4 2 2 -
New Brunswick—Totals 118 16 10 1
Lobster canneries 73 4 6 - Clam canneries 12 1 Sardine cannerie. 3 I 3 1 - Fish curing establishments 22 8 1 - Freezing plants 5 - S - Reduction plants 3 1 1 1
Quebee—Totais 13.5 22 54 51
Lobster canneries 16 2 14 - Salmon canneries 62 1 Other fish cannery 1 f 6 - 51 Fish curing establishments 46 11 33 Freezing plants 9 1 Reduction plant i f 3 7 -
British Columbia—Totals 75 7 68 -
Salmon canneries 38 _ 38 -
Clam canneries / Other fish canneries 1 5 _ Fish curing establishments 19 f Freezing plants 2 f 6 15 - Reduction plants 10 _ 10 -
(a) Work is performed by proprietors.
89667-131
195

196 FISHERIES STATISTICS
M. (1) Classification of Vessels and Boats used in the Sea Fisheries according to Principal Rinds of Fish Taken, 1938
Vessels Fishing for
Groundfish
Boats Fishing for
Groundfish Fishing Districts
Value
Prince Edward Island
Kings County (all) 1
Queens County (all) 2
Men
no.
486
375 42,500
3 4
Vessels Fishing for
Fishing Districts
Groundfish
Value
Nova Scotia
32 414 28,770 111 41 563 14,350 110
Richmond C,ounty- 1 Inverness county line to St. Peter's canal including Ile Madame 2 St. Peter's canal to Cape Breton county line
15 173 5,250 45 17 217 11,250 62 28 478 31,200 150
Cape Breton County- 3 Richmond county line to White Point inclusive and head of East
Bay included 4 White Point to Bridgeport inclusive 5 Bridgeport and head of East Bay to Victoria county line
122 5,800 30 6 76 3,800 27
Victoria County- 6 South of Path End inclusive 7 Path End to Green Cove inclusive 8 Green Cove to Inverness county line
Inverness County- 9 Vittoria county line to Broad Cove
10 Broad Cove included to Richmond county line
Cumberland County- 11 From New Brunswick line to Lewis Head 12 From Lewis Head to Colchester county line 13 Bay of Fundy shore
Colchester County- 14 Northumberland Strait shore 15 Bay of Fundy shore
Pistou County- 16 From Colchester countyl me to Pictou Harbour
17 Pictou Harbour including Pictou Island t,o Antigonish county line
18 Antigonish County (all)
7,250 90,000

FISHERIES STATISTICS
III. (1) Classification of Vessels and Boats used in the Sea Fisheries according to Principal Binds of Fish Taken, 1938—con.
Boats Fishing for
Herring Mackerel Salmon Lobsters Oysters
No. Value Men No. Value Men No. Value Men No. Value Men No. Value Men
$ no. $ no. $ no. $ no. $ no.
84 132,500 932 62 14,900 119 6 1,200 6 589 132,750 960 8 800 8 1
180 45,000 320 100 25,000 280 - - 278 68,600 526 18 180 20 2
192 48,000 394 40 9,000 80 - - - 199 49,750 390 270 21,710 270 3 450 90,000 885 450 90,000 885 - - - 355 71,000 645 41 410 41 4
VceselsfIshingfor
Halibut Swordfish Scallops
No. Tonnage Value Men No. Tonnage Value Men No. Tonnage Value Men
$ no. $ DO. $ DO.
- - - - 32 414 28,770 111 - - - - 1 - - - 10 140 3,500 30 - - - - 2
- - - - 15 173 5,250 45 - - - - 3 - - - - 17 217 11,250 62 - - - - 4 28 478 31,200 150 29 518 34,200 158 - - - - 5
- _ - f - - - _
_ 8 122 5,800 3 - _ _ - î
- - - 6 76 3,800 2 - - ê
- - - 1(
_
- - - _ _ - _ _ _ - - - 1 4
_ _ _ - - - - 11
_
197

FISHERIES STATISTICS
III. (1) Classification of Vessels and Boats used in the Sea Fisheries according to Principal Nil' Ids of Fish Taken, 1938-con.
Boats Fishing for
Fishing Districts Groundfish Herring Mackerel
No. Value Men No. Value Men No. Value Men
$ no. $ no. S no.
Nova Scotla-con.
Richmond County-
1 Inverness county line to St. Peter's canal, including Ile Madame 280 46,060 496 90 36,000 190 120 32,000 240
2 St. Peter's canal to Cape Breton county line 279 50,660 470 SO 24,004) 160 109 21,800 211
Cape Breton County-
3 Richmond county line to White Point inclusive and head of East Bay included 48 13,360 80 2 600 4 10 3,000 20
4 White Point to Bridgeport inclusive 220 49,965 380 130 24,500 242 82 17,368 164 5 Bridgeport and head of East Bay to Victoria
county line. 122 12,364 191 122 12.364 191 28 5,600 56
Victoria County-
6 South of Path End inclusive 138 14,340 187 12 1,250 20 - - - 7 Path End to Green Cove inclusive 75 15,000 140 40 13,000 100 40 7,500 50 8 Green Cove to Inverness county line 75 15,300 90 60 6,000 75 30 3,000 40
Inverness County-
9 Victoria county line to Broad Cove 190 58,000 470 180 62,000 425 212 68,000 575 10 Broad Cove included to Richmond county line 77 15,400 166 249 26,140 381 23 4,600 69
Cumberland County-
11 From New Brunswick line to Lewis Head - - - 4 600 8 3 450 6 12 From Lewis Head to Colchester county line. - - - - - - 4 600 4 13 Bay of Fiindy shore 14 2,525 20 14 2,525 20 - - -
Colchester County-
14 Northumberland Strait shore 1 200 2 I 200 2 1 200 15 Bay of Fundy shore I 150 1 1 150 1 - - -
Pictou C,ounty-
16 From C,olchester county line to Pictou Harbour 6 1,200 12 15 2,200 20 2 300 4 17 Pictou Harbour including Pictou Island to Anti-
gonish county line. 35 7,000 55 55 11,000 55 40 8,000 V 40
18 Antigonish County (all) 110 19,250 150 365 52,275 461 85 14,875 100
198

FISHERIES STATISTICS
III. (1) Classification of Vessels and Boats used in the Sea Fisheries according to Principal Kinds of Fish Taken, 1938—con.
Boats Fishing for
199
0
1 2 3
4 5
7
8
fiWnion Swordfish Lobsters (33nders Scallops
No. Value lien No. Value lien No. Iiidue lien No. 'Value lien No. Value lien
$ no. S no. $ no. $ no. S no.
6 125 6 - - - 256 39,800 511 - - - - - - 1 8 320 16 - - - 251 75,300 382 - - - - - - 5
- - - - - - 30 9,00 7 - - - - - -1 27 5,400 53 115 28,700 292 225 50,67 413 - - - - - - 4
- - - - - - 122 12,364 19 - - - - - - 1
40 4,800 70 - - - 124 14,760 186 25 1,710 40 - - - 12 1,750 12 - - - 72 15,200 107 - - - - - ' 21 3,600 21 - - - 131 14,320 158 - - - - -
47 11,500 75 - - - 160 53,000 354 - - - 41 11,500 75 7 600 12 - - - 239 2,800 384 28 1,120 67 - - - 1
- - - - - - 355,250 98 - - - - - 1 - - - - - - 202 30,300 280 SO 800 80 - - 1
2 350 3 - - - 9 1,67 11 - - - - - - 1
- - - - - - 21 4,200 31 11 2,20 49 - - 1 46 2,535 47 - - - - _ _ _ _
2 300 4 - - - 201 40,200 345 33 2,150 5 - _ - 1
26 520 25 - - 112 22,400 193 30 3,000 7 - _ _ 1
65 6,500 75 - - - 365 52,275 461 27 875 2 - - I

200 FISIIERIES STATISTICS
III. (1) Classification of Vessels and Boats used in the Sea Fisheries according to Principal Bin.ds of Fish Taken, 1938—con.
Vessels Fishing for
Fishing Districts Groundfish
no.
Nova Scotia—con.
1 12 800 25 345 33,000 15 191 15,000
1 2 3
Guysborough County-
From .Antigonish county line to Fox Island inclusive From Fox Island to Isaac's Harbour From Isaac's Harbour to Halifax county line
4 129
61
6 75 3,500 3 33 1,100
10 592 78,400 22 286 12,100
20 11
123 132
Halifax C,ounty-
4 From Guysborough county line to East Ship Harbour 5 From West Ship Harbour to but not including Cole Harbour 6 Cole Harbour to Pennant Point inclusive 7 Irom Pennant Point to Lunenburg county line
8 Hanta CountY (all)
21 282 12,600 57 3,740 740,000
12 168 12,250
15 714 105,000 57 691 51,100
57 816 59,200
7 110 5,400
2 50 10,000
11
Lunenburg County-
9 From Halifax county line to and including Mahone Bay 10 From Mahone Bay to Queens county line
Queens CountY (all)... 56
Shelburne County-
12 From Queens 'county line to but not including Shelburne town 13 From and including Shelburne town to Yarmouth county line
14 Yarmouth County (all) 271
Digby County--
15 From Yarmouth county line to the Sissiboo river 16 The Sissiboo' river included to Annapolis county line including
Digby Neck
7
10
17 Annapolis County (all)
18 Kings County (all)
mrie
75 1,010
237 195

6
8
FISHERIES STATISTICS
III. (1) Classification of Vessels and Boats used in the Sea Fisheries according to Principal Kinds of Fish Taken, 1938—con.
Vessels Fishing for
Halibut Swordfish Scallops
No. Tonnage Value Men No. Tonnage Value Men No. Tonnage Value Men
5 no. S no. 5 no.
_ _ _ 1 12 800 4 - - - -1 25 345 33,000 129 25 345 33,000 129 - - - - 2 15 191 15,000 61 15 191 15,000 61 - - - - 3
6 75 3,500 2 - - -- - - - -4 3 33 1,100 1 - - _ _ _ _ _ - a 1 43 4,500 15 7 86 4,900 29 - - - - f
- _ _ 15 185 9,250 90 _ _ _ - i
- - - - 21 282 12,600 75 - - - - 1 9 810 180,000 225 5 120 10,000 20 4 110 12,500 18 11
- - - - 9 117 7,200 36 1 24 800 4 1:
5 308 60,000 125 2 55 15,000 15 - - - - 1: - - - - 7 86 6,500 26 - - - - 1:
9 145 11,000 60 5 146 12,000 28 - - - -
_ - - - - _ _ 14 265 59,000 611
- _ - - - - 28 420 44,800 841
201
4
89667--14

Groundfish Fishing Districts
III. (1) Classification of Vessels and Boats used in the Sea Fisheries according to Principal Binds of Fish Taken, 1938-con.
Boats Fishing for
Mackerel
No. Value Value Men
DO.
Nova Scotia-concluded
Guysborough C,ounty-
From Antigonish county line to Fou Island inclusive
From Fox Island to Isaac's Harbour, From Isaac's Harbour to Halifax
county line
30,125 90,000
76,000
25,500
47,600
20,000 35,000
24,000
300 225
c.4 120
Halifax County-
4 From Guysborough county line to East Ship Harbour
5 From West Ship Harbour to but not including Cole Harbour
6 Cole Harbour to Pennant Point inclu-sive
7 From Pennant Point to Luhenburg county line
8 Hanta County (all)
Lunenburg County-
9 From Halifax county line to and in-cluding Mahone Bay
10. From Mahone Bay to Queens county line
Queens County (all)
Shelburne County-
12 From Queens county lino to but not including Shelbunie town
13 From and including Shelburne t,own to Yarmouth county line
14 Yarmouth County (all)
Digby County-
lb From Yarmouth county line to the Sissiboo river
16 The Sissiboo river included to Anna-polis county line including Digby Neck
17 Annapolis County (all)
18 Ir.ings County (all)
11
13,500 161 90 13,500 161 77 11,550
18,000 320 75 7,50 100 75 7,500
50,800 465 110 33,000 125 145 43,500
27,000 290 140 14,400 250 140 16,400
175 17,000
250 62,500
95 19,000
15,000 180 150 15,000 250
62,500 350 250 62,500 370
32,400 336 160 30,000 260
35,000 320 120 12,000 140
24,000 1,200 30 7,500 45
29,800 241 67 15,060 114
30,700 135
101,250 560 12 240 18
39,550 230
5,700 120 60 1,200 120
450
175
90
100
250
204
225
400
118
135
241 300
190
90
143
313
225
4
1
2 3
142
100 rag
255
260
225
370
175
202, FISHERIES STATISTICS

FISHERIES STATISTICS
III. (1) Classification of Vessels and Boats used in the Sea Fisheries according to Principal Kinds of Fish Taken, 1938-con.
Boats Fishing for
Salmon Ssvordftsh Lobsters Oysters Scallops
No. Wile Men No. Value lien No. Value Men No. Value Men No. Value lien
S no. S no. $ no. S no. $ no.
21 1,500 24 1 200 4 250 25,000 337 - - - - - - 1 21 2,100 21 - - - 600 66,000 874 - - - - - - 2
40 5,560 40 40 16,000 80 196 78,400 284 - - - - 3
81 2,000 81 - - - 328 36,850 533 - - - 2 350 4 4
12 450 22 - - - 260 20,500 338 - - - - - - 5
64 7,400 64 - - - 201 45,680 201 - - - - - - 6
65 4,400 70 - - - 240 14,400 250 - - - - - - 7
492,600 50 - - - - - - - - - _ _ -8
75 1,500 75 - - - 250 20,000 290 - - - 40 6,000 80 9
50 1,000 50 - - - 250 62,500 370 - - - 16 4,000 3010
194 4,265 194 - - - 202 32,200 336 - - - - - - 11
_ _ _ _ _ - 180 15,000 208 - - - - - - 12
-. - - - - 500 162,500 1,000 - - _ _ _ - 13
17 221 17 - - - 602 150,500 1,135 - - - - - - 14
- _ - _ _ - 97 29,100 193 - - _ - _ - 15
_ _ - - _ - 160 33,000 235 - - - 24 24,800 7216
_ - - - _ _ - _ - - - - - - -11
2 300 2 - - - 25 1,800 32 - - - - - - If
89667--141
203

204
2
FISHERIES STATISTICS
III. (1) Classification of Vessels and Boats used in the Sea Fisheries according to Principal Kinds of Fish Taken, 1938-eon.
Vessels Fishing for Boats Fishing for
Fishing Districts Groundfish Groundfish Fferring
Ton-
No. Value Men No. Value Men No. Value Men nage
$ no. S no. $ no.
New Brunswick-Sea Fisheries
Charlotte County-
1 From International boundary line to Public Wharf, Back Bay 1 11 800 3 50 9,500 70 127 6,800 96
2 From Public Wharf, Back Bay to Saint John county lin. e - - - - 50 8,900 70 7 750 16
3 West Isles and Deer Island 3 45 1,200 9 27 13,500 36 474 113,825 337 4 Campobello 1 11 1,500 5 165 83,800 238 207 10,620 149 5 Grand Malian Island 6 70 4,200 21 240 100,000 325 .450 202,500 500
Saint John County-
I Saint John Harbour including Mispec and Saint John river - - - - 9 2,900 17 - - -
7 The remaining portion of Saint John county 1 11 800 2 24 8,160 34 44 4,880 44
8 Albert County (all) - - - - - - - - - -
Westmorland County-
9 Bay of Fundy wat,ershed - - - - - - - - - hi Northumberland Strait shore... - - - - 20 870 35 400 3,200 800
Kent County-
11 From Westmorland county line to Chockpish river 1 11 1,000 3 64 11,200 104 200 23,450 400
12 From Chockpish river to Point Sapin 11 119 4,700 31 120 38,000 350 250 46,500 476 13 From Point Sapin to Northumber-
land county line - - - - 40 5,000 SO 30 3,000 60
Northumberland C,ounty-
l4 From Kent county line to Point-au- Car 13 130 7,475 22 50 8,000 100 15 3,000 30
[5 From Point-au-Car to lower end o Grand Down Island - - - - - - - - - -
16 From lower end of Grand Down Island to Gloucester county line 1 12 900 2 30 7,350 90 65 1,950 140
[7 Northwest and Southwest Miramichi rivers - - - - - - - - - -
Gloucester County-
8 From Northumberland county line to Shippeean Gully inclusive - - - - 45 4,000 90 90 2,000 225
9 From Shippegan Gully to Bass River. 98 1,827 33,209 418 200 23,000 418 240 2,400 375 [0 From Bass River inclusive to Resti-
gouche county line 4 44 2,700 14 72 12,280 151 290 8,000 385 [1 Miscou and Shippegan Islands 50 720 72,000 200 590 30,538 1,180 380 15,200 760
2 Restigoucbe County (all) - - - - 20 1,500 40 50 1,000 100

FISHERIES STATISTICS
III. (1) Classification of Vessels and Boats used in the Sea Fisheries according to Principal Binds of Fish Taken, 1938-con.
Boats Fishing for-concluded
Sardines Mackerel Salmon Lobsters Oysters
No. Value Men No. Value Men No. Value lien No. Value Men No. Value Men
$ no. $ no. $ no. 1 no. $ no.
127 6,800 96 - - - - - - 2 150 3 - - - 1
210 15,750 204 - - - - - - 24 4,320 39 - - - 2
- - - 474 113,825 337 - - - 8 600 10 - - - 3
- - - - - - - 6 830 14 - - -4
- - - - - - - 200 80,000 350 - - - 5
5 600 5 - - - 80 15,200 160 7 1,900 14 - - - 6
44 4,880 44 - - - 73 24,820 141 52 13,27 64 - _ - -7
- - - - - - 6 265 7 5 480 5 - - -8
- - - - - - 14 1,110 23 - _ _ _ _ - 9
- - - 70 10,500 125 - - - 354 53,100 708 10 80 2010
- - - 20 3,000 40 1 300 2 250 32,200 490 450 4,500 481 11
- - - 15 3,000 30 15 4,500 30 275 55,000 525 60 2,100 103 12
- - - 30 3,000 60 2 100 4 IGO 16,500 320 - - - 13
- - - 25 13,000 50 65 5,000 130 120 20,000 240 200 6,000 25014
- - - - - - 91 455 g - - - 60 480 6015
- - - 30 2,550 85 10 1,660 20 110 27,500 134 58 1,740 901E
- _ _ _ - - - - - - - - - - -13
- - - 33 2 500 75 1,300 6 110 21,000 220 - - - 16 ,
- - - - - - 22 220 44 160 17,600 272 110 1,100 185 11 ,
- _ - - _ 8 500 18 8 1,200 88 128 16,500
_ _ -
- - - - - - 120 2,300 123 40 4,000 6 - - - 21
205

206 FISHERIES STATISTICS
III. (I) Classification of Vessels and Boats used in the Sea Fisheries according to Principal Kinds of Fish Taken, 1938—con.
Vessels Fishing for Boats Fishing for
Fishing Districts Groundfu3h Groundfish
No. Tonnage Value Men No. Value Mea
$ no. $ no.
Quebec—Sea Fisheries
Bonaventure County-
1 From head of tidal waters to but not including Miguasha Point - - - - - - -
2 Miçuesha Point included to Grand Cascapedia river inclusive - - - - 6 1,655 15
3 From but not including Grand Cascapedia river to New Carlisle inclusive - - - - 63 8,100 133
4 Paspebinc included to Gaspe county line S 80 4,000 26 260 37,475 440
Gaspe County-
5 From Bonaventure countY line to west Bide of
' Breche-a-Manon river 31 341 15,500 131 292 43,550 617
6 From west side of Breche-a-Manon river to Mal Bay 7 72 3,500 29 165 56,885 459
7 Point St. Peter included to Cape Gaspe including Gaspe Bay - - - - 226 40,095 470
8 From Cape Ga-spe to Little Fox river inclusive - - - - 223 54,630 403
9 From Little Cape to Fame Point inclusive - - - - 131 24,140 221
10 From St. Helier to western boundary of Duchesnay township - - - - 542 124,060 974
11 From westerns boundary of Duchesnay township to Cape Chat - - - - 309 26,855 384
Magdalen Islands-
12 Southern subdistrict 1 18 1,200 5 456 75,690 1,282
13 Northern subdistrict - - - - 100 25,000 260
Saguenay County-
14 Tadoussac to but not including Bersimis - - - - - - -
15 Bersimis to but not including Godbout nver - - - - 28 7,900 66
16 Godbout river included to Point-a-Jambon inclusive - - - - 55 11,000 110
17 From but not including Pointe-a-Jambon to river Pigou inclusive - - - - 42 5,200 34
18 From but not including river Pigou to Havre St Pierre inclusive - - - - 106 18,310 473
19 From but not including.Havre St. Pierre to but not including Kegashka river - - - - 45 12,000 94
20 Ilegashka river included to but not including Mutton Bay - - - - 143 50,050 201
21 Mutton Bay included to Bonne Esperance inclusive - - - - 148 44,400 241
22 From but not including Bonne Esperance to Blanc Sablon inclusive - - - - 131 22,500 171
23 Matane County (all) - - - - 70 5,600 143
24 Rimouski County (all) - - - - - - -

207 FISHERIES STATISTICS
III. (1) Classification of Vessels and Boats used in the Sea Fisheries according to Principal Kinds of Fish Taken, 1938—con.
Boats Fishing for
Herring Mackerel Salmon Lobsters
No. Value Men No. Value Men No. Wile Men No. 'Value Men
$ no. $ no. $ no. $ no.
180 14 - - - 20 2,220 40 - - - 1
96 4,488 120 - - - 96 4,488 120 96 4,488 120 2
370 11,100 453 4 1,200 12 2 60 4 28 840 28 3
45 1,128 40 à 2,090 15 24 600 30 50 1,250 100 4
18 270 18 2 800 7 9 180 9 16 320 50 5
26 390 26 - - 16 400 16 51 1,275 56 6
32 800 3 - - 51 1,275 51 17 340 17 7
_ - _ - _ _ 1 30 1 _ _ -8
_ _ - - - - - 9 -
_ - - - - - 20 800 20 - - -10
- - - - - - 15 375 18 - - - 11
138 5,420 261 140 41,040 312 - - - 176 52,800 34012
35 3,500 50 87 21,750 236 - - - 234 70,200 427 13
10 2,000 22 - - - 30 900 60 - - - 14
_ _ _ - - - 9 370 18 - - -15
- - _ - - - 24 1,600 42 - - -16
35 1,050 3 - _ _ 38 1,140 5 - - - 17
_ - - - - - 30 1,890 4 - - - 18
_ _ - - - 23 5,500 4 - - - 19 -
- -
- - _ _ - 20 2,14 2 - -20
2 600 2 - - - 39 9,70 4 - - 21
_ _ - - - - 14 2,20 2 - - 22
104 2,040 128 - - 14 280 1 - _ - 23
- - - - - - - - - - -24

208
1
1
2
FISHERIES STATISTICS
III. (1) Classification of Vessels and Boats used in the Sea Fisheries according to Principal Kinds of Fish Taken, 1938—con.
Vessels Fishing for
Fishing Districts Groundfish Halibut
No. Tonnage Value Men No. Tonnage Value Men
$ DO. $ DO.
British Columbia
District No. 1— •
1 Fraser River and Howe Sound 9 250 91,800 24 28 961 385,000 124
District No. 2—
2 Massett Inlet and northern Graham Island, Queen Charlotte Islands - - - - -
._ -
3 Southern Queen Charlotte Islands, including Skidegate Inlet - - - - - - - -
4 The Naas river - - - - - - -
5 Skeena river including Prince Rupert and the Upper Skeena - - - - 34 621 346,000 190
6 Grenville-Principe area - - - - - - -
7 Butedale including Gardiner canal - - - - - -
8 Bella Bella and Fitzhugh Sound - - - - - - -
9 Bella Cools, Dean and Burke Channels - - - _ - - -
10 Rivers Inlet - - - - - - -
Il Smiths Inlet - - - - - _ -
District No. 3--
i2 Cape Scott to Tuna Point including all waters between Vancouver Island and the mainland. - - - - 9 143 54,750 27
13 Tuna Point to Shelter Point including main- land waters opposite - - - - - _ _
[4 Shelter Point to French Creek 8 353 48,000 22 - -
5 Mainland waters from George Point to Gower Point - - - - - -
.6 French Creek to Shoal Harbour including Nanaimo 9 104 35,000 18 - - -
7 Shoal Harbour to Sambrio Point including Victoria - - - - - - -
8 Sanabrio Point to Pachena Point including Nitinat Arm - - - - - - -
9 Barclay Sound and Port Alberni - - - - 2 23 10,000 6
'0 Wreck Bay to Estevan Point including Clayo- quot Sound. - - - - - - -
1 Estevan Point to Tatchu Point including Nootka Sound - - - - - - -
2 Tatchu Point to Cape Cook including Kyuquot Sound - - - - - - -
3 Cape Cook to Cape Scott including Quatsino Sound - - - - 2 36 10,000 7

FISHERIES STATISTICS 209
HI. (1) Classification of Vessels and Boats used in the Sea Fisheries according to Principal Kinds of Fish Taken, 1938-con. '
Vessels Fishing for
Herring Pilchards Salmon
No. Tonnage Value Men No. Tonnage Value Men No. Tonnage Value Men
S no. $ no. $ no.
- - - - - - - - 110 2,508 882,000 754 1
1 30 15,000 7 - - - - 16 309 93,500 95 2
- - _ _ _ _ _ 29 566 198,000 172 3 - - - - - - 22 506 169,000 142 4
7 249 104,000 48 - - - - 1 26 12,000 4 5 - - - - - _ _ _ 26 561 189,000 162 6
2 87 40,000 14 - - - 61 1,364 500,000 383 7 _ _ _ _ _ _ _ 33 777 300,000 211 8
3 92 36,500 21 - - - 9 237 74,000 60 9
6 191 82,500 40 - - - 11 251 105,000 69 10
_ _ _ _ _ _ _ 7 143 81,500 43 11
1 21 3,000 7 - _ - _ 126 2,679 958,500 856 12
_ _ _ - _ _ _ _ 52 968 310,000 11313
_ _ _ _ _ _ _ 59 1,114 462,000 373 14
_ _ _ _ _ _ 13 198 76,500 60 15
12 216 90,000 156 - - - 36 690 260,000 203 16
_ _ _ _ _ _ 1 10 3,500 417
_ _ _ - - 21 423 183,000 135 18
12 420 220,000 84 12 420 220,000 84 34 798 347,000 22619
8 300 80,000 56 12 540 120,000 84 21 340 170,000 6820
10 339 156,000 70 26 1,058 443,000 193 12 194 45,000 6021
8 256 105,000 59 26 1,078 435,000 185 4 61 16,000 24 22
37 1,597 618,500 171 37 1,597 618,500 171 17 381 114,000 71 23

Boats Fishing for
Fishing Districts
no. $
60
11
55
45
41
51
31
20
8
2
3,600
24,700
9,900
33,000
18,100
21,810
18,100
18,000
10,000
7,000
8
62
11
57
49
45
51
31
20
5
210 FISHERIES STATISTICS
III. (1) Classification of Vessels and Boats used in the Sea Fisheries according to Principal Kinds of Fish Taken, 1938—con.
British Columbia—concluded
District No. I-
1 Fraser River and Howe Sound
District No. 2—
2 Massett Inlet and northern Graham Island, Queen Charlotte Islands
3 Southern Queen Charlotte Islands, including Skidegate Inlet
4 The Naas river
5 Skeena river including Prince Rupert and the Upper Skeena
6 Grenville-Principe area
7 Butedale including Gardiner connl
8 Bella Bella and Fitzhugh Sound
9 Bella Cools, Dean and Burke Channels
10 Rivers Inlet
11 Smiths Inlet
District No. 3—
12 Cape Scott to Tuna Point including all waters between Vancouver Island and the mainland
13 Tuna Point to Shelter Point including mainland waters opposite
14 Shelter Point to French Creek
15 Mainland waters from George Point to Gower Point
16 French Creek to Shoal Harbour including Nanaimo
17 Shoal Harbour to Sambrio Point including Victoria
18 Sambrio Point to Pachena Point including Nitinat Arm
19 Barclay Sound and Port Alberni
20 Wreck Bay to Estevan Point including Clayoquot Sound
21 Estevan Point t,o Tatchu Point including Nootka Sound
22 Tachut Point to Cape Cook including Kyuquot Sound
23 Cape Cook to Cape Scott including Quatsino Sound

FISHERIES STATISTICS
III. (1) Classification of Vessels and Boats used in the Sea Fisheries according to Principal Kinds of Fish Taken, 1938-concluded
Boats Fishing for
"Halibut Herring Salmon
No. Value Men No. Value Men No. Value Men
$ no. $ no. $ no.
- - - 17 8,500 17 2,612 1,314,000 2,873 1
- - - - - 330 275,825 415 2
- - - - - - 93 90,250 141 3
- - - - - - 408 234,977 474 4
68 19,500 219 1 800 4 1,136 896,105 1,666 5
- - - - - 122 114,964 217 6
- - - - - - - 141 76,985 171 7
- - _ _ _ _ 430 269,000 400 8
- - - - - 272 109,565 275 9
- - - - - 1,772 650,520 1,878 10
- - - - - - 469 247,025 487 11
27 3,830 3 - - - 768 368,885 830 12
_ - - _ - - 439 97,530 445 13
- - - - - - 158 55,350 164 14
- - - 6 2,400 12 160 82,200 175 15
- - - 16 12,000 22 197 57,900 204 16
6 3,000 6 - - - 82 34,000 8817
- - - - - - 91 36,460 116 18
- - - - - - 300 119,900 32419
2 4,000 4 - - - 81 56,000 8320
- - - - - - 35 26,500 5521
- - - - - - 90 90,000 98 22
- - - - - - 90 60,680 78 22
211

>12 FISHERIES STATISTICS
III. (2) Imports and Exports of Fish and Fishery Products
(a) Statement showing the Quantities and Values of Fish and Fishery Products Im-ported into Canada for Consumption during the Calendar years 1936, 1937 and 1938
(Compiled by the External Trade Branch)
1936 1937 1938 Classification
Quantity Value Quantity Value Quantity Value
$ $ S Fish and Fishery Products-
Fish- Crabs or clams in sealed containers.. lb. 1,614,580 248,708 1,234,697 225,011 1,254,856 204,391 Cod, haddock and pollock-
Dried lb. 1,735,276 56,795 759,731 32,385 1,582,553 56,688 Fresh lb. 1,556,323 21, 798 1,409,437 19,958 2,098,493 27,237 Smoked lb. 1,050 100 156 8 - - Wet salted or pickled lb. 294,659 13,379 67,278 2,424 397,726 8,148
Halibut, fresh lb. 437,472 37,040 426,430 38,584 611,325 51,665 Halibut livers, fresh lb. 30,880 12,868 36,561 16,408 4,023 1,135 Herrings, fresh lb. 277,916 3,897 294,732 4,370 3,629,533 14,432 Herrings, pickled or salted lb. 3,707,280 132,108 2,493,167 90,943 2,772,260 111,241 Herrings, smoked lb. 212,711 15,967 423,666 23,444 229,551 20,557 Kippered herrings in sealed contakersib. 729,378 53,827 557,093 45,007 369,820 31,624 Herring (not including kippered her-
ring in sealed containers) packed in oil or otherwise, in sealed containers (From February 26, 1937) lb. - - 94,250 12,208 120,972 14,631
Live fish and fish eggs for pronagating purposes - 10,554 - 11,976 - 11,849
Lobsters, canned, n.o.p lb. 522,595 200,061 170,620 68,530 212,249 80,650 Lobsters, fresh , lb. 193,333 21,469 928,934 137,273 537,705 59,314 Mackerel, fresli lb. 31,731 2,035 20,560 1,551 22,629 1,879 Mackerel, pickled lb. 1,673 49 21,320 559 1,526 126 Oysters, canned in cans not over one
pint can 141,045 13,956 159,909 14,306 107,624 11,743 Oysters, canned in cans over one pint
but not over one quart can 5,571 2,161 15,879 5,805 18,009 5,626 Oysters, canned, in cans exceeding one
quart qt. 3,034 1,896 18,054 8,114 25,702 10,032 Oysters in the shell bbl. 1,136 , 7,644 1,183 8,492 1,055 7,996 Oysters, shelled in bulk gal. 116,674 206,797 118,491 227,597 111,945 197,515 Oysters, prepared or preserved, n.o.p..1b. 18,889 5,186 26,424 8,742 25,571 7,932 Oysters, seed and breeding, imported
for the purpose of being planted in Canadian waters - 3,926 - 2,289 - 4,456
Salmon, canned, prepared or pre- served, n.o.O• lb. 67,370 12,170 41,494 7,276 37,129 6,320
Salmon, fresh lb. 2,755,480 202,185 1,461,109 163,385 5,160,825 453,624 Salmon, pickled or salted lb. 117,028 12,722 284,863 26,124 161,494 13,865 Salmon, smoked lb. 16,389 2,824 13,478 2,813 5,072 1,429 Sardines, anchocies, sprats and pil-
chards (Included herring prior to Feb. 26, 1937) packed in tin boxes weighkg-
Over 20 but not over 36ounces each.box 4,868 1,409 7,003 3.113 8,282 3,009 Over 12 but not over 20 ounces each. box 194,838 21,231 66,036 10,725 64,943 12,533 Over 8 but not over 12 ounces each, box 91,051 9,710.
66,456 8,682 52,317 6,907
8 ounces or less box 5,611,983 336,278 4,374,952 296,682 4,513,259 335,526 Squid, fresh - 21,775 - 24,445 - 15,714 Tuna fish, prepared or preserved,
n.o.p lb. 1,228,464 188,932 1,126,777 171,523 1,628,500 230,923 Other fish-
' Dried lb. 105,054 16,136 163,110 25,119 153,356 19,980 Fresh lb. 602,327 51,844 704,614 61,401 7,561,835 84,970 Pickled or salted lb. 1,304,090 61,775 627,238 39,514 905,482 51,709 Preserved in oil, /1.0.1). • - 21,161 - 31,044 - 24,105 Preserved or prepared, n.o•P - 85,567 _ 85,817 - 73,904 Smoked or boneless lb. 9,361 1,238 55,747 5,464 24,491 4,238
Fishery Products- Ambergris - - - 112 - ' 119 Fish offal or refuse cvrt. 10,239 15,477 12,180 23,278 19,115 59,289 Fur skins, undressed, the produce of
marine animals no. 835 3,333 12,679 14,770 588 1,452 Oils-
Cod liver oil gal. 403,412 345,263 380,529 369,109 303,872 334,984 Halibut liver oil, crude or refuled
(From February 28, 1937) - - - 39,706 - 14,327 Seal oil gal. 380,401 132,552 316,967 127,197 228,978 63,721 Whale and spermaceti oil gal. 19,862 10,372 32,666 18,879 25,180 10,824 Other fish od gal. 18,173 51,343 43,223 72,874 30,875 46,959
Pearl, mother of, unmanufactured - 18,183 - 17,123 - 3,834 Shells-
Tortoise and other shells, unmanu- factured - 458 - 10,671 - 6,554
Shells, n.o.p. crushed or ground...cwt 334,273 83,955 247,897 59,215 228,811 59,235 Sponges of marine production - 59,970 - 71,012 - 59,478 Turtles - 2,046 - 2,118 . - 2,891 Whalebone, unmanufactured lb. 1,956 586 209 165 1,347 448 Other articles, the product of the fish-
eries - 75,735 - 81,791 - 92,989 Total Fish and Fishery Products. - 2,918,251 - 2,877,131 - 3,036,227

FISHERIES STATISTICS
III. (2) Imports and Exports of Fish and Fishery Products-con.
(b) Statement showing the Quantities and Values of Fish and Fishery Products of Canadian Origin Exported from Canada during the Calendar years, 1936, 1937 and 1938
(Compiled by the External Trade Branch)
1936 1937 1938 Classification
Quantity Value Quantity Value Quantity Value
$ 8 $
Fish and Fishery Products- Fish-
Alewives, salted cwt. 28,478 58,289 39,100 68,775 39,766 80,378 Bait fish cwt. 7,180 8,252 - 5,027 5,044 9,515 10,949 Clams, canned cwt. 191 2,068 93 851 369 6,307 Clams, fresh cwt. 47,464 53,855 56,362 65,311 40,077 55,379 Codfish, boneless or dried cwt. 22,474 195,744 19,541 171,668 , 21,037 187,096 Codfish dried, n.o p cwt. 213,444 1,074,572 205,992 1,210,661 210,278 1,175,645 Codfish, fresh and frozen cwt. 45,984 289,400 46,493 325,319 38,980 253,135 Codfish, green-salted (pielded) cwt. 163,760 490,135 97,301 280,815 94,809 282,413 Codfish, smoked cwt. 18,268 183,698 17,870 183,441 17,664 179,759 Eels, fresh and frozen cwt. 5,671 34,213 16,454 147,636 9,257 81,070 Haddock, canned CNVÈ. 222 2,230 98 796 72 667 Haddock, dried cwt. 4,398 16,849 2,185 9,768 1,780 7,797 Haddock, fresh and frozen cwt. 51,147 309,754 37,432 243,255 31,033 191,734 Haddock, smoked cwt. 8,048 82,032 8,744 87,897 8,432 81,383 Halibut, fresh and frozen cwt. 643l9 595,318 68,542 679,670 90,199 910,203 FIerrings, lake, fresh and frozen cwt. 14,047 163,926 13,107 169,509 19,060 285,700 Herrings, sea, canned cwt. 13,168 99,068 21,701 168,996 32,332 250,523 Herrings, sua, dry-salted cwt. 313,14 391,08 287,026 346,131 191,528 221,608 Herrings, sea, fre.sh and frozen cwt. 307,36 270,219 204,773 176,276 152,742 169,561 Herrings, sea, pickled cwt. 19,241 47,113 26,024 59,342 18,325 51,402 Herrings, sen, smoked . cwt. 54,256 175,828 61,919 197,535 35,872 131,157 Lobsters, canned cwt. 38,162 2,080,005 37,167 1,984,167 41,170 1,898,838 Lobsters, fresh cwt. 98,864 2,100,762 113,630 2,438,400 106,879 1,952,697 Mackerel, fresh and frozen cwt. 4,689 21,292 22,072 132,567 12,936 71,604 Mackerel, pickled cwt. 89,145 279,816 89,143 419,291 120,245 427,366 Oysters, fresh cwt. 413 2,75 54 3,44 3,290 3,677 Pilchards, canned cwt. 7,496 57,315 6,978 50,673 12,851 104,832 Pollock, hake and cusk, dried cwt. 46,377 164,079 78,702 306,919 67,237 280,571 Pollock, hake and cask, fresh and
frozen cwt. 5,580 16,258 2,798 7,391 1,499 5,178 Pollock, hake and cusk, green-salted.cwt. 24,706 36,478 20,297 37,107 14,842 27,95 Pollock, hake and cask, smoked cwt. 65 743 - - _
Salmon, canned cwt. 471,838 6,367,323 591,793 7,533,648 488,400 7,128,194 Salmon, dry-salted (chum) cwt. 168,615 335,282 122,582 308,921 77,202 192,454 Salmon, fresh and frozen cwt. 154,659 1,455,878 146,421 1,652,145 121,243 1,567,860 Salmon, pickled cist 14,539 241,728 25,092 445,001 33,925 582,972 Salmon, smoked . cwt. 274 6,244 256 6,050 259 6,268 Salmon trout or lake trout, fresh and
frozen civt 45,970 468,710 50,709 556,442 48,814 526,130 Sardines (little fish mou) cwt 54,108 471,819 78,643 693,890 71,260 629,037 Scallops and other shellfish, fresh- cwt 14,217 245,827 14,677 237,979 6,817 110,344 Smelts, fresh and frozen cwt. 83,170 819,604 57,414 541,473 61,774 620,945 Sturgeon, fresh and frozen cwt. 1,658 46,942 2,567 80,590 3,656 119,951 Swordfish, fresh and frozen cwt. 21,552 270,862 14,971 203,274 13,005 158,539 Tongues and Sounds cwt. 697 5,633 565 4,200 79 7 5,186
Tullibee, fresh and frozen cwt. 18,576 113,114 6,141 45,349 10,545 76,433
Whitefish, fresh and frozen cwt. 119,234 1,458,827 131,426 1,605,862 125,626 1,514,870
Other fresh water fish, fresh and frozen cwt. 314,584 2,345,781 381 445 2,768,714 350,147 2,607,136
Other fresh water fish, salted, dried ,
smoked or pickled cwt. 714 6,763 163 2,112 45 669
Other sea fish, fresh and frozen cwt. 8,325 60,056 16,484 101,736 8,944 62,217
Other sea fish, salted, dried, smoked or pickled cwt. 2,528 12,389 2,395 12,718 1,928 10,942
Other sea fish, canned or preserved, /1.0.1) cwt. 17 313 173 4,129 233 2,667
Fishery Products- Fish livers, entrails and viseem far
oil. (From April 1, 1936) cwt. 3,833 369,543 7,118 214,130 20,355 280,581
Fish meal cwt. 320,079 539,483 475,525 879,891 430,309 798,735
Fish offal or refuse cwt. • 13,687 17,889 13,241 17,870 23,378 53,086
Oils- Cod liver oil gal. 52,768 35,130 40,814 29,665 87,392 55,952
Pilchard oil gal. 433,341 94,373 838,790 219,793 1,788,165 305,114
Seal oil • gal. - 13,916 5,984 10 10
Whale oil Other fish oil
gal. 551,129 128,898 553,960 149,489 458,236 144,969
gal. 737,991 242,206 1,304,002 444,957 1,474,904 469,446
Seal skins, undressed no. 14,900 39,951 33,152 68,268 18,746 37,676
Other articles the product of the fisheries (Included "Fish livers" prior to April I, 1936) - 94,196 - 89,21 - 88,718
Total Fish and Fishery Products - 25,393,102 - 28,902,152 - 27,543,680
213

mcn
tzi
14■3
III. Miscellaneous—(2) Imports and Exports of Fish and Fishery Products—con.
(c) Statement showing Quantities of Fish and Fishery Products of Canadian Origin, Exported from Canada, by Countries of Destination, during the Calendar Year 1938
(Compiled by the External Trade Branch)
Ale- Clams Codfish
Eels, Haddock Halibut
Countries to which Exported wives ' Bait fresh
fish Fresh Green- Fresh Fresh
salted Canned Fresh Boneless, Dried, and salted Smoked and Canned Dried and Smoked and
drie d n 'a'P' frozen (pickled) frozen frozen frozen
cwt. cwt. cwt. cwt. ewt. cwt. cwt. cwt. cwt. cwt. cwt. cwt. cwt. cwt. cwt.
United Kingdom - - 47 - 23 17 - 15 - 1 - - - 31,475 Ireland (Eire) - - - - - - - - - - - - - Aden - - - - - - - - - - - - Africa-
British East - - - - - - - - - - - - British South - - 1 - - 12 - - 36 - - - 6 Southern Rhodesia - - - - - - - - - 23 - - - - British West-
Gold Coast - - - - - - - - - - - - - Nigeria - - - - - - - - - - - - - - Sierra Leone - - - - - - - - - - - - - -
Bermuda - - - - 409 4,133 51 - 145 - 2 - 60 127 5 British East Indies-
British India - - - - - 3 - - - - - - 8 Burma - - - - - - 5 - - - - - - 6 Ceylon - - - 1 - - 2 - - - - - - 108 Straits Settlements - - - - - - 3 - - - - - - 141 Other British East Indies - - - -- - - - - - - - - -
British Guiana 44 - - 0 3 2,046 4 16 - - 202 - 32 - • British Honduras - - - - - 42 - - - - - - 3 -
British Sudan - - - - - - - - - - - - - - British West Indies-
Barbados 120 - - - 8 1,621 12 - 30 - - 89 2 19 - Jamaica 21,324 - 1 - 20 16,609 2 - 74 - - 17 12 51 4 Trinidad and Tobago 16 - 1 - 10 39,313 112 - 14 - - 70 6 4 2 Other British West Indies 779 - - - 3 4,676 3 - - 3 54 1 28 -
Gibraltar - - - - - - - - - - - - - - Hong Kong - - 10 51 -
. - 303 6 - - - - 3 200 Malta - - _ - _
- - - _ _ _ _ - 3 Newfoundland - - - 14 - 3,123 - 1,467 1 - - - - 118 - Oceania—
Australia - - 9 - - - 112 - 114 - - - - - 351 Fiji - - - - - - 1 • -- - - - - - 4 Now Zealand - - - - - - - _ _ - _ _ _ - Other Oceania - - - - - - - _ _ _ _ _ _ -
Palestine - - - - - - _ _ _ _ _ - - Argentina - _ - - 2 - - _ _ _ _ _ _ - - Belgium - - _ • - - - - - - - - - - 194
Belgian Congo - - - - - - - _ _ _ _ _ - _ Bolivia - - - - - - - _ _ _ _ _ - - - Brazil - - - - 1 4,212 - - - - - 494 - - -
er==r=arnmarars!!!!

fir
1 Chile China Colombia Costa Rica Cuba Czechoslovakia Denmark Ecuador Egypt Finland France
French Africa French Guiana
• French Oceania French West Indies Madagascar St. Pierre and Miquelon
Germany Hayti Iraq Italy Japan Liberia Mexico Morocco Netherlands
Netherlands East Indies Netherlands Guiana Netherlands West Indies
Nicaragua Norway Panama Persia Peru Poland and Danzig Portugal
Portuguese Africa Portuguese Asia
Salvador San Domingo Siam Sweden Switzerland United States
Alaska American Virgin Islands Guam Hawaii Philippine Islands Puerto Rico
Venezuela
•••
8 31 10 8 •••
420 37,472
9
1 377
•■■
20 .1■1.
•■•
11 1 3,122 •■•
5,42- 1 14,92- 8 207 •■•
SD
LL
SII
VIS
SZ
IUS
HS
I3
25
•••
118 43 4
135 15 1,826
4
13 1
166 26
602
o O 3 ■■•
3,757 - 4 •■•
2 •■. •••
100 •••
-
-
-
-
-
-
-
•••
9- 4
58,274
062
27,078 16
.1■1. ■■• 129
335
3
242
45 51
56,332
454
7,78- 1
1- 4
93,33- 7 5
30,952 62- 2
84
16,774 6,135 38,290 35,380 20,572 294 5,560 4,021
•■•
•■• ■••
•••
90,199 8,432 - -
385
8,047
1,780 31,033 72 17,604 9,257 94,809 38,980 210,278 21,037 9,515 360 40,077 39,766 Total Exports •
To British Empire...
To Foreign Countries
32,322 81 438 05 45 1,467 642 71,670 453 75 09 22,283 57,877
çn
30,962 7 1,342 17,249 9,257 93,342 38,338 138,602 20,684 40,002 300 9,515 17,483

Miscellaneous—(2) Imports and Exports of Fish and Fishery Products—con.
(c) Statement showing Quantities of Fish and Fishery Products of Canadian Origin, Exported from Canada, by Countries of Destination, during the Calendar Year 1938—con.
(Compiled by the External Trade Branch)
Herrings, Herrings,sea Lobsters Mackerel Shell Fish Pilchards
lake, Countries to which Exported fresh Fresh Fresh Dr - Or ,
and Canned Y and Pickled Smoked Canned Fresh and Pickled Canned frozen frozen
Oyst ors, Oth , salted fh fh
f rozen res res
owt, cwt. cwt. cwt. cwt. cwt. cwt. cwt. cwt. cwt. civt, cwt. cwt.
United Kingdom - I - - - 105 27,758 - 12 27 40 Ireland (Eire) - - - 36 - _ - - Aden . - - - - - - - - Africa-
British East - • 62 - - - - - - - - - - British South - 10,530 - - - - - - - - 102 Southern Rhodesia - 343 - - - - - - - - 12 British West-
Gold Coast - - - - - - - - Nigeria - 6 - - - - - - - Sierra Leone - 20 - - - - - - - - - -
Bermuda - 62 - 4 31 79 13 56 153 1 21 1 British East Indies-
British India - 87 - I - 6 2 7 1 - Burma - 10 - - - - - - - - Ceylon - 1 - 1 - 1 - - - - - Straits Settlements - 2,560 22 - - - 2 - - 2 - Other British East Indies - 120 - - - - - - - -
British Guiana - 2,379 - 7 226 1,275 8 - - 5,972 17 - 181 British Honduras - 337 - - - - - - - - British Sudan - - - - - - - - - - - British West Indies-
Barbados - 141 - 4 781 1,772 - - 505 - - 87 Jamaica - 760 - - 4,694 135 - - 74,605 2 - 1 Trinidad and Tobago - 1,017 5 3 406 4,429 5 1 1,332 - - - Other British West Indies - 85 28 3 2,130 1,456 - 1 1,817 - - 17
Gibraltar - - - - - - - - - - - Hong Kong - 45 - 534 - 110 1 - - - - 4 Malta - 57 - - - - - _ _ - Newfoundland - 24 - 2 4 - - 1 73 - - Oceania-
Australia - 8,453 2 57 - - - - - - - - 8,184 Fiji - 1 - - - I ..• - - - - 21 New Zealand - 1,339 - - - 14 25 - - - - - 4,113 Other Oceania - - - - - - - - - _ -
Palestine - 232 - - _ - _ _ _ _ - - Argentina - _ - - _ _ - _ - Belgium - - - _ 597 _ - - - -
Belgium Congo - - _ -- - - - - - Bolivia - - - _ - - _ - - - - Brazil - - - - - - - - - -

Chile China Colombia Costa Rica Cuba Czechoslovakia Denmark Ecuador Egypt Finland France
French Africa French Guiana French Oceania French West Indies Madagascar St. Pierre and Miquelon
Germany Hayti Iraq Italy Japan Liberia Mexico Morocco Netherlands
Netherlands East Indies Netherlands Guiana Netherlands West Indies
Nicaragua Norway Panama Persia Peru Poland and Danzig Portugal
Portuguese Africa Portuguese Asia
Salvador San Domingo Siam Sweden Switzerland United States
Alaska American Virgin Islands Guam Hawaii Philippine Islands Puerto Rico
Venezuela
7 9
28,972 74 38 108 314 19- 2
175 15
158 6 1 7
172 2,023
217
10 •••
1,488
- 9 2 28 3
399 8,869 19 511
SDLL
SII
VIS
SaI 2
1311
SI3
162,486 8
870
139 1 6
69 2
77 753 7
2 15 54 2
2 1 28
378
229
166 10 1 250
49
397
42
121
•••
I
-
l
32,272
644
273
0,893
4,909 53
4.785 6,752 3,199 12,873 106,869
9,217 6, 3 90 3
68 63
1- 1
_ -
700 4,138
18,320 35,872
8,270 9,377
10,055 26.495
152,044 11 19,060
2
•••
12,851 6,817 120,245 3,290 12,936 100,879 41,170 191,528 152,742 32,332 19,060 Total Exports
To British Empire
To Foreign Countries
12,772 51 112 84,388 60 2 27,856 014 57 28,072 79 6,766 3,178 35,857 12,876 106,877 13,314 152,128 191,471 3,060 19,060

0'3
SD
LL
SIL
V,L
S S
SI2
12H
SI3
III. Miscellaneous—(2) Imports and Exports of Fish and Fishery Products—con.
(c) Statement showing ..uantities of Fish and Fishery Products of Canadian Origin, Exported from Canada, by ountries of Destination, during the Calendar Year 1938—con.
(Compiled by the External Trade Branch)
Pollock, hake and cusk Salmon Salmon
trout Sur- or Sword- () r dines Smelts . geon, fish, Tongues
lake (little fresh Countries to which Exported Fresh Dry- Fresh fresh fresh and
Green- trout fish and Dried and Canned salted and Pickled Smoked fres
dh frozen and and sounds
salted in
frozen (chum) frozen frozen frozen an oil) frozen
cwt. cwt. cwt. cwt. cwt. cwt. cwt. cwt. cwt. ewt. cwt cwt. cwt. cwt.
United Kingdom - - 171,320 - 50,238 3,107 - - - - - - Ireland (Eire) - - - - - - - - - - - - Aden - - 6 - - - - - 10 - - - Africa-
British East - 1,097 - - - - - 420 - - - British South - - 32,015 - 130 - 1 - 30,023 - - Southern Rhodesia - - 555 - - - - - 500 - - - British West-
Gold Cost - - 529 - - - - - - - - Nigeria - 526 - - - - - 6 - - Sierra Leone - 164 - - - - - 58 - -
Bermuda 63 - - 259 - 86 3 - - 404 2 - - 14 British East Indies— .
British India - 4,576 - 115 1 13 - 1,372 - - Burma - 48 - 7 - 1 18 - - Ceylon - - 382 - 67 - . 121 - - - Straits Settlements - - 720 - 264 - 17 - 781 - - Other British East Indies - - - - - - - - 120 - -
British Guiana 29,291 - 2,167 - 21 116 1 1,802 - - British Honduras - 418 - - - - - 327 - - British Sudan - - - - - - _ 192 - - - British West Indies-
Barbados 162 - 1,693 - 23 113 1 881 - - - Jamaica 1,723 - 1,708 - 16 160 2 4,446 - - - Trinidad and Tobago 768 - 81 5,840 3 2 205 - 3,564 - - 1 Other British West Indies 13,305 - 13 360 - 11 82 - - 1,358 - 1
Gibraltar - 48 - - - - - - -
Hong Kong - 424 74 - 6 170 560 - - - Malta . - 89 24 - - 176 - - - Newfoundland - 266 4 2 - 511 - - - Oceania-
Australia - - - 134,631 383 267 129 - 11,011 - - - Fiji - 7,744 7 - 2,080 - - - Now Zealand - - 33,514 31 - 3,858 -- - - Other Oceania - 765 - - - _ _ - _
Palestine - 84 - - - 462 - - - Argentina - - - - - - - - Belgium - - 3,862 051 1,075 - -.- _ -._
Belgian Congo - 7 - - - 80 _ _ - _ Bolivia - 842 - - - _ _ _ _ Brunit 5,933 - 57 - - - - - - -

..weveminmeung., - -xximeme,weeene,
64 358
12 290
60
206
673 157
3,512 196
49
12 291
58,553 202
12 2,634
12 86 25 26 46 48
120
Chile China Colombia Costa Rica Cuba Czechoslovakia Denmark Ecuador Egypt Finland France
French Africa French Guiana French Oceania French West Indies Madagascar St. Pierre and Miquelon
Germany Hayti Iraq Italy Japan Liberia Mexico Morocco Netherlands
Netherlands East Indies Netherlands Guiana Netherlands West Indies
Nicaragua Norway Panama Persia Peru Poland and Danzig Portugal
Portuguese Africa Portuguese Asia
Salvador San Domingo Siam Sweden Switzerland United States
Alaska American Virgin Islands Guam Hawaii Philippine Islands Puerto Rico
Venezuela
2 102
-- ,
94- 8
173
2
15,437
1,349
5
2,052
2,073
7,63- 4
99- 5 49 30 13
79- 5 51 133
1- 8 2,050
12- 8 272
1,459
200
-
-
-
-
-
-
--
-
-
--
-
- SO
LL
SII
VIS
SU
RIZ
EIS
I3
3,200 77,115 -5
12
710 107 468
12
4- 9 1,347
49
56
3
20 462
59
3,304 21
•■•
937 12
426
2,031 77 25
322
2,617 50
50,084 1 1
7-81 13,005 3,950 01,772 240 48,644 27 2,336 6,366 34 14,748 1,499 2,734 68 35 29
389
2,709
726
488,400
401,948
86,452
1,918 • ■•
474 7,429
797 13,005 3,650 71,260 61,774 48,814 259 33,025 121,243 77,202 14,842 1,499 67,237 Total Exports
To British Empire
To Foreign Countries
16 65,097 2 170 171 4,146 31 51,503 94 45,312 781 r.) 13,005 3,056 61,772 48,644 0,163 88 29,779 69,740 77,199 14,748 1,490 21,925
to

III. Miscellaneous—(2) Imports and Exports of Fish and Fishery Products—con. (c) Statement showing Quantities of Fish and Fishery Products of Canadian Origin, Exported from Canada,
by Countries of Destination, during the Calendar Year 1938—concluded (Compiled by the External Trade Branch)
Other fresh Other
White- water fish sea fish Fish
Tullibee, fish Cod Seal Countries to which Exported freh s '
d ,,ann a livers, Fish
Fresh Salted, s • entrails Fish
l offal ,, Pilchard Fish oil, Seal Whale skins,
fresh Fresh Salted, ,-,
and drie, dried, and mea or "v" oil other oil oil un-
frozen and and smoked and smoked Or pre- viscera refuse oil dressed
frozen served,
frozen frozen Or for oil
pickled pickled cwt. cwt , cwt. cwt. cwt. cwt. cwt , cwt. cwt. cwt. gal , gal. gal , gal. gal. no.
United Kingdom - -- 491 56 12 1 131,078 - - 417,984 870,737 - - 14,724 Ireland (Eire) - _ - - - - - - - - - - Aden - - - - - - - - - - - - - - Africa-
British East - - - - - - - - - - - - British South - - - - - 71 40 - - - 66 - - - - Southern Rhodesia - - - - 1 - - - - - - - - British West-
Gold Coast - - - - - - - - - - - - - - Nigeria - - - - - - - - - - - - - - Sierra Leone - - - - - - - - - - - - - - - -
Bermuda - - 78 6 15 - 2 - - - - - - - British East Indies-
British India - - - 20 - - - - - - - - -
Burma - - - - - - - - - - - - - - Ceylon - - - - - - - - - - - - - - - Straits Settlements - - 19 - - - - - - - - - - Other British East ladies - - - - - - - - - - - - -
British Guiana - - - - 13 4 - - - - - - - - - British Honduras - - - 1 1 2 - - - - - - - - - British Sudan - - - - - - - - - - - - - - - British SVest Indies-
Barbados - - 1 26 - - - - - - - - - Jamaica - - - - 19 67 - - - - 183 - 1,120 - - - Trinidad and Tobago. - - - - 35 12 4 - - - - - - - - Other British West ladies - - 16 15 205 4 - - - - - - -
Gibraltar - - - - - - - - - - - - - - - Hong Kong - - - - 11 5 19 - - - - - _ - _ Malta - - - 3 - - - - - _ - _ - - Newfoundland - - - - 1 3 - - 4 - 156 - - - - 30 Oceania— .
Australia - - - - 663 21 3 - _ - 21,209 13,632 _ _ _
New Zealand - - - 5 - - - - -- 21,773 2,983 - _ _ Other Oceania - - - - - - - - ,.- - - - _ _
Palestine - - - - - - - - _ - - - - _ -
Argentina - _ - - - -. - _ - - - - _ -
Belgium - - - - - - - - 3,687 -- - - - - - Belgian Congo - - - - ._- - - _ - - - - _ -
Bolivia _ - _ _ - _ - - _ _ - - _ - - -
Brazil - - - - - 511 - - - - - - - -
o
cn cn )-3
cn H
cn

=4SUESZ=S
Chile China Colombia Costa Rica Cuba Czechoslovakia Denmark Ecuador EgYPt Finland France
French Africa French Guiana French Oceania French West Indies Madagascar St. Pierre and Miquelon
Germany Hayti Iraq Italy Japan Liberia Mexico Morocco Netherlands
Netherlands East Indics Netherlands Guiana Netherlands West Indies
Nicaragua Norway Panama Persia Peru Poland and Dancing Portugal
Portuguese Africa Portuguese Asia
Salvador San Domingo Siam Sweden Switzerland United States
Alaska American Virgin Islands Guam Hawaii Philippine Islands Puerto Rico
Venezuela
Total Exports
To British Empire
To Foreign Cowitries.
1
135 147
•• •
•• • ■ •
■
•■•
1 411,379
•■•
- 1,326,862 6,720 5
SD
I MIL
VJ,S
SanIS
HS
I3
.1■•
•• •
.1 I.
14,001 11
27 4
9 •• •
276 2,144 •■•
2
962 240 -
- 163,099 600
•
10 457,274 3,087 87,053 274,817 23,378 20,314 707
14
3
92 7,473 31
28 350,147 10,545 125,626
18,746 10 458,236 87,392 1,788,165 1,474,904 430,309 23,378 20,355 1,928 233 45 8,944 350,147 10,545 125,626
897,472 14,754 461,027 339 131,084 41 407 127 1,365 17
458,236 3,992 577,432 10 87,053 1,327,138 299,225 23,378 20,314 7,579 1,521 106 350,147 28 10,545 125,626

FISHERIES STATISTICS
III. Miscellaneous-(2) Imports and Exports of Fish and Fishery Products--concluded
(d) Statement showing the Total Value of Fish and Fishery Products of Canadian Origin Exported from Canada, by Countries of Destination, during the Calendar Years 1937 and 1938
(Compiled by the External Trade Branch)
Total Value of Exports Total Value of Exports Country Country
1937 1938 1937 1938
$ $ $ $ United Kingdom 6,721,764 6,880,661 Eizrpt 6,196 3,953
Ireland (Eire) 8,610 1,700 FinLand 780 8,075 Aden - 203 France 784,746 691,833 Africa- French Africa 3,124 1,551
British East 10,033 13,095 French Guiana - 82 British South 602,936 621,345 French Oceania 15,624 18,450 Southern Rhodesia 16,428 12,970 French West Indies 7,404 4,453 British West- Madagascar - 888
Gambia 132 - St. Pierre and Mquelon 1,203 576 Gold Coast 12,401 3,943 Germany 556,422 687,844 Nigeria 15,606 3,912 Hayti 104,630 92,835 Sierra Leone 7,370 1,782 Iceland 16 -
Bermuda 37,642 46,031 Iraq 1,630 6,078 British East Indies- Italy 8,133 925
British India 41,547 53,385 Japan 585,193 459,783 Burma - 950 Liberia 308 251 Ceylon 6,324 6,706 Mexico 21,407 16,575 Straits Settlements 38,496 39,503 Morocco 495 82 Other British East Indies 507 2,102 Netherlands - 33,578 45,116
British Guiana 160,597 216,81. Netherlands East Indies 17,943 16,547 British Honduras 6,808 9,121 Netherlands Guiana 15,170 21,337 British Sudan 910 1,433 Netherlands West Indies 13,810 22,103 British West Indies- Nicaragua 249 100
Barbados 67,965 43,301 Norway 68,066 86,551 Jamaica 422,991 421,158 Panama 16,600 32,001 Trinidad and Tobago 345,733 363,116 Persia - 100 Other British West Indies.. - 100,651 118,953 Peru 4,146 3,215
Gibraltar 400 400 Poland and Danzig 1,603 2,308 Hong Kong 84,403 22,469 Portugal - 994 Malta 2,279 3,031 Portuguese Africa 35,882 28,011 Newfoundland 19,648 23,247 Portuguese Asia 800 644 Oceania- Salvador 22 205
Australia 1,963,688 1,932, 655 San Domingo 59,297 21,155 Fiji 55,536 78,912 Siam 54 350 New Zealand 408,081 522,680 Sweden 340,151 331,738 Other Oceania 6,370 6,123 Switzerland 2,397 4,028
Palestine 12,716 5,977 United States.., 14,004,575 12,713,819 1rgentina 16 15 Alaska 3,165 19,985 lelgium 139,119 100,736 American Virgin Islands 19,586 17,298 Belgian Congo 2,927 720 Guam 1,249 2,672
lolivia 8,130 6,018 Hawaii 5,838 314 1razil 100,561 59,308 Philippine Islands 92,875 18,105 nile 8,094 5,363 Puerto Rico 215,709 182,945 Alba 99,912 42,687 Venezuela 5,543 10,739 :lolombia 33,940 29,497 losta Rica 18,209 16,512 Total txports 28,902,152 27,543,680 kba 239,980 212,739 1zechoslovakia 7,296 10,710 To British Empire 11,178,572 11,457,680 knmark 8,135 24,903 ileuador 700 88 To Foreign Countries...... 17.723,580 16.086.000
III. (3) Statement showing the Exports of Dried Cod from the Chief Exporting Countries during the years 1936, 1937 and 1938 (a)
(Quantities in hundredweights of 100 lbs.)
Country 1936 1937 193 8
cwt. cwt. cwt.
Norway (b) 1,231,660 1,596,192 1,486,914 Newfoundland (e) 1,381,202 1,081,583 890,980 Iceland (d) 607,500 574,629 454,941 France 493,502 601,624 440,483 United Kingdom 246,475 270.601 332,356 Canada 213,444 205.992 210,278
(a) The information is obtained from the Trade Reports of the several countries Where the metric system is used the quantities are reduced to hundredweights by using the proportion of 220.46 quintals to 100 potuids. The United Kingdom's Eiundredweight of 112 pounds and Newfoundland's quintal of 112 pounds are likewise reduced to the equivalent of the hun-dredweight of 100 pounds.
(b) The Norwegian figures comprise: In 1936: 794,825 cw-t. klipfish and 436,835 cwt. stockfish. In 1937: 851,437 cwt. klipfish and 744,755 uwt. stockfish • In 1938: 913,586 cwt. klipfish and 573,328 cwt. stockfish.
(c) Year ended June 30. (d) The Icelandic figures comprise:
In 1936: 595,132 cwt. klipfish and 12,368 cwt. stockfish. In 1937: 555,780 cwt. klipfish and 18,849 cwt. stockfish. In 1938: 444,668 cwt. klipfish and 10,273 cwt. stockfish.
222

Province and County
Prince Edward Island- Kins Prinée Queens
Total
Nova Scotia- Annapolis Antigonish Cape Breton Cumberland Digby Guysborough Halifax Inverness KiWgs Lunenburg Pictou Queens Richmond Shelburne Victoria Yarmouth
Total
New Brunswick- Charlotte Gloucester Kent Northumberland Restigouche Saint John Westmorland
Total
Quebec- • Bonaventure Gaspe Matane Saguenay
Total
Grand Total
FISHERIES STATISTICS
III. Miscellaneous-(4) Detailed Statement of Fishing Bounties Paid to Vessels and Boats for the Year 1938 (a)
223
Total Bounty
No.
of , _,„,,. Average No. of ArnowIt No. of No. of Amount Paid to Vass els -" Tonnage Men Paid Boats Men Paid Ve els
and Boats
$ $ cts. S cts.
1 10 10 3 28 00 183 258 1,614 90 1,642 90 4 58 14 12 130 00 793 1,487 9,221 35 9,351 35 1 11 11 1 17 00 350 631 3,979 80 3,996 80
6 79 13 16 175 00 1,326 2,376 14,816 05 14,991 05
5 105 21 33 303 00 174 270 1,672 50 1,975 50 - - - - - 226 343 2,12965 2,129 65 40 616 15 196 1,804 30 553 758 6,006,80 7,811 10 - - - - 5 5 32 75 32 75 21 304 15 73 742 00 413 724 4,431 20 5,173 20 40 541 14 146 1,417 00 618 1,008 6,21240 7,629 40 46 620 14 190 1,760 00 926 1,253 7,880 15 9,640 15
3 39 13 14 123 00 240 570 3,403 50 3,526 50 - - - - - 71 93 587 15 587 15 77 3,623 47 1,090 10,163 00 640 799 5,074 45 15,237 45 - - - _ 31 49 302 95 302 95 14 184 13 63 56200 203 329 2,02895 2,58095 81 981 12 226 2,337 00 309 505 3,111 75 5,448 75
• 86 1,628 19 489 4,56200 793 1,287 7,91588 12,497 85 13 185 14 46 46800 105 435 2,72025 3,181 25
• 56 816 15 209 2,07000 158 337 2.02815 4,00835
• 482 9,642 20 2,775 26,304 30 5,666 8,765 55,558 65 81,862 95
• 6 69 11 16 165 00 303 551 3,36105 3,52605 • 165 2,781 17 640 6,621 00 602 1,078 6,713 65 13,334 65 • 9 96 11 25 246 00 236 411 2,51705 2,76305 • 15 158 10 27 320 00 30 48 26640 616 40
- - - - 3 6 36 30 36 30 - - - - - 28 43 265 65 265 65
- - - 81 130 802 50 802 50
• 195 3,101 16 708 7,35200 1,283 2,267 13,992 60 21,344 60
• 12 124 10 43 382 00 458 857 5,251 20 5,633 20 • 39 439 11 165 1,429 00 2,278 4,511 27,516 55 28,945 55
- - - - 107 175 1,078 25 1,078 25 - - - - - 542 982 6,127 10 6,127 10
• 51 563 11 208 1,81100 3,385 6,525 39,973 10 41,784 10
• 734 13,388 18 3,707 38,64230 11,660 19,933 124,310 40 159,982 70
III. Miscellaneous (5) Statement showing the Salmon Pack (b) of the Province of British Columbia by Districts and Species, 1938
Central District
Rivers Area No.3
Species Fraser Nana Skeena Inlet and and (Van- Total
River River River Srniths Queen couver,
Charlotte Island,
Inlet Islands etc.)
cases cases cases cases cases cases cases
Sockeye 217,882 14,795 73,508 86,490 39,065 15,713 447,453
Springs,red. 4,592 13 3,361 716 206 1,388 10,276
Springs, pink 413 165 1,165 136 358 85 2,322
Springs, white 1,532 125 259 351 114 552 2,933
Blueback 21,923 - - - - 5,494 27,417
Steelhead 72 188 42 99 467 167 1,035
Cohoe 54,314 3,986 100,658 14,284 65,399 35,065 273,706
Pink 29,862 29.843 146,676 12,447 140,592 41,456 400,876
Churn 181,444 6,804 34,785 17,109 158,501 143,176 541,812
Total 512,034 55,919 360,451 131,625 104,702 213,096 1,707,830
(a) A number of "Late" claims amounting 'n all to $5, 93.50 and which are included in this statement are for the season
1397, as the basis of distribution for 1937 differed from that of 1935, a number of the figures in the "Amount" columns do not,
as a result, balance with the number of claires paid. (b) Standard cases of 48 pounds.

FISHERIES STATISTICS
III. Miscellaneous-(6) Statement showing the Salmon Pack (a) of the Province of British Columbia, by Species, 1929 to 1938
Species 1929 1930 1931 1932 1933 1934 1935 1936 1937 1938
cases cases cases cases cases cases cases cases cases cases
Sockeye 281,277 477,678 291,297 284,355 258,107 377,952 350,444 415,024 325.774 447,453 Springs, red 2,955 16,059 6,270 31,898 5,983 (b) 10,187 16,493 10,963 10,276 Springs, pink 5,397 9,398 15,597 29,015 8,429 29,584 3,114 2,527 1,788 2,322 Springs, white 9,413 11,069 5,387 15,045 5,854 (b) 6,619 10,834 3,420 2,933 Blueback - - - - 1 29,556 15,319 33,718 19,236 27,417 Steelhead {
-. 23,748 43,610 26,629 29,673 23,222 f 1,282 596 1,068 844 1,035
Cohoe 173,237 150,168 76,746 160,526 137,289 195,874 216,173 212,343 113,972 273,706 Pink. 477,8531,111,937 207,828 223,758 532.558 435,364 514,966 591,532 585,576 400,876 Chum 424,890 401,900 56,155 306,761 293,630 513,184 410,604 597,487 447,602 541,812
Total 1,398,7702,221,819 685,909 1,081,031 1,265,072 1,582,796 1,530,022 1,881,0261,509,175 1,707,830
224
(a) Standard cases of 48 pounds. (b) Included for 1934 with "Springs, pink".
III. Miscellaneous-(7) The Lobster Pack (a) of Canada by Provinces, 1920 to 1938
Prince N . ova New Edward Séotia Brunswick Quebec Canada Year Island
Number Number Number Number Number of Cases of Cases of Cases of Cases of Cases
1920 40,322 79,253 24,532 19,192 163,299 1921 31,155 69,255 22,356 14,841 137,607 1022 42,220 64,552 26,077 15,795 148,644 1923 43,831 63,971 26,098 17,139 151,039 1924 26,814 40,831 23,548 10,925 102,118 1925 34,121 53,745 27,236 12,395 127,497 1926 29,442 56,277 24,041 13,759 123.519 1927 27,896 55,771 18,866 11,404 113,937 1928 25,077 55,277 19.468 12,164 111,986 1929 28,399 60,661 27,146 11,310 127,516 1930 31,935 63,422 31,983 11.769 139.109 1931 37,055 65,617 34,476 9,190 146,338 1932 44,490 74,060 35,490 12,759 166,799 1933 32,895 50,729 26,417 12,021 122,062 1934 30,214 50,553 23,815 11,562 116,144 1935 25,170 46,863 18,275 9,597 99,905 1936 22,345 37,690 20,428 7,639 88,102 1937 20,052 34,649 26,957 6,023 88,581 1938 24,625 37.838 23,060 5,481 92,001
(a) Standard cases of 48 Pounds.
III. Miscellaneous-(8) Statement showing the Steam Trawler Landings on the Atlantic Coast during the calendar years 1935, 1936, 1937 and 1938
Kindslanded 1935 1936 1937 1938
lb. lb. lb. lb.
Cod 4,863,337 4,741,021 7,286,869 9,627,543 Haddock 8,392,691 9,884,181 7,370,784 6,978.684 Scrod 4,704,278 1,352,243 695,042 1,009,183 Hakeandeunk - 134,805 26,160 6,810 Pollock 706,000 731,273 501,633 1,058,482 Halibut 152,060 133,098 88,309 105,241 S3rate 74,202 74,254 64,115 89,609 Soles 907,870 1,528,181 1,900,529 1,600,309 Herring 900 - 2,405 4,680 Mackerel - 20 - 65 Catfish 82,994 81,769 53,635 79,958 Itosefish (Ocean perch) - 212,860 65,850 477,916 Sh'ad - 1,068 7 35 Ademives - 11,710 1,090 -
Totals 19,881,332 18,866,479 18,057,328 21,038,515
During the calendar year 1938 three steam trawlers were in operation.

FISHERIES STATISTICS
The following statement, prepared from Canadian fisheries statistics for the year shows the catches by Canadian fishermen in 1938 in certain areas, defined by the North American Council on Fishery Investigations, an international body representative of Canada, United States, Newfoundland and France for the co-ordination of fishery investigations in the Atlantic waters of the Continent. The boundaries of the areas are indicated on the accompanying chart.
III. Miscellaneous-(9) Fisheries Production in 1938 in Certain Areas Defined by the North American Council on Fishery Investigations
Kind of Fish Area Area Area Area Total-
No. 19 (a) No. 20 (b) No. 21 (c) No. 22 (d) ..
Cod cwt. 476,370 362,376 " 817,806 26,836 1,683,388 Haddock cwt. 2,039 382,668 8,882 393,589 Hake and cask cwt. 77,831 155,278 28,747 261,856 Pollock cwt . - 81,892 19,442 101,334 Catfish cat. 4,336 - 4,336 Halibut cwt. 2,713 - 39,530 50 42,293 Flounders, brill, plaice cwt 3,673 9,789 253 13,685 Skate cwt. 33,262 199 33,461 Soles cwt. 107 16,941 - 17,048 Herring cwt. 795,742 - 231,171 122,151 1,149,064 Mackerel cnt 74,553 210,503 509 285,565 Sardines bbl 41 3,770 180,639 184,450 Alewives cwt. 28,748 30,425 44,253 103,426 Bass cwt. 163 - 163 Perch cwt. 45 - 5 - 50 Rosefish cwt. - 4,779 - 4,779 Salmon cwt. 24,339 3,309 2,775 80,423 Shad cwt. 6,511 4,296 4,003 , 44,810 Smelts cwt. 65,699 3,701 89 69,489 Sturgeon cwt 64 - - . „" 64 Trout cwt 318 - - 418 Tuna cwt • - 5,331 - 5,331 Capelin, launce and silversides cul. 35,478 - - - 35,478 Eels cut 981 - 1,520 - 2,501 Grayfish cwt. 600 - 36,820 - 37,420 Soutd cwt. 1,078 - 1,406 - 2,484 Swordfish cwt. - 10,929 - 10,929 Tom cod cwt. 14,498 25 - 14,523 Mixed fish cwt. 10,316 50,333 - 60,649 Clams cwt. 22,813 - 8,256 . 42,826 73,895 Crabs cwt. 1,628 - 75 30 1,733 Lobsters cwt. 208,010 - 102,501 3,874 314,385 Oysters bbl. 20,769 - 728 - 21,497 • Quahaugs cwt. 6,514 - - 6,514 Scallops. gal. 496 92,000 3,190 95,686 Winkles cwt. - 90 206 296 Hulse, green cwt. - 700 2,343 3,043 Seaweed cwt. 455 4,200 6,503 11,158 Hair seals no. . 22,831 - 22,831 Belugas 110. 2 - - 2
c--,
(a) Comprises the province of Prince Edward Island; the counties of Cumberland (Northumberland Strait side), Col-chester (Northumberland Strait side), Pictou, Antigonish, and Inverness in Nova Scotia; the counties of Westmorland (Northumberland Strait side), Kent, Northumberland, Gloucester and Restigouche in New Brunswick; and the counties of Bonaventure, Gaspe, Saguenay, Matane and Rimouski, and the Magdalen Islands in Quebec.
(b) The quantity taken by the Lunenburg fishing fleet on the Grand Banks. (c) Comprises the counties of Richmond, Cape Breton, Victoria, Guysborough, Halifax, Hauts, Lunenburg (excepting
the quantity of cod shown in area 20 as taken by the Lunenburg fishing fleet on the Grand Banks), Queens, Shelburne, Yar-mouth, Digby, Annapolis, Kings, and the Bay of Fundy side of Cumberland and Colchester counties in Nova Scotia.
(d) Comprises the counties of Albert, St. John and Charlotte and the Bay of Fundy side of Westmorland county in New Brunswick.
89667-15

LABS DOR
ATTLEHAR R?52° 15'
XIffl U •.:. EAST COAST F
NEWFOUNDL ND
E5LAW4
••
.ft Ln.': ' XX CAPE P CATA1Y, .. GRAND BANt
_____ ____________ ____________ ____________ ____________ ______ LONG 67t9 '' -- ,,ff / X) .......
I I NOVA SCOTIA LAT.43°30. j) j c .... •-s WNG55° ••'.
/ \.. r-&. ...• .........
I.AT4iI3\.n. J HG .7I4 - __________________ ________
NW ENGLA) NORTH AMERICAN COUNCIL 0M FISHERY INVESTIGATIONS
___ CHART NO.2. if MIDD•L STATISTICAL AREAS XVII TO XXII
.
ATLAfJTIC ___________ _______ __________________________________________________________ _______ ________ L

h:-
CANADA—MINISTÈRE DU COMMERCE
BUREAU FÉDÉRAL DE LA STATISTIQUE—BRANCHE DE LA STATISTIQUE DES PÊCHERIES,
DES FOURRURES ET DE L'INDUSTRIE LAITIÈRE
Statisticien du Dominion: R. H. Coats, LL.D., F.R.S.C., F.S.S. (Hon.) Chef, Branche de la statistique des Pêcheries, des Fourrures et de l'Industrie Laitière: F. A. Brown.
STATISTIQUE DES PÊCHERIES 1938
(En collaboration avec les ministères des Pêcheries du Gouvernement Fédéral et des Provinces)
Publié par ordre de Pilon. W. D. Euler, M.P. Ministre du Commerce
OTTAWA J.O. PATENAUDE,
IMPRIMEUR DE SA TRÈS EXCELLENTE MAJESTÉ LE ROI 1940
88867-15i

228 STATISTIQUES DES PÊCHERIES
TABLE DES MATIÈRES PAGE
Aperçu historique sur les pêcheries du Canada 229 Revue des pêcheries, 1938 - 237
Introduction et Résumé Quantité et valeur des principaux poissons commerciaux, 1934-38 239 Quantité et valeur du poisson pêché et mis en vente, 1937 et 1938 240 Outillage-capital et employés 1938-1938—
Opérations primaires— Capital 246, 247 Employés 246, 248
Conserveries et saurisseries— Capital 247, 248
• Employés 247, 249 Détails sur les conserveries et les saurisseries, 1936-1938—
Employés, salaires et gages 249 / Employés à. gages, Par mois 250
Matières premières 250 Valeur de la production 251
Revue des pêcheries par province— Valeur totale des pêcheries, 1934-1938 252 Quantité et valeur des principaux poissons commerciaux, 1934-1938 252 Quantité et valeur de tout le poisson pêché et mis en vente en 1938 255 Valeur totale, par comté et district, de tout le poisson de mer pêché et mis en vente, 1936-1938 263
Proportion de poisson de mer pris en haute mer, 1938 264
Outillage-capital, 1938 270 Employés, 1938 272
Primes 274 Commerce extérieur 274 Revue rétrospective 274 Tableau de conversion de la pesée du poisson 280
Tableaux d'ensemble L Poisson pris et vendu, 1938 56
Ile du Prince-Edouard, 56; Nouvelle-Ecosse, 60; Nouveau-Brunswick, 92; Québec, 106; Ontario, 118; Manitoba, 120; Saskatchewan, 122; Alberta, 126; Yukon, 127; Colombie Britannique, I2S.
II. Outillage-capital et employés, 1938 140 Partie 1.--Opérations primaires-
11e du Prince-Edouard, 140; Nouvelle-Ecosse, 142; Nouveau-Brunswick, 154; Québec, 160; Ontario, 166; Manitoba, 168; Saskatchewan, 170; Alberta, 172; Yukon, 172; Colombie Britannique, 174.
Partie 2.—Conserveries et saurisseries— (a) Relevé général des statistiques 180
(b) Capital 186
(c) Employés, salaires et gages 186
(d) Employés à gages par mois 188
(e) Consommation de combustible 190
(8) Force motrice 192
(g) Classification des établissements selon la valeur de la production 194
(h) Classification des établissements selon le nombre d'employés 195
(1) Classification des vaisseaux et navires utilisés pour la pêche en haute mer, d'après les principales espèces de poissons pêchés, 1938 198
(2) (a) Quantités et valeurs du poisson et de produits poissonniers importés au Canada pour y être consommés, en 1936, 1937 et 1938 212
(b) Quantités et valeurs du poisson et des produits poissonniers de provenance canadienne exportés du Canada en 1936, 1937 et 1938 213
(e) Quantités et valeurs du poisson et des produits poissonniers de provenance canadienne exportés du Canada, par pays de destination, en 1938 214
(d) Valeur totale des exportations de poisson et de produits poissonniers de provenance canadienne, par pays de destination, 1937 et 1938 222
(3) Exportations de morue séchée des principaux pays exportateurs, 1936, 1937 et 1938 222
(4) Primes aux vaisseaux de pêche, 1938 223
(5) Mise en conserve du saumon en Colombie Britannique, par district et par espèce, 1938 223
(6) Mise en conserve du saumon en Colombie Britannique, par espèce, 1928 à 1938 224
(7) Mise en conserve du homard au Canada, 1918 à 1938 224
(8) Débarquements des chalutiers à vapeur sur la côte de l'Atlantique, 1935 it 1938 224
(9) Production poissonnière dans certaines zones définies par le conseil d'enquête sur les pêcheries de l'Amérique du Nord, 1938 225
onsafflill

STATISTIQUES DES PÊCHERIES 229
PRÉFACE
Ce rapport est publié en vertu d'une entente établissant la coopération en matière de statistique entre le Bureau Fédéral de la Statistique et les différents services gouvernementaux ayant juridiction sur les pêcheries canadiennes. Ces services comprennent le Ministère fédéral des Pêcheries, qui exerce sa juridiction sur les pêcheries des Provinces Maritimes, du Yukon, de la Colombie Britan-nique et des Iles-de-la-Madeleine, -et les divisions des Pêcheries des provinces d'Ontario, Québec, Manitoba, Saskatchewan et Alberta, qui régissent les pêche-ries de leurs provinces respectives, sauf les pêcheries des Iles-de-la-Madeleine, en Québec, lesquelles sont sous la juridiction du Ministère des Pêcheries du Dominion. La Colombie Britannique possède une division des Pêcheries, mais cet organisme ne s'occupe pas de statistique pour son propre compte.
En vertu de l'arrangement dont il est parlé plus haut, les statistiques du poisson pêché et des produits offerts en vente à l'état frais ou après une pré-paration sommaire, sont recueillies par les fonctionnaires locaux du Ministère des Pêcheries, vérifiées et condensées au Ministère des Pêcheries, puis compilées au Bureau Fédéral de la Statistique. En ce qui concerne le poisson industrielle-ment préparé et ses sous-produits, des formules similaires à celles en usage dans le recensement des autres branches de la production sont envoyées directement par le Bureau aux usines poissonnières, les fonctionnaires des services des Pêcheries s'assurant que ces formules sont consciencieusement remplies et promptement retournées. Les fonctionnaires des gouvernements provinciaux voudront bien accepter nos remerciements pour le concours qu'ils nous ont prêté.
R. H. COATS, Statisticien du Dominion.
BUREAU FÉDÉRAL DE LA STATISTIQUE,
Ottawa, le 7 novembre 1939.
LM!!

230 STATISTIQUES DES PÊCHERIES
LES PÊCHERIES DU CANADA
Le début des pêcheries.—La pêche est une des plus anciennes industries du Canada. Laissant de côté les traditions et les légendes pour s'en remettre aux faits établis, il faut admettre que c'est à Jean Cabot que revient l'honneur d'avoir découvert, en 1497, les bancs de morue de Terre-Neuve, quand il vit pour la pre-mière fois la terre ferme de l'Amérique du Nord. Il rapporta que la mer y était si poissonneuse qu'il était possible de pêcher "avec un panier dans lequel il y avait une pierre pour le faire plonger". Cap-Breton, l'un des plus anciens noms géogra-phiques de l'Amérique, est un souvenir des premiers pêcheurs français que les Espagnols et les Portugais ne tardèrent pas à suivre. Fernandez de Navarette nous apprend que des pêcheurs de ces trois nationalités fréquentaient le Grand Banc en 1502. La pêche se pratiquait au moyen de lignes à mains passées sur des barils fixés et l'extérieur du passavant pour éviter le contact des lignes avec les flancs du navire; les bateaux de pêche se livraient à leurs opérations tant que durait le beau temps, puis s'en retournaient en France avec leurs prises de 30,000 à 50,000 morues. Les voyages entrepris le long du littoral démontrèrent bientôt que la morue était aussi abondante en, vue du rivage que sur les bancs lointains, et les équipages s'accoutumèrent alors à jeter l'ancre dans une baie, à construire une hutte sur la grève et à faire dans leurs petites chaloupes des excursions quoti-diennes dont le produit était salé et séché à terre, puis expédié en France à la fin de la saison. Lorsqu'il remonta le Saint-Laurent en 1534, Jacques Cartier trouva partout les traces du passage de ces "capitaines courageux" et de leurs rivalités, lesquelles s'exerçaient aussi bien dans des rencontres armées que dans la capture du poisson qui les avait attirés si loin de chez eux. Chauvin fonda un établisse-ment de cette sorte à Tadoussac, en 1599. Bientôt après les pêcheurs s'habituèrent à passer l'hiver en Amérique et à y construire de véritables villages. La première concession de pêche fut octroyée par le roi de France à de Monts, en 1603. On peut donc considérer la pêche comme la première industrie à laquelle se soient livrés systématiquement les Européens au Canada; depuis ces temps lointains elle n'a jamais cessé de donner sa récolte annuelle.
Lieux de pêche du Canada.—Les pêcheries canadiennes sont probablement les plus vastes de l'univers. Sur l'Atlantique, depuis Grand Manan jusqu'au Labrador, le rivage mesure plus de 5,000 milles, à l'exclusion des anses et échan-crures qui le dentellent. La baie de Fundy avec 8,000 milles carrés, le golfe Saint-Laurent dix fois plus grand, et d'autres eaux océaniques représentent ensemble environ 200,000 milles carrés, c'est-à-dire plus des quatre cinquièmes des pêcheries du nord de l'Atlantique. De plus, l'on compte sur les bords de l'Atlantique 15,000 milles carrés d'eaux territoriales sous le contrôle absolu du Dominion. Mais ces vastes étendues ne représentent qu'une partie des eaux canadiennes. Sur le Paci-fique, le littoral canadien mesure 7,180 milles; ses baies et fiords innombrables offrent aux pêcheurs une multitude d'abris très sûrs. Enfin, disséminés sur tout le territoire s'égrènent une série de lacs qui, tous ensemble, contiennent plus de la moitié des eaux douces du globe, la part du Canada dans les Grands Lacs seulement couvrant plus de 34,000 milles carrés, auxquels viennent s'ajouter le lac Winnipeg (9,457 milles carrés), le lac Manitoba et de nombreux autres non moins vastes.
Mais la qualité des produits des pêcheries canadiennes est encore plus remar-quable. Chacun sait que l'excellence de la chair du poisson est en proportion directe de la pureté et de la fraîcheur des eaux qu'il habite. Considérés sous cet angle, le saumon, la morue, le flétan, le hareng, le maquereau et le coré gone du Canada n'ont pas de rivaux dans l'univers. Il est donc évident que les plus magni-fiques pêcheries de l'hémisphère occidental, sinon du globe, appartiennent au Canada.
Le bref exposé qui précède démontre qu'il est impossible d'envisager les pêcheries canadiennes sous un unique aspect; embrassant tout un continent, elles offrent nécessairement une grande diversité. Laissant de côté la baie d'Hudson et la région subarctique qui s'étend depuis 1' Ungava jusqu'à l'Alaska, on peut diviser comme suit les pêcheries canadiennes:

STATISTIQUES DES PÊCHERIES 231
I. PÊCHERIES DE L'ATLANTIQUE.—Elles sont les premières en date et, jusqu'en 1918, elles furent les plus importantes par la valeur de leurs produits. On y prend la morue, le flétan, l'églefin, le hareng, le maquereau, l'éperlan, la sardine, l'espa-don, le saumon, le homard et l'huître. Les opérations de pêche sont communément considérées sous deux aspects distincts, la pêche hauturière ou de haute mer et la pêche côtière. Cette dernière se pratique au moyen de petites embarcations le plus souvent automotrices, montées par deux ou trois hommes; on y emploie aussi de petits navires dont l'équipage se compose de quatre à sept hommes. Les engins de pêche le plus fréquemment employés sont les rets à mailles, les lignes à main et les chaluts; d'autre part, on dispose le long du rivage des filets, des seines et des nasses. L'églefin, comme la morue, est un produit de consommation courante; le printemps et l'été ce poisson est ouvert et salé mais la meilleure saison est l'automne, le poisson étant alors expédié frais ou fumé. La pêche en haute mer se pratique au moyen de navires de 40 à 100 tonnes, portant de douze à vingt hommes, qui pêchent surtout dans des doris au moyen de lignes de fond; en outre, on pêche parfois directement des navires au moyen de lignes à main. Les Milles fréquentent tout à tour les différents bancs de pêche tels que le Grand Banc, le Banc Intermédiaire et le Ban-quereau. Ces navires, construits sur place, restent parfois plusieurs mois en mer; les naufrages sont rares, tant est grande l'habileté de leurs équipages. A leur retour, le poisson, qui a été vidé et salé à bord, est débarqué, lavé et séché. Les Antilles sont le principal débouché de ce produit; aucune autre morue ne pourrait supporter le climat tropical aussi bien que celle préparée par les pêcheurs de la Nouvelle-Ecosse. De grands chalutiers à vapeur, tels que ceux en usage dans la mer du Nord, ont été introduits depuis plusieurs années dans les pêcheries canadiennes du littoral de l'Atlantique. Ces chalutiers se livrent à la pêche presque toute l'année; leurs prises approvisionnent le commerce de poisson frais. En vertu de la loi des pêcheries, les chalutiers doivent être inscrits comme navires britanniques au Canada, appartenir à des gens du Canada et être pourvus d'un permis émanant du ministre des Pêcheries; leurs opérations doivent se restreindre aux eaux situées à 12 milles au moins du littoral.
La pêche du homard est une industrie caractéristique. En 1870, il n'existait que trois homarderies sur le littoral de l'Atlantique; en 1.938 on en compte 215, occupant près de 5,000 personnes; 30,000,000 de homards constituent une prise normale. En outre du homard en boite, une forte quantité est mise sur le marché en carapace, dont la majeure partie est exportée aux Etats-Unis. L'un des constants problèmes de cette industrie, c'est d'assurer l'exécution des dispositions prohibant la capture des jeunes homards et des adultes au moment du frai; on croit qu'avec la coopération des pêcheurs le rendement de cette pêche peut se maintenir. Au Nouveau-Brunswick, la mise en boîte des sardines, qui sont de jeunes harengs et non une espèce distincte, est la principale industrie poissonnière. Grâce à l'os-tréiculture, que le Gouvernement a développée, l'huître autrefois abondante niais qui avait de beaucoup diminué pendant un certain nombre d'années reprend sa position importante de jadis. On a mis du naissain dans les endroits favorables des eaux de fie du Prince-Edouard et de la Nouvelle-Ecosse. Ce travail est dirigé par des experts en ostréiculture.
Les pêcheurs des Provinces Maritimes constituent une population industrielle spécialisée. La pêche côtière s'y pratique d'avril à novembre et même en janvier dans les districts abrités et, quoique les plus grands navires travaillent pendant tout l'hiver, plusieurs milliers d'hommes sont disponibles à certains moments de l'année pour d'autres travaux. Les uns cultivent des parcelles de terre entourant leurs maisons, les autres travaillent dans les chantiers de bois du Nouveau-Brunswick ou bien dans les charbonnages de la Nouvelle-Ecosse. Quelques pêcheurs de Lunen-burg et d'ailleurs font du négoce avec les Antilles. Outre les restrictions imposées par la température et les saisons fermées, la méthode généralement répandue de payer les hommes au tantième tend encore, les années où la prise et les prix sont faibles, à les attirer vers les occupations secondaires.

232 STATISTIQUES DES PÊCHERIES
• 2. PÊCHERIES INTÉRIEURES.—Les Grands Lacs et les eaux tributaires du St-Laurent constituent une deuxième grande division des pêcheries canadiennes. La valeur des pêcheries intérieures du Québec se compose principalement de pro-duits de la pêche à l'anguille, au doré et à l'esturgeon. En Ontario, le corégone, la truite, la sandre, le hareng des lacs, la perche, le doré et le tullibee sont les pois-sons les plus importants, commercialement parlant, quoique le brochet, l'esturgeon et quelques autres poissons ne soient pas à dédaigner. Dans les Grands Lacs la saison de pêche dure de six à huit mois; quelques pêcheurs continuent leurs opéra-tions durant l'hiver en creusant des trous dans la glace, mais le plus grand nombre cherchent une autre occupation dans l'intermède des saisons. En se dirigeant plus à l'ouest, le lac Winnipeg, le lac Winnipegosis, le lac Manitoba et des lacs plus petits au nord et à l'est de celui-ci, fournissent la plupart des poissons du Manitoba. Le coré gone et le doré sont les principaux d'entre eux, mais le brochet, le tullibee, l'oeil-d'or et nombre d'autres variétés s'y trouvent aussi. En Saskatchewan et en Alberta, la pêche pour le commerce est confinée aux régions situées au nord de la rivière Saskatchewan où, l'on prend de grandes quantités de corégone. Les diffi-cultés du transport n'ont pas encore été surmontées; quelques-uns des plus grands lacs du continent, les lacs Reindeer, Grand Esclave, Grand Ours et des centaines de lacs plus petits n'ont aucune communication avec les marchés de consommation. Toutefois, les lacs de l'Ouest jouent le même rôle que le St-Laurent. au temps du régime français et que les bancs de morue dans l'histoire de la Nouvelle-Angleterre, en facilitant la colonisation du pays, puisqu'ils offrent un aliment certain aux colons nouvellement arrivés.
3. PÊCHERIES DU PACIFIQUE.—La Colombie Britannique possède des pêche-ries d'eau douce presque similaires à celles de la région des Prairies; il est douteux que le commerce des fourrures (qui devait être l'agent de liaison entre cette province et le reste du Canada à travers les Montagnes Rocheuses) eût pu s'établir au com-mencement de l'histoire de cette province si ces pêcheries n'eussent pas existé. Les pêcheries de la Colombie Britannique sont d'une grande richesse; elles repré-sentent environ les deux cinquièmes de l'industrie poissonnière du Canada et ses produits se consomment jusqu'aux extrémités de la terre; ils sont essentiellement constitués par le saumon pêché à l'embouchure du fleuve Fraser, de la Skeena, de la Naas et d'autres rivières qui descendent le versant occidental des montagnes. Chacune des variétés de ce roi des poissons comestibles (qui toutefois n'est pas le salmo salar ou vrai saumon) fréquentant les eaux du Pacifique se trouve sur le littoral de la Colombie Britannique, c'est-à-dire le sockeye ou dos bleu, le saumon de printemps, le saumon argenté, le saumon rose et le saumon bécard. Entre tous ceux-ci, le sockeye, bien qu'il ne donne pas d'aussi fortes prises que le saumon rose et le bécard, est de beaucoup le plus important, en raison de l'excellence de sa chair, dont la belle couleur rougeâtre est tant appréciée des consommateurs de la Grande-Bretagne et des pays étrangers. Le fleuve Fraser était autrefois la principale source d'approvi-sionnement de saumon, mais sa production est aujourd'hui dépassée par celle des eaux septentrionales; la prise varie considérablement d'année en année. La montée du saumon commence vers la fin de juillet et atteint son apogée dans les premières semaines d'août; néanmoins, les régions septentrionales ont une saison plus hâtive. Le saumon de printemps ou quinnat est un très gros poisson, c'est la première espèce qui fut mise en boîte aux Etats-Unis; la migration de ce poisson s'opère au commencement du printemps et se continue jusqu'en juillet. Le saumon argenté est plus petit; comme le sockeye, il voyage par bandes innombrables, pendant septembre et octobre, dans le fleuve Fraser, et un peu plus tôt dans les cours d'eau plus au nord. Le saumon bécard est mis en boîte et une quantité considérable est salée pour l'exportation en Orient. La montée du saumon rose se produit environ trois ou quatre semaines après celle du sockeye.
Le flétan abonde à hauteur de l'île Vancouver et entre les îles de la Reine Charlotte et le continent; quoique la première tentative d'exploitation industrielle de ce poisson ait avorté, dès 1903 la Colombie Britannique contribuait pour 10,000,000

STATISTIQUES DES PÊCHERIES 233
de livres à la production de 25,000,000 de livres pêchées sur le littoral du Pacifique au nord de la Californie, chiffre qui a triplé depuis plusieurs années, bien que depuis 1980 cette pêche ait diminué à la suite des restrictions imposées en vertu des dispositions du traité conclu entre le Canada et les Etats-Unis pour la conservation de ces pêcheries. Le hareng est pris en grandes quantités par les pêcheurs de la Colombie Britannique et il est surtout employé à la préparation de produits salés à sec (pour exportations à la Chine et au Japon) et à la production d'huile et de poudre. Le pilchard, qui est de la famille du hareng et pour lequel les rapports au Canada n'ont trait qu'à la prise du littoral du Pacifique, occupe le troisième rang parmi les principaux poissons de commerce de la Colombie Britannique. La production de pilchard en boîte est considérable, mais les principaux item de production de la pêche sont l'huile et la poudre. On y pêche aussi la baleine et deux stations sont en opération dans les îles de la Reine Charlotte. On y pêche des cétacés de différentes sortes: baleines franches, rorquals, dauphins et cachalots. La pêche à la baleine se pratique dans des bateaux rapides armés de canons lance-harpons Svend Foyn, système venu de Norvège. Aucune partie de la baleine ne se perd, l'huile et la poudre ou engrais en sont les produits les plus importants. Le cabillaud, la lingue, l'oulachon, le turbot, la raie, la sole, la coque et l'huître sont également abondants dans les eaux de la Colombie Britannique.
Il convient d'ajouter un mot concernant les pêcheries de phoque à fourrure du Pacifique dont le siège historique était autrefois et Victoria. Au début du siècle actuel, par suite de la raréfaction des animaux, cette industrie n'avait plus qu'une bien faible importance, et en 1911 un traité fut conclu entre la Grande-Bretagne, les Etats-Unis, le Japon et la Russie, à l'effet d'interdire la pêche pélagique ou hauturière. Ce traité, qui est resté en vigueur, a pour objet la conservation du phoque et il en est résulté un accroissement considérable des bandes de ces animaux. A titre de compensation pour la renonciation à ses droits de pêche au phoque, le Canada touche annuellement des gouvernements des Etats-Unis, du Japon et de la Russie une part du revenu de la pêche du phoque aux îles Pribaloff et à d'autres endroits, appartenant à ces trois pays, où se trouvent des colonies de phoques. Les Indiens de la Colombie Britannique sont exempts des dispositions de ce traité, mais ils ne peuvent pratiquer ce genre de chasse qu'à l'aide de bateaux non pontés, dont chacun ne peut avoir un équipage de plus de cinq personnes, l'emploi d'armes à feu leur étant interdit.
Le sport de la pêche.—Le relevé ci-dessus est purement industriel et commercial; mais le sport de la pêche comporte un aspect économique dans un pays où foisonnent des poissons aussi réputés que le saumon de la Restigouche et autres rivières du Nouveau-Brunswick, l'achigan et la truite mouchetée du Québec et des hautes terres d'Ontario, la truite rouge du Nipigon et le saumon et la truite arc-en-ciel de la Colombie Britannique. Le gouvernement perçoit des revenus très élevés en louant soit à des clubs, soit à des particuliers, le droit de pêche dans les lacs et les cours d'eau des contrées les moins peuplées; d'autre part, des centaines de guides y trouvent une occupation pendant les mois d'été.
LE GOUVERNEMENT ET LES PÊCHERIES
Dès l'organisation du Gouvernement fédéral à la Confédération, le Ministère de la Marine et des Pêcheries administrait les pêcheries canadiennes. De bonne heure en 1.930 un ministère des Pêcheries, sous la direction d'un ministre, a été organisé. Ce ministère administre maintenant toutes les pêcheries en eau salée (excepté celles de la partie continentale du Québec qui, en vertu d'un accord, relèvent de l'administration provinciale), les pêcheries en eau douce de la Nouvelle-Ecosse el les pêcheries du Yukon et des Territoires du Nord-Ouest. Les pêcheries en eau douce du Nouveau-Brunswick, de Vile du Prince-Edouard, de l'Ontario, des Pro-vinces des Prairies et de la Colombie Britannique, et les pêcheries du Québec, tant
* Revisé sous la direction de J. J. Cowie, sous-ministre suppléant, Ministère des Pêcheries, Ottawa.
89667— In
LORI

234 STATISTIQUES DES PÊCHERIES
en eau salée qu'en eau douce, (excepté celles des Iles-de-la-Madeleine) sont admi-nistrées par les provinces respectives, bien que le ministère fédéral exécute certains travaux de protection dans les eaux douces du Nouveau-Brunswick, de l'Ile du Prince-Edouard et de la Colombie Britannique. Cependant, le Gouvernement fédéral possède seul le droit de légiférer sur les pêcheries. (Voir loi des pêche-ries, 22-23 Geo. V, c. 42.) L'année fiscale 1938-39 les dépenses du Dominion pour les pêcheries, y compris les salaires du gouvernement civil, les contingences, etc., sont de 82,568,443 et les recettes, de 8112,778.
Conservation.—Les pêcheries fluviales et lacustres incontestablement et les pêcheries maritimes probablement, si elles étaient abandonnées à elles-mêmes, subiraient la loi économique de l'appauvrissement. Pour combattre cette tendance le Gouvernement canadien dut légiférer, interdisant la pêche en certaines saisons, la pollution des rivières et l'obstruction de leur cours; il dut aussi spécifier les dimen-sions des mailles de filets, réglementer les agrès et les opérations de pêche. En outre, un vaste système de pisciculture a été organisé. En 1938 le Dominion a exploité 13 frayères, 1 vivier auxiliaire, 6 aleviniers, 8 bassins à saumon et plusieurs stations de cueillette des oeufs, ayant coûté 8233,408 et ayant distribué 33,685,000 alevins et poissons des espèces saumon et truite. La distribution s'est faite dans des eaux appropriées choisies. Depuis 1929 le Ministère fédéral des Pêcheries a poursuivi avec succès dans l'Ile du Prince-Edouard des recherches et des expériences en vue d'établir l'ostréiculture commerciale; depuis quelque temps ces opérations s'étendent à la Nouvelle-Ecosse. Le gouvernement de chacune de ces provinces a transféré à l'autorité fédérale le contrôle des régions huîtrières. Dans les deux autres pro-vinces productrices d'huîtres, le Nouveau-Brunswick et la Colombie Britannique, le contrôle des régions est entre les mains de la province, sauf une petite bande du littoral du Nouveau-Brunswick dont les régions ont été tranférées par le gouverne-ment provincial au contrôle du Ministère fédéral des Pêcheries, pour y poursuivre certaines recherches.
Aide directe.—Sur la côte de l'Atlantique où les conditions qui accompagnent les opérations de la pêche rendent un tel service désirable, il a été établi un système de radio qui émet des rapports sur les probabilités de la température, les approvisionne-ments de boitte et de glace et les conditions de la glace. Ces quelques dernières années le Ministère des Pêcheries a organisé des systèmes d'instruction sur les nou-velles méthodes de manutention du poisson, de saurissage, etc.
Continuant le plan suivi pendant plusieurs années relativement à l'aide directe pour les pécheurs nécessiteux, la somme de 8500,000 a été allouée à cette fin à même les crédits du Ministère des Pêcheries pour l'année fiscale 1938-39. En coopéra-tion avec les gouvernements de la Nouvelle-Ecosse, du Nouveau-Brunswick, de l'Ile du Prince-Edouard et du Québec, 14,308 pêcheurs et 36 associations de pêchuers ont joui de prêts et subventions pendant l'année. Des fonds communs de secours ont été constitués en chaque province au moyen de contribution du ministère et du gouvernement provincial, et à même ces fonds les pêcheurs ont reçu de l'aide pour s'établir; les dépenses totales Provenant des crédits alloués par le ministère se sont élevées à 8369 43-
Le Ministère des Pêcheries a poursuivi encore pendant l'année une campagne nationale de réclame en faveur des aliments poissonniers, afin d'aider les pêcheurs en faisant augmenter la demande pour leurs produits. Environ 8150,000 ont été dépensés à cette fin en 1937-38. Toute cette somme, sauf 815,000, a été dépensér au Canada. Un montant de 815,000 a été transféré au Royaume-Uni pour servir à alimenter la campagne de réclame "L'Appel du Canada" en, faveur du saumon en boite et du homard en boite. En outre de la réclame dans le Dominion, le minis-tère a retenu les services de conférencières-démonstratrices ambulantes traitant de la cuisson, du poisson, comme autre moyen d'augmenter l'usage des aliments pois-sonniers.

STATISTIQUES DES PÊCHERIES
Recherches scientifiques.—Sous la direction du Conseil de recherches sur les pêcheries (autrefois le Conseil biologique du Canada), des stations pour la poursuite de recherches sur les nombreux problèmes complexes relatifs aux pêche-ries sont établies à Halifax, N.-E., St-Andrews, N.-B., Grande-Rivière, Québec, et Nanaimo et Prince-Rupert, C.B. Le Conseil dirige une autre station à Ellerslie, I.P.-E., pour recherches en ostréiculture principalement, et une sous-station à Cultus-Lake, C.B., pour recherches sur le saumon. Le Conseil emploie un per-sonnel permanent de techniciens. Le cycle évolutif des poissons comestibles, la bactériologie du poisson frais ou sauri, l'amélioration des méthodes de manutention et de préparation du poisson, et de nombreux autres problèmes pratiques ont fait le sujet d'importants mémoires et rapports scientifiques.
Problèmes internationaux.—Des problèmes d'importance internationale concernant les pêcheries ont surgi de temps en temps sur les deux littoraux du Do-minion, de même que dans la région des Grands Lacs où les problèmes sont com-pliqués par le nombre de gouvernements des Etat,s concernés. La question des pri-vilèges des Etats-Unis dans les pêcheries canadiennes de l'Atlantique a été un pro-blème international important. L'esquisse historique de cette question se trouve aux pages 233-234 de la Statistique des Pêcheries, 1935. Depuis 1933, en vertu de l'ancien système de modus vivendi, résultat du traité non ratifié de 1888, les vaisseaux des Etats-Unis ont encore reçu la permission d'entrer dans les ports canadiens pour acheter de la boitte et tous autres approvisionnements.
Le Canada et les Etats-Unis ont pris ces dernières années des mesures con-jointes pour traiter deux importants problèmes concernant les pêcheries du littoral du Pacifique—le premier est la protection de la pêche du flétan dans le Pacifique septentrional; l'autre est la protection, la préservation et l'extension des pêcheries de saumon sockeye dams le système du fleuve Fraser.
Le premier traité concernant les pêcheries de flétan a été signé le 2 mars 1923. En vertu de ce traité, la pêche du flétan est interdite pendant un certain temps chaque année et une commission internationale a été établie pour faire une enquête sur la pêche et le cycle évolutif du flétan. Une autre convention, signée à Ottawa le 9 mai 1930 et ratifiée par les gouvernements respectifs le 9 mai 1931, pourvoit à la régle-mentation de la pêche par la commission en divisant en zones de pêche les eaux visées par la convention, en changeant les dates des saisons prohibées, etc. Une nou-velle convention a été signée à Ottawa le 29 janvier 1937, étendant les pouvoirs de réglementation de la commission. Les mesures prises par la commission interna-tionale en vertu des diverses conventions ont eu pour résultat d'améliorer conti-nuellement l'état des pêcheries de flétan dans les eaux concernées.
La convention relative aux pêcheries de saumon sockeye a été signée à Washing-ton le 26 mai 1930, mais l'échange de ratifications n'a pas eu lieu avant le 28 juillet 1937, bien que le Parlement canadien eût approuvé le traité plusieurs années avant cette date. Les eaux visées par la convention comprennent non seulement la ligne de partage des eaux du fleuve Fraser en Colombie Britannique, mais aussi certaines eaux canadiennes, américaines et internationales formant les abords du Fraser et où passe le sockeye du fleuve Fraser.
En vertu du traité relatif au sockeye, la Commission internationale des Pêche-ries du saumon dans le Pacifique a été établie en 1937 et comprend trois membres nommés par le Canada et un nombre égal nommé par les Etats-Unis. La commis-sion qui a établi son siège à New-TVestminster, C.B., est autorisée par la convention faire "une étude complète de l'histoire naturelle du saumon sockeye du fleuve Fraser, des méthodes de pisciculture, des conditions des frayères et autres sujets qui s'y rat-tachent", à diriger les activités de la culture du saumon sockeye dans les eaux visées par le traité et à recommander aux gouvernements "l'enlèvement ou tout autre moyen de faire disparaître les obstacles qui empêchent le saumon sockeye de remonter les cours d'eau désignés par la présente convention. . ." La convention a également
S9667-16§
235

736 STATISTIQUES DES PÊCHERIES
• donné à la commission certains pouvoirs de réglementation, mais l'une des ententes conditionnant l'approbation du traité par les deux pays veut que "La commission ne doit pas promulguer ou mettre en vigueur des règlements avant que les recherches scientifiques prévues dans la convention n'aient couvert deux cycles de montée du saumon sockeye, soit huit ans".
Primes.—Une loi de 1882 (45 Vict., c. 18), pour le développement des pêcheries maritimes et l'encouragement à la construction des navires de pêche, a consacré une somme annuelle de 8150,000, représentant l'intérêt sur le montant de la sentence arbitrale d'Halifax, à la distribution de primes aux pêcheurs et aux propriétaires de bateaux de pêche sur l'Atlantique et à leurs équipages. Une autre loi, votée en 1891, (54-55 Vict., c. 42) éleva ces primes à 8160,000, les détails de leur distribution étant réglés chaque année par arrêté ministériel.
INDUSTRIE MODERNE
L'industrie de la pêche commerciale au Canada a commencé à prendre de l'expansion dans la dernière moitié du XIXe siècle. En 1844, la valeur estimative des prises n'était que de 8125,000. Elle doubla dans la décade suivante et, dès 1860, elle dépassait 81,000,000. Dix ans plus tard elle atteignait 86,000,000, chiffre plus que doublé en 1878. En 1900 elle avait atteint un total de 821,000,000 et l'augmen-tation s'est continuée avec peu d'interruption jusqu'en 1918, alors qu'elle toucha la cime de 860,000,000. Depuis lors, il y a eu des diminutions, niais elles sont attri-buables à l'abaissement des prix plutôt qu'à une réduction de la prise. En 1938 la valeur s'établit à 840,492,976. Il est entendu que ces chiffres représentent la valeur totale du poisson vendu soit frais, soit séché, soit en conserve ou autrement préparé. Le nombre d'employés a augmenté en même temps en proportion égale. Il s'est élevé à plus de 90,000 certaines années. Le capital engagé s'est établi d'ailleurs jusqu'à 864,000,000. En 1938 le nombre d'employés est de 85,994 et le capital immobilisé est de 848,561,442.
Entre tous les poissons, la morue de l'Atlantique et le saumon du Pacifique se disputèrent longtemps la primauté; mais depuis 1895 le saumon tient définitive-ment la première place et la quantité de homard et son prix élevé ont plus d'une fois, ces dernières années, relégué la morue au troisième rang. La valeur annuelle moyenne de la production de la pêche de saumon au cours de la période de 1929 à 1938 est de 812,515,482; celle de la pêche de homard, de 84,567,646; celle de la pêche de morue, de 83,319,603. Pour le saumon la cime est 1930 (817,731,891); pour le homard et la morue, c'est 1929 (85,696,542 et 85,394,636 respectivement). Les premiers temps la Nouvelle-Ecosse était à la tête des provinces; mais la Colombie Britannique occupe maintenant la première place, la Nouvelle-Ecosse vient au deuxième rang et le Nouveau-Brunswick est troisième.
COMMERCE
Vu la quantité immense de poisson pris annuellement par les pêcheurs cana-diens, le commerce doit dépendre dans une large mesure du marché étranger comme débouché du produit. On peut évaluer approximativement à 60 ou 70 p.c. des prises annuelles la portion exportée, dont les Etats-Unis absorbent environ la moitié et le Royaume-Uni, le quart. L'année civile 1938 les exportations totales s'élèvent à 827,543,680; les Etats-Unis en reçoivent pour 812,713,819 et le Royaume-Uni, pour 86,880,661. Un autre groupement des statistiques des exportations indique que les pays de l'Empire Britannique en reçoivent pour 811,457,680 et les pays étrangers, pour 816,086,000. Le plus important des poissons exportés est le saumon en boîte (expédié au Royaume-Uni et aux marchés européens), suivi par le homard

STATISTIQUES DES PÊCHERIES 237:
frais, le homard en boîte, le saumon frais, le coré gone frais et la morue séchée (aux Antilles et en Amérique du Sud, etc.). Pour le poisson frais, les Etats-Unis cons-tituent le principal débouché. En 1938 les importations canadiennes de poisson se placent à 83,036 ,227.
REVUE DES PÊCHERIES, ANNÉE CIVILE 1938
En 1938 les prises commerciales de poissons, mollusques et crustacés des pêcheurs canadiens montrent une diminution en regard du total de 1937; mais ja valeur marchande de la production de l'année ($40,492,976) accuse une aug-mentation de plus de $1,500,000 et est plus forte que la valeur marchande de toute autre année depuis 1930. La prise totale provenant des pêcheries mari-times et d'eau douce est de 10,741,150 quintaux, soit environ 176,900 quintaux de moins que l'année précédente. Il y a diminution des prises des pêcheries maritimes, qui s'élèvent à 9,845,723 quintaux comparativement à 10,026,396 quintaux l'année précédente. Les prises des pêcheries intérieures ou d'eau douce, 895,427 quintaux, augmentent de 3,000 à 4,000 quintaux. La valeur au débarquement de la prise des pêcheries maritimes ou, en d'autres termes, la valeur de la prise pour les pêcheurs au débarquement augmente de plus de $58,000, bien que la prise de poissons, mollusques et crustacés pendant l'année soit plus faible que celle de 1937. D'autre part, dans le cas des pêcheries inté-rieures la valeur au débarquement fait voir une diminution de $422,279, bien_ que la prise soit plus considérable. Au point de vue de la valeur marchande, ce sont les pêcheries maritimes qui montrent une augmentation, soit de $1,790,- 101. La valeur marchande de la prise des pêcheries intérieures, $6,718,828, diminue de 8273,419. Cinq des provinces (Manitoba, Alberta, Ile du Prince-Edouard, Québec et Colombie Britannique) ont à leur crédit des augmentations de valeur marchande. Toutefois, le plus grand gain (plus de $2,517,000) est celui de la Colombie Britannique.
Grande pêche.—Pour l'ensemble du Dominion la pêche au saumon tient encore la tête au point de vue de la valeur marchande de la prise de l'année. La prise de saumon augmente de plus de 42,500 quintaux et sa valeur marchande ($14,992,500 en chiffres ronds) surpasse de plus de $2,622,000 celle de 1937. La pêche au homard, venant en deuxième lieu après le pêche au saumon au point de vue de la valeur marchande, accuse une augmentation de prise com-parativement à 1937; mais la faiblesse des prix sur les marchés d'exportation a pour effet de réduire la valeur marchande de plus de $840,000. La valeur marchande de la prise de homard est de $3,793,219. Pour ce qui est de la pêche à la morue, il y a une augmentation tant de la prise que de la valeur marchande. Les prises des pêcheurs de morue, environ 1,702,000 quintaux, augmentent de près de 178,400 quintaux et leur valeur marchande, $3,335,231, montre un gain de $195,000. La pêche au hareng n'est pas aussi heureuse qu'elle l'a été l'année précédente, la prise de même que la valeur marchande diminuent. Le corégone est encore de première importance dans les pêcheries d'eau douce, bien que la prise et la valeur diminuent. Les débarquements de corégone atteignent 154,244 quintaux et leur valeur marchande est de $1,650,347, soit une diminu-tion d'environ 19,400 quintaux d'une part et de 8237,500 d'autre part. Les autres poissons, d'eau salée ou d'eau douce, dont la valeur marchande s'établit à plus de $1,000,000 sont les suivants: flétan, 81,789,444; sardine, $1,393,129; églefin, $1,361,992; truite, $1,036,292; doré, $1,031,868.
malin

238 STATISTIQUES DES PÊCHERIES
PÊCHERIES MARITIMES Le tableau suivant donne, par province, les chiffres montrant la prise de
poissons, mollusques et crustacés de mer les années civiles 1938 et 1937:
1938 1937 lb lb
Colombie Britannique 456,286 400 495,419 500 Québec 86,507 800 71,596,600 Nouveau-Brunswick 127,173,100 137,790,700 Ile du Prince-Edouard 29,420,400 27,525,000 Nouvelle-Ecosse 285,184,600 270,307,800
Totaux 984,572,300 1,002,639,600
Pour la plupart des plus importantes pêcheries la production est plus grande en 1938 qu'en 1937, bien que la prise globale des pêcheries maritimes augmente. La morue débarquée sur le littoral de l'Atlantique, par exemple, s'établit à 168,338,800 livres, soit environ 17,400,000 livres de plus qu'en 1937. Les débarquements de hareng de l'Atlantique, 114,906,400 livres, sont d'environ 7,160,000 livres plus considérables que l'année précédente. La prise d'églefin, de homard, de maquereau et de sardine fait voir une augmentation en 1938; le hareng s'établit à $39,358,900 livres; le homard, à 31,438,500 livres; le maque-reau, à 28,556,500 livres; la sardine, à 184,450 barils.
Sur la côte du Pacifique, la prise de saumon est de 173,466,400 livres contre 169,173,600 en 1937. La quantité de flétan débarquée en Colombie Britannique par les bateaux de pêche canadiens est de 12,024,700 livres, augmentation de 303,000 livres en chiffres ronds. La production de hareng de la Colombie Bri-tannique, cependant, diminue tout à fait brusquement et se place à moins de 132,892,000 livres comparativement à 192,979,500 livres l'année précédente. Tandis que la prise de hareng diminue, les débarquements de pilchard montrent un gain, •tout comme ceux de saumon et de flétan. En 1937 les pêcheurs de pilchard ont débarqué 96,148,500 livres, mais en 1938 leurs prises s'élèvent à 103,537,000 livres. Toutefois, les prises globales de toutes les pêcheries de la Colombie Britannique sont moins considérables en 1938 qu'elles ne l'étaient l'année précédente.
PÊCHERIES INTÉRIEURES
Deux des régions où se pratique la pêche d'eau douce, l'Alberta et le Mani-toba, font voir des augmentations dans la valeur de la production poissonnière en 1938 comparativement à 1937; mais ailleurs il y a des diminutions et le résultat net est que la production de l'ensemble des pêcheries d'eau douce ne vaut que 86,718,828, soit $273,400 de moins (en chiffres ronds) qu'en 1937. La diminu-tion majeure (près de $262,000) se produit en Ontario et dans cette province la réduction est attribuable en majeure partie au succès moins grand de la pêche à la sandre. La prise de sandre—cette espèce particulière de poisson ne se prend qu'en Ontario—diminue de quelque 21,300 quintaux en regard de l'an dernier, alors qu'elle s'élevait à 94,500 quintaux (en chiffres ronds). La valeur marchande de la prise de 1938, légèrement supérieure à $497,500, fait voir une diminution de $315,100.
En Alberta le gain est de $59,600 et au Manitoba, de 815,100. En Sas-katchewan la valeur marchande de la pêche diminue de $58,500, tandis que pour les pêcheries d'eau douce du Québec la réduction est de 821,200. La production des pêcheries intérieures du Nouveau-Brunswick baisse de près de $3,000; au Yukon la diminution approche 83,500. Il s'agit des chiffres ronds dans tous les cas donnés ici.
NctrA.—La précédente "Revue des Pêcheries, 1938" est publiée grâce à la courtoisie du sous-ministre des Pêcheries, au ministère duquel elle a été préparée

STATISTIQUES DES PÊCHERIES 239
STATISTIQUES DES PÊCHERIES DU CANADA, 1938 La valeur globale des produits poissonniers du Canada en 1938 est de
$40,492,976, comparativement à $38,976,294 en 1937 et $39,165,055 en 1936. Ces chiffres représentent la valeur de tous les produits tels que mis sur le marché, qu'ils aient été vendus pour consommation à l'état frais ou qu'ils aient subi un traitement ou Iule transformation quelconques dans une usine ou au domicile des pêcheurs. Le tableau qui suit montre les prises et la valeur marchande des principaux poissons commerciaux (dont la pêche a donné une valeur de $100,000 ou plus) les cinq dernières années, avec une indication dans la dernière colonne de l'augmentation ou diminution en 1938 comparativement à 1937.
1.-Quantité (a) et valeur (b) des principaux poissons commerciaux pêchés au Canada, 1934-1938
Augmentation ou diminution
Espèce 1934 1935 1936 1937 1938 en1938sur1937 Jing- 1- Dira. -
Saumon qtx 1,696,856 1,824,205 2,029,704 1,724,213 1,766,728 1- 42,515
S 12,875,257 12,540,307 13,867,513 12,370,219 14,992,544 -E 2,622,325 Homard qtx 361,992 319,969 283,273 309,950 314,385 -E- 4,435
8 4,269,764 4,378,742 4,383,428 4,833,429 3,793.219 - 840,210
Morue qtx 1,714,059 1,539,150 1,699,974 1,523,626 1,702,023 -E 178,397
S 3,327,507 2,758,140 3,331,750 3,140,230 3,335,231 -E 195,001 Hareng qtx 1,901,874 2,060,320 2,852,381 3,057,503 2,533,677 - 523,828
$ 1.799,967 1,817,540 2,576,533 2,556,883 2,487,231 - 69,652 Flétan (c) qtx 123,152 132,130 138,468 150,583 162,540 -I-- 11,957
$ 1,134,307 1,285,587 1,441,310 1,598,190 1,789,444 -F 191,254 Corégone qtx 144,615 147,456 144,603 173,675 154,244 - 19,431
$ 1,358,692 1,432,072 1,525,700 1,887,889 1,650,347 - 237,542 Sardine brl 191,549 187,666 247,238 159,481 184,450 1- 24,969
$ 1,039,002 1,335,798 1,598,562 1,e26,505 1,393,129 - 133,376 Eglefin qtx 356,068 368,426 403,010 388,823 393,589 -E 4,766
$ 1,075,529 1,129,695 1,291,905 1,296,313 1,361,992 1- 65,679
Truite qtr 58,977 86,325 72,973 70,588 72,873 1- 2,285
S 594,354 768,568 842,738 1,031,740 1,036,292 -E 4,552 Doré citx 122,512 109,548 145,635 143,020 128,812 - 14,208
5 844,848 801,822 1,109,397 1,043,532 1,031,868 - 11,664 Pilchard qtx 860,103 911,411 889,037 961,485 1,035,369 1- 73,884
5 549,910 870,328 667,313 902,619 867,007 - 35,612 Maquereau qtx 190,818 160,495 227,638 239,163 285,565 -E 46,402
S 421,013 308,721 461,868 635,740 580,716 - 75,024 Sandre qtr 24,321 51,230 68,995 94,496 73,171 - 21,325
$ 116,741 302,259 614,055 812,665 497,564 - 315,101
Doré noir qtr 48,695 35,044 47,711 82,676 95,007 -1- 12,331
S 242,889 155,975 263,579 377,884 488,786 -F 110,902 Epérlan qtx 59,909 79,409 94,868 67,343 71,256 1- 3,913
$ 557,538 588,333 655,658 444,473 486,485 -E 42,012
Perche qtx 72,766 72,001 32,258 35,231 43,661 -1- 8,430
$ 384,889 401,034 268,653 277,220 335,563 1- 58,343 Coque (c) qtx 85,314 137,944 143,274 142,472 150,528 -E 8,058
s 111,885 173,626 192,910 240,184 285,561 1- 45,377 Tullibee qtx 44,078 39,721 59,265 55,966 57,932 1- - 1,966
s 204,984 225,808 276,464 284,288 283,836 - 452 Lingue qtx 47,806 62,841 88,932 42,858 46,516 -F 3,858
$ 281,644 326,029 392,147 275,817 283,511 -1- 7,694 Merluche et brosmius qtx 248,179 189,756 228,047 229,225 261,898 -1- 32,673
$ 257,340 221,341 316,200 299,004 280,161 -18,843 Brochet qtx 37,195 44,761 54,370 51,320 62,283 1- 10,963
$ 149,821 181,263 225,589 215,306 233,182 -E 17;878 Frultre brl 24,964 27,113 28,965 24,687 24,476 - 211
$ 158,241 178,126 189,922 180,079 175,620 - 4,459 Anguille qtx 25,238 25,091 23,440 20,980 22,064 1-- 1,084
$ 159,674 162,370 153,495 144,277 157,198 1- 12,921 Pétoncle gal. 89,890 133,225 170,762 183,755 95,686 - 88,069
$ 168,415 207,641 334,424 296,529 140,509 - 156,020 Poisson gris qtx 117,020 107,400 145,701 148,913 197,110 1- 48,197
S 64,715 53,079 86,783 81,238 136,660 1- 55,422 Espadon qtx 14,091 22,339 17,853 15,020 10,929 - 4,091
Y 176,640 264,097 230.798 238,165 132,763 - 105,402 Gasparot qtr 70,739 83,086 88,860 74,890 104,520 1- 29,630
$ 72,479 98,244 93,628 76,698 116.414 1- 39,716 Merlan qtx 85,037 82,048 126,345 239,845 101,334 - 138,511
$ 95,024 82,745 114,200 222,208 115,017 -- 107,191 Sole qtx 14,469 16.578 24,301 27,456 23,602 - 3.854
$ 71,741 79,246 108,409 123,398 107,957 - 15,441
(a) Quantité prise. (b) Valeur des ventes.
(e) Comprise avec mactre ou praire antérieurement à 1935.
ÉMUE

240 STATISTIQUES DES PÊCHERIES
2. Quantité et valeur du poisson pêché et mis en vente, Canada, 1937 et 1938
Pêcheries maritimes
Espèces 1937 1938
Quantité Valeur Quantité Valeur
$ $
Morne, prise qtx 1,523,626 2,079,924 1,702,023 2,135,065 Mise en vente-
A l'état frais qtx 113,616 305,571 102,668 264,890 Filets frais qtx 85,630 675,881 94,118 797,583 Verte-salée qtx 150,736 430,016 179,215 515,304 En conserve caisses 4,458 16,320 563 2,477
Fumée qta 295 2,670 476 3,658 Fileta fumés qtx 60,602 517,064 55,838 479,765 Séchée. qtx 189,930 923,496 220,568 942,198 Sans arêtes qtx 23,166 192,114 31,140 252,081 Œufs qtx 46 460 - -
Foies qtx - - 150 750 Poudre de foie tonnes 2 170 3 160 Huile de foie, médicinale
49,624 30,122 62,611 35,667
•
Huile Pl 122,822 46,316 109,120 40,698
Total, valeur marchande - 3,140,230 - 3,335,231
Eglefin, pris qta 388,823 637,378 393,589 635,514 Mis en vente-
A l'état frais qtx 98,956 374,008 100,473 385,893 Filets frais qtx 70,756 660,039 67,635 653,370 En conserve caisses 7,196 28,137 22,096 88,824 Fumé qtx 20,379 171,911 24,548 201,360 Fileta fumés qtx 6,752 55,998 2,460 20,006 Vert-salé qtx 467 981 1,170 2,252 Séché qtx 1,327 4,602 1,695 4,860 Sans arêtes qtx 53 320 678 3,429 Œufs qtx 28 317 185 1,998
• Total, valeur marchande - 1,296,313 - 1,361,992
'
Merluche et brosmlus, pris qtx 229,225 109,299 261,898 130,599 Mis en vente-
A l'état frais qtx 22,873 23,505 52,521 48,318 Filets frais qtx 6,335 39,963 3,751 22,468 En conserve caisses 12,522 53,278 9,119 37,492
• Verts-salés cite 42,666 80,589 41,179 76,687
Fumés qtx - - 96 480 Filets fumés qtx 4,611 29,388 3,264 21,463
Séchés qtx 21,470 65,264 23,046 62,701 Sans arêtes qtx 1,019 6,291 1,759 9,733 Huile gal. 1,750 726 2,937 819
Total, valeur marchande - 299,004 - 280,161
llerian, pris qtx 239,845 99,122 101,331 57,098 Mis en vente-
A l'état Irais qta 14,242 16,359 12,429 25,097 Fileta frais qtx 451 2,861 899 1,121 Vert-salé qtx 39,298 71,604 11,344 24,264 Fumé qtx - - 4 19 Séché qtx 98,558 130,190 21,142 64,128 Sans arêtes qtx 7 35 23 138 Huile gal. 3,125 1,159 1,090 250
Total, valeur marchande - 222,208 - 115,017
Silure nain, pris qtx 3,913 1,885 4,336 1,631 Mis en vente-
A l'état frais qtx 628 2,499 ' 1,134 3,306 Filets frais qtx 1,095 9,038 1,072 7,859
Total, valeur marchande - 11,537 - 11,165
Vhiting, pris qtx 17 42 20 58
Mis en vente à l'état frais qtx 17 50 20 62
létan, pris qtx 150,583 1,231,715 162,510 1,220,359 Mis en vente-
A l'état frais qtx 148,472 1,461,576 152,596 1,402,891 Filets frais qtx 663 16,575 6,983 127,209 En conserve caisses 175 1,312 128 822 Foies qtx 2,362 117,290 3,725 182,722 Huile de foie de flétan gal. 843 168 750 18,750 Huile de viscères de flétan gal. - - 815 57,050 Poudre tonnes 42 1,269 - -
Total, valeur marchande - 1,598,190 - 1,769,444

Espèces
Turbot, barbue, plie, pris qtx Mis en vente-
A l'état frais qtx Filets Irais qtx
Total, valeur marchande
Baie, prise (a) qtx Mise en vente à l'état frais qtx
Sole, prise qtx Mise en vente-
A l'état frais qtx Filets frais qtx
Total, valeur marchande
Hareng, pris qtx Mis en vente-
A l'état frais qtx En conserve (entier) caisse En conserve (rai-saur) caisse
Fumé (entier) qtx Fumé (sans arêtes) qtx Mi-saur qtx Salé au sel sec qtx Saumuré brl Comme boette brl
En engrais brl Huile gal Poudre tonne Ecaill es qtx
Total, valeur marchande
Maquereau, pris qtx Mis en vente-
A l'état frais qtx
Filets frais qtx En conserve caisse Fumé qtx Saumuré brl Filets salés brl Comme boette brl
Total, valeur marchande
Sardine, prise brl Mise en vente-
Fralche et salée brl En conserve.. caissi
Total, valeur marchande
Pilchard, pris tex Mis en vente-
A l'état frais qtx En conserve caisse Comme bette brl Huile Poudre tonne
Total, valeur marchande
Gasparot, pris qtx Mie en vente-
A l'état frais qtx Fumé qtx Salé brl
Total, valeur marchande
STATISTIQUES DES PÊCHERIES
2. Quantité et valeur du poisson pêché et mis en vente, Canada, 1937 et 1938-suite
241
Pêcherie; maritimes
1937 1938
Quantité Videur C/imundté Videur
8 s
13,345 15,521 15,861 21,631
7,501 21,151 10,205 32,056
1,948 23,292 1,762 26,342
- 44,443 - 58,398
18,344 6,115 - 34,155 9,244
2,176 10,330 5,131 7,254
27,456 60,796 23,602 68,662
12,585 65,874 8,299 43,240
4,957 57,524 5,101 64,717
- 123,398 - 107,957
3,007,267 930,034 2,477,977 874,221
193,346 252,100 186,670 287,369
76,739 292,712 79,878 317,375
4,911 15,129 15,819 69,957
28,792 . 90,104 27,764 72,757
1,367 10,026 6,077 70,844
6,655 49,847 8.545 71,393
203,401 203,401 149,700 142,115
24,318 169,622 34,489 150,778
215,755 383,831 200,921 319,253
177,456 93,313 189,524 71,506
1,313,337 291,241 1,028.376 154,111
14,427 460,139 11,073 420,277
4.194 12,511 2,936 8,034
- 2,263,976 - 2,185,769
239,163 384,288 285,565 345,369
67,010 188,978 62.312 133,511
1,777 22,822 263 1,524
898 3,696 634 2,598
60 300 40 280
39,381 262,764 43,268 208,477
7,312 117,321 8,631 102,628
9,344 39,859 28,814 111,698
- 635,740 - 560,716
159,481 211,132 181,450 340,761
74,873 67,688 115,624 195,440
423,043 1,458,817 349,887 1,197,689
- 1,526,505 - 1,393,129
961,485 421,613 1,035,369 452,999
33 150 19 50
40,975 110,351 69,473 232,311
1,045 1,090 310 620
1,707,276 513,906 2,195,850 313,559
8,483 277,122 8,891 320,467
- 902,619 - 867,007
73,854 41,600 103,426 60,521 '
37,864 29,613 52,129 48,028
2,987 7,408 2,968 7,082
11,046 37,832 16,490 59,495
- 74,853 - 114,605
158 766 195 1,002
158 1,002 195 1,244 Bar, pris qtx
Mis en vente à l'état frais qtx -
(a) Une partie utilisée dans la production de poudre et d'huile de poisson.

242 STATISTIQUES DES PÊCHERIES
2. Quantité et valeur du poisson pêché et mis en vente, Canada, 1937 et 1938-suite
Pêcheries maritimes
Espèces 1937 1938
Quantité Valeur Quantité Valeur
$ $
Perche, prise qtx 559 3,632 591 3,90.5 Mise en vente-
A l'état frais qtx 559 3,772 549 3,982 Filets frais qtx - - 15 90
Total, valeur marchande - 3,772 - 4,072
Sébaste, pris qtx 970 807 4,779 3,137 Mis en vente-
A l'état frais. qtz 706 1,412 4,357 8,714 Filets frais qtx 88 1,094 141 705
Total, valeur marchande - 2,506 - 9,419
Saumon, pris qtx 1,722,097 5,674,919 1,765,087 6,719,237 Mis en vente-
A l'état frais qtx 290,694 2,182,014 241,835 2,056,402 En conserve caisses 1,509,520 9,268,404 1,708,835 12,274,863 Peiné qtx 88 2,217 . 116 2,150 Mi-saur qtx 100 1,300 113 1,269 Salé au sel sec qtx 108,983 314,853 69,209 179,282 Peu salé qtx 26,238 440,403 19,684 355,554 Saumuré qtx 248 3,303 1,087 12,305 Œufs qtx 9,360 24,932 8,492 18,411 Comme bette qtx 237 564 50 123 Huile gal. 169,239 41,590 114,797 22.142 Poudre tonnes 1,845 58,838 1,229 46,148
Total, valeur marchande - 12,338,468 - 14,968,649
Alose, prise qtx 12,393 32,907 14,810 39,928 Mise en vente-
A l'état frais qtx 12,164 41,332 13,673 46,471 Salée brl 76 632 379 3,68f
Total, valeur marchande _ 41,964 _ 50,151
Eperian, pris qtx 66,433 323,266 70,226 342,933 Mis en vente ili l'état frais qtx 66,433 438,823 70,226 480,60:
Esturgeon, pris qtx 152 1,973 251 3,212 Mis en vente à l'état frais qtx 152 2,046 251 3,62:
Truite, prise qtx - _ 318 1,901 Mise en vente, en conserve caisses - 460 2,90:
Cabillaud, pris qtx 13,410 54,011 8,463 34,444 Mis en vente-
A l'état frais qtx 10,328 60.793 5,887 38,67: Fumé qtx 1,633 21,912 1,288 16,851 Foies qtx 29S 12,546 397 14,521 Huile de foie gal. - - 50 1,251
Total, valeur marchande - 95,251 .. 71,291
Lingue, prise qtx 42,858 238,186 46,516 208,501 Mise en vente-
A l'état frais qtz 42,750 254,172 46,486 248,89: Fumée qtx 54 729 15 181 Foies qtx 518 20,916 830 33,661 Huile de foie gal. - 31 77:
Total, valeur marchande - 275,817 - 283,511
5Iorue rouge et morue de roche, prises qtx 1,801 5,562 6,874 17,47i Mises en vente-
A l'état frais qtx 1,801 7,554 6,806 19,24: Fumées qtx - 3.. 40: Foies qtx 11 422 26 431 Huile de foie gal - 88 2,201
Tntal valour marrthAndn - 7,976 - 22,281

Pècheries maritimes
Espèces 1937 1938
Quantité Valeur Quantité Valeur
s $
Thon, pris qtx 8,978 24,990 5,331 19,212 Mis en vente-
A l'état frais. qtx 8, -.96 35,558 5.331 22,081 En conserve caisses 995 5,970 - - Foies qtx 23 345 25 375
Total, valeur marchande - 41,873 - 22,456 .
Capelan, lançon, et sauelet ou Joël, pris qtx 31,876 13,211 35,516 19,148 Mis en vente à l'état frais qtx 31,876 15,468 35,516 23,732
Anguille, prise qtx 2,050 11,310 2,501 14,461 Mise en vente à l'état frais qtx 2,050 12,745 2,501 16,3 01
Poisson gris, pris qta 148,913 39,332 197,110 34,431 Mis en vente-
A l'état frais qtx 4,420 1,399 49,351 2,901 Foies qtx 1,789 10,702 9,333 49.271 Huile gal. 134,274 31,017 133,010 20,606 Poudre tonnes 1,068 38,120 1,874 63,801
Total, valeur marchande - 81,238 - 136,66C
Poulpe, pris qtx 202 866 223 921 Mis en vente à l'état frais qtx 202 923 223 1,011
Oulachon, pris qtx 120 300 209 711 Mis en vente à l'état frais qtx 120 337 209 761
Encornet, pris (la 1,308 1,528 2,481 2,54: Comme boate qtx 1,308 1,897 2,484 3,70
Espadon, pris qtx 15,020 170,198 10,929 101,52 Mis en vente-
A l'état frais qtx 15,020 236,095 10,929 132,171 Foies qtx 138 2,070 39 58
Total, valeur marchande - 238,165 - 132,70
Petite morue, prise qtx 9,261 14,757 14,523 37,25' Mise en vente à l'état frais qtx 9,264 23,472 14,523 48,45
Poissons divers, pris (a) qtx 51,165 54,93e 60,649 56,31 (Non compris les poissons énumérés ailleurs)
Mis en vente à l'état frais qtx 10,110 50,170 10,499 50,881
Ormiers, pris brl 53 13 - - Mis en vente, en conserve caisses 53 47 - -
Coques, prises qtx 142,472 114,506 150,528 118,18 Mises en vente-
A l'état frais qtx 74,162 64,558 73,773 63,03 En conserve caisses 35,908 168,359 43,292 203,59 En matelotte caisses 1,898 7,267 5,102 18,93
Total, valeur marchande - 240,184 - 285,56
Crabes, plis qtx 8,696 31,767 9,675 25,82 Mis en vente-
A l'état frais qtx 5,448 27,352 5,942 2i,65 En conserve caisses 1,564 25,296 2,173 33,70
Total, valeur marchande - 52,648 - 55,36
Homard, pris qtx 309,950 3,719,618 314,385 2,864,07
Mis en vente- Carapace qtx 123,553 2,366,529 118,591 1,864,27
Chair qtx 1,858 122,476 2,128 140,85
En conserve caisses 88,581 2, 084 , 120 92,004 1,733,79
Foies caisses 6,132 60,304 6,048 54,29
Total. valpur mal-eh/Inde. - 4,633,429 - 3,793,21
7
6
3 4
5
9 4
i!
ii
7
8 1 2
1
7
1
0
1
STATISTIQUES DES PÊCHERIES
2. Quantité et valeur du poisson pêché et mis en vente, Canada, 1937 et 1938-suite
atil
243
(a) Une partie utilisée dans la production de poudre et d'huile de poisson.

244 STATISTIQUES DES PÊCHERIES
2. Quantité et valeur du poisson pêché et mis en vente, Canada, 1937 et 1938-suite
Pêcheries maritimes
Espèces 1937 1938
Quantité Valeur Quantité Valeur
S $
Huîtres, prises brl 21,687 138,751 24,476 127,696 Mises en vente-
A l'état frais brl 24,100 174,209 22,862 166,324 En conserve caisses 587 5,870 1,426 9,296
Total,valeur marchande qtx _ 180,079 - 175,620
Praires, prises brl 4,564 3,401 6,514 4,617 Mises en vente-
A l'état frais brl 1,932 1,310 3,112 3,079 En conserve caisses 1,316 7,907 1,485 8,984
Total, valeur marchande - 9,217 _ 12,063
Pétoncles, pris gal 183,755 279,014 95,686 124,0119 Mis en vente-
Ecaillés gal 183,695 296,409 95,190 139,359 En conserve caisses 15 120 115 1.150
Total, valeur marchande - 296,529 140,509
Crevettes, prises qtx 1,212 13,911 1,504 15,333 Mises en vente-
A l'état frais qtx 652 9,670 864 12,431
En conserve caisses 222 5,760 460 6,554
Total, valeur marchande - 15,430 - 18,985
Langues et noues, marinées ou séchées qtx 687 4,970 1,137 6,561
Littorines, prises qtx 632 1,169 296 591
Mises en vente à l'état frais qtx 632 1.169 296 597
Algue, verte qtx 4,471 4,883 3,e13 2,77;
Mise en vente séchée qtx 677 10.480 453 5,171
Varech, vert qtx 4,800 530 11,158 1,584
Mis en vente- Séché qtx 60 45 385 3,610
Poudre tonnes 127 5,080 107 6,920 En engrais tonnes 25 150 - -
Total, valeur marchande - 5,275 - 10,530
Phoque à fourrure, pris nomb. 2,671 12,431 1,367 3,071
Peaux vendues nomb. 2,671 12,431 1,367 3,070
Phoque commun, pris nomb. 17,794 34,299 22,831 99,561
Peaux vendues nomb. 17,794 30,443 22,831 37,118
Huile gal. 75,699 22,978 93,593 16,801
Total, valeur marchande - 53,421 - 53,910
Bélugas, pris nomb. 423 6,345 2 11
Peaux vendues nomb. 423 2,130 2 2 1
Huile gal 19,120 4,810 80 24
Total, valeur marchande - 6,940 - 44
Baleines, prises nomb. 317 220,251 310 184,074
Mises en vente- Huile gal. 662,355 197,227 543,378 162,700
Poudre de fanon tonnes 268 5,896 273 6,001
Engrais tonnes 527 17,128 512 15,36(
Total, valeur marchande - 220,251 - 184,074
Produits divers- Huile de poisson (autre), n.a,é gal. 9,050 1,979 9,480 2,21 1
Poudre de poisson, n.a é tonnes 6,562 309,630 5,823 294,53 1
Engrais de poisson, n.a é tonnes 159 1,272 192 1,251
Issues de poisson tonnes 12,678 21,005 14,344 24,88 0
Peaux et os de poisson qtx 21,421 24,690 18,635 21,271
Autres produits - 59.723 - 162,210
Valeur totale du poisson de mer- Valeur des prises - 17,508,929 - 17,567,671 v.h..... metrrhnindP - 31.984,047 - 33,774,141

STATISTIQUES DES PÊCHERIES 245
2. Quantité et valeur du poisson pêché et mis en vente, Canada, 1937 et 1938-suite
Pêcheries maritimes
Espèces 1937 1938
Quantité Valeur Quantité Valeur
S $
Gasparot, pris qtx 1,036 1,845 1,094 1,809 Mis en vente à l'état frais qtx 1,036 1,845 1,094 1,809
Bar, pris qtx 390 4,260 484 4,995 Mis en vente à l'état frais qtx 390 4,260 484 4,995
Sandre, prise qtx 94,49 718,170 73,171 453,660 Mise en vente à l'état frais qtx 94,496 812,665 73,171 497,564
Carpe, prise qtx 17,844 57,074 17,556 46,491 Mise en vente qtx 17,844 62,508 17,556 51,853
Silure nain, pris qtx 11,519 76,856 10,976 60,623 Mis en vente à l'état frais qtx 11,519 82,448 10,976 65,654
Anguille, Prise (lis 18,930 130,783 19,533 140,292 Mise en vente à l'état frais qtx 18,93 131,532 19,563 140,811
Trigle ou grondin, pris qtx 20 564 106 211 Mis en vente à l'état frais qtx 20 836 106 315
Œils-d'or, pris qtx 5,53 31,05 4,530 33,874 Mis en vente-
A l'état frais qtx 2,06 14,24 968 7,361 Fumés qtx 2,168 44,60 2,282 53,38 1
Total, valeur marchande - 58,85 - 60,741
Hareng, pris qtx 50,236 218,144 55,700 207,401 Mis en vente à l'état frais qtx 50,236 292,907 55,700 301,46:
Lote, prise qtx 3,521 3,558 3,603 3,17: Mise en vente à l'état frais qtx 3,524 3,664 3,603 3,66 1
Maskinongé, pris qtx - - 535 5,74 1 Mis en vente à l'état frais qtx - - 535 5,741
Poissons divers, pris qtx 47,960 241,386 52,118 306,081 (gade, chabot, ouananiche, etc.)
Mis en vente à l'état frais qtx 47,960 273,469 52,118 337,82, '
' Chevesne, pris qtx 20 20 3 , ' Mie en vente à l'état frais qtx 20 20 3 ,
Perche, prise qta 34,672 239,083 43,067 283,911
Mise en vente à l'état frais qtx 34,672 273,448 43,067 331,49
Doré, pris qta 143,020 795,929 128,812 713,227
Mis en vente à l'état frais qtx 143,020 1,043, 532 128,812 1,011,861
Brochet, pris qta 51,320 161,121 62,283 173,33;
Mis en vente à l'état frais qtx 51,320 215,306 62,283 233,187
Saumon, pris qtx 2,116 31,751 1,611 23,89;
Mis en vente à l'état frais qtx 2,116 31,751 1,641 23,891
Doré noir, pris qtx 82,676 325,802 95,007 408,967
Mis en vente à l'état frais qtx 82,676 377,884 95,007 488,781
Alose, prise qtx 5,132 23,621 4,680 20,76:
Mise en vente- A l'état frais qtx 4,382 21,371 4,050 18,96:
Salée brl 250 2,250 200 1,801
_ '23,621 - 20,767
(a) Une partie utilisée dans la production de poudre de poisson et une partie, dans la production d'huile.

5,650 5,650
5,880 5,880 1,030
1 , 030
246 STATISTIQUES DES PÊCHERIES
2. Quantité et valeur du poisson pêché et mis en vente, Canada, 1937 et 1938-fin
Pêcheries Intérieures
Espèces 1937 1938
Quantité Valeur Quantité Valeur
Eperian, pris qtx Mis en vente à l'état frais qtx
Esturgeon, pris qtx Mis en vente-
A l'état frais qtx Caviar liv.
Total, valeur marchande
Cyprin-sucet, pris qtx
Mis en vente à l'état frais qtx
Petite morue, prise qtx Mise en vente à l'état frais qta
Truite, prise qtx Mise en vente àl'étatfrais qtx
Tutlibee, Pris qtx Mis en vente-
A l'état frais qtx Fumé qtx
Total, valeur marchande
Corégone, pris ex Mis en vente-
A l'état frais qtx Fumé qtx
Total, valeur marchande
Valeur totale du poisson d'eau douce- Valeur des prises Valeur marchande
Valeur totale de tout le poisson- Valeur des prises Valeur marchande
910 910
6,191 62,229
6,194 67,344
3,181 3,256
- 70,600
13,693 15,531
13,693 21,532
70,588 887,440
70,538 1,031,740
55,966 224,764 '
53,015 271,899
1,844 12,389
- 284,289
173,675 1,421,521
173,653 1,887,615
14 274
- 1,887,889
- 5,684,158 - 6,992,217
- 23,193,087 - 38,976,294
.•■■
7,326 70,479
7,326 83,770
4,203 4,333
- 88,103
23,121 23,488
23,121 33,383
4,290 21,450
4,290 21,450
72,555 854,914
72,555 1,033,390
57,932 215,187
54,850 269,160
1,926 14,676
283,836
151,244 1,182,025
154,225 1,650,137
12 210
- 1,650,347
- 5,261,879 - 6,718,828
- 22,829,519 - 40,492,976
OUTILLAGE-CAPITAL ET EMPLOYÉS
Opérations primaires
Capital.-Les immobilisations représentées par les vaisseaux, barques et appareils employés dans les opérations primaires de la prise et du débarquement du poisson ont une valeur totale de $26,598,944 en 1938, dont $21,679,805 ou 82 p.c. pour les pêcheries maritimes et $4,919,139 ou 18 p.c. pour les pêcheries intérieures. Le total comprend 41,319 vaisseaux et barques valant $14,760,329, des filets, seines, pièges et autres appareils valant $11,838,615. Comparative-ment à l'année précédente, les immobilisations des pêcheries maritimes montrent une réduction de $203,132, tandis que la valeur de l'outillage employé dans les pêcheries intérieures augmente de $5,697, soit une diminution de 8197,435 pour l'outillage global des deux pêcheries.
Employés.-Les hommes employés dans les pêcheries au cours de l'année se chiffrent à 71,510, dont 57,034 dans les pêcheries maritimes et 14,476 dans les pêcheries intérieures. Comparativement à l'année précédente, le nombre de pêcheurs augmente de 1,529.

STATISTIQUES DES PÊCHERIES 247
Conserveries et saurisseries
Capital.-Les immobilisations des conserveries et saurisseries, branche de l'industrie des pêcheries, passent de $18,130,385 en 1937 à $21,962,498 en 1938. L'augmentation est principalement attribuable aux plus grandes immobilisa-tions dans les saumoneries. L'état suivant des pourcentages montre la relation qui existe entre le capital de chaque classification et les immobilisations totales: saumoneries, 53 p.c.; saurisseries, 24 p.c.; sardineries et autres conserveries, 10 p.c.; homarderies, 6 p.c huileries, 4 p.c.; glacières, 2 p.c.; conserveries de coques, 1 p.c.
Employés.-Les personnes employées dans les établissements pendant l'année se chiffrent à 14,484, à rapprocher de 14,044 l'année dernière.
Les tableaux 3 et 6 qui suivent montrent en résumé l'outillage-capital et les employés aux opérations primaires et dans les conserveries et saurisseries pour l'ensemble du Canada; d'autres tableaux de l'introduction présentent les statistiques par province, tandis que la Partie II du rapport donne les statis-tiques par comté et sous-district de pêche.
3. Outillage-capital-Opérations primaires. Valeur des vaisseaux, barques, filets, pièges, môles et quais, etc., employés dans les pêcheries canadiennes en 1936, 1937 et 1938
Pêcheries maritimes
Nomenclature 1936 1937 1938
Nombre Valeur Nombre Valeur Nombre Valeur
s s Chalutiers à vapeur 3
599,759 3 75,000 3 69,000
Vaisseaux21 vapeur 6 150,000 6 150,000 6 150,000 Vaisseaux à voiles, gazoline et diesel 1,000 4,170,500 999 4,337,314 1,133 3,960,120 Barques à gazoline et diesel 20,155 7,645,067 19,880 7,610,194 19,875 7,486,346 Barques à voiles, à rames 15,158 425,278 13,695 384,626 14,518 390,424 Pinasses et vaisseaux servant à recueillir le
poisson 585 1,676,335 456 690,274 425 882,274 Filets à mailles 71,594 929,595 69,410 855,658 69,584 857,589 Filets dérivants à saumon 13,054 1,146,022 12,543 1,043,442 13,511 1,323,470 Parcs en filets à saumon 949 367,260 959 391,480 987 397,490 Autres parcs en filets 551 264,860 509 263,620 639 281,170 Filets à éperlan 17,289 372,074 15,725 357,650 15,974 366,638 Filets tremblants 62 8,680 51 7,650 49 7,350 Seines à oulachons 18 540 27 810 28 840 Filets à crevettes 25 1,775 28 2,350 23 1,975 Seines à poche à saumon 220 248,500 208 259,200 262 301,200 Seines tralnantes pour saumon 9 5,800 21 10,750 9 5,350 Autres seines 843 213,575 882 257,675 888 241,425 Nasses 374 299,093 393 319,695 490 380,025 Tessures 2,833 52,975 3,654 66,044 3,034 58,475 Baquets de palangre 22,055 288,887 21,770 293,383 22,828 307,172 Chaluts à panneaux 14 2,050 13 2,150 15 6,850 Lignes à main 72,906 161,034 70,197 174,415 70,629 175,343 Pièges à crabes 7,265 27,225 8,741 33,272 6,778 26,545 Pièges à anguilles 395 73 625 5,898 782 1,112 Pièges à homards 2,134,762 2,321,774 2,210,517 2,580,096 2,094,070 2,315,970 Parcs à homards 54 69,830 52 67,280 33 65,275 Râteaux à hultres 1,605 6,423 1,873 5,803 1,879 5,852 RAteaux à pétoncles 835 23,278 1,025 23,362 662 20,799 Râteaux à praires 184 628 170 583 277 896 Quais et môles 1,759 665,020 1,753 594,810 1,721 573,675 Glacières et réfrigérateurs 620 233,800 715 256,880 727 251,945 Petits poissons et fumeries 8,161 701,633 7,405 699,358 7,443 699,473 Autres appareils - 35,986 - 62,215 - 67,737
Valeur totale - 22,584,931 - 21,882,937 - 21,679,805

nomb.
75
5,083
48,918
965
3,300
nomb.
75
5,201
46,788
594
3,140
nomb.
79
5,843
47,161
649
3,302
nomb.
8,994
132
4,238
nomb.
8,689
128
5,366
nomb.
7
8,384
102
5,990
57,031 55,798 14,183 13,361
248 STATISTIQUES DES PÊCHERIES
3. Outillage-capital-Opérations primaires. Valeur des vaisseaux, barques, filets, pièges, môles et quais, etc., employés dans les pêcheries canadiennes en 1936, 1937 et 1938-fin
Pêcheries Intérieures
Nomenclature 1936 1937 1938
Nombre Valeur Nombre Valeur Nombre Valeur
$ S S Vaisseaux pour le transport du poisson 27 125,850 27 126,700 27 124,850 Remorqueurs 99 653,450 91 609,633 101 685,010 Barques à gazoline 1,682 888,723 1,575 900,418 1,629 903,126 Barques et chaloupes 3,608 119,972 3,753 109,871 3,602 109,179 Filets à mailles - 1,547,136 - 1,791,202 - 1,793,774 Seines 168 21,533 344 26,986 317 23,319 Parcs en filets - - 1 700 1 SOO Filets tremblants 1,152 542,628 1,094 555,927 1,112 534,580 Filets cylindriques 1,116 24,929 1,136 27,283 1,462 30,969 Filets à rouleaux 97 402 93 1.184 68 298 Autres filets - 767 22,940 - - Lignes 2,876 19,581 1,250 8,377 1,849 13,263 Nasses 919 125,950 60 700 342 67,500 Pièges à anguilles 130 260 639 89,590 260 1,100 Dards 231 1,687 86 603 325 1,396 Roues à poisson 9 765 10 850 8 680 Quais et môles 546 164,943 500 152,373 578 155,252 Glacières et réfrigérateurs 915 375,635 855 432,195 940 412,753 Petits poissons et fumeries 196 60,125 157 55,910 195 61,290
Valeur totale - 4,673,569 - 4,913,442 - 4,919,139
4. Employés aux opérations primaires, 1936, 1937 et 1938
Pêcheries marli mes Pêcheries Intérieures
1936 1936 1937 1938 1936 1937
Hommes employés-
A bord des chalutiers à vapeur
A bord des navires
A bord des chaloupes
A bord des pinasses
Pêcheurs sans embarcations
Total
5. Outillage -capital (a)-Conserveries et saurisseries, 1936, 1937 et 1938
1936 1937 1938 lltablissements
Nombre Valeur Nombre Valeur Nombre Valeur
$ S S
Homarderies 304 1,606,073 277 1,660,901 215 1,220,121
Saumoneries 68 9,365,076 72 8,399,825 102 11,615,322
Conserveries de coques 17 113,892 21 206,056 25 284,706
Sardineries et autres conserveries 15 1,690,575 12 1,837,321 11 2,181,350
Saurisseries 188 4,606,602 178 4,500,166 172 5,333,983
Glacières 15 433,680 19 412,557 18 404,971
Huileries (b) 17 ' 798,694 18 1,113,559 18 922,012
Total 624 18,614,592 597 18,130,385 561 21,962,498
(a) Comprend la"vrdeur des terrains, bàtiments, outillage, produits, matériaux et provisions en main, argent en caisse et billets à recevoir.
(b) Bien que la majeure partie de la poudre et de l'huile de poisson soit produite dans les établissements classifiés comma ''huileries", il y en a de petites quantités enregistrées parmi les Produits des saurisseries.
58,371 11,476
■.■

STATISTIQUES DES PÊCHERIES
6. Employés dans les conserveries et les saurisseries, 1936, 1937 et 1938
1936 1937 1938 -
Hommes Femmes Total Hommes Femmes Total Hommes Femmes Total
nomb. nomb. nomb. nomb. nomb. nomb. nomb. nomb. nomb. Personnes employées dans les-
Homarderies 2,278 3,256 5,534 2,077 3,099 5,176 1,789 2,949 4,738 Saumoneries 2,960 2,553 5,513 2,305 2,174 4,479 2,714 2,439 5,153 Conserveries de coques 94 177 271 120 196 316 138 268 406 Sardineries et autres
conserveries 374 354 728 403 427 830 443 478 921 Saurisseries 2,421 307 2,728 2,309 322 2,631 2,315 408 2,723 Glacières 138 10 148 214 43 257 178 34 212 Huileries 308 8 316 346 9 355 319 12 331
Total 8,573 6,665 15,238 7,774 6,270 14,044 7,896 6,588 14,484
Détails sur les conserveries et les saurisseries
Nombre d'établissements.-Les rapports des établissements s'occupant des opérations de conserverie et saurisserie sont classifiés d'après l'item principal de production, et les statistiques sont données séparément dans le rapport pour chaque groupe, excepté lorsqu'il y a moins de trois établissements dans un groupe. Les établissements en. opération en 1938 se chiffrent à 561 et se répartissent comme suit: 215 homarderies, 102 saumoneries, 25 conserveries de mollusques et crus-tacés, 11 sardineries et conserveries d'autres poissons, 172 saurisseries, 18 gla-cières et 18 huileries. Les saumoneries augmentent de 75 en 1937 à 102 en 1938; mais cette augmentation a trait presque entièrement aux petites saumoneries dans la province de Québec, où le nombre passe de 33 à 62. Sur le littoral du Pacifique toutes les saumoneries ont une grande capacité, elles se chiffrent à 38 comparativement à 37 en 1937. Il y a 62 homarderies de moins qu'en 1937. Le total de toutes catégories accuse une diminution de 36. La préparation du poisson est une industrie qui se confine aux provinces bordant la mer et les établissements sont situés SUI les rives des baies et estuaires où les pêcheurs ont un accès facile pour faire la livraison de leurs prises.
Employés, salaires et gages.-En 1938 les établissements emploient 14,484 personnes, augmentation de 440 sur l'année précédente. Le total comprend 642 employés salariés, 9,092 employés à gages et 4,750 apiéceurs. Les apiéceurs se rencontrent principalement dans les saumoneries de la Colombie Britannique où une grande partie du travail se fait à l'entreprise; l'entrepreneur embauche et paie ses propres employés et est lui-même rémunéré selon la quantité de poisson mis en conserve. Environ 80 p.c. des travailleurs dans les saumoneries de la Colombie Britannique sont classifiés comme apiéceurs. Voici la méthode employée pour en arriver au nombre total d'employés: sur le rapport de chaque établissement est faite l'addition du nombre de travailleurs à gages indiqués pour chaque mois, et le total ainsi obtenu est divisé par le nombre de mois pen-dant lesquels l'établissement a été en exploitation durant l'année. Par exemple, une homarderie emploie 12 personnes en mai, 14 en juin, 12 en juillet et 10 en août, en tout 48. On divise ce total par le nombre de mois d'exploitation, c'est-à-dire 4, ce qui donne 12 comme nombre d'ouvriers à gages de l'établisse-ment. A ce nombre on ajoute celui des salariés et celui des apiéceurs, dont l'emploiement est une base annuelle ou saisonnière et non mensuelle. Le chiffre définitivement obtenu sera le nombre d'employés attribué à l'établisse-ment en question pour l'année, et le calcul de ces totaux fournit le nombre d'em-ployés dans toute l'industrie. L'emploiement dans les établissements est le plus
249

104 114 166 394
2,692 2,397
885 1,344 1,134
697 273 140
2,114 1,806 1,950 3,286 7,818 7,991 5,760 6,033 5,539 4,739 3,535 2,410
250 STATISTIQUES DES PÊCHERIES
considérable pendant les mois d'été il atteint sa cime en juin. Dans plusieurs établissements, spécialement les homarderies, le travail est intermittent; il dépend largement du volume de poisson entré pour préparation. Quand il en arrive une quantité considérable, il faut des employés supplémentaires et un nombre additionnel de personnes, dont plusieurs femmes; sont employées pendant deux ou trois jours de la semaine. Dans les statistiques mensuelles de l'emploie-ment il n'est pas fait de distinction entre les employés à temps entier et les em-ployés à temps partiel.
Le bordereau de paye de l'année s'établit à $4,227,955 et se répartit comme suit parmi les classes d'employés: $772,493 pour les salariés, S2,775,425 pour les employés à gages et 8680,037 pour les apiéceurs. Comparativement à l'année précédente, il y a une diminution de $185,390.
Le tableau suivant donne le nombre d'employés que comprend chacune des catégories et les salaires et gages payés à ces derniers en 1938 et chacune des deux années précédentes.
7. Employés des conserveries et saurisseries en 1936, 1937 et 1938-nombre, salaires et gages
Nombretotal Année Salariés Employés à gages Apiéceurs d'employés, salaires
et gages
nonab. $ nonab. S nonab. S nonab. S
1936 558 734,678 10,073 2,544,903 4,607 724,269 15,238 4,003,850 1937 602 722,651 9,671 2,632,120 3,771 687,794 14,014 4,042,565 1938 642 772,493 9,092 2,775,425 4,750 680,037 14,484 4,227,955
Employés à gages par mois.-Dans l'ensemble de l'industrie l'emploiement est à son apogée pendant les mois de mai et de juin, étant influencé par les opé-rations des homarderies qui se confinent principalement à ces deux mois. Dans les saumoneries le travail se poursuit de mai à octobre, tandis que dans plusieurs saurisseries et conserveries de coques et sardineries l'emploiement dure toute l'année. Le tableau suivant présente les statistiques de l'emploiement des employés à gages par mois de 1936 à 1938.
8. Travailleurs à gages dans les conserveries et les saurisseries inscrits sur le bordereau de paye chaque mois, 1936, 1937 et 1938 (a)
Hommes
1936
Femmes Total Hommes
1937
Femmes Total Hommes
1938
Femmes Total Mois
nomb. nomb. nomb. nomb. nomb. nornb. nomb. nomb. nomb.
1,509 1,483 1,564 2,957 5,636 5,996 4,877 4,576 4,471 4,200 3,453 2,342
48 70 80
327 3,405 3,156 1,263
954 877 749 334 195
1,557 1,553 1,644 3,284 9,041 9,152 6,140 5,530 5,348 4,949 3,787 2,537
1,913 1,837 1,836 2,832 5,315 5,669 4,832 4,940 4,636 4,452 3,596 2,764
149 158 147 419
3,078 2,638
989 1,407 1,201
878 385 240
2,062 1,995 1,983 3,251 8,393 8,307 5,821 6,347 5,837 5,328 3,981 3,004
2,010 1,692 1,784 2,892 5,126 5,594 4,875 4,689 4,405 4,042 3,262 2,270
Janvier Février Mars Avril Mai Juin Juillet Août Septembre Octobre Novembre Décembre
955 974 862 Moyenne 3,589 4,514 5,718 4,692 3,553 4,415
(a) Al'exclusiondes apiéceurs.
Matières premières.-La quantité de poisson absorbée par les établissements en 1938 est de 7,826,520 quintaux, soit 79 p.c. de la prise totale des pêcheries maritimes du Dominion, comparativement à 7,431,030 quintaux et une pro-portion de 75 p.c. l'année précédente. Le reste de la prise est mis sur le marché directement par les pêcheurs, soit à l'état frais, soit en conserves domestiques.
Le tableau suivant donne la quantité et la valeur du poisson et de toutes autres matières employées les années 1936 à 1938.

1936 1938 1937
Poisson vendu pour
CGILSOril-nlation à
l'état frais
Poisson mis en
conserve ou autre-
ment apprété
Poisson vendu 'pour
consom-mation à
l'état frais
Poisson mis en
conserve ou autre-
ment apprêté
Poisson vendu pour
consom-mation à
l'état frais
Poisson mis en
conserve ou autre-
ment apprêté
Description des établissements Valeur
totale Valeur totale
Valeur totale
Homarderies Saumoneries Conserveries de coques Sardineries et conserve-
ries d'autres poissons Saurisseries Glacières ... Huileries
056,073 663,453
38
115,442 4,142,843
546,326 5,999
2,395,633 12,302,585
91,046
1,916,458 2,533,866
40,966 974,074
3,351,706 12,966.038
91,084
2,031,900 6,676,709
587,292 980,072
1,082,704 590,377
1,355
108,399 4,576,639
689,759 6,808
2,300,802 10,470,591
199,362
2,083,378 2,558,099
51,495 1,368,860
3,383,606 11,060,968
200,717
2,191,777 7,134,735
741,254 1,375,668
437,597 587,789
961
104,916 4,406,120
513,386 1,628
1,939,391 13,251,902
269,060
2,211,540 3,197,870
45,242 981,806
2,376,988 13,839,691
270,021
2,316,456 7,603,990
558,628 983,434
Total 6,430,174 20,254,627 26,681,801 7,056,011 19,032,581 26,088,625 6,052,397 21,696,811 27,919,208
STATISTIQUES DES PÊCHERIES
9. Quantité et valeur des matières premières utilisées dans les conserveries et les sau-risseries, 1936, 1937 et 1938
1936 1937 1938 Matière premières
Quantité Valeur Quantité Valeur Quantité Valeur
$ s $ Poisson qtx 7,786,297 11,916,080 7,431,030 12,179,219 7,826,520 12,589,724 Huilesconnestibles gal. 178,208 137,144 182,171 133,998 217,308 104,043 Sel qtx 535,326 256,651 406,340 208,510 381,461 206,797 Récipients - 3,672,437 - 3,353,174 - 3,728,603 Autresinatièrespremières - 477,626 - 443,880 - 452,893
Total - 16,459,938 - 16,318,781 - 17.082.060
Production.-La production des établissements en 1938 a une valeur totale de 827,949,208, dont $21,896,811 pour les produits mis en boite, en conserve ou autrement préparés et 86,052,397 pour le poisson mis sur le marché pour con-sommation à l'état frais. La valeur totale montre une augmentation de $1,860,583 ou de 7 p.c. sur l'année précédente. Les diverses classifications con-tribuent comme suit à la valeur totale en 1938: saumoneries, 50 p.c.; saurisseries, 27 p.c.; homarderies, 8 p.c.; sardineries et conserveries d'autres poissons, 8 p.c.; huileries, 4 p.c.; glacières, 2 p.c.; conserveries de coques, 1 p.c. La Colombie Britannique, avec ses importantes saumoneries, occupe la première place parmi les provinces pour ce qui est de la valeur totale de la production; la Nouvelle-Ecosse, dont la production dépend principalement des glacières et homarderies, se classe deuxième. L'état suivant des pourcentages donne la position de chaque province en relation du total pour le Dominion: Colombie Britannique, 64 p.c.; Nouvelle-Ecosse, 23 p.c.; Nouveau-Brunswick, 9 p.c.; Québec et Ile du Prince-Edouard, 2 p.c. chacun. La valeur de production des établissements en 1938 représente 83 p.c. de la valeur totale des produits des pêcheries maritimes mis sur le marché pendant l'année. Le reste-17 p.c.-est mis directement sur le marché par les pêcheurs, soit en conserves domestiques, soit pour consomma-tion à l'état frais.
Le tableau suivant donne pour chaque classification d'établissement la valeur de la production du poisson vendu pour consommation à l'état frais et du poisson apprêté, de 1936 à 1938.
10. Valeur de la production des conserveries et des saurisseries, 1936, 1937 et 1938
Revue des pêcheries par province
Les tableaux ci-dessous (11-17) montrent, par province: la valeur totale des pêcheries; la quantité prise et débarquée et la valeur marchande des prin-cipaux poissons commerciaux; la quantité et la valeur de tout le poisson pris, débarqué et mis sur le marché; les valeurs totales, par comté ou district, du poisson de mer pris, débarqué et mis sur le marché; la quantité de poisson de mer produite par les pêcheries côtières; l'outillage-capital; le personnel.
251

Augmentation ou diminution
en 1938 sur 1937 Aug. (-1-1 Dim. (-)
1935 1934 Espèce 1937 1936 1938
252 STATISTIQUES DES PÊCHERIES
11. Valeur des pêcheries, par province, de 1934 à 1938, par ordre d'importance en 1938
Augmentation ou diminution
Province 1934 1935 1936 1937 1938 en 1938sur 1937 Aug. (-1-) Dim. (--)
$ s s s s $ Delonabieikitannique 15,234,335 15,169,529 17,231,534 16,155,439 18,672,750 -F 2,517,311
Nouvelle-Ecosse 7,673,865 7,852,899 8,905,268 9,229,834 8,804,231 - 425,603
Nouveau-Brunswick 3,670,970 3,949,615 4,399,735 4,447,688 3,996,064 - 451,624
Ontario 2,218,550 2,852,007 3,209,422 3,615,666 3,353,775 - 261,891
Québec 2,306,517 1,947,259 2,108,404 1,892,036 1,957,279 -1- 65,243
Manitoba 1,465,358 1,258,335 1,667,371 1,796,012 1,811,124 -1- 15,112
He dulprince-Edouard 963,926 899,685 953,029 870,299 930,874 -I- 60,575
Alberta 245,405 225,741 309,882 433,354 492,943 1- 59,589
Saskatchewan 219,772 252,059 367,025 527,199 468,646 -- 58,553
Yukon 14,625 20,725 13,385 8,767 5,296 - 3,477
Total 34,022,323 34,427,854 39,165,055 38,976,294 40,492.976 -4- 1.516,682
12. Quantité (a) et valeur (b) des principaux poissons commerciaux, par province, 1934-1938
Ile du Prince-Edouard
Homard qtx 76,582 63,876 59,286 58,238 71,213 4- 12,971
$ 674,186 605,107 614,789 538,792 606,134 i- 67,342
Morue qtx 46,423 45,451 62,120 67,504 68,425 -1.- 921
$ 84,445 85,269 103,867 88,900 76,415 - 12,488
Hareng qtx 48,625 31,525 56,498 64,928 56,056 - 8,872
5 53,872 44,502 66,987 66,964 57,728 - 9,236
Epmlan ex 8,238 10,015 11,843 8,900 9,608 -E 701
$ 40,360 49,560 53,896 40,856 50,725 i- 9,868
Merlucheetbrosmiue qtx 15,448 18,739 25,597 38,237 49,155 -I- 10,918
$ 17,817 16,657 25,365 33,026 46,100 -E. 13,074
Nouvel e-Ecosse •
Morue qtx 1,006,673 924,391 1,079,328 1,693,965 1,192,438 -E 98,473
$ 2,068,566 1,809,273 2,341,724 2,404,452 2,496,631 -1- 92,179
Homard qtx 184,590 176,836 145,091 158,961 155,405 - 3,556
$ 2,487,633 2,732,872 2,570,274 2,757,880 2,282,169 - 475,711
Eglefin qtx 341,506 356,342 391,848 385,047 383,546 - 1,501
$ 1,042,361 1,104,133 1,263,161 1,282,023 1,320,345 -1- 38,322
Flétan qtx 24,254 29,035 31,044 31,301 39,544 A- 8,243
$ 292,695 338,017 388,461 392,335 499,175 1- 106,840
Maquereau qtx 143,782 110,820 190,616 176,032 227,960 -1- 51,928
$ 330,805 213,718 384,499 465,803 447,561 - 13,242
Hareng qtx 194,678 219,009 226,704 201,214 255,654 -1- 54,440
$ 301,204 351,998 366,815 342,426 407,146 -1- 64,720
Merluche et brosmius.. . gtx 154,357 115,233 141,053 144,289 165,870 -1- 21,581
8 173,081 162,585 243,374 210,653 195,349 - 15,304
Pétoncles gal. 73,136 126,371 163,305 180,855 92,000 - 88,855
$ 137,656 196,808 322,537 291,225 135,460 - 155,765
Espadon qtx 14,091 22,339 17,853 15,020 10,929 - 4,091
$ 176,640 264,097 230,798 238,165 132,763 - 105,402
61erlan qtx 61,889 49,990 75,210 106,485 81,892 - 24,593
$ 71,339 53,732 79,511 102,005 93,761 - 8,244
(a) Quantité prise. (b ) Valeur des ventes.

518,638 909,300
402,769 609,423
418,950 681,556
231,864 431,557
319,842 527,050
352,323 251,733
367,265 281,381
418,709 272,551
383,948 300,333
295,650 244,339
35,747 295,900
19,293 183,304
20,165 247,755
22,397 281,515
24.426 222,064
11,267 116,058
12.855 155,336
11,167 114,597
10,376 116,009
11,599 96,884
, 22,643 145,016
18,450 128,185
21,786 143,222
22,628 149,216
18,743 138,775
28,838 53,956
39,161 66,309
16,164 27,263
41,840 101,768
35,640 59,300
10,521 61,415
8,466 47,962
10,611 49,313
7,569 48,533
9,489 41,021
4,475 47,730
4,580 55,150
4,521 52,170
4,674 53,584
4,705 53,387
4,574 44,982
4,435 44,120
5.170 54,478
5,113 55,929
5,194 54,907
. qtx
Doré qtx
Esturgeon gtx
Brochet cltm 5,195 44,650
5,186 42,889
5,482 44.467
5,27 44,01
5,526 44,745
Horne qtx
Hareng qtx
Homard qtx
Saumon qtx
Anguille qtx
Maquereau qtx
Effllan
4- 87,978 95,493
A- 51,444 - 8,830
- 872 64,451
1,688 40,739
293 10,590
2,679 - 38,459
-1- 2,055 13,453
- 105 - 7,420
139 862
80 605
STATISTIQUES DES PÊCHERIES
12.«Quantité (a) et valeur (b) des principaux poissons commerciaux, par province, 1934-1938 suite
Augmentation ou diminution Espèce 1934 1935 1936 1937 1938 en 1938 sur 1937
Aug. (±) Dim. (-)
Nouveau-Brunswick
Sardines ... bd l 191,155 187,499 246,368 158,842 180,639 -Ih 21,797
$ 1,038,189 1,335,279 1,597,192 1,525,602 • 1,389,195 136,407
Homard qtx 65,073 54,831 56,499 72,586 68,474 - 4,112
s 812,045 818,699 916,850 1,089,002 - 721,612 - 367,390
Hareng etx 457,225 480,338 521,620 452,765 427,315 - 25,450
9 463,512 508,150 506,562 443,739 626,469 ir 182,730
Eperlan qtx 36,868 52,739 63,875 42,720 43,609 -11- 889
6 399,474 429,840 478,853 295,290 308,991 -1- 13,701
Saumon qtx 19,221 16,562 17,279 - 16,241 14,210 - 2,031
$ 261,744 243,554 256,338 261,740 258,994 - 2,746
Morue qtx 129,514 149,848 131,477 115,987 102,683 - 13,304
S 222,171 197,714 178,667 172,369 167,322 - 5,047
Coques qtx 37,256 59,464 62,462 72,002 55,919 - 16,083
s 49,240 70,251 71,614 114,475 94,580 - 19,895
Hudtres brl 8,273 8,371 9,109 11,54 12,369 -11- 822
$ 44,870 47,294 58,508 .75,487 76,512 -Ir 1,025
Clasparot qtx 48,003 48,969 61,809 44,149 60,957 + 16,808
$ 51,327 64,894 66,606 52,015 76,230 HI- 24,215
Québec
Ontario
Truite qtx 52,952 62,563 64,587 60,991 60,405 - 586
$ 555,996 738,243 768,586 945,360 924,196 - 21,164
Corégone qtx 49,230 51.783 57,903 55,185 49,477 - 5,708
s 595,683 684,789 810,642 816,738 732,261 - 84,477
Sandre qtx 24,321 51,230 68,995 94,496 73,171 - 21,325
$ 116,741 302,259 614,055 812,665 497,564 - 315,101
Hareng qtx 28,761 25,291 42,986 41,536 47,030 -Ih 5,494
$ 100,664 88,520 193,439 240,907 268,072 -Ir 27,165
Perche qtx 60,185 60,397 15,870 20,502 29,779 -Ir 9,277
8 294,907 332,185 131,720 166,066 235,256 -1- 69,190
Doré qtx 22,921 - 24,319 23,932 ' 21,363 23,128 lr 1,765
$ 160,447 199,417 224,961 183,722 217,404 -I- 33,682
Tidlibee qtx 11,052 10,710 9,202 9,472 7,598 - 1,874
$ 93,942 108,171 92;941 156,289 125,369 - - 30,920
.253
(a) Quantité prise. (b Valeur des ventes.

Augmentation ou diminution
en 1938 sur 1937 Aug. (+) Dim. (-)
1934 1938 1936 1935 1937 Espèce
• 254 STATISTIQUES DES PÊCHERIES
12. Quantité (a) et valeur (b) des principaux poissons commerciaux, par province, 1934-1938- fin
Manitoba
Doré qtx 83,448 72,183 105,054 104,095 90,662 -- 13,432
$ 553,504 498,958 757,243 715,187 695,264 - 19,922 Doré noir qtx 48,695 35,044 47,711 82,676 95,007 -F 12,331
$ 242,889 155,975 263,579 377,884 488,786 1- 110,902 Coré,gone ea 48,968 37,878 21,275 32,301 30,081 - 2,22C
8 422,760 376,121 219,504 373,383 269,134 - 104,241 Tullibee qtx 29,158 22,128 38,331 16,936 18,050 1- 1,114
$ 102,453 95,939 160,930 69,204 89,918 -1- 20,714 Brochet qtx 10,492 ' 13,996 24,332 23,984 33,179 1- 9,195
$ 31,489 50,313 98,073 97,851 88,961 - 8,89C CEilatPor qtx 3,253 3,283 5.845 5,462 4,490 - 972
$ 46,736 37,256 49,880 57,980 60,098 1- 2,118 Perche qtx 6,108 4,533 9,340 7,829 6,641 - 1,189
S 54,518 28,429 95,868 65,237 58,041 - 7,196
Saskatchewan
Corégone qtx 25,305 33,202 38,951 54,725 39,904 - 14,821
$ 162,323 187,949 251,012 352,080 270,185 - 81,895 Truite qtx 4,861 2,759 6,348 7,559 10,149 1- 2,595
S 27,894 19,422 57,077 68,627 92,713 -F 24,081 Tidlibee qtx 1,752 2,216 4,240 15,028 17,385 1- 2,351
5 5,262 7,033 10,693 34,565 34,504 - 61 Doré qtx 1,921 3,012 4,060 6,428 5,085 - 1,342
i 10,291 15.059 20,538 34,070 29,392 - 4,67E
Alberta
Corégone qtx 17,800 17,508 22,395 27,836 31,286 -1- 3,45f
8 148,364 146,113 207,322 312,827 350,467 1- 37,84C
Brochet qtx 7,687 9,762 8,634 6,352 8,047 -F 1,695
$ 19,040 17,487 18,900 20,494 42,794 1- 22,30C
Doré qtx 9,465 5,316 7,984 6,462 5,252 - 1,21(
8 66,803 34,416 53,882 54,681 40,881 - 13,80C
Tullibee qtx 2,114 4,667 7,492 14,530 14,899 1- 361
S 3,327 14,665 11.900 24.230 34,045 -1- 9,815
Colomble Britannique
Saumon qtx 1,659,900 1,789,431 1,995,499 1,691,736 1,734,664 1- 42,92 5
$ 12,402,012 12,099,275 13,387,344 11,907,905 14,491,285 1- 2,583,381
Flétan qtx 97,681 101,927 105,918 117,212 120,247 A- 3,03 1
5 833,829 940,862 1,039,879 1,190,056 1,272,385 1- 82,321
Pilchard qtx 860,103 911,411 889,037 961,485 1,035,369 -F 73,88
8 549,910 670.328 667,313 902,619 867,007 - 35,612
Hareng qtx 820,362 1,008,507 1,620,625 1,929,795 1,328,913 - 600,882
i 628,982 580,031 1,142,397 1,181,466 855,265 - 328,201
Lingue qtx 47,806 62,841 68,932 42,858 46,516 1- 3,651
5 281,644 326,029 392,147 275,817 283,511 1- 7,694
Coques qtx 17,962 35.804 51,446 46,078 76,633 -1- 30,55 9
5 33,402 61,886 88,422 95,371 162,508 11- . 67,131
Poieaongris qtx 117,020 76,800 116,140 113,220 159,690 1- 46,471
5 64,715 46,668 69,719 66,790 113,190 1- 46,409
Cabillaud qtx 6,391 9,698 7,196 13,410 8,463 - 4,94:
$ 44,057 65,862 53,497 95,251 71,297 - 23,95,
Yukon
Saumon qtx 300 520 510 412 129 - 283
$ 6 , 00e 10,400 10,200 6,438 2,072 - 4,365
CA)régone qtx 100 80 99 83 98 -1-
s 2,000 1,600 1,980 1,401 1,647 1- 246
Truite qtx 170 200 49 40 102 -F 62
S 3,400 4,000 735 628 1,476 1- 845
(a) Quantité prise. (b) Valeur des ventes.
3

STATISTIQUES DES PÊCHERIES 255
13. Quantité et valeur du poisson pêché et mis en vente durant l'année 1938, par province
Pêcheries maritimes
Be du Prince- Nouvelle- Nouveau- Colombie Espèce Edouard Brosse Brunswick (a) Québec (a) Britannique
Quai'. Valeur Quan- Valeur Quan- Valeur Quan- Valeur Quan. Valeur tité tité tité ur tité tité
8 $ 8 $ $ Morue, prise qtx 68,425 49,880 1,192,438 1,597,424 102,683 103,548 319,842 429,008 18,635 45,205
Mise en vente- A l'état frais qtx 12,396 17,795 52,550 161,894 11,814 19,530 19,768 41,798 6,140 23,873 Filets frais qtx - - 82,206 699,774 260 1,837 7,401 53,832 4,251 42,140 Verte-salée qtx 21,552 54,144 83,617 253,734 16,863 52,451 57,183 154,975 - - En conserve caisses - - 563 2,477 - - - - - - Fumée qtx - - 371 2,608 - - - - 105 1,050 Filets fumés qtx - - 55,260 475,593 54 428 524 3,744 - - Séchée qtx 215 1,275 149,352 602,045 18,243 90,819 52,758 248,059 - - Sans arêtes qta 140 1,120 29,828 242,178 205 1,699 967 7,084 - - Foies qtx - - - - - - - - 150 750 Poudre de foie tonnes Huile de foie, médi- - - 3 160 - _ , _ - - -
cinale gal 1,989 1,3.52 46,352 24,322 391 235 13,882 9,758 - - H ile gal 2,888 729 76,153 31,846 1,605 323 28,474 7,800 - -
Total, valeur marchande... - 76,415 - 2,496,631 - 167,322 - 527,050 - 67,813
Eglefin, pris qtx 386 636 383,546 615,963 9,172 18,299 485 616 - - Mis en vente-
A l'état frais qtx 386 940 97,995 366,715 7,781 17,499 311 739 - - Filets frais qtx - - 67,583 653,039 52 331 - - - - En conserve . caisses - - 17,385 68,681 4,711 20,143 - - - - Fumé qtx - - 24,368 199,575 180 1,785 - - - - Filets fumés qtx - - 2,460 20,006 - - - - - Vert-salé qtx - - 1,167 2,245 3 7 - - - -
Séché qtx - - 1,609 4,657 28 56 58 147 - - Sans ttrête.s qtx - - 678 3,429 - - - - - -
CEuls qtx - - 185 1,998 - - - - - -
Total, valeur marchande... - 940 - 1,320,345 - 39,821 - 886 - -
Merluche et brosmius, pris qtx 49,155 19,747 165,870 85,999 4,5,698 23,913 1,133 841 42 99
Mis en vente- A l'état frais qtx 11,189 12,080 22,575 21,799 18,217 13,469 498 866 42 104 Filets frais qtx - - 3,489 20,840 202 1,388 60 240 - - En conserve caisses - - 9,119 37,492 - - - - Verts-salés qtx 16,424 30,463 18,706 33,871 5,877 11,897 172 456 - - Fumés qtx - - 96 480 - - - - - Filets fumés qtx - - 3,084 20,063 170 1,360 10 40 - - Séchés qtx 1,146 3,497 18,945 51,131 2,928 7,965 27 108 - - Sans arêtes ex 15 60 1,744 9,673 - - - - - - Huile gal - - - 2,937 819 - - - -
Total, valeur marchande... - 46,100 - 195,349 - 36,898 - 1,710 - 104
Merlan, pris qtx - - 81,892 43,695 19,442 13,403 - - - - Mis en vente-
A l'état frais qt: - - 9,982 23,092 2,447 2,005 - - - - Fileta frais qtx - - 93 518 806 603 - -- - Vert-salé qtx - - 9,175 18,685 2,169 5,579 - _ - - Fumé qtx - - 4 19 - - - - - _
Séché qtx - - 17,729 51,189 3,413 12,939 - - - - Sans tuétes qtx - - 23 138 - - - - _ -
Huile gal. - - 400 120 690 130 - - - -
Total, valeur marchande... - - - 93,761 - 21,25 - - - -
Silure nain, pris qtx - - 4,336 1,63 - - - _ - - Mis en vente-
A l'état frais tex - - 1,134 3,306 - - -_ _ _
Filets frais qtx - - 1,072 7,85 - - _ _ _ -
Total, valeur marchande.. - - 11,16 - - _ _ - _
Whiting, pris qtx - - - - _ _ - _ 20 51 Mis en vente à l'état
Irais o tx - - - - _ - - 20 6:
(a) Voir aussi pécheries intérieures.

256 STATISTIQUES DES PÊCHERIES
13. Quantité et valeur de tout le poisson pêché et mis en vente durant l'année 1938, par province-suite
Pêcheries maritimes
Ile du Prince- Nouvelle- Nouveau- Colombie
Espèce Edouard Ecosse Brunswick (a) Québec (a) Britannique
Valeur Qu'au- Val Quai'. Valeur Quan- itale,,„ Valeur
tit6 tité Valeur tité tité Valeur tité '
$ $ *$ S $
Flétan, pris qtx - - 39,544 362,203 76 808 2,673 16,691 120,247 840,667 Mis en vente-
•A l'état frais • qtx - - * 29,637 344,027 76 . 896 2,636 16,803 120,247 1,041,165 Filets frais qtz . - 6,983 127,209 - - - - -
- En conserve caisses • - 91 637 - - 37 185 - - Foies qtz - - 676 27,302 - - - 3,049 155,420
" Huile de foie de flé- tan gal. - - - - - - - 750 18,750
Huile de viscères de flétan gal. - - - _ - - - - - 815 57,050
Total, valeur marchande... - - - 499,175 - 896 - 16,988 - 1,272,385
Turbot, barbue, plie, pris qtx 592 457 10,459 12,309 2,579 3,001 65 105 2,176 5,759
Mis en vente- A l'état frais qtz 582 582 4,803 20,126 2,579 4,456 65 125 2,176 6,767 Filets frais qtz - - 1,782 26,342 - - - - - -
Total, valeur marchande... - 582 - 46,468 - 4,456 - 125 - 6,767
Raie, prise (a) ex - - (h)33,262 7,035 199 137 - - 694 2,072 Mise en vente à l'état
- frais qtx - - 4,238 4,448 199 339 - - 694 2,467
801e, prise qtx - - 16,911 30,301 - - • 107 107 6,551 38,251 Mise en vente-
A l'état frais qtx - - 2,802 13,417 - - 62 144 5,435 29,679 Filets frais qtz - - - 4,713 56,561 - - 15 156 373 8,000
Total, valeur marchande... - - - 69,978 - - - 300 - 37.879
Elareng, pris qtx 56,056 29,174 255,651 167,807 427,315 192,939 410,039 168,117 1,328,913 316,181 Mis en vente--
A l'état frais qtx 4,686 5,085 62,108 105,086 35,437 32,291 49,584 83,591 34,855 61,316 En conserve (en-
tier) caisses 35 131- - 56;487 241,336 - - 23,356 75,908 En conserve (mi-
saur) caisses - - 990 7,920 14,809 61,897 - - 20 140 Fumé (entier) qtX - - 426 1,353 8,880 24,821 18,406 46,178 52 405
Fumé (sans arêtes). qtx - - 3 44 6,074 70,800 - - - - Mi-saur qtx - - 5,580 48,260 10 50 - - 2,955 23,083 Salé au sel sec qtx - - - - - - - 149,700 142, 115 Saumuré brl 643 3,011 20,992 92,280 3,076 17,429 9,758 37,762 20 296 Comme boate brl 24,563 49,426 61,273 133,053 48,869 79,710 46,899 43,500 19,317 43,564 En engrais brl 75 75 - 98,111 43,301 91,338 28,130 - Huile gal. - - 7.020 500 92,198 15,225 - - 929,158 138,386 Poudre tonnes - - 414 14,000 1,035 36,225 - - 9,624 370,052 Ecailles qta - - 1,550 4,650 1,386 3,384 - - -
Total, valeur marchande... - 57,728 - 407,146 - 626,469 - 239,161 - 855,265
llanuereau, pris qtx 10,559 16,146 227,960 274,515 7,885 12,770 39,161 41,908 - - Mis en vente-
A l'état frais qtx 5,715 16,771 45,230 88,70' 7,546 20,696 3,821 7,339 - - Filets frais qtx - - 263 1,524 - - - - - - En conserve caisses 436 1,886 65 271 130 423 3 18 - Fumé qtx - - 40 28 - - - - - Saumuré brl 180 1,470 34,426 170,164 66 699 8,596 36,144 - - Filets salés brl 107 1,326 6,263 79,024 - - 2,261 22,278 - - Comme boette brl 1,775 3,550 26,749 107,593 25 25 285 530 - -
Total, videur marchande... - 25,003 - 447,561 - 21,843 - 66,309 - -
Sardine, prise brl - - 3,770 3,770 180,639 336,826 41 164 _
Mise en vente- Fralche et salée.- brl - - 3,770 3,770 111,813 191,506 41 164 - - En conserve caisses - - - 349,887 1,197,689 - - - -
Total, valeur marchande... - - - 3,770 - 1,389,195 - 164 _
(a) Voir aussi pêcheries intérieures. (b) Partie employée dans la production de farine et d'huile de poisson.

STATISTIQUES DES PÊCHERIES
13. Quantité et valeur de tout le poisson pêché et rais en vente durant l'année 1938, par province-suite
Pêcheries maritimes
Ile du Prince- Nouvelle- Nouveau- Colombie Espèce Edouard Ecosse Guébec (a)
Brunswick (a) - • • Britannique
Quan" Valeur Qu"' Valeur Quan- Valeur Quan" Valeur Qum" Valeur
tité tité tité tité tité
8 8 8 8 8
Pilchard, pris qtx - - - - - - - - ,035,369 452,999 Mis en vente-
A l'état frais qtz - - - - - - - _ 19 50 En conserve caisses - - - - - - - - 69,473 232,311 Comme boette brl - - - - - - - - 310 620 Huile gal. - - - - - - - - 2,195,850 313,559 Poudre tonnes - - - - - - - 8,891 320,467
Total, valeur marchande... - - - - - - - - - 867,007
Gasparot, pris qtx 4,810 2,520 38,723 25,499 59,863 32,502 - - - - Mis en vente-
A l'état frais qtz 4,690 4,690 26,572 22,755 20,867 20,583 - - - - Fumé qtx - - 2,496 4,932 472 2,150 - - - - Salé brl 50 200 2,605 7,607 13,835 51,688 - - - -
Total, valeur marchande... - 4,890 - 35,294 - 74,421 - - - -
Bar, pris 'qtx
Mis en vente à l'état b-4 - - 163 930 - - 32 72 frais qtx - - 163 1,158 - - - 32 80
Perche, prise qtx - - 5 10 - 45 68 511 3,827 Mise en vente-
A l'état frais qtx - - 5 40 - - - 544 3,942 Filets frais qtz - - - - - - 15 90 - -
Total, valeur marchande... - - - 40 - - - 90 - 3,942
Sébaste, pris qtx - - 4,779 3,137 - - - - - Mis en vente-
A l'état frais qtx - - 4,357 8,714 - - - - - - Pilots frais qt x - - 141 705 .- - - - -
Total, valeur marchande... - - - 9,419 - - - - -
Saumon, pris qtx 16 160 4,854 69,518 13,778 195,623 11,775 152,526 1,734,664 6,331,410 Mis en vente-
A l'état frais qtx 16 240 4,664 81,806 14,710 250,572 9,691 133,268 212,754 1,590,516 En conserve caisses - 271 2,810 - - 734 4,588 1,707,830 12,267,465 Fumé qtx - - - - - 90 1,800 26 350 Mi-saur qtx - - - - - _ 113 1,269 Salé au sel sec qtx - - - - - - - - 69,209 179,282 Peu salé qtx - - - - - - - - 19,684 355,554 Saumuré qtx - - - - - - 285 2,280 802 10,025 Œufs qtx - - - - - - - 8,492 18,411 Comme boêtte qtz - - - - - - - 50 123 Huile gal. - - - - - - - - 114,797 22,142 Poudre tonnes - - - - - 1,229 46,148
Total, valeur marchande... - 240 - 84,616 - 250,572 - 141,936 - 14,491,285
Mose, prise qtx Mise en vente- - - 4,296 11,963 10,437 27,638 77 327 - -
A l'état frais qtx - - 3,387 15,244 10,209 30,764 77 471 - - Salée bd l - - 303 2,360 76 1,320 - - - -
Total, valeur marchande... - - - 17,604 - 32,084 - 471 - -
Eperlan, pris qtx Mis en vente à l'état 9,608 34,125 6,781 39,702 43,609 209,468 9,491 53,207 737 6,431
frais qtx 9,608 50,725 6,417 58,470 44,567 308,991 8,897 55,535 737 6,884
Esturgeon, pris qtx Mis en vente à l'état - - - - - - 64 612 187 2,603
ii,k;c1 ni, - - - - - - 64 612 187 3,013
(a) Voir aussi pêcheries intérieures.
89667-17

258 STATISTIQUES DES PÊCHERIES
13. Quantité et valeur de tout le poisson pêché et mis en vente durant l'année 1938, par province-suite
Pêcheries maritimes
Ile du Prince- Edouard
Nouvelle- Ecosse
Nouveau- Brunswick (a)
Colombie Britannique Espèce Québec (a)
Quan- Valeur tité Quan- tité
Quan- tité
Quan- tité
Quan- tité Valeur Valeur Valeur Valeur
Truite, prise qtx Mise en vente en con-
serve caisses 318 1,908 460 2,902
Cabillaud, pris qts Mis en vente-
A l'état frais q tx Fumé qtx Foies qtx Huile de foie gal.
Total, valeur marchande...
8,463 31,414
5,887 1,288
397 50
38,672 16,854 14,521 1,250
71,297
Lingue, prise qts Mise en vente-
A l'état frais qtx Fumée qtx Foies qtx Huile de foie gal.
Total, valeur marchande...
' 46,516
46,486 15
830 31
208,508
248,895 ISO
33,661 775
283,511
Morue rouge et morue de roche, prises qtx
Mises en vente-- A l'état frais qtx Fumées qts Foies qtx Huile de foie gal.
Total, valeur marchande...
6,871 17,474
19,242 408 436
2,200
22,286
6,806 34 26 SS
Thon, pris qtx Mis en vente-
A l'état frais qtx Foies qtx
Total, valeur marchande...
5,331
5,331 25
19,212
22,081 375
22,456
Capelan, lançon et sau-clet ou Joël, pris. qtx
Mis en vente à l'état frais qtx
3,078 2,682
3,078 3,078
1,000 250
1,000 250 31,400 16,072 38 444 31,400 19,960 38 444
Anguille, prise qtx Mise en vente à l'état
frais qtx 21.4 806 214 919
1,711 9,079
1,711 10,784
37,420 7,314
3,400 670
19,650 1,800
612 21,000
- 23,470
208 952 208 1,047
368 3,630 368 3,630
Poisson gris, pris qta Mis en vente-
A l'état frais qtx Foies qtx Ruile gal Poudre tonnes
159,699 27,037
45,951 9,333
113,360 1,262
2,310 49,271 18,802 42,807
Total, valeur marchande... 113,190
Poulpe, pris qtx Mis en vente à l'état
frais qtx 223 927 223 1,016
Oulachon, pris qtx Mis en vente à l'état
frais qtx 209 716
760 209
(a) Voir aussi pécheries intérieures. (b) Partie employée dans la production de poudre et d'huile de poisson.

STATISTIQUES DES PÊCHERIES 259
13. Quantité et valeur de tout le poisson pêché et mis en vente durant l'année 1938, par province-suite
' Pêcheries maritimes
Be du Prince- Nouvelle- Nouveau- Colombie Espèce Edouard Ecosse Brunswick (a) Québec (a) Britannique
Qu'el- Valeur Qu'an- Valeur Qaan" Valeur Quan" Valeur Quan" Valeur tité tité tité tité tité
$ S S S $
Encornet, pris qtx. - - 2,216 2,285 - - 268 258 - - Comme boette qtx - - 2,216 3,446 - - 268 258 - -
Espadon, pris qt x - - 10,929 101,529 -- - - _ Mis en vente-
A l'état trais qtx - - 10,929 132,178 - - - - - - Foies qtx - - 39 555 - - - - - -
Total, valeur marchande... - - - 132,763 - - - - - -
Petite morue, prise qtx Mise en vente à l'état 373 363 275 1.55 8,875 11,741 5,000 25,000 - -
Irais qtx 373 401 275 250 8,875 22,773 5,000 25,000 - -
Poissons divers, pris qtx - - (b)50,323 5,466 126 424 10,190 50,420 - - (Non compris les
poissons énumérés ailleurs)
Mis en vente à l'état frais qtx - - 183 36 126 424 10,190 50,420 - -
Coques, prises qtx 6,912 3,471 8,318 6,899 55,919 36,513 2,706 2,044 76,633 69,261 Mises en vente-
A l'état trais qtx 1,440 770 6,732 6,147 20,766 13,971 2,666 2,024 42,169 40,42 1 En conserve caisses 2,201 12,502 798 4,080 18,118 64,777 20 150 22,155 122,081 En matelotte caisses 800 2,800 - 4,302 16,13 - - - -
Total, valeur marchande... - 16,072 - 10,227 - 94,580 - 2,174 - 162,50 1
Crabes, pris qtx 125 32 75 150 1,530 311 - 7,912 25,321 Mis en vente-
A l'état frais qtx - - 75 le 1,530 314 - - 4,337 21,151 En conserve caisses 16 288 - - - - - 2,157 33,411
Total, valeur marchande... - 28S- 187 - 314 - - - 54,57.1
Homard, pris qtx 71,213 453,762 155,405 1,770,722 68,474 497,320 19,293 137,266 - - 31is en vente-
Carapace qtx 11, 072117,044 82,530 1, 423, 138 18,554 264,267 6,435 69,629 - - Chair qtx 11 495 1,131 91,072 974 48,744 12 540 - - En conserve caisses 24,625 474,397 37,838 734,086 23,060 403,473 6,481 121,s41 - - Foies caisses 1,559 14,193 3,684 33,873 686 5,128 119 1,094 - -
Total, valeur marchande... - 606,134 - 2,282,169 - 721,61 - 183,304 - -
lluitres, prises brl 5,242 29,232 3,886 16,210 12,369 45,96 - - 2,979 36,251 Mises en vente-
A l'état trais brl 5,242 39,193 3,886 22,462 12,369 76,51 - 1,365 28,151 En conserve caisses - - - - - - - 1,426 9,29 1
Total, valeur marchande... - 39,193 - 22,462 - 76,51 - - - 37,45:
Praires, prises qtx 2,145 881 918 408 3,451 3,328 - - - - Mises en vente-
A t'état trais qtx 1,491 959 286 288 1,333 1,83 - - - - En conserve caisses 108 785 280 1,050 1,097 7,14 - _ - -
Total, valeur marchande... - 1,744 - 1,338 - 8,98 - _ - -
Pétoncles, pris gal - - 92,000 119,109 3,190 3,899 496 992 - -
Mis en vente- Ecaillés gal. - - 92,000 13.5,460 3,190 3,89 - - - -
En conserve caisses - - - - - - 115 1,150 - •••
Tniel ,nlal, mnrohanda _ .. - - 135.460 - 3,89 - 1,150 - -
;
i ;
7 3
(a) Voir aussi pêcheries intérieures.
89687-171

260 STATISTIQUES DES PÊCHERIES
13. Quantité et valeur de tout le poisson pêché et mis en vente durant l'année 1938, par province-suite
Pêcheries maritimes
Ile du Prince- Nouvelle- Nouveau- Colombie Espèce Edouard Ecosse Brunswick (a) Québec (a) Britannique
Qu'Ill' Valeur Quan- Valeur Quan- Valeur Quan- Val Qum' Valeur tité tité r tité tité Valeur tité
5 $ $ S 5
Crevettes, prises qtx - - - - - - - - 1,504 15,333 Mises en vente-
A l'état frais qtx - - - - - - _ 864 12,431
En conserve ...... „caisses - - - - - - - 460 6,554
Total, valeur marchande... - - - - _ - - - - 18,985
Langues et noues, marinées ou sé- chées qtx 147 322 933 5,836 57 408 - - -
Littorines, prises qtx - - 90 180 206 411 - - - -
Mises en vente à l'état trais qtx - 90 180 206 417 - - - -
Algue, verte qtx- - 700 550 2,113 2,227 - _ - -
Mise en vente séchée qtx - 140 980 313 4,191 - - - -
Varech, vert qtx - - 4,655 810 6,503 774 - - - - Mis en vente-
Séché qtx - - 105 810 280 2,800 - - - - Poudre tonnes - - 95 6,500 12 420 - - - -
Total, valeur marchande... - - - 7,310 - 3,220 - - - -
Phoques à fourrure, pris nornb. - - _ - - - - - 1,367 3,076
Peaux vendues floral), - - _ - - - - - 1,367 3,076
Phoques communs, - - - - - 22,831 49,562 - -
pris nomb. Peaux vendues nomb. - - - - - - 22,831 37,115 - - Huile gal - - - - - - 93,593 16,801 - -
Total, valeur marchande... - - - - - - - 53,916 - -
Bélugas, pris nomb. - - - - - - 2 15 - - Peaux vendues nomb. - - - - - - 2 20 - - Huile gal - - - - - _ 80 24 _ _
Total, valeur marchande... - - - - - - - 44 - -
Baleines, prises nomb. - - - - - - - - 310 184,074 Mises en vente-
Huile gal - - - - - - - - 543,378 162,708 Poudre de lanon tonnes - - - - - - - - 273 6,006 Engrais gal - - - - - - - 512 15,360
Total, valeur marchande... - - - - - - - - - 184,074
Produits divers- Huile de poisson (au-
tre), n.a 6 gal - - 9,480 2,218 - _ _ _ - - Poudre de poisson,
n.a é tonnes - - 5,697 289,563 126 4,969 - - - - Engrais de poisson
' produit tonnes - - 95 475 97 778 - - - - Issues de poisson tonnes - - 14,324 24,806 20 80 - - - -
Peaux et os de poisson qtz - - 18,160 20,725 265 82 210 455 - - Autres produits qtx 100 - 4,662 - 52,501 - 133 - 104,819
Valeur totale du poisson de mer-
Valeur des prises - 649,074 - 5,323,582 - 1,774,994 - 1,151,454 - 8,668,566 Valeur marchande - 930,874 - 8,804,231 - 3,971,699 - 1,394,694 - 18,672,750
(a) Voir aussi pécheries intérieures.

STATISTIQUES DES PÊCHERIES 261
13. Quantité et valeur de tout le poisson pêché et mis en vente durant l'année 1938, par province-suite
Pêcheries intérieures
Espùce Nouveau-
Brunswick (a) Québec (a) Ontario
Quan- tité
Quan- tité
Quan- tité Valeur
Gasparot, pris qtx Mis en vente à l'état frais qtx
Bar, pris qtx Mis en vente à l'état frais qtx
Sandre, prise qtx Mise en vente à l'état frais qtx
Carpe, prise qtx Mise en vente à l'état frais qtx
Silure nain, pris qtx Mis en vente à l'état frais qtx
Anguille, prise qtx Mise en vente à l'état frais qtx
Hareng, pris qtx Mis en vente à l'état frais qtx
Maskinongé, pris qtx
Mis en vente à l'état frais qtx
Poissons divers, pris qtx (gade, chabot, ouananiche, etc.)
Mis en vente à l'état frais qtx
Perche, prise qtx Mise en vente à l'état frais qtx
Doré, pris qtx Mis en vente à l'état frais qtx
Brochet, pris qtx Mis en vente M'état frais qtx
Saumon, pris qtx Mis en vente à l'état frais qtx
Alose, prise qtx Mise en vente-
A l'état frais qtx Salée. brl
Total, valeur marchande
Eperian, pris qtx Mis en vente à l'état frais qtx
Esturgeon, pris qtx Mis en vente-
A l'état frais qtx Caviar lb
Total, valeur marchande
Cyprin-sucet, pris qtx Mis en vente à l'état frais qtx
Truite, prise qtx Mise en vente :1 l'état frais qtx
Petite morue, prise qtx Mise en vente à l'état frais qtx
Tuilibee, pris qtx Mis en vente à l'état frais qtx
Corégone, pris qtx Mis en vente à l'état frais qtx
Valeur totale du poisson d'eau douce-Valeur des prises
Valeur marchande
1,091
4,195 4,195
73,171 73,171 497.564
453,660
432 432
2,950
2,350 200
13,320
- - 13,320
10 10 4,885 10 10 4,885
210 1,197 4,475 210 1,197 4,475
- - 5,195 - - 5,195
432 3,422 1,080 432 8,422 1,080
950 10,223 1,730
350 8,423 1,730 200 1,800
- 10,223
1,030 - 1,030
360 4,510
360 4,510
36
36
68 GS
1,465
6,835 6,835
6,100 6,100
4,290 4,290
535 535
35,770 35,770
40,795 40,795
135,145 135,145
33,390. 33,390
5,740
67,935
67,935
21,960 24,960
47,730 47,730
44,650 44,650
13,400 13,400
10,540
10,540
21,450 21,450
44,370
10,721 10,721
47,030 47,030
30,914
30,914
29,779 29,779
23,128 23,128
10,038 10,038
60,405 60,405
4,740 4,740
1,577
1,577 3,841
526 526
174,011 268,072
228,763
259,676 )01
205,475 235,256
182,711 217,404
924,196 803,387
10,721
18,960 23,700
16,083
30,114 40.152
3,682 4,208
5,520
5,993 3,841
9,834
3 3
24,465
24,165
3,395 3.395
562,585
562,585
26,635 26,635 49,477
19,477
7,598 7,59S
2,850,585
3,353,775
110,171 125,369
623,410 732,261
(a) Voir aussi pécheries maritimes.

262 STATISTIQUES DES PÊCHERIES
13. Quantité et valeur de tout le poisson pêché et mis en vente durant l'année 1938, par province-fin
Pêcheries intérieures
Espèce Manitoba Saskatchewan Alberta Yukon
Quan-
Valeur Quan- Valeur Quan- Valeur Quan- Valeur
tit6 ' tité tité tité
$ $ S S
Silure nain, pris qtx 136 868 - - - - - - Mis en vente à l'état frais. qtx 138 1,159 - - - - - -
Trigle et grondin, pris qtx 106 211 - - - - - - Mis en vente à l'état frais qtx 106 319 - - - - - -
Œils-d'or, pris qtx 4,490 33,551 40 323 - - - - Mis en vente-
A l'état frais qtx 928 6,718 40 648 - - - Fumé qtx 2,282 53,380 - - - - -
Total, valeur marchande - 60,098 - 648 - - -
Lote, prise qtx - - 3,603 3,179 - - - Mise en vente à l'état frais c - ttx - - 3,603 3,665 - - -
Poissons divers, pris qtx 296 1,757 - - 7,585 7,532 3 94 Mis en vente à l'état frais qtx 296 2,305 - - 7,585 7,814 3 94
Chevesne, pris qtx 3 3 - - - - - Mis en vente à l'état frais qtx 3 5 - - - - - -
Perche, prise qtx 6,641 46,508 81 405 1,671 6,555 - - Mise en vente à l'état frais qtx 6,641 58,041 81 609 1,671 12,615 - -
Doré, pris qtx 90,662 147,231 5,035 13,939 5,252 20,420 - _ Mis en vente à l'état frais qtx 90,662 695,284 5,085 29,392 5,252 40,881 - -
Brochet, pris qtx 33,179 71,332 5,824 8,542 8,047 18,697 - - Mis en vente à l'état frais qtx 33,179 88,961 5,824 16,825 8,047 42,794 - _
Saumon, pris qtx - - - - - - 129 2,073 Mis en vente à l'état frais.. qtx _ - - - - 129 2,073
Doré noir, pris qtx 95,007 408,9e1 - - - - - - Mis en vente à l'état frais ... qtx 95,007 488,786 _ - - - _ _
Esturgeon, pris qtx 689 13,073 514 7,156 - - - - Mis en vente à l'état frais qtx 689 22,192 514 10,855 - - Caviar lu 362 492 - - - - - -
Total, valeur marchande - 22,684 - 10,855 -
- -
Cyprin-suret, pris qta 17,833 17,526 5.220 5,801 - - - - Mis en vente à l'état frais qtx 17,833 23,772 5,220 9,450 - - -
Truite, prise qtx 1,439 8,845 10,149 38,362 460 2,341 102 1,476 Mise en vente à l'état frais qtx 1,439 10,678 10,149 92,713 460 4,327 102 1,476
Tuilibee, pris qtx 18,050 67,772 17,385 25,656 14,899 11,588 - - Mis en vente-
A l'état frais qtx 14,968 75,242 17,385 34,504 14,899 34,045 - - Fumé qtx 1,926 14,676 - - - - -
Total, valeur marchande - 89,918 - 34,504 - 31,045 - -
Corégone, pris qtx 30,081 189,445 39,901 146,475 31,286 194,395 98 1,647 Mis en vente-
A l'état frais qtx 30,062 268,924 39,904 270,185 31.286 350,467 98 1,647 Fumé qtr 12 210 - - - - - -
Total, valeur marchande - 269,134 - 270,185 - 350,467 - 1,647
Valeur totale du poisson d'eau douce-
Valeur des prises - 1,307,085 - 2.50,338 - 261,531 - 5,290
Valeur marchande - 1,811,124 - 468,646 - 492,943 - 5,290

STATISTIQUES DES PÊCHERIES
14. Valeur totale, par comté et district, du poisson pêché et mis en vente durant les années 1936, 1937 et 1938
Pêcheries maritimes
1936 1937 1938 Province et comté ou district Valeur Valeur Valeur
Valeur totale du Valeur totale du Valeur totale do
totale poisson totale poisson totale poisson
du et des du et des du et des
poisson produits poisson produits poisson produits
péché poissonniers pêché poissonniers pêché poissonniers
mis en vente misenvente misenvente
$ S $ S $ $ Canada-Totaux 17,051,514 32,951,504 17,508,929 31,984,047 17,567,670 33,774,148
Be du Prince-Edouard-Totaux... . 725,417 953,029 713,632 870,299 649,074 930,874 Kings 225,415 331,193 232,869 279,032 228,948 297,470 Queens 222,556 271,787 190,665 237,206 147,217 204,747 Prince 277,444 350,049 290,098 354,061 272,909 428,657
Nouvelle-Ecosse-Totaux 5,491,552 8,905,268 6,015,179 9,229,831 5,323,582 8,804,231
Richmond 160,540 157,588 147,523 173,219 117,063 152,894 Cap-Breton 363,043 562,567 375,189 693,541 357,040 611,757 Victoria 170,831 234,617 174,886 193,884 147,057 177,067 Inverness 204,137 255,049 213,539 251,953 171,339 217,982 Cumberland 109,590 152,483 117,325 149,740 83,870 134,985 CkAchester 15,786 17,852 11,470 13,731 11,596 15,307 Pictou 209,494 377,798 170,968 306,010 142,620 285,570 Antigonish 147,549 220,393 133,627 205,249 115,094 169,337 Guyaborough 343,451 556,719 336,064 502,587 292,868 458,562 Halifax 851,096 1,876,663 984,801 2,031,817 917,334 2,085,518 riants 5,599 9,903 4,375 6,619 6,326 10,261 Lunenburg 844,857 1,230,646 1,032,489 1,323,844 947,476 1,256,502 Queens 154,552 233,379 132,677 225,805 123,325 195,947 Shelburne 883,018 1,534,286 940,833 1,552,027 865,715 1,503,801 Yarmouth 454,077 592,507 629,614 730,702 535,938 751,926 Digby 461,856 792,259 522,870 779,623 426,801 708,845 Annapolis 88,278 75,861 70,326 72,918 43,612 48,411 Rings 24,698 24,698 16,603 16,565 18,508 19,559
Nouveau-Brunswick--Totaux 2,070,423 4,370,401 1,883,173 4,420,251 1,774,991 3,971,599
Charlotte 619,346 2,260,500 476,766 2,332,370 566,322 2,115,991 Saint-John 129,215 206,706 139,051 207,264 128,244 213,471 Albert 701 701 273 273 699 699 Westmorland 222,818 419,188 206,431 521,126 232,541 366,059 Kent 330,414 395,124 328,519 398,058 204,383 357,223 Northumberland 317,992 443,047 321,088 394,257 292,702 406,042 Gloucester 366,137 512,968 350,264 475,454 293,551 426,750 Restigouche 83,800 132,170 58,781 91,449 56,552 85,364
Québec-Totaux 1,260,125 1,491,269 1,059,015 1,308,224 1,151,454 1,391,694
Bonaventure 180,403 192,272 142,721 157,374 170,813 182,528 Gaspé 498,058 566,326 315,083 387,892 401,070 482,648 11es-de-la-Madeleine 293.488 423,458 299.340 425,312 239,451 360,335 Saguenay 142,705 155,143 138,032 172,462 176,245 197,230 Matane 13,202 21,501 14,259 15,604 22,875 30,953 Rimouski 132,569 132,569 149,580 149,580 141,000 141,000
Colombie Britannique-Totaux 7,503,697 17,231,534 7,837,930 16,155,439 8,668,566 18,672,750
District N° I 1,662,094 4,697,869 1,391,133 4,930,201 2,259,195 6,225,783 District N'2 3,431,128 8,048,426 3,590,318 7,087,808 3,831,676 8,991,470 District N° 3 2,410,475 4,485,239 2,856,479 4,137,430 2,577,695 3,455,497
263

264 STATISTIQUES DES PÊCHERIES
15. Proportion de poisson de mer pris en haute mer par les chalutiers à vapeur et autres navires de 40 tonnes ou plus, pêchant sur les bancs, 1938.
Morue Eglefin Merluche et brosmius
Province et comté ou district
Prise Prise Prise Prise Prise Prise Prise Prise
au sur les ttal nu sur les Prise O e totale au sur les
large côtes large côtes large côtes totale
. qtx qtx qtx qtx qtx qtx qtx qtx qtx
1 Canada-Totaux 728,998 963,025 1,702,023 173,961 219,628 393,589 15,146 246,752 261,898
2 Be du Prince-Edouard-Totaux - 68,425 68,425 - 386 386 - 49,155 49,155
3 Kings - 16,841 16,841 - 136 136 - 21,058 21,058 4 Queens - 22,331 22,331 - 245 245 - 8,399 8,399 5 Prince - 29,253 29,253 - 5 5 - 19,698 19,698
6 Nouvelle-Ecosse-Totaux 738,998 453,440 1,192,438 173,961 209,685 383,546 15,146 150,724 165,870
7 Richmond - 14,921 14,921 - 21,299 21,299 - 318 318 8 Cap-Breton - 84,572 84,572 - 11,494 11,494 - 2,289 2,2 89 9 Victoria - 13,421 13,421 - 29,218 29,218 - 277 277
10 Inverness - 11,309 11,309 - 754 754 - 6,339 6,339 11 Cumberland - 321 321 - - - - 76 76 12 Colchester - 107 107 - - - - - - 13 Pictou - 329 329 - 69 69 - 1,032 1,032 14 Antigonish - 610 610 - 55 55 - 3,145 3,145 15 Guysborough 1,293 56,019 57,312 34 5,959 5,993 9 1,700 1,709 16 Halifax 175,749 33,343 209,092 128,432 9,839 138,271 989 615 1,604 17 Hanta - 106 106 - - - - - - 18 Lunenburg 457,720 21,440 479,160 19,200 5,060 24,260 3,840 2,000 5,840 19 Queens 9,798 23,219 33,017 3,852 4,578 8,430 2,248 3,814 6,062 20 Shelburne 87,647 115,144 202,791 22,398 46,685 69,083 7,140 15,929 23,069 21 Yarmouth 6,791 23,288 30,079 45 5,298 5,343 920 5,428 6,348 22 Digby - 44,696 44,696 - 65,714 65,714 - 96,715 96,715 23 Annapolis - 7,688 7,688 - 3,464 3,464 - 11,032 11,032 24 Kings - 2,907 2,907 - 99 99 - 15 15
,
25 Nouveau-Brunswick-Totaux - 102,683 102,683 - 9,172 9,172 - 45,698 45,693
26 Charlotte - 22.634 22,634 - 8,335 8,335 - 26,009 26,009 27 Saint-John - 4,116 4,416 - 547 547 - 2,738 2,738 28 Albert - 4 4 - - - - - 29 Westmorland - 82 82 - - - - - - 30 Kent - 729 729 - - - - 10,986 10,986 31 Northumberland - 522 522 - - - - - - 32 Gloucester - 74,105 74,105 - 260 260 - 5,842 5,842 33 Restigouche - 491 491 - 30 30 - 123 123
34 Québec-Totaux - 319,842 319,842- 485 485 - 1,133 1,133
35 Bonaventure - 29,951 29,951 - 194 194 - 1,053 1,053 36 Gaspé - 190,316 190,316 - 171 171 - SO 80 37 Iles-de-la-Madeleine - 50,037 50,037 - 120 120 - - - 38 Saguenay - 48,138 48,138 - - - - - 39 .Matane - 1,400 1,400 - - - - -. 40 Rimouski - - - - - - -
41 Colombie Britannique-Totaux - 18,635 18,635- - - - 42 42
42 District N°1 - 11,717 11,717- - - - 42 42 43 District N° 2 - - - - - - 44 District N°3 - 6,918 6,918 -- - - -

STATISTIQUES DES PÊCHERIES 265
15. Proportion de poisson de mer pris en haute mer par les chalutiers à vapeur et autres navires de 40 tonnes ou plus, pêchant sur les bancs, 1938-suite
1
Merlan Silure nain Flétan Turbot, barbue et plie
,
Prise Prise Prise Prise Prise Prise ori e au suries '
Prise Prise -,,,n_se
Prise P
au suries au suries au suries Prise
large côtes totale rise
large côtes teale large côtes tot e large côtes totale
qtx qtx qtx qtx qtx qtx qtx qtx qtx qtx qtx qtx
16,881 81,453 101,334 940 3,396 4,336 114,475 48,065 162,510 3,476 12,383 15,861 1
- - - - - - - - - 582 582 2
- - - - - _ _ _ _ -3
- - - - - - - - - 330 330 4
- - - - - - - - - 252 252 5
16,881 65,011 81,892 940 3,396 4,336 28,249 11,295 39,511 3,178 6,981 10,459 6
- - - - - - 31 31 - 28 287
- - - - - - 2,664 2,664 - 1,049 1,049 8
- - - - - - 144 144 - - - 9
- - - - - - 14 14 - -10
- 115 115 - - - 7 7 - 505 30511
- - - - - - - - 3 312
- - - - - - - - - 13
- - - - - - - - 200 20014
- 693 693 3 3 45 629 674 4 213 217 15
11,399 8,909 20,208 940 49 989 8,734 1,813 10,547 1,691 100 1,79116
- - _ - - - - - - - - - 17
2,820 1,570 4,390 - - - 8,210 660 8,870 1,100 10 1,11018
- 2,576 2,576 . - - - 123 645 768 216 281 49719
2,017 9,278 11,295 - 3,344 3,344 10,638 2,487 13,125 467 4,229 4,69620
645 12,100 12,745 - - - 499 1,572 2,071 - - - 21
- 25,475 25,475 - - - 444 444 - 363 363 22
- 2,825 2,825 - - - 153 153 - - - 23
- 1,470 1,470 - - - - 32 32 - - - 24
- 19,142 19,442 _ _ _ 76 76 - 2,579 2,57925
- 19,41619,416 - - - 50 50 - 250 25026
- 26 26 - - - - - 3 3 27
- - - _ _ _ - - - 28
- - - _ _ _ - - _ 29
- - - _ _ _ - - 52 52 30
- - - _ _ _ - - - - 31
_ - - - - - 26 26 - 1,609 1,60932
_ _ _ - - - - 665 66533
_ _ _ - - - 2,673 2,673 - 65 6534
_ _ _ _ _ _ - - - 45 4535
_ _ _ _ - - 273 273 - - -36
_ - - _ _ _ 63 63 - - -37
_ _ _ _ _ _ - 2,266 2,266 - 20 2038
_ - _ _ - - 71 71 - -39
_ _ _ _ - - - - - 40
_ _ _ - 86,226 31,021 120,247 - 2,176 2,17641
_ _ - _ - - 28,155 28,155 - 957 95742
_ - - - - - 86,226 - 86,226 - - - 43
_ _ - - 5,866 5,866 1,219 1,21944

266 STATISTIQUES DES PÊCHERIES
15. Proportion de poisson de mer pris en haute mer par les chalutiers à vapeur et autres navires de 40 tonnes ou plus, pêchant sur les bancs, 1938-suite
Raie Sole Hareng
Province et comté ou district Prise Prise
Prise Prise pri 0 Prise Prise 0_, _ r ise
. p . au sur les tota-le au sur les „',,,r„s,' au sur les totale
large côtes large côtes '''''' e large côtes
qtx qtx qtx qtx qtx qtx qtx qtx qtx
1 Canada-Totaux 881 33,271 34,155 16,618 6,984 23,602 47 2,477,930 2,477,977
2 Be du Prince-Edouard-Totaux - - - - - - - 56,056 56,056
3 Kings - - - - - - - 9.951 9,951 4 Queens - - - - - - - 12,756 12,756 5 Prince - - - - - - - 33.349 33,349
6 Nouvelle-F,cosse-Totaux 881 32,381 33,262 16,618 323 16,941 47 255 ,607 255,654
7 Richmond - - - - - - - 3.568 3,568 8 Cap-Breton - - - - - - - 4,491 4,491 9 Victoria - - - - - - - 16,164 16,164
10 Inverness - - - - - - - 12.878 12,878 Il Cumberland - - - - - - - 458 458 12 Colchester - - - - - - - 137 137 13 Pictou - - - - - - - 1.036 1,036 14 Antigonish - - - - - - - 10,405 10,405 15 Guysborough - - - 15 304 319 - 15.470 15,470 16 Halifax 8S1 5 886 16,603 19 16,622 47 36.879 36,926 17 Hants - - - - - - - 75 75 18 Lunenburg - - - - - - - 50,315 50,315 19 Queens - - - - - - - 15,266 15,266 20 Shelburne - 1,733 1,733 - - - - 35,165 35,165 21 Yarmouth - - - - - - - 24.665 24.665 22 Digby - 27,650 27,650 - - - - 13.800 13,800 23 Annapolis - 2,993 2,993 - - - - 13,059 13,059 24 Kings - - - - - - - 1.776 1,776
25 Nouveau-Brunswick-Totaux - 199 199 - - - - 427,315 427,315
26 Charlotte - 199 199 - - - - 117,936 117,936 27 Saint-John - - - - - - - 4,183 4,183 28 Albert - - - - - - - - - 29 Westmorland - - - - - - - 91,311S 91,368 31 Kent - - - - - - - 71,426 71,426 31 Northumberland - - - - - - - 12,471 12,471 32 Gloucester - - - - - - - 123,574 123,574 33 Restigouche - - - - - - - 6,357 6,357
34 Québec-Totaux - - - - 107 107 - 410,039 410,039
35 Bonaventure - - - - 107 107 - 153,437 153,437 36 Gaspé - - - - - - - 106,431 106,431 37 lies-de-la-Madeleine - - - - - - - 123,322 123,322 38 Saguenay - - - - - - 5,505 5,505 39 Matane - - - - - - - 11,344 11,344 40 Rimouski. - - - - - - 10,000 10,000
' 41 Colombie Britannique-Totaux . - 694 694 - 6,551 6,554 - 1,328,913 1,328,913
42 District /sr 1 591 591 - 4,374 4,374 - 12,170 12,170 43 District l'e 2 64 64 - 364,420 364,420 44 District Ne 3 103 103 - 2,116 2,116 - 952,323 952,323

STATISTIQUES DES PÊCHERIES
15. Proportion de poisson de mer pris en haute mer par les chalutiers à vapeur et autres navires de 40 tonnes ou plus, pêchant sur les bancs, 1938-suite
Sébaste Cabillaud Lingue Morue rouge et morue de roche
- Prise Prise Prise P Prise Prise Prise Prise p 4 „ Prise Prise Prise au sur les totale nu "'les
rise r totale au sur les "" au sur les al large côtes large côtes tot e large côtes large côtes totale
qtx qtx qtx qtx qtx qtx qtx qtx qtx qtx qta qtx
4,779 - 4,779 3,443 5,020 8,463 116 46,400 46,516 75 6,799 6,874 1
- - - - - - - - - -2
- - - - - - - - - -4 - - - _ _ _ _ _ _ -5
4,779 - 4,779 - - - - - - - 6
- 7 _ - - - _ - _ _ _ 8 - _ _ - 9 - _ _ - - - - - - -10 _ _ _ - - - - - - - 11 - - - - - - - - - - - 12 - - - _ - _ - _ - _ _ - 13 - - _ _ _ - - - - - - - 14 - - - _ _ _ _ - _ _ - 15
4,779 - 4,779 - - - - - - - -16
- - _ _ - - - - - - 17
- - _ _ _ _ - - - 18 - - - _ _ _ - - - - - 19 - - - _ _ _ - - - - - 2€ - - - _ _ _ - - - - -21 - - - _ _ _ - - - - -22 - - - _ _ - - - - - - 23 - - - - _ _ - - - - -24
_ - _ _ _ _ _ - _ _ - 25 _ _ _ _ _ _ _ - _ _ - 2E _ - _ _ _ _ _ _ _ _ - 27 _ _ _ _ _ _ _ - - - -26
_ _ _ _ _ _ - _ - - -21
_ _ _ _ _ _ - _ _ _ - 3€ _ _ _ _ _ _ _ - - - -31 _ _ _ _ _ _ _ _ _ _ -32 _ _ _ _ _ _ _ _ _ - 33
_ _ - - - _ _ _ _ - 34 _ _ - - _ _ - _ - 35 _ - _ - - - _ - _ - 36
- _ - - - 37 _ _ - - . _ - 38 _ _ - - - - _ - _ _ - - - - - _ - - - 39 _ - - - - - - - - -40
- - 3,443 5,020 8,463 116 46,400 46,516 75 6,799 6,874 41 _ - - - 2,833 2,833 - 17,823 17,823 - 2,357 2,357 42 - - - 3443 - 3,443 116 - 116 75 - 75 43 _ _ -
, - 2,187 2,187 - 28,577 28,577 - 4,442 4,442 44
267
ji

268 STATISTIQUES DES PÊCHERIES
15. Proportion de poisson de mer pris en haute mer par les chalutiers à vapeur et autres navires de 40 tonnes ou plus, pêchant sur les bancs, 1938—suite
Espadon Poissons divers
Province et comté ou district Prise Prise Prise Prise
ausur les Prise au r les Prise sur totale large côtes large côtes
qtx qtx qtx qtx qtr qtx
1 Canada—Totaux 742 10,187 10,929 41,291 16,355 60,619
211e du Prince-Edouard - - - - - -
3 Rings _ - - - - -
4 Queens - - - - - - 5 Prince - - - - - -
6 Nouvelle-Ecosse—Totaux 742 10,187 10,929 41,291 6,039 50,333
7 Richmond - 88 88 - 183 153 8 Cap-Breton - 7,223 7,223 - - - 9 Victoria - 2,617 2,617 - - -
10 Inverness - - - - - 11 Cumberland - - - - -
- -
12 Colchester - - - - - 13 Pictou - - - - - 14 Antigonish - - - - - - 15 Guysborough - 99 99 - 4,200 4,200 16 Halifax - 30 30 44,294 1,656 45,950 17 Hante - - - - , " 18 Lunenburg - 30 30 - - - 19 Queens - - - - - 20 Shelburne 100 100 - - - 21 Yarmouth 742 - 742 - - - 22 Digby - - - - - 23 Annapolis - - - - - - 24 Rings - - - - -
25 Nouveau-Brunswick—Totaux - - - - 126 126
26 Charlotte - - - - - - 27 Saint-John - - - - - - 28 Albert - .- - - .. - 29 Westmorland - - - - - - 3 Kent - - - - - - 31 Northumberland - - - - 126 126 32 Gloucester. - - - - - 3 Restigouche - - - - - -
34 Québec—Totaux - - - - 10,190 10,190
35 Bonaventure - - - - - - 36 Gaspé - - - - - - 37 Iles-de-la-Madeleine - - - - - 38 Saguenay - - - 190 190
39 Matane - - - - - 40 Rimouski - - - 10,000 10,000
41 Colombie Britannique—Totaux - - - - - -
92 District N° 1 - - - - - - 93 District N° 2 - - - - - 44 District N° 3 - - - - - -

STATISTIQUES DES PÊCHERIES 269
15. Proportion de poisson de mer pris en haute mer par les chalutiers à vapeur et autres navires de 40 tonnes ou plus, pêchant sur les bancs, 1938-fin
Baleines Tous autres poissons Total (a)
Nombre N'ombre Prise Prise Prise au sur les Nombre
large côtes total sur les au sur les Prise
côtes large côtes totale
nonab. nom"). nonab. ex ex qtx citx
310 - 310 4,530,198 1,134,874 8,710,849 9,845,723 1
_ - - 119,600 - 291,204 294,204 2
- - 36,311 - 84,297 84,297 3
- - 31,052 - 75,113 75,113 4
• - - 52,237 - 134,794 134,794 5
- 601,863 1,045,014 1,606,832 2,851,846 C
_ 35,259 - 75,695 75,695 1
- 26,439 - 140,221 140,221 6
- 20,002 - 81,843 81,843 1
_ _ 40,83' - 72,129 72,129 1(
- 14,878 - 16,360 16,360 11
_ 4,606 - 4,853 4,853 15
_ 21,213 - 23,679 23,679 12
_ _ 14,857 29,272 29,272 14
- - - 75,314 1,400 160,603 162,0031£
- - 66,924 394,538 160,181 554,719 11
- - 7,57 7,756 7,75611
- - 89.046 492,890 170,131 663,021 1£
- • 16,230 16,237 66,609 82,846 11
- - 17,504 130,307 251,598 381,905 21
_ _ - 32,224 9,642 104,575 114,21721
- 106,209 381,066 381,066 21
- 8,349 49,563 49,563 2:
- 4,399 10,698 10,6982
- - 664,411 - 1,271,731 1,271,7312,
- - - 378,046 - 572,875 572,8752 1
- - - 83,545 - 95,158 95,1582'
_ _ - 72 _ 76 1621
- - - 30,747 - 122,197 122,1972 1
_ _ _ 54,238 _ 137,431 137,43131
_ _ - 61,979 _ 75,098 75,09213
- - - , 47,000 _ 252,416 252,4163:
- - 8,814 - 16,480 16,48031
- - - 120,541 - 865,078 865,0783.
_ _ _ 12,94 - 197,729 197,729 à
- - - 10,63 - 307,909 307,909 3
- - - 53,48 - 227,022 227,0223'
- - - 35,49 - 91,617 91,617 3;
_ _ _ 1,786 - 14,601 14,601
_ - 6,200 - 26,200 26,2004
311 - 310 3,023,750 89,860 4,173,004 4,562,8614
- - - 335,507 - 410,526 416,526 4
310 - 310 888,952 89,860 1,253,436 1,313,2964:
- _ _ 1,709,291 - 2,803,042 2,803,0424
(a) Excepté les phoques à fourrure, les baleines et les algues.
5
1

270 STATISTIQUES DES PÊCHERIES
16. Résumé des capitaux engagés, par province, 1938
De du Prince-Edouard Nouvelle-Ecosse
Opérations primaires
Nombre Valeur Nombre Valeur
$ $
1 Chalutiers à vapeur - 3 69,000 2 Bateaux à voiles, à gazoline et diesel 11 6,400 526 1,371,320 3 Barques à gazoline et diesel 1,673 377,400 5,907 1,540,795 4 Barques à voiles et à rames 722 8,220 4,755 100,804 5 Barques et chaloupes - - _ 6 Pinasses et vaisseaux servant à recueillir le poisson 8 3,000 106 134,850 7 Filets à mailles 3,114 24, 062 38,775 403,508 8 Filets dérivants à saumon - 55 5,750 9 Parcs en filets à saumon I 600 509 128,290
10 Autres filets à pièges 4 800 376 197,330 Il Filets à éperlan 2,360 16,963 4,262 30,858 12 Filets à parcs - - - 13 Filets tubulaires - - - - 14 Nasses - - 70 17,580 15 Seines - 227 25,610 16 Tessures de filets - - 1.190 10,270 17 Baquets de palangre 1,330 26,600 14,056 185.713 18 Lignes à main 1,918 3,836 24,501 23,700 19 Pièges à crabes 40 40 50 50 20 Pièges à anguilles - - 771 1,074 21 Pièges è. homards 391,045 391.045 1,129,890 1,397,332 22 Parcs à homards - 14 13,530 23 Râteaux à huîtres 339 1,017 367 1,292 24 FtAteaux à praires 101 303 - - 25 Rilteaux 5. pétoncles - 501 17,700 26 Dards - - - - 27 Quais et môles 37 34,200 1,036 374,985 28 Glacières 27 5,875 229 59,880 29 Fumeries 305 18,020 3,550 243,553 30 Autres - - - 2,325
31 Valeur totale - 918,141 - 6,361,195
Ontario , Manitoba
Opérations primaires
Nombre Valeur Nombre Valeur
$ S
32 Bateaux à vapeur - _ - - 33 Bateaux à voiles, à gazoline et diesel - _ - 34 Barques à gazoline et diesel 1,036 666,926 214 156,960 35 Barques à voiles et à rames .‘ - - - - 36 Barques et chaloupes 1,008 43,692 844 31,665 37 Vaisseaux pour le transport du poisson - - 25 118.830 38 Remorqueurs 99 672,484 - 39 Filets à mailles (a) 8, 251, 640 903,474 72,335 557,455 40 Filets dérivants à saumon - - - 41 Parcs en filets à saumon - - - - 42 Autres filets à pièges - - - - 43 Seines à poche à saumon. - - - - 44 Seines de fond pour saumon - - - 45 Autres seines 131 16,812 - - 46 Tessures de filets - - - - 47 Filets à éperlan - - - - 48 Filets à parcs 1,112 534,580 - 49 Filets tubulaires 879 22,119 38 650 50 Filets à rouleaux 64 292 4 6 51 Filets à oulachon - - - 52 Filets à crevettes - - - - 53 Chaluts à panneaux - - - 54 Lignes à main 546 7,550 21 32 55 Pièges à crabes - - - 56 Dards 119 984 - 57 Roues à poissons - - - 58 Quais et môles 399 107,685 73 21,297 59 Glacières 539 252,654 111 115,659 60 Fumeries - - 181 50,246 61 Autres - - - -
62 Valeur totale - 3,229,2E2 1,052,801
(a) Pour l'Ontario les fileta à mailles sont donnés en verges:

STATISTIQUES DES PÊCHERIES
16. Résumé des capitaux engagés, par province, 1938-suite
Nouveau-Brunswick Québec
Pêcheries Pêcheries Total, Pêcheries Pêcheries Total,
maritimes intérieures pêcheries maritimes intérieures pêcheries
Nom-'Valeur m- Nom- Valeur Nom- Valeur Nom" Valeur Nom- Valeur bre bre bre bre bre
S $ $ $ S $
- - - - - - - - - - -1
293 240,300 - - 293 240,300 47 24,200 - 47 24,200 2
2,812 775,969 - - 2,812 775,969 2,943 874,983 201 28,405 3,144 903,390 3
4.852 124,977 - - 4,852 124,977 2,895 95,748 - 2,895 95,748 4
- - 326 1,792 326 1,792 - - 1,235 21,855 1,235 21,855 5
89 189,349 - - 89 189,349 13 7,200 - 13 7,200 6
12,939 82,449 624 5,128 13,563 87,577 14,724 341,710 94 4,150 14,818 345,860 7
6,557 103,164 - - 6,557 103,164 - - - - - 8
308 140,450 - - 308 140,450 164 53,150 - 164 53,150 9
140 3,780 - - 140 3,780 119 79,200 - 119 79,20010
8,017 284,168 - - 8,017 284,168 1,264 31.799 - 1,264 31,79911
49 7,350 - - 49 7,350 - - - - - 12
- - - - - - - - 525 8,000 525 8,00013
370 357,445 - - 370 357,445 50 5,000 342 67,500 392 72,500 14
417 65,100 - - 417 65,100 200 31,915 156 6,507 386 38,42215
- - - - - - - - - -16
1,610 15,966 - - 1,610 15,966 5,832 80,873 - 5,832 80,873 17
9,366 7,644 - - 9,366 7,644 20,554 25,129 513 1,617 21,067 26,74618
- - - - - - - - - - 19
11 35 200 400 211 438 - 60 700 60 700 20
431,438 376,273 - - 431,438 376,273 141,697 151,320 - - 141,697 151,32021
17 51,395 - - 17 51,395 2 350 - - 2 35022
1,173 3,543 - - 1,173 3,543 - - - - - 23
176 593 - - 176 593 - - - - - 24
157 3,065 - - 157 3,065 4 28 - - 4 2825
- - - - - - 206 412 206 41226
361 105,090 - - 361 105,090 277 48,400 54 10,800 331 59,20027
140 88,715 - - 140 88,715 321 71,175 199 18,900 320 90,07528
1,171 254,790 - - 1,171 254,790 2,375 132,210 1 400 2,376 132,610 29
- 29,070 - - - 29,070 - 34,560 - - - 34,860 30
- 3,310,093 - 7,320 - 3,313,003 - 2,089,252 - 169,216 - 2,256,498 31
Saskatchewan Alberta Colombie Britannique Yukon
Nombre Valeur Nombre Valeur Nombre Valeur Nombre - Valeur
$ $ S S
- - - - 6 150,000 _ - 32 - - - 256 2,317,900 _ - 33 40 17,235 126 30,000 6,540 3,917,197 12 3,60034 - - - 1,294 60,675 - - 35 42 1,700 137 8,125 - 10 35036 - - 2 209 547,875 - - 37 - - 2 18,526 - _ - 38
11,046 138,237 9,540 184,700 32 5,800 65 63039 - - - 6,899 1,214,556 _ - 40 - - - - 5 75,000 _ - 41
1 SOO - - - _ - 42 _ - - 262 301,200 - - 43 - - - 9 5,350 _ - 44 - - - 44 118,800 _ - 45 - - - 1,844 42,205 - 46 - - _ 51 2,850 _ - 47 - - _ - _ - 4S 20 200 - - - - - 49
- 50- - _ - _ - _ - 28 840 - - 51
- - _ 23 1,975 _ -52 - _ - 15 6,850 _ -53
769 4,064 - 14,290 115,034 _ - 54 - _ - 6,688 26,455 _ - 55 - - - - - _ - 56
- - - - - 8 68057
13 1,320 39 14,150 10 11,000 - - 58 25 2,870 63 22,600 10 26,300 3 4556
1 1,500 10 9,100 42 50,900 2 5060
- - - - 1,482 - -61
- 167,926 - 287,201 - 9,000,244 - 5,35562
271

Valeur Nombre
Ile du Prince-Edouard
Etablissements
Homarderies
Saumoneries
Conserveries de coques
Sardineries et autres poissonneries
Saurisseries
Glacières •
Huileries
Total
1
2
3
4
5
6
7
8 78 180,525
64
4
10
$
139,325
9,000
32,200
272 STATISTIQUES DES PÊCHERIES
16. Résumé des capitaux engagés, par province, 1938—suite
17. Résumé du personnel, par province, 1938
Nouveau-Brunswick Ile du Nouvelle- - Prince- Ecosse Edouard
Maritimes Intérieures Total
Nombre Nombre Nombre Nombre Nombre
9 Hommes employés sur les bateaux, embar- cations, etc 3,309 18,548 13,713 417 14,130
10 Personnes employées dans les saurisseries... 1,234 3,325 2,652 2,652
11 Total 4,543 21,873 16,365 417 16,782

STATISTIQUES DES PÊCHERIES
16. Résumé des capitaux engagés, par province, 1938-en
Nouvelle-Ecosse Nouveau-Brunswick Québec Colombie Britannique
Nombre Valeur Nombre Valeur Nombre Valeur Nombre Valeur
$ S $ $
62 514,950 73 476,546 16 89,300 - - 1
- 62 1 38 11,597,913 2 26,528
: 1 12 I - 4 I 3
1,818,069 421,19
5 198,168 3 1 i 10,509 2 4
75 1 22 157,377 46 225,865 19 1 5
2,799,534 2,377,645
2 5 90,104 91 2 6 75,912
4 218,66 3 15,425 1 f 10 668,267 7
155 3,757,847 118 2,557,521 135 401,586 75 15,065,019 8
17. Résumé du personnel, par province, 1938-fin
Québec
Ontario 31anitoba Saskat- Colombie Alberta Mitan- Yukon
cluvran taque Maritimes Intérieures Total
Nombre Nombre Nombre Nombre Nombre Nombre Nombre Nombre Nombre
11,150 1,534 12,684 4,170 3,819 1,547 2,954 10,314 35 9
1,170 - 1,170 - - - 6,103 - 10
12,320 1,531 13,851 4,170 3,819 1,547 2,954 16,417 3511
273
00667-18

274 STATISTIQUES DES PÊCHERIES
Primes En vertu d'une "Loi pour encourager le développement des pêcheries
maritimes et la construction des navires de pêche", une somme de $160,000 est donnée en primes chaque année par le Gouverneur en conseil. Sous le nom de primes de pêche elles sont distribuées par le Ministère des Pêcheries parmi les pêcheurs et les propriétaires de navires et barques de pêche du littoral de l'Atlan-tique selon les règlements édictés de temps à autre par le Gouverneur en conseil.
En 1938 les versements sont effectués sur la base suivante:— Aux propriétaires de navires de pêche ayant droit à cette prime, $1 par
tonne enregistrée; avec un maximum de $80 par navire. A chaque membre de l'équipage ayant droit à la prime, $6.00. Aux propriétaires de barques mesurant au moins 12 pieds de quille, $1 par
embarcation. A chaque pêcheur d'une barque ayant droit à une prime, S5.55. Le montant payé en 1938 est de $159,982.70, réparti comme suit:
A 734 propriétaires de navires et leurs équipages $ 35,642.30 A 11,660 barques et leurs équipages $124,340.40
Commerce extérieur Exportations.—La valeur totale du poisson et produits poissonniers cana
diens exportés pendant l'année civile 1938 est de $27,543,680, à rapprocher de $28,902,152 en 1937 et $25,398,102 en 1936. Par ordre de valeur, les principaux item sont les suivants en 1938: saumon, $7,128,194; homard frais, $1,952,697; homard en boîte, $1,898,838; corégone frais et congelé, $1,514,870; morue séchée, $1,175,645. Pendant l'année la valeur totale des exportations de poisson frais et congelé est de $11,344,363; celle du poisson préparé (en boîte, salé, fumé, etc.), $13,965,030; celle des huiles de poisson, $975,491; celle des produits poissonniers divers, $1,258,796. Les principaux pays de destination sont les suivants: Etats-Unis, S12,713,819; Royaume-Uni, $6,880,661; Australie, $1,932,655; Antilles britanniques (comprenant Barbades, Jamaïque, Trinidad et Tobago, et autres), $946,528; France, $691,833; Allemagne, $687,844; Sud-Africain britannique, $621,345; Nouvelle-Zélande, $522,680. En tout 87 pays reçoivent du poisson et des produits poissonniers canadiens en 1938 et la liste des exporta-tions renferme 58 item distincts.
Importations.—La valeur du poisson et des produits poissonniers importés pour consommation s'établit à $3,036,227, en regard de $2,877,131 l'année précé-dente et $2,918,251 en 1936. Les principales importations sont les suivantes: saumon frais des Etats-Unis, de Terre-Neuve et de l'Alaska; huîtres des Etats-Unis; sardines de la Norvège, de la France, de l'Italie et du Portugal; huile de foie de morue du Royaume-Uni, des Etats-Unis, de Terre-Neuve et de la Norvège.
Le tableau suivant donne la valeur des exportations et des importations de 1926 à 1938. Valeur des exportations et des importations de poisson et de produits poissonniers,
années terminées le 31 décembre, 1926 à 193
Année Exportations Importations Année Exportations Importations
S S S $ 1926 37,089,545 2,045,838 1933 20,223,610 1,694,325 1927 34,814,448 3,768,901 1934 92,497,135 2,121,762 1928 38,096,245 4,068,074 1935 24,859,486 2,597,856 1929 37,546,393 4,233,906 1936 25,398,102 2,918,251 1930 31,869,350 3,446,601 1937 28,902,152 2,877,131 1931 25,849,585 9 ,653,894 1938 27,543,680 3,036,227 1932 18,752,107 1,862,337
Revue rétrospective Les cinq tableaux suivants présentent une revue rétrospective de l'industrie
de la pêche au Canada pendant les années passées. En ce qui concerne la pro-duction, les données sont établies par province et par année et remontent jusqu'à 1870. Quant au nombre et à la valeur des navires, barques, etc., les chiffres partent de l'année 1880; le personnel qu'emploie cette industrie est révélé depuis 1895.

STATISTIQUES DES PÊCHERIES
18. Revue rétrospective-(a) Valeur totale des pêcheries dans les différentes provinces du Canada pour les années 1870 et 1875 jusqu'à 1938 inclusivement
Manitoba, Be du Année Prince-Nouvelle- Nouveau' Colombie Saskat- Total
Edouard Ecosse Bruns- Québec Ontario Britan- cbewan, pour tout wick nique Alberta le Canada et Yukon
S S S S $ $ S S 1870 Inconnu 4,019,425 1,131,433 1,161,551 624,982 Inconnu Inconnu 6,577,391 1875 298,927 5,573,851 2,427,654 1,596,759 453,194 Inconnu Inconnu 10,350,385 1876 494,967 6,029,050 1,953,389 2,097,668 437,229 104,697 Inconnu 11,117,000 1877 763,036 5,527,858 2,133,237 2,560,147 438,223 583,433 Inconnu 12,005,934 1878 840,344 6,131,600 2,305,790 2,664,055 348,122 925,767 Inconnu 1 3,2 15,678 1879 1,402,301 5,752,937 2,554,722 2,820,395 367,133 631,766 Inconnu 13,529,254
1880 1,675,089 6,291,061 2,744,447 2,631,556 444,491 713,335 Inconnu 14,499,979 1881 1,955,290 6,214,782 2,930,904 2,751,962 509,903 1,454,321 Inconnu 15,817,162 1882 1,855,687 7,131,418 3,192,339 1,976,516 825,457 1,842,675 Inconnu 16,824,092 1883 1,272,468 7,689,374 3,185,674 2,138,997 1,027,033 1,644,646 Inconnu 16,958,192 1884 1,085,619 8,763,779 3,730,454 1,694,561 1,133.724 1,358,267 Inconnu 17,766,404
1885 1,293,430 8,283,922 4.005,431 1,719,460 1,342,692 1,078,038 Inconnu 17,722,973 1886 1,141,991 8,415,362 4,180,227 1,741,382 1,435,998 1,577,348 186,980 18,679,288 1887 1,037,426 8,379,782 3,559,507 1,773,567 1,531,850 1,974,887 129,084 18,386,103 1888 876,862 7,817,030 2,941,863 1,860,012 1,839,869 1,902,195 180,677 17,418,508 1889 886,430 6,346,722 3,067,039 1,876,194 1,963,123 3,348,067 167,679 17,655,254
1890 1,041,109 6,636,444 2,699,055 1,615,119 2,009,637 3,481,432 232,104 17,714,900 1891 1,238,733 7,011,300 3,571,050 2,008,678 1,806,389 3,008,755 332,969 18,977,874 1892 1,179,856 6,340,724 3,203,922 2,236,732 2,042,198 2,849,483 1,088,254 18,941,169 1893 1,133,368 6,407,279 3,746,121 2,218,905 1,694,930 4,443,963 1,042,093 20,686,659 1894 1,119,738 6,547,387 4,351,526 2,303,386 1,659,968 3,950,478 787,087 20,719,570
1895 976,836 6,213,131 4,403,158 1,867,920 1,584,473 4,401,354 752,466 20,199,338 1896 976,126 6,070,895 4,799,433 2,025,754 1,605,674 4,183,999 745,543 20,407,424 1897 954,949 8,090,346 3,934,135 1,737,011 1,289,822 6,138,865 638.416 22,783,544 1898 1,070,202 7,226,034 3,849,357 1,761,440 1,433,632 3,713,101 613,355 19,667,121 1899 1,043,645 7,347,604 4,119,891 1,953,134 1,590,447 5,214,074 622,911 21,891,706
1900 1,059,193 7,809,152 3,769,742 1,989,279 1,333,294 4,878,820 718,159 21,557,639 1901 1,050,623 7,989,548 4,193,264 2,174,459 1,428,078 7,942,771 958,410 25,737,153 190 9 887,024 7,351,753 3,912,514 2,059,175 1,265,706 5,284,824 1,198,437 21,959,433 1903 1,099.510 7,841,602 4,186,800 2,211,792 1,535,144 4,747,365 1,478,665 23,100,878 1904 1,077,546 7,287,099 4,671,084 1,751,397 1,793,229 5,219,107 1,716,977 23,516,439
1905 998,922 8,259,085 4,847,900 2,003,716 1,708,963 9,850,216 1,811,570 29,479,562 1906 1,168,939 7,799,160 4,905,225 2,175,035 1,734,856 7,003,347 1,492,923 26,279,485 1907 1,492,695 7,632,330 5,300,564 2,047,390 1,935,020 6,122,923 968,422 25,499,349 1908 1,378,624 8,009,838 4,754,298 1,881,817 2,100,078 6,465,038 861,392 25,451,085 1909 1,197,557 8,081,111 4,676,315 1,808,437 2,177,813 10,314,755 1,373,181 29,629,169
1910 1,153,708 10,119,243 4,134,144 1,692,475 2,026,121 9,163,235 1,676,216 29,965,142 1911 1,196,396 9,367,550 4,886,157 1,868,136 2,205,438 13,677,125 1,467,072 34,667,872 1912 1,379,905 7,384,055 4,264,054 1,988,241 2,842,878 14,455,488 1,074,843 33,389,464 1913 1,280,447 8,297,626 4,308,707 1,850,427 2,674,685 13,891,398 904,458 33,207,748 1914 1,261,666 7,730,191 4,940,083 1,924,430 2,755,291 11,515,086 1,137,884 31,264,631
1915 933,682 9,166,851 4,737,145 2,076,851 3,341,182 14,538,320 1,066,677 35,860,708 1916 1,344,179 10,092,902 5,656,859 2,991,624 2,658,993 14,637,346 1,826,475 39,208,378 1017 1,786,310 14,468,319 6,143,088 3,414,378 2,866,419 21,518,595 2,114,935 52,312,044 1918 1,148,201 15,143,066 6,298,990 4,577,973 3,175,111 27,282,223 2,634,180 60,259,744 1919 1,536,844 15,171,929 4,979,574 4,258,731 3,410,750 25,301,607 1,849,044 56,508,479
1920 1,708,723 12,742,659 4,423,745 2,592,382 3,336,412 22,329,161 2,108,257 49,241,339 1921 924,529 9,778,623 3,690,726 1,815,284 3,065,042 13,953,670 1,704,061 34,931,935 1922 1,612,599 10,209,258 4,685,660 2,089,414 2,858,122 18,849,658 1,495,499 41,800,210 1923 1,754,980 8,448,38,5 4,548,535 2,100,412 3,159,427 20,795,914 1,757,892 42,565,545 1924 1,201,772 8,777,251 5,383,809 2,283,314 3,557,587 21,257,567 2,072,935 44,534,235
1925 1,598,119 10,213,779 4,798,589 3,044,919 3,436,412 22,414,618 2,435,695 47,942,131 1926 1,358,934 12,505,922 5,325,478 3,110,964 3,152,193 27,367,109 3,540,033 56,360,633 1927 1,367,807 10,783,631 4,406,673 2,736,450 3,670,229 22,890,913 3,267,906 49,123,609 1928 1,196,681 11,681,995 5,001,641 2,996,614 4,030,753 26,562,727 3,580,562 55,050,973 1929 1,297,125 11,427,491 5,935,625 2,933,339 3,919,144 23,930,692 4,075,095 53,518,521
1930 1,141,279 10,411,202 4,853,575 2,502,998 3,294,629 23,103,302 2,497,231 47,804,216 1931 1,078,901 7,986,711 4,169,811 1,952,894 2,477,131 11,108,873 1,742,985 30,517,306 1932 988,919 6,557,943 2,972,682 1,815,544 2,147,990 0,009,116 1,564,915 25,057,100 1933 842,345 6,010,601 3,000,045 2,128,471 2,089,842 12,001,471 1,424,171 27,496,946 1934 963,926 7,673,865 3,679,970 2,306,517 2,218,550 15,234,335 1,945,160 34,022,323
1935 899,685 7,852,899 3,949,615 1,947,259 2,852,007 15,169,529 1,756,860 34,427,854 1936 953,029 8,905,268 4,399,735 2,108,404 3,209,422 17,231,534 2,357,663 39,165,055 1937 870,299 9,229,834 4,447,688 1,892,036 3,615,666 16,155,439 2,765,332 38,976,294 1938 930,874 8,804,231 3,996,064 1,957,279 3,353,775 18,672,750 2,778,003 40,492,976
275

276 STATISTIQUES DES PÊCHERIES
18. Revue rétrospective-(b) Nombre et valeur des navires et barques de pêche du Canada et valeur des agrès de pêche et du matériel de l'industrie poissonnière pour les années 1880, 1885, 1890,1895, 1900 et de 1905 à 1938
Valeur Navires Barques des filets Valeur
et seines et des Total Année des divers saurisseries du
engins et et conser- capital Nombre Valeur Nombre Valeur outillage de veries (a)
péche (a)
$ S $ S S
1880 1,181 1,814,688 25,266 716,352 985,978 419,564 3,936,582 1885 1,177 2,021,633 28,472 852,257 1,219,284 2,604,285 6,697,459 1890 1,069 2,152.790 29,803 924,346 1,095,358 2,000,147 7,32.641 1895 1,121 2,318,290 34,268 1,014,057 1,713,190 4,208,311 9,253,848 1900 1,212 1,940,329 38,930 1,248,171 2,405,860 5,395,765 10,990,125
1905 1,384 2,813,834 41,463 1,373.337 2,310,508 6,393,218 12,880,897 190,, 1,439 2,841,875 39,634 1,402,374 2,420,341 7,824,975 14,555,565 1907 1,390 2,748,234 38,711 1,437,196 2,266,722 8,374,440 14,826,592 1908 1,441 3,571,871 39,905 1,696,856 2,283,127 7,957,500 15,509,354 1909 1,750 3,303,121 41,170 1,855,629 2,572,820 9,626,302 17,357,932
1910 1,080 3,028,625 38,977 2.483,996 2,780,546 10,720,701 19,019,870 1911 1,048 3,502,928 36,701 2,695,650 2,453,191 12,281,135 20,932,904 1912 1,069 4,671,923 34,501 3,072,115 4,154,880 12,489,541 24,388,459 1913 1,992 4,445,259 27,680 3,834,178 3,423,110 15,761,486 27,464,033 1914 1.892 4,390,660 39,144 3,957,912 3,313,581 13,071,009 24,733,162
1915 1,984 4,594,504 38.536 4,345,954 3,544,087 12,371,030 25,855,575 1916 1,965 5,207.724 40,105 4,829,793 4,485,269 14,146,176 28,728,962 1917 1,533 6,268,946 42,089 5,770,464 14,737,014 20,366,701 47,143,125 1918 1,417 6,790,888 38,726 7,059,638 16,037,208 30,334,129 60,221,863 1919 1,373 7,768,160 36,434 7,470,095 16,137,897 23,200,874 54,577,026
1920 1,228 8,316,071 30,522 7,859,999 13,717,143 20,512,265 50,405,478 1921 1,145 6,326,803 31,747 7,379,606 12,551,078 19,411,990 45,609,477 1922 1,251 6,704,986 35,160 6,696,512 12,047,152 22,116,338 47,764,988 1923 1,162 6,249,971 32,360 5,813,421 11.582,009 24,027,549 47,672,950 1924 1211 5,612,448 34,110 6,232,613 11,707,504 20,304,785 43,857,350
1925 1,399 0,702,074 34,835 6,809,445 12,221,126 21,139,985 40,872,630 1926 1,560 8,642,596 35,564 7,431,191 12,904,826 28,868,071 57,908,684 1927 1,727 10,473,032 36,703 7,713,204 13,665,743 24,454,482 56,306,461 1928 1,577 9,652,435 35,843 8,277,605 13,201,048 20,941,283 58,072,371 1929 1,470 10,020,484 38,285 9,267,222 14,647,296 28,044,442 62,579,444
1930 1,368 9,583,739 37,160 10,051,019 13,563.932 30,827,607 64,026,297 1931 1,040 5,075,360 37,022 9,027,445 12,137,196 19,085,513 45,325,514 1932 1,060 4,780,709 38,659 8,965,692 10,999,665 17,043,212 41,789,278 1933 996 4,401,156 39,060 10,276,051 10,704,075 15,532,775 40,914,057 1934 984 4,189,005 40,309 11,198,457 10,825,241 17,372,799 43,585,502
1935 950 4,238,570 40,600 11,199,454 10,915,358 17,144,806 43,498,188 1936 1,009 4,389,250 41,314 11,534,675 11,334,625 18,614,592 45,873,142 1937 1,008 4,562,314 39,477 10,431,716 11,802,349 18,130,385 44,920,764 1938 1,142 4,179,120 40,177 10,581,209 11,838,615 21,962,498 48,561,442
(a) Avant 1917, la valeur des divers appareils de pêche était comprise dans la valeur des conserveries et saurisseries.

STATISTIQUES DES PÊCHERIES
18. Revue rétrospective-(e) Nombre de personnes employées dans l'industrie poisonnière en 1895, 1900 et 1905 jusqu'à 1938
Total
Employés des
dans les Pécheurs Pêcheurs Pêcheurs Total employés Année conserveries sur en sans des dams et navires barques bateaux(a) pêcheurs l'industrie
saurisseries poisson- nière.
nombre nombre nombre nombre nombre nombre 1895 13,030 9,804 61,530 - 71,334 84,364 1900 18,205 9,205 71,859 - 81,064 99,269
1905 14,037 9,366 73,505 - 82,871 96,908 1906 12,317 9,058 67,646 76,704 89,021 1907 11,442 8,089 63,165 71,254 82,696 1908 13,753 8.550 62,520 71,070 84,823 1909 21,694 7,931 60,732 68,663 90,357
1910 24,978 8,521 60,089 68,610 93,588 1911 25,206 9,056 56,870 65,926 91,132 1912 23,327 9,076 56,005 65,081 88,408 1913 26,893 10,525 61,251 71,776 98,669 1914 24,559 9,400 60,554 69,954 94,513
•
1915 27,320 9,541 65,321 74,862 102,182 1916 25,680 9,192 60,432 69,624 95,304 1917 22,732 8,946 62,700 744 72,390 95,122 1918 18,554 8,668 58,110 1,738 68,516 87,070 1919 18.356 8,908 56,280 2,616 67,804 86,160
1920 18,499 7,918 47,418 1,861 57,197 75,696 1921 14,104 6,899 46,580 1,751 55,230 69,334 1929 16,577 7,503 48,480 1,897 57,880 74,457 1923 15,447 6,694 44,482 2,341 53,517 68,964 1924 15,536 6,663 44,326 2,925 53,914 69,450
1925 16,272 7,566 47,531 3,176 58,273 74,545 1926 17,408 8,638 49,058 3,675 61,371 78,779 1927 16,697 3,851 48,800 5,764 63,415 80,112 1928 15,434 8.560 46,784 7,441 62,785 78,219 1929 16,367 7,979 48,247 7,857 64,083 80,450
1930 15,722 7,545 48,691 7,600 63,836 79,558 1931 13,071 5,553 49,803 6,455 61,811 74,882 1932 13,724 5,170 52,959 6,355 64,484 78,208 1933 14,042 5,097 54,575 5,834 65,506 79,548 1934 14,802 4,905 57,782 5,947 68,634 83,436
1935 14,361 5,018 57,121 6,418 68,557 82,918 1936 15,238 5,158 59,039 7,538 71,735 86,973 1937 14,044 5,276 56,199 8,506 69,981 84,025 1938 14,484 5,922 56,296 9.292 71,510 85,994
(a) Non classifiés séparément antérieurement il 1917.
277

278 STATISTIQUES DES PÊCHERIES
18. Revue rétrospective-(d) Capital engagé dans l'industrie de la pêche, par province, 1880, 1885, 1890, 1895 et de 1900 à 1938
Manitoba,
Ile duNouvelle- Nouveau- Colombie Saskat- Année Prince- Ecosse Bruns- Québec Ontario Britan- chewan. Canada
Edouard wick nique Alberta et Yukon
$ $ s $ $ $ $ $
1880 106,011 2,225,403 490,714 756,706 177,543 182,025 Inconnu 3,938,582 1885 493,143 3,010,000 1,075,879 930,358 378,274 809,805 " 6,697,459 1890 348,320 3,243,310 1,184,745 521,544 563,443 1,511,279 " 7,372,641 1895 479,639 3,139,968 1,710,347 804,703 831,505 2,085,435 202,251 9,253.848
1900 442,120 3,278,623 2,361,087 830,869 789.042 2,987,104 301.280 10,990,125 1901 425,539 3,319,334 2,233,825 954,661 750,921 3,360,082 446,888 11,491,300 1902 395,648 3,485,489 1,943,654 1,014,168 816,392 3,160,683 489,925 11.305,959 1903 464,792 3,937,428 2,005,391 1,124,848 846,368 3,256,102 6116,525 12,241,454 1904 444,868 4,016,661 2,113,377 1,243,085 931,097 2,935,416 672,438 12,356,942
1905 417,951 4,361,897 2,182,059 1,138,875 960,700 3,158,145 661,270 12.880,897 1906 460,694 4,529,301 2,171,083 1,207,515 942,910 4,591,560 652,502 14,555,565 1907 488,905 4,469,041 2,332,455 1,134,315 1,099,403 4,767,863 534,610 14,826,592 1908 547,714 5,052,148 2,365,563 1,101,746 1,125,884 4,898,854 417,445 15,509,354 1909 • 568,828 5,014,909 2,346,467 1,097,767 1,147,075 6,823,852 359,034 17,357.932
1910 601,753 5,334,083 2,576,795 1,031,813 1,165,229 7,830,976 479,221 19,019,870 1911 641.731 5,645,276 2,894,795 1,215,532 1.170,365 8,903,000 462.205 20,932,904 1912 851,070 6,531,590 3,503,899 1,440,114 1,808.404 9,941,049 307,333 24,388,459 1913 948,667 7,110,210 3,600,517 1,445,871 1,506.581 12,489,613 362,544 27,464,033 1914 1,030,464 7,568,821 3,765,020 1,392,039 1,752,339 8,829,740 394,739 24,733,162
1915 1,024,268 7,899,112 3,958,714 1,464,373 1.860,732 0,141,915 506,461 25,855,575 1916 1,178,148 8,661,643 4,487,601 1,479,593 2,027,018 10,371,303 523,656 28,728,962 1917. 1,770,949 11,702,311 5,733,071 3,283,218 2.331,182 21,696,345 626,049 47,143,125 1918 1,529,184 13,084,412 6,960,327 4,469,164 2,694,102 30,478,437 1,006,237 60,221,863 1919 1,528,541 13,971,628 5,878,652 3,767,293 3. 049.682 25,373,497 1,017,733 54,577,026
1920 1,309,179 13,347,270 4,931,856 3,246,442 3,269,971 23,290,359 1,010,401 50,405,478 1921 970,798 12,265,465 4,416,076 2,735,617 3,151,715 21,135,723 974,083 45,669,477 1922 1,161,325 12,860,960 4,614,008 2.142,572 3,352,410 22,763.363 870,350 47,764,988 1923 1,273,481 12,188,808 4.574.617 9 ,267,511 2,807,368 23.577,988 978.177 47,672,950 1924 1,211,858 10,900,472 5,357,891 2,328,671 2,995,362 19,905,883 1,067,213 43,857,350
1925 1,237,972 11,674,790 5,247,448 2,708,239 3,235,510 21,674,584 1,094,087 46,872,630 1926 1,166,620 12,094,428 5,369,112 2,766,536 3,337,737 31,862,753 1,389,498 57,906,684 1927 1,117,473 11,469,249 5,526,988 2,408,274 3,257,190 31,117,986 1,409,301 56,306,461 1928 940,944 11,079.262 5,655,548 2,434,693 3,432,528 32,926,325 1,603,071 58,072,371 1929 905,125 11,252,655 5,886,719 2,800,987 3,479,380 36,256,087 1,998,491 62,579,444
1930 930,037 11,244,740 5,927.643 2,886,847 3,423,012 37,661,577 1.952,441 64,026,297 1931 939,212 10,207,805 6,099,993 2,639,960 3,137,842 20,750,316 1,550.386 45,325,514 1932 1,106,635 9,269,171 5,737,922 2,805,200 2,920,418 18,814,322 1,135,610 41,789,278 1933 1,093,767 8,212,828 5,186,356 2,840,551 2,877,909 19,576,822 1,125,824 40,914,057 1934 1,097,712 8,762,521 5,436,035 2,935,119 2,893,018 21,359,019 1,102,078 43,585,502 1935 1,090,709 8,991,261 5,487,035 2,956,043 2,986,500 20,771,125 1,215,515 43,498,188
1936 1,182,481 9,381,443 5,579,839 2,922,988 3,070,028 22,401,930 1,333,833 45,873,142 1937 1,150,632 9,775,114 5,684,342 2,553,340 3,277,567 21,046,644 1,439,125 44,926.764 1938 1,098,966 10,119,032 5,875,524 2,060,084 3,229,282 24,065,263 1,513,291 48,561,442

0
9 2 9 0
8 2 8 8 6
8 3 5 4
STATISTIQUES DES PÊCHERIES
18. Revue rétrospective-(e) Personnel de l'industrie de la pêche au Canada, par province, 1895 et de 1900 à 1938
Manitoba,
11e du Nouveau- Colombie Saale- Nouvelle- ru ums- Québec Ontario Britan- ehevvan, Canes Année Prince- Feosse
Bruns-&huard vvlek nique Alberta
et Yukon
nornb, nonnb, nord) , nonab. nonab, nonab, nonab. norob.
1895 7,058 29,369 14,489 14,119 3,259 14,485 1,585 84,364
1900 8,175 31,659 18,079 16,231 2,502 21,294 1,326 99,269 1901 7,041 29,529 17,713 13,252 2,802 20,354 2,914 93,605 1909 6,576 28,546 17,305 13,977 2,885 18,563 3,512 91,364 1903 6,318 28,260 17,333 16,528 3,003 19,137 2,573 93,152 1904 6,706 28,860 18,342 14,498 ' 3,125 15,236 4,559 91,326
1905 5,520 30,782 19,406 14,768 3,185 18,220 5,027 96,90E 1906 5,788 27,864 19,502 13,316 3,085 15,535 3,931 89,021 1907 6,249 26,797 18,179 12,908 3,180 12,834 2.549 82,69E 1908 5,899 28,227 21,419 12,321 3,263 11,768 1,926 84,82E 1909 5,832 26,673 20,427 12,054 3,601 19,500 2,270 90,351
1910 7,975 26,568 22,660 12,052 3,767 17,108 3,458 93,55 1911 5,888 28,365 22,157 12,552 3,831 15,167 3,139 91,15 191' 5,703 26,538 21,675 11,386 3,604 15,628 3,874 88,40! 1913 6,264 25,879 21,876 10,973 3,511 20,707 6,459 98,65 1914 5,832 29,364 22,034 11,012 4,076 18.328 3,867 94,55
1915 5,643 29,062 23,373 13,797 4,114 17,920 8,373 102,15 1916 6,235 25,652 21,799 12,158 3,592 18,355 4,483 95,30, 1917 5,858 26,557 21,030 11,721 3,705 20,883 5,338 95,15 1918 5,684 25,368 15,712 12,180 3,918 20,157 4,051 87,07, 1919 5,369 26,133 13,759 12,210 4,156 20,803 3,700 86,16,
1920 4,793 23,374 11,325 10,460 3,693 18,881 2,970 75,69 1921 3,644 23,238 10,542 9,635 3,600 15,674 3,001 69,33 1929 4,204 23,977 12,130 11,127 4,003 15,813 3,203 74,45 1923 4,585 bISé 11,454 9,978 3,742 14,857 3,731 68,96 1924 4,205 19,192 11,119 10,023 4,267 16,180 4,464 69,45
1925 4,749 19,870 11,340 11,SOS 4,263 17,382 5,133 74,54 1926 4,450 20,191 11,43 5 12,010 4,145 20,598 5,917 78,77 1927 4,136 19,747 12,344 12,144 4,156 21,322 6,263 80,11 1928 3,607 19,595 13,075 12,121 4,128 18,994 6,699 78,21 1929 3,466 19,833 14,055 11,066 4,043 20,435 7,552 80,45
1930 3,495 19,150 14,316 12,233 4,074 19,347 6,943 79,55 1931 3,505 19,238 15,161 13,566 3,865 13,940 5,007 74,88 1932 4,568 20,086 15,957 14,691 3,816 14,822 4,268 78,2C 1933 4,698 20,567 14,664 14,566 3,954 16,856 4,213 79,54 1934 4,474 22,075 15,397 15,091 4,125 17,926 4,345 83,4E
1935 4,751 21,399 15,261 15,238 3,958 17,030 5,251 82,91 1936 4,427 22,023 16,527 15,102 4,280 17,989 6,62' 86,97 1937 4,472 21,653 16,483 12,556 4,440 16,767 7,654 84,0E 1938 4,543 21,873 16,782 13,854 4,170 16,417 8,35' 85,9 1
279

20. Tableau de conversion de la pesée du poisson
Dans ce tableau, dans le cas de la morue, de l'églefin, de la merluche et du brosmius, du merlan et du flétan (littoral de l'Atlantique) on entend par poisson frais le poisson dont on a enlevé les entrailles et non la tête. Le poids du flétan sur la côte du Pacifique est pris après l'enlèvement de la tête et des entrailles. Dans le cas de l'espadon et du thon le poids comprend le poisson après l'enlèvement de la tête, de la queue et des entrailles. Pour tous les autres poissons le terme "poisson frais" signifie le poisson tel qu'il est sorti de l'eau.
MORUE, ÉGLEFIN, MERLUCAF, ET BROSMIUS OU MERLAN 300 lb de poisson frais donnent 1 qt1 de filets frais. 160 lb de poisson frais donnent une caisse de poisson en boîte. 200 lb de poisson frais donnent 1 qtl de poisson salé vert. 300 lb de poisson frais donnent 1 qtl de filets fumés. 200 lb de poisson frais donnent 1 qtl de poisson fumé. 300 lb de poisson frais donnent 1 qtl de poisson séché. 400 lb de poisson frais donnent 1 qtl de poisson désossé.
' HARENG 70 lb de poisson frais donnent une caisse de hareng en boîte.
200 lb de poisson frais donnent 1 qt1 de hareng fumé. 300 lb de poisson frais donnent un baril de hareng saumuré. 200 lb de poisson frais donnent un baril de boette (fraîche ou salée). 200 lb de poisson frais donnent un baril d'engrais. 125 lb de poisson frais donnent 1 qtl de hareng salé à sec.
MAQUEREAU OU ALOSE 70 lb de poisson frais donnent une caisse de poisson en boîte.
300 lb de poisson frais donnent un baril de poisson saumuré. 400 lb de poisson frais donnent un baril de filets de maquereau salés.
SARDINE Un baril de poisson frais donne de 4 à 5 caisses de poisson en boite. Une caisse de 25 livres équivaut à 100 boîtes de de lb chacune.
PILCHARD 70 lb de poisson frais donnent une caisse de poisson en boîte.
200 lb de poisson frais donnent un baril de boette.
GASPAROT 200 lb de poisson frais donnent 1 qtl de poisson fumé. 275 lb de poisson frais donnent un baril de poisson saumuré.
SAUMON 84 lb de poisson frais (Pacifique) donnent une caisse de 48 lb de poisson en boite. 70 lb de poisson frais (Atlantique) donnent une caisse de 48 lb de poisson en boîte.
170 lb de poisson frais donnent I qt1 de poisson fumé. 125 lb de poisson frais donnent 1 qtl de poisson salé à sec. 150 lb de poisson frais donnent 1 qtl de poisson fumé doux. 150 lb de poisson frais donnent 1 qtl de poisson saumuré.
THON 100 lb de poisson frais donnent une caisse de poisson en boîte.
COQUES Littoral de l'Atlantique--
200 lb de coques fraîches donnent une caisse de coques en boîte. (48 boîtes de 5 onces de chair chacune.)
Uttoral du Pacifique- Couteaux.-80 lb de chair fraîche donnent une caisse de chair en boîte. (48 boîtes de 6 onces
de chair chacune.) Praires du Pacifique, amandes de mer, etc.-150 lb de chair fraîche donnent une caisse de
chair en boîte. (48 boîtes de 6 onces de chair chacune.)
CRABES 800 lb de crabe frais donnent une caisse de crabe en boîte.
HOMARD 200 lb de hordard frais donnent une caisse de homard en boîte.
(48 boîtes de 12 onces de chair chacune.) 500 lb de homard frais donnent 1 qtl de chair.
280 STATISTIQUES DES PÊCHERIES