3.4.5 Number of research papers per teacher in the Journals ...
486
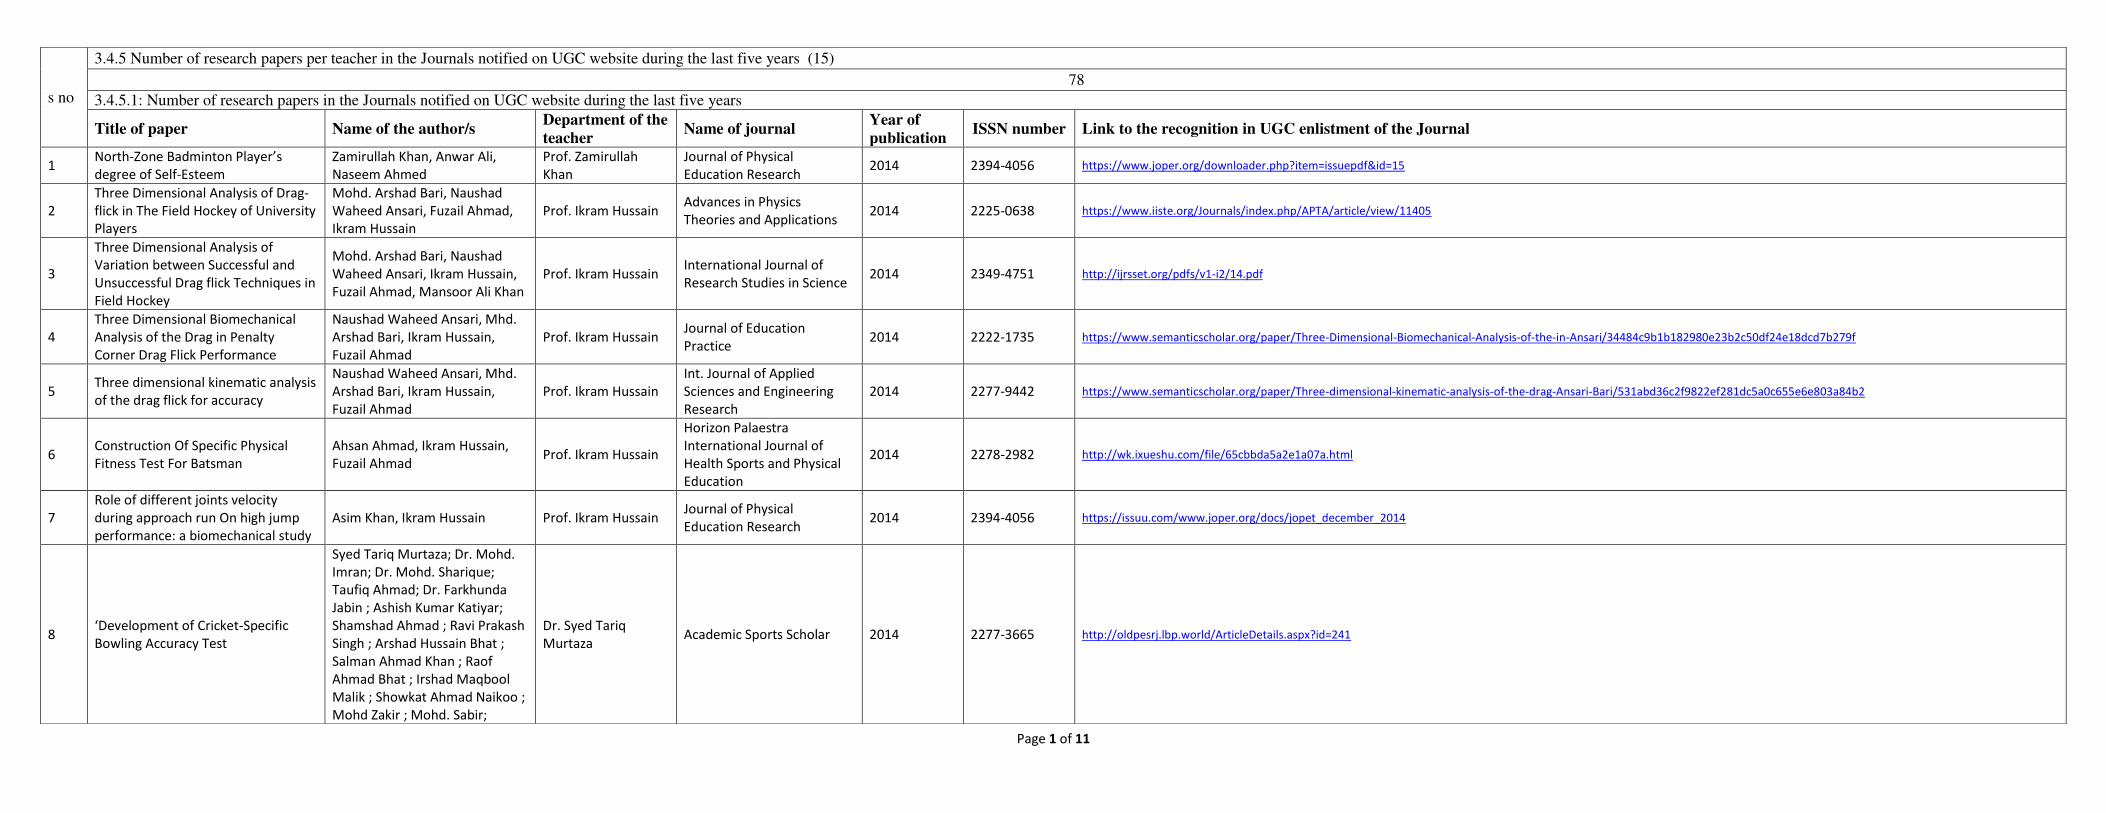
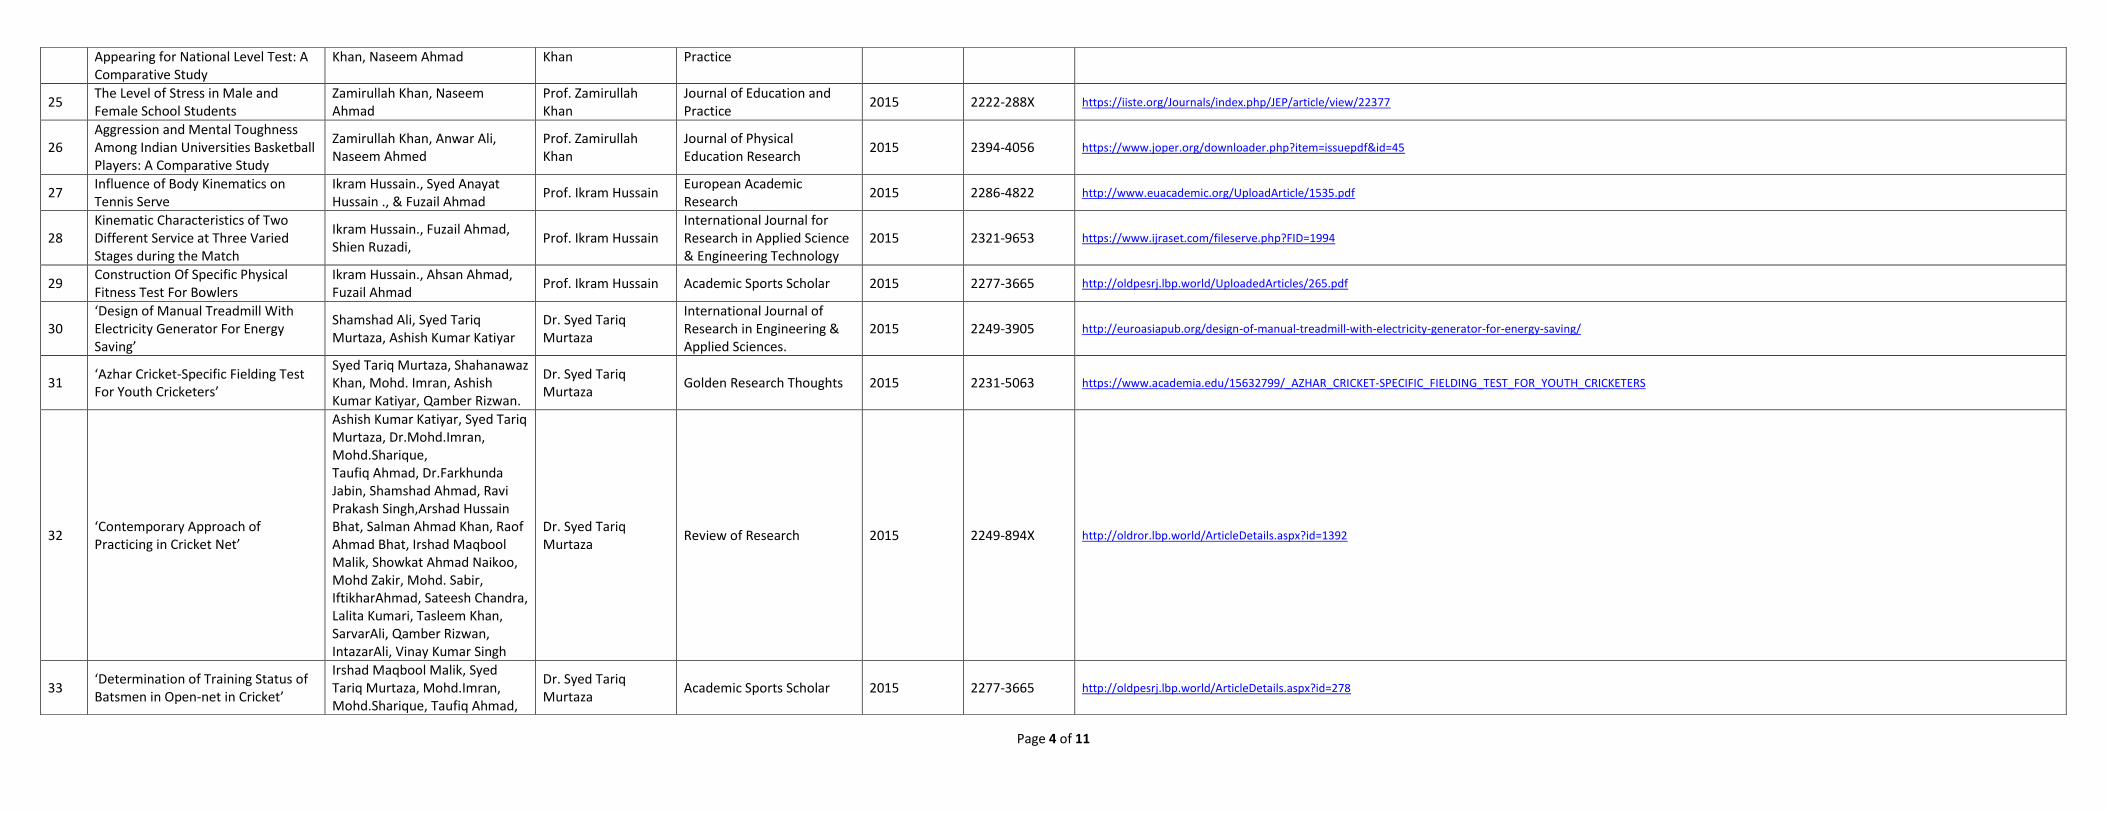
Page 1 of 11 s no 3.4.5 Number of research papers per teacher in the Journals notified on UGC website during the last five years (15) 78 3.4.5.1: Number of research papers in the Journals notified on UGC website during the last five years Title of paper Name of the author/s Department of the teacher Name of journal Year of publication ISSN number Link to the recognition in UGC enlistment of the Journal 1 North-Zone Badminton Player’s degree of Self-Esteem Zamirullah Khan, Anwar Ali, Naseem Ahmed Prof. Zamirullah Khan Journal of Physical Education Research 2014 2394-4056 https://www.joper.org/downloader.php?item=issuepdf&id=15 2 Three Dimensional Analysis of Drag- flick in The Field Hockey of University Players Mohd. Arshad Bari, Naushad Waheed Ansari, Fuzail Ahmad, Ikram Hussain Prof. Ikram Hussain Advances in Physics Theories and Applications 2014 2225-0638 https://www.iiste.org/Journals/index.php/APTA/article/view/11405 3 Three Dimensional Analysis of Variation between Successful and Unsuccessful Drag flick Techniques in Field Hockey Mohd. Arshad Bari, Naushad Waheed Ansari, Ikram Hussain, Fuzail Ahmad, Mansoor Ali Khan Prof. Ikram Hussain International Journal of Research Studies in Science 2014 2349-4751 http://ijrsset.org/pdfs/v1-i2/14.pdf 4 Three Dimensional Biomechanical Analysis of the Drag in Penalty Corner Drag Flick Performance Naushad Waheed Ansari, Mhd. Arshad Bari, Ikram Hussain, Fuzail Ahmad Prof. Ikram Hussain Journal of Education Practice 2014 2222-1735 https://www.semanticscholar.org/paper/Three-Dimensional-Biomechanical-Analysis-of-the-in-Ansari/34484c9b1b182980e23b2c50df24e18dcd7b279f 5 Three dimensional kinematic analysis of the drag flick for accuracy Naushad Waheed Ansari, Mhd. Arshad Bari, Ikram Hussain, Fuzail Ahmad Prof. Ikram Hussain Int. Journal of Applied Sciences and Engineering Research 2014 2277-9442 https://www.semanticscholar.org/paper/Three-dimensional-kinematic-analysis-of-the-drag-Ansari-Bari/531abd36c2f9822ef281dc5a0c655e6e803a84b2 6 Construction Of Specific Physical Fitness Test For Batsman Ahsan Ahmad, Ikram Hussain, Fuzail Ahmad Prof. Ikram Hussain Horizon Palaestra International Journal of Health Sports and Physical Education 2014 2278-2982 http://wk.ixueshu.com/file/65cbbda5a2e1a07a.html 7 Role of different joints velocity during approach run On high jump performance: a biomechanical study Asim Khan, Ikram Hussain Prof. Ikram Hussain Journal of Physical Education Research 2014 2394-4056 https://issuu.com/www.joper.org/docs/jopet_december_2014 8 ‘Development of Cricket-Specific Bowling Accuracy Test Syed Tariq Murtaza; Dr. Mohd. Imran; Dr. Mohd. Sharique; Taufiq Ahmad; Dr. Farkhunda Jabin ; Ashish Kumar Katiyar; Shamshad Ahmad ; Ravi Prakash Singh ; Arshad Hussain Bhat ; Salman Ahmad Khan ; Raof Ahmad Bhat ; Irshad Maqbool Malik ; Showkat Ahmad Naikoo ; Mohd Zakir ; Mohd. Sabir; Dr. Syed Tariq Murtaza Academic Sports Scholar 2014 2277-3665 http://oldpesrj.lbp.world/ArticleDetails.aspx?id=241
-
Upload
khangminh22 -
Category
Documents
-
view
0 -
download
0
Transcript of 3.4.5 Number of research papers per teacher in the Journals ...
Page 1 of 11
s no
3.4.5 Number of research papers per teacher in the Journals notified on UGC website during the last five years (15)
78
3.4.5.1: Number of research papers in the Journals notified on UGC website during the last five years
Title of paper Name of the author/s Department of the
teacher Name of journal
Year of
publication ISSN number Link to the recognition in UGC enlistment of the Journal
1 North-Zone Badminton Player’s
degree of Self-Esteem
Zamirullah Khan, Anwar Ali,
Naseem Ahmed
Prof. Zamirullah
Khan
Journal of Physical
Education Research 2014 2394-4056 https://www.joper.org/downloader.php?item=issuepdf&id=15
2
Three Dimensional Analysis of Drag-
flick in The Field Hockey of University
Players
Mohd. Arshad Bari, Naushad
Waheed Ansari, Fuzail Ahmad,
Ikram Hussain
Prof. Ikram Hussain Advances in Physics
Theories and Applications 2014 2225-0638 https://www.iiste.org/Journals/index.php/APTA/article/view/11405
3
Three Dimensional Analysis of
Variation between Successful and
Unsuccessful Drag flick Techniques in
Field Hockey
Mohd. Arshad Bari, Naushad
Waheed Ansari, Ikram Hussain,
Fuzail Ahmad, Mansoor Ali Khan
Prof. Ikram Hussain International Journal of
Research Studies in Science 2014 2349-4751 http://ijrsset.org/pdfs/v1-i2/14.pdf
4
Three Dimensional Biomechanical
Analysis of the Drag in Penalty
Corner Drag Flick Performance
Naushad Waheed Ansari, Mhd.
Arshad Bari, Ikram Hussain,
Fuzail Ahmad
Prof. Ikram Hussain Journal of Education
Practice 2014 2222-1735 https://www.semanticscholar.org/paper/Three-Dimensional-Biomechanical-Analysis-of-the-in-Ansari/34484c9b1b182980e23b2c50df24e18dcd7b279f
5 Three dimensional kinematic analysis
of the drag flick for accuracy
Naushad Waheed Ansari, Mhd.
Arshad Bari, Ikram Hussain,
Fuzail Ahmad
Prof. Ikram Hussain
Int. Journal of Applied
Sciences and Engineering
Research
2014 2277-9442 https://www.semanticscholar.org/paper/Three-dimensional-kinematic-analysis-of-the-drag-Ansari-Bari/531abd36c2f9822ef281dc5a0c655e6e803a84b2
6 Construction Of Specific Physical
Fitness Test For Batsman
Ahsan Ahmad, Ikram Hussain,
Fuzail Ahmad Prof. Ikram Hussain
Horizon Palaestra
International Journal of
Health Sports and Physical
Education
2014 2278-2982 http://wk.ixueshu.com/file/65cbbda5a2e1a07a.html
7
Role of different joints velocity
during approach run On high jump
performance: a biomechanical study
Asim Khan, Ikram Hussain Prof. Ikram Hussain Journal of Physical
Education Research 2014 2394-4056 https://issuu.com/www.joper.org/docs/jopet_december_2014
8 ‘Development of Cricket-Specific
Bowling Accuracy Test
Syed Tariq Murtaza; Dr. Mohd.
Imran; Dr. Mohd. Sharique;
Taufiq Ahmad; Dr. Farkhunda
Jabin ; Ashish Kumar Katiyar;
Shamshad Ahmad ; Ravi Prakash
Singh ; Arshad Hussain Bhat ;
Salman Ahmad Khan ; Raof
Ahmad Bhat ; Irshad Maqbool
Malik ; Showkat Ahmad Naikoo ;
Mohd Zakir ; Mohd. Sabir;
Dr. Syed Tariq
Murtaza Academic Sports Scholar 2014 2277-3665 http://oldpesrj.lbp.world/ArticleDetails.aspx?id=241

Page 2 of 11
Iftikhar Ahmad; Sateesh Chandra
; Lalita Kumari ; Tasleem Khan ;
Sarver Ali; Qamber Rizwan ;
Intazar Ali; Vinay Kumar Singh
9 ‘Novel Approach of Training the Skills
of the Game of Cricket’
Syed Tariq Murtaza; Dr.
Mohd.Imran; Dr.Mohd.Sharique
; Taufiq Ahmad; Dr.Farkhunda
Jabin; Ashish Kumar Katiyar;
Shamshad Ahmad; Ravi Prakash
Singh; Arshad Hussain Bhat;
Salman Ahmad Khan; Raof
Ahmad Bhat; Irshad Maqbool
Malik; Showkat Ahmad Naiko;
Mohd Zakir; Mohd. Sabir;
Iftikhar Ahmad; Sateesh
Chandra; Lalita Kumari; Tasleem
Khan; Sarver Ali; Qamber Rizwan
; Intazar Ali; Vinay Kumar Singh
Dr. Syed Tariq
Murtaza Research Dimensions 2014 2249-3867 http://oldpesrj.lbp.world/ArticleDetails.aspx?id=241
10 ‘Construction & Standardization of
Fielding Test In Cricket’
Syed Tariq Murtaza, Mohd.
Imran , Taufiq Ahmad, Mohd.
Sharique, Farkhunda Jabin (as
Physician), Shamshad Ahmad,
Ravi Prakash Singh, Arshad
Hussain Bhat, Ashish Kumar
Katiyar, Irfan Khan, Bhupesh
Kumar, Sanjeev Pandey, Salman
Ahmed Khan, Raof Ahmad Bhat,
Irshad Maqbool Malik, Showkat
Ahmad Naikoo, Mohd. Zakir
Dr. Syed Tariq
Murtaza
Indian Streams Research
Journal 2014 2230-7850 https://www.semanticscholar.org/paper/CONSTRUCTION-%26-STANDARDIZATION-OF-FIELDING-TEST-IN-Ravi-Syed/d9cef7f585b3b386edb28c37dd6a5209e2ebaa97
11
Three Dimensional Analysis of
Variation between Successful and
Unsuccessful Drag flick Techniques in
Field Hockey
Mohd Arshad Bari, Naushad
Waheed Ansari, Ikram Hussain ,
Fuzail Ahmad, Mansoor Ali Khan
Dr. Mohd. Arshad
Bari
International Journal of
Research Studies in Science,
Engineering and Technology
2014 2349-4751 http://ijrsset.org/pdfs/v1-i2/14.pdf
12
Three Dimensional Analysis of
Dragflick in The Field Hockey of
University Players
Mohd Arshad Bari, Naushad
Waheed Ansari, Fuzail Ahmad,
Ikram Hussain
Dr. Mohd. Arshad
Bari
Journal of advance physics
and application 2014 2225-0638 https://www.iiste.org/Journals/index.php/APTA/article/view/11405/11763
13 Three dimensional analysis of Mohd Arshad Bari, Naushad Dr. Mohd. Arshad International Journal of 2014 2349-4751 http://www.ijrsset.org/pdfs/v1-i2/14.pdf

Page 3 of 11
variation between successful and
unsuccessful drag flick techniques in
field hockey
Waheed Ansari, Ikram Hussain,
Fuzail Ahmad, Mansoor Ali Khan
Bari Research Studies in Science,
Engineering and Technology
14
Biomechanical analysis of force
production during under-arm
throwing techniques in cricket
Syed Ibrahim1 , Mohammed
Arshad Bari2 and Ikram Hussain2
Dr. Mohd. Arshad
Bari
Annals of Biological
Research 2014 0976-1233 https://www.scholarsresearchlibrary.com/articles/biomechanical-analysis-of-force-production-during-underarm-throwing-techniques-in-cricket.pdf
15 Three dimensional kinematic analysis
of the drag flick for accuracy
Naushad Waheed Ansari, Mohd
Arshad Bari, Ikram Hussain,
Fuzail Ahmad
Dr. Naushad Waheed
Ansari
International Journal of
Applied Sciences and
Engineering Research
2014 2277-9442 https://www.semanticscholar.org/paper/Three-dimensional-kinematic-analysis-of-the-drag-Ansari-Bari/531abd36c2f9822ef281dc5a0c655e6e803a84b2
16
Three Dimensional Analysis of
Variation between Successful and
Unsuccessful Drag flick Techniques in
Field Hockey
Naushad Waheed Ansari, Mohd
Arshad Bari, Ikram Hussain,
Fuzail Ahmad
Dr. Naushad Waheed
Ansari
International Journal of
Research Studies in Science 2014 2349-4751 http://ijrsset.org/pdfs/v1-i2/14.pdf
17
Three Dimensional Biomechanical
Analysis of the Drag in Penalty
Corner Drag Flick Performance
Naushad Waheed Ansari, Mohd
Arshad Bari, Ikram Hussain,
Fuzail Ahmad
Dr. Naushad Waheed
Ansari
Journal of Education
Practice 2014 2222-1735 https://www.semanticscholar.org/paper/Three-Dimensional-Biomechanical-Analysis-of-the-in-Ansari/34484c9b1b182980e23b2c50df24e18dcd7b279f
18
Three Dimensional Analysis of Drag-
flick in The Field Hockey of University
Players
Mohd Arshad Bari, Naushad
Waheed Ansari, Fuzail Ahmad,
Ikram Hussain
Dr. Naushad Waheed
Ansari
Advances in Physics
Theories and Applications 2014 2225-0638 https://www.iiste.org/Journals/index.php/APTA/article/view/11405
19
Three Dimensional Analysis of Drag-
flick in The Field Hockey of University
Players
Mohd Arshad Bari, Naushad
Waheed Ansari, Fuzail Ahmad,
Ikram Hussain
Dr. Fuzail Ahmad Advances in Physics
Theories and Applications 2014 2225-0638 https://www.iiste.org/Journals/index.php/APTA/article/view/11405
20
Three Dimensional Analysis of
Variation between Successful and
Unsuccessful Drag flick Techniques in
Field Hockey
Naushad Waheed Ansari, Mohd
Arshad Bari, Ikram Hussain,
Fuzail Ahmad
Dr. Fuzail Ahmad International Journal of
Research Studies in Science 2014 2349-4751 http://ijrsset.org/pdfs/v1-i2/14.pdf
21
Three Dimensional Biomechanical
Analysis of the Drag in Penalty
Corner Drag Flick Performance
Naushad Waheed Ansari, Mohd
Arshad Bari, Ikram Hussain,
Fuzail Ahmad
Dr. Fuzail Ahmad Journal of Education
Practice 2014 2222-1735 https://www.semanticscholar.org/paper/Three-Dimensional-Biomechanical-Analysis-of-the-in-Ansari/34484c9b1b182980e23b2c50df24e18dcd7b279f
22 Three dimensional kinematic analysis
of the drag flick for accuracy
Naushad Waheed Ansari, Mohd
Arshad Bari, Ikram Hussain,
Fuzail Ahmad
Dr. Fuzail Ahmad
International Journal of
Applied Sciences and
Engineering Research
2014 2277-9442 https://www.semanticscholar.org/paper/Three-dimensional-kinematic-analysis-of-the-drag-Ansari-Bari/531abd36c2f9822ef281dc5a0c655e6e803a84b2
23 Construction Of Specific Physical
Fitness Test For Batsman
Ahsan Ahmad, Ikram Hussain,
Fuzail Ahmad Dr. Fuzail Ahmad
Horizon Palaestra
International Journal of
Health Sports and Physical
Education
2014 2278-2982 http://wk.ixueshu.com/file/65cbbda5a2e1a07a.html
24 Level of Anxiety among Two Genders Zamirullah Khan Zamirullah Prof. Zamirullah Journal of Education and 2015 2222-288X https://iiste.org/Journals/index.php/JEP/article/view/22377
Page 4 of 11
Appearing for National Level Test: A
Comparative Study
Khan, Naseem Ahmad Khan Practice
25 The Level of Stress in Male and
Female School Students
Zamirullah Khan, Naseem
Ahmad
Prof. Zamirullah
Khan
Journal of Education and
Practice 2015 2222-288X https://iiste.org/Journals/index.php/JEP/article/view/22377
26
Aggression and Mental Toughness
Among Indian Universities Basketball
Players: A Comparative Study
Zamirullah Khan, Anwar Ali,
Naseem Ahmed
Prof. Zamirullah
Khan
Journal of Physical
Education Research 2015 2394-4056 https://www.joper.org/downloader.php?item=issuepdf&id=45
27 Influence of Body Kinematics on
Tennis Serve
Ikram Hussain., Syed Anayat
Hussain ., & Fuzail Ahmad Prof. Ikram Hussain
European Academic
Research 2015 2286-4822 http://www.euacademic.org/UploadArticle/1535.pdf
28
Kinematic Characteristics of Two
Different Service at Three Varied
Stages during the Match
Ikram Hussain., Fuzail Ahmad,
Shien Ruzadi, Prof. Ikram Hussain
International Journal for
Research in Applied Science
& Engineering Technology
2015 2321-9653 https://www.ijraset.com/fileserve.php?FID=1994
29 Construction Of Specific Physical
Fitness Test For Bowlers
Ikram Hussain., Ahsan Ahmad,
Fuzail Ahmad Prof. Ikram Hussain Academic Sports Scholar 2015 2277-3665 http://oldpesrj.lbp.world/UploadedArticles/265.pdf
30
‘Design of Manual Treadmill With
Electricity Generator For Energy
Saving’
Shamshad Ali, Syed Tariq
Murtaza, Ashish Kumar Katiyar
Dr. Syed Tariq
Murtaza
International Journal of
Research in Engineering &
Applied Sciences.
2015 2249-3905 http://euroasiapub.org/design-of-manual-treadmill-with-electricity-generator-for-energy-saving/
31 ‘Azhar Cricket-Specific Fielding Test
For Youth Cricketers’
Syed Tariq Murtaza, Shahanawaz
Khan, Mohd. Imran, Ashish
Kumar Katiyar, Qamber Rizwan.
Dr. Syed Tariq
Murtaza Golden Research Thoughts 2015 2231-5063 https://www.academia.edu/15632799/_AZHAR_CRICKET-SPECIFIC_FIELDING_TEST_FOR_YOUTH_CRICKETERS
32 ‘Contemporary Approach of
Practicing in Cricket Net’
Ashish Kumar Katiyar, Syed Tariq
Murtaza, Dr.Mohd.Imran,
Mohd.Sharique,
Taufiq Ahmad, Dr.Farkhunda
Jabin, Shamshad Ahmad, Ravi
Prakash Singh,Arshad Hussain
Bhat, Salman Ahmad Khan, Raof
Ahmad Bhat, Irshad Maqbool
Malik, Showkat Ahmad Naikoo,
Mohd Zakir, Mohd. Sabir,
IftikharAhmad, Sateesh Chandra,
Lalita Kumari, Tasleem Khan,
SarvarAli, Qamber Rizwan,
IntazarAli, Vinay Kumar Singh
Dr. Syed Tariq
Murtaza Review of Research 2015 2249-894X http://oldror.lbp.world/ArticleDetails.aspx?id=1392
33 ‘Determination of Training Status of
Batsmen in Open-net in Cricket’
Irshad Maqbool Malik, Syed
Tariq Murtaza, Mohd.Imran,
Mohd.Sharique, Taufiq Ahmad,
Dr. Syed Tariq
Murtaza Academic Sports Scholar 2015 2277-3665 http://oldpesrj.lbp.world/ArticleDetails.aspx?id=278

Page 5 of 11
Farkhunda Jabin, Ashish Kumar
Katiyar, Shamshad Ahmad, Ravi
Prakash Singh, Arshad Hussain
Bhat,Salman Ahmad Khan, Raof
Ahmad Bhat, Showkat Ahmad
Naikoo, Mohd Zakir8,Mohd.
Sabir, IftikharAhmad, Sateesh
Chandra, Lalita Kumari, Tasleem
Khan,SarverAli, Qamber Rizwan,
IntazarAli, Vinay Kumar Singh
34 ‘Training Log to Determine Skills of
Fielding in Cricket’
Mohd Zakir; Syed Tariq Murtaza
; Dr.Mohd.Imran ;
Dr.Mohd.Sharique3 ; Taufiq
Ahmad; Dr.Farkhunda Jabin ;
Ashish Kumar Katiyar; Shamshad
Ahmad; Ravi Prakash Singh ;
Arshad Hussain Bhat; Salman
Ahmad Khan; Raof Ahmad Bhat;
Irshad Maqbool Malik; Showkat
Ahmad Naikoo; Mohd.Sabir;
Iftikhar Ahmad; Sateesh Chandra
; Lalita Kumari ; Tasleem Khan ;
Sarver Ali; Qamber Rizwan ;
Intazar Ali; Vinay Kumar Singh
Dr. Syed Tariq
Murtaza Golden Research Thought 2015 2231-5063 http://oldgrt.lbp.world/ArticleDetails.aspx?id=5227
35 ‘Construction of Training Log for
Wicket-Keeper in Cricket’
Salman Ahmad Khan; Syed Tariq
Murtaza; Dr.Mohd.Imran ;
Dr.Mohd.Sharique; Taufiq
Ahmad; Dr.Farkhunda Jabin;
Ashish Kumar Katiyar; Shamshad
Ahmad; Ravi Prakash Singh ;
Arshad Hussain Bhat ; Raof
Ahmad Bhat ; Irshad Maqbool
Malik; Showkat Ahmad Naikoo;
Mohd Zakir ; Mohd. Sabir;
Iftikhar Ahmad; Sateesh
Chandra; Lalita Kumari; Tasleem
Khan; Sarver Ali; Qamber Rizwan
; Intazar Ali; Vinay Kumar Singh
Dr. Syed Tariq
Murtaza Golden Research Thought 2015 2231-5063, http://oldgrt.lbp.world/ArticleDetails.aspx?id=5228

Page 6 of 11
36 ‘Need Based Cricket-Specific Training
Log for Batsmen in Closed Net’
Raof Ahmad Bhat; Syed Tariq
Murtaza; Dr.Mohd.Imran;
Dr.Mohd.Sharique; Taufiq
Ahmad; Dr.Farkhunda Jabin ;
Ashish Kumar Katiyar ;
Shamshad Ahmad; Ravi Prakash
Singh; Arshad Hussain Bhat;
Salman Ahmad Khan; Irshad
Maqbool Malik; Showkat Ahmad
Naikoo; Mohd Zakir; Mohd.
Sabir; Iftikhar Ahmad; Sateesh
Chandra; Lalita Kumari; Tasleem
Khan; Sarver Ali; Qamber
Rizwan; Intazar Ali; Vinay Kumar
Singh
Dr. Syed Tariq
Murtaza Review of Research 2015 2249-894X http://oldror.lbp.world/ArticleDetails.aspx?id=1393
37 ‘Observatory Log for Spinners in the
Game of Cricket’
Lalita Kumari; Syed Tariq
Murtaza, PhD; Dr.Mohd.Imran;
Dr.Mohd.Sharique ; Taufiq
Ahmad; Dr.Farkhunda Jabin ;
Ashish Kumar Katiyar; Shamshad
Ahmad; Ravi Prakash Singh;
Arshad Hussain Bhat; Salman
Ahmad Khan; Raof Ahmad Bhat;
Irshad Maqbool Malik; Showkat
Ahmad Naiko; Mohd Zakir;
Mohd. Sabir; Iftikhar Ahmad;
Sateesh Chandra; Tasleem Khan;
Sarver Ali; Qamber Rizwan ;
Intazar Ali; Vinay Kumar Singh
Dr. Syed Tariq
Murtaza Golden Research Thought 2015 2231-5063 http://oldgrt.lbp.world/ArticleDetails.aspx?id=5226
38 ‘Log to Determine the Status for Fast
Bowler’
Qamber Rizwan ; Syed Tariq
Murtaza, PhD; Dr.Mohd.Imran;
Dr.Mohd.Sharique ; Taufiq
Ahmad; Dr.Farkhunda Jabin ;
Ashish Kumar Katiyar; Shamshad
Ahmad; Ravi Prakash Singh;
Arshad Hussain Bhat; Salman
Ahmad Khan; Raof Ahmad Bhat;
Irshad Maqbool Malik; Showkat
Dr. Syed Tariq
Murtaza Research Direction 2015 2321-5488, https://www.researchgate.net/publication/301815196_LOG_TO_DETERMINE_THE_STATUS_FOR_FAST_BOWLER
Page 7 of 11
Ahmad Naiko; Mohd Zakir;
Mohd. Sabir; Iftikhar Ahmad;
Sateesh Chandra; Lalita Kumari;
Tasleem Khan; Sarver Ali; Intazar
Ali; Vinay Kumar Singh.
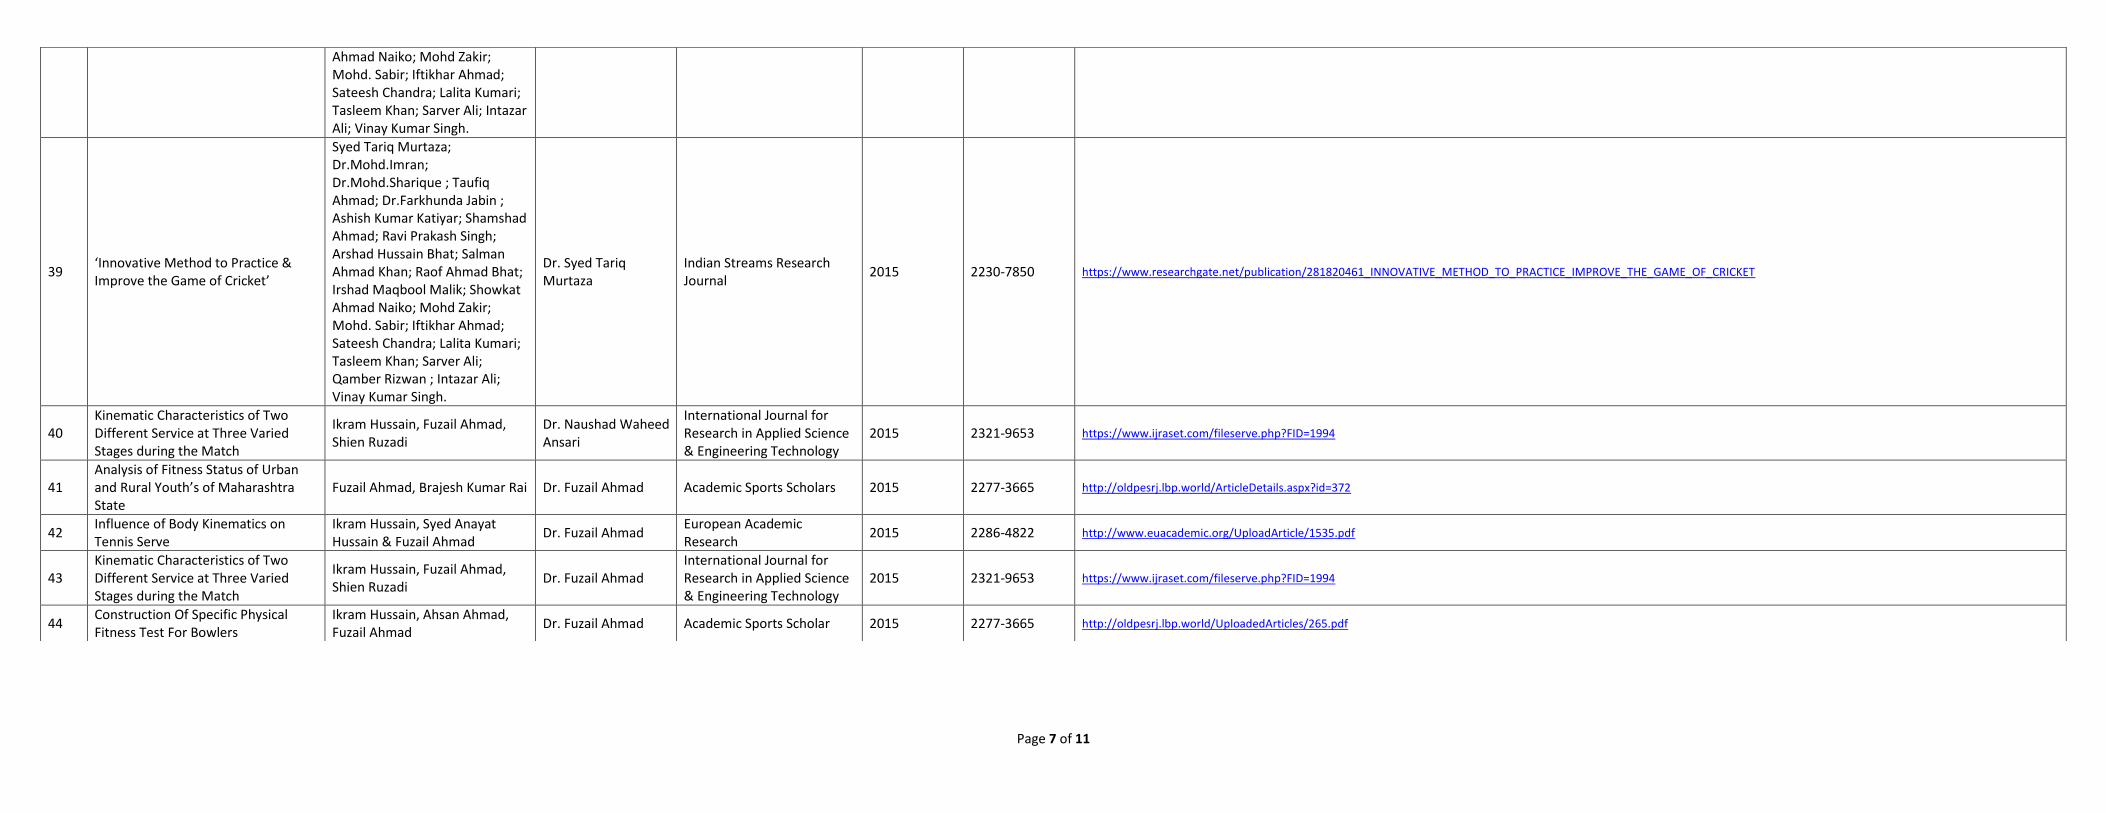
39 ‘Innovative Method to Practice &
Improve the Game of Cricket’
Syed Tariq Murtaza;
Dr.Mohd.Imran;
Dr.Mohd.Sharique ; Taufiq
Ahmad; Dr.Farkhunda Jabin ;
Ashish Kumar Katiyar; Shamshad
Ahmad; Ravi Prakash Singh;
Arshad Hussain Bhat; Salman
Ahmad Khan; Raof Ahmad Bhat;
Irshad Maqbool Malik; Showkat
Ahmad Naiko; Mohd Zakir;
Mohd. Sabir; Iftikhar Ahmad;
Sateesh Chandra; Lalita Kumari;
Tasleem Khan; Sarver Ali;
Qamber Rizwan ; Intazar Ali;
Vinay Kumar Singh.
Dr. Syed Tariq
Murtaza
Indian Streams Research
Journal 2015 2230-7850 https://www.researchgate.net/publication/281820461_INNOVATIVE_METHOD_TO_PRACTICE_IMPROVE_THE_GAME_OF_CRICKET
40
Kinematic Characteristics of Two
Different Service at Three Varied
Stages during the Match
Ikram Hussain, Fuzail Ahmad,
Shien Ruzadi
Dr. Naushad Waheed
Ansari
International Journal for
Research in Applied Science
& Engineering Technology
2015 2321-9653 https://www.ijraset.com/fileserve.php?FID=1994
41
Analysis of Fitness Status of Urban
and Rural Youth’s of Maharashtra
State
Fuzail Ahmad, Brajesh Kumar Rai Dr. Fuzail Ahmad Academic Sports Scholars 2015 2277-3665 http://oldpesrj.lbp.world/ArticleDetails.aspx?id=372
42 Influence of Body Kinematics on
Tennis Serve
Ikram Hussain, Syed Anayat
Hussain & Fuzail Ahmad Dr. Fuzail Ahmad
European Academic
Research 2015 2286-4822 http://www.euacademic.org/UploadArticle/1535.pdf
43
Kinematic Characteristics of Two
Different Service at Three Varied
Stages during the Match
Ikram Hussain, Fuzail Ahmad,
Shien Ruzadi Dr. Fuzail Ahmad
International Journal for
Research in Applied Science
& Engineering Technology
2015 2321-9653 https://www.ijraset.com/fileserve.php?FID=1994
44 Construction Of Specific Physical
Fitness Test For Bowlers
Ikram Hussain, Ahsan Ahmad,
Fuzail Ahmad Dr. Fuzail Ahmad Academic Sports Scholar 2015 2277-3665 http://oldpesrj.lbp.world/UploadedArticles/265.pdf

Page 8 of 11
45
Investigate the Manipulation of
Kinematics on Tennis Serve
Performance
Ikram Hussain.,Naushad
Waheed Ansari., & Fuzail Ahmad Prof. Ikram Hussain
International Journal of
Engineering Sciences &
Research.
2016 2277-9655 https://zenodo.org/record/60843#.XnSQL4gzbIU
46
Influence Of Spatio-Temporal
Parameters On Gait Speed In School
Children
Ikram Hussain., Syed Anayat
Hussain, Fuzail Ahmad Prof. Ikram Hussain
International Journal of
Advanced Research 2016 2320-5407 https://www.academia.edu/25905339/INFLUENCE_OF_SPATIO-TEMPORAL_PARAMETERS_ON_GAIT_SPEED_IN_SCHOOL_CHILDREN
47 Kinematics of Usain Bolt’s 100 m
performance: A Review
Ikram Hussain, Tawseef Ahmad
Bhat & Syed Anayat Hussain Prof. Ikram Hussain
International Journal for
Research in Applied Science
& Engineering Technology
2016 2321-9653 https://www.ijraset.com/fileserve.php?FID=5780
48 The Generic Preparation Phases For
100 Meter Male University Sprinter
Ikram Hussain, Sayed
Mohammad Ayub Prof. Ikram Hussain Research Pedia 2016 2347-9000 https://www.academia.edu/29453345/THE_GENERIC_PREPARATION_PHASES_FOR_100_METER_MALE_UNIVERSITY_SPRINTER
49
"A Study on Biacromial Bicristal
Diameter of Elite Male Hammer
Throwers"
Brij Bhushan Singh Prof. Brij Bhushan
Singh
International Conference on
"Global Conference on
Scientific Culture in Physical
Education & Sports"
sponsored by International
Council of Sports Science &
Research (ICSSR), organized
by Department of Physical
Education, Punjabi
University, Patiala, Punjab
2016 978-93-85446-
45-0
https://www.academia.edu/17759981/GLOBAL_CONFERENCE_ON_SCIENTIFIC_CULTURE_IN_PHYSICAL_EDUCATION_AND_SPORTS

Page 9 of 11
50
Effects of Asanas and Pranayama on
Motor Learning Development of
School Boys
Rajendra Singh, Dharmendra
Kumar Singh, Durvesh Kumar Dr. Rajendra Singh
Journal of Physical
Education Research 2016 2394-4056
http://euacademic.org/UploadArticle/2568.pdf
51
Changes in Behavior among Juvenile
Deliquents after 6 weeks of Yogic
Practice
Rajendra Singh, Gagan Kumar Dr. Rajendra Singh Journal of Physical
Education Research 2016 2394-4056
https://www.joper.org/
52 Meta-Analysis on the Development
of Cricket Bat Over the Years
Ashish Kumar Katiyar, Syed Tariq
Murtaza and Shamshad Ali
Dr. Syed Tariq
Murtaza Golden Research Thoughts 2016 2231-5063 https://www.researchgate.net/publication/301684029_META-ANALYSIS_ON_THE_DEVELOPMENT_OF_CRICKET_BAT_OVER_THE_YEARS
53 ‘Innovative Cricket Bat- A Way to
Reduce player’s Burdon’ Syed Tariq Murtaza, Shamshad
Ali, Ashish Kumar Katiyar
Dr. Syed Tariq
Murtaza
International Journal of
Engineering & Scientific
Research
2016 2249-5894 https://www.ijmra.us/2016ijesr_january.php
54 Role of Media in the Promotion of
Sports Merajudddin Faridi,
Dr. Merajuddin
Faridi
International Research
Journal of Human Resources
and Social Sciences
2016 2349-4085 http://aarf.asia/hr2.php?p=Volume3,Issue2,February2016
55
Joint Effect of Stride length and
Stride width on Running
Performance
Naushad Waheed Ansari Dr. Naushad Waheed
Ansari
International Journal of
Engineering Sciences &
Research Technology
2016 2277-9655
https://zenodo.org/record/160901#.XpQR_UAzbIU
56
Investigate the Manipulation of
Kinematics on Tennis Serve
Performance
Ikram Hussain, Naushad Waheed
Ansari & Fuzail Ahmad Dr. Fuzail Ahmad
International Journal of
Engineering Sciences &
Research
2016 2277- 9655 https://zenodo.org/record/60843#.XnSQL4gzbIU
57
Influence Of Spatio-Temporal
Parameters On Gait Speed In School
Children
Ikram Hussain, Syed Anayat
Hussain, Fuzail Ahmad Dr. Fuzail Ahmad
International Journal of
Advanced Research 2016 2320-5407 https://www.academia.edu/25905339/INFLUENCE_OF_SPATIO-TEMPORAL_PARAMETERS_ON_GAIT_SPEED_IN_SCHOOL_CHILDREN
Page 10 of 11
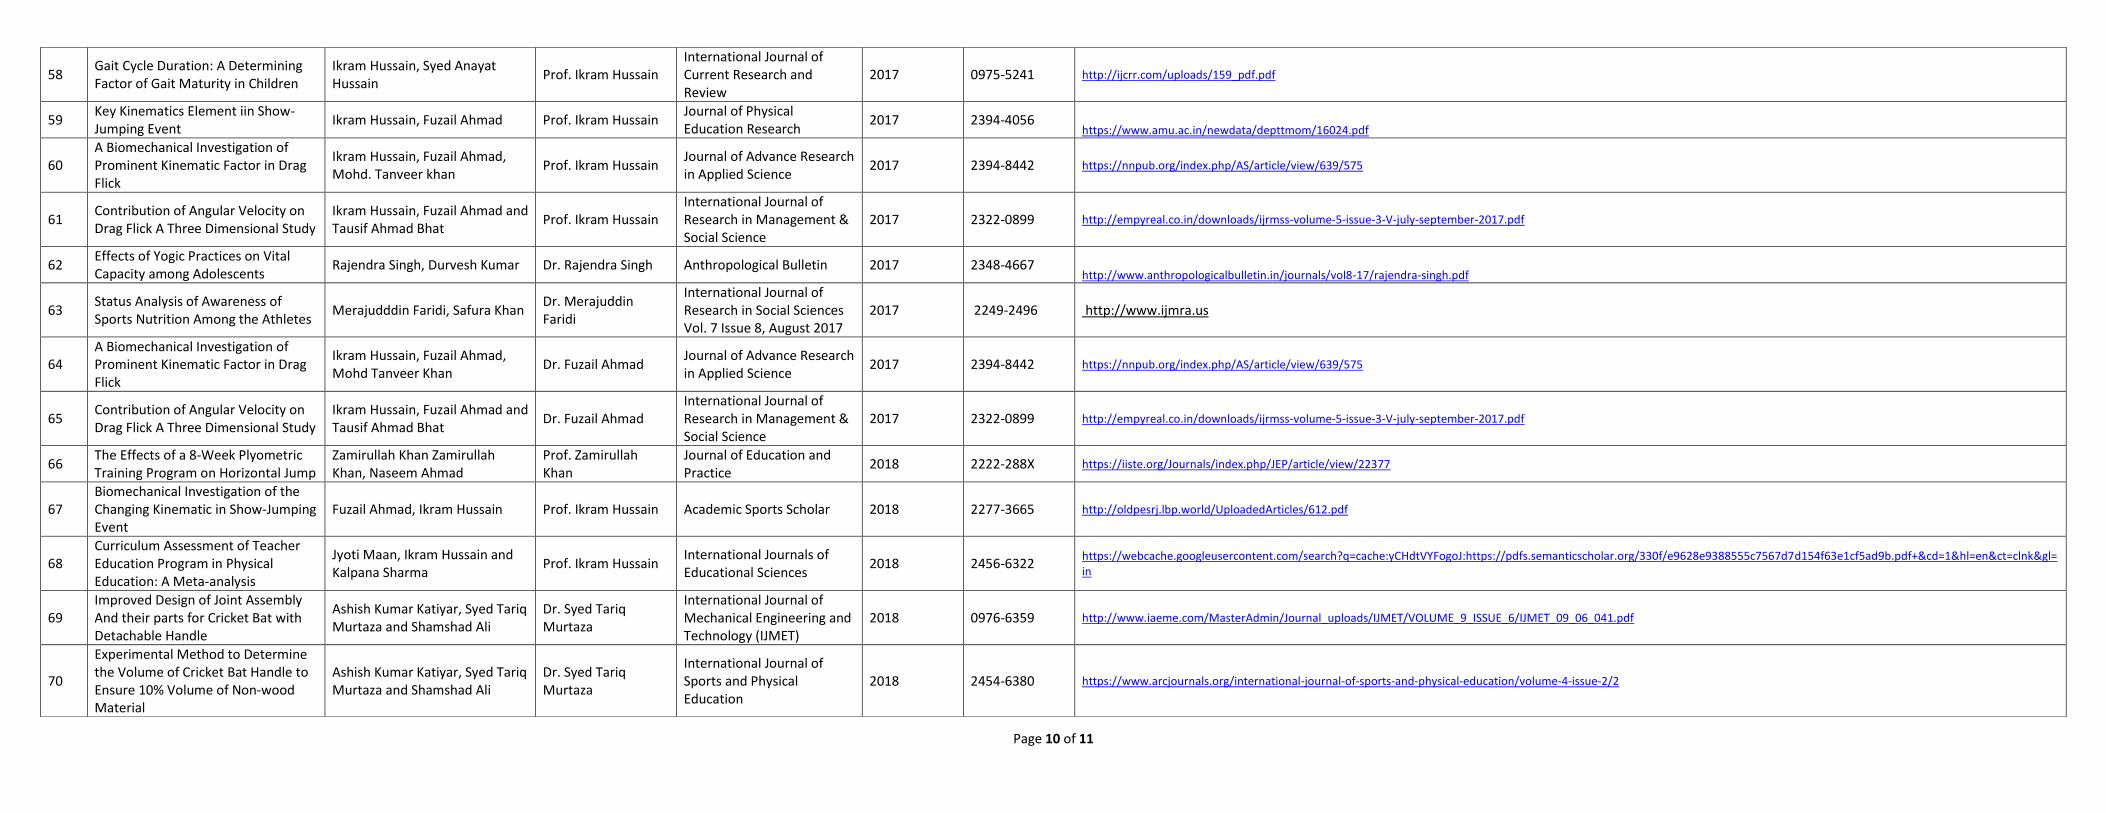
58 Gait Cycle Duration: A Determining
Factor of Gait Maturity in Children
Ikram Hussain, Syed Anayat
Hussain Prof. Ikram Hussain
International Journal of
Current Research and
Review
2017 0975-5241 http://ijcrr.com/uploads/159_pdf.pdf
59 Key Kinematics Element iin Show-
Jumping Event Ikram Hussain, Fuzail Ahmad Prof. Ikram Hussain
Journal of Physical
Education Research 2017 2394-4056
https://www.amu.ac.in/newdata/depttmom/16024.pdf
60
A Biomechanical Investigation of
Prominent Kinematic Factor in Drag
Flick
Ikram Hussain, Fuzail Ahmad,
Mohd. Tanveer khan Prof. Ikram Hussain
Journal of Advance Research
in Applied Science 2017 2394-8442 https://nnpub.org/index.php/AS/article/view/639/575
61 Contribution of Angular Velocity on
Drag Flick A Three Dimensional Study
Ikram Hussain, Fuzail Ahmad and
Tausif Ahmad Bhat Prof. Ikram Hussain
International Journal of
Research in Management &
Social Science
2017 2322-0899 http://empyreal.co.in/downloads/ijrmss-volume-5-issue-3-V-july-september-2017.pdf
62 Effects of Yogic Practices on Vital
Capacity among Adolescents Rajendra Singh, Durvesh Kumar Dr. Rajendra Singh Anthropological Bulletin 2017 2348-4667
http://www.anthropologicalbulletin.in/journals/vol8-17/rajendra-singh.pdf
63 Status Analysis of Awareness of
Sports Nutrition Among the Athletes Merajudddin Faridi, Safura Khan
Dr. Merajuddin
Faridi
International Journal of
Research in Social Sciences
Vol. 7 Issue 8, August 2017
2017 2249-2496 http://www.ijmra.us
64
A Biomechanical Investigation of
Prominent Kinematic Factor in Drag
Flick
Ikram Hussain, Fuzail Ahmad,
Mohd Tanveer Khan Dr. Fuzail Ahmad
Journal of Advance Research
in Applied Science 2017 2394-8442 https://nnpub.org/index.php/AS/article/view/639/575
65 Contribution of Angular Velocity on
Drag Flick A Three Dimensional Study
Ikram Hussain, Fuzail Ahmad and
Tausif Ahmad Bhat Dr. Fuzail Ahmad
International Journal of
Research in Management &
Social Science
2017 2322-0899 http://empyreal.co.in/downloads/ijrmss-volume-5-issue-3-V-july-september-2017.pdf
66 The Effects of a 8-Week Plyometric
Training Program on Horizontal Jump
Zamirullah Khan Zamirullah
Khan, Naseem Ahmad
Prof. Zamirullah
Khan
Journal of Education and
Practice 2018 2222-288X https://iiste.org/Journals/index.php/JEP/article/view/22377
67
Biomechanical Investigation of the
Changing Kinematic in Show-Jumping
Event
Fuzail Ahmad, Ikram Hussain Prof. Ikram Hussain Academic Sports Scholar 2018 2277-3665 http://oldpesrj.lbp.world/UploadedArticles/612.pdf
68
Curriculum Assessment of Teacher
Education Program in Physical
Education: A Meta-analysis
Jyoti Maan, Ikram Hussain and
Kalpana Sharma Prof. Ikram Hussain
International Journals of
Educational Sciences 2018 2456-6322
https://webcache.googleusercontent.com/search?q=cache:yCHdtVYFogoJ:https://pdfs.semanticscholar.org/330f/e9628e9388555c7567d7d154f63e1cf5ad9b.pdf+&cd=1&hl=en&ct=clnk&gl=
in
69
Improved Design of Joint Assembly
And their parts for Cricket Bat with
Detachable Handle
Ashish Kumar Katiyar, Syed Tariq
Murtaza and Shamshad Ali
Dr. Syed Tariq
Murtaza
International Journal of
Mechanical Engineering and
Technology (IJMET)
2018 0976-6359 http://www.iaeme.com/MasterAdmin/Journal_uploads/IJMET/VOLUME_9_ISSUE_6/IJMET_09_06_041.pdf
70
Experimental Method to Determine
the Volume of Cricket Bat Handle to
Ensure 10% Volume of Non-wood
Material
Ashish Kumar Katiyar, Syed Tariq
Murtaza and Shamshad Ali
Dr. Syed Tariq
Murtaza
International Journal of
Sports and Physical
Education
2018 2454-6380 https://www.arcjournals.org/international-journal-of-sports-and-physical-education/volume-4-issue-2/2

Page 11 of 11
71
Utilization, Processing, Grading and
Manufacturing Process Of Laminated
Cane Handles (Calamus Manan)
Ashish Kumar Katiyar, Syed Tariq
Murtaza and Shamshad Ali
Dr. Syed Tariq
Murtaza
IOSR Journal of Sports and
Physical Education 2018 2347-6737 https://www.iosrjournals.org/iosr-jspe/pages/vol5-iss3-ver-1.html
72
Constraining Numerical Values For A
Referenced Cricket Bat Handle On
Selected Geometrical Parameters
Ashish Kumar Katiyar, Syed Tariq
Murtaza and Shamshad Ali
Dr. Syed Tariq
Murtaza
European Journal of Physical
Education and Sports
Science
2018 25011235 https://oapub.org/edu/index.php/ejep/article/view/1630
73
A Study of Motivational Factors
Affecting Students’ Participation in
Inter-Hostel and
Inter-Hall Sports
Merajuddin Faridi, Wasim
Ahmad
Dr. Merajuddin
Faridi
International Journal of
Research in Economics and
Social Sciences(IJRESS)
2018 2249-7382 https://www.ijmra.us/2018ijrss_january.php
74
Measuring Aerobic Capacity of
Cricket Players Off and on the High
Altitude Astrand-Ryhming Sub
Maximal Aerobic Test
Zamirullah Khan, Waseem
Hassan Raja, Naseem Ahmed
Khan
Prof. Zamirullah
Khan
Journal of Physical
Education Research 2019 2394-4056 https://www.joper.org/downloader.php?item=issuepdf&id=190
75
"An attitude study of high and low
performance of Indian male
sprinters"
Brij Bhushan Singh, Yogendra
Sharma
Prof. Brij Bhushan
Singh
International Journal of
Yogic, Human Movement
and Sports Sciences
2019 2456-4419
http://www.theyogicjournal.com/pdf/2019/vol4issue1/PartC/4-1-30-507.pdf
76 "A study on somatotype of top Indian
male 100 m. sprinters"
Brij Bhushan Singh, Yogendra
Sharma
Prof. Brij Bhushan
Singh
International Journal of
Physiology, Nutrition and
Physical Education
2019 2456-0057
http://www.journalofsports.com/pdf/2019/vol4issue1/PartE/4-1-48-431.pdf
77
A study of Sport Facilities
Management Available in Indian
Educational Institutions
Merajudddin Faridi, Iftikhar
Ahmad Wani
Dr. Merajuddin
Faridi Think India Journal 2019 0971-1260 https://journals.eduindex.org/index.php/think-india/issue/archive
78
Global Approaches to Sport
Organization’s Effectiveness – Some
Proven Thrillers
Merajuddin Faridi, Iftikhar
Ahmad Wani
Dr. Merajuddin
Faridi
Journal of XI'AN University
of Architecture &
Technology
2020 1006-7930 http://xajzkjdx.cn/Current-Issue/
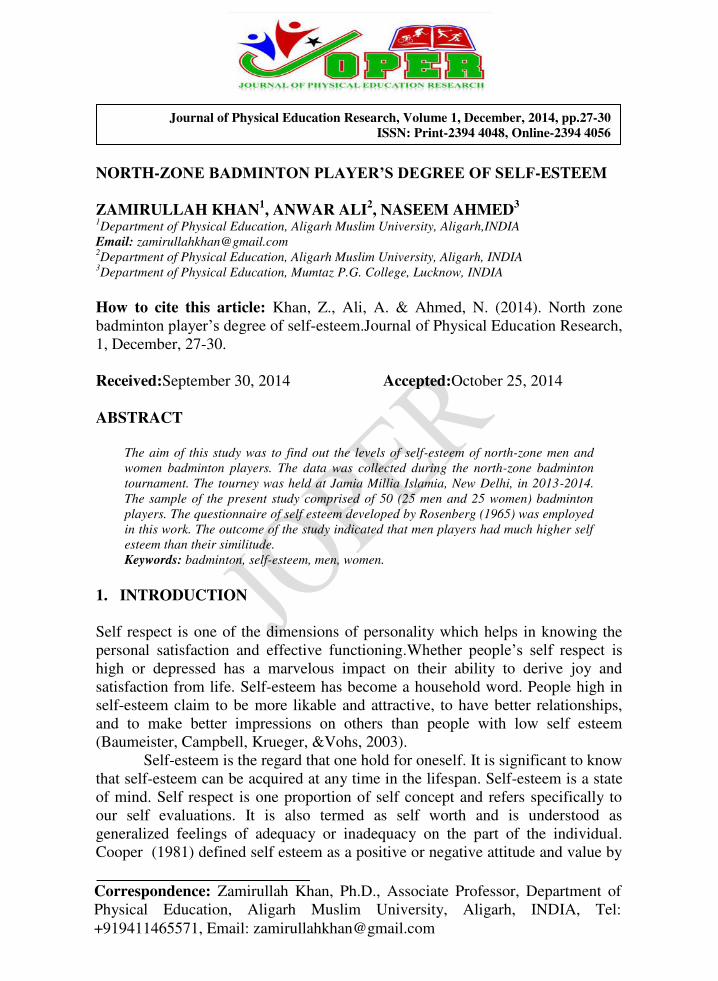
NORTH-ZONE BADMINTON PLAYER’S DEGREE OF SELF-ESTEEM ZAMIRULLAH KHAN1, ANWAR ALI2, NASEEM AHMED3 1Department of Physical Education, Aligarh Muslim University, Aligarh,INDIA
Email: [email protected] 2Department of Physical Education, Aligarh Muslim University, Aligarh, INDIA
3Department of Physical Education, Mumtaz P.G. College, Lucknow, INDIA
How to cite this article: Khan, Z., Ali, A. & Ahmed, N. (2014). North zone
badminton player’s degree of self-esteem.Journal of Physical Education Research,
1, December, 27-30. Received:September 30, 2014 Accepted:October 25, 2014
ABSTRACT
The aim of this study was to find out the levels of self-esteem of north-zone men and
women badminton players. The data was collected during the north-zone badminton
tournament. The tourney was held at Jamia Millia Islamia, New Delhi, in 2013-2014.
The sample of the present study comprised of 50 (25 men and 25 women) badminton
players. The questionnaire of self esteem developed by Rosenberg (1965) was employed
in this work. The outcome of the study indicated that men players had much higher self
esteem than their similitude.
Keywords: badminton, self-esteem, men, women.
1. INTRODUCTION
Self respect is one of the dimensions of personality which helps in knowing the
personal satisfaction and effective functioning.Whether people’s self respect is high or depressed has a marvelous impact on their ability to derive joy and
satisfaction from life. Self-esteem has become a household word. People high in
self-esteem claim to be more likable and attractive, to have better relationships,
and to make better impressions on others than people with low self esteem
(Baumeister, Campbell, Krueger, &Vohs, 2003).
Self-esteem is the regard that one hold for oneself. It is significant to know
that self-esteem can be acquired at any time in the lifespan. Self-esteem is a state
of mind. Self respect is one proportion of self concept and refers specifically to
our self evaluations. It is also termed as self worth and is understood as
generalized feelings of adequacy or inadequacy on the part of the individual.
Cooper (1981) defined self esteem as a positive or negative attitude and value by
Journal of Physical Education Research, Volume 1, December, 2014, pp.27-30 ISSN: Print-2394 4048, Online-2394 4056
Correspondence: Zamirullah Khan, Ph.D., Associate Professor, Department of
Physical Education, Aligarh Muslim University, Aligarh, INDIA, Tel:
+919411465571, Email: [email protected]

Khan, Z., Ali, A. & Ahmed, N. (2014). North zone badminton player’s degree of self-esteem.
Journal of Physical Education Research, 1, December, 27-30.
28 | JOPER JOPER® www.joper.org
which a person view the self image and the evaluation or judgment he makes
about it from the person’s self esteem.
People who value their competence and worth in terms of positive terms
are said to have high self esteem and those whose self evaluations are poor
described as having low self-esteem (Pestonjee, 2011). Self-esteem is important
from such points of view as the individual’s gaining his autonomy, having a life full of satisfaction, carrying out activities directed at a goal, establishing healthy
and perpetual relations, having a high level of the ability to adaptation, developing
value systems, being successful and the ability to plan the future.
Self-esteem is a psychological state that arises from the affirmation of the
concept of ego that a person attains as a result of adopting himself and having a
high opinion about himself, his self confidence and self esteem. Such positive
psychological traits as self-esteem, optimism, will be successful, not giving in the
difficult are observed in individuals with a high level of self-esteem. Individuals
with a low level of self-esteem, on the contrary, has a low level of self-esteem,
they give away to despair easily and shortly they are more down to developed
negative psychological symptoms. Kassin (1998), has stated that the individuals with a low level of self-
esteem have exhibited such traits as waiting for the failure, nervousness, showing
a low level of effort and that they may neglect important aspects of life and may
blame themselves as valueless and untalented when they are unsuccessful.
2. METHODS AND MATERIALS 2.1 Subjects
Data was collected from north-zone badminton intervarsity tournament held at
Jamia Milia Islamia, New Delhi, India. The sample consisted of 50 (25 men and
25 women) badminton players. The age of the subjects ranged from 18 to 28
years.
2.2Tool
The researcher used self esteem questionnaire developed by Rosenberg, (1965).
The scale consists of 10 items related to the self esteem. Four alternatives
characterized by the nature of the statements from which a respondent has to
choose any one. The higher score indicates the higher level of the self esteem.
2.3Procedure
For the acquisition of data, researcher contacted with the coaches and team
managers for their consent. After acquiring consent the questionnaire of self-

Khan, Z., Ali, A. & Ahmed, N. (2014). North zone badminton player’s degree of self-esteem.
Journal of Physical Education Research, 1, December, 27-30.
29 | JOPER JOPER® www.joper.org
esteem was administered on the subjects during north-zone badminton
competitions.
2.4Statistical Analysis
Descriptive statistic was used for the analysis of obtained data.
3. RESULTS
The result of the study is presented in the following Table.
Table1:Indicating descriptive statistics of the level of self-esteem between men and women badminton players
Gender
Levels of Self Esteem
High Self Esteem Medium Self
Esteem Low Self Esteem Total
N Scoring of the
Players N
Scoring of
the Players N
Scoring of
the Players
Men 12 48% 8 32% 5 20% 25
Women 9 36% 13 52% 3 12% 25
From the Table 1 it is evident that most of the men badminton players showing
high self esteem as compared to women badminton players.
The above table showed that 12 i.e.48% men badminton players scored high
self esteem as compared to women 9 i.e. 36% badminton players out of 25. On
the other hand 8 i.e. 32% men players as compared to 13 i.e. 52% women
showing medium self esteem and 5 i.e. 20% men players and 3 i.e. 12% women
players scored low self esteem.
4. DISCUSSION
The results obtained from the data showed that men badminton players scored
higher self esteem scale as compared to women badminton players.Men
badminton players scored higher as compared to their counterpart, it might have
been due to inclusion of 10 players (subjects in the sample) who compete till the
final in the men section.Women players have lower self-esteem than men players
this is supported by the Marcotte, Fortin, Potvin, & Papillion, (2002), who
observed that men have high self esteem as compared to women players.Result in
this study is also inline with the findings ofBaumeister, et al. (2003), who in their
research work proved that men badminton players had high self esteem in
comparison to women badminton players.

Khan, Z., Ali, A. & Ahmed, N. (2014). North zone badminton player’s degree of self-esteem.
Journal of Physical Education Research, 1, December, 27-30.
30 | JOPER JOPER® www.joper.org
5. CONCLUSIONS
On the basis of results it is found that men badminton players have high degree of
self-esteem, it implies they are convinced and feel honest about themselves,
which is helpful to perform well in the contest. They accept more energy for
working hard to take care because of high self regard.
6. REFERENCES
Baumeister, R. F., Campbell, J. D., Krueger, J. I., &Vohs, K. D. (2003). Does
high self esteem cause better performance, interpersonal success,
happiness, or healthier esteem lifestyles? Psychological Science in the
Public Interest, 4, 1-44.
Cooper, S.K., (1981). Discussion of some variables effecting attitudes of
workers.Indian Journal of Psychology, 5(1), 78-81.
Kassin, S., (1998).Psychology(2nd
Ed.), New Jersey: Prentice Hall.
Marcotte, D., Fortin, L., Potvin, P.& Papillion, M. (2002). Gender differences in
depressive symptoms during adolescence: Role of gender-typed
characteristics, self-esteem, body image, and pubertal status. Journal of
Emotional & Behavioral Disorders, 10 (1), 29-43. Martens R. (1987).Coaches guide to sport psychology Illinois.President Human
Kinetics Publishers.
Pestonjee, D.M. (2011). A study on the job areas of job satisfaction in relation to
involvement and participation.International Multidisciplinary Research
Journal, 5(1), 67-69.

Advances in Physics Theories and Applications www.iiste.org
ISSN 2224-719X (Paper) ISSN 2225-0638 (Online)
Vol.29, 2014
87
Three Dimensional Analysis of Drag-flick in The Field Hockey of
University Players
Mohd Arshad Bari
Department of Physical Education, Aligarh Muslim University, Aligarh (U.P) 202002 India
Tel: +91-8439438134 E-mail [email protected]
Naushad Waheed Ansari (Corresponding author)
Department of Physical Education, Aligarh Muslim University, Aligarh (U.P) 202002 India
Tel: +91-98972288992 E-mail [email protected]
Fuzail Ahmad
Department of Physical Education, Aligarh Muslim University, Aligarh (U.P) 202002 India
Tel: +91-9634982713 E-mail [email protected]
Ikram Hussain
Department of Physical Education, Aligarh Muslim University, Aligarh (U.P) 202002 India
Tel: +91-9411465663 E-mail [email protected]
The authors would like to acknowledge the cooperation of UGC-SAP (DRS-I) Programme, Department
of Physical Education, Aligarh Muslim University, Aligarh
Abstract
The penalty corner one of the most important technique to score the goal in field hockey. The penalty corner
depends upon three different technical applications like push, stop and drag. Technical application of drag flick
in penalty corner covered maximum number of successful goal. The main aim of this study was to analyze
spatial and temporal kinematics in the drag flick of elite field hockey players. Two main drag flickers from
Aligarh Muslim University, Aligarh hockey team were selected as a subject for this study. The body weight,
Height and Age of each subject ware recorded subsequently Sub1=65 kg body weight, 180.50cm of height and 19
years of age and Sub2= 60 kg body weight, 167.00 cm of height and 19 years of age. A static calibration method
was used to capture drag flick by Two Cameras, sampling at 50 Hz. Six successful trials at target were selected
from each subject for the study. Videos of selected trials were digitized by the Max Track 3D motion analysis
software. The three dimensional (3D) motion was determined from digitized video analysis using 18-point body
model together. Results of this study shows that spatial / temporal variable between the players, there exist little
difference in stance width in ball contact phase, recommended that little or no difference exist in techniques
between both players.
Key points: spatial / temporal, kinematics, drag, digitized.
1. Introduction
The success of the penalty corners depend three main technical application i.e. pusher, stopper and drag flicker.
Out of the three , the drag flicker contribute the most in the success of goals scored that have come from the
penalty corner (Lees, 2002).
The most important scoring plays in the field hockey are the technique of penalty corner (Laird and Sunderland,
2003 and Pineiro, 2008). The drag-flick is used in the field hockey for shooting at goal with speed and desire
accuracy as it is more scoring than other techniques such as hits and pushes during the penalty corner (Yusoff et
al., 2008).
As per the rules book of hockey (FIH, 2009), there is no any set rules regarding the maximum and minimum
height of the ball when the first shot to score a goal is a push or a drag-flick. Sports scientist, have focused on
strike techniques in field hockey but a few have analysed the technical aspect of drag-flick (Yussoff et al., 2008),

Advances in Physics Theories and Applications www.iiste.org
ISSN 2224-719X (Paper) ISSN 2225-0638 (Online)
Vol.29, 2014
88
focus to analyzed biomechanical parameters in relation to the performance of the players.
Biomechanical analysis of the techniques have no any single definition, however it is scientifically agreed that
technique analysis depend on the way in which skills are executed, from all parameters of biomechanics
(Kinetics and kinematics) (O’Donoghue., 2010). Both Biomechanical studies were conducted a 2D or 3D motion
analysis based on videography with a set specified sampling frequency. Biomechanics of throwing and hitting
skills should be follow same pattern as drag flick in field hockey which aim to get higher speed and accuracy of
the free end (distal) segment at release. In these techniques, back to back segments reach their maximum speed
in the beginning of series with those utmost from the free end of the kinetic chain (Bartlett and Best, 1988).
Kinetics chain of segmental rotations of the pelvis, upper trunk, and stick occurred in the drag-flick (Hussain et.
all. 2012). Kerr and Ness (2006) found that the movement pattern of the push is a compounding of consecutive
and simultaneous segment rotations. Furthermore, during the drag-flick the major contribution to the ball
velocity were stance, stance width, the distance between ball and front foot, the beginning of double foot contact,
angular and linear velocity of different body segment at ball release (McLaughlin, 1997; Kerr and Ness, 2006).
The most of the previous researches have been conducted a 2D analysis, there is a dearth of research on the 3D
analysis of the drag flick in the field hockey. However no 3D biomechanical study of the drag-flick techniques
has been done in Indian players. Thus, the research has been proposed to carry out 3D analysis of elite
specialized drag flicker from Aligarh Muslim University, Aligah.
2. Methodology
2.1 Selection of Subjects
Two specialized right handed drag flickers are current member of Aligarh Muslim University male hockey team
has been selected as the subject. The measurements were recorded by using the standard equipment, which were
presently available at hand. The body weight of each subject ware recorded in kilogram Sub1=65 kg and Sub2=
60 kg by using weighing machine (including player’s kit, which was wearing during the videography session).
Heights of each subject were recorded in centimeter (Sub1=180.50cm and Sub2=167.00 cm) by using stadiometer
and age of both subjects were 19 years measured in chronological order.
2.2 Filming Procedure:
The film recording conducted on sunny and clear weather in the Astroturf Hockey field during regularly
scheduled practice session. Subjects instructed to wear complete specified kit in order to perform successful drag
flick requirement of the study. The target 1"×1" square fixed at upper left corner of the goal post. 06 successful
drag flicks toward target of each drag flicker were selected for the analysis.
2.3 Variables: Kinematic / temporal variables, determined from the digitized 3D data, were used to describe five
(04) key positions (a) approach(From to the last left foot contact before ball pick up) (b) ball Contact (c) drag
Phase (From left foot contact to ball release) and (d) follow throw (From ball release to end of recovery) during
drag flick.
2.4 Model of Dreg Arm
The dreg arm was modeled as two segment kinetic chain composed of (a) upper arm segment and (b) distal
segment that include the forearm, hand and hockey stick. The distal segment was assumed to be a rigid body
with its longitudinal axis led along the longitudinal axis of the forearm
2.5 Videographic Equipments and Location
The subject’s drag flick movements were recorded using two Canon Legria SF-10, 8.1 video cameras in a field
setting, operating with a specified shutter speed and frame rate. The cameras were set-up on a rigid tripod and
secured to the floor in the location. The drag-flicks recorded with two cameras, sampling at 50 Hz. Both cameras
intersect to each other at 600 angles. First camera place right side 34 ft from the ball points at 90
0 of mediolateral
axis parallel to the ground, second camera placed laterally at the distance of 31.5ft and cameras were fielded
synchronized, static calibration method was used to calibrate both the cameras.
Videos of all trials were digitized using the Max Track 3D motion analysis software. Digitization was done from

Advances in Physics Theories and Applications www.iiste.org
ISSN 2224-719X (Paper) ISSN 2225-0638 (Online)
Vol.29, 2014
89
right foot contact with the ground to eight frames after the ball leaving the stick.
The 3D motion of the drag flicker, stick and ball were determined from digitized video analysis using 18-point
body model together. The following points were digitised; Joint centers and points describing the stick and the
ball were estimated.
3. Results
The main purpose of this study was to determine kinematical differences between two best drag flickers of
Aligarh Muslim University, Aligarh and find out those variables which is given positive contribution in ball
speed. If a common intersegment coordinative pattern existed between drag flickers, with the hopes of being able
to make drag flick look the same kinetics. T-test and regression analysis were used to find out differences and
relationship between drag flickers.
The analysis of data table-1 that there is an insignificant differences exist between both drag flicker in distance of
left foot from ball (DLB1) and stick velocity (SV1) during approach phase as obtain ‘t’ ratio is less than the
required ‘t’ value of 2.30
The analysis of data table-2 that there is a significant differences find between drag flicker in stance width (SW2)
during ball contact phase as obtain‘t’ ratio is greater than the required ‘t’ value of 2.30. Whereas no significance
differences were found in the distance of right foot from ball (DLB2), stick velocity (SV2), shoulder axis
orientation (SAO2) and hip axis orientation (HAO2) exist between drag flicker during ball contact phase.
The analysis of data table-3 that there is no significant differences were found between both drag flicker in drag
distance (DD), left knee angle (LKA), stick velocity (SV3), shoulder axis orientation (SAO3) and hip axis
orientation (HAO3) during drag phase as obtain‘t’ ratio is lesser than the required ‘t’ value of 2.30.
The analysis of data table-4 that there is no significant differences exist between both university drag flicker in
ball velocity (BV), stick velocity (SV4), shoulder axis orientation (SAO4) and hip axis orientation (HAO4) during
drag phase as obtain‘t’ ratio is lesser than the required ‘t’ value of 2.30.
The analysis of data table-5 that there is a significant relationship exist ball velocity after release with stick
velocity final phase in both drag flickers. Whereas insignificance relationship exit ball velocity after ball release
with drag distance, shoulder axis orientation and hip axis orientation in follow through phase.
4. Discussions
The technique analysis of drag flick in field hockey had aim to find out the biomechanical variation in
techniques between two best drag flicker of Aligarh Muslim University hockey players. Results of this study
show that, insignificantly differences exist in plantation of left foot behind the ball and stick velocity of between
hockey players during approach. Plantation of left foot behind the ball play significant role in different aspect of
drag flick like: it will demand of the flicker to reach behind the ball properly, force generation, it required to
adjust body properly further will then the ball will be dragged over a greater distance (Subijana et al., 2011 and
2012) and to attain peak angular velocity of the sticks.
In ball Contact Phase significant differences exist between both drag flickers in stance width. In which the
flicker average stance width subsequently are Sub1=1.42m and Sub2= 1.77m. Player Sub1 was fulfilled the
mostly criteria of international level athlete, reported as 1.42m (McLaughlin., 1997), 1.49m, 1.55m (Lopez de
Subijana et al., 2010) and 1.51m (Lopez de Subijana et al., 2011). Player Sub2 had greater stance width as
compare to Sub1 and reported studies. The variation in stance width may be due to anthropometrical difference
exist between the athlete (Hussain et al., 2012). this extremely wide stance width enable the drag flicker to get
the low hip and provided large distance of ball could be accelerate toward the target (Yusoff et al. 2002).
In drag phase insignificant differences exist between drag flicker players in drag distance, left knee angle, stick
velocity during drag, shoulder axis orientation and hip axis orientation. As left foot contact with ground the ball
has been dragged with hockey stick toward the target by the total drag distance mean consequently Sub1=2.30m
and Sub2=2.33m with greater drag distance directly associated with greater resultant ball velocity (Yusoff et al.
2002). These statements support the result of this study as both players had insignificant differences in drag
distance and resultant ball velocity.
In follow-through phase insignificant differences exist between both university players in ball velocity, stick
velocity, shoulder axis orientation and hip axis orientation. Ball velocity at ball release mean range between drag

Advances in Physics Theories and Applications www.iiste.org
ISSN 2224-719X (Paper) ISSN 2225-0638 (Online)
Vol.29, 2014
90
flickers is 18.09 – 21.39 m/s. Highest ball velocity play significant contribution in scoring of goal. When ball
travelled toward the target with greater speed, the goal keeper has little time to change our body position to safe
the goal (Yusoff et al. 2002).
Both drag flicker ball velocity after the ball release has significant positive correlated with stick velocity in final
phase. Sub1 and Sub2 stick velocity in final phase has 77% and 92% subsequently contribute on ball velocity
after ball release. Highest stick velocity help to generate greater momentum force and greater stick velocity both
are directly associated with resultant ball velocity (Bartlet, 2007). The player Sub1: Drag distance and shoulder
axis orientation has insignificant positive relationship and hip axis orientation has insignificant negative
relationship with ball velocity. Player Sub2: Drag distance, shoulder axis orientation and hip axis orientation in
follow through phase has insignificant positive relation with ball velocity. Finally, the drag flicker of Aligarh
Muslim University had a greater stance, long drag, and proper leg flexed than previous study reported by
(Bartlett, 2012, Nichol, 2005, and Mosquera et al, 2007) indicate approximately good technique. When
comparing biomechanical variable between the players, there exist little difference in stance width in ball contact
phase, recommended that little or no difference exist in techniques between both players.
References
1. Hussain I. Ahmed S. and Khan S. (2012), Biomechanical Study on Drag Flick in Field Hockey, International
journal of behavioral social and movement sciences, vol.01,july2012, issue03..
2. Bartlett, R. (2007). Introduction to Sports Biomechanics. Abingdon: Routledge.
3. Bartlett, R. (2012). Quantitative and qualitative analysis. In Encyclopaedia of International Sports
Studies (Ed. R. Bartlett, C. Graton and C.G. Rolf), pp. 1115-1116. London: Routledge.
4. Laird, P. and Sutherland, P. (2003). Penalty Corners in Field Hockey: A guide to success.International
Journal of Performance Analysis in Sport, 3(1), 19-26.
5. Lees, A. (2002). Technique analysis in sports: a critical review. Journal of Sports Sciences, 20, 813-828.
6. López de Subijana, C.L., Juárez, D., Mallo, J. and Navarro, E. (2010). Biomechanical analysis of the
penalty-corner drag-flick of elite male and female hockey players. Sports Biomechanics, 9(2), 72-78.
7. López de Subijana, C.L., Juárez, D., Mallo, J. and Navarro, E. (2011). The application of biomechanics to
penalty corner drag-flick training: a case study. Journal of Sports Science and Medicine, 10, 590-595.
8. López de Subijana Hernández, C., de Antonio, R., Frutos, P.G. and Cabello, E.N. (2011). Anàlisi de la
cadena cinemàtica del drag-flick. Educació Fisica i Esportes, 104(2), 106-113.
9. López de Subijana, C.L., Gómez, M., Martín-Casadom L. and Navarro, E. (2012). Training induced changes
in drag-flick technique in female field hockey players. Biology of Sport, 29(4), 263-268.
10. McLaughlin, P. (1997). Three-dimensional biomechanical analysis of the hockey drag flick: full report.
Belconnen, A.C.T.; Australia: Australian Sports Commission.
11. Mosquera, R. P., Molinuevo, J. S., and Roman, I. R. (2007). Differences between international men’s and
women’s teams in the strategic action of the penalty corner in field hockey. International Journal of
Performance Analysis of Sport, 7(3), 67-83.
12. Nichol, G. (2005). Goal scoring including the drag flick. Available
at: https://www.google.co.uk/url?sa=t&rct=j&q=&esrc=s&source=web&cd=1&ved=0CDUQFjAA&url=htt
p%3A%2F%2Fwww.sportingpulse.com%2Fget_file.cgi%3Fid%3D1947175&ei=Tyg7UaWqL5Lo7AbiwY
CICw&usg=AFQjCNHrZ7oepeGcCMfOd3P-uqWtEYSnXA&bvm=bv.43287494,d.ZGU (Accessed: 9
March 2013).
13. O’Donoghue, P. (2010). Research Methods for Sports Performance Analysis. London: Routledge.
14. Yusoff, S., Hasan, N. and Wilson, B. (2008) Tree-dimensional biomechanical analysis of the hockey drag
flick performed in competition. ISN Bulletin, National Sport Institute of Malaysia 1, 35-43.
15. Bartlett, R. M., and Best, R. J. (1988). The biomechanics of javelin throwing: A review. Journal of Sport
Sciences, 6(1), 1-38.
16. Kerr, R., and Ness, K. (2006). Kinematics of the field hockey penalty corner push-in. Sports Biomechanics,
5 (1), 47-61.

Advances in Physics Theories and Applications www.iiste.org
ISSN 2224-719X (Paper) ISSN 2225-0638 (Online)
Vol.29, 2014
91
Table:01 Approach (From to the last left foot contact before ball pick up)
Variables Subjects Sub1 Sub2 t- value
DLB1 Mean 0.17 0.40 1.01
SD 0.02 0.54
SV1 Mean 0.80 0.86 0.14
SD 0.24 0.17
DLB 1= Distance of left foot from ball in approach (m).
SV1= Stick velocity in approach (m/s)
Table:02 Ball Contact
Variables Subjects Sub1 Sub2 t- value
DLB 2 Mean 0.47 0.62 2.05
SD 0.08 0.16
SW2 Mean 1.42 1.77 2.89*
SD 0.08 0.29
SV2 Mean 1.46 1.50 0.21
SD 0.36 0.31
SAO2 Mean -5.33 -5.16 0.08
SD 4.03 3.19
HAO2 Mean -5.33 -5.17 0.64
SD 4.03 3.19
Tab t.0.05
(10) =2.30 *Significance at 0.05 levels.
DLB2= Distance of right foot from ball in ball contact phase (m)
SW2= Stance width in ball contact phase (m)
SV2= Stick velocity in ball contact phase (m/s)
SAO2= Shoulder axis orientation in ball contact phase
HAO2= Hip axis orientation in ball contact phase
Table: 03 Drag Phase
Variables Subjects Sub1 Sub2 t- value
DD Mean 2.30 2.33 0.10
SD 0.52 0.48
LKA Mean 113.83 117.83 0.59
SD 10.74 12.62
SV3 Mean 6.99 6.93 0.00
SD 1.53 1.47
SAO3 Mean -2.83 -6.83 1.79
SD 2.93 4.62
HAO3 Mean 25.50 25.83 0.07
SD 8.36 9.13
DD= Drag distance
LKA= Left knee angle
SV3= Stick velocity in drag phase
SAO3= Shoulder axis orientation in drag phase
HAO3= Hip axis orientation in drag phase

Advances in Physics Theories and Applications www.iiste.org
ISSN 2224-719X (Paper) ISSN 2225-0638 (Online)
Vol.29, 2014
92
Table: 04 Follow- through Variables Subjects Sub1 Sub2 t- value
BV Mean 21.39 18.09 1.40
SD 4.41 3.73
SV4 Mean 18.91 15.39 1.55
SD 3.83 4.04
SAO4 Mean 63.83 67.67 0.67
SD 11.44 8.16
HAO4 Mean 51.50 51.83 0.06
SD 10.21 10.42
BV= Ball velocity
SV4=Drag distance in follow-through
SAO4= Shoulder axis orientation in follow-through
HAO4= Hip axis orientation in follow-through
Table: 5 Regressions
Subjects Dependent
variable
Predictors R R Square Adjusted R Square
Sub1 Ball velocity
after ball release
SV4 0.85* 0.77 0.65
DD 0.45 0.21 0.01
SAO4 0.00 0.00 -0.25
HAO4 -0.16 0.02 -0.22
Sub2 Ball velocity
after ball release
SV4 0.96* 0.92 0.90
DD 0.30 0.09 -0.14
SAO4 0.62 0.38 0.23
HAO4 0.49 0.23 0.05 *Significance at 0.05 levels.
SV4= Stick velocity
DD=Drag distance
SAO4= Shoulder axis orientation in follow-through
HAO4= Hip axis orientation in follow-through
Figure 01- Drag flick Phase from ground contact to ball release.

Advances in Physics Theories and Applications www.iiste.org
ISSN 2224-719X (Paper) ISSN 2225-0638 (Online)
Vol.29, 2014
93
Subject: Sub1 Subject: Sub2
Figure 02- Stick figure whole drag phase:
Graph 01: Stick velocity m/s Phase by phase
Sub1 Sub2
Graph 02 : ( Hockey and Ball ) velocity v/s time graph
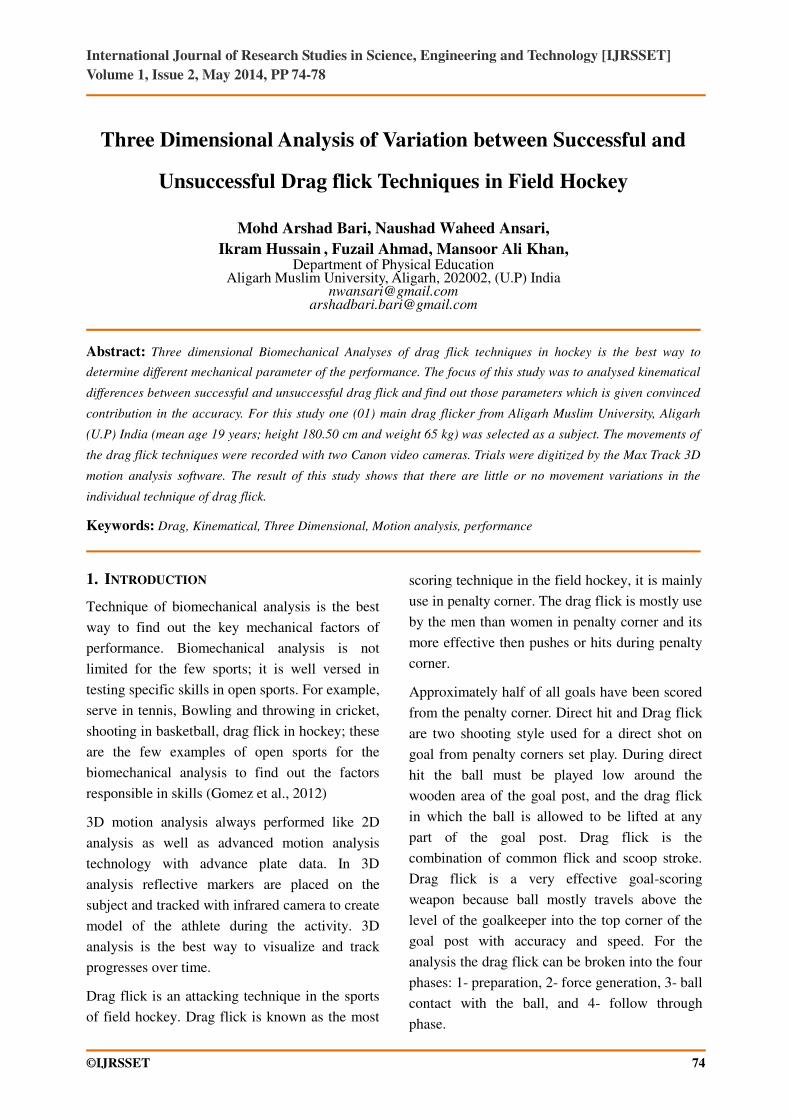
International Journal of Research Studies in Science, Engineering and Technology [IJRSSET]
Volume 1, Issue 2, May 2014, PP 74-78
©IJRSSET 74
Three Dimensional Analysis of Variation between Successful and
Unsuccessful Drag flick Techniques in Field Hockey
Mohd Arshad Bari, Naushad Waheed Ansari,
Ikram Hussain , Fuzail Ahmad, Mansoor Ali Khan,
Department of Physical Education Aligarh Muslim University, Aligarh, 202002, (U.P) India
[email protected] [email protected]
Abstract: Three dimensional Biomechanical Analyses of drag flick techniques in hockey is the best way to
determine different mechanical parameter of the performance. The focus of this study was to analysed kinematical
differences between successful and unsuccessful drag flick and find out those parameters which is given convinced
contribution in the accuracy. For this study one (01) main drag flicker from Aligarh Muslim University, Aligarh
(U.P) India (mean age 19 years; height 180.50 cm and weight 65 kg) was selected as a subject. The movements of
the drag flick techniques were recorded with two Canon video cameras. Trials were digitized by the Max Track 3D
motion analysis software. The result of this study shows that there are little or no movement variations in the
individual technique of drag flick.
Keywords: Drag, Kinematical, Three Dimensional, Motion analysis, performance
1. INTRODUCTION
Technique of biomechanical analysis is the best
way to find out the key mechanical factors of
performance. Biomechanical analysis is not
limited for the few sports; it is well versed in
testing specific skills in open sports. For example,
serve in tennis, Bowling and throwing in cricket,
shooting in basketball, drag flick in hockey; these
are the few examples of open sports for the
biomechanical analysis to find out the factors
responsible in skills (Gomez et al., 2012)
3D motion analysis always performed like 2D
analysis as well as advanced motion analysis
technology with advance plate data. In 3D
analysis reflective markers are placed on the
subject and tracked with infrared camera to create
model of the athlete during the activity. 3D
analysis is the best way to visualize and track
progresses over time.
Drag flick is an attacking technique in the sports
of field hockey. Drag flick is known as the most
scoring technique in the field hockey, it is mainly
use in penalty corner. The drag flick is mostly use
by the men than women in penalty corner and its
more effective then pushes or hits during penalty
corner.
Approximately half of all goals have been scored
from the penalty corner. Direct hit and Drag flick
are two shooting style used for a direct shot on
goal from penalty corners set play. During direct
hit the ball must be played low around the
wooden area of the goal post, and the drag flick
in which the ball is allowed to be lifted at any
part of the goal post. Drag flick is the
combination of common flick and scoop stroke.
Drag flick is a very effective goal-scoring
weapon because ball mostly travels above the
level of the goalkeeper into the top corner of the
goal post with accuracy and speed. For the
analysis the drag flick can be broken into the four
phases: 1- preparation, 2- force generation, 3- ball
contact with the ball, and 4- follow through
phase.

Mohd Arshad Bari et al.
International Journal of Research Studies in Science, Engineering and Technology [IJRSSET] 75
Mechanics of each phase of the drag flick has
significant with the performance (Bari et al.
2014). Main aim of this study to find out
kinematical factors which are responsible for
better performance in relation to accuracy.
2. METHODOLOGY
One main drag flicker of Aligarh Muslim
University, Aligarh (U.P) India (mean age 19
years; height 180.50 cm and weight 65 kg)
participated as a subject in this study. Participant
was free of injury and had a hockey drag flick
experience of 06 years.
Player wear specified tight clothing during the
data collection. Reflective marker were placed
on Clavicle, Sternum, Shoulder (right and left),
elbow (right and left), wrist (right and left), pelvic
left and right axis, Knee (right and left), medial
knee (right and left), ankle (right and left)and
three point in hockey stick.
The three dimensional (3D) motion of the drag
flicks, stick and ball were ascertained from
digitized video analysis using 21-point body
model together. The complying markers were
digitised; Joint centres and points describing the
stick and the ball were estimated (Bari et. al,
2014).
The data recording of drag flick conducted on
sunny and clear weather condition in the
Astroturf Hockey field during regularly practice
scheduled. The target 1×1 square feet was fixed at
upper left corner of the goal post. Twelve drag
flicks toward target were selected (Six successful
and Six unsuccessful) for the analysis.
The movements of the drag flick were captured
using two Canon Legria SF-10, 8.1 video
cameras in a field setting operating and with a
specified shutter speed and frame rate field
setting (sampling at 50 Hz). Cameras intersect to
each other at 600 angles. Placement of the first
camera on the right side at 34 ft from the ball
points at 900
of mediolateral axis parallel of
latitude to the ground, second camera placed
laterally at the distance of 31.5ft. Cameras were
fielded synchronized, static calibration method
was used to calibrate both the cameras (Bari et.
al, 2014).Videos of all trials were digitized using
the Max Track 3D motion analysis software.
3. RESULTS
The main purpose of this study was to determine
kinematical differences between successful and
unsuccessful drag flick and find out those
variables which has given positive contribution in
ball accuracy. T-test and correlation analysis were
used to find out differences and relationship
between successful and unsuccessful drag flicks.
Table 1.
Var
iabl
e
N Mea
n
Std.D
eviati
on
Std.
Error
Mean
t-
valu
e
DD
(m)
SF 06 2.14 0.50 0.20 0.53
UF 06 2.00 0.39 0.16
BV
(m/
s)
SF 06 18.61 3.30 1.34 1.35
UF 06 16.29 2.63 1.07
SV
(m/
s)
SF 06 16.39 3.86 1.56 0.83
UF 06 14.92 1.96 0.80
SA
O
(°)
SF 06 63.67 12.74 5.20 1.30
UF 06 54.17 12.56 5.13
HA
O
(°)
SF 06 49.17 9.11 3.72 0.14
UF 06 48.33 11.20 4.57
*Significance at 0.05 levels.
DD=Drag distance (m)
BV= Ball Velocity after ball release (m/s)
SV= Stick velocity (m/s)
SAO= Shoulder axis orientation in follow-
through (°)
HAO= Hip axis orientation in follow-through (°)
The analysis of data table-1 shows that there is an
insignificant differences shows between
successful and unsuccessful drag flicks
kinematics i.e. drag distance (DD), Ball velocity
after ball release (BV), stick velocity (SV) during
follow-through phase as obtain ‘t’ ratio is less than the required ‘t’ value of 2.30

Three Dimensional Analysis of Variation between Successful and Unsuccessful Drag flick Techniques in Field
Hockey
International Journal of Research Studies in Science, Engineering and Technology [IJRSSET] 76
Graph 1. Drage distance (m)
Graph 2. Ball and stick velocity (m/s)
Graph 3. shoulder and hip axis orientation (m/s)
Table 2. correlations
Subjects Dependent
variable
Predictors R
Successful Ball velocity
after ball
release
DD 0.52
SV 0.71
SAO -0.10
HAO 0.24
*Significance at 0.05 levels.
DD=Drag distance (m)
BV= Ball Velocity after ball release (m/s)
SV= Stick velocity (m/s)
SAO= Shoulder axis orientation in follow-through (°)
HAO= Hip axis orientation in follow-through (°)
The analysis of data table-2 shows that there were
no significant relationship between ball velocity
after release with Drag distance (DD),stick
velocity (SV), shoulder axis orientation (SAO)
and hip axis orientation (HAO) in follow through
phase during successful drag flick.
Table 3. correlations
Subjects Dependent
variable
Predictors R
Un-
Successful
Ball
velocity
after ball
release
DD 0.515
SV 0.858*
SAO 0.645
HAO 0.046
*Significance at 0.05 levels.
DD=Drag distance (m)
BV= Ball Velocity after ball release (m/s)
SV= Stick velocity (m/s)
SAO= Shoulder axis orientation in follow-through (°)
HAO= Hip axis orientation in follow-through (°)
The analysis of data table-3 shows that there is a
significant positive relationship between ball
velocity after release with stick velocity in follow
through phase. Whereas insignificance
relationship exit between ball velocities after ball
release with drag distance, shoulder axis
orientation and hip axis orientation in follow
through phase during unsuccessful drag flick.
4. DISCUSSION
The main purpose of this study was to find out
the kinematical differences in the drag-flick
pattern between successful and unsuccessful drag
flicks in order to render to the point selective
information for goalkeepers. Many researchers
have studied the kinetic and kinematical pattern
of the drag-flick technique, with the propose to
find the reminds for an optimum performance
(Subijana et al., 2010; Yusoff et al., 2008). In
addition, some research was focused on the
goalkeepers’ anticipation when facing a penalty corner (Canal-Bruland et al., 2010).
Result of this study has shown no significant
differences between successful and unsuccessful
drag-flick pattern depending on the direction of

Mohd Arshad Bari et al.
International Journal of Research Studies in Science, Engineering and Technology [IJRSSET] 77
the shot. Result of the study contradicts with the
result of (Gomez et al., 2012) as the direction of
the shot occurred before the dragging action of
the stick (Gomez et al., 2012).
The participants in the study by Gomez et al.,
2012 had more experience and skillful than the
participant in this study. They were skilled drag-
flickers, their patterns could have been more
consistent than the one described in the present
study. This may be a reason that no significant
differences were shown between successful and
unsuccessful drag-flick pattern.
Furthermore, there were no significant
differences between successful and unsuccessful
drag-flick patterns. Successful and unsuccessful
drag-flick patterns showed the same kinematic
sequence of drag distance (m), Ball Velocity after
ball release (m/s), Stick velocity (m/s), Shoulder
axis orientation in follow-through (%) and Hip
axis orientation in follow-through (%). This
kinematic sequence differed from that described
by Subijana et al. (2010), again with successful
drag flick where higher stick and ball velocity of
the stick preceded maximum shoulder axis
orientation in follow-through (%) and Hip axis
orientation in follow-through (%) as compare to
unsuccessful drag flick.
In this study, the drag-flicks shot in set target
showed lower ball velocities (18.61 ± 3.30 m/s
successful drag-flicks; 16.39 ± 2.63 m/s
unsuccessful drag-flicks) than in the study
by López de Subijana et al. (2010) with male
hockey players (21.9 ± 1.7 m/s) and female
hockey players (17.9 ± 1.7 m/s). These values
were also lower than those reported
by McLaughlin (1997) (19.1 to 21.9 m/s) and
Yusoff et al. (2008) (19.6 to 27.8 m/s). It was
noticeable that there were no significant
differences in ball velocities between successful
and unsuccessful drag-flicks, but successful drag
flick recorded higher mean ball velocity as
compare with unsuccessful drag flicks, so
velocity of ball were equally efficient to get
accuracy.
The drag distance successful and unsuccessful
drag flicks shows insignificant relationship with
ball velocity after ball release. Therefore the drag
distances of drag flick were 2.14 m (Successful)
and 2.00 m (unsuccessful) drag flick techniques.
Successful drag flick technique toward target had
greater mean drag distance as compare with
unsuccessful drag flick techniques.
Average drag distance was lower than the value
found for junior players by (Subhijana et. al,
2012) and elite and sub elite players by (Mc
laughem, 1997) . there was not a big difference
between the mean value of drag distance of
successful and unsuccessful drag flick.
Drag distance highly correlated with criterion ball
velocity. Additionally importance of create higher
ball velocity after release (Mc laughem, 1997).
These studies also supported with, the successful
drag flick techniques had greater ball velocity and
greater drag distance as compare with
unsuccessful drag flick (Gonez et al. 2012).
In successful drag flicks, drag distance, stick
velocity and hip axis orientation produced
insignificant positive contribution and shoulder
axis orientation insignificant negative
contribution on ball velocity after release.
Unsuccessful drag flicks, drag distance, and hip
axis and shoulder axis orientation insignificant
contribute in ball velocity after release. Therefore
stick velocity shows significant positive
contribution on ball velocity after release.
An accurate motor execution of the drag flick
techniques is essential to construct a proper
skilled of drag flick performance (Canal-Bruland
et al., 2010). Furthermore, in high-speed sports
such as drag flick in hockey, the speed of play
and ball velocity dictate that decisions must often
be made in advance of the action (Savelsbergh et
al., 2002).
There are little or no movement variations in the
individual technique of drag flick between
successful and unsuccessful drag flick. Some
movement’s variations are necessary to accommodate with experimental constraints in

Three Dimensional Analysis of Variation between Successful and Unsuccessful Drag flick Techniques in Field
Hockey
International Journal of Research Studies in Science, Engineering and Technology [IJRSSET] 78
successful and unsuccessful drag flick situations
(Beckmann et al., 2010).
ACKNOWLEDGEMENT
The authors would like to acknowledge the
cooperation of UGC-SAP (DRS-1) programme,
department of Physical Education, Aligarh
Muslim University, Aligarh.
REFERENCES
[1] Bari, M. A., Ansari, N. W., Ahmad, F., &
Hussain, I. (2014). Three Dimensional
Analysis of Drag-flick in The Field Hockey
of University Players. Advances in Physics
Theories and Applications, 29, 87-93.
[2] Beckmann H, Winkel C & Schollhorn WI.
(2010). Optimal range of variation in hockey
technique training, Int. J Sport Psychology,
41, 5–45.
[3] Canal-Bruland R, Van der Kamp J,
Arkesteijn M, Janssen RJ, Van Kesteren J &
Savelsbergh GJP. (2010).Visual search
behaviour in skilled field-hockey
goalkeepers. Int J Sport Psychol, 41, 327–339.
[4] Lopez de Subijana C, Juarez D, Mallo D &
Navarro E. (2010) Biomechanical analysis of
the penalty-corner drag-flick of elite male
and female hockey players. Sport Biomech,
9(2), 72–78.
[5] Maria Gomez, Cristina Lopez de Subijana,
Raquel Antonio & Enrique Navarro (2012).
Journal of Human Kinetics, 35, 27–33.
[6] McLaughlin P. (1997). Three-dimensional
biomechanical analysis of the hockey drag-
flick: full report.Belconnen, A.C.T.,
Australia: Australian Sports Commission.
[7] Savelsbergh GJP, Williams AM, Van der
Kamp J & Ward P. (2002). Visual search
anticipation and expertise in soccer
goalkeepers, J Sport Sci. 20, 279–287.
[8] Yusoff S, Hasan N & Wilson B. (2008).
Three-dimensional biomechanical analysis of
the hockey drag flick performed in
competition. ISN Bulletin, National Sport
Institute of Malaysia, 1(1), 35–43.
5/18/2020 Three Dimensional Biomechanical Analysis of the Drag in Penalty Corner Drag Flick Performance | Semantic Scholar
https://www.semanticscholar.org/paper/Three-Dimensional-Biomechanical-Analysis-of-the-in-Ansari/9c30433485f0722767d6b93a36e42e6ceb4d0… 1/3
ABSTRACT
9 REFERENCES
RELATED PAPERS
References
Publications referenced by this paper.
Corpus ID: 55767850
Three Dimensional Biomechanical
Analysis of the Drag in Penalty Corner
Drag Flick Performance
Naushad Waheed Ansari • Published 2014 • Mathematics
Penalty corner in eld hockey is a complex motor skill. It required high level ofcoordination. The aim of this study was to provide important biomechanicalvariables related information for the Sports biomechanist, Young sportsscientist, Coaches and also for drag ick specialist for their performanceenhancement programs. Four specialist male drag-ickers of two differentuniversities namely LNIPE, Gawalior , and Aligarh Muslim University , Aligarh,age range 19-25 years, height ranged 174-182cm and weight range 59.4- 66.8Kg. and all having six to eight years of experiences were participated in thisstudy. Three dimensional (3D) experimental setup was conducted for the study.All of the measurements were carried out on the Asto truf ground in theirrespective universities elds. Two video cameras Canon Legria SF-10 were usedto capture all drag ick trials. The shuttering speed of cameras were set on1/1000 and 50hz frame rate. Both cameras were set with the help of tripodplaced at right side of the subjects mounted at a height of 1.2m. Duringcaptured drag ick, the distances of cameras were set at 13m and 17m from thestationary ball position and optical axes of the recording cameras wereintersect each other on the subject at 90° and 60° respectively to right side in aeld setting. The drag ickers and ball movement during the drag ick phasewere recorded. Videos footages were edited and synchronized for 3Dbiomechanical analysis. DLT method was used to calibrate of both the cameras.The drag distance, stride length, ball velocity and acceleration, angles, linear andangular velocity and linear and angular acceleration of shoulder, knee, elbow,wrist of left and right side were digitized and three dimensional data wasobtained with the help of Max TRAQ 3D motion analysis software.SPSSv.16. wasused to calculate the selected parameters and statistical analysis mean andstandard deviations. T-test was used to nd out the comparison between LNIPE,Gawalior and A.M.U.Aligarh. And the result was found that drag distance andhockey stick blade, linear velocity of shoulder (L&R), pelvic (L&R), Knee (L) andwrist (R),angular velocity of shoulder (L&R), elbow (L&R), pelvic(L&R), Knee(L),ankle(R) and wrist(R), linear acceleration of hockey stick blade and ball,shoulder (L), Knee(R), ankle(R) and toe(R), angular acceleration of wrist (R) andjoint angles of shoulder (L&R), elbow (L), wrist (R) and ankle(R) during dragdiffers signicantly and hence does inuences on drag ick technique underaccuracy condition. Keywords: Drag of Dragick, Biomechanical, ThreeDimensional, Motion analysis, performance LESS
Save To Library Create Alert Cite Launch Research Feed
Share This Paper
FAQ About Contact • Sign In Create Free AccountSearchAll Fields

5/18/2020 Three Dimensional Biomechanical Analysis of the Drag in Penalty Corner Drag Flick Performance | Semantic Scholar
https://www.semanticscholar.org/paper/Three-Dimensional-Biomechanical-Analysis-of-the-in-Ansari/9c30433485f0722767d6b93a36e42e6ceb4d0… 2/3
SHOWING 1-9 OF 9 REFERENCES
Biomechanical Study on Drag Flick in Field HockeyIkram Hussain, Saleem Ahmed, Sartaj Khan • 2012
Kinematic Pattern of the Drag-Flick: a Case StudyMaria Gomez, Cristina López de Subijana, Raquel Carros Antonio, Enrique Fernando Canto Navarro • Medicine, Computer Science• Journal of human kinetics • 2012
Training-induced changes in drag-ick technique in female eld hockey playersCristina López de Subijana Hernández, María Gómez Jiménez, Laura Martín Casado, Enrique Navarro Cabello • Engineering •2012
Biomechanical analysis of the penalty-corner drag-ick of elite male and female hockey playersCristina López de Subijana Hernández, Daniel Juárez Santos-García, Javier Mallo Sainz, Enrique Navarro Cabello • Engineering •2010
VIEW 1 EXCERPT
Biomechanical analysis of the penalty-corner drag-ick of elite male and female hockey players.Cristina López de Subijana, Daniel Juárez, Javier Mallo, Enrique Fernando Canto Navarro • Medicine, Mathematics • Sportsbiomechanics • 2010
Differences between international men’s and women’s teams in the strategic action of the penalty corner in eldhockeyRebeca Piñeiro Mosquera, J. Sampedro Molinuevo, Ignacio Refoyo Román • Psychology • 2007
VIEW 1 EXCERPT
Penalty Corners in Field Hockey: A guide to successPeter Laird, P. W. Sutherland • Psychology • 2003
VIEW 1 EXCERPT
P Mclaughlin • 1997
VIEW 3 EXCERPTS
P. McLaughlin • 1997
VIEW 3 EXCERPTS
Related Papers
Three-dimensional biomechanical analysis of the hockey drag ick: full report
Three-dimensional biomechanical analysis of the hockey drag ick: full report. Belconnen: Australian SportsCommission

5/18/2020 Three Dimensional Biomechanical Analysis of the Drag in Penalty Corner Drag Flick Performance | Semantic Scholar
https://www.semanticscholar.org/paper/Three-Dimensional-Biomechanical-Analysis-of-the-in-Ansari/9c30433485f0722767d6b93a36e42e6ceb4d0… 3/3
Show More 2/0
Proudly built by AI2 with the help of our Collaborators using these Sources.Research • Publisher Partnerships • Data Partnerships • API and Open Corpus
Terms of Service • Privacy Policy

5/18/2020 Three dimensional kinematic analysis of the drag flick for accuracy | Semantic Scholar
https://www.semanticscholar.org/paper/Three-dimensional-kinematic-analysis-of-the-drag-Ansari-Bari/531abd36c2f9822ef281dc5a0c655e6e803a… 1/3
ABSTRACT
8 REFERENCES
RELATED PAPERS
References
Publications referenced by this paper.
SHOWING 1-8 OF 8 REFERENCES
Biomechanical Study on Drag Flick in Field HockeyIkram Hussain, Saleem Ahmed, Sartaj Khan • 2012
Kinematic Pattern of the Drag-Flick: a Case StudyMaria Gomez, Cristina López de Subijana, Raquel Carros Antonio, Enrique Fernando Canto Navarro • Medicine, Computer Science• Journal of human kinetics • 2012
Corpus ID: 32659527
Three dimensional kinematic
analysis of the drag ick for accuracy
Naushad Waheed Ansari, Mohd. Arshad Bari, +1 author Fuzail Ahmad •
Published 2014 • Mathematics
The purpose of this study was to assess the effects of biomechanical selectedparameters of penalty corner drag ick for accuracy. The best drag icker ofA.M.U. Aligarh, Hockey team has been selected for this study. His age, height,weight was 19yrs, 180.50cm and 65kg respectively. The subject used his ownstick approved by the All India Association Committee, India. He took 10 trials ofdrag ick from stationary ball to hit given target (1 X 1feet) hung on the rightcorner of the goal post. The two Canon Legria SF-10, 8.1 video cameras wereused. The lm was recorded on sunny and clear weather at Astroturf HockeyField during evening training session. For the 3D co-ordinates 18 bodylandmarks were used to reconstruct the 3D motion using standard DLTprocedures. The digitized 3D data were collected from two phase (1) Contactphase and (2) Release phase. The Knee exion angle was considered for thefront foot only. Max TRAQ 3D motion analysis software was used to calculatethe selected parameters and statistical analysis was accepted using SPSSv.16,mean, standard deviations and correlation was used to nd out the relationshipof selected variables of the study with ball velocity. The alpha level ofsignicance was set at p<0.05 for all statistical tests. The result was found thatsignicant relationship exist ball velocity with HSB at both phases, EA at contactphase, EV at contact phase and KA at release. Where as insignicantrelationship exist ball velocity with ES, PS SA, PA, SV, PV and KV at both phasesand KA at contact phase and EA and EV at release phase. LESS
Save To Library Create Alert Cite Launch Research Feed
Share This Paper
Alternate Sources
FAQ About Contact • Sign In Create Free AccountSearchAll Fields

5/18/2020 Three dimensional kinematic analysis of the drag flick for accuracy | Semantic Scholar
https://www.semanticscholar.org/paper/Three-dimensional-kinematic-analysis-of-the-drag-Ansari-Bari/531abd36c2f9822ef281dc5a0c655e6e803a… 2/3
VIEW 2 EXCERPTS
Stiffness variation in hockey sticks and the impact on stick performanceGraeme Nigel Carlisle • Engineering • 2012
VIEW 3 EXCERPTS
TRAINING-INDUCED CHANGES IN DRAG-FLICK TECHNIQUE IN FEMALE FIELD HOCKEY PLAYERSC.L. de Subijana, María Argenis Bonilla Gómez, Laura Martín-Casado, Eusebio Gómez Navarro • Computer Science, Medicine •Biology of sport • 2012
The application of biomechanics to penalty corner drag-ick training: a case study.Cristina López de Subijana, Daniel Juárez, Javier Mallo, Enrique Fernando Canto Navarro • Computer Science, Medicine • Journalof sports science & medicine • 2011
C. López de Subijana, D. Juarez, J. Mallo, E. Navarro • 2010
VIEW 2 EXCERPTS
C. LópezdeSubijana, D. Juarez, J. Mallo, E Navarro • Sports Biomechanics • 2010
P. McLaughlin • 1997
VIEW 1 EXCERPT
Related Papers
Biomechanical analysis of the penaltycorner drag-ick of elite male and female hockey players. SportsBiomechanics
Biomechanical analysis of the penaltycorner dragick of elite male and female hockey players
Three-dimensional biomechanical analysis of the hockey drag ick: full report. Belconnen: Australian SportsCommission

5/18/2020 Three dimensional kinematic analysis of the drag flick for accuracy | Semantic Scholar
https://www.semanticscholar.org/paper/Three-dimensional-kinematic-analysis-of-the-drag-Ansari-Bari/531abd36c2f9822ef281dc5a0c655e6e803a… 3/3
Show More 2/0
Proudly built by AI2 with the help of our Collaborators using these Sources.Research • Publisher Partnerships • Data Partnerships • API and Open Corpus
Terms of Service • Privacy Policy

PRINT ISSN : 2278 - 2982, ON LINE ISSN : 2319 - 6459Double Blind Peer-Reviewed Refereed Research Journal
Available online http//www.horizonpalaestra.org
Construction of Specific Physical Fitness Test for Batsman
HORIZON PALAESTRA International Journal of Health, Sports and Physical Education Vol.3 No. 1 (July 2014) : 31 - 36
Ahsan Ahmad, Ikram Hussain and Fuzail Ahmad
Correspondence to :
Ahsan Ahmad
Research Scholar,
Department of Physical Education,
Aligarh Muslim University, Aligarh (India)
How to Cite this article : Ahmad, A., Hussain, I. and Ahmad, F. (2014). Construction of Specific Physical Fitness Test for Batsman. Horizon
Palaestra : International Journal of Health, Sports and Physical Education, 3 (1), 31 - 36.
Sports and games unite individuals, societies and
Nations. A competitive sport is a universal passion and usually
seen as an alternative to the smile which removes barriers.
Sports have now achieved a significant position in the culture
of the society and this culture is measured through its
achievement in sports. Test and measurement in the field of
physical education are relatively recent outgrowth of the
general testing movements. Beginning late in the19th century
as strength test, test of track and field and anthropometric
measurement, they have increased in number and
completeness with amazing rapidly. During most of the skills
on abilities measured, the development of test in physical
education has avoided many of the pitfalls that have been
encountered by test builders in the mental discipline (Flegel
and Kolobe 2002).
Hence, there is a need to pay attention specific fitness
to a great extent. On the basis of different findings by
researchers and sports scientists, that fitness has been
analyzed as the degree of a person to function effectively, and
the aim to full fill his potential. Many researchers, scientists
and physical educationists have written much about the
“principles of specificity”. But very few have defined a specific
fitness. As Singh (1984) has stated that each sports activity
demands different types and levels of different motor, abilities
and when a sports man possesses these, he said to have
specific fitness. The concept of specific physical fitness test
requires that the test avoid as much as possible highly
specialized skills (Haywood and Getchell, 2005). In
considering of the construction of a physical fitness test battery
for players of any chronological age, growth, and maturational
characteristics of the subjects.
Moreover, administrative feasibility, available of
economy of time, tools and the practice of testing a maximum
number of subjects should be considered in developing an
effective physical fitness test battery (Bravo, 1994). Though a
small number of scientifically constructed physical test battery
for players of different games is available (Girard, 2006). No
How to Cite this URL : Ahmad, A., Hussain, I. and Ahmad, F. (2014). Construction of Specific Physical Fitness Test for Batsman. Horizon
Palaestra : International Journal of Health, Sports and Physical Education, 3 (1), 31 - 36. Available from : http://www.horizonpalaestra.org/
journal/paperv3.i1.10.pdf (Accessed Date)
Construction of Specific Physical Fitness Test for
Batsman

specific physical fitness test battery is existing for the batsman
cricketers of any age. Sport-specific tests are increasingly
popular in modern sports and are mostly developed to
replicate characteristic sport performances, with the main
idea of them being similar to real-life sport situations. It is
generally accepted that these tests are more appropriate than
standard tests (General Fitness Tests) for assessing
athletes’ capacities that are challenged during a real
competition (Meckel, 2009), the appropriate variables for
sport-specific selection and orientation (Sattler, 2012), and
the physical qualities that are useful for discriminating
between different positions in team sports (Kondric, 2012;
Melchiorri, 2009).
Therefore, the fitness of a cricketer which is specific to
the game has no utility for the fitness of other game. Cricket
occupies a significant place among all other games and
sports. In some respects it is unique as a sport Cricket requires
specific physical fitness characteristics to be on top gear to
take all the qualities in the match. In some respects it is
unique as a sport. It is an ideal sport and is a giving enjoyment
and pleasure and demanding fitness and dedication. Even
though cricket is one of the oldest organized sports, there are
very few studies on the physical demands of the game
(Woolmer and Noakes, 2008; Christie and King, 2008;
Christie, 2008). Batting is intermittent in nature with the
demands placed on the players being dictated by the type of
match being played. Due to this stop-start nature of cricket,
accurate assessments are often difficult and as such,
research is sparse (Bartlett, 2003).
Here the concern of researcher is construction of
specific physical fitness, particularly for the batsman, game
of cricket. Cricket batsman fitness training is a form of sport-
specific training designed for batsman cricket players During
an innings two members of the batting side are on the pitch
at any time: the one facing the current delivery from the bowler
is denoted the striker, while the other is the non-striker. Batting
tactics and strategy vary depending on the type of match being
played as well as the current state of play. The main concerns
for the batsmen are not to lose their wicket and to score as
many runs as quickly as possible. The top cricket players in
the world use fitness plans to developed and customized for
their needs by their coaches. And other people can consult
with personal trainers and cricket coaches to get advice on
creating a cricket fitness training program, provide information
and assistance with fitness training, including recommended
workout schedules that people can use as a basis for the
program. Cricket is a physically demanding sport. Players
need to be capable of high intensity bursts of energy, but they
also need the endurance to make it all the way through a
match. Brute muscular power is not a liability to this position,
but reaction time, batting technique, and balance in the crease
are of basic importance. A batsman may be required to
maintain his position for a number of hours. The cricket batting
stroke relies upon core strength, particularly in the abdominal
and oblique muscle groups, the gluteal muscles, and the
upper arms and shoulders.
Therefore argue that only the best physically prepared
cricketers will perform better, more consistently and with fewer
injuries and, in turn, will enjoy longer and more illustrious
careers. Thus, understanding the specific fitness placed on
players and in particular batsmen respectively. It is important
to recognize fitness level, skills and mental aptitude needed
to succeed for a good batsman in the game of cricket. (Noakes
and Durandt, 2000) Specific Physical fitness of the game
enhancing and bringing the game forward, even though,
scientific and systematic, approach of training and research
in the field of cricket contributes to improved performance.
Subjects
The subjects for the study were 30 intervarsity cricket
players specialized in batting. The chronological age of the
players was between 18 to 25 years. They were recruited
randomly from various universities participated in North-zone
intervarsity cricket tournament held at Aligarh Muslim
University, Aligarh. No grouping of players was made during
this phase. The sample for the construction phase was 30
players exposed to sixteen different fitness items. Then after
taking data, all the skills were raised through factorial analysis.
Variable and Test Items
In order to select the broad component of test, the
available literature of physical fitness were critically reviewed
and opinions of experts regarding these tests obtained. Also
existing literature on the appropriate component of physical
fitness in Indian geographical condition / situation were
considered. All the components of the physical fitness were
considered. On the basis of these the following components
for the specific physical f itness test for cricketer are
considered. The physical fitness components are : Strength,
Endurance, Agility, Flexibility, Coordination and Balance.
During the process of selection of the components of
specific fitness test, the test items for each components were
also identified along with and 16 test items were considered
as : Standing vertical Jump, Sit - ups, Dips, Pull - ups, Zig -
zag, Shuttle run, 50 yard dash, Side - stepping, Squat Thrust,
600mts run/walk, Criss-cross, Skipping, Stroke Stand, Trunk
lift, Sit and reach, and Head Reaction.
Method of Execution
Each experimental test items administration was
adhered strictly administration procedure outline and
protocol.
Statistical Analysis
The results have been obtained through the statistical
package social sciences SPSS version 17.0. The Pearson
product formula has been utilizing for correlation of variables
and the matrix of inter correlation among the sixteen variables
was obtained. The data was then being factor analysis. The
principal component analysis was used to extract factors.
Varimax rotation (Kaiser’s normalization) was used to
generate rotated factor matrix. After that the rotated factor matrix
was used to the selected factor for analysis of data.
Available online http//www.horizonpalaestra.org
HORIZON PALAESTRA International Journal of Health, Sports and Physical Education Vol.3 No. 1 (July 2014) : 31 - 36
32
Ahsan Ahmad, Ikram Hussain and Fuzail Ahmad
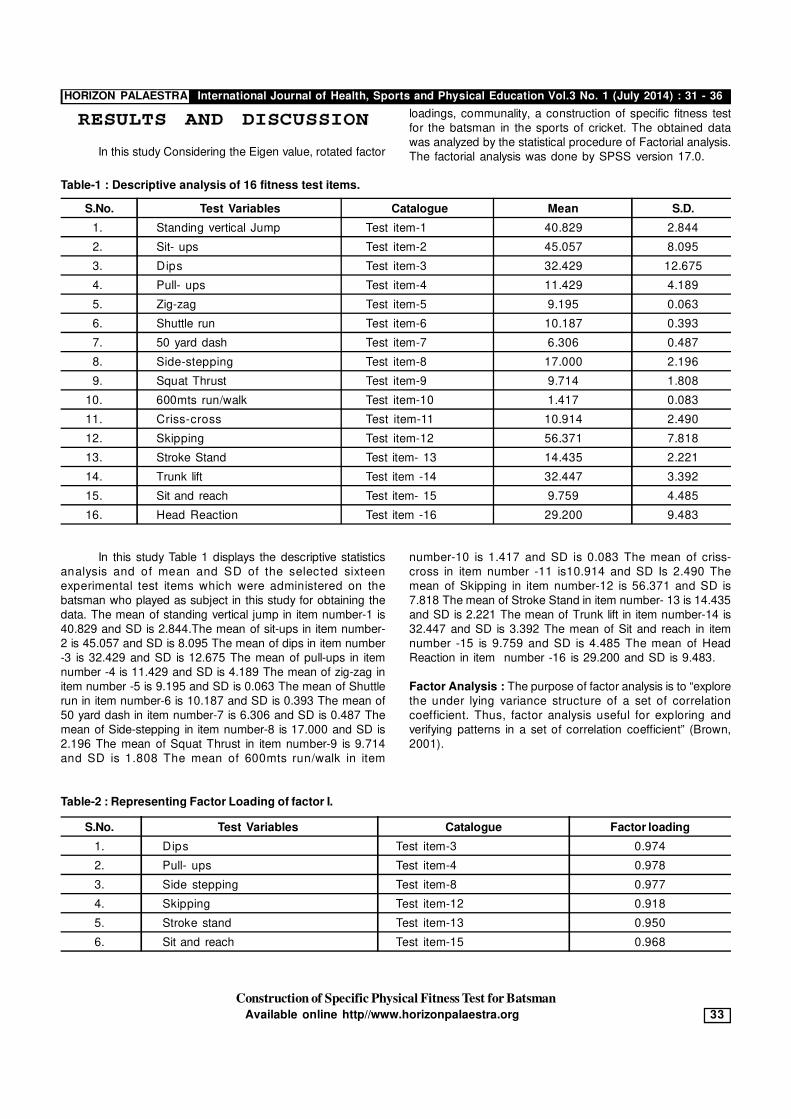
In this study Considering the Eigen value, rotated factor
loadings, communality, a construction of specific fitness test
for the batsman in the sports of cricket. The obtained data
was analyzed by the statistical procedure of Factorial analysis.
The factorial analysis was done by SPSS version 17.0.
Table-1 : Descriptive analysis of 16 fitness test items.
S.No. Test Variables Catalogue Mean S.D.
1. Standing vertical Jump Test item-1 40.829 2.844
2. Sit- ups Test item-2 45.057 8.095
3. Dips Test item-3 32.429 12.675
4. Pull- ups Test item-4 11.429 4.189
5. Zig-zag Test item-5 9.195 0.063
6. Shuttle run Test item-6 10.187 0.393
7. 50 yard dash Test item-7 6.306 0.487
8. Side-stepping Test item-8 17.000 2.196
9. Squat Thrust Test item-9 9.714 1.808
10. 600mts run/walk Test item-10 1.417 0.083
11. Criss-cross Test item-11 10.914 2.490
12. Skipping Test item-12 56.371 7.818
13. Stroke Stand Test item- 13 14.435 2.221
14. Trunk lift Test item -14 32.447 3.392
15. Sit and reach Test item- 15 9.759 4.485
16. Head Reaction Test item -16 29.200 9.483
In this study Table 1 displays the descriptive statistics
analysis and of mean and SD of the selected sixteen
experimental test items which were administered on the
batsman who played as subject in this study for obtaining the
data. The mean of standing vertical jump in item number-1 is
40.829 and SD is 2.844.The mean of sit-ups in item number-
2 is 45.057 and SD is 8.095 The mean of dips in item number
-3 is 32.429 and SD is 12.675 The mean of pull-ups in item
number -4 is 11.429 and SD is 4.189 The mean of zig-zag in
item number -5 is 9.195 and SD is 0.063 The mean of Shuttle
run in item number-6 is 10.187 and SD is 0.393 The mean of
50 yard dash in item number-7 is 6.306 and SD is 0.487 The
mean of Side-stepping in item number-8 is 17.000 and SD is
2.196 The mean of Squat Thrust in item number-9 is 9.714
and SD is 1.808 The mean of 600mts run/walk in item
number-10 is 1.417 and SD is 0.083 The mean of criss-
cross in item number -11 is10.914 and SD Is 2.490 The
mean of Skipping in item number-12 is 56.371 and SD is
7.818 The mean of Stroke Stand in item number- 13 is 14.435
and SD is 2.221 The mean of Trunk lift in item number-14 is
32.447 and SD is 3.392 The mean of Sit and reach in item
number -15 is 9.759 and SD is 4.485 The mean of Head
Reaction in item number -16 is 29.200 and SD is 9.483.
Factor Analysis : The purpose of factor analysis is to “explore
the under lying variance structure of a set of correlation
coefficient. Thus, factor analysis useful for exploring and
verifying patterns in a set of correlation coefficient” (Brown,
2001).
Table-2 : Representing Factor Loading of factor I.
S.No. Test Variables Catalogue Factor loading
1. Dips Test item-3 0.974
2. Pull- ups Test item-4 0.978
3. Side stepping Test item-8 0.977
4. Skipping Test item-12 0.918
5. Stroke stand Test item-13 0.950
6. Sit and reach Test item-15 0.968
Construction of Specific Physical Fitness Test for Batsman
Available online http//www.horizonpalaestra.org 33
HORIZON PALAESTRA International Journal of Health, Sports and Physical Education Vol.3 No. 1 (July 2014) : 31 - 36
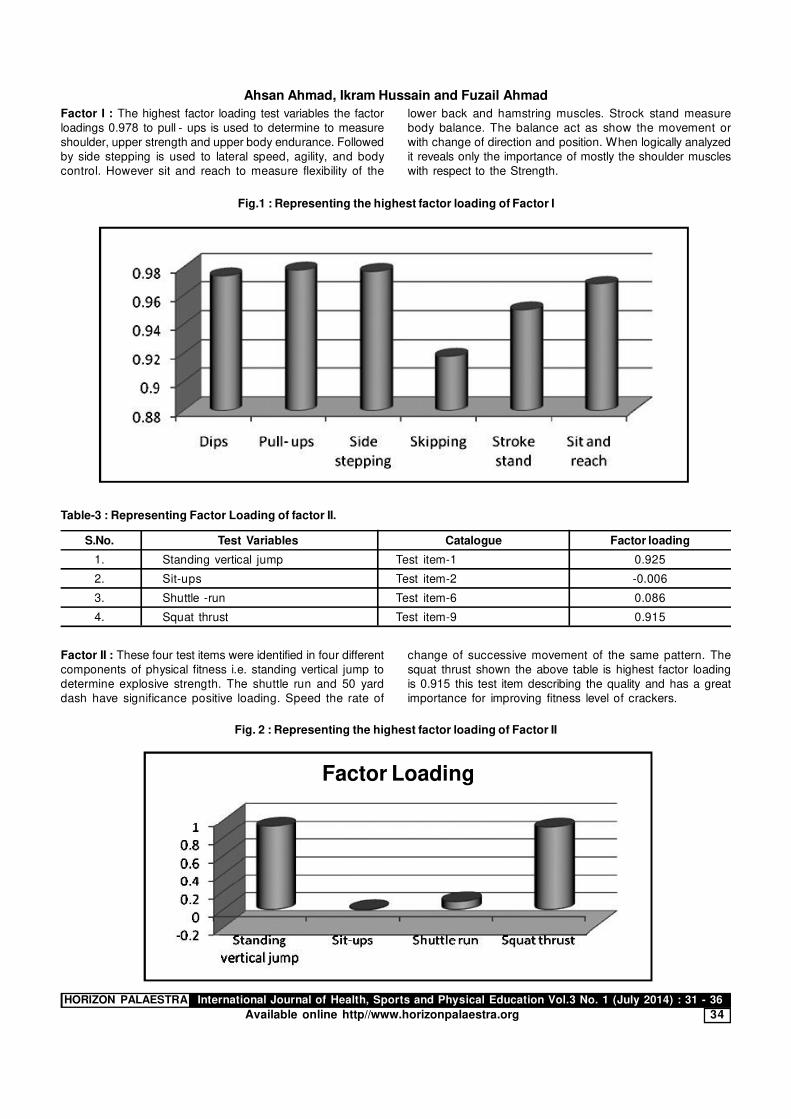
Factor I : The highest factor loading test variables the factor
loadings 0.978 to pull - ups is used to determine to measure
shoulder, upper strength and upper body endurance. Followed
by side stepping is used to lateral speed, agility, and body
control. However sit and reach to measure flexibility of the
lower back and hamstring muscles. Strock stand measure
body balance. The balance act as show the movement or
with change of direction and position. When logically analyzed
it reveals only the importance of mostly the shoulder muscles
with respect to the Strength.
Fig.1 : Representing the highest factor loading of Factor I
Table-3 : Representing Factor Loading of factor II.
S.No. Test Variables Catalogue Factor loading
1. Standing vertical jump Test item-1 0.925
2. Sit-ups Test item-2 -0.006
3. Shuttle -run Test item-6 0.086
4. Squat thrust Test item-9 0.915
Factor II : These four test items were identified in four different
components of physical fitness i.e. standing vertical jump to
determine explosive strength. The shuttle run and 50 yard
dash have significance positive loading. Speed the rate of
change of successive movement of the same pattern. The
squat thrust shown the above table is highest factor loading
is 0.915 this test item describing the quality and has a great
importance for improving fitness level of crackers.
Fig. 2 : Representing the highest factor loading of Factor II
Factor Loading
Ahsan Ahmad, Ikram Hussain and Fuzail Ahmad
Available online http//www.horizonpalaestra.org
HORIZON PALAESTRA International Journal of Health, Sports and Physical Education Vol.3 No. 1 (July 2014) : 31 - 36
34

Factor III : Zig-zag running appear to be primarily reaction
ability and measure of coordination movement and speed.
Cress-cross shown the highest factor loading is 0.723 this
Table-4 : Representing Factor Loading of factor III.
S.No. Test Variables Catalogue Factor loading
1. Zig-zag running Test item-5 0.478
2. Criss-cross Test item-11 0.723
factor emphasis the development of athletes improve agility
for rapid and accurate directional change in play, it improve
body awareness and eye, and foot coordination.
Fig. 3 : Representing the highest factor loading of Factor III
Factor Loading
Table-5 : Representing Factor Loading of factor IV.
S.No. Test Variables Catalogue Factor loading
1. 50 yard Dash Test item-7 0.958
2. 600 mts run/walk Test item-10 0.138
3. Trunk lift Test item-14 0.050
4. Hand reaction Test item-16 0.021
Factor IV : Many physical fitness factor contribute to excellence
in physical fitness test including strength, power, endurance
flexibility, agility etc. But the entire factor affect in the physical
fitness. Which are 600 meters run/walk determine measure
of cardio-respiratory fitness. In this table 50 yard dash shown
the highest factor loading is 0.958. speed as the rate of motion
or velocity. Hand reaction this factor emphasis react faster.
However Trunk lifts has shown the flexibility in this factor.
Based on the findings and statistical analysis, critiques
and experts deliberation in the light of critical literature and
scientific information on the performance demands of
construction of specific physical fitness test for batsmen,
cricketers. Existing knowledge could be completed by
obtaining the considered opinions and insides of coaches
and players. This information would also provide a framework
for the development of design of batting a specific
assessment, focused on systematic training, conditioning
and coaching protocols.
In the light of facts the following conclusions were drawn.
1. Factor analysis Rotated Varimax solution significantly
and appropriately identified the test items for the
Fig. 4 : Representing the highest factor loading of Factor IV
Factor Loading
HORIZON PALAESTRA International Journal of Health, Sports and Physical Education Vol.3 No. 1 (July 2014) : 31 - 36
Construction of Specific Physical Fitness Test for Batsman
Available online http//www.horizonpalaestra.org 35

construction a specific physical fitness test for batsman
for North - Zone level cricket players.
2. Every sport differs from one to another and the demand
of specific physical fitness ability in various games/jobs.
3. A batsman differs from bowlers, fielders etc in a quality
and quantity of fitness components like balance, reaction
ability (sharp movement ability to change position
immediately). The test items derived indisputably
represent the specific physical fitness components for
batsman.
1 Factor-1 Pull-ups 0.978
2 Factor-2 Standing Vertical Jump 0.925
3 Factor-3 Criss-cross 0.723
4 Factor-4 50 yard dash 0.958
Table-6 : Constructed specific physical test battery for
batsman (cricket).
Factor-I is Pull-up which is the first test item obtained
during the construction of test battery. Pull-ups used to
measure shoulder, upper arms strength and upper body
endurance. It’s very important test items for batsman in cricket,
because for playing full stroke is to be needed shoulder and
upper body strength.
Factor-II is standing vertical jump the second test items
obtained by constructed design test battery. Vertical bat shots
can be played either off the front foot or the back foot depending
upon the predictable height of the ball at the moment it reaches
the batsman, the characteristic position of the bat is a vertical
alignment at point of contact. Vertical bat shots are typically
played to accurately judge the line of the ball. The batsman
should have explosive power for quick movement and
immediate acceleration or pickup the run during matches.
The third factor is Criss-Cross, physical fitness test
can improve agility for rapid and accurate directional change
in play, it improves body awareness and eye, hand and foot
coordination. It helps to develop explosive start speeds and
footwork for running events, develops upper-body momentum,
and anaerobic fitness. Criss - cross is more beneficial for
testing overall fitness and physical efficiency for batsman
needed in cricket.
The last and fourth factor is 50 yard dash have positive
significance loading. Speed is the rate of change of
successive movement of the same pattern. Fast movements
of the body (arms and legs) with a minimum numbers effort
were designed in the test of the factors. 50 yard dash sprinting
is to be needed to run between the wickets.
In the light of above mentioned discussion researcher
reached the conclusion that these test items are highly specific
in measuring the specific physical fitness test for batsman in
the game of cricket.
Bartlett, R.M. (2003). The Science and Medicine Of Cricket : An
Overview And Update. Journal of Sports Sciences, 21, 733 -
752.
Bravo, G., Gauthier, P., Roy, P.M., Daniel, T., Gaulin, P., Dubois
M,F. and Peloquin, L. (1994). The Functional Fitness
Assessment Battery : Reliability and Validity Data for Elderly
Women Patients with Alzheimer’s Disease. The TEMP-AD
Protocol, JAPA, 2(1), 67 - 79.
Brown, J.D. (2001). Using Surveys in Language Programs.
Cambridge : Cambridge University Press.
Cozenes, F.W. (1929). The Measurement of General Athletic Ability
for College Men. Oregon : University of Oregon Publication.
Flegel, J. and Kolobe, T.H.A. (2002). Predictive Ability of the Test
of Infant Motor Performance as Measured by the Bruininks -
Oseretsky Test of Motor Proficiency at School Age Physical
Therapy. 82(8), 762 - 771.
Girard, O., Chevalier, R., Micallef, J.P. and Millet, G.P. (2006).
Specific Incremental Field Test for Aerobic Fitness in Tennis.
British journal of Sports Medicine, 40, 791 - 796.
Brace, D.K. (1927). Measuring Motor Ability. NY : A.S. Barnes and co.
Haywood, K.M. and Getchell, N. (2005). Life Span Motor
Development. 4th edition. Human Kinetics, Champaign.
Kondric, M., Uljevic, O., Gabrilo, G., Kontic, D. and Sekulic, D.
(2012). General Anthropometric and Specific Physical Fitness
Profile of High-Level Junior Water Polo Players. Journal of Human
Kinetics, 32, 157 - 165.
Lewes, T. (1994). MCC Masterclass : The New MCC Coaching Book.
London : Weidenfeld and Nicholson.
Meckel, Y., Machnai, O. and Eliakim, A. (2009). Relationship among
Repeated Sprint Tests, Aerobic Fitness, and Anaerobic Fitness
In Elite Adolescent Soccer Players. Journal of Strength and
Conditioning Research, 23(1), 163 - 169.
Melchiorri, G., Manzi, V., Padua, E., Sardella, F. and Bonifazi, M.
(2009). Shuttle Swim Test for Water Polo Players : Validity and
Reliability. Journal of Sports Medicine and Physical Fitness, 49(3),
327 - 330.
Sattler, T., Sekulic, D., Hadzic, V., Uljevic, O. and Dervisevic, E.
(2012). Vertical Jumping Tests in Volleyball : Reliability, Validity,
and Playing-Position Specifics. Journal of Strength and
Conditioning Research, 26(6), 1532 - 1538.
Singh, J. (1984). Physical Conditioning Vs Physical Fitness. SNIPES
Journal. 5, 28.
Woolmer, B. and Noakes, T.D. (2008). Art and Science of Cricket.
Cape Town : Struik Publishers.
All the Authors declared there is not any potential conflict
of interests regarding this article.
Author's affiliations :
Ikram Hussain
Professor
Department of Physical Education,
Aligarh Muslim University, Aligarh (India)
Fuzail Ahmad
Research Scholar, Department of Physical Education,
Aligarh Muslim University, Aligarh (India)
Ahsan Ahmad, Ikram Hussain and Fuzail Ahmad
Available online http//www.horizonpalaestra.org
HORIZON PALAESTRA International Journal of Health, Sports and Physical Education Vol.3 No. 1 (July 2014) : 31 - 36
36

PRINT ISSN : 2278 - 2982, ON LINE ISSN : 2319 - 6459Double Blind Peer-Reviewed Refereed Research Journal
Available online http//www.horizonpalaestra.org
Construction of Specific Physical Fitness Test for Batsman
HORIZON PALAESTRA International Journal of Health, Sports and Physical Education Vol.3 No. 1 (July 2014) : 31 - 36
Ahsan Ahmad, Ikram Hussain and Fuzail Ahmad
Correspondence to :
Ahsan Ahmad
Research Scholar,
Department of Physical Education,
Aligarh Muslim University, Aligarh (India)
How to Cite this article : Ahmad, A., Hussain, I. and Ahmad, F. (2014). Construction of Specific Physical Fitness Test for Batsman. Horizon
Palaestra : International Journal of Health, Sports and Physical Education, 3 (1), 31 - 36.
Sports and games unite individuals, societies and
Nations. A competitive sport is a universal passion and usually
seen as an alternative to the smile which removes barriers.
Sports have now achieved a significant position in the culture
of the society and this culture is measured through its
achievement in sports. Test and measurement in the field of
physical education are relatively recent outgrowth of the
general testing movements. Beginning late in the19th century
as strength test, test of track and field and anthropometric
measurement, they have increased in number and
completeness with amazing rapidly. During most of the skills
on abilities measured, the development of test in physical
education has avoided many of the pitfalls that have been
encountered by test builders in the mental discipline (Flegel
and Kolobe 2002).
Hence, there is a need to pay attention specific fitness
to a great extent. On the basis of different findings by
researchers and sports scientists, that fitness has been
analyzed as the degree of a person to function effectively, and
the aim to full fill his potential. Many researchers, scientists
and physical educationists have written much about the
“principles of specificity”. But very few have defined a specific
fitness. As Singh (1984) has stated that each sports activity
demands different types and levels of different motor, abilities
and when a sports man possesses these, he said to have
specific fitness. The concept of specific physical fitness test
requires that the test avoid as much as possible highly
specialized skills (Haywood and Getchell, 2005). In
considering of the construction of a physical fitness test battery
for players of any chronological age, growth, and maturational
characteristics of the subjects.
Moreover, administrative feasibility, available of
economy of time, tools and the practice of testing a maximum
number of subjects should be considered in developing an
effective physical fitness test battery (Bravo, 1994). Though a
small number of scientifically constructed physical test battery
for players of different games is available (Girard, 2006). No
How to Cite this URL : Ahmad, A., Hussain, I. and Ahmad, F. (2014). Construction of Specific Physical Fitness Test for Batsman. Horizon
Palaestra : International Journal of Health, Sports and Physical Education, 3 (1), 31 - 36. Available from : http://www.horizonpalaestra.org/
journal/paperv3.i1.10.pdf (Accessed Date)
Construction of Specific Physical Fitness Test for
Batsman
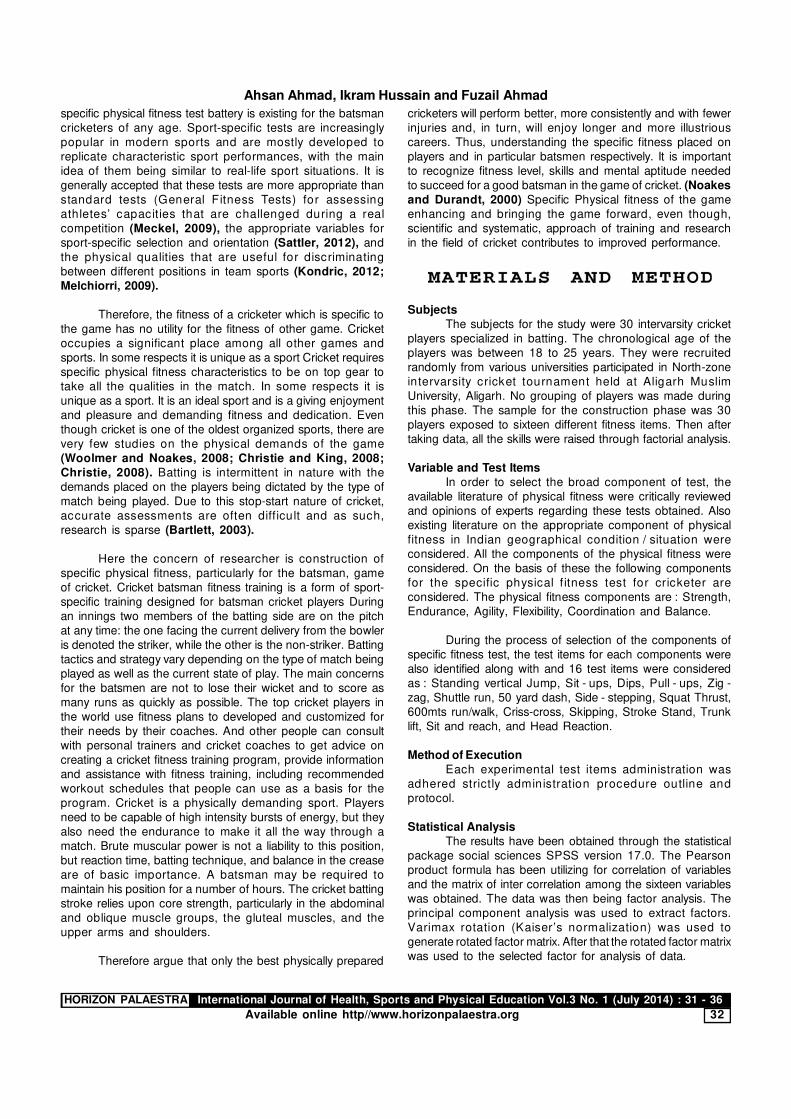
specific physical fitness test battery is existing for the batsman
cricketers of any age. Sport-specific tests are increasingly
popular in modern sports and are mostly developed to
replicate characteristic sport performances, with the main
idea of them being similar to real-life sport situations. It is
generally accepted that these tests are more appropriate than
standard tests (General Fitness Tests) for assessing
athletes’ capacities that are challenged during a real
competition (Meckel, 2009), the appropriate variables for
sport-specific selection and orientation (Sattler, 2012), and
the physical qualities that are useful for discriminating
between different positions in team sports (Kondric, 2012;
Melchiorri, 2009).
Therefore, the fitness of a cricketer which is specific to
the game has no utility for the fitness of other game. Cricket
occupies a significant place among all other games and
sports. In some respects it is unique as a sport Cricket requires
specific physical fitness characteristics to be on top gear to
take all the qualities in the match. In some respects it is
unique as a sport. It is an ideal sport and is a giving enjoyment
and pleasure and demanding fitness and dedication. Even
though cricket is one of the oldest organized sports, there are
very few studies on the physical demands of the game
(Woolmer and Noakes, 2008; Christie and King, 2008;
Christie, 2008). Batting is intermittent in nature with the
demands placed on the players being dictated by the type of
match being played. Due to this stop-start nature of cricket,
accurate assessments are often difficult and as such,
research is sparse (Bartlett, 2003).
Here the concern of researcher is construction of
specific physical fitness, particularly for the batsman, game
of cricket. Cricket batsman fitness training is a form of sport-
specific training designed for batsman cricket players During
an innings two members of the batting side are on the pitch
at any time: the one facing the current delivery from the bowler
is denoted the striker, while the other is the non-striker. Batting
tactics and strategy vary depending on the type of match being
played as well as the current state of play. The main concerns
for the batsmen are not to lose their wicket and to score as
many runs as quickly as possible. The top cricket players in
the world use fitness plans to developed and customized for
their needs by their coaches. And other people can consult
with personal trainers and cricket coaches to get advice on
creating a cricket fitness training program, provide information
and assistance with fitness training, including recommended
workout schedules that people can use as a basis for the
program. Cricket is a physically demanding sport. Players
need to be capable of high intensity bursts of energy, but they
also need the endurance to make it all the way through a
match. Brute muscular power is not a liability to this position,
but reaction time, batting technique, and balance in the crease
are of basic importance. A batsman may be required to
maintain his position for a number of hours. The cricket batting
stroke relies upon core strength, particularly in the abdominal
and oblique muscle groups, the gluteal muscles, and the
upper arms and shoulders.
Therefore argue that only the best physically prepared
cricketers will perform better, more consistently and with fewer
injuries and, in turn, will enjoy longer and more illustrious
careers. Thus, understanding the specific fitness placed on
players and in particular batsmen respectively. It is important
to recognize fitness level, skills and mental aptitude needed
to succeed for a good batsman in the game of cricket. (Noakes
and Durandt, 2000) Specific Physical fitness of the game
enhancing and bringing the game forward, even though,
scientific and systematic, approach of training and research
in the field of cricket contributes to improved performance.
Subjects
The subjects for the study were 30 intervarsity cricket
players specialized in batting. The chronological age of the
players was between 18 to 25 years. They were recruited
randomly from various universities participated in North-zone
intervarsity cricket tournament held at Aligarh Muslim
University, Aligarh. No grouping of players was made during
this phase. The sample for the construction phase was 30
players exposed to sixteen different fitness items. Then after
taking data, all the skills were raised through factorial analysis.
Variable and Test Items
In order to select the broad component of test, the
available literature of physical fitness were critically reviewed
and opinions of experts regarding these tests obtained. Also
existing literature on the appropriate component of physical
fitness in Indian geographical condition / situation were
considered. All the components of the physical fitness were
considered. On the basis of these the following components
for the specific physical f itness test for cricketer are
considered. The physical fitness components are : Strength,
Endurance, Agility, Flexibility, Coordination and Balance.
During the process of selection of the components of
specific fitness test, the test items for each components were
also identified along with and 16 test items were considered
as : Standing vertical Jump, Sit - ups, Dips, Pull - ups, Zig -
zag, Shuttle run, 50 yard dash, Side - stepping, Squat Thrust,
600mts run/walk, Criss-cross, Skipping, Stroke Stand, Trunk
lift, Sit and reach, and Head Reaction.
Method of Execution
Each experimental test items administration was
adhered strictly administration procedure outline and
protocol.
Statistical Analysis
The results have been obtained through the statistical
package social sciences SPSS version 17.0. The Pearson
product formula has been utilizing for correlation of variables
and the matrix of inter correlation among the sixteen variables
was obtained. The data was then being factor analysis. The
principal component analysis was used to extract factors.
Varimax rotation (Kaiser’s normalization) was used to
generate rotated factor matrix. After that the rotated factor matrix
was used to the selected factor for analysis of data.
Available online http//www.horizonpalaestra.org
HORIZON PALAESTRA International Journal of Health, Sports and Physical Education Vol.3 No. 1 (July 2014) : 31 - 36
32
Ahsan Ahmad, Ikram Hussain and Fuzail Ahmad

In this study Considering the Eigen value, rotated factor
loadings, communality, a construction of specific fitness test
for the batsman in the sports of cricket. The obtained data
was analyzed by the statistical procedure of Factorial analysis.
The factorial analysis was done by SPSS version 17.0.
Table-1 : Descriptive analysis of 16 fitness test items.
S.No. Test Variables Catalogue Mean S.D.
1. Standing vertical Jump Test item-1 40.829 2.844
2. Sit- ups Test item-2 45.057 8.095
3. Dips Test item-3 32.429 12.675
4. Pull- ups Test item-4 11.429 4.189
5. Zig-zag Test item-5 9.195 0.063
6. Shuttle run Test item-6 10.187 0.393
7. 50 yard dash Test item-7 6.306 0.487
8. Side-stepping Test item-8 17.000 2.196
9. Squat Thrust Test item-9 9.714 1.808
10. 600mts run/walk Test item-10 1.417 0.083
11. Criss-cross Test item-11 10.914 2.490
12. Skipping Test item-12 56.371 7.818
13. Stroke Stand Test item- 13 14.435 2.221
14. Trunk lift Test item -14 32.447 3.392
15. Sit and reach Test item- 15 9.759 4.485
16. Head Reaction Test item -16 29.200 9.483
In this study Table 1 displays the descriptive statistics
analysis and of mean and SD of the selected sixteen
experimental test items which were administered on the
batsman who played as subject in this study for obtaining the
data. The mean of standing vertical jump in item number-1 is
40.829 and SD is 2.844.The mean of sit-ups in item number-
2 is 45.057 and SD is 8.095 The mean of dips in item number
-3 is 32.429 and SD is 12.675 The mean of pull-ups in item
number -4 is 11.429 and SD is 4.189 The mean of zig-zag in
item number -5 is 9.195 and SD is 0.063 The mean of Shuttle
run in item number-6 is 10.187 and SD is 0.393 The mean of
50 yard dash in item number-7 is 6.306 and SD is 0.487 The
mean of Side-stepping in item number-8 is 17.000 and SD is
2.196 The mean of Squat Thrust in item number-9 is 9.714
and SD is 1.808 The mean of 600mts run/walk in item
number-10 is 1.417 and SD is 0.083 The mean of criss-
cross in item number -11 is10.914 and SD Is 2.490 The
mean of Skipping in item number-12 is 56.371 and SD is
7.818 The mean of Stroke Stand in item number- 13 is 14.435
and SD is 2.221 The mean of Trunk lift in item number-14 is
32.447 and SD is 3.392 The mean of Sit and reach in item
number -15 is 9.759 and SD is 4.485 The mean of Head
Reaction in item number -16 is 29.200 and SD is 9.483.
Factor Analysis : The purpose of factor analysis is to “explore
the under lying variance structure of a set of correlation
coefficient. Thus, factor analysis useful for exploring and
verifying patterns in a set of correlation coefficient” (Brown,
2001).
Table-2 : Representing Factor Loading of factor I.
S.No. Test Variables Catalogue Factor loading
1. Dips Test item-3 0.974
2. Pull- ups Test item-4 0.978
3. Side stepping Test item-8 0.977
4. Skipping Test item-12 0.918
5. Stroke stand Test item-13 0.950
6. Sit and reach Test item-15 0.968
Construction of Specific Physical Fitness Test for Batsman
Available online http//www.horizonpalaestra.org 33
HORIZON PALAESTRA International Journal of Health, Sports and Physical Education Vol.3 No. 1 (July 2014) : 31 - 36

Factor I : The highest factor loading test variables the factor
loadings 0.978 to pull - ups is used to determine to measure
shoulder, upper strength and upper body endurance. Followed
by side stepping is used to lateral speed, agility, and body
control. However sit and reach to measure flexibility of the
lower back and hamstring muscles. Strock stand measure
body balance. The balance act as show the movement or
with change of direction and position. When logically analyzed
it reveals only the importance of mostly the shoulder muscles
with respect to the Strength.
Fig.1 : Representing the highest factor loading of Factor I
Table-3 : Representing Factor Loading of factor II.
S.No. Test Variables Catalogue Factor loading
1. Standing vertical jump Test item-1 0.925
2. Sit-ups Test item-2 -0.006
3. Shuttle -run Test item-6 0.086
4. Squat thrust Test item-9 0.915
Factor II : These four test items were identified in four different
components of physical fitness i.e. standing vertical jump to
determine explosive strength. The shuttle run and 50 yard
dash have significance positive loading. Speed the rate of
change of successive movement of the same pattern. The
squat thrust shown the above table is highest factor loading
is 0.915 this test item describing the quality and has a great
importance for improving fitness level of crackers.
Fig. 2 : Representing the highest factor loading of Factor II
Factor Loading
Ahsan Ahmad, Ikram Hussain and Fuzail Ahmad
Available online http//www.horizonpalaestra.org
HORIZON PALAESTRA International Journal of Health, Sports and Physical Education Vol.3 No. 1 (July 2014) : 31 - 36
34

Factor III : Zig-zag running appear to be primarily reaction
ability and measure of coordination movement and speed.
Cress-cross shown the highest factor loading is 0.723 this
Table-4 : Representing Factor Loading of factor III.
S.No. Test Variables Catalogue Factor loading
1. Zig-zag running Test item-5 0.478
2. Criss-cross Test item-11 0.723
factor emphasis the development of athletes improve agility
for rapid and accurate directional change in play, it improve
body awareness and eye, and foot coordination.
Fig. 3 : Representing the highest factor loading of Factor III
Factor Loading
Table-5 : Representing Factor Loading of factor IV.
S.No. Test Variables Catalogue Factor loading
1. 50 yard Dash Test item-7 0.958
2. 600 mts run/walk Test item-10 0.138
3. Trunk lift Test item-14 0.050
4. Hand reaction Test item-16 0.021
Factor IV : Many physical fitness factor contribute to excellence
in physical fitness test including strength, power, endurance
flexibility, agility etc. But the entire factor affect in the physical
fitness. Which are 600 meters run/walk determine measure
of cardio-respiratory fitness. In this table 50 yard dash shown
the highest factor loading is 0.958. speed as the rate of motion
or velocity. Hand reaction this factor emphasis react faster.
However Trunk lifts has shown the flexibility in this factor.
Based on the findings and statistical analysis, critiques
and experts deliberation in the light of critical literature and
scientific information on the performance demands of
construction of specific physical fitness test for batsmen,
cricketers. Existing knowledge could be completed by
obtaining the considered opinions and insides of coaches
and players. This information would also provide a framework
for the development of design of batting a specific
assessment, focused on systematic training, conditioning
and coaching protocols.
In the light of facts the following conclusions were drawn.
1. Factor analysis Rotated Varimax solution significantly
and appropriately identified the test items for the
Fig. 4 : Representing the highest factor loading of Factor IV
Factor Loading
HORIZON PALAESTRA International Journal of Health, Sports and Physical Education Vol.3 No. 1 (July 2014) : 31 - 36
Construction of Specific Physical Fitness Test for Batsman
Available online http//www.horizonpalaestra.org 35

construction a specific physical fitness test for batsman
for North - Zone level cricket players.
2. Every sport differs from one to another and the demand
of specific physical fitness ability in various games/jobs.
3. A batsman differs from bowlers, fielders etc in a quality
and quantity of fitness components like balance, reaction
ability (sharp movement ability to change position
immediately). The test items derived indisputably
represent the specific physical fitness components for
batsman.
1 Factor-1 Pull-ups 0.978
2 Factor-2 Standing Vertical Jump 0.925
3 Factor-3 Criss-cross 0.723
4 Factor-4 50 yard dash 0.958
Table-6 : Constructed specific physical test battery for
batsman (cricket).
Factor-I is Pull-up which is the first test item obtained
during the construction of test battery. Pull-ups used to
measure shoulder, upper arms strength and upper body
endurance. It’s very important test items for batsman in cricket,
because for playing full stroke is to be needed shoulder and
upper body strength.
Factor-II is standing vertical jump the second test items
obtained by constructed design test battery. Vertical bat shots
can be played either off the front foot or the back foot depending
upon the predictable height of the ball at the moment it reaches
the batsman, the characteristic position of the bat is a vertical
alignment at point of contact. Vertical bat shots are typically
played to accurately judge the line of the ball. The batsman
should have explosive power for quick movement and
immediate acceleration or pickup the run during matches.
The third factor is Criss-Cross, physical fitness test
can improve agility for rapid and accurate directional change
in play, it improves body awareness and eye, hand and foot
coordination. It helps to develop explosive start speeds and
footwork for running events, develops upper-body momentum,
and anaerobic fitness. Criss - cross is more beneficial for
testing overall fitness and physical efficiency for batsman
needed in cricket.
The last and fourth factor is 50 yard dash have positive
significance loading. Speed is the rate of change of
successive movement of the same pattern. Fast movements
of the body (arms and legs) with a minimum numbers effort
were designed in the test of the factors. 50 yard dash sprinting
is to be needed to run between the wickets.
In the light of above mentioned discussion researcher
reached the conclusion that these test items are highly specific
in measuring the specific physical fitness test for batsman in
the game of cricket.
Bartlett, R.M. (2003). The Science and Medicine Of Cricket : An
Overview And Update. Journal of Sports Sciences, 21, 733 -
752.
Bravo, G., Gauthier, P., Roy, P.M., Daniel, T., Gaulin, P., Dubois
M,F. and Peloquin, L. (1994). The Functional Fitness
Assessment Battery : Reliability and Validity Data for Elderly
Women Patients with Alzheimer’s Disease. The TEMP-AD
Protocol, JAPA, 2(1), 67 - 79.
Brown, J.D. (2001). Using Surveys in Language Programs.
Cambridge : Cambridge University Press.
Cozenes, F.W. (1929). The Measurement of General Athletic Ability
for College Men. Oregon : University of Oregon Publication.
Flegel, J. and Kolobe, T.H.A. (2002). Predictive Ability of the Test
of Infant Motor Performance as Measured by the Bruininks -
Oseretsky Test of Motor Proficiency at School Age Physical
Therapy. 82(8), 762 - 771.
Girard, O., Chevalier, R., Micallef, J.P. and Millet, G.P. (2006).
Specific Incremental Field Test for Aerobic Fitness in Tennis.
British journal of Sports Medicine, 40, 791 - 796.
Brace, D.K. (1927). Measuring Motor Ability. NY : A.S. Barnes and co.
Haywood, K.M. and Getchell, N. (2005). Life Span Motor
Development. 4th edition. Human Kinetics, Champaign.
Kondric, M., Uljevic, O., Gabrilo, G., Kontic, D. and Sekulic, D.
(2012). General Anthropometric and Specific Physical Fitness
Profile of High-Level Junior Water Polo Players. Journal of Human
Kinetics, 32, 157 - 165.
Lewes, T. (1994). MCC Masterclass : The New MCC Coaching Book.
London : Weidenfeld and Nicholson.
Meckel, Y., Machnai, O. and Eliakim, A. (2009). Relationship among
Repeated Sprint Tests, Aerobic Fitness, and Anaerobic Fitness
In Elite Adolescent Soccer Players. Journal of Strength and
Conditioning Research, 23(1), 163 - 169.
Melchiorri, G., Manzi, V., Padua, E., Sardella, F. and Bonifazi, M.
(2009). Shuttle Swim Test for Water Polo Players : Validity and
Reliability. Journal of Sports Medicine and Physical Fitness, 49(3),
327 - 330.
Sattler, T., Sekulic, D., Hadzic, V., Uljevic, O. and Dervisevic, E.
(2012). Vertical Jumping Tests in Volleyball : Reliability, Validity,
and Playing-Position Specifics. Journal of Strength and
Conditioning Research, 26(6), 1532 - 1538.
Singh, J. (1984). Physical Conditioning Vs Physical Fitness. SNIPES
Journal. 5, 28.
Woolmer, B. and Noakes, T.D. (2008). Art and Science of Cricket.
Cape Town : Struik Publishers.
All the Authors declared there is not any potential conflict
of interests regarding this article.
Author's affiliations :
Ikram Hussain
Professor
Department of Physical Education,
Aligarh Muslim University, Aligarh (India)
Fuzail Ahmad
Research Scholar, Department of Physical Education,
Aligarh Muslim University, Aligarh (India)
Ahsan Ahmad, Ikram Hussain and Fuzail Ahmad
Available online http//www.horizonpalaestra.org
HORIZON PALAESTRA International Journal of Health, Sports and Physical Education Vol.3 No. 1 (July 2014) : 31 - 36
36

Academic Sports Scholar ISSN : 2277-3665Vol. 3 | Issue. 11 | Nov 2014 Impact Factor : 1.3205 (UIF)
DEVELOPMENT OF CRICKET-SPECIFIC BOWLING ACCURACY TEST
Abstract:-It has been observed in competitive sports scenario that certain amount of proficiency is inevitable for successful participation in games & sports in our society (A Yobu 2010). There have been many motor-skill tests that are constructed especially in the last few decades for almost all types of physical activities thus measuring every sort of physical movement.
Keywords:physical movement , Development , Cricket-Specific Bowling , sports scenario .
INTRODUCTIONOver the past one decade the amount of cricket being played has increased many-folds at the
global plane. Though the game of cricket relishes the history of 400-Odd years, no standardized test is available in literature till date to measure the skill level (accuracy) of bowlers in cricket (Murtaza S. T. & et. al. 2014). In the game of cricket, bowling is the process of prompt the ball towards the stumps safeguarded or secured by the batsman. A player proficient at bowling is called a bowler. The main task of the bowler is to bowl at the right line and length, thereby preventing the batsman from scoring runs and to get him out. Accurate quantitative measurement of cricketer's abilities has never been made, especially in the literature of physical education & sports sciences. In addition to subjective evaluation, a player's ability is often judged by comparing his batting and bowling averages to those of other players (Richard A. S., 1984).
1.Objective of the Test: The test was ideated with the single objective i.e. to construct the test which assesses the
bowling accuracy of male cricketers.
2.Utility of the Test: Modern day’s cricket has been transformed into more competitive & become more
1 2 3 4 5 6 7Please cite this Article as :Syed Tariq Murtaza, PhD , Mohd.Imran , Mohd.Sharique , Taufiq Ahmad , Farkhunda Jabin , Ashish Kumar Katiyar , Shamshad Ahmad ,Ravi Prakash
7 7 8 8 8 8 8 9 9Singh , Arshad Hussain Bhat , Salman Ahmad Khan , Raof Ahmad Bhat , Irshad Maqbool Malik , Showkat Ahmad Naikoo , Mohd Zakir , Mohd. Sabir , Iftikhar Ahmad , Sateesh
9 9 9 9 9 9 9Chandra , Lalita Kumari , Tasleem Khan , Sarver Ali ,Qamber Rizwan , Intazar Ali , Vinay Kumar Singh , “DEVELOPMENT OF CRICKET-SPECIFIC BOWLING ACCURACY TEST” : Academic Sports Scholar (Nov ; 2014)
1 2 3 4Syed Tariq Murtaza, PhD , Mohd.Imran , Mohd.Sharique , Taufiq Ahmad ,
5 6 7Farkhunda Jabin , Ashish Kumar Katiyar , Shamshad Ahmad ,
7 7 8 8Ravi Prakash Singh , Arshad Hussain Bhat , Salman Ahmad Khan , Raof Ahmad Bhat ,
8 8 8 9Irshad Maqbool Malik , Showkat Ahmad Naikoo , Mohd Zakir , Mohd. Sabir ,
9 9 9 9 9Iftikhar Ahmad , Sateesh Chandra , Lalita Kumari , Tasleem Khan , Sarver Ali ,
9 9 9Qamber Rizwan , Intazar Ali , Vinay Kumar Singh
1Assistant Professor, Department of Physical Education, A.M.U., Aligarh.
2PTT (+2, Boys), A.M.U., Aligarh.
3Assistant Professor, Department of Physical Education, KMCUAF University, Lucknow.
4Assistant Director of Physical Education & Sports, Department of Physical Education, A.M.U., Aligarh.
5Registered Physician & Assistant Professor, Ayurveda & Unani medical College & Hospital, Aligarh.
6Physical Education Teacher, Brilliant public School, Aligarh.
7Research Scholars, Department of Physical Education, A.M.U., Aligarh.
8Students M.P.ED (Sem. III), Department of Physical Education, A.M.U., Aligarh.9Students M.P.ED (Sem. I), Department of Physical Education, A.M.U., Aligarh.
1

.
aggressive where every player has to put extra efforts in order to perform at the optimum level. In such a scenario, players have no objective method to analyze their bowling skills, and moreover traditional methods have been adopted in the selection process by letting the bowlers bowl mechanically where even neither they nor selectors concentrate on no-balls. Due to the preceding reasons, the authors set out to construct a bowling accuracy test for the cricketers. The most important aspect of the test is that it will play an instrumental role to boost the confidence level of the bowlers & the selection process will become more objectified.
3.Nomenclature of the Test: Every motor-skill test has been christened by the choice of the testers, this test is henceforth
christened as the NARAASHANS CRICKET BOWLING ACCURACY TEST, and where-in Naraashans is the Vedic word means ‘a praised man’ or ‘a man who has been eulogized among mankind’.
4.Equipments: Following equipments are needed for the proper execution of the test:
5. Marking for the Test: A square of 9 inches with its centre is drawn at a distance of 3 metre from the popping
crease. The back line of the square must be perpendicular to the leg stump that represent the four (4) point area, and is as per the standard measurement of the distance of cricket stumps i.e. 9 inches. A square of 9 inches is also drawn on the batting crease (i.e block-hole of the batsman) just in front of the stumps that also represent the four (4) point area. Three (3) point area is drawn by extending 9 inches from above, below and front side of the four (4) point area. Two (2) point area is made by extending 9 inches from above, below and front side of the three (3) point area. Similarly, one (1) point area is drawn by extending 9 inches from above, below and front side of the two (2) point area. All lines are 3cm thick and included in their respective point areas. The foregoing marking areas shall be the target zones for the bowlers.
Diagram of the test
DEVELOPMENT OF CRICKET-SPECIFIC BOWLING ACCURACY TEST
2Academic Sports Scholar | Volume 3 | Issue 11 | Nov 2014
S. No. Equipments Quantity
1 Measuring tape (30 mt.) 1
2 Coloured chalks As per the requirement
3 4-piece standard cricket balls 6
4 Rope (10 mt.) & Nails 1 & 2
5 Score sheet 1 per Bowler
6 Pen/pencil As per the requirement
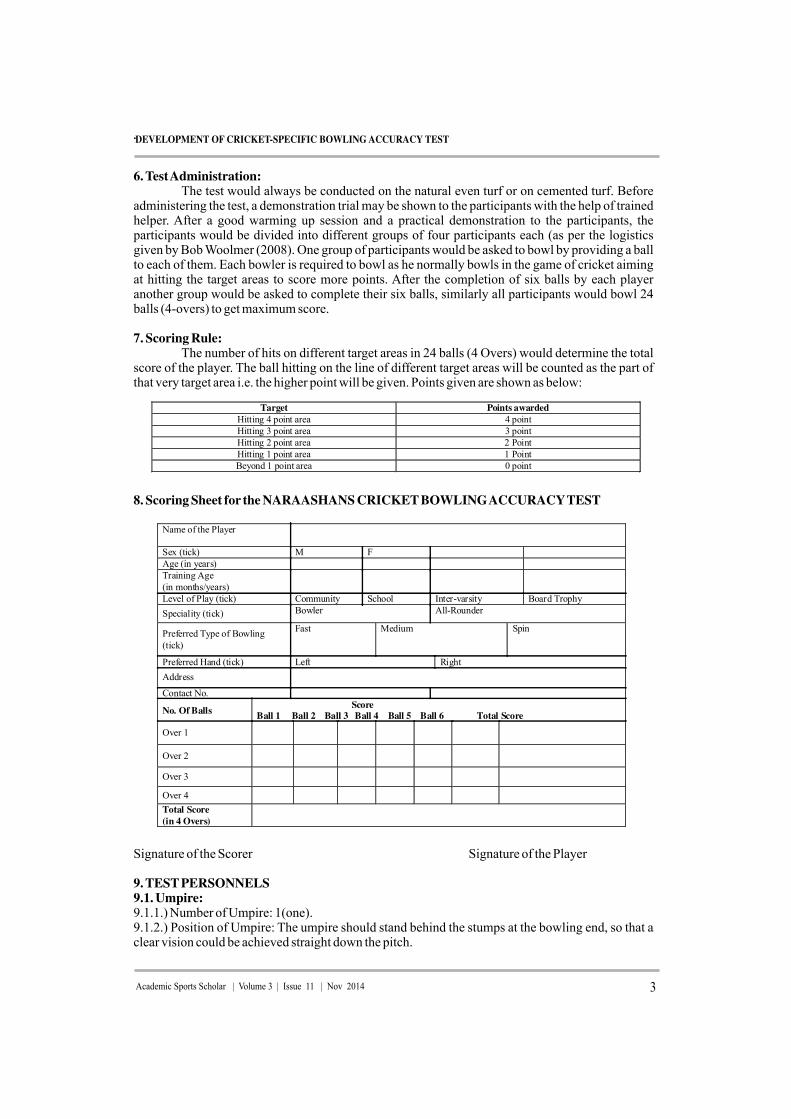
.
6. Test Administration: The test would always be conducted on the natural even turf or on cemented turf. Before administering the test, a demonstration trial may be shown to the participants with the help of trained helper. After a good warming up session and a practical demonstration to the participants, the participants would be divided into different groups of four participants each (as per the logistics given by Bob Woolmer (2008). One group of participants would be asked to bowl by providing a ball to each of them. Each bowler is required to bowl as he normally bowls in the game of cricket aiming at hitting the target areas to score more points. After the completion of six balls by each player another group would be asked to complete their six balls, similarly all participants would bowl 24 balls (4-overs) to get maximum score.
7. Scoring Rule: The number of hits on different target areas in 24 balls (4 Overs) would determine the total
score of the player. The ball hitting on the line of different target areas will be counted as the part of that very target area i.e. the higher point will be given. Points given are shown as below:
8. Scoring Sheet for the NARAASHANS CRICKET BOWLING ACCURACY TEST
Signature of the Scorer Signature of the Player
9. TEST PERSONNELS9.1. Umpire:9.1.1.) Number of Umpire: 1(one).9.1.2.) Position of Umpire: The umpire should stand behind the stumps at the bowling end, so that a clear vision could be achieved straight down the pitch.
3Academic Sports Scholar | Volume 3 | Issue 11 | Nov 2014
Target Points awarded
Hitting 4 point area 4 point
Hitting 3 point area 3 point
Hitting 2 point area 2 Point
Hitting 1 point area 1 Point
Beyond 1 point area 0 point
Name of the Player
Sex (tick) M F
Age (in years)
Training Age
(in months/years)
Level of Play (tick) Community School Inter-varsity Board Trophy
Speciality (tick) Bowler All-Rounder
Preferred Type of Bowling
(tick)
Fast Medium Spin
Preferred Hand (tick) Left Right
Address
Contact No.
No. Of Balls Score
Ball 1 Ball 2 Ball 3 Ball 4 Ball 5 Ball 6 Total Score
Over 1
Over 2
Over 3
Over 4
Total Score
(in 4 Overs)
DEVELOPMENT OF CRICKET-SPECIFIC BOWLING ACCURACY TEST
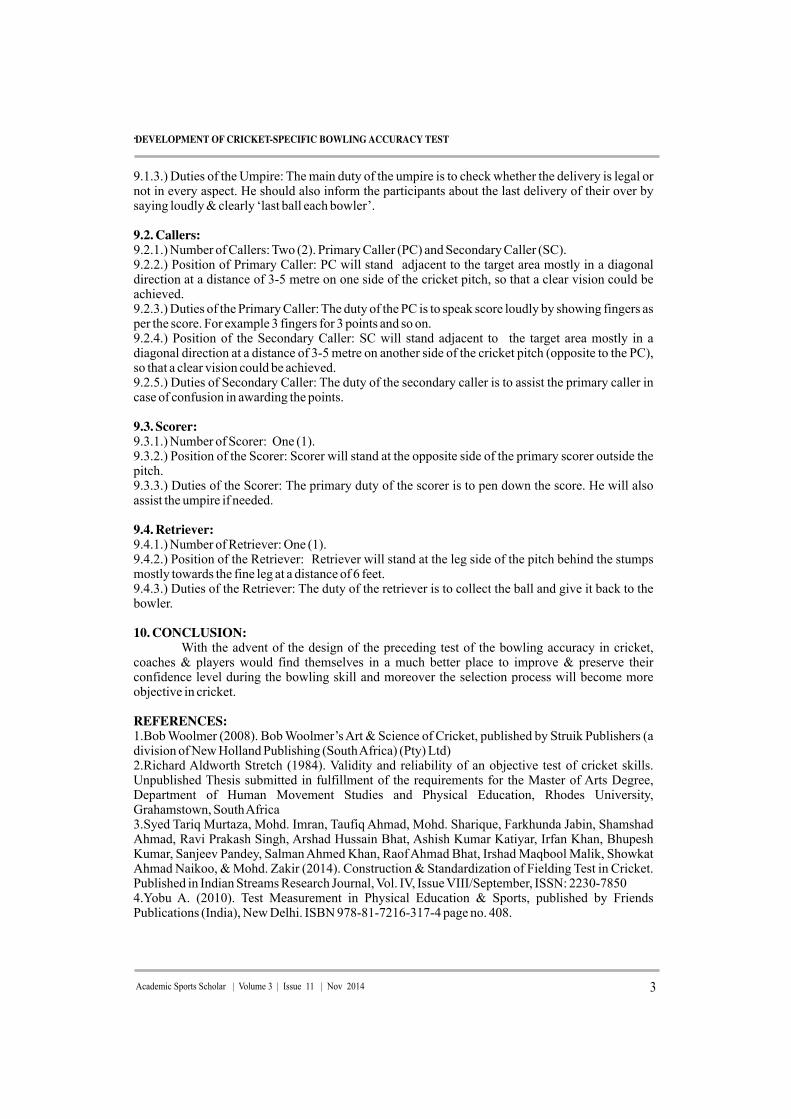
.
9.1.3.) Duties of the Umpire: The main duty of the umpire is to check whether the delivery is legal or not in every aspect. He should also inform the participants about the last delivery of their over by saying loudly & clearly ‘last ball each bowler’.
9.2. Callers:9.2.1.) Number of Callers: Two (2). Primary Caller (PC) and Secondary Caller (SC).9.2.2.) Position of Primary Caller: PC will stand adjacent to the target area mostly in a diagonal direction at a distance of 3-5 metre on one side of the cricket pitch, so that a clear vision could be achieved.9.2.3.) Duties of the Primary Caller: The duty of the PC is to speak score loudly by showing fingers as per the score. For example 3 fingers for 3 points and so on.9.2.4.) Position of the Secondary Caller: SC will stand adjacent to the target area mostly in a diagonal direction at a distance of 3-5 metre on another side of the cricket pitch (opposite to the PC), so that a clear vision could be achieved. 9.2.5.) Duties of Secondary Caller: The duty of the secondary caller is to assist the primary caller in case of confusion in awarding the points.
9.3. Scorer:9.3.1.) Number of Scorer: One (1).9.3.2.) Position of the Scorer: Scorer will stand at the opposite side of the primary scorer outside the pitch.9.3.3.) Duties of the Scorer: The primary duty of the scorer is to pen down the score. He will also assist the umpire if needed.
9.4. Retriever:9.4.1.) Number of Retriever: One (1).9.4.2.) Position of the Retriever: Retriever will stand at the leg side of the pitch behind the stumps mostly towards the fine leg at a distance of 6 feet.9.4.3.) Duties of the Retriever: The duty of the retriever is to collect the ball and give it back to the bowler.
10. CONCLUSION:With the advent of the design of the preceding test of the bowling accuracy in cricket,
coaches & players would find themselves in a much better place to improve & preserve their confidence level during the bowling skill and moreover the selection process will become more objective in cricket.
REFERENCES:1.Bob Woolmer (2008). Bob Woolmer’s Art & Science of Cricket, published by Struik Publishers (a division of New Holland Publishing (South Africa) (Pty) Ltd) 2.Richard Aldworth Stretch (1984). Validity and reliability of an objective test of cricket skills. Unpublished Thesis submitted in fulfillment of the requirements for the Master of Arts Degree, Department of Human Movement Studies and Physical Education, Rhodes University, Grahamstown, South Africa3.Syed Tariq Murtaza, Mohd. Imran, Taufiq Ahmad, Mohd. Sharique, Farkhunda Jabin, Shamshad Ahmad, Ravi Prakash Singh, Arshad Hussain Bhat, Ashish Kumar Katiyar, Irfan Khan, Bhupesh Kumar, Sanjeev Pandey, Salman Ahmed Khan, Raof Ahmad Bhat, Irshad Maqbool Malik, Showkat Ahmad Naikoo, & Mohd. Zakir (2014). Construction & Standardization of Fielding Test in Cricket. Published in Indian Streams Research Journal, Vol. IV, Issue VIII/September, ISSN: 2230-78504.Yobu A. (2010). Test Measurement in Physical Education & Sports, published by Friends Publications (India), New Delhi. ISBN 978-81-7216-317-4 page no. 408.
3Academic Sports Scholar | Volume 3 | Issue 11 | Nov 2014
DEVELOPMENT OF CRICKET-SPECIFIC BOWLING ACCURACY TEST
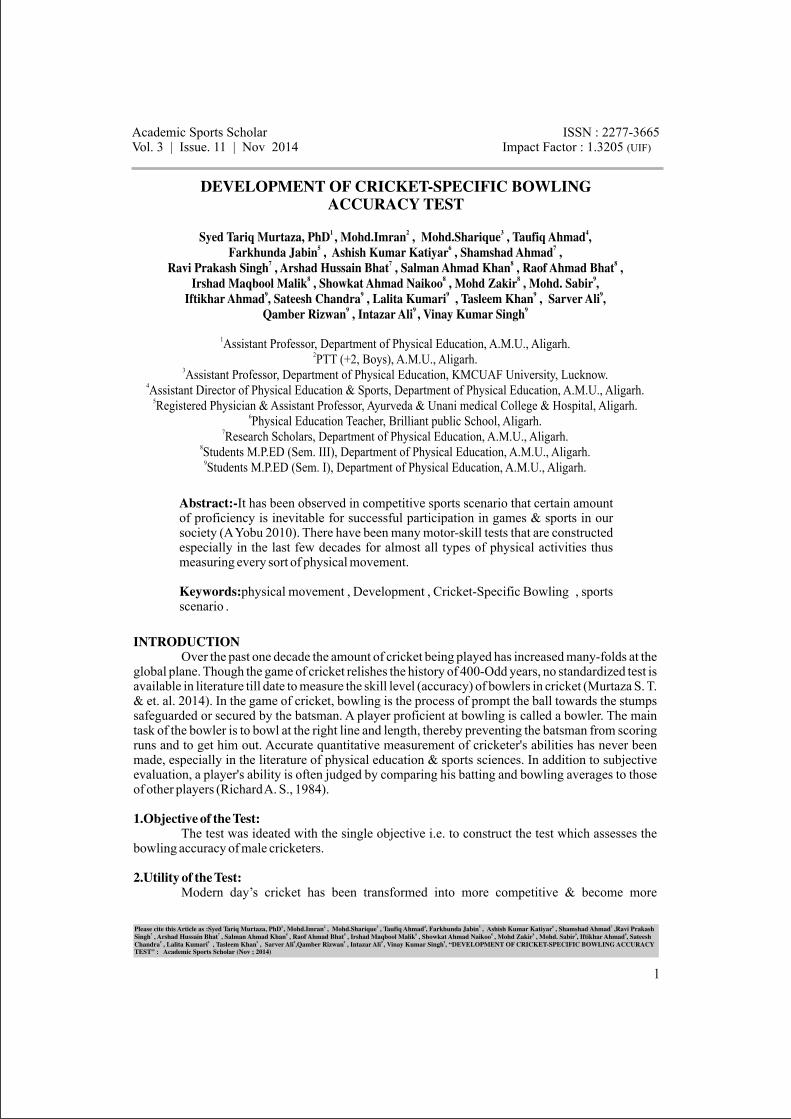

International Journal of Research Studies in Science, Engineering and Technology [IJRSSET]
Volume 1, Issue 2, May 2014, PP 74-78
©IJRSSET 74
Three Dimensional Analysis of Variation between Successful and
Unsuccessful Drag flick Techniques in Field Hockey
Mohd Arshad Bari, Naushad Waheed Ansari,
Ikram Hussain , Fuzail Ahmad, Mansoor Ali Khan,
Department of Physical Education Aligarh Muslim University, Aligarh, 202002, (U.P) India
[email protected] [email protected]
Abstract: Three dimensional Biomechanical Analyses of drag flick techniques in hockey is the best way to
determine different mechanical parameter of the performance. The focus of this study was to analysed kinematical
differences between successful and unsuccessful drag flick and find out those parameters which is given convinced
contribution in the accuracy. For this study one (01) main drag flicker from Aligarh Muslim University, Aligarh
(U.P) India (mean age 19 years; height 180.50 cm and weight 65 kg) was selected as a subject. The movements of
the drag flick techniques were recorded with two Canon video cameras. Trials were digitized by the Max Track 3D
motion analysis software. The result of this study shows that there are little or no movement variations in the
individual technique of drag flick.
Keywords: Drag, Kinematical, Three Dimensional, Motion analysis, performance
1. INTRODUCTION
Technique of biomechanical analysis is the best
way to find out the key mechanical factors of
performance. Biomechanical analysis is not
limited for the few sports; it is well versed in
testing specific skills in open sports. For example,
serve in tennis, Bowling and throwing in cricket,
shooting in basketball, drag flick in hockey; these
are the few examples of open sports for the
biomechanical analysis to find out the factors
responsible in skills (Gomez et al., 2012)
3D motion analysis always performed like 2D
analysis as well as advanced motion analysis
technology with advance plate data. In 3D
analysis reflective markers are placed on the
subject and tracked with infrared camera to create
model of the athlete during the activity. 3D
analysis is the best way to visualize and track
progresses over time.
Drag flick is an attacking technique in the sports
of field hockey. Drag flick is known as the most
scoring technique in the field hockey, it is mainly
use in penalty corner. The drag flick is mostly use
by the men than women in penalty corner and its
more effective then pushes or hits during penalty
corner.
Approximately half of all goals have been scored
from the penalty corner. Direct hit and Drag flick
are two shooting style used for a direct shot on
goal from penalty corners set play. During direct
hit the ball must be played low around the
wooden area of the goal post, and the drag flick
in which the ball is allowed to be lifted at any
part of the goal post. Drag flick is the
combination of common flick and scoop stroke.
Drag flick is a very effective goal-scoring
weapon because ball mostly travels above the
level of the goalkeeper into the top corner of the
goal post with accuracy and speed. For the
analysis the drag flick can be broken into the four
phases: 1- preparation, 2- force generation, 3- ball
contact with the ball, and 4- follow through
phase.
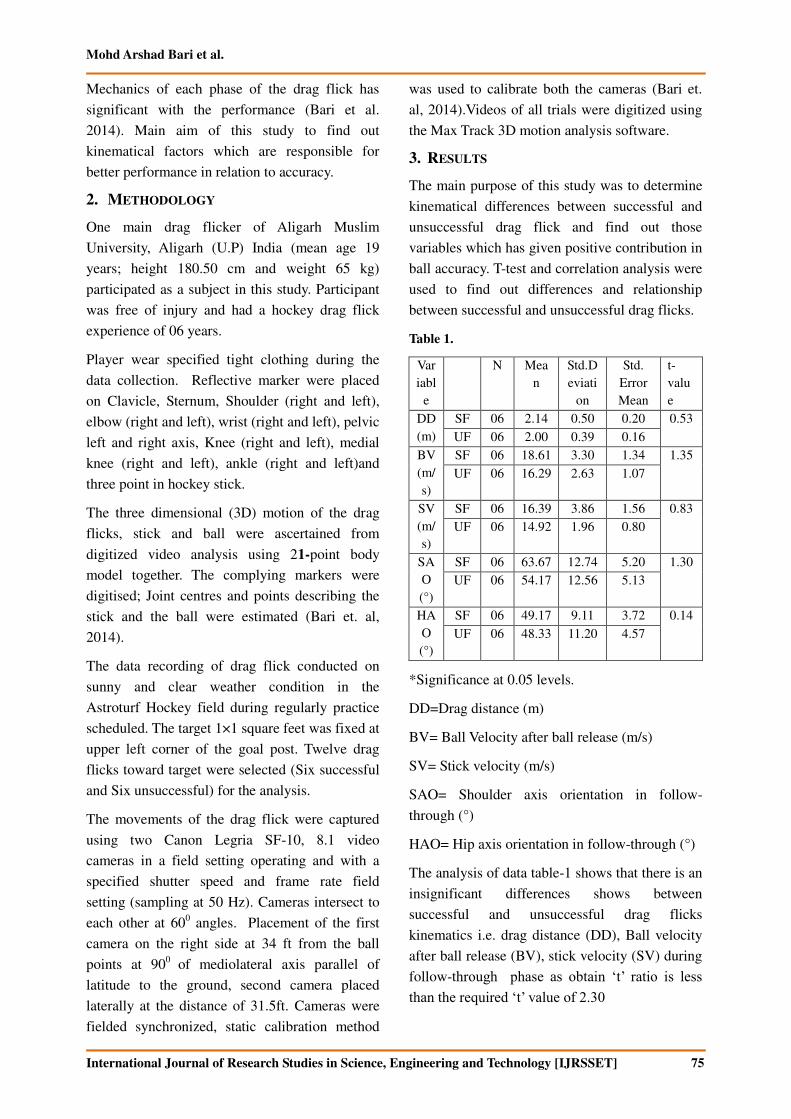
Mohd Arshad Bari et al.
International Journal of Research Studies in Science, Engineering and Technology [IJRSSET] 75
Mechanics of each phase of the drag flick has
significant with the performance (Bari et al.
2014). Main aim of this study to find out
kinematical factors which are responsible for
better performance in relation to accuracy.
2. METHODOLOGY
One main drag flicker of Aligarh Muslim
University, Aligarh (U.P) India (mean age 19
years; height 180.50 cm and weight 65 kg)
participated as a subject in this study. Participant
was free of injury and had a hockey drag flick
experience of 06 years.
Player wear specified tight clothing during the
data collection. Reflective marker were placed
on Clavicle, Sternum, Shoulder (right and left),
elbow (right and left), wrist (right and left), pelvic
left and right axis, Knee (right and left), medial
knee (right and left), ankle (right and left)and
three point in hockey stick.
The three dimensional (3D) motion of the drag
flicks, stick and ball were ascertained from
digitized video analysis using 21-point body
model together. The complying markers were
digitised; Joint centres and points describing the
stick and the ball were estimated (Bari et. al,
2014).
The data recording of drag flick conducted on
sunny and clear weather condition in the
Astroturf Hockey field during regularly practice
scheduled. The target 1×1 square feet was fixed at
upper left corner of the goal post. Twelve drag
flicks toward target were selected (Six successful
and Six unsuccessful) for the analysis.
The movements of the drag flick were captured
using two Canon Legria SF-10, 8.1 video
cameras in a field setting operating and with a
specified shutter speed and frame rate field
setting (sampling at 50 Hz). Cameras intersect to
each other at 600 angles. Placement of the first
camera on the right side at 34 ft from the ball
points at 900
of mediolateral axis parallel of
latitude to the ground, second camera placed
laterally at the distance of 31.5ft. Cameras were
fielded synchronized, static calibration method
was used to calibrate both the cameras (Bari et.
al, 2014).Videos of all trials were digitized using
the Max Track 3D motion analysis software.
3. RESULTS
The main purpose of this study was to determine
kinematical differences between successful and
unsuccessful drag flick and find out those
variables which has given positive contribution in
ball accuracy. T-test and correlation analysis were
used to find out differences and relationship
between successful and unsuccessful drag flicks.
Table 1.
Var
iabl
e
N Mea
n
Std.D
eviati
on
Std.
Error
Mean
t-
valu
e
DD
(m)
SF 06 2.14 0.50 0.20 0.53
UF 06 2.00 0.39 0.16
BV
(m/
s)
SF 06 18.61 3.30 1.34 1.35
UF 06 16.29 2.63 1.07
SV
(m/
s)
SF 06 16.39 3.86 1.56 0.83
UF 06 14.92 1.96 0.80
SA
O
(°)
SF 06 63.67 12.74 5.20 1.30
UF 06 54.17 12.56 5.13
HA
O
(°)
SF 06 49.17 9.11 3.72 0.14
UF 06 48.33 11.20 4.57
*Significance at 0.05 levels.
DD=Drag distance (m)
BV= Ball Velocity after ball release (m/s)
SV= Stick velocity (m/s)
SAO= Shoulder axis orientation in follow-
through (°)
HAO= Hip axis orientation in follow-through (°)
The analysis of data table-1 shows that there is an
insignificant differences shows between
successful and unsuccessful drag flicks
kinematics i.e. drag distance (DD), Ball velocity
after ball release (BV), stick velocity (SV) during
follow-through phase as obtain ‘t’ ratio is less than the required ‘t’ value of 2.30

Three Dimensional Analysis of Variation between Successful and Unsuccessful Drag flick Techniques in Field
Hockey
International Journal of Research Studies in Science, Engineering and Technology [IJRSSET] 76
Graph 1. Drage distance (m)
Graph 2. Ball and stick velocity (m/s)
Graph 3. shoulder and hip axis orientation (m/s)
Table 2. correlations
Subjects Dependent
variable
Predictors R
Successful Ball velocity
after ball
release
DD 0.52
SV 0.71
SAO -0.10
HAO 0.24
*Significance at 0.05 levels.
DD=Drag distance (m)
BV= Ball Velocity after ball release (m/s)
SV= Stick velocity (m/s)
SAO= Shoulder axis orientation in follow-through (°)
HAO= Hip axis orientation in follow-through (°)
The analysis of data table-2 shows that there were
no significant relationship between ball velocity
after release with Drag distance (DD),stick
velocity (SV), shoulder axis orientation (SAO)
and hip axis orientation (HAO) in follow through
phase during successful drag flick.
Table 3. correlations
Subjects Dependent
variable
Predictors R
Un-
Successful
Ball
velocity
after ball
release
DD 0.515
SV 0.858*
SAO 0.645
HAO 0.046
*Significance at 0.05 levels.
DD=Drag distance (m)
BV= Ball Velocity after ball release (m/s)
SV= Stick velocity (m/s)
SAO= Shoulder axis orientation in follow-through (°)
HAO= Hip axis orientation in follow-through (°)
The analysis of data table-3 shows that there is a
significant positive relationship between ball
velocity after release with stick velocity in follow
through phase. Whereas insignificance
relationship exit between ball velocities after ball
release with drag distance, shoulder axis
orientation and hip axis orientation in follow
through phase during unsuccessful drag flick.
4. DISCUSSION
The main purpose of this study was to find out
the kinematical differences in the drag-flick
pattern between successful and unsuccessful drag
flicks in order to render to the point selective
information for goalkeepers. Many researchers
have studied the kinetic and kinematical pattern
of the drag-flick technique, with the propose to
find the reminds for an optimum performance
(Subijana et al., 2010; Yusoff et al., 2008). In
addition, some research was focused on the
goalkeepers’ anticipation when facing a penalty corner (Canal-Bruland et al., 2010).
Result of this study has shown no significant
differences between successful and unsuccessful
drag-flick pattern depending on the direction of

Mohd Arshad Bari et al.
International Journal of Research Studies in Science, Engineering and Technology [IJRSSET] 77
the shot. Result of the study contradicts with the
result of (Gomez et al., 2012) as the direction of
the shot occurred before the dragging action of
the stick (Gomez et al., 2012).
The participants in the study by Gomez et al.,
2012 had more experience and skillful than the
participant in this study. They were skilled drag-
flickers, their patterns could have been more
consistent than the one described in the present
study. This may be a reason that no significant
differences were shown between successful and
unsuccessful drag-flick pattern.
Furthermore, there were no significant
differences between successful and unsuccessful
drag-flick patterns. Successful and unsuccessful
drag-flick patterns showed the same kinematic
sequence of drag distance (m), Ball Velocity after
ball release (m/s), Stick velocity (m/s), Shoulder
axis orientation in follow-through (%) and Hip
axis orientation in follow-through (%). This
kinematic sequence differed from that described
by Subijana et al. (2010), again with successful
drag flick where higher stick and ball velocity of
the stick preceded maximum shoulder axis
orientation in follow-through (%) and Hip axis
orientation in follow-through (%) as compare to
unsuccessful drag flick.
In this study, the drag-flicks shot in set target
showed lower ball velocities (18.61 ± 3.30 m/s
successful drag-flicks; 16.39 ± 2.63 m/s
unsuccessful drag-flicks) than in the study
by López de Subijana et al. (2010) with male
hockey players (21.9 ± 1.7 m/s) and female
hockey players (17.9 ± 1.7 m/s). These values
were also lower than those reported
by McLaughlin (1997) (19.1 to 21.9 m/s) and
Yusoff et al. (2008) (19.6 to 27.8 m/s). It was
noticeable that there were no significant
differences in ball velocities between successful
and unsuccessful drag-flicks, but successful drag
flick recorded higher mean ball velocity as
compare with unsuccessful drag flicks, so
velocity of ball were equally efficient to get
accuracy.
The drag distance successful and unsuccessful
drag flicks shows insignificant relationship with
ball velocity after ball release. Therefore the drag
distances of drag flick were 2.14 m (Successful)
and 2.00 m (unsuccessful) drag flick techniques.
Successful drag flick technique toward target had
greater mean drag distance as compare with
unsuccessful drag flick techniques.
Average drag distance was lower than the value
found for junior players by (Subhijana et. al,
2012) and elite and sub elite players by (Mc
laughem, 1997) . there was not a big difference
between the mean value of drag distance of
successful and unsuccessful drag flick.
Drag distance highly correlated with criterion ball
velocity. Additionally importance of create higher
ball velocity after release (Mc laughem, 1997).
These studies also supported with, the successful
drag flick techniques had greater ball velocity and
greater drag distance as compare with
unsuccessful drag flick (Gonez et al. 2012).
In successful drag flicks, drag distance, stick
velocity and hip axis orientation produced
insignificant positive contribution and shoulder
axis orientation insignificant negative
contribution on ball velocity after release.
Unsuccessful drag flicks, drag distance, and hip
axis and shoulder axis orientation insignificant
contribute in ball velocity after release. Therefore
stick velocity shows significant positive
contribution on ball velocity after release.
An accurate motor execution of the drag flick
techniques is essential to construct a proper
skilled of drag flick performance (Canal-Bruland
et al., 2010). Furthermore, in high-speed sports
such as drag flick in hockey, the speed of play
and ball velocity dictate that decisions must often
be made in advance of the action (Savelsbergh et
al., 2002).
There are little or no movement variations in the
individual technique of drag flick between
successful and unsuccessful drag flick. Some
movement’s variations are necessary to accommodate with experimental constraints in

Three Dimensional Analysis of Variation between Successful and Unsuccessful Drag flick Techniques in Field
Hockey
International Journal of Research Studies in Science, Engineering and Technology [IJRSSET] 78
successful and unsuccessful drag flick situations
(Beckmann et al., 2010).
ACKNOWLEDGEMENT
The authors would like to acknowledge the
cooperation of UGC-SAP (DRS-1) programme,
department of Physical Education, Aligarh
Muslim University, Aligarh.
REFERENCES
[1] Bari, M. A., Ansari, N. W., Ahmad, F., &
Hussain, I. (2014). Three Dimensional
Analysis of Drag-flick in The Field Hockey
of University Players. Advances in Physics
Theories and Applications, 29, 87-93.
[2] Beckmann H, Winkel C & Schollhorn WI.
(2010). Optimal range of variation in hockey
technique training, Int. J Sport Psychology,
41, 5–45.
[3] Canal-Bruland R, Van der Kamp J,
Arkesteijn M, Janssen RJ, Van Kesteren J &
Savelsbergh GJP. (2010).Visual search
behaviour in skilled field-hockey
goalkeepers. Int J Sport Psychol, 41, 327–339.
[4] Lopez de Subijana C, Juarez D, Mallo D &
Navarro E. (2010) Biomechanical analysis of
the penalty-corner drag-flick of elite male
and female hockey players. Sport Biomech,
9(2), 72–78.
[5] Maria Gomez, Cristina Lopez de Subijana,
Raquel Antonio & Enrique Navarro (2012).
Journal of Human Kinetics, 35, 27–33.
[6] McLaughlin P. (1997). Three-dimensional
biomechanical analysis of the hockey drag-
flick: full report.Belconnen, A.C.T.,
Australia: Australian Sports Commission.
[7] Savelsbergh GJP, Williams AM, Van der
Kamp J & Ward P. (2002). Visual search
anticipation and expertise in soccer
goalkeepers, J Sport Sci. 20, 279–287.
[8] Yusoff S, Hasan N & Wilson B. (2008).
Three-dimensional biomechanical analysis of
the hockey drag flick performed in
competition. ISN Bulletin, National Sport
Institute of Malaysia, 1(1), 35–43.
Advances in Physics Theories and Applications www.iiste.org
ISSN 2224-719X (Paper) ISSN 2225-0638 (Online)
Vol.29, 2014
87
Three Dimensional Analysis of Drag-flick in The Field Hockey of
University Players
Mohd Arshad Bari
Department of Physical Education, Aligarh Muslim University, Aligarh (U.P) 202002 India
Tel: +91-8439438134 E-mail [email protected]
Naushad Waheed Ansari (Corresponding author)
Department of Physical Education, Aligarh Muslim University, Aligarh (U.P) 202002 India
Tel: +91-98972288992 E-mail [email protected]
Fuzail Ahmad
Department of Physical Education, Aligarh Muslim University, Aligarh (U.P) 202002 India
Tel: +91-9634982713 E-mail [email protected]
Ikram Hussain
Department of Physical Education, Aligarh Muslim University, Aligarh (U.P) 202002 India
Tel: +91-9411465663 E-mail [email protected]
The authors would like to acknowledge the cooperation of UGC-SAP (DRS-I) Programme, Department
of Physical Education, Aligarh Muslim University, Aligarh
Abstract
The penalty corner one of the most important technique to score the goal in field hockey. The penalty corner
depends upon three different technical applications like push, stop and drag. Technical application of drag flick
in penalty corner covered maximum number of successful goal. The main aim of this study was to analyze
spatial and temporal kinematics in the drag flick of elite field hockey players. Two main drag flickers from
Aligarh Muslim University, Aligarh hockey team were selected as a subject for this study. The body weight,
Height and Age of each subject ware recorded subsequently Sub1=65 kg body weight, 180.50cm of height and 19
years of age and Sub2= 60 kg body weight, 167.00 cm of height and 19 years of age. A static calibration method
was used to capture drag flick by Two Cameras, sampling at 50 Hz. Six successful trials at target were selected
from each subject for the study. Videos of selected trials were digitized by the Max Track 3D motion analysis
software. The three dimensional (3D) motion was determined from digitized video analysis using 18-point body
model together. Results of this study shows that spatial / temporal variable between the players, there exist little
difference in stance width in ball contact phase, recommended that little or no difference exist in techniques
between both players.
Key points: spatial / temporal, kinematics, drag, digitized.
1. Introduction
The success of the penalty corners depend three main technical application i.e. pusher, stopper and drag flicker.
Out of the three , the drag flicker contribute the most in the success of goals scored that have come from the
penalty corner (Lees, 2002).
The most important scoring plays in the field hockey are the technique of penalty corner (Laird and Sunderland,
2003 and Pineiro, 2008). The drag-flick is used in the field hockey for shooting at goal with speed and desire
accuracy as it is more scoring than other techniques such as hits and pushes during the penalty corner (Yusoff et
al., 2008).
As per the rules book of hockey (FIH, 2009), there is no any set rules regarding the maximum and minimum
height of the ball when the first shot to score a goal is a push or a drag-flick. Sports scientist, have focused on
strike techniques in field hockey but a few have analysed the technical aspect of drag-flick (Yussoff et al., 2008),
Advances in Physics Theories and Applications www.iiste.org
ISSN 2224-719X (Paper) ISSN 2225-0638 (Online)
Vol.29, 2014
88
focus to analyzed biomechanical parameters in relation to the performance of the players.
Biomechanical analysis of the techniques have no any single definition, however it is scientifically agreed that
technique analysis depend on the way in which skills are executed, from all parameters of biomechanics
(Kinetics and kinematics) (O’Donoghue., 2010). Both Biomechanical studies were conducted a 2D or 3D motion
analysis based on videography with a set specified sampling frequency. Biomechanics of throwing and hitting
skills should be follow same pattern as drag flick in field hockey which aim to get higher speed and accuracy of
the free end (distal) segment at release. In these techniques, back to back segments reach their maximum speed
in the beginning of series with those utmost from the free end of the kinetic chain (Bartlett and Best, 1988).
Kinetics chain of segmental rotations of the pelvis, upper trunk, and stick occurred in the drag-flick (Hussain et.
all. 2012). Kerr and Ness (2006) found that the movement pattern of the push is a compounding of consecutive
and simultaneous segment rotations. Furthermore, during the drag-flick the major contribution to the ball
velocity were stance, stance width, the distance between ball and front foot, the beginning of double foot contact,
angular and linear velocity of different body segment at ball release (McLaughlin, 1997; Kerr and Ness, 2006).
The most of the previous researches have been conducted a 2D analysis, there is a dearth of research on the 3D
analysis of the drag flick in the field hockey. However no 3D biomechanical study of the drag-flick techniques
has been done in Indian players. Thus, the research has been proposed to carry out 3D analysis of elite
specialized drag flicker from Aligarh Muslim University, Aligah.
2. Methodology
2.1 Selection of Subjects
Two specialized right handed drag flickers are current member of Aligarh Muslim University male hockey team
has been selected as the subject. The measurements were recorded by using the standard equipment, which were
presently available at hand. The body weight of each subject ware recorded in kilogram Sub1=65 kg and Sub2=
60 kg by using weighing machine (including player’s kit, which was wearing during the videography session).
Heights of each subject were recorded in centimeter (Sub1=180.50cm and Sub2=167.00 cm) by using stadiometer
and age of both subjects were 19 years measured in chronological order.
2.2 Filming Procedure:
The film recording conducted on sunny and clear weather in the Astroturf Hockey field during regularly
scheduled practice session. Subjects instructed to wear complete specified kit in order to perform successful drag
flick requirement of the study. The target 1"×1" square fixed at upper left corner of the goal post. 06 successful
drag flicks toward target of each drag flicker were selected for the analysis.
2.3 Variables: Kinematic / temporal variables, determined from the digitized 3D data, were used to describe five
(04) key positions (a) approach(From to the last left foot contact before ball pick up) (b) ball Contact (c) drag
Phase (From left foot contact to ball release) and (d) follow throw (From ball release to end of recovery) during
drag flick.
2.4 Model of Dreg Arm
The dreg arm was modeled as two segment kinetic chain composed of (a) upper arm segment and (b) distal
segment that include the forearm, hand and hockey stick. The distal segment was assumed to be a rigid body
with its longitudinal axis led along the longitudinal axis of the forearm
2.5 Videographic Equipments and Location
The subject’s drag flick movements were recorded using two Canon Legria SF-10, 8.1 video cameras in a field
setting, operating with a specified shutter speed and frame rate. The cameras were set-up on a rigid tripod and
secured to the floor in the location. The drag-flicks recorded with two cameras, sampling at 50 Hz. Both cameras
intersect to each other at 600 angles. First camera place right side 34 ft from the ball points at 90
0 of mediolateral
axis parallel to the ground, second camera placed laterally at the distance of 31.5ft and cameras were fielded
synchronized, static calibration method was used to calibrate both the cameras.
Videos of all trials were digitized using the Max Track 3D motion analysis software. Digitization was done from

Advances in Physics Theories and Applications www.iiste.org
ISSN 2224-719X (Paper) ISSN 2225-0638 (Online)
Vol.29, 2014
89
right foot contact with the ground to eight frames after the ball leaving the stick.
The 3D motion of the drag flicker, stick and ball were determined from digitized video analysis using 18-point
body model together. The following points were digitised; Joint centers and points describing the stick and the
ball were estimated.
3. Results
The main purpose of this study was to determine kinematical differences between two best drag flickers of
Aligarh Muslim University, Aligarh and find out those variables which is given positive contribution in ball
speed. If a common intersegment coordinative pattern existed between drag flickers, with the hopes of being able
to make drag flick look the same kinetics. T-test and regression analysis were used to find out differences and
relationship between drag flickers.
The analysis of data table-1 that there is an insignificant differences exist between both drag flicker in distance of
left foot from ball (DLB1) and stick velocity (SV1) during approach phase as obtain ‘t’ ratio is less than the
required ‘t’ value of 2.30
The analysis of data table-2 that there is a significant differences find between drag flicker in stance width (SW2)
during ball contact phase as obtain‘t’ ratio is greater than the required ‘t’ value of 2.30. Whereas no significance
differences were found in the distance of right foot from ball (DLB2), stick velocity (SV2), shoulder axis
orientation (SAO2) and hip axis orientation (HAO2) exist between drag flicker during ball contact phase.
The analysis of data table-3 that there is no significant differences were found between both drag flicker in drag
distance (DD), left knee angle (LKA), stick velocity (SV3), shoulder axis orientation (SAO3) and hip axis
orientation (HAO3) during drag phase as obtain‘t’ ratio is lesser than the required ‘t’ value of 2.30.
The analysis of data table-4 that there is no significant differences exist between both university drag flicker in
ball velocity (BV), stick velocity (SV4), shoulder axis orientation (SAO4) and hip axis orientation (HAO4) during
drag phase as obtain‘t’ ratio is lesser than the required ‘t’ value of 2.30.
The analysis of data table-5 that there is a significant relationship exist ball velocity after release with stick
velocity final phase in both drag flickers. Whereas insignificance relationship exit ball velocity after ball release
with drag distance, shoulder axis orientation and hip axis orientation in follow through phase.
4. Discussions
The technique analysis of drag flick in field hockey had aim to find out the biomechanical variation in
techniques between two best drag flicker of Aligarh Muslim University hockey players. Results of this study
show that, insignificantly differences exist in plantation of left foot behind the ball and stick velocity of between
hockey players during approach. Plantation of left foot behind the ball play significant role in different aspect of
drag flick like: it will demand of the flicker to reach behind the ball properly, force generation, it required to
adjust body properly further will then the ball will be dragged over a greater distance (Subijana et al., 2011 and
2012) and to attain peak angular velocity of the sticks.
In ball Contact Phase significant differences exist between both drag flickers in stance width. In which the
flicker average stance width subsequently are Sub1=1.42m and Sub2= 1.77m. Player Sub1 was fulfilled the
mostly criteria of international level athlete, reported as 1.42m (McLaughlin., 1997), 1.49m, 1.55m (Lopez de
Subijana et al., 2010) and 1.51m (Lopez de Subijana et al., 2011). Player Sub2 had greater stance width as
compare to Sub1 and reported studies. The variation in stance width may be due to anthropometrical difference
exist between the athlete (Hussain et al., 2012). this extremely wide stance width enable the drag flicker to get
the low hip and provided large distance of ball could be accelerate toward the target (Yusoff et al. 2002).
In drag phase insignificant differences exist between drag flicker players in drag distance, left knee angle, stick
velocity during drag, shoulder axis orientation and hip axis orientation. As left foot contact with ground the ball
has been dragged with hockey stick toward the target by the total drag distance mean consequently Sub1=2.30m
and Sub2=2.33m with greater drag distance directly associated with greater resultant ball velocity (Yusoff et al.
2002). These statements support the result of this study as both players had insignificant differences in drag
distance and resultant ball velocity.
In follow-through phase insignificant differences exist between both university players in ball velocity, stick
velocity, shoulder axis orientation and hip axis orientation. Ball velocity at ball release mean range between drag

Advances in Physics Theories and Applications www.iiste.org
ISSN 2224-719X (Paper) ISSN 2225-0638 (Online)
Vol.29, 2014
90
flickers is 18.09 – 21.39 m/s. Highest ball velocity play significant contribution in scoring of goal. When ball
travelled toward the target with greater speed, the goal keeper has little time to change our body position to safe
the goal (Yusoff et al. 2002).
Both drag flicker ball velocity after the ball release has significant positive correlated with stick velocity in final
phase. Sub1 and Sub2 stick velocity in final phase has 77% and 92% subsequently contribute on ball velocity
after ball release. Highest stick velocity help to generate greater momentum force and greater stick velocity both
are directly associated with resultant ball velocity (Bartlet, 2007). The player Sub1: Drag distance and shoulder
axis orientation has insignificant positive relationship and hip axis orientation has insignificant negative
relationship with ball velocity. Player Sub2: Drag distance, shoulder axis orientation and hip axis orientation in
follow through phase has insignificant positive relation with ball velocity. Finally, the drag flicker of Aligarh
Muslim University had a greater stance, long drag, and proper leg flexed than previous study reported by
(Bartlett, 2012, Nichol, 2005, and Mosquera et al, 2007) indicate approximately good technique. When
comparing biomechanical variable between the players, there exist little difference in stance width in ball contact
phase, recommended that little or no difference exist in techniques between both players.
References
1. Hussain I. Ahmed S. and Khan S. (2012), Biomechanical Study on Drag Flick in Field Hockey, International
journal of behavioral social and movement sciences, vol.01,july2012, issue03..
2. Bartlett, R. (2007). Introduction to Sports Biomechanics. Abingdon: Routledge.
3. Bartlett, R. (2012). Quantitative and qualitative analysis. In Encyclopaedia of International Sports
Studies (Ed. R. Bartlett, C. Graton and C.G. Rolf), pp. 1115-1116. London: Routledge.
4. Laird, P. and Sutherland, P. (2003). Penalty Corners in Field Hockey: A guide to success.International
Journal of Performance Analysis in Sport, 3(1), 19-26.
5. Lees, A. (2002). Technique analysis in sports: a critical review. Journal of Sports Sciences, 20, 813-828.
6. López de Subijana, C.L., Juárez, D., Mallo, J. and Navarro, E. (2010). Biomechanical analysis of the
penalty-corner drag-flick of elite male and female hockey players. Sports Biomechanics, 9(2), 72-78.
7. López de Subijana, C.L., Juárez, D., Mallo, J. and Navarro, E. (2011). The application of biomechanics to
penalty corner drag-flick training: a case study. Journal of Sports Science and Medicine, 10, 590-595.
8. López de Subijana Hernández, C., de Antonio, R., Frutos, P.G. and Cabello, E.N. (2011). Anàlisi de la
cadena cinemàtica del drag-flick. Educació Fisica i Esportes, 104(2), 106-113.
9. López de Subijana, C.L., Gómez, M., Martín-Casadom L. and Navarro, E. (2012). Training induced changes
in drag-flick technique in female field hockey players. Biology of Sport, 29(4), 263-268.
10. McLaughlin, P. (1997). Three-dimensional biomechanical analysis of the hockey drag flick: full report.
Belconnen, A.C.T.; Australia: Australian Sports Commission.
11. Mosquera, R. P., Molinuevo, J. S., and Roman, I. R. (2007). Differences between international men’s and
women’s teams in the strategic action of the penalty corner in field hockey. International Journal of
Performance Analysis of Sport, 7(3), 67-83.
12. Nichol, G. (2005). Goal scoring including the drag flick. Available
at: https://www.google.co.uk/url?sa=t&rct=j&q=&esrc=s&source=web&cd=1&ved=0CDUQFjAA&url=htt
p%3A%2F%2Fwww.sportingpulse.com%2Fget_file.cgi%3Fid%3D1947175&ei=Tyg7UaWqL5Lo7AbiwY
CICw&usg=AFQjCNHrZ7oepeGcCMfOd3P-uqWtEYSnXA&bvm=bv.43287494,d.ZGU (Accessed: 9
March 2013).
13. O’Donoghue, P. (2010). Research Methods for Sports Performance Analysis. London: Routledge.
14. Yusoff, S., Hasan, N. and Wilson, B. (2008) Tree-dimensional biomechanical analysis of the hockey drag
flick performed in competition. ISN Bulletin, National Sport Institute of Malaysia 1, 35-43.
15. Bartlett, R. M., and Best, R. J. (1988). The biomechanics of javelin throwing: A review. Journal of Sport
Sciences, 6(1), 1-38.
16. Kerr, R., and Ness, K. (2006). Kinematics of the field hockey penalty corner push-in. Sports Biomechanics,
5 (1), 47-61.

Advances in Physics Theories and Applications www.iiste.org
ISSN 2224-719X (Paper) ISSN 2225-0638 (Online)
Vol.29, 2014
91
Table:01 Approach (From to the last left foot contact before ball pick up)
Variables Subjects Sub1 Sub2 t- value
DLB1 Mean 0.17 0.40 1.01
SD 0.02 0.54
SV1 Mean 0.80 0.86 0.14
SD 0.24 0.17
DLB 1= Distance of left foot from ball in approach (m).
SV1= Stick velocity in approach (m/s)
Table:02 Ball Contact
Variables Subjects Sub1 Sub2 t- value
DLB 2 Mean 0.47 0.62 2.05
SD 0.08 0.16
SW2 Mean 1.42 1.77 2.89*
SD 0.08 0.29
SV2 Mean 1.46 1.50 0.21
SD 0.36 0.31
SAO2 Mean -5.33 -5.16 0.08
SD 4.03 3.19
HAO2 Mean -5.33 -5.17 0.64
SD 4.03 3.19
Tab t.0.05
(10) =2.30 *Significance at 0.05 levels.
DLB2= Distance of right foot from ball in ball contact phase (m)
SW2= Stance width in ball contact phase (m)
SV2= Stick velocity in ball contact phase (m/s)
SAO2= Shoulder axis orientation in ball contact phase
HAO2= Hip axis orientation in ball contact phase
Table: 03 Drag Phase
Variables Subjects Sub1 Sub2 t- value
DD Mean 2.30 2.33 0.10
SD 0.52 0.48
LKA Mean 113.83 117.83 0.59
SD 10.74 12.62
SV3 Mean 6.99 6.93 0.00
SD 1.53 1.47
SAO3 Mean -2.83 -6.83 1.79
SD 2.93 4.62
HAO3 Mean 25.50 25.83 0.07
SD 8.36 9.13
DD= Drag distance
LKA= Left knee angle
SV3= Stick velocity in drag phase
SAO3= Shoulder axis orientation in drag phase
HAO3= Hip axis orientation in drag phase

Advances in Physics Theories and Applications www.iiste.org
ISSN 2224-719X (Paper) ISSN 2225-0638 (Online)
Vol.29, 2014
92
Table: 04 Follow- through Variables Subjects Sub1 Sub2 t- value
BV Mean 21.39 18.09 1.40
SD 4.41 3.73
SV4 Mean 18.91 15.39 1.55
SD 3.83 4.04
SAO4 Mean 63.83 67.67 0.67
SD 11.44 8.16
HAO4 Mean 51.50 51.83 0.06
SD 10.21 10.42
BV= Ball velocity
SV4=Drag distance in follow-through
SAO4= Shoulder axis orientation in follow-through
HAO4= Hip axis orientation in follow-through
Table: 5 Regressions
Subjects Dependent
variable
Predictors R R Square Adjusted R Square
Sub1 Ball velocity
after ball release
SV4 0.85* 0.77 0.65
DD 0.45 0.21 0.01
SAO4 0.00 0.00 -0.25
HAO4 -0.16 0.02 -0.22
Sub2 Ball velocity
after ball release
SV4 0.96* 0.92 0.90
DD 0.30 0.09 -0.14
SAO4 0.62 0.38 0.23
HAO4 0.49 0.23 0.05 *Significance at 0.05 levels.
SV4= Stick velocity
DD=Drag distance
SAO4= Shoulder axis orientation in follow-through
HAO4= Hip axis orientation in follow-through
Figure 01- Drag flick Phase from ground contact to ball release.

Advances in Physics Theories and Applications www.iiste.org
ISSN 2224-719X (Paper) ISSN 2225-0638 (Online)
Vol.29, 2014
93
Subject: Sub1 Subject: Sub2
Figure 02- Stick figure whole drag phase:
Graph 01: Stick velocity m/s Phase by phase
Sub1 Sub2
Graph 02 : ( Hockey and Ball ) velocity v/s time graph

International Journal of Research Studies in Science, Engineering and Technology [IJRSSET]
Volume 1, Issue 2, May 2014, PP 74-78
©IJRSSET 74
Three Dimensional Analysis of Variation between Successful and
Unsuccessful Drag flick Techniques in Field Hockey
Mohd Arshad Bari, Naushad Waheed Ansari,
Ikram Hussain , Fuzail Ahmad, Mansoor Ali Khan,
Department of Physical Education Aligarh Muslim University, Aligarh, 202002, (U.P) India
[email protected] [email protected]
Abstract: Three dimensional Biomechanical Analyses of drag flick techniques in hockey is the best way to
determine different mechanical parameter of the performance. The focus of this study was to analysed kinematical
differences between successful and unsuccessful drag flick and find out those parameters which is given convinced
contribution in the accuracy. For this study one (01) main drag flicker from Aligarh Muslim University, Aligarh
(U.P) India (mean age 19 years; height 180.50 cm and weight 65 kg) was selected as a subject. The movements of
the drag flick techniques were recorded with two Canon video cameras. Trials were digitized by the Max Track 3D
motion analysis software. The result of this study shows that there are little or no movement variations in the
individual technique of drag flick.
Keywords: Drag, Kinematical, Three Dimensional, Motion analysis, performance
1. INTRODUCTION
Technique of biomechanical analysis is the best
way to find out the key mechanical factors of
performance. Biomechanical analysis is not
limited for the few sports; it is well versed in
testing specific skills in open sports. For example,
serve in tennis, Bowling and throwing in cricket,
shooting in basketball, drag flick in hockey; these
are the few examples of open sports for the
biomechanical analysis to find out the factors
responsible in skills (Gomez et al., 2012)
3D motion analysis always performed like 2D
analysis as well as advanced motion analysis
technology with advance plate data. In 3D
analysis reflective markers are placed on the
subject and tracked with infrared camera to create
model of the athlete during the activity. 3D
analysis is the best way to visualize and track
progresses over time.
Drag flick is an attacking technique in the sports
of field hockey. Drag flick is known as the most
scoring technique in the field hockey, it is mainly
use in penalty corner. The drag flick is mostly use
by the men than women in penalty corner and its
more effective then pushes or hits during penalty
corner.
Approximately half of all goals have been scored
from the penalty corner. Direct hit and Drag flick
are two shooting style used for a direct shot on
goal from penalty corners set play. During direct
hit the ball must be played low around the
wooden area of the goal post, and the drag flick
in which the ball is allowed to be lifted at any
part of the goal post. Drag flick is the
combination of common flick and scoop stroke.
Drag flick is a very effective goal-scoring
weapon because ball mostly travels above the
level of the goalkeeper into the top corner of the
goal post with accuracy and speed. For the
analysis the drag flick can be broken into the four
phases: 1- preparation, 2- force generation, 3- ball
contact with the ball, and 4- follow through
phase.

Mohd Arshad Bari et al.
International Journal of Research Studies in Science, Engineering and Technology [IJRSSET] 75
Mechanics of each phase of the drag flick has
significant with the performance (Bari et al.
2014). Main aim of this study to find out
kinematical factors which are responsible for
better performance in relation to accuracy.
2. METHODOLOGY
One main drag flicker of Aligarh Muslim
University, Aligarh (U.P) India (mean age 19
years; height 180.50 cm and weight 65 kg)
participated as a subject in this study. Participant
was free of injury and had a hockey drag flick
experience of 06 years.
Player wear specified tight clothing during the
data collection. Reflective marker were placed
on Clavicle, Sternum, Shoulder (right and left),
elbow (right and left), wrist (right and left), pelvic
left and right axis, Knee (right and left), medial
knee (right and left), ankle (right and left)and
three point in hockey stick.
The three dimensional (3D) motion of the drag
flicks, stick and ball were ascertained from
digitized video analysis using 21-point body
model together. The complying markers were
digitised; Joint centres and points describing the
stick and the ball were estimated (Bari et. al,
2014).
The data recording of drag flick conducted on
sunny and clear weather condition in the
Astroturf Hockey field during regularly practice
scheduled. The target 1×1 square feet was fixed at
upper left corner of the goal post. Twelve drag
flicks toward target were selected (Six successful
and Six unsuccessful) for the analysis.
The movements of the drag flick were captured
using two Canon Legria SF-10, 8.1 video
cameras in a field setting operating and with a
specified shutter speed and frame rate field
setting (sampling at 50 Hz). Cameras intersect to
each other at 600 angles. Placement of the first
camera on the right side at 34 ft from the ball
points at 900
of mediolateral axis parallel of
latitude to the ground, second camera placed
laterally at the distance of 31.5ft. Cameras were
fielded synchronized, static calibration method
was used to calibrate both the cameras (Bari et.
al, 2014).Videos of all trials were digitized using
the Max Track 3D motion analysis software.
3. RESULTS
The main purpose of this study was to determine
kinematical differences between successful and
unsuccessful drag flick and find out those
variables which has given positive contribution in
ball accuracy. T-test and correlation analysis were
used to find out differences and relationship
between successful and unsuccessful drag flicks.
Table 1.
Var
iabl
e
N Mea
n
Std.D
eviati
on
Std.
Error
Mean
t-
valu
e
DD
(m)
SF 06 2.14 0.50 0.20 0.53
UF 06 2.00 0.39 0.16
BV
(m/
s)
SF 06 18.61 3.30 1.34 1.35
UF 06 16.29 2.63 1.07
SV
(m/
s)
SF 06 16.39 3.86 1.56 0.83
UF 06 14.92 1.96 0.80
SA
O
(°)
SF 06 63.67 12.74 5.20 1.30
UF 06 54.17 12.56 5.13
HA
O
(°)
SF 06 49.17 9.11 3.72 0.14
UF 06 48.33 11.20 4.57
*Significance at 0.05 levels.
DD=Drag distance (m)
BV= Ball Velocity after ball release (m/s)
SV= Stick velocity (m/s)
SAO= Shoulder axis orientation in follow-
through (°)
HAO= Hip axis orientation in follow-through (°)
The analysis of data table-1 shows that there is an
insignificant differences shows between
successful and unsuccessful drag flicks
kinematics i.e. drag distance (DD), Ball velocity
after ball release (BV), stick velocity (SV) during
follow-through phase as obtain ‘t’ ratio is less than the required ‘t’ value of 2.30
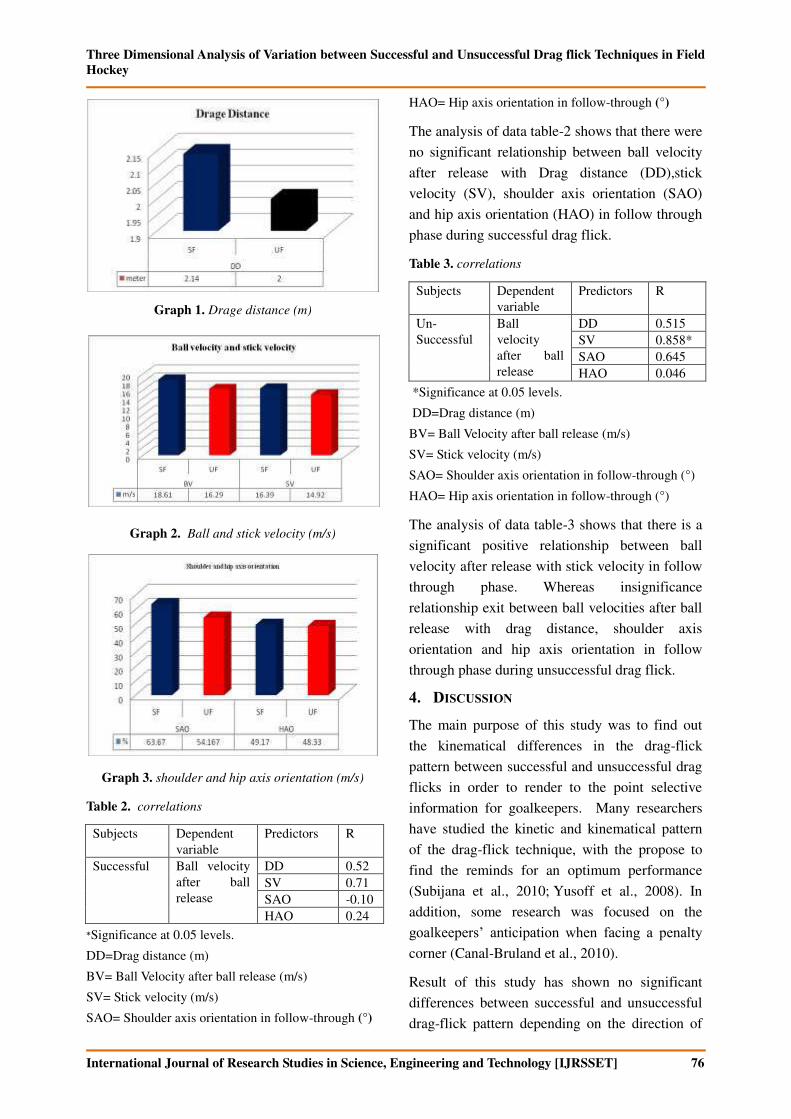
Three Dimensional Analysis of Variation between Successful and Unsuccessful Drag flick Techniques in Field
Hockey
International Journal of Research Studies in Science, Engineering and Technology [IJRSSET] 76
Graph 1. Drage distance (m)
Graph 2. Ball and stick velocity (m/s)
Graph 3. shoulder and hip axis orientation (m/s)
Table 2. correlations
Subjects Dependent
variable
Predictors R
Successful Ball velocity
after ball
release
DD 0.52
SV 0.71
SAO -0.10
HAO 0.24
*Significance at 0.05 levels.
DD=Drag distance (m)
BV= Ball Velocity after ball release (m/s)
SV= Stick velocity (m/s)
SAO= Shoulder axis orientation in follow-through (°)
HAO= Hip axis orientation in follow-through (°)
The analysis of data table-2 shows that there were
no significant relationship between ball velocity
after release with Drag distance (DD),stick
velocity (SV), shoulder axis orientation (SAO)
and hip axis orientation (HAO) in follow through
phase during successful drag flick.
Table 3. correlations
Subjects Dependent
variable
Predictors R
Un-
Successful
Ball
velocity
after ball
release
DD 0.515
SV 0.858*
SAO 0.645
HAO 0.046
*Significance at 0.05 levels.
DD=Drag distance (m)
BV= Ball Velocity after ball release (m/s)
SV= Stick velocity (m/s)
SAO= Shoulder axis orientation in follow-through (°)
HAO= Hip axis orientation in follow-through (°)
The analysis of data table-3 shows that there is a
significant positive relationship between ball
velocity after release with stick velocity in follow
through phase. Whereas insignificance
relationship exit between ball velocities after ball
release with drag distance, shoulder axis
orientation and hip axis orientation in follow
through phase during unsuccessful drag flick.
4. DISCUSSION
The main purpose of this study was to find out
the kinematical differences in the drag-flick
pattern between successful and unsuccessful drag
flicks in order to render to the point selective
information for goalkeepers. Many researchers
have studied the kinetic and kinematical pattern
of the drag-flick technique, with the propose to
find the reminds for an optimum performance
(Subijana et al., 2010; Yusoff et al., 2008). In
addition, some research was focused on the
goalkeepers’ anticipation when facing a penalty corner (Canal-Bruland et al., 2010).
Result of this study has shown no significant
differences between successful and unsuccessful
drag-flick pattern depending on the direction of
Mohd Arshad Bari et al.
International Journal of Research Studies in Science, Engineering and Technology [IJRSSET] 77
the shot. Result of the study contradicts with the
result of (Gomez et al., 2012) as the direction of
the shot occurred before the dragging action of
the stick (Gomez et al., 2012).
The participants in the study by Gomez et al.,
2012 had more experience and skillful than the
participant in this study. They were skilled drag-
flickers, their patterns could have been more
consistent than the one described in the present
study. This may be a reason that no significant
differences were shown between successful and
unsuccessful drag-flick pattern.
Furthermore, there were no significant
differences between successful and unsuccessful
drag-flick patterns. Successful and unsuccessful
drag-flick patterns showed the same kinematic
sequence of drag distance (m), Ball Velocity after
ball release (m/s), Stick velocity (m/s), Shoulder
axis orientation in follow-through (%) and Hip
axis orientation in follow-through (%). This
kinematic sequence differed from that described
by Subijana et al. (2010), again with successful
drag flick where higher stick and ball velocity of
the stick preceded maximum shoulder axis
orientation in follow-through (%) and Hip axis
orientation in follow-through (%) as compare to
unsuccessful drag flick.
In this study, the drag-flicks shot in set target
showed lower ball velocities (18.61 ± 3.30 m/s
successful drag-flicks; 16.39 ± 2.63 m/s
unsuccessful drag-flicks) than in the study
by López de Subijana et al. (2010) with male
hockey players (21.9 ± 1.7 m/s) and female
hockey players (17.9 ± 1.7 m/s). These values
were also lower than those reported
by McLaughlin (1997) (19.1 to 21.9 m/s) and
Yusoff et al. (2008) (19.6 to 27.8 m/s). It was
noticeable that there were no significant
differences in ball velocities between successful
and unsuccessful drag-flicks, but successful drag
flick recorded higher mean ball velocity as
compare with unsuccessful drag flicks, so
velocity of ball were equally efficient to get
accuracy.
The drag distance successful and unsuccessful
drag flicks shows insignificant relationship with
ball velocity after ball release. Therefore the drag
distances of drag flick were 2.14 m (Successful)
and 2.00 m (unsuccessful) drag flick techniques.
Successful drag flick technique toward target had
greater mean drag distance as compare with
unsuccessful drag flick techniques.
Average drag distance was lower than the value
found for junior players by (Subhijana et. al,
2012) and elite and sub elite players by (Mc
laughem, 1997) . there was not a big difference
between the mean value of drag distance of
successful and unsuccessful drag flick.
Drag distance highly correlated with criterion ball
velocity. Additionally importance of create higher
ball velocity after release (Mc laughem, 1997).
These studies also supported with, the successful
drag flick techniques had greater ball velocity and
greater drag distance as compare with
unsuccessful drag flick (Gonez et al. 2012).
In successful drag flicks, drag distance, stick
velocity and hip axis orientation produced
insignificant positive contribution and shoulder
axis orientation insignificant negative
contribution on ball velocity after release.
Unsuccessful drag flicks, drag distance, and hip
axis and shoulder axis orientation insignificant
contribute in ball velocity after release. Therefore
stick velocity shows significant positive
contribution on ball velocity after release.
An accurate motor execution of the drag flick
techniques is essential to construct a proper
skilled of drag flick performance (Canal-Bruland
et al., 2010). Furthermore, in high-speed sports
such as drag flick in hockey, the speed of play
and ball velocity dictate that decisions must often
be made in advance of the action (Savelsbergh et
al., 2002).
There are little or no movement variations in the
individual technique of drag flick between
successful and unsuccessful drag flick. Some
movement’s variations are necessary to accommodate with experimental constraints in

Three Dimensional Analysis of Variation between Successful and Unsuccessful Drag flick Techniques in Field
Hockey
International Journal of Research Studies in Science, Engineering and Technology [IJRSSET] 78
successful and unsuccessful drag flick situations
(Beckmann et al., 2010).
ACKNOWLEDGEMENT
The authors would like to acknowledge the
cooperation of UGC-SAP (DRS-1) programme,
department of Physical Education, Aligarh
Muslim University, Aligarh.
REFERENCES
[1] Bari, M. A., Ansari, N. W., Ahmad, F., &
Hussain, I. (2014). Three Dimensional
Analysis of Drag-flick in The Field Hockey
of University Players. Advances in Physics
Theories and Applications, 29, 87-93.
[2] Beckmann H, Winkel C & Schollhorn WI.
(2010). Optimal range of variation in hockey
technique training, Int. J Sport Psychology,
41, 5–45.
[3] Canal-Bruland R, Van der Kamp J,
Arkesteijn M, Janssen RJ, Van Kesteren J &
Savelsbergh GJP. (2010).Visual search
behaviour in skilled field-hockey
goalkeepers. Int J Sport Psychol, 41, 327–339.
[4] Lopez de Subijana C, Juarez D, Mallo D &
Navarro E. (2010) Biomechanical analysis of
the penalty-corner drag-flick of elite male
and female hockey players. Sport Biomech,
9(2), 72–78.
[5] Maria Gomez, Cristina Lopez de Subijana,
Raquel Antonio & Enrique Navarro (2012).
Journal of Human Kinetics, 35, 27–33.
[6] McLaughlin P. (1997). Three-dimensional
biomechanical analysis of the hockey drag-
flick: full report.Belconnen, A.C.T.,
Australia: Australian Sports Commission.
[7] Savelsbergh GJP, Williams AM, Van der
Kamp J & Ward P. (2002). Visual search
anticipation and expertise in soccer
goalkeepers, J Sport Sci. 20, 279–287.
[8] Yusoff S, Hasan N & Wilson B. (2008).
Three-dimensional biomechanical analysis of
the hockey drag flick performed in
competition. ISN Bulletin, National Sport
Institute of Malaysia, 1(1), 35–43.

www.scholarsresearchlibrary.comt Available online a
Scholars Research Library
Annals of Biological Research, 2014, 5 (4):62-67 (http://scholarsresearchlibrary.com/archive.html)
ISSN 0976-1233
CODEN (USA): ABRNBW
62
Scholars Research Library
Biomechanical analysis of force production during under-arm
throwing techniques in cricket
Syed Ibrahim1, Mohammed Arshad Bari
2 and Ikram Hussain
2
1Physical Education Department, King Fahd University of Petroleum and Minerals, Dhahran, KSA
2Department of Physical Education, Aligarh Muslim University, Aligarh (U.P) India
_____________________________________________________________________________________________
ABSTRACT
10 cricketers representing Aligarh University in the North-Zone inter university cricket tournament were selected as
subjects for this study. The subjects were asked to make under-arm throws from marked spot at 900 angle from the
stump/target situated at a distance of 10 m. All the subjects were instructed to follow to take first step run with
approach angles (1800). Successful throws were selected on the basis of experts rating and qualitative analysis. The
variable analyzed were velocity, acceleration, force and the angle of the wrist joint to that of the force model when
under arm throws were made. The subject’s under arm throwing movements were recorded using Canon Legria SF-
10, 8.1 Mp video camera in a field setting operating at a nominal frame rate of 50 Hz and with shutter speed of
1/2000 s and at 60fps camera in a field setting. The camera was set-up on a rigid tripod and secured to the floor in
the location. From that, the data for velocity, acceleration, angle of wrist and distance when throwing were asserted.
The data was subjected to Biomechanical analysis with the application of Silicon Coach Pro-7 and Statistical
Package for the Social Sciences (SPSS-18). The equation that related with the variables was identified according to
the result from SPSS-18 table of summary for regression model, ANOVA of regression model and coefficient of
regression model for each variable. This study will help the cricket teams to create and determine the best and
possible solution to enhance their throwing skills.
Keywords: Biomechanics, kinematics, acceleration, velocity, angle, force
_____________________________________________________________________________________________
INTRODUCTION
Throwing is a fundamental movement skill that forms the cornerstone of many games and the development of this
skill could be of paramount importance for some athletes [7]. Not only appropriate physical movements are
important in ball throwing, but proper sense also plays an important role. In the technique of under arm throwing a
thrower must be able to execute the skill accurately. The numerous aspects of throwing make it a complex skill to
gain expertise, and therefore generally follow different predictable stages. The theoretical concept have conclusively
defines that elite sportsmen of skilled levels exhibit mechanical variability.
The biomechanical analysis of throwing technique is the response to full fill existential vacuum, refinement, and
stabilization of the game and sports arising in the competitive sporting world to the changing demand at the
international level of competition where a minute variation may result in win or loss. Every nation is backing their
sports person with biomechanical researches to accomplish the much needed fillip to climb higher ladder of
performance [5].
The developing countries have incorporated changes according to the demand and thus superseded the global level
of performance. In this context the game cricket also needs support from researchers to identify variation and
variables to steer their performance and optimize it to greater heights. The objective of the present investigation was

Syed Ibrahim et al Annals of Biological Research, 2014, 5 (4):62-67
______________________________________________________________________________
63
Scholars Research Library
to produce vital information on the segment interaction and force production during under arm throwing technique,
which in turn would permit a better understanding of the factor that affect the motion of the throwing arm during
under arm cricket ball throwing. Hence, the present research has been under taken to find out under arm throwing
techniques in relation to biomechanical aspect of high skilled cricket players.
MATERIALS AND METHODS
2.1 The Subjects:
Ten (10) cricket players of Intervarsity level participated in this study, with mean age (21.90± 3.63), height (171±
4.50) and weight (60.30± 7.17). All the selected players had readily agreed and volunteered to act as subject for the
study.
2.2 Selection of trails:
The subject had taken under-arm throws from marked spot at 900 angle from the stump/target situated at a distance
of 10 m. They had been instructed to follow approach angles (1800) selected for research purpose. Each thrower
performed 03 accurate throws with 1800 angle of approaches from 10 mts. throwing distance. The best throw among
the 03 was selected on the basis of expert rating through qualitative analysis.
2.3 Videography Techniques:
The video graphic technique was further organized into two sections in the following manner:
(i) Video Graphic Equipment and Location
(ii) Subject and Trail Identification
2.3.1 Vediographic Equipment and Location:
The subject’s throwing motion were recorded using Canon SF-10, 8.1 Mp video camera in a field setting with a
shutter speed of 1/2000 s and at 60fps camera in a field setting. The camera was set-up on a rigid tripod and
secured to the floor in the location.The camera was positioned perpendicular to the sagittal plane and parallel to the
Medio lateral axis (camera optical axes perpendicular on the sagittal plane) as their throwing arm giving
approximately 90o
between their respective optical axes. The camera was also elevated to 95 cms and tilted down in
order to get the image of the subject as large as possible while all the points of interest remained within the range.
2.3.2 Subject and trail Identifications: To identify the subject in the video graph, each subject was allotted a number, so as to distinguish in the data
recorded. To identify best throws, the trails were viewed on the computer and the subjects were distinguished in the
trail for the data acquisition. The identified successful throws were spotted, slashed and edited for analysis.
2.4 Data reduction:
After video recordings and trail identification, the identified trails were played in Sony Vegas-10 software to make
separate clips as well as rendering the data of each player. Separate clips were then opened on to the Silicon Coach
Pro-7 software for analysis. The software has provision to analyze the angles, displacement, time, speed,
acceleration and number of frames as in the feature.
Under arm throwers who have a flexed elbow during the latter stages of throwing carry the ball in the hand for some
distance from the upper arm internal rotation axis, providing the opportunity to take advantage of this segmental
rotation to contribute to ball speed. A two-link model representing the upper arm and forearm was used to compare
the wrist/ball speed produced by a straight or a flexed throwing arm during throws [4]. Thus, to the ball speed

Syed Ibrahim et al Annals of Biological Research, 2014, 5 (4):62-67
______________________________________________________________________________
64
Scholars Research Library
contribution formula we now add the upper arm angular velocity (internal rotation) (ῲ IR) times the ball-internal
rotation axis distance (ῲ D). However, since a flexed elbow also decreases the shoulder-wrist distance (rf< TA), it is
necessary to consider the reduction in the contribution to ball speed from the arm's angular flexion velocity (ῲ A)
RESULTS
The resultant arm length (rA) decreases as the flexion angle (0) is increased whereas the effective wrist-internal
rotation axis distance (d) increases (Table 3). With an increase in elbow flexion angle to 60°, the resultant arm length
decreases minimally (0.410 m) while distance d increases to 0.201 m.
Table-I Kinematics of Wrist Angle During Under-Arm Throwing Phase by Phase
Kinematics of Wrist Angle During Under-Arm Throwing Phase by Phase.
Phases X-axis(Angle) Y-axis(Angle) Delta time (s) Measurement (°)
1- Phase 148 362 0 144.90
2- Phase 164 361 0 131.71
3- Phase 213 347 0 101.99
4- Phase 247 316 0 149.55
5- Phase 277 302 0 173.30
6- Phase 314 310 0 170.32
7- Phase 358 321 0 158.93
8- Phase 377 339 0 123.40
Table-II Kinematics of Wrist during Under-Arm throwing Phase by Phase at scale 108 pixels per Meters
Continuous
distance
Continuous
distance Scale 108 pixels per Meters
X-axis Y-axis Abs time
(s)
Delta time
(s)
Measurement
(m)
Cumulative measurement
(m)
Speed
(m/s)
Accelerati
on
253 285 1.28 0 0 0 0 0
294 259 1.34 0.060 0.451 0.45 7.68 5.29
342 243 1.40 0.059 0.470 0.92 11.09 108.41
433 260 1.46 0.060 0.861 1.78 13.81 -17.97
516 281 1.52 0.059 0.796 2.58 16.53 108.62
641 307 1.58 0.060 1.187 3.77 14.59 -173.04
701 316 1.64 0.060 0.564 4.33 12.15 91.70
796 331 1.70 0.060 0.894 5.22 0 0
Table III- The Resulting Shoulder-Wrist Distance and the Effective Wrist-Internal Rotation Axis Distance as a Result of Elbow Flexion
Elbow flexion
Angle degree
Resultant throwing
arm length (m)
Effective wrist-IR
axis distance (m)
Degree (ᶿ) Mean Mean
00 0.473 0.000
10 0.463 0.042
20 0.452 0.061
30 0.440 0.098
40 0.427 0.117
50 0.418 0.142
60 0.410 0.201
As ᶿ is changed from 0° to 60° the increase in wrist speed due to internal rotation at either 1150 0/s or 2200
0/s
becomes increasingly greater than the loss in wrist linear velocity due to a decrease in forearm length. Few authors
have reported angular velocities of the arm for throwing, although calculations based on the data in the review
Journal [1] which suggest a value of approximately (30 r/s) is required to produce the recorded ball speeds. The
studies of [2] and [3] have reported upper arm internal rotation speeds of about (100 r/s) in baseball pitching. Note
that the internal rotation speeds achievable are influenced by the mass of the ball being thrown.
3.1 Least squares, regression analysis: The methods of least squares and regression analysis are conceptually different. However, the method of least
squares is often used to generate estimators and other statistics in regression analysis. Consider a simple example
drawn from physics. A under arm throwing arm should obey Hooke's law which states that the flexion of a
throwing arm is proportional to the force, F, applied to it.
F (F i , k)= k F i

Syed Ibrahim et al Annals of Biological Research, 2014, 5 (4):62-67
______________________________________________________________________________
65
Scholars Research Library
Constitutes the model, where F is the independent variable. To estimate the force constant, k, a series of n
measurements with different forces will produce a set of data, (F i ,yi) , i = 1,n where yi is a measured arm flexion.
Each experimental observation will contain some error. If we denote this error ε, we may specify an empirical model
for our observations,
yi = kFi+εi.
There are many methods we might use to estimate the unknown parameter k. noting that the n equations in the m
variables in our data comprise an over determined system with one unknown and n equations, we may choose to
estimate k using least squares. The sum of squares to be minimized is
n
S=∑(y i- k Fi)2
i-1
The least squares estimate of the force constant, k, is given by
K= ∑i .Fi Yi / ∑I Fi2
One of Newton’s laws was that force equals mass multiplied by acceleration. We already know that the ball is about
0.16 kg. Now, we just need to find the acceleration of the ball, which is the change in velocity of the ball.
The force acting on the ball is the mass of the ball, 0.16 kg, multiplied by the acceleration. Considering the
Newton’s third law, in which every force is balanced by an equal but opposite force, so the same amount of force
would be acting on the player’s arm as well as on the ball. If we want to convert this amount to a weight, we would
look for what mass would have this as its weight. The weight of a mass m kilogram is 9.8m.
3.2 Regression analysis:
3.2.1 Velocity: Table 4 shows a regression model for velocity. The productivity regression model, R2 as the
coefficient of the multiple determinations for the productivity regression model, R2 = 1.00 and the output reports R2
× 100% = 100%. This can be interpreted as indicating that the model containing velocity for approximately 100% of
the observed variability in force.
Table 4: Summary of regression for velocity
Model R R2 Adjusted R2 Std. error of the estimate
1 1.00 1.00 1.00 0.1342
Figure I :The basic throwing technique (right-handed cricket player) have many characteristics: the run-up, wind-up phase, left foot
contact, throwing arm rotation, late- cocking phase, acceleration phase, ball release, and follow-though in respect to cricket ball velocity
phase by phase
For a straight throwing arm, ball velocity (BVe) can be considered to be the sum of the linear velocity of the
shoulder (LVSh) plus the linear velocity of the hand (LVh) plus the linear velocity of the wrist (LVWr) resulting
from arm motion (ῲA Am) as a result of hand flexion (ῲAHf) (Figure 2). This analysis examines the changes to the
LVwr component of ball speed as a result of elbow flexion. We assume changes to wrist speed would have the same
effect on ball speed for both straight and flexed elbow deliveries.

Syed Ibrahim et al Annals of Biological Research, 2014, 5 (4):62-67
______________________________________________________________________________
66
Scholars Research Library
Figure-II.The throwing arm represented as a simple two-link model, showing the contribution of arm and hand flexion angular velocity
to wrist and ball velocity
3.2.2 Force: The force acting on the ball is the mass of the ball, 0.16 kg, multiplied by the acceleration, 1234.15
m/s2, which is 197.464 kg tm/s
2 per second squared. If we want to convert this amount to a weight, we would look
for what mass would have this as its weight. The weight of mass m kilograms is 9.8m, so we want 9.8m = 197.464.
This means m = 197.464/9.8 = 20.14 kg. So a professional University cricket player would experience a force on his
arm during under arm throwing at 10m distance that would likely to be weight of 20.14 kg.
DISCUSSION
The highest average force is 4936.00 N and 197.464 kilograms times’ meters per second squared at 17.25 m sec-1
average velocity. Other than that, the objective to come out with one force equation which cover all the parameters
involved has been done using SPSS software which includes some assumption.
Under arm cricket thrower do not hold a flexed elbow during the starting phase of delivery. This effectively
invalidates the possible contribution of upper arm internal rotation, which is a major subscriber to ball or racquet
speed in most other throwing [6]. From our calculations, thrower using a flexed elbow during delivery may be able
to produce a clear-cut advantage when originating wrist speed. The generation of wrist speed via upper arm internal
rotation significantly outweighs any loss of wrist speed due to a reduction in effective bowling arm length. The
range of elbow angles (0-60°) used and the slow internal rotation speed gain in wrist speed (and therefore ball
speed) was between 0.89^124 m/s). Internal rotation speed is limited by the mass of the ball, and thus one would
expect greater internal rotation speeds than this during the under arm throws of a cricket ball. Therefore, it does not
matter whether a bowler consciously maintains a flexed elbow during delivery, nor has an elbow deformity either of
the fixed flexion or carry angle type — both provide the potential for substantially increased wrist and ball speed
through the use of internal rotation of the upper arm.
CONCLUSION
It was concluded that the internal rotation of the upper arm increases the wrist and ball speed irrespective of the
player keeping a flexed elbow or is effected by elbow deformity while attempting an under arm throw in cricket.
.

Syed Ibrahim et al Annals of Biological Research, 2014, 5 (4):62-67
______________________________________________________________________________
67
Scholars Research Library
REFERENCES
[1] Bartlett, R. M., Stockill, N. P., Elliott, B. C., & Burnett, A. F., Journal of Sports Sciences, 1996, vol. 14: 403-424.
[2] Elliott, B. & Anderson, G., Journal of Human Movement Studies,1996, vol. 18: 1-24.
[3] Feltner, M. &Dapena, J., International Journal of Sport Biomechanics,1986, vol. 2 (4): 235-260.
[4] Hussain, I., Bari M.A., Khan, A., & Mohammad A. Ahmad A., International Journal of Sports Science and
Engineering,2011, Vol. 05, 1, 043-048.
[5] Lucas McKay,J and Lena H. Ting., PLOS Computational Biology, 2011,8(4).
[6] Marshall, R. N., and Elliott, B. C., Journal of Sports Sciences, 2000,18, 247-254.
[7] Solum, J.,Science of shooting - water polo fundamentals (1st ed.) Los Angeles, California, USA, 2010.

5/18/2020 Three dimensional kinematic analysis of the drag flick for accuracy | Semantic Scholar
https://www.semanticscholar.org/paper/Three-dimensional-kinematic-analysis-of-the-drag-Ansari-Bari/531abd36c2f9822ef281dc5a0c655e6e803a… 1/3
ABSTRACT
8 REFERENCES
RELATED PAPERS
References
Publications referenced by this paper.
SHOWING 1-8 OF 8 REFERENCES
Biomechanical Study on Drag Flick in Field HockeyIkram Hussain, Saleem Ahmed, Sartaj Khan • 2012
Kinematic Pattern of the Drag-Flick: a Case StudyMaria Gomez, Cristina López de Subijana, Raquel Carros Antonio, Enrique Fernando Canto Navarro • Medicine, Computer Science• Journal of human kinetics • 2012
Corpus ID: 32659527
Three dimensional kinematic
analysis of the drag ick for accuracy
Naushad Waheed Ansari, Mohd. Arshad Bari, +1 author Fuzail Ahmad •
Published 2014 • Mathematics
The purpose of this study was to assess the effects of biomechanical selectedparameters of penalty corner drag ick for accuracy. The best drag icker ofA.M.U. Aligarh, Hockey team has been selected for this study. His age, height,weight was 19yrs, 180.50cm and 65kg respectively. The subject used his ownstick approved by the All India Association Committee, India. He took 10 trials ofdrag ick from stationary ball to hit given target (1 X 1feet) hung on the rightcorner of the goal post. The two Canon Legria SF-10, 8.1 video cameras wereused. The lm was recorded on sunny and clear weather at Astroturf HockeyField during evening training session. For the 3D co-ordinates 18 bodylandmarks were used to reconstruct the 3D motion using standard DLTprocedures. The digitized 3D data were collected from two phase (1) Contactphase and (2) Release phase. The Knee exion angle was considered for thefront foot only. Max TRAQ 3D motion analysis software was used to calculatethe selected parameters and statistical analysis was accepted using SPSSv.16,mean, standard deviations and correlation was used to nd out the relationshipof selected variables of the study with ball velocity. The alpha level ofsignicance was set at p<0.05 for all statistical tests. The result was found thatsignicant relationship exist ball velocity with HSB at both phases, EA at contactphase, EV at contact phase and KA at release. Where as insignicantrelationship exist ball velocity with ES, PS SA, PA, SV, PV and KV at both phasesand KA at contact phase and EA and EV at release phase. LESS
Save To Library Create Alert Cite Launch Research Feed
Share This Paper
Alternate Sources
FAQ About Contact • Sign In Create Free AccountSearchAll Fields

5/18/2020 Three dimensional kinematic analysis of the drag flick for accuracy | Semantic Scholar
https://www.semanticscholar.org/paper/Three-dimensional-kinematic-analysis-of-the-drag-Ansari-Bari/531abd36c2f9822ef281dc5a0c655e6e803a… 2/3
VIEW 2 EXCERPTS
Stiffness variation in hockey sticks and the impact on stick performanceGraeme Nigel Carlisle • Engineering • 2012
VIEW 3 EXCERPTS
TRAINING-INDUCED CHANGES IN DRAG-FLICK TECHNIQUE IN FEMALE FIELD HOCKEY PLAYERSC.L. de Subijana, María Argenis Bonilla Gómez, Laura Martín-Casado, Eusebio Gómez Navarro • Computer Science, Medicine •Biology of sport • 2012
The application of biomechanics to penalty corner drag-ick training: a case study.Cristina López de Subijana, Daniel Juárez, Javier Mallo, Enrique Fernando Canto Navarro • Computer Science, Medicine • Journalof sports science & medicine • 2011
C. López de Subijana, D. Juarez, J. Mallo, E. Navarro • 2010
VIEW 2 EXCERPTS
C. LópezdeSubijana, D. Juarez, J. Mallo, E Navarro • Sports Biomechanics • 2010
P. McLaughlin • 1997
VIEW 1 EXCERPT
Related Papers
Biomechanical analysis of the penaltycorner drag-ick of elite male and female hockey players. SportsBiomechanics
Biomechanical analysis of the penaltycorner dragick of elite male and female hockey players
Three-dimensional biomechanical analysis of the hockey drag ick: full report. Belconnen: Australian SportsCommission

5/18/2020 Three dimensional kinematic analysis of the drag flick for accuracy | Semantic Scholar
https://www.semanticscholar.org/paper/Three-dimensional-kinematic-analysis-of-the-drag-Ansari-Bari/531abd36c2f9822ef281dc5a0c655e6e803a… 3/3
Show More 2/0
Proudly built by AI2 with the help of our Collaborators using these Sources.Research • Publisher Partnerships • Data Partnerships • API and Open Corpus
Terms of Service • Privacy Policy

International Journal of Research Studies in Science, Engineering and Technology [IJRSSET]
Volume 1, Issue 2, May 2014, PP 74-78
©IJRSSET 74
Three Dimensional Analysis of Variation between Successful and
Unsuccessful Drag flick Techniques in Field Hockey
Mohd Arshad Bari, Naushad Waheed Ansari,
Ikram Hussain , Fuzail Ahmad, Mansoor Ali Khan,
Department of Physical Education Aligarh Muslim University, Aligarh, 202002, (U.P) India
[email protected] [email protected]
Abstract: Three dimensional Biomechanical Analyses of drag flick techniques in hockey is the best way to
determine different mechanical parameter of the performance. The focus of this study was to analysed kinematical
differences between successful and unsuccessful drag flick and find out those parameters which is given convinced
contribution in the accuracy. For this study one (01) main drag flicker from Aligarh Muslim University, Aligarh
(U.P) India (mean age 19 years; height 180.50 cm and weight 65 kg) was selected as a subject. The movements of
the drag flick techniques were recorded with two Canon video cameras. Trials were digitized by the Max Track 3D
motion analysis software. The result of this study shows that there are little or no movement variations in the
individual technique of drag flick.
Keywords: Drag, Kinematical, Three Dimensional, Motion analysis, performance
1. INTRODUCTION
Technique of biomechanical analysis is the best
way to find out the key mechanical factors of
performance. Biomechanical analysis is not
limited for the few sports; it is well versed in
testing specific skills in open sports. For example,
serve in tennis, Bowling and throwing in cricket,
shooting in basketball, drag flick in hockey; these
are the few examples of open sports for the
biomechanical analysis to find out the factors
responsible in skills (Gomez et al., 2012)
3D motion analysis always performed like 2D
analysis as well as advanced motion analysis
technology with advance plate data. In 3D
analysis reflective markers are placed on the
subject and tracked with infrared camera to create
model of the athlete during the activity. 3D
analysis is the best way to visualize and track
progresses over time.
Drag flick is an attacking technique in the sports
of field hockey. Drag flick is known as the most
scoring technique in the field hockey, it is mainly
use in penalty corner. The drag flick is mostly use
by the men than women in penalty corner and its
more effective then pushes or hits during penalty
corner.
Approximately half of all goals have been scored
from the penalty corner. Direct hit and Drag flick
are two shooting style used for a direct shot on
goal from penalty corners set play. During direct
hit the ball must be played low around the
wooden area of the goal post, and the drag flick
in which the ball is allowed to be lifted at any
part of the goal post. Drag flick is the
combination of common flick and scoop stroke.
Drag flick is a very effective goal-scoring
weapon because ball mostly travels above the
level of the goalkeeper into the top corner of the
goal post with accuracy and speed. For the
analysis the drag flick can be broken into the four
phases: 1- preparation, 2- force generation, 3- ball
contact with the ball, and 4- follow through
phase.

Mohd Arshad Bari et al.
International Journal of Research Studies in Science, Engineering and Technology [IJRSSET] 75
Mechanics of each phase of the drag flick has
significant with the performance (Bari et al.
2014). Main aim of this study to find out
kinematical factors which are responsible for
better performance in relation to accuracy.
2. METHODOLOGY
One main drag flicker of Aligarh Muslim
University, Aligarh (U.P) India (mean age 19
years; height 180.50 cm and weight 65 kg)
participated as a subject in this study. Participant
was free of injury and had a hockey drag flick
experience of 06 years.
Player wear specified tight clothing during the
data collection. Reflective marker were placed
on Clavicle, Sternum, Shoulder (right and left),
elbow (right and left), wrist (right and left), pelvic
left and right axis, Knee (right and left), medial
knee (right and left), ankle (right and left)and
three point in hockey stick.
The three dimensional (3D) motion of the drag
flicks, stick and ball were ascertained from
digitized video analysis using 21-point body
model together. The complying markers were
digitised; Joint centres and points describing the
stick and the ball were estimated (Bari et. al,
2014).
The data recording of drag flick conducted on
sunny and clear weather condition in the
Astroturf Hockey field during regularly practice
scheduled. The target 1×1 square feet was fixed at
upper left corner of the goal post. Twelve drag
flicks toward target were selected (Six successful
and Six unsuccessful) for the analysis.
The movements of the drag flick were captured
using two Canon Legria SF-10, 8.1 video
cameras in a field setting operating and with a
specified shutter speed and frame rate field
setting (sampling at 50 Hz). Cameras intersect to
each other at 600 angles. Placement of the first
camera on the right side at 34 ft from the ball
points at 900
of mediolateral axis parallel of
latitude to the ground, second camera placed
laterally at the distance of 31.5ft. Cameras were
fielded synchronized, static calibration method
was used to calibrate both the cameras (Bari et.
al, 2014).Videos of all trials were digitized using
the Max Track 3D motion analysis software.
3. RESULTS
The main purpose of this study was to determine
kinematical differences between successful and
unsuccessful drag flick and find out those
variables which has given positive contribution in
ball accuracy. T-test and correlation analysis were
used to find out differences and relationship
between successful and unsuccessful drag flicks.
Table 1.
Var
iabl
e
N Mea
n
Std.D
eviati
on
Std.
Error
Mean
t-
valu
e
DD
(m)
SF 06 2.14 0.50 0.20 0.53
UF 06 2.00 0.39 0.16
BV
(m/
s)
SF 06 18.61 3.30 1.34 1.35
UF 06 16.29 2.63 1.07
SV
(m/
s)
SF 06 16.39 3.86 1.56 0.83
UF 06 14.92 1.96 0.80
SA
O
(°)
SF 06 63.67 12.74 5.20 1.30
UF 06 54.17 12.56 5.13
HA
O
(°)
SF 06 49.17 9.11 3.72 0.14
UF 06 48.33 11.20 4.57
*Significance at 0.05 levels.
DD=Drag distance (m)
BV= Ball Velocity after ball release (m/s)
SV= Stick velocity (m/s)
SAO= Shoulder axis orientation in follow-
through (°)
HAO= Hip axis orientation in follow-through (°)
The analysis of data table-1 shows that there is an
insignificant differences shows between
successful and unsuccessful drag flicks
kinematics i.e. drag distance (DD), Ball velocity
after ball release (BV), stick velocity (SV) during
follow-through phase as obtain ‘t’ ratio is less than the required ‘t’ value of 2.30

Three Dimensional Analysis of Variation between Successful and Unsuccessful Drag flick Techniques in Field
Hockey
International Journal of Research Studies in Science, Engineering and Technology [IJRSSET] 76
Graph 1. Drage distance (m)
Graph 2. Ball and stick velocity (m/s)
Graph 3. shoulder and hip axis orientation (m/s)
Table 2. correlations
Subjects Dependent
variable
Predictors R
Successful Ball velocity
after ball
release
DD 0.52
SV 0.71
SAO -0.10
HAO 0.24
*Significance at 0.05 levels.
DD=Drag distance (m)
BV= Ball Velocity after ball release (m/s)
SV= Stick velocity (m/s)
SAO= Shoulder axis orientation in follow-through (°)
HAO= Hip axis orientation in follow-through (°)
The analysis of data table-2 shows that there were
no significant relationship between ball velocity
after release with Drag distance (DD),stick
velocity (SV), shoulder axis orientation (SAO)
and hip axis orientation (HAO) in follow through
phase during successful drag flick.
Table 3. correlations
Subjects Dependent
variable
Predictors R
Un-
Successful
Ball
velocity
after ball
release
DD 0.515
SV 0.858*
SAO 0.645
HAO 0.046
*Significance at 0.05 levels.
DD=Drag distance (m)
BV= Ball Velocity after ball release (m/s)
SV= Stick velocity (m/s)
SAO= Shoulder axis orientation in follow-through (°)
HAO= Hip axis orientation in follow-through (°)
The analysis of data table-3 shows that there is a
significant positive relationship between ball
velocity after release with stick velocity in follow
through phase. Whereas insignificance
relationship exit between ball velocities after ball
release with drag distance, shoulder axis
orientation and hip axis orientation in follow
through phase during unsuccessful drag flick.
4. DISCUSSION
The main purpose of this study was to find out
the kinematical differences in the drag-flick
pattern between successful and unsuccessful drag
flicks in order to render to the point selective
information for goalkeepers. Many researchers
have studied the kinetic and kinematical pattern
of the drag-flick technique, with the propose to
find the reminds for an optimum performance
(Subijana et al., 2010; Yusoff et al., 2008). In
addition, some research was focused on the
goalkeepers’ anticipation when facing a penalty corner (Canal-Bruland et al., 2010).
Result of this study has shown no significant
differences between successful and unsuccessful
drag-flick pattern depending on the direction of

Mohd Arshad Bari et al.
International Journal of Research Studies in Science, Engineering and Technology [IJRSSET] 77
the shot. Result of the study contradicts with the
result of (Gomez et al., 2012) as the direction of
the shot occurred before the dragging action of
the stick (Gomez et al., 2012).
The participants in the study by Gomez et al.,
2012 had more experience and skillful than the
participant in this study. They were skilled drag-
flickers, their patterns could have been more
consistent than the one described in the present
study. This may be a reason that no significant
differences were shown between successful and
unsuccessful drag-flick pattern.
Furthermore, there were no significant
differences between successful and unsuccessful
drag-flick patterns. Successful and unsuccessful
drag-flick patterns showed the same kinematic
sequence of drag distance (m), Ball Velocity after
ball release (m/s), Stick velocity (m/s), Shoulder
axis orientation in follow-through (%) and Hip
axis orientation in follow-through (%). This
kinematic sequence differed from that described
by Subijana et al. (2010), again with successful
drag flick where higher stick and ball velocity of
the stick preceded maximum shoulder axis
orientation in follow-through (%) and Hip axis
orientation in follow-through (%) as compare to
unsuccessful drag flick.
In this study, the drag-flicks shot in set target
showed lower ball velocities (18.61 ± 3.30 m/s
successful drag-flicks; 16.39 ± 2.63 m/s
unsuccessful drag-flicks) than in the study
by López de Subijana et al. (2010) with male
hockey players (21.9 ± 1.7 m/s) and female
hockey players (17.9 ± 1.7 m/s). These values
were also lower than those reported
by McLaughlin (1997) (19.1 to 21.9 m/s) and
Yusoff et al. (2008) (19.6 to 27.8 m/s). It was
noticeable that there were no significant
differences in ball velocities between successful
and unsuccessful drag-flicks, but successful drag
flick recorded higher mean ball velocity as
compare with unsuccessful drag flicks, so
velocity of ball were equally efficient to get
accuracy.
The drag distance successful and unsuccessful
drag flicks shows insignificant relationship with
ball velocity after ball release. Therefore the drag
distances of drag flick were 2.14 m (Successful)
and 2.00 m (unsuccessful) drag flick techniques.
Successful drag flick technique toward target had
greater mean drag distance as compare with
unsuccessful drag flick techniques.
Average drag distance was lower than the value
found for junior players by (Subhijana et. al,
2012) and elite and sub elite players by (Mc
laughem, 1997) . there was not a big difference
between the mean value of drag distance of
successful and unsuccessful drag flick.
Drag distance highly correlated with criterion ball
velocity. Additionally importance of create higher
ball velocity after release (Mc laughem, 1997).
These studies also supported with, the successful
drag flick techniques had greater ball velocity and
greater drag distance as compare with
unsuccessful drag flick (Gonez et al. 2012).
In successful drag flicks, drag distance, stick
velocity and hip axis orientation produced
insignificant positive contribution and shoulder
axis orientation insignificant negative
contribution on ball velocity after release.
Unsuccessful drag flicks, drag distance, and hip
axis and shoulder axis orientation insignificant
contribute in ball velocity after release. Therefore
stick velocity shows significant positive
contribution on ball velocity after release.
An accurate motor execution of the drag flick
techniques is essential to construct a proper
skilled of drag flick performance (Canal-Bruland
et al., 2010). Furthermore, in high-speed sports
such as drag flick in hockey, the speed of play
and ball velocity dictate that decisions must often
be made in advance of the action (Savelsbergh et
al., 2002).
There are little or no movement variations in the
individual technique of drag flick between
successful and unsuccessful drag flick. Some
movement’s variations are necessary to accommodate with experimental constraints in

Three Dimensional Analysis of Variation between Successful and Unsuccessful Drag flick Techniques in Field
Hockey
International Journal of Research Studies in Science, Engineering and Technology [IJRSSET] 78
successful and unsuccessful drag flick situations
(Beckmann et al., 2010).
ACKNOWLEDGEMENT
The authors would like to acknowledge the
cooperation of UGC-SAP (DRS-1) programme,
department of Physical Education, Aligarh
Muslim University, Aligarh.
REFERENCES
[1] Bari, M. A., Ansari, N. W., Ahmad, F., &
Hussain, I. (2014). Three Dimensional
Analysis of Drag-flick in The Field Hockey
of University Players. Advances in Physics
Theories and Applications, 29, 87-93.
[2] Beckmann H, Winkel C & Schollhorn WI.
(2010). Optimal range of variation in hockey
technique training, Int. J Sport Psychology,
41, 5–45.
[3] Canal-Bruland R, Van der Kamp J,
Arkesteijn M, Janssen RJ, Van Kesteren J &
Savelsbergh GJP. (2010).Visual search
behaviour in skilled field-hockey
goalkeepers. Int J Sport Psychol, 41, 327–339.
[4] Lopez de Subijana C, Juarez D, Mallo D &
Navarro E. (2010) Biomechanical analysis of
the penalty-corner drag-flick of elite male
and female hockey players. Sport Biomech,
9(2), 72–78.
[5] Maria Gomez, Cristina Lopez de Subijana,
Raquel Antonio & Enrique Navarro (2012).
Journal of Human Kinetics, 35, 27–33.
[6] McLaughlin P. (1997). Three-dimensional
biomechanical analysis of the hockey drag-
flick: full report.Belconnen, A.C.T.,
Australia: Australian Sports Commission.
[7] Savelsbergh GJP, Williams AM, Van der
Kamp J & Ward P. (2002). Visual search
anticipation and expertise in soccer
goalkeepers, J Sport Sci. 20, 279–287.
[8] Yusoff S, Hasan N & Wilson B. (2008).
Three-dimensional biomechanical analysis of
the hockey drag flick performed in
competition. ISN Bulletin, National Sport
Institute of Malaysia, 1(1), 35–43.

5/18/2020 Three Dimensional Biomechanical Analysis of the Drag in Penalty Corner Drag Flick Performance | Semantic Scholar
https://www.semanticscholar.org/paper/Three-Dimensional-Biomechanical-Analysis-of-the-in-Ansari/9c30433485f0722767d6b93a36e42e6ceb4d0… 1/3
ABSTRACT
9 REFERENCES
RELATED PAPERS
References
Publications referenced by this paper.
Corpus ID: 55767850
Three Dimensional Biomechanical
Analysis of the Drag in Penalty Corner
Drag Flick Performance
Naushad Waheed Ansari • Published 2014 • Mathematics
Penalty corner in eld hockey is a complex motor skill. It required high level ofcoordination. The aim of this study was to provide important biomechanicalvariables related information for the Sports biomechanist, Young sportsscientist, Coaches and also for drag ick specialist for their performanceenhancement programs. Four specialist male drag-ickers of two differentuniversities namely LNIPE, Gawalior , and Aligarh Muslim University , Aligarh,age range 19-25 years, height ranged 174-182cm and weight range 59.4- 66.8Kg. and all having six to eight years of experiences were participated in thisstudy. Three dimensional (3D) experimental setup was conducted for the study.All of the measurements were carried out on the Asto truf ground in theirrespective universities elds. Two video cameras Canon Legria SF-10 were usedto capture all drag ick trials. The shuttering speed of cameras were set on1/1000 and 50hz frame rate. Both cameras were set with the help of tripodplaced at right side of the subjects mounted at a height of 1.2m. Duringcaptured drag ick, the distances of cameras were set at 13m and 17m from thestationary ball position and optical axes of the recording cameras wereintersect each other on the subject at 90° and 60° respectively to right side in aeld setting. The drag ickers and ball movement during the drag ick phasewere recorded. Videos footages were edited and synchronized for 3Dbiomechanical analysis. DLT method was used to calibrate of both the cameras.The drag distance, stride length, ball velocity and acceleration, angles, linear andangular velocity and linear and angular acceleration of shoulder, knee, elbow,wrist of left and right side were digitized and three dimensional data wasobtained with the help of Max TRAQ 3D motion analysis software.SPSSv.16. wasused to calculate the selected parameters and statistical analysis mean andstandard deviations. T-test was used to nd out the comparison between LNIPE,Gawalior and A.M.U.Aligarh. And the result was found that drag distance andhockey stick blade, linear velocity of shoulder (L&R), pelvic (L&R), Knee (L) andwrist (R),angular velocity of shoulder (L&R), elbow (L&R), pelvic(L&R), Knee(L),ankle(R) and wrist(R), linear acceleration of hockey stick blade and ball,shoulder (L), Knee(R), ankle(R) and toe(R), angular acceleration of wrist (R) andjoint angles of shoulder (L&R), elbow (L), wrist (R) and ankle(R) during dragdiffers signicantly and hence does inuences on drag ick technique underaccuracy condition. Keywords: Drag of Dragick, Biomechanical, ThreeDimensional, Motion analysis, performance LESS
Save To Library Create Alert Cite Launch Research Feed
Share This Paper
FAQ About Contact • Sign In Create Free AccountSearchAll Fields

5/18/2020 Three Dimensional Biomechanical Analysis of the Drag in Penalty Corner Drag Flick Performance | Semantic Scholar
https://www.semanticscholar.org/paper/Three-Dimensional-Biomechanical-Analysis-of-the-in-Ansari/9c30433485f0722767d6b93a36e42e6ceb4d0… 2/3
SHOWING 1-9 OF 9 REFERENCES
Biomechanical Study on Drag Flick in Field HockeyIkram Hussain, Saleem Ahmed, Sartaj Khan • 2012
Kinematic Pattern of the Drag-Flick: a Case StudyMaria Gomez, Cristina López de Subijana, Raquel Carros Antonio, Enrique Fernando Canto Navarro • Medicine, Computer Science• Journal of human kinetics • 2012
Training-induced changes in drag-ick technique in female eld hockey playersCristina López de Subijana Hernández, María Gómez Jiménez, Laura Martín Casado, Enrique Navarro Cabello • Engineering •2012
Biomechanical analysis of the penalty-corner drag-ick of elite male and female hockey playersCristina López de Subijana Hernández, Daniel Juárez Santos-García, Javier Mallo Sainz, Enrique Navarro Cabello • Engineering •2010
VIEW 1 EXCERPT
Biomechanical analysis of the penalty-corner drag-ick of elite male and female hockey players.Cristina López de Subijana, Daniel Juárez, Javier Mallo, Enrique Fernando Canto Navarro • Medicine, Mathematics • Sportsbiomechanics • 2010
Differences between international men’s and women’s teams in the strategic action of the penalty corner in eldhockeyRebeca Piñeiro Mosquera, J. Sampedro Molinuevo, Ignacio Refoyo Román • Psychology • 2007
VIEW 1 EXCERPT
Penalty Corners in Field Hockey: A guide to successPeter Laird, P. W. Sutherland • Psychology • 2003
VIEW 1 EXCERPT
P Mclaughlin • 1997
VIEW 3 EXCERPTS
P. McLaughlin • 1997
VIEW 3 EXCERPTS
Related Papers
Three-dimensional biomechanical analysis of the hockey drag ick: full report
Three-dimensional biomechanical analysis of the hockey drag ick: full report. Belconnen: Australian SportsCommission

5/18/2020 Three Dimensional Biomechanical Analysis of the Drag in Penalty Corner Drag Flick Performance | Semantic Scholar
https://www.semanticscholar.org/paper/Three-Dimensional-Biomechanical-Analysis-of-the-in-Ansari/9c30433485f0722767d6b93a36e42e6ceb4d0… 3/3
Show More 2/0
Proudly built by AI2 with the help of our Collaborators using these Sources.Research • Publisher Partnerships • Data Partnerships • API and Open Corpus
Terms of Service • Privacy Policy

Advances in Physics Theories and Applications www.iiste.org
ISSN 2224-719X (Paper) ISSN 2225-0638 (Online)
Vol.29, 2014
87
Three Dimensional Analysis of Drag-flick in The Field Hockey of
University Players
Mohd Arshad Bari
Department of Physical Education, Aligarh Muslim University, Aligarh (U.P) 202002 India
Tel: +91-8439438134 E-mail [email protected]
Naushad Waheed Ansari (Corresponding author)
Department of Physical Education, Aligarh Muslim University, Aligarh (U.P) 202002 India
Tel: +91-98972288992 E-mail [email protected]
Fuzail Ahmad
Department of Physical Education, Aligarh Muslim University, Aligarh (U.P) 202002 India
Tel: +91-9634982713 E-mail [email protected]
Ikram Hussain
Department of Physical Education, Aligarh Muslim University, Aligarh (U.P) 202002 India
Tel: +91-9411465663 E-mail [email protected]
The authors would like to acknowledge the cooperation of UGC-SAP (DRS-I) Programme, Department
of Physical Education, Aligarh Muslim University, Aligarh
Abstract
The penalty corner one of the most important technique to score the goal in field hockey. The penalty corner
depends upon three different technical applications like push, stop and drag. Technical application of drag flick
in penalty corner covered maximum number of successful goal. The main aim of this study was to analyze
spatial and temporal kinematics in the drag flick of elite field hockey players. Two main drag flickers from
Aligarh Muslim University, Aligarh hockey team were selected as a subject for this study. The body weight,
Height and Age of each subject ware recorded subsequently Sub1=65 kg body weight, 180.50cm of height and 19
years of age and Sub2= 60 kg body weight, 167.00 cm of height and 19 years of age. A static calibration method
was used to capture drag flick by Two Cameras, sampling at 50 Hz. Six successful trials at target were selected
from each subject for the study. Videos of selected trials were digitized by the Max Track 3D motion analysis
software. The three dimensional (3D) motion was determined from digitized video analysis using 18-point body
model together. Results of this study shows that spatial / temporal variable between the players, there exist little
difference in stance width in ball contact phase, recommended that little or no difference exist in techniques
between both players.
Key points: spatial / temporal, kinematics, drag, digitized.
1. Introduction
The success of the penalty corners depend three main technical application i.e. pusher, stopper and drag flicker.
Out of the three , the drag flicker contribute the most in the success of goals scored that have come from the
penalty corner (Lees, 2002).
The most important scoring plays in the field hockey are the technique of penalty corner (Laird and Sunderland,
2003 and Pineiro, 2008). The drag-flick is used in the field hockey for shooting at goal with speed and desire
accuracy as it is more scoring than other techniques such as hits and pushes during the penalty corner (Yusoff et
al., 2008).
As per the rules book of hockey (FIH, 2009), there is no any set rules regarding the maximum and minimum
height of the ball when the first shot to score a goal is a push or a drag-flick. Sports scientist, have focused on
strike techniques in field hockey but a few have analysed the technical aspect of drag-flick (Yussoff et al., 2008),

Advances in Physics Theories and Applications www.iiste.org
ISSN 2224-719X (Paper) ISSN 2225-0638 (Online)
Vol.29, 2014
88
focus to analyzed biomechanical parameters in relation to the performance of the players.
Biomechanical analysis of the techniques have no any single definition, however it is scientifically agreed that
technique analysis depend on the way in which skills are executed, from all parameters of biomechanics
(Kinetics and kinematics) (O’Donoghue., 2010). Both Biomechanical studies were conducted a 2D or 3D motion
analysis based on videography with a set specified sampling frequency. Biomechanics of throwing and hitting
skills should be follow same pattern as drag flick in field hockey which aim to get higher speed and accuracy of
the free end (distal) segment at release. In these techniques, back to back segments reach their maximum speed
in the beginning of series with those utmost from the free end of the kinetic chain (Bartlett and Best, 1988).
Kinetics chain of segmental rotations of the pelvis, upper trunk, and stick occurred in the drag-flick (Hussain et.
all. 2012). Kerr and Ness (2006) found that the movement pattern of the push is a compounding of consecutive
and simultaneous segment rotations. Furthermore, during the drag-flick the major contribution to the ball
velocity were stance, stance width, the distance between ball and front foot, the beginning of double foot contact,
angular and linear velocity of different body segment at ball release (McLaughlin, 1997; Kerr and Ness, 2006).
The most of the previous researches have been conducted a 2D analysis, there is a dearth of research on the 3D
analysis of the drag flick in the field hockey. However no 3D biomechanical study of the drag-flick techniques
has been done in Indian players. Thus, the research has been proposed to carry out 3D analysis of elite
specialized drag flicker from Aligarh Muslim University, Aligah.
2. Methodology
2.1 Selection of Subjects
Two specialized right handed drag flickers are current member of Aligarh Muslim University male hockey team
has been selected as the subject. The measurements were recorded by using the standard equipment, which were
presently available at hand. The body weight of each subject ware recorded in kilogram Sub1=65 kg and Sub2=
60 kg by using weighing machine (including player’s kit, which was wearing during the videography session).
Heights of each subject were recorded in centimeter (Sub1=180.50cm and Sub2=167.00 cm) by using stadiometer
and age of both subjects were 19 years measured in chronological order.
2.2 Filming Procedure:
The film recording conducted on sunny and clear weather in the Astroturf Hockey field during regularly
scheduled practice session. Subjects instructed to wear complete specified kit in order to perform successful drag
flick requirement of the study. The target 1"×1" square fixed at upper left corner of the goal post. 06 successful
drag flicks toward target of each drag flicker were selected for the analysis.
2.3 Variables: Kinematic / temporal variables, determined from the digitized 3D data, were used to describe five
(04) key positions (a) approach(From to the last left foot contact before ball pick up) (b) ball Contact (c) drag
Phase (From left foot contact to ball release) and (d) follow throw (From ball release to end of recovery) during
drag flick.
2.4 Model of Dreg Arm
The dreg arm was modeled as two segment kinetic chain composed of (a) upper arm segment and (b) distal
segment that include the forearm, hand and hockey stick. The distal segment was assumed to be a rigid body
with its longitudinal axis led along the longitudinal axis of the forearm
2.5 Videographic Equipments and Location
The subject’s drag flick movements were recorded using two Canon Legria SF-10, 8.1 video cameras in a field
setting, operating with a specified shutter speed and frame rate. The cameras were set-up on a rigid tripod and
secured to the floor in the location. The drag-flicks recorded with two cameras, sampling at 50 Hz. Both cameras
intersect to each other at 600 angles. First camera place right side 34 ft from the ball points at 90
0 of mediolateral
axis parallel to the ground, second camera placed laterally at the distance of 31.5ft and cameras were fielded
synchronized, static calibration method was used to calibrate both the cameras.
Videos of all trials were digitized using the Max Track 3D motion analysis software. Digitization was done from

Advances in Physics Theories and Applications www.iiste.org
ISSN 2224-719X (Paper) ISSN 2225-0638 (Online)
Vol.29, 2014
89
right foot contact with the ground to eight frames after the ball leaving the stick.
The 3D motion of the drag flicker, stick and ball were determined from digitized video analysis using 18-point
body model together. The following points were digitised; Joint centers and points describing the stick and the
ball were estimated.
3. Results
The main purpose of this study was to determine kinematical differences between two best drag flickers of
Aligarh Muslim University, Aligarh and find out those variables which is given positive contribution in ball
speed. If a common intersegment coordinative pattern existed between drag flickers, with the hopes of being able
to make drag flick look the same kinetics. T-test and regression analysis were used to find out differences and
relationship between drag flickers.
The analysis of data table-1 that there is an insignificant differences exist between both drag flicker in distance of
left foot from ball (DLB1) and stick velocity (SV1) during approach phase as obtain ‘t’ ratio is less than the
required ‘t’ value of 2.30
The analysis of data table-2 that there is a significant differences find between drag flicker in stance width (SW2)
during ball contact phase as obtain‘t’ ratio is greater than the required ‘t’ value of 2.30. Whereas no significance
differences were found in the distance of right foot from ball (DLB2), stick velocity (SV2), shoulder axis
orientation (SAO2) and hip axis orientation (HAO2) exist between drag flicker during ball contact phase.
The analysis of data table-3 that there is no significant differences were found between both drag flicker in drag
distance (DD), left knee angle (LKA), stick velocity (SV3), shoulder axis orientation (SAO3) and hip axis
orientation (HAO3) during drag phase as obtain‘t’ ratio is lesser than the required ‘t’ value of 2.30.
The analysis of data table-4 that there is no significant differences exist between both university drag flicker in
ball velocity (BV), stick velocity (SV4), shoulder axis orientation (SAO4) and hip axis orientation (HAO4) during
drag phase as obtain‘t’ ratio is lesser than the required ‘t’ value of 2.30.
The analysis of data table-5 that there is a significant relationship exist ball velocity after release with stick
velocity final phase in both drag flickers. Whereas insignificance relationship exit ball velocity after ball release
with drag distance, shoulder axis orientation and hip axis orientation in follow through phase.
4. Discussions
The technique analysis of drag flick in field hockey had aim to find out the biomechanical variation in
techniques between two best drag flicker of Aligarh Muslim University hockey players. Results of this study
show that, insignificantly differences exist in plantation of left foot behind the ball and stick velocity of between
hockey players during approach. Plantation of left foot behind the ball play significant role in different aspect of
drag flick like: it will demand of the flicker to reach behind the ball properly, force generation, it required to
adjust body properly further will then the ball will be dragged over a greater distance (Subijana et al., 2011 and
2012) and to attain peak angular velocity of the sticks.
In ball Contact Phase significant differences exist between both drag flickers in stance width. In which the
flicker average stance width subsequently are Sub1=1.42m and Sub2= 1.77m. Player Sub1 was fulfilled the
mostly criteria of international level athlete, reported as 1.42m (McLaughlin., 1997), 1.49m, 1.55m (Lopez de
Subijana et al., 2010) and 1.51m (Lopez de Subijana et al., 2011). Player Sub2 had greater stance width as
compare to Sub1 and reported studies. The variation in stance width may be due to anthropometrical difference
exist between the athlete (Hussain et al., 2012). this extremely wide stance width enable the drag flicker to get
the low hip and provided large distance of ball could be accelerate toward the target (Yusoff et al. 2002).
In drag phase insignificant differences exist between drag flicker players in drag distance, left knee angle, stick
velocity during drag, shoulder axis orientation and hip axis orientation. As left foot contact with ground the ball
has been dragged with hockey stick toward the target by the total drag distance mean consequently Sub1=2.30m
and Sub2=2.33m with greater drag distance directly associated with greater resultant ball velocity (Yusoff et al.
2002). These statements support the result of this study as both players had insignificant differences in drag
distance and resultant ball velocity.
In follow-through phase insignificant differences exist between both university players in ball velocity, stick
velocity, shoulder axis orientation and hip axis orientation. Ball velocity at ball release mean range between drag

Advances in Physics Theories and Applications www.iiste.org
ISSN 2224-719X (Paper) ISSN 2225-0638 (Online)
Vol.29, 2014
90
flickers is 18.09 – 21.39 m/s. Highest ball velocity play significant contribution in scoring of goal. When ball
travelled toward the target with greater speed, the goal keeper has little time to change our body position to safe
the goal (Yusoff et al. 2002).
Both drag flicker ball velocity after the ball release has significant positive correlated with stick velocity in final
phase. Sub1 and Sub2 stick velocity in final phase has 77% and 92% subsequently contribute on ball velocity
after ball release. Highest stick velocity help to generate greater momentum force and greater stick velocity both
are directly associated with resultant ball velocity (Bartlet, 2007). The player Sub1: Drag distance and shoulder
axis orientation has insignificant positive relationship and hip axis orientation has insignificant negative
relationship with ball velocity. Player Sub2: Drag distance, shoulder axis orientation and hip axis orientation in
follow through phase has insignificant positive relation with ball velocity. Finally, the drag flicker of Aligarh
Muslim University had a greater stance, long drag, and proper leg flexed than previous study reported by
(Bartlett, 2012, Nichol, 2005, and Mosquera et al, 2007) indicate approximately good technique. When
comparing biomechanical variable between the players, there exist little difference in stance width in ball contact
phase, recommended that little or no difference exist in techniques between both players.
References
1. Hussain I. Ahmed S. and Khan S. (2012), Biomechanical Study on Drag Flick in Field Hockey, International
journal of behavioral social and movement sciences, vol.01,july2012, issue03..
2. Bartlett, R. (2007). Introduction to Sports Biomechanics. Abingdon: Routledge.
3. Bartlett, R. (2012). Quantitative and qualitative analysis. In Encyclopaedia of International Sports
Studies (Ed. R. Bartlett, C. Graton and C.G. Rolf), pp. 1115-1116. London: Routledge.
4. Laird, P. and Sutherland, P. (2003). Penalty Corners in Field Hockey: A guide to success.International
Journal of Performance Analysis in Sport, 3(1), 19-26.
5. Lees, A. (2002). Technique analysis in sports: a critical review. Journal of Sports Sciences, 20, 813-828.
6. López de Subijana, C.L., Juárez, D., Mallo, J. and Navarro, E. (2010). Biomechanical analysis of the
penalty-corner drag-flick of elite male and female hockey players. Sports Biomechanics, 9(2), 72-78.
7. López de Subijana, C.L., Juárez, D., Mallo, J. and Navarro, E. (2011). The application of biomechanics to
penalty corner drag-flick training: a case study. Journal of Sports Science and Medicine, 10, 590-595.
8. López de Subijana Hernández, C., de Antonio, R., Frutos, P.G. and Cabello, E.N. (2011). Anàlisi de la
cadena cinemàtica del drag-flick. Educació Fisica i Esportes, 104(2), 106-113.
9. López de Subijana, C.L., Gómez, M., Martín-Casadom L. and Navarro, E. (2012). Training induced changes
in drag-flick technique in female field hockey players. Biology of Sport, 29(4), 263-268.
10. McLaughlin, P. (1997). Three-dimensional biomechanical analysis of the hockey drag flick: full report.
Belconnen, A.C.T.; Australia: Australian Sports Commission.
11. Mosquera, R. P., Molinuevo, J. S., and Roman, I. R. (2007). Differences between international men’s and
women’s teams in the strategic action of the penalty corner in field hockey. International Journal of
Performance Analysis of Sport, 7(3), 67-83.
12. Nichol, G. (2005). Goal scoring including the drag flick. Available
at: https://www.google.co.uk/url?sa=t&rct=j&q=&esrc=s&source=web&cd=1&ved=0CDUQFjAA&url=htt
p%3A%2F%2Fwww.sportingpulse.com%2Fget_file.cgi%3Fid%3D1947175&ei=Tyg7UaWqL5Lo7AbiwY
CICw&usg=AFQjCNHrZ7oepeGcCMfOd3P-uqWtEYSnXA&bvm=bv.43287494,d.ZGU (Accessed: 9
March 2013).
13. O’Donoghue, P. (2010). Research Methods for Sports Performance Analysis. London: Routledge.
14. Yusoff, S., Hasan, N. and Wilson, B. (2008) Tree-dimensional biomechanical analysis of the hockey drag
flick performed in competition. ISN Bulletin, National Sport Institute of Malaysia 1, 35-43.
15. Bartlett, R. M., and Best, R. J. (1988). The biomechanics of javelin throwing: A review. Journal of Sport
Sciences, 6(1), 1-38.
16. Kerr, R., and Ness, K. (2006). Kinematics of the field hockey penalty corner push-in. Sports Biomechanics,
5 (1), 47-61.
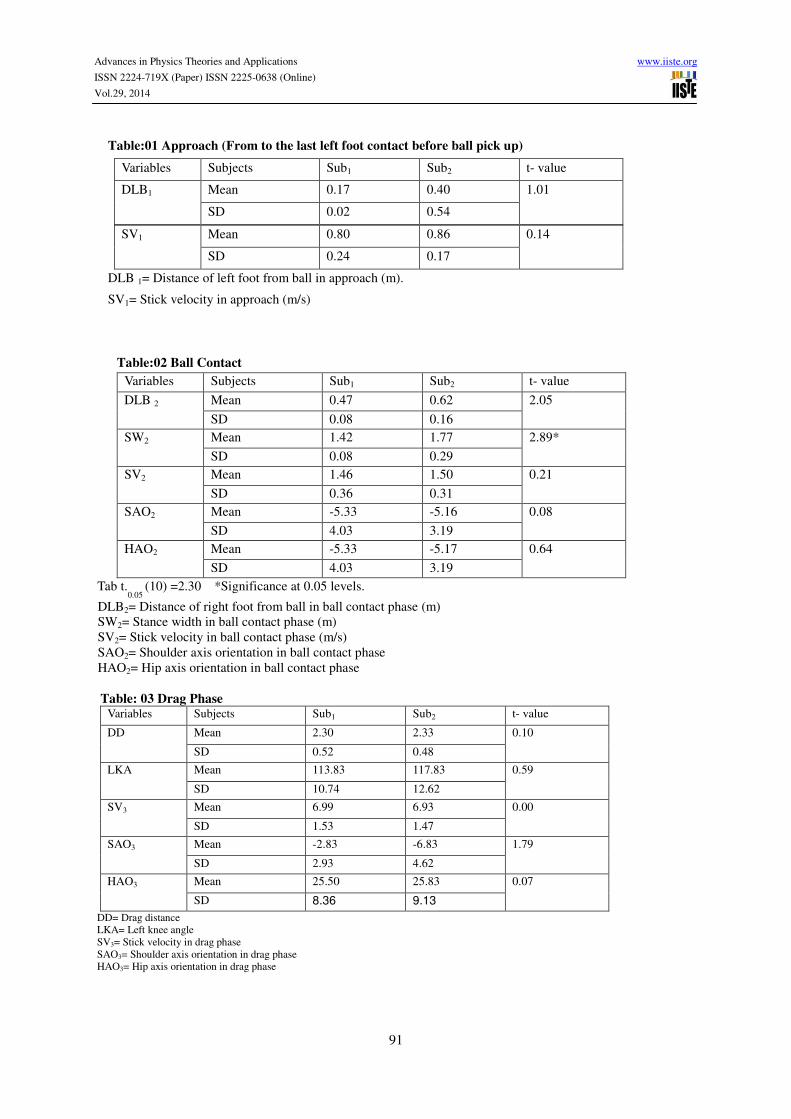
Advances in Physics Theories and Applications www.iiste.org
ISSN 2224-719X (Paper) ISSN 2225-0638 (Online)
Vol.29, 2014
91
Table:01 Approach (From to the last left foot contact before ball pick up)
Variables Subjects Sub1 Sub2 t- value
DLB1 Mean 0.17 0.40 1.01
SD 0.02 0.54
SV1 Mean 0.80 0.86 0.14
SD 0.24 0.17
DLB 1= Distance of left foot from ball in approach (m).
SV1= Stick velocity in approach (m/s)
Table:02 Ball Contact
Variables Subjects Sub1 Sub2 t- value
DLB 2 Mean 0.47 0.62 2.05
SD 0.08 0.16
SW2 Mean 1.42 1.77 2.89*
SD 0.08 0.29
SV2 Mean 1.46 1.50 0.21
SD 0.36 0.31
SAO2 Mean -5.33 -5.16 0.08
SD 4.03 3.19
HAO2 Mean -5.33 -5.17 0.64
SD 4.03 3.19
Tab t.0.05
(10) =2.30 *Significance at 0.05 levels.
DLB2= Distance of right foot from ball in ball contact phase (m)
SW2= Stance width in ball contact phase (m)
SV2= Stick velocity in ball contact phase (m/s)
SAO2= Shoulder axis orientation in ball contact phase
HAO2= Hip axis orientation in ball contact phase
Table: 03 Drag Phase
Variables Subjects Sub1 Sub2 t- value
DD Mean 2.30 2.33 0.10
SD 0.52 0.48
LKA Mean 113.83 117.83 0.59
SD 10.74 12.62
SV3 Mean 6.99 6.93 0.00
SD 1.53 1.47
SAO3 Mean -2.83 -6.83 1.79
SD 2.93 4.62
HAO3 Mean 25.50 25.83 0.07
SD 8.36 9.13
DD= Drag distance
LKA= Left knee angle
SV3= Stick velocity in drag phase
SAO3= Shoulder axis orientation in drag phase
HAO3= Hip axis orientation in drag phase
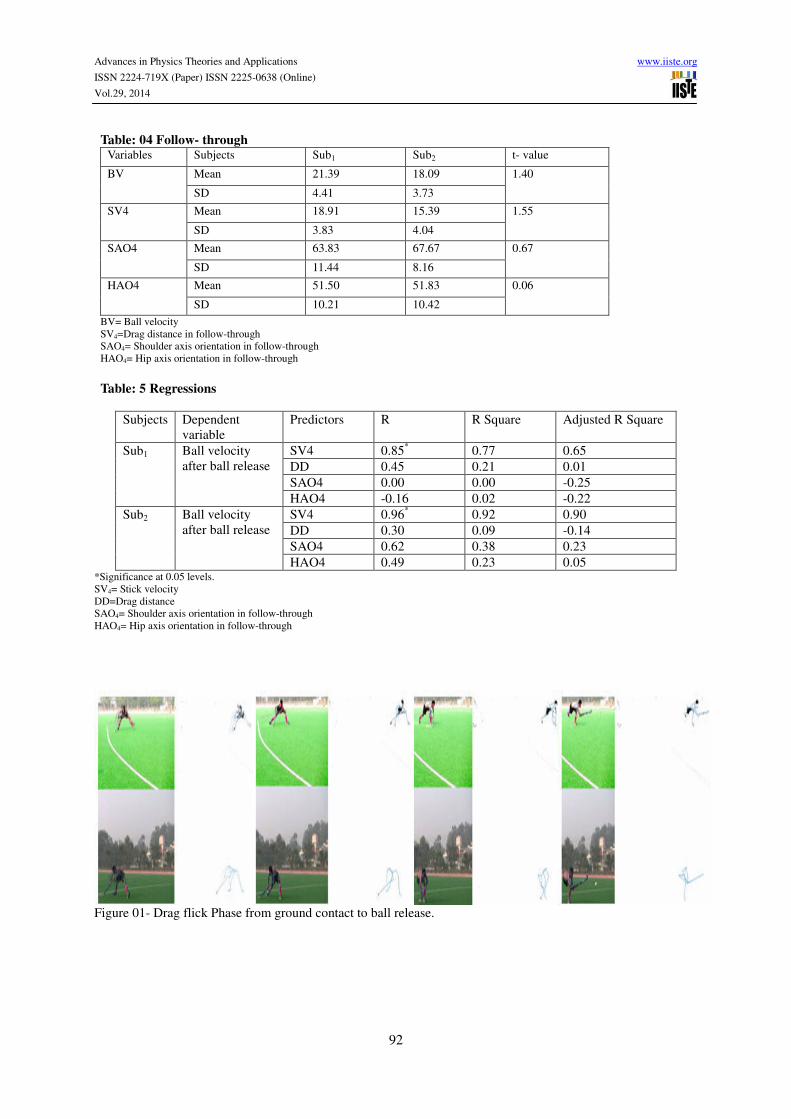
Advances in Physics Theories and Applications www.iiste.org
ISSN 2224-719X (Paper) ISSN 2225-0638 (Online)
Vol.29, 2014
92
Table: 04 Follow- through Variables Subjects Sub1 Sub2 t- value
BV Mean 21.39 18.09 1.40
SD 4.41 3.73
SV4 Mean 18.91 15.39 1.55
SD 3.83 4.04
SAO4 Mean 63.83 67.67 0.67
SD 11.44 8.16
HAO4 Mean 51.50 51.83 0.06
SD 10.21 10.42
BV= Ball velocity
SV4=Drag distance in follow-through
SAO4= Shoulder axis orientation in follow-through
HAO4= Hip axis orientation in follow-through
Table: 5 Regressions
Subjects Dependent
variable
Predictors R R Square Adjusted R Square
Sub1 Ball velocity
after ball release
SV4 0.85* 0.77 0.65
DD 0.45 0.21 0.01
SAO4 0.00 0.00 -0.25
HAO4 -0.16 0.02 -0.22
Sub2 Ball velocity
after ball release
SV4 0.96* 0.92 0.90
DD 0.30 0.09 -0.14
SAO4 0.62 0.38 0.23
HAO4 0.49 0.23 0.05 *Significance at 0.05 levels.
SV4= Stick velocity
DD=Drag distance
SAO4= Shoulder axis orientation in follow-through
HAO4= Hip axis orientation in follow-through
Figure 01- Drag flick Phase from ground contact to ball release.
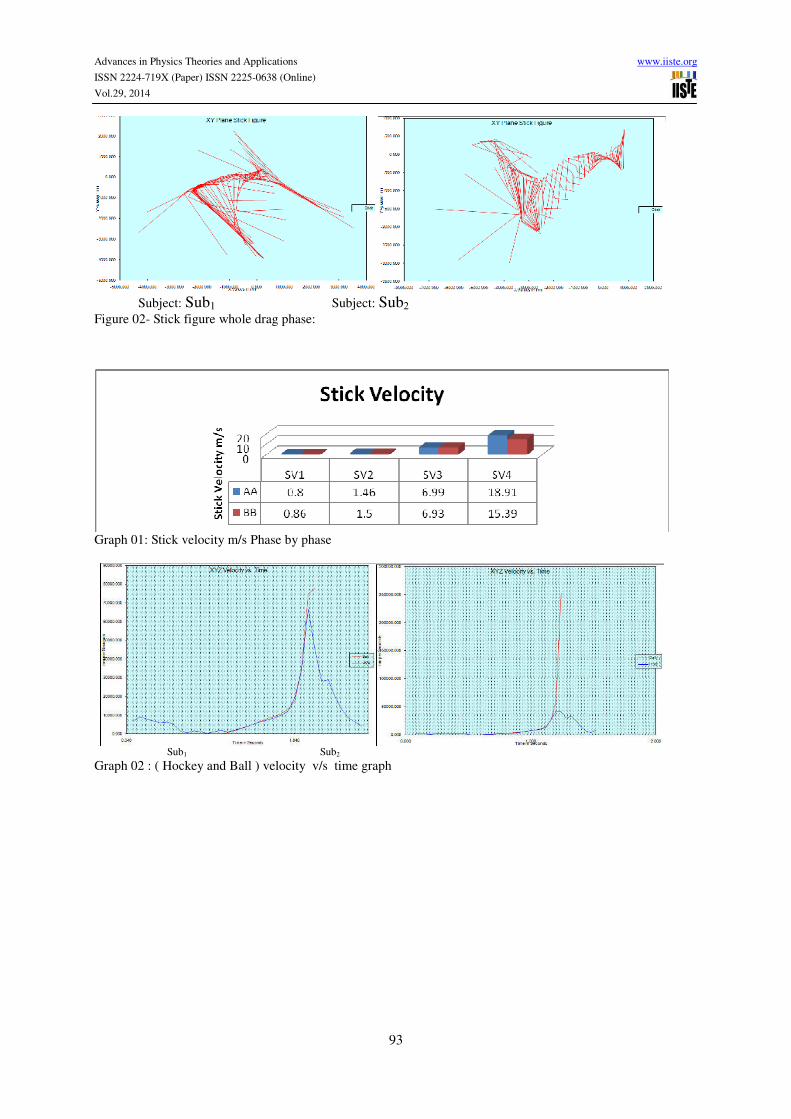
Advances in Physics Theories and Applications www.iiste.org
ISSN 2224-719X (Paper) ISSN 2225-0638 (Online)
Vol.29, 2014
93
Subject: Sub1 Subject: Sub2
Figure 02- Stick figure whole drag phase:
Graph 01: Stick velocity m/s Phase by phase
Sub1 Sub2
Graph 02 : ( Hockey and Ball ) velocity v/s time graph

Advances in Physics Theories and Applications www.iiste.org
ISSN 2224-719X (Paper) ISSN 2225-0638 (Online)
Vol.29, 2014
87
Three Dimensional Analysis of Drag-flick in The Field Hockey of
University Players
Mohd Arshad Bari
Department of Physical Education, Aligarh Muslim University, Aligarh (U.P) 202002 India
Tel: +91-8439438134 E-mail [email protected]
Naushad Waheed Ansari (Corresponding author)
Department of Physical Education, Aligarh Muslim University, Aligarh (U.P) 202002 India
Tel: +91-98972288992 E-mail [email protected]
Fuzail Ahmad
Department of Physical Education, Aligarh Muslim University, Aligarh (U.P) 202002 India
Tel: +91-9634982713 E-mail [email protected]
Ikram Hussain
Department of Physical Education, Aligarh Muslim University, Aligarh (U.P) 202002 India
Tel: +91-9411465663 E-mail [email protected]
The authors would like to acknowledge the cooperation of UGC-SAP (DRS-I) Programme, Department
of Physical Education, Aligarh Muslim University, Aligarh
Abstract
The penalty corner one of the most important technique to score the goal in field hockey. The penalty corner
depends upon three different technical applications like push, stop and drag. Technical application of drag flick
in penalty corner covered maximum number of successful goal. The main aim of this study was to analyze
spatial and temporal kinematics in the drag flick of elite field hockey players. Two main drag flickers from
Aligarh Muslim University, Aligarh hockey team were selected as a subject for this study. The body weight,
Height and Age of each subject ware recorded subsequently Sub1=65 kg body weight, 180.50cm of height and 19
years of age and Sub2= 60 kg body weight, 167.00 cm of height and 19 years of age. A static calibration method
was used to capture drag flick by Two Cameras, sampling at 50 Hz. Six successful trials at target were selected
from each subject for the study. Videos of selected trials were digitized by the Max Track 3D motion analysis
software. The three dimensional (3D) motion was determined from digitized video analysis using 18-point body
model together. Results of this study shows that spatial / temporal variable between the players, there exist little
difference in stance width in ball contact phase, recommended that little or no difference exist in techniques
between both players.
Key points: spatial / temporal, kinematics, drag, digitized.
1. Introduction
The success of the penalty corners depend three main technical application i.e. pusher, stopper and drag flicker.
Out of the three , the drag flicker contribute the most in the success of goals scored that have come from the
penalty corner (Lees, 2002).
The most important scoring plays in the field hockey are the technique of penalty corner (Laird and Sunderland,
2003 and Pineiro, 2008). The drag-flick is used in the field hockey for shooting at goal with speed and desire
accuracy as it is more scoring than other techniques such as hits and pushes during the penalty corner (Yusoff et
al., 2008).
As per the rules book of hockey (FIH, 2009), there is no any set rules regarding the maximum and minimum
height of the ball when the first shot to score a goal is a push or a drag-flick. Sports scientist, have focused on
strike techniques in field hockey but a few have analysed the technical aspect of drag-flick (Yussoff et al., 2008),

Advances in Physics Theories and Applications www.iiste.org
ISSN 2224-719X (Paper) ISSN 2225-0638 (Online)
Vol.29, 2014
88
focus to analyzed biomechanical parameters in relation to the performance of the players.
Biomechanical analysis of the techniques have no any single definition, however it is scientifically agreed that
technique analysis depend on the way in which skills are executed, from all parameters of biomechanics
(Kinetics and kinematics) (O’Donoghue., 2010). Both Biomechanical studies were conducted a 2D or 3D motion
analysis based on videography with a set specified sampling frequency. Biomechanics of throwing and hitting
skills should be follow same pattern as drag flick in field hockey which aim to get higher speed and accuracy of
the free end (distal) segment at release. In these techniques, back to back segments reach their maximum speed
in the beginning of series with those utmost from the free end of the kinetic chain (Bartlett and Best, 1988).
Kinetics chain of segmental rotations of the pelvis, upper trunk, and stick occurred in the drag-flick (Hussain et.
all. 2012). Kerr and Ness (2006) found that the movement pattern of the push is a compounding of consecutive
and simultaneous segment rotations. Furthermore, during the drag-flick the major contribution to the ball
velocity were stance, stance width, the distance between ball and front foot, the beginning of double foot contact,
angular and linear velocity of different body segment at ball release (McLaughlin, 1997; Kerr and Ness, 2006).
The most of the previous researches have been conducted a 2D analysis, there is a dearth of research on the 3D
analysis of the drag flick in the field hockey. However no 3D biomechanical study of the drag-flick techniques
has been done in Indian players. Thus, the research has been proposed to carry out 3D analysis of elite
specialized drag flicker from Aligarh Muslim University, Aligah.
2. Methodology
2.1 Selection of Subjects
Two specialized right handed drag flickers are current member of Aligarh Muslim University male hockey team
has been selected as the subject. The measurements were recorded by using the standard equipment, which were
presently available at hand. The body weight of each subject ware recorded in kilogram Sub1=65 kg and Sub2=
60 kg by using weighing machine (including player’s kit, which was wearing during the videography session).
Heights of each subject were recorded in centimeter (Sub1=180.50cm and Sub2=167.00 cm) by using stadiometer
and age of both subjects were 19 years measured in chronological order.
2.2 Filming Procedure:
The film recording conducted on sunny and clear weather in the Astroturf Hockey field during regularly
scheduled practice session. Subjects instructed to wear complete specified kit in order to perform successful drag
flick requirement of the study. The target 1"×1" square fixed at upper left corner of the goal post. 06 successful
drag flicks toward target of each drag flicker were selected for the analysis.
2.3 Variables: Kinematic / temporal variables, determined from the digitized 3D data, were used to describe five
(04) key positions (a) approach(From to the last left foot contact before ball pick up) (b) ball Contact (c) drag
Phase (From left foot contact to ball release) and (d) follow throw (From ball release to end of recovery) during
drag flick.
2.4 Model of Dreg Arm
The dreg arm was modeled as two segment kinetic chain composed of (a) upper arm segment and (b) distal
segment that include the forearm, hand and hockey stick. The distal segment was assumed to be a rigid body
with its longitudinal axis led along the longitudinal axis of the forearm
2.5 Videographic Equipments and Location
The subject’s drag flick movements were recorded using two Canon Legria SF-10, 8.1 video cameras in a field
setting, operating with a specified shutter speed and frame rate. The cameras were set-up on a rigid tripod and
secured to the floor in the location. The drag-flicks recorded with two cameras, sampling at 50 Hz. Both cameras
intersect to each other at 600 angles. First camera place right side 34 ft from the ball points at 90
0 of mediolateral
axis parallel to the ground, second camera placed laterally at the distance of 31.5ft and cameras were fielded
synchronized, static calibration method was used to calibrate both the cameras.
Videos of all trials were digitized using the Max Track 3D motion analysis software. Digitization was done from
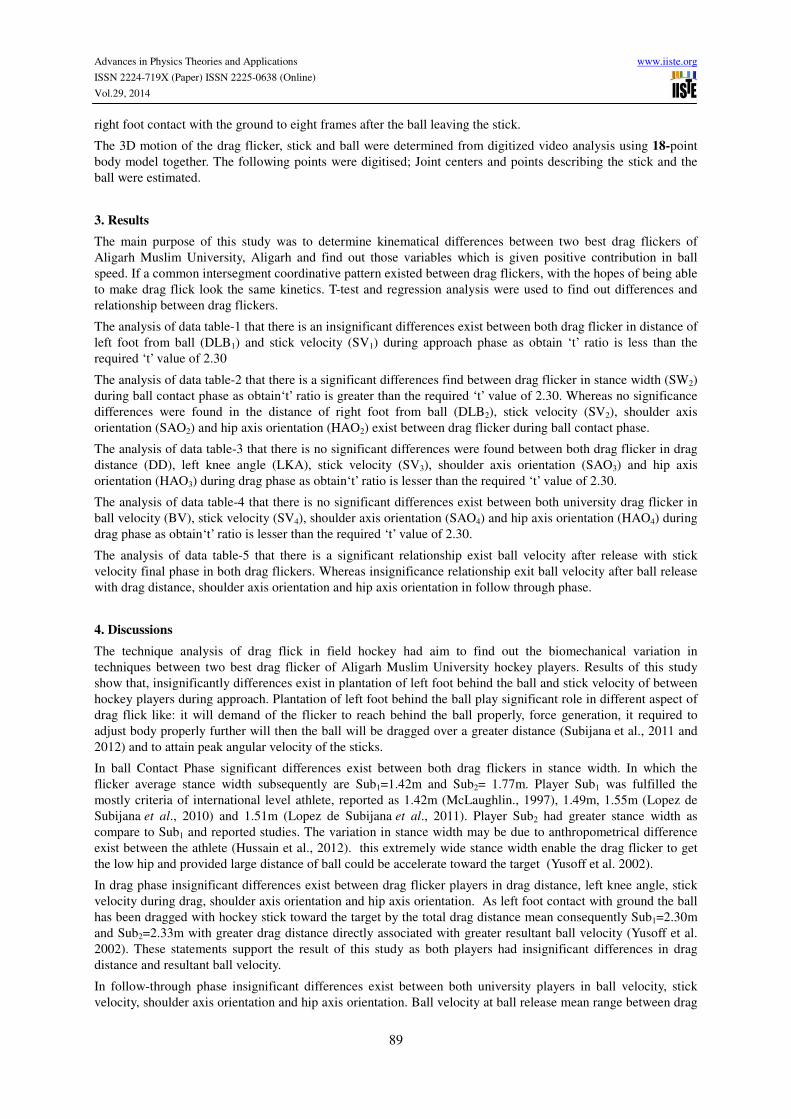
Advances in Physics Theories and Applications www.iiste.org
ISSN 2224-719X (Paper) ISSN 2225-0638 (Online)
Vol.29, 2014
89
right foot contact with the ground to eight frames after the ball leaving the stick.
The 3D motion of the drag flicker, stick and ball were determined from digitized video analysis using 18-point
body model together. The following points were digitised; Joint centers and points describing the stick and the
ball were estimated.
3. Results
The main purpose of this study was to determine kinematical differences between two best drag flickers of
Aligarh Muslim University, Aligarh and find out those variables which is given positive contribution in ball
speed. If a common intersegment coordinative pattern existed between drag flickers, with the hopes of being able
to make drag flick look the same kinetics. T-test and regression analysis were used to find out differences and
relationship between drag flickers.
The analysis of data table-1 that there is an insignificant differences exist between both drag flicker in distance of
left foot from ball (DLB1) and stick velocity (SV1) during approach phase as obtain ‘t’ ratio is less than the
required ‘t’ value of 2.30
The analysis of data table-2 that there is a significant differences find between drag flicker in stance width (SW2)
during ball contact phase as obtain‘t’ ratio is greater than the required ‘t’ value of 2.30. Whereas no significance
differences were found in the distance of right foot from ball (DLB2), stick velocity (SV2), shoulder axis
orientation (SAO2) and hip axis orientation (HAO2) exist between drag flicker during ball contact phase.
The analysis of data table-3 that there is no significant differences were found between both drag flicker in drag
distance (DD), left knee angle (LKA), stick velocity (SV3), shoulder axis orientation (SAO3) and hip axis
orientation (HAO3) during drag phase as obtain‘t’ ratio is lesser than the required ‘t’ value of 2.30.
The analysis of data table-4 that there is no significant differences exist between both university drag flicker in
ball velocity (BV), stick velocity (SV4), shoulder axis orientation (SAO4) and hip axis orientation (HAO4) during
drag phase as obtain‘t’ ratio is lesser than the required ‘t’ value of 2.30.
The analysis of data table-5 that there is a significant relationship exist ball velocity after release with stick
velocity final phase in both drag flickers. Whereas insignificance relationship exit ball velocity after ball release
with drag distance, shoulder axis orientation and hip axis orientation in follow through phase.
4. Discussions
The technique analysis of drag flick in field hockey had aim to find out the biomechanical variation in
techniques between two best drag flicker of Aligarh Muslim University hockey players. Results of this study
show that, insignificantly differences exist in plantation of left foot behind the ball and stick velocity of between
hockey players during approach. Plantation of left foot behind the ball play significant role in different aspect of
drag flick like: it will demand of the flicker to reach behind the ball properly, force generation, it required to
adjust body properly further will then the ball will be dragged over a greater distance (Subijana et al., 2011 and
2012) and to attain peak angular velocity of the sticks.
In ball Contact Phase significant differences exist between both drag flickers in stance width. In which the
flicker average stance width subsequently are Sub1=1.42m and Sub2= 1.77m. Player Sub1 was fulfilled the
mostly criteria of international level athlete, reported as 1.42m (McLaughlin., 1997), 1.49m, 1.55m (Lopez de
Subijana et al., 2010) and 1.51m (Lopez de Subijana et al., 2011). Player Sub2 had greater stance width as
compare to Sub1 and reported studies. The variation in stance width may be due to anthropometrical difference
exist between the athlete (Hussain et al., 2012). this extremely wide stance width enable the drag flicker to get
the low hip and provided large distance of ball could be accelerate toward the target (Yusoff et al. 2002).
In drag phase insignificant differences exist between drag flicker players in drag distance, left knee angle, stick
velocity during drag, shoulder axis orientation and hip axis orientation. As left foot contact with ground the ball
has been dragged with hockey stick toward the target by the total drag distance mean consequently Sub1=2.30m
and Sub2=2.33m with greater drag distance directly associated with greater resultant ball velocity (Yusoff et al.
2002). These statements support the result of this study as both players had insignificant differences in drag
distance and resultant ball velocity.
In follow-through phase insignificant differences exist between both university players in ball velocity, stick
velocity, shoulder axis orientation and hip axis orientation. Ball velocity at ball release mean range between drag
Advances in Physics Theories and Applications www.iiste.org
ISSN 2224-719X (Paper) ISSN 2225-0638 (Online)
Vol.29, 2014
90
flickers is 18.09 – 21.39 m/s. Highest ball velocity play significant contribution in scoring of goal. When ball
travelled toward the target with greater speed, the goal keeper has little time to change our body position to safe
the goal (Yusoff et al. 2002).
Both drag flicker ball velocity after the ball release has significant positive correlated with stick velocity in final
phase. Sub1 and Sub2 stick velocity in final phase has 77% and 92% subsequently contribute on ball velocity
after ball release. Highest stick velocity help to generate greater momentum force and greater stick velocity both
are directly associated with resultant ball velocity (Bartlet, 2007). The player Sub1: Drag distance and shoulder
axis orientation has insignificant positive relationship and hip axis orientation has insignificant negative
relationship with ball velocity. Player Sub2: Drag distance, shoulder axis orientation and hip axis orientation in
follow through phase has insignificant positive relation with ball velocity. Finally, the drag flicker of Aligarh
Muslim University had a greater stance, long drag, and proper leg flexed than previous study reported by
(Bartlett, 2012, Nichol, 2005, and Mosquera et al, 2007) indicate approximately good technique. When
comparing biomechanical variable between the players, there exist little difference in stance width in ball contact
phase, recommended that little or no difference exist in techniques between both players.
References
1. Hussain I. Ahmed S. and Khan S. (2012), Biomechanical Study on Drag Flick in Field Hockey, International
journal of behavioral social and movement sciences, vol.01,july2012, issue03..
2. Bartlett, R. (2007). Introduction to Sports Biomechanics. Abingdon: Routledge.
3. Bartlett, R. (2012). Quantitative and qualitative analysis. In Encyclopaedia of International Sports
Studies (Ed. R. Bartlett, C. Graton and C.G. Rolf), pp. 1115-1116. London: Routledge.
4. Laird, P. and Sutherland, P. (2003). Penalty Corners in Field Hockey: A guide to success.International
Journal of Performance Analysis in Sport, 3(1), 19-26.
5. Lees, A. (2002). Technique analysis in sports: a critical review. Journal of Sports Sciences, 20, 813-828.
6. López de Subijana, C.L., Juárez, D., Mallo, J. and Navarro, E. (2010). Biomechanical analysis of the
penalty-corner drag-flick of elite male and female hockey players. Sports Biomechanics, 9(2), 72-78.
7. López de Subijana, C.L., Juárez, D., Mallo, J. and Navarro, E. (2011). The application of biomechanics to
penalty corner drag-flick training: a case study. Journal of Sports Science and Medicine, 10, 590-595.
8. López de Subijana Hernández, C., de Antonio, R., Frutos, P.G. and Cabello, E.N. (2011). Anàlisi de la
cadena cinemàtica del drag-flick. Educació Fisica i Esportes, 104(2), 106-113.
9. López de Subijana, C.L., Gómez, M., Martín-Casadom L. and Navarro, E. (2012). Training induced changes
in drag-flick technique in female field hockey players. Biology of Sport, 29(4), 263-268.
10. McLaughlin, P. (1997). Three-dimensional biomechanical analysis of the hockey drag flick: full report.
Belconnen, A.C.T.; Australia: Australian Sports Commission.
11. Mosquera, R. P., Molinuevo, J. S., and Roman, I. R. (2007). Differences between international men’s and
women’s teams in the strategic action of the penalty corner in field hockey. International Journal of
Performance Analysis of Sport, 7(3), 67-83.
12. Nichol, G. (2005). Goal scoring including the drag flick. Available
at: https://www.google.co.uk/url?sa=t&rct=j&q=&esrc=s&source=web&cd=1&ved=0CDUQFjAA&url=htt
p%3A%2F%2Fwww.sportingpulse.com%2Fget_file.cgi%3Fid%3D1947175&ei=Tyg7UaWqL5Lo7AbiwY
CICw&usg=AFQjCNHrZ7oepeGcCMfOd3P-uqWtEYSnXA&bvm=bv.43287494,d.ZGU (Accessed: 9
March 2013).
13. O’Donoghue, P. (2010). Research Methods for Sports Performance Analysis. London: Routledge.
14. Yusoff, S., Hasan, N. and Wilson, B. (2008) Tree-dimensional biomechanical analysis of the hockey drag
flick performed in competition. ISN Bulletin, National Sport Institute of Malaysia 1, 35-43.
15. Bartlett, R. M., and Best, R. J. (1988). The biomechanics of javelin throwing: A review. Journal of Sport
Sciences, 6(1), 1-38.
16. Kerr, R., and Ness, K. (2006). Kinematics of the field hockey penalty corner push-in. Sports Biomechanics,
5 (1), 47-61.

Advances in Physics Theories and Applications www.iiste.org
ISSN 2224-719X (Paper) ISSN 2225-0638 (Online)
Vol.29, 2014
91
Table:01 Approach (From to the last left foot contact before ball pick up)
Variables Subjects Sub1 Sub2 t- value
DLB1 Mean 0.17 0.40 1.01
SD 0.02 0.54
SV1 Mean 0.80 0.86 0.14
SD 0.24 0.17
DLB 1= Distance of left foot from ball in approach (m).
SV1= Stick velocity in approach (m/s)
Table:02 Ball Contact
Variables Subjects Sub1 Sub2 t- value
DLB 2 Mean 0.47 0.62 2.05
SD 0.08 0.16
SW2 Mean 1.42 1.77 2.89*
SD 0.08 0.29
SV2 Mean 1.46 1.50 0.21
SD 0.36 0.31
SAO2 Mean -5.33 -5.16 0.08
SD 4.03 3.19
HAO2 Mean -5.33 -5.17 0.64
SD 4.03 3.19
Tab t.0.05
(10) =2.30 *Significance at 0.05 levels.
DLB2= Distance of right foot from ball in ball contact phase (m)
SW2= Stance width in ball contact phase (m)
SV2= Stick velocity in ball contact phase (m/s)
SAO2= Shoulder axis orientation in ball contact phase
HAO2= Hip axis orientation in ball contact phase
Table: 03 Drag Phase
Variables Subjects Sub1 Sub2 t- value
DD Mean 2.30 2.33 0.10
SD 0.52 0.48
LKA Mean 113.83 117.83 0.59
SD 10.74 12.62
SV3 Mean 6.99 6.93 0.00
SD 1.53 1.47
SAO3 Mean -2.83 -6.83 1.79
SD 2.93 4.62
HAO3 Mean 25.50 25.83 0.07
SD 8.36 9.13
DD= Drag distance
LKA= Left knee angle
SV3= Stick velocity in drag phase
SAO3= Shoulder axis orientation in drag phase
HAO3= Hip axis orientation in drag phase

Advances in Physics Theories and Applications www.iiste.org
ISSN 2224-719X (Paper) ISSN 2225-0638 (Online)
Vol.29, 2014
92
Table: 04 Follow- through Variables Subjects Sub1 Sub2 t- value
BV Mean 21.39 18.09 1.40
SD 4.41 3.73
SV4 Mean 18.91 15.39 1.55
SD 3.83 4.04
SAO4 Mean 63.83 67.67 0.67
SD 11.44 8.16
HAO4 Mean 51.50 51.83 0.06
SD 10.21 10.42
BV= Ball velocity
SV4=Drag distance in follow-through
SAO4= Shoulder axis orientation in follow-through
HAO4= Hip axis orientation in follow-through
Table: 5 Regressions
Subjects Dependent
variable
Predictors R R Square Adjusted R Square
Sub1 Ball velocity
after ball release
SV4 0.85* 0.77 0.65
DD 0.45 0.21 0.01
SAO4 0.00 0.00 -0.25
HAO4 -0.16 0.02 -0.22
Sub2 Ball velocity
after ball release
SV4 0.96* 0.92 0.90
DD 0.30 0.09 -0.14
SAO4 0.62 0.38 0.23
HAO4 0.49 0.23 0.05 *Significance at 0.05 levels.
SV4= Stick velocity
DD=Drag distance
SAO4= Shoulder axis orientation in follow-through
HAO4= Hip axis orientation in follow-through
Figure 01- Drag flick Phase from ground contact to ball release.

Advances in Physics Theories and Applications www.iiste.org
ISSN 2224-719X (Paper) ISSN 2225-0638 (Online)
Vol.29, 2014
93
Subject: Sub1 Subject: Sub2
Figure 02- Stick figure whole drag phase:
Graph 01: Stick velocity m/s Phase by phase
Sub1 Sub2
Graph 02 : ( Hockey and Ball ) velocity v/s time graph

International Journal of Research Studies in Science, Engineering and Technology [IJRSSET]
Volume 1, Issue 2, May 2014, PP 74-78
©IJRSSET 74
Three Dimensional Analysis of Variation between Successful and
Unsuccessful Drag flick Techniques in Field Hockey
Mohd Arshad Bari, Naushad Waheed Ansari,
Ikram Hussain , Fuzail Ahmad, Mansoor Ali Khan,
Department of Physical Education Aligarh Muslim University, Aligarh, 202002, (U.P) India
[email protected] [email protected]
Abstract: Three dimensional Biomechanical Analyses of drag flick techniques in hockey is the best way to
determine different mechanical parameter of the performance. The focus of this study was to analysed kinematical
differences between successful and unsuccessful drag flick and find out those parameters which is given convinced
contribution in the accuracy. For this study one (01) main drag flicker from Aligarh Muslim University, Aligarh
(U.P) India (mean age 19 years; height 180.50 cm and weight 65 kg) was selected as a subject. The movements of
the drag flick techniques were recorded with two Canon video cameras. Trials were digitized by the Max Track 3D
motion analysis software. The result of this study shows that there are little or no movement variations in the
individual technique of drag flick.
Keywords: Drag, Kinematical, Three Dimensional, Motion analysis, performance
1. INTRODUCTION
Technique of biomechanical analysis is the best
way to find out the key mechanical factors of
performance. Biomechanical analysis is not
limited for the few sports; it is well versed in
testing specific skills in open sports. For example,
serve in tennis, Bowling and throwing in cricket,
shooting in basketball, drag flick in hockey; these
are the few examples of open sports for the
biomechanical analysis to find out the factors
responsible in skills (Gomez et al., 2012)
3D motion analysis always performed like 2D
analysis as well as advanced motion analysis
technology with advance plate data. In 3D
analysis reflective markers are placed on the
subject and tracked with infrared camera to create
model of the athlete during the activity. 3D
analysis is the best way to visualize and track
progresses over time.
Drag flick is an attacking technique in the sports
of field hockey. Drag flick is known as the most
scoring technique in the field hockey, it is mainly
use in penalty corner. The drag flick is mostly use
by the men than women in penalty corner and its
more effective then pushes or hits during penalty
corner.
Approximately half of all goals have been scored
from the penalty corner. Direct hit and Drag flick
are two shooting style used for a direct shot on
goal from penalty corners set play. During direct
hit the ball must be played low around the
wooden area of the goal post, and the drag flick
in which the ball is allowed to be lifted at any
part of the goal post. Drag flick is the
combination of common flick and scoop stroke.
Drag flick is a very effective goal-scoring
weapon because ball mostly travels above the
level of the goalkeeper into the top corner of the
goal post with accuracy and speed. For the
analysis the drag flick can be broken into the four
phases: 1- preparation, 2- force generation, 3- ball
contact with the ball, and 4- follow through
phase.

Mohd Arshad Bari et al.
International Journal of Research Studies in Science, Engineering and Technology [IJRSSET] 75
Mechanics of each phase of the drag flick has
significant with the performance (Bari et al.
2014). Main aim of this study to find out
kinematical factors which are responsible for
better performance in relation to accuracy.
2. METHODOLOGY
One main drag flicker of Aligarh Muslim
University, Aligarh (U.P) India (mean age 19
years; height 180.50 cm and weight 65 kg)
participated as a subject in this study. Participant
was free of injury and had a hockey drag flick
experience of 06 years.
Player wear specified tight clothing during the
data collection. Reflective marker were placed
on Clavicle, Sternum, Shoulder (right and left),
elbow (right and left), wrist (right and left), pelvic
left and right axis, Knee (right and left), medial
knee (right and left), ankle (right and left)and
three point in hockey stick.
The three dimensional (3D) motion of the drag
flicks, stick and ball were ascertained from
digitized video analysis using 21-point body
model together. The complying markers were
digitised; Joint centres and points describing the
stick and the ball were estimated (Bari et. al,
2014).
The data recording of drag flick conducted on
sunny and clear weather condition in the
Astroturf Hockey field during regularly practice
scheduled. The target 1×1 square feet was fixed at
upper left corner of the goal post. Twelve drag
flicks toward target were selected (Six successful
and Six unsuccessful) for the analysis.
The movements of the drag flick were captured
using two Canon Legria SF-10, 8.1 video
cameras in a field setting operating and with a
specified shutter speed and frame rate field
setting (sampling at 50 Hz). Cameras intersect to
each other at 600 angles. Placement of the first
camera on the right side at 34 ft from the ball
points at 900
of mediolateral axis parallel of
latitude to the ground, second camera placed
laterally at the distance of 31.5ft. Cameras were
fielded synchronized, static calibration method
was used to calibrate both the cameras (Bari et.
al, 2014).Videos of all trials were digitized using
the Max Track 3D motion analysis software.
3. RESULTS
The main purpose of this study was to determine
kinematical differences between successful and
unsuccessful drag flick and find out those
variables which has given positive contribution in
ball accuracy. T-test and correlation analysis were
used to find out differences and relationship
between successful and unsuccessful drag flicks.
Table 1.
Var
iabl
e
N Mea
n
Std.D
eviati
on
Std.
Error
Mean
t-
valu
e
DD
(m)
SF 06 2.14 0.50 0.20 0.53
UF 06 2.00 0.39 0.16
BV
(m/
s)
SF 06 18.61 3.30 1.34 1.35
UF 06 16.29 2.63 1.07
SV
(m/
s)
SF 06 16.39 3.86 1.56 0.83
UF 06 14.92 1.96 0.80
SA
O
(°)
SF 06 63.67 12.74 5.20 1.30
UF 06 54.17 12.56 5.13
HA
O
(°)
SF 06 49.17 9.11 3.72 0.14
UF 06 48.33 11.20 4.57
*Significance at 0.05 levels.
DD=Drag distance (m)
BV= Ball Velocity after ball release (m/s)
SV= Stick velocity (m/s)
SAO= Shoulder axis orientation in follow-
through (°)
HAO= Hip axis orientation in follow-through (°)
The analysis of data table-1 shows that there is an
insignificant differences shows between
successful and unsuccessful drag flicks
kinematics i.e. drag distance (DD), Ball velocity
after ball release (BV), stick velocity (SV) during
follow-through phase as obtain ‘t’ ratio is less than the required ‘t’ value of 2.30

Three Dimensional Analysis of Variation between Successful and Unsuccessful Drag flick Techniques in Field
Hockey
International Journal of Research Studies in Science, Engineering and Technology [IJRSSET] 76
Graph 1. Drage distance (m)
Graph 2. Ball and stick velocity (m/s)
Graph 3. shoulder and hip axis orientation (m/s)
Table 2. correlations
Subjects Dependent
variable
Predictors R
Successful Ball velocity
after ball
release
DD 0.52
SV 0.71
SAO -0.10
HAO 0.24
*Significance at 0.05 levels.
DD=Drag distance (m)
BV= Ball Velocity after ball release (m/s)
SV= Stick velocity (m/s)
SAO= Shoulder axis orientation in follow-through (°)
HAO= Hip axis orientation in follow-through (°)
The analysis of data table-2 shows that there were
no significant relationship between ball velocity
after release with Drag distance (DD),stick
velocity (SV), shoulder axis orientation (SAO)
and hip axis orientation (HAO) in follow through
phase during successful drag flick.
Table 3. correlations
Subjects Dependent
variable
Predictors R
Un-
Successful
Ball
velocity
after ball
release
DD 0.515
SV 0.858*
SAO 0.645
HAO 0.046
*Significance at 0.05 levels.
DD=Drag distance (m)
BV= Ball Velocity after ball release (m/s)
SV= Stick velocity (m/s)
SAO= Shoulder axis orientation in follow-through (°)
HAO= Hip axis orientation in follow-through (°)
The analysis of data table-3 shows that there is a
significant positive relationship between ball
velocity after release with stick velocity in follow
through phase. Whereas insignificance
relationship exit between ball velocities after ball
release with drag distance, shoulder axis
orientation and hip axis orientation in follow
through phase during unsuccessful drag flick.
4. DISCUSSION
The main purpose of this study was to find out
the kinematical differences in the drag-flick
pattern between successful and unsuccessful drag
flicks in order to render to the point selective
information for goalkeepers. Many researchers
have studied the kinetic and kinematical pattern
of the drag-flick technique, with the propose to
find the reminds for an optimum performance
(Subijana et al., 2010; Yusoff et al., 2008). In
addition, some research was focused on the
goalkeepers’ anticipation when facing a penalty corner (Canal-Bruland et al., 2010).
Result of this study has shown no significant
differences between successful and unsuccessful
drag-flick pattern depending on the direction of

Mohd Arshad Bari et al.
International Journal of Research Studies in Science, Engineering and Technology [IJRSSET] 77
the shot. Result of the study contradicts with the
result of (Gomez et al., 2012) as the direction of
the shot occurred before the dragging action of
the stick (Gomez et al., 2012).
The participants in the study by Gomez et al.,
2012 had more experience and skillful than the
participant in this study. They were skilled drag-
flickers, their patterns could have been more
consistent than the one described in the present
study. This may be a reason that no significant
differences were shown between successful and
unsuccessful drag-flick pattern.
Furthermore, there were no significant
differences between successful and unsuccessful
drag-flick patterns. Successful and unsuccessful
drag-flick patterns showed the same kinematic
sequence of drag distance (m), Ball Velocity after
ball release (m/s), Stick velocity (m/s), Shoulder
axis orientation in follow-through (%) and Hip
axis orientation in follow-through (%). This
kinematic sequence differed from that described
by Subijana et al. (2010), again with successful
drag flick where higher stick and ball velocity of
the stick preceded maximum shoulder axis
orientation in follow-through (%) and Hip axis
orientation in follow-through (%) as compare to
unsuccessful drag flick.
In this study, the drag-flicks shot in set target
showed lower ball velocities (18.61 ± 3.30 m/s
successful drag-flicks; 16.39 ± 2.63 m/s
unsuccessful drag-flicks) than in the study
by López de Subijana et al. (2010) with male
hockey players (21.9 ± 1.7 m/s) and female
hockey players (17.9 ± 1.7 m/s). These values
were also lower than those reported
by McLaughlin (1997) (19.1 to 21.9 m/s) and
Yusoff et al. (2008) (19.6 to 27.8 m/s). It was
noticeable that there were no significant
differences in ball velocities between successful
and unsuccessful drag-flicks, but successful drag
flick recorded higher mean ball velocity as
compare with unsuccessful drag flicks, so
velocity of ball were equally efficient to get
accuracy.
The drag distance successful and unsuccessful
drag flicks shows insignificant relationship with
ball velocity after ball release. Therefore the drag
distances of drag flick were 2.14 m (Successful)
and 2.00 m (unsuccessful) drag flick techniques.
Successful drag flick technique toward target had
greater mean drag distance as compare with
unsuccessful drag flick techniques.
Average drag distance was lower than the value
found for junior players by (Subhijana et. al,
2012) and elite and sub elite players by (Mc
laughem, 1997) . there was not a big difference
between the mean value of drag distance of
successful and unsuccessful drag flick.
Drag distance highly correlated with criterion ball
velocity. Additionally importance of create higher
ball velocity after release (Mc laughem, 1997).
These studies also supported with, the successful
drag flick techniques had greater ball velocity and
greater drag distance as compare with
unsuccessful drag flick (Gonez et al. 2012).
In successful drag flicks, drag distance, stick
velocity and hip axis orientation produced
insignificant positive contribution and shoulder
axis orientation insignificant negative
contribution on ball velocity after release.
Unsuccessful drag flicks, drag distance, and hip
axis and shoulder axis orientation insignificant
contribute in ball velocity after release. Therefore
stick velocity shows significant positive
contribution on ball velocity after release.
An accurate motor execution of the drag flick
techniques is essential to construct a proper
skilled of drag flick performance (Canal-Bruland
et al., 2010). Furthermore, in high-speed sports
such as drag flick in hockey, the speed of play
and ball velocity dictate that decisions must often
be made in advance of the action (Savelsbergh et
al., 2002).
There are little or no movement variations in the
individual technique of drag flick between
successful and unsuccessful drag flick. Some
movement’s variations are necessary to accommodate with experimental constraints in

Three Dimensional Analysis of Variation between Successful and Unsuccessful Drag flick Techniques in Field
Hockey
International Journal of Research Studies in Science, Engineering and Technology [IJRSSET] 78
successful and unsuccessful drag flick situations
(Beckmann et al., 2010).
ACKNOWLEDGEMENT
The authors would like to acknowledge the
cooperation of UGC-SAP (DRS-1) programme,
department of Physical Education, Aligarh
Muslim University, Aligarh.
REFERENCES
[1] Bari, M. A., Ansari, N. W., Ahmad, F., &
Hussain, I. (2014). Three Dimensional
Analysis of Drag-flick in The Field Hockey
of University Players. Advances in Physics
Theories and Applications, 29, 87-93.
[2] Beckmann H, Winkel C & Schollhorn WI.
(2010). Optimal range of variation in hockey
technique training, Int. J Sport Psychology,
41, 5–45.
[3] Canal-Bruland R, Van der Kamp J,
Arkesteijn M, Janssen RJ, Van Kesteren J &
Savelsbergh GJP. (2010).Visual search
behaviour in skilled field-hockey
goalkeepers. Int J Sport Psychol, 41, 327–339.
[4] Lopez de Subijana C, Juarez D, Mallo D &
Navarro E. (2010) Biomechanical analysis of
the penalty-corner drag-flick of elite male
and female hockey players. Sport Biomech,
9(2), 72–78.
[5] Maria Gomez, Cristina Lopez de Subijana,
Raquel Antonio & Enrique Navarro (2012).
Journal of Human Kinetics, 35, 27–33.
[6] McLaughlin P. (1997). Three-dimensional
biomechanical analysis of the hockey drag-
flick: full report.Belconnen, A.C.T.,
Australia: Australian Sports Commission.
[7] Savelsbergh GJP, Williams AM, Van der
Kamp J & Ward P. (2002). Visual search
anticipation and expertise in soccer
goalkeepers, J Sport Sci. 20, 279–287.
[8] Yusoff S, Hasan N & Wilson B. (2008).
Three-dimensional biomechanical analysis of
the hockey drag flick performed in
competition. ISN Bulletin, National Sport
Institute of Malaysia, 1(1), 35–43.

5/18/2020 Three Dimensional Biomechanical Analysis of the Drag in Penalty Corner Drag Flick Performance | Semantic Scholar
https://www.semanticscholar.org/paper/Three-Dimensional-Biomechanical-Analysis-of-the-in-Ansari/9c30433485f0722767d6b93a36e42e6ceb4d0… 1/3
ABSTRACT
9 REFERENCES
RELATED PAPERS
References
Publications referenced by this paper.
Corpus ID: 55767850
Three Dimensional Biomechanical
Analysis of the Drag in Penalty Corner
Drag Flick Performance
Naushad Waheed Ansari • Published 2014 • Mathematics
Penalty corner in eld hockey is a complex motor skill. It required high level ofcoordination. The aim of this study was to provide important biomechanicalvariables related information for the Sports biomechanist, Young sportsscientist, Coaches and also for drag ick specialist for their performanceenhancement programs. Four specialist male drag-ickers of two differentuniversities namely LNIPE, Gawalior , and Aligarh Muslim University , Aligarh,age range 19-25 years, height ranged 174-182cm and weight range 59.4- 66.8Kg. and all having six to eight years of experiences were participated in thisstudy. Three dimensional (3D) experimental setup was conducted for the study.All of the measurements were carried out on the Asto truf ground in theirrespective universities elds. Two video cameras Canon Legria SF-10 were usedto capture all drag ick trials. The shuttering speed of cameras were set on1/1000 and 50hz frame rate. Both cameras were set with the help of tripodplaced at right side of the subjects mounted at a height of 1.2m. Duringcaptured drag ick, the distances of cameras were set at 13m and 17m from thestationary ball position and optical axes of the recording cameras wereintersect each other on the subject at 90° and 60° respectively to right side in aeld setting. The drag ickers and ball movement during the drag ick phasewere recorded. Videos footages were edited and synchronized for 3Dbiomechanical analysis. DLT method was used to calibrate of both the cameras.The drag distance, stride length, ball velocity and acceleration, angles, linear andangular velocity and linear and angular acceleration of shoulder, knee, elbow,wrist of left and right side were digitized and three dimensional data wasobtained with the help of Max TRAQ 3D motion analysis software.SPSSv.16. wasused to calculate the selected parameters and statistical analysis mean andstandard deviations. T-test was used to nd out the comparison between LNIPE,Gawalior and A.M.U.Aligarh. And the result was found that drag distance andhockey stick blade, linear velocity of shoulder (L&R), pelvic (L&R), Knee (L) andwrist (R),angular velocity of shoulder (L&R), elbow (L&R), pelvic(L&R), Knee(L),ankle(R) and wrist(R), linear acceleration of hockey stick blade and ball,shoulder (L), Knee(R), ankle(R) and toe(R), angular acceleration of wrist (R) andjoint angles of shoulder (L&R), elbow (L), wrist (R) and ankle(R) during dragdiffers signicantly and hence does inuences on drag ick technique underaccuracy condition. Keywords: Drag of Dragick, Biomechanical, ThreeDimensional, Motion analysis, performance LESS
Save To Library Create Alert Cite Launch Research Feed
Share This Paper
FAQ About Contact • Sign In Create Free AccountSearchAll Fields

5/18/2020 Three Dimensional Biomechanical Analysis of the Drag in Penalty Corner Drag Flick Performance | Semantic Scholar
https://www.semanticscholar.org/paper/Three-Dimensional-Biomechanical-Analysis-of-the-in-Ansari/9c30433485f0722767d6b93a36e42e6ceb4d0… 2/3
SHOWING 1-9 OF 9 REFERENCES
Biomechanical Study on Drag Flick in Field HockeyIkram Hussain, Saleem Ahmed, Sartaj Khan • 2012
Kinematic Pattern of the Drag-Flick: a Case StudyMaria Gomez, Cristina López de Subijana, Raquel Carros Antonio, Enrique Fernando Canto Navarro • Medicine, Computer Science• Journal of human kinetics • 2012
Training-induced changes in drag-ick technique in female eld hockey playersCristina López de Subijana Hernández, María Gómez Jiménez, Laura Martín Casado, Enrique Navarro Cabello • Engineering •2012
Biomechanical analysis of the penalty-corner drag-ick of elite male and female hockey playersCristina López de Subijana Hernández, Daniel Juárez Santos-García, Javier Mallo Sainz, Enrique Navarro Cabello • Engineering •2010
VIEW 1 EXCERPT
Biomechanical analysis of the penalty-corner drag-ick of elite male and female hockey players.Cristina López de Subijana, Daniel Juárez, Javier Mallo, Enrique Fernando Canto Navarro • Medicine, Mathematics • Sportsbiomechanics • 2010
Differences between international men’s and women’s teams in the strategic action of the penalty corner in eldhockeyRebeca Piñeiro Mosquera, J. Sampedro Molinuevo, Ignacio Refoyo Román • Psychology • 2007
VIEW 1 EXCERPT
Penalty Corners in Field Hockey: A guide to successPeter Laird, P. W. Sutherland • Psychology • 2003
VIEW 1 EXCERPT
P Mclaughlin • 1997
VIEW 3 EXCERPTS
P. McLaughlin • 1997
VIEW 3 EXCERPTS
Related Papers
Three-dimensional biomechanical analysis of the hockey drag ick: full report
Three-dimensional biomechanical analysis of the hockey drag ick: full report. Belconnen: Australian SportsCommission

5/18/2020 Three Dimensional Biomechanical Analysis of the Drag in Penalty Corner Drag Flick Performance | Semantic Scholar
https://www.semanticscholar.org/paper/Three-Dimensional-Biomechanical-Analysis-of-the-in-Ansari/9c30433485f0722767d6b93a36e42e6ceb4d0… 3/3
Show More 2/0
Proudly built by AI2 with the help of our Collaborators using these Sources.Research • Publisher Partnerships • Data Partnerships • API and Open Corpus
Terms of Service • Privacy Policy

5/18/2020 Three dimensional kinematic analysis of the drag flick for accuracy | Semantic Scholar
https://www.semanticscholar.org/paper/Three-dimensional-kinematic-analysis-of-the-drag-Ansari-Bari/531abd36c2f9822ef281dc5a0c655e6e803a… 1/3
ABSTRACT
8 REFERENCES
RELATED PAPERS
References
Publications referenced by this paper.
SHOWING 1-8 OF 8 REFERENCES
Biomechanical Study on Drag Flick in Field HockeyIkram Hussain, Saleem Ahmed, Sartaj Khan • 2012
Kinematic Pattern of the Drag-Flick: a Case StudyMaria Gomez, Cristina López de Subijana, Raquel Carros Antonio, Enrique Fernando Canto Navarro • Medicine, Computer Science• Journal of human kinetics • 2012
Corpus ID: 32659527
Three dimensional kinematic
analysis of the drag ick for accuracy
Naushad Waheed Ansari, Mohd. Arshad Bari, +1 author Fuzail Ahmad •
Published 2014 • Mathematics
The purpose of this study was to assess the effects of biomechanical selectedparameters of penalty corner drag ick for accuracy. The best drag icker ofA.M.U. Aligarh, Hockey team has been selected for this study. His age, height,weight was 19yrs, 180.50cm and 65kg respectively. The subject used his ownstick approved by the All India Association Committee, India. He took 10 trials ofdrag ick from stationary ball to hit given target (1 X 1feet) hung on the rightcorner of the goal post. The two Canon Legria SF-10, 8.1 video cameras wereused. The lm was recorded on sunny and clear weather at Astroturf HockeyField during evening training session. For the 3D co-ordinates 18 bodylandmarks were used to reconstruct the 3D motion using standard DLTprocedures. The digitized 3D data were collected from two phase (1) Contactphase and (2) Release phase. The Knee exion angle was considered for thefront foot only. Max TRAQ 3D motion analysis software was used to calculatethe selected parameters and statistical analysis was accepted using SPSSv.16,mean, standard deviations and correlation was used to nd out the relationshipof selected variables of the study with ball velocity. The alpha level ofsignicance was set at p<0.05 for all statistical tests. The result was found thatsignicant relationship exist ball velocity with HSB at both phases, EA at contactphase, EV at contact phase and KA at release. Where as insignicantrelationship exist ball velocity with ES, PS SA, PA, SV, PV and KV at both phasesand KA at contact phase and EA and EV at release phase. LESS
Save To Library Create Alert Cite Launch Research Feed
Share This Paper
Alternate Sources
FAQ About Contact • Sign In Create Free AccountSearchAll Fields
5/18/2020 Three dimensional kinematic analysis of the drag flick for accuracy | Semantic Scholar
https://www.semanticscholar.org/paper/Three-dimensional-kinematic-analysis-of-the-drag-Ansari-Bari/531abd36c2f9822ef281dc5a0c655e6e803a… 2/3
VIEW 2 EXCERPTS
Stiffness variation in hockey sticks and the impact on stick performanceGraeme Nigel Carlisle • Engineering • 2012
VIEW 3 EXCERPTS
TRAINING-INDUCED CHANGES IN DRAG-FLICK TECHNIQUE IN FEMALE FIELD HOCKEY PLAYERSC.L. de Subijana, María Argenis Bonilla Gómez, Laura Martín-Casado, Eusebio Gómez Navarro • Computer Science, Medicine •Biology of sport • 2012
The application of biomechanics to penalty corner drag-ick training: a case study.Cristina López de Subijana, Daniel Juárez, Javier Mallo, Enrique Fernando Canto Navarro • Computer Science, Medicine • Journalof sports science & medicine • 2011
C. López de Subijana, D. Juarez, J. Mallo, E. Navarro • 2010
VIEW 2 EXCERPTS
C. LópezdeSubijana, D. Juarez, J. Mallo, E Navarro • Sports Biomechanics • 2010
P. McLaughlin • 1997
VIEW 1 EXCERPT
Related Papers
Biomechanical analysis of the penaltycorner drag-ick of elite male and female hockey players. SportsBiomechanics
Biomechanical analysis of the penaltycorner dragick of elite male and female hockey players
Three-dimensional biomechanical analysis of the hockey drag ick: full report. Belconnen: Australian SportsCommission

5/18/2020 Three dimensional kinematic analysis of the drag flick for accuracy | Semantic Scholar
https://www.semanticscholar.org/paper/Three-dimensional-kinematic-analysis-of-the-drag-Ansari-Bari/531abd36c2f9822ef281dc5a0c655e6e803a… 3/3
Show More 2/0
Proudly built by AI2 with the help of our Collaborators using these Sources.Research • Publisher Partnerships • Data Partnerships • API and Open Corpus
Terms of Service • Privacy Policy

PRINT ISSN : 2278 - 2982, ON LINE ISSN : 2319 - 6459Double Blind Peer-Reviewed Refereed Research Journal
Available online http//www.horizonpalaestra.org
Construction of Specific Physical Fitness Test for Batsman
HORIZON PALAESTRA International Journal of Health, Sports and Physical Education Vol.3 No. 1 (July 2014) : 31 - 36
Ahsan Ahmad, Ikram Hussain and Fuzail Ahmad
Correspondence to :
Ahsan Ahmad
Research Scholar,
Department of Physical Education,
Aligarh Muslim University, Aligarh (India)
How to Cite this article : Ahmad, A., Hussain, I. and Ahmad, F. (2014). Construction of Specific Physical Fitness Test for Batsman. Horizon
Palaestra : International Journal of Health, Sports and Physical Education, 3 (1), 31 - 36.
Sports and games unite individuals, societies and
Nations. A competitive sport is a universal passion and usually
seen as an alternative to the smile which removes barriers.
Sports have now achieved a significant position in the culture
of the society and this culture is measured through its
achievement in sports. Test and measurement in the field of
physical education are relatively recent outgrowth of the
general testing movements. Beginning late in the19th century
as strength test, test of track and field and anthropometric
measurement, they have increased in number and
completeness with amazing rapidly. During most of the skills
on abilities measured, the development of test in physical
education has avoided many of the pitfalls that have been
encountered by test builders in the mental discipline (Flegel
and Kolobe 2002).
Hence, there is a need to pay attention specific fitness
to a great extent. On the basis of different findings by
researchers and sports scientists, that fitness has been
analyzed as the degree of a person to function effectively, and
the aim to full fill his potential. Many researchers, scientists
and physical educationists have written much about the
“principles of specificity”. But very few have defined a specific
fitness. As Singh (1984) has stated that each sports activity
demands different types and levels of different motor, abilities
and when a sports man possesses these, he said to have
specific fitness. The concept of specific physical fitness test
requires that the test avoid as much as possible highly
specialized skills (Haywood and Getchell, 2005). In
considering of the construction of a physical fitness test battery
for players of any chronological age, growth, and maturational
characteristics of the subjects.
Moreover, administrative feasibility, available of
economy of time, tools and the practice of testing a maximum
number of subjects should be considered in developing an
effective physical fitness test battery (Bravo, 1994). Though a
small number of scientifically constructed physical test battery
for players of different games is available (Girard, 2006). No
How to Cite this URL : Ahmad, A., Hussain, I. and Ahmad, F. (2014). Construction of Specific Physical Fitness Test for Batsman. Horizon
Palaestra : International Journal of Health, Sports and Physical Education, 3 (1), 31 - 36. Available from : http://www.horizonpalaestra.org/
journal/paperv3.i1.10.pdf (Accessed Date)
Construction of Specific Physical Fitness Test for
Batsman

specific physical fitness test battery is existing for the batsman
cricketers of any age. Sport-specific tests are increasingly
popular in modern sports and are mostly developed to
replicate characteristic sport performances, with the main
idea of them being similar to real-life sport situations. It is
generally accepted that these tests are more appropriate than
standard tests (General Fitness Tests) for assessing
athletes’ capacities that are challenged during a real
competition (Meckel, 2009), the appropriate variables for
sport-specific selection and orientation (Sattler, 2012), and
the physical qualities that are useful for discriminating
between different positions in team sports (Kondric, 2012;
Melchiorri, 2009).
Therefore, the fitness of a cricketer which is specific to
the game has no utility for the fitness of other game. Cricket
occupies a significant place among all other games and
sports. In some respects it is unique as a sport Cricket requires
specific physical fitness characteristics to be on top gear to
take all the qualities in the match. In some respects it is
unique as a sport. It is an ideal sport and is a giving enjoyment
and pleasure and demanding fitness and dedication. Even
though cricket is one of the oldest organized sports, there are
very few studies on the physical demands of the game
(Woolmer and Noakes, 2008; Christie and King, 2008;
Christie, 2008). Batting is intermittent in nature with the
demands placed on the players being dictated by the type of
match being played. Due to this stop-start nature of cricket,
accurate assessments are often difficult and as such,
research is sparse (Bartlett, 2003).
Here the concern of researcher is construction of
specific physical fitness, particularly for the batsman, game
of cricket. Cricket batsman fitness training is a form of sport-
specific training designed for batsman cricket players During
an innings two members of the batting side are on the pitch
at any time: the one facing the current delivery from the bowler
is denoted the striker, while the other is the non-striker. Batting
tactics and strategy vary depending on the type of match being
played as well as the current state of play. The main concerns
for the batsmen are not to lose their wicket and to score as
many runs as quickly as possible. The top cricket players in
the world use fitness plans to developed and customized for
their needs by their coaches. And other people can consult
with personal trainers and cricket coaches to get advice on
creating a cricket fitness training program, provide information
and assistance with fitness training, including recommended
workout schedules that people can use as a basis for the
program. Cricket is a physically demanding sport. Players
need to be capable of high intensity bursts of energy, but they
also need the endurance to make it all the way through a
match. Brute muscular power is not a liability to this position,
but reaction time, batting technique, and balance in the crease
are of basic importance. A batsman may be required to
maintain his position for a number of hours. The cricket batting
stroke relies upon core strength, particularly in the abdominal
and oblique muscle groups, the gluteal muscles, and the
upper arms and shoulders.
Therefore argue that only the best physically prepared
cricketers will perform better, more consistently and with fewer
injuries and, in turn, will enjoy longer and more illustrious
careers. Thus, understanding the specific fitness placed on
players and in particular batsmen respectively. It is important
to recognize fitness level, skills and mental aptitude needed
to succeed for a good batsman in the game of cricket. (Noakes
and Durandt, 2000) Specific Physical fitness of the game
enhancing and bringing the game forward, even though,
scientific and systematic, approach of training and research
in the field of cricket contributes to improved performance.
Subjects
The subjects for the study were 30 intervarsity cricket
players specialized in batting. The chronological age of the
players was between 18 to 25 years. They were recruited
randomly from various universities participated in North-zone
intervarsity cricket tournament held at Aligarh Muslim
University, Aligarh. No grouping of players was made during
this phase. The sample for the construction phase was 30
players exposed to sixteen different fitness items. Then after
taking data, all the skills were raised through factorial analysis.
Variable and Test Items
In order to select the broad component of test, the
available literature of physical fitness were critically reviewed
and opinions of experts regarding these tests obtained. Also
existing literature on the appropriate component of physical
fitness in Indian geographical condition / situation were
considered. All the components of the physical fitness were
considered. On the basis of these the following components
for the specific physical f itness test for cricketer are
considered. The physical fitness components are : Strength,
Endurance, Agility, Flexibility, Coordination and Balance.
During the process of selection of the components of
specific fitness test, the test items for each components were
also identified along with and 16 test items were considered
as : Standing vertical Jump, Sit - ups, Dips, Pull - ups, Zig -
zag, Shuttle run, 50 yard dash, Side - stepping, Squat Thrust,
600mts run/walk, Criss-cross, Skipping, Stroke Stand, Trunk
lift, Sit and reach, and Head Reaction.
Method of Execution
Each experimental test items administration was
adhered strictly administration procedure outline and
protocol.
Statistical Analysis
The results have been obtained through the statistical
package social sciences SPSS version 17.0. The Pearson
product formula has been utilizing for correlation of variables
and the matrix of inter correlation among the sixteen variables
was obtained. The data was then being factor analysis. The
principal component analysis was used to extract factors.
Varimax rotation (Kaiser’s normalization) was used to
generate rotated factor matrix. After that the rotated factor matrix
was used to the selected factor for analysis of data.
Available online http//www.horizonpalaestra.org
HORIZON PALAESTRA International Journal of Health, Sports and Physical Education Vol.3 No. 1 (July 2014) : 31 - 36
32
Ahsan Ahmad, Ikram Hussain and Fuzail Ahmad

In this study Considering the Eigen value, rotated factor
loadings, communality, a construction of specific fitness test
for the batsman in the sports of cricket. The obtained data
was analyzed by the statistical procedure of Factorial analysis.
The factorial analysis was done by SPSS version 17.0.
Table-1 : Descriptive analysis of 16 fitness test items.
S.No. Test Variables Catalogue Mean S.D.
1. Standing vertical Jump Test item-1 40.829 2.844
2. Sit- ups Test item-2 45.057 8.095
3. Dips Test item-3 32.429 12.675
4. Pull- ups Test item-4 11.429 4.189
5. Zig-zag Test item-5 9.195 0.063
6. Shuttle run Test item-6 10.187 0.393
7. 50 yard dash Test item-7 6.306 0.487
8. Side-stepping Test item-8 17.000 2.196
9. Squat Thrust Test item-9 9.714 1.808
10. 600mts run/walk Test item-10 1.417 0.083
11. Criss-cross Test item-11 10.914 2.490
12. Skipping Test item-12 56.371 7.818
13. Stroke Stand Test item- 13 14.435 2.221
14. Trunk lift Test item -14 32.447 3.392
15. Sit and reach Test item- 15 9.759 4.485
16. Head Reaction Test item -16 29.200 9.483
In this study Table 1 displays the descriptive statistics
analysis and of mean and SD of the selected sixteen
experimental test items which were administered on the
batsman who played as subject in this study for obtaining the
data. The mean of standing vertical jump in item number-1 is
40.829 and SD is 2.844.The mean of sit-ups in item number-
2 is 45.057 and SD is 8.095 The mean of dips in item number
-3 is 32.429 and SD is 12.675 The mean of pull-ups in item
number -4 is 11.429 and SD is 4.189 The mean of zig-zag in
item number -5 is 9.195 and SD is 0.063 The mean of Shuttle
run in item number-6 is 10.187 and SD is 0.393 The mean of
50 yard dash in item number-7 is 6.306 and SD is 0.487 The
mean of Side-stepping in item number-8 is 17.000 and SD is
2.196 The mean of Squat Thrust in item number-9 is 9.714
and SD is 1.808 The mean of 600mts run/walk in item
number-10 is 1.417 and SD is 0.083 The mean of criss-
cross in item number -11 is10.914 and SD Is 2.490 The
mean of Skipping in item number-12 is 56.371 and SD is
7.818 The mean of Stroke Stand in item number- 13 is 14.435
and SD is 2.221 The mean of Trunk lift in item number-14 is
32.447 and SD is 3.392 The mean of Sit and reach in item
number -15 is 9.759 and SD is 4.485 The mean of Head
Reaction in item number -16 is 29.200 and SD is 9.483.
Factor Analysis : The purpose of factor analysis is to “explore
the under lying variance structure of a set of correlation
coefficient. Thus, factor analysis useful for exploring and
verifying patterns in a set of correlation coefficient” (Brown,
2001).
Table-2 : Representing Factor Loading of factor I.
S.No. Test Variables Catalogue Factor loading
1. Dips Test item-3 0.974
2. Pull- ups Test item-4 0.978
3. Side stepping Test item-8 0.977
4. Skipping Test item-12 0.918
5. Stroke stand Test item-13 0.950
6. Sit and reach Test item-15 0.968
Construction of Specific Physical Fitness Test for Batsman
Available online http//www.horizonpalaestra.org 33
HORIZON PALAESTRA International Journal of Health, Sports and Physical Education Vol.3 No. 1 (July 2014) : 31 - 36

Factor I : The highest factor loading test variables the factor
loadings 0.978 to pull - ups is used to determine to measure
shoulder, upper strength and upper body endurance. Followed
by side stepping is used to lateral speed, agility, and body
control. However sit and reach to measure flexibility of the
lower back and hamstring muscles. Strock stand measure
body balance. The balance act as show the movement or
with change of direction and position. When logically analyzed
it reveals only the importance of mostly the shoulder muscles
with respect to the Strength.
Fig.1 : Representing the highest factor loading of Factor I
Table-3 : Representing Factor Loading of factor II.
S.No. Test Variables Catalogue Factor loading
1. Standing vertical jump Test item-1 0.925
2. Sit-ups Test item-2 -0.006
3. Shuttle -run Test item-6 0.086
4. Squat thrust Test item-9 0.915
Factor II : These four test items were identified in four different
components of physical fitness i.e. standing vertical jump to
determine explosive strength. The shuttle run and 50 yard
dash have significance positive loading. Speed the rate of
change of successive movement of the same pattern. The
squat thrust shown the above table is highest factor loading
is 0.915 this test item describing the quality and has a great
importance for improving fitness level of crackers.
Fig. 2 : Representing the highest factor loading of Factor II
Factor Loading
Ahsan Ahmad, Ikram Hussain and Fuzail Ahmad
Available online http//www.horizonpalaestra.org
HORIZON PALAESTRA International Journal of Health, Sports and Physical Education Vol.3 No. 1 (July 2014) : 31 - 36
34

Factor III : Zig-zag running appear to be primarily reaction
ability and measure of coordination movement and speed.
Cress-cross shown the highest factor loading is 0.723 this
Table-4 : Representing Factor Loading of factor III.
S.No. Test Variables Catalogue Factor loading
1. Zig-zag running Test item-5 0.478
2. Criss-cross Test item-11 0.723
factor emphasis the development of athletes improve agility
for rapid and accurate directional change in play, it improve
body awareness and eye, and foot coordination.
Fig. 3 : Representing the highest factor loading of Factor III
Factor Loading
Table-5 : Representing Factor Loading of factor IV.
S.No. Test Variables Catalogue Factor loading
1. 50 yard Dash Test item-7 0.958
2. 600 mts run/walk Test item-10 0.138
3. Trunk lift Test item-14 0.050
4. Hand reaction Test item-16 0.021
Factor IV : Many physical fitness factor contribute to excellence
in physical fitness test including strength, power, endurance
flexibility, agility etc. But the entire factor affect in the physical
fitness. Which are 600 meters run/walk determine measure
of cardio-respiratory fitness. In this table 50 yard dash shown
the highest factor loading is 0.958. speed as the rate of motion
or velocity. Hand reaction this factor emphasis react faster.
However Trunk lifts has shown the flexibility in this factor.
Based on the findings and statistical analysis, critiques
and experts deliberation in the light of critical literature and
scientific information on the performance demands of
construction of specific physical fitness test for batsmen,
cricketers. Existing knowledge could be completed by
obtaining the considered opinions and insides of coaches
and players. This information would also provide a framework
for the development of design of batting a specific
assessment, focused on systematic training, conditioning
and coaching protocols.
In the light of facts the following conclusions were drawn.
1. Factor analysis Rotated Varimax solution significantly
and appropriately identified the test items for the
Fig. 4 : Representing the highest factor loading of Factor IV
Factor Loading
HORIZON PALAESTRA International Journal of Health, Sports and Physical Education Vol.3 No. 1 (July 2014) : 31 - 36
Construction of Specific Physical Fitness Test for Batsman
Available online http//www.horizonpalaestra.org 35

construction a specific physical fitness test for batsman
for North - Zone level cricket players.
2. Every sport differs from one to another and the demand
of specific physical fitness ability in various games/jobs.
3. A batsman differs from bowlers, fielders etc in a quality
and quantity of fitness components like balance, reaction
ability (sharp movement ability to change position
immediately). The test items derived indisputably
represent the specific physical fitness components for
batsman.
1 Factor-1 Pull-ups 0.978
2 Factor-2 Standing Vertical Jump 0.925
3 Factor-3 Criss-cross 0.723
4 Factor-4 50 yard dash 0.958
Table-6 : Constructed specific physical test battery for
batsman (cricket).
Factor-I is Pull-up which is the first test item obtained
during the construction of test battery. Pull-ups used to
measure shoulder, upper arms strength and upper body
endurance. It’s very important test items for batsman in cricket,
because for playing full stroke is to be needed shoulder and
upper body strength.
Factor-II is standing vertical jump the second test items
obtained by constructed design test battery. Vertical bat shots
can be played either off the front foot or the back foot depending
upon the predictable height of the ball at the moment it reaches
the batsman, the characteristic position of the bat is a vertical
alignment at point of contact. Vertical bat shots are typically
played to accurately judge the line of the ball. The batsman
should have explosive power for quick movement and
immediate acceleration or pickup the run during matches.
The third factor is Criss-Cross, physical fitness test
can improve agility for rapid and accurate directional change
in play, it improves body awareness and eye, hand and foot
coordination. It helps to develop explosive start speeds and
footwork for running events, develops upper-body momentum,
and anaerobic fitness. Criss - cross is more beneficial for
testing overall fitness and physical efficiency for batsman
needed in cricket.
The last and fourth factor is 50 yard dash have positive
significance loading. Speed is the rate of change of
successive movement of the same pattern. Fast movements
of the body (arms and legs) with a minimum numbers effort
were designed in the test of the factors. 50 yard dash sprinting
is to be needed to run between the wickets.
In the light of above mentioned discussion researcher
reached the conclusion that these test items are highly specific
in measuring the specific physical fitness test for batsman in
the game of cricket.
Bartlett, R.M. (2003). The Science and Medicine Of Cricket : An
Overview And Update. Journal of Sports Sciences, 21, 733 -
752.
Bravo, G., Gauthier, P., Roy, P.M., Daniel, T., Gaulin, P., Dubois
M,F. and Peloquin, L. (1994). The Functional Fitness
Assessment Battery : Reliability and Validity Data for Elderly
Women Patients with Alzheimer’s Disease. The TEMP-AD
Protocol, JAPA, 2(1), 67 - 79.
Brown, J.D. (2001). Using Surveys in Language Programs.
Cambridge : Cambridge University Press.
Cozenes, F.W. (1929). The Measurement of General Athletic Ability
for College Men. Oregon : University of Oregon Publication.
Flegel, J. and Kolobe, T.H.A. (2002). Predictive Ability of the Test
of Infant Motor Performance as Measured by the Bruininks -
Oseretsky Test of Motor Proficiency at School Age Physical
Therapy. 82(8), 762 - 771.
Girard, O., Chevalier, R., Micallef, J.P. and Millet, G.P. (2006).
Specific Incremental Field Test for Aerobic Fitness in Tennis.
British journal of Sports Medicine, 40, 791 - 796.
Brace, D.K. (1927). Measuring Motor Ability. NY : A.S. Barnes and co.
Haywood, K.M. and Getchell, N. (2005). Life Span Motor
Development. 4th edition. Human Kinetics, Champaign.
Kondric, M., Uljevic, O., Gabrilo, G., Kontic, D. and Sekulic, D.
(2012). General Anthropometric and Specific Physical Fitness
Profile of High-Level Junior Water Polo Players. Journal of Human
Kinetics, 32, 157 - 165.
Lewes, T. (1994). MCC Masterclass : The New MCC Coaching Book.
London : Weidenfeld and Nicholson.
Meckel, Y., Machnai, O. and Eliakim, A. (2009). Relationship among
Repeated Sprint Tests, Aerobic Fitness, and Anaerobic Fitness
In Elite Adolescent Soccer Players. Journal of Strength and
Conditioning Research, 23(1), 163 - 169.
Melchiorri, G., Manzi, V., Padua, E., Sardella, F. and Bonifazi, M.
(2009). Shuttle Swim Test for Water Polo Players : Validity and
Reliability. Journal of Sports Medicine and Physical Fitness, 49(3),
327 - 330.
Sattler, T., Sekulic, D., Hadzic, V., Uljevic, O. and Dervisevic, E.
(2012). Vertical Jumping Tests in Volleyball : Reliability, Validity,
and Playing-Position Specifics. Journal of Strength and
Conditioning Research, 26(6), 1532 - 1538.
Singh, J. (1984). Physical Conditioning Vs Physical Fitness. SNIPES
Journal. 5, 28.
Woolmer, B. and Noakes, T.D. (2008). Art and Science of Cricket.
Cape Town : Struik Publishers.
All the Authors declared there is not any potential conflict
of interests regarding this article.
Author's affiliations :
Ikram Hussain
Professor
Department of Physical Education,
Aligarh Muslim University, Aligarh (India)
Fuzail Ahmad
Research Scholar, Department of Physical Education,
Aligarh Muslim University, Aligarh (India)
Ahsan Ahmad, Ikram Hussain and Fuzail Ahmad
Available online http//www.horizonpalaestra.org
HORIZON PALAESTRA International Journal of Health, Sports and Physical Education Vol.3 No. 1 (July 2014) : 31 - 36
36

Journal of Education and Practice www.iiste.org
ISSN 2222-1735 (Paper) ISSN 2222-288X (Online)
Vol.6, No.13, 2015
166
The Level of Stress in Male and Female School Students
Zamirullah Khan Abul Barkat Lanin Naseem Ahmad
Deptt. Of Physical Education, Aligarh Muslim University, Aligarh, U.P. India. 2 Mumtaj P G college, Lucknow University, Lucknow, U.P. India
Abstract
This study aimed at the level of stress in male and female school students. For the purpose of the study the researcher randomly selected 64 school students aged between 14-18 years. To collect the data researcher used students stress scale (SSS) developed by Dr. Zaki Akhtar (2011). During collection of data researcher used means and method fit for this scale. The result of the study showed boys having much more stress in comparison to girls. The study concluded that school boys are more stressful than school girls.
Introduction
Stress is an integral part of our life. Stress could be positive as well as negative. When we are doing our work properly and systematically then it is because of positive stress or eustress but when we lose our rhythm for same work, it is negative stress or distress. So, stress is good in one way and bad in other way. Hans Selye (1956) first popularized the concept of “stress” in the 1950s. Selye theorized that all individuals respond to all types of threatening situations in the same manner, and he called this the General Adaptation Syndrome (GAS).
Lazarus & Folkman (1984) defined that, stress is a mental or physical phenomenon formed through one’s cognitive appraisal of the stimulation and is a result of one’s interaction with the environment. The existence of stress depends on the existence of the stressor. Chang’s Dictionary of Psychology Terms, stress is “a state of physical or mental tension that causes emotional distress or even feeling of pains to an individual” (Lai et al., 1996). Vijaya and Karunakaran (2013) stated that stress is a complex phenomenon. It largely depends on one's temperaments, environmental conditions, experiences and situations. It is experienced by every individual in any one situations or the other. It is a part of life and it is generated by constant changing situations that one has to face. It refers to an internal state, which results from frustration or under dissatisfactory conditions. To a certain extent in every one's life it is unavoidable, because it is complex in nature. It is a part of fabric of life. But it can be managed to some extent. Piekarska (2000) pointed out that the essential factors for the formation of stress are frequent and strong. There is a related connection between the results of stress and psychological and personality characteristics. Selye (1976) stated that in most approaches stress now designates bodily processes created by circumstances that place physical or psychological demands on an individual. Selye (1976) theories that focus on the specific relationship between external demands (stressors) and bodily processes (stress) can be grouped in two different categories: approaches to `systemic stress' based in physiology and psychobiology (among others,) and approaches to psychological stress' developed within the field of cognitive psychology. McGrath (1982) said that the external forces that impinge on the body are called stressors. Feng (1992) and Volpe (2000) defined stressor as anything that challenges an individual’s adaptability or stimulates an individual’s body or mentality. Stress can be caused by environmental factors, psychological factors, biological factors, and social factors. It can be negative or positive to an individual, depending on the strength and persistence of the stress, the individual’s personality, cognitive appraisal of the stress, and social support. Vijaya and Karunakaran (2013) in their study found that majority of boys expressed high level of stress and moderate stress compared to girls. Whereas majority of girl students exhibited low level of stress compared to Boys. Chiang (1995) proposed that school is one of the main sources of stress among adolescents. Such stress comes from too much homework, unsatisfactory academic performance, preparation for tests, lack of interest in a particular subject, and teacher’s punishment. Generally, parents are very concerned about their children’s academic achievement and moral behaviors. Parents expect their children not only to respect teachers and follow moral norms but also become elite in the future. Chang & Lu (2007) suggested that academic institutions have different work settings compared to nonacademic and therefore one would expect the difference in symptoms, causes, and consequences of stress. Stevenson & Harper (2006) pointed out that stress in academic institutions can have both positive and negative consequences if not well managed. Goodman (1993) revealed that students have different expectations, goals, and values that they want to fulfill, which is only possible if the students’ expectations, goals, and values are integrated with that of the institution. Goodman (1993) stated that stressors affecting students can be categorized as academic, financial, time or health related, and self- imposed.
After going through available literature in hard copy as well as soft copies on internet the researcher found that sufficient work has not been done in this area. So researcher goaded to carry out this investigation to fill the gap in the domain of knowledge. The type of stress which is analysed in this paper is distress among school going students.

Journal of Education and Practice www.iiste.org
ISSN 2222-1735 (Paper) ISSN 2222-288X (Online)
Vol.6, No.13, 2015
167
Methodology
The purpose of the present study was to know the level of stress among school going children.
Sample
The sample of the present study was taken from Jawahar Navodaya School Bareilly (U.P.). For the purpose of the study 42 male and 22 female students were randomly selected. Their age ranged between 14-18 years.
Tools used The researcher used students stress scale developed by Dr. Zaki Akhtar (2011) Jamshedpur. The scale consisted of 51 statements related to the major kind of stress prevalent in students at adolescent age, and all kinds of situations faced by students.
Statistical Technique Used
Descriptive statistical technique, Mean and Standard Deviation were used
Mean SD N
Boys 158.96 11.40 42
Girls 163.57 5.63 22
RESULTS
Gender STRESS LEVELS TOTAL
Very High
Stress
High Stress Moderate
Stress
Low Stress Very Low
Stress
Boys 08 12 12 05 05 42
Girls 00 03 04 09 06 22
From the table it is evident that most of the boys showing very high stress (Boys 19% and girls 0%) and high stress (boys 28.5% and girls 13.6%) as well as moderate stress where as girls are having 18.1% and boys 28.5%.
DISCUSSION
From the result we can find out that majority of girls have shown low stress and very low stress. Some research worked on level of stress showing the same result i.e., research work done by Vijaya and Karunakaran (2013). This study resulted that boys are much more stressful than girls. There can be many reason for this, it may be their parents expectation from them or it may be boy’s high goal and target for their bright and successful career. Teachers should take care of male students and try to resolve their problems which are responsible for their high stress. Parents also can play a vital role to reduce the stress of their children as they are more close to them. Chiang (1995) has also stated that generally parents are very concerned about their children’s academic achievement and moral behaviors. Parents expect their children not only to respect teachers and follow moral norms but also become elite in the future. School is also a best medium to work on the stress level of the students and treat them accordingly as it is revealed by the Goodman (1993) that students have different expectations, goals, and values that they want to fulfill, which is only possible if the students’ expectations, goals, and values are integrated with that of the institution.
Conclusions
The researcher concluded that schools going male students are more stressful in comparison to female students.
References
Chang K, & Lu L. (2007). Characteristics of organisational culture, stressors and wellbeing: The case of Taiwanese organisations, Journal of Managerial Psychology, 22 (6):549- 568.
Chiang, C. X. (1995). A Study of Stress Reactions among Adolescents. Chinese Journal of School Health, 26, 33-37.
Feng, G. F. (1992). Management of Stress and Loss. Taipei: Psychological Publishing Company, Ltd. Goodman, E.D. (1993). How to handle the stress of being a student. Imprint, 40:43 Krohne and L Laux (Eds), (1982). Achievement, Stress, and Anxiety (pp. 19–48). Lazarus, R S, (1966). Psychological Stress and the Coping Process. New York: McGraw-Hill. Lazarus, R S, (1991). Emotion and Adaptation. New York: Oxford University Press. Lazarus, R S and Folkman, S, (1984). Stress, Appraisal, and Coping. New York: Springer. Lai, P. C., Chao, W. C., Chanf. Y. Y., and Chang, T. T. (1996). Adolescent Psychology. Taipei: National Open
University. McGrath, J E, (1982). Methodological problems in research on stress. In H W Washington, DC,: Hemisphere.
Abstract-Psychology INFO | $Order Document

Journal of Education and Practice www.iiste.org
ISSN 2222-1735 (Paper) ISSN 2222-288X (Online)
Vol.6, No.13, 2015
168
Piekarska, A. (2000). School stress, teachers’ abusive behaviors, and children’s coping strategies. Child Abuse and Neglect, 24, 11, 1443-1449 (2000)
Selye, H. (1976). The Stress of Life (revised edition). New York: McGraw-Hill. Selye, H. (1956). The Stress of Life. New York: McGraw-Hill Stevenson, A & Harper S. (2006). Workplace stress and the student learning experience, Quality Assurance in
Education, 14(2): 167-178. Volpe, J. F. (2000). A guide to effective stress management. Career and Technical Education, 48(10), 183-188.

The IISTE is a pioneer in the Open-Access hosting service and academic event management.
The aim of the firm is Accelerating Global Knowledge Sharing.
More information about the firm can be found on the homepage:
http://www.iiste.org
CALL FOR JOURNAL PAPERS
There are more than 30 peer-reviewed academic journals hosted under the hosting platform.
Prospective authors of journals can find the submission instruction on the following
page: http://www.iiste.org/journals/ All the journals articles are available online to the
readers all over the world without financial, legal, or technical barriers other than those
inseparable from gaining access to the internet itself. Paper version of the journals is also
available upon request of readers and authors.
MORE RESOURCES
Book publication information: http://www.iiste.org/book/
Academic conference: http://www.iiste.org/conference/upcoming-conferences-call-for-paper/
IISTE Knowledge Sharing Partners
EBSCO, Index Copernicus, Ulrich's Periodicals Directory, JournalTOCS, PKP Open
Archives Harvester, Bielefeld Academic Search Engine, Elektronische Zeitschriftenbibliothek
EZB, Open J-Gate, OCLC WorldCat, Universe Digtial Library , NewJour, Google Scholar

Journal of Education and Practice www.iiste.org
ISSN 2222-1735 (Paper) ISSN 2222-288X (Online)
Vol.6, No.13, 2015
166
The Level of Stress in Male and Female School Students
Zamirullah Khan Abul Barkat Lanin Naseem Ahmad
Deptt. Of Physical Education, Aligarh Muslim University, Aligarh, U.P. India. 2 Mumtaj P G college, Lucknow University, Lucknow, U.P. India
Abstract
This study aimed at the level of stress in male and female school students. For the purpose of the study the researcher randomly selected 64 school students aged between 14-18 years. To collect the data researcher used students stress scale (SSS) developed by Dr. Zaki Akhtar (2011). During collection of data researcher used means and method fit for this scale. The result of the study showed boys having much more stress in comparison to girls. The study concluded that school boys are more stressful than school girls.
Introduction
Stress is an integral part of our life. Stress could be positive as well as negative. When we are doing our work properly and systematically then it is because of positive stress or eustress but when we lose our rhythm for same work, it is negative stress or distress. So, stress is good in one way and bad in other way. Hans Selye (1956) first popularized the concept of “stress” in the 1950s. Selye theorized that all individuals respond to all types of threatening situations in the same manner, and he called this the General Adaptation Syndrome (GAS).
Lazarus & Folkman (1984) defined that, stress is a mental or physical phenomenon formed through one’s cognitive appraisal of the stimulation and is a result of one’s interaction with the environment. The existence of stress depends on the existence of the stressor. Chang’s Dictionary of Psychology Terms, stress is “a state of physical or mental tension that causes emotional distress or even feeling of pains to an individual” (Lai et al., 1996). Vijaya and Karunakaran (2013) stated that stress is a complex phenomenon. It largely depends on one's temperaments, environmental conditions, experiences and situations. It is experienced by every individual in any one situations or the other. It is a part of life and it is generated by constant changing situations that one has to face. It refers to an internal state, which results from frustration or under dissatisfactory conditions. To a certain extent in every one's life it is unavoidable, because it is complex in nature. It is a part of fabric of life. But it can be managed to some extent. Piekarska (2000) pointed out that the essential factors for the formation of stress are frequent and strong. There is a related connection between the results of stress and psychological and personality characteristics. Selye (1976) stated that in most approaches stress now designates bodily processes created by circumstances that place physical or psychological demands on an individual. Selye (1976) theories that focus on the specific relationship between external demands (stressors) and bodily processes (stress) can be grouped in two different categories: approaches to `systemic stress' based in physiology and psychobiology (among others,) and approaches to psychological stress' developed within the field of cognitive psychology. McGrath (1982) said that the external forces that impinge on the body are called stressors. Feng (1992) and Volpe (2000) defined stressor as anything that challenges an individual’s adaptability or stimulates an individual’s body or mentality. Stress can be caused by environmental factors, psychological factors, biological factors, and social factors. It can be negative or positive to an individual, depending on the strength and persistence of the stress, the individual’s personality, cognitive appraisal of the stress, and social support. Vijaya and Karunakaran (2013) in their study found that majority of boys expressed high level of stress and moderate stress compared to girls. Whereas majority of girl students exhibited low level of stress compared to Boys. Chiang (1995) proposed that school is one of the main sources of stress among adolescents. Such stress comes from too much homework, unsatisfactory academic performance, preparation for tests, lack of interest in a particular subject, and teacher’s punishment. Generally, parents are very concerned about their children’s academic achievement and moral behaviors. Parents expect their children not only to respect teachers and follow moral norms but also become elite in the future. Chang & Lu (2007) suggested that academic institutions have different work settings compared to nonacademic and therefore one would expect the difference in symptoms, causes, and consequences of stress. Stevenson & Harper (2006) pointed out that stress in academic institutions can have both positive and negative consequences if not well managed. Goodman (1993) revealed that students have different expectations, goals, and values that they want to fulfill, which is only possible if the students’ expectations, goals, and values are integrated with that of the institution. Goodman (1993) stated that stressors affecting students can be categorized as academic, financial, time or health related, and self- imposed.
After going through available literature in hard copy as well as soft copies on internet the researcher found that sufficient work has not been done in this area. So researcher goaded to carry out this investigation to fill the gap in the domain of knowledge. The type of stress which is analysed in this paper is distress among school going students.
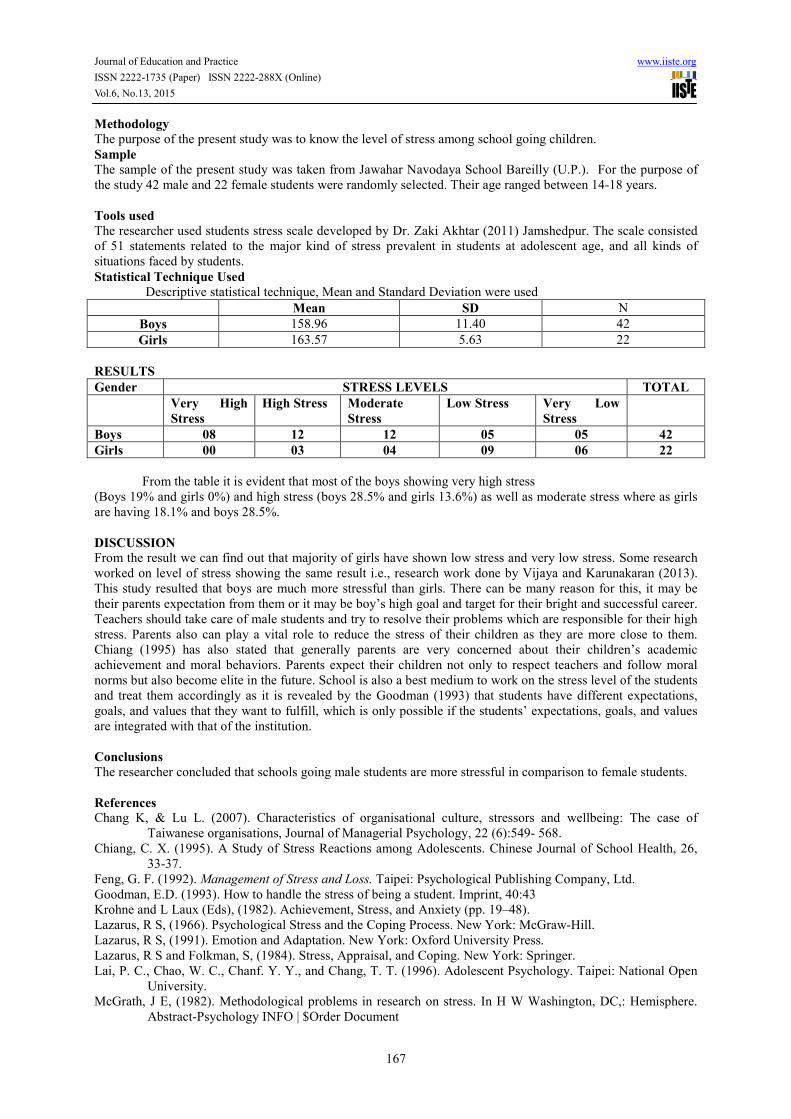
Journal of Education and Practice www.iiste.org
ISSN 2222-1735 (Paper) ISSN 2222-288X (Online)
Vol.6, No.13, 2015
167
Methodology
The purpose of the present study was to know the level of stress among school going children.
Sample
The sample of the present study was taken from Jawahar Navodaya School Bareilly (U.P.). For the purpose of the study 42 male and 22 female students were randomly selected. Their age ranged between 14-18 years.
Tools used The researcher used students stress scale developed by Dr. Zaki Akhtar (2011) Jamshedpur. The scale consisted of 51 statements related to the major kind of stress prevalent in students at adolescent age, and all kinds of situations faced by students.
Statistical Technique Used
Descriptive statistical technique, Mean and Standard Deviation were used
Mean SD N
Boys 158.96 11.40 42
Girls 163.57 5.63 22
RESULTS
Gender STRESS LEVELS TOTAL
Very High
Stress
High Stress Moderate
Stress
Low Stress Very Low
Stress
Boys 08 12 12 05 05 42
Girls 00 03 04 09 06 22
From the table it is evident that most of the boys showing very high stress (Boys 19% and girls 0%) and high stress (boys 28.5% and girls 13.6%) as well as moderate stress where as girls are having 18.1% and boys 28.5%.
DISCUSSION
From the result we can find out that majority of girls have shown low stress and very low stress. Some research worked on level of stress showing the same result i.e., research work done by Vijaya and Karunakaran (2013). This study resulted that boys are much more stressful than girls. There can be many reason for this, it may be their parents expectation from them or it may be boy’s high goal and target for their bright and successful career. Teachers should take care of male students and try to resolve their problems which are responsible for their high stress. Parents also can play a vital role to reduce the stress of their children as they are more close to them. Chiang (1995) has also stated that generally parents are very concerned about their children’s academic achievement and moral behaviors. Parents expect their children not only to respect teachers and follow moral norms but also become elite in the future. School is also a best medium to work on the stress level of the students and treat them accordingly as it is revealed by the Goodman (1993) that students have different expectations, goals, and values that they want to fulfill, which is only possible if the students’ expectations, goals, and values are integrated with that of the institution.
Conclusions
The researcher concluded that schools going male students are more stressful in comparison to female students.
References
Chang K, & Lu L. (2007). Characteristics of organisational culture, stressors and wellbeing: The case of Taiwanese organisations, Journal of Managerial Psychology, 22 (6):549- 568.
Chiang, C. X. (1995). A Study of Stress Reactions among Adolescents. Chinese Journal of School Health, 26, 33-37.
Feng, G. F. (1992). Management of Stress and Loss. Taipei: Psychological Publishing Company, Ltd. Goodman, E.D. (1993). How to handle the stress of being a student. Imprint, 40:43 Krohne and L Laux (Eds), (1982). Achievement, Stress, and Anxiety (pp. 19–48). Lazarus, R S, (1966). Psychological Stress and the Coping Process. New York: McGraw-Hill. Lazarus, R S, (1991). Emotion and Adaptation. New York: Oxford University Press. Lazarus, R S and Folkman, S, (1984). Stress, Appraisal, and Coping. New York: Springer. Lai, P. C., Chao, W. C., Chanf. Y. Y., and Chang, T. T. (1996). Adolescent Psychology. Taipei: National Open
University. McGrath, J E, (1982). Methodological problems in research on stress. In H W Washington, DC,: Hemisphere.
Abstract-Psychology INFO | $Order Document

Journal of Education and Practice www.iiste.org
ISSN 2222-1735 (Paper) ISSN 2222-288X (Online)
Vol.6, No.13, 2015
168
Piekarska, A. (2000). School stress, teachers’ abusive behaviors, and children’s coping strategies. Child Abuse and Neglect, 24, 11, 1443-1449 (2000)
Selye, H. (1976). The Stress of Life (revised edition). New York: McGraw-Hill. Selye, H. (1956). The Stress of Life. New York: McGraw-Hill Stevenson, A & Harper S. (2006). Workplace stress and the student learning experience, Quality Assurance in
Education, 14(2): 167-178. Volpe, J. F. (2000). A guide to effective stress management. Career and Technical Education, 48(10), 183-188.

The IISTE is a pioneer in the Open-Access hosting service and academic event management.
The aim of the firm is Accelerating Global Knowledge Sharing.
More information about the firm can be found on the homepage:
http://www.iiste.org
CALL FOR JOURNAL PAPERS
There are more than 30 peer-reviewed academic journals hosted under the hosting platform.
Prospective authors of journals can find the submission instruction on the following
page: http://www.iiste.org/journals/ All the journals articles are available online to the
readers all over the world without financial, legal, or technical barriers other than those
inseparable from gaining access to the internet itself. Paper version of the journals is also
available upon request of readers and authors.
MORE RESOURCES
Book publication information: http://www.iiste.org/book/
Academic conference: http://www.iiste.org/conference/upcoming-conferences-call-for-paper/
IISTE Knowledge Sharing Partners
EBSCO, Index Copernicus, Ulrich's Periodicals Directory, JournalTOCS, PKP Open
Archives Harvester, Bielefeld Academic Search Engine, Elektronische Zeitschriftenbibliothek
EZB, Open J-Gate, OCLC WorldCat, Universe Digtial Library , NewJour, Google Scholar

Correspondence: Zamirullah Khan, Ph.D., Professor, Department of Physical
Education, Aligarh Muslim University, Aligarh, INDIA, Tel: +919411465571,
Email: [email protected]
AGGRESSION AND MENTAL TOUGHNESS AMONG INDIAN
UNIVERSITIES BASKETBALL PLAYERS: A COMPARATIVE STUDY
ZAMIRULLAH KHAN1, ANWAR ALI
2, NASEEM AHMED
3
1Department of Physical Education, Aligarh Muslim University, Aligarh, INDIA.
Email: [email protected] 2Department of Physical Education, Aligarh Muslim University, Aligarh, INDIA.
3Mumtaz P.G. College Lucknow, Lucknow, INDIA.
How to cite this article: Khan, Z., Ali, A., & Ahmed, N., (September, 2015).
Aggression and mental toughness among Indian universities basketball players: A
comparative study. Journal of Physical Education Research, Volume 2, Issue III,
53-61.
Received: March 22, 2015 Accepted: September 12, 2015
ABSTRACT
The purpose of this study was to compare the aggression and mental toughness of men
and women basketball players of all India intervarsity. One hundred (50 men & 50
women) basketball players were randomly selected as the subjects. Aggression
inventory constructed and standardized by Srivastava (1984), and Mental toughness
questionnaire prepared by Goldberg (1995) was used to collect players responses on
aggression and mental toughness, respectively. The data were analyzed by applying
descriptive statistic i.e. mean, standard deviation and t-test. The significance level was
set at 0.05. The findings of the study showed that there is no substantial significant
difference in mental toughness and aggression between men and women all India
universities basketball players.
Keywords: Aggression, mental toughness, basketball, players, Indian universities.
1. INTRODUCTION
All over the globe, the concept of sports psychology has changed. Today, players
face sharp and unique challenges. The competition standards are higher
(Alderman, 1974; Silva, & Weinberg, 1984)). All sports include psychological as
well as physical strains (Cratty, 1968; Edwards, 2003). They involve mental
images (Honari, Heidary, Moradi, & Emami, 2011), thought patterns (Jones,
2002), one’s mind and physical conditioning (Tapp, 1991). If one has trained
more and better, his/her present capacity will be higher than the one who has
trained less or less well. Recent research has proved that mental toughness is
Journal of Physical Education Research, Volume 2, Issue III, September 2015, pp.53-61
ISSN: Print-2394 4048, Online-2394 4056, IBI Factor: 4.29

Khan, Z., Ali, A., & Ahmed, N., (September, 2015). Aggression and mental toughness among
Indian universities basketball players: A comparative study. Journal of Physical Education
Research, Volume 2, Issue III, 53-61.
JOPER® www.joper.org JOPER 54
largely important to achieve success in sports (Thelwell, Weston, & Greenlees,
2005). It is a quality, which differentiates the winner from the loser, the champion
from the rest of the field. Basically, sportsmen with mental toughness have the
ability to raise their game to the highest level at crucial moments in a match
(Crust, & Clough, 2005). This also implies that the mental toughness gives them
the necessary focus and ability to concentrate on the goal (Gucciardi, Gordon, &
Dimmock, 2000; Rani, Malik, & Thapa, 2012).
Mental toughness is the ability to concentrate on the proceeding of a
particular sporting discipline and not let the pressure of the match situation or the
sense of occasion to get the better of the players (Fox, 2000; Golby, Sheard, &
Lavallee, 2003; Gucciardi, 2011). Aggression among human is as old as the
human race. Aggression is defined as the deliberate to harm another person. This
includes physical, psychological as social harm is the primary focus (Jones, Bray,
& Olivier, 2005; Grange, & Kerr, 2010; Katko, Meyer, Mihura, & Bombel, 2010).
On the other hand, highly tough behaviour within the rules of the games is not
aggression (Gazar, & Raziek, 2010). Aggression is defined as the infliction of an
oversize stimulus physical, verbal or gestural upon one person by another
(Berkowitz, 1962). In sports psychology, the term aggression is generally defined
as any behavior that is intended to harm another individual who does not want to
be harmed (Baron & Richardson, 1994). It is an ability to constantly sustain over
the ideal performance state during an adversity in competition. It is also being
defined as that unshakable perseverance and conviction towards some goal
despite pressure or adversities. Weinberg and Forlenza (2012) defined mental
toughness is a view embedded in a multidimensional framework that includes
personal characteristics e.g., winning attitude, handling pressure, concentration
and situations (e.g., playing environment, injury, or mental and physical
preparation). Research has identified tough mindedness and aggressiveness as a
personality trait which coincide positively with athletic ability and success
(Salam, & Sardar, 2010; Rascle, Traclet, Souchon, Coulomb, & Petrucci, 2010).
Researchchers have performed numerus of studies concerning problems related to
aggression and mental toughness. Kumar, and Chandrappa (2011) in their study
documented that athletes are aggressive because of vicarious and operant
reinforcements. They see other players regarded in terms of cheers and high
monitory prizes and salaries for being aggressive and violent and they follow suit.
Mudimela (2010) in his study found champion athletes to be significantly
distinguished than other athletes as the former manifested high aggression. Sidhu,
Singh, and Singh, (2011) reported that aggression is significantly associated with
success in athletic skill. Gazar, and Raziek, (2010) in their investigation found
that the gold medallist wretsler are more aggressive than the non medallist
wretsler. Mishra (2001) found high achieving female athletes are more aggressive
as compared to low achievers. Mishra (2010) found sprinters possessing high
Khan, Z., Ali, A., & Ahmed, N., (September, 2015). Aggression and mental toughness among
Indian universities basketball players: A comparative study. Journal of Physical Education
Research, Volume 2, Issue III, 53-61.
JOPER® www.joper.org JOPER 55
aggressive tendencies performed better in competitive sports than the kho-kho
players possessing low aggressive tendencies.
In this modern era of competition the psychological preparation of a team
is as much important as teaching the different skill of a game on the scientific line
(Katko, et al., 2010; Kannur, Reddy, & Reddy, 2010). The team are not only to
play the games, but to win the games & for running the games, it is not only the
proficiency in the skill which bring victory, but more important is the will, spirit,
desire of the player which they play & perform their best in the competition
(Kaur, 2010; Ali, Hussain, & Rahaman, 2010). There are studies which reveal
differences in performance among men and women players, but such studies are
not often in India (Bandura, Ross, & Ross, 1961; Buss, 1961; Baron, &
Richardson, 1994; Barimani, Sina, Niaz-Azari, & Makerani, 2009; Mohammad,
& Hasan, 2015).
The present researchers wanted to examine aggression and mental
toughness among basketball players during competition and also find out any
possible difference between men and women basketball players. The study might
help the players and coach to analyze the level of aggression and mental
toughness. The knowledge of the aggression and mental toughness will help the
coach to handle the players of the team in a better way. The study would help to
prepare and/or modify the psychological training program, according to the level
of the players. The purpose of the study was to compare the aggression and
mental toughness variables of the all India Intervarsity basketball players.
2. METHODS AND MATERIALS
2.1 Subjects
For the purpose of this study one hundred (100) basketball players (men= 50,
women = 50), who participated in all India Intervarsity (Satayabama University,
Chennai and Banasthai University, Jaipur, India) basketball competitions, were
considered as subjects. The age of the subjects ranged between 18 to 28 years.
2.2 Tools
The data were collected for all the subjects by administering the Srivastava (1984)
sports aggression inventory and Goldberg (1995) mental toughness questionnaire.
Mental toughness questionnaire consists of 60 items measuring the mental
toughness in four areas i.e. handling pressure, concentration, mental rebounding
and winning attitude. Sports aggression inventory consists of 25 items. These
were only true/false or yes/no reply option.
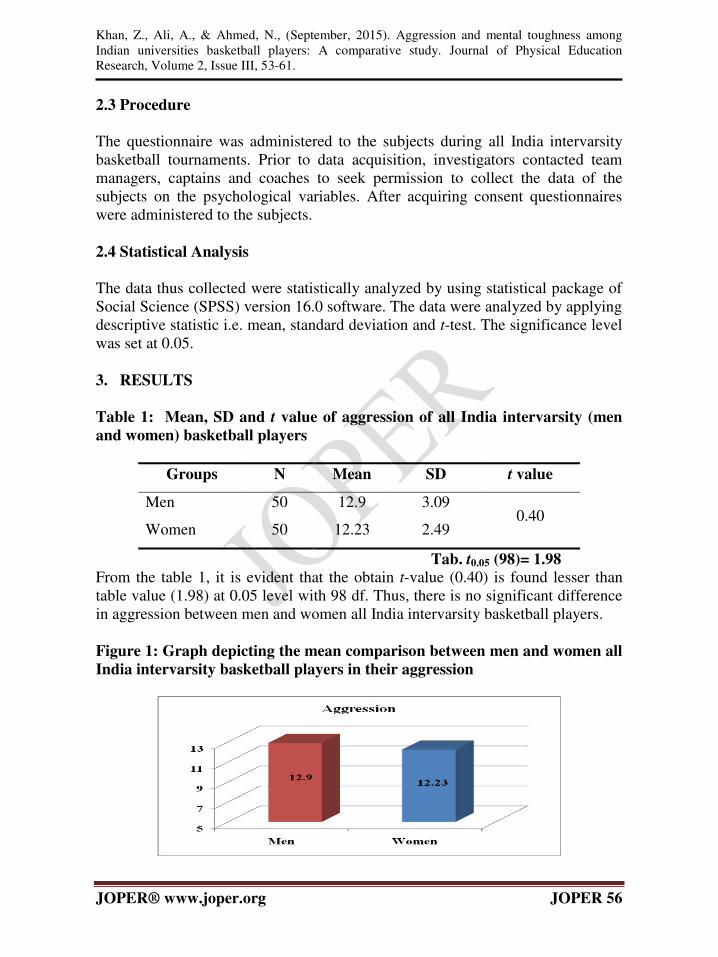
Khan, Z., Ali, A., & Ahmed, N., (September, 2015). Aggression and mental toughness among
Indian universities basketball players: A comparative study. Journal of Physical Education
Research, Volume 2, Issue III, 53-61.
JOPER® www.joper.org JOPER 56
2.3 Procedure
The questionnaire was administered to the subjects during all India intervarsity
basketball tournaments. Prior to data acquisition, investigators contacted team
managers, captains and coaches to seek permission to collect the data of the
subjects on the psychological variables. After acquiring consent questionnaires
were administered to the subjects.
2.4 Statistical Analysis
The data thus collected were statistically analyzed by using statistical package of
Social Science (SPSS) version 16.0 software. The data were analyzed by applying
descriptive statistic i.e. mean, standard deviation and t-test. The significance level
was set at 0.05.
3. RESULTS
Table 1: Mean, SD and t value of aggression of all India intervarsity (men
and women) basketball players
Groups N Mean SD t value
Men 50 12.9 3.09 0.40
Women 50 12.23 2.49
Tab. t0.05 (98)= 1.98
From the table 1, it is evident that the obtain t-value (0.40) is found lesser than
table value (1.98) at 0.05 level with 98 df. Thus, there is no significant difference
in aggression between men and women all India intervarsity basketball players.
Figure 1: Graph depicting the mean comparison between men and women all
India intervarsity basketball players in their aggression

Khan, Z., Ali, A., & Ahmed, N., (September, 2015). Aggression and mental toughness among
Indian universities basketball players: A comparative study. Journal of Physical Education
Research, Volume 2, Issue III, 53-61.
JOPER® www.joper.org JOPER 57
Table 2: Mean, SD and t value of mental toughness amongst all India
intervarsity (men and women) basketball players
Groups N Mean SD t value
Men 50 19.6 3.34 0.97
Women 50 18.23 3.76
Tab. t0.05 (98)= 1.98
From the readings of the above table 2, it is vivid that the obtain t-value (0.97) is
found lesser than table value (1.98) at 0.05 level with 98 df. Thus, there is no
significant difference exist in mental toughness between men and women all India
intervarsity basketball players.
Figure 2: Graph depicting the mean comparison between men and women all
India intervarsity basketball players in their mental toughness
4. DISCUSSION
The study was designed with the purpose to determine the significant difference
between men and women all India intervarsity basketball players on the variable
of aggression and mental toughness. The results of the study revealed that there
was no significant difference found between men and women all India intervarsity
basketball players on the variable of aggression and mental toughness.
This result documented that at all India intervarsity level completion men and
women did not differ significantly as far as aggression and mental toughness is
concerned. This result is supported by the Naseer and Singh (2013) as their
finding showed that there was no significant difference between aggression and
mental toughness of the armed force sportsperson and civilian sportsman. Further

Khan, Z., Ali, A., & Ahmed, N., (September, 2015). Aggression and mental toughness among
Indian universities basketball players: A comparative study. Journal of Physical Education
Research, Volume 2, Issue III, 53-61.
JOPER® www.joper.org JOPER 58
the findings of this study also supported by the findings of Peter (2014) and
Kumar (2013).
5. CONCLUSIONS
The study showed that there was no significant difference between men and
women all India Intervarsity level basketball players in their aggression as well as
mental toughness. This clearly reveals that all India Intervarsity basketball player
whether they are men or women required similar quantity of aggression and
mental toughness as they involve themselves for various competitions.
6. REFERENCES
Alderman, R. B. (1974). Psychological behavior in sports. Philadelphia: W.B.
Saunders Co.
Ali, J. Hussain, I., & Rahaman, A. (2010). A comparative study of aggression and
sports achievement motivation of hockey players of Manipur. AMASS
Multilateral Research Journal, 2(2), 23-26.
Bandura, A., Ross, D., & Ross, S.A. (1961). Transmission of aggression through
limitation of aggressive models. Journal of Abnormal and social
Psychology, 63(3), 575-582.
Barimani, A., Sina, F. S., Niaz-Azari, K., & Makerani, F. K. (2009). Comparing
and examining the amount of aggression between the athletic and non-
athletic students. World Applied Sciences Journal, 6(4), 460-463.
Baron, R.A., & Richardson, D.R. (1994). Human aggression (2nd
ed.). New York:
Plenum.
Berkowitz, L. (1962). Aggression: A social psychological analysis. New York:
McGraw-Hill Co.
Buss, A. H. (1961). The psychology of aggression. New York: Wiley.
Cratty, B.J. (1968). Psychology and physical activity, (p.15). New Jersey:
Englewood Cliffs, Prentice hall Inc.
Crust, L., & Clough, P.J. (2005). Relationship between mental toughness and
physical endurance. Perceptual and Motor Skills, 100(1), 192-194.
Edwards, S. D. (2003). Physical exercise and psychological wellness in health
club members: A comparative and longitudinal study. South African
Journal for Research in Sport, Physical Education and Recreation, 25 (1):
23-33.
Fox, K.R. (2000). Physical activity and mental health promotion: The natural
partnership. International Journal of Mental Health Promotion, 2: 4-12.
Gazar, I. A., & Raziek, M.M.A. (2010). Sport aggression and its relationship with
ranking of the junior Egyptian wrestlers. World Journal of Sport Sciences,
Khan, Z., Ali, A., & Ahmed, N., (September, 2015). Aggression and mental toughness among
Indian universities basketball players: A comparative study. Journal of Physical Education
Research, Volume 2, Issue III, 53-61.
JOPER® www.joper.org JOPER 59
3(5), 252-257.
Golby, J., Sheard, M., & Lavallee, D. (2003). A cognitive-behavioural analysis of
mental toughness in national rugby league football teams. Perceptual
Motor Skills, 96(2), 455-462.
Grange, P., & Kerr, J. H. (2010). Physical aggression in Australian football: A
qualitative study of elite athletes. Psychology of Sport and Exercise, 11,
36-43.
Gucciardi, D.F. (2011). The relationship between developmental experiences and
mental toughness in adolescent cricketers. Journal of sports and exercise
Psychology, 33(3), 370-393.
Gucciardi, D.F., Gordon, S., & Dimmock, J.A. (2000). Advancing mental
toughnesss research and theory using personal construct psychology.
International Review of Sport and Exercise Psychology, 2(1), 54-72.
Honari, H., Heidary, A., Moradi. M. and Emami, A. (2011). A consideration of
the relationship between fitness and mental preparation of non-athlete and
athlete students in Alame Tabatabaei University, Iran. Journal of PE and
Sports Management, 2 (2): 21-25.
Jones, G. (2002). What is this thing called mental toughness? An investigation of
elite sport performers. Journal of Applied Sport Psychology, 14(3), 205-
218.
Jones, M.V., Bray, S.R., & Olivier, S. (2005). Game location and aggression in
rugby league. Journal of Sports Sciences, 23(4), 387-393.
Kannur, N.G., Reddy, I.B., & Reddy, P.V. (2010). A comparative study of
aggression and achievement motivation among the M.Ed and M.P.Ed
students. Osmania Journal of Physical Education, 4, 07-12.
Katko, N.J., Meyer, G.J., Mihura, J.L., & Bombel, G. (2010). A principal
components analysis of rorschach aggression and hostility variables.
Journal of Personality Assessment, 92(6), 594-598.
Kaur, A. (2010). The comparative study of aggression between female players
and non-players. Journal of Health and Fitness, 2(2), 30-34.
Kumar, A., Kumar, J., & Maurya, S.K. (2010). A study of anxiety, aggression and
achievement motivation of university level kabaddi players. AMASS
Multilateral Research Journal, 3(1), 36-39.
Kumar, P.U., & Chandrappa (2011). A comparative study on anxiety and
aggression among athletes and non-athletes. International Journal of
Health, Physical Education and Computer Science in Sports, 2(1), 134-
135.
Kumar, R. (2013). Comparative study of aggression in women cricket players of
different levels of participation. International Journal of Physical
Education, Sports and Yogic Sciences 2(2), 17-18.
Mishra, S. (2010). A study of aggression, anxiety and achievement motivation of
Khan, Z., Ali, A., & Ahmed, N., (September, 2015). Aggression and mental toughness among
Indian universities basketball players: A comparative study. Journal of Physical Education
Research, Volume 2, Issue III, 53-61.
JOPER® www.joper.org JOPER 60
university level kho-kho players. AMASS, Multilateral Research Journal,
2(1), 59-60.
Mishra, V. (2001). Assessment of aggression and anxiety among players of
selected sports. Indian Journal of Sports Studies, 6(2), 24-27.
Mohammad, A., & Hasan, M. (2015). Aggression of Indian female field hockey
players at different levels of competitions. International Journal of Sports
and Physical Education, 1(1), 9-13.
Mudimela, S.S.R. (2010). Impact of level of participation on aggression, anxiety,
achievement motivation and performance among soccer players. British
Journal of Sports Medicine, 44(S1), 61.
Naseer, M.K.A., & Singh, T.D. (2013). Comparison of aggression and mental
toughness between armed force sportsmen and civilian sportsmen.
Academic Sports Scholar, 1(12), 01-06.
Peter, V.F. (2014). The study of group cohesion and aggression between all India
inter university and national female hockey player’s. Research Journal of
Physical Education Sciences, 2(7), 4-7.
Rani, P., Malik, N. and Thapa, G. (2012). A study of mental health of sports and
non-sports senior secondary school students. South Asian Academic
Research Journals, 2 (3): 219-231.
Rani, U., & Mathana, S. K. (2010). Difference in aggression of school and college
level volleyball players. Journal of Physical Education and Yoga, 1(2),
129-131.
Rascle, O., Traclet, A., Souchon, N., Coulomb, C.G., & Petrucci, C. (2010).
Aggressor-victim dissent in perceived legitimacy of aggression in soccer:
the moderating role of situational background. Research Quarterly for
Exercise and Sport, 81(3), 340-348.
Razeena, K.I. (2004). Comparative relationship of state anxiety and aggression of
defensive and offensive women hockey players. Journal of Sports and
Sports Sciences, 27(4), 103-128.
Salam, C., & Sardar, S. (2010). Aggression and violence behaviour among the
spectators of contact and non-contact games. Journal of Health and
Fitness, 2(2), 21-29.
Sardar, S., & Das, P. K. (2010). Violence and aggression behaviour of spectators.
AMASS Multilateral Research Journal, 3(1), 87-92.
Schat, A. C. H., & Frone, M. R. (2011). Exposure to psychological aggression at
work and job performance: the mediating role of job attitudes and personal
health. Work and Stress, 25(1), 23-40.
Sharma, K. Khan, K.A., Haider, Z., & Khan S. (2012). Aggressive behavior in
field soccer players: A comparative study. International Journal of
Physical and Social Sciences, 2(8), 387-393.
Sheard, M. (2009). A cross-national analysis of mental toughness and hardiness in

Khan, Z., Ali, A., & Ahmed, N., (September, 2015). Aggression and mental toughness among
Indian universities basketball players: A comparative study. Journal of Physical Education
Research, Volume 2, Issue III, 53-61.
JOPER® www.joper.org JOPER 61
elite university rugby league teams 1. Perceptual and Motor Skills, 109
(1), 213-223.
Sidhu, J.S., Singh, K., & Singh, C. (2011). Anxiety and aggression level between
male and female athletes at university level: An empirical study. Journal
of Health and Fitness, 3(1), 84-88.
Silva, J.M., & Weinberg, R.S. (1984). Psychological foundation of sports.
Champaign, I.L.: Human Kinetic Publisher, Inc.
Tapp, J. (1991). Mental toughness. Referee, 16, 44-48.
Thelwell, R. Weston, N. & Greenlees, I. (2005). Defining and understanding
mental toughness within soccer. Journal of Applied Sport Psychology,
17(4), 326-332.

238
ISSN 2286-4822
www.euacademic.org
EUROPEAN ACADEMIC RESEARCH
Vol. III, Issue 1/ April 2015
Impact Factor: 3.4546 (UIF)
DRJI Value: 5.9 (B+)
Influence of Body Kinematics on Tennis Serve
IKRAM HUSSAIN Professor
Department of Physical Education
Aligarh Muslim University, Aligarh, U.P., India
SYED ANAYAT HUSSAIN
FUZAIL AHMAD
Research Scholars
Department of Physical Education
Aligarh Muslim University, Aligarh, U.P., India
Abstract:
Improving the serve speed is most important for competitive
tennis players. The aim of this study was to examine the influence of
body kinematics on ball velocity, thereby to propose possible
suggestions to improve serving skill. Body kinematics of four Indian
international players, who participated in Davis cup held at Indore,
India having mean age (years), height (cm) and weight (kg) of
27.00±4.97, 186.50±6.03 and 81.25±7.41, respectively were
investigated. The tennis serve was divided into three phases: (I)
preparatory phase, (II) force-generation phase, and (III) follow-through
phase. The recorded data of service motion was analyzed using
appropriate motion analysis software and statistical analysis was done
by using SPSSv 17. The mean, standard deviation (SD) and
correlation coefficient (r) were determined to find out any relationship
between the selected kinematic variables and ball velocity. It was
shown that, during phase I, wrist angular velocity (r= 0.50), during
phase II, wrist velocity (r= 0.52), shoulder velocity (r= 0.45), elbow
angular velocity (r= 0.43), elbow angular acceleration (r= 0.45) and
during phase III, racket velocity at impact (r= 0.53), elbow angular
acceleration (r= 0.44) were significantly correlated with ball velocity.
Players therefore should concentrate on increasing the extension
velocities of these identified joints during training.
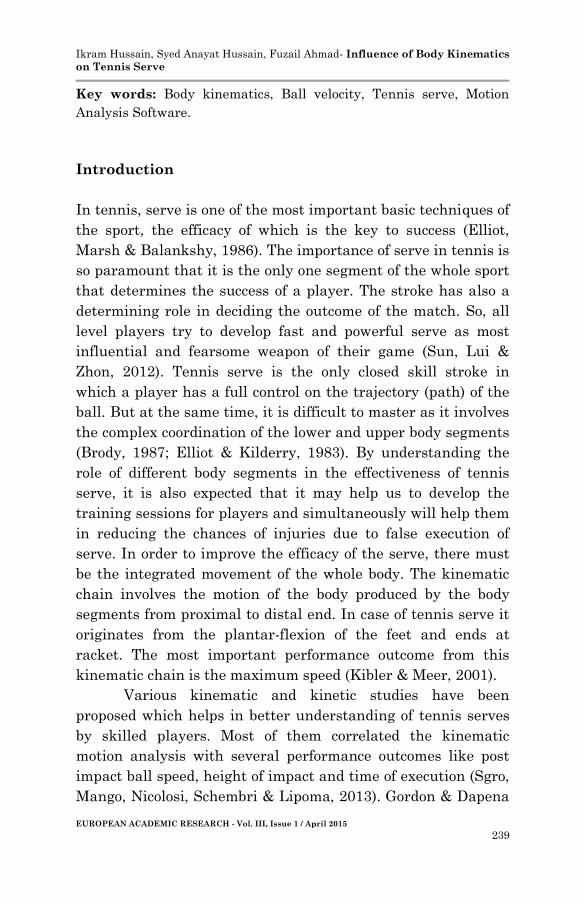
Ikram Hussain, Syed Anayat Hussain, Fuzail Ahmad- Influence of Body Kinematics
on Tennis Serve
EUROPEAN ACADEMIC RESEARCH - Vol. III, Issue 1 / April 2015
239
Key words: Body kinematics, Ball velocity, Tennis serve, Motion
Analysis Software.
Introduction
In tennis, serve is one of the most important basic techniques of
the sport, the efficacy of which is the key to success (Elliot,
Marsh & Balankshy, 1986). The importance of serve in tennis is
so paramount that it is the only one segment of the whole sport
that determines the success of a player. The stroke has also a
determining role in deciding the outcome of the match. So, all
level players try to develop fast and powerful serve as most
influential and fearsome weapon of their game (Sun, Lui &
Zhon, 2012). Tennis serve is the only closed skill stroke in
which a player has a full control on the trajectory (path) of the
ball. But at the same time, it is difficult to master as it involves
the complex coordination of the lower and upper body segments
(Brody, 1987; Elliot & Kilderry, 1983). By understanding the
role of different body segments in the effectiveness of tennis
serve, it is also expected that it may help us to develop the
training sessions for players and simultaneously will help them
in reducing the chances of injuries due to false execution of
serve. In order to improve the efficacy of the serve, there must
be the integrated movement of the whole body. The kinematic
chain involves the motion of the body produced by the body
segments from proximal to distal end. In case of tennis serve it
originates from the plantar-flexion of the feet and ends at
racket. The most important performance outcome from this
kinematic chain is the maximum speed (Kibler & Meer, 2001).
Various kinematic and kinetic studies have been
proposed which helps in better understanding of tennis serves
by skilled players. Most of them correlated the kinematic
motion analysis with several performance outcomes like post
impact ball speed, height of impact and time of execution (Sgro,
Mango, Nicolosi, Schembri & Lipoma, 2013). Gordon & Dapena
Ikram Hussain, Syed Anayat Hussain, Fuzail Ahmad- Influence of Body Kinematics
on Tennis Serve
EUROPEAN ACADEMIC RESEARCH - Vol. III, Issue 1 / April 2015
240
(2006) studied that the speed of racket came sequentially from
kinematic motions of different body segments like shoulder
abduction, elbow extension, ulnar deviation, rotation at the
wrist, axial rotation of upper trunk relative to lower trunk and
wrist flexion. They also found that forearm pronation had a
little negative effect on racket speed. Springer, Marshal, Elliott
& Jennings (1994), also reported the reduction of racket head
speed by elbow extension at contact. This was also supported by
(Springer, 1994) who also noted a negative role played by elbow
extension which reduced the forward velocity of centre of the
racket impact. Contrary to the previous researches, Elliot
(1988) found that during tennis serve execution, the linear
velocities of various body joints increased progressively from
knee, hip, shoulder, elbow and wrist and summation of the
resultant linear velocities of these joints resulted in maximum
angular velocity of the racket. Fleising, Nichollas, Elliot &
Escamilla (2003) studied the serve motion of players in 2000
Olympics and quantified their kinematics of knees, pelvis,
trunk, shoulder, elbows and wrists during high velocity serves
and suggested that the players must be trained to develop
kinematic profiles similar to 2000 Olympics, so as to produce
high velocity serves. Also a significant association between body
height and serve speed was reported by Vaverka & Cernosek
(2013). For high speed tennis serves, it is believed that vertical
drive from legs is one of the most determining factor, however
researchers differs in views demands the kinematic analysis of
whole body segments to be investigated for better
understanding of serve kinematic chain. Therefore present
study was structured to study the influence of whole body
kinematic parameters on ball velocity, thereby proposing the
possible training strategies for quality tennis serve to gain high
ball velocity.

Ikram Hussain, Syed Anayat Hussain, Fuzail Ahmad- Influence of Body Kinematics
on Tennis Serve
EUROPEAN ACADEMIC RESEARCH - Vol. III, Issue 1 / April 2015
241
Methodology
Four male International players, participated in Davis Cup,
held at Indore in November 2013 were recruited for the study.
The mean and standard deviation (SD) of their age (yrs), body
height (cm) and body weight (kg) were 27 4.97, 186 6.03 and
81.25 7.41 respectively.
The kinematic chain of body segments (producing
motion in the body) was taken as a model for tennis serve and
composed of (a) foot (b) lower leg (c) thigh (d) Trunk (e) Upper
arm (f) fore arm (g) hand and racket.
A cannon camcorder operating at shutter speed of 1/2000
and frame rate of 50 Hz was used for obtaining the two-
dimensional kinematic data of whole body particularly focusing
on right side of the players. The camera was positioned
perpendicular to the sagittal plane on the right side at a
distance of 17 meters from the mid of base line of tennis court
to capture the serve motion.
The total number of four trials of each player were taken
under consideration for the study and the selected parameters
of various body segments i.e. Toe velocity (VT), Ankle velocity
(VA), Knee velocity (VK), Hip velocity (VH), Shoulder velocity
(VS), Elbow velocity (VE), Wrist velocity (Vw), Ankle angular
velocity (AVA), Knee angular velocity (AVK), Hip angular
velocity (AVH), Shoulder angular velocity (AVS), Elbow angular
velocity (AVE), Wrist angular velocity (AVW), Elbow angular
acceleration (AAE) and also, Toss height (TH), Toss angle (TA),
Reach height (RH), Racket velocity at impact (VRI), Racket
velocity post impact (VRPI), and Ball velocity (VB), were analyzed
during three time periods of the serve i.e. at preparation phase,
at force generation phase and finally at follow through phase.
This procedure was applied for first and second serve only.
After obtaining the required data, the recorded videos
were carefully viewed and best performance clips of subjects
were extracted for analysis which was done by appropriate

Ikram Hussain, Syed Anayat Hussain, Fuzail Ahmad- Influence of Body Kinematics
on Tennis Serve
EUROPEAN ACADEMIC RESEARCH - Vol. III, Issue 1 / April 2015
242
motion analysis software. The software provides to identify the
required angles, displacement, time and number of frames.
Preparatory Phase Force generation Phase
Follow Through Phase
Results
The main objective of this scientific venture was to determine
the relationship between players’ kinematic variables and ball velocity of the serve. The results of the study are presented in
the given tables below;
Table No.: 1 Mean, SD & relationship among players’ kinematic variables and ball velocity of serve during Preparation Phase.
Variable Mean SD Correlation (r)
Toss Angle (TA) 9.21 4.05 0.02
Wrist Velocity (Vw) 138.61 26.56 0.04
Elbow Velocity (VE) 96.42 18.66 0.30
Shoulder Velocity(VS) 86.23 13.89 0.31
Hip Velocity (VH) 73.22 15.63 0.15
Knee velocity (VK) 60.98 14.80 0.13
Ankle Velocity (VA) 37.01 11.79 0.39
Toe Velocity (VT) 35.42 14.58 0.40
Wrist Angular Velocity (AVW) 422.84 148.74 0.50*
Elbow Angular Velocity (AVE) 428.04 182.18 0.15
Shoulder Angular Velocity (AVS) 91.79 21.17 0.41
Hip Angular Velocity (AVH) 189.99 167.36 -0.01
Knee Angular Velocity (AVK) 761.41 553.10 0.35

Ikram Hussain, Syed Anayat Hussain, Fuzail Ahmad- Influence of Body Kinematics
on Tennis Serve
EUROPEAN ACADEMIC RESEARCH - Vol. III, Issue 1 / April 2015
243
Ankle Angular Velocity (AVA) 245.31 203.75 0.17
Elbow Angular Acceleration (AAE) 8234.71 4269.75 0.19
*Significance level at 0.05
Tab r 0.05 (22) = 0.42
A critical evaluation of table 1 shows that no significant
relationship exists between the ball velocity and the Toss angle,
the linear and angular velocities of toe, ankle, knee, hip,
shoulder, elbow, wrist and also angular acceleration of elbow,
except the wrist angular velocity which was found significantly
correlated with the ball velocity (r = 0.50; p < 0.05).
Thus, the above statistical findings reveal that all the
selected kinematic variables except the wrist angular velocity
show insignificant relationship and hence do not influence on
ball velocity at preparation phase during match conditions.
Table No.: 2 Mean, SD & relationship among players’ kinematic variables and ball velocity of serve during Force Generation Phase.
Variable Mean SD Correlation (r)
Toss Height (TH) 4.79 0.55 0.12
Reach Height (RH) 3.47 1.15 0.07
Wrist Velocity (VW) 815.86 106.94 0.52*
Elbow Velocity (VE) 678.69 59.41 0.17
Shoulder Velocity (VS) 387.27 31.80 0.45*
Hip Velocity (VH) 184.95 45.75 -0.30
Knee velocity (KK) 167.27 34.14 -0.11
Ankle Velocity (VA) 150.97 32.70 -0.13
Toe Velocity (VT) 225.92 71.20 -0.02
Wrist Angular Velocity (AVW) 2063.39 582.69 -0.13
Elbow Angular Velocity (AVE) 1625.09 393.57 0.43*
Shoulder Angular Velocity (AVS) 440.14 98.46 -0.20
Hip Angular Velocity (AVH) 1651.55 556.84 0.42
Knee Angular Velocity (AVK) 1726.06 491.01 0.12
Ankle Angular Velocity (AVA) 1593.29 457.01 -0.01
Elbow Angular Acceleration (AAE) 32543.77 7023.61 0.45*
*Significance level at 0.05
Tab r 0.05 (22) = 0.42
Readings of Table 2 shows a significant relationship exists
between the ball velocity and wrist velocity (r = 0.52; p < 0.05),
shoulder velocity (r = 0.45; p < 0.05), elbow angular velocity (r =

Ikram Hussain, Syed Anayat Hussain, Fuzail Ahmad- Influence of Body Kinematics
on Tennis Serve
EUROPEAN ACADEMIC RESEARCH - Vol. III, Issue 1 / April 2015
244
0.43; p < 0.05) and elbow angular acceleration (r = 0.45; p <
0.05). Insignificant relationship is observed in the remaining
selected variables in this study.
The above statistical findings reveal that except wrist
linear velocity, shoulder velocity, elbow angular velocity and
elbow angular acceleration (which show significant
relationship), all selected kinematic variables exhibit
insignificant relationship and hence do not have influence on
ball velocity at force generation phase during match conditions.
Table No.: 3 Mean, SD & relationship among players’ kinematic variables and ball velocity of serve during Follow Through Phase.
Variable Mean SD Correlation
(r)
Racket velocity at Impact (VRI) 1457.24 205.44 0.53*
Racket velocity at post Impact (VRPI) 1498.38 288.19 0.03
Wrist Velocity (VW) 754.03 102.34 0.26
Elbow Velocity (VS) 399.37 32.77 0.12
Shoulder Velocity (VS) 218.75 28.51 0.10
Hip Velocity (VH) 178.06 33.50 0.02
Knee velocity (VK) 78.86 22.18 0.11
Ankle Velocity (VA) 331.78 54.92 0.09
Toe Velocity (VT) 405.85 64.57 -0.11
Wrist Angular Velocity (AVW) 140.35 11.55 -0.06
Elbow Angular Velocity (AVE) 142.51 24.57 -0.03
Shoulder Angular Velocity (AVS) 134.51 20.09 -0.03
Hip Angular Velocity (AVH) 160.63 6.02 0.09
Knee Angular Velocity (AVK) 213.68 191.17 -0.10
Ankle Angular Velocity (AVA) 124.87 14.01 -0.05
Elbow Angular Acceleration (AAE) 1640.80 869.68 0.44*
*Significance level at 0.05
Tab r 0.05 (22) = 0.42
From the critical analysis of above table, it is evidenced that
the velocity of racket at impact (r = 0.53; p < 0.05) and elbow
angular acceleration (r = 0.44; p < 0.05) are significantly
correlated with the ball velocity. Further no significant
relationship exists between the ball velocity and other selected
kinematic variables and hence does not influence the ball
velocity at follow through phase during match conditions.

Ikram Hussain, Syed Anayat Hussain, Fuzail Ahmad- Influence of Body Kinematics
on Tennis Serve
EUROPEAN ACADEMIC RESEARCH - Vol. III, Issue 1 / April 2015
245
Discussion
The fast and powerful serve has a determining role in the
outcome of the match (Sun, Lui & Zhou 2012), therefore every
player tries to develop fast and accurate serve to gain
advantage during the match. The tennis serve involves a
complex coordination of lower and upper body segments to
provide a kinematic chain for the transference of force from
proximal to distal end of the body and thereby to the ball
resulting in its greater velocity.
The results of the statistical analysis of data showed
significant relationship of ball velocity to the linear and angular
velocity of wrist, angular velocity and angular acceleration of
elbow, linear velocity of shoulder and racket velocity at impact.
No significant relationship existed between the ball velocity
and other selected kinematic variables in all the three phases of
serve. Sweany, Reid & Elliot (2012) reported that the increased
vertical linear velocity from lower limbs enhances the linear
velocity drive of racket side shoulder, hence leading to greater
ball velocity. The greater force of vertical drive is the
contribution of pushing the ground downwards with the feet
and flexion of knee which acts as link to transfer this force to
upper limbs.
Gordan & Dapena (2006) also reported the increased
racket head speed and hence ball velocity came sequentially
from greater shoulder abduction, elbow extension, ulnar
rotation at wrist, wrist flexion and twist rotation of upper trunk
and further more the study showed that elbow extension is the
second largest contributor of racket velocity at impact. Elliot
(1998) also reported that the linear velocities of various joints
increases progressively from the lower limbs and gets
transferred to the upper extremities i.e. shoulder, elbow and
wrist and the summation of these maximum linear velocities
produce maximum angular velocity of the racket. In a
subsequent study Elliot, Marshal & Noffal (1995) reported that
Ikram Hussain, Syed Anayat Hussain, Fuzail Ahmad- Influence of Body Kinematics
on Tennis Serve
EUROPEAN ACADEMIC RESEARCH - Vol. III, Issue 1 / April 2015
246
internal rotation of shoulder was found to generate
approximately 50 percent of linear racket head velocity. Fleisig,
Nicholls, Elliot & Escamilla (2003) further reported that high
shoulder internal rotation velocity measurement was critical for
producing high ball serve velocity.
The faster ball velocity can be linked to the key role
played by the lower limbs in creating a vertical drive during the
execution of serve. The toe, ankle, knee, trunk creates a link
system which transfers the force to upper limbs in such a
coordinated way that one segment energy decreases and the
next participating body segment energy increases, thereby
making the ball to gain maximum velocity.
Hence, it is suggested that in producing high velocity
serves, coaches while imparting training, should focus on
movement specifics like joint angles and velocities. In
particular, the results suggest that special focus should be on
wrist, elbow and shoulder extensions for greater ball velocities.
Conclusion
In our study of body kinematic analysis, various velocities and
accelerations of specific joints were identified which were
significantly related to ball velocity. These include linear and
angular velocities of wrist and elbow, shoulder velocity, angular
acceleration of elbow and racket velocity at impact. So we can
conclude that the serve kinematics can be adjusted to improve
ball velocity and may allow players to enhance the serving skill.
REFERENCES
Brody, H. (1987). Tennis Science for Tennis Players.
Philadelphia: University of Pennsylvania Press.
Elliott, B.C. (1998). Biomechanics of the serve in tennis-A
biomedical perspective. Sports Medicine, 6, 285–294.

Ikram Hussain, Syed Anayat Hussain, Fuzail Ahmad- Influence of Body Kinematics
on Tennis Serve
EUROPEAN ACADEMIC RESEARCH - Vol. III, Issue 1 / April 2015
247
Elliott, B.C., & Kilderry, R. (1983). The Art and Science of
Tennis. Philadelphia: Saunders College Publishing.
Elliot, B.C., Marshal, R.N., & Noffal, G.J. (1995). Contribution
of upper limb segment rotations during the power serve
in tennis. Journal of applied biomechanics, 11, 433-442
Elliott, B., Marsh, A., & Blanksby, B. (1986). A three-
dimensional cinematographic analysis of the tennis
serve. International Journal of Sport Biomechanics, 2(4),
260-270.
Fleisig, G., Nicholls, R., Elliott, B., & Escamilla, R. (2003).
Kinematics used by world class tennis players to
produce high velocity serves. Sports Biomechanics, 2,
51–64.
Gordon, B.J., & Dapena, J. (2006). Contributions of joint
rotations to racquet speed in the tennis serve. Journal of
Sports Sciences, 24, 31–49.
Kibler, W.B., & Meer, D.V.D. (2001). Mastering the kinetic
chain. In World-Class Tennis Technique, P. Roetert and
J. Groppel, Eds. Champaign, IL: Human Kinetics, 99-
113.
Sgro, F., Mango, P., Nicolosis, S., Schembri, R., & Lipoma, M.
(2013). Analysis of knee joint motion in tennis flat serve
using low-cost technological approach. International
workshop on computer sciences in sports, 250-254.
Sun, Y., Liu, Y., & Zhou, Z. (2012). A kinematic analysis of a top
10 WTA tennis player’s first serve. In Proceeding of 30th
Annual Conference of Biomechanics in Sport, 253-225,
Australia: Melbourne.
Sweeney, M., Reid, M., & Elliot, B. (2012). Lower Limb and
Trunk Function in the High Performance Tennis Serve.
Asian Journal of Exercise & Sports Science. 9 (1), 13–20.
Springer, E., Marshall, R., Elliott, B., and Jennings, L. (1994).
A three dimensional kinematic method for determining
the effectiveness of arm segment rotations in producing

Ikram Hussain, Syed Anayat Hussain, Fuzail Ahmad- Influence of Body Kinematics
on Tennis Serve
EUROPEAN ACADEMIC RESEARCH - Vol. III, Issue 1 / April 2015
248
racquet head speed. Journal of Biomechanics, 27, 245–254.
Vaverka, F., Cernosek, M. (2013). Association between body
height and serve speed in elite tennis players. Sports
Biomechanics, 12(1), 30–37.
Wong, F.K., Keung, J.H., Law, N.W., Ng, D.K., Chung, J.W., &
Chow, D.H. (2014). Effects of body mass index and full
body kinematics on tennis serve speed. Journal of
Human Kinematics, 40, 21-28.

3 IV April 2015

www.ijraset.com Volume 3 Issue IV, April 2015
IC Value: 13.98 ISSN: 2321-9653
International Journal for Research in Applied Science & Engineering
Technology (IJRASET)
©IJRASET 2015: All Rights are Reserved
388
Kinematic Characteristics of Two Different Service
at Three Varied Stages during the Match
Ikram Hussain1, Fuzail Ahmad
2, Naushad W. Ansari
3, Shiny Raizada
4
1Professor, Department of Physical Education, 2Research Scholar, Department of Physical Education, 3Assistant
Professor, Department of Physical Education, 1,2,3,Aligarh Muslim University, Aligarh., 4Research Scholar, Lakshmibai National Institute of Physical Education,
Gwalior.
Abstract: The purpose of the study was designed to determine the variation between first and second serve at different time
frame, i.e.: start of the match (initial period), mid of the match (mid period) and at the end flag of the match (end period) for
Indian players during Davis cup. Four Indian international tennis players of mean age, height and weight were 27.00 ± 4.97
years, 186.50 ± 6.03 cm, 81.25 ±7.41 kg, respectively were recorded in Davis Cup held in Indore, India. The study focused on the
mechanical source of service by comparing the body, racket and ball kinematics of first and second service. The recorded service
motion was analyzed by motion analysis software and was used to calculate the selected parameters for this study and statistical
analysis was accepted using SPSSv.17, mean, standard deviations and t-test was used to find out the difference between the
kinematic parameters of this second service for Indian elite players except the ball velocity in the end period of the match in
follow through.
Keywords: Kinematics, first serve, second serve, time frame.
I. INTRODUCTION TO TENNIS SERVE
A good serve in tennis is essential. Every point in a tennis match begins with a serve. Probably the most analyzed shot in tennis, an
effective serve requires precise timing and arm coordination. Success in tennis is greatly affected by the technique a player uses and
biomechanics plays an integral role in stroke production. Player development based on scientific evidence allows an individualized
approach to be structured, with due consideration to the key mechanical features of each skill, while also fostering fair and
permitting the physical characteristics of a player to be considered (Elliot, 2006).
The serve is one of the most important skills a tennis player must acquire in order to have an effective attack. The primary objective
of the serve is to direct the ball into the service area on the opponent's side of the court. The serve is an effective offensive weapon
because the ball can be hit with a tremendous amount of velocity, thus reducing the opposition’s reaction time and consequently
their ability to return the ball. The tennis serve is a more complex sequence that uses a combination of horizontal and vertical
movements. Variations of the service action can also cause the ball to spin. A slice serve is used in order to gain an advantage via
the unpredictability of a spinning ball bounce. Biomechanical analysis of the skill enables us to give effective instruction and
appropriate technical cues to improve the performance of students and athletes (Hooper, 2001). One of the elements that all high
level tennis players, college tennis players and world class tennis professionals share are efficient and biomechanical sound tennis
strokes.
The serve, a closed skill which players have total control over is also a difficult stroke to master. Not only do the arms prescribe
different movement patterns and rhythms, but they must coordinate with the movement of the lower limbs and the trunk. Because of
its importance and complexity, the tennis serve becomes a closely watched issue; especially the flat serve which is the fastest of all
the service types and is also probably the most intimidating and fearsome weapon a player can have (Yuliang Sun, Yu Liu and
Xinglong Zhou, 2012)
Powerful serve in tennis requires balancing the generation of forces and motions necessary to move the body, especially the
shoulder and elbow, and propel the racquet and the control of these forces and motions for precision of performance and protection
of the joints from excessive loading. The body achieves this balance by integrating the physiological muscle activations and the
resulting biomechanical forces and motions throughout all the segments or links of the kinetic chain (Kibler, 2009).
Kinematics of the tennis serve have been described quite extensively, focusing on the upper-limb movements (Elliott, Marsh, &
Blanksby, 1986; Elliott, Fleisig, Nicholls, & Escamilia, 2003; Reid, Elliott, & Alderson, 2007), or the patterns of the lower-limb

www.ijraset.com Volume 3 Issue IV, April 2015
IC Value: 13.98 ISSN: 2321-9653
International Journal for Research in Applied Science & Engineering
Technology (IJRASET)
©IJRASET 2015: All Rights are Reserved
389
(Elliott & Wood, 1983; Girard, Micallef, & Millet, 2005), or the function of trunk (Chow, Shim, & Lim, 2003; Chow, Park, &
Tillman, 2009). According to Tanabe, 2007 the joint movement that produces the difference in horizontal racket head velocity
between fast and slow servers is shoulder internal rotation, and angular velocity of shoulder internal rotation must be developed to
produce a high racket speed.
The tennis serve is commonly associated with musculoskeletal injury. Different types of serves, e.g. the flat and the kick types, may
involve different kinematics and different musculoskeletal demands at the joints that play an important role in the development of
long term injuries (Reid, 2007).
The spin serves produces more lateral flexion moments than flat serve; this moment comes mainly from the lateral flexion of the
trunk. The spin serve has a significant difference from the flat serve: the former produces more knee bend than the latter during
acceleration, and more backward pelvis tilting. This will help to increase the momentum during the serve and its transfer (Kuo-
Cheng Lo, 2004). The tennis serve is a commonly performed athletic skill and has received some attention in the scientific
biomechanical literature. During the tennis serve the greatest forces and moments are applied at the shoulder joint. Also, the lower
extremities are important to the successful performance of the tennis serve (Seeley, n.d.).
The study has been designed to determine the variation between first and second serve at different time frame i.e.: start of the match
(initial period), mid of the match (mid period) and at the end flag of the match (end period) for Indian players during Davis cup. The
study focused on the mechanical source of service by comparing the body, racket and ball kinematics of first and second service.
II. METHODOLOGY
A. Participants
A total of four elite male International tennis players were selected as subjects for the study, who participants in Davis Cup, held at
Indore, India in November, 2013. The mean and standard deviation (SD) of players of age (year), height (cm) and weight (kg) were
27.00 ± 4.97, 186.50 ± 6.03, 81.25 ±7.41, respectively.
B. Model of Tennis Serve
The tennis service was modeled as segments of the kinetic chain composed together of (a) foot (b) lower leg segment (c) upper leg
segment (d) trunk segment (e) upper arm segment (f) forearm and (g) hand with tennis racket. The ankle, knee and upper body
significantly flexed to make use of ground reaction force (GRF) to start the execution while extending ankle, knee and upper body
in a sequential manner for summation of force. The body makes an arc extending the shoulder with internal rotation of the upper
arm and pronation of the forearm.
C. Equipment’s and Set-up
To obtain the kinematic data for this study the equipment used were camera, tripod, computer, two-dimensional calibration frame,
motion analysis software and measuring tape. Two-dimensional kinematics data of the body were obtained with the high speed
canon camcorder operating at the shutter speed of 1/2000 with a frame rate of 50 Hz. The camera was placed perpendicular to
sagittal plane on the right side at a distance of seventeen meters from the mid of base line of the tennis court to capture the service
motion.
D. Parameters
The kinematic parameters considered for this study during preparation phase, force generation phase and follow through phase were
toss angle (ToA), toss height (TH), reach height (RH), ball velocity (Bv), racket velocity at impact (RIv), racket velocity post impact
(RPv), wrist velocity (Wv), elbow velocity (Ev), shoulder velocity (Sv), pelvic/ hip velocity (Hv), knee velocity (Kv), ankle velocity
(Av), toe velocity (Tv), wrist angular velocity (WAv), elbow angular velocity (EAv), shoulder angular velocity (SAv), pelvic
angular velocity (HAv), knee angular velocity (KAv), ankle angular velocity (AAv), toe angular velocity (TAv)
E. Subject and Trail Identification
The subjects’ identification code in the video recording for distinguishing them in the recorded data. The recorded videos were
viewed carefully in the playback system and extracted of the best performance of the subjects for analysis.
F. Data Reduction
The identified valid first and second serve of each player’s selected video footages were downloaded, slashed, edited and trimmed
by using the Xilisoft Video Converter. The trimmed video data were digitized in motion analysis software with the process of

www.ijraset.com Volume 3 Issue IV, April 2015
IC Value: 13.98 ISSN: 2321-9653
International Journal for Research in Applied Science & Engineering
Technology (IJRASET)
©IJRASET 2015: All Rights are Reserved
390
markless digitization and a database of each player’s serves was developed.
G. Statistical Procedure
Descriptive statistics and t-test were performed by SPSS version 17.0 for all the variables under this study were computed at Level
of significance for 0.05 with 6 degree of freedom.
III. RESULT
The main purpose of this study was to determine kinematical variations at the time of the preparation phase, force generation phase
and follow through phase during first and second serve during three time periods of the match i.e.: initial period, mid period and end
period.
Ball velocity and velocity of a racket at the time of impact and post impact were also studied during first and second serve.
Table No.: 1 Kinematics parameters of first and second serve during preparation Phase at Initial, mid & End Period of Match.
Variable Serve Initial Period Mid Period End Period
Mean±SD t-value Mean±SD t-value Mean±SD t-value
TAO FS 9.25 ± 5.56
0.00 9.00 ± 3.83
0.09 9.00 ± 4.69
0.15 SS 9.25 ± 4.35 9.25 ± 4.03 9.50 ± 4.80
WRvel FS 147.31±16.30
0.18 143.49±33.88
0.26 125.15±33.36
0.34 SS 144.71±23.67 137.83±27.25 133.18±33.42
ERvel FS 106.77±18.57
0.86 98.66±25.36
0.01 84.83±24.28
0.74 SS 94.89±20.31 98.48±13.54 94.89±12.49
SRvel FS 98.86±9.70
0.77 86.48±18.92
0.11 77.41±19.05
0.51 SS 86.29±11.73 85.35±9.15 82.99±10.55
PRvel FS 84.95±14.20
0.91 77.40±21.99
0.30 65.72±17.65
0.15 SS 70.11±12.53 73.74±12.61 67.43±14.81
KRvel FS 74.25±19.85
0.11 65.23±22.38
0.38 54.53±12.80
0.12 SS 55.77±8.80 60.65±9.16 55.43±8.24
ARvel FS 44.76±17.29
0.15 33.64±10.38
0.50 35.59±15.66
0.17 SS 36.83±6.18 37.33±10.74 33.95±12.27
TRvel FS 44.67±22.83
0.13 31.14±15.36
0.53 35.84±15.43
0.31 SS 31.85±8.38 36.51±13.00 32.52±15.08
WAacc FS 539.02±27.53
0.17 598.79±166.62
0.98 525.67±161.01
0.20 SS 528.56±117.85 515.39±36.11 506.66±111.35
EAacc FS 1083.78±231.56
1.54 970.39±307.93
0.58 687.14±221.46
0.44 SS 853.65±189.45 877.55±94.61 749.07±172.68
WAO FS 145.99±6.20
0.57 153.88±21.72
0.08 154.76±17.31
0.89 SS 150.07±12.97 152.86±14.64 146.11±8.67
EAO FS 108.15±9.90
1.09 115.79±24.65
0.27 123.68±21.95
0.41 SS 118.67±16.57 120.03±18.69 118.25±14.79
SAO FS 39.01±11.23
0.27 36.58±10.64
0.03 36.42±10.75
0.07 SS 37.11±8.76 36.78±13.72 36.95±10.78
WAO/S FS 509.73±193.84
0.86 354.45±143.34
0.42 403.92±197.39
0.65 SS 401.21±160.51 397.68±150.56 470.04±53.60
EAO/S FS 392.41±190.12
0.40 358.16±203.68
0.94 427.60±207.06
0.15 SS 445.64±188.84 494.86±209.97 449.58±197.50
SAO/S FS 97.33±27.36
0.39 93.89±22.50
0.21 83.29±26.22
0.34 SS 90.31±23.72 96.77±15.93 89.13±22.14

www.ijraset.com Volume 3 Issue IV, April 2015
IC Value: 13.98 ISSN: 2321-9653
International Journal for Research in Applied Science & Engineering
Technology (IJRASET)
©IJRASET 2015: All Rights are Reserved
391
Tab t 0.05 (6) =2.45 *Significance at 0.05 levels.
The analysis of data table -1 shows that there is no significant differences found between first and second serve of body kinematics.
The linear kinematic of toss angle (TA), the velocity of wrist angle (WR), elbow angle (ER), shoulder angle (SR), pelvic angle (PR),
knee right (KR) and ankle right (AR). The acceleration of wrist angle (WAacc), elbow angle (EAacc), angles and angular velocity of
wrist angle (WAO/S), elbow angle (EAO/S), shoulder angle (SAO/S) have shown |t|cal. values are less than the t0.05, 6 value at 0.05 level
of significance.
This statistical finding exhibits that all the linear and angular kinematics of right side of wrist, elbow, shoulder, pelvic, Knee and
ankle during first and second serve does not differ significantly and hence does not influence on the performance of tennis serve at
preparation phase during initial, mid and end phases under the match condition.
Graph no. 1: Graphical representation of the linear velocity (meter/s) of the parameters in first serve during preparation phase of
tennis serve.
Graph no. 2: Graphical representation of the linear velocity (meter/s) of the parameters in second serve during preparation phase of
tennis serve.
0
20
40
60
80
100
120
140
160
WR ER SR PR KR AR TR
Initial
Mid
End
0
20
40
60
80
100
120
140
160
WR ER SR PR KR AR TR
Initial
Mid
End
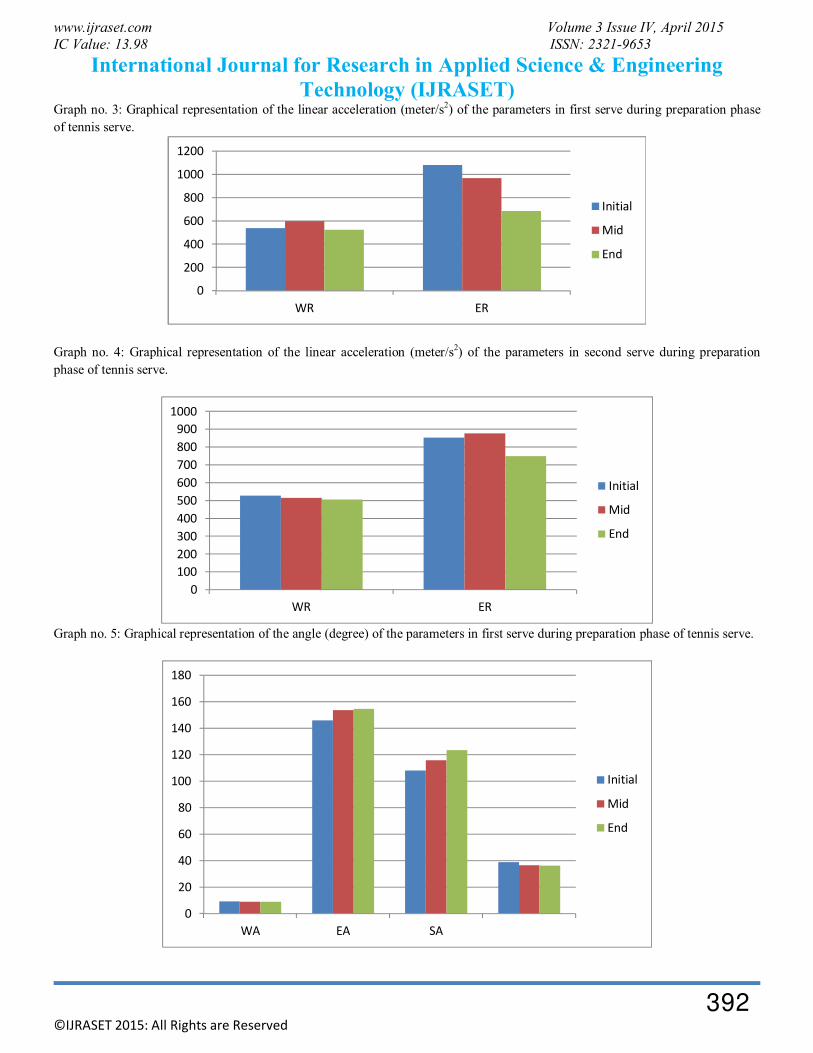
www.ijraset.com Volume 3 Issue IV, April 2015
IC Value: 13.98 ISSN: 2321-9653
International Journal for Research in Applied Science & Engineering
Technology (IJRASET)
©IJRASET 2015: All Rights are Reserved
392
Graph no. 3: Graphical representation of the linear acceleration (meter/s2) of the parameters in first serve during preparation phase
of tennis serve.
Graph no. 4: Graphical representation of the linear acceleration (meter/s2) of the parameters in second serve during preparation
phase of tennis serve.
Graph no. 5: Graphical representation of the angle (degree) of the parameters in first serve during preparation phase of tennis serve.
0
200
400
600
800
1000
1200
WR ER
Initial
Mid
End
0
100
200
300
400
500
600
700
800
900
1000
WR ER
Initial
Mid
End
0
20
40
60
80
100
120
140
160
180
WA EA SA
Initial
Mid
End
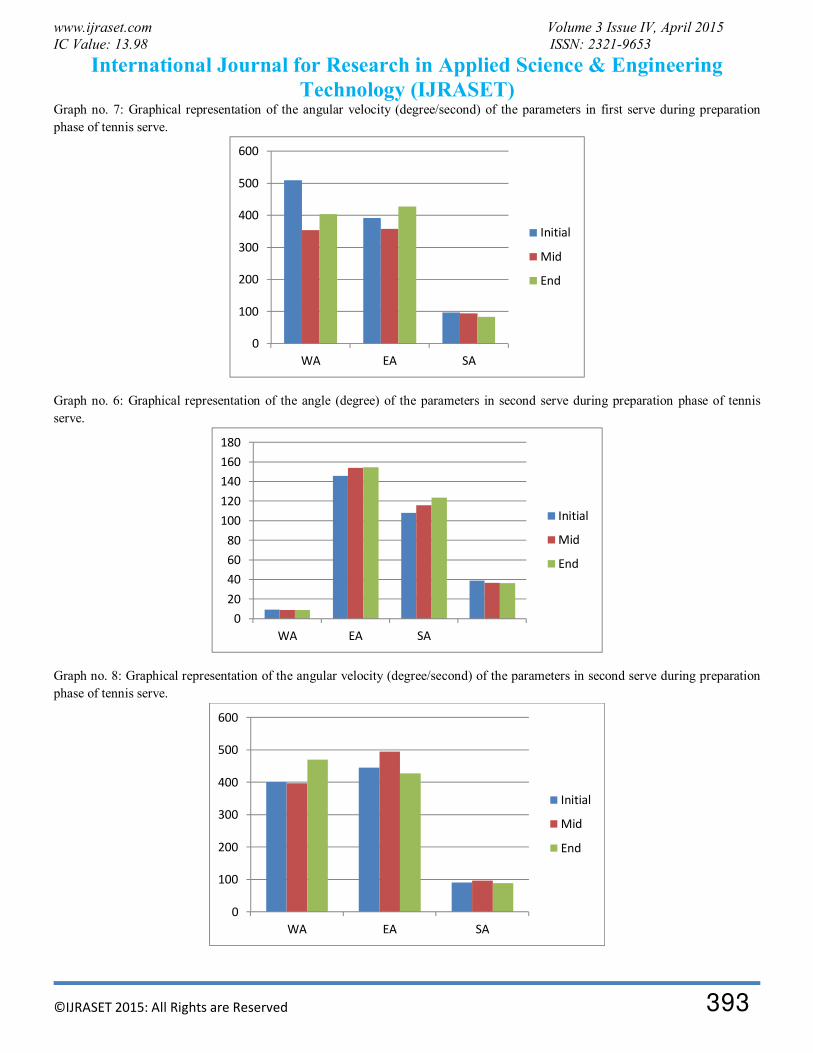
www.ijraset.com Volume 3 Issue IV, April 2015
IC Value: 13.98 ISSN: 2321-9653
International Journal for Research in Applied Science & Engineering
Technology (IJRASET)
©IJRASET 2015: All Rights are Reserved
393
Graph no. 7: Graphical representation of the angular velocity (degree/second) of the parameters in first serve during preparation
phase of tennis serve.
Graph no. 6: Graphical representation of the angle (degree) of the parameters in second serve during preparation phase of tennis
serve.
Graph no. 8: Graphical representation of the angular velocity (degree/second) of the parameters in second serve during preparation
phase of tennis serve.
0
100
200
300
400
500
600
WA EA SA
Initial
Mid
End
0
20
40
60
80
100
120
140
160
180
WA EA SA
Initial
Mid
End
0
100
200
300
400
500
600
WA EA SA
Initial
Mid
End
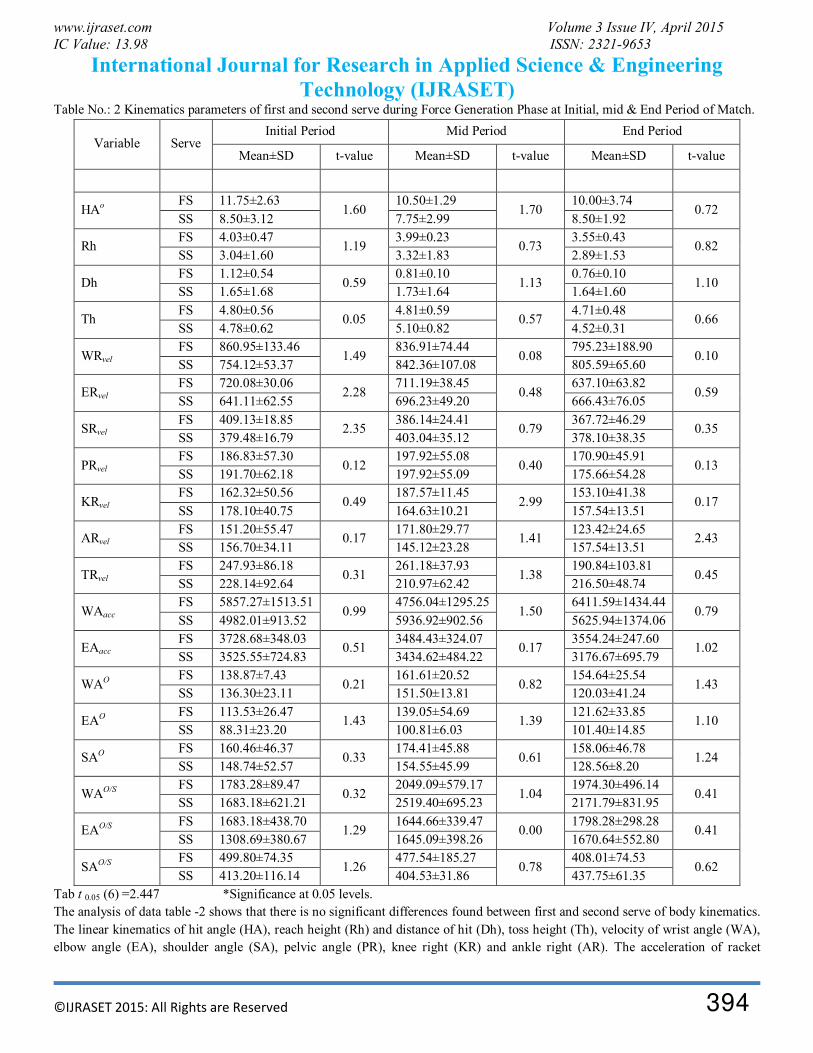
www.ijraset.com Volume 3 Issue IV, April 2015
IC Value: 13.98 ISSN: 2321-9653
International Journal for Research in Applied Science & Engineering
Technology (IJRASET)
©IJRASET 2015: All Rights are Reserved
394
Table No.: 2 Kinematics parameters of first and second serve during Force Generation Phase at Initial, mid & End Period of Match.
Variable Serve Initial Period Mid Period End Period
Mean±SD t-value Mean±SD t-value Mean±SD t-value
HAo FS 11.75±2.63
1.60 10.50±1.29
1.70 10.00±3.74
0.72 SS 8.50±3.12 7.75±2.99 8.50±1.92
Rh FS 4.03±0.47
1.19 3.99±0.23
0.73 3.55±0.43
0.82 SS 3.04±1.60 3.32±1.83 2.89±1.53
Dh FS 1.12±0.54
0.59 0.81±0.10
1.13 0.76±0.10
1.10 SS 1.65±1.68 1.73±1.64 1.64±1.60
Th FS 4.80±0.56
0.05 4.81±0.59
0.57 4.71±0.48
0.66 SS 4.78±0.62 5.10±0.82 4.52±0.31
WRvel FS 860.95±133.46
1.49 836.91±74.44
0.08 795.23±188.90
0.10 SS 754.12±53.37 842.36±107.08 805.59±65.60
ERvel FS 720.08±30.06
2.28 711.19±38.45
0.48 637.10±63.82
0.59 SS 641.11±62.55 696.23±49.20 666.43±76.05
SRvel FS 409.13±18.85
2.35 386.14±24.41
0.79 367.72±46.29
0.35 SS 379.48±16.79 403.04±35.12 378.10±38.35
PRvel FS 186.83±57.30
0.12 197.92±55.08
0.40 170.90±45.91
0.13 SS 191.70±62.18 197.92±55.09 175.66±54.28
KRvel FS 162.32±50.56
0.49 187.57±11.45
2.99 153.10±41.38
0.17 SS 178.10±40.75 164.63±10.21 157.54±13.51
ARvel FS 151.20±55.47
0.17 171.80±29.77
1.41 123.42±24.65
2.43 SS 156.70±34.11 145.12±23.28 157.54±13.51
TRvel FS 247.93±86.18
0.31 261.18±37.93
1.38 190.84±103.81
0.45 SS 228.14±92.64 210.97±62.42 216.50±48.74
WAacc FS 5857.27±1513.51
0.99 4756.04±1295.25
1.50 6411.59±1434.44
0.79 SS 4982.01±913.52 5936.92±902.56 5625.94±1374.06
EAacc FS 3728.68±348.03
0.51 3484.43±324.07
0.17 3554.24±247.60
1.02 SS 3525.55±724.83 3434.62±484.22 3176.67±695.79
WAO FS 138.87±7.43
0.21 161.61±20.52
0.82 154.64±25.54
1.43 SS 136.30±23.11 151.50±13.81 120.03±41.24
EAO FS 113.53±26.47
1.43 139.05±54.69
1.39 121.62±33.85
1.10 SS 88.31±23.20 100.81±6.03 101.40±14.85
SAO FS 160.46±46.37
0.33 174.41±45.88
0.61 158.06±46.78
1.24 SS 148.74±52.57 154.55±45.99 128.56±8.20
WAO/S FS 1783.28±89.47
0.32 2049.09±579.17
1.04 1974.30±496.14
0.41 SS 1683.18±621.21 2519.40±695.23 2171.79±831.95
EAO/S FS 1683.18±438.70
1.29 1644.66±339.47
0.00 1798.28±298.28
0.41 SS 1308.69±380.67 1645.09±398.26 1670.64±552.80
SAO/S FS 499.80±74.35
1.26 477.54±185.27
0.78 408.01±74.53
0.62 SS 413.20±116.14 404.53±31.86 437.75±61.35
Tab t 0.05 (6) =2.447 *Significance at 0.05 levels.
The analysis of data table -2 shows that there is no significant differences found between first and second serve of body kinematics.
The linear kinematics of hit angle (HA), reach height (Rh) and distance of hit (Dh), toss height (Th), velocity of wrist angle (WA),
elbow angle (EA), shoulder angle (SA), pelvic angle (PR), knee right (KR) and ankle right (AR). The acceleration of racket

www.ijraset.com Volume 3 Issue IV, April 2015
IC Value: 13.98 ISSN: 2321-9653
International Journal for Research in Applied Science & Engineering
Technology (IJRASET)
©IJRASET 2015: All Rights are Reserved
395
(RaCacc), wrist angle (WAacc), elbow angle (EAacc), angles and angular velocity of wrist angle (WAO/S), elbow angle (EAO/S),
shoulder angle (SAO/S) have shown |t|cal. values are less than the t0.05, 6 value at 0.05 level of significance.
This statistical finding exhibits that all the linear and angular kinematics of right side of wrist, elbow, shoulder, pelvic, knee and
ankle during first and second serve does not differ significantly and hence does not influence on the performance of tennis serve at
force generation phase during initial, mid and end phases under the match condition.
Graph no. 9: Graphical representation of the linear velocity (meter/s) of the parameters in first serve during force generation phase
of tennis serve.
Graph no. 10: Graphical representation of the linear velocity (meter/s) of the parameters in second serve during force generation
phase of tennis serve.
0
100
200
300
400
500
600
700
800
900
1000
WR ER SR PR KR AR TR
Initial
Mid
End
0
100
200
300
400
500
600
700
800
900
WR ER SR PR KR AR TR
Initial
Mid
End

www.ijraset.com Volume 3 Issue IV, April 2015
IC Value: 13.98 ISSN: 2321-9653
International Journal for Research in Applied Science & Engineering
Technology (IJRASET)
©IJRASET 2015: All Rights are Reserved 396
Graph no. 11: Graphical representation of the linear distance (meter) of the parameters in first serve during force generation phase of
tennis serve.
Graph no. 13: Graphical representation of the linear acceleration (meter/s2) of the parameters in first serve during force generation
phase of tennis serve.
Graph no. 12: Graphical representation of the linear distance (meter) of the parameters in second serve during force generation
phase of tennis serve.
0
1
2
3
4
5
6
Rh Dh Th
Initial
Mid
End
0
1000
2000
3000
4000
5000
6000
7000
WR ER
Initial
Mid
End
0
1
2
3
4
5
6
Rh Dh Th
Initial
Mid
End

www.ijraset.com Volume 3 Issue IV, April 2015
IC Value: 13.98 ISSN: 2321-9653
International Journal for Research in Applied Science & Engineering
Technology (IJRASET)
©IJRASET 2015: All Rights are Reserved
397
Graph no. 14: Graphical representation of the linear acceleration (meter/s2) of the parameters in second serve during force
generation phase of tennis serve.
Graph no. 15: Graphical representation of the angle (degree) of the parameters in first serve during force generation phase of tennis
serve.
0
1
2
3
4
5
6
Rh Dh Th
Initial
Mid
End
0
1000
2000
3000
4000
5000
6000
7000
WR ER
Initial
Mid
End
0
20
40
60
80
100
120
140
160
180
200
HA WA EA SA
Initial
Mid
End

www.ijraset.com Volume 3 Issue IV, April 2015
IC Value: 13.98 ISSN: 2321-9653
International Journal for Research in Applied Science & Engineering
Technology (IJRASET)
©IJRASET 2015: All Rights are Reserved
398
Graph no. 17: Graphical representation of the angular velocity (degree/second) of the parameters in first serve during force
generation phase of tennis serve.
Graph no. 16: Graphical representation of the angle (degree) of the parameters in first serve during force generation phase of second
serve.
Graph no. 18: Graphical representation of the angular velocity (degree/second) of the parameters in second serve during force
generation phase of tennis serve.
0
500
1000
1500
2000
2500
WA EA SA
Initial
Mid
End
0
20
40
60
80
100
120
140
160
180
HA WA EA SA
Initial
Mid
End
0
500
1000
1500
2000
2500
3000
WA EA SA
Initial
Mid
End
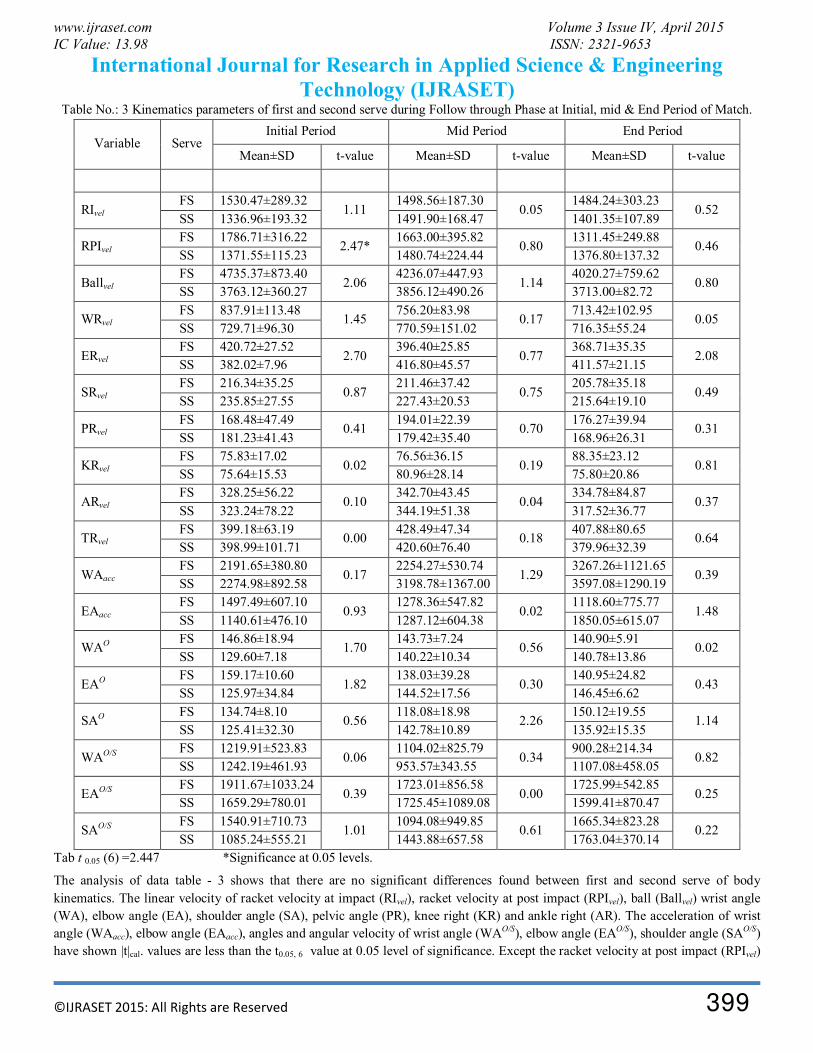
www.ijraset.com Volume 3 Issue IV, April 2015
IC Value: 13.98 ISSN: 2321-9653
International Journal for Research in Applied Science & Engineering
Technology (IJRASET)
©IJRASET 2015: All Rights are Reserved
399
Table No.: 3 Kinematics parameters of first and second serve during Follow through Phase at Initial, mid & End Period of Match.
Variable Serve Initial Period Mid Period End Period
Mean±SD t-value Mean±SD t-value Mean±SD t-value
RIvel FS 1530.47±289.32
1.11 1498.56±187.30
0.05 1484.24±303.23
0.52 SS 1336.96±193.32 1491.90±168.47 1401.35±107.89
RPIvel FS 1786.71±316.22
2.47* 1663.00±395.82
0.80 1311.45±249.88
0.46 SS 1371.55±115.23 1480.74±224.44 1376.80±137.32
Ballvel FS 4735.37±873.40
2.06 4236.07±447.93
1.14 4020.27±759.62
0.80 SS 3763.12±360.27 3856.12±490.26 3713.00±82.72
WRvel FS 837.91±113.48
1.45 756.20±83.98
0.17 713.42±102.95
0.05 SS 729.71±96.30 770.59±151.02 716.35±55.24
ERvel FS 420.72±27.52
2.70 396.40±25.85
0.77 368.71±35.35
2.08 SS 382.02±7.96 416.80±45.57 411.57±21.15
SRvel FS 216.34±35.25
0.87 211.46±37.42
0.75 205.78±35.18
0.49 SS 235.85±27.55 227.43±20.53 215.64±19.10
PRvel FS 168.48±47.49
0.41 194.01±22.39
0.70 176.27±39.94
0.31 SS 181.23±41.43 179.42±35.40 168.96±26.31
KRvel FS 75.83±17.02
0.02 76.56±36.15
0.19 88.35±23.12
0.81 SS 75.64±15.53 80.96±28.14 75.80±20.86
ARvel FS 328.25±56.22
0.10 342.70±43.45
0.04 334.78±84.87
0.37 SS 323.24±78.22 344.19±51.38 317.52±36.77
TRvel FS 399.18±63.19
0.00 428.49±47.34
0.18 407.88±80.65
0.64 SS 398.99±101.71 420.60±76.40 379.96±32.39
WAacc FS 2191.65±380.80
0.17 2254.27±530.74
1.29 3267.26±1121.65
0.39 SS 2274.98±892.58 3198.78±1367.00 3597.08±1290.19
EAacc FS 1497.49±607.10
0.93 1278.36±547.82
0.02 1118.60±775.77
1.48 SS 1140.61±476.10 1287.12±604.38 1850.05±615.07
WAO FS 146.86±18.94
1.70 143.73±7.24
0.56 140.90±5.91
0.02 SS 129.60±7.18 140.22±10.34 140.78±13.86
EAO FS 159.17±10.60
1.82 138.03±39.28
0.30 140.95±24.82
0.43 SS 125.97±34.84 144.52±17.56 146.45±6.62
SAO FS 134.74±8.10
0.56 118.08±18.98
2.26 150.12±19.55
1.14 SS 125.41±32.30 142.78±10.89 135.92±15.35
WAO/S FS 1219.91±523.83
0.06 1104.02±825.79
0.34 900.28±214.34
0.82 SS 1242.19±461.93 953.57±343.55 1107.08±458.05
EAO/S FS 1911.67±1033.24
0.39 1723.01±856.58
0.00 1725.99±542.85
0.25 SS 1659.29±780.01 1725.45±1089.08 1599.41±870.47
SAO/S FS 1540.91±710.73
1.01 1094.08±949.85
0.61 1665.34±823.28
0.22 SS 1085.24±555.21 1443.88±657.58 1763.04±370.14
Tab t 0.05 (6) =2.447 *Significance at 0.05 levels.
The analysis of data table - 3 shows that there are no significant differences found between first and second serve of body
kinematics. The linear velocity of racket velocity at impact (RIvel), racket velocity at post impact (RPIvel), ball (Ballvel) wrist angle
(WA), elbow angle (EA), shoulder angle (SA), pelvic angle (PR), knee right (KR) and ankle right (AR). The acceleration of wrist
angle (WAacc), elbow angle (EAacc), angles and angular velocity of wrist angle (WAO/S), elbow angle (EAO/S), shoulder angle (SAO/S)
have shown |t|cal. values are less than the t0.05, 6 value at 0.05 level of significance. Except the racket velocity at post impact (RPIvel)

www.ijraset.com Volume 3 Issue IV, April 2015
IC Value: 13.98 ISSN: 2321-9653
International Journal for Research in Applied Science & Engineering
Technology (IJRASET)
©IJRASET 2015: All Rights are Reserved
400
during initial period of the match. Which shows a significant difference where|t|cal. values is more than the t0.05, 6 value at 0.05 level
of significance.
Graph no. 19: Graphical representation of the linear velocity (meter/s) of the parameters in first serve during follow through phase
of tennis serve.
Graph no. 21: Graphical representation of the linear acceleration (meter/s2) of the parameters in first serve during follow through
phase of tennis serve.
Graph no. 20: Graphical representation of the linear velocity (meter/s) of the parameters in second serve during follow through
phase of tennis serve.
0
500
1000
1500
2000
2500
3000
3500
4000
4500
5000
RI RPI Ball WR ER SR PR KR AR TR
Initial
Mid
End
0
500
1000
1500
2000
2500
3000
3500
WR ER
Initial
Mid
End

www.ijraset.com Volume 3 Issue IV, April 2015
IC Value: 13.98 ISSN: 2321-9653
International Journal for Research in Applied Science & Engineering
Technology (IJRASET)
©IJRASET 2015: All Rights are Reserved
401
Graph no. 22: Graphical representation of the linear acceleration (meter/s2) of the parameters in second serve during follow through
phase of tennis serve.
Graph no. 23: Graphical representation of the angle (degree) of the parameters in first serve during follow through phase of tennis
serve.
0
1000
2000
3000
4000
5000
RI RPI Ball WR ER SR PR KR AR TR
Initial
Mid
End
0
500
1000
1500
2000
2500
3000
3500
4000
WR ER
Initial
Mid
End
0
20
40
60
80
100
120
140
160
180
WA EA SA
Initial
Mid
End

www.ijraset.com Volume 3 Issue IV, April 2015
IC Value: 13.98 ISSN: 2321-9653
International Journal for Research in Applied Science & Engineering
Technology (IJRASET)
©IJRASET 2015: All Rights are Reserved
402
Graph no. 25: Graphical representation of the angular velocity (degree/second) of the parameters in first serve during follow through
phase of tennis serve.
Graph no. 24: Graphical representation of the angle (degree) of the parameters in second serve during follow through phase of tennis
serve.
Graph no. 26: Graphical representation of the angular velocity (degree/second) of the parameters in second serve during follow
through phase of tennis serve.
0
500
1000
1500
2000
2500
WA EA SA
Initial
Mid
End
110
115
120
125
130
135
140
145
150
WA EA SA
Initial
Mid
End
0
500
1000
1500
2000
WA EA SA
Initial
Mid
End

www.ijraset.com Volume 3 Issue IV, April 2015
IC Value: 13.98 ISSN: 2321-9653
International Journal for Research in Applied Science & Engineering
Technology (IJRASET)
©IJRASET 2015: All Rights are Reserved
403
This statistical finding exhibits that all the linear and angular kinematics of right side of wrist, elbow, shoulder, pelvic, Knee and
ankle during first and second serve does not differ significantly and hence does not influence on the performance of tennis serve at
follow through phase during initial, mid and end phases under the match condition.
IV. DISCUSSION
Service is a key element in the game of tennis. Advanced players can hit the serve in many different ways and often use it as an
offensive weapon to gain an advantage in the point or to win. Professional players are expected to win most of their games in
service, may be the first serve or second serve. The flexion & extension of body joints are the keys to generate maximum
momentum and also contribute in performance of tennis serves. When executing a tennis serve, vigorous movement of the trunk
help to generate as much angular momentum as possible to transfer it to the racquet (Bahamonde, 2000). The statistical analysis of
data for different body segment kinematics revealed no significance difference between first and second service for Indian elite
players.
The linear and angular kinematics of body joints point and body joint angle of right wrist, elbow, shoulder, pelvis, knee and ankle.
And other kinematics as, toss angle, hit angle, reach, height, distance of the hit, toss height, racket velocity at impact, racket velocity
at post impact, ball shows no significant differences between the both first and second tennis serve. The knees and hips extend and
the back moves from extension to flexion and rotates toward the non-dominant side (Abrams, 2011).
Chew et. al. (2003) reported absolute racket velocities were comparable between first serve and second serve, and were developed
to similar magnitudes, independent of serve location. The comparison of studies has reached to the conclusion that the shoulder
plays an important role in generating power, as well as transfers the power to the distal segments to contribute to the performance
(Putnam, 1993; Elliott et al., 1995). However, there are some disagreements between different investigations. For example, Elliott et
al. (1995) concluded that forearm extension at the elbow actually has a negative effect on racquet speed which may reduce the ball
speed. This contradicts another study that showed elbow extension to be the second greatest contributor to racquet speed at impact
(Gordon & Dapena, 2006).
Elliott et al. (2003) studied the tennis serve’s biomechanical properties using a two-camera system and compared male and female
results during competition at the 2000 Sydney Olympic Games. They chose to analyze serves with the highest velocity and
concluded that males created higher forces from their shoulder and elbow while also serving at higher speed. They also founded that
an increased knee flexion during the backswing leads to generate low forces of upper extremity and recommended that players be
encouraged to perform knee flexion. Reid et al. (2008) have investigated the factors which were most critical to the different serving
techniques were the range of extension of front and rear knee, peak angular velocity of rear knee drive extension. The shoulder joint
and foot kinematics influence higher in higher racquet linear velocity.
The tennis serve and throwing motion have a great relationship within each other. The movement uses whole body kinematics to
impact the direction and velocity on the ball. There are ten segments in a position to be activated during these movements of tennis
serve and throw. They are the ankles, feet, knees, pelvis, trunk, shoulder girdle, arm, forearm, and hand working in synchronicity.
Each has its own movements relative to its own proximal articulation. These articulations can perform more than one movement;
each movement depends upon the skill to be performed. Therefore, the link system tends to go faster as the movements proceed to
its distal end to gain maximum ball velocity (Wigley, n.d). Finally, the follow-through phase begins just after the ball contact and
ending with completion of the stroke (Pradhan, 2001). A number of investigations have been conducted to further delineate the
specific biomechanics of serve in tennis (Elliott, 1986; Bahamonde, 1989; Dillman, 1995; Elliott, 1995; Noffal, 1999; Elliott, 2003;
Gordon & Dapena, 2006).
V. CONCLUSION
From the data of the 2-D kinematics of the body moment of tennis serve of elite Indian players, we can see that the velocity of the
ball produces more by the combination of the body kinematics moment, and this moment comes mainly from the extension of the
knee, trunk, shoulder, elbow and wrist. This point can be verified by the 2-D kinematics results of the study. Elite tennis players
maintain their body kinematics in both first and second serve, and also manipulate their body kinematics to control the maximum
ball velocity till the end period of the match, which is executed through the racket velocity generated by the sequential movement of
the body segments involve in the serve motion of the tennis. From this study, we can further understand the role of body joint
kinematics in the on the maintenance of the performance of the tennis serve throughout the match. This will provide a reference to
the serve motions and the execution of the serve techniques for training and teaching, with a view to improve serving efficiency.

www.ijraset.com Volume 3 Issue IV, April 2015
IC Value: 13.98 ISSN: 2321-9653
International Journal for Research in Applied Science & Engineering
Technology (IJRASET)
©IJRASET 2015: All Rights are Reserved
404
REFERENCES
[1] Abrams, G. D., Sheets, A. L., Andriacchi, T. P. & Safran, M. R. (2011). Review of tennis serve motion analysis and the biomechanics of three serve types
with implications for injury. Sports Biomechanics, 10(4): 378-390.
[2] Applied proceedings of the XVII international symposium on biomechanics in sports: Tennis (pp. 27–34). Perth: Edith Cowan University Press.
[3] Bahamonde, R. E. (1989). Kinetic analysis of the serving arm during the performance of the tennis serve. Journal of Biomechanics, 22, 983.
[4] Bradley, J. P., & Tibone, J. E. (1991). Electromyographic analysis of muscle action about the shoulder. Clinics in Sports Medicine, 10, 901–911.
[5] Brody, H. (1987). The serve. In H. Brody (Ed.), Tennis science for tennis players (pp. 106–110). Philadelphia, PA: University of Pennsylvania Press.
[6] Dillman, C. J., Schultheis, J. M., Hintermeister, R. A., & Hawkins, R. J. (1995). What do we know about body mechanics involved in tennis skills? In H.
Krahl, H. Pieper, B. Kibler, and P. Renstrom (Eds.), Tennis: Sports medicine and science (pp. 6–11). Dusseldorf: Society for Tennis Medicine and
Science.
[7] Dillman, C. J., Smutz, P., & Werner, S. (1991). Valgus extension overload in baseball pitching. Medicine and Science in Sport and Exercise, 23, S135.
[8] Durovic, N., Lozovina, V., Pavicc, L. & Mrduljas, D. (2008). Kinematics Analysis of the tennis serve in young tennis players. Acta Kinesiologica, 2(2),
50-56.
[9] Elliot, B.C. & Wood, GA. (1983). The biomechanics of the foot-up and foot-back tennis service techniques. The Australian Journal of Sport Sciences,
3(2), 3-6
[10] Elliott, B (2006), “Biomechanics and tennis”, British Journal of Sports Medicine; 40(5): 392–396.
[11] Elliott, B. & Wood, G. (1983), “The Biomechanics of the Foot-Up and Foot-Back Tennis Serve Techniques”, The Australian Journal of Sports Sciences,
3(2), 3-5.
[12] Kuo-Cheng Lo, Lin-Hwa Wang, Chia-Ching Wu , Fong-Chin Su(2004), “Kinematics of lower extremity in tennis flat and spin serve”, Journal of Medical
and Biological Engineering, 24(4): 209-212.
[13] Elliott, B. C., & Kilderry, R. (1983). The art and science of tennis. Philadelphia, PA: WB Saunders.
[14] Elliott, B. C., Marshall, R. N., & Noffal, G. J. (1995). Contributions of upper limb segment rotations during the power serve in tennis. Journal of Applied
Biomechanics, 11, 433–442.
[15] Elliott, B., Marsh, T., & Blanksby, B. (1986). A three-dimensional analysis of the tennis serve. International Journal of Sports Biomechanics, 2, 260–271.
[16] Gordon, B. J., & Dapena, J. (2006). Contributions of joint rotations to racquet speed in the tennis serve. Journal of Sport Sciences, 24, 31–49.
[17] Groppel, J.L. (1984). Tennis for advanced players: and those who would like to be champion. Champaign, IL: Human Kinetics.
[18] Groppel, J.L. (1992). High-tech tennis. Champaign, IL: Human Kinetics.
[19] Kibler, W. B., & Safran, M. (2000). Musculoskeletal injuries in the young tennis player. Clinics in Sports Medicine, 19, 781–792.
[20] Kibler, W. B., & Safran, M. (2005). Tennis injuries. Medicine and Sport Science, 48, 120–137
[21] Noffal, G. (1999). Where do high speed tennis serves come from? In B. Elliott, B. Gibson, and D. Knudson (Eds.),
[22] Pradhan, R. L., Itoi, E., Hatakeyama, Y., Urayama, M., & Sato, K. (2001). Superior labral strain during the throwing motion. A cadaveric study. American
Journal of Sports Medicine, 29, 488–492.
[23] Putnam, C. M. (1993). Sequential motions of body segments in striking and throwing skills: Descriptions and explanations. Journal of Biomechanics, 26
(S1), 125 –135.
[24] Reid M. et al. (2007), British Journal Sports Medicine, 41, 884-889.
[25] Reid, M., Elliott, B., & Alderson, J. (2008). Lower limb coordination and shoulder joint mechanics in the tennis serve. Medicine and Science in Sports
and Exercise, 40, 308–315.
[26] T, Satoru & I, Akira (2007), “A three-dimensional analysis of the contributions of upper limb joint movements to horizontal racket head velocity at ball
impact during tennis serving”, Sports Biomechanics, 6(3), 418-433.
[27] Whiteside, D., Elliott, B., Lay, B. & Reid, B. (2013). Human Movement Science, 32, 822-835.
[28] Wigley, R. (n.d). Teaching Tennis Biomechanics. Retrieved from http://www.teachingtennis.com/site/body1.htm
[29] Yuliang Sun, Yu Liu and Xinglong Zhou (2012), “A Kinematic Analysis Of A Top 10 Wta Tennis Player’s First Serve”, 30th Annual Conference of
Biomechanics in Sports – Melbourne 2012
[30] Chow, J., Park, S. & Tillman, M. (2009). Lower trunk kinematics and muscle activity during different types of tennis serve. Sports Medicine,
Arthroscopy, Rehabilitation, Therapy & Technology, 1, 24-37.
[31] Bahamonde, R. E. (2000). Changes in angular momentum during the tennis serve. J Sports Science, 18: 579-592.
[32] Hooper, T. (2001). Biomechanical Analysis of the Tennis Serve. Retrieve from
http://web.uvic.ca/~thopper/PE117/Pe117/Assignments/Greg%20Serve%20Analysis.pdf
[33] Seeley, M. K. (n.d.). A Review of Tennis Serve Bimechanics. Retrieved from http://biomech.byu.edu/Portals/83/docs/exsc362/tennis_example.pdf


Academic Sports ScholarISSN : 2277-3665Impact Factor : 2.1052(UIF)
Vol. 4 | Issue. 1 | Jan 2015Available online at www.lsrj.in
CONSTRUCTION OF SPECIFIC PHYSICAL FITNESSTEST FOR BOWLERS
Abstract:- In order to construct a scientifically designed to assess the specific physical fitness test battery for bowlers, this paper aim to construct the Specific Physical Fitness Test of Bowlers in Cricket. A 16 experimental test items purported to measure Speed, Strength, Endurance, Agility, Flexibility, coordination and Balance were Administered to 25 Players of North- Zone level intervarsity cricket players. The age ranged from between 18 to 25 years of age. The collected data was subjected to factor analysis (SPSS VERSION 17.0). The factor matrix was extracted to have rotated factor loadings. By considering the administrative feasibility, logistic interpretation with respect to the relevant field of application, rotated factor loadings and communality a test battery of four test items to measure the specific physical fitness test for bowlers of North- Zone level cricket players.
Keywords:Factor Analysis, Factor loading, Construction, Specific Physical Fitness.
INTRODUCTION
Today’s sports have different forms in the sense that earlier, more emphasis was laid on creative aspects, competition was become the defining feature of sports in modern society. Even though cricket is one of the oldest organized sports, there are very few studies on the physical demands of the game (Woolmer & Noakes, 2008) Actually, the cricketers are exposed to more demanding schedules, with longer period of time for training and practicing (Davies, 2008). Basically, cricket is a popular team game in most Commonwealth countries. In past it was played solely in a specific season (in Asian countries it was winter and in western countries it was summer). But its popularity has gained tremendous momentum since last three decades and now it is played throughout the year. Cricket is an endurance game and requires potential physical-physiological ability to excel the performance. Cricketers are therefore exposed to more demanding schedules, with longer periods of training and practicing. The increased workload may be one of the contributing factors to the increased incidence of injuries (Davies, 2008).
The importance of Specific fitness involves focusing the fitness goals of an athlete to meet the specific needs of an activity. An awareness of specific fitness cans workout to their performance in their sport. The performance potential of a cricketer player can be improved by specific fitness training which is generally divided up into aerobic, anaerobic and specific muscle training. Sport-specific strength training programs are fundamental to an athlete's development and success. The requirements of fitness are highly specific to sports for example a bowling in cricket player needs different type of fitness than batting etc. Fitness involves focusing the fitness goals of an athlete to meet the specific need of an activity. The term is most common when referring to athletes who play a particular sport; the athletes identify the specific physical requirements of that sport and then target exercises that will increase their fitness in those areas. An awareness of specific fitness can help athletes excel in their chosen sports because it directly connects their workouts to their performance in their sport. The development specific fitness requires the appropriate level or amount of motor abilities in relation to the requirement of the game concerned have also to be kept in view. And (Henson, 1987) also opined that the training is affected by the specificity and so, it must be specific to the requirements of the event.
The fitness of a cricketer which is specific to the game has no utility for the fitness of other game. Here the
1 2 3Ahsan Ahmad , Ikram Hussain and Fuzail Ahmad ,“CONSTRUCTION OF SPECIFIC PHYSICAL FITNESS TEST FOR
BOWLERS ” Academic Sports Scholar | Volume 4 | Issue 1 | Jan 2015 , Online & Print
1 2 3Ahsan Ahmad , Ikram Hussain and Fuzail Ahmad
1Research Scholar , Department of Physical Education, Aligarh Muslim University., Aligarh, U.P., India.
2Professor , Department of Physical Education, Aligarh Muslim University., Aligarh, U.P., India.
3Research Scholar , Department of Physical Education,Aligarh Muslim University., Aligarh, U.P., India.
1

.
concern of researcher is specific fitness, particularly bowling for the game of cricket. Cricket fitness training is a form of sport-specific training designed for cricket players. The top cricket players in the world use fitness plans to developed and adapted for their needs by their coaches. Players need to be capable of high intensity bursts of energy, but they also need the endurance to make it all the way through a match. Muscular strength, speed, Coordination, flexibility, and agility are also important as cricket players. Harre (1979) for achieving a higher level of efficiency in technique and tactics in most of the sports, a high level of specific fitness is more important, because a Specific fitness is the key point of success for sportsman in the higher level competitions.
Although every player of the team is required to bat and field during the match, generally, each player possesses specific physical fitness, skills that defines their role and contributes to overall performance of the game (Stuelckenet, 2007). In respect of research on the physiological demands of bowling is sparse with the only studies available being those which included some physiological measures when assessing other aspects of the game. One study has found that heart rates of between 154 and158 bt./min during a 6-over fast bowling spell (Devlin, 2000). This was confirmed by Taliep, (2003) who found that heart rates during fast bowling ranged between 73% and 77% HR max. (Burnett ,1996) reported peak heart rates of between 180 and 190 bt./min during a 12-over fast bowling spell,(Noakes & Durandt, 2000). It is common in cricket for a fast bowler to experience a series of collisions with the ground in the run-up which are followed by a large impact at rear- and front- foot landing on the pitch during the delivery stride. The major impact with the pitch at front foot strike generates peak forces of approximately five times body weight vertically and two times body weight horizontally irrespective of the standard of performance (Elliott, 2000). So, adequate energy level must be maintained. With respect to bowling, although most of the research has focused on lower back injuries (Stretch, 2000), it is the view of (Noakes & Durandt, 2000), that the repeated eccentric actions during fast bowling are the real source of stress for fast bowlers and that this needs to be followed up and related to speed and accuracy of bowling as well as injury potential. Substantial specific fitness and muscle strength is required to reduce muscle damage arising from these repeated actions (Thompso, 1999). In playing positions such as bowling, a great amount of strength of the back muscles is required. Mechanical factors play an important role in the etiology of degenerative processes and injuries to the lumbar spine. Especially in fast bowling, where a player must absorb vertical and horizontal components of the ground reaction force that are approximately five and two times body weight at front-foot and rear-foot impact respectively, thus, assessment of back strength is essential (Elliott, 2000). The maximum capacity of the back muscles must be known and subsequently muscle endurance, if assessments are to be made of muscle fatigue during playing conditions (Mannion, 1999). However, the anatomical and biomechanical structures of the back are extremely complex and consequently, accurately measuring back muscle strength is problematic outside of a research setting. Further, the increased demands being placed on many cricketers now provide further need for them to be in peak physical condition not only for performance, but also for prevention of injury (Noakes & Durandt, 2000).
Here the concern of researcher is construction of specific physical fitness, particularly for the bowlers, game of cricket. The top cricket players in the world use fitness plans to developed and customized for their needs by their coaches. And other people can consult with personal trainers and cricket coaches to get advice on creating a cricket fitness training program, provide information and assistance with fitness training, including recommended workout schedules that people can use as a basis for the program. Cricket is a physically demanding sport. Players need to be capable of high intensity bursts of energy, but they also need the endurance to make it all the way through a match. At the elite level, sides like Australia and England are now extremely fit utilizing various fitness techniques to enhance the athletic abilities of their squads. There are a range of physical and mental factors that contribute to successful performance in sports. Cricket is basically a 'skills' game. A player has to be fit enough to perform a given job on the field without getting tired. Cricket fitness training is a form of sport-specific training designed for cricket players. Cricket is a physically demanding sport. Players need to be capable of high intensity bursts of energy, but they also need the endurance to make it all the way through a match. Coordination, flexibility, and agility are also important as cricket players. People who play cricket professionally and who want to develop their amateur games need fitness training to be able to take their performance to the next level. Getting too focused on one area of fitness can limit the athlete's versatility within his /her sport because most sports require a variety of skills. Another problem that can arise as a result of sport- or task-oriented fitness is that the athlete can create unnatural imbalances in his / her fitness that can eventually have health repercussions. It is also important for athletes to remember achieving their specific fitness goals. Physical fitness describes the functional capacity of the individual for the task (Messmer, 2014).
To meet the specific need of an activity an athlete requires focusing on fitness goals. It refers to those athletes who involve in a particular sport. Such types of athlete identify their specific exercise requirement and then select exercises to increase their fitness in specific areas. Such type of selected exercises helps directly to enhance performance of athlete in their selected sports. When athlete concentrates only on specific fitness, it may hamper general fitness, so athlete should know about exercises as well. The nature of the position requires that a bowler has the ability to move explosively in the run up to delivery, as a speedy run up will physically translate into a faster delivery of the ball; the arm, shoulder, and core body strength and stamina are necessary to deliver the ball repeatedly.
CONSTRUCTION OF SPECIFIC PHYSICAL FITNESS TEST FOR BOWLERS
2Academic Sports Scholar | Volume 4 | Issue 1 | Jan 2015

.
The above mentioned literature emphasized the growing need of construction of specific physical fitness for bowlers. As the investigator interested in developing a specific physical fitness test battery. It becomes mandatory to explore the existing knowledge regarding the cricketer’s specific physical fitness.
METHODOLOGY
Selection of the subjects
The subjects for the study were 25 intervarsity cricket players specialized in bowlers. The chronological age of the players was between 18 to 25 years. They were recruited randomly from various universities participated in North-zone intervarsity cricket tournament held at Aligarh Muslim University, Aligarh. No grouping of players was made during this phase. The sample for the construction phase was 25 players exposed to sixteen different fitness items. Then after taking data, all the skills were raised through factorial analysis.
SELECTION OF TEST ITEMS
In order to select the broad component of test, the available literature of physical fitness were critically reviewed and opinions of experts regarding these tests obtained. Also existing literature on the appropriate component of physical fitness in Indian geographical condition/ situation were considered. All the components of the physical fitness were considered. On the basis of these the following components for the specific physical fitness test for cricketer are considered. The physical fitness components are: Strength, Endurance, Agility, Flexibility, Coordination and Balance.
EXPERIMENTAL TEST ITEMS:
During the process of selection of the components of specific fitness test, the test items for each components were also identified along with and 16 test items were considered as: Standing broad Jump, Sit- ups, Dips, Pull- ups, Zig-zag, Shuttle run, 50 yard dash, Side-stepping, Squat Thrust, 600mts run/walk, Criss-cross, Skipping, Stroke Stand, Trunk lift, Sit and reach, and Hand Reaction.
METHOD OF EXECUTION:
Each experimental test items administration was adhered strictly administration procedure outline and protocol.
STATISTICAL TECHNIQUE:
The results have been obtained through the statistical package social sciences SPSS version 17.0. The Pearson product moment correlation formula has been utilizing for correlation of variables and the matrix of inter correlation among the sixteen variables was obtained. The data was then being factor analysis. The principal component analysis was used to extract factors. Varimax rotation (Kaiser’s normalization) was used to generate rotated factor matrix. After that the rotated factor matrix was used to the selected factor for analysis of data.
RESULT AND DISCUSSION
In this study of development of specific fitness test for the bowlers in the sports of cricket. The obtained data was analyzed by the statistical procedure of Factorial analysis. The factorial analysis was done by SPSS version 17.0
3Academic Sports Scholar | Volume 4 | Issue 1 | Jan 2015
CONSTRUCTION OF SPECIFIC PHYSICAL FITNESS TEST FOR BOWLERS

.
Table -1: Descriptive analysis of 16 fitness test items
In this study Table 1 displays the descriptive statistics analysis i.e.: mean and SD of the selected Sixteen test items which were administered on the bowlers who played as subject in this study for obtaining the data.
The mean of standing broad jump test item number-1 is 2.624 and SD is 0.237.The mean of sit-ups test item number-2 is 47.960 and SD is 8.942. The mean of Dips test item number is-3 is 53.200 and SD is 6.745.The mean of pull-ups test item number-4 is 11.120 and SD is 3.745.The mean of zig-zag test item number-5 is 9.220 and SD is 0.066.The mean of Shuttle run test item number-6 is 10.199 and SD is 0.331.The mean of 50 yard dash test item number-7 is 6.324 and SD is 0.418. The mean of Side stepping test item number-8 is 16.880 and SD is 1.986. The mean of Squat Thrust test item number-9 is 9.800 and SD is 1.893.The mean of 600mts run/walk test item number-10 is1.420 and SD is 0.085.The mean of Criss-cross test item number-11is 10.680 and SD is 2.626.The mean of Skipping test item number-12is 56.200 and SD is 7.511.The mean of Stroke Stand test item number-13is14.403 and SD is 2.146.The mean of Trunk lift test item number-14 is 32.525 and SD is 3.128.The mean of Sit and reach Test items-15 is 9.916 and SD is 4.347.The mean of Hand Reaction Test items-16 is 29.320 and SD is 8.924.
Factor Analysis: The purpose of factor analysis is to “explore the under lying variance structure of a set of correlation coefficient. Thus, factor analysis useful for exploring and verifying patterns in a set of correlation coefficient” (Brown, 2001).
Table-2: Representing Factor Loading of factor I
Factor I (Table 2):- The factor I is defined by test which can measure flexibility. The highest factor loading is 0.977 to sit and reach is used to measure of the lower back and hamstring muscles. Pull-ups and dips are used to measure shoulder upper arm strength and upper body strength is very important for fast bowlers in the game of cricket. A side stepping this test item has greater affinity toward sprinting speed. Strock stand measures body balance of the body. Which is criss cross test can improve agility for rapid and accurate directional change in play.
4Academic Sports Scholar | Volume 4 | Issue 1 | Jan 2015
S.No. Test variables Catalogue Mean S.D
1 Standing broad Jump Test item-1 2.624 0.237
2 Sit- ups Test item-2 47.960 8.942
3 Dips Test item-3 53.200 6.745
4 Pull- ups Test item-4 11.120 3.745
5 Zig-zag-running Test item-5 9.220 0.066
6 Shuttle run Test item-6 10.199 0.331
7 50 yard dash Test item-7 6.324 0.418
8 Side-stepping Test item-8 16.880 1.986
9 Squat Thrust Test item-9 9.800 1.893
10 600mts run/walk Test item-10 1.420 0.085
11 Criss-cross Test item-11 10.680 2.626
12 Skipping Test item-12 56.200 7.511
13 Stroke Stand Test item-13 14.403 2.146
14 Trunk lift Test item-14 32.525 3.128
15 Sit and reach Test item-15 9.916 4.347
16 Hand Reaction Test item-16 29.320 8.924
S.No. Test Variables Catalogue Factor loading
1 Dips Test item-3 0.974
2 Pull-ups Test item-4 0.954
3 Side stepping Test item-8 0.965
4 Criss cross Test item-11 0.517
5 Skipping Test item-12 0.965
6 Stroke stand Test item-13 0.940
7 Sit and reach Test item-15 0.977
CONSTRUCTION OF SPECIFIC PHYSICAL FITNESS TEST FOR BOWLERS

.
Fig.1: Representing the highest factor loading of Factor I
Table-3: Representing Factor Loading of factor II
Factor II (Table 2):- These two items were identified in different components of physical fitness i.e. Which is sit-ups is exhibit significance positive factor loading is 0.843.basically sit-up test primarily measures abdominal and hip–flexor muscles, strength and endurance training exercise. It is the basic exercise used by cricketer’s fitness training. It plays a significant role for the core stability and back support. Whereas standing broad jump to measure the identified/emphasized on the ability to exert maximum explosive energy on maximum effort.
Fig. 2: Representing the highest factor loading of Factor II
Table-4: Representing Factor Loading of factor III
5Academic Sports Scholar | Volume 4 | Issue 1 | Jan 2015
S.No. Test Variables Catalogue Factor loading
1 Standing broad jump Test item-1 0.717
2 Sit-ups Test item-2 0.843
S.No. Test Variables Catalogue Factor loading
1 Zig zag Test item-5 0.915
2 Shuttle run Test item-6 0.172
3 600mts run/walk Test item-10 0.185
4 Trunk lift Test item-14 0.166
5 Hand reaction Test item-16 0.120
CONSTRUCTION OF SPECIFIC PHYSICAL FITNESS TEST FOR BOWLERS
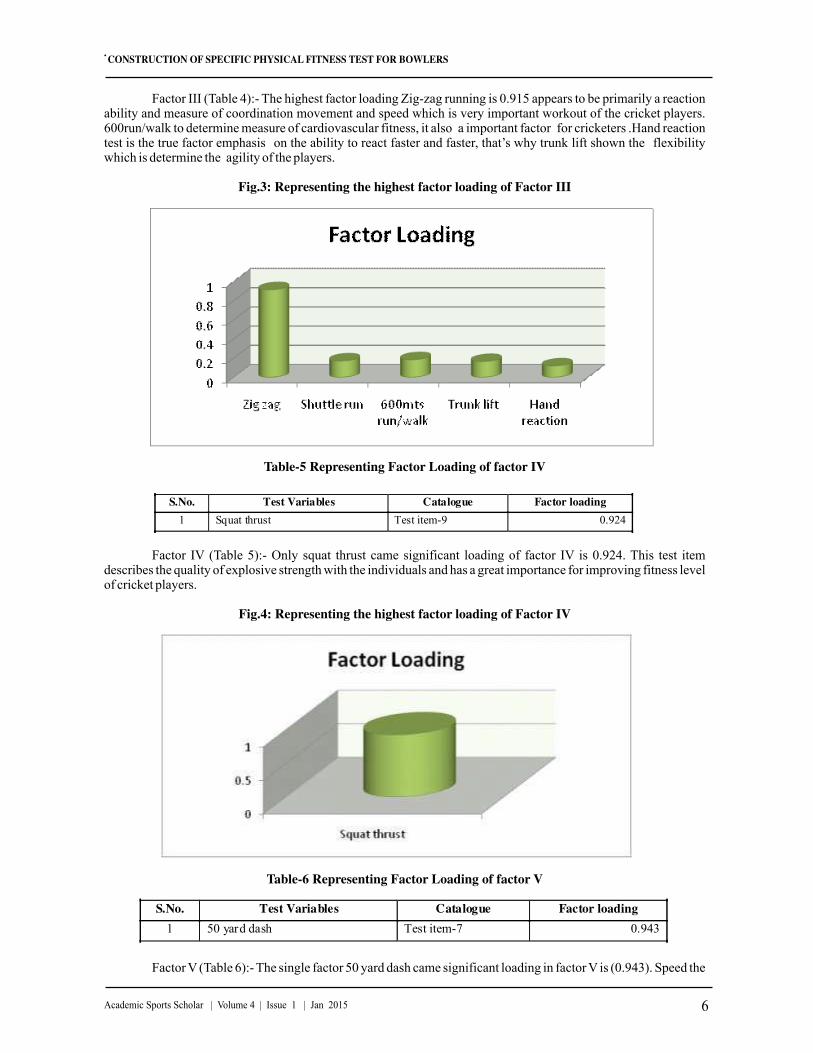
.
Factor III (Table 4):- The highest factor loading Zig-zag running is 0.915 appears to be primarily a reaction ability and measure of coordination movement and speed which is very important workout of the cricket players. 600run/walk to determine measure of cardiovascular fitness, it also a important factor for cricketers .Hand reaction test is the true factor emphasis on the ability to react faster and faster, that’s why trunk lift shown the flexibility which is determine the agility of the players.
Fig.3: Representing the highest factor loading of Factor III
Table-5 Representing Factor Loading of factor IV
Factor IV (Table 5):- Only squat thrust came significant loading of factor IV is 0.924. This test item describes the quality of explosive strength with the individuals and has a great importance for improving fitness level of cricket players.
Fig.4: Representing the highest factor loading of Factor IV
Table-6 Representing Factor Loading of factor V
Factor V (Table 6):- The single factor 50 yard dash came significant loading in factor V is (0.943). Speed the
6Academic Sports Scholar | Volume 4 | Issue 1 | Jan 2015
S.No. Test Variables Catalogue Factor loading
1 Squat thrust Test item-9 0.924
S.No. Test Variables Catalogue Factor loading
1 50 yard dash Test item-7 0.943
CONSTRUCTION OF SPECIFIC PHYSICAL FITNESS TEST FOR BOWLERS

.
rate of change of successive movement of the same pattern.
Fig.5: Representing the highest factor loading of Factor V
DEVELOPMENT OF THE TEST BATTERY.
The bringing together several tests, which turn out to measure the same factor, is not very efficient. According to Fleishman (1964) inefficient test batteries are those with too many tests on one factor and none from one or more of the factors identified. The test items were selected to be included in the test on the basis of results obtained from the factor analysis to serve as the criteria to measure the specific physical fitness test for bowlers in cricket. Considering the administrative feasibility logistic and educational application following specific physical fitness test recommended for the north- zone level cricketers.
Table -7 Constructed of specific physical test battery for bowler (cricket)
CONCLUSIONS
Based on the findings and statistical analysis, critiques and experts deliberation in the light of critical literature and scientific information on the performance demands of construction of specific physical fitness test for bowlers in cricket. Existing knowledge could be completed by obtaining the considered opinions and insides of coaches and players. This information would also provide a framework for the development of specific physical components of bowling as specific assessment, focused on systematic training, conditioning, coaching and training protocols.
In the light of result the conclusions were drawn as the Factor analysis Rotated Varimax solution significantly and appropriately identified the test items for the construction a specific physical fitness test for bowler for North - Zone level cricket players. Every sport differs from one to another and also the demand of specific physical fitness ability in various games and sports. A bowlers differs from batsman and fielders etc in a quality and quantity of fitness components like balance, reaction ability (sharp movement ability to change position immediately). The test items derived indisputably represent the specific physical fitness components for bowler.
REFERENCE:
1.Adams, K., O'Shea, J. P., O'Shea, K. L. & Climstein, M. (1992). The effect of six weeks of squat, plyometric and squat-plyometric training on power production. J Appl Sport Sci Res. 6, 36-41.2.Bartlett, R. M. (2003). The science and medicine of cricket: an overview and update. Journal of Sports Sciences, 21, 733-752.
7Academic Sports Scholar | Volume 4 | Issue 1 | Jan 2015
1 Factor -1 Sit and reach 0.977
2 Factor-2 Sit-ups 0.843
3 Factor-3 Zig zag running 0.915
4 Factor-4 Squat thrust 0.924
5 Factor-5 50 yard dash 0.943
CONSTRUCTION OF SPECIFIC PHYSICAL FITNESS TEST FOR BOWLERS

.
3.Burnett, A. F., Khangure, M. S., Elliott, B. C., Foster, D. H., Marshall, R. N. & Hardcastle, P. H. (1996). Thoracolumbar disc degeneration in young fast bowlers in cricket: a4.Christie, C. J.; Pote, L. & Sheppard, B. (2011a). Changes in physiological and perceptual responses over time during a simulated high scoring batting work bout.5.Clutch, D., Wilson, C., McGown, C. and Bryce, G. R. The effect of depth jumps and weight training on leg strength and vertical jump. Res Quarterly. 54:5-106.Davies, R., du-Randt, R., Venter, D & Stretch, R. (2008). Cricket: Nature and incidenceOf fast-bowling injuries at an elite, junior level and associated risk factors. South African Journal of Sports Medicine, 20, 115-119.7.Devlin, L. (2000). Recurrent posterior thigh symptoms detrimental to performance in Rugby Union. Sports Medicine, 29(4), 273-277.8.Elliott, B. (2000). Back injuries and the fast bowlers in cricket. Journal of Sports Sciences, 18, 983-991. 9.Mannion, A. F., Adams, M. A., Cooper, R. G., Dolan, P. (1999). Prediction of maximal back muscle strength from indices of body mass and fat-free body mass. Rheumatology, 38, 652-655. doi:10.1093/rheumatology/38.7.652 10.Noakes, T. D., Durandt, J. J. (2000). Physiological requirements of cricket. J Sports Sci, 18, 919-929. http://dx.doi.org/10.1080%2F02640410044673911.Noakes, T. D. & Durandt, J. J. (2000). Physiological requirements of cricket. Journal of Sports Sciences, 18, 919-929.12.Preston, I. & Thomas, J. (2000). Batting strategy in limited overs cricket, Statistician, 49(1), 95–106.13.Stuelcken, M., Pyne, D. & Sicclair, P. (2007). Anthropometric characteristics of elite cricket fast bowlers. Journal of Sports Sciences, 25, 1587-1597.14.Taliep, M. S., Gray, J., St Clair Gibson, A., Calder, S., Lambert, M. I. & Noakes, T. D. (2003). The effect of a 12-over bowling spell on bowling accuracy and pace in cricket15.Wilson, G. J., Newton, R. U., Murphy, A. J. & Humphries, B. J. (1993). The optimal training load for the development of dynamic athletic performance. Med Sci Sports Exerc. 25(11), 1279-86.16.Woolmer, B. & Noakes, T. D. (2008). Art and Science of Cricket, Cape Town: Struik Publishers, South Africa.
8Academic Sports Scholar | Volume 4 | Issue 1 | Jan 2015
CONSTRUCTION OF SPECIFIC PHYSICAL FITNESS TEST FOR BOWLERS

IJREAS VOLUME 5, ISSUE 12 (December, 2015) (ISSN 2249-3905)
International Journal of Research in Engineering and Applied Sciences (IMPACT FACTOR – 5.981)
International Journal of Research in Engineering & Applied Sciences
Email:- [email protected], http://www.euroasiapub.org
1
DESIGN OF MANUAL TREADMILL WITH ELECTRICITY GENERATOR FOR
ENERGY SAVING
Shamshad Ali 1,
Assistant Professor
Mechanical Engg. Section,
University Polytechnic, A.M.U., Aligarh (U.P.) India
Syed Tariq Murtaza 2,
2Associate Professor
Dept of Physical Education, A.M.U.,
Aligarh (U.P.) India.
Ashish Kumar Katiyar 3
3Research Scholar
Dept of Physical Education, A.M.U.,
Aligarh (U.P.) India.
ABSTRACT:
With global technological advancement energy
demand is increasing and there is a strong
dependence on unsustainable fossil fuels based
power generation. The fossil fuels are burnt for
power generation which causes pollution.
Pollution is a crucial problem globally and
there are so many adverse effects of pollution
on living things as well as on environment.
Today in a polluted environment and changed
life style it is very difficult to live healthy. In fact,
regular physical activity can help to manage a
wide range of health problems. Treadmill is one
of the exercise machine in which someone
walks/runs over a belt. This belt is wrapped
around two rollers which are mounted on left
and right uprights at one side and base frame
on other side respectively.
The human effort during exercise goes waste in
conventional manual treadmill. The author has
designed a treadmill with Electricity Generator
to produce electricity during exercise. The
generator is coupled with the roller Flywheel
with help of a V-belt to generate electricity
using human effort. The electricity generated
during exercise may be used for charging a
battery or for any other work. The design of this
Treadmill has been presented in this paper.
Keywords: Generator, Treadmill, Energy
Conservation, Exercise Machine.
INTRODUCTION
Every body knows that exercise is good for
health. No one can ignore the health benefits
of regular exercise and physical activity
regardless of age, sex or physical ability. There
are many advantages of exercise. Some
benefits are as below [1]:
(a) Exercise controls the weight.
(b) Exercise decreases the risk of
cardiovascular diseases.

IJREAS VOLUME 5, ISSUE 12 (December, 2015) (ISSN 2249-3905)
International Journal of Research in Engineering and Applied Sciences (IMPACT FACTOR – 5.981)
International Journal of Research in Engineering & Applied Sciences
Email:- [email protected], http://www.euroasiapub.org
13
(c) Exercise stimulates various brain
chemicals which can leave us
feeling happier and relaxed.
Exercise also makes our
appearance better resulting boost
in our confidence.
(d) Regular exercise improves the
strength of our muscles and boosts
our endurance. Exercise also
delivers oxygen and nutrients to
the tissues and helps in efficient
working of cardiovascular system.
(e) Exercise is helpful in fall asleep
faster and deeper the sleep.
(f) Exercise helps in connecting with
friends and family members in a
fun social setting.
Most of the people do exercise worldwide.
Different types of machines are used for
exercise. Many exercise machines are
operated manually. In manual exercise
machines muscle power goes waste during
exercise. The power which otherwise goes
waste during exercise may be used by
converting it into any other form of energy.
With the technological advancement
worldwide, demand of energy is continuously
increasing. The power generation is also
increasing and most of the energy generation
plants are using fossil fuels which bring up
many adverse effects which are as below:
(i) The available quantity of fossil fuel
is fixed and there depletion in their
available quantity and they will be
exhausted at sometime or other.
(ii) The fossil fuels are burnt to
produce electricity resulting
environmental pollution and
climate change.
(iii) Global warming is occurring due to
climate change.
In view of the above facts there is a need of
alternative methods of power generation.
Inventions are going on worldwide for
generating power through alternative
methods. Most of the people do exercise
worldwide. The electricity may be produced
by using manual exercise machines integrated
with Electricity Generators. In this way
manual power may be used to generate
electricity during exercise and we can
overcome the above mentioned problems up
to some extent.
Different types of exercise machines are used
for exercise. In conventional manual treadmill
human effort goes waste during the exercise.
Many inventors invented treadmills with
Electricity Generator. Douglas G. Bayerlein
and et al. invented a treadmill in which a
generator was coupled with a roller axle
through a belt drive system. A separate pulley
was mounted on roller axle to operate the
generator [1]. The Aurel A. Astilean invented a
treadmill having a concave shape of running
surface of belt. In this treadmill drooping
down of belt is prevented [2]. A treadmill
manufacturing company wood way
manufactured a treadmill which generates
power for display and can even be used for
charging a phone or MP3 player [3].
Author has designed a treadmill integrated
with an Electricity Generator in which
Generator is coupled with roller flywheel
through a v-belt drive system. The leg power
is used in this system to generate the
electricity during exercise and this generated
electricity may be used to charge the battery.
OBJECTIVE
To provide a treadmill with Electricity
Generator to save electrical energy.
To provide a treadmill with Electricity
Generator, as this may be useful for
battery charging for such areas where
electricity is not available.
To provide a treadmill with Electricity
Generator. this is simple in design.
To provide a treadmill with Electricity
Generator at low cost.
To provide a treadmill with Electricity
Generator to manufacture easily.
To provide a treadmill with Electricity
Generator to reduce the pollution upto
some extent by saving energy.
To provide a treadmill with Electricity
Generator with simple design.
MAIN COMPONENTS OF TREADMILL WITH
ELECTRICITY GENERATOR
The main components of the treadmill are as
below:
(i) Base frame

IJREAS VOLUME 5, ISSUE 12 (December, 2015) (ISSN 2249-3905)
International Journal of Research in Engineering and Applied Sciences (IMPACT FACTOR – 5.981)
International Journal of Research in Engineering & Applied Sciences
Email:- [email protected], http://www.euroasiapub.org
14
(ii) Left upright
(iii) Right upright
(iv) Flywheel
(v) Roller
(vi) Working Belt
(vii) Side Molding
(viii) Adjustable Bracket
(ix) Upright Support
(x) U-shaped Handrail
(xi) V-Grooved flywheel
(xii) Electricity Generator
(xiii) V-Pulley
(xiv) V-Belt
(xv) Generator Support
(xvi)
WORKING PRINCIPLE
The conventional manual treadmill without
Electricity Generator is shown in Fig. 1.
When someone walks runs on the walking belt
flywheels runs at 200 r.p.m. This flywheel
rotation is used to generate the electricity. For
mounting the Electricity Generator a support
is welded on left upright as shown in Fig. 2.
An Electricity Generator is mounted on this
support and a v-pulley is fixed on the
generator shaft as shown in Fig. 2. A walking
belt is wrapped around roller 1 and roller 2.
Roller 1 is mounted on the left and right
upright and roller 2 is mounted on lower end
of the base frame. A V-grooved flywheel is
mounted on the left side of the roller 1 and
another flywheel is mounted on the right and
of the roller 1 as shown in Fig 3.
The V-Grooved Flywheel is connected with the
V-Pulley mounted on Generator shaft through
a V-belt. When someone walks / runs on the
walking belt roller 1 and 2 rotate. As the V-

IJREAS VOLUME 5, ISSUE 12 (December, 2015) (ISSN 2249-3905)
International Journal of Research in Engineering and Applied Sciences (IMPACT FACTOR – 5.981)
International Journal of Research in Engineering & Applied Sciences
Email:- [email protected], http://www.euroasiapub.org
15
grooved flywheel is mounted on roller 1 and
there is no relative motion between the
flywheel and roller 1. Thus V-grooved flywheel
rotates with roller 1. The diameter of V-
grooved flywheel is kept 5 times more than
the diameter of the v-pulley mounted on the
shaft of the generator. If flywheel rotates at
200 r.p.m. the generator shaft will rotate at
1000 r.p.m. and electricity will be generated
which may be used to charge the battery or it
may be used to run the MP3 player, low
voltage CFL etc.
DISCUSSION
The manual treadmill with Electricity
Generator generates about 14- W max power
per person while Pedal operated stationary
bicycle based generator generates maximum
power 100-244 watt.[4]
The treadmill generator can generates energy
and this energy may be stored in the batteries
and later it may be useful for different
applications. This energy generation system is
sustainable and free from adverse efforts. The
treadmill with Electricity Generator reduces
the energy consumption resulting money
saving. This system may be used in gym
environment and more energy may be
produced which can be stored in batteries for
operating different appliances.
CONCLUSION
This manual treadmill with Electricity
Generator is simple in design.
The manual treadmill with Electricity
Generator is simple in design.
This manual treadmill with Electricity
Generator is sustainable.
A wide range of health problems can
be managed using this manual
treadmill.
This treadmill with Electricity
Generator is useful for such areas
where electricity is not available.
Electrical energy can be saved by using
this manual treadmill with Electricity
Generator.
Green House Gases can be reduced up
to some extent by this manual
treadmill with Electricity Generator.
Strength of muscles can be improved
by using this manual treadmill with
Electricity Generator.
REFERENCES:
1. http://www.google.com/patents/US2
0120010048
2. http://www.google.co.in/patents/US8
308619
3. http://www.woodway.com/products/
ecomill
4. http://conservancy.umn.edu/bitstrea
m/132115/1/Harsh%20Mankodi%20
cum%20laude%20CSE%20sp12.pdf.
5/18/2020 (PDF) ‘AZHAR’ CRICKET-SPECIFIC FIELDING TEST FOR YOUTH CRICKETERS | Ashish Kumar Katiyar - Academia.edu
https://www.academia.edu/15632799/_AZHAR_CRICKET-SPECIFIC_FIELDING_TEST_FOR_YOUTH_CRICKETERS 1/7
PDFPDF
‘AZHAR’ CRICKET-SPECIFIC FIELDING TESTFOR YOUTH CRICKETERS
or download with email
A. Katiyar
Download with Google Download with Facebook
ORIGINAL ARTICLE
ISSN No :2231-5063
International MultidisciplinaryResearch Journal
Vol 5 Issue 1 July 2015
READ PAPER
LOG IN SIGN UP‘AZHAR’ CRICKET-SPECIFIC FIELDING TEST FOR YOUTH CRICKETERS DOWNLOAD

5/18/2020 (PDF) ‘AZHAR’ CRICKET-SPECIFIC FIELDING TEST FOR YOUTH CRICKETERS | Ashish Kumar Katiyar - Academia.edu
https://www.academia.edu/15632799/_AZHAR_CRICKET-SPECIFIC_FIELDING_TEST_FOR_YOUTH_CRICKETERS 2/7
Golden R esearch
Thoughts
Chief EditorDr.Tukaram Narayan Shinde
PublisherMrs.Laxmi Ashok Yakkaldevi
Associate EditorDr.Rajani Dalvi
HonoraryMr.Ashok Yakkaldevi
International Advisory Board
Welcome to GRTISSN No.2231-5063
Golden Research Thoughts Journal is a multidisciplinary research journal, published monthly in English,Hindi & Marathi Language. All research papers submitted to the journal will be double - blind peer reviewedreferred by members of the editorial board.Readers will include investigator in universities, research institutesgovernment and industry with research interest in the general subjects.
RNI MAHMUL/2011/38595
Mohammad HailatDept. of Mathematical Sciences,University of South Carolina Aiken
Abdullah SabbaghEngineering Studies, Sydney
Ecaterina PatrascuSpiru Haret University, Bucharest
Loredana BoscaSpiru Haret University, Romania
Fabricio Moraes de AlmeidaFederal University of Rondonia Brazil
Hasan BaktirEnglish Language and LiteratureDepartment, Kayseri
Ghayoor Abbas ChotanaDept of Chemistry, Lahore University ofManagement Sciences[PK]
Anna Maria ConstantinoviciAL. I. Cuza University, Romania
Ilie Pintea,Spiru Haret University, Romania
Xiaohua Yang
Flávio de São Pedro FilhoFederal University of Rondonia, Brazil
Kamani Perera
Regional Center For Strategic Studies, SriLanka
Janaki SinnasamyLibrarian, University of Malaya
Romona MihailaSpiru Haret University, Romania
Delia SerbescuSpiru Haret University Bucharest
‘AZHAR’ CRICKET-SPECIFIC FIELDING TEST FOR YOUTH CRICKETERS DOWNLOAD

5/18/2020 (PDF) ‘AZHAR’ CRICKET-SPECIFIC FIELDING TEST FOR YOUTH CRICKETERS | Ashish Kumar Katiyar - Academia.edu
https://www.academia.edu/15632799/_AZHAR_CRICKET-SPECIFIC_FIELDING_TEST_FOR_YOUTH_CRICKETERS 3/7
Editorial Board
Address:-Ashok Yakkaldevi 258/34, Raviwar Peth, Solapur - 413 005 Maharashtra, IndiaCell : 9595 359 435, Ph No: 02172372010 Email: [email protected] Website: www.aygrt.isrj.in
Pratap Vyamktrao NaikwadeASP College Devrukh,Ratnagiri,MS India
R. R. PatilHead Geology Department SolapurUniversity,Solapur
Rama BhosalePrin. and Jt. Director Higher Education,Panvel
Salve R. N.Department of Sociology, ShivajiUniversity,Kolhapur
Govind P. ShindeBharati Vidyapeeth School of DistanceEducation Center, Navi Mumbai
Chakane Sanjay DnyaneshwarArts, Science & Commerce College,Indapur, Pune
Awadhesh Kumar ShirotriyaSecretary,Play India Play,Meerut(U.P.)
Iresh SwamiEx - VC. Solapur University, Solapur
N.S. DhaygudeEx. Prin. Dayanand College, Solapur
Narendra KaduJt. Director Higher Education, Pune
K. M. BhandarkarPraful Patel College of Education, Gondia
Sonal SinghVikram University, Ujjain
G. P. PatankarS. D. M. Degree College, Honavar, Karnataka
Maj. S. Bakhtiar ChoudharyDirector,Hyderabad AP India.
S.Parvathi DeviPh.D.-University of Allahabad
Sonal Singh,Vikram University, Ujjain
Rajendra ShendgeDirector, B.C.U.D. Solapur University,Solapur
R. R. YalikarDirector Managment Institute, Solapur
Umesh RajderkarHead Humanities & Social ScienceYCMOU,Nashik
S. R. PandyaHead Education Dept. Mumbai University,Mumbai
Alka Darshan ShrivastavaShaskiya Snatkottar Mahavidyalaya, Dhar
Rahul Shriram SudkeDevi Ahilya Vishwavidyalaya, Indore
S.KANNANAnnamalai University,TN
Satish Kumar KalhotraMaulana Azad National Urdu University
Federal University of Rondonia, Brazil
George - Calin SERITANFaculty of Philosophy and Socio-PoliticalSciences Al. I. Cuza University, Iasi
Xiaohua YangPhD, USA
......More
Spiru Haret University, Bucharest,Romania
Anurag MisraDBS College, Kanpur
Titus PopPhD, Partium ChristianUniversity, Oradea,Romania
Golden Research Thoughts Impact Factor : 3.4052(UIF)
ISSN 2231-5063 Volume - 5 | Issue - 1 | July - 2015
‘AZHAR’ CRICKET-SPECIFIC FIELDING TEST
FOR YOUTH CRICKETERS
.
1 2 3 4 5Syed Tariq M urtaza Shahanawaz Khan M ohd. Imran Ashish Kumar Katiyar Qamber Rizwan
INTRODUCTION :
The game of cricket has
a magnificent past and
a complex history (Bob
Woo lmer 2008) . I t
relishes 400-Odd years
of annals (M urtaza S. T.
& et. al. 2014). Authors
believe that it has been
originated from the
ancient sport of India
i.e. Gilli Danda (Tipcat
in English) which has
possibly t he or igin over
2500 years ago (Steve
Craig-2002 & John
Arlott-1975). Cricket
was taken by the Brit ish
to their Colonies &
s t a r t e d p l a y i n g &
expanding into every
continent on t he globe.
Modern day’s cricket
innovat ion in their
arsenal. They focused
on providing the basic
s k i l l s a n d s i m p l y
update them to a level
that maintains theircompetit iveness at the
global p lane. This
method still applies
b u t w i t h f e w
o p p o r t u n i t i e s &
chance for innovation.
Recent ly however ,
some t rends have
emerged that drive
the innovation process
among coaches &
players. Due to the
b u r g e o n i n g
competitions at local
& international level,
all players are exposed
Abstract
Keywords
Short Profile
Syed Tariq M urtaza is working as an Assistant
Professor, Department of Physical Education,
In day today cricket the bar of excellence is
going h igher and higher, every team consists of eleven
players but they want to perform like a unit in all areas
of cricket. But t heir unit y is seen especially at t he time of
fielding. In a t eam, level of fielding plays a remarkablerole in order to perform them like a unit. If a team
renders less chances to others by their quick ‘accurate
fielding throwing they are quite ahead from others.
With the help of good fielding, a team can manage
those runs which could not be scored by bat ting, and to
stop opponents at low score. M ore over an accurate
throw change a whole game because when bowler
doesn’t make any impact on bat ting side, tw o or t hree
accurate throws change the whole face of game and
guide it in your favor.
CRICKET-SPECIFIC FIELDING:
‘AZHAR’ CRICKET-SPECIFIC FIELDING TEST FOR YOUTH CRICKETERS DOWNLOAD

5/18/2020 (PDF) ‘AZHAR’ CRICKET-SPECIFIC FIELDING TEST FOR YOUTH CRICKETERS | Ashish Kumar Katiyar - Academia.edu
https://www.academia.edu/15632799/_AZHAR_CRICKET-SPECIFIC_FIELDING_TEST_FOR_YOUTH_CRICKETERS 4/7
Modern day s cricket
has been transformed
into more competitive
& b e c o m e m o r e
aggressive where every
player has to put extra
ef for ts in order to
p e r f o r m a t t h e
o p t i m u m l e v e l
(M urtaza S. T. & et . al.
2014). Innovation incricket is very rare. In
the past, many cricket
teams have been able
to survive even with very limited amounts of
repeatedly in front of
t h e i r o p p o n e n t s;
hence there is an
increased push to
improve eff iciency and
effectiveness of the
skil ls. Teams need
m o r e t h a n go o d
practice to survive;
t h e y r e q u i r e
innovative processes
and management that
c an d r i v e d o w n
injuries and improve their skill level unknown to
others.
A.M.U., Aligarh. He Has Complet ed Ph.D.
Available online at w ww.lsrj.in
1.Assistant Professor, Depart ment of Physical Education, A.M .U., Aligarh
2
.Assistant Professor, Department of Physical Education, Shri Varshney College, Aligarh.3.PTT (+2, Boys), A.M .U., Aligarh
4.Research Scholar, Departm ent of Physical Education, A.M .U., Aligarh
5.Student M .P.ED III semester, Departm ent of Physical Education, A.M .U., Aligarh
1
2.0 OBJECTIVE OF TEST
3.0 UTILITY OF TEST
Accuracy of young male cricketers of U-16years to h it stump.
As the game of cricket is going to be more &
more standardized, playing skills, specially fielding is
getting more weightage. A run out, can change the
whole game. Run out is a chance & to convert this
chance into a run out a player has to be accurate in his
th rows. It is quite easy to attempt run out when all
th ree stumps are visible but it goes prett y difficult to
hit single visible stump. This test is constructed to
know the accuracy of young players, hitting singlestump & react to-wards call under the stress.
4.0 NOM ENCLATURE OF TEST
5.0EQUIPM ENTS REQUIRED
The proposed test has been christened afterthe name of t he father of one of t he originators i.e.
‘Azhar Cricket-Specif ic Field ing Test for Yout h
Cricketers’.
5.1Measuring tape.
5.26 standard cricket stumps.
5.36 standard leather cricket balls.
5.4Pen/ pencil.
5.5Chalk powder.
5.6Wicket keeping gloves, pads, helmet .
5.7Opt ional equipment s (for wicket keeper)5.7.1Pads.
5.7.2Helmets.
6.0M ARKING OF TEST
Diagram of ‘Azhar ’ Cricket Fielding Test for Youth
This test consists of t hree row s. All three rows
are 9.5 m long and parallel t o each other. First row for
stum ps, second row for first t hree balls which are at
the distance of 6 m from first row, third row for second
three balls which are at the distance of 20 m from
second row. On first row stumps are fixed in such a
rest t wo are placed 2 m at eit her side of the fir st ball.
This test may be conducted where minimum
of 30 m × 35 m open field is available. Before
7.0 TEST ADM INISTRATION
‘AZHAR’ CRICKET-SPECIFIC FIELDING TESTFOR YOUTH CRICKETERS
‘AZHAR’ CRICKET-SPECIFIC FIELDING TEST FOR YOUTH CRICKETERS DOWNLOAD
5/18/2020 (PDF) ‘AZHAR’ CRICKET-SPECIFIC FIELDING TEST FOR YOUTH CRICKETERS | Ashish Kumar Katiyar - Academia.edu
https://www.academia.edu/15632799/_AZHAR_CRICKET-SPECIFIC_FIELDING_TEST_FOR_YOUTH_CRICKETERS 5/7
Available online at w ww.lsrj.in 2
p
way that they are 1.5 m apart from each other by
leaving 1 m space at either ends. Three balls are
placed on second row w hich is at the distance of 6 m
from f irst row. First ball of second row is placed in such
a way that it comes in center o f all six stum ps and rest
two are placed 1 m at either side of the first ball.
Second three balls are place on third row at the
distance of 20 m from second row. First ball of thi rd
row is placed followed by first ball of second row and
p
administrat ing the t est, a demonstrating t rial should
be given to the participants wit h the help of t rained
helpers. After a good warming up, players divided
individually & perform this test one by one. On the
signal go fielder shall to run towards the balls of
second row & pick any ball of his choice and hit the
stum p under arm on which t he keeper is backing up.
As he t hrows t he ball again run back towards the ball
of t hird row and pick any ball of his convenience and
‘AZHAR’ CRICKET-SPECIFIC FIELDING TEST FOR YOUTH CRICKETERS DOWNLOAD

5/18/2020 (PDF) ‘AZHAR’ CRICKET-SPECIFIC FIELDING TEST FOR YOUTH CRICKETERS | Ashish Kumar Katiyar - Academia.edu
https://www.academia.edu/15632799/_AZHAR_CRICKET-SPECIFIC_FIELDING_TEST_FOR_YOUTH_CRICKETERS 6/7
‘AZHAR’ CRICKET-SPECIFIC FIELDING TEST FOR YOUTH CRICKETERS DOWNLOAD
5/18/2020 (PDF) ‘AZHAR’ CRICKET-SPECIFIC FIELDING TEST FOR YOUTH CRICKETERS | Ashish Kumar Katiyar - Academia.edu
https://www.academia.edu/15632799/_AZHAR_CRICKET-SPECIFIC_FIELDING_TEST_FOR_YOUTH_CRICKETERS 7/7
About Press Blog People Papers Job Board Advertise We're Hiring! Help Center
Find new research papers in: Physics Chemistry Biology Health Sciences Ecology Earth Sciences Cognitive Science Mathematics Computer Science
Terms Privacy Copyright Academia ©2020
‘AZHAR’ CRICKET-SPECIFIC FIELDING TEST FOR YOUTH CRICKETERS DOWNLOAD

ORIGINAL ARTICLE
ISSN No : 2249-894X
Monthly MultidisciplinaryResearch Journal
Review Of
Research Journal
Vol 4 Issue 5 Feb 2015
Chief Editors
Ashok Yakkaldevi A R Burla College, India
Flávio de São Pedro FilhoFederal University of Rondonia, Brazil
Ecaterina PatrascuSpiru Haret University, Bucharest
Kamani PereraRegional Centre For Strategic Studies,Sri Lanka
Delia SerbescuSpiru Haret University, Bucharest, Romania
Xiaohua YangUniversity of San Francisco, San Francisco
Karina XavierMassachusetts Institute of Technology (MIT), USA
May Hongmei GaoKennesaw State University, USA
Marc FetscherinRollins College, USA
Liu ChenBeijing Foreign Studies University, China
Mabel MiaoCenter for China and Globalization, China
Ruth WolfUniversity Walla, Israel
Jie HaoUniversity of Sydney, Australia
Pei-Shan Kao AndreaUniversity of Essex, United Kingdom
Loredana BoscaSpiru Haret University, Romania
Ilie PinteaSpiru Haret University, Romania
Flávio de São Pedro FilhoFederal University of Rondonia, Brazil
Kamani PereraRegional Centre For Strategic Studies, Sri Lanka
Ecaterina PatrascuSpiru Haret University, Bucharest
Fabricio Moraes de AlmeidaFederal University of Rondonia, Brazil
Anna Maria ConstantinoviciAL. I. Cuza University, Romania
Romona MihailaSpiru Haret University, Romania
Mahdi MoharrampourIslamic Azad University buinzahra Branch, Qazvin, Iran
Titus PopPhD, Partium Christian University, Oradea,Romania
J. K. VIJAYAKUMARKing Abdullah University of Science & Technology,Saudi Arabia.
George - Calin SERITANPostdoctoral ResearcherFaculty of Philosophy and Socio-Political Sciences Al. I. Cuza University, Iasi
REZA KAFIPOURShiraz University of Medical Sciences Shiraz, Iran
Rajendra ShendgeDirector, B.C.U.D. Solapur University, Solapur
Nimita KhannaDirector, Isara Institute of Management, New Delhi
Salve R. N.Department of Sociology, Shivaji University, Kolhapur
P. MalyadriGovernment Degree College, Tandur, A.P.
S. D. SindkhedkarPSGVP Mandal's Arts, Science and Commerce College, Shahada [ M.S. ]
Anurag MisraDBS College, Kanpur
C. D. BalajiPanimalar Engineering College, Chennai
Bhavana vivek patolePhD, Elphinstone college mumbai-32
Awadhesh Kumar ShirotriyaSecretary, Play India Play (Trust),Meerut (U.P.)
Govind P. ShindeBharati Vidyapeeth School of Distance Education Center, Navi Mumbai
Sonal SinghVikram University, Ujjain
Jayashree Patil-DakeMBA Department of Badruka College Commerce and Arts Post Graduate Centre (BCCAPGC),Kachiguda, Hyderabad
Maj. Dr. S. Bakhtiar ChoudharyDirector,Hyderabad AP India.
AR. SARAVANAKUMARALAGAPPA UNIVERSITY, KARAIKUDI,TN
V.MAHALAKSHMIDean, Panimalar Engineering College
S.KANNANPh.D , Annamalai University
Kanwar Dinesh SinghDept.English, Government Postgraduate College , solan More.........
Advisory Board
Welcome to Review Of ResearchISSN No.2249-894X
Review Of Research Journal is a multidisciplinary research journal, published monthly in English, Hindi & Marathi Language. All research papers submitted to the journal will be double - blind peer reviewed referred by members of the editorial Board readers will include investigator in universities, research institutes government and industry with research interest in the general subjects.
RNI MAHMUL/2011/38595
Address:-Ashok Yakkaldevi 258/34, Raviwar Peth, Solapur - 413 005 Maharashtra, IndiaCell : 9595 359 435, Ph No: 02172372010 Email: [email protected] Website: www.ror.isrj.org

Review Of Research ISSN:-2249-894XImpact Factor : 3.1402(UIF)
Vol. 4 | Issue. 5 | Feb. 2015Available online at www.ror.isrj.org
CONTEMPORARY APPROACH OF PRACTICING IN CRICKET NET
Abstract:-More is always good is an aphorism which haunts everybody especially in the field of games & sports. Long hours practice without aiming at something worthwhile has become the norm in cricket. Net practice in cricket is a very traditional form of practice. Sessions at nets have full potential to simulate the match-like situation and offer a very operative long term type of practice for each players especially batsmen & bowlers to improve their skills, and eventually their performance. But despite having the potential of resembling the competition-like situations, nets are handled and used without purpose where batsmen usually pad-up and bat for 10-20 minute without concentrating on specific shots or weak points, and the net session continues each day in a similar fashion. Planning for net sessions is vital & decisive to thriving coaching. Authors in this paper strove to create a training methodology using close nets concentrating on performance and avoiding pitfalls of traditional practice in cricket.
keywords : aphorism , training methodology ,Contemporary Approach .
INTRODUCTION:
Dedication with optimistic approach is required to attain proficiency in sports skills (Murtaza et. al. 2014). ‘Practice makes perfect’ precept gives an idea to many people associated with sports coaching that the more I practice, the more I become perfect. Due to which coaches and parents typically encourage long practice (Online 2014). The same is true in cricket. The practice for cricket skills is being done using net which traditionally is called as ‘net practice’ (Murtaza et. al. 2014). Most of the time net practice is the only option available for many cricketers around the world (Bob Woolmer-2008). Nets for practice & coaching usually set up either outdoors or indoors on the temporary or permanent basis. Outdoor nets are of generally two types, one is closed net in which bowlers bowled their balls and batsmen do either their specific-shot practice of general practice. Open net is another type of net practice where the middle wicket of the ground is used and fielders are set and batsmen practice their shots and 4-5 bowlers bowl. Sessions at nets have full potential to simulate the match-like situation and offer a very operative long term type of practice for each players especially batsmen & bowlers to improve their skills, and eventually their performance. But despite having the potential of resembling the competition-like situations, nets are handled and
Ashish Kumar Katiyar1, Syed Tariq Murtaza, Ph.D.2, Dr.Mohd.Imran3, Mohd.Sharique4, Taufiq Ahmad5, Dr.Farkhunda Jabin6, Shamshad Ahmad7, Ravi Prakash Singh7, Arshad Hussain Bhat7, Salman Ahmad Khan8, Raof Ahmad Bhat8, Irshad Maqbool Malik8, Showkat Ahmad Naikoo8, Mohd Zakir8, Mohd. Sabir9, Iftikhar Ahmad9, Sateesh Chandra9, Lalita Kumari9, Tasleem Khan9, Sarvar Ali9, Qamber Rizwan9, Intazar Ali9, Vinay Kumar Singh9 “CONTEMPORARY APPROACH OF PRACTICING IN CRICKET NET” Review of Research | Volume 4 | Issue 5 | Feb 2015 | Online & Print
1 2 3 4Ashish Kumar Katiyar , Syed Tariq Murtaza, Ph.D. , Dr.Mohd.Imran , Mohd.Sharique ,
5 6 7 7Taufiq Ahmad , Dr.Farkhunda Jabin , Shamshad Ahmad , Ravi Prakash Singh ,
7 8 8Arshad Hussain Bhat , Salman Ahmad Khan , Raof Ahmad Bhat ,
8 8 8Irshad Maqbool Malik , Showkat Ahmad Naikoo , Mohd Zakir ,
9 9 9 9Mohd. Sabir , Iftikhar Ahmad , Sateesh Chandra , Lalita Kumari ,
9 9 9 9 9Tasleem Khan , Sarvar Ali , Qamber Rizwan , Intazar Ali , Vinay Kumar Singh
1&7Research Scholars, Department of Physical Education, A.M.U., Aligarh.
2Assistant Professor, Department of Physical Education, A.M.U., Aligarh.
3PTT (+2, Boys), A.M.U., Aligarh.
4Assistant Professor, Department of Physical Education, KMCUAF University, Lucknow.
5Assistant Director of Physical Education & Sports, Department of Physical Education, A.M.U., Aligarh.6Registered Physician & Associate Professor, Ayurveda & Unani medical College & Hospital, Aligarh.
8Students M.P.ED (Sem. IV), Department of Physical Education, A.M.U., Aligarh.9Students M.P.ED (Sem. II), Department of Physical Education, A.M.U., Aligarh.
1

.
used without purpose where batsmen usually pad-up and bat for 10-20 minute without concentrating on specific shots or weak points, and the net session continues each day in a similar fashion. Another peculiarity of net practice is that every other player becomes bowler & the practice sessions continue until every-one has batted. One can obviously sense that such net sessions are partly effective, providing very limited scope of general cricketing sense. Conventionally coaches set up their academy with no specific sketch in mind. Many a times it is found that such net sessions seem out of order & messy, the players do not put any attention on practice, found to be inattentive which results in lesser improvement. Thus planning for net sessions is vital & decisive to thriving coaching.
2.OBJECTIVES OF THE CONTEMPORARY APPROACH TO NET PRACTICE:
2.1.To replicate real match-like conditions. and2.2.To make sure that every player is involved and come with certain aim in the appropriate manner.
3.NOMENCLATURE OF THE PRACTICE:
The proposed contemporary approach to Net practice for training will from now onwards will be called as ‘NARAASHANS NET PRACTICE’. ‘Naraashans’ is the Vedic word which is mentioned 33 times in ancient religious scripture and has the meaning of ‘a man who is much praised by his men’.
4.EQUIPMENTS:
Following equipments will be needed for the Naraashans Net Practice:
4.1.One Regular Net Practice Area (full length wicket i.e. 20.12 meter)4.2.Two Sets of Stumps4.3.Bats4.4. Five Cricket Leather Balls (standard)4.5.Well Marked Batting & Bowling Areas4.6.One Whistle; and4.7.One Stop Watch.
5.MARKING FOR THE PRACTICE AREA:
The field for this innovative game shall have the round shape. 30 meter circle drawn from the batting stump is recommended. One batting stump shall be placed in the middle of the field. Four cones shall be placed in the ground each 20.12 meter away from the batting stump.
CONTEMPORARY APPROACH OF PRACTICING IN CRICKET NET
2Review Of Research | Volume 4 | Issue 5 | Feb 2015
Diagram of Naraashans Net Practice

.
6.ADMINISTRATION OF THE NARAASHANS NET PRACTICE:
6.1. BOWLERS:
Each Naraashans Net shall have maximum of Seven (7) to Eight (8) bowlers, irrespective of their type. Only Five (5) bowlers shall be allowed to bowl at any given time during the practice. Other bowlers will be instructed by the coach to practice drills. If any bowler bowls any illegal delivery, then he/she shall be replaced with the waiting bowlers and the net practice shall continue in the same fashion.
6.2. BATSMAN:
One batsman at a time shall come to bat in the Net for practice. Batsman shall face first Six (6) balls on the trial basis, then after his/her inning shall start with Run-ball.
6.3. RUNS:
The coach/any other player shall call aloud ‘Run-ball’ on every 3rd ball and the batsman shall run for Two (2) runs on every 4th ball until he/she gets out twice.
6.4. OUT:
Batsmen shall be dismissed bowled, caught & bowled, LBW, Hit-wicket, or run-out. Batsman shall be dismissed once only with any way of dismissal other than run-out.
6.4.1. RUN-OUT:
Maximum of Two (2) run-outs shall be allowed only with the following variations:
(a) Ball towards the Bowler: If the batsman hits/played the ball and the ball travels towards the bowler beyond the batting crease, the bowler shall pick the ball up & come back to the bowling end and throw under-arm towards the batting end to hit the stumps. The thrower’s feet shall be beyond the bowling crease while releasing the ball for the run-out. If the ball hits the stumps & the batsman is out of the crease then the batsman shall be declared run-out.
(b) Ball towards the Wicket-Keeper: If the batsman played the ball behind the stumps or the ball remains behind the batting crease, the bowler shall rush towards the ball and throw under-arm towards the bowling-end where any of the bowlers shall become the fielder, he/she shall gather the ball and throw it under-arm towards the batting stumps. If the ball hits the stumps & the batsman is out of the crease then the batsman shall be declared run-out.
7. NET PRACTICE PERSONALS:
One (1) Coach who may act as Umpire also shall be required for the completion of the Naraashans Net Practice.
8.VARIATIONS IN THE PRACTICE:
Following variations may be done in order to make the practice more intense:
8.1.The bowler may become the wicket keeper after throwing the ball towards the fielder at the bowling end and hit the stumps with the ball after gathering it. 8.2.One run-out, instead of two may be incorporated during the practice.8.3.The proposed Naraashans Net Practice may also be done in the Open Net with all real fielders.
CONCLUSION:
The traditional way of practicing cricket is not very productive nor stimulating for the players. Innovative methods & procedures for the practice must be evolved by coaches & players regularly. The discussed methodology of training is innovative & intense which will be of much benefit for the improvement of skills of the players. More alterations may be add-in during the practice to make it more intense and interesting to the players and may also be changed/modified according to the age-group of the players. Small competitions may also be held between two nets. Authors propose the Naraashans Net Practice with the conviction that the cricketers will enjoy the practice, and keep
3Review Of Research | Volume 4 | Issue 5 | Feb 2015
CONTEMPORARY APPROACH OF PRACTICING IN CRICKET NET

.
on looking forward to come again & again at the nets with more vigor & simultaneously will improve in their skills & understanding of the game of cricket in real competition-like situation.
REFERENCES:
1.Bob Woolmer (2008). Bob Woolmer’s Art & Science of Cricket, published by Struik Publishers (a division of New Holland Publishing (South Africa) (Pty) Ltd).2.Murtaza, Syed Tariq, Mohd. Imran, Taufiq Ahmad, Mohd. Sharique, Farkhunda Jabin, Shamshad Ahmad, Ravi Prakash Singh, Arshad Hussain Bhat, Ashish Kumar Katiyar, Irfan Khan, Bhupesh Kumar, Sanjeev Pandey, Salman Ahmed Khan, Raof Ahmad Bhat, Irshad Maqbool Malik, Showkat Ahmad Naikoo, & Mohd. Zakir (2014). Construction & Standardization of Fielding Test in Cricket. Published in Indian Streams Research Journal, Vol. IV, Issue VIII/September, ISSN: 2230-7850.3.Murtaza, Syed Tariq, PhD; Dr. Mohd.Imran; Dr. Mohd.Sharique; Taufiq Ahmad; Dr.Farkhunda Jabin; Ashish Kumar Katiyar; Shamshad Ahmad; Ravi Prakash Singh; Arshad Hussain Bhat; Salman Ahmad Khan; Raof Ahmad Bhat; Irshad Maqbool Malik; Showkat Ahmad Naikoo; Mohd Zakir; Mohd. Sabir; Iftikhar Ahmad; Sateesh Chandra; Lalita Kumari; Tasleem Khan; Sarver Ali; Qamber Rizwan; Intazar Ali; Vinay Kumar Singh. Development Of Cricket-Specific Bowling Accuracy Test .Published in Academic Sports Scholar, Vol. 3 Issue 11 November 2014 ISSN 2277-3665. 4.Online (2014) http://optimumsportsperformance.com/blog/practice-is-important-for-young-athletes-but-make-time-to-train-also/ Accessed at 18:52 IST on 06.12.2014)
4Review Of Research | Volume 4 | Issue 5 | Feb 2015
CONTEMPORARY APPROACH OF PRACTICING IN CRICKET NET
Publish Research ArticleInternational Level Multidisciplinary Research Journal
For All Subjects
Dear Sir/Mam, We invite unpublished Research Paper,Summary of Research Project,Theses,Books and Books Review for publication,you will be pleased to know that our journals are
Associated and Indexed,India
¬
¬International Scientific Journal Consortium Scientific¬OPEN J-GATE
Directory Of Research Journal Indexing
Associated and Indexed,USA
?
?
?Crossref DOI?Index Copernicus?Publication Index?Academic Journal Database?Contemporary Research Index?Academic Paper Databse?Digital Journals Database?Current Index to Scholarly Journals?Elite Scientific Journal Archive?Directory Of Academic Resources?Scholar Journal Index?Recent Science Index?Scientific Resources Database
DOAJEBSCO
Review Of Research Journal 258/34 Raviwar Peth Solapur-413005,Maharashtra
[email protected]/[email protected]
Website : www.ror.isrj.org

Academic Sports ScholarISSN : 2277-3665Impact Factor : 2.1052(UIF)
Vol. 4 | Issue. 2 | Feb 2015Available online at www.lsrj.in
DETERMINATION OF TRAINING STATUS OF BATSMEN IN OPEN NET IN CRICKET
Abstract:- Today’s cricket has become more competitive in nature by amending format and rules of the game. The changes may put mental pressure on the player to survive in the game and now the game of cricket demands not only technical but psychological preparation of player. So to have performance in competition, there is need to design scientific, psychological and innovative based training methods due to which player can fulfill the demands of today’s cricket.
Keywords : Training Status , mental pressure , scientific, psychological .
INTRODUCTION
“Score doesn’t add up; these are the runs taken well and wisely” (Irshad Malik)Modern times of games and sports are not only confined to participate but to perform well (Yobu A. 2010).
Every game and sport focuses on developing modern techniques and methods which ultimately aims at enhancing the performance, so same is the true with the game of cricket as well. Cricket nowadays is not merely to perform at national and international level but to give best performance to survive in the game because cricket has become most competitive game in the world (Bob Woolmer 2008). In cricket as in rest of the games various means and methods are used and innovations are being made with the ultimate aim to enhance the performance of player as well as team (Murtaza, S. T. & et. al 2014). So it is on the part of coach that how he designs and implements the methods in order to evaluate and interpret the best results in the future which will be beneficial for individual player as well as for team performance.
As the literature reviewed, the researchers found no where the design of training log in cricket which could be served as the tool for coaches to evaluate the performance and interpret the results according to the level which a player truly requires. So researchers propose training log for batsman for open net in cricket which is first of its kind and includes both physical as well as psychological aspect of performance.
The training log for batsman in open net is basically based on the fact that provides competitive situation to
Irshad Maqbool Malik1, Syed Tariq Murtaza, Ph,D,2, Mohd.Imran3, Mohd.Sharique4, Taufiq Ahmad5, Farkhunda Jabin6, Ashish Kumar Katiyar7, Shamshad Ahmad7, Ravi Prakash Singh7, Arshad Hussain Bhat7, Salman Ahmad Khan8, Raof Ahmad Bhat8, Showkat Ahmad Naikoo8, Mohd Zakir8, Mohd. Sabir9, Iftikhar Ahmad9, Sateesh Chandra9, Lalita Kumari9, Tasleem Khan9, Sarver Ali9, Qamber Rizwan9, Intazar Ali9, Vinay Kumar Singh9, “DETERMINATION OF TRAINING STATUS OF BATSMEN IN OPEN NET IN CRICKETEDUCATION” Academic Sports Scholar | Volume 4 | Issue 2 | Feb 2015 , Online & Print
1
1 2 3Irshad Maqbool Malik , Syed Tariq Murtaza, Ph.D. , Mohd.Imran ,
4 5 6 7Mohd.Sharique , Taufiq Ahmad , Farkhunda Jabin , Ashish Kumar Katiyar ,
7 7 7Shamshad Ahmad , Ravi Prakash Singh , Arshad Hussain Bhat ,
8 8 8 8Salman Ahmad Khan , Raof Ahmad Bhat , Showkat Ahmad Naikoo , Mohd Zakir ,
9 9 9 9 9Mohd. Sabir , Iftikhar Ahmad , Sateesh Chandra , Lalita Kumari , Tasleem Khan ,
9 9 9 9Sarver Ali , Qamber Rizwan , Intazar Ali , Vinay Kumar Singh
1&7Students M.P.ED (Sem. IV), Department of Physical Education, A.M.U., Aligarh.
2Assistant Professor, Department of Physical Education, A.M.U., Aligarh.
3PTT (+2, Boys), A.M.U., Aligarh.
4Assistant Professor, Department of Physical Education, KMCUAF University, Lucknow.
5Assistant Director of Physical Education & Sports, Department of Physical Education, A.M.U., Aligarh.6Registered Physician & Associate Professor, Ayurveda & Unani medical College & Hospital, Aligarh.
8Research Scholars, Department of Physical Education, A.M.U., Aligarh.
9Students M.P.ED (Sem. II), Department of Physical Education, A.M.U., Aligarh.
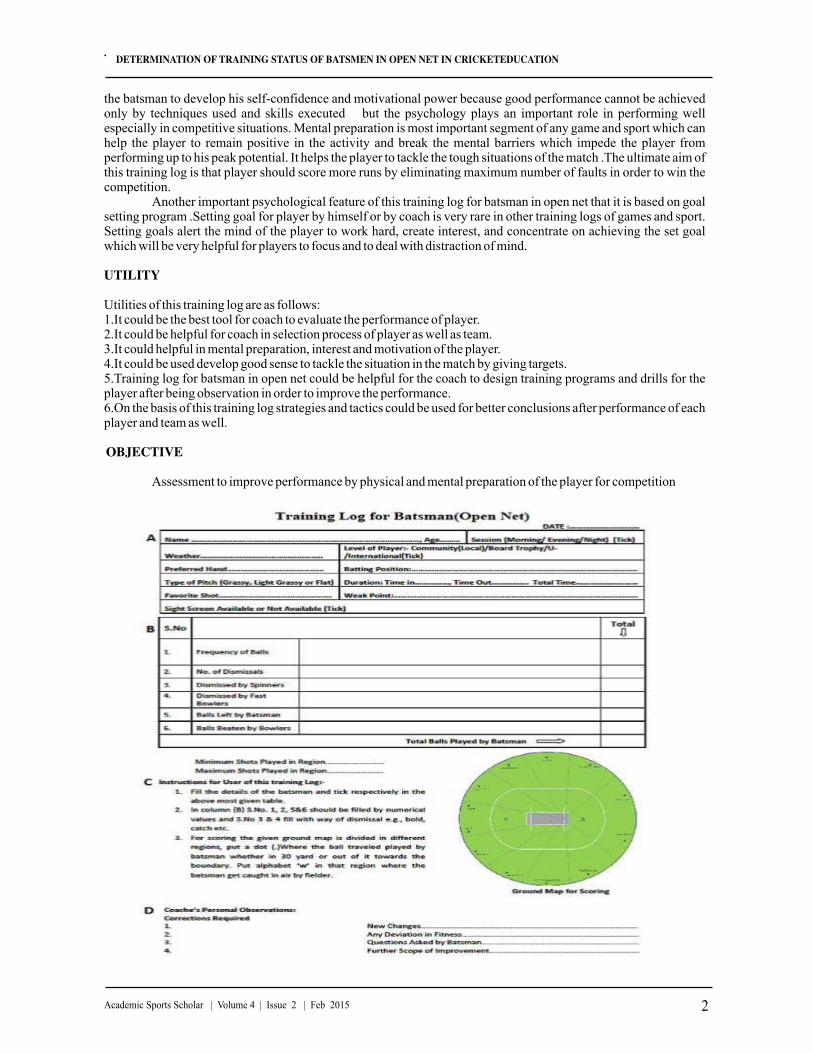
.
the batsman to develop his self-confidence and motivational power because good performance cannot be achieved only by techniques used and skills executed but the psychology plays an important role in performing well especially in competitive situations. Mental preparation is most important segment of any game and sport which can help the player to remain positive in the activity and break the mental barriers which impede the player from performing up to his peak potential. It helps the player to tackle the tough situations of the match .The ultimate aim of this training log is that player should score more runs by eliminating maximum number of faults in order to win the competition.
Another important psychological feature of this training log for batsman in open net that it is based on goal setting program .Setting goal for player by himself or by coach is very rare in other training logs of games and sport. Setting goals alert the mind of the player to work hard, create interest, and concentrate on achieving the set goal which will be very helpful for players to focus and to deal with distraction of mind.
UTILITY
Utilities of this training log are as follows:1.It could be the best tool for coach to evaluate the performance of player.2.It could be helpful for coach in selection process of player as well as team.3.It could helpful in mental preparation, interest and motivation of the player.4.It could be used develop good sense to tackle the situation in the match by giving targets.5.Training log for batsman in open net could be helpful for the coach to design training programs and drills for the player after being observation in order to improve the performance.6.On the basis of this training log strategies and tactics could be used for better conclusions after performance of each player and team as well.
OBJECTIVE
Assessment to improve performance by physical and mental preparation of the player for competition
DETERMINATION OF TRAINING STATUS OF BATSMEN IN OPEN NET IN CRICKETEDUCATION
2Academic Sports Scholar | Volume 4 | Issue 2 | Feb 2015

.
PROCEDURE
The said training log for batsman in open net is divided into three columns. The column (A) is demographic profile of player which is filled by coach at the beginning of the practice session. In column (B) all headings is to be filled with numerical values as per the performance of the player. In final column(C) the ground map is divided into different regions should be used for scoring purpose. E.g. the ball travelled to 30 yard or out of it towards the boundary should be mentioned in the regions accordingly by dots. If the batsman gets caught in the air in any above mentioned region is represented by letter ’W’ in that particular region, After the practice session is over the coach while using the observation method would be able to assess the performance, check out the faults and accordingly correct them and plan the next training session.
CONCLUSION
The coach having the written record of batsman’s performance on the basis of which the coach can assess the performance of player hence can plan further performance improving trainings and methods. The player can also know the status of his performance which can create interest, develop self-confidence, positive sense, concentration and motivate him to achieve his goals.
REFERENCES
1.Bob Woolmer (2008). Bob Woolmer’s Art & Science of Cricket, published by Struik Publishers (a division of New Holland Publishing (South Africa) (Pty) Ltd.2.Syed Tariq Murtaza, Mohd. Imran, Taufiq Ahmad, Mohd. Sharique, Farkhunda Jabin, Shamshad Ahmad, Ravi Prakash Singh, Arshad Hussain Bhat, Ashish Kumar Katiyar, Irfan Khan, Bhupesh Kumar, Sanjeev Pandey, Salman Ahmed Khan, Raof Ahmad Bhat, Irshad Maqbool Malik, Showkat Ahmad Naikoo, & Mohd. Zakir (2014). Construction & Standardization of Fielding Test in Cricket. Published in Indian Streams Research Journal, Vol. IV, Issue VIII/September, ISSN: 2230-7850.3.Yobu A. (2010). Test Measurement in Physical Education & Sports, published by Friends Publications (India), New Delhi. ISBN 978-81-7216-317-4 page no. 408.
3Academic Sports Scholar | Volume 4 | Issue 2 | Feb 2015
DETERMINATION OF TRAINING STATUS OF BATSMEN IN OPEN NET IN CRICKETEDUCATION
Irshad Maqbool MalikStudents M.P.ED (Sem. IV), Department of Physical Education, A.M.U., Aligarh.

ORIGINAL ARTICLE
ISSN No :2231-5063
International Multidisciplinary Research Journal
Golden Research Thoughts
Chief EditorDr.Tukaram Narayan Shinde
PublisherMrs.Laxmi Ashok Yakkaldevi
Associate EditorDr.Rajani Dalvi
HonoraryMr.Ashok Yakkaldevi
Vol 4 Issue 8 Feb 2015
Editorial Board
International Advisory Board
Welcome to GRTISSN No.2231-5063
Golden Research Thoughts Journal is a multidisciplinary research journal, published monthly in English, Hindi & Marathi Language. All research papers submitted to the journal will be double - blind peer reviewed referred by members of the editorial board.Readers will include investigator in universities, research institutes government and industry with research interest in the general subjects.
RNI MAHMUL/2011/38595
Address:-Ashok Yakkaldevi 258/34, Raviwar Peth, Solapur - 413 005 Maharashtra, IndiaCell : 9595 359 435, Ph No: 02172372010 Email: [email protected] Website: www.aygrt.isrj.org
Pratap Vyamktrao NaikwadeASP College Devrukh,Ratnagiri,MS India
R. R. PatilHead Geology Department Solapur University,Solapur
Rama BhosalePrin. and Jt. Director Higher Education, Panvel
Salve R. N.Department of Sociology, Shivaji University,Kolhapur
Govind P. ShindeBharati Vidyapeeth School of Distance Education Center, Navi Mumbai
Chakane Sanjay DnyaneshwarArts, Science & Commerce College, Indapur, Pune
Awadhesh Kumar ShirotriyaSecretary,Play India Play,Meerut(U.P.)
Iresh SwamiEx - VC. Solapur University, Solapur
N.S. DhaygudeEx. Prin. Dayanand College, Solapur
Narendra KaduJt. Director Higher Education, Pune
K. M. BhandarkarPraful Patel College of Education, Gondia
Sonal SinghVikram University, Ujjain
G. P. PatankarS. D. M. Degree College, Honavar, Karnataka
Maj. S. Bakhtiar ChoudharyDirector,Hyderabad AP India.
S.Parvathi DeviPh.D.-University of Allahabad
Sonal Singh,Vikram University, Ujjain
Rajendra ShendgeDirector, B.C.U.D. Solapur University, Solapur
R. R. YalikarDirector Managment Institute, Solapur
Umesh RajderkarHead Humanities & Social Science YCMOU,Nashik
S. R. PandyaHead Education Dept. Mumbai University, Mumbai
Alka Darshan ShrivastavaShaskiya Snatkottar Mahavidyalaya, Dhar
Rahul Shriram SudkeDevi Ahilya Vishwavidyalaya, Indore
S.KANNANAnnamalai University,TN
Satish Kumar KalhotraMaulana Azad National Urdu University
Mohammad HailatDept. of Mathematical Sciences, University of South Carolina Aiken
Abdullah SabbaghEngineering Studies, Sydney
Ecaterina PatrascuSpiru Haret University, Bucharest
Loredana BoscaSpiru Haret University, Romania
Fabricio Moraes de AlmeidaFederal University of Rondonia, Brazil
George - Calin SERITANFaculty of Philosophy and Socio-Political Sciences Al. I. Cuza University, Iasi
Hasan BaktirEnglish Language and Literature Department, Kayseri
Ghayoor Abbas ChotanaDept of Chemistry, Lahore University of Management Sciences[PK]
Anna Maria ConstantinoviciAL. I. Cuza University, Romania
Ilie Pintea,Spiru Haret University, Romania
Xiaohua YangPhD, USA
......More
Flávio de São Pedro FilhoFederal University of Rondonia, Brazil
Kamani PereraRegional Center For Strategic Studies, Sri Lanka
Janaki SinnasamyLibrarian, University of Malaya
Romona MihailaSpiru Haret University, Romania
Delia SerbescuSpiru Haret University, Bucharest, Romania
Anurag MisraDBS College, Kanpur
Titus PopPhD, Partium Christian University, Oradea,Romania

Golden Research ThoughtsISSN 2231-5063Impact Factor : 3.4052(UIF)
Volume-4 | Issue-8 | Feb-2015Available online at www.aygrt.isrj.org
TRAINING LOG TO DETERMINE SKILLS OF FIELDING IN CRICKET
Abstract:-In the course of time it has been seen that current and recent times’ cricket is striking in
appearance and the level of competition has multiplied exponentially. In order to compete the players require systematic practice to be flourished or performed at all levels of cricket (irrespective of age group). Therefore, exact and accurate training log has become an essential to have a prosperous and successful planning.
Keywords : Determine Skills , Training Log , systematic training .
INTRODUCTION
No doubt it is a universal acceptance that cricket has been playing for more than 4 century (Murtaza S.T. & et. al. 2014). With the passage of time it has become much competitive at national and international level. Each and every cricketer desires to play at maximum possible level of cricket but in order to bring that desires into reality; he has to impose himself in different systematic training for the acquisition of proficiency in skill. The role of coach or trainer is vital to lead the players towards the right path (Bob Woolmer 2008). Coach effectively observe the players efficiency as well as deficiency during the practice and he either make corrections or gives advice or to plan a program which removes the mistakes and makes him more efficient (Yobu A. 2010). The training log provides a clear picture of players’ previous and current performance.
UTILITY:
As compared to last two decades of cricket the current cricket is quiet changed in all aspects. It has become fully competitive where each individual has to perform out of his comfort zone so that he may secure his position at different level of cricket. As far as the performance records are concerned different coaches are using their own training log but they are publicized. The training log which is absent in the world of cricket can help the coaches or trainers to have a complete records of players’ past and present which can increase his performance efficiency,
7 1 2 3 4 5 6 6 6 6Mohd Zakir ; Syed Tariq Murtaza, PhD ; Mohd.Imran ; Mohd.Sharique ; Taufiq Ahmad ; Farkhunda Jabin ; Ashish Kumar Katiyar ; Shamshad Ahmad ; Ravi Prakash Singh ; Arshad Hussain Bhat ; Salman
7 7 7 7 8 8 8 8 8 8 8Ahmad Khan ; Raof Ahmad Bhat ; Irshad Maqbool Malik ; Showkat Ahmad Naikoo ; Mohd. Sabir ; Iftikhar Ahmad ; Sateesh Chandra ; Lalita Kumari ; Tasleem Khan ; Sarver Ali ; Qamber Rizwan ; Intazar
8 8Ali ; Vinay Kumar Singh , “TRAINING LOG TO DETERMINE SKILLS OF FIELDING IN CRICKET”, Golden Research Thoughts | Volume 4 | Issue 8 | Feb 2015 | Online & Print
7 1 2 3Mohd Zakir ; Syed Tariq Murtaza, PhD ; Mohd.Imran ; Mohd.Sharique ;
4 5 6 6Taufiq Ahmad ; Farkhunda Jabin ; Ashish Kumar Katiyar ; Shamshad Ahmad ;
6 6 7Ravi Prakash Singh ; Arshad Hussain Bhat ; Salman Ahmad Khan ;
7 7 7Raof Ahmad Bhat ; Irshad Maqbool Malik ; Showkat Ahmad Naikoo ;
8 8 8 8Mohd. Sabir ; Iftikhar Ahmad ; Sateesh Chandra ; Lalita Kumari ;
8 8 8 8 8Tasleem Khan ; Sarver Ali ; Qamber Rizwan ; Intazar Ali ; Vinay Kumar Singh
1Assistant Professor, Department of Physical Education, A.M.U., Aligarh.
2PTT (+2, Boys), A.M.U., Aligarh.
3Assistant Professor, Department of Physical Education, KMCUAF University, Lucknow.
4Assistant Director of Physical Education & Sports, Department of Physical Education, A.M.U., Aligarh.5Registered Physician & Associate Professor, Ayurveda & Unani medical College & Hospital, Aligarh.
6Research Scholars, Department of Physical Education, A.M.U., Aligarh.
7Students M.P.ED (Sem. IV), Department of Physical Education, A.M.U., Aligarh.8Students M.P.ED (Sem. II), Department of Physical Education, A.M.U., Aligarh.
1
GRT

.
decreased and remove the deficiencies. For selection point of view there are two things which are taken into consideration i.e. batting and bowling with the help of the training log players fielding skill can also be measured. It is very difficult for a coach or trainer to realize and keep all the things in mind all the records during practice through visual observation but in the training log all the information, records, observation, corrections required can be added in an instant by the coach and he can work upon the players through the training log it can also utilized for research purpose and to select the players and teams.
OBJECTIVE:To maintain and secure the record of players performance in between fielding practice session and for setting further training program and improvement.
2Golden Research Thoughts | Volume 4 | Issue 8 | Feb 2015
Training Log To Determine Skills Of Fielding In Cricket

.
PROCEDURE:
1.Column ‘A’ required to fill by demographic profile of the player.2.Column’B’ and ‘C’ must be filled in numerical values e.g. 1, 2, 3 and so on before respective type of fielding.3.Column ‘D’ includes some instructions for the users regarding the log.4.Column ‘E’ will be used by filling corrections name if required by the coach to amend.
NOTE: the column ‘C’ which is for throws scoring that must be filled by alphabet ‘B’ and ‘C’(if the ball is thrown from boundary put ‘B’ and ‘C’ from circle respectively).
CONCLUSION:
By using the training log both the players and coaches or trainers can conclude each and everything performed during practice. A coach by analyzing the performance of the player during practice can set a good training program for further training sessions and can improve his fielding efficiency. It can further utilize for comparative study in research purpose and when a particular player handed over from one coach to another coach he will start to guide the player from the last instead from beginning.
REFERENCES
1.Bob Woolmer (2008). Bob Woolmer’s Art & Science of Cricket, published by Struik Publishers (a division of New Holland Publishing (South Africa) (Pty) Ltd).2.Syed Tariq Murtaza, Mohd. Imran, Taufiq Ahmad, Mohd. Sharique, Farkhunda Jabin, Shamshad Ahmad, Ravi Prakash Singh, Arshad Hussain Bhat, Ashish Kumar Katiyar, Irfan Khan, Bhupesh Kumar, Sanjeev Pandey, Salman Ahmed Khan, Raof Ahmad Bhat, Irshad Maqbool Malik, Showkat Ahmad Naikoo, & Mohd. Zakir (2014). Construction & Standardization of Fielding Test in Cricket. Published in Indian Streams Research Journal, Vol. IV, Issue VIII/September, ISSN: 2230-7850.3.Yobu A. (2010). Test Measurement in Physical Education & Sports, published by Friends Publications (India), New Delhi. ISBN 978-81-7216-317-4 page no. 408.
3Golden Research Thoughts | Volume 4 | Issue 8 | Feb 2015
Training Log To Determine Skills Of Fielding In Cricket
Mohd ZakirStudents M.P.ED (Sem. IV), Department of Physical Education, A.M.U., Aligarh.

ORIGINAL ARTICLE
Publish Research ArticleInternational Level Multidisciplinary Research Journal
For All Subjects
Dear Sir/Mam, We invite unpublished Research Paper,Summary of Research Project,Theses,Books and Book Review for publication,you will be pleased to know that our journals are
Associated and Indexed,India
¬
¬OPEN J-GATE International Scientific Journal Consortium
Associated and Indexed,USA
?
?Index Copernicus?Publication Index?Academic Journal Database?Contemporary Research Index?Academic Paper Databse?Digital Journals Database?Current Index to Scholarly Journals?Elite Scientific Journal Archive?Directory Of Academic Resources?Scholar Journal Index?Recent Science Index?Scientific Resources Database?Directory Of Research Journal Indexing
EBSCO
Golden Research Thoughts 258/34 Raviwar Peth Solapur-413005,Maharashtra
[email protected]/[email protected]
Website : www.aygrt.isrj.org

ORIGINAL ARTICLE
ISSN No :2231-5063
International Multidisciplinary Research Journal
Golden Research Thoughts
Chief EditorDr.Tukaram Narayan Shinde
PublisherMrs.Laxmi Ashok Yakkaldevi
Associate EditorDr.Rajani Dalvi
HonoraryMr.Ashok Yakkaldevi
Vol 4 Issue 8 Feb 2015

Editorial Board
International Advisory Board
Welcome to GRTISSN No.2231-5063
Golden Research Thoughts Journal is a multidisciplinary research journal, published monthly in English, Hindi & Marathi Language. All research papers submitted to the journal will be double - blind peer reviewed referred by members of the editorial board.Readers will include investigator in universities, research institutes government and industry with research interest in the general subjects.
RNI MAHMUL/2011/38595
Address:-Ashok Yakkaldevi 258/34, Raviwar Peth, Solapur - 413 005 Maharashtra, IndiaCell : 9595 359 435, Ph No: 02172372010 Email: [email protected] Website: www.aygrt.isrj.org
Pratap Vyamktrao NaikwadeASP College Devrukh,Ratnagiri,MS India
R. R. PatilHead Geology Department Solapur University,Solapur
Rama BhosalePrin. and Jt. Director Higher Education, Panvel
Salve R. N.Department of Sociology, Shivaji University,Kolhapur
Govind P. ShindeBharati Vidyapeeth School of Distance Education Center, Navi Mumbai
Chakane Sanjay DnyaneshwarArts, Science & Commerce College, Indapur, Pune
Awadhesh Kumar ShirotriyaSecretary,Play India Play,Meerut(U.P.)
Iresh SwamiEx - VC. Solapur University, Solapur
N.S. DhaygudeEx. Prin. Dayanand College, Solapur
Narendra KaduJt. Director Higher Education, Pune
K. M. BhandarkarPraful Patel College of Education, Gondia
Sonal SinghVikram University, Ujjain
G. P. PatankarS. D. M. Degree College, Honavar, Karnataka
Maj. S. Bakhtiar ChoudharyDirector,Hyderabad AP India.
S.Parvathi DeviPh.D.-University of Allahabad
Sonal Singh,Vikram University, Ujjain
Rajendra ShendgeDirector, B.C.U.D. Solapur University, Solapur
R. R. YalikarDirector Managment Institute, Solapur
Umesh RajderkarHead Humanities & Social Science YCMOU,Nashik
S. R. PandyaHead Education Dept. Mumbai University, Mumbai
Alka Darshan ShrivastavaShaskiya Snatkottar Mahavidyalaya, Dhar
Rahul Shriram SudkeDevi Ahilya Vishwavidyalaya, Indore
S.KANNANAnnamalai University,TN
Satish Kumar KalhotraMaulana Azad National Urdu University
Mohammad HailatDept. of Mathematical Sciences, University of South Carolina Aiken
Abdullah SabbaghEngineering Studies, Sydney
Ecaterina PatrascuSpiru Haret University, Bucharest
Loredana BoscaSpiru Haret University, Romania
Fabricio Moraes de AlmeidaFederal University of Rondonia, Brazil
George - Calin SERITANFaculty of Philosophy and Socio-Political Sciences Al. I. Cuza University, Iasi
Hasan BaktirEnglish Language and Literature Department, Kayseri
Ghayoor Abbas ChotanaDept of Chemistry, Lahore University of Management Sciences[PK]
Anna Maria ConstantinoviciAL. I. Cuza University, Romania
Ilie Pintea,Spiru Haret University, Romania
Xiaohua YangPhD, USA
......More
Flávio de São Pedro FilhoFederal University of Rondonia, Brazil
Kamani PereraRegional Center For Strategic Studies, Sri Lanka
Janaki SinnasamyLibrarian, University of Malaya
Romona MihailaSpiru Haret University, Romania
Delia SerbescuSpiru Haret University, Bucharest, Romania
Anurag MisraDBS College, Kanpur
Titus PopPhD, Partium Christian University, Oradea,Romania
Golden Research ThoughtsISSN 2231-5063Impact Factor : 3.4052(UIF)
Volume-4 | Issue-8 | Feb-2015Available online at www.aygrt.isrj.org
CONSTRUCTION OF TRAINING LOG FOR WICKET KEEPER IN CRICKET
Abstract:- In order to collect information about the current status of performance of players and its utilization a coach or trainer always look for a handy tool which may preserves the records of players for further improvement and to make training more systematic and result oriented. For the sake of it the training log is prerequisite for a coach or trainer. Hence, the authors propose the training log for wicket-keepers.
Keywords: collect information , Construction Of Training , Wicket Keeper .
INTRODUCTION :
In process of time it has been noticed that the cricket of present time has made a strong impression throughout the world whereby the competition amongst players has also been increased to be a great extent (Murtaza, S. T. & et. al 2014). As a result of this increment in competition the level of training has also become more scientific and systematic (Yobu A. 2010). But during practice session because of the continuity of movements it is difficult for a coach to keep all the things in mind related to players’ skill but the training log redresses these difficulties and give a new shape to training and makes the training systematic and performance oriented (Bob Woolmer 2008).
UTILITY:
The utility of training log includes many aspects of wicket keepers’ training. A wicket keeper is the backbone of the fielding side who can never be relaxed as compared to other players during the game. He has to work more than other players. With the help of training log the coach or trainer can realize the performance of the wicket keeper and shortcomings and can amend it. The training log acts as a performance recording sheet whereby the level of performance can be increased and reduce the shortcomings by setting a systematic and planned training program. The utility of training log further extended for the selection of players and teams respectively. It can also lead for the comparative study and classification of players irrespective of level of performance. The utility of training log is of prime importance for players performance enhancement.
7 1 2 3 4 5 6 6 6 6Salman Ahmad Khan , Syed Tariq Murtaza, PhD , Mohd.Imran , Mohd.Sharique , Taufiq Ahmad , Farkhunda Jabin , Ashish Kumar Katiyar , Shamshad Ahmad , Ravi Prakash Singh , Arshad Hussain Bhat , Raof
7 7 7 7 8 8 8 8 8 8 8 8Ahmad Bhat ,Irshad Maqbool Malik , Showkat Ahmad Naikoo , Mohd Zakir , Mohd. Sabir , Iftikhar Ahmad , Sateesh Chandra , Lalita Kumari , Tasleem Khan , Sarver Ali , Qamber Rizwan , Intazar Ali and Vinay
8Kumar Singh , ““TEACHING AS A CAREER”-CONSTRUCTION OF TRAINING LOG FOR WICKET KEEPER IN CRICKET”, Golden Research Thoughts | Volume 4 | Issue 8 | Feb 2015 | Online & Print
7 1 2Salman Ahmad Khan , Syed Tariq Murtaza, PhD , Mohd.Imran ,
3 4 5 6Mohd.Sharique , Taufiq Ahmad , Farkhunda Jabin , Ashish Kumar Katiyar ,
6 6 6 7Shamshad Ahmad , Ravi Prakash Singh , Arshad Hussain Bhat , Raof Ahmad Bhat ,
7 7 7 8Irshad Maqbool Malik , Showkat Ahmad Naikoo , Mohd Zakir , Mohd. Sabir ,
8 8 8 8 8Iftikhar Ahmad , Sateesh Chandra , Lalita Kumari , Tasleem Khan , Sarver Ali ,
8 8 8Qamber Rizwan , Intazar Ali and Vinay Kumar Singh
1Assistant Professor, Department of Physical Education, A.M.U., Aligarh.
2PTT (+2, Boys), A.M.U., Aligarh.
3Assistant Professor, Department of Physical Education, KMCUAF University, Lucknow.
4Assistant Director of Physical Education & Sports, Department of Physical Education, A.M.U., Aligarh.5Registered Physician & Associate Professor, Ayurveda & Unani medical College & Hospital, Aligarh.
6Research Scholars, Department of Physical Education, A.M.U., Aligarh.
7Students M.P.ED (Sem. IV), Department of Physical Education, A.M.U., Aligarh.8Students M.P.ED (Sem. II), Department of Physical Education, A.M.U., Aligarh.
1
GRT

.
OBJECTIVE:
To have a record of wicket-keeper’s performance and information for further improvement and to make training more skill-oriented for learners.
PROCEDURE:
1.Column ‘A’ required to fill by demographic profile of the player.2.Column’ B’ and ‘C’ must be filled in numerical values e.g. 1, 2, 3 and so on before respective type of takings.3.Column ‘D’ includes some instructions for the users regarding the log.4.Column ‘E’ will be used by filling corrections name if required by the coach to amend.
CONCLUSION:
In order to keep the training on the right track training log is prerequisite for wicket-keepers as well as coaches or trainers. The utilization of training log helps the coach for future improvement, comparison, classifications, and selections of players. Its uses may further be extended for systematic analyzing of players and setting a well planned training program for better performance.
Construction Of Training Log For Wicket Keeper In Cricket
2Golden Research Thoughts | Volume 4 | Issue 8 | Feb 2015
.
REFERENCES
1.Bob Woolmer (2008). Bob Woolmer’s Art & Science of Cricket, published by Struik Publishers (a division of New Holland Publishing (South Africa) (Pty) Ltd) 2.Syed Tariq Murtaza, Mohd. Imran, Taufiq Ahmad, Mohd. Sharique, Farkhunda Jabin, Shamshad Ahmad, Ravi Prakash Singh, Arshad Hussain Bhat, Ashish Kumar Katiyar, Irfan Khan, Bhupesh Kumar, Sanjeev Pandey, Salman Ahmed Khan, Raof Ahmad Bhat, Irshad Maqbool Malik, Showkat Ahmad Naikoo, & Mohd. Zakir (2014). Construction & Standardization of Fielding Test in Cricket. Published in Indian Streams Research Journal, Vol. IV, Issue VIII/September, ISSN: 2230-78503.Yobu A. (2010). Test Measurement in Physical Education & Sports, published by Friends Publications (India), New Delhi. ISBN 978-81-7216-317-4 page no. 408.
3Golden Research Thoughts | Volume 4 | Issue 8 | Feb 2015
Salman Ahmad KhanAssistant Professor, Department of Physical Education, A.M.U., Aligarh.
Construction Of Training Log For Wicket Keeper In Cricket

ORIGINAL ARTICLE
Publish Research ArticleInternational Level Multidisciplinary Research Journal
For All Subjects
Dear Sir/Mam, We invite unpublished Research Paper,Summary of Research Project,Theses,Books and Book Review for publication,you will be pleased to know that our journals are
Associated and Indexed,India
¬
¬OPEN J-GATE International Scientific Journal Consortium
Associated and Indexed,USA
?
?Index Copernicus?Publication Index?Academic Journal Database?Contemporary Research Index?Academic Paper Databse?Digital Journals Database?Current Index to Scholarly Journals?Elite Scientific Journal Archive?Directory Of Academic Resources?Scholar Journal Index?Recent Science Index?Scientific Resources Database?Directory Of Research Journal Indexing
EBSCO
Golden Research Thoughts 258/34 Raviwar Peth Solapur-413005,Maharashtra
[email protected]/[email protected]
Website : www.aygrt.isrj.org

ORIGINAL ARTICLE
ISSN No : 2249-894X
Monthly MultidisciplinaryResearch Journal
Review Of
Research Journal
Vol 4 Issue 5 Feb 2015
Chief Editors
Ashok Yakkaldevi A R Burla College, India
Flávio de São Pedro FilhoFederal University of Rondonia, Brazil
Ecaterina PatrascuSpiru Haret University, Bucharest
Kamani PereraRegional Centre For Strategic Studies,Sri Lanka

Delia SerbescuSpiru Haret University, Bucharest, Romania
Xiaohua YangUniversity of San Francisco, San Francisco
Karina XavierMassachusetts Institute of Technology (MIT), USA
May Hongmei GaoKennesaw State University, USA
Marc FetscherinRollins College, USA
Liu ChenBeijing Foreign Studies University, China
Mabel MiaoCenter for China and Globalization, China
Ruth WolfUniversity Walla, Israel
Jie HaoUniversity of Sydney, Australia
Pei-Shan Kao AndreaUniversity of Essex, United Kingdom
Loredana BoscaSpiru Haret University, Romania
Ilie PinteaSpiru Haret University, Romania
Flávio de São Pedro FilhoFederal University of Rondonia, Brazil
Kamani PereraRegional Centre For Strategic Studies, Sri Lanka
Ecaterina PatrascuSpiru Haret University, Bucharest
Fabricio Moraes de AlmeidaFederal University of Rondonia, Brazil
Anna Maria ConstantinoviciAL. I. Cuza University, Romania
Romona MihailaSpiru Haret University, Romania
Mahdi MoharrampourIslamic Azad University buinzahra Branch, Qazvin, Iran
Titus PopPhD, Partium Christian University, Oradea,Romania
J. K. VIJAYAKUMARKing Abdullah University of Science & Technology,Saudi Arabia.
George - Calin SERITANPostdoctoral ResearcherFaculty of Philosophy and Socio-Political Sciences Al. I. Cuza University, Iasi
REZA KAFIPOURShiraz University of Medical Sciences Shiraz, Iran
Rajendra ShendgeDirector, B.C.U.D. Solapur University, Solapur
Nimita KhannaDirector, Isara Institute of Management, New Delhi
Salve R. N.Department of Sociology, Shivaji University, Kolhapur
P. MalyadriGovernment Degree College, Tandur, A.P.
S. D. SindkhedkarPSGVP Mandal's Arts, Science and Commerce College, Shahada [ M.S. ]
Anurag MisraDBS College, Kanpur
C. D. BalajiPanimalar Engineering College, Chennai
Bhavana vivek patolePhD, Elphinstone college mumbai-32
Awadhesh Kumar ShirotriyaSecretary, Play India Play (Trust),Meerut (U.P.)
Govind P. ShindeBharati Vidyapeeth School of Distance Education Center, Navi Mumbai
Sonal SinghVikram University, Ujjain
Jayashree Patil-DakeMBA Department of Badruka College Commerce and Arts Post Graduate Centre (BCCAPGC),Kachiguda, Hyderabad
Maj. Dr. S. Bakhtiar ChoudharyDirector,Hyderabad AP India.
AR. SARAVANAKUMARALAGAPPA UNIVERSITY, KARAIKUDI,TN
V.MAHALAKSHMIDean, Panimalar Engineering College
S.KANNANPh.D , Annamalai University
Kanwar Dinesh SinghDept.English, Government Postgraduate College , solan More.........
Advisory Board
Welcome to Review Of ResearchISSN No.2249-894X
Review Of Research Journal is a multidisciplinary research journal, published monthly in English, Hindi & Marathi Language. All research papers submitted to the journal will be double - blind peer reviewed referred by members of the editorial Board readers will include investigator in universities, research institutes government and industry with research interest in the general subjects.
RNI MAHMUL/2011/38595
Address:-Ashok Yakkaldevi 258/34, Raviwar Peth, Solapur - 413 005 Maharashtra, IndiaCell : 9595 359 435, Ph No: 02172372010 Email: [email protected] Website: www.ror.isrj.org
Review Of Research ISSN:-2249-894XImpact Factor : 3.1402(UIF)
Vol. 4 | Issue. 5 | Feb. 2015Available online at www.ror.isrj.org
NEED BASED CRICKET-SPECIFIC TRAINING LOG FOR BATSMEN IN CLOSE NET
Abstract:-It has been observed that modern day’s cricket has changed dramatically and becomes more competitive in nature . Players need good & well planned practice to survive; they require innovative methods to practice for the improvement of their skills in order to compete proficiently at regional and global plane (Murtaza S.T & et .al, 2014 & Yobu A. 2010)). Hence precise training log has become imperative for successful planning where each detail of training must be recorded.
Keywords : global plane , Contemporary Cricket , serious business .
INTRODUCTION:
Contemporary Cricket is a serious business & is much more competitive at both regional and global plane (Bob Woolmer 2008). It is every cricketers dream to play at national or at international level, but to turn this dream into reality players have to put themselves to competitive training to improve efficiency & effectiveness of the skills (Murtaza, S. T. & et. al 2014). The coach has a key role to play in keeping the cricketing stars on the right track. Coaching is subjective in description (Yobu A. 2010), where the coach observes or looks at the player in action on the nets and determines the problem areas of the player to correct the faults that are observed .In the absence of training log it is quite impossible to retain memories especially minor errors which a player committed during practice. To keep the player in the right form, a training log is one of the best tools for coaches to keep a complete personal record of events, experiences and observations.
UTILITY:
A training log is a factual written account of important events which may be taken as an extended account in prose or verse of personal record of events, experiences and observations. Modern day’s cricket has made a marked change in its form and nature and becomes more competitive where players have to give their 100 percent in order to perform at the optimum level. A training log is one of the best tools to keep the player at a pace required at
Raof Ahmad Bhat1, Syed Tariq Murtaza, Ph.D.2, Mohd.Imran3, Mohd.Sharique4, Taufiq Ahmad5, Farkhunda Jabin6, Ashish Kumar Katiyar7, Shamshad Ahmad7, Ravi Prakash Singh7, Arshad Hussain Bhat7, Salman Ahmad Khan8, Irshad Maqbool Malik8, Showkat Ahmad Naikoo8, Mohd Zakir8, Mohd. Sabir9, Iftikhar Ahmad9, Sateesh Chandra9, Lalita Kumari9, Tasleem Khan9, Sarver Ali9, Qamber Rizwan9, Intazar Ali9, Vinay Kumar Singh9, “NEED BASED CRICKET-SPECIFIC TRAINING LOG FOR BATSMEN IN CLOSE NET” Review of Research | Volume 4 | Issue 5 | Feb 2015 | Online & Print
1 2 3Raof Ahmad Bhat , Syed Tariq Murtaza, Ph.D. , Mohd.Imran ,
4 5 6 7Mohd.Sharique , Taufiq Ahmad , Farkhunda Jabin , Ashish Kumar Katiyar ,
7 7 7 8Shamshad Ahmad , Ravi Prakash Singh , Arshad Hussain Bhat , Salman Ahmad Khan ,
8 8 8 9Irshad Maqbool Malik , Showkat Ahmad Naikoo , Mohd Zakir , Mohd. Sabir ,
9 9 9 9Iftikhar Ahmad , Sateesh Chandra , Lalita Kumari , Tasleem Khan ,
9 9 9 9 Sarver Ali , Qamber Rizwan , Intazar Ali , Vinay Kumar Singh
1&7Students M.P.ED (Sem. IV), Department of Physical Education, A.M.U., Aligarh.
2Assistant Professor, Department of Physical Education, A.M.U., Aligarh.
3PTT (+2, Boys), A.M.U., Aligarh.
4Assistant Professor, Department of Physical Education, KMCUAF University, Lucknow.
5Assistant Director of Physical Education & Sports, Department of Physical Education, A.M.U., Aligarh.6Registered Physician & Associate Professor, Ayurveda & Unani medical College & Hospital, Aligarh.
8Research Scholars, Department of Physical Education, A.M.U., Aligarh.
9Students M.P.ED (Sem. II), Department of Physical Education, A.M.U., Aligarh.
1

.
competitive level. Patterns and trends of performance cannot be seen by observing one day at a time, but observing the patterns of ups and downs and rise and fall against the background of a training schedule can red-flag the issues and faults of training .A training log helps the coach ,plan to get better, confirm goals, Gives your athlete what they need, create motivation, build confidence, confirm patterns, correct performance slumps, identify what it takes to be really fast, emotional outlet and above all makes the player accountable for his /her performance
OBJECTIVE:
To keep a complete record of events, experiences and observations of players during close net practice
2Review Of Research | Volume 4 | Issue 5 | Feb 2015
NEED BASED CRICKET-SPECIFIC TRAINING LOG FOR BATSMEN IN CLOSE NET

.
PROCEDURE:
The proposed training log for batsman in close net shall be used by filling first the demographic profile (column A) of the player. In column 2 all serial numbers should be filled by numeric values as per the result. In column 3 the observer has to put the value before the given shots played by the batsman. At the end of practice session the Coach evaluates the training log and accordingly plans the next training session for the trainee.
CONCLUSION:
With the commencement of the design of the preceding training log for batsman in close net .Coaches and players find themselves in a much better place to improve efficiency & effectiveness of the skills and maintain their optimum confidence level with the use of the proposed training log. Authors believe that keeping proper records makes the coach & players accountable because a training log makes it tougher to bunk off training sessions when one knows that they have to log the actions for the day.
REFERENCES
1.Bob Woolmer (2008). Bob Woolmer’s Art & Science of Cricket, published by Struik Publishers (a division of New Holland Publishing (South Africa) (Pty) Ltd).2.Syed Tariq Murtaza, Mohd. Imran, Taufiq Ahmad, Mohd. Sharique, Farkhunda Jabin, Shamshad Ahmad, Ravi Prakash Singh, Arshad Hussain Bhat, Ashish Kumar Katiyar, Irfan Khan, Bhupesh Kumar, Sanjeev Pandey, Salman Ahmed Khan, Raof Ahmad Bhat, Irshad Maqbool Malik, Showkat Ahmad Naikoo, & Mohd. Zakir (2014). Construction & Standardization of Fielding Test in Cricket. Published in Indian Streams Research Journal, Vol. IV, Issue VIII/September, ISSN: 2230-7850.3.Yobu A. (2010). Test Measurement in Physical Education & Sports, Published by Friends Publications (India), New Delhi. ISBN 978-81-7216-317-4 page no. 408.
3Review Of Research | Volume 4 | Issue 5 | Feb 2015
NEED BASED CRICKET-SPECIFIC TRAINING LOG FOR BATSMEN IN CLOSE NET
Raof Ahmad BhatStudents M.P.ED (Sem. IV), Department of Physical Education, A.M.U., Aligarh.

Publish Research ArticleInternational Level Multidisciplinary Research Journal
For All Subjects
Dear Sir/Mam, We invite unpublished Research Paper,Summary of Research Project,Theses,Books and Books Review for publication,you will be pleased to know that our journals are
Associated and Indexed,India
¬
¬International Scientific Journal Consortium Scientific¬OPEN J-GATE
Directory Of Research Journal Indexing
Associated and Indexed,USA
?
?
?Crossref DOI?Index Copernicus?Publication Index?Academic Journal Database?Contemporary Research Index?Academic Paper Databse?Digital Journals Database?Current Index to Scholarly Journals?Elite Scientific Journal Archive?Directory Of Academic Resources?Scholar Journal Index?Recent Science Index?Scientific Resources Database
DOAJEBSCO
Review Of Research Journal 258/34 Raviwar Peth Solapur-413005,Maharashtra
[email protected]/[email protected]
Website : www.ror.isrj.org

ORIGINAL ARTICLE
ISSN No :2231-5063
International Multidisciplinary Research Journal
Golden Research Thoughts
Chief EditorDr.Tukaram Narayan Shinde
PublisherMrs.Laxmi Ashok Yakkaldevi
Associate EditorDr.Rajani Dalvi
HonoraryMr.Ashok Yakkaldevi
Vol 4 Issue 8 Feb 2015

Editorial Board
International Advisory Board
Welcome to GRTISSN No.2231-5063
Golden Research Thoughts Journal is a multidisciplinary research journal, published monthly in English, Hindi & Marathi Language. All research papers submitted to the journal will be double - blind peer reviewed referred by members of the editorial board.Readers will include investigator in universities, research institutes government and industry with research interest in the general subjects.
RNI MAHMUL/2011/38595
Address:-Ashok Yakkaldevi 258/34, Raviwar Peth, Solapur - 413 005 Maharashtra, IndiaCell : 9595 359 435, Ph No: 02172372010 Email: [email protected] Website: www.aygrt.isrj.org
Pratap Vyamktrao NaikwadeASP College Devrukh,Ratnagiri,MS India
R. R. PatilHead Geology Department Solapur University,Solapur
Rama BhosalePrin. and Jt. Director Higher Education, Panvel
Salve R. N.Department of Sociology, Shivaji University,Kolhapur
Govind P. ShindeBharati Vidyapeeth School of Distance Education Center, Navi Mumbai
Chakane Sanjay DnyaneshwarArts, Science & Commerce College, Indapur, Pune
Awadhesh Kumar ShirotriyaSecretary,Play India Play,Meerut(U.P.)
Iresh SwamiEx - VC. Solapur University, Solapur
N.S. DhaygudeEx. Prin. Dayanand College, Solapur
Narendra KaduJt. Director Higher Education, Pune
K. M. BhandarkarPraful Patel College of Education, Gondia
Sonal SinghVikram University, Ujjain
G. P. PatankarS. D. M. Degree College, Honavar, Karnataka
Maj. S. Bakhtiar ChoudharyDirector,Hyderabad AP India.
S.Parvathi DeviPh.D.-University of Allahabad
Sonal Singh,Vikram University, Ujjain
Rajendra ShendgeDirector, B.C.U.D. Solapur University, Solapur
R. R. YalikarDirector Managment Institute, Solapur
Umesh RajderkarHead Humanities & Social Science YCMOU,Nashik
S. R. PandyaHead Education Dept. Mumbai University, Mumbai
Alka Darshan ShrivastavaShaskiya Snatkottar Mahavidyalaya, Dhar
Rahul Shriram SudkeDevi Ahilya Vishwavidyalaya, Indore
S.KANNANAnnamalai University,TN
Satish Kumar KalhotraMaulana Azad National Urdu University
Mohammad HailatDept. of Mathematical Sciences, University of South Carolina Aiken
Abdullah SabbaghEngineering Studies, Sydney
Ecaterina PatrascuSpiru Haret University, Bucharest
Loredana BoscaSpiru Haret University, Romania
Fabricio Moraes de AlmeidaFederal University of Rondonia, Brazil
George - Calin SERITANFaculty of Philosophy and Socio-Political Sciences Al. I. Cuza University, Iasi
Hasan BaktirEnglish Language and Literature Department, Kayseri
Ghayoor Abbas ChotanaDept of Chemistry, Lahore University of Management Sciences[PK]
Anna Maria ConstantinoviciAL. I. Cuza University, Romania
Ilie Pintea,Spiru Haret University, Romania
Xiaohua YangPhD, USA
......More
Flávio de São Pedro FilhoFederal University of Rondonia, Brazil
Kamani PereraRegional Center For Strategic Studies, Sri Lanka
Janaki SinnasamyLibrarian, University of Malaya
Romona MihailaSpiru Haret University, Romania
Delia SerbescuSpiru Haret University, Bucharest, Romania
Anurag MisraDBS College, Kanpur
Titus PopPhD, Partium Christian University, Oradea,Romania
Golden Research ThoughtsISSN 2231-5063Impact Factor : 3.4052(UIF)
Volume-4 | Issue-8 | Feb-2015Available online at www.aygrt.isrj.org
OBSERVATORY LOG FOR SPINNERS IN THE GAME OF CRICKET
Abstract:-The ladder of standards for cricket getting higher and higher. It is very difficult to
imagine what will happen next and that too at what extent. It is just dreaming something. The way the game of cricket has become competitive, seems that this game needs super humans, who have the ability to adjust, adopt, firm determination and who makes own standards to break. To reach that ever increasing standards, new promising methods for practice is needed to get good competitive edge over opponents at world level (Murtaza S. T. & et.al. 2014).
Keywords : Spinners , Observatory ,firm determination .
INTRODUCTION
From business point of view cricket has become a big hub throughout the world. Youth have great interest in cricket and want to be a part of national and international team. To turn this interest in profession youth is ready to break all barriers of hard work to improve and to adopt the super human ability which differentiate them from others (Yobu A. 2010). In this process of training, coaches and trainers act as a driver who guides the players to the path of achieving the goal (Bob Woolmer 2008). In order to know the ladder of performance of a spinner the proposed training log will act as a root which provides all needed information and feedback.
UTILITY
Proposed training log provides blue print of performance in order to compete at satisfactory level. In this high competitive era of cricket a cricketer has to fully update him/herself (Bob Woolmer 2008) with different hidden weapons which differentiate and lead them ahead from others. It provides stairs through which a spinner can find out merits and demerits of the long training process as they cannot be deducted instantly and suddenly. By maintaining the log a coach knows whether the applied means and methods are working to achieve the required goal or not. To know the standard of performance proposed training log is very helpful because at national and international standard there is narrow column for mistake. Proposed training log would help spin bowler to know things to be
8 1 2 3 4 5 6 6 6 6Lalita Kumari ; Syed Tariq Murtaza, PhD ; Mohd.Imran ; Mohd.Sharique ; Taufiq Ahmad ; Farkhunda Jabin ; Ashish Kumar Katiyar ; Shamshad Ahmad ; Ravi Prakash Singh ; Arshad Hussain Bhat ;
7 7 7 7 7 8 8 8 8 8 8Salman Ahmad Khan ; Raof Ahmad Bhat ; Irshad Maqbool Malik ; Showkat Ahmad Naikoo ; Mohd Zakir ; Mohd. Sabir ; Iftikhar Ahmad ; Sateesh Chandra ; Tasleem Khan ; Sarver Ali ; Qamber Rizwan ;
8 8Intazar Ali ; Vinay Kumar Singh , “OBSERVATORY LOG FOR SPINNERS IN THE GAME OF CRICKET”, Golden Research Thoughts | Volume 4 | Issue 8 | Feb 2015 | Online & Print
8 1 2 3Lalita Kumari ; Syed Tariq Murtaza, PhD ; Mohd.Imran ; Mohd.Sharique ;
4 5 6 6 Taufiq Ahmad ; Farkhunda Jabin ; Ashish Kumar Katiyar ; Shamshad Ahmad ;
6 6 7Ravi Prakash Singh ; Arshad Hussain Bhat ; Salman Ahmad Khan ;
7 7 7Raof Ahmad Bhat ; Irshad Maqbool Malik ; Showkat Ahmad Naikoo ;
7 8 8 8Mohd Zakir ; Mohd. Sabir ; Iftikhar Ahmad ; Sateesh Chandra ;
8 8 8 8 8Tasleem Khan ; Sarver Ali ; Qamber Rizwan ; Intazar Ali ; Vinay Kumar Singh
1Assistant Professor, Department of Physical Education, A.M.U., Aligarh.
2PTT (+2, Boys), A.M.U., Aligarh.
3Assistant Professor, Department of Physical Education, KMCUAF University, Lucknow.
4Assistant Director of Physical Education & Sports, Department of Physical Education, A.M.U., Aligarh.5Registered Physician & Associate Professor, Ayurveda & Unani medical College & Hospital, Aligarh.
6Research Scholars, Department of Physical Education, A.M.U., Aligarh.
7Students M.P.ED (Sem. IV), Department of Physical Education, A.M.U., Aligarh.8Students M.P.ED (Sem. II), Department of Physical Education, A.M.U., Aligarh.
1
GRT
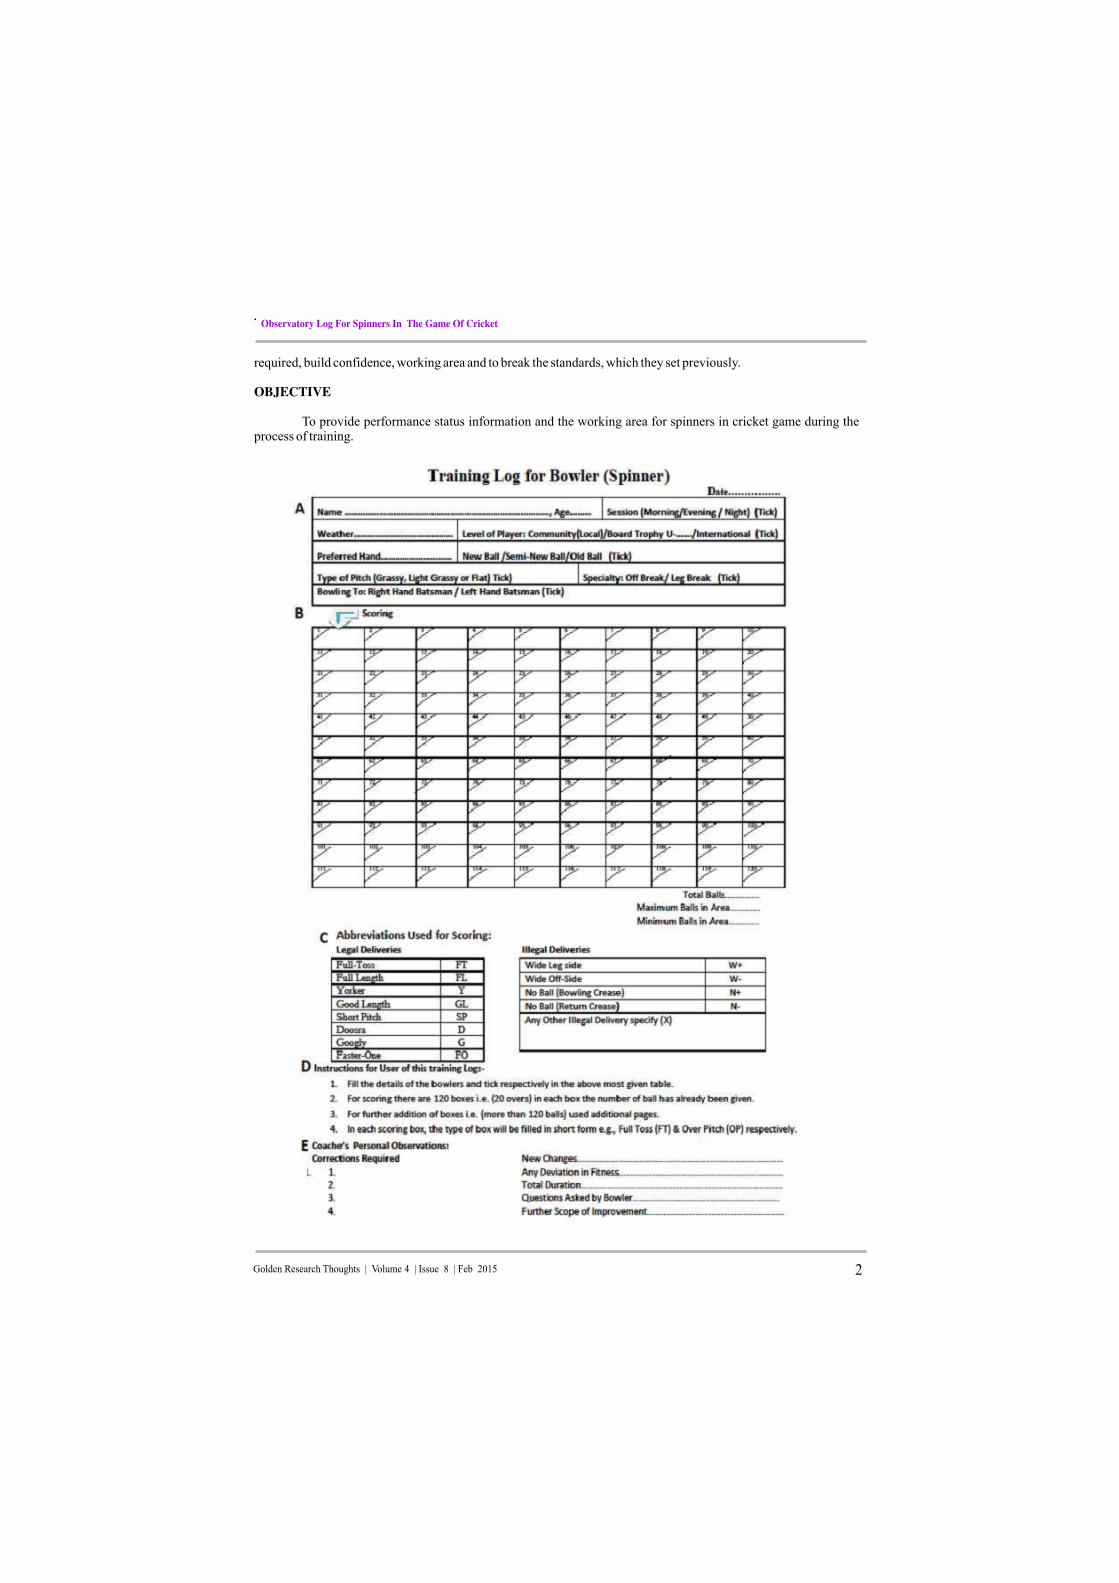
.
required, build confidence, working area and to break the standards, which they set previously.
OBJECTIVE
To provide performance status information and the working area for spinners in cricket game during the process of training.
2Golden Research Thoughts | Volume 4 | Issue 8 | Feb 2015
Observatory Log For Spinners In The Game Of Cricket

.
PROCEDURE
Proceeding training log is to be filled according to the performance of the spinner at the time of their performance, either in practice or competition or both.1-Column A contains the demographic profile of spin bowlers.2-‘B’ should be filled according to the deliveries bowled by spin bowler followed by Abbreviations given in column C.3-Column D contains the instruction for coaches & trainers.4-Column E is to be filled on the basis of coaches personal observation, like new changes, any short of correction which is related to spin bowlers skill etc.
CONCLUSION
If a coach implement proposed training log to train spinner he/she find him/herself in a place from where a coach can observe all ups and downs, merits and demerits to guide spinner to achieve their goal. Authors have a firm determination that if records are managed they act as a feedback in order to improve skill thus ameliorating the performance level of each spinner.
REFERENCES
1.Bob Woolmer (2008). Bob Woolmer’s Art & Science of Cricket, published by Struik Publishers (a division of New Holland Publishing (South Africa) (Pty) Ltd).2.Syed Tariq Murtaza, Mohd. Imran, Taufiq Ahmad, Mohd. Sharique, Farkhunda Jabin, Shamshad Ahmad, Ravi Prakash Singh, Arshad Hussain Bhat, Ashish Kumar Katiyar, Irfan Khan, Bhupesh Kumar, Sanjeev Pandey, Salman Ahmed Khan, Raof Ahmad Bhat, Irshad Maqbool Malik, Showkat Ahmad Naikoo, & Mohd. Zakir (2014). Construction & Standardization of Fielding Test in Cricket. Published in Indian Streams Research Journal, Vol. IV, Issue VIII/September, ISSN: 2230-7850.3.Yobu A. (2010). Test Measurement in Physical Education & Sports, published by Friends Publications (India), New Delhi. ISBN 978-81-7216-317-4 page no. 408.
3Golden Research Thoughts | Volume 4 | Issue 8 | Feb 2015
Observatory Log For Spinners In The Game Of Cricket
Lalita KumariStudents M.P.ED (Sem. II), Department of Physical Education, A.M.U., Aligarh.
ORIGINAL ARTICLE
Publish Research ArticleInternational Level Multidisciplinary Research Journal
For All Subjects
Dear Sir/Mam, We invite unpublished Research Paper,Summary of Research Project,Theses,Books and Book Review for publication,you will be pleased to know that our journals are
Associated and Indexed,India
¬
¬OPEN J-GATE International Scientific Journal Consortium
Associated and Indexed,USA
?
?Index Copernicus?Publication Index?Academic Journal Database?Contemporary Research Index?Academic Paper Databse?Digital Journals Database?Current Index to Scholarly Journals?Elite Scientific Journal Archive?Directory Of Academic Resources?Scholar Journal Index?Recent Science Index?Scientific Resources Database?Directory Of Research Journal Indexing
EBSCO
Golden Research Thoughts 258/34 Raviwar Peth Solapur-413005,Maharashtra
[email protected]/[email protected]
Website : www.aygrt.isrj.org

5/18/2020 LOG TO DETERMINE THE STATUS FOR FAST BOWLER | Request PDF
https://www.researchgate.net/publication/301815196_LOG_TO_DETERMINE_THE_STATUS_FOR_FAST_BOWLER 1/3
LOG TO DETERMINE THE STATUS FOR FAST BOWLER
Article · February 2015 with 59 Reads
Show more authors
Abstract
It has been well -known fact that nowadays cricket has been changing andmodifying day by day and it has been becoming more and more competitive. Sothe young cricket champs have to need a well-planned schedule practice totrain. New innovation method for practice is required for the betterment andimproving cricketing skills to compete with others at regional and nationalplatforms (Murtaza S.T. & et.al 2014). Therefore proposed training log wouldplay a big role in the effectiveness of training.
Do you want to read the rest of this article?
Jan 2014Syed Tariq Murtaza · Mohd · Taufiq Imran · Ahmad · Mohd · Farkhunda Sharique ·Shamshad Jabin · Ahmad
Syed Tariq Murtaza, Mohd. Imran, Taufiq Ahmad, Mohd. Sharique, Farkhunda Jabin,Shamshad Ahmad, Ravi Prakash Singh, Arshad Hussain Bhat, Ashish Kumar Katiyar,Irfan Khan, Bhupesh Kumar, Sanjeev Pandey, Salman Ahmed Khan, Raof Ahmad Bhat,Irshad Maqbool Malik, Showkat Ahmad Naikoo, & Mohd. Zakir (2014).
Bob Woolmer's Art & Science of Cricket
Cite this publication
Qamber Rizwan Syed Tariq Murtaza
+ 19Mohd Imran19.35 · Punjab Technical University
Mohd. Sharique
Request full-text
Citations (0) References (4)
FEATURED VIDEOS
Greenland is melting at an historically unprecedenterate Read More
Powered by
Recruit researchers Join for free Login
Greenland is melting at an historically unprec…
See all ›4 References Download citation Share Request full-text

5/18/2020 LOG TO DETERMINE THE STATUS FOR FAST BOWLER | Request PDF
https://www.researchgate.net/publication/301815196_LOG_TO_DETERMINE_THE_STATUS_FOR_FAST_BOWLER 2/3
Jan 2008Bob WoolmerBob Woolmer (2008). Bob Woolmer's Art & Science of Cricket, published by StruikPublishers (a division of New Holland Publishing (South Africa) (Pty) Ltd).
Test Measurement in Physical Education & Sports, published by FriendsPublications (India)Jan 2010 · 408
A YobuYobu A. (2010). Test Measurement in Physical Education & Sports, published by FriendsPublications (India), New Delhi. ISBN 978-81-7216-317-4 page no. 408.
Jan 2010A YobuYobu A. (2010). Test Measurement in Physical Education & Sports, published by FriendsPublications (India), New Delhi. ISBN 978-81-7216-317-4 page no. 408.
Recommended publicationsDiscover more publications, questions and projects in Fasting
Last Updated: 11 Apr 2020
Article
NEED BASED CRICKET-SPECIFIC TRAINING LOG FOR BATSMEN IN CLOSE NET
February 2015
Syed Tariq Murtaza · Raof Ahmad Bhat · [...] · Salman Ahmad Khan
It has been observed that modern day’s cricket has changed dramatically and becomes more competitive in nature. Players need good & well -planned practice to survive; they require innovative methods to practice for the improvement of their skills in order to compete proficiently at theregional and global plane (Murtaza S.T & et .al, 2014 & Yobu A. 2010)). Hence precise training log has become ... [Show full abstract]
Read more
Discover more
Company
About usNewsCareers
Support
Help Center
Business solutions
AdvertisingRecruiting
© 2008-2020 ResearchGate GmbH. All rights reserved. Terms · Privacy · Copyright · Imprint

5/18/2020 LOG TO DETERMINE THE STATUS FOR FAST BOWLER | Request PDF
https://www.researchgate.net/publication/301815196_LOG_TO_DETERMINE_THE_STATUS_FOR_FAST_BOWLER 3/3

5/16/2020 INNOVATIVE METHOD TO PRACTICE & IMPROVE THE GAME OF CRICKET | Request PDF
https://www.researchgate.net/publication/281820461_INNOVATIVE_METHOD_TO_PRACTICE_IMPROVE_THE_GAME_OF_CRICKET 1/3
Request the full-text directly from the authors on ResearchGate.
INNOVATIVE METHOD TO PRACTICE & IMPROVE THE GAME OFCRICKET
Article
January 2015
Syed Tariq Murtaza · Mohd Imran · Mohd.Sharique · Show all 23authors · Vinay Kumar Singh
Request the full-text directly from the authors on ResearchGate.
Abstract
The game of cricket has a magnificentpast and a complex history (BobWoolmer 2008). It relishes 400-Oddyears of annals (Murtaza S. T. & et. al.2014). Authors believe that it has beenoriginated from the ancient sport of Indiai.e. Gilli Danda (Tipcat in English) whichhas possibly the origin over 2500 yearsago (Steve Craig-2002 & John Arlott-1975). Cricket was taken by the Britishto their Colonies & started playing &expanding into every continent on theglobe. Modern day’s cricket has beentransformed into more competitive &become more aggressive where everyplayer has to put extra efforts in order toperform at the optimum level (MurtazaS. T. & et. al. 2014). Innovation in cricketis very rare. In the past, many cricketteams have been able to survive evenwith very limited amounts of innovationin their arsenal. They focused onproviding the basic skills and simplyupdate them to a level that maintainstheir competitiveness at the globalplane. This method still applies but withfew opportunities & chance forinnovation.
Discover the world'sresearch
17+ millionmembers
135+ millionpublications
700k+ researchprojects
No full-text available
Request thearticle directly
from theauthors on
ResearchGate.
Citations (3) References (9)
Citations (3) References (9)
Join for free
Request full-text
FEATURED VIDEOS
DEA agents go after fentanyl suppliers with help fromscientists Read More
Powered by
Recruit researchers Join for free Login
DEA agents go after fentanyl suppliers with h…Request full-text Download citation Copy link
Request full-text Download citation Copy link

5/16/2020 INNOVATIVE METHOD TO PRACTICE & IMPROVE THE GAME OF CRICKET | Request PDF
https://www.researchgate.net/publication/281820461_INNOVATIVE_METHOD_TO_PRACTICE_IMPROVE_THE_GAME_OF_CRICKET 2/3
ANALYSIS OF THE PERFORMANCE &RELIABILITY OF MATERIALS TO BE USED IN…
Thesis Full-text available
Jul 2018Ashish Kumar Katiyar
META-ANALYSIS ON THE DEVELOPMENT OFCRICKET BAT OVER THE YEARS
Article
Apr 2016Ashish Kumar Katiyar · Syed Tariq Murtaza ·
Shamshad Ali
A Review: The Chronology of Changes in theLaw 6 of Cricket
Article
Oct 2015Syed Tariq Murtaza · Shamshad Ali · AshishKumar Katiyar
Citations (3) References (9)
... Council (Wikipedia-2014). Murtaza et al.,(2015) also believe that it has beenoriginated from the ancient sport of India i.e.Gilli Danda (Tipcat in English) which haspossibly the origin over 2500 years ago(Craig, 2002 andArlott, 1975 . ...
View Show abstract
View Show abstract
View Show abstract

5/16/2020 INNOVATIVE METHOD TO PRACTICE & IMPROVE THE GAME OF CRICKET | Request PDF
https://www.researchgate.net/publication/281820461_INNOVATIVE_METHOD_TO_PRACTICE_IMPROVE_THE_GAME_OF_CRICKET 3/3
Recommended publications Discover more about: Cricket
Last Updated: 11 Apr 2020
Article
Cricket and globalization: Global processes and the imperial game
July 2013 · Journal of Global History
Fahad Mustafa
This article seeks to reposition sport as a subject of analysis in ‘global historical’ processes. It examines the diffusion of cricket in theBritish empire, its appropriation by the colonies, and the subsequent commercialization of the sport. It asks the question: how did anelite English sport come to be one controlled by a former colony – India? With this as the substantive question, it seeks ... [Show fullabstract]
Read more
Company
About usNewsCareers
Support
Help Center
Business solutions
AdvertisingRecruiting
© 2008-2020 ResearchGate GmbH. All rights reserved. Terms · Privacy · Copyright · Imprint

3 IV April 2015

www.ijraset.com Volume 3 Issue IV, April 2015
IC Value: 13.98 ISSN: 2321-9653
International Journal for Research in Applied Science & Engineering
Technology (IJRASET)
©IJRASET 2015: All Rights are Reserved
388
Kinematic Characteristics of Two Different Service
at Three Varied Stages during the Match
Ikram Hussain1, Fuzail Ahmad
2, Naushad W. Ansari
3, Shiny Raizada
4
1Professor, Department of Physical Education, 2Research Scholar, Department of Physical Education, 3Assistant
Professor, Department of Physical Education, 1,2,3,Aligarh Muslim University, Aligarh., 4Research Scholar, Lakshmibai National Institute of Physical Education,
Gwalior.
Abstract: The purpose of the study was designed to determine the variation between first and second serve at different time
frame, i.e.: start of the match (initial period), mid of the match (mid period) and at the end flag of the match (end period) for
Indian players during Davis cup. Four Indian international tennis players of mean age, height and weight were 27.00 ± 4.97
years, 186.50 ± 6.03 cm, 81.25 ±7.41 kg, respectively were recorded in Davis Cup held in Indore, India. The study focused on the
mechanical source of service by comparing the body, racket and ball kinematics of first and second service. The recorded service
motion was analyzed by motion analysis software and was used to calculate the selected parameters for this study and statistical
analysis was accepted using SPSSv.17, mean, standard deviations and t-test was used to find out the difference between the
kinematic parameters of this second service for Indian elite players except the ball velocity in the end period of the match in
follow through.
Keywords: Kinematics, first serve, second serve, time frame.
I. INTRODUCTION TO TENNIS SERVE
A good serve in tennis is essential. Every point in a tennis match begins with a serve. Probably the most analyzed shot in tennis, an
effective serve requires precise timing and arm coordination. Success in tennis is greatly affected by the technique a player uses and
biomechanics plays an integral role in stroke production. Player development based on scientific evidence allows an individualized
approach to be structured, with due consideration to the key mechanical features of each skill, while also fostering fair and
permitting the physical characteristics of a player to be considered (Elliot, 2006).
The serve is one of the most important skills a tennis player must acquire in order to have an effective attack. The primary objective
of the serve is to direct the ball into the service area on the opponent's side of the court. The serve is an effective offensive weapon
because the ball can be hit with a tremendous amount of velocity, thus reducing the opposition’s reaction time and consequently
their ability to return the ball. The tennis serve is a more complex sequence that uses a combination of horizontal and vertical
movements. Variations of the service action can also cause the ball to spin. A slice serve is used in order to gain an advantage via
the unpredictability of a spinning ball bounce. Biomechanical analysis of the skill enables us to give effective instruction and
appropriate technical cues to improve the performance of students and athletes (Hooper, 2001). One of the elements that all high
level tennis players, college tennis players and world class tennis professionals share are efficient and biomechanical sound tennis
strokes.
The serve, a closed skill which players have total control over is also a difficult stroke to master. Not only do the arms prescribe
different movement patterns and rhythms, but they must coordinate with the movement of the lower limbs and the trunk. Because of
its importance and complexity, the tennis serve becomes a closely watched issue; especially the flat serve which is the fastest of all
the service types and is also probably the most intimidating and fearsome weapon a player can have (Yuliang Sun, Yu Liu and
Xinglong Zhou, 2012)
Powerful serve in tennis requires balancing the generation of forces and motions necessary to move the body, especially the
shoulder and elbow, and propel the racquet and the control of these forces and motions for precision of performance and protection
of the joints from excessive loading. The body achieves this balance by integrating the physiological muscle activations and the
resulting biomechanical forces and motions throughout all the segments or links of the kinetic chain (Kibler, 2009).
Kinematics of the tennis serve have been described quite extensively, focusing on the upper-limb movements (Elliott, Marsh, &
Blanksby, 1986; Elliott, Fleisig, Nicholls, & Escamilia, 2003; Reid, Elliott, & Alderson, 2007), or the patterns of the lower-limb

www.ijraset.com Volume 3 Issue IV, April 2015
IC Value: 13.98 ISSN: 2321-9653
International Journal for Research in Applied Science & Engineering
Technology (IJRASET)
©IJRASET 2015: All Rights are Reserved
389
(Elliott & Wood, 1983; Girard, Micallef, & Millet, 2005), or the function of trunk (Chow, Shim, & Lim, 2003; Chow, Park, &
Tillman, 2009). According to Tanabe, 2007 the joint movement that produces the difference in horizontal racket head velocity
between fast and slow servers is shoulder internal rotation, and angular velocity of shoulder internal rotation must be developed to
produce a high racket speed.
The tennis serve is commonly associated with musculoskeletal injury. Different types of serves, e.g. the flat and the kick types, may
involve different kinematics and different musculoskeletal demands at the joints that play an important role in the development of
long term injuries (Reid, 2007).
The spin serves produces more lateral flexion moments than flat serve; this moment comes mainly from the lateral flexion of the
trunk. The spin serve has a significant difference from the flat serve: the former produces more knee bend than the latter during
acceleration, and more backward pelvis tilting. This will help to increase the momentum during the serve and its transfer (Kuo-
Cheng Lo, 2004). The tennis serve is a commonly performed athletic skill and has received some attention in the scientific
biomechanical literature. During the tennis serve the greatest forces and moments are applied at the shoulder joint. Also, the lower
extremities are important to the successful performance of the tennis serve (Seeley, n.d.).
The study has been designed to determine the variation between first and second serve at different time frame i.e.: start of the match
(initial period), mid of the match (mid period) and at the end flag of the match (end period) for Indian players during Davis cup. The
study focused on the mechanical source of service by comparing the body, racket and ball kinematics of first and second service.
II. METHODOLOGY
A. Participants
A total of four elite male International tennis players were selected as subjects for the study, who participants in Davis Cup, held at
Indore, India in November, 2013. The mean and standard deviation (SD) of players of age (year), height (cm) and weight (kg) were
27.00 ± 4.97, 186.50 ± 6.03, 81.25 ±7.41, respectively.
B. Model of Tennis Serve
The tennis service was modeled as segments of the kinetic chain composed together of (a) foot (b) lower leg segment (c) upper leg
segment (d) trunk segment (e) upper arm segment (f) forearm and (g) hand with tennis racket. The ankle, knee and upper body
significantly flexed to make use of ground reaction force (GRF) to start the execution while extending ankle, knee and upper body
in a sequential manner for summation of force. The body makes an arc extending the shoulder with internal rotation of the upper
arm and pronation of the forearm.
C. Equipment’s and Set-up
To obtain the kinematic data for this study the equipment used were camera, tripod, computer, two-dimensional calibration frame,
motion analysis software and measuring tape. Two-dimensional kinematics data of the body were obtained with the high speed
canon camcorder operating at the shutter speed of 1/2000 with a frame rate of 50 Hz. The camera was placed perpendicular to
sagittal plane on the right side at a distance of seventeen meters from the mid of base line of the tennis court to capture the service
motion.
D. Parameters
The kinematic parameters considered for this study during preparation phase, force generation phase and follow through phase were
toss angle (ToA), toss height (TH), reach height (RH), ball velocity (Bv), racket velocity at impact (RIv), racket velocity post impact
(RPv), wrist velocity (Wv), elbow velocity (Ev), shoulder velocity (Sv), pelvic/ hip velocity (Hv), knee velocity (Kv), ankle velocity
(Av), toe velocity (Tv), wrist angular velocity (WAv), elbow angular velocity (EAv), shoulder angular velocity (SAv), pelvic
angular velocity (HAv), knee angular velocity (KAv), ankle angular velocity (AAv), toe angular velocity (TAv)
E. Subject and Trail Identification
The subjects’ identification code in the video recording for distinguishing them in the recorded data. The recorded videos were
viewed carefully in the playback system and extracted of the best performance of the subjects for analysis.
F. Data Reduction
The identified valid first and second serve of each player’s selected video footages were downloaded, slashed, edited and trimmed
by using the Xilisoft Video Converter. The trimmed video data were digitized in motion analysis software with the process of

www.ijraset.com Volume 3 Issue IV, April 2015
IC Value: 13.98 ISSN: 2321-9653
International Journal for Research in Applied Science & Engineering
Technology (IJRASET)
©IJRASET 2015: All Rights are Reserved
390
markless digitization and a database of each player’s serves was developed.
G. Statistical Procedure
Descriptive statistics and t-test were performed by SPSS version 17.0 for all the variables under this study were computed at Level
of significance for 0.05 with 6 degree of freedom.
III. RESULT
The main purpose of this study was to determine kinematical variations at the time of the preparation phase, force generation phase
and follow through phase during first and second serve during three time periods of the match i.e.: initial period, mid period and end
period.
Ball velocity and velocity of a racket at the time of impact and post impact were also studied during first and second serve.
Table No.: 1 Kinematics parameters of first and second serve during preparation Phase at Initial, mid & End Period of Match.
Variable Serve Initial Period Mid Period End Period
Mean±SD t-value Mean±SD t-value Mean±SD t-value
TAO FS 9.25 ± 5.56
0.00 9.00 ± 3.83
0.09 9.00 ± 4.69
0.15 SS 9.25 ± 4.35 9.25 ± 4.03 9.50 ± 4.80
WRvel FS 147.31±16.30
0.18 143.49±33.88
0.26 125.15±33.36
0.34 SS 144.71±23.67 137.83±27.25 133.18±33.42
ERvel FS 106.77±18.57
0.86 98.66±25.36
0.01 84.83±24.28
0.74 SS 94.89±20.31 98.48±13.54 94.89±12.49
SRvel FS 98.86±9.70
0.77 86.48±18.92
0.11 77.41±19.05
0.51 SS 86.29±11.73 85.35±9.15 82.99±10.55
PRvel FS 84.95±14.20
0.91 77.40±21.99
0.30 65.72±17.65
0.15 SS 70.11±12.53 73.74±12.61 67.43±14.81
KRvel FS 74.25±19.85
0.11 65.23±22.38
0.38 54.53±12.80
0.12 SS 55.77±8.80 60.65±9.16 55.43±8.24
ARvel FS 44.76±17.29
0.15 33.64±10.38
0.50 35.59±15.66
0.17 SS 36.83±6.18 37.33±10.74 33.95±12.27
TRvel FS 44.67±22.83
0.13 31.14±15.36
0.53 35.84±15.43
0.31 SS 31.85±8.38 36.51±13.00 32.52±15.08
WAacc FS 539.02±27.53
0.17 598.79±166.62
0.98 525.67±161.01
0.20 SS 528.56±117.85 515.39±36.11 506.66±111.35
EAacc FS 1083.78±231.56
1.54 970.39±307.93
0.58 687.14±221.46
0.44 SS 853.65±189.45 877.55±94.61 749.07±172.68
WAO FS 145.99±6.20
0.57 153.88±21.72
0.08 154.76±17.31
0.89 SS 150.07±12.97 152.86±14.64 146.11±8.67
EAO FS 108.15±9.90
1.09 115.79±24.65
0.27 123.68±21.95
0.41 SS 118.67±16.57 120.03±18.69 118.25±14.79
SAO FS 39.01±11.23
0.27 36.58±10.64
0.03 36.42±10.75
0.07 SS 37.11±8.76 36.78±13.72 36.95±10.78
WAO/S FS 509.73±193.84
0.86 354.45±143.34
0.42 403.92±197.39
0.65 SS 401.21±160.51 397.68±150.56 470.04±53.60
EAO/S FS 392.41±190.12
0.40 358.16±203.68
0.94 427.60±207.06
0.15 SS 445.64±188.84 494.86±209.97 449.58±197.50
SAO/S FS 97.33±27.36
0.39 93.89±22.50
0.21 83.29±26.22
0.34 SS 90.31±23.72 96.77±15.93 89.13±22.14
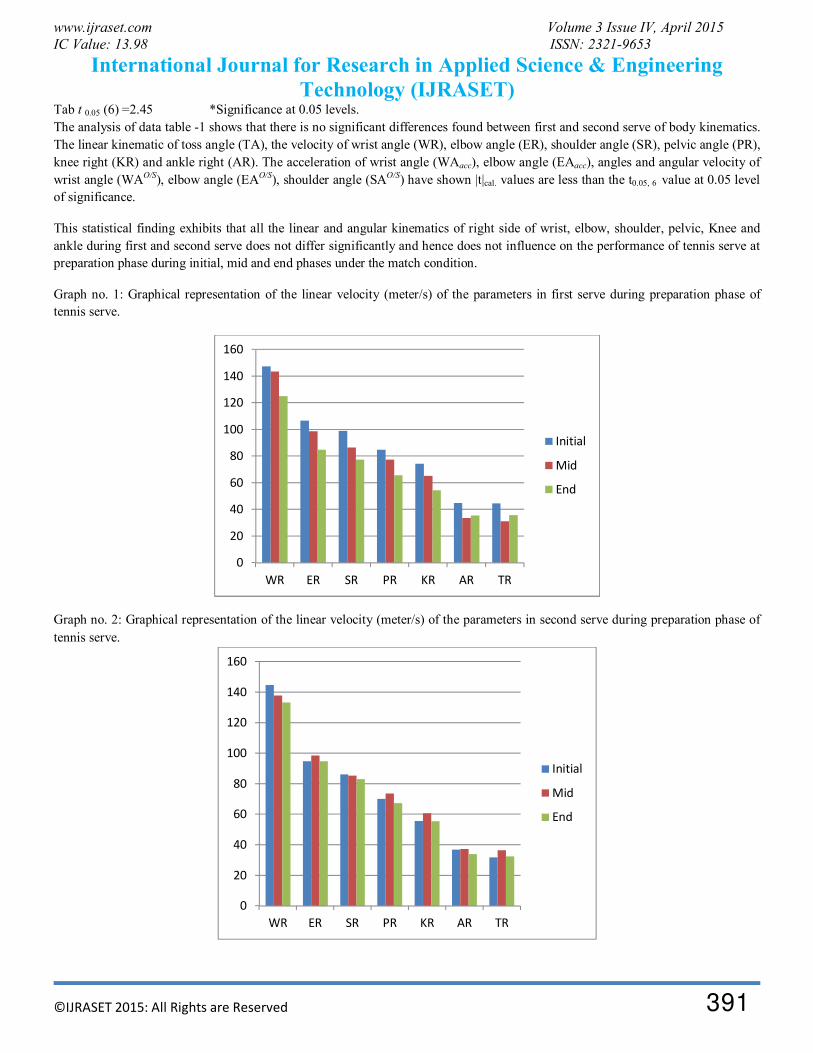
www.ijraset.com Volume 3 Issue IV, April 2015
IC Value: 13.98 ISSN: 2321-9653
International Journal for Research in Applied Science & Engineering
Technology (IJRASET)
©IJRASET 2015: All Rights are Reserved
391
Tab t 0.05 (6) =2.45 *Significance at 0.05 levels.
The analysis of data table -1 shows that there is no significant differences found between first and second serve of body kinematics.
The linear kinematic of toss angle (TA), the velocity of wrist angle (WR), elbow angle (ER), shoulder angle (SR), pelvic angle (PR),
knee right (KR) and ankle right (AR). The acceleration of wrist angle (WAacc), elbow angle (EAacc), angles and angular velocity of
wrist angle (WAO/S), elbow angle (EAO/S), shoulder angle (SAO/S) have shown |t|cal. values are less than the t0.05, 6 value at 0.05 level
of significance.
This statistical finding exhibits that all the linear and angular kinematics of right side of wrist, elbow, shoulder, pelvic, Knee and
ankle during first and second serve does not differ significantly and hence does not influence on the performance of tennis serve at
preparation phase during initial, mid and end phases under the match condition.
Graph no. 1: Graphical representation of the linear velocity (meter/s) of the parameters in first serve during preparation phase of
tennis serve.
Graph no. 2: Graphical representation of the linear velocity (meter/s) of the parameters in second serve during preparation phase of
tennis serve.
0
20
40
60
80
100
120
140
160
WR ER SR PR KR AR TR
Initial
Mid
End
0
20
40
60
80
100
120
140
160
WR ER SR PR KR AR TR
Initial
Mid
End

www.ijraset.com Volume 3 Issue IV, April 2015
IC Value: 13.98 ISSN: 2321-9653
International Journal for Research in Applied Science & Engineering
Technology (IJRASET)
©IJRASET 2015: All Rights are Reserved
392
Graph no. 3: Graphical representation of the linear acceleration (meter/s2) of the parameters in first serve during preparation phase
of tennis serve.
Graph no. 4: Graphical representation of the linear acceleration (meter/s2) of the parameters in second serve during preparation
phase of tennis serve.
Graph no. 5: Graphical representation of the angle (degree) of the parameters in first serve during preparation phase of tennis serve.
0
200
400
600
800
1000
1200
WR ER
Initial
Mid
End
0
100
200
300
400
500
600
700
800
900
1000
WR ER
Initial
Mid
End
0
20
40
60
80
100
120
140
160
180
WA EA SA
Initial
Mid
End

www.ijraset.com Volume 3 Issue IV, April 2015
IC Value: 13.98 ISSN: 2321-9653
International Journal for Research in Applied Science & Engineering
Technology (IJRASET)
©IJRASET 2015: All Rights are Reserved
393
Graph no. 7: Graphical representation of the angular velocity (degree/second) of the parameters in first serve during preparation
phase of tennis serve.
Graph no. 6: Graphical representation of the angle (degree) of the parameters in second serve during preparation phase of tennis
serve.
Graph no. 8: Graphical representation of the angular velocity (degree/second) of the parameters in second serve during preparation
phase of tennis serve.
0
100
200
300
400
500
600
WA EA SA
Initial
Mid
End
0
20
40
60
80
100
120
140
160
180
WA EA SA
Initial
Mid
End
0
100
200
300
400
500
600
WA EA SA
Initial
Mid
End

www.ijraset.com Volume 3 Issue IV, April 2015
IC Value: 13.98 ISSN: 2321-9653
International Journal for Research in Applied Science & Engineering
Technology (IJRASET)
©IJRASET 2015: All Rights are Reserved
394
Table No.: 2 Kinematics parameters of first and second serve during Force Generation Phase at Initial, mid & End Period of Match.
Variable Serve Initial Period Mid Period End Period
Mean±SD t-value Mean±SD t-value Mean±SD t-value
HAo FS 11.75±2.63
1.60 10.50±1.29
1.70 10.00±3.74
0.72 SS 8.50±3.12 7.75±2.99 8.50±1.92
Rh FS 4.03±0.47
1.19 3.99±0.23
0.73 3.55±0.43
0.82 SS 3.04±1.60 3.32±1.83 2.89±1.53
Dh FS 1.12±0.54
0.59 0.81±0.10
1.13 0.76±0.10
1.10 SS 1.65±1.68 1.73±1.64 1.64±1.60
Th FS 4.80±0.56
0.05 4.81±0.59
0.57 4.71±0.48
0.66 SS 4.78±0.62 5.10±0.82 4.52±0.31
WRvel FS 860.95±133.46
1.49 836.91±74.44
0.08 795.23±188.90
0.10 SS 754.12±53.37 842.36±107.08 805.59±65.60
ERvel FS 720.08±30.06
2.28 711.19±38.45
0.48 637.10±63.82
0.59 SS 641.11±62.55 696.23±49.20 666.43±76.05
SRvel FS 409.13±18.85
2.35 386.14±24.41
0.79 367.72±46.29
0.35 SS 379.48±16.79 403.04±35.12 378.10±38.35
PRvel FS 186.83±57.30
0.12 197.92±55.08
0.40 170.90±45.91
0.13 SS 191.70±62.18 197.92±55.09 175.66±54.28
KRvel FS 162.32±50.56
0.49 187.57±11.45
2.99 153.10±41.38
0.17 SS 178.10±40.75 164.63±10.21 157.54±13.51
ARvel FS 151.20±55.47
0.17 171.80±29.77
1.41 123.42±24.65
2.43 SS 156.70±34.11 145.12±23.28 157.54±13.51
TRvel FS 247.93±86.18
0.31 261.18±37.93
1.38 190.84±103.81
0.45 SS 228.14±92.64 210.97±62.42 216.50±48.74
WAacc FS 5857.27±1513.51
0.99 4756.04±1295.25
1.50 6411.59±1434.44
0.79 SS 4982.01±913.52 5936.92±902.56 5625.94±1374.06
EAacc FS 3728.68±348.03
0.51 3484.43±324.07
0.17 3554.24±247.60
1.02 SS 3525.55±724.83 3434.62±484.22 3176.67±695.79
WAO FS 138.87±7.43
0.21 161.61±20.52
0.82 154.64±25.54
1.43 SS 136.30±23.11 151.50±13.81 120.03±41.24
EAO FS 113.53±26.47
1.43 139.05±54.69
1.39 121.62±33.85
1.10 SS 88.31±23.20 100.81±6.03 101.40±14.85
SAO FS 160.46±46.37
0.33 174.41±45.88
0.61 158.06±46.78
1.24 SS 148.74±52.57 154.55±45.99 128.56±8.20
WAO/S FS 1783.28±89.47
0.32 2049.09±579.17
1.04 1974.30±496.14
0.41 SS 1683.18±621.21 2519.40±695.23 2171.79±831.95
EAO/S FS 1683.18±438.70
1.29 1644.66±339.47
0.00 1798.28±298.28
0.41 SS 1308.69±380.67 1645.09±398.26 1670.64±552.80
SAO/S FS 499.80±74.35
1.26 477.54±185.27
0.78 408.01±74.53
0.62 SS 413.20±116.14 404.53±31.86 437.75±61.35
Tab t 0.05 (6) =2.447 *Significance at 0.05 levels.
The analysis of data table -2 shows that there is no significant differences found between first and second serve of body kinematics.
The linear kinematics of hit angle (HA), reach height (Rh) and distance of hit (Dh), toss height (Th), velocity of wrist angle (WA),
elbow angle (EA), shoulder angle (SA), pelvic angle (PR), knee right (KR) and ankle right (AR). The acceleration of racket

www.ijraset.com Volume 3 Issue IV, April 2015
IC Value: 13.98 ISSN: 2321-9653
International Journal for Research in Applied Science & Engineering
Technology (IJRASET)
©IJRASET 2015: All Rights are Reserved
395
(RaCacc), wrist angle (WAacc), elbow angle (EAacc), angles and angular velocity of wrist angle (WAO/S), elbow angle (EAO/S),
shoulder angle (SAO/S) have shown |t|cal. values are less than the t0.05, 6 value at 0.05 level of significance.
This statistical finding exhibits that all the linear and angular kinematics of right side of wrist, elbow, shoulder, pelvic, knee and
ankle during first and second serve does not differ significantly and hence does not influence on the performance of tennis serve at
force generation phase during initial, mid and end phases under the match condition.
Graph no. 9: Graphical representation of the linear velocity (meter/s) of the parameters in first serve during force generation phase
of tennis serve.
Graph no. 10: Graphical representation of the linear velocity (meter/s) of the parameters in second serve during force generation
phase of tennis serve.
0
100
200
300
400
500
600
700
800
900
1000
WR ER SR PR KR AR TR
Initial
Mid
End
0
100
200
300
400
500
600
700
800
900
WR ER SR PR KR AR TR
Initial
Mid
End

www.ijraset.com Volume 3 Issue IV, April 2015
IC Value: 13.98 ISSN: 2321-9653
International Journal for Research in Applied Science & Engineering
Technology (IJRASET)
©IJRASET 2015: All Rights are Reserved 396
Graph no. 11: Graphical representation of the linear distance (meter) of the parameters in first serve during force generation phase of
tennis serve.
Graph no. 13: Graphical representation of the linear acceleration (meter/s2) of the parameters in first serve during force generation
phase of tennis serve.
Graph no. 12: Graphical representation of the linear distance (meter) of the parameters in second serve during force generation
phase of tennis serve.
0
1
2
3
4
5
6
Rh Dh Th
Initial
Mid
End
0
1000
2000
3000
4000
5000
6000
7000
WR ER
Initial
Mid
End
0
1
2
3
4
5
6
Rh Dh Th
Initial
Mid
End
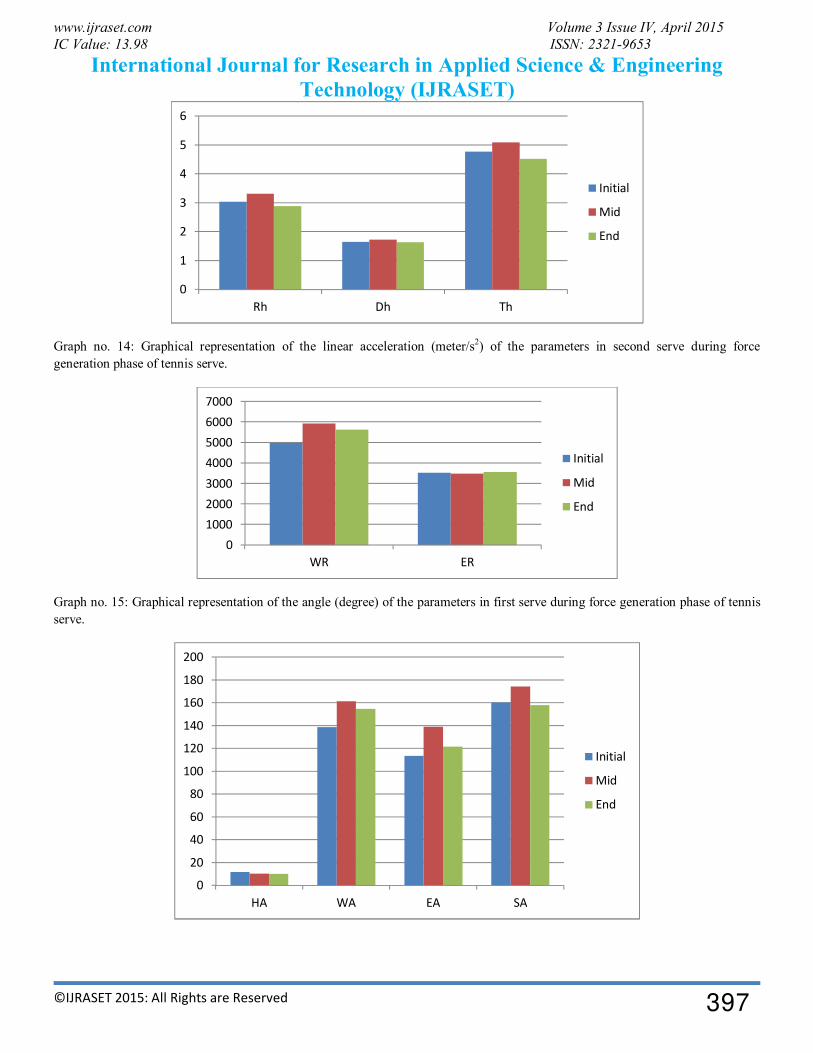
www.ijraset.com Volume 3 Issue IV, April 2015
IC Value: 13.98 ISSN: 2321-9653
International Journal for Research in Applied Science & Engineering
Technology (IJRASET)
©IJRASET 2015: All Rights are Reserved
397
Graph no. 14: Graphical representation of the linear acceleration (meter/s2) of the parameters in second serve during force
generation phase of tennis serve.
Graph no. 15: Graphical representation of the angle (degree) of the parameters in first serve during force generation phase of tennis
serve.
0
1
2
3
4
5
6
Rh Dh Th
Initial
Mid
End
0
1000
2000
3000
4000
5000
6000
7000
WR ER
Initial
Mid
End
0
20
40
60
80
100
120
140
160
180
200
HA WA EA SA
Initial
Mid
End

www.ijraset.com Volume 3 Issue IV, April 2015
IC Value: 13.98 ISSN: 2321-9653
International Journal for Research in Applied Science & Engineering
Technology (IJRASET)
©IJRASET 2015: All Rights are Reserved
398
Graph no. 17: Graphical representation of the angular velocity (degree/second) of the parameters in first serve during force
generation phase of tennis serve.
Graph no. 16: Graphical representation of the angle (degree) of the parameters in first serve during force generation phase of second
serve.
Graph no. 18: Graphical representation of the angular velocity (degree/second) of the parameters in second serve during force
generation phase of tennis serve.
0
500
1000
1500
2000
2500
WA EA SA
Initial
Mid
End
0
20
40
60
80
100
120
140
160
180
HA WA EA SA
Initial
Mid
End
0
500
1000
1500
2000
2500
3000
WA EA SA
Initial
Mid
End

www.ijraset.com Volume 3 Issue IV, April 2015
IC Value: 13.98 ISSN: 2321-9653
International Journal for Research in Applied Science & Engineering
Technology (IJRASET)
©IJRASET 2015: All Rights are Reserved
399
Table No.: 3 Kinematics parameters of first and second serve during Follow through Phase at Initial, mid & End Period of Match.
Variable Serve Initial Period Mid Period End Period
Mean±SD t-value Mean±SD t-value Mean±SD t-value
RIvel FS 1530.47±289.32
1.11 1498.56±187.30
0.05 1484.24±303.23
0.52 SS 1336.96±193.32 1491.90±168.47 1401.35±107.89
RPIvel FS 1786.71±316.22
2.47* 1663.00±395.82
0.80 1311.45±249.88
0.46 SS 1371.55±115.23 1480.74±224.44 1376.80±137.32
Ballvel FS 4735.37±873.40
2.06 4236.07±447.93
1.14 4020.27±759.62
0.80 SS 3763.12±360.27 3856.12±490.26 3713.00±82.72
WRvel FS 837.91±113.48
1.45 756.20±83.98
0.17 713.42±102.95
0.05 SS 729.71±96.30 770.59±151.02 716.35±55.24
ERvel FS 420.72±27.52
2.70 396.40±25.85
0.77 368.71±35.35
2.08 SS 382.02±7.96 416.80±45.57 411.57±21.15
SRvel FS 216.34±35.25
0.87 211.46±37.42
0.75 205.78±35.18
0.49 SS 235.85±27.55 227.43±20.53 215.64±19.10
PRvel FS 168.48±47.49
0.41 194.01±22.39
0.70 176.27±39.94
0.31 SS 181.23±41.43 179.42±35.40 168.96±26.31
KRvel FS 75.83±17.02
0.02 76.56±36.15
0.19 88.35±23.12
0.81 SS 75.64±15.53 80.96±28.14 75.80±20.86
ARvel FS 328.25±56.22
0.10 342.70±43.45
0.04 334.78±84.87
0.37 SS 323.24±78.22 344.19±51.38 317.52±36.77
TRvel FS 399.18±63.19
0.00 428.49±47.34
0.18 407.88±80.65
0.64 SS 398.99±101.71 420.60±76.40 379.96±32.39
WAacc FS 2191.65±380.80
0.17 2254.27±530.74
1.29 3267.26±1121.65
0.39 SS 2274.98±892.58 3198.78±1367.00 3597.08±1290.19
EAacc FS 1497.49±607.10
0.93 1278.36±547.82
0.02 1118.60±775.77
1.48 SS 1140.61±476.10 1287.12±604.38 1850.05±615.07
WAO FS 146.86±18.94
1.70 143.73±7.24
0.56 140.90±5.91
0.02 SS 129.60±7.18 140.22±10.34 140.78±13.86
EAO FS 159.17±10.60
1.82 138.03±39.28
0.30 140.95±24.82
0.43 SS 125.97±34.84 144.52±17.56 146.45±6.62
SAO FS 134.74±8.10
0.56 118.08±18.98
2.26 150.12±19.55
1.14 SS 125.41±32.30 142.78±10.89 135.92±15.35
WAO/S FS 1219.91±523.83
0.06 1104.02±825.79
0.34 900.28±214.34
0.82 SS 1242.19±461.93 953.57±343.55 1107.08±458.05
EAO/S FS 1911.67±1033.24
0.39 1723.01±856.58
0.00 1725.99±542.85
0.25 SS 1659.29±780.01 1725.45±1089.08 1599.41±870.47
SAO/S FS 1540.91±710.73
1.01 1094.08±949.85
0.61 1665.34±823.28
0.22 SS 1085.24±555.21 1443.88±657.58 1763.04±370.14
Tab t 0.05 (6) =2.447 *Significance at 0.05 levels.
The analysis of data table - 3 shows that there are no significant differences found between first and second serve of body
kinematics. The linear velocity of racket velocity at impact (RIvel), racket velocity at post impact (RPIvel), ball (Ballvel) wrist angle
(WA), elbow angle (EA), shoulder angle (SA), pelvic angle (PR), knee right (KR) and ankle right (AR). The acceleration of wrist
angle (WAacc), elbow angle (EAacc), angles and angular velocity of wrist angle (WAO/S), elbow angle (EAO/S), shoulder angle (SAO/S)
have shown |t|cal. values are less than the t0.05, 6 value at 0.05 level of significance. Except the racket velocity at post impact (RPIvel)

www.ijraset.com Volume 3 Issue IV, April 2015
IC Value: 13.98 ISSN: 2321-9653
International Journal for Research in Applied Science & Engineering
Technology (IJRASET)
©IJRASET 2015: All Rights are Reserved
400
during initial period of the match. Which shows a significant difference where|t|cal. values is more than the t0.05, 6 value at 0.05 level
of significance.
Graph no. 19: Graphical representation of the linear velocity (meter/s) of the parameters in first serve during follow through phase
of tennis serve.
Graph no. 21: Graphical representation of the linear acceleration (meter/s2) of the parameters in first serve during follow through
phase of tennis serve.
Graph no. 20: Graphical representation of the linear velocity (meter/s) of the parameters in second serve during follow through
phase of tennis serve.
0
500
1000
1500
2000
2500
3000
3500
4000
4500
5000
RI RPI Ball WR ER SR PR KR AR TR
Initial
Mid
End
0
500
1000
1500
2000
2500
3000
3500
WR ER
Initial
Mid
End
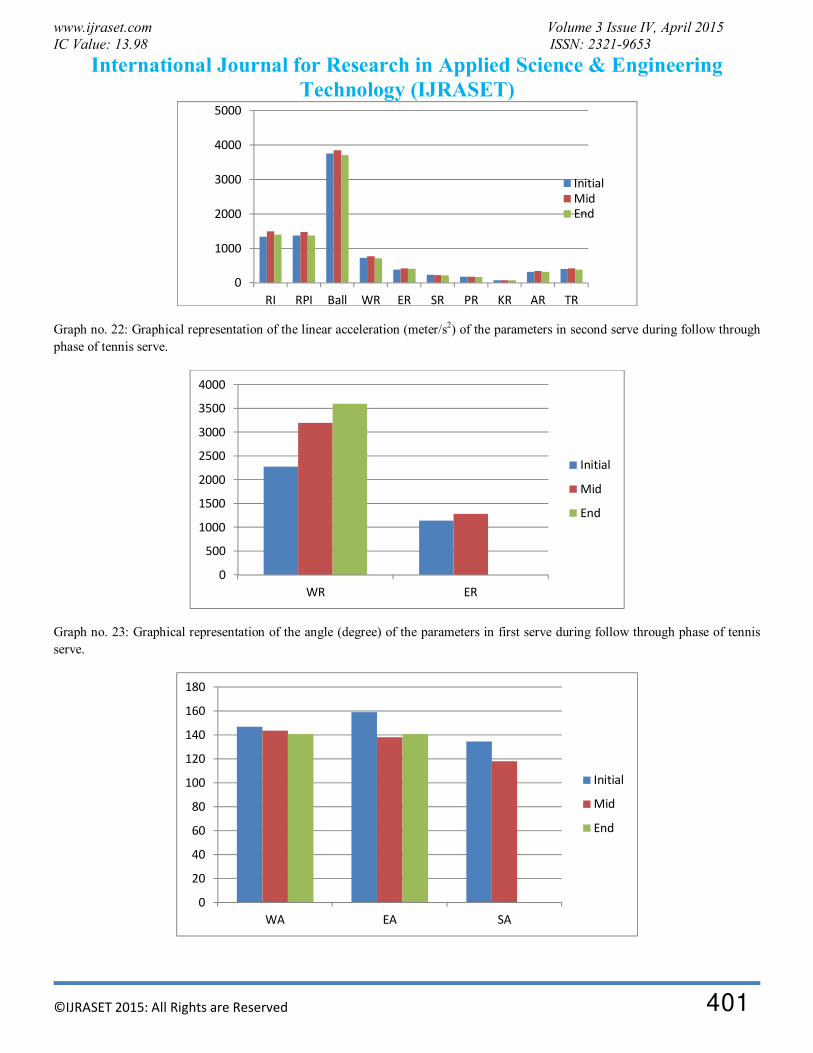
www.ijraset.com Volume 3 Issue IV, April 2015
IC Value: 13.98 ISSN: 2321-9653
International Journal for Research in Applied Science & Engineering
Technology (IJRASET)
©IJRASET 2015: All Rights are Reserved
401
Graph no. 22: Graphical representation of the linear acceleration (meter/s2) of the parameters in second serve during follow through
phase of tennis serve.
Graph no. 23: Graphical representation of the angle (degree) of the parameters in first serve during follow through phase of tennis
serve.
0
1000
2000
3000
4000
5000
RI RPI Ball WR ER SR PR KR AR TR
Initial
Mid
End
0
500
1000
1500
2000
2500
3000
3500
4000
WR ER
Initial
Mid
End
0
20
40
60
80
100
120
140
160
180
WA EA SA
Initial
Mid
End

www.ijraset.com Volume 3 Issue IV, April 2015
IC Value: 13.98 ISSN: 2321-9653
International Journal for Research in Applied Science & Engineering
Technology (IJRASET)
©IJRASET 2015: All Rights are Reserved
402
Graph no. 25: Graphical representation of the angular velocity (degree/second) of the parameters in first serve during follow through
phase of tennis serve.
Graph no. 24: Graphical representation of the angle (degree) of the parameters in second serve during follow through phase of tennis
serve.
Graph no. 26: Graphical representation of the angular velocity (degree/second) of the parameters in second serve during follow
through phase of tennis serve.
0
500
1000
1500
2000
2500
WA EA SA
Initial
Mid
End
110
115
120
125
130
135
140
145
150
WA EA SA
Initial
Mid
End
0
500
1000
1500
2000
WA EA SA
Initial
Mid
End

www.ijraset.com Volume 3 Issue IV, April 2015
IC Value: 13.98 ISSN: 2321-9653
International Journal for Research in Applied Science & Engineering
Technology (IJRASET)
©IJRASET 2015: All Rights are Reserved
403
This statistical finding exhibits that all the linear and angular kinematics of right side of wrist, elbow, shoulder, pelvic, Knee and
ankle during first and second serve does not differ significantly and hence does not influence on the performance of tennis serve at
follow through phase during initial, mid and end phases under the match condition.
IV. DISCUSSION
Service is a key element in the game of tennis. Advanced players can hit the serve in many different ways and often use it as an
offensive weapon to gain an advantage in the point or to win. Professional players are expected to win most of their games in
service, may be the first serve or second serve. The flexion & extension of body joints are the keys to generate maximum
momentum and also contribute in performance of tennis serves. When executing a tennis serve, vigorous movement of the trunk
help to generate as much angular momentum as possible to transfer it to the racquet (Bahamonde, 2000). The statistical analysis of
data for different body segment kinematics revealed no significance difference between first and second service for Indian elite
players.
The linear and angular kinematics of body joints point and body joint angle of right wrist, elbow, shoulder, pelvis, knee and ankle.
And other kinematics as, toss angle, hit angle, reach, height, distance of the hit, toss height, racket velocity at impact, racket velocity
at post impact, ball shows no significant differences between the both first and second tennis serve. The knees and hips extend and
the back moves from extension to flexion and rotates toward the non-dominant side (Abrams, 2011).
Chew et. al. (2003) reported absolute racket velocities were comparable between first serve and second serve, and were developed
to similar magnitudes, independent of serve location. The comparison of studies has reached to the conclusion that the shoulder
plays an important role in generating power, as well as transfers the power to the distal segments to contribute to the performance
(Putnam, 1993; Elliott et al., 1995). However, there are some disagreements between different investigations. For example, Elliott et
al. (1995) concluded that forearm extension at the elbow actually has a negative effect on racquet speed which may reduce the ball
speed. This contradicts another study that showed elbow extension to be the second greatest contributor to racquet speed at impact
(Gordon & Dapena, 2006).
Elliott et al. (2003) studied the tennis serve’s biomechanical properties using a two-camera system and compared male and female
results during competition at the 2000 Sydney Olympic Games. They chose to analyze serves with the highest velocity and
concluded that males created higher forces from their shoulder and elbow while also serving at higher speed. They also founded that
an increased knee flexion during the backswing leads to generate low forces of upper extremity and recommended that players be
encouraged to perform knee flexion. Reid et al. (2008) have investigated the factors which were most critical to the different serving
techniques were the range of extension of front and rear knee, peak angular velocity of rear knee drive extension. The shoulder joint
and foot kinematics influence higher in higher racquet linear velocity.
The tennis serve and throwing motion have a great relationship within each other. The movement uses whole body kinematics to
impact the direction and velocity on the ball. There are ten segments in a position to be activated during these movements of tennis
serve and throw. They are the ankles, feet, knees, pelvis, trunk, shoulder girdle, arm, forearm, and hand working in synchronicity.
Each has its own movements relative to its own proximal articulation. These articulations can perform more than one movement;
each movement depends upon the skill to be performed. Therefore, the link system tends to go faster as the movements proceed to
its distal end to gain maximum ball velocity (Wigley, n.d). Finally, the follow-through phase begins just after the ball contact and
ending with completion of the stroke (Pradhan, 2001). A number of investigations have been conducted to further delineate the
specific biomechanics of serve in tennis (Elliott, 1986; Bahamonde, 1989; Dillman, 1995; Elliott, 1995; Noffal, 1999; Elliott, 2003;
Gordon & Dapena, 2006).
V. CONCLUSION
From the data of the 2-D kinematics of the body moment of tennis serve of elite Indian players, we can see that the velocity of the
ball produces more by the combination of the body kinematics moment, and this moment comes mainly from the extension of the
knee, trunk, shoulder, elbow and wrist. This point can be verified by the 2-D kinematics results of the study. Elite tennis players
maintain their body kinematics in both first and second serve, and also manipulate their body kinematics to control the maximum
ball velocity till the end period of the match, which is executed through the racket velocity generated by the sequential movement of
the body segments involve in the serve motion of the tennis. From this study, we can further understand the role of body joint
kinematics in the on the maintenance of the performance of the tennis serve throughout the match. This will provide a reference to
the serve motions and the execution of the serve techniques for training and teaching, with a view to improve serving efficiency.
www.ijraset.com Volume 3 Issue IV, April 2015
IC Value: 13.98 ISSN: 2321-9653
International Journal for Research in Applied Science & Engineering
Technology (IJRASET)
©IJRASET 2015: All Rights are Reserved
404
REFERENCES
[1] Abrams, G. D., Sheets, A. L., Andriacchi, T. P. & Safran, M. R. (2011). Review of tennis serve motion analysis and the biomechanics of three serve types
with implications for injury. Sports Biomechanics, 10(4): 378-390.
[2] Applied proceedings of the XVII international symposium on biomechanics in sports: Tennis (pp. 27–34). Perth: Edith Cowan University Press.
[3] Bahamonde, R. E. (1989). Kinetic analysis of the serving arm during the performance of the tennis serve. Journal of Biomechanics, 22, 983.
[4] Bradley, J. P., & Tibone, J. E. (1991). Electromyographic analysis of muscle action about the shoulder. Clinics in Sports Medicine, 10, 901–911.
[5] Brody, H. (1987). The serve. In H. Brody (Ed.), Tennis science for tennis players (pp. 106–110). Philadelphia, PA: University of Pennsylvania Press.
[6] Dillman, C. J., Schultheis, J. M., Hintermeister, R. A., & Hawkins, R. J. (1995). What do we know about body mechanics involved in tennis skills? In H.
Krahl, H. Pieper, B. Kibler, and P. Renstrom (Eds.), Tennis: Sports medicine and science (pp. 6–11). Dusseldorf: Society for Tennis Medicine and
Science.
[7] Dillman, C. J., Smutz, P., & Werner, S. (1991). Valgus extension overload in baseball pitching. Medicine and Science in Sport and Exercise, 23, S135.
[8] Durovic, N., Lozovina, V., Pavicc, L. & Mrduljas, D. (2008). Kinematics Analysis of the tennis serve in young tennis players. Acta Kinesiologica, 2(2),
50-56.
[9] Elliot, B.C. & Wood, GA. (1983). The biomechanics of the foot-up and foot-back tennis service techniques. The Australian Journal of Sport Sciences,
3(2), 3-6
[10] Elliott, B (2006), “Biomechanics and tennis”, British Journal of Sports Medicine; 40(5): 392–396.
[11] Elliott, B. & Wood, G. (1983), “The Biomechanics of the Foot-Up and Foot-Back Tennis Serve Techniques”, The Australian Journal of Sports Sciences,
3(2), 3-5.
[12] Kuo-Cheng Lo, Lin-Hwa Wang, Chia-Ching Wu , Fong-Chin Su(2004), “Kinematics of lower extremity in tennis flat and spin serve”, Journal of Medical
and Biological Engineering, 24(4): 209-212.
[13] Elliott, B. C., & Kilderry, R. (1983). The art and science of tennis. Philadelphia, PA: WB Saunders.
[14] Elliott, B. C., Marshall, R. N., & Noffal, G. J. (1995). Contributions of upper limb segment rotations during the power serve in tennis. Journal of Applied
Biomechanics, 11, 433–442.
[15] Elliott, B., Marsh, T., & Blanksby, B. (1986). A three-dimensional analysis of the tennis serve. International Journal of Sports Biomechanics, 2, 260–271.
[16] Gordon, B. J., & Dapena, J. (2006). Contributions of joint rotations to racquet speed in the tennis serve. Journal of Sport Sciences, 24, 31–49.
[17] Groppel, J.L. (1984). Tennis for advanced players: and those who would like to be champion. Champaign, IL: Human Kinetics.
[18] Groppel, J.L. (1992). High-tech tennis. Champaign, IL: Human Kinetics.
[19] Kibler, W. B., & Safran, M. (2000). Musculoskeletal injuries in the young tennis player. Clinics in Sports Medicine, 19, 781–792.
[20] Kibler, W. B., & Safran, M. (2005). Tennis injuries. Medicine and Sport Science, 48, 120–137
[21] Noffal, G. (1999). Where do high speed tennis serves come from? In B. Elliott, B. Gibson, and D. Knudson (Eds.),
[22] Pradhan, R. L., Itoi, E., Hatakeyama, Y., Urayama, M., & Sato, K. (2001). Superior labral strain during the throwing motion. A cadaveric study. American
Journal of Sports Medicine, 29, 488–492.
[23] Putnam, C. M. (1993). Sequential motions of body segments in striking and throwing skills: Descriptions and explanations. Journal of Biomechanics, 26
(S1), 125 –135.
[24] Reid M. et al. (2007), British Journal Sports Medicine, 41, 884-889.
[25] Reid, M., Elliott, B., & Alderson, J. (2008). Lower limb coordination and shoulder joint mechanics in the tennis serve. Medicine and Science in Sports
and Exercise, 40, 308–315.
[26] T, Satoru & I, Akira (2007), “A three-dimensional analysis of the contributions of upper limb joint movements to horizontal racket head velocity at ball
impact during tennis serving”, Sports Biomechanics, 6(3), 418-433.
[27] Whiteside, D., Elliott, B., Lay, B. & Reid, B. (2013). Human Movement Science, 32, 822-835.
[28] Wigley, R. (n.d). Teaching Tennis Biomechanics. Retrieved from http://www.teachingtennis.com/site/body1.htm
[29] Yuliang Sun, Yu Liu and Xinglong Zhou (2012), “A Kinematic Analysis Of A Top 10 Wta Tennis Player’s First Serve”, 30th Annual Conference of
Biomechanics in Sports – Melbourne 2012
[30] Chow, J., Park, S. & Tillman, M. (2009). Lower trunk kinematics and muscle activity during different types of tennis serve. Sports Medicine,
Arthroscopy, Rehabilitation, Therapy & Technology, 1, 24-37.
[31] Bahamonde, R. E. (2000). Changes in angular momentum during the tennis serve. J Sports Science, 18: 579-592.
[32] Hooper, T. (2001). Biomechanical Analysis of the Tennis Serve. Retrieve from
http://web.uvic.ca/~thopper/PE117/Pe117/Assignments/Greg%20Serve%20Analysis.pdf
[33] Seeley, M. K. (n.d.). A Review of Tennis Serve Bimechanics. Retrieved from http://biomech.byu.edu/Portals/83/docs/exsc362/tennis_example.pdf

5/18/2020 Article Details
oldpesrj.lbp.world/ArticleDetails.aspx?id=372 1/1
Home Received Articles Articles in Press Current Issue Archive Post Publication Submit Article
Microsoft® Translator
ISSN NO : 2277-3665
INDEX YOUR JOURNAL
Editorial
Board of Editors
Disciplines Covered
Publication Ethics
Call For Chapters
Guidelines to Authors
Research Paper Format
Track Article
Contact Us
Translate this page
Unavailable
Article Details ::
Article Name :
ANALYSIS OF FITNESS STATUS OF URBAN AND RURAL YOUTH’S OF MAHARATRA STATEAuthor Name :
Fuzail Ahmad , Brajesh Kumar RaiPublisher :
Ashok YakkaldeviArticle Series No.:
ISRJ-372Article URL :
Author Profile
Abstract :
Fitness is the pre-requisite for any person to sustain the daily activities of life. This aim of this study was to examinethe differences in levels of fitness among the rural and urban youths of Maharashtra state. For the purpose of thisstudy a sample of 40 urban and rural youth of (15-24) years of age were selected randomly from the region ofdistrict Maharashtra using simple random sampling. The subjects were divided into two groups viz, urban youth andrural youth. The subjects were tested for selected motor fitness variables (Pull-ups, Sit-ups, Shuttle run, Standingbroad jump, 50 meters dash and 600 run & walk). The data was analyzed by using standard deviation, mean and t-test to describe the difference between the urban and rural youth’s fitness level.
Keywords :
fitnessruralurbant-testyouths
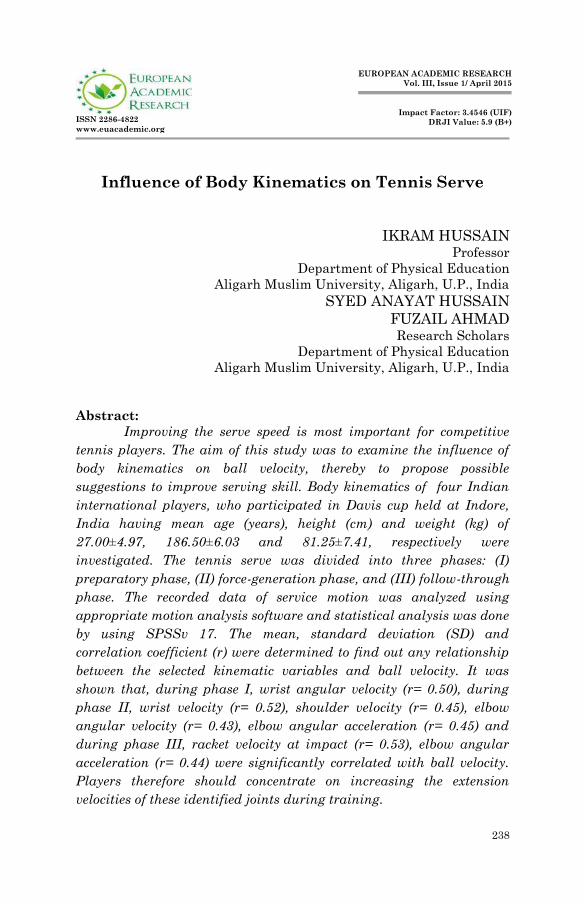
238
ISSN 2286-4822
www.euacademic.org
EUROPEAN ACADEMIC RESEARCH
Vol. III, Issue 1/ April 2015
Impact Factor: 3.4546 (UIF)
DRJI Value: 5.9 (B+)
Influence of Body Kinematics on Tennis Serve
IKRAM HUSSAIN Professor
Department of Physical Education
Aligarh Muslim University, Aligarh, U.P., India
SYED ANAYAT HUSSAIN
FUZAIL AHMAD
Research Scholars
Department of Physical Education
Aligarh Muslim University, Aligarh, U.P., India
Abstract:
Improving the serve speed is most important for competitive
tennis players. The aim of this study was to examine the influence of
body kinematics on ball velocity, thereby to propose possible
suggestions to improve serving skill. Body kinematics of four Indian
international players, who participated in Davis cup held at Indore,
India having mean age (years), height (cm) and weight (kg) of
27.00±4.97, 186.50±6.03 and 81.25±7.41, respectively were
investigated. The tennis serve was divided into three phases: (I)
preparatory phase, (II) force-generation phase, and (III) follow-through
phase. The recorded data of service motion was analyzed using
appropriate motion analysis software and statistical analysis was done
by using SPSSv 17. The mean, standard deviation (SD) and
correlation coefficient (r) were determined to find out any relationship
between the selected kinematic variables and ball velocity. It was
shown that, during phase I, wrist angular velocity (r= 0.50), during
phase II, wrist velocity (r= 0.52), shoulder velocity (r= 0.45), elbow
angular velocity (r= 0.43), elbow angular acceleration (r= 0.45) and
during phase III, racket velocity at impact (r= 0.53), elbow angular
acceleration (r= 0.44) were significantly correlated with ball velocity.
Players therefore should concentrate on increasing the extension
velocities of these identified joints during training.

Ikram Hussain, Syed Anayat Hussain, Fuzail Ahmad- Influence of Body Kinematics
on Tennis Serve
EUROPEAN ACADEMIC RESEARCH - Vol. III, Issue 1 / April 2015
239
Key words: Body kinematics, Ball velocity, Tennis serve, Motion
Analysis Software.
Introduction
In tennis, serve is one of the most important basic techniques of
the sport, the efficacy of which is the key to success (Elliot,
Marsh & Balankshy, 1986). The importance of serve in tennis is
so paramount that it is the only one segment of the whole sport
that determines the success of a player. The stroke has also a
determining role in deciding the outcome of the match. So, all
level players try to develop fast and powerful serve as most
influential and fearsome weapon of their game (Sun, Lui &
Zhon, 2012). Tennis serve is the only closed skill stroke in
which a player has a full control on the trajectory (path) of the
ball. But at the same time, it is difficult to master as it involves
the complex coordination of the lower and upper body segments
(Brody, 1987; Elliot & Kilderry, 1983). By understanding the
role of different body segments in the effectiveness of tennis
serve, it is also expected that it may help us to develop the
training sessions for players and simultaneously will help them
in reducing the chances of injuries due to false execution of
serve. In order to improve the efficacy of the serve, there must
be the integrated movement of the whole body. The kinematic
chain involves the motion of the body produced by the body
segments from proximal to distal end. In case of tennis serve it
originates from the plantar-flexion of the feet and ends at
racket. The most important performance outcome from this
kinematic chain is the maximum speed (Kibler & Meer, 2001).
Various kinematic and kinetic studies have been
proposed which helps in better understanding of tennis serves
by skilled players. Most of them correlated the kinematic
motion analysis with several performance outcomes like post
impact ball speed, height of impact and time of execution (Sgro,
Mango, Nicolosi, Schembri & Lipoma, 2013). Gordon & Dapena

Ikram Hussain, Syed Anayat Hussain, Fuzail Ahmad- Influence of Body Kinematics
on Tennis Serve
EUROPEAN ACADEMIC RESEARCH - Vol. III, Issue 1 / April 2015
240
(2006) studied that the speed of racket came sequentially from
kinematic motions of different body segments like shoulder
abduction, elbow extension, ulnar deviation, rotation at the
wrist, axial rotation of upper trunk relative to lower trunk and
wrist flexion. They also found that forearm pronation had a
little negative effect on racket speed. Springer, Marshal, Elliott
& Jennings (1994), also reported the reduction of racket head
speed by elbow extension at contact. This was also supported by
(Springer, 1994) who also noted a negative role played by elbow
extension which reduced the forward velocity of centre of the
racket impact. Contrary to the previous researches, Elliot
(1988) found that during tennis serve execution, the linear
velocities of various body joints increased progressively from
knee, hip, shoulder, elbow and wrist and summation of the
resultant linear velocities of these joints resulted in maximum
angular velocity of the racket. Fleising, Nichollas, Elliot &
Escamilla (2003) studied the serve motion of players in 2000
Olympics and quantified their kinematics of knees, pelvis,
trunk, shoulder, elbows and wrists during high velocity serves
and suggested that the players must be trained to develop
kinematic profiles similar to 2000 Olympics, so as to produce
high velocity serves. Also a significant association between body
height and serve speed was reported by Vaverka & Cernosek
(2013). For high speed tennis serves, it is believed that vertical
drive from legs is one of the most determining factor, however
researchers differs in views demands the kinematic analysis of
whole body segments to be investigated for better
understanding of serve kinematic chain. Therefore present
study was structured to study the influence of whole body
kinematic parameters on ball velocity, thereby proposing the
possible training strategies for quality tennis serve to gain high
ball velocity.
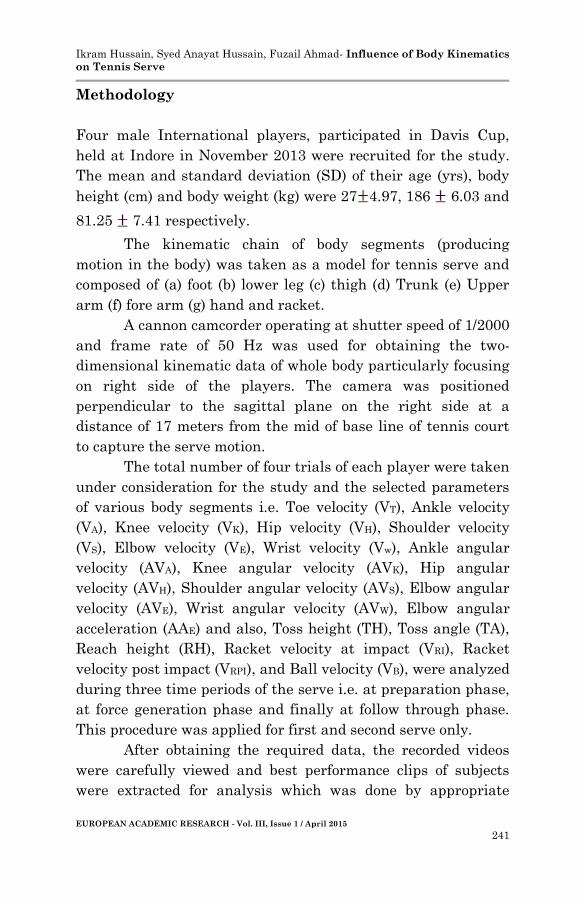
Ikram Hussain, Syed Anayat Hussain, Fuzail Ahmad- Influence of Body Kinematics
on Tennis Serve
EUROPEAN ACADEMIC RESEARCH - Vol. III, Issue 1 / April 2015
241
Methodology
Four male International players, participated in Davis Cup,
held at Indore in November 2013 were recruited for the study.
The mean and standard deviation (SD) of their age (yrs), body
height (cm) and body weight (kg) were 27 4.97, 186 6.03 and
81.25 7.41 respectively.
The kinematic chain of body segments (producing
motion in the body) was taken as a model for tennis serve and
composed of (a) foot (b) lower leg (c) thigh (d) Trunk (e) Upper
arm (f) fore arm (g) hand and racket.
A cannon camcorder operating at shutter speed of 1/2000
and frame rate of 50 Hz was used for obtaining the two-
dimensional kinematic data of whole body particularly focusing
on right side of the players. The camera was positioned
perpendicular to the sagittal plane on the right side at a
distance of 17 meters from the mid of base line of tennis court
to capture the serve motion.
The total number of four trials of each player were taken
under consideration for the study and the selected parameters
of various body segments i.e. Toe velocity (VT), Ankle velocity
(VA), Knee velocity (VK), Hip velocity (VH), Shoulder velocity
(VS), Elbow velocity (VE), Wrist velocity (Vw), Ankle angular
velocity (AVA), Knee angular velocity (AVK), Hip angular
velocity (AVH), Shoulder angular velocity (AVS), Elbow angular
velocity (AVE), Wrist angular velocity (AVW), Elbow angular
acceleration (AAE) and also, Toss height (TH), Toss angle (TA),
Reach height (RH), Racket velocity at impact (VRI), Racket
velocity post impact (VRPI), and Ball velocity (VB), were analyzed
during three time periods of the serve i.e. at preparation phase,
at force generation phase and finally at follow through phase.
This procedure was applied for first and second serve only.
After obtaining the required data, the recorded videos
were carefully viewed and best performance clips of subjects
were extracted for analysis which was done by appropriate

Ikram Hussain, Syed Anayat Hussain, Fuzail Ahmad- Influence of Body Kinematics
on Tennis Serve
EUROPEAN ACADEMIC RESEARCH - Vol. III, Issue 1 / April 2015
242
motion analysis software. The software provides to identify the
required angles, displacement, time and number of frames.
Preparatory Phase Force generation Phase
Follow Through Phase
Results
The main objective of this scientific venture was to determine
the relationship between players’ kinematic variables and ball velocity of the serve. The results of the study are presented in
the given tables below;
Table No.: 1 Mean, SD & relationship among players’ kinematic variables and ball velocity of serve during Preparation Phase.
Variable Mean SD Correlation (r)
Toss Angle (TA) 9.21 4.05 0.02
Wrist Velocity (Vw) 138.61 26.56 0.04
Elbow Velocity (VE) 96.42 18.66 0.30
Shoulder Velocity(VS) 86.23 13.89 0.31
Hip Velocity (VH) 73.22 15.63 0.15
Knee velocity (VK) 60.98 14.80 0.13
Ankle Velocity (VA) 37.01 11.79 0.39
Toe Velocity (VT) 35.42 14.58 0.40
Wrist Angular Velocity (AVW) 422.84 148.74 0.50*
Elbow Angular Velocity (AVE) 428.04 182.18 0.15
Shoulder Angular Velocity (AVS) 91.79 21.17 0.41
Hip Angular Velocity (AVH) 189.99 167.36 -0.01
Knee Angular Velocity (AVK) 761.41 553.10 0.35
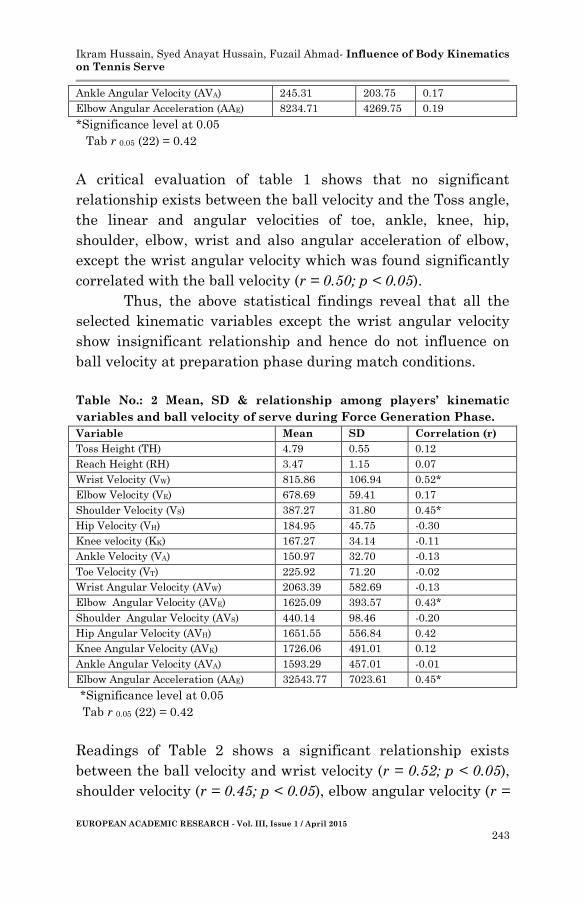
Ikram Hussain, Syed Anayat Hussain, Fuzail Ahmad- Influence of Body Kinematics
on Tennis Serve
EUROPEAN ACADEMIC RESEARCH - Vol. III, Issue 1 / April 2015
243
Ankle Angular Velocity (AVA) 245.31 203.75 0.17
Elbow Angular Acceleration (AAE) 8234.71 4269.75 0.19
*Significance level at 0.05
Tab r 0.05 (22) = 0.42
A critical evaluation of table 1 shows that no significant
relationship exists between the ball velocity and the Toss angle,
the linear and angular velocities of toe, ankle, knee, hip,
shoulder, elbow, wrist and also angular acceleration of elbow,
except the wrist angular velocity which was found significantly
correlated with the ball velocity (r = 0.50; p < 0.05).
Thus, the above statistical findings reveal that all the
selected kinematic variables except the wrist angular velocity
show insignificant relationship and hence do not influence on
ball velocity at preparation phase during match conditions.
Table No.: 2 Mean, SD & relationship among players’ kinematic variables and ball velocity of serve during Force Generation Phase.
Variable Mean SD Correlation (r)
Toss Height (TH) 4.79 0.55 0.12
Reach Height (RH) 3.47 1.15 0.07
Wrist Velocity (VW) 815.86 106.94 0.52*
Elbow Velocity (VE) 678.69 59.41 0.17
Shoulder Velocity (VS) 387.27 31.80 0.45*
Hip Velocity (VH) 184.95 45.75 -0.30
Knee velocity (KK) 167.27 34.14 -0.11
Ankle Velocity (VA) 150.97 32.70 -0.13
Toe Velocity (VT) 225.92 71.20 -0.02
Wrist Angular Velocity (AVW) 2063.39 582.69 -0.13
Elbow Angular Velocity (AVE) 1625.09 393.57 0.43*
Shoulder Angular Velocity (AVS) 440.14 98.46 -0.20
Hip Angular Velocity (AVH) 1651.55 556.84 0.42
Knee Angular Velocity (AVK) 1726.06 491.01 0.12
Ankle Angular Velocity (AVA) 1593.29 457.01 -0.01
Elbow Angular Acceleration (AAE) 32543.77 7023.61 0.45*
*Significance level at 0.05
Tab r 0.05 (22) = 0.42
Readings of Table 2 shows a significant relationship exists
between the ball velocity and wrist velocity (r = 0.52; p < 0.05),
shoulder velocity (r = 0.45; p < 0.05), elbow angular velocity (r =
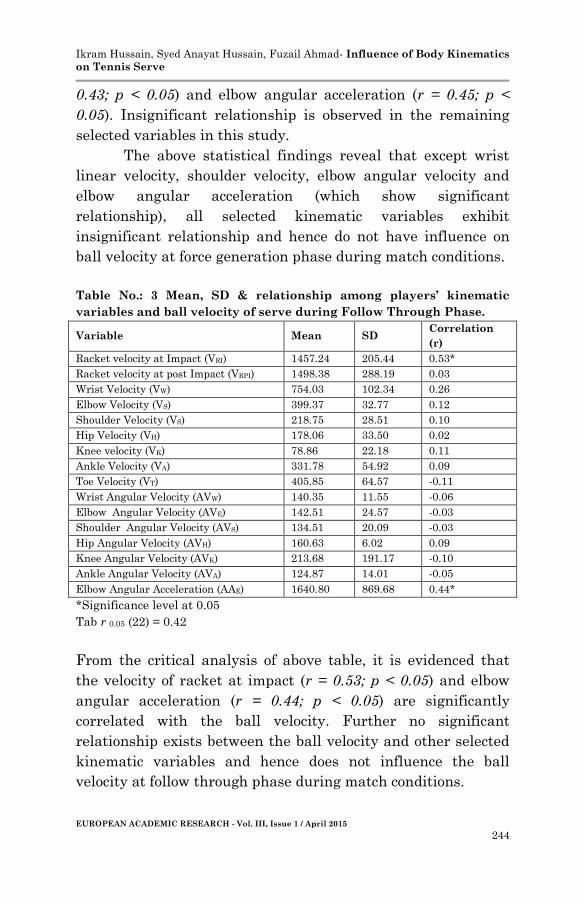
Ikram Hussain, Syed Anayat Hussain, Fuzail Ahmad- Influence of Body Kinematics
on Tennis Serve
EUROPEAN ACADEMIC RESEARCH - Vol. III, Issue 1 / April 2015
244
0.43; p < 0.05) and elbow angular acceleration (r = 0.45; p <
0.05). Insignificant relationship is observed in the remaining
selected variables in this study.
The above statistical findings reveal that except wrist
linear velocity, shoulder velocity, elbow angular velocity and
elbow angular acceleration (which show significant
relationship), all selected kinematic variables exhibit
insignificant relationship and hence do not have influence on
ball velocity at force generation phase during match conditions.
Table No.: 3 Mean, SD & relationship among players’ kinematic variables and ball velocity of serve during Follow Through Phase.
Variable Mean SD Correlation
(r)
Racket velocity at Impact (VRI) 1457.24 205.44 0.53*
Racket velocity at post Impact (VRPI) 1498.38 288.19 0.03
Wrist Velocity (VW) 754.03 102.34 0.26
Elbow Velocity (VS) 399.37 32.77 0.12
Shoulder Velocity (VS) 218.75 28.51 0.10
Hip Velocity (VH) 178.06 33.50 0.02
Knee velocity (VK) 78.86 22.18 0.11
Ankle Velocity (VA) 331.78 54.92 0.09
Toe Velocity (VT) 405.85 64.57 -0.11
Wrist Angular Velocity (AVW) 140.35 11.55 -0.06
Elbow Angular Velocity (AVE) 142.51 24.57 -0.03
Shoulder Angular Velocity (AVS) 134.51 20.09 -0.03
Hip Angular Velocity (AVH) 160.63 6.02 0.09
Knee Angular Velocity (AVK) 213.68 191.17 -0.10
Ankle Angular Velocity (AVA) 124.87 14.01 -0.05
Elbow Angular Acceleration (AAE) 1640.80 869.68 0.44*
*Significance level at 0.05
Tab r 0.05 (22) = 0.42
From the critical analysis of above table, it is evidenced that
the velocity of racket at impact (r = 0.53; p < 0.05) and elbow
angular acceleration (r = 0.44; p < 0.05) are significantly
correlated with the ball velocity. Further no significant
relationship exists between the ball velocity and other selected
kinematic variables and hence does not influence the ball
velocity at follow through phase during match conditions.
Ikram Hussain, Syed Anayat Hussain, Fuzail Ahmad- Influence of Body Kinematics
on Tennis Serve
EUROPEAN ACADEMIC RESEARCH - Vol. III, Issue 1 / April 2015
245
Discussion
The fast and powerful serve has a determining role in the
outcome of the match (Sun, Lui & Zhou 2012), therefore every
player tries to develop fast and accurate serve to gain
advantage during the match. The tennis serve involves a
complex coordination of lower and upper body segments to
provide a kinematic chain for the transference of force from
proximal to distal end of the body and thereby to the ball
resulting in its greater velocity.
The results of the statistical analysis of data showed
significant relationship of ball velocity to the linear and angular
velocity of wrist, angular velocity and angular acceleration of
elbow, linear velocity of shoulder and racket velocity at impact.
No significant relationship existed between the ball velocity
and other selected kinematic variables in all the three phases of
serve. Sweany, Reid & Elliot (2012) reported that the increased
vertical linear velocity from lower limbs enhances the linear
velocity drive of racket side shoulder, hence leading to greater
ball velocity. The greater force of vertical drive is the
contribution of pushing the ground downwards with the feet
and flexion of knee which acts as link to transfer this force to
upper limbs.
Gordan & Dapena (2006) also reported the increased
racket head speed and hence ball velocity came sequentially
from greater shoulder abduction, elbow extension, ulnar
rotation at wrist, wrist flexion and twist rotation of upper trunk
and further more the study showed that elbow extension is the
second largest contributor of racket velocity at impact. Elliot
(1998) also reported that the linear velocities of various joints
increases progressively from the lower limbs and gets
transferred to the upper extremities i.e. shoulder, elbow and
wrist and the summation of these maximum linear velocities
produce maximum angular velocity of the racket. In a
subsequent study Elliot, Marshal & Noffal (1995) reported that

Ikram Hussain, Syed Anayat Hussain, Fuzail Ahmad- Influence of Body Kinematics
on Tennis Serve
EUROPEAN ACADEMIC RESEARCH - Vol. III, Issue 1 / April 2015
246
internal rotation of shoulder was found to generate
approximately 50 percent of linear racket head velocity. Fleisig,
Nicholls, Elliot & Escamilla (2003) further reported that high
shoulder internal rotation velocity measurement was critical for
producing high ball serve velocity.
The faster ball velocity can be linked to the key role
played by the lower limbs in creating a vertical drive during the
execution of serve. The toe, ankle, knee, trunk creates a link
system which transfers the force to upper limbs in such a
coordinated way that one segment energy decreases and the
next participating body segment energy increases, thereby
making the ball to gain maximum velocity.
Hence, it is suggested that in producing high velocity
serves, coaches while imparting training, should focus on
movement specifics like joint angles and velocities. In
particular, the results suggest that special focus should be on
wrist, elbow and shoulder extensions for greater ball velocities.
Conclusion
In our study of body kinematic analysis, various velocities and
accelerations of specific joints were identified which were
significantly related to ball velocity. These include linear and
angular velocities of wrist and elbow, shoulder velocity, angular
acceleration of elbow and racket velocity at impact. So we can
conclude that the serve kinematics can be adjusted to improve
ball velocity and may allow players to enhance the serving skill.
REFERENCES
Brody, H. (1987). Tennis Science for Tennis Players.
Philadelphia: University of Pennsylvania Press.
Elliott, B.C. (1998). Biomechanics of the serve in tennis-A
biomedical perspective. Sports Medicine, 6, 285–294.
Ikram Hussain, Syed Anayat Hussain, Fuzail Ahmad- Influence of Body Kinematics
on Tennis Serve
EUROPEAN ACADEMIC RESEARCH - Vol. III, Issue 1 / April 2015
247
Elliott, B.C., & Kilderry, R. (1983). The Art and Science of
Tennis. Philadelphia: Saunders College Publishing.
Elliot, B.C., Marshal, R.N., & Noffal, G.J. (1995). Contribution
of upper limb segment rotations during the power serve
in tennis. Journal of applied biomechanics, 11, 433-442
Elliott, B., Marsh, A., & Blanksby, B. (1986). A three-
dimensional cinematographic analysis of the tennis
serve. International Journal of Sport Biomechanics, 2(4),
260-270.
Fleisig, G., Nicholls, R., Elliott, B., & Escamilla, R. (2003).
Kinematics used by world class tennis players to
produce high velocity serves. Sports Biomechanics, 2,
51–64.
Gordon, B.J., & Dapena, J. (2006). Contributions of joint
rotations to racquet speed in the tennis serve. Journal of
Sports Sciences, 24, 31–49.
Kibler, W.B., & Meer, D.V.D. (2001). Mastering the kinetic
chain. In World-Class Tennis Technique, P. Roetert and
J. Groppel, Eds. Champaign, IL: Human Kinetics, 99-
113.
Sgro, F., Mango, P., Nicolosis, S., Schembri, R., & Lipoma, M.
(2013). Analysis of knee joint motion in tennis flat serve
using low-cost technological approach. International
workshop on computer sciences in sports, 250-254.
Sun, Y., Liu, Y., & Zhou, Z. (2012). A kinematic analysis of a top
10 WTA tennis player’s first serve. In Proceeding of 30th
Annual Conference of Biomechanics in Sport, 253-225,
Australia: Melbourne.
Sweeney, M., Reid, M., & Elliot, B. (2012). Lower Limb and
Trunk Function in the High Performance Tennis Serve.
Asian Journal of Exercise & Sports Science. 9 (1), 13–20.
Springer, E., Marshall, R., Elliott, B., and Jennings, L. (1994).
A three dimensional kinematic method for determining
the effectiveness of arm segment rotations in producing

Ikram Hussain, Syed Anayat Hussain, Fuzail Ahmad- Influence of Body Kinematics
on Tennis Serve
EUROPEAN ACADEMIC RESEARCH - Vol. III, Issue 1 / April 2015
248
racquet head speed. Journal of Biomechanics, 27, 245–254.
Vaverka, F., Cernosek, M. (2013). Association between body
height and serve speed in elite tennis players. Sports
Biomechanics, 12(1), 30–37.
Wong, F.K., Keung, J.H., Law, N.W., Ng, D.K., Chung, J.W., &
Chow, D.H. (2014). Effects of body mass index and full
body kinematics on tennis serve speed. Journal of
Human Kinematics, 40, 21-28.

3 IV April 2015
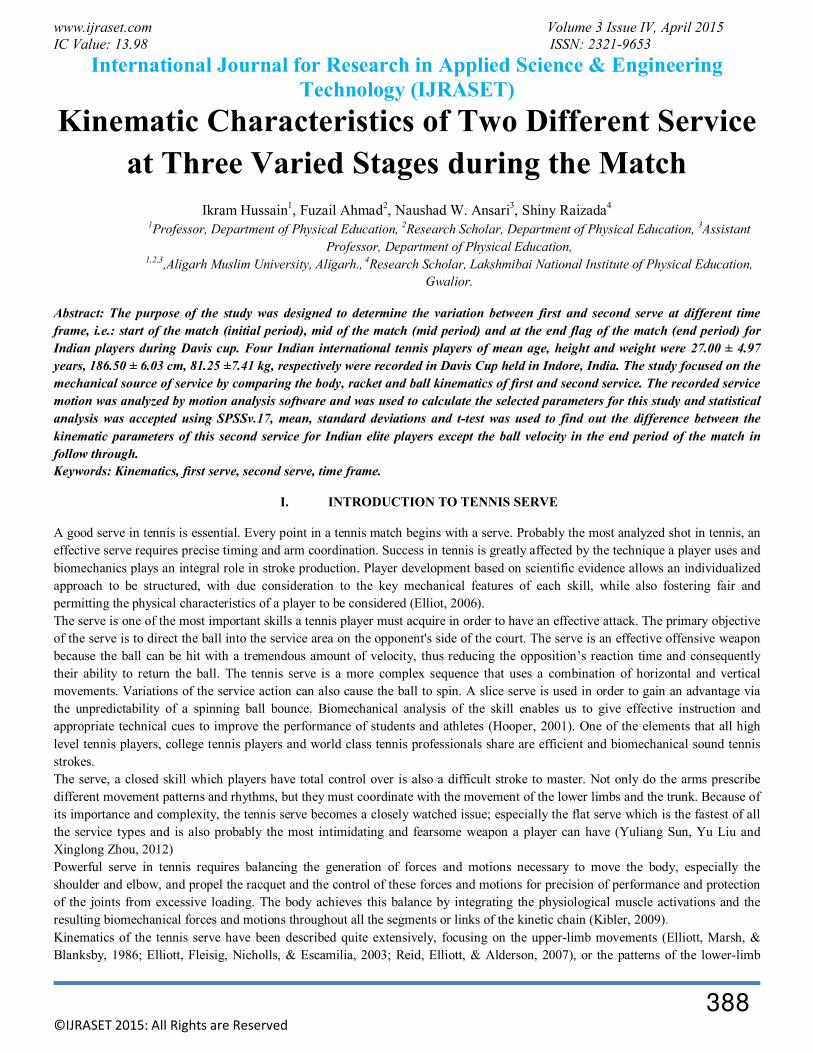
www.ijraset.com Volume 3 Issue IV, April 2015
IC Value: 13.98 ISSN: 2321-9653
International Journal for Research in Applied Science & Engineering
Technology (IJRASET)
©IJRASET 2015: All Rights are Reserved
388
Kinematic Characteristics of Two Different Service
at Three Varied Stages during the Match
Ikram Hussain1, Fuzail Ahmad
2, Naushad W. Ansari
3, Shiny Raizada
4
1Professor, Department of Physical Education, 2Research Scholar, Department of Physical Education, 3Assistant
Professor, Department of Physical Education, 1,2,3,Aligarh Muslim University, Aligarh., 4Research Scholar, Lakshmibai National Institute of Physical Education,
Gwalior.
Abstract: The purpose of the study was designed to determine the variation between first and second serve at different time
frame, i.e.: start of the match (initial period), mid of the match (mid period) and at the end flag of the match (end period) for
Indian players during Davis cup. Four Indian international tennis players of mean age, height and weight were 27.00 ± 4.97
years, 186.50 ± 6.03 cm, 81.25 ±7.41 kg, respectively were recorded in Davis Cup held in Indore, India. The study focused on the
mechanical source of service by comparing the body, racket and ball kinematics of first and second service. The recorded service
motion was analyzed by motion analysis software and was used to calculate the selected parameters for this study and statistical
analysis was accepted using SPSSv.17, mean, standard deviations and t-test was used to find out the difference between the
kinematic parameters of this second service for Indian elite players except the ball velocity in the end period of the match in
follow through.
Keywords: Kinematics, first serve, second serve, time frame.
I. INTRODUCTION TO TENNIS SERVE
A good serve in tennis is essential. Every point in a tennis match begins with a serve. Probably the most analyzed shot in tennis, an
effective serve requires precise timing and arm coordination. Success in tennis is greatly affected by the technique a player uses and
biomechanics plays an integral role in stroke production. Player development based on scientific evidence allows an individualized
approach to be structured, with due consideration to the key mechanical features of each skill, while also fostering fair and
permitting the physical characteristics of a player to be considered (Elliot, 2006).
The serve is one of the most important skills a tennis player must acquire in order to have an effective attack. The primary objective
of the serve is to direct the ball into the service area on the opponent's side of the court. The serve is an effective offensive weapon
because the ball can be hit with a tremendous amount of velocity, thus reducing the opposition’s reaction time and consequently
their ability to return the ball. The tennis serve is a more complex sequence that uses a combination of horizontal and vertical
movements. Variations of the service action can also cause the ball to spin. A slice serve is used in order to gain an advantage via
the unpredictability of a spinning ball bounce. Biomechanical analysis of the skill enables us to give effective instruction and
appropriate technical cues to improve the performance of students and athletes (Hooper, 2001). One of the elements that all high
level tennis players, college tennis players and world class tennis professionals share are efficient and biomechanical sound tennis
strokes.
The serve, a closed skill which players have total control over is also a difficult stroke to master. Not only do the arms prescribe
different movement patterns and rhythms, but they must coordinate with the movement of the lower limbs and the trunk. Because of
its importance and complexity, the tennis serve becomes a closely watched issue; especially the flat serve which is the fastest of all
the service types and is also probably the most intimidating and fearsome weapon a player can have (Yuliang Sun, Yu Liu and
Xinglong Zhou, 2012)
Powerful serve in tennis requires balancing the generation of forces and motions necessary to move the body, especially the
shoulder and elbow, and propel the racquet and the control of these forces and motions for precision of performance and protection
of the joints from excessive loading. The body achieves this balance by integrating the physiological muscle activations and the
resulting biomechanical forces and motions throughout all the segments or links of the kinetic chain (Kibler, 2009).
Kinematics of the tennis serve have been described quite extensively, focusing on the upper-limb movements (Elliott, Marsh, &
Blanksby, 1986; Elliott, Fleisig, Nicholls, & Escamilia, 2003; Reid, Elliott, & Alderson, 2007), or the patterns of the lower-limb

www.ijraset.com Volume 3 Issue IV, April 2015
IC Value: 13.98 ISSN: 2321-9653
International Journal for Research in Applied Science & Engineering
Technology (IJRASET)
©IJRASET 2015: All Rights are Reserved
389
(Elliott & Wood, 1983; Girard, Micallef, & Millet, 2005), or the function of trunk (Chow, Shim, & Lim, 2003; Chow, Park, &
Tillman, 2009). According to Tanabe, 2007 the joint movement that produces the difference in horizontal racket head velocity
between fast and slow servers is shoulder internal rotation, and angular velocity of shoulder internal rotation must be developed to
produce a high racket speed.
The tennis serve is commonly associated with musculoskeletal injury. Different types of serves, e.g. the flat and the kick types, may
involve different kinematics and different musculoskeletal demands at the joints that play an important role in the development of
long term injuries (Reid, 2007).
The spin serves produces more lateral flexion moments than flat serve; this moment comes mainly from the lateral flexion of the
trunk. The spin serve has a significant difference from the flat serve: the former produces more knee bend than the latter during
acceleration, and more backward pelvis tilting. This will help to increase the momentum during the serve and its transfer (Kuo-
Cheng Lo, 2004). The tennis serve is a commonly performed athletic skill and has received some attention in the scientific
biomechanical literature. During the tennis serve the greatest forces and moments are applied at the shoulder joint. Also, the lower
extremities are important to the successful performance of the tennis serve (Seeley, n.d.).
The study has been designed to determine the variation between first and second serve at different time frame i.e.: start of the match
(initial period), mid of the match (mid period) and at the end flag of the match (end period) for Indian players during Davis cup. The
study focused on the mechanical source of service by comparing the body, racket and ball kinematics of first and second service.
II. METHODOLOGY
A. Participants
A total of four elite male International tennis players were selected as subjects for the study, who participants in Davis Cup, held at
Indore, India in November, 2013. The mean and standard deviation (SD) of players of age (year), height (cm) and weight (kg) were
27.00 ± 4.97, 186.50 ± 6.03, 81.25 ±7.41, respectively.
B. Model of Tennis Serve
The tennis service was modeled as segments of the kinetic chain composed together of (a) foot (b) lower leg segment (c) upper leg
segment (d) trunk segment (e) upper arm segment (f) forearm and (g) hand with tennis racket. The ankle, knee and upper body
significantly flexed to make use of ground reaction force (GRF) to start the execution while extending ankle, knee and upper body
in a sequential manner for summation of force. The body makes an arc extending the shoulder with internal rotation of the upper
arm and pronation of the forearm.
C. Equipment’s and Set-up
To obtain the kinematic data for this study the equipment used were camera, tripod, computer, two-dimensional calibration frame,
motion analysis software and measuring tape. Two-dimensional kinematics data of the body were obtained with the high speed
canon camcorder operating at the shutter speed of 1/2000 with a frame rate of 50 Hz. The camera was placed perpendicular to
sagittal plane on the right side at a distance of seventeen meters from the mid of base line of the tennis court to capture the service
motion.
D. Parameters
The kinematic parameters considered for this study during preparation phase, force generation phase and follow through phase were
toss angle (ToA), toss height (TH), reach height (RH), ball velocity (Bv), racket velocity at impact (RIv), racket velocity post impact
(RPv), wrist velocity (Wv), elbow velocity (Ev), shoulder velocity (Sv), pelvic/ hip velocity (Hv), knee velocity (Kv), ankle velocity
(Av), toe velocity (Tv), wrist angular velocity (WAv), elbow angular velocity (EAv), shoulder angular velocity (SAv), pelvic
angular velocity (HAv), knee angular velocity (KAv), ankle angular velocity (AAv), toe angular velocity (TAv)
E. Subject and Trail Identification
The subjects’ identification code in the video recording for distinguishing them in the recorded data. The recorded videos were
viewed carefully in the playback system and extracted of the best performance of the subjects for analysis.
F. Data Reduction
The identified valid first and second serve of each player’s selected video footages were downloaded, slashed, edited and trimmed
by using the Xilisoft Video Converter. The trimmed video data were digitized in motion analysis software with the process of

www.ijraset.com Volume 3 Issue IV, April 2015
IC Value: 13.98 ISSN: 2321-9653
International Journal for Research in Applied Science & Engineering
Technology (IJRASET)
©IJRASET 2015: All Rights are Reserved
390
markless digitization and a database of each player’s serves was developed.
G. Statistical Procedure
Descriptive statistics and t-test were performed by SPSS version 17.0 for all the variables under this study were computed at Level
of significance for 0.05 with 6 degree of freedom.
III. RESULT
The main purpose of this study was to determine kinematical variations at the time of the preparation phase, force generation phase
and follow through phase during first and second serve during three time periods of the match i.e.: initial period, mid period and end
period.
Ball velocity and velocity of a racket at the time of impact and post impact were also studied during first and second serve.
Table No.: 1 Kinematics parameters of first and second serve during preparation Phase at Initial, mid & End Period of Match.
Variable Serve Initial Period Mid Period End Period
Mean±SD t-value Mean±SD t-value Mean±SD t-value
TAO FS 9.25 ± 5.56
0.00 9.00 ± 3.83
0.09 9.00 ± 4.69
0.15 SS 9.25 ± 4.35 9.25 ± 4.03 9.50 ± 4.80
WRvel FS 147.31±16.30
0.18 143.49±33.88
0.26 125.15±33.36
0.34 SS 144.71±23.67 137.83±27.25 133.18±33.42
ERvel FS 106.77±18.57
0.86 98.66±25.36
0.01 84.83±24.28
0.74 SS 94.89±20.31 98.48±13.54 94.89±12.49
SRvel FS 98.86±9.70
0.77 86.48±18.92
0.11 77.41±19.05
0.51 SS 86.29±11.73 85.35±9.15 82.99±10.55
PRvel FS 84.95±14.20
0.91 77.40±21.99
0.30 65.72±17.65
0.15 SS 70.11±12.53 73.74±12.61 67.43±14.81
KRvel FS 74.25±19.85
0.11 65.23±22.38
0.38 54.53±12.80
0.12 SS 55.77±8.80 60.65±9.16 55.43±8.24
ARvel FS 44.76±17.29
0.15 33.64±10.38
0.50 35.59±15.66
0.17 SS 36.83±6.18 37.33±10.74 33.95±12.27
TRvel FS 44.67±22.83
0.13 31.14±15.36
0.53 35.84±15.43
0.31 SS 31.85±8.38 36.51±13.00 32.52±15.08
WAacc FS 539.02±27.53
0.17 598.79±166.62
0.98 525.67±161.01
0.20 SS 528.56±117.85 515.39±36.11 506.66±111.35
EAacc FS 1083.78±231.56
1.54 970.39±307.93
0.58 687.14±221.46
0.44 SS 853.65±189.45 877.55±94.61 749.07±172.68
WAO FS 145.99±6.20
0.57 153.88±21.72
0.08 154.76±17.31
0.89 SS 150.07±12.97 152.86±14.64 146.11±8.67
EAO FS 108.15±9.90
1.09 115.79±24.65
0.27 123.68±21.95
0.41 SS 118.67±16.57 120.03±18.69 118.25±14.79
SAO FS 39.01±11.23
0.27 36.58±10.64
0.03 36.42±10.75
0.07 SS 37.11±8.76 36.78±13.72 36.95±10.78
WAO/S FS 509.73±193.84
0.86 354.45±143.34
0.42 403.92±197.39
0.65 SS 401.21±160.51 397.68±150.56 470.04±53.60
EAO/S FS 392.41±190.12
0.40 358.16±203.68
0.94 427.60±207.06
0.15 SS 445.64±188.84 494.86±209.97 449.58±197.50
SAO/S FS 97.33±27.36
0.39 93.89±22.50
0.21 83.29±26.22
0.34 SS 90.31±23.72 96.77±15.93 89.13±22.14

www.ijraset.com Volume 3 Issue IV, April 2015
IC Value: 13.98 ISSN: 2321-9653
International Journal for Research in Applied Science & Engineering
Technology (IJRASET)
©IJRASET 2015: All Rights are Reserved
391
Tab t 0.05 (6) =2.45 *Significance at 0.05 levels.
The analysis of data table -1 shows that there is no significant differences found between first and second serve of body kinematics.
The linear kinematic of toss angle (TA), the velocity of wrist angle (WR), elbow angle (ER), shoulder angle (SR), pelvic angle (PR),
knee right (KR) and ankle right (AR). The acceleration of wrist angle (WAacc), elbow angle (EAacc), angles and angular velocity of
wrist angle (WAO/S), elbow angle (EAO/S), shoulder angle (SAO/S) have shown |t|cal. values are less than the t0.05, 6 value at 0.05 level
of significance.
This statistical finding exhibits that all the linear and angular kinematics of right side of wrist, elbow, shoulder, pelvic, Knee and
ankle during first and second serve does not differ significantly and hence does not influence on the performance of tennis serve at
preparation phase during initial, mid and end phases under the match condition.
Graph no. 1: Graphical representation of the linear velocity (meter/s) of the parameters in first serve during preparation phase of
tennis serve.
Graph no. 2: Graphical representation of the linear velocity (meter/s) of the parameters in second serve during preparation phase of
tennis serve.
0
20
40
60
80
100
120
140
160
WR ER SR PR KR AR TR
Initial
Mid
End
0
20
40
60
80
100
120
140
160
WR ER SR PR KR AR TR
Initial
Mid
End

www.ijraset.com Volume 3 Issue IV, April 2015
IC Value: 13.98 ISSN: 2321-9653
International Journal for Research in Applied Science & Engineering
Technology (IJRASET)
©IJRASET 2015: All Rights are Reserved
392
Graph no. 3: Graphical representation of the linear acceleration (meter/s2) of the parameters in first serve during preparation phase
of tennis serve.
Graph no. 4: Graphical representation of the linear acceleration (meter/s2) of the parameters in second serve during preparation
phase of tennis serve.
Graph no. 5: Graphical representation of the angle (degree) of the parameters in first serve during preparation phase of tennis serve.
0
200
400
600
800
1000
1200
WR ER
Initial
Mid
End
0
100
200
300
400
500
600
700
800
900
1000
WR ER
Initial
Mid
End
0
20
40
60
80
100
120
140
160
180
WA EA SA
Initial
Mid
End

www.ijraset.com Volume 3 Issue IV, April 2015
IC Value: 13.98 ISSN: 2321-9653
International Journal for Research in Applied Science & Engineering
Technology (IJRASET)
©IJRASET 2015: All Rights are Reserved
393
Graph no. 7: Graphical representation of the angular velocity (degree/second) of the parameters in first serve during preparation
phase of tennis serve.
Graph no. 6: Graphical representation of the angle (degree) of the parameters in second serve during preparation phase of tennis
serve.
Graph no. 8: Graphical representation of the angular velocity (degree/second) of the parameters in second serve during preparation
phase of tennis serve.
0
100
200
300
400
500
600
WA EA SA
Initial
Mid
End
0
20
40
60
80
100
120
140
160
180
WA EA SA
Initial
Mid
End
0
100
200
300
400
500
600
WA EA SA
Initial
Mid
End

www.ijraset.com Volume 3 Issue IV, April 2015
IC Value: 13.98 ISSN: 2321-9653
International Journal for Research in Applied Science & Engineering
Technology (IJRASET)
©IJRASET 2015: All Rights are Reserved
394
Table No.: 2 Kinematics parameters of first and second serve during Force Generation Phase at Initial, mid & End Period of Match.
Variable Serve Initial Period Mid Period End Period
Mean±SD t-value Mean±SD t-value Mean±SD t-value
HAo FS 11.75±2.63
1.60 10.50±1.29
1.70 10.00±3.74
0.72 SS 8.50±3.12 7.75±2.99 8.50±1.92
Rh FS 4.03±0.47
1.19 3.99±0.23
0.73 3.55±0.43
0.82 SS 3.04±1.60 3.32±1.83 2.89±1.53
Dh FS 1.12±0.54
0.59 0.81±0.10
1.13 0.76±0.10
1.10 SS 1.65±1.68 1.73±1.64 1.64±1.60
Th FS 4.80±0.56
0.05 4.81±0.59
0.57 4.71±0.48
0.66 SS 4.78±0.62 5.10±0.82 4.52±0.31
WRvel FS 860.95±133.46
1.49 836.91±74.44
0.08 795.23±188.90
0.10 SS 754.12±53.37 842.36±107.08 805.59±65.60
ERvel FS 720.08±30.06
2.28 711.19±38.45
0.48 637.10±63.82
0.59 SS 641.11±62.55 696.23±49.20 666.43±76.05
SRvel FS 409.13±18.85
2.35 386.14±24.41
0.79 367.72±46.29
0.35 SS 379.48±16.79 403.04±35.12 378.10±38.35
PRvel FS 186.83±57.30
0.12 197.92±55.08
0.40 170.90±45.91
0.13 SS 191.70±62.18 197.92±55.09 175.66±54.28
KRvel FS 162.32±50.56
0.49 187.57±11.45
2.99 153.10±41.38
0.17 SS 178.10±40.75 164.63±10.21 157.54±13.51
ARvel FS 151.20±55.47
0.17 171.80±29.77
1.41 123.42±24.65
2.43 SS 156.70±34.11 145.12±23.28 157.54±13.51
TRvel FS 247.93±86.18
0.31 261.18±37.93
1.38 190.84±103.81
0.45 SS 228.14±92.64 210.97±62.42 216.50±48.74
WAacc FS 5857.27±1513.51
0.99 4756.04±1295.25
1.50 6411.59±1434.44
0.79 SS 4982.01±913.52 5936.92±902.56 5625.94±1374.06
EAacc FS 3728.68±348.03
0.51 3484.43±324.07
0.17 3554.24±247.60
1.02 SS 3525.55±724.83 3434.62±484.22 3176.67±695.79
WAO FS 138.87±7.43
0.21 161.61±20.52
0.82 154.64±25.54
1.43 SS 136.30±23.11 151.50±13.81 120.03±41.24
EAO FS 113.53±26.47
1.43 139.05±54.69
1.39 121.62±33.85
1.10 SS 88.31±23.20 100.81±6.03 101.40±14.85
SAO FS 160.46±46.37
0.33 174.41±45.88
0.61 158.06±46.78
1.24 SS 148.74±52.57 154.55±45.99 128.56±8.20
WAO/S FS 1783.28±89.47
0.32 2049.09±579.17
1.04 1974.30±496.14
0.41 SS 1683.18±621.21 2519.40±695.23 2171.79±831.95
EAO/S FS 1683.18±438.70
1.29 1644.66±339.47
0.00 1798.28±298.28
0.41 SS 1308.69±380.67 1645.09±398.26 1670.64±552.80
SAO/S FS 499.80±74.35
1.26 477.54±185.27
0.78 408.01±74.53
0.62 SS 413.20±116.14 404.53±31.86 437.75±61.35
Tab t 0.05 (6) =2.447 *Significance at 0.05 levels.
The analysis of data table -2 shows that there is no significant differences found between first and second serve of body kinematics.
The linear kinematics of hit angle (HA), reach height (Rh) and distance of hit (Dh), toss height (Th), velocity of wrist angle (WA),
elbow angle (EA), shoulder angle (SA), pelvic angle (PR), knee right (KR) and ankle right (AR). The acceleration of racket
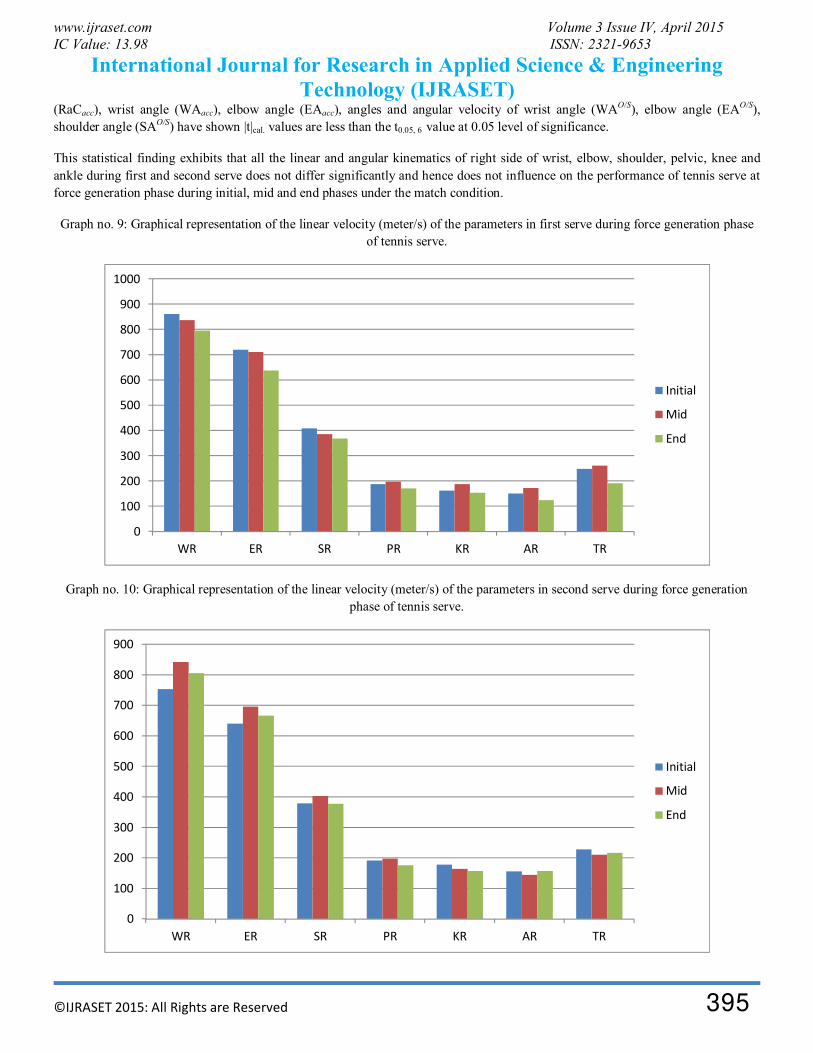
www.ijraset.com Volume 3 Issue IV, April 2015
IC Value: 13.98 ISSN: 2321-9653
International Journal for Research in Applied Science & Engineering
Technology (IJRASET)
©IJRASET 2015: All Rights are Reserved
395
(RaCacc), wrist angle (WAacc), elbow angle (EAacc), angles and angular velocity of wrist angle (WAO/S), elbow angle (EAO/S),
shoulder angle (SAO/S) have shown |t|cal. values are less than the t0.05, 6 value at 0.05 level of significance.
This statistical finding exhibits that all the linear and angular kinematics of right side of wrist, elbow, shoulder, pelvic, knee and
ankle during first and second serve does not differ significantly and hence does not influence on the performance of tennis serve at
force generation phase during initial, mid and end phases under the match condition.
Graph no. 9: Graphical representation of the linear velocity (meter/s) of the parameters in first serve during force generation phase
of tennis serve.
Graph no. 10: Graphical representation of the linear velocity (meter/s) of the parameters in second serve during force generation
phase of tennis serve.
0
100
200
300
400
500
600
700
800
900
1000
WR ER SR PR KR AR TR
Initial
Mid
End
0
100
200
300
400
500
600
700
800
900
WR ER SR PR KR AR TR
Initial
Mid
End

www.ijraset.com Volume 3 Issue IV, April 2015
IC Value: 13.98 ISSN: 2321-9653
International Journal for Research in Applied Science & Engineering
Technology (IJRASET)
©IJRASET 2015: All Rights are Reserved 396
Graph no. 11: Graphical representation of the linear distance (meter) of the parameters in first serve during force generation phase of
tennis serve.
Graph no. 13: Graphical representation of the linear acceleration (meter/s2) of the parameters in first serve during force generation
phase of tennis serve.
Graph no. 12: Graphical representation of the linear distance (meter) of the parameters in second serve during force generation
phase of tennis serve.
0
1
2
3
4
5
6
Rh Dh Th
Initial
Mid
End
0
1000
2000
3000
4000
5000
6000
7000
WR ER
Initial
Mid
End
0
1
2
3
4
5
6
Rh Dh Th
Initial
Mid
End

www.ijraset.com Volume 3 Issue IV, April 2015
IC Value: 13.98 ISSN: 2321-9653
International Journal for Research in Applied Science & Engineering
Technology (IJRASET)
©IJRASET 2015: All Rights are Reserved
397
Graph no. 14: Graphical representation of the linear acceleration (meter/s2) of the parameters in second serve during force
generation phase of tennis serve.
Graph no. 15: Graphical representation of the angle (degree) of the parameters in first serve during force generation phase of tennis
serve.
0
1
2
3
4
5
6
Rh Dh Th
Initial
Mid
End
0
1000
2000
3000
4000
5000
6000
7000
WR ER
Initial
Mid
End
0
20
40
60
80
100
120
140
160
180
200
HA WA EA SA
Initial
Mid
End
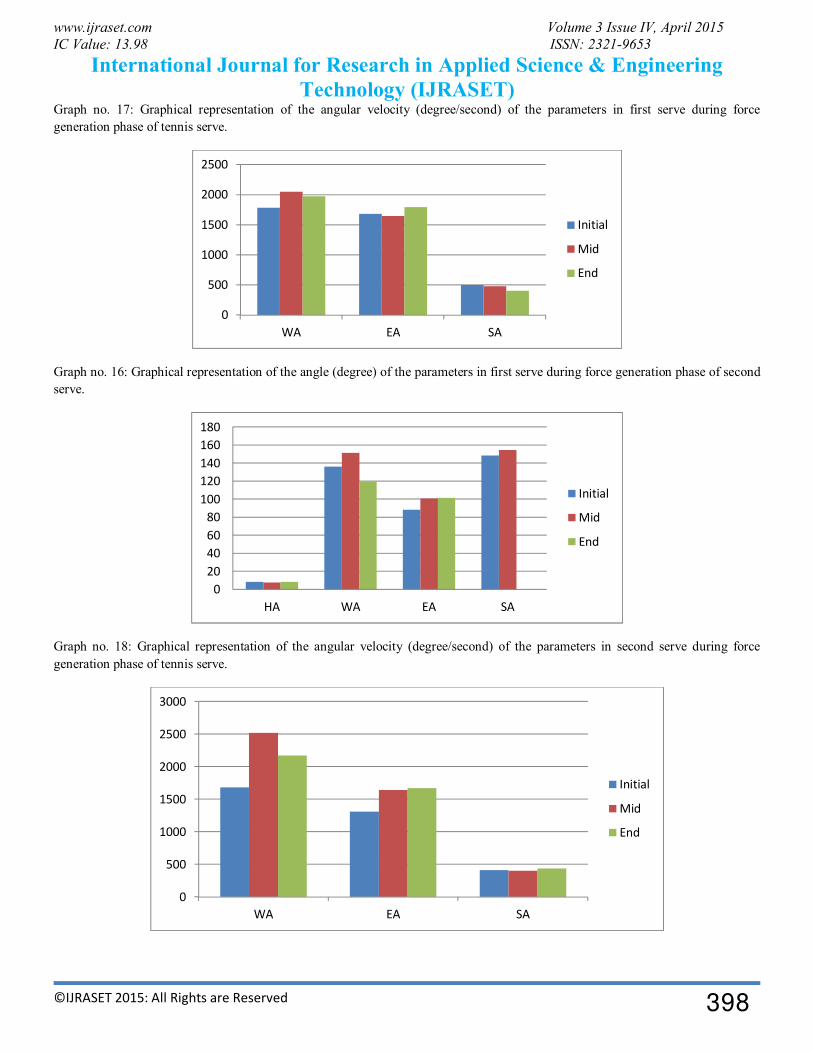
www.ijraset.com Volume 3 Issue IV, April 2015
IC Value: 13.98 ISSN: 2321-9653
International Journal for Research in Applied Science & Engineering
Technology (IJRASET)
©IJRASET 2015: All Rights are Reserved
398
Graph no. 17: Graphical representation of the angular velocity (degree/second) of the parameters in first serve during force
generation phase of tennis serve.
Graph no. 16: Graphical representation of the angle (degree) of the parameters in first serve during force generation phase of second
serve.
Graph no. 18: Graphical representation of the angular velocity (degree/second) of the parameters in second serve during force
generation phase of tennis serve.
0
500
1000
1500
2000
2500
WA EA SA
Initial
Mid
End
0
20
40
60
80
100
120
140
160
180
HA WA EA SA
Initial
Mid
End
0
500
1000
1500
2000
2500
3000
WA EA SA
Initial
Mid
End

www.ijraset.com Volume 3 Issue IV, April 2015
IC Value: 13.98 ISSN: 2321-9653
International Journal for Research in Applied Science & Engineering
Technology (IJRASET)
©IJRASET 2015: All Rights are Reserved
399
Table No.: 3 Kinematics parameters of first and second serve during Follow through Phase at Initial, mid & End Period of Match.
Variable Serve Initial Period Mid Period End Period
Mean±SD t-value Mean±SD t-value Mean±SD t-value
RIvel FS 1530.47±289.32
1.11 1498.56±187.30
0.05 1484.24±303.23
0.52 SS 1336.96±193.32 1491.90±168.47 1401.35±107.89
RPIvel FS 1786.71±316.22
2.47* 1663.00±395.82
0.80 1311.45±249.88
0.46 SS 1371.55±115.23 1480.74±224.44 1376.80±137.32
Ballvel FS 4735.37±873.40
2.06 4236.07±447.93
1.14 4020.27±759.62
0.80 SS 3763.12±360.27 3856.12±490.26 3713.00±82.72
WRvel FS 837.91±113.48
1.45 756.20±83.98
0.17 713.42±102.95
0.05 SS 729.71±96.30 770.59±151.02 716.35±55.24
ERvel FS 420.72±27.52
2.70 396.40±25.85
0.77 368.71±35.35
2.08 SS 382.02±7.96 416.80±45.57 411.57±21.15
SRvel FS 216.34±35.25
0.87 211.46±37.42
0.75 205.78±35.18
0.49 SS 235.85±27.55 227.43±20.53 215.64±19.10
PRvel FS 168.48±47.49
0.41 194.01±22.39
0.70 176.27±39.94
0.31 SS 181.23±41.43 179.42±35.40 168.96±26.31
KRvel FS 75.83±17.02
0.02 76.56±36.15
0.19 88.35±23.12
0.81 SS 75.64±15.53 80.96±28.14 75.80±20.86
ARvel FS 328.25±56.22
0.10 342.70±43.45
0.04 334.78±84.87
0.37 SS 323.24±78.22 344.19±51.38 317.52±36.77
TRvel FS 399.18±63.19
0.00 428.49±47.34
0.18 407.88±80.65
0.64 SS 398.99±101.71 420.60±76.40 379.96±32.39
WAacc FS 2191.65±380.80
0.17 2254.27±530.74
1.29 3267.26±1121.65
0.39 SS 2274.98±892.58 3198.78±1367.00 3597.08±1290.19
EAacc FS 1497.49±607.10
0.93 1278.36±547.82
0.02 1118.60±775.77
1.48 SS 1140.61±476.10 1287.12±604.38 1850.05±615.07
WAO FS 146.86±18.94
1.70 143.73±7.24
0.56 140.90±5.91
0.02 SS 129.60±7.18 140.22±10.34 140.78±13.86
EAO FS 159.17±10.60
1.82 138.03±39.28
0.30 140.95±24.82
0.43 SS 125.97±34.84 144.52±17.56 146.45±6.62
SAO FS 134.74±8.10
0.56 118.08±18.98
2.26 150.12±19.55
1.14 SS 125.41±32.30 142.78±10.89 135.92±15.35
WAO/S FS 1219.91±523.83
0.06 1104.02±825.79
0.34 900.28±214.34
0.82 SS 1242.19±461.93 953.57±343.55 1107.08±458.05
EAO/S FS 1911.67±1033.24
0.39 1723.01±856.58
0.00 1725.99±542.85
0.25 SS 1659.29±780.01 1725.45±1089.08 1599.41±870.47
SAO/S FS 1540.91±710.73
1.01 1094.08±949.85
0.61 1665.34±823.28
0.22 SS 1085.24±555.21 1443.88±657.58 1763.04±370.14
Tab t 0.05 (6) =2.447 *Significance at 0.05 levels.
The analysis of data table - 3 shows that there are no significant differences found between first and second serve of body
kinematics. The linear velocity of racket velocity at impact (RIvel), racket velocity at post impact (RPIvel), ball (Ballvel) wrist angle
(WA), elbow angle (EA), shoulder angle (SA), pelvic angle (PR), knee right (KR) and ankle right (AR). The acceleration of wrist
angle (WAacc), elbow angle (EAacc), angles and angular velocity of wrist angle (WAO/S), elbow angle (EAO/S), shoulder angle (SAO/S)
have shown |t|cal. values are less than the t0.05, 6 value at 0.05 level of significance. Except the racket velocity at post impact (RPIvel)

www.ijraset.com Volume 3 Issue IV, April 2015
IC Value: 13.98 ISSN: 2321-9653
International Journal for Research in Applied Science & Engineering
Technology (IJRASET)
©IJRASET 2015: All Rights are Reserved
400
during initial period of the match. Which shows a significant difference where|t|cal. values is more than the t0.05, 6 value at 0.05 level
of significance.
Graph no. 19: Graphical representation of the linear velocity (meter/s) of the parameters in first serve during follow through phase
of tennis serve.
Graph no. 21: Graphical representation of the linear acceleration (meter/s2) of the parameters in first serve during follow through
phase of tennis serve.
Graph no. 20: Graphical representation of the linear velocity (meter/s) of the parameters in second serve during follow through
phase of tennis serve.
0
500
1000
1500
2000
2500
3000
3500
4000
4500
5000
RI RPI Ball WR ER SR PR KR AR TR
Initial
Mid
End
0
500
1000
1500
2000
2500
3000
3500
WR ER
Initial
Mid
End

www.ijraset.com Volume 3 Issue IV, April 2015
IC Value: 13.98 ISSN: 2321-9653
International Journal for Research in Applied Science & Engineering
Technology (IJRASET)
©IJRASET 2015: All Rights are Reserved
401
Graph no. 22: Graphical representation of the linear acceleration (meter/s2) of the parameters in second serve during follow through
phase of tennis serve.
Graph no. 23: Graphical representation of the angle (degree) of the parameters in first serve during follow through phase of tennis
serve.
0
1000
2000
3000
4000
5000
RI RPI Ball WR ER SR PR KR AR TR
Initial
Mid
End
0
500
1000
1500
2000
2500
3000
3500
4000
WR ER
Initial
Mid
End
0
20
40
60
80
100
120
140
160
180
WA EA SA
Initial
Mid
End
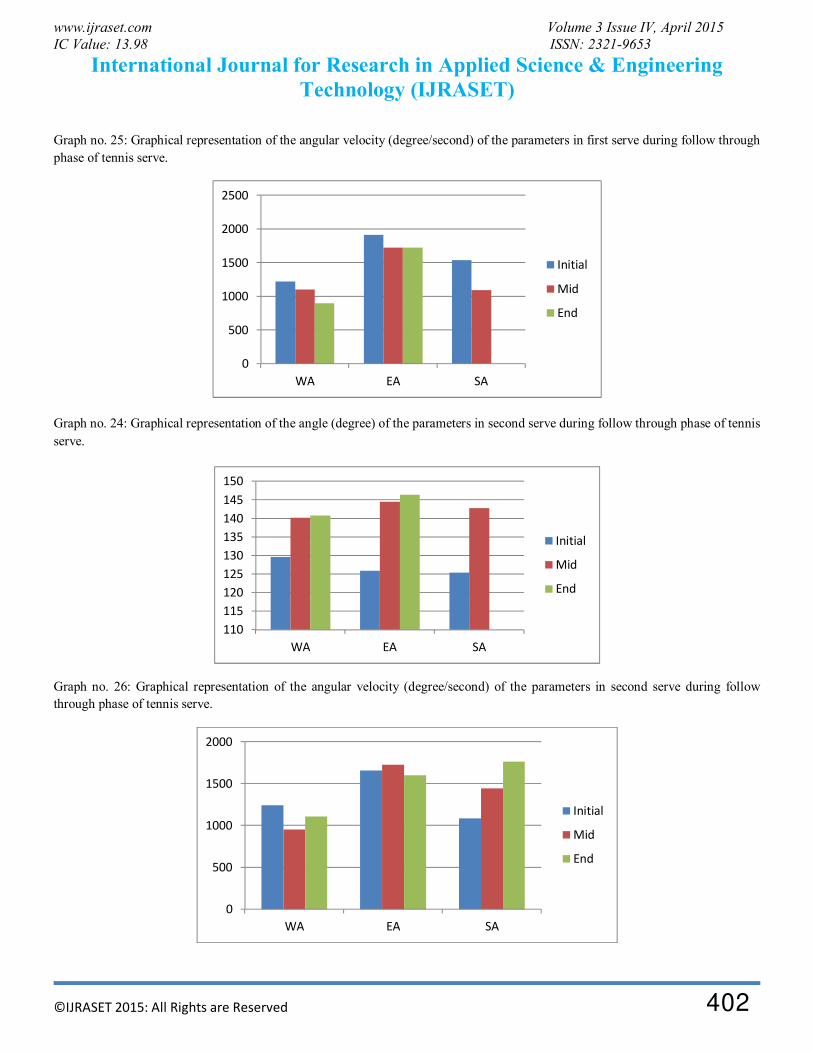
www.ijraset.com Volume 3 Issue IV, April 2015
IC Value: 13.98 ISSN: 2321-9653
International Journal for Research in Applied Science & Engineering
Technology (IJRASET)
©IJRASET 2015: All Rights are Reserved
402
Graph no. 25: Graphical representation of the angular velocity (degree/second) of the parameters in first serve during follow through
phase of tennis serve.
Graph no. 24: Graphical representation of the angle (degree) of the parameters in second serve during follow through phase of tennis
serve.
Graph no. 26: Graphical representation of the angular velocity (degree/second) of the parameters in second serve during follow
through phase of tennis serve.
0
500
1000
1500
2000
2500
WA EA SA
Initial
Mid
End
110
115
120
125
130
135
140
145
150
WA EA SA
Initial
Mid
End
0
500
1000
1500
2000
WA EA SA
Initial
Mid
End
www.ijraset.com Volume 3 Issue IV, April 2015
IC Value: 13.98 ISSN: 2321-9653
International Journal for Research in Applied Science & Engineering
Technology (IJRASET)
©IJRASET 2015: All Rights are Reserved
403
This statistical finding exhibits that all the linear and angular kinematics of right side of wrist, elbow, shoulder, pelvic, Knee and
ankle during first and second serve does not differ significantly and hence does not influence on the performance of tennis serve at
follow through phase during initial, mid and end phases under the match condition.
IV. DISCUSSION
Service is a key element in the game of tennis. Advanced players can hit the serve in many different ways and often use it as an
offensive weapon to gain an advantage in the point or to win. Professional players are expected to win most of their games in
service, may be the first serve or second serve. The flexion & extension of body joints are the keys to generate maximum
momentum and also contribute in performance of tennis serves. When executing a tennis serve, vigorous movement of the trunk
help to generate as much angular momentum as possible to transfer it to the racquet (Bahamonde, 2000). The statistical analysis of
data for different body segment kinematics revealed no significance difference between first and second service for Indian elite
players.
The linear and angular kinematics of body joints point and body joint angle of right wrist, elbow, shoulder, pelvis, knee and ankle.
And other kinematics as, toss angle, hit angle, reach, height, distance of the hit, toss height, racket velocity at impact, racket velocity
at post impact, ball shows no significant differences between the both first and second tennis serve. The knees and hips extend and
the back moves from extension to flexion and rotates toward the non-dominant side (Abrams, 2011).
Chew et. al. (2003) reported absolute racket velocities were comparable between first serve and second serve, and were developed
to similar magnitudes, independent of serve location. The comparison of studies has reached to the conclusion that the shoulder
plays an important role in generating power, as well as transfers the power to the distal segments to contribute to the performance
(Putnam, 1993; Elliott et al., 1995). However, there are some disagreements between different investigations. For example, Elliott et
al. (1995) concluded that forearm extension at the elbow actually has a negative effect on racquet speed which may reduce the ball
speed. This contradicts another study that showed elbow extension to be the second greatest contributor to racquet speed at impact
(Gordon & Dapena, 2006).
Elliott et al. (2003) studied the tennis serve’s biomechanical properties using a two-camera system and compared male and female
results during competition at the 2000 Sydney Olympic Games. They chose to analyze serves with the highest velocity and
concluded that males created higher forces from their shoulder and elbow while also serving at higher speed. They also founded that
an increased knee flexion during the backswing leads to generate low forces of upper extremity and recommended that players be
encouraged to perform knee flexion. Reid et al. (2008) have investigated the factors which were most critical to the different serving
techniques were the range of extension of front and rear knee, peak angular velocity of rear knee drive extension. The shoulder joint
and foot kinematics influence higher in higher racquet linear velocity.
The tennis serve and throwing motion have a great relationship within each other. The movement uses whole body kinematics to
impact the direction and velocity on the ball. There are ten segments in a position to be activated during these movements of tennis
serve and throw. They are the ankles, feet, knees, pelvis, trunk, shoulder girdle, arm, forearm, and hand working in synchronicity.
Each has its own movements relative to its own proximal articulation. These articulations can perform more than one movement;
each movement depends upon the skill to be performed. Therefore, the link system tends to go faster as the movements proceed to
its distal end to gain maximum ball velocity (Wigley, n.d). Finally, the follow-through phase begins just after the ball contact and
ending with completion of the stroke (Pradhan, 2001). A number of investigations have been conducted to further delineate the
specific biomechanics of serve in tennis (Elliott, 1986; Bahamonde, 1989; Dillman, 1995; Elliott, 1995; Noffal, 1999; Elliott, 2003;
Gordon & Dapena, 2006).
V. CONCLUSION
From the data of the 2-D kinematics of the body moment of tennis serve of elite Indian players, we can see that the velocity of the
ball produces more by the combination of the body kinematics moment, and this moment comes mainly from the extension of the
knee, trunk, shoulder, elbow and wrist. This point can be verified by the 2-D kinematics results of the study. Elite tennis players
maintain their body kinematics in both first and second serve, and also manipulate their body kinematics to control the maximum
ball velocity till the end period of the match, which is executed through the racket velocity generated by the sequential movement of
the body segments involve in the serve motion of the tennis. From this study, we can further understand the role of body joint
kinematics in the on the maintenance of the performance of the tennis serve throughout the match. This will provide a reference to
the serve motions and the execution of the serve techniques for training and teaching, with a view to improve serving efficiency.

www.ijraset.com Volume 3 Issue IV, April 2015
IC Value: 13.98 ISSN: 2321-9653
International Journal for Research in Applied Science & Engineering
Technology (IJRASET)
©IJRASET 2015: All Rights are Reserved
404
REFERENCES
[1] Abrams, G. D., Sheets, A. L., Andriacchi, T. P. & Safran, M. R. (2011). Review of tennis serve motion analysis and the biomechanics of three serve types
with implications for injury. Sports Biomechanics, 10(4): 378-390.
[2] Applied proceedings of the XVII international symposium on biomechanics in sports: Tennis (pp. 27–34). Perth: Edith Cowan University Press.
[3] Bahamonde, R. E. (1989). Kinetic analysis of the serving arm during the performance of the tennis serve. Journal of Biomechanics, 22, 983.
[4] Bradley, J. P., & Tibone, J. E. (1991). Electromyographic analysis of muscle action about the shoulder. Clinics in Sports Medicine, 10, 901–911.
[5] Brody, H. (1987). The serve. In H. Brody (Ed.), Tennis science for tennis players (pp. 106–110). Philadelphia, PA: University of Pennsylvania Press.
[6] Dillman, C. J., Schultheis, J. M., Hintermeister, R. A., & Hawkins, R. J. (1995). What do we know about body mechanics involved in tennis skills? In H.
Krahl, H. Pieper, B. Kibler, and P. Renstrom (Eds.), Tennis: Sports medicine and science (pp. 6–11). Dusseldorf: Society for Tennis Medicine and
Science.
[7] Dillman, C. J., Smutz, P., & Werner, S. (1991). Valgus extension overload in baseball pitching. Medicine and Science in Sport and Exercise, 23, S135.
[8] Durovic, N., Lozovina, V., Pavicc, L. & Mrduljas, D. (2008). Kinematics Analysis of the tennis serve in young tennis players. Acta Kinesiologica, 2(2),
50-56.
[9] Elliot, B.C. & Wood, GA. (1983). The biomechanics of the foot-up and foot-back tennis service techniques. The Australian Journal of Sport Sciences,
3(2), 3-6
[10] Elliott, B (2006), “Biomechanics and tennis”, British Journal of Sports Medicine; 40(5): 392–396.
[11] Elliott, B. & Wood, G. (1983), “The Biomechanics of the Foot-Up and Foot-Back Tennis Serve Techniques”, The Australian Journal of Sports Sciences,
3(2), 3-5.
[12] Kuo-Cheng Lo, Lin-Hwa Wang, Chia-Ching Wu , Fong-Chin Su(2004), “Kinematics of lower extremity in tennis flat and spin serve”, Journal of Medical
and Biological Engineering, 24(4): 209-212.
[13] Elliott, B. C., & Kilderry, R. (1983). The art and science of tennis. Philadelphia, PA: WB Saunders.
[14] Elliott, B. C., Marshall, R. N., & Noffal, G. J. (1995). Contributions of upper limb segment rotations during the power serve in tennis. Journal of Applied
Biomechanics, 11, 433–442.
[15] Elliott, B., Marsh, T., & Blanksby, B. (1986). A three-dimensional analysis of the tennis serve. International Journal of Sports Biomechanics, 2, 260–271.
[16] Gordon, B. J., & Dapena, J. (2006). Contributions of joint rotations to racquet speed in the tennis serve. Journal of Sport Sciences, 24, 31–49.
[17] Groppel, J.L. (1984). Tennis for advanced players: and those who would like to be champion. Champaign, IL: Human Kinetics.
[18] Groppel, J.L. (1992). High-tech tennis. Champaign, IL: Human Kinetics.
[19] Kibler, W. B., & Safran, M. (2000). Musculoskeletal injuries in the young tennis player. Clinics in Sports Medicine, 19, 781–792.
[20] Kibler, W. B., & Safran, M. (2005). Tennis injuries. Medicine and Sport Science, 48, 120–137
[21] Noffal, G. (1999). Where do high speed tennis serves come from? In B. Elliott, B. Gibson, and D. Knudson (Eds.),
[22] Pradhan, R. L., Itoi, E., Hatakeyama, Y., Urayama, M., & Sato, K. (2001). Superior labral strain during the throwing motion. A cadaveric study. American
Journal of Sports Medicine, 29, 488–492.
[23] Putnam, C. M. (1993). Sequential motions of body segments in striking and throwing skills: Descriptions and explanations. Journal of Biomechanics, 26
(S1), 125 –135.
[24] Reid M. et al. (2007), British Journal Sports Medicine, 41, 884-889.
[25] Reid, M., Elliott, B., & Alderson, J. (2008). Lower limb coordination and shoulder joint mechanics in the tennis serve. Medicine and Science in Sports
and Exercise, 40, 308–315.
[26] T, Satoru & I, Akira (2007), “A three-dimensional analysis of the contributions of upper limb joint movements to horizontal racket head velocity at ball
impact during tennis serving”, Sports Biomechanics, 6(3), 418-433.
[27] Whiteside, D., Elliott, B., Lay, B. & Reid, B. (2013). Human Movement Science, 32, 822-835.
[28] Wigley, R. (n.d). Teaching Tennis Biomechanics. Retrieved from http://www.teachingtennis.com/site/body1.htm
[29] Yuliang Sun, Yu Liu and Xinglong Zhou (2012), “A Kinematic Analysis Of A Top 10 Wta Tennis Player’s First Serve”, 30th Annual Conference of
Biomechanics in Sports – Melbourne 2012
[30] Chow, J., Park, S. & Tillman, M. (2009). Lower trunk kinematics and muscle activity during different types of tennis serve. Sports Medicine,
Arthroscopy, Rehabilitation, Therapy & Technology, 1, 24-37.
[31] Bahamonde, R. E. (2000). Changes in angular momentum during the tennis serve. J Sports Science, 18: 579-592.
[32] Hooper, T. (2001). Biomechanical Analysis of the Tennis Serve. Retrieve from
http://web.uvic.ca/~thopper/PE117/Pe117/Assignments/Greg%20Serve%20Analysis.pdf
[33] Seeley, M. K. (n.d.). A Review of Tennis Serve Bimechanics. Retrieved from http://biomech.byu.edu/Portals/83/docs/exsc362/tennis_example.pdf

Academic Sports ScholarISSN : 2277-3665Impact Factor : 2.1052(UIF)
Vol. 4 | Issue. 1 | Jan 2015Available online at www.lsrj.in
CONSTRUCTION OF SPECIFIC PHYSICAL FITNESSTEST FOR BOWLERS
Abstract:- In order to construct a scientifically designed to assess the specific physical fitness test battery for bowlers, this paper aim to construct the Specific Physical Fitness Test of Bowlers in Cricket. A 16 experimental test items purported to measure Speed, Strength, Endurance, Agility, Flexibility, coordination and Balance were Administered to 25 Players of North- Zone level intervarsity cricket players. The age ranged from between 18 to 25 years of age. The collected data was subjected to factor analysis (SPSS VERSION 17.0). The factor matrix was extracted to have rotated factor loadings. By considering the administrative feasibility, logistic interpretation with respect to the relevant field of application, rotated factor loadings and communality a test battery of four test items to measure the specific physical fitness test for bowlers of North- Zone level cricket players.
Keywords:Factor Analysis, Factor loading, Construction, Specific Physical Fitness.
INTRODUCTION
Today’s sports have different forms in the sense that earlier, more emphasis was laid on creative aspects, competition was become the defining feature of sports in modern society. Even though cricket is one of the oldest organized sports, there are very few studies on the physical demands of the game (Woolmer & Noakes, 2008) Actually, the cricketers are exposed to more demanding schedules, with longer period of time for training and practicing (Davies, 2008). Basically, cricket is a popular team game in most Commonwealth countries. In past it was played solely in a specific season (in Asian countries it was winter and in western countries it was summer). But its popularity has gained tremendous momentum since last three decades and now it is played throughout the year. Cricket is an endurance game and requires potential physical-physiological ability to excel the performance. Cricketers are therefore exposed to more demanding schedules, with longer periods of training and practicing. The increased workload may be one of the contributing factors to the increased incidence of injuries (Davies, 2008).
The importance of Specific fitness involves focusing the fitness goals of an athlete to meet the specific needs of an activity. An awareness of specific fitness cans workout to their performance in their sport. The performance potential of a cricketer player can be improved by specific fitness training which is generally divided up into aerobic, anaerobic and specific muscle training. Sport-specific strength training programs are fundamental to an athlete's development and success. The requirements of fitness are highly specific to sports for example a bowling in cricket player needs different type of fitness than batting etc. Fitness involves focusing the fitness goals of an athlete to meet the specific need of an activity. The term is most common when referring to athletes who play a particular sport; the athletes identify the specific physical requirements of that sport and then target exercises that will increase their fitness in those areas. An awareness of specific fitness can help athletes excel in their chosen sports because it directly connects their workouts to their performance in their sport. The development specific fitness requires the appropriate level or amount of motor abilities in relation to the requirement of the game concerned have also to be kept in view. And (Henson, 1987) also opined that the training is affected by the specificity and so, it must be specific to the requirements of the event.
The fitness of a cricketer which is specific to the game has no utility for the fitness of other game. Here the
1 2 3Ahsan Ahmad , Ikram Hussain and Fuzail Ahmad ,“CONSTRUCTION OF SPECIFIC PHYSICAL FITNESS TEST FOR
BOWLERS ” Academic Sports Scholar | Volume 4 | Issue 1 | Jan 2015 , Online & Print
1 2 3Ahsan Ahmad , Ikram Hussain and Fuzail Ahmad
1Research Scholar , Department of Physical Education, Aligarh Muslim University., Aligarh, U.P., India.
2Professor , Department of Physical Education, Aligarh Muslim University., Aligarh, U.P., India.
3Research Scholar , Department of Physical Education,Aligarh Muslim University., Aligarh, U.P., India.
1
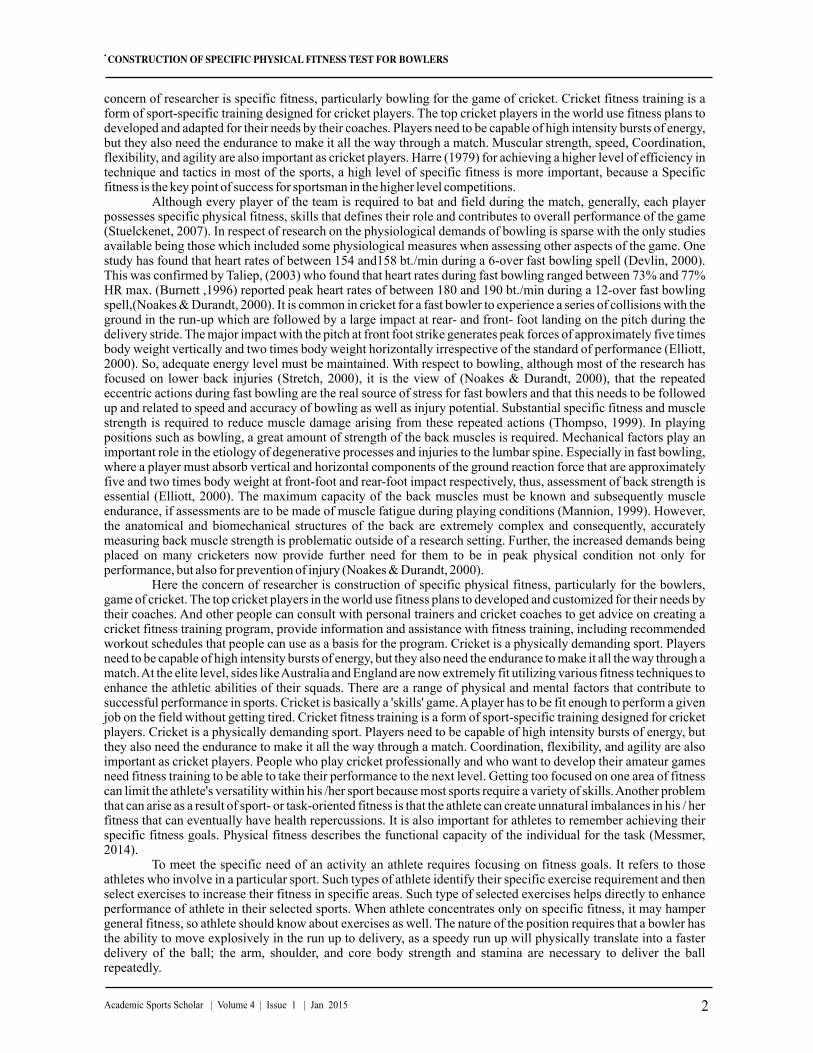
.
concern of researcher is specific fitness, particularly bowling for the game of cricket. Cricket fitness training is a form of sport-specific training designed for cricket players. The top cricket players in the world use fitness plans to developed and adapted for their needs by their coaches. Players need to be capable of high intensity bursts of energy, but they also need the endurance to make it all the way through a match. Muscular strength, speed, Coordination, flexibility, and agility are also important as cricket players. Harre (1979) for achieving a higher level of efficiency in technique and tactics in most of the sports, a high level of specific fitness is more important, because a Specific fitness is the key point of success for sportsman in the higher level competitions.
Although every player of the team is required to bat and field during the match, generally, each player possesses specific physical fitness, skills that defines their role and contributes to overall performance of the game (Stuelckenet, 2007). In respect of research on the physiological demands of bowling is sparse with the only studies available being those which included some physiological measures when assessing other aspects of the game. One study has found that heart rates of between 154 and158 bt./min during a 6-over fast bowling spell (Devlin, 2000). This was confirmed by Taliep, (2003) who found that heart rates during fast bowling ranged between 73% and 77% HR max. (Burnett ,1996) reported peak heart rates of between 180 and 190 bt./min during a 12-over fast bowling spell,(Noakes & Durandt, 2000). It is common in cricket for a fast bowler to experience a series of collisions with the ground in the run-up which are followed by a large impact at rear- and front- foot landing on the pitch during the delivery stride. The major impact with the pitch at front foot strike generates peak forces of approximately five times body weight vertically and two times body weight horizontally irrespective of the standard of performance (Elliott, 2000). So, adequate energy level must be maintained. With respect to bowling, although most of the research has focused on lower back injuries (Stretch, 2000), it is the view of (Noakes & Durandt, 2000), that the repeated eccentric actions during fast bowling are the real source of stress for fast bowlers and that this needs to be followed up and related to speed and accuracy of bowling as well as injury potential. Substantial specific fitness and muscle strength is required to reduce muscle damage arising from these repeated actions (Thompso, 1999). In playing positions such as bowling, a great amount of strength of the back muscles is required. Mechanical factors play an important role in the etiology of degenerative processes and injuries to the lumbar spine. Especially in fast bowling, where a player must absorb vertical and horizontal components of the ground reaction force that are approximately five and two times body weight at front-foot and rear-foot impact respectively, thus, assessment of back strength is essential (Elliott, 2000). The maximum capacity of the back muscles must be known and subsequently muscle endurance, if assessments are to be made of muscle fatigue during playing conditions (Mannion, 1999). However, the anatomical and biomechanical structures of the back are extremely complex and consequently, accurately measuring back muscle strength is problematic outside of a research setting. Further, the increased demands being placed on many cricketers now provide further need for them to be in peak physical condition not only for performance, but also for prevention of injury (Noakes & Durandt, 2000).
Here the concern of researcher is construction of specific physical fitness, particularly for the bowlers, game of cricket. The top cricket players in the world use fitness plans to developed and customized for their needs by their coaches. And other people can consult with personal trainers and cricket coaches to get advice on creating a cricket fitness training program, provide information and assistance with fitness training, including recommended workout schedules that people can use as a basis for the program. Cricket is a physically demanding sport. Players need to be capable of high intensity bursts of energy, but they also need the endurance to make it all the way through a match. At the elite level, sides like Australia and England are now extremely fit utilizing various fitness techniques to enhance the athletic abilities of their squads. There are a range of physical and mental factors that contribute to successful performance in sports. Cricket is basically a 'skills' game. A player has to be fit enough to perform a given job on the field without getting tired. Cricket fitness training is a form of sport-specific training designed for cricket players. Cricket is a physically demanding sport. Players need to be capable of high intensity bursts of energy, but they also need the endurance to make it all the way through a match. Coordination, flexibility, and agility are also important as cricket players. People who play cricket professionally and who want to develop their amateur games need fitness training to be able to take their performance to the next level. Getting too focused on one area of fitness can limit the athlete's versatility within his /her sport because most sports require a variety of skills. Another problem that can arise as a result of sport- or task-oriented fitness is that the athlete can create unnatural imbalances in his / her fitness that can eventually have health repercussions. It is also important for athletes to remember achieving their specific fitness goals. Physical fitness describes the functional capacity of the individual for the task (Messmer, 2014).
To meet the specific need of an activity an athlete requires focusing on fitness goals. It refers to those athletes who involve in a particular sport. Such types of athlete identify their specific exercise requirement and then select exercises to increase their fitness in specific areas. Such type of selected exercises helps directly to enhance performance of athlete in their selected sports. When athlete concentrates only on specific fitness, it may hamper general fitness, so athlete should know about exercises as well. The nature of the position requires that a bowler has the ability to move explosively in the run up to delivery, as a speedy run up will physically translate into a faster delivery of the ball; the arm, shoulder, and core body strength and stamina are necessary to deliver the ball repeatedly.
CONSTRUCTION OF SPECIFIC PHYSICAL FITNESS TEST FOR BOWLERS
2Academic Sports Scholar | Volume 4 | Issue 1 | Jan 2015

.
The above mentioned literature emphasized the growing need of construction of specific physical fitness for bowlers. As the investigator interested in developing a specific physical fitness test battery. It becomes mandatory to explore the existing knowledge regarding the cricketer’s specific physical fitness.
METHODOLOGY
Selection of the subjects
The subjects for the study were 25 intervarsity cricket players specialized in bowlers. The chronological age of the players was between 18 to 25 years. They were recruited randomly from various universities participated in North-zone intervarsity cricket tournament held at Aligarh Muslim University, Aligarh. No grouping of players was made during this phase. The sample for the construction phase was 25 players exposed to sixteen different fitness items. Then after taking data, all the skills were raised through factorial analysis.
SELECTION OF TEST ITEMS
In order to select the broad component of test, the available literature of physical fitness were critically reviewed and opinions of experts regarding these tests obtained. Also existing literature on the appropriate component of physical fitness in Indian geographical condition/ situation were considered. All the components of the physical fitness were considered. On the basis of these the following components for the specific physical fitness test for cricketer are considered. The physical fitness components are: Strength, Endurance, Agility, Flexibility, Coordination and Balance.
EXPERIMENTAL TEST ITEMS:
During the process of selection of the components of specific fitness test, the test items for each components were also identified along with and 16 test items were considered as: Standing broad Jump, Sit- ups, Dips, Pull- ups, Zig-zag, Shuttle run, 50 yard dash, Side-stepping, Squat Thrust, 600mts run/walk, Criss-cross, Skipping, Stroke Stand, Trunk lift, Sit and reach, and Hand Reaction.
METHOD OF EXECUTION:
Each experimental test items administration was adhered strictly administration procedure outline and protocol.
STATISTICAL TECHNIQUE:
The results have been obtained through the statistical package social sciences SPSS version 17.0. The Pearson product moment correlation formula has been utilizing for correlation of variables and the matrix of inter correlation among the sixteen variables was obtained. The data was then being factor analysis. The principal component analysis was used to extract factors. Varimax rotation (Kaiser’s normalization) was used to generate rotated factor matrix. After that the rotated factor matrix was used to the selected factor for analysis of data.
RESULT AND DISCUSSION
In this study of development of specific fitness test for the bowlers in the sports of cricket. The obtained data was analyzed by the statistical procedure of Factorial analysis. The factorial analysis was done by SPSS version 17.0
3Academic Sports Scholar | Volume 4 | Issue 1 | Jan 2015
CONSTRUCTION OF SPECIFIC PHYSICAL FITNESS TEST FOR BOWLERS

.
Table -1: Descriptive analysis of 16 fitness test items
In this study Table 1 displays the descriptive statistics analysis i.e.: mean and SD of the selected Sixteen test items which were administered on the bowlers who played as subject in this study for obtaining the data.
The mean of standing broad jump test item number-1 is 2.624 and SD is 0.237.The mean of sit-ups test item number-2 is 47.960 and SD is 8.942. The mean of Dips test item number is-3 is 53.200 and SD is 6.745.The mean of pull-ups test item number-4 is 11.120 and SD is 3.745.The mean of zig-zag test item number-5 is 9.220 and SD is 0.066.The mean of Shuttle run test item number-6 is 10.199 and SD is 0.331.The mean of 50 yard dash test item number-7 is 6.324 and SD is 0.418. The mean of Side stepping test item number-8 is 16.880 and SD is 1.986. The mean of Squat Thrust test item number-9 is 9.800 and SD is 1.893.The mean of 600mts run/walk test item number-10 is1.420 and SD is 0.085.The mean of Criss-cross test item number-11is 10.680 and SD is 2.626.The mean of Skipping test item number-12is 56.200 and SD is 7.511.The mean of Stroke Stand test item number-13is14.403 and SD is 2.146.The mean of Trunk lift test item number-14 is 32.525 and SD is 3.128.The mean of Sit and reach Test items-15 is 9.916 and SD is 4.347.The mean of Hand Reaction Test items-16 is 29.320 and SD is 8.924.
Factor Analysis: The purpose of factor analysis is to “explore the under lying variance structure of a set of correlation coefficient. Thus, factor analysis useful for exploring and verifying patterns in a set of correlation coefficient” (Brown, 2001).
Table-2: Representing Factor Loading of factor I
Factor I (Table 2):- The factor I is defined by test which can measure flexibility. The highest factor loading is 0.977 to sit and reach is used to measure of the lower back and hamstring muscles. Pull-ups and dips are used to measure shoulder upper arm strength and upper body strength is very important for fast bowlers in the game of cricket. A side stepping this test item has greater affinity toward sprinting speed. Strock stand measures body balance of the body. Which is criss cross test can improve agility for rapid and accurate directional change in play.
4Academic Sports Scholar | Volume 4 | Issue 1 | Jan 2015
S.No. Test variables Catalogue Mean S.D
1 Standing broad Jump Test item-1 2.624 0.237
2 Sit- ups Test item-2 47.960 8.942
3 Dips Test item-3 53.200 6.745
4 Pull- ups Test item-4 11.120 3.745
5 Zig-zag-running Test item-5 9.220 0.066
6 Shuttle run Test item-6 10.199 0.331
7 50 yard dash Test item-7 6.324 0.418
8 Side-stepping Test item-8 16.880 1.986
9 Squat Thrust Test item-9 9.800 1.893
10 600mts run/walk Test item-10 1.420 0.085
11 Criss-cross Test item-11 10.680 2.626
12 Skipping Test item-12 56.200 7.511
13 Stroke Stand Test item-13 14.403 2.146
14 Trunk lift Test item-14 32.525 3.128
15 Sit and reach Test item-15 9.916 4.347
16 Hand Reaction Test item-16 29.320 8.924
S.No. Test Variables Catalogue Factor loading
1 Dips Test item-3 0.974
2 Pull-ups Test item-4 0.954
3 Side stepping Test item-8 0.965
4 Criss cross Test item-11 0.517
5 Skipping Test item-12 0.965
6 Stroke stand Test item-13 0.940
7 Sit and reach Test item-15 0.977
CONSTRUCTION OF SPECIFIC PHYSICAL FITNESS TEST FOR BOWLERS

.
Fig.1: Representing the highest factor loading of Factor I
Table-3: Representing Factor Loading of factor II
Factor II (Table 2):- These two items were identified in different components of physical fitness i.e. Which is sit-ups is exhibit significance positive factor loading is 0.843.basically sit-up test primarily measures abdominal and hip–flexor muscles, strength and endurance training exercise. It is the basic exercise used by cricketer’s fitness training. It plays a significant role for the core stability and back support. Whereas standing broad jump to measure the identified/emphasized on the ability to exert maximum explosive energy on maximum effort.
Fig. 2: Representing the highest factor loading of Factor II
Table-4: Representing Factor Loading of factor III
5Academic Sports Scholar | Volume 4 | Issue 1 | Jan 2015
S.No. Test Variables Catalogue Factor loading
1 Standing broad jump Test item-1 0.717
2 Sit-ups Test item-2 0.843
S.No. Test Variables Catalogue Factor loading
1 Zig zag Test item-5 0.915
2 Shuttle run Test item-6 0.172
3 600mts run/walk Test item-10 0.185
4 Trunk lift Test item-14 0.166
5 Hand reaction Test item-16 0.120
CONSTRUCTION OF SPECIFIC PHYSICAL FITNESS TEST FOR BOWLERS

.
Factor III (Table 4):- The highest factor loading Zig-zag running is 0.915 appears to be primarily a reaction ability and measure of coordination movement and speed which is very important workout of the cricket players. 600run/walk to determine measure of cardiovascular fitness, it also a important factor for cricketers .Hand reaction test is the true factor emphasis on the ability to react faster and faster, that’s why trunk lift shown the flexibility which is determine the agility of the players.
Fig.3: Representing the highest factor loading of Factor III
Table-5 Representing Factor Loading of factor IV
Factor IV (Table 5):- Only squat thrust came significant loading of factor IV is 0.924. This test item describes the quality of explosive strength with the individuals and has a great importance for improving fitness level of cricket players.
Fig.4: Representing the highest factor loading of Factor IV
Table-6 Representing Factor Loading of factor V
Factor V (Table 6):- The single factor 50 yard dash came significant loading in factor V is (0.943). Speed the
6Academic Sports Scholar | Volume 4 | Issue 1 | Jan 2015
S.No. Test Variables Catalogue Factor loading
1 Squat thrust Test item-9 0.924
S.No. Test Variables Catalogue Factor loading
1 50 yard dash Test item-7 0.943
CONSTRUCTION OF SPECIFIC PHYSICAL FITNESS TEST FOR BOWLERS

.
rate of change of successive movement of the same pattern.
Fig.5: Representing the highest factor loading of Factor V
DEVELOPMENT OF THE TEST BATTERY.
The bringing together several tests, which turn out to measure the same factor, is not very efficient. According to Fleishman (1964) inefficient test batteries are those with too many tests on one factor and none from one or more of the factors identified. The test items were selected to be included in the test on the basis of results obtained from the factor analysis to serve as the criteria to measure the specific physical fitness test for bowlers in cricket. Considering the administrative feasibility logistic and educational application following specific physical fitness test recommended for the north- zone level cricketers.
Table -7 Constructed of specific physical test battery for bowler (cricket)
CONCLUSIONS
Based on the findings and statistical analysis, critiques and experts deliberation in the light of critical literature and scientific information on the performance demands of construction of specific physical fitness test for bowlers in cricket. Existing knowledge could be completed by obtaining the considered opinions and insides of coaches and players. This information would also provide a framework for the development of specific physical components of bowling as specific assessment, focused on systematic training, conditioning, coaching and training protocols.
In the light of result the conclusions were drawn as the Factor analysis Rotated Varimax solution significantly and appropriately identified the test items for the construction a specific physical fitness test for bowler for North - Zone level cricket players. Every sport differs from one to another and also the demand of specific physical fitness ability in various games and sports. A bowlers differs from batsman and fielders etc in a quality and quantity of fitness components like balance, reaction ability (sharp movement ability to change position immediately). The test items derived indisputably represent the specific physical fitness components for bowler.
REFERENCE:
1.Adams, K., O'Shea, J. P., O'Shea, K. L. & Climstein, M. (1992). The effect of six weeks of squat, plyometric and squat-plyometric training on power production. J Appl Sport Sci Res. 6, 36-41.2.Bartlett, R. M. (2003). The science and medicine of cricket: an overview and update. Journal of Sports Sciences, 21, 733-752.
7Academic Sports Scholar | Volume 4 | Issue 1 | Jan 2015
1 Factor -1 Sit and reach 0.977
2 Factor-2 Sit-ups 0.843
3 Factor-3 Zig zag running 0.915
4 Factor-4 Squat thrust 0.924
5 Factor-5 50 yard dash 0.943
CONSTRUCTION OF SPECIFIC PHYSICAL FITNESS TEST FOR BOWLERS

.
3.Burnett, A. F., Khangure, M. S., Elliott, B. C., Foster, D. H., Marshall, R. N. & Hardcastle, P. H. (1996). Thoracolumbar disc degeneration in young fast bowlers in cricket: a4.Christie, C. J.; Pote, L. & Sheppard, B. (2011a). Changes in physiological and perceptual responses over time during a simulated high scoring batting work bout.5.Clutch, D., Wilson, C., McGown, C. and Bryce, G. R. The effect of depth jumps and weight training on leg strength and vertical jump. Res Quarterly. 54:5-106.Davies, R., du-Randt, R., Venter, D & Stretch, R. (2008). Cricket: Nature and incidenceOf fast-bowling injuries at an elite, junior level and associated risk factors. South African Journal of Sports Medicine, 20, 115-119.7.Devlin, L. (2000). Recurrent posterior thigh symptoms detrimental to performance in Rugby Union. Sports Medicine, 29(4), 273-277.8.Elliott, B. (2000). Back injuries and the fast bowlers in cricket. Journal of Sports Sciences, 18, 983-991. 9.Mannion, A. F., Adams, M. A., Cooper, R. G., Dolan, P. (1999). Prediction of maximal back muscle strength from indices of body mass and fat-free body mass. Rheumatology, 38, 652-655. doi:10.1093/rheumatology/38.7.652 10.Noakes, T. D., Durandt, J. J. (2000). Physiological requirements of cricket. J Sports Sci, 18, 919-929. http://dx.doi.org/10.1080%2F02640410044673911.Noakes, T. D. & Durandt, J. J. (2000). Physiological requirements of cricket. Journal of Sports Sciences, 18, 919-929.12.Preston, I. & Thomas, J. (2000). Batting strategy in limited overs cricket, Statistician, 49(1), 95–106.13.Stuelcken, M., Pyne, D. & Sicclair, P. (2007). Anthropometric characteristics of elite cricket fast bowlers. Journal of Sports Sciences, 25, 1587-1597.14.Taliep, M. S., Gray, J., St Clair Gibson, A., Calder, S., Lambert, M. I. & Noakes, T. D. (2003). The effect of a 12-over bowling spell on bowling accuracy and pace in cricket15.Wilson, G. J., Newton, R. U., Murphy, A. J. & Humphries, B. J. (1993). The optimal training load for the development of dynamic athletic performance. Med Sci Sports Exerc. 25(11), 1279-86.16.Woolmer, B. & Noakes, T. D. (2008). Art and Science of Cricket, Cape Town: Struik Publishers, South Africa.
8Academic Sports Scholar | Volume 4 | Issue 1 | Jan 2015
CONSTRUCTION OF SPECIFIC PHYSICAL FITNESS TEST FOR BOWLERS
Journal of Education and Practice www.iiste.org
ISSN 2222-1735 (Paper) ISSN 2222-288X (Online)
Vol.6, No.13, 2015
166
The Level of Stress in Male and Female School Students
Zamirullah Khan Abul Barkat Lanin Naseem Ahmad
Deptt. Of Physical Education, Aligarh Muslim University, Aligarh, U.P. India. 2 Mumtaj P G college, Lucknow University, Lucknow, U.P. India
Abstract
This study aimed at the level of stress in male and female school students. For the purpose of the study the researcher randomly selected 64 school students aged between 14-18 years. To collect the data researcher used students stress scale (SSS) developed by Dr. Zaki Akhtar (2011). During collection of data researcher used means and method fit for this scale. The result of the study showed boys having much more stress in comparison to girls. The study concluded that school boys are more stressful than school girls.
Introduction
Stress is an integral part of our life. Stress could be positive as well as negative. When we are doing our work properly and systematically then it is because of positive stress or eustress but when we lose our rhythm for same work, it is negative stress or distress. So, stress is good in one way and bad in other way. Hans Selye (1956) first popularized the concept of “stress” in the 1950s. Selye theorized that all individuals respond to all types of threatening situations in the same manner, and he called this the General Adaptation Syndrome (GAS).
Lazarus & Folkman (1984) defined that, stress is a mental or physical phenomenon formed through one’s cognitive appraisal of the stimulation and is a result of one’s interaction with the environment. The existence of stress depends on the existence of the stressor. Chang’s Dictionary of Psychology Terms, stress is “a state of physical or mental tension that causes emotional distress or even feeling of pains to an individual” (Lai et al., 1996). Vijaya and Karunakaran (2013) stated that stress is a complex phenomenon. It largely depends on one's temperaments, environmental conditions, experiences and situations. It is experienced by every individual in any one situations or the other. It is a part of life and it is generated by constant changing situations that one has to face. It refers to an internal state, which results from frustration or under dissatisfactory conditions. To a certain extent in every one's life it is unavoidable, because it is complex in nature. It is a part of fabric of life. But it can be managed to some extent. Piekarska (2000) pointed out that the essential factors for the formation of stress are frequent and strong. There is a related connection between the results of stress and psychological and personality characteristics. Selye (1976) stated that in most approaches stress now designates bodily processes created by circumstances that place physical or psychological demands on an individual. Selye (1976) theories that focus on the specific relationship between external demands (stressors) and bodily processes (stress) can be grouped in two different categories: approaches to `systemic stress' based in physiology and psychobiology (among others,) and approaches to psychological stress' developed within the field of cognitive psychology. McGrath (1982) said that the external forces that impinge on the body are called stressors. Feng (1992) and Volpe (2000) defined stressor as anything that challenges an individual’s adaptability or stimulates an individual’s body or mentality. Stress can be caused by environmental factors, psychological factors, biological factors, and social factors. It can be negative or positive to an individual, depending on the strength and persistence of the stress, the individual’s personality, cognitive appraisal of the stress, and social support. Vijaya and Karunakaran (2013) in their study found that majority of boys expressed high level of stress and moderate stress compared to girls. Whereas majority of girl students exhibited low level of stress compared to Boys. Chiang (1995) proposed that school is one of the main sources of stress among adolescents. Such stress comes from too much homework, unsatisfactory academic performance, preparation for tests, lack of interest in a particular subject, and teacher’s punishment. Generally, parents are very concerned about their children’s academic achievement and moral behaviors. Parents expect their children not only to respect teachers and follow moral norms but also become elite in the future. Chang & Lu (2007) suggested that academic institutions have different work settings compared to nonacademic and therefore one would expect the difference in symptoms, causes, and consequences of stress. Stevenson & Harper (2006) pointed out that stress in academic institutions can have both positive and negative consequences if not well managed. Goodman (1993) revealed that students have different expectations, goals, and values that they want to fulfill, which is only possible if the students’ expectations, goals, and values are integrated with that of the institution. Goodman (1993) stated that stressors affecting students can be categorized as academic, financial, time or health related, and self- imposed.
After going through available literature in hard copy as well as soft copies on internet the researcher found that sufficient work has not been done in this area. So researcher goaded to carry out this investigation to fill the gap in the domain of knowledge. The type of stress which is analysed in this paper is distress among school going students.

Journal of Education and Practice www.iiste.org
ISSN 2222-1735 (Paper) ISSN 2222-288X (Online)
Vol.6, No.13, 2015
167
Methodology
The purpose of the present study was to know the level of stress among school going children.
Sample
The sample of the present study was taken from Jawahar Navodaya School Bareilly (U.P.). For the purpose of the study 42 male and 22 female students were randomly selected. Their age ranged between 14-18 years.
Tools used The researcher used students stress scale developed by Dr. Zaki Akhtar (2011) Jamshedpur. The scale consisted of 51 statements related to the major kind of stress prevalent in students at adolescent age, and all kinds of situations faced by students.
Statistical Technique Used
Descriptive statistical technique, Mean and Standard Deviation were used
Mean SD N
Boys 158.96 11.40 42
Girls 163.57 5.63 22
RESULTS
Gender STRESS LEVELS TOTAL
Very High
Stress
High Stress Moderate
Stress
Low Stress Very Low
Stress
Boys 08 12 12 05 05 42
Girls 00 03 04 09 06 22
From the table it is evident that most of the boys showing very high stress (Boys 19% and girls 0%) and high stress (boys 28.5% and girls 13.6%) as well as moderate stress where as girls are having 18.1% and boys 28.5%.
DISCUSSION
From the result we can find out that majority of girls have shown low stress and very low stress. Some research worked on level of stress showing the same result i.e., research work done by Vijaya and Karunakaran (2013). This study resulted that boys are much more stressful than girls. There can be many reason for this, it may be their parents expectation from them or it may be boy’s high goal and target for their bright and successful career. Teachers should take care of male students and try to resolve their problems which are responsible for their high stress. Parents also can play a vital role to reduce the stress of their children as they are more close to them. Chiang (1995) has also stated that generally parents are very concerned about their children’s academic achievement and moral behaviors. Parents expect their children not only to respect teachers and follow moral norms but also become elite in the future. School is also a best medium to work on the stress level of the students and treat them accordingly as it is revealed by the Goodman (1993) that students have different expectations, goals, and values that they want to fulfill, which is only possible if the students’ expectations, goals, and values are integrated with that of the institution.
Conclusions
The researcher concluded that schools going male students are more stressful in comparison to female students.
References
Chang K, & Lu L. (2007). Characteristics of organisational culture, stressors and wellbeing: The case of Taiwanese organisations, Journal of Managerial Psychology, 22 (6):549- 568.
Chiang, C. X. (1995). A Study of Stress Reactions among Adolescents. Chinese Journal of School Health, 26, 33-37.
Feng, G. F. (1992). Management of Stress and Loss. Taipei: Psychological Publishing Company, Ltd. Goodman, E.D. (1993). How to handle the stress of being a student. Imprint, 40:43 Krohne and L Laux (Eds), (1982). Achievement, Stress, and Anxiety (pp. 19–48). Lazarus, R S, (1966). Psychological Stress and the Coping Process. New York: McGraw-Hill. Lazarus, R S, (1991). Emotion and Adaptation. New York: Oxford University Press. Lazarus, R S and Folkman, S, (1984). Stress, Appraisal, and Coping. New York: Springer. Lai, P. C., Chao, W. C., Chanf. Y. Y., and Chang, T. T. (1996). Adolescent Psychology. Taipei: National Open
University. McGrath, J E, (1982). Methodological problems in research on stress. In H W Washington, DC,: Hemisphere.
Abstract-Psychology INFO | $Order Document

Journal of Education and Practice www.iiste.org
ISSN 2222-1735 (Paper) ISSN 2222-288X (Online)
Vol.6, No.13, 2015
168
Piekarska, A. (2000). School stress, teachers’ abusive behaviors, and children’s coping strategies. Child Abuse and Neglect, 24, 11, 1443-1449 (2000)
Selye, H. (1976). The Stress of Life (revised edition). New York: McGraw-Hill. Selye, H. (1956). The Stress of Life. New York: McGraw-Hill Stevenson, A & Harper S. (2006). Workplace stress and the student learning experience, Quality Assurance in
Education, 14(2): 167-178. Volpe, J. F. (2000). A guide to effective stress management. Career and Technical Education, 48(10), 183-188.

The IISTE is a pioneer in the Open-Access hosting service and academic event management.
The aim of the firm is Accelerating Global Knowledge Sharing.
More information about the firm can be found on the homepage:
http://www.iiste.org
CALL FOR JOURNAL PAPERS
There are more than 30 peer-reviewed academic journals hosted under the hosting platform.
Prospective authors of journals can find the submission instruction on the following
page: http://www.iiste.org/journals/ All the journals articles are available online to the
readers all over the world without financial, legal, or technical barriers other than those
inseparable from gaining access to the internet itself. Paper version of the journals is also
available upon request of readers and authors.
MORE RESOURCES
Book publication information: http://www.iiste.org/book/
Academic conference: http://www.iiste.org/conference/upcoming-conferences-call-for-paper/
IISTE Knowledge Sharing Partners
EBSCO, Index Copernicus, Ulrich's Periodicals Directory, JournalTOCS, PKP Open
Archives Harvester, Bielefeld Academic Search Engine, Elektronische Zeitschriftenbibliothek
EZB, Open J-Gate, OCLC WorldCat, Universe Digtial Library , NewJour, Google Scholar

[Hussain*et al., 5(8): August, 2016] ISSN: 2277-9655
IC™ Value: 3.00 Impact Factor: 4.116
http: // www.ijesrt.com© International Journal of Engineering Sciences & Research Technology
[988]
IJESRT INTERNATIONAL JOURNAL OF ENGINEERING SCIENCES & RESEARCH
TECHNOLOGY
INVESTIGATE THE MANIPULATION OF KINEMATICS ON TENNIS SERVE
PERFORMANCE Ikram Hussain, Naushad Waheed Ansari, Fuzail Ahmad*
* Department of Physical Education, Aligarh Muslim University, Aligarh, India
DOI: 10.5281/zenodo.60843
ABSTRACT The study aimed to explore the effect of elite tennis player body kinematics during preparatory, force generation and
follow through phase ( between first serve and second serve) at three different time periods i.e. initial, mid and end
of the match. Four Indian International male tennis players were selected as subjects for the study. The mean and
standard deviation of players of age (year), height (cm) and weight (kg) were 27.00 ± 4.97, 186.50 ± 6.03, 81.25
±7.41, respectively. The tennis service was modeled as segments of the kinematics chain composed of body
segments. 2D kinematics data of the body were obtained for this study with the high speed canon camcorder
operating at the shutter speed of 1/2000 with a frame rate of 50 Hz. Descriptive statistics and t-test were performed
by SPSS version 17.0 for all the variables under this study were computed at Level of significance for 0.05 with 6
degree of freedom. Results revealed that selected kinematics variables of selected subjects does not play significant
role in first and second serve at different phases during three different stages of the Tennis match.
KEYWORDS: Davis cup, Kinematics, first serve, second serve, motion analysis software and Tennis.
INTRODUCTION All content The most important skill in game of tennis is serve which a player must get in order to have successful
attack. It is also the power stroke that has gained attention to the most analytical interest as of biomechanists. The
objective of the server’s is to serve the ball directly into service area of challenger’s court. For reducing the
challenger’s reaction time and their ability to return the ball accordingly, the ball must be smash with greater amount of ball velocity. According to Mark Kovacs, 2011, the serve has been studied in a similar manner to the throwing
motion in baseball, although some significant differences do exist between the serving motion and the throwing
motion. These differences include planes of motion, the non-dominant arm tossing the tennis ball, the tennis racket,
the technical components of the serve, and the variety of placements and goals of the motion (spin, speed, angle,
direction etc.).
Actually tennis serve is an overhead motion and characterized by a series of segmental rotations involving the entire
kinematics of the player’s body. It is the most complex stroke in tennis match. Effective server maximally utilizes
their entire kinematic sequence via the synchronous use of selective joint angles, segmental rotations and
coordinated lower and upper extremities. This lower extremity kinematics help into the upper body kinematics to
produce momentum of the body through racket which is prerequisite for serve. If any kinematic series of the links in
the lower and upper extremities sequence are not synchronized effectively, this results the ineffectiveness attack as
the outcome of the serve.
Tennis coaches and trainers focus on the mechanical consistency in serve production. Traditionally tennis coaches
and trainers decompose the service action and break down its component consistency in learning of the serve. In
these circumstances, the serve practice is characterized by the preparation of ball toss into diagonally opponent
service court directly without rally.
However, there is a limited scientific knowledge base for players and coaches to draw upon when seeking to
improve serve technique in tennis game. Many of the kinematic variables analyses into tennis serves or strokes were
conducted more than ten years ago, with different analysis methods during the match for enhancement the serve
performance. It has only recently been possible to analyses the different types of the serve (flat, slice, kick serve,
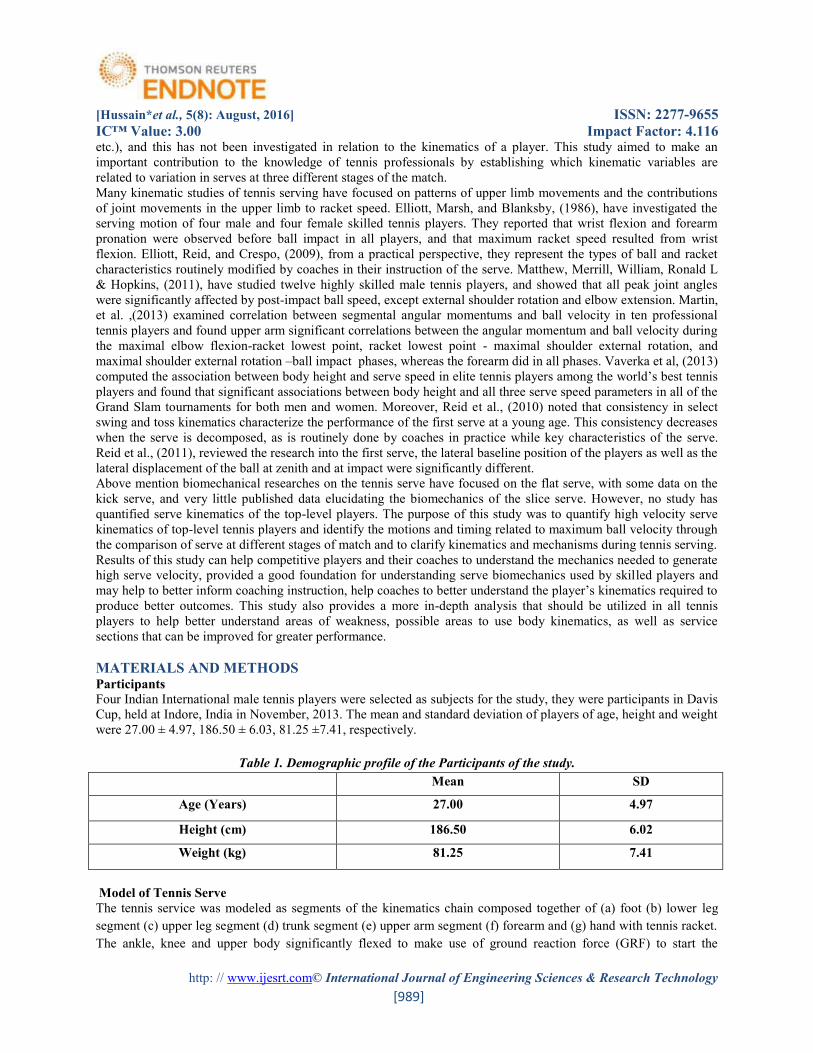
[Hussain*et al., 5(8): August, 2016] ISSN: 2277-9655
IC™ Value: 3.00 Impact Factor: 4.116
http: // www.ijesrt.com© International Journal of Engineering Sciences & Research Technology
[989]
etc.), and this has not been investigated in relation to the kinematics of a player. This study aimed to make an
important contribution to the knowledge of tennis professionals by establishing which kinematic variables are
related to variation in serves at three different stages of the match.
Many kinematic studies of tennis serving have focused on patterns of upper limb movements and the contributions
of joint movements in the upper limb to racket speed. Elliott, Marsh, and Blanksby, (1986), have investigated the
serving motion of four male and four female skilled tennis players. They reported that wrist flexion and forearm
pronation were observed before ball impact in all players, and that maximum racket speed resulted from wrist
flexion. Elliott, Reid, and Crespo, (2009), from a practical perspective, they represent the types of ball and racket
characteristics routinely modified by coaches in their instruction of the serve. Matthew, Merrill, William, Ronald L
& Hopkins, (2011), have studied twelve highly skilled male tennis players, and showed that all peak joint angles
were significantly affected by post-impact ball speed, except external shoulder rotation and elbow extension. Martin,
et al. ,(2013) examined correlation between segmental angular momentums and ball velocity in ten professional
tennis players and found upper arm significant correlations between the angular momentum and ball velocity during
the maximal elbow flexion-racket lowest point, racket lowest point - maximal shoulder external rotation, and
maximal shoulder external rotation –ball impact phases, whereas the forearm did in all phases. Vaverka et al, (2013)
computed the association between body height and serve speed in elite tennis players among the world’s best tennis players and found that significant associations between body height and all three serve speed parameters in all of the
Grand Slam tournaments for both men and women. Moreover, Reid et al., (2010) noted that consistency in select
swing and toss kinematics characterize the performance of the first serve at a young age. This consistency decreases
when the serve is decomposed, as is routinely done by coaches in practice while key characteristics of the serve.
Reid et al., (2011), reviewed the research into the first serve, the lateral baseline position of the players as well as the
lateral displacement of the ball at zenith and at impact were significantly different.
Above mention biomechanical researches on the tennis serve have focused on the flat serve, with some data on the
kick serve, and very little published data elucidating the biomechanics of the slice serve. However, no study has
quantified serve kinematics of the top-level players. The purpose of this study was to quantify high velocity serve
kinematics of top-level tennis players and identify the motions and timing related to maximum ball velocity through
the comparison of serve at different stages of match and to clarify kinematics and mechanisms during tennis serving.
Results of this study can help competitive players and their coaches to understand the mechanics needed to generate
high serve velocity, provided a good foundation for understanding serve biomechanics used by skilled players and
may help to better inform coaching instruction, help coaches to better understand the player’s kinematics required to produce better outcomes. This study also provides a more in-depth analysis that should be utilized in all tennis
players to help better understand areas of weakness, possible areas to use body kinematics, as well as service
sections that can be improved for greater performance.
MATERIALS AND METHODS Participants Four Indian International male tennis players were selected as subjects for the study, they were participants in Davis
Cup, held at Indore, India in November, 2013. The mean and standard deviation of players of age, height and weight
were 27.00 ± 4.97, 186.50 ± 6.03, 81.25 ±7.41, respectively.
Table 1. Demographic profile of the Participants of the study.
Mean SD
Age (Years) 27.00 4.97
Height (cm) 186.50 6.02
Weight (kg) 81.25 7.41
Model of Tennis Serve
The tennis service was modeled as segments of the kinematics chain composed together of (a) foot (b) lower leg
segment (c) upper leg segment (d) trunk segment (e) upper arm segment (f) forearm and (g) hand with tennis racket.
The ankle, knee and upper body significantly flexed to make use of ground reaction force (GRF) to start the
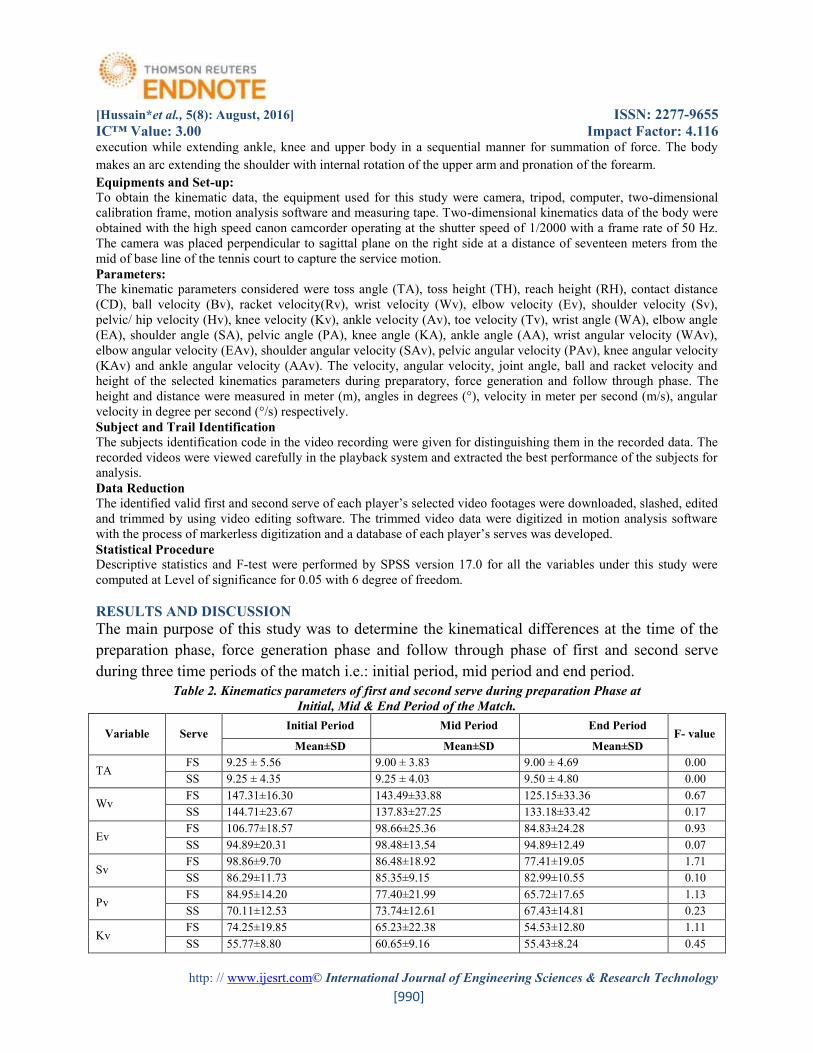
[Hussain*et al., 5(8): August, 2016] ISSN: 2277-9655
IC™ Value: 3.00 Impact Factor: 4.116
http: // www.ijesrt.com© International Journal of Engineering Sciences & Research Technology
[990]
execution while extending ankle, knee and upper body in a sequential manner for summation of force. The body
makes an arc extending the shoulder with internal rotation of the upper arm and pronation of the forearm.
Equipments and Set-up:
To obtain the kinematic data, the equipment used for this study were camera, tripod, computer, two-dimensional
calibration frame, motion analysis software and measuring tape. Two-dimensional kinematics data of the body were
obtained with the high speed canon camcorder operating at the shutter speed of 1/2000 with a frame rate of 50 Hz.
The camera was placed perpendicular to sagittal plane on the right side at a distance of seventeen meters from the
mid of base line of the tennis court to capture the service motion.
Parameters:
The kinematic parameters considered were toss angle (TA), toss height (TH), reach height (RH), contact distance
(CD), ball velocity (Bv), racket velocity(Rv), wrist velocity (Wv), elbow velocity (Ev), shoulder velocity (Sv),
pelvic/ hip velocity (Hv), knee velocity (Kv), ankle velocity (Av), toe velocity (Tv), wrist angle (WA), elbow angle
(EA), shoulder angle (SA), pelvic angle (PA), knee angle (KA), ankle angle (AA), wrist angular velocity (WAv),
elbow angular velocity (EAv), shoulder angular velocity (SAv), pelvic angular velocity (PAv), knee angular velocity
(KAv) and ankle angular velocity (AAv). The velocity, angular velocity, joint angle, ball and racket velocity and
height of the selected kinematics parameters during preparatory, force generation and follow through phase. The
height and distance were measured in meter (m), angles in degrees (°), velocity in meter per second (m/s), angular
velocity in degree per second (°/s) respectively.
Subject and Trail Identification
The subjects identification code in the video recording were given for distinguishing them in the recorded data. The
recorded videos were viewed carefully in the playback system and extracted the best performance of the subjects for
analysis.
Data Reduction
The identified valid first and second serve of each player’s selected video footages were downloaded, slashed, edited and trimmed by using video editing software. The trimmed video data were digitized in motion analysis software
with the process of markerless digitization and a database of each player’s serves was developed.
Statistical Procedure
Descriptive statistics and F-test were performed by SPSS version 17.0 for all the variables under this study were
computed at Level of significance for 0.05 with 6 degree of freedom.
RESULTS AND DISCUSSION
The main purpose of this study was to determine the kinematical differences at the time of the
preparation phase, force generation phase and follow through phase of first and second serve
during three time periods of the match i.e.: initial period, mid period and end period.
Table 2. Kinematics parameters of first and second serve during preparation Phase at
Initial, Mid & End Period of the Match.
Variable Serve Initial Period Mid Period End Period
F- value Mean±SD Mean±SD Mean±SD
TA FS 9.25 ± 5.56 9.00 ± 3.83 9.00 ± 4.69 0.00
SS 9.25 ± 4.35 9.25 ± 4.03 9.50 ± 4.80 0.00
Wv FS 147.31±16.30 143.49±33.88 125.15±33.36 0.67
SS 144.71±23.67 137.83±27.25 133.18±33.42 0.17
Ev FS 106.77±18.57 98.66±25.36 84.83±24.28 0.93
SS 94.89±20.31 98.48±13.54 94.89±12.49 0.07
Sv FS 98.86±9.70 86.48±18.92 77.41±19.05 1.71
SS 86.29±11.73 85.35±9.15 82.99±10.55 0.10
Pv FS 84.95±14.20 77.40±21.99 65.72±17.65 1.13
SS 70.11±12.53 73.74±12.61 67.43±14.81 0.23
Kv FS 74.25±19.85 65.23±22.38 54.53±12.80 1.11
SS 55.77±8.80 60.65±9.16 55.43±8.24 0.45

[Hussain*et al., 5(8): August, 2016] ISSN: 2277-9655
IC™ Value: 3.00 Impact Factor: 4.116
http: // www.ijesrt.com© International Journal of Engineering Sciences & Research Technology
[991]
Av FS 44.76±17.29 33.64±10.38 35.59±15.66 0.65
SS 36.83±6.18 37.33±10.74 33.95±12.27 0.13
Tv FS 44.67±22.83 31.14±15.36 35.84±15.43 0.57
SS 31.85±8.38 36.51±13.00 32.52±15.08 0.16
Rv FS 439.93±33.48 391.71±72.50 371.84±82.20 1.44
SS 336.31±142.99 417.18±52.01 393.71±71.16 0.24
Bv FS 232.63±50.55 255.32±48.62 276.73±30.61 0.22
SS 216.19±90.19 297.88±33.50 281.55±27.41 0.66
WA FS 145.99±6.20 153.88±21.72 154.76±17.31 0.35
SS 150.07±12.97 152.86±14.64 146.11±8.67 0.30
EA FS 108.15±9.90 115.79±24.65 123.68±21.95 0.61
SS 118.67±16.57 120.03±18.69 118.25±14.79 0.01
SA FS 39.01±11.23 36.58±10.64 36.42±10.75 0.31
SS 37.11±8.76 36.78±13.72 36.95±10.78 0.52
PA FS 171.43±17.41 171.65±15.26 168.65±11.15 0.10
SS 141.19±61.97 166.83±15.16 163.03±10.03 0.14
KA FS 176.51±13.08 173.75±10.70 170.10±0.77 0.19
SS 140.19±66.28 173.56±9.66 167.47±2.44 1.78
AA FS 178.26±48.96 181.49±52.18 168.55±52.59 0.20
SS 160.90±62.99 142.78±60.69 130.66±9.19 0.38
WAv FS 489.28±212.20 354.45±143.34 403.92±197.39 0.78
SS 383.73±181.82 397.68±150.56 470.04±53.60 0.39
EAv FS 326.14±187.07 358.16±203.68 427.60±207.06 0.12
SS 338.16±170.06 494.86±209.97 449.58±197.50 0.08
SAv FS 101.07±27.26 93.89±22.50 83.29±26.22 0.33
SS 80.71±32.36 96.77±15.93 89.13±22.14 0.16
PAv FS 59.59±38.97 175.36±167.86 223.87±233.71 0.19
SS 122.87±94.83 133.87±154.69 322.96±190.97 1.86
KAv FS 511.14±506.53 698.63±679.06 906.00±616.57 0.12
SS 651.93±473.17 826.58±562.29 653.41±436.05 0.21
AAv FS 367.62±188.99 170.06±81.53 229.35±113.66 1.40
SS 200.50±154.86 285.15±294.04 343.17±316.46 1.04
Tab F0.05 (2,9) =4.26 *Significance at 0.05 levels.
Table-2 reveals that calculated F-value of selected kinematical variables of tennis players in first and second serve at
preparatory phase in different three time periods of the match of tennis match is less than tabulated F-value. Hence
there are selected kinematics variables of selected subjects does not play significant role in first and second serve at
preparatory phase during three different stages of the Tennis match.
Table 3. Kinematics parameters of first and second serve during Force Generation Phase at
Initial, Mid & End Period of the Match.
Variable Serve Initial Period Mid Period End Period
F- value Mean±SD Mean±SD Mean±SD
TA FS 11.75±2.63 10.50±1.29 10.00±3.74 0.43
SS 8.50±3.11 7.75±2.99 8.50±1.91 0.10
RH FS 4.03±0.47 3.99±0.23 3.55±0.43 1.88
SS 3.04±1.60 3.32±1.83 2.89±1.53 0.07
CD FS 1.12±0.54 0.81±0.10 0.76±0.10 0.27
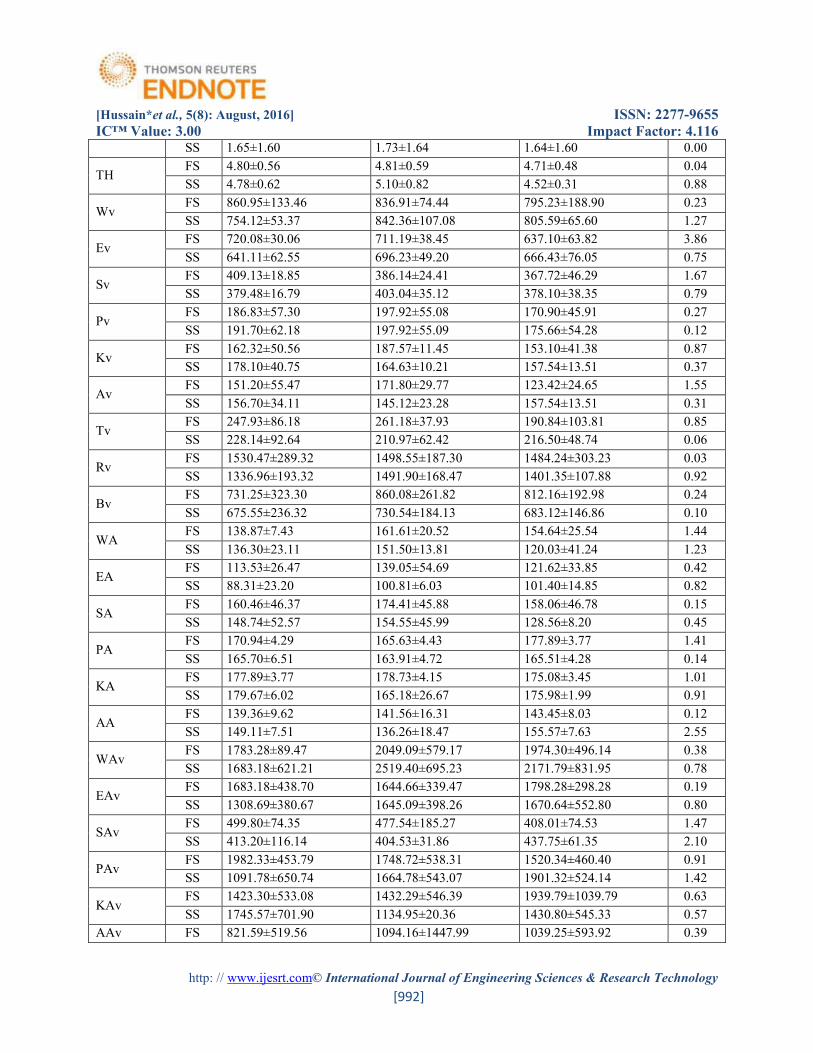
[Hussain*et al., 5(8): August, 2016] ISSN: 2277-9655
IC™ Value: 3.00 Impact Factor: 4.116
http: // www.ijesrt.com© International Journal of Engineering Sciences & Research Technology
[992]
SS 1.65±1.60 1.73±1.64 1.64±1.60 0.00
TH FS 4.80±0.56 4.81±0.59 4.71±0.48 0.04
SS 4.78±0.62 5.10±0.82 4.52±0.31 0.88
Wv FS 860.95±133.46 836.91±74.44 795.23±188.90 0.23
SS 754.12±53.37 842.36±107.08 805.59±65.60 1.27
Ev FS 720.08±30.06 711.19±38.45 637.10±63.82 3.86
SS 641.11±62.55 696.23±49.20 666.43±76.05 0.75
Sv FS 409.13±18.85 386.14±24.41 367.72±46.29 1.67
SS 379.48±16.79 403.04±35.12 378.10±38.35 0.79
Pv FS 186.83±57.30 197.92±55.08 170.90±45.91 0.27
SS 191.70±62.18 197.92±55.09 175.66±54.28 0.12
Kv FS 162.32±50.56 187.57±11.45 153.10±41.38 0.87
SS 178.10±40.75 164.63±10.21 157.54±13.51 0.37
Av FS 151.20±55.47 171.80±29.77 123.42±24.65 1.55
SS 156.70±34.11 145.12±23.28 157.54±13.51 0.31
Tv FS 247.93±86.18 261.18±37.93 190.84±103.81 0.85
SS 228.14±92.64 210.97±62.42 216.50±48.74 0.06
Rv FS 1530.47±289.32 1498.55±187.30 1484.24±303.23 0.03
SS 1336.96±193.32 1491.90±168.47 1401.35±107.88 0.92
Bv FS 731.25±323.30 860.08±261.82 812.16±192.98 0.24
SS 675.55±236.32 730.54±184.13 683.12±146.86 0.10
WA FS 138.87±7.43 161.61±20.52 154.64±25.54 1.44
SS 136.30±23.11 151.50±13.81 120.03±41.24 1.23
EA FS 113.53±26.47 139.05±54.69 121.62±33.85 0.42
SS 88.31±23.20 100.81±6.03 101.40±14.85 0.82
SA FS 160.46±46.37 174.41±45.88 158.06±46.78 0.15
SS 148.74±52.57 154.55±45.99 128.56±8.20 0.45
PA FS 170.94±4.29 165.63±4.43 177.89±3.77 1.41
SS 165.70±6.51 163.91±4.72 165.51±4.28 0.14
KA FS 177.89±3.77 178.73±4.15 175.08±3.45 1.01
SS 179.67±6.02 165.18±26.67 175.98±1.99 0.91
AA FS 139.36±9.62 141.56±16.31 143.45±8.03 0.12
SS 149.11±7.51 136.26±18.47 155.57±7.63 2.55
WAv FS 1783.28±89.47 2049.09±579.17 1974.30±496.14 0.38
SS 1683.18±621.21 2519.40±695.23 2171.79±831.95 0.78
EAv FS 1683.18±438.70 1644.66±339.47 1798.28±298.28 0.19
SS 1308.69±380.67 1645.09±398.26 1670.64±552.80 0.80
SAv FS 499.80±74.35 477.54±185.27 408.01±74.53 1.47
SS 413.20±116.14 404.53±31.86 437.75±61.35 2.10
PAv FS 1982.33±453.79 1748.72±538.31 1520.34±460.40 0.91
SS 1091.78±650.74 1664.78±543.07 1901.32±524.14 1.42
KAv FS 1423.30±533.08 1432.29±546.39 1939.79±1039.79 0.63
SS 1745.57±701.90 1134.95±20.36 1430.80±545.33 0.57
AAv FS 821.59±519.56 1094.16±1447.99 1039.25±593.92 0.39

[Hussain*et al., 5(8): August, 2016] ISSN: 2277-9655
IC™ Value: 3.00 Impact Factor: 4.116
http: // www.ijesrt.com© International Journal of Engineering Sciences & Research Technology
[993]
SS 1604.21±876.42 1164.37±766.46 1686.18±540.92 0.58
Tab F0.05 (2,9) =4.26 *Significance at 0.05 levels.
Table-3 reveals that calculated F-value of selected kinematical variables of tennis players in first and second serve at
force generation phase in different three time periods of the match of tennis match is less than tabulated F-value.
Hence there are selected kinematics variables of selected subjects does not play significant role in first and second
serve at preparatory phase during three different stages of the Tennis match.
Table 4. Kinematics parameters of first and second serve during Follow through Phase at
Initial, Mid & End Period of the Match.
Variable Serve Initial Period Mid Period End Period
F- value Mean±SD Mean±SD Mean±SD
Wv FS 837.91±113.48 756.20±83.98 713.42±102.95 1.56
SS 729.71±96.30 770.59±151.02 716.35±55.24 0.27
Ev FS 420.72±27.52 396.40±25.85 368.71±35.35 3.04
SS 382.02±7.96 416.80±45.57 411.57±21.15 1.58
Sv FS 216.34±35.25 211.46±37.42 205.78±35.18 0.09
SS 235.85±27.55 227.43±20.53 215.64±19.10 0.80
Pv FS 168.48±47.49 194.01±22.39 176.27±39.94 0.47
SS 181.23±41.43 179.42±35.40 168.96±26.31 0.15
Kv FS 75.83±17.02 76.56±36.15 88.35±23.12 0.28
SS 75.64±15.53 80.96±28.14 75.80±20.86 0.08
Av FS 328.25±56.22 342.70±43.45 334.78±84.87 0.05
SS 323.24±78.22 344.19±51.38 317.52±36.77 0.23
Tv FS 399.18±63.19 428.49±47.34 407.88±80.65 0.21
SS 398.99±101.71 420.60±76.40 379.96±32.39 0.29
Rv FS 1786.71±316.22 1663.00±395.82 1311.45±249.87 2.29
SS 1371.55±115.23 1480.74±224.44 1376.80±137.32 0.55
Bv FS 4735.37±873.40 4236.08±447.94 5020.27±692.05 1.31
SS 3763.12±360.27 3856.11±490.26 3713.00±82.72 0.17
WA FS 146.86±18.94 143.73±7.24 140.90±5.91 0.24
SS 129.60±7.18 140.22±10.34 140.78±13.86 1.36
EA FS 159.17±10.60 138.03±39.28 140.95±24.82 0.69
SS 125.97±34.84 144.52±17.56 146.45±6.62 0.98
SA FS 134.74±8.10 118.08±18.98 150.12±19.55 3.81
SS 125.41±32.30 142.78±10.89 135.92±15.35 0.66
PA FS 157.54±4.87 160.08±10.14 161.35±6.97 0.26
SS 162.03±4.10 159.36±4.02 163.43±6.42 0.69
KA FS 172.97±16.68 184.32±16.01 168.95±16.79 0.93
SS 177.75±11.59 161.85±37.81 166.24±8.80 0.49
AA FS 119.76±11.67 128.77±12.02 123.39±11.71 0.59
SS 127.89±13.97 118.08±20.33 131.34±17.08 0.63
Wav FS 1219.91±523.83 1104.02±825.79 900.28±214.34 0.31
SS 1242.19±461.93 953.57±343.55 1107.08±458.05 0.46
EAv FS 1911.67±1033.24 1723.01±856.58 1725.99±542.85 0.53
SS 1659.29±780.01 1725.45±1089.08 1599.41±870.47 0.01
SAv FS 1540.91±710.73 1094.08±949.85 1665.34±823.28 0.52

[Hussain*et al., 5(8): August, 2016] ISSN: 2277-9655
IC™ Value: 3.00 Impact Factor: 4.116
http: // www.ijesrt.com© International Journal of Engineering Sciences & Research Technology
[994]
SS 1085.24±555.21 1443.88±657.58 1763.04±370.14 1.57
PAv FS 1324.92±315.77 1099.24±721.75 1145.30±868.73 0.12
SS 1170.28±23.42 1055.20±662.85 1201.26±768.32 0.07
KAv FS 1001.70±580.15 1466.09±545.44 1163.09±58.70 0.24
SS 1114.88±76.66 1415.84±559.06 1413.85±443.27 0.70
AAv FS 236.16±67.365 212.94±113.77 170.28±52.35 0.66
SS 317.07±270.03 135.19±73.08 322.95±66.05 1.66
Tab F0.05 (2,9) =4.26 *Significance at 0.05 levels.
Table-4 reveals that calculated F-value of selected kinematical variables of tennis players in first and second serve at
force generation phase in different three stages of Tennis match is less than tabulated F-value. Hence there are
selected kinematics variables of selected subjects does not play significant role in first and second serve at
preparatory phase during three different stages of the Tennis match.
CONCLUSION The result of the statistical analysis for tennis serve kinematics at initial, mid and end period as well as during
preparatory, force generation phase and follow through phase showed no significant differences. However
kinematics parameters tested have shown visible variation from initial to final as well as from preparatory to follow
through phase. Elliott (1988) found in his research that the linear velocities of various joints during tennis serves
progressively increased which is distinction of the present study. The results of Murray et al., 2001; Escamilla et al.,
2007 suggested that the kinematics and kinetics parameters decreases from initial to end period during baseball
pitching.
Angular velocities of the different kinematical parameters have mean variations in three phases (Preparatory, force
generation and follow through) between FS and SS, at initial, mid and end period of served during the tennis match.
In baseball, the trunk forward tilt angle and angular velocity at the instant of ball release are of higher magnitude for
higher velocity throwers, Matsuo et al., (2001) and Elliott (2006) suggested that the anteroposterior rotation of the
trunk enables internal rotation of the upper arm at the shoulder to play an important role in the Picher’s action. The joint angles of different parameters of the study have variation in FS &SS at initial, mid and end period of the
match. Matthew K.et al (2011) research results showed that peak joint angle and joint angle at impact were
significantly influenced by ball speed for all racket-side joints, except the elbow and shoulder. The horizontal
abduction angle shows that the upper arm is marginally in front of the shoulder alignment at this point in the service
action. While the magnitude of external rotation may seem extreme, it is similar to the 175° to 185° mean values
found for elite baseball pitchers (Dillman et al, 1993; Fleisig et al, 1999; Matsuo et al., 2001).
Result shows that the toss angle, reach height, reach distance and toss height have variations at three different stages
of match in different phases of the first and second serve. Mendes et al., (2013), the location and height of the tennis
ball toss becomes fundamental in the tennis serve, since these variables can help to identify tennis serve
effectiveness and impact location on the tennis racket. It was investigated that the serve performance of the elite
tennis players marks a partial difference in mean ball velocity on first serve rather than negligible difference was
observed in second serve of tennis at different stages of the match. Through above the conduct study inspite of
internal physiological changes of the elite tennis players, it is the kinematic manipulation cooperate to maintain the
serve performance in tennis player.
REFERENCES [1] Dillman, C.J., Fleisig, G.S., Andrews, J.R., (1993). Biomechanics of pitching with emphasis upon shoulder
kinematics. Journal of Orthopaedic & Sports Physical Therapy 18, 402–408.

[Hussain*et al., 5(8): August, 2016] ISSN: 2277-9655
IC™ Value: 3.00 Impact Factor: 4.116
http: // www.ijesrt.com© International Journal of Engineering Sciences & Research Technology
[995]
[2] Elliott B.C. (1988) Biomechanics of the serve in tennis. A biomedical perspective.Sports Medicine 6, 285-
294.
[3] Elliott, B., Marsh, T., & Blanksby, B. (1986). A three-dimensional cinematographic analysis of the tennis
serve. International Journal of Sport Biomechanics, 2, 260-271.
[4] Elliott B. Biomechanics and tennis. Br J Sports Med. 2006;40(5):392–396.
[5] Elliott B.C., Reid M.M., Crespo M. (2009) Technique development in tennis stroke production. ITF Ltd;
London.
[6] Fleisig, G.S., Barrentine, S.W., Zheng, N., Escamilla, R.F., Andrews, J.R., 1999. Kinematic and kinetic
comparison of baseball pitching among various levels of development. Journal of Biomechanics 32, 1371–1375.
[7] Mark Kovacs, (2011) An 8-stage model for evaluating the tennis serve: implications for performance
enhancement and injury prevention. Sports Health 3, 504-513.
[8] Matthew K Seeley · Merrill D Funk · William Matthew Denning · Ronald L Hager · J Ty Hopkins (2011)
Tennis forehand kinematics change as post-impact ball speed is altered., Sports Biomechanics, 10(4):415-
26.
[9] Matsuo, T., Escamilla, R.F., Fleisg,G.S., Barrentine, S.W., and Andrews, J.R.(2001). Comparison of
kinematics and temporal parameters between different pitch velocity groups. Journal of Applied
Biomechanics, 17, 1-13.
[10] Martin Caroline., Richard Kulpa , Paul Delamarche & Benoit Bideau (2013) "Professional tennis players'
serve: correlation between segmental angular momentums and ball velocity." Sports Biomechanics 12.1: 2-
14.
[11] Mendes, P. C., Fuentes, J. P., Mendes, R., Martins, F. M. L., Clemente, F. M., & Couceiro, M. S. (2013).
The variability of the serve toss in tennis under the influence of artificial crosswind.(Research
article)(Report). Journal of Sports Science and Medicine, 2 309.
[12] Reid Machar, David Whiteside, and Bruce Elliott. (2010) "Effect of skill decomposition on racket and ball
kinematics of the elite junior tennis serve." Sports Biomechanics 9.4: 296-303.
[13] Reid Machar, David Whiteside, and Bruce Elliott (2011). "Serving to different locations: set-up, toss, and
racket kinematics of the professional tennis serve." Sports Biomechanics 10.4: 407-414.
[14] Vaverka, Frantisek, and Miroslav Cernosek. (2013)"Association between body height and serve speed in
elite tennis players." Sports Biomechanics 12.1: 30-37.
5/16/2020 (PDF) INFLUENCE OF SPATIO-TEMPORAL PARAMETERS ON GAIT SPEED IN SCHOOL CHILDREN | IJAR Indexing - Academi…
https://www.academia.edu/25905339/INFLUENCE_OF_SPATIO-TEMPORAL_PARAMETERS_ON_GAIT_SPEED_IN_SCHOOL_CHILDREN 1/5
PDFPDF
INFLUENCE OF SPATIO-TEMPORALPARAMETERS ON GAIT SPEED IN SCHOOLCHILDREN
or download with email
IJAR Indexing
Download with Google Download with Facebook
ISSN 2320-5407 International Journal of Advanced Research (2016), Volume 4, Issue 4, 768-772
Journal homepage: http://www.journalijar.com INTERNATIONAL JOURNAL
Journal DOI: 10.21474/IJAR01 OF ADVANCED RESEARCH
RESEARCH ARTICLE
INFLUENCE OF SPATIO-TEMPORAL PARAMETERS ON GAIT SPEED IN SCHOOL CHILDREN.
Ikram Hussain1, Syed Anayat Hussain
2, Fuzail Ahmad
3.
1. Professor, Department of Physical Education, Aligarh Muslim University, Aligarh.
2. Research Scholar, Department of Physical Education, Aligarh Muslim University, Aligarh.
3. Assistant Professor, Department of Physical Education, Aligarh Muslim University, Aligarh
Manuscript Info Abstract
Manuscript History:
Received: 12 February 2016
Final Accepted: 22 March 2016
Published Online: April 2016
Key words:Gait speed, Spatio-temporal.
*Corresponding Author
Fuzail Ahmad.
This paper explores the influence of gait speed on various time-distance
parameters. The approach consists of designing an experimental set up to
gather running data at fast gait speeds. A total of number of twelve school
children having mean and standard deviation (SD) of their age (yrs), bodyheight (cms) and body weight (kgs) as 5.25±0.13, 122.33 ± 7.79 and 21.16±
2.82 respectively were selected for the study. The Spatio-temporal gait
parameters were recorded during a complete gait cycle and were analyzed
using appropriate motion analysis software. The statistical analysis was done
using SPSSv17.0. The mean, standard deviation (SD) and correlation
coefficient (r) was determined to find out any relationship between the
selected Spatio-temporal parameters and gait speed. The results showed that
stride length (r=0.72) is significantly correlated with gait speed. Therefore,
while making an assessment of gait patterns in children for the management
READ PAPER
LOG IN SIGN UP
INFLUENCE OF SPATIO-TEMPORAL PARAMETERS ON GAIT SPEED IN SCHOOL CHILDREN DOWNLOAD
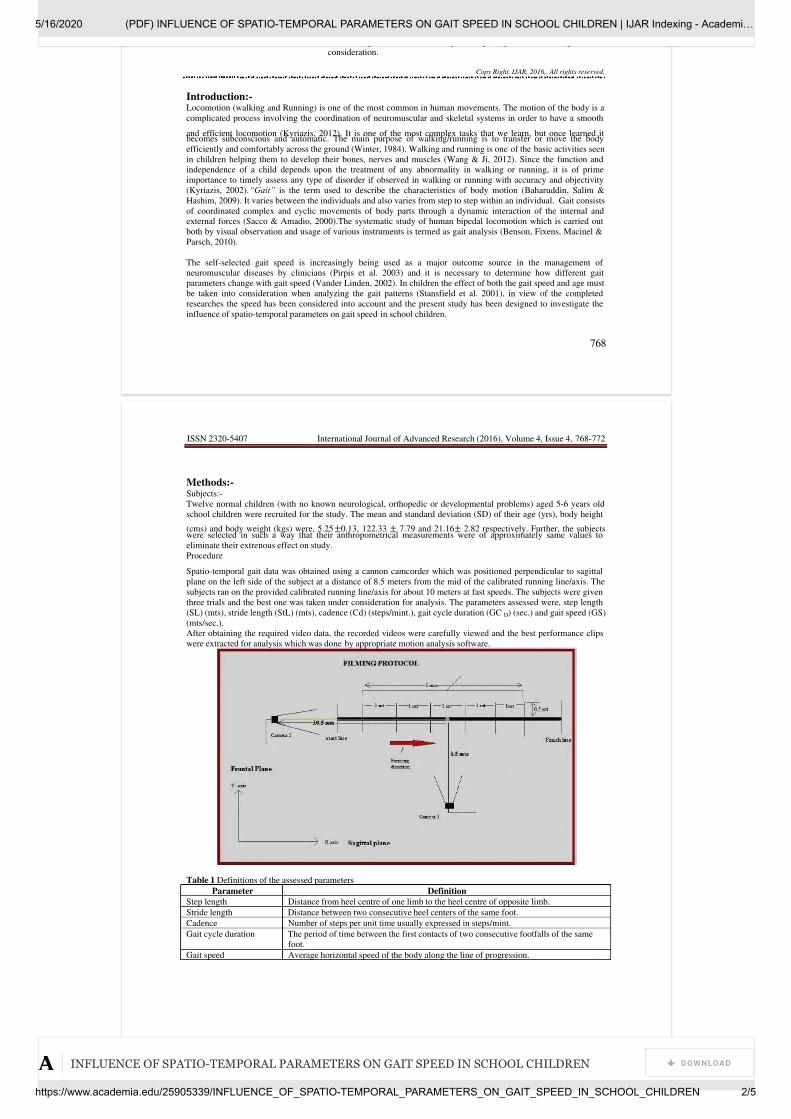
5/16/2020 (PDF) INFLUENCE OF SPATIO-TEMPORAL PARAMETERS ON GAIT SPEED IN SCHOOL CHILDREN | IJAR Indexing - Academi…
https://www.academia.edu/25905339/INFLUENCE_OF_SPATIO-TEMPORAL_PARAMETERS_ON_GAIT_SPEED_IN_SCHOOL_CHILDREN 2/5
768
of neurological diseases, the impact of gait speed should be given due
consideration.
Copy Right, IJAR, 2016,. All rights reserved.
Introduction:-Locomotion (walking and Running) is one of the most common in human movements. The motion of the body is a
complicated process involving the coordination of neuromuscular and skeletal systems in order to have a smooth
and efficient locomotion (Kyriazis, 2012). It is one of the most complex tasks that we learn, but once learned itbecomes subconscious and automatic. The main purpose of walking/running is to transfer or move the body
efficiently and comfortably across the ground (Winter, 1984). Walking and running is one of the basic activities seen
in children helping them to develop their bones, nerves and muscles (Wang & Ji, 2012). Since the function and
independence of a child depends upon the treatment of any abnormality in walking or running, it is of prime
importance to timely assess any type of disorder if observed in walking or running with accuracy and objectivity
(Kyriazis, 2002).“Gait” is the term used to describe the characteristics of body motion (Baharuddin, Salim &
Hashim, 2009). It varies between the individuals and also varies from step to step within an individual. Gait consists
of coordinated complex and cyclic movements of body parts through a dynamic interaction of the internal and
external forces (Sacco & Amadio, 2000).The systematic study of human bipedal locomotion which is carried out
both by visual observation and usage of various instruments is termed as gait analysis (Benson, Fixens, Macinel &
Parsch, 2010).
The self-selected gait speed is increasingly being used as a major outcome source in the management of
neuromuscular diseases by clinicians (Pirpis et al. 2003) and it is necessary to determine how different gait
parameters change with gait speed (Vander Linden, 2002). In children the effect of both the gait speed and age must
be taken into consideration when analyzing the gait patterns (Stansfield et al. 2001), in view of the completed
researches the speed has been considered into account and the present study has been designed to investigate the
influence of spatio-temporal parameters on gait speed in school children.
ISSN 2320-5407 International Journal of Advanced Research (2016), Volume 4, Issue 4, 768-772
769
Methods:-Subjects:-
Twelve normal children (with no known neurological, orthopedic or developmental problems) aged 5-6 years old
school children were recruited for the study. The mean and standard deviation (SD) of their age (yrs), body height
(cms) and body weight (kgs) were, 5.25±0.13, 122.33 ± 7.79 and 21.16± 2.82 respectively. Further, the subjectswere selected in such a way that their anthropometrical measurements were of approximately same values to
eliminate their extrenous effect on study.
Procedure
Spatio-temporal gait data was obtained using a cannon camcorder which was positioned perpendicular to sagittal
plane on the left side of the subject at a distance of 8.5 meters from the mid of the calibrated running line/axis. The
subjects ran on the provided calibrated running line/axis for about 10 meters at fast speeds. The subjects were given
three trials and the best one was taken under consideration for analysis. The parameters assessed were, step length
(SL) (mts), stride length (StL) (mts), cadence (Cd) (steps/mint.), gait cycle duration (GC D) (sec.) and gait speed (GS)
(mts/sec.).
After obtaining the required video data, the recorded videos were carefully viewed and the best performance clips
were extracted for analysis which was done by appropriate motion analysis software.
Table 1 Definitions of the assessed parameters
Parameter Definition
Step length Distance from heel centre of one limb to the heel centre of opposite limb.
Stride length Distance between two consecutive heel centers of the same foot.
Cadence Number of steps per unit time usually expressed in steps/mint.
Gait cycle duration The period of time between the first contacts of two consecutive footfalls of the same
foot.
Gait speed Average horizontal speed of the body along the line of progression.
INFLUENCE OF SPATIO-TEMPORAL PARAMETERS ON GAIT SPEED IN SCHOOL CHILDREN DOWNLOAD

5/16/2020 (PDF) INFLUENCE OF SPATIO-TEMPORAL PARAMETERS ON GAIT SPEED IN SCHOOL CHILDREN | IJAR Indexing - Academi…
https://www.academia.edu/25905339/INFLUENCE_OF_SPATIO-TEMPORAL_PARAMETERS_ON_GAIT_SPEED_IN_SCHOOL_CHILDREN 3/5
ISSN 2320-5407 International Journal of Advanced Research (2016), Volume 4, Issue 4, 768-772
770
Figure 1 Analyzing of Step and Stride Length.
Figure 2 Analyzing of Cadence & Gait velocity.
Figure 3 Analyzing of Gait cycle duration.
INFLUENCE OF SPATIO-TEMPORAL PARAMETERS ON GAIT SPEED IN SCHOOL CHILDREN DOWNLOAD
5/16/2020 (PDF) INFLUENCE OF SPATIO-TEMPORAL PARAMETERS ON GAIT SPEED IN SCHOOL CHILDREN | IJAR Indexing - Academi…
https://www.academia.edu/25905339/INFLUENCE_OF_SPATIO-TEMPORAL_PARAMETERS_ON_GAIT_SPEED_IN_SCHOOL_CHILDREN 4/5
INFLUENCE OF SPATIO-TEMPORAL PARAMETERS ON GAIT SPEED IN SCHOOL CHILDREN DOWNLOAD

5/16/2020 (PDF) INFLUENCE OF SPATIO-TEMPORAL PARAMETERS ON GAIT SPEED IN SCHOOL CHILDREN | IJAR Indexing - Academi…
https://www.academia.edu/25905339/INFLUENCE_OF_SPATIO-TEMPORAL_PARAMETERS_ON_GAIT_SPEED_IN_SCHOOL_CHILDREN 5/5
About Press Blog People Papers Job Board Advertise We're Hiring! Help Center
Find new research papers in: Physics Chemistry Biology Health Sciences Ecology Earth Sciences Cognitive Science Mathematics Computer Science
Terms Privacy Copyright Academia ©2020

4 XI November 2016

www.ijraset.com Volume 4 Issue XI, November 2016
IC Value: 13.98 ISSN: 2321-9653
International Journal for Research in Applied Science & Engineering
Technology (IJRASET)
©IJRASET: All Rights are Reserved
162
Kinematics of Usain Bolt’s 100 m performance: A
Review Ikram Hussain1, Tawseef Ahmad Bhat2, Syed Anayat Hussain3
1Professor, Department of Physical Education, Aligarh Muslim University, Aligarh 2Assistant Director, Directorate of Physical Education and Sports, University of Kashmir, Srinagar
3Lecturer Department of Youth Services and Sports, Jammu and Kashmir.
Abstract: The sprint event viz, 100m is considered as the blue riband event in the world, as athlete tries to cover the maximum
distance in the shortest possible time. This study was aimed to review the kinematics of Usain Bolt’s 100m performance. Bolt is
considered as the world’s highest profile athlete, through his success in the field of athletics, he has revolutionised the sprint
mechanics by his record breaking performances and has owned the name world’s fastest man and lightning bolt. In this study
the kinematics and physical characteristics of his best three performances was brought into light with the help of data retrieved
from the official website of IAAF, research papers and from many other citations. The 20 cm longer stride length, higher stride
frequency and high velocity helps him to maintain his momentum in the last stage of the 100 m race than his other counterparts
of the race, and finally makes him superior than other rivals. This longer stride length, higher frequency and high velocity may
be the reason, which makes him faster than other athletes of the world.
Key Words: Kinematics Mechanics, and Sprints.
I. INTRODUCTION
The 100 m sprint was officially introduced in the Modern Olympic Games in 1896, in Athens, Greece. The inaugural event was won by Thomas Burke, of the Unite States, with a timing of 12.00 seconds, (IAAF, 2009). This event is considered as the most attractive event of the athletics at the major championships, as almost all the spectators witness this event with full zeal and enthusiasm. The primary motive of this event is to cover the maximum distance in minimum possible time, and thus making it the world’s blue riband event of the athletics. The athlete who owns the record in 100 m event is given a prominent title, world’s fastest man. The world’s fastest sprinters run 100 m in just below 10 seconds. They run with an average velocity of 10 m/s, and take approximately 45 steps to complete the 100 m race, (Brüggeman, Koszewski and Müller 1999). The sprinters experience four different phases of speed during this short time and least number of steps they take, with reaction speed phase at the time of start, the acceleration phase, maximal speed phase and speed maintenance phase, (Smith, 2005). The current world record holder of the 100 m race is Usain Bolt of Jamaica with a timing of 9.58 s, and also holds the current 200m world record of 19.19 s both the world records set at Berlin in 12th International Association of Athletics Federations (IAAF), World Championships in Athletics 2009. The 100 m sprints performance of the Usain Bolt is of physical interest, because he achieves his speed and acceleration within no time as compared to the other 100 m sprinters. In this respect, the people of 21st century are enjoying the golden era of the athletics, especially because of the record breaking performance being given by the Usain Bolt, and has revolutionised the sprint mechanics. In the last 8 years of his career, he has improved the 100 m world record twice from 9.79 s to 9.69 s and from 9.69 s to 9.58 s (IAAF, 2013). The 10 s barrier in 100 m was broken in 1968 summer Olympic Games in Mexico. After that the record has been improved by 0.37 s from (1968 – 2009), with an increase in the performance by 3.72%. Mann and Herman (1985) have conducted a similar research and have found that the performance of the 100 m sprints depends upon the sprinting speed, stride length, stride frequency, and joint velocities. These kinematic parameters of the 100 m sprints are mutually dependent on each other; increase in both the parameters simultaneously is very difficult due their interdependency. Thus making change in one parameter will lead to the improvement of sprint velocity, as long as the other parameter does not change similarly (Hunter at el., 2004). Increasing frequency will lead to the decrease in stride length and vice versa. Thus the increase in the stride frequency is directly proportional to the decrease in the stride length, especially at the initial acceleration phase of the race (Mackala, 2007). Hunter et al. (2004) and Bezodias et al. (2008) have studied that relative importance of developing a long stride length or high stride rate remains inconsistent. Bezodias et al. (2008) have revealed that the stride frequency is the main contributor to the increase in velocity of sprint performance. However, Mero and Komi (1985), Gajer et al. (1999), Shen (2000) and Mackala

www.ijraset.com Volume 4 Issue XI, November 2016
IC Value: 13.98 ISSN: 2321-9653
International Journal for Research in Applied Science & Engineering
Technology (IJRASET)
©IJRASET: All Rights are Reserved
163
(2007) have revealed that the stride length was more significant than stride frequency. Therefore, it is not clear how the kinematic parameters interact with each other. In context of the above research, the present study is structured to review the kinematics of Usain Bolts 100 m sprint performance.
II. STEREOTYPE OF USAIN BOLT Physically Usain Bolt is 196 cm in height, thus making him worlds one of the tallest sprinter. Bolt’s height is about 20 cm, 18.7 cm and 16.6 cm greater than the average height of the other counterparts of the 100 m (2012 Beijing Olympic Games, 2009 Berlin World Championships in Athletics and 2012 London Olympic Games). Despite of having greater height, Bolt has got heavy mass of about 93 kg which also makes him heavy contingent in terms of mass. Bolt was having higher body mass than his other rivals, Beijing 14.8%, Berlin 12.3% and 10.7% in London.
III. PERFORMANCE OF USAIN BOLT IN BRIEF
Usain Bolt is considered as the sprint king, he has won 9 Olympic gold medals viz, 3 gold medals at 2008 summer Olympic games in Beijing, 3 gold medals at 2012 summer Olympic games in London and 3 gold medals at 2016 summer Olympic games in Rio de Jenerio and has also 11 world athletic championship gold medals to his credit, viz, 3 gold medals at the 2009 world athletic championships in Berlin, 2 gold medals at 2011 world athletic championships in Daegu, 3 gold medals at 2013 world athletic championships in Moscow and 3 gold medals at 2015 world athletic championships in Beijing, besides this he has also won a gold medal in relay race at common wealth games held at Glasgow, Scotland in 2014 respectively. Since Beijing Olympics 2008, he has lost only one 100 m final at Daegu, South Korea due to false start, since then he has ruled the 100 m, 200 m and 4 X 100 m relay races. He became the only sprinter in the world to defend his Olympic titles thrice in a row at three consecutive summer Olympics viz, 2008, 2012 and 2016. He made a clean sweep of triple treble of gold medals in Olympics thus has own the title “Lightening Bolt”. He has also won three 100 m gold medals in world athletic championships out of his four appearances, the only time he could not won his 100 m gold medal was at Daegu world athletic championships 2011, because of his false start that lead him to the disqualification in the final. Bolt has completed all his fastest 100 m races at an average of 41.13 strides. He starts his race with smaller baby steps at the beginning of the race and covers 2.45 meter with one stride. Stride length which is inversely linked to the frequency, which is 0.30 Hz lower (IAAF, 2009). Each 100 m section of Beijing was similar to that of Berlin and London. The average difference is 0.02, however clear differences were seen in the first 10 meters and last 10 meters. Bolts first 10 meters at Berlin was slower by 0.04 s to that of Beijing Olympics 2008, which cost him about 0.07 s compared to the time needed for the last 10 m in Berlin, so, if Bolt had started the 100 m race at Berlin world championship in the same way as he did at Beijing Olympics, then he would have definitely improved his 100 m performance to sub 9.50 s. Another significant difference was found in the last 10 meters of the race, (IAAF, 2009). As per the above facts, it is evident that Bolt would be able to cover first 10 m in 1.85 s. As per the analysis made by his coach Glen Mills at Beijing Olympics 2008, the way Bolt was running at Beijing Olympics, he could have finished his 100 m race in just 9.52 s, if he had not slowed down to start pre mature celebration of his victory from the 80 meters, as none of the other athletes was close to him. This pre mature celebration cost him to finish in 9.69 s.
IV. STATISTICS OF BOLT’S THREE BEST 100 M PERFORMANCES
Table 1: Statistics of Bolt’ 100 m performance with timing, since 2008 Year Event Competition Venue Place Time
(Seconds)
2008 100 m Olympic Games Beijing, China Ist 9.69 2009 100 m World Athletic Championships Berlin, Germany Ist 9.58 2011 100 m World Athletic Championships Daegu, South Korea Disqualified ---------- 2012 100 m Olympic Games London, United
Kingdom Ist 9.63
2013 100 m World Athletic Championships Moscow, Russia Ist 9.77 2015 100 m World Athletic Championships Beijing, China Ist 9.79 2016 100 m Olympic Games Rio de Janeiro, Brazil Ist 9.81
1. Data retrieved from IAAF –Berlin 2009. 2. Data from https://en.wikipedia.org/wiki/Usain_Bolt
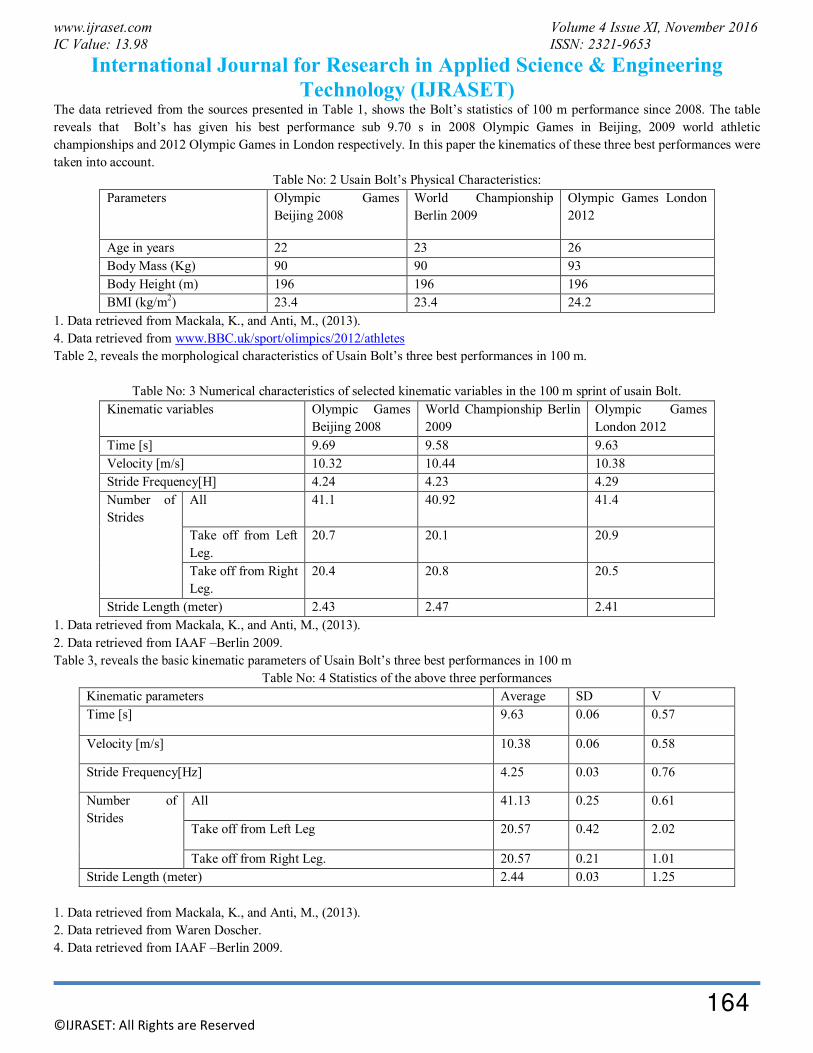
www.ijraset.com Volume 4 Issue XI, November 2016
IC Value: 13.98 ISSN: 2321-9653
International Journal for Research in Applied Science & Engineering
Technology (IJRASET)
©IJRASET: All Rights are Reserved
164
The data retrieved from the sources presented in Table 1, shows the Bolt’s statistics of 100 m performance since 2008. The table reveals that Bolt’s has given his best performance sub 9.70 s in 2008 Olympic Games in Beijing, 2009 world athletic championships and 2012 Olympic Games in London respectively. In this paper the kinematics of these three best performances were taken into account.
Table No: 2 Usain Bolt’s Physical Characteristics: Parameters Olympic Games
Beijing 2008 World Championship Berlin 2009
Olympic Games London 2012
Age in years 22 23 26 Body Mass (Kg) 90 90 93 Body Height (m) 196 196 196 BMI (kg/m2) 23.4 23.4 24.2
1. Data retrieved from Mackala, K., and Anti, M., (2013). 4. Data retrieved from www.BBC.uk/sport/olimpics/2012/athletes Table 2, reveals the morphological characteristics of Usain Bolt’s three best performances in 100 m.
Table No: 3 Numerical characteristics of selected kinematic variables in the 100 m sprint of usain Bolt. Kinematic variables Olympic Games
Beijing 2008 World Championship Berlin 2009
Olympic Games London 2012
Time [s] 9.69 9.58 9.63 Velocity [m/s] 10.32 10.44 10.38 Stride Frequency[H] 4.24 4.23 4.29 Number of Strides
All 41.1 40.92 41.4
Take off from Left Leg.
20.7 20.1 20.9
Take off from Right Leg.
20.4 20.8 20.5
Stride Length (meter) 2.43 2.47 2.41 1. Data retrieved from Mackala, K., and Anti, M., (2013). 2. Data retrieved from IAAF –Berlin 2009. Table 3, reveals the basic kinematic parameters of Usain Bolt’s three best performances in 100 m
Table No: 4 Statistics of the above three performances Kinematic parameters Average SD V Time [s] 9.63 0.06 0.57
Velocity [m/s] 10.38 0.06 0.58
Stride Frequency[Hz] 4.25 0.03 0.76
Number of Strides
All 41.13 0.25 0.61
Take off from Left Leg 20.57 0.42 2.02
Take off from Right Leg. 20.57 0.21 1.01 Stride Length (meter) 2.44 0.03 1.25
1. Data retrieved from Mackala, K., and Anti, M., (2013). 2. Data retrieved from Waren Doscher. 4. Data retrieved from IAAF –Berlin 2009.

www.ijraset.com Volume 4 Issue XI, November 2016
IC Value: 13.98 ISSN: 2321-9653
International Journal for Research in Applied Science & Engineering
Technology (IJRASET)
©IJRASET: All Rights are Reserved
165
Table 4, reveals the average performance of Usain Bolt’s three best performances. The table reveals that Bolt completed all three fastest 100 m races at an average of 41.13 strides, with a stride frequency of 4.25 HZ, and with a running velocity of 10.38 m/s.
V. DISCUSSION
The 100 m sprints event is very individual and mainly depends upon the athlete’s morphological and kinematic parameters. The study reveals that that the impact of the Usain Bolt’s biological characteristics viz, body height and body mass son the stride length and stride frequency gives him an edge to be faster in the 100 m event, because of the above characteristics Bolt attained the title, sprint king of 100 m. The longer limbs enable him to propel very fast during sprinting. The high stride frequency makes him to maintain the fast speed till the finishing line. The study also reveals that Bolt takes just 41.13 strides on average to complete 100 m race, an average stride length of 2.44 m, average stride frequency of 4.25 Hz and with an average velocity of 10.38 m/s. Bolt’s body height and lower limbs make him faster than other rivals and moreover his 20 cm longer stride length helps him in the last stage of the race to propel fastely towards victory (Mackala and Mero 2013). As mentioned above, it is clear that stride length has a great impact on the stride frequency; change in one parameter may affect another (Hunter et al., 2000). The elongated stride length is attained with the help of strength and power, and this stride length ultimately leads to the production of high velocity during sprinting (Hunter et al., 2004). Thus Bolt’s strength and power may be the reason for his higher stride length and high velocity at the time of sprinting.
VI. CONCLUSION
The main purpose of the study was to review the kinematic characteristics of the Usain Bolt’s 100 m performance. The study reveals that following kinematic characteristics viz, stride frequency, stride length, time and velocity define an efficient performance of Bolt in 100 m race. On the basis of the above mentioned data, the study reveals that Bolts higher stride frequency and longer stride length helps him maintain the top speed till the finishing line. In context of the above study, it is noteworthy that the main focus in the 100 m race should be on the optimal interaction between stride frequencies and stride length, which would finally lead to the production of high velocity. Thus, coaches and trainers should ponder upon the certain training programmes, which would help the athletes to develop their strength and power, so that they can enhance their stride length and stride frequency and there by ultimately helping them to maintain the velocity throughout the race.
REFERENCES [1] Bezodis, I.M., Sal., AI., & Kerwin, D.G.(2008). A longitudinal case study of step characteristics in a world class sprint athlete. ISBS Conference 537‐540.
Seoul: Korea. [2] Biomechanical Proceedings of XVIII. (2000). International Symposium of Biomechanics in Sports, Hong‐ Kong, 333‐336. [3] Brüggemann, G.P., Koszewski, D., & Mülle, H.(1999). Biomechanical Research Project. Athens 1997, Final report. Meyer & Meyer Sport, Oxford, 1999; 12–
41. [4] Deutscher., Leichtathletic., & Verband, (2009). Scientific Research Project Biomechanical Analyses of World Championships 2009 Berlin: Final Report, Sprint
Men. [5] Ferro, A., Rivera, A., Pagola, I., Ferreruela, M., Martin, À. and Rocandio V. (1999). (2001) Biomechanical analysis of the 7th World Championships in
Athletics Seville. New Study of Athletics. 16: 25–60. [6] Gajer, B., Thepau, J., Mathieu, C., and Lehenaff, D.(1999). Evolution of stride and amplitude during course of the 100 m event in athletics. New Studies in
Athletics, 3, 43.50. [7] Hunter, JP., Marshall, RN., and McNair, PJ. (2004). Interaction of step length and step rate during sprint running. Med Sci Sport Exer. 36: 261‐271. [8] IAAF (2009) 100 m -http://www.iaaf.org/ community/athletics/trackfield /newsid=4666.html. [9] Mackala, K., and Anti, M., (2013). A kinematic Analysis of three best performances. Journal of Human Kinetics, 36, 149-160. [10] Mackala, K., (2007). Optimisation of performance through kinematic analysis of the different phases of the 100 meters. New Studies in Athletics.22(2): 7-16. [11] Mann, R., and Herman, J. (1985). Kinematics analysis of Olympic sprint performance: men’s 200 meters. Int J Sport Biomech 1: 151–162. [12] Mero, A., and Komi, PV. (1985). Effect of supramaximal velocity on biomechanical variables in sprinting. Int J Sport Biomech .1: 240–252. [13] Müller, H., and Hommel, H. (1997) .Biomechanical research project at VI the world championships in athletics, Athens 1997 – sprints. [14] Scientific Research Project (2011). IAAF, (DVL) World Championship in Athletics, Berlin, Germany. Available at: www. iaaf.org; accessed on 16.10.2016. [15] Shen, W. (2000). The effects of stride length and frequency on the speeds of elite sprinters in 100 meter dash. Biomechanical Proceedings of XVIII
International Symposium of Biomechanics in Sports, Hong-Kong, 333-336s [16] Smith M. (2005) High performance sprinting. The Crowood Press Ltd., Ramsbury.


5/16/2020 (PDF) THE GENERIC PREPARATION PHASES FOR 100 METER MALE UNIVERSITY SPRINTER | Researchpaedia Journal - Aca…
https://www.academia.edu/29453345/THE_GENERIC_PREPARATION_PHASES_FOR_100_METER_MALE_UNIVERSITY_SPRINTER 1/8
PDFPDF
THE GENERIC PREPARATION PHASESFOR 100 METER MALE UNIVERSITYSPRINTER
or download with email
R. Journal
Download with Google Download with Facebook
Researchpaedia Vol. 3 No. 2, July, 2016 ISSN 2347 - 9000
THE GENERIC PREPARATION PHASES FOR 100 METER MALEUNIVERSITY SPRINTERREAD PAPER
LOG IN SIGN UPTHE GENERIC PREPARATION PHASES FOR 100 METER MALE UNIVERSI… DOWNLOAD

5/16/2020 (PDF) THE GENERIC PREPARATION PHASES FOR 100 METER MALE UNIVERSITY SPRINTER | Researchpaedia Journal - Aca…
https://www.academia.edu/29453345/THE_GENERIC_PREPARATION_PHASES_FOR_100_METER_MALE_UNIVERSITY_SPRINTER 2/8
27
Prof. Ikram Hussain Sayed Mohammad AyubDepartment of Physical Education, Research Scholar
Aligarh Muslim University, Aligarh Muslim University,Aligarh, UP Aligarh, UP
Abstract
Sprint is an act of running over a short distance (or near) at top speed. The intensity of sprintdepends upon muscle fibers type and the flexibility. Sprint in the Athletics is a well-knownphenomenon in the modern age as part and parcel of speed. In Athletics event, it is a part oftrack event in which an athlete has to compete against the time
Keywords: Sprinting, Neuromuscular coordination, Force, Speed.
Introduction
A well-known fact that sprinting is an activity that underlet on the neuromuscularcoordination and on the caliber of the central nervous system for fend as many breaking andfriction movements as possible.
Mechanically, sprinting is not a complex skill, according to neurologically aspect sprinting iscomplex series or sequence of firing by motor neurons to activate the muscles to move thehuman lever system in order to effectively apply force. As we know a sprinter performancelaid down by the force and speed with which muscles can contract and relax and, because ofthe cyclic motion, the correct timing of the change from contraction (force application) torelaxation.(USATF 1999,Schmolinsky 1983,Plaff 2001).
The purpose of developing this paper will give the effective 12 week generic preparation statefor 100 meter male university sprinter
Performance Factor in Sprinter
The aim of sprinter in 100m race is to attain the highest maximal horizontal velocity. For elitesprinter this velocity is developed over the course of 43- 46 strides (men) which that make upthe 100m race. A stride consists of a support and a recovery phase. The sprinter horizontalpropulsion only produced during the support phase. The support leg applies force against theground in a backward downward direction (the action) and the ground “reaction” result in thehorizontal propulsion in a forward upward direction.
There is very inappreciable time available for the sprinter to apply force during the supportphase. At the point of maximum velocity, the sprinter foot is only on the ground 0.08 to 0.09seconds during the support phase. So, the sprinter must be able to effectively apply force and
THE GENERIC PREPARATION PHASES FOR 100 METER MALEUNIVERSITY SPRINTER
ISSN 2347 - 9000
during this short time period to maintain horizontal velocity. So, alone characteristic the needof sprinting having the ability to apply force in very short time period.
According to Mathematical term, the sprinting velocity is the product of stride length andstride frequency. These two factor are interact in 100m; after that they have reach the certainpoint following a phase of mutually increasing (within the first 50m) an increase in eitherparameter will result in a corresponding decreased in the other(i.e. if the sprinter increasedhis stride length after 50m that the stride rate(frequency) must be decreased). This point inthe race depends on many factors like body type, power production, training status, fatiguelevel, etc, and individual to each athlete. So there is an optimal stride length and frequency
for each athlete.Biomechanical factors in the 100m Sprint.
100 meter sprint is fundamentally divided into different phase:
1 The reaction phase at the start
THE GENERIC PREPARATION PHASES FOR 100 METER MALE UNIVERSI… DOWNLOAD
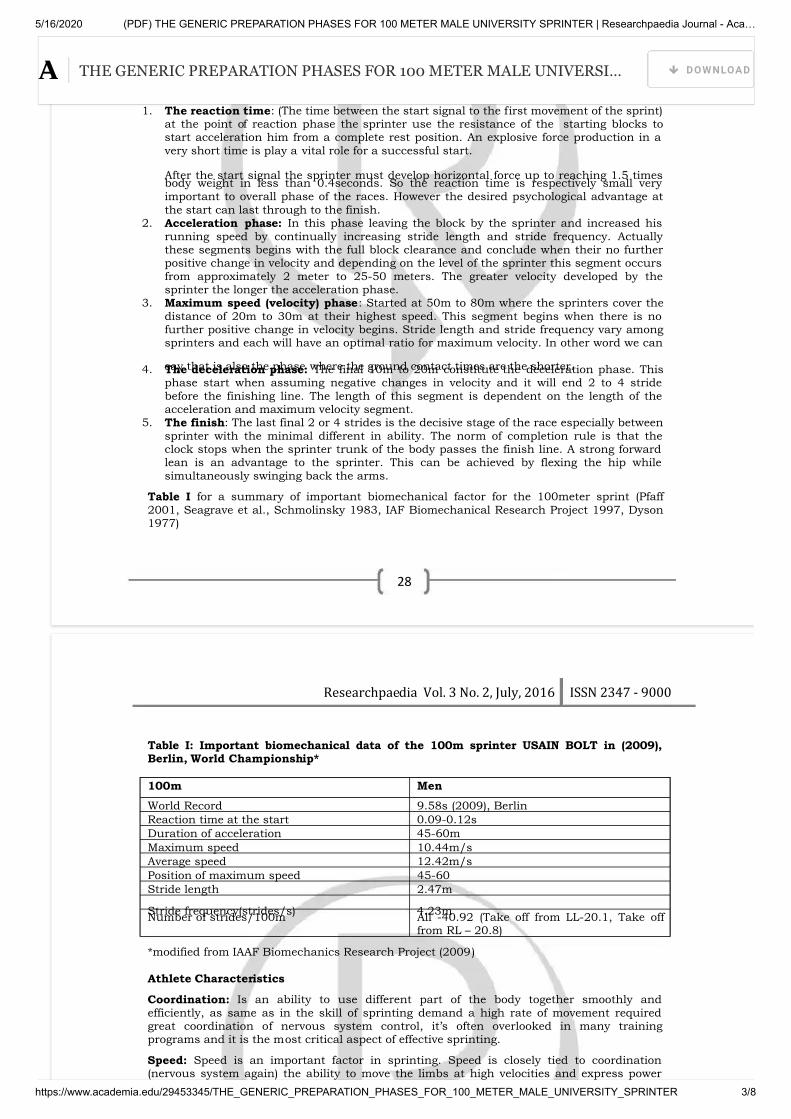
5/16/2020 (PDF) THE GENERIC PREPARATION PHASES FOR 100 METER MALE UNIVERSITY SPRINTER | Researchpaedia Journal - Aca…
https://www.academia.edu/29453345/THE_GENERIC_PREPARATION_PHASES_FOR_100_METER_MALE_UNIVERSITY_SPRINTER 3/8
28
1. The reaction phase at the start2. The acceleration phase (increased in speed)3. The phase of maximum speed (constant speed)4. The decelerations phase(decreasing in speed)5. The finish
1. The reaction time: (The time between the start signal to the first movement of the sprint)at the point of reaction phase the sprinter use the resistance of the starting blocks tostart acceleration him from a complete rest position. An explosive force production in avery short time is play a vital role for a successful start.
After the start signal the sprinter must develop horizontal force up to reaching 1.5 timesbody weight in less than 0.4seconds. So the reaction time is respectively small veryimportant to overall phase of the races. However the desired psychological advantage atthe start can last through to the finish.
2. Acceleration phase: In this phase leaving the block by the sprinter and increased hisrunning speed by continually increasing stride length and stride frequency. Actuallythese segments begins with the full block clearance and conclude when their no furtherpositive change in velocity and depending on the level of the sprinter this segment occursfrom approximately 2 meter to 25-50 meters. The greater velocity developed by thesprinter the longer the acceleration phase.
3. Maximum speed (velocity) phase: Started at 50m to 80m where the sprinters cover thedistance of 20m to 30m at their highest speed. This segment begins when there is nofurther positive change in velocity begins. Stride length and stride frequency vary amongsprinters and each will have an optimal ratio for maximum velocity. In other word we can
say that is also the phase where the ground contact times are the shorter.4. The deceleration phase: The final 10m to 20m constitute the deceleration phase. Thisphase start when assuming negative changes in velocity and it will end 2 to 4 stridebefore the finishing line. The length of this segment is dependent on the length of theacceleration and maximum velocity segment.
5. The finish: The last final 2 or 4 strides is the decisive stage of the race especially betweensprinter with the minimal different in ability. The norm of completion rule is that theclock stops when the sprinter trunk of the body passes the finish line. A strong forwardlean is an advantage to the sprinter. This can be achieved by flexing the hip whilesimultaneously swinging back the arms.
Table I for a summary of important biomechanical factor for the 100meter sprint (Pfaff2001, Seagrave et al., Schmolinsky 1983, IAF Biomechanical Research Project 1997, Dyson1977)
Researchpaedia Vol. 3 No. 2, July, 2016 ISSN 2347 - 9000
Table I: Important biomechanical data of the 100m sprinter USAIN BOLT in (2009),Berlin, World Championship*
100m Men
World Record 9.58s (2009), Berlin
Reaction time at the start 0.09-0.12s
Duration of acceleration 45-60m
Maximum speed 10.44m/s
Average speed 12.42m/s
Position of maximum speed 45-60
Stride length 2.47m
Stride frequency(strides/s) 4.23mNumber of strides/100m All -40.92 (Take off from LL-20.1, Take off
from RL – 20.8)
*modified from IAAF Biomechanics Research Project (2009)
Athlete Characteristics
Coordination: Is an ability to use different part of the body together smoothly andefficiently, as same as in the skill of sprinting demand a high rate of movement requiredgreat coordination of nervous system control, it’s often overlooked in many trainingprograms and it is the most critical aspect of effective sprinting.
Speed: Speed is an important factor in sprinting. Speed is closely tied to coordination(nervous system again) the ability to move the limbs at high velocities and express power
THE GENERIC PREPARATION PHASES FOR 100 METER MALE UNIVERSI… DOWNLOAD

5/16/2020 (PDF) THE GENERIC PREPARATION PHASES FOR 100 METER MALE UNIVERSITY SPRINTER | Researchpaedia Journal - Aca…
https://www.academia.edu/29453345/THE_GENERIC_PREPARATION_PHASES_FOR_100_METER_MALE_UNIVERSITY_SPRINTER 4/8
29
through those movement to propel the body down the track at high velocities.
Strength/ Power sprinter must overcome their own inertia as quickly as possible,development of the ability to produced large amount of power with the muscles involved isabsolutely necessary.
Flexibility: Is refer to the absolute range of movement in a joint or series of joint, so thegood sprinters possess a high degree of flexibility in a hips and ankles. Increased flexibilityallow for loss muscle resistance through any given range of motion
Reaction time: Reaction time is the amount of time it takes the respond to a stimulus ashort reaction time is a must for an event that is over in 10-12 second.All elite sprinter have short reaction times (0.12-0.19 second) (Schmolinsky 1983, Bowermanet. al. 1991, Belloti, Pfaff. 2001).For the sprint event, Torim (1988) identifies physical performance capacities and theirimportant rank for the sprint. The table is also given an accurate description of the demand
of the 100m sprint.
Table II: Physical Performance capacity and importance rank for sprints.(1= most important)
CAPACITY 100M
Reaction Speed 3
Acceleration 2
Maximal Speed 1
*From Torim (1988)
THE GENERIC PREPARATION PHASES FOR 100 METER MALE UNIVERSI… DOWNLOAD

5/16/2020 (PDF) THE GENERIC PREPARATION PHASES FOR 100 METER MALE UNIVERSITY SPRINTER | Researchpaedia Journal - Aca…
https://www.academia.edu/29453345/THE_GENERIC_PREPARATION_PHASES_FOR_100_METER_MALE_UNIVERSITY_SPRINTER 5/8
THE GENERIC PREPARATION PHASES FOR 100 METER MALE UNIVERSI… DOWNLOAD

5/16/2020 (PDF) THE GENERIC PREPARATION PHASES FOR 100 METER MALE UNIVERSITY SPRINTER | Researchpaedia Journal - Aca…
https://www.academia.edu/29453345/THE_GENERIC_PREPARATION_PHASES_FOR_100_METER_MALE_UNIVERSITY_SPRINTER 6/8
THE GENERIC PREPARATION PHASES FOR 100 METER MALE UNIVERSI… DOWNLOAD

5/16/2020 (PDF) THE GENERIC PREPARATION PHASES FOR 100 METER MALE UNIVERSITY SPRINTER | Researchpaedia Journal - Aca…
https://www.academia.edu/29453345/THE_GENERIC_PREPARATION_PHASES_FOR_100_METER_MALE_UNIVERSITY_SPRINTER 7/8
THE GENERIC PREPARATION PHASES FOR 100 METER MALE UNIVERSI… DOWNLOAD
5/16/2020 (PDF) THE GENERIC PREPARATION PHASES FOR 100 METER MALE UNIVERSITY SPRINTER | Researchpaedia Journal - Aca…
https://www.academia.edu/29453345/THE_GENERIC_PREPARATION_PHASES_FOR_100_METER_MALE_UNIVERSITY_SPRINTER 8/8
About Press Blog People Papers Job Board Advertise We're Hiring! Help Center
Find new research papers in: Physics Chemistry Biology Health Sciences Ecology Earth Sciences Cognitive Science Mathematics
Computer Science
Terms Privacy Copyright Academia ©2020
THE GENERIC PREPARATION PHASES FOR 100 METER MALE UNIVERSI… DOWNLOAD

5/16/2020 (PDF) GLOBAL CONFERENCE ON SCIENTIFIC CULTURE IN PHYSICAL EDUCATION AND SPORTS | Lalit Tiwari - Academia.edu
https://www.academia.edu/17759981/GLOBAL_CONFERENCE_ON_SCIENTIFIC_CULTURE_IN_PHYSICAL_EDUCATION_AND_SPORTS 1/7
PDFPDF
GLOBAL CONFERENCE ON SCIENTIFICCULTURE IN PHYSICAL EDUCATION ANDSPORTS
or download with email
Lalit Tiwari
Download with Google Download with Facebook
GLOB L CONFERENCE ON SCIENTIFIC CULTURE
LOCOSCPES
G
READ PAPER
LOG IN SIGN UPGLOBAL CONFERENCE ON SCIENTIFIC CULTURE IN PHYSICAL EDUCATION AND SPORTS DOWNLOAD
5/16/2020 (PDF) GLOBAL CONFERENCE ON SCIENTIFIC CULTURE IN PHYSICAL EDUCATION AND SPORTS | Lalit Tiwari - Academia.edu
https://www.academia.edu/17759981/GLOBAL_CONFERENCE_ON_SCIENTIFIC_CULTURE_IN_PHYSICAL_EDUCATION_AND_SPORTS 2/7
IN PHYSIC L EDUC TION ND SPORTS
(GLOCOSCPES - 2016)
February 18th -20th, 2016
Under the Auspices ofDepartment of Physical Education
Punjabi University Patiala, Punjab (India)
About the Conference:
On behalf of the Department of Physical Education Punjabi University Patiala
we are delighted to invite you to GLOB L CONFERENCE ON SCIENTIFIC CULTURE IN
PHYSIC L EDUC TION ND SPORTS (GLOCOSCPES 2016) being organized by
Department of Physical Education Punjabi University Patiala, Punjab from
February 18th -20th, 2016. The theme is indeed apposite pplication of
Scientific Technology for the Enhancement of the Quality of Physical
Education and Sports.
This Conference will bring together practitioners, researchers and educators
from around the world who are engaged in Physical Education and sports
sciences in any capacity. The conference goal is to provide a forum for
Physical Education and sports practitioners and students to discuss the
increasing role of Scientific Technology for the enhancement of the quality of
physical education and sports and its association with other disciplines.
Department of Physical Education is dedicated to fostering growth and
innovation in this arena, and the conference enriches opportunities for learning
about the sports and health.
GLOB L CONFERENCE ON SCIENTIFIC CULTURE IN PHYSIC L EDUC TION ND SPORTS
(GLOCOSCPES - 2016)
Theme Application of Scientific Technology for the Enhancement of the
Quality of Physical ducation and Sports
We are pleased to invite you to the
GLOBAL CONFERENCE ON SCIENTIFIC CULTURE IN PHYSICAL EDUCATION AND SPORTS DOWNLOAD

5/16/2020 (PDF) GLOBAL CONFERENCE ON SCIENTIFIC CULTURE IN PHYSICAL EDUCATION AND SPORTS | Lalit Tiwari - Academia.edu
https://www.academia.edu/17759981/GLOBAL_CONFERENCE_ON_SCIENTIFIC_CULTURE_IN_PHYSICAL_EDUCATION_AND_SPORTS 3/7
We are pleased to invite you to the Global Conference on Scientific Culture in
Physical Education and Sports (GLOCOSCPES-2016). The Conference is
organized by Department of Physical Education Punjabi University Patiala, and
will be held February 18th -20th, 2016.
Call for Papers:
The Organizing Committee is now calling for research and practical papers
for oral/posters in the listed Areas of Interest related to Physical Education,
Health, leisure, exercise, sports science and sports medicine.
All the accepted papers will be published in Conference Proceeding with ISBN No.
Areas of Interest:
Paper can be submitted in the following area of interest:
1. Adapted Physical Education 2. Physical Education and Sports
3. Talent Identification and Sports Training
in Young Athletes
4. Leisure and Wellness, Health and Fitness
5. Sports Nutrition 6. Sports Biomechanics
7. Exercise Physiology 8. Sports Therapies
9. Physical Activity and Health Promotion 10. Sports Coaching and Training Science
11. Information and Sports Technology 12. Sports Genetics
13. Sports Philosophy 14. Sports Technology
15. Sports Pedagogy 16. Sports Sociology
17. Sports Medicine 18. Sports Politics
19. Sports Management 20. Sports Psychology
21. Strength and Conditioning 22. Anthropometry
For the Oral Presentation:
Each accepted paper will be allotted 7 minutes for oral presentation followed
by 3 minutes of questions, answers and discussion.
For the Poster presentation:
Each accepted poster will be assigned to a poster session and a poster board
space. Each accepted poster will be allotted four (4) minutes to present their
GLOBAL CONFERENCE ON SCIENTIFIC CULTURE IN PHYSICAL EDUCATION AND SPORTS DOWNLOAD

5/16/2020 (PDF) GLOBAL CONFERENCE ON SCIENTIFIC CULTURE IN PHYSICAL EDUCATION AND SPORTS | Lalit Tiwari - Academia.edu
https://www.academia.edu/17759981/GLOBAL_CONFERENCE_ON_SCIENTIFIC_CULTURE_IN_PHYSICAL_EDUCATION_AND_SPORTS 4/7
GLOBAL CONFERENCE ON SCIENTIFIC CULTURE IN PHYSICAL EDUCATION AND SPORTS DOWNLOAD
5/16/2020 (PDF) GLOBAL CONFERENCE ON SCIENTIFIC CULTURE IN PHYSICAL EDUCATION AND SPORTS | Lalit Tiwari - Academia.edu
https://www.academia.edu/17759981/GLOBAL_CONFERENCE_ON_SCIENTIFIC_CULTURE_IN_PHYSICAL_EDUCATION_AND_SPORTS 5/7
GLOBAL CONFERENCE ON SCIENTIFIC CULTURE IN PHYSICAL EDUCATION AND SPORTS DOWNLOAD

5/16/2020 (PDF) GLOBAL CONFERENCE ON SCIENTIFIC CULTURE IN PHYSICAL EDUCATION AND SPORTS | Lalit Tiwari - Academia.edu
https://www.academia.edu/17759981/GLOBAL_CONFERENCE_ON_SCIENTIFIC_CULTURE_IN_PHYSICAL_EDUCATION_AND_SPORTS 6/7
GLOBAL CONFERENCE ON SCIENTIFIC CULTURE IN PHYSICAL EDUCATION AND SPORTS DOWNLOAD

5/16/2020 (PDF) GLOBAL CONFERENCE ON SCIENTIFIC CULTURE IN PHYSICAL EDUCATION AND SPORTS | Lalit Tiwari - Academia.edu
https://www.academia.edu/17759981/GLOBAL_CONFERENCE_ON_SCIENTIFIC_CULTURE_IN_PHYSICAL_EDUCATION_AND_SPORTS 7/7
About Press Blog People Papers Job Board Advertise We're Hiring! Help Center
Find new research papers in: Physics Chemistry Biology Health Sciences Ecology Earth Sciences Cognitive Science Mathematics Computer Science
Terms Privacy Copyright Academia ©2020
GLOBAL CONFERENCE ON SCIENTIFIC CULTURE IN PHYSICAL EDUCATION AND SPORTS DOWNLOAD

2253
ISSN 2286-4822
www.euacademic.org
EUROPEAN ACADEMIC RESEARCH
Vol. IV, Issue 3/ June 2016
Impact Factor: 3.4546 (UIF)
DRJI Value: 5.9 (B+)
Role of Yoga for Development Motor Learning of
School Boys
Dr. RAJENDRA SINGH
Associate Professor, Department of Physical Education
AMU Aligarh
DHARMENDRA KUMAR SINGH
GAGAN KUMAR
Research Scholar, Department of Physical Education
AMU Aligarh
Abstract:
The purports of this study was to investigate the role of yoga to
develop motor learning of school boys. Fifty (50) male school boys were
randomly selected as subjects for the purpose of this study from
Brilliant Public School, Aligarh. The age group of the subjects was in
between 12-16 years which was recorded from the school registers.
They were divided randomly into two groups of 25 each. Group A
acted as experimental group (yogic group) and Group B acted as
control group (no treatment group).The selected motor learning was
measured by Adams Sports-Type Motor learning test . The collected
data from both the groups were taken before and after the experiment
and was statistically analyzed by using t-test. The results of this study
showed that the motor learning of the experimental group has
increased significantly through yoga in comparison with the motor
learning of the control group.
Key words: Yogic practices, Motor Learning, School Boys
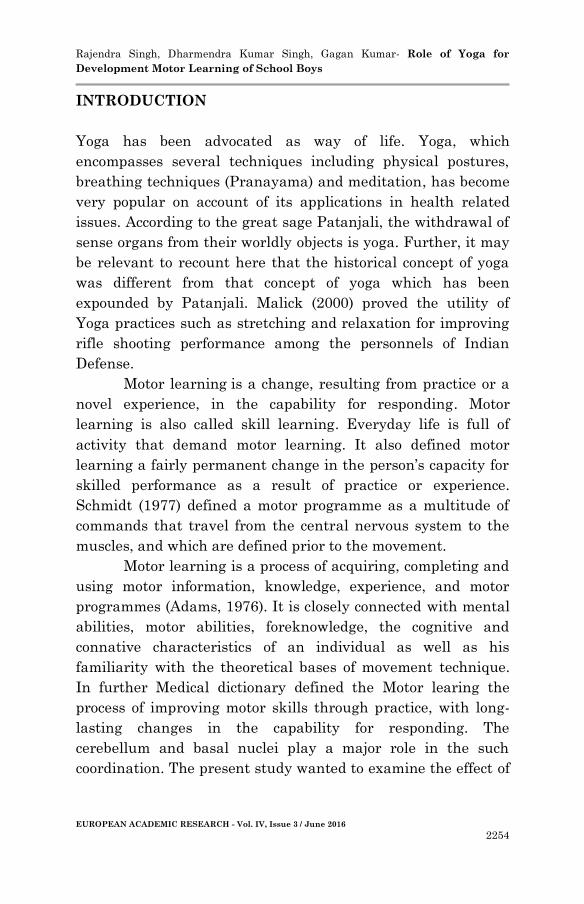
Rajendra Singh, Dharmendra Kumar Singh, Gagan Kumar- Role of Yoga for
Development Motor Learning of School Boys
EUROPEAN ACADEMIC RESEARCH - Vol. IV, Issue 3 / June 2016
2254
INTRODUCTION
Yoga has been advocated as way of life. Yoga, which
encompasses several techniques including physical postures,
breathing techniques (Pranayama) and meditation, has become
very popular on account of its applications in health related
issues. According to the great sage Patanjali, the withdrawal of
sense organs from their worldly objects is yoga. Further, it may
be relevant to recount here that the historical concept of yoga
was different from that concept of yoga which has been
expounded by Patanjali. Malick (2000) proved the utility of
Yoga practices such as stretching and relaxation for improving
rifle shooting performance among the personnels of Indian
Defense.
Motor learning is a change, resulting from practice or a
novel experience, in the capability for responding. Motor
learning is also called skill learning. Everyday life is full of
activity that demand motor learning. It also defined motor
learning a fairly permanent change in the person’s capacity for skilled performance as a result of practice or experience.
Schmidt (1977) defined a motor programme as a multitude of
commands that travel from the central nervous system to the
muscles, and which are defined prior to the movement.
Motor learning is a process of acquiring, completing and
using motor information, knowledge, experience, and motor
programmes (Adams, 1976). It is closely connected with mental
abilities, motor abilities, foreknowledge, the cognitive and
connative characteristics of an individual as well as his
familiarity with the theoretical bases of movement technique.
In further Medical dictionary defined the Motor learing the
process of improving motor skills through practice, with long-
lasting changes in the capability for responding. The
cerebellum and basal nuclei play a major role in the such
coordination. The present study wanted to examine the effect of
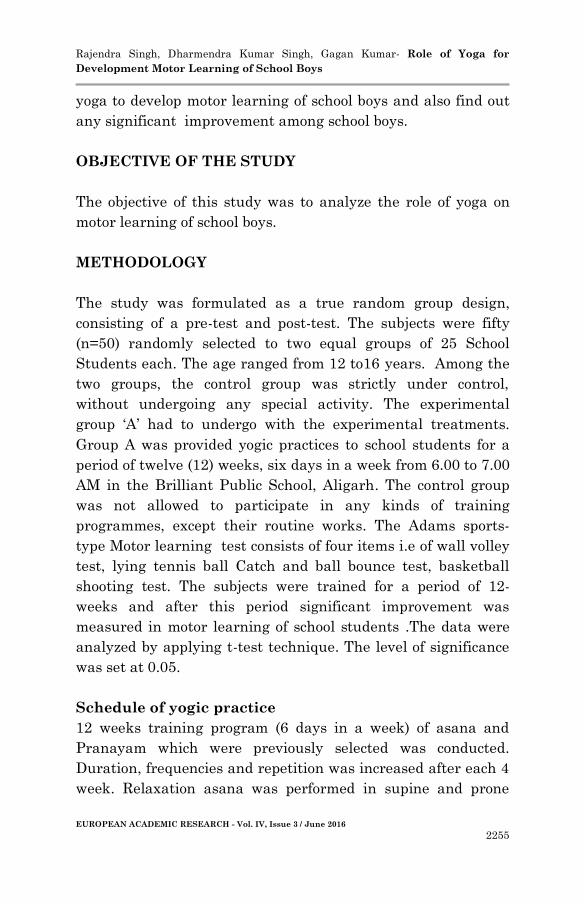
Rajendra Singh, Dharmendra Kumar Singh, Gagan Kumar- Role of Yoga for
Development Motor Learning of School Boys
EUROPEAN ACADEMIC RESEARCH - Vol. IV, Issue 3 / June 2016
2255
yoga to develop motor learning of school boys and also find out
any significant improvement among school boys.
OBJECTIVE OF THE STUDY
The objective of this study was to analyze the role of yoga on
motor learning of school boys.
METHODOLOGY
The study was formulated as a true random group design,
consisting of a pre-test and post-test. The subjects were fifty
(n=50) randomly selected to two equal groups of 25 School
Students each. The age ranged from 12 to16 years. Among the
two groups, the control group was strictly under control,
without undergoing any special activity. The experimental
group ‘A’ had to undergo with the experimental treatments.
Group A was provided yogic practices to school students for a
period of twelve (12) weeks, six days in a week from 6.00 to 7.00
AM in the Brilliant Public School, Aligarh. The control group
was not allowed to participate in any kinds of training
programmes, except their routine works. The Adams sports-
type Motor learning test consists of four items i.e of wall volley
test, lying tennis ball Catch and ball bounce test, basketball
shooting test. The subjects were trained for a period of 12-
weeks and after this period significant improvement was
measured in motor learning of school students .The data were
analyzed by applying t-test technique. The level of significance
was set at 0.05.
Schedule of yogic practice
12 weeks training program (6 days in a week) of asana and
Pranayam which were previously selected was conducted.
Duration, frequencies and repetition was increased after each 4
week. Relaxation asana was performed in supine and prone

Rajendra Singh, Dharmendra Kumar Singh, Gagan Kumar- Role of Yoga for
Development Motor Learning of School Boys
EUROPEAN ACADEMIC RESEARCH - Vol. IV, Issue 3 / June 2016
2256
position after each asana (Shavasana & Makarasana). The
training program i.e. names of various Asanas and Pranayam
with their positions, number of frequencies, duration of
excecution and recovery time, is presented below.
12 weeks Name of Asana Duration of
asana
Frequency Recovery
Between
repetition
Recovery
between
next
asana
Standing asana
1- Trikon asana. 20 sec. each side 2 15 sec 25 sec
2- Ardhchandrakar asana. 15 sec each side 2 15 sec 25 sec
3- Tadasana. 25 sec. 4 5 sec 20 sec
4- Veerbhadrasana. 20 sec each side 2 20 sec 30 sec
Asanas in lying position
1- Pavanmuktasana. 20 sec 3 10 sec 30 sec
2- Naukasana. (both side) 15 sec 2 15 sec 30 sec
3- Sarvangasana. 25 sec 2 20 sec 30 sec
4- Bhujangasana. 30 sec 2 15 sec 30 sec
5- Halasana. 20 sec 2 20 sec 45 sec
6- Shalabhasana. (both leg) 15 sec 2 15 sec 30 sec
7- Dhanurasana. 15 sec 2 15 sec 30 sec
8- Chakrasana. 15 sec 2 15 sec 30 sec
Asanas in sitting position
1-Ardha-Matsyendrasana 15 sec each side 2 20 sec 45 sec
2-Pashchimottanasana. 15 sec. 3 15 sec 40 sec.
3- suptavajrasana. 20 sec 2 15 sec -
Anulomvilom 25
(each nostril)
2
Bhramari 10-15 times
Om chanting 2-5 min
*Relaxation asana was performed in supine and prone position after each
asana. (Shavasana & Makarasana)
STATISTICAL ANALYSIS
Table-1: Mean, Standard Deviation, Std. error mean, and t-value of
Experimental group.
Group Variables Test N Mean SD Std.error
mean t –value
Experimental
Group
Wall volley Pre Test 25 27.52 6.29 1.26
5.06* Post Test 25 31.36 5.31 1.06
Lying Tennis
Ball Catch
Pre Test 25 4.40 1.94 .39 3.89*
Post Test 25 5.28 1.84 .37
Ball Bounce
Test
Pre Test 25 51.52 10.04 2.01 6.68*
Post Test 25 58.88 8.73 1.74
Shooting Test Pre Test 25 4.56 1.53 .30 5.20*
Post Test 25 5.64 1.22 .24
Tabulated value = 1.68, df= 48, level of significance 0.05, *significant

Rajendra Singh, Dharmendra Kumar Singh, Gagan Kumar- Role of Yoga for
Development Motor Learning of School Boys
EUROPEAN ACADEMIC RESEARCH - Vol. IV, Issue 3 / June 2016
2257
It is evident from the table – 1 that there is significant
differences exist between the Pre test and Post Test among the
wall volley, Lying tennis ball catch, Ball bounce and shooting
test , since the calculated ‘t’ value 5.06, 3.89, 6.68 and 5.20
respectively, which is greater than the tabulated value (1.68)
significance at 0.05 level.
Therefore there is significant difference exist in wall
volley, Lying tennis ball catch, Ball bounce and shooting test of
Pre Test and Post Test.
Fig.1: Graphical representation of Mean of wall volley, Lying tennis
ball catch, Ball bounce and shooting test variables of Exp. group.
Table- 2: Mean, Standard Deviation, Std.error mean, and t-value of
Control group
Group Variables Test N Mean SD Std.error
mean t –value
Control
Group
Wall volley Pre Test 25 24.80 6.37 1.27
1.03** Post Test 25 25.16 5.73 1.14
Lying Tennis
Ball Catch
Pre Test 25 3.12 .93 .18 0.94**
Post Test 25 3.28 .98 .19
Ball Bounce
Test
Pre Test 25 39.20 7.39 1.48 0.97**
Post Test 25 39.68 7.16 1.43
Shooting Test Pre Test 25 3.44 1.32 .26 1.00**
Post Test 25 3.64 .99 .20
Tabulated value = 1.68, df= 48, level of significance 0.05, *significant,
**insignificant
It is evident from the table – 2 that there is insignificant
differences exist between the Pre test and Post Test among the
wall volley, Lying tennis ball catch, Ball bounce and shooting
test , since the calculated ‘t’ value 1.03, 0.94, 0.97 and 1.00

Rajendra Singh, Dharmendra Kumar Singh, Gagan Kumar- Role of Yoga for
Development Motor Learning of School Boys
EUROPEAN ACADEMIC RESEARCH - Vol. IV, Issue 3 / June 2016
2258
respectively, which is lesser than the tabulated value (1.68)
required to be significancant at 0.05 level.
Therefore there is insignificant difference exist between
Pre test and Post Test among the wall volley, Lying tennis ball
catch, Ball bounce and shooting test.
Fig. 2: Graphical representation of Mean of wall volley, Lying tennis
ball catch, Ball bounce and shooting test variables of Control Group.
It was observed by the t-test, that findings of experimental
group improved motor learning significantly with the help of
four motor learning test parameters and as mentioned above,
all the tabulated value was 1.68, df , 48 and were significant at
0.05 level of confidence.
RESULTS
The calculation of mean of the yogic group, pre and post test is
presented in the table 1. Using the means, standard deviation
and standard error mean of the group ‘t’- ratio was computed to
find out whether there was any significant difference among
the scores of pre and post tests. Experimental group Pre and
Post calculated t- value of wall volley is 5.06, Lying tennis ball
catch 3.89, Ball bounce 6.68, and basketball shooting test 5.20
respectively. All the calculated t-value are greater than the
tabulated t- value (1.68) so there is a significant difference
between the scores of before treatment and after treatment of
experimental group. Control group Pre and Post calculated t-

Rajendra Singh, Dharmendra Kumar Singh, Gagan Kumar- Role of Yoga for
Development Motor Learning of School Boys
EUROPEAN ACADEMIC RESEARCH - Vol. IV, Issue 3 / June 2016
2259
value of wall volley is 1.03, Lying tennis ball catch 0.94, Ball
bounce 0.97 and basketball shooting test 1.00 respectively. All
the calculated t-value are lesser than the tabulated t- value
(1.68) so there is insignificant difference between the scores of
before treatment and after treatment of control group.
Significant difference in this study is due to the selected yogic
practices in experimental group that included asanas,
pranayamas and Om chanting undergone by the group for a
period of twelve weeks.
DISCUSSION AND FINDING:
Based on statistical analysis of data it was concluded that
twelve weeks of yogic practices caused significant improvement
in motor learning of school boys. The learning of motor skill is
mainly depending on preparation of movement through
kinesthetic vestibular tactical receptor and functional
mechanics of central nervous system. Through yogic asanas the
kinesthetic sense of proprioceptors may improve significantly.
The present study supported these earlier findings by Garrote
(1979) and Singh (2010). Yoga improves concentration which
are helpful to improve accuracy. The results are in agreement
with the result of the previous research findings. (Deasi, 1979;
Singh 1996; Kennison and James. E. (1967) determined the
effect of yogic practices to develop the skill and accuracy.
Shirley et al (1994) conducted a study on the improvement in
static motor performances following Yogic training in school
children, which showed a significant difference after the
training period.
These observations suggest that yoga helps to improve
motor learning. This study is also supported by Pratap (1968)
and Kocher (1974) which emphasized the importance of yogic
asanas for improving performance in motor learning. Through
yogic practice perception of depth can be improved significantly
Sahu and Gharote, (1985). Perception is major factor which

Rajendra Singh, Dharmendra Kumar Singh, Gagan Kumar- Role of Yoga for
Development Motor Learning of School Boys
EUROPEAN ACADEMIC RESEARCH - Vol. IV, Issue 3 / June 2016
2260
may affect the performance in accuracy. K. Pradeep et al (2014)
also noted that exercises and yogic asanas improve lying tennis
ball catch ability.
CONCLUSION
The selected yogic practices did contribute to the improvement
of motor learning among the school boys of Brilliant Public
School. Yogic asanas improve the strength, flexibility and
posture, pranayama improves the cardiorespiratory system and
‘om’ chanting improves the concentration which is helpful to improve motor learning among the sports persons and school
boys. Based on the finding it is concluded that selected yogic
practices could be of great contribution to improve motor
learning in adolescence.
REFERENCES
1. Adams, J. (1976). Issues for a closed-loop theory of motor
learning. In Stelmach, G. E.: Motor control (87-107).
New York: Academic Press
2. Deasi, J. Ram, J. (1979). Effect of asana on skill
development in basket ball. (Unpublished master thesis,
Jiwaji University).
3. Gharrote, M.L. (1979). Physical fitness in relation to the
practice of selected yogic exercises. Yoga Mimamsa, 18,
59-72
4. Kennison, and James, E. (1967). The effects of four
training programmes of the acquisition of speed and
accuracy in motor performance. Completed Research. 9,
69.
5. Kocher, H.C. (1974). Some Appraisal of Steadiness and
Two Hands Coordination as a result of yogic
practices. Yoga Mimamsa, Vol XVI 3 &4, 131-1, 48.

Rajendra Singh, Dharmendra Kumar Singh, Gagan Kumar- Role of Yoga for
Development Motor Learning of School Boys
EUROPEAN ACADEMIC RESEARCH - Vol. IV, Issue 3 / June 2016
2261
6. Pradeep. K. et al (2014), Comparative study of certain
yogic asanas and physical exercises on lying tennis ball
catch ability, IJHMSAS, Vol-1, Issue- II, PP. 15-21.
7. Pratap, V. (1968). Steadiness in normal before and after
yogic practices. An exploratory study, Lonavala
Kaivalayadham Yoga Mimamsa. Vol. XI, 2:1-13.
8. Sahu, R.J. and Gharote, M.L. (1985). Effect of short term
yogic practices on the perception of the third
dimension—a pilot study. Yoga-Mimamsa, 24(2):11-20.
9. Schmidt, R. (1977), Schema Theory- Implication for
movement education. Motor skills- Theory and Practice,
2.
10. Shirley, T., Nagarathna and Nagendra, 1994. Yoga
research abstracts. The International Journal of Nero
Science, 76: 87-93.
11. Singh R. (2010). A study of certain yogic asanas and
physical exercises on kinesthetic ability. AMASS.

5/16/2020 Critical Analysis on The Design and Use of Materials in Cricket Bat Handles | Request PDF
https://www.researchgate.net/publication/310240266_Critical_Analysis_on_The_Design_and_Use_of_Materials_in_Cricket_Bat_Handles 1/6
Critical Analysis on The Design and Use of Materials in Cricket Bat Handles
Article · November 2016 with 398 Reads
Abstract
A review was carried out to identify published work on use of material into thehandle of cricket bat for its design and manufacturing. As the time andpopularity of the game surprisingly increases, little research had been done forthe advancement of the equipments when there is no restriction on the use ofmaterials, such as composite materials, carbon fiber, titanium etc. As the newLaw came into effect from 1 st October 2008, all these bats were ruled to be incontravention of the Laws of cricket and have since been withdrawn. And Tofurther improvement in the performance of cricket bat, without violating the rulesof the game, advance materials are to be used. And such advancements,together with use of stiff and lightweight composite materials, have engenderedmany designs would be explored in the future. Innovation is limited in cricketwhere the rules insist that the use of predominant material in cricket bat mustbe, for the blades-use of willow (100%) only and for the handles–total (90%)volume of bat handles should consist of cane, wood and/or twine with the other(10%) for other purpose like reducing vibration.
Do you want to read the rest of this article?
ANALYSIS OF THE PERFORMANCE & RELIABILITY OF MATERIALS TO BE USED INCRICKET BAT HANDLE
Thesis Full-text available
Cite this publication
Ashish Kumar Katiyar1.81 Syed Tariq Murtaza
Shamshad Ali
Request full-text
Citations (3) References (14)
... Katiyar, Murtaza, & Ali (2016a) stated that there were no regulations on cricketbats, up until the mid-nineteenth century so players used many different types ofwood bats from long, heavy, round ones to short, flat bats that were similar tobaseball bat and hockey sticks, but today bat geometry is tightly regulated in alllevelsof play. The rules of cricket, although strict, have left open an opportunity toalter the handle design (i.e. ...
Join ResearchGate to find the people andresearch you need to help your work.
17+ million members
135+ million publications
700k+ research projects
Join for free
Recruit researchers Join for free Login
See all ›3 Citations
See all ›14 References Download citation Share Request full-text
5/16/2020 Critical Analysis on The Design and Use of Materials in Cricket Bat Handles | Request PDF
https://www.researchgate.net/publication/310240266_Critical_Analysis_on_The_Design_and_Use_of_Materials_in_Cricket_Bat_Handles 2/6
Jul 2018Ashish Kumar Katiyar
DETERMINING GEOMETRICAL PARAMETERS FOR A REFERENCED CRICKET BATHANDLE
Article
Apr 2018Ashish Kumar Katiyar · Syed Tariq Murtaza · Shamshad Ali
CONSTRAINING NUMERICAL VALUES FOR A REFERENCED CRICKET BATHANDLE ON SELECTED GEOMETRICAL PARAMETERS
Article
May 2018Ashish Kumar Katiyar · Syed Tariq Murtaza · Shamshad Ali
Recommended publications
View Show abstract
... But innovative features of commercial designs of bats are restricted to variationin geometry of the back of the blade. Within the boundaries of the game rules,numerous enhanced bat designs with material alteration had been preceded tocommercial production (Katiyar, Murtaza, & Ali, 2016a) . In which includeslaminated cane handles with rubber spring introduced aiming to reduce thevibration produced from the blade to the handle on impact of ball and the blade isalso improved through perimeter weighting (Grant, 1998). ...
View Show abstract
View Show abstract

5/16/2020 Critical Analysis on The Design and Use of Materials in Cricket Bat Handles | Request PDF
https://www.researchgate.net/publication/310240266_Critical_Analysis_on_The_Design_and_Use_of_Materials_in_Cricket_Bat_Handles 3/6
Article
DETERMINING GEOMETRICAL PARAMETERS FOR A REFERENCED CRICKET BAT HANDLE
April 2018
Ashish Kumar Katiyar · Syed Tariq Murtaza · Shamshad Ali
This work had been intended to set and determine the geometrical parameters for a referenced cricket bat handle for our purpose, due togeometric variations found in the handles. By reviewing related literature based on past research work carried by many researcher on cricketbat. The criterion used for selecting and determining major parameters of the handle with some new technical parameters ... [Show full abstract]
Read more
Book
Materials in sports equipment
July 2003
M. Jenkins
Improvements in materials technology have made a significant impact on sporting performance in recent years. Advanced materials and novelprocessing methods have enabled the development of new types of equipment with enhanced properties, as well as improving the overalldesign of sporting goods. The interdependence between material technology and design, and its impact on many of the most popular ... [Showfull abstract]
Read more
Article
Describing the Performance of Cricket Bats and Balls
January 2008
Harsimranjeet Singh · Lloyd Smith
The aim of this study was to describe the performance of cricket bats and balls. An experimental test apparatus was developed to measure theperformance of cricket bats and balls under dynamic impact conditions representative of play. Experiments were carried out to measure theelasticity and hardness of the cricket balls as the function of incoming speed. It was observed that the ball ... [Show full abstract]
Read more
Article
Grade separated junctions, Their concept and design
November 2004
X. Massallé Puig
The function of grade separated junctions and their classification both from the technical and functional point o view are analysed. A criticalanalysis of the design parameter values that guide the layout: speed and visibility is carried out The advantages and disadvantages of the mostusual types of grade separated junctions: diamonds, dumbbell interchanges, two bridge roundabouts, full ... [Show full abstract]
Read more

5/16/2020 Critical Analysis on The Design and Use of Materials in Cricket Bat Handles | Request PDF
https://www.researchgate.net/publication/310240266_Critical_Analysis_on_The_Design_and_Use_of_Materials_in_Cricket_Bat_Handles 4/6
Article Full-text available
Modelling, Analysis and Design of a Bottle-Shaped Building
January 2015
Anthony Ede · Edidiong Godwin Udoh
The emergence of unique structures around the world have turned the points of it location to centers of attraction thereby yielding benefits tothe economy of the cities where they are cited. Worldwide, iconic structures stand out, placing its location on the map. Hence, the idea of bottle-shaped building was birthed trying to put bottle to tension. This research models, analyses and designs a ... [Show full abstract]
View full-text
Thesis Full-text available
Improving Machining System Performance through designed-in Damping: Modelling, Analysis and Design S...
May 2012
Lorenzo Daghini
With advances in material technology, allowing, for instance, engines to withstand higher combustion pressure and consequently improvingperformance, comes challenges to productivity. These materials are, in fact, more difficult to machine with regards to tool wear and especiallymachine tool stability. Machining vibrations have historically been one of the major limitations to productivity and ... [Show full abstract]
View full-text
Article Full-text available
A Whole Body Postural Loading Simulation and Assessment Model for Workplace Analysis and Design
November 2012 · International journal of occupational safety and ergonomics: JOSE
Francisco Rebelo · Katie Correia · Waldemar Karwowski
This study reports on the development and validation of a new computer model for simulating human postures at work, and assessing thereaction forces and bending moments in 43 human articulation joints. The proposed model estimates the intradiscal pressure in the vertebralcolumn in response to external loading forces encountered during human interactions with work objects or processes. The model ... [Show fullabstract]
View full-text
Conference Paper
Exploration and Utilization of Extra-Terrestrial Bodies
November 2018
Valentina Sumini · Sam Wald · Caitlin Mueller · [...] · Olivier Ladislas de Weck
Much like their Earth-based counterparts, the requirements of future space habitat structures can be defined by their ability to protect theiroccupants and provide usable space to live and work in an extreme, isolated environment. Due to the high cost of transporting resources off ofEarth’s surface, recent efforts focus on developing increasingly Earth-independent structural designs. These new ... [Show full abstract]
Read more

5/16/2020 Critical Analysis on The Design and Use of Materials in Cricket Bat Handles | Request PDF
https://www.researchgate.net/publication/310240266_Critical_Analysis_on_The_Design_and_Use_of_Materials_in_Cricket_Bat_Handles 5/6
Article
A Survey on Post-Silicon Functional Validation for Multicore Architectures
August 2017 · ACM Computing Surveys
Padma Jayaraman · Ranjani Parthasarathi
During a processor development cycle, post-silicon validation is performed on the first fabricated chip to detect and fix design errors. Designerrors occur due to functional issues when a unit in a design does not meet its specification. The chances of occurrence of such errors are highwhen new features are added in a processor. Thus, in multicore architectures, with new features being added in ... [Show full abstract]
Read more
Conference Paper
Adaptive Maintenance Knowledge Bases for Field Service
April 2007 · IEEE Aerospace Conference Proceedings
Jianhui Luo · Sudipto Ghoshal · A. Mathur · Krishna R. Pattipati
A maintenance knowledge base (MKB) is an information system capable of offering solutions to diagnostic problems at a level comparable withthat of experts in the field. The development of a maintenance knowledge base for a system is an iterative process; it is typically built usingprevious experience and expertise. In most cases, the development of diagnostic procedures in a MKB is a completely ... [Show full abstract]
Read more
Article Full-text available
A comparative study of balance ability between different levels of cricket players
July 2017
Manish Kumar
The present study has been designed to investigate the balance ability between different levels (district, state and national) of cricket players.For accomplish the study total 84 school level cricket players (28 district, 28 state and 28 national) were randomly selected as sample. Allsamples were selected from the Haryana. The age of the subjects was ranged from 16-28 years. One-way analysis ... [Show full abstract]
View full-text
Article
Design criteria of coal storage piles
November 1984
De Faveri Dante Marco · L. Rubino · G. Rettagliata · G. Zerbo
The energy program in Italy envisages a tenfold increase of coal consumption compared with the actual one in the 1990s, rising from 5multiplied by 10**6 to nearly 50 multiplied by 10**6 t. The massive use of coal will require the realization of large coastal stock yards close tosome strategic ports, equipped for receiving high-tonnage ships. Likewise, open storage piles will be arranged within ... [Show full abstract]
Read more

5/16/2020 Critical Analysis on The Design and Use of Materials in Cricket Bat Handles | Request PDF
https://www.researchgate.net/publication/310240266_Critical_Analysis_on_The_Design_and_Use_of_Materials_in_Cricket_Bat_Handles 6/6
Last Updated: 11 Apr 2020
Discover more
Company
About usNewsCareers
Support
Help Center
Business solutions
AdvertisingRecruiting
© 2008-2020 ResearchGate GmbH. All rights reserved. Terms · Privacy · Copyright · Imprint

5/16/2020 META-ANALYSIS ON THE DEVELOPMENT OF CRICKET BAT OVER THE YEARS | Request PDF
https://www.researchgate.net/publication/301684029_META-ANALYSIS_ON_THE_DEVELOPMENT_OF_CRICKET_BAT_OVER_THE_YEARS 1/3
META-ANALYSIS ON THE DEVELOPMENT OFCRICKET BAT OVER THE YEARS
Article · April 2016 with 592 Reads
Abstract
There has been a major transformationin cricket bats throughout the history. Soa review was carriedout to identifypublished work on cricket bat design anddevelopment of its manufacturing overthe years in a sequence. The origin ofcricket can be followed a magnificentpast and a complex history (BobWoolmer 2008). It relishes 400-oddyears of annals (Murtaza S. T. & et. al.2014). Authors believe that it has beenoriginated from the ancient sport of Indiai.e. Gilli Danda (Tipcat in English) whichhas possibly the origin over 2500 yearsago (Steve Craig-2002 & John Arlott-1975). The first bat was an unfashionedbranch from a tree and was used todefend against a suitably rounded stonein the game from which cricket evolved.Since this time, the design of the bat hasbeen as intrinsic part of the games
Cite this publication
Ashish Kumar Katiyar1.81
Syed Tariq Murtaza
Shamshad Ali
Join ResearchGate to find the people andresearch you need to help your work.
17+ million members
135+ million publications
700k+ research projects
Join for free
Recruit researchers Join for free Login
See all ›2 Citations
See all ›18 References Download citation Share Request full-text

5/16/2020 META-ANALYSIS ON THE DEVELOPMENT OF CRICKET BAT OVER THE YEARS | Request PDF
https://www.researchgate.net/publication/301684029_META-ANALYSIS_ON_THE_DEVELOPMENT_OF_CRICKET_BAT_OVER_THE_YEARS 2/3
development, but these changes havebeen empirical and the effectiveness ofthe bat maker and batsman
Do you want to read the restof this article?
ANALYSIS OF THE PERFORMANCE &RELIABILITY OF MATERIALS TO BE USED IN…
Thesis Full-text available
Jul 2018Ashish Kumar Katiyar
DETERMINING GEOMETRICAL PARAMETERSFOR A REFERENCED CRICKET BAT HANDLE
Article
Apr 2018Ashish Kumar Katiyar · Syed Tariq Murtaza ·
Shamshad Ali
Recommended publications
Request full-text
Citations (2) References (18)
View Show abstract
View Show abstract

5/16/2020 META-ANALYSIS ON THE DEVELOPMENT OF CRICKET BAT OVER THE YEARS | Request PDF
https://www.researchgate.net/publication/301684029_META-ANALYSIS_ON_THE_DEVELOPMENT_OF_CRICKET_BAT_OVER_THE_YEARS 3/3
Last Updated: 11 Apr 2020
Chapter
Cricket and Masculinity in Early Forms of Cricket
January 2015
Philippa Velija
Cricket developed as a modern sport in England and it was in England that the first ‘laws’ of the gamewere published. The first recorded women’s match was also played in England in 1745. The first countryto have a governing body for the women’s game was also England, in 1926. Whilst a substantial amounthas been written about the men’s game and the history development and diffusion of the game, ... [Showfull abstract]
Read more
Discover more
Company
About usNewsCareers
Support
HelpCenter
Businesssolutions
AdvertisingRecruiting
© 2008-2020 ResearchGate GmbH. All rights reserved. Terms · Privacy · Copyright · Imprint
https://www.researchgate.net/publication/305232936_Cricket_and_Masculinity_in_Early_Forms_of_Cricket
© Associated Asia Research Foundation (AARF) A Monthly Double-Blind Peer Reviewed Refereed Open Access International e-Journal - Included in the International Serial Directories.
Page | 371
Comparative Study of Critical Factors affecting Intervarsity Sports
Dr. Merajuddin Faridi
Assistant Professor, Department of Physical Education, Aligarh Muslim University, Aligarh
Abstract
The purpose of this study was to critically compare the factors affecting sport from
the perspective of undergraduate and postgraduate sportspersonsat Aligarh Muslim
University. The survey approach was adopted for collecting data by using a comprehensive
questionnaire developed by Prasad (1993) and personal interviews. The questionnaires were
administered on experts, coaches, and sports persons of Aligarh Muslim University.
Wherever needed, the subjects were personally interviewed for getting more detailed
information. In addition to the above methods, information was also obtained through office
record reports and broachers. The subjects, 15 administrators, 15 coaches, and 50 players for
the present study were randomly selected from the various residential halls of Aligarh
Muslim University. „t‟ test was employed to explore the difference among the various
categories of subjects on critical factors influencing the Intervarsity sports. Furthermore, to
find the differences among various categories of subjects on the everyday items of the
questionnaire,the „Kruskal-Wallis‟ test was employed. The results of the study revealed
thatSignificant differences were not found between the mean scores of Under Graduate and
Post Graduate sportsperson.
Keywords: Factors, Affecting Sport, comparative
International Research Journal of Human Resource and Social Sciences
Impact Factoe-3.866
Volume 3, Issue 5, May 2016ISSN(O): (2349-4085) ISSN(P): (2394-4218)
©ASSOCIATED Asia Research Foundation
Website- www.aarf.asia, Email : [email protected] , [email protected]

© Associated Asia Research Foundation (AARF) A Monthly Double-Blind Peer Reviewed Refereed Open Access International e-Journal - Included in the International Serial Directories.
Page | 372
Introduction
Howell (1994) has also pointed out that “Sport has a very prominent role in modern
society. It is important to an individual, a group, and a nation – indeed the world. There are,
for example, more nations competing in the Olympic games than they are participating in
United Nations deliberations”. Throughout the world, sports has a widespread appeal among
people of all ages and both sexes. Sports competitions offer us heroes and heroines – ideal
people that we can look up to, and achievements that we can marvel at. For many youths,
sports stars are better known than the leading politicians of a country.
The sports activities have all the more become an essential part of the modern push-
button civilization. Numerous researchers have revealed that most of the diseases were
caused due to physical inactivity. Thus, it has become necessary by every human being
irrespective to one‟s age and sex to follow a routine schedule of physical activities to
maintain the optimum level of health and vigor to effectively discharge the routine works on
one hand and also to have some surplus energy which could be utilized towards the growth
and development of the society. It has been noticed that a sense of well-being has prevailed,
and the present-day society has become more health-conscious when compared to the earlier
generation. A more significant part of the social practice sports for the sake of health,
physical fitness, and mental poise. Whereas those who wanted to excel in any sporting event
at the national and international level, have to follow a more strenuous and scientifically
designed training schedule for a prolonged period to reach the peak of their performance.
In view of increasing value of sports in the society, a systematic approach to train the
athletes for higher performance and provide them exposure in competition was realized with
the result that various associations, federations, committees, and organizations came into
existence. The revival of modern Olympic games in Athens in 1896 provided a befitting
climax when sports began to assume the central role in the cultures of all the countries. The
Supreme body to control, co-ordinate and monitor the modern Olympic games, the
International Olympic Committee came into existence in 1894 with its permanent
headquarter in Lausanne, Switzerland. The federation International de Football Association
(FIFA) was formed in 1904, the formation of Imperial Cricket Conference (ICC) in 1909, the
federation International de Hockey (FIH) was formed on 7th Jan 1924 with its headquarter at
Vienna (Austria) and International Badminton Federation was formed in 1934. The Asian
Games Federation was formed in New Delhi in 1949. Like Olympic games, the Asian Games

© Associated Asia Research Foundation (AARF) A Monthly Double-Blind Peer Reviewed Refereed Open Access International e-Journal - Included in the International Serial Directories.
Page | 373
are also held on the pattern of the Olympics every four years, and the countries affiliated
have to be Asian Countries. The formation of these bodies gave birth to highly organized
sports competitions both at international and national levels. The sports are being organized
at everyUniversity. Keeping all these things in mind, the researcher thought to conduct a
study on Critical Factors affecting Intervarsity Sports.
Methodology
At the outset,the survey approach was adopted for collecting data by using a
comprehensive questionnaire developed by Prasad (1993) and personal interviews. The
questionnaires were administered on experts, coaches, and sports persons of Aligarh Muslim
University. Wherever needed, the subjects were personally interviewed for getting more
detailed information. In addition to the above methods, information was also obtained
through office record reports and broachers of Aligarh Muslim University. The subjects, 15
administrators, 15 coaches, and 50 players for the present study were randomly selected from
the various residential halls of Aligarh Muslim University. „t‟ test was employed to explore
the difference among the various categories of subjects on critical factors influencing the
Intervarsity sports. Furthermore, to find the differences among various categories of subjects
on the everyday items of the questionnaire,the „Kruskal-Wallis‟ test was employed.
Results and Discussion
TableIndicating the comparison between the mean scores of Under Graduate and Post
Graduate sports persons on items related to critical factors influencing the Intervarsity sports:
Group N Mean SD t-values P
Item-1: Playfield faci lities
Under Graduate 21 3.44 1.75
1.01 > 0.05
Post Graduate 29 3.73 1.67
Item-2: Indoor gymnasium faci lities
Under Graduate 21 2.32 1.01
0.92 > 0.05
Post Graduate 29 2.47 0.89
Item-3: Services of some other reputed coaches
Under Graduate 21 2.57 1.29
5.06 < 0.01

© Associated Asia Research Foundation (AARF) A Monthly Double-Blind Peer Reviewed Refereed Open Access International e-Journal - Included in the International Serial Directories.
Page | 374
Post Graduate 29 4.66 0.53
Group N Mean SD t-values P
Item-4: Methods of coaching used by coaches
Under Graduate 21 2.51 1.29
3.60 <0.01
Post Graduate 29 1.37 1.02
Item-5: Behavior of coaches 0.78 > 0.05
Under Graduate 21 3.08 1.06
Post Graduate 29 3.21 0.96
Item-6: Sympathetic attitude of coaches
Under Graduate 21 3.63 0.95
0.06 > 0.05
Post Graduate 29 3.64 0.93
Item-7: Monitoring the progress of performance
Under Graduate 21 3.60 0.72
4.90 < 0.01
Post Graduate 29 2.75 0.99
Item-8: Criteria of Selection of players for coaching camps
Under Graduate 21 2.14 1.20
3.99 < 0.01
Post Graduate 29 3.96 1.30
Item-9: Encouragement received from parents for rigorous training
Under Graduate 21 3.24 1.23
5.45 < 0.01
Post Graduate 29 4.20 6.74
© Associated Asia Research Foundation (AARF) A Monthly Double-Blind Peer Reviewed Refereed Open Access International e-Journal - Included in the International Serial Directories.
Page | 375
In the above table Significant differences were not found between the mean scores of
Under Graduate and Post Graduate sports persons playfield facilities,(t = 1.01, p > 0.05),
indoor gymnasium facilities (t = 0.92, p > 0.05), behavior of coaches (t = 0.78, p > 0.05),
sympathetic attitude of coaches(t = 0.06, p > 0.05),
Under Graduate sports persons scored significantly higher than the Post Graduate
sports persons on services of some other reputed coaches(t = 4.15, p <0.05), methods of
coaching used by the coaches (t = 3.60, p < 0.01), monitoring the progress of performance (t
= 4.90, p<0.01), criteria of Selection of players for coaching camps(t = 3.99, p < 0.01),The
data computed through Kruskal-Wallis one-way analysis of variance by ranks to examine the
differences between the subjects on playing facilities, equipment, and incentives are
presented here.
Playing facilities
Concerning playing facilities, table value indicated that the probability associated
with the occurrence is smaller than the set level of significance. It is concluded that the
perception of administrators, coaches, and players concerning playing facilities varies
significantly.
Incentives
In the case of incentives, the table value indicated that the probability associated with
the occurrence is more significant than the set level of significance. It is concluded that the
perception of administrators, coaches, and players concerning incentives did not differ
significantly.
Reputed Coach
As far as the reputed coach is concerned, the table value indicated that the probability
associated with the occurrence is more significant than the set level of significance.
Therefore, it is concluded that the perception of administrators, coaches, and players
concerningthe reputed coach did not differ significantly.
© Associated Asia Research Foundation (AARF) A Monthly Double-Blind Peer Reviewed Refereed Open Access International e-Journal - Included in the International Serial Directories.
Page | 376
Conclusion
It is concluded that Significant differences were not found between the mean scores
of Under Graduate and Post Graduate sportspersonon; playing facilities,indoor gymnasium
facilities, the behavior of coaches, a sympathetic attitude of coaches. The undergraduate
sports persons scored significantly higher than the Post Graduate sports persons on services
of some other reputed coaches; methods of coaching used by the coaches, monitoring the
progress of performance, and criteria of Selection of players for coaching camps.The findings
suggest that the Aligarh Muslim University Games Committee seems to have great concern
about creating the largest playing facilities and sports infrastructure in order to create a
sporting environment for the masses in the University. The finding also revealed that the
University Games Committee provides the incentives for the excellent performance of its
athlete at All India, North Zone Intervarsity Sports Competitions.
The main aim of establishing the University Games Committee was to nurture the
talent under the specialized coaches in order to produce elite sportspersons who could bring
laurels to the state during national and international competitions. It is observed that the
University Games committee has succeeded to a minimal extent in the achievement of this
goal.
The University Games Committee does not hold meetings of administrators very
frequently to share the views on policy matters, including the development of sports, and
there is a lack of communication between senior administrators and coaches.

© Associated Asia Research Foundation (AARF) A Monthly Double-Blind Peer Reviewed Refereed Open Access International e-Journal - Included in the International Serial Directories.
Page | 377
References
Bhullar, J. (1965).Evaluation of the Existing Programme of Physical Education in
Government High/ Higher Secondary Schools in Chandigarh, Unpublished
Thesis, Department of Physical Education, Punjab University, Chandigarh.
Burns, R.E. (1976).A History, &Eveluation of the Ministry of Health, Physical Education,
Sports and Recreation at Jackson State, Jackson Missiccippi, from 1877 to 1973,
Dissertation Abstract International, 45, 12, 3576-A.
Burwitz les et al (2008). Future directions for performance‐ related sports science research:
An interdisciplinary approach: Journal of Sports Sciences: Vol 12, No 1Pages 93-
109 | Accepted 27th Sep 1993, Published online: 01st Feb 2008
Chason, R.F. (1985).A Survey of Athletic Directors, Principals and Facility Directors to
Determine the Administration Programme, Dissertation Abstract International,
45, 12: 3576-A.
Coker, CE (1972).A Survey of Physical Education Programmes for Boys in Selected Senior
High Schools in Lovislona 1967-70 Academic Year, Dissertation Abstracts
International 33: 1484-85A.
Donand, J.V.K. (1978).The Athletic Directors in Selected Institutions of Higher Education,
Dissertation Abstract International.38, 7, 2021A.
Dreidame, R.E. (1975). A Survey of the Organizational and Administration of Women’s
Inter Collegiates Athletics programmes in the 1973-74 AIAW Active Member of
School. Dissertation Abstract International.35, 8, 5094A.
Eggert, S.R. (1979). Coaching Success in Women’s Athletics: The Relationship of Selected
Factors in Preparation of Coaches, Dissertation Abstract International, 39, 8,
4121A.
Frisby, W. (1984). The Organizational Structure and Effectiveness of Canadian National
Sports Governing Bodies, Dissertation Abstract International, 44, 10, 3008A.
Gans, M. (1972).Sequential Steps in Planning Facilities for Health, Physical Education,
Recreation and Athletics, Dissertation Abstract International, 33, 6, 2750A.

© Associated Asia Research Foundation (AARF) A Monthly Double-Blind Peer Reviewed Refereed Open Access International e-Journal - Included in the International Serial Directories.
Page | 378
Garbett, M.J. (1976).The Effect of the Community School, Concept Upon Planning and
Utilization of Indoor Physical Education Facilities in the United States Since
1970, Dissertation Abstract International, 37: 1451A.
Govindrajulu, K.L. (1959).What the Indian Universities can do for Physical Education,
Journal of Physical Education and Recreation. 7, 16-19.
Green, L. (1981).The Relationship between Leadership Style, Performance Variables and
Specific Self-concept, Dissertation Abstract International, 41, 10, 4339A.
Happer, WK (1986).A Study of State Athletic Directors on their own Administrative
behavior, Dissertation Abstract International, 45, 12, 209.
Harlachar, E. (1963).Physical Education Facilities for a Junior College, JOHPHER 39, 22-
23.
Ian M. Franks. (2000).A systematic approach to analyzing sports performance: Journal of
Sports Sciences: journal of sports sciences, Vol 4, issue-1 Pages 49-59. Accepted
18th Jan 1986, Published online: 01st Feb 2008
Jack, H.K. (1946).Analysis of the Physical Education Programme of Minnesota Secondary
Schools, Research Quarterly 17, 24.
Jarrett, S.O. (1979).A Survey of the Physical Education Teachers Professional Preparation
available facilities and activities including in the adopted Physical Education
Programme in All Secondary Schools of the State of Tennesse, Dissertation
Abstract International, 39, 3455A.
Jefferies, S.C. (1984).Youth Sports in the Soviet Union, Dissertation Abstract International,
44, 7, 2084A.
Kang, K.S. (1984).A Survey of the Existing Intramural Sports Programmes in the Colleges
of Physical Education in India (1968). Thesis Abstracts (1965-80) Gwalior:
Laxmibai National College of Physical Education, 17-19.
Kelley, D.R. (1984).Changes in University General Operating Budgets, Athletics
Department Budget, Salaries of Academicians, Administrators, and Athletics
Personnel, Dissertation Abstract International, 44, 12, 3629A.

© Associated Asia Research Foundation (AARF) A Monthly Double-Blind Peer Reviewed Refereed Open Access International e-Journal - Included in the International Serial Directories.
Page | 379
Kothiwala, D.B. (1959).A plea for making Physical Education Subject for University Degree
Examination, J. of Physical Education and Recreation: 29-31.
Lees Adrian. (2010).Technique analysis in sports: a critical review: Journal of Sports
Sciences: Vol 20, No 10 journal of sports sciences issue-10 volume 20, 2002 -
Pages 813-828 | Published online: 09th Dec 2010.
Liebermann G. Dario et al (2010). Advances in the application of information technology
to sport performance: Journal of Sports Sciences: Vol 20, No 10 Volume 20, 2002
Pages 755-769 ISSUE-10 Published online: 09th Dec 2010.
Lim, Et al (1994). Properties of Financial Investments in Mass Sports in Korea, Journal of
Sports Management, 8, 1, 57-62.
Magnotta, J.R. (1987).An Analysis of Actual Ideal Importance of Board of Physical
Education and Sports Administrators of Arizona State, Dissertation Abstract
International, 47, 7, 196.
Mears. (1971).A Study of the Organization and Administration of Intercollegiate Athletics in
Church Related Colleges and Universities of the United States, Dissertation
Abstract International, 31, 7, 3322A.
Melalho’s, R. (1982).Duties of Sports Administrators in Selected Brazilian Sports
Association with Implication for Professional Preparation, Dissertation Abstract
International, 43, 4, 1079A.
Mendenhall, W. & Ramey, M. (1973).Statistics for Psychology. California: Wordsworth
Publishing Co. Inc.
Miller, G.L. (1984). A Current Status of Recommended Standards Regarding Space used
for Athletics, Physical Education and Recreation in United States, Dissertation
Abstract International, 44, 7, 2085A.
Mizuguchi, NK (1972).Survey of Boys Physical Education Programme in Junior and Senior
High Schools in Honolulu, Hawai: Dissertation Abstract International, 32, 3479-
4166A.
Mohsin, SM (1984).Research Methods in behavioural Sciences. ISBN: Orient Longmen Ltd.
Moon, S.C. (1998). An Evaluation of Sport Education Programs in Selected Universities in
the Republic of Korea, United States Sports Academy (1155) Degree: EDD
© Associated Asia Research Foundation (AARF) A Monthly Double-Blind Peer Reviewed Refereed Open Access International e-Journal - Included in the International Serial Directories.
Page | 380
(1997): 306. Internet Order No. ACC 9805222 ProQuest-Dissertation Abstracts,
Source DAI-A 58/08, 3062.
Nikos, Ntoumanis, Stuart, Biddle. (2010). A review of motivational climate in physical
activity: Journal of Sports Sciences: Vol 17, No 8, Pages 643-665.
Pastore, L.D. et al (1996).NCAA College Coaches and Athletic Administrative Support,
Journal of Sports Management, Human Kinetics Publishers, India, 10, 4, 373-387.
Petersen, J.C. (1998).Indoor Activity Space and Ancillary Space Analysis for New Mexico
High Schools, Internet-Order No. AAC 9818091 ProQuest-Dissertation Abstract
Source: DAI-A58/12, 4597.
Prakash, S. (1994). A Study of Organization and Working of Sports Academic Wings of
Sports Authority of India. An Unpublished Thesis, Punjab University, 288-289.
Prasad, Y. (1993).A Study of Facilities Organization and Administration of Physical
Education and Sports in Himachal Pradesh Universities.An Unpublished Thesis,
Punjab University.
Rao, V.V. (1984).A Suggested Pattern of Organization of Physical Education for a
Teaching-cum-Affiliating University in India. Thesis Absracts (1965-80),
Gwalior: Laxmibai National Institute of Physical Education, 8-9.
Robertson Sam. (2017). Evaluating strategic periodization in team sport: Journal of Sports
Sciences: Vol 0, No 0 Journal of sports sciences,Pages 1-7 | Accepted 22nd Feb
2017, Published online: 07th Mar 2017.
Rowen, K.L. (1981).The Management of College and University Football Coaches,
Dissertation Abstract International, 41, 12, 50255A.
Savage, M.P. (1987).A Study of the Programmes in the Directorate of Physical Education
and Sports of Indiana State, Dissertation Abstract International, 45, 12, 169.
Singh, M.P. (1996).Existing Condition of Games and Sports for the Promotion of Health
Programme in the Senior Secondary Schools of Haryana.Kurukshetra: An
Unpublished Thesis, Department of Physical Education, Kurukshetra University.
Singh, S. (1989). National Institute of Sports (A Study of its Administration and
Working).AnUnbpublished Thesis, Meerut University.
© Associated Asia Research Foundation (AARF) A Monthly Double-Blind Peer Reviewed Refereed Open Access International e-Journal - Included in the International Serial Directories.
Page | 381
Smith C. Nikolas (2010).A test of processing efficiency theory in a team sport context:
Journal of Sports Sciences: Vol 19, No 5 Volume 19, 2001 – Pages 321-332 |
Published online: 09th Dec 2010.
Sodhi, H.S. &Negi SC (1995). A Study of Utility of Services of Physical Education Teachers
at School, National Institute of Sports Scientific Journal, NetajiSubhas National
Institute of Sports, 18, 1, 30.
Stillman, A.C. (1987).A Study of the Development of Directorate of Physical Education and
Sports Administrators in New York State, Dissertation Abstract, 45,12, 268.
Sunderajan, S. (1998). A Study of Management of Inter-School Sports Programmes
(MSSSP) in High/ Higher and Secondary Schools in Tamilnadu, Patiala: Sports
Authority of India Scientific Journal, NSNIS, 1, 4, 42.
Sunderajan, S. (1999).Sports Management in 21st Century Efficacy of Management
Functions in Physical Education, Sports Authority of India Scientific Journal,
NSNIS,22.4: 22.
Swamikannu, S. (1974). The Attitudes of Madras City Collegiate Men Students towards
Physical Education Subject.UnpublishedThesis.University of Madras.
Tenard W.R. (1980). An Assessment of Management Policies and Procedures of Sports
Centres in England, Dissertation Abstract International, 44 3, 983A.
Thakur, S. (1997). Assessment of Physical Education Programmes in Secondary Schools of
Himachal Pradesh.An Unpublished Thesis, Punjab University.
© Associated Asia Research Foundation (AARF) A Monthly Double-Blind Peer Reviewed Refereed Open Access International e-Journal - Included in the International Serial Directories.
Page | 277
Role of Media in the Promotion of Sports
Dr. Merajuddin Faridi
Assistant Professor, Department of Physical Education, Aligarh Muslim University, Aligarh
Abstract
The purpose of the study was to know the role of Media in the Promotion of Sports. The
survey design was used to collect, collate, and analyze data by employing the instrumentation of
interview and Questionnaire developed by Sahu (2005) and modified by the researcher. The
sample of the study was the print media persons (n = 20) of Aligarh, related to different print
media houses; they were randomly selected. Frequency tables and simple percentages were used
to analyze and interpret the data. The result of the study revealed that Media does not play its
proper role in promoting the sport in Aligarh.
Keywords: role of Media, promotion, sports.
Introduction
Media is a technical system, which consists of printed and electronic communication, which
communicates rapidly and simultaneously with a large percentage of the population.The element
in the communications process by which the message is transmitted is known as media.The
Media affects sport itself, as well as teams and individuals; the Media includes any form of
promotion of sport, such as:
TV and Radio - Show (or commentate on) matches and competitions. There are also
highlights; documentaries and quiz show about sports.
Cable and Satellite TV - These show events on a pay-per-view basis
International Research Journal of Human Resources and Social Sciences ISSN(O): (2349-4085) ISSN(P): (2394-4218)
Impact Factor- 2.561, Volume 3, Issue 2, February 2016 ASSOCIATED ASIA RESEARCH FOUNDATION
Website- www.aarf.asia, Email : [email protected] , [email protected]

© Associated Asia Research Foundation (AARF) A Monthly Double-Blind Peer Reviewed Refereed Open Access International e-Journal - Included in the International Serial Directories.
Page | 278
Internet - All teams and dominant athletes have their websites where you can find all
kinds of information about the team/athlete/matches
Newspapers and Magazines - Print predictions and results, as well as articles about
athletes and clubs
Books and Films - Biographies are big business for ex-sports players
Technology is fundamental to the coverage of sport in the media. Not only does it allow
all of these forms of media to be possible, but it also allows features like photo finishes,
instant replays, split times,etc
Positive Effects; The media coverage of sport has sound effects:
Money - Media companies pay for the rights to show a sporting event. Also, sports
shown on the TV generate more sponsorship
Education - People learn the rules of the sport from watching it on TV
Role models - Seeing good sportspeople on TV and in newspapers makes them a role
model for people to look up to
Inspiration - Media brings sport to people who may not usually get to experience it
otherwise. This can encourage people to get involved
Coaching aid - Watching professionals on the TV can help you see how a technique
should be performed which could help your performance
Negative Effects; The media can also harm sport:
Bias - Only accessible sports get much attention on the TV and in newspapers etc. This
does not help encourage people into the less popular sports
Lack of Attendance - For matches that are shown on TV, ticket sales often drop
Overload - There is much sport onTV nowadays, some say too much.
The media must be considered as clients. Effective relations with media outlets
will provide significant opportunities for communicating marketing concepts and
product information with other clients and customers. Radio, television, and
newspapers are the traditional media sources with which the sports marketers must become
familiar, by providing a high-quality service to the media, all marketing functions can be
enhanced.
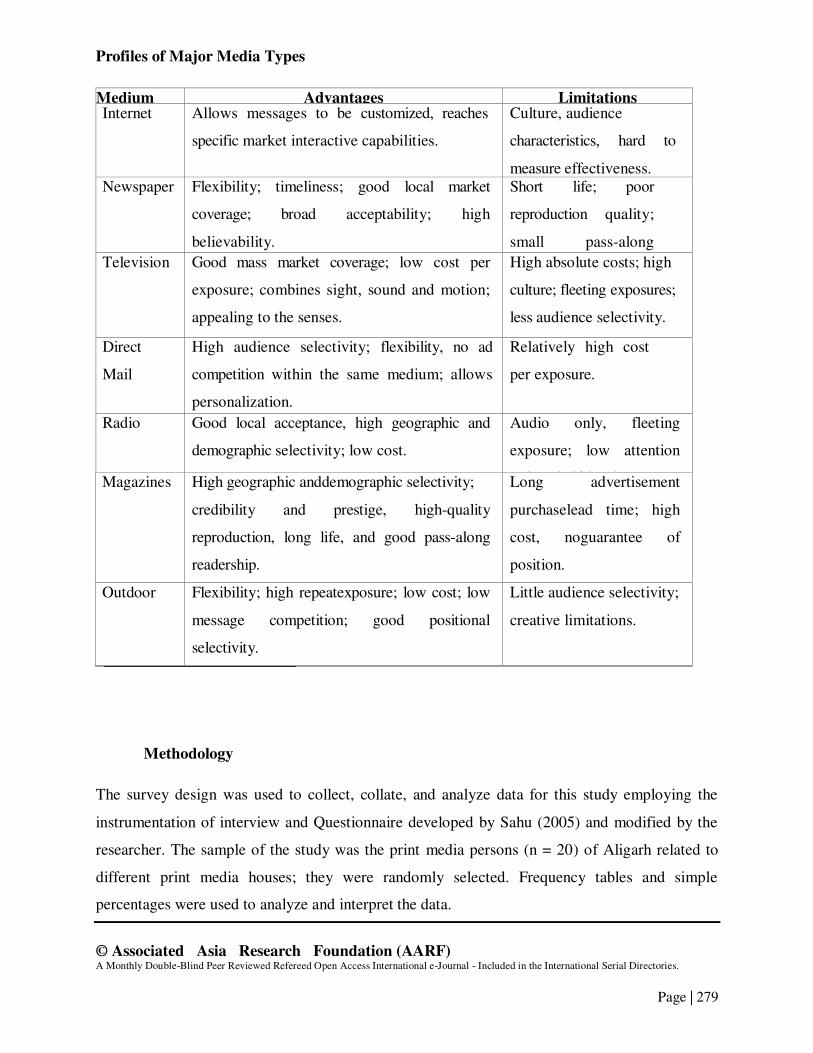
© Associated Asia Research Foundation (AARF) A Monthly Double-Blind Peer Reviewed Refereed Open Access International e-Journal - Included in the International Serial Directories.
Page | 279
Profiles of Major Media Types
Medium Advantages Limitations Internet Allows messages to be customized, reaches
specific market interactive capabilities.
Culture, audience
characteristics, hard to
measure effectiveness. Newspaper Flexibility; timeliness; good local market
coverage; broad acceptability; high
believability.
Short life; poor
reproduction quality;
small pass-along
Television Good mass market coverage; low cost per
exposure; combines sight, sound and motion;
appealing to the senses.
High absolute costs; high
culture; fleeting exposures;
less audience selectivity.
Direct
High audience selectivity; flexibility, no ad
competition within the same medium; allows
personalization.
Relatively high cost
per exposure.
Radio
Good local acceptance, high geographic and
demographic selectivity; low cost.
Audio only, fleeting
exposure; low attention
(“the half-head”medium) Magazines High geographic anddemographic selectivity;
credibility and prestige, high-quality
reproduction, long life, and good pass-along
readership.
Long advertisement
purchaselead time; high
cost, noguarantee of
position.
Outdoor Flexibility; high repeatexposure; low cost; low
message competition; good positional
selectivity.
Little audience selectivity;
creative limitations.
Methodology
The survey design was used to collect, collate, and analyze data for this study employing the
instrumentation of interview and Questionnaire developed by Sahu (2005) and modified by the
researcher. The sample of the study was the print media persons (n = 20) of Aligarh related to
different print media houses; they were randomly selected. Frequency tables and simple
percentages were used to analyze and interpret the data.

© Associated Asia Research Foundation (AARF) A Monthly Double-Blind Peer Reviewed Refereed Open Access International e-Journal - Included in the International Serial Directories.
Page | 280
Results and Discussion
Table 1 representing the frequency and percentage of respondents satisfied with the
functioning of print media in Aligarh city?
Types of response Frequency of response Percentage Chi-square
YES 8 40%
2.4
NO 12 60%
Table 1. revealed that 40% of print media personalities gavethe response that they are satisfied with
the functioning of print media in Aligarh City, while 60% of respondentsgave their responses
negatively.The chi-square analysis was carried out to check the divergence of the responses. The
obtained x2 value of 31.40at 0.05 level of significance was lesser than the tabulated x2 value
of 2.4. This clearly indicates that a significant difference was not found in the pattern of
response for the item satisfied with the functioning of all print media in Aligarh City.
Table 2 represents the frequency and percentage of responses: satisfied with the coverage
of mega sports events by print media is Aligarh city?
Types of response Frequency of response Percentage Chi-square
YES 14 70%
15*
NO 06 30%
*Significant x2m5 (01) = 3.84
Table 2. revealed that 70% of print media personalities gave the response that they are
satisfied with the coverage of mega sports events by print media in Aligarh City, while 30%
responded negatively.The chi-square analysis was carried out to check the divergence of the
responses. The obtained x2 value of 31.40at 0.05 level of significance is greater than the
tabulated x2 value of 15. This clearly indicates that a significant difference was found in the
© Associated Asia Research Foundation (AARF) A Monthly Double-Blind Peer Reviewed Refereed Open Access International e-Journal - Included in the International Serial Directories.
Page | 281
pattern of response for the item satisfied with the coverage of mega sports events by print media
is Aligarh City.
Conclusion
It is concluded that the Media does not play its proper role in promoting the sport in
Aligarh. It was seen that the Media’s functioning related to the promotion of sport was not
satisfactorily. It was also seen that the media are covering only the mega-evens of sport.
Furthermore, it is concluded that due to the lesser media coverage of sport, the sport and the
sportspersons of the area are getting lesser recognition. Hence the media should pay more
attention to the coverage of sports in Aligarh so that the name, fame, and the economy of the area
can be generated.
References
1. Brena, Pitts and Stotlar David K. Fundamentals of Sport Marketing. Morgantown:
FitnessInformation Technology Inc.,1996.Cicora, K.Sponsoring Special Events.
ParksandRecreation,1991.Desmond, Morris.TheSoccer Tribe. London:Jonathan
CapeLtd.,1981.
2. Docharty, Tommy. Better Football. New Delhi: Vision Books Pvt. Ltd., 1980.
3. Dunning, Eric E.;Maguire, Joseph A.andPearton, Robert E.The Sports Process: A
Comparative and Developmental Approach. Champaign: HumanKineticsPublishers, 1993.
4. Garrett, HerryE.StatisticsinPsychology and Education. Mubmai: Vakils,
FefferandSimonsLtd.,1981.
5. Gratton, C.andTaylor, Port andRecreation: AnEconomicAnalysis. London: F.N.Spon,1985.
6. Howard, Dennis R.andCrompton, JohnL.FinancingSport. Morgantown: Fitness Information
Technology Inc.,1995.
7. IrwinD.InSearchofSponsors. AthleticManagement, 1993".
8. Kotler, Philip. and Armstrong, Gray. Marketing An Introduction 4th ed.
UpperSaddle,N.J.:PrenticeHallInc.
9. Orlando, Duarte. The Encyclopedia of World Cup Soccer. New York: McGraw-Hill
Inc.,1994.
10. Pitts,BrendaG.andStotlas,DavidK.FundamentalsofSportMarketing. Morgantown:
FitnessInformationTechnology Inc.,1996.

© Associated Asia Research Foundation (AARF) A Monthly Double-Blind Peer Reviewed Refereed Open Access International e-Journal - Included in the International Serial Directories.
Page | 282
11. Raja,RamanV.FundamentalsofComputers. NewDelhi:PrenticeHallof IndiaPvt.Ltd.,2000.
12. Shank,MathewD.Sport Marketing. NewJersey:PrenticeHallInc., 1999.
13. Stauble, V. “The Significance ofSport Marketing and the Case of the Olympic Games.” in
P.J.Graham (ed.) Sports Business, Dubugue, IA:BrownBenchmark, 1994.179
14. Wagg, Stephen. TheFootballWorld.Great Britain: TheHarvester Press Ltd., 1984.
15. Wilson,N.TheSportsBusiness.London:Piatkus, 1988.
16. Hock, Janet et al. “Sponsorship and Advertising: AComparisonoftheir Effects.” Journal
ofMarketingCommunications (1997):21-32.
17. Menon, B.N.K.The FIFA WorldCup Italia- 90APreview. Mumbai: TheMarineSports,
1990.
18. Banerjee, Chandra. PhilipsLeaguetoKick-off Today.” TheTimesofIndia, Mumbai
(17December, 1996):24.
19. Basu,Jaydeep.” Soccer Teams SilenceCritics.” TheHindustan Times New
Delhi(20April1997):22.
20. DeccanHerals,Panjim(December 1992):24.
21. D’Souza, Derick. DeccanHerold,Panjim(15December, 1992):24.
22. Ghosh, Rajib Kumar. “Indian Footbal1Towards aNewEra.” (Unpublished Project Work
forPostgraduate DiplomainMass Communication &Journalism, University ofBurdwan,
1997).
23. Hamilton, Gavin.” BoomorBust?” WorldSoccer38:6(March 1998):26.
HeraldSportsWatch,Panaji(12February, 1999):8.
24. Kapadia, Novy. “New Dimentions.” Sports World 12:25 (February 1997):26-31.
25. Kapadia, Novy.” AnEnhanced Image.” SportsWorld9:22(April 1997):36-41.
26. Mid-Day, Mumbai(November 1991):38.
27. Shaji,P.” IndianSoccer: ItsTransformation Towards Professionalism -An Analytical
Survey.” (Unpublished Ph.D.’s Thesis, LNIPE, Gwalior, 2000).180
28. Shreekumar, S.S. and Raghunath, G. “Soccer Sans Laurels.” The Blitz Mumbai
(February 1993):7.
29. Srivatsa, V. “Footballer isGettingHisDueatLast.” The Sunday Times,
NewDelhi(2November, 1997):22.
30. Suryanarayan, S.R. “Professionalism and Indian Football.” cited in the EiderInternational
Jawaharlal NehruFootballGold Cup Souvenir(1997).

© Associated Asia Research Foundation (AARF) A Monthly Double-Blind Peer Reviewed Refereed Open Access International e-Journal - Included in the International Serial Directories.
Page | 283
31. The India Express, Kochi(23September,1997),p.20.World Soccer 33:12(September
1993):25.

ISSN: 2277-9655
[Ansari* et al., 5(10): October, 2016] Impact Factor: 4.116
IC™ Value: 3.00 CODEN: IJESS7
http: // www.ijesrt.com© International Journal of Engineering Sciences & Research Technology
[574]
IJESRT INTERNATIONAL JOURNAL OF ENGINEERING SCIENCES & RESEARCH
TECHNOLOGY
JOINT EFFECT OF STRIDE LENGTH AND STRIDE WIDTH ON RUNNING
PERFORMANCE Dr.Naushad Waheed Ansari*
* Assistant Professor, Department of Physical Education Aligarh Muslim University, Aligarh
(U.P.)India
DOI: 10.5281/zenodo.160901
ABSTRACT The purpose of this study is to describe joint effect of stride length and stride width on running performance of
100m sprinters and 5000m distance runners during completion. Twenty runners (Ten100m sprinters & Ten
5000m distance) from All India Athletic Meet were selected for the study. The aged ranged from 18-25years,
height ranged from 1.56-1.85 m, body weight ranged from 49 - 75 kg were of subjects. The subject’s running
motion was recorded using two Synchronised video cameras. One was secured to 2m behind 100m starting line
for recording stride width and second was secured 18m away from first lane and 50 m from starting line in filed
area for recording the stride length. Softwares MPEG, Photo Studio, SthSDVD , Coral-5 , Coral –9 , Player, and
SPSS Software were used to analysed recorded data. F- Test has been applied to know the joint effect of stride
length and stride width on running performance timings. The result was found that joint effect of stride length
and stride width have significant effect on sprinter’s running while joint effect of stride length and stride width
have no significant effect on 5000m long distance running. Statistical significance was set at P< 0.05.
INTRODUCTION A significant component of running performance of a sportsperson and prevention from injury is correct running
style. Correct running style and running mechanics help to an athlete for make more efficient runner, run easier,
faster and improve their running economy whereas poor running form is a cause of slow running and decrease
athlete’s running efficiency and also can even be the cause of many running injuries.
Running as a form of exercise which one of the other natural body movements that humans are blessed with.
Every human being runs in different running style. Two major categories of athletes in running events of track
and field are sprinting and distance running. Differences between these two groups are distance running
concentrates on the economy of body movement whereas power and speed are associated with sprinting. During
close to finish line of the any race, economy of movement gives way to speed. Nowadays, sprinting is not
simply running fast and same as distance running is not simply running long. For separate of these two running
categories, there are distinct variations in running technique and form.
Distance runners represent the foot-strike is often near the heel in an effort to absorb impact, and the feet are
lifted no higher than necessary to complete each stride. Little vertical oscillation is found among distance
runners, while arm motion is primarily for proper counterbalance (Williams and Cavanagh, 1987). Running
speed is determined by two factors, the length of stride and frequency of stride. For increasing the running
speed, one or both of these factors must be increased. Length of stride is dependent primarily upon leg length
and the power of the stride. Leg speed (frequency) is mostly dependent upon speed and strength of muscle
contraction as well as neuro-muscular coordinator in running. (Shaw, 1998)
The running speed increases when stride length remains constant and stride rate increases. Similarly, if stride
rate remains constant then stride length increases resulting increase in speed (Enoka, 1994). The stride length is
again related with the range of motion about a joint (quantity) and the pattern of displacement (quality). As the
runner goes from a walk to a run the angular displacement around about the knee joint increases. Likewise, the
range of motion around both shoulder and elbow joints also increases as a person goes from walk to a sprint
(Vaughan, 1984). As the length of the race increases beyond 400m normally regarded as the longest sprint

ISSN: 2277-9655
[Ansari* et al., 5(10): October, 2016] Impact Factor: 4.116
IC™ Value: 3.00 CODEN: IJESS7
http: // www.ijesrt.com© International Journal of Engineering Sciences & Research Technology
[575]
event. The athlete’s stride length and stride frequency are both substantially reduced; so too are the range and
vigor of most of athlete’s actions. The forcefulness of the extension of the hip, knee and ankle joints during the
driving phase is reduced (Hay, 1993)
To rationalize a movement as an efficient one, it is very important to investigate the movement first. Some time,
it is very difficult for a human eye to analyse all the movements of various body segments and joints at the same
time, so this has been potentiated by technical advances including faster cameras and marker systems which
eliminate the need to hand digitize frame after frame of video. The best method to analyse or evaluate various
movements is called cinematography. This is a quantitative method which is very accurate but at the same time
costly and time consuming. The role of cinematography in biomechanical research involves form of recording
motion to a sophisticated means of computer analysis of better efficiency. Over the years, new techniques in
filming and timing have been perfected to aid the research in achieving accurate time measurements of both
simple and complex locomoting patterns. (Newton and Arononcher, 1996)
However, researchers have committed their time to study the running complex motion of track events by
investigative the relevant biomechanical variables. These includeStride length also contributes to the success of
a runner (Cavanagh, 1987;Nummela et al., 2007). When a runner increases speed, stride length increases even
with a self-selected optimal stride lengths displayed by each runner (Nummela et al., 2007). Further research can
identify characteristics in stride lengthdisplayed by each group at various speeds. Mercer, Black, Branks and
Hreljac (2001) have studied stride length effects on ground reaction forces during running. Aron, Robert and
Aaron (2003) have studied kinematic determinants of early acceleration in field sport athletes.
Due to the complex nature of running motion, Coaches and sports scientists are taking interest to identifying the
factors that affect running performance. Identifying variations in the biomechanical attributes between athletes
of special talent is important, but All India athletes are rarely available in the same place and at the same time.
Thus data collection during competitions is a good solution. Since athletes perform to their best during
competitions, this should result in the best performance data. Such comparative studies can provide joint effect
of stride length and stride width into the key biomechanical variables that potentially differentiate running
performance. There is, however, a paucity of studies comparing athletes of a All India level. The main aim of
the present study was to establish joint effect of stride length and stride width on running performance of
sprinters as well as distance runners. It was also hoped that our findings would provide new information for
technique training of sprinter and distance endurance runners.
METHODOLOGY Twenty runners (Ten sprinters & Ten 5000m distance) from All India Athletic Meet were selected for the study.
The aged from 18-25years, height ranged from 1.56-1.85 m, body weight from 49 - 75 kg were of subjects.
Table-1 has shown anthropometric description of subjects. All subjects were free from any physical injury at the
time of video recording. The subject’s running motion was recorded using two Synchronised Panasonic F15 S-
VHS video cameras in a field setting. Two video cameras were projected on rigid tripod stands. One was
secured to 2m behind 100m starting line for recording Step Width (SW) and second was secured 18m away
from first lane and 50 m from starting line in filed area for recording the Stride Length (SL). SL and SW are
represented by elgon figures 1& 2. The locations of the cameras were chosen such that the optical axes of the
cameras intersected at 90 degrees at both planes namely Sagital plane, and Frontal plane. Once positioned of the
cameras was over, the zoom on the camera was adjusted in order to see that the four selected sprinter’s stride of
the whole motion during the 100meter sprint were recorded into video tape. The sampling rates of the video
cameras were 25 frames per second. In order to eliminate the effect of blurring at the time of video recording,
the shutter of the cameras was fixed with a high speed (1/1000th of a second). Softwares like MPEG, Photo
Studio, SthSDVD , Coral-5 , Coral –9 , Player, and SPSS Software were used to analysed recorded data. F- test
has been applied to know the joint effect of Stride Length and Stride Width on sprinter’s running on
performance timings. Statistical significance was set at P< 0.05.
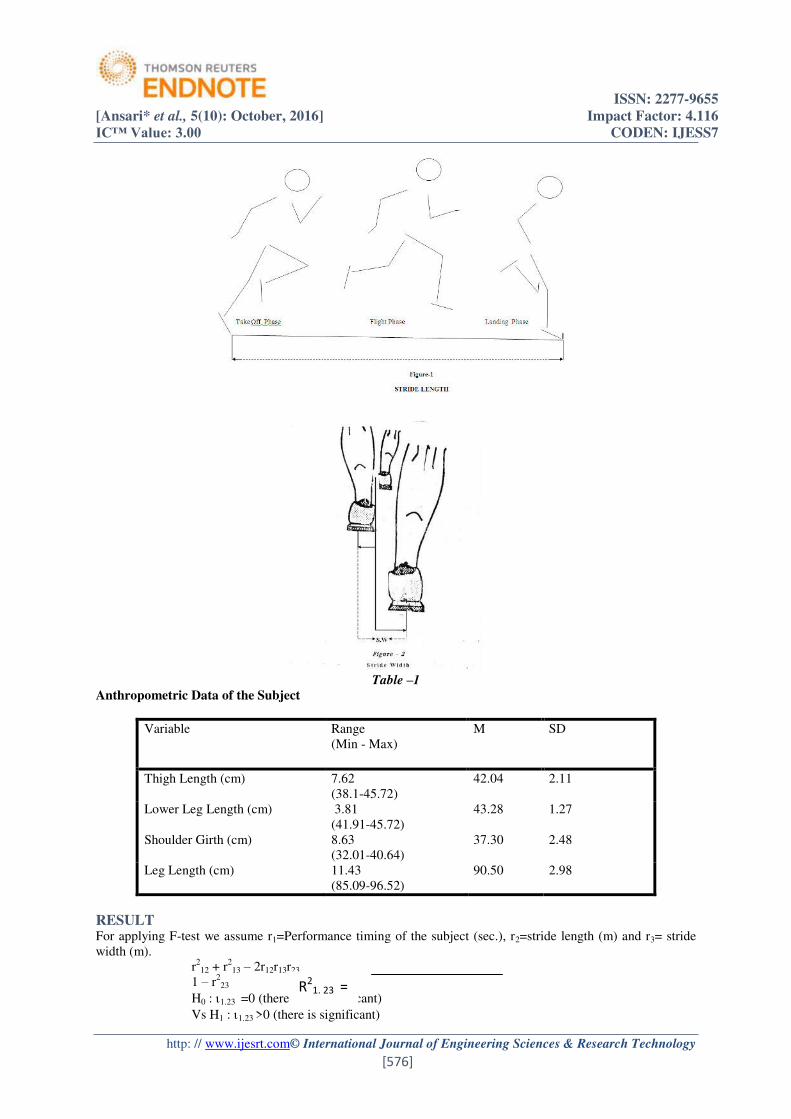
ISSN: 2277-9655
[Ansari* et al., 5(10): October, 2016] Impact Factor: 4.116
IC™ Value: 3.00 CODEN: IJESS7
http: // www.ijesrt.com© International Journal of Engineering Sciences & Research Technology
[576]
Table –1
Anthropometric Data of the Subject
Variable Range
(Min - Max)
M SD
Thigh Length (cm) 7.62
(38.1-45.72)
42.04 2.11
Lower Leg Length (cm) 3.81
(41.91-45.72)
43.28 1.27
Shoulder Girth (cm) 8.63
(32.01-40.64)
37.30 2.48
Leg Length (cm) 11.43
(85.09-96.52)
90.50 2.98
RESULT For applying F-test we assume r1=Performance timing of the subject (sec.), r2=stride length (m) and r3= stride
width (m).
r2
12 + r2
13 – 2r12r13r23
1 – r2
23
H0 : 1.23 =0 (there is no significant)
Vs H1 : 1.23 >0 (there is significant)
R2
1. 23 =

ISSN: 2277-9655
[Ansari* et al., 5(10): October, 2016] Impact Factor: 4.116
IC™ Value: 3.00 CODEN: IJESS7
http: // www.ijesrt.com© International Journal of Engineering Sciences & Research Technology
[577]
Table-2
5000m long Distance
running
F-
Value
100m Sprint F-
Value
r12 -0.20
2.17
r12 -
0.86
45.55 r23 -0.09 r23 -
0.09
r13 -0.05 r13 -
0.05
F.05;2,08= 2.17
Table-2 revealed that the calculated F in 5000m long distance running is less than tabulated F.Therefore the
joint effect of S.L and S.W does not play a significant role on 5000m long distance running mechanics. Since
the calculated F in 100m sprint is greater than tabulated F. Therefore the joint effect of S.L and S.W play a
significant role on 100m sprint running mechanics.
DISCUSSION The result of this study indicated that the joint effect of the stride length and stride width was significant in
sprint while the joint effect of the stride length and stride width was not significant in 5000m distance running.
Increased speed is the characteristic of running and achieved by increased horizontal force when it is impossible
to swing the leg forward before the other finishes its drive, the body is pushed hard in its forward and upward
direction. The length of the stride is longer as a result of progress during non-support and of the greater angle of
the driving leg. The greater angle of back ward gives an increased forward component. The body weight rides
lower so supporting knee bends more as the body passes over it.
Monica and Kokubun (1998) observed that the stride length was sufficient to compensate the decreases in stride
rate, thus maintaining the velocity, only when fatigue was not severe. Despite natural differences in stride
length, similarities exist within groups. Sprinters have a longer stride length compared to distance runners
(Armstrong et al., 1984; Bushnell & Hunter, 2007). Derrick and Hamill (1996) reported that the energy
absorbed by the hip, knee and ankle during non-fatigued running was dependent on stride rate. Subjects ran at a
constant speed, and changed stride rate to higher or lower rates compared to the preferred stride rate. Derrick, et
al., 1996 was reported that the level of impact was lower and the energy absorbed by the lower extremity was
lower during the higher stride rates. The energy absorbed by each joint was dependent on stride rate r elative to
the preferred stride rate. At stride rates greater than preferred, most of the energy was absorbed by the knee and
ankle. At stride rates lower than the preferred, most of the energy was absorbed by the knee.
REFERENCES [1] Aron J.M., Robert G. L. and Aaron J. C., “Kinematic determinants of early acceleration in field sport
athletes”, Journal of Sports Science and Medicine., 2003; 2, 144-150
[2] Armstrong LE, Costill DL, Gehlsen G.Biomechanical comparison of university sprintersand marathon
runners. Track Technique 87:2781-2782, 1984.
[3] Bushnell T, Hunter I. Differences in technique between sprinters and distance runners at equal and
maximal speeds. Sports biomech 6(3):261-268, 2007.
[4] Cavanagh P.R, “The biomechanics of lower extremity action in distance running”., Foot Ankle. 1987
Feb;7(4):197-217.
[5] Derrick T.R. and Hamill J., “Energy absorption during running at various stride frequencies”., Proceedings of the Ninth Biennial Conference of the Canadian Society for Biomechanics., 1996.
[6] Enoka, R. M., “Nuromechanical Basis of Kinesiology”. Champaign, II:Human Kinetic
Publishers.,1994.
[7] Hay, J. (1993) The Biomechanics of Sports Techniques. Englewood Cliffs, New Jersey: Prentice Hall
Inc.
[8] Mercer J.A., Black D., Branks D. and Hreljac A., “Stride length effects on ground reaction forces
during running”., American Society of Biomechanics.,2001.
[9] Monica M. V. B. and Kokubun E., “Interval training for sprint running: Effects of the duration of the
pause on running kinematics and blood lactate”.ISBS,1998,july,22.,

ISSN: 2277-9655
[Ansari* et al., 5(10): October, 2016] Impact Factor: 4.116
IC™ Value: 3.00 CODEN: IJESS7
http: // www.ijesrt.com© International Journal of Engineering Sciences & Research Technology
[578]
[10] Newton J, and Arononcher J., “Inexpensive Timing Method for Cinematography”., Research
Quarterly.,1996,P.480.
[11] Nummela, A., Keranen, T. and Mikkelsson, L.O. (2007) Factors related to top running speed and
economy. International Journal of Sports Medicine 28, 655-661.
[12] Williams R. K., and Cavanagh P.R., “Biomechanical studies of elite female distance runners”. International journal of Medicine., 1987 Nov;8 Suppl. 2:107-18
[13] Shaw D,“Siences of teaching of scientific basis of human motion”.,Peadagogie, kinesiology, 1998.p,
221-222 .
[14] Vaughan, C. L., “Biomechanics of running gait”.,CRC Critical Reviews in Biomedical Engineering,
1984, pp.1-48.


Preparing document for printing... 100%
Cancel


5/18/2020 (PDF) INFLUENCE OF SPATIO-TEMPORAL PARAMETERS ON GAIT SPEED IN SCHOOL CHILDREN | IJAR Indexing - Academia.edu
https://www.academia.edu/25905339/INFLUENCE_OF_SPATIO-TEMPORAL_PARAMETERS_ON_GAIT_SPEED_IN_SCHOOL_CHILDREN 1/5
PDFPDF
INFLUENCE OF SPATIO-TEMPORALPARAMETERS ON GAIT SPEED IN SCHOOLCHILDREN
or download with email
IJAR Indexing
Download with Google Download with Facebook
ISSN 2320-5407 International Journal of Advanced Research (2016), Volume 4, Issue 4, 768-772
Journal homepage: http://www.journalijar.com INTERNATIONAL JOURNAL
Journal DOI: 10.21474/IJAR01 OF ADVANCED RESEARCH
RESEARCH ARTICLE
INFLUENCE OF SPATIO-TEMPORAL PARAMETERS ON GAIT SPEED IN SCHOOL CHILDREN.
Ikram Hussain1, Syed Anayat Hussain
2, Fuzail Ahmad
3.
1. Professor, Department of Physical Education, Aligarh Muslim University, Aligarh.
2. Research Scholar, Department of Physical Education, Aligarh Muslim University, Aligarh.
3. Assistant Professor, Department of Physical Education, Aligarh Muslim University, Aligarh
Manuscript Info Abstract
Manuscript History:
Received: 12 February 2016
Final Accepted: 22 March 2016
Published Online: April 2016
Key words:Gait speed, Spatio-temporal.
This paper explores the influence of gait speed on various time-distance
parameters. The approach consists of designing an experimental set up togather running data at fast gait speeds. A total of number of twelve school
children having mean and standard deviation (SD) of their age (yrs), body
height (cms) and body weight (kgs) as 5.25±0.13, 122.33 ± 7.79 and 21.16±
2.82 respectively were selected for the study. The Spatio-temporal gait
parameters were recorded during a complete gait cycle and were analyzed
using appropriate motion analysis software. The statistical analysis was done
READ PAPER
LOG IN SIGN UPINFLUENCE OF SPATIO-TEMPORAL PARAMETERS ON GAIT SPEED IN SCHOOL CHILDREN DOWNLOAD
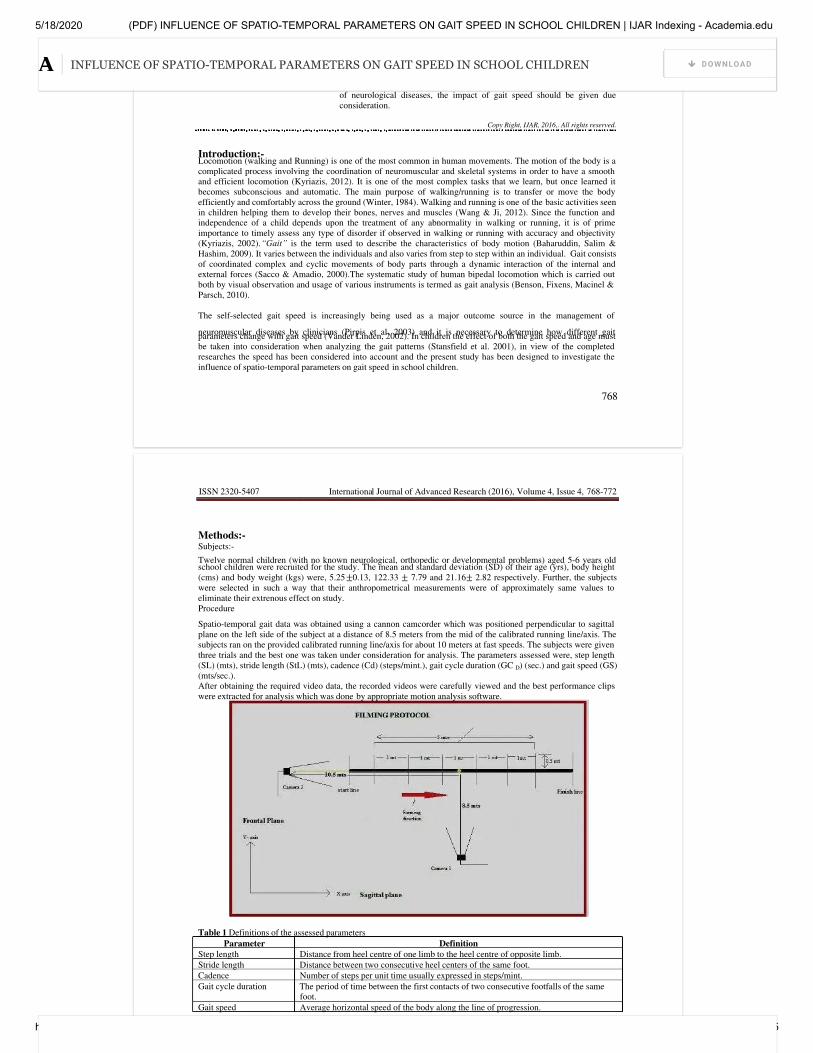
5/18/2020 (PDF) INFLUENCE OF SPATIO-TEMPORAL PARAMETERS ON GAIT SPEED IN SCHOOL CHILDREN | IJAR Indexing - Academia.edu
https://www.academia.edu/25905339/INFLUENCE_OF_SPATIO-TEMPORAL_PARAMETERS_ON_GAIT_SPEED_IN_SCHOOL_CHILDREN 2/5
768
*Corresponding Author
Fuzail Ahmad.
using SPSSv17.0. The mean, standard deviation (SD) and correlation
coefficient (r) was determined to find out any relationship between the
selected Spatio-temporal parameters and gait speed. The results showed that
stride length (r=0.72) is significantly correlated with gait speed. Therefore,
while making an assessment of gait patterns in children for the management
of neurological diseases, the impact of gait speed should be given due
consideration.
Copy Right, IJAR, 2016,. All rights reserved.
Introduction:-Locomotion (walking and Running) is one of the most common in human movements. The motion of the body is a
complicated process involving the coordination of neuromuscular and skeletal systems in order to have a smooth
and efficient locomotion (Kyriazis, 2012). It is one of the most complex tasks that we learn, but once learned it
becomes subconscious and automatic. The main purpose of walking/running is to transfer or move the body
efficiently and comfortably across the ground (Winter, 1984). Walking and running is one of the basic activities seen
in children helping them to develop their bones, nerves and muscles (Wang & Ji, 2012). Since the function and
independence of a child depends upon the treatment of any abnormality in walking or running, it is of prime
importance to timely assess any type of disorder if observed in walking or running with accuracy and objectivity
(Kyriazis, 2002).“Gait” is the term used to describe the characteristics of body motion (Baharuddin, Salim &
Hashim, 2009). It varies between the individuals and also varies from step to step within an individual. Gait consists
of coordinated complex and cyclic movements of body parts through a dynamic interaction of the internal and
external forces (Sacco & Amadio, 2000).The systematic study of human bipedal locomotion which is carried out
both by visual observation and usage of various instruments is termed as gait analysis (Benson, Fixens, Macinel &
Parsch, 2010).
The self-selected gait speed is increasingly being used as a major outcome source in the management of
neuromuscular diseases by clinicians (Pirpis et al. 2003) and it is necessary to determine how different gaitparameters change with gait speed (Vander Linden, 2002). In children the effect of both the gait speed and age must
be taken into consideration when analyzing the gait patterns (Stansfield et al. 2001), in view of the completed
researches the speed has been considered into account and the present study has been designed to investigate the
influence of spatio-temporal parameters on gait speed in school children.
ISSN 2320-5407 International Journal of Advanced Research (2016), Volume 4, Issue 4, 768-772
Methods:-Subjects:-
Twelve normal children (with no known neurological, orthopedic or developmental problems) aged 5-6 years oldschool children were recruited for the study. The mean and standard deviation (SD) of their age (yrs), body height
(cms) and body weight (kgs) were, 5.25±0.13, 122.33 ± 7.79 and 21.16± 2.82 respectively. Further, the subjects
were selected in such a way that their anthropometrical measurements were of approximately same values to
eliminate their extrenous effect on study.
Procedure
Spatio-temporal gait data was obtained using a cannon camcorder which was positioned perpendicular to sagittal
plane on the left side of the subject at a distance of 8.5 meters from the mid of the calibrated running line/axis. The
subjects ran on the provided calibrated running line/axis for about 10 meters at fast speeds. The subjects were given
three trials and the best one was taken under consideration for analysis. The parameters assessed were, step length
(SL) (mts), stride length (StL) (mts), cadence (Cd) (steps/mint.), gait cycle duration (GC D) (sec.) and gait speed (GS)
(mts/sec.).
After obtaining the required video data, the recorded videos were carefully viewed and the best performance clips
were extracted for analysis which was done by appropriate motion analysis software.
Table 1 Definitions of the assessed parameters
Parameter Definition
Step length Distance from heel centre of one limb to the heel centre of opposite limb.
Stride length Distance between two consecutive heel centers of the same foot.
Cadence Number of steps per unit time usually expressed in steps/mint.
Gait cycle duration The period of time between the first contacts of two consecutive footfalls of the same
foot.
Gait speed Average horizontal speed of the body along the line of progression.
INFLUENCE OF SPATIO-TEMPORAL PARAMETERS ON GAIT SPEED IN SCHOOL CHILDREN DOWNLOAD

5/18/2020 (PDF) INFLUENCE OF SPATIO-TEMPORAL PARAMETERS ON GAIT SPEED IN SCHOOL CHILDREN | IJAR Indexing - Academia.edu
https://www.academia.edu/25905339/INFLUENCE_OF_SPATIO-TEMPORAL_PARAMETERS_ON_GAIT_SPEED_IN_SCHOOL_CHILDREN 3/5
769
ISSN 2320-5407 International Journal of Advanced Research (2016), Volume 4, Issue 4, 768-772
770
Figure 1 Analyzing of Step and Stride Length.
Figure 2 Analyzing of Cadence & Gait velocity.
Figure 3 Analyzing of Gait cycle duration.
INFLUENCE OF SPATIO-TEMPORAL PARAMETERS ON GAIT SPEED IN SCHOOL CHILDREN DOWNLOAD
5/18/2020 (PDF) INFLUENCE OF SPATIO-TEMPORAL PARAMETERS ON GAIT SPEED IN SCHOOL CHILDREN | IJAR Indexing - Academia.edu
https://www.academia.edu/25905339/INFLUENCE_OF_SPATIO-TEMPORAL_PARAMETERS_ON_GAIT_SPEED_IN_SCHOOL_CHILDREN 4/5
INFLUENCE OF SPATIO-TEMPORAL PARAMETERS ON GAIT SPEED IN SCHOOL CHILDREN DOWNLOAD

5/18/2020 (PDF) INFLUENCE OF SPATIO-TEMPORAL PARAMETERS ON GAIT SPEED IN SCHOOL CHILDREN | IJAR Indexing - Academia.edu
https://www.academia.edu/25905339/INFLUENCE_OF_SPATIO-TEMPORAL_PARAMETERS_ON_GAIT_SPEED_IN_SCHOOL_CHILDREN 5/5
About Press Blog People Papers Job Board Advertise We're Hiring! Help Center
Find new research papers in: Physics Chemistry Biology Health Sciences Ecology Earth Sciences Cognitive Science Mathematics Computer Science
Terms Privacy Copyright Academia ©2020
INFLUENCE OF SPATIO-TEMPORAL PARAMETERS ON GAIT SPEED IN SCHOOL CHILDREN DOWNLOAD
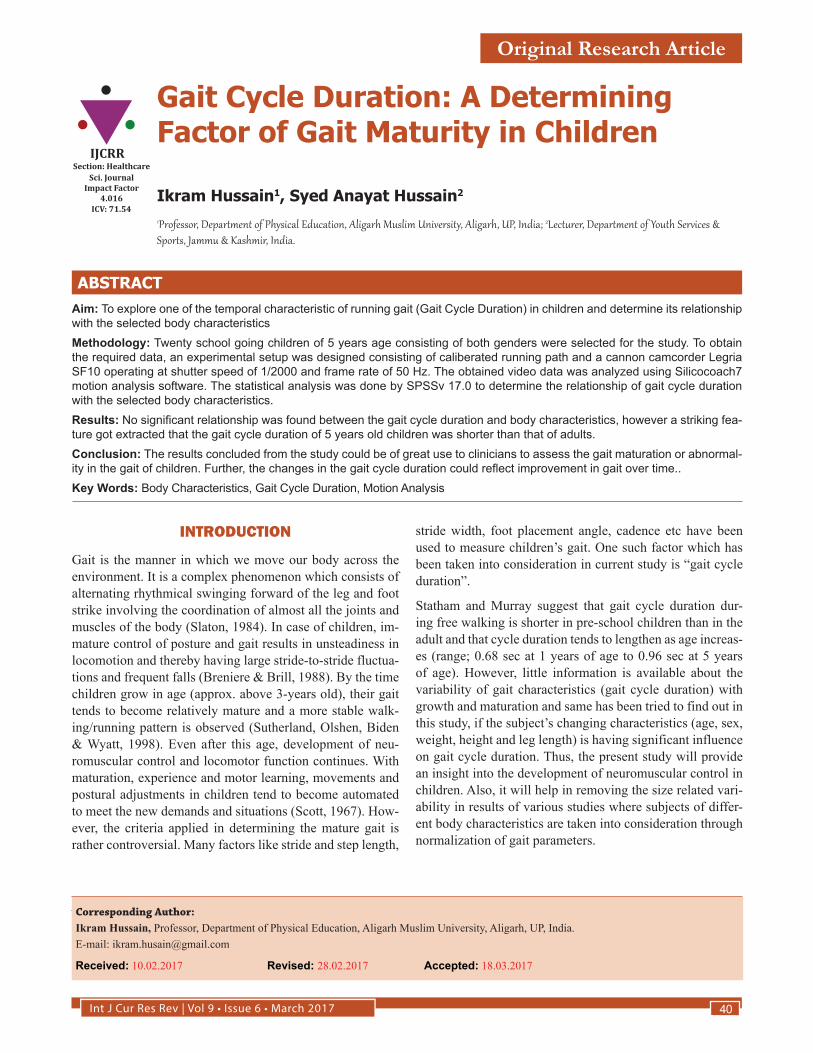
Int J Cur Res Rev | Vol 9 • Issue 6 • March 2017 40
Gait Cycle Duration: A Determining Factor of Gait Maturity in Children
Ikram Hussain1, Syed Anayat Hussain2
1Professor, Department of Physical Education, Aligarh Muslim University, Aligarh, UP, India; 2Lecturer, Department of Youth Services & Sports, Jammu & Kashmir, India.
ABSTRACT
Aim: To explore one of the temporal characteristic of running gait (Gait Cycle Duration) in children and determine its relationship
with the selected body characteristics
Methodology: Twenty school going children of 5 years age consisting of both genders were selected for the study. To obtain
the required data, an experimental setup was designed consisting of caliberated running path and a cannon camcorder Legria
SF10 operating at shutter speed of 1/2000 and frame rate of 50 Hz. The obtained video data was analyzed using Silicocoach7
motion analysis software. The statistical analysis was done by SPSSv 17.0 to determine the relationship of gait cycle duration
with the selected body characteristics.
Results: No significant relationship was found between the gait cycle duration and body characteristics, however a striking fea-
ture got extracted that the gait cycle duration of 5 years old children was shorter than that of adults.
Conclusion: The results concluded from the study could be of great use to clinicians to assess the gait maturation or abnormal-
ity in the gait of children. Further, the changes in the gait cycle duration could reflect improvement in gait over time..
Key Words: Body Characteristics, Gait Cycle Duration, Motion Analysis
Corresponding Author:
Ikram Hussain, Professor, Department of Physical Education, Aligarh Muslim University, Aligarh, UP, India.
E-mail: [email protected]
Received: 10.02.2017 Revised: 28.02.2017 Accepted: 18.03.2017
INTRODUCTION
Gait is the manner in which we move our body across the
environment. It is a complex phenomenon which consists of
alternating rhythmical swinging forward of the leg and foot
strike involving the coordination of almost all the joints and
muscles of the body (Slaton, 1984). In case of children, im-
mature control of posture and gait results in unsteadiness in
locomotion and thereby having large stride-to-stride fluctua-
tions and frequent falls (Breniere & Brill, 1988). By the time
children grow in age (approx. above 3-years old), their gait
tends to become relatively mature and a more stable walk-
ing/running pattern is observed (Sutherland, Olshen, Biden
& Wyatt, 1998). Even after this age, development of neu-
romuscular control and locomotor function continues. With
maturation, experience and motor learning, movements and
postural adjustments in children tend to become automated
to meet the new demands and situations (Scott, 1967). How-
ever, the criteria applied in determining the mature gait is
rather controversial. Many factors like stride and step length,
stride width, foot placement angle, cadence etc have been
used to measure children’s gait. One such factor which has
been taken into consideration in current study is “gait cycle
duration”.
Statham and Murray suggest that gait cycle duration dur-
ing free walking is shorter in pre-school children than in the
adult and that cycle duration tends to lengthen as age increas-
es (range; 0.68 sec at 1 years of age to 0.96 sec at 5 years
of age). However, little information is available about the
variability of gait characteristics (gait cycle duration) with
growth and maturation and same has been tried to find out in
this study, if the subject’s changing characteristics (age, sex,
weight, height and leg length) is having significant influence
on gait cycle duration. Thus, the present study will provide
an insight into the development of neuromuscular control in
children. Also, it will help in removing the size related vari-
ability in results of various studies where subjects of differ-
ent body characteristics are taken into consideration through
normalization of gait parameters.
IJCRRSection: Healthcare
Sci. Journal
Impact Factor
4.016
ICV: 71.54
Original Research Article
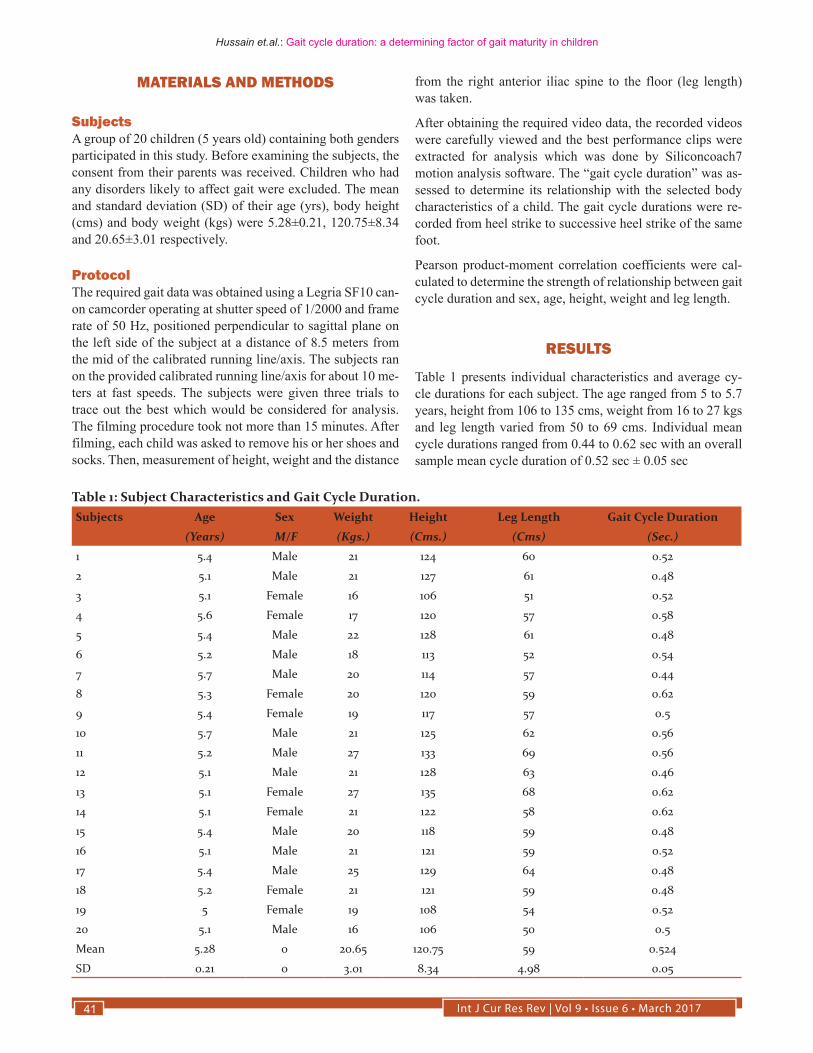
Int J Cur Res Rev | Vol 9 • Issue 6 • March 201741
Hussain et.al.: Gait cycle duration: a determining factor of gait maturity in children
MATERIALS AND METHODS
SubjectsA group of 20 children (5 years old) containing both genders
participated in this study. Before examining the subjects, the
consent from their parents was received. Children who had
any disorders likely to affect gait were excluded. The mean
and standard deviation (SD) of their age (yrs), body height
(cms) and body weight (kgs) were 5.28±0.21, 120.75±8.34
and 20.65±3.01 respectively.
ProtocolThe required gait data was obtained using a Legria SF10 can-
on camcorder operating at shutter speed of 1/2000 and frame
rate of 50 Hz, positioned perpendicular to sagittal plane on
the left side of the subject at a distance of 8.5 meters from
the mid of the calibrated running line/axis. The subjects ran
on the provided calibrated running line/axis for about 10 me-
ters at fast speeds. The subjects were given three trials to
trace out the best which would be considered for analysis.
The filming procedure took not more than 15 minutes. After
filming, each child was asked to remove his or her shoes and
socks. Then, measurement of height, weight and the distance
from the right anterior iliac spine to the floor (leg length)
was taken.
After obtaining the required video data, the recorded videos
were carefully viewed and the best performance clips were
extracted for analysis which was done by Siliconcoach7
motion analysis software. The “gait cycle duration” was as-
sessed to determine its relationship with the selected body
characteristics of a child. The gait cycle durations were re-
corded from heel strike to successive heel strike of the same
foot.
Pearson product-moment correlation coefficients were cal-
culated to determine the strength of relationship between gait
cycle duration and sex, age, height, weight and leg length.
RESULTS
Table 1 presents individual characteristics and average cy-
cle durations for each subject. The age ranged from 5 to 5.7
years, height from 106 to 135 cms, weight from 16 to 27 kgs
and leg length varied from 50 to 69 cms. Individual mean
cycle durations ranged from 0.44 to 0.62 sec with an overall
sample mean cycle duration of 0.52 sec ± 0.05 sec
Table 1: Subject Characteristics and Gait Cycle Duration.
Subjects Age Sex Weight Height Leg Length Gait Cycle Duration
(Years) M/F (Kgs.) (Cms.) (Cms) (Sec.)
1 5.4 Male 21 124 60 0.52
2 5.1 Male 21 127 61 0.48
3 5.1 Female 16 106 51 0.52
4 5.6 Female 17 120 57 0.58
5 5.4 Male 22 128 61 0.48
6 5.2 Male 18 113 52 0.54
7 5.7 Male 20 114 57 0.44
8 5.3 Female 20 120 59 0.62
9 5.4 Female 19 117 57 0.5
10 5.7 Male 21 125 62 0.56
11 5.2 Male 27 133 69 0.56
12 5.1 Male 21 128 63 0.46
13 5.1 Female 27 135 68 0.62
14 5.1 Female 21 122 58 0.62
15 5.4 Male 20 118 59 0.48
16 5.1 Male 21 121 59 0.52
17 5.4 Male 25 129 64 0.48
18 5.2 Female 21 121 59 0.48
19 5 Female 19 108 54 0.52
20 5.1 Male 16 106 50 0.5
Mean 5.28 0 20.65 120.75 59 0.524
SD 0.21 0 3.01 8.34 4.98 0.05

Int J Cur Res Rev | Vol 9 • Issue 6 • March 2017 42
Hussain et.al.: Gait cycle duration: a determining factor of gait maturity in children
The subjective notations I made during filming procedure
suggest that most of the children were feeling somewhat hes-
itating and uncomfortable and were showing extra cautious
attitude. Also few subjects did not maintain the proper swing
of their arms during running. Inspite of this, no relationship
existed between postural attitudes or upper extremity posi-
tion and the duration of corresponding gait cycles.
Table 2 represents the correlation of gait cycle duration and
the selected individual characteristics. I found that no sig-
nificant relationships between cycle duration and subject
characteristics.
Table 2: Pearson-Product-Moment Coefficients
Age Weight Height Leg Length
Gait Cycle Duration
Age 1
Weight -0.03 1
Height 0.10 0.87 1
Leg Length 0.10 0.93 0.95 1
Gait Cycle Duration
-0.13 0.17 0.19 0.16 1
*Significance level at 0.05
Tab r 0.05
(19) = 0.45
DISCUSSION
The mean gait cycle duration of 5 years old children as deter-
mined through the current study is 0.52 sec, which is shorter
in comparison to adults (Statham & Murray, 1971). The rea-
sons for this is however not clear, but Statham and Murray
suggest that;
1) The shorter cycle duration or increased cadence could
be an attempt by children to decrease the lateral dis-
placement of their high centre of gravity. Murray had
found that, faster gait speeds in adults decreased the
lateral displacement of centre of gravity, and then as
such as child grows older and centre of gravity gradu-
ally descends, the gait cycle duration also lengthens.
Our results also seem to support this hypothesis.
Another explanation for shorter gait cycle duration in chil-
dren as compared to adults is reported by Saunders and his
associates who suggest that;
2) The shorter cycle duration could be the lack of acqui-
sition of six determinants of mature gait in children
(pelvic tilt, pelvic rotation, knee flexion at mid-stance,
foot and knee coordination at heel and toe-off and
lateral displacement of pelvis). If this could be the
reason, then cycle duration should lengthen to same
extent as that of adult by the time a mature gait is
achieved. Sutherland and his associates also suggest
the same. From their data, it was reported that cycle
duration rapidly increased during initial periods of
walking/running until 3 years of age. Then after, this
increase continues but at a slower rate. This suggests
that cycle duration is directly related with acquisition
of gait determinants.
Although no significant relationship was determined be-
tween gait cycle duration and body characteristics of chil-
dren in our study, yet relationships may exist if some other
age group is considered or a larger sample is studied. If the
significant relationship is determined, it could be of use to
clinicians to assess further maturity or abnormality in gait
in childhood. Changes in gait cycle duration could reflect
improvement in gait over time.
CONCLUSIONS
The mean running gait cycle duration in 5 year old children
is shorter than adults; many reasons have been put forth as
discussed in the content of discussions. The results as de-
picted by our study are consistent with the results of other
studies showing a trend of increasing of gait cycle duration
with age. However, further studies need to get completed in
order to determine the feasibility of using gait cycle duration
as a tool for measuring gait maturity or abnormality in clini-
cal setting.
ACKNOWLEDGEMENT
The authors acknowledge the immense help received from
the scholars whose articles are cited and included in refer-
ences of this manuscript. The authors are also grateful to au-
thors/ editors/ publishers of all those articles, journals and
books from where the literature for this article has been re-
viewed and discussed.
REFERENCES
1. Breniere, Y., & Brill, B. (1988). Why do children walk when
felling down, while adults fell down in walking? Computes Ren-
dus Academie Sciencies III, 307: 617-662.
2. Sutherland, D. H., Olshen, R. A., Biden, E. N., & Wyatt, M.
P. (1988). The development of mature walking. Oxford, UK:
Mackieth.
3. Scott, L. (1967). Child development: An individual longitudinal
approach, New York, NY, HoH, Rinehart & Winston General
Book, 20-144.
4. Statham, L., & Murray, M. P. (1971). Early walking patterns of
normal children. Clinical Orthopedics and Related Research,
79: 8-24.
5. Slaton, D. S. (1984). Gait cycle duration in 3-year-old children.
Physical Therapy, 65: 1, 17-22.

Int J Cur Res Rev | Vol 9 • Issue 6 • March 201743
Hussain et.al.: Gait cycle duration: a determining factor of gait maturity in children
6. Saunders, J. B., Inam, V. T., & Eberhart, H. D. (1953). The major
determinants of normal and pathological gait. Journal of Bone
and Joint Surgery (Am), 35: 543-558.
Figure 1: Experimental protocol.
Figure 2: Initial phase of gait cycle (Heel Strike)
Figure 3: Toe-Off phase of Gait Cycle.
Figure 4: Terminal Strike phase of gait cycle and recording of
total gait cycle duration.


A BIOMECHANICAL INVESTIGATION OF PROMINENT KINEMATIC
FACTOR IN DRAG FLICK
Ikram Hussain1, Fuzail Ahmad1*, Mohd. Tanveer Khan1
1Department of Physical Education, Aligarh Muslim University, Aligarh, 202002, INDIA
*Corresponding Author
Abstract
Drag flick being one of the most offensive and frequently used techniques during penalty corner in field
hockey requires better understanding of its complex nature in order to make the skill efficient and accurate.
The aim of the present study was to determine the kinematic factors which were significantly related to ball
velocity during drag flick, thereby proposing the possible suggestions to improve skill efficiency. Six male
intervarsity hockey players specialist in drag flicking from Aligarh Muslim University and LNIPE, Gwalior ,
who’s ranged in age from 18-24 years, height ranged between 174-182 cm and weight ranged 59.4-66.8 kg
were recruited for the study. The kinematic data was obtained by using two Canon Legria SF-10 camcorders.
The subjects were asked to perform 15 consecutive drag flick trails from stationary ball position. Out of 15
trails best 6 successful trails were selected for each subject and were taken under consideration for analysis.
Trail was defined as successful every time the ball hit the target whose dimensions were predetermined. The
obtained videos data were analyzed using Max TRAQ 3D motion analysis software. The ball velocity was
measured from ball-stick contact to the point of release of the ball. The factor analysis and product moment
correlation statistical analysis was done using SPSSv.16. The results revealed that, left wrist velocity and
acceleration, left elbow acceleration, both right and left shoulder angular velocity, left pelvic angular velocity,
right knee velocity and acceleration, and left knee angular magnitude and angular velocity were significantly
related with ball velocity and hence it is suggested that players should concentrate on these factors during
training of the drag flick technique.
Keywords: Drag flick, kinematic factors, Max Traq 3D, technique and performance.
Introduction The drag flick was introduced in the early 1990’s by Dutch player Taco Hajo Van Den Honert, it is one of the
most offensive weapons in relation to field hockey used by skilled players all over the world, from international level right down to local leagues, as a set play during penalty corners. Besides being used during
penalty corners, it is also frequently used during field play as a strong pass to break lines. It is one of the most
successful methods for scoring goals (Laird & Sutherland, 2003; Mosquera et al., 2007). As the penalty corner
is a set piece, a range of different plays, formations and unique routines can be rehearsed during training.
Because of this it has become one of the most important facets of the modern game. The drag flick is the best
offensive technique which is approximately 1.4 to 2.7 times more efficient than hitting or pushing the ball
towards the goal during penalty corner (McLaughlin, 1997; Piñeiro et al., 2007; Yusoff et al., 2008). Drag
flick techniques has added to new dimensions in the execution of penalty corner and therefore needs better
execution technique and accuracy especially during scoring. For better understanding of the technique, one has
to study the movement patterns during the performance of drag flick. Therefore, biomechanical analysis is
becoming increasingly important in this regard to understand its complex nature.
Many sports biomechanists have analyzed about drag flick and found stance width and drag distance to be the
variables most highly correlated with the principal criterion ball velocity. McLaughlin (1997) and Gómez et al.
(2012) focused upon identifying the differences in kinematic variables of drag flicking depending upon the
shot location and found a significantly greater negative angular velocity of the stick when flicking to the right
than to left. López de Subijana et al., (2010); López de Subijana Hernández et al., (2011); has described the
importance of creating sequential maximal velocities – from proximal to distal – of the hips, shoulders, hands
and then to stick, was emphasized. The significance of performing these maximal velocities in this order has
also been acknowledged as an important link transferring the momentum to stick and finally to ball
maximizing the ball velocity. However, due to procedural difference and low variable consideration in
Journal of Advance Research in Applied Science ISSN: 2208-2352
Volume-3 | Issue-10 | October,2017 | Paper-3 23

previous researches, this study is designed to determine the underlying kinematic factors which are
determinant during drag flick and enhancing the performance of technique.
Methodology The study was conducted on six Intervarsity level male specialized hockey players from Aligarh Muslim
University and LNIPE, Gwalior, aged 18-24 years. Their height ranged between 174-182 cm and weight
between 59.4-66.8 kg. Three dimensional (3D) setup was established for the study and kinematic parameters
and successful scores were used as criterion for the study. The kinematic data was obtained by using two
Canon Legria SF-10 camcorders which were placed at right side of the subjects at a distance of 13m and 17m
away from the stationary ball position, mounted at height of 1.2m from the ground. The frame rates of these
cameras were set on 50 hz and speed 1/1000. Subjects were instructed to wear proper kit in order to give their
best performance clip for analysis. The subjects were asked to perform 15 consecutive drag flick trails from
stationary ball position. Out of 15 trails best 6 successful trails were selected for each subject and were taken
under consideration for analysis. Trail was defined as successful every time the ball hit the target whose
dimensions were predetermined.
The obtained data was analyzed using Max TRAQ 3D motion analysis software. The ball velocity was
measured from ball-stick contact to the point of release of the ball. In order to find out the determinant
kinematic factors and inter relationship between various factors, the factor analysis and Pearson’s product moment correlations was applied respectively. The statistical analysis was done using SPSSv.16. with level of
significance fixed at 0.05.
Results & Discussion The main objective of the study was to extract the determinant factors which were significantly related with
ball velocity and hence the efficiency of drag flick. The results and its discussion are represented as below:
Table 1: Descriptive analysis of fifty kinematic parameters
S. No. Kinematic Variables Code Mean SD
1. Wrist left velocity WLV 24.20 30.65
2. Elbow left velocity ELV 9.32 6.82
3. Shoulder left velocity SLV 7.33 4.50
4. Pelvic left velocity PLV 4.37 2.41
5. Knee left velocity KLV 4.32 2.76
6. Ankle left velocity ALV 3.73 2.48
7. Toe left velocity TLV 3.90 2.35
8. Wrist right velocity WRV 12.87 5.53
9. Elbow right velocity ERV 19.35 28.24
10. Shoulder right velocity SRV 9.30 6.66
11. Pelvic right velocity PRV 5.32 3.44
12. Knee right velocity KRV 15.12 16.35
13. Ankle right velocity ARV 21.65 19.61
14. Toe right velocity TRV 20.58 21.17
15. Wrist left acceleration WLA -38.36 101.34
16. Elbow left acceleration ELA -20.27 30.33
17. Shoulder left acceleration SLA -12.72 19.61
18. Pelvic left acceleration PLA -18.12 26.43
19. Knee left acceleration KLA -13.58 19.25
20. Ankle left acceleration ALA -3.25 8.27
21. Toe left acceleration TLA -7.39 7.57
22. Wrist right acceleration WRA 3.07 105.83
23. Elbow right acceleration ERA -3.18 85.34
24. Shoulder right acceleration SRA -1.70 23.10
25. Pelvic right acceleration PRA -0.56 11.73
26. Knee right acceleration KRA 7.16 118.54
27. Ankle right acceleration ARA 24.43 118.96
Journal of Advance Research in Applied Science ISSN: 2208-2352
Volume-3 | Issue-10 | October,2017 | Paper-3 24

28. Toe right acceleration TRA 58.55 83.74
29. Elbow left angular magnitude ELAM 118.11 17.98
30. Shoulder left angular magnitude SLAM 66.82 33.42
31. Pelvic left angular magnitude PLAM 72.34 21.86
32. Knee left angular magnitude KLAM 104.63 27.51
33. Ankle left angular magnitude ALAM 93.58 41.87
34. Wrist right angular magnitude WRAM 115.15 20.52
35. Elbow right angular magnitude ERAM 112.68 22.38
36. Shoulder right angular magnitude SRAM 82.23 22.90
37. Pelvic right angular magnitude PRAM 85.01 27.54
38. Knee right angular magnitude KRAM 103.54 32.22
39. Ankle right angular magnitude ARAM 84.43 32.37
40. Elbow left angular velocity ELAV -56.72 261.80
41. Shoulder left angular velocity SLAV -5.45 169.39
42. Pelvic left angular velocity PLAV 102.80 135.33
43. Knee left angular velocity KLAV 68.54 123.76
44. Ankle left angular velocity ALAV -7.16 98.57
45. Wrist right angular velocity WRAV 21.08 287.36
46. Elbow right angular velocity ERAV -74.35 147.64
47. Shoulder right angular velocity SRAV 36.27 157.44
48. Pelvic right angular velocity PRAV -59.59 272.14
49. Knee right angular velocity KRAV 13.40 223.13
50. Ankle right angular velocity ARAV -105.32 200.15
51. Ball velocity Ball 87.57 148.48
Table 1 shows the descriptive statistics analysis of fifty one kinematic parameters of the drag flicker. The mean
and standard deviation (SD) of the kinematic parameters were taken for the study.
Factor Analysis: The purpose of factor analysis is to explore the under lying factors that explains the correlations among a set of
variables. The relationship of each variable to the underlying factor is expressed by so called factor loading.
Table 2: Representing Factor loading of factor I
S.No. Kinematic Variables Code Factor Loading
1 Pelvic left velocity PLV 0.740
2 Knee left velocity KLV 0.868
3 Pelvic right velocity PRV 0.883
4 Knee right velocity KRV 0.904
5 Ankle right velocity ARV 0.765
6 Shoulder left acceleration SLA 0.520
7 Elbow right acceleration ERA 0.565
8 Shoulder right acceleration SRA 0.684
9 Pelvic right acceleration PRA 0.397
10 Toe right acceleration TRA 0.692
11 Pelvic left angular magnitude PLAM 0.643
Factor I (Table 2): The highest factor loading of 0.904 is attributed to knee right velocity as shown in the above
table. The right knee velocity acts as a medium of transference of momentum from the toe to the pelvis which
during swinging action carries the ball forward due to the conservation of momentum, thus generating the
speed of the ball to maximum during drag flick.
Journal of Advance Research in Applied Science ISSN: 2208-2352
Volume-3 | Issue-10 | October,2017 | Paper-3 25

Table 3: Representing Factor Loading of factor II
S.No. Kinematic Variables Code Factor Loading
1 Wrist left velocity WLV 0.853
2 Elbow left velocity ELV 0.823
3 Ankle left velocity ALV 0.579
4 Toe left velocity TLV 0.810
5 Wrist right velocity WRV 0.844
6 Elbow right velocity ERV 0.764
7 Shoulder right velocity SRV 0.743
8 Toe right velocity TRV 0.813
9 Ankle left acceleration ALA 0.514
10 Toe left acceleration TLA 0.416
11 Shoulder left angular magnitude SLAM 0.710
12 Ankle left angular magnitude ALAM 0.749
13 Shoulder right angular magnitude SRAM 0.554
14 Ankle right angular magnitude ARAM 0.642
15 Shoulder left angular velocity SLAV 0.537
16 Ankle left angular velocity ALAV 0.345
Factor II (Table 3): Wrist left velocity exhibits significant positive factor loading of 0.853. Flicking is all in the
wrists. The wrist needs to rotate the stick enough so that stick face is angled to throw the ball into the air, but
not so far that the ball will slip over the head while performing the push action. Besides wrist right velocity,
elbow left velocity and toe left velocity are also responsible for swinging of the particular articulation and
transfer the moment to their relative parts of the body that play a dominant role in factor II.
.000
.100
.200
.300
.400
.500
.600
.700
.800
.900
1.000
Factor
I
Factor
II
Factor
III
Factor
IV
Factor
V
Factor
VI
Factor
VII
Factor
VIII
Factor
IX
Factor
X
Factor I
Factor II
Factor III
Factor IV
Factor V
Factor VI
Factor VII
Factor VIII
Factor IX
Factor X
Journal of Advance Research in Applied Science ISSN: 2208-2352
Volume-3 | Issue-10 | October,2017 | Paper-3 26

Table 4: Representing Factor Loading of factor III
S.No. Kinematic Variables Code Factor Loading
1 Shoulder left velocity SLV 0.544
2 Wrist left acceleration WLA 0.625
3 Pelvic left acceleration PLA 0.200
4 Wrist right acceleration WRA 0.433
5 Elbow right angular velocity ERAV 0.521
6 Pelvic right angular velocity PRAV 0.155
7 Ankle right angular velocity ARAV 0.249
Factor III (Table 4): The table depicts the maximum factor loading for Wrist left acceleration (WLA) which is
0.625, thus playing a significant role in factor III. The players are having their left hand closer to their bodies,
so that they can create a greater angle in order to increase the acceleration of left wrist during cross over step.
Furthermore, the work of the left shoulder is pointing in the direction of drag flick and wrapping the stick
around and below the left shoulder for enhancement of the shoulder left velocity.
.000
.100
.200
.300
.400
.500
.600
.700
.800
.900
Factor II
WLV
ELV
ALV
TLV
WRV
ERV
SRV
TRV
ALA
TLA
.000
.100
.200
.300
.400
.500
.600
.700
SLV WLA PLA WRA ERAV PRAV ARAV
Factor III
SLV
WLA
PLA
WRA
ERAV
PRAV
Journal of Advance Research in Applied Science ISSN: 2208-2352
Volume-3 | Issue-10 | October,2017 | Paper-3 27

Table 5: Representing Factor Loading of factor IV
S.No. Kinematic Variables Code Factor Loading
1 Knee left angular magnitude KLAM 0.713
2 Wrist right angular magnitude WRAM 0.589
3 Elbow left angular velocity ELAV 0.316
Factor IV (Table 5): The maximum factor loading is of knee left angular magnitude which is 0.713 as evident
from the above table. The knee left angular magnitude is responsible for production of momentum and
transferring it from one part to another with the help of degree of knee angles as well as horizontal
displacement. The other two factors are prime prelude for augmentation of ball velocity and enhancement
performance in the area of drag flick.
Table 6: Representing Factor Loading of factor V
S.no. Kinematic Variables Code Factor Loading
1 Knee right acceleration KRA 0.457
2 Elbow left angular magnitude ELAM 0.446
3 Pelvic right angular magnitude PRAM 0.414
Factor V (Table 6): The knee right acceleration is having maximum factor loading of 0.457. The amorousness
of this factor is providing a channel to develop or reduce acceleration with the phases of knee right horizontal
displacement that is efficacy of the drag flick skill. The other parameter is the elbow left angular magnitude
that maintains the coordination between both hands and sticks.
0
0.1
0.2
0.3
0.4
0.5
0.6
0.7
0.8
KLAM WRAM ELAV
Factor IV
KLAM
WRAM
ELAV
Journal of Advance Research in Applied Science ISSN: 2208-2352
Volume-3 | Issue-10 | October,2017 | Paper-3 28

Table 7: Representing Factor Loading of factor VI
S.No. Kinematic Variables Code Factor Loading
1 Knee right angular magnitude KRAM 0.511
2 Shoulder right angular velocity SRAV 0.798
Factor VI (Table 7): The factor loading of shoulder right angular velocity is 0.798 which is maximum, playing
a tremendous effect in this factor. Basically the shoulder right contains all short pocket of forces that are taken
from various lower parts of body and produced maximum angular velocity.
Table 8: Representing Factor Loading of factor VII
S.No. Kinematic Variables Code Factor Loading
1 Knee left acceleration KLA 0.386
2 Ankle right acceleration ARA 0.700
3 Pelvic left angular velocity PLAV 0.709
4 Knee right angular velocity KRAV 0.561
0.39
0.4
0.41
0.42
0.43
0.44
0.45
0.46
0.47
KRA ELAM PRAM
Factor V
KRA
ELAM
PRAM
0
0.2
0.4
0.6
0.8
1
KRAM SRAV
Factor VI
KRAM
SRAV
Journal of Advance Research in Applied Science ISSN: 2208-2352
Volume-3 | Issue-10 | October,2017 | Paper-3 29

Factor VII (Table 8): The maximum factor loading is of pelvic left angular velocity equal to 0.709. During the
rotation of the body the angular velocity of the pelvic changes from right negative to left positive, because left
leg raises and then swings with the help of left side of the hip. The ankle right acceleration is providing
momentum to its lower extremities for shifting the whole weight from right to left feet and it becomes easier to
perform skill of drag flick.
Table 9: Representing Factor Loading of factor VIII
S.No. Kinematic Variables Code Factor Loading
1 Shoulder left angular velocity SLAV 0.439
Factor VIII (Table 9): The factor loading of shoulder left angular velocity is 0.439. The left shoulder is pointed
in the direction of the goal, doing this aid in the accuracy and increases the angular velocity keeping the ball on
target
Table 10: Representing Factor Loading of factor IX
S.No. Kinematic Variables Code Factor Loading
1 Elbow left acceleration ELA 0.569
2 Elbow right angular magnitude ERAM 0.499
3 Wrist right angular velocity WRAV 0.301
0
0.1
0.2
0.3
0.4
0.5
0.6
0.7
0.8
KLA ARA PLAV KRAV
Factor VII
KLA
ARA
PLAV
KRAV
0
0.1
0.2
0.3
0.4
0.5
SLAV
Factor VIII
SLAV
Journal of Advance Research in Applied Science ISSN: 2208-2352
Volume-3 | Issue-10 | October,2017 | Paper-3 30

Factor IX (Table 10): The maximum factor loading is of elbow left acceleration equal to 0.569. It starts with
slower movement but with the passage of time gradually increases due to generated and transfer force from
segment to segment. The elbow right angular magnitude is also boon due achieving angles, swing and
displacement to encourage ball velocity during drag flick.
Table 11: Representing Factor Loading of factor X
S.No. Kinematic Variables Code Factor Loading
1 Knee left angular velocity KLAV 0.505
Factor 10 (Table 11): The factor loading of knee left angular velocity is 0.505 that is a single prominent factor
loading in factor 10. The work of this parameter is bending and swinging knee to increases angular velocity
that is necessary for enhancement of ball velocity.
Table 12: Correlation of Factors with Ball velocity.
Correlations
Factors Ball
WLV 0.91
0
0.1
0.2
0.3
0.4
0.5
0.6
ELA ERAM WRAV
Factor IX
ELA
ERAM
WRAV
0
0.1
0.2
0.3
0.4
0.5
0.6
KLAV
Factor X
KLAV
Journal of Advance Research in Applied Science ISSN: 2208-2352
Volume-3 | Issue-10 | October,2017 | Paper-3 31

KRV 0.09
WLA -0.10
ELA -0.28
KRA -0.06
KLAM -0.15
SLAV 0.22
PLAV -0.11
KLAV 0.00
SRAV -0.14
The correlation of factors with ball velocity is represented through graphs as below;
Figure 1: The wrist left velocity is exhibiting
significant positive correlation with ball velocity
which is 0.91thereby playing a significant role in
enhancing the performance of drag flick in hockey.
Figure 2: The knee right velocity is having a
positive correlation of 0.09 with ball velocity. The
graph shows the gradual increase in the rate of
knee right velocity with ball velocity.
Figure 3: The correlation coefficient of wrist left
acceleration is -0.10 that is demonstrating
significant negative correlation with wrist left
acceleration and ball velocity.
Figure 4: The elbow left acceleration is exhibiting
a correlation coefficient of -0.28 with elbow left
acceleration and ball velocity. It is supported by
the other parameters with the help of negatively
affect for ameliorate performance while drag flick
in hockey.
0
20
40
60
80
100
120
0 200 400 600
WLV
BALL VELOCITY
WLV
Linear
(WLV)
0
10
20
30
40
50
60
0 200 400 600
KR
V
BALL VELOCITY
KRV
Linear
(KRV)
-150
-100
-50
0
50
100
0 200 400 600
WLA
BALL VELOCITY
WLA
Linear (WLA)
-100
-50
0
50
0 200 400 600
ELA
BALL VELOCITY
ELA
Linear (ELA)
Journal of Advance Research in Applied Science ISSN: 2208-2352
Volume-3 | Issue-10 | October,2017 | Paper-3 32
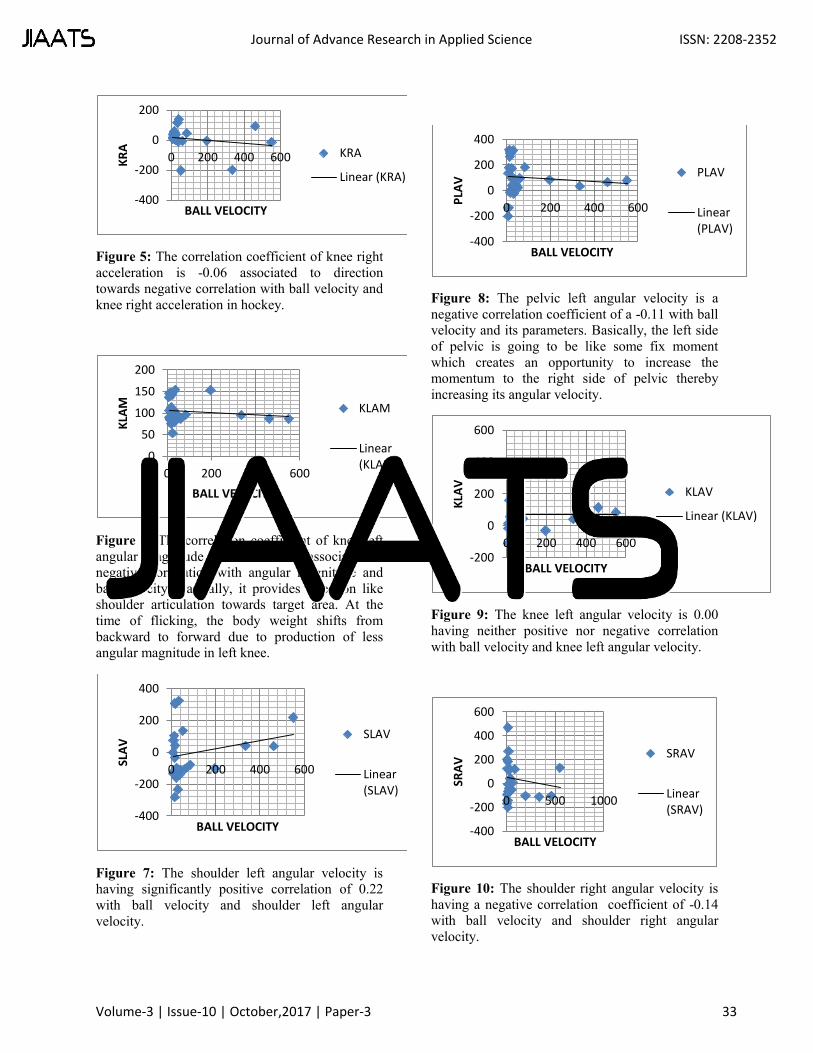
Figure 5: The correlation coefficient of knee right
acceleration is -0.06 associated to direction
towards negative correlation with ball velocity and
knee right acceleration in hockey.
Figure 6: The correlation coefficient of knee left
angular magnitude is -0.15 that is associated to
negative correlation with angular magnitude and
ball velocity. Basically, it provides direction like
shoulder articulation towards target area. At the
time of flicking, the body weight shifts from
backward to forward due to production of less
angular magnitude in left knee.
Figure 7: The shoulder left angular velocity is
having significantly positive correlation of 0.22
with ball velocity and shoulder left angular
velocity.
Figure 8: The pelvic left angular velocity is a
negative correlation coefficient of a -0.11 with ball
velocity and its parameters. Basically, the left side
of pelvic is going to be like some fix moment
which creates an opportunity to increase the
momentum to the right side of pelvic thereby
increasing its angular velocity.
Figure 9: The knee left angular velocity is 0.00
having neither positive nor negative correlation
with ball velocity and knee left angular velocity.
Figure 10: The shoulder right angular velocity is
having a negative correlation coefficient of -0.14
with ball velocity and shoulder right angular
velocity.
-400
-200
0
200
0 200 400 600
KR
A
BALL VELOCITY
KRA
Linear (KRA)
0
50
100
150
200
0 200 400 600
KLA
M
BALL VELOCITY
KLAM
Linear
(KLAM)
-400
-200
0
200
400
0 200 400 600
SLA
V
BALL VELOCITY
SLAV
Linear
(SLAV)
-400
-200
0
200
400
0 200 400 600
PLA
V
BALL VELOCITY
PLAV
Linear
(PLAV)
-200
0
200
400
600
0 200 400 600
KLA
V
BALL VELOCITY
KLAV
Linear (KLAV)
-400
-200
0
200
400
600
0 500 1000
SR
AV
BALL VELOCITY
SRAV
Linear
(SRAV)
Journal of Advance Research in Applied Science ISSN: 2208-2352
Volume-3 | Issue-10 | October,2017 | Paper-3 33

Conclusion: In this study of kinematic analysis of body during drag flick, various kinematic factors were determined which
were effecting the skill and were significantly related with ball velocity. These include, left wrist velocity and
acceleration , left elbow acceleration, both right and left shoulder angular velocity, left pelvic angular velocity,
right knee velocity and acceleration, and left knee angular magnitude and angular velocity. Hence, we can
conclude that the above determinants should be given due consideration in order to enhance the efficiency of
drag flick.
References Ansari, N.W., Bari, M.A., Hussain, I. & Ahmad, F. (2014). Three Dimensional Biomechanical Analysis of the
Drag in Penalty Corner Drag Flick Performance. Journal of Education and Practice. Vol. 5(20), 91-
96.
Ansari, N.W., Bari, M.A., Hussain, I. & Ahmad, F. (2014). Three dimensional kinematic analysis of the drag
flick for accuracy. International Journal of Applied Sciences and Engineering Research, Vol. 3(2),
431-435.
Bari, M. A., Ansari, N.W., Hussain, I., Ahmad, F. & Khan, M. A. (2014). Three Dimensional Analysis of
Variation between Successful and Unsuccessful Drag flick Techniques in Field Hockey.
International Journal of Research Studies in Science, Engineering and Technology. Vol. 1(2), 74-78.
Bari, M.A., Ansari, N.W., Ahmad, F. & Hussain, I. (2014). Three Dimensional Analysis Of Drag-Flick In The
Field Hockey Of University Players. Advances in Physics Theories and Applications, Vol. 29, 87-
93.
Bartlett, R. (2007). Introduction to sports biomechanics. London: Rutledge.
Glencross, D. (1985). 100 Hockey Tips. Rigby Australia.
Ikram, H., Saleem A., Sartaj K. (2012). Biomechanical study on drag flick in field hockey. International
journal of behavioral social and movement sciences,1(3).
Laird. P., Sutherland, P. (2003). Penalty corners in field hockey: A guide to success. Int J Perform Anal Sport.
2003;3(1):19–26.
López de Subijana, C., Juarez, D., Mallo, J., Navarro, E. (2010). Biomechanical analysis of the penalty corner
Drag flick of elite male and female hockey players. Sports Biomechanics 9(2), 7278
McLaughlin, P. (1997). Three-dimensional biomechanical analysis of the hockey drag flick full report.
Belconnen, A.C.T., Australia: Australian Sports Commission.
Piñeiro R., Sampedro J., Refoyo I. (2007). Differences between international men’s andwomen’s teams in the strategic action of the penalty corner in field hockey. International Journal of Performance
Analysis in Sport 7(3), 6783
Piñeiro, R. (2008). Observación y análisis de la acción de gol en hockey hierba. [The goal play in field
hockey: observation and analysis]Sevilla: Wanceulen; (In Spanish)
Yusoff, S., Hasan, N., Wilson , B. (2008). Three dimensional biomechanical analysis of the hockey drag flick.
Journal of Advance Research in Applied Science ISSN: 2208-2352
Volume-3 | Issue-10 | October,2017 | Paper-3 34
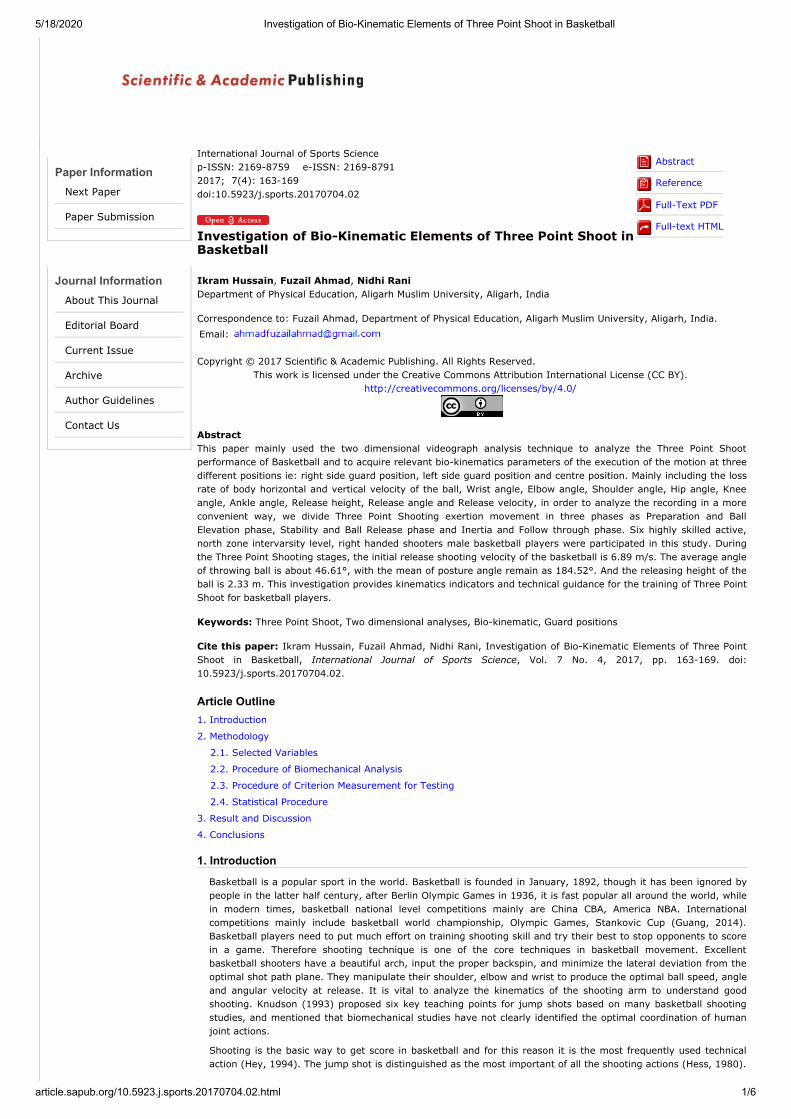
5/18/2020 Investigation of Bio-Kinematic Elements of Three Point Shoot in Basketball
article.sapub.org/10.5923.j.sports.20170704.02.html 1/6
Paper InformationNext Paper
Paper Submission
Journal InformationAbout This Journal
Editorial Board
Current Issue
Archive
Author Guidelines
Contact Us
International Journal of Sports Sciencep-ISSN: 2169-8759 e-ISSN: 2169-87912017; 7(4): 163-169doi:10.5923/j.sports.20170704.02
Investigation of Bio-Kinematic Elements of Three Point Shoot inBasketball
Abstract
Reference
Full-Text PDF
Full-text HTML
Ikram Hussain, Fuzail Ahmad, Nidhi RaniDepartment of Physical Education, Aligarh Muslim University, Aligarh, India
Correspondence to: Fuzail Ahmad, Department of Physical Education, Aligarh Muslim University, Aligarh, India.
Email:
Copyright © 2017 Scientific & Academic Publishing. All Rights Reserved.This work is licensed under the Creative Commons Attribution International License (CC BY).
http://creativecommons.org/licenses/by/4.0/
AbstractThis paper mainly used the two dimensional videograph analysis technique to analyze the Three Point Shootperformance of Basketball and to acquire relevant bio-kinematics parameters of the execution of the motion at threedifferent positions ie: right side guard position, left side guard position and centre position. Mainly including the lossrate of body horizontal and vertical velocity of the ball, Wrist angle, Elbow angle, Shoulder angle, Hip angle, Kneeangle, Ankle angle, Release height, Release angle and Release velocity, in order to analyze the recording in a moreconvenient way, we divide Three Point Shooting exertion movement in three phases as Preparation and BallElevation phase, Stability and Ball Release phase and Inertia and Follow through phase. Six highly skilled active,north zone intervarsity level, right handed shooters male basketball players were participated in this study. Duringthe Three Point Shooting stages, the initial release shooting velocity of the basketball is 6.89 m/s. The average angleof throwing ball is about 46.61°, with the mean of posture angle remain as 184.52°. And the releasing height of theball is 2.33 m. This investigation provides kinematics indicators and technical guidance for the training of Three PointShoot for basketball players.
Keywords: Three Point Shoot, Two dimensional analyses, Bio-kinematic, Guard positions
Cite this paper: Ikram Hussain, Fuzail Ahmad, Nidhi Rani, Investigation of Bio-Kinematic Elements of Three PointShoot in Basketball, International Journal of Sports Science, Vol. 7 No. 4, 2017, pp. 163-169. doi:10.5923/j.sports.20170704.02.
Article Outline1. Introduction
2. Methodology
2.1. Selected Variables
2.2. Procedure of Biomechanical Analysis
2.3. Procedure of Criterion Measurement for Testing
2.4. Statistical Procedure
3. Result and Discussion
4. Conclusions
1. Introduction
Basketball is a popular sport in the world. Basketball is founded in January, 1892, though it has been ignored bypeople in the latter half century, after Berlin Olympic Games in 1936, it is fast popular all around the world, whilein modern times, basketball national level competitions mainly are China CBA, America NBA. Internationalcompetitions mainly include basketball world championship, Olympic Games, Stankovic Cup (Guang, 2014).Basketball players need to put much effort on training shooting skill and try their best to stop opponents to scorein a game. Therefore shooting technique is one of the core techniques in basketball movement. Excellentbasketball shooters have a beautiful arch, input the proper backspin, and minimize the lateral deviation from theoptimal shot path plane. They manipulate their shoulder, elbow and wrist to produce the optimal ball speed, angleand angular velocity at release. It is vital to analyze the kinematics of the shooting arm to understand goodshooting. Knudson (1993) proposed six key teaching points for jump shots based on many basketball shootingstudies, and mentioned that biomechanical studies have not clearly identified the optimal coordination of humanjoint actions.
Shooting is the basic way to get score in basketball and for this reason it is the most frequently used technicalaction (Hey, 1994). The jump shot is distinguished as the most important of all the shooting actions (Hess, 1980).

5/18/2020 Investigation of Bio-Kinematic Elements of Three Point Shoot in Basketball
article.sapub.org/10.5923.j.sports.20170704.02.html 2/6
Miller (1996) has discussed the relationship between basketball shooting kinematics, distance and playingposition. Chin (2002) also analyzed the basketball shooting of different distances and movements. Some previousstudies (Elliott, 1992; Miller & Bartlett, 1993; Okazaki & Rodacki, 2012) measured shooters’ shoulder, elbow andwrist joint motions at release for shooting, and reported the effect of increased shooting distance. In this paper,we weigh against successful and unsuccessful kinematics of Three Point Shooting at different positions and findout key actions of the selected kinematics to produce the optimal release speed, angle and backspin in executingthe Three Point Shooting motion at left & right guard position and center position.
2. Methodology
Six highly skilled active, right handed shooters male and female basketball players were participated in this study.All players were playing in north zone intervarsity level. All of the participants were practicing according to theirteam’s regular training schedule. All the subjects were playing from all the post guards, forwards, and centers.The participants were free of any kind of musculoskeletal injuries at the time of data collection. The placement ofthe cameras and the calibration frame was adjusted accordingly to the experimental setup and motion of theexecution of the Three Point Shoot.
Figure 1. Illustration of the motion of Three Point Shoot
2.1. Selected Variables
In three point basketball shooting different parameters play a great role for making a shot ‘successful’ and‘unsuccessful’ shooting in the performance such as psychology, physiology and anthropometry of the player andetc. But here researcher selected only the biomechanical parameters, and worked on it and try to find out theeffect of selected biomechanical parameters on the successful and unsuccessful three Point Shoot of basketball.The selected biomechanical variables in the study were as:
2.2. Procedure of Biomechanical Analysis
The researcher selected the standard basketball court for data collection. The experimental set-up was arrangedon the half side of the court for the research data in the department of Physical Education, Aligarh MuslimUniversity, Aligarh. The 3D point shooting area was selected for the study. The three positions of data collectionwas (1) shooting right side guard position, (2) left side guard position, and (3) centre position. The motion of theshooting was recorded on the right side of the 3 D point shooting area. Two Canon HF S-10 cameras wereadopted for the process of Videography. The camera placed on the right side of the motion to capture on thesagittal plane was coined as Cam_1 and Cam_2 respectively. The first camera was placed perpendicular to thebody position of the subject to capture the movement of the subjects for close-up recording and the second wasplaced behind of the first camera and perpendicular to the height of release of the ball position capturing thewhole motion of the ball from the hand of the subject after release to the basket or ring. Three experimentalsetups was arranged and layout to capture the movement of the Three Point Shoot as Setup A, Setup B and SetupC for the recording of the Three Point Shoot executed on right side guard position, Center position and left sideguard position respectively [Figure: 2, 3, 4, 5]. All six subjects of the study were educated for the data collection.The markers were placed on the subject’s right wrist joint point, elbow joint point, shoulder joint point, hip jointpoint, knee joint point, ankle joint point, toe and heel respectively. The instruction about data collection andwarm-up time was provided to the subjects. The video cameras were set on 1/2000 of shutter speed and wereput on recording mode for the video recording. After warm-up every subjects performed Three Point Shooting tentimes on all the setups (ie: Setup A, Setup B & Setup C). Three best trails were selected after playing varioustimes on the video playback system and the best-suited trails have opted. The shortlisted trails were slashed andedited. The edited videos were analyzed with the help of Silicon Coach Pro 8.1 Motion analysis to obtain the datafor further analysis.
In this study Wrist angle, Elbow angle, Shoulder angle, Hip angle, Knee angle, Ankle angle, Release height,Release angle and Release velocity were measured to draw and built the conclusion. The wrist angle measuredbetween palm and forearm. The Elbow angle measured between forearm and upper arm. The shoulder anglemeasured between torso and upper arm. The hip angle was measured between torso and upper leg. The kneeangle was measured between upper leg and lower leg. The ankle angle was measured between lower leg and foot.The release height was measured by the vertical distance from the floor to the center of the ball. The releaseangle of the ball was measured when the ball release from the players hand in execution phase. The releasevelocity measured by the speed of the ball at the time of execution. The trajectory was observed from ball releaseto the drop of the in the basket or ring.
Figure 2. Point of Location of Data Collection as Right and Left Guard Position and Center

5/18/2020 Investigation of Bio-Kinematic Elements of Three Point Shoot in Basketball
article.sapub.org/10.5923.j.sports.20170704.02.html 3/6
Position
Figure 3. Experiment Set-up A at Right Guard Position. Camera 1 placed 9.50 meter awayfrom the plane of execution, at 1.28 meter high and Camera 2 placed at 15.40 meter, at1.56 meter high
Figure 4. Experiment Set-up B at Right Guard Position. Camera 1 placed 10.40 meteraway from the plane of execution, at 1.28 meter high and Camera 2 placed at 13.27 meteraway, at 1.80 meter high
Figure 5. Experiment Set-up C at Right Guard Position. Camera 1 placed 7.52 meter awayfrom the plane of execution, at 1.30 meter high and Camera 2 placed at 12.11 meter, at1.45 meter high
2.3. Procedure of Criterion Measurement for Testing
Figure 6. Illustration of the measurement of Release height and angle of release
2.4. Statistical Procedure
The acquired data was given an appropriate statistical treatment to draw a conclusion in this investigation. In thisstudy, descriptive statistics were applied to the successful and unsuccessful shot; mean and standard deviation ofall variables were computed in the first phase of data analysis. In the second phase paired t-test was applied toknow the difference in the selected biomechanical variables between the successful and unsuccessful Three PointShoot. All statistical functions were performed with the SPSS (v.17) software. In all statistical analyses, thesignificance threshold was set at p< 0.05. The degree of freedom was 50.
Figure 7. Measurement of Release angle, entry angle, and release height of ball at thetime of execution through Silicon Coach
3. Result and Discussion
Table 1. Descriptive statistics of the Democratic profile of the subjects
The purpose of the present study was to determine the kinematic influence for the selected fundamental skill ie:Three Point Shooting. This skill is divided into three phases such as Phase I Preparation and Ball Angle, Phase IIStability and Ball Release, Phase III Inertia and Follow Through. In phase I, the parameters wrist angle, elbowangle, shoulder angle, hip angle, knee angle, ankle angle, were selected for the analysis; Table 2 reveal the resultthat no significant differences are found in the body joints angles during the phase I, but there were calculationdifferences (random) between the successful and unsuccessful shooting (Diar, 2014). During the study it wasobserved that the wrist angle displayed for successful Three Point Shoot as Mean ± SD = 139.26 ± 15.65 and forunsuccessful Three Point Shoot Mean ± SD = 139.42 ± 18.71, The elbow angle for successful Three Point Shootas Mean ± SD = 69.38 ± 14.03 and for unsuccessful shot Mean ± SD = 65.00 ± 12.16. Shoulder angle forsuccessful & unsuccessful as 78.42 ± 23.93 & 73.65 ± 19.38 respectively. The subjects displayed hip angle forsuccessful as 162.61 ± 6.03 and 163.03 ± 7.55 for unsuccessful. The knee angle and ankle angle for successfulshot were 112.11 ± 6.03 & 84.42 ± 7.75, whereas for unsuccessful as 111.61 ± 6.22 & 83.07 ± 6.18respectively. No significant changes were showed on Knee angle and ankle at the initial stage (extension) of theexecution (Diar, 20214; Nassaif & Mazer, 1979). The p>0.05 for the all the body angles examined during phase I.Least mean difference among the selected kinematics variables were observed between the successful andunsuccessful during Three Point Shoot.
Table 3, shows significant difference in shoulder angle in making the score during Stability and Ball Releasephase. The selected parameters for the phase II were wrist angle, elbow angle, shoulder angle, hip angle, kneeangle, ankle angle, release height, release angle and release velocity. The wrist angle for successful &unsuccessful are 142.88 ± 1.39 & 145.57 ± 14.98 and elbow angle shows 155.11 ± 17.92 & = 150.84 ± 15.28(as Mean ± SD). But both wrist and elbow angle displays a no significant result. Similarly, Diehl, Tant, Emmoms,Osbon shows 175.20 as wrist and 157.8 as elbow angle in his study which was also not significant.

5/18/2020 Investigation of Bio-Kinematic Elements of Three Point Shoot in Basketball
article.sapub.org/10.5923.j.sports.20170704.02.html 4/6
Table 2. Comparison of Kinematic variables in Preparation and Ball Angle phase during Three Point Shoot among Boys
Graph 1. Graphical representation of Means of the selected kinematic variables ofSuccessful and Unsuccessful Three Point Shoot of Boys Basketball Players duringPreparation and Ball Angle phase
Table 3. Phase II Stability and Ball Release among Boys
The mean and sd for shoulder angle for successful Three Point Shoot is 119.50 ± 9.83 and for unsuccessful it is114.50 ± 8.39. Diar, 2014 and Rojas, 2000 also supports that a significant result in angle of shooting armshoulder joint at the end of the preparatory phase was showed due to the player is used to lap the ball near hischest with full flexion of the elbow joint. Shoulder angle towards the end of the pushing in flight in favor of shot inmaking it successful. Hip angle, the boys display the hip angle for successful as 184.07 ± 3.85 and for
unsuccessful as 184.96 ± 4.57. The 5th variable knee angle, the boys display the knee angle for successful ThreePoint Shoot as Mean ± SD = 168.88 ± 7.96 and for unsuccessful Three Point Shoot Mean ± SD = 171.26 ± 8.31.No significant change was observed in the angular contrast for the knee joint at the ball release stage (Rojas,2000). And the ankle angle successful Three Point Shoot was 131.96 ± 9.32 and for unsuccessful 134.88 ± 5.79.
Chung et al. (2004) suggest that the ball release from finger was a key factor; the kinematics chain was from theshank, thigh, trunk, upper arm and forearm segments which also influences release height. Comparable outcomehas being promoted by this examination, release height was 233.43 ± 12.89 (cm) for successful, whereas forunsuccessful the Mean ± SD was 232.25 ± 15.21(cm). The ball variables as release angle and release velocity forsuccessful and unsuccessful Three Point Shoot are also shown as not significant in this study, with very leastmean difference as 0.70 & 0.27.
Inertia and Follow Through is the third and last phase of the Three Point Shoot. Table 4, shows wrist angle as theonly significant value among all the selected variables. Wrist flexion in the meantime and the forefinger compelset out toward the end is accord with human body development mechanics principle, index finger, and metacarpal
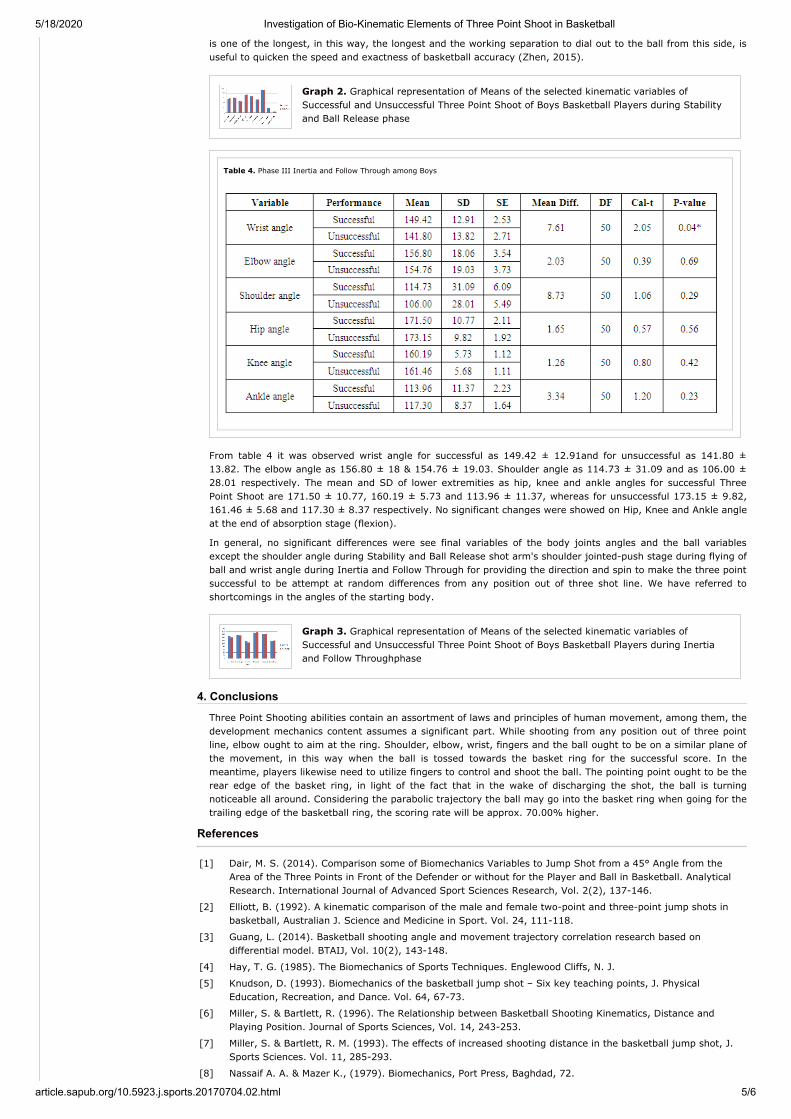
5/18/2020 Investigation of Bio-Kinematic Elements of Three Point Shoot in Basketball
article.sapub.org/10.5923.j.sports.20170704.02.html 5/6
is one of the longest, in this way, the longest and the working separation to dial out to the ball from this side, isuseful to quicken the speed and exactness of basketball accuracy (Zhen, 2015).
Graph 2. Graphical representation of Means of the selected kinematic variables ofSuccessful and Unsuccessful Three Point Shoot of Boys Basketball Players during Stabilityand Ball Release phase
Table 4. Phase III Inertia and Follow Through among Boys
From table 4 it was observed wrist angle for successful as 149.42 ± 12.91and for unsuccessful as 141.80 ±13.82. The elbow angle as 156.80 ± 18 & 154.76 ± 19.03. Shoulder angle as 114.73 ± 31.09 and as 106.00 ±28.01 respectively. The mean and SD of lower extremities as hip, knee and ankle angles for successful ThreePoint Shoot are 171.50 ± 10.77, 160.19 ± 5.73 and 113.96 ± 11.37, whereas for unsuccessful 173.15 ± 9.82,161.46 ± 5.68 and 117.30 ± 8.37 respectively. No significant changes were showed on Hip, Knee and Ankle angleat the end of absorption stage (flexion).
In general, no significant differences were see final variables of the body joints angles and the ball variablesexcept the shoulder angle during Stability and Ball Release shot arm's shoulder jointed-push stage during flying ofball and wrist angle during Inertia and Follow Through for providing the direction and spin to make the three pointsuccessful to be attempt at random differences from any position out of three shot line. We have referred toshortcomings in the angles of the starting body.
Graph 3. Graphical representation of Means of the selected kinematic variables ofSuccessful and Unsuccessful Three Point Shoot of Boys Basketball Players during Inertiaand Follow Throughphase
4. Conclusions
Three Point Shooting abilities contain an assortment of laws and principles of human movement, among them, thedevelopment mechanics content assumes a significant part. While shooting from any position out of three pointline, elbow ought to aim at the ring. Shoulder, elbow, wrist, fingers and the ball ought to be on a similar plane ofthe movement, in this way when the ball is tossed towards the basket ring for the successful score. In themeantime, players likewise need to utilize fingers to control and shoot the ball. The pointing point ought to be therear edge of the basket ring, in light of the fact that in the wake of discharging the shot, the ball is turningnoticeable all around. Considering the parabolic trajectory the ball may go into the basket ring when going for thetrailing edge of the basketball ring, the scoring rate will be approx. 70.00% higher.
References
[1] Dair, M. S. (2014). Comparison some of Biomechanics Variables to Jump Shot from a 45° Angle from theArea of the Three Points in Front of the Defender or without for the Player and Ball in Basketball. AnalyticalResearch. International Journal of Advanced Sport Sciences Research, Vol. 2(2), 137-146.
[2] Elliott, B. (1992). A kinematic comparison of the male and female two-point and three-point jump shots inbasketball, Australian J. Science and Medicine in Sport. Vol. 24, 111-118.
[3] Guang, L. (2014). Basketball shooting angle and movement trajectory correlation research based ondifferential model. BTAIJ, Vol. 10(2), 143-148.
[4] Hay, T. G. (1985). The Biomechanics of Sports Techniques. Englewood Cliffs, N. J.
[5] Knudson, D. (1993). Biomechanics of the basketball jump shot – Six key teaching points, J. PhysicalEducation, Recreation, and Dance. Vol. 64, 67-73.
[6] Miller, S. & Bartlett, R. (1996). The Relationship between Basketball Shooting Kinematics, Distance andPlaying Position. Journal of Sports Sciences, Vol. 14, 243-253.
[7] Miller, S. & Bartlett, R. M. (1993). The effects of increased shooting distance in the basketball jump shot, J.Sports Sciences. Vol. 11, 285-293.
[8] Nassaif A. A. & Mazer K., (1979). Biomechanics, Port Press, Baghdad, 72.

5/18/2020 Investigation of Bio-Kinematic Elements of Three Point Shoot in Basketball
article.sapub.org/10.5923.j.sports.20170704.02.html 6/6
[9] Okazaki, V.H.A. & Rodacki, A.L.F. (2012). Increased distance of shooting on basketball jump shot, J. SportsScience and Medicine, Vol. 11, 231- 237.
[10] Zhen, L., Wang, L & Hao Z. (2015). A Biomechanical Analysis of Basketball Shooting. International Journal ofSimulation Systems, Science & Technology. Vol. 16(1). 1.1-1.5.
Home | About Us | Terms and Conditions | Privacy Policy | Feedback | Sitemap | Contact Us
Copyright © 2017 Scientific & Academic Publishing Co. All rights reserved.

COMPARATIVE EFFECT OF YOGIC
PRACTICES AND RECREATIONAL
EXERCISES ON EMOTIONAL AND
BEHAVIOUR PROBLEMS AMONG
JUVENILE DELINQUENTS
1 2Dr. Rajendra Singh and Gagan Kumar1Associate Professor, Department of Physical
Education A.M.U. Aligarh .2Research Scholar, Department of Physical
Education A.M.U. Aligarh .
Available online at www.lbp.world
ABSTRACT :
his study aims to investigate the comparative
effects of yogic practices and recreational Texercises on emotional and behaviour problems
among juvenile delinquents. Fifty (50) juvenile boys,
age ranging 14-17 years were selected as subjects
from Government Juvenile Home (Boys), Mathura
(UP). They were divided randomly into two groups of
25 each. Group ‘A’ acted as yogic practices group and
Group ‘B’ acted as recreational exercises group.
Emotional and Behaviour problems of subjects were
rated by their supervisors on ‘Emotional and Behavior
Problem scale (EBPS) developed by McCarney &
Arthaud in pre and post intervention sessions. As
intervention, subjects were administered with selected
yogic practices and recreational exercises for a period
of 12 weeks. Paired samples t-test was used to see the
significance of difference between pre and post scores.
Results indicate a significant change in scores of EBPS
from pre to post rating sessions. This study concludes
that both the interventions are helpful to reduce the
Academic Sports ScholarsISSN: 2277-3665
Impact Factor : 5.3149(UIF) Volume - 6 | Issue - 10 | OCTOBER - 2017
1
symptoms of emotional and behavior problems,
however yogic practices have greater effect in
reducing the symptoms in comparison to recreational
exercises.
Yogic practices, Recreational exercises,
Juvenile delinquents.
Juvenile delinquents are the kids conspiring to
hurt their teachers, teenagers shooting people and
committing rapes, young thugs running gangs and
terrorizing neighbourhood, and showing no regret
when they get caught (Welch, Fenwick & Robert,
1997). Due to media sensationalism, the public
continues to have belief that the crime of violent
juveniles is rising and getting out of control (Shepherd,
1999). Generally this moral panic is the part of an
alarmist reaction to crime (Welch et al., 1997). There is
still no “magic bullet” to cure juvenile delinquency, but
at some certain levels, juvenile delinquents need
specialized training program to develop positive
behaviour. Such training programmes have been the
products of extensive researches in concerning fields
which initially are administered over some specified
subjects to check its reliability under controlled
conditions. Yogic practices i.e. asanas, pranayams,
kriya and recreational exercises are some such
programmes.
The ancient science of yoga discovered by our
Sages and Saints thousands of years back has become
in modern age a way of life, a cure for a number of
physical and mental diseases. It is an efficient remedy
for stress and tension. As the problem of deviant
behaviour of children has become a matter of great
concern in all over the world, the art and science of
yoga has a lot to offer for not only juvenile delinquents
but to all the children in terms of their health as well as
complete well-being. Yoga helps to correct the deviant
behaviour in juvenile delinquents and cultivates
conscious awareness and increase self-awareness. It is
believed that yoga has a great role to play in
transformation of juvenile’s life. Yoga is known as one
of the surest remedies for physical and psychological
ailments. Yoga makes the organs of the body active in
KEYWORDS :
INTRODUCTION
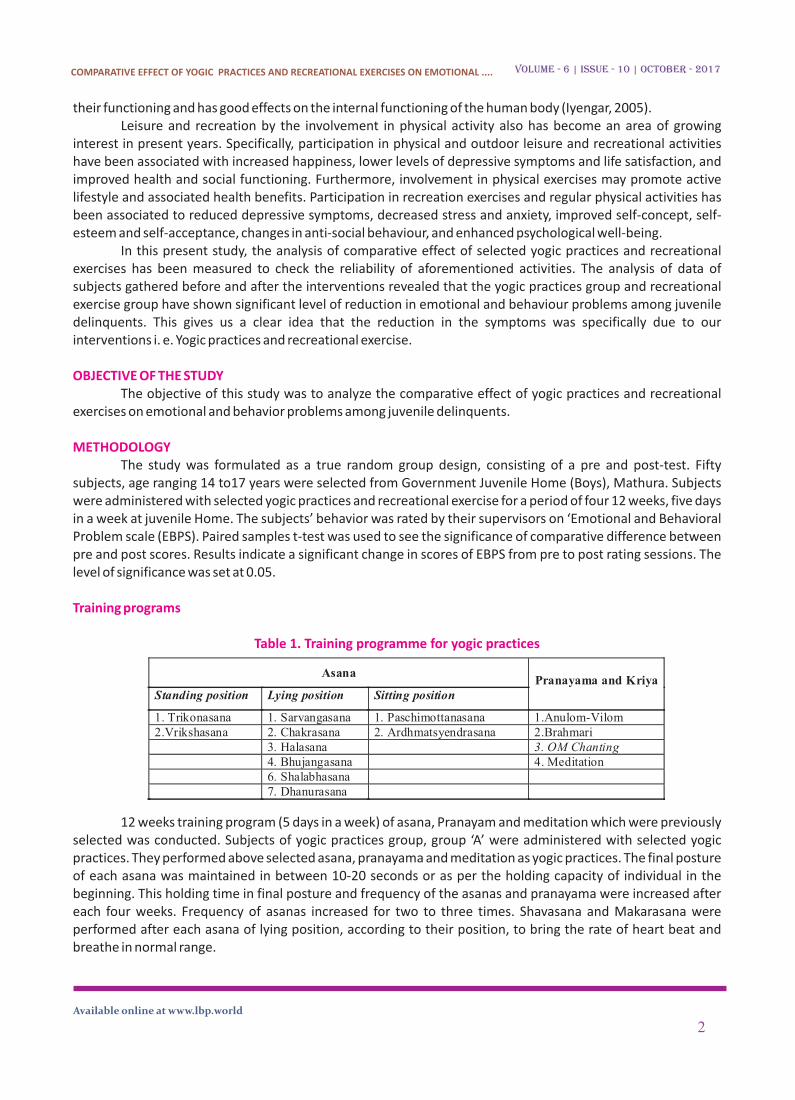
COMPARATIVE EFFECT OF YOGIC PRACTICES AND RECREATIONAL EXERCISES ON EMOTIONAL ....
their functioning and has good effects on the internal functioning of the human body (Iyengar, 2005).
Leisure and recreation by the involvement in physical activity also has become an area of growing
interest in present years. Specifically, participation in physical and outdoor leisure and recreational activities
have been associated with increased happiness, lower levels of depressive symptoms and life satisfaction, and
improved health and social functioning. Furthermore, involvement in physical exercises may promote active
lifestyle and associated health benefits. Participation in recreation exercises and regular physical activities has
been associated to reduced depressive symptoms, decreased stress and anxiety, improved self-concept, self-
esteem and self-acceptance, changes in anti-social behaviour, and enhanced psychological well-being.
In this present study, the analysis of comparative effect of selected yogic practices and recreational
exercises has been measured to check the reliability of aforementioned activities. The analysis of data of
subjects gathered before and after the interventions revealed that the yogic practices group and recreational
exercise group have shown significant level of reduction in emotional and behaviour problems among juvenile
delinquents. This gives us a clear idea that the reduction in the symptoms was specifically due to our
interventions i. e. Yogic practices and recreational exercise.
The objective of this study was to analyze the comparative effect of yogic practices and recreational
exercises on emotional and behavior problems among juvenile delinquents.
The study was formulated as a true random group design, consisting of a pre and post-test. Fifty
subjects, age ranging 14 to17 years were selected from Government Juvenile Home (Boys), Mathura. Subjects
were administered with selected yogic practices and recreational exercise for a period of four 12 weeks, five days
in a week at juvenile Home. The subjects’ behavior was rated by their supervisors on ‘Emotional and Behavioral
Problem scale (EBPS). Paired samples t-test was used to see the significance of comparative difference between
pre and post scores. Results indicate a significant change in scores of EBPS from pre to post rating sessions. The
level of significance was set at 0.05.
12 weeks training program (5 days in a week) of asana, Pranayam and meditation which were previously
selected was conducted. Subjects of yogic practices group, group ‘A’ were administered with selected yogic
practices. They performed above selected asana, pranayama and meditation as yogic practices. The final posture
of each asana was maintained in between 10-20 seconds or as per the holding capacity of individual in the
beginning. This holding time in final posture and frequency of the asanas and pranayama were increased after
each four weeks. Frequency of asanas increased for two to three times. Shavasana and Makarasana were
performed after each asana of lying position, according to their position, to bring the rate of heart beat and
breathe in normal range.
OBJECTIVE OF THE STUDY
METHODOLOGY
Training programs
Table 1. Training programme for yogic practices
Available online at www.lbp.world
2
Volume - 6 | Issue - 10 | OCTOBER - 2017
Asana
Pranayama and Kriya
Standing position Lying position Sitting position
1. Trikonasana 1. Sarvangasana 1. Paschimottanasana 1.Anulom-Vilom
2.Vrikshasana 2. Chakrasana 2. Ardhmatsyendrasana 2.Brahmari
3. Halasana 3. OM Chanting
4. Bhujangasana 4. Meditation
6. Shalabhasana
7. Dhanurasana

Table 2. Training program of recreational exercises
Statistical Analysis
Table 3. Comparison of means between pre and post test of both the groups.
Fig.1: Graphical representation of Mean of emotional and behavior problems of both the groups.
DISCUSSION
Subjects of recreational exercises group, group ‘B’ were administered with selected recreational
exercises. They performed above selected six recreational games as recreational exercises. Two games were
played every day and each game was played for 15 minutes in the beginning. There was 5 minute rest between
the games. Duration of games was increased after each four weeks for specific time as per the schedule.
Paired samples t-test was used to see the significance of difference between pre and post scores. It is
evident from the table – 3 that there is significant differences exist between the Pre-test and Post test scores in
emotional and behavior problems. Since the calculated ‘t’ values of yogic practices are 10.23 and 9.00
respectively, which is greater than the tabulated value 2.06, significance at 0.05 level.
Therefore there is significant difference exist in the symptoms of emotional and behavior problems
between Pre Test and Post Test.
One of the important aims of yoga is to attain tranquillity of the mind and create a sense of well-being,
feelings of relaxation, improved self-confidence, improved efficiency, increased attentiveness, lowered
irritability, and an optimistic outlook on life (Arora S. and et.al 2008). As the present study emphasises, the Yogic
practices are objectively effective in improvement in the symptoms of emotional and behaviour problems. The
findings of this study seem to be in consonance with the studies of Innes et al (2005) and Brotto et al (2009) who
assert that yogic practices result in increased feelings of satisfaction, self-confidence, well-being and self-
control. This study is also supported by the study of Serwacki and Cook-Cottone (2012), who reviewed 12
Available online at www.lbp.world
3
Volume - 6 | Issue - 10 | OCTOBER - 2017
Day Recreational Games 1 to 4 weeks 5 to 8 weeks 9 to 12 weeks
Monday &
Thursday
Musical chair &
Blind man’s buff
30 minute 40 minute 50 minute
Tuesday & Friday
Dodge ball & Burning balls
30 minute 40 minute 50 minute
Wednesday Stole the meet &
Lemon race
30 minute 40 minute 50 minute
Group Mean Mean difference SD T Sig. (p)
Pre Post Pre Post
Yogic Practices 53.52 45.28 8.24 12.41 9.81 10.23 <.001
Recreational Exercises 50.88 45.28 5.60 9.93 8.40 9.00 <.001
COMPARATIVE EFFECT OF YOGIC PRACTICES AND RECREATIONAL EXERCISES ON EMOTIONAL ....
preliminary studies of yoga in schools and concluded that the yoga interventions exerted positive effects on
emotional balance, attentional control, cognitive efficiency, anxiety, negative thought patterns, emotional and
physical arousal, reactivity, and negative behavior.
In an effort to draw out the influence of a possible confounder to Yoga, this study has included another
experimental group that is recreational exercises. To testify research considered an extra experimental group
and to have a comparative view that how far Yoga is different from recreational exercise to achieve the stated
outcomes. The findings of this study clearly indicate that recreational exercises are capable enough to reduce the
negative behaviour amongst the juvenile delinquents. This is however worth mentioning that in terms of
comparative efficacy, Yoga is far superior to recreational exercises to reduce the symptoms of negative
behaviours. For the evidence of support, Ross et al (2010) found that Yoga and exercise both seem to help the
healthy and diseased populations but yoga may be as effective as or better than exercise at improving a variety of
health-related outcome measures. Likewise, Ramajayam et al (2016), on the basis of their review write that
evidence suggests that yoga interventions appear to be equal and/or superior to exercise in most outcome
measures. Emphasis on breath regulation, mindfulness during practice, and importance given to maintenance of
postures are some of the elements which differentiate yoga practices from physical exercises.
The data obtained suggest that yogic practices and recreational exercises help in reducing inappropriate
behavior and depression among juvenile delinquents and increase the feelings of satisfaction, self-confidence,
well-being and self-control. Yogic practices with asanas, pranayam and meditation work directly on the brain and
the endocrine system, therefore on the mind and emotional levels of the child, helping to re-establish harmony.
On the basis of statistical analysis of data it was concluded that 12weeks of yogic practices and recreational
exercises caused significant reduction in emotional and behavior problems among juvenile delinquents while
yogic practices are more effective in reducing the symptoms of emotional and behaviour problems.
Welch, M., Fenwick, M., & Roberts, M. (1997). Primary definition of crime and moral panic: A content analysis of
experts’ quotes in feature newspaper articles on crime. Journal of Research in crime and delinquency,
34, 474.
Shepherd, R.E. (1999). Film at eleven: The news media and juvenile crime. Quinnipiac law review, 18, 687-700.
Iyengar, K.S. (2005). Light on Yoga: The Bible of Modern Yoga (Revised Edition).
Sharma, P.D. (2004).Yoga, Yogasana, and Pranayama for health.www.pubmed.com
Arora S, Bhattacharjee J. Modulation of immune response in stress by yoga. International J Journal of Yoga.
2008;1:45–55.[PMC free article] [PubMed].
Innes KE, Bourguignon C, Taylor AG (2005) Risk indices associated with the insulin resistance syndrome,
cardiovascular disease, and possible protection with yoga: A systematic review. J Am Board Fam Pract18:
491-519.
Brotto LA, Mehak L, Kit C (2009) Yoga and sexual functioning: A review. J Sex Marital Ther35: 378-390.
Serwacki ML, Cook-Cottone C. Yoga in the schools: A systematic review of the literature. International Journal of
Yoga Therapy. 2012;(22)(22):101-109.
Ross A, Thomas S (2010), The health benefits of yoga and exercise: a review of comparison studies. J Altern
Complement Med 16: 3-12.
Ramajayam G., Sneha K. and Shivrama V. (2016), Yoga and physical exercise- a review and comparison, Journal
International Review of psychiatry, Vol. 28, Issue. 3 yoga and mental health, pp. 242-253.
CONCLUSION
REFERENCES
Available online at www.lbp.world
4
Volume - 6 | Issue - 10 | OCTOBER - 2017 COMPARATIVE EFFECT OF YOGIC PRACTICES AND RECREATIONAL EXERCISES ON EMOTIONAL ....

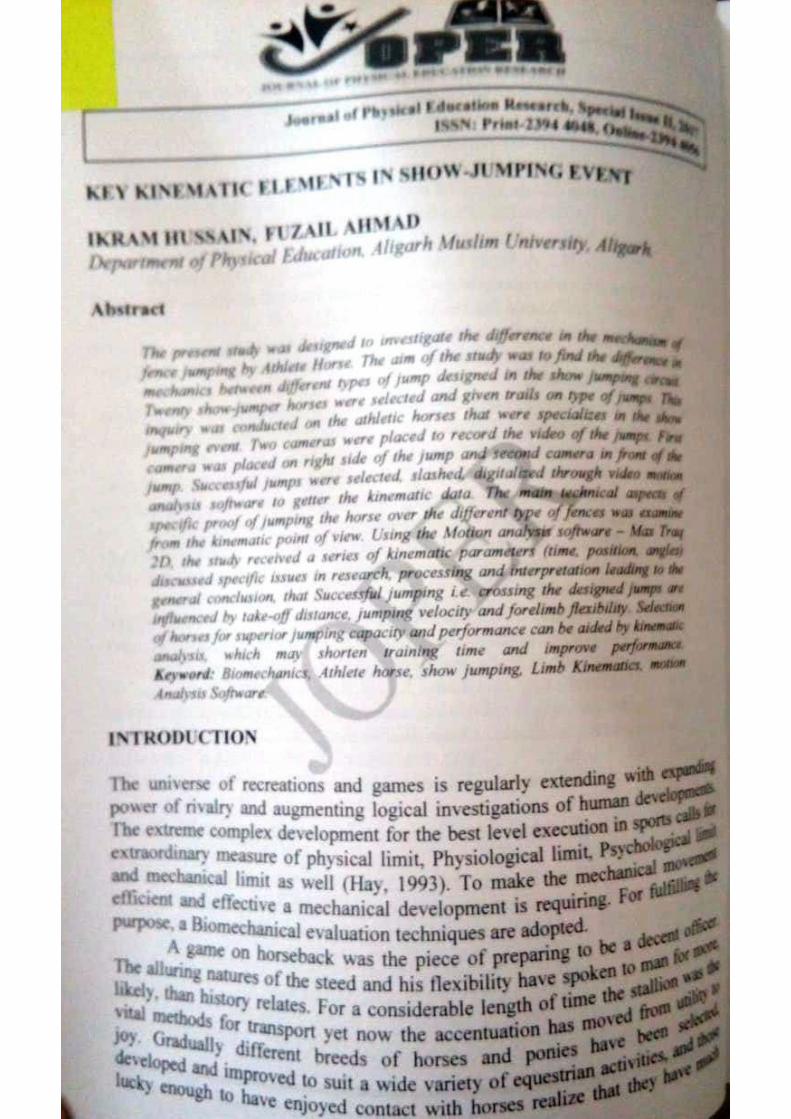
A BIOMECHANICAL INVESTIGATION OF PROMINENT KINEMATIC
FACTOR IN DRAG FLICK
Ikram Hussain1, Fuzail Ahmad1*, Mohd. Tanveer Khan1
1Department of Physical Education, Aligarh Muslim University, Aligarh, 202002, INDIA
*Corresponding Author
Abstract
Drag flick being one of the most offensive and frequently used techniques during penalty corner in field
hockey requires better understanding of its complex nature in order to make the skill efficient and accurate.
The aim of the present study was to determine the kinematic factors which were significantly related to ball
velocity during drag flick, thereby proposing the possible suggestions to improve skill efficiency. Six male
intervarsity hockey players specialist in drag flicking from Aligarh Muslim University and LNIPE, Gwalior ,
who’s ranged in age from 18-24 years, height ranged between 174-182 cm and weight ranged 59.4-66.8 kg
were recruited for the study. The kinematic data was obtained by using two Canon Legria SF-10 camcorders.
The subjects were asked to perform 15 consecutive drag flick trails from stationary ball position. Out of 15
trails best 6 successful trails were selected for each subject and were taken under consideration for analysis.
Trail was defined as successful every time the ball hit the target whose dimensions were predetermined. The
obtained videos data were analyzed using Max TRAQ 3D motion analysis software. The ball velocity was
measured from ball-stick contact to the point of release of the ball. The factor analysis and product moment
correlation statistical analysis was done using SPSSv.16. The results revealed that, left wrist velocity and
acceleration, left elbow acceleration, both right and left shoulder angular velocity, left pelvic angular velocity,
right knee velocity and acceleration, and left knee angular magnitude and angular velocity were significantly
related with ball velocity and hence it is suggested that players should concentrate on these factors during
training of the drag flick technique.
Keywords: Drag flick, kinematic factors, Max Traq 3D, technique and performance.
Introduction The drag flick was introduced in the early 1990’s by Dutch player Taco Hajo Van Den Honert, it is one of the
most offensive weapons in relation to field hockey used by skilled players all over the world, from international level right down to local leagues, as a set play during penalty corners. Besides being used during
penalty corners, it is also frequently used during field play as a strong pass to break lines. It is one of the most
successful methods for scoring goals (Laird & Sutherland, 2003; Mosquera et al., 2007). As the penalty corner
is a set piece, a range of different plays, formations and unique routines can be rehearsed during training.
Because of this it has become one of the most important facets of the modern game. The drag flick is the best
offensive technique which is approximately 1.4 to 2.7 times more efficient than hitting or pushing the ball
towards the goal during penalty corner (McLaughlin, 1997; Piñeiro et al., 2007; Yusoff et al., 2008). Drag
flick techniques has added to new dimensions in the execution of penalty corner and therefore needs better
execution technique and accuracy especially during scoring. For better understanding of the technique, one has
to study the movement patterns during the performance of drag flick. Therefore, biomechanical analysis is
becoming increasingly important in this regard to understand its complex nature.
Many sports biomechanists have analyzed about drag flick and found stance width and drag distance to be the
variables most highly correlated with the principal criterion ball velocity. McLaughlin (1997) and Gómez et al.
(2012) focused upon identifying the differences in kinematic variables of drag flicking depending upon the
shot location and found a significantly greater negative angular velocity of the stick when flicking to the right
than to left. López de Subijana et al., (2010); López de Subijana Hernández et al., (2011); has described the
importance of creating sequential maximal velocities – from proximal to distal – of the hips, shoulders, hands
and then to stick, was emphasized. The significance of performing these maximal velocities in this order has
also been acknowledged as an important link transferring the momentum to stick and finally to ball
maximizing the ball velocity. However, due to procedural difference and low variable consideration in
Journal of Advance Research in Applied Science ISSN: 2208-2352
Volume-3 | Issue-10 | October,2017 | Paper-3 23

previous researches, this study is designed to determine the underlying kinematic factors which are
determinant during drag flick and enhancing the performance of technique.
Methodology The study was conducted on six Intervarsity level male specialized hockey players from Aligarh Muslim
University and LNIPE, Gwalior, aged 18-24 years. Their height ranged between 174-182 cm and weight
between 59.4-66.8 kg. Three dimensional (3D) setup was established for the study and kinematic parameters
and successful scores were used as criterion for the study. The kinematic data was obtained by using two
Canon Legria SF-10 camcorders which were placed at right side of the subjects at a distance of 13m and 17m
away from the stationary ball position, mounted at height of 1.2m from the ground. The frame rates of these
cameras were set on 50 hz and speed 1/1000. Subjects were instructed to wear proper kit in order to give their
best performance clip for analysis. The subjects were asked to perform 15 consecutive drag flick trails from
stationary ball position. Out of 15 trails best 6 successful trails were selected for each subject and were taken
under consideration for analysis. Trail was defined as successful every time the ball hit the target whose
dimensions were predetermined.
The obtained data was analyzed using Max TRAQ 3D motion analysis software. The ball velocity was
measured from ball-stick contact to the point of release of the ball. In order to find out the determinant
kinematic factors and inter relationship between various factors, the factor analysis and Pearson’s product moment correlations was applied respectively. The statistical analysis was done using SPSSv.16. with level of
significance fixed at 0.05.
Results & Discussion The main objective of the study was to extract the determinant factors which were significantly related with
ball velocity and hence the efficiency of drag flick. The results and its discussion are represented as below:
Table 1: Descriptive analysis of fifty kinematic parameters
S. No. Kinematic Variables Code Mean SD
1. Wrist left velocity WLV 24.20 30.65
2. Elbow left velocity ELV 9.32 6.82
3. Shoulder left velocity SLV 7.33 4.50
4. Pelvic left velocity PLV 4.37 2.41
5. Knee left velocity KLV 4.32 2.76
6. Ankle left velocity ALV 3.73 2.48
7. Toe left velocity TLV 3.90 2.35
8. Wrist right velocity WRV 12.87 5.53
9. Elbow right velocity ERV 19.35 28.24
10. Shoulder right velocity SRV 9.30 6.66
11. Pelvic right velocity PRV 5.32 3.44
12. Knee right velocity KRV 15.12 16.35
13. Ankle right velocity ARV 21.65 19.61
14. Toe right velocity TRV 20.58 21.17
15. Wrist left acceleration WLA -38.36 101.34
16. Elbow left acceleration ELA -20.27 30.33
17. Shoulder left acceleration SLA -12.72 19.61
18. Pelvic left acceleration PLA -18.12 26.43
19. Knee left acceleration KLA -13.58 19.25
20. Ankle left acceleration ALA -3.25 8.27
21. Toe left acceleration TLA -7.39 7.57
22. Wrist right acceleration WRA 3.07 105.83
23. Elbow right acceleration ERA -3.18 85.34
24. Shoulder right acceleration SRA -1.70 23.10
25. Pelvic right acceleration PRA -0.56 11.73
26. Knee right acceleration KRA 7.16 118.54
27. Ankle right acceleration ARA 24.43 118.96
Journal of Advance Research in Applied Science ISSN: 2208-2352
Volume-3 | Issue-10 | October,2017 | Paper-3 24
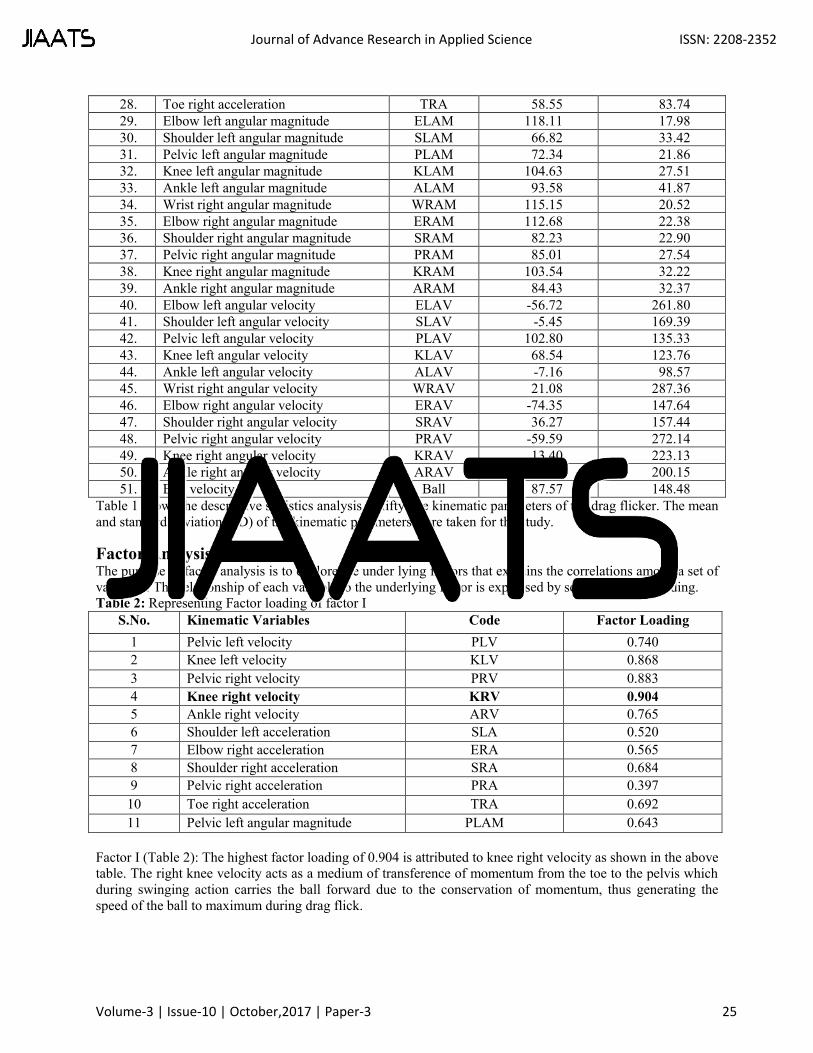
28. Toe right acceleration TRA 58.55 83.74
29. Elbow left angular magnitude ELAM 118.11 17.98
30. Shoulder left angular magnitude SLAM 66.82 33.42
31. Pelvic left angular magnitude PLAM 72.34 21.86
32. Knee left angular magnitude KLAM 104.63 27.51
33. Ankle left angular magnitude ALAM 93.58 41.87
34. Wrist right angular magnitude WRAM 115.15 20.52
35. Elbow right angular magnitude ERAM 112.68 22.38
36. Shoulder right angular magnitude SRAM 82.23 22.90
37. Pelvic right angular magnitude PRAM 85.01 27.54
38. Knee right angular magnitude KRAM 103.54 32.22
39. Ankle right angular magnitude ARAM 84.43 32.37
40. Elbow left angular velocity ELAV -56.72 261.80
41. Shoulder left angular velocity SLAV -5.45 169.39
42. Pelvic left angular velocity PLAV 102.80 135.33
43. Knee left angular velocity KLAV 68.54 123.76
44. Ankle left angular velocity ALAV -7.16 98.57
45. Wrist right angular velocity WRAV 21.08 287.36
46. Elbow right angular velocity ERAV -74.35 147.64
47. Shoulder right angular velocity SRAV 36.27 157.44
48. Pelvic right angular velocity PRAV -59.59 272.14
49. Knee right angular velocity KRAV 13.40 223.13
50. Ankle right angular velocity ARAV -105.32 200.15
51. Ball velocity Ball 87.57 148.48
Table 1 shows the descriptive statistics analysis of fifty one kinematic parameters of the drag flicker. The mean
and standard deviation (SD) of the kinematic parameters were taken for the study.
Factor Analysis: The purpose of factor analysis is to explore the under lying factors that explains the correlations among a set of
variables. The relationship of each variable to the underlying factor is expressed by so called factor loading.
Table 2: Representing Factor loading of factor I
S.No. Kinematic Variables Code Factor Loading
1 Pelvic left velocity PLV 0.740
2 Knee left velocity KLV 0.868
3 Pelvic right velocity PRV 0.883
4 Knee right velocity KRV 0.904
5 Ankle right velocity ARV 0.765
6 Shoulder left acceleration SLA 0.520
7 Elbow right acceleration ERA 0.565
8 Shoulder right acceleration SRA 0.684
9 Pelvic right acceleration PRA 0.397
10 Toe right acceleration TRA 0.692
11 Pelvic left angular magnitude PLAM 0.643
Factor I (Table 2): The highest factor loading of 0.904 is attributed to knee right velocity as shown in the above
table. The right knee velocity acts as a medium of transference of momentum from the toe to the pelvis which
during swinging action carries the ball forward due to the conservation of momentum, thus generating the
speed of the ball to maximum during drag flick.
Journal of Advance Research in Applied Science ISSN: 2208-2352
Volume-3 | Issue-10 | October,2017 | Paper-3 25

Table 3: Representing Factor Loading of factor II
S.No. Kinematic Variables Code Factor Loading
1 Wrist left velocity WLV 0.853
2 Elbow left velocity ELV 0.823
3 Ankle left velocity ALV 0.579
4 Toe left velocity TLV 0.810
5 Wrist right velocity WRV 0.844
6 Elbow right velocity ERV 0.764
7 Shoulder right velocity SRV 0.743
8 Toe right velocity TRV 0.813
9 Ankle left acceleration ALA 0.514
10 Toe left acceleration TLA 0.416
11 Shoulder left angular magnitude SLAM 0.710
12 Ankle left angular magnitude ALAM 0.749
13 Shoulder right angular magnitude SRAM 0.554
14 Ankle right angular magnitude ARAM 0.642
15 Shoulder left angular velocity SLAV 0.537
16 Ankle left angular velocity ALAV 0.345
Factor II (Table 3): Wrist left velocity exhibits significant positive factor loading of 0.853. Flicking is all in the
wrists. The wrist needs to rotate the stick enough so that stick face is angled to throw the ball into the air, but
not so far that the ball will slip over the head while performing the push action. Besides wrist right velocity,
elbow left velocity and toe left velocity are also responsible for swinging of the particular articulation and
transfer the moment to their relative parts of the body that play a dominant role in factor II.
.000
.100
.200
.300
.400
.500
.600
.700
.800
.900
1.000
Factor
I
Factor
II
Factor
III
Factor
IV
Factor
V
Factor
VI
Factor
VII
Factor
VIII
Factor
IX
Factor
X
Factor I
Factor II
Factor III
Factor IV
Factor V
Factor VI
Factor VII
Factor VIII
Factor IX
Factor X
Journal of Advance Research in Applied Science ISSN: 2208-2352
Volume-3 | Issue-10 | October,2017 | Paper-3 26

Table 4: Representing Factor Loading of factor III
S.No. Kinematic Variables Code Factor Loading
1 Shoulder left velocity SLV 0.544
2 Wrist left acceleration WLA 0.625
3 Pelvic left acceleration PLA 0.200
4 Wrist right acceleration WRA 0.433
5 Elbow right angular velocity ERAV 0.521
6 Pelvic right angular velocity PRAV 0.155
7 Ankle right angular velocity ARAV 0.249
Factor III (Table 4): The table depicts the maximum factor loading for Wrist left acceleration (WLA) which is
0.625, thus playing a significant role in factor III. The players are having their left hand closer to their bodies,
so that they can create a greater angle in order to increase the acceleration of left wrist during cross over step.
Furthermore, the work of the left shoulder is pointing in the direction of drag flick and wrapping the stick
around and below the left shoulder for enhancement of the shoulder left velocity.
.000
.100
.200
.300
.400
.500
.600
.700
.800
.900
Factor II
WLV
ELV
ALV
TLV
WRV
ERV
SRV
TRV
ALA
TLA
.000
.100
.200
.300
.400
.500
.600
.700
SLV WLA PLA WRA ERAV PRAV ARAV
Factor III
SLV
WLA
PLA
WRA
ERAV
PRAV
Journal of Advance Research in Applied Science ISSN: 2208-2352
Volume-3 | Issue-10 | October,2017 | Paper-3 27

Table 5: Representing Factor Loading of factor IV
S.No. Kinematic Variables Code Factor Loading
1 Knee left angular magnitude KLAM 0.713
2 Wrist right angular magnitude WRAM 0.589
3 Elbow left angular velocity ELAV 0.316
Factor IV (Table 5): The maximum factor loading is of knee left angular magnitude which is 0.713 as evident
from the above table. The knee left angular magnitude is responsible for production of momentum and
transferring it from one part to another with the help of degree of knee angles as well as horizontal
displacement. The other two factors are prime prelude for augmentation of ball velocity and enhancement
performance in the area of drag flick.
Table 6: Representing Factor Loading of factor V
S.no. Kinematic Variables Code Factor Loading
1 Knee right acceleration KRA 0.457
2 Elbow left angular magnitude ELAM 0.446
3 Pelvic right angular magnitude PRAM 0.414
Factor V (Table 6): The knee right acceleration is having maximum factor loading of 0.457. The amorousness
of this factor is providing a channel to develop or reduce acceleration with the phases of knee right horizontal
displacement that is efficacy of the drag flick skill. The other parameter is the elbow left angular magnitude
that maintains the coordination between both hands and sticks.
0
0.1
0.2
0.3
0.4
0.5
0.6
0.7
0.8
KLAM WRAM ELAV
Factor IV
KLAM
WRAM
ELAV
Journal of Advance Research in Applied Science ISSN: 2208-2352
Volume-3 | Issue-10 | October,2017 | Paper-3 28

Table 7: Representing Factor Loading of factor VI
S.No. Kinematic Variables Code Factor Loading
1 Knee right angular magnitude KRAM 0.511
2 Shoulder right angular velocity SRAV 0.798
Factor VI (Table 7): The factor loading of shoulder right angular velocity is 0.798 which is maximum, playing
a tremendous effect in this factor. Basically the shoulder right contains all short pocket of forces that are taken
from various lower parts of body and produced maximum angular velocity.
Table 8: Representing Factor Loading of factor VII
S.No. Kinematic Variables Code Factor Loading
1 Knee left acceleration KLA 0.386
2 Ankle right acceleration ARA 0.700
3 Pelvic left angular velocity PLAV 0.709
4 Knee right angular velocity KRAV 0.561
0.39
0.4
0.41
0.42
0.43
0.44
0.45
0.46
0.47
KRA ELAM PRAM
Factor V
KRA
ELAM
PRAM
0
0.2
0.4
0.6
0.8
1
KRAM SRAV
Factor VI
KRAM
SRAV
Journal of Advance Research in Applied Science ISSN: 2208-2352
Volume-3 | Issue-10 | October,2017 | Paper-3 29
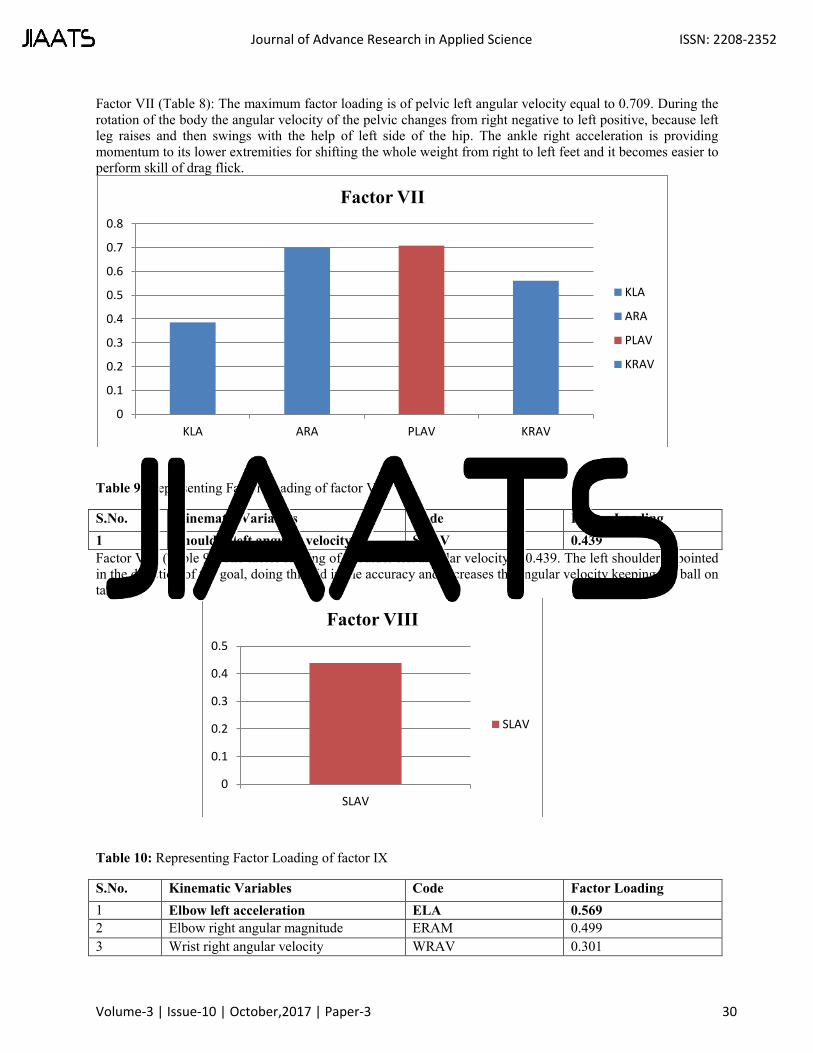
Factor VII (Table 8): The maximum factor loading is of pelvic left angular velocity equal to 0.709. During the
rotation of the body the angular velocity of the pelvic changes from right negative to left positive, because left
leg raises and then swings with the help of left side of the hip. The ankle right acceleration is providing
momentum to its lower extremities for shifting the whole weight from right to left feet and it becomes easier to
perform skill of drag flick.
Table 9: Representing Factor Loading of factor VIII
S.No. Kinematic Variables Code Factor Loading
1 Shoulder left angular velocity SLAV 0.439
Factor VIII (Table 9): The factor loading of shoulder left angular velocity is 0.439. The left shoulder is pointed
in the direction of the goal, doing this aid in the accuracy and increases the angular velocity keeping the ball on
target
Table 10: Representing Factor Loading of factor IX
S.No. Kinematic Variables Code Factor Loading
1 Elbow left acceleration ELA 0.569
2 Elbow right angular magnitude ERAM 0.499
3 Wrist right angular velocity WRAV 0.301
0
0.1
0.2
0.3
0.4
0.5
0.6
0.7
0.8
KLA ARA PLAV KRAV
Factor VII
KLA
ARA
PLAV
KRAV
0
0.1
0.2
0.3
0.4
0.5
SLAV
Factor VIII
SLAV
Journal of Advance Research in Applied Science ISSN: 2208-2352
Volume-3 | Issue-10 | October,2017 | Paper-3 30
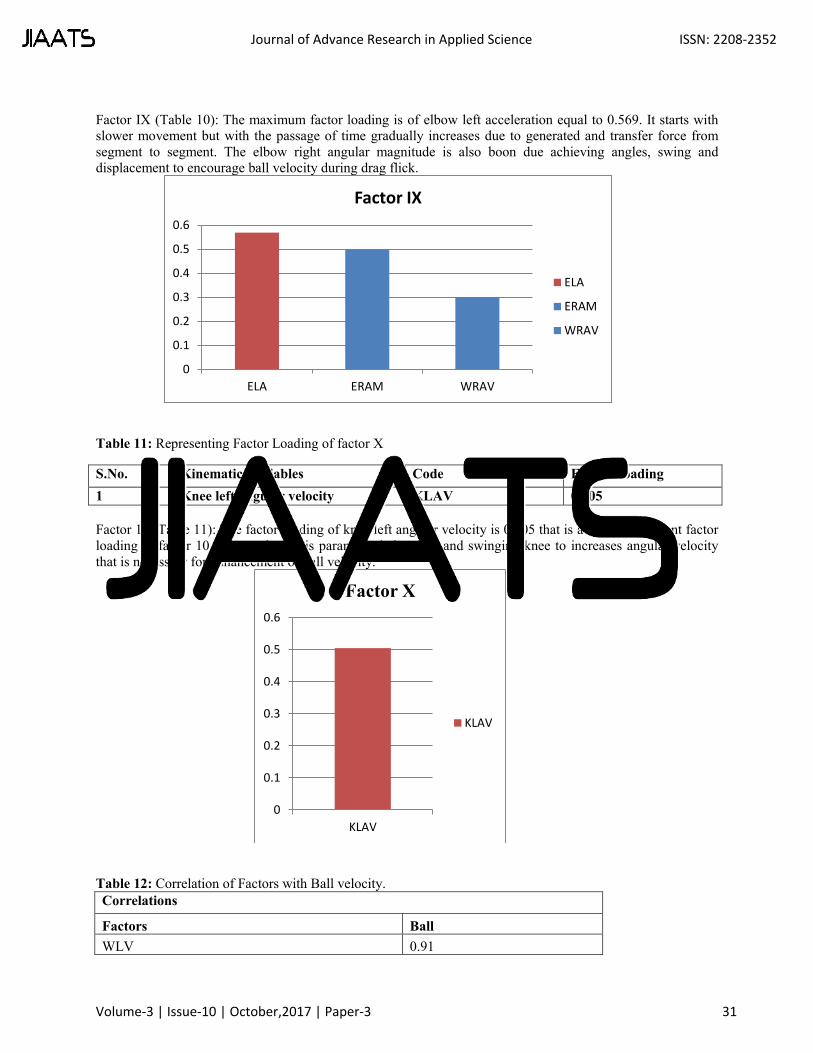
Factor IX (Table 10): The maximum factor loading is of elbow left acceleration equal to 0.569. It starts with
slower movement but with the passage of time gradually increases due to generated and transfer force from
segment to segment. The elbow right angular magnitude is also boon due achieving angles, swing and
displacement to encourage ball velocity during drag flick.
Table 11: Representing Factor Loading of factor X
S.No. Kinematic Variables Code Factor Loading
1 Knee left angular velocity KLAV 0.505
Factor 10 (Table 11): The factor loading of knee left angular velocity is 0.505 that is a single prominent factor
loading in factor 10. The work of this parameter is bending and swinging knee to increases angular velocity
that is necessary for enhancement of ball velocity.
Table 12: Correlation of Factors with Ball velocity.
Correlations
Factors Ball
WLV 0.91
0
0.1
0.2
0.3
0.4
0.5
0.6
ELA ERAM WRAV
Factor IX
ELA
ERAM
WRAV
0
0.1
0.2
0.3
0.4
0.5
0.6
KLAV
Factor X
KLAV
Journal of Advance Research in Applied Science ISSN: 2208-2352
Volume-3 | Issue-10 | October,2017 | Paper-3 31

KRV 0.09
WLA -0.10
ELA -0.28
KRA -0.06
KLAM -0.15
SLAV 0.22
PLAV -0.11
KLAV 0.00
SRAV -0.14
The correlation of factors with ball velocity is represented through graphs as below;
Figure 1: The wrist left velocity is exhibiting
significant positive correlation with ball velocity
which is 0.91thereby playing a significant role in
enhancing the performance of drag flick in hockey.
Figure 2: The knee right velocity is having a
positive correlation of 0.09 with ball velocity. The
graph shows the gradual increase in the rate of
knee right velocity with ball velocity.
Figure 3: The correlation coefficient of wrist left
acceleration is -0.10 that is demonstrating
significant negative correlation with wrist left
acceleration and ball velocity.
Figure 4: The elbow left acceleration is exhibiting
a correlation coefficient of -0.28 with elbow left
acceleration and ball velocity. It is supported by
the other parameters with the help of negatively
affect for ameliorate performance while drag flick
in hockey.
0
20
40
60
80
100
120
0 200 400 600
WLV
BALL VELOCITY
WLV
Linear
(WLV)
0
10
20
30
40
50
60
0 200 400 600
KR
V
BALL VELOCITY
KRV
Linear
(KRV)
-150
-100
-50
0
50
100
0 200 400 600
WLA
BALL VELOCITY
WLA
Linear (WLA)
-100
-50
0
50
0 200 400 600
ELA
BALL VELOCITY
ELA
Linear (ELA)
Journal of Advance Research in Applied Science ISSN: 2208-2352
Volume-3 | Issue-10 | October,2017 | Paper-3 32

Figure 5: The correlation coefficient of knee right
acceleration is -0.06 associated to direction
towards negative correlation with ball velocity and
knee right acceleration in hockey.
Figure 6: The correlation coefficient of knee left
angular magnitude is -0.15 that is associated to
negative correlation with angular magnitude and
ball velocity. Basically, it provides direction like
shoulder articulation towards target area. At the
time of flicking, the body weight shifts from
backward to forward due to production of less
angular magnitude in left knee.
Figure 7: The shoulder left angular velocity is
having significantly positive correlation of 0.22
with ball velocity and shoulder left angular
velocity.
Figure 8: The pelvic left angular velocity is a
negative correlation coefficient of a -0.11 with ball
velocity and its parameters. Basically, the left side
of pelvic is going to be like some fix moment
which creates an opportunity to increase the
momentum to the right side of pelvic thereby
increasing its angular velocity.
Figure 9: The knee left angular velocity is 0.00
having neither positive nor negative correlation
with ball velocity and knee left angular velocity.
Figure 10: The shoulder right angular velocity is
having a negative correlation coefficient of -0.14
with ball velocity and shoulder right angular
velocity.
-400
-200
0
200
0 200 400 600
KR
A
BALL VELOCITY
KRA
Linear (KRA)
0
50
100
150
200
0 200 400 600
KLA
M
BALL VELOCITY
KLAM
Linear
(KLAM)
-400
-200
0
200
400
0 200 400 600
SLA
V
BALL VELOCITY
SLAV
Linear
(SLAV)
-400
-200
0
200
400
0 200 400 600
PLA
V
BALL VELOCITY
PLAV
Linear
(PLAV)
-200
0
200
400
600
0 200 400 600
KLA
V
BALL VELOCITY
KLAV
Linear (KLAV)
-400
-200
0
200
400
600
0 500 1000
SR
AV
BALL VELOCITY
SRAV
Linear
(SRAV)
Journal of Advance Research in Applied Science ISSN: 2208-2352
Volume-3 | Issue-10 | October,2017 | Paper-3 33

Conclusion: In this study of kinematic analysis of body during drag flick, various kinematic factors were determined which
were effecting the skill and were significantly related with ball velocity. These include, left wrist velocity and
acceleration , left elbow acceleration, both right and left shoulder angular velocity, left pelvic angular velocity,
right knee velocity and acceleration, and left knee angular magnitude and angular velocity. Hence, we can
conclude that the above determinants should be given due consideration in order to enhance the efficiency of
drag flick.
References Ansari, N.W., Bari, M.A., Hussain, I. & Ahmad, F. (2014). Three Dimensional Biomechanical Analysis of the
Drag in Penalty Corner Drag Flick Performance. Journal of Education and Practice. Vol. 5(20), 91-
96.
Ansari, N.W., Bari, M.A., Hussain, I. & Ahmad, F. (2014). Three dimensional kinematic analysis of the drag
flick for accuracy. International Journal of Applied Sciences and Engineering Research, Vol. 3(2),
431-435.
Bari, M. A., Ansari, N.W., Hussain, I., Ahmad, F. & Khan, M. A. (2014). Three Dimensional Analysis of
Variation between Successful and Unsuccessful Drag flick Techniques in Field Hockey.
International Journal of Research Studies in Science, Engineering and Technology. Vol. 1(2), 74-78.
Bari, M.A., Ansari, N.W., Ahmad, F. & Hussain, I. (2014). Three Dimensional Analysis Of Drag-Flick In The
Field Hockey Of University Players. Advances in Physics Theories and Applications, Vol. 29, 87-
93.
Bartlett, R. (2007). Introduction to sports biomechanics. London: Rutledge.
Glencross, D. (1985). 100 Hockey Tips. Rigby Australia.
Ikram, H., Saleem A., Sartaj K. (2012). Biomechanical study on drag flick in field hockey. International
journal of behavioral social and movement sciences,1(3).
Laird. P., Sutherland, P. (2003). Penalty corners in field hockey: A guide to success. Int J Perform Anal Sport.
2003;3(1):19–26.
López de Subijana, C., Juarez, D., Mallo, J., Navarro, E. (2010). Biomechanical analysis of the penalty corner
Drag flick of elite male and female hockey players. Sports Biomechanics 9(2), 7278
McLaughlin, P. (1997). Three-dimensional biomechanical analysis of the hockey drag flick full report.
Belconnen, A.C.T., Australia: Australian Sports Commission.
Piñeiro R., Sampedro J., Refoyo I. (2007). Differences between international men’s andwomen’s teams in the strategic action of the penalty corner in field hockey. International Journal of Performance
Analysis in Sport 7(3), 6783
Piñeiro, R. (2008). Observación y análisis de la acción de gol en hockey hierba. [The goal play in field
hockey: observation and analysis]Sevilla: Wanceulen; (In Spanish)
Yusoff, S., Hasan, N., Wilson , B. (2008). Three dimensional biomechanical analysis of the hockey drag flick.
Journal of Advance Research in Applied Science ISSN: 2208-2352
Volume-3 | Issue-10 | October,2017 | Paper-3 34

5/18/2020 Investigation of Bio-Kinematic Elements of Three Point Shoot in Basketball
article.sapub.org/10.5923.j.sports.20170704.02.html 1/6
Paper InformationNext Paper
Paper Submission
Journal InformationAbout This Journal
Editorial Board
Current Issue
Archive
Author Guidelines
Contact Us
International Journal of Sports Sciencep-ISSN: 2169-8759 e-ISSN: 2169-87912017; 7(4): 163-169doi:10.5923/j.sports.20170704.02
Investigation of Bio-Kinematic Elements of Three Point Shoot inBasketball
Abstract
Reference
Full-Text PDF
Full-text HTML
Ikram Hussain, Fuzail Ahmad, Nidhi RaniDepartment of Physical Education, Aligarh Muslim University, Aligarh, India
Correspondence to: Fuzail Ahmad, Department of Physical Education, Aligarh Muslim University, Aligarh, India.
Email:
Copyright © 2017 Scientific & Academic Publishing. All Rights Reserved.This work is licensed under the Creative Commons Attribution International License (CC BY).
http://creativecommons.org/licenses/by/4.0/
AbstractThis paper mainly used the two dimensional videograph analysis technique to analyze the Three Point Shootperformance of Basketball and to acquire relevant bio-kinematics parameters of the execution of the motion at threedifferent positions ie: right side guard position, left side guard position and centre position. Mainly including the lossrate of body horizontal and vertical velocity of the ball, Wrist angle, Elbow angle, Shoulder angle, Hip angle, Kneeangle, Ankle angle, Release height, Release angle and Release velocity, in order to analyze the recording in a moreconvenient way, we divide Three Point Shooting exertion movement in three phases as Preparation and BallElevation phase, Stability and Ball Release phase and Inertia and Follow through phase. Six highly skilled active,north zone intervarsity level, right handed shooters male basketball players were participated in this study. Duringthe Three Point Shooting stages, the initial release shooting velocity of the basketball is 6.89 m/s. The average angleof throwing ball is about 46.61°, with the mean of posture angle remain as 184.52°. And the releasing height of theball is 2.33 m. This investigation provides kinematics indicators and technical guidance for the training of Three PointShoot for basketball players.
Keywords: Three Point Shoot, Two dimensional analyses, Bio-kinematic, Guard positions
Cite this paper: Ikram Hussain, Fuzail Ahmad, Nidhi Rani, Investigation of Bio-Kinematic Elements of Three PointShoot in Basketball, International Journal of Sports Science, Vol. 7 No. 4, 2017, pp. 163-169. doi:10.5923/j.sports.20170704.02.
Article Outline1. Introduction
2. Methodology
2.1. Selected Variables
2.2. Procedure of Biomechanical Analysis
2.3. Procedure of Criterion Measurement for Testing
2.4. Statistical Procedure
3. Result and Discussion
4. Conclusions
1. Introduction
Basketball is a popular sport in the world. Basketball is founded in January, 1892, though it has been ignored bypeople in the latter half century, after Berlin Olympic Games in 1936, it is fast popular all around the world, whilein modern times, basketball national level competitions mainly are China CBA, America NBA. Internationalcompetitions mainly include basketball world championship, Olympic Games, Stankovic Cup (Guang, 2014).Basketball players need to put much effort on training shooting skill and try their best to stop opponents to scorein a game. Therefore shooting technique is one of the core techniques in basketball movement. Excellentbasketball shooters have a beautiful arch, input the proper backspin, and minimize the lateral deviation from theoptimal shot path plane. They manipulate their shoulder, elbow and wrist to produce the optimal ball speed, angleand angular velocity at release. It is vital to analyze the kinematics of the shooting arm to understand goodshooting. Knudson (1993) proposed six key teaching points for jump shots based on many basketball shootingstudies, and mentioned that biomechanical studies have not clearly identified the optimal coordination of humanjoint actions.
Shooting is the basic way to get score in basketball and for this reason it is the most frequently used technicalaction (Hey, 1994). The jump shot is distinguished as the most important of all the shooting actions (Hess, 1980).

5/18/2020 Investigation of Bio-Kinematic Elements of Three Point Shoot in Basketball
article.sapub.org/10.5923.j.sports.20170704.02.html 2/6
Miller (1996) has discussed the relationship between basketball shooting kinematics, distance and playingposition. Chin (2002) also analyzed the basketball shooting of different distances and movements. Some previousstudies (Elliott, 1992; Miller & Bartlett, 1993; Okazaki & Rodacki, 2012) measured shooters’ shoulder, elbow andwrist joint motions at release for shooting, and reported the effect of increased shooting distance. In this paper,we weigh against successful and unsuccessful kinematics of Three Point Shooting at different positions and findout key actions of the selected kinematics to produce the optimal release speed, angle and backspin in executingthe Three Point Shooting motion at left & right guard position and center position.
2. Methodology
Six highly skilled active, right handed shooters male and female basketball players were participated in this study.All players were playing in north zone intervarsity level. All of the participants were practicing according to theirteam’s regular training schedule. All the subjects were playing from all the post guards, forwards, and centers.The participants were free of any kind of musculoskeletal injuries at the time of data collection. The placement ofthe cameras and the calibration frame was adjusted accordingly to the experimental setup and motion of theexecution of the Three Point Shoot.
Figure 1. Illustration of the motion of Three Point Shoot
2.1. Selected Variables
In three point basketball shooting different parameters play a great role for making a shot ‘successful’ and‘unsuccessful’ shooting in the performance such as psychology, physiology and anthropometry of the player andetc. But here researcher selected only the biomechanical parameters, and worked on it and try to find out theeffect of selected biomechanical parameters on the successful and unsuccessful three Point Shoot of basketball.The selected biomechanical variables in the study were as:
2.2. Procedure of Biomechanical Analysis
The researcher selected the standard basketball court for data collection. The experimental set-up was arrangedon the half side of the court for the research data in the department of Physical Education, Aligarh MuslimUniversity, Aligarh. The 3D point shooting area was selected for the study. The three positions of data collectionwas (1) shooting right side guard position, (2) left side guard position, and (3) centre position. The motion of theshooting was recorded on the right side of the 3 D point shooting area. Two Canon HF S-10 cameras wereadopted for the process of Videography. The camera placed on the right side of the motion to capture on thesagittal plane was coined as Cam_1 and Cam_2 respectively. The first camera was placed perpendicular to thebody position of the subject to capture the movement of the subjects for close-up recording and the second wasplaced behind of the first camera and perpendicular to the height of release of the ball position capturing thewhole motion of the ball from the hand of the subject after release to the basket or ring. Three experimentalsetups was arranged and layout to capture the movement of the Three Point Shoot as Setup A, Setup B and SetupC for the recording of the Three Point Shoot executed on right side guard position, Center position and left sideguard position respectively [Figure: 2, 3, 4, 5]. All six subjects of the study were educated for the data collection.The markers were placed on the subject’s right wrist joint point, elbow joint point, shoulder joint point, hip jointpoint, knee joint point, ankle joint point, toe and heel respectively. The instruction about data collection andwarm-up time was provided to the subjects. The video cameras were set on 1/2000 of shutter speed and wereput on recording mode for the video recording. After warm-up every subjects performed Three Point Shooting tentimes on all the setups (ie: Setup A, Setup B & Setup C). Three best trails were selected after playing varioustimes on the video playback system and the best-suited trails have opted. The shortlisted trails were slashed andedited. The edited videos were analyzed with the help of Silicon Coach Pro 8.1 Motion analysis to obtain the datafor further analysis.
In this study Wrist angle, Elbow angle, Shoulder angle, Hip angle, Knee angle, Ankle angle, Release height,Release angle and Release velocity were measured to draw and built the conclusion. The wrist angle measuredbetween palm and forearm. The Elbow angle measured between forearm and upper arm. The shoulder anglemeasured between torso and upper arm. The hip angle was measured between torso and upper leg. The kneeangle was measured between upper leg and lower leg. The ankle angle was measured between lower leg and foot.The release height was measured by the vertical distance from the floor to the center of the ball. The releaseangle of the ball was measured when the ball release from the players hand in execution phase. The releasevelocity measured by the speed of the ball at the time of execution. The trajectory was observed from ball releaseto the drop of the in the basket or ring.
Figure 2. Point of Location of Data Collection as Right and Left Guard Position and Center

5/18/2020 Investigation of Bio-Kinematic Elements of Three Point Shoot in Basketball
article.sapub.org/10.5923.j.sports.20170704.02.html 3/6
Position
Figure 3. Experiment Set-up A at Right Guard Position. Camera 1 placed 9.50 meter awayfrom the plane of execution, at 1.28 meter high and Camera 2 placed at 15.40 meter, at1.56 meter high
Figure 4. Experiment Set-up B at Right Guard Position. Camera 1 placed 10.40 meteraway from the plane of execution, at 1.28 meter high and Camera 2 placed at 13.27 meteraway, at 1.80 meter high
Figure 5. Experiment Set-up C at Right Guard Position. Camera 1 placed 7.52 meter awayfrom the plane of execution, at 1.30 meter high and Camera 2 placed at 12.11 meter, at1.45 meter high
2.3. Procedure of Criterion Measurement for Testing
Figure 6. Illustration of the measurement of Release height and angle of release
2.4. Statistical Procedure
The acquired data was given an appropriate statistical treatment to draw a conclusion in this investigation. In thisstudy, descriptive statistics were applied to the successful and unsuccessful shot; mean and standard deviation ofall variables were computed in the first phase of data analysis. In the second phase paired t-test was applied toknow the difference in the selected biomechanical variables between the successful and unsuccessful Three PointShoot. All statistical functions were performed with the SPSS (v.17) software. In all statistical analyses, thesignificance threshold was set at p< 0.05. The degree of freedom was 50.
Figure 7. Measurement of Release angle, entry angle, and release height of ball at thetime of execution through Silicon Coach
3. Result and Discussion
Table 1. Descriptive statistics of the Democratic profile of the subjects
The purpose of the present study was to determine the kinematic influence for the selected fundamental skill ie:Three Point Shooting. This skill is divided into three phases such as Phase I Preparation and Ball Angle, Phase IIStability and Ball Release, Phase III Inertia and Follow Through. In phase I, the parameters wrist angle, elbowangle, shoulder angle, hip angle, knee angle, ankle angle, were selected for the analysis; Table 2 reveal the resultthat no significant differences are found in the body joints angles during the phase I, but there were calculationdifferences (random) between the successful and unsuccessful shooting (Diar, 2014). During the study it wasobserved that the wrist angle displayed for successful Three Point Shoot as Mean ± SD = 139.26 ± 15.65 and forunsuccessful Three Point Shoot Mean ± SD = 139.42 ± 18.71, The elbow angle for successful Three Point Shootas Mean ± SD = 69.38 ± 14.03 and for unsuccessful shot Mean ± SD = 65.00 ± 12.16. Shoulder angle forsuccessful & unsuccessful as 78.42 ± 23.93 & 73.65 ± 19.38 respectively. The subjects displayed hip angle forsuccessful as 162.61 ± 6.03 and 163.03 ± 7.55 for unsuccessful. The knee angle and ankle angle for successfulshot were 112.11 ± 6.03 & 84.42 ± 7.75, whereas for unsuccessful as 111.61 ± 6.22 & 83.07 ± 6.18respectively. No significant changes were showed on Knee angle and ankle at the initial stage (extension) of theexecution (Diar, 20214; Nassaif & Mazer, 1979). The p>0.05 for the all the body angles examined during phase I.Least mean difference among the selected kinematics variables were observed between the successful andunsuccessful during Three Point Shoot.
Table 3, shows significant difference in shoulder angle in making the score during Stability and Ball Releasephase. The selected parameters for the phase II were wrist angle, elbow angle, shoulder angle, hip angle, kneeangle, ankle angle, release height, release angle and release velocity. The wrist angle for successful &unsuccessful are 142.88 ± 1.39 & 145.57 ± 14.98 and elbow angle shows 155.11 ± 17.92 & = 150.84 ± 15.28(as Mean ± SD). But both wrist and elbow angle displays a no significant result. Similarly, Diehl, Tant, Emmoms,Osbon shows 175.20 as wrist and 157.8 as elbow angle in his study which was also not significant.
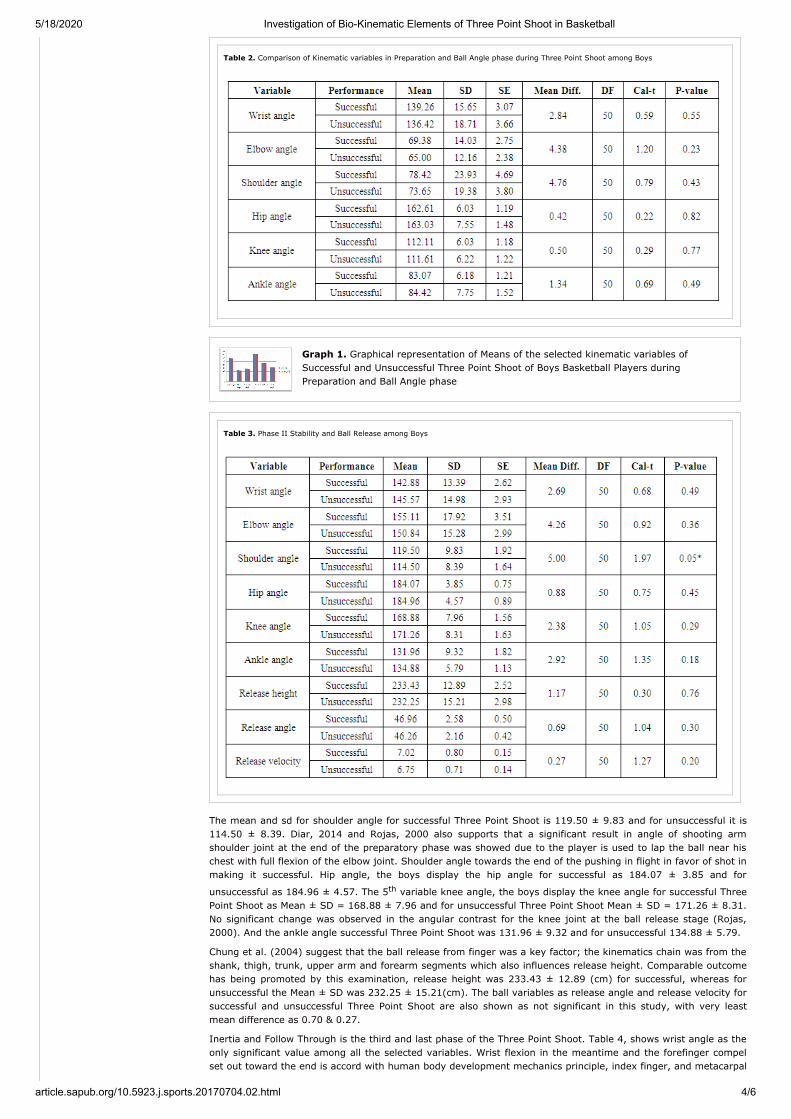
5/18/2020 Investigation of Bio-Kinematic Elements of Three Point Shoot in Basketball
article.sapub.org/10.5923.j.sports.20170704.02.html 4/6
Table 2. Comparison of Kinematic variables in Preparation and Ball Angle phase during Three Point Shoot among Boys
Graph 1. Graphical representation of Means of the selected kinematic variables ofSuccessful and Unsuccessful Three Point Shoot of Boys Basketball Players duringPreparation and Ball Angle phase
Table 3. Phase II Stability and Ball Release among Boys
The mean and sd for shoulder angle for successful Three Point Shoot is 119.50 ± 9.83 and for unsuccessful it is114.50 ± 8.39. Diar, 2014 and Rojas, 2000 also supports that a significant result in angle of shooting armshoulder joint at the end of the preparatory phase was showed due to the player is used to lap the ball near hischest with full flexion of the elbow joint. Shoulder angle towards the end of the pushing in flight in favor of shot inmaking it successful. Hip angle, the boys display the hip angle for successful as 184.07 ± 3.85 and for
unsuccessful as 184.96 ± 4.57. The 5th variable knee angle, the boys display the knee angle for successful ThreePoint Shoot as Mean ± SD = 168.88 ± 7.96 and for unsuccessful Three Point Shoot Mean ± SD = 171.26 ± 8.31.No significant change was observed in the angular contrast for the knee joint at the ball release stage (Rojas,2000). And the ankle angle successful Three Point Shoot was 131.96 ± 9.32 and for unsuccessful 134.88 ± 5.79.
Chung et al. (2004) suggest that the ball release from finger was a key factor; the kinematics chain was from theshank, thigh, trunk, upper arm and forearm segments which also influences release height. Comparable outcomehas being promoted by this examination, release height was 233.43 ± 12.89 (cm) for successful, whereas forunsuccessful the Mean ± SD was 232.25 ± 15.21(cm). The ball variables as release angle and release velocity forsuccessful and unsuccessful Three Point Shoot are also shown as not significant in this study, with very leastmean difference as 0.70 & 0.27.
Inertia and Follow Through is the third and last phase of the Three Point Shoot. Table 4, shows wrist angle as theonly significant value among all the selected variables. Wrist flexion in the meantime and the forefinger compelset out toward the end is accord with human body development mechanics principle, index finger, and metacarpal

5/18/2020 Investigation of Bio-Kinematic Elements of Three Point Shoot in Basketball
article.sapub.org/10.5923.j.sports.20170704.02.html 5/6
is one of the longest, in this way, the longest and the working separation to dial out to the ball from this side, isuseful to quicken the speed and exactness of basketball accuracy (Zhen, 2015).
Graph 2. Graphical representation of Means of the selected kinematic variables ofSuccessful and Unsuccessful Three Point Shoot of Boys Basketball Players during Stabilityand Ball Release phase
Table 4. Phase III Inertia and Follow Through among Boys
From table 4 it was observed wrist angle for successful as 149.42 ± 12.91and for unsuccessful as 141.80 ±13.82. The elbow angle as 156.80 ± 18 & 154.76 ± 19.03. Shoulder angle as 114.73 ± 31.09 and as 106.00 ±28.01 respectively. The mean and SD of lower extremities as hip, knee and ankle angles for successful ThreePoint Shoot are 171.50 ± 10.77, 160.19 ± 5.73 and 113.96 ± 11.37, whereas for unsuccessful 173.15 ± 9.82,161.46 ± 5.68 and 117.30 ± 8.37 respectively. No significant changes were showed on Hip, Knee and Ankle angleat the end of absorption stage (flexion).
In general, no significant differences were see final variables of the body joints angles and the ball variablesexcept the shoulder angle during Stability and Ball Release shot arm's shoulder jointed-push stage during flying ofball and wrist angle during Inertia and Follow Through for providing the direction and spin to make the three pointsuccessful to be attempt at random differences from any position out of three shot line. We have referred toshortcomings in the angles of the starting body.
Graph 3. Graphical representation of Means of the selected kinematic variables ofSuccessful and Unsuccessful Three Point Shoot of Boys Basketball Players during Inertiaand Follow Throughphase
4. Conclusions
Three Point Shooting abilities contain an assortment of laws and principles of human movement, among them, thedevelopment mechanics content assumes a significant part. While shooting from any position out of three pointline, elbow ought to aim at the ring. Shoulder, elbow, wrist, fingers and the ball ought to be on a similar plane ofthe movement, in this way when the ball is tossed towards the basket ring for the successful score. In themeantime, players likewise need to utilize fingers to control and shoot the ball. The pointing point ought to be therear edge of the basket ring, in light of the fact that in the wake of discharging the shot, the ball is turningnoticeable all around. Considering the parabolic trajectory the ball may go into the basket ring when going for thetrailing edge of the basketball ring, the scoring rate will be approx. 70.00% higher.
References
[1] Dair, M. S. (2014). Comparison some of Biomechanics Variables to Jump Shot from a 45° Angle from theArea of the Three Points in Front of the Defender or without for the Player and Ball in Basketball. AnalyticalResearch. International Journal of Advanced Sport Sciences Research, Vol. 2(2), 137-146.
[2] Elliott, B. (1992). A kinematic comparison of the male and female two-point and three-point jump shots inbasketball, Australian J. Science and Medicine in Sport. Vol. 24, 111-118.
[3] Guang, L. (2014). Basketball shooting angle and movement trajectory correlation research based ondifferential model. BTAIJ, Vol. 10(2), 143-148.
[4] Hay, T. G. (1985). The Biomechanics of Sports Techniques. Englewood Cliffs, N. J.
[5] Knudson, D. (1993). Biomechanics of the basketball jump shot – Six key teaching points, J. PhysicalEducation, Recreation, and Dance. Vol. 64, 67-73.
[6] Miller, S. & Bartlett, R. (1996). The Relationship between Basketball Shooting Kinematics, Distance andPlaying Position. Journal of Sports Sciences, Vol. 14, 243-253.
[7] Miller, S. & Bartlett, R. M. (1993). The effects of increased shooting distance in the basketball jump shot, J.Sports Sciences. Vol. 11, 285-293.
[8] Nassaif A. A. & Mazer K., (1979). Biomechanics, Port Press, Baghdad, 72.

5/18/2020 Investigation of Bio-Kinematic Elements of Three Point Shoot in Basketball
article.sapub.org/10.5923.j.sports.20170704.02.html 6/6
[9] Okazaki, V.H.A. & Rodacki, A.L.F. (2012). Increased distance of shooting on basketball jump shot, J. SportsScience and Medicine, Vol. 11, 231- 237.
[10] Zhen, L., Wang, L & Hao Z. (2015). A Biomechanical Analysis of Basketball Shooting. International Journal ofSimulation Systems, Science & Technology. Vol. 16(1). 1.1-1.5.
Home | About Us | Terms and Conditions | Privacy Policy | Feedback | Sitemap | Contact Us
Copyright © 2017 Scientific & Academic Publishing Co. All rights reserved.

Journal of Education and Practice www.iiste.org
ISSN 2222-1735 (Paper) ISSN 2222-288X (Online)
Vol.6, No.13, 2015
166
The Level of Stress in Male and Female School Students
Zamirullah Khan Abul Barkat Lanin Naseem Ahmad
Deptt. Of Physical Education, Aligarh Muslim University, Aligarh, U.P. India. 2 Mumtaj P G college, Lucknow University, Lucknow, U.P. India
Abstract
This study aimed at the level of stress in male and female school students. For the purpose of the study the researcher randomly selected 64 school students aged between 14-18 years. To collect the data researcher used students stress scale (SSS) developed by Dr. Zaki Akhtar (2011). During collection of data researcher used means and method fit for this scale. The result of the study showed boys having much more stress in comparison to girls. The study concluded that school boys are more stressful than school girls.
Introduction
Stress is an integral part of our life. Stress could be positive as well as negative. When we are doing our work properly and systematically then it is because of positive stress or eustress but when we lose our rhythm for same work, it is negative stress or distress. So, stress is good in one way and bad in other way. Hans Selye (1956) first popularized the concept of “stress” in the 1950s. Selye theorized that all individuals respond to all types of threatening situations in the same manner, and he called this the General Adaptation Syndrome (GAS).
Lazarus & Folkman (1984) defined that, stress is a mental or physical phenomenon formed through one’s cognitive appraisal of the stimulation and is a result of one’s interaction with the environment. The existence of stress depends on the existence of the stressor. Chang’s Dictionary of Psychology Terms, stress is “a state of physical or mental tension that causes emotional distress or even feeling of pains to an individual” (Lai et al., 1996). Vijaya and Karunakaran (2013) stated that stress is a complex phenomenon. It largely depends on one's temperaments, environmental conditions, experiences and situations. It is experienced by every individual in any one situations or the other. It is a part of life and it is generated by constant changing situations that one has to face. It refers to an internal state, which results from frustration or under dissatisfactory conditions. To a certain extent in every one's life it is unavoidable, because it is complex in nature. It is a part of fabric of life. But it can be managed to some extent. Piekarska (2000) pointed out that the essential factors for the formation of stress are frequent and strong. There is a related connection between the results of stress and psychological and personality characteristics. Selye (1976) stated that in most approaches stress now designates bodily processes created by circumstances that place physical or psychological demands on an individual. Selye (1976) theories that focus on the specific relationship between external demands (stressors) and bodily processes (stress) can be grouped in two different categories: approaches to `systemic stress' based in physiology and psychobiology (among others,) and approaches to psychological stress' developed within the field of cognitive psychology. McGrath (1982) said that the external forces that impinge on the body are called stressors. Feng (1992) and Volpe (2000) defined stressor as anything that challenges an individual’s adaptability or stimulates an individual’s body or mentality. Stress can be caused by environmental factors, psychological factors, biological factors, and social factors. It can be negative or positive to an individual, depending on the strength and persistence of the stress, the individual’s personality, cognitive appraisal of the stress, and social support. Vijaya and Karunakaran (2013) in their study found that majority of boys expressed high level of stress and moderate stress compared to girls. Whereas majority of girl students exhibited low level of stress compared to Boys. Chiang (1995) proposed that school is one of the main sources of stress among adolescents. Such stress comes from too much homework, unsatisfactory academic performance, preparation for tests, lack of interest in a particular subject, and teacher’s punishment. Generally, parents are very concerned about their children’s academic achievement and moral behaviors. Parents expect their children not only to respect teachers and follow moral norms but also become elite in the future. Chang & Lu (2007) suggested that academic institutions have different work settings compared to nonacademic and therefore one would expect the difference in symptoms, causes, and consequences of stress. Stevenson & Harper (2006) pointed out that stress in academic institutions can have both positive and negative consequences if not well managed. Goodman (1993) revealed that students have different expectations, goals, and values that they want to fulfill, which is only possible if the students’ expectations, goals, and values are integrated with that of the institution. Goodman (1993) stated that stressors affecting students can be categorized as academic, financial, time or health related, and self- imposed.
After going through available literature in hard copy as well as soft copies on internet the researcher found that sufficient work has not been done in this area. So researcher goaded to carry out this investigation to fill the gap in the domain of knowledge. The type of stress which is analysed in this paper is distress among school going students.

Journal of Education and Practice www.iiste.org
ISSN 2222-1735 (Paper) ISSN 2222-288X (Online)
Vol.6, No.13, 2015
167
Methodology
The purpose of the present study was to know the level of stress among school going children.
Sample
The sample of the present study was taken from Jawahar Navodaya School Bareilly (U.P.). For the purpose of the study 42 male and 22 female students were randomly selected. Their age ranged between 14-18 years.
Tools used The researcher used students stress scale developed by Dr. Zaki Akhtar (2011) Jamshedpur. The scale consisted of 51 statements related to the major kind of stress prevalent in students at adolescent age, and all kinds of situations faced by students.
Statistical Technique Used
Descriptive statistical technique, Mean and Standard Deviation were used
Mean SD N
Boys 158.96 11.40 42
Girls 163.57 5.63 22
RESULTS
Gender STRESS LEVELS TOTAL
Very High
Stress
High Stress Moderate
Stress
Low Stress Very Low
Stress
Boys 08 12 12 05 05 42
Girls 00 03 04 09 06 22
From the table it is evident that most of the boys showing very high stress (Boys 19% and girls 0%) and high stress (boys 28.5% and girls 13.6%) as well as moderate stress where as girls are having 18.1% and boys 28.5%.
DISCUSSION
From the result we can find out that majority of girls have shown low stress and very low stress. Some research worked on level of stress showing the same result i.e., research work done by Vijaya and Karunakaran (2013). This study resulted that boys are much more stressful than girls. There can be many reason for this, it may be their parents expectation from them or it may be boy’s high goal and target for their bright and successful career. Teachers should take care of male students and try to resolve their problems which are responsible for their high stress. Parents also can play a vital role to reduce the stress of their children as they are more close to them. Chiang (1995) has also stated that generally parents are very concerned about their children’s academic achievement and moral behaviors. Parents expect their children not only to respect teachers and follow moral norms but also become elite in the future. School is also a best medium to work on the stress level of the students and treat them accordingly as it is revealed by the Goodman (1993) that students have different expectations, goals, and values that they want to fulfill, which is only possible if the students’ expectations, goals, and values are integrated with that of the institution.
Conclusions
The researcher concluded that schools going male students are more stressful in comparison to female students.
References
Chang K, & Lu L. (2007). Characteristics of organisational culture, stressors and wellbeing: The case of Taiwanese organisations, Journal of Managerial Psychology, 22 (6):549- 568.
Chiang, C. X. (1995). A Study of Stress Reactions among Adolescents. Chinese Journal of School Health, 26, 33-37.
Feng, G. F. (1992). Management of Stress and Loss. Taipei: Psychological Publishing Company, Ltd. Goodman, E.D. (1993). How to handle the stress of being a student. Imprint, 40:43 Krohne and L Laux (Eds), (1982). Achievement, Stress, and Anxiety (pp. 19–48). Lazarus, R S, (1966). Psychological Stress and the Coping Process. New York: McGraw-Hill. Lazarus, R S, (1991). Emotion and Adaptation. New York: Oxford University Press. Lazarus, R S and Folkman, S, (1984). Stress, Appraisal, and Coping. New York: Springer. Lai, P. C., Chao, W. C., Chanf. Y. Y., and Chang, T. T. (1996). Adolescent Psychology. Taipei: National Open
University. McGrath, J E, (1982). Methodological problems in research on stress. In H W Washington, DC,: Hemisphere.
Abstract-Psychology INFO | $Order Document
Journal of Education and Practice www.iiste.org
ISSN 2222-1735 (Paper) ISSN 2222-288X (Online)
Vol.6, No.13, 2015
168
Piekarska, A. (2000). School stress, teachers’ abusive behaviors, and children’s coping strategies. Child Abuse and Neglect, 24, 11, 1443-1449 (2000)
Selye, H. (1976). The Stress of Life (revised edition). New York: McGraw-Hill. Selye, H. (1956). The Stress of Life. New York: McGraw-Hill Stevenson, A & Harper S. (2006). Workplace stress and the student learning experience, Quality Assurance in
Education, 14(2): 167-178. Volpe, J. F. (2000). A guide to effective stress management. Career and Technical Education, 48(10), 183-188.

The IISTE is a pioneer in the Open-Access hosting service and academic event management.
The aim of the firm is Accelerating Global Knowledge Sharing.
More information about the firm can be found on the homepage:
http://www.iiste.org
CALL FOR JOURNAL PAPERS
There are more than 30 peer-reviewed academic journals hosted under the hosting platform.
Prospective authors of journals can find the submission instruction on the following
page: http://www.iiste.org/journals/ All the journals articles are available online to the
readers all over the world without financial, legal, or technical barriers other than those
inseparable from gaining access to the internet itself. Paper version of the journals is also
available upon request of readers and authors.
MORE RESOURCES
Book publication information: http://www.iiste.org/book/
Academic conference: http://www.iiste.org/conference/upcoming-conferences-call-for-paper/
IISTE Knowledge Sharing Partners
EBSCO, Index Copernicus, Ulrich's Periodicals Directory, JournalTOCS, PKP Open
Archives Harvester, Bielefeld Academic Search Engine, Elektronische Zeitschriftenbibliothek
EZB, Open J-Gate, OCLC WorldCat, Universe Digtial Library , NewJour, Google Scholar
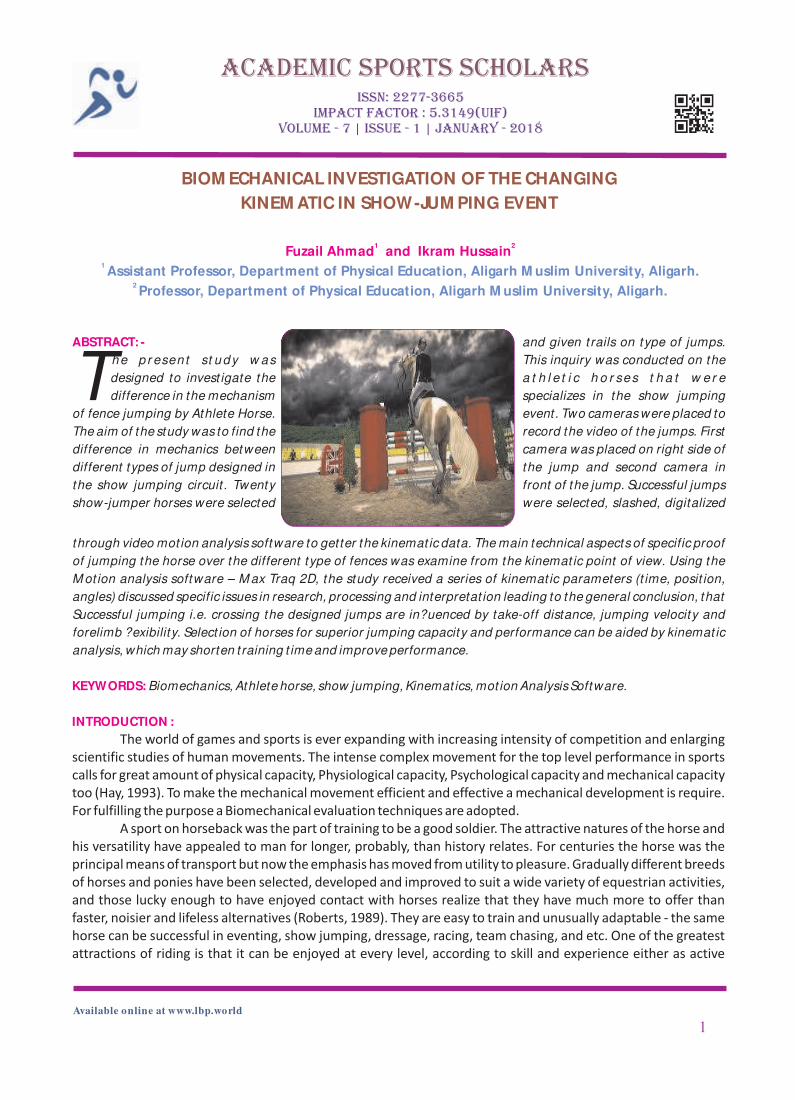
BIOM ECHANICAL INVESTIGATION OF THE CHANGING
KINEM ATIC IN SHOW-JUM PING EVENT
Available online at www.lbp.world
ABSTRACT: -
he p r esen t st udy w as
designed to invest igate the Tdifference in the mechanism
of fence jumping by Athlete Horse.
The aim of the study was to find the
difference in mechanics between
different types of jump designed in
the show jumping circuit . Twenty
show-jumper horses were selected
1
Academic Sports ScholarsISSN: 2277-3665
Impact Factor : 5.3149(UIF) Volume - 7 | Issue - 1 | january - 2018
1 2Fuzail Ahmad and Ikram Hussain
1 Assistant Professor, Department of Physical Education, Aligarh M uslim University, Aligarh.
2 Professor, Department of Physical Education, Aligarh M uslim University, Aligarh.
through video mot ion analysis software to getter the kinemat ic data. The main technical aspects of specific proof
of jumping the horse over the different type of fences was examine from the kinemat ic point of view. Using the
M ot ion analysis software – M ax Traq 2D, the study received a series of kinemat ic parameters (t ime, posit ion,
angles) discussed specific issues in research, processing and interpretat ion leading to the general conclusion, that
Successful jumping i.e. crossing the designed jumps are in?uenced by take-off distance, jumping velocity and
forelimb ?exibility. Select ion of horses for superior jumping capacity and performance can be aided by kinemat ic
analysis, which may shorten t raining t ime and improve performance.
Biomechanics, Athlete horse, show jumping, Kinemat ics, mot ion Analysis Software.
The world of games and sports is ever expanding with increasing intensity of competition and enlarging
scientific studies of human movements. The intense complex movement for the top level performance in sports
calls for great amount of physical capacity, Physiological capacity, Psychological capacity and mechanical capacity
too (Hay, 1993). To make the mechanical movement efficient and effective a mechanical development is require.
For fulfilling the purpose a Biomechanical evaluation techniques are adopted.
A sport on horseback was the part of training to be a good soldier. The attractive natures of the horse and
his versatility have appealed to man for longer, probably, than history relates. For centuries the horse was the
principal means of transport but now the emphasis has moved from utility to pleasure. Gradually different breeds
of horses and ponies have been selected, developed and improved to suit a wide variety of equestrian activities,
and those lucky enough to have enjoyed contact with horses realize that they have much more to offer than
faster, noisier and lifeless alternatives (Roberts, 1989). They are easy to train and unusually adaptable - the same
horse can be successful in eventing, show jumping, dressage, racing, team chasing, and etc. One of the greatest
attractions of riding is that it can be enjoyed at every level, according to skill and experience either as active
KEYWORDS:
INTRODUCTION :
and given t rails on type of jumps.
This inquiry was conducted on the
a t h l e t i c h o r ses t h a t w e r e
specializes in the show jumping
event . Two cameras were placed to
record the video of the jumps. First
camera was placed on right side of
the jump and second camera in
front of the jump. Successful jumps
were selected, slashed, digitalized
participants or interested spec¬tators (Watson, 1989).
Show jumping is a relatively new equestrian sport. Which came into force in England in the 18th century.
A jumping competition is one in which combination of the horse and competitor is tested under various
conditions over a course of obstacles. It is a test intended to demonstrate the horse’s freedom, its energy, its skills
and its obedience in jumping and the competition’s horsemanship.
Jumping competition had been taken place after the Second World War. It appears that the first
competition for show-jumping took place in Paris in 1866. In 1912, show jumping was included in the Olympic
Games for the first time (FEI, n.d.). At that time eight countries got together to draw up the rules for some
guidelines for show jumping, i.e: Belgium, Denmark, France, Italy, Japan, Norway, Sweden and the United States
of America. There are five types of show jumping events in the equestrian sports i.e.: Topscore, Knockout
jumping, Rescue relay, Puissance and six bars.
The main complexity in show jumping event seems to be the obtaining high jumping performance of the
horse over the fence in as short as possible time, generating maximum power, maintain the balance, reducing
the injury and having great efficiency (Morgan, 1962).
Various authors introduces the methods for assessing the variability of horse and human movement and
superior methods for data analysis specific to horse movement in jumping event. The methods used to obtain
such information must satisfy the scientific requirements in terms of confidence and accuracy of the
methodology for their application. For kinematic characteristics, Real-time motion analysis is the essential tool
in monitoring sportive technique, on is an and involves the existence of an operational system through which the
data that are acquired by using software technology, can be processed, interpreted and exploited for accurate
description and awareness of the technical issues. (Payton & Bartlett, 2008).
The study aim to bring out the specific kinematic element to jump by the horse in show jumping event.
To draw the conclusion the study finds the difference in the jumping the obstacle successfully.
The research protocol followed during the investigation was presented in five sections as preliminary
investigation, selection of subjects, filming procedure, selection of trails and selection of frames for analysis.
For the study one Jumping mare of age of five year old and height = 170 cm was examined to jump
parallel jump at the height & width of 100 cm and 80 cm respectively. The mare was academy-level jumping
horse at national division in an equestrian sports club in India. Participating mare was free from musculoskeletal
injury/pathology at the time of data collection.
A Canon camera was used to record motion of the horse while jumping the obstacle i.e: parallel bar
jump. A 2-D kinematic data from the right extremities of the horse at 50 Hz was captured from each trail
performing maximal jumping with a 4 stride run up and an approach. The jump was positioned such that it
allowed the horse to take clear jump over the parallel jump. In accordance to the protocol the camera was
position perpendicular to sagittal plane of the jumping motion to record the full motion. Two Dimensional
calibrating frame was used to calibrate the video of the jumping motion of the horse over the obstacle.
The Angles of Joints (Elbow, Knee, Stifle and Hock), Velocity during Different phases (Take-off, In-flight
and Landing) and Stride length were selected as the parameter of the study. A t-test statistical procedure was
used to draw the result.
M ETHODOLOGY:
Available online at www.lbp.world
2
Volume - 7 | Issue - 1 | january - 2018BIOM ECHANICAL INVESTIGATION OF THE CHANGING KINEM ATIC IN SHOW-JUM PING EVENT

Result and Discussion:
Table no. 1
Table no. 2
CONCLUSION:
REFERENCES
The analysis of data table-1 shows that there is a significant differences exist between both the
successful jumps and unsuccessful jumps in Velocity (Vt) during Take-off phase, Velocity (Vf ) during In-flight
phase and Stride Length as obtain‘t’ ratio is greater than the required ‘t’ value of 2.228. Whereas insignificance
differences in velocity of landing (Vl ) exist between both successful jumps and unsuccessful jumps.
The analysis of data table-2 shows that there is a significant differences exist between both the
successful jumps and unsuccessful jumps in Stifle joint angle (SA) during jumping the fence as the obtain‘t’ ratio
is greater than the required ‘t’ value of 2.228.
Whereas insignificance differences is found in Elbow joint angle (EA), Knee joint angle (KA) and Hock
joint angle (HA) between both the jumps.
The study present some reference values on biomechanics of jumping of horse over the fence. The
Stride length of the horse before Take-off is directly proposal to the velocity during jump. Velocity during landing
may affect the successful jump. Elbow joint angle and stifle joint angle helps the horse to cross over the fence.
Whereas, Knee joint angle and Hock joint angle assist the horse during Take-off.
International Federation for Equestrian Sports, (n.d.). History of equestrian event at the 1912 Olympic games in
Stockholm, Sweden.
German national Equestrian Federation (1985). The principles of riding, Sherwsbury, Kenilworth Press.
Gillet, J. & Gillet, M. (2014). Sports, Animal and Society. NY: Routledge.
Goodwin, D. (2005). Defining the terms and processes associated with equitation. Proceedings of the 1st
International Wquitation Science Symposium. Melbourne, Australia.
Available online at www.lbp.world
3
Volume - 7 | Issue - 1 | january - 2018
Variables
No. Mean. S.D t-value
Vt SS 06 7.48 0.46
3.231* US 06 6.05 0.99
Vf SS 06 5.90 0.35
4.249* US 06 5.08 0.32
Vl SS 06 6.85 0.29
1.079 US 06 6.62 0.44
SL SS 06 2.28 0.26
3.566* US 06 1.76 0.25
Variables
No. Mean. S.D t-value
EA SS 06 118.17 10.03
1.995 US 06 128.83 8.42
KA SS 06 179.33 0.817
0.286 US 06 179.17 1.169
SA SS 06 100.17 3.76
3.166* US 06 111.50 7.92
HA SS 06 125.33 3.88
0.224 US 06 126.00 6.16
BIOM ECHANICAL INVESTIGATION OF THE CHANGING KINEM ATIC IN SHOW-JUM PING EVENT
Hay, J. G. (1993). Human mechanics; Physiological aspects, 4th edition, New Jersey: Englewood Cliffs.
Kearsley, C.G. S., Woolliams, J A., Coffey, M. P. & Brotherstone, S. (2008). Use of competition data for genetic
evaluation of eventing horses in Britain: Analysis of the dressage, showjumping and cross country
phases of eventing competition. Livestock Science, 118, 72-81.
Minetti, A. E., Ardigo, L. P., Reinach, E. & Saibene, F. 1999. The relationship between mechanical work and energy
expenditure of locomotion in horses. J. Exp. Biol. 202, 2329–2338.
Miragaya, A M. (2006). The process of inclusion of women in the olympic games.
Morgan, M. H. (1962). The art of Horsemanship by Xenophon, London, J. A. Allen.
Payton, C. J. & Bartlett, R. M. (2008). Biomechanical evaluation of movement in sport and exercise. Routledge
publishing house – Taylor & Francis Group, London, 33 – 35.
Powersa, P. & Harrison, A. (2002). Effects of the Rider on the Linear Kinematics of Jumping Horses, Sports
Biomechanics, Vol. 1(2). 135-146.
Robert, P. (1989). The complete book of the Horse. New York: W.H.Smith Publishers Inc.
Santamaria, S., Bobbert, M. F., Back, W., Barneveld, A. & Van Weeren, P. R. (2006). Can early training of show
jumpers bias outcome of selection event? Livestock Science, 102, 163-170.
Watson, M. G. (1989). The Handbook of Riding. Italy: Stephen Greene Press.
Available online at www.lbp.world
4
Volume - 7 | Issue - 1 | january - 2018
Fuzail Ahmad
Ikram Hussain
Assistant Professor, Department of Physical Education, Aligarh M uslim University,
Aligarh.
Professor, Department of Physical Education, Aligarh M uslim University, Aligarh.
BIOM ECHANICAL INVESTIGATION OF THE CHANGING KINEM ATIC IN SHOW-JUM PING EVENT
5/18/2020 Curriculum Assessment of Teacher Education Program in Physical Education: A Meta-analysis
https://webcache.googleusercontent.com/search?q=cache:yCHdtVYFogoJ:https://pdfs.semanticscholar.org/330f/e9628e9388555c7567d7d154f6… 1/9
This is the HTML version of the file https://pdfs.semanticscholar.org/330f/e9628e9388555c7567d7d154f63e1cf5ad9b.pdf.Google automatically generates HTML versions of documents as we crawl the web.
Tip: To quickly find your search term on this page, press Ctrl+F or -F (Mac) and use the find bar.
Page 1
Curriculum Assessment of Teacher Education Programin Physical Education: A Meta-analysis
Jyoti Maan1, Ikram Hussain2 and Kalpana Sharma3
1Amity School of Physical Education and Sports Sciences, Amity University,Uttar Pradesh, Noida 201 313, Uttar Pradesh, India
2Department of Physical Education, Aligarh Muslim University,Aligarh, Uttar Pradesh, India
3Amity School of Physical Education and Sports Sciences, Amity University,Noida 201 313, Uttar Pradesh, India
E-mail:1<[email protected]>, 2<[email protected]>,3<[email protected]>
KEYWORDS Sports. Benchmarking. University. Teaching. Report. Evaluation
ABSTRACT The present paper was undertaken with an objective to find the existing process of curricular deliveryof physical education program. A systematic search of the review of literature was undertaken from 1985 to 2016.Studies were included if they were having a component of physical education with special reference to teachereducation. Findings from reviews, papers and abstract from 1985 to 2016 were analyzed. The qualitative meta-analysis revealed that physical education curriculum differs from country to country and within the institutions inthe country (India). University or colleges do not have same functional and delivery process in India. It wasconcluded that the objectives of teacher education program in physical education vary as the result of geographicaldifferences at national and international platform. It was concluded that curriculum in India needs to be benchmarkedglobally to prepare students with the global career options in physical education and sports.
INTRODUCTION
Physical Education teacher preparation pro-gram is a critical and essential component ofcurricula in primary, elementary, secondary anduniversity level. It plays a vital role to preparefuture sports leaders. The curriculum enablesstudents to innovate new things, to become ac-tive learner and help them in developing the ra-tionale and objective approach towards theirheritage environment, tradition and culture. Hard-man and Marshall (2000) reported at Berlin Phys-
allocation, subject status, material, human andfinancial resources, gender and disability issuesand the quality of program delivery. Accordingto Joseph et al. (2014) ensuring physical educa-tion curricula is the responsibility of physicaleducators, with ultimate accountability restingwith the profession; and ensuring quality phys-ical education experiences for every student callsfor advocacy by the profession; and profession-al physical educators are primary caregivers ofstudents with regard to physical education; andschools are primary venues through which phys-
Int J Edu Sci, 22(1-3): 37-44 (2018)
DOI: 10.31901/24566322.2019/23.1-3.1021
© Kamla-Raj 2018
PRINT: ISSN 0975-1122 ONLINE: ISSN 2456-6322

5/18/2020 Curriculum Assessment of Teacher Education Program in Physical Education: A Meta-analysis
https://webcache.googleusercontent.com/search?q=cache:yCHdtVYFogoJ:https://pdfs.semanticscholar.org/330f/e9628e9388555c7567d7d154f6… 2/9
Address for correspondence:Dr. Kalpana SharmaASPESS, Amity University Campus,Sector 125, NOIDA, UP, India, 201313Telephone: 0120 4392879 / 9871010619Fax: 0120 4659009E-mail: [email protected]
ical Education World Summit in November 1999in a report by the World Health Organisationwhich has provided an insight into the situationof physical education worldwide. They confirmeda decline and/or marginalization of physical ed-ucation in schools in many countries of the worldwith perceived deficiencies in curriculum time
ical education should be delivered. Improvementin Physical education is not only desirable butit is urgently required to fill the gap betweenwhat students learn and how they apply thislearning. Policy makers have formulated a finecurriculum but they have ignored the real con-ditions in the school or colleges. The differencebetween this reality and present curricula hasmade this whole program futile. Physical educa-tion is considered as the least important subjectamong all academic subjects.
Many nations carry out sample evaluationof their teacher training program in order to de-velop teacher training curricula. How teachers
Page 2
38 JYOTI MAAN, IKRAM HUSSAIN AND KALPANA SHARMA
are being prepared and how they ought to beprepared are important questions in order to for-mulate the plan for preparing a teacher. Physicaleducation program is facing an uphill task ofproviding meaningful learning experiences foryouths. With the changing time, a universal pro-gram of health and physical education pedago-gy is emphasized by Mohanty (2010). PhysicalEducation is perceived as a non-educationalactivity in Asian countries with special focus onIndia and Pakistan. Physical Education is gener-ally not even a part of the curriculum. There isno special provision in physical education fordisabled students. Physical Education is con-sidered as unfeminine; therefore girls are restrict-ed to take part in Physical Education activities.Curriculum of physical education in Asian coun-tries does not meet the requirement of presentsociety. Teacher education should be endowedwith the latest trends and concept of global rel-evance which are important for universalizationof teacher education as observed by Hardmanand Marshall (2000).
Curriculum Assessment of any institution hasstarted with goal and objective of program andend with student learning outcome structure. Itis essential to know that what students shouldknow by the end of course work. The assess-ment program of curriculum of any institutionincludes accreditation, unit of assessment, cri-teria of assessment, curricular designing andplanning, curriculum transaction and evaluation,research development and extension, infrastruc-ture, learning resources, students support pro-
sion to curriculum makers, policymakers,physical education personnel’s and stake-holders toward reconstructing curriculumand its development and delivery with glo-bal prospective.
To intend guidelines for reconstruction ofthe curriculum of Physical Education basedon the outcomes of the study.
To highlight the differences and similaritiesin the curriculum of physical educationteacher preparation program and process-es of physical education.
METHODOLOGY
The study reviewed literature having curric-ular reference to teacher education, curriculumanalysis, benchmarking, standards or physicaleducation, advocacy. Survey studies and reportsof the various international and national agen-cies have been referenced. All reviews includedwere published papers (print or online) reportsup to 2016. Studies which were directed towardidentifying achievement were excluded. Themeta-analysis was conducted to identify policyframeworks, uniformity of curriculum, levels ofdelivery, facility availability, financial assistance,time allotment, literature of the subject, instruc-tional process, evaluation and assessment,teacher education, implementation, inclusivity,innovative approach, and monitoring etc. Theseareas were reviewed from the studies to identifythe gaps as well as make recommendationsaccordingly.

5/18/2020 Curriculum Assessment of Teacher Education Program in Physical Education: A Meta-analysis
https://webcache.googleusercontent.com/search?q=cache:yCHdtVYFogoJ:https://pdfs.semanticscholar.org/330f/e9628e9388555c7567d7d154f6… 3/9
gression organisation and help in contributingto nurturing worldwide competencies amongstudents and teachers as emphasized by NAAC(2007).
Physical education as a subject is being stud-ied at the senior secondary level of education.The addition of physical education in the presentday curriculum of education has proved to be ofgreat help to students. University has widenedits scope. It is contributing in the field of teachereducation by broadening its functions and thesefunctions can be the basis of formulation of na-tional educational policy.
Objectives
The aim of the paper is: To analyze physical education curriculum
transaction globally. It may provide envi-
RESULTS
Twenty national and international studiesregarding the status of physical education inschools and colleges were reviewed. The re-viewed studies have been briefed as under bythe scholar. University Grants Commission(2013) has drawn attention to the new globallycompetitive world. The need is not only for phys-ical education as an integral part of curriculumonly but physical education should be intro-duced with wider scope by including new sub-jects like sports marketing, health managementetc. at the university level. Also, physical edu-cation program should focus on creating a pos-itive attitude among students by including yoga.Present curriculum of physical education at high-er education is not dynamic and needs revision.
Page 3
PHYSICAL EDUCATION CURRICULUM ASSESSMENT 39
It does not have sports marketing which meetsthe requirements of modern society. A numberof inventory of sports were suggested for re-structuring the curriculum of physical educa-tion by Nijhawan et al. (2008).
The curriculum of physical education is notbeing implemented properly in Mumbai city col-leges due to the poor condition of resourcesavailable there. Physical education is not a com-pulsory subject in the curriculum. Asai (2012)reports that coach facilities and play fields fordifferent sports need to be provided to raise thestandard of sports. The status of sports andphysical education in Indian society is deprived.There is a need to revise curriculum of physicaleducation to improve the status of physical ed-ucation suggests Somaraya (2012).
Physical education needs to be introducedas an integral subject in colleges. Many prob-lems have been reported by the teacher in refer-ence to status of physical education programssuch as, inadequate financial assistance and timeallotment and resources. No college has sub-scribed to journals of physical education in theirinstitutions reports Swain (2013). The teachershave a similar and positive opinion towards therestructured curriculum at undergraduate levelin Kerala. The higher authorities must confine
is a certain gap in between quality and quantityof teacher education. The role of teacher educa-tor is very challenging in requisites of trainingskills, research guidance, teaching aspect, cur-riculum designing and policy making which donot find a position in existing curricula. It is sug-gested that modifications should be broughtabout in the preparation of teacher educatorswith new dimensions. It should be systematical-ly developed on empirical basis reports Mahal(2011). Doðan and Altun (2013) conducted astudy on teachers’ perception towards the ef-fectiveness of curriculum mapping in three per-spectives, short range planning, long-range plan-ning and standard alignment. It shows curricu-lum mapping is an effectual tool for curriculumplanning. The most influential factors are teach-ing experience, devoted time and self-knowl-edge, feedback for teachers of Turkey. The studyshows teachers who have more experiencespend more time and prior knowledge of curric-ulum mapping as an effective tool.
Song (2013) found that attitude of teachers,students and organisation towards physicaleducation curriculum is to reframe health andphysical education practice. Analysis of curric-ulum of higher education in China is an accumu-lative effort to show a vision to develop a newmodel of physical education curriculum. Teach-
5/18/2020 Curriculum Assessment of Teacher Education Program in Physical Education: A Meta-analysis
https://webcache.googleusercontent.com/search?q=cache:yCHdtVYFogoJ:https://pdfs.semanticscholar.org/330f/e9628e9388555c7567d7d154f6… 4/9
steps to eliminate the minor limitations in therestructured curriculum at undergraduate level.Then only the higher education of the state canwithstand the challenges of the globalized erasuggests Santhosh (2014).
To prepare teacher educator through M.Ed.curricula reflects the demand of high quality ofteachers in school. There is no coordination andlinkage between curriculum of school educationand teacher education so that there is an urgentneed to formulate the curriculum on basis ofteacher’s reviews reports Yadav (2013). TheWorld Health Organization (WHO) (2000) report-ed the status of physical education in schoolsworldwide that has perceived it as non-educa-tional activity in Asian countries with specialfocus on India and Pakistan. Physical Educa-tion is generally not even a part of the curricu-lum. There is no special provision in physicaleducation for disabled students as observed byHardman and Marshall (2000).
It has been revealed that quality of M.Ed.program has not sustained the effect of global-ization. Content analysis is being done of M.Ed.curricula of different universities of India. There
er Education improvement project shows theparameter to know the improvement of prospec-tive teachers program. This project was done inGrambling University, LA. The project highlight-ed some indicators as curriculum revision, stu-dent assessment, faculty development, programmonitoring and instructional development sug-gests Mills (1985-86).
Teacher perception towards the effectivenessof curriculum planning is investigated. It showscurriculum mapping is an effectual tool for cur-riculum planning. The most influential factorsare teaching experience, devoted time, self-knowledge and feedback. It showed special ef-fects on their professional development andchoices in future (Dogan 2013).
Evaluation of physical education programwas done on the basis of some indicators suchas course content; course objectives; curricu-lum development; curriculum evaluation; edu-cational resources; elementary secondary edu-cation; faculty development; mission state-ments; physical education; program evaluation;student educational objectives as reported byArmstrong et al. (1996).
Page 4
40 JYOTI MAAN, IKRAM HUSSAIN AND KALPANA SHARMA
Physical Education Teacher Education (un-der-graduate training program) was investigat-ed through some descriptors like worldview ori-entation, underpinning discourse, curricula,structure and organization of Canada. The re-sult was analyzed on the basis of views of 36teachers from 20 different universities. Physicaleducation teacher education in Canada as sug-gested by the author’s needs to be relooked inlight of the changing societal and student needsfor globally, socially and culturally responsivephysical education teacher education Melny-chuk et al. (2011). The Global Forum for PhysicalEducation Pedagogy was organized in SouthAfrica in 2014. It focused on reframing the phys-ical education pedagogy. A hundred profession-als included from fifty countries spoke aboutthe contemporary challenges faced by the teach-er educator of physical education. It emphasizedto promote global best practices states Naul etal. (2012). Mihaela and Iulian (2015) have foundin their qualitative study that curricular physicaleducation activities differ at primary and sec-
reviewed the perspectives and relevance of thenational curriculum framework 2009, in the his-torical perspective of the development of theframework.
A comparative study of selected nationalpolicies of different five countries which areAustralia, UK, Hungary, Sweden and France isbeing done on best practices in sport and phys-ical activity for health promotion. It shows eachcountry has a different approach in nationalpolicies to promote physical activity and health.Policies are not self-implemented. Some coun-tries have made policies to promote only healthstatus. On another hand, some have a focus onbest practices. There is a gap in best practicesamong different countries. On the basis of thereport five components; capacity, consultation,coordination, and communication and commit-ment are summed up. These are building blocksto promote sports, health and physical activitynationwide reports Ivarsson (2014).
Thomson and Robertson (2014) analyzed thecurriculum policies of thirteen provinces and
5/18/2020 Curriculum Assessment of Teacher Education Program in Physical Education: A Meta-analysis
https://webcache.googleusercontent.com/search?q=cache:yCHdtVYFogoJ:https://pdfs.semanticscholar.org/330f/e9628e9388555c7567d7d154f6… 5/9
ondary levels despite having common infrastruc-ture requirements.
PECAT is a tool for analyzing written physi-cal education curriculum to conclude how inti-mately they align with national standards forthe high quality physical education program. Itconducts a clear, complete and consistent anal-ysis of physical education curriculum. It intro-duces to assess the high quality of physicaleducation program on some parameters: goal,overview, lesson plan, and assessment of stu-dent learning, instruction preparation, learningexperiences and curriculum alignment as report-ed by Wechsler et al. (2006).
Curriculum evaluation is an important part ineducational processes. Different evaluation pro-cedures, methods and instruments are used inOman. It consists of, mission and vision of cur-riculum evaluation, aims and learning objectivesand outcomes, methods and approaches, re-sources, instruction time, assessment, teachertraining, management and evaluation researchinto stakeholders’ needs and expectations inOman and also developing specific learning out-comes for each grade of the curriculum as stud-ied by Al-Jardani (2012). Mann and Sharma(2015) studied the teacher preparation programin physical education and found differences inthe physical education curriculum delivered invarious institutions. Mondal et al. (2015) have
territories by using a framework based on tradi-tional and emerging physical education modelin the literature. The findings of the study showthat, the learning outcome and philosophies ofcurriculum policies replicate largely more tradi-tional physical education models. This authorsuggests the physical education policy shouldbe revised in the light of present social realitiesthrough a broader understanding of physicalactivity and wellness.
DISCUSSION
It has been observed that policy frameworkis not put into practice. There is a certain gap inuniformity of curriculum across the country.There is currently no vacancy for physical edu-cation teachers at primary level in India (UGC2003). Various problems have been reported byteachers in reference to the status of physicaleducation program such as, inadequate finan-cial assistance, time allotment and resources.Odisha Higher Education faced the criticism inthe context of curriculum, instructional practic-es and evaluation system. M.Ed. curricula re-flect the demand of high quality of teachers inschool.
There is no coordination and linkage betweencurriculum of school education and teacher ed-ucation. Most of the universities do not provide
Page 5
PHYSICAL EDUCATION CURRICULUM ASSESSMENT 41
minimal facilities of sports to the students onthe university campus. It has been seen thatmany features influenced the status of sports ina country such as implementation of subject sta-tus, academic issue curriculum aim, content,monitoring and equity, resources. Physical Edu-cation is perceived as non-educational activityin Asian countries with special focus on Indiaand Pakistan. There is no special provision inphysical education for disabled students. Actu-al implementation regularly does not meet upwith legal expectations. It has been noted thatthe quality of M.Ed. program has not sustainedthe effect of globalization. This study was con-ducted to identify the problem in teacher Educa-tion Program in four countries. There are lots ofdisparities in the teacher education program in
ferent countries. On the basis of the report, itcan be said that it is a sum up five components;capacity, consultation, coordination, and com-munication and commitment. These are buildingblocks to promote sports, health and physicalactivity nationwide. It introduces to assess ahigh quality of physical education program onsome parameters: goal, overview, lesson plan,and assessment of student learning, instructionpreparation, learning experiences and curricu-lum alignment. Evaluation of physical educationprogram is done on the basis of some indicatorssuch as course content; course objectives; cur-riculum development; curriculum evaluation;educational resources; elementary secondaryeducation; faculty development; mission state-ments; physical education; program evaluation;

5/18/2020 Curriculum Assessment of Teacher Education Program in Physical Education: A Meta-analysis
https://webcache.googleusercontent.com/search?q=cache:yCHdtVYFogoJ:https://pdfs.semanticscholar.org/330f/e9628e9388555c7567d7d154f6… 6/9
term of program duration, curriculum weight age,curricular areas and its execution at secondarystages in four countries. It has been examinedthat focus on theory, infrastructure, ICT facility,transaction method are very pitiable in four coun-tries. There is no correlation between preservesteacher education curriculum and school curric-ulum. There is a certain gap in between qualityand quantity of teacher education. A critical andcontent analysis is being done of M.Ed. curricu-la of the different universities of India for pre-service teacher education program in India.
The status of sports and physical educationin Indian society is underprivileged. Teachereducation improvement project shows the pa-rameter to know the improvement of prospectiveteachers program. The project done in GramblingUniversity Los Angles (1985-86) highlighted someindicators such as curriculum revision, studentassessment, faculty development, program mon-itoring and instructional development. Analysisof curriculum of higher education in China is ac-cumulative effort to show a vision to develop anew model of physical education curriculum.
It is concluded that curriculum content, struc-ture, objective and evaluation pattern is realis-tic. A lot of research directed toward finding so-lutions to the issues and problems of physicaleducation are desired. Physical EducationTeacher Education (undergraduate training pro-gram) was investigated through some descrip-tors like worldview orientation, underpinningdiscourse, curricula, structure and organizationof Canada. Curriculum evaluation is an impor-tant part in educational practices. It is revealedthat there is a gap in best practices among dif-
student educational objectives.The major differences are seen in the objec-tives of Physical Education Program among thecountries due to the social and economic factorof every country. This study analyzed the cur-riculum policies of thirteen provinces and terri-tories by using a framework based on traditionaland emerging physical education model in theliterature.
The finding of the study shows that the learn-ing outcome and philosophies of curriculumpolicies replicate largely more traditional physi-cal education models (European states, Canadi-an Analysis). Physical Education professionalsneed to address the quality physical educationprogram delivery with dedicated outcomes.
CONCLUSION
It is found out that there has been a consid-erable difference between national standards ofphysical education in India and other countries.The difference in physical education objectivesdue to the social and economic development ofeach country was analyzed. In India, presentcurriculum does not prepare students with glo-bal career option, only traditional career optionis provided to the future leader of sports. It isevident that there have been some variation, in-discretion, and gaps between proposed curricu-lums. The policy framework is not put into prac-tice. There are certain gaps in uniformity of cur-riculum across the country. All studies signifiedthat the status of physical education is under-privileged in India. Facilities, resources, time al-lotment, financial assistance and learning re-
Page 6
42 JYOTI MAAN, IKRAM HUSSAIN AND KALPANA SHARMA
sources are extremely poor. It is not perceivedas an educational activity. It is found that thereis no coordination and linkage between curricu-lum of school education and teacher education.On the basis of review of 12 national studies, itis found that teachers, students, stakeholdersand administrators have a positive attitude to-wards formulating the curriculum in the light ofglobal practices whereas training skills, researchguidance, teaching aspect, curriculum design-ing and policymaking areas need to be strength-
es and financial assistance are extremely poor inIndia. Curriculum assessment is required to eval-uate the efficacy and accountability of teacherpreparation program. This study will help to-ward the development of the standard curricu-lum of physical education.
In the light of the study and the nature of thestudy the following conclusions have beendrawn. It is concluded that curriculum content,structure, objective and evaluation pattern isrealistic. On the other hand, teacher education

5/18/2020 Curriculum Assessment of Teacher Education Program in Physical Education: A Meta-analysis
https://webcache.googleusercontent.com/search?q=cache:yCHdtVYFogoJ:https://pdfs.semanticscholar.org/330f/e9628e9388555c7567d7d154f6… 7/9
ened. Most of the studies have supported thatthere is a certain gap in between quality andquantity of teacher education and higher edu-cation faced the criticism in the context of cur-riculum, instructional practices and evaluationsystem in India.
International studies show some perspec-tives towards physical education curriculum. Itreveals that curriculum assessment or evalua-tion is an ongoing process in some countriesassessment and evaluation pattern is most im-portant part of educational practices. It is con-cluded that curriculum content, structure, ob-jective and evaluation pattern is realistic. Mostof the studies reveal this evaluation pattern phys-ical education program consisting of some indi-cators such as course content; course objec-tives; curriculum development; curriculum eval-uation; educational resources; elementary sec-ondary education; faculty development; missionstatements; physical education; program evalu-ation; student educational objectives curricu-lum mapping is also applied to update the cur-riculum. It is an effective tool to nurture the teach-er education program of physical education.Each country has different approaches in na-tional policy, research area, facilities, teachingand learning practice. Technology is extremelygood to promote physical education program.
This meta-analysis of national and interna-tional studies provide a new starting point forphysical education teachers, personnel and oth-er stakeholders with the goal of developing thecurricula that meet the unique need and interestof learners at the school level or community lev-el. It is concluded that the teacher educationpreparation program at various institutions aredifferent as their objectives vary as the result ofgeographical difference on the national and in-ternational platform. Present curriculum in Indiadoes not prepare students with the global ca-reer option. It is concluded that facilities, resourc-
program in physical education to contribute tothe substance outcome based education pro-viding learner with the opportunities and chal-lenges of the profession. It is suggested thatbefore reforming a curriculum it is necessary toexecute the facilities, resources and teacher’savailability in college.
RECOMMENDATIONS
The paper recommends curriculum revisionin physical education. The curriculum could bedesigned benchmarking with the internationaltrends. Courses should be reframed in conso-nance of global practices. Physical educationshould be introduced with wider scope by in-cluding new subjects like sports marketing,health management etc. Revised curriculumshould be able to provide with new career op-tion so that courses of physical education mightattract the youth more widely. There is an ur-gent need to upgrade the facility resources likeplay field, gymnasium, laboratory, library, sportsequipments and swimming pool in school andcolleges. Government policymakers and quali-fied educators should take responsibilities toexecute the policies according to the resourcesand professional standards. To raise the stan-dard of teacher preparation program all proce-dure should be uniform in all colleges/ universi-ty. Policymakers and government agenciesshould deal with the existing need of infrastruc-ture and resources for a sustainable outlook ofphysical education. Physical education seemsto have proficient the same status as other sub-jects. There is concern about teacher supply andquality: insufficiency and inadequacy of appro-priately qualified physical education teachersare widely evident, particularly at the primaryschool level. There is need to explore more inter-national trends in national settings through ed-ucational trips. It gives more exposure to the
Page 7
PHYSICAL EDUCATION CURRICULUM ASSESSMENT 43
students on the international platform. Thus thefollowing recommendations are being present-ed as result of this meta-analysis:
i. Curriculum revision is urgently requiredto meet the demand of high excellenceprogram of physical education.
Final Report. Manchester: University of Manches-ter.
Ivarsson V 2014. Best Practices in Sport and PhysicalActivity for Health Promotion: A Comparative Studyof Selected National Policies. Lausanne: Swiss Fed-eral Office for Public Health.
Kipng’etich Kirui J, Rotich K Alexander 2014. A sur-
5/18/2020 Curriculum Assessment of Teacher Education Program in Physical Education: A Meta-analysis
https://webcache.googleusercontent.com/search?q=cache:yCHdtVYFogoJ:https://pdfs.semanticscholar.org/330f/e9628e9388555c7567d7d154f6… 8/9
ii. Courses should design in the light of needof sports industry/school/colleges. Suchcourses should be reframed in conso-nance of global practice.
iii. Physical education should be introducedwith wider scope by including new sub-jects like sports marketing, health man-agement etc.
iv. New career options to physical educa-tion to attract the youth more widely.
v. Facility resources like playfield, gymna-sium, laboratory, library, sports equipmentand swimming pool in school and colleg-es are upgraded.
vi. Qualified educators to take responsibili-ties to execute the policies according tothe resources and professional standards.
vii. Uniformity in teacher preparation programin physical education to procedure com-petitive product.
viii. Teacher supply and quality be ensuredproportionately at all levels.
ix. International benchmarking in physicaleducation be promoted.
ACKNOWLEDGEMENTS
The researchers acknowledge the facilityprovided by Amity University, Uttar Pradesh tothem to conduct the research work.
REFERENCES
Al-Jardani KSS 2012. Evaluating a developed frame-work for curriculum evaluation in Oman. Interna-tional Journal of English Linguistics, 2(6): 17-26.
Armstrong RG, Prior B, Brubaker D, Bloomcamp PA1996. Physical Education Grades K-12 ProgramEvaluation 1995-1996: Focus on Program Evalua-tion. Report, Des Moines Public Schools, Iowa, pp.1-47.
Asai KK 2012. An investigation into the physical edu-cation facility available in junior colleges in Mum-bai city. International Journal of Social Scienceand Interdisciplinary Research, 1(10): 83-94.
Doðan RAS, Altum S 2013. Teachers’ perceptions onthe effectiveness of curriculum mapping: The caseof Turkey. WJELS, 3(4): 50-60.
Hardman K, Marshall JJ 2000. World-Wide Survey ofthe State and Status of School Physical Education.
vey of the practice of physical education and sportsfor all in secondary schools in Bomet County inKenya. International Journal of Sports Science,4(6): 223-229.
Mahal AHM 2011. Enriching Teacher Educator Prep-aration Curriculum and Testing its Effectiveness.From <http://shodhganga.inflibnet.ac.in/handle/10603/56772> (Retrieved on 19 April 2016).
Mann J, Sharma K 2015. Physical education teacherpreparation programme in Northern India: An anal-ysis. Journal of Physical Education Research, 2(2):53-59.
Melnychuk N, Robinson D, Lu C, Chorney D, RandallL 2011. Physical education teacher education(PETE) in Canada. Canadian Journal of Educa-tion, 34(2): 148-168.
Mihaela IT, Iulian AD 2015. Differences and similari-ties in curriculum and assessment in physical educa-tion in eastern European states. Journal Science,Movement and Health, 15(1): 41-46.
Mills JR 1985-86. Teacher Education ImprovementProject. LA: Grambling State University. From <ht-tps://files.eric.ed.gov/fulltext/ED277674.pdf>.
Mohanty BS 2010 Curriculum Framework for Qualityof Teacher Education: Towards Preparing Profes-sional and Humane Teacher, National Council forTeacher Education, Book Review, E Journal of AllIndia Association for Educational Research, 22(1).
Mondal A, Aniruddha S, Baidya MN 2015. Nationalcurriculum framework for teacher education: A re-view of its perspectives and relevance. Internation-al Journal of Applied Research, 1(9): 776-778.
National Assessment and Accreditation Council (NAAC)2007. Manual for Self-Appraisal of Physical Edu-cation Institutions. Bangalore: National Assessmentand Accreditation Council.
Naul R, Edginton CR, Chin MK 2012. Global forum forphysical education pedagogy 2012 (GoFPEP 2012).The Global Journal of Health and Physical Educa-tion Pedagogy, 1(2): 166-168.
Nijhawan V, Singh K, Sandhu K 2008. A Study of De-velopment of Physical Education Curriculum in theLight of Sports Marketing Perspective. From <www.researchgate.net/.../242601281> (Retrieved on 24April 2016).
Santhosh A 2014. Attitude of teachers towards the re-structured curriculum at undergraduate level in Ker-ala. Journal of Research, Extension and Develop-ment, 2(5):1-10.
Song L 2013. Analysis and Strategy of the CurrentSituation of Physical Education Curriculum Con-struction in Higher Education in China. Proceed-ings 2nd International Conference on ManagementScience and Industrial Engineering, October, Ji-nan, Shandong, pp. 602-605.
Page 8
44 JYOTI MAAN, IKRAM HUSSAIN AND KALPANA SHARMA
Somaraya NA 2012. Sports and physical education in Wechsler H, Mohnson B, Barrios L, Lee SM 2013.

5/18/2020 Curriculum Assessment of Teacher Education Program in Physical Education: A Meta-analysis
https://webcache.googleusercontent.com/search?q=cache:yCHdtVYFogoJ:https://pdfs.semanticscholar.org/330f/e9628e9388555c7567d7d154f6… 9/9
Indian society: An overview. Indian Journal of Re-search, 1(11): 143-144.
Swain BC, Pradhan DK, Palei D 2013. Status of phys-ical education program in degree colleges in in Od-isha: A study. Scholarly Research Journal for Inter-disciplinary Studies, 2(15): 2198-2205.
Thomson DC, Robertson L 2014. Critical analysis ofCanadian physical education curriculum. CriticalEducation, 5(19): 4-20.
University Grant Commission (UGC) 2003. HigherEducation in India: Issues, Concerns and New Di-rections. Report on Recommendation of UniversityGrants Commission Golden Jubilee Seminars heldat Eleven Universities in India, December, UGC,New Delhi, pp. 14-15.
Physical Education Curriculum Analysis Tool. US:National Center for Chronic Disease Preventionand Health Promotion, Centers for Disease Controland Prevention, US Department of Health and Hu-man Services.
WHO 2000. An Update on the Status of Physical Edu-cation in Schools Worldwide. ICSSPE.
Yadav SK 2013. Preparing Teacher Educators: MEdCurriculum Review and Reconstruction. New Del-hi: National Council for Educational Research andTraining, Department of Teacher Education,NCERT.
Paper received for publication on March 2017Paper accepted for publication on March 2018

http://www.iaeme.com/IJMET/index.asp 360 [email protected]
International Journal of Mechanical Engineering and Technology (IJMET) Volume 9, Issue 6, June 2018, pp.360–366, Article ID: IJMET_09_06_041
Available online at http://www.iaeme.com/IJMET/issues.asp?JType=IJMET&VType=9&IType=6
ISSN Print: 0976-6340 and ISSN Online: 0976-6359
© IAEME Publication Scopus Indexed
IMPROVED DESIGN OF JOINT ASSEMBLY
AND THEIR PARTS FOR CRICKET BAT WITH
DETACHABLE HANDLE
Ashish Kumar Katiyar
Research Scholar, Department of Physical Education,
Aligarh Muslim University, Aligarh (U.P.) India
Syed Tariq Murtaza, Ph.D
Associate Professor, Department of Physical Education,
Aligarh Muslim University, Aligarh (U.P.) India
Er. Shamshad Ali
Associate Professor, Mechanical Engg. Section, University Polytechnic,
Aligarh Muslim University, Aligarh (U.P.) India
ABSTRACT
The improved design of joint assembly & their parts, made up of non wood
material are presented. After finding out volume of non-wood material from a
referenced handle based on constraint measurement, from which joint assembly would
be prepared, with the help of this joint assembly the handle would be attached or
detached. The design and manufacturing process of the joint assembly with their parts
has been presented in this paper as per the Law 5-the bat of MCC, 2017 which
quantify the use of non-wood materials up to only one-tenth part from the total volume
of the handle.
Key words: Designing, Joint Assembly, Referenced Handle, Modified Handle, Non-
wood Material, Cane wood (Calamus manan).
Cite this Article: Ashish Kumar Katiyar, Syed Tariq Murtaza and Shamshad Ali,
Improved Design of Joint Assembly and their Parts for Cricket Bat with Detachable
Handle, International Journal of Mechanical Engineering and Technology 9(6), 2018,
pp. 360–366.
http://www.iaeme.com/IJMET/issues.asp?JType=IJMET&VType=9&IType=6
1. INTRODUCTION
This is predominantly marked within the tennis racket design and developments, even
though, much of these improvements only make marginal improvement to the performance
[1]. However as with many sports, the increasing demand among consumers for the latest
high performance sport equipments, now a day’s research is fuelling scientifically and engineered by sports manufacturers particularly for golf club, baseball bats, tennis rackets and
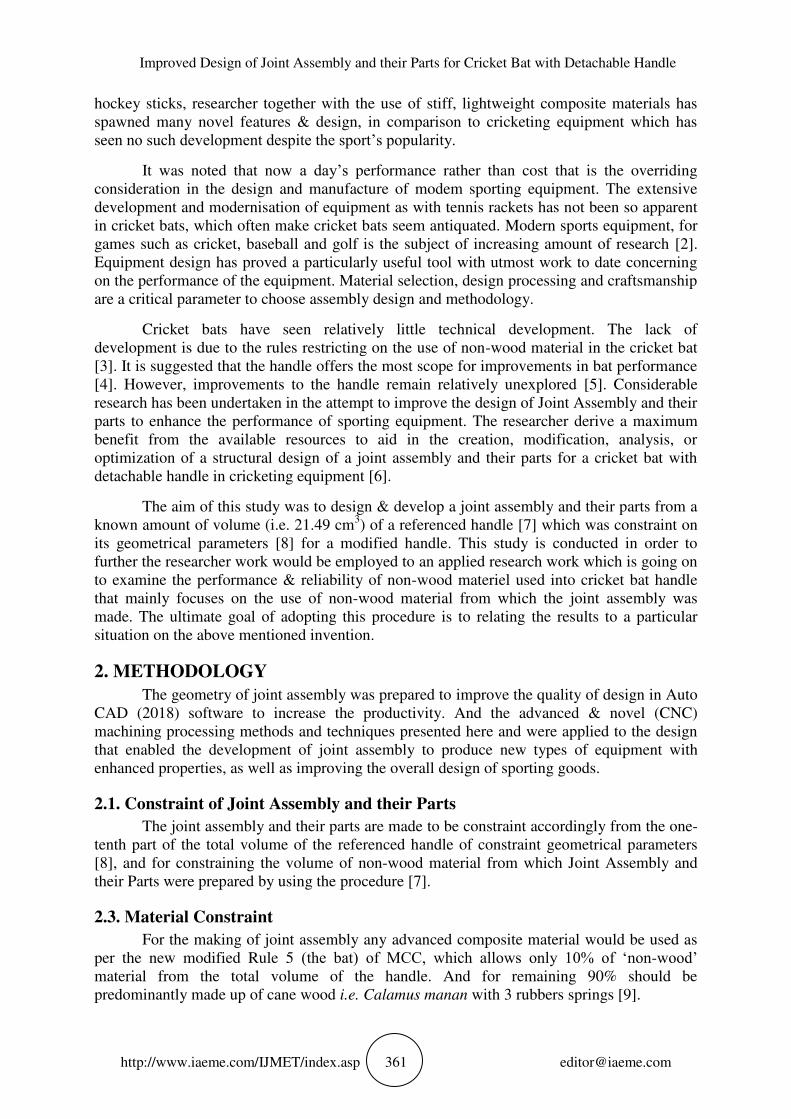
Improved Design of Joint Assembly and their Parts for Cricket Bat with Detachable Handle
http://www.iaeme.com/IJMET/index.asp 361 [email protected]
hockey sticks, researcher together with the use of stiff, lightweight composite materials has
spawned many novel features & design, in comparison to cricketing equipment which has
seen no such development despite the sport’s popularity.
It was noted that now a day’s performance rather than cost that is the overriding
consideration in the design and manufacture of modem sporting equipment. The extensive
development and modernisation of equipment as with tennis rackets has not been so apparent
in cricket bats, which often make cricket bats seem antiquated. Modern sports equipment, for
games such as cricket, baseball and golf is the subject of increasing amount of research [2].
Equipment design has proved a particularly useful tool with utmost work to date concerning
on the performance of the equipment. Material selection, design processing and craftsmanship
are a critical parameter to choose assembly design and methodology.
Cricket bats have seen relatively little technical development. The lack of
development is due to the rules restricting on the use of non-wood material in the cricket bat
[3]. It is suggested that the handle offers the most scope for improvements in bat performance
[4]. However, improvements to the handle remain relatively unexplored [5]. Considerable
research has been undertaken in the attempt to improve the design of Joint Assembly and their
parts to enhance the performance of sporting equipment. The researcher derive a maximum
benefit from the available resources to aid in the creation, modification, analysis, or
optimization of a structural design of a joint assembly and their parts for a cricket bat with
detachable handle in cricketing equipment [6].
The aim of this study was to design & develop a joint assembly and their parts from a
known amount of volume (i.e. 21.49 cm3) of a referenced handle [7] which was constraint on
its geometrical parameters [8] for a modified handle. This study is conducted in order to
further the researcher work would be employed to an applied research work which is going on
to examine the performance & reliability of non-wood materiel used into cricket bat handle
that mainly focuses on the use of non-wood material from which the joint assembly was
made. The ultimate goal of adopting this procedure is to relating the results to a particular
situation on the above mentioned invention.
2. METHODOLOGY
The geometry of joint assembly was prepared to improve the quality of design in Auto
CAD (2018) software to increase the productivity. And the advanced & novel (CNC)
machining processing methods and techniques presented here and were applied to the design
that enabled the development of joint assembly to produce new types of equipment with
enhanced properties, as well as improving the overall design of sporting goods.
2.1. Constraint of Joint Assembly and their Parts
The joint assembly and their parts are made to be constraint accordingly from the one-
tenth part of the total volume of the referenced handle of constraint geometrical parameters
[8], and for constraining the volume of non-wood material from which Joint Assembly and
their Parts were prepared by using the procedure [7].
2.3. Material Constraint
For the making of joint assembly any advanced composite material would be used as
per the new modified Rule 5 (the bat) of MCC, which allows only 10% of ‘non-wood’ material from the total volume of the handle. And for remaining 90% should be
predominantly made up of cane wood i.e. Calamus manan with 3 rubbers springs [9].
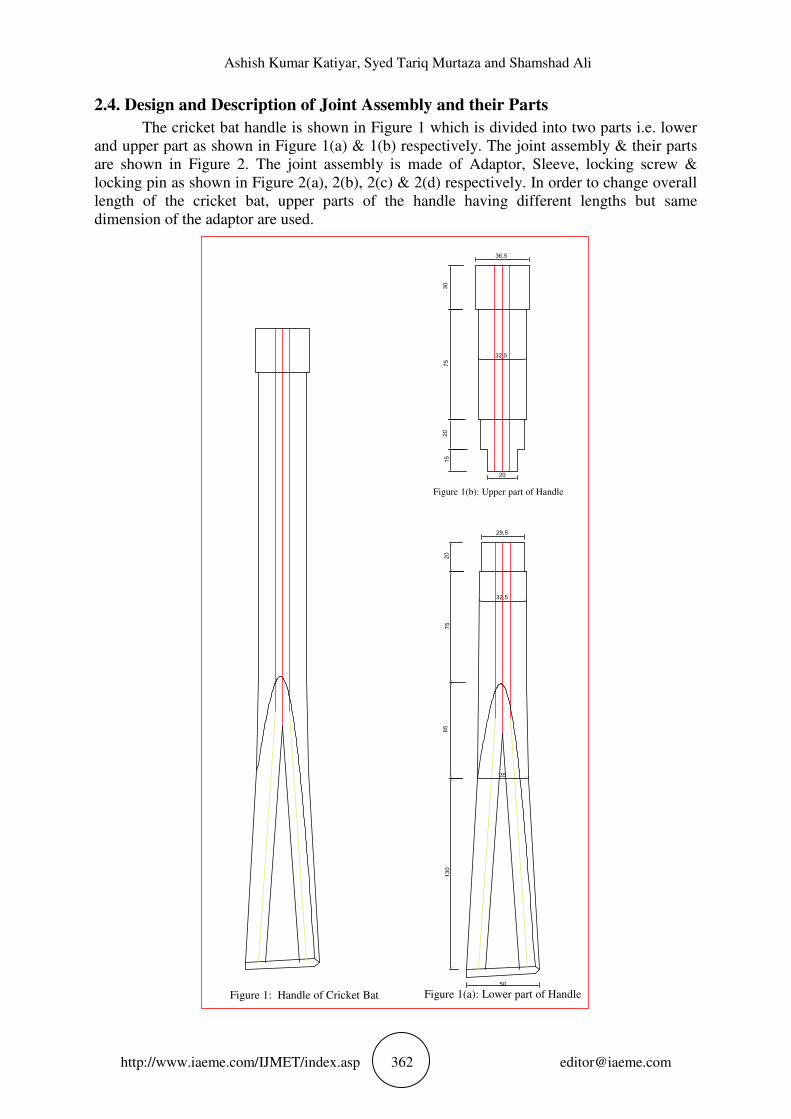
Ashish Kumar Katiyar, Syed Tariq Murtaza and Shamshad Ali
http://www.iaeme.com/IJMET/index.asp 362 [email protected]
2.4. Design and Description of Joint Assembly and their Parts
The cricket bat handle is shown in Figure 1 which is divided into two parts i.e. lower
and upper part as shown in Figure 1(a) & 1(b) respectively. The joint assembly & their parts
are shown in Figure 2. The joint assembly is made of Adaptor, Sleeve, locking screw &
locking pin as shown in Figure 2(a), 2(b), 2(c) & 2(d) respectively. In order to change overall
length of the cricket bat, upper parts of the handle having different lengths but same
dimension of the adaptor are used.
15
20
75
30
13
0
65
75
20
36,5
32,5
20
Figure 1(b): Upper part of Handle
29,5
32,5
35
50
Figure 1: Handle of Cricket Bat Figure 1(a): Lower part of Handle
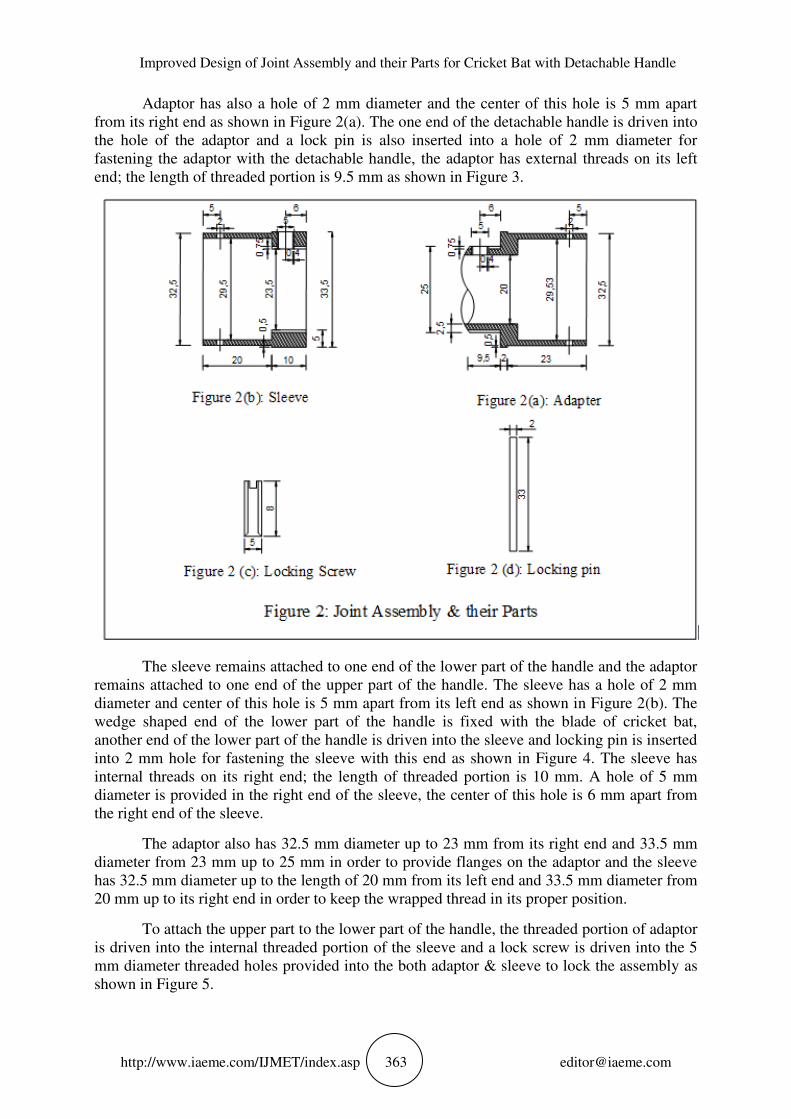
Improved Design of Joint Assembly and their Parts for Cricket Bat with Detachable Handle
http://www.iaeme.com/IJMET/index.asp 363 [email protected]
Adaptor has also a hole of 2 mm diameter and the center of this hole is 5 mm apart
from its right end as shown in Figure 2(a). The one end of the detachable handle is driven into
the hole of the adaptor and a lock pin is also inserted into a hole of 2 mm diameter for
fastening the adaptor with the detachable handle, the adaptor has external threads on its left
end; the length of threaded portion is 9.5 mm as shown in Figure 3.
The sleeve remains attached to one end of the lower part of the handle and the adaptor
remains attached to one end of the upper part of the handle. The sleeve has a hole of 2 mm
diameter and center of this hole is 5 mm apart from its left end as shown in Figure 2(b). The
wedge shaped end of the lower part of the handle is fixed with the blade of cricket bat,
another end of the lower part of the handle is driven into the sleeve and locking pin is inserted
into 2 mm hole for fastening the sleeve with this end as shown in Figure 4. The sleeve has
internal threads on its right end; the length of threaded portion is 10 mm. A hole of 5 mm
diameter is provided in the right end of the sleeve, the center of this hole is 6 mm apart from
the right end of the sleeve.
The adaptor also has 32.5 mm diameter up to 23 mm from its right end and 33.5 mm
diameter from 23 mm up to 25 mm in order to provide flanges on the adaptor and the sleeve
has 32.5 mm diameter up to the length of 20 mm from its left end and 33.5 mm diameter from
20 mm up to its right end in order to keep the wrapped thread in its proper position.
To attach the upper part to the lower part of the handle, the threaded portion of adaptor
is driven into the internal threaded portion of the sleeve and a lock screw is driven into the 5
mm diameter threaded holes provided into the both adaptor & sleeve to lock the assembly as
shown in Figure 5.

Ashish Kumar Katiyar, Syed Tariq Murtaza and Shamshad Ali
http://www.iaeme.com/IJMET/index.asp 364 [email protected]

Improved Design of Joint Assembly and their Parts for Cricket Bat with Detachable Handle
http://www.iaeme.com/IJMET/index.asp 365 [email protected]
Ashish Kumar Katiyar, Syed Tariq Murtaza and Shamshad Ali
http://www.iaeme.com/IJMET/index.asp 366 [email protected]
To detach the upper part of the handle from lower part of the handle, the lock screw is
loosen and is drawn out from the 5 mm diameter holes of adaptor and the sleeve. After that
adapter attached with the upper part of the handle is loosen and drawn out from the threaded
portion of the sleeve.
In this way the overall length of the cricket bat can be changed by using upper part of
the handle having different lengths. In figure 6 the front and side view of the assembled
handle with the lower & upper part of handle by using Joint Assembly was showed.
3. CONCLUSIONS
The present method of designing and manufacturing of the joint assembly & their
parts is based on 10 % volume from the total volume of the cricket bat handle as only 10%
volume of non wood material is permissible according to law 5-the bat [3]. The 21.49 cm3
volume of material was used to make the joint assembly and their parts [7]. The material used
for making of handle would be Singapore cane with 3 rubber spring [9], and for joint
assembly it should be made up of any advanced composite material that meet out the demands
according to the mechanical & physical properties of cane wood, without changing the
general playing properties of handle in relation to the referenced handle.
4. SUGGESTION FOR FUTURE WORK
The future aspect of this newly designed joint assembly, the materials to be used for
manufacturing must have high strength to weight ratio, high stiffness, and flexibility. The
advanced fiber composite materials compatible with the manufacturing processes may be used
for manufacturing the joint assembly. Further the design would be modeled with different
handle’s geometry and the placement of Joint Assembly may also be shifted as per the requirements or need of the days.
REFERENCES
[1] C. Grant & S., A .Nixon, ‘Parametric modelling of the dynamic performance of a cricket bat’, Proceedings of the International Conference on The Engineering of Sport, Sheffield, U.K.,
July 1996. In Haake S.(ed.), The Engineering of Sport, Balkema, Rotterdam, p254-249, 1996.
[2] C. Grant., ‘Improved Dynamic Performance of a Bat’, Proceedings of Third International
Conference on Composites Engineering, New Orleans, USA, 1996.
[3] MCC, ‘© Marylebone Cricket Club Laws of Cricket 2017 Code’, no. April, pp. 1–82, 2017.
[4] C. Grant, ‘The role of materials in the design of an improved cricket bat’, MRS Bull., vol. 23,
no. 3, pp. 50–53, 1998.
[5] S. John, and Z. B. Li, ‘Multi-directional vibration analysis of cricket bats’, In S. Ujihashi, and
S. J. Haake (eds) The engineering of sport, vol.4, pp.96– 103, Blackwell, Oxford, 2002.
[6] S. Ali, S. T. Murtaza, and A. K. Katiyar, ‘Innovative Cricket Bat-A Way to Reduce player’s Burdon’, Int. J. Eng. Sci. Res., vol. 4, no. 1, pp. 189–196, 2016.
[7] A. K. Katiyar, S. T. Murtaza, and S. Ali, ‘Experimental Method to Determine the Volume of Cricket Bat Handle to Ensure 10% Volume of Non-wood Material’, Int. J. Sport. Phys. Educ.,
vol. 4, no. 2, pp. 8–12, 2018.
[8] A. K. Katiyar, S. T. Murtaza, and S. Ali, ‘Constraining Numerical Values for a Referenced Cricket Bat Handle on Selected Geometrical Parameters’, Eur. J. Phys. Educ. Sport Sci., vol.
4, no. 5, pp. 68–74, 2018.
[9] A. K. Katiyar, S. T. Murtaza, and S. Ali, ‘Utilization, Processing, Grading And Manufacturing Process Of Laminated Cane Handles (Calamus Manan)’, IOSR J. Sport. Phys. Educ., vol. 5,
no. 3, pp. 5–8, 2018.

5/18/2020 Experimental Method to Determine the Volume of Cricket Bat Handle to Ensure 10% Volume of Non-wood Material | International Jo…
https://www.arcjournals.org/international-journal-of-sports-and-physical-education/volume-4-issue-2/2 1/3
(/)
(/international-journal-of-sports-and-physical-education/submit-paper)
(/international-journal-of-sports-and-physical-education/article-processing-fee)
(/international-journal-of-sports-and-physical-education/pay-online)
DOI Prefix 10.20431
IJSPE Home (/international-journal-of-sports-and-physical-education/index)
Scope of Journal (/international-journal-of-sports-and-physical-education/scope-of-journal)
Editorial Board (/international-journal-of-sports-and-physical-education/editorial-board)
Early View (/international-journal-of-sports-and-physical-education/volume-6-issue-1/)
Current Issue (/international-journal-of-sports-and-physical-education/volume-6-issue-1/)
Past Issues (/international-journal-of-sports-and-physical-education/past-issues)
Information
https://www.arcjournals.org/international-journal-of-sports-and-physical-education/volume-6-issue-1/
5/18/2020 Experimental Method to Determine the Volume of Cricket Bat Handle to Ensure 10% Volume of Non-wood Material | International Jo…
https://www.arcjournals.org/international-journal-of-sports-and-physical-education/volume-4-issue-2/2 2/3
For Authors (/international-journal-of-sports-and-physical-education/for-authors)
For Reviewers (/international-journal-of-sports-and-physical-education/for-reviewers)
For Editors (/international-journal-of-sports-and-physical-education/for-editors)
Journal Policies
Plagiarism Policy (/international-journal-of-sports-and-physical-education/plagiarism-policy)
Copyright Policy (/international-journal-of-sports-and-physical-education/copyright-policy)
Useful Links
Indexing (/international-journal-of-sports-and-physical-education/indexing)
Peer Review Process (/international-journal-of-sports-and-physical-education/peer-review-
process)
Special Issue Proposal (/international-journal-of-sports-and-physical-education/special-issue-
proposal)
Published Special Issues (/international-journal-of-sports-and-physical-education/published-
special-issues)
Conference Proposal (/international-journal-of-sports-and-physical-education/conference-
proposal)
Conference Proceedings (/international-journal-of-sports-and-physical-education/conference-
proceedings)
International Journal of Sports and Physical EducationVolume 4, Issue 2, 2018, Page No: 8-12
Experimental Method to Determine the Volume of Cricket BatHandle to Ensure 10% Volume of Non-wood Material
Ashish Kumar Katiyar , Syed Tariq Murtaza , Ph.D., Shamshad Ali
1.Research Scholar, Department of Physical Education, A.M.U., Aligarh (U.P.) India2.Associate Professor, Department of Physical Education, A.M.U., Aligarh (U.P.) India3.Associate Professor, Mechanical Engg. Section, University Polytechnic, A.M.U., Aligarh (U.P.)India
Citation : Ashish Kumar Katiyar,Syed Tariq Murtaza,Shamshad Ali, Experimental Method toDetermine the Volume of Cricket Bat Handle to Ensure 10% Volume of Non-woodMaterialInternational Journal of Sports and Physical Education 2018 ,4(2) : 8-12
Abstract
As per the law 5 the-bat with appendix-B pertaining to the materials in handle, the researcher quantifiedthe use of non-wood materials other than cane, wood or twin is only one-tenth part from the total volumeof the handle. The experiment carried out on Grade 'A' handles, was short in size and round in shape,made up of finest quality of Singapore cane or Rattan Manau (Calamus Manan) four pieces of laminatedwith 3 rubber insertions. A referenced cricket bat handle was used that is constraint by its geometrical
1* 2 3

5/18/2020 Experimental Method to Determine the Volume of Cricket Bat Handle to Ensure 10% Volume of Non-wood Material | International Jo…
https://www.arcjournals.org/international-journal-of-sports-and-physical-education/volume-4-issue-2/2 3/3
parameters. The aims of this study were to experimentally measure and numerically determine the 10%volume of Non-wood material from the total volume of the handle for making joint assembly & their partsfor a detachable cricket bat handle. So, the experiment was conducted by using water displacementmethod and by using some mathematical formulas to find out the total volume of handle from which 10%of non-wood material is determined. And the preceding study revealed that (21.49 cm3) volume of non-wood material would be used, from which the joint assembly and their parts prepared finally.
Download Full paper: Click Here (/pdfs/ijspe/v4-i2/2.pdf)
Home (/index)
About Us (/about-us)
Open Access (/open-access)
FAQs (/faqs)
Submit Paper (/submit-paper)
Author Guidelines (/author-guidelines)
Privacy Policy (/privacy-policy)
Special Issue Propasal (/special-issue-propasal)
Blog (/blog)
Publication Ethics (/publication-ethics)
Terms and Conditions (/terms-and-conditions)
Contact Us (/contact-us)
ARC Publications, LLC # 37-1-4(15), First Floor,
Second Line, Annavarappadu, Ongole, Andhra Pradesh,INDIA, PIN-523001.
[email protected] (mailto:[email protected])
Copyright 2012-20 © by ARC Publications. All Rights Reserved.

IOSR Journal of Sports and Physical Education (IOSR-JSPE)
e-ISSN: 2347-6737, p-ISSN: 2347-6745, Volume 5, Issue 3, (May - June 2018), PP 05-08
www.iosrjournals.org
DOI: 10.9790/6737-05030508 www.iosrjournals.org 5 | Page
Utilization, Processing, Grading And Manufacturing Process Of
Laminated Cane Handles (Calamus Manan)
Ashish Kumar Katiyar1, Syed Tariq Murtaza, Ph.D. 2, Shamshad Ali 3
1. Research Scholar, Department of Physical Education, A.M.U., Aligarh (U.P.) India.
2. Associate Professor, Department of Physical Education, A.M.U., Aligarh (U.P.) India.
3. Associate Professor, Mechanical Engg. Section, University Polytechnic, A.M.U., Aligarh (U.P.) India.
Corresponding Author: Ashish Kumar Katiyar1
Abstract: During the middle of the first decade this century, bat makers began innovating with handle designs,
altering and going over through the high quality of material that is predominantly constructed and produced
from rattan (also known as cane wood). The handle is made from cane with strips of cork or rubber dividing the
cane into sections running the length of the handle, this construction has been designed to give the handle
suitable damping and stiffness properties. By having good physical properties like moisture content, density,
and mechanical properties like flexibility, stiffness, durability, lightness and having natural strength to resist the
capacity of force produced by the ball impacting over 100mph, due to these characteristics that are needed into
the cricket bat handles, rattans are considered as unique multifunctional raw materials for the manufacturing
and construction of cricket bat handle by the different sports manufacturing industries.
--------------------------------------------------------------------------------------------------------------------------------------- Date of Submission: 09-05-2018 Date of acceptance: 26-05-2018 ----------------------------------------------------------------------------------------------------------------------------- ----------
I. Introduction Cricket bat handles have been manufactured in the same manner for over 168 years. The process, from
the time of harvest, may have become a little more mechanised over the years, but is still essentially the same as it was in the 1850’s (Laver & Wood, 2017).
Cricket bats were originally made out of a single piece of wood including the handle (Gunn & Moore, 2001). This meant there was no shock attenuation when the bat struck the ball. The bat would have jarred in the hands of the batsman every time they hit the ball. To overcome this problem, bats were made out of two pieces of timber, usually just another piece of willow spliced into the handle.
In the 1850’s there was another evolution to the handle, with cane used to minimize the ‘sting’ of impact and provide flexibility (Barty-king, H., 1979), later on solid Manau Cane, being introduced in 1853 (Colleyer, 1993). This subsequently improved the balance of the bat, but still did not adequately attenuate the shock. In 1856 canes were split and laminated back together with rubber between the canes (Edlin, H., L., 1973). This technique dealt with the jarring, and the 1850’s technology has stood the test of time.
This paper presents a state of art report on largest rattan genus (Calamus), exported from Southeast
Asia, mainly used by cricket bat manufacturers in India. This report specify history and utilization of raw rattan,
their importance of processing and grading, important applications, uses and finally this report furnish a
profound and handy knowledge incorporating all steps involved in manufacturing process or making of
laminated cane handles from raw material and also identify the research needs.
HISTORY OF RATTAN UTILIZATION
There is a long history of rattan utilization in Asia and Malaysia. Rattans were pulled from the forest and traded down rivers to coastal entrepreneurs who marketed them on to traders in Singapore (Dransfield, 1992). Export of raw rattan cane are sourced from Southeast Asia especially in Indonesia, Malaysia & Singapore (Manau or Sarawak) and also harvested from the jungles of Sumatra.
The term rattans (also canes) is collectively applied to the long, slender, pliable and joined stems of certain spiny, trailing or climbing palms belonging to subfamily Calamoideae (J Dransfield. 2002) that also includes tree palms such as Raphia (Raffia) and Metroxylon (Sago palm) and shrub palms such as Salacca (Salak) (Uhl & Dransfield, 1987). There are 13 different genera of rattans that include in all some 600 species. Rattan is also known as manila, or malacca, named after the ports of shipment Manila and Malacca City, and as manau (from the Malay rotan manau, the trade name for Calamus manan canes in Southeast Asia) (Johnson, Dennis V. 2004). The largest rattan genus is Calamus, distributed in Asia except for one species represented in Africa. The climbing habit is associated with the characteristics of its flexible woody stem, derived typically from a secondary growth, makes rattan a liana rather than a true wood.
Utilization, Processing, Grading And Manufacturing Process Of Laminated Cane Handles...
DOI: 10.9790/6737-05030508 www.iosrjournals.org 6 | Page
Commercially the finest quality canes that dominate international market are species of Calamus, e.g. C. Maman, C. Caesius and C. Trachycoleus. Owing to strength and resilience, rattans are used for making handle of hockey sticks and cricket bats. A good example is the First Division of Sarawak Cane, where up to twelve different species of rattan have been cultivated, supplying in a variety of cane colours and texture that are integrated into high quality cane put them to countless practical use and aesthetic artefacts. Their utility has been based on a unique combination of features such as abundance (in past), strength, low weight, durability, lustrous finish and beauty for the use of particularly in the making of household articles, furniture, tool handles, lifting heavy items and in bridge construction, sports equipments etc.
II. Manufacturing Process Of Laminated Cane Handle Processing and Grading of Raw Rattan
The canes are imported and transported in 2 basic thicknesses, thick and thin pole lengths of around 3 metre and graded by straightness and evenness of the stranding. They are initially cured or boiled in oil improve the strength properties of rattan cane (Yudodibroto, 1985) after that the canes are washed and air-dried in an open area for several weeks. Before being graded the canes go through the process of sulphur fumigation in a chamber with external container burning sulphur. The fumigation process uses the sulphur fumes to bring out the best of the canes’ colour, while at the same time as killing any borer that may be present in the cane. The fumes are carried into the chamber by a flue, and the canes are smoked overnight, sometimes up to 24 hours, until an even colour is obtained. After that the canes are graded according to the Stem diameter and evenness of diameter along the length (Razak, W., Tarzimi, M., & Arshad, O., 2001). Then it was cut down into the pieces of 1.5 metres (60 inches) in length for further actions.
Process of Making Laminated Handle
The best pieces of cane that was thick in diameter and straight with even strands along the length are chosen for this study. The most popular pattern used for making handle from large diameter cane for long or short in length had been typically consist of 4 pieces of cane with 3 rubber inserts. Between the cane section rubber or cork is inserted before the handle is glued, sanded and spliced together using twine (Edlin, H., L., 1973). Cane for the short handles is firstly sawn to the right length of 480 mm and then three cuts are made along the length, then the cane was split and separated into 4 pieces. The first cut, straight down the middle of the cane along the length and the second and third cuts are made either side of the middle cut from top to bottom of the cane.
Now, the faces planed to ensure a good gluing surface and glued together with three cork or rubber laminations used for shock absorption. A single piece of cork/rubber of 170 mm long and 0.5 mm thick is then placed into the middle cut and remaining two piece of rubber/cork of 160 mm long and 0.5 mm thick is then placed into either side of the middle section. A wedge is jammed into the middle cut allowing glue to be applied thoroughly, followed by a piece of fibreboard of 60 mm in length, Two more pieces of latex bonded cork in rectangular strips of 70 mm in length of 2 mm thick and width half the diameter of the handle are then glued together and positioned within the handle composite along their thinnest edge are then applied with glue and used to fill the other two cuts.
The handle is tied up and left to dry for 24 hrs, Once dry the handle is untied, next is to cut the remaining wedge out from the cleft, that is positioned within the centre of the handle 'sandwich' to approximately 80% of its length from the final element to the handle. The reason for including the wedge is to increase the depth of the handle towards its base as many bat models exhibit a deep cross section towards the shoulder of the bat. The handle needs to accommodate this deep cross section to ensure a continuous surface over the back of the blade for following machining. The freshly glued handles are stacked and wedges are used to separate the handles and provide some compression to aid the adhesion of all elements. Process and Technique Involved for Finishing and Shaping of the Handle
Once the glue has cured the handles are cross cut to the exact length and sawn to the required handle length and set aside for machining because when the laminated handles get there they will be about half to twice as thick as the finished handle.
The first stage of the manufacturing process is to turn the handles on a lathe, which reduces them down close to the width required to go into a bat. The top part of the handle is then shaped according to the constraint measurements. The circular profile of the handles is machined between centres on a copy-shaping machine with a rotating cutter and the handle is rotated slowly to produce a round section. Handles are turned to an appropriate size however, various profile patterns exist for the different sizes for example, and the handles may be turned to produce either long or short in length and round and oval in shape.
In the second stage, the base of handle is ready for cutting the splice and sawn so as to it is fitted through the precise splicing of the handle into the blade. A splicing saw is used to cut the deep V into both blade
Utilization, Processing, Grading And Manufacturing Process Of Laminated Cane Handles...
DOI: 10.9790/6737-05030508 www.iosrjournals.org 7 | Page
and handle, using special jigs, this cut needs to be carefully made so the join between the handle and the blade fit together tight and perfectly fitting is vital to achieving both balance and performance of the bat.
On the third stage, the splice of handle and blade has been cut then the handle can be fitted in to the blade using a mallet. Before fitting against each cleft the handles are checked and make sure that it has reached to the base of the joint then, the handle are aligned to set slightly forward of the blade, according to the bow and the particular characteristics of the blade and glued together by using PVA adhesive to ensure a strong joint is made. The bat is then clamped and left to dry/cure for a minimum of 15 hours or an overnight. After the due course of time, the adhesive is strong enough for further machining.
On the fourth stage, the bare Cane handles are wounded / covered with a layer of traditional linen/ cotton thread which is applied on a custom made binding lathe. The bat is mounted in the lathe which is controlled using a foot treadle; the handle is brushed with glue and whipped with the twine which provides strength to the splice and throughout the length of the handle. The winding process begins at the top of the handle and the string is stapled upon reaching the shoulders of the bat. It is believed that the string adds structural support to the handle increasing flexural rigidity and also the tension applied during winding acts to compress the handle reinforcing the integrity of glued components.
On the fifth and final stage, the rubber grip is added to the handle on top of the wound string, increasing the diameter of the handle and gives a surface with substantial grip against the batsman's gloves. The tubular rubber grip has a diameter smaller than the handle and so must be strained to fit the handle. This is achieved through expanding the rubber tube over the inside of a larger diameter pipe by removing the air between the two. The handle is then positioned inside the pipe and the vacuum released, the rubber attempts to regain its original shape tightly enveloping the handle.
Each handle is then weighed together with the accompanying rubber handle grip to measure the mass of the finished product. The handles are stamped to register according to their shape and size, corresponds to the mass of the bat.
III. Discussion The source of the material used for the making of cane handles from South East Asia. (Grant, C.1998b)
suggested that the handle offers the most scope for improvements in bat performance. However, improvements to the handle remain relatively unexplored (John & Li, 2002). So, we have experimented with making handles with the constraint measurements on selected geometrical parameters (Katiyar, Murtaza, & Ali, 2018a), although we also purchase raw materials of handles in their most basic form and then they are processed, shaped and finished according to the need we make our handles with careful craftsmanship to reduce the chance of oddness into the handle’s profile for determining the volume of the referenced handle (Katiyar, Murtaza, & Ali, 2018b).
IV. Conclusion The first solid Manau cane handles were used in 1853, they were deemed to cause too much vibration
which made the bat painful to hold therefore rubber laminations were introduced in 1856, the same handle materials as cane wood that has the tenacity and high in strength with rubber to dampen down the shock of the ball hitting the bat are used to this day. Three years later in 1856, handles took the form they have maintained until now. The handles that are used now a day that is similar to those were used in the 1850’s. However, the procedures adopted in this current study are believed to be a more thorough investigation than was previously published literature. Therefore this study will identify the required materials and manufacturing process of handles which might offer an alternative or out-perform the cricket bat handle (Calamus Manan) that is currently used.
References [1]. Barty-King, H. Quiltwinder and Pod Shavers- The History of Cricket Bat and Ball Manufature. London: Macdonald and James,
1979. [2]. Collyer, D. (1993). An engineering study o f the cricket bat. Unpublished Final Year Project. Bolton Institute o f Higher Education. [3]. Edlin, H., L. (1973). Woodland crafts in Britain. Second Edition, Batsford Ltd; London. [4]. Grant, C. (1998). Design o f a better cricket bat. Materials Research Society Bulletin: Advanced Materials in Sports & Leisure
Equipment. [5]. Gunn & Moore. (2001). http://www.cricket.org/link_to_database/national/eng/ competition s/gm/batmaking.html [6]. J Dransfield. (2002). General Introduction to Rattan - The Biological Background to Exploitation and the History of Rattan
Research. http://www.fao.org/docrep/003/y2783e/y2783e06.htm#P889_66944 [7]. John, S., & Li, Z., B. (2002). Multi-directional vibration analysis of cricket bats. In, Subic, A., and Haake, S., J. (Ed). The
Engineering of Sport. Balkema; Rotterdam. [8]. Johnson, Dennis V. (2004): Rattan Glossary: And Compendium Glossary with Emphasis on Africa. Rome: Food and Agriculture
Organization of the United Nations, p. 22. [9]. Katiyar, A. K., Murtaza, S. T., & Ali, S. (2018a). DETERMINING GEOMETRICAL PARAMETERS FOR A REFERENCED
CRICKET BAT HANDLE. European Journal of Physical Education and Sport Science, 4(3), 158–164.
Utilization, Processing, Grading And Manufacturing Process Of Laminated Cane Handles...
DOI: 10.9790/6737-05030508 www.iosrjournals.org 8 | Page
https://doi.org/10.5281/zenodo.1218138 [10]. Katiyar, A. K., Murtaza, S. T., & Ali, S. (2018b)." Experimental Method to Determine the Volume of Cricket Bat Handle to
Ensure 10% Volume of Non-wood Material" International Journal of Sports and Physical Education (IJSPE), vol 4, no. 2, 2018, pp. 8-12. http://dx.doi.org/10.20431/2454-6380.0402002.
[11]. Laver & Wood: Cricket bat lore – Part 3 (2017). http://about.crichq.com/blog/laver-wood-cricket-bat-lore-part-3 Accessed on Sept 2017.
[12]. Razak, W., Tarzimi, M., & Arshad, O. (2001). Rattan oil curing, bleaching and preservation. Transfer of Technology Model Series. [13]. Uhl, N.W. & Dransfield, J., (1987). Genera palmarum: a classification of palms based on the work of H.E.Moore Jr. pp 610. The
International Palm Society & the Bailey Hortorium, Kansas. [14]. Wikieducator. Bamboo and Rattan/rattan/course-2-unit-7-wikieducator.com; 2016. www.wikipedia.com. Accessed on Nov. 2016. [15]. Yudodibroto, H. (1985). Anatomy, strength properties and the utilization of some Indonesia rattan species. In proceedings of the
rattan seminar 2 - 4 Oct. 1984, Kuala Lumpur.
Ashish Kumar Katiyar. " Utilization, Processing, Grading And Manufacturing Process Of Laminated Cane Handles (Calamus Manan)." IOSR Journal of Sports and Physical Education (IOSR-JSPE) 5.3 (2018): 05-08.

European Journal of Physical Education and Sport Science ISSN: 2501 - 1235
ISSN-L: 2501 - 1235
Available on-line at: www.oapub.org/edu
Copyright © The Author(s). All Rights Reserved.
© 2015 – 2018 Open Access Publishing Group 158
doi: 10.5281/zenodo.1218138 Volume 4 Issue 3 2018
DETERMINING GEOMETRICAL PARAMETERS FOR
A REFERENCED CRICKET BAT HANDLE
Ashish Kumar Katiyar1i,
Syed Tariq Murtaza2,
Shamshad Ali3
1Research Scholar, Department of Physical Education,
A.M.U., Aligarh (U.P.) India 2Associate Professor, Department of Physical Education,
A.M.U., Aligarh (U.P.) India 3Associate Professor, Mechanical Engg. Section, University Polytechnic,
A.M.U., Aligarh (U.P.) India
Abstract:
This work had been intended to set and determine the geometrical parameters for a
referenced cricket bat handle for our purpose, due to geometric variations found in the
handles. By reviewing related literature based on past research work carried by many
researcher on cricket bat. The criterion used for selecting and determining major
parameters of the handle with some new technical parameters with reference to more
traditional design based on to other performance-oriented geometrical features widely
employed in commercial designs of cricket bat made by the different manufacturers’ of sporting equipment in present. And so far, some new and typical geometrical
parameters are considered and established for a referenced Cricket bat handle, which in
turn used in a cricket bat with having a detachable handle for further study.
Keywords: Cricket bat, detachable handle, joint assembly, Cricket bat with detachable
handle
1. Introduction
Now a day’s cricket is renowned all along each corner of the globe and it also preserves a long history and tradition. It had been noticed and observed in comparison to other
sports very little improvements had been done into the structural design to advance the
performance of Cricket bat since its origin (Katiyar, Murtaza, & Ali, 2016). During the
present century different blade & handles, geometrical shapes have been modeled using
different materials. But innovative features of commercial designs of bats are restricted
to variation in geometry of the back of the blade. Within the boundaries of the game
Ashish Kumar Katiyar, Syed Tariq Murtaza, Shamshad Ali
DETERMINING GEOMETRICAL PARAMETERS FOR A REFERENCED CRICKET BAT HANDLE
European Journal of Physical Education and Sport Science - Volume 4 Issue 3 2018 159
rules, numerous enhanced bat designs with material alteration had been preceded to
commercial production (Katiyar, Murtaza, & Ali, 2016a). In which includes laminated
cane handles with rubber spring introduced aiming to reduce the vibration produced
from the blade to the handle on impact of ball and the blade is also improved through
perimeter weighting (Grant, 1998). However, these changes were still far from
optimum.
Due to deep conservatism of MCC, strictly restrict all those types of equipment
which came out due to the enhancement of technologies, that had proven benefit only
to the batsmen in the modern rules of the games (MCC, 2017). Only English Willow
used to improve the blade design and perimeter weighting in which no change to the
material composition is allowed, but for handle where there is no limitation to the
innovative possibilities and rules do not strictly restrict to change design or improve the
structure. MCC has left their door open for any possibilities to alter material
composition, or inclusion of any additional instrument into the handle; however, these
changes come under the boundaries of law 5 the bat (MCC, 2017). As in result to that an
innovative Cricket bat (993/DEL/2014 A, 2014) with detachable handle comes out.
The dynamics of a Cricket bat handle are determined from its geometry and
material composition, and the performance characteristics of handle are accessed by
testing physical & mechanical properties associated with the handle such as flexural
stiffness, density, bat model shapes and natural frequencies. So, for this reason
geometrical parameters of handle are the prime concern to conducted such type of work
aiming to determine geometrical parameters for a referenced cricket bat handle for our
purpose due to geometric variations found into the handles for making a cricket bat
with detachable handle (Ali, Murtaza & Katiyar, 2016).
2. Material & methods
The main object of this study is to further the results of the researchers S. Ali, & S. T.
Murtaza (993/DEL/2014 A, 2014), who mainly focused upon developing detachable
handle of cricket bat. By reviewing literature based on past work carried out on cricket
bat research by many researchers such as C. Grant and S. A. Nixon (Grant et al., 1996) &
S. Fisher (Fisher, 2005). The criterion used for selecting and determining major
parameters of handle with some newly technical parameters with reference to more
traditional design, based on to other performance-oriented geometrical features.
So, in keeping the view of geometrical parameters of Cricket bat as described by
many researchers and their findings associated to bat research widely employed in
commercial designs of cricket bat made by the different manufacturers’ of sporting equipment presently. And so far the researcher determines the following Technical
geometric parameters of a cricket bat handle such as (Full handle, Handle outside the blade,
handle inside the blade, handle in the neck region, Diameter of Handle, and Rubber insertions)
which are used to describe a referenced handle in respect to features of a more
conventional cricket bat handle as given in table 1.

Ashish Kumar Katiyar, Syed Tariq Murtaza, Shamshad Ali
DETERMINING GEOMETRICAL PARAMETERS FOR A REFERENCED CRICKET BAT HANDLE
European Journal of Physical Education and Sport Science - Volume 4 Issue 3 2018 160
Table 1: Geometrical Parameters of a Referenced Cricket Bat Handle
S.No. Main Parameters of Handle Technical Parameters Symbol
1 Full Handle Total Length of Handle TLOH
2 Handle Outside the Blade
Total Length of Handle Outside the Blade TLOB
Length of Top Part LTP
Length of Middle Part LMP
3
Handle Inside the Blade
Total Length of Handle Inside the Blade TLHIB
Length of Handle Inside Blade from Neck Point LHIBNP
Thickness of handle at Neck Point THNP
Thickness of handle at Bottom Point THBP
Breadth of handle at Neck Point BHNP
Breadth of handle at Bottom Point BHBP
4 Handle In Neck Region Total Length of Handle in Neck Region TLHN
Tapered Angle of handle in spine TAHS
5 Handle Diameter Diameter of Handle’s Top Part DHTP
Diameter of Handle’s Middle Part DHMP
6 Rubber Insertions Middle Insertion of Rubber MRI
Side Insertion of Rubber SRI
3. Brief Description of the Design
As in the above Table 1 all the parameters related to cricket bat handle are already
described, and it is also better to know the full specification and limitation as lay down
by the MCC regarding dimensions of the bat. Although the dimensions of a bat may be
ranged much depending upon the need of the individual player.
A bat is used to hit a bounce-delivered ball. The basic structure of cricket bat
consists of a handle, and a blade. Here basic requirements and measurements from Law
5- the bat (MCC, 2017) is presented, for more detailed specifications see Appendix B.
The total length of the bat should be 96.52 cm/38 in, along with the insertion of lower
part of the handle into the blade. The width, depth and edges of blade of the bat shall
not exceed from 10.8cm/4.25in, 6.7cm/ 2.64in / and 4.0cm /1.56in respectively. Apart
from the size 6 and less, the total length of handle shall not exceed 52% from the overall
length of the bat.
Designing of Cricket bat handle with the help of the Auto CAD software had
been done and presented in figure 1. Apart from the handle, the rest part of bat is called
blade. The blade of bat is made of wood, and the blade has a face, a back, a toe, sides,
and shoulders. The face of the blade is the main striking surface which is either flat or
has a slight convex curve. The opposite surface is called back. The shoulders, sides, and
toe are the remaining surfaces, separating the face and the back. The shoulders, one on
each side of the handle, are along that portion of the blade between the first entry point
of the handle and the point at which the blade first reaches its full width. The toe is the
surface opposite to the shoulders taken as a pair. The sides, one each side of the blade,
are along the rest of the blade, between the toe and the shoulders.

Ashish Kumar Katiyar, Syed Tariq Murtaza, Shamshad Ali
DETERMINING GEOMETRICAL PARAMETERS FOR A REFERENCED CRICKET BAT HANDLE
European Journal of Physical Education and Sport Science - Volume 4 Issue 3 2018 161
Figure 1: Designing of Cricket bat
The handle is a straight shaft used for holding the bat, and it should be made
predominantly of cane and/or wood. The one end of the handle that is wholly outside
the blade is to be defined as upper part of the handle. The other end of the handle is
inserted into a recess in the blade as a means of joining the handle and the blade. This
lower portion of the handle is used purely for joining the blade and the handle together.
It is not part of the blade but, the blade shall be considered to extend also to this lower
portion of the handle.
4. Discussion
The proportions and manufacturing of the bat are predetermined by MCC, which is the
sole authority and responsible to amend the major rules of cricket, and which had been
continuously made changes with developments in the technology and use of advance
materials. The major changes had been done in the following eras (MCC, 1962; MCC,
1980; MCC, 2008; MCC, 2010 & MCC, 2017). As consequence of material restrictions,
most cricket bat developments are geometry related. An accurate model could aid
developers in predicting the effect of changes to design of a bat (Allen, Fauteux-Brault,
James, & Curtis, 2014). Various metrics are being used to access the performance of bat
simply determine by testing material’s physical & mechanical properties of bat. As suggested by many experts of cricket bat research that following nine major parameters
to be taken care of before construction and utilisation of cricket bat in which player’s comfort and performance is determined i.e. ‘Sweet Spot, Centre of Percussion (COP), Coefficient of Restitution (COR), Rigid Body Approximation, Moment of Inertia (MOI),
Collision Replication, Bat Substitution, Bat Vibration, Forces between Bat and Ball’ (Kilpatrick, Mulcahy, & Blicblau, 2016). The dynamics of Cricket bat handle is as
important as mechanical and physical of properties of bat. Over above to all those
characteristics the prime concern goes to the geometry and material composition of
cricket bat. The dimensions of a bat vary depending upon the need of individual player
as suggested by (Fisher, 2005) and can be ranges significantly. Ashby (1999) noted that a
Ashish Kumar Katiyar, Syed Tariq Murtaza, Shamshad Ali
DETERMINING GEOMETRICAL PARAMETERS FOR A REFERENCED CRICKET BAT HANDLE
European Journal of Physical Education and Sport Science - Volume 4 Issue 3 2018 162
structure’s design is the contribution of the functionality, the geometric parameters and material properties. Therefore, the performance can be maximised by correctly selecting
a material and optimum geometric dimensions. So, the geometrical parameters and
material composition are the main factor which are always to be kept prior to design
and construction of bat to determine performance and comfort of player.
5. Conclusions
The preceding study is intended to determine and set new geometrical parameters for a
referenced cricket bat handle due to geometric variations found in the handle. For this
purpose, the researcher went through a thorough literature review to find out the
published and unpublished research work carried out by many researchers, to improve
the performance and effectiveness of handle’s design and geometry of cricket bat in relation to geometrical parameters, which are prime concern to player’s comfort. And it had been noticed and observed that little improvements had done into the structural
design during the present century with different blade & handle materials and in
accordance to that, their geometry shapes have been modelled. However, very less
work found in comparison to other sports. The researcher made the comparison on
basis of past work and prevalence of more traditional designs of cricket bat handle, and
so far some new and typical geometrical parameters are considered and established for
a referenced Cricket bat handle, which in turn would be used in a cricket bat with
having a detachable handle (Murtaza, Ali, & Katiyar, 2016) employed for further
research work.
Conflicts of interest
No author has any conflicts of interest to declare.
References:
1. Ali, S., & Murtaza, S. T. (2014). 993/DEL/2014 A. India: The Patent Office Journal,
India. Retrieved from
http://www.ipindia.nic.in/writereaddata/Portal/IPOJournal/1_142_1/official-
journal-20-06-2014-part1.pdf
2. Ali, S., Murtaza, S. T., & Katiyar, A. K. (2016). Innovative Cricket Bat-A Way to
Reduce player’s Burdon. International Journal of Engineering & Scientific Research, 4(1), 189–196.
3. Allen, T., Fauteux-Brault, O., James, D., & Curtis, D. (2014). Finite Element Model
of a Cricket Ball Impacting a Bat. Procedia Engineering, 72, 521–526.
https://doi.org/10.1016/j.proeng.2014.06.090
4. Ashby, M., F (1999). Materials selection in mechanical design. Second Edition.
Butterworth Heinemann; Oxford.
5. Fisher, S. (2005). Experimental and finite element analysis of cricket bats
(Doctoral dissertation, University of Bath).
Ashish Kumar Katiyar, Syed Tariq Murtaza, Shamshad Ali
DETERMINING GEOMETRICAL PARAMETERS FOR A REFERENCED CRICKET BAT HANDLE
European Journal of Physical Education and Sport Science - Volume 4 Issue 3 2018 163
6. Grant, C., & Nixon, S., A. (1996). Parametric modelling of the dynamic
performance of a cricket bat. In, Haake, S., J. (Ed). The Engineering of Sport.
Balkema; Rotterdam.
7. Grant, C. (1998). The role of materials in the design of an improved cricket bat.
MRS Bulletin, 23(3), 50–53. https://doi.org/10.1557/S0883769400029997 -
8. Katiyar, A. K., Murtaza, S. T., & Ali, S. (2016). Meta-Analysis on the
Development of Cricket Bat over the Years. Golden Research Thoughts, 5(10), 7.
9. Katiyar, A. K., Murtaza, S. T., & Ali, S. (2016a). Critical Analysis on The Design
and Use of Materials in Cricket Bat Handles. International Journal of Research in
Economics and Social Sciences (IJRESS), 6225(10), 223–228. Retrieved from
http://euroasiapub.org/current.php?title=IJRESS
10. Kilpatrick, T., Mulcahy, L., & Blicblau, A. (2016). Improving the performance of
cricket bats: An experimental and modelling approach. Sensoria: A Journal of
Mind, Brain & Culture, 12(2), 47–54. https://doi.org/10.7790/sa.v12i2.443
11. MCC (1962). The laws of cricket. Wakefield, UK: EP Pub.
12. MCC (1992). The Laws of Cricket (1980 Code) 2nd Edition, Marylebone Cricket
Club.
13. MCC (2008). Law 6 –The Bat. Retrieved on July 8, 2015 from
http://www.lords.org/mcc/laws-of-cricket/laws/appendix-e-the-bat/
14. MCC (2010). Appendix E - The bat - Laws - Laws of Cricket - Laws & Spirit -
Lord's. retrieved 24 May from
15. http://www.lords.org/laws-and-spirit/laws-of-cricket/laws/appendix-e-the-
bat,1028,AR.html
16. MCC. (2017). © Marylebone Cricket Club Laws of Cricket 2017 Code, (April), 1–82.
Ashish Kumar Katiyar, Syed Tariq Murtaza, Shamshad Ali
DETERMINING GEOMETRICAL PARAMETERS FOR A REFERENCED CRICKET BAT HANDLE
European Journal of Physical Education and Sport Science - Volume 4 Issue 3 2018 164
Creative Commons licensing terms
Authors will retain the copyright of their published articles agreeing that a Creative Commons Attribution 4.0 International License (CC BY 4.0) terms will be applied to their work. Under the terms of this license, no permission is required from the author(s) or publisher for members of the community to copy, distribute, transmit or adapt the article content, providing a proper, prominent and unambiguous attribution to the authors in a manner that
makes clear that the materials are being reused under permission of a Creative Commons License. Views, opinions and conclusions expressed in this research article are views, opinions and conclusions of the author(s). Open Access Publishing Group and European Journal of Physical Education and
Sport Science shall not be responsible or answerable for any loss, damage or liability caused in relation to/arising out of conflict of interests, copyright violations and inappropriate or inaccurate use of any kind content related or integrated on the research work. All the published works are meeting the Open Access Publishing requirements and can be freely accessed, shared, modified, distributed and used in educational, commercial and non-
commercial purposes under a Creative Commons attribution 4.0 International License (CC BY 4.0).

BIOM ECHANICAL INVESTIGATION OF THE CHANGING
KINEM ATIC IN SHOW-JUM PING EVENT
Available online at www.lbp.world
ABSTRACT: -
he p r esen t st udy w as
designed to invest igate the Tdifference in the mechanism
of fence jumping by Athlete Horse.
The aim of the study was to find the
difference in mechanics between
different types of jump designed in
the show jumping circuit . Twenty
show-jumper horses were selected
1
Academic Sports ScholarsISSN: 2277-3665
Impact Factor : 5.3149(UIF) Volume - 7 | Issue - 1 | january - 2018
1 2Fuzail Ahmad and Ikram Hussain
1 Assistant Professor, Department of Physical Education, Aligarh M uslim University, Aligarh.
2 Professor, Department of Physical Education, Aligarh M uslim University, Aligarh.
through video mot ion analysis software to getter the kinemat ic data. The main technical aspects of specific proof
of jumping the horse over the different type of fences was examine from the kinemat ic point of view. Using the
M ot ion analysis software – M ax Traq 2D, the study received a series of kinemat ic parameters (t ime, posit ion,
angles) discussed specific issues in research, processing and interpretat ion leading to the general conclusion, that
Successful jumping i.e. crossing the designed jumps are in?uenced by take-off distance, jumping velocity and
forelimb ?exibility. Select ion of horses for superior jumping capacity and performance can be aided by kinemat ic
analysis, which may shorten t raining t ime and improve performance.
Biomechanics, Athlete horse, show jumping, Kinemat ics, mot ion Analysis Software.
The world of games and sports is ever expanding with increasing intensity of competition and enlarging
scientific studies of human movements. The intense complex movement for the top level performance in sports
calls for great amount of physical capacity, Physiological capacity, Psychological capacity and mechanical capacity
too (Hay, 1993). To make the mechanical movement efficient and effective a mechanical development is require.
For fulfilling the purpose a Biomechanical evaluation techniques are adopted.
A sport on horseback was the part of training to be a good soldier. The attractive natures of the horse and
his versatility have appealed to man for longer, probably, than history relates. For centuries the horse was the
principal means of transport but now the emphasis has moved from utility to pleasure. Gradually different breeds
of horses and ponies have been selected, developed and improved to suit a wide variety of equestrian activities,
and those lucky enough to have enjoyed contact with horses realize that they have much more to offer than
faster, noisier and lifeless alternatives (Roberts, 1989). They are easy to train and unusually adaptable - the same
horse can be successful in eventing, show jumping, dressage, racing, team chasing, and etc. One of the greatest
attractions of riding is that it can be enjoyed at every level, according to skill and experience either as active
KEYWORDS:
INTRODUCTION :
and given t rails on type of jumps.
This inquiry was conducted on the
a t h l e t i c h o r ses t h a t w e r e
specializes in the show jumping
event . Two cameras were placed to
record the video of the jumps. First
camera was placed on right side of
the jump and second camera in
front of the jump. Successful jumps
were selected, slashed, digitalized

participants or interested spec¬tators (Watson, 1989).
Show jumping is a relatively new equestrian sport. Which came into force in England in the 18th century.
A jumping competition is one in which combination of the horse and competitor is tested under various
conditions over a course of obstacles. It is a test intended to demonstrate the horse’s freedom, its energy, its skills
and its obedience in jumping and the competition’s horsemanship.
Jumping competition had been taken place after the Second World War. It appears that the first
competition for show-jumping took place in Paris in 1866. In 1912, show jumping was included in the Olympic
Games for the first time (FEI, n.d.). At that time eight countries got together to draw up the rules for some
guidelines for show jumping, i.e: Belgium, Denmark, France, Italy, Japan, Norway, Sweden and the United States
of America. There are five types of show jumping events in the equestrian sports i.e.: Topscore, Knockout
jumping, Rescue relay, Puissance and six bars.
The main complexity in show jumping event seems to be the obtaining high jumping performance of the
horse over the fence in as short as possible time, generating maximum power, maintain the balance, reducing
the injury and having great efficiency (Morgan, 1962).
Various authors introduces the methods for assessing the variability of horse and human movement and
superior methods for data analysis specific to horse movement in jumping event. The methods used to obtain
such information must satisfy the scientific requirements in terms of confidence and accuracy of the
methodology for their application. For kinematic characteristics, Real-time motion analysis is the essential tool
in monitoring sportive technique, on is an and involves the existence of an operational system through which the
data that are acquired by using software technology, can be processed, interpreted and exploited for accurate
description and awareness of the technical issues. (Payton & Bartlett, 2008).
The study aim to bring out the specific kinematic element to jump by the horse in show jumping event.
To draw the conclusion the study finds the difference in the jumping the obstacle successfully.
The research protocol followed during the investigation was presented in five sections as preliminary
investigation, selection of subjects, filming procedure, selection of trails and selection of frames for analysis.
For the study one Jumping mare of age of five year old and height = 170 cm was examined to jump
parallel jump at the height & width of 100 cm and 80 cm respectively. The mare was academy-level jumping
horse at national division in an equestrian sports club in India. Participating mare was free from musculoskeletal
injury/pathology at the time of data collection.
A Canon camera was used to record motion of the horse while jumping the obstacle i.e: parallel bar
jump. A 2-D kinematic data from the right extremities of the horse at 50 Hz was captured from each trail
performing maximal jumping with a 4 stride run up and an approach. The jump was positioned such that it
allowed the horse to take clear jump over the parallel jump. In accordance to the protocol the camera was
position perpendicular to sagittal plane of the jumping motion to record the full motion. Two Dimensional
calibrating frame was used to calibrate the video of the jumping motion of the horse over the obstacle.
The Angles of Joints (Elbow, Knee, Stifle and Hock), Velocity during Different phases (Take-off, In-flight
and Landing) and Stride length were selected as the parameter of the study. A t-test statistical procedure was
used to draw the result.
M ETHODOLOGY:
Available online at www.lbp.world
2
Volume - 7 | Issue - 1 | january - 2018BIOM ECHANICAL INVESTIGATION OF THE CHANGING KINEM ATIC IN SHOW-JUM PING EVENT

Result and Discussion:
Table no. 1
Table no. 2
CONCLUSION:
REFERENCES
The analysis of data table-1 shows that there is a significant differences exist between both the
successful jumps and unsuccessful jumps in Velocity (Vt) during Take-off phase, Velocity (Vf ) during In-flight
phase and Stride Length as obtain‘t’ ratio is greater than the required ‘t’ value of 2.228. Whereas insignificance
differences in velocity of landing (Vl ) exist between both successful jumps and unsuccessful jumps.
The analysis of data table-2 shows that there is a significant differences exist between both the
successful jumps and unsuccessful jumps in Stifle joint angle (SA) during jumping the fence as the obtain‘t’ ratio
is greater than the required ‘t’ value of 2.228.
Whereas insignificance differences is found in Elbow joint angle (EA), Knee joint angle (KA) and Hock
joint angle (HA) between both the jumps.
The study present some reference values on biomechanics of jumping of horse over the fence. The
Stride length of the horse before Take-off is directly proposal to the velocity during jump. Velocity during landing
may affect the successful jump. Elbow joint angle and stifle joint angle helps the horse to cross over the fence.
Whereas, Knee joint angle and Hock joint angle assist the horse during Take-off.
International Federation for Equestrian Sports, (n.d.). History of equestrian event at the 1912 Olympic games in
Stockholm, Sweden.
German national Equestrian Federation (1985). The principles of riding, Sherwsbury, Kenilworth Press.
Gillet, J. & Gillet, M. (2014). Sports, Animal and Society. NY: Routledge.
Goodwin, D. (2005). Defining the terms and processes associated with equitation. Proceedings of the 1st
International Wquitation Science Symposium. Melbourne, Australia.
Available online at www.lbp.world
3
Volume - 7 | Issue - 1 | january - 2018
Variables
No. Mean. S.D t-value
Vt SS 06 7.48 0.46
3.231* US 06 6.05 0.99
Vf SS 06 5.90 0.35
4.249* US 06 5.08 0.32
Vl SS 06 6.85 0.29
1.079 US 06 6.62 0.44
SL SS 06 2.28 0.26
3.566* US 06 1.76 0.25
Variables
No. Mean. S.D t-value
EA SS 06 118.17 10.03
1.995 US 06 128.83 8.42
KA SS 06 179.33 0.817
0.286 US 06 179.17 1.169
SA SS 06 100.17 3.76
3.166* US 06 111.50 7.92
HA SS 06 125.33 3.88
0.224 US 06 126.00 6.16
BIOM ECHANICAL INVESTIGATION OF THE CHANGING KINEM ATIC IN SHOW-JUM PING EVENT

Hay, J. G. (1993). Human mechanics; Physiological aspects, 4th edition, New Jersey: Englewood Cliffs.
Kearsley, C.G. S., Woolliams, J A., Coffey, M. P. & Brotherstone, S. (2008). Use of competition data for genetic
evaluation of eventing horses in Britain: Analysis of the dressage, showjumping and cross country
phases of eventing competition. Livestock Science, 118, 72-81.
Minetti, A. E., Ardigo, L. P., Reinach, E. & Saibene, F. 1999. The relationship between mechanical work and energy
expenditure of locomotion in horses. J. Exp. Biol. 202, 2329–2338.
Miragaya, A M. (2006). The process of inclusion of women in the olympic games.
Morgan, M. H. (1962). The art of Horsemanship by Xenophon, London, J. A. Allen.
Payton, C. J. & Bartlett, R. M. (2008). Biomechanical evaluation of movement in sport and exercise. Routledge
publishing house – Taylor & Francis Group, London, 33 – 35.
Powersa, P. & Harrison, A. (2002). Effects of the Rider on the Linear Kinematics of Jumping Horses, Sports
Biomechanics, Vol. 1(2). 135-146.
Robert, P. (1989). The complete book of the Horse. New York: W.H.Smith Publishers Inc.
Santamaria, S., Bobbert, M. F., Back, W., Barneveld, A. & Van Weeren, P. R. (2006). Can early training of show
jumpers bias outcome of selection event? Livestock Science, 102, 163-170.
Watson, M. G. (1989). The Handbook of Riding. Italy: Stephen Greene Press.
Available online at www.lbp.world
4
Volume - 7 | Issue - 1 | january - 2018
Fuzail Ahmad
Ikram Hussain
Assistant Professor, Department of Physical Education, Aligarh M uslim University,
Aligarh.
Professor, Department of Physical Education, Aligarh M uslim University, Aligarh.
BIOM ECHANICAL INVESTIGATION OF THE CHANGING KINEM ATIC IN SHOW-JUM PING EVENT
Correspondence: Zamirullah Khan (Ph.D.), Head and Professor, Department of Physical Education, Aligarh Muslim University,
Aligarh, INDIA, Emails: [email protected].
MEASURING AEROBIC CAPACITY OF CRICKET PLAYERS OFF AND ON THE HIGH
ALTITUDE ASTRAND-RYHMING SUB MAXIMAL AEROBIC TEST
ZAMIRULLAH KHAN1*, WASEEM HASSAN RAJA1, NASEEM AHMED KHAN2 1Department of Physical Education, Aligarh Muslim University, Aligarh, INDIA.
Emails: [email protected] 2Mumtaj P.G. College, Lucknow University, Lucknow, INIDA.
How to cite this article: Khan, Z., Raja, W.H., & Khan, N.A. (September, 2019). Measuring aerobic
capacity of cricket players off and on the high altitude Astrand-Ryhming sub maximal aerobic test. Journal
of Physical Education Research, Volume 6, Issue III, 46-49.
Received: August 02, 2018 Accepted: July 25, 2019
ABSTRACT
The purpose of the study was to find out the aerobic capacity of cricket players. Researcher selected geographically
two region of India to measure Aerobic capacity of same cricket players “on” high altitude (Kashmir, J&K), & “off” high altitude (Aligarh, U.P.). For the purpose of study, 30 subjects were selected. For measuring aerobic capacity researcher used Astrand-Ryhming Sub-maximal Aerobic Test. The test was conducted on the same Cricket
Players in Kashmir & in Aligarh Muslim University Campus and recorded the efficiency of aerobic capacity of subjects. The descriptive statistical mean was calculated to measure the aerobic capacity efficiency of cricket
players. The result of the study revealed that there was a significant difference of cricket player’s aerobic capacity efficiency.
Keywords: Aerobic capacity efficiency, aerobic training, physical fitness, Astrand-Ryhming Sub maximal.
1. INTRODUCTION
Aerobic capacity is the maximum amount of oxygen that the body can utilize during an exercise session,
usually measured during a brief period of high-intensity exercise. It is possible for a person to improve his
or her aerobic capacity. For athletes, their aerobic capacity also known as Vo2 max, short for volume of
oxygen maximum is an important aspect of their physical fitness (Sheokand, 2007). Vital capacity is the
maximum amount of air a person can expel from the lungs after a maximum inhalation. It is equal to the
sum of inspiratory reserve volume, tidal volume, and expiratory reserve volume (Miller-Keane & O’Toole, 2003). Aerobic capacity is not the same as lung capacity, which is simply the volume of air that a person’s lung can hold.
Aerobic capacity is perhaps the most important area of any fitness programme. Research clearly
indicates that acceptable levels of aerobic capacity are associated with a reduced risk of high blood pressure
coronary heart disease, obesity, diabetes, some forms of cancer, and other health problems in adults
(Mohammad, & Tareq, 2016). The evidence record the health benefits of physical activity has been
summarized most concisely in physical activity and health (Mohammad, 2017).
The American college of sports medicine (ACSM) defines aerobic exercise on “any activity that
uses large muscle groups, can be maintained continuously, and is rhythmic in nature”. Theoretically, the
more oxygen you can use during high level exercise, the more ATP (energy) you can produce. Sports
training is a pedagogical process, based on scientific principles, aiming at preparing sportsmen for higher
performances in sports competitions. There is less oxygen at higher altitude, an athlete will generally have 5
percent decrease in Vo2 max results with a 5,000 feet gain in altitude. Living at an altitude for a month
enhances subsequent endurance performance, probably by increasing the oxygen-carrying capacity of the
blood through an increase in production of red blood cells (Coote, 1995). Aerobic exercise helps in
reducing the risk of diabetes. Another important aspect is the psychological benefit of aerobic activity as it
reduces anxiety and depression (Mohammad, 2016). The United States President’s Council on Physical Fitness and Sports defined the term physical fitness as “the ability to carry out daily tasks with stamina and
alertness without undue fatigue, with more energy to enjoy leisure time pursuits and to meet unexpected
emergencies” (Clarke, 1976).
Despite its long history and global appeal, relatively little is known about the physiological and
other requirements of cricket. It has been suggested that the physiological demands of cricket are relatively
mild, except in fast bowlers during prolonged bowling spells in warm conditions. However, the
physiological demands of cricket may be underestimated because of the intermittent nature of the activity
Journal of Physical Education Research, Volume 6, Issue III, September 2019, pp.46-49 ISSN: Print-2394 4048, Online-2394 4056
Khan, Z., Raja, W.H., & Khan, N.A. (September, 2019). Measuring aerobic capacity of cricket players off and on the high altitude
Astrand-Ryhming sub maximal aerobic test. Journal of Physical Education Research, Volume 6, Issue III, 46-49.
JOPER® www.joper.org JOPER 47
and the generally inadequate understanding of the physiological demands of intermittent activity (Noakes,
& Durandt, 2001). The purpose of the present study was to determine aerobic capacity of cricket players
“off” and “on “the high altitude Astrand-Ryhming Sub Maximal Aerobic Test.
2. METHODS AND MATERIALS
2.1 Sample and Sampling Technique
It was decided to conduct the study of measuring aerobic capacity of cricket players “off” and “on” the high altitude Astrand-Ryhming Sub Maximal Aerobic Test. For this study it was required to design the test. For
the purpose of study 30 male subjects were selected from AMU, Aligarh, India.
The test measures two geographical region of India i.e., High and Low altitude. For conducnting
the experiment Kashmir was decided as High altitude and for Low altitude A.M.U. campus Aligarh, U.P.
was considered. Astrand-Ryhming Sub maximal Aerobic capacity Test was applied for the collection of the
data. The test was conducted to Measuring Aerobic Capacity of same cricket players “off” and “on” the high altitude. Subjects were selected through simple random sampling method. The age of the selected
subjects were ranged from 21-28 years.
2.2 Apparatus used for Data Collection
For obtaining data stepping benches (40×40 cm high), Metronome, Stopwatch, and Stethoscope were used.
2.3 Test Administrations
Data on above cited variable were obtained with the standard procedure. The cricketers were asked to
perform stepping on a 40 cm high bench. Before the commencement of the test a demonstration of the four
count ‘up-up-down-down’ step test to be performed at a rate of 22.5 steps per minute was given to the
participants. Further, the subjects were asked to get ready for the exercise. At the signal ‘Go’ the subjects start stepping up-up-down-down (four counts for step exercise) and the timer switches on the stopwatch.
After one minute of exercise the timer announces, ‘stop for pulse count.’ The position, and announces for
the restart of exercise. Thus, the pulse count was taken after each minute of exercise was same; it was
considered to have reached a steady stage. In case the steady stage was not reached, the pulse count after the
fifth minute was considered for the scoring. This procedure was applied twice for collecting data on high
and low altitude.
2.4 Data Analysis
Obtained data was analyzed by using paired sample t-test, before that raw data was tabulated and
standardized for statistical analysis. All statistical functions were performed on SPSS v.19 software, and it
was decided to level of significance will be taken at 0.05 with 28 degree of freedom.
3. RESULTS
Table 1: Mean, standard deviation, and t-test of Astrand Ryhming sub maximal aerobic test
Variables Mean S.D. Df t-test
Cricket Players in Kashmir 133 12.95 28 2.12*
Cricket Players in Aligarh 126.5 10.5
*p<0.05
It can be observed from the Table 1 that the calculated mean and standard deviation “off” and “on” the high altitude Kashmir and Aligarh for same group of Cricketers by using of Astrand-Ryhming sub
maximal aerobic test are 133 (12.95) and 126.5 (10.5), respectively. The calculated paired sample t-
value is 2.12. The table value at 28 degree of freedom is 1.70 with 0.05 levels of significance which
means there is significant difference found between “off” and “on” high altitude aerobic capacity of
same group of cricketers.

Khan, Z., Raja, W.H., & Khan, N.A. (September, 2019). Measuring aerobic capacity of cricket players off and on the high altitude
Astrand-Ryhming sub maximal aerobic test. Journal of Physical Education Research, Volume 6, Issue III, 46-49.
JOPER® www.joper.org JOPER 48
Figure 1: Mean, standard deviation, and t-test of Astrand-Ryhming sub maximal aerobic test “off” & “on” in Kashmir and in Aligarh
4. DISCUSSION
It is observed from the finding of the study that the mean ‘off and on’ high altitude cricket players were found significant different. The result shows that at Kashmir cricket players have high aerobic capacity than
Aligarh. It is recognized that physiological fitness is much needed for high level performance such as
aerobic and anaerobic capacity, heart rate, and vital capacity. Blood pressure etc. Tremblay, Colley,
Saunders, Healy, and Owen, (2010) preaches that fast bowling is predominantly an anaerobic activity which
requires an aerobic base. Physiological requirement of player playing at different positions are different. In
some games like cricket every skill requires a different physiological status; the batsmen may have different
physiological status than a pace bowler or wicketkeeper (Negi, & Pritam, 2012). Living at an altitude for a
month enhances subsequent endurance performance, probably by increasing the oxygen-carrying capacity
(Coote, 1995). Cricket is one such sport which needs stamina and physical endurance as well. The
cardiovascular adaptations, respiratory rate or breathing frequency at a high altitude, effect the aerobic
capacity of cricket players The selected cricket players are by birth in (high altitude) Kashmir, this is one of
the factor that high altitude players having such a high aerobic capacity than sea level in (Aligarh). Bärtsch
and Saltin, (2008) it is clear there is a large endurance component in the game of cricket and particularly
fast bowling. Cricket is game which needs physical endurance, thus Altitude training is a popular method
athletes utilize, especially aerobic endurance of athletes. The high altitude players to achieve higher vital
capacity than low altitude players. Ahsan and Mohammad (2018) argued that residing at high altitude leads
to rise in vital capacity. The result of the present study may be different than the earlier findings may be
because less number of sample as well as the level of participation in sport.
5. CONCLUSION
On the basis of Astrand Ryhming sub maximal aerobic test, it is concluded that high altitude cricket players
were better in Aerobic Capacity, heart rate, vital capacity than low altitude cricket players.
6. REFERENCES
Ahsan, M. & Mohammad, A. (2018). Effects of different warm-up techniques on dynamic balance and
muscular strength on players: A study. European Journal of Physical Education and Sports
Science, 4(12), 29-38.
Bärtsch, P.P. & Saltin, B.B. (2008). General introduction to altitude adaptation and mountain sickness.
Scandinavian Journal of Medicine & Science in Sports, 181, 10.
Cink, R.E. & Thomas, T.R. (1981). Validity of the Astrand-Ryhming nomogram for predicting maximal
oxygen intake. British Journal of Sports Medicine, 15(3), 182-185.
Clarke, D.H. (1976). Exercise physiology. Longman Higher Education.
Coote, J.H. (1995). Medicine and mechanisms in altitude sickness: recommendations. Sports Medicine, 20,
148-159.
Dar, U.R. (2016). Effect of aerobic training on physical fitness components of cricket players of university
of Kashmir. International Journal of Physical Education, Sports and Health, 3(6), 18-20.
0
20
40
60
80
100
120
140
In Kashmir In Aligarh
133 126.5
12.95 10.5
Mean
S.D.

Khan, Z., Raja, W.H., & Khan, N.A. (September, 2019). Measuring aerobic capacity of cricket players off and on the high altitude
Astrand-Ryhming sub maximal aerobic test. Journal of Physical Education Research, Volume 6, Issue III, 46-49.
JOPER® www.joper.org JOPER 49
Legge, B.J. & Banister, E.W. (1986). The Astrand-Ryhming nomogram revisited. Journal of Applied
Physiology, 61(3), 1203-1209.
McArdle, W.D., Katch, F.I., & Katch, W.L. (2006). Essentials of exercise physiology. Lippincott Williams
& Wilkins.
Miller-Keane & O’Toole, M. (2003). Miller-Keane encyclopedia and dictionary of medicine, nursing, and
allied health, (7th Ed.), USA: Saunders, Elsevier, Inc.
Mohammad, A. & Tareq, A. (2016). The Relationship between body fat percentage with speed, agility and
reaction time of male football players of Bangladesh. International Journal of Science Culture and
Sport, 4(4), 453-460.
Mohammad, A. (2016). Effect of weight training exercises on the improvement of arm and leg strength of
wrestlers. International Journal of Sports and Physical Education, 2(2), 8-11.
Mohammad, A. (2017). Physical fitness variables required for pre-service teachers. European Journal of
Physical Education and Sports Science, 3(11), 396-406.
Negi, B. & Pritam, A. (2012). A comparative study of physiological variables of female cricket players at
different levels of participation. International Journal of Research Review in Engineering Science
and Technology, 1(1), 87-93.
Noakes, T.D. & Durandt, J. (2001). Physiological requirements of cricket. Journal of Sports Sciences,
18(12), 919-929.
Sheokand, D. (2007). Physiology of physical fitness. New Delhi, Indian: Sports Publication.
Tremblay, M.S., Colley, R.C., Saunders, T.J., Healy, G.N., & Owen, N. (2010). Physiological and health
implications of a sedentary lifestyle. Applied Physiology, Nutrition, and Metabolism, 35(6), 725-
740.

~ 125 ~
International Journal of Yogic, Human Movement and Sports Sciences 2019; 4(1): 125-126
ISSN: 2456-4419 Impact Factor: (RJIF): 5.18 Yoga 2019; 4(1): 125-126 © 2019 Yoga www.theyogicjournal.com Received: 06-11-2018 Accepted: 09-12-2018 Brij Bhushan Singh Supervisor, Department of Physical Education, Aligarh Muslim University, Aligarh, Utter Pradesh, India Yogendra Sharma Research Scholar, Department of Physical Education, Aligarh Muslim University, Aligarh, Utter Pradesh, India Correspondence Yogendra Sharma Research Scholar, Department of Physical Education, Aligarh Muslim University, Aligarh, Utter Pradesh, India
An attitude study of high and low performance of
Indian male sprinters
Brij Bhushan Singh and Yogendra Sharma
Abstract
Current study aimed to assess the attitude toward physical education and physical activity of Indian male
100, 200 and 400 m. high and low performer sprinters. For the purpose of this study, data on attitude was
collected through Jimmie Ishee (25/09/2001) scale from 79th All India Inter-University Athletics (Men &
Women), Championship 2018-19 held at (Mangalagangothri) Karnataka, from 25 to 29, Nov., 2018 and
22nd Federation-cup National Senior Athletics Championship 2018 held at NS-NIS (Patiala), Punjab
from 5th to 8th March 2018.
Keywords: Low performance, Indian male sprinters, physical activity
Introduction
Athlete’s attitudes towards physical education and physical activity have a significant role in his performance. Positive attitudes are an important steady steering wheel driving the athletes
towards performance enhancement. They are the dynamics of human action. Bartholomew,
(2000) [1].
Aim of the study
The present study aimed to assess the Attitude toward physical education and physical activity
of 100, 200 and 400 m. sprinters.
Methodology
For the purpose of this study, data on attitude was collected through the standard inventory on
attitude toward physical education and physical activity (APEPA), developed by Jimmie Ishee
(25/09/2001) from 79th All India Inter-University Athletics (Men & Women), Championship
2018-19 held at (Mangalagangothri) Karnataka from 25 to 29 November, 2018 and 22nd
Federation-cup National Senior Athletics Championship 2018 held at NS NIS (Patiala), Punjab
from 5th to 8th March 2018.
The questionnaire was distributed to the subjects and method was explained for filling the
response by the researcher.
Test Administration
The coaches and subjects (Athletes) were consulted personally and their sincere cooperation
was solicited. Respondents were called to a common place when they were not busy and had
enough time to spare for testing. Necessary instructions were passed on to the athletes before
the administration of each test inventory. The researcher motivated the athletes respondents by
promising to send a separate abstract of the conclusions of his study to each of the subjects.
Confidentiality of responses was assured so that the subject would not camouflage their real
feelings. No time limit for filling in the questionnaire was set but the subjects were made to
respond as quickly as possible once the instructions are clearly understood by them. As soon
as subject completed questionnaire.
There are seven scales in the scoring and scholar awarded following points against score
achieved by sports persons.
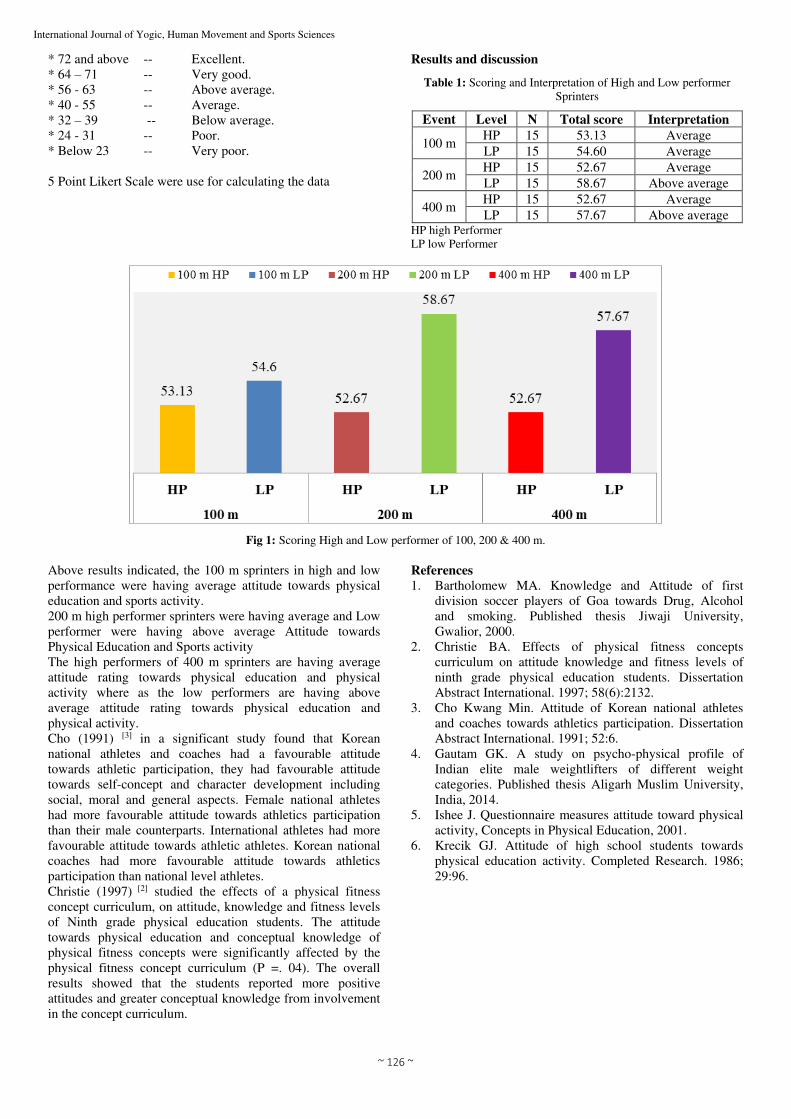
~ 126 ~
International Journal of Yogic, Human Movement and Sports Sciences
* 72 and above -- Excellent.
* 64 – 71 -- Very good.
* 56 - 63 -- Above average.
* 40 - 55 -- Average.
* 32 – 39 -- Below average.
* 24 - 31 -- Poor.
* Below 23 -- Very poor.
5 Point Likert Scale were use for calculating the data
Results and discussion
Table 1: Scoring and Interpretation of High and Low performer
Sprinters
Event Level N Total score Interpretation
100 m HP 15 53.13 Average
LP 15 54.60 Average
200 m HP 15 52.67 Average
LP 15 58.67 Above average
400 m HP 15 52.67 Average
LP 15 57.67 Above average HP high Performer
LP low Performer
Fig 1: Scoring High and Low performer of 100, 200 & 400 m.
Above results indicated, the 100 m sprinters in high and low
performance were having average attitude towards physical
education and sports activity.
200 m high performer sprinters were having average and Low
performer were having above average Attitude towards
Physical Education and Sports activity
The high performers of 400 m sprinters are having average
attitude rating towards physical education and physical
activity where as the low performers are having above
average attitude rating towards physical education and
physical activity.
Cho (1991) [3] in a significant study found that Korean
national athletes and coaches had a favourable attitude
towards athletic participation, they had favourable attitude
towards self-concept and character development including
social, moral and general aspects. Female national athletes
had more favourable attitude towards athletics participation
than their male counterparts. International athletes had more
favourable attitude towards athletic athletes. Korean national
coaches had more favourable attitude towards athletics
participation than national level athletes.
Christie (1997) [2] studied the effects of a physical fitness
concept curriculum, on attitude, knowledge and fitness levels
of Ninth grade physical education students. The attitude
towards physical education and conceptual knowledge of
physical fitness concepts were significantly affected by the
physical fitness concept curriculum (P =. 04). The overall
results showed that the students reported more positive
attitudes and greater conceptual knowledge from involvement
in the concept curriculum.
References
1. Bartholomew MA. Knowledge and Attitude of first
division soccer players of Goa towards Drug, Alcohol
and smoking. Published thesis Jiwaji University,
Gwalior, 2000.
2. Christie BA. Effects of physical fitness concepts
curriculum on attitude knowledge and fitness levels of
ninth grade physical education students. Dissertation
Abstract International. 1997; 58(6):2132.
3. Cho Kwang Min. Attitude of Korean national athletes
and coaches towards athletics participation. Dissertation
Abstract International. 1991; 52:6.
4. Gautam GK. A study on psycho-physical profile of
Indian elite male weightlifters of different weight
categories. Published thesis Aligarh Muslim University,
India, 2014.
5. Ishee J. Questionnaire measures attitude toward physical
activity, Concepts in Physical Education, 2001.
6. Krecik GJ. Attitude of high school students towards
physical education activity. Completed Research. 1986;
29:96.

~ 209 ~
International Journal of Physiology, Nutrition and Physical Education 2019; 4(1): 209-210
ISSN: 2456-0057 IJPNPE 2019; 4(1): 209-210 © 2019 IJPNPE www.journalofsports.com Received: 08-11-2018 Accepted: 11-12-2018 Brij Bhushan Singh Supervisor, Department of Physical Education, Aligarh Muslim University, Aligarh, Utter Pradesh, India Yogendra Sharma Research Scholar, Department of Physical Education, Aligarh Muslim University, Aligarh, Utter Pradesh, India Correspondence Yogendra Sharma Research Scholar, Department of Physical Education, Aligarh Muslim University, Aligarh, Utter Pradesh, India
A study on somatotype of top Indian male 100 m.
sprinters
Brij Bhushan Singh and Yogendra Sharma
Abstract
This study aimed to assess the somatotype profile of 100 m sprinters. Ten anthropometric dimensions i.e.
stature (height), body mass (weight), four skin folds (triceps, sub scapular, supra spinal, medial calf), two
bone breadths (bi-epicondylar humerus and femur), and two limb girths (arm flexed and tensed, calf)
were collected from 12 top ranking athletes participating in 22nd Federation cup National Senior
Athletics Championship 2018 held at NS NIS (Patiala), Punjab from 5th to 8th March 2018.
Keywords: Somatotype, sprinters
Introduction
Sheldon believed that Somatotype was fixed through genetic morphological traits but the
present view is that the Somatotype is phenotypical and thus amenable to change under the
influence of growth, ageing exercise and nutrition Carter and Heath, (1990) [1]. The 100 m.
sprinters require powerful quick action of the muscles for success in the event for this a
specific type of physique is developed under the influence of heredity and training. The
purpose of this study was to asses the somatotype of top ranking 100 m. sprinters of the
country.
Methodology
For the purpose of this study, top 12 ranking athletes were selected from 22nd federation cup
national senior athletics championship 2018 held at NS NIS (Patiala), Punjab from 5th to 8th
March 2018.
The appropriate anthropometrical techniques and instruments approved by ISAK (1986) [4]
were used for measuring ten anthropometric dimensions i.e. stature (height), body mass
(weight), four skin folds (triceps, sub scapular, supra spinal, medial calf), two bone breadths
(bi-epicondylar humerus and femur), and two limb girths (arm flexed and tensed, calf). The
following descriptions are adapted from Carter and Heath (1990) [1].
These measurements were put into the formulae given by Heath and Carter (1990) [1]. The
following somatotype for each of the chosen athletes was derived from the calculation.
Table 1: Somatotype rating of top Indian male 100 m sprinters
S. No. Endomorph Mesomorph Ectomorph
A. 1. 2.42 4.64 0.76
A. 2. 2.6 4.57 2.06
A. 3. 2.74 5.34 1.58
A. 4. 2.4 3.98 3.01
A. 5. 2.55 5.52 1.55
A. 6. 2.63 3.14 1.15
A. 7. 2.56 4.45 0.73
A. 8. 2.86 3.97 2.15
A. 9. 2.75 5.15 1.74
A. 10. 2.62 3.88 2.91
A. 11. 2.35 6.93 0.84
A. 12. 1.97 4.18 2.36
A = athletes

~ 210 ~
International Journal of Physiology, Nutrition and Physical Education
Table 2: Mean and SD of Endomorph, Mesomorph and Ectomorph
Somatotype N Mean Std. Deviation
Endomorphy 12 2.66 0.49
Mesomorph 12 4.66 1.07
Ectomorph 12 1.83 0.71
Graphical Illustration of Somatotype Mean and SD
Results and discussion
It is evident from the results that 100 m sprinters are having
maximum mesomorphy in their somatotype followed by
endomorphy than ectomorphy. As is seen the 100 m sprinters
are very muscular with broad shoulders and powerful arms.
Their greater endomorphy component is also characterised by
their wider bones in shoulder arms and leg areas and not by
excess fat. The mesomorphy strong musculature gives them
quick and powerful movements for running the distance in
shortest possible time.
The average somstotype of different groups in male Indian
track sprint events is 2.4-3.7-3.3 for 100 m and 200 m. 2.0-
3.9-3.4 for 400 m. Sodhi & Sidhu (1984) [5].
De Garay et al., (1974) [2]; Tanner (1964) [4]. Found that the
average somatotype of the sprinters was 2.5-5.5-3.0 studied
137 competitors of Olympic, British Empire and
Commonwealth games. This sample represented a little over a
third of all those at Rome who had achieved the Olympic
standard.
References
1. Carter JEL, Heath BH. Somatotyping-Development and
Applications. Cambridge University Press; Cambridge,
1990.
2. De. Garay AL, Levins L, Carter JEL. Genetic and
Anthropological studies of Olympic Athletes. Acadmic
Press, New York, Londan, 1974.
3. Heath BH, Carter JEL. A modified somatotype method,
American Journal of Physical Anthropology. 1967;
27:57-74.
4. ISAK. International Standards for Anthropometric
Assessment. Under dale, S A., International Society for
the Advancement of Kin-anthropometry, 1986.
5. Sodhii SH, Sidhu LS. Physique and selection of
sportsman ‘a kinenthropometric study’ Punjab publishing house, Patiala, 1984.
6. Tanner JM. The Physique of Olympic Athletes, London
George Allen and Unwin Ltd, 1964, 76.

Formulation of Sport Management Strategic Planning using SWOT Analysis
Author(s):
Iftikhar Ahmad Wani
Dr. Merajuddin Faridi*
Designation & Institution:
Research Scholar, Department of Physical Education, AMU, Aligarh
*Assistant Professor at Department of physical education AMU, Aligarh
Communication:
[email protected], +917780808935, +917065246187
Abstract
This analysis aimed to bringforward the procedure and significance of SWOT
analysis in the formulation of Strategic Planning in sports management. To serve the mission,
the researcher consulted several books and journals to collect the information. An online
search was also done in this regard through Google Scholar, Scopus, ResearchGate,
ScienceDirect, and Shodhganga. The studies that focused on the formulation of Strategic
Planning based on SWOT analysis and were in English Language only were selected for the
consideration of the study. The outcomes of the survey disclosed that there are six (6)
essential phases of doing a SWOT analysis, which is critical for every organization to
consider before formulating any effective strategic planning for managing the sport. These
phases have been explained in the main content of this article.
Keywords: Strategic Planning, Sports Management, SWOT analysis
Parishodh Journal
Volume IX, Issue III, March/2020
ISSN NO:2347-6648
Page No:5479

Introduction
SWOT is a fundamental concept showing the significance of internally and externally
powers to consider the origins of a competitive edge. This is a critical analytical method that
must be added with the comprehensive strategic, resource,organizational, andeconomic
research.SWOT aidsin regulating whether an organization’s core problems revolve around a
need to revise policy, a need to strengthen the execution of the plan, or both.SWOT review
can typically help to represent a strategic administrative scenario and determine what work
needs to be done and, therefore, what decisions are likely to be put at both the individual and
the organizational level. The approach aims to look at the actual success of the "strengths and
weaknesses" of the organization and the future "opportunities and threats" of the organization
by fully recognizing the aspects which occur in the external world.“SWOT” is a strong
concept that can be put into action for individuals, schools, groups, organizations, or even
proposals (David, 1997).
SWOT analysis is a strategy which is commonly for use in strategic planning. The
characters are for "Strengths, Weaknesses, Opportunities, and Threats." Since its introduction
in the 1950s and 1960s, SWOT analysis has been a fundamental method in strategic planning
and is still widely used today(Hill and Westbrook, 1997).The SWOT method (Learned et
al., 1965) was developed as the primary technique tool for analyzing case studies from earlier
Harvard Business School efforts.Since Learned et al. (1965) concluded the study,
educational debates occurred in different business schools around the United States,
concentrating on organizational "strengths and weaknesses," and linking them to
"opportunities and threats"(Mintzberg et al., 1998).A business strategy conference was then
hosted at Harvard in 1963: the SWOT analysis was widely discussed and considered an
important method for "strategic planning.".
Even though many models and frameworks have arisen, SWOT has remained
virtually unchanged–all these are iterations in the same context. SWOT has been a basic
conceptual model in which several fields of study and practice in strategic management were
focused in one way or the other. SWOT study is a method for “strategic planning”; This is the
initial move in several strategic iterations (Dyson, 2002; Hindle, 1994).SWOT analysis can
assist in evaluating the best match between external trends“opportunities and threats” and
Parishodh Journal
Volume IX, Issue III, March/2020
ISSN NO:2347-6648
Page No:5480
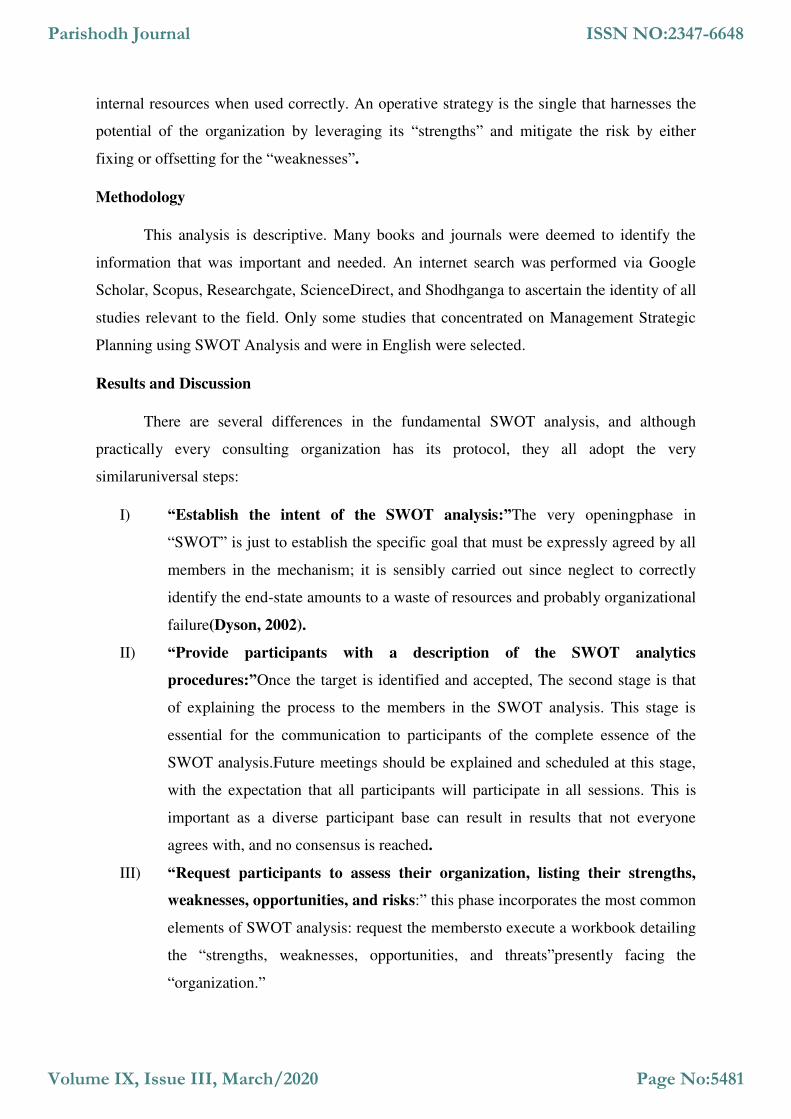
internal resources when used correctly. An operative strategy is the single that harnesses the
potential of the organization by leveraging its “strengths” and mitigate the risk by either
fixing or offsetting for the “weaknesses”.
Methodology
This analysis is descriptive. Many books and journals were deemed to identify the
information that was important and needed. An internet search was performed via Google
Scholar, Scopus, Researchgate, ScienceDirect, and Shodhganga to ascertain the identity of all
studies relevant to the field. Only some studies that concentrated on Management Strategic
Planning using SWOT Analysis and were in English were selected.
Results and Discussion
There are several differences in the fundamental SWOT analysis, and although
practically every consulting organization has its protocol, they all adopt the very
similaruniversal steps:
I) “Establish the intent of the SWOT analysis:”The very openingphase in
“SWOT” is just to establish the specific goal that must be expressly agreed by all
members in the mechanism; it is sensibly carried out since neglect to correctly
identify the end-state amounts to a waste of resources and probably organizational
failure(Dyson, 2002).
II) “Provide participants with a description of the SWOT analytics
procedures:”Once the target is identified and accepted, The second stage is that
of explaining the process to the members in the SWOT analysis. This stage is
essential for the communication to participants of the complete essence of the
SWOT analysis.Future meetings should be explained and scheduled at this stage,
with the expectation that all participants will participate in all sessions. This is
important as a diverse participant base can result in results that not everyone
agrees with, and no consensus is reached.
III) “Request participants to assess their organization, listing their strengths,
weaknesses, opportunities, and risks:” this phase incorporates the most common
elements of SWOT analysis: request the membersto execute a workbook detailing
the “strengths, weaknesses, opportunities, and threats”presently facing the
“organization.”
Parishodh Journal
Volume IX, Issue III, March/2020
ISSN NO:2347-6648
Page No:5481

a) Based on Strengths (internal strengths and competencies – everything that we
possess).
b) Reducing weaknesses (lack of proven strengths and expertise-what, we have
little or no).
c) Enable opportunities (positive external conditions-what we can get).
d) Alleviate detrimental consequences (external adverse conditions – that we
could lose).
“Strengths and weaknesses” are perceived as interiorfeatures that can be
managed and implemented.“Opportunities and threats” are exteriorfeaturesthat are
uncontrollable and shape the external context in which the organization’s success.
"Strengths" are attributes of success including a highly competitive role,
"weaknesses" are other attributes that hinder the organization from achieving that
competitive edge. At around the same time, "opportunity" is increased to match
the concepts and assets of the organization(Hatton et al., 1992).Organizational
Strengthis the attribute that contributes to something and makes it so unique.
Compared to something else, Strength means something is more beneficial. In this
context, force refers to a positive, helpful, and innovative characteristic.
Organizational Weaknesses relate to not possessing the quality and competency
required for something. Weakness means that something is more detrimental
when likened to something else. In this respect, vulnerability is a trait that is
negative and unfavorable. Opportunities mean a suitable circumstance or
environment for operation. Chance is an advantage, and it is the driving force for
action. It has a positive and beneficial value for this. The threat is a circumstance
or condition that endangers an activity’s actualization. This applies to an adverse
case. It has a negative characteristic that should be avoided for this reason.
IV) “Merge the worksheets in one single sheet:”When personal contributions have
all been collected, the challenge now is to integrate these responses into a broader
picture with all viewpoints on “organizational strengths, weaknesses,
opportunities, and threats.”This can be achieved in a digital format that could be
circulated to each person, and more generally on wall posters or computer-
screens, which can show a picture on a large screen to promote dialog.
Parishodh Journal
Volume IX, Issue III, March/2020
ISSN NO:2347-6648
Page No:5482
V) “Indulge the team in discussion and discuss the description of each
object:”Promotingplanneddiscussion can be the component of the SWOT review
through the utmost significant possible for enhancing member viewpoints.So it is
appropriate to ask questions like:How could this danger be an opportunity as well?
Moreover, is that potential also involving threats? Moreover, How could the
“Strength become a weakness”? Responses to these queries will stretch managers
innovativevisions into selectingpractical approaches and new customs of doing
things regarding reported issues (Thompson, 1993).
VI) “Create concrete actions to move ahead:”A practical consequence of the
strategic dialog is the formation of a strategy for engagement, Considering the
areas to be accomplished or the anticipated end-state to be accomplished as a
consequence of the “SWOT” study (Mintzberg, 1987).The aim of SWOT is “to
draw on the strengths, resolve weaknesses, take full advantage of opportunities,
and the consequences of threats.” SWOT will, hence, be utilized to recognize
problems that are deemed necessary to the organization’s current and potential
success (Hill and Westbrook, 1997).Such essential mattersshould be identified
and closely monitored during any initiative, plan, or decision being planned,
enforced, and evaluated (Koch, 2000; Thompson, 1993).Upon conducting the
perception-based research,quality time must be used to assess the factors under
review. Following the analysis and comparison of choices, the aim is to determine
how to minimize the number of possibilities (Hill and Westbrook, 1997;
Mintzberg, 1987; Thompson, 1993) (Chermack & Kasshanna, 2007) (Chang
& Huang, 2006) (Gurel & Tat, 2017)).
Conclusion
It would appearimpartial to say that the review of SWOT as a strategic framework
resource for sports management has not yet been thoroughly recorded. There are considerable
Parishodh Journal
Volume IX, Issue III, March/2020
ISSN NO:2347-6648
Page No:5483

chances to research the SWOT analysis in greater detail, which would add weight to the value
of their tests. All quantitative and qualitative research orientations provide these possibilities.
The researcher concludes that SWOT analysis is a highly useful tool to help
sportsorganizations stay fit within internal and external environments.
SWOT analysis is fundamental when formulating a strategy. The study of potential
opportunities and challenges is specifically aimed at determining how a sportsorganization
can take advantage of opportunities and escape risks while facing an uncontrollable outside
setting. A review of internal strengths and weaknesses primarily aims at determining how a
sports organization conducts its interior work, such as management. This article has presented
six (6) essential phases of doing SWOT Analysis of any sports organization which should be
followed, and the best strategic planning for managing different sport should be formulated.
References
Balamuralikrishna, R., & Dugger, J. (1995). SWOT Analysis: A Management Tool for
Initiating New Programs in Vocational Schools. Journal of Vocational and Technical
Education. DOI:10.21061/jcte.v12i1.498
Parishodh Journal
Volume IX, Issue III, March/2020
ISSN NO:2347-6648
Page No:5484

Barney, J. B. (1993-2005). Looking inside for Competitive Advantage. The Academy of
Management Executive, 49-61. Retrieved from
https://www.jstor.org/stable/4165288?seq=1#metadata_info_tab_contents
Chang, H.-H., & Huang, W.-C. (2006). Application of a quantification SWOT analytical
method. Mathematical and Computer Modelling 43, 158-169.
DOI:10.1016/j.mcm.2005.08.016
Chermack, T. J., & Kasshanna, B. K. (2007). The Use and Misuse of SWOT Analysis and
Implications for HRD Professionals. Human Resource Development International,
383-399. DOI:10.1080/13678860701718760
David, F. (1997) Strategic Management, 6th edn (Upper Saddle River, NJ: Prentice-Hall).
Dyson, R. (2002) Strategic development and SWOT analysis at the University of Warwick,
European Journal of Operational Research, 152, pp. 631 – 40.
Gurel, E., & Tat, M. (2017). SWOT ANALYSIS: A THEORETICAL REVIEW. The Journal
of International Social Research. DOI:10.17719/jisr.2017.1832
Helms, M. M., & Nixon, J. (2010). Exploring SWOT analysis – where are we now? A review
of academic research from the last decade. Journal of Strategy and Management, 215-
251. DOI:10.1108/17554251011064837
Hill, T. and Westbrook, R. (1997) SWOT analysis: It is time for a product recall, Long Range
Planning, 30, pp. 46 – 52.
Koch, A. (2000) SWOT does not need to be recalled: It needs to be enhanced. Swinburne
University of Technology
Learned, A., Christensen, C., Andrews, R. S. and Guth, D. (1965) Business Policy: Text and
Cases (Homewood, Illinois: Irwin).
Mintzberg, H. (1987) The strategy concept 1: Five Ps for strategy, California Management
Review, 30, pp. 11 – 24.
Mintzberg, H., Ahlstrand, B. and Lampel, J. (1998) Strategy Safari: A Guided Tour Through
the Wilds of Strategic Management (New York: Free Press).
Thompson, J. L. (1993) Strategic Management: Awareness and Change, 2nd edn (London:
Chapman & Hall).
Parishodh Journal
Volume IX, Issue III, March/2020
ISSN NO:2347-6648
Page No:5485

Parishodh Journal
Volume IX, Issue III, March/2020
ISSN NO:2347-6648
Page No:5486