3-D thermal effect of late Cenozoic erosion and deposition ...
34
Geophysical Journal International Geophys. J. Int. (2018) 213, 885–918 doi: 10.1093/gji/ggy013 Advance Access publication 2018 January 15 GJI Heat flow and volcanology 3-D thermal effect of late Cenozoic erosion and deposition within the Lofoten–Vester˚ alen segment of the Mid-Norwegian continental margin Yuriy Petrovich Maystrenko, Laurent Gernigon, Odleiv Olesen, Dag Ottesen and Leif Rise Geological Survey of Norway, Leiv Eirikssons vei 39, 7040 Trondheim, Norway. E-mail: [email protected] Accepted 2018 January 13. Received 2018 January 2; in original form 2017 September 05 SUMMARY A 3-D subsurface temperature distribution within the Lofoten–Vester˚ alen segment of the Mid- Norwegian continental margin and adjacent areas has been studied to understand the thermal effect of late Cenozoic erosion of old sedimentary and crystalline rocks and subsequent de- position of glacial sediments during the Pleistocene. A lithosphere-scale 3-D structural model of the Lofoten–Vester˚ alen area has been used as a realistic approximation of the geometries of the sedimentary infill, underlying crystalline crust and lithospheric mantle during the 3-D thermal modelling. The influence of late Cenozoic erosion and sedimentation has been in- cluded during the 3-D thermal calculations. In addition, the 3-D thermal modelling has been carried out by taking also into account the influence of early Cenozoic continental breakup. The results of the 3-D thermal modelling demonstrate that the mainland is generally colder than the basin areas within the upper part of the 3-D model. The thermal influence of the early Cenozoic breakup is still clearly recognizable within the western and deep parts of the Lofoten–Vester˚ alen margin segment in terms of the increased temperatures. The ther- mal effects of the erosion and deposition within the study area also indicate that a positive thermal anomaly exists within the specific subareas where sedimentary and crystalline rocks were eroded. A negative thermal effect occurs in the subareas affected by subsidence and sedimentation. The erosion-related positive thermal anomaly reaches its maximum of more than +27 ◦ C at depths of 17–22 km beneath the eastern part of the Vestfjorden Basin. The most pronounced deposition-related negative anomaly shows a minimum of around −70 ◦ C at 17–20 km depth beneath the Lofoten Basin. The second negative anomaly is located within the northeastern part of the Vøring Basin and has minimal values of around −48 ◦ C at 12–14 km depth. These prominent thermal anomalies are associated with the subareas where relatively high erosional and depositional rates were observed for late Cenozoic time. Key words: Heat flow; Atlantic Ocean; Europe; Numerical modelling; Continental margins: divergent; Neotectonics; Sedimentary basin processes. 1 INTRODUCTION The Lofoten–Vester˚ alen margin represents an uplifted segment in the northeastern part of the Mid-Norwegian continental mar- gin, covering the area around the Lofoten–Vester˚ alen archipelago (Fig. 1). The Mid-Norwegian continental margin is a rifted passive margin where a continental breakup took place in the early Ceno- zoic about 55 Ma ago (e.g. Talwani & Eldholm 1977; Srivastava & Tapscott 1986; Brekke 2000; Olesen et al. 2007; Faleide et al. 2008; Gernigon et al. 2015). During the last decades, the tectonic evolution and structure of the Lofoten–Vester˚ alen segment and adjacent areas have been thoroughly studied by both geological and geophysical methods, in- cluding geological mapping (e.g. Sigmond 2002), drilling of wells (Olesen et al. 2007b, NPD 2017), interpretation of reflection seis- mic data (Mokhtari & Pegrum 1992; Bergh et al. 2007; Eidvin et al. 2007; Ottesen et al. 2009; Hansen et al. 2012; Rise et al. 2013; Hen- stra et al. 2017; Montelli et al. 2017) and refraction seismic data analysis (Avedik et al. 1984; Drivenes et al. 1984; Goldschmidt- Rokita et al. 1988; Mjelde et al. 1992; Kodaira et al. 1995; Mjelde et al. 1996; Mjelde et al. 2001; Mjelde et al. 2003; Mjelde et al. 1995; Breivik et al. 2009; Breivik et al. 2017). In addition, 2-D and 3-D potential field modelling helped further to understand the deep structure of this region (e.g. Fichler et al. 1999; Olesen et al. 2002; C The Author(s) 2018. Published by Oxford University Press on behalf of The Royal Astronomical Society. 885 Downloaded from https://academic.oup.com/gji/article/213/2/885/4810550 by guest on 16 April 2022
-
Upload
khangminh22 -
Category
Documents
-
view
0 -
download
0
Transcript of 3-D thermal effect of late Cenozoic erosion and deposition ...
Geophysical Journal InternationalGeophys J Int (2018) 213 885ndash918 doi 101093gjiggy013Advance Access publication 2018 January 15GJI Heat flow and volcanology
3-D thermal effect of late Cenozoic erosion and depositionwithin the LofotenndashVesteralen segment of the Mid-Norwegiancontinental margin
Yuriy Petrovich Maystrenko Laurent Gernigon Odleiv Olesen Dag Ottesenand Leif RiseGeological Survey of Norway Leiv Eirikssons vei 39 7040 Trondheim Norway E-mail yuriymaystrenkonguno
Accepted 2018 January 13 Received 2018 January 2 in original form 2017 September 05
S U M M A R YA 3-D subsurface temperature distribution within the LofotenndashVesteralen segment of the Mid-Norwegian continental margin and adjacent areas has been studied to understand the thermaleffect of late Cenozoic erosion of old sedimentary and crystalline rocks and subsequent de-position of glacial sediments during the Pleistocene A lithosphere-scale 3-D structural modelof the LofotenndashVesteralen area has been used as a realistic approximation of the geometriesof the sedimentary infill underlying crystalline crust and lithospheric mantle during the 3-Dthermal modelling The influence of late Cenozoic erosion and sedimentation has been in-cluded during the 3-D thermal calculations In addition the 3-D thermal modelling has beencarried out by taking also into account the influence of early Cenozoic continental breakupThe results of the 3-D thermal modelling demonstrate that the mainland is generally colderthan the basin areas within the upper part of the 3-D model The thermal influence of theearly Cenozoic breakup is still clearly recognizable within the western and deep parts ofthe LofotenndashVesteralen margin segment in terms of the increased temperatures The ther-mal effects of the erosion and deposition within the study area also indicate that a positivethermal anomaly exists within the specific subareas where sedimentary and crystalline rockswere eroded A negative thermal effect occurs in the subareas affected by subsidence andsedimentation The erosion-related positive thermal anomaly reaches its maximum of morethan +27 C at depths of 17ndash22 km beneath the eastern part of the Vestfjorden Basin Themost pronounced deposition-related negative anomaly shows a minimum of around minus70 C at17ndash20 km depth beneath the Lofoten Basin The second negative anomaly is located within thenortheastern part of the Voslashring Basin and has minimal values of around minus48 C at 12ndash14 kmdepth These prominent thermal anomalies are associated with the subareas where relativelyhigh erosional and depositional rates were observed for late Cenozoic time
Key words Heat flow Atlantic Ocean Europe Numerical modelling Continental marginsdivergent Neotectonics Sedimentary basin processes
1 I N T RO D U C T I O N
The LofotenndashVesteralen margin represents an uplifted segmentin the northeastern part of the Mid-Norwegian continental mar-gin covering the area around the LofotenndashVesteralen archipelago(Fig 1) The Mid-Norwegian continental margin is a rifted passivemargin where a continental breakup took place in the early Ceno-zoic about 55 Ma ago (eg Talwani amp Eldholm 1977 Srivastava ampTapscott 1986 Brekke 2000 Olesen et al 2007 Faleide et al 2008Gernigon et al 2015)
During the last decades the tectonic evolution and structureof the LofotenndashVesteralen segment and adjacent areas have been
thoroughly studied by both geological and geophysical methods in-cluding geological mapping (eg Sigmond 2002) drilling of wells(Olesen et al 2007b NPD 2017) interpretation of reflection seis-mic data (Mokhtari amp Pegrum 1992 Bergh et al 2007 Eidvin et al2007 Ottesen et al 2009 Hansen et al 2012 Rise et al 2013 Hen-stra et al 2017 Montelli et al 2017) and refraction seismic dataanalysis (Avedik et al 1984 Drivenes et al 1984 Goldschmidt-Rokita et al 1988 Mjelde et al 1992 Kodaira et al 1995 Mjeldeet al 1996 Mjelde et al 2001 Mjelde et al 2003 Mjelde et al1995 Breivik et al 2009 Breivik et al 2017) In addition 2-D and3-D potential field modelling helped further to understand the deepstructure of this region (eg Fichler et al 1999 Olesen et al 2002
Ccopy The Author(s) 2018 Published by Oxford University Press on behalf of The Royal Astronomical Society 885
Dow
nloaded from httpsacadem
icoupcomgjiarticle21328854810550 by guest on 16 April 2022
886 YP Maystrenko et al
Figure 1 Overview map of northwestern Europe (bathymetry and topography from the Norwegian Mapping Authority) with location of the lithosphere-scale3-D structuralthermal model of the LofotenndashVesteralen margin segment and adjacent areas (blue frame)
Tsikalas et al 2005 Bronner et al 2013 Gradmann amp Ebbing2015 Maystrenko et al 2017)
The study area is characterized by a prominent contrasting re-lief changing at a relatively short distance from elevations higherthan 15 km within the Scandes Mountains onshore to bathyme-tries deeper than minus3 km within the oceanic Lofoten Basin offshore(Fig 2) In addition to this contrasting relief the crystalline rocksare exposed on the Earthrsquos surface over most of the mainland (egSigmond 2002) The preserved sedimentary rocks are mainly rep-resented by the relatively thin Jurassic and Cretaceous sequences inthe northeastern part of the Andoslashya island (Dalland 1975 Smelroret al 2001) The crystalline rocks also crop out at the seafloor withinthe structural highs and near the coastline (Sigmond 2002) More-over the Nordland area is characterized by increased seismicity andneotectonic activities (Keiding et al 2015 Janutyte et al 2017)The above-mentioned direct indications of neotectonics togetherwith the additional neotectonic features have been summarized byOlesen et al (2013a 2004) for this structurally complex area
In this study the main goal has been to model and reveal the 3-Dconductive thermal pattern beneath the LofotenndashVesteralen mar-gin the adjacent parts of the mainland and the adjacent AtlanticOcean In particular our study has been performed to recognize thetemporal changes of the subsurface 3-D thermal pattern during thelate Cenozoic uplift and erosion of the mainland and the northeast-ern part of the LofotenndashVesteralen margin segment and the rapiddeposition of the eroded material within the southwestern part of
the LofotenndashVesteralen margin and the adjacent northeastern partof the Voslashring Basin The lithosphere-scale 3-D structural model ofthe LofotenndashVesteralen segment of the Mid-Norwegian margin fromMaystrenko et al (2017) has been taken as the main structural back-ground for the 3-D thermal modelling This 3-D structural modelrepresents the most recent structural approximation of the deep sub-surface covering the major tectonic units of the LofotenndashVesteralenarea and the northeastern part of the Voslashring Basin (Fig 2)
2 T E C T O N I C OV E RV I E WA N D P R E V I O U S W O R K
The LofotenndashVesteralen continental margin and the adjacent main-land had already undergone significant uplift and erosion duringthe Scandian phase of the Caledonian Orogeny in Silurian-EarlyDevonian time (Roberts amp Gee 1985) when large-scale overthrust-ing and subsequent uplift were caused by amalgamation of severalterranes to the Baltican protomargin During the Devonian theCaledonian Orogen collapsed as a result of a regional extension(Braathen et al 2002 Steltenpohl et al 2004 Fossen 2010) Dur-ing the Late PalaeozoicndashMesozoic several extensional events ledto the formation of Permian Triassic and Jurassic subbasins withinthe Troslashndelag Platform (eg Blystad et al 1995 Brekke 2000) theJurassicndashCretaceous depocentres within the Ribban and Vestfjordenbasins and possibly including the Roslashst Basin where sedimentary
Dow
nloaded from httpsacadem
icoupcomgjiarticle21328854810550 by guest on 16 April 2022
3-D thermal effect of Cenozoic erosion amp deposition 887
Figure 2 Tectonic configuration within the LofotenndashVesteralen and the northern Voslashring segments of the Mid-Norwegian continental margin superimposedon the bathymetry and topography with location of the 3-D structuralthermal model (based on Blystad et al 1995 Sigmond 2002 Hansen 2009 Hansen et al2012) (bathymetry and topography from the Norwegian Mapping Authority) Thick magenta lines correspond to the selected vertical slices shown in Fig 23Black dashed line corresponds to the present-day shelf edge COB the continent-ocean boundary LVLDM low-velocitylow-density mantle
rocks are overlain by lava flows (Tsikalas et al 2001 Hansen et al2012 Faeligrseth 2012 Eig 2012 Henstra et al 2017) During theLate JurassicndashCretaceous a large tectonic and thermal subsidenceaffected the adjacent Voslashring Basin (eg Gernigon et al 2004 Lien2005 Mjelde et al 2016) The continental break-up finally split theLaurasia palaeocontinent in the late Palaeocene-early Eocene andthe present-day Mid-Norwegian continental margin and the oceanicLofoten Basin started to form (Talwani amp Eldholm 1977)
During the Cenozoic the LofotenndashVesteralen segment of theMid-Norwegian continental margin has undergone an uplift whichwas followed by erosion andor non-deposition over a large partof the LofotenndashVesteralen margin (eg Loslashseth amp Tveten 1996Riis 1996 Faeligrseth 2012) The most recent erosion occurred dur-ing the Quaternary glacial periods when preserved sedimentaryrocks and part of the existing weathered crystalline rocks wereremoved by glacial erosion forming the typical present-day Nor-wegian coastal landscape the so-called strandflat (Olesen et al2013ab Holtedahl 1998) The strandflat is particularly well de-veloped south of the Lofoten margin along the coast of Helge-land (Olesen et al 2013a Holtedahl 1998) The eroded materialwas deposited farther offshore creating significant depocentres ofthe glacier-derived Naust Formation during Pleistocene times (egRise et al 2005 Dowdeswell et al 2010 Dowdeswell et al 2006Ottesen et al 2009 Montelli et al 2017) Moreover elevated pas-sive continental margins have also been well documented in otherplaces of the world (eg Greenland NE Brazil South Africa) but asin the case of the Mid-Norwegian margin there is still no commongeodynamic model that can fully explain their origin (eg Greenet al 2017)
The origin and nature of the late Cenozoic uplift are still a matterof debate and obviously resulted from the superposition of several
factors (Loslashseth amp Tveten 1996 Riis 1996 Faeligrseth 2012 Fjeld-skaar et al 2000) Four major phases of the Cenozoic uplift in thePalaeogene Middle Miocene late Pliocene and Pleistocene havebeen identified by Riis (1996) The Palaeogene uplift was inter-preted as a marginal uplift related to the opening of the NorthAtlantic Ocean and the late Pliocene event was considered to bedue to unloading (Riis 1996) On the other hand the causes of theMiddle Miocene and Pleistocene phases remain unknown Riis ampFjeldskaar (1992) have shown that the postglacial uplift is not to-tally isostatically compensated and Fjeldskaar et al (2000) haveproposed that this uplift has also a tectonic origin Furthermore theridge-push forces associated with Cenozoic seafloor spreading inthe North Atlantic Ocean have also been proposed as a primary ex-planation for the Fennoscandian uplift (eg Fejerskov amp Lindholm2000)
In spite of many uncertainties about the causes of these Cenozoicuplift events the magnitude of the uplift at different time intervalsand the amount of the eroded material have been approximatelyquantified by use of different methods Based on apatite fissiontrack and (UndashTh)He analyses the post-Caledonian denudation his-tory of western Fennoscandia is characterized by clearly definedand relatively high cooling rates throughout the whole Cenozoic era(Hendriks amp Andriessen 2002 Hendriks et al 2010 Davids et al2013 Ksienzyk et al 2014) Particularly the present-day exposedEarthrsquos surface in Lofoten and Vesteralen could be characterized byrelatively high palaeotemperatures at the beginning of the Cenozoicranging from 30 to 90 C and recorded at different locations (Hen-driks et al 2010) Hendriks et al (2010) indicate a differential upliftof the LofotenndashVesteralen area with magnitude variations from 1 tomore than 3 km locally during the Cenozoic Furthermore based onthe study of the weathered crystalline crust Olesen et al (2013a b)
Dow
nloaded from httpsacadem
icoupcomgjiarticle21328854810550 by guest on 16 April 2022
888 YP Maystrenko et al
have suggested that the Pleistocene erosion was about 500 m alongthe coastline in the Nordland area In SW Norway Steer et al(2012) have proposed that significant erosion must have also takenplace in close vicinity to present-day high elevation during the latePliocene and Quaternary glaciations However they did not con-sider the erosion within the inner shelf Based on the volume of thePleistocene Naust Formation off mid Norway Dowdeswell et al(2010) suggested a similar amount of average glacial erosion overthe mainland and inner shelf The estimated thickness of the restoredmatrix of the Cenozoic deposits in the close vicinity of the highlyelevated Scandes Mountains within the study area could possiblyreach more than 3 km as modelled by Goledowski et al (2013) Theamount of fluvial and glacial erosion predicted by the erosionalmodel of Medvedev amp Hartz (2015) suggests that it should not bemore than 15 km over the area located near the high-altitude Scan-des Mountains in the study area and should only reach c 175 kmlocally within some fjords Based on maximum estimated burialdepth in offshore wells and wells on Andoslashya a total erosion in theLofoten and Vesteralen region could have reached up to 2 km be-tween Andoslashya and the mainland (Eig 2012 NPD 2010) Moreovera possible presence of large-scale boudinage structures beneathLofotenndashVesteralen could be an additional factor which compli-cated the post-breakup development of the study area (Braun ampMarquart 2004)
3 I N P U T S T RU C T U R A L DATA S E T S
Bathymetry and topography have been taken from the NorwegianMapping Authority and the sedimentary infill of the 3-D structuralmodel has already been described in Maystrenko et al (2017) Inthis paper the uppermost sedimentary layers of the Bjoslashrnoslashya FanSlide Complex and the KaindashNaust formations (Middle Miocene-Pleistocene interval) have been subdivided into four layers in orderto investigate the thermal effect of erosion and deposition duringthe Pleistocene time interval Therefore the detailed sedimentaryunits for the input 3-D model are represented by the following layers(Figs 3 and 4 numbering is according to Maystrenko et al (2017))
(1) the Naust Formation (sequences U S and T) and analoguesin the Lofoten Basin (layer 21 Pleistocene with an age of c 06ndash0Ma)
(2) the Naust Formation (sequence A) and analogues in the Lo-foten Basin (layer 22 Pleistocene with an age of c 15ndash06 Ma)
(3) the Naust Formation (sequence N) and analogues in the Lo-foten Basin (layer 23 lower Pleistocene with an age of c 27ndash15Ma)
(4) the Kai Formation and the Molo Formation (layer 24 MiddleMiocenendashPliocene with an age of c 18ndash27 Ma)
(5) the Brygge Formation and the undefined Cenozoic (layer 3mainly Eocenendashlower Miocene with an age of c 56ndash18 Ma)
(6) the Upper CretaceousndashPalaeocene (near top CenomanianndashtopPalaeocene) without a sedimentary succession in the Roslashst Basin(layers 5ndash6)
(7) the Lower Cretaceous (base Cretaceous unconformity-neartop Cenomanian) without a sedimentary succession in the RoslashstBasin (layer 7)
(8) the pre-Cretaceous (Jurassic Triassic Permian and older sed-imentary rocks) without a sedimentary succession in the Roslashst Basin(layer 8)
(9) the undivided pre-Cretaceous Cretaceous and Palaeocenewithin the Roslashst Basin (layers 5ndash8)
It is important to note that the KaindashNaust and Brygge formationscorrespond to the Nordland and Hordaland groups respectivelyand the Palaeocene corresponds to the Rogaland group The UpperCretaceous and the Lower Cretaceous do not exactly correlate withthe Shetland and Cromer Knoll groups within some local areas (egDalland et al 1988)
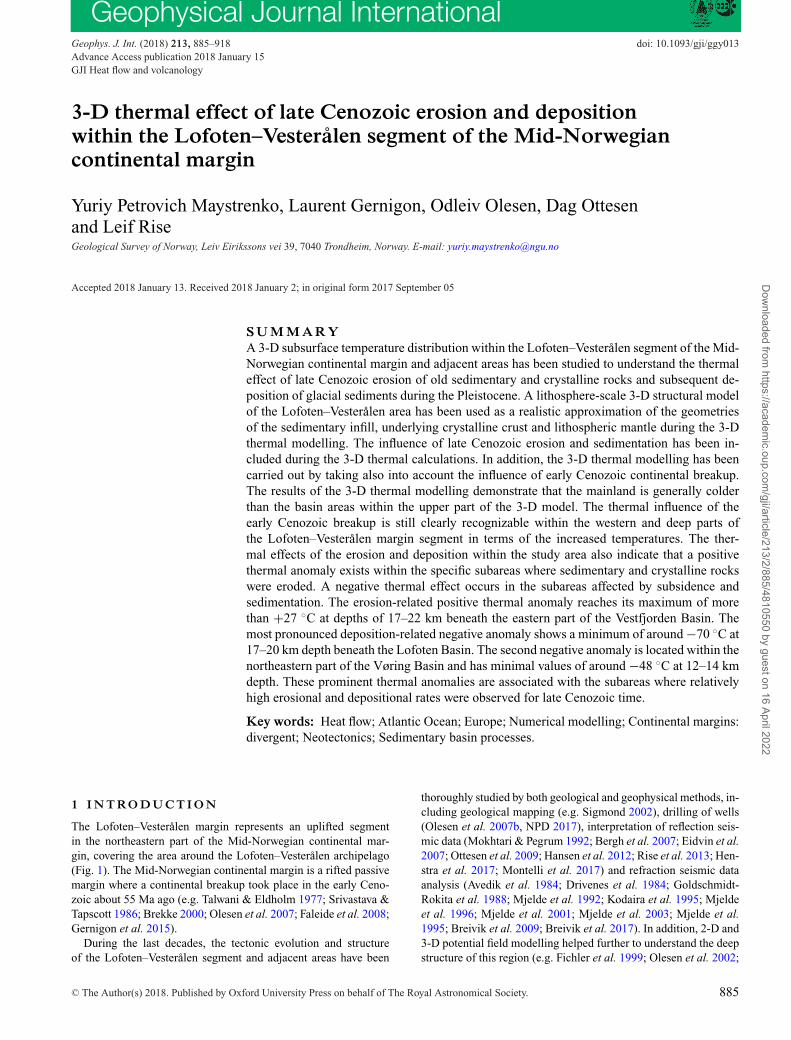
The maps for the BryggendashNaust (EocenendashPleistocene) intervalwithin the LofotenndashVesteralen and Voslashring segments of the Mid-Norwegian continental margin (Fig 3) have been compiled by us-ing data from Rise et al (2005) Eidvin et al (2007) Dowdeswellet al (2010) Rise et al (2010) and Ottesen et al (2012) whereasmaps for the post-break-up interval in the Lofoten Basin (Fig 3)have been derived from Fiedler amp Faleide (1996) Hjelstuen et al(2007) and Laberg et al (2012) In particular the mega-slide 2 ofthe Bjoslashrnoslashya Fan Slide Complex with an age of c 078ndash05 Ma fromHjelstuen et al (2007) has been merged with the Naust Formation(U S and T sequences c 06ndash0 Ma) and the mega-slide 1 of theBjoslashrnoslashya Fan Slide Complex with an age of c 15ndash078 Ma hasbeen added to the Naust Formation (A sequence c 15ndash06 Ma)In addition thicknesses of the fluvio-glacial erosional material withan age of c 07ndash0 15ndash07 and 27ndash15 Ma from Fiedler amp Faleide(1996) and Laberg et al (2012) have been merged with the NaustFormation (U S and T sequences c 06ndash0 Ma) Naust Formation(A sequence c 15ndash06 Ma) and Naust Formation (N sequence c27ndash15 Ma) respectively There are small differences in age be-tween the merged successions but the most important area of ourstudy corresponds to the Mid-Norwegian margin rather than theLofoten Basin Therefore the Naust ages from Dowdeswell et al(2010) have been assigned to the merged sedimentary layers inFig 3 The thickness pattern of the Naust sequences and analogues(Figs 3andashc) is characterized by two distinct zones dominated bymega-slides within the Lofoten Basin and a more complex patternwithin the SW LofotenndashVesteralen margin and NE Voslashring BasinThe sedimentary sequences in the Lofoten Basin are mostly rep-resented by eroded sedimentary rocks from the Barents Sea area(Fiedler amp Faleide 1996 Hjelstuen et al 2007 Laberg et al 2012)In contrast the Naust sequences show a more local origin fromthe adjacent mainland or the northeastern part of the LofotenndashVesteralen margin (eg Dowdeswell et al 2010 Rise et al 2010Ottesen et al 2012) The thickest part of the Naust Formation corre-sponds to the sequence N reaching more than 1600 m (Fig 3c) andthe thickest sedimentary rocks of the Lofoten Basin are analoguesto sequence A of the Naust Formation reaching more than 1300m (Fig 3b) Unfortunately there is no direct information about theanalogues of the Kai and Brygge Formations within the LofotenBasin where the age of the sedimentary sequences still remainsuncertain (Figs 3d and e) We have included the undefined Ceno-zoic sedimentary layers excluding the Palaeocene together with theBrygge Formation within the Lofoten Basin and the entire oceaniccrustal domain of the study area (Fig 3e)
The Palaeocene Cretaceous and pre-Cretaceous (Fig 4) havebeen taken from Brekke (2000) Hansen (2009) Maystrenko ampScheck-Wenderoth (2009) Hansen et al (2012) Eig (2012) NGUdata (interpreted by Gernigon in 2014) and Maystrenko et al (2018)Sedimentary rocks within the Roslashst Basin and the pre-Cretaceoushave been described in detail by Maystrenko et al (2017) Thepre-break-up sedimentary rocks in Fig 4 are thick and are char-acterized by a broad zone of distribution southwest of the BivrostLineament (Fig 4) On the other hand the Palaeocene Cretaceousand pre-Cretaceous are generally thinner northeast of the BivrostLineament with relatively thick sequences restricted to the Ribbanand Vestfjorden basins
Dow
nloaded from httpsacadem
icoupcomgjiarticle21328854810550 by guest on 16 April 2022
3-D thermal effect of Cenozoic erosion amp deposition 889
Figure 3 Thicknesses of the Cenozoic post-breakup sedimentary rocks (a) the Naust Formation (sequences U S and T) and analogues (layer 21) (b) theNaust Formation (sequence A) and analogues (layer 22) (c) the Naust Formation (sequence N) and analogues (layer 23) (d) the Kai Formation (layer 24)and (e) the Brygge Formation (Eocene-lower Miocene) and the undefined Cenozoic (layer 3) (based on Fiedler amp Faleide 1996 Rise et al 2005 Eidvin et al2007 Hjelstuen et al 2007 Dowdeswell et al 2010 Rise et al 2010 Laberg et al 2012 Ottesen et al 2012) Black dashed line corresponds to the present-dayshelf edge COB continent-ocean boundary HG Hel Graben NH Nyk High NR Nordland Ridge NS Nagrind Syncline TB Traeligna Basin TP TroslashndelagPlatform UH Utgard High VB Voslashring Basin The question marks refer to the areas where the thickness pattern is not well defined
The thickness pattern of the crystalline crust (Fig 5) is basedon the recent 3-D density modelling by Maystrenko et al (2017)constrained by different geophysical data including (1) deep seis-mic refraction and reflection lines (Mjelde et al 1992 Mjelde et al1993 Mjelde et al 2003 Kodaira et al 1995 Mjelde et al 2001
Breivik et al 2009 Hansen et al 2012 Breivik et al 2017) (2) tele-seismic receiver function data (Ottemoller amp Midzi 2003 Olssonet al 2008 Ben Mansour et al 2014) and (3) additional structuralbase and isopach maps (Maystrenko amp Scheck-Wenderoth 2009Ebbing amp Olesen 2010 Maystrenko et al 2018)
Dow
nloaded from httpsacadem
icoupcomgjiarticle21328854810550 by guest on 16 April 2022
890 YP Maystrenko et al
Figure 4 Cumulative thickness of the pre-breakup sedimentary rocks pre-Cretaceous Cretaceous and Palaeocene (based on Brekke 2000 Hansen2009 Maystrenko amp Scheck-Wenderoth 2009 Eig 2012 Hansen et al 2012Maystrenko et al 2017) Black dashed line corresponds to the present-dayshelf edge COB continent-ocean boundary HG Hel Graben NH NykHigh NR Nordland Ridge NS Nagrind Syncline TB Traeligna Basin TPTroslashndelag Platform UH Utgard High VB Voslashring Basin
The top of the crystalline basement (Fig 6a) (Maystrenko et al2017) is divided into two zones by the Bivrost Lineament TheVoslashring Basin and the Troslashndelag Platform southwest of the linea-ment show a very deeply located basement (more than 15ndash17 kmdeep) whereas the LofotenndashVesteralen margin has shallower base-ment depths (8ndash11 km) To the east the near-coast shelf has a veryshallow basement (less than 1 km deep) which crops out at theEarthrsquos surface within the LofotenndashVesteralen archipelago and onthe mainland The Moho topography (Fig 6b) (Maystrenko et al2017) is deeply located (at around 40 km on average) beneath themainland has moderate depths (20ndash28 km) beneath the continentalmargin and is shallow (11ndash14 km depths) within the ocean domain
The lithosphere-asthenosphere boundary (Fig 6c) beneath themainland has been derived from Calcagnile (1982) Artemieva et al(2006) and Ebbing et al (2012) The depth to the lithosphere-asthenosphere boundary beneath the oceanic domain has been ob-tained according to empirical relations between lithospheric age
(Muller et al 2008) and Love and Rayleigh wave-phase velocityprovided by Zhang amp Lay (1999)
The upper mantle of the LofotenndashVesteralen margin and the ad-jacent areas is characterized by the presence of a low-velocitylow-density zone (see thick magenta line in Figs 6b and c) based onseismic tomography (Bannister et al 1991 Pilidou et al 2005Yakovlev et al 2012 Hejrani et al 2017) and 3-D density mod-elling (Maystrenko et al 2017) The origin of the low-velocitylow-density mantle can be related to both thermal and compositionalvariations but is still not known in detail
4 M E T H O D O L O G Y
41 Reconstruction of erosion
In order to reconstruct the Cenozoic erosion history of the LofotenndashVesteralen margin the estimated thickness of the eroded materialfrom NPD (2010) and Eig (2012) has been mainly used The re-construction is based on maximum burial depths from wells locatedoffshore and on Andoslashya which have been estimated according to thedegree of maturation of organic matter in sedimentary rocks (NPD2010) It can therefore be considered as a reasonable estimate ofthe magnitude of the erosion within the LofotenndashVesteralen regionThe total thickness of the eroded material (Eig 2012 NPD 2010)has been reconstructed only for the offshore part of the study areaThe estimates for onshore areas have been calculated by interpo-lation andor extrapolation of the existing offshore values Techni-cally the Kriging and Minimum Curvature gridding methods havebeen used for interpolation and extrapolation In addition resultsof the apatite fission track analyses (Hendriks amp Andriessen 2002Hendriks et al 2010 Davids et al 2013) have been considered tocontrol the reconstructed thickness of the eroded rocks onshore inorder to avoid unrealistic artefacts due to extrapolation Besidesthe reconstructed thickness onshore has been modified to con-sider the topography (the positive topography has been subtractedfrom the extrapolated values) assuming that the present-day reliefof the Earthrsquos surface was similar to the palaeotopography of the topbasement prior to the erosion This assumption is supported by thepresence of the thin Jurassic-Cretaceous sedimentary rocks in thenortheastern part of Andoslashya island (Dalland 1975 Smelror et al
Figure 5 (a) Thicknesses of the oceanic layer 2AB (layer 4) and (b) cumulative thickness of the crystalline crust according to Maystrenko et al (2017) COBcontinent-ocean boundary HG Hel Graben NH Nyk High NR Nordland Ridge NS Nagrind Syncline TB Traeligna Basin TP Troslashndelag Platform UHUtgard High VB Voslashring Basin
Dow
nloaded from httpsacadem
icoupcomgjiarticle21328854810550 by guest on 16 April 2022
3-D thermal effect of Cenozoic erosion amp deposition 891
Figure 6 (a) Depth to the top of the crystalline basement (b) Moho topog-raphy and (c) depth to the lithospherendashasthenosphere boundary (the shadedarea corresponds to an introduced positive thermal anomaly at the base ofthe lithosphere) Black dashed line corresponds to the present-day shelfedge COB continent-ocean boundary HG Hel Graben LAB lithospherendashasthenosphere boundary LVLDM low-velocitylow-density mantle NHNyk High NR Nordland Ridge NS Nagrind Syncline TB Traeligna BasinTP Troslashndelag Platform UH Utgard High VB Voslashring Basin
2001) and by the pre-existence of a deeply weathered Mesozoic sur-faces until the present day in Norway (Olesen et al 2013b Fredinet al 2017) In this case the eroded material could be representedmainly by the Cretaceous Jurassic and older sedimentary rocks theweathered crystalline rocks as well as by the Cenozoic sedimen-tary sequences locally Comparison of the derived thickness of thereconstructed eroded rocks at the end of the Kai interval (Fig 7d)with the results of the combined study by Medvedev amp Hartz (2015)on the vertical motions caused by the Quaternary glacial erosion
using published results of Apatite Fission Track (AFT) analysisdemonstrates in general some qualitative and quantitative similar-ities over the greater part of the mainland However some valuesare slightly different locally
The reconstructed total thickness of the eroded rocks in Fig 7(a)can represent the distribution of the eroded material (mainly sed-imentary rocks with the partial presence of weathered crystallinerocks) at the end of the Cretaceous prior to the well-known latestCretaceousndashearliest Cenozoic tectonic events (Gernigon et al 2003Lundin et al 2013 Ren et al 2003 Ren et al 1998) Thereforethis total thickness could still have existed at the end of the Creta-ceous indicating that the LofotenndashVesteralen archipelago and partof the mainland represented continental shelf at that time This issupported by the reflection seismic data offshore by the regionallytraced near base Cenozoic unconformity in the Voslashring and Moslashrebasins (eg Brekke 2000) which indicates a regional uplift and localerosion
The next step of reconstruction of the erosional history withinthe study area aims to estimate the amount of erosion during thedifferent Cenozoic time intervals and main depositional stages Theamount of erosion has been calculated for the Palaeocene BryggeKai Naust (N) Naust (A) and Naust (U S and T) intervals forwhich we have the present-day thicknesses (Figs 3 and 4) Thereconstruction of the erosion during each stage has been done pro-portionally to the volume of the deposited sediments In other wordsthe percentage of the deposited volume from the total volume of thedeposited Cenozoic for each interval has been used to calculate thevolume of eroded material in relation to the total volume of erosion(Table 1) represented by the thickness in Fig 7(a) In this casethe erosion rate is proportional to the sedimentation rate of eachselected interval reflecting changes of the erosion intensity duringthe Cenozoic It is important to note that the volume of the post-breakup Cenozoic from the Lofoten Basin has been excluded fromour calculations since these sedimentary rocks are mostly the resultof extensive erosion in the Western Barents Sea region (Fiedler ampFaleide 1996 Hjelstuen et al 2007 Laberg et al 2012) Thereforethe sedimentary sequences within the Lofoten Basin do not reallyhave a strong and direct relationship with regard to the reconstructedand specific erosion of the LofotenndashVesteralen margin and adjacentmainland Furthermore the thick Palaeocene within the Hel Graben(Lundin et al 2013 Zastrozhnov et al 2018) and a possibly simi-lar Palaeocene sequence in the Roslashst Basin have also been excludedfrom the total volume of the deposited Cenozoic since these depositsrepresent the eroded material sourced from Lower and Upper Cre-taceous sedimentary rocks (NPD 2017) at the conjugate Greenlandside of the proto-Atlantic region (Petersen et al 2015 Meinholdet al 2013)
According to Table 1 the volume of the eroded material is slightlymore than two times higher than the volume of the deposited sedi-mentary rocks The volume of the undefined Cenozoic in the caseof layer 3 is around 27 782 km3 Some of the eroded material onthe eastern slopes of the Scandes Mountains was not transportedto the LofotenndashVesteralen margin and the estimated volume of thismaterial is approximately 14 430 km3 The volume of the total de-posited material is estimated to be 62 718 + 27 782 = 90 500 km3
and the total eroded material is approximately 136 122 minus 14 430 =121 692 km3 The estimated uncertainty of the volume calculationsis plusmn 7 per cent and can be definitely higher if the uncertainties inthe original data and the reconstructed maps are considered In thiscase the total volume of the eroded material is only 34 per centlarger than the deposited one This mismatch can be explained byseveral processes including differential erosion and transportation
Dow
nloaded from httpsacadem
icoupcomgjiarticle21328854810550 by guest on 16 April 2022
892 YP Maystrenko et al
Table 1 Volume of rocks deposited and eroded during the Cenozoic within the LofotenmdashVesteralen margin and the adjacent continent The Naust analoguesin the Lofoten Basin the undefined Cenozoic of layer 3 and the Palaeocene in the Hel Graben and Roslashst Basin are excluded from the calculations
No Layer Age [Ma]Volume of the depositedmaterial Vdeposited (km3)
Percentage of total Cz(per cent)
Volume of eroded materialVeroded (km3)
21 Naust U S T 06ndash0 6956 111 1513422 Naust A 15ndash06 6722 107 1454123 Naust N 27ndash15 18645 297 4042824 Kai 18ndash27 3882 62 84403 Brygge 56ndash18 13612 217 295385 Palaeocene 66ndash56 12901 206 28041
Total Cenozoic 62718 100 136122
of the fine-grained eroded material to the Atlantic Ocean dissolu-tion of carbonates loss due to wind transport and other processesrelated to transport and deposition of the eroded products Based onTable 1 the thickness of the eroded rocks has been calculated foreach stage and finally has been subtracted step-by-step from thetotal thickness of the eroded material at the end of the Cretaceous(Fig 7a) The derived thicknesses of the eroded rocks (Fig 7) showa gradual decrease of the reconstructed thicknesses throughout theCenozoic as a result of continuous erosion
42 3-D thermal modelling
A 3-D temperature model within the LofotenndashVesteralen marginand adjacent areas has been obtained with the help of COMSOLMultiphysics which is a finite-element analysis software packageDuring the 3-D thermal simulations the Heat Transfer Module hasbeen used to model the stationary and time-dependent heat transferin solid materials by heat conduction through the lithosphere Adetailed description of the methodology has already been given byMaystrenko amp Gernigon (2018) and here only the most importantpoints of the used approach will be repeated and particular featuresof the 3-D thermal modelling applied in this study will be described
The 3-D conductive thermal field has been calculated betweentwo thermal boundary conditions at the Earthrsquos surfaceseafloor andthe lithospherendashasthenosphere boundary In particular the upperthermal boundary condition has been set as time-dependent averagetemperatures at the Earthrsquos surface and the seafloor The annualaverage air temperatures from Raab amp Vedin (1995) and Tveitoet al (2000) represent the present-day temperature at the Earthacutessurface onshore whereas the temperature at the seafloor offshorehas been taken to be dependent on the bathymetry (Table 2) basedon Ottersen (2009) and Korablev et al (2014) (Fig 8)
In addition the detailed palaeoclimatic changes of the surfacetemperature during the last two glaciations (the Saalian and Weich-selian glacial periods) have been considered during the 3-D ther-mal modelling A model of the spatiotemporal variations of theice cover within Scandinavia during the Weichselian glacial period(Fig 9) by Olsen et al (2013) has been used for reconstructionof the palaeoclimatic conditions during the Weichselian glaciationWhen the study area was covered by the ice sheet a temperatureof minus05 C has been chosen at the Earthacutes surface beneath the icecover as previously used and discussed by Slagstad et al (2009)Seafloor palaeotemperatures during the glacial periods have beenset to be 0 C which is in agreement with reconstructed temper-ature anomalies for the Norwegian Sea by Eldevik et al (2014)Palaeotemperatures at the ice-free Earthrsquos surface have been takenfrom Schmittner et al (2011) indicating that the near-surface airtemperature difference could be about minus20 C lower compared tothe pre-industrial period and is only valid for the Last Glacial Max-
imum when the air temperatures were at their lowest level duringthe last glaciation In order to take into account this fact tempera-tures lower than minus11 C from Schmittner et al (2011) have beendecreased by 1ndash4 C Palaeotemperatures along the marginal partsof the ice cover have been obtained by an interpolation betweenminus05 C beneath the ice cover and the palaeotemperatures over theice-free land areas The same palaeoclimatic scenario was also ap-plied for the Saalian glacialEemian interglacial period (220 000ndash118 000 yr BP) considering that palaeoclimatic conditions wererelatively similar during the Weichselian and Saalian glacial peri-ods (eg Andersen amp Borns 1994) The palaeotemperatures duringthe last 8000 yr (Table 3 Fig 10) have been taken from to Daviset al (2003) Nesje et al (2008) Mann et al (2009) and Seppa et al(2009)
During the Weichselian glaciation the global palaeo-sea levelwas 80ndash120 m lower than the present-day one (eg Hasencleveret al 2017) However the glacial erosion of the sedimentary covercould have been locally significant (Fig 7) We expect that thepresent-day bathymetry was different from the one that existed dur-ing Wechselian time Therefore a zone showing a gradual transitionof temperatures from the mainland conditions towards the sea hasbeen included into the palaeotemperature scenario for the wholeWeichselian glaciation (Fig 10) including the present-day offshoreareas covered by the reconstructed eroded sediments in Fig 7 Thereconstructed average palaeotemperatures (Fig 10) show that thestudy area was mostly characterized by much lower temperaturesduring the Weichselian glaciation compared to the present-day con-ditions (Fig 8)
The Cenozoic palaeoclimatic scenario reflects a continuous de-crease of the palaeotemperature from 18 C 66 Ma ago to thepresent-day air temperature over the mainland (Zachos et al 2001Pekar et al 2006 Rise et al 2006 Eldrett et al 2009 Ehlers et al2011 Hansen et al 2013 Inglis et al 2017) A temperature varia-tion from 8 C 45 Ma ago to 0 C at the present-day seafloor withinthe deep sea was also considered (Zachos et al 2001 Ravelo et al2004 Pekar et al 2006 Filippelli amp Flores 2009 Hansen et al2013)
The lithospherendashasthenosphere boundary (Fig 6c) has been cho-sen as a lower thermal boundary condition with a 1300 C isotherm(eg Turcotte amp Schubert 2002) Alternatively the constant heatflux density can also be used on the bottom lithospheric isotherm asthe lower thermal boundary condition (eg Doin amp Fleitout 1996)Besides the temperature at the lower thermal boundary has beenenhanced within the low-velocitylow-density zone of the uppermantle (Figs 6b and c) This has been done in accordance withthe results of seismic tomography which indicate a decrease of anS-velocity by c 3 per cent at 100ndash200 km depth in relation to thereference velocity model or even by more than 3 per cent in relationto the surrounding mantle (eg Pilidou et al 2005 Hejrani et al
Dow
nloaded from httpsacadem
icoupcomgjiarticle21328854810550 by guest on 16 April 2022
3-D thermal effect of Cenozoic erosion amp deposition 893
Figure 7 Reconstructed thicknesses of the eroded material during the Cenozoic at the end of the Cretaceous (a) at the end of the Palaeocene (b) at the endof the Brygge (c) at the end of the Kai (d) at the end of the Naust N (e) and at the end of the Naust A (f) Black dashed line corresponds to the present-dayshelf edge COB continent-ocean boundary HG Hel Graben NH Nyk High NR Nordland Ridge NS Nagrind Syncline TB Traeligna Basin TP TroslashndelagPlatform UH Utgard High VB Voslashring Basin
Table 2 Average annual present-day temperature at the seafloor of the Norwegian Sea
Bathymetry (m) 100 300 500 600 700 750 800 850 and deeper
Temperature (C) 7 6 5 4 3 2 1 0
Dow
nloaded from httpsacadem
icoupcomgjiarticle21328854810550 by guest on 16 April 2022
894 YP Maystrenko et al
Figure 8 Present-day upper thermal boundary annual average air temper-atures at the Earthrsquos surface and average seafloor temperatures (based onRaab amp Vedin 1995 Tveito et al 2000 Ottersen 2009 Korablev et al2014) COB continent-ocean boundary HG Hel Graben LVLDM low-velocitylow-density mantle NH Nyk High NR Nordland Ridge NSNagrind Syncline TB Traeligna Basin TP Troslashndelag Platform UH UtgardHigh VB Voslashring Basin
2017) Taking into account that the S-velocity changes by 1ndash2 percent per 100 C (Cammarano et al 2003) or even by 1 per centper 100 C (Lee 2003) we can infer that a thermal anomaly ofabout +250 C at 150 km depth can be at least partially responsi-ble for the origin of the low-velocity zone within the upper mantleMoreover the density contrast between the low-density lithosphericmantle and the surrounding mantle of 18ndash35 kg mminus3 within the en-tire column of the lithospheric mantle (Maystrenko et al 2017) canbe translated to an even higher temperature contrast than 250 Cat 100ndash150 km depth A +250 C mantle low-velocitylow-densityzone at 150 km depth has been chosen as a compromise value be-cause the origin of the low-velocitylow-density mantle can also bethe result of compositional variations in addition to changes of tem-perature (eg Slagstad et al 2018) Therefore the thermal anomalyof +250 C has been set for the 150 km depth or slightly shallowerbase of the anomalous lithospheric mantle This thermal anomalyat 150 km depth has been further projected proportionally to thethickness of the lithosphere to the base of the shallower lithospherewithin the zone with the low-velocitylow-density lithospheric man-tle Therefore the 1300 C isotherm has to be shallower within thezone of the low-velocitylow-density mantle pointing to an upliftof the lithospherendashasthenosphere boundary beneath the study area(Fig 6c)
The influence of the early Cenozoic continental breakup has beenroughly estimated in the 3-D thermal modelling workflow in termsof two additional lithospherendashasthenosphere boundaries the firstone represents the lithospheric configuration immediately after thecontinental breakup c 55 Ma ago (Fig 11a) and the second one rep-resents a colder and thickened lithosphere expected at the end of thedeposition of the Brygge Formation (18 Ma ago Fig 11b) Thesetwo time steps (55 and 18 Ma) allow us to roughly simulate theincreased thermal effect during the continental breakup in the earlyCenozoic and the subsequent cooling of the oceanic lithosphere dur-ing the rest of the Cenozoic As a major limitation of the model theprecise position of the lithospherendashasthenosphere boundary duringthe Early Eocene breakup is still poorly known but numerical mod-els (eg Chen amp Lin 2004 Kawakatsu et al 2009) along modernspreading axe predict a shallow position of the 1300 C isothermIn our study the depth to the base of the lithosphere 55 Ma ago has
been tentatively taken to be 13ndash17 km deep beneath the present-dayoceanic domain representing the newly formed Cenozoic litho-sphere According to estimations for 0 Ma oceanic lithosphere byZhang amp Lay (1999) the taken depth position of the lithospherendashasthenosphere boundary 55 Ma ago could theoretically vary in therange of plusmn5 km In addition the modelled heat flux density over theimposed lithospheric configuration immediately after the continen-tal breakup has been compared with the present-day heat flux den-sity values at the Mid-Atlantic oceanic ridge (Hasterok et al 2011)demonstrating that the modelled values are in the proper rangeThe present-day depths of the lithospherendashasthenosphere boundarydeeper than 95 km have not been changed whereas the depth tothe base of the lithosphere between the Cenozoic oceanic domainand the more than 95 km deep lithosphere has been obtained bylinear interpolation assuming that the continental lithosphere hasbeen at least partially affected by thinning in the vicinity of theoceanic domain (Fig 11a) The lithospherendashasthenosphere bound-ary at 18 Ma ago (Fig 11b) has been calculated in the same wayas the present-day one according to empirical relations betweenthe age of the lithosphere and seismic velocities in Zhang amp Lay(1999) We cannot exclude the large inherent uncertainties in ourpalaeo-depth estimations of lithospherendashasthenosphere boundaries(Fig 11) They could be related to potential small-scale changes inthe intensity of the syn-breakup magmatism which could locallyenhance the geothermal gradient and modify the thermal proper-ties of the deep continental crust However breakup and associatedmagmatic processes are still unclear and require a more detailedstudy which is outside the scope of our investigation Consequentlythe influence of the local syn-breakup magmatism has been mainlyneglected in the present study whereas the large-scale one is consid-ered in terms of the uplifted lithospherendashasthenosphere boundary55 Ma ago (Fig 11a)
The thermal effects of the post-breakup uplift and erosion withinthe study area with further deposition of the Naust (Pleistocene) Kai(Middle MiocenendashPliocene) and Brygge (Eocenendashlower Miocene)formations (layers 21ndash23 24 and 3 respectively Fig 3) have beenincluded into the 3-D thermal modelling workflow allowing us tofocus more specifically on the time-dependent perturbations in thesubsurface thermal regime due to the post-Palaeocene erosion andsedimentation
The 3-D thermal modelling workflow includes the following sixsteps
(1) Calculation of the steady-state 3-D conductive thermal fieldafter the continental breakup 55 Ma ago The Brygge Kai and Naustformations (EocenendashPleistocene interval Fig 3) have been ex-cluded from these calculations whereas a new layer represented bythe reconstructed eroded rocks at the end of the Palaeocene (Fig 7b)has been added to the top of the model The lower thermal bound-ary has been represented by the 1300 C isotherm at the inferredlithospherendashasthenosphere boundary 55 Ma ago (Fig 11a) andthe top of the eroded rocks is set as a new upper thermal boundaryThe top of the Upper CretaceousndashPalaeocene deposits (layers 5ndash6)or deeperolder rocks have been used as the upper thermal bound-ary in places where the eroded rocks were not restored Porosityof the pre-breakup sedimentary succession has been readjusted toshallower depth conditions by subtraction of the thickness of thepost-breakup sedimentary package (Brygge Kai and Naust forma-tions EocenendashPleistocene interval) from the present-day depths andcorrection of the present-day position of deep seafloor Accordinglythe porosity-dependent thermal conductivities and densities of thesedimentary cover have been adjusted to shallower depths
Dow
nloaded from httpsacadem
icoupcomgjiarticle21328854810550 by guest on 16 April 2022
3-D thermal effect of Cenozoic erosion amp deposition 895
Figure 9 Ice cover variations during the Weichselian glacial period according to Olsen et al (2013) The magenta frame corresponds to the 3-D struc-turalthermal model
Table 3 Relative changes of the palaeotemperatures in comparison to the present-day temperature for the last 8000 yr
Time years before present BP 0 Present day 400 Little Ice Age 7500 Holocene Climate Optimum 8000
Temperature difference in relation to present day (C) 0 minus04 +1 minus1
(2)ndash(6) Calculation of the time-dependent (transient) 3-Dconductive thermal field
(2) For the period from 55 Ma ago to the end of the Brygge inter-val in the early Miocene 18 Ma ago The calculated 3-D temperaturedistribution from step (1) has been used as the initial tempera-
ture condition at the beginning of the time-dependent calculations(55 Ma ago) The Kai and Naust formations (Middle MiocenendashPleistocene interval Figs 3andashd) have been excluded from thesecalculations whereas a new layer represented by the reconstructederoded rocks for the end of the Brygge interval (Fig 7c) has beenadded to the top of the model The lower thermal boundary has been
Dow
nloaded from httpsacadem
icoupcomgjiarticle21328854810550 by guest on 16 April 2022
896 YP Maystrenko et al
Figure 10 Average palaeotemperatures at the Earthrsquos surface and the seafloor during the Weichselian glacial period within the area covered by the 3-Dstructuralthermal model
represented by the 1300 C isotherm at the inferred lithospherendashasthenosphere boundary at 18 Ma ago (Fig 11b) and the top ofthe eroded rocks has been set as a new upper thermal boundaryThe top of the Brygge Formation (layers 3) or deeperolder rockshave been used as the upper thermal boundary in places where theeroded rocks were not restored Accordingly the porosity of the pre-breakup sedimentary succession and Brygge sequence have beenadjusted to shallower depth conditions compared to the present-dayones by subtracting the total thickness of the Kai and Naust for-mations (EocenendashPleistocene interval) from the present-day depthsand correction of the present-day position of deep seafloor
(3) During the Kai interval from 18 to 27 Ma ago The final cal-culated 3-D temperature distribution from the previous step (2) hasbeen used as the initial temperature condition at the beginning of thetime-dependent calculations (18 Ma ago) The whole of the NaustFormation (Pleistocene interval Figs 3andashc) has been excluded fromthese calculations whereas a new layer represented by the recon-
structed eroded rocks at the end of the Kai interval (Fig 7d) hasbeen added to the top of the model The lower thermal boundary hasbeen represented by the 1300 C isotherm at the present-day as a newupper thermal boundary The top of the Kai Formation (layer 24) ordeeperolder rocks have been used as the upper thermal boundaryin places where the eroded rocks were not restored Accordinglythe porosity of the pre-breakup sedimentary succession and Bryggeand Kai sequences has been adjusted to shallower depth conditionscompared to the present-day ones by subtracting the total thicknessof the Naust Formation (Pleistocene interval) from the present-daydepths and correction of the present-day position of deep seafloor
(4) During the Naust (N) interval from 27 to 15 Ma ago Thefinal calculated 3-D temperature distribution from step (3) has beenused as the initial temperature condition at the beginning of thetime-dependent calculations (27 Ma ago) The sequences A U Sand T of the Naust Formation (Pleistocene interval Figs 3a and b)have been excluded from these calculations whereas a new layer
Dow
nloaded from httpsacadem
icoupcomgjiarticle21328854810550 by guest on 16 April 2022
3-D thermal effect of Cenozoic erosion amp deposition 897
Figure 11 Inferred depths to the lithospherendashasthenosphere boundary cor-responding to the 1300 C isotherm after the continental breakup 55 Ma ago(a) and at the end of the Brygge interval 18 Ma ago (b) The shaded area cor-responds to an area where a positive thermal anomaly has been introducedat the base of the lithosphere COB continent-ocean boundary HG HelGraben LVLDM low-velocitylow-density mantle NH Nyk High NRNordland Ridge NS Nagrind Syncline TB Traeligna Basin TP TroslashndelagPlatform UH Utgard High VB Voslashring Basin
represented by the reconstructed eroded rocks for the end of theNaust (N) interval (Fig 7e) has been added to the top of the modelThe lower thermal boundary has been represented by the 1300 Cisotherm at the present-day lithospherendashasthenosphere boundary(Fig 6c) and the top of the eroded rocks has been taken to be anupper thermal boundary The top of the sequence N of the NaustFormation (layer 23) or deeperolder rocks have been used as theupper thermal boundary in places where the eroded rocks were notrestored The porosity of the pre-breakup sedimentary successionand Brygge Kai and Naust (N) sequences have been adjusted toshallower depth conditions compared to the present-day ones bysubtracting the total thickness of the sequences A U S and T ofthe Naust Formation (Pleistocene interval Figs 3a and b) from thepresent-day depths and correction of the present-day position ofdeep seafloor
(5) During the Naust (A) interval from 15 to 06 Ma ago Thefinal calculated 3-D temperature distribution from step (4) has beenused as the initial temperature condition at the beginning of thetime-dependent calculations (15 Ma ago) The sequences U S andT of the Naust Formation (Pleistocene interval Fig 3a) have beenexcluded from these calculations whereas a new layer representedby the reconstructed eroded rocks at the end of the Naust (A) interval(Fig 7d) has been added to the top of the model The lower thermal
boundary has been represented by the 1300 C isotherm at thepresent-day lithospherendashasthenosphere boundary (Fig 6c) and thetop of the eroded rocks has been taken to be an upper thermalboundary The top of sequence A of the Naust Formation (layer 22)or deeperolder rocks have been used as the upper thermal boundaryin places where the eroded rocks were not restored The porosity ofthe pre-breakup sedimentary succession and Brygge Kai and Naust(N and A) sequences has been adjusted to shallower depth conditionscompared to the present-day ones by subtracting the total thicknessof the sequences U S and T of the Naust Formation (Pleistoceneinterval Fig 3a) from the present-day depths and correction of thepresent-day position of deep seafloor
(6) For the period from 06 Ma ago to the present-day The finalcalculated 3-D temperature distribution from step (5) has been usedas the initial temperature condition at the beginning of the time-dependent calculations (06 Ma ago) The lower thermal boundaryhas been represented by the 1300 C isotherm at the present-daylithospherendashasthenosphere boundary (Fig 6c) and the top of the 3-Dstructural model (present-day seafloor and Earthrsquos surface onshore)has been considered as the upper thermal boundary Porosity hasbeen estimated according to the present-day depths
During all steps the lower thermal boundary has been thermallyenhanced within the low-velocitylow-density zone of the uppermantle as it is described above During all steps palaeotemperatureat the upper thermal boundary has been taken to be time-dependentin accordance with Tables 2ndash4 and Fig 10
During the 3-D thermal modelling the eroded rocks have beenassumed to be mainly represented by sedimentary rocks and weath-ered crystalline crust which is characterized by a density and aporosity similar to sedimentary rocks rather than crystalline onesThe porosity of the eroded rocks has been kept the same for all stepsas it is in the case of a completely reconstructed eroded sequence(Fig 7a) with zero-level at the top of this complete sequence as-suming that a possible decompaction of these rocks due to erosionwas very minor or even absent at each time step Compaction of thedeposited sedimentary rocks has only been considered in terms ofchanges in porositydensity according to exponential functions inMaystrenko et al (2017) but thicknessesvolume of the depositedsuccessions have been kept constant due to some limitations ofthe used software This approach is sufficient for the Pleistocenewhich is the key interval of our study Changes in thicknesses ofthe Pleistocene sequences due to compaction are estimated to beless than 12 per cent (c 200 m) for the thickest (1700 m thick)succession and is less than 4ndash8 per cent on average 4ndash8 per cent ofthe total Pleistocene thickness is in the range of uncertainties of theused thicknesses and can therefore be neglected at the first-orderapproximation
Isostatic readjustment due the re-distribution of mass during ero-siondeposition has not been applied during the modelling becausethe main goal of this study is related to the thermal effect of lateCenozoic erosion and deposition This thermal effect has been in-vestigated by step-by-step moving of the upper thermal boundaryto the base of the eroded rocks (top of the remining rocks) and tothe top of the deposited sedimentary rocks In this case the maincontrolling factor of the conductive heat transfer is related to the dis-tance between the lower and upper thermal boundaries and thermalproperties in between On the other hand the real vertical positionof the surface played a very minor role especially if the propertiesof rocks have always been adjacent according to new depth positionin our workflow Therefore our approach is sufficient for the subver-tical conductive heat transfer On the other hand possible changes
Dow
nloaded from httpsacadem
icoupcomgjiarticle21328854810550 by guest on 16 April 2022
898 YP Maystrenko et al
Table 4 Palaeotemperatures during the Cenozoic (based on Zachos et al 2001 Pekar et al 2006 Rise et al 2006 Eldrett et al 2009Filippelli amp Flores 2009 Ehlers et al 2011 Hansen et al 2013 Inglis et al 2017)
No Time (Ma ago) Mainland temperature (C) Deep sea temperature (C)
1 66 18 ndash2 55 175 ndash3 45 14 84 34 10 35 25 115 56 18 105 47 16 12 68 12 9 39 5 6 110 36 +3 C to present-day temperature 011 045 Present-day temperature Present-day temperature12 035 The same as glacial maximum 27 000 yr ago in Fig 10 The same as glacial maximum 27 000 yr ago in Fig 1013 0228 Present-day temperature Present-day temperature14 0220ndash0118 The same as 0110ndash00105 Ma ago The same as 0110ndash00105 Ma ago15 0110ndash00105 Fig 10 Fig 10
Table 5 Thermal properties of the layers of the 3-D structural model used during the 3-D thermal modelling (lithology of sediments is derived from Bell et al2014 and NPD 2017)
NoLayer of the 3-D structural
model Dominant lithologySpecific heat capacity Cp
(J kgminus1 Kminus1)Thermal conductivity scale
value kr [W mminus1 Kminus1]Radiogenic heat
production S [μW mminus3]
21ndash23 Naust Mainly shale and sandstone 1180 23 059ndash2024 Kai Mainly shale and sandstone 1180 23 057ndash193 Brygge and undefined
CenozoicMainly shale and sandstone 1180 22 048ndash16
4 Oceanic layer 2AB Basalts and tuffs 880 18 045ndash6 Upper Cretaceous-Palaeocene 88 per cent shale 12 per cent
sandstone1180 25 068ndash187
7 Lower Cretaceous 92 per cent shale 3 per centsandstone 5 per cent
limestone
1180 24 083ndash199
8 Pre-Cretaceous 80 per cent shale 20 per centsandstone
1180 33 112ndash22
5ndash8 Undivided Palaeocene andCretaceous of the Roslashst Basin
87 per cent shale 11 per centsandstone 2 per cent
limestone
1180 25 14
Xx Eroded material Mainly sedimentary depositswith crystalline rocks
1180 30 14
9 Upper-crustal high-densitycrystalline rocks
Gabbro to anorthositic rocksmetamorphic rocks
880 29 04
10ndash11 Upper crust Metasediments andor graniteand gneiss
880 32 15ndash2 (02ndash25)
12 Middle crust Granitoids andor gneiss 950 31 086 (01ndash25)13 Lower crust Metamorphic rocks 1050 30 03214 High-density intra-crustal
layerMafic granulites gabbros 1050 30 032
15 Oceanic layer 3A Sheeted dykesgabbroicintrusions
1050 27 04
16ndash17 High-density lower-crustallayer and oceanic layer 3B
Gabbro and high-grademetamorphic rocks
1100 28ndash31 02
18 Lithospheric upper mantle Peridotite 1200 479 003
in the subhorizontal heat transfer could disturb the calculated ther-mal field locally if there were significant vertical movements of theclosely located local areas but this is actually not the case in theLofoten area
5 T H E R M A L P RO P E RT I E S
Thermal properties represented by specific heat capacity thermalconductivity and radiogenic heat production (Table 5) have beenassigned for each layer of the 3-D structural model
The thermal conductivity for the sedimentary cover has beentaken from the previous estimations of the matrix thermal conduc-tivity from wells within the northern part of the Viking Graben(Brigaud et al 1992) the Mid-Norwegian continental margin andadjacent areas (Eldholm et al 2005 Pascal amp Midttoslashmme 2006Pascal 2015) and based on unconsolidated sampled sedimentaryrocks from the Voslashring Basin according to Midttoslashmme et al (1995)The obtained thermal conductivities of sedimentary rocks have beencross-validated with results of measurements of rock samples withsimilar lithology (Cermak amp Rybach 1982 Clauser 2011) and the
Dow
nloaded from httpsacadem
icoupcomgjiarticle21328854810550 by guest on 16 April 2022
3-D thermal effect of Cenozoic erosion amp deposition 899
wide-ranging thermal conductivities of different sedimentary rockssummarized by Midttoslashmme amp Roaldset (1999) The thermal con-ductivity of basalts (layer 4) has been set to be 18 W mminus1 Kminus1
on average according to Balling et al (2006) Thermal conduc-tivities of the upper crystalline crustal rocks have been set to bein the range of the rock-sample measurements within the Nor-wegian mainland (eg Olesen et al 1993 Slagstad et al 2009Maystrenko et al 2015b) The mentioned thermal conductivitiesof the sedimentary infill basalts and upper-crustal rocks have beensupplemented with published values for the deeper crystalline crustand the lithospheric mantle (Cermak amp Rybach 1982 Wollenbergamp Smith 1987 Hofmeister 1999 Artemieva et al 2006 Scheck-Wenderoth amp Maystrenko 2008 Scheck-Wenderoth amp Maystrenko2013 Maystrenko et al 2014)
The thermal conductivity of sedimentary rocks has been set to betemperature- and porosity-dependent to take into account changesof the thermal conductivity as a result of increasing temperatureand decreasing porosity with depth The thermal conductivity ofthe fluid in the pores of sedimentary rocks has been set to be thetemperature-dependent thermal conductivity of water according toWagner amp Kretzschmar (2008) The thermal conductivities of thecrystalline rocks have been set to be dependent only on temperaturebecause the average porosities of the crystalline rocks are usuallyextremely low at the regional scale and can therefore be neglectedThe empirical equations from Sass et al (1992) and Vosteen ampSchellschmidt (2003) have been used to describe a dependence ofthermal conductivities of sedimentary and crystalline rocks on tem-perature The thermal conductivity of the lithospheric mantle hasbeen set to be both pressure- and temperature-dependent accordingto Hofmeister (1999) and van den Berg et al (2001) Porosity anddensity of the sedimentary rocks have been obtained based on expo-nential functions of increasing densities with depth in Maystrenkoet al (2017) and densities of the crystalline rocks have also beentaken from Maystrenko et al (2017) The depth-dependent porosi-ties have been calculated by use of the same density of 2700 kgmminus3 for all sedimentary layers due to uncertainties in definingthe lithological composition The detailed description of how thetemperature- pressure- and porosity-dependent thermal conduc-tivities have been calculated is given in Maystrenko amp Gernigon(2018)
The chosen specific heat capacity (Table 5) has been set to beconstant for each layer of the 3-D model during the 3-D thermalmodelling representing the temperature-dependent average valuesof the specific heat capacity based on laboratory measurements atdifferent temperature conditions according to Cermak amp Rybach(1982) Afonso et al (2005) and Clauser (2011)
The radiogenic heat production of sedimentary layers of the3-D model has been derived from the results of gamma-ray loggingin selected wells according to the empirical relationship betweentotal natural gamma and radiogenic heat production in Bucker ampRybach (1996) An example of the used natural gamma ray logsand the derived radiogenic heat production is shown in Fig 12 Thechosen wells are located within the southwestern part of the modelarea (Fig 13) where the sedimentary cover has been drilled for thepurposes of the petroleum industry There are only a few shallowwells drilled through the sedimentary cover within the rest of theLofotenndashVesteralen margin and unfortunately well logs of theseshallow wells are not easily accessible
Based on the results of calculations the average radiogenic heatproduction of the sedimentary rocks shows a wide range of valuesfrom 047 to 202 μW mminus3 (Table 6) The stratigraphic subdivisionof the used wells does not include sequences N A U S and T of the
Figure 12 Example of a plot showing stratigraphy total natural gamma andcalculated radiogenic heat production for one of the wells (well 65075-1)used to calculate the radiogenic heat production of sedimentary infill (thestratigraphy and gamma-ray log are from NPD (2017))
Dow
nloaded from httpsacadem
icoupcomgjiarticle21328854810550 by guest on 16 April 2022
900 YP Maystrenko et al
Figure 13 Radiogenic heat production of the sedimentary layers based on the well data the Naust (Middle Miocene-Pleistocene) formation (a) the KaiFormation (b) Brygge (Eocene-lower Miocene) Formation (c) the Upper Cretaceous-Palaeocene (d) the Lower Cretaceous (e) and the pre-Cretaceous (f)Black circles indicate locations of the wells used to derive the radiogenic heat production COB continent-ocean boundary TP Troslashndelag Platform VBVoslashring Basin
Naust Formation (NPD 2017) and therefore the average values forthe total Naust Formation have been used for the Naust (N) Naust(A) and Naust (U S and T) intervals (layers 21ndash23) Moreoverthe Nordland Group (Naust plus Kai formations) has only beenindicated in some of the wells In this case the same value of theradiogenic heat production has been used for both the Naust and theKai formations This is actually supported by well 65102-1 R wherethe Naust and Kai formations are characterized by the same values
of the radiogenic heat production (Table 6) The derived averagevalues of the radiogenic heat production for each sedimentary layerhave been further used to construct maps by interpolation betweenthese values in the used wells with extrapolation to the areas withoutthe well data (Fig 13)
The uppermost layers represented by Naust (layers 21ndash23) andKai (layer 24) are characterized by a very similar pattern of thederived radiogenic heat production (cf Figs 13a and b) in spite
Dow
nloaded from httpsacadem
icoupcomgjiarticle21328854810550 by guest on 16 April 2022
3-D thermal effect of Cenozoic erosion amp deposition 901
Table 6 Average radiogenic heat production of sedimentary rocks derived from gamma ray logs in the selected wells Units of radiogenic heat productionare μW mminus3 (Fm is formation and Gr is group)
WellNaust Fm (layers
21ndash23)Kai Fm (layer
24)Hordaland Group
(layer 3)Rogaland-Shetlandgroups (layer 5ndash6)
Cromer Knoll Gr(layer 7)
pre-Cretaceous(layer 8)
65075-1 12 09 07 075 093 11365102-1 R 068 068 072 069 094 16566107-2 086 086 047 067 082 11670710-1 054 054 ndash 102 ndash ndash66075-1 202 192 ndash 188 2 ndash66088-1 118 135 141 149 ndash 16966102-1 S 088 088 146 168 116 25667066-1 1 057 1 12 ndash ndash671010-1 124 124 16 15 ndash ndash
of the fact that some values are different (Table 6) A similar dis-tribution of the radiogenic heat production is also found for theBrygge (Fig 13c) and the Upper CretaceousndashPalaeocene layers(Fig 13d) Moreover the relatively high radiogenic heat produc-tion in well 66075-1 and the relatively low one in wells 65075-165102-1 R and 66088-1 representative for the southwestern cor-ner of the model area are clearly or partially recognizable in mapsfor the Naust Kai and Brygge formations the Upper CretaceousndashPalaeocene and the Lower Cretaceous (cf Figs 13andashe) This meansthat the similar pattern of radiogenic heat production is character-istic for the more than 100 million-year-long stratigraphic inter-val This long-term inheritance for the CretaceousndashCenozoic inter-val has already been identified in the Voslashring and Moslashre basins byMaystrenko amp Gernigon (2018) indicating a possible inheritancein clastic material transportation from original localities with anincreased or decreased content of the radiogenic elements Alter-natively it may indicate a differential sorting of the eroded prod-ucts during transportation from source to sink The deposition ofsedimentary rocks with a more argillaceous composition in partic-ular areas of the Mid-Norwegian continental margin may explainthe local increase of heat production within specific areas becauseargillaceous rocks are usually characterized by a higher radiogenicheat production compared to more sandy sedimentary rocks (egCermak amp Rybach 1982 McKenna amp Sharp 1998 Villa et al2010)
The assigned radiogenic heat productions of the upper andmiddle-crustal layers (layers 9 10ndash11 and 12) onshore are mainlybased on the measured radiogenic heat production for different ge-ologicallithological units in Norway (Slagstad 2008 Slagstad et al2009 Slagstad amp Lauritsen 2013) The radiogenic heat productionof the oceanic crust lower continental crust and the lithosphericmantle (layers 13ndash18) have been set to be constant (Table 5) ac-cording to published values for the assumed lithological composi-tion of each layer (Cermak amp Rybach 1982 Scheck-Wenderoth ampMaystrenko 2008 Villa et al 2010) To remove a misfit betweenmeasured and modelled temperatures in the available wells offshorelateral changes in the radiogenic heat production of the upper andmiddle continental crust have been applied Other possible expla-nations for some local changes of the observed temperature couldbe associated with atypical fluid flow strong variations in thermalconductivities structural uncertainties andor limited resolution ofour 3-D model The above-mentioned alternative hypotheses wouldhowever require additional structural data and sampling material tobe tested as well as simulation of other physical processes such asfluid flow etc The absence of detailed structural data and supple-mentary measurements together with technical difficulties in mod-elling the detailed fluid flow at the scale of our 3-D model do notallow us to test the variety of other possible reasons in addition
to the variable radiogenic heat production On the other hand theradiogenic heat production of the crystalline rocks varies within themainland (eg Slagstad 2008 Pascal amp Rudlang 2016) implyingthat a possible similar variability exists offshore as well During the3-D thermal modelling several models with different values of theradiogenic heat production have been tested to fit the measured andmodelled temperatures in the available wells
The upper crystalline crust is characterized by the increased ra-diogenic heat production up to 22 μW mminus3 within the SN-strikingzone onshore in the middle of the southern part of the model area(Fig 14a) Towards the north a wide zone with an increased heatproduction (2 μW mminus3) corresponds to the thickened low-densityupper crustal layer inferred by Maystrenko et al (2017) Both areaswith an increased radiogenic heat can be represented by granitegranitic gneiss andor granitoids with the increased content of theradiogenic elements similar to the Precambrian TransscandinavianIgneous Belt granites which are characterized by an average radio-genic heat production of 26 μW mminus3 (locally up to 4 μW mminus3)according to Slagstad (2008) Within the southwestern part of themodel area the radiogenic heat production varies from 02 to 25μW mminus3 (Fig 14a) indicating a possible lithological differentiationof the upper crust there
The middle crust is characterized by an average radiogenic heatproduction of c 086 μW mminus3 within the greater part of the studyarea (Fig 14b) and slightly increased to 092 μW mminus3 within the ar-eas where the upper-crustal layer is absent (cf Figs 14a and b) Thesame pattern of radiogenic heat production as in the case of the up-per crust has been applied within the southwestern part of the modelarea (cf Figs 14a and b) The thicknesses of the upper and middlecrust within the southwestern part of the model area are mostly inthe range 05ndash4 km and 1ndash5 km on average respectively with somelocal thickening and thinning These relatively small thicknesses ofthe upper-middle crustal layers imply that the assigned radiogenicheat production does not drastically affect the modelled tempera-tures in that area compared to the mainland where the thickness ofthese layers is 12 km on average with local thickening up to morethan 20 km Therefore even if our assumption of varying radiogenicheat production offshore may appears to be partially erroneous theregional-scale pattern of the modelled temperature should not beaffected by any notable extent
6 R E S U LT S O F T H E 3 - D T H E R M A LM O D E L L I N G
The 3-D conductive thermal pattern beneath the study area (Fig 15)has been modelled by assigning thermal properties (Tables 5 and6) to the layers of the 3-D structural model from Maystrenko et al
Dow
nloaded from httpsacadem
icoupcomgjiarticle21328854810550 by guest on 16 April 2022
902 YP Maystrenko et al
Figure 14 Radiogenic heat production of the upper crystalline crust (alayers 10ndash11) and the middle crystalline crust (b layer 12) COB continent-ocean boundary HG Hel Graben NH Nyk High NR Nordland Ridge NSNagrind Syncline TB Traeligna Basin TP Troslashndelag Platform UH UtgardHigh VB Voslashring Basin
(2017) assigning thermal boundary conditions at the top and bot-tom of the 3-D model (eg Figs 6c 8 10 and 11 Tables 2ndash4)and including the thermal influence of the Cenozoic erosion anddeposition (Fig 7 Table 1)
61 Temperature within the upper part of the 3-D model
The results of the 3-D thermal modelling for the upper part of the3-D structural model are shown in Fig 16 and are represented by thetemperature maps of six horizontal model slices at depths below sealevel of 2 5 7 10 15 and 18 km It can be seen that the mainlandis generally colder compared to the continental margin (Fig 16) Ata depth of 2 km below sea level the Scandes Mountains are clearlyreflected by the increased temperatures beneath the mainland (cfFigs 2 and 16a) This is a result of the topographic effect due to thepresence of the 1ndash15 km elevated Scandes Mountains compared tothe rest of the mainland where the relief is smoother and deeperThe upper thermal boundary has been set at the Earthrsquos surface andtherefore the elevated relief of the Scandes Mountains adds an ad-ditional 1ndash15 km to the distance from the upper thermal boundaryto the depths below sea level in Fig 16 This topographic thermaleffect of the Scandes Mountains is still clearly visible at a depth of5 km and even deeper where it is smoothed by other thermal effectsIn contrast the thermal influence of the deep bathymetry offshoreis reflected in the decreased temperature beneath the Lofoten Basin
(Fig 16) where the seafloor is located at depths of more than 2ndash3km (Fig 2) Actually the white (blank) area in Fig 16(a) outlinesthe bathymetry deeper than 2 km The shape of this blank areais still clearly recognizable in terms of the lower temperatures atdepths of 5 and 7 km (Figs 16b and c) reflecting the steeply deep-ening sea bottom which corresponds to the upper thermal boundaryand therefore pulls the influence of the low (c 0 C) deep-seatemperatures down to greater depths
The eastern part of the mainland is notably colder than the conti-nental margin (Fig 16) This difference in temperature between themainland and the continental margin increases with depth (Fig 16)mainly reflecting both a chimney effect of the relatively high ther-mally conductive crystalline rocks exposed at the Earthrsquos surfacewithin the mainland and a very deep location of the lower thermalboundary represented by the base of the lithosphere beneath themainland (Figs 6c and 11)
The next interesting aspect of the thermal pattern within the upperpart of the 3-D model is related to the straight spatial relationshipbetween areas with thick sedimentary infill and areas with increasedtemperatures within the LofotenndashVesteralen margin and the VoslashringBasin (cf Figs 3 4 and 16) This feature of temperature distributionis associated with the low thermal conductivity of the sedimen-tary cover which enhanced the heat storage within the areas withthickened sedimentary rocks This thermal insulation effect is re-flected by the higher modelled temperatures within the Ribban andVestfjorden basins compared to the Lofoten Ridge which is locatedbetween these two basins This effect is also very pronounced atdepths of 15ndash18 km within the deep Nagrind Syncline (Figs 16e andf) Moreover superposition of (1) different temperature-increasingeffects (thermal insulation by the thick sedimentary rocks within theRoslashst Basin and the Hel Graben Fig 4) and significant shallowingof the lower thermal boundary towards the oceanic domain (Figs6c and 11) and (2) opposite temperature-decreasing effects [deepbathymetry (Fig 2) and thick less than 27 Ma old sedimentaryrocks within the Lofoten Basin (Figs 3andashc)] are responsible for anNEndashSW-trending zone with increased temperature within the RoslashstBasin and the Hel Graben which is especially pronounced at depthsof 10 15 and 18 km (Figs 16dndashf) This zone of increased tempera-ture should have extended towards the oceanic Lofoten Basin if thebathymetry had not been so deep and if the thickness of the youngand therefore thermally not equilibrated Pleistocene sedimentaryrocks had not been so great there
The major controlling factor of the modelled temperatures at thetop of the crystalline basement (Fig 17) is related to the geome-try of the top-basement (Fig 6a) clearly showing that the deepertop-basement corresponds to the highest modelled temperaturesand vice versa Thus the highest temperatures have been modelledwithin the deepest parts of the Voslashring Basin where the modelledtemperatures are 400ndash450 C on average (Fig 17) whereas the Rib-ban and Vestfjorden basins are characterized by lower temperaturesless than 300 C on average with some local increase to more than350 C within the Vestfjorden Basin The modelled temperatures onthe mainland and the LofotenndashVesteralen archipelago simply repro-duce the present-day Earthacutes surface temperature (cf Figs 8 and 17)because the crystalline basement crops out at the Earthrsquos surfacethere
611 Modelled temperature versus measured temperature
The obtained temperatures within the uppermost part of the 3-Dmodel have been compared with measured temperatures in available
Dow
nloaded from httpsacadem
icoupcomgjiarticle21328854810550 by guest on 16 April 2022
3-D thermal effect of Cenozoic erosion amp deposition 903
Figure 15 The lithosphere-scale 3-D thermal model of the LofotenndashVesteralen segment of the Mid-Norwegian continental margin and adjacent areasExaggerated slightly more than three times vertically
wells which are shown in Fig 18 Positions of the wells with onlydrill-stem test (DST) temperatures offshore and temperatures fromwell loggings onshore (Fig 18a) are plotted separately from thelocations of all available wells including the wells with less reliablebottom-hole temperatures (BHT) in Fig 18(b) Due to the fact thatonly a few wells with DST temperatures are available offshore andtheir restricted locations are close to each other (Fig 18a) the BHThave been used particularly to check the calculated temperatureswith the measured ones However it is important to note that BHTcan be disturbed by circulation of the drilling fluid and thereforeare less reliable compared to DST temperatures (temperature offluids thermally equilibrated with the host sedimentary rocks) andtemperature logs (measured under thermal equilibrium conditionsin the wells) In this case a comparison between the observationsand the results of the 3-D thermal modelling is provided separatelyfor the wells with DST temperatures and temperature logs (Figs 18aand 19a Table 7) and for the wells with BHT (Figs 18b and 19bTable 8)
Comparison between the modelled and measured temperaturesdemonstrates that the greater part of the obtained temperatures isin reasonable agreement with the main tendency in distribution ofthe measured temperatures (Fig 19) The latter is especially truewhen only DST and temperature logs are considered (Fig 19a)Larger misfits are present when compared with the BHT estima-tions (Fig 19b) To investigate the magnitude of these misfits indetail an additional study has been carried out by plotting the dif-ference between the measured and the modelled temperatures intables (Tables 7 and 8) and the related maps (Fig 18) According toTable 7 and Fig 18(a) it is clear that most of the misfits (923 percent) between the modelled and measured DST and well-log tem-peratures are in the range of plusmn5 C with only one well showing amisfit of slightly higher than 5 C In contrast if the wells with BHTare also considered in addition to the previous wells only around51 per cent of the misfits are in the range of plusmn5 C and the misfitswith a range of plusmn10 C form almost 85 per cent of the total numberof the used wells (Table 8) Consequently the greater portion of the
Dow
nloaded from httpsacadem
icoupcomgjiarticle21328854810550 by guest on 16 April 2022
904 YP Maystrenko et al
Figure 16 Maps with modelled temperatures at the present day within the upper part of the 3-D thermal model (Fig 15) represented by the temperaturehorizontal slices for the depths (below sea level) of 2 km (a) 5 km (b) 7 km (c) 10 km (d) 15 km (e) and 18 km (f) The black dashed line corresponds tothe present-day shelf edge and the white area in panel (a) corresponds to the area where the sea bottom is located deeper than 2 km COB continent-oceanboundary HG Hel Graben NH Nyk High NR Nordland Ridge NS Nagrind Syncline TB Traeligna Basin TP Troslashndelag Platform UH Utgard High VBVoslashring Basin
reasonable differences for this kind of regional-scale study lies inthe range of plusmn10 C indicating that the major trend of the measuredtemperatures has been reasonably well reproduced during our 3-Dthermal modelling
Misfits larger than plusmn10 C are also present in Table 8 The spatialdistribution of these larger misfits (Fig 18b) demonstrates that the
wells with large differences of plusmn20 C are located close to the wellswith the smaller differences of plusmn10 C or even plusmn5 C Howeverthere is almost no way to reduce such a large difference because thedistance between the wells with different misfits is locally less thanthe 4 km horizontal resolution provided by our 3-D structural modelAny attempt to reduce the misfit in a particular well with a large
Dow
nloaded from httpsacadem
icoupcomgjiarticle21328854810550 by guest on 16 April 2022
3-D thermal effect of Cenozoic erosion amp deposition 905
Figure 17 Modelled present-day temperatures at the top of the crystallinebasement The black dashed line corresponds to the present-day shelf edgeCOB continent-ocean boundary HG Hel Graben NH Nyk High NRNordland Ridge NS Nagrind Syncline TB Traeligna Basin TP TroslashndelagPlatform UH Utgard High VB Voslashring Basin
Table 7 Difference between modelled temperatures and measured ones(measured values minus the modelled ones) from different wells located in-side the detailed 3-D model area Only the DST (drill-stem test) temperaturesare used
No
Temperature range ofdifferences between modelledand measured temperatures
Percentage ofvalues (per cent)
Number ofvalues
4 from minus5 to 5 923 125 from 5 to 10 77 1
misfit will automatically increase the misfit in the closely locatedwell(s) and vice versa Moreover the local-scale thermal pattern foreach particular well cannot be reproduced during our simulationswithout including a more detailed lithological section of these wellsand surrounding areas This is technically very difficult in the case ofthe regional-scale 3-D thermal modelling Most of the large misfitsare possibly caused by relatively local processes such as fluid flowIn the case of intensive fluid flow circulation of the heated or cooledfluids through the sedimentary rocks can play an important role interms of convective or advective heat transfers in addition to themodelled regional-scale heat conduction
Figure 18 Locations of the available wells with the measured temperatures and spatial distribution of the temperature variations (measured temperatures minusthe modelled ones) within the 3-D model area (a) Wells with drill-stem test (DST) temperatures offshore and temperature logs onshore and (b) wells with lessreliable bottom-hole temperatures (BHT) together with temperatures in the wells in Fig 18(a) Black dashed line corresponds to the present-day shelf edge
Figure 19 Comparison of the modelled (blue dots) and the observed (red dots) temperatures for the available wells with only drill-stem test (DST) temperaturesand temperature logs (a) and bottom-hole temperatures (BHT) together with temperatures in Figs 18(a) and 19(a)
Dow
nloaded from httpsacadem
icoupcomgjiarticle21328854810550 by guest on 16 April 2022
906 YP Maystrenko et al
Table 8 Difference between modelled temperatures and measured ones(measured values minus the modelled ones) in available deep wells locatedinside the detailed 3-D model area In addition to the DST (drill-stem test)temperatures the less reliable bottom-hole temperatures (BHT) are alsoincluded
No
Temperature range ofdifferences between modelledand measured temperatures
Percentage ofvalues (per cent)
Number ofvalues
3 from minus20 to minus10 19 14 from minus10 to minus5 170 95 from minus5 to 5 509 276 from 5 to 10 170 97 from 10 to 20 132 7
62 Temperature within the lower part of the 3-D model
The modelled temperatures within the lower part of the 3-D modelare shown in Fig 20 by using the temperature maps for four hor-izontal slices through the 3-D thermal model at depths below sealevel of 25 40 80 and 100 km From these maps (Fig 20) it is evenmore obvious that the areas beneath the mainland are characterizedby lower temperatures compared with the continental margin andthe oceanic domain This is due to the fact that the thermal influ-ence of the lower thermal boundary configuration (Figs 6c and 11)
becomes more evident at great depths where the distance to thebase of the lithosphere becomes shorter The deepening of thelower thermal boundary beneath the mainland causes a decreasein temperatures there whereas the shallowing of the lithospherendashasthenosphere boundary beneath the oceanic domain results in in-creased modelled temperatures (cf Figs 6c 11 and 20) Moreoverthe shape of the low-velocitylow-density mantle is reflected by theincreased modelled temperatures as a result of the pre-defined 250C thermal anomaly at the depth of 100 km projected to the lowerthermal boundary assuming that the low seismic shear wave veloc-ities (eg Pilidou et al 2005 Hejrani et al 2017) and inferred lowdensities (Maystrenko et al 2017) within this atypical mantle areat least partially related to its enhanced temperature in addition topossible compositional variations
In addition to the deep-seated temperature-controlling factorsthe near-surface thermal influence is still recognizable at a depth of25 km Decreased temperatures within the Lofoten Basin comparedwith the Roslashst Basin and the Utroslashst Ridge (Fig 20a) are due to thedeep bathymetry and the deposition of the Pleistocene sedimentaryrocks which are thermally not equilibrated In contrast the mod-elled thermal trend is already strongly controlled by the shape of thelower thermal boundary at a depth of 40 km (cf Figs 6c and 20b)At depths of 80 and 100 km the white (blank) area corresponds to
Figure 20 Maps with modelled temperatures at the present day within the lower part of the 3-D thermal model (Fig 15) represented by the temperaturehorizontal slices below sea level for the depths of 25 km (a) 40 km (b) 80 km (c) and 100 km (d) The white areas correspond to the asthenosphere COBcontinent-ocean boundary HG Hel Graben LVLDM low-velocitylow-density mantle NH Nyk High NR Nordland Ridge NS Nagrind Syncline TBTraeligna Basin TP Troslashndelag Platform UH Utgard High VB Voslashring Basin
Dow
nloaded from httpsacadem
icoupcomgjiarticle21328854810550 by guest on 16 April 2022
3-D thermal effect of Cenozoic erosion amp deposition 907
Figure 21 Modelled present-day temperatures at the Moho COBcontinent-ocean boundary HG Hel Graben LVLDM low-velocitylow-density mantle NH Nyk High NR Nordland Ridge NS Nagrind SynclineTB Traeligna Basin TP Troslashndelag Platform UH Utgard High VB VoslashringBasin
sublithospheric mantle that is located beneath the lower thermalboundary Therefore the configuration of the lower thermal bound-ary represented by the lithospherendashasthenosphere boundary has amajor impact on the modelled temperature distribution within thedeep part of the 3-D model
The calculated temperatures at the Moho discontinuity level(Fig 21) partially reflect its geometry (Fig 6b) The key factorcontrolling the modelled temperature at the Moho is not only itsdepth position but also the distance between the Moho and the lowerthermal boundary that is the thickness of the lithospheric mantleTherefore both Moho depth and the thickness of the lithosphericmantle mainly control the distribution of the modelled temperatureat the Moho In addition one of the secondary factors is related toa higher radiogenic heat production of the crystalline crust com-pared to the lithospheric mantle rocks (more than 10 times loweron average) (Table 5) Therefore the thickness of the crust plays animportant role as well The interaction between these factors canbe recognized in the temperature map in Fig 21 where two max-ima of the modelled temperature have different origins The firsttemperature maximum (up to more than 800 C) is located beneaththe mainland in the south of the model area where the Moho to-pography is at its deepest (46ndash48 km depth on average Fig 6b)Therefore this maximum of the modelled temperature is mainlycaused by the depth position of the Moho and partially by the thick-ening of the internally more heat-productive crystalline crust Thesecond temperature maximum (up to 800 C) is located beneaththe LofotenndashVesteralen archipelago (Fig 21) where the Moho isabout 10 km shallower than the previous temperature maximumHowever the lithospherendashasthenosphere boundary is about 25 kmdeeper beneath the first temperature maximum indicating that thedistance between the Moho and the lower thermal boundary is 25km more in that location compared with the thinner lithosphericmantle beneath the LofotenndashVesteralen archipelago Therefore thereduced distance from the Moho to the deep heat emanating from theEarthrsquos interior beneath the LofotenndashVesteralen archipelago playsan important role in addition to the relatively deep position of theMoho there The rest of the modelled temperatures at the Moho levelreflects the dominance of the Moho topography as the controllingfactor
Figure 22 Depth to the calculated 1300 C isotherm at the present dayrepresenting the present-day thermal lithospherendashasthenosphere bound-ary COB continent-ocean boundary HG Hel Graben LVLDM low-velocitylow-density mantle NH Nyk High NR Nordland Ridge NSNagrind Syncline TB Traeligna Basin TP Troslashndelag Platform UH UtgardHigh VB Voslashring Basin
Fig 22 shows the present-day depth to the 1300 C isothermwhich represents the base of the thermal lithosphere There is aclearly visible uplift of the lithospherendashasthenosphere boundarywithin the low-velocitylow-density zone of the upper mantle Thisuplift reflects the thermal anomaly (+250 C at 150 km depth) whichhas been set to at least partially take into account the presence of thelow-velocitylow-density zone within the upper mantle The upliftof the lithospherendashasthenosphere boundary is around 15 km on aver-age compared to the input present-day lithospherendashasthenosphereboundary in Fig 6(c) reaching more than 25 km in the east andbeing very smoothed in the northwest where it varies from 5 to 10km However the precise amplitude of the uplift is tentative dueto uncertainties in transformation of the low-velocity upper-mantleanomaly into a temperature anomaly (Cammarano et al 2003 Lee2003 Afonso et al 2010)
63 Vertical slices through the 3-D model
Three vertical 2-D slices (Fig 23) through the 3-D thermal model(Fig 15) have been selected to illustrate cross-sectional views of themodelled temperatures The locations of these cross-sections havebeen chosen to be at the same location as the crustal sections de-scribed in Maystrenko et al (2017) These slices allow us to see thevertical distribution of the modelled temperatures (Fig 23) in addi-tion to the horizontal ones shown in Figs 16 and 20 The increasedtemperature within the low-velocitylow-density mantle is displayedalong all three vertical slices in Fig 23 A zone with increased tem-perature within the anomalous mantle is especially pronounced nearthe lithospherendashasthenosphere boundary along the vertical slice 2(Fig 23b) which crosses this low-velocitylow-density zone almostin the middle (Fig 2) In contrast the vertical slices 1 and 3 crossthe marginal parts of the anomalous mantle (Fig 2) and thereforethe related increase of temperature is smoother compared with theone in slice 2 (cf Figs 23andashc) The thermal anomaly within thelow-velocitylow-density mantle becomes very smooth at shallowdepths where it is almost unrecognizable A remarkable featurealong the vertical slices is the absence of the straightforward corre-lation between an uplift of the modelled isotherms and the shallowMoho (Fig 19) This is mostly due to the fact that the lower ther-mal boundary at the base of the lithosphere is shallow within the
Dow
nloaded from httpsacadem
icoupcomgjiarticle21328854810550 by guest on 16 April 2022
908 YP Maystrenko et al
Figure 23 Present-day distribution of the modelled temperatures along three selected 2-D vertical slices through the 3-D thermal model (for the location seeFig 2) LAB lithospherendashasthenosphere boundary TCB top of the crystalline basement
Dow
nloaded from httpsacadem
icoupcomgjiarticle21328854810550 by guest on 16 April 2022
3-D thermal effect of Cenozoic erosion amp deposition 909
western part of the model area In addition the thermal influenceof the positive thermal anomaly within the anomalous mantle is su-perimposed on the thermal trend controlled by the configuration ofthe lower thermal boundary The thermal influence of the shallow-ing lithospherendashasthenosphere boundary is more pronounced alongslice 3 which crosses the oceanic domain to the west (Fig 23c) Itconfirms that the thermal influence of the early Cenozoic continen-tal breakup reflected by the shallowing base of the lithosphere isstill clearly recognizable within the western part of the LofotenndashVesteralen margin segment in terms of increased temperatures Themodelled regional-scale thermal pattern is also affected by the in-sulation effect of the thick low-thermally conductive sedimentaryrocks which is particularly obvious along slice 1 where the modelledisotherms are slightly uplifted beneath the Voslashring Basin
64 Thermal effect caused by the erosionaland depositional processes
The transient 3-D thermal modelling shows that the modelled tem-peratures beneath the reconstructed eroded rocks (Fig 7) graduallydecreased through the Cenozoic (Fig 24) reaching the highest val-ues at the end of the Cretaceous (Fig 24a) when the thicknessof the eroded material was greatest and consequently the base ofthe reconstructed rocks was at its maximal burial depth (Fig 7a)At the end of the Cretaceous the modelled temperatures beneaththe reconstructed rocks could have reached up to 90 C within thenortheastern part of the Vestfjorden Basin and more than 80 C nearAndoslashya and farther west in the southern part of the Lofoten Ridge(Fig 24a) The modelled temperatures at the base of the erodedrocks decreased as a result of the Cenozoic uplift and erosion indi-cating a progressive cooling of the LofotenndashVesteralen margin andadjacent areas Decrease in the modelled temperatures is directlyproportional to the estimated amount of the material eroded duringeach time interval (cf Figs 7 and 24)
The thermal effects of the simultaneous erosion and depositionhave been estimated by calculating the temperature difference be-tween the results of the 3-D thermal modelling when taking intoaccount or not taking into account the erosion and subsequent depo-sition In other words the calculated temperatures of the model with-out consideration of the erosion and deposition during the modellingworkflow have been subtracted from the modelled temperatures inthe case of the model with erosion and deposition The resultingdifferences are shown in terms of temperature maps in Fig 25showing that a positive thermal anomaly should exist within theareas where the sedimentary andor crystalline rocks were erodedwhereas the negative values appear to be present in the Voslashring andLofoten basins showing the most important Cenozoic depocentresThermal anomalies in Fig 25 are shown at different depths indi-cating that these anomalies are very smooth towards the thermalequilibrium at shallow depths (eg 2 km in Fig 25a) whereas theerosiondeposition-related anomalies are characterized by high am-plitudes at greater depths (Figs 25c and d) At a depth of 2 kmthe positive anomaly near the Lofoten Ridge is only around 7 Cand the negative one within the Voslashring Basin is about minus14 C Incontrast the erosion-caused positive thermal anomaly within theVestfjorden Basin is up to 17 24 and 27 C and the negative ther-mal anomaly within the Voslashring Basin is almost minus33 minus47 and minus40C at 5 10 and 25 km depth respectively The same is true for thenegative temperature anomaly modelled beneath the Lofoten Basinwhere the amplitudes vary with depth from minus33 C at 5 km depthto almost minus64 C at 25 km depth Our results support the previous
2-D modelling by Pascal amp Midttoslashmme (2006) who concluded thatthe thermal state of the southeastern part of our study area waslikely affected by strong modifications due to glacial erosion anddeposition during the Quaternary
According to the calculated 3-D temperature cube the differ-ences between the modelled temperature with and without the ther-mal effect caused by erosion and deposition or in other words theobtained erosion-related positive thermal anomaly reaches its max-imum of more than +27 C at depths of 17ndash22 km beneath theeastern part of the Vestfjorden Basin The deposition-related nega-tive anomaly is situated within the northeastern part of the VoslashringBasin showing a minimal value of c minus48 C at 12ndash14 km depthThe most prominent negative anomaly is characterized by a mini-mum of c minus70 C at 17ndash20 km depth beneath the oceanic LofotenBasin These zones of maxima and minima of the obtained ther-mal anomalies are mainly associated with the areas where relativelyrapid erosion and deposition took place during late Cenozoic timein the Pleistocene reflecting the thermal effect of heat advection bysolid rocks due to vertical movements of these rocks in addition toheat conduction between the upper and lower thermal boundariesMoreover the above-described erosiondeposition-related thermaldisturbances beneath the Vestfjorden and Voslashring basins are still rec-ognizable at more than 60 km depth within the continental marginOn the other hand the negative thermal anomaly is already verysmooth at 55 km depth beneath the Lofoten Basin The amplitudesof the positive and negative thermal anomalies are mainly controlledby the distances to the upper and lower thermal boundaries becausethe system reaches a thermal equilibrium faster at shorter distancesto the boundary condition Therefore the maximum amplitude ofthese thermal anomalies must be located at some distance from thethermal boundaries In addition thermal properties (mainly ther-mal diffusivity) of rocks play an important role in the distributionof thermally non-equilibrated zones within the 3-D thermal modelboth vertically and laterally In other words erosion or depositionrespectively decreases or increases the distance between the thermalboundaries and the conductive thermal field of the 3-D model needstime to reach a thermal equilibrium under these new conditions andalso the required equilibration time increases away from the thermalboundaries depending on the thermal properties of rocks
7 D I S C U S S I O N
The regional configuration of the modelled erosiondeposition-induced zones with non-equilibrated temperatures within the studyarea is dependent on several factors The most important parame-ters are the reconstructed thicknesses of the eroded rocks the localinfluence of fluid flow the palaeoclimatic scenario configuration ofthe lower thermal boundary subhorizontal heat advection by solidrocks and the rate of erosion and deposition
One of the most critical factors is the reliability of the recon-structed thickness of the eroded rocks (Fig 7a) the offshore partof which is based on the published map of NPD (2010) and Eig(2012) and therefore is strongly dependent on these input dataIn order to validate the reconstructed erosion locally on Andoslashyathe vitrinite reflectance data of Bjoroslashy et al (1980) have been usedindependently The comparison shows that if a new kinetic vitrinitereflectance model lsquobasinRorsquo by Nielsen et al (2017) is used theestimated maximum burial temperature is around 80 C on averagefor the rocks containing the vitrinite reflectance of 045Ro In thecase of our study the modelled temperature at the base of the to-tal reconstructed thickness of the eroded rocks within the eastern
Dow
nloaded from httpsacadem
icoupcomgjiarticle21328854810550 by guest on 16 April 2022
910 YP Maystrenko et al
Figure 24 Temperatures at the base of the eroded sediments at the end of the Cretaceous (a) at the end of the Palaeocene (b) at the end of the Brygge (c)at the end of the Kai (d) at the end of the Naust N (e) and at the end of the Naust A (f) The black dashed line corresponds to the present-day shelf edgeCOB continent-ocean boundary HG Hel Graben NH Nyk High NR Nordland Ridge NS Nagrind Syncline TB Traeligna Basin TP Troslashndelag PlatformUH Utgard High VB Voslashring Basin
parts of Andoslashya is also around 80 C (Fig 24a) Therefore this fitsvery well between the vitrinite reflectance-based and the modelledtemperatures Such similar independent results support our final to-tal thickness estimation of the eroded material within at least theeastern part of Andoslashya where the rock samples of Cretaceous andJurassic age were collected and studied by Bjoroslashy et al (1980) In
addition our own results demonstrate a gradual decrease of temper-ature at the present-day surface beneath the eroded succession dur-ing the Cenozoic (Fig 7) This variation coincides with the generaltrend of decreasing temperatures through the Cenozoic predictedby independent results of the apatite fission-track analyses onshore(Hendriks amp Andriessen 2002 Hendriks et al 2010 Davids et al
Dow
nloaded from httpsacadem
icoupcomgjiarticle21328854810550 by guest on 16 April 2022
3-D thermal effect of Cenozoic erosion amp deposition 911
Figure 25 Thermal anomalies due to erosion and deposition during the Cenozoic calculated as a difference between the modelled temperatures with thethermal effect of erosiondeposition and the modelled temperatures without this effect The black dashed line corresponds to the present-day shelf edge andthe white area in Fig 25(a) corresponds to the area where the sea bottom is located deeper than 2 km COB continent-ocean boundary HG Hel Graben NHNyk High NR Nordland Ridge NS Nagrind Syncline TB Traeligna Basin TP Troslashndelag Platform UH Utgard High VB Voslashring Basin
2013) However precise comparison of our modelled temperaturesat different time intervals of the Cenozoic with the Cenozoic tem-peratures according to the apatite fission track analyses is difficultdue to the different resolutions of the methods
Based on our total reconstructed thickness of the eroded materialat the end of the Cretaceous (Fig 7a) the main depocentre was lo-calized over the adjacent offshore areas to the LofotenndashVesteralenarchipelago and shows the thickness maxima within the Vestfjordenand near Andoslashya This is partially supported by the recent studieson the vertical motions caused by fluvial and glacial erosion withan AFT analysis by Medvedev amp Hartz (2015) who have also ob-tained the thickest eroded succession within NW Vestfjorden andadjacent smaller fjords However our own estimation of the ero-sion within the western part of the LofotenndashVesteralen archipelagoand the adjacent offshore areas is larger compared with that recon-structed by Medvedev amp Hartz (2015) It is however important tonote that Medvedev amp Hartz (2015) have already indicated that theexhumation of the outermost (western) Lofoten islands was signif-icantly underestimated in their study and this therefore indirectlysupports our higher values for the reconstructed thickness there
For completeness we would like to mention that the restoredthickness maximum of the Cenozoic deposits as modelled by Gole-dowski et al (2013) is in close proximity to the present-day high
elevation of the Scandes Mountains in the study area Goledowskiet al (2013) also calculated palaeotemperatures of more than 60ndash70 C at the present-day surface beneath this thick reconstructedCenozoic matrix However our estimates do not fit the trend ofthe reconstructed erosion proposed in Goledowski et al (2013)In addition results of inverse modelling of the fission-track databy Hendriks amp Andriessen (2002) do not really support a strongeruplift of the high-elevated area on the mainland in relation to theadjacent LofotenndashVesteralen archipelago (eg Hendriks et al 2010Davids et al 2013) at least within the northern part of the studyarea Nevertheless the limited number of the studied samples doesnot exclude the possibility proposed by Goledowski et al (2013)
The next important disturbing factor is related to possible fluidflow through both the sedimentary and the crystalline rocks withinthe study area It has already been mentioned above that someof the large misfits between the modelled and observed tempera-tures in the wells offshore may indicate a local disturbance of theregional conductive thermal field by additional convective andoradvective heat transfer caused by the circulation of fluids (mainlygroundwater) through the MesozoicndashCenozoic sedimentary rocksTheoretically the conditions are especially favourable for the fluidflow through the less consolidated uppermost part of the sedimen-tary cover represented by the young sedimentary rocks of the Naust
Dow
nloaded from httpsacadem
icoupcomgjiarticle21328854810550 by guest on 16 April 2022
912 YP Maystrenko et al
Formation within the LofotenndashVesteralen margin and the VoslashringBasin and its analogues within the Lofoten Basin The possibilityof significant fluid flow is supported by the ocean drilling pro-gram (ODP Site 642) which is located farther south on the VoslashringPlateau This well shows evidence of a relatively strong fluid inflow(Channell et al 2005) Therefore the modelled temperatures can betheoretically disturbed by the fluid circulation through very poroussedimentary rocks which are expected to be present within theuppermost Cenozoic sedimentary successions Moreover the the-oretical differentiation between upper and middle crystalline crustinto blocks with different radiogenic heat production (Fig 14) canalternatively be indicative for the temperatures enforced by the fluidflow within the sedimentary cover in places with the assigned in-creased radiogenic heat production and vice versa Furthermorethe results of 2-D modelling of coupled groundwater flow and heattransfer (Maystrenko et al 2015a) point to a possibility of ground-water flow through the crystalline rocks onshore implying that themodelled erosion-induced positive thermal anomaly can in realitybe significantly reduced andor even locally enhanced by a differ-ently cooled andor heated groundwater respectively The influenceof the groundwater flow could have been especially strong duringthe melting of the ice sheets The resulting cold water could advec-tively cool the subsurface by flowing through the faults and cracksthat were reactivated during tectonic the related isostatic uplift
Possible undulations of the inferred palaeotemperatures at theEarthrsquos surface and on the seafloor (Figs 8 and 10 Tables 2ndash4)can also affect the calculated thermal anomalies at shallow depths(mainly within 2 km from the upper thermal boundary) It is obviousthat the palaeoclimatic scenario employed here is rather simplifiedfor the greater part of the Cenozoic prior to the Weichselian glacialperiod c 110 000 yr ago (Table 4) In addition the relatively detailedpalaeotemperature distribution during the Weichselian glaciation(Fig 10) is partially uncertain and could have varied significantlyThe main uncertainties are also related to some parts of the studyarea which were periodically free of ice and seawater Thereforethe modelled temperature especially near the coastline within theareas with shallow bathymetry can possibly be affected by theuncertainties in the Weichselian palaeoclimatic conditions withinthose areas
The next uncertainty concerns the changes of rock porositiesdue to variations in the shallow palaeobathymetry (shallower than700 m) and the shape of the ice sheet on the continental shelf Theinfluence of the present-day bathymetry on the continental shelf isindirectly included by the depth-dependent porosity according to ex-ponential functions of increasing densities with depth in Maystrenkoet al (2017) because these empirical functions are based on theoffshore well data and also taking into account the bathymetryMoreover the changes in deep bathymetry (deeper than 700 m)within the oceanic lithospheric domain have been included in theworkflow of the modelling through the Cenozoic by considering thedeepening of the seafloor with time due to cooling of the oceaniclithosphere (eg Stein amp Stein 1992) Unfortunately the changesin the shallow bathymetry within the present-day continental shelfcannot be properly quantified but these changes were not more than140 m during the last 120 000 yr (Hasenclever et al 2017) and werealso not significant during the greater part of the Cenozoic that isreflected by more or less continuous sedimentation The areas withreconstructed eroded material (Fig 7) are most likely characterizedby the very low sea level andor were above sea level for a largepart of the Cenozoic The thickness of the ice sheet during the lastglaciation could have reached more than 1 km onshore (Siegert et al2001) where glaciers covered the crystalline rocks and remaining
sedimentary rocks which were already affected by compaction atmore than 1 km palaeoburial depth at the end of the Cretaceous (cfFigs 7a and f) thus implying that the load of the ice sheet couldnot have drastically changed the compaction parameters of the un-derlying substrate The present-day offshore areas were mostly freeof ice during the last glaciation (Olsen et al 2013 Fig 9) and thethickness of the ice sheet was comparable with bathymetry duringtime intervals when the ice sheet expanded on the present-day con-tinental shelf and replaced the seawater (Siegert et al 2001) Basedon the statements above fluctuations of the sea level and the icesheet load did not significantly affect the porosities of the under-lying rocks and therefore their influence can be neglected on thecontinental shelf and the mainland in our regional-scale study
In addition the configuration of the lower thermal boundary (Figs6c and 11) is also partially uncertain especially for the time steps55 and 18 Ma ago and within the low-velocitylow-density zonewithin the upper mantle It is obvious that the thermal influenceof the younger oceanic lithosphere was stronger compared to thatof the present-day but the magnitude of this difference related tobreakup is still difficult to estimate precisely The same is true forthe predefined +250 C thermal anomaly at 150 km depth projectedto the lower thermal boundary which must be theoretically presentwithin the low-densityvelocity mantle but again the precise am-plitude of this anomaly is uncertain Moreover the geometry ofthe lithospherendashasthenosphere boundary itself is somewhat specu-lative within the anomalous mantle area of the continental marginwhich also contributes to the uncertainties in the modelled tempera-tures with depth towards the lower thermal boundary According toMaystrenko et al (2014) two possible cases with plusmn 20 km depth tothe lithospherendashasthenosphere boundary in relation to the preferreddepth at 120 km have been examined in terms of thermal influencesof these probable depth variations of the base of the lithosphereThe thermal influence of the examined depths of the lower thermalboundary decreases towards the Earthrsquos surface Deviations of themodelled temperature reach sim4 per cent at 6 km depth for the 20km deeper base of the lithosphere and sim12 per cent for the 20 kmshallower one This sensitivity test indicates that an influence ofthe lower thermal boundary at the shallower depths is importantbecause the distance between the lower and upper boundaries be-comes smaller According to Leroy et al (2008) the conductivethermal evolution of continental passive margins during 80 millionyears after the breakup is characterized by a thermal thinning ofthe unstretched continental lithosphere and by a thermal thickeningin the stretched continental lithosphere The thermal thickening ofthe stretched lithosphere is considered to arise by deepening of thebase of the lithosphere during the post-breakup time beneath theoceanic domain and in its close vicinity In contrast thermal thin-ning of the unstretched lithosphere beneath the present-day main-land has not been included into the workflow due to a presence ofthe upper-mantle low-velocitylow-density zone effect which couldbe superimposed or even control the thermal history of the studyarea beneath the continental domain Moreover the thickness of thelithosphere beneath the mainland is more than 120 km implyingthat small thermal perturbations at and beyond this depth shouldnot strongly affect our results within the upper part of the model
The results of the 3-D thermal modelling show that the BivrostLineament divides the modelled thermal pattern within the studyarea into two parts with the generally higher temperatures northeastof this lineament within the LofotenndashVesteralen margin segment andthe lower temperatures in the southwest within the Voslashring Basin(Figs 16 and 20) The Bivrost Lineament is a deep-seated faultzone along which sedimentary crustal and mantle blocks with
Dow
nloaded from httpsacadem
icoupcomgjiarticle21328854810550 by guest on 16 April 2022
3-D thermal effect of Cenozoic erosion amp deposition 913
different lithologies and thicknesses are juxtaposed (Mokhtari ampPegrum 1992 Olesen et al 2002 Maystrenko et al 2017) There-fore the assigned thermal properties also differ along the linea-ment contributing to a thermal differentiation between the LofotenndashVesteralen and Voslashring margin segments On the other hand this reg-ularity in temperature distribution within the deep part of the modelis mainly controlled by a spatial coincidence between the BivrostLineament and the southwestern limit of the low-velocitylow-density upper-mantle anomaly (eg Fig 22) which outlines thepredefined positive thermal anomaly at the lower thermal boundaryBesides the erosion-induced positive thermal anomaly within theLofotenndashVesteralen margin segment (the Lofoten Ridge Ribbanand Vestfjorden basins) and the accompanying negative anomalywithin the northeastern part of the Voslashring Basin significantly af-fect the temperature distribution in the upper part of the model(Fig 25) and are also responsible for the higher modelled tempera-tures northeast of the Bivrost Lineament and the lower ones south-west of this lineament Unfortunately there are only a few availablewells with measured temperatures northeast of the Bivrost Linea-ment (Fig 18) and therefore our results cannot be unquestionablyverified there On the other hand the obtained misfit between themeasured and modelled temperatures is acceptable in the availablewells (Fig 18b) supporting at least partially our results
Vertical heat advection by solid rocks (eg Mancktelow amp Grase-mann 1997 Stuwe 2007) has been considered during the 3-D ther-mal modelling by thickness changes of the eroded and depositedmaterial at different steps of the 3-D thermal modelling when theposition of the upper thermal boundary has been changed accord-ingly However a subhorisontal heat advection by solid rocks couldcomplicate the obtained thermal pattern in Fig 25 The subho-risontal heat advection by solid rocks could be especially importantwithin the Lofoten Basin where the Pleistocene and older large-scale submarine slides have been documented by interpretationof the reflection seismic lines (Fiedler amp Faleide 1996 Hjelstuenet al 2007) According to Hjelstuen et al (2007) the thickness ofthe Pleistocene mega-slides can be more than 300ndash400 m within thearea of the Lofoten Basin covered by our 3-D model In this case thetemperature at the bottom of the mega-slides could be higher thanthe adopted temperature at the seafloor during the 3-D modellingThese mega-slides originated from the SW Barents Sea (Hjelstuenet al 2007) where a positive temperature anomaly due to Ceno-zoic erosion could have already been significant during the slidingevents (eg Cavanagh et al 2006) Besides the sedimentary rocksof the mega-slides could also have been affected by Quaternaryglaciations which acted in the opposite direction to the Cenozoicerosion decreasing temperature within the sedimentary cover downto around 2 km depth (Fjeldskaar amp Amantov 2018) Therefore thesedimentary rocks of the late Cenozoic mega-slides were not inthermal equilibrium prior to sliding which makes it problematic inestimating the influence of heat To include the heat advection dur-ing the sliding events the additional detailed 3-D thermal modellingmust be performed within the SW Barents Sea outside of our studyarea which is not in the scope of the present study In any case theexpected thermal effect of solid-rock subhorisontal heat advectionmay reach a maximum of +10ndash20 C if the influence of the glacialevents is neglected However a decrease of subsurface temperatureduring the last glaciations within the SW Barents Sea could eventheoretically have enhanced the modelled negative thermal anomalywithin the Lofoten Basin in Fig 25 Besides medium- and small-scale submarine slides are present at the shelf edge within the modelarea (Hjelstuen et al 2007 Rise et al 2013) but their rather localthermal effect has been neglected during this regional-scale study
In fact the amplitudes of the calculated erosion-deposition-induced thermal anomalies would be higher if gradual real-timeerosion and deposition had been considered instead of removing oradding packages of rocks through several time-restricted steps as wehave done This is due to the fact that gradual erosion or depositionis extended in time compared to moving packages of rocks at thebeginning of each step Therefore rocks in places of gradual erosionor deposition are less thermally equilibrated than rocks in placeswhere a package of rocks was added or removed Unfortunately thegradual erosion and deposition cannot be modelled by the availablemodules of the used software In this case the obtained positiveand negative thermal anomalies should be slightly higher or lowerrespectively if the gradual erosion and deposition had been appliedduring the thermal modelling
In order to consider in more detail the relationship between ero-siondeposition and thermal reequilibration at deeper crustal andmantle levels a fully coupled thermomechanical 3-D modellingapproach should be used For instance Cacace amp Scheck-Wenderoth(2016) have shown that the detailed temporal evolution of the litho-spheric strength which controls the subsidence history is stronglycoupled to the temporal thermal configuration of the lithosphereMoreover crustal faulting has played an important role in bothstructural and thermal configuration of the continental margins (egClift et al 2002 Geoffroy et al 2015) implying that movementsof the crustal blocks along the major faults could represent a sig-nificant heat advection by solid rocks Therefore our results of thetransient 3-D thermal modelling are a good starting point to createa dynamical thermomechanical model for the LofotenndashVesteralencontinental margin and adjacent areas allowing us to minimize allthe uncertainties mentioned above
8 C O N C LU S I O N S
The obtained results of the time-dependent 3-D conductive ther-mal modelling for the LofotenndashVesteralen margin the northeasternVoslashring Basin and adjacent areas demonstrate that the present-daysubsurface temperature is characterized by the presence of ther-mally non-equilibrated zones clearly influenced by the Cenozoicerosion and deposition within the study area
The erosion-induced positive thermal anomaly has its maximumof more than +27 C at depths of 17ndash22 km beneath the easternpart of the Vestfjorden Basin where erosion has been particularlystrong during the last 27 million years The accompanying negativeanomaly within the northeastern part of the Voslashring Basin has min-imal values of around minus48 C at 12ndash14 km depth and is mainly theresult of the relatively rapid deposition of the Naust Formation dur-ing the Pleistocene Moreover the most intensive deposition-relatednegative anomaly is almost minus70 C at 17ndash20 km depth beneath theoceanic Lofoten Basin where the rapid Pleistocene deposition wasaccompanied by submarine mega-sliding of the sedimentary rockssourced from the Barents Sea
Besides the thermal influence of the early Cenozoic lithosphericthinning and the continental breakup with formation of new oceaniclithosphere is still recognizable within the western part of theLofotenndashVesteralen region in terms of the increasing temperaturestowards the oceanic domain recorded within the obtained 3-D ther-mal model
In addition to heat conduction convective andor advective heattransfer by fluids is indicated by large misfits between the modelledand measured temperatures within some local wells which arelocated relatively close to the majority of the wells with much better
Dow
nloaded from httpsacadem
icoupcomgjiarticle21328854810550 by guest on 16 April 2022
914 YP Maystrenko et al
fits implying that the modelled erosiondeposition-related thermalanomalies could also be theoretically affected by the groundwaterflow
A C K N OW L E D G E M E N T S
This study has been supported in the framework of the NEONOR2project by the Norwegian Research Council the Geological Surveyof Norway the Norwegian Petroleum Directorate the NorwegianMapping Authority Aker BP DEA Norge DONG Norge EONNorge Lundin Norway Maersk Oil Norway Norske Shell Norwe-gian Energy Company (Noreco) Repsol Exploration Norge Sta-toil and VNG Norge Special thanks go to Mauro Cacace fromthe Helmholtz Centre Potsdam GFZ German Research Centre forGeosciences for his help with the code for creating the 3-D mesh ofthe geometrically complex layers We are grateful to Alexander Mi-nakov and an anonymous reviewer for their very helpful commentswhich improved our manuscript Our gratitude also goes to DavidRoberts for improvement of the English
R E F E R E N C E S
Afonso JC Ranalli G amp Fernandez M 2005 Thermal expansivity andelastic properties of the lithospheric mantle results from mineral physicsof composites Phys Earth planet Inter 149(1ndash4) 71ndash80
Afonso JC Ranalli G Fernandez M Griffin WL OrsquoReilly SY ampFaul U 2010 On the VpVs-Mg correlation in mantle peridotitesimplications for the identification of thermal and compositional anomaliesin the upper mantle Earth planet Sci Lett 289(3ndash4) 606ndash618
Andersen BG amp Borns HW Jr 1994 The Ice Age World pp 208Scandinavian University Press (Universitetsforlaget AS)
Artemieva IM Thybo H amp Kaban MK 2006 Deep Europe today geo-physical synthesis of the upper mantle structure and lithospheric processesover 35 Ga Geol Soc London Mem 32(1) 11ndash41
Avedik F Berendsen D Fucke H Goldflam S Hirschleber H Meiss-ner R Sellevoll MA amp Weinrebe W 1984 Seismic investigationsalong the Scandinavian lsquoBlue Normarsquo profile Ann Geophys 2 571ndash577
Balling N Breiner N amp Waagstein R 2006 Thermal structure of thedeep Lopra-11A borehole in the Faroe Islands Geol Surv DenmarkGreenland Bull 9 91ndash107
Bannister SC Ruud BO amp Husebye ES 1991 Tomographic estimatesof sub-Moho seismic velocities in Fennoscandia and structural implica-tions Tectonophysics 189(1ndash4) 37ndash53
Bell RE Jackson CAL Elliott GM Gawthorpe RL Sharp IR ampMichelsen L 2014 Insights into the development of major rift-relatedunconformities from geologically constrained subsidence modelling Hal-ten Terrace offshore mid Norway Basin Res 26(1) 203ndash224
Ben Mansour W Moorkamp M amp England RW 2014 Joint inver-sion of seismological data and magnetotelluric data for the northernscandinavian mountains in American Geophysical Union Fall MeetingAbstractT23B-4668
Bergh SG Eig K Kloslashvjan OS Henningsen T Olesen O amp HansenJA 2007 The LofotenndashVesteralen continental margin a multiphaseMesozoic-Palaeogene rifted shelf as shown by offshore-onshore brittlefault-fracture analysis Norwegian J Geol 87 29ndash58
Bjoroslashy M Hall K amp Vigran JO 1980 An organic geochemical studyof Mesozoic shales from Andoslashya North Norway Phys Chem Earth 1277ndash91
Blystad P Brekke H Faeligrseth RB Larsen BT Skogseid J ampToslashrudbakken B 1995 Structural elements of the Norwegian continentalshelf Part II The Norwegian Sea Region Norwegian Pet DirectorateBull 8 0ndash45
Braathen A Osmundsen PT Nordgulen Oslash Roberts D amp Meyer G B2002 Orogen-parallel extension of the Caledonides in northern CentralNorway an overview Norwegian J Geol 82 225ndash241
Braun A amp Marquart G 2004 Evolution of the LofotenndashVesteralen mar-gin inferred from gravity and crustal modeling J geophys Res 109(B6)b06404 doi 1010292004jb003063
Breivik AJ Faleide JI Mjelde R amp Flueh ER 2009 Magma pro-ductivity and early seafloor spreading rate correlation on the northernVoslashring Margin Norway - Constraints on mantle melting Tectonophysics468(1ndash4) 206ndash223
Breivik AJ Faleide JI Mjelde R Flueh ER amp Murai Y 2017 A newtectono-magmatic model for the LofotenVesteralen Margin at the outerlimit of the Iceland Plume influence Tectonophysics 718 25ndash44
Brekke H 2000 The tectonic evolution of the Norwegian Sea continentalmargin with emphasis on the Voslashring and Moslashre basins in Dynamics ofthe Norwegian Margin Vol 136 pp 327ndash378 eds Noslashttvedt A et alGeological Society London Special Publications
Brigaud F Vasseur G amp Caillet G 1992 Thermal state in the NorthViking Graben (North Sea) determined from oil exploration well dataGeophysics 57(1) 69ndash88
Bronner M Gernigon L amp Nasuti A 2013 Lofoten-Vestfjorden Aero-magnetic Survey 2011 (LOVAS) Acquisition processing and interpreta-tion report pp 136 Geological Survey of Norway Trondheim
Buecker C amp Rybach L 1996 A simple method to determine heat pro-duction from gamma-ray logs Mar Pet Geol 13(4) 373ndash375
Cacace M amp Scheck-Wenderoth M 2016 Why intracontinental basinssubside longer 3-D feedback effects of lithospheric cooling and sedimen-tation on the flexural strength of the lithosphere J geophys Res 1213742ndash3761
Calcagnile G 1982 The lithosphere-asthenosphere system in Fennoscan-dia Tectonophysics 90(1ndash2) 19ndash35
Cammarano F Goes S Vacher P amp Giardini D 2003 Inferring upper-mantle temperatures from seismic velocities Phys Earth planet Inter138(3ndash4) 197ndash222
Cavanagh AJ di Primio R Scheck-Wenderoth M amp Horsfield B 2006Severity and timing of Cenozoic exhumation in the southwestern BarentsSea J Geol Soc 163(5) 761ndash774
Cermak V amp Rybach L 1982 Thermal properties thermal conductivityand specific heat of minerals and rocks in Physical Properties of Rockspp 305ndash343 ed Angenheister G Springer
Channell JET Kanamatsu T Sato T Stein R Alvarez Zarikian CAMalone MJ amp the Expedition 303306 Scientists 2005 Site U1315in Proceedings of the Integrated Ocean Drilling Program 303306doi102204iodpproc3033061142006
Chen YJ amp Lin J 2004 High sensitivity of ocean ridge thermal structureto changes in magma supply the Galapagos Spreading Center Earthplanet Sci Lett 221(1ndash4) 263ndash273
Clauser C 2011 Thermal storage and transport properties of rocks in HeatCapacity and Latent Heat Encyclopedia of Solid Earthacutes Geophysics pp1423ndash1431 ed Gupta H Springer
Clift P Lin J amp Barckhausen U 2002 Evidence of low flexural rigidityand low viscosity lower continental crust during continental break-up inthe South China Sea Mar Pet Geol 19(8) 951ndash970
Dalland A 1975 The Mesozoic Rocks of Andoslashya Northern NorwayNorges Geologiske Undersoslashkelse 316 271ndash287
Dalland A Worsley D amp Ofstad K 1988 A lithostratigraphic schemefor the Mesozoic and Cenozoic succession offshore mid- and northernNorway Norwegian Pet Directorate Bull 4 0ndash65
Davids C Wemmer K Zwingmann H Kohlmann F Jacobs J amp BerghSG 2013 KAr illite and apatite fission track constraints on brittlefaulting and the evolution of the northern Norwegian passive marginTectonophysics 608 196ndash211
Davis BAS Brewer S Stevenson AC amp Guiot J 2003 The tempera-ture of Europe during the Holocene reconstructed from pollen data QuatSci Rev 22(15ndash17) 1701ndash1716
Doin MP amp Fleitout L 1996 Thermal evolution of the oceaniclithosphere an alternative view Earth planet Sci Lett 142(1ndash2)121ndash136
Dow
nloaded from httpsacadem
icoupcomgjiarticle21328854810550 by guest on 16 April 2022
3-D thermal effect of Cenozoic erosion amp deposition 915
Dowdeswell JA Ottesen D amp Rise L 2006 Flow switching and large-scale deposition by ice streams draining former ice sheets Geology 34(4)313ndash316
Dowdeswell JA Ottesen D amp Rise L 2010 Rates of sediment deliveryfrom the Fennoscandian Ice Sheet through an ice age Geology 38(1)3ndash6
Drivenes G Sellevoll MA Renard V Avedik F amp Pajchel J 1984The continental margincrustal structure off the Lofoten Islands NorthernNorway in Petroleum Geology of the North European Margin pp 211ndash216 ed Spencer AM Springer
Ebbing J amp Olesen O 2010 New compilation of top basement and base-ment thickness for the Norwegian continental shelf reveals the segmenta-tion of the passive margin system Pet Geol Conf Proc 7 885ndash897
Ebbing J England RW Korja T Lauritsen T Olesen O Stratford Wamp Weidle C 2012 Structure of the Scandes lithosphere from surface todepth Tectonophysics 536 1ndash24
Ehlers J Gibbard PL amp Hughes PD 2011 Quaternary GlaciationsExtent and Chronology A Closer Look Elsevier
Eidvin T Bugge T amp Smelror M 2007 The Molo Formation depositedby coastal progradation on the inner Mid-Norwegian continental shelfcoeval with the Kai Formation to the west and the Utsira Formation in theNorth Sea Norwegian J Geol 87 75ndash142
Eig K 2012 Lofoten and Vesteralen promised land or Fata MorganaGEO ExPro 9 54ndash58
Eldevik T et al 2014 A brief history of climate the northern seas from theLast Glacial Maximum to global warming Quat Sci Rev 106 225ndash246
Eldholm O Thiede J amp Party SS 2005 Thermal conductivity of ODPHole 104ndash642C PANGAEA
Eldrett JS Greenwood DR Harding IC amp Huber M 2009 Increasedseasonality through the Eocene to Oligocene transition in northern highlatitudes Nature 459(7249) 969ndash973
Faeligrseth RB 2012 Structural development of the continental shelf offshoreLofotenndashVesteralen northern Norway Norwegian J Geol 92 19ndash40
Faleide JI Tsikalas F Breivik AJ Mjelde R Ritzmann O Engen OWilson J amp Eldholm O 2008 Structure and evolution of the continentalmargin off Norway and Barents Sea Episodes 31 82ndash91
Fejerskov M amp Lindholm CD 2000 Crustal stress in and around Norwayan evaluation of stress-generating mechanisms Geol Soc London SpecPubl 167(1) 451ndash467
Fichler C Rundhovde E Olesen O Saeligther BM Rueslatten HLundin E amp Dore AG 1999 Regional tectonic interpretation of imageenhanced gravity and magnetic data covering the Mid-Norwegian shelfand adjacent mainland Tectonophysics 306(2) 183ndash197
Fiedler A amp Faleide JI 1996 Cenozoic sedimentation along the south-western Barents Sea margin in relation to uplift and erosion of the shelfGlob Planet Change 12(1ndash4) 75ndash93
Filippelli GM amp Flores J-A 2009 From the warm Pliocene to the coldPleistocene a tale of two oceans Geology 37(10) 959ndash960
Fjeldskaar W amp Amantov A 2018 Effects of glaciations on sedimentarybasins J Geodyn in press doi 101016jjog201710005
Fjeldskaar W Lindholm CD Dehls JF amp Fjeldskaar I 2000 Post-glacial uplift neotectonics and seismicity in Fennoscandia Quat SciRev 19(14ndash15) 1413ndash1422
Fossen H 2010 Extensional tectonics in the North Atlantic Caledonidesaregional view in Continental Tectonics and Mountain Building TheLegacy of Peach and Horne pp 767ndash793 eds Law RD Butler RWHHoldsworth R E Krabbendam M amp Strachan RA The GeologicalSociety of London
Fredin O et al 2017 The inheritance of a Mesozoic landscape in westernScandinavia Nat Commun 8 14879 doi101038ncomms14879
Geoffroy L Burov EB amp Werner P 2015 Volcanic passive marginsanother way to break up continents Sci Rep 5 14828
Gernigon L Ringenbach JC Planke S Le Gall B amp Jonquet-KolstoslashH 2003 Extension crustal structure and magmatism at the outer VoringBasin Norwegian margin J Geol Soc 160(2) 197ndash208
Gernigon L Ringenbach JC Planke S amp Le Gall B 2004 Deep struc-tures and breakup along volcanic rifted margins insights from integratedstudies along the outer Voslashring Basin (Norway) Mar Pet Geol 21(3)363ndash372
Gernigon 2014 Unpublished NGU dataGernigon L Blischke A Nasuti A amp Sand M 2015 Conjugate volcanic
rifted margins seafloor spreading and microcontinent Insights from newhigh-resolution aeromagnetic surveys in the Norway Basin Tectonics34(5) 907ndash933
Goldschmidt-Rokita A Sellevoll MA Hirschleber HB amp AvedikF 1988 Results of two seismic refraction profiles off LofotenNorthern Norway Spec Publ - Norges Geologiske Undersoslashkelse 349ndash57
Goledowski B Egholm DL Nielsen SB Clausen OR amp McGre-gor ED 2013 Cenozoic erosion and flexural isostasy of ScandinaviaJGeodyn 70 49ndash57
Gradmann S amp Ebbing J 2015 Large-scale gravity anomaly in northernNorway tectonic implications of shallow or deep source depth and apossible conjugate in northeast Greenland Geophys J Int 203(3) 2070ndash2088
Green PF Japsen P Chalmers JA Bonow JM amp Duddy IR 2018Post-breakup burial and exhumation of passive continental marginsseven propositions to inform geodynamic models Gondwana Res 5358ndash81
Hansen J Sato M Russell G amp Kharecha P 2013 Climate sensitivitysea level and atmospheric carbon dioxide Phil Trans R Soc A 7120120284 doi101098rsta20120294
Hansen JA 2009 Onshore-offshore tectonic relations on the Lofoten andVesteralen Margin PhD dissertation Universitetet i Tromsoslash
Hansen JA Bergh SG amp Henningsen T 2012 Mesozoic rifting andbasin evolution on the Lofoten and Vesteralen Margin North-Norwaytime constraints and regional implications Norwegian J Geol 91 203ndash228
Hasenclever J et al 2017 Sea level fall during glaciation stabilized atmo-spheric CO2 by enhanced volcanic degassing Nat Commun 8 15867doi101038ncomms15867
Hasterok D Chapman DS amp Davis EE 2011 Oceanic heat flowimplications for global heat loss Earth planet Sci Lett 311(3ndash4)386ndash395
Hejrani B Balling N Jacobsen BH amp England R 2017 Upper-mantlevelocities below the Scandinavian Mountains from P- and S-wave travel-time tomography Geophys J Int 208(1) 177ndash192
Hendriks BWH amp Andriessen PAM 2002 Pattern and timing of thepost-Caledonian denudation of northern Scandinavia constrained by ap-atite fission-track thermochronology Geol Soc London Spec Publ196(1) 117ndash137
Hendriks BWH Osmundsen PT amp Redfield TF 2010 Normal faultingand block tilting in Lofoten and Vesteralen constrained by Apatite FissionTrack data Tectonophysics 485(1ndash4) 154ndash163
Henstra GA Gawthorpe RL Helland-Hansen W Ravnas R amp Rote-vatn A 2017 Depositional systems in multiphase rifts seismic casestudy from the Lofoten margin Norway Basin Research 29(4) 447ndash469
Hjelstuen BO Eldholm O amp Faleide JI 2007 Recurrent Pleistocenemega-failures on the SW Barents Sea margin Earth planet Sci Lett258(3ndash4) 605ndash618
Hofmeister AM 1999 Mantle values of thermal conductivity and thegeotherm from phonon lifetimes Science 283(5408) 1699ndash1706
Holtedahl H 1998 The Norwegian strandflat ndash a geomorphological puzzleNorsk Geologisk Tidsskrift 78 47ndash66
Inglis GN et al 2017 Mid-latitude continental temperatures through theearly Eocene in Western Europe Earth planet Sci Lett 460 86ndash96
Janutyte I Lindholm C amp Olesen O 2017 Relation between seismicityand tectonic structures offshore and onshore Nordland northern NorwayNorwegian J Geol 97 163ndash175
Kawakatsu H Kumar P Takei Y Shinohara M Kanazawa T ArakiE amp Suyehiro K 2009 Seismic evidence for sharp lithosphere-asthenosphere boundaries of oceanic plates Science 324(5926) 499ndash502
Keiding M Kreemer C Lindholm CD Gradmann S Olesen O ampKierulf HP 2015 A comparison of strain rates and seismicity forFennoscandia depth dependency of deformation from glacial isostaticadjustment Geophys J Int 202(2) 1021ndash1028
Dow
nloaded from httpsacadem
icoupcomgjiarticle21328854810550 by guest on 16 April 2022
916 YP Maystrenko et al
Kodaira S Mjelde R Sellevoll MA Hirschleber HB Iwasaki TKanazawa T amp Shimamura H 1995 Crustal transect across the LofotenVolcanic Passive Continental Margin N Norway obtained by use of oceanbottom seismographs and implications for its evolution J Phys Earth43(6) 729ndash745
Korablev A Smirnov A amp Baranova OK 2014 Climatological Atlas ofthe Nordic Seas and Northern North Atlantic in NOAA Atlas NESDISVol 77 pp 122 eds Seidov D amp Parsons AR doi107289V54B2Z78
Ksienzyk AK Dunkl I Jacobs J Fossen H amp Kohlmann F 2014From orogen to passive margin constraints from fission track and(UndashTh)He analyses on Mesozoic uplift and fault reactivation in SWNorway Geol Soc London Spec Publ 390(1) 679ndash702
Laberg JS Andreassen K amp Vorren TO 2012 Late Cenozoic erosionof the high-latitude southwestern Barents Sea shelf revisited Bull geolSoc Am 124(1ndash2) 77ndash88
Lee C-TA 2003 Compositional variation of density and seismic velocitiesin natural peridotites at STP conditions implications for seismic imagingof compositional heterogeneities in the upper mantle J geophys Res108(B9)
Leroy M Gueydan F amp Dauteuil O 2008 Uplift and strength evolutionof passive margins inferred from 2-D conductive modelling Geophys JInt 172(1) 464ndash476
Lien T 2005 From rifting to drifting effects on the development of deep-water hydrocarbon reservoirs in a passive margin setting Norwegian SeaNorwegian J Geol 85 319ndash332
Loslashseth H amp Tveten E 1996 Post-Caledonian structural evolution of theLofoten and Vesteralen offshore and onshore areas Norsk Geol Tidsskr76 215ndash230
Lundin ER Dore AG Roslashnning K amp Kyrkjebo R 2013 Repeatedinversion and collapse in the Late Cretaceous-Cenozoic northern VoringBasin offshore Norway Pet Geosci 19(4) 329ndash341
Mancktelow NS amp Grasemann B 1997 Time-dependent effects of heatadvection and topography on cooling histories during erosion Tectono-physics 270(3ndash4) 167ndash195
Mann ME et al 2009 Global signatures and dynamical origins of theLittle Ice Age and Medieval climate anomaly Science 326(5957) 1256ndash1260
Maystrenko Y amp Scheck-Wenderoth M 2009 Density contrasts in theupper mantle and lower crust across the continent-ocean transition con-straints from 3-D gravity modelling at the Norwegian margin GeophysJ Int 179(1) 536ndash548
Maystrenko YP amp Gernigon L 2018 3-D temperature distribution be-neath the Mid-Norwegian continental margin (the Voslashring and Moslashrebasins) Geophys J Int 212(1) 694ndash724
Maystrenko YP Elvebakk HK Ganeroslashd GV Lutro O Olesen Oamp Roslashnning JS 2014 2D structural and thermal models in southeast-ern Norway based on the recently drilled Arvollskogen borehole and2D density magnetic and thermal modelling Geotherm Energy 2(1)doi101186s40517-014-0015-z
Maystrenko YP Olesen O amp Elvebakk HK 2015 Indication of deepgroundwater flow through the crystalline rocks of Southern Norway Ge-ology 43 327ndash330
Maystrenko YP Slagstad T Elvebakk HK Olesen O Ganeroslashd GVamp Roslashnning JS 2015 New heat flow data from three boreholes nearBergen Stavanger and Moss southern Norway Geothermics 56 79ndash92
Maystrenko YP Olesen O Gernigon L amp Gradmann S 2017 Deepstructure of the LofotenndashVesteralen segment of the Mid-Norwegian con-tinental margin and adjacent areas derived from 3-D density modeling Jgeophys Res 122 1402ndash1433
Maystrenko YP Gernigon L Nasuti A amp Olesen O 2018 Deep struc-ture of the Mid-Norwegian continental margin (the Voslashring and Moslashrebasins) according to 3-D density and magnetic modelling Geophys JInt 212(3) 1696ndash1721
McKenna TE amp Sharp JM Jr 1998 Radiogenic heat production insedimentary rocks of the Gulf of Mexico basin South Texas AAPG Bull82 484ndash496
Medvedev S amp Hartz EH 2015 Evolution of topography of post-Devonian Scandinavia effects and rates of erosion Geomorphology 231229ndash245
Meinhold G Morton AC amp Avigad D 2013 New insights into peri-Gondwana paleogeography and the Gondwana super-fan system fromdetrital zircon U-Pb ages Gondwana Res 23 661ndash665
Midttoslashmme K amp Roaldset E 1999 Thermal conductivity of sedimentaryrocks uncertainties in measurement and modelling Geol Soc LondonSpec Publ 158 45ndash60
Midttoslashmme K Slaeligttem J Roaldset E amp Zielinski GW 1995 Ther-mal conductivity of unconsolidated marine sediments from Voslashring BasinNorwegian Sea in SAGE 57th Conference and Technical Exhibition Glas-gow Scotland
Mjelde R Sellevoll MA Shimamura H Iwasaki T amp KanazawaT 1992 A crustal study off Lofoten N Norway by use of3-component Ocean Bottom Seismographs Tectonophysics 212269ndash288
Mjelde R Sellevoll MA Shimamura H Iwasaki T amp Kanazawa T1993 Crustal structure beneath Lofoten N Norway from vertical inci-dence and wide-angle seismic data Geophys J Int 114 116ndash126
Mjelde R Sellevoll MA Shimamura H Iwwasaki T amp Kanazawa T1995 S-wave anisotropy off Lofoten Norway indicative of fluids in thelower continental crust Geophys J Int 120 87ndash96
Mjelde R Kodaira S amp Sellevoll MA 1996 Crustal structure of theLofoten Margin N Norway from normal incidence and wide-angle seis-mic data a review Norsk Geol Tidsskr 76 187ndash198
Mjelde R et al 2001 Crustal structure of the outer Voslashring Plateau offshoreNorway from ocean bottom seismic and gravity data J geophys Res106 6769ndash6791
Mjelde R Shimamura H Kanazawa T Kodaira S Raum T amp ShiobaraH 2003 Crustal lineaments distribution of lower crustal intrusives andstructural evolution of the Voslashring Margin NE Atlantic new insight fromwide-angle seismic models Tectonophysics 369 199ndash218
Mjelde R Kvarven T Faleide JI amp Thybo H 2016 Lower crustalhigh-velocity bodies along North Atlantic passive margins and theirlink to Caledonian suture zone eclogites and early Cenozoic magmatismTectonophysics 670 16ndash29
Mokhtari M amp Pegrum RM 1992 Structure and evolution of the Lofotencontinental margin offshore Norway Norsk Geol Tidsskr 72 339ndash355
Montelli A Dowdeswell JA Ottesen D amp Johansen SE 2017 Ice-sheet dynamics through the Quaternary on the mid-Norwegian continentalmargin inferred from 3D seismic data Mar Pet Geol 80 228ndash242
Muller RD Sdrolias M Gaina C amp Roest WR 2008 Age spreadingrates and spreading asymmetry of the worldrsquos ocean crust GeochemGeophys Geosyst 9 doi1010292007GC001743
Nesje A Dahl SO Thun T amp Nordli O 2008 The lsquoLittle Ice Agersquoglacial expansion in western Scandinavia summer temperature or winterprecipitation Clim Dyn 30 789ndash801
Nielsen SB Clausen OR amp McGregor E 2017 basinRo a vitrinitereflectance model derived from basin and laboratory data Basin Res 29515ndash536
NPD 2010 Geofaglig Vurdering av Petroleumsressursene i HavomradeneUtenfor Lofoten Vesteralen og Senja Norwegian Petroleum Directorate
NPD 2017 lsquoThe NPDrsquos fact pages well data summary sheets Nor-wegian Petroleum Directoratersquo Available at httpfactpagesnpdnoFactPagesDefaultaspxnav1=wellboreampnav2=PageView|Exploration|Allampnav3=6753 (January 2017)
Olesen O Reitan M amp Saeligther PO 1993 Petrofysisk database PETBASE30 Brukerbeskrivelse NGU Trondheim Norway NGU Internrapport93023
Olesen O et al 2002 Bridging the gap between the onshore and offshoregeology in Nordland northern Norway Norwegian J Geol 82 243ndash262
Olesen O et al 2004 Neotectonic deformation in Norway and its impli-cations a review Norwegian J Geol 84 3ndash34
Olesen O et al 2007a An improved tectonic model for the Eocene openingof the NorwegianndashGreenland Sea use of modern magnetic data Mar PetGeol 24 53ndash66
Olesen O et al 2007b KONTIKI Final Report CONTInental Crust andHeat Generation In 3D NGU Report 2007042
Olesen O Bungum H Dehls J Lindholm C Pascal C amp RobertsD 2013a Neotectonics seismicity and contemporary stress field in Nor-way ndash mechanisms and implications in Quaternary Geology of Norway
Dow
nloaded from httpsacadem
icoupcomgjiarticle21328854810550 by guest on 16 April 2022
3-D thermal effect of Cenozoic erosion amp deposition 917
pp 145ndash174 eds Olsen L Fredin O amp Olesen O Geological Surveyof Norway Special Publication v 13
Olesen O Kierulf HP Bronner M Dalsegg E Fredin O ampSolbakk T 2013b Deep weathering neotectonics and strandflatformation in Nordland northern Norway Norwegian J Geol 93189ndash213
Olsen L Sveian H Bergstroslashm B Ottesen D amp Rise L 2013 Qua-ternary glaciations and their variations in Norway and on the Norwegiancontinental shelf in Quaternary Geology of Norway pp 27ndash78 edsOlsen L Fredin O amp Olesen O Geological Survey of Norway SpecialPublication v 13
Olsson S Roberts RG amp Bodvarsson R 2008 Moho depth varia-tion in the Baltic Shield from analysis of converted waves GFF 130113ndash122
Ottemoller L amp Midzi V 2003 The crustal structure of Norway frominversion of teleseismic receiver functions J Seismol 7 35ndash48
Ottersen G 2009 A Digital Temperature Archive for the Norwegian SeaVol 6 Institute of Marine Research
Ottesen D Rise L Andersen ES Bugge T amp Eidvin T 2009 Geo-logical evolution of the Norwegian continental shelf between 61 degreesN and 68 degrees N during the last 3 million years Norwegian J Geol89 251ndash265
Ottesen D Dowdeswell JA Rise L amp Bugge T 2012 Large-scaledevelopment of the mid-Norwegian shelf over the last three million yearsand potential for hydrocarbon reservoirs in glacial sediments Geol SocLondon Spec Publ 368 53ndash73
Pascal C 2015 Heat flow of Norway and its continental shelf Mar PetGeol 66 956ndash969
Pascal C amp Midttoslashmme K 2006 Impact of Recent Glacial Erosionon Subsurface Temperatures The Mid-Norwegian Margin NGU-rapport2006088
Pascal C amp Rudlang T 2016 Discovery of highly radioactive granite inthe Bergen Region Norwegian J Geol 96 319ndash328
Pekar SF DeConto RM amp Harwood DM 2006 Resolving a lateOligocene conundrum deep-sea warming and Antarctic glaciationPalaeogeogr Palaeoclimatol Palaeoecol 231 29ndash40
Petersen TG Hamann NE amp Stemmerik L 2015 Tectono-sedimentaryevolution of the Paleogene succession offshore Northeast Greenland MarPet Geol 67 481ndash497
Pilidou S Priestley K Debayle E amp Gudmundsson O 2005 Rayleighwave tomography in the North Atlantic high resolution images of theIceland Azores and Eifel mantle plumes Lithos 79 453ndash474
Raab B amp Vedin H 1995 The National Atlas of Sweden Climate Lakesand Rivers Bokforlaget Bra Bocker
Ravelo AC Andreasen DH Lyle M Lyle AO amp Wara MW 2004Regional climate shifts caused by gradual global cooling in the PlioceneEpoch Nature 429 263ndash267
Ren SC Skogseid J amp Eldholm O 1998 Late Cretaceous-Palaeoceneextension on the Voslashring Volcanic Margin Mar Geophys Res 20 343ndash369
Ren SC Faleide JI Eldholm O Skogseid J amp Gradstein F 2003 LateCretaceousndashPaleocene tectonic development of the NW Voslashring BasinMar Pet Geol 20 177ndash206
Riis F amp Fjeldskaar W 1992 On the magnitude of the late Tertiary andQuaternary erosion and its significance for the uplift of Scandinavia andthe Barents Sea Spec Publ - Norwegian Pet Soc NPF 1 163ndash185
Riis F 1996 Quantification of Cenozoic vertical movements of Scandinaviaby correlation of morphological surfaces with offshore data Glob PlanetChange 12 331ndash357
Rise L Ottesen D Berg K amp Lundin E 2005 Large-scale developmentof the mid-Norwegian margin during the last 3 million years Mar PetGeol 22 33ndash44
Rise L Ottesen D Longva O Solheim A Andersen ES amp Ayers S2006 The Sklinnadjupet Slide and its relation to the Elsterian glaciationon the mid-Norwegian margin Mar Pet Geol 23 569ndash583
Rise L Chand S Hjelstuen BO Haflidason H amp Boslashe R 2010Late Cenozoic geological development of the south Voslashring margin mid-Norway Mar Pet Geol 27 1789ndash1803
Rise L Boslashe R Riis F Bellec VK Laberg JS Eidvin T ElvenesS amp Thorsnes T 2013 The LofotenndashVesteralen continental marginNorth Norway Canyons and mass-movement activity Mar Pet Geol45 134ndash149
Roberts D amp Gee DG 1985 An introduction to the structure ofthe Scandinavian Caledonides in The Caledonide orogen - Scandi-navia and related areas pp 55ndash68 eds Gee D amp Sturt BA JohnWiley amp Sons
Sass JH Lachenbruch AH Moses TH Jr amp Morgan P 1992 Heatflow from a scientific research well at Cajon Pass California J geophysRes 97 5017ndash5030
Scheck-Wenderoth M amp Maystrenko Y 2008 How warm are passivecontinental margins A 3-D lithosphere-scale study from the Norwegianmargin Geology 36 419ndash422
Scheck-Wenderoth M amp Maystrenko YP 2013 Deep control on shallowheat in sedimentary basins Energy Procedia 40 266ndash275
Schmittner A Urban NM Shakun JD Mahowald NM Clark PUBartlein PJ Mix AC amp Rosell-Mele A 2011 Climate sensitivityestimated from temperature reconstructions of the last glacial maximumScience 334 1385ndash1388
Seppa H Bjune AE Telford RJ Birks HJB amp Veski S 2009 Lastnine-thousand years of temperature variability in northern Europe ClimPast 5 523ndash535
Siegert MJ Dowdeswell JA Hald M amp Svendsen JI 2001 Modellingthe Eurasian ice sheet through a full (Weichselian) glacial cycle GlobPlanet Change 31 367ndash385
Sigmond EMO 2002 Geological map land and sea areas of northernEurope 14 million in Commision for the Geological Map of the WorldGeological Survey of Norway Trondheim
Slagstad T 2008 Radiogenic heat production of Archaean to Permiangeological provinces in Norway Norwegian J Geol 88 149ndash166
Slagstad T amp Lauritsen T 2013 Heat production calculations in COOPPhase I - Crustal Onshore-Offshore Project NGU Report 2013002 74ndash111 eds Olesen O Bronner M Ebbing J Elvebakk H Gellein JKoziel J Lauritsen T Lutro O Maystrenko Y Muller C Nasuti AOsmundsen PT Slagstad T amp Storroslash G
Slagstad T Balling N Elvebakk H Midttoslashmme K Olesen O OlsenL amp Pascal C 2009 Heat-flow measurements in Late Palaeoprotero-zoic to Permian geological provinces in south and central Norway and anew heat-flow map of Fennoscandia and the Norwegian-Greenland SeaTectonophysics 473 341ndash361
Slagstad T Maystrenko YP Maupin V amp Gradmann S 2018 An ex-tinct Late Mesoproterozoic Sveconorwegian mantle wedge beneath SWFennoscandia reflected in seismic tomography and assessed by thermalmodeling Terra Nova 30(1) 72ndash77
Smelror M Moslashrk A Moslashrk MBE Weiss HM amp Loslashseth H 2001Middle Jurassic-Lower Cretaceous transgressive-regressive sequencesand facies distribution off northern Nordland and Troms Norway inSedimentary Environments Offshore Norway - Palaeozoic to Recentpp 211ndash232 eds Martinsen O J amp Dreyer T NPF Special Publi-cations
Srivastava SP amp Tapscott CR 1986 Plate kinematics of the NorthAtlantic in The Western North Atlantic Region pp 379ndash404 edsVogt PR amp Tucholke BE Geological Society of America SpecialPublications
Steer P Huismans RS Valla PG Gac S amp Herman F 2012 Bi-modal Plio-Quaternary glacial erosion of fjords and low-relief surfacesin Scandinavia Nat Geosci 5 635ndash639
Stein CA amp Stein S 1992 A model for the global variation in oceanicdepth and heat flow with lithospheric age Nature 359 123ndash129
Steltenpohl MG Hames WE amp Andresen A 2004 The Silurian toPermian history of a metamorphic core complex in Lofoten northernScandinavian Caledonides Tectonics 23 doi1010292003TC001522
Stuwe K 2007 Geodynamics of the Lithosphere An Introduction Geo-dynamics of the Lithosphere An Introduction pp 493 Springer-Verlagdoi101007978-3-540-71237-4
Talwani M amp Eldholm O 1977 Evolution of the Norwegian-GreenlandSea Bull geol Soc Am 88 969ndash999
Dow
nloaded from httpsacadem
icoupcomgjiarticle21328854810550 by guest on 16 April 2022
918 YP Maystrenko et al
Tsikalas F Faleide JI amp Eldholm A 2001 Lateral variations in tectono-magmatic style along the LofotenndashVesteralen volcanic margin off NorwayMar Pet Geol 18 807ndash832
Tsikalas F Eldholm O amp Faleide JI 2005 Crustal structure of theLofotenndashVesteralen continental margin off Norway Tectonophysics 404151ndash174
Turcotte DL amp Schubert G 2002 Geodynamics Cambridge UniversityPress
Tveito OE et al 2000 Nordic Temperature Maps DNMI-Report 0900KLIMA
van den Berg AP Yuen DA amp Steinbach V 2001 The effects of variablethermal conductivity on mantle heat-transfer Geophys Res Lett 28875ndash878
Villa M Fernandez M amp Jimenez Munt I 2010 Radiogenic heat produc-tion variability of some common lithological groups and its significanceto lithospheric thermal modeling Tectonophysics 490 152ndash164
Vosteen H-D amp Schellschmidt R 2003 Influence of temperature on ther-mal conductivity thermal capacity and thermal diffusivity for differenttypes of rock Phys Chem Earth Parts ABC 28 499ndash509
Wagner W amp Kretzschmar H-J 2008 International Steam Tables ndashProperties of Water and Steam Based on the Industrial FormulationIAPWS-IF97 Springer-Verlag
Wollenberg HA amp Smith AR 1987 Radiogenic heat production ofcrustal rocks an assessment based on geochemical data Geophys ResLett 14 295ndash298
Yakovlev AV Bushenkova NA Koulakov IY amp Dobretsov NL 2012Structure of upper mantle in Arctic region based on data of regionalseismotomography Geol Geophys 53 1261ndash1272
Zachos J Pagani M Sloan L Thomas E amp Billups K 2001 Trendsrhythms and aberrations in global climate 65 Ma to present Science 292686ndash693
Zastrozhnov D Gernigon L Gogin I Abdelmalak MM Planke SFaleide JI Eide S amp Myklebust R 2008 Cretaceous-Paleocene evo-lution and crustal structure of the northern Voslashring Margin (offshoreMid-Norway) results from integrated geological and geophysical studyTectonics doi 1010022017TC004655
Zhang Y-S amp Lay T 1999 Evolution of oceanic upper mantle structurePhys Earth planet Inter 114 71ndash80
Dow
nloaded from httpsacadem
icoupcomgjiarticle21328854810550 by guest on 16 April 2022

886 YP Maystrenko et al
Figure 1 Overview map of northwestern Europe (bathymetry and topography from the Norwegian Mapping Authority) with location of the lithosphere-scale3-D structuralthermal model of the LofotenndashVesteralen margin segment and adjacent areas (blue frame)
Tsikalas et al 2005 Bronner et al 2013 Gradmann amp Ebbing2015 Maystrenko et al 2017)
The study area is characterized by a prominent contrasting re-lief changing at a relatively short distance from elevations higherthan 15 km within the Scandes Mountains onshore to bathyme-tries deeper than minus3 km within the oceanic Lofoten Basin offshore(Fig 2) In addition to this contrasting relief the crystalline rocksare exposed on the Earthrsquos surface over most of the mainland (egSigmond 2002) The preserved sedimentary rocks are mainly rep-resented by the relatively thin Jurassic and Cretaceous sequences inthe northeastern part of the Andoslashya island (Dalland 1975 Smelroret al 2001) The crystalline rocks also crop out at the seafloor withinthe structural highs and near the coastline (Sigmond 2002) More-over the Nordland area is characterized by increased seismicity andneotectonic activities (Keiding et al 2015 Janutyte et al 2017)The above-mentioned direct indications of neotectonics togetherwith the additional neotectonic features have been summarized byOlesen et al (2013a 2004) for this structurally complex area
In this study the main goal has been to model and reveal the 3-Dconductive thermal pattern beneath the LofotenndashVesteralen mar-gin the adjacent parts of the mainland and the adjacent AtlanticOcean In particular our study has been performed to recognize thetemporal changes of the subsurface 3-D thermal pattern during thelate Cenozoic uplift and erosion of the mainland and the northeast-ern part of the LofotenndashVesteralen margin segment and the rapiddeposition of the eroded material within the southwestern part of
the LofotenndashVesteralen margin and the adjacent northeastern partof the Voslashring Basin The lithosphere-scale 3-D structural model ofthe LofotenndashVesteralen segment of the Mid-Norwegian margin fromMaystrenko et al (2017) has been taken as the main structural back-ground for the 3-D thermal modelling This 3-D structural modelrepresents the most recent structural approximation of the deep sub-surface covering the major tectonic units of the LofotenndashVesteralenarea and the northeastern part of the Voslashring Basin (Fig 2)
2 T E C T O N I C OV E RV I E WA N D P R E V I O U S W O R K
The LofotenndashVesteralen continental margin and the adjacent main-land had already undergone significant uplift and erosion duringthe Scandian phase of the Caledonian Orogeny in Silurian-EarlyDevonian time (Roberts amp Gee 1985) when large-scale overthrust-ing and subsequent uplift were caused by amalgamation of severalterranes to the Baltican protomargin During the Devonian theCaledonian Orogen collapsed as a result of a regional extension(Braathen et al 2002 Steltenpohl et al 2004 Fossen 2010) Dur-ing the Late PalaeozoicndashMesozoic several extensional events ledto the formation of Permian Triassic and Jurassic subbasins withinthe Troslashndelag Platform (eg Blystad et al 1995 Brekke 2000) theJurassicndashCretaceous depocentres within the Ribban and Vestfjordenbasins and possibly including the Roslashst Basin where sedimentary
Dow
nloaded from httpsacadem
icoupcomgjiarticle21328854810550 by guest on 16 April 2022
3-D thermal effect of Cenozoic erosion amp deposition 887
Figure 2 Tectonic configuration within the LofotenndashVesteralen and the northern Voslashring segments of the Mid-Norwegian continental margin superimposedon the bathymetry and topography with location of the 3-D structuralthermal model (based on Blystad et al 1995 Sigmond 2002 Hansen 2009 Hansen et al2012) (bathymetry and topography from the Norwegian Mapping Authority) Thick magenta lines correspond to the selected vertical slices shown in Fig 23Black dashed line corresponds to the present-day shelf edge COB the continent-ocean boundary LVLDM low-velocitylow-density mantle
rocks are overlain by lava flows (Tsikalas et al 2001 Hansen et al2012 Faeligrseth 2012 Eig 2012 Henstra et al 2017) During theLate JurassicndashCretaceous a large tectonic and thermal subsidenceaffected the adjacent Voslashring Basin (eg Gernigon et al 2004 Lien2005 Mjelde et al 2016) The continental break-up finally split theLaurasia palaeocontinent in the late Palaeocene-early Eocene andthe present-day Mid-Norwegian continental margin and the oceanicLofoten Basin started to form (Talwani amp Eldholm 1977)
During the Cenozoic the LofotenndashVesteralen segment of theMid-Norwegian continental margin has undergone an uplift whichwas followed by erosion andor non-deposition over a large partof the LofotenndashVesteralen margin (eg Loslashseth amp Tveten 1996Riis 1996 Faeligrseth 2012) The most recent erosion occurred dur-ing the Quaternary glacial periods when preserved sedimentaryrocks and part of the existing weathered crystalline rocks wereremoved by glacial erosion forming the typical present-day Nor-wegian coastal landscape the so-called strandflat (Olesen et al2013ab Holtedahl 1998) The strandflat is particularly well de-veloped south of the Lofoten margin along the coast of Helge-land (Olesen et al 2013a Holtedahl 1998) The eroded materialwas deposited farther offshore creating significant depocentres ofthe glacier-derived Naust Formation during Pleistocene times (egRise et al 2005 Dowdeswell et al 2010 Dowdeswell et al 2006Ottesen et al 2009 Montelli et al 2017) Moreover elevated pas-sive continental margins have also been well documented in otherplaces of the world (eg Greenland NE Brazil South Africa) but asin the case of the Mid-Norwegian margin there is still no commongeodynamic model that can fully explain their origin (eg Greenet al 2017)
The origin and nature of the late Cenozoic uplift are still a matterof debate and obviously resulted from the superposition of several
factors (Loslashseth amp Tveten 1996 Riis 1996 Faeligrseth 2012 Fjeld-skaar et al 2000) Four major phases of the Cenozoic uplift in thePalaeogene Middle Miocene late Pliocene and Pleistocene havebeen identified by Riis (1996) The Palaeogene uplift was inter-preted as a marginal uplift related to the opening of the NorthAtlantic Ocean and the late Pliocene event was considered to bedue to unloading (Riis 1996) On the other hand the causes of theMiddle Miocene and Pleistocene phases remain unknown Riis ampFjeldskaar (1992) have shown that the postglacial uplift is not to-tally isostatically compensated and Fjeldskaar et al (2000) haveproposed that this uplift has also a tectonic origin Furthermore theridge-push forces associated with Cenozoic seafloor spreading inthe North Atlantic Ocean have also been proposed as a primary ex-planation for the Fennoscandian uplift (eg Fejerskov amp Lindholm2000)
In spite of many uncertainties about the causes of these Cenozoicuplift events the magnitude of the uplift at different time intervalsand the amount of the eroded material have been approximatelyquantified by use of different methods Based on apatite fissiontrack and (UndashTh)He analyses the post-Caledonian denudation his-tory of western Fennoscandia is characterized by clearly definedand relatively high cooling rates throughout the whole Cenozoic era(Hendriks amp Andriessen 2002 Hendriks et al 2010 Davids et al2013 Ksienzyk et al 2014) Particularly the present-day exposedEarthrsquos surface in Lofoten and Vesteralen could be characterized byrelatively high palaeotemperatures at the beginning of the Cenozoicranging from 30 to 90 C and recorded at different locations (Hen-driks et al 2010) Hendriks et al (2010) indicate a differential upliftof the LofotenndashVesteralen area with magnitude variations from 1 tomore than 3 km locally during the Cenozoic Furthermore based onthe study of the weathered crystalline crust Olesen et al (2013a b)
Dow
nloaded from httpsacadem
icoupcomgjiarticle21328854810550 by guest on 16 April 2022
888 YP Maystrenko et al
have suggested that the Pleistocene erosion was about 500 m alongthe coastline in the Nordland area In SW Norway Steer et al(2012) have proposed that significant erosion must have also takenplace in close vicinity to present-day high elevation during the latePliocene and Quaternary glaciations However they did not con-sider the erosion within the inner shelf Based on the volume of thePleistocene Naust Formation off mid Norway Dowdeswell et al(2010) suggested a similar amount of average glacial erosion overthe mainland and inner shelf The estimated thickness of the restoredmatrix of the Cenozoic deposits in the close vicinity of the highlyelevated Scandes Mountains within the study area could possiblyreach more than 3 km as modelled by Goledowski et al (2013) Theamount of fluvial and glacial erosion predicted by the erosionalmodel of Medvedev amp Hartz (2015) suggests that it should not bemore than 15 km over the area located near the high-altitude Scan-des Mountains in the study area and should only reach c 175 kmlocally within some fjords Based on maximum estimated burialdepth in offshore wells and wells on Andoslashya a total erosion in theLofoten and Vesteralen region could have reached up to 2 km be-tween Andoslashya and the mainland (Eig 2012 NPD 2010) Moreovera possible presence of large-scale boudinage structures beneathLofotenndashVesteralen could be an additional factor which compli-cated the post-breakup development of the study area (Braun ampMarquart 2004)
3 I N P U T S T RU C T U R A L DATA S E T S
Bathymetry and topography have been taken from the NorwegianMapping Authority and the sedimentary infill of the 3-D structuralmodel has already been described in Maystrenko et al (2017) Inthis paper the uppermost sedimentary layers of the Bjoslashrnoslashya FanSlide Complex and the KaindashNaust formations (Middle Miocene-Pleistocene interval) have been subdivided into four layers in orderto investigate the thermal effect of erosion and deposition duringthe Pleistocene time interval Therefore the detailed sedimentaryunits for the input 3-D model are represented by the following layers(Figs 3 and 4 numbering is according to Maystrenko et al (2017))
(1) the Naust Formation (sequences U S and T) and analoguesin the Lofoten Basin (layer 21 Pleistocene with an age of c 06ndash0Ma)
(2) the Naust Formation (sequence A) and analogues in the Lo-foten Basin (layer 22 Pleistocene with an age of c 15ndash06 Ma)
(3) the Naust Formation (sequence N) and analogues in the Lo-foten Basin (layer 23 lower Pleistocene with an age of c 27ndash15Ma)
(4) the Kai Formation and the Molo Formation (layer 24 MiddleMiocenendashPliocene with an age of c 18ndash27 Ma)
(5) the Brygge Formation and the undefined Cenozoic (layer 3mainly Eocenendashlower Miocene with an age of c 56ndash18 Ma)
(6) the Upper CretaceousndashPalaeocene (near top CenomanianndashtopPalaeocene) without a sedimentary succession in the Roslashst Basin(layers 5ndash6)
(7) the Lower Cretaceous (base Cretaceous unconformity-neartop Cenomanian) without a sedimentary succession in the RoslashstBasin (layer 7)
(8) the pre-Cretaceous (Jurassic Triassic Permian and older sed-imentary rocks) without a sedimentary succession in the Roslashst Basin(layer 8)
(9) the undivided pre-Cretaceous Cretaceous and Palaeocenewithin the Roslashst Basin (layers 5ndash8)
It is important to note that the KaindashNaust and Brygge formationscorrespond to the Nordland and Hordaland groups respectivelyand the Palaeocene corresponds to the Rogaland group The UpperCretaceous and the Lower Cretaceous do not exactly correlate withthe Shetland and Cromer Knoll groups within some local areas (egDalland et al 1988)
The maps for the BryggendashNaust (EocenendashPleistocene) intervalwithin the LofotenndashVesteralen and Voslashring segments of the Mid-Norwegian continental margin (Fig 3) have been compiled by us-ing data from Rise et al (2005) Eidvin et al (2007) Dowdeswellet al (2010) Rise et al (2010) and Ottesen et al (2012) whereasmaps for the post-break-up interval in the Lofoten Basin (Fig 3)have been derived from Fiedler amp Faleide (1996) Hjelstuen et al(2007) and Laberg et al (2012) In particular the mega-slide 2 ofthe Bjoslashrnoslashya Fan Slide Complex with an age of c 078ndash05 Ma fromHjelstuen et al (2007) has been merged with the Naust Formation(U S and T sequences c 06ndash0 Ma) and the mega-slide 1 of theBjoslashrnoslashya Fan Slide Complex with an age of c 15ndash078 Ma hasbeen added to the Naust Formation (A sequence c 15ndash06 Ma)In addition thicknesses of the fluvio-glacial erosional material withan age of c 07ndash0 15ndash07 and 27ndash15 Ma from Fiedler amp Faleide(1996) and Laberg et al (2012) have been merged with the NaustFormation (U S and T sequences c 06ndash0 Ma) Naust Formation(A sequence c 15ndash06 Ma) and Naust Formation (N sequence c27ndash15 Ma) respectively There are small differences in age be-tween the merged successions but the most important area of ourstudy corresponds to the Mid-Norwegian margin rather than theLofoten Basin Therefore the Naust ages from Dowdeswell et al(2010) have been assigned to the merged sedimentary layers inFig 3 The thickness pattern of the Naust sequences and analogues(Figs 3andashc) is characterized by two distinct zones dominated bymega-slides within the Lofoten Basin and a more complex patternwithin the SW LofotenndashVesteralen margin and NE Voslashring BasinThe sedimentary sequences in the Lofoten Basin are mostly rep-resented by eroded sedimentary rocks from the Barents Sea area(Fiedler amp Faleide 1996 Hjelstuen et al 2007 Laberg et al 2012)In contrast the Naust sequences show a more local origin fromthe adjacent mainland or the northeastern part of the LofotenndashVesteralen margin (eg Dowdeswell et al 2010 Rise et al 2010Ottesen et al 2012) The thickest part of the Naust Formation corre-sponds to the sequence N reaching more than 1600 m (Fig 3c) andthe thickest sedimentary rocks of the Lofoten Basin are analoguesto sequence A of the Naust Formation reaching more than 1300m (Fig 3b) Unfortunately there is no direct information about theanalogues of the Kai and Brygge Formations within the LofotenBasin where the age of the sedimentary sequences still remainsuncertain (Figs 3d and e) We have included the undefined Ceno-zoic sedimentary layers excluding the Palaeocene together with theBrygge Formation within the Lofoten Basin and the entire oceaniccrustal domain of the study area (Fig 3e)
The Palaeocene Cretaceous and pre-Cretaceous (Fig 4) havebeen taken from Brekke (2000) Hansen (2009) Maystrenko ampScheck-Wenderoth (2009) Hansen et al (2012) Eig (2012) NGUdata (interpreted by Gernigon in 2014) and Maystrenko et al (2018)Sedimentary rocks within the Roslashst Basin and the pre-Cretaceoushave been described in detail by Maystrenko et al (2017) Thepre-break-up sedimentary rocks in Fig 4 are thick and are char-acterized by a broad zone of distribution southwest of the BivrostLineament (Fig 4) On the other hand the Palaeocene Cretaceousand pre-Cretaceous are generally thinner northeast of the BivrostLineament with relatively thick sequences restricted to the Ribbanand Vestfjorden basins
Dow
nloaded from httpsacadem
icoupcomgjiarticle21328854810550 by guest on 16 April 2022
3-D thermal effect of Cenozoic erosion amp deposition 889
Figure 3 Thicknesses of the Cenozoic post-breakup sedimentary rocks (a) the Naust Formation (sequences U S and T) and analogues (layer 21) (b) theNaust Formation (sequence A) and analogues (layer 22) (c) the Naust Formation (sequence N) and analogues (layer 23) (d) the Kai Formation (layer 24)and (e) the Brygge Formation (Eocene-lower Miocene) and the undefined Cenozoic (layer 3) (based on Fiedler amp Faleide 1996 Rise et al 2005 Eidvin et al2007 Hjelstuen et al 2007 Dowdeswell et al 2010 Rise et al 2010 Laberg et al 2012 Ottesen et al 2012) Black dashed line corresponds to the present-dayshelf edge COB continent-ocean boundary HG Hel Graben NH Nyk High NR Nordland Ridge NS Nagrind Syncline TB Traeligna Basin TP TroslashndelagPlatform UH Utgard High VB Voslashring Basin The question marks refer to the areas where the thickness pattern is not well defined
The thickness pattern of the crystalline crust (Fig 5) is basedon the recent 3-D density modelling by Maystrenko et al (2017)constrained by different geophysical data including (1) deep seis-mic refraction and reflection lines (Mjelde et al 1992 Mjelde et al1993 Mjelde et al 2003 Kodaira et al 1995 Mjelde et al 2001
Breivik et al 2009 Hansen et al 2012 Breivik et al 2017) (2) tele-seismic receiver function data (Ottemoller amp Midzi 2003 Olssonet al 2008 Ben Mansour et al 2014) and (3) additional structuralbase and isopach maps (Maystrenko amp Scheck-Wenderoth 2009Ebbing amp Olesen 2010 Maystrenko et al 2018)
Dow
nloaded from httpsacadem
icoupcomgjiarticle21328854810550 by guest on 16 April 2022
890 YP Maystrenko et al
Figure 4 Cumulative thickness of the pre-breakup sedimentary rocks pre-Cretaceous Cretaceous and Palaeocene (based on Brekke 2000 Hansen2009 Maystrenko amp Scheck-Wenderoth 2009 Eig 2012 Hansen et al 2012Maystrenko et al 2017) Black dashed line corresponds to the present-dayshelf edge COB continent-ocean boundary HG Hel Graben NH NykHigh NR Nordland Ridge NS Nagrind Syncline TB Traeligna Basin TPTroslashndelag Platform UH Utgard High VB Voslashring Basin
The top of the crystalline basement (Fig 6a) (Maystrenko et al2017) is divided into two zones by the Bivrost Lineament TheVoslashring Basin and the Troslashndelag Platform southwest of the linea-ment show a very deeply located basement (more than 15ndash17 kmdeep) whereas the LofotenndashVesteralen margin has shallower base-ment depths (8ndash11 km) To the east the near-coast shelf has a veryshallow basement (less than 1 km deep) which crops out at theEarthrsquos surface within the LofotenndashVesteralen archipelago and onthe mainland The Moho topography (Fig 6b) (Maystrenko et al2017) is deeply located (at around 40 km on average) beneath themainland has moderate depths (20ndash28 km) beneath the continentalmargin and is shallow (11ndash14 km depths) within the ocean domain
The lithosphere-asthenosphere boundary (Fig 6c) beneath themainland has been derived from Calcagnile (1982) Artemieva et al(2006) and Ebbing et al (2012) The depth to the lithosphere-asthenosphere boundary beneath the oceanic domain has been ob-tained according to empirical relations between lithospheric age
(Muller et al 2008) and Love and Rayleigh wave-phase velocityprovided by Zhang amp Lay (1999)
The upper mantle of the LofotenndashVesteralen margin and the ad-jacent areas is characterized by the presence of a low-velocitylow-density zone (see thick magenta line in Figs 6b and c) based onseismic tomography (Bannister et al 1991 Pilidou et al 2005Yakovlev et al 2012 Hejrani et al 2017) and 3-D density mod-elling (Maystrenko et al 2017) The origin of the low-velocitylow-density mantle can be related to both thermal and compositionalvariations but is still not known in detail
4 M E T H O D O L O G Y
41 Reconstruction of erosion
In order to reconstruct the Cenozoic erosion history of the LofotenndashVesteralen margin the estimated thickness of the eroded materialfrom NPD (2010) and Eig (2012) has been mainly used The re-construction is based on maximum burial depths from wells locatedoffshore and on Andoslashya which have been estimated according to thedegree of maturation of organic matter in sedimentary rocks (NPD2010) It can therefore be considered as a reasonable estimate ofthe magnitude of the erosion within the LofotenndashVesteralen regionThe total thickness of the eroded material (Eig 2012 NPD 2010)has been reconstructed only for the offshore part of the study areaThe estimates for onshore areas have been calculated by interpo-lation andor extrapolation of the existing offshore values Techni-cally the Kriging and Minimum Curvature gridding methods havebeen used for interpolation and extrapolation In addition resultsof the apatite fission track analyses (Hendriks amp Andriessen 2002Hendriks et al 2010 Davids et al 2013) have been considered tocontrol the reconstructed thickness of the eroded rocks onshore inorder to avoid unrealistic artefacts due to extrapolation Besidesthe reconstructed thickness onshore has been modified to con-sider the topography (the positive topography has been subtractedfrom the extrapolated values) assuming that the present-day reliefof the Earthrsquos surface was similar to the palaeotopography of the topbasement prior to the erosion This assumption is supported by thepresence of the thin Jurassic-Cretaceous sedimentary rocks in thenortheastern part of Andoslashya island (Dalland 1975 Smelror et al
Figure 5 (a) Thicknesses of the oceanic layer 2AB (layer 4) and (b) cumulative thickness of the crystalline crust according to Maystrenko et al (2017) COBcontinent-ocean boundary HG Hel Graben NH Nyk High NR Nordland Ridge NS Nagrind Syncline TB Traeligna Basin TP Troslashndelag Platform UHUtgard High VB Voslashring Basin
Dow
nloaded from httpsacadem
icoupcomgjiarticle21328854810550 by guest on 16 April 2022
3-D thermal effect of Cenozoic erosion amp deposition 891
Figure 6 (a) Depth to the top of the crystalline basement (b) Moho topog-raphy and (c) depth to the lithospherendashasthenosphere boundary (the shadedarea corresponds to an introduced positive thermal anomaly at the base ofthe lithosphere) Black dashed line corresponds to the present-day shelfedge COB continent-ocean boundary HG Hel Graben LAB lithospherendashasthenosphere boundary LVLDM low-velocitylow-density mantle NHNyk High NR Nordland Ridge NS Nagrind Syncline TB Traeligna BasinTP Troslashndelag Platform UH Utgard High VB Voslashring Basin
2001) and by the pre-existence of a deeply weathered Mesozoic sur-faces until the present day in Norway (Olesen et al 2013b Fredinet al 2017) In this case the eroded material could be representedmainly by the Cretaceous Jurassic and older sedimentary rocks theweathered crystalline rocks as well as by the Cenozoic sedimen-tary sequences locally Comparison of the derived thickness of thereconstructed eroded rocks at the end of the Kai interval (Fig 7d)with the results of the combined study by Medvedev amp Hartz (2015)on the vertical motions caused by the Quaternary glacial erosion
using published results of Apatite Fission Track (AFT) analysisdemonstrates in general some qualitative and quantitative similar-ities over the greater part of the mainland However some valuesare slightly different locally
The reconstructed total thickness of the eroded rocks in Fig 7(a)can represent the distribution of the eroded material (mainly sed-imentary rocks with the partial presence of weathered crystallinerocks) at the end of the Cretaceous prior to the well-known latestCretaceousndashearliest Cenozoic tectonic events (Gernigon et al 2003Lundin et al 2013 Ren et al 2003 Ren et al 1998) Thereforethis total thickness could still have existed at the end of the Creta-ceous indicating that the LofotenndashVesteralen archipelago and partof the mainland represented continental shelf at that time This issupported by the reflection seismic data offshore by the regionallytraced near base Cenozoic unconformity in the Voslashring and Moslashrebasins (eg Brekke 2000) which indicates a regional uplift and localerosion
The next step of reconstruction of the erosional history withinthe study area aims to estimate the amount of erosion during thedifferent Cenozoic time intervals and main depositional stages Theamount of erosion has been calculated for the Palaeocene BryggeKai Naust (N) Naust (A) and Naust (U S and T) intervals forwhich we have the present-day thicknesses (Figs 3 and 4) Thereconstruction of the erosion during each stage has been done pro-portionally to the volume of the deposited sediments In other wordsthe percentage of the deposited volume from the total volume of thedeposited Cenozoic for each interval has been used to calculate thevolume of eroded material in relation to the total volume of erosion(Table 1) represented by the thickness in Fig 7(a) In this casethe erosion rate is proportional to the sedimentation rate of eachselected interval reflecting changes of the erosion intensity duringthe Cenozoic It is important to note that the volume of the post-breakup Cenozoic from the Lofoten Basin has been excluded fromour calculations since these sedimentary rocks are mostly the resultof extensive erosion in the Western Barents Sea region (Fiedler ampFaleide 1996 Hjelstuen et al 2007 Laberg et al 2012) Thereforethe sedimentary sequences within the Lofoten Basin do not reallyhave a strong and direct relationship with regard to the reconstructedand specific erosion of the LofotenndashVesteralen margin and adjacentmainland Furthermore the thick Palaeocene within the Hel Graben(Lundin et al 2013 Zastrozhnov et al 2018) and a possibly simi-lar Palaeocene sequence in the Roslashst Basin have also been excludedfrom the total volume of the deposited Cenozoic since these depositsrepresent the eroded material sourced from Lower and Upper Cre-taceous sedimentary rocks (NPD 2017) at the conjugate Greenlandside of the proto-Atlantic region (Petersen et al 2015 Meinholdet al 2013)
According to Table 1 the volume of the eroded material is slightlymore than two times higher than the volume of the deposited sedi-mentary rocks The volume of the undefined Cenozoic in the caseof layer 3 is around 27 782 km3 Some of the eroded material onthe eastern slopes of the Scandes Mountains was not transportedto the LofotenndashVesteralen margin and the estimated volume of thismaterial is approximately 14 430 km3 The volume of the total de-posited material is estimated to be 62 718 + 27 782 = 90 500 km3
and the total eroded material is approximately 136 122 minus 14 430 =121 692 km3 The estimated uncertainty of the volume calculationsis plusmn 7 per cent and can be definitely higher if the uncertainties inthe original data and the reconstructed maps are considered In thiscase the total volume of the eroded material is only 34 per centlarger than the deposited one This mismatch can be explained byseveral processes including differential erosion and transportation
Dow
nloaded from httpsacadem
icoupcomgjiarticle21328854810550 by guest on 16 April 2022
892 YP Maystrenko et al
Table 1 Volume of rocks deposited and eroded during the Cenozoic within the LofotenmdashVesteralen margin and the adjacent continent The Naust analoguesin the Lofoten Basin the undefined Cenozoic of layer 3 and the Palaeocene in the Hel Graben and Roslashst Basin are excluded from the calculations
No Layer Age [Ma]Volume of the depositedmaterial Vdeposited (km3)
Percentage of total Cz(per cent)
Volume of eroded materialVeroded (km3)
21 Naust U S T 06ndash0 6956 111 1513422 Naust A 15ndash06 6722 107 1454123 Naust N 27ndash15 18645 297 4042824 Kai 18ndash27 3882 62 84403 Brygge 56ndash18 13612 217 295385 Palaeocene 66ndash56 12901 206 28041
Total Cenozoic 62718 100 136122
of the fine-grained eroded material to the Atlantic Ocean dissolu-tion of carbonates loss due to wind transport and other processesrelated to transport and deposition of the eroded products Based onTable 1 the thickness of the eroded rocks has been calculated foreach stage and finally has been subtracted step-by-step from thetotal thickness of the eroded material at the end of the Cretaceous(Fig 7a) The derived thicknesses of the eroded rocks (Fig 7) showa gradual decrease of the reconstructed thicknesses throughout theCenozoic as a result of continuous erosion
42 3-D thermal modelling
A 3-D temperature model within the LofotenndashVesteralen marginand adjacent areas has been obtained with the help of COMSOLMultiphysics which is a finite-element analysis software packageDuring the 3-D thermal simulations the Heat Transfer Module hasbeen used to model the stationary and time-dependent heat transferin solid materials by heat conduction through the lithosphere Adetailed description of the methodology has already been given byMaystrenko amp Gernigon (2018) and here only the most importantpoints of the used approach will be repeated and particular featuresof the 3-D thermal modelling applied in this study will be described
The 3-D conductive thermal field has been calculated betweentwo thermal boundary conditions at the Earthrsquos surfaceseafloor andthe lithospherendashasthenosphere boundary In particular the upperthermal boundary condition has been set as time-dependent averagetemperatures at the Earthrsquos surface and the seafloor The annualaverage air temperatures from Raab amp Vedin (1995) and Tveitoet al (2000) represent the present-day temperature at the Earthacutessurface onshore whereas the temperature at the seafloor offshorehas been taken to be dependent on the bathymetry (Table 2) basedon Ottersen (2009) and Korablev et al (2014) (Fig 8)
In addition the detailed palaeoclimatic changes of the surfacetemperature during the last two glaciations (the Saalian and Weich-selian glacial periods) have been considered during the 3-D ther-mal modelling A model of the spatiotemporal variations of theice cover within Scandinavia during the Weichselian glacial period(Fig 9) by Olsen et al (2013) has been used for reconstructionof the palaeoclimatic conditions during the Weichselian glaciationWhen the study area was covered by the ice sheet a temperatureof minus05 C has been chosen at the Earthacutes surface beneath the icecover as previously used and discussed by Slagstad et al (2009)Seafloor palaeotemperatures during the glacial periods have beenset to be 0 C which is in agreement with reconstructed temper-ature anomalies for the Norwegian Sea by Eldevik et al (2014)Palaeotemperatures at the ice-free Earthrsquos surface have been takenfrom Schmittner et al (2011) indicating that the near-surface airtemperature difference could be about minus20 C lower compared tothe pre-industrial period and is only valid for the Last Glacial Max-
imum when the air temperatures were at their lowest level duringthe last glaciation In order to take into account this fact tempera-tures lower than minus11 C from Schmittner et al (2011) have beendecreased by 1ndash4 C Palaeotemperatures along the marginal partsof the ice cover have been obtained by an interpolation betweenminus05 C beneath the ice cover and the palaeotemperatures over theice-free land areas The same palaeoclimatic scenario was also ap-plied for the Saalian glacialEemian interglacial period (220 000ndash118 000 yr BP) considering that palaeoclimatic conditions wererelatively similar during the Weichselian and Saalian glacial peri-ods (eg Andersen amp Borns 1994) The palaeotemperatures duringthe last 8000 yr (Table 3 Fig 10) have been taken from to Daviset al (2003) Nesje et al (2008) Mann et al (2009) and Seppa et al(2009)
During the Weichselian glaciation the global palaeo-sea levelwas 80ndash120 m lower than the present-day one (eg Hasencleveret al 2017) However the glacial erosion of the sedimentary covercould have been locally significant (Fig 7) We expect that thepresent-day bathymetry was different from the one that existed dur-ing Wechselian time Therefore a zone showing a gradual transitionof temperatures from the mainland conditions towards the sea hasbeen included into the palaeotemperature scenario for the wholeWeichselian glaciation (Fig 10) including the present-day offshoreareas covered by the reconstructed eroded sediments in Fig 7 Thereconstructed average palaeotemperatures (Fig 10) show that thestudy area was mostly characterized by much lower temperaturesduring the Weichselian glaciation compared to the present-day con-ditions (Fig 8)
The Cenozoic palaeoclimatic scenario reflects a continuous de-crease of the palaeotemperature from 18 C 66 Ma ago to thepresent-day air temperature over the mainland (Zachos et al 2001Pekar et al 2006 Rise et al 2006 Eldrett et al 2009 Ehlers et al2011 Hansen et al 2013 Inglis et al 2017) A temperature varia-tion from 8 C 45 Ma ago to 0 C at the present-day seafloor withinthe deep sea was also considered (Zachos et al 2001 Ravelo et al2004 Pekar et al 2006 Filippelli amp Flores 2009 Hansen et al2013)
The lithospherendashasthenosphere boundary (Fig 6c) has been cho-sen as a lower thermal boundary condition with a 1300 C isotherm(eg Turcotte amp Schubert 2002) Alternatively the constant heatflux density can also be used on the bottom lithospheric isotherm asthe lower thermal boundary condition (eg Doin amp Fleitout 1996)Besides the temperature at the lower thermal boundary has beenenhanced within the low-velocitylow-density zone of the uppermantle (Figs 6b and c) This has been done in accordance withthe results of seismic tomography which indicate a decrease of anS-velocity by c 3 per cent at 100ndash200 km depth in relation to thereference velocity model or even by more than 3 per cent in relationto the surrounding mantle (eg Pilidou et al 2005 Hejrani et al
Dow
nloaded from httpsacadem
icoupcomgjiarticle21328854810550 by guest on 16 April 2022
3-D thermal effect of Cenozoic erosion amp deposition 893
Figure 7 Reconstructed thicknesses of the eroded material during the Cenozoic at the end of the Cretaceous (a) at the end of the Palaeocene (b) at the endof the Brygge (c) at the end of the Kai (d) at the end of the Naust N (e) and at the end of the Naust A (f) Black dashed line corresponds to the present-dayshelf edge COB continent-ocean boundary HG Hel Graben NH Nyk High NR Nordland Ridge NS Nagrind Syncline TB Traeligna Basin TP TroslashndelagPlatform UH Utgard High VB Voslashring Basin
Table 2 Average annual present-day temperature at the seafloor of the Norwegian Sea
Bathymetry (m) 100 300 500 600 700 750 800 850 and deeper
Temperature (C) 7 6 5 4 3 2 1 0
Dow
nloaded from httpsacadem
icoupcomgjiarticle21328854810550 by guest on 16 April 2022
894 YP Maystrenko et al
Figure 8 Present-day upper thermal boundary annual average air temper-atures at the Earthrsquos surface and average seafloor temperatures (based onRaab amp Vedin 1995 Tveito et al 2000 Ottersen 2009 Korablev et al2014) COB continent-ocean boundary HG Hel Graben LVLDM low-velocitylow-density mantle NH Nyk High NR Nordland Ridge NSNagrind Syncline TB Traeligna Basin TP Troslashndelag Platform UH UtgardHigh VB Voslashring Basin
2017) Taking into account that the S-velocity changes by 1ndash2 percent per 100 C (Cammarano et al 2003) or even by 1 per centper 100 C (Lee 2003) we can infer that a thermal anomaly ofabout +250 C at 150 km depth can be at least partially responsi-ble for the origin of the low-velocity zone within the upper mantleMoreover the density contrast between the low-density lithosphericmantle and the surrounding mantle of 18ndash35 kg mminus3 within the en-tire column of the lithospheric mantle (Maystrenko et al 2017) canbe translated to an even higher temperature contrast than 250 Cat 100ndash150 km depth A +250 C mantle low-velocitylow-densityzone at 150 km depth has been chosen as a compromise value be-cause the origin of the low-velocitylow-density mantle can also bethe result of compositional variations in addition to changes of tem-perature (eg Slagstad et al 2018) Therefore the thermal anomalyof +250 C has been set for the 150 km depth or slightly shallowerbase of the anomalous lithospheric mantle This thermal anomalyat 150 km depth has been further projected proportionally to thethickness of the lithosphere to the base of the shallower lithospherewithin the zone with the low-velocitylow-density lithospheric man-tle Therefore the 1300 C isotherm has to be shallower within thezone of the low-velocitylow-density mantle pointing to an upliftof the lithospherendashasthenosphere boundary beneath the study area(Fig 6c)
The influence of the early Cenozoic continental breakup has beenroughly estimated in the 3-D thermal modelling workflow in termsof two additional lithospherendashasthenosphere boundaries the firstone represents the lithospheric configuration immediately after thecontinental breakup c 55 Ma ago (Fig 11a) and the second one rep-resents a colder and thickened lithosphere expected at the end of thedeposition of the Brygge Formation (18 Ma ago Fig 11b) Thesetwo time steps (55 and 18 Ma) allow us to roughly simulate theincreased thermal effect during the continental breakup in the earlyCenozoic and the subsequent cooling of the oceanic lithosphere dur-ing the rest of the Cenozoic As a major limitation of the model theprecise position of the lithospherendashasthenosphere boundary duringthe Early Eocene breakup is still poorly known but numerical mod-els (eg Chen amp Lin 2004 Kawakatsu et al 2009) along modernspreading axe predict a shallow position of the 1300 C isothermIn our study the depth to the base of the lithosphere 55 Ma ago has
been tentatively taken to be 13ndash17 km deep beneath the present-dayoceanic domain representing the newly formed Cenozoic litho-sphere According to estimations for 0 Ma oceanic lithosphere byZhang amp Lay (1999) the taken depth position of the lithospherendashasthenosphere boundary 55 Ma ago could theoretically vary in therange of plusmn5 km In addition the modelled heat flux density over theimposed lithospheric configuration immediately after the continen-tal breakup has been compared with the present-day heat flux den-sity values at the Mid-Atlantic oceanic ridge (Hasterok et al 2011)demonstrating that the modelled values are in the proper rangeThe present-day depths of the lithospherendashasthenosphere boundarydeeper than 95 km have not been changed whereas the depth tothe base of the lithosphere between the Cenozoic oceanic domainand the more than 95 km deep lithosphere has been obtained bylinear interpolation assuming that the continental lithosphere hasbeen at least partially affected by thinning in the vicinity of theoceanic domain (Fig 11a) The lithospherendashasthenosphere bound-ary at 18 Ma ago (Fig 11b) has been calculated in the same wayas the present-day one according to empirical relations betweenthe age of the lithosphere and seismic velocities in Zhang amp Lay(1999) We cannot exclude the large inherent uncertainties in ourpalaeo-depth estimations of lithospherendashasthenosphere boundaries(Fig 11) They could be related to potential small-scale changes inthe intensity of the syn-breakup magmatism which could locallyenhance the geothermal gradient and modify the thermal proper-ties of the deep continental crust However breakup and associatedmagmatic processes are still unclear and require a more detailedstudy which is outside the scope of our investigation Consequentlythe influence of the local syn-breakup magmatism has been mainlyneglected in the present study whereas the large-scale one is consid-ered in terms of the uplifted lithospherendashasthenosphere boundary55 Ma ago (Fig 11a)
The thermal effects of the post-breakup uplift and erosion withinthe study area with further deposition of the Naust (Pleistocene) Kai(Middle MiocenendashPliocene) and Brygge (Eocenendashlower Miocene)formations (layers 21ndash23 24 and 3 respectively Fig 3) have beenincluded into the 3-D thermal modelling workflow allowing us tofocus more specifically on the time-dependent perturbations in thesubsurface thermal regime due to the post-Palaeocene erosion andsedimentation
The 3-D thermal modelling workflow includes the following sixsteps
(1) Calculation of the steady-state 3-D conductive thermal fieldafter the continental breakup 55 Ma ago The Brygge Kai and Naustformations (EocenendashPleistocene interval Fig 3) have been ex-cluded from these calculations whereas a new layer represented bythe reconstructed eroded rocks at the end of the Palaeocene (Fig 7b)has been added to the top of the model The lower thermal bound-ary has been represented by the 1300 C isotherm at the inferredlithospherendashasthenosphere boundary 55 Ma ago (Fig 11a) andthe top of the eroded rocks is set as a new upper thermal boundaryThe top of the Upper CretaceousndashPalaeocene deposits (layers 5ndash6)or deeperolder rocks have been used as the upper thermal bound-ary in places where the eroded rocks were not restored Porosityof the pre-breakup sedimentary succession has been readjusted toshallower depth conditions by subtraction of the thickness of thepost-breakup sedimentary package (Brygge Kai and Naust forma-tions EocenendashPleistocene interval) from the present-day depths andcorrection of the present-day position of deep seafloor Accordinglythe porosity-dependent thermal conductivities and densities of thesedimentary cover have been adjusted to shallower depths
Dow
nloaded from httpsacadem
icoupcomgjiarticle21328854810550 by guest on 16 April 2022
3-D thermal effect of Cenozoic erosion amp deposition 895
Figure 9 Ice cover variations during the Weichselian glacial period according to Olsen et al (2013) The magenta frame corresponds to the 3-D struc-turalthermal model
Table 3 Relative changes of the palaeotemperatures in comparison to the present-day temperature for the last 8000 yr
Time years before present BP 0 Present day 400 Little Ice Age 7500 Holocene Climate Optimum 8000
Temperature difference in relation to present day (C) 0 minus04 +1 minus1
(2)ndash(6) Calculation of the time-dependent (transient) 3-Dconductive thermal field
(2) For the period from 55 Ma ago to the end of the Brygge inter-val in the early Miocene 18 Ma ago The calculated 3-D temperaturedistribution from step (1) has been used as the initial tempera-
ture condition at the beginning of the time-dependent calculations(55 Ma ago) The Kai and Naust formations (Middle MiocenendashPleistocene interval Figs 3andashd) have been excluded from thesecalculations whereas a new layer represented by the reconstructederoded rocks for the end of the Brygge interval (Fig 7c) has beenadded to the top of the model The lower thermal boundary has been
Dow
nloaded from httpsacadem
icoupcomgjiarticle21328854810550 by guest on 16 April 2022
896 YP Maystrenko et al
Figure 10 Average palaeotemperatures at the Earthrsquos surface and the seafloor during the Weichselian glacial period within the area covered by the 3-Dstructuralthermal model
represented by the 1300 C isotherm at the inferred lithospherendashasthenosphere boundary at 18 Ma ago (Fig 11b) and the top ofthe eroded rocks has been set as a new upper thermal boundaryThe top of the Brygge Formation (layers 3) or deeperolder rockshave been used as the upper thermal boundary in places where theeroded rocks were not restored Accordingly the porosity of the pre-breakup sedimentary succession and Brygge sequence have beenadjusted to shallower depth conditions compared to the present-dayones by subtracting the total thickness of the Kai and Naust for-mations (EocenendashPleistocene interval) from the present-day depthsand correction of the present-day position of deep seafloor
(3) During the Kai interval from 18 to 27 Ma ago The final cal-culated 3-D temperature distribution from the previous step (2) hasbeen used as the initial temperature condition at the beginning of thetime-dependent calculations (18 Ma ago) The whole of the NaustFormation (Pleistocene interval Figs 3andashc) has been excluded fromthese calculations whereas a new layer represented by the recon-
structed eroded rocks at the end of the Kai interval (Fig 7d) hasbeen added to the top of the model The lower thermal boundary hasbeen represented by the 1300 C isotherm at the present-day as a newupper thermal boundary The top of the Kai Formation (layer 24) ordeeperolder rocks have been used as the upper thermal boundaryin places where the eroded rocks were not restored Accordinglythe porosity of the pre-breakup sedimentary succession and Bryggeand Kai sequences has been adjusted to shallower depth conditionscompared to the present-day ones by subtracting the total thicknessof the Naust Formation (Pleistocene interval) from the present-daydepths and correction of the present-day position of deep seafloor
(4) During the Naust (N) interval from 27 to 15 Ma ago Thefinal calculated 3-D temperature distribution from step (3) has beenused as the initial temperature condition at the beginning of thetime-dependent calculations (27 Ma ago) The sequences A U Sand T of the Naust Formation (Pleistocene interval Figs 3a and b)have been excluded from these calculations whereas a new layer
Dow
nloaded from httpsacadem
icoupcomgjiarticle21328854810550 by guest on 16 April 2022
3-D thermal effect of Cenozoic erosion amp deposition 897
Figure 11 Inferred depths to the lithospherendashasthenosphere boundary cor-responding to the 1300 C isotherm after the continental breakup 55 Ma ago(a) and at the end of the Brygge interval 18 Ma ago (b) The shaded area cor-responds to an area where a positive thermal anomaly has been introducedat the base of the lithosphere COB continent-ocean boundary HG HelGraben LVLDM low-velocitylow-density mantle NH Nyk High NRNordland Ridge NS Nagrind Syncline TB Traeligna Basin TP TroslashndelagPlatform UH Utgard High VB Voslashring Basin
represented by the reconstructed eroded rocks for the end of theNaust (N) interval (Fig 7e) has been added to the top of the modelThe lower thermal boundary has been represented by the 1300 Cisotherm at the present-day lithospherendashasthenosphere boundary(Fig 6c) and the top of the eroded rocks has been taken to be anupper thermal boundary The top of the sequence N of the NaustFormation (layer 23) or deeperolder rocks have been used as theupper thermal boundary in places where the eroded rocks were notrestored The porosity of the pre-breakup sedimentary successionand Brygge Kai and Naust (N) sequences have been adjusted toshallower depth conditions compared to the present-day ones bysubtracting the total thickness of the sequences A U S and T ofthe Naust Formation (Pleistocene interval Figs 3a and b) from thepresent-day depths and correction of the present-day position ofdeep seafloor
(5) During the Naust (A) interval from 15 to 06 Ma ago Thefinal calculated 3-D temperature distribution from step (4) has beenused as the initial temperature condition at the beginning of thetime-dependent calculations (15 Ma ago) The sequences U S andT of the Naust Formation (Pleistocene interval Fig 3a) have beenexcluded from these calculations whereas a new layer representedby the reconstructed eroded rocks at the end of the Naust (A) interval(Fig 7d) has been added to the top of the model The lower thermal
boundary has been represented by the 1300 C isotherm at thepresent-day lithospherendashasthenosphere boundary (Fig 6c) and thetop of the eroded rocks has been taken to be an upper thermalboundary The top of sequence A of the Naust Formation (layer 22)or deeperolder rocks have been used as the upper thermal boundaryin places where the eroded rocks were not restored The porosity ofthe pre-breakup sedimentary succession and Brygge Kai and Naust(N and A) sequences has been adjusted to shallower depth conditionscompared to the present-day ones by subtracting the total thicknessof the sequences U S and T of the Naust Formation (Pleistoceneinterval Fig 3a) from the present-day depths and correction of thepresent-day position of deep seafloor
(6) For the period from 06 Ma ago to the present-day The finalcalculated 3-D temperature distribution from step (5) has been usedas the initial temperature condition at the beginning of the time-dependent calculations (06 Ma ago) The lower thermal boundaryhas been represented by the 1300 C isotherm at the present-daylithospherendashasthenosphere boundary (Fig 6c) and the top of the 3-Dstructural model (present-day seafloor and Earthrsquos surface onshore)has been considered as the upper thermal boundary Porosity hasbeen estimated according to the present-day depths
During all steps the lower thermal boundary has been thermallyenhanced within the low-velocitylow-density zone of the uppermantle as it is described above During all steps palaeotemperatureat the upper thermal boundary has been taken to be time-dependentin accordance with Tables 2ndash4 and Fig 10
During the 3-D thermal modelling the eroded rocks have beenassumed to be mainly represented by sedimentary rocks and weath-ered crystalline crust which is characterized by a density and aporosity similar to sedimentary rocks rather than crystalline onesThe porosity of the eroded rocks has been kept the same for all stepsas it is in the case of a completely reconstructed eroded sequence(Fig 7a) with zero-level at the top of this complete sequence as-suming that a possible decompaction of these rocks due to erosionwas very minor or even absent at each time step Compaction of thedeposited sedimentary rocks has only been considered in terms ofchanges in porositydensity according to exponential functions inMaystrenko et al (2017) but thicknessesvolume of the depositedsuccessions have been kept constant due to some limitations ofthe used software This approach is sufficient for the Pleistocenewhich is the key interval of our study Changes in thicknesses ofthe Pleistocene sequences due to compaction are estimated to beless than 12 per cent (c 200 m) for the thickest (1700 m thick)succession and is less than 4ndash8 per cent on average 4ndash8 per cent ofthe total Pleistocene thickness is in the range of uncertainties of theused thicknesses and can therefore be neglected at the first-orderapproximation
Isostatic readjustment due the re-distribution of mass during ero-siondeposition has not been applied during the modelling becausethe main goal of this study is related to the thermal effect of lateCenozoic erosion and deposition This thermal effect has been in-vestigated by step-by-step moving of the upper thermal boundaryto the base of the eroded rocks (top of the remining rocks) and tothe top of the deposited sedimentary rocks In this case the maincontrolling factor of the conductive heat transfer is related to the dis-tance between the lower and upper thermal boundaries and thermalproperties in between On the other hand the real vertical positionof the surface played a very minor role especially if the propertiesof rocks have always been adjacent according to new depth positionin our workflow Therefore our approach is sufficient for the subver-tical conductive heat transfer On the other hand possible changes
Dow
nloaded from httpsacadem
icoupcomgjiarticle21328854810550 by guest on 16 April 2022
898 YP Maystrenko et al
Table 4 Palaeotemperatures during the Cenozoic (based on Zachos et al 2001 Pekar et al 2006 Rise et al 2006 Eldrett et al 2009Filippelli amp Flores 2009 Ehlers et al 2011 Hansen et al 2013 Inglis et al 2017)
No Time (Ma ago) Mainland temperature (C) Deep sea temperature (C)
1 66 18 ndash2 55 175 ndash3 45 14 84 34 10 35 25 115 56 18 105 47 16 12 68 12 9 39 5 6 110 36 +3 C to present-day temperature 011 045 Present-day temperature Present-day temperature12 035 The same as glacial maximum 27 000 yr ago in Fig 10 The same as glacial maximum 27 000 yr ago in Fig 1013 0228 Present-day temperature Present-day temperature14 0220ndash0118 The same as 0110ndash00105 Ma ago The same as 0110ndash00105 Ma ago15 0110ndash00105 Fig 10 Fig 10
Table 5 Thermal properties of the layers of the 3-D structural model used during the 3-D thermal modelling (lithology of sediments is derived from Bell et al2014 and NPD 2017)
NoLayer of the 3-D structural
model Dominant lithologySpecific heat capacity Cp
(J kgminus1 Kminus1)Thermal conductivity scale
value kr [W mminus1 Kminus1]Radiogenic heat
production S [μW mminus3]
21ndash23 Naust Mainly shale and sandstone 1180 23 059ndash2024 Kai Mainly shale and sandstone 1180 23 057ndash193 Brygge and undefined
CenozoicMainly shale and sandstone 1180 22 048ndash16
4 Oceanic layer 2AB Basalts and tuffs 880 18 045ndash6 Upper Cretaceous-Palaeocene 88 per cent shale 12 per cent
sandstone1180 25 068ndash187
7 Lower Cretaceous 92 per cent shale 3 per centsandstone 5 per cent
limestone
1180 24 083ndash199
8 Pre-Cretaceous 80 per cent shale 20 per centsandstone
1180 33 112ndash22
5ndash8 Undivided Palaeocene andCretaceous of the Roslashst Basin
87 per cent shale 11 per centsandstone 2 per cent
limestone
1180 25 14
Xx Eroded material Mainly sedimentary depositswith crystalline rocks
1180 30 14
9 Upper-crustal high-densitycrystalline rocks
Gabbro to anorthositic rocksmetamorphic rocks
880 29 04
10ndash11 Upper crust Metasediments andor graniteand gneiss
880 32 15ndash2 (02ndash25)
12 Middle crust Granitoids andor gneiss 950 31 086 (01ndash25)13 Lower crust Metamorphic rocks 1050 30 03214 High-density intra-crustal
layerMafic granulites gabbros 1050 30 032
15 Oceanic layer 3A Sheeted dykesgabbroicintrusions
1050 27 04
16ndash17 High-density lower-crustallayer and oceanic layer 3B
Gabbro and high-grademetamorphic rocks
1100 28ndash31 02
18 Lithospheric upper mantle Peridotite 1200 479 003
in the subhorizontal heat transfer could disturb the calculated ther-mal field locally if there were significant vertical movements of theclosely located local areas but this is actually not the case in theLofoten area
5 T H E R M A L P RO P E RT I E S
Thermal properties represented by specific heat capacity thermalconductivity and radiogenic heat production (Table 5) have beenassigned for each layer of the 3-D structural model
The thermal conductivity for the sedimentary cover has beentaken from the previous estimations of the matrix thermal conduc-tivity from wells within the northern part of the Viking Graben(Brigaud et al 1992) the Mid-Norwegian continental margin andadjacent areas (Eldholm et al 2005 Pascal amp Midttoslashmme 2006Pascal 2015) and based on unconsolidated sampled sedimentaryrocks from the Voslashring Basin according to Midttoslashmme et al (1995)The obtained thermal conductivities of sedimentary rocks have beencross-validated with results of measurements of rock samples withsimilar lithology (Cermak amp Rybach 1982 Clauser 2011) and the
Dow
nloaded from httpsacadem
icoupcomgjiarticle21328854810550 by guest on 16 April 2022
3-D thermal effect of Cenozoic erosion amp deposition 899
wide-ranging thermal conductivities of different sedimentary rockssummarized by Midttoslashmme amp Roaldset (1999) The thermal con-ductivity of basalts (layer 4) has been set to be 18 W mminus1 Kminus1
on average according to Balling et al (2006) Thermal conduc-tivities of the upper crystalline crustal rocks have been set to bein the range of the rock-sample measurements within the Nor-wegian mainland (eg Olesen et al 1993 Slagstad et al 2009Maystrenko et al 2015b) The mentioned thermal conductivitiesof the sedimentary infill basalts and upper-crustal rocks have beensupplemented with published values for the deeper crystalline crustand the lithospheric mantle (Cermak amp Rybach 1982 Wollenbergamp Smith 1987 Hofmeister 1999 Artemieva et al 2006 Scheck-Wenderoth amp Maystrenko 2008 Scheck-Wenderoth amp Maystrenko2013 Maystrenko et al 2014)
The thermal conductivity of sedimentary rocks has been set to betemperature- and porosity-dependent to take into account changesof the thermal conductivity as a result of increasing temperatureand decreasing porosity with depth The thermal conductivity ofthe fluid in the pores of sedimentary rocks has been set to be thetemperature-dependent thermal conductivity of water according toWagner amp Kretzschmar (2008) The thermal conductivities of thecrystalline rocks have been set to be dependent only on temperaturebecause the average porosities of the crystalline rocks are usuallyextremely low at the regional scale and can therefore be neglectedThe empirical equations from Sass et al (1992) and Vosteen ampSchellschmidt (2003) have been used to describe a dependence ofthermal conductivities of sedimentary and crystalline rocks on tem-perature The thermal conductivity of the lithospheric mantle hasbeen set to be both pressure- and temperature-dependent accordingto Hofmeister (1999) and van den Berg et al (2001) Porosity anddensity of the sedimentary rocks have been obtained based on expo-nential functions of increasing densities with depth in Maystrenkoet al (2017) and densities of the crystalline rocks have also beentaken from Maystrenko et al (2017) The depth-dependent porosi-ties have been calculated by use of the same density of 2700 kgmminus3 for all sedimentary layers due to uncertainties in definingthe lithological composition The detailed description of how thetemperature- pressure- and porosity-dependent thermal conduc-tivities have been calculated is given in Maystrenko amp Gernigon(2018)
The chosen specific heat capacity (Table 5) has been set to beconstant for each layer of the 3-D model during the 3-D thermalmodelling representing the temperature-dependent average valuesof the specific heat capacity based on laboratory measurements atdifferent temperature conditions according to Cermak amp Rybach(1982) Afonso et al (2005) and Clauser (2011)
The radiogenic heat production of sedimentary layers of the3-D model has been derived from the results of gamma-ray loggingin selected wells according to the empirical relationship betweentotal natural gamma and radiogenic heat production in Bucker ampRybach (1996) An example of the used natural gamma ray logsand the derived radiogenic heat production is shown in Fig 12 Thechosen wells are located within the southwestern part of the modelarea (Fig 13) where the sedimentary cover has been drilled for thepurposes of the petroleum industry There are only a few shallowwells drilled through the sedimentary cover within the rest of theLofotenndashVesteralen margin and unfortunately well logs of theseshallow wells are not easily accessible
Based on the results of calculations the average radiogenic heatproduction of the sedimentary rocks shows a wide range of valuesfrom 047 to 202 μW mminus3 (Table 6) The stratigraphic subdivisionof the used wells does not include sequences N A U S and T of the
Figure 12 Example of a plot showing stratigraphy total natural gamma andcalculated radiogenic heat production for one of the wells (well 65075-1)used to calculate the radiogenic heat production of sedimentary infill (thestratigraphy and gamma-ray log are from NPD (2017))
Dow
nloaded from httpsacadem
icoupcomgjiarticle21328854810550 by guest on 16 April 2022
900 YP Maystrenko et al
Figure 13 Radiogenic heat production of the sedimentary layers based on the well data the Naust (Middle Miocene-Pleistocene) formation (a) the KaiFormation (b) Brygge (Eocene-lower Miocene) Formation (c) the Upper Cretaceous-Palaeocene (d) the Lower Cretaceous (e) and the pre-Cretaceous (f)Black circles indicate locations of the wells used to derive the radiogenic heat production COB continent-ocean boundary TP Troslashndelag Platform VBVoslashring Basin
Naust Formation (NPD 2017) and therefore the average values forthe total Naust Formation have been used for the Naust (N) Naust(A) and Naust (U S and T) intervals (layers 21ndash23) Moreoverthe Nordland Group (Naust plus Kai formations) has only beenindicated in some of the wells In this case the same value of theradiogenic heat production has been used for both the Naust and theKai formations This is actually supported by well 65102-1 R wherethe Naust and Kai formations are characterized by the same values
of the radiogenic heat production (Table 6) The derived averagevalues of the radiogenic heat production for each sedimentary layerhave been further used to construct maps by interpolation betweenthese values in the used wells with extrapolation to the areas withoutthe well data (Fig 13)
The uppermost layers represented by Naust (layers 21ndash23) andKai (layer 24) are characterized by a very similar pattern of thederived radiogenic heat production (cf Figs 13a and b) in spite
Dow
nloaded from httpsacadem
icoupcomgjiarticle21328854810550 by guest on 16 April 2022
3-D thermal effect of Cenozoic erosion amp deposition 901
Table 6 Average radiogenic heat production of sedimentary rocks derived from gamma ray logs in the selected wells Units of radiogenic heat productionare μW mminus3 (Fm is formation and Gr is group)
WellNaust Fm (layers
21ndash23)Kai Fm (layer
24)Hordaland Group
(layer 3)Rogaland-Shetlandgroups (layer 5ndash6)
Cromer Knoll Gr(layer 7)
pre-Cretaceous(layer 8)
65075-1 12 09 07 075 093 11365102-1 R 068 068 072 069 094 16566107-2 086 086 047 067 082 11670710-1 054 054 ndash 102 ndash ndash66075-1 202 192 ndash 188 2 ndash66088-1 118 135 141 149 ndash 16966102-1 S 088 088 146 168 116 25667066-1 1 057 1 12 ndash ndash671010-1 124 124 16 15 ndash ndash
of the fact that some values are different (Table 6) A similar dis-tribution of the radiogenic heat production is also found for theBrygge (Fig 13c) and the Upper CretaceousndashPalaeocene layers(Fig 13d) Moreover the relatively high radiogenic heat produc-tion in well 66075-1 and the relatively low one in wells 65075-165102-1 R and 66088-1 representative for the southwestern cor-ner of the model area are clearly or partially recognizable in mapsfor the Naust Kai and Brygge formations the Upper CretaceousndashPalaeocene and the Lower Cretaceous (cf Figs 13andashe) This meansthat the similar pattern of radiogenic heat production is character-istic for the more than 100 million-year-long stratigraphic inter-val This long-term inheritance for the CretaceousndashCenozoic inter-val has already been identified in the Voslashring and Moslashre basins byMaystrenko amp Gernigon (2018) indicating a possible inheritancein clastic material transportation from original localities with anincreased or decreased content of the radiogenic elements Alter-natively it may indicate a differential sorting of the eroded prod-ucts during transportation from source to sink The deposition ofsedimentary rocks with a more argillaceous composition in partic-ular areas of the Mid-Norwegian continental margin may explainthe local increase of heat production within specific areas becauseargillaceous rocks are usually characterized by a higher radiogenicheat production compared to more sandy sedimentary rocks (egCermak amp Rybach 1982 McKenna amp Sharp 1998 Villa et al2010)
The assigned radiogenic heat productions of the upper andmiddle-crustal layers (layers 9 10ndash11 and 12) onshore are mainlybased on the measured radiogenic heat production for different ge-ologicallithological units in Norway (Slagstad 2008 Slagstad et al2009 Slagstad amp Lauritsen 2013) The radiogenic heat productionof the oceanic crust lower continental crust and the lithosphericmantle (layers 13ndash18) have been set to be constant (Table 5) ac-cording to published values for the assumed lithological composi-tion of each layer (Cermak amp Rybach 1982 Scheck-Wenderoth ampMaystrenko 2008 Villa et al 2010) To remove a misfit betweenmeasured and modelled temperatures in the available wells offshorelateral changes in the radiogenic heat production of the upper andmiddle continental crust have been applied Other possible expla-nations for some local changes of the observed temperature couldbe associated with atypical fluid flow strong variations in thermalconductivities structural uncertainties andor limited resolution ofour 3-D model The above-mentioned alternative hypotheses wouldhowever require additional structural data and sampling material tobe tested as well as simulation of other physical processes such asfluid flow etc The absence of detailed structural data and supple-mentary measurements together with technical difficulties in mod-elling the detailed fluid flow at the scale of our 3-D model do notallow us to test the variety of other possible reasons in addition
to the variable radiogenic heat production On the other hand theradiogenic heat production of the crystalline rocks varies within themainland (eg Slagstad 2008 Pascal amp Rudlang 2016) implyingthat a possible similar variability exists offshore as well During the3-D thermal modelling several models with different values of theradiogenic heat production have been tested to fit the measured andmodelled temperatures in the available wells
The upper crystalline crust is characterized by the increased ra-diogenic heat production up to 22 μW mminus3 within the SN-strikingzone onshore in the middle of the southern part of the model area(Fig 14a) Towards the north a wide zone with an increased heatproduction (2 μW mminus3) corresponds to the thickened low-densityupper crustal layer inferred by Maystrenko et al (2017) Both areaswith an increased radiogenic heat can be represented by granitegranitic gneiss andor granitoids with the increased content of theradiogenic elements similar to the Precambrian TransscandinavianIgneous Belt granites which are characterized by an average radio-genic heat production of 26 μW mminus3 (locally up to 4 μW mminus3)according to Slagstad (2008) Within the southwestern part of themodel area the radiogenic heat production varies from 02 to 25μW mminus3 (Fig 14a) indicating a possible lithological differentiationof the upper crust there
The middle crust is characterized by an average radiogenic heatproduction of c 086 μW mminus3 within the greater part of the studyarea (Fig 14b) and slightly increased to 092 μW mminus3 within the ar-eas where the upper-crustal layer is absent (cf Figs 14a and b) Thesame pattern of radiogenic heat production as in the case of the up-per crust has been applied within the southwestern part of the modelarea (cf Figs 14a and b) The thicknesses of the upper and middlecrust within the southwestern part of the model area are mostly inthe range 05ndash4 km and 1ndash5 km on average respectively with somelocal thickening and thinning These relatively small thicknesses ofthe upper-middle crustal layers imply that the assigned radiogenicheat production does not drastically affect the modelled tempera-tures in that area compared to the mainland where the thickness ofthese layers is 12 km on average with local thickening up to morethan 20 km Therefore even if our assumption of varying radiogenicheat production offshore may appears to be partially erroneous theregional-scale pattern of the modelled temperature should not beaffected by any notable extent
6 R E S U LT S O F T H E 3 - D T H E R M A LM O D E L L I N G
The 3-D conductive thermal pattern beneath the study area (Fig 15)has been modelled by assigning thermal properties (Tables 5 and6) to the layers of the 3-D structural model from Maystrenko et al
Dow
nloaded from httpsacadem
icoupcomgjiarticle21328854810550 by guest on 16 April 2022
902 YP Maystrenko et al
Figure 14 Radiogenic heat production of the upper crystalline crust (alayers 10ndash11) and the middle crystalline crust (b layer 12) COB continent-ocean boundary HG Hel Graben NH Nyk High NR Nordland Ridge NSNagrind Syncline TB Traeligna Basin TP Troslashndelag Platform UH UtgardHigh VB Voslashring Basin
(2017) assigning thermal boundary conditions at the top and bot-tom of the 3-D model (eg Figs 6c 8 10 and 11 Tables 2ndash4)and including the thermal influence of the Cenozoic erosion anddeposition (Fig 7 Table 1)
61 Temperature within the upper part of the 3-D model
The results of the 3-D thermal modelling for the upper part of the3-D structural model are shown in Fig 16 and are represented by thetemperature maps of six horizontal model slices at depths below sealevel of 2 5 7 10 15 and 18 km It can be seen that the mainlandis generally colder compared to the continental margin (Fig 16) Ata depth of 2 km below sea level the Scandes Mountains are clearlyreflected by the increased temperatures beneath the mainland (cfFigs 2 and 16a) This is a result of the topographic effect due to thepresence of the 1ndash15 km elevated Scandes Mountains compared tothe rest of the mainland where the relief is smoother and deeperThe upper thermal boundary has been set at the Earthrsquos surface andtherefore the elevated relief of the Scandes Mountains adds an ad-ditional 1ndash15 km to the distance from the upper thermal boundaryto the depths below sea level in Fig 16 This topographic thermaleffect of the Scandes Mountains is still clearly visible at a depth of5 km and even deeper where it is smoothed by other thermal effectsIn contrast the thermal influence of the deep bathymetry offshoreis reflected in the decreased temperature beneath the Lofoten Basin
(Fig 16) where the seafloor is located at depths of more than 2ndash3km (Fig 2) Actually the white (blank) area in Fig 16(a) outlinesthe bathymetry deeper than 2 km The shape of this blank areais still clearly recognizable in terms of the lower temperatures atdepths of 5 and 7 km (Figs 16b and c) reflecting the steeply deep-ening sea bottom which corresponds to the upper thermal boundaryand therefore pulls the influence of the low (c 0 C) deep-seatemperatures down to greater depths
The eastern part of the mainland is notably colder than the conti-nental margin (Fig 16) This difference in temperature between themainland and the continental margin increases with depth (Fig 16)mainly reflecting both a chimney effect of the relatively high ther-mally conductive crystalline rocks exposed at the Earthrsquos surfacewithin the mainland and a very deep location of the lower thermalboundary represented by the base of the lithosphere beneath themainland (Figs 6c and 11)
The next interesting aspect of the thermal pattern within the upperpart of the 3-D model is related to the straight spatial relationshipbetween areas with thick sedimentary infill and areas with increasedtemperatures within the LofotenndashVesteralen margin and the VoslashringBasin (cf Figs 3 4 and 16) This feature of temperature distributionis associated with the low thermal conductivity of the sedimen-tary cover which enhanced the heat storage within the areas withthickened sedimentary rocks This thermal insulation effect is re-flected by the higher modelled temperatures within the Ribban andVestfjorden basins compared to the Lofoten Ridge which is locatedbetween these two basins This effect is also very pronounced atdepths of 15ndash18 km within the deep Nagrind Syncline (Figs 16e andf) Moreover superposition of (1) different temperature-increasingeffects (thermal insulation by the thick sedimentary rocks within theRoslashst Basin and the Hel Graben Fig 4) and significant shallowingof the lower thermal boundary towards the oceanic domain (Figs6c and 11) and (2) opposite temperature-decreasing effects [deepbathymetry (Fig 2) and thick less than 27 Ma old sedimentaryrocks within the Lofoten Basin (Figs 3andashc)] are responsible for anNEndashSW-trending zone with increased temperature within the RoslashstBasin and the Hel Graben which is especially pronounced at depthsof 10 15 and 18 km (Figs 16dndashf) This zone of increased tempera-ture should have extended towards the oceanic Lofoten Basin if thebathymetry had not been so deep and if the thickness of the youngand therefore thermally not equilibrated Pleistocene sedimentaryrocks had not been so great there
The major controlling factor of the modelled temperatures at thetop of the crystalline basement (Fig 17) is related to the geome-try of the top-basement (Fig 6a) clearly showing that the deepertop-basement corresponds to the highest modelled temperaturesand vice versa Thus the highest temperatures have been modelledwithin the deepest parts of the Voslashring Basin where the modelledtemperatures are 400ndash450 C on average (Fig 17) whereas the Rib-ban and Vestfjorden basins are characterized by lower temperaturesless than 300 C on average with some local increase to more than350 C within the Vestfjorden Basin The modelled temperatures onthe mainland and the LofotenndashVesteralen archipelago simply repro-duce the present-day Earthacutes surface temperature (cf Figs 8 and 17)because the crystalline basement crops out at the Earthrsquos surfacethere
611 Modelled temperature versus measured temperature
The obtained temperatures within the uppermost part of the 3-Dmodel have been compared with measured temperatures in available
Dow
nloaded from httpsacadem
icoupcomgjiarticle21328854810550 by guest on 16 April 2022
3-D thermal effect of Cenozoic erosion amp deposition 903
Figure 15 The lithosphere-scale 3-D thermal model of the LofotenndashVesteralen segment of the Mid-Norwegian continental margin and adjacent areasExaggerated slightly more than three times vertically
wells which are shown in Fig 18 Positions of the wells with onlydrill-stem test (DST) temperatures offshore and temperatures fromwell loggings onshore (Fig 18a) are plotted separately from thelocations of all available wells including the wells with less reliablebottom-hole temperatures (BHT) in Fig 18(b) Due to the fact thatonly a few wells with DST temperatures are available offshore andtheir restricted locations are close to each other (Fig 18a) the BHThave been used particularly to check the calculated temperatureswith the measured ones However it is important to note that BHTcan be disturbed by circulation of the drilling fluid and thereforeare less reliable compared to DST temperatures (temperature offluids thermally equilibrated with the host sedimentary rocks) andtemperature logs (measured under thermal equilibrium conditionsin the wells) In this case a comparison between the observationsand the results of the 3-D thermal modelling is provided separatelyfor the wells with DST temperatures and temperature logs (Figs 18aand 19a Table 7) and for the wells with BHT (Figs 18b and 19bTable 8)
Comparison between the modelled and measured temperaturesdemonstrates that the greater part of the obtained temperatures isin reasonable agreement with the main tendency in distribution ofthe measured temperatures (Fig 19) The latter is especially truewhen only DST and temperature logs are considered (Fig 19a)Larger misfits are present when compared with the BHT estima-tions (Fig 19b) To investigate the magnitude of these misfits indetail an additional study has been carried out by plotting the dif-ference between the measured and the modelled temperatures intables (Tables 7 and 8) and the related maps (Fig 18) According toTable 7 and Fig 18(a) it is clear that most of the misfits (923 percent) between the modelled and measured DST and well-log tem-peratures are in the range of plusmn5 C with only one well showing amisfit of slightly higher than 5 C In contrast if the wells with BHTare also considered in addition to the previous wells only around51 per cent of the misfits are in the range of plusmn5 C and the misfitswith a range of plusmn10 C form almost 85 per cent of the total numberof the used wells (Table 8) Consequently the greater portion of the
Dow
nloaded from httpsacadem
icoupcomgjiarticle21328854810550 by guest on 16 April 2022
904 YP Maystrenko et al
Figure 16 Maps with modelled temperatures at the present day within the upper part of the 3-D thermal model (Fig 15) represented by the temperaturehorizontal slices for the depths (below sea level) of 2 km (a) 5 km (b) 7 km (c) 10 km (d) 15 km (e) and 18 km (f) The black dashed line corresponds tothe present-day shelf edge and the white area in panel (a) corresponds to the area where the sea bottom is located deeper than 2 km COB continent-oceanboundary HG Hel Graben NH Nyk High NR Nordland Ridge NS Nagrind Syncline TB Traeligna Basin TP Troslashndelag Platform UH Utgard High VBVoslashring Basin
reasonable differences for this kind of regional-scale study lies inthe range of plusmn10 C indicating that the major trend of the measuredtemperatures has been reasonably well reproduced during our 3-Dthermal modelling
Misfits larger than plusmn10 C are also present in Table 8 The spatialdistribution of these larger misfits (Fig 18b) demonstrates that the
wells with large differences of plusmn20 C are located close to the wellswith the smaller differences of plusmn10 C or even plusmn5 C Howeverthere is almost no way to reduce such a large difference because thedistance between the wells with different misfits is locally less thanthe 4 km horizontal resolution provided by our 3-D structural modelAny attempt to reduce the misfit in a particular well with a large
Dow
nloaded from httpsacadem
icoupcomgjiarticle21328854810550 by guest on 16 April 2022
3-D thermal effect of Cenozoic erosion amp deposition 905
Figure 17 Modelled present-day temperatures at the top of the crystallinebasement The black dashed line corresponds to the present-day shelf edgeCOB continent-ocean boundary HG Hel Graben NH Nyk High NRNordland Ridge NS Nagrind Syncline TB Traeligna Basin TP TroslashndelagPlatform UH Utgard High VB Voslashring Basin
Table 7 Difference between modelled temperatures and measured ones(measured values minus the modelled ones) from different wells located in-side the detailed 3-D model area Only the DST (drill-stem test) temperaturesare used
No
Temperature range ofdifferences between modelledand measured temperatures
Percentage ofvalues (per cent)
Number ofvalues
4 from minus5 to 5 923 125 from 5 to 10 77 1
misfit will automatically increase the misfit in the closely locatedwell(s) and vice versa Moreover the local-scale thermal pattern foreach particular well cannot be reproduced during our simulationswithout including a more detailed lithological section of these wellsand surrounding areas This is technically very difficult in the case ofthe regional-scale 3-D thermal modelling Most of the large misfitsare possibly caused by relatively local processes such as fluid flowIn the case of intensive fluid flow circulation of the heated or cooledfluids through the sedimentary rocks can play an important role interms of convective or advective heat transfers in addition to themodelled regional-scale heat conduction
Figure 18 Locations of the available wells with the measured temperatures and spatial distribution of the temperature variations (measured temperatures minusthe modelled ones) within the 3-D model area (a) Wells with drill-stem test (DST) temperatures offshore and temperature logs onshore and (b) wells with lessreliable bottom-hole temperatures (BHT) together with temperatures in the wells in Fig 18(a) Black dashed line corresponds to the present-day shelf edge
Figure 19 Comparison of the modelled (blue dots) and the observed (red dots) temperatures for the available wells with only drill-stem test (DST) temperaturesand temperature logs (a) and bottom-hole temperatures (BHT) together with temperatures in Figs 18(a) and 19(a)
Dow
nloaded from httpsacadem
icoupcomgjiarticle21328854810550 by guest on 16 April 2022
906 YP Maystrenko et al
Table 8 Difference between modelled temperatures and measured ones(measured values minus the modelled ones) in available deep wells locatedinside the detailed 3-D model area In addition to the DST (drill-stem test)temperatures the less reliable bottom-hole temperatures (BHT) are alsoincluded
No
Temperature range ofdifferences between modelledand measured temperatures
Percentage ofvalues (per cent)
Number ofvalues
3 from minus20 to minus10 19 14 from minus10 to minus5 170 95 from minus5 to 5 509 276 from 5 to 10 170 97 from 10 to 20 132 7
62 Temperature within the lower part of the 3-D model
The modelled temperatures within the lower part of the 3-D modelare shown in Fig 20 by using the temperature maps for four hor-izontal slices through the 3-D thermal model at depths below sealevel of 25 40 80 and 100 km From these maps (Fig 20) it is evenmore obvious that the areas beneath the mainland are characterizedby lower temperatures compared with the continental margin andthe oceanic domain This is due to the fact that the thermal influ-ence of the lower thermal boundary configuration (Figs 6c and 11)
becomes more evident at great depths where the distance to thebase of the lithosphere becomes shorter The deepening of thelower thermal boundary beneath the mainland causes a decreasein temperatures there whereas the shallowing of the lithospherendashasthenosphere boundary beneath the oceanic domain results in in-creased modelled temperatures (cf Figs 6c 11 and 20) Moreoverthe shape of the low-velocitylow-density mantle is reflected by theincreased modelled temperatures as a result of the pre-defined 250C thermal anomaly at the depth of 100 km projected to the lowerthermal boundary assuming that the low seismic shear wave veloc-ities (eg Pilidou et al 2005 Hejrani et al 2017) and inferred lowdensities (Maystrenko et al 2017) within this atypical mantle areat least partially related to its enhanced temperature in addition topossible compositional variations
In addition to the deep-seated temperature-controlling factorsthe near-surface thermal influence is still recognizable at a depth of25 km Decreased temperatures within the Lofoten Basin comparedwith the Roslashst Basin and the Utroslashst Ridge (Fig 20a) are due to thedeep bathymetry and the deposition of the Pleistocene sedimentaryrocks which are thermally not equilibrated In contrast the mod-elled thermal trend is already strongly controlled by the shape of thelower thermal boundary at a depth of 40 km (cf Figs 6c and 20b)At depths of 80 and 100 km the white (blank) area corresponds to
Figure 20 Maps with modelled temperatures at the present day within the lower part of the 3-D thermal model (Fig 15) represented by the temperaturehorizontal slices below sea level for the depths of 25 km (a) 40 km (b) 80 km (c) and 100 km (d) The white areas correspond to the asthenosphere COBcontinent-ocean boundary HG Hel Graben LVLDM low-velocitylow-density mantle NH Nyk High NR Nordland Ridge NS Nagrind Syncline TBTraeligna Basin TP Troslashndelag Platform UH Utgard High VB Voslashring Basin
Dow
nloaded from httpsacadem
icoupcomgjiarticle21328854810550 by guest on 16 April 2022
3-D thermal effect of Cenozoic erosion amp deposition 907
Figure 21 Modelled present-day temperatures at the Moho COBcontinent-ocean boundary HG Hel Graben LVLDM low-velocitylow-density mantle NH Nyk High NR Nordland Ridge NS Nagrind SynclineTB Traeligna Basin TP Troslashndelag Platform UH Utgard High VB VoslashringBasin
sublithospheric mantle that is located beneath the lower thermalboundary Therefore the configuration of the lower thermal bound-ary represented by the lithospherendashasthenosphere boundary has amajor impact on the modelled temperature distribution within thedeep part of the 3-D model
The calculated temperatures at the Moho discontinuity level(Fig 21) partially reflect its geometry (Fig 6b) The key factorcontrolling the modelled temperature at the Moho is not only itsdepth position but also the distance between the Moho and the lowerthermal boundary that is the thickness of the lithospheric mantleTherefore both Moho depth and the thickness of the lithosphericmantle mainly control the distribution of the modelled temperatureat the Moho In addition one of the secondary factors is related toa higher radiogenic heat production of the crystalline crust com-pared to the lithospheric mantle rocks (more than 10 times loweron average) (Table 5) Therefore the thickness of the crust plays animportant role as well The interaction between these factors canbe recognized in the temperature map in Fig 21 where two max-ima of the modelled temperature have different origins The firsttemperature maximum (up to more than 800 C) is located beneaththe mainland in the south of the model area where the Moho to-pography is at its deepest (46ndash48 km depth on average Fig 6b)Therefore this maximum of the modelled temperature is mainlycaused by the depth position of the Moho and partially by the thick-ening of the internally more heat-productive crystalline crust Thesecond temperature maximum (up to 800 C) is located beneaththe LofotenndashVesteralen archipelago (Fig 21) where the Moho isabout 10 km shallower than the previous temperature maximumHowever the lithospherendashasthenosphere boundary is about 25 kmdeeper beneath the first temperature maximum indicating that thedistance between the Moho and the lower thermal boundary is 25km more in that location compared with the thinner lithosphericmantle beneath the LofotenndashVesteralen archipelago Therefore thereduced distance from the Moho to the deep heat emanating from theEarthrsquos interior beneath the LofotenndashVesteralen archipelago playsan important role in addition to the relatively deep position of theMoho there The rest of the modelled temperatures at the Moho levelreflects the dominance of the Moho topography as the controllingfactor
Figure 22 Depth to the calculated 1300 C isotherm at the present dayrepresenting the present-day thermal lithospherendashasthenosphere bound-ary COB continent-ocean boundary HG Hel Graben LVLDM low-velocitylow-density mantle NH Nyk High NR Nordland Ridge NSNagrind Syncline TB Traeligna Basin TP Troslashndelag Platform UH UtgardHigh VB Voslashring Basin
Fig 22 shows the present-day depth to the 1300 C isothermwhich represents the base of the thermal lithosphere There is aclearly visible uplift of the lithospherendashasthenosphere boundarywithin the low-velocitylow-density zone of the upper mantle Thisuplift reflects the thermal anomaly (+250 C at 150 km depth) whichhas been set to at least partially take into account the presence of thelow-velocitylow-density zone within the upper mantle The upliftof the lithospherendashasthenosphere boundary is around 15 km on aver-age compared to the input present-day lithospherendashasthenosphereboundary in Fig 6(c) reaching more than 25 km in the east andbeing very smoothed in the northwest where it varies from 5 to 10km However the precise amplitude of the uplift is tentative dueto uncertainties in transformation of the low-velocity upper-mantleanomaly into a temperature anomaly (Cammarano et al 2003 Lee2003 Afonso et al 2010)
63 Vertical slices through the 3-D model
Three vertical 2-D slices (Fig 23) through the 3-D thermal model(Fig 15) have been selected to illustrate cross-sectional views of themodelled temperatures The locations of these cross-sections havebeen chosen to be at the same location as the crustal sections de-scribed in Maystrenko et al (2017) These slices allow us to see thevertical distribution of the modelled temperatures (Fig 23) in addi-tion to the horizontal ones shown in Figs 16 and 20 The increasedtemperature within the low-velocitylow-density mantle is displayedalong all three vertical slices in Fig 23 A zone with increased tem-perature within the anomalous mantle is especially pronounced nearthe lithospherendashasthenosphere boundary along the vertical slice 2(Fig 23b) which crosses this low-velocitylow-density zone almostin the middle (Fig 2) In contrast the vertical slices 1 and 3 crossthe marginal parts of the anomalous mantle (Fig 2) and thereforethe related increase of temperature is smoother compared with theone in slice 2 (cf Figs 23andashc) The thermal anomaly within thelow-velocitylow-density mantle becomes very smooth at shallowdepths where it is almost unrecognizable A remarkable featurealong the vertical slices is the absence of the straightforward corre-lation between an uplift of the modelled isotherms and the shallowMoho (Fig 19) This is mostly due to the fact that the lower ther-mal boundary at the base of the lithosphere is shallow within the
Dow
nloaded from httpsacadem
icoupcomgjiarticle21328854810550 by guest on 16 April 2022
908 YP Maystrenko et al
Figure 23 Present-day distribution of the modelled temperatures along three selected 2-D vertical slices through the 3-D thermal model (for the location seeFig 2) LAB lithospherendashasthenosphere boundary TCB top of the crystalline basement
Dow
nloaded from httpsacadem
icoupcomgjiarticle21328854810550 by guest on 16 April 2022
3-D thermal effect of Cenozoic erosion amp deposition 909
western part of the model area In addition the thermal influenceof the positive thermal anomaly within the anomalous mantle is su-perimposed on the thermal trend controlled by the configuration ofthe lower thermal boundary The thermal influence of the shallow-ing lithospherendashasthenosphere boundary is more pronounced alongslice 3 which crosses the oceanic domain to the west (Fig 23c) Itconfirms that the thermal influence of the early Cenozoic continen-tal breakup reflected by the shallowing base of the lithosphere isstill clearly recognizable within the western part of the LofotenndashVesteralen margin segment in terms of increased temperatures Themodelled regional-scale thermal pattern is also affected by the in-sulation effect of the thick low-thermally conductive sedimentaryrocks which is particularly obvious along slice 1 where the modelledisotherms are slightly uplifted beneath the Voslashring Basin
64 Thermal effect caused by the erosionaland depositional processes
The transient 3-D thermal modelling shows that the modelled tem-peratures beneath the reconstructed eroded rocks (Fig 7) graduallydecreased through the Cenozoic (Fig 24) reaching the highest val-ues at the end of the Cretaceous (Fig 24a) when the thicknessof the eroded material was greatest and consequently the base ofthe reconstructed rocks was at its maximal burial depth (Fig 7a)At the end of the Cretaceous the modelled temperatures beneaththe reconstructed rocks could have reached up to 90 C within thenortheastern part of the Vestfjorden Basin and more than 80 C nearAndoslashya and farther west in the southern part of the Lofoten Ridge(Fig 24a) The modelled temperatures at the base of the erodedrocks decreased as a result of the Cenozoic uplift and erosion indi-cating a progressive cooling of the LofotenndashVesteralen margin andadjacent areas Decrease in the modelled temperatures is directlyproportional to the estimated amount of the material eroded duringeach time interval (cf Figs 7 and 24)
The thermal effects of the simultaneous erosion and depositionhave been estimated by calculating the temperature difference be-tween the results of the 3-D thermal modelling when taking intoaccount or not taking into account the erosion and subsequent depo-sition In other words the calculated temperatures of the model with-out consideration of the erosion and deposition during the modellingworkflow have been subtracted from the modelled temperatures inthe case of the model with erosion and deposition The resultingdifferences are shown in terms of temperature maps in Fig 25showing that a positive thermal anomaly should exist within theareas where the sedimentary andor crystalline rocks were erodedwhereas the negative values appear to be present in the Voslashring andLofoten basins showing the most important Cenozoic depocentresThermal anomalies in Fig 25 are shown at different depths indi-cating that these anomalies are very smooth towards the thermalequilibrium at shallow depths (eg 2 km in Fig 25a) whereas theerosiondeposition-related anomalies are characterized by high am-plitudes at greater depths (Figs 25c and d) At a depth of 2 kmthe positive anomaly near the Lofoten Ridge is only around 7 Cand the negative one within the Voslashring Basin is about minus14 C Incontrast the erosion-caused positive thermal anomaly within theVestfjorden Basin is up to 17 24 and 27 C and the negative ther-mal anomaly within the Voslashring Basin is almost minus33 minus47 and minus40C at 5 10 and 25 km depth respectively The same is true for thenegative temperature anomaly modelled beneath the Lofoten Basinwhere the amplitudes vary with depth from minus33 C at 5 km depthto almost minus64 C at 25 km depth Our results support the previous
2-D modelling by Pascal amp Midttoslashmme (2006) who concluded thatthe thermal state of the southeastern part of our study area waslikely affected by strong modifications due to glacial erosion anddeposition during the Quaternary
According to the calculated 3-D temperature cube the differ-ences between the modelled temperature with and without the ther-mal effect caused by erosion and deposition or in other words theobtained erosion-related positive thermal anomaly reaches its max-imum of more than +27 C at depths of 17ndash22 km beneath theeastern part of the Vestfjorden Basin The deposition-related nega-tive anomaly is situated within the northeastern part of the VoslashringBasin showing a minimal value of c minus48 C at 12ndash14 km depthThe most prominent negative anomaly is characterized by a mini-mum of c minus70 C at 17ndash20 km depth beneath the oceanic LofotenBasin These zones of maxima and minima of the obtained ther-mal anomalies are mainly associated with the areas where relativelyrapid erosion and deposition took place during late Cenozoic timein the Pleistocene reflecting the thermal effect of heat advection bysolid rocks due to vertical movements of these rocks in addition toheat conduction between the upper and lower thermal boundariesMoreover the above-described erosiondeposition-related thermaldisturbances beneath the Vestfjorden and Voslashring basins are still rec-ognizable at more than 60 km depth within the continental marginOn the other hand the negative thermal anomaly is already verysmooth at 55 km depth beneath the Lofoten Basin The amplitudesof the positive and negative thermal anomalies are mainly controlledby the distances to the upper and lower thermal boundaries becausethe system reaches a thermal equilibrium faster at shorter distancesto the boundary condition Therefore the maximum amplitude ofthese thermal anomalies must be located at some distance from thethermal boundaries In addition thermal properties (mainly ther-mal diffusivity) of rocks play an important role in the distributionof thermally non-equilibrated zones within the 3-D thermal modelboth vertically and laterally In other words erosion or depositionrespectively decreases or increases the distance between the thermalboundaries and the conductive thermal field of the 3-D model needstime to reach a thermal equilibrium under these new conditions andalso the required equilibration time increases away from the thermalboundaries depending on the thermal properties of rocks
7 D I S C U S S I O N
The regional configuration of the modelled erosiondeposition-induced zones with non-equilibrated temperatures within the studyarea is dependent on several factors The most important parame-ters are the reconstructed thicknesses of the eroded rocks the localinfluence of fluid flow the palaeoclimatic scenario configuration ofthe lower thermal boundary subhorizontal heat advection by solidrocks and the rate of erosion and deposition
One of the most critical factors is the reliability of the recon-structed thickness of the eroded rocks (Fig 7a) the offshore partof which is based on the published map of NPD (2010) and Eig(2012) and therefore is strongly dependent on these input dataIn order to validate the reconstructed erosion locally on Andoslashyathe vitrinite reflectance data of Bjoroslashy et al (1980) have been usedindependently The comparison shows that if a new kinetic vitrinitereflectance model lsquobasinRorsquo by Nielsen et al (2017) is used theestimated maximum burial temperature is around 80 C on averagefor the rocks containing the vitrinite reflectance of 045Ro In thecase of our study the modelled temperature at the base of the to-tal reconstructed thickness of the eroded rocks within the eastern
Dow
nloaded from httpsacadem
icoupcomgjiarticle21328854810550 by guest on 16 April 2022
910 YP Maystrenko et al
Figure 24 Temperatures at the base of the eroded sediments at the end of the Cretaceous (a) at the end of the Palaeocene (b) at the end of the Brygge (c)at the end of the Kai (d) at the end of the Naust N (e) and at the end of the Naust A (f) The black dashed line corresponds to the present-day shelf edgeCOB continent-ocean boundary HG Hel Graben NH Nyk High NR Nordland Ridge NS Nagrind Syncline TB Traeligna Basin TP Troslashndelag PlatformUH Utgard High VB Voslashring Basin
parts of Andoslashya is also around 80 C (Fig 24a) Therefore this fitsvery well between the vitrinite reflectance-based and the modelledtemperatures Such similar independent results support our final to-tal thickness estimation of the eroded material within at least theeastern part of Andoslashya where the rock samples of Cretaceous andJurassic age were collected and studied by Bjoroslashy et al (1980) In
addition our own results demonstrate a gradual decrease of temper-ature at the present-day surface beneath the eroded succession dur-ing the Cenozoic (Fig 7) This variation coincides with the generaltrend of decreasing temperatures through the Cenozoic predictedby independent results of the apatite fission-track analyses onshore(Hendriks amp Andriessen 2002 Hendriks et al 2010 Davids et al
Dow
nloaded from httpsacadem
icoupcomgjiarticle21328854810550 by guest on 16 April 2022
3-D thermal effect of Cenozoic erosion amp deposition 911
Figure 25 Thermal anomalies due to erosion and deposition during the Cenozoic calculated as a difference between the modelled temperatures with thethermal effect of erosiondeposition and the modelled temperatures without this effect The black dashed line corresponds to the present-day shelf edge andthe white area in Fig 25(a) corresponds to the area where the sea bottom is located deeper than 2 km COB continent-ocean boundary HG Hel Graben NHNyk High NR Nordland Ridge NS Nagrind Syncline TB Traeligna Basin TP Troslashndelag Platform UH Utgard High VB Voslashring Basin
2013) However precise comparison of our modelled temperaturesat different time intervals of the Cenozoic with the Cenozoic tem-peratures according to the apatite fission track analyses is difficultdue to the different resolutions of the methods
Based on our total reconstructed thickness of the eroded materialat the end of the Cretaceous (Fig 7a) the main depocentre was lo-calized over the adjacent offshore areas to the LofotenndashVesteralenarchipelago and shows the thickness maxima within the Vestfjordenand near Andoslashya This is partially supported by the recent studieson the vertical motions caused by fluvial and glacial erosion withan AFT analysis by Medvedev amp Hartz (2015) who have also ob-tained the thickest eroded succession within NW Vestfjorden andadjacent smaller fjords However our own estimation of the ero-sion within the western part of the LofotenndashVesteralen archipelagoand the adjacent offshore areas is larger compared with that recon-structed by Medvedev amp Hartz (2015) It is however important tonote that Medvedev amp Hartz (2015) have already indicated that theexhumation of the outermost (western) Lofoten islands was signif-icantly underestimated in their study and this therefore indirectlysupports our higher values for the reconstructed thickness there
For completeness we would like to mention that the restoredthickness maximum of the Cenozoic deposits as modelled by Gole-dowski et al (2013) is in close proximity to the present-day high
elevation of the Scandes Mountains in the study area Goledowskiet al (2013) also calculated palaeotemperatures of more than 60ndash70 C at the present-day surface beneath this thick reconstructedCenozoic matrix However our estimates do not fit the trend ofthe reconstructed erosion proposed in Goledowski et al (2013)In addition results of inverse modelling of the fission-track databy Hendriks amp Andriessen (2002) do not really support a strongeruplift of the high-elevated area on the mainland in relation to theadjacent LofotenndashVesteralen archipelago (eg Hendriks et al 2010Davids et al 2013) at least within the northern part of the studyarea Nevertheless the limited number of the studied samples doesnot exclude the possibility proposed by Goledowski et al (2013)
The next important disturbing factor is related to possible fluidflow through both the sedimentary and the crystalline rocks withinthe study area It has already been mentioned above that someof the large misfits between the modelled and observed tempera-tures in the wells offshore may indicate a local disturbance of theregional conductive thermal field by additional convective andoradvective heat transfer caused by the circulation of fluids (mainlygroundwater) through the MesozoicndashCenozoic sedimentary rocksTheoretically the conditions are especially favourable for the fluidflow through the less consolidated uppermost part of the sedimen-tary cover represented by the young sedimentary rocks of the Naust
Dow
nloaded from httpsacadem
icoupcomgjiarticle21328854810550 by guest on 16 April 2022
912 YP Maystrenko et al
Formation within the LofotenndashVesteralen margin and the VoslashringBasin and its analogues within the Lofoten Basin The possibilityof significant fluid flow is supported by the ocean drilling pro-gram (ODP Site 642) which is located farther south on the VoslashringPlateau This well shows evidence of a relatively strong fluid inflow(Channell et al 2005) Therefore the modelled temperatures can betheoretically disturbed by the fluid circulation through very poroussedimentary rocks which are expected to be present within theuppermost Cenozoic sedimentary successions Moreover the the-oretical differentiation between upper and middle crystalline crustinto blocks with different radiogenic heat production (Fig 14) canalternatively be indicative for the temperatures enforced by the fluidflow within the sedimentary cover in places with the assigned in-creased radiogenic heat production and vice versa Furthermorethe results of 2-D modelling of coupled groundwater flow and heattransfer (Maystrenko et al 2015a) point to a possibility of ground-water flow through the crystalline rocks onshore implying that themodelled erosion-induced positive thermal anomaly can in realitybe significantly reduced andor even locally enhanced by a differ-ently cooled andor heated groundwater respectively The influenceof the groundwater flow could have been especially strong duringthe melting of the ice sheets The resulting cold water could advec-tively cool the subsurface by flowing through the faults and cracksthat were reactivated during tectonic the related isostatic uplift
Possible undulations of the inferred palaeotemperatures at theEarthrsquos surface and on the seafloor (Figs 8 and 10 Tables 2ndash4)can also affect the calculated thermal anomalies at shallow depths(mainly within 2 km from the upper thermal boundary) It is obviousthat the palaeoclimatic scenario employed here is rather simplifiedfor the greater part of the Cenozoic prior to the Weichselian glacialperiod c 110 000 yr ago (Table 4) In addition the relatively detailedpalaeotemperature distribution during the Weichselian glaciation(Fig 10) is partially uncertain and could have varied significantlyThe main uncertainties are also related to some parts of the studyarea which were periodically free of ice and seawater Thereforethe modelled temperature especially near the coastline within theareas with shallow bathymetry can possibly be affected by theuncertainties in the Weichselian palaeoclimatic conditions withinthose areas
The next uncertainty concerns the changes of rock porositiesdue to variations in the shallow palaeobathymetry (shallower than700 m) and the shape of the ice sheet on the continental shelf Theinfluence of the present-day bathymetry on the continental shelf isindirectly included by the depth-dependent porosity according to ex-ponential functions of increasing densities with depth in Maystrenkoet al (2017) because these empirical functions are based on theoffshore well data and also taking into account the bathymetryMoreover the changes in deep bathymetry (deeper than 700 m)within the oceanic lithospheric domain have been included in theworkflow of the modelling through the Cenozoic by considering thedeepening of the seafloor with time due to cooling of the oceaniclithosphere (eg Stein amp Stein 1992) Unfortunately the changesin the shallow bathymetry within the present-day continental shelfcannot be properly quantified but these changes were not more than140 m during the last 120 000 yr (Hasenclever et al 2017) and werealso not significant during the greater part of the Cenozoic that isreflected by more or less continuous sedimentation The areas withreconstructed eroded material (Fig 7) are most likely characterizedby the very low sea level andor were above sea level for a largepart of the Cenozoic The thickness of the ice sheet during the lastglaciation could have reached more than 1 km onshore (Siegert et al2001) where glaciers covered the crystalline rocks and remaining
sedimentary rocks which were already affected by compaction atmore than 1 km palaeoburial depth at the end of the Cretaceous (cfFigs 7a and f) thus implying that the load of the ice sheet couldnot have drastically changed the compaction parameters of the un-derlying substrate The present-day offshore areas were mostly freeof ice during the last glaciation (Olsen et al 2013 Fig 9) and thethickness of the ice sheet was comparable with bathymetry duringtime intervals when the ice sheet expanded on the present-day con-tinental shelf and replaced the seawater (Siegert et al 2001) Basedon the statements above fluctuations of the sea level and the icesheet load did not significantly affect the porosities of the under-lying rocks and therefore their influence can be neglected on thecontinental shelf and the mainland in our regional-scale study
In addition the configuration of the lower thermal boundary (Figs6c and 11) is also partially uncertain especially for the time steps55 and 18 Ma ago and within the low-velocitylow-density zonewithin the upper mantle It is obvious that the thermal influenceof the younger oceanic lithosphere was stronger compared to thatof the present-day but the magnitude of this difference related tobreakup is still difficult to estimate precisely The same is true forthe predefined +250 C thermal anomaly at 150 km depth projectedto the lower thermal boundary which must be theoretically presentwithin the low-densityvelocity mantle but again the precise am-plitude of this anomaly is uncertain Moreover the geometry ofthe lithospherendashasthenosphere boundary itself is somewhat specu-lative within the anomalous mantle area of the continental marginwhich also contributes to the uncertainties in the modelled tempera-tures with depth towards the lower thermal boundary According toMaystrenko et al (2014) two possible cases with plusmn 20 km depth tothe lithospherendashasthenosphere boundary in relation to the preferreddepth at 120 km have been examined in terms of thermal influencesof these probable depth variations of the base of the lithosphereThe thermal influence of the examined depths of the lower thermalboundary decreases towards the Earthrsquos surface Deviations of themodelled temperature reach sim4 per cent at 6 km depth for the 20km deeper base of the lithosphere and sim12 per cent for the 20 kmshallower one This sensitivity test indicates that an influence ofthe lower thermal boundary at the shallower depths is importantbecause the distance between the lower and upper boundaries be-comes smaller According to Leroy et al (2008) the conductivethermal evolution of continental passive margins during 80 millionyears after the breakup is characterized by a thermal thinning ofthe unstretched continental lithosphere and by a thermal thickeningin the stretched continental lithosphere The thermal thickening ofthe stretched lithosphere is considered to arise by deepening of thebase of the lithosphere during the post-breakup time beneath theoceanic domain and in its close vicinity In contrast thermal thin-ning of the unstretched lithosphere beneath the present-day main-land has not been included into the workflow due to a presence ofthe upper-mantle low-velocitylow-density zone effect which couldbe superimposed or even control the thermal history of the studyarea beneath the continental domain Moreover the thickness of thelithosphere beneath the mainland is more than 120 km implyingthat small thermal perturbations at and beyond this depth shouldnot strongly affect our results within the upper part of the model
The results of the 3-D thermal modelling show that the BivrostLineament divides the modelled thermal pattern within the studyarea into two parts with the generally higher temperatures northeastof this lineament within the LofotenndashVesteralen margin segment andthe lower temperatures in the southwest within the Voslashring Basin(Figs 16 and 20) The Bivrost Lineament is a deep-seated faultzone along which sedimentary crustal and mantle blocks with
Dow
nloaded from httpsacadem
icoupcomgjiarticle21328854810550 by guest on 16 April 2022
3-D thermal effect of Cenozoic erosion amp deposition 913
different lithologies and thicknesses are juxtaposed (Mokhtari ampPegrum 1992 Olesen et al 2002 Maystrenko et al 2017) There-fore the assigned thermal properties also differ along the linea-ment contributing to a thermal differentiation between the LofotenndashVesteralen and Voslashring margin segments On the other hand this reg-ularity in temperature distribution within the deep part of the modelis mainly controlled by a spatial coincidence between the BivrostLineament and the southwestern limit of the low-velocitylow-density upper-mantle anomaly (eg Fig 22) which outlines thepredefined positive thermal anomaly at the lower thermal boundaryBesides the erosion-induced positive thermal anomaly within theLofotenndashVesteralen margin segment (the Lofoten Ridge Ribbanand Vestfjorden basins) and the accompanying negative anomalywithin the northeastern part of the Voslashring Basin significantly af-fect the temperature distribution in the upper part of the model(Fig 25) and are also responsible for the higher modelled tempera-tures northeast of the Bivrost Lineament and the lower ones south-west of this lineament Unfortunately there are only a few availablewells with measured temperatures northeast of the Bivrost Linea-ment (Fig 18) and therefore our results cannot be unquestionablyverified there On the other hand the obtained misfit between themeasured and modelled temperatures is acceptable in the availablewells (Fig 18b) supporting at least partially our results
Vertical heat advection by solid rocks (eg Mancktelow amp Grase-mann 1997 Stuwe 2007) has been considered during the 3-D ther-mal modelling by thickness changes of the eroded and depositedmaterial at different steps of the 3-D thermal modelling when theposition of the upper thermal boundary has been changed accord-ingly However a subhorisontal heat advection by solid rocks couldcomplicate the obtained thermal pattern in Fig 25 The subho-risontal heat advection by solid rocks could be especially importantwithin the Lofoten Basin where the Pleistocene and older large-scale submarine slides have been documented by interpretationof the reflection seismic lines (Fiedler amp Faleide 1996 Hjelstuenet al 2007) According to Hjelstuen et al (2007) the thickness ofthe Pleistocene mega-slides can be more than 300ndash400 m within thearea of the Lofoten Basin covered by our 3-D model In this case thetemperature at the bottom of the mega-slides could be higher thanthe adopted temperature at the seafloor during the 3-D modellingThese mega-slides originated from the SW Barents Sea (Hjelstuenet al 2007) where a positive temperature anomaly due to Ceno-zoic erosion could have already been significant during the slidingevents (eg Cavanagh et al 2006) Besides the sedimentary rocksof the mega-slides could also have been affected by Quaternaryglaciations which acted in the opposite direction to the Cenozoicerosion decreasing temperature within the sedimentary cover downto around 2 km depth (Fjeldskaar amp Amantov 2018) Therefore thesedimentary rocks of the late Cenozoic mega-slides were not inthermal equilibrium prior to sliding which makes it problematic inestimating the influence of heat To include the heat advection dur-ing the sliding events the additional detailed 3-D thermal modellingmust be performed within the SW Barents Sea outside of our studyarea which is not in the scope of the present study In any case theexpected thermal effect of solid-rock subhorisontal heat advectionmay reach a maximum of +10ndash20 C if the influence of the glacialevents is neglected However a decrease of subsurface temperatureduring the last glaciations within the SW Barents Sea could eventheoretically have enhanced the modelled negative thermal anomalywithin the Lofoten Basin in Fig 25 Besides medium- and small-scale submarine slides are present at the shelf edge within the modelarea (Hjelstuen et al 2007 Rise et al 2013) but their rather localthermal effect has been neglected during this regional-scale study
In fact the amplitudes of the calculated erosion-deposition-induced thermal anomalies would be higher if gradual real-timeerosion and deposition had been considered instead of removing oradding packages of rocks through several time-restricted steps as wehave done This is due to the fact that gradual erosion or depositionis extended in time compared to moving packages of rocks at thebeginning of each step Therefore rocks in places of gradual erosionor deposition are less thermally equilibrated than rocks in placeswhere a package of rocks was added or removed Unfortunately thegradual erosion and deposition cannot be modelled by the availablemodules of the used software In this case the obtained positiveand negative thermal anomalies should be slightly higher or lowerrespectively if the gradual erosion and deposition had been appliedduring the thermal modelling
In order to consider in more detail the relationship between ero-siondeposition and thermal reequilibration at deeper crustal andmantle levels a fully coupled thermomechanical 3-D modellingapproach should be used For instance Cacace amp Scheck-Wenderoth(2016) have shown that the detailed temporal evolution of the litho-spheric strength which controls the subsidence history is stronglycoupled to the temporal thermal configuration of the lithosphereMoreover crustal faulting has played an important role in bothstructural and thermal configuration of the continental margins (egClift et al 2002 Geoffroy et al 2015) implying that movementsof the crustal blocks along the major faults could represent a sig-nificant heat advection by solid rocks Therefore our results of thetransient 3-D thermal modelling are a good starting point to createa dynamical thermomechanical model for the LofotenndashVesteralencontinental margin and adjacent areas allowing us to minimize allthe uncertainties mentioned above
8 C O N C LU S I O N S
The obtained results of the time-dependent 3-D conductive ther-mal modelling for the LofotenndashVesteralen margin the northeasternVoslashring Basin and adjacent areas demonstrate that the present-daysubsurface temperature is characterized by the presence of ther-mally non-equilibrated zones clearly influenced by the Cenozoicerosion and deposition within the study area
The erosion-induced positive thermal anomaly has its maximumof more than +27 C at depths of 17ndash22 km beneath the easternpart of the Vestfjorden Basin where erosion has been particularlystrong during the last 27 million years The accompanying negativeanomaly within the northeastern part of the Voslashring Basin has min-imal values of around minus48 C at 12ndash14 km depth and is mainly theresult of the relatively rapid deposition of the Naust Formation dur-ing the Pleistocene Moreover the most intensive deposition-relatednegative anomaly is almost minus70 C at 17ndash20 km depth beneath theoceanic Lofoten Basin where the rapid Pleistocene deposition wasaccompanied by submarine mega-sliding of the sedimentary rockssourced from the Barents Sea
Besides the thermal influence of the early Cenozoic lithosphericthinning and the continental breakup with formation of new oceaniclithosphere is still recognizable within the western part of theLofotenndashVesteralen region in terms of the increasing temperaturestowards the oceanic domain recorded within the obtained 3-D ther-mal model
In addition to heat conduction convective andor advective heattransfer by fluids is indicated by large misfits between the modelledand measured temperatures within some local wells which arelocated relatively close to the majority of the wells with much better
Dow
nloaded from httpsacadem
icoupcomgjiarticle21328854810550 by guest on 16 April 2022
914 YP Maystrenko et al
fits implying that the modelled erosiondeposition-related thermalanomalies could also be theoretically affected by the groundwaterflow
A C K N OW L E D G E M E N T S
This study has been supported in the framework of the NEONOR2project by the Norwegian Research Council the Geological Surveyof Norway the Norwegian Petroleum Directorate the NorwegianMapping Authority Aker BP DEA Norge DONG Norge EONNorge Lundin Norway Maersk Oil Norway Norske Shell Norwe-gian Energy Company (Noreco) Repsol Exploration Norge Sta-toil and VNG Norge Special thanks go to Mauro Cacace fromthe Helmholtz Centre Potsdam GFZ German Research Centre forGeosciences for his help with the code for creating the 3-D mesh ofthe geometrically complex layers We are grateful to Alexander Mi-nakov and an anonymous reviewer for their very helpful commentswhich improved our manuscript Our gratitude also goes to DavidRoberts for improvement of the English
R E F E R E N C E S
Afonso JC Ranalli G amp Fernandez M 2005 Thermal expansivity andelastic properties of the lithospheric mantle results from mineral physicsof composites Phys Earth planet Inter 149(1ndash4) 71ndash80
Afonso JC Ranalli G Fernandez M Griffin WL OrsquoReilly SY ampFaul U 2010 On the VpVs-Mg correlation in mantle peridotitesimplications for the identification of thermal and compositional anomaliesin the upper mantle Earth planet Sci Lett 289(3ndash4) 606ndash618
Andersen BG amp Borns HW Jr 1994 The Ice Age World pp 208Scandinavian University Press (Universitetsforlaget AS)
Artemieva IM Thybo H amp Kaban MK 2006 Deep Europe today geo-physical synthesis of the upper mantle structure and lithospheric processesover 35 Ga Geol Soc London Mem 32(1) 11ndash41
Avedik F Berendsen D Fucke H Goldflam S Hirschleber H Meiss-ner R Sellevoll MA amp Weinrebe W 1984 Seismic investigationsalong the Scandinavian lsquoBlue Normarsquo profile Ann Geophys 2 571ndash577
Balling N Breiner N amp Waagstein R 2006 Thermal structure of thedeep Lopra-11A borehole in the Faroe Islands Geol Surv DenmarkGreenland Bull 9 91ndash107
Bannister SC Ruud BO amp Husebye ES 1991 Tomographic estimatesof sub-Moho seismic velocities in Fennoscandia and structural implica-tions Tectonophysics 189(1ndash4) 37ndash53
Bell RE Jackson CAL Elliott GM Gawthorpe RL Sharp IR ampMichelsen L 2014 Insights into the development of major rift-relatedunconformities from geologically constrained subsidence modelling Hal-ten Terrace offshore mid Norway Basin Res 26(1) 203ndash224
Ben Mansour W Moorkamp M amp England RW 2014 Joint inver-sion of seismological data and magnetotelluric data for the northernscandinavian mountains in American Geophysical Union Fall MeetingAbstractT23B-4668
Bergh SG Eig K Kloslashvjan OS Henningsen T Olesen O amp HansenJA 2007 The LofotenndashVesteralen continental margin a multiphaseMesozoic-Palaeogene rifted shelf as shown by offshore-onshore brittlefault-fracture analysis Norwegian J Geol 87 29ndash58
Bjoroslashy M Hall K amp Vigran JO 1980 An organic geochemical studyof Mesozoic shales from Andoslashya North Norway Phys Chem Earth 1277ndash91
Blystad P Brekke H Faeligrseth RB Larsen BT Skogseid J ampToslashrudbakken B 1995 Structural elements of the Norwegian continentalshelf Part II The Norwegian Sea Region Norwegian Pet DirectorateBull 8 0ndash45
Braathen A Osmundsen PT Nordgulen Oslash Roberts D amp Meyer G B2002 Orogen-parallel extension of the Caledonides in northern CentralNorway an overview Norwegian J Geol 82 225ndash241
Braun A amp Marquart G 2004 Evolution of the LofotenndashVesteralen mar-gin inferred from gravity and crustal modeling J geophys Res 109(B6)b06404 doi 1010292004jb003063
Breivik AJ Faleide JI Mjelde R amp Flueh ER 2009 Magma pro-ductivity and early seafloor spreading rate correlation on the northernVoslashring Margin Norway - Constraints on mantle melting Tectonophysics468(1ndash4) 206ndash223
Breivik AJ Faleide JI Mjelde R Flueh ER amp Murai Y 2017 A newtectono-magmatic model for the LofotenVesteralen Margin at the outerlimit of the Iceland Plume influence Tectonophysics 718 25ndash44
Brekke H 2000 The tectonic evolution of the Norwegian Sea continentalmargin with emphasis on the Voslashring and Moslashre basins in Dynamics ofthe Norwegian Margin Vol 136 pp 327ndash378 eds Noslashttvedt A et alGeological Society London Special Publications
Brigaud F Vasseur G amp Caillet G 1992 Thermal state in the NorthViking Graben (North Sea) determined from oil exploration well dataGeophysics 57(1) 69ndash88
Bronner M Gernigon L amp Nasuti A 2013 Lofoten-Vestfjorden Aero-magnetic Survey 2011 (LOVAS) Acquisition processing and interpreta-tion report pp 136 Geological Survey of Norway Trondheim
Buecker C amp Rybach L 1996 A simple method to determine heat pro-duction from gamma-ray logs Mar Pet Geol 13(4) 373ndash375
Cacace M amp Scheck-Wenderoth M 2016 Why intracontinental basinssubside longer 3-D feedback effects of lithospheric cooling and sedimen-tation on the flexural strength of the lithosphere J geophys Res 1213742ndash3761
Calcagnile G 1982 The lithosphere-asthenosphere system in Fennoscan-dia Tectonophysics 90(1ndash2) 19ndash35
Cammarano F Goes S Vacher P amp Giardini D 2003 Inferring upper-mantle temperatures from seismic velocities Phys Earth planet Inter138(3ndash4) 197ndash222
Cavanagh AJ di Primio R Scheck-Wenderoth M amp Horsfield B 2006Severity and timing of Cenozoic exhumation in the southwestern BarentsSea J Geol Soc 163(5) 761ndash774
Cermak V amp Rybach L 1982 Thermal properties thermal conductivityand specific heat of minerals and rocks in Physical Properties of Rockspp 305ndash343 ed Angenheister G Springer
Channell JET Kanamatsu T Sato T Stein R Alvarez Zarikian CAMalone MJ amp the Expedition 303306 Scientists 2005 Site U1315in Proceedings of the Integrated Ocean Drilling Program 303306doi102204iodpproc3033061142006
Chen YJ amp Lin J 2004 High sensitivity of ocean ridge thermal structureto changes in magma supply the Galapagos Spreading Center Earthplanet Sci Lett 221(1ndash4) 263ndash273
Clauser C 2011 Thermal storage and transport properties of rocks in HeatCapacity and Latent Heat Encyclopedia of Solid Earthacutes Geophysics pp1423ndash1431 ed Gupta H Springer
Clift P Lin J amp Barckhausen U 2002 Evidence of low flexural rigidityand low viscosity lower continental crust during continental break-up inthe South China Sea Mar Pet Geol 19(8) 951ndash970
Dalland A 1975 The Mesozoic Rocks of Andoslashya Northern NorwayNorges Geologiske Undersoslashkelse 316 271ndash287
Dalland A Worsley D amp Ofstad K 1988 A lithostratigraphic schemefor the Mesozoic and Cenozoic succession offshore mid- and northernNorway Norwegian Pet Directorate Bull 4 0ndash65
Davids C Wemmer K Zwingmann H Kohlmann F Jacobs J amp BerghSG 2013 KAr illite and apatite fission track constraints on brittlefaulting and the evolution of the northern Norwegian passive marginTectonophysics 608 196ndash211
Davis BAS Brewer S Stevenson AC amp Guiot J 2003 The tempera-ture of Europe during the Holocene reconstructed from pollen data QuatSci Rev 22(15ndash17) 1701ndash1716
Doin MP amp Fleitout L 1996 Thermal evolution of the oceaniclithosphere an alternative view Earth planet Sci Lett 142(1ndash2)121ndash136
Dow
nloaded from httpsacadem
icoupcomgjiarticle21328854810550 by guest on 16 April 2022
3-D thermal effect of Cenozoic erosion amp deposition 915
Dowdeswell JA Ottesen D amp Rise L 2006 Flow switching and large-scale deposition by ice streams draining former ice sheets Geology 34(4)313ndash316
Dowdeswell JA Ottesen D amp Rise L 2010 Rates of sediment deliveryfrom the Fennoscandian Ice Sheet through an ice age Geology 38(1)3ndash6
Drivenes G Sellevoll MA Renard V Avedik F amp Pajchel J 1984The continental margincrustal structure off the Lofoten Islands NorthernNorway in Petroleum Geology of the North European Margin pp 211ndash216 ed Spencer AM Springer
Ebbing J amp Olesen O 2010 New compilation of top basement and base-ment thickness for the Norwegian continental shelf reveals the segmenta-tion of the passive margin system Pet Geol Conf Proc 7 885ndash897
Ebbing J England RW Korja T Lauritsen T Olesen O Stratford Wamp Weidle C 2012 Structure of the Scandes lithosphere from surface todepth Tectonophysics 536 1ndash24
Ehlers J Gibbard PL amp Hughes PD 2011 Quaternary GlaciationsExtent and Chronology A Closer Look Elsevier
Eidvin T Bugge T amp Smelror M 2007 The Molo Formation depositedby coastal progradation on the inner Mid-Norwegian continental shelfcoeval with the Kai Formation to the west and the Utsira Formation in theNorth Sea Norwegian J Geol 87 75ndash142
Eig K 2012 Lofoten and Vesteralen promised land or Fata MorganaGEO ExPro 9 54ndash58
Eldevik T et al 2014 A brief history of climate the northern seas from theLast Glacial Maximum to global warming Quat Sci Rev 106 225ndash246
Eldholm O Thiede J amp Party SS 2005 Thermal conductivity of ODPHole 104ndash642C PANGAEA
Eldrett JS Greenwood DR Harding IC amp Huber M 2009 Increasedseasonality through the Eocene to Oligocene transition in northern highlatitudes Nature 459(7249) 969ndash973
Faeligrseth RB 2012 Structural development of the continental shelf offshoreLofotenndashVesteralen northern Norway Norwegian J Geol 92 19ndash40
Faleide JI Tsikalas F Breivik AJ Mjelde R Ritzmann O Engen OWilson J amp Eldholm O 2008 Structure and evolution of the continentalmargin off Norway and Barents Sea Episodes 31 82ndash91
Fejerskov M amp Lindholm CD 2000 Crustal stress in and around Norwayan evaluation of stress-generating mechanisms Geol Soc London SpecPubl 167(1) 451ndash467
Fichler C Rundhovde E Olesen O Saeligther BM Rueslatten HLundin E amp Dore AG 1999 Regional tectonic interpretation of imageenhanced gravity and magnetic data covering the Mid-Norwegian shelfand adjacent mainland Tectonophysics 306(2) 183ndash197
Fiedler A amp Faleide JI 1996 Cenozoic sedimentation along the south-western Barents Sea margin in relation to uplift and erosion of the shelfGlob Planet Change 12(1ndash4) 75ndash93
Filippelli GM amp Flores J-A 2009 From the warm Pliocene to the coldPleistocene a tale of two oceans Geology 37(10) 959ndash960
Fjeldskaar W amp Amantov A 2018 Effects of glaciations on sedimentarybasins J Geodyn in press doi 101016jjog201710005
Fjeldskaar W Lindholm CD Dehls JF amp Fjeldskaar I 2000 Post-glacial uplift neotectonics and seismicity in Fennoscandia Quat SciRev 19(14ndash15) 1413ndash1422
Fossen H 2010 Extensional tectonics in the North Atlantic Caledonidesaregional view in Continental Tectonics and Mountain Building TheLegacy of Peach and Horne pp 767ndash793 eds Law RD Butler RWHHoldsworth R E Krabbendam M amp Strachan RA The GeologicalSociety of London
Fredin O et al 2017 The inheritance of a Mesozoic landscape in westernScandinavia Nat Commun 8 14879 doi101038ncomms14879
Geoffroy L Burov EB amp Werner P 2015 Volcanic passive marginsanother way to break up continents Sci Rep 5 14828
Gernigon L Ringenbach JC Planke S Le Gall B amp Jonquet-KolstoslashH 2003 Extension crustal structure and magmatism at the outer VoringBasin Norwegian margin J Geol Soc 160(2) 197ndash208
Gernigon L Ringenbach JC Planke S amp Le Gall B 2004 Deep struc-tures and breakup along volcanic rifted margins insights from integratedstudies along the outer Voslashring Basin (Norway) Mar Pet Geol 21(3)363ndash372
Gernigon 2014 Unpublished NGU dataGernigon L Blischke A Nasuti A amp Sand M 2015 Conjugate volcanic
rifted margins seafloor spreading and microcontinent Insights from newhigh-resolution aeromagnetic surveys in the Norway Basin Tectonics34(5) 907ndash933
Goldschmidt-Rokita A Sellevoll MA Hirschleber HB amp AvedikF 1988 Results of two seismic refraction profiles off LofotenNorthern Norway Spec Publ - Norges Geologiske Undersoslashkelse 349ndash57
Goledowski B Egholm DL Nielsen SB Clausen OR amp McGre-gor ED 2013 Cenozoic erosion and flexural isostasy of ScandinaviaJGeodyn 70 49ndash57
Gradmann S amp Ebbing J 2015 Large-scale gravity anomaly in northernNorway tectonic implications of shallow or deep source depth and apossible conjugate in northeast Greenland Geophys J Int 203(3) 2070ndash2088
Green PF Japsen P Chalmers JA Bonow JM amp Duddy IR 2018Post-breakup burial and exhumation of passive continental marginsseven propositions to inform geodynamic models Gondwana Res 5358ndash81
Hansen J Sato M Russell G amp Kharecha P 2013 Climate sensitivitysea level and atmospheric carbon dioxide Phil Trans R Soc A 7120120284 doi101098rsta20120294
Hansen JA 2009 Onshore-offshore tectonic relations on the Lofoten andVesteralen Margin PhD dissertation Universitetet i Tromsoslash
Hansen JA Bergh SG amp Henningsen T 2012 Mesozoic rifting andbasin evolution on the Lofoten and Vesteralen Margin North-Norwaytime constraints and regional implications Norwegian J Geol 91 203ndash228
Hasenclever J et al 2017 Sea level fall during glaciation stabilized atmo-spheric CO2 by enhanced volcanic degassing Nat Commun 8 15867doi101038ncomms15867
Hasterok D Chapman DS amp Davis EE 2011 Oceanic heat flowimplications for global heat loss Earth planet Sci Lett 311(3ndash4)386ndash395
Hejrani B Balling N Jacobsen BH amp England R 2017 Upper-mantlevelocities below the Scandinavian Mountains from P- and S-wave travel-time tomography Geophys J Int 208(1) 177ndash192
Hendriks BWH amp Andriessen PAM 2002 Pattern and timing of thepost-Caledonian denudation of northern Scandinavia constrained by ap-atite fission-track thermochronology Geol Soc London Spec Publ196(1) 117ndash137
Hendriks BWH Osmundsen PT amp Redfield TF 2010 Normal faultingand block tilting in Lofoten and Vesteralen constrained by Apatite FissionTrack data Tectonophysics 485(1ndash4) 154ndash163
Henstra GA Gawthorpe RL Helland-Hansen W Ravnas R amp Rote-vatn A 2017 Depositional systems in multiphase rifts seismic casestudy from the Lofoten margin Norway Basin Research 29(4) 447ndash469
Hjelstuen BO Eldholm O amp Faleide JI 2007 Recurrent Pleistocenemega-failures on the SW Barents Sea margin Earth planet Sci Lett258(3ndash4) 605ndash618
Hofmeister AM 1999 Mantle values of thermal conductivity and thegeotherm from phonon lifetimes Science 283(5408) 1699ndash1706
Holtedahl H 1998 The Norwegian strandflat ndash a geomorphological puzzleNorsk Geologisk Tidsskrift 78 47ndash66
Inglis GN et al 2017 Mid-latitude continental temperatures through theearly Eocene in Western Europe Earth planet Sci Lett 460 86ndash96
Janutyte I Lindholm C amp Olesen O 2017 Relation between seismicityand tectonic structures offshore and onshore Nordland northern NorwayNorwegian J Geol 97 163ndash175
Kawakatsu H Kumar P Takei Y Shinohara M Kanazawa T ArakiE amp Suyehiro K 2009 Seismic evidence for sharp lithosphere-asthenosphere boundaries of oceanic plates Science 324(5926) 499ndash502
Keiding M Kreemer C Lindholm CD Gradmann S Olesen O ampKierulf HP 2015 A comparison of strain rates and seismicity forFennoscandia depth dependency of deformation from glacial isostaticadjustment Geophys J Int 202(2) 1021ndash1028
Dow
nloaded from httpsacadem
icoupcomgjiarticle21328854810550 by guest on 16 April 2022
916 YP Maystrenko et al
Kodaira S Mjelde R Sellevoll MA Hirschleber HB Iwasaki TKanazawa T amp Shimamura H 1995 Crustal transect across the LofotenVolcanic Passive Continental Margin N Norway obtained by use of oceanbottom seismographs and implications for its evolution J Phys Earth43(6) 729ndash745
Korablev A Smirnov A amp Baranova OK 2014 Climatological Atlas ofthe Nordic Seas and Northern North Atlantic in NOAA Atlas NESDISVol 77 pp 122 eds Seidov D amp Parsons AR doi107289V54B2Z78
Ksienzyk AK Dunkl I Jacobs J Fossen H amp Kohlmann F 2014From orogen to passive margin constraints from fission track and(UndashTh)He analyses on Mesozoic uplift and fault reactivation in SWNorway Geol Soc London Spec Publ 390(1) 679ndash702
Laberg JS Andreassen K amp Vorren TO 2012 Late Cenozoic erosionof the high-latitude southwestern Barents Sea shelf revisited Bull geolSoc Am 124(1ndash2) 77ndash88
Lee C-TA 2003 Compositional variation of density and seismic velocitiesin natural peridotites at STP conditions implications for seismic imagingof compositional heterogeneities in the upper mantle J geophys Res108(B9)
Leroy M Gueydan F amp Dauteuil O 2008 Uplift and strength evolutionof passive margins inferred from 2-D conductive modelling Geophys JInt 172(1) 464ndash476
Lien T 2005 From rifting to drifting effects on the development of deep-water hydrocarbon reservoirs in a passive margin setting Norwegian SeaNorwegian J Geol 85 319ndash332
Loslashseth H amp Tveten E 1996 Post-Caledonian structural evolution of theLofoten and Vesteralen offshore and onshore areas Norsk Geol Tidsskr76 215ndash230
Lundin ER Dore AG Roslashnning K amp Kyrkjebo R 2013 Repeatedinversion and collapse in the Late Cretaceous-Cenozoic northern VoringBasin offshore Norway Pet Geosci 19(4) 329ndash341
Mancktelow NS amp Grasemann B 1997 Time-dependent effects of heatadvection and topography on cooling histories during erosion Tectono-physics 270(3ndash4) 167ndash195
Mann ME et al 2009 Global signatures and dynamical origins of theLittle Ice Age and Medieval climate anomaly Science 326(5957) 1256ndash1260
Maystrenko Y amp Scheck-Wenderoth M 2009 Density contrasts in theupper mantle and lower crust across the continent-ocean transition con-straints from 3-D gravity modelling at the Norwegian margin GeophysJ Int 179(1) 536ndash548
Maystrenko YP amp Gernigon L 2018 3-D temperature distribution be-neath the Mid-Norwegian continental margin (the Voslashring and Moslashrebasins) Geophys J Int 212(1) 694ndash724
Maystrenko YP Elvebakk HK Ganeroslashd GV Lutro O Olesen Oamp Roslashnning JS 2014 2D structural and thermal models in southeast-ern Norway based on the recently drilled Arvollskogen borehole and2D density magnetic and thermal modelling Geotherm Energy 2(1)doi101186s40517-014-0015-z
Maystrenko YP Olesen O amp Elvebakk HK 2015 Indication of deepgroundwater flow through the crystalline rocks of Southern Norway Ge-ology 43 327ndash330
Maystrenko YP Slagstad T Elvebakk HK Olesen O Ganeroslashd GVamp Roslashnning JS 2015 New heat flow data from three boreholes nearBergen Stavanger and Moss southern Norway Geothermics 56 79ndash92
Maystrenko YP Olesen O Gernigon L amp Gradmann S 2017 Deepstructure of the LofotenndashVesteralen segment of the Mid-Norwegian con-tinental margin and adjacent areas derived from 3-D density modeling Jgeophys Res 122 1402ndash1433
Maystrenko YP Gernigon L Nasuti A amp Olesen O 2018 Deep struc-ture of the Mid-Norwegian continental margin (the Voslashring and Moslashrebasins) according to 3-D density and magnetic modelling Geophys JInt 212(3) 1696ndash1721
McKenna TE amp Sharp JM Jr 1998 Radiogenic heat production insedimentary rocks of the Gulf of Mexico basin South Texas AAPG Bull82 484ndash496
Medvedev S amp Hartz EH 2015 Evolution of topography of post-Devonian Scandinavia effects and rates of erosion Geomorphology 231229ndash245
Meinhold G Morton AC amp Avigad D 2013 New insights into peri-Gondwana paleogeography and the Gondwana super-fan system fromdetrital zircon U-Pb ages Gondwana Res 23 661ndash665
Midttoslashmme K amp Roaldset E 1999 Thermal conductivity of sedimentaryrocks uncertainties in measurement and modelling Geol Soc LondonSpec Publ 158 45ndash60
Midttoslashmme K Slaeligttem J Roaldset E amp Zielinski GW 1995 Ther-mal conductivity of unconsolidated marine sediments from Voslashring BasinNorwegian Sea in SAGE 57th Conference and Technical Exhibition Glas-gow Scotland
Mjelde R Sellevoll MA Shimamura H Iwasaki T amp KanazawaT 1992 A crustal study off Lofoten N Norway by use of3-component Ocean Bottom Seismographs Tectonophysics 212269ndash288
Mjelde R Sellevoll MA Shimamura H Iwasaki T amp Kanazawa T1993 Crustal structure beneath Lofoten N Norway from vertical inci-dence and wide-angle seismic data Geophys J Int 114 116ndash126
Mjelde R Sellevoll MA Shimamura H Iwwasaki T amp Kanazawa T1995 S-wave anisotropy off Lofoten Norway indicative of fluids in thelower continental crust Geophys J Int 120 87ndash96
Mjelde R Kodaira S amp Sellevoll MA 1996 Crustal structure of theLofoten Margin N Norway from normal incidence and wide-angle seis-mic data a review Norsk Geol Tidsskr 76 187ndash198
Mjelde R et al 2001 Crustal structure of the outer Voslashring Plateau offshoreNorway from ocean bottom seismic and gravity data J geophys Res106 6769ndash6791
Mjelde R Shimamura H Kanazawa T Kodaira S Raum T amp ShiobaraH 2003 Crustal lineaments distribution of lower crustal intrusives andstructural evolution of the Voslashring Margin NE Atlantic new insight fromwide-angle seismic models Tectonophysics 369 199ndash218
Mjelde R Kvarven T Faleide JI amp Thybo H 2016 Lower crustalhigh-velocity bodies along North Atlantic passive margins and theirlink to Caledonian suture zone eclogites and early Cenozoic magmatismTectonophysics 670 16ndash29
Mokhtari M amp Pegrum RM 1992 Structure and evolution of the Lofotencontinental margin offshore Norway Norsk Geol Tidsskr 72 339ndash355
Montelli A Dowdeswell JA Ottesen D amp Johansen SE 2017 Ice-sheet dynamics through the Quaternary on the mid-Norwegian continentalmargin inferred from 3D seismic data Mar Pet Geol 80 228ndash242
Muller RD Sdrolias M Gaina C amp Roest WR 2008 Age spreadingrates and spreading asymmetry of the worldrsquos ocean crust GeochemGeophys Geosyst 9 doi1010292007GC001743
Nesje A Dahl SO Thun T amp Nordli O 2008 The lsquoLittle Ice Agersquoglacial expansion in western Scandinavia summer temperature or winterprecipitation Clim Dyn 30 789ndash801
Nielsen SB Clausen OR amp McGregor E 2017 basinRo a vitrinitereflectance model derived from basin and laboratory data Basin Res 29515ndash536
NPD 2010 Geofaglig Vurdering av Petroleumsressursene i HavomradeneUtenfor Lofoten Vesteralen og Senja Norwegian Petroleum Directorate
NPD 2017 lsquoThe NPDrsquos fact pages well data summary sheets Nor-wegian Petroleum Directoratersquo Available at httpfactpagesnpdnoFactPagesDefaultaspxnav1=wellboreampnav2=PageView|Exploration|Allampnav3=6753 (January 2017)
Olesen O Reitan M amp Saeligther PO 1993 Petrofysisk database PETBASE30 Brukerbeskrivelse NGU Trondheim Norway NGU Internrapport93023
Olesen O et al 2002 Bridging the gap between the onshore and offshoregeology in Nordland northern Norway Norwegian J Geol 82 243ndash262
Olesen O et al 2004 Neotectonic deformation in Norway and its impli-cations a review Norwegian J Geol 84 3ndash34
Olesen O et al 2007a An improved tectonic model for the Eocene openingof the NorwegianndashGreenland Sea use of modern magnetic data Mar PetGeol 24 53ndash66
Olesen O et al 2007b KONTIKI Final Report CONTInental Crust andHeat Generation In 3D NGU Report 2007042
Olesen O Bungum H Dehls J Lindholm C Pascal C amp RobertsD 2013a Neotectonics seismicity and contemporary stress field in Nor-way ndash mechanisms and implications in Quaternary Geology of Norway
Dow
nloaded from httpsacadem
icoupcomgjiarticle21328854810550 by guest on 16 April 2022
3-D thermal effect of Cenozoic erosion amp deposition 917
pp 145ndash174 eds Olsen L Fredin O amp Olesen O Geological Surveyof Norway Special Publication v 13
Olesen O Kierulf HP Bronner M Dalsegg E Fredin O ampSolbakk T 2013b Deep weathering neotectonics and strandflatformation in Nordland northern Norway Norwegian J Geol 93189ndash213
Olsen L Sveian H Bergstroslashm B Ottesen D amp Rise L 2013 Qua-ternary glaciations and their variations in Norway and on the Norwegiancontinental shelf in Quaternary Geology of Norway pp 27ndash78 edsOlsen L Fredin O amp Olesen O Geological Survey of Norway SpecialPublication v 13
Olsson S Roberts RG amp Bodvarsson R 2008 Moho depth varia-tion in the Baltic Shield from analysis of converted waves GFF 130113ndash122
Ottemoller L amp Midzi V 2003 The crustal structure of Norway frominversion of teleseismic receiver functions J Seismol 7 35ndash48
Ottersen G 2009 A Digital Temperature Archive for the Norwegian SeaVol 6 Institute of Marine Research
Ottesen D Rise L Andersen ES Bugge T amp Eidvin T 2009 Geo-logical evolution of the Norwegian continental shelf between 61 degreesN and 68 degrees N during the last 3 million years Norwegian J Geol89 251ndash265
Ottesen D Dowdeswell JA Rise L amp Bugge T 2012 Large-scaledevelopment of the mid-Norwegian shelf over the last three million yearsand potential for hydrocarbon reservoirs in glacial sediments Geol SocLondon Spec Publ 368 53ndash73
Pascal C 2015 Heat flow of Norway and its continental shelf Mar PetGeol 66 956ndash969
Pascal C amp Midttoslashmme K 2006 Impact of Recent Glacial Erosionon Subsurface Temperatures The Mid-Norwegian Margin NGU-rapport2006088
Pascal C amp Rudlang T 2016 Discovery of highly radioactive granite inthe Bergen Region Norwegian J Geol 96 319ndash328
Pekar SF DeConto RM amp Harwood DM 2006 Resolving a lateOligocene conundrum deep-sea warming and Antarctic glaciationPalaeogeogr Palaeoclimatol Palaeoecol 231 29ndash40
Petersen TG Hamann NE amp Stemmerik L 2015 Tectono-sedimentaryevolution of the Paleogene succession offshore Northeast Greenland MarPet Geol 67 481ndash497
Pilidou S Priestley K Debayle E amp Gudmundsson O 2005 Rayleighwave tomography in the North Atlantic high resolution images of theIceland Azores and Eifel mantle plumes Lithos 79 453ndash474
Raab B amp Vedin H 1995 The National Atlas of Sweden Climate Lakesand Rivers Bokforlaget Bra Bocker
Ravelo AC Andreasen DH Lyle M Lyle AO amp Wara MW 2004Regional climate shifts caused by gradual global cooling in the PlioceneEpoch Nature 429 263ndash267
Ren SC Skogseid J amp Eldholm O 1998 Late Cretaceous-Palaeoceneextension on the Voslashring Volcanic Margin Mar Geophys Res 20 343ndash369
Ren SC Faleide JI Eldholm O Skogseid J amp Gradstein F 2003 LateCretaceousndashPaleocene tectonic development of the NW Voslashring BasinMar Pet Geol 20 177ndash206
Riis F amp Fjeldskaar W 1992 On the magnitude of the late Tertiary andQuaternary erosion and its significance for the uplift of Scandinavia andthe Barents Sea Spec Publ - Norwegian Pet Soc NPF 1 163ndash185
Riis F 1996 Quantification of Cenozoic vertical movements of Scandinaviaby correlation of morphological surfaces with offshore data Glob PlanetChange 12 331ndash357
Rise L Ottesen D Berg K amp Lundin E 2005 Large-scale developmentof the mid-Norwegian margin during the last 3 million years Mar PetGeol 22 33ndash44
Rise L Ottesen D Longva O Solheim A Andersen ES amp Ayers S2006 The Sklinnadjupet Slide and its relation to the Elsterian glaciationon the mid-Norwegian margin Mar Pet Geol 23 569ndash583
Rise L Chand S Hjelstuen BO Haflidason H amp Boslashe R 2010Late Cenozoic geological development of the south Voslashring margin mid-Norway Mar Pet Geol 27 1789ndash1803
Rise L Boslashe R Riis F Bellec VK Laberg JS Eidvin T ElvenesS amp Thorsnes T 2013 The LofotenndashVesteralen continental marginNorth Norway Canyons and mass-movement activity Mar Pet Geol45 134ndash149
Roberts D amp Gee DG 1985 An introduction to the structure ofthe Scandinavian Caledonides in The Caledonide orogen - Scandi-navia and related areas pp 55ndash68 eds Gee D amp Sturt BA JohnWiley amp Sons
Sass JH Lachenbruch AH Moses TH Jr amp Morgan P 1992 Heatflow from a scientific research well at Cajon Pass California J geophysRes 97 5017ndash5030
Scheck-Wenderoth M amp Maystrenko Y 2008 How warm are passivecontinental margins A 3-D lithosphere-scale study from the Norwegianmargin Geology 36 419ndash422
Scheck-Wenderoth M amp Maystrenko YP 2013 Deep control on shallowheat in sedimentary basins Energy Procedia 40 266ndash275
Schmittner A Urban NM Shakun JD Mahowald NM Clark PUBartlein PJ Mix AC amp Rosell-Mele A 2011 Climate sensitivityestimated from temperature reconstructions of the last glacial maximumScience 334 1385ndash1388
Seppa H Bjune AE Telford RJ Birks HJB amp Veski S 2009 Lastnine-thousand years of temperature variability in northern Europe ClimPast 5 523ndash535
Siegert MJ Dowdeswell JA Hald M amp Svendsen JI 2001 Modellingthe Eurasian ice sheet through a full (Weichselian) glacial cycle GlobPlanet Change 31 367ndash385
Sigmond EMO 2002 Geological map land and sea areas of northernEurope 14 million in Commision for the Geological Map of the WorldGeological Survey of Norway Trondheim
Slagstad T 2008 Radiogenic heat production of Archaean to Permiangeological provinces in Norway Norwegian J Geol 88 149ndash166
Slagstad T amp Lauritsen T 2013 Heat production calculations in COOPPhase I - Crustal Onshore-Offshore Project NGU Report 2013002 74ndash111 eds Olesen O Bronner M Ebbing J Elvebakk H Gellein JKoziel J Lauritsen T Lutro O Maystrenko Y Muller C Nasuti AOsmundsen PT Slagstad T amp Storroslash G
Slagstad T Balling N Elvebakk H Midttoslashmme K Olesen O OlsenL amp Pascal C 2009 Heat-flow measurements in Late Palaeoprotero-zoic to Permian geological provinces in south and central Norway and anew heat-flow map of Fennoscandia and the Norwegian-Greenland SeaTectonophysics 473 341ndash361
Slagstad T Maystrenko YP Maupin V amp Gradmann S 2018 An ex-tinct Late Mesoproterozoic Sveconorwegian mantle wedge beneath SWFennoscandia reflected in seismic tomography and assessed by thermalmodeling Terra Nova 30(1) 72ndash77
Smelror M Moslashrk A Moslashrk MBE Weiss HM amp Loslashseth H 2001Middle Jurassic-Lower Cretaceous transgressive-regressive sequencesand facies distribution off northern Nordland and Troms Norway inSedimentary Environments Offshore Norway - Palaeozoic to Recentpp 211ndash232 eds Martinsen O J amp Dreyer T NPF Special Publi-cations
Srivastava SP amp Tapscott CR 1986 Plate kinematics of the NorthAtlantic in The Western North Atlantic Region pp 379ndash404 edsVogt PR amp Tucholke BE Geological Society of America SpecialPublications
Steer P Huismans RS Valla PG Gac S amp Herman F 2012 Bi-modal Plio-Quaternary glacial erosion of fjords and low-relief surfacesin Scandinavia Nat Geosci 5 635ndash639
Stein CA amp Stein S 1992 A model for the global variation in oceanicdepth and heat flow with lithospheric age Nature 359 123ndash129
Steltenpohl MG Hames WE amp Andresen A 2004 The Silurian toPermian history of a metamorphic core complex in Lofoten northernScandinavian Caledonides Tectonics 23 doi1010292003TC001522
Stuwe K 2007 Geodynamics of the Lithosphere An Introduction Geo-dynamics of the Lithosphere An Introduction pp 493 Springer-Verlagdoi101007978-3-540-71237-4
Talwani M amp Eldholm O 1977 Evolution of the Norwegian-GreenlandSea Bull geol Soc Am 88 969ndash999
Dow
nloaded from httpsacadem
icoupcomgjiarticle21328854810550 by guest on 16 April 2022
918 YP Maystrenko et al
Tsikalas F Faleide JI amp Eldholm A 2001 Lateral variations in tectono-magmatic style along the LofotenndashVesteralen volcanic margin off NorwayMar Pet Geol 18 807ndash832
Tsikalas F Eldholm O amp Faleide JI 2005 Crustal structure of theLofotenndashVesteralen continental margin off Norway Tectonophysics 404151ndash174
Turcotte DL amp Schubert G 2002 Geodynamics Cambridge UniversityPress
Tveito OE et al 2000 Nordic Temperature Maps DNMI-Report 0900KLIMA
van den Berg AP Yuen DA amp Steinbach V 2001 The effects of variablethermal conductivity on mantle heat-transfer Geophys Res Lett 28875ndash878
Villa M Fernandez M amp Jimenez Munt I 2010 Radiogenic heat produc-tion variability of some common lithological groups and its significanceto lithospheric thermal modeling Tectonophysics 490 152ndash164
Vosteen H-D amp Schellschmidt R 2003 Influence of temperature on ther-mal conductivity thermal capacity and thermal diffusivity for differenttypes of rock Phys Chem Earth Parts ABC 28 499ndash509
Wagner W amp Kretzschmar H-J 2008 International Steam Tables ndashProperties of Water and Steam Based on the Industrial FormulationIAPWS-IF97 Springer-Verlag
Wollenberg HA amp Smith AR 1987 Radiogenic heat production ofcrustal rocks an assessment based on geochemical data Geophys ResLett 14 295ndash298
Yakovlev AV Bushenkova NA Koulakov IY amp Dobretsov NL 2012Structure of upper mantle in Arctic region based on data of regionalseismotomography Geol Geophys 53 1261ndash1272
Zachos J Pagani M Sloan L Thomas E amp Billups K 2001 Trendsrhythms and aberrations in global climate 65 Ma to present Science 292686ndash693
Zastrozhnov D Gernigon L Gogin I Abdelmalak MM Planke SFaleide JI Eide S amp Myklebust R 2008 Cretaceous-Paleocene evo-lution and crustal structure of the northern Voslashring Margin (offshoreMid-Norway) results from integrated geological and geophysical studyTectonics doi 1010022017TC004655
Zhang Y-S amp Lay T 1999 Evolution of oceanic upper mantle structurePhys Earth planet Inter 114 71ndash80
Dow
nloaded from httpsacadem
icoupcomgjiarticle21328854810550 by guest on 16 April 2022
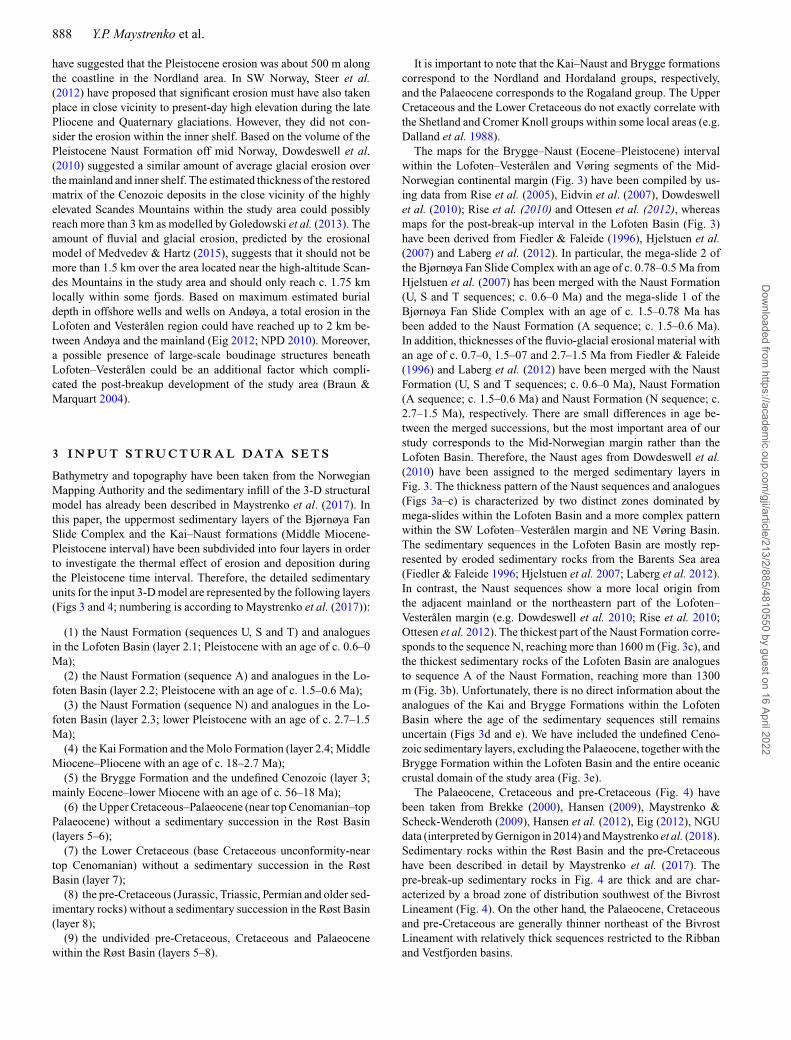
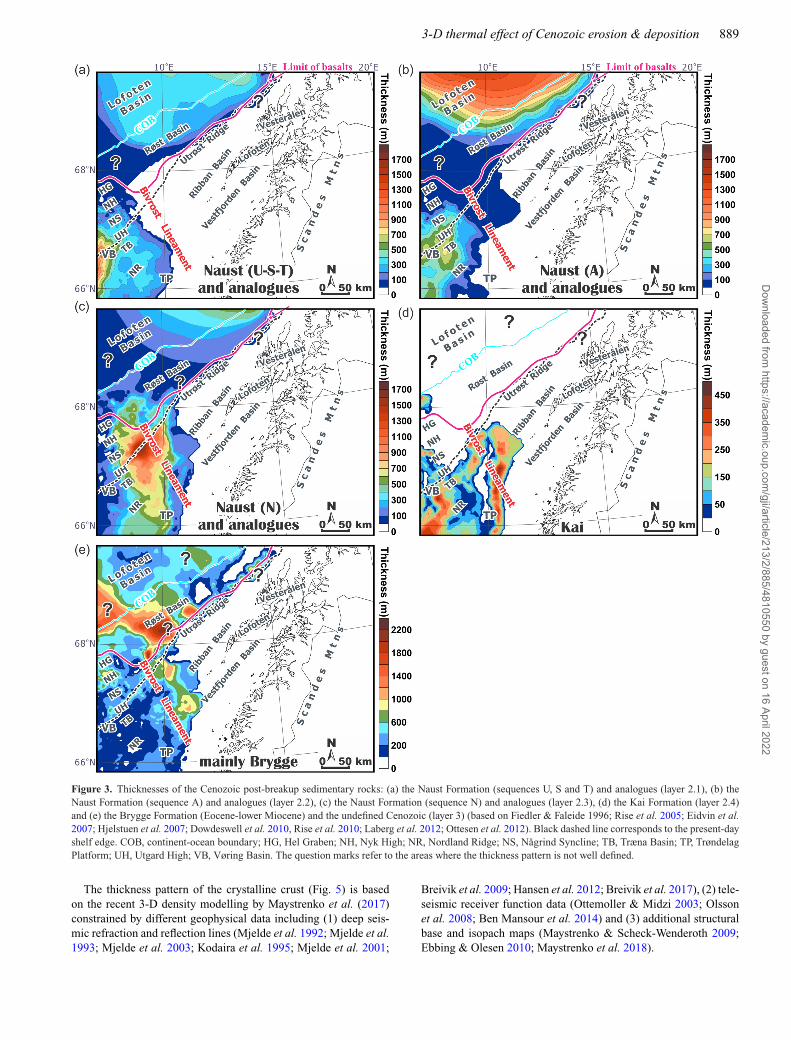
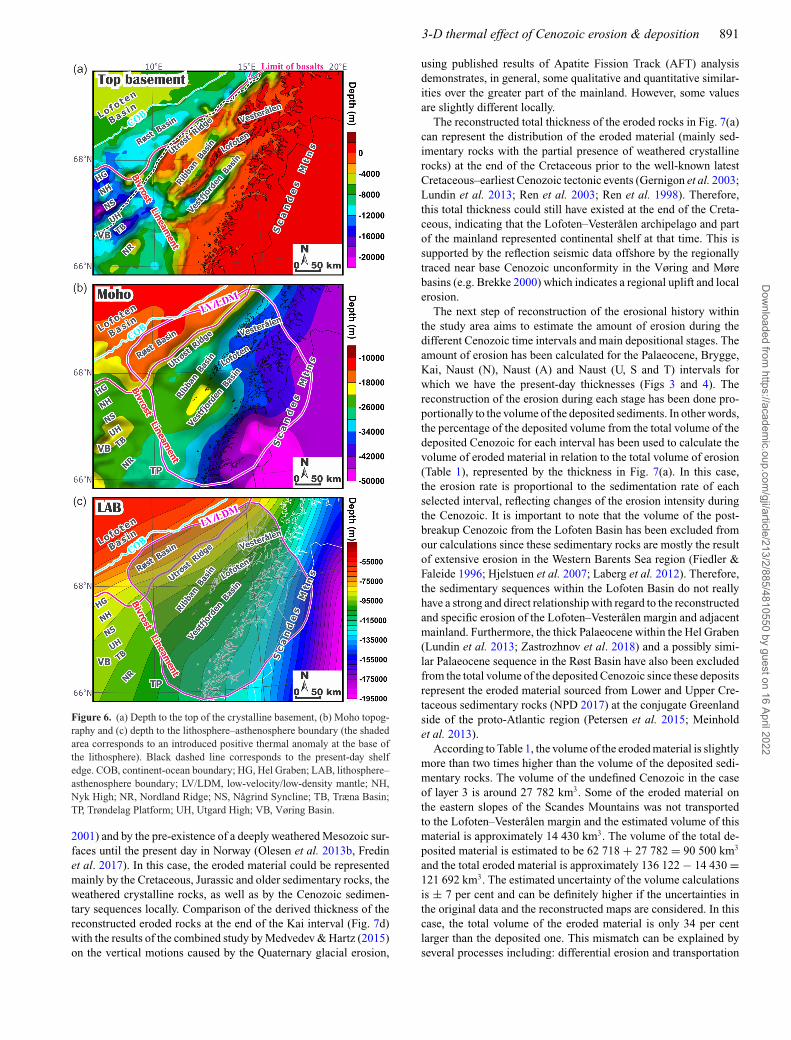
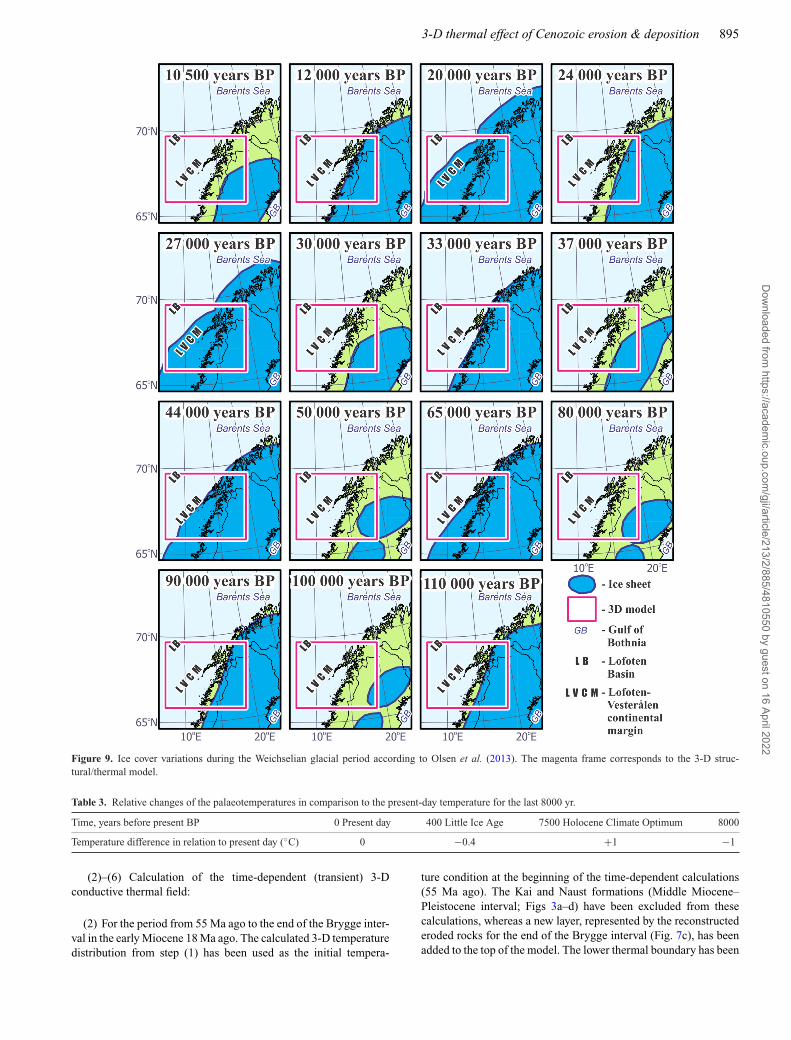
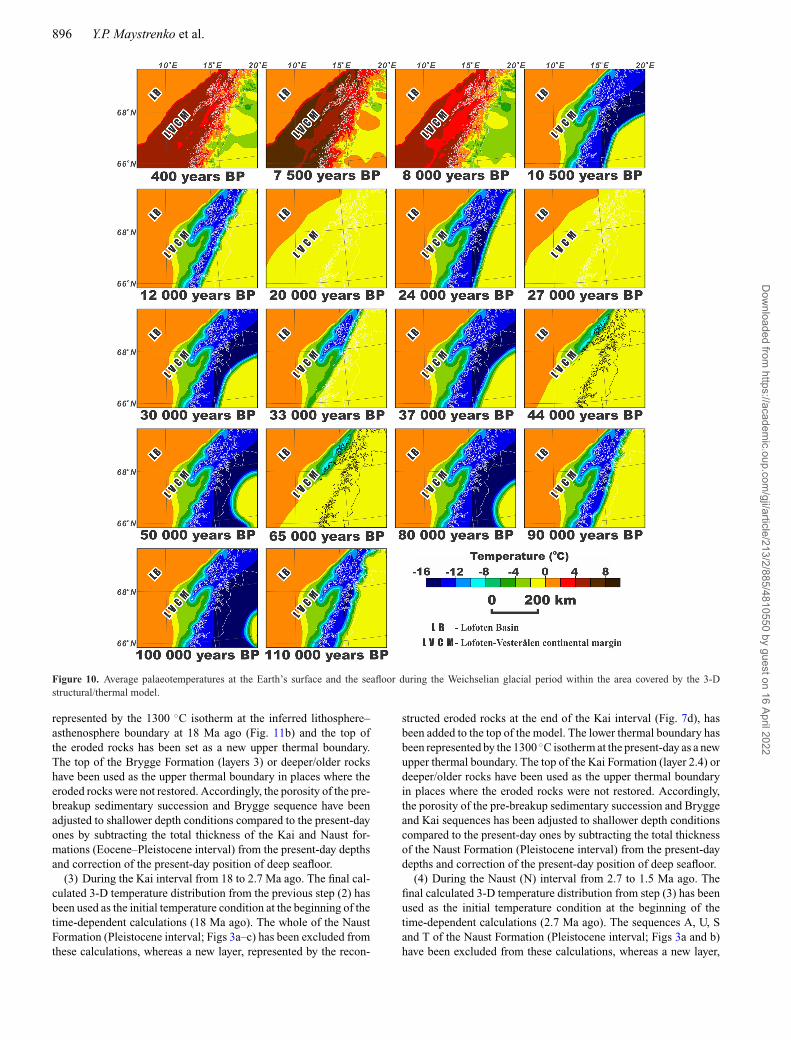
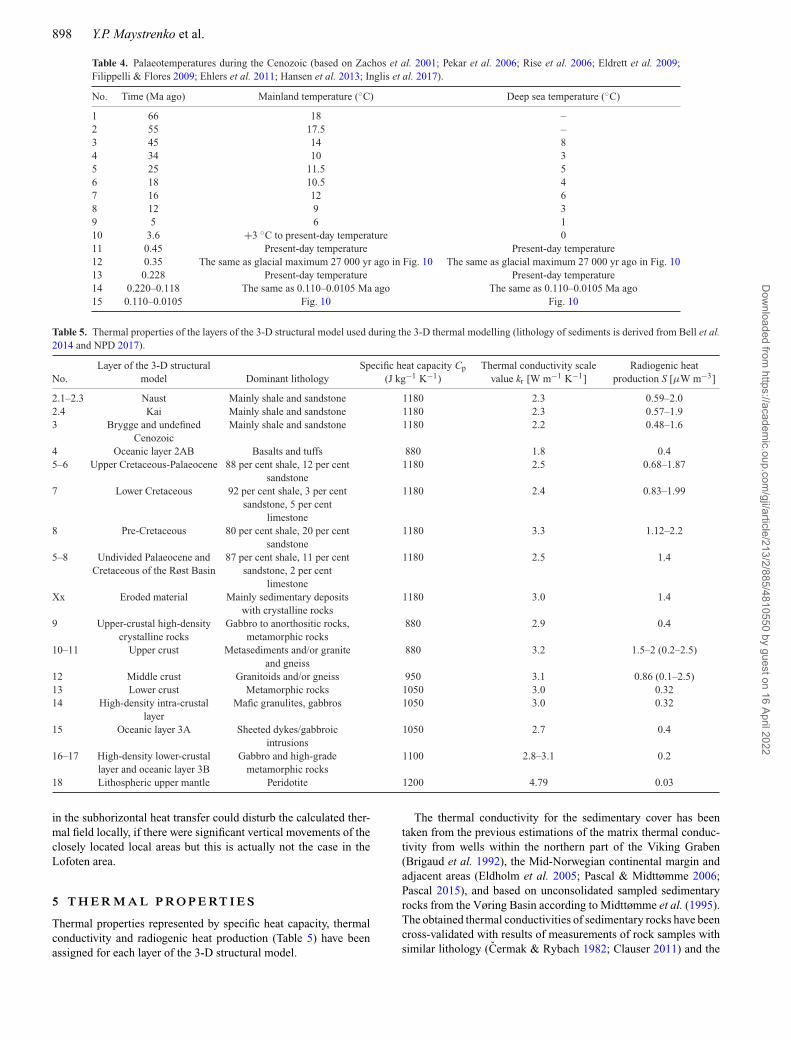
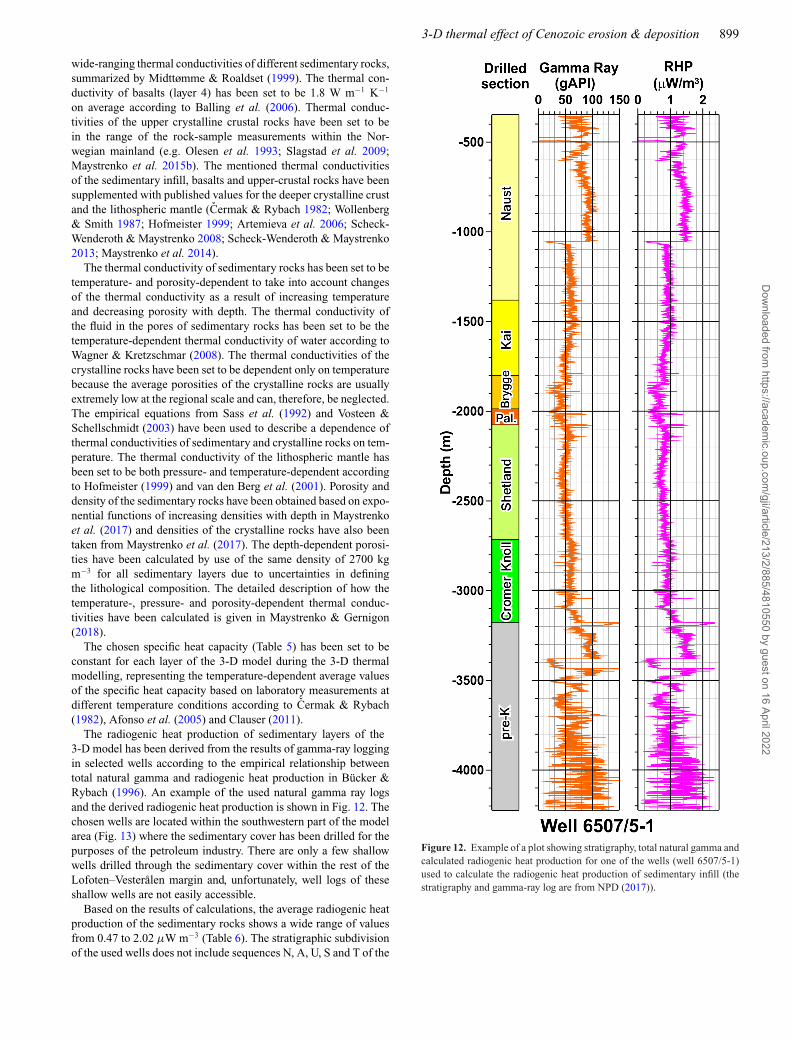
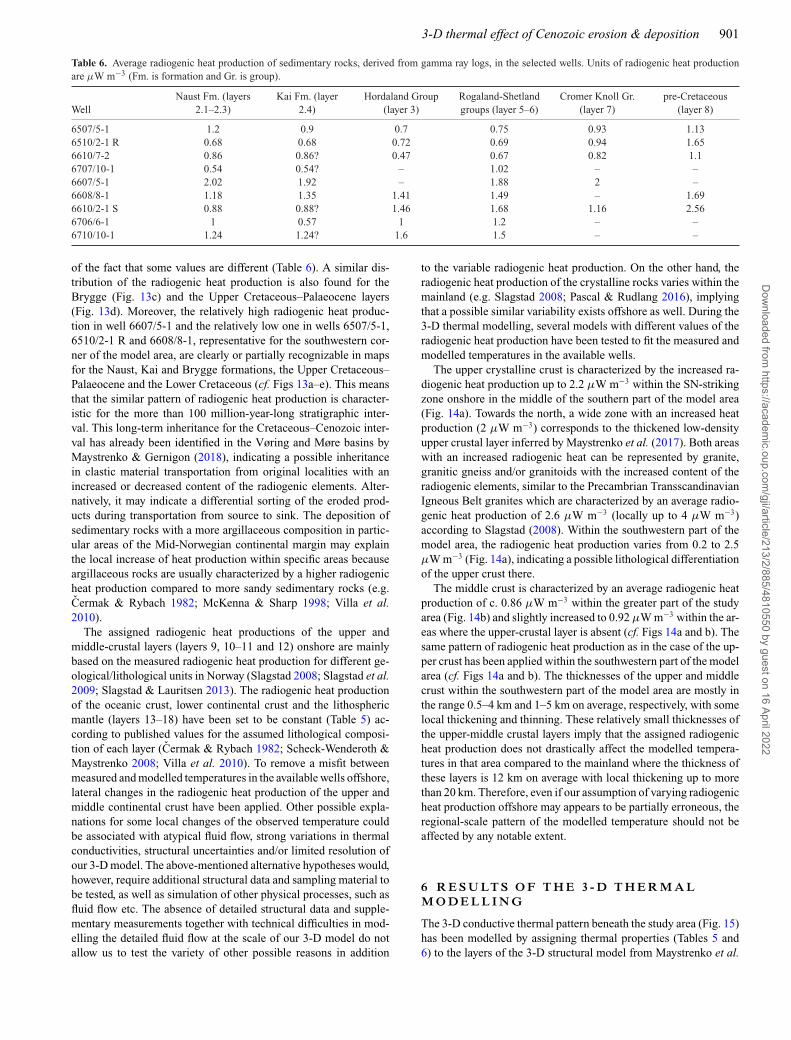
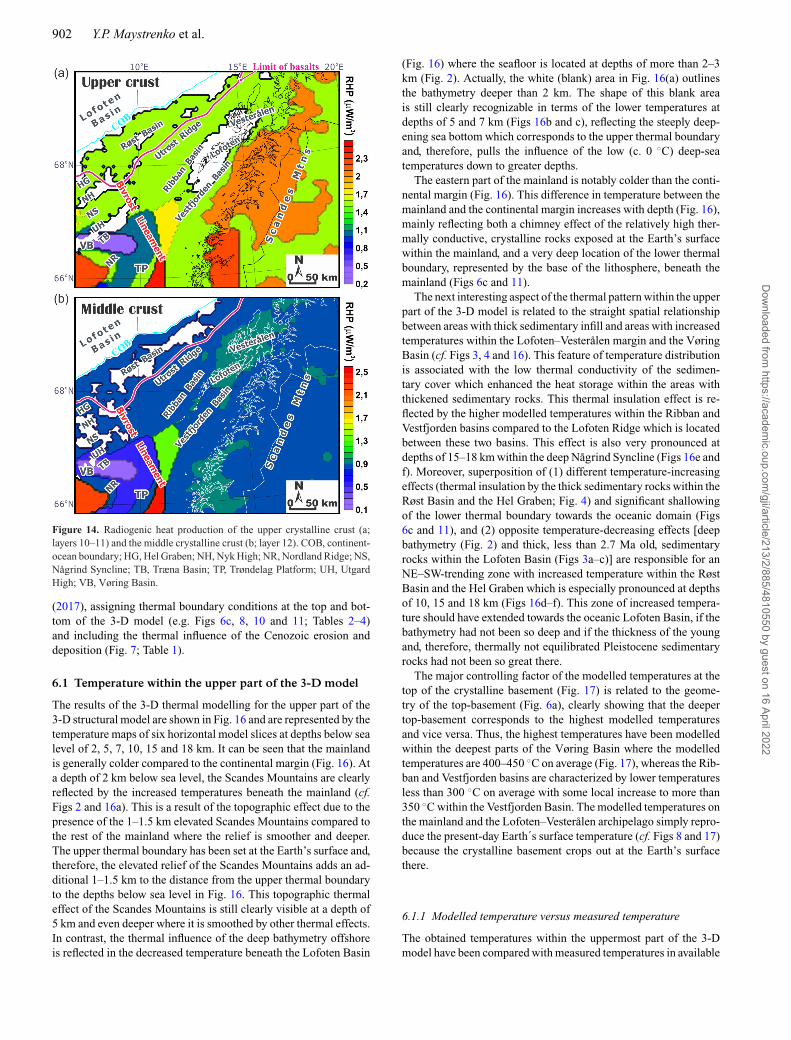
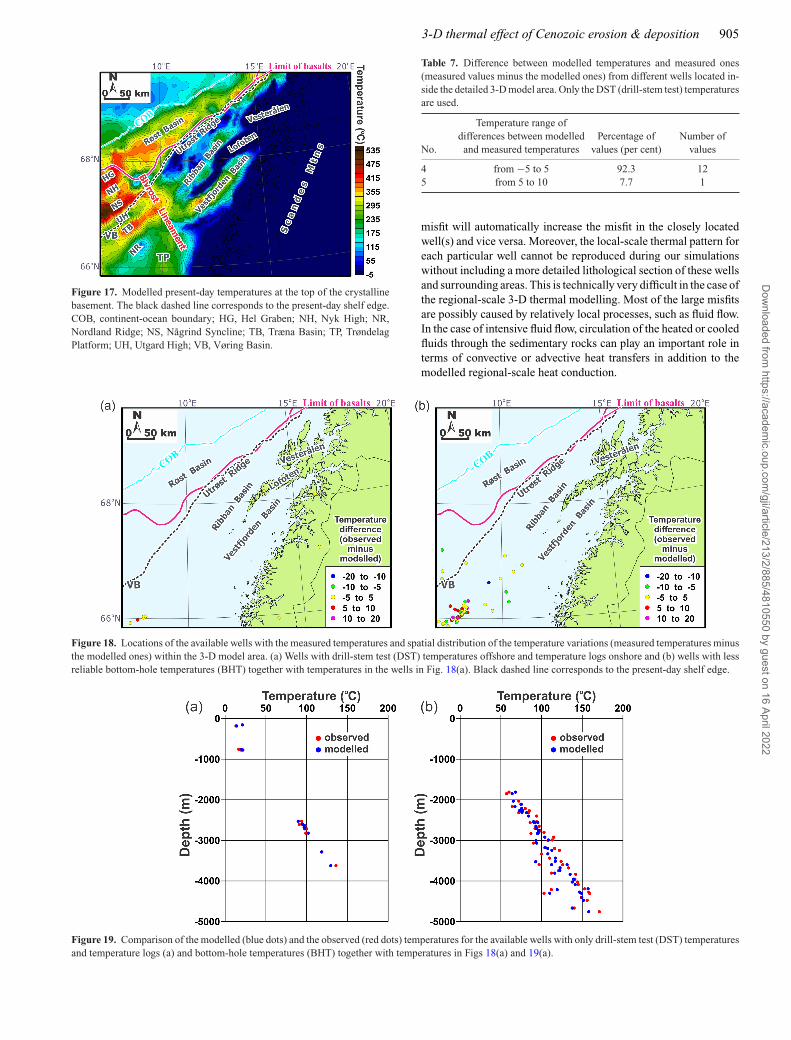
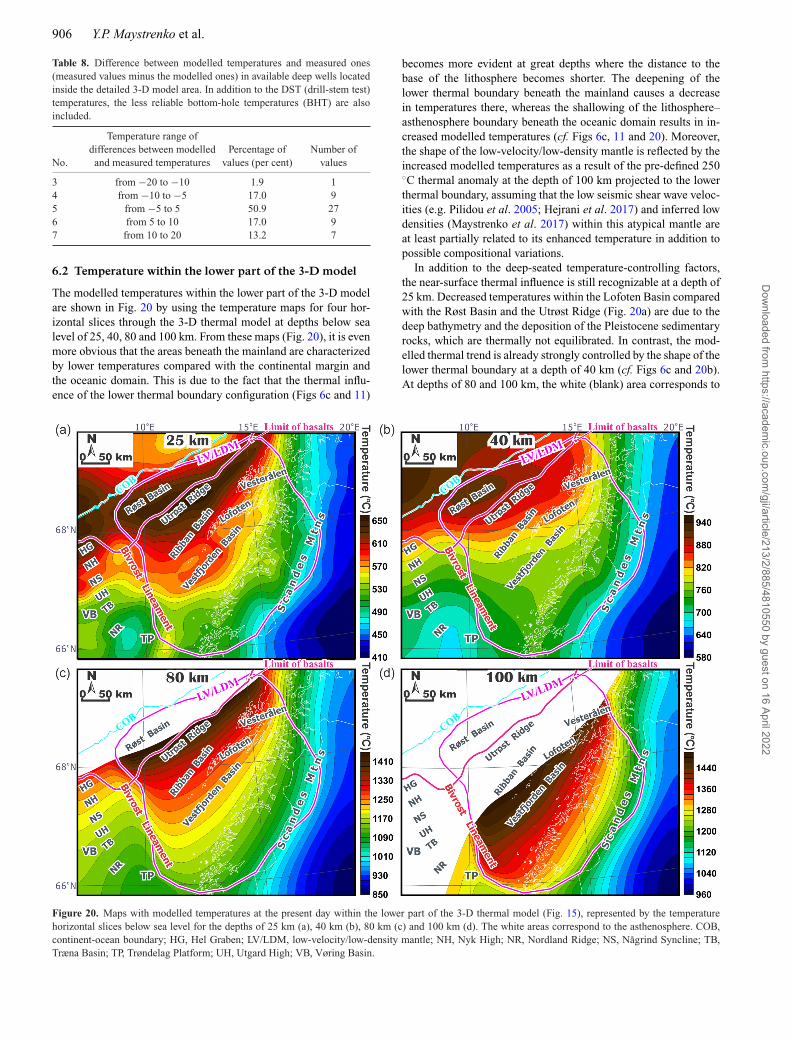
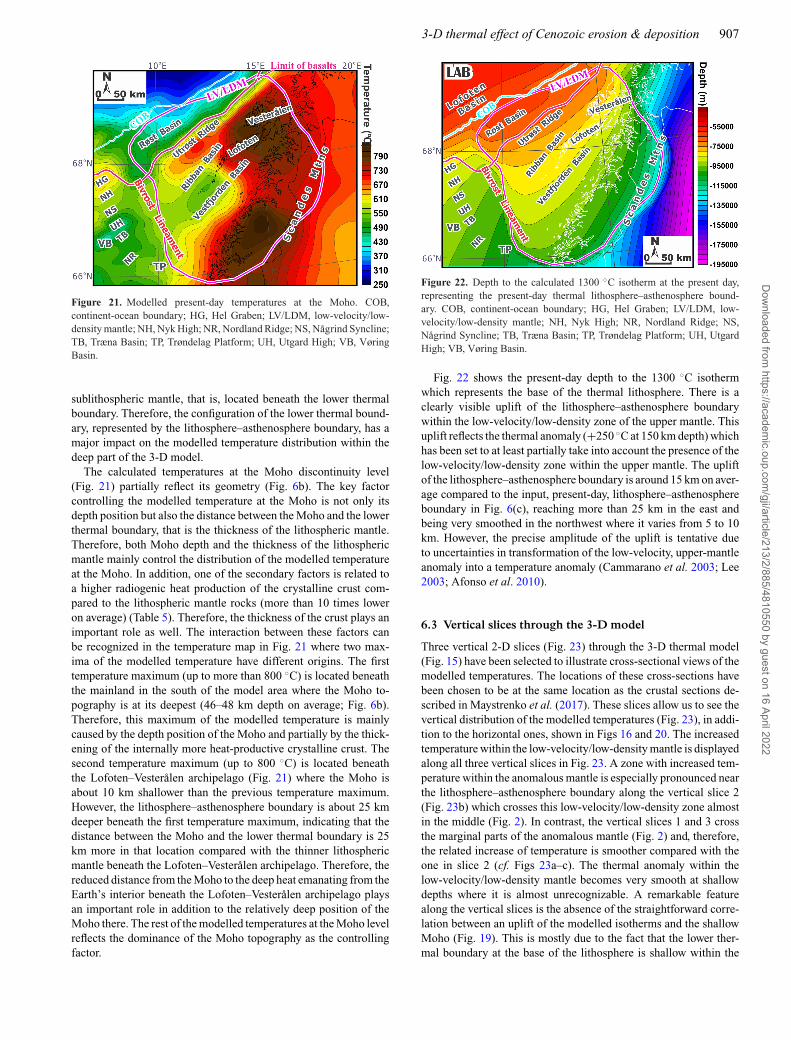
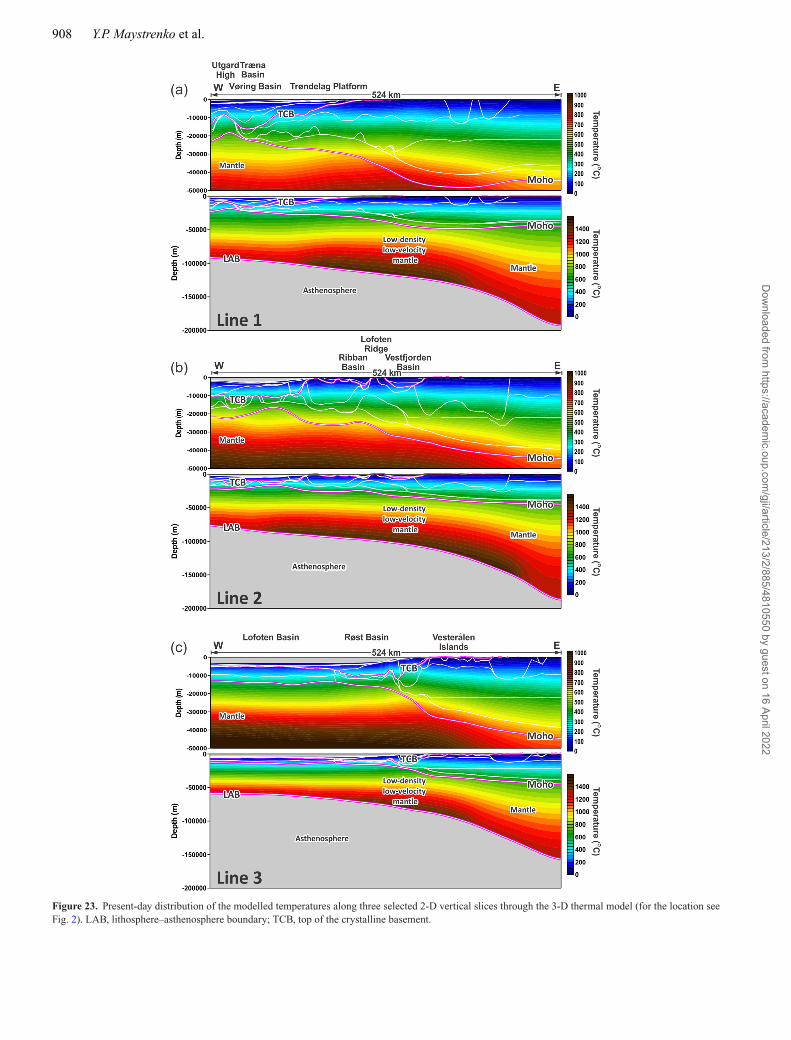
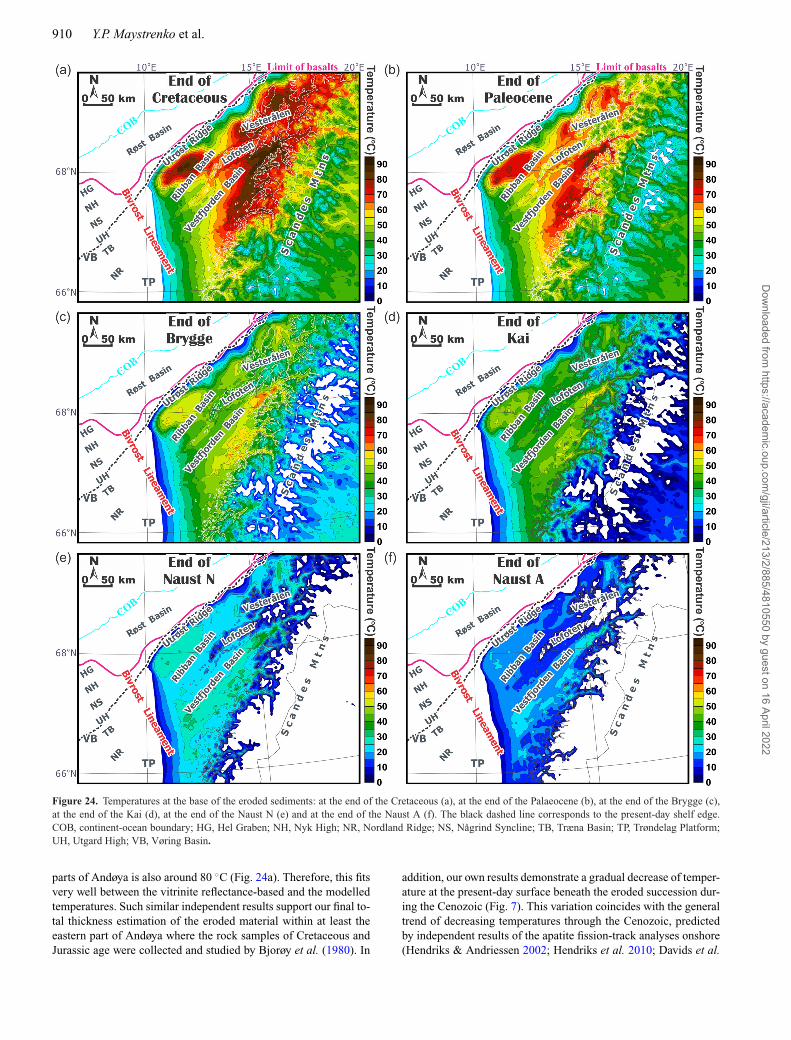
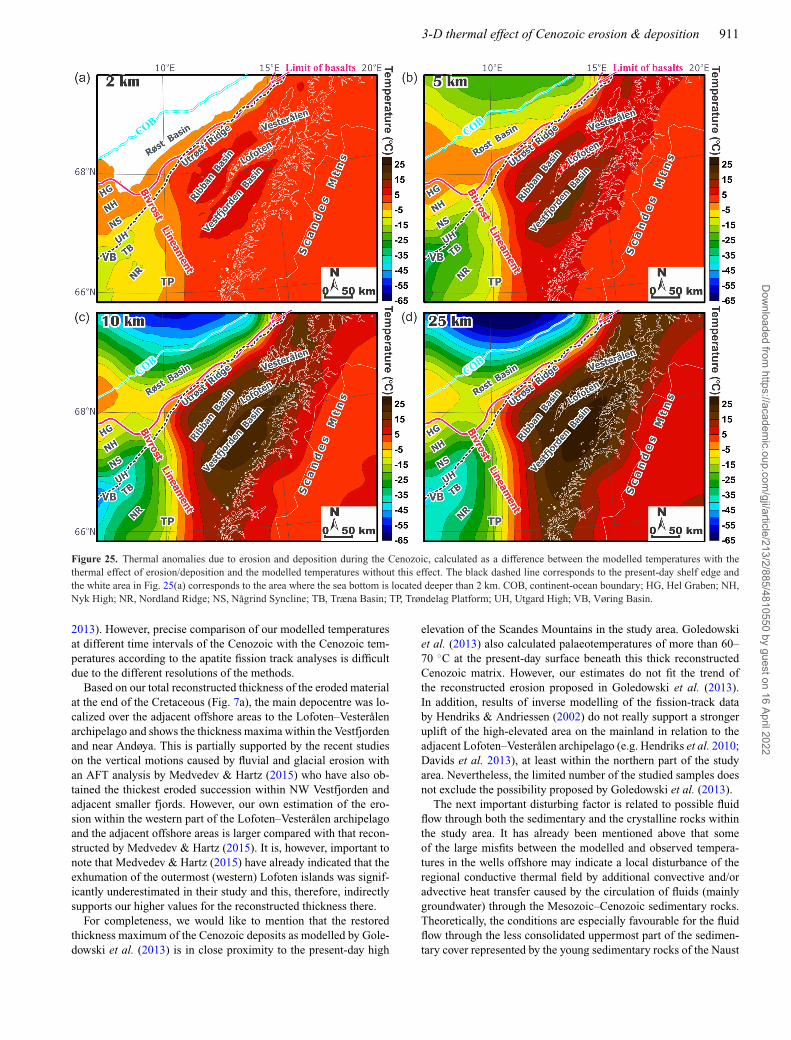
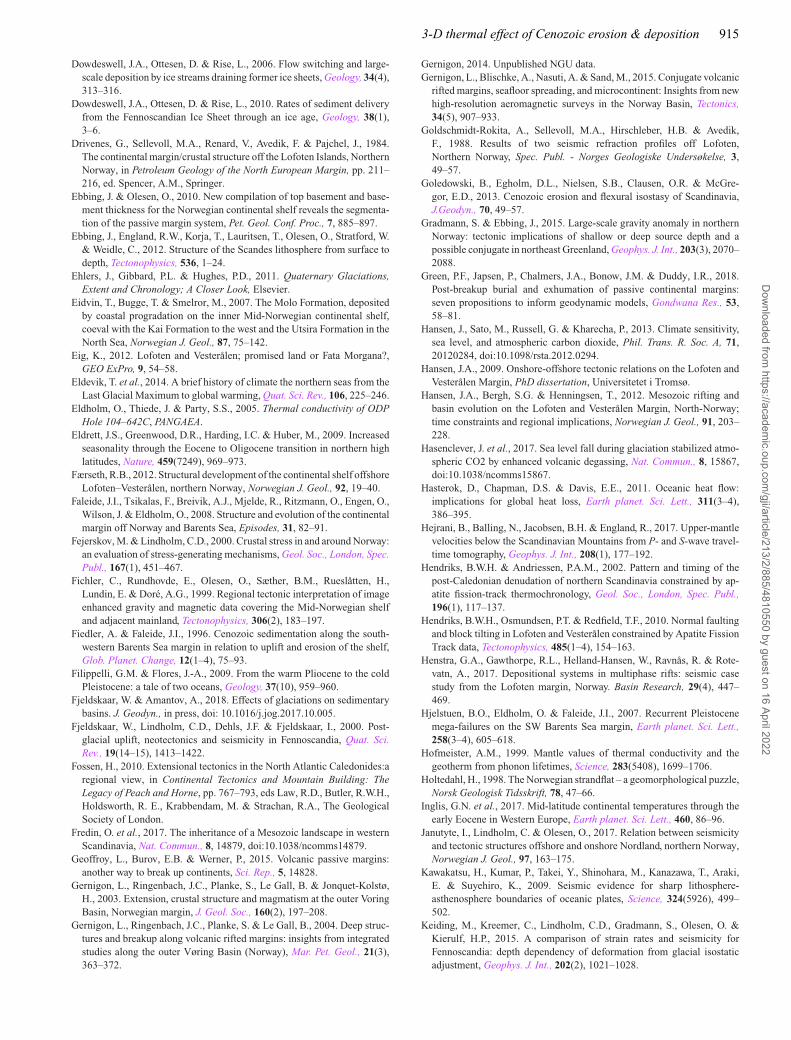