3-D Ear Modeling and Recognition From Video Sequences Using Shape From Shading
10
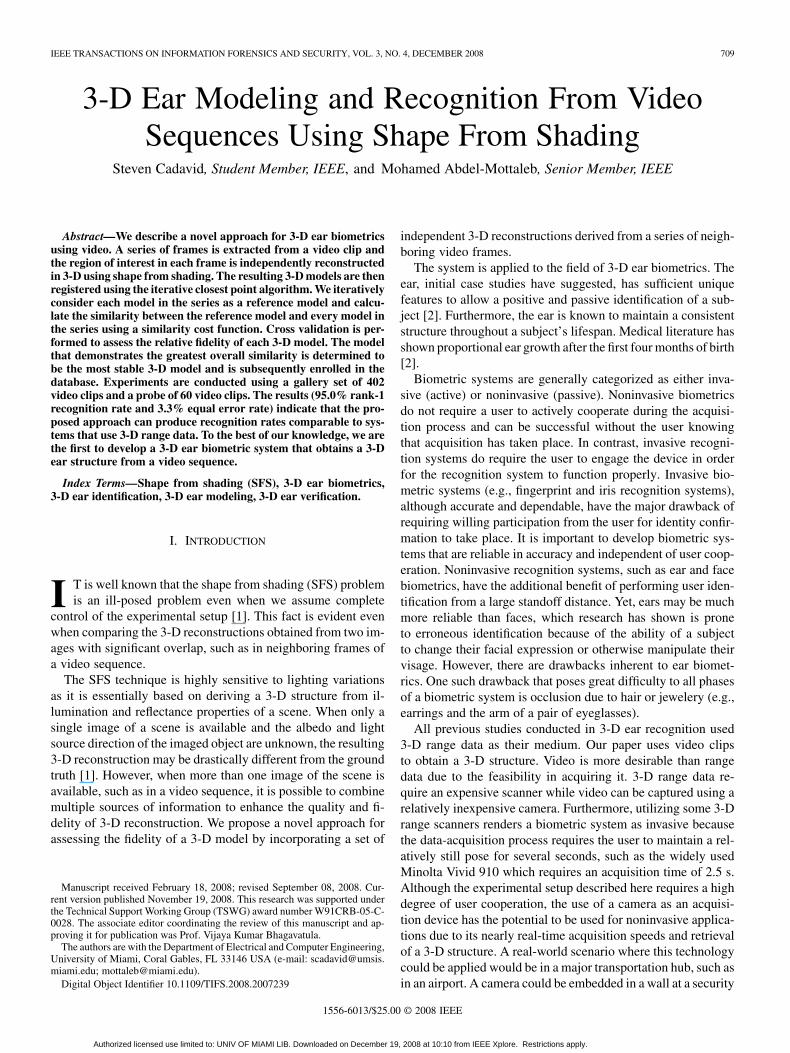
IEEE TRANSACTIONS ON INFORMATION FORENSICS AND SECURITY, VOL. 3, NO. 4, DECEMBER 2008 709 3-D Ear Modeling and Recognition From Video Sequences Using Shape From Shading Steven Cadavid, Student Member, IEEE, and Mohamed Abdel-Mottaleb, Senior Member, IEEE Abstract—We describe a novel approach for 3-D ear biometrics using video. A series of frames is extracted from a video clip and the region of interest in each frame is independently reconstructed in 3-D using shape from shading. The resulting 3-D models are then registered using the iterative closest point algorithm. We iteratively consider each model in the series as a reference model and calcu- late the similarity between the reference model and every model in the series using a similarity cost function. Cross validation is per- formed to assess the relative fidelity of each 3-D model. The model that demonstrates the greatest overall similarity is determined to be the most stable 3-D model and is subsequently enrolled in the database. Experiments are conducted using a gallery set of 402 video clips and a probe of 60 video clips. The results (95.0% rank-1 recognition rate and 3.3% equal error rate) indicate that the pro- posed approach can produce recognition rates comparable to sys- tems that use 3-D range data. To the best of our knowledge, we are the first to develop a 3-D ear biometric system that obtains a 3-D ear structure from a video sequence. Index Terms—Shape from shading (SFS), 3-D ear biometrics, 3-D ear identification, 3-D ear modeling, 3-D ear verification. I. INTRODUCTION I T is well known that the shape from shading (SFS) problem is an ill-posed problem even when we assume complete control of the experimental setup [1]. This fact is evident even when comparing the 3-D reconstructions obtained from two im- ages with significant overlap, such as in neighboring frames of a video sequence. The SFS technique is highly sensitive to lighting variations as it is essentially based on deriving a 3-D structure from il- lumination and reflectance properties of a scene. When only a single image of a scene is available and the albedo and light source direction of the imaged object are unknown, the resulting 3-D reconstruction may be drastically different from the ground truth [1]. However, when more than one image of the scene is available, such as in a video sequence, it is possible to combine multiple sources of information to enhance the quality and fi- delity of 3-D reconstruction. We propose a novel approach for assessing the fidelity of a 3-D model by incorporating a set of Manuscript received February 18, 2008; revised September 08, 2008. Cur- rent version published November 19, 2008. This research was supported under the Technical Support Working Group (TSWG) award number W91CRB-05-C- 0028. The associate editor coordinating the review of this manuscript and ap- proving it for publication was Prof. Vijaya Kumar Bhagavatula. The authors are with the Department of Electrical and Computer Engineering, University of Miami, Coral Gables, FL 33146 USA (e-mail: scadavid@umsis. miami.edu; [email protected]). Digital Object Identifier 10.1109/TIFS.2008.2007239 independent 3-D reconstructions derived from a series of neigh- boring video frames. The system is applied to the field of 3-D ear biometrics. The ear, initial case studies have suggested, has sufficient unique features to allow a positive and passive identification of a sub- ject [2]. Furthermore, the ear is known to maintain a consistent structure throughout a subject’s lifespan. Medical literature has shown proportional ear growth after the first four months of birth [2]. Biometric systems are generally categorized as either inva- sive (active) or noninvasive (passive). Noninvasive biometrics do not require a user to actively cooperate during the acquisi- tion process and can be successful without the user knowing that acquisition has taken place. In contrast, invasive recogni- tion systems do require the user to engage the device in order for the recognition system to function properly. Invasive bio- metric systems (e.g., fingerprint and iris recognition systems), although accurate and dependable, have the major drawback of requiring willing participation from the user for identity confir- mation to take place. It is important to develop biometric sys- tems that are reliable in accuracy and independent of user coop- eration. Noninvasive recognition systems, such as ear and face biometrics, have the additional benefit of performing user iden- tification from a large standoff distance. Yet, ears may be much more reliable than faces, which research has shown is prone to erroneous identification because of the ability of a subject to change their facial expression or otherwise manipulate their visage. However, there are drawbacks inherent to ear biomet- rics. One such drawback that poses great difficulty to all phases of a biometric system is occlusion due to hair or jewelery (e.g., earrings and the arm of a pair of eyeglasses). All previous studies conducted in 3-D ear recognition used 3-D range data as their medium. Our paper uses video clips to obtain a 3-D structure. Video is more desirable than range data due to the feasibility in acquiring it. 3-D range data re- quire an expensive scanner while video can be captured using a relatively inexpensive camera. Furthermore, utilizing some 3-D range scanners renders a biometric system as invasive because the data-acquisition process requires the user to maintain a rel- atively still pose for several seconds, such as the widely used Minolta Vivid 910 which requires an acquisition time of 2.5 s. Although the experimental setup described here requires a high degree of user cooperation, the use of a camera as an acquisi- tion device has the potential to be used for noninvasive applica- tions due to its nearly real-time acquisition speeds and retrieval of a 3-D structure. A real-world scenario where this technology could be applied would be in a major transportation hub, such as in an airport. A camera could be embedded in a wall at a security 1556-6013/$25.00 © 2008 IEEE Authorized licensed use limited to: UNIV OF MIAMI LIB. Downloaded on December 19, 2008 at 10:10 from IEEE Xplore. Restrictions apply.
Transcript of 3-D Ear Modeling and Recognition From Video Sequences Using Shape From Shading
IEEE TRANSACTIONS ON INFORMATION FORENSICS AND SECURITY, VOL. 3, NO. 4, DECEMBER 2008 709
3-D Ear Modeling and Recognition From VideoSequences Using Shape From Shading
Steven Cadavid, Student Member, IEEE, and Mohamed Abdel-Mottaleb, Senior Member, IEEE
Abstract—We describe a novel approach for 3-D ear biometricsusing video. A series of frames is extracted from a video clip andthe region of interest in each frame is independently reconstructedin 3-D using shape from shading. The resulting 3-D models are thenregistered using the iterative closest point algorithm. We iterativelyconsider each model in the series as a reference model and calcu-late the similarity between the reference model and every model inthe series using a similarity cost function. Cross validation is per-formed to assess the relative fidelity of each 3-D model. The modelthat demonstrates the greatest overall similarity is determined tobe the most stable 3-D model and is subsequently enrolled in thedatabase. Experiments are conducted using a gallery set of 402video clips and a probe of 60 video clips. The results (95.0% rank-1recognition rate and 3.3% equal error rate) indicate that the pro-posed approach can produce recognition rates comparable to sys-tems that use 3-D range data. To the best of our knowledge, we arethe first to develop a 3-D ear biometric system that obtains a 3-Dear structure from a video sequence.
Index Terms—Shape from shading (SFS), 3-D ear biometrics,3-D ear identification, 3-D ear modeling, 3-D ear verification.
I. INTRODUCTION
I T is well known that the shape from shading (SFS) problemis an ill-posed problem even when we assume complete
control of the experimental setup [1]. This fact is evident evenwhen comparing the 3-D reconstructions obtained from two im-ages with significant overlap, such as in neighboring frames ofa video sequence.
The SFS technique is highly sensitive to lighting variationsas it is essentially based on deriving a 3-D structure from il-lumination and reflectance properties of a scene. When only asingle image of a scene is available and the albedo and lightsource direction of the imaged object are unknown, the resulting3-D reconstruction may be drastically different from the groundtruth [1]. However, when more than one image of the scene isavailable, such as in a video sequence, it is possible to combinemultiple sources of information to enhance the quality and fi-delity of 3-D reconstruction. We propose a novel approach forassessing the fidelity of a 3-D model by incorporating a set of
Manuscript received February 18, 2008; revised September 08, 2008. Cur-rent version published November 19, 2008. This research was supported underthe Technical Support Working Group (TSWG) award number W91CRB-05-C-0028. The associate editor coordinating the review of this manuscript and ap-proving it for publication was Prof. Vijaya Kumar Bhagavatula.
The authors are with the Department of Electrical and Computer Engineering,University of Miami, Coral Gables, FL 33146 USA (e-mail: [email protected]; [email protected]).
Digital Object Identifier 10.1109/TIFS.2008.2007239
independent 3-D reconstructions derived from a series of neigh-boring video frames.
The system is applied to the field of 3-D ear biometrics. Theear, initial case studies have suggested, has sufficient uniquefeatures to allow a positive and passive identification of a sub-ject [2]. Furthermore, the ear is known to maintain a consistentstructure throughout a subject’s lifespan. Medical literature hasshown proportional ear growth after the first four months of birth[2].
Biometric systems are generally categorized as either inva-sive (active) or noninvasive (passive). Noninvasive biometricsdo not require a user to actively cooperate during the acquisi-tion process and can be successful without the user knowingthat acquisition has taken place. In contrast, invasive recogni-tion systems do require the user to engage the device in orderfor the recognition system to function properly. Invasive bio-metric systems (e.g., fingerprint and iris recognition systems),although accurate and dependable, have the major drawback ofrequiring willing participation from the user for identity confir-mation to take place. It is important to develop biometric sys-tems that are reliable in accuracy and independent of user coop-eration. Noninvasive recognition systems, such as ear and facebiometrics, have the additional benefit of performing user iden-tification from a large standoff distance. Yet, ears may be muchmore reliable than faces, which research has shown is proneto erroneous identification because of the ability of a subjectto change their facial expression or otherwise manipulate theirvisage. However, there are drawbacks inherent to ear biomet-rics. One such drawback that poses great difficulty to all phasesof a biometric system is occlusion due to hair or jewelery (e.g.,earrings and the arm of a pair of eyeglasses).
All previous studies conducted in 3-D ear recognition used3-D range data as their medium. Our paper uses video clipsto obtain a 3-D structure. Video is more desirable than rangedata due to the feasibility in acquiring it. 3-D range data re-quire an expensive scanner while video can be captured using arelatively inexpensive camera. Furthermore, utilizing some 3-Drange scanners renders a biometric system as invasive becausethe data-acquisition process requires the user to maintain a rel-atively still pose for several seconds, such as the widely usedMinolta Vivid 910 which requires an acquisition time of 2.5 s.Although the experimental setup described here requires a highdegree of user cooperation, the use of a camera as an acquisi-tion device has the potential to be used for noninvasive applica-tions due to its nearly real-time acquisition speeds and retrievalof a 3-D structure. A real-world scenario where this technologycould be applied would be in a major transportation hub, such asin an airport. A camera could be embedded in a wall at a security
1556-6013/$25.00 © 2008 IEEE
Authorized licensed use limited to: UNIV OF MIAMI LIB. Downloaded on December 19, 2008 at 10:10 from IEEE Xplore. Restrictions apply.
710 IEEE TRANSACTIONS ON INFORMATION FORENSICS AND SECURITY, VOL. 3, NO. 4, DECEMBER 2008
checkpoint and capture video of subjects passing by. The cap-tured video could then be analyzed by our algorithm for crowdmonitoring.
This paper is organized as follows: Section II presents re-lated work in ear biometrics. Section III describes the systemapproach and all of its processes. Section IV gives details onthe experimental setup. Section V reports experimental results.Finally, conclusions and future work are given in Section VI.
II. RELATED WORK
3-D ear biometrics is a relatively new area of research. Therehave been relatively few studies conducted, and as previouslymentioned, all related work has been based on ear models ac-quired using 3-D range scanners. To the best of our knowledge,we are the first to develop a 3-D ear-recognition system thatobtains a 3-D ear structure from a video sequence. In this sec-tion, we will review the literature on 3-D ear reconstruction frommultiple views, 2-D ear recognition, and 3-D ear recognition.
It is worth noting that a direct comparison between the perfor-mances of different systems is difficult and can, at times, be mis-leading. This is due to the fact that datasets may be of varyingsizes, the image resolution and the amount of occlusion con-tained within the region of interest (ROI) may be different, andsome may use a multiimage gallery for a subject while othersuse a single-image gallery.
Liu et al. [3] describe a 3-D ear-reconstruction techniqueusing multiple views. This method uses the fundamental ma-trix and motion estimation techniques to derive the 3-D shapeof the ear. The greatest difficulty of this approach is obtaininga set of reliable feature point correspondences due to the lackof texture on the ear surface. They first use the Harris cornercriteria to detect salient features in each image and apply cor-relation matching. Then, they use random sample consensus(RANSAC) [4] to eliminate outliers from the set of detected fea-tures. They report that automatically extracting feature pointsin this way yields poor results. Therefore, a semiautomatic ap-proach is taken that allows the user to manually relocate featurepoints that are poorly matched.
Burge and Burger [5], [6] presented one of the first ap-proaches in 2-D ear biometrics. They used graph-matchingtechniques on a Voroni diagram of curves extracted from aCanny edge map to perform subject identification. Hurley et al.proposed a method for performing ear recognition by detectingear wells and channels from a 2-D intensity image [7]. Theystate that each person’s ear contains wells and channels that areunique to each individual. By utilizing the locations of theseregions, one can successfully perform subject recognition.Chang et al. used principal component analysis (PCA) (i.e.,“Eigen-Ear”) to perform recognition [8]. They reported a rank-1recognition rate of 71.6%. Moreno et al. experimented withthree different techniques: identification using feature points,identification using morphology, and identification using com-pression networks [9]. Their gallery and probe sets consistedof 28 and 20 ear models from unique subjects, respectively.The neural-network approach, using a compression network,yielded the best result of 93% rank-1 recognition. Yuizono etal. developed an ear-recognition system that uses a geneticlocal search algorithm [10]. Their gallery consisted of three
separate images for each of the 110 unique individuals. In ad-dition, their probe set was comprised of three different imagesfor each of the 110 subjects. They claimed that their systemyielded 100% rank-1 recognition as well as 100% rejection forunknown subjects. Abdel-Mottaleb and Zhou presented a 2-Dear-recognition system using profile images obtained from stillcameras [11]. They extracted ridges and ravines, such as theear helix, for recognition purposes. The ridges identified in aprobe are then compared to those found in the gallery models.Alignment between a probe and a gallery model is performedusing Partial Hausdorff Distance. A gallery, consisting of asingle image from each of the 103 subjects, was used. Of those103 subjects, 29 of them had second and third images that wereused as probes. They claimed that out of 58 queries, 51 resultedin rank-1 recognition and four of the remaining seven querieswere within the first three matches. Mu et al. [12] described ageometrical approach to 2-D ear biometrics. They use a shapefeature vector of the outer ear and the structural feature vectorof the inner ear to represent a subject. They reported an 85%rank-1 recognition rate using this approach.
Chen and Bhanu presented an ear-recognition system using alocal surface patch (LSP) representation and the iterative closestpoint (ICP) algorithm [13]. They used 3-D ear-range imagesobtained from the University of California at Riverside (UCR)dataset as well as the Notre Dame collection. The UCR col-lection is comprised of 155 subjects with 902 images, whilethe Notre Dame collection is comprised of 302 subjects. Theyclaimed to have achieved a rank-1 recognition rate of 100%.Chen and Bhanu also developed an algorithm for ear matchingby using a two-step ICP approach [14]. The first step involveddetecting and aligning the helixes of the gallery and probe earmodels. Second, a series of affine transformations is applied tothe probe model to best align the two models. The root meansquare difference (RMSD) is used to measure the accuracy ofthe alignment. The identity of the gallery model that shares thesmallest RMSD value with the probe model is declared as theidentity of the probe model. They claimed that out of a databaseof 30 subjects, 28 of them were recognized correctly. They alsodeveloped a simple method of detecting an ear region from a 3-Drange image [15]. They claimed 91.5% correct detection with a2.52% false positive rate. Chen and Bhanu also presented a com-plete human recognition system for 3-D ear biometrics [16].
Yan and Bowyer presented an investigation of ear biometricsusing the largest database to date [17]. They experimentedwith several different approaches including the “Eigen-Ear”with 2-D intensity images, PCA on 3-D range images, Haus-dorff matching of edge images from range images, and ICPmatching of the 3-D data. Experimental results for the dif-ferent approaches included 63.8% rank-1 recognition for the“Eigen-Ear,” 55.3% for the 3-D range image PCA, 67.5% forthe Hausdorff matching, and 98.7% for the ICP matching.The ICP-based matching resulted in the best recognition rateof 98.7%. This approach also proved to be capable of goodscalability for large data sets. The database they used consistedof 300 subjects, each of which had at least two images taken ondifferent dates. Then, they tested their ICP-based approach onan extended data set consisting of 404 unique individuals. Theyclaimed a rank-1 recognition rate of 97.5%.
Authorized licensed use limited to: UNIV OF MIAMI LIB. Downloaded on December 19, 2008 at 10:10 from IEEE Xplore. Restrictions apply.

CADAVID AND ABDEL-MOTTALEB: 3-D EAR MODELING AND RECOGNITION 711
In our previous work [18], we presented two 3-D ear-recogni-tion systems using structure from motion (SFM) and SFS tech-niques, respectively. For the SFS system, only a single imageis used to derive the 3-D ear structure. The motivation of ourcurrent work is to determine whether the video frame selectedto undergo 3-D reconstruction has an effect on the recognitionperformance. In our previous work, image selection was per-formed manually and left up to the user to make a visual choiceon a frame that appeared adequate. Our aim in this paper is todevelop a systematic approach to select an optimal video framebased on a fidelity assessment measure.
For a review of further papers on ear, multimodal ear, and facebiometrics, refer to [19] and [20].
III. SYSTEM APPROACH
We present a novel approach for assessing the quality andfidelity of 3-D reconstruction based on a similarity cost func-tion that compares the angle between normals, the differencebetween curvature shape index, and the Euclidean distance be-tween a reference model and every model within a set. Theoverall fidelity of a 3-D model is represented in the form of asimilarity accumulator. First, a set of frames is extracted froma video clip. The ear region contained within each frame is lo-calized and segmented. The 3-D structure of each segmentedear region is then derived, and each resulting model is globallyaligned. A similarity between every model and all other modelsis computed based on the aforementioned cost function. The 3-Dmodel that exhibits the greatest overall similarity is determinedto be the most stable model in the set. Finally, a recognitionsystem is developed to test the viability of our approach. Thefollowing section will describe in detail the steps of the pro-posed system.
A. Video Frames Independently Reconstructed in 3-D UsingSFS
A video is comprised of a sequence of image frames where,normally, there is little content variation between neighboringframes. This redundancy can be utilized to assess the quality ofa video frame with respect to its neighboring frames. We obtainan independent 3-D reconstruction of the ear from each framein a sequence of frames. An SFS algorithm, developed by Tsaiand Shah [21] (for more details on the mathematical formulationof Tsai and Shah’s SFS method, refer to the Appendix), is usedto obtain the 3-D shape of the object from each video frame.The ill-posed nature of the SFS algorithm is apparent even be-tween the 3-D shapes derived from a pair of images with highredundancy, such as in neighboring video frames. These shapevariations can be caused by a variety of factors, including com-pression artifacts and changes in illumination. Our objective isto determine which independent 3-D reconstruction is the mostreliable and exhibits the greatest fidelity.
Prior to acquiring the 3-D structure for each frame in the set,a series of preprocessing steps is performed. First, the ear re-gion is segmented from each video frame. A segmentation al-gorithm, provided by West Virginia University (WVU) [22], isutilized to locate the ear region. First, a skin filter along with aseries of morphological operations is applied to the input image
Fig. 1. Ear segmentation process. (a) Original image. (b) Convex hull. (c) Bi-nary mask. (d) Segmented ear.
to detect image regions that represent skin. The Canny edge de-tector is then applied to the skin regions. To eliminate any super-fluous edges, a threshold is applied, which is obtained throughtraining. This is again followed by a series of mathematical mor-phological operations whose thresholds are obtained throughtraining. The output of this algorithm is a binary image and aconvex hull polygon constructed along the borders of the de-tected ear region. Fig. 1 shows an original image, the convexhull constructed around the borders of the identified ear region,the binary mask, and the final segmentation of the video frame.It should be noted that the black rectangular region occludingthe subject’s face is for the purpose of obscuring identity, and isnot due to any preprocessing.
Second, to reduce the blocky artifacts present in the videoframes, which are primarily caused by compression, a medianfilter (of size 7 7) is applied to each video frame. The medianfilter smoothes an image by replacing a pixel’s value by the me-dian of the values of the pixels surrounding it. By reducing theamount of noise in the video frame, the 3-D reconstruction ofthe object will result in a much smoother surface. Fig. 2 illus-trates the difference between the surface of a 3-D model thatwas reconstructed from an image without filtering and one withfiltering. From Fig. 2, it is apparent that the 3-D surface afterfiltering has a substantially smoother appearance.
At the end of this paper (Fig. 10), we present examples fromour database that show segmented ear regions from the videoframes that were selected to undergo 3-D reconstruction alongwith their corresponding 3-D models.
These models are then enrolled in the gallery and are subse-quently matched against the probes.
B. 3-D Model Registration
After obtaining the 3-D reconstruction of each video framewithin the series, the resulting 3-D models are globally alignedusing the ICP algorithm. Fig. 3 illustrates the 3-D reconstructionand global registration processes. To simplify visualizing the
Authorized licensed use limited to: UNIV OF MIAMI LIB. Downloaded on December 19, 2008 at 10:10 from IEEE Xplore. Restrictions apply.

712 IEEE TRANSACTIONS ON INFORMATION FORENSICS AND SECURITY, VOL. 3, NO. 4, DECEMBER 2008
Fig. 2. Effect of smoothing on surface reconstruction. (a) Without filtering. (b)With filtering.
Fig. 3. 3-D reconstruction and global registration.
global registration in Fig. 3 (right-hand side 3-D ear models),only the first two 3-D ear models are globally aligned.
C. Similarity Accumulator
The 3-D models independently derived from a set of imageframes generally share surface regions that consist of the sameshape. However, there are other surface regions that changeshape with varying frequency across the 3-D models. Wedevised a method for determining which 3-D model shares thegreatest shape similarity with respect to the rest of the 3-Dmodels in the set. A reference model is first chosen from themodel set and, as mentioned in the previous section, all othermodels are globally aligned to it. Suppose the model setconsists of models given by
(1)
where denotes the reference model. Initially, is setequal to . The similarity between and is computedusing a similarity cost function. The cost function, given by
(2)
Fig. 4. Creating the search window.
is comprised of three weighted terms that consider the Euclideandistance between surface points, the difference in angle betweennormals (Norm), and the difference between curvature shapeindex (Cur) [23]. The weighting coefficients ( , , and ) sumto one. The active-set algorithm [24]—a constrained nonlinearoptimization technique—was used to obtain an optimal set ofweighting coefficients. The area under the cumulative matchingcharacteristic (CMC) curve obtained from the recognition re-sults for a set of training ear models is used as the objective func-tion in the optimization. The optimal set of weights obtainedfrom the experimental results was , , and
. All experiments that are described in later sectionsused this optimal set of weights.
The three terms in (2) are further defined as
distance
Normnormal normal
(3)
The nearest surface point on to a surface point on isfound and a local search window is created around it. The searchwindow contains points that are within a small radial proximityto the nearest surface point found on . This concept is illus-trated in Fig. 4.
In (3), the term is the Euclidean distance between the ten-tative similar points on and the surface point on ; is theradius of the search space around the tentative similar points on
. The term finds the angle between normal1 (normalof surface point on ) and normal2 (normal of surface pointon ). The “ ” denotes the dot product between the normals.The term is a quantitative measure of the shape of a surfaceat a model point. , , and ,2 are the maximum andminimum principal curvatures of the surface points on and
, respectively (see the Appendix for further details on prin-cipal curvature). In (2), we can see that each term is always neg-ative; therefore, greater similarity means values that are closerto zero, and zero means identical models. Fig. 5 illustrates themaximum and minimum principal curvatures as well as the nor-mals of a sample 3-D ear model.
Authorized licensed use limited to: UNIV OF MIAMI LIB. Downloaded on December 19, 2008 at 10:10 from IEEE Xplore. Restrictions apply.
CADAVID AND ABDEL-MOTTALEB: 3-D EAR MODELING AND RECOGNITION 713
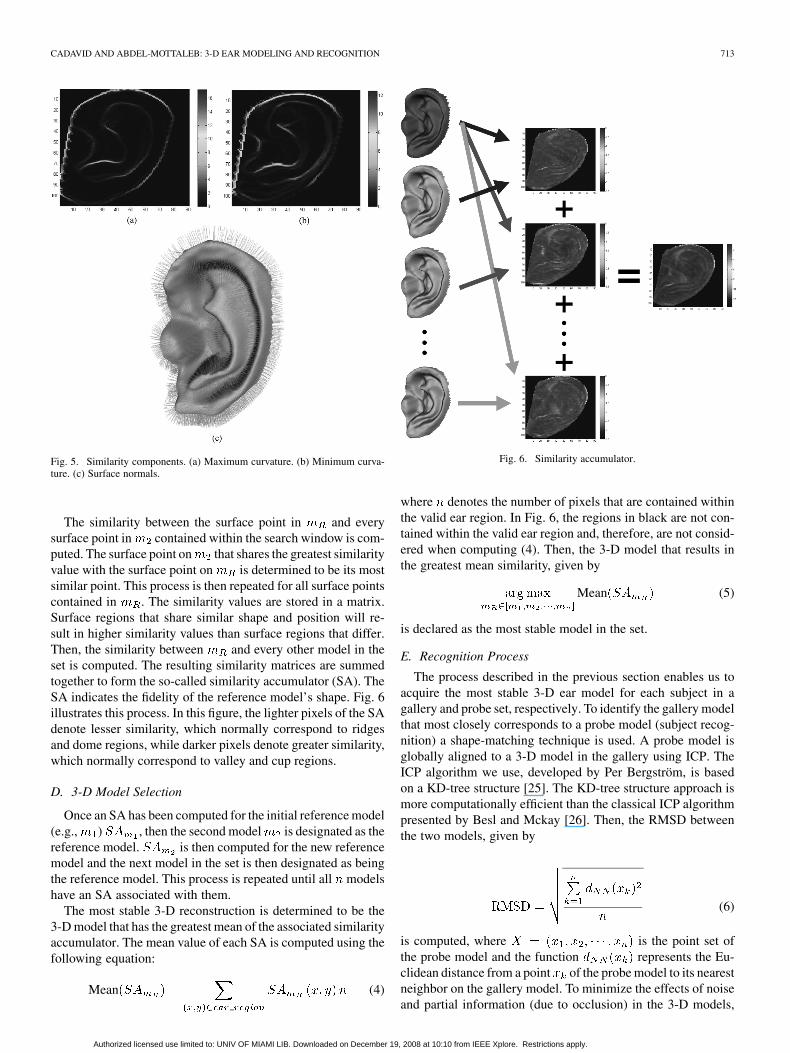
Fig. 5. Similarity components. (a) Maximum curvature. (b) Minimum curva-ture. (c) Surface normals.
The similarity between the surface point in and everysurface point in contained within the search window is com-puted. The surface point on that shares the greatest similarityvalue with the surface point on is determined to be its mostsimilar point. This process is then repeated for all surface pointscontained in . The similarity values are stored in a matrix.Surface regions that share similar shape and position will re-sult in higher similarity values than surface regions that differ.Then, the similarity between and every other model in theset is computed. The resulting similarity matrices are summedtogether to form the so-called similarity accumulator (SA). TheSA indicates the fidelity of the reference model’s shape. Fig. 6illustrates this process. In this figure, the lighter pixels of the SAdenote lesser similarity, which normally correspond to ridgesand dome regions, while darker pixels denote greater similarity,which normally correspond to valley and cup regions.
D. 3-D Model Selection
Once an SA has been computed for the initial reference model(e.g., ) , then the second model is designated as thereference model. is then computed for the new referencemodel and the next model in the set is then designated as beingthe reference model. This process is repeated until all modelshave an SA associated with them.
The most stable 3-D reconstruction is determined to be the3-D model that has the greatest mean of the associated similarityaccumulator. The mean value of each SA is computed using thefollowing equation:
Mean (4)
Fig. 6. Similarity accumulator.
where denotes the number of pixels that are contained withinthe valid ear region. In Fig. 6, the regions in black are not con-tained within the valid ear region and, therefore, are not consid-ered when computing (4). Then, the 3-D model that results inthe greatest mean similarity, given by
Mean (5)
is declared as the most stable model in the set.
E. Recognition Process
The process described in the previous section enables us toacquire the most stable 3-D ear model for each subject in agallery and probe set, respectively. To identify the gallery modelthat most closely corresponds to a probe model (subject recog-nition) a shape-matching technique is used. A probe model isglobally aligned to a 3-D model in the gallery using ICP. TheICP algorithm we use, developed by Per Bergström, is basedon a KD-tree structure [25]. The KD-tree structure approach ismore computationally efficient than the classical ICP algorithmpresented by Besl and Mckay [26]. Then, the RMSD betweenthe two models, given by
(6)
is computed, where is the point set ofthe probe model and the function represents the Eu-clidean distance from a point of the probe model to its nearestneighbor on the gallery model. To minimize the effects of noiseand partial information (due to occlusion) in the 3-D models,
Authorized licensed use limited to: UNIV OF MIAMI LIB. Downloaded on December 19, 2008 at 10:10 from IEEE Xplore. Restrictions apply.

714 IEEE TRANSACTIONS ON INFORMATION FORENSICS AND SECURITY, VOL. 3, NO. 4, DECEMBER 2008
only a certain percentage of surface points contribute to theRMSD. The distances between the point set and their nearestneighbors in the point set of the gallery model are sorted in as-cending order, and only a certain percentage, say, the top 90%,are considered. This process of aligning the probe model to agallery model and computing the distance is then repeated for allother 3-D models enrolled in the gallery. Ultimately, the iden-tity of the gallery model that has the smallest RMSD value isdeclared as the identity of the probe ear model.
IV. EXPERIMENTAL SETUP
We used a dataset of 462 video clips, collected by WVU,where in each clip the camera moves in a circular motion aroundthe subject’s face. The video clips were captured in an indoor en-vironment with controlled lighting conditions. The camera cap-tured a full profile of each subject’s face starting with the leftear and ending on the right ear by moving around the face whilethe subject sits still in a chair. The video clips have a frame res-olution of 640 480 pixels and are encoded using the UleadMCMP/MJPEG encoder [27].
Four-hundred two video clips contain unique subjects, whilethe remaining 60 video clips contain repeated subjects. Re-peated video clips (multiple video clips of the same subject)were all acquired on the same day. The 402 video clips wereenrolled in the gallery and the 60 video clips were used asprobes.
There are 135 gallery video clips that contain occlusionsaround the ear region. These occlusions occur in 42 clips wherethe subjects are wearing earrings, 38 clips where the upper halfof the ear is covered by hair, and 55 clips where the subjectsare wearing eyeglasses.
V. EXPERIMENTAL RESULTS
We conducted a series of experiments to evaluate the accu-racy and consistency of the system described before. First, wepresent our results and then we compare them to other state-of-the-art 3-D ear biometric systems. As mentioned earlier, to thebest of our knowledge, we are the only group to use video toobtain the 3-D ear structure. All other systems use a 3-D rangescanner in their acquisition stage.
We conducted an experiment to compare recognition perfor-mance when using 3-D models that are selected arbitrarily andmodels that are selected using the fidelity assessment methoddescribed in previous sections. First, we establish a set of videoframes that will be used for the 3-D reconstruction. In our exper-iments, we sampled six frames at intervals of 10 frames, whereeach frame has a clear view of the ear region. Since both thecamera’s movement around each subject’s head and the initialhead pose were the same across all captured videos, it was suffi-cient to select a general frame range (frames 375–425) where itis certain that the ear was at a frontal pose. For the sake of clarityin the following explanation, we will denote the frame by:
(7)
In the first experiment, we test the validity of the fidelity as-sessment approach. A series of six datasets is created, each one
Fig. 7. Mean CMC curves of different frames.
corresponding to a frame in . In dataset 1, all gallery and probemodels are created by three-dimensionally reconstructing frame
. Then, for dataset 2, all models are constructed from frame
. This process is then repeated for all remaining frames inframeset . Up to this point, each of the six created datasets iscomprised of models that were reconstructed from only framesthat correspond to the frame in . The selection of an arbi-trary frame is the simplest method because it does not requireany analysis. A seventh dataset, denoted by , is then added,which utilizes the fidelity assessment method to select an op-timal frame from for each subject. This means that in the sev-enth dataset, unlike the first six datasets, the model selected foreach subject does not necessarily have to be the same. For ex-ample, one subject could have their selected model derived fromframe and another subject’s model could have been derivedfrom frame ; it all depends on the relative quality/fidelity ofthe 3-D model. Seven datasets have now been created, whereeach dataset is comprised of a gallery and probe set. These sevendatasets, cumulatively labeled as data series 1, are all createdfrom frames that are contained within the frontal ear pose framerange (stated earlier as frames 375–425). Then, for only theprobe sets, a data series for each of five offaxis poses—5 , 10 ,15 , 20 , and 25 —is created using the same procedure as theone previously described, while the corresponding gallery setsare maintained at a frontal ear pose.
At this point, we have six data series, where each one corre-sponds to a particular offaxis pose plus the 0 pose. To measurethe overall validity of the fidelity assessment method, a seriesof cumulative match characteristic (CMC) curves is constructedfrom the created datasets. For example, a CMC curve foris computed from each of the six data series. These six CMCcurves are averaged out and a mean CMC curve for is ob-tained. A mean CMC curve is then constructed for each of theremaining frames in frameset , including SA, using the sameprocedure. Fig. 7 illustrates the results that were obtained.
Clearly, the mean CMC curve for the fidelity assessment ap-proach yields an overall higher recognition rate than arbitrarilyselecting any frame.
Authorized licensed use limited to: UNIV OF MIAMI LIB. Downloaded on December 19, 2008 at 10:10 from IEEE Xplore. Restrictions apply.
CADAVID AND ABDEL-MOTTALEB: 3-D EAR MODELING AND RECOGNITION 715
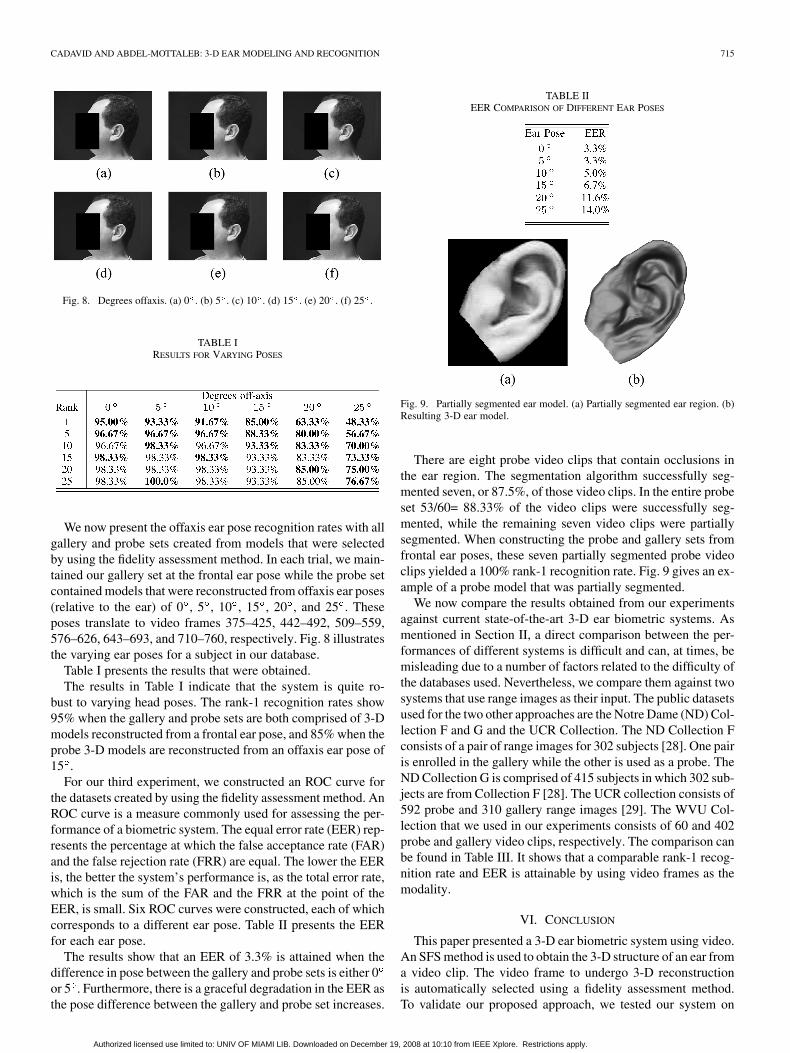
Fig. 8. Degrees offaxis. (a) 0 . (b) 5 . (c) 10 . (d) 15 . (e) 20 . (f) 25 .
TABLE IRESULTS FOR VARYING POSES
We now present the offaxis ear pose recognition rates with allgallery and probe sets created from models that were selectedby using the fidelity assessment method. In each trial, we main-tained our gallery set at the frontal ear pose while the probe setcontained models that were reconstructed from offaxis ear poses(relative to the ear) of 0 , 5 , 10 , 15 , 20 , and 25 . Theseposes translate to video frames 375–425, 442–492, 509–559,576–626, 643–693, and 710–760, respectively. Fig. 8 illustratesthe varying ear poses for a subject in our database.
Table I presents the results that were obtained.The results in Table I indicate that the system is quite ro-
bust to varying head poses. The rank-1 recognition rates show95% when the gallery and probe sets are both comprised of 3-Dmodels reconstructed from a frontal ear pose, and 85% when theprobe 3-D models are reconstructed from an offaxis ear pose of15 .
For our third experiment, we constructed an ROC curve forthe datasets created by using the fidelity assessment method. AnROC curve is a measure commonly used for assessing the per-formance of a biometric system. The equal error rate (EER) rep-resents the percentage at which the false acceptance rate (FAR)and the false rejection rate (FRR) are equal. The lower the EERis, the better the system’s performance is, as the total error rate,which is the sum of the FAR and the FRR at the point of theEER, is small. Six ROC curves were constructed, each of whichcorresponds to a different ear pose. Table II presents the EERfor each ear pose.
The results show that an EER of 3.3% is attained when thedifference in pose between the gallery and probe sets is either 0or 5 . Furthermore, there is a graceful degradation in the EER asthe pose difference between the gallery and probe set increases.
TABLE IIEER COMPARISON OF DIFFERENT EAR POSES
Fig. 9. Partially segmented ear model. (a) Partially segmented ear region. (b)Resulting 3-D ear model.
There are eight probe video clips that contain occlusions inthe ear region. The segmentation algorithm successfully seg-mented seven, or 87.5%, of those video clips. In the entire probeset 53/60= 88.33% of the video clips were successfully seg-mented, while the remaining seven video clips were partiallysegmented. When constructing the probe and gallery sets fromfrontal ear poses, these seven partially segmented probe videoclips yielded a 100% rank-1 recognition rate. Fig. 9 gives an ex-ample of a probe model that was partially segmented.
We now compare the results obtained from our experimentsagainst current state-of-the-art 3-D ear biometric systems. Asmentioned in Section II, a direct comparison between the per-formances of different systems is difficult and can, at times, bemisleading due to a number of factors related to the difficulty ofthe databases used. Nevertheless, we compare them against twosystems that use range images as their input. The public datasetsused for the two other approaches are the Notre Dame (ND) Col-lection F and G and the UCR Collection. The ND Collection Fconsists of a pair of range images for 302 subjects [28]. One pairis enrolled in the gallery while the other is used as a probe. TheND Collection G is comprised of 415 subjects in which 302 sub-jects are from Collection F [28]. The UCR collection consists of592 probe and 310 gallery range images [29]. The WVU Col-lection that we used in our experiments consists of 60 and 402probe and gallery video clips, respectively. The comparison canbe found in Table III. It shows that a comparable rank-1 recog-nition rate and EER is attainable by using video frames as themodality.
VI. CONCLUSION
This paper presented a 3-D ear biometric system using video.An SFS method is used to obtain the 3-D structure of an ear froma video clip. The video frame to undergo 3-D reconstructionis automatically selected using a fidelity assessment method.To validate our proposed approach, we tested our system on
Authorized licensed use limited to: UNIV OF MIAMI LIB. Downloaded on December 19, 2008 at 10:10 from IEEE Xplore. Restrictions apply.

716 IEEE TRANSACTIONS ON INFORMATION FORENSICS AND SECURITY, VOL. 3, NO. 4, DECEMBER 2008
TABLE IIIPERFORMANCE COMPARISON TO OTHER 3-D EAR BIOMETRIC SYSTEMS
Fig. 10. Three-dimensional ear model examples.
an ear video database consisting of a gallery set of 402 uniquesubjects and a probe set of 60 subjects. The results obtainedwith our fidelity assessment method achieved higher recognitionrates than any result obtained from selecting an arbitrary image.In addition, this method can be used for any application thatrequires selecting an image from a series of images to undergo3-D reconstruction using SFS.
We then conducted an experiment to test the system’s robust-ness to ear pose variations. We maintained our initial gallery setof frontal ear poses, and reconstructed our probe set from videoframes containing offaxis ear poses. We varied the offaxis anglebetween 0 (frontal ear pose) and 25 . The experimental resultswe obtained indicate that the system is, to some degree, robust topose variations. As the offaxis angle becomes greater, the recog-nition performance gracefully degrades.
The 3-D ear reconstruction approach presented in this paper,although not as accurate as 3-D range data, does produce 3-Dmodels that achieve recognition results comparable to those ofthe state of the art. Although the experimental setup presentedhere does require user cooperation, there is potential for devel-oping a noninvasive biometric system based on the proposedapproach. Furthermore, the cost of acquiring images or videois substantially lower than the cost of acquiring 3-D range im-agery.
The proposed fidelity assessment method for 3-D models canbe extended for use in other applications. Given an image se-quence of a rigid object, it is possible to use this method. Asexplained in Section III, the first stage involves segmenting andpreprocessing the ROI in each image of the sequence. Naturally,an alternative segmentation algorithm will need to be developedfor the particular object, or simply manual segmentation cantake place. Then, the remainder of the process is the same asdescribed earlier.
In the future, we will further improve our system’s robustnessto pose variations. Each 3-D model produced by our system isderived from a single video frame. In actuality, our 3-D rep-resentations are 2.5-D models because they capture the depthinformation from just a single view. Further improvements willinclude registering and integrating multiple 2.5-D views to con-struct the final 3-D model [31].
APPENDIX
A. Principal Curvature
Curvature at a given point is defined as having a magnitudeequal to the reciprocal of the radius of a circle that is tangent tothe given point. The curvature at point is also a vector pointingin the direction of that circle’s center. The curvature of a normalsurface in Euclidean 3-D space is measured by a linear oper-ator, known as a shape operator, which estimates the change inthe normal between sequential points. There are two quadraticforms used for analyzing a smooth surface known as the firstand second fundamental forms. The knowledge of these formsprovides analysis and classification for a regular surface shape.For a regular surface , and , representing the first andsecond fundamentals, respectively, are given by
(8)
(9)
Authorized licensed use limited to: UNIV OF MIAMI LIB. Downloaded on December 19, 2008 at 10:10 from IEEE Xplore. Restrictions apply.

CADAVID AND ABDEL-MOTTALEB: 3-D EAR MODELING AND RECOGNITION 717
where the subscripts of represent derivatives with respect tothe variables and/or . The equation for the shape operator isgiven by
(10)
When a 3-D manifold is sliced with a 2-D plane centered at apoint , a curve results from the intersection. The curvature ofthe resulting curve is known as a normal curvature to the point .As the plane is rotated, we find that there are an infinite numberof curves that result from the intersection of the rotating planeand the 3-D manifold. The collective curvatures of each curveare known as the normal curvatures at point . The maximumand minimum values of the normal curvature at a point on aregular surface are known as the principal curvatures. The di-rections in which they occur are called the principal directions.The principal curvatures are the eigenvalues of the shape oper-ator, while the principal directions are the eigenvectors to thosecorresponding curves.
B. Tsai and Shah’s Linear Shape From Shading Method
For a Lambertian surface, the brightness of a point isrelated to the gradients and by the following image irradianceequation:
(11)
where is a reflectance map that is dependent on the positionof the light source, and are partial derivatives of a surfacein the and directions, and is a constant that depends onthe albedo of the surface. The albedo of a surface is defined asthe fraction of incident sunlight that is reflected off the surface.An object which reflects most of its incoming sunlight appearsbright and has a high albedo while a surface that absorbs mostof its incoming sunlight appears dark and has a low albedo. Fora Lambertian surface, the reflectance map can be expressed as
(12)
where the incident light direction is . In our case, wehad a frontal light source, given by the direction [0 0 1].
Tsai and Shah’s method linearly approximates anddirectly by finite differences, given by
(13)
By using these approximations, we can rewrite (11) in the fol-lowing form:
(14)
where is a linear approximation of the reflectance map .Since our light source direction is assumed to be [0 0 1], we
could rewrite (14) as
(15)
Tsai and Shah’s method is a modified version of theNewton–Raphson method. The goal is to solve the systemfound in (14) by using the following iteration:
(16)
where
(17)
and and denote the two partial derivatives of .must abide by two constraints.
1) should be close to the value of ifis defined and 0, otherwise.
2) should head towards 0 as approaches .Ultimately, the values we obtain for are taken to be
the surface’s depth values.
ACKNOWLEDGMENT
The authors would like to thank The FBI Academy personnelfor their continuous feedback on this project.
REFERENCES
[1] E. Prados and O. Faugeras, “Shape from shading: A well-posedproblem?,” in Proc. IEEE Comput. Soc. Conf. Computer Vision andPattern Recognition, San Diego, CA, Jun. 2005, vol. 2, pp. 870–877.
[2] A. Ianarelli, “Ear identification,” in Forensic Identification Series.Fremont, CA: Paramount, 1989.
[3] H. Liu, J. Yan, and D. J. Zhang, “3D ear reconstruction attempts: Usingmulti-view,” Lect. Notes Control Inform. Sci., no. 345, pp. 578–583,Jan. 2006.
[4] M. Fischler and R. Bolles, “Random sample consensus: A paradigmfor model fitting with application to image analysis and automated car-tography,” Commun. ACM, vol. 24, pp. 381–395.
[5] M. Burge and W. Burger, “Ear biometrics,” in BIOMETRICS: PersonalIdentification in a Networked Society. Norwell, MA: Kluwer, 1998,pp. 273–286.
[6] M. Burge and W. Burger, “Ear biometrics in computer vision,” in Proc.Int. Conf. Pattern Recognition, 2002, pp. 822–826.
[7] D. Hurley, M. Nixon, and J. Carter, “Automatic ear recognition by forcefield transformations,” presented at the Inst. Elect. Eng. Colloq. VisualBiometrics, London, U.K., Jul. 2000.
Authorized licensed use limited to: UNIV OF MIAMI LIB. Downloaded on December 19, 2008 at 10:10 from IEEE Xplore. Restrictions apply.

718 IEEE TRANSACTIONS ON INFORMATION FORENSICS AND SECURITY, VOL. 3, NO. 4, DECEMBER 2008
[8] K. C. Chang, K. W. Bowyer, S. Sarkar, and B. Victor, “Comparison andcombination of ear and face images in appearance-based biometrics,”IEEE Trans. Pattern Anal. Mach. Intell., vol. 25, no. 9, pp. 1160–1165,Sep. 2003.
[9] B. Moreno, A. Sanchez, and J. Velez, “On the use of outer ear im-ages for personal identification in security applications,” in Proc. IEEEInt. Carnaham Conf. Security Technology, Madrid, Spain, 1999, pp.469–476.
[10] T. Yuizono, Y. Wang, K. Satoh, and S. Nakayama, “Study on indi-vidual recognition for ear images by using genetic local search,” inProc. Congr. Evolutionary Computation, Washington, DC, 2002, pp.237–242.
[11] M. Abdel-Mottaleb and J. Zhou, “A system for ear biometrics fromface profile images,” Int. J. Graphics, Vis. Image Process., pp. 29–34,2006.
[12] Z. Mu, L. Yuan, Z. Xu, D. Xi, and S. Qi, “Shape and structural featurebased ear recognition,” in Advances in Biometric Person Authentica-tion, ser. Lect. Notes Comput. Sci. New York: Springer, 2004, vol.3338, pp. 663–670.
[13] B. Bhanu and H. Chen, “Human ear recognition in 3D,” in Proc. Work-shop on Multimodal User Authentication, Santa Barbara, CA, 2003,pp. 91–98.
[14] H. Chen and B. Bhanu, “Contour matching for 3D ear recognition,” inProc. 7th IEEE Workshops on Application of ComputerVision, Breck-enridge, CO, 2005, pp. 123–128.
[15] H. Chen and B. Bhanu, “Human ear detection from side face range im-ages,” in Proc. Int. Conf. Pattern Recognition, Cambridge, U.K., 2004,pp. 574–577.
[16] H. Chen and B. Bhanu, “Human ear recognition in 3D,” IEEE Trans.Pattern Anal. Mach. Intell., vol. 29, no. 4, pp. 718–737, Apr. 2007.
[17] P. Yan and K. W. Bowyer, “Biometric recognition using 3D ear shape,”IEEE Trans. Pattern Anal. Mach. Intell., vol. 29, no. 8, pp. 1297–1308,Aug. 2007.
[18] S. Cadavid and M. Abdel-Mottaleb, “Human identification based on3D ear models,” in Proc. 1st IEEE Int. Conf. Biometrics: Theory, Ap-plications, and Systems, Washington, DC, Sep. 2007, pp. 1–6.
[19] A. K. Jain, P. J. Flynn, and A. Ross, Handbook of Biometrics. Berlin,Germany: Springer, 2007.
[20] D. J. Hurley, B. Arbab-Zavar, and M. S. Nixon, “The ear as a bio-metric,” presented at the European Signal Processing Conf., Poznan,Poland, 2007.
[21] P.-S. Tsai and M. Shah, “Shape from shading using linear approxima-tion,” Image Vis. Comput., vol. 12, no. 8, pp. 487–498, Oct. 1994.
[22] E. H. Said, A. Abaza, and H. Ammar, “Ear segmentation in color fa-cial images using mathematical morphology,” in Proc. 6th BiometricsSymp., Tampa, FL, 2008, pp. 29–34.
[23] Z. Mao, P. Siebert, P. Cockshott, and A. Ayoub, “Constructing densecorrespondences to analyze 3D facial change,” in Proc. 17th Int. Conf.Pattern Recognition, Cambridge, U.K., Aug. 2004, pp. 144–148.
[24] P. E. Gill, W. Murray, and M. H. Wright, Practical Optimization.London, U.K.: Academic, 1981.
[25] J. L. Bentley, “Multidimensional binary search trees used for associa-tive searching,” Commun. ACM, vol. 18, no. 9, pp. 509–517, Sep. 1975.
[26] P. J. Besl and N. D. McKay, “A method for registration of 3d shapes,”IEEE Trans. Pattern Anal. Mach. Intell., vol. 14, no. 2, pp. 239–256,Feb. 1992.
[27] Lead Technologies, Inc., MJPEG Video Codec by LEAD. [On-line]. Available: http://www.leadcodecs.com/Codecs/LEAD-MCMP-MJPEG.htm.
[28] K. Bowyer, Univ. Notre Dame Biometrics Database. [Online]. Avail-able: http://www.nd.edu/cvrl/UNDBiometricsDatabase.html.
[29] UCR, UCR Ear Range Image Database. [Online]. Available: http://vislab.ucr.edu/. 2006.
[30] P. Yan and K. W. Bowyer, “An automatic 3D ear recognition system,”presented at the 3rd Int. Symp. 3D Data Processing, Visualization andTransmission, Chapel Hill, NC, 2006.
[31] C. Dorai, G. Wang, A. K. Jain, and C. Mercer, “Registration and in-tegration of multiple object views for 3D model construction,” IEEETrans. Pattern Anal. Mach. Intell., vol. 20, no. 1, pp. 83–89, Jan. 1998.
[32] J. R. Tena, M. Hamouz, A. Hilton, and J. Illingworth, “A validatedmethod for dense non-rigid 3D face registration,” in Proc. IEEE Int.Conf. Video and Signal Based Surveillance, Sydney, Australia, Nov.2006, p. 81.
[33] L. Yuan and Z. Mu, “Ear recognition based on 2D images,” in Proc.IEEE Conf. Biometrics: Theory, Applications and Systems, Wash-ington, DC, 2007, pp. 1–5.
[34] M. Choras, “Perspective methods human identification: Ear biomet-rics,” Opto-Electronics Rev., vol. 16, no. 1, pp. 49–60, 2008.
[35] A. Sana, P. Gupta, and R. Purkai, “Ear biometrics: A new approach,” inAdvances in Pattern Recognition. Singapore: World Scientific, 2007,pp. 46–50.
[36] M. Choras, “Image feature extraction methods for ear biometrics—Asurvey,” in Proc. 6th Int. Conf. Computer Information Systems and In-dustrial Management Applications, Elk, Poland, 2007, pp. 261–265.
[37] D. J. Hurley, M. S. Nixon, and J. N. Carter, “Force field feature extrac-tion for ear biometrics,” Comput. Vis. Image Understand., pp. 491–512,2005.
Steven Cadavid (S’07) received the B.S. and M.S.degrees in electrical and computer engineeringfrom the University of Miami, Coral Gables, FL, in2005 and 2007, respectively, where he is currentlypursuing the Ph.D. degree in electrical and computerengineering.
His research interests include computer vision,image processing, and pattern recognition. His workcurrently focuses on recovering the 3-D structure ofa human ear from a video sequence.
Mohamed Abdel-Mottaleb (SM’03) received thePh.D. degree in computer science from the Univer-sity of Maryland, College Park, in 1993.
Currently, he is a Professor in the Department ofElectrical and Computer Engineering at the Univer-sity of Miami, Coral Gables. His research focuseson 3-D face recognition, dental biometrics, visualtracking, and human activity recognition. Prior tojoining the University of Miami from 1993 to 2000,he was with Philips Research, Briarcliff Manor, NY,where he was a Principal Member of the Research
Staff and a Project Leader, where he led several projects in image processingand content-based multimedia retrieval. He holds 20 U.S. patents and haspublished more than 85 journal and conference papers in the areas of imageprocessing, computer vision, and content-based retrieval. He is an associateeditor for the Pattern Recognition journal.
Authorized licensed use limited to: UNIV OF MIAMI LIB. Downloaded on December 19, 2008 at 10:10 from IEEE Xplore. Restrictions apply.