Aprende a convertir coordenadas geograficas en UTM y UTM en geograficas
Upload
khangminh22Category
view
1download
0

i
2nd Proceeding of Civil Engineering Volume 1- Structure and Materials
Volume 2- Construction Management, Geotechnics and Transportation
Volume 3- Environmental Engineering, Hydraulics and Hydrology
Published by Faculty of Civil Engineering
Universiti Teknologi Malaysia
81310 Johor Bahru
Johor, MALAYSIA
© Faculty of Civil Engineering, Universiti Teknologi Malaysia
Perpustakaan Negara Malaysia Catalaguing-in-Publication Data Printed in Malaysia
ISBN 978-967-2171-04-1
List of Editors 1. Dr. Norhisham Bin Bakhary
2. Dr. Nur Hafizah Abd Khalid
3. Dr. Libriati Zardasti
4. Dr. Kogila Vani Annammala
5. Dr. Eeydzah Aminudin
6. Dr. Nur Syamimi Zaidi
7. Dr. Mohd Ridza Mohd Haniffah
8. Dr. Roslida Abd.Samat
9. Datin Fauziah Kasim
10. Mrs. Normala Hashim
11. Dr. Ain Naadia Mazlan
No responsibility is assumed by the Publisher for any injury and/or any damage to persons or properties as a matter of products
liability, negligence or otherwise, or from any use or operation of any method, product, instruction, or idea contained in the material
herein.
Copyright © 2017 by Faculty of Civil Engineering, Universiti Teknologi Malaysia. All rights reserved. This publication is
protected by Copyright and permission should be obtained from the publisher prior to any prohibited reproduction, storage in a
retrieval system, or transmission in any form or by any means, electronic, mechanical, photocopying, recording, or likewise.
ii
PREFACE
We proudly present the first proceeding of civil engineering research work by our final year students
in the Faculty of Civil Engineering at University Teknologi Malaysia in session 2016/2017. These students
had undergone two semesters of final year project where literature reviews were carried out and proposals
were prepared during the first semester while the research projects were executed and final year project
reports were written up during the second semester. Each of the completed research project was presented by
the student before a panel of presentation that consisted of academic staff that are well versed in the
particular research area together with a representative from the industry. The final year project presentation
that was held on the 4th to 5th June 2017 allowed the dissemination of knowledge and results in theory,
methodology and application on the different fields of civil engineering among the audience and served as a
platform where any vague knowledge was clarified and any misunderstood theories, procedures and
interpretation of the research works were corrected.
All accepted technical papers have been submitted to peer-review by a panel of expert referees, and
selected based on originality, significance and clarity for the purpose of the proceeding. The quality of these
technical papers ranged from good to excellent, illustrating the experience and training of the young
researchers. We sincerely hope that the proceeding provides a broad overview of the latest research results
on related fields. The articles of the proceeding are published in three volumes and are organized in broad
categories as follows:
Volume 1- Structure and Materials
Volume 2- Construction Management, Geotechnics and Transportation
Volume 3- Environmental Engineering, Hydraulics and Hydrology
The review process was owing to the educational nature of the proceeding. We would like to express
our sincere gratitude to all the Technical Proceeding Committee members for their hard work, precious time
and endeavor preparing for the proceeding. Last but not least, we would like to thank each and every
contributing final year project students for their efforts and academic staff who serve as supervisors for their
support for this proceeding.
iii
TABLE OF CONTENT TITLE PAGE Editorial Boards i Preface ii Table of Content iii Structure Displacement Measurement of Structural Response Using Matlab Image Processing and Object .................................... 1 Dam Break Test for Scaled Down Dom-ino Flat Slab House Structural System ............................................................... 7 Seismic Test for Two Storey Dom-Ino Buildings ............................................................................................................ 13 Strength Development of Martian Concrete with 1mm Aggregate by using Hot-mixed Method .................................... 19 Modeling of FRP Confined HSC Column by Nonlinear Finite Element Method ............................................................ 25 Design and Reanalysis of Pile Cap with 4 Pile Groups due to Pile Failure ...................................................................... 31 Plane Stress Analysis of Structure with Known Nodal Displacements using Numerical Formulation ............................ 37 Optimum Analysis and Design of Cantilever Retaining Wall .......................................................................................... 42 Moment and Shear Coefficients of Continuous Beam Under Eurocode Loading Arrangement ...................................... 48 Flexural Behaviour of Reinforced Concrete Beam Using Cold-Formed C-Channel Section as Part of Reinforcement .. 53 Seismic Performance of Conventional Built-up Battened Column under Quasi-Static Cyclic Loading .......................... 59 Structural Behavior of Prefabricated Pad Footing System Designed Using Cold Formed Steel Lipped Channel Section .......................................................................................................................................................................................... 65 Structural Behaviour of 16th Storey Conventional and Diagrid Buildings Based on STAAD Pro ................................... 78 Influence of Different Configuration of Diagrid-frame System in Reducing the Lateral Displacement of Structures ..... 85 Section Properties Calculation by MATLAB Software of Lipped C Section ................................................................... 92 Structural Behaviour of Light Weight Steel Frame under Combined Gravity and Lateral Loadings ............................... 97 Parametric Study on The Structural Performance of Kenaf Sandwich Composites Using Finite Element Analysis ..... 102 Assessment of Existing Reinforced Concrete Shear Wall Subjected to the Earthquake Loading .................................. 108 Nonlinear Response of a Building under Soil Structure Interaction ............................................................................... 114 Analysis of Buckling behaviors of cold-formed steel C-section with Addition of Stiffeners Using CUFSM Software 120 The Effect of Placing Nominal Bar in the Compression Zone of a Singly Reinforced Concrete Section ...................... 126 Finite Element Analysis on Beam to Column Connection Cold-formed Steel ............................................................... 132 Analysis of Cold-Formed Steel Beam to Column Connection by Using Finite Element Method .................................. 137 Materials Compressive Strength of Concrete Containing High Volume of Ceramic Tile Waste Aggregate with Fly Ash ............ 143 Compressive Strength of Concrete Containing High Volume of Ceramic Waste ....................................................... 150 Modelling the Behaviour of Steel Fibre Reinforced Precast Concrete Beam-to-Column Connection ........................... 155 The properties of bottom ash foamed concrete as thermal reduction for decorative wall............................................... 162 Performance of Geopolymer Concrete Consisting Glass as Fine Aggregate Replacement ............................................ 167 Self-Healing Concrete-Potential Use of Effective Microorganism (EM) for Normal Concrete ..................................... 172 The Effect on Reactive Silica Concrete Containing Eggshell Powder on Pozzolanic Reaction ..................................... 177 Behaviour of Rice Husk - High Density Polyethylene (HDPE) Bio-composites Profile Decking Structure under Bending Load using Finite Element Modelling ............................................................................................................................ 183 Bond Stress between Deformed Steel Bar and Grout ..................................................................................................... 189 Compressive strength of concrete containing high volume of oil palm waste ................................................................ 195 The Hydration Effect on Reactive Silica Concrete Containing Eggshell Powder .......................................................... 201 Bond Strength Between Deformed Steel Reinforcement Bar and Fibre Reinforced Grout ............................................ 206 Performance of Self-Curing Concrete with Palm Oil Clinker as Fine Aggregate Replacement .................................... 211 Possibility of Using Seawater in Concrete Production ................................................................................................... 217 Behaviour of Rubber Concrete Cured in Seawater ......................................................................................................... 222 Mechanical Properties of Lightweight Foamed Concrete with 0.5% Polycarboxylic Ether Superplasticizer ................ 228 Effect of Coconut Fibres on the Mechanical Properties of the Concrete ........................................................................ 234 Mechanical Properties of Locally Treated Bamboo ....................................................................................................... 240 The Strength Development of Martian Concrete with maximum Aggregate 5 mm using Cold and Hot mix Method ... 248 Experimental Investigation of Long Interlocking Brick Column Subjected to Eccentric Load ..................................... 254

1
Displacement Measurement of Structural Response Using Matlab Image Processing and Object
Lim Yee Chih1, Ahmad Razin Zainal Abidin2, Ahmad Kueh Beng Hong3 Faculty of Civil Engineering, Universiti Teknologi Malaysia, Malaysia
[email protected], [email protected]
Keywords: Non-contact Measurement; Digital Image Processing; Object Tracking; MATLAB; Circular Hough Transform Technique; Kanade-Lucas-Tomasi Feature Tracker.
ABSTRACT. This paper presents a non-contact measurement method to measure displacements of a structural response, which is based on digital image processing and object tracking techniques. This method utilises MATLAB programming, which has been developed through three phases; object detection, calibration, and object tracking. For the object detection and calibration algorithms, Circular Hough Transform (CHT) technique is adopted, while for the object tracking algorithm, the Kanade-Lucas-Tomasi (KLT) feature tracker is employed. Videos are acquired through a vision-based system using a smartphone camera, and then they are analysed and interpreted using the developed program to obtain measurement data. The relationship between parameters of video resolution, distance between objects to camera and radius of target is established for guideline purposes. In order to evaluate the accuracy and reliability of this approach, parametric studies were carried out and the obtained results were compared against the ones provided by the conventional approach using a dial gauge. In overall, the computed results show a good agreement with the actual results with relatively small differences. This makes the proposed alternative method as a simple and cost-effective method yet provides favourable characterisation outcomes.
INTRODUCTION
Image processing and object tracking techniques, are both hybrid of the vision-based and computer-assisted system, where images or videos are acquired before analysed with the aid of a computer. Object tracking requires the detection of objects to initialize the tracking while the detection part is performed by image processing approach. These techniques adopt the concept of photogrammetry, in which the data and information are extracted from the images or videos for further analysis. The integration of image processing and object tracking implies a great potential to be further improved and developed for its practical capability in different areas.
Problem Statement The application of image processing and object tracking techniques in structural analysis is as yet limited and uncommon. Although there is an increase in the number of research studies in the structural analysis field, there remain many research questions and uncertainties that need to be clarified; How does a thorough process perform in extracting the data and information from images or videos by using programming algorithms? Would the results of this method be accurate and reliable like theoretical and experimental testing? To what extent can this method be applied and its limitation?
Moreover, the uses of image processing and computer vision system toolbox in programming are also very general. There are indeed many ways to perform the image processing and object tracking depending on the data and outcome desired. However, the algorithms have not been standardized and hence not application-friendly. Thus, there is a need for a dedicated program to be developed for the ease of accomplishing the task.
Objectives The main purpose of the research is to study the feasibility of developing a programming tool for analysing structures using a simple photogrammetric method with the use of smartphone digital camera technology and MATLAB software. The objectives of this study are:
1. To identify the available photogrammetric methods in engineering applications particularly in structural analysis problem;
2. To develop an image processing and object tracking model in detecting and tracking multiple nodal displacements of a structure using MATLAB programming, and;
3. To determine the accuracy and the reliability of the developed model through a parametric study. Scope of Study The study applies the concept of low-budget photogrammetric technique where the hardware and the software used are cost-effective and user-friendly. The study considers only 1-dimensional (1D) static analysis of structural problems where the structure is devised so that the displacements are in one direction only. The structure is assumed to be linear elastic with reasonably small deformation. The initiative of the study is to discover and explore photogrammetric
2
method as a new technique in structural analysis that could replace the conventional measurement method and yet provides a reasonable accuracy.
The study utilises the available image processing and computer vision system toolbox in MATLAB software to acquire, collect, and analyse data from the captured images and videos. This also involves the development of programming codes in order to achieve the objectives of the study.
LITERATURE REVIEW
The science of acquiring, measuring, and interpreting the information about the characteristics of objects without any physical contact with the objects is called photogrammetry [1]. Photogrammetry is a measuring technique which uses numerous photographs of the same target but different views, to establish and provide a 3-dimensional coordinate of unknown points [2]. The professional equipment for photogrammetry, such as professional metric camera, CCD camera, and photogrammetry software is very costly and require a high level of photogrammetry knowledge. A low budget photogrammetry system, which refers to the combination of simple, available and cost-effective hardware and software, for geotechnical laboratories applications was developed by Thomas and Canre [3]. A digital rectifier (DIRECT) system, which is a combination of image processing and photogrammetric system with low-cost hardware, powerful software and user-friendly interfaces, had been presented at the early development stage of image processing [4].
There is a significant growth of the practice and application of image processing in a wide variety of the disciplines, particularly in the science and technology fields. Image processing is commonly used in medicine and biology for inspection and interpretation of images produced by X-rays, MRI or CAT scans and analysis of the cell images, in agriculture for quality inspection and classification of fruits and vegetables, in industrial areas for automatic inspection and control of the items on a production line. In law enforcement, it is used for fingerprint analysis and sharpening the speed-camera images [5]. Apart from that, the capability and feasibility of image processing techniques are being studied in the field of civil engineering, including in structural, material, geotechnical, and highway applications.
Despite obtaining information from a digital image, sometimes facts are also required to extract from the video. Image processing however, cannot perform the video processing and analysis unless the video is converted to numerous frames and interpreted one-by-one with the penalty of high time consumption. Hence, object tracking is introduced to overcome this drawback. Object tracking is the process of locating object of interest over time across multiple frames whereas object detection is the process of locating the object or multiple objects in a single frame [6]. Object tracking emerges to be one of the most important components in lots of application of computer vision, including surveillance, traffic control and medical imaging. Object tracking algorithm cannot perform alone without the affiliation of object detection. Kanade-Lucas-Tomasi (KLT) method is a feature-tracking algorithm. The pioneers in developing KLT tracker are Lucas and Kanade [7]. The associated early work was developed fully by Tomasi and Kanade [8], and was further modified by Shi and Tomasi [9]. KLT tracker performs the tracking task based on three basic assumptions: constant brightness, small increments in motion, and spatially coherent. Lots of researches have been made based on KLT tracker. For instance, a robust framework for human upper-body tracking in an indoor environment for security surveillance system using KLT feature aided by Kalman filter approach to predict and estimate the best tracked path of KLT tracking results was proposed [10].
MATLAB is a high-level programming language that provides a great platform for millions of engineers and scientists to solve the high complexity problems as it synthesises math, graphics, and programming in an interactive desktop environment. In addition, there is a variety of add-on toolboxes available to cover the application in multiples disciplines, such as image processing and computer vision toolbox. The integration of tools and capabilities of MATLAB makes it a simple and productive software.
METHODOLOGY
This research consisted of three key activities; development of MATLAB program, simple experimental testing set-up, and parametric studies. Development of MATLAB Program There are three phases in the development of a MATLAB programming, which are objects detection in an image, calibration of the object size in the image with real object and finally objects tracking in a series of images (a video). For object detection phase, image processing technique was employed where an image with a single point was tested initially and then increased to multi-points, whereas in object tracking phase, the algorithm was improved to enable it to detect and track moving objects instead of detecting static objects only. For this purpose, the object tracker toolbox (available in computer vision system toolbox in MATLAB) is adopted.
Simple Experimental Testing Set-Up A strut of size 650 × 25 × 3 mm with both fixed-end condition was prepared and set-up in the structure teaching laboratory, Faculty of Civil Engineering, University Teknologi Malaysia. A vision-based system composed of a tripod, a portable and easy-to-install smartphone camera was formed to generate videos for measuring displacements of strut
3
specimen. A black cardboard was used as a backdrop to facilitate the detection and tracking process as it minimizes the interference of the video acquired compared to other background colour as well as free from shadow images. The surface of the strut was attached with orange colour adhesive targets, which are circular shape with 19mm diameter. The adhesive markers represent the points of interest used to obtain the nodal displacements of the strut when the load is applied. The factors, such as lighting, distance from the strut surface, and angle during the video recording were kept constant and the direction of the camera was perpendicular to the strut surface. A series of videos in various resolutions were generated when the strut was loaded in small increments from the beginning to the end of the test.
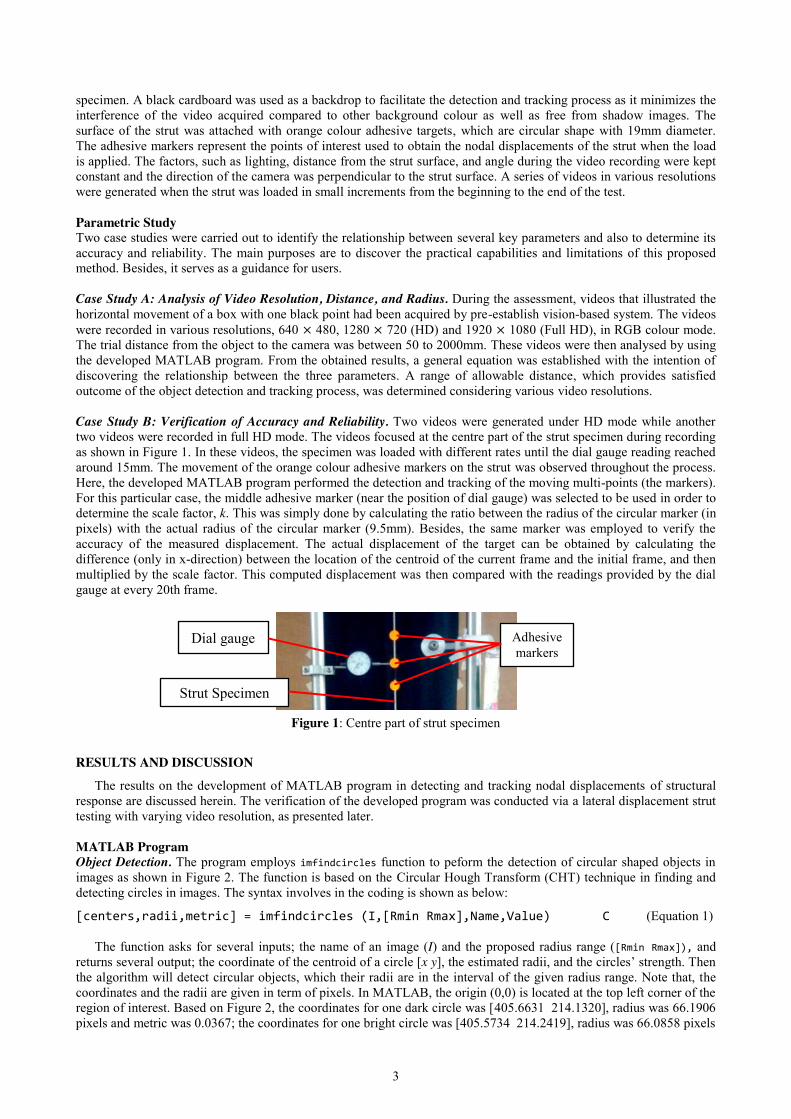
Parametric Study Two case studies were carried out to identify the relationship between several key parameters and also to determine its accuracy and reliability. The main purposes are to discover the practical capabilities and limitations of this proposed method. Besides, it serves as a guidance for users. Case Study A: Analysis of Video Resolution, Distance, and Radius. During the assessment, videos that illustrated the horizontal movement of a box with one black point had been acquired by pre-establish vision-based system. The videos were recorded in various resolutions, 640 × 480, 1280 × 720 (HD) and 1920 × 1080 (Full HD), in RGB colour mode. The trial distance from the object to the camera was between 50 to 2000mm. These videos were then analysed by using the developed MATLAB program. From the obtained results, a general equation was established with the intention of discovering the relationship between the three parameters. A range of allowable distance, which provides satisfied outcome of the object detection and tracking process, was determined considering various video resolutions. Case Study B: Verification of Accuracy and Reliability. Two videos were generated under HD mode while another two videos were recorded in full HD mode. The videos focused at the centre part of the strut specimen during recording as shown in Figure 1. In these videos, the specimen was loaded with different rates until the dial gauge reading reached around 15mm. The movement of the orange colour adhesive markers on the strut was observed throughout the process. Here, the developed MATLAB program performed the detection and tracking of the moving multi-points (the markers). For this particular case, the middle adhesive marker (near the position of dial gauge) was selected to be used in order to determine the scale factor, k. This was simply done by calculating the ratio between the radius of the circular marker (in pixels) with the actual radius of the circular marker (9.5mm). Besides, the same marker was employed to verify the accuracy of the measured displacement. The actual displacement of the target can be obtained by calculating the difference (only in x-direction) between the location of the centroid of the current frame and the initial frame, and then multiplied by the scale factor. This computed displacement was then compared with the readings provided by the dial gauge at every 20th frame.
Figure 1: Centre part of strut specimen
RESULTS AND DISCUSSION
The results on the development of MATLAB program in detecting and tracking nodal displacements of structural response are discussed herein. The verification of the developed program was conducted via a lateral displacement strut testing with varying video resolution, as presented later.
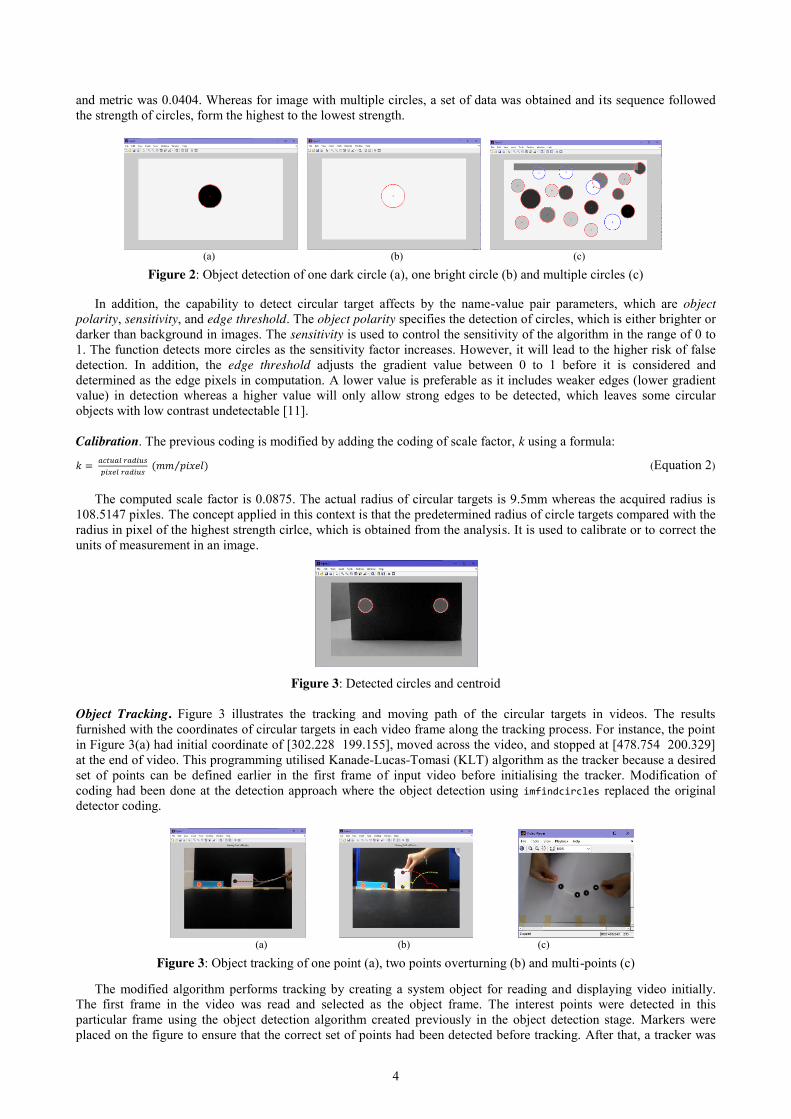
MATLAB Program Object Detection. The program employs imfindcircles function to peform the detection of circular shaped objects in images as shown in Figure 2. The function is based on the Circular Hough Transform (CHT) technique in finding and detecting circles in images. The syntax involves in the coding is shown as below:
[centers,radii,metric] = imfindcircles (I,[Rmin Rmax],Name,Value) C (Equation 1) The function asks for several inputs; the name of an image (I) and the proposed radius range ([Rmin Rmax]), and
returns several output; the coordinate of the centroid of a circle [x y], the estimated radii, and the circles’ strength. Then the algorithm will detect circular objects, which their radii are in the interval of the given radius range. Note that, the coordinates and the radii are given in term of pixels. In MATLAB, the origin (0,0) is located at the top left corner of the region of interest. Based on Figure 2, the coordinates for one dark circle was [405.6631 214.1320], radius was 66.1906 pixels and metric was 0.0367; the coordinates for one bright circle was [405.5734 214.2419], radius was 66.0858 pixels
Dial gauge Adhesive markers
Strut Specimen
4
and metric was 0.0404. Whereas for image with multiple circles, a set of data was obtained and its sequence followed the strength of circles, form the highest to the lowest strength.
(a) (b) (c)
Figure 2: Object detection of one dark circle (a), one bright circle (b) and multiple circles (c) In addition, the capability to detect circular target affects by the name-value pair parameters, which are object
polarity, sensitivity, and edge threshold. The object polarity specifies the detection of circles, which is either brighter or darker than background in images. The sensitivity is used to control the sensitivity of the algorithm in the range of 0 to 1. The function detects more circles as the sensitivity factor increases. However, it will lead to the higher risk of false detection. In addition, the edge threshold adjusts the gradient value between 0 to 1 before it is considered and determined as the edge pixels in computation. A lower value is preferable as it includes weaker edges (lower gradient value) in detection whereas a higher value will only allow strong edges to be detected, which leaves some circular objects with low contrast undetectable [11].
Calibration. The previous coding is modified by adding the coding of scale factor, k using a formula:
𝑘 = 𝑎𝑐𝑡𝑢𝑎𝑙 𝑟𝑎𝑑𝑖𝑢𝑠𝑝𝑖𝑥𝑒𝑙 𝑟𝑎𝑑𝑖𝑢𝑠
(𝑚𝑚 𝑝𝑖𝑥𝑒𝑙)⁄ (Equation 2)
The computed scale factor is 0.0875. The actual radius of circular targets is 9.5mm whereas the acquired radius is 108.5147 pixles. The concept applied in this context is that the predetermined radius of circle targets compared with the radius in pixel of the highest strength cirlce, which is obtained from the analysis. It is used to calibrate or to correct the units of measurement in an image.
Figure 3: Detected circles and centroid
Object Tracking. Figure 3 illustrates the tracking and moving path of the circular targets in videos. The results furnished with the coordinates of circular targets in each video frame along the tracking process. For instance, the point in Figure 3(a) had initial coordinate of [302.228 199.155], moved across the video, and stopped at [478.754 200.329] at the end of video. This programming utilised Kanade-Lucas-Tomasi (KLT) algorithm as the tracker because a desired set of points can be defined earlier in the first frame of input video before initialising the tracker. Modification of coding had been done at the detection approach where the object detection using imfindcircles replaced the original detector coding.
(a) (b) (c)
Figure 3: Object tracking of one point (a), two points overturning (b) and multi-points (c) The modified algorithm performs tracking by creating a system object for reading and displaying video initially.
The first frame in the video was read and selected as the object frame. The interest points were detected in this particular frame using the object detection algorithm created previously in the object detection stage. Markers were placed on the figure to ensure that the correct set of points had been detected before tracking. After that, a tracker was
5
created and initialized based on the assigned detected points in the object frame. The tracker reads, tracks, demonstrates points and results in each video frame.
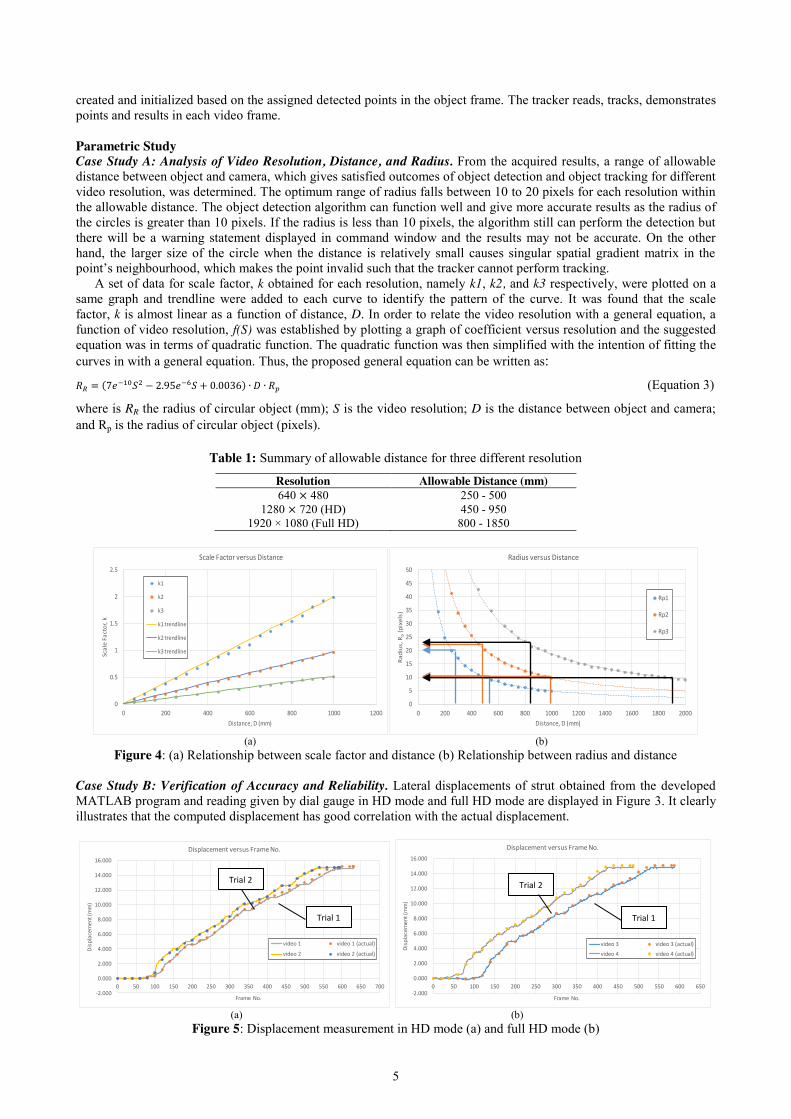
Parametric Study Case Study A: Analysis of Video Resolution, Distance, and Radius. From the acquired results, a range of allowable distance between object and camera, which gives satisfied outcomes of object detection and object tracking for different video resolution, was determined. The optimum range of radius falls between 10 to 20 pixels for each resolution within the allowable distance. The object detection algorithm can function well and give more accurate results as the radius of the circles is greater than 10 pixels. If the radius is less than 10 pixels, the algorithm still can perform the detection but there will be a warning statement displayed in command window and the results may not be accurate. On the other hand, the larger size of the circle when the distance is relatively small causes singular spatial gradient matrix in the point’s neighbourhood, which makes the point invalid such that the tracker cannot perform tracking.
A set of data for scale factor, k obtained for each resolution, namely k1, k2, and k3 respectively, were plotted on a same graph and trendline were added to each curve to identify the pattern of the curve. It was found that the scale factor, k is almost linear as a function of distance, D. In order to relate the video resolution with a general equation, a function of video resolution, f(S) was established by plotting a graph of coefficient versus resolution and the suggested equation was in terms of quadratic function. The quadratic function was then simplified with the intention of fitting the curves in with a general equation. Thus, the proposed general equation can be written as:
𝑅𝑅 = (7𝑒−10𝑆2 − 2.95𝑒−6𝑆 + 0.0036) ∙ 𝐷 ∙ 𝑅𝑝 (Equation 3)
where is RR the radius of circular object (mm); S is the video resolution; D is the distance between object and camera; and Rp is the radius of circular object (pixels).
Table 1: Summary of allowable distance for three different resolution Resolution Allowable Distance (mm) 640 × 480 250 - 500
1280 × 720 (HD) 450 - 950 1920 × 1080 (Full HD) 800 - 1850
(a) (b)
Figure 4: (a) Relationship between scale factor and distance (b) Relationship between radius and distance Case Study B: Verification of Accuracy and Reliability. Lateral displacements of strut obtained from the developed MATLAB program and reading given by dial gauge in HD mode and full HD mode are displayed in Figure 3. It clearly illustrates that the computed displacement has good correlation with the actual displacement.
(a) (b)
Figure 5: Displacement measurement in HD mode (a) and full HD mode (b)
0
0.5
1
1.5
2
2.5
0 200 400 600 800 1000 1200
Scal
e Fa
ctor
, k
Distance, D (mm)
Scale Factor versus Distance
k1
k2
k3
k1 trendline
k2 trendline
k3 trendline
0
5
10
15
20
25
30
35
40
45
50
0 200 400 600 800 1000 1200 1400 1600 1800 2000
Radi
us, R
p(p
ixel
s)
Distance, D (mm)
Radius versus Distance
Rp1
Rp2
Rp3
-2.000
0.000
2.000
4.000
6.000
8.000
10.000
12.000
14.000
16.000
0 50 100 150 200 250 300 350 400 450 500 550 600 650 700
Disp
lace
men
t (m
m)
Frame No.
Displacement versus Frame No.
video 1 video 1 (actual)
video 2 video 2 (actual)
-2.000
0.000
2.000
4.000
6.000
8.000
10.000
12.000
14.000
16.000
0 50 100 150 200 250 300 350 400 450 500 550 600 650
Disp
lace
men
t (m
m)
Frame No.
Displacement versus Frame No.
video 3 video 3 (actual)video 4 video 4 (actual)
Trial 2
Trial 1
Trial 2
Trial 1
6
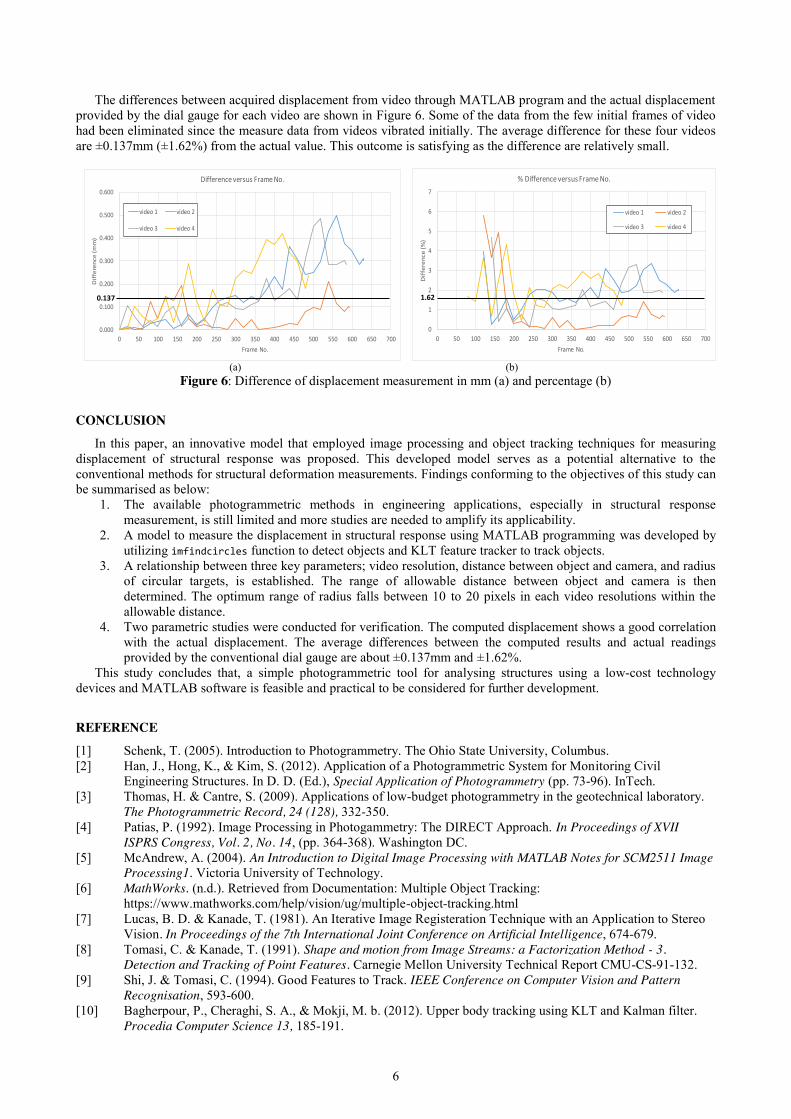
The differences between acquired displacement from video through MATLAB program and the actual displacement provided by the dial gauge for each video are shown in Figure 6. Some of the data from the few initial frames of video had been eliminated since the measure data from videos vibrated initially. The average difference for these four videos are ±0.137mm (±1.62%) from the actual value. This outcome is satisfying as the difference are relatively small.
(a) (b)
Figure 6: Difference of displacement measurement in mm (a) and percentage (b)
CONCLUSION
In this paper, an innovative model that employed image processing and object tracking techniques for measuring displacement of structural response was proposed. This developed model serves as a potential alternative to the conventional methods for structural deformation measurements. Findings conforming to the objectives of this study can be summarised as below:
1. The available photogrammetric methods in engineering applications, especially in structural response measurement, is still limited and more studies are needed to amplify its applicability.
2. A model to measure the displacement in structural response using MATLAB programming was developed by utilizing imfindcircles function to detect objects and KLT feature tracker to track objects.
3. A relationship between three key parameters; video resolution, distance between object and camera, and radius of circular targets, is established. The range of allowable distance between object and camera is then determined. The optimum range of radius falls between 10 to 20 pixels in each video resolutions within the allowable distance.
4. Two parametric studies were conducted for verification. The computed displacement shows a good correlation with the actual displacement. The average differences between the computed results and actual readings provided by the conventional dial gauge are about ±0.137mm and ±1.62%.
This study concludes that, a simple photogrammetric tool for analysing structures using a low-cost technology devices and MATLAB software is feasible and practical to be considered for further development.
REFERENCE
[1] Schenk, T. (2005). Introduction to Photogrammetry. The Ohio State University, Columbus. [2] Han, J., Hong, K., & Kim, S. (2012). Application of a Photogrammetric System for Monitoring Civil
Engineering Structures. In D. D. (Ed.), Special Application of Photogrammetry (pp. 73-96). InTech. [3] Thomas, H. & Cantre, S. (2009). Applications of low-budget photogrammetry in the geotechnical laboratory.
The Photogrammetric Record, 24 (128), 332-350. [4] Patias, P. (1992). Image Processing in Photogammetry: The DIRECT Approach. In Proceedings of XVII
ISPRS Congress, Vol. 2, No. 14, (pp. 364-368). Washington DC. [5] McAndrew, A. (2004). An Introduction to Digital Image Processing with MATLAB Notes for SCM2511 Image
Processing1. Victoria University of Technology. [6] MathWorks. (n.d.). Retrieved from Documentation: Multiple Object Tracking:
https://www.mathworks.com/help/vision/ug/multiple-object-tracking.html [7] Lucas, B. D. & Kanade, T. (1981). An Iterative Image Registeration Technique with an Application to Stereo
Vision. In Proceedings of the 7th International Joint Conference on Artificial Intelligence, 674-679. [8] Tomasi, C. & Kanade, T. (1991). Shape and motion from Image Streams: a Factorization Method - 3.
Detection and Tracking of Point Features. Carnegie Mellon University Technical Report CMU-CS-91-132. [9] Shi, J. & Tomasi, C. (1994). Good Features to Track. IEEE Conference on Computer Vision and Pattern
Recognisation, 593-600. [10] Bagherpour, P., Cheraghi, S. A., & Mokji, M. b. (2012). Upper body tracking using KLT and Kalman filter.
Procedia Computer Science 13, 185-191.
0.000
0.100
0.200
0.300
0.400
0.500
0.600
0 50 100 150 200 250 300 350 400 450 500 550 600 650 700
Dif
fere
nce
(mm
)
Frame No.
Difference versus Frame No.
video 1 video 2
video 3 video 4
0
1
2
3
4
5
6
7
0 50 100 150 200 250 300 350 400 450 500 550 600 650 700
Diff
eren
ce (%
)
Frame No.
% Difference versus Frame No.
video 1 video 2
video 3 video 4
0.137 1.62

7
Dam Break Test for Scaled Down Dom-ino Flat Slab House Structural System
Mohamad Ridzuan Bin Mat Yasim1, Abdul Kadir Marsono2 Faculty of Civil Engineering, Universiti Teknologi Malaysia, Malaysia
Keywords: Tsunami, Dom-ino house, Dam Break Test, Hydrodynamic force.
ABSTRACT. Tsunami is a succession of waves travelling throughout water body which is resulted by the sudden displacement of a substantial volume of water on the ocean. This disastrous event typically generated due to seismic activity occurs on the seabed or any kind of disturbance that happen either naturally or man-made, below or above the ocean. The hydrostatic pressure produced during this catastrophic event might cause significant damage to many common structures should that they are not being built to resist such imposed load by the tsunami. Tsunami field survey observations also indicate that the structural failure would be escalated more in the presence of water borne debris such as wooden logs, vehicles, containers or other heavy objects. Through this paper, the outcomes of the experimental study are obtainable for the quantification of the hydrodynamic pressure force on the structures. The structure used for the experiment is a scaled down model by utilising the flat slab structural system, a typical structural system that being used in most building worldwide other than the slab beam structural system, thus resembling the exact behaviour of failure to the real structure when it imposed with the tsunami pressure.
INTRODUCTION
In the recent years, several places throughout the globe had been struck by the tsunami. Tsunami which also known as harbour wave is a kind of natural disaster that is generated due to seismic activity or movement of tectonic plate on seabed. These caused the displacement of large volume of water on the ocean and travelled to the land at nearly 800km/hr. One of the most deadly tsunami ever recorded striking the land was in Japan that is generated due to the earthquake event known as Tohoku, one of the massive Earthquakes that ever recorded in the modern history. The earthquake of magnitude 9.0-9.1 (MW) had generates a massive tsunami wave that reaching up to 40.5m height which hit the nearest countryside such as Miyako city in Tohoku and Sendai. This disastrous natural event had resulted in such a substantial losses and damages of properties and structures, which caused by the earthquake shaking as well as the high pressure induced by the tsunami wave.
From a conducted investigation to the earthquake and tsunami event on that year, it was found that the objects that are adrift through the flowing tsunami wave such as vehicles, timber logs, shipping vessel and other kind of debris had travelled up to 10 km inland and caused significant damages to the buildings and structures. In addition, from the inspection of the damaged building after the disastrous event indicates that some of the buildings involved were designed to resist the seismic shaking of the earthquake, however were not capable of surviving the imposed impact by the tsunami load. Through the investigation too, it was found that the damage was primarily caused by the hydrodynamic force that induced by the debris. The structures standing on land are subjected to damages because of their vertical orientation opposes objects that travelling horizontally with the flow of tsunami wave.
Apparently, proper quantification of forces acted due to the impact of the hydrodynamic pressure of tsunami wave is crucial in designing structures that located in tsunami prone areas. The typical residential building nowadays might consist of timber, concrete or steel with external façade and it is vital to further develop knowledge on the impact force from the hydrodynamic pressure to the affected structures during tsunami event. Hence, comprehending the loads which generated by the tsunamis would help in enhancing the safety and durability of tsunami-resistant buildings and structures. This paper would only focuses on the impact of the hydrodynamic pressure induced by tsunami wave on the structural buildings near the shore, using a scaled down Dom-ino flat slab structure model, without the impact of water borne debris. Problem Statement In the pass, the design of building structure is being made by only emphasising the gravitational load that are subjected to the building, where various types of lateral load that might possibly imposed to the building is being ignored and not considered by the engineers. As the result, most of the old stock building does not have the capacity to resist the lateral forces that induced by different kind of natural disaster such as seismic movement during an earthquake event, the flowing water borne debris during tsunami as well as in the event of landslide movement. Besides, most building that being built presently and in the pass typically had adopted the open building architectural concept, which has several flaws and weaknesses for instance like structurally unstable, lack of redundancy and unsymmetrical. Having said that,
8
most of the old stock buildings were containing fragility where improvement of the conventional practice of designing the old building should be made to make it remain relevant to be implemented in the present day and in the future. This had increase the curiosity on how to improve the structural system so that building that being constructed in the future are durable and safer like never before, especially on encountering the impact of natural disaster. This paper would focuses on tsunami impact to the structure system only, without considering the non-structural elements. To that sense, the test to simulate the tsunami occurrence have to be made in order to obtain all of the hydrodynamic parameter when tsunami hit the structure, so that the impact of tsunami to typical building are able to be quantified and analysed.
Objectives This study is conducted to examine the impact of forces due to tsunami wave to the building structures. Thus, this study has to fulfil the following objectives:
1. To construct the one tenth of scaled down reinforced concrete Dom-ino flat slab model for dam break test. 2. To test the model using dam break test at various impounding water level to obtain the tested static and
dynamic time history parameters of pressure and natural frequencies due to water surge. Scopes of Study A scaled down 1:10 flat slab building model being cast based on the basic architectural model known as Dom-ino house, an open floor plan structure consisting of concrete slabs supported by reinforced concrete column. No shear wall used to support the structure which resembles the typical structural system of low rise building in Malaysia nowadays. The model cast using mix design with proportion 33.36: 65.88: 31.00: 14.13 of cement, coarse aggregate, fine aggregate and water respectively. The model is then tested in dam breaker test by applying the impounding water in rotation reservoir. The result obtained from the test later would be compared with the harmonic vibration test of the structure during its intact condition (undisturbed).
LITERATURE REVIEW
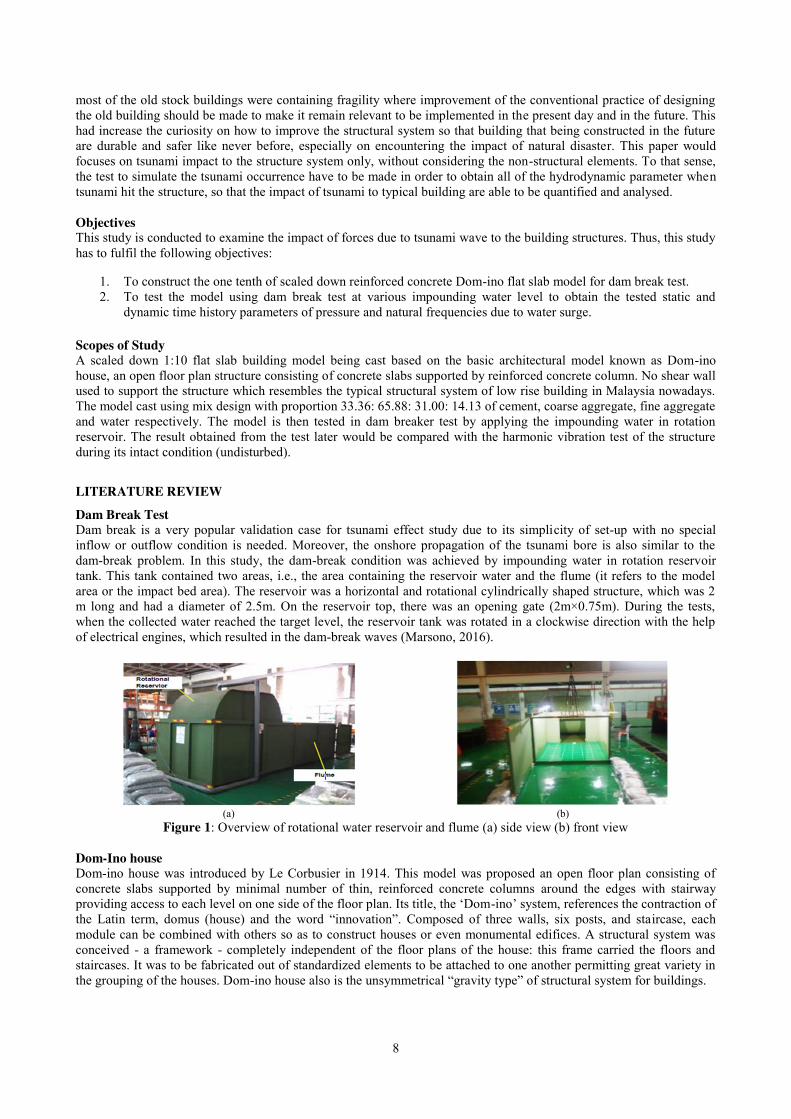
Dam Break Test Dam break is a very popular validation case for tsunami effect study due to its simplicity of set-up with no special inflow or outflow condition is needed. Moreover, the onshore propagation of the tsunami bore is also similar to the dam-break problem. In this study, the dam-break condition was achieved by impounding water in rotation reservoir tank. This tank contained two areas, i.e., the area containing the reservoir water and the flume (it refers to the model area or the impact bed area). The reservoir was a horizontal and rotational cylindrically shaped structure, which was 2 m long and had a diameter of 2.5m. On the reservoir top, there was an opening gate (2m×0.75m). During the tests, when the collected water reached the target level, the reservoir tank was rotated in a clockwise direction with the help of electrical engines, which resulted in the dam-break waves (Marsono, 2016).
(a) (b)
Figure 1: Overview of rotational water reservoir and flume (a) side view (b) front view Dom-Ino house Dom-ino house was introduced by Le Corbusier in 1914. This model was proposed an open floor plan consisting of concrete slabs supported by minimal number of thin, reinforced concrete columns around the edges with stairway providing access to each level on one side of the floor plan. Its title, the ‘Dom-ino’ system, references the contraction of the Latin term, domus (house) and the word “innovation”. Composed of three walls, six posts, and staircase, each module can be combined with others so as to construct houses or even monumental edifices. A structural system was conceived - a framework - completely independent of the floor plans of the house: this frame carried the floors and staircases. It was to be fabricated out of standardized elements to be attached to one another permitting great variety in the grouping of the houses. Dom-ino house also is the unsymmetrical “gravity type” of structural system for buildings.
9
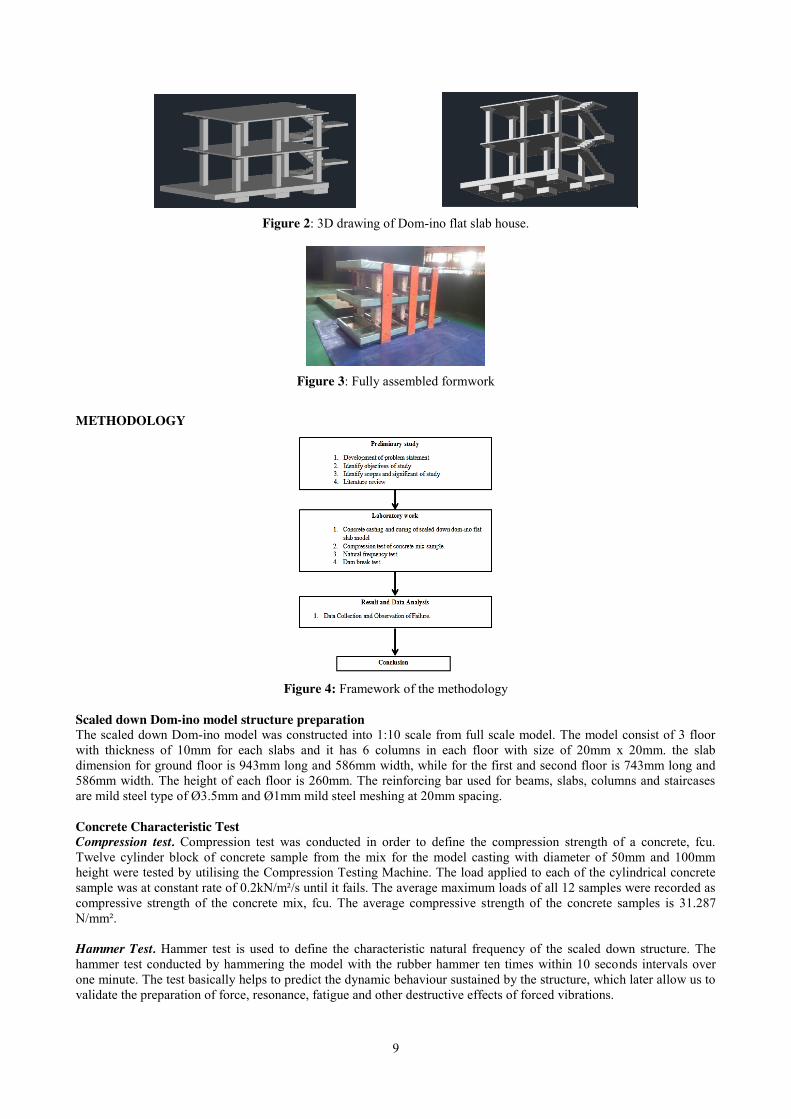
Figure 2: 3D drawing of Dom-ino flat slab house.
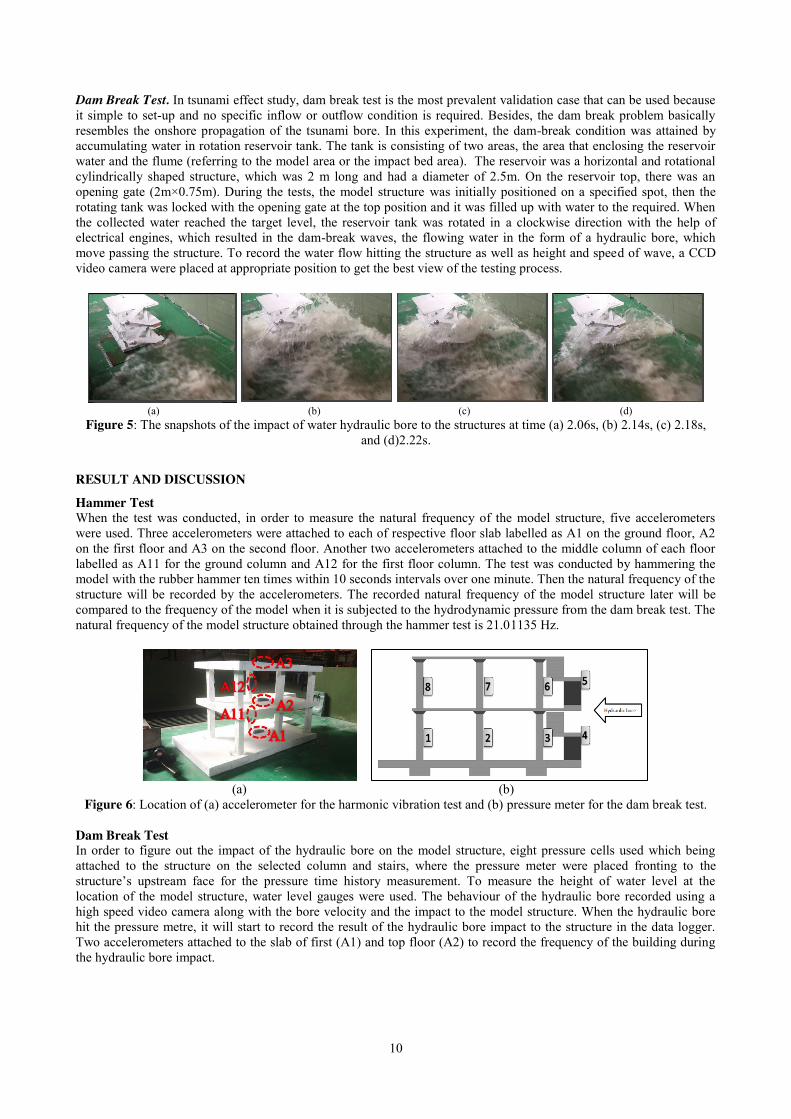
Figure 3: Fully assembled formwork
METHODOLOGY
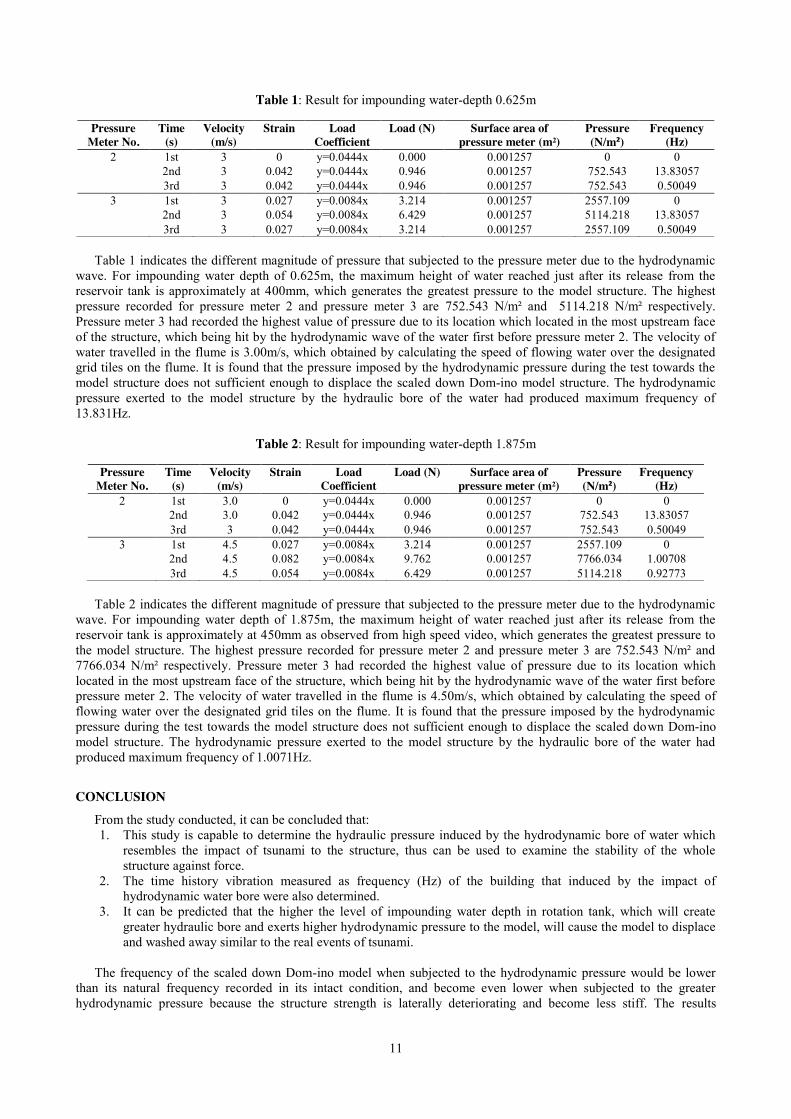
Figure 4: Framework of the methodology
Scaled down Dom-ino model structure preparation The scaled down Dom-ino model was constructed into 1:10 scale from full scale model. The model consist of 3 floor with thickness of 10mm for each slabs and it has 6 columns in each floor with size of 20mm x 20mm. the slab dimension for ground floor is 943mm long and 586mm width, while for the first and second floor is 743mm long and 586mm width. The height of each floor is 260mm. The reinforcing bar used for beams, slabs, columns and staircases are mild steel type of Ø3.5mm and Ø1mm mild steel meshing at 20mm spacing. Concrete Characteristic Test Compression test. Compression test was conducted in order to define the compression strength of a concrete, fcu. Twelve cylinder block of concrete sample from the mix for the model casting with diameter of 50mm and 100mm height were tested by utilising the Compression Testing Machine. The load applied to each of the cylindrical concrete sample was at constant rate of 0.2kN/m²/s until it fails. The average maximum loads of all 12 samples were recorded as compressive strength of the concrete mix, fcu. The average compressive strength of the concrete samples is 31.287 N/mm². Hammer Test. Hammer test is used to define the characteristic natural frequency of the scaled down structure. The hammer test conducted by hammering the model with the rubber hammer ten times within 10 seconds intervals over one minute. The test basically helps to predict the dynamic behaviour sustained by the structure, which later allow us to validate the preparation of force, resonance, fatigue and other destructive effects of forced vibrations.
10
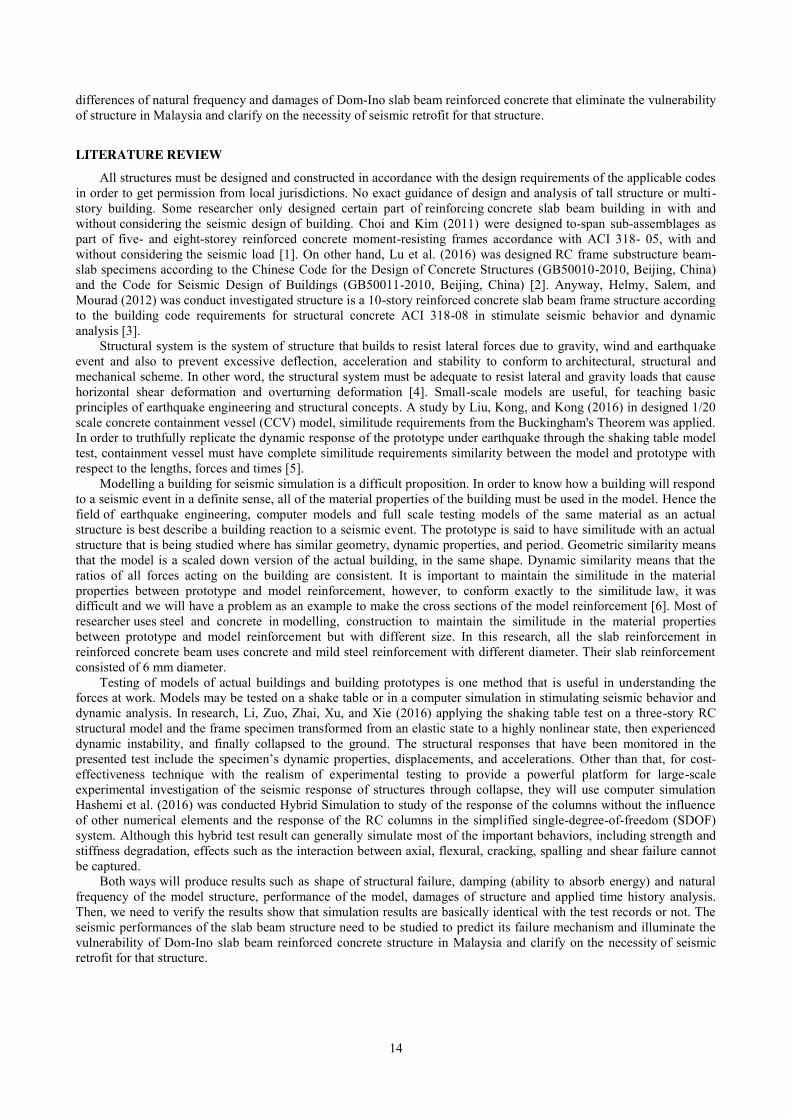
Dam Break Test. In tsunami effect study, dam break test is the most prevalent validation case that can be used because it simple to set-up and no specific inflow or outflow condition is required. Besides, the dam break problem basically resembles the onshore propagation of the tsunami bore. In this experiment, the dam-break condition was attained by accumulating water in rotation reservoir tank. The tank is consisting of two areas, the area that enclosing the reservoir water and the flume (referring to the model area or the impact bed area). The reservoir was a horizontal and rotational cylindrically shaped structure, which was 2 m long and had a diameter of 2.5m. On the reservoir top, there was an opening gate (2m×0.75m). During the tests, the model structure was initially positioned on a specified spot, then the rotating tank was locked with the opening gate at the top position and it was filled up with water to the required. When the collected water reached the target level, the reservoir tank was rotated in a clockwise direction with the help of electrical engines, which resulted in the dam-break waves, the flowing water in the form of a hydraulic bore, which move passing the structure. To record the water flow hitting the structure as well as height and speed of wave, a CCD video camera were placed at appropriate position to get the best view of the testing process.
(a) (b) (c) (d)
Figure 5: The snapshots of the impact of water hydraulic bore to the structures at time (a) 2.06s, (b) 2.14s, (c) 2.18s, and (d)2.22s.
RESULT AND DISCUSSION
Hammer Test When the test was conducted, in order to measure the natural frequency of the model structure, five accelerometers were used. Three accelerometers were attached to each of respective floor slab labelled as A1 on the ground floor, A2 on the first floor and A3 on the second floor. Another two accelerometers attached to the middle column of each floor labelled as A11 for the ground column and A12 for the first floor column. The test was conducted by hammering the model with the rubber hammer ten times within 10 seconds intervals over one minute. Then the natural frequency of the structure will be recorded by the accelerometers. The recorded natural frequency of the model structure later will be compared to the frequency of the model when it is subjected to the hydrodynamic pressure from the dam break test. The natural frequency of the model structure obtained through the hammer test is 21.01135 Hz.
(a) (b)
Figure 6: Location of (a) accelerometer for the harmonic vibration test and (b) pressure meter for the dam break test. Dam Break Test In order to figure out the impact of the hydraulic bore on the model structure, eight pressure cells used which being attached to the structure on the selected column and stairs, where the pressure meter were placed fronting to the structure’s upstream face for the pressure time history measurement. To measure the height of water level at the location of the model structure, water level gauges were used. The behaviour of the hydraulic bore recorded using a high speed video camera along with the bore velocity and the impact to the model structure. When the hydraulic bore hit the pressure metre, it will start to record the result of the hydraulic bore impact to the structure in the data logger. Two accelerometers attached to the slab of first (A1) and top floor (A2) to record the frequency of the building during the hydraulic bore impact.
11
Table 1: Result for impounding water-depth 0.625m
Table 1 indicates the different magnitude of pressure that subjected to the pressure meter due to the hydrodynamic
wave. For impounding water depth of 0.625m, the maximum height of water reached just after its release from the reservoir tank is approximately at 400mm, which generates the greatest pressure to the model structure. The highest pressure recorded for pressure meter 2 and pressure meter 3 are 752.543 N/m² and 5114.218 N/m² respectively. Pressure meter 3 had recorded the highest value of pressure due to its location which located in the most upstream face of the structure, which being hit by the hydrodynamic wave of the water first before pressure meter 2. The velocity of water travelled in the flume is 3.00m/s, which obtained by calculating the speed of flowing water over the designated grid tiles on the flume. It is found that the pressure imposed by the hydrodynamic pressure during the test towards the model structure does not sufficient enough to displace the scaled down Dom-ino model structure. The hydrodynamic pressure exerted to the model structure by the hydraulic bore of the water had produced maximum frequency of 13.831Hz.
Table 2: Result for impounding water-depth 1.875m
Table 2 indicates the different magnitude of pressure that subjected to the pressure meter due to the hydrodynamic
wave. For impounding water depth of 1.875m, the maximum height of water reached just after its release from the reservoir tank is approximately at 450mm as observed from high speed video, which generates the greatest pressure to the model structure. The highest pressure recorded for pressure meter 2 and pressure meter 3 are 752.543 N/m² and 7766.034 N/m² respectively. Pressure meter 3 had recorded the highest value of pressure due to its location which located in the most upstream face of the structure, which being hit by the hydrodynamic wave of the water first before pressure meter 2. The velocity of water travelled in the flume is 4.50m/s, which obtained by calculating the speed of flowing water over the designated grid tiles on the flume. It is found that the pressure imposed by the hydrodynamic pressure during the test towards the model structure does not sufficient enough to displace the scaled down Dom-ino model structure. The hydrodynamic pressure exerted to the model structure by the hydraulic bore of the water had produced maximum frequency of 1.0071Hz.
CONCLUSION From the study conducted, it can be concluded that: 1. This study is capable to determine the hydraulic pressure induced by the hydrodynamic bore of water which
resembles the impact of tsunami to the structure, thus can be used to examine the stability of the whole structure against force.
2. The time history vibration measured as frequency (Hz) of the building that induced by the impact of hydrodynamic water bore were also determined.
3. It can be predicted that the higher the level of impounding water depth in rotation tank, which will create greater hydraulic bore and exerts higher hydrodynamic pressure to the model, will cause the model to displace and washed away similar to the real events of tsunami.
The frequency of the scaled down Dom-ino model when subjected to the hydrodynamic pressure would be lower
than its natural frequency recorded in its intact condition, and become even lower when subjected to the greater hydrodynamic pressure because the structure strength is laterally deteriorating and become less stiff. The results
Pressure Meter No.
Time (s)
Velocity (m/s)
Strain Load Coefficient
Load (N) Surface area of pressure meter (m²)
Pressure (N/m²)
Frequency (Hz)
2 1st 3 0 y=0.0444x 0.000 0.001257 0 0 2nd 3 0.042 y=0.0444x 0.946 0.001257 752.543 13.83057 3rd 3 0.042 y=0.0444x 0.946 0.001257 752.543 0.50049
3 1st 3 0.027 y=0.0084x 3.214 0.001257 2557.109 0 2nd 3 0.054 y=0.0084x 6.429 0.001257 5114.218 13.83057 3rd 3 0.027 y=0.0084x 3.214 0.001257 2557.109 0.50049
Pressure Meter No.
Time (s)
Velocity (m/s)
Strain Load Coefficient
Load (N) Surface area of pressure meter (m²)
Pressure (N/m²)
Frequency (Hz)
2 1st 3.0 0 y=0.0444x 0.000 0.001257 0 0 2nd 3.0 0.042 y=0.0444x 0.946 0.001257 752.543 13.83057 3rd 3 0.042 y=0.0444x 0.946 0.001257 752.543 0.50049
3 1st 4.5 0.027 y=0.0084x 3.214 0.001257 2557.109 0 2nd 4.5 0.082 y=0.0084x 9.762 0.001257 7766.034 1.00708 3rd 4.5 0.054 y=0.0084x 6.429 0.001257 5114.218 0.92773

12
obtained from the test had proved that the invisible cracks will always initiated in the system even if the building is minimally disturbed.
REFERENCES [1] Marsono, A. K. (2016). Experimental Investigation Of Tsunami Waterborne. International Journal of
GEOMATE. [2] Nouri, Y., Nistor, I., Palermo, D., & Cornett, A. (2009). Experimental investigation of the impact of a tsunami-
induced bore on structures. [3] Nouri, Y., Nistor, I., Palermo, D., & Cornett, A. (2009). Structural Analysis For Tsunami-Induced Force And
Debris Impact. [4] Saatcioglu, Murat; Ghobarah, Ahmed; Nistor, Ian;. (2006). Performance of Structure in Indonesia during the
December 2004 Great Sumatra Earthquake and Indian Ocean Tsunami.

13
Seismic Test for Two Storey Dom-Ino Buildings Muhammad Kamil Yahya1, Rosli Anang2, Abdul Kadir Marsono3
Faculty of Civil Engineering, Universiti Teknologi Malaysia, Malaysia
[email protected], [email protected]
Keywords: Building System; Undisturbed Test; Shaking Table Test; Natural Frequency
ABSTRACT. Building is a structure that is designed essentially for residential, commercial or industrial purposes. Other categories of buildings include institutional, public assembly and multiple use structures. An essential characteristic of a building is that it has floors. Dom-Ino Slab beam structure is one of the building system which has commonly known in Malaysia and conventionally use is in other country. The key objectives of this research is to study natural frequency and damages on seismic behaviour of slab beam reinforced concrete structural in undisturbed test and shaking table test (disturbed test) with different value of peak ground acceleration (PGA). 1:10 scale-downed Dom-Ino frame structure was built and performed on shaking table and its results is used to make comparison with other concrete structure which is Flab Slab. From the research, natural frequency of the model will reduced after excites of seismic denoting that the internal invisible failure was already occurring.
INTRODUCTION
Earthquake is one of natural phenomena that related deaths are caused by collapse of infra-structure and structure. Based on previous earthquake case, huge amount of life and economic lose has been reported. Earthquake phenomena is unexpected and cannot be avoided. The number of loses will be impact the growth of the country in economic development such as Japan and South Korea. Malaysia can be consider exceptional as it a non-Earthquake zone but it is surrounded by active seismic bay which is located between two major boundaries of tectonic plates, Indo- Australian plate in the West of a Peninsular Malaysia and Eurasian plate in the East of Malaysia. Thus, seismic waves can be felt in Malaysia if any big-magnitude earthquake from 350km away through the closet active fault line in Sumatra island of Indonesia and Philippines. Problem Statement Most buildings in Malaysia are an old stock building which consider vertical load and only designed for nominal lateral load. For short buildings, the lateral wind effect is unconsidered during the design. In structural analysis, lateral load is mainly the seismic movement and wind pressure that causes a structure to drift and slide. Two most important and most frequently found deficiencies in old structures are no shear reinforcement in the joint and poor end anchorages leading to joint shear and bond failures respectively. Often such failures lead to partial or complete collapse of structures because the building was designed using an old codes of British Standards.
After experienced several tremors originating from neighbouring countries especially from Sumatra, Indonesia, Malaysian start to ask a questions on integrity of existing structures in Malaysia to withstand even a small the earthquake load. In past decades, there is no serious structural damages report due to field ground motion and tremors in Malaysia. However, many researchers and engineer concerned on the effect of such as seismic activities on the stability and safety of the building. It is good practice if seismic excitation force is considered in the structural design. Objectives The objectives of this study are:
1. Construct the model based on a 1:10 scaled reinforced concrete Dom-Ino design. 2. Test model using shaking table (disturbed) test to obtain natural frequency and damages using a progressive
time history signal of Sabah 2015. 3. To make a comparison between undisturbed and disturbed test as between Dom-Ino slab beam and flat slabs
system. Scope of Study This research only study the effect of Dom- Ino slab beam model structure on the seismic behavior. A scaled down 1:10 frame structure slab beam model is constructed based on mix design and wall infills excluded from this scopes. Therefore, time histories of acceleration is selected as the input data, and history signal of Sabah, Malaysia for shaking table test. Furthermore, the test only considers lateral load from the seismic movement and wind load was ignored. Other than that, design the model with BS EN 1998-1:2004 Eurocode 8, scale down model using similitude rule and modelling for structural analysis is excluded on the study. Therefore, the outcomes of this study will obtain the
14
differences of natural frequency and damages of Dom-Ino slab beam reinforced concrete that eliminate the vulnerability of structure in Malaysia and clarify on the necessity of seismic retrofit for that structure.
LITERATURE REVIEW All structures must be designed and constructed in accordance with the design requirements of the applicable codes
in order to get permission from local jurisdictions. No exact guidance of design and analysis of tall structure or multi-story building. Some researcher only designed certain part of reinforcing concrete slab beam building in with and without considering the seismic design of building. Choi and Kim (2011) were designed to-span sub-assemblages as part of five- and eight-storey reinforced concrete moment-resisting frames accordance with ACI 318- 05, with and without considering the seismic load [1]. On other hand, Lu et al. (2016) was designed RC frame substructure beam-slab specimens according to the Chinese Code for the Design of Concrete Structures (GB50010-2010, Beijing, China) and the Code for Seismic Design of Buildings (GB50011-2010, Beijing, China) [2]. Anyway, Helmy, Salem, and Mourad (2012) was conduct investigated structure is a 10-story reinforced concrete slab beam frame structure according to the building code requirements for structural concrete ACI 318-08 in stimulate seismic behavior and dynamic analysis [3].
Structural system is the system of structure that builds to resist lateral forces due to gravity, wind and earthquake event and also to prevent excessive deflection, acceleration and stability to conform to architectural, structural and mechanical scheme. In other word, the structural system must be adequate to resist lateral and gravity loads that cause horizontal shear deformation and overturning deformation [4]. Small-scale models are useful, for teaching basic principles of earthquake engineering and structural concepts. A study by Liu, Kong, and Kong (2016) in designed 1/20 scale concrete containment vessel (CCV) model, similitude requirements from the Buckingham's Theorem was applied. In order to truthfully replicate the dynamic response of the prototype under earthquake through the shaking table model test, containment vessel must have complete similitude requirements similarity between the model and prototype with respect to the lengths, forces and times [5].
Modelling a building for seismic simulation is a difficult proposition. In order to know how a building will respond to a seismic event in a definite sense, all of the material properties of the building must be used in the model. Hence the field of earthquake engineering, computer models and full scale testing models of the same material as an actual structure is best describe a building reaction to a seismic event. The prototype is said to have similitude with an actual structure that is being studied where has similar geometry, dynamic properties, and period. Geometric similarity means that the model is a scaled down version of the actual building, in the same shape. Dynamic similarity means that the ratios of all forces acting on the building are consistent. It is important to maintain the similitude in the material properties between prototype and model reinforcement, however, to conform exactly to the similitude law, it was difficult and we will have a problem as an example to make the cross sections of the model reinforcement [6]. Most of researcher uses steel and concrete in modelling, construction to maintain the similitude in the material properties between prototype and model reinforcement but with different size. In this research, all the slab reinforcement in reinforced concrete beam uses concrete and mild steel reinforcement with different diameter. Their slab reinforcement consisted of 6 mm diameter.
Testing of models of actual buildings and building prototypes is one method that is useful in understanding the forces at work. Models may be tested on a shake table or in a computer simulation in stimulating seismic behavior and dynamic analysis. In research, Li, Zuo, Zhai, Xu, and Xie (2016) applying the shaking table test on a three-story RC structural model and the frame specimen transformed from an elastic state to a highly nonlinear state, then experienced dynamic instability, and finally collapsed to the ground. The structural responses that have been monitored in the presented test include the specimen’s dynamic properties, displacements, and accelerations. Other than that, for cost-effectiveness technique with the realism of experimental testing to provide a powerful platform for large-scale experimental investigation of the seismic response of structures through collapse, they will use computer simulation Hashemi et al. (2016) was conducted Hybrid Simulation to study of the response of the columns without the influence of other numerical elements and the response of the RC columns in the simplified single-degree-of-freedom (SDOF) system. Although this hybrid test result can generally simulate most of the important behaviors, including strength and stiffness degradation, effects such as the interaction between axial, flexural, cracking, spalling and shear failure cannot be captured.
Both ways will produce results such as shape of structural failure, damping (ability to absorb energy) and natural frequency of the model structure, performance of the model, damages of structure and applied time history analysis. Then, we need to verify the results show that simulation results are basically identical with the test records or not. The seismic performances of the slab beam structure need to be studied to predict its failure mechanism and illuminate the vulnerability of Dom-Ino slab beam reinforced concrete structure in Malaysia and clarify on the necessity of seismic retrofit for that structure.

15
METHODOLOGY
The main objective of the research is to obtain frequency and damages of slab beam reinforced concrete structure on seismic behaviour in different peak ground acceleration (PGA). In addition, frequency of Dom-Ino slab beam reinforced concrete structure in shaking table experiment was compared with natural frequency from undisturbed test. This research methodology consisted of 4 key activities: slab beam reinforced concrete preparation, slab beam reinforced concrete characteristic test, undisturbed test, and shaking table (disturbed) test.
Figure 1: Flowchart of Methodology.
Slab Beam Reinforced Concrete Preparation The small model of Dom-Ino Slab Beam structure was fabricated into 1:10 scale of full scale model using mix design for small model as is shown Table 1. For the model specimen, a span, thickness is 40 mm and length of the ground slab were 986 mm and 786 first floor and second floor slab. Columns cross sections were 40 mm x 40 mm reinforced with 3 mm diameter longitudinal bars. Meanwhile, beam cross sections were 30 mm x 20 mm reinforced with 3 mm diameter longitudinal bars. An 18mm of plywood has been used to prepare the formwork of the model. In order to know how a building will respond to a seismic event in a definite sense, all of the material properties of the building must be used in the model. Small-scale models are useful for teaching basic principles of earthquake engineering and structural concepts.
Table 1: Mix Design of 1:10 Small Model for 1 m3
Element Mass (kg) Cement 550 Water 233
Fine Aggregate (less than 3 mm) 511 Course Aggregate (5 mm) 1085
Glenium 6.6 Slab Beam Reinforced Concrete Characteristic Test Cylinder Compression Test. Compression test is used to measure the compression strength, 𝐹𝑐𝑢 of a concrete. While casting process, nine sample of cylinder was prepared refer to three sample for three batch of casting. After 28 days of curing, nine cylinder of size 100cm3 was trimmed from the autoclaved aerated concrete blocks, and placed in the Compression Testing Machine. The load was applied at a constant rate of 0.2kN/m²/s until the concrete cube failed. The average maximum load of three samples was recorded as compressive strength, 𝐹𝑐𝑢.
Preliminary study 1. Development of problem statement 2. Identify objectives of study 3. Identify scopes and significant of study 4. Literature review.
Laboratory Work 1. Plywood Formwork preparation 2. Preparation of reinforced bar 3. Specimen casting and curing 4. Specimen finishing 5. Cube Compressive Test 6. Undisturbed Test (Free vibration test & Harmonic Vibration Test) 7. Disturbed Test (Shaking Table Test)
Result and Data Analysis 1. Data collection and Observation of Failure 2. Comparison of Undisturbed Test and Disturbed Test.
Recommendation and Conclusion
16
Undisturbed Test of Model. Undisturbed Test which consists of free vibration tests and Harmonic Force Vibration Method are conducted to detect the natural frequency of the slab beam reinforced concrete structure. According to the structure or element type, their location and the experimental conditions, free vibrations can be recorded by measuring the structure displacements, the deformation of structural elements or the accelerations in different important points of the structure. Three accelerometers were located on every slab of floor to detect the acceleration of structure. The natural frequency can be observed with corresponding maximum value Fourier amplitude determined from the variation graph of the frequency at free vibrations in seismosignal. Before processing, the recorded accelerations were corrected, using a baseline correction, and filtered, to remove the interferences produced by ambient vibrations or other sources. The correction and the processing were performed with Seismosignal, a strong-motion data processing software. One can determine the vibration frequency of the structure corresponding to a given mode of vibration, fi, and the corresponding vibration period, Ti , by identifying the quasi-resonant frequency, which corresponds to the higher structural response as shown in Eqn 1.
𝑇𝑖 = 1𝑓𝑖
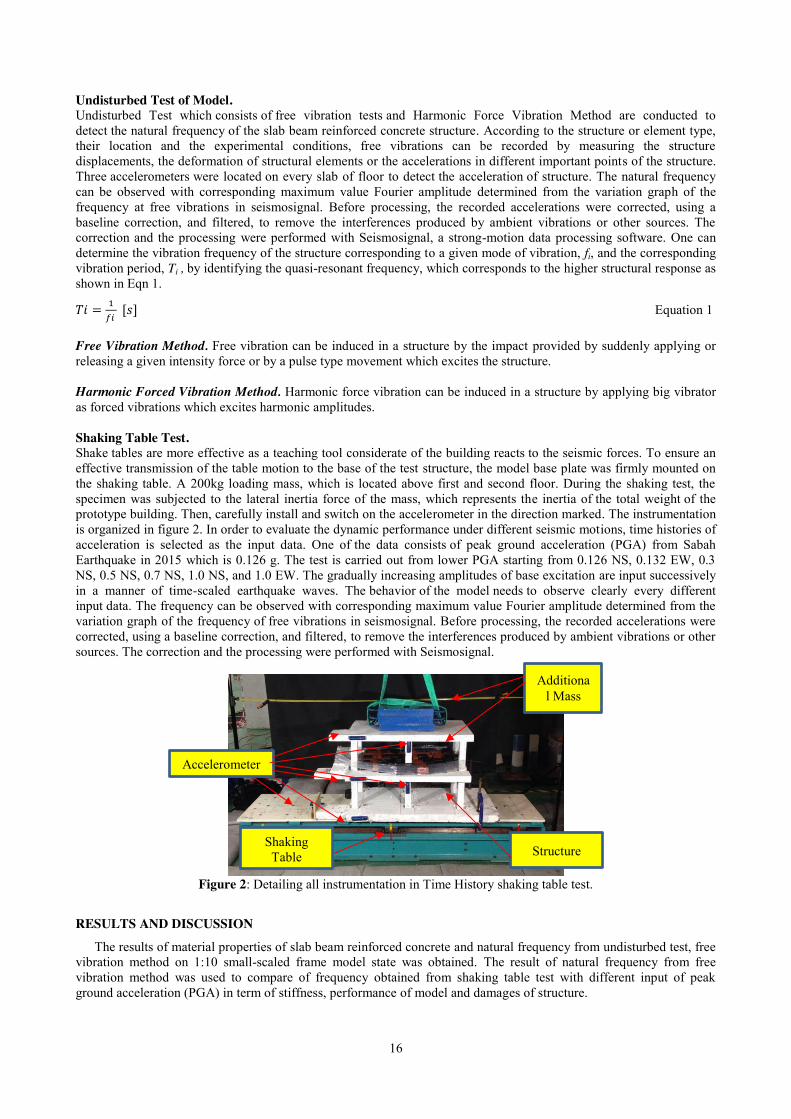
[𝑠] Equation 1 Free Vibration Method. Free vibration can be induced in a structure by the impact provided by suddenly applying or releasing a given intensity force or by a pulse type movement which excites the structure. Harmonic Forced Vibration Method. Harmonic force vibration can be induced in a structure by applying big vibrator as forced vibrations which excites harmonic amplitudes. Shaking Table Test. Shake tables are more effective as a teaching tool considerate of the building reacts to the seismic forces. To ensure an effective transmission of the table motion to the base of the test structure, the model base plate was firmly mounted on the shaking table. A 200kg loading mass, which is located above first and second floor. During the shaking test, the specimen was subjected to the lateral inertia force of the mass, which represents the inertia of the total weight of the prototype building. Then, carefully install and switch on the accelerometer in the direction marked. The instrumentation is organized in figure 2. In order to evaluate the dynamic performance under different seismic motions, time histories of acceleration is selected as the input data. One of the data consists of peak ground acceleration (PGA) from Sabah Earthquake in 2015 which is 0.126 g. The test is carried out from lower PGA starting from 0.126 NS, 0.132 EW, 0.3 NS, 0.5 NS, 0.7 NS, 1.0 NS, and 1.0 EW. The gradually increasing amplitudes of base excitation are input successively in a manner of time-scaled earthquake waves. The behavior of the model needs to observe clearly every different input data. The frequency can be observed with corresponding maximum value Fourier amplitude determined from the variation graph of the frequency of free vibrations in seismosignal. Before processing, the recorded accelerations were corrected, using a baseline correction, and filtered, to remove the interferences produced by ambient vibrations or other sources. The correction and the processing were performed with Seismosignal.
Figure 2: Detailing all instrumentation in Time History shaking table test.
RESULTS AND DISCUSSION
The results of material properties of slab beam reinforced concrete and natural frequency from undisturbed test, free vibration method on 1:10 small-scaled frame model state was obtained. The result of natural frequency from free vibration method was used to compare of frequency obtained from shaking table test with different input of peak ground acceleration (PGA) in term of stiffness, performance of model and damages of structure.
Additional Mass
Accelerometers
Shaking Table Structure
17
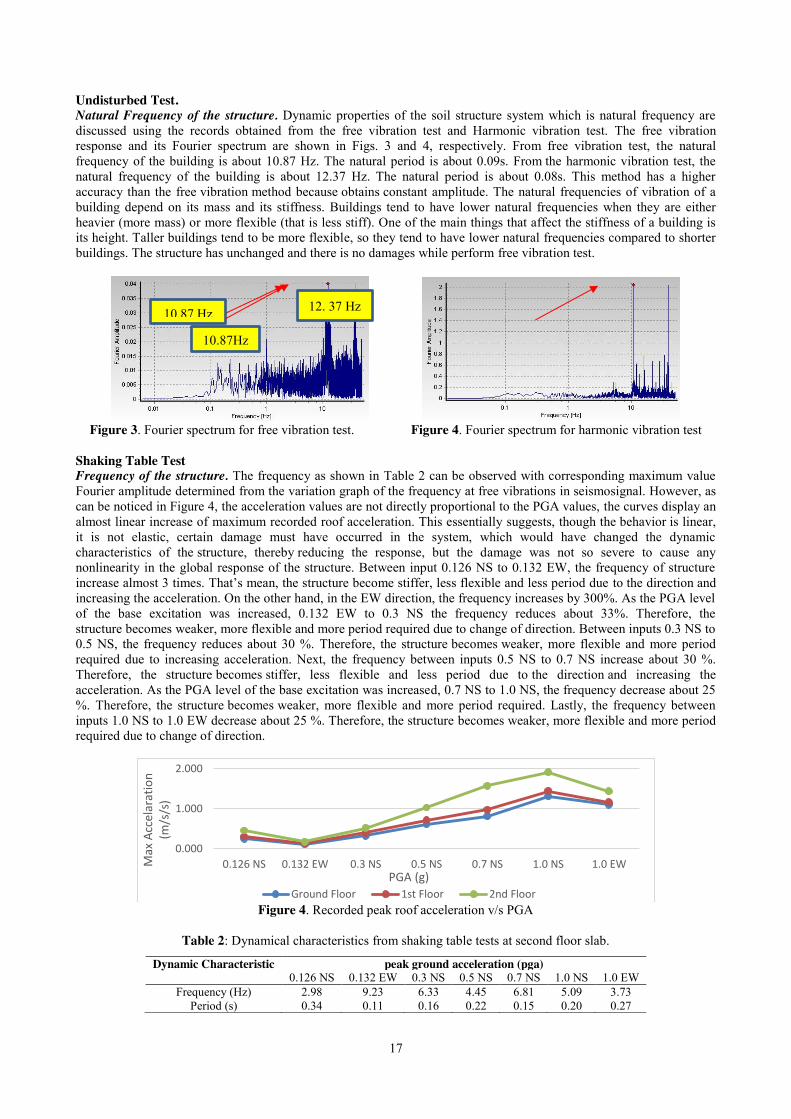
Undisturbed Test. Natural Frequency of the structure. Dynamic properties of the soil structure system which is natural frequency are discussed using the records obtained from the free vibration test and Harmonic vibration test. The free vibration response and its Fourier spectrum are shown in Figs. 3 and 4, respectively. From free vibration test, the natural frequency of the building is about 10.87 Hz. The natural period is about 0.09s. From the harmonic vibration test, the natural frequency of the building is about 12.37 Hz. The natural period is about 0.08s. This method has a higher accuracy than the free vibration method because obtains constant amplitude. The natural frequencies of vibration of a building depend on its mass and its stiffness. Buildings tend to have lower natural frequencies when they are either heavier (more mass) or more flexible (that is less stiff). One of the main things that affect the stiffness of a building is its height. Taller buildings tend to be more flexible, so they tend to have lower natural frequencies compared to shorter buildings. The structure has unchanged and there is no damages while perform free vibration test.
Figure 3. Fourier spectrum for free vibration test. Figure 4. Fourier spectrum for harmonic vibration test
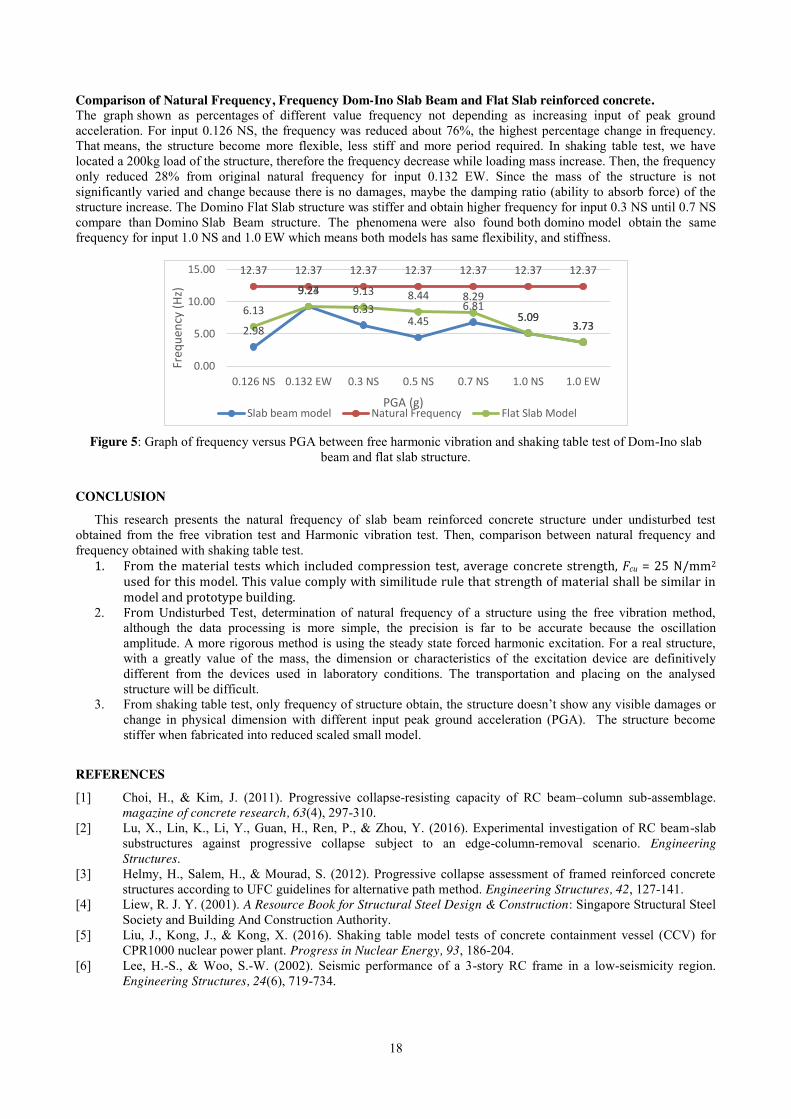
Shaking Table Test Frequency of the structure. The frequency as shown in Table 2 can be observed with corresponding maximum value Fourier amplitude determined from the variation graph of the frequency at free vibrations in seismosignal. However, as can be noticed in Figure 4, the acceleration values are not directly proportional to the PGA values, the curves display an almost linear increase of maximum recorded roof acceleration. This essentially suggests, though the behavior is linear, it is not elastic, certain damage must have occurred in the system, which would have changed the dynamic characteristics of the structure, thereby reducing the response, but the damage was not so severe to cause any nonlinearity in the global response of the structure. Between input 0.126 NS to 0.132 EW, the frequency of structure increase almost 3 times. That’s mean, the structure become stiffer, less flexible and less period due to the direction and increasing the acceleration. On the other hand, in the EW direction, the frequency increases by 300%. As the PGA level of the base excitation was increased, 0.132 EW to 0.3 NS the frequency reduces about 33%. Therefore, the structure becomes weaker, more flexible and more period required due to change of direction. Between inputs 0.3 NS to 0.5 NS, the frequency reduces about 30 %. Therefore, the structure becomes weaker, more flexible and more period required due to increasing acceleration. Next, the frequency between inputs 0.5 NS to 0.7 NS increase about 30 %. Therefore, the structure becomes stiffer, less flexible and less period due to the direction and increasing the acceleration. As the PGA level of the base excitation was increased, 0.7 NS to 1.0 NS, the frequency decrease about 25 %. Therefore, the structure becomes weaker, more flexible and more period required. Lastly, the frequency between inputs 1.0 NS to 1.0 EW decrease about 25 %. Therefore, the structure becomes weaker, more flexible and more period required due to change of direction.
Figure 4. Recorded peak roof acceleration v/s PGA
Table 2: Dynamical characteristics from shaking table tests at second floor slab.
0.000
1.000
2.000
0.126 NS 0.132 EW 0.3 NS 0.5 NS 0.7 NS 1.0 NS 1.0 EWMax
Acc
elar
atio
n (m
/s/s
)
PGA (g) Ground Floor 1st Floor 2nd Floor
Dynamic Characteristic peak ground acceleration (pga) 0.126 NS 0.132 EW 0.3 NS 0.5 NS 0.7 NS 1.0 NS 1.0 EW
Frequency (Hz) 2.98 9.23 6.33 4.45 6.81 5.09 3.73 Period (s) 0.34 0.11 0.16 0.22 0.15 0.20 0.27
10.87Hz
12. 37 Hz 10.87 Hz
18
Comparison of Natural Frequency, Frequency Dom-Ino Slab Beam and Flat Slab reinforced concrete. The graph shown as percentages of different value frequency not depending as increasing input of peak ground acceleration. For input 0.126 NS, the frequency was reduced about 76%, the highest percentage change in frequency. That means, the structure become more flexible, less stiff and more period required. In shaking table test, we have located a 200kg load of the structure, therefore the frequency decrease while loading mass increase. Then, the frequency only reduced 28% from original natural frequency for input 0.132 EW. Since the mass of the structure is not significantly varied and change because there is no damages, maybe the damping ratio (ability to absorb force) of the structure increase. The Domino Flat Slab structure was stiffer and obtain higher frequency for input 0.3 NS until 0.7 NS compare than Domino Slab Beam structure. The phenomena were also found both domino model obtain the same frequency for input 1.0 NS and 1.0 EW which means both models has same flexibility, and stiffness.
Figure 5: Graph of frequency versus PGA between free harmonic vibration and shaking table test of Dom-Ino slab
beam and flat slab structure.
CONCLUSION
This research presents the natural frequency of slab beam reinforced concrete structure under undisturbed test obtained from the free vibration test and Harmonic vibration test. Then, comparison between natural frequency and frequency obtained with shaking table test.
1. From the material tests which included compression test, average concrete strength, Fcu = 25 N/mm2 used for this model. This value comply with similitude rule that strength of material shall be similar in model and prototype building.
2. From Undisturbed Test, determination of natural frequency of a structure using the free vibration method, although the data processing is more simple, the precision is far to be accurate because the oscillation amplitude. A more rigorous method is using the steady state forced harmonic excitation. For a real structure, with a greatly value of the mass, the dimension or characteristics of the excitation device are definitively different from the devices used in laboratory conditions. The transportation and placing on the analysed structure will be difficult.
3. From shaking table test, only frequency of structure obtain, the structure doesn’t show any visible damages or change in physical dimension with different input peak ground acceleration (PGA). The structure become stiffer when fabricated into reduced scaled small model.
REFERENCES
[1] Choi, H., & Kim, J. (2011). Progressive collapse-resisting capacity of RC beam–column sub-assemblage. magazine of concrete research, 63(4), 297-310.
[2] Lu, X., Lin, K., Li, Y., Guan, H., Ren, P., & Zhou, Y. (2016). Experimental investigation of RC beam-slab substructures against progressive collapse subject to an edge-column-removal scenario. Engineering Structures.
[3] Helmy, H., Salem, H., & Mourad, S. (2012). Progressive collapse assessment of framed reinforced concrete structures according to UFC guidelines for alternative path method. Engineering Structures, 42, 127-141.
[4] Liew, R. J. Y. (2001). A Resource Book for Structural Steel Design & Construction: Singapore Structural Steel Society and Building And Construction Authority.
[5] Liu, J., Kong, J., & Kong, X. (2016). Shaking table model tests of concrete containment vessel (CCV) for CPR1000 nuclear power plant. Progress in Nuclear Energy, 93, 186-204.
[6] Lee, H.-S., & Woo, S.-W. (2002). Seismic performance of a 3-story RC frame in a low-seismicity region. Engineering Structures, 24(6), 719-734.
2.98
9.23 6.33
4.45 6.81
5.09 3.73
12.37 12.37 12.37 12.37 12.37 12.37 12.37
6.13
9.24 9.13 8.44 8.29
5.09 3.73
0.00
5.00
10.00
15.00
0.126 NS 0.132 EW 0.3 NS 0.5 NS 0.7 NS 1.0 NS 1.0 EW
Freq
uenc
y (H
z)
PGA (g) Slab beam model Natural Frequency Flat Slab Model

19
Strength Development of Martian Concrete with 1mm Aggregate by using Hot-mixed Method
Nur ‘Afini Dzulkifli1, Norhazilan Md. Noor2 Faculty of Civil Engineering, Universiti Teknologi Malaysia, Malaysia
Keywords: Martian Concrete; Sulphur Concrete, Mix Design; Particles Size Distribution.
ABSTRACT. National Aeronautics and Space Exploration (NASA) has mentioned that humans will be living and working on Mars colonies entirely independent of Earth by the 2030s. Thus, study on material use for construction on Mars is necessary. The best way to construct a building is by using on-site material. Since, molten sulphur is abundance on Mars, new construction material composed of simulated Martian soil and molten sulphur is developed. Sulphur concrete have same strength as conventional cementitious concrete, resistant to acid and salt environment, fast curing, and can be recycle are characteristics of developed Martian Concrete. In this study, different percentage of sulphur are investigate to obtain best mix design. Unconfined compression, flexural, and splitting test were conducted to determine strength variability, strength development and failure mechanism. Particles size distribution plays a significance role in the mechanical properties of the concrete. Thus, the test result are compared with different aggregates size. In addition, since Martian soil is metal rich, thus sulphates and polysulphates are formed when react with sulphur during hot mixing, which increase the material strength. The optimal mix of developed Martian Concrete has unconfined compression strength of 50 MPa which equivalent to roughly 150 MPa concrete on Mars.
INTRODUCTION
Scientific study regarding possible human colonization is focus much on Mars. Presence of water on Mars and its suitable condition make it more convincing as hospitable of the planets in the Solar System after Earth. In addition, billion years ago, Mars has thicker atmosphere that trap heat near the Martian surface which is help to warm the surface whereby water can maintain in a liquid state. As technology has advanced, colonization is become one of science fiction’s most prevalent themes. With the help of technology, permanent human habitation on Mars will become reality and having a shelter is a must. Building a shelter on Mars requires high strength materials that can withstand extremely cold temperature and dusty storm which is does not happen on Earth. When building a shelter, the best way is to extract the material that found on location. Due to Mars was known as “sulphur-rich” planet, thus, sulphur will become the main material that acts as binding agent. Therefore, Martian Concrete is developed by using molten sulphur and Mars soil.
Problem Statement Many studies have been conducted to enable humans to live on Mars. In order to live on Mars, shelter is the most important things that everyone needs to have. On Earth, concrete is the main material to build a building. Since Mars has no water and has different atmosphere from Earth, replacement of concrete needs to be studied along with the conformity of the weather condition. In addition, the method to produce Martian Concrete is certainly different from the Earth as the materials used are not the same. After the concrete has been produced, tests must be conducted to identify the effectiveness of the concrete. Objectives In this thesis, there are few objectives that need to achieve at the end of this project.
i. To determine the best mix design in producing Martian Concrete. ii. To determine the strength development, strength variability and failure mechanism through flexural test,
unconfined compression and splitting test respectively.
Scope of Study This study consist of experimental work to investigate the strength of Martian Concrete with the combination of sulphur, Mars soil and aggregate by using two methods; cold and hot mix methods. The strength development, strength variability and failure mechanism of Martian concrete were investigated under various loading condition which are unconfined compression, flexural and splitting. Testing methods and procedures are specified according to ASTM C39, ASTM C78, ASTM C496 and BS 410 for compression, flexure, splitting test and sieve analysis respectively.
20
LITERATURE REVIEW
Martian concrete is the concrete that is produced by using materials that available on Mars. The use of sulphur as a molten bonding agent has been practicing for quite a long time in human history. Knowing that Mars has been considered as ‘sulphur-rich planet’, material that made up of that element which is molten sulphur when combined with the Mars soil itself is the major contributor to the new construction material. Sulphur is classified as the 16th most abundant element in nature. Sulphur being comparatively low fusibility, acid proof, wet-resistant, high dielectric strength and low heat conductivity seems to be an ideal material for special construction works [1] for material construction. Elemental sulphur occurs under standard conditions which have yellow orthorhombic crystal with a density of 2.07 Mg/m3 [2]. Crystalline sulphur has a ring type structure with formula S8. Molten sulphur become more vicious at high temperature. The sulphur exist in two forms, solid or liquid (molten).
After Viking and Pathfinder’s rover was landed on Mars, the instruments were used to identify the physical and chemical properties of the Martian soil. JSC Mars-1 Martian regolith simulant at NASA’s Johnson Space Center in 1988 were developed to support scientific research, engineering studies and education. The simulant of Martian soil or JSC Mars 1 was obtained on the Pu’u Nene cinder cone, located in the saddle between Mauna Loa and Mauna Kea volcanoes on the Island of Hawaii. It contains palagonitic tephra which is glassy volcanic ash that altered at low temperature, with particle size fraction less than 1 millimetre [3]. The process of the simulant is done by mining and sieving into size of quarry which can be found into two sizes of fraction, less than 1 millimetre and less than 5 millimetre. In this study, JSC Mars-1 with 1mm aggregate will be used. However, there is no particle size less than 13µm and no additional milling or crushing to the material.
Elemental Sulphur Concrete (ESC) is a product of concrete that formed from elemental sulphur and aggregates without adding any chemical additives. ESC have low permeability and high resistance to strong acids and saline solutions. Furthermore, rapid strength development of ESC is advantageous when concreting for both low- and high temperature. Compared to normal concrete, its maturity age is achieved only a few hours after casting, where moisture and temperature do not influence the development strength [4]. Compressive strength for ESC range from 40 MPa to 50 MPa. When pure elemental sulphur is heated to 120-130˚C, and then cooled to ambient temperature, monoclinic sulphur is instantaneously formed followed by a reversion to orthorhombic sulphur that is nearly complete in less than 24 hours [2], expansion and contraction will occur when subjected to thermal cycles, hence variations in the hydro-mechanical thermal properties will be expected. Rapid transformation from monoclinic sulphur (Sβ) to orthorhombic (Sα), in which Sα is much denser than (Sβ), and leads to 6% volume decrease, hence resulting in high stress construction material but have cavities due to sulphur shrinkage [5]. High stress in sulphur binder will fail the products prematurely. High shrinkage will affect the final dimension of the products as well as distortion to the products. Furthermore, ESC failed when exposed to repeated cycles of freezing and thawing, humid conditions, or immersion in water [2] By modifying the sulphur binder, so that it remains in β-phase for a longer duration or by accepting the transition into α-phase will help to relieve the material from imposed stress due to contraction. By accepting the transition into α-phase, prevention of formation of microsulfur crystal would be necessary to avoid contraction.
Sulphur Concrete (SC) or Modified Sulphur Concrete (MSC) is a thermoplastic construction material composed of mineral aggregates with modified sulphur as a binder. With a small percentage of a polymer modifier react with elemental sulphur producing modified sulphur binder will improve physical properties and durability of the SC. In addition to the elemental sulphur concrete (ESC) ingredients, sulphur concrete required two more ingredients which are chemical additives and mineral fillers. During cooling process, sulphur modifier will keep the sulphur in preferential crystalline forms, through allotropic transformation to resist concrete fracturing, resulting less stress sulphur concrete and increase its durability [2]. Sulphur modifier will improve ductility and durability of sulphur concrete by strengthening the bonds between the sulphur matrix and the aggregates and sulphur crystals in the matrix [6]. For earth application, sulphur concrete benefits us as it is improves mechanical performance, cost benefits, environmental profile [5]. Mechanical performance such as high compressive and flexural strength, have high durability which could be placed year-round in below-freezing temperature, excellent resistance to attack by most acid and salts, resist corrosive electrolyte attack, excellent finished surface and pigmentation, and superior freeze/thaw performance. It is cost benefits because it has faster setting time. It can hardened within hours and increase tolerance to aggregate choice. Sulphur concrete is an environmental products because it reduce CO2 footprint. The composition materials can be recycled plus no water needed to produce sulphur concrete.
Martian Concrete is the improvement from Sulphur Concrete. Martian Concrete is made up of two materials, a) sulphur and b) Regolith Simulant Mars Soil by hot mixing. Best mix producing Martian Concrete is 50% sulphur and 50% Martian soil with 1mm aggregates size [5]. The optimum compression strength gained from this mix proportioning is above 50 MPa. The size of aggregates plays a significant role in achieving high strength of Martian concrete compared to sulphur concrete with regular sand. During hot mixing, rich metal element in Martian soil are found to be reactive with sulphur, forming sulphates and poly-sulphates which further increase Martian concrete strength [5]. Same as sulphur concrete, Martian Concrete also can be reused and has fast curing time. This will benefit in terms of costing and less formwork used in real construction. The atmospheric pressure on Mars is about 0.636 kPa and the temperature is range less than 35˚C are found to be perfect for application of sulphur concrete [5]. The environmental condition and it magnitude in pressure above the solid-vapour interface on Mars is on a stable state of sulphur (Rhombic), therefore Martian Concrete is suitable to be construct on a Mars planet. Sulphur concrete shared most of its properties with
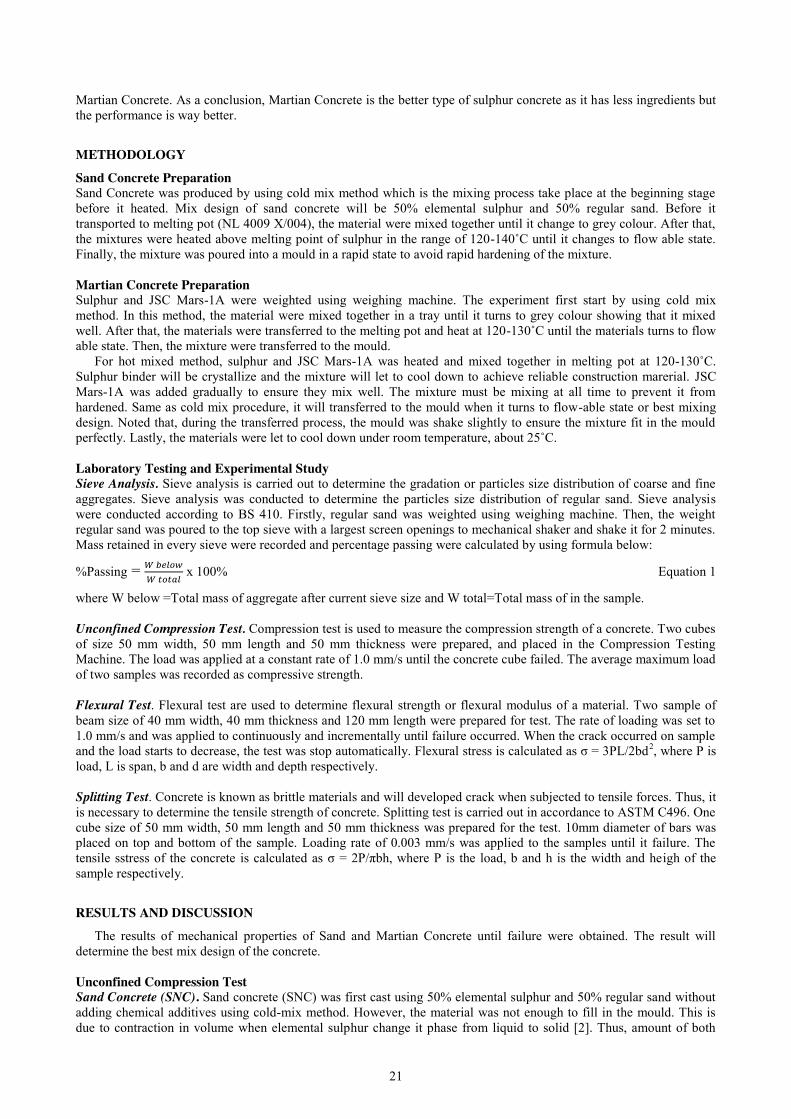
21
Martian Concrete. As a conclusion, Martian Concrete is the better type of sulphur concrete as it has less ingredients but the performance is way better.
METHODOLOGY Sand Concrete Preparation Sand Concrete was produced by using cold mix method which is the mixing process take place at the beginning stage before it heated. Mix design of sand concrete will be 50% elemental sulphur and 50% regular sand. Before it transported to melting pot (NL 4009 X/004), the material were mixed together until it change to grey colour. After that, the mixtures were heated above melting point of sulphur in the range of 120-140˚C until it changes to flow able state. Finally, the mixture was poured into a mould in a rapid state to avoid rapid hardening of the mixture. Martian Concrete Preparation Sulphur and JSC Mars-1A were weighted using weighing machine. The experiment first start by using cold mix method. In this method, the material were mixed together in a tray until it turns to grey colour showing that it mixed well. After that, the materials were transferred to the melting pot and heat at 120-130˚C until the materials turns to flow able state. Then, the mixture were transferred to the mould.
For hot mixed method, sulphur and JSC Mars-1A was heated and mixed together in melting pot at 120-130˚C. Sulphur binder will be crystallize and the mixture will let to cool down to achieve reliable construction marerial. JSC Mars-1A was added gradually to ensure they mix well. The mixture must be mixing at all time to prevent it from hardened. Same as cold mix procedure, it will transferred to the mould when it turns to flow-able state or best mixing design. Noted that, during the transferred process, the mould was shake slightly to ensure the mixture fit in the mould perfectly. Lastly, the materials were let to cool down under room temperature, about 25˚C. Laboratory Testing and Experimental Study Sieve Analysis. Sieve analysis is carried out to determine the gradation or particles size distribution of coarse and fine aggregates. Sieve analysis was conducted to determine the particles size distribution of regular sand. Sieve analysis were conducted according to BS 410. Firstly, regular sand was weighted using weighing machine. Then, the weight regular sand was poured to the top sieve with a largest screen openings to mechanical shaker and shake it for 2 minutes. Mass retained in every sieve were recorded and percentage passing were calculated by using formula below:
%Passing = 𝑊 𝑏𝑒𝑙𝑜𝑤𝑊 𝑡𝑜𝑡𝑎𝑙
x 100% Equation 1
where W below =Total mass of aggregate after current sieve size and W total=Total mass of in the sample. Unconfined Compression Test. Compression test is used to measure the compression strength of a concrete. Two cubes of size 50 mm width, 50 mm length and 50 mm thickness were prepared, and placed in the Compression Testing Machine. The load was applied at a constant rate of 1.0 mm/s until the concrete cube failed. The average maximum load of two samples was recorded as compressive strength. Flexural Test. Flexural test are used to determine flexural strength or flexural modulus of a material. Two sample of beam size of 40 mm width, 40 mm thickness and 120 mm length were prepared for test. The rate of loading was set to 1.0 mm/s and was applied to continuously and incrementally until failure occurred. When the crack occurred on sample and the load starts to decrease, the test was stop automatically. Flexural stress is calculated as σ = 3PL/2bd2, where P is load, L is span, b and d are width and depth respectively. Splitting Test. Concrete is known as brittle materials and will developed crack when subjected to tensile forces. Thus, it is necessary to determine the tensile strength of concrete. Splitting test is carried out in accordance to ASTM C496. One cube size of 50 mm width, 50 mm length and 50 mm thickness was prepared for the test. 10mm diameter of bars was placed on top and bottom of the sample. Loading rate of 0.003 mm/s was applied to the samples until it failure. The tensile sstress of the concrete is calculated as σ = 2P/πbh, where P is the load, b and h is the width and heigh of the sample respectively.
RESULTS AND DISCUSSION
The results of mechanical properties of Sand and Martian Concrete until failure were obtained. The result will determine the best mix design of the concrete.
Unconfined Compression Test Sand Concrete (SNC). Sand concrete (SNC) was first cast using 50% elemental sulphur and 50% regular sand without adding chemical additives using cold-mix method. However, the material was not enough to fill in the mould. This is due to contraction in volume when elemental sulphur change it phase from liquid to solid [2]. Thus, amount of both
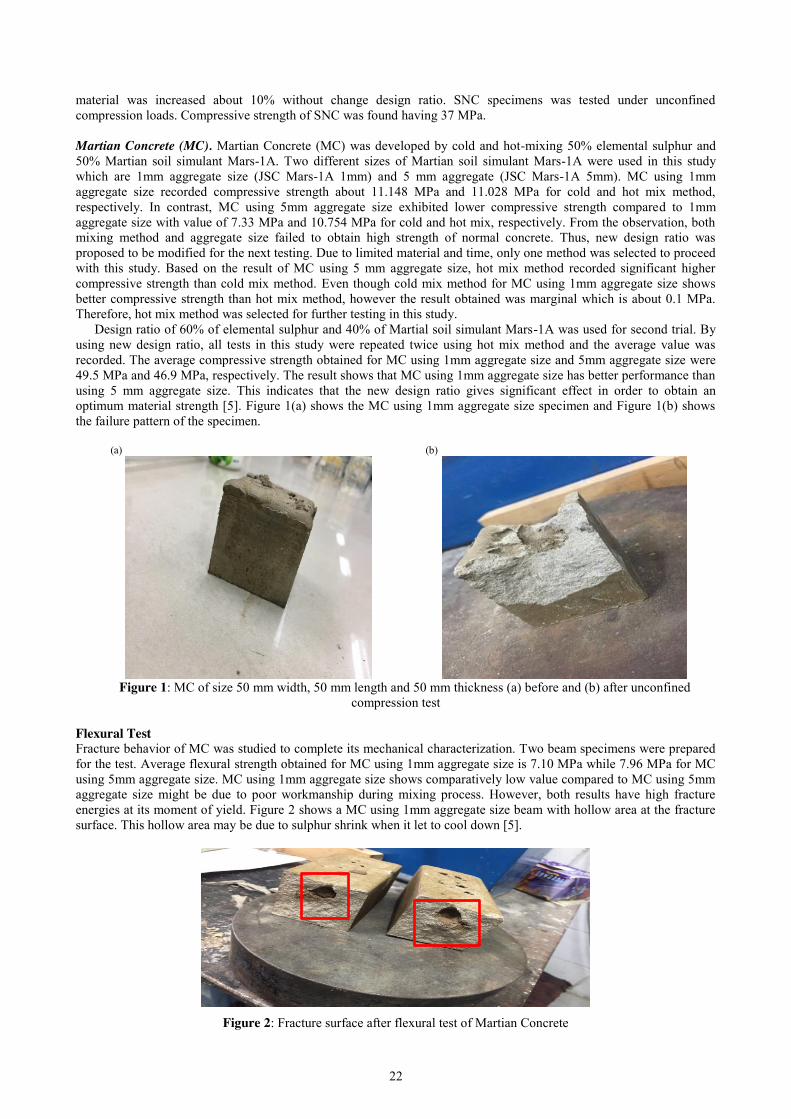
22
material was increased about 10% without change design ratio. SNC specimens was tested under unconfined compression loads. Compressive strength of SNC was found having 37 MPa. Martian Concrete (MC). Martian Concrete (MC) was developed by cold and hot-mixing 50% elemental sulphur and 50% Martian soil simulant Mars-1A. Two different sizes of Martian soil simulant Mars-1A were used in this study which are 1mm aggregate size (JSC Mars-1A 1mm) and 5 mm aggregate (JSC Mars-1A 5mm). MC using 1mm aggregate size recorded compressive strength about 11.148 MPa and 11.028 MPa for cold and hot mix method, respectively. In contrast, MC using 5mm aggregate size exhibited lower compressive strength compared to 1mm aggregate size with value of 7.33 MPa and 10.754 MPa for cold and hot mix, respectively. From the observation, both mixing method and aggregate size failed to obtain high strength of normal concrete. Thus, new design ratio was proposed to be modified for the next testing. Due to limited material and time, only one method was selected to proceed with this study. Based on the result of MC using 5 mm aggregate size, hot mix method recorded significant higher compressive strength than cold mix method. Even though cold mix method for MC using 1mm aggregate size shows better compressive strength than hot mix method, however the result obtained was marginal which is about 0.1 MPa. Therefore, hot mix method was selected for further testing in this study.
Design ratio of 60% of elemental sulphur and 40% of Martial soil simulant Mars-1A was used for second trial. By using new design ratio, all tests in this study were repeated twice using hot mix method and the average value was recorded. The average compressive strength obtained for MC using 1mm aggregate size and 5mm aggregate size were 49.5 MPa and 46.9 MPa, respectively. The result shows that MC using 1mm aggregate size has better performance than using 5 mm aggregate size. This indicates that the new design ratio gives significant effect in order to obtain an optimum material strength [5]. Figure 1(a) shows the MC using 1mm aggregate size specimen and Figure 1(b) shows the failure pattern of the specimen.
(a) (b)
Figure 1: MC of size 50 mm width, 50 mm length and 50 mm thickness (a) before and (b) after unconfined
compression test Flexural Test Fracture behavior of MC was studied to complete its mechanical characterization. Two beam specimens were prepared for the test. Average flexural strength obtained for MC using 1mm aggregate size is 7.10 MPa while 7.96 MPa for MC using 5mm aggregate size. MC using 1mm aggregate size shows comparatively low value compared to MC using 5mm aggregate size might be due to poor workmanship during mixing process. However, both results have high fracture energies at its moment of yield. Figure 2 shows a MC using 1mm aggregate size beam with hollow area at the fracture surface. This hollow area may be due to sulphur shrink when it let to cool down [5].
Figure 2: Fracture surface after flexural test of Martian Concrete

23
Splitting Test For splitting test, only one sample was tested for both MC using 1mm aggregate size and MC using 5 mm aggregate size due to insufficient materials and time constraint. Splitting tensile strengths obtained for MC using 1mm aggregate size and 5 mm aggregate size were 2.05 MPa and 1.4 MPa respectively. MC using 1mm aggregate size again proved to have better performance compared to MC using 5mm aggregate size. As shown in Figure 3, the compressive stress start from 0 and reach at peak before it fails at 3.5 N/mm with the strain of 0.0075mm/mm, where nominal strain is calculated as vertical displacement divided by specimen height.
Figure 3: Compressive stress versus compressive strain when subjected to splitting test.
Discussion of Experimental Works Cold-mix method versus hot-mix method. Final products that achieve high mechanical strength, less voids and have good workability are consider as high performance concrete. Based on the result obtained in experimental works, hot mixed method have better performance compared to cold mixed method for Martian Concrete. This may due to rich metal element in JSC Mars-1A that are found to be reactive with sulphur during hot mixing, forming sulphates and polysulphates, which further increase MC strength as describes by [5] This is because, cold mixing process will slow down the reaction of Martian simulant with sulphur, hence recorded low compressive strength. In Martian Concrete, sulphur is not just a binder but it is also reacts with element in Martian soil compared to Sand Concrete. Particles Size Distribution. Sand Concrete obtained it high compressive strength through cold-mix method with mix design 50% elemental sulphur and 50% regular sand which is not adequate for Martian Concrete. This may due to range of aggregates size in sand particles. The required amount of binder paste is dependent upon the total surface area that must be covered and void space that must be filled. Spacing is the greatest when the particles are of uniform size, but when different size is used, binder requirement is lowered and the void spaces are filled. The more these voids are filled, the more strength the concrete becomes [2]. This prove that range size of aggregates used will increase concrete performance.
Martian Concrete using 1 mm aggregate size has better mechanical properties compared to Martian Concrete using 5 mm aggregates size. Obviously, MC using 1mm aggregate size have less total surface area compared to MC using 5mm aggregate size. With fixed amount of elemental sulphur used for both aggregates, MC using 1mm aggregate size has higher probability of aggregates to coat evenly. Thus, size of aggregates prove to plays an important roles in determining the optimum material strength [2]. Best Mix Design. From experimental work, best mix design found is hot mixing 60% elemental sulphur and 40% JSC Mars-1A (see Fig. 4). 50% sulphur and 50% Mars soil is not adequate to produce Martian Concrete due to insufficient volume of binding agent. Unncessary crack will form in finished product when minimizing the binder content [2]. During heating process of elemental sulphur, sulphur will change it phase from liquid to solid which is leads to contraction in volume of 7%. On further cooling process after solidification (β-phase), sulphur needs to transform to achievable construction material (α-phase) which leads to another contraction in volume of 6%. Thus, total contraction in volume by using elemental sulphur is 13% [2]. By increasing the sulphur binder, which is sulphur, will increase concrete performace. Criteria used to determine the best mix design are based on adjusting the binder level to provide the best balance between maximum compressive strength, maximum specific gravity, minimum absorption, and workable mixture [2]. Thus, it prove that 60% sulphur and 40% JSC Mars-1A is the best mix design for this study with optimum compressive strength of 50 MPa. However, this result is not inline with previous study where best mix design found to be 50% sulphur and 50% mars soil with same optimum compressive strength, 50 MPa. This may due to instrument used for mixing process. Manual mixing required more binder and energy to coat the aggregates.
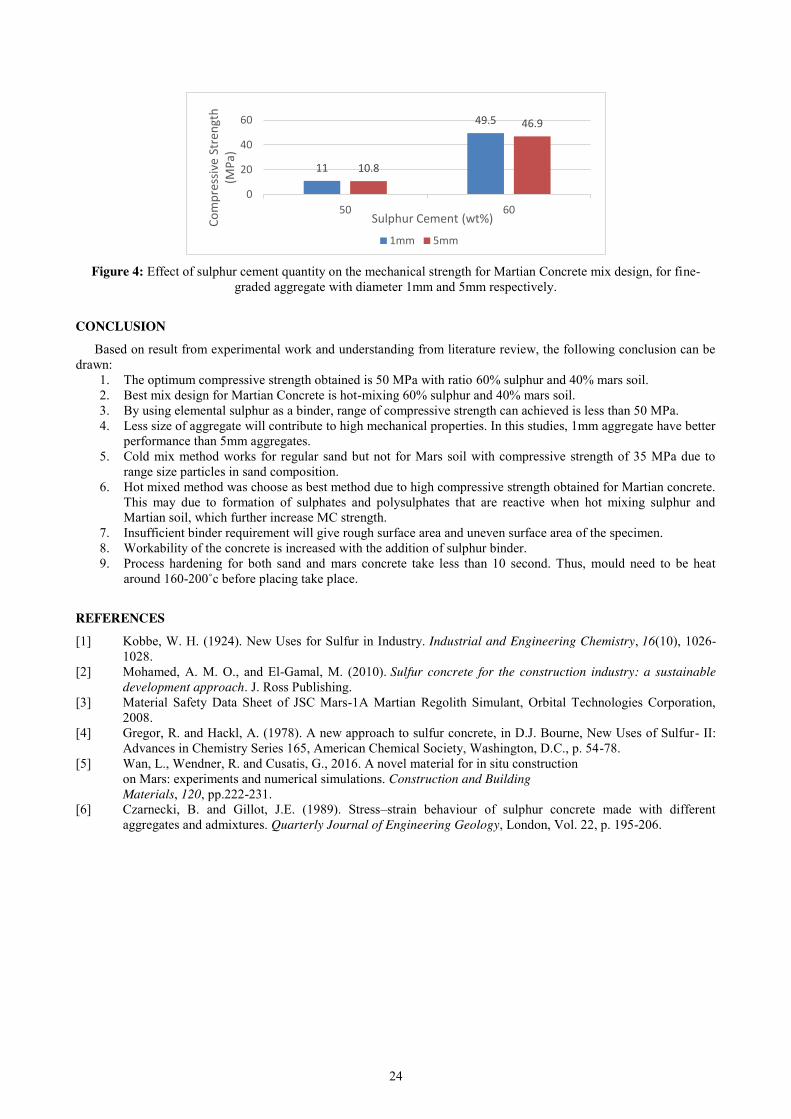
24
Figure 4: Effect of sulphur cement quantity on the mechanical strength for Martian Concrete mix design, for fine-
graded aggregate with diameter 1mm and 5mm respectively.
CONCLUSION Based on result from experimental work and understanding from literature review, the following conclusion can be
drawn: 1. The optimum compressive strength obtained is 50 MPa with ratio 60% sulphur and 40% mars soil. 2. Best mix design for Martian Concrete is hot-mixing 60% sulphur and 40% mars soil. 3. By using elemental sulphur as a binder, range of compressive strength can achieved is less than 50 MPa. 4. Less size of aggregate will contribute to high mechanical properties. In this studies, 1mm aggregate have better
performance than 5mm aggregates. 5. Cold mix method works for regular sand but not for Mars soil with compressive strength of 35 MPa due to
range size particles in sand composition. 6. Hot mixed method was choose as best method due to high compressive strength obtained for Martian concrete.
This may due to formation of sulphates and polysulphates that are reactive when hot mixing sulphur and Martian soil, which further increase MC strength.
7. Insufficient binder requirement will give rough surface area and uneven surface area of the specimen. 8. Workability of the concrete is increased with the addition of sulphur binder. 9. Process hardening for both sand and mars concrete take less than 10 second. Thus, mould need to be heat
around 160-200˚c before placing take place.
REFERENCES [1] Kobbe, W. H. (1924). New Uses for Sulfur in Industry. Industrial and Engineering Chemistry, 16(10), 1026- 1028. [2] Mohamed, A. M. O., and El-Gamal, M. (2010). Sulfur concrete for the construction industry: a sustainable development approach. J. Ross Publishing. [3] Material Safety Data Sheet of JSC Mars-1A Martian Regolith Simulant, Orbital Technologies Corporation, 2008. [4] Gregor, R. and Hackl, A. (1978). A new approach to sulfur concrete, in D.J. Bourne, New Uses of Sulfur- II: Advances in Chemistry Series 165, American Chemical Society, Washington, D.C., p. 54-78. [5] Wan, L., Wendner, R. and Cusatis, G., 2016. A novel material for in situ construction
on Mars: experiments and numerical simulations. Construction and Building Materials, 120, pp.222-231.
[6] Czarnecki, B. and Gillot, J.E. (1989). Stress–strain behaviour of sulphur concrete made with different aggregates and admixtures. Quarterly Journal of Engineering Geology, London, Vol. 22, p. 195-206.
11
49.5
10.8
46.9
0
20
40
60
50 60Co
mpr
essiv
e St
reng
th
(MPa
) Sulphur Cement (wt%)
1mm 5mm

25
Modeling of FRP Confined HSC Column by Nonlinear Finite Element Method
Ong Kee Yen1, Ma Chau Khun2 Faculty of Civil Engineering, Universiti Teknologi Malaysia, Malaysia
Keywords: Fiber-Reinforced Polymer; High Strength Concrete; Cyclic lateral load; Finite Element Analysis.
ABSTRACT. The analytical behavior of high-strength concrete (HSC) columns confined with fiber-reinforced polymer (FRP) subjected to combined axial and cyclic lateral loading is presented in this paper. FRP confinement method has been widely used in construction especially in high rise buildings and bridges, which offers a cheaper and safer construction in seismic activity area. As the experimental study is costly for full scale specimen, a finite element analysis (FEA) is chosen for the study. Most of the studies done have focused on examining the axial load behavior of FRP-confined HSC column instead of combined axial and cyclic lateral load behavior. The lack of study on seismic behavior of FRP-confined HSC columns has been the main interest in the industry. The key objective of this research is to develop a reliable numerical non-linear FEA model to represent the behavior of FRP confined HSC column. A FEA model is developed to study the cyclic behavior of the confined HSC column. Comparisons between experimental results from previous research and the predicted results were made based on load versus displacement relationships and ultimate strength of column. The results showed that HSC column increased in ductility and able to deform to a greater extent with the increase of the FRP confinement. The higher the confinement ratio, the FRP-confined HSC column achieved a higher moment resistance, thus indicated a higher strength in the column due to cyclic lateral load. It was found that the proposed FEA model can regenerate the experimental results with adequate accuracy.
INTRODUCTION The application of high-strength concrete (HSC) in the industry is increasing intermittenly corresponding to the
advancement of concrete technology. It is known HSC is brittle in nature and low ductility. The failure mode of HSC is sudden and explosive due to lack of ductility. In order to solve the problem, confinement is found able to improve the ductility of HSC. There are many ways of confinement, one of it is the fiber-reinforced polymer (FRP) confinement.
Fiber-reinforced polymer (FRP) is provided as an effective composite material to retrofit concrete columns. They have been used in high-rise buildings and bridges to improve the strength capacity and ductility of concrete. A column in high-rise building may be subjected to axial load and cyclic lateral loading during the seismic activity. During earthquake, columns have to maintain the axial load carrying capacity while being exerted to the cyclic lateral acceleration. Therefore, understand the behavior of the FRP confined HSC columns exposed to earthquake loads is very important.
Finite element analysis (FEA) provides an alternative way to study the behavior of concrete structures instead of carried out exhaustive experimental work. Hence, this study is aimed to investigate the behavior of the FRP-confined HSC column subjected to axial and cyclic lateral load. Problem Statement For the purpose of designing structural element like column, it has to be able to withstand axial and cyclic lateral load due to the occurrence of seismic activity. Therefore, it is very crucial to understand the behavior of the reinforced concrete column under earthquake event. In order to study the behavior of fiber reinforced polymer confined high strength concrete column under axial and cyclic lateral load, we can perform an experimental study or numerical finite element analysis modeling. However, the experimental study is time costing, inconvenient to carry out, and required more human power. Experimental study is also limited by the capability of lab testing apparatus. A full-scale column testing required greater and larger machinery to perform the test, not to forget the time taken to prepare the full-scale specimen. It resulted in greater difficulties in performing such an experimental testing on FRP confined HSC columns. Therefore, finite element analysis modeling is more preferable and dependable technique in term of appropriateness and efficient.
Previous experimental study on FRP confined HSC columns has been carried out and numerical modeling has yet to be developed. Most of the research works done are focused on examining the axial load behavior of FRP confined HSC columns instead of combined axial and cyclic lateral load behavior. The lack of study on seismic behavior of FRP confined HSC columns has been the main interest in carried out this study. A nonlinear finite element analysis is selected for its effectiveness to predict the behavior of the concrete structure. In this study, a developed finite element analysis model is validated by the existing experimental results done by other research. The computing software named ABAQUS is chosen to perform the finite element analysis modeling.

26
Objectives The aim of this study is to investigate the structural behavior of FRP-confined HSC column due to axial and cyclic lateral load. The key objectives of this study are as follows:
1. To develop a reliable numerical non-linear FEA model to represent non-linear behavior of FRP confined HSC column
2. To study the structural behavior of FRP confined HSC column under axial compression and cyclic lateral load through the FEA model
3. To investigate the effect of the confinement on the high strength concrete column in ultimate strength and maximum displacement through the FEA model
Scope of Study This research is carried out to develop a reliable FEA model based on FRP confined HSC column so that the model can be use to predict the behavior of column such as ultimate strength and maximum lateral displacement. An experiment work model by Idris and Ozbakkaloglu [5] is regenerated according to the dimension provided in the experimental study. The model is loaded and tested in axial and cyclic lateral load test. The predicted results from the FEA model will be validated by the results from the experimental work done previously.
LITERATURE REVIEW
HSC is known as a versatile material possesses advantageous properties in addition to its high strength. For high rise building, the reduced weight is very important in determining the smaller section of load-carrying elements like columns. By using HSC, a more beneficial floor plan can be achieved through the uses of reduced size column. The usable space of a floor is greatly increase by application of HSC which favors the architectural point of view. Consider the reduced volume of structural member, the total volume of concrete and amount of reinforcement steel required is reduced for a load-carrying member. This prove that the HSC is able to provide more economical alternative compared to normal-strength concrete (NSC) [2].
Unlike NSC, the matrix stiffness of HSC is denser and the bond strength between matrix and aggregates also become higher. This contributes to a lower number and shorter cracks in HSC. The crack developed in HSC will run straight through the aggregate grain which increase the brittleness. The cracks are becoming active only at a higher load, and the extension of cracks will increase immediately follow by the sudden failure of concrete, which known as the brittle behavior. The stress-strain curve of a HSC has a steeper gradient compare to NSC and a lower displacement until the failure of the element. This means the deformation in HSC is less observable than the NSC, and bring difficulty to identify when is the concrete failure will happen. However, this undesirable characteristic can be rectified by using lateral compression or reinforcement, which improve the ductility of the HSC [9].
Passive confinement is known as confining the concrete without exerted any pre-stressing force onto the concrete. When there is no load on concrete, expansion will not occur and hence the confinement pressure is zero. Passive confinement is only activated once the concrete starts bulging or expand. The lateral expansion is restrained by confining concrete with materials such as fibre-reinforce polymer (FRP) sheets or steel jackets. When the lateral expansion of concrete begins due to Poisson’s effect and microcracking, the passive confinement increases [4]. Stirrup used in ordinary reinforce-concrete is an example of passive reinforcement. When the concrete is expanding laterally, tensile stress will induce in the stirrup whereby the confining reaction occur.
To enhance the knowledge on the behavior of HSC confined with FRP composites under seismic loading, an experimental study is carried out based on half-scale cantilever columns that represent the lower portion of a first-story building [5]. The specimens are tested under constant axial compression and incremental cyclic lateral deformation which simulated the cyclic lateral load during earthquake. The findings showed as the HSC is confined with FRP composites, the lateral drift capacities has increased remarkably. Like previous study, in this paper it also showed that the performance of square concrete columns is comparatively lower than circular column. It also found that with the increase of the axial load acted on the column, the column deformability is decreased due to the decrease in the confined concrete strength that neutralized by the increased confinement ratio.
In order to define the stress-strain model of the FRP-confined concrete, a general unified concrete model is adopted. Youssef [11]’s model is found to be able to define the stress-strain curve of FRP jacket concrete due to different cross-section type. The model divides the stress-strian curve into two portion: 1) First portion indicated the stress-strain curve of unconfined concrete until the jacket starts to get activated; 2) Second portion is made up of linear curve which either ascend or descend depends on the geometry of the cross-section and the confinement ratio provided.
Research using FEA has increased remarkably during the past few decades. Piscesa et al. [8] had predicted the behavior of FRP wrapped reinforced-concrete column with a proposed flow rule to automatically adjust the dilation rate of concrete from the passive to active confinement and vice versa using FEA model. The proposed model was found to generate more accurate results compared to other plasticity models. Xiao et al. [10] had developed a 3D FE model for FRP-confined circular cylinders based on plastic-damage constitutive model for concrete. The model was able to provide a useful tool for the investigation of effect of confinement in various FRP-confined concrete columns. Haghinejada and Nematzadeh [3] studied on nonlinear analysis of axially loaded steel tube-confined concrete (STCC) stub columns using a new confinement relationship and performed with FEA model to be validated against the
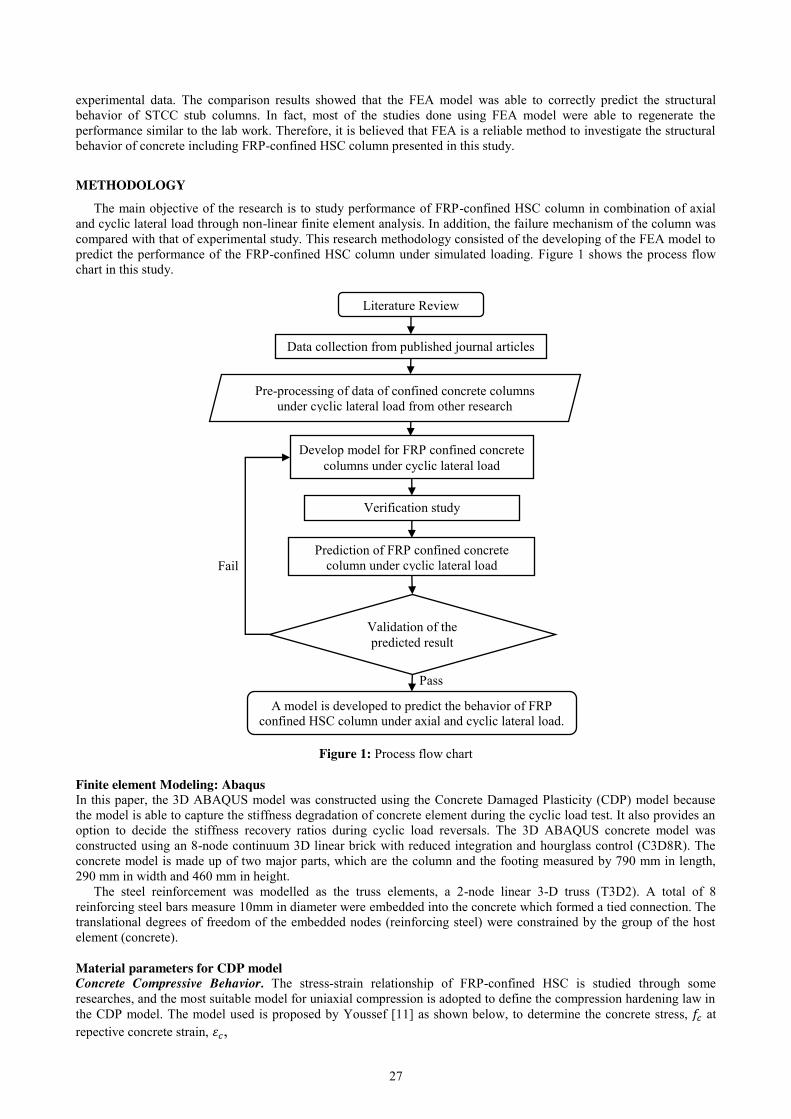
27
experimental data. The comparison results showed that the FEA model was able to correctly predict the structural behavior of STCC stub columns. In fact, most of the studies done using FEA model were able to regenerate the performance similar to the lab work. Therefore, it is believed that FEA is a reliable method to investigate the structural behavior of concrete including FRP-confined HSC column presented in this study.
METHODOLOGY
The main objective of the research is to study performance of FRP-confined HSC column in combination of axial and cyclic lateral load through non-linear finite element analysis. In addition, the failure mechanism of the column was compared with that of experimental study. This research methodology consisted of the developing of the FEA model to predict the performance of the FRP-confined HSC column under simulated loading. Figure 1 shows the process flow chart in this study.
Figure 1: Process flow chart
Finite element Modeling: Abaqus In this paper, the 3D ABAQUS model was constructed using the Concrete Damaged Plasticity (CDP) model because the model is able to capture the stiffness degradation of concrete element during the cyclic load test. It also provides an option to decide the stiffness recovery ratios during cyclic load reversals. The 3D ABAQUS concrete model was constructed using an 8-node continuum 3D linear brick with reduced integration and hourglass control (C3D8R). The concrete model is made up of two major parts, which are the column and the footing measured by 790 mm in length, 290 mm in width and 460 mm in height.
The steel reinforcement was modelled as the truss elements, a 2-node linear 3-D truss (T3D2). A total of 8 reinforcing steel bars measure 10mm in diameter were embedded into the concrete which formed a tied connection. The translational degrees of freedom of the embedded nodes (reinforcing steel) were constrained by the group of the host element (concrete).
Material parameters for CDP model Concrete Compressive Behavior. The stress-strain relationship of FRP-confined HSC is studied through some researches, and the most suitable model for uniaxial compression is adopted to define the compression hardening law in the CDP model. The model used is proposed by Youssef [11] as shown below, to determine the concrete stress, 𝑓𝑐 at repective concrete strain, 𝜀𝑐,
Pre-processing of data of confined concrete columns under cyclic lateral load from other research
Develop model for FRP confined concrete columns under cyclic lateral load
Verification study
Prediction of FRP confined concrete column under cyclic lateral load
Validation of the predicted result
A model is developed to predict the behavior of FRP confined HSC column under axial and cyclic lateral load.
Data collection from published journal articles
Literature Review
Pass
Fail
28
When 0 ≪ 𝜀𝑐 ≪ 𝜀𝑡 𝑎𝑛𝑑 𝐸2 > 0, 𝑓𝑐 = 𝐸𝑐𝜀𝑐 [1 −
1𝑛
(1 −𝐸2
𝐸𝑐) (
𝜀𝑐
𝜀𝑡)
𝑛−1] #(1)
𝑛 =(𝐸𝑐 − 𝐸2)𝜀𝑡
𝐸𝑐𝜀𝑡 − 𝑓𝑡 #(2)
When 0 ≪ 𝜀𝑐 ≪ 𝜀𝑡 𝑎𝑛𝑑 𝐸2 < 0,
𝑓𝑐 = 𝐸𝑐𝜀𝑐 [1 −1𝑛
(𝜀𝑐
𝜀𝑡)
𝑛−1] #(3)
𝑛 =𝐸𝑐𝜀𝑡
𝐸𝑐𝜀𝑡 − 𝑓𝑡#(4)
where Ec is the modulus of elasticity of concrete; E2 is the slope of the curve in second region; ε is the axial strain at the boundary point of the first and second region where the jacket is beginning to get fully activated; and ft is the axial stress at the boundary point of the first and second region where the jacket is beginning to get fully activated. For the part at 𝜀𝑡 ≪ 𝜀𝑐 ≪ 𝜀𝑐𝑢,
𝑓𝑐 = 𝑓𝑡 + 𝐸2(𝜀𝑐 − 𝜀𝑡) #(5)
The ultimate strength and strain of FRP-confined concrete, and the axial stress and strain at the boundary point were determined by the equation in Table 1 below, where f’cu is the ultimate strength of FRP-confined concrete; f’c is the compressive strength of unconfined concrete; f’lu is the effective lateral confining stress at ultimate condition of FRP jacket; fju is thetensile strength of FRP jacket; Ej is thetensile modulus of FRP jacket in the hoop direction; ρj is the volumetric ratio of FRP jacket; εjt is the FRP jacket strain at transition from first to second region; and εcu is the ultimate confined concrete compressive strain
Table 1: Parameters of stress-strain equation for circular section and rectangular section
Parameters Proposed Equation Circular cross-section Rectangular cross section
𝑓𝑐𝑢′
𝑓𝑐′
1.0 + 2.25 (𝑓𝑙𝑢
′
𝑓𝑐′ )
54 0.5 + 1.225 (
𝑓𝑙𝑢′
𝑓𝑐′ )
35
𝜀𝑐𝑢 0.003368 + 0.2590 (
𝑓𝑙𝑢′
𝑓𝑐′ ) (
𝑓𝑗𝑢
𝐸𝑗)
12 0.004325 + 0.2625 (
𝑓𝑙𝑢′
𝑓𝑐′ ) (
𝑓𝑗𝑢
𝑓𝑐′ )
12
𝑓𝑡
𝑓𝑐′ 1.0 + 3.0 (
𝜌𝑗𝐸𝑗𝜀𝑗𝑡
𝑓𝑐′ )
54 1.0 + 1.1350 (
𝜌𝑗𝐸𝑗𝜀𝑗𝑡
𝑓𝑐′ )
54
𝜀𝑡 0.002748 + 0.1169 (
𝜌𝑗𝐸𝑗𝜀𝑗𝑡
𝑓𝑐′ )
67
(𝑓𝑗𝑢
𝐸𝑗)
12
0.002
+ 0.0775 (𝜌𝑗𝐸𝑗𝜀𝑗𝑡
𝑓𝑐′ )
67
(𝑓𝑗𝑢
𝑓𝑐′ )
12
Concrete tensile behavior. The concrete in tension is found to be highly non-linear after the peak stress. The tension softening curve consists of an ascending branch and a bilinear softening branch for concrete after cracking. To capture the non-linearity of the tension stiffening curve, a modified tension stiffening model is proposed by Bitiusca [1]. This is necessary to allow a gradual response from the concrete and enhance convergence issue. Figure 2 shows the tensile behavior of concrete used in this study, where fctk is the Characteristic axial tensile strength of concrete; εcr is the Strain of concrete at axial tensile strength; and Ecm is the Secant modulus of elasticity of concrete.
Figure 2: Tensile behavior of concrete (reproduced from Bitiusca [1])
Simulation of Cyclic Lateral Load The simulation of the test was performed according to the actual experimental work. Firstly, the axial load was applied on top of the column. The cyclic lateral load was applied as displacement control in Abaqus at the increment rate of 10mm for 3 full cycle. The maximum moment recorded was calculated by multiplying the average total force applied in push and pull direction, with the shear span of the column. The maximum displacement and moment obtained were compared to the experimental results.
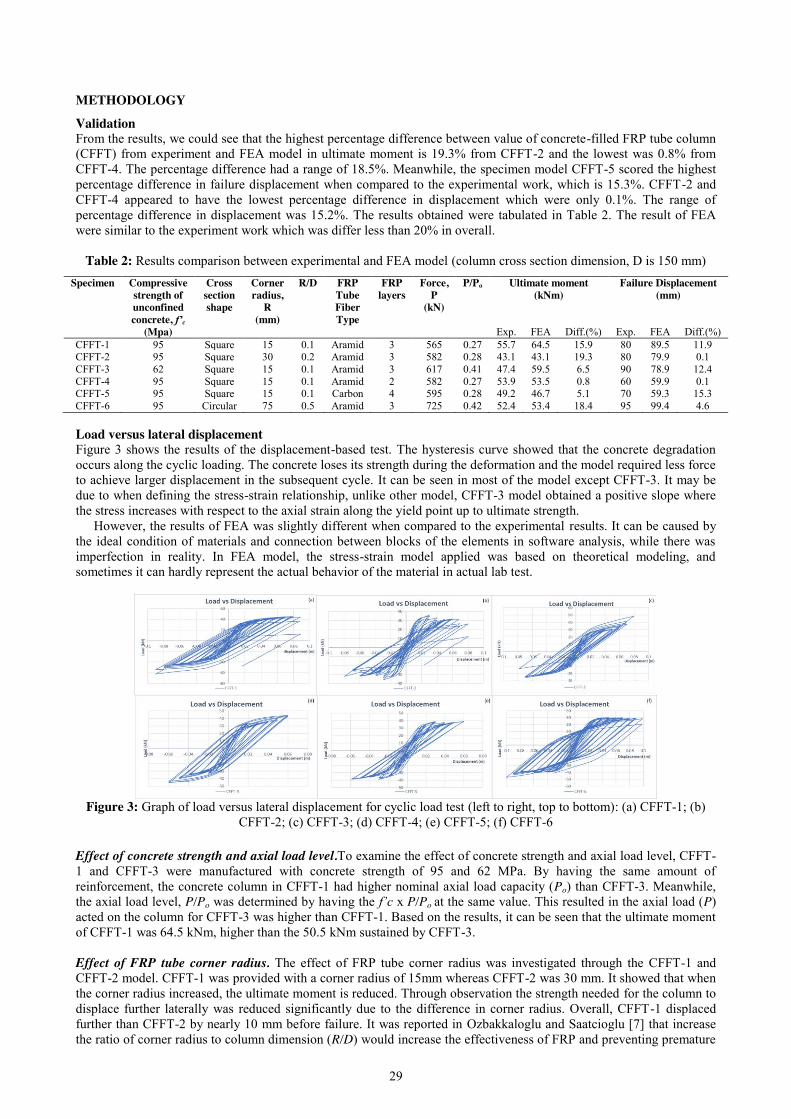
29
METHODOLOGY
Validation From the results, we could see that the highest percentage difference between value of concrete-filled FRP tube column (CFFT) from experiment and FEA model in ultimate moment is 19.3% from CFFT-2 and the lowest was 0.8% from CFFT-4. The percentage difference had a range of 18.5%. Meanwhile, the specimen model CFFT-5 scored the highest percentage difference in failure displacement when compared to the experimental work, which is 15.3%. CFFT-2 and CFFT-4 appeared to have the lowest percentage difference in displacement which were only 0.1%. The range of percentage difference in displacement was 15.2%. The results obtained were tabulated in Table 2. The result of FEA were similar to the experiment work which was differ less than 20% in overall.
Table 2: Results comparison between experimental and FEA model (column cross section dimension, D is 150 mm) Specimen Compressive
strength of unconfined concrete, f’c
(Mpa)
Cross section shape
Corner radius,
R (mm)
R/D FRP Tube Fiber Type
FRP layers
Force, P
(kN)
P/Po Ultimate moment (kNm)
Failure Displacement (mm)
Exp. FEA Diff.(%) Exp. FEA Diff.(%) CFFT-1 95 Square 15 0.1 Aramid 3 565 0.27 55.7 64.5 15.9 80 89.5 11.9 CFFT-2 95 Square 30 0.2 Aramid 3 582 0.28 43.1 43.1 19.3 80 79.9 0.1 CFFT-3 62 Square 15 0.1 Aramid 3 617 0.41 47.4 59.5 6.5 90 78.9 12.4 CFFT-4 95 Square 15 0.1 Aramid 2 582 0.27 53.9 53.5 0.8 60 59.9 0.1 CFFT-5 95 Square 15 0.1 Carbon 4 595 0.28 49.2 46.7 5.1 70 59.3 15.3 CFFT-6 95 Circular 75 0.5 Aramid 3 725 0.42 52.4 53.4 18.4 95 99.4 4.6 Load versus lateral displacement Figure 3 shows the results of the displacement-based test. The hysteresis curve showed that the concrete degradation occurs along the cyclic loading. The concrete loses its strength during the deformation and the model required less force to achieve larger displacement in the subsequent cycle. It can be seen in most of the model except CFFT-3. It may be due to when defining the stress-strain relationship, unlike other model, CFFT-3 model obtained a positive slope where the stress increases with respect to the axial strain along the yield point up to ultimate strength.
However, the results of FEA was slightly different when compared to the experimental results. It can be caused by the ideal condition of materials and connection between blocks of the elements in software analysis, while there was imperfection in reality. In FEA model, the stress-strain model applied was based on theoretical modeling, and sometimes it can hardly represent the actual behavior of the material in actual lab test.
Figure 3: Graph of load versus lateral displacement for cyclic load test (left to right, top to bottom): (a) CFFT-1; (b)
CFFT-2; (c) CFFT-3; (d) CFFT-4; (e) CFFT-5; (f) CFFT-6 Effect of concrete strength and axial load level.To examine the effect of concrete strength and axial load level, CFFT-1 and CFFT-3 were manufactured with concrete strength of 95 and 62 MPa. By having the same amount of reinforcement, the concrete column in CFFT-1 had higher nominal axial load capacity (Po) than CFFT-3. Meanwhile, the axial load level, P/Po was determined by having the f’c x P/Po at the same value. This resulted in the axial load (P) acted on the column for CFFT-3 was higher than CFFT-1. Based on the results, it can be seen that the ultimate moment of CFFT-1 was 64.5 kNm, higher than the 50.5 kNm sustained by CFFT-3. Effect of FRP tube corner radius. The effect of FRP tube corner radius was investigated through the CFFT-1 and CFFT-2 model. CFFT-1 was provided with a corner radius of 15mm whereas CFFT-2 was 30 mm. It showed that when the corner radius increased, the ultimate moment is reduced. Through observation the strength needed for the column to displace further laterally was reduced significantly due to the difference in corner radius. Overall, CFFT-1 displaced further than CFFT-2 by nearly 10 mm before failure. It was reported in Ozbakkaloglu and Saatcioglu [7] that increase the ratio of corner radius to column dimension (R/D) would increase the effectiveness of FRP and preventing premature
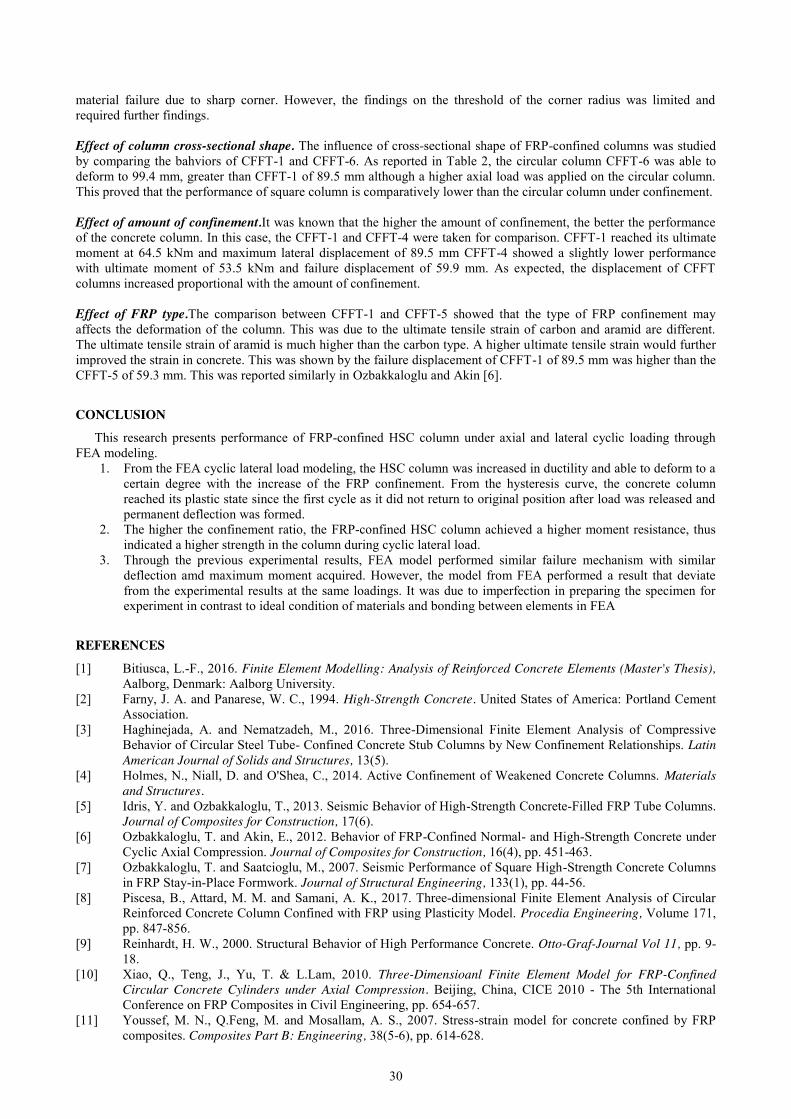
30
material failure due to sharp corner. However, the findings on the threshold of the corner radius was limited and required further findings. Effect of column cross-sectional shape. The influence of cross-sectional shape of FRP-confined columns was studied by comparing the bahviors of CFFT-1 and CFFT-6. As reported in Table 2, the circular column CFFT-6 was able to deform to 99.4 mm, greater than CFFT-1 of 89.5 mm although a higher axial load was applied on the circular column. This proved that the performance of square column is comparatively lower than the circular column under confinement. Effect of amount of confinement.It was known that the higher the amount of confinement, the better the performance of the concrete column. In this case, the CFFT-1 and CFFT-4 were taken for comparison. CFFT-1 reached its ultimate moment at 64.5 kNm and maximum lateral displacement of 89.5 mm CFFT-4 showed a slightly lower performance with ultimate moment of 53.5 kNm and failure displacement of 59.9 mm. As expected, the displacement of CFFT columns increased proportional with the amount of confinement. Effect of FRP type.The comparison between CFFT-1 and CFFT-5 showed that the type of FRP confinement may affects the deformation of the column. This was due to the ultimate tensile strain of carbon and aramid are different. The ultimate tensile strain of aramid is much higher than the carbon type. A higher ultimate tensile strain would further improved the strain in concrete. This was shown by the failure displacement of CFFT-1 of 89.5 mm was higher than the CFFT-5 of 59.3 mm. This was reported similarly in Ozbakkaloglu and Akin [6].
CONCLUSION This research presents performance of FRP-confined HSC column under axial and lateral cyclic loading through
FEA modeling. 1. From the FEA cyclic lateral load modeling, the HSC column was increased in ductility and able to deform to a
certain degree with the increase of the FRP confinement. From the hysteresis curve, the concrete column reached its plastic state since the first cycle as it did not return to original position after load was released and permanent deflection was formed.
2. The higher the confinement ratio, the FRP-confined HSC column achieved a higher moment resistance, thus indicated a higher strength in the column during cyclic lateral load.
3. Through the previous experimental results, FEA model performed similar failure mechanism with similar deflection amd maximum moment acquired. However, the model from FEA performed a result that deviate from the experimental results at the same loadings. It was due to imperfection in preparing the specimen for experiment in contrast to ideal condition of materials and bonding between elements in FEA
REFERENCES
[1] Bitiusca, L.-F., 2016. Finite Element Modelling: Analysis of Reinforced Concrete Elements (Master's Thesis), Aalborg, Denmark: Aalborg University.
[2] Farny, J. A. and Panarese, W. C., 1994. High-Strength Concrete. United States of America: Portland Cement Association.
[3] Haghinejada, A. and Nematzadeh, M., 2016. Three-Dimensional Finite Element Analysis of Compressive Behavior of Circular Steel Tube- Confined Concrete Stub Columns by New Confinement Relationships. Latin American Journal of Solids and Structures, 13(5).
[4] Holmes, N., Niall, D. and O'Shea, C., 2014. Active Confinement of Weakened Concrete Columns. Materials and Structures.
[5] Idris, Y. and Ozbakkaloglu, T., 2013. Seismic Behavior of High-Strength Concrete-Filled FRP Tube Columns. Journal of Composites for Construction, 17(6).
[6] Ozbakkaloglu, T. and Akin, E., 2012. Behavior of FRP-Confined Normal- and High-Strength Concrete under Cyclic Axial Compression. Journal of Composites for Construction, 16(4), pp. 451-463.
[7] Ozbakkaloglu, T. and Saatcioglu, M., 2007. Seismic Performance of Square High-Strength Concrete Columns in FRP Stay-in-Place Formwork. Journal of Structural Engineering, 133(1), pp. 44-56.
[8] Piscesa, B., Attard, M. M. and Samani, A. K., 2017. Three-dimensional Finite Element Analysis of Circular Reinforced Concrete Column Confined with FRP using Plasticity Model. Procedia Engineering, Volume 171, pp. 847-856.
[9] Reinhardt, H. W., 2000. Structural Behavior of High Performance Concrete. Otto-Graf-Journal Vol 11, pp. 9-18.
[10] Xiao, Q., Teng, J., Yu, T. & L.Lam, 2010. Three-Dimensioanl Finite Element Model for FRP-Confined Circular Concrete Cylinders under Axial Compression. Beijing, China, CICE 2010 - The 5th International Conference on FRP Composites in Civil Engineering, pp. 654-657.
[11] Youssef, M. N., Q.Feng, M. and Mosallam, A. S., 2007. Stress-strain model for concrete confined by FRP composites. Composites Part B: Engineering, 38(5-6), pp. 614-628.
31
Design and Reanalysis of Pile Cap with 4 Pile Groups due to Pile Failure Nadzirah Mohd Fozi1, Azhar Ahmad2
Faculty of Civil Engineering, Universiti Teknologi Malaysia, Malaysia [email protected]
Keywords: Pile cap; failure; eccentricity; design.
ABSTRACT. Foundation is one of the most essential parts of structures such as building, bridges, tunnels and others. It usually located below ground level and transfer the load of the superstructure to the underlying materials such as soil, rock or seabed. The foundation holds a structure firmly to prevent it from lateral movement of the supporting material. It is done by ensuring the structure is held securely to the ground to avoid it from sinking into the ground and being lifted or blown away. Since problems during installation of piles is not considered during early stage of design process, it is vital to ensure that the foundation is properly designed to avoid any kind of problem later on due to poor design. Although it is rarely happened, the possibility of driven piles to break or fails during installation may occur since concrete driven pile is vulnerable to damage if it is over drive. Therefore, this study is carried out to design and reanalyze the pile cap due to pile failure. It also concentrates on the possibility of the same design to be used after pile failure, the number of replacement piles to be installed at the most ideal position while taking the effect of eccentricity into consideration. Thus, the main aim of this research is to figure out of solving the design and reanalysis of pile cap due to pile failure occurs at site by developing an excel spreadsheet for pile cap design before and after failure. In this study, the method used to design and analyze the pile cap is beam theory method because of the flexibility and no restriction in specific number of piles used in the design. The practice code used for all of the design is based EUROCODE: MS EN 1992-1-1:2010. The system is analyzed by equivalent frame method as stated in Clause 9.8.1 in EN 1992-1-1:2014 (E). There are four main outcomes in this study. The first part of the outcome is normal design of pile cap including detail specifications, analysis and checking. The second part is to justify theoretically that the pile cap will fail due to pile failure. The third outcome is the reanalysis of pile capacity by providing numbers of replacement piles at optimum location. The last part is redesign of pile cap with addition of new replacement piles. The result of this study to develop a chart that can be used at site to determine the net coordinate of replacement piles.
INTRODUCTION
Pile foundation is one type of a foundation that is commonly used to distribute the load of the building over a vast area to transfer the loading intensity within a safe bearing capacity of soil underneath the structure. In some cases when the bearing capacity of soil is not sufficient to withstand the load of a structure, pile foundation might be used based on the conditions at site, soil condition and operational condition. This will eventually distribute the load of bearing surface at a uniform rate to inhibit differing settlement and increase the stability of structure as a whole. A pile cap, a concrete block casted on top of group of piles, is link between column and the driven piles to distribute the load equally to each piles. However, problem may arise when failure or damage occurs to the pile during installation since the load of distribution is no longer equal to each pile and might cause the superstructure to collapse. Thus, early precaution and actions need to be taken to tackle the problem properly. Problem Statement Engineers are responsible to ensure that the design of pile is following the code to assure the safety of pile against failure. The design of piles include the working stresses in piles under service condition and it is relatively rare for a pile structure fails under a working condition. However, it is common for driven piles to face structural failure during the installation process at site. The example of problem encountered during pile driving is the pile fails due to many factors such as impact from hammer. The pile will experience a significantly high dynamic driving force and resulting in stresses that exceed the strength of pile. The failure of pile will probably occur at the pile toe, head or even along the pile shaft. This condition cause the site engineer to face a new challenge to reanalyze the pile cap system since piles work as a group, hence the load need to be distributed evenly to each pile even after a pile fails. Although every engineer has their own way to tackle the problems by replacing the failed pile. However, there is no appropriate methods to locate the replacement piles and redesign the pile cap system.
Objectives The aim of this study is to solve the problem of design and analysis of pile cap due to pile failure during piling activities that occur at site. In order to achieve this aim, several case objective have been issued which are:
1. To develop a computer program using Microsoft Excel to design a pile cap of 4 pile group. 2. To reanalyze the pile cap due to single pile failure at any location. 3. To determine the optimum location of replacement pile. All the design is based on EUROCODE 2 : MS EN 1992-1-1 : 2010
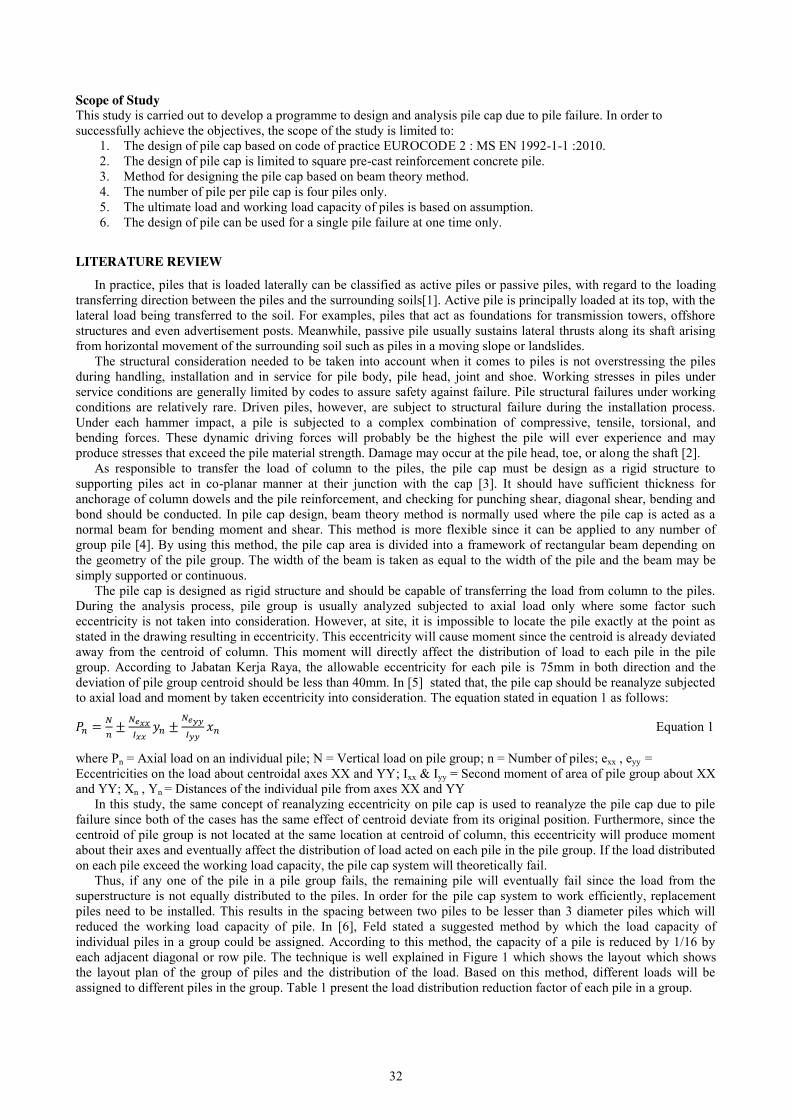
32
Scope of Study This study is carried out to develop a programme to design and analysis pile cap due to pile failure. In order to successfully achieve the objectives, the scope of the study is limited to:
1. The design of pile cap based on code of practice EUROCODE 2 : MS EN 1992-1-1 :2010. 2. The design of pile cap is limited to square pre-cast reinforcement concrete pile. 3. Method for designing the pile cap based on beam theory method. 4. The number of pile per pile cap is four piles only. 5. The ultimate load and working load capacity of piles is based on assumption. 6. The design of pile can be used for a single pile failure at one time only.
LITERATURE REVIEW
In practice, piles that is loaded laterally can be classified as active piles or passive piles, with regard to the loading transferring direction between the piles and the surrounding soils[1]. Active pile is principally loaded at its top, with the lateral load being transferred to the soil. For examples, piles that act as foundations for transmission towers, offshore structures and even advertisement posts. Meanwhile, passive pile usually sustains lateral thrusts along its shaft arising from horizontal movement of the surrounding soil such as piles in a moving slope or landslides.
The structural consideration needed to be taken into account when it comes to piles is not overstressing the piles during handling, installation and in service for pile body, pile head, joint and shoe. Working stresses in piles under service conditions are generally limited by codes to assure safety against failure. Pile structural failures under working conditions are relatively rare. Driven piles, however, are subject to structural failure during the installation process. Under each hammer impact, a pile is subjected to a complex combination of compressive, tensile, torsional, and bending forces. These dynamic driving forces will probably be the highest the pile will ever experience and may produce stresses that exceed the pile material strength. Damage may occur at the pile head, toe, or along the shaft [2].
As responsible to transfer the load of column to the piles, the pile cap must be design as a rigid structure to supporting piles act in co-planar manner at their junction with the cap [3]. It should have sufficient thickness for anchorage of column dowels and the pile reinforcement, and checking for punching shear, diagonal shear, bending and bond should be conducted. In pile cap design, beam theory method is normally used where the pile cap is acted as a normal beam for bending moment and shear. This method is more flexible since it can be applied to any number of group pile [4]. By using this method, the pile cap area is divided into a framework of rectangular beam depending on the geometry of the pile group. The width of the beam is taken as equal to the width of the pile and the beam may be simply supported or continuous.
The pile cap is designed as rigid structure and should be capable of transferring the load from column to the piles. During the analysis process, pile group is usually analyzed subjected to axial load only where some factor such eccentricity is not taken into consideration. However, at site, it is impossible to locate the pile exactly at the point as stated in the drawing resulting in eccentricity. This eccentricity will cause moment since the centroid is already deviated away from the centroid of column. This moment will directly affect the distribution of load to each pile in the pile group. According to Jabatan Kerja Raya, the allowable eccentricity for each pile is 75mm in both direction and the deviation of pile group centroid should be less than 40mm. In [5] stated that, the pile cap should be reanalyze subjected to axial load and moment by taken eccentricity into consideration. The equation stated in equation 1 as follows:
𝑃𝑛 = 𝑁𝑛
± 𝑁𝑒𝑥𝑥𝐼𝑥𝑥
𝑦𝑛 ±𝑁𝑒𝑦𝑦
𝐼𝑦𝑦𝑥𝑛 Equation 1
where Pn = Axial load on an individual pile; N = Vertical load on pile group; n = Number of piles; exx , eyy = Eccentricities on the load about centroidal axes XX and YY; Ixx & Iyy = Second moment of area of pile group about XX and YY; Xn , Yn = Distances of the individual pile from axes XX and YY
In this study, the same concept of reanalyzing eccentricity on pile cap is used to reanalyze the pile cap due to pile failure since both of the cases has the same effect of centroid deviate from its original position. Furthermore, since the centroid of pile group is not located at the same location at centroid of column, this eccentricity will produce moment about their axes and eventually affect the distribution of load acted on each pile in the pile group. If the load distributed on each pile exceed the working load capacity, the pile cap system will theoretically fail.
Thus, if any one of the pile in a pile group fails, the remaining pile will eventually fail since the load from the superstructure is not equally distributed to the piles. In order for the pile cap system to work efficiently, replacement piles need to be installed. This results in the spacing between two piles to be lesser than 3 diameter piles which will reduced the working load capacity of pile. In [6], Feld stated a suggested method by which the load capacity of individual piles in a group could be assigned. According to this method, the capacity of a pile is reduced by 1/16 by each adjacent diagonal or row pile. The technique is well explained in Figure 1 which shows the layout which shows the layout plan of the group of piles and the distribution of the load. Based on this method, different loads will be assigned to different piles in the group. Table 1 present the load distribution reduction factor of each pile in a group.
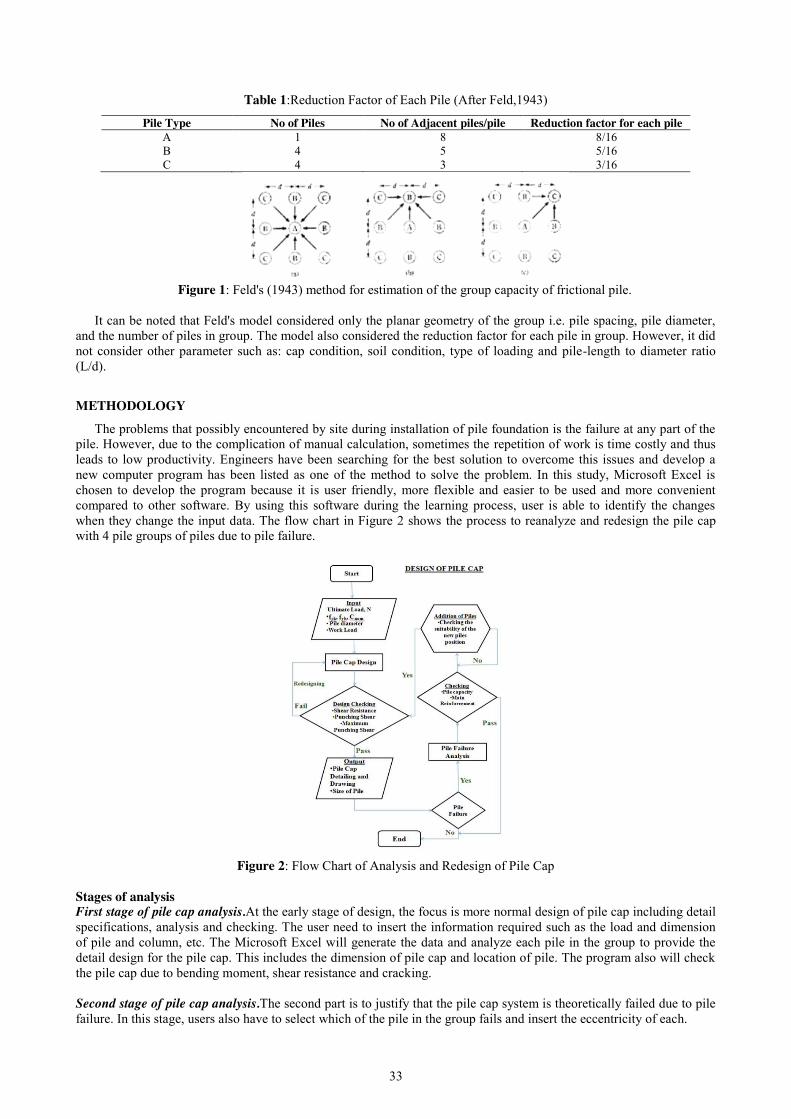
33
Table 1:Reduction Factor of Each Pile (After Feld,1943)
Pile Type No of Piles No of Adjacent piles/pile Reduction factor for each pile A 1 8 8/16 B 4 5 5/16 C 4 3 3/16
Figure 1: Feld's (1943) method for estimation of the group capacity of frictional pile.
It can be noted that Feld's model considered only the planar geometry of the group i.e. pile spacing, pile diameter,
and the number of piles in group. The model also considered the reduction factor for each pile in group. However, it did not consider other parameter such as: cap condition, soil condition, type of loading and pile-length to diameter ratio (L/d).
METHODOLOGY
The problems that possibly encountered by site during installation of pile foundation is the failure at any part of the pile. However, due to the complication of manual calculation, sometimes the repetition of work is time costly and thus leads to low productivity. Engineers have been searching for the best solution to overcome this issues and develop a new computer program has been listed as one of the method to solve the problem. In this study, Microsoft Excel is chosen to develop the program because it is user friendly, more flexible and easier to be used and more convenient compared to other software. By using this software during the learning process, user is able to identify the changes when they change the input data. The flow chart in Figure 2 shows the process to reanalyze and redesign the pile cap with 4 pile groups of piles due to pile failure.
Figure 2: Flow Chart of Analysis and Redesign of Pile Cap
Stages of analysis First stage of pile cap analysis.At the early stage of design, the focus is more normal design of pile cap including detail specifications, analysis and checking. The user need to insert the information required such as the load and dimension of pile and column, etc. The Microsoft Excel will generate the data and analyze each pile in the group to provide the detail design for the pile cap. This includes the dimension of pile cap and location of pile. The program also will check the pile cap due to bending moment, shear resistance and cracking. Second stage of pile cap analysis.The second part is to justify that the pile cap system is theoretically failed due to pile failure. In this stage, users also have to select which of the pile in the group fails and insert the eccentricity of each.
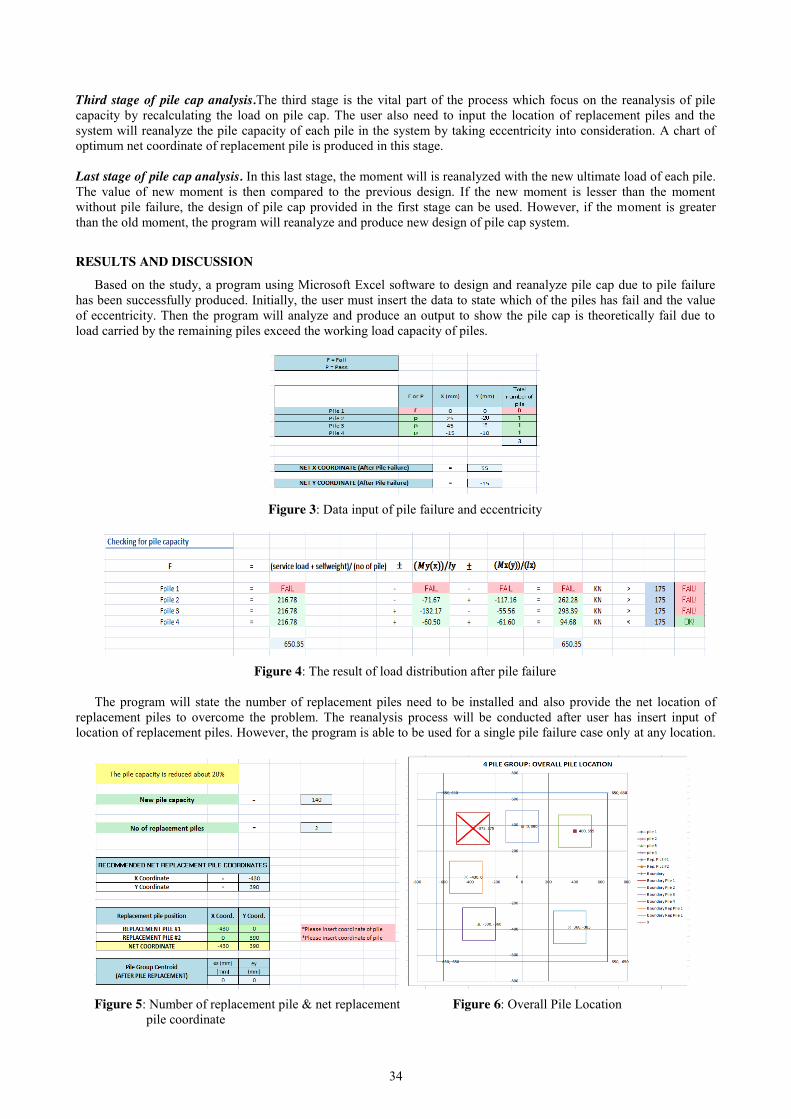
34
Third stage of pile cap analysis.The third stage is the vital part of the process which focus on the reanalysis of pile capacity by recalculating the load on pile cap. The user also need to input the location of replacement piles and the system will reanalyze the pile capacity of each pile in the system by taking eccentricity into consideration. A chart of optimum net coordinate of replacement pile is produced in this stage. Last stage of pile cap analysis. In this last stage, the moment will is reanalyzed with the new ultimate load of each pile. The value of new moment is then compared to the previous design. If the new moment is lesser than the moment without pile failure, the design of pile cap provided in the first stage can be used. However, if the moment is greater than the old moment, the program will reanalyze and produce new design of pile cap system.
RESULTS AND DISCUSSION
Based on the study, a program using Microsoft Excel software to design and reanalyze pile cap due to pile failure has been successfully produced. Initially, the user must insert the data to state which of the piles has fail and the value of eccentricity. Then the program will analyze and produce an output to show the pile cap is theoretically fail due to load carried by the remaining piles exceed the working load capacity of piles.
Figure 3: Data input of pile failure and eccentricity
Figure 4: The result of load distribution after pile failure
The program will state the number of replacement piles need to be installed and also provide the net location of
replacement piles to overcome the problem. The reanalysis process will be conducted after user has insert input of location of replacement piles. However, the program is able to be used for a single pile failure case only at any location.
Figure 5: Number of replacement pile & net replacement Figure 6: Overall Pile Location pile coordinate
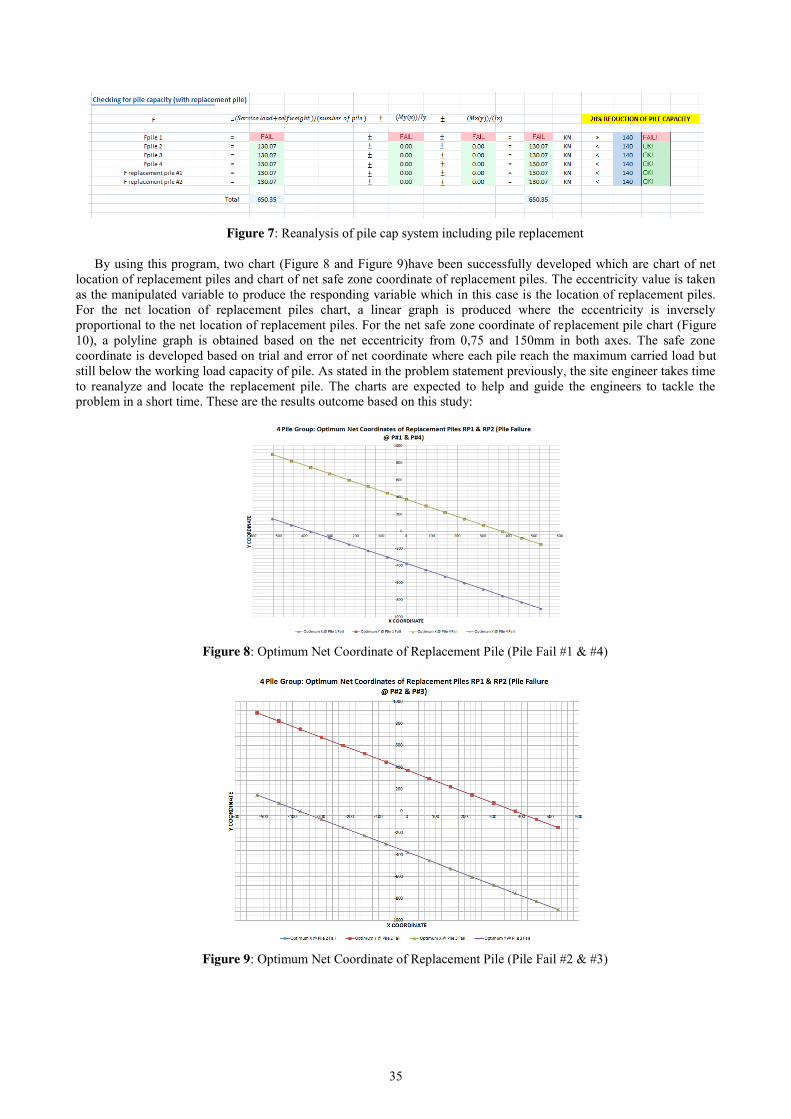
35
Figure 7: Reanalysis of pile cap system including pile replacement
By using this program, two chart (Figure 8 and Figure 9)have been successfully developed which are chart of net
location of replacement piles and chart of net safe zone coordinate of replacement piles. The eccentricity value is taken as the manipulated variable to produce the responding variable which in this case is the location of replacement piles. For the net location of replacement piles chart, a linear graph is produced where the eccentricity is inversely proportional to the net location of replacement piles. For the net safe zone coordinate of replacement pile chart (Figure 10), a polyline graph is obtained based on the net eccentricity from 0,75 and 150mm in both axes. The safe zone coordinate is developed based on trial and error of net coordinate where each pile reach the maximum carried load but still below the working load capacity of pile. As stated in the problem statement previously, the site engineer takes time to reanalyze and locate the replacement pile. The charts are expected to help and guide the engineers to tackle the problem in a short time. These are the results outcome based on this study:
Figure 8: Optimum Net Coordinate of Replacement Pile (Pile Fail #1 & #4)
Figure 9: Optimum Net Coordinate of Replacement Pile (Pile Fail #2 & #3)
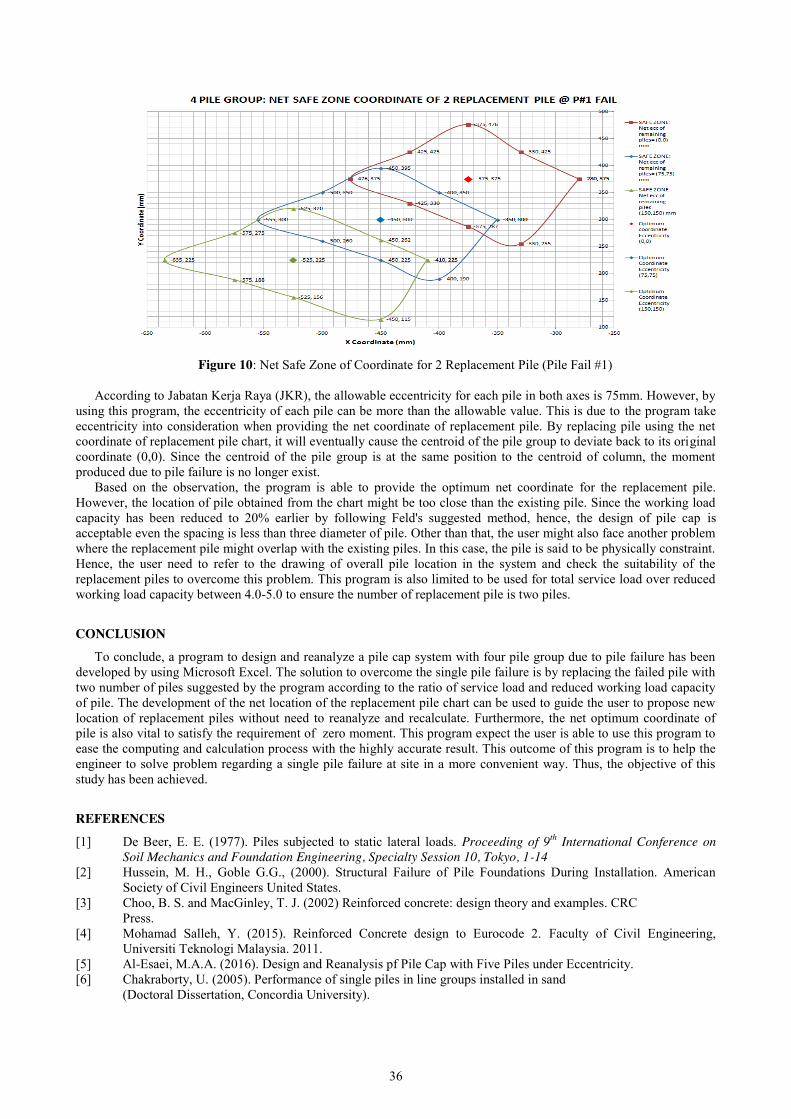
36
Figure 10: Net Safe Zone of Coordinate for 2 Replacement Pile (Pile Fail #1)
According to Jabatan Kerja Raya (JKR), the allowable eccentricity for each pile in both axes is 75mm. However, by
using this program, the eccentricity of each pile can be more than the allowable value. This is due to the program take eccentricity into consideration when providing the net coordinate of replacement pile. By replacing pile using the net coordinate of replacement pile chart, it will eventually cause the centroid of the pile group to deviate back to its original coordinate (0,0). Since the centroid of the pile group is at the same position to the centroid of column, the moment produced due to pile failure is no longer exist.
Based on the observation, the program is able to provide the optimum net coordinate for the replacement pile. However, the location of pile obtained from the chart might be too close than the existing pile. Since the working load capacity has been reduced to 20% earlier by following Feld's suggested method, hence, the design of pile cap is acceptable even the spacing is less than three diameter of pile. Other than that, the user might also face another problem where the replacement pile might overlap with the existing piles. In this case, the pile is said to be physically constraint. Hence, the user need to refer to the drawing of overall pile location in the system and check the suitability of the replacement piles to overcome this problem. This program is also limited to be used for total service load over reduced working load capacity between 4.0-5.0 to ensure the number of replacement pile is two piles.
CONCLUSION
To conclude, a program to design and reanalyze a pile cap system with four pile group due to pile failure has been developed by using Microsoft Excel. The solution to overcome the single pile failure is by replacing the failed pile with two number of piles suggested by the program according to the ratio of service load and reduced working load capacity of pile. The development of the net location of the replacement pile chart can be used to guide the user to propose new location of replacement piles without need to reanalyze and recalculate. Furthermore, the net optimum coordinate of pile is also vital to satisfy the requirement of zero moment. This program expect the user is able to use this program to ease the computing and calculation process with the highly accurate result. This outcome of this program is to help the engineer to solve problem regarding a single pile failure at site in a more convenient way. Thus, the objective of this study has been achieved.
REFERENCES
[1] De Beer, E. E. (1977). Piles subjected to static lateral loads. Proceeding of 9th International Conference on Soil Mechanics and Foundation Engineering, Specialty Session 10, Tokyo, 1-14 [2] Hussein, M. H., Goble G.G., (2000). Structural Failure of Pile Foundations During Installation. American Society of Civil Engineers United States. [3] Choo, B. S. and MacGinley, T. J. (2002) Reinforced concrete: design theory and examples. CRC Press. [4] Mohamad Salleh, Y. (2015). Reinforced Concrete design to Eurocode 2. Faculty of Civil Engineering, Universiti Teknologi Malaysia. 2011. [5] Al-Esaei, M.A.A. (2016). Design and Reanalysis pf Pile Cap with Five Piles under Eccentricity. [6] Chakraborty, U. (2005). Performance of single piles in line groups installed in sand (Doctoral Dissertation, Concordia University).
37
Plane Stress Analysis of Structure with Known Nodal Displacements using Numerical Formulation
Mohamad Fakhry Maruti1, Ahmad Razin Zainal Abidin2 Faculty of Civil Engineering, Universiti Teknologi Malaysia, Malaysia
Keywords: Structural Analysis; Numerical Methods; Known Displacements; Matlab Programming; Image Processing.
ABSTRACT. Structural analysis using experimental approach requires dedicated devices such as strain gauges that are often costly and difficult to handle. On the other hand, there are many available numerical techniques that can be used to analyse structure, but they are depending on assumptions and approximation. Nowadays, there is an effort to integrate image processing concept in structural analysis practice to reduce the use of experimental devices and at the same time to upgrade the conventional approach with the current technology facilities. The key objectives of this study are, first, to identify the most practical and efficient method for analysis of structure with known nodal displacements, and then, to develop a Matlab program that can automatically calculate stress from the known nodal displacements and, finally, to conduct a parametric study on the accuracy of the developed program based on regular and irregular nodes distribution. This study assumes that the displacement taken from an image is already known, and therefore it is termed as structural analysis with known displacements. Two different numerical methods were considered in this study which are Finite Element Method (FEM) and a meshfree method known as the Element Free Galerkin (EFG) method. Detailed comparisons were made to determine the most suitable method that can be used in the development of Matlab program to perform analysis of structures with known nodal displacements. Further study to determine the effect of node distributions on the accuracy of the approximation was conducted and verified against available analytical solution. It can be concluded that a meshfree method gives more flexibility to deal with structural analysis with known nodal displacements due to the elimination of mesh requirement. The accuracy of the prediction considering different nodes distributions is shown to be acceptable under a certain range of mesh size and the degree of randomness.
INTRODUCTION
A lot of structural analysis based programming tools that utilized the numerical method in their system was developed such as LUSAS, STAAD PRO and so on. Most of the procedure in the programs is to calculate stress with unknown displacements. Nowadays with the rapid development in image processing, the possibility of applying the image processing concept in structural analysis is within reach. The reading of data for structural analysis will no longer requires expensive and sophisticated devices but just by using a recorded video or pictures. If the application of the image processing concept in structural analysis is a success, a new procedure for numerical structural analysis that calculate stress based on known displacements (extracted from videos or images) has to be developed.
Problem Statement There were two approaches in structural analysis: experimental and theoretical approach. In experimental, the structure is analysed by using devices. One of the devices is called strain gauges which directly get displacement and strain that will be used to calculate stress. But, it is expensive and the procedure to install this equipment can be quite sophisticated. On the othe hand, theoretical approach which is done purely using calculation and formulation. It is divided into two methods which are analytical method and numerical method. Analytical method is very hard to be utilized in complex structures and mathematically demanding. Instead, numerical method is a famous approach in engineering world due to its capability to simulate sufficiently accurate result without relying on experimental devices. But, the solution in numerical method is not the exact solution as its use assumptions on the structural properties which do not represent the real structural behaviour as in the experimental study. That is why The idea is to replace the use of strain gauges by applying the image processing concept in the experiment has to be executed.
Objectives In this study, an automated programming tool that can integrate between numerical structural analysis approach and image processing concept is proposed. The objectives of this study are:
1. To identify the most practical and efficient method for analysis of structure with known nodal displacements. 2. To develop a Matlab program that can automatically calculate stress from the known nodal displacements. 3. To conduct a parametric study on the accuracy of the developed program based on regular and irregular nodes
distribution.
38
Scope of Study The structural analysis will be based on 2D structure elements under the influence of plane stress. This study assumes that the displacement taken from the image is already known, and therefore it is termed as structural analysis with known displacements. In this study, the structure elements are assumed to be linear or not exceed the elastic limit. The case for the load is static and there is no dynamic load applied to the structure.
LITERATURE REVIEW
In general, plane stress element is used to represent thin body or structure that is under plane loading [1]. Bearing walls and steel web usually used plane stress element as model for shear and load. The study of plane stress is important in this research because the structural analysis conducted herein is based on 2D structure. The partial differential equation (PDE) for plane stress is stated below:
[𝜕][𝐸][𝜕]𝑇{𝑢}𝑇 = {𝑓} (Eq 1.1)
where [𝜕] is termed as differential operator matrix, E is Young’s (Elasticity) modulus, {u} is the vector that contain displacement components for both x and y directions (u and v), and {f} is the vector of body force in x direction and y directions.
Finite Element Method (FEM) is one of the numerical methods that will be discussed in this study. FEM have been widely recognized by the world as a well-developed numerical method and most of the structural analysis software incorporates FEM in their program. The formulation of FEM will be implemented to calculate the plane stress of the structure. Referred from A.Y. Yassin et al. (2013), the formulation of FEM for plane stress is stated below:
[𝑘]{ū}𝑇 = {𝑞} + {𝑏} = {𝑟} (Eq 2.1)
The equation shown above is the discretized equation for plane stress where {b} is the nodal loads vector:
{𝑏} = ∫ [𝑁]𝑇𝑠 {𝑏}𝑇𝑑𝑠 (Eq 2.2)
Term{q} act as a vector for body force where:
{𝑞} = ∫ ∫ [𝑁]𝑇𝑦𝑥 {𝑓}𝑑𝑦𝑑𝑥 (Eq 2.3)
And [k] is the stiffness matrix that represents the left side of integration by part (IBP) equation:
∫ ∫ [𝑁]𝑇𝑦𝑥 [𝜕][𝐸][𝜕]𝑇[𝑁]{ū}𝑇𝑑𝑦𝑑𝑥 = ∫ ∫ [𝑁]𝑇
𝑦𝑥 {𝑓}𝑑𝑦𝑑𝑥 ∫ [𝑁]𝑇{𝑏}𝑇𝑑𝑠𝑠 (Eq 2.4)
[𝑘] = ∫ ∫ [𝑁]𝑇𝑦𝑥 [𝜕][𝐸][𝜕]𝑇[𝑁]𝑑𝑦𝑑𝑥 (Eq 2.5)
On the other hand, meshfree methods are the latter version of numerical methods. Compared to FEM, Meshfree method is still new and yet rapidly progressing to become a well-developed numerical method. Meshfree method is called ‘meshfree’ because a predefined mesh is not required in its system of algebraic equation for the whole problem domain, or in some cases. more flexible and easily generable meshes are used [2]. There are many methods that are categorized as meshfree methods but the one that will be discussed in this study is the Element Free Galerkin (EFG) method introduced by Belytschko et al. [3]. The EFG method uses Moving Least Square (MLS) approximation for the creation of shape function. In this method, the imposition of essential boundary condition [4] is made via a penalty method. Detailed description of MLS method can be found in a paper written by Lancaster and Salkauskas [5]. From the study, the formulation for plane stress based on a meshfree method is given below:
[𝐤 + 𝐤α]𝐮 = 𝐟 (Eq 3.1)
where
𝐤𝐼𝐽 = ∫ 𝐁𝑠𝐼
𝑇𝐃Ω 𝐁𝑠𝐽𝑑Ω (Eq 3.2)
𝐤𝛼𝐼𝐽 = ∫ 𝚿𝑰Γ𝑡
𝛂𝚿𝑱𝒅𝚪 (Eq 3.3)
𝐟𝐼 = ∫ 𝐍𝑠𝐼
𝑇𝐛𝑑Ω +Ω ∫ 𝐍𝑠𝐼
𝑇𝐭𝚪𝑑ΓΓ𝑡 (Eq 3.4)
uI consists of 2 components degree of freedoms (DOF) for 2D problem, which are{u. v}T and
𝚿𝑰 = [𝜙𝐼 00 𝜙𝐼
] , 𝛂 = [𝛼𝑥 00 𝛼𝑦
] and 𝐁𝑠 = ∇𝑠𝐍𝑠 = [𝐍𝑠
𝑥 0 𝐍𝑠𝑦
0 𝐍𝑠𝑦 𝐍𝑠
𝑥]
𝑇
(Eq 3.5)
39
Note that, ϕI is a shape function, N,x and N,y is a vector of derivatives of shape function with respect to x and y, respectively, while αx and αy are the penalty parameters.
METHODOLOGY
The main objective of this study is to select the most suitable method for structural analysis with known displacements and to develop a Matlab program based from the method chosen. Then, the developed program will be tested for different nodes distribution by comparing against available analytical solution. The methodology of this study is consisted of four main components: methods identification, selection of appropriate method, Matlab program development, and parametric study.
Review of Numerical Method In this part, two numerical methods were considered for a review to select the potential method to be used in structural analysis with known nodal displacements. The choices are between Finite Element Method (FEM) and a meshfree method. The procedure for both methods was studied and discussed. For the meshfree method, formulation of Element Free Galerkin (EFG) with penalty method is adopted. Selection of Appropriate Method From the two methods undergone the review process, a detailed comparison was made in terms of its properties and compatibility for structural analysis with known nodal displacements. The challenge in the known nodal displacements case is the reading of displacement values are obtained through arbitrary points distributed over the structural domain, and hence the chosen numerical method should have a flexibility to deal with irregularities of the nodes distribution. Ultimately, the most practical method was selected for Matlab program development. Matlab Program Development The numerical procedure for the Matlab program was developed based on the formulation of plane stress of the selected method. But, the original procedure of the method, which calculates stress from unknown displacements, need to be modified considering the known nodal displacements case. The value of displacements was created separately by assuming that the data of the displacement is already known (possibly taken from image processing analysis). The program is expected to automatically calculate plane stress from the known displacement. Parametric Study The accuracy of the program was tested by changing the nodes distribution from regular pattern to irregular nodes pattern. The reason of considering irregularities of the nodes distribution in this study is to take into consideration the practical situation where points (markers) are placed arbitrarily within the structure domain. The level of irregularities is known as ‘degree of randomness’ (DOR) hereafter. The test was conducted with different sets of nodes number, which is based on the mesh division or mesh size. The mesh division were fixed as 10, 15, 20, 25, 30, 35, and 40, while each of this set was subjected to different DOR, for example, 0, 0.01, 0.02, 0.03, …, 0.1. The results obtained from the test were compared with the result of analytical solution and the value of errors was calculated.
RESULTS AND DISCUSSION From the study of the Finite Element Method (FEM) and the Element-free Galerkin (EFG) method, the differences
between them can be highlighted as shown in Figure 1. It can be seen that the FEM is depending heavily on element mesh, and it is well known that the quality of the element mesh influences the accuracy of the approximation. This is not a problem for the case of regular nodes distribution, but in this study, the case of irregular nodes distribution is also considered where sets of nodes with different DOR were tested. With high level of disorganized nodes distribution, the mesh in FEM might become distorted, thus affecting the result of calculation while the EFG method does not have any problem with the nodes arrangement. Therefore, the formulation from the meshfree method was chosen as the numerical procedure for the development of the Matlab program.
Figure 2 shows the proposed algorithm and a part of Matlab source codes that is used to calculate stress from nodal displacements of a structure (load from a filedata). The program requires input data such as geometry and material properties to create background cells (virtual nodes) to interpolate the nodal displacements. Then, stress can be computed using σ = BDu, where u is the known displacements vector, D is the plane stress constitutive matrix and B is the differential matrix of shape functions. To calculate B, MLS shape functions N are required as shown in the figure.
After the Matlab program development completed, a parametric study was conducted to test the accuracy of the program approximation. The result of the study was compared against analytical solution and the percentage of errors calculated are shown in Table 1, where percentage of errors above 10% is highlighted with red colour. From the table, it can be seen that the smaller the mesh size, the more accurate the approximation, and the lesser the DOR, the higher the accuracy of the approximation. By plotting the result in a graph as shown in Figure 3, it can be summarized that the

40
acceptable range for the program to obtain good accuracy is that the mesh size must not be more than 0.04L (where L is the beam length) and the DOR for nodes distribution is between 0 and 0.03. This is the recommended range that can be used as a guideline for future work on digital image processing in structural analysis.
Figure 1: Differences between FEM and Meshfree.
Figure 2: Development of Matlab program for Structural analysis with known displacement
FEM
Element mesh generation
Shape function creation based on element with proper mapping
Discretized equation using weak
forms integrated based on element
Global matrix assembly
Imposition of essential boundary condition
Solution for displacements
Computation of strain and stresses from displacement
Result assessment
MESHFREE
Nodal generation
Shape function creation based on selected local nodes
Strain field construction
Discretized equation using
weak forms integrated based on integration cells
Global matrix assembly
Imposition of essential boundary condition
Solution for displacements
Computation of strain and stresses from displacement
Result assessment
Highlights on the differences
FEM use pre-defined shape functions. The shape functions are generated based on
element. S
MESHFREE use MLS shape functions. The shape functions are generated based
on nodes distributed over the domain.
FEM uses row-column elimination in K matrix.
MESHFREE use penalty
method to impose boundary conditions.
% Background cells [xQ,WxQ] = BGcells(Bnodes);
%% DATA INPUT % define the structures properties L = 1000*1e-3; H = 200*1e-3; tw = 1*1e-3; v = 0.3; % poissons ratio E = 210e9;%210000; Ebar = E; vbar = v; % plane stress D = Ebar/(1-vbar^2)*[1 vbar 0; vbar 1 0; 0 0 (1-vbar)/2];
% MLS shape function [~,N1,N2] = phi(xi,xQ,ri,c,2:3);
% calculate stresses Sxz = zeros(3,size(xQ,1)); for i = 1:size(xQ,1) B = diag2 ... (N1(:,i),N2(:,i),2)'; Sxz(:,i) = D*B*Uxz; end
START
Input (geometry & material properties)
Create background cells from boundary nodes
Shape function creation (MLS approximation)
Differential matrix of shape function (B matrix))
Calculation of stress, σ = DBu
Load known displacement, u) load('data.txt'
)
Matlab Coding

41
Table 1: Percentage of errors with different mesh sizes and degree of randomness
Mesh size (h)
No. of div degree of randomness (%) 0 0.01 0.02 0.03 0.04 0.05 0.06 0.07 0.08 0.09 0.10
0.100 10 27 96 119 179 187 331 119 229 302 178 156 0.067 15 9 28 56 36 78 66 44 66 64 88 118 0.050 20 7 9 9 29 9 11 27 14 14 20 16 0.040 25 6 8 11 5 2 5 7 0 1 25 2 0.033 30 4 7 9 7 11 3 6 8 4 9 2 0.029 35 2 3 8 1 4 2 1 2 9 9 10 0.025 40 0 5 7 3 3 0 6 8 12 4 2
Figure 3: The graph of error percentage difference (y-axis) against the degree of randomness (x-axis)
CONCLUSION
From this study the development of Matlab program that able to integrate between numerical structural analysis approach and image processing concept is successfully achieved. The program automatically calculates stress based on the known displacement field that is assumed to be obtained from digital image processing data. The conclusion of this study is as follows:
1. Comparisons between two numerical methods were made which are Finite Element Method (FEM) and Meshfree method. The low dependency toward nodes distribution and mesh quality put Meshfree at advantages against FEM thus; Meshfree method was identified as the most suitable method for structural analysis with known displacement.
2. A Matlab program that able to automatically calculate stress from known displacement was developed based on Meshfree method. This program can generate a smooth and continuous stress field since the Meshfree formulation is based on continuous MLS shape functions.
3. A parametric study was conducted to determine the accuracy of program prediction based on different nodes distribution. From the result, the accuracy of the program approximation is considered acceptable within the range of 0.00 to 0.04 L for the mesh size and 0 to 0.03 for the degree of randomness.
REFERENCES
[1] A.Y. Yassin, M.A. Noor, E.H. Kamisan, & M.Z. Jamil (2013). Linear and Nonlinear Finite Element Analysis for Solids and Fluids (Unedited 1st Draft), Universiti Teknologi Malaysia, Johor Bharu.
[2] G.R. Liu (2010). Meshfree Method: Moving beyond the Finite Element (second edition), CRC Press, Taylor and Francis Group.
[3] Belytschko, T., Lu, Y. Y., and Gu, L., Element-free Galerkin methods, Int. J. Numerical Methods Eng., 37, 229–256, 1994.
[4] Liu, G. R. and Yang, K. Y., A penalty method for enforce essential boundary conditions in element free Galerkin method, in Proceedings of the 3rd HPC Asia’98, Singapore, 1998, pp. 715–721.
[5] Lancaster, P. and Salkauskas, K., Surfaces generated by moving least squares methods, Math. Comput., 37, 141–158, 1981.
0%
10%
20%
30%
40%
50%
0 0.01 0.02 0.03 0.04 0.05 0.06 0.07 0.08 0.09 0.1
Perc
enta
ge o
f err
ors
Degree of randomness (DOR)
0.1 L
0.067 L
0.050 L
0.040 L
0.033 L
0.029 L
0.025 L

42
Optimum Analysis and Design of Cantilever Retaining Wall Siti Farah Aiman Md Sopian1, Azhar Ahmad2
Faculty of Civil Engineering, Universiti Teknologi Malaysia, Malaysia [email protected]
Keywords: Inverted T shaped Cantilever Retaining Wall, Factor of Safety(FOS), Excel Spreadsheet.
ABSTRACT. Retaining wall is provided when there is different level of one stretch ground with neighbouring stretch of ground and the slope between them is too steep to be stable on its own. The necessity of retaining wall is determined at the beginning of a project. Engineers play important roles to determine retaining wall system needed in a project such as the dimension and type by considering the various geotechnical and non- geotechnical factors involved. The key objectives of this study is to provide a proper dimension of cantilever retaining wall and passing the desired factor of safety with minimum value. In addition, this study also aims to provide a template to be used by engineers to design optimum cantilever retaining wall. The optimum dimension is obtained by increase the length of base of retaining wall.
INTRODUCTION Retaining wall is used to retain any material (usually earth) in vertical or nearly vertical positions and prevent slope
from sliding or eroding away. This study is focus on the inverted T cantilever retaining wall. They consist of thin stem and base slab. Base slab is divided into two parts which are toe and heel. This type of wall uses much less material than traditional gravity walls. This wall type is believed to be economical up to 7m only. [6]. Sometimes cantilever wall are buttressed on the front or a counterfeit on the back to increase their stability against heavy load for the height greater than 7m. Problem Statement Generally, to design economic reinforced concrete cantilever retaining wall, designer need to vary the dimension of the wall several times which making the calculation very tedious and monotonous. However, it is very difficult to obtain a design satisfied all the safety requirements. There is some software have been developed for optimum design of retaining wall. However, their applications are limited due to the fact that they require gradient information and usually seek to improve the solution in the neighbourhood of a starting point. [5] Objectives The objectives of this study are:
1. Design an optimum dimension of cantilever retaining wall for a few variable heights. 2. Analyse the effect of different length of toe toward moment and factor of safety. 3. To develop a program using Microsoft Excel to obtain and design optimum retaining wall.
Scope of Study The scope of this study to produce safe, effective and optimum conventional inverted T cantilever retaining wall without adding heel beam. All the design will be done according to Eurocode 2. In addition, the density of backfill used in design is limited to density of soil which is 1900 kg/m3
. Other than that, the retaining wall stability against overturning, sliding and settlement is analysed with three value factor of safety (1,1.5 ,2.0). In this study, the height of retaining wall (H) is variable and limited from 3m to 7m only.
LITERATURE REVIEW
A retaining wall is a structure designed and constructed when there is a transition in ground elevation that exceeds the angle of repose of the soil. A retaining wall will use it self-weight and soil above the wall’s footing to resist the lateral forces from earth behind retaining wall. The earth behind the wall may be either the natural embankment or the backfill placed adjacent to the retaining wall. The optimum design for the retaining wall is determine by minimise the total expected cost considering the uncertainties in the soil parameters and the costs of failure associated with the different failure modes. [4] Design Criteria Active Pressure. Retaining wall are generally subjected earth pressure due to retained material on the wall. Type of soil retained will give different magnitude and direction of the earth pressure on retaining wall. The pressure intensity of soil on retaining walls is assumed as linear distribution. The pressure intensity increased with depth linearly related to
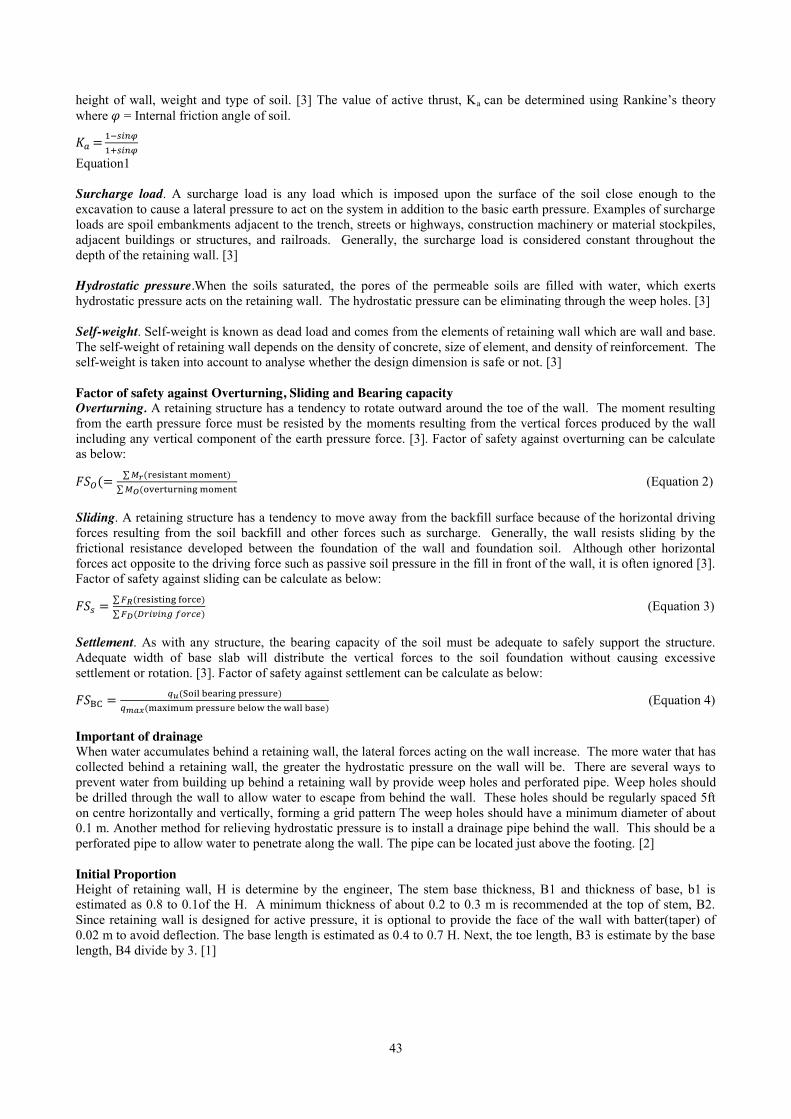
43
height of wall, weight and type of soil. [3] The value of active thrust, Ka can be determined using Rankine’s theory where 𝜑 = Internal friction angle of soil.
𝐾𝑎 = 1−𝑠𝑖𝑛𝜑1+𝑠𝑖𝑛𝜑
Equation1 Surcharge load. A surcharge load is any load which is imposed upon the surface of the soil close enough to the excavation to cause a lateral pressure to act on the system in addition to the basic earth pressure. Examples of surcharge loads are spoil embankments adjacent to the trench, streets or highways, construction machinery or material stockpiles, adjacent buildings or structures, and railroads. Generally, the surcharge load is considered constant throughout the depth of the retaining wall. [3] Hydrostatic pressure.When the soils saturated, the pores of the permeable soils are filled with water, which exerts hydrostatic pressure acts on the retaining wall. The hydrostatic pressure can be eliminating through the weep holes. [3] Self-weight. Self-weight is known as dead load and comes from the elements of retaining wall which are wall and base. The self-weight of retaining wall depends on the density of concrete, size of element, and density of reinforcement. The self-weight is taken into account to analyse whether the design dimension is safe or not. [3] Factor of safety against Overturning, Sliding and Bearing capacity Overturning. A retaining structure has a tendency to rotate outward around the toe of the wall. The moment resulting from the earth pressure force must be resisted by the moments resulting from the vertical forces produced by the wall including any vertical component of the earth pressure force. [3]. Factor of safety against overturning can be calculate as below:
𝐹𝑆𝑂(= ∑ 𝑀𝑟(resistant moment)∑ 𝑀𝑂(overturning moment
(Equation 2) Sliding. A retaining structure has a tendency to move away from the backfill surface because of the horizontal driving forces resulting from the soil backfill and other forces such as surcharge. Generally, the wall resists sliding by the frictional resistance developed between the foundation of the wall and foundation soil. Although other horizontal forces act opposite to the driving force such as passive soil pressure in the fill in front of the wall, it is often ignored [3]. Factor of safety against sliding can be calculate as below:
𝐹𝑆𝑠 = ∑ 𝐹𝑅(resisting force)∑ 𝐹𝐷(𝐷𝑟𝑖𝑣𝑖𝑛𝑔 𝑓𝑜𝑟𝑐𝑒)
(Equation 3) Settlement. As with any structure, the bearing capacity of the soil must be adequate to safely support the structure. Adequate width of base slab will distribute the vertical forces to the soil foundation without causing excessive settlement or rotation. [3]. Factor of safety against settlement can be calculate as below:
𝐹𝑆BC = 𝑞𝑢(Soil bearing pressure)𝑞𝑚𝑎𝑥(maximum pressure below the wall base)
(Equation 4) Important of drainage When water accumulates behind a retaining wall, the lateral forces acting on the wall increase. The more water that has collected behind a retaining wall, the greater the hydrostatic pressure on the wall will be. There are several ways to prevent water from building up behind a retaining wall by provide weep holes and perforated pipe. Weep holes should be drilled through the wall to allow water to escape from behind the wall. These holes should be regularly spaced 5ft on centre horizontally and vertically, forming a grid pattern The weep holes should have a minimum diameter of about 0.1 m. Another method for relieving hydrostatic pressure is to install a drainage pipe behind the wall. This should be a perforated pipe to allow water to penetrate along the wall. The pipe can be located just above the footing. [2] Initial Proportion Height of retaining wall, H is determine by the engineer, The stem base thickness, B1 and thickness of base, b1 is estimated as 0.8 to 0.1of the H. A minimum thickness of about 0.2 to 0.3 m is recommended at the top of stem, B2. Since retaining wall is designed for active pressure, it is optional to provide the face of the wall with batter(taper) of 0.02 m to avoid deflection. The base length is estimated as 0.4 to 0.7 H. Next, the toe length, B3 is estimate by the base length, B4 divide by 3. [1]
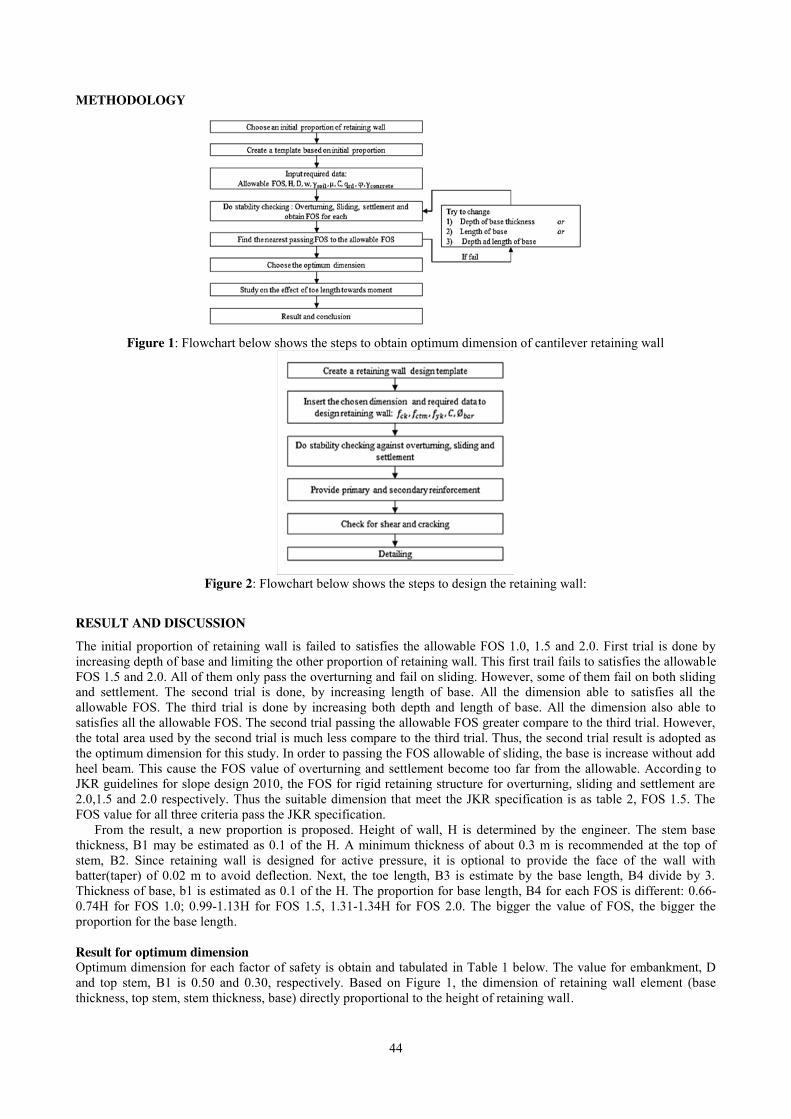
44
METHODOLOGY
Figure 1: Flowchart below shows the steps to obtain optimum dimension of cantilever retaining wall
Figure 2: Flowchart below shows the steps to design the retaining wall:
RESULT AND DISCUSSION The initial proportion of retaining wall is failed to satisfies the allowable FOS 1.0, 1.5 and 2.0. First trial is done by increasing depth of base and limiting the other proportion of retaining wall. This first trail fails to satisfies the allowable FOS 1.5 and 2.0. All of them only pass the overturning and fail on sliding. However, some of them fail on both sliding and settlement. The second trial is done, by increasing length of base. All the dimension able to satisfies all the allowable FOS. The third trial is done by increasing both depth and length of base. All the dimension also able to satisfies all the allowable FOS. The second trial passing the allowable FOS greater compare to the third trial. However, the total area used by the second trial is much less compare to the third trial. Thus, the second trial result is adopted as the optimum dimension for this study. In order to passing the FOS allowable of sliding, the base is increase without add heel beam. This cause the FOS value of overturning and settlement become too far from the allowable. According to JKR guidelines for slope design 2010, the FOS for rigid retaining structure for overturning, sliding and settlement are 2.0,1.5 and 2.0 respectively. Thus the suitable dimension that meet the JKR specification is as table 2, FOS 1.5. The FOS value for all three criteria pass the JKR specification.
From the result, a new proportion is proposed. Height of wall, H is determined by the engineer. The stem base thickness, B1 may be estimated as 0.1 of the H. A minimum thickness of about 0.3 m is recommended at the top of stem, B2. Since retaining wall is designed for active pressure, it is optional to provide the face of the wall with batter(taper) of 0.02 m to avoid deflection. Next, the toe length, B3 is estimate by the base length, B4 divide by 3. Thickness of base, b1 is estimated as 0.1 of the H. The proportion for base length, B4 for each FOS is different: 0.66-0.74H for FOS 1.0; 0.99-1.13H for FOS 1.5, 1.31-1.34H for FOS 2.0. The bigger the value of FOS, the bigger the proportion for the base length. Result for optimum dimension Optimum dimension for each factor of safety is obtain and tabulated in Table 1 below. The value for embankment, D and top stem, B1 is 0.50 and 0.30, respectively. Based on Figure 1, the dimension of retaining wall element (base thickness, top stem, stem thickness, base) directly proportional to the height of retaining wall.

45
Figure 3: The element of retaining wall
Table 1: Optimum dimension for each factor of safety
Figure 1: The height of retaining wall versus dimension of retaining wall element for FOS =1 (left), FOS = 1.5
(middle), FOS = 2.0. Effect of toe length towards moment and FOS for FOS: Overturning: 1.5, Sliding: 1.5, Settlement: 1.5 The toe length is determined based on the thickness of the stem. At first, the toe length is assumed same with thickness of the base. Then, length of toe is increase with 1.5 times greater than the base thickness. The length is increased until any FOS fail. The result is compared with toe length at B4/3(data in the first row for each height).
The toe length that is less than dimension of length of base/3 will has higher restraining moment, bigger FOS of overturning and sliding. Meanwhile, the toe length that greater than dimension of length of base/3 will cause the sliding fail. The length of toe length does not affect the overturning moment. It only affects the restraining moment.
3.00
4.00
5.00
6.00
7.00
8.00
0.00 2.00 4.00 6.00
Heig
ht o
f ret
aini
ng w
all (
m)
Dimension (m)
basethickness,b1top stem,B1
stemthickness,B2base,B4
toe,B3
heel,B53.00
4.00
5.00
6.00
7.00
8.00
0.00 5.00 10.00
Heig
ht o
f ret
aini
ng w
all (
m)
Dimension (m)
basethickness,b1top stem,B1
stemthickness,B2base,B4
toe,B3
heel,B53.00
4.00
5.00
6.00
7.00
8.00
0.00 5.00 10.00
Heig
ht o
f ret
aini
ng w
all (
m)
Dimension (m)
basethickness,b1top stem,B1
stemthickness,B2base,B4
toe,B3
heel,B5
Height of retaining wall, H
(m)
Base thickness,
B1 (m)
Slope, a (m)
Stem thickness,
B2 (m)
Base, B4 (m)
Toe, B3 (m)
Heel, B5 (m)
Factor of Safety, FOS Output Total area used
(mm2) Overturning Sliding Settlement Overturning: 1.0, Sliding: 1.0, Settlement: 1.0
3.00 0.30 2.20 0.30 2.22 0.74 1.18 2.78 OK 1.01 OK 3.76 OK Pass 1.48 4.00 0.40 3.10 0.40 2.84 0.95 1.49 2.82 OK 1.01 OK 2.96 OK Pass 2.40 5.00 0.50 4.00 0.50 3.45 1.15 1.80 2.84 OK 1.02 OK 2.44 OK Pass 3.53 6.00 0.60 4.90 0.60 4.08 1.36 2.12 2.88 OK 1.02 OK 2.08 OK Pass 4.89 7.00 0.70 5.80 0.70 4.62 1.54 2.38 2.81 OK 1.01 OK 1.77 OK Pass 6.38
Overturning: 1.5, Sliding: 1.5, Settlement: 1.5 3.00 0.30 2.20 0.30 3.39 1.13 1.96 6.40 OK 1.51 OK 7.57 OK Pass 1.83 4.00 0.40 3.10 0.40 4.28 1.43 2.45 6.35 OK 1.52 OK 5.82 OK Pass 2.97 5.00 0.50 4.00 0.50 5.15 1.72 2.93 6.29 OK 1.51 OK 4.65 OK Pass 4.38 6.00 0.60 4.90 0.60 6.06 2.02 3.44 6.34 OK 1.52 OK 3.98 OK Pass 6.07 7.00 0.70 5.80 0.70 6.93 2.31 3.92 6.31 OK 1.52 OK 3.45 OK Pass 8.00
Overturning: 2.0, Sliding: 2.0, Settlement: 2.0 3.00 0.30 2.20 0.30 4.53 1.51 2.72 11.3 OK 2.01 OK 10.8 OK Pass 2.17 4.00 0.40 3.10 0.40 5.72 1.91 3.41 11.3 OK 2.02 OK 8.42 OK Pass 3.55 5.00 0.50 4.00 0.50 6.85 2.28 4.07 11.1 OK 2.01 OK 6.82 OK Pass 5.23 6.00 0.60 4.90 0.60 8.04 2.68 4.76 11.2 OK 2.02 OK 5.78 OK Pass 7.25 7.00 0.70 5.80 0.70 9.17 3.06 5.41 11.1 OK 2.01 OK 4.98 OK Pass 9.57
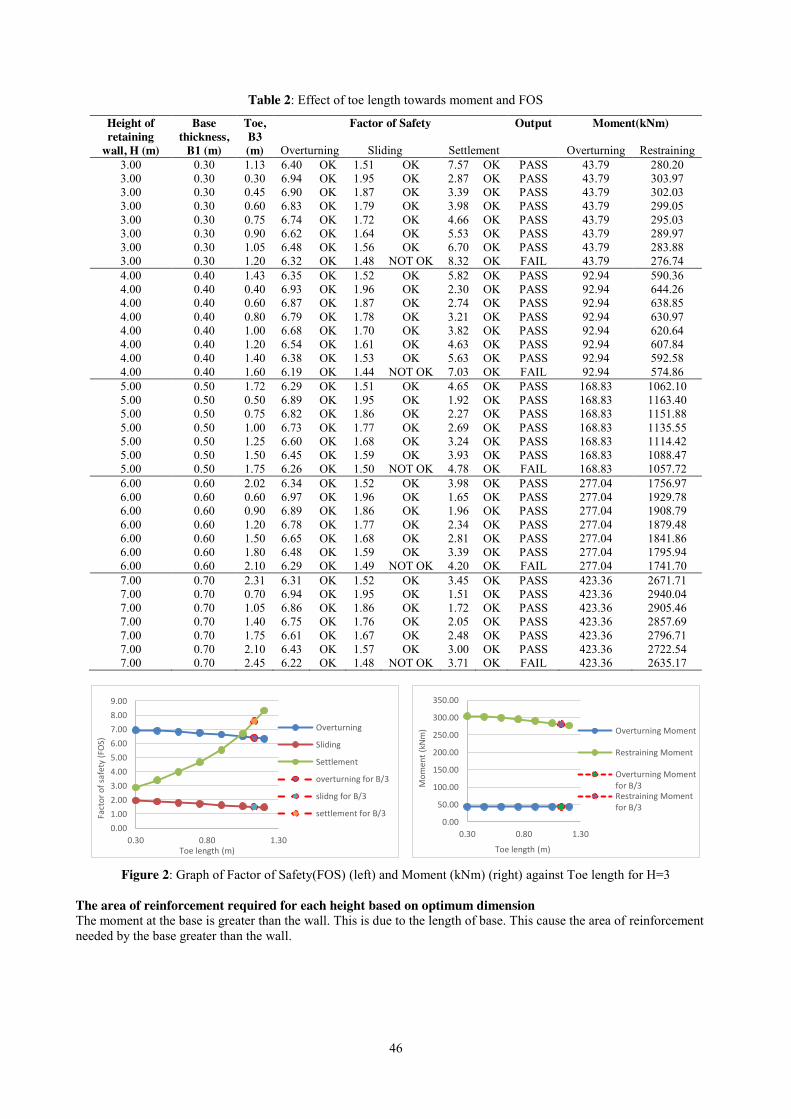
46
Table 2: Effect of toe length towards moment and FOS
Height of retaining
wall, H (m)
Base thickness,
B1 (m)
Toe, B3 (m)
Factor of Safety Output Moment(kNm)
Overturning Sliding Settlement Overturning Restraining 3.00 0.30 1.13 6.40 OK 1.51 OK 7.57 OK PASS 43.79 280.20 3.00 0.30 0.30 6.94 OK 1.95 OK 2.87 OK PASS 43.79 303.97 3.00 0.30 0.45 6.90 OK 1.87 OK 3.39 OK PASS 43.79 302.03 3.00 0.30 0.60 6.83 OK 1.79 OK 3.98 OK PASS 43.79 299.05 3.00 0.30 0.75 6.74 OK 1.72 OK 4.66 OK PASS 43.79 295.03 3.00 0.30 0.90 6.62 OK 1.64 OK 5.53 OK PASS 43.79 289.97 3.00 0.30 1.05 6.48 OK 1.56 OK 6.70 OK PASS 43.79 283.88 3.00 0.30 1.20 6.32 OK 1.48 NOT OK 8.32 OK FAIL 43.79 276.74 4.00 0.40 1.43 6.35 OK 1.52 OK 5.82 OK PASS 92.94 590.36 4.00 0.40 0.40 6.93 OK 1.96 OK 2.30 OK PASS 92.94 644.26 4.00 0.40 0.60 6.87 OK 1.87 OK 2.74 OK PASS 92.94 638.85 4.00 0.40 0.80 6.79 OK 1.78 OK 3.21 OK PASS 92.94 630.97 4.00 0.40 1.00 6.68 OK 1.70 OK 3.82 OK PASS 92.94 620.64 4.00 0.40 1.20 6.54 OK 1.61 OK 4.63 OK PASS 92.94 607.84 4.00 0.40 1.40 6.38 OK 1.53 OK 5.63 OK PASS 92.94 592.58 4.00 0.40 1.60 6.19 OK 1.44 NOT OK 7.03 OK FAIL 92.94 574.86 5.00 0.50 1.72 6.29 OK 1.51 OK 4.65 OK PASS 168.83 1062.10 5.00 0.50 0.50 6.89 OK 1.95 OK 1.92 OK PASS 168.83 1163.40 5.00 0.50 0.75 6.82 OK 1.86 OK 2.27 OK PASS 168.83 1151.88 5.00 0.50 1.00 6.73 OK 1.77 OK 2.69 OK PASS 168.83 1135.55 5.00 0.50 1.25 6.60 OK 1.68 OK 3.24 OK PASS 168.83 1114.42 5.00 0.50 1.50 6.45 OK 1.59 OK 3.93 OK PASS 168.83 1088.47 5.00 0.50 1.75 6.26 OK 1.50 NOT OK 4.78 OK FAIL 168.83 1057.72 6.00 0.60 2.02 6.34 OK 1.52 OK 3.98 OK PASS 277.04 1756.97 6.00 0.60 0.60 6.97 OK 1.96 OK 1.65 OK PASS 277.04 1929.78 6.00 0.60 0.90 6.89 OK 1.86 OK 1.96 OK PASS 277.04 1908.79 6.00 0.60 1.20 6.78 OK 1.77 OK 2.34 OK PASS 277.04 1879.48 6.00 0.60 1.50 6.65 OK 1.68 OK 2.81 OK PASS 277.04 1841.86 6.00 0.60 1.80 6.48 OK 1.59 OK 3.39 OK PASS 277.04 1795.94 6.00 0.60 2.10 6.29 OK 1.49 NOT OK 4.20 OK FAIL 277.04 1741.70 7.00 0.70 2.31 6.31 OK 1.52 OK 3.45 OK PASS 423.36 2671.71 7.00 0.70 0.70 6.94 OK 1.95 OK 1.51 OK PASS 423.36 2940.04 7.00 0.70 1.05 6.86 OK 1.86 OK 1.72 OK PASS 423.36 2905.46 7.00 0.70 1.40 6.75 OK 1.76 OK 2.05 OK PASS 423.36 2857.69 7.00 0.70 1.75 6.61 OK 1.67 OK 2.48 OK PASS 423.36 2796.71 7.00 0.70 2.10 6.43 OK 1.57 OK 3.00 OK PASS 423.36 2722.54 7.00 0.70 2.45 6.22 OK 1.48 NOT OK 3.71 OK FAIL 423.36 2635.17
Figure 2: Graph of Factor of Safety(FOS) (left) and Moment (kNm) (right) against Toe length for H=3
The area of reinforcement required for each height based on optimum dimension The moment at the base is greater than the wall. This is due to the length of base. This cause the area of reinforcement needed by the base greater than the wall.
0.001.002.003.004.005.006.007.008.009.00
0.30 0.80 1.30
Fact
or o
f saf
ety
(FO
S)
Toe length (m)
Overturning
Sliding
Settlement
overturning for B/3
slidng for B/3
settlement for B/30.00
50.00
100.00
150.00
200.00
250.00
300.00
350.00
0.30 0.80 1.30
Mom
ent (
kNm
)
Toe length (m)
Overturning Moment
Restraining Moment
Overturning Momentfor B/3Restraining Momentfor B/3
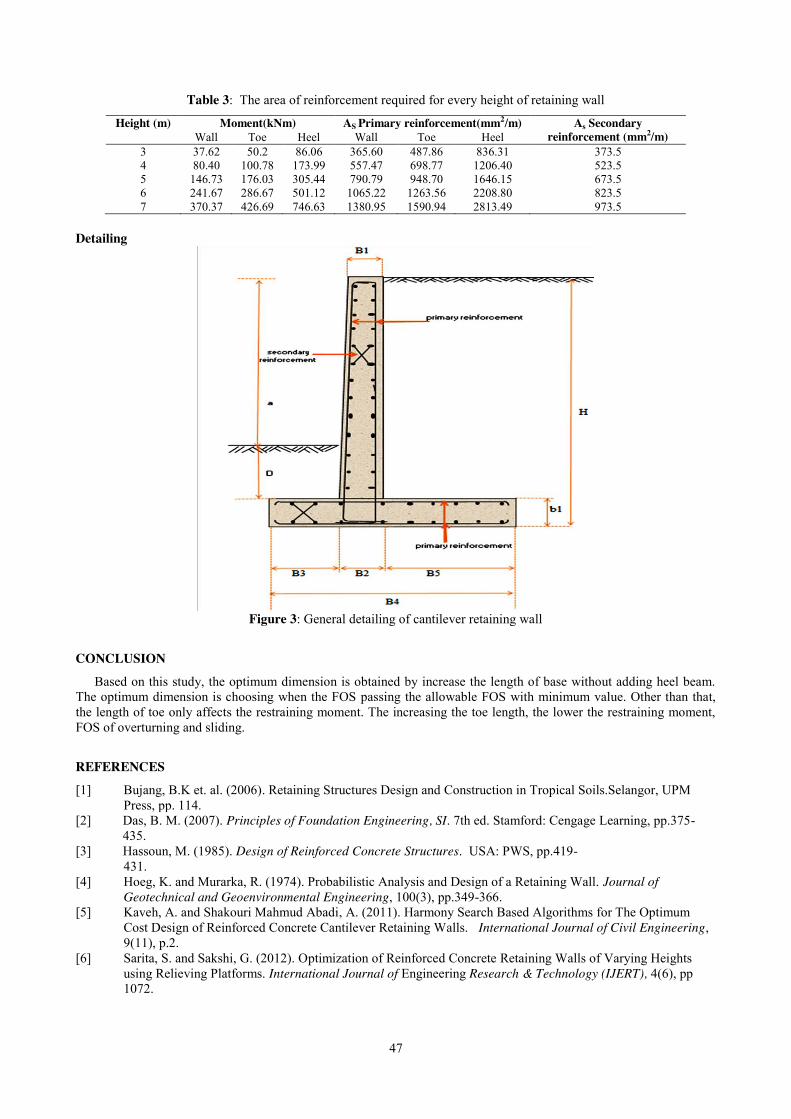
47
Table 3: The area of reinforcement required for every height of retaining wall
Height (m) Moment(kNm) AS Primary reinforcement(mm2/m) As Secondary reinforcement (mm2/m) Wall Toe Heel Wall Toe Heel
3 37.62 50.2 86.06 365.60 487.86 836.31 373.5 4 80.40 100.78 173.99 557.47 698.77 1206.40 523.5 5 146.73 176.03 305.44 790.79 948.70 1646.15 673.5 6 241.67 286.67 501.12 1065.22 1263.56 2208.80 823.5 7 370.37 426.69 746.63 1380.95 1590.94 2813.49 973.5
Detailing
Figure 3: General detailing of cantilever retaining wall
CONCLUSION
Based on this study, the optimum dimension is obtained by increase the length of base without adding heel beam. The optimum dimension is choosing when the FOS passing the allowable FOS with minimum value. Other than that, the length of toe only affects the restraining moment. The increasing the toe length, the lower the restraining moment, FOS of overturning and sliding.
REFERENCES [1] Bujang, B.K et. al. (2006). Retaining Structures Design and Construction in Tropical Soils.Selangor, UPM
Press, pp. 114. [2] Das, B. M. (2007). Principles of Foundation Engineering, SI. 7th ed. Stamford: Cengage Learning, pp.375-
435. [3] Hassoun, M. (1985). Design of Reinforced Concrete Structures. USA: PWS, pp.419-
431. [4] Hoeg, K. and Murarka, R. (1974). Probabilistic Analysis and Design of a Retaining Wall. Journal of
Geotechnical and Geoenvironmental Engineering, 100(3), pp.349-366. [5] Kaveh, A. and Shakouri Mahmud Abadi, A. (2011). Harmony Search Based Algorithms for The Optimum
Cost Design of Reinforced Concrete Cantilever Retaining Walls. International Journal of Civil Engineering, 9(11), p.2.
[6] Sarita, S. and Sakshi, G. (2012). Optimization of Reinforced Concrete Retaining Walls of Varying Heights using Relieving Platforms. International Journal of Engineering Research & Technology (IJERT), 4(6), pp 1072.
48
Moment and Shear Coefficients of Continuous Beam Under Eurocode Loading Arrangement
Syahirah binti Mohd Noor1, Izni Syahrizal bin Ibrahim2 Faculty of Civil Engineering, Universiti Teknologi Malaysia, Malaysia
Keywords: Continuous Beam; Shear Force Diagram; Bending Moment Diagram.
ABSTRACT. Beam is a structural element that is installed purposely to withstand load primarily by resisting against bending. The self-weight of the beam, external loads, span and external reactions results the beam to experience induced bending force into the material called bending moment. Beams generally carry vertical gravitational forces but can also used to carry horizontal loads, for instance loads due to an earthquake or wind. The key objectives of this research is to identify the load cases developed by Load Set 1 loading arrangement, in addition to generate the moment and shear coefficients of the load cases of continuous beam based on the enveloped bending moment obtained from Staad-Pro 2014 software. Structural analysis was done to compute the coefficients based on the enveloped moment and shear produced. The results were then tabulated with all the limitations stated along with the coefficients calculated where they can be used to design a continuous beam under Load Set 1 loading arrangement.
INTRODUCTION
Beam is a structural element that will internally experience compressive, tensile and shear stresses due to the loads applied to them [1]. Therefore, for simply supported beams, the original length of the beam will be slightly reduced to enclose a smaller radius arc at the top of the beam, resulting in compression, while the same original beam length at the bottom of the beam is slightly stretched to enclose a larger radius arc, resulting in tension. Since the middle part of the beam is halfway between the top and bottom, it experiences neither compression nor tension and denoted as the neutral axis of the beam. A continuous beam is a statically indeterminate multispan beam on hinged support where the end spans may be cantilevered, freely supported or fixed supported. Beams are made continuous over the supports in order to increase the structural integrity by providing an alternative path in the case of failure at a section. Continuous beams should be analyzed for the loading arrangements, which give the maximum stresses at each section [2].
Problem Statement
The variable loads acted on a continuous beam can usually cover the whole or any spans of the beam. Therefore, a continuous beam should be analyzed according to the loading arrangements, which give maximum stresses at each section. The sets of load arrangements that can be used for building structures are Load Set 1, alternate or two adjacent spans with maximum loading and Load Set 2, all or alternate spans with maximum loading.
This study will be further discussed on the Load Set 1 loading arrangement. Since this set of loading arrangement produce numerous load cases due to the increasing number of span in a continuous beam, the assessment would be lengthy and it has not been used in the structure design. Therefore, generalized shear and moment coefficients for this set of loading will be generated and tabulated from this study for different number and length of span, and value of loadings.
Objectives The objectives of this study are:
1. To identify the load cases developed by Load Set 1 loading arrangement, alternate or adjacent spans loaded, for different number of spans of continuous beam.
2. To generate the moment and shear coefficients under Load Set 1 loading arrangement of continuous beam using STAAD-Pro 2004 software.
3. To generate moment and shear coefficients in tabulated form. Scope of Study
This study is an attempt in developing the shear and moment coefficients for continuous beams under Load Set 1 distributed loading arrangement, which will be applicable in analyzing structures. Load Set 1 loading arrangement, according to EC 2 : Section 5.1.3, is more preferable to be used in structure design instead of Load Set 2, which currently been used. Load cases developed by Load Set 1 loading arrangement acted upon a continuous beam will be assessed and identified before the analysis takes place. The number of cases will vary according to the number of span of the beam. For studying the behavior of beams, and develop moment and shear coefficients a well-developed program STAAD-Pro 2004 was used.
49
LITERATURE REVIEW
The structural elements that are capable of withstanding the load primarily by resisting bending are known as structural beams. Structural beams are one of the major elements in a structure where they will carry loads by developing shear forces and bending moments along their span. It is convenient to consider shear force and bending moment distributions in beams simultaneously since they are directly related [3]. In addition, the different types of beams can be classified based on the type of support. The five types of beams are simply supported beam, fixed beam, cantilever beam, continuously supported beam and overhanging beam.
Generally, loads on civil engineering falls into two categories, which are dead loads and imposed loads. Dead loads are loads that act on a structure permanently which includes its self-weight, fixtures, suspended ceilings, cladding, floor finishes and others. On the other hand, live or imposed loads are moving loads, which includes vehicles crossing a bridge, people moving around, snow, temporary partitions and so on in the form of uniformly distributed, uniformly varying or concentrated load [4]. Wind loads are considered to be live loads but their effects are considered separately as they are affected by the location, size and shape of a structure. Soil or hydrostatic pressure and dynamic effects produced, for instance, by vibrating machinery, wind gusts, wave actions or earthquake action, are the other types of load.
Differ from those loadings, there are other types of loading that usually applied on structural members. Structural members may be subjected to complex loading systems apparently comprised of several different types of load. However, no matter how complex the systems appear to be, they consists of a maximum of four basic load types, which are axial loads, shear loads, bending moments and torsion [5].
Shear force occurs when two parallel forces act out of alignment with each other. shear forces often have to be taken into account during the design and build stages. Shear forces tend to result in catastrophic failure before a structure shows signs of bending or distorting while many other forces may act on any given structure or object. Shear forces cause an object to experience shear stress, which is the result of two forces acting on an object in opposite directions.
Bending moment, which has an obvious asymmetric characteristic, is the reaction induced in a structural element commonly beam, when an external force or moment is applied to the element causing it to bend. Bending moment of a beam is defined as the algebraic sum of all the moments to the neutral axis of any cross-section of a beam. In other words, bending moment is simply the bend that occurs in a beam due to developed moment or the torque that keeps a beam together, anywhere along the beam [6].
Buildings must be designed and constructed according tot he provisions of a building code, a legal documentation with requirements related to structural and fire safety, plumbing, ventilation and accessibility [7]. BS 8110 is a code of practice fort he structural use of concrete. BS 8110 : Part 1 : 1997 gives recommendations for the structural use of concrete in buildings and structures, excluding bridges and structural concrete made with high alumina cement [8]. However, the relevant committee of the British Standards Institute had considered that there is no need to support BS 8110 since the Department for Communities and Local Government have indicated that Eurocode 2 is acceptable for design according tot he Building Regulations.
European Code, EN 1992-1-1 describes the principles and requirements for safety, serviceability and durability of concrete structures, together with specific provisions for buildings. It is based on the limit state concept used in conjunction with a partial factor method. For the design of new structures, EN 1992-1-1 intended to be used for direct application, together with other parts of EN 1992 [9].
STAAD-Pro is an integrated finite element analysis and design offering, including a state-of-art user interface, visualization tools and international design codes. It is capable of analyzing any structure exposed to static loading, a dynamic response, wind, earthquake and moving load. STAAD-Pro also provides fixed-end-moment analysis and design for any type of project including towers, culverts, plants, bridges, stadiums and marine structures. In addition, it is computer software, which is used to process modeling, analysis and structural design in engineering field.
Microsoft Excel is a spreadsheet, which features calculation, graphing tools, pivot tables, and a macro programming language called Visual Basic for Applications. This software can be used to analyze data, manage record data, identify trends, build charts and forms and perform budgeting. Microsoft Excel simplifies work in so many ways. For instance, for calculation purposes, specific equations or formulas are keyed in and it will automatically calculated when data is inserted.
METHODOLOGY
Throughout the study, the STAAD-Pro 2004 and Microsoft Excel had been utilized. STAAD-Pro is comprehensive structural engineering software that addresses all aspects of structural engineering such as design and analyzes simple and complex structure for a wide range of loading conditions. Different loadings and number of spans of continuous beam were analyzed and the coefficients of moment and shear for the loading were computed. The main objective of the study is to generate the moment and shear coefficients for the load cases under Load Set 1 loading arrangement and tabulate the results in an organized and understandable table. This research methodology consisted of 4 key activities: identify the load cases apply on a continuous beam according to the number of spans, analyze the continuous beam and obtain the enveloped bending moment and shear forec and hence compute the coefficients using spreadsheet.
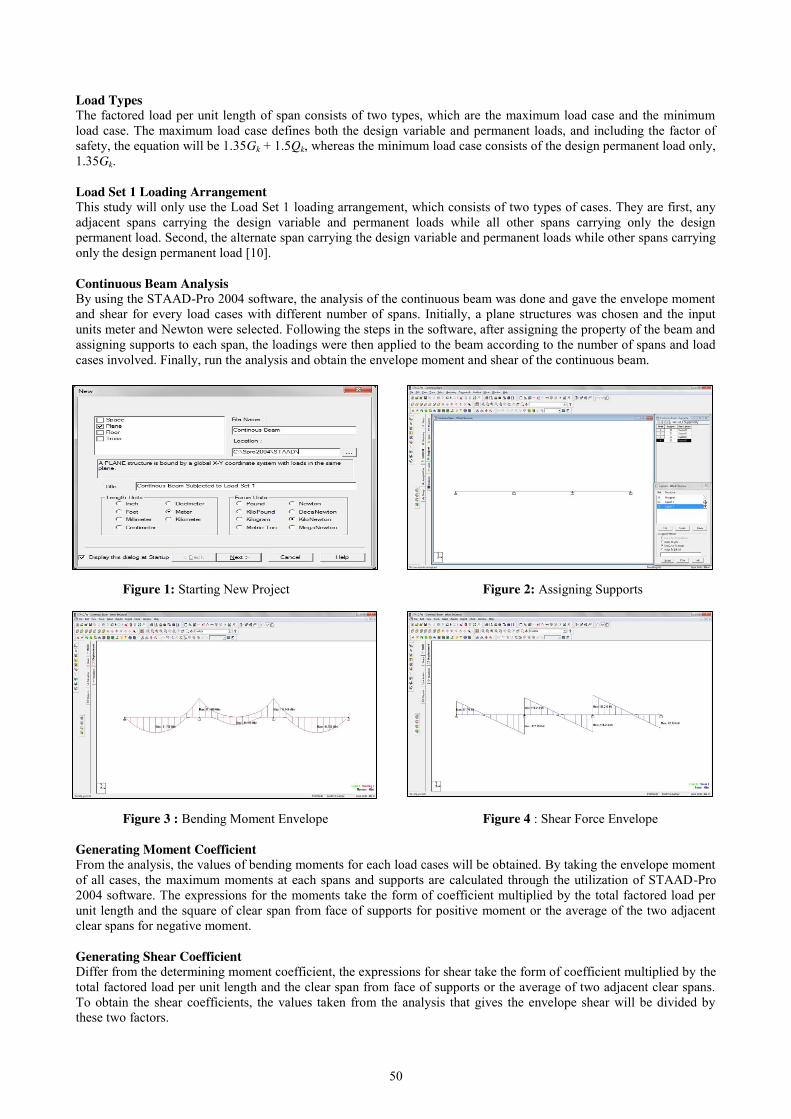
50
Load Types The factored load per unit length of span consists of two types, which are the maximum load case and the minimum load case. The maximum load case defines both the design variable and permanent loads, and including the factor of safety, the equation will be 1.35Gk + 1.5Qk, whereas the minimum load case consists of the design permanent load only, 1.35Gk. Load Set 1 Loading Arrangement This study will only use the Load Set 1 loading arrangement, which consists of two types of cases. They are first, any adjacent spans carrying the design variable and permanent loads while all other spans carrying only the design permanent load. Second, the alternate span carrying the design variable and permanent loads while other spans carrying only the design permanent load [10]. Continuous Beam Analysis By using the STAAD-Pro 2004 software, the analysis of the continuous beam was done and gave the envelope moment and shear for every load cases with different number of spans. Initially, a plane structures was chosen and the input units meter and Newton were selected. Following the steps in the software, after assigning the property of the beam and assigning supports to each span, the loadings were then applied to the beam according to the number of spans and load cases involved. Finally, run the analysis and obtain the envelope moment and shear of the continuous beam.
Figure 1: Starting New Project Figure 2: Assigning Supports
Figure 3 : Bending Moment Envelope Figure 4 : Shear Force Envelope Generating Moment Coefficient From the analysis, the values of bending moments for each load cases will be obtained. By taking the envelope moment of all cases, the maximum moments at each spans and supports are calculated through the utilization of STAAD-Pro 2004 software. The expressions for the moments take the form of coefficient multiplied by the total factored load per unit length and the square of clear span from face of supports for positive moment or the average of the two adjacent clear spans for negative moment. Generating Shear Coefficient Differ from the determining moment coefficient, the expressions for shear take the form of coefficient multiplied by the total factored load per unit length and the clear span from face of supports or the average of two adjacent clear spans. To obtain the shear coefficients, the values taken from the analysis that gives the envelope shear will be divided by these two factors.
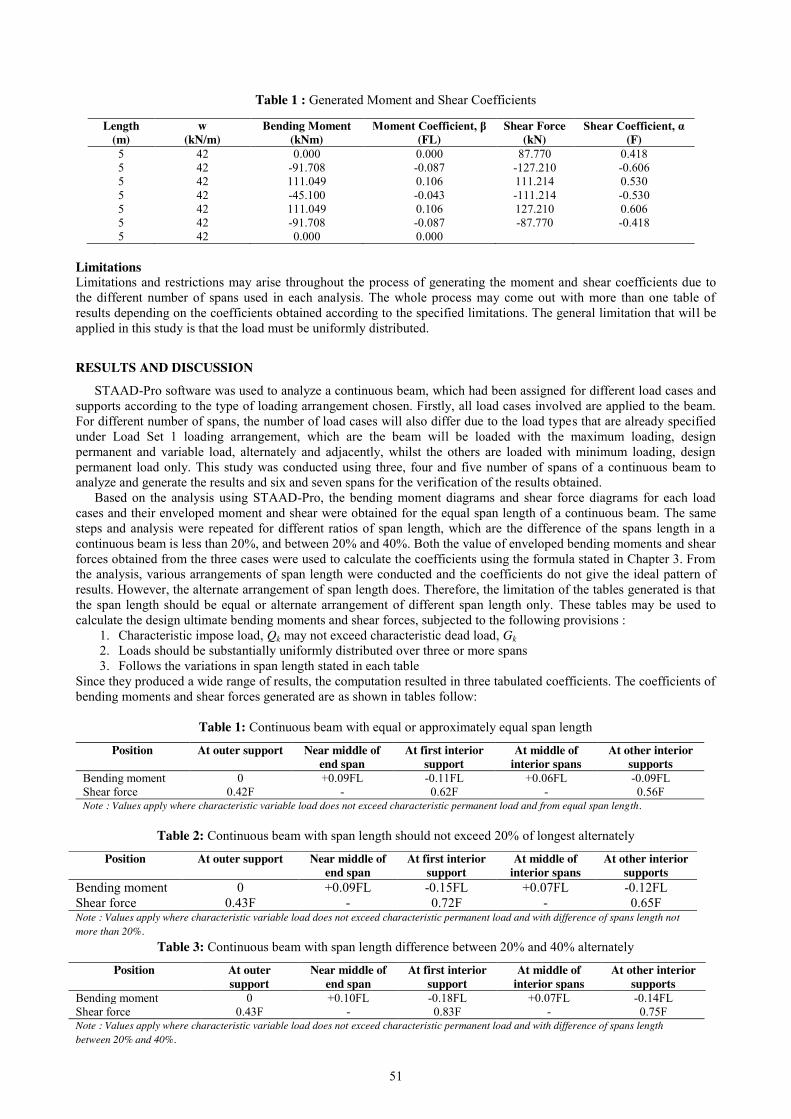
51
Table 1 : Generated Moment and Shear Coefficients
Limitations Limitations and restrictions may arise throughout the process of generating the moment and shear coefficients due to the different number of spans used in each analysis. The whole process may come out with more than one table of results depending on the coefficients obtained according to the specified limitations. The general limitation that will be applied in this study is that the load must be uniformly distributed.
RESULTS AND DISCUSSION STAAD-Pro software was used to analyze a continuous beam, which had been assigned for different load cases and
supports according to the type of loading arrangement chosen. Firstly, all load cases involved are applied to the beam. For different number of spans, the number of load cases will also differ due to the load types that are already specified under Load Set 1 loading arrangement, which are the beam will be loaded with the maximum loading, design permanent and variable load, alternately and adjacently, whilst the others are loaded with minimum loading, design permanent load only. This study was conducted using three, four and five number of spans of a continuous beam to analyze and generate the results and six and seven spans for the verification of the results obtained.
Based on the analysis using STAAD-Pro, the bending moment diagrams and shear force diagrams for each load cases and their enveloped moment and shear were obtained for the equal span length of a continuous beam. The same steps and analysis were repeated for different ratios of span length, which are the difference of the spans length in a continuous beam is less than 20%, and between 20% and 40%. Both the value of enveloped bending moments and shear forces obtained from the three cases were used to calculate the coefficients using the formula stated in Chapter 3. From the analysis, various arrangements of span length were conducted and the coefficients do not give the ideal pattern of results. However, the alternate arrangement of span length does. Therefore, the limitation of the tables generated is that the span length should be equal or alternate arrangement of different span length only. These tables may be used to calculate the design ultimate bending moments and shear forces, subjected to the following provisions :
1. Characteristic impose load, Qk may not exceed characteristic dead load, Gk 2. Loads should be substantially uniformly distributed over three or more spans 3. Follows the variations in span length stated in each table
Since they produced a wide range of results, the computation resulted in three tabulated coefficients. The coefficients of bending moments and shear forces generated are as shown in tables follow:
Table 1: Continuous beam with equal or approximately equal span length
Position At outer support Near middle of end span
At first interior support
At middle of interior spans
At other interior supports
Bending moment 0 +0.09FL -0.11FL +0.06FL -0.09FL Shear force 0.42F - 0.62F - 0.56F Note : Values apply where characteristic variable load does not exceed characteristic permanent load and from equal span length.
Table 2: Continuous beam with span length should not exceed 20% of longest alternately
Table 3: Continuous beam with span length difference between 20% and 40% alternately
Length (m)
w (kN/m)
Bending Moment (kNm)
Moment Coefficient, β (FL)
Shear Force (kN)
Shear Coefficient, α (F)
5 42 0.000 0.000 87.770 0.418 5 42 -91.708 -0.087 -127.210 -0.606 5 42 111.049 0.106 111.214 0.530 5 42 -45.100 -0.043 -111.214 -0.530 5 42 111.049 0.106 127.210 0.606 5 42 -91.708 -0.087 -87.770 -0.418 5 42 0.000 0.000
Position At outer support Near middle of end span
At first interior support
At middle of interior spans
At other interior supports
Bending moment 0 +0.09FL -0.15FL +0.07FL -0.12FL Shear force 0.43F - 0.72F - 0.65F Note : Values apply where characteristic variable load does not exceed characteristic permanent load and with difference of spans length not more than 20%.
Position At outer support
Near middle of end span
At first interior support
At middle of interior spans
At other interior supports
Bending moment 0 +0.10FL -0.18FL +0.07FL -0.14FL Shear force 0.43F - 0.83F - 0.75F Note : Values apply where characteristic variable load does not exceed characteristic permanent load and with difference of spans length between 20% and 40%.
52
CONCLUSION This study presents the generated coefficients of bending moment and shear force of a continuous beam with Load
Set 1 loading arrangement. 1. From the analysis, the load cases of Load Set 1 loading arrangement acted upon a continuous beam of different
number of span had been identified and the envelope bending moment and shear force of each cases were obtained using STAAD-Pro 2004 software.
2. The moment and shear coefficients were calculated based on the enveloped moment and shear obtained and the results were tabulated in three different tables according to the span ratios since the coefficients produced had wide range of results.
Having this table, the manual calculation using the moment distribution method, which is lengthy and time consuming can be skipped. Differ from the coefficients generated from Load Set 2 loading arrangement, this study has resulted in three tables of different span ratios, which makes the results have more limitations since the number of load cases is increasing with the number of spans used. Moreover, instead of using these tables for various arrangements of span length, they can only be used for equal span length and the alternate arrangement of different span length due to the same problem.
The general limitations of using these tables for design purposes are that the characteristic imposed load may not exceed the characteristic dead load and the loads should be substantially uniformly distributed over three or more span. Apart from these limitations, the tables are restricted to either having equal spans throughout the continuous beam or different span length arranged alternately with certain ratios of the adjacent spans along the beam.
REFERENCES [1] Nik F.I (2011). Tensile Force and Bond Stress of Longitudinal Reinforcement in Heavily Reinforced Concrete
Beam, 7. [2] Adam, F. M. (2015). Charts for Bending Moment Coefficients for Continuous Beams, 869(8), 208–226. [3] Megson, T. H. G. (2014). Normal Force, Shear Force, Bending Moment and Torsion. Structural and Stress
Analysis, 2, 38–78. [4] Megson, T. H. . (2005). Influence Lines. Structural and Stress Analysis, 640–683. [5] Abdul, M., & Pritom, P. (2017). Cost Analysis of RCC , Steel and Composite Multi-Storied Car Parking
Subjected to High Wind Exposure in Bangladesh, 3(2), 95–104. [6] Sherif, E. T. (2005). Journal of Structural Engineering, Volume 131. [7] Pillai, S. U., & Menon, D. (2013). Reinforced Concrete Design. [8] British Standard. (1997). Structural use of concrete - Part 1. Code of practice for design and construction. [9] Walraven, J. C. (2008). Eurocode 2 : Design of concrete structures, (February). [10] Mohamad, S. Y. (2015). Reinforced Concrete Design to Eurocode 2, 111.

53
Flexural Behaviour of Reinforced Concrete Beam Using Cold-Formed C-Channel Section as Part of Reinforcement
Muhammad Dinie Naqiruddin Jafri1, Arizu Sulaiman2 Faculty of Civil Engineering, Universiti Teknologi Malaysia, Malaysia
Keywords: Cold-Formed Steel; Reinforced Concrete Beam; Flexural Test; Cracking.
ABSTRACT. The application of cold-formed steel sections is mentioned to be one of the alternatives method of construction in future. The advantages with respect to the properties of cold-formed steel in engineering applications have led to many research studies being conducted. However, the application of cold-formed steel as part of reinforcement in beam has not yet been developed and recognized as a common practice in construction. The insufficient researches in providing information on the influence of cold-formed in beams performance might be one of the factors. Hence, an experimental program has been conducted in order to investigate the flexural behaviour of reinforced concrete beams using cold-formed C-channel section as part of reinforcement. A test series consisting of two simple beams with two different arrangements of cold-formed C-channel section (horizontal and vertical position) had been conducted in this investigation. The beams which are of 3500mm in length and 200 mm × 300 mm cross-sectional dimension, loaded with two equal concentrated point loads (4 points load test). The variables considered in the experimental program are the cross-section of the cold-formed C-channel, the bar diameter (10mm, 12mm) and the amount of transverse reinforcement in the beam (H8-200). A concrete strength of grade 30 N/mm² has been used to construct the beams. The load, P and the deflection were recorded until the beams fails. At the same time, the crack patterns were also observed. In conclusion, the experimental results showed that the proposed usage of cold-formed C-channel section as part of reinforcement improved the load carrying capacity of the beams significantly; and both beams failed in flexure as predicted. A comparison between the two beams have verified the arrangement of cold-formed C-channel section horizontally as in beam B1 is better than vertically as in beam B2 in terms of performances under flexure.
INTRODUCTION
Cold-formed are used for a number of different applications ,primarily associated with either the building envelope or light-steel structure elements used in walls ,partitions and floors. Current improvements in the practical application of cold-formed sections in building construction have shown a faster ,better, and stronger method of structural construction compared to the previous days. The cold-formed steel members have various engineering properties such as the tension, compression, axial loading, bending and deflection. To deal with the current and future challenges, further researches and studies on cold-formed shall be always carried out in order for professionals as well as public to develop a new method of construction using cold-formed as part of reinforcement.
Problem Statement In these days, application of cold-formed steel members had been widely used in construction as structural members but there is still a fewer research or laboratory test are being done on the behaviour of cold-formed steel section as structural members in Malaysia. The information and data from the research are very essential in understanding the efficiency of utilizing the cold-formed steel sections in different types of construction and as the main element to sustain loads structurally.
There are various cross-section and different strength properties for the cold-formed steel members starting with the range of 280 N/mm² until 550N/m². This different in strength have promotes a new reinforced concrete design by using this cold-formed steel members as part of reinforcement. It also provides a more economical design for reinforced concrete beam that are need to be test. However, the small thickness of the section maybe an important subject for challenge that need to be faced by the researchers.
Objectives The objectives of this study are:
4. To determine the performance reinforced concrete beam with cold-formed C-channel section as part of tension reinforcement.
5. To obtain the ultimate load and bending moment resistance of the proposed beams subjected to the flexural bending test.
6. To observe the mode of failures and crack patterns of the beam. 7. To justify the behaviour of the proposed beam by relating the theoretical calculations and experimental results. 8. To compare the performance between the two proposed beams.

54
Scope of Study This research is carried out to study the flexural behavior and failure modes of reinforced concrete beam using cold-formed c-channel as part of reinforcement so that this one of a kind beam can be implemented in building construction project. The experiment will be carried out on two specimens of reinforced concrete beams by using cold-formed C-channel section as part reinforcement with the size of 3500mm length, 200mm width and 300mm of overall depth. The two specimens will be cast with the same number and dimension of the cold-formed C-channel section as part of reinforcement in the beam but with different arrangement of the cold-formed position. The specimens will be tested until failure with two-point load testing at the distance of about 1500mm from the supports. The compressive strength of the proposed reinforced beam will be 30 N/mm². The manipulated variable in the specimens are the arrangement and position of the cold-formed C-channel section that will be act as part of reinforcement in the beam. The mid-span reinforcement strain was not investigated on this research. The experimental result will be compared with theoretical calculation results to justify the behaviour of the proposed beam.
LITERATURE REVIEW
In the early years of 1850s ,the application of cold-formed steelwork members has been introduced in United States and great Britain for the building construction [1].Only in the early 1930s ,the use of cold-formed steel were widely used in the construction of building but before that the cold-formed steel were being used in the automobile industry for vehicles body part ,home utensils ,storage racks and bridge construction .The reason behind this is because the reduction in the weight of the steel as a leading factor for easier design and installation. “Cold-formed steel members are steel structural products that are made by bending flat sheets of steel at ambient temperature into shapes which will support more than the flat sheets themselves” [2] .The cold-formed have been manufactured since the early 1850s when the first flat steel sheets were made by the steel mills .However ,in modern days ,the development of a higher strength materials properties and broader range of civil structural field application have triggered a significant progression in cold-formed steel relative to the traditional heavy-weight hot-rolled steel members [3].
The properties of cold-formed steel consist of two main key which is the yield point and tensile strength that are being classified by the grade of carbon steel and high strength low alloy steel used to produce cold-formed steel. The yield point of the cold-formed steel production usually in the ranges of 230 MPa to 380 MPa and higher [4]. Besides that, the tensile strength and ductile are important characteristic because of the manner related to formability. The tensile strength usually must be taken into account, or cold-formed steels, the ratio of tensile strength to yield strength normally ranges from 1.2 to 1.8. Though, for specific applications, steels with a lower ratio can be used.
The reason behind the choosing cold-formed as reinforcement in proposed beam is due to its advantages which is lightness in weight, high strength and stiffness, pre-galvanized or pre-coated for corrosion resistance, non-combustible, versatility of profile shape and most importantly, it possesses uniform quality. The c-channel section were most widely used as shelf beam and steel racks for supporting storage pallets and act as flexural members. Basically, cold-formed are materials that been produced with a uniform thickness and in cooler temperature. There are three methods exist in manufacturing cold-formed steel members includes cold roll forming, press brake operation, bending brake operation [1].
The elements of buckling and distortion on section properties of cold-formed is important in this research findings. New recent findings have provided a valuable data on the distortional buckling mode where they find the edge stiffened element fails by transverse bending of the stiffener and it is also known as flange-distortional to differentiate this type of mode from the lateral-distortional mode that might occur in flexure [2]. This elements is essential in proposing cold-formed as reinforcement and can be correlate with the behaviour of beam in bending when introduced. The value of bending moment can be produced when beam in bending. The reinforcement is introduced at the bottom part of the beam to resist the tensile bending stresses and also overcome the tensile weakness of the concrete [5].
For theoretical calculation in flexural design method, it deals with the analysis and design of section for ultimate limit state design consideration of structural elements subjected to bending In this practice ,the design for flexure have to meet several requirements such as cross-section of the beam ,concrete strength ,steel bar strength and applied ultimate bending moment to determine the area and number of reinforcement needed [5]. The design then need to be check to produce an economical and adequate strength of structural members based on the design proposed for example the number and size of steel reinforcement provided and checking for moment resistance. The types of reinforced concrete section in this research are rectangular section with doubly-reinforced section.
There are three different series of test setup to determine shear, flexure and combination of shear failure [6]. The flexural behaviour of beam can be observed through flexural bending test of the beam. The test considers a two- point loading using the jack attached to the loading frame [7]. The behaviour of beam is keenly observed from beginning to the failure. This type of test is important to attain the values of ultimate load, deflection and cracking patterns to show wether the tested beams exerts similar behaviour between each other and to meet the requirement of the flexural failure criteria. To design the beam to fail under flexure solely is by implementing the suitable span-depth ratio (av/d)).
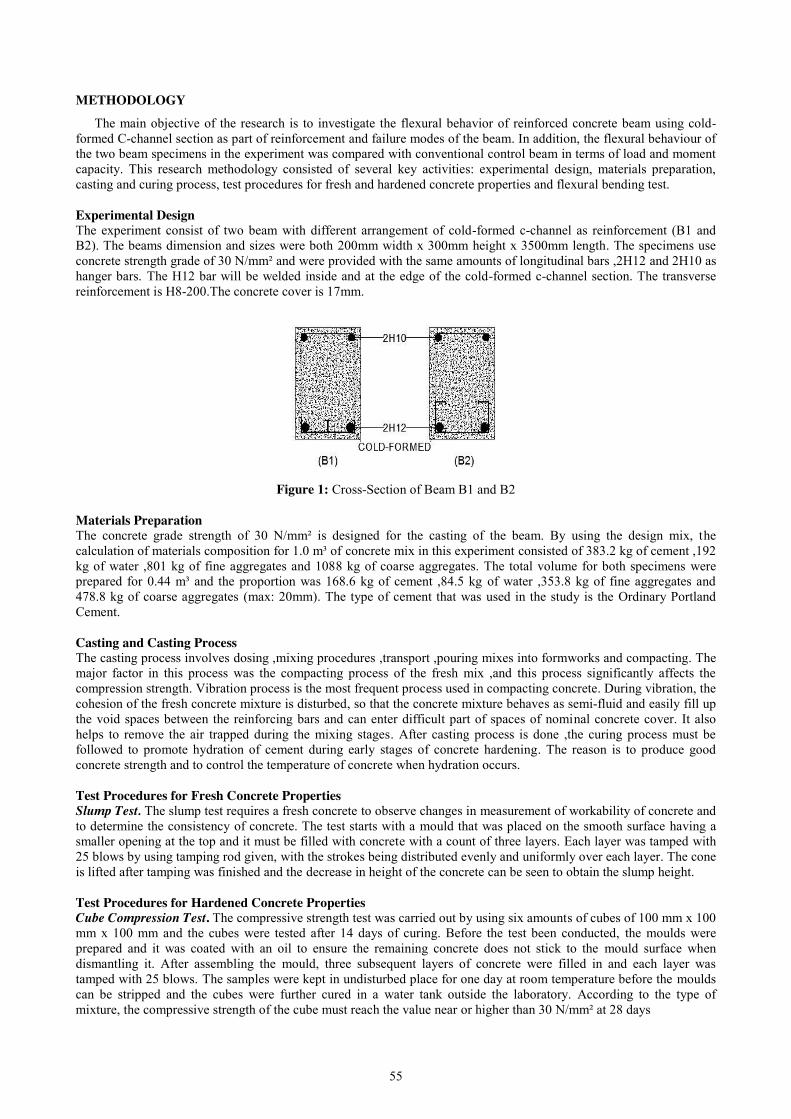
55
METHODOLOGY
The main objective of the research is to investigate the flexural behavior of reinforced concrete beam using cold-formed C-channel section as part of reinforcement and failure modes of the beam. In addition, the flexural behaviour of the two beam specimens in the experiment was compared with conventional control beam in terms of load and moment capacity. This research methodology consisted of several key activities: experimental design, materials preparation, casting and curing process, test procedures for fresh and hardened concrete properties and flexural bending test.
Experimental Design The experiment consist of two beam with different arrangement of cold-formed c-channel as reinforcement (B1 and B2). The beams dimension and sizes were both 200mm width x 300mm height x 3500mm length. The specimens use concrete strength grade of 30 N/mm² and were provided with the same amounts of longitudinal bars ,2H12 and 2H10 as hanger bars. The H12 bar will be welded inside and at the edge of the cold-formed c-channel section. The transverse reinforcement is H8-200.The concrete cover is 17mm.
Figure 1: Cross-Section of Beam B1 and B2
Materials Preparation The concrete grade strength of 30 N/mm² is designed for the casting of the beam. By using the design mix, the calculation of materials composition for 1.0 m³ of concrete mix in this experiment consisted of 383.2 kg of cement ,192 kg of water ,801 kg of fine aggregates and 1088 kg of coarse aggregates. The total volume for both specimens were prepared for 0.44 m³ and the proportion was 168.6 kg of cement ,84.5 kg of water ,353.8 kg of fine aggregates and 478.8 kg of coarse aggregates (max: 20mm). The type of cement that was used in the study is the Ordinary Portland Cement. Casting and Casting Process The casting process involves dosing ,mixing procedures ,transport ,pouring mixes into formworks and compacting. The major factor in this process was the compacting process of the fresh mix ,and this process significantly affects the compression strength. Vibration process is the most frequent process used in compacting concrete. During vibration, the cohesion of the fresh concrete mixture is disturbed, so that the concrete mixture behaves as semi-fluid and easily fill up the void spaces between the reinforcing bars and can enter difficult part of spaces of nominal concrete cover. It also helps to remove the air trapped during the mixing stages. After casting process is done ,the curing process must be followed to promote hydration of cement during early stages of concrete hardening. The reason is to produce good concrete strength and to control the temperature of concrete when hydration occurs. Test Procedures for Fresh Concrete Properties Slump Test. The slump test requires a fresh concrete to observe changes in measurement of workability of concrete and to determine the consistency of concrete. The test starts with a mould that was placed on the smooth surface having a smaller opening at the top and it must be filled with concrete with a count of three layers. Each layer was tamped with 25 blows by using tamping rod given, with the strokes being distributed evenly and uniformly over each layer. The cone is lifted after tamping was finished and the decrease in height of the concrete can be seen to obtain the slump height. Test Procedures for Hardened Concrete Properties Cube Compression Test. The compressive strength test was carried out by using six amounts of cubes of 100 mm x 100 mm x 100 mm and the cubes were tested after 14 days of curing. Before the test been conducted, the moulds were prepared and it was coated with an oil to ensure the remaining concrete does not stick to the mould surface when dismantling it. After assembling the mould, three subsequent layers of concrete were filled in and each layer was tamped with 25 blows. The samples were kept in undisturbed place for one day at room temperature before the moulds can be stripped and the cubes were further cured in a water tank outside the laboratory. According to the type of mixture, the compressive strength of the cube must reach the value near or higher than 30 N/mm² at 28 days
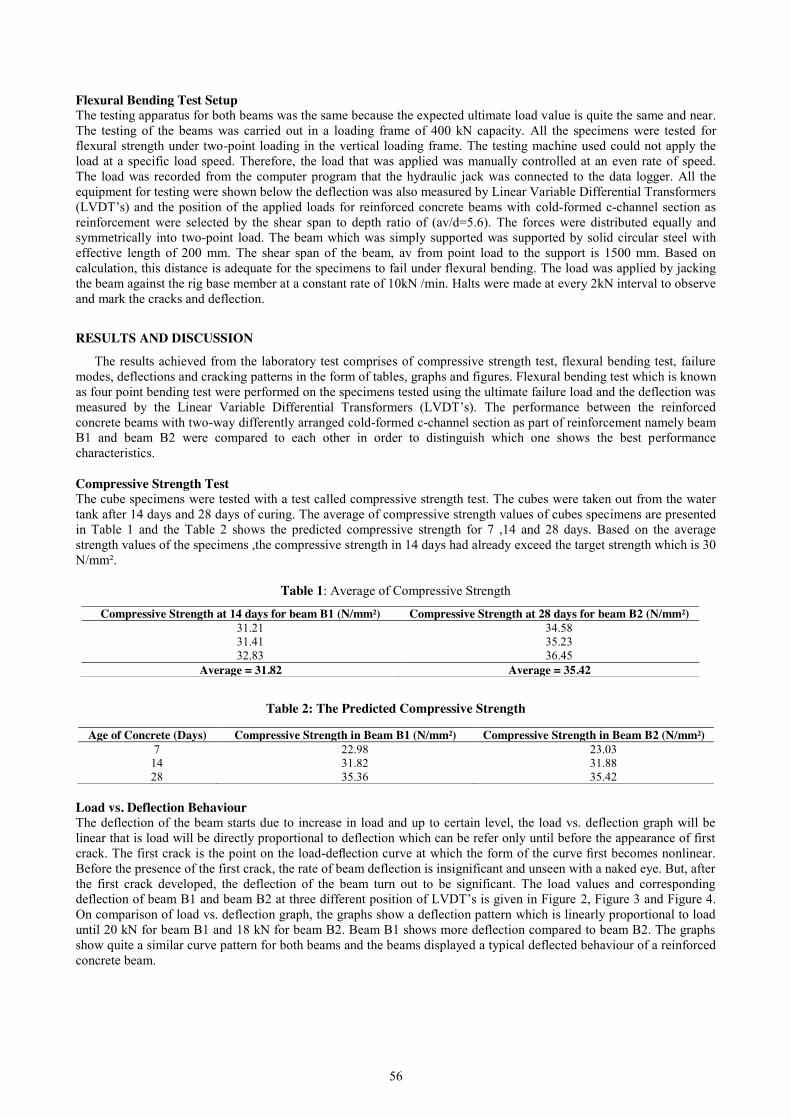
56
Flexural Bending Test Setup The testing apparatus for both beams was the same because the expected ultimate load value is quite the same and near. The testing of the beams was carried out in a loading frame of 400 kN capacity. All the specimens were tested for flexural strength under two-point loading in the vertical loading frame. The testing machine used could not apply the load at a specific load speed. Therefore, the load that was applied was manually controlled at an even rate of speed. The load was recorded from the computer program that the hydraulic jack was connected to the data logger. All the equipment for testing were shown below the deflection was also measured by Linear Variable Differential Transformers (LVDT’s) and the position of the applied loads for reinforced concrete beams with cold-formed c-channel section as reinforcement were selected by the shear span to depth ratio of (av/d=5.6). The forces were distributed equally and symmetrically into two-point load. The beam which was simply supported was supported by solid circular steel with effective length of 200 mm. The shear span of the beam, av from point load to the support is 1500 mm. Based on calculation, this distance is adequate for the specimens to fail under flexural bending. The load was applied by jacking the beam against the rig base member at a constant rate of 10kN /min. Halts were made at every 2kN interval to observe and mark the cracks and deflection.
RESULTS AND DISCUSSION
The results achieved from the laboratory test comprises of compressive strength test, flexural bending test, failure modes, deflections and cracking patterns in the form of tables, graphs and figures. Flexural bending test which is known as four point bending test were performed on the specimens tested using the ultimate failure load and the deflection was measured by the Linear Variable Differential Transformers (LVDT’s). The performance between the reinforced concrete beams with two-way differently arranged cold-formed c-channel section as part of reinforcement namely beam B1 and beam B2 were compared to each other in order to distinguish which one shows the best performance characteristics.
Compressive Strength Test The cube specimens were tested with a test called compressive strength test. The cubes were taken out from the water tank after 14 days and 28 days of curing. The average of compressive strength values of cubes specimens are presented in Table 1 and the Table 2 shows the predicted compressive strength for 7 ,14 and 28 days. Based on the average strength values of the specimens ,the compressive strength in 14 days had already exceed the target strength which is 30 N/mm².
Table 1: Average of Compressive Strength
Table 2: The Predicted Compressive Strength
Load vs. Deflection Behaviour The deflection of the beam starts due to increase in load and up to certain level, the load vs. deflection graph will be linear that is load will be directly proportional to deflection which can be refer only until before the appearance of first crack. The first crack is the point on the load-deflection curve at which the form of the curve first becomes nonlinear. Before the presence of the first crack, the rate of beam deflection is insignificant and unseen with a naked eye. But, after the first crack developed, the deflection of the beam turn out to be significant. The load values and corresponding deflection of beam B1 and beam B2 at three different position of LVDT’s is given in Figure 2, Figure 3 and Figure 4. On comparison of load vs. deflection graph, the graphs show a deflection pattern which is linearly proportional to load until 20 kN for beam B1 and 18 kN for beam B2. Beam B1 shows more deflection compared to beam B2. The graphs show quite a similar curve pattern for both beams and the beams displayed a typical deflected behaviour of a reinforced concrete beam.
Compressive Strength at 14 days for beam B1 (N/mm²) Compressive Strength at 28 days for beam B2 (N/mm²) 31.21 31.41 32.83
34.58 35.23 36.45
Average = 31.82 Average = 35.42
Age of Concrete (Days) Compressive Strength in Beam B1 (N/mm²) Compressive Strength in Beam B2 (N/mm²) 7 22.98 23.03
14 31.82 31.88 28 35.36 35.42
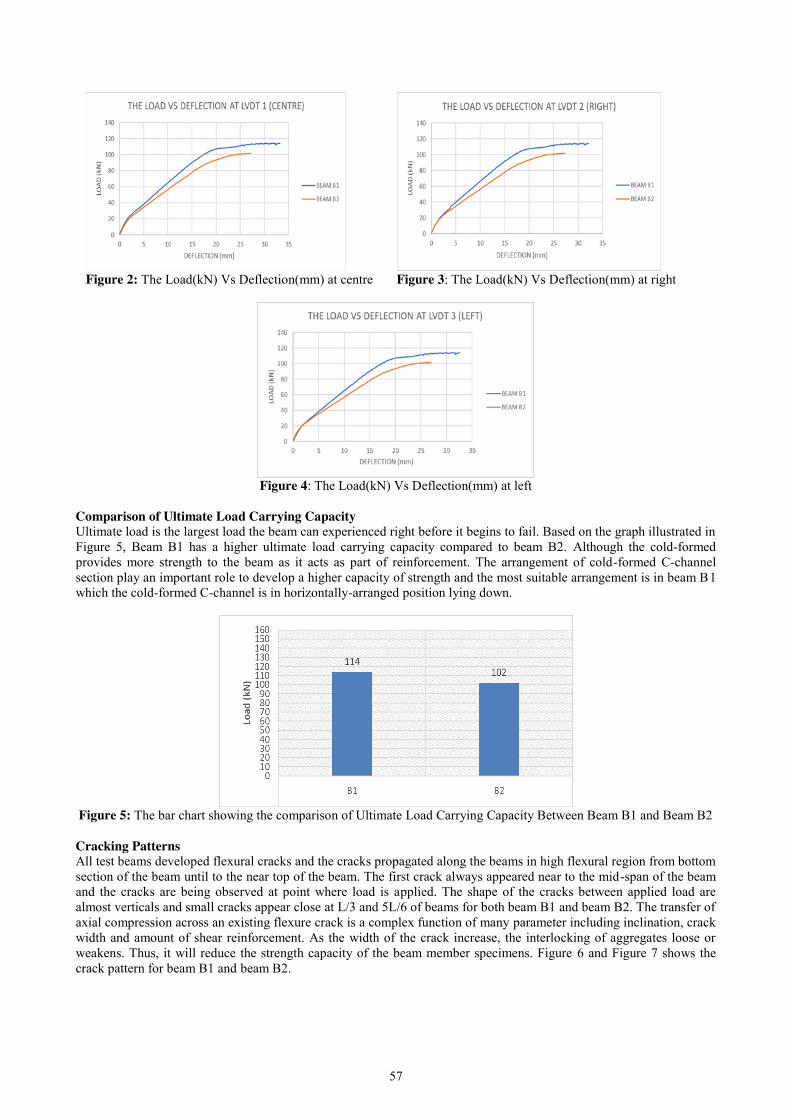
57
Figure 2: The Load(kN) Vs Deflection(mm) at centre Figure 3: The Load(kN) Vs Deflection(mm) at right
Figure 4: The Load(kN) Vs Deflection(mm) at left
Comparison of Ultimate Load Carrying Capacity Ultimate load is the largest load the beam can experienced right before it begins to fail. Based on the graph illustrated in Figure 5, Beam B1 has a higher ultimate load carrying capacity compared to beam B2. Although the cold-formed provides more strength to the beam as it acts as part of reinforcement. The arrangement of cold-formed C-channel section play an important role to develop a higher capacity of strength and the most suitable arrangement is in beam B1 which the cold-formed C-channel is in horizontally-arranged position lying down.
Figure 5: The bar chart showing the comparison of Ultimate Load Carrying Capacity Between Beam B1 and Beam B2 Cracking Patterns All test beams developed flexural cracks and the cracks propagated along the beams in high flexural region from bottom section of the beam until to the near top of the beam. The first crack always appeared near to the mid-span of the beam and the cracks are being observed at point where load is applied. The shape of the cracks between applied load are almost verticals and small cracks appear close at L/3 and 5L/6 of beams for both beam B1 and beam B2. The transfer of axial compression across an existing flexure crack is a complex function of many parameter including inclination, crack width and amount of shear reinforcement. As the width of the crack increase, the interlocking of aggregates loose or weakens. Thus, it will reduce the strength capacity of the beam member specimens. Figure 6 and Figure 7 shows the crack pattern for beam B1 and beam B2.

58
Figure 6: Crack Patterns of Beam B1 (left) B2 (right)
Comparison of Theoretical and Experimental Values Beam TB is the control specimen based on theoretical calculation design without the use of cold-formed C-channel section as reinforcement in this investigation. The purpose of this control beam is to evaluate and to compare the strength between beam B1 and beam B2. The theoretical value for control beam (TB) of moment and shear resistance that theoretically designed and calculated is 24.77 kNm and 33.03 kN, respectively. Table 3 shows the comparison of theoretical and experimental value of beams that was applied by cold-formed C-channel section as reinforcement which is beam B1 and beam B2. Beam B1 and beam B2 have a different set of cold-formed arrangements as reinforcement. The ratio of moment of resistance and shear resistance for Beam B1 gives value of 0.89 while beam B2 gives value of 0.80.
Table 3:Comparison of Theoretical And Experimental Values for Beam B1and Beam B2
Value Beam B1 (Horizontally Arranged Cold-Formed)
Beam B2 (VerticallyArranged Cold-Formed)
Theoretical Experimental Ratio Theoretical Experimental Ratio Moment of Resistance, M (kNm) 48.06 42.75 0.89 48.06 38.25 0.80
Shear Resistance, V (kN) 64.08 57 0.89 64.08 51 0.80
CONCLUSION
Based on the experimental works in the study on for the flexural behaviour of the reinforced concrete beam using cold-formed steel with c-channel section as part of reinforcement, the results obtained are concluded as:
1. The ultimate load capacity for beam of which the C-channel section is placed horizontally (B1) is higher compared to the beam of which the C-channel section is placed vertically (B2) with a value of 114 kN and 102 kN respectively. Beam B1 produces a higher deflection compared to beam B2.
2. Beam B1 produces a higher deflection compared to beam B2 with a value of 33.25 mm and 27.21 mm respectively.
3. Both beam B1 and beam B2 have failed under flexural failure as predicted. 4. The performance of the proposed cold formed reinforced concrete beam in comparison with the theoretical
predictions and experimental results is in good agreement. 5. The performance of beam B1 are better than beam B2 due to the cold-formed C-channel section arrangement
in beam B1 that provides better capacity and strength. As overall conclusion, it can be stated that the addition of cold-formed C-channel section as part of reinforcement at
the tension region to form one of a kind beam has resulted in significant and valuable performances in terms of strength which covers the ultimate load capacity, flexural capacity and deflection values.
RECOMMENDATION Further investigation can be carried out by using different shape and section of cold-formed so that their flexural and shear can be evaluated. Several other parameters for future research can be proposed and tested such as abrasion, strain gages, abrasion, crack width and etc. The specimen model can be deliberate analytically using various software such as LUSAS, Orion, ANSYS, Tekla and etc. The studies can be expanded with the using of other design mixes also.
REFERENCES
[1] Yu, W. (2000). Steel Design Third Edition. [2] (Hancock, G. . (2003). Cold-formed steel structures. Journal of Constructional Steel Research, 59(4), 473–487.
https://doi.org/10.1016/S0143-974X(02)00103-7 [3] Davies, J. . (2000). Recent research advances in cold-formed steel structures. Journal of Constructional Steel
Research, 55(1–3), 267–288. https://doi.org/10.1016/S0143-974X(99)00089-9 [4] Yu, W.W. 1991 . Cold Formed Steel Design ,John Wiley & Sons ,New York. [5] Mohamad Salleh Yassin (2012), Reinforced Cnncrete Design To Eurocode 2, Universiti Teknologi Malaysia. [6] Nguyen, R. P. (1988). Strength of Composite Cold-formed Steel-concrete Beams. [7] Zachariah, M. A. (2016). Experimental Analysis of Flexural Behaviour and Crack Pattern of RCC Composite
Beam, 3(3), 58–65.
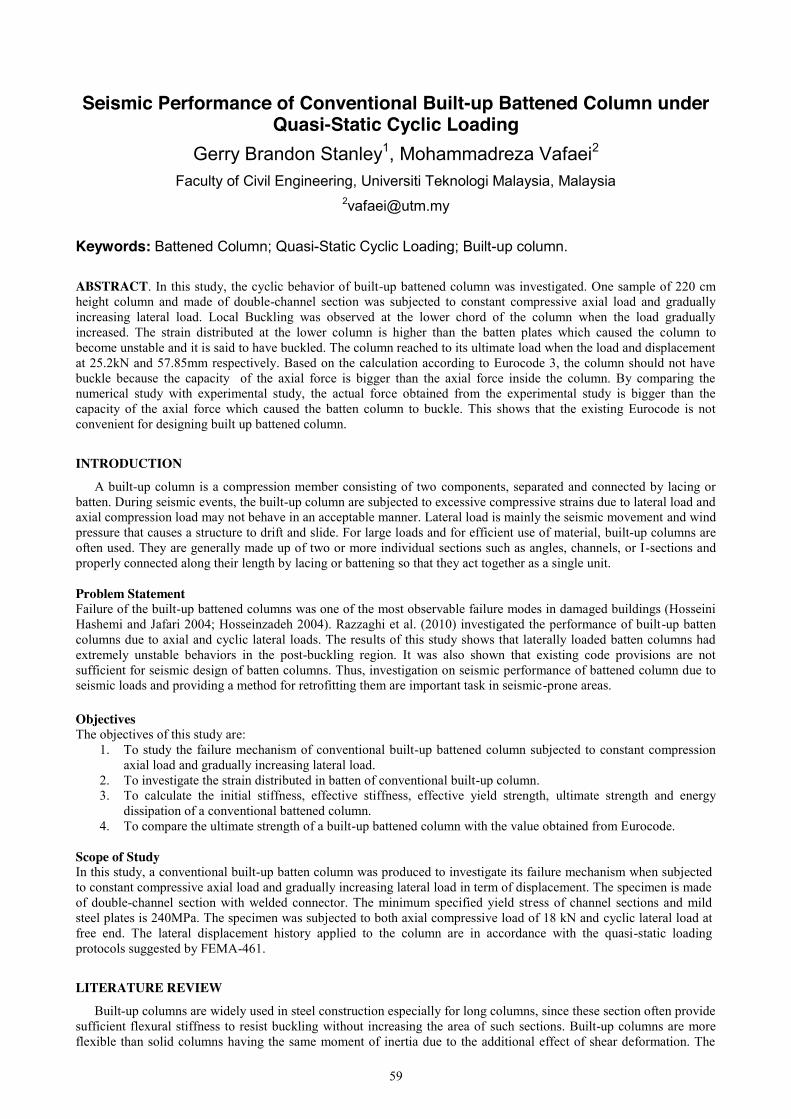
59
Seismic Performance of Conventional Built-up Battened Column under Quasi-Static Cyclic Loading
Gerry Brandon Stanley1, Mohammadreza Vafaei2 Faculty of Civil Engineering, Universiti Teknologi Malaysia, Malaysia
Keywords: Battened Column; Quasi-Static Cyclic Loading; Built-up column.
ABSTRACT. In this study, the cyclic behavior of built-up battened column was investigated. One sample of 220 cm height column and made of double-channel section was subjected to constant compressive axial load and gradually increasing lateral load. Local Buckling was observed at the lower chord of the column when the load gradually increased. The strain distributed at the lower column is higher than the batten plates which caused the column to become unstable and it is said to have buckled. The column reached to its ultimate load when the load and displacement at 25.2kN and 57.85mm respectively. Based on the calculation according to Eurocode 3, the column should not have buckle because the capacity of the axial force is bigger than the axial force inside the column. By comparing the numerical study with experimental study, the actual force obtained from the experimental study is bigger than the capacity of the axial force which caused the batten column to buckle. This shows that the existing Eurocode is not convenient for designing built up battened column.
INTRODUCTION
A built-up column is a compression member consisting of two components, separated and connected by lacing or batten. During seismic events, the built-up column are subjected to excessive compressive strains due to lateral load and axial compression load may not behave in an acceptable manner. Lateral load is mainly the seismic movement and wind pressure that causes a structure to drift and slide. For large loads and for efficient use of material, built-up columns are often used. They are generally made up of two or more individual sections such as angles, channels, or I-sections and properly connected along their length by lacing or battening so that they act together as a single unit.
Problem Statement Failure of the built-up battened columns was one of the most observable failure modes in damaged buildings (Hosseini Hashemi and Jafari 2004; Hosseinzadeh 2004). Razzaghi et al. (2010) investigated the performance of built-up batten columns due to axial and cyclic lateral loads. The results of this study shows that laterally loaded batten columns had extremely unstable behaviors in the post-buckling region. It was also shown that existing code provisions are not sufficient for seismic design of batten columns. Thus, investigation on seismic performance of battened column due to seismic loads and providing a method for retrofitting them are important task in seismic-prone areas. Objectives The objectives of this study are:
1. To study the failure mechanism of conventional built-up battened column subjected to constant compression axial load and gradually increasing lateral load.
2. To investigate the strain distributed in batten of conventional built-up column. 3. To calculate the initial stiffness, effective stiffness, effective yield strength, ultimate strength and energy
dissipation of a conventional battened column. 4. To compare the ultimate strength of a built-up battened column with the value obtained from Eurocode.
Scope of Study In this study, a conventional built-up batten column was produced to investigate its failure mechanism when subjected to constant compressive axial load and gradually increasing lateral load in term of displacement. The specimen is made of double-channel section with welded connector. The minimum specified yield stress of channel sections and mild steel plates is 240MPa. The specimen was subjected to both axial compressive load of 18 kN and cyclic lateral load at free end. The lateral displacement history applied to the column are in accordance with the quasi-static loading protocols suggested by FEMA-461.
LITERATURE REVIEW
Built-up columns are widely used in steel construction especially for long columns, since these section often provide sufficient flexural stiffness to resist buckling without increasing the area of such sections. Built-up columns are more flexible than solid columns having the same moment of inertia due to the additional effect of shear deformation. The
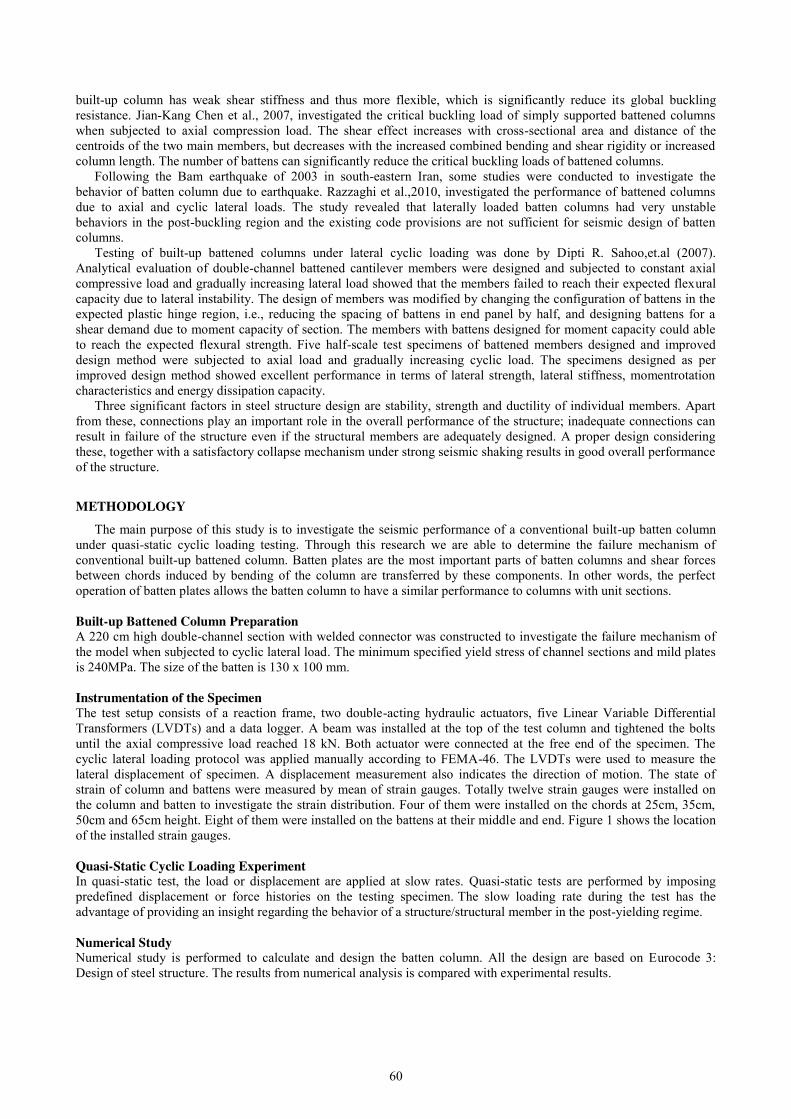
60
built-up column has weak shear stiffness and thus more flexible, which is significantly reduce its global buckling resistance. Jian-Kang Chen et al., 2007, investigated the critical buckling load of simply supported battened columns when subjected to axial compression load. The shear effect increases with cross-sectional area and distance of the centroids of the two main members, but decreases with the increased combined bending and shear rigidity or increased column length. The number of battens can significantly reduce the critical buckling loads of battened columns.
Following the Bam earthquake of 2003 in south-eastern Iran, some studies were conducted to investigate the behavior of batten column due to earthquake. Razzaghi et al.,2010, investigated the performance of battened columns due to axial and cyclic lateral loads. The study revealed that laterally loaded batten columns had very unstable behaviors in the post-buckling region and the existing code provisions are not sufficient for seismic design of batten columns.
Testing of built-up battened columns under lateral cyclic loading was done by Dipti R. Sahoo,et.al (2007). Analytical evaluation of double-channel battened cantilever members were designed and subjected to constant axial compressive load and gradually increasing lateral load showed that the members failed to reach their expected flexural capacity due to lateral instability. The design of members was modified by changing the configuration of battens in the expected plastic hinge region, i.e., reducing the spacing of battens in end panel by half, and designing battens for a shear demand due to moment capacity of section. The members with battens designed for moment capacity could able to reach the expected flexural strength. Five half-scale test specimens of battened members designed and improved design method were subjected to axial load and gradually increasing cyclic load. The specimens designed as per improved design method showed excellent performance in terms of lateral strength, lateral stiffness, momentrotation characteristics and energy dissipation capacity.
Three significant factors in steel structure design are stability, strength and ductility of individual members. Apart from these, connections play an important role in the overall performance of the structure; inadequate connections can result in failure of the structure even if the structural members are adequately designed. A proper design considering these, together with a satisfactory collapse mechanism under strong seismic shaking results in good overall performance of the structure.
METHODOLOGY The main purpose of this study is to investigate the seismic performance of a conventional built-up batten column
under quasi-static cyclic loading testing. Through this research we are able to determine the failure mechanism of conventional built-up battened column. Batten plates are the most important parts of batten columns and shear forces between chords induced by bending of the column are transferred by these components. In other words, the perfect operation of batten plates allows the batten column to have a similar performance to columns with unit sections. Built-up Battened Column Preparation A 220 cm high double-channel section with welded connector was constructed to investigate the failure mechanism of the model when subjected to cyclic lateral load. The minimum specified yield stress of channel sections and mild plates is 240MPa. The size of the batten is 130 x 100 mm. Instrumentation of the Specimen The test setup consists of a reaction frame, two double-acting hydraulic actuators, five Linear Variable Differential Transformers (LVDTs) and a data logger. A beam was installed at the top of the test column and tightened the bolts until the axial compressive load reached 18 kN. Both actuator were connected at the free end of the specimen. The cyclic lateral loading protocol was applied manually according to FEMA-46. The LVDTs were used to measure the lateral displacement of specimen. A displacement measurement also indicates the direction of motion. The state of strain of column and battens were measured by mean of strain gauges. Totally twelve strain gauges were installed on the column and batten to investigate the strain distribution. Four of them were installed on the chords at 25cm, 35cm, 50cm and 65cm height. Eight of them were installed on the battens at their middle and end. Figure 1 shows the location of the installed strain gauges. Quasi-Static Cyclic Loading Experiment In quasi-static test, the load or displacement are applied at slow rates. Quasi-static tests are performed by imposing predefined displacement or force histories on the testing specimen. The slow loading rate during the test has the advantage of providing an insight regarding the behavior of a structure/structural member in the post-yielding regime. Numerical Study Numerical study is performed to calculate and design the batten column. All the design are based on Eurocode 3: Design of steel structure. The results from numerical analysis is compared with experimental results.

61
Figure 1. Location of strain gauges.
Figure 2. Dimension of built-up battened column.
RESULTS AND DISCUSSION
The results of the experiment was obtained by presenting the load-displacement hysteresis curves. The initial stiffness, effective stiffness and effective yield strength, ultimate strength and energy dissipation, failure mechanism of the specimen and strain distributed in battens are discussed. Failure mechanism. The mode of failure of battened column as observed in experimental studies as shown in Figure 3. Failure of the built-up battened column was observable failure modes in the column. Local buckling was observed at the lower column which resulted in failure of the specimen.
0.45cm
13cm
10cm
Batten plate
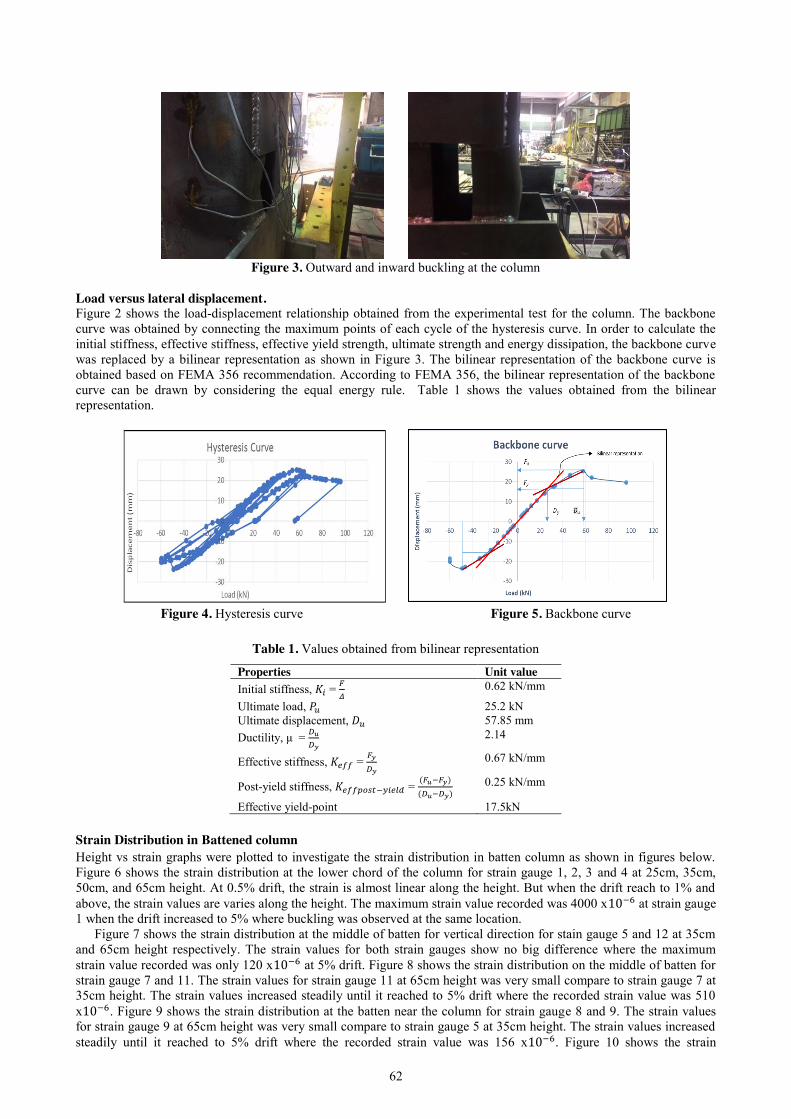
62
Figure 3. Outward and inward buckling at the column
Load versus lateral displacement. Figure 2 shows the load-displacement relationship obtained from the experimental test for the column. The backbone curve was obtained by connecting the maximum points of each cycle of the hysteresis curve. In order to calculate the initial stiffness, effective stiffness, effective yield strength, ultimate strength and energy dissipation, the backbone curve was replaced by a bilinear representation as shown in Figure 3. The bilinear representation of the backbone curve is obtained based on FEMA 356 recommendation. According to FEMA 356, the bilinear representation of the backbone curve can be drawn by considering the equal energy rule. Table 1 shows the values obtained from the bilinear representation.
Figure 4. Hysteresis curve Figure 5. Backbone curve
Table 1. Values obtained from bilinear representation
Properties Unit value Initial stiffness, 𝐾𝑖 = 𝐹
𝛥 0.62 kN/mm
Ultimate load, 𝑃𝑢 25.2 kN Ultimate displacement, 𝐷𝑢 57.85 mm Ductility, μ = 𝐷𝑢
𝐷𝑦 2.14
Effective stiffness, 𝐾𝑒𝑓𝑓 = 𝐹𝑦
𝐷𝑦 0.67 kN/mm
Post-yield stiffness, 𝐾𝑒𝑓𝑓𝑝𝑜𝑠𝑡−𝑦𝑖𝑒𝑙𝑑 = (𝐹𝑢−𝐹𝑦)(𝐷𝑢−𝐷𝑦)
0.25 kN/mm
Effective yield-point 17.5kN Strain Distribution in Battened column Height vs strain graphs were plotted to investigate the strain distribution in batten column as shown in figures below. Figure 6 shows the strain distribution at the lower chord of the column for strain gauge 1, 2, 3 and 4 at 25cm, 35cm, 50cm, and 65cm height. At 0.5% drift, the strain is almost linear along the height. But when the drift reach to 1% and above, the strain values are varies along the height. The maximum strain value recorded was 4000 x10−6 at strain gauge 1 when the drift increased to 5% where buckling was observed at the same location.
Figure 7 shows the strain distribution at the middle of batten for vertical direction for stain gauge 5 and 12 at 35cm and 65cm height respectively. The strain values for both strain gauges show no big difference where the maximum strain value recorded was only 120 x10−6 at 5% drift. Figure 8 shows the strain distribution on the middle of batten for strain gauge 7 and 11. The strain values for strain gauge 11 at 65cm height was very small compare to strain gauge 7 at 35cm height. The strain values increased steadily until it reached to 5% drift where the recorded strain value was 510 x10−6. Figure 9 shows the strain distribution at the batten near the column for strain gauge 8 and 9. The strain values for strain gauge 9 at 65cm height was very small compare to strain gauge 5 at 35cm height. The strain values increased steadily until it reached to 5% drift where the recorded strain value was 156 x10−6. Figure 10 shows the strain
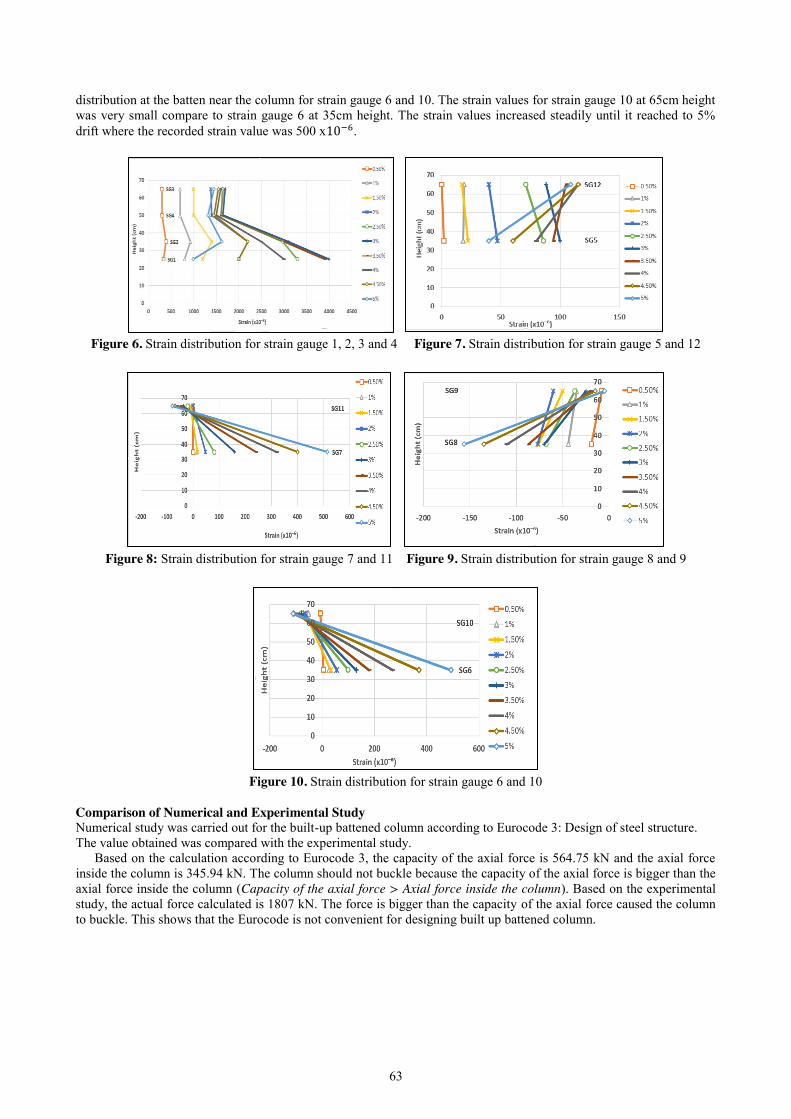
63
distribution at the batten near the column for strain gauge 6 and 10. The strain values for strain gauge 10 at 65cm height was very small compare to strain gauge 6 at 35cm height. The strain values increased steadily until it reached to 5% drift where the recorded strain value was 500 x10−6.
Figure 6. Strain distribution for strain gauge 1, 2, 3 and 4 Figure 7. Strain distribution for strain gauge 5 and 12
Figure 8: Strain distribution for strain gauge 7 and 11 Figure 9. Strain distribution for strain gauge 8 and 9
Figure 10. Strain distribution for strain gauge 6 and 10
Comparison of Numerical and Experimental Study Numerical study was carried out for the built-up battened column according to Eurocode 3: Design of steel structure. The value obtained was compared with the experimental study.
Based on the calculation according to Eurocode 3, the capacity of the axial force is 564.75 kN and the axial force inside the column is 345.94 kN. The column should not buckle because the capacity of the axial force is bigger than the axial force inside the column (Capacity of the axial force > Axial force inside the column). Based on the experimental study, the actual force calculated is 1807 kN. The force is bigger than the capacity of the axial force caused the column to buckle. This shows that the Eurocode is not convenient for designing built up battened column.

64
Figure 11. Built-up battened column considered in this study
Table 2. Properties of built-up battened column
Properties Value Length,L (cm) 220 Yield stress,𝑓𝑦 Mpa 250 Modulus of elasticity, E (Gpa) 200 Moment of inertia, I (𝑐𝑚4) 379.2 Effective moment of inertia, 𝐼𝑒𝑓𝑓 (𝑐𝑚4) 3686.2 Axial load, 𝑁𝐸𝑑 (kN) 18 Design moment, 𝑀𝐸𝑑 (kNm) 69.3 Area, A (𝑐𝑚2) 22.59 Capacity of axial force, 𝑁𝑐ℎ,𝐸𝑑 (kN) 345.94 Axial force inside the column, 𝑁𝑏,𝑅𝑑 (kN) 564.75
CONCLUSION
From the data and results that has been analyzed, the conclusion of the study can be state in order to answer the objectives of the study.
1. Failure of the built-up battened column was detected where buckling occurred at the lower chord of the batten column.
2. The strain distributed at the chord is higher than on the batten which caused the lower chord of the column at strain gauge 1 to become unstable and it is said to have buckled.
3. From the bilinear representation of backbone curve, the initial stiffness is 0.62 kN/mm, effective stiffness is 0.67 kN/mm, effective yield strength is 17.5 kN, ultimate strength is 25.2 kN, and energy dissipation is 0.25 kN/mm.
4. Based on the Eurocode, the capacity of the axial load is 564.75 kN and the axial force inside the column is 345.94kN. The column should not buckle because the capacity of the axial force is bigger than the axial force inside the column, but it buckled. Based on the experimental study, the actual force is 1807 kN which is bigger than the capacity which caused the batten column to buckle. It was also shown that the existing code provisions are not sufficient for seismic design of batten column.
REFERENCES
[1] Chen, J., & Li, L. (2013). Elastic axially compressed buckling of battened columns. International Journal of Mechanical Sciences, 77, 1-7. [2] Sahoo, D. R., & Rai, D. C. (2007). Built-up battened columns under lateral cyclic loading. Thin- Walled Structures, 45(5), 552-562. [3] Aghoury, M. E., Salem, A., Hanna, M., & Amoush, E. (2015). Strength of cold formed battened columns
subjected to eccentric axial compressive force. Journal of Constructional Steel Research, 113, 58-70. [4] Hashemi, B. H., & Jafari, M. A. (2012). Evaluation of Ayrton–Perry formula to predict the compressive strength of batten columns. Journal of Constructional Steel Research, 68(1), 89-96. [5] Razzaghi, M. S., Khalkhaliha, M., & Aziminejad, A. (2016). Cyclic performance of concrete filled steel batten
built-up columns. International Journal of Advanced Structural Engineering (IJASE) Int J Adv Struct Eng, 8(1), 45-51.
65
Structural Behavior of Prefabricated Pad Footing System Designed Using Cold Formed Steel Lipped Channel Section
Nur Adilah Mohd Idrus1, Mahmood Md Tahir2, Shek Poi Ngian3 Faculty of Civil Engineering, Universiti Teknologi Malaysia, Malaysia
[email protected], [email protected]
Keywords: Pad Footing; Cold Formed Steel Lipped Channel Section; Compression Resistance; Axial Compression Test
ABSTRACT. Conventional methods for constructing the pad footings required the used of plywood as formwork and reinforcement bar, thus both materials required the used of skilled workmanship in construction site. The main concern in conventional pad footing is wastage, this is because some of the materials such that plywood can no longer be used and will contribute to the additional construction cost. The purpose of this research is to investigate the structural behavior of prefabricated pad footing system using cold formed steel (CFS) lipped channel section where CFS were used as reinforcement bar and permanent formwork, by carrying out experimental tests. In addition, the experimental test results were validate with theoretical calculation and the economical aspect of CFS in pad footing system were compared with conventional pad footing throughout the steel area required. There were nine (9) full scales of samples which divided into three classes, namely case one is square pad footing with internal CFS is parallel to the support, case two is square footing with internal CFS is perpendicular to the support and case three is rectangular pad footing with internal CFS is perpendicular to the support. All samples are tested until failure using uniform axial compression tests. During the testing, all samples were put under increment of loads; maximum failure load, failure modes and displacement were observed and recorded. Case 2 shows higher compression resistance compared to case 1 and case 3. All samples in case 1 and case 3 failed in flexural failure, while in case 2, the pad footing samples failed in normal shear. Experimental results were then compared to theoretical prediction using MS EN 1992 (2010) Eurocode 2 part 1-1. The comparison shows good result between experimental and theoretical calculation. The use of CFS in ad footing seems more economic compared of using conventional methods of constructing the pad footing.
INTRODUCTION
Industrialized building system (IBS) defined as the process of construction that applied techniques, products, components or building system in which components are manufactured in a restricted environment whether it involved with prefabricated components and on-site installation [7]. Quality, speed of construction and cost saving are the main factors emphases given in the building construction.
Steel construction, there are primarily two types of structural members which namely as hot-rolled steel shape and cold formed steel shapes. Cold formed steel (CSF) is a thin sheet steel which has been used extensively in building industry and range from the purlins to roof sheeting and floor decking. It offers many other advantages, including lightness, high strength and stiffness, mass production, fast and easy installation and economy in transportation and handling [1]. Cold formed steel members is formed within room temperature and made from structural quality sheet steel then it formed into shape, either through press-braking blanks sheared from sheets or coils or more commonly by roll forming the steel through a series of dies. The steel used in CFS sections is relatively thin, typically 1.0 - 4.0 mm and it is galvanized for corrosion protection.
The application of CFS is widely used in many sectors of construction, for instance mezzanine floors, industrial buildings, commercial buildings, hotels and residential sectors. The main forms of construction include load-bearing frames and infill walls of steel or concrete framed buildings. There are many methods of construction using CFS, such that, light steel framing, stick built construction, panel construction, modular construction, platform and balloon construction, infill wall construction and balconies. Steel constructions have achieved high demand in several of the sector where the main benefits include high speed of construction, higher level of quality, reliability and longevity. Steel quality also assured high strength, long life, adaptable.
Problem Statement The conventional pad footing was constructed using plywood as formwork and rebar, therefore both materials, increasing the use of workmanship in construction site and increasing the wastage which would contribute in increasing of overall construction cost. As nowadays, most of construction site encounters main problems of abandoned of wastage where some of the plywood cannot be used anymore. Foremost, the conventional method of construction also increases the duration of the project.
The use of pre-fabrication concept for the construction of pad footing structures is rarely been done, especially in a pad footing system, thus, there is a need to encourage the local builders and designers to implement this concept in order to speed up the construction time, reduce workers, reduce material usage and provides a better quality of the
66
construction. The implementation of pre-fabricated pad footing is expected to enhance the global competitiveness of local builders and designers while the dependency of foreign labors could be reduced. In this research, the performance of the prefabricated pad footing system using cold formed steel lipped channel section is investigating.
Objectives The objectives of this study are:
1. To study the structural behavior of CFS section in pad footing system by carried out experimental tests. 2. To validate the capacity of the CFS section in pad footing system by comparing the experimental result with
theoretical prediction. 3. To compare the economical aspect of CFS in pad footing system with conventional pad footing throughout the
steel area required. Scope of Study In experimental works, there are nine (9) full-scale of samples which divided equally into 3 cases, namely square footing (1m x 1m) with different configuration of internal CFS and rectangular footing (1m x 1.75m). All samples subjected to axial compression test. From the experimental test, the structural behavior and failure mechanism of prefabricated pad footing using CFS lipped channel section will be recorded. The capacity of pad footing from the experimental test is validate with theoretical prediction and study on economical aspect of CFS is determined throughout steel area required by comparing with conventional pad footing.
LITERATURE REVIEW Industrialized building system (IBS) defined as the process of construction that applied techniques, products,
components or building system in which components are manufactured in a restricted environment whether it involved with prefabricated components and on-site installation [7]. The use of prefabricated system has known to increase the strength of the structure, shear capacity and the bending moment of the structural members. The steel frame system is one of the types for pre-fabricated building materials and it is most compatible due to steel is light in weight, strong and structurally stable and also environmentally friendly.
Currently the pre-fabricated system in construction is being popularized under government effort by introducing the comprehensive national Industrialized Building System (IBS) by the Construction Industry Development Board Malaysia (CIDB). Various efforts have been made to benefit the pre-fabricate construction in Malaysia. Quality, speed of construction and cost saving are the main factors emphases given in the building construction. A building system for the fully pre-fabricated construction method can be classified into two main categories which are on-site pre-fabricated and the off-site pre-fabricated [8]. Selangor was the first state in Malaysia that would advance in the concept of pre-fabricated affordable housing to fulfill the demand of homes needed by the society from the low - income group [7].
Steel construction, there are primarily two types of structural members which namely as hot-rolled steel shape and cold formed steel shapes. This thesis more concentrated on cold formed steel (CFS) as main material to construct and design the pad footing. Cold formed steel members is formed within room temperature and made from structural quality sheet steel then it formed into shape, either through press-braking blanks sheared from sheets or coils or more commonly by roll forming the steel through a series of dies. The steel used in CFS sections is relatively thin, typically 1.0 – 4.0 mm and it is galvanized for corrosion protection [1].
Cold formed steel (CFS) members depend on shape rather than thickness to support the loading and normally the thickness of the CFS members are small compared to their width. Therefore, when steel member subjected to axial compressive stresses, the thin compression member tends to buckle before it reaches yield strength. As the cross section of an element fails, the member capacity is reached. Consequently, local buckling becomes a limit state for strength of steel shapes subjected to compressive stress and the designing of compression members focused on the calculation of its buckling resistance. Previous study of composite structure was focus on profile steel sheeting where local buckling may occur when the profiled steel sheeting is subjected to axial loads. Composite structure has higher stress at which elastic buckling occurs compared with the non-composite structure because of the intimate contact of steel and concrete cause restraint with the plate which delays the formation of buckles [4].
In the concept of the composite structure of composite profiled beams and fully braced box section which constructed as formwork before pouring the concrete to form a composite profiled beam. The result showed that an increase in flexural strength and more ductile than reinforced concrete beam as the reduction of 40% in deflection and increasing of span/depth ratio as much as 20%. This proved that this structure may undergo local buckling as there were increases in the span / depth ratio [5]. The used profiled sheet as formwork to form a composite profile beams showed that the composite beam is unlike the standard forms of buckling of thin plate element because of concrete restricted to form outwards and the result proved that increasing of the width of the plate about 70% as this buckling permit [6].
Wong [3] proposed the composite structure of pad foting constructed using cold formed steel lipped channel section as permanent formwork and BRC as reinforcement. The implementation of prefabricated pad footing was using framing system approach for the formwork. The used of CFS lipped channel section as permanent formwork showed an increment in the strength of the pad footing range from 48% to 124%. The conclusion of this research shown that data of the actual strength of the pad were 97.7% of the calculation derived values
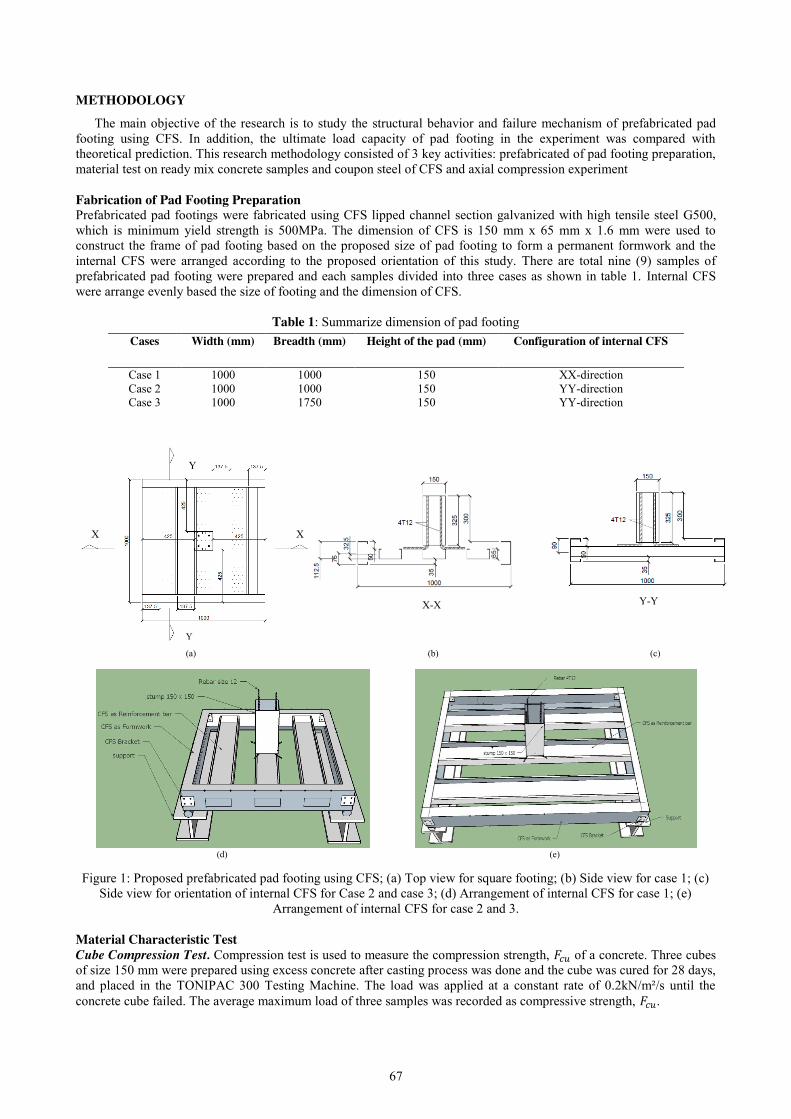
67
METHODOLOGY
The main objective of the research is to study the structural behavior and failure mechanism of prefabricated pad footing using CFS. In addition, the ultimate load capacity of pad footing in the experiment was compared with theoretical prediction. This research methodology consisted of 3 key activities: prefabricated of pad footing preparation, material test on ready mix concrete samples and coupon steel of CFS and axial compression experiment Fabrication of Pad Footing Preparation Prefabricated pad footings were fabricated using CFS lipped channel section galvanized with high tensile steel G500, which is minimum yield strength is 500MPa. The dimension of CFS is 150 mm x 65 mm x 1.6 mm were used to construct the frame of pad footing based on the proposed size of pad footing to form a permanent formwork and the internal CFS were arranged according to the proposed orientation of this study. There are total nine (9) samples of prefabricated pad footing were prepared and each samples divided into three cases as shown in table 1. Internal CFS were arrange evenly based the size of footing and the dimension of CFS.
Table 1: Summarize dimension of pad footing
(a) (b) (c)
(d) (e)
Figure 1: Proposed prefabricated pad footing using CFS; (a) Top view for square footing; (b) Side view for case 1; (c) Side view for orientation of internal CFS for Case 2 and case 3; (d) Arrangement of internal CFS for case 1; (e)
Arrangement of internal CFS for case 2 and 3. Material Characteristic Test Cube Compression Test. Compression test is used to measure the compression strength, 𝐹𝑐𝑢 of a concrete. Three cubes of size 150 mm were prepared using excess concrete after casting process was done and the cube was cured for 28 days, and placed in the TONIPAC 300 Testing Machine. The load was applied at a constant rate of 0.2kN/m²/s until the concrete cube failed. The average maximum load of three samples was recorded as compressive strength, 𝐹𝑐𝑢.
Cases Width (mm) Breadth (mm) Height of the pad (mm) Configuration of internal CFS
Case 1 1000 1000 150 XX-direction Case 2 1000 1000 150 YY-direction Case 3 1000 1750 150 YY-direction
Y
Y
X X
X-X Y-Y

68
Tensile Test. Tensile test is used to predict the behavior of material under forms of loading and it is measured during development of new materials and process so that different materials and processes can be compared. The strength of materials is measured in term of stress which cause appreciable plastic deformation or maximum stress that a material can withstand. The CFS lipped channel section were cut into 6 coupon shape and each sample is labeled, then placed in the DARTEC Universal Testing Machine to comply BS EN 10002-1:2001 to determine the yield strength and ductility of the materials used. The stress was applied until the coupon steel can no longer received any stress. The average maximum stress of six samples was recorded as yield strength, Fyk. Axial Compression Test. The axial compression test is used to measure the ultimate capacity of prefabricated pad footing. There are total nine (9) full scale of samples were prepared according to specification where the samples was divided equally into three cases. The test was conducted using the DARTEC Test Rig with the tested sample laid on roller I-beam. I-beam is used to elevate the samples above the ground to allow for testing of shearing. This machine also will read load and displacement concurrently at one second interval. After desired concrete strength achieves, the sample was securely placed in the test rig with the measurement system. The data deflection software in the computer was checked to ensure all all channel connected to the instrument, the test was started and the load was applied constantly until the pad footing failed. The result of the load, deflection and failure mode was recorded. The graph of load against displacement was plotted.
Figure 2 DARTEC Test Rig setup equipment for axial compression test using I-beam
RESULTS AND DISCUSSION
The results of material properties of ready mix concrete and CSF steel and experimental test on a prefabricated pad footing using CFS were obtained. The material properties were used to define the readily mix concrete material and CFS steel yield strength, and the properties were inserted into the theoretical calculation to get the actual theoretical prediction for pad footing. The failure mode of pad footing was observed to determine the type of failures occurs. The results of the axial compression test of prefabricated pad footing were compared with theoretical calculation. The economical aspect of CFS was compared with conventional pad footing throughout the steel area required.
Axial Compression Test Failure Mode of Pad Footing. All samples undergo the process of gradually increment of concentrated load applied through cylinder steel core from the DARTEC Test Rig and transferred between the steel plate located between the stump and cylinder steel core. Based on the observation in case one, all samples showed no effect in the early stage of loading. When the load is gradually increased the crack start to occur, the first crack occurred at load 44.9 kN, 90 kN and 54 kN with a displacement of 0.59 mm, 4.38 mm and 0.15mm. When the load increases further a lot of crack occurs especially at the bottom of pad footing, top of the footing and the bracket began to lose. A wide line of crack Y-direction appears and cause the pad to fail received any load increment. When the pad footings can no longer receive any load and load value start to decrease gradually, the experiment was stopped. The pad footing was filed in flexural due to a crack occur at the column face.
In case three, throughout the observation, the samples have same failure modes as in case one which is flexural failure. In the beginning of the experiment, all samples showed no effect in the early stage of loading. When the applied load was gradually increased the crack start to occur, the first crack occurred at load 122 kN, 132 kN and 163 kN with a displacement of 5.98 mm, 2.23 mm and 9.41 mm. When the load increases further a lot of crack occurs especially at the bottom and top of pad footing. The bracket was still in good conditioned. When the pads can no longer receive any load and load value start to decrease gradually, the experiment was stopped. The failure mechanism of rectangular pad footing due to a large crack occurs in the column face in x-direction which known as flexural failure. Figure 1 showed the flexural failure in case one and three.
Load Cell
Steel Plate
Cylinder Steel Core
LVDT
Sample Pad Footing
Roller Support
DARTEC Test Rig
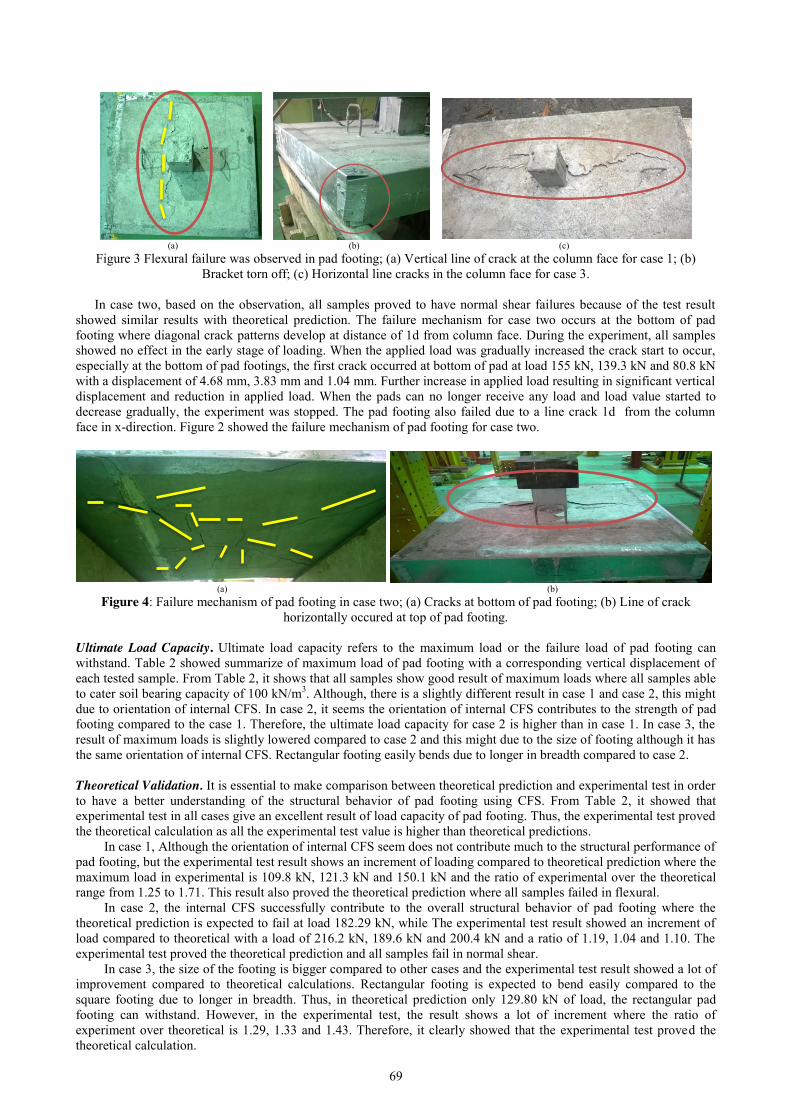
69
(a) (b) (c) Figure 3 Flexural failure was observed in pad footing; (a) Vertical line of crack at the column face for case 1; (b)
Bracket torn off; (c) Horizontal line cracks in the column face for case 3.
In case two, based on the observation, all samples proved to have normal shear failures because of the test result showed similar results with theoretical prediction. The failure mechanism for case two occurs at the bottom of pad footing where diagonal crack patterns develop at distance of 1d from column face. During the experiment, all samples showed no effect in the early stage of loading. When the applied load was gradually increased the crack start to occur, especially at the bottom of pad footings, the first crack occurred at bottom of pad at load 155 kN, 139.3 kN and 80.8 kN with a displacement of 4.68 mm, 3.83 mm and 1.04 mm. Further increase in applied load resulting in significant vertical displacement and reduction in applied load. When the pads can no longer receive any load and load value started to decrease gradually, the experiment was stopped. The pad footing also failed due to a line crack 1d from the column face in x-direction. Figure 2 showed the failure mechanism of pad footing for case two.
(a) (b) Figure 4: Failure mechanism of pad footing in case two; (a) Cracks at bottom of pad footing; (b) Line of crack
horizontally occured at top of pad footing. Ultimate Load Capacity. Ultimate load capacity refers to the maximum load or the failure load of pad footing can withstand. Table 2 showed summarize of maximum load of pad footing with a corresponding vertical displacement of each tested sample. From Table 2, it shows that all samples show good result of maximum loads where all samples able to cater soil bearing capacity of 100 kN/m3. Although, there is a slightly different result in case 1 and case 2, this might due to orientation of internal CFS. In case 2, it seems the orientation of internal CFS contributes to the strength of pad footing compared to the case 1. Therefore, the ultimate load capacity for case 2 is higher than in case 1. In case 3, the result of maximum loads is slightly lowered compared to case 2 and this might due to the size of footing although it has the same orientation of internal CFS. Rectangular footing easily bends due to longer in breadth compared to case 2. Theoretical Validation. It is essential to make comparison between theoretical prediction and experimental test in order to have a better understanding of the structural behavior of pad footing using CFS. From Table 2, it showed that experimental test in all cases give an excellent result of load capacity of pad footing. Thus, the experimental test proved the theoretical calculation as all the experimental test value is higher than theoretical predictions.
In case 1, Although the orientation of internal CFS seem does not contribute much to the structural performance of pad footing, but the experimental test result shows an increment of loading compared to theoretical prediction where the maximum load in experimental is 109.8 kN, 121.3 kN and 150.1 kN and the ratio of experimental over the theoretical range from 1.25 to 1.71. This result also proved the theoretical prediction where all samples failed in flexural.
In case 2, the internal CFS successfully contribute to the overall structural behavior of pad footing where the theoretical prediction is expected to fail at load 182.29 kN, while The experimental test result showed an increment of load compared to theoretical with a load of 216.2 kN, 189.6 kN and 200.4 kN and a ratio of 1.19, 1.04 and 1.10. The experimental test proved the theoretical prediction and all samples fail in normal shear.
In case 3, the size of the footing is bigger compared to other cases and the experimental test result showed a lot of improvement compared to theoretical calculations. Rectangular footing is expected to bend easily compared to the square footing due to longer in breadth. Thus, in theoretical prediction only 129.80 kN of load, the rectangular pad footing can withstand. However, in the experimental test, the result shows a lot of increment where the ratio of experiment over theoretical is 1.29, 1.33 and 1.43. Therefore, it clearly showed that the experimental test proved the theoretical calculation.
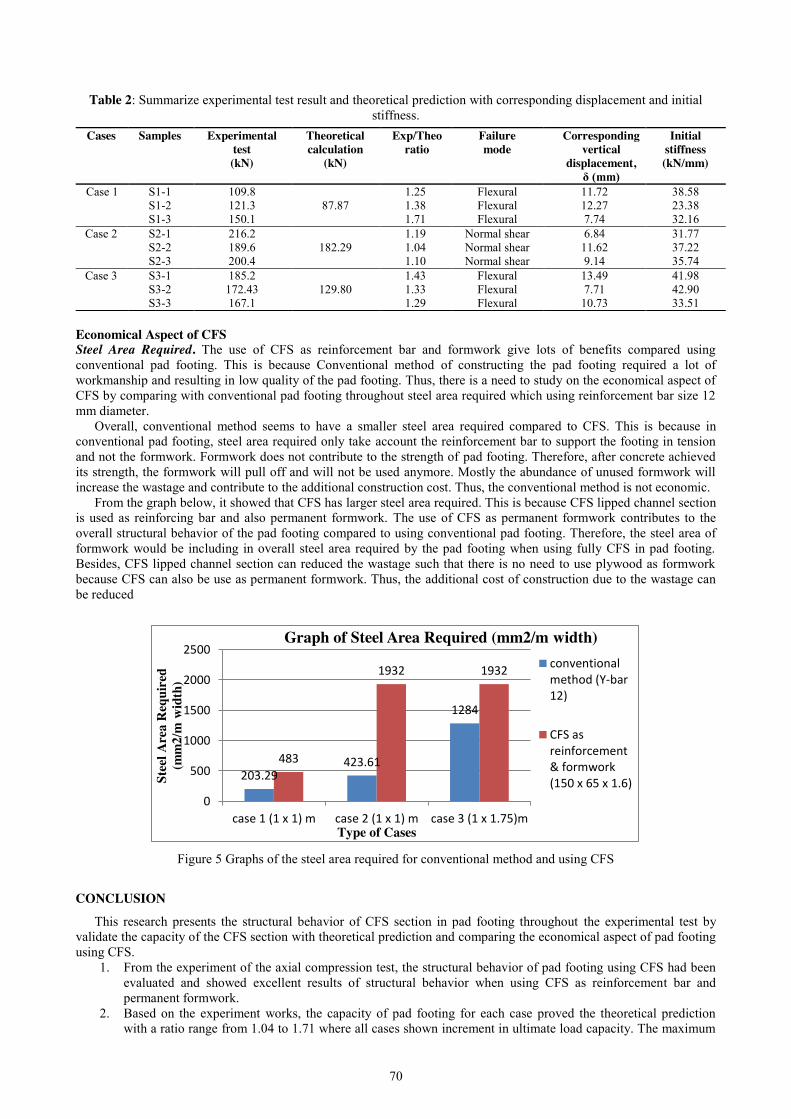
70
Table 2: Summarize experimental test result and theoretical prediction with corresponding displacement and initial stiffness.
Economical Aspect of CFS Steel Area Required. The use of CFS as reinforcement bar and formwork give lots of benefits compared using conventional pad footing. This is because Conventional method of constructing the pad footing required a lot of workmanship and resulting in low quality of the pad footing. Thus, there is a need to study on the economical aspect of CFS by comparing with conventional pad footing throughout steel area required which using reinforcement bar size 12 mm diameter.
Overall, conventional method seems to have a smaller steel area required compared to CFS. This is because in conventional pad footing, steel area required only take account the reinforcement bar to support the footing in tension and not the formwork. Formwork does not contribute to the strength of pad footing. Therefore, after concrete achieved its strength, the formwork will pull off and will not be used anymore. Mostly the abundance of unused formwork will increase the wastage and contribute to the additional construction cost. Thus, the conventional method is not economic.
From the graph below, it showed that CFS has larger steel area required. This is because CFS lipped channel section is used as reinforcing bar and also permanent formwork. The use of CFS as permanent formwork contributes to the overall structural behavior of the pad footing compared to using conventional pad footing. Therefore, the steel area of formwork would be including in overall steel area required by the pad footing when using fully CFS in pad footing. Besides, CFS lipped channel section can reduced the wastage such that there is no need to use plywood as formwork because CFS can also be use as permanent formwork. Thus, the additional cost of construction due to the wastage can be reduced
Figure 5 Graphs of the steel area required for conventional method and using CFS
CONCLUSION
This research presents the structural behavior of CFS section in pad footing throughout the experimental test by validate the capacity of the CFS section with theoretical prediction and comparing the economical aspect of pad footing using CFS.
1. From the experiment of the axial compression test, the structural behavior of pad footing using CFS had been evaluated and showed excellent results of structural behavior when using CFS as reinforcement bar and permanent formwork.
2. Based on the experiment works, the capacity of pad footing for each case proved the theoretical prediction with a ratio range from 1.04 to 1.71 where all cases shown increment in ultimate load capacity. The maximum
203.29 423.61
1284
483
1932 1932
0
500
1000
1500
2000
2500
case 1 (1 x 1) m case 2 (1 x 1) m case 3 (1 x 1.75)m
Stee
l Are
a R
equi
red
(mm
2/m
wid
th)
Type of Cases
Graph of Steel Area Required (mm2/m width) conventionalmethod (Y-bar12)
CFS asreinforcement& formwork(150 x 65 x 1.6)
Cases Samples Experimental test (kN)
Theoretical calculation
(kN)
Exp/Theo ratio
Failure mode
Corresponding vertical
displacement, δ (mm)
Initial stiffness (kN/mm)
Case 1 S1-1 109.8 1.25 Flexural 11.72 38.58 S1-2 121.3 87.87 1.38 Flexural 12.27 23.38 S1-3 150.1 1.71 Flexural 7.74 32.16
Case 2 S2-1 216.2 1.19 Normal shear 6.84 31.77 S2-2 189.6 182.29 1.04 Normal shear 11.62 37.22 S2-3 200.4 1.10 Normal shear 9.14 35.74
Case 3 S3-1 185.2 1.43 Flexural 13.49 41.98 S3-2 172.43 129.80 1.33 Flexural 7.71 42.90 S3-3 167.1 1.29 Flexural 10.73 33.51
71
load in case one is 109.8 kN, 121.3 kN, 150.1 kN while for case 2 is 216.2 kN, 189.6 kN and 200.4 kN. In Case 3, the maximum load is 185.2 kN, 172.43 kN and 167.1 kN.
3. Although the steel area required for CFS is higher compared with conventional pad footing, but the used of CFS in pad footing system is more economical due to less wastage occurs as the formwork is replaced with CFS which act as permanent formwork.
REFERENCES
[1] Yu, C. and Schafer, B.W., 2005. Distortional buckling of cold-formed steel members in bending. [2] Badir, Y.F., Kadir, M.A. and Hashim, A.H., 2002. Industrialized building systems construction in
Malaysia. Journal of Architectural Engineering, 8(1), pp.19-23. [3] Wong, K.L., 2010. Structural behaviour of pre-fabricated composite pad footing foundation using cold-formed
steel lipped channel sections (Doctoral dissertation, Universiti Teknologi Malaysia). [4] Winter, G., 1947. Strength of thin steel compression flanges. Transactions of the American Society of Civil
Engineers, 112(1), pp.527-554. [5] Oehlers, D.J., 1993. Composite profiled beams. Journal of Structural Engineering, 119(4), pp.1085-1100. [6] Oehlers, D.J., Wright, H.D. and Burnet, M.J., 1994. Flexural strength of profiled beams. Journal of Structural
Engineering, 120(2), pp.378-393. [7] Mohamad, D., Ramli, M.Z., Danuri, H.N. and Sapuan, W.K., 2016. Demand of the industrialized building
system (IBS) implementation in Malaysian government projects. [8] Badir, Y., 1998. Theory of classification: its application and Badir-Razali building Systems
classification. Journal of Institute Engineer.

72
Behaviour of Proposed Truss Shear Wall Replacing Existing RC Type Shear Wall Subjected to Earthquake Loading
Jabarudin Bin Mohammad Burah1, Redzuan Bin Abdullah2 Faculty of Civil Engineering, Universiti Teknologi Malaysia, Malaysia
Keywords: Truss-type Shear Wall; Response Spectrum Analysis; 2D Linear Dynamics Analysis; Finite Element Analysis.
ABSTRACT. Shear wall is an important component in a building that resists lateral load from either wind load, or earthquake load. Usually the lateral load is resisted by the shear wall only. Columns and beams will do not take the lateral load. RC-type shear wall is mostly used in the concrete buildings. However, steel truss type shear wall gives better performance in term of flexibility and ductility and it is more economical. The key objective of this study is to study the effect of an earthquake loading to the steel type shear wall which replaces an existing RC-type shear wall. Two type of truss-type shear wall namely x-braced and z-braced frame with same stiffness with the existing RC-type shear wall were modelled and deflection and base shear of both x-braced steel frame model and the z-braced steel frame model when an earthquake load that applied was compared. From the analysis, the maximum deflection of the x-braced frame and z-braced frame are 10.573mm and 11.498mm. The shear developed at the base are 1413.53 kN and 1518.43 kN respectively. The shear force at the base of the RC-type shear wall is 978.63 kN. These values are for applied earthquake loadings only without combining with other loads. In this study, the axial force developed inside the bracing member cannot be compared with the section capacity.
INTRODUCTION
Recent event of earthquake that was occurred in Ranau, Sabah last year was eye-opening to our society that Malaysia is no longer safe from earthquake hazard. On morning 5th June, who would expect an earthquake with magnitude of 5.9 will striking Ranau. The tremors can be felt as far as Miri in Sarawak. This earthquake is the strongest earthquake ever happened to Malaysia since 1976. From this tragedy, many buildings in six different districts were reported damaged. Among damages that were reported are crack on the wall, beams and columns. Here we can see that, the existing structure is not design properly to take the earthquake loading. The building cannot cater the excitation from the tremor. As the results, many of the structural parts of the building need to be repair and even cannot be used anymore like what happened to a building of SKJC Pai Wen, Ranau.
Shear wall is a structural member that is added to the structure to deals with the horizontal loads. Shear wall is very important member of the building as it can avoid the building from collapse especially the buildings that is constructed in earthquake prone area. The material used in shear wall usually reinforced concrete as it is more cheap and easy to construct compared to steel. However, the steel type truss shear wall gives better performance in term of flexibility and it is more economical. Due to this matter, a study needs to be done to analyse the behaviour of the shear wall if the existing shear wall is replaced with a steel type shear wall.
Problem Statement Many tall building in Malaysia is not design to earthquake loading. The design only up to the wind design stage and it is ready for approval. This is because Malaysia is not yet imposed the law to enforce the designer to design the building for earthquake resistance. However, due to recent event of earthquake, it is not enough to design the building only for wind load but must include the design for earthquake load also. However, how about the existing building that already constructed? Is it it will collapse when earthquake occur?In order to know the behaviour of the building when applied to earthquake, an analysis of the building need to be conducted especially the shear wall as it is the main structural part to resist the lateral load. Since experimental testing is not applicable, the only way is to analyze by using finite element analysis software. It can give a reliable result to predict the performance of the building.
Objectives The aim of this study is to study the effect of an earthquake to the structure if the shear wall is replaced by a steel type shear wall. There are several objectives of this research to help achieve the aim as in the following:
1. To propose two model of steel type shear walls namely x-braced frame and z-braced frame as a replacement of RC type shear wall in an existing tall building structure that has the same stiffness.
2. To analyse the model with linear dynamic analysis by using finite element software. 3. To compare the deflection and base shear of both x-braced steel frame model and the z-braced steel frame
model model when an earthquake load is applied with the base shear of RC-type shear wall. 4. To compare the axial load developed due to seismic excitation with the load capacity of the section.
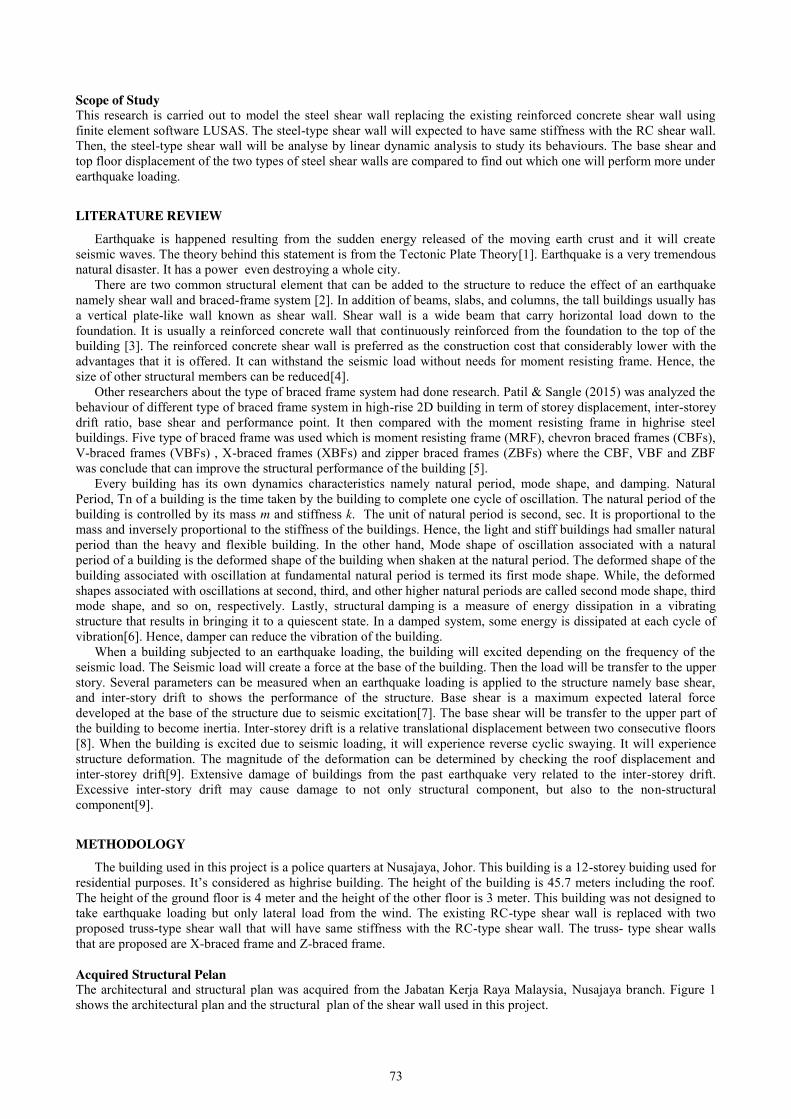
73
Scope of Study This research is carried out to model the steel shear wall replacing the existing reinforced concrete shear wall using finite element software LUSAS. The steel-type shear wall will expected to have same stiffness with the RC shear wall. Then, the steel-type shear wall will be analyse by linear dynamic analysis to study its behaviours. The base shear and top floor displacement of the two types of steel shear walls are compared to find out which one will perform more under earthquake loading.
LITERATURE REVIEW
Earthquake is happened resulting from the sudden energy released of the moving earth crust and it will create seismic waves. The theory behind this statement is from the Tectonic Plate Theory[1]. Earthquake is a very tremendous natural disaster. It has a power even destroying a whole city.
There are two common structural element that can be added to the structure to reduce the effect of an earthquake namely shear wall and braced-frame system [2]. In addition of beams, slabs, and columns, the tall buildings usually has a vertical plate-like wall known as shear wall. Shear wall is a wide beam that carry horizontal load down to the foundation. It is usually a reinforced concrete wall that continuously reinforced from the foundation to the top of the building [3]. The reinforced concrete shear wall is preferred as the construction cost that considerably lower with the advantages that it is offered. It can withstand the seismic load without needs for moment resisting frame. Hence, the size of other structural members can be reduced[4].
Other researchers about the type of braced frame system had done research. Patil & Sangle (2015) was analyzed the behaviour of different type of braced frame system in high-rise 2D building in term of storey displacement, inter-storey drift ratio, base shear and performance point. It then compared with the moment resisting frame in highrise steel buildings. Five type of braced frame was used which is moment resisting frame (MRF), chevron braced frames (CBFs), V-braced frames (VBFs) , X-braced frames (XBFs) and zipper braced frames (ZBFs) where the CBF, VBF and ZBF was conclude that can improve the structural performance of the building [5].
Every building has its own dynamics characteristics namely natural period, mode shape, and damping. Natural Period, Tn of a building is the time taken by the building to complete one cycle of oscillation. The natural period of the building is controlled by its mass m and stiffness k. The unit of natural period is second, sec. It is proportional to the mass and inversely proportional to the stiffness of the buildings. Hence, the light and stiff buildings had smaller natural period than the heavy and flexible building. In the other hand, Mode shape of oscillation associated with a natural period of a building is the deformed shape of the building when shaken at the natural period. The deformed shape of the building associated with oscillation at fundamental natural period is termed its first mode shape. While, the deformed shapes associated with oscillations at second, third, and other higher natural periods are called second mode shape, third mode shape, and so on, respectively. Lastly, structural damping is a measure of energy dissipation in a vibrating structure that results in bringing it to a quiescent state. In a damped system, some energy is dissipated at each cycle of vibration[6]. Hence, damper can reduce the vibration of the building.
When a building subjected to an earthquake loading, the building will excited depending on the frequency of the seismic load. The Seismic load will create a force at the base of the building. Then the load will be transfer to the upper story. Several parameters can be measured when an earthquake loading is applied to the structure namely base shear, and inter-story drift to shows the performance of the structure. Base shear is a maximum expected lateral force developed at the base of the structure due to seismic excitation[7]. The base shear will be transfer to the upper part of the building to become inertia. Inter-storey drift is a relative translational displacement between two consecutive floors [8]. When the building is excited due to seismic loading, it will experience reverse cyclic swaying. It will experience structure deformation. The magnitude of the deformation can be determined by checking the roof displacement and inter-storey drift[9]. Extensive damage of buildings from the past earthquake very related to the inter-storey drift. Excessive inter-story drift may cause damage to not only structural component, but also to the non-structural component[9].
METHODOLOGY
The building used in this project is a police quarters at Nusajaya, Johor. This building is a 12-storey buiding used for residential purposes. It’s considered as highrise building. The height of the building is 45.7 meters including the roof. The height of the ground floor is 4 meter and the height of the other floor is 3 meter. This building was not designed to take earthquake loading but only lateral load from the wind. The existing RC-type shear wall is replaced with two proposed truss-type shear wall that will have same stiffness with the RC-type shear wall. The truss- type shear walls that are proposed are X-braced frame and Z-braced frame. Acquired Structural Pelan The architectural and structural plan was acquired from the Jabatan Kerja Raya Malaysia, Nusajaya branch. Figure 1 shows the architectural plan and the structural plan of the shear wall used in this project.
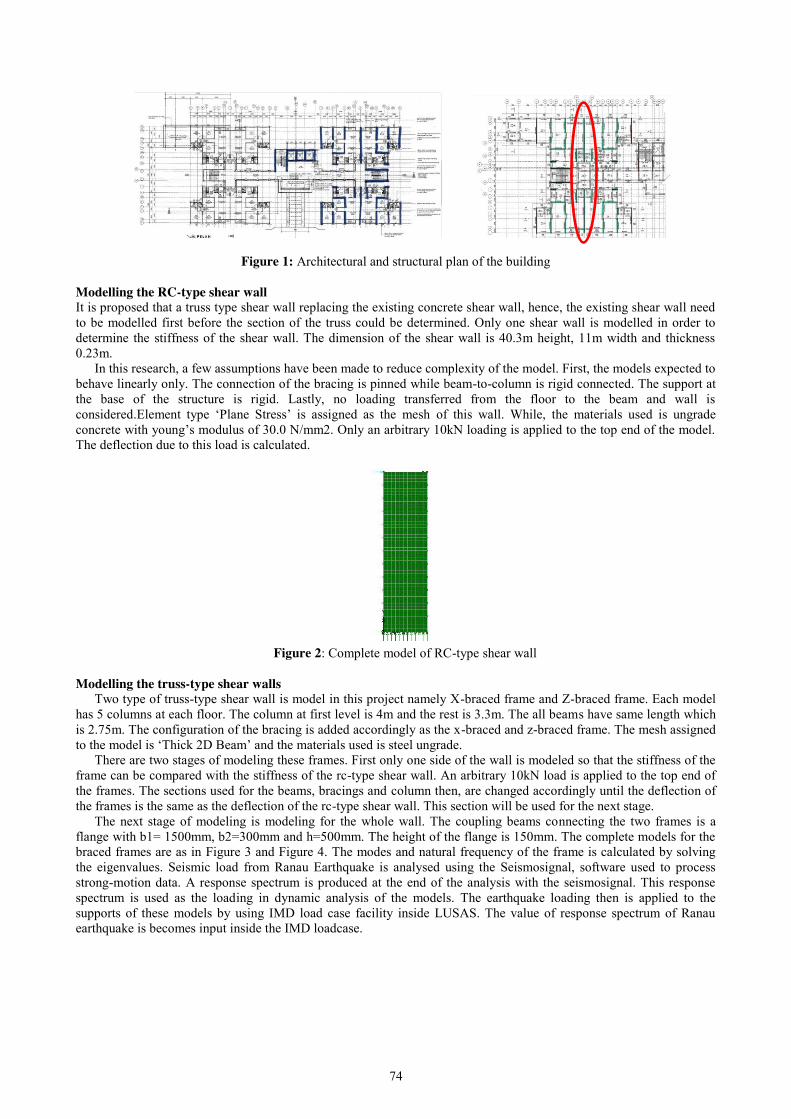
74
Figure 1: Architectural and structural plan of the building
Modelling the RC-type shear wall It is proposed that a truss type shear wall replacing the existing concrete shear wall, hence, the existing shear wall need to be modelled first before the section of the truss could be determined. Only one shear wall is modelled in order to determine the stiffness of the shear wall. The dimension of the shear wall is 40.3m height, 11m width and thickness 0.23m.
In this research, a few assumptions have been made to reduce complexity of the model. First, the models expected to behave linearly only. The connection of the bracing is pinned while beam-to-column is rigid connected. The support at the base of the structure is rigid. Lastly, no loading transferred from the floor to the beam and wall is considered.Element type ‘Plane Stress’ is assigned as the mesh of this wall. While, the materials used is ungrade concrete with young’s modulus of 30.0 N/mm2. Only an arbitrary 10kN loading is applied to the top end of the model. The deflection due to this load is calculated.
Figure 2: Complete model of RC-type shear wall
Modelling the truss-type shear walls
Two type of truss-type shear wall is model in this project namely X-braced frame and Z-braced frame. Each model has 5 columns at each floor. The column at first level is 4m and the rest is 3.3m. The all beams have same length which is 2.75m. The configuration of the bracing is added accordingly as the x-braced and z-braced frame. The mesh assigned to the model is ‘Thick 2D Beam’ and the materials used is steel ungrade.
There are two stages of modeling these frames. First only one side of the wall is modeled so that the stiffness of the frame can be compared with the stiffness of the rc-type shear wall. An arbitrary 10kN load is applied to the top end of the frames. The sections used for the beams, bracings and column then, are changed accordingly until the deflection of the frames is the same as the deflection of the rc-type shear wall. This section will be used for the next stage.
The next stage of modeling is modeling for the whole wall. The coupling beams connecting the two frames is a flange with b1= 1500mm, b2=300mm and h=500mm. The height of the flange is 150mm. The complete models for the braced frames are as in Figure 3 and Figure 4. The modes and natural frequency of the frame is calculated by solving the eigenvalues. Seismic load from Ranau Earthquake is analysed using the Seismosignal, software used to process strong-motion data. A response spectrum is produced at the end of the analysis with the seismosignal. This response spectrum is used as the loading in dynamic analysis of the models. The earthquake loading then is applied to the supports of these models by using IMD load case facility inside LUSAS. The value of response spectrum of Ranau earthquake is becomes input inside the IMD loadcase.
75
Figure 3: X-braced Frame Figure 4: Z-braced frame
Theoretical check The capacity of the bracing used in this project is checked by calculating the formula from the Eurocode 3. The safety factor of the bracing used is calculated the ratio of axial load due to earthquake over the capacity of the section. Only one maximum axial load is taken from the model for the calculation.
RESULTS AND DISCUSSION
The stiffness of the braced frame is same as the stiffness of the RC-type shear wall when the deflection due to arbitrary loads of 10kN is same. Trial and error method is used to determine the steel sections that will produce same magnitude of deflection as the RC-type shear wall due to the arbitrary load.
The base shear and the deflection of the frames due to the Ranau earthquake was obtained. However, the axial load in the bracing cannot be obtained due to the LUSAS software didn’t have the facility to combining the IMD loadcase with other load on the structure. Section Used For the Analysis After few trials, the final section that can produce the same deflection with the RC-type shear wall was obtained. This section is used for the dynamic analysis as shown in Table 1.
Table 1: The list of section used for the model
Section X-braced frame Z-braced frame Beams 406x178x74kg UB 610x229x140kg UB
Bracings 305x165x54kg UB 533x210x101kg UB Columns 356x406x634kg UC 356x406x634kg UC
Free Vibration Analysis A free vibration analysis is performed to get the mode shape and its natural frequency. 10 mode shapes is obtained from the analysis for each model as shown in Table 2. This natural frequency is used for the response spectrum analysis.
Lateral Deflection of the Frame. After the analysis is done, we can get the displacement at each floor by using utility ‘Graph Through 2D’. By cutting the vertical nodes at any column, the displacement due to earthquake loading can be determined. The maximum displacement occurred at the top of the wall. The maximum displacement obtained from the X-braced frame is 1.08 mm while for the Z-braced frame is 1.17 mm. The following are the displacement at each floor as shown in Table 3
Table 2: Mode shape, natural frequency and natural period of x- and z-braced frame
Mode x-braced frame z-braced frame Eigenvalue Frequency (s-1) Period (s) Eigenvalue Frequency (s-1) Period (s)
1 651.772 4.0632 0.25 615.696 3.94915 0.25 2 6642.03 12.9709 0.08 5927.51 12.2534 0.08 3 20385.8 22.7239 0.04 19198.3 22.0522 0.05 4 23426.3 24.3597 0.04 20920.7 23.0202 0.04 5 29673.8 27.4162 0.04 27876.4 26.5728 0.04 6 39619.2 31.6791 0.03 41445.1 32.4009 0.03 7 43012.1 33.0077 0.03 42410.2 32.7759 0.03 8 44063.5 33.4087 0.03 46718.6 34.4005 0.03 9 45665.2 34.0105 0.03 49788.1 35.5127 0.03 10 49596.9 35.4444 0.03 52571.2 36.4917 0.03
76
Table 3: Lateral deflection at each floor
Floor Height from base (m) Lateral deflection (mm) x-braced frame z-braced frame
GF 0.0 0.000 0.000 1F 4.0 0.880 0.934 2F 7.3 1.743 1.874 3F 10.6 2.651 2.884 4F 13.9 3.613 3.955 5F 17.2 4.603 5.055 6F 20.5 5.597 6.156 7F 23.8 6.571 7.230 8F 27.1 7.507 8.254 9F 30.4 8.385 9.206
10F 33.7 9.191 10.067 11F 37.0 9.918 10.826 12F 40.3 10.573 11.498
Figure 5: Lateral Displacement at Each Floor of X-braced and Z-braced Frame
Base shear The base shear of the walls is calculated by determining the reactions in x-direction, Fx at each support. From the calculation, the base shear of the x-braced frame is 1413.53 kN while the base shear of the z-braced frame is 1518.43 kN. This variation in the base shear is due to the size of the beam and bracing used is different. The no weight of the walls is also different. From the analysis of RC-type of shear wall, the shear force developed at the base is 978.63 kN which is lower than the shear developed at the base of the X-braced and Z-braced frame.
Table 4: Base Shear of X-braced and Z-braced frame
Support distance (m) Reaction,Rx(N) x-braced frame z-braced frame
0.00 117994.80 195689.30 2.75 148619.40 34513.92 5.50 158722.20 290557.80 8.25 153802.70 35095.54
11.00 127626.90 203359.00 18.10 127626.90 203359.00 20.85 153802.70 35095.54 23.60 158722.20 290557.80 26.35 148619.40 34513.92 29.10 117994.80 195689.30
Base shear 1413532 1518431
Maximum Axial Force Developed in the Bracing The maximum axial load is determined so that it can be compare with the capacity of the section. By right, if the axial load is lower than the capacity of the section, it means that, the bracing didn’t fail if earthquake at the same or lower magnitude occurs.
However, from the analysis, all axial load enveloped in the member is positive. It means that, all the member is in tension. This is not true because in truss system, the members cannot act all in tension or all in compression. Hence, the comparison between axial load developed in the member and its capacity cannot be performed we didn’t know either the member is in tension or in compression.
0.05.0
10.015.020.025.030.035.040.045.0
0.000 2.000 4.000 6.000 8.000 10.000 12.000 14.000
Hei
ght
(m)
Lateral Displacement (mm)
X-braced z-braced
77
CONCLUSION AND RECOMMENDATION
This research presents the analysis behaviour of proposed truss shear wall replacing existing RC type shear wall subjected to earthquake loading.
1. From the trial and test, the sections used for the beams, bracings, and columns that have the same deflection with the RC-type shear wall was obtained. When using these section, the braced frames are assume to have the same stiffness as the RC-type shear wall. However, the frame is very stiff as the deflection due to the abitrary load for x-braced frame and z-braced frame are 0.307 mm and 0.304 mm respectively. Hence, this section are not suitable to be used since it can be take as over design.
2. The dynamics analysis was done by using IMD loadcase facility inside the LUSAS. However, the results for the analysis are shown purely from earthquake only. This software didn’t have option for combining earthquake load with other loads. Hence, it is suggested to further analyse the frame with either using IMDplus facility or by using other softwares like SAP2000 or ETABS, which have the ability to doing response spectrum analysis combining with the dead loads and live loads of the structure.
3. The deflection and base shear of the x-braced frame and z-braced frame due to earthquake loading only were obtained. The deflections of the models are 10.573mm and 11.498mm respectively. While the base shear developed are 1413.53 kN and 1518.43 kN respectively. The base shears developed by the truss-type shear wall are higher than the base shear developed in the RC-type shear wall. Hence, the RC-type shear wall performed more under the moderate earthquake loading.
4. Since by using the IMD loadcase, the software have the ability to analyzing the earthquake loading alone, the developed axial load in the member cannot be compared with its capacity since we didn’t know either it is in tension or in compression. Hence, it is suggested that, this model is to be analyse futher using IMDplus inside the software or by using other software available.
5. 3D analysis of the buildings should have been done including other loadings such as permanent load and imposed load so that; we can have better result in determining the resistance of the structure to the earthquake loading.
REFERENCES [1] “Earthquake Glossary - seismogenic.” [Online]. Available:
http://earthquake.usgs.gov/learn/glossary/?term=seismogenic. [Accessed: 27-Nov-2016]. [2] M. et al D’Alessio, Earthquake Science Explained A Series of Ten Short Articles for Students , Teachers , and
Families General Interest Product 21 A Series of Ten Short Articles for Students , Teachers , and Families. 2005.
[3] C. V. R. Murty, “Earthquake Tip 23 - Why are Buildings with Shear Walls preferred in Seismic Regions?,” Learning Earthquake Design and Construction, pp. 45–46, 2005.
[4] J. Maffei and N. Yuen, Seismic Performance and Design Requirements for High-Rise Concrete Buildings, no. April. 2007.
[5] D. M. Patil and K. K. Sangle, “Seismic Behaviour of Different Bracing Systems in High Rise 2-D Steel Buildings,” Structures, vol. 3, pp. 282–305, 2015.
[6] R. E. Blake, “Basic vibration theory,” Harris’ Shock Vib. Handb., p. 2.1-2.32, 2010. [7] Mike Dodson et.al, “Course Module: Seismic Load,” Washington State University, 2000. . [8] J. Zhou, G. B. Bu, and K. N. Li, “Calculation Methods for Inter-Story Drifts of Building Structures,” 15th
World Conf. Earthq. Eng., no. 3, p. 7, 2012. [9] R. K. L. Su, N. T. K. Lam, and H. H. Tsang, “Seismic drift demand and capacity of non-seismically designed
concrete buildings in Hong Kong,” Electron. J. Struct. Eng., vol. 8, pp. 110–121, 2008.

78
Structural Behaviour of 16th Storey Conventional and Diagrid Buildings Based on STAAD Pro
Mohamad Firdaus Zulkiflee1, Suhaimi Abu Bakar2 Faculty of Civil Engineering, Universiti Teknologi Malaysia, Malaysia
Keywords: Tall Buildings; Structural System; Diagrid; First order analysis; P-delta Effect; STAAD.Pro.
ABSTRACT. Nowadays as the population increase, the demands for building also increase. To fulfil the demand, many building need to be construct, however it been restricted by the limited space available especially in urban area. Because of this, the limited space available needs to be fully utilised by constructing a tall building. Constructing a tall building is not an easy task as the lateral load acting on it become more significant when the height increase. The risk and cost of the building also will be increased. Proper design need to be done to ensure that the building constructed is safe and within budget. Recently, the use of diagrid structural system has increased because of what it can offer. In this study, a conventional and two diagrid building with different angle (63o & 76o) will be analyse to see their performance under several load case. A sixteen storey building with plan dimension of 18m x 18m is analysed by using STAAD.Pro Software. All structural members are designed by using Eurocode 3. In diagrid structure, the lateral load acting on it is mostly taken by the diagonal member at the perimeter of the building. The beam in both diagrid building has low shear and bending moment except in certain beam where the values are remain unchanged. The bending moment in internal column for 63o diagrid building is significantly low compared to the conventional building. However for 76o diagrid structure, the bending moment in internal column is increased. Different diagrid angle used affecting their performance. It is also found that the total volume needed for diagrid structure to be able to withstand all load applied to it is smaller compared to the conventional building. P-delta effect is not significant in all sixteen storey building that been analyse.
INTRODUCTION
Diagrid is a new structural system that been invented based on the previous structural system which is exterior-braced frame structure. All perimeter columns in the exterior braced frame structure are being eliminated in diagrid system. Therefore, the diagonal member will need to resist both gravitational and lateral load simultaneously. Recently, this new structural system had become trend and popular choice among the structural engineer and architect around the world because of what’s the structural system can offer to them. Usually, this system is being applied in tall building structure because of it capability to resist lateral load efficiently. To cope with current and future challenges, further researches and studies on diagrid structural system shall be always carried out in order to prove and increase the understanding about it. Researches also need to be done to develop level of confidence on implementation of this structural system in construction. Problem Statement The limited space available especially in urban area makes the design of new building to become taller in order to fulfill the user demand on the limited space. Constructing a tall building is very challenging since the stability of the building will be reduce as the height of the building increase. Besides that, the construction cost also will be increase with the height of building. Unsafe building or the building that are too expensive will make the potential client loss interest to buy the building. Because of this, the problem related with stability and total cost of building need to be solve quickly. Recently, there are new structural system which is diagrid been invented. It is said that the diagrid system can solve all problem that been stated earlier. However, the limited sources that available make it hard to verify it. There also no study being done on the p-delta effect to the diagrid structure so we does not know how the behavior of the building under the p delta effect. Objectives The objectives of this study are:
1. To determine the different in term of structural behavior between conventional and diagrid building by first order analysis.
2. To study the behavior of diagrid structure with different angle. 3. To determine which structural system is more economical. 4. To study the significant of p-delta effect on conventional and diagrid building.
Scope of Study This study is conducted to determine the different between conventional and diagrid building in term of performance and structural behavior. All the building will be analyze with two types of analysis which are first order and p-delta

79
analysis. The analysis will be done by using STAAD.Pro V8i software. For this study, two diagrid building with different inclination angles will be analyzed while only one for conventional building.
LITERATURE REVIEW Tall building is a building where the occupants need elevator to go to their destination [4]. It also can be said that it
is a building where the height strongly influence the design and planning of the building [7]. Tall buildings or also known as ‘high-rise building’ have their own unique design and because of this, it is not easy to construct this type of building. It’s been reported that, the country with the highest number of tall building is United States of America with 48.9% [11]. The height classifications for tall building are differ in each country. For Malaysia, the buildings with height more than 21 meter can already be classified as tall building [7]. To construct a tall building, there must be at least one structural system be included in the building.
Structural system is the systems that were built within the building to resist both gravitational and lateral load so that the building would not have excessive deflection and increase the building stability [7]. Structural system can be divided into two main categories which is interior and exterior structure [8]. It been divided based on the primary component which resist lateral load that act on the building [2]. For exterior structural system, the primary component that resist lateral load is located at building parameter while for interior structural system, it’s will be within the building. Although the structural system have been categorized base on the location of its primary lateral load resisting component, there still will be a minor components that resist lateral load at the location vice versa with the location where the structural system been categorized [2]. Khushbu Jani and Paresh V. Patel (2013) said that, in tall building structure, the lateral resisting system is more important compared to the structural system that resist gravitational loads. Recently, many architect and structural engineer attracted to a new structural system which named diagrid system.
Diagrid is a particular form of space truss which consist of perimeter grid made up of a series of triangulated truss system. It is a new form of structural system that been invented based on previous structural system which is exterior-braced frame structure [6].Diagrid name for the structural system is taken from the combination of two words which is “diagonal” and “grid” [12]. The difference between the diagrid structure and exterior braced frame is there is no column present around the building parameter of diagrid building [12]. This is possible because the diagonal member in diagrid structural system able to withstand both gravitational and lateral force that acting on it [6].The elimination of the perimeter column also give the flexibility in architectural planning thus allowing variety and complex shape of building to be construct [5].
Module in diagrid structural system is one triangulated configuration of structural member that becomes primary factor in determining the internal axial force, shear and bending rigidity for the structure [8]. However, the geometry of diagrid module is affected by the inclination angle of diagonal member so, it is important to know the optimum angle to ensure that the diagrid can perform effectively. Optimal angle of the columns for maximum bending rigidity is 90° and that of the diagonals for maximum shear rigidity is about 35° [6].Due to this fact, Milana G. (2014) said that the optimum inclination angle will be between these angles as the diagonal member will need to provide both resistance in shear and bending stiffness for the building. Besides that, the optimum diagonal angle will also be affected by the ratio of height to width of the building [9]. High ratio indicates that the building will behave like bending beam and the angle of inclination should be steeper because steeper angle will enable the diagonal member to resist the bending moment more effectively [10]. If the ratio of height to width is low, the building will act more like shear beam, thus the angle of diagonal member should be small. From the research that been done by Kyoung Sun Moon (2008), had found that the optimal angle for building with height to width ratio between 4 and 9 is approximately 60 to 70 degrees. It also found that the building with height to width ratio more than 7 is more suitable to have varying diagonal angle that have angle steeper angle toward the base [10].
Constructability is an important issue because the node of diagrid is much more complicated than those nodes of conventional square structure [9]. It is crucial to ensure that the geometry of the nodal element and connection node is precise so that there will not be any problem during the assembly process. To ensure that there is no defect to the connection node, all of it been fabricated in this factory [3]. K.Moon (2009) said that, the jobsite work should be reduce as the environment are unexpected and cannot be controlled to meet the suitable condition for fabrication of the nodes. It is also more easy to monitor the work been done by the worker compared to the site.
Structural Analysis is the process of obtaining the effect of all action on the structure in order to check the ultimate states and serviceability limit states of the structure. The first order analysis is also known as linear analysis. This analysis assumes that there will be no changes in the geometry of the structure when load apply to it. This assumption makes it more simple and able to be calculate without need to use computer software. Force method and displacement method are the example of well know 1st order analysis methods. Furthermore, in this analysis the deformation are proportional to the applied load. Other structural analysis is second order analysis or also known as P-delta effect. It is the analyses that consider deformation of the structure in the evaluation of internal forces and displacement. Both deflections in local and global axis were taken into consideration during the analysis.P-∆ effect is the effect from global deflection while P-δ effect is the effect from the local deflection. This type of analysis can only be done by using computer software such as Lusas and Staad.Pro. It is found that the result of analysis by using this method is sensitive compared to ordinary linear analysis. However, second order effect can be neglect if the differences in result obtain for the analysis is less than 10% [13].
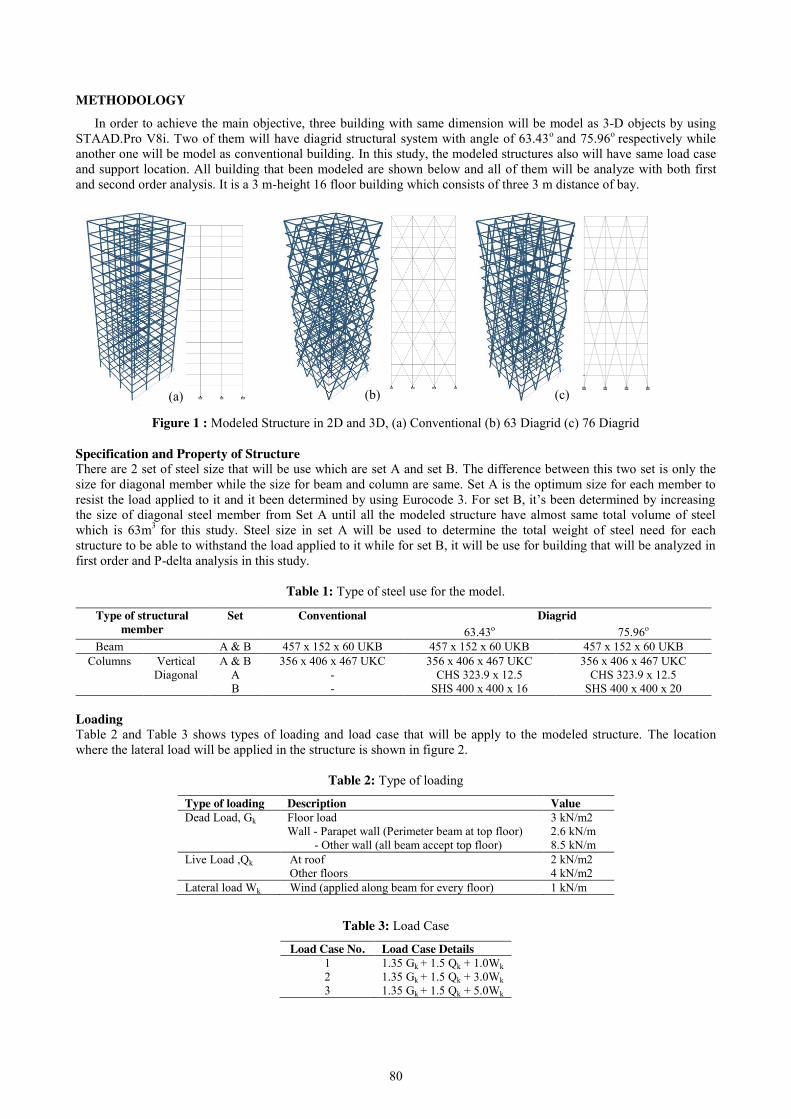
80
METHODOLOGY
In order to achieve the main objective, three building with same dimension will be model as 3-D objects by using STAAD.Pro V8i. Two of them will have diagrid structural system with angle of 63.43o and 75.96o respectively while another one will be model as conventional building. In this study, the modeled structures also will have same load case and support location. All building that been modeled are shown below and all of them will be analyze with both first and second order analysis. It is a 3 m-height 16 floor building which consists of three 3 m distance of bay.
Figure 1 : Modeled Structure in 2D and 3D, (a) Conventional (b) 63 Diagrid (c) 76 Diagrid
Specification and Property of Structure There are 2 set of steel size that will be use which are set A and set B. The difference between this two set is only the size for diagonal member while the size for beam and column are same. Set A is the optimum size for each member to resist the load applied to it and it been determined by using Eurocode 3. For set B, it’s been determined by increasing the size of diagonal steel member from Set A until all the modeled structure have almost same total volume of steel which is 63m3 for this study. Steel size in set A will be used to determine the total weight of steel need for each structure to be able to withstand the load applied to it while for set B, it will be use for building that will be analyzed in first order and P-delta analysis in this study.
Table 1: Type of steel use for the model.
Loading Table 2 and Table 3 shows types of loading and load case that will be apply to the modeled structure. The location where the lateral load will be applied in the structure is shown in figure 2.
Table 2: Type of loading Type of loading Description Value Dead Load, Gk Floor load
Wall - Parapet wall (Perimeter beam at top floor) - Other wall (all beam accept top floor)
3 kN/m2 2.6 kN/m 8.5 kN/m
Live Load ,Qk At roof Other floors
2 kN/m2 4 kN/m2
Lateral load Wk Wind (applied along beam for every floor) 1 kN/m
Table 3: Load Case Load Case No. Load Case Details
1 1.35 Gk + 1.5 Qk + 1.0Wk 2 1.35 Gk + 1.5 Qk + 3.0Wk 3 1.35 Gk + 1.5 Qk + 5.0Wk
Type of structural member
Set Conventional Diagrid 63.43o 75.96o
Beam A & B 457 x 152 x 60 UKB 457 x 152 x 60 UKB 457 x 152 x 60 UKB Columns Vertical A & B 356 x 406 x 467 UKC 356 x 406 x 467 UKC 356 x 406 x 467 UKC
Diagonal A - CHS 323.9 x 12.5 CHS 323.9 x 12.5 B - SHS 400 x 400 x 16 SHS 400 x 400 x 20
(a) (b) (c)
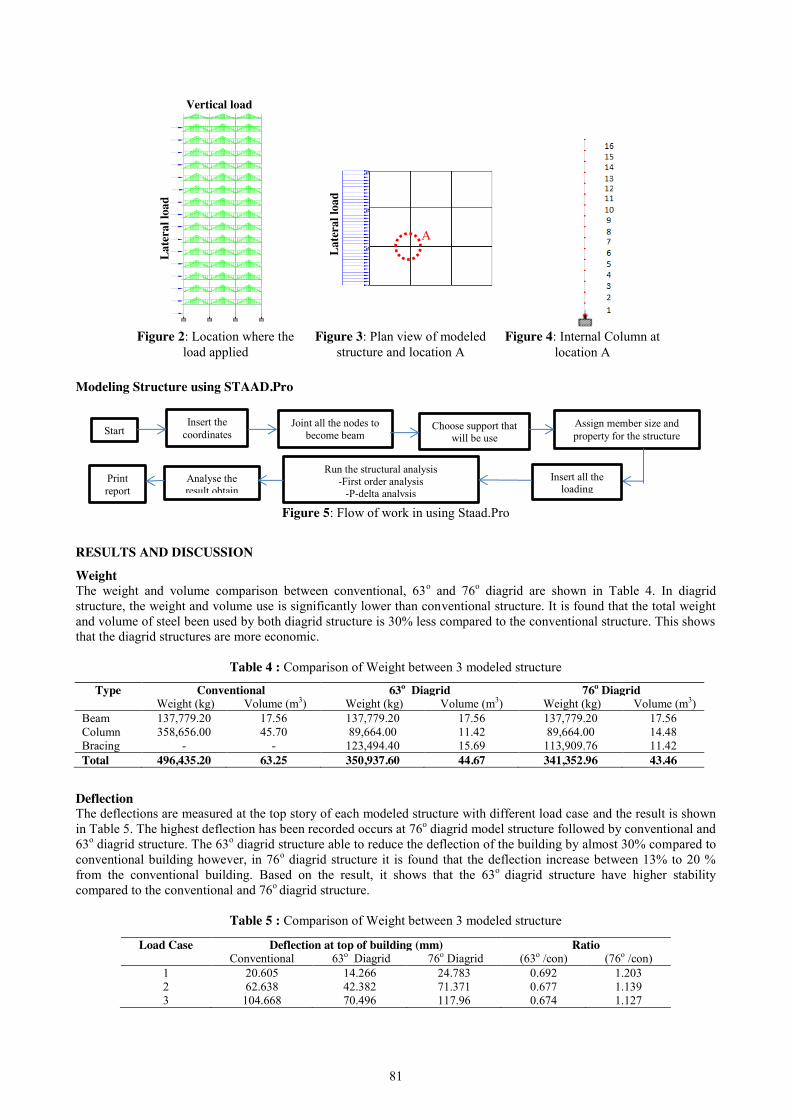
81
Modeling Structure using STAAD.Pro
Figure 5: Flow of work in using Staad.Pro
RESULTS AND DISCUSSION
Weight The weight and volume comparison between conventional, 63o and 76o diagrid are shown in Table 4. In diagrid structure, the weight and volume use is significantly lower than conventional structure. It is found that the total weight and volume of steel been used by both diagrid structure is 30% less compared to the conventional structure. This shows that the diagrid structures are more economic.
Table 4 : Comparison of Weight between 3 modeled structure Type Conventional 63o Diagrid 76o Diagrid
Weight (kg) Volume (m3) Weight (kg) Volume (m3) Weight (kg) Volume (m3) Beam 137,779.20 17.56 137,779.20 17.56 137,779.20 17.56 Column 358,656.00 45.70 89,664.00 11.42 89,664.00 14.48 Bracing - - 123,494.40 15.69 113,909.76 11.42 Total 496,435.20 63.25 350,937.60 44.67 341,352.96 43.46
Deflection The deflections are measured at the top story of each modeled structure with different load case and the result is shown in Table 5. The highest deflection has been recorded occurs at 76o diagrid model structure followed by conventional and 63o diagrid structure. The 63o diagrid structure able to reduce the deflection of the building by almost 30% compared to conventional building however, in 76o diagrid structure it is found that the deflection increase between 13% to 20 % from the conventional building. Based on the result, it shows that the 63o diagrid structure have higher stability compared to the conventional and 76o diagrid structure.
Table 5 : Comparison of Weight between 3 modeled structure
Load Case Deflection at top of building (mm) Ratio Conventional 63o Diagrid 76o Diagrid (63o /con) (76o /con)
1 20.605 14.266 24.783 0.692 1.203 2 62.638 42.382 71.371 0.677 1.139 3 104.668 70.496 117.96 0.674 1.127
Figure 4: Internal Column at location A
Late
ral l
oad
Figure 3: Plan view of modeled structure and location A
A
Vertical load
Late
ral l
oad
Figure 2: Location where the load applied
Start Insert the
coordinates Joint all the nodes to
become beam Choose support that
will be use Assign member size and property for the structure
Insert all the loading
Run the structural analysis -First order analysis
-P-delta analysis Analyse the result obtain
Print report
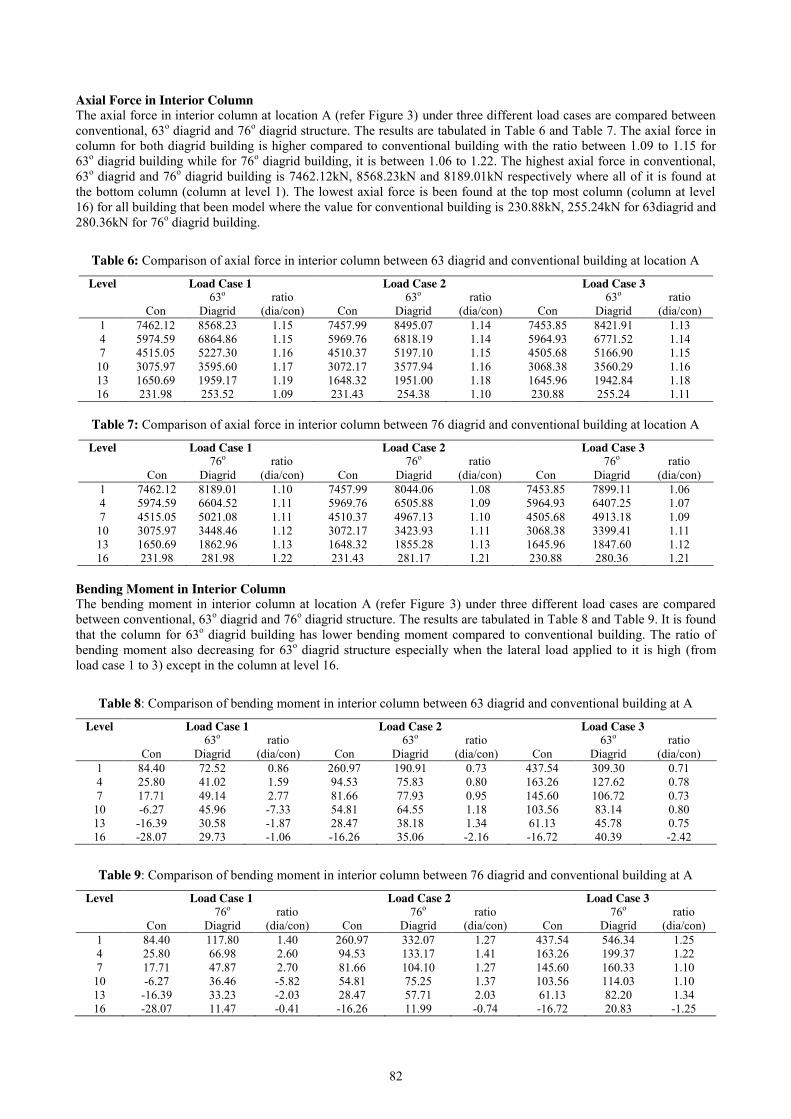
82
Axial Force in Interior Column The axial force in interior column at location A (refer Figure 3) under three different load cases are compared between conventional, 63o diagrid and 76o diagrid structure. The results are tabulated in Table 6 and Table 7. The axial force in column for both diagrid building is higher compared to conventional building with the ratio between 1.09 to 1.15 for 63o diagrid building while for 76o diagrid building, it is between 1.06 to 1.22. The highest axial force in conventional, 63o diagrid and 76o diagrid building is 7462.12kN, 8568.23kN and 8189.01kN respectively where all of it is found at the bottom column (column at level 1). The lowest axial force is been found at the top most column (column at level 16) for all building that been model where the value for conventional building is 230.88kN, 255.24kN for 63diagrid and 280.36kN for 76o diagrid building.
Table 6: Comparison of axial force in interior column between 63 diagrid and conventional building at location A
Level Load Case 1 Load Case 2 Load Case 3
Con 63o
Diagrid ratio
(dia/con) Con 63o
Diagrid ratio
(dia/con) Con 63o
Diagrid ratio
(dia/con) 1 7462.12 8568.23 1.15 7457.99 8495.07 1.14 7453.85 8421.91 1.13 4 5974.59 6864.86 1.15 5969.76 6818.19 1.14 5964.93 6771.52 1.14 7 4515.05 5227.30 1.16 4510.37 5197.10 1.15 4505.68 5166.90 1.15
10 3075.97 3595.60 1.17 3072.17 3577.94 1.16 3068.38 3560.29 1.16 13 1650.69 1959.17 1.19 1648.32 1951.00 1.18 1645.96 1942.84 1.18 16 231.98 253.52 1.09 231.43 254.38 1.10 230.88 255.24 1.11
Table 7: Comparison of axial force in interior column between 76 diagrid and conventional building at location A
Level Load Case 1 Load Case 2 Load Case 3
Con 76o
Diagrid ratio
(dia/con) Con 76o
Diagrid ratio
(dia/con) Con 76o
Diagrid ratio
(dia/con) 1 7462.12 8189.01 1.10 7457.99 8044.06 1.08 7453.85 7899.11 1.06 4 5974.59 6604.52 1.11 5969.76 6505.88 1.09 5964.93 6407.25 1.07 7 4515.05 5021.08 1.11 4510.37 4967.13 1.10 4505.68 4913.18 1.09
10 3075.97 3448.46 1.12 3072.17 3423.93 1.11 3068.38 3399.41 1.11 13 1650.69 1862.96 1.13 1648.32 1855.28 1.13 1645.96 1847.60 1.12 16 231.98 281.98 1.22 231.43 281.17 1.21 230.88 280.36 1.21
Bending Moment in Interior Column The bending moment in interior column at location A (refer Figure 3) under three different load cases are compared between conventional, 63o diagrid and 76o diagrid structure. The results are tabulated in Table 8 and Table 9. It is found that the column for 63o diagrid building has lower bending moment compared to conventional building. The ratio of bending moment also decreasing for 63o diagrid structure especially when the lateral load applied to it is high (from load case 1 to 3) except in the column at level 16.
Table 8: Comparison of bending moment in interior column between 63 diagrid and conventional building at A
Level Load Case 1 Load Case 2 Load Case 3
Con 63o
Diagrid ratio
(dia/con) Con 63o
Diagrid ratio
(dia/con) Con 63o
Diagrid ratio
(dia/con) 1 84.40 72.52 0.86 260.97 190.91 0.73 437.54 309.30 0.71 4 25.80 41.02 1.59 94.53 75.83 0.80 163.26 127.62 0.78 7 17.71 49.14 2.77 81.66 77.93 0.95 145.60 106.72 0.73
10 -6.27 45.96 -7.33 54.81 64.55 1.18 103.56 83.14 0.80 13 -16.39 30.58 -1.87 28.47 38.18 1.34 61.13 45.78 0.75 16 -28.07 29.73 -1.06 -16.26 35.06 -2.16 -16.72 40.39 -2.42
Table 9: Comparison of bending moment in interior column between 76 diagrid and conventional building at A
Level Load Case 1 Load Case 2 Load Case 3
Con 76o
Diagrid ratio
(dia/con) Con 76o
Diagrid ratio
(dia/con) Con 76o
Diagrid ratio
(dia/con) 1 84.40 117.80 1.40 260.97 332.07 1.27 437.54 546.34 1.25 4 25.80 66.98 2.60 94.53 133.17 1.41 163.26 199.37 1.22 7 17.71 47.87 2.70 81.66 104.10 1.27 145.60 160.33 1.10
10 -6.27 36.46 -5.82 54.81 75.25 1.37 103.56 114.03 1.10 13 -16.39 33.23 -2.03 28.47 57.71 2.03 61.13 82.20 1.34 16 -28.07 11.47 -0.41 -16.26 11.99 -0.74 -16.72 20.83 -1.25
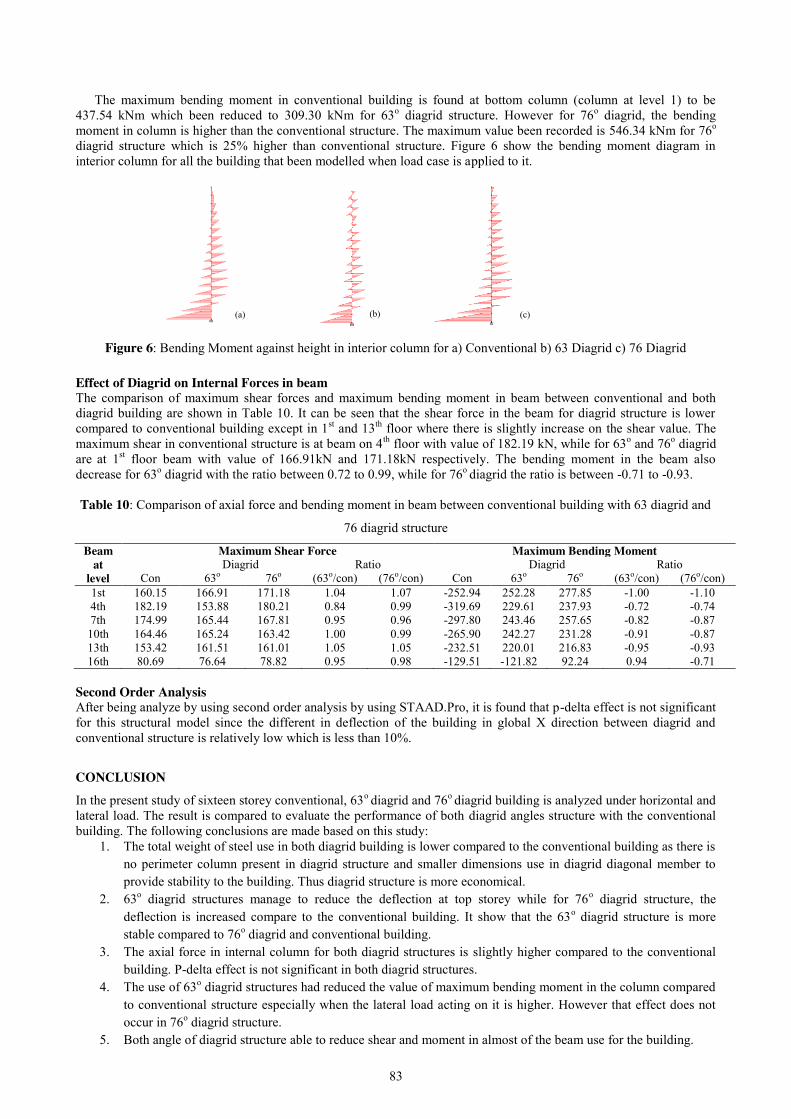
83
The maximum bending moment in conventional building is found at bottom column (column at level 1) to be 437.54 kNm which been reduced to 309.30 kNm for 63o diagrid structure. However for 76o diagrid, the bending moment in column is higher than the conventional structure. The maximum value been recorded is 546.34 kNm for 76o diagrid structure which is 25% higher than conventional structure. Figure 6 show the bending moment diagram in interior column for all the building that been modelled when load case is applied to it.
Effect of Diagrid on Internal Forces in beam The comparison of maximum shear forces and maximum bending moment in beam between conventional and both diagrid building are shown in Table 10. It can be seen that the shear force in the beam for diagrid structure is lower compared to conventional building except in 1st and 13th floor where there is slightly increase on the shear value. The maximum shear in conventional structure is at beam on 4th floor with value of 182.19 kN, while for 63o and 76o diagrid are at 1st floor beam with value of 166.91kN and 171.18kN respectively. The bending moment in the beam also decrease for 63o diagrid with the ratio between 0.72 to 0.99, while for 76o diagrid the ratio is between -0.71 to -0.93.
Table 10: Comparison of axial force and bending moment in beam between conventional building with 63 diagrid and
76 diagrid structure
Beam at
level
Maximum Shear Force Maximum Bending Moment
Con Diagrid Ratio
Con Diagrid Ratio
63o 76o (63o/con) (76o/con) 63o 76o (63o/con) (76o/con) 1st 160.15 166.91 171.18 1.04 1.07 -252.94 252.28 277.85 -1.00 -1.10 4th 182.19 153.88 180.21 0.84 0.99 -319.69 229.61 237.93 -0.72 -0.74 7th 174.99 165.44 167.81 0.95 0.96 -297.80 243.46 257.65 -0.82 -0.87 10th 164.46 165.24 163.42 1.00 0.99 -265.90 242.27 231.28 -0.91 -0.87 13th 153.42 161.51 161.01 1.05 1.05 -232.51 220.01 216.83 -0.95 -0.93 16th 80.69 76.64 78.82 0.95 0.98 -129.51 -121.82 92.24 0.94 -0.71
Second Order Analysis After being analyze by using second order analysis by using STAAD.Pro, it is found that p-delta effect is not significant for this structural model since the different in deflection of the building in global X direction between diagrid and conventional structure is relatively low which is less than 10%.
CONCLUSION In the present study of sixteen storey conventional, 63o diagrid and 76o diagrid building is analyzed under horizontal and lateral load. The result is compared to evaluate the performance of both diagrid angles structure with the conventional building. The following conclusions are made based on this study:
1. The total weight of steel use in both diagrid building is lower compared to the conventional building as there is no perimeter column present in diagrid structure and smaller dimensions use in diagrid diagonal member to provide stability to the building. Thus diagrid structure is more economical.
2. 63o diagrid structures manage to reduce the deflection at top storey while for 76o diagrid structure, the deflection is increased compare to the conventional building. It show that the 63o diagrid structure is more stable compared to 76o diagrid and conventional building.
3. The axial force in internal column for both diagrid structures is slightly higher compared to the conventional building. P-delta effect is not significant in both diagrid structures.
4. The use of 63o diagrid structures had reduced the value of maximum bending moment in the column compared to conventional structure especially when the lateral load acting on it is higher. However that effect does not occur in 76o diagrid structure.
5. Both angle of diagrid structure able to reduce shear and moment in almost of the beam use for the building.
Figure 6: Bending Moment against height in interior column for a) Conventional b) 63 Diagrid c) 76 Diagrid
(a) (b) (c)

84
It is found that the building with 63o diagrid structural systems perform the best compared to conventional and 76o diagrid structural system. For building with 76o diagrid structure, although its use the same type of structural system which is diagrid, it performs poorer compared to the conventional building in deflection and bending moment for interior column. This might happen because the angle of inclination used for 76o diagrid structures is already exceeding the optimum inclination angle for this building. Further study need to be done in order to know the optimum inclination angle for this building. In general, diagrid structural system can give better performance and lower the total construction cost if the inclination angle are been selected properly.
CONCLUSION
[1] (n.d.). Retrieved October 2016, 30, from Definition.net: http://www.definitions.net/definition/building [2] Ali, M. M., & Moon, K. S. (2007). Structural Developments in Tall Buildings: Current. Architectural Science
Review, 205-223. [3] Boake, T. M. (n.d.). Diagrid Structures: Innovation and Detailing. [4] Craighead, G. (n.d.). High-Rise Security and Fire Life Safety. New York: Butterworth-Heinemann publication. [5] Jani, K., & Patel, P. V. (2013). Analysis and Design of Diagrid Structural System for High Rise Steel.
Procedia Engineering , 92 – 100. [6] Kyoung-Sun Moon, J. J. (2007). DIAGRID STRUCTURAL SYSTEMS FOR TALL
BUILDINGS:CHARACTERISTICS AND METHODOLOGY FOR PRELIMINARY DESIGN. THE STRUCTURAL DESIGN OF TALL AND SPECIAL BUILDINGS, 205–230.
[7] Marsono, A. P. (n.d.). Tall Building System Analysis and Design. University Technology Malaysia. [8] Milana, G., Gkoumas, K., & Bontempi, F. (2014). Sustainability Concepts in the Design of High-Rise
buildings: the. Third International Workshop on Design in Civil and Environmental Engineering (pp. 1-10). Rome: ResearchGate.
[9] Moon, K. (2009). Design and Construction of Steel Diagrid Structures. Nordic Steel Construction Conference 2009, (pp. 398-405). USA.
[10] Moon, K. S. (2008). Optimal Grid Geometry of Diagrid Structures forTall Buildings. Architectural Science Review, 239-251.
[11] Moon, M. M. (2007). Structural Developments in Tall Buildings: Current Trends and Future Prospects. Architectural Science Review, 205-223.
[12] Yadav, S., & Garg, D. V. (2015). Advantage of Steel Diagrid Building Over Conventional Building. International Journal of Civil and Structural Engineering Research, 394-406.
[13] ZALKA, K., & MACLEOD, I. A. (1996). The equivalent column concept in stability analysis of buildings. The Structural Engineer, 405-411.
85
Influence of Different Configuration of Diagrid-frame System in Reducing the Lateral Displacement of Structures
Nadia Farhanis Binti Zulkifli1, Roslida Abd Samat2 Faculty of Civil Engineering, Universiti Teknologi Malaysia, Malaysia
Keywords: Diagrid structures; High rise; Lateral displacement
ABSTRACT: Diagrid system is a tall building system that has emerged to control the lateral displacement high rise building. Diagrid which comes from the combination of the words “diagonal” and “grid”, consists of diagonally intersecting metal, concrete or wooden beams of framework that are used for construction of roofs and buildings. Many researches had been conducted on full diagrid structures where diagrid members are constructed at the entire height of a high rise building. However, there is no research had been carried out on the diagrid system that is constructed above other tall building systems despite the existence of such buildings in the world. The purpose of this study is to understand the behaviour of the lateral displacement of diagrid system that is built above a frame system. STAAD.Pro V8i software was utilized to analyse for the lateral displacement of four model types which are full frame, full diagrid and combination of diagrid-frame that had the diagrid starts at two different levels. An experiment on the physical models of the four model types was conducted to obtain the lateral displacement of the models. It is concluded that the lateral displacement of the diagrid-frame model was smaller than the one of the full frame models but was larger than the one of full diagrid models. The lateral displacement of diagrid-frame model is significantly larger when the diagrid started at mid height of the models compared to when the diagrid started at one third height of the models for aspect ratio that ranged between 4 to 5. The lateral displacement of both diagrid-frame model types was almost the same for aspect ratio exceeding 5.
INTRODUCTION
High rise building is defined differently in each source. One of them is from Massachusetts, United States General Laws which defines high rise building as more than 70 feet (21m), while the building that has 100m high or more is called as skyscraper in accordance with emporis which is a leading database for building information worldwide. Super tall building has 300m high or more and building that has 600m high or higher is called as mega-tall. These tall buildings have their own structural systems to support their loading which are gravity loads that are caused by dead and live loads and the lateral wind and earthquake loads. The structural system can divided be into two categories which are: Interior Structures and Exterior Structures
The interior structure is defined as a structure that has the main part of the lateral load resisting system located inside of the building. Examples of the interior structural system are rigid frame, shear wall structure and outrigger structure. Exterior structures is defined as a structure that has its main part of the lateral load resisting system located at the building perimeter. Examples of this structures is tube system, diagrid system, space truss and super frame structures. Problem Statement The Lotte World Tower building as shown in Figure 1 is located in Seoul, South Korea and has the height of 555.7m and 123 floors. This construction of the tower begun on 2011 and was completed this year, in 2016. The structural design of the building applies the diagrid system only at the exterior top of the building that are exposed. Furthermore, the lateral load resisting system for this tower consists of central reinforced concrete core walls, two sets of steel outriggers, eight reinforced concrete core walls, two sets of steel outriggers, eight reinforced concrete mega-columns, and two sets of steel belt trusses as shown in Figure 1 (Kim et al, 2015). According to Professor Kim Jong-rak from School of Architecture in Soongsil University, the diagrid structure without large corner columns also can withhold the weight of building. The forces which are caused by typhoon and earthquake will increase the horizontal resistance of diagrid.
Another building that utilizes diagrid which is constructed above another tall building system is Hearst Tower, New York. The diagrid system of Hearst Tower is supported by mega columns and super-diagonals that are constructed from the foundation to the 10th floor. (Rahimian and Eilon, 2006). There are abundance of researches that had been conducted on full diagrid structures, but, nevertheless there is no study on combination of diagrid with other tall building systems that had been carried out.
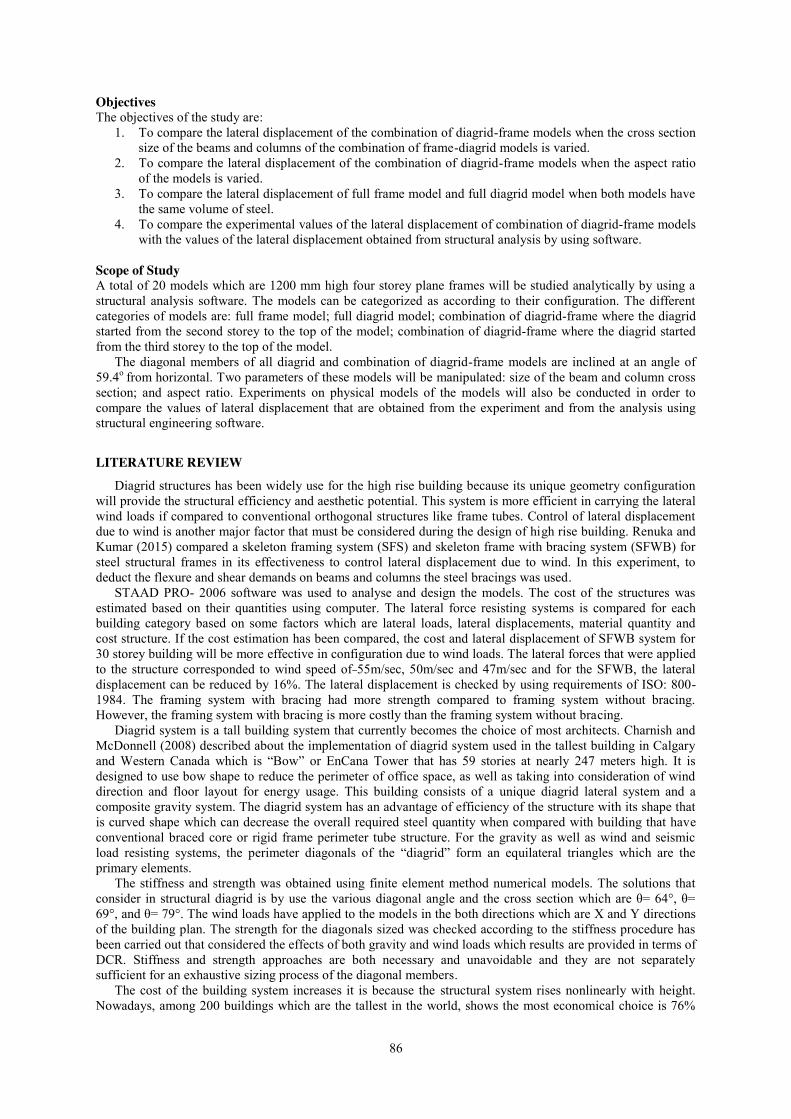
86
Objectives The objectives of the study are:
1. To compare the lateral displacement of the combination of diagrid-frame models when the cross section size of the beams and columns of the combination of frame-diagrid models is varied.
2. To compare the lateral displacement of the combination of diagrid-frame models when the aspect ratio of the models is varied.
3. To compare the lateral displacement of full frame model and full diagrid model when both models have the same volume of steel.
4. To compare the experimental values of the lateral displacement of combination of diagrid-frame models with the values of the lateral displacement obtained from structural analysis by using software.
Scope of Study A total of 20 models which are 1200 mm high four storey plane frames will be studied analytically by using a structural analysis software. The models can be categorized as according to their configuration. The different categories of models are: full frame model; full diagrid model; combination of diagrid-frame where the diagrid started from the second storey to the top of the model; combination of diagrid-frame where the diagrid started from the third storey to the top of the model.
The diagonal members of all diagrid and combination of diagrid-frame models are inclined at an angle of 59.4o from horizontal. Two parameters of these models will be manipulated: size of the beam and column cross section; and aspect ratio. Experiments on physical models of the models will also be conducted in order to compare the values of lateral displacement that are obtained from the experiment and from the analysis using structural engineering software.
LITERATURE REVIEW
Diagrid structures has been widely use for the high rise building because its unique geometry configuration will provide the structural efficiency and aesthetic potential. This system is more efficient in carrying the lateral wind loads if compared to conventional orthogonal structures like frame tubes. Control of lateral displacement due to wind is another major factor that must be considered during the design of high rise building. Renuka and Kumar (2015) compared a skeleton framing system (SFS) and skeleton frame with bracing system (SFWB) for steel structural frames in its effectiveness to control lateral displacement due to wind. In this experiment, to deduct the flexure and shear demands on beams and columns the steel bracings was used.
STAAD PRO- 2006 software was used to analyse and design the models. The cost of the structures was estimated based on their quantities using computer. The lateral force resisting systems is compared for each building category based on some factors which are lateral loads, lateral displacements, material quantity and cost structure. If the cost estimation has been compared, the cost and lateral displacement of SFWB system for 30 storey building will be more effective in configuration due to wind loads. The lateral forces that were applied to the structure corresponded to wind speed of 55m/sec, 50m/sec and 47m/sec and for the SFWB, the lateral displacement can be reduced by 16%. The lateral displacement is checked by using requirements of ISO: 800-1984. The framing system with bracing had more strength compared to framing system without bracing. However, the framing system with bracing is more costly than the framing system without bracing.
Diagrid system is a tall building system that currently becomes the choice of most architects. Charnish and McDonnell (2008) described about the implementation of diagrid system used in the tallest building in Calgary and Western Canada which is “Bow” or EnCana Tower that has 59 stories at nearly 247 meters high. It is designed to use bow shape to reduce the perimeter of office space, as well as taking into consideration of wind direction and floor layout for energy usage. This building consists of a unique diagrid lateral system and a composite gravity system. The diagrid system has an advantage of efficiency of the structure with its shape that is curved shape which can decrease the overall required steel quantity when compared with building that have conventional braced core or rigid frame perimeter tube structure. For the gravity as well as wind and seismic load resisting systems, the perimeter diagonals of the “diagrid” form an equilateral triangles which are the primary elements.
The stiffness and strength was obtained using finite element method numerical models. The solutions that consider in structural diagrid is by use the various diagonal angle and the cross section which are θ= 64°, θ= 69°, and θ= 79°. The wind loads have applied to the models in the both directions which are X and Y directions of the building plan. The strength for the diagonals sized was checked according to the stiffness procedure has been carried out that considered the effects of both gravity and wind loads which results are provided in terms of DCR. Stiffness and strength approaches are both necessary and unavoidable and they are not separately sufficient for an exhaustive sizing process of the diagonal members.
The cost of the building system increases it is because the structural system rises nonlinearly with height. Nowadays, among 200 buildings which are the tallest in the world, shows the most economical choice is 76%

87
are within the range of 50-70 stories. Using the simple braced frame model, the optimal angle for diagonal members can be estimated. The difference between core bracings and diagrids are the core bracing are configured to generate different fundamental periods in the x and y directions but the diagrids are configured symmetrically in both directions. Then, each scheme 2 structure will divided into two separate structures which are a braced core and a diagrid to estimate the respective contributions of perimeter diagrids and the braced core to the lateral stiffness.
The lateral stiffness for the diagrid structures is attractive because it is not only for static loads but also for dynamic loads that create responses in windward and across-wind directions. The aspect ratio for 42-story buildings is about 5, it is good range if the ratio lower than 10° in terms of bending which can reduce the lateral displacement when the building height decreases
METHODOLOGY
Generally, there were four types of models used in this study. Each model was a four story plane frame that had different configuration as shown in Figure 2. The four configurations of models used are: Full frame model; Full diagrid model; Combination of diagrid-frame where the diagrid started from the second storey to the top of the model; Combination of diagrid-frame where the diagrid started from the third storey to the top of the model.
Figure 2: Four types models studied: (a) full frame (b) full diagrid (c) combination of diagrid-frame where
diagrid started at Level 2 (d) combination of diagrid-frame where diagrid started at Level 3
The four structural model types were designed such that the diagonal members formed an angle of 59.4o from the horizontal. These models were analysed by using the STAAD.Pro V8i structural engineering software to determine the lateral displacement when a uniform distributed lateral load of 10kN/mm was applied to the entire height of the models. The beams and columns had the same cross section size. The same procedure was repeated when the size of the beam and column cross section was changed. The size of the beam and column cross section used was: 50 mm wide x 6 mm thick, 50 mm wide x 8 mm thick, 80 mm wide x 6 mm thick and 80 mm wide x 8 mm thick. The volume of each structure was calculated. Then, graphs of lateral displacement and the steel volume versus size of the beam and column cross section for each model types were plotted.
The next part of this study is to understand the behaviour of the lateral displacement of the four types of models when the aspect ratio of the models is varied. Three different aspect ratios that were used are 4, 5 and 6.7. Only the breadth of the models was varied while keeping the height of the models as 1200mm for all aspect ratios. The models which were acted by a uniform distributed lateral load of 10 kN/mm were analysed for lateral displacement by using StaadPro. Graphs of lateral displacement with varying aspect ratio was plotted for all model types.
(a) (b)
Figure 3: (a) Full diagrid model under testing (b) data logger used to record the data
(a) (b) (c) (d)
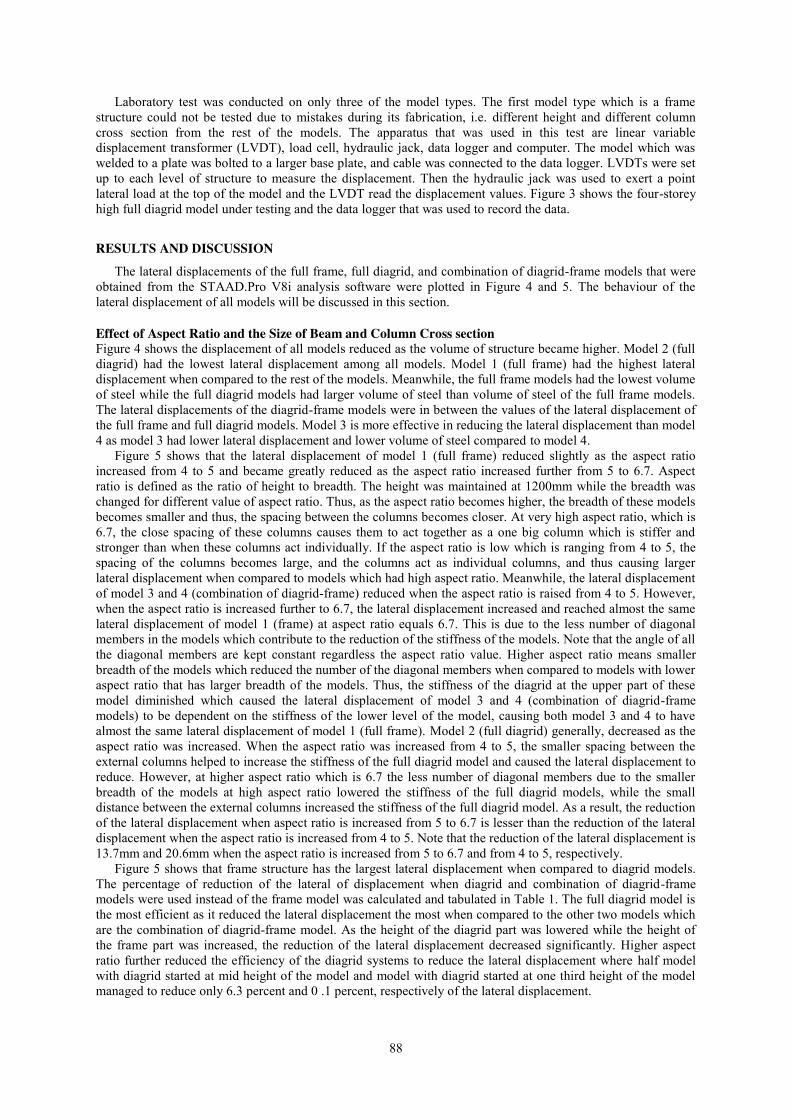
88
Laboratory test was conducted on only three of the model types. The first model type which is a frame structure could not be tested due to mistakes during its fabrication, i.e. different height and different column cross section from the rest of the models. The apparatus that was used in this test are linear variable displacement transformer (LVDT), load cell, hydraulic jack, data logger and computer. The model which was welded to a plate was bolted to a larger base plate, and cable was connected to the data logger. LVDTs were set up to each level of structure to measure the displacement. Then the hydraulic jack was used to exert a point lateral load at the top of the model and the LVDT read the displacement values. Figure 3 shows the four-storey high full diagrid model under testing and the data logger that was used to record the data.
RESULTS AND DISCUSSION The lateral displacements of the full frame, full diagrid, and combination of diagrid-frame models that were
obtained from the STAAD.Pro V8i analysis software were plotted in Figure 4 and 5. The behaviour of the lateral displacement of all models will be discussed in this section.
Effect of Aspect Ratio and the Size of Beam and Column Cross section Figure 4 shows the displacement of all models reduced as the volume of structure became higher. Model 2 (full diagrid) had the lowest lateral displacement among all models. Model 1 (full frame) had the highest lateral displacement when compared to the rest of the models. Meanwhile, the full frame models had the lowest volume of steel while the full diagrid models had larger volume of steel than volume of steel of the full frame models. The lateral displacements of the diagrid-frame models were in between the values of the lateral displacement of the full frame and full diagrid models. Model 3 is more effective in reducing the lateral displacement than model 4 as model 3 had lower lateral displacement and lower volume of steel compared to model 4.
Figure 5 shows that the lateral displacement of model 1 (full frame) reduced slightly as the aspect ratio increased from 4 to 5 and became greatly reduced as the aspect ratio increased further from 5 to 6.7. Aspect ratio is defined as the ratio of height to breadth. The height was maintained at 1200mm while the breadth was changed for different value of aspect ratio. Thus, as the aspect ratio becomes higher, the breadth of these models becomes smaller and thus, the spacing between the columns becomes closer. At very high aspect ratio, which is 6.7, the close spacing of these columns causes them to act together as a one big column which is stiffer and stronger than when these columns act individually. If the aspect ratio is low which is ranging from 4 to 5, the spacing of the columns becomes large, and the columns act as individual columns, and thus causing larger lateral displacement when compared to models which had high aspect ratio. Meanwhile, the lateral displacement of model 3 and 4 (combination of diagrid-frame) reduced when the aspect ratio is raised from 4 to 5. However, when the aspect ratio is increased further to 6.7, the lateral displacement increased and reached almost the same lateral displacement of model 1 (frame) at aspect ratio equals 6.7. This is due to the less number of diagonal members in the models which contribute to the reduction of the stiffness of the models. Note that the angle of all the diagonal members are kept constant regardless the aspect ratio value. Higher aspect ratio means smaller breadth of the models which reduced the number of the diagonal members when compared to models with lower aspect ratio that has larger breadth of the models. Thus, the stiffness of the diagrid at the upper part of these model diminished which caused the lateral displacement of model 3 and 4 (combination of diagrid-frame models) to be dependent on the stiffness of the lower level of the model, causing both model 3 and 4 to have almost the same lateral displacement of model 1 (full frame). Model 2 (full diagrid) generally, decreased as the aspect ratio was increased. When the aspect ratio was increased from 4 to 5, the smaller spacing between the external columns helped to increase the stiffness of the full diagrid model and caused the lateral displacement to reduce. However, at higher aspect ratio which is 6.7 the less number of diagonal members due to the smaller breadth of the models at high aspect ratio lowered the stiffness of the full diagrid models, while the small distance between the external columns increased the stiffness of the full diagrid model. As a result, the reduction of the lateral displacement when aspect ratio is increased from 5 to 6.7 is lesser than the reduction of the lateral displacement when the aspect ratio is increased from 4 to 5. Note that the reduction of the lateral displacement is 13.7mm and 20.6mm when the aspect ratio is increased from 5 to 6.7 and from 4 to 5, respectively.
Figure 5 shows that frame structure has the largest lateral displacement when compared to diagrid models. The percentage of reduction of the lateral of displacement when diagrid and combination of diagrid-frame models were used instead of the frame model was calculated and tabulated in Table 1. The full diagrid model is the most efficient as it reduced the lateral displacement the most when compared to the other two models which are the combination of diagrid-frame model. As the height of the diagrid part was lowered while the height of the frame part was increased, the reduction of the lateral displacement decreased significantly. Higher aspect ratio further reduced the efficiency of the diagrid systems to reduce the lateral displacement where half model with diagrid started at mid height of the model and model with diagrid started at one third height of the model managed to reduce only 6.3 percent and 0 .1 percent, respectively of the lateral displacement.
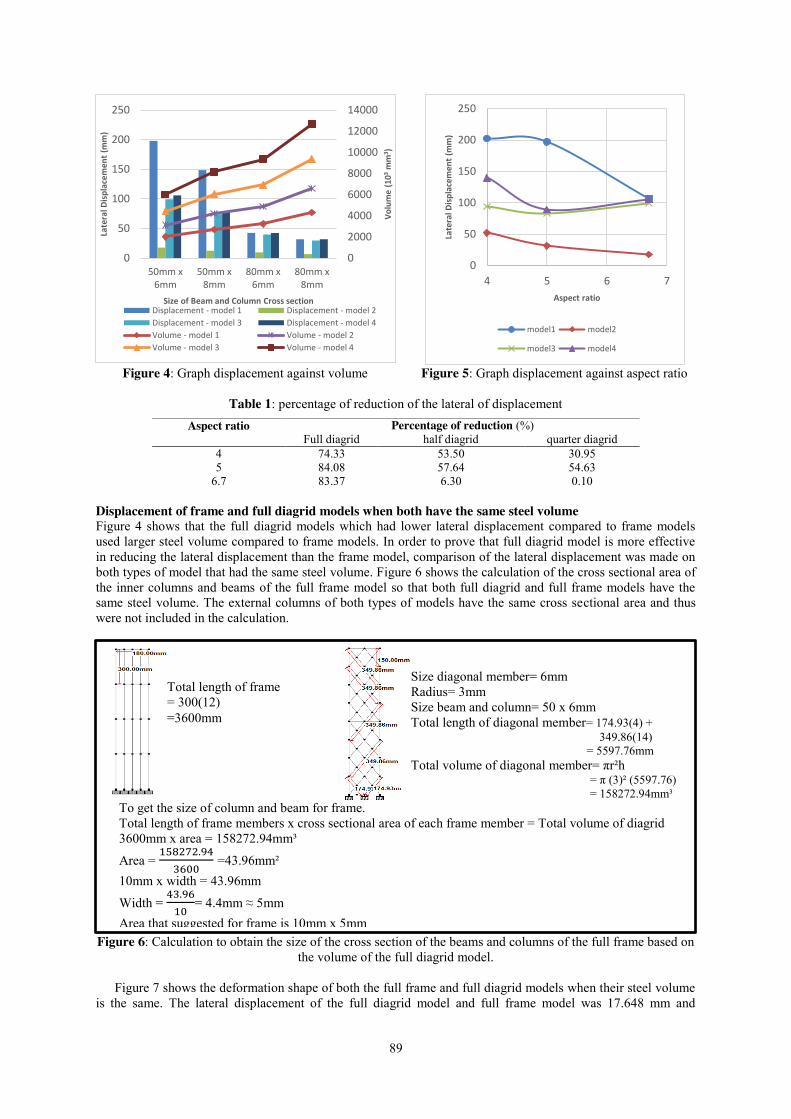
89
Figure 4: Graph displacement against volume Figure 5: Graph displacement against aspect ratio
Table 1: percentage of reduction of the lateral of displacement
Displacement of frame and full diagrid models when both have the same steel volume Figure 4 shows that the full diagrid models which had lower lateral displacement compared to frame models used larger steel volume compared to frame models. In order to prove that full diagrid model is more effective in reducing the lateral displacement than the frame model, comparison of the lateral displacement was made on both types of model that had the same steel volume. Figure 6 shows the calculation of the cross sectional area of the inner columns and beams of the full frame model so that both full diagrid and full frame models have the same steel volume. The external columns of both types of models have the same cross sectional area and thus were not included in the calculation.
Figure 6: Calculation to obtain the size of the cross section of the beams and columns of the full frame based on
the volume of the full diagrid model.
Figure 7 shows the deformation shape of both the full frame and full diagrid models when their steel volume is the same. The lateral displacement of the full diagrid model and full frame model was 17.648 mm and
0
2000
4000
6000
8000
10000
12000
14000
0
50
100
150
200
250
50mm x6mm
50mm x8mm
80mm x6mm
80mm x8mm
Vol
ume
(103
mm
3 )
Late
ral D
ispl
acem
ent
(mm
)
Size of Beam and Column Cross section Displacement - model 1 Displacement - model 2Displacement - model 3 Displacement - model 4Volume - model 1 Volume - model 2Volume - model 3 Volume - model 4
0
50
100
150
200
250
4 5 6 7
Late
ral D
ispl
acem
ent
(mm
)
Aspect ratio
model1 model2
model3 model4
Aspect ratio Percentage of reduction (%) Full diagrid half diagrid quarter diagrid
4 74.33 53.50 30.95 5 84.08 57.64 54.63
6.7 83.37 6.30 0.10
Size diagonal member= 6mm Radius= 3mm Size beam and column= 50 x 6mm Total length of diagonal member= 174.93(4) +
349.86(14) = 5597.76mm
Total volume of diagonal member= πr²h = π (3)² (5597.76) = 158272.94mm³
Total length of frame = 300(12) =3600mm
To get the size of column and beam for frame. Total length of frame members x cross sectional area of each frame member = Total volume of diagrid 3600mm x area = 158272.94mm³
Area = 158272.94
3600 =43.96mm²
10mm x width = 43.96mm
Width = 43.96
10= 4.4mm ≈ 5mm
Area that suggested for frame is 10mm x 5mm
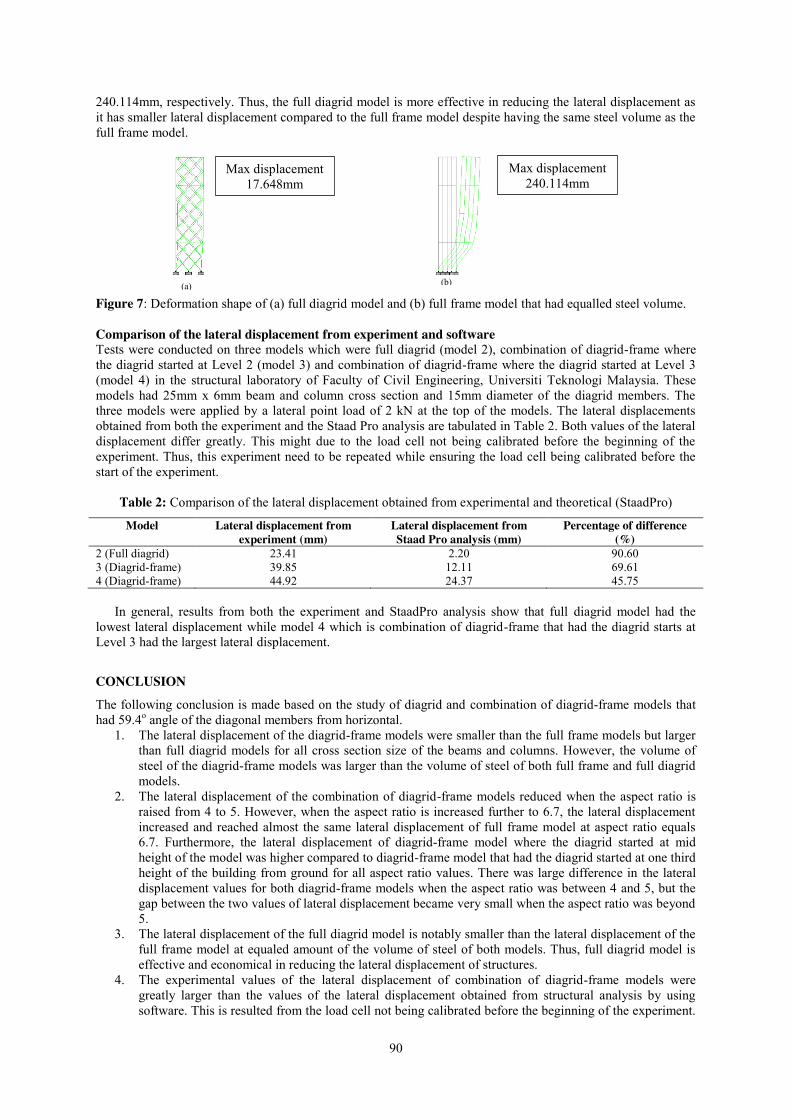
90
240.114mm, respectively. Thus, the full diagrid model is more effective in reducing the lateral displacement as it has smaller lateral displacement compared to the full frame model despite having the same steel volume as the full frame model.
Figure 7: Deformation shape of (a) full diagrid model and (b) full frame model that had equalled steel volume. Comparison of the lateral displacement from experiment and software Tests were conducted on three models which were full diagrid (model 2), combination of diagrid-frame where the diagrid started at Level 2 (model 3) and combination of diagrid-frame where the diagrid started at Level 3 (model 4) in the structural laboratory of Faculty of Civil Engineering, Universiti Teknologi Malaysia. These models had 25mm x 6mm beam and column cross section and 15mm diameter of the diagrid members. The three models were applied by a lateral point load of 2 kN at the top of the models. The lateral displacements obtained from both the experiment and the Staad Pro analysis are tabulated in Table 2. Both values of the lateral displacement differ greatly. This might due to the load cell not being calibrated before the beginning of the experiment. Thus, this experiment need to be repeated while ensuring the load cell being calibrated before the start of the experiment.
Table 2: Comparison of the lateral displacement obtained from experimental and theoretical (StaadPro)
Model Lateral displacement from experiment (mm)
Lateral displacement from Staad Pro analysis (mm)
Percentage of difference (%)
2 (Full diagrid) 23.41 2.20 90.60 3 (Diagrid-frame) 39.85 12.11 69.61 4 (Diagrid-frame) 44.92 24.37 45.75
In general, results from both the experiment and StaadPro analysis show that full diagrid model had the lowest lateral displacement while model 4 which is combination of diagrid-frame that had the diagrid starts at Level 3 had the largest lateral displacement.
CONCLUSION
The following conclusion is made based on the study of diagrid and combination of diagrid-frame models that had 59.4o angle of the diagonal members from horizontal.
1. The lateral displacement of the diagrid-frame models were smaller than the full frame models but larger than full diagrid models for all cross section size of the beams and columns. However, the volume of steel of the diagrid-frame models was larger than the volume of steel of both full frame and full diagrid models.
2. The lateral displacement of the combination of diagrid-frame models reduced when the aspect ratio is raised from 4 to 5. However, when the aspect ratio is increased further to 6.7, the lateral displacement increased and reached almost the same lateral displacement of full frame model at aspect ratio equals 6.7. Furthermore, the lateral displacement of diagrid-frame model where the diagrid started at mid height of the model was higher compared to diagrid-frame model that had the diagrid started at one third height of the building from ground for all aspect ratio values. There was large difference in the lateral displacement values for both diagrid-frame models when the aspect ratio was between 4 and 5, but the gap between the two values of lateral displacement became very small when the aspect ratio was beyond 5.
3. The lateral displacement of the full diagrid model is notably smaller than the lateral displacement of the full frame model at equaled amount of the volume of steel of both models. Thus, full diagrid model is effective and economical in reducing the lateral displacement of structures.
4. The experimental values of the lateral displacement of combination of diagrid-frame models were greatly larger than the values of the lateral displacement obtained from structural analysis by using software. This is resulted from the load cell not being calibrated before the beginning of the experiment.
Max displacement 240.114mm
Max displacement 17.648mm
(a) (b)
91
Thus, it is recommended to repeat the experiment, but the load cell must be calibrated beforehand to ensure the accuracy of the experimental data.
REFERENCES [1] Rahimian, Ahmad and Eilon, Yoran (2006). New York’s Hearst Tower: A Restoration, an Adaptive
Reuse and a Modern Steel Tower Rolled Into One, Structure magazine, February 2006, pp 25-29 [2] Renuka, J. and Kumar, M.P. (2015). Effect of configuration on lateral displacement and cost of the
structure for high rise steel space frames subjected to wind loads. International Journal of Research in Engineering and Technology Vol 4, Issue 1
[3] Charnish, B. and McDonell, T. (2008). “The Bow”: Unique Diagrid Structural System for a Sustainable Tall Building. Council on Tall Buildings and Urban Habitat 8th World Congress 2008ced high strength steel tube diagrid using TRIZ and nonlinear pushover analysis. Journal of Constructional Steel Research 96: 151-158
[4] Smith and Coull, 1991.Tall Building Structures: Analysis and Design. Wiley. [5] Wang, A.P and Lin, Y.H. (2007). Vibration control of a tall building subjected to earthquake excitation,
Journal of Sound and Vibration 299: 757-773
92
Section Properties Calculation by MATLAB Software of Lipped C Section
Nurizaty Zuhan1, Shek Poi Ngian2 Faculty of Civil Engineering, Universiti Teknologi Malaysia, Malaysia
Keywords: lightweight steel; graphical user interface; lipped C stud
ABSTRACT. This paper present details of study on developing a software to calculate the Gross section properties and Effective section properties of lipped C section which is one of the Cold Formed Steel section for a single section. Thus, the calculation of the gross section properties and effective section are based on BS EN 1993-1-1, BS EN 1993-1-3 and BS EN 1993-1-5. The software been develop by using Graphical User Interface (GUI) application from MATLAB on calculation the properties. Based on study, at the beginning of development of software, it start with produce small function for every single calculation on the properties , next all the small function combined together by using coding in the GUI’s function that been design the interface required. After all the formula for calculation is ready, the result produce is analyzed by making comparison with the existing data from existing company for example STEELON, RONDO and EVOSTEEL company provided in their catalogue. During the comparison, there are difference ratio between the results and the existing data been produce. Other than that, the interface produce by the study also been compared with the existing interface of SwinChannel produce by Swinburne University of Technology form Melbourne, Australia. The interface been compared in term of friendly user interface which mean easy to be used and understood by the users. The study shows that the program that been develop via this study produce a good agreement within the existing software in term of friendly user interface and also the result just slightly different compared to existing data as the result and existing data ratio in range 0.94-1.04.
INTRODUCTION
Cold formed section (CFS) uses of galvanized cold formed steel section as the main structural component by construction industry [1]. Thus, engineer that involve in structural analysis on the frame need to masters on how to analyze it in term of buckling capacity. This is because of it slenderness, CFS tend to buckle easily compare to universal ‘I’ section. Even though, it is very sensitive in buckling capacity, there are few advantages found which can improve construction industry in our country. CFS have high resistance against moisture, fire, beat, and insects and chemical which mean it can resist corrosive [2].
Current scenario in engineering field show that the needs of software as a tool become more crucial due to working demand today as the engineer need to compete with the other engineers and other company. Besides, software can provide less time consuming and less error working result as the criteria meet with demand for today industries. Thus, it is become a needs for all engineering students to learn on how to produce and master software in order for them to survive in engineering field [3]. There are few software currently used by the certain engineers to analyse their structure i.e. ETABs, STAADPRO, THINWALL and TEDDS. However, the software provided in the market is very expensive to afford by company especially the. At the meantime, it is quite costly for a student that just want to learn about it. Besides, some of user facing problem of difficulty to conduct the software as there is no specific instruction for the user to use it.
Problem Statement Cold Formed Section (CFS) become common material to be used in construction industry. However, some of engineer facing difficulties in analyse of the structural member of CFS due to complex calculation. Besides, manual calculation is no longer appropriate to be applied due to complexity in design and less time consuming required, which mean an engineer can finish up their analysis in short of period with less error result. As for today, it is become a competition among the engineer in the market as the client would demanding the result in short time of period. Therefore, production of software become needs in today construction industry as software will lead to many benefits for the users themselves.
In industry, software can save cost as the shorter duration for the engineer to analyse the structure and produce structural detail drawing. In addition, for complex calculation like LSF, software become crucial tool to be applied. Even though, there are a lot of software been develop to help the engineer to do complex calculation, not many of the software been develop to analyse CFS on lipped channel type of section. As if there is a software, the price will be
93
much more expensive and only certain company have it. Commonly, in order to produce a tender, the engineer need to show their design calculation in the proposal, thus, the engineer need data on the gross section properties and effective section properties in producing design calculation.
Commonly, gross section properties is provided in the catalogue by material company, but not for effective section properties. Thus, either, the engineer need to calculate the effective properties by self or ask the other engineer to calculate for them that would include cost. The problem rise when the situation involve the cost and time consumption. Plus, if the engineer simple used gross section properties in their design process, they might wrongly estimate the capacity of steel that might induces errors. For example for Capacity of Cross Section, 𝑁𝑐,𝑅𝑑 value from cross section area, Ag multiply with design strength, 𝑓𝑦. The calculation will produce bigger value when using gross section area compare to effective section area. That is why effective section properties is important. Objective The purpose of this study is to develop analysis software of lipped ‘C’ section problem. The objective of this study are as follow:
1. To develop a software in order to calculate gross section properties and effective section properties of lipped channel section.
2. To validate the existing software result with the section properties from steel company. 3. To do comparison between the interface from study with the interface from existing software. 4. To do parametric study on the influence of effective area to the cross section capacity.
Scope of Study The scope of the study are to develop and run software by calculate section properties of lipped C section using available channel in market; to validate the result with the existing section properties steel company; to compared the interface with interface from existing software; to do parametric study on influence of area towards the cross section capacity.
LITRETURE REVIEW
Previous Research Recent year, technology been develop rapidly in order to inspire easy life for the human being as well as construction industries. People tend to develop software for their uses as they just need to enter the input then, they will get the answer [2]. Software is part of computer system that consist of encoded that contain computer’s information or instruction. Some of software happened in a web such people just need excess it by using internet. Some exist in a file that can be copied by anyone without need the software tools.
The studies can be focus in two ways which on how the software requirement theoretically and the best research on the cold formed steel section by carry out the experiment. One of the research is by Tian [4], showed the increase in axial load capacity of cold formed steel wall frames based on the sheltering type and material properties. The attachment of boards to the side of the wall can increase the axial strength of the wall up to 91% when comparing the case of no sheathing (Bare-Bare) to that of oriented strand board on both sides (OSB-OSB).
Tang (2016) have conduct full experiment study on the load bearing capacity of lightweight modular wall stud panel with different configuration of stud such as single lipped C stud, double back-to-back lipped C stud and double box lipped stud [5]. From the experiment, the load capacity of the wall panel with single lipped C is 43.80kN and for the double back-to-back lipped C section is in range 111.10kN to 118.90kN. Then for double box lipped C stud wall is in the range of 82.70kN to 93.10kN respectively. Thus, it show that the back-to-back lipped C section has much higher cross section capacity compared to the other arrangement.
Existing Software Interface Software interface by the research study will be compare with the existing interface from SwinChannel software develop by Swinburne University of Technology, Melbourne. Thus, Figure 2 show the existing software interface by SwinChannel in order to calculate the gross section properties of lipped C section. Existing Data Catalogue from a few material company been taken in order to validate the result from research study, so that the difference ratio can be defined. Thus, the existing data for gross section properties and effective section properties been review from the catalogue. There is no big issues for gross section properties as it is common to be provided, however, for effective section properties which is needed in design process, usually not been provided in the catalogue. Thus, Figure 2 show example of existing data from STEELON Company’s catalogue.
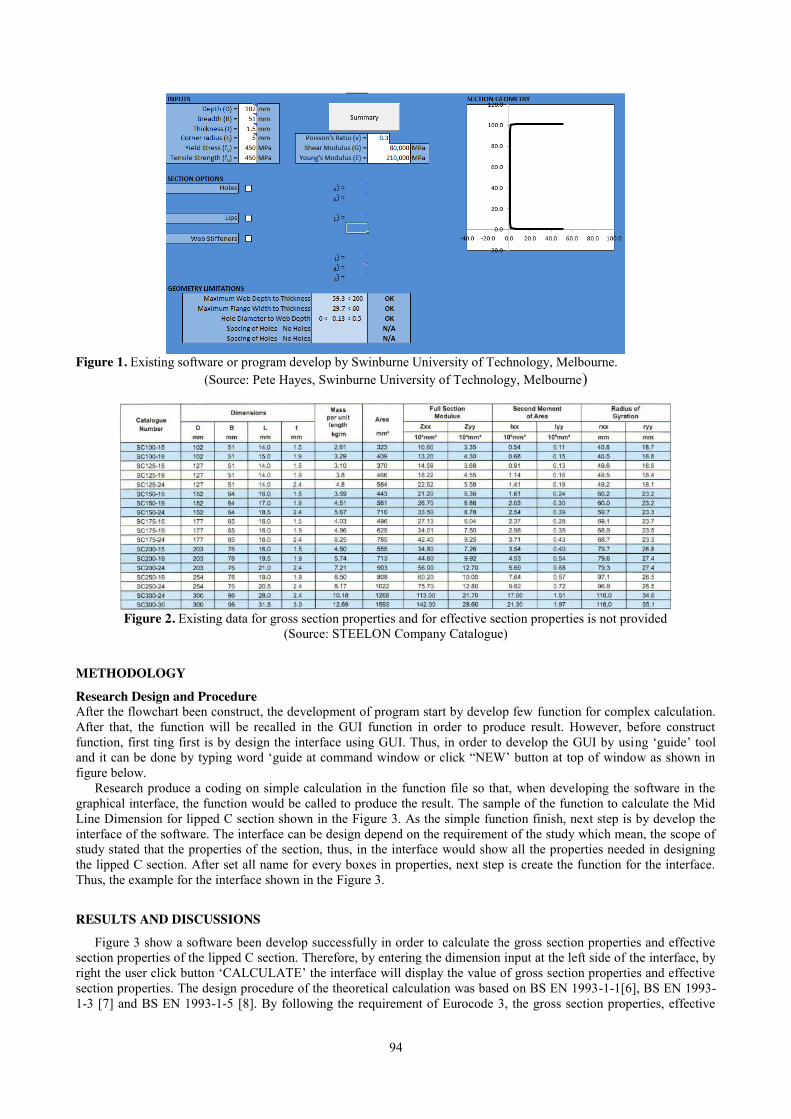
94
Figure 1. Existing software or program develop by Swinburne University of Technology, Melbourne.
(Source: Pete Hayes, Swinburne University of Technology, Melbourne)
Figure 2. Existing data for gross section properties and for effective section properties is not provided
(Source: STEELON Company Catalogue)
METHODOLOGY
Research Design and Procedure After the flowchart been construct, the development of program start by develop few function for complex calculation. After that, the function will be recalled in the GUI function in order to produce result. However, before construct function, first ting first is by design the interface using GUI. Thus, in order to develop the GUI by using ‘guide’ tool and it can be done by typing word ‘guide at command window or click “NEW’ button at top of window as shown in figure below.
Research produce a coding on simple calculation in the function file so that, when developing the software in the graphical interface, the function would be called to produce the result. The sample of the function to calculate the Mid Line Dimension for lipped C section shown in the Figure 3. As the simple function finish, next step is by develop the interface of the software. The interface can be design depend on the requirement of the study which mean, the scope of study stated that the properties of the section, thus, in the interface would show all the properties needed in designing the lipped C section. After set all name for every boxes in properties, next step is create the function for the interface. Thus, the example for the interface shown in the Figure 3.
RESULTS AND DISCUSSIONS
Figure 3 show a software been develop successfully in order to calculate the gross section properties and effective section properties of the lipped C section. Therefore, by entering the dimension input at the left side of the interface, by right the user click button ‘CALCULATE’ the interface will display the value of gross section properties and effective section properties. The design procedure of the theoretical calculation was based on BS EN 1993-1-1[6], BS EN 1993-1-3 [7] and BS EN 1993-1-5 [8]. By following the requirement of Eurocode 3, the gross section properties, effective
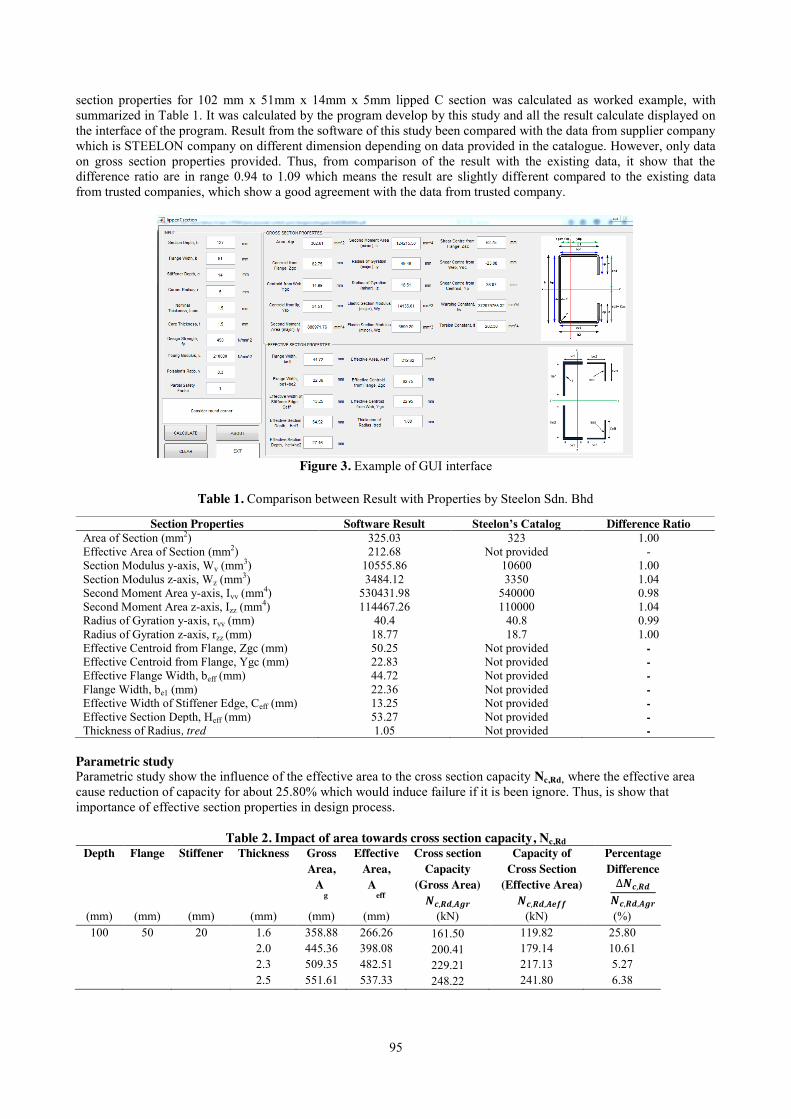
95
section properties for 102 mm x 51mm x 14mm x 5mm lipped C section was calculated as worked example, with summarized in Table 1. It was calculated by the program develop by this study and all the result calculate displayed on the interface of the program. Result from the software of this study been compared with the data from supplier company which is STEELON company on different dimension depending on data provided in the catalogue. However, only data on gross section properties provided. Thus, from comparison of the result with the existing data, it show that the difference ratio are in range 0.94 to 1.09 which means the result are slightly different compared to the existing data from trusted companies, which show a good agreement with the data from trusted company.
Figure 3. Example of GUI interface
Table 1. Comparison between Result with Properties by Steelon Sdn. Bhd
Parametric study Parametric study show the influence of the effective area to the cross section capacity Nc,Rd, where the effective area cause reduction of capacity for about 25.80% which would induce failure if it is been ignore. Thus, is show that importance of effective section properties in design process.
Table 2. Impact of area towards cross section capacity, Nc,Rd Depth Flange Stiffener Thickness Gross
Area, A
g
Effective Area, A
eff
Cross section Capacity
(Gross Area) 𝑵𝒄,𝑹𝒅,𝑨𝒈𝒓
Capacity of Cross Section
(Effective Area) 𝑵𝒄,𝑹𝒅,𝑨𝒆𝒇𝒇
Percentage Difference
∆𝑵𝒄,𝑹𝒅
𝑵𝒄,𝑹𝒅,𝑨𝒈𝒓
(mm) (mm) (mm) (mm) (mm) (mm) (kN) (kN) (%) 100 50 20 1.6 358.88 266.26 161.50 119.82 25.80
2.0 445.36 398.08 200.41 179.14 10.61 2.3 509.35 482.51 229.21 217.13 5.27 2.5 551.61 537.33 248.22 241.80 6.38
Section Properties Software Result Steelon’s Catalog Difference Ratio Area of Section (mm2) 325.03 323 1.00 Effective Area of Section (mm2) 212.68 Not provided - Section Modulus y-axis, Wy (mm3) 10555.86 10600 1.00 Section Modulus z-axis, Wz (mm3) 3484.12 3350 1.04 Second Moment Area y-axis, Iyy (mm4) 530431.98 540000 0.98 Second Moment Area z-axis, Izz (mm4) 114467.26 110000 1.04 Radius of Gyration y-axis, ryy (mm) 40.4 40.8 0.99 Radius of Gyration z-axis, rzz (mm) 18.77 18.7 1.00 Effective Centroid from Flange, Zgc (mm) 50.25 Not provided - Effective Centroid from Flange, Ygc (mm) 22.83 Not provided - Effective Flange Width, beff (mm) 44.72 Not provided - Flange Width, be1 (mm) 22.36 Not provided - Effective Width of Stiffener Edge, Ceff (mm) 13.25 Not provided - Effective Section Depth, Heff (mm) 53.27 Not provided - Thickness of Radius, tred 1.05 Not provided -
96
CONCLUSION
The theoretical result on cold formed lipped C section on gross section properties, effective section properties, output from developed software and validation of result with the data from existing material company like STEELON Company from their catalogue is present in this paper. This paper also show the example of coding by using MATLAB as tool for the interface and also the theoretical calculation. Thus, several conclusion been stated below:
1. The results from the developed software shows good agreement with the existing software and provide more data that suitable for designer using Eurocode 3.
2. The properties calculated from the software shows good agreement with the data provided by local steel company.
3. The capacity calculated using effective properties shows significant reduction as compared to those calculated using gross properties, where the difference is in the range of 1.0% to 25.8%
4. The parametric study show that, area of cross section influence the capacity of cross section.
REFERENCES [1] Stark, G., Gad, E., F., Duffield, C., F., Hutchinson, G., L., Mansell, D., S., 1999. Lateral performance of cold-
formed steel-framed domestic. Engineering Structures, Volume 21, pp. 83-95. [2] Clifton, C., n.d. Frequently Asked Questions about Light Steel Framed Housing (LSF), New Zealand: National
Association of Steel-Framed Housing Inc. [3] Ghazali, A., 2011. Software Development Of Meshfree Method (Polynomial Interpolation Method (Pim)) For I-
dimensional Beam Problem, Johor Bahru: Universiti Teknologi Malaysia. [4] Tian, Y., Wang, J., & Lu, T. (2007). Axial Load Capacity of Cold-Formed Steel Wall Stud with Sheathing. [5] TING, T. S., 2016. Structural Behaviour Of Lightweight Modular Wall, Johor Bahru, Malaysia: Universiti
Teknologi Malaysia. [6] BSI. (2006). BS EN 1991-1-1. [7] BSI. (2006). BS EN 1993-1-3. [8] BSI. (2006). BS EN 1993-1-5.

97
Structural Behaviour of Light Weight Steel Frame under Combined Gravity and Lateral Loadings
Lim Teck Thong1, Shek Poi Ngian2 Faculty of Civil Engineering, University Technology Malaysia, Malaysia
Keywords: Light Weight Steel Frame; Cold Formed Steel; Structural Behavior; Combined Gravity and Lateral Loadings.
ABSTRACT. Cold-formed steel is a rolling process of steel at temperature close to normal room temperature. This type of steel in the past few decades has gained exponential popularity due to its magnificent advantages offered in application of construction industry. The purpose of this research is to investigate the structural behavior of wall panel made from cold-formed steel when subjected to combined lateral and gravity loading. A total of 6 specimens wall frame with 3 different types of wall stud configuration have built and tested under 2 experiment phases. In first phase of the experiment, 1 specimen from each different type of wall stud configuration is tested under sole monotonic lateral loading. On the second phase, the other 1 specimen from each different type of wall stud configuration is tested under combined gravity and lateral loading. The primary objective of the test is to determine the failure mode and structural behavior of wall panel. The finding of the experiment shows that type 2 and 3 wall stud configurations has increased the lateral wall resistance significantly.
INTRODUCTION For the past few decades, application of cold-formed steel in construction sector has becoming more prevalent as
cold-formed steel offers a wide variety of advantages like cost effectiveness, lightweight, high strength-to-weight ratio, high quality, long design life, high efficiency in fabrication, speedy construction, able to recycle and re-use, and produce less waste materials. Despite all these advantages offered by cold-formed steel, the application of cold-formed steel in Malaysia still in its infancy state where its application only limited to roofing system. To cope with current and future development of cold-formed steel, intensive study should be done to ensure safe, economical and high quality of cold-formed steel application in Malaysia construction industry.
Problem Statement Progressive development of cold-formed steel application in construction industry of Malaysia is inevitable due to its mass advantages. Design in cold-formed steel structure should be reliable, safe and appropriate for the intended function. However, in most of the cases, structural designer would neglect the effect of lateral loading to their cold-formed steel structure. This scenario has post an unknown risk to the structure. Effect of lateral loadings from winds could be significant for low-rise buildings as these structures have close natural frequency to wind blows. Resonance is likely to occur. In the view of the above factor, further study of cold-formed steel frame need to be carry out to ensure safe and reliable structure. Objectives The objectives of this study are:
1. To investigate the structural behaviour, lateral load resistance and deformation of lightweight modular wall panel with different wall stud configuration when subjected to combined gravity and lateral loading.
2. To compare the effect of different wall stud configuration to lateral wall resistance under lateral loading and combined gravity and lateral loading.
3. To compare the effect of gravity load to the lateral wall resistance with different wall stud configuration. Scope of Study This research involves a series of full-scale light weight 3m x 0.936m wall panel tests. A total of 6 specimens were assembled with 3 different types of wall stud arrangement. Each type of the wall stud arrangement has 2 specimens. First specimen from each type of wall stud arrangement has undergone test phase 1 (Sole monotonic lateral loading), and the second wall panel has undergone test phase 2 (Combined lateral and gravity loadings). The three type of wall stud arrangement are: (1) Single lipped C stud (SLC 1, SLC 2); (2) Double back-to-back lipped C stud (DB 1, DB 2); (3) Double box lipped C stud. (DBB 1, DBB 2). The key focus of this research is to determine the structural behaviour, failure mode, and displacement of wall panel under combined lateral and gravity loading.
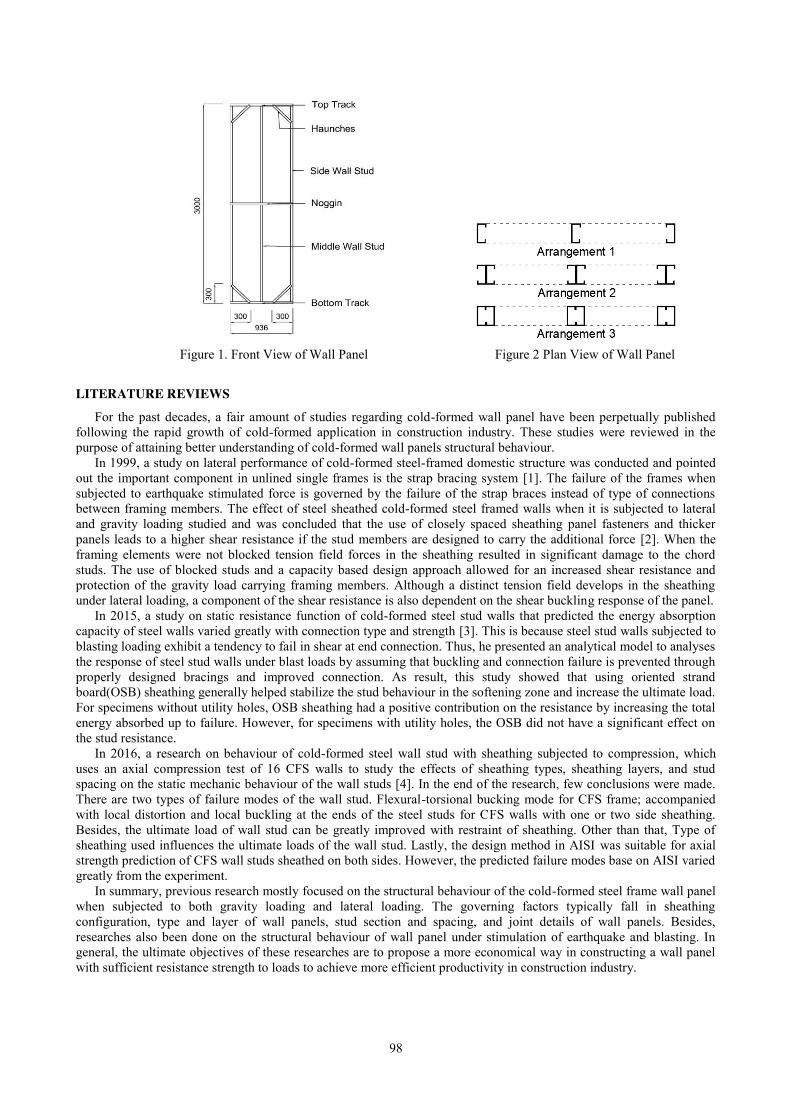
98
Figure 1. Front View of Wall Panel Figure 2 Plan View of Wall Panel
LITERATURE REVIEWS
For the past decades, a fair amount of studies regarding cold-formed wall panel have been perpetually published following the rapid growth of cold-formed application in construction industry. These studies were reviewed in the purpose of attaining better understanding of cold-formed wall panels structural behaviour.
In 1999, a study on lateral performance of cold-formed steel-framed domestic structure was conducted and pointed out the important component in unlined single frames is the strap bracing system [1]. The failure of the frames when subjected to earthquake stimulated force is governed by the failure of the strap braces instead of type of connections between framing members. The effect of steel sheathed cold-formed steel framed walls when it is subjected to lateral and gravity loading studied and was concluded that the use of closely spaced sheathing panel fasteners and thicker panels leads to a higher shear resistance if the stud members are designed to carry the additional force [2]. When the framing elements were not blocked tension field forces in the sheathing resulted in significant damage to the chord studs. The use of blocked studs and a capacity based design approach allowed for an increased shear resistance and protection of the gravity load carrying framing members. Although a distinct tension field develops in the sheathing under lateral loading, a component of the shear resistance is also dependent on the shear buckling response of the panel.
In 2015, a study on static resistance function of cold-formed steel stud walls that predicted the energy absorption capacity of steel walls varied greatly with connection type and strength [3]. This is because steel stud walls subjected to blasting loading exhibit a tendency to fail in shear at end connection. Thus, he presented an analytical model to analyses the response of steel stud walls under blast loads by assuming that buckling and connection failure is prevented through properly designed bracings and improved connection. As result, this study showed that using oriented strand board(OSB) sheathing generally helped stabilize the stud behaviour in the softening zone and increase the ultimate load. For specimens without utility holes, OSB sheathing had a positive contribution on the resistance by increasing the total energy absorbed up to failure. However, for specimens with utility holes, the OSB did not have a significant effect on the stud resistance.
In 2016, a research on behaviour of cold-formed steel wall stud with sheathing subjected to compression, which uses an axial compression test of 16 CFS walls to study the effects of sheathing types, sheathing layers, and stud spacing on the static mechanic behaviour of the wall studs [4]. In the end of the research, few conclusions were made. There are two types of failure modes of the wall stud. Flexural-torsional bucking mode for CFS frame; accompanied with local distortion and local buckling at the ends of the steel studs for CFS walls with one or two side sheathing. Besides, the ultimate load of wall stud can be greatly improved with restraint of sheathing. Other than that, Type of sheathing used influences the ultimate loads of the wall stud. Lastly, the design method in AISI was suitable for axial strength prediction of CFS wall studs sheathed on both sides. However, the predicted failure modes base on AISI varied greatly from the experiment.
In summary, previous research mostly focused on the structural behaviour of the cold-formed steel frame wall panel when subjected to both gravity loading and lateral loading. The governing factors typically fall in sheathing configuration, type and layer of wall panels, stud section and spacing, and joint details of wall panels. Besides, researches also been done on the structural behaviour of wall panel under stimulation of earthquake and blasting. In general, the ultimate objectives of these researches are to propose a more economical way in constructing a wall panel with sufficient resistance strength to loads to achieve more efficient productivity in construction industry.
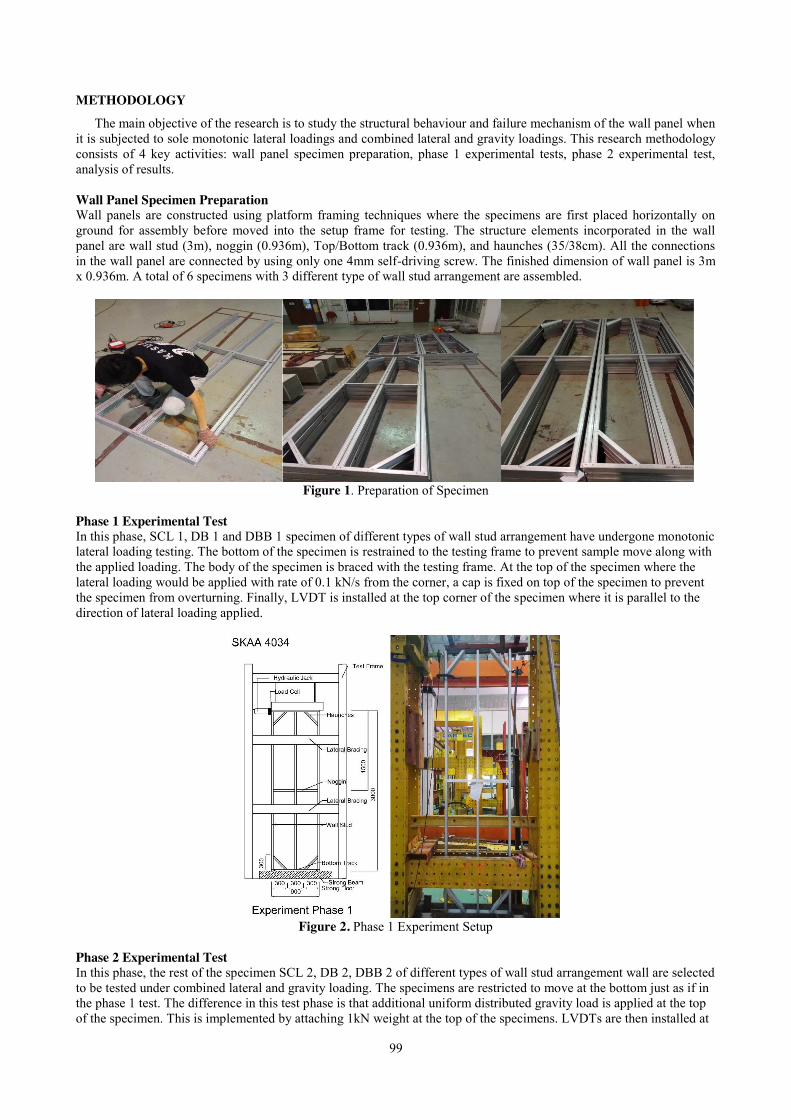
99
METHODOLOGY
The main objective of the research is to study the structural behaviour and failure mechanism of the wall panel when it is subjected to sole monotonic lateral loadings and combined lateral and gravity loadings. This research methodology consists of 4 key activities: wall panel specimen preparation, phase 1 experimental tests, phase 2 experimental test, analysis of results.
Wall Panel Specimen Preparation Wall panels are constructed using platform framing techniques where the specimens are first placed horizontally on ground for assembly before moved into the setup frame for testing. The structure elements incorporated in the wall panel are wall stud (3m), noggin (0.936m), Top/Bottom track (0.936m), and haunches (35/38cm). All the connections in the wall panel are connected by using only one 4mm self-driving screw. The finished dimension of wall panel is 3m x 0.936m. A total of 6 specimens with 3 different type of wall stud arrangement are assembled.
Figure 1. Preparation of Specimen
Phase 1 Experimental Test In this phase, SCL 1, DB 1 and DBB 1 specimen of different types of wall stud arrangement have undergone monotonic lateral loading testing. The bottom of the specimen is restrained to the testing frame to prevent sample move along with the applied loading. The body of the specimen is braced with the testing frame. At the top of the specimen where the lateral loading would be applied with rate of 0.1 kN/s from the corner, a cap is fixed on top of the specimen to prevent the specimen from overturning. Finally, LVDT is installed at the top corner of the specimen where it is parallel to the direction of lateral loading applied.
Figure 2. Phase 1 Experiment Setup
Phase 2 Experimental Test In this phase, the rest of the specimen SCL 2, DB 2, DBB 2 of different types of wall stud arrangement wall are selected to be tested under combined lateral and gravity loading. The specimens are restricted to move at the bottom just as if in the phase 1 test. The difference in this test phase is that additional uniform distributed gravity load is applied at the top of the specimen. This is implemented by attaching 1kN weight at the top of the specimens. LVDTs are then installed at
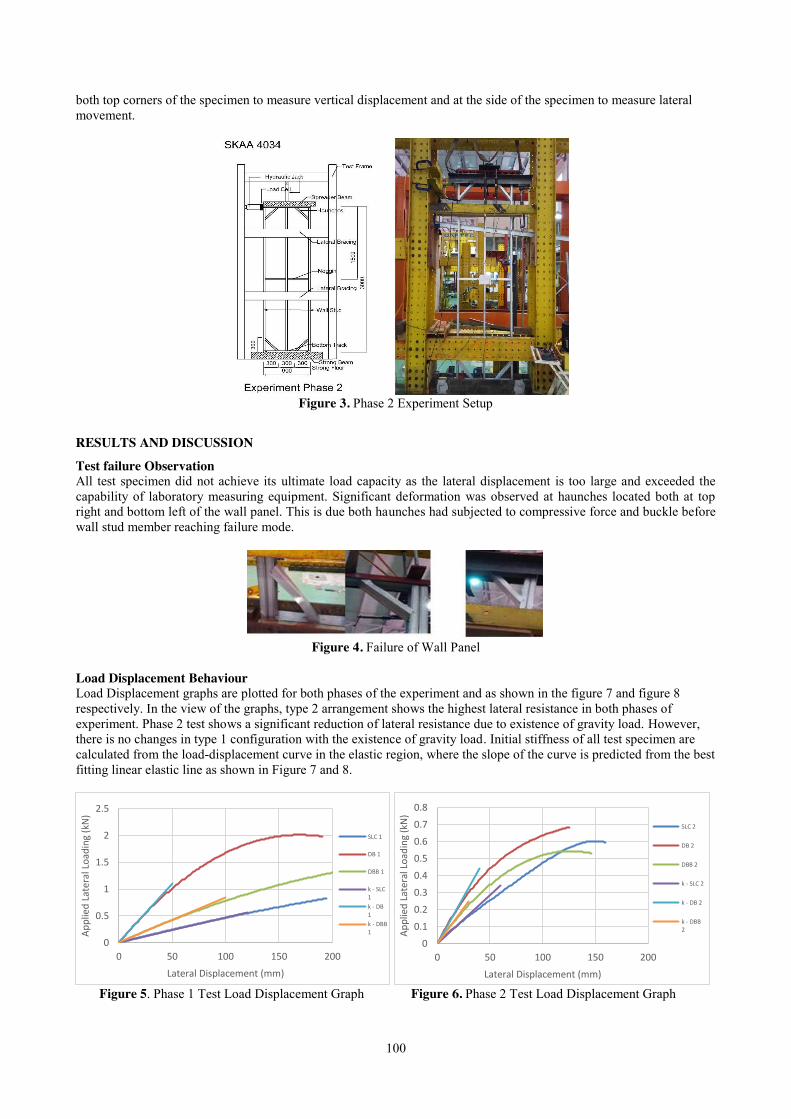
100
both top corners of the specimen to measure vertical displacement and at the side of the specimen to measure lateral movement.
Figure 3. Phase 2 Experiment Setup
RESULTS AND DISCUSSION
Test failure Observation All test specimen did not achieve its ultimate load capacity as the lateral displacement is too large and exceeded the capability of laboratory measuring equipment. Significant deformation was observed at haunches located both at top right and bottom left of the wall panel. This is due both haunches had subjected to compressive force and buckle before wall stud member reaching failure mode.
Figure 4. Failure of Wall Panel
Load Displacement Behaviour Load Displacement graphs are plotted for both phases of the experiment and as shown in the figure 7 and figure 8 respectively. In the view of the graphs, type 2 arrangement shows the highest lateral resistance in both phases of experiment. Phase 2 test shows a significant reduction of lateral resistance due to existence of gravity load. However, there is no changes in type 1 configuration with the existence of gravity load. Initial stiffness of all test specimen are calculated from the load-displacement curve in the elastic region, where the slope of the curve is predicted from the best fitting linear elastic line as shown in Figure 7 and 8.
Figure 5. Phase 1 Test Load Displacement Graph Figure 6. Phase 2 Test Load Displacement Graph
0
0.5
1
1.5
2
2.5
0 50 100 150 200
Appl
ied
Late
ral L
oadi
ng (k
N)
Lateral Displacement (mm)
SLC 1
DB 1
DBB 1
k - SLC1k - DB1k - DBB1
00.1
0.2
0.3
0.4
0.50.6
0.7
0.8
0 50 100 150 200
Appl
ied
Late
ral L
oadi
ng (k
N)
Lateral Displacement (mm)
SLC 2
DB 2
DBB 2
k - SLC 2
k - DB 2
k - DBB2
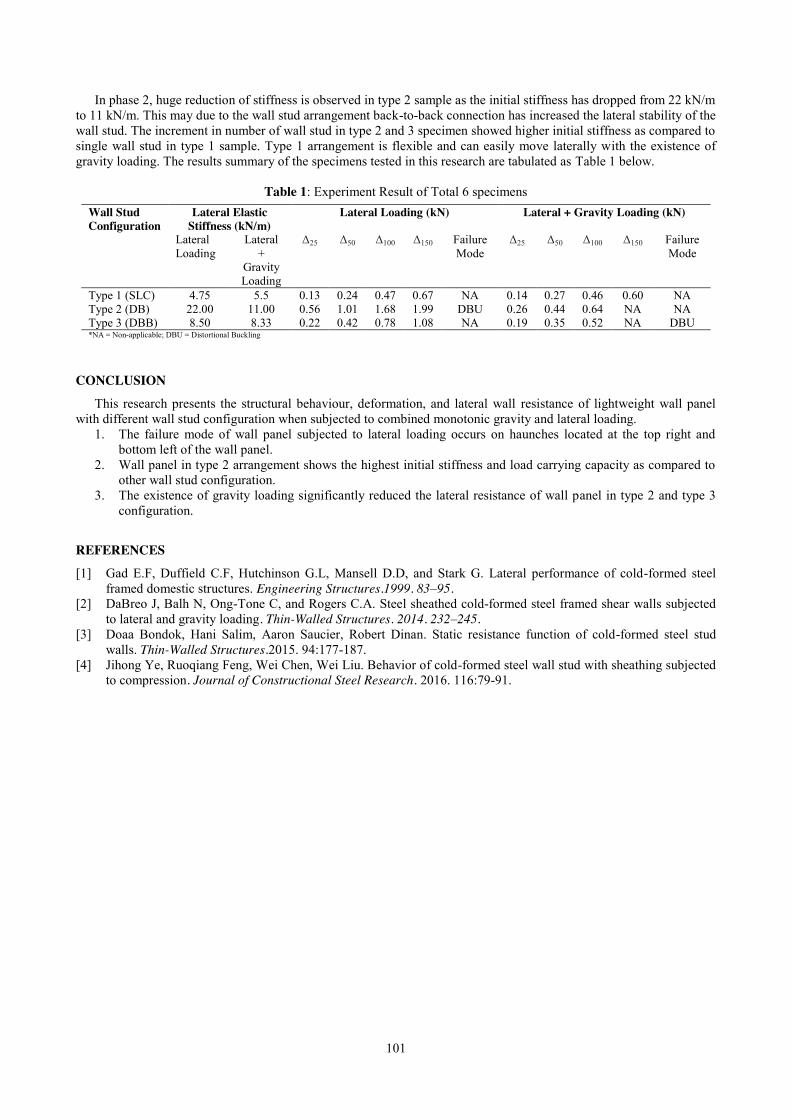
101
In phase 2, huge reduction of stiffness is observed in type 2 sample as the initial stiffness has dropped from 22 kN/m to 11 kN/m. This may due to the wall stud arrangement back-to-back connection has increased the lateral stability of the wall stud. The increment in number of wall stud in type 2 and 3 specimen showed higher initial stiffness as compared to single wall stud in type 1 sample. Type 1 arrangement is flexible and can easily move laterally with the existence of gravity loading. The results summary of the specimens tested in this research are tabulated as Table 1 below.
Table 1: Experiment Result of Total 6 specimens
CONCLUSION
This research presents the structural behaviour, deformation, and lateral wall resistance of lightweight wall panel with different wall stud configuration when subjected to combined monotonic gravity and lateral loading.
1. The failure mode of wall panel subjected to lateral loading occurs on haunches located at the top right and bottom left of the wall panel.
2. Wall panel in type 2 arrangement shows the highest initial stiffness and load carrying capacity as compared to other wall stud configuration.
3. The existence of gravity loading significantly reduced the lateral resistance of wall panel in type 2 and type 3 configuration.
REFERENCES [1] Gad E.F, Duffield C.F, Hutchinson G.L, Mansell D.D, and Stark G. Lateral performance of cold-formed steel
framed domestic structures. Engineering Structures.1999. 83–95. [2] DaBreo J, Balh N, Ong-Tone C, and Rogers C.A. Steel sheathed cold-formed steel framed shear walls subjected
to lateral and gravity loading. Thin-Walled Structures. 2014. 232–245. [3] Doaa Bondok, Hani Salim, Aaron Saucier, Robert Dinan. Static resistance function of cold-formed steel stud
walls. Thin-Walled Structures.2015. 94:177-187. [4] Jihong Ye, Ruoqiang Feng, Wei Chen, Wei Liu. Behavior of cold-formed steel wall stud with sheathing subjected
to compression. Journal of Constructional Steel Research. 2016. 116:79-91.
Wall Stud Configuration
Lateral Elastic Stiffness (kN/m)
Lateral Loading (kN) Lateral + Gravity Loading (kN)
Lateral Loading
Lateral +
Gravity Loading
Δ25
Δ50
Δ100
Δ150
Failure Mode
Δ25
Δ50
Δ100
Δ150
Failure Mode
Type 1 (SLC) 4.75 5.5 0.13 0.24 0.47 0.67 NA 0.14 0.27 0.46 0.60 NA Type 2 (DB) 22.00 11.00 0.56 1.01 1.68 1.99 DBU 0.26 0.44 0.64 NA NA Type 3 (DBB) 8.50 8.33 0.22 0.42 0.78 1.08 NA 0.19 0.35 0.52 NA DBU *NA = Non-applicable; DBU = Distortional Buckling
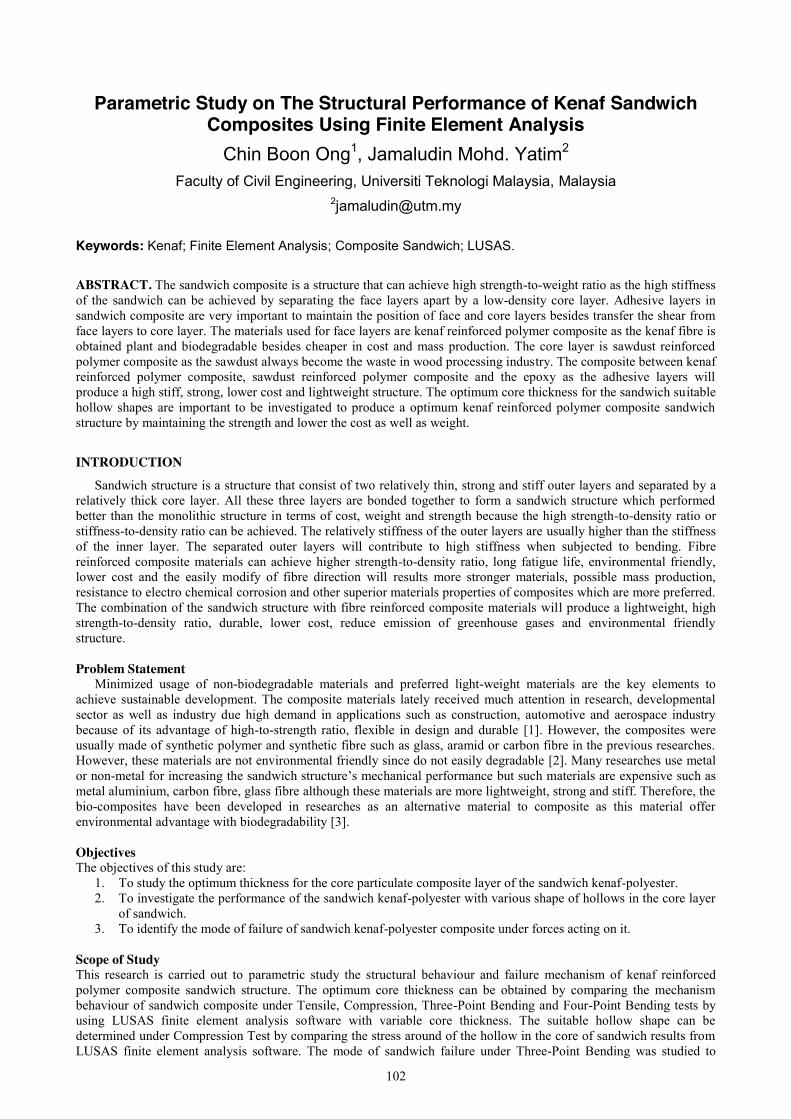
102
Parametric Study on The Structural Performance of Kenaf Sandwich Composites Using Finite Element Analysis
Chin Boon Ong1, Jamaludin Mohd. Yatim2 Faculty of Civil Engineering, Universiti Teknologi Malaysia, Malaysia
Keywords: Kenaf; Finite Element Analysis; Composite Sandwich; LUSAS.
ABSTRACT. The sandwich composite is a structure that can achieve high strength-to-weight ratio as the high stiffness of the sandwich can be achieved by separating the face layers apart by a low-density core layer. Adhesive layers in sandwich composite are very important to maintain the position of face and core layers besides transfer the shear from face layers to core layer. The materials used for face layers are kenaf reinforced polymer composite as the kenaf fibre is obtained plant and biodegradable besides cheaper in cost and mass production. The core layer is sawdust reinforced polymer composite as the sawdust always become the waste in wood processing industry. The composite between kenaf reinforced polymer composite, sawdust reinforced polymer composite and the epoxy as the adhesive layers will produce a high stiff, strong, lower cost and lightweight structure. The optimum core thickness for the sandwich suitable hollow shapes are important to be investigated to produce a optimum kenaf reinforced polymer composite sandwich structure by maintaining the strength and lower the cost as well as weight.
INTRODUCTION
Sandwich structure is a structure that consist of two relatively thin, strong and stiff outer layers and separated by a relatively thick core layer. All these three layers are bonded together to form a sandwich structure which performed better than the monolithic structure in terms of cost, weight and strength because the high strength-to-density ratio or stiffness-to-density ratio can be achieved. The relatively stiffness of the outer layers are usually higher than the stiffness of the inner layer. The separated outer layers will contribute to high stiffness when subjected to bending. Fibre reinforced composite materials can achieve higher strength-to-density ratio, long fatigue life, environmental friendly, lower cost and the easily modify of fibre direction will results more stronger materials, possible mass production, resistance to electro chemical corrosion and other superior materials properties of composites which are more preferred. The combination of the sandwich structure with fibre reinforced composite materials will produce a lightweight, high strength-to-density ratio, durable, lower cost, reduce emission of greenhouse gases and environmental friendly structure.
Problem Statement
Minimized usage of non-biodegradable materials and preferred light-weight materials are the key elements to achieve sustainable development. The composite materials lately received much attention in research, developmental sector as well as industry due high demand in applications such as construction, automotive and aerospace industry because of its advantage of high-to-strength ratio, flexible in design and durable [1]. However, the composites were usually made of synthetic polymer and synthetic fibre such as glass, aramid or carbon fibre in the previous researches. However, these materials are not environmental friendly since do not easily degradable [2]. Many researches use metal or non-metal for increasing the sandwich structure’s mechanical performance but such materials are expensive such as metal aluminium, carbon fibre, glass fibre although these materials are more lightweight, strong and stiff. Therefore, the bio-composites have been developed in researches as an alternative material to composite as this material offer environmental advantage with biodegradability [3].
Objectives The objectives of this study are:
1. To study the optimum thickness for the core particulate composite layer of the sandwich kenaf-polyester. 2. To investigate the performance of the sandwich kenaf-polyester with various shape of hollows in the core layer
of sandwich. 3. To identify the mode of failure of sandwich kenaf-polyester composite under forces acting on it.
Scope of Study This research is carried out to parametric study the structural behaviour and failure mechanism of kenaf reinforced polymer composite sandwich structure. The optimum core thickness can be obtained by comparing the mechanism behaviour of sandwich composite under Tensile, Compression, Three-Point Bending and Four-Point Bending tests by using LUSAS finite element analysis software with variable core thickness. The suitable hollow shape can be determined under Compression Test by comparing the stress around of the hollow in the core of sandwich results from LUSAS finite element analysis software. The mode of sandwich failure under Three-Point Bending was studied to
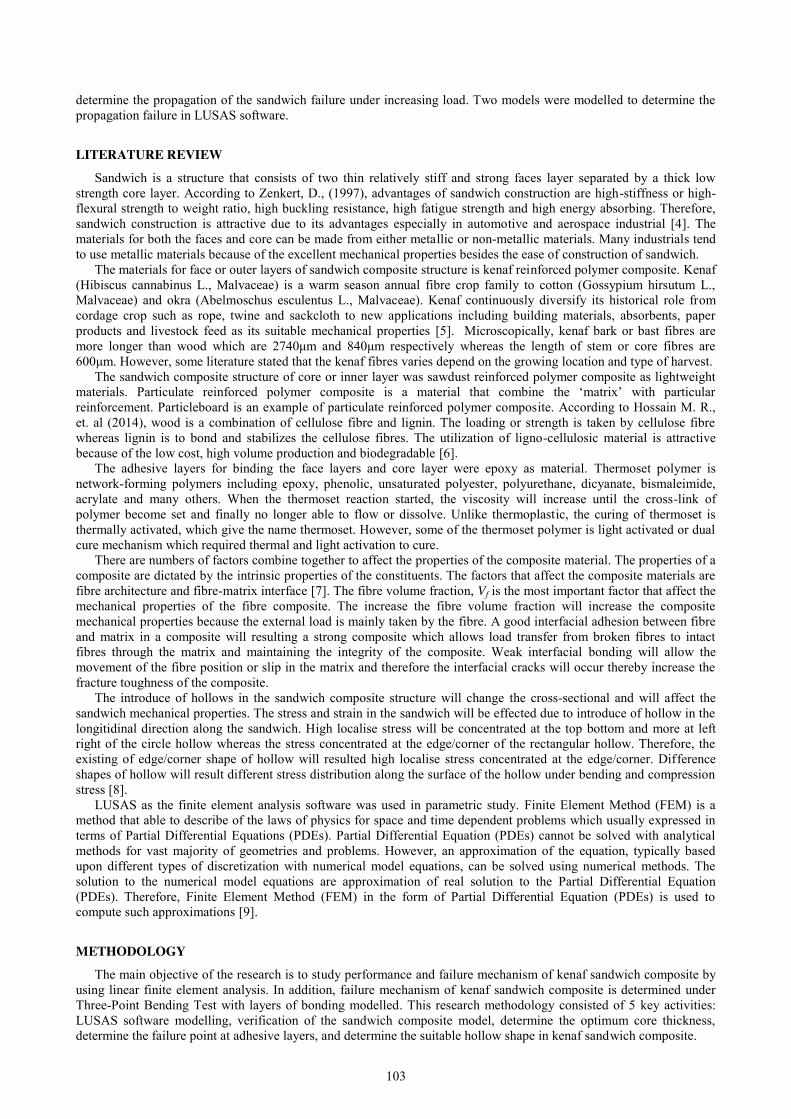
103
determine the propagation of the sandwich failure under increasing load. Two models were modelled to determine the propagation failure in LUSAS software.
LITERATURE REVIEW
Sandwich is a structure that consists of two thin relatively stiff and strong faces layer separated by a thick low strength core layer. According to Zenkert, D., (1997), advantages of sandwich construction are high-stiffness or high-flexural strength to weight ratio, high buckling resistance, high fatigue strength and high energy absorbing. Therefore, sandwich construction is attractive due to its advantages especially in automotive and aerospace industrial [4]. The materials for both the faces and core can be made from either metallic or non-metallic materials. Many industrials tend to use metallic materials because of the excellent mechanical properties besides the ease of construction of sandwich.
The materials for face or outer layers of sandwich composite structure is kenaf reinforced polymer composite. Kenaf (Hibiscus cannabinus L., Malvaceae) is a warm season annual fibre crop family to cotton (Gossypium hirsutum L., Malvaceae) and okra (Abelmoschus esculentus L., Malvaceae). Kenaf continuously diversify its historical role from cordage crop such as rope, twine and sackcloth to new applications including building materials, absorbents, paper products and livestock feed as its suitable mechanical properties [5]. Microscopically, kenaf bark or bast fibres are more longer than wood which are 2740μm and 840μm respectively whereas the length of stem or core fibres are 600μm. However, some literature stated that the kenaf fibres varies depend on the growing location and type of harvest.
The sandwich composite structure of core or inner layer was sawdust reinforced polymer composite as lightweight materials. Particulate reinforced polymer composite is a material that combine the ‘matrix’ with particular reinforcement. Particleboard is an example of particulate reinforced polymer composite. According to Hossain M. R., et. al (2014), wood is a combination of cellulose fibre and lignin. The loading or strength is taken by cellulose fibre whereas lignin is to bond and stabilizes the cellulose fibres. The utilization of ligno-cellulosic material is attractive because of the low cost, high volume production and biodegradable [6].
The adhesive layers for binding the face layers and core layer were epoxy as material. Thermoset polymer is network-forming polymers including epoxy, phenolic, unsaturated polyester, polyurethane, dicyanate, bismaleimide, acrylate and many others. When the thermoset reaction started, the viscosity will increase until the cross-link of polymer become set and finally no longer able to flow or dissolve. Unlike thermoplastic, the curing of thermoset is thermally activated, which give the name thermoset. However, some of the thermoset polymer is light activated or dual cure mechanism which required thermal and light activation to cure.
There are numbers of factors combine together to affect the properties of the composite material. The properties of a composite are dictated by the intrinsic properties of the constituents. The factors that affect the composite materials are fibre architecture and fibre-matrix interface [7]. The fibre volume fraction, Vf is the most important factor that affect the mechanical properties of the fibre composite. The increase the fibre volume fraction will increase the composite mechanical properties because the external load is mainly taken by the fibre. A good interfacial adhesion between fibre and matrix in a composite will resulting a strong composite which allows load transfer from broken fibres to intact fibres through the matrix and maintaining the integrity of the composite. Weak interfacial bonding will allow the movement of the fibre position or slip in the matrix and therefore the interfacial cracks will occur thereby increase the fracture toughness of the composite.
The introduce of hollows in the sandwich composite structure will change the cross-sectional and will affect the sandwich mechanical properties. The stress and strain in the sandwich will be effected due to introduce of hollow in the longitidinal direction along the sandwich. High localise stress will be concentrated at the top bottom and more at left right of the circle hollow whereas the stress concentrated at the edge/corner of the rectangular hollow. Therefore, the existing of edge/corner shape of hollow will resulted high localise stress concentrated at the edge/corner. Difference shapes of hollow will result different stress distribution along the surface of the hollow under bending and compression stress [8].
LUSAS as the finite element analysis software was used in parametric study. Finite Element Method (FEM) is a method that able to describe of the laws of physics for space and time dependent problems which usually expressed in terms of Partial Differential Equations (PDEs). Partial Differential Equation (PDEs) cannot be solved with analytical methods for vast majority of geometries and problems. However, an approximation of the equation, typically based upon different types of discretization with numerical model equations, can be solved using numerical methods. The solution to the numerical model equations are approximation of real solution to the Partial Differential Equation (PDEs). Therefore, Finite Element Method (FEM) in the form of Partial Differential Equation (PDEs) is used to compute such approximations [9].
METHODOLOGY
The main objective of the research is to study performance and failure mechanism of kenaf sandwich composite by using linear finite element analysis. In addition, failure mechanism of kenaf sandwich composite is determined under Three-Point Bending Test with layers of bonding modelled. This research methodology consisted of 5 key activities: LUSAS software modelling, verification of the sandwich composite model, determine the optimum core thickness, determine the failure point at adhesive layers, and determine the suitable hollow shape in kenaf sandwich composite.
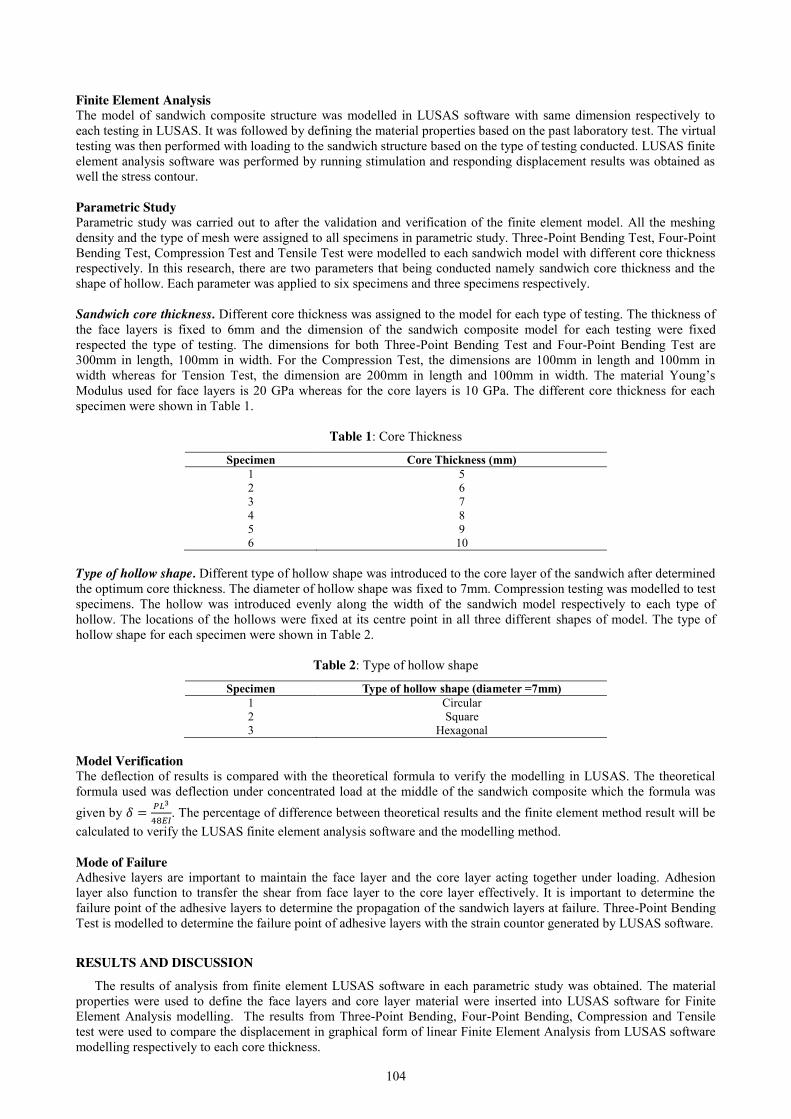
104
Finite Element Analysis The model of sandwich composite structure was modelled in LUSAS software with same dimension respectively to each testing in LUSAS. It was followed by defining the material properties based on the past laboratory test. The virtual testing was then performed with loading to the sandwich structure based on the type of testing conducted. LUSAS finite element analysis software was performed by running stimulation and responding displacement results was obtained as well the stress contour. Parametric Study Parametric study was carried out to after the validation and verification of the finite element model. All the meshing density and the type of mesh were assigned to all specimens in parametric study. Three-Point Bending Test, Four-Point Bending Test, Compression Test and Tensile Test were modelled to each sandwich model with different core thickness respectively. In this research, there are two parameters that being conducted namely sandwich core thickness and the shape of hollow. Each parameter was applied to six specimens and three specimens respectively. Sandwich core thickness. Different core thickness was assigned to the model for each type of testing. The thickness of the face layers is fixed to 6mm and the dimension of the sandwich composite model for each testing were fixed respected the type of testing. The dimensions for both Three-Point Bending Test and Four-Point Bending Test are 300mm in length, 100mm in width. For the Compression Test, the dimensions are 100mm in length and 100mm in width whereas for Tension Test, the dimension are 200mm in length and 100mm in width. The material Young’s Modulus used for face layers is 20 GPa whereas for the core layers is 10 GPa. The different core thickness for each specimen were shown in Table 1.
Table 1: Core Thickness
Specimen Core Thickness (mm) 1 5 2 6 3 7 4 8 5 9 6 10
Type of hollow shape. Different type of hollow shape was introduced to the core layer of the sandwich after determined the optimum core thickness. The diameter of hollow shape was fixed to 7mm. Compression testing was modelled to test specimens. The hollow was introduced evenly along the width of the sandwich model respectively to each type of hollow. The locations of the hollows were fixed at its centre point in all three different shapes of model. The type of hollow shape for each specimen were shown in Table 2.
Table 2: Type of hollow shape
Specimen Type of hollow shape (diameter =7mm) 1 Circular 2 Square 3 Hexagonal
Model Verification The deflection of results is compared with the theoretical formula to verify the modelling in LUSAS. The theoretical formula used was deflection under concentrated load at the middle of the sandwich composite which the formula was given by 𝛿 = 𝑃𝐿3
48𝐸𝐼. The percentage of difference between theoretical results and the finite element method result will be
calculated to verify the LUSAS finite element analysis software and the modelling method. Mode of Failure Adhesive layers are important to maintain the face layer and the core layer acting together under loading. Adhesion layer also function to transfer the shear from face layer to the core layer effectively. It is important to determine the failure point of the adhesive layers to determine the propagation of the sandwich layers at failure. Three-Point Bending Test is modelled to determine the failure point of adhesive layers with the strain countor generated by LUSAS software.
RESULTS AND DISCUSSION
The results of analysis from finite element LUSAS software in each parametric study was obtained. The material properties were used to define the face layers and core layer material were inserted into LUSAS software for Finite Element Analysis modelling. The results from Three-Point Bending, Four-Point Bending, Compression and Tensile test were used to compare the displacement in graphical form of linear Finite Element Analysis from LUSAS software modelling respectively to each core thickness.
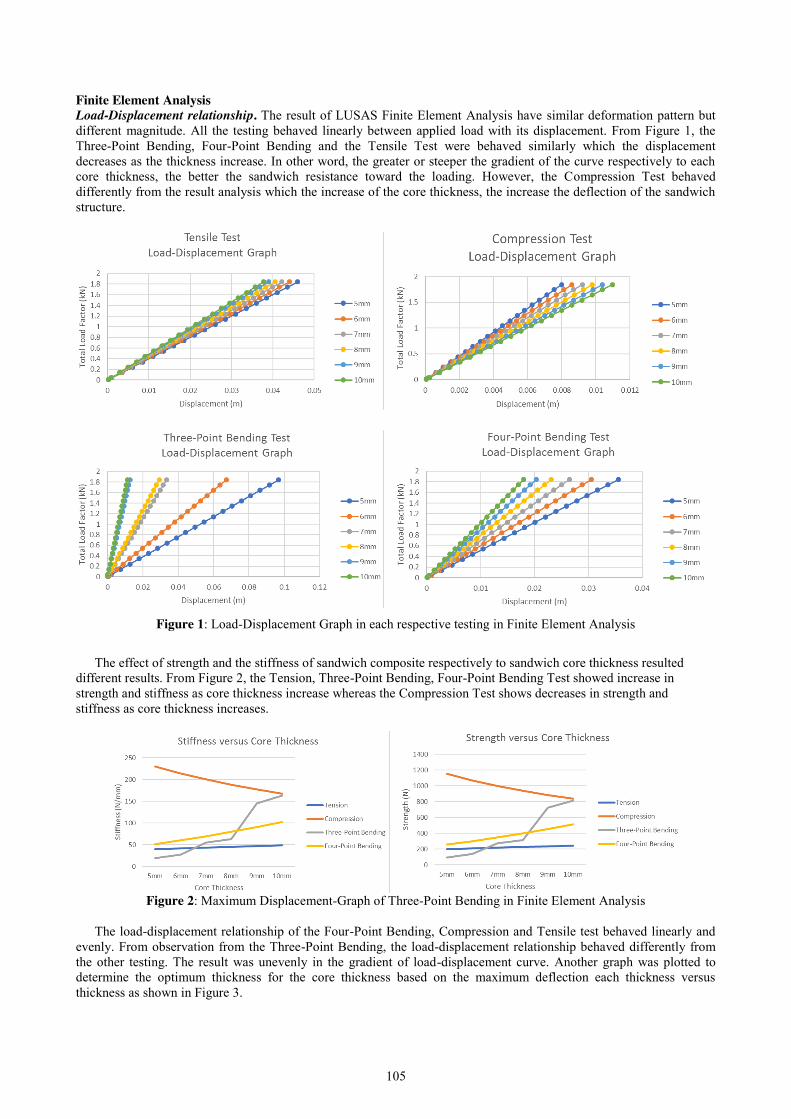
105
Finite Element Analysis Load-Displacement relationship. The result of LUSAS Finite Element Analysis have similar deformation pattern but different magnitude. All the testing behaved linearly between applied load with its displacement. From Figure 1, the Three-Point Bending, Four-Point Bending and the Tensile Test were behaved similarly which the displacement decreases as the thickness increase. In other word, the greater or steeper the gradient of the curve respectively to each core thickness, the better the sandwich resistance toward the loading. However, the Compression Test behaved differently from the result analysis which the increase of the core thickness, the increase the deflection of the sandwich structure.
Figure 1: Load-Displacement Graph in each respective testing in Finite Element Analysis
The effect of strength and the stiffness of sandwich composite respectively to sandwich core thickness resulted
different results. From Figure 2, the Tension, Three-Point Bending, Four-Point Bending Test showed increase in strength and stiffness as core thickness increase whereas the Compression Test shows decreases in strength and stiffness as core thickness increases.
Figure 2: Maximum Displacement-Graph of Three-Point Bending in Finite Element Analysis
The load-displacement relationship of the Four-Point Bending, Compression and Tensile test behaved linearly and
evenly. From observation from the Three-Point Bending, the load-displacement relationship behaved differently from the other testing. The result was unevenly in the gradient of load-displacement curve. Another graph was plotted to determine the optimum thickness for the core thickness based on the maximum deflection each thickness versus thickness as shown in Figure 3.
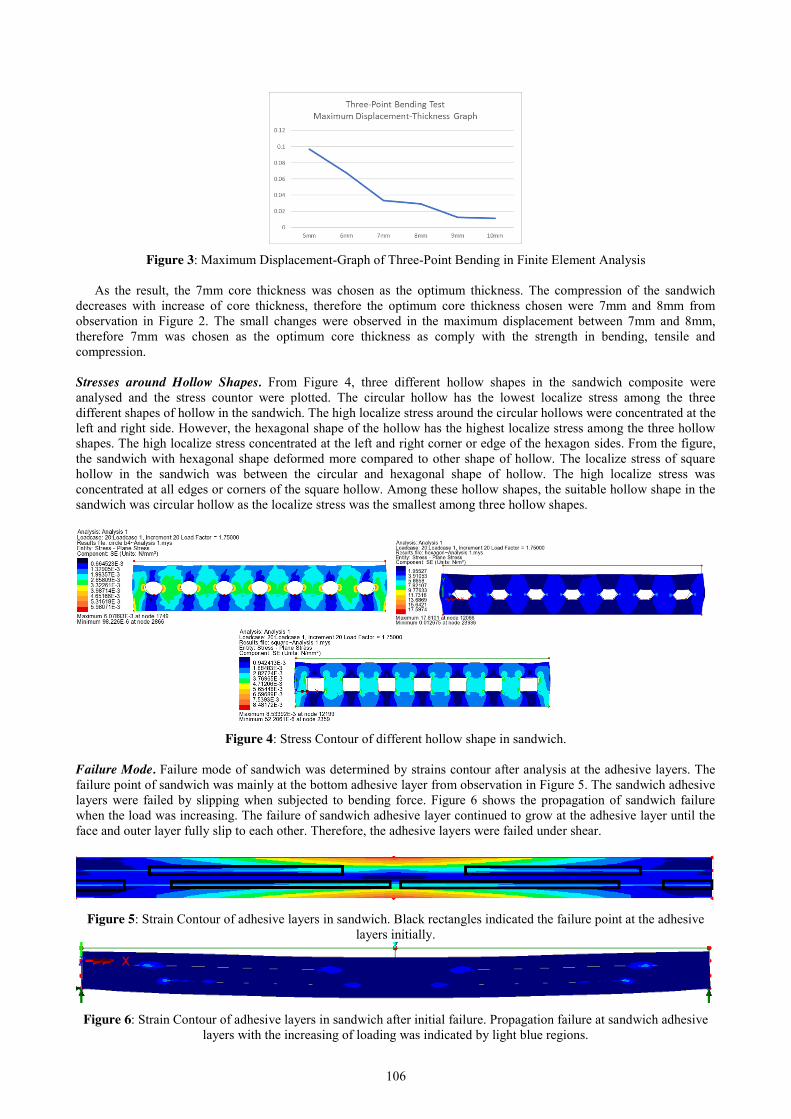
106
Figure 3: Maximum Displacement-Graph of Three-Point Bending in Finite Element Analysis
As the result, the 7mm core thickness was chosen as the optimum thickness. The compression of the sandwich
decreases with increase of core thickness, therefore the optimum core thickness chosen were 7mm and 8mm from observation in Figure 2. The small changes were observed in the maximum displacement between 7mm and 8mm, therefore 7mm was chosen as the optimum core thickness as comply with the strength in bending, tensile and compression.
Stresses around Hollow Shapes. From Figure 4, three different hollow shapes in the sandwich composite were analysed and the stress countor were plotted. The circular hollow has the lowest localize stress among the three different shapes of hollow in the sandwich. The high localize stress around the circular hollows were concentrated at the left and right side. However, the hexagonal shape of the hollow has the highest localize stress among the three hollow shapes. The high localize stress concentrated at the left and right corner or edge of the hexagon sides. From the figure, the sandwich with hexagonal shape deformed more compared to other shape of hollow. The localize stress of square hollow in the sandwich was between the circular and hexagonal shape of hollow. The high localize stress was concentrated at all edges or corners of the square hollow. Among these hollow shapes, the suitable hollow shape in the sandwich was circular hollow as the localize stress was the smallest among three hollow shapes.
Figure 4: Stress Contour of different hollow shape in sandwich.
Failure Mode. Failure mode of sandwich was determined by strains contour after analysis at the adhesive layers. The failure point of sandwich was mainly at the bottom adhesive layer from observation in Figure 5. The sandwich adhesive layers were failed by slipping when subjected to bending force. Figure 6 shows the propagation of sandwich failure when the load was increasing. The failure of sandwich adhesive layer continued to grow at the adhesive layer until the face and outer layer fully slip to each other. Therefore, the adhesive layers were failed under shear.
Figure 5: Strain Contour of adhesive layers in sandwich. Black rectangles indicated the failure point at the adhesive
layers initially.
Figure 6: Strain Contour of adhesive layers in sandwich after initial failure. Propagation failure at sandwich adhesive
layers with the increasing of loading was indicated by light blue regions.
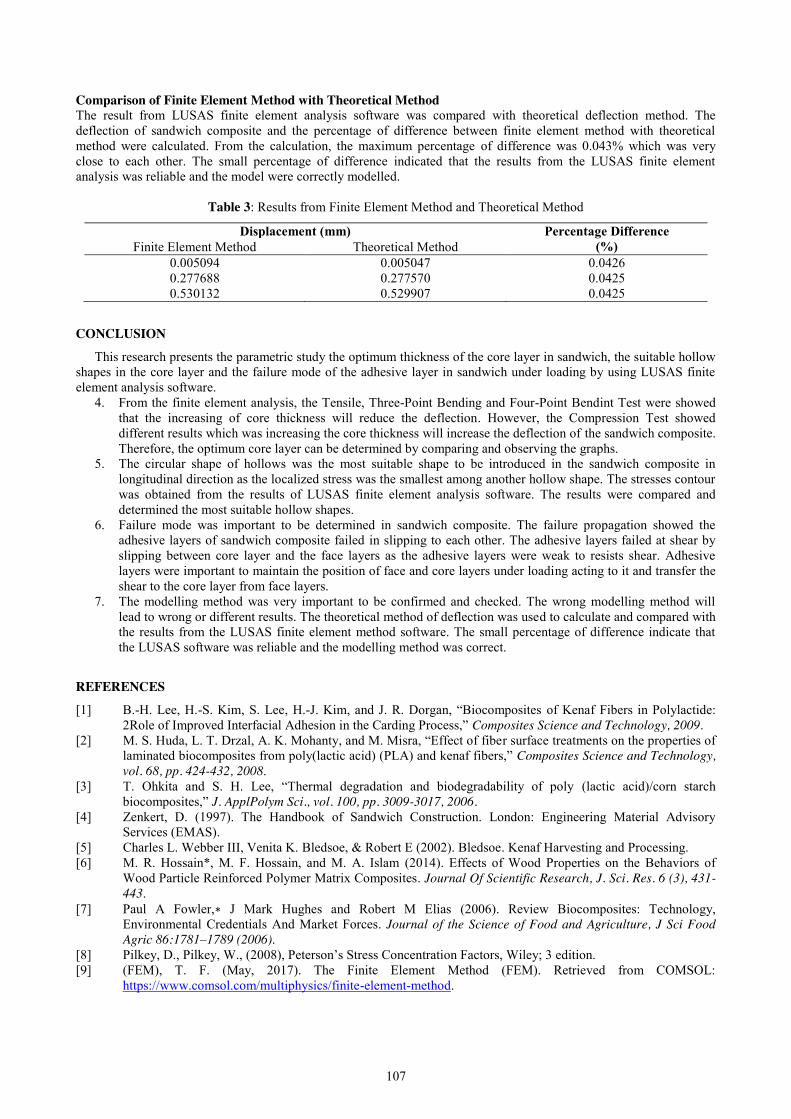
107
Comparison of Finite Element Method with Theoretical Method The result from LUSAS finite element analysis software was compared with theoretical deflection method. The deflection of sandwich composite and the percentage of difference between finite element method with theoretical method were calculated. From the calculation, the maximum percentage of difference was 0.043% which was very close to each other. The small percentage of difference indicated that the results from the LUSAS finite element analysis was reliable and the model were correctly modelled.
Table 3: Results from Finite Element Method and Theoretical Method
Displacement (mm) Percentage Difference (%) Finite Element Method Theoretical Method
0.005094 0.005047 0.0426 0.277688 0.277570 0.0425 0.530132 0.529907 0.0425
CONCLUSION
This research presents the parametric study the optimum thickness of the core layer in sandwich, the suitable hollow shapes in the core layer and the failure mode of the adhesive layer in sandwich under loading by using LUSAS finite element analysis software.
4. From the finite element analysis, the Tensile, Three-Point Bending and Four-Point Bendint Test were showed that the increasing of core thickness will reduce the deflection. However, the Compression Test showed different results which was increasing the core thickness will increase the deflection of the sandwich composite. Therefore, the optimum core layer can be determined by comparing and observing the graphs.
5. The circular shape of hollows was the most suitable shape to be introduced in the sandwich composite in longitudinal direction as the localized stress was the smallest among another hollow shape. The stresses contour was obtained from the results of LUSAS finite element analysis software. The results were compared and determined the most suitable hollow shapes.
6. Failure mode was important to be determined in sandwich composite. The failure propagation showed the adhesive layers of sandwich composite failed in slipping to each other. The adhesive layers failed at shear by slipping between core layer and the face layers as the adhesive layers were weak to resists shear. Adhesive layers were important to maintain the position of face and core layers under loading acting to it and transfer the shear to the core layer from face layers.
7. The modelling method was very important to be confirmed and checked. The wrong modelling method will lead to wrong or different results. The theoretical method of deflection was used to calculate and compared with the results from the LUSAS finite element method software. The small percentage of difference indicate that the LUSAS software was reliable and the modelling method was correct.
REFERENCES
[1] B.-H. Lee, H.-S. Kim, S. Lee, H.-J. Kim, and J. R. Dorgan, “Biocomposites of Kenaf Fibers in Polylactide: 2Role of Improved Interfacial Adhesion in the Carding Process,” Composites Science and Technology, 2009.
[2] M. S. Huda, L. T. Drzal, A. K. Mohanty, and M. Misra, “Effect of fiber surface treatments on the properties of laminated biocomposites from poly(lactic acid) (PLA) and kenaf fibers,” Composites Science and Technology, vol. 68, pp. 424-432, 2008.
[3] T. Ohkita and S. H. Lee, “Thermal degradation and biodegradability of poly (lactic acid)/corn starch biocomposites,” J. ApplPolym Sci., vol. 100, pp. 3009-3017, 2006.
[4] Zenkert, D. (1997). The Handbook of Sandwich Construction. London: Engineering Material Advisory Services (EMAS).
[5] Charles L. Webber III, Venita K. Bledsoe, & Robert E (2002). Bledsoe. Kenaf Harvesting and Processing. [6] M. R. Hossain*, M. F. Hossain, and M. A. Islam (2014). Effects of Wood Properties on the Behaviors of
Wood Particle Reinforced Polymer Matrix Composites. Journal Of Scientific Research, J. Sci. Res. 6 (3), 431-443.
[7] Paul A Fowler,∗ J Mark Hughes and Robert M Elias (2006). Review Biocomposites: Technology, Environmental Credentials And Market Forces. Journal of the Science of Food and Agriculture, J Sci Food Agric 86:1781–1789 (2006).
[8] Pilkey, D., Pilkey, W., (2008), Peterson’s Stress Concentration Factors, Wiley; 3 edition. [9] (FEM), T. F. (May, 2017). The Finite Element Method (FEM). Retrieved from COMSOL:
https://www.comsol.com/multiphysics/finite-element-method.

108
Assessment of Existing Reinforced Concrete Shear Wall Subjected to the Earthquake Loading
Ahmad Syakir bin Zakaria1, Redzuan Abdullah2 Faculty of Civil Engineering, Universiti Teknologi Malaysia, Malaysia
Keywords: Shear Wall; Earthquake Resistance; Seismic Analysis; Finite Element Analysis.
ABSTRACT. Shear walls are the main lateral earthquake resistant elements in many buildings. Using Shear walls in tall building is very important as it can counter the effects of lateral load acting on a structure. A study is carried out to assess the shear capacity of shear wall of an existing building which were not designed to resist earthquake when subjected to a mild earthquake loading. Response spectrum analysis was carried by applying the earthquake data that striked Ranau, Sabah on 5 June 2015 with magnitude of 5.9. Maximum shear stress obtained from the analysis was compared with the shear resistance at the wall. The shear resistance capacity is obtained by calculation in academic with Eurocode Reinforced Concrete design theory. It was found that the existing shear wall is not able to resist the earthquake loading.
INTRODUCTION
Buildings in Malaysia were not built to withstand seismic shocks. This is due the fact that Malaysia is not located in earthquake zone, hence all buildings were not designed to resist the earthquake [1]. High rise buildings in particular, were only designed to withstand lateral forces by wind but not to withstand earthquake. Even though the building in Malaysia were not designed to resist earthquake, they may have been sufficiently strong to handle moderate earthquakes. Construction cost for earthquake-resistance buildings is high compared to the non-earthquake-resistance buildings. For this reason the owner normally will not keen to design or build a structure out of such expectations considering that Malaysia is located out of the earthquake zone.
Problem Statement Structure and building in Malaysia mostly not designated to withstand an earthquake because Malaysia is not located in earthquake zone. However the earthquake incident that happened at Ranau, Sabah on 5 June 2015 with magnitude of 5.9 that lasted for 30 seconds has changed the mind set of most people towards the importance to build buildings that can withstand earthquake. That was the strongest earthquake happened at Malaysia since 1976. That incident has attracted the attention of the public as the incident resulting in the deaths of 18 people [2].
A well designed structure should be capable of resisting earthquake motions equally from all possible directions [3]. Earthquake resistance should be included during designing to avoid bad scenario from happen again as peoples life is become an engineer’s top priority during designing a structure. For an existing building we can check whether it can withstand an earthquake by doing an analysis to examine its capacity of resisting earthquake. Shear wall is one of an important part in building for resisting lateral force [4]. That is why in this research, analysis was being done by focusing on shear wall. Based on the modelling of the shear wall that being applied load, we can know the maximum shear for that shear walls. The maximum shear become a bench mark whether the existing building or structure that have been analysed can accommodate an earthquake forces.
Objectives The aim of this study is to examine the earthquake resistance of an existing building with reinforced concrete that had not been designed to resist earthquake. In order to achieve this aim, several objectives are set out:
1. To obtain maximum shear stress in the shear wall when the building is subjected to mild earthquake loading. 2. To compare the maximum shear in the shear wall that caused by earthquake force with shear resistance capacity
calculated in accordance with Eurocode design theory. 3. To determine whether the existing building which were not designed to resist earthquake, can cater a mild
earthquake loading. Scope of study Throughout the research, a computer software: LUSAS will be used to analysis the earthquake resistance of shear wall. The modelling of the shear wall will be applied load to accommodate the force from selfweight loading and earthquake. The analysis will be apply to calculate maximum shear for 12 storey shear wall. Compare shear capacity of shear wall with the maximum shear from analysis of shear wall that be modelling according to the detail design from plan. Loading that will be applied to the modelling is an earthquake loading. The value of the maximum shear of the modelling that being applied load is become an indicator whether the buildings that being analysed is safe from the earthquake or not.
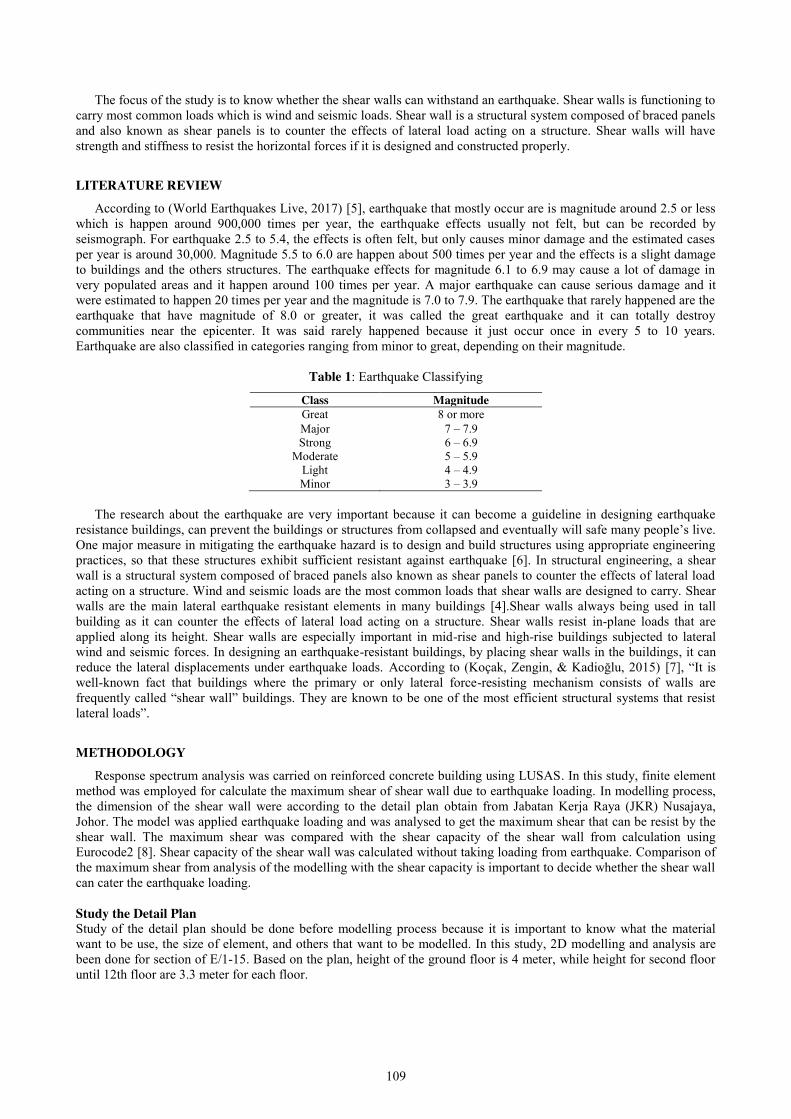
109
The focus of the study is to know whether the shear walls can withstand an earthquake. Shear walls is functioning to carry most common loads which is wind and seismic loads. Shear wall is a structural system composed of braced panels and also known as shear panels is to counter the effects of lateral load acting on a structure. Shear walls will have strength and stiffness to resist the horizontal forces if it is designed and constructed properly.
LITERATURE REVIEW According to (World Earthquakes Live, 2017) [5], earthquake that mostly occur are is magnitude around 2.5 or less
which is happen around 900,000 times per year, the earthquake effects usually not felt, but can be recorded by seismograph. For earthquake 2.5 to 5.4, the effects is often felt, but only causes minor damage and the estimated cases per year is around 30,000. Magnitude 5.5 to 6.0 are happen about 500 times per year and the effects is a slight damage to buildings and the others structures. The earthquake effects for magnitude 6.1 to 6.9 may cause a lot of damage in very populated areas and it happen around 100 times per year. A major earthquake can cause serious damage and it were estimated to happen 20 times per year and the magnitude is 7.0 to 7.9. The earthquake that rarely happened are the earthquake that have magnitude of 8.0 or greater, it was called the great earthquake and it can totally destroy communities near the epicenter. It was said rarely happened because it just occur once in every 5 to 10 years. Earthquake are also classified in categories ranging from minor to great, depending on their magnitude.
Table 1: Earthquake Classifying
Class Magnitude Great 8 or more Major 7 – 7.9 Strong 6 – 6.9
Moderate 5 – 5.9 Light 4 – 4.9 Minor 3 – 3.9
The research about the earthquake are very important because it can become a guideline in designing earthquake
resistance buildings, can prevent the buildings or structures from collapsed and eventually will safe many people’s live. One major measure in mitigating the earthquake hazard is to design and build structures using appropriate engineering practices, so that these structures exhibit sufficient resistant against earthquake [6]. In structural engineering, a shear wall is a structural system composed of braced panels also known as shear panels to counter the effects of lateral load acting on a structure. Wind and seismic loads are the most common loads that shear walls are designed to carry. Shear walls are the main lateral earthquake resistant elements in many buildings [4].Shear walls always being used in tall building as it can counter the effects of lateral load acting on a structure. Shear walls resist in-plane loads that are applied along its height. Shear walls are especially important in mid-rise and high-rise buildings subjected to lateral wind and seismic forces. In designing an earthquake-resistant buildings, by placing shear walls in the buildings, it can reduce the lateral displacements under earthquake loads. According to (Koçak, Zengin, & Kadioğlu, 2015) [7], “It is well-known fact that buildings where the primary or only lateral force-resisting mechanism consists of walls are frequently called “shear wall” buildings. They are known to be one of the most efficient structural systems that resist lateral loads”.
METHODOLOGY Response spectrum analysis was carried on reinforced concrete building using LUSAS. In this study, finite element
method was employed for calculate the maximum shear of shear wall due to earthquake loading. In modelling process, the dimension of the shear wall were according to the detail plan obtain from Jabatan Kerja Raya (JKR) Nusajaya, Johor. The model was applied earthquake loading and was analysed to get the maximum shear that can be resist by the shear wall. The maximum shear was compared with the shear capacity of the shear wall from calculation using Eurocode2 [8]. Shear capacity of the shear wall was calculated without taking loading from earthquake. Comparison of the maximum shear from analysis of the modelling with the shear capacity is important to decide whether the shear wall can cater the earthquake loading. Study the Detail Plan Study of the detail plan should be done before modelling process because it is important to know what the material want to be use, the size of element, and others that want to be modelled. In this study, 2D modelling and analysis are been done for section of E/1-15. Based on the plan, height of the ground floor is 4 meter, while height for second floor until 12th floor are 3.3 meter for each floor.
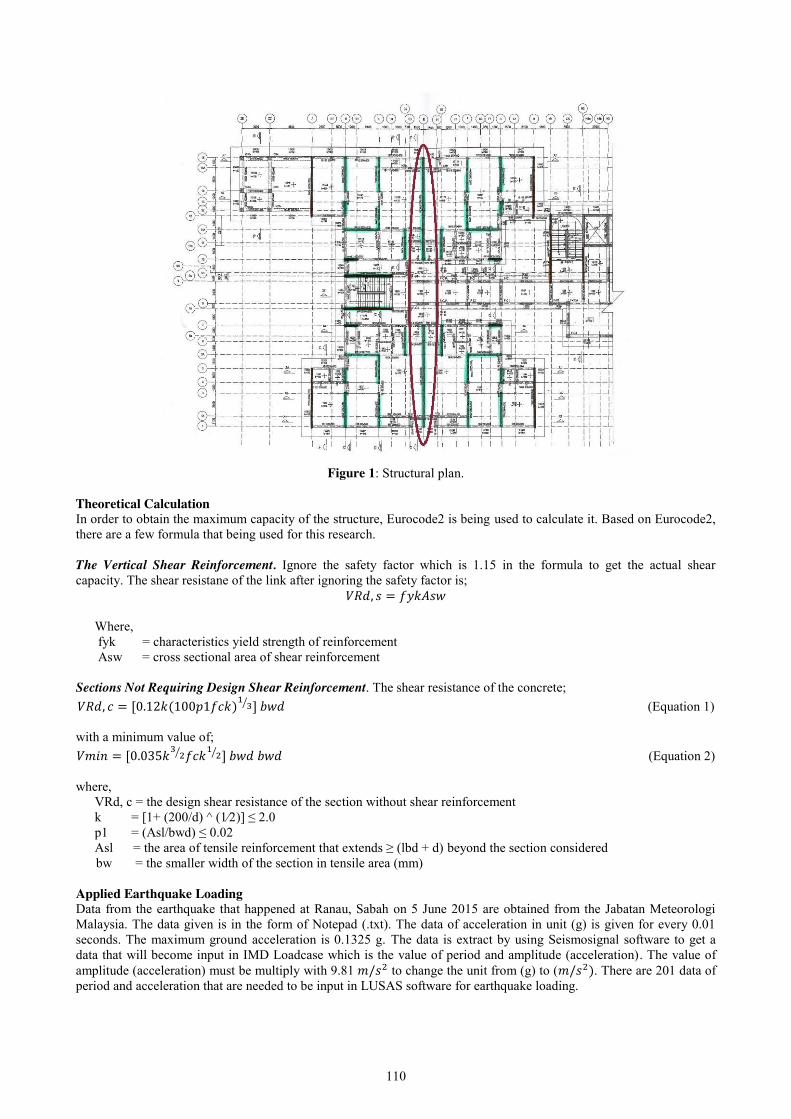
110
Figure 1: Structural plan.
Theoretical Calculation In order to obtain the maximum capacity of the structure, Eurocode2 is being used to calculate it. Based on Eurocode2, there are a few formula that being used for this research. The Vertical Shear Reinforcement. Ignore the safety factor which is 1.15 in the formula to get the actual shear capacity. The shear resistane of the link after ignoring the safety factor is;
𝑉𝑅𝑑, 𝑠 = 𝑓𝑦𝑘𝐴𝑠𝑤
Where, fyk = characteristics yield strength of reinforcement Asw = cross sectional area of shear reinforcement
Sections Not Requiring Design Shear Reinforcement. The shear resistance of the concrete; 𝑉𝑅𝑑, 𝑐 = [0.12𝑘(100𝑝1𝑓𝑐𝑘)1
3⁄ ] 𝑏𝑤𝑑 (Equation 1)
with a minimum value of; 𝑉𝑚𝑖𝑛 = [0.035𝑘3
2⁄ 𝑓𝑐𝑘12⁄ ] 𝑏𝑤𝑑 𝑏𝑤𝑑 (Equation 2)
where,
VRd, c = the design shear resistance of the section without shear reinforcement k = [1+ (200/d) ^ (1⁄2)] ≤ 2.0 p1 = (Asl/bwd) ≤ 0.02 Asl = the area of tensile reinforcement that extends ≥ (lbd + d) beyond the section considered
bw = the smaller width of the section in tensile area (mm) Applied Earthquake Loading Data from the earthquake that happened at Ranau, Sabah on 5 June 2015 are obtained from the Jabatan Meteorologi Malaysia. The data given is in the form of Notepad (.txt). The data of acceleration in unit (g) is given for every 0.01 seconds. The maximum ground acceleration is 0.1325 g. The data is extract by using Seismosignal software to get a data that will become input in IMD Loadcase which is the value of period and amplitude (acceleration). The value of amplitude (acceleration) must be multiply with 9.81 𝑚/𝑠2 to change the unit from (g) to (𝑚/𝑠2). There are 201 data of period and acceleration that are needed to be input in LUSAS software for earthquake loading.

111
Figure 2: Response spectrum curve Figure 3: SeismoSignal Software
Modelling Creating a model in LUSAS software requiring to follow a few steps. Firstly, nodes must be create to make a line or a surface. Then, the attributes that need to be done are meshing the line with 2D-thick beam and surface with structural element type of plane stress. Geometry for the lines in model is thick beam while all the surfaces have a thickness of 230mm. Material for all elements in model are been assigned as ungraded concrete while fixed support are being used as structural support. Loading that been assigned to the model are earthquake loading and also the body force with 9.81kg/N in y direction. IMD Loadcase. The loadcase must be done for inserting earthquake data into modelling. The excitation have to be set as support motion and while the results have to be set as spectral. Then, the data that needed to be insert are in period (sec) and acceleration. Total of 201 data of acceleration are need to be key-in in the table between period 0 – 4 seconds.
RESULTS AND DISCUSSION
The result from the analysis of 2D model of shear wall that been applied earthquake loading using LUSAS and also the result from calculation by using Eurocode2 to get the shear capacity from shear wall are imoportant in this research to define is that the shear wall durable enough to cater earthquake loading. Calculation of shear capacity The vertical shear reinforcement. From the detailing plan, the reinforcement bar for vertical shear is using 2R10-125. Assuming the characteristic yield strength of the reinforcement, fyk = 250 N/𝑚𝑚2. The cross sectional area of shear reinforcement, Asw = 4146.90 𝑚𝑚2 as the diameter of one bar is 10mm. So; 𝑉𝑅𝑑, 𝑠 = 𝑓𝑦𝑘𝐴𝑠𝑤 𝑉𝑅𝑑, 𝑠 = 250𝑁/𝑚𝑚2 × 4146.9𝑚𝑚2 𝑉𝑅𝑑, 𝑠 = 1036.725 𝑘𝑁 Sections not requiring shear reinforcement. From the detailing plan, the reinforcement bar for vertical shear is using 2T10-125. Assuming the characteristic strength of concrete, fck = 25 N/𝑚𝑚2, Structural class = S4, exposure class = XC1and standard of fire resistance = 1 hour. The cross sectional area of reinforcement, Asl = 6399.42 𝑚𝑚2 as the diameter of one bar is 10mm. So; k = 2.0 p1 = 0.0042 𝑏𝑤 = 11000𝑚𝑚 𝑑 = 140𝑚𝑚 𝑉𝑅𝑑, 𝑐 = [0.12𝑘(100𝑝1𝑓𝑐𝑘)1
3⁄ ] 𝑏𝑤𝑑 𝑉𝑅𝑑, 𝑐 = [0.12 × 2.0 × (100 × 0.0042 × 25)1
3⁄ ] × 11000 × 140 𝑉𝑅𝑑, 𝑐 = 809.335 𝑘𝑁 With a minimum value of: 𝑉𝑚𝑖𝑛 = [0.035𝑘3
2⁄ 𝑓𝑐𝑘12⁄ ] 𝑏𝑤𝑑
𝑉𝑚𝑖𝑛 = [0.035 × (2)32⁄ × (25)1
2⁄ ] × 11000 × 140 𝑉𝑚𝑖𝑛 = 762.261 𝑘𝑁 Analysis of the modelling Maximum shear stress are obtained from the analysis of the 2D model. Result of the model after taking earthquake loading shown that the highest shear stress is at node 1154 with 611.396 kN/𝑚2 and the lowest shear stress is at node 1.29433 kN/𝑚2. The maximum displacement is at node 1158 with 14.26 mm. The results obtained were due to the earthquake loading only without considering other loads.
0
0.2
0.4
0.6
0 1 2 3 4 5
Acce
lera
tion/
Dam
p=5%
(g)
Period(sec)
Response Spectrum Curve

112
Figure 4: Result analysis of 2D-model of shear wall.
Values of the shear stress can be obtained by doing graph through 2D. The value should be multiply with width of
the shear wall and also the thickness of the shear wall which is 230mm to get the maximum shear. The total shear will become the shear capacity for the shear wall.
Figure 5: Graph through 2D
Table 2: Calculation of Total Shear
Length (m) Stress Sxy (N/m2) Width (m) Thickness (m) Shear stress (N) Shear stress (kN) 0 543107.9373 0.5 0.23 62457.4128 62.46 1 503589.3738 1 0.23 115825.5560 115.83 2 419589.3306 1 0.23 96505.5460 96.51 3 354136.8317 1 0.23 81451.4713 81.45 4 321616.5204 1 0.23 73971.7997 73.97 5 305970.3045 1 0.23 70373.1700 70.37 6 303782.1391 1 0.23 69869.8920 69.87 7 314743.883 1 0.23 72391.0931 72.39 8 342546.1439 1 0.23 78785.6131 78.79 9 399069.5216 1 0.23 91785.9900 91.79
10 468378.2242 1 0.23 107726.9916 107.73 11 499912.8244 0.5 0.23 57489.9748 57.49
Total Shear (kN) 978.63 Comparison of Maximum Shear of Shear Wall with the Shear Capacity The shear resistance of link, VRd,s is equal to 1036.725 kN is the highest value of the shear capacity. While the calculation for sections not requiring design shear reinforcement, the shear resistance of concrete VRd,c is equal to 809.335 kN with minimum value, Vmin of 762.261 kN. Assuming for worst case scenario, the minimum value of shear resistance of concrete using calculation for sections not requiring design shear reinforcement is taking as the shear
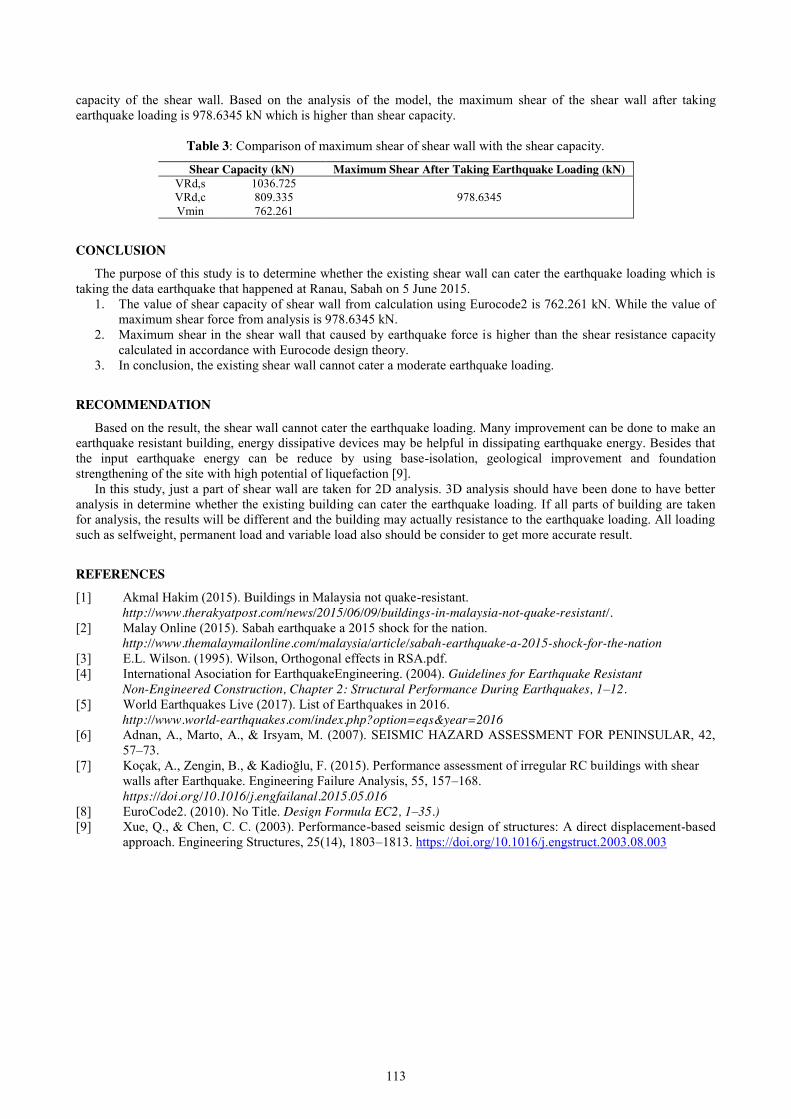
113
capacity of the shear wall. Based on the analysis of the model, the maximum shear of the shear wall after taking earthquake loading is 978.6345 kN which is higher than shear capacity.
Table 3: Comparison of maximum shear of shear wall with the shear capacity.
Shear Capacity (kN) Maximum Shear After Taking Earthquake Loading (kN) VRd,s 1036.725
978.6345 VRd,c 809.335 Vmin 762.261
CONCLUSION
The purpose of this study is to determine whether the existing shear wall can cater the earthquake loading which is taking the data earthquake that happened at Ranau, Sabah on 5 June 2015.
1. The value of shear capacity of shear wall from calculation using Eurocode2 is 762.261 kN. While the value of maximum shear force from analysis is 978.6345 kN.
2. Maximum shear in the shear wall that caused by earthquake force is higher than the shear resistance capacity calculated in accordance with Eurocode design theory.
3. In conclusion, the existing shear wall cannot cater a moderate earthquake loading.
RECOMMENDATION
Based on the result, the shear wall cannot cater the earthquake loading. Many improvement can be done to make an earthquake resistant building, energy dissipative devices may be helpful in dissipating earthquake energy. Besides that the input earthquake energy can be reduce by using base-isolation, geological improvement and foundation strengthening of the site with high potential of liquefaction [9].
In this study, just a part of shear wall are taken for 2D analysis. 3D analysis should have been done to have better analysis in determine whether the existing building can cater the earthquake loading. If all parts of building are taken for analysis, the results will be different and the building may actually resistance to the earthquake loading. All loading such as selfweight, permanent load and variable load also should be consider to get more accurate result.
REFERENCES
[1] Akmal Hakim (2015). Buildings in Malaysia not quake-resistant. http://www.therakyatpost.com/news/2015/06/09/buildings-in-malaysia-not-quake-resistant/. [2] Malay Online (2015). Sabah earthquake a 2015 shock for the nation. http://www.themalaymailonline.com/malaysia/article/sabah-earthquake-a-2015-shock-for-the-nation [3] E.L. Wilson. (1995). Wilson, Orthogonal effects in RSA.pdf. [4] International Asociation for EarthquakeEngineering. (2004). Guidelines for Earthquake Resistant Non-Engineered Construction, Chapter 2: Structural Performance During Earthquakes, 1–12. [5] World Earthquakes Live (2017). List of Earthquakes in 2016. http://www.world-earthquakes.com/index.php?option=eqs&year=2016 [6] Adnan, A., Marto, A., & Irsyam, M. (2007). SEISMIC HAZARD ASSESSMENT FOR PENINSULAR, 42,
57–73. [7] Koçak, A., Zengin, B., & Kadioğlu, F. (2015). Performance assessment of irregular RC buildings with shear
walls after Earthquake. Engineering Failure Analysis, 55, 157–168. https://doi.org/10.1016/j.engfailanal.2015.05.016
[8] EuroCode2. (2010). No Title. Design Formula EC2, 1–35.) [9] Xue, Q., & Chen, C. C. (2003). Performance-based seismic design of structures: A direct displacement-based
approach. Engineering Structures, 25(14), 1803–1813. https://doi.org/10.1016/j.engstruct.2003.08.003
114
Nonlinear Response of a Building under Soil Structure Interaction Lim Eng Chuan1, Azlan bin Adnan2
Faculty of Civil Engineering, Universiti Teknologi Malaysia, Malaysia [email protected]
Keywords: Soil Structure interaction; 1D Ground Response Analysis
ABSTRACT. The 1D ground response analysis is a conventional analytical approach to predict the free surface motion or free-field motion. The local site effect, such as the thickness of soil sediment on bedrock, irregular surface topography will significant influence the strong ground motion when it reachs the earth surface. The key objectives of this research is to investigate the degree of amplification of ground motion in 4 different boreholes, which are dominantly silt and clay. An analytical study on Frequency domain linear analysis of layered soil on elastic bedrock has been studied and a Matlab script has been produced. From the research, equivalent linear analysis shows an amplification of 295% of ground motion when it reaches the surface. The result generated from DEEPSOIL indicates both frequency linear and time domain linear analysis only show a disparency of 5.4%, indicates the water table has minor influence on site response analysis. But a nonlinear analysis predicts 57% less amplification than the equivalent-linear method due to the distint difference between the numerical methods applied on those analysis. In addition, soil structure interaction is studied by conducting time history analysis on an 8–storey steel frame on structure to investigate the amplification of base shear when subjected to a free surface motion. From the result, the base shear increase by 114% when the ground motion being amplified.
INTRODUCTION
Evidence from the actual observation of earthquake motion is obtained in 1957, San Francisco ground motion with a magnitude of 5.3. Several ground motion recording shows the ground surface motion at the rock were quite similar, but the amplitude of the ground motion on soil surface is significantly different. Other similar evidence is also observed, such as Mexico City in 1985 and San Francisco Bay in 1989. [1] Ground response analysis is important as an evaluation of earthquake-induced forces that can lead to instability of earth, earth-retaining structure as well as structural building. Ground response analysis can be modelled in the frequency or time domain. Ground response analysis can be further divided into one-dimensional, two-dimensional, and three dimensional group response analysis depends on the actual site condition. Generally, two or three-dimensional ground response analysis will be needed in certain situation such as a sloping or irregular ground surface, the presence of heavy structures or stiff, embedded structures, or walls and tunnels. Ground motion is amplified when it travels toward the earth surface as a result of conservation of elastic wave energy. Through the observation of 4 borehole data obtained, the soil layer of the particular site is predominantly silt and clay for 35+m, which significantly increase the free surface motion by 295% when equivalent linear analysis is used. The difference in numerical method used in frequency linear, equivalentlinear, time domain linear and nonlinear is fully studied by the resercher at oversea, but it is still remain arguable and often, they are compared with one and another to have better agreement.
Problem Statement Malaysia is considered as a country with relatively low seismicity. However, for the State of Sabah, earthquakes of local origin are known to occur from time to time. It was reported that between 1923 and 2007, Sabah had experienced a total of 65 earthquakes, with magnitudes ranging from 3.3 to 6.5 on a Richter scale. [2] Currently, seismic design is not yet implemented in Malaysia due to the unawareness of damage can be caused by seismic acitivty as well as economical reason. Equivalent linear method overestimate of the peak acceleration and shear strength under large earthquake and the other is underestimation of peak acceleration which cause by underestimation of amplification ratio in high frequency region. [3] In constrast, nonlinear codes give smaller amplification factors than equivalent-linear for high levels of shaking.[4] Nonlinear method predicts less amplification at high frequencies which is greater than 25 Hz as well as natural frequency of the site, more amplification at moderate frequencies, which is range between 5 to 25 Hz. [5] In this paper, all analysis method have been executed in order to validate those statement.
Objectives The objectives of this study are:
1. To predict the shear wave velocity profile of soil by standard penetration test (SPT) correlations 2. To identify the degree of amplification of ground acceleration with considering the 4 different case of site effect
with DEEPSOIL by using frequency linear, equivalent linear, time domain linear and nonlinear analysis. 3. To produce 1-dimensional linear and equivalent linear site response analysis of layered damped soil on elastic
bedrock by Matlab code.

115
4. Identify the degree of effect of amplified ground acceleration on base shear of an 8 storey 3D steel frame by Nonlinear Time History Analysis.
Scope of Study This research is carried out to study degree of amplification of ground motion and its influence on an 8–storey steel frame. Four boreholes has been chosen and the correlation between shear wave velocities to Standard Penetration number corrected for field condition (N60) is studied. An analytical method of frequency linear site response is carried out and it is scripted in Matlab in order to verify the result generated from DEEPSOIL. Frequency equivalent and Time domain site reponse analysis are purely executed by DEEPSOIL without any further verification. An 8 storey 3D steel frame has been modelled in SAP2000 to investigate the difference of base shear due to the different surface motion.
LITERATURE REVIEW Earthquake are normally experienced as a series of cyclic movements of the earth surface and are the result of the
fracturing or faulting of the earth crust. The source of the vibratory energy is the release of accumulated strain energy resulting from sudden shear failures, which involve the slipping of the boundaries of large rock beneath the earth surface. Local site condition, such as local soil deposit, surface topography and basin geometry can influence the amplitude, frequency content and the duration of ground motion. The effect of the local site condition can be proven by the theoretical ground response analysis or the measurement on actual observation of earthquake motion. Through theoretical ground response analysis, the softer site will amplify low frequency bedrock motions more than the stiff site and vice versa provided that the density and stiffness of bedrock is remain the same. Evidence from the effect of local site effect with actual observation of earthquake motion is obtained in 1957, San Francisco ground motion with a magnitude of 5.3. Mexico City in 1985 and San Francisco Bay in 1989. [1]
In one-dimensional seismic ground response analysis, a few assumption have been made, e.g., soil deposits are assumed to be horizontally layered over a uniform half-space, and the shear wave is assumed to consist of only vertically propagating shear waves. Few assumption has been made such as the boundaries or the soil layers are extended to infinity in the horizontal direction and has the half space as the bottom layer. The responses in the soil profile are caused by the upward propagation of shear waves from the underlying rock half-space. Beside, each layer is homogeneous and isotropic, and it is completely defined by its shear modulus, damping ratio, total unit weight or corresponding mass density, and thickness. [6]
Linear approach is the simplest approach to conduct a ground response analysis because it does not consider the nonlinear soil properties. Soil is linear-elastic and deformation that remains after earthquake loading cannot be predicted. [7] By calculating the transfer function of site soil, the different response parameters such as displacement, velocity, acceleration, shear stress, and shear strain based on the input motion parameters such as accelerated bed rock can be determined. In equivalent linear approach, non-linear behaviour of soil can be approximated using an iterative procedure with equivalent linear soil properties. In the equivalent linear approach, linear analyses are performed with soil properties that are iteratively adjusted to be consistent with an effective level of shear strain induced in the soil. The nonlinear hysteretic stress-strain behaviour of cyclically loaded soils can be determined by considering the soil equivalent linear properties. The equivalent linear shear modulus, G, is generally taken as a secant shear modulus and the equivalent linear damping ratio, ξ. Equivalent linear soil properties is also refer as strain- compatible soil properties. [1] The equivalent linear soil properties can be obtained after three to five iterations with the difference less than 5 to 10%. [6] The secant shear modulus, depth of bedrock, and types of sand or clay have a significant effect on the results of site response analysis. Conversely, the low-strain damping ratio and variations of water tables have only a minor influence on site response analysis. [8]
Non-linear response of a soil deposit can be obtained by using direct numerical integration in the time domain. By integrating the equation of motion in small time steps, any linear or nonlinear stress-strain model or advanced constitutive model can be used. [8] Non-linear analysis computes the dynamic response of the soil deposit using a 1D model of lumped masses and nonlinear shear springs subjected to an input rock motion. The analysis is performed in the time domain solves the differential equations of motion incrementally between time steps. The stiffness of each soil layer is modified after each time step based on the induced shear stress and shear strain. The time stepping method introduces some computational error to the calculation, but allows the fully nonlinear response of the soil to be modelled. [5]
Shear-wave velocity can be measured using appropriate techniques, which may include surface wave methods, suspension logging, downhole testing, and crosshole testing. According to Dobry and Vucetic, the shear modulus and shear wave velocity increase with geologic age as well as the confining pressure or overburden pressure.[4] Besides, according to Parham Study, the coastal plain of Peninsular Malaysia is dominated by Holocene age deposits. [9]
Table 1: SPT–shear wave velocity correlation emprical equations for Holocene Age Soil [10]
Equation No. Type of soil Formulae 4.21 Clay 90.6*(N60)0.25 4.32 Silt 97.2*(1.2+N60)*0.33 4.48 Sand 88.4*(1+N60)0.3 4.9 Gravel 63*N600.43
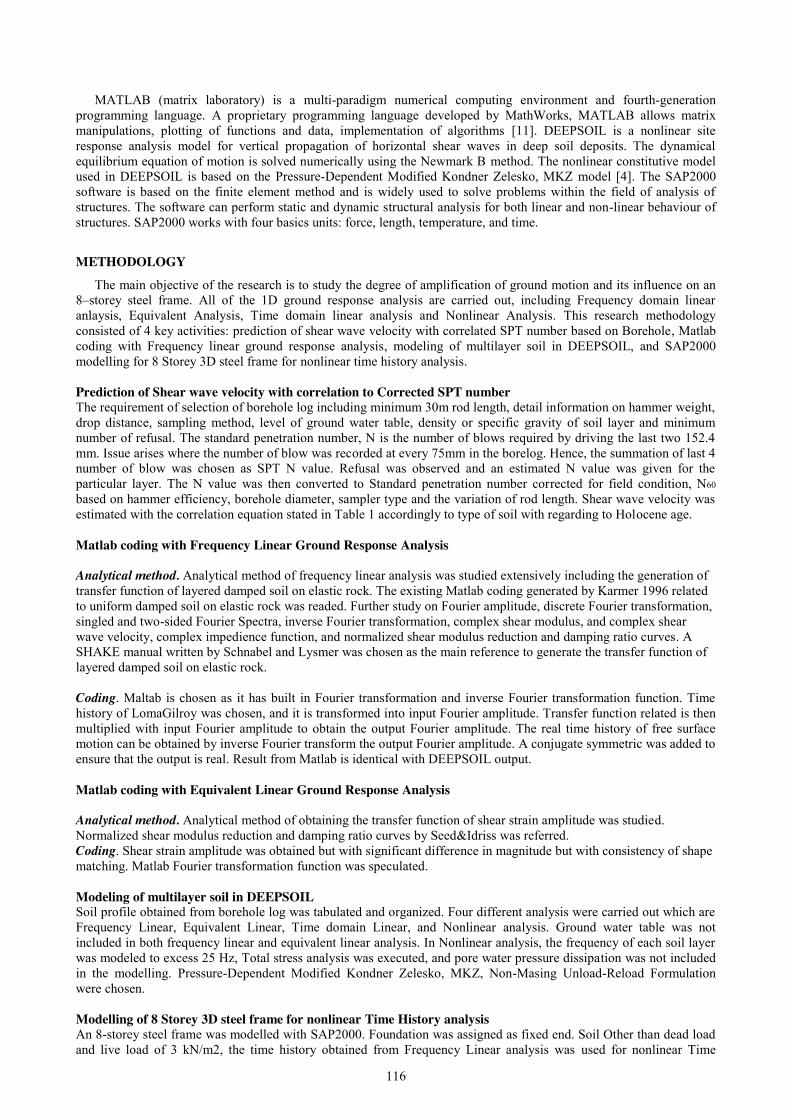
116
MATLAB (matrix laboratory) is a multi-paradigm numerical computing environment and fourth-generation programming language. A proprietary programming language developed by MathWorks, MATLAB allows matrix manipulations, plotting of functions and data, implementation of algorithms [11]. DEEPSOIL is a nonlinear site response analysis model for vertical propagation of horizontal shear waves in deep soil deposits. The dynamical equilibrium equation of motion is solved numerically using the Newmark B method. The nonlinear constitutive model used in DEEPSOIL is based on the Pressure-Dependent Modified Kondner Zelesko, MKZ model [4]. The SAP2000 software is based on the finite element method and is widely used to solve problems within the field of analysis of structures. The software can perform static and dynamic structural analysis for both linear and non-linear behaviour of structures. SAP2000 works with four basics units: force, length, temperature, and time.
METHODOLOGY
The main objective of the research is to study the degree of amplification of ground motion and its influence on an 8–storey steel frame. All of the 1D ground response analysis are carried out, including Frequency domain linear anlaysis, Equivalent Analysis, Time domain linear analysis and Nonlinear Analysis. This research methodology consisted of 4 key activities: prediction of shear wave velocity with correlated SPT number based on Borehole, Matlab coding with Frequency linear ground response analysis, modeling of multilayer soil in DEEPSOIL, and SAP2000 modelling for 8 Storey 3D steel frame for nonlinear time history analysis. Prediction of Shear wave velocity with correlation to Corrected SPT number The requirement of selection of borehole log including minimum 30m rod length, detail information on hammer weight, drop distance, sampling method, level of ground water table, density or specific gravity of soil layer and minimum number of refusal. The standard penetration number, N is the number of blows required by driving the last two 152.4 mm. Issue arises where the number of blow was recorded at every 75mm in the borelog. Hence, the summation of last 4 number of blow was chosen as SPT N value. Refusal was observed and an estimated N value was given for the particular layer. The N value was then converted to Standard penetration number corrected for field condition, N60 based on hammer efficiency, borehole diameter, sampler type and the variation of rod length. Shear wave velocity was estimated with the correlation equation stated in Table 1 accordingly to type of soil with regarding to Holocene age. Matlab coding with Frequency Linear Ground Response Analysis Analytical method. Analytical method of frequency linear analysis was studied extensively including the generation of transfer function of layered damped soil on elastic rock. The existing Matlab coding generated by Karmer 1996 related to uniform damped soil on elastic rock was readed. Further study on Fourier amplitude, discrete Fourier transformation, singled and two-sided Fourier Spectra, inverse Fourier transformation, complex shear modulus, and complex shear wave velocity, complex impedience function, and normalized shear modulus reduction and damping ratio curves. A SHAKE manual written by Schnabel and Lysmer was chosen as the main reference to generate the transfer function of layered damped soil on elastic rock. Coding. Maltab is chosen as it has built in Fourier transformation and inverse Fourier transformation function. Time history of LomaGilroy was chosen, and it is transformed into input Fourier amplitude. Transfer function related is then multiplied with input Fourier amplitude to obtain the output Fourier amplitude. The real time history of free surface motion can be obtained by inverse Fourier transform the output Fourier amplitude. A conjugate symmetric was added to ensure that the output is real. Result from Matlab is identical with DEEPSOIL output. Matlab coding with Equivalent Linear Ground Response Analysis Analytical method. Analytical method of obtaining the transfer function of shear strain amplitude was studied. Normalized shear modulus reduction and damping ratio curves by Seed&Idriss was referred. Coding. Shear strain amplitude was obtained but with significant difference in magnitude but with consistency of shape matching. Matlab Fourier transformation function was speculated. Modeling of multilayer soil in DEEPSOIL Soil profile obtained from borehole log was tabulated and organized. Four different analysis were carried out which are Frequency Linear, Equivalent Linear, Time domain Linear, and Nonlinear analysis. Ground water table was not included in both frequency linear and equivalent linear analysis. In Nonlinear analysis, the frequency of each soil layer was modeled to excess 25 Hz, Total stress analysis was executed, and pore water pressure dissipation was not included in the modelling. Pressure-Dependent Modified Kondner Zelesko, MKZ, Non-Masing Unload-Reload Formulation were chosen. Modelling of 8 Storey 3D steel frame for nonlinear Time History analysis An 8-storey steel frame was modelled with SAP2000. Foundation was assigned as fixed end. Soil Other than dead load and live load of 3 kN/m2, the time history obtained from Frequency Linear analysis was used for nonlinear Time
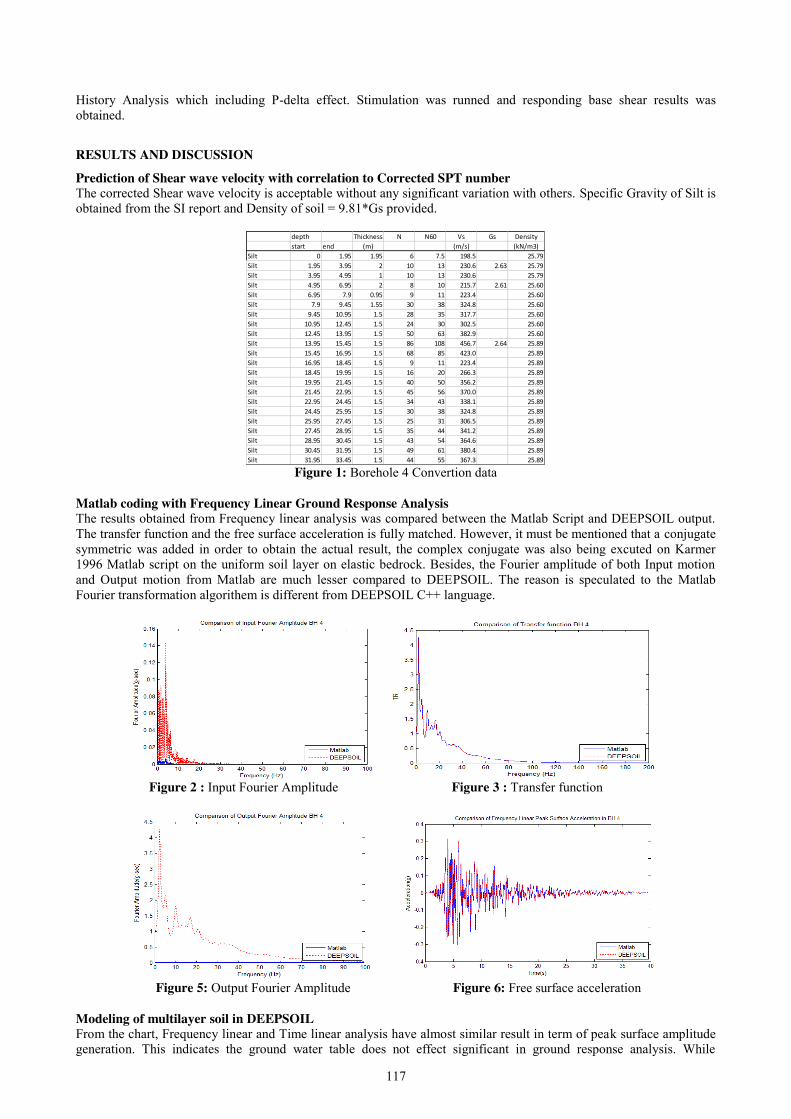
117
History Analysis which including P-delta effect. Stimulation was runned and responding base shear results was obtained.
RESULTS AND DISCUSSION
Prediction of Shear wave velocity with correlation to Corrected SPT number The corrected Shear wave velocity is acceptable without any significant variation with others. Specific Gravity of Silt is obtained from the SI report and Density of soil = 9.81*Gs provided.
Figure 1: Borehole 4 Convertion data
Matlab coding with Frequency Linear Ground Response Analysis The results obtained from Frequency linear analysis was compared between the Matlab Script and DEEPSOIL output. The transfer function and the free surface acceleration is fully matched. However, it must be mentioned that a conjugate symmetric was added in order to obtain the actual result, the complex conjugate was also being excuted on Karmer 1996 Matlab script on the uniform soil layer on elastic bedrock. Besides, the Fourier amplitude of both Input motion and Output motion from Matlab are much lesser compared to DEEPSOIL. The reason is speculated to the Matlab Fourier transformation algorithem is different from DEEPSOIL C++ language.
Figure 2 : Input Fourier Amplitude Figure 3 : Transfer function
Figure 5: Output Fourier Amplitude Figure 6: Free surface acceleration Modeling of multilayer soil in DEEPSOIL From the chart, Frequency linear and Time linear analysis have almost similar result in term of peak surface amplitude generation. This indicates the ground water table does not effect significant in ground response analysis. While
depth Thickness N N60 Vs Gs Densitystart end (m) (m/s) (kN/m3)
Silt 0 1.95 1.95 6 7.5 198.5 25.79Silt 1.95 3.95 2 10 13 230.6 2.63 25.79Silt 3.95 4.95 1 10 13 230.6 25.79Silt 4.95 6.95 2 8 10 215.7 2.61 25.60Silt 6.95 7.9 0.95 9 11 223.4 25.60Silt 7.9 9.45 1.55 30 38 324.8 25.60Silt 9.45 10.95 1.5 28 35 317.7 25.60Silt 10.95 12.45 1.5 24 30 302.5 25.60Silt 12.45 13.95 1.5 50 63 382.9 25.60Silt 13.95 15.45 1.5 86 108 456.7 2.64 25.89Silt 15.45 16.95 1.5 68 85 423.0 25.89Silt 16.95 18.45 1.5 9 11 223.4 25.89Silt 18.45 19.95 1.5 16 20 266.3 25.89Silt 19.95 21.45 1.5 40 50 356.2 25.89Silt 21.45 22.95 1.5 45 56 370.0 25.89Silt 22.95 24.45 1.5 34 43 338.1 25.89Silt 24.45 25.95 1.5 30 38 324.8 25.89Silt 25.95 27.45 1.5 25 31 306.5 25.89Silt 27.45 28.95 1.5 35 44 341.2 25.89Silt 28.95 30.45 1.5 43 54 364.6 25.89Silt 30.45 31.95 1.5 49 61 380.4 25.89Silt 31.95 33.45 1.5 44 55 367.3 25.89
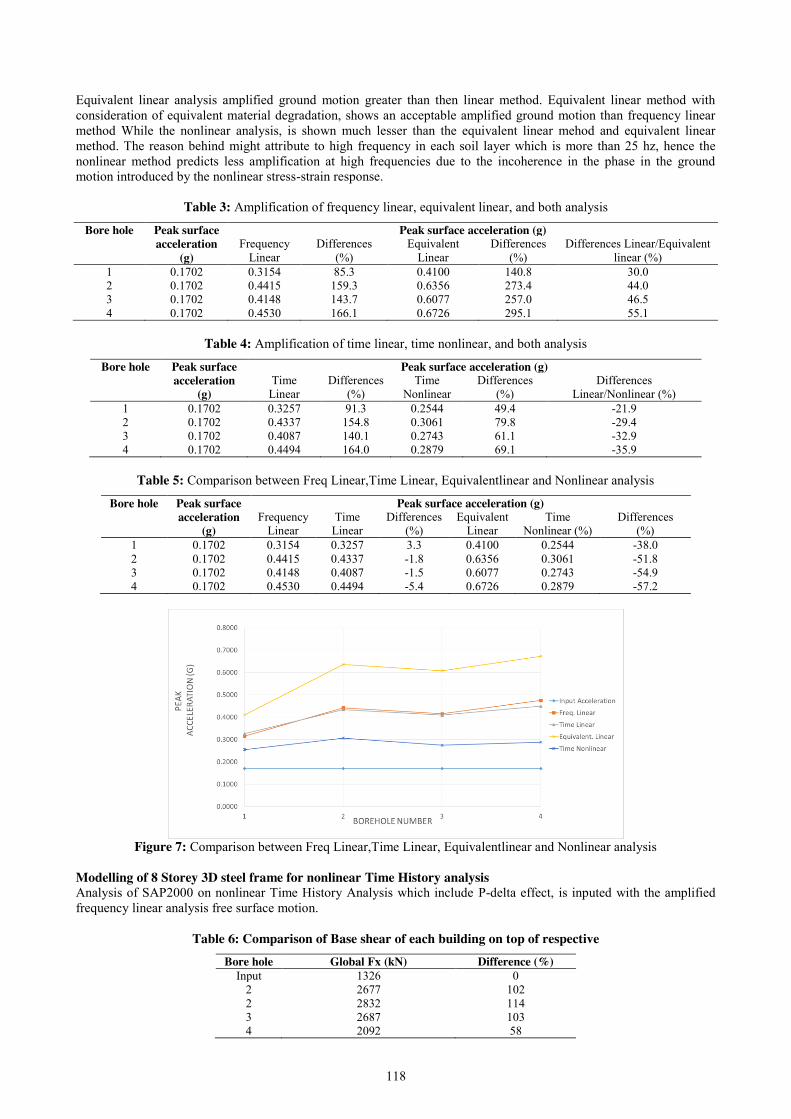
118
Equivalent linear analysis amplified ground motion greater than then linear method. Equivalent linear method with consideration of equivalent material degradation, shows an acceptable amplified ground motion than frequency linear method While the nonlinear analysis, is shown much lesser than the equivalent linear mehod and equivalent linear method. The reason behind might attribute to high frequency in each soil layer which is more than 25 hz, hence the nonlinear method predicts less amplification at high frequencies due to the incoherence in the phase in the ground motion introduced by the nonlinear stress-strain response.
Table 3: Amplification of frequency linear, equivalent linear, and both analysis
Bore hole Peak surface acceleration
(g)
Peak surface acceleration (g) Frequency
Linear Differences
(%) Equivalent
Linear Differences
(%) Differences Linear/Equivalent
linear (%) 1 0.1702 0.3154 85.3 0.4100 140.8 30.0 2 0.1702 0.4415 159.3 0.6356 273.4 44.0 3 0.1702 0.4148 143.7 0.6077 257.0 46.5 4 0.1702 0.4530 166.1 0.6726 295.1 55.1
Table 4: Amplification of time linear, time nonlinear, and both analysis
Bore hole Peak surface acceleration
(g)
Peak surface acceleration (g) Time
Linear Differences
(%) Time
Nonlinear Differences
(%) Differences
Linear/Nonlinear (%) 1 0.1702 0.3257 91.3 0.2544 49.4 -21.9 2 0.1702 0.4337 154.8 0.3061 79.8 -29.4 3 0.1702 0.4087 140.1 0.2743 61.1 -32.9 4 0.1702 0.4494 164.0 0.2879 69.1 -35.9
Table 5: Comparison between Freq Linear,Time Linear, Equivalentlinear and Nonlinear analysis
Bore hole Peak surface acceleration
(g)
Peak surface acceleration (g) Frequency
Linear Time
Linear Differences
(%) Equivalent
Linear Time
Nonlinear (%) Differences
(%) 1 0.1702 0.3154 0.3257 3.3 0.4100 0.2544 -38.0 2 0.1702 0.4415 0.4337 -1.8 0.6356 0.3061 -51.8 3 0.1702 0.4148 0.4087 -1.5 0.6077 0.2743 -54.9 4 0.1702 0.4530 0.4494 -5.4 0.6726 0.2879 -57.2
Figure 7: Comparison between Freq Linear,Time Linear, Equivalentlinear and Nonlinear analysis
Modelling of 8 Storey 3D steel frame for nonlinear Time History analysis Analysis of SAP2000 on nonlinear Time History Analysis which include P-delta effect, is inputed with the amplified frequency linear analysis free surface motion.
Table 6: Comparison of Base shear of each building on top of respective Bore hole Global Fx (kN) Difference (%)
Input 1326 0 2 2677 102 2 2832 114 3 2687 103 4 2092 58

119
CONCLUSION
This research presents the amplification of ground motion with different type of analysis. And the base shear was analysed with SAP2000 modeling. The research achieve its objective where:
1. The shear wave velocity profile of soil can be estimated with standard penetration test (SPT) correlations can be done. Real shear wave velocity should be measure accurately in site with SWSS method, but in the case of lack of site information or the accessment to site, this correlation provides approximate solution.
2. Matlab code has been produced for 1-dimensional linear and site response analysis of layered damped soil on elastic bedrock. This again, validated the DEEPSOIL software for it frequency linear analysis.
3. Degree of amplification of ground acceleration with considering the 4 different case of site effect with DEEPSOIL by using frequency linear, equivalent linear, time domain linear and nonlinear analysis has been done. Frequency linear method and time linear method show no significant difference indicates the ground water table does not effect significant in ground response analysis. Again, all the
4. The amplified ground acceleration has increase base shear of an 8 storey 3D steel frame by approximately 80% based on the real soil profile beneath. Structural engineer should consider these amplified base shear so that design process can be executed accordingly.
REFERENCES
[1] S. L. Kramer, Geotechnical earthquake engineering (Prentice-Hall international series in civil engineering and engineering mechanics). Upper Saddle River, N.J.: Prentice Hall, 1996, pp. xviii, 653 p.
[2] A. b. Mohamed, "Monitoring Active Faults in Ranau, Sabah Using GPS *," presented at the Nineteenth United Nations Regional Cartographic Conference for Asia and the Pacific Bangkok, 2012.
[3] K. Miura, S. Kobayashi, and N. Yoshida, "Equivalent linear analysis considering large strains and frequency dependent characteristics," in Proceeings 12-th World Conference on Earthquake Engineering, Auckland, New Zealand, Paper, 2000, no. 1832.
[4] J. P. Stewart, A. O.-L. Kwok, Y. M. A. Hashash, N. Matasovic, R. Pyke, and Z. Wang, "Benchmarking of Nonlinear Geotechnical Ground Response Analysis Procedures," Pacific Earthquake Engineering Research Center College of EngineeringUniversity of California, Berkeley 2008.
[5] E. Rathje and A. Kottke, "Relative differences between equivalent linear and nonlinear site response methods," in 5th International conference on earthquake geotechnical engineering, Santiago, Chile, 2011.
[6] P. B. Schnabel et al., SHAKE: A Computer Program for Earthquake Response Analysis on Horizontally Layered Sites. University of California, College of Engineering, 1972.
[7] I. Towhata, Geotechnical earthquake engineering (Springer series in geomechanics and geoengineering). Berlin: Springer, 2008, pp. xx, 684 p.
[8] A. Asakereh, H. Jamali, and E. Naderi, "The Influence of Seismic Parameters on Site Response," Civil Engineering Dimension, vol. 17, no. 2, pp. 76-87, 2015.
[9] P. R. PARHAM, "Late Cenozoic relative sea-level highstand record from Peninsular Malaysia and Malaysian Borneo: Implications for vertical crustal movements," Bulletin of the Geological Society of Malaysia, vol. 62, pp. 91-115, 2016.
[10] B. R. Wair, Hason T. Dejong, and Thomas Shantz, "Guidelines for Estimation of Shear Wave Velocity Profiles," Pacific Earthquake Engineering Research Center, Headquarters at the University of California2012.
[11] T. Mathwork, "User’s guide version 6. The MathWorks Inc," 2009.
120
Analysis of Buckling behaviors of cold-formed steel C-section with Addition of Stiffeners Using CUFSM Software
Kamel Nihad Alshobaki1, Hazlan Bin Abdul Hamid2 Faculty of Civil Engineering, Universiti Teknologi Malaysia, Malaysia
Keywords: Local Buckling; Distortional Buckling; Cold-formed steel; C-section; CUFSM, Stiffener
ABSTRACT. This study presents the local and distortional buckling analysis result of cold-formed steel C-section in compression. Cold-formed steel as a construction is due to finite information on its use in current existing building codes. When cold-formed steel C-section is loaded either in compression or tension, the failure modes that can occur is local and distortional buckling due to the thinness of the C-sections. This study aims at identifying the local and distortional buckling behavior of cold-formed steel C-sections with the addition of stiffeners. Other than varying stiffener’s location and stiffener’s number, C-section of different thicknesses (1.55mm, 190mm, 2.50mm), depths of C-section (150mm, 200mm, 250mm) and steel grades of C-section (G350, G450, G550) were used. These parameters were chosen as they are critical parameters for designing cold-formed steel C-section. Therefore, the main objective of this study is to analyze the behavior of local and distortional buckling of cold-formed steel section, when stiffeners are added. Buckling results were obtained using CUFSM software based on finite strip method. The results indicate that the addition of stiffeners does improve the load carrying capacity of cold-formed steel section, but their effectiveness depends on the location, depth, thickness and steel grade of stiffeners.
INTRODUCTION
Cold-formed steel is the common word for steel made by rolling or pressing sheet steel into semi-finished or finished goods at low temperature. Hence, no heat is needed to form the cold formed steel shapes. Nowadays, the usage of cold-formed steel in construction industries has become more common than before as construction materials. The first use was in the 1980’s, where United State and Great Britain were the first countries that used this technology. Cold-formed steel members are usually light, thin, and efficient. However, this efficiency could create some complications and issues, and designers should take into account the buckling of thin members of the cross-section.
Problem Statement The use of cold-formed steel C-section is influenced by local and distortional buckling due to thin and light cross-section of the member. In fact, the very thin elements of the cold-formed steel used will definitely buckle before yielding. However, with stiffeners added, cold-formed steel sections are still considered workable as a construction material due to its deformable feature. So this study is carried out to investigate the effects of adding stiffeners to cold-form steel sections. It is important to know that, changes in the cross-sectional geometry such as location and number of the stiffeners and also the depth, length and steel grade of the section, will change the strength of the section. Objectives The objectives of this study are:
1. To analyze the difference in strength capacity (load factor) of cold-formed steel C-sections. 2. To determine the behavior of cold-formed steel section with variation in member depth, thickness and steel
grades. 3. To analyze the buckling behavior of cold-formed steel when stiffener is added to the flange and webs of C-
sections. Scope of Study This research is carried out to study the buckling behavior of cold-formed steel C-section. Identifying the behavior of buckling is done by using CUFSM software which is based on finite strip method. In this research, C-section shape of cold-formed steel is used with variable depth of (150 mm, 200 mm, 250 mm), thickness of (1.55 mm, 1.90 mm, 2.50 mm) and steel grade of the C-section (355, 450, 550). The buckling behaviors that need to be determined in this research are local buckling and distortional buckling.
LITERATURE REVIEW
Cold-formed steel is the newest materials for building construction. However, cold-formed steel members have thin plate thickness, and most of the sections are open sections. Thus, the possibility of having buckling instability during the application of load is high. Using stiffeners which are normally inserted in the plate members either in the web or in the flange will strengthen the performance of the plate member. These stiffeners are able to provide accepted support
121
for the compression flanges. Otherwise, the columns will have high possibility of buckling occurring perpendicular to the plane of the cross-section of the member [1].
The stiffeners used to improve the steel section are varied in terms of the shape of stiffener (arc, rectangular, V shape, inclined lopped channel) and the ultimate resistance capacity. A finite strip program CUFSM to analyze the local buckling and distortional buckling studied shows that direct strength method of the North American is also used to calculate the ultimate resistance capacities of cold-formed members [2]. They applied that on cold-formed steel C-section with single stiffener added at the middle web for all four types of stiffeners. The objective of this test is to specify the optimal stiffener.
The result of the study is that the value of ultimate resistance capacity of the members under axial compression with V- shape stiffener is higher than other types of stiffeners. If the ultimate resistance of the member under pure bending occurs, the difference is often limited. Thus, in terms of the comprehensive considerations, the stiffener of the V-shape on web is the optimal choice comparing with the other types.
Finite strip method was first introduced which introduced and explained the finite strip method in depth [3]. The usage of the finite strip method was then expanded [4]. According to Hancock, finite strip method is an efficient tool to analyze the structures with simple boundary conditions and regular geometric section. Indeed, the finite strip method is a variation of the finite element method.
These two methods use the same theory and basic methodology. Piecewise shape functions are used for approximating the continuous curves in terms of nodal degree of freedom. However, the difference between the finite element method and finite strip methods is about the discretization. The finite strip method utilizes individual element for modeling the longitudinal direction instead of a series of elements. According to the result of using the finite strip method, the number of equations needed for getting the solution is highly decreased as compared to the typical finite element solution.
The semi-analytical finite strip method was employed in CUFSM in providing solution to the cross-section stability of this kind of members. CUFSM is considered an open source of finite strip method software, provided for free by Schafer, which can provide engineers with this capability [5]. The main objective of using CUFSM software is to identify and to have a good understanding of the behavior of elastic buckling of steel thin members. This software will be able to determine the exact elastic buckling stress of thin-walled section.
METHODOLOGY This model was constructed using finite strip analysis software, namely CUFSM. To achieve the objectives of the
research, this research methodology consisted of 3 key activities: identifying the cold-formed steel C-section to be used for study, constructing the model structure by using CUFSM and analyze cold-formed steel section with regards to buckling stress, taking into account the effect of stiffener on buckling of the flange and web of cold-formed steel.
Design the Cold-Formed Steel Section Model The models used in this research are cold-formed steel with C-section shape. These models are designed using CUFSM software. The designation of the models is varied in criteria and specification such as thickness, depth, radius and steel grade. By this way, the result can show the differences between these models in terms of their strength capacity. Constructing the Model by Using CUFSM The first step to start constructing the model is by inserting the dimensions’ value of the model of the cold-formed C-section. The dimensions used are centerline dimension but not out-to-out. The dimensions chosen for this research are typically from local manufacturer (Kemuning Structures Sdn.Bhd). The reason of using manufacturer’s data is to have more effective result and because it is commonly used for structures. The second step is related to the coordinates of the nodes. The coordinate of each single node is editable. So, the nodes should be specified and respectively. Next step is setting up the applied load to the steel section. This process is significant in constructing the model. Analyzing the Model The software of CUFSM is used to define the elastic buckling behavior as it calculates the values of buckling stress in term of load factor and buckling mode. In this research, there are four main parameters that were chosen to be used for the analysis. These parameters will influence the strength capacity of cold-formed C section in terms of the load factor. The aspects are the yield stress, the depth, the thickness and the position of the stiffener added to the cold-formed C section. The variations used in this research of the cold-formed steel with C section mode are shown in Table 1 as followed:
Table 1: The Variations Used for Constructing the Models Depth Thickness Steel Grade Stiffener Position 150mm 1.55mm 350 No Stiffener 200mm 1.90mm 450 Single stiffener at Middle Web 250mm 2.50mm 550 Two Stiffener at Web
- - - Stiffener at Middle Flanges - - - Single Stiffener at Middle web and flanges
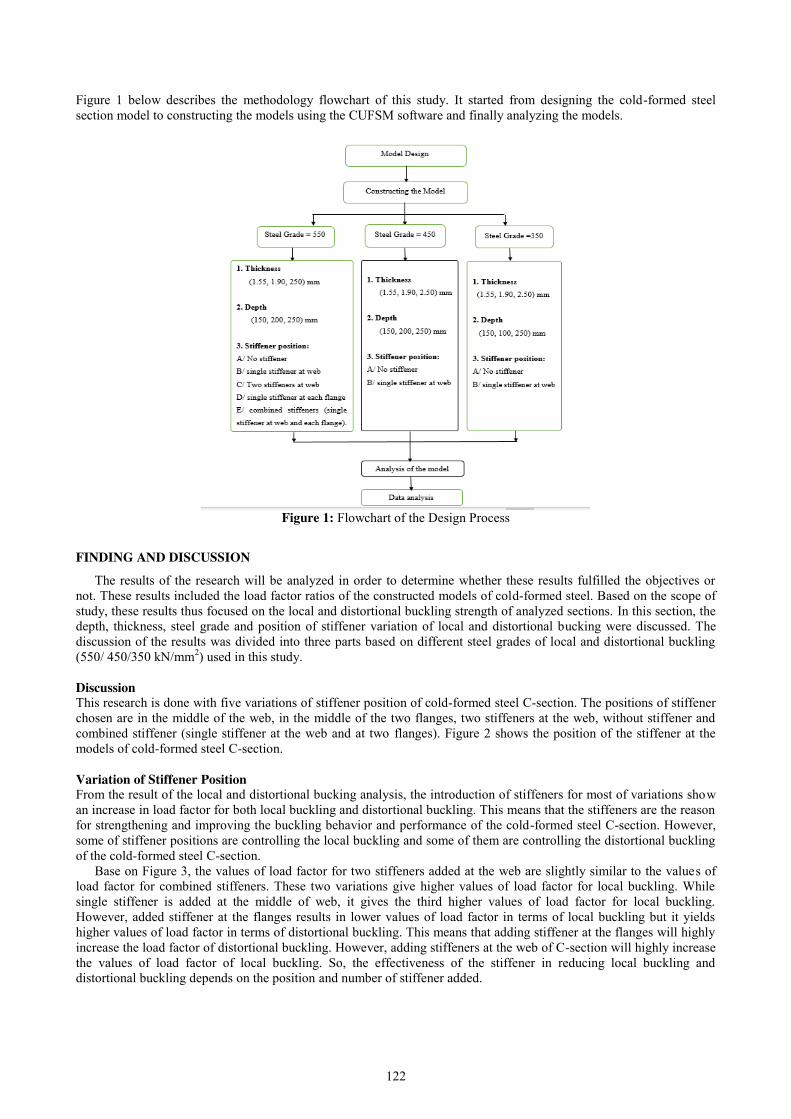
122
Figure 1 below describes the methodology flowchart of this study. It started from designing the cold-formed steel section model to constructing the models using the CUFSM software and finally analyzing the models.
Figure 1: Flowchart of the Design Process
FINDING AND DISCUSSION
The results of the research will be analyzed in order to determine whether these results fulfilled the objectives or not. These results included the load factor ratios of the constructed models of cold-formed steel. Based on the scope of study, these results thus focused on the local and distortional buckling strength of analyzed sections. In this section, the depth, thickness, steel grade and position of stiffener variation of local and distortional bucking were discussed. The discussion of the results was divided into three parts based on different steel grades of local and distortional buckling (550/ 450/350 kN/mm2) used in this study.
Discussion This research is done with five variations of stiffener position of cold-formed steel C-section. The positions of stiffener chosen are in the middle of the web, in the middle of the two flanges, two stiffeners at the web, without stiffener and combined stiffener (single stiffener at the web and at two flanges). Figure 2 shows the position of the stiffener at the models of cold-formed steel C-section. Variation of Stiffener Position From the result of the local and distortional bucking analysis, the introduction of stiffeners for most of variations show an increase in load factor for both local buckling and distortional buckling. This means that the stiffeners are the reason for strengthening and improving the buckling behavior and performance of the cold-formed steel C-section. However, some of stiffener positions are controlling the local buckling and some of them are controlling the distortional buckling of the cold-formed steel C-section.
Base on Figure 3, the values of load factor for two stiffeners added at the web are slightly similar to the values of load factor for combined stiffeners. These two variations give higher values of load factor for local buckling. While single stiffener is added at the middle of web, it gives the third higher values of load factor for local buckling. However, added stiffener at the flanges results in lower values of load factor in terms of local buckling but it yields higher values of load factor in terms of distortional buckling. This means that adding stiffener at the flanges will highly increase the load factor of distortional buckling. However, adding stiffeners at the web of C-section will highly increase the values of load factor of local buckling. So, the effectiveness of the stiffener in reducing local buckling and distortional buckling depends on the position and number of stiffener added.
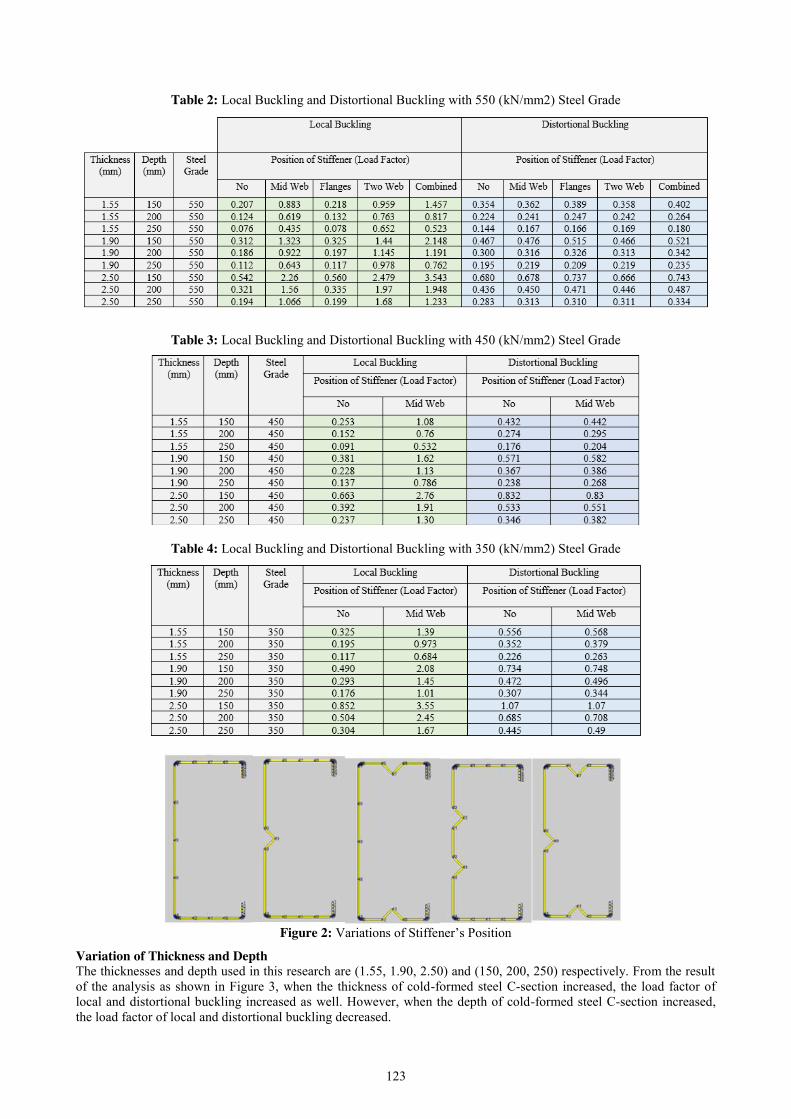
123
Table 2: Local Buckling and Distortional Buckling with 550 (kN/mm2) Steel Grade
Table 3: Local Buckling and Distortional Buckling with 450 (kN/mm2) Steel Grade
Table 4: Local Buckling and Distortional Buckling with 350 (kN/mm2) Steel Grade
Figure 2: Variations of Stiffener’s Position
Variation of Thickness and Depth The thicknesses and depth used in this research are (1.55, 1.90, 2.50) and (150, 200, 250) respectively. From the result of the analysis as shown in Figure 3, when the thickness of cold-formed steel C-section increased, the load factor of local and distortional buckling increased as well. However, when the depth of cold-formed steel C-section increased, the load factor of local and distortional buckling decreased.
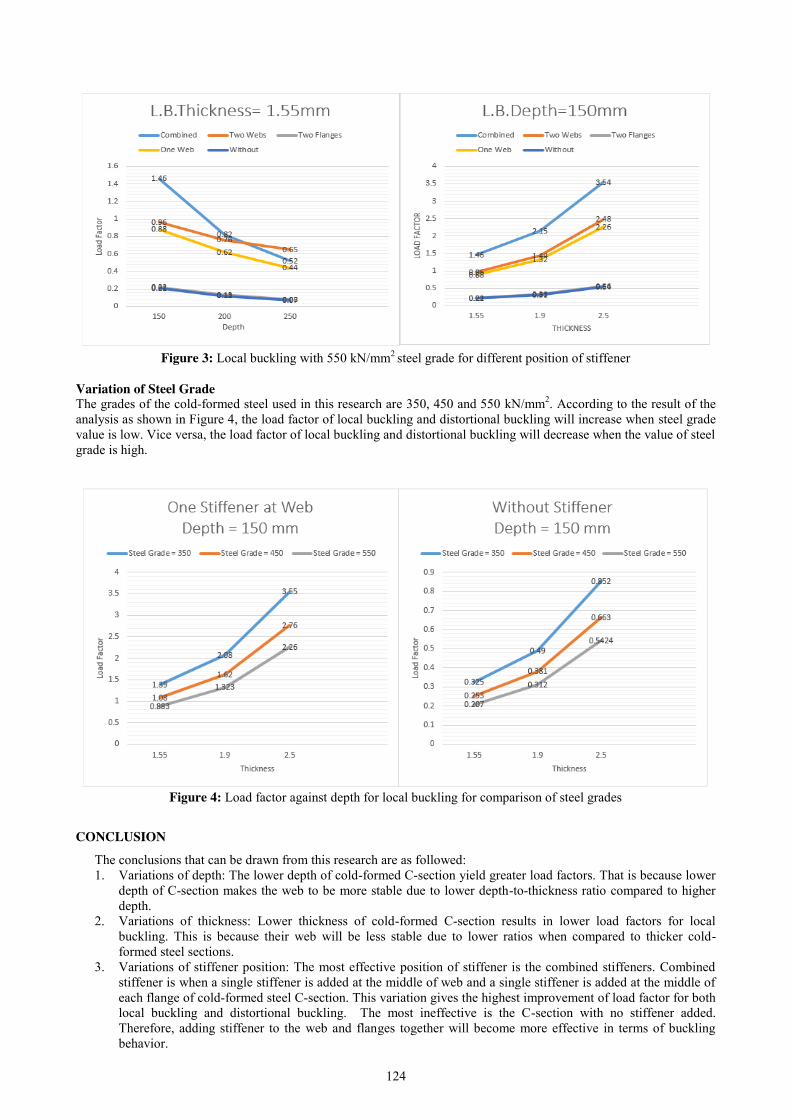
124
Figure 3: Local buckling with 550 kN/mm2 steel grade for different position of stiffener
Variation of Steel Grade The grades of the cold-formed steel used in this research are 350, 450 and 550 kN/mm2. According to the result of the analysis as shown in Figure 4, the load factor of local buckling and distortional buckling will increase when steel grade value is low. Vice versa, the load factor of local buckling and distortional buckling will decrease when the value of steel grade is high.
Figure 4: Load factor against depth for local buckling for comparison of steel grades
CONCLUSION
The conclusions that can be drawn from this research are as followed: 1. Variations of depth: The lower depth of cold-formed C-section yield greater load factors. That is because lower
depth of C-section makes the web to be more stable due to lower depth-to-thickness ratio compared to higher depth.
2. Variations of thickness: Lower thickness of cold-formed C-section results in lower load factors for local buckling. This is because their web will be less stable due to lower ratios when compared to thicker cold-formed steel sections.
3. Variations of stiffener position: The most effective position of stiffener is the combined stiffeners. Combined stiffener is when a single stiffener is added at the middle of web and a single stiffener is added at the middle of each flange of cold-formed steel C-section. This variation gives the highest improvement of load factor for both local buckling and distortional buckling. The most ineffective is the C-section with no stiffener added. Therefore, adding stiffener to the web and flanges together will become more effective in terms of buckling behavior.
125
4. Variations of steel grade: The higher grade of steel leads to lower load of factor in terms of local buckling. Vice versa, lower grade of steel can cause higher load factor of local and distortional buckling. Thus the addition of stiffeners will be more beneficial for higher grade steel C-section.
5. The local buckling of the steel is totally controlled by the web of cold-formed C-section. Whereas the distortional buckling of the steel is controlled by the flanges of cold-formed C-section. Therefore, adding stiffener to the web of C-section will lead to better performance and behavior of local buckling. While adding stiffener to flanges will lead to better performance and behavior of distortional buckling.
REFERENCES [1] Young, B. (2005), Experimental Investigation of Cold-Formed Steel lipped Angle Concentrically Loaded
Compression Members [J], Journal of Structural Engineering, Vol. 131, pp. 1390-1396. [2] Zhao, Y.H., Sun, G.J., Lu, L., Zhu, J. (2015) Steel Structure Co., Ltd., Ningbo 315000, China [3] Cheung, Y.K. & Tham. L.G. (1997). Finite Strip Method. CRC Press. [4] Hancock, G.J. (1998). Thin-Wall: Cross-Section Analysis and Finite Strip Analysis of Thin-Walled Structures,
Thin-Wall V2.1. Centre for Advanced Structural Engineering, University of Sydney. [5] Schafer B.W.& Pekoz T., (1998) Computational Modelling of Cold-Formed Steel: Characterizing Geometric
Imperfections and Residual Stresses. Journal of Constructional Research, 1998, v 47, pp 193-210.
126
The Effect of Placing Nominal Bar in the Compression Zone of a Singly Reinforced Concrete Section
Noraimidarfila Hud1, Ahmad Zaidon Rais2 Faculty of Civil Engineering, Universiti Teknologi Malaysia, Malaysia
Keywords: Nominal Bar; Singly Reinforced Concrete; Rectangular Section; Cross-Section Analysis.
ABSTRACT. Reinforced concrete is a composite material where steel is embedded in concrete and the function of the steel is to help the concrete to take tensile stress. In reinforced concrete, there are two types of beam which is singly reinforced and doubly reinforced. According to Eurocode 2, when K value is less than the Kbal, then the beam is a singly reinforced, where the reinforcement bars are not needed in compression zone and are only placed in tensile zone. In practice, the nominal bar is placed in the compression zone of a singly reinforced section. The key objective of this research is to study and determine the effect of placing the nominal bar in the singly reinforced rectangular section. In this study, Microsoft Excel has been used to analyse the cross section and gives the output which is the moment resistance of the section. Two spreadsheets have been made to analyse the rectangular section which is singly reinforced section and doubly reinforced section. The analysis is made based from the stress block diagram. From the research, the placement of nominal bar, regardless its size and area will definitely gives an effect to the resisting moment of the section.
INTRODUCTION Reinforced concrete is a composite material where steel is embedded in concrete and the function of the steel is to
help the concrete to take tensile stress. This is due to the mechanics properties of the concrete where it is good in compression but poor in tension [1]. According to Nanni et. al, the revolution in construction starts in late seventeenth century where the architect and designer start using experimental sciences and model before constructing the structure. In this century, they start to use glass in construction. However, it is not widely used. Soon after, in eighteenth century, designers start to have wider ideas in determining the size of the structure to use and the use of iron in construction is found. The use of reinforced concrete start over the second half of nineteenth century since the steel has become one of the major industrial breakthrough [2].
Problem Statement In reinforced concrete, there are two types of beam which is singly reinforced and doubly reinforced. According to Eurocode 2, when K value is less than the Kbal, then the beam is a singly reinforced, where the reinforcement bars are not needed in compression zone and are only placed in tensile zone. But, when the design moment exceed the Mbal, the moment comes from the loading cannot be fully resist by the moment induces from the steel. Therefore, additional reinforcement needs to be placed in compression zone so that it can provide additional moment resistance to external moment.
However, in practice, when the beam is singly reinforced, nominal bar will be placed at the compression zone to fulfill the requirement by the standards. The method has been used in practice, and without proper research, the effect of placing the nominal bar in compression zone is unknown. It may have positive effects to the structure, however it is not confirmed until further research or analysis is made. Objectives The objective of this study is to study and determine the effect of placing nominal bar in compression zone for a singly reinforced concrete section. Scope of Study Rectangular section with concrete grade C30 is used as the sample of the study. The sizes of the section used are 150 mm x 300 mm, 200 mm x 400 mm and 250 mm x 500 mm. Two controlled variables are established to ensure that the analysis made is not drifted from the objective of the study.
LITERATURE REVIEW
Feng Lin et. al have conduct a study on the flexural behaviour of reinforced concrete beams reinforced with compressive steel bars and two-piece enclosed stirrups [3]. The objective of the study is to gain experimental evidence of flexural behaviour of a beam and the stiffness of the stirrups. In their studies, six beams are fabricated to undergo experimental procedures and three finite element models are developed to study the behaviour of buckling of the compression bars. In FEM models, the plastic material properties are considered to determine the resistance and
127
mechanism of the beams. At the end of the study, they found that the compression bar almost outward buckled between two consecutive stirrups. The beams sample that they made shows no loosening or removal of stirrups and the hook deformation increased linearly with the increase of the force applied. In term of capacity of the beam, the increase of stirrups spacing will result to the increment of the moment contributed from compressive concrete.
D.S Pedro et. al study on the moment-curvature of reinforced concrete beam with various shapes [4]. In this study, it is mentioned that the bond between the reinforcement bar and the concrete may not be linear; hence a nonlinear analytical approach has been taken to come out with mathematical formulas in determining the depth of neutral axis and the moment-curvature. Then, a computer program has been developed to ease the computation and graph of bending moment against moment curvature and neutral axis depth against the section’s curvature is plotted. Two cross section have been analysed which are rectangular section and T-section. The deformations of the section are monitored and the cross section collapse due to reach of maximum permissible strain of either steel bar or concrete is predicted. In this study, they mentioned that the neutral axis may lies inside the cross section or outside of the cross section where the magnitude of axial force is very large. Besides, they also mentioned that the negative value of neutral axis depth shows that most of the cross section undergo tensile stress and very little part of the section undergoes compressive stress.
H.M Mohamad et. al have investigate the bending stiffness and neutral axis depth variation of over-reinforced high strength concrete beams [5]. The objective of the study is to provide experimental evidence of variation of the neutral axis depth and moment of inertia of over-reinforced sections with the tension reinforcement percentage. In this study, they have provided four over-reinforced high strength concrete beam and all the beams are tested to failure. The important parameter of the study is the ratio of tensile reinforcement and the size of the beams are kept constant. The result shows that cracking occurs on the surface of the beams and causing the moment of the inertia in each beam varies along the span. They found that in simply supported beam, the stiffness of beam increase along the length of the support towards midspan and decreasing when it moves back toward another support. In terms of neutral axis, changes in percentage of tensile reinforcement result to changes of neutral axis depth and it is increase in ultimate load state. The neutral axis depth variation is defined by the slope of the line connecting the origin of first crack to the initial yielding of failure point.
In 2006, a paper about effect of material properties on ductility of reinforced concrete beams is written by M.A.A Siddique and M.A Rouf [6]. In this paper, they aim to compare the moment-curvature behaviour of reinforced concrete beam under loading for various steel contents by the model with analytical result. For experimental purpose, two doubly reinforced concrete beams, one singly reinforced concrete beam has been made as models. After running the test, they found that all the curves for properties of concrete have similar trends where it starts with relatively straight line and begin to curve to horizontal and falling branch. In term of moment-curvature, they found that it varies along the span of the beams and it is because of the variation in neutral axis along the span. The result of the analysis also shows that increases in moment will decrease the curvature. The compressive strength also gives significant impact to the ductility of the curvature for both singly and doubly reinforced concrete beams where the ductility increases with increase of the compressive strength. Interestingly, for the same compressive strength, the ductility can be increased with increased of compression reinforcement and lastly, the ductility of the curvature decrease with the increase in yield strength of the steel reinforcement.
L.F.A Bernado has conducted a study on neutral axis depth versus flexural ductility in high strength concrete. The method that they used to achieve the objective is by doing experimental test and the make 19 sample of beams [7]. The test beams are classified into six classes, Class A to Class F according their concrete strength. For class A, the concrete is supplied by ready mix company and the other five is made in laboratory. Each beam is loaded by two symmetrical concentrated loads applied at one third’s of the span and the ratio of longitudinal bar varies from beam to beam. At the end of the study, they found that the neutral axis depth increased as the load applied is increased and the graph of the behaviour of the beam is plotted. At the first zone, the neutral axis is situated near the midheight and at the second zone, the neutral axis stabilizes as the beam suffer considerable amount of deformation when the load slowly increased. At the third zone, the neutral axis rise due to the behaviour of the beams that reach its limit.
METHODOLOGY
The main objective of the research is to study the effect of placing nominal bar in compression zone for a singly reinforced concrete section. The use of computer program has become beneficial in design or analysis of a section. In this study, Microsoft Excel has been used to analyse the cross section and gives the output which is the moment resistance of the section. Two spreadsheet has been made to analyse the rectangular section which is singly reinforced section and doubly reinforced section. The analysis is made based from the stress block diagram. Preparation for Singly Reinforced Spreadsheet The installation of tensile reinforcement induce resisting force Fst in the section while at the compression zone, the concrete induce compressive force Fcc that acts at the centroid of the effective area of concrete in compression. The internal force of Fcc and Fst is obtained by multiplying the design compressive stress of concrete with the area of stress block and design characteristic yield stress with area of steel reinforcement respectively. By taking equilibrium condition, where the Fst and Fcc will cancel out each other, the depth of neutral axis, x is obtained to calculate the lever arm, z. For normal strength concrete, the depth of stress block is 80% of the depth of neutral axis. Since Fcc is acting through the centroid of the stress block, which is 40% of the neutral axis depth,x from the top of concrete surface, hence
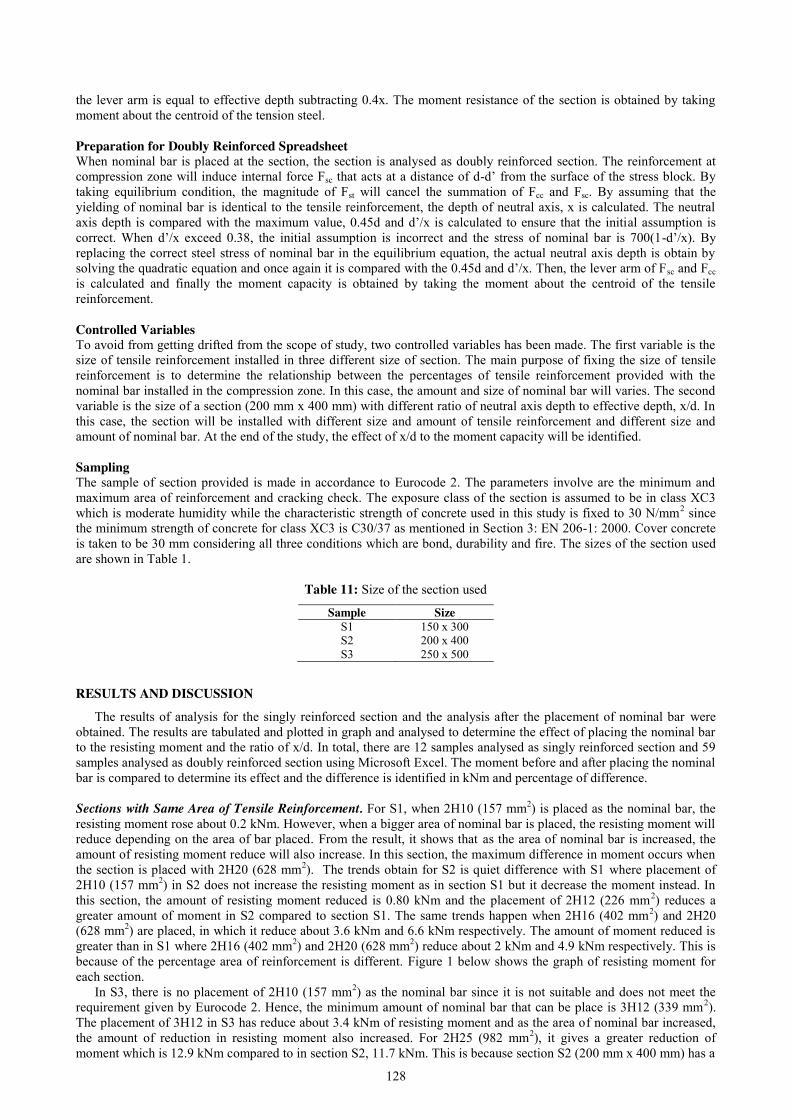
128
the lever arm is equal to effective depth subtracting 0.4x. The moment resistance of the section is obtained by taking moment about the centroid of the tension steel.
Preparation for Doubly Reinforced Spreadsheet When nominal bar is placed at the section, the section is analysed as doubly reinforced section. The reinforcement at compression zone will induce internal force Fsc that acts at a distance of d-d’ from the surface of the stress block. By taking equilibrium condition, the magnitude of Fst will cancel the summation of Fcc and Fsc. By assuming that the yielding of nominal bar is identical to the tensile reinforcement, the depth of neutral axis, x is calculated. The neutral axis depth is compared with the maximum value, 0.45d and d’/x is calculated to ensure that the initial assumption is correct. When d’/x exceed 0.38, the initial assumption is incorrect and the stress of nominal bar is 700(1-d’/x). By replacing the correct steel stress of nominal bar in the equilibrium equation, the actual neutral axis depth is obtain by solving the quadratic equation and once again it is compared with the 0.45d and d’/x. Then, the lever arm of Fsc and Fcc is calculated and finally the moment capacity is obtained by taking the moment about the centroid of the tensile reinforcement. Controlled Variables To avoid from getting drifted from the scope of study, two controlled variables has been made. The first variable is the size of tensile reinforcement installed in three different size of section. The main purpose of fixing the size of tensile reinforcement is to determine the relationship between the percentages of tensile reinforcement provided with the nominal bar installed in the compression zone. In this case, the amount and size of nominal bar will varies. The second variable is the size of a section (200 mm x 400 mm) with different ratio of neutral axis depth to effective depth, x/d. In this case, the section will be installed with different size and amount of tensile reinforcement and different size and amount of nominal bar. At the end of the study, the effect of x/d to the moment capacity will be identified. Sampling The sample of section provided is made in accordance to Eurocode 2. The parameters involve are the minimum and maximum area of reinforcement and cracking check. The exposure class of the section is assumed to be in class XC3 which is moderate humidity while the characteristic strength of concrete used in this study is fixed to 30 N/mm2 since the minimum strength of concrete for class XC3 is C30/37 as mentioned in Section 3: EN 206-1: 2000. Cover concrete is taken to be 30 mm considering all three conditions which are bond, durability and fire. The sizes of the section used are shown in Table 1.
Table 11: Size of the section used Sample Size
S1 150 x 300 S2 200 x 400 S3 250 x 500
RESULTS AND DISCUSSION
The results of analysis for the singly reinforced section and the analysis after the placement of nominal bar were obtained. The results are tabulated and plotted in graph and analysed to determine the effect of placing the nominal bar to the resisting moment and the ratio of x/d. In total, there are 12 samples analysed as singly reinforced section and 59 samples analysed as doubly reinforced section using Microsoft Excel. The moment before and after placing the nominal bar is compared to determine its effect and the difference is identified in kNm and percentage of difference.
Sections with Same Area of Tensile Reinforcement. For S1, when 2H10 (157 mm2) is placed as the nominal bar, the resisting moment rose about 0.2 kNm. However, when a bigger area of nominal bar is placed, the resisting moment will reduce depending on the area of bar placed. From the result, it shows that as the area of nominal bar is increased, the amount of resisting moment reduce will also increase. In this section, the maximum difference in moment occurs when the section is placed with 2H20 (628 mm2). The trends obtain for S2 is quiet difference with S1 where placement of 2H10 (157 mm2) in S2 does not increase the resisting moment as in section S1 but it decrease the moment instead. In this section, the amount of resisting moment reduced is 0.80 kNm and the placement of 2H12 (226 mm2) reduces a greater amount of moment in S2 compared to section S1. The same trends happen when 2H16 (402 mm2) and 2H20 (628 mm2) are placed, in which it reduce about 3.6 kNm and 6.6 kNm respectively. The amount of moment reduced is greater than in S1 where 2H16 (402 mm2) and 2H20 (628 mm2) reduce about 2 kNm and 4.9 kNm respectively. This is because of the percentage area of reinforcement is different. Figure 1 below shows the graph of resisting moment for each section.
In S3, there is no placement of 2H10 (157 mm2) as the nominal bar since it is not suitable and does not meet the requirement given by Eurocode 2. Hence, the minimum amount of nominal bar that can be place is 3H12 (339 mm2). The placement of 3H12 in S3 has reduce about 3.4 kNm of resisting moment and as the area of nominal bar increased, the amount of reduction in resisting moment also increased. For 2H25 (982 mm2), it gives a greater reduction of moment which is 12.9 kNm compared to in section S2, 11.7 kNm. This is because section S2 (200 mm x 400 mm) has a
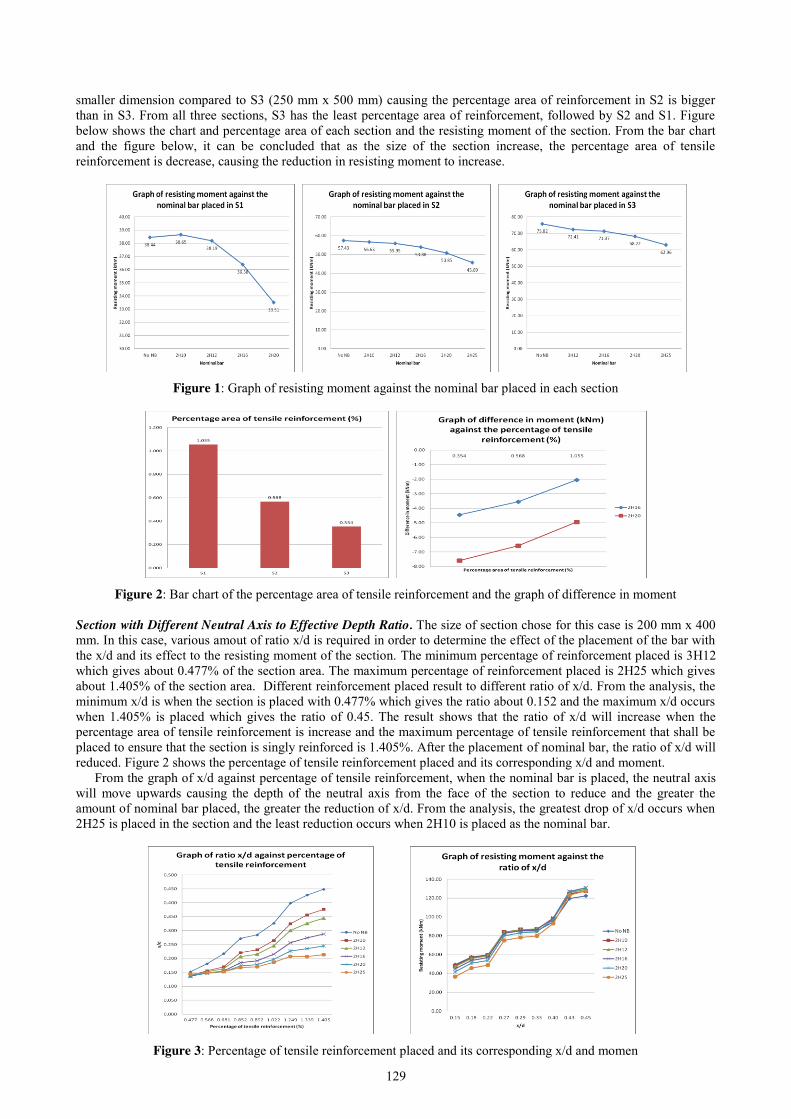
129
smaller dimension compared to S3 (250 mm x 500 mm) causing the percentage area of reinforcement in S2 is bigger than in S3. From all three sections, S3 has the least percentage area of reinforcement, followed by S2 and S1. Figure below shows the chart and percentage area of each section and the resisting moment of the section. From the bar chart and the figure below, it can be concluded that as the size of the section increase, the percentage area of tensile reinforcement is decrease, causing the reduction in resisting moment to increase.
Figure 1: Graph of resisting moment against the nominal bar placed in each section
Figure 2: Bar chart of the percentage area of tensile reinforcement and the graph of difference in moment
Section with Different Neutral Axis to Effective Depth Ratio. The size of section chose for this case is 200 mm x 400 mm. In this case, various amout of ratio x/d is required in order to determine the effect of the placement of the bar with the x/d and its effect to the resisting moment of the section. The minimum percentage of reinforcement placed is 3H12 which gives about 0.477% of the section area. The maximum percentage of reinforcement placed is 2H25 which gives about 1.405% of the section area. Different reinforcement placed result to different ratio of x/d. From the analysis, the minimum x/d is when the section is placed with 0.477% which gives the ratio about 0.152 and the maximum x/d occurs when 1.405% is placed which gives the ratio of 0.45. The result shows that the ratio of x/d will increase when the percentage area of tensile reinforcement is increase and the maximum percentage of tensile reinforcement that shall be placed to ensure that the section is singly reinforced is 1.405%. After the placement of nominal bar, the ratio of x/d will reduced. Figure 2 shows the percentage of tensile reinforcement placed and its corresponding x/d and moment.
From the graph of x/d against percentage of tensile reinforcement, when the nominal bar is placed, the neutral axis will move upwards causing the depth of the neutral axis from the face of the section to reduce and the greater the amount of nominal bar placed, the greater the reduction of x/d. From the analysis, the greatest drop of x/d occurs when 2H25 is placed in the section and the least reduction occurs when 2H10 is placed as the nominal bar.
Figure 3: Percentage of tensile reinforcement placed and its corresponding x/d and momen
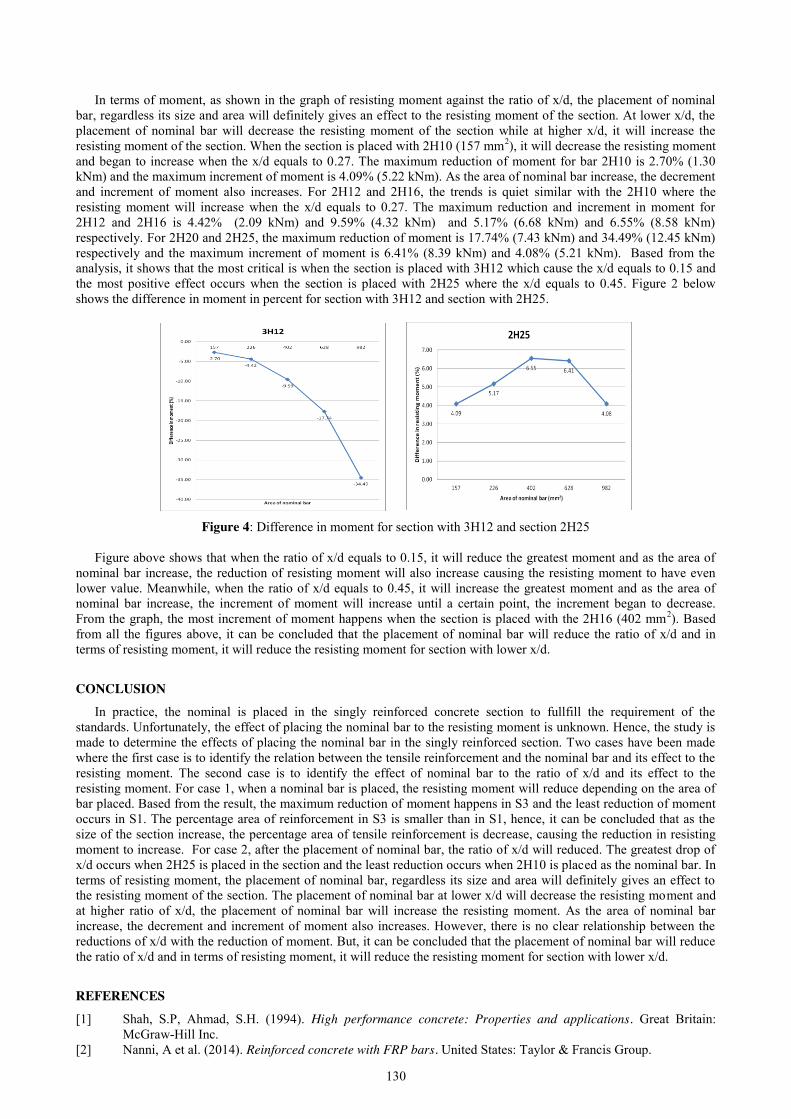
130
In terms of moment, as shown in the graph of resisting moment against the ratio of x/d, the placement of nominal bar, regardless its size and area will definitely gives an effect to the resisting moment of the section. At lower x/d, the placement of nominal bar will decrease the resisting moment of the section while at higher x/d, it will increase the resisting moment of the section. When the section is placed with 2H10 (157 mm2), it will decrease the resisting moment and began to increase when the x/d equals to 0.27. The maximum reduction of moment for bar 2H10 is 2.70% (1.30 kNm) and the maximum increment of moment is 4.09% (5.22 kNm). As the area of nominal bar increase, the decrement and increment of moment also increases. For 2H12 and 2H16, the trends is quiet similar with the 2H10 where the resisting moment will increase when the x/d equals to 0.27. The maximum reduction and increment in moment for 2H12 and 2H16 is 4.42% (2.09 kNm) and 9.59% (4.32 kNm) and 5.17% (6.68 kNm) and 6.55% (8.58 kNm) respectively. For 2H20 and 2H25, the maximum reduction of moment is 17.74% (7.43 kNm) and 34.49% (12.45 kNm) respectively and the maximum increment of moment is 6.41% (8.39 kNm) and 4.08% (5.21 kNm). Based from the analysis, it shows that the most critical is when the section is placed with 3H12 which cause the x/d equals to 0.15 and the most positive effect occurs when the section is placed with 2H25 where the x/d equals to 0.45. Figure 2 below shows the difference in moment in percent for section with 3H12 and section with 2H25.
Figure 4: Difference in moment for section with 3H12 and section 2H25
Figure above shows that when the ratio of x/d equals to 0.15, it will reduce the greatest moment and as the area of
nominal bar increase, the reduction of resisting moment will also increase causing the resisting moment to have even lower value. Meanwhile, when the ratio of x/d equals to 0.45, it will increase the greatest moment and as the area of nominal bar increase, the increment of moment will increase until a certain point, the increment began to decrease. From the graph, the most increment of moment happens when the section is placed with the 2H16 (402 mm2). Based from all the figures above, it can be concluded that the placement of nominal bar will reduce the ratio of x/d and in terms of resisting moment, it will reduce the resisting moment for section with lower x/d.
CONCLUSION In practice, the nominal is placed in the singly reinforced concrete section to fullfill the requirement of the
standards. Unfortunately, the effect of placing the nominal bar to the resisting moment is unknown. Hence, the study is made to determine the effects of placing the nominal bar in the singly reinforced section. Two cases have been made where the first case is to identify the relation between the tensile reinforcement and the nominal bar and its effect to the resisting moment. The second case is to identify the effect of nominal bar to the ratio of x/d and its effect to the resisting moment. For case 1, when a nominal bar is placed, the resisting moment will reduce depending on the area of bar placed. Based from the result, the maximum reduction of moment happens in S3 and the least reduction of moment occurs in S1. The percentage area of reinforcement in S3 is smaller than in S1, hence, it can be concluded that as the size of the section increase, the percentage area of tensile reinforcement is decrease, causing the reduction in resisting moment to increase. For case 2, after the placement of nominal bar, the ratio of x/d will reduced. The greatest drop of x/d occurs when 2H25 is placed in the section and the least reduction occurs when 2H10 is placed as the nominal bar. In terms of resisting moment, the placement of nominal bar, regardless its size and area will definitely gives an effect to the resisting moment of the section. The placement of nominal bar at lower x/d will decrease the resisting moment and at higher ratio of x/d, the placement of nominal bar will increase the resisting moment. As the area of nominal bar increase, the decrement and increment of moment also increases. However, there is no clear relationship between the reductions of x/d with the reduction of moment. But, it can be concluded that the placement of nominal bar will reduce the ratio of x/d and in terms of resisting moment, it will reduce the resisting moment for section with lower x/d.
REFERENCES
[1] Shah, S.P, Ahmad, S.H. (1994). High performance concrete: Properties and applications. Great Britain: McGraw-Hill Inc.
[2] Nanni, A et al. (2014). Reinforced concrete with FRP bars. United States: Taylor & Francis Group.

131
[3] Lin, F., Zhong, Q., & Zhang, Z. (2016). Flexural behaviour of RC beams reinforced with compressive steel bars and two-piece enclosed stirrups. Construction and Building Materials, 126, 55–65. https://doi.org/10.1016/j.conbuildmat.2016.09.016.
[4] Dias, P., Barros, H., Costa, C., & Marques, T. (2016). Closed-form moment-curvature relations for reinforced concrete cross sections under bending moment and axial force.
[5] Mohammadhassani, M., Jumaat, M. Z. Bin, Chemrouk, M., Maghsoudi, A. A., Jameel, M., & Akib, S. (2011). An experimental investigation on bending stiffness and neutral axis depth variation of over-reinforced high strength concrete beams. Nuclear Engineering and Design, 241(6), 2060–2067. https://doi.org/10.1016/j.nucengdes.2011.02.022
[6] Al, M., & Siddique, A. (n.d.). EFFECT OF MATERIAL PROPERTIES ON DUCTILITY OF. [7] Bernardo, L. F. A., & Lopes, S. M. R. (2004). Neutral Axis Depth versus Flexural Ductility in High-Strength
Concrete Beams, 130(March), 452–459.
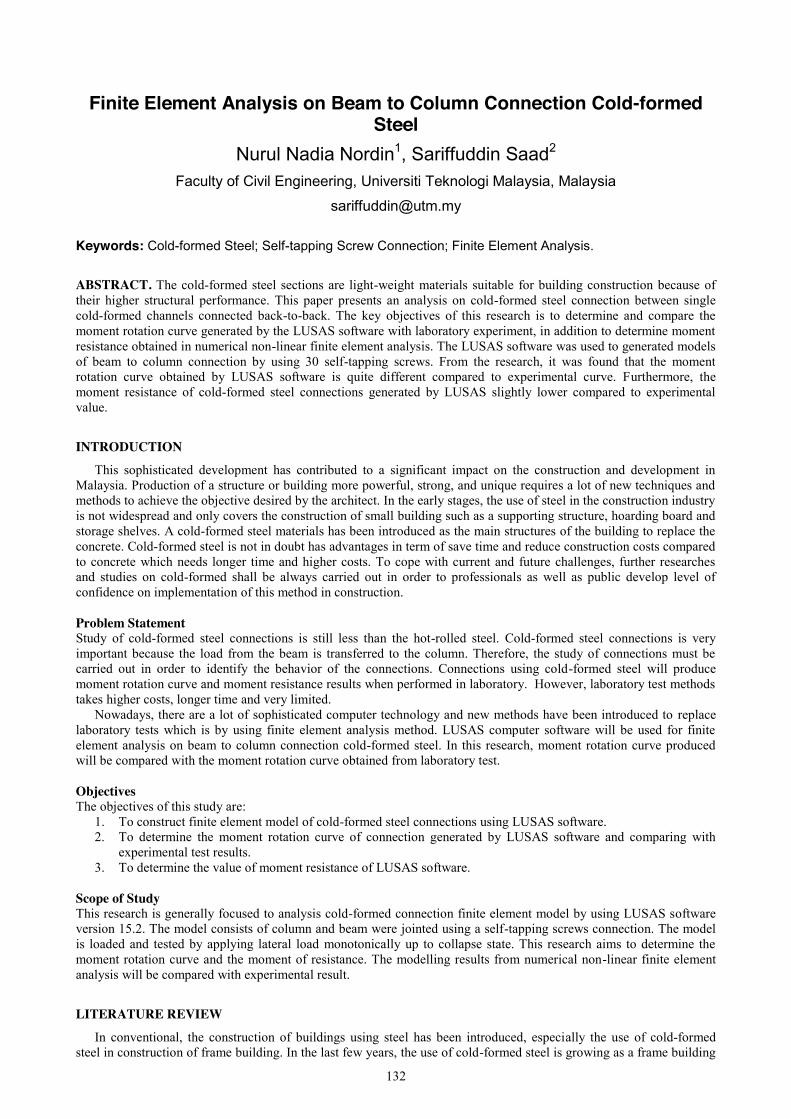
132
Finite Element Analysis on Beam to Column Connection Cold-formed Steel
Nurul Nadia Nordin1, Sariffuddin Saad2 Faculty of Civil Engineering, Universiti Teknologi Malaysia, Malaysia
Keywords: Cold-formed Steel; Self-tapping Screw Connection; Finite Element Analysis.
ABSTRACT. The cold-formed steel sections are light-weight materials suitable for building construction because of their higher structural performance. This paper presents an analysis on cold-formed steel connection between single cold-formed channels connected back-to-back. The key objectives of this research is to determine and compare the moment rotation curve generated by the LUSAS software with laboratory experiment, in addition to determine moment resistance obtained in numerical non-linear finite element analysis. The LUSAS software was used to generated models of beam to column connection by using 30 self-tapping screws. From the research, it was found that the moment rotation curve obtained by LUSAS software is quite different compared to experimental curve. Furthermore, the moment resistance of cold-formed steel connections generated by LUSAS slightly lower compared to experimental value.
INTRODUCTION
This sophisticated development has contributed to a significant impact on the construction and development in Malaysia. Production of a structure or building more powerful, strong, and unique requires a lot of new techniques and methods to achieve the objective desired by the architect. In the early stages, the use of steel in the construction industry is not widespread and only covers the construction of small building such as a supporting structure, hoarding board and storage shelves. A cold-formed steel materials has been introduced as the main structures of the building to replace the concrete. Cold-formed steel is not in doubt has advantages in term of save time and reduce construction costs compared to concrete which needs longer time and higher costs. To cope with current and future challenges, further researches and studies on cold-formed shall be always carried out in order to professionals as well as public develop level of confidence on implementation of this method in construction.
Problem Statement Study of cold-formed steel connections is still less than the hot-rolled steel. Cold-formed steel connections is very important because the load from the beam is transferred to the column. Therefore, the study of connections must be carried out in order to identify the behavior of the connections. Connections using cold-formed steel will produce moment rotation curve and moment resistance results when performed in laboratory. However, laboratory test methods takes higher costs, longer time and very limited.
Nowadays, there are a lot of sophisticated computer technology and new methods have been introduced to replace laboratory tests which is by using finite element analysis method. LUSAS computer software will be used for finite element analysis on beam to column connection cold-formed steel. In this research, moment rotation curve produced will be compared with the moment rotation curve obtained from laboratory test.
Objectives The objectives of this study are:
1. To construct finite element model of cold-formed steel connections using LUSAS software. 2. To determine the moment rotation curve of connection generated by LUSAS software and comparing with
experimental test results. 3. To determine the value of moment resistance of LUSAS software.
Scope of Study This research is generally focused to analysis cold-formed connection finite element model by using LUSAS software version 15.2. The model consists of column and beam were jointed using a self-tapping screws connection. The model is loaded and tested by applying lateral load monotonically up to collapse state. This research aims to determine the moment rotation curve and the moment of resistance. The modelling results from numerical non-linear finite element analysis will be compared with experimental result.
LITERATURE REVIEW
In conventional, the construction of buildings using steel has been introduced, especially the use of cold-formed steel in construction of frame building. In the last few years, the use of cold-formed steel is growing as a frame building
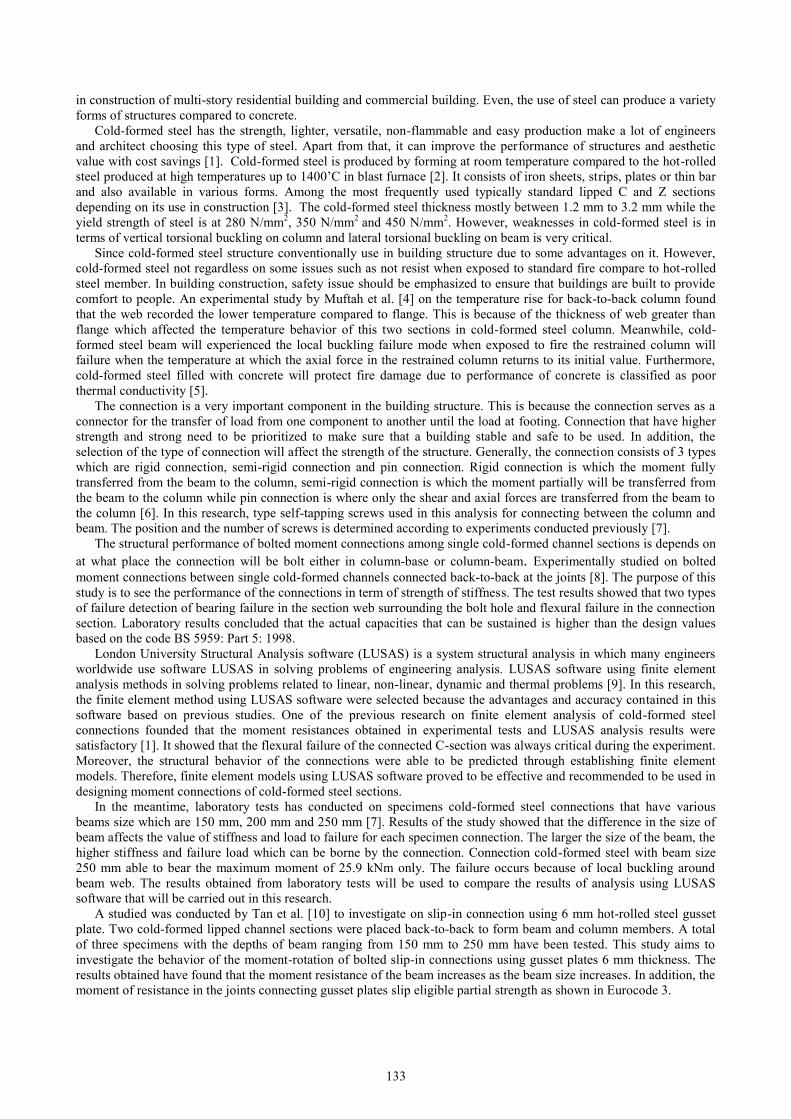
133
in construction of multi-story residential building and commercial building. Even, the use of steel can produce a variety forms of structures compared to concrete.
Cold-formed steel has the strength, lighter, versatile, non-flammable and easy production make a lot of engineers and architect choosing this type of steel. Apart from that, it can improve the performance of structures and aesthetic value with cost savings [1]. Cold-formed steel is produced by forming at room temperature compared to the hot-rolled steel produced at high temperatures up to 1400’C in blast furnace [2]. It consists of iron sheets, strips, plates or thin bar and also available in various forms. Among the most frequently used typically standard lipped C and Z sections depending on its use in construction [3]. The cold-formed steel thickness mostly between 1.2 mm to 3.2 mm while the yield strength of steel is at 280 N/mm2, 350 N/mm2 and 450 N/mm2. However, weaknesses in cold-formed steel is in terms of vertical torsional buckling on column and lateral torsional buckling on beam is very critical.
Since cold-formed steel structure conventionally use in building structure due to some advantages on it. However, cold-formed steel not regardless on some issues such as not resist when exposed to standard fire compare to hot-rolled steel member. In building construction, safety issue should be emphasized to ensure that buildings are built to provide comfort to people. An experimental study by Muftah et al. [4] on the temperature rise for back-to-back column found that the web recorded the lower temperature compared to flange. This is because of the thickness of web greater than flange which affected the temperature behavior of this two sections in cold-formed steel column. Meanwhile, cold-formed steel beam will experienced the local buckling failure mode when exposed to fire the restrained column will failure when the temperature at which the axial force in the restrained column returns to its initial value. Furthermore, cold-formed steel filled with concrete will protect fire damage due to performance of concrete is classified as poor thermal conductivity [5].
The connection is a very important component in the building structure. This is because the connection serves as a connector for the transfer of load from one component to another until the load at footing. Connection that have higher strength and strong need to be prioritized to make sure that a building stable and safe to be used. In addition, the selection of the type of connection will affect the strength of the structure. Generally, the connection consists of 3 types which are rigid connection, semi-rigid connection and pin connection. Rigid connection is which the moment fully transferred from the beam to the column, semi-rigid connection is which the moment partially will be transferred from the beam to the column while pin connection is where only the shear and axial forces are transferred from the beam to the column [6]. In this research, type self-tapping screws used in this analysis for connecting between the column and beam. The position and the number of screws is determined according to experiments conducted previously [7].
The structural performance of bolted moment connections among single cold-formed channel sections is depends on at what place the connection will be bolt either in column-base or column-beam. Experimentally studied on bolted moment connections between single cold-formed channels connected back-to-back at the joints [8]. The purpose of this study is to see the performance of the connections in term of strength of stiffness. The test results showed that two types of failure detection of bearing failure in the section web surrounding the bolt hole and flexural failure in the connection section. Laboratory results concluded that the actual capacities that can be sustained is higher than the design values based on the code BS 5959: Part 5: 1998.
London University Structural Analysis software (LUSAS) is a system structural analysis in which many engineers worldwide use software LUSAS in solving problems of engineering analysis. LUSAS software using finite element analysis methods in solving problems related to linear, non-linear, dynamic and thermal problems [9]. In this research, the finite element method using LUSAS software were selected because the advantages and accuracy contained in this software based on previous studies. One of the previous research on finite element analysis of cold-formed steel connections founded that the moment resistances obtained in experimental tests and LUSAS analysis results were satisfactory [1]. It showed that the flexural failure of the connected C-section was always critical during the experiment. Moreover, the structural behavior of the connections were able to be predicted through establishing finite element models. Therefore, finite element models using LUSAS software proved to be effective and recommended to be used in designing moment connections of cold-formed steel sections.
In the meantime, laboratory tests has conducted on specimens cold-formed steel connections that have various beams size which are 150 mm, 200 mm and 250 mm [7]. Results of the study showed that the difference in the size of beam affects the value of stiffness and load to failure for each specimen connection. The larger the size of the beam, the higher stiffness and failure load which can be borne by the connection. Connection cold-formed steel with beam size 250 mm able to bear the maximum moment of 25.9 kNm only. The failure occurs because of local buckling around beam web. The results obtained from laboratory tests will be used to compare the results of analysis using LUSAS software that will be carried out in this research.
A studied was conducted by Tan et al. [10] to investigate on slip-in connection using 6 mm hot-rolled steel gusset plate. Two cold-formed lipped channel sections were placed back-to-back to form beam and column members. A total of three specimens with the depths of beam ranging from 150 mm to 250 mm have been tested. This study aims to investigate the behavior of the moment-rotation of bolted slip-in connections using gusset plates 6 mm thickness. The results obtained have found that the moment resistance of the beam increases as the beam size increases. In addition, the moment of resistance in the joints connecting gusset plates slip eligible partial strength as shown in Eurocode 3.
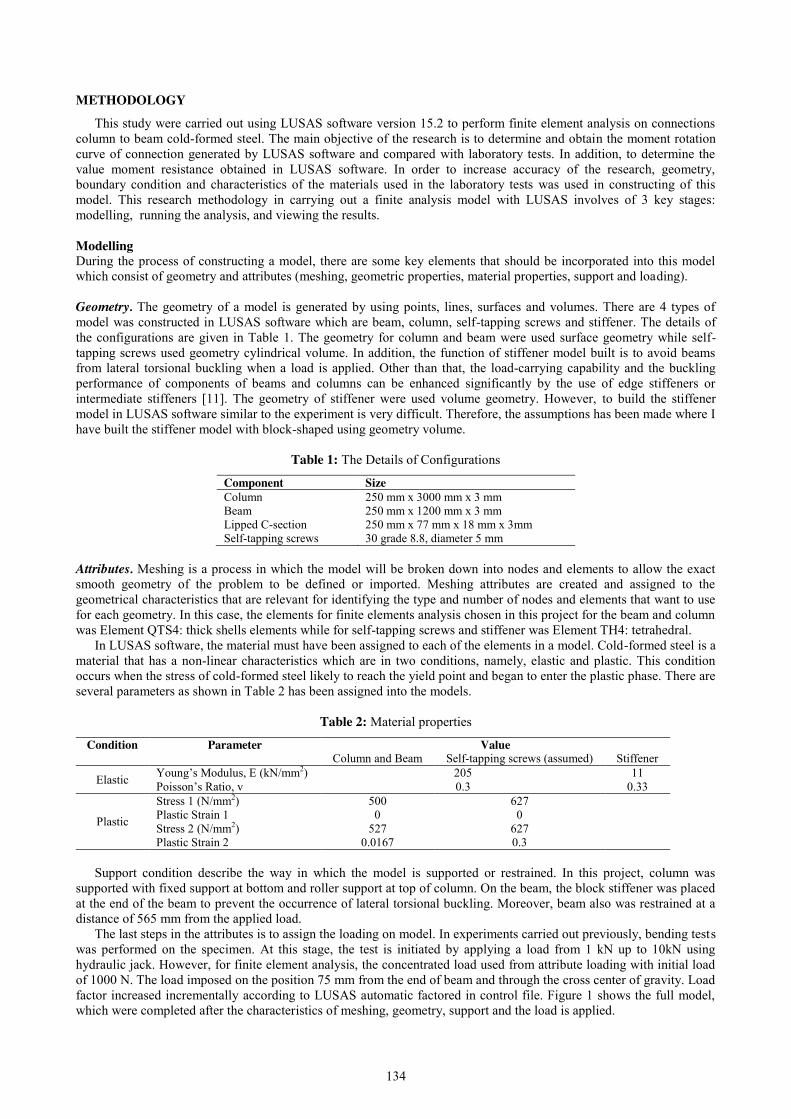
134
METHODOLOGY
This study were carried out using LUSAS software version 15.2 to perform finite element analysis on connections column to beam cold-formed steel. The main objective of the research is to determine and obtain the moment rotation curve of connection generated by LUSAS software and compared with laboratory tests. In addition, to determine the value moment resistance obtained in LUSAS software. In order to increase accuracy of the research, geometry, boundary condition and characteristics of the materials used in the laboratory tests was used in constructing of this model. This research methodology in carrying out a finite analysis model with LUSAS involves of 3 key stages: modelling, running the analysis, and viewing the results. Modelling During the process of constructing a model, there are some key elements that should be incorporated into this model which consist of geometry and attributes (meshing, geometric properties, material properties, support and loading). Geometry. The geometry of a model is generated by using points, lines, surfaces and volumes. There are 4 types of model was constructed in LUSAS software which are beam, column, self-tapping screws and stiffener. The details of the configurations are given in Table 1. The geometry for column and beam were used surface geometry while self-tapping screws used geometry cylindrical volume. In addition, the function of stiffener model built is to avoid beams from lateral torsional buckling when a load is applied. Other than that, the load-carrying capability and the buckling performance of components of beams and columns can be enhanced significantly by the use of edge stiffeners or intermediate stiffeners [11]. The geometry of stiffener were used volume geometry. However, to build the stiffener model in LUSAS software similar to the experiment is very difficult. Therefore, the assumptions has been made where I have built the stiffener model with block-shaped using geometry volume.
Table 1: The Details of Configurations
Component Size Column 250 mm x 3000 mm x 3 mm Beam 250 mm x 1200 mm x 3 mm Lipped C-section 250 mm x 77 mm x 18 mm x 3mm Self-tapping screws 30 grade 8.8, diameter 5 mm
Attributes. Meshing is a process in which the model will be broken down into nodes and elements to allow the exact smooth geometry of the problem to be defined or imported. Meshing attributes are created and assigned to the geometrical characteristics that are relevant for identifying the type and number of nodes and elements that want to use for each geometry. In this case, the elements for finite elements analysis chosen in this project for the beam and column was Element QTS4: thick shells elements while for self-tapping screws and stiffener was Element TH4: tetrahedral.
In LUSAS software, the material must have been assigned to each of the elements in a model. Cold-formed steel is a material that has a non-linear characteristics which are in two conditions, namely, elastic and plastic. This condition occurs when the stress of cold-formed steel likely to reach the yield point and began to enter the plastic phase. There are several parameters as shown in Table 2 has been assigned into the models.
Table 2: Material properties
Condition Parameter Value Column and Beam Self-tapping screws (assumed) Stiffener
Elastic Young’s Modulus, E (kN/mm2) 205 11 Poisson’s Ratio, v 0.3 0.33
Plastic
Stress 1 (N/mm2) 500 627 Plastic Strain 1 0 0 Stress 2 (N/mm2) 527 627 Plastic Strain 2 0.0167 0.3
Support condition describe the way in which the model is supported or restrained. In this project, column was
supported with fixed support at bottom and roller support at top of column. On the beam, the block stiffener was placed at the end of the beam to prevent the occurrence of lateral torsional buckling. Moreover, beam also was restrained at a distance of 565 mm from the applied load.
The last steps in the attributes is to assign the loading on model. In experiments carried out previously, bending tests was performed on the specimen. At this stage, the test is initiated by applying a load from 1 kN up to 10kN using hydraulic jack. However, for finite element analysis, the concentrated load used from attribute loading with initial load of 1000 N. The load imposed on the position 75 mm from the end of beam and through the cross center of gravity. Load factor increased incrementally according to LUSAS automatic factored in control file. Figure 1 shows the full model, which were completed after the characteristics of meshing, geometry, support and the load is applied.
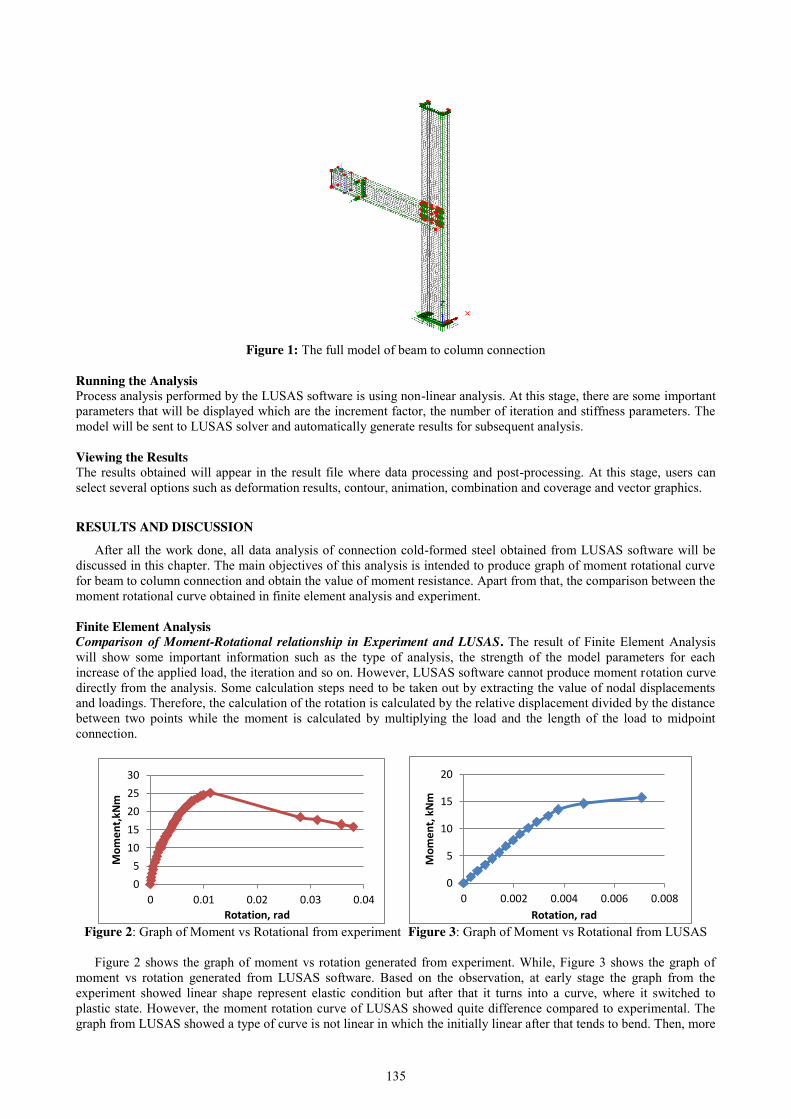
135
Figure 1: The full model of beam to column connection
Running the Analysis Process analysis performed by the LUSAS software is using non-linear analysis. At this stage, there are some important parameters that will be displayed which are the increment factor, the number of iteration and stiffness parameters. The model will be sent to LUSAS solver and automatically generate results for subsequent analysis. Viewing the Results The results obtained will appear in the result file where data processing and post-processing. At this stage, users can select several options such as deformation results, contour, animation, combination and coverage and vector graphics.
RESULTS AND DISCUSSION
After all the work done, all data analysis of connection cold-formed steel obtained from LUSAS software will be discussed in this chapter. The main objectives of this analysis is intended to produce graph of moment rotational curve for beam to column connection and obtain the value of moment resistance. Apart from that, the comparison between the moment rotational curve obtained in finite element analysis and experiment.
Finite Element Analysis Comparison of Moment-Rotational relationship in Experiment and LUSAS. The result of Finite Element Analysis will show some important information such as the type of analysis, the strength of the model parameters for each increase of the applied load, the iteration and so on. However, LUSAS software cannot produce moment rotation curve directly from the analysis. Some calculation steps need to be taken out by extracting the value of nodal displacements and loadings. Therefore, the calculation of the rotation is calculated by the relative displacement divided by the distance between two points while the moment is calculated by multiplying the load and the length of the load to midpoint connection.
Figure 2: Graph of Moment vs Rotational from experiment Figure 3: Graph of Moment vs Rotational from LUSAS
Figure 2 shows the graph of moment vs rotation generated from experiment. While, Figure 3 shows the graph of
moment vs rotation generated from LUSAS software. Based on the observation, at early stage the graph from the experiment showed linear shape represent elastic condition but after that it turns into a curve, where it switched to plastic state. However, the moment rotation curve of LUSAS showed quite difference compared to experimental. The graph from LUSAS showed a type of curve is not linear in which the initially linear after that tends to bend. Then, more
05
1015202530
0 0.01 0.02 0.03 0.04
Mom
ent,
kNm
Rotation, rad
0
5
10
15
20
0 0.002 0.004 0.006 0.008
Mom
ent,
kN
m
Rotation, rad
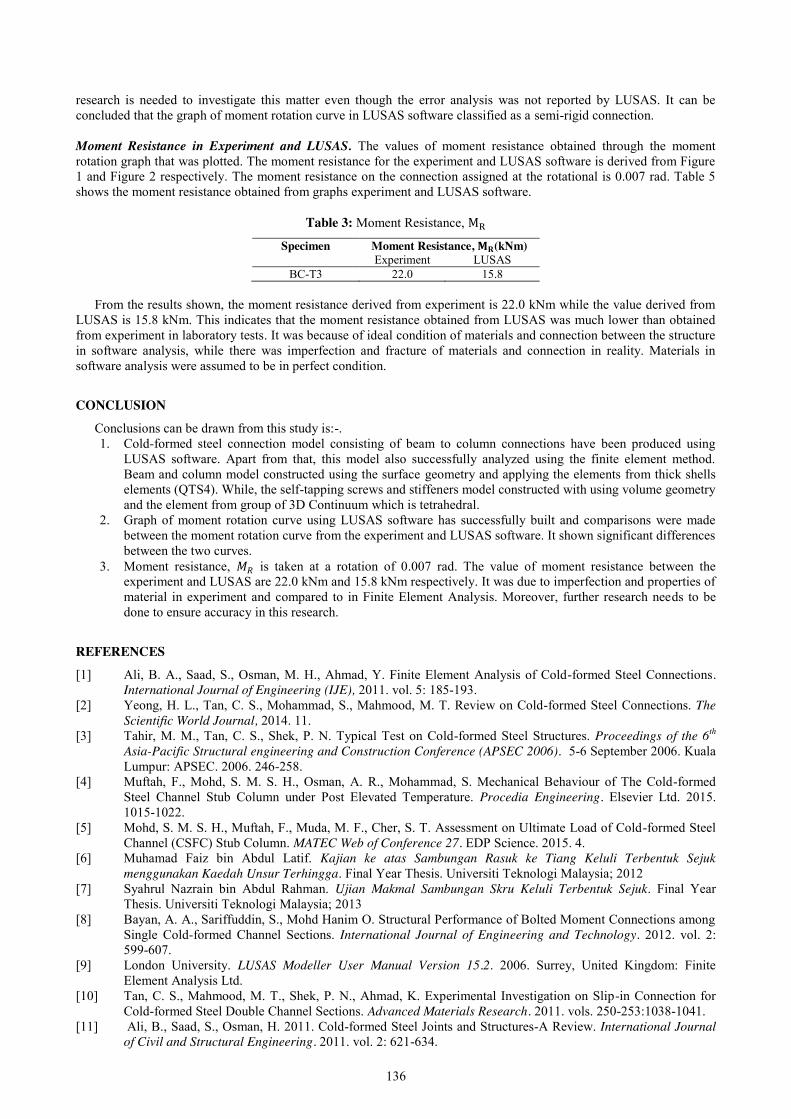
136
research is needed to investigate this matter even though the error analysis was not reported by LUSAS. It can be concluded that the graph of moment rotation curve in LUSAS software classified as a semi-rigid connection. Moment Resistance in Experiment and LUSAS. The values of moment resistance obtained through the moment rotation graph that was plotted. The moment resistance for the experiment and LUSAS software is derived from Figure 1 and Figure 2 respectively. The moment resistance on the connection assigned at the rotational is 0.007 rad. Table 5 shows the moment resistance obtained from graphs experiment and LUSAS software.
Table 3: Moment Resistance, MR
Specimen Moment Resistance, 𝐌𝐑(kNm) Experiment LUSAS
BC-T3 22.0 15.8
From the results shown, the moment resistance derived from experiment is 22.0 kNm while the value derived from LUSAS is 15.8 kNm. This indicates that the moment resistance obtained from LUSAS was much lower than obtained from experiment in laboratory tests. It was because of ideal condition of materials and connection between the structure in software analysis, while there was imperfection and fracture of materials and connection in reality. Materials in software analysis were assumed to be in perfect condition.
CONCLUSION
Conclusions can be drawn from this study is:-. 1. Cold-formed steel connection model consisting of beam to column connections have been produced using
LUSAS software. Apart from that, this model also successfully analyzed using the finite element method. Beam and column model constructed using the surface geometry and applying the elements from thick shells elements (QTS4). While, the self-tapping screws and stiffeners model constructed with using volume geometry and the element from group of 3D Continuum which is tetrahedral.
2. Graph of moment rotation curve using LUSAS software has successfully built and comparisons were made between the moment rotation curve from the experiment and LUSAS software. It shown significant differences between the two curves.
3. Moment resistance, 𝑀𝑅 is taken at a rotation of 0.007 rad. The value of moment resistance between the experiment and LUSAS are 22.0 kNm and 15.8 kNm respectively. It was due to imperfection and properties of material in experiment and compared to in Finite Element Analysis. Moreover, further research needs to be done to ensure accuracy in this research.
REFERENCES
[1] Ali, B. A., Saad, S., Osman, M. H., Ahmad, Y. Finite Element Analysis of Cold-formed Steel Connections. International Journal of Engineering (IJE), 2011. vol. 5: 185-193.
[2] Yeong, H. L., Tan, C. S., Mohammad, S., Mahmood, M. T. Review on Cold-formed Steel Connections. The Scientific World Journal, 2014. 11.
[3] Tahir, M. M., Tan, C. S., Shek, P. N. Typical Test on Cold-formed Steel Structures. Proceedings of the 6th Asia-Pacific Structural engineering and Construction Conference (APSEC 2006). 5-6 September 2006. Kuala Lumpur: APSEC. 2006. 246-258.
[4] Muftah, F., Mohd, S. M. S. H., Osman, A. R., Mohammad, S. Mechanical Behaviour of The Cold-formed Steel Channel Stub Column under Post Elevated Temperature. Procedia Engineering. Elsevier Ltd. 2015. 1015-1022.
[5] Mohd, S. M. S. H., Muftah, F., Muda, M. F., Cher, S. T. Assessment on Ultimate Load of Cold-formed Steel Channel (CSFC) Stub Column. MATEC Web of Conference 27. EDP Science. 2015. 4.
[6] Muhamad Faiz bin Abdul Latif. Kajian ke atas Sambungan Rasuk ke Tiang Keluli Terbentuk Sejuk menggunakan Kaedah Unsur Terhingga. Final Year Thesis. Universiti Teknologi Malaysia; 2012
[7] Syahrul Nazrain bin Abdul Rahman. Ujian Makmal Sambungan Skru Keluli Terbentuk Sejuk. Final Year Thesis. Universiti Teknologi Malaysia; 2013
[8] Bayan, A. A., Sariffuddin, S., Mohd Hanim O. Structural Performance of Bolted Moment Connections among Single Cold-formed Channel Sections. International Journal of Engineering and Technology. 2012. vol. 2: 599-607.
[9] London University. LUSAS Modeller User Manual Version 15.2. 2006. Surrey, United Kingdom: Finite Element Analysis Ltd.
[10] Tan, C. S., Mahmood, M. T., Shek, P. N., Ahmad, K. Experimental Investigation on Slip-in Connection for Cold-formed Steel Double Channel Sections. Advanced Materials Research. 2011. vols. 250-253:1038-1041.
[11] Ali, B., Saad, S., Osman, H. 2011. Cold-formed Steel Joints and Structures-A Review. International Journal of Civil and Structural Engineering. 2011. vol. 2: 621-634.
137
Analysis of Cold-Formed Steel Beam to Column Connection by Using Finite Element Method
Hannis Khazwany Mohmad Kadir1, Sariffuddin Saad2 Faculty of Civil Engineering, Universiti Teknologi Malaysia, Malaysia
Keywords: Cold-formed steel; C-Section; Beam; Column; Finite Element Analysis; Moment Rotation Curve.
ABSTRACT. This paper presents the analysis of cold-formed steel (CFS) section of beam to column connection by using finite element method. Many research of CFS has undertaken by previous study to obtain the performance of structures and moment rotation curve (M-Ф). Normally, to obtain the moment rotation of a connection a laboratory test need to be done and it require a high cost. By using LUSAS finite element software, it can minimize the cost and the accuracy of the result can be attained. The model of beam to column with depth of beam 200 mm was generated using 30 self-tapping screws and thickness of the elements is 3 mm. From the analysis, the moment rotation curve obtained from LUSAS is quite different compare to experimental curve. The value of moment resistance for beam to column connection obtained by using LUSAS, finite element software was 13.5 kNm while result obtained from experimental laboratory was 18.7 kNm. Under this circumstance, the moment resistance generated by LUSAS was too small compared to experiment value. Consequently, further study in this analysis is recommended.
INTRODUCTION
CFS is a lightweight material that used in construction and the usage has seen increased for residential and multi-story commercial buildings [1]. CFS members are widely used as main structure like frames, beams and columns. The use of CFS is gained traction from developers for the low-rise residential. It has also been recognized as major contributor in the development country due to the design of sustainable structures [2]. The properties of CFS has increased the effieciency of construction industry with their good strength, durability, non-flammable and high of ductility. This research is about the analysis of beam to column connection by using the finite element method. The analysis was carried out based on a study conducted by previous researchers which providing a sample tested in laboratory experiments. Beam of 200 mm depth and 1200 mm length of span is attched to the column with height of 3000 mm by using back-to-back method.
The LUSAS finite elemet software was used to develop the model of beam to column connection by using the geometry, attributes and analyses to run the model. The nonlinear and transient analysis are use to run the analysis of elastic plastic analysis with a concentrated load applying at the point of 75 mm from the edge of beam. Result from the experiments of CFS beam to column connection provided the moment rotation curve and the graphs were plotted [3]. After completion the analysis, momet rotation curve from the LUSAS will be compared with the experiment curve and the perentage difference of the analysis will be obtained.
Problem Statement
The study of the behavior of cold-formed steel connection has been carried out by laboratory experiments and the results obtained are more accurate as a full-scale experimental study in the laboratory is the most reliable method to assess and investigate the performance of the connection. Normally, the information obtained through laboratory testing is the moment of rotation. However, laboratory tests conducted on a cold formed steel is limited because it requires time and high cost to run the tests in the laboratory. The actual component testing is costly and difficult to implement because to obtained the accurate result required a lot of models and each test will destroy the model. So, another option to minimize the cost is to create a modeling analysis using the appropriate software. Nowadays, with the advent of computer software there might be an alternative with running the finite element analysis to get the moment rotation curves for CFS connections. The software using is LUSAS 15.2 [4]. The result of moment rotation curves will be compared with the experimental curve to verify the use of methods LUSAS. Although the real structure unlikely behave like the modelling structure, it does not mean that the analysis results rejected for practical purposes.
Objectives The objectives of this study are:
1. To validate the proposed model of CFS using finite element method, LUSAS with experimental results. 2. To study the behavior of the proposed connection by comparing between finite element method and
experimental test results. Scope of Study The scope of this project will focus on the modeling of CFS connections and analyze the moment rotation curve. This study is generally divided into two types of literature review and analysis. The literature review will be done by looking
138
the previous studies that have been conducted in Universiti Teknologi Malaysia (UTM) by the researchers regarding the CFS. The second part of study is modeling and analyze the structure using computer software. This part will also look at the effectiveness of the model studies analysis. In this project analysis, the modeling with provided a geometry of beam, column, screws and stiffener. The dimensions of modeling were based on the laboratory experiment by Syahrul Nazrain [3]. The experimental result will be compared with modelling results from numerical non-linear finite element analysis.
LITERATURE REVIEW
In recent years, the use of CFS structures has growing rapidly due to the significant progress in manufacturing technology and the development of high strength steel in construction industry [5]. The application of CFS are widely in bridge construction, building construction, storage racks, drainage facilities, transmission tower and various types of equipment. Besides, it is used as a secondary member of structure that acts to support the main structural members such as purlin. CFS is a steel product that is formed by bending a flat sheet steel at ambient temperature [6]. CFS is the main steel in the construction and more popular to practice than the hot-rolled steel due to their physical characteristics which is match with current development.
Many researchers had conducted the studies about the behavior of shear connector with CFS. Most of these researches were focused on behavior of shear connector in composite material such as self-compacting concrete (SCC) and ferro-cement jacket [7, 8, 9]. A recent research which involved exposure about the performance of shear connector by was using a bolt as a shear connector mechanism [7]. The main finding of their research was the capability of the bolt and nut as shear connector. They conducted push out test to the specimens with bolted shear connector until reached failure. The result said that connector was reached the capability and also the significant resistance. Means that, the shear connector with CFS was suitable to use in composite construction.
Another study was to increase the compressive strength of composite column of CFS since the usage of CFS is getting popular in column structure [8]. The use of CFS with connector could be one of the sustainable factors due to practical use in construction. However, a study by Alhajri et. al [2] was conducted a behavior of pre-cast beam with integrating CFS and ferro-cement slab. In their studies, nine specimens were tested and the lipped channel act with ferro-cement slabs as bolted shear connector. The findings presents that the ultimate load capacity of composite section incresed up to 219% with increasing of number wire mesh layer and the thickness of steel.
Several publications have appeared in recent years documenting about CFS. There are also studies on CFS frame, beam and column with bolted moment connections. According to research studies by Ali et. al [1], an experimental investigation of CFS frame has been carried out with beam attached to column members formed by single lipped channel using a back-to-back method at the joints. In this study, they were explored ten of column-base connection and beam-column subframe tests with different stiffness of bolted moment connection by conducted a test under lateral load and found that there was a significant effect on the structural behavior of frames. Results showed that the implementation of moment connection among CFS members were effective and structurally feasible intact. Hence, to overcome the downsides of conventional products, the engineers were encouraged to do some modification in construction industry with built light weight low to medium rise moment frames with CFS section.
In the meantime, the studies on structural performance of bolted moment connection [10] indicate that there were two modes of failure obtained from the experimental investigation. The first mode was Mode BFcsw where the bearing failure in section web and second mode was Mode FFcs which the flexural failure occurred in connections section. Mohd Sani et. al. [11] reported that the failure mode occurred in CFS columns which filled with normal concrete of grade C30 gave highest ultimate load over than column with infilled concrete.
Generally, CFS sections are applied as primary and secondary structural members in the construction development. Besides that, CFS also can be found not only in construction industry but in rail transport, automobile industry and shipbuilding [12]. The advantages of CFS are consistency and accuracy of profile which the quality CFS can be controlled using computer system in the factory. Apart of that, the problems of decomposition or rot are no longer appear because the CFS free from insect and fungal infection. Normally, steel is the material that inseparable with the corrosion problem. Thus, the corrosion resistance can be enhanced with pre-galvanization or pre-coating with materials like zinc hi-ten.
METHODOLOGY
The paper presents the study of finite element analysis which is one of the method used to analyze the properties of CFS beam to column connection. LUSAS Software Version 15.2 is finite element software that been chose for the analysis compared to various types of finite element software that exist out there. Apart from producing good results with an animation, graph and so on, it is also a very popular and well-liked software besides easy to operate. The analysis of experiment in the laboratory will be compared to the results obtained by LUSAS. To achieve the objectives of this study, characteristics of the model built using LUSAS must be similar with the characteristics of specimens tested in laboratory experiment. This research methodology consists of laboratory experiment, modeling using LUSAS and finite element analysis.
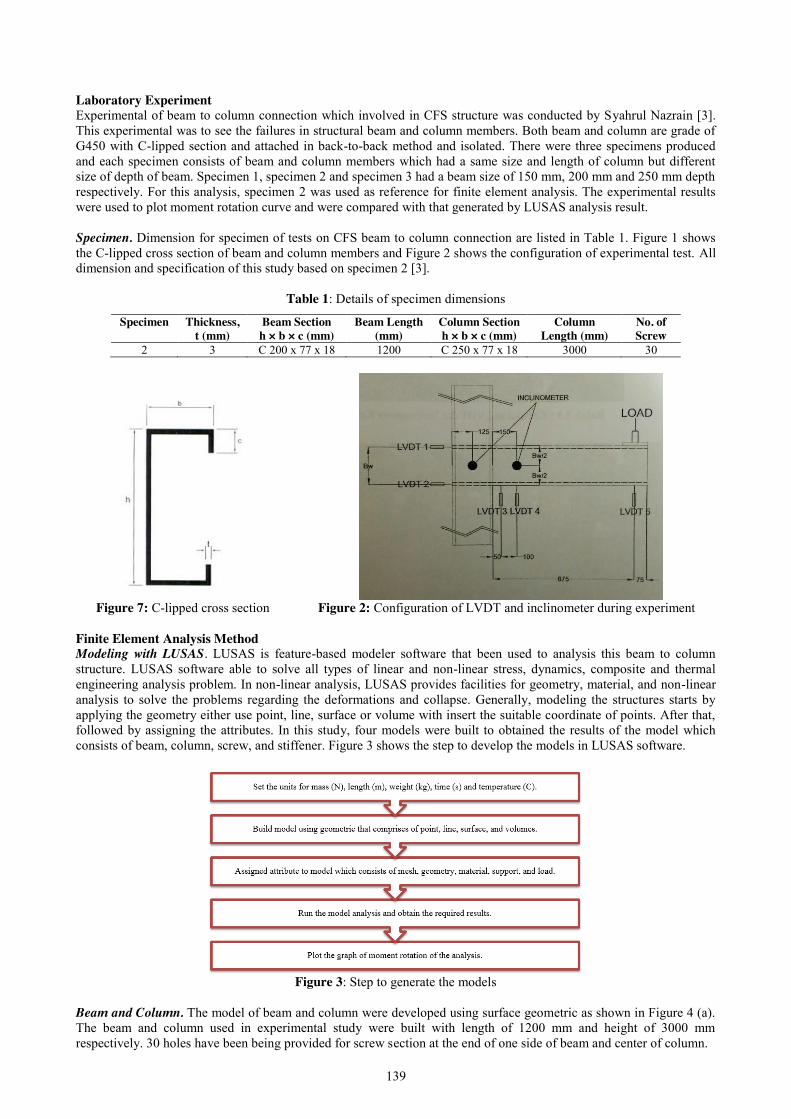
139
Laboratory Experiment Experimental of beam to column connection which involved in CFS structure was conducted by Syahrul Nazrain [3]. This experimental was to see the failures in structural beam and column members. Both beam and column are grade of G450 with C-lipped section and attached in back-to-back method and isolated. There were three specimens produced and each specimen consists of beam and column members which had a same size and length of column but different size of depth of beam. Specimen 1, specimen 2 and specimen 3 had a beam size of 150 mm, 200 mm and 250 mm depth respectively. For this analysis, specimen 2 was used as reference for finite element analysis. The experimental results were used to plot moment rotation curve and were compared with that generated by LUSAS analysis result. Specimen. Dimension for specimen of tests on CFS beam to column connection are listed in Table 1. Figure 1 shows the C-lipped cross section of beam and column members and Figure 2 shows the configuration of experimental test. All dimension and specification of this study based on specimen 2 [3].
Table 1: Details of specimen dimensions
Specimen Thickness, t (mm)
Beam Section h × b × c (mm)
Beam Length (mm)
Column Section h × b × c (mm)
Column Length (mm)
No. of Screw
2 3 C 200 x 77 x 18 1200 C 250 x 77 x 18 3000 30
Figure 7: C-lipped cross section Figure 2: Configuration of LVDT and inclinometer during experiment
Finite Element Analysis Method Modeling with LUSAS. LUSAS is feature-based modeler software that been used to analysis this beam to column structure. LUSAS software able to solve all types of linear and non-linear stress, dynamics, composite and thermal engineering analysis problem. In non-linear analysis, LUSAS provides facilities for geometry, material, and non-linear analysis to solve the problems regarding the deformations and collapse. Generally, modeling the structures starts by applying the geometry either use point, line, surface or volume with insert the suitable coordinate of points. After that, followed by assigning the attributes. In this study, four models were built to obtained the results of the model which consists of beam, column, screw, and stiffener. Figure 3 shows the step to develop the models in LUSAS software.
Figure 3: Step to generate the models
Beam and Column. The model of beam and column were developed using surface geometric as shown in Figure 4 (a). The beam and column used in experimental study were built with length of 1200 mm and height of 3000 mm respectively. 30 holes have been being provided for screw section at the end of one side of beam and center of column.
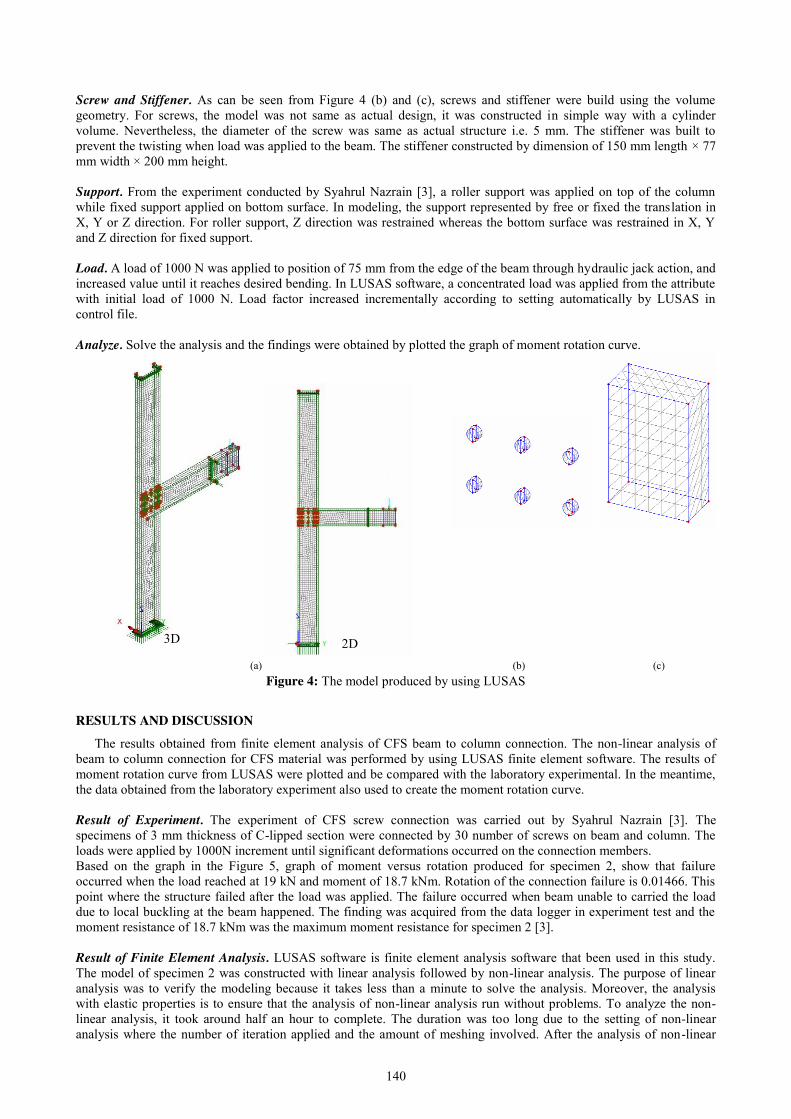
140
Screw and Stiffener. As can be seen from Figure 4 (b) and (c), screws and stiffener were build using the volume geometry. For screws, the model was not same as actual design, it was constructed in simple way with a cylinder volume. Nevertheless, the diameter of the screw was same as actual structure i.e. 5 mm. The stiffener was built to prevent the twisting when load was applied to the beam. The stiffener constructed by dimension of 150 mm length × 77 mm width × 200 mm height. Support. From the experiment conducted by Syahrul Nazrain [3], a roller support was applied on top of the column while fixed support applied on bottom surface. In modeling, the support represented by free or fixed the translation in X, Y or Z direction. For roller support, Z direction was restrained whereas the bottom surface was restrained in X, Y and Z direction for fixed support. Load. A load of 1000 N was applied to position of 75 mm from the edge of the beam through hydraulic jack action, and increased value until it reaches desired bending. In LUSAS software, a concentrated load was applied from the attribute with initial load of 1000 N. Load factor increased incrementally according to setting automatically by LUSAS in control file. Analyze. Solve the analysis and the findings were obtained by plotted the graph of moment rotation curve.
(a)
(b)
(c) Figure 4: The model produced by using LUSAS
RESULTS AND DISCUSSION The results obtained from finite element analysis of CFS beam to column connection. The non-linear analysis of
beam to column connection for CFS material was performed by using LUSAS finite element software. The results of moment rotation curve from LUSAS were plotted and be compared with the laboratory experimental. In the meantime, the data obtained from the laboratory experiment also used to create the moment rotation curve. Result of Experiment. The experiment of CFS screw connection was carried out by Syahrul Nazrain [3]. The specimens of 3 mm thickness of C-lipped section were connected by 30 number of screws on beam and column. The loads were applied by 1000N increment until significant deformations occurred on the connection members. Based on the graph in the Figure 5, graph of moment versus rotation produced for specimen 2, show that failure occurred when the load reached at 19 kN and moment of 18.7 kNm. Rotation of the connection failure is 0.01466. This point where the structure failed after the load was applied. The failure occurred when beam unable to carried the load due to local buckling at the beam happened. The finding was acquired from the data logger in experiment test and the moment resistance of 18.7 kNm was the maximum moment resistance for specimen 2 [3]. Result of Finite Element Analysis. LUSAS software is finite element analysis software that been used in this study. The model of specimen 2 was constructed with linear analysis followed by non-linear analysis. The purpose of linear analysis was to verify the modeling because it takes less than a minute to solve the analysis. Moreover, the analysis with elastic properties is to ensure that the analysis of non-linear analysis run without problems. To analyze the non-linear analysis, it took around half an hour to complete. The duration was too long due to the setting of non-linear analysis where the number of iteration applied and the amount of meshing involved. After the analysis of non-linear
3D 2D

141
completed, post-processing take placed to obtain the desired results like deformed mesh, vectors and diagrams. In modeling, the failure can be views on deformed mesh where the deformation occurred.
The graph on Figure 6 shows the curve of moment versus rotation of finite element analysis, LUSAS. Through the observation, the curve of LUSAS analysis slightly different with experimental curve where the curve is straightly linear. From the graph, moment resistance for LUSAS analysis is 13.5 kNm where it occurred at load of 12 kN.
Figure 5: Moment rotation curve of specimen 2 [3] Figure 6: Moment rotation curve of finite element analysis
Moment Resistance. Table 2 shows the moment resistance for both analysis of experimental and finite element analysis of CFS connection. Moment resistance for experimental test is 18.7 kNm while the moment resistance obtained from LUSAS analysis is 13.5 kNm. As can be seen, the results obtained that the moment resistance of LUSAS analysis is smaller than experiment.
Table 2: Moment Resistance, MR
Specimen Moment Resistance, MR (kNm) Experiment LUSAS
2 18.7 13.5
CONCLUSION
The findings of this research are quite considerable, and thus the following conclusions can be drawn: 4. Model of beam to column connection with properties of CFS has been successfully developed and analyzed
using LUSAS finite element software. Beam and column model was build using surface geometry with element of thick shell (QTS 4) while the screws and stiffener build using volume geometry with tetrahedral element (TH4).
5. The moment rotation curve of finite element analysis is successfully generated. The moment resistance for experiment test is 18.7 kNm at rotation of 0.01466 rad while moment resistance and rotation for LUSAS analysis are 13.5 kNm and 0.00471 rad respectively.
REFERENCES
[1] Ali, B. A., Saad, S. and Osman, M. H. Cold-Formed Steel Frame with Bolted Moment Connections. International Journal of Civil and Structural Engineering. 2010. 1(3): 534-544.
[2] Alhajri, T. M., Tahir, M. M., Azimi, M., Mirza, J., Lawan, M. M., Alenezi, K. K. and Ragaee, M. B. Behavior of pre-cast U-Shaped Composite Beam integrating cold-formed steel with ferro-cement slab. Thin-Walled Structures. 2016. 102: 18-29.
[3] Syahrul Nazrain bin Abdul Rahman. Ujian Makmal Sambungan Skru Keluli Terbentuk Sejuk. Undergraduate Thesis. Universiti Teknologi Malaysai; 2013.
[4] LUSAS. LUSAS Modeller User Manual Version 15.2. United Kingdom. 2016. [5] Narayanan, S. and Mahendran, M. Ultimate Capacity of Innovative Cold-Formed Steel Columns. Journal of
Constructional Steel Research. 2003. 59:489-508. [6] Hancock, G. J.Cold-Formes Steel Structures. Journal of Constructional Steel Research. 2003. 59: 473-487 [7] Lawan, M. M., Tahir, M. M., and Hosseinpour, E. Feasibility of Using Bolted Shear Connector with Cold-
formed Steel in Composite Construction. Jurnal Teknologi (Science & Engineering). 2016. 78: 7-13. [8] Alenezi, K. K., Tahir, M. M., Alhajri, T., Badr, M. R. K., and Mirza, J. Behavior of shear connectors in
composite column of cold-formed steel with lipped C-channel assembled with ferro-cement jacket. Construction and Building Materials. 2015. 84: 39-45.
[9] Lawan, M. M. and Tahir, M. M. Strength Capacity of Bolted Shear Connectors with Cold-formes Steel Section Integrated as Composite Beam in Self-Compacting Concrete. Jurnal Teknologi (Science & Engineering). 2015. 77: 105-112.
0
2
4
6
8
10
12
14
16
0.0000 0.0005 0.0010 0.0015 0.0020 0.0025 0.0030 0.0035 0.0040 0.0045 0.0050
Mom
ent (
kNm
)
Rotation (rad)
Moment vs Rotation (LUSAS)

142
[10] Anwer, B., Saad, S., and Osman, H. Structural Performance of Bolted Moment Connection among Single Cold-Formed Channel Sections. International Journal of Civil and Structural Engineering. 2012. 2 (4): 599-607
[11] Mohd Sani, M. S. H, Muftah, F, Muda, M. F, and Tan, C. S. Resistance of Built-Up Cold-Formed Steel Channel Columns Filled With Concrete. Jurnal Teknologi (Science & Engineering). 2016. 78: 99-104.
[12] Mahmood, M. T., Thong, C. M. And Tan, C. S. Performance of Locally Produced Cold-Formed Steel Section For Roof Truss System. Jurnal Teknologi. 2005. 42: 11-28.
143
Compressive Strength of Concrete Containing High Volume of Ceramic Tile Waste Aggregate with Fly Ash
Abd Khareez Kasbulah1, Abdullah Zawawi Awang2 Faculty of Civil Engineering, Universiti Teknologi Malaysia, Malaysia
Keywords: Ceramic Tile Waste; Fly Ash; Normal Weight Concrete; Compressive Strength Test.
ABSTRACT. Ceramic tile waste is mostly produced from human and industrial activities daily. Some wastes are being handled properly and some are not. These wastes would be beneficial if they are processed into something that could be used in construction. This study aimed to determine the compressive strength of concrete containing ceramic tile waste aggregate with fly ash and its physical properties. By using additives of fly ash with ceramic tile waste as fine and coarse aggregate replacement, concrete production with such materials contributes a great potential in moving towards sustainability with a comparable compressive strength with conventional concrete. In this research, three phases were involved where phase one involved in using fly ash as cement replacement whereas phase two and three replaces fine and coarse ceramic tile waste as sand and granite replacement respectively. Mortar with size 50mm x 50mm are produced for phase one and two whereas concrete of size 100mm x 100mm are produced for phase three. For phase one, four groups of mortar samples comprising 0%-30% (10% interval) cement replacement labelled as A0, A1, A2, and A3 respectively. Four mortar samples in phase two were conducted using optimum fly ash cement replacement (obtained from phase one) with 0%, 15%, 30%, and 50% of fine ceramic tile waste as sand replacement denoted as B0, B1, B2, and B3. Phase three involved five samples having conventional concrete (no additives) as CC, optimum fly ash and fine ceramic tile waste (obtained from phase one and two) with sample of 0%-30% (10% interval) of coarse ceramic tile waste aggregate denoted as C0, C1, C2, and C3 respectively. Thus, this study found out that adding these waste additives to the composites increases the strength of the composite after 28 days. The increase in strength is only up to a certain additives content. Based on the tests conducted for the three phases, the optimum percentage replacements for fly ash is 20%, 30% for fine ceramic tile waste, and 20% for coarse ceramic tile waste aggregate. When being compared to conventional concrete, the additives of ceramic tile waste and fly ash give contribution to higher compressive test.
INTRODUCTION Following a normal growth in population, the structural construction has increased accordingly to fit the demand of
infrastructural development across the world. The continuous extraction of aggregates from nature has caused resources depletion at a significant rate. Thus, there is an increasing demand to find another material as alternative materials to be used as aggregates in concrete. Granite is considered as a non-renewable resource as it will take a long period to be formed in the Earth’s crust. Once the granite is removed, it cannot be replaced. Technology in concrete has been developed in many ways to improve the quality and properties of concrete. One of the technological advances in enhancing concrete quality is by using additives. Thus, this is an effort to reduce the material usage such as granite and simultaneously utilizing crushed fine and coarse ceramic tiles with fly ash as aggregate and cement partial replacement Problem Statement Ceramic tile waste from ceramic industries is considered one of the serious problems of waste generation by the industries. Ceramic industrial waste is used into production of new concrete by replacing natural coarse aggregate and fine aggregate such as sand and granite at different levels of construction. However, the usage of different proportions of ceramic tile waste may lead to variable mechanical properties of the concrete. Thus, this study investigated the effect of partially replacement of fine and coarse aggregate ceramic tile waste as fine and coarse aggregate in concrete towards compressive strength and density of the concrete.
Objectives The objectives of this study are:
1. To obtain the physical properties of mortar and concrete containing partial replacement of ceramic tile waste aggregate with fly ash
2. To determine the compressive strength of mortar and concrete containing partial replacement of ceramic tile waste aggregate with fly ash
3. To determine the optimal amount of fly ash and ceramic tile waste aggregates as substitution substances for cement and aggregate in concrete.

144
Scope of Study This research will be focusing on the utilization of crushed fine and coarse ceramic tiles obtained from Johor with fly ash. The size of the coarse crushed ceramic tiles aggregate used are ones that passed sieve 10mm and retained at 4.75mm. whereas for fine crushed ceramic tiles aggregate, the size used are the aggregate that passed sieve 4.75mm and retained at 600Pm. This research will also be focusing on normal weight concrete with mass density following BS 8110: Part 1 where the mass density must not exceed 2600 kg/m3, but can be as low as 2000 kg/m3 depending on the materials used. The target strength for mortar is 33Mpa whereas 40Mpa for concrete.
LITERATURE REVIEW
Ceramic aggregate waste contains 100% residual product that could be used as aggregate in Green concrete. Apart from that, it is also noted that utilizing ceramic waste in concrete production will benefit the environment and reduces natural resources extraction [1]. Industrial waste usage as aggregate in concrete is possibly the only real potential for utilization of bulk quantities of waste and also prevention of depletion of natural resources.
Properties of ceramic sanitary ware waste do not depart from properties of traditional natural aggregate, and therefore it may be used as concrete aggregate. Another characteristic property is high water absorption. Ceramic sanitary ware waste aggregate can be used for concrete production. [2]
Fly ash is one of the most commonly used pozzolans in the world and is a waste product of coal-based electricity generating thermal power plants. One of the most common practice of fly ash is by using it as one of the materials in cement concrete mix. Fly ash has an almost spherical particle shape thus allowing them to blend and flow freely in concrete mixtures. This property is what makes fly ash a desirable admixture to be used for making concrete. [3]
When a high volume of fly ash is used on concrete mix, the strength continues to increase with age due to pozzolanic reaction of fly ash and the strengthening of the interfacial bond between aggregate and cement paste. Because of the slow pozzolanic reaction, at later age, the compressive strength of high volume fly ash concrete will generally be good. [4]
Studies were conducted on the strength of concrete based cement using recycle ceramic waste as aggregate. For the research, recycled ceramic waste is used as aggregate. The result of the compression test of the concrete mixes containing recycled ceramic waste aggregates is compared to that of conventional concrete. It is observed that concrete mixes containing recycled ceramic waste aggregates achieve strength levels between 80 to 95 % compared to the conventional concrete. Thus, the results indicate that recycled ceramic waste has a potential to be used as coarse aggregates for making concrete. [5]
In another study, ceramic tile wastes were used in concrete as natural coarse aggregate replacement. The percentage replacement varies from 0%, 10%, 20% and to 30% of the substitution where concrete with M20 grade concrete were used. The concrete moulds were casted and the hardened concrete are subjected for compressive strength and split tensile strength test after a curing for period of 3, 7 & 28 days. Based on the result, it is indicated that, 30% of ceramic tiles aggregate replacement with natural coarse aggregate gives the maximum compressive strength. [6]
Investigation was conducted on the effect of waste ceramic tiles in partial replacement of coarse and fine aggregate of concrete. It is observed that increasing usage of tiles powder leads to the increase in strength and workability of concrete. Apart from that, the maximum compressive strength obtained for the mix is when 20% of tile powder is replaced. When both coarse and fine are combined, the compressive strength is increased for all mixes and maximum compressive strength obtained is when the mix has 10% and 20% of crushed tiles and of tiles powder respectively. [7]
In a previous work, the effect of partial replacement of fine and coarse aggregate with ceramic waste on the properties of concrete was studied. The aim of the study is to utilize ceramic waste as a partial replacement of fine and coarse aggregate in concrete. Different percentage replacement of ceramic waste is used such as 0%, 10%, 20%, and 30% in grade M25 to evaluate various properties of data. Basedon the results, it is observed that the strength developed in concrete is increased where it can be equated to higher strength concrete thus could be used as construction material in construction work. [8]
METHODOLOGY
The present study aims to investigate the workability, density, compressive strength and mode of failure of concrete containing ceramic tile waste. The mixing is divided into three phases. Phase one involves in using fly ash as cement replacement whereas phase two and three replaces fine and coarse ceramic tile waste as sand and granite replacement respectively. The information may be very useful for future study and future development of building materials. Mortar were casted in 50mm x 50mm whereas concrete was casted in 100mm x 100mm mould.
Phase one, four groups of mortar samples comprising 0%-30% (10% interval) cement replacement labelled as A0, A1, A2, and A3 respectively. The process is continuous where the four mortar samples in phase two were conducted using optimum fly ash cement replacement (obtained from phase one) with 0%, 15%, 30%, and 50% of fine ceramic tile waste as sand replacement denoted as B0, B1, B2, and B3. Phase three involved five samples having conventional concrete (no additives) as CC, optimum fly ash and fine ceramic tile waste (obtained from phase one and two) with sample of 0%-30% (10% interval) of coarse ceramic tile waste aggregate denoted as C0, C1, C2, and C3 respectively.
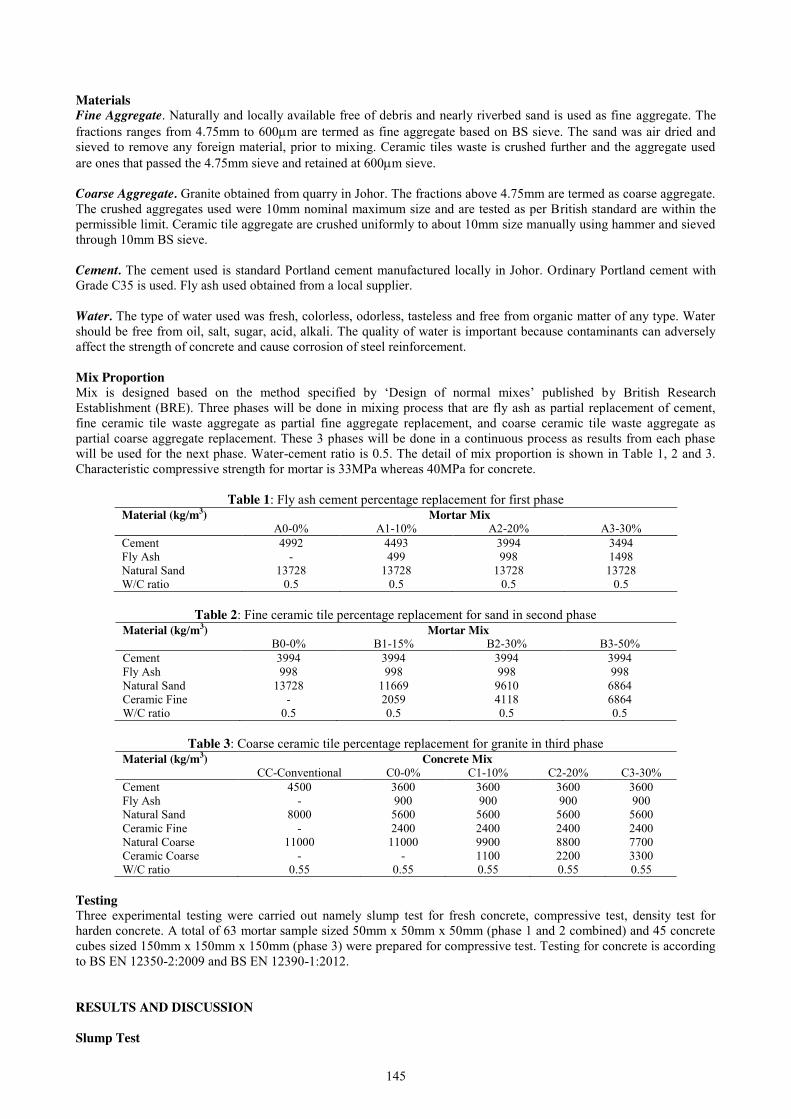
145
Materials Fine Aggregate. Naturally and locally available free of debris and nearly riverbed sand is used as fine aggregate. The fractions ranges from 4.75mm to 600Pm are termed as fine aggregate based on BS sieve. The sand was air dried and sieved to remove any foreign material, prior to mixing. Ceramic tiles waste is crushed further and the aggregate used are ones that passed the 4.75mm sieve and retained at 600Pm sieve.
Coarse Aggregate. Granite obtained from quarry in Johor. The fractions above 4.75mm are termed as coarse aggregate. The crushed aggregates used were 10mm nominal maximum size and are tested as per British standard are within the permissible limit. Ceramic tile aggregate are crushed uniformly to about 10mm size manually using hammer and sieved through 10mm BS sieve. Cement. The cement used is standard Portland cement manufactured locally in Johor. Ordinary Portland cement with Grade C35 is used. Fly ash used obtained from a local supplier.
Water. The type of water used was fresh, colorless, odorless, tasteless and free from organic matter of any type. Water should be free from oil, salt, sugar, acid, alkali. The quality of water is important because contaminants can adversely affect the strength of concrete and cause corrosion of steel reinforcement.
Mix Proportion Mix is designed based on the method specified by ‘Design of normal mixes’ published by British Research Establishment (BRE). Three phases will be done in mixing process that are fly ash as partial replacement of cement, fine ceramic tile waste aggregate as partial fine aggregate replacement, and coarse ceramic tile waste aggregate as partial coarse aggregate replacement. These 3 phases will be done in a continuous process as results from each phase will be used for the next phase. Water-cement ratio is 0.5. The detail of mix proportion is shown in Table 1, 2 and 3. Characteristic compressive strength for mortar is 33MPa whereas 40MPa for concrete.
Table 1: Fly ash cement percentage replacement for first phase Material (kg/m3) Mortar Mix
A0-0% A1-10% A2-20% A3-30% Cement 4992 4493 3994 3494 Fly Ash - 499 998 1498 Natural Sand 13728 13728 13728 13728 W/C ratio 0.5 0.5 0.5 0.5
Table 2: Fine ceramic tile percentage replacement for sand in second phase
Material (kg/m3) Mortar Mix B0-0% B1-15% B2-30% B3-50%
Cement 3994 3994 3994 3994 Fly Ash 998 998 998 998 Natural Sand 13728 11669 9610 6864 Ceramic Fine - 2059 4118 6864 W/C ratio 0.5 0.5 0.5 0.5
Table 3: Coarse ceramic tile percentage replacement for granite in third phase
Material (kg/m3) Concrete Mix CC-Conventional C0-0% C1-10% C2-20% C3-30%
Cement 4500 3600 3600 3600 3600 Fly Ash - 900 900 900 900 Natural Sand 8000 5600 5600 5600 5600 Ceramic Fine - 2400 2400 2400 2400 Natural Coarse 11000 11000 9900 8800 7700 Ceramic Coarse - - 1100 2200 3300 W/C ratio 0.55 0.55 0.55 0.55 0.55
Testing Three experimental testing were carried out namely slump test for fresh concrete, compressive test, density test for harden concrete. A total of 63 mortar sample sized 50mm x 50mm x 50mm (phase 1 and 2 combined) and 45 concrete cubes sized 150mm x 150mm x 150mm (phase 3) were prepared for compressive test. Testing for concrete is according to BS EN 12350-2:2009 and BS EN 12390-1:2012. RESULTS AND DISCUSSION Slump Test
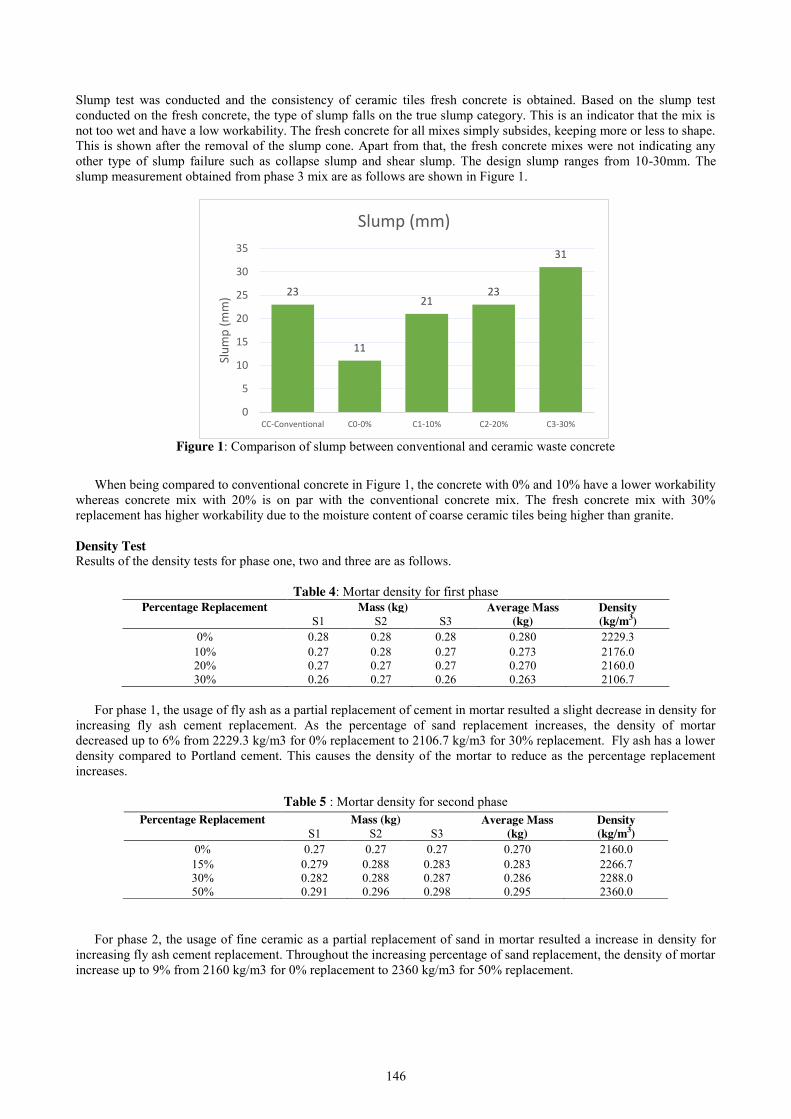
146
Slump test was conducted and the consistency of ceramic tiles fresh concrete is obtained. Based on the slump test conducted on the fresh concrete, the type of slump falls on the true slump category. This is an indicator that the mix is not too wet and have a low workability. The fresh concrete for all mixes simply subsides, keeping more or less to shape. This is shown after the removal of the slump cone. Apart from that, the fresh concrete mixes were not indicating any other type of slump failure such as collapse slump and shear slump. The design slump ranges from 10-30mm. The slump measurement obtained from phase 3 mix are as follows are shown in Figure 1.
Figure 1: Comparison of slump between conventional and ceramic waste concrete
When being compared to conventional concrete in Figure 1, the concrete with 0% and 10% have a lower workability
whereas concrete mix with 20% is on par with the conventional concrete mix. The fresh concrete mix with 30% replacement has higher workability due to the moisture content of coarse ceramic tiles being higher than granite. Density Test Results of the density tests for phase one, two and three are as follows.
Table 4: Mortar density for first phase Percentage Replacement Mass (kg) Average Mass
(kg) Density (kg/m3) S1 S2 S3
0% 0.28 0.28 0.28 0.280 2229.3 10% 0.27 0.28 0.27 0.273 2176.0 20% 0.27 0.27 0.27 0.270 2160.0 30% 0.26 0.27 0.26 0.263 2106.7
For phase 1, the usage of fly ash as a partial replacement of cement in mortar resulted a slight decrease in density for
increasing fly ash cement replacement. As the percentage of sand replacement increases, the density of mortar decreased up to 6% from 2229.3 kg/m3 for 0% replacement to 2106.7 kg/m3 for 30% replacement. Fly ash has a lower density compared to Portland cement. This causes the density of the mortar to reduce as the percentage replacement increases.
Table 5 : Mortar density for second phase
For phase 2, the usage of fine ceramic as a partial replacement of sand in mortar resulted a increase in density for increasing fly ash cement replacement. Throughout the increasing percentage of sand replacement, the density of mortar increase up to 9% from 2160 kg/m3 for 0% replacement to 2360 kg/m3 for 50% replacement.
23
11
21 23
31
0
5
10
15
20
25
30
35
CC-Conventional C0-0% C1-10% C2-20% C3-30%
Slum
p (m
m)
Slump (mm)
Percentage Replacement Mass (kg) Average Mass (kg)
Density (kg/m3) S1 S2 S3
0% 0.27 0.27 0.27 0.270 2160.0 15% 0.279 0.288 0.283 0.283 2266.7 30% 0.282 0.288 0.287 0.286 2288.0 50% 0.291 0.296 0.298 0.295 2360.0

147
Table 6 : Concrete density for third phase
For phase 3, the increasing replacement of coarse ceramic tiles waste as a partial replacement of granite in concrete resulted a decrease in density of concrete. The density of concrete decreased up to 4% from 2390.0 kg/m3 for 0% replacement to 2296.7 kg/m3 for 30% replacement. When being compared to conventional concrete, concrete containing coarse and fine ceramic tiles waste with fly ash has a lower density by a small margin. Compressive Strength Phase 1. Compression test result shows that the compressive strength is increased as the percentage of cement replacement increased. At 7 days, it is shown that the compressive strength increases from samples A0 to A2 before going down at A3. The optimum compressive strength obtained is in sample A2 having a fly ash percentage replacement of 20% with compressive strength is 30.40Mpa.
At 14 days of curing, it is shown that, compressive strength increases with from A0 to A1 before decreasing starting sample A2 following with A3. The optimum compressive strength obtained in sample A1 instead of A2. The differences of compressive strength between A1 and A2 is not significant and this must be caused by an error while mixing. At 10% percentage replacement in A1, the compressive strength is 33.06Mpa which is the highest compared to other samples.
For 28th day testing, compressive strength increases from samples having percentage replacement of 0% to 20% before decreasing at 30%. The optimum compressive strength obtained is in samples A2 at 20% with compressive strength 38.61Mpa. As curing day increased, compressive strength increased. The optimum percentage replacement for fly ash is taken as 20% as it shows the highest compressive strength compared to other percentages.
Figure 2: Compressive strength for phase one (left) and phase two (right)
Phase 2. Compression test result shows that the compressive strength is increased as the percentage of fine ceramic tile waste replacement increased. At 7 days, it is shown that the compressive strength increases from samples B0 to B2 before going down at B3. The optimum compressive strength obtained is in sample B2 having a fly ash percentage replacement of 30% with compressive strength is 35.57Mpa.
At 14 days of curing, it is shown that, compressive strength increases with from B0 to B3 with no peak strength between samples. The optimum compressive strength obtained in sample B3 instead of B2. The differences of compressive strength between B3 and B2 is not significant and this must be caused by an error while mixing the mortar. At 50% percentage replacement in B3, the compressive strength is 43.78Mpa which is the highest compared to other samples.
For 28th day testing, compressive strength increases from samples having percentage replacement of 0% to 30% before decreasing at 50%. The optimum compressive strength obtained is in samples B2 at 30% with compressive strength 48.82Mpa. As curing day increased, compressive strength increased. The optimum percentage replacement for fine ceramic tile waste is taken as 30% as it shows the highest compressive strength compared to other percentages.
21.42
28.61
35.33
22.12
33.06
36.03
30.40 29.49
38.61
21.5824.04
28.87
0
5
10
15
20
25
30
35
40
45
7 14 28
Compressiv
e�Strength,�M
pa
DaysA0-0%�Replacement A1-10%�Replacement A2-20%�Replacement A3-30%�Replacement
30.40 29.49
38.61
34.1437.03
45.98
35.57
39.20
48.82
30.44
43.7846.59
0
10
20
30
40
50
60
7 14 28
Compressiv
e�Strength,�M
pa
DaysB0-0%�Replacement B1-15%�Replacement B2-30%�Replacement B3-50%�Replacement
Percentage Replacement Mass (kg) Average Mass (kg)
Density (kg/m3) S1 S2 S3
Conventional 2.330 2.390 2.280 2.333 2333.3 0% 2.430 2.360 2.380 2.390 2390.0 10% 2.380 2.330 2.390 2.366 2366.7 20% 2.330 2.310 2.330 2.323 2323.3 30% 2.310 2.280 2.300 2.297 2296.7
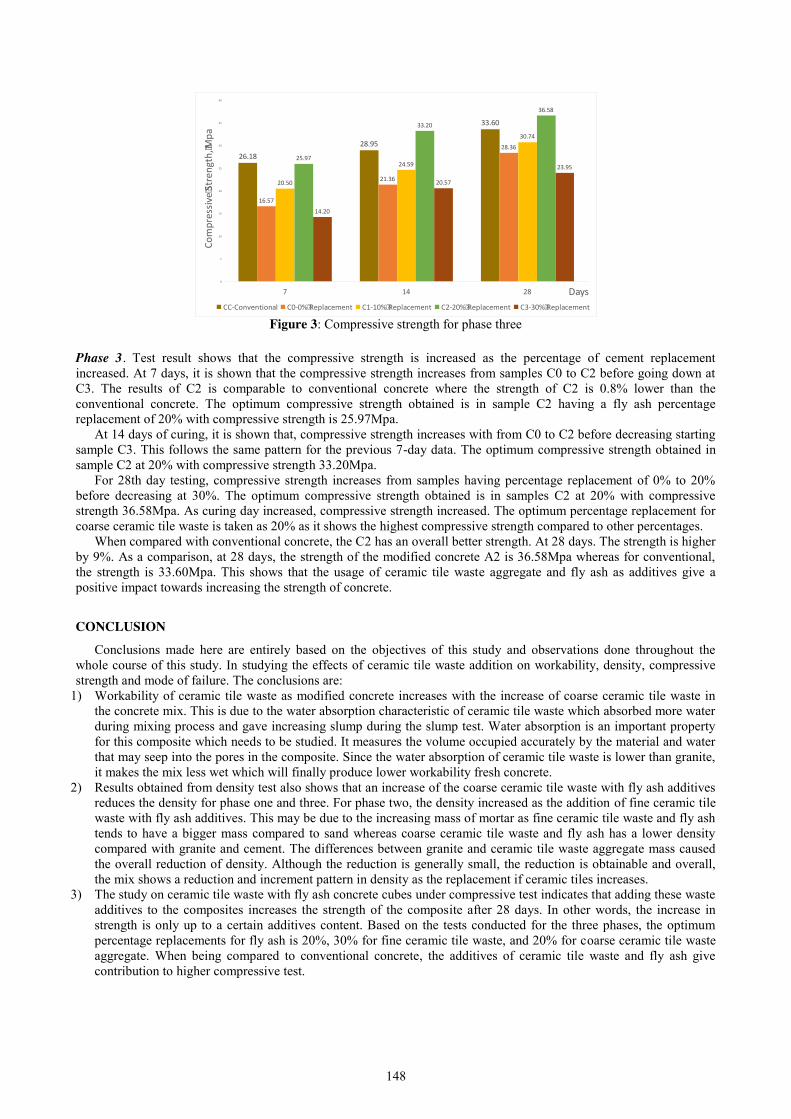
148
Figure 3: Compressive strength for phase three
Phase 3. Test result shows that the compressive strength is increased as the percentage of cement replacement increased. At 7 days, it is shown that the compressive strength increases from samples C0 to C2 before going down at C3. The results of C2 is comparable to conventional concrete where the strength of C2 is 0.8% lower than the conventional concrete. The optimum compressive strength obtained is in sample C2 having a fly ash percentage replacement of 20% with compressive strength is 25.97Mpa.
At 14 days of curing, it is shown that, compressive strength increases with from C0 to C2 before decreasing starting sample C3. This follows the same pattern for the previous 7-day data. The optimum compressive strength obtained in sample C2 at 20% with compressive strength 33.20Mpa.
For 28th day testing, compressive strength increases from samples having percentage replacement of 0% to 20% before decreasing at 30%. The optimum compressive strength obtained is in samples C2 at 20% with compressive strength 36.58Mpa. As curing day increased, compressive strength increased. The optimum percentage replacement for coarse ceramic tile waste is taken as 20% as it shows the highest compressive strength compared to other percentages.
When compared with conventional concrete, the C2 has an overall better strength. At 28 days. The strength is higher by 9%. As a comparison, at 28 days, the strength of the modified concrete A2 is 36.58Mpa whereas for conventional, the strength is 33.60Mpa. This shows that the usage of ceramic tile waste aggregate and fly ash as additives give a positive impact towards increasing the strength of concrete.
CONCLUSION
Conclusions made here are entirely based on the objectives of this study and observations done throughout the whole course of this study. In studying the effects of ceramic tile waste addition on workability, density, compressive strength and mode of failure. The conclusions are:
1) Workability of ceramic tile waste as modified concrete increases with the increase of coarse ceramic tile waste in the concrete mix. This is due to the water absorption characteristic of ceramic tile waste which absorbed more water during mixing process and gave increasing slump during the slump test. Water absorption is an important property for this composite which needs to be studied. It measures the volume occupied accurately by the material and water that may seep into the pores in the composite. Since the water absorption of ceramic tile waste is lower than granite, it makes the mix less wet which will finally produce lower workability fresh concrete.
2) Results obtained from density test also shows that an increase of the coarse ceramic tile waste with fly ash additives reduces the density for phase one and three. For phase two, the density increased as the addition of fine ceramic tile waste with fly ash additives. This may be due to the increasing mass of mortar as fine ceramic tile waste and fly ash tends to have a bigger mass compared to sand whereas coarse ceramic tile waste and fly ash has a lower density compared with granite and cement. The differences between granite and ceramic tile waste aggregate mass caused the overall reduction of density. Although the reduction is generally small, the reduction is obtainable and overall, the mix shows a reduction and increment pattern in density as the replacement if ceramic tiles increases.
3) The study on ceramic tile waste with fly ash concrete cubes under compressive test indicates that adding these waste additives to the composites increases the strength of the composite after 28 days. In other words, the increase in strength is only up to a certain additives content. Based on the tests conducted for the three phases, the optimum percentage replacements for fly ash is 20%, 30% for fine ceramic tile waste, and 20% for coarse ceramic tile waste aggregate. When being compared to conventional concrete, the additives of ceramic tile waste and fly ash give contribution to higher compressive test.
26.1828.95
33.60
16.57
21.36
28.36
20.50
24.59
30.74
25.97
33.20
36.58
14.20
20.57
23.95
0
5
10
15
20
25
30
35
40
7 14 28
Compressiv
e�Strength,�M
pa
DaysCC-Conventional C0-0%�Replacement C1-10%�Replacement C2-20%�Replacement C3-30%�Replacement
149
References [1] Nirmala, R. (2016). Experimental Study on Properties of Concrete by Partial Replacement of Ceramic Waste
as Coarse Aggregate and Egg Shell as Fine Aggregate. International Journal of Engineering Research & Technology (IJERT). 4(5); 650-652.
[2] Halicka, A., Ogrodnik, P. & Zegardlo, B. (2013). Using Ceramic Sanitary Ware Waste as Concrete Aggregate. Construction and Building Materials. 48; 295- 305.
[3] Pati, S.L., Kale, J.N. & Suman S. (2016). Fly ash concrete: A technical analysis for compressive strength. International Journal of Advanced Engineering Research and Studies. 1(2); 128-129.
[4] Bremseth, S.K. (2009). Fly ash in concrete: A literature study of the advantages and disadvantages. Oslo: AIT AS e-dit.
[5] Mustafa Al Bakri, A.M., Norazian, M.N., Kamarudin, H., Mohd Salleh, M.A.A., & Alida, A. (2013). Strength of Concrete Based Cement Using Recycle Ceramic Waste As Aggregate. Advanced Materials Research Online. 740; 734-738.
[6] Shruthi, H., Prasad, M.G., Taj, S., & Pasha, S.R. (2016). Reuse of Ceramic Waste as Aggregate in Concrete. International Research Journal of Engineering and Technology (IRJET). 3(7); 115-119.
[7] Kumar, H., Ramakrishna, A., Babu, S., Guravaiah, Naveen, & Jani. (2015). Effect of Waste Ceramic Tiles in Partial Replacement of Coarse and Fine Aggregate of Concrete. International Advanced Research Journal in Science, Engineering
[8] Rajora, V., & Sidhu, G.S. (2016) Effect of Partial Replacement of Fine and Coarse Aggregate (10mm) with Ceramic Waste on the Properties of Concrete. International Journal of Science and Research (IJSR). 5(8); 75-77.

150
Compressive Strength of Concrete Containing High Volume of Ceramic Waste
Amirul Asyraf Mohammad1, Abdullah Zawawi Awang2 Faculty of Civil Engineering, Universiti Teknologi Malaysia, Malaysia
Keywords: Ceramic Waste; Compressive Strength; Cement Replacement; Fine Aggregates Replacement; Coarse Aggregates Replacement.
ABSTRACT. The application of the concrete in construction was commonly used as the building material that consists of fine aggregates, coarse aggregates and cement. Ceramic is one of the waste material that generated mostly in Malaysia. Most people do not realize ceramic waste has a high potential to be used in concrete production as substitution substances. Thus, this study aimed to determine the physical properties of concrete containing high volume of ceramic waste and its compressive strength. Using ceramic waste as cement, fine and coarse aggregates is a great potential for making concrete a green and sustainable material with a comparable compressive strength of conventional concrete. There are three phases are involved in this research where phase one involved in using ceramic powder as cement replacement in mortar by 10%, 20% and 30% while phase two involved in using 10% cement replacement and 15%, 30% and 50% ceramic fine aggregates as replacement in mortar. Phase three involved in using coarse ceramic aggregates with 10%, 20% and 30% replacement with 10% cement replacement and 30% fine aggregates replacement. Cube with size 50mm x 50mm x 50mm were used in phase one and two while 100mm x 100mm x 100mm cube were used in phase 3. In addition, ceramic waste was crushed and later were sieved until passing 75 µm for cement replacement, passing 4.75 mm and retained at 600 µm sieve for fine aggregates replacement and passing 10 mm while retained at 4.75 mm sieve for coarse aggregates replacement. The result shows that the highest compressive strength using cement replacement is only at 10% replacement with 11.34% of control strength. However, the compressive strength increased again to 48.86% of control strength when a combination of cement and fine aggregates replacement used. The maximum compressive strength in phase three is 41.91 MPa which at 30% replacement with 24.73% of control strength. Thus, this study found that waste ceramic causes an increasing in compressive strength and it is suitable to use as replacement materials in concrete.
INTRODUCTION In the ceramic industry, the production of ceramic tile will produce 15% to 30% amount of waste. This waste is not
fully utilized with other application. However, it is undeniable that the ceramic waste is durable, hard and highly resistant to biological, chemical and physical degradation forces. Ceramic waste will consume a large space in the landfill and it gives burden to the ceramic industry to find solutions for the disposal of ceramics.
Today, concrete and mortar are widely used as construction materials, but at the same time the environmental impact from the uses of this material is questionable to the society. Many construction industries are now focusing on development of crushed stone as the substitution construction material compare to the ceramic waste. The compressive strength of the concrete is still the same when ceramic waste is used to replace crushed stone. To reduce the amount of ceramic waste deposited in landfill and help to save the natural resources, recycling of the ceramic waste as a replacement material have been investigated. Problem Statement Malaysia is one of the developing countries and there are many constructions are still running for development of country. Therefore, the demand of concrete will be increase. Many of the construction industry will focus on recycle or reuse material to produce a new replacement material for the construction.
In this research, the ceramic waste was used as cement, fine and coarse aggregates replacement. As we all know that ceramic waste cannot be disposed and it consumes large space in landfill, this research will provide new ways to recycle the ceramic waste and make the world more sustainable by preserving the nature of our planet. Objectives The main objective of this research is to study the properties of concrete containing ceramic waste as cement, coarse and fine aggregates replacement. Related objective of the research as follows:
1. To determine physical properties of mortar and concrete that contains ceramic waste materials as replacement substances.
2. To determine the compressive strength of mortar and concrete that contains ceramic waste materials as cement, fine and coarse aggregates replacement.
3. To determine the optimal amount of ceramic powder and aggregates as substitution substances for cement and aggregates in concrete.
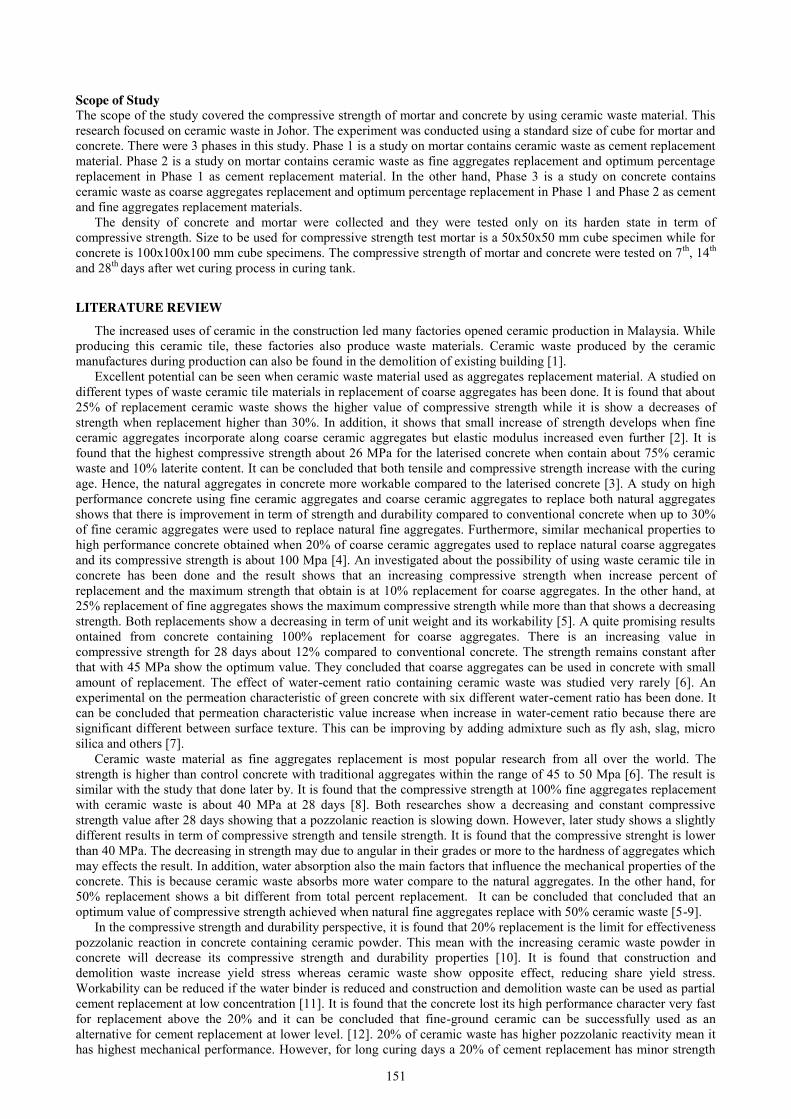
151
Scope of Study The scope of the study covered the compressive strength of mortar and concrete by using ceramic waste material. This research focused on ceramic waste in Johor. The experiment was conducted using a standard size of cube for mortar and concrete. There were 3 phases in this study. Phase 1 is a study on mortar contains ceramic waste as cement replacement material. Phase 2 is a study on mortar contains ceramic waste as fine aggregates replacement and optimum percentage replacement in Phase 1 as cement replacement material. In the other hand, Phase 3 is a study on concrete contains ceramic waste as coarse aggregates replacement and optimum percentage replacement in Phase 1 and Phase 2 as cement and fine aggregates replacement materials.
The density of concrete and mortar were collected and they were tested only on its harden state in term of compressive strength. Size to be used for compressive strength test mortar is a 50x50x50 mm cube specimen while for concrete is 100x100x100 mm cube specimens. The compressive strength of mortar and concrete were tested on 7th, 14th and 28th days after wet curing process in curing tank.
LITERATURE REVIEW
The increased uses of ceramic in the construction led many factories opened ceramic production in Malaysia. While producing this ceramic tile, these factories also produce waste materials. Ceramic waste produced by the ceramic manufactures during production can also be found in the demolition of existing building [1].
Excellent potential can be seen when ceramic waste material used as aggregates replacement material. A studied on different types of waste ceramic tile materials in replacement of coarse aggregates has been done. It is found that about 25% of replacement ceramic waste shows the higher value of compressive strength while it is show a decreases of strength when replacement higher than 30%. In addition, it shows that small increase of strength develops when fine ceramic aggregates incorporate along coarse ceramic aggregates but elastic modulus increased even further [2]. It is found that the highest compressive strength about 26 MPa for the laterised concrete when contain about 75% ceramic waste and 10% laterite content. It can be concluded that both tensile and compressive strength increase with the curing age. Hence, the natural aggregates in concrete more workable compared to the laterised concrete [3]. A study on high performance concrete using fine ceramic aggregates and coarse ceramic aggregates to replace both natural aggregates shows that there is improvement in term of strength and durability compared to conventional concrete when up to 30% of fine ceramic aggregates were used to replace natural fine aggregates. Furthermore, similar mechanical properties to high performance concrete obtained when 20% of coarse ceramic aggregates used to replace natural coarse aggregates and its compressive strength is about 100 Mpa [4]. An investigated about the possibility of using waste ceramic tile in concrete has been done and the result shows that an increasing compressive strength when increase percent of replacement and the maximum strength that obtain is at 10% replacement for coarse aggregates. In the other hand, at 25% replacement of fine aggregates shows the maximum compressive strength while more than that shows a decreasing strength. Both replacements show a decreasing in term of unit weight and its workability [5]. A quite promising results ontained from concrete containing 100% replacement for coarse aggregates. There is an increasing value in compressive strength for 28 days about 12% compared to conventional concrete. The strength remains constant after that with 45 MPa show the optimum value. They concluded that coarse aggregates can be used in concrete with small amount of replacement. The effect of water-cement ratio containing ceramic waste was studied very rarely [6]. An experimental on the permeation characteristic of green concrete with six different water-cement ratio has been done. It can be concluded that permeation characteristic value increase when increase in water-cement ratio because there are significant different between surface texture. This can be improving by adding admixture such as fly ash, slag, micro silica and others [7].
Ceramic waste material as fine aggregates replacement is most popular research from all over the world. The strength is higher than control concrete with traditional aggregates within the range of 45 to 50 Mpa [6]. The result is similar with the study that done later by. It is found that the compressive strength at 100% fine aggregates replacement with ceramic waste is about 40 MPa at 28 days [8]. Both researches show a decreasing and constant compressive strength value after 28 days showing that a pozzolanic reaction is slowing down. However, later study shows a slightly different results in term of compressive strength and tensile strength. It is found that the compressive strenght is lower than 40 MPa. The decreasing in strength may due to angular in their grades or more to the hardness of aggregates which may effects the result. In addition, water absorption also the main factors that influence the mechanical properties of the concrete. This is because ceramic waste absorbs more water compare to the natural aggregates. In the other hand, for 50% replacement shows a bit different from total percent replacement. It can be concluded that concluded that an optimum value of compressive strength achieved when natural fine aggregates replace with 50% ceramic waste [5-9].
In the compressive strength and durability perspective, it is found that 20% replacement is the limit for effectiveness pozzolanic reaction in concrete containing ceramic powder. This mean with the increasing ceramic waste powder in concrete will decrease its compressive strength and durability properties [10]. It is found that construction and demolition waste increase yield stress whereas ceramic waste show opposite effect, reducing share yield stress. Workability can be reduced if the water binder is reduced and construction and demolition waste can be used as partial cement replacement at low concentration [11]. It is found that the concrete lost its high performance character very fast for replacement above the 20% and it can be concluded that fine-ground ceramic can be successfully used as an alternative for cement replacement at lower level. [12]. 20% of ceramic waste has higher pozzolanic reactivity mean it has highest mechanical performance. However, for long curing days a 20% of cement replacement has minor strength

152
loss. In term of the durability properties, it stated that there are no relevant differences can be seen for oxygen permeability and partial replacement of cement responsible for very low chloride diffusion coefficient [6].
METHODOLOGY
Sample Preparation In this study, the sample of waste ceramic tiles was obtained from local ceramic tile warehouse around Johor. The samples are in form of crushed ceramic tile. In order to get suitable ceramic size as cement, fine and coarse aggregates replacement, waste ceramic tile was crushed by using the Los Angeles machine to turn it into desirable size. Ceramic later were sieved until passing 75 µm for cement replacement, passing 4.75 mm and retained at 600 µm sieve for fine aggregates replacement and passing 10 mm while retained at 4.75 mm sieve for coarse aggregates replacement. Ordinary Portland cement sample was prepared based on MS: 522: Part 1: 1989 which was obtained from Portland cement manufacturing company in Malaysia. Mix Proportion The mix proportion used is in three phases. Phase one is for cement replacement and phase two is for fine aggregates replacement with fixed 10% cement replacement. The details of mix proportion for mortar is shown in Table 1 and Table 2. Phase three is for coarse aggregates replacement with fixed 10% cement and 30% fine aggregates replacement. Characteristic compressive strenght for concrete in this phase is 30 MPa while target compressive strength is 43 MPa. The details of mix proportion of concrete is shown in Table 3.
Table 1: Mix proportion of mortar for 1 m3 Phase 1
Material Mortar Mix Control 10% 20% 30%
Cement (kg) 4992 4493 3994 3494 Ceramic Powder (kg) - 499 998 1498 Natural Sand (kg) 13728 13728 13728 13728 w/c ratio 0.5 0.5 0.5 0.5
Table 2: Mix proportion of mortar for 1 m3 Phase 2
Material Mortar Mix Control 0% 15% 30% 50%
Cement (kg) 4992 4493 4493 4493 4493 Ceramic Powder (kg) - 499 499 499 499 Natural Sand (kg) 13728 13728 11669 9610 6864 Ceramic Fine (kg) - - 2059 4118 6864 w/c ratio 0.5 0.5 0.5 0.5 0.5
Table 3: Mix proportion of concrete for 1 m3 Phase 3
RESULTS AND DISCUSSION
Figure 1 below show a density of mortar specimen in all phases at age of 28 days. The average of density for control mortar specimen is 2224 kg/m3. In phase one, the density increased about 1.44% of control density which is 2256 kg/m3
at 10% replacement. However, the density of the specimen slightly decreased at 20% replacement which is 2250 kg/m3 and 30% replacement which is 2224 kg/m3. The density of replacement specimens is higher than control density, but it has found that the density of mortar will reduce as higher percentages of the ceramic powder were being replaced. While in phase two, the density of specimen at 0% replacement is 2256 kg/m3. The density increased at 10% and 20% replacement which is 2288 kg/m3 and 2336 kg/m3. However, it is decreased to 2240 kg/m3 at the 30% replacement.
In phase three, the average control density of concrete cube is 2340 kg/m3. At 0% replacement give concrete density about 2310 kg/m3 and it is slightly decreased about 1.28% compared to the control density. The density at 10% and
Material Concrete Mix Control 0% 10% 20% 30%
Cement (kg) 4500 4050 4050 4050 4050 Ceramic Powder (kg) - 450 450 450 450 Natural Sand (kg) 8000 5600 5600 5600 5600 Ceramic Fine (kg) - 2400 2400 2400 2400 Natural Coarse (kg) 11000 11000 9900 8800 7700 Ceramic Coarse (kg) - - 1100 2200 3300 w/c ratio 0.55 0.55 0.55 0.55 0.55
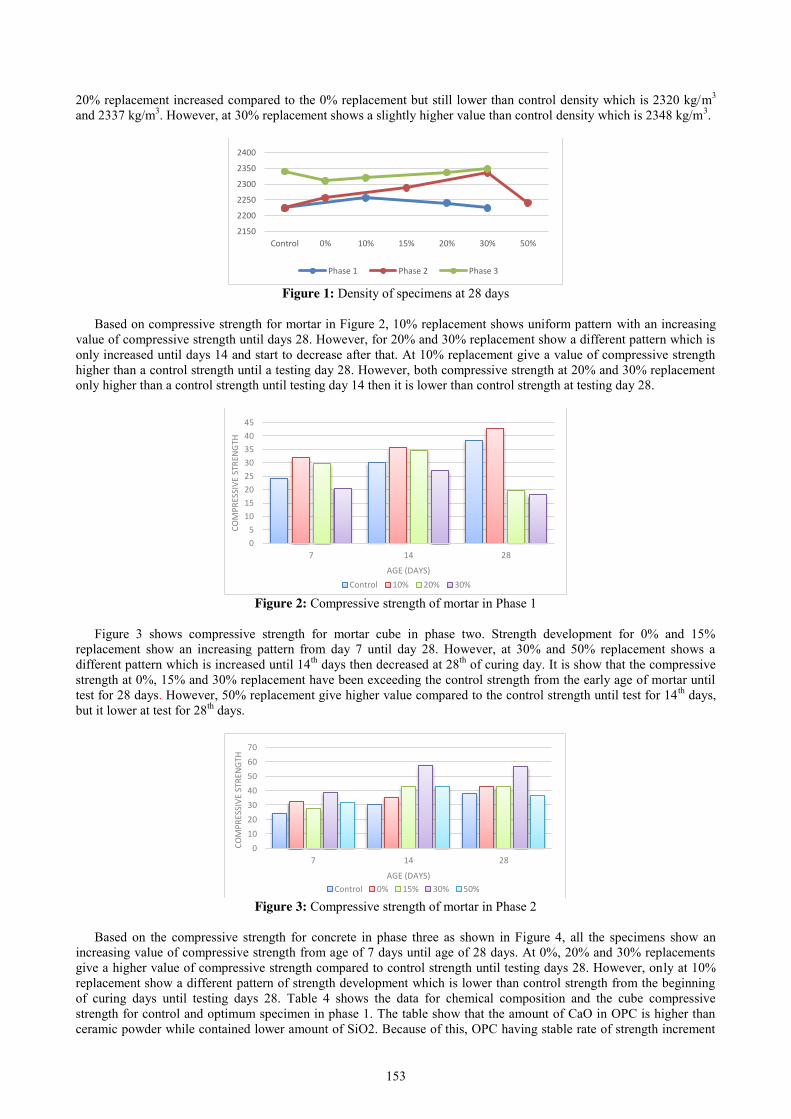
153
20% replacement increased compared to the 0% replacement but still lower than control density which is 2320 kg/m3 and 2337 kg/m3. However, at 30% replacement shows a slightly higher value than control density which is 2348 kg/m3.
Figure 1: Density of specimens at 28 days
Based on compressive strength for mortar in Figure 2, 10% replacement shows uniform pattern with an increasing
value of compressive strength until days 28. However, for 20% and 30% replacement show a different pattern which is only increased until days 14 and start to decrease after that. At 10% replacement give a value of compressive strength higher than a control strength until a testing day 28. However, both compressive strength at 20% and 30% replacement only higher than a control strength until testing day 14 then it is lower than control strength at testing day 28.
Figure 2: Compressive strength of mortar in Phase 1
Figure 3 shows compressive strength for mortar cube in phase two. Strength development for 0% and 15%
replacement show an increasing pattern from day 7 until day 28. However, at 30% and 50% replacement shows a different pattern which is increased until 14th days then decreased at 28th of curing day. It is show that the compressive strength at 0%, 15% and 30% replacement have been exceeding the control strength from the early age of mortar until test for 28 days. However, 50% replacement give higher value compared to the control strength until test for 14th days, but it lower at test for 28th days.
Figure 3: Compressive strength of mortar in Phase 2
Based on the compressive strength for concrete in phase three as shown in Figure 4, all the specimens show an
increasing value of compressive strength from age of 7 days until age of 28 days. At 0%, 20% and 30% replacements give a higher value of compressive strength compared to control strength until testing days 28. However, only at 10% replacement show a different pattern of strength development which is lower than control strength from the beginning of curing days until testing days 28. Table 4 shows the data for chemical composition and the cube compressive strength for control and optimum specimen in phase 1. The table show that the amount of CaO in OPC is higher than ceramic powder while contained lower amount of SiO2. Because of this, OPC having stable rate of strength increment
2150
2200
2250
2300
2350
2400
Control 0% 10% 15% 20% 30% 50%
Phase 1 Phase 2 Phase 3
05
1015202530354045
7 14 28
COM
PRES
SIVE
STR
ENG
TH
AGE (DAYS) Control 10% 20% 30%
010203040506070
7 14 28
COM
PRES
SIVE
STR
ENG
TH
AGE (DAYS) Control 0% 15% 30% 50%
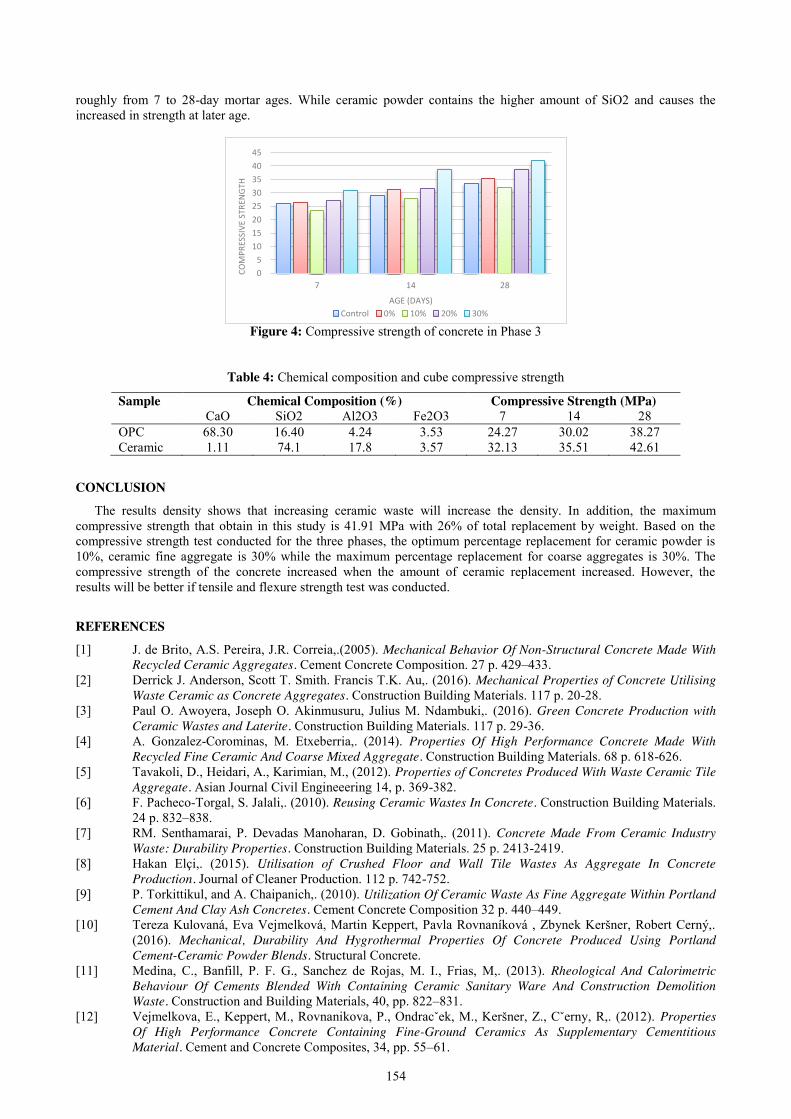
154
roughly from 7 to 28-day mortar ages. While ceramic powder contains the higher amount of SiO2 and causes the increased in strength at later age.
Figure 4: Compressive strength of concrete in Phase 3
Table 4: Chemical composition and cube compressive strength
Sample Chemical Composition (%) Compressive Strength (MPa) CaO SiO2 Al2O3 Fe2O3 7 14 28
OPC 68.30 16.40 4.24 3.53 24.27 30.02 38.27 Ceramic 1.11 74.1 17.8 3.57 32.13 35.51 42.61
CONCLUSION
The results density shows that increasing ceramic waste will increase the density. In addition, the maximum compressive strength that obtain in this study is 41.91 MPa with 26% of total replacement by weight. Based on the compressive strength test conducted for the three phases, the optimum percentage replacement for ceramic powder is 10%, ceramic fine aggregate is 30% while the maximum percentage replacement for coarse aggregates is 30%. The compressive strength of the concrete increased when the amount of ceramic replacement increased. However, the results will be better if tensile and flexure strength test was conducted.
REFERENCES
[1] J. de Brito, A.S. Pereira, J.R. Correia,.(2005). Mechanical Behavior Of Non-Structural Concrete Made With Recycled Ceramic Aggregates. Cement Concrete Composition. 27 p. 429–433.
[2] Derrick J. Anderson, Scott T. Smith. Francis T.K. Au,. (2016). Mechanical Properties of Concrete Utilising Waste Ceramic as Concrete Aggregates. Construction Building Materials. 117 p. 20-28.
[3] Paul O. Awoyera, Joseph O. Akinmusuru, Julius M. Ndambuki,. (2016). Green Concrete Production with Ceramic Wastes and Laterite. Construction Building Materials. 117 p. 29-36.
[4] A. Gonzalez-Corominas, M. Etxeberria,. (2014). Properties Of High Performance Concrete Made With Recycled Fine Ceramic And Coarse Mixed Aggregate. Construction Building Materials. 68 p. 618-626.
[5] Tavakoli, D., Heidari, A., Karimian, M., (2012). Properties of Concretes Produced With Waste Ceramic Tile Aggregate. Asian Journal Civil Engineeering 14, p. 369-382.
[6] F. Pacheco-Torgal, S. Jalali,. (2010). Reusing Ceramic Wastes In Concrete. Construction Building Materials. 24 p. 832–838.
[7] RM. Senthamarai, P. Devadas Manoharan, D. Gobinath,. (2011). Concrete Made From Ceramic Industry Waste: Durability Properties. Construction Building Materials. 25 p. 2413-2419.
[8] Hakan Elçi,. (2015). Utilisation of Crushed Floor and Wall Tile Wastes As Aggregate In Concrete Production. Journal of Cleaner Production. 112 p. 742-752.
[9] P. Torkittikul, and A. Chaipanich,. (2010). Utilization Of Ceramic Waste As Fine Aggregate Within Portland Cement And Clay Ash Concretes. Cement Concrete Composition 32 p. 440–449.
[10] Tereza Kulovaná, Eva Vejmelková, Martin Keppert, Pavla Rovnaníková , Zbynek Keršner, Robert Cerný,. (2016). Mechanical, Durability And Hygrothermal Properties Of Concrete Produced Using Portland Cement-Ceramic Powder Blends. Structural Concrete.
[11] Medina, C., Banfill, P. F. G., Sanchez de Rojas, M. I., Frias, M,. (2013). Rheological And Calorimetric Behaviour Of Cements Blended With Containing Ceramic Sanitary Ware And Construction Demolition Waste. Construction and Building Materials, 40, pp. 822–831.
[12] Vejmelkova, E., Keppert, M., Rovnanikova, P., Ondracˇek, M., Keršner, Z., Cˇerny, R,. (2012). Properties Of High Performance Concrete Containing Fine-Ground Ceramics As Supplementary Cementitious Material. Cement and Concrete Composites, 34, pp. 55–61.
05
1015202530354045
7 14 28
COM
PRES
SIVE
STR
ENG
TH
AGE (DAYS) Control 0% 10% 20% 30%

155
Modelling the Behaviour of Steel Fibre Reinforced Precast Concrete Beam-to-Column Connection
Chai Chang Ein1, Noor Nabilah Sarbini2 Faculty of Civil Engineering, Universiti Teknologi Malaysia, Malaysia
Keywords: Precast Connection; Steel Fibre Reinforced Concrete; Finite Element Analysis.
ABSTRACT. The numerical behaviour of steel fibre reinforced concrete (SFRC) corbels reinforced with different fibre volume ratio subjected to vertical incremental load until failure is presented in this paper. Precast concrete structures had become popular in the construction field, which offer a faster, neater, safer, easier and cheaper construction work. The construction components are prefabricated in controlled environment under strict supervision before being erected on site. However, precast beam-column connections are prone to failure due to the brittle properties of concrete. Finite element analysis (FEA) is adopted due to the nonlinear behaviour of concrete and SFRC. The key objective of this research is to develop a reliable nonlinear FEA model to represent the behaviour of reinforced concrete corbel. The developed model is calibrated and validated with experimental data from previous researches. Then, the validated FEA model is used to predict the behaviour of SFRC corbel reinforced with different fibre volume ratio by changing the material parameters. The predicted results from FEA are in terms of load-deformation relationships, ultimate load capacity, and stress distribution. The results show that the addition of steel fibre (SF) increases the load carrying capacity, ductility, stiffness, and changed the failure mode of corbel from brittle bending-shear to flexural ductile. On the other hand, the increasing of SF volume ratio also leads to increased load carrying capacity, ductility, and stiffness of corbel.
INTRODUCTION Cast in-situ reinforced concrete (RC) is one of the most commonly used materials in the construction field since
long ago. This material had been used for decades to build houses, bridges and even monuments all around the world [8]. However, the trend had changed and the use of precast reinforced concrete (PRC) had become popular in the construction field. It brings a lot of benefits compared to conventional cast in-situ RC structures [18]. The PRC components are fabricated in controlled environment under the supervision of experts which ensure the quality of the construction components [7][10]. This reduced the risk of concrete structure failure due to poor workmanship on site. Besides, PRC allows the use of smaller structural members which can enhance the appearance of a building [7]. In short, there are still many advantages of using PRC compared to conventional cast in-situ RC which it would makes PRC as the future trend of construction [18]. Therefore, more researches on PRC should be carried out to enhance this construction material.
Problem Statement The use of PRC had been the future of construction field [18]. In a PRC design, the connection of the precast member is the most important and critical component. Most of failure in PRC structures is caused by the failure of connection [10]. To date there are many researches have been conducted on PRC [1][18]. However, there is limited research focused on a connection of PRC using SFRC. Hence, the research area of a connection in PRC is lacking a lot of information [1]. In this research, behaviour of precast concrete corbel reinforced with different volume ratio of SF is investigated through modelling of a component in LUSAS analysis software.
Objectives This study is based on objectives as stated below:
1. To implement constitutive models for concrete and SFRC into FEA model. 2. To validate the numerical modelling with experimental data from case study. 3. To make recommendation on the effects of SF on precast SFRC beam-to-column connection.
Scope of Study This research is carried out to model the behaviour of precast concrete corbel reinforced with different SF volume ratio. A FEA model is developed by implementing constitutive models for concrete in the model. Experimental data from previous research is adopted to validate the prediction of the model. The validated model is used to model the behaviour of SFRC corbels reinforced with different SF volume ratio. Only hooked-end type SF with length of 30mm, diameter of 0.38mm, tensile strength of 2300MPa, aspect ratio of 80 is considered in the study. Five SF volume ratios are adopted in the study, 0%, 0.5%, 1.0%, 1.5%, and 2.0%. The current study only considers a vertical loading on connection.
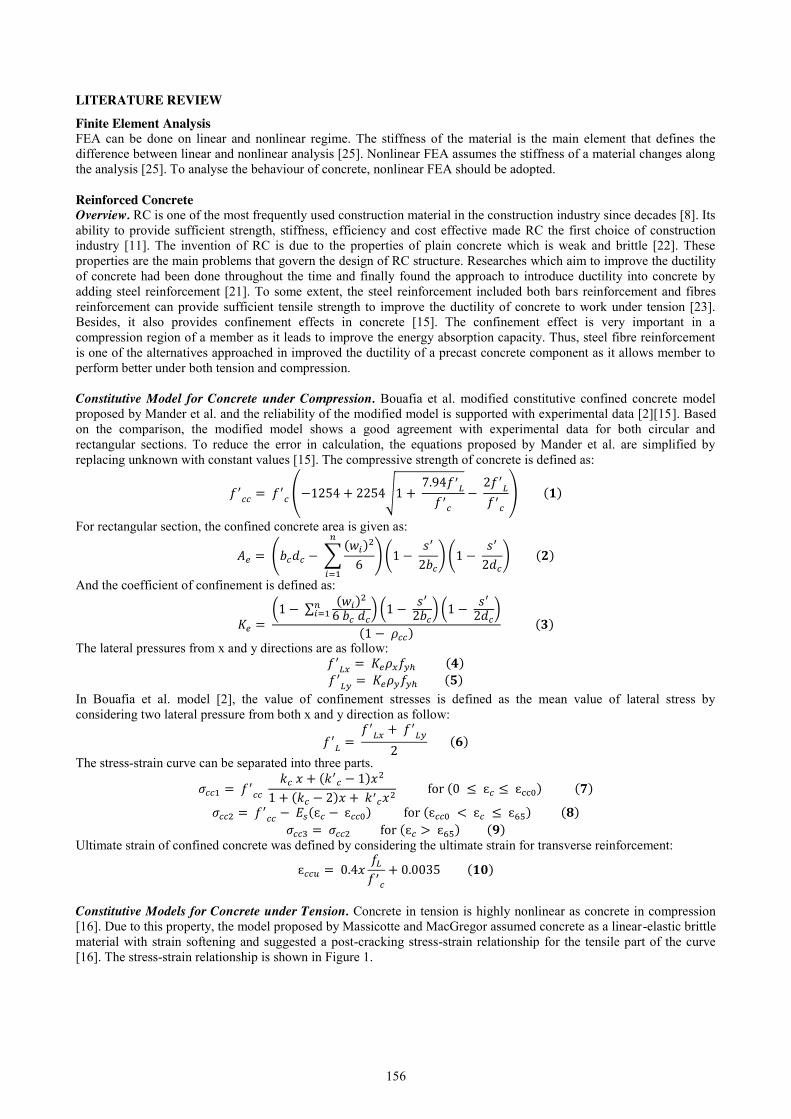
156
LITERATURE REVIEW
Finite Element Analysis FEA can be done on linear and nonlinear regime. The stiffness of the material is the main element that defines the difference between linear and nonlinear analysis [25]. Nonlinear FEA assumes the stiffness of a material changes along the analysis [25]. To analyse the behaviour of concrete, nonlinear FEA should be adopted.
Reinforced Concrete Overview. RC is one of the most frequently used construction material in the construction industry since decades [8]. Its ability to provide sufficient strength, stiffness, efficiency and cost effective made RC the first choice of construction industry [11]. The invention of RC is due to the properties of plain concrete which is weak and brittle [22]. These properties are the main problems that govern the design of RC structure. Researches which aim to improve the ductility of concrete had been done throughout the time and finally found the approach to introduce ductility into concrete by adding steel reinforcement [21]. To some extent, the steel reinforcement included both bars reinforcement and fibres reinforcement can provide sufficient tensile strength to improve the ductility of concrete to work under tension [23]. Besides, it also provides confinement effects in concrete [15]. The confinement effect is very important in a compression region of a member as it leads to improve the energy absorption capacity. Thus, steel fibre reinforcement is one of the alternatives approached in improved the ductility of a precast concrete component as it allows member to perform better under both tension and compression. Constitutive Model for Concrete under Compression. Bouafia et al. modified constitutive confined concrete model proposed by Mander et al. and the reliability of the modified model is supported with experimental data [2][15]. Based on the comparison, the modified model shows a good agreement with experimental data for both circular and rectangular sections. To reduce the error in calculation, the equations proposed by Mander et al. are simplified by replacing unknown with constant values [15]. The compressive strength of concrete is defined as:
𝑓′𝑐𝑐 = 𝑓′
𝑐 (−1254 + 2254√1 + 7.94𝑓′
𝐿𝑓′
𝑐−
2𝑓′𝐿
𝑓′𝑐
) (𝟏)
For rectangular section, the confined concrete area is given as:
𝐴𝑒 = (𝑏𝑐𝑑𝑐 − ∑(𝑤𝑖)2
6
𝑛
𝑖=1
) (1 − 𝑠′
2𝑏𝑐) (1 −
𝑠′
2𝑑𝑐) (𝟐)
And the coefficient of confinement is defined as:
𝐾𝑒 = (1 − ∑ (𝑤𝑖)2
6 𝑏𝑐 𝑑𝑐𝑛𝑖=1 ) (1 − 𝑠′
2𝑏𝑐) (1 − 𝑠′
2𝑑𝑐)
(1 − 𝜌𝑐𝑐) (𝟑)
The lateral pressures from x and y directions are as follow: 𝑓′
𝐿𝑥 = 𝐾𝑒𝜌𝑥𝑓𝑦ℎ (𝟒) 𝑓′
𝐿𝑦 = 𝐾𝑒𝜌𝑦𝑓𝑦ℎ (𝟓) In Bouafia et al. model [2], the value of confinement stresses is defined as the mean value of lateral stress by considering two lateral pressure from both x and y direction as follow:
𝑓′𝐿 =
𝑓′𝐿𝑥 + 𝑓′
𝐿𝑦
2 (𝟔)
The stress-strain curve can be separated into three parts.
𝜎𝑐𝑐1 = 𝑓′𝑐𝑐
𝑘𝑐 𝑥 + (𝑘′𝑐 − 1)𝑥2
1 + (𝑘𝑐 − 2)𝑥 + 𝑘′𝑐𝑥2 for (0 ≤ ɛ𝑐 ≤ ɛcc0) (𝟕)
𝜎𝑐𝑐2 = 𝑓′𝑐𝑐 − 𝐸𝑠(ɛ𝑐 − ɛ𝑐𝑐0) for (ɛ𝑐𝑐0 < ɛ𝑐 ≤ ɛ65) (𝟖)
𝜎𝑐𝑐3 = 𝜎𝑐𝑐2 for (ɛ𝑐 > ɛ65) (𝟗) Ultimate strain of confined concrete was defined by considering the ultimate strain for transverse reinforcement:
ɛ𝑐𝑐𝑢 = 0.4𝑥𝑓𝐿
𝑓′𝑐
+ 0.0035 (𝟏𝟎) Constitutive Models for Concrete under Tension. Concrete in tension is highly nonlinear as concrete in compression [16]. Due to this property, the model proposed by Massicotte and MacGregor assumed concrete as a linear-elastic brittle material with strain softening and suggested a post-cracking stress-strain relationship for the tensile part of the curve [16]. The stress-strain relationship is shown in Figure 1.
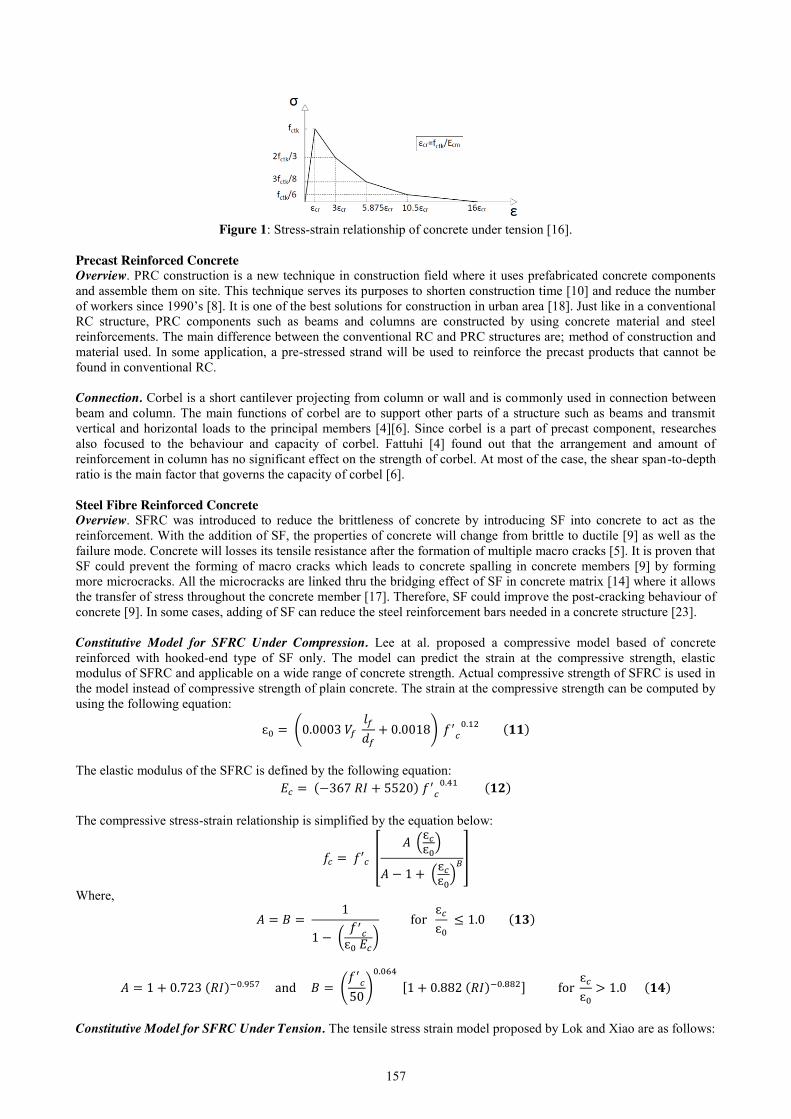
157
Figure 1: Stress-strain relationship of concrete under tension [16].
Precast Reinforced Concrete Overview. PRC construction is a new technique in construction field where it uses prefabricated concrete components and assemble them on site. This technique serves its purposes to shorten construction time [10] and reduce the number of workers since 1990’s [8]. It is one of the best solutions for construction in urban area [18]. Just like in a conventional RC structure, PRC components such as beams and columns are constructed by using concrete material and steel reinforcements. The main difference between the conventional RC and PRC structures are; method of construction and material used. In some application, a pre-stressed strand will be used to reinforce the precast products that cannot be found in conventional RC. Connection. Corbel is a short cantilever projecting from column or wall and is commonly used in connection between beam and column. The main functions of corbel are to support other parts of a structure such as beams and transmit vertical and horizontal loads to the principal members [4][6]. Since corbel is a part of precast component, researches also focused to the behaviour and capacity of corbel. Fattuhi [4] found out that the arrangement and amount of reinforcement in column has no significant effect on the strength of corbel. At most of the case, the shear span-to-depth ratio is the main factor that governs the capacity of corbel [6]. Steel Fibre Reinforced Concrete Overview. SFRC was introduced to reduce the brittleness of concrete by introducing SF into concrete to act as the reinforcement. With the addition of SF, the properties of concrete will change from brittle to ductile [9] as well as the failure mode. Concrete will losses its tensile resistance after the formation of multiple macro cracks [5]. It is proven that SF could prevent the forming of macro cracks which leads to concrete spalling in concrete members [9] by forming more microcracks. All the microcracks are linked thru the bridging effect of SF in concrete matrix [14] where it allows the transfer of stress throughout the concrete member [17]. Therefore, SF could improve the post-cracking behaviour of concrete [9]. In some cases, adding of SF can reduce the steel reinforcement bars needed in a concrete structure [23]. Constitutive Model for SFRC Under Compression. Lee at al. proposed a compressive model based of concrete reinforced with hooked-end type of SF only. The model can predict the strain at the compressive strength, elastic modulus of SFRC and applicable on a wide range of concrete strength. Actual compressive strength of SFRC is used in the model instead of compressive strength of plain concrete. The strain at the compressive strength can be computed by using the following equation:
ɛ0 = (0.0003 𝑉𝑓 𝑙𝑓
𝑑𝑓+ 0.0018) 𝑓′
𝑐0.12 (𝟏𝟏)
The elastic modulus of the SFRC is defined by the following equation:
𝐸𝑐 = (−367 𝑅𝐼 + 5520) 𝑓′𝑐
0.41 (𝟏𝟐) The compressive stress-strain relationship is simplified by the equation below:
𝑓𝑐 = 𝑓′𝑐 [𝐴 (ɛ𝑐
ɛ0)
𝐴 − 1 + (ɛ𝑐ɛ0
)𝐵]
Where,
𝐴 = 𝐵 = 1
1 − (𝑓′
𝑐ɛ0 𝐸𝑐
) for
ɛ𝑐
ɛ0 ≤ 1.0 (𝟏𝟑)
𝐴 = 1 + 0.723 (𝑅𝐼)−0.957 and 𝐵 = (𝑓′
𝑐50
)0.064
[1 + 0.882 (𝑅𝐼)−0.882] for ɛ𝑐
ɛ0> 1.0 (𝟏𝟒)
Constitutive Model for SFRC Under Tension. The tensile stress strain model proposed by Lok and Xiao are as follows:
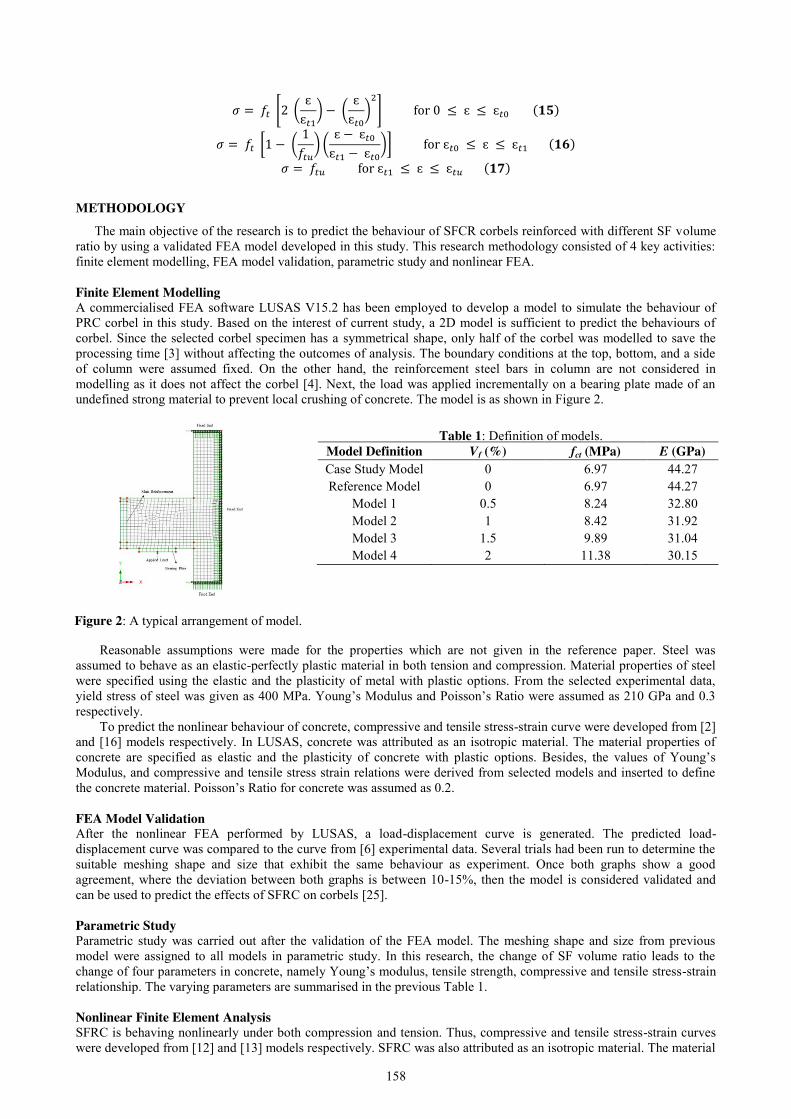
158
𝜎 = 𝑓𝑡 [2 (ɛ
ɛ𝑡1) − (
ɛɛ𝑡0
)2
] for 0 ≤ ɛ ≤ ɛ𝑡0 (𝟏𝟓)
𝜎 = 𝑓𝑡 [1 − (1
𝑓𝑡𝑢) (
ɛ − ɛ𝑡0
ɛ𝑡1 − ɛ𝑡0)] for ɛ𝑡0 ≤ ɛ ≤ ɛ𝑡1 (𝟏𝟔)
𝜎 = 𝑓𝑡𝑢 for ɛ𝑡1 ≤ ɛ ≤ ɛ𝑡𝑢 (𝟏𝟕)
METHODOLOGY The main objective of the research is to predict the behaviour of SFCR corbels reinforced with different SF volume
ratio by using a validated FEA model developed in this study. This research methodology consisted of 4 key activities: finite element modelling, FEA model validation, parametric study and nonlinear FEA. Finite Element Modelling A commercialised FEA software LUSAS V15.2 has been employed to develop a model to simulate the behaviour of PRC corbel in this study. Based on the interest of current study, a 2D model is sufficient to predict the behaviours of corbel. Since the selected corbel specimen has a symmetrical shape, only half of the corbel was modelled to save the processing time [3] without affecting the outcomes of analysis. The boundary conditions at the top, bottom, and a side of column were assumed fixed. On the other hand, the reinforcement steel bars in column are not considered in modelling as it does not affect the corbel [4]. Next, the load was applied incrementally on a bearing plate made of an undefined strong material to prevent local crushing of concrete. The model is as shown in Figure 2.
Reasonable assumptions were made for the properties which are not given in the reference paper. Steel was assumed to behave as an elastic-perfectly plastic material in both tension and compression. Material properties of steel were specified using the elastic and the plasticity of metal with plastic options. From the selected experimental data, yield stress of steel was given as 400 MPa. Young’s Modulus and Poisson’s Ratio were assumed as 210 GPa and 0.3 respectively.
To predict the nonlinear behaviour of concrete, compressive and tensile stress-strain curve were developed from [2] and [16] models respectively. In LUSAS, concrete was attributed as an isotropic material. The material properties of concrete are specified as elastic and the plasticity of concrete with plastic options. Besides, the values of Young’s Modulus, and compressive and tensile stress strain relations were derived from selected models and inserted to define the concrete material. Poisson’s Ratio for concrete was assumed as 0.2. FEA Model Validation After the nonlinear FEA performed by LUSAS, a load-displacement curve is generated. The predicted load-displacement curve was compared to the curve from [6] experimental data. Several trials had been run to determine the suitable meshing shape and size that exhibit the same behaviour as experiment. Once both graphs show a good agreement, where the deviation between both graphs is between 10-15%, then the model is considered validated and can be used to predict the effects of SFRC on corbels [25]. Parametric Study Parametric study was carried out after the validation of the FEA model. The meshing shape and size from previous model were assigned to all models in parametric study. In this research, the change of SF volume ratio leads to the change of four parameters in concrete, namely Young’s modulus, tensile strength, compressive and tensile stress-strain relationship. The varying parameters are summarised in the previous Table 1. Nonlinear Finite Element Analysis SFRC is behaving nonlinearly under both compression and tension. Thus, compressive and tensile stress-strain curves were developed from [12] and [13] models respectively. SFRC was also attributed as an isotropic material. The material
Model Definition Vf (%) fct (MPa) E (GPa) Case Study Model 0 6.97 44.27 Reference Model 0 6.97 44.27
Model 1 0.5 8.24 32.80 Model 2 1 8.42 31.92 Model 3 1.5 9.89 31.04 Model 4 2 11.38 30.15
Table 1: Definition of models.
Figure 2: A typical arrangement of model.
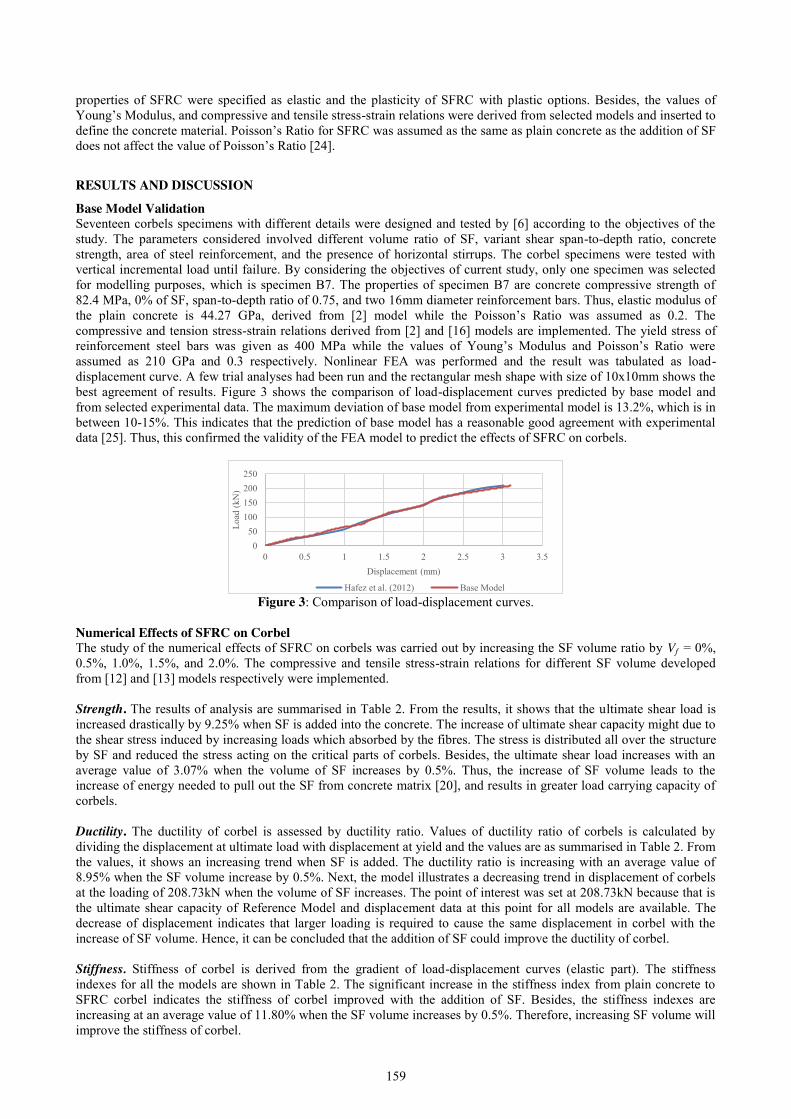
159
properties of SFRC were specified as elastic and the plasticity of SFRC with plastic options. Besides, the values of Young’s Modulus, and compressive and tensile stress-strain relations were derived from selected models and inserted to define the concrete material. Poisson’s Ratio for SFRC was assumed as the same as plain concrete as the addition of SF does not affect the value of Poisson’s Ratio [24].
RESULTS AND DISCUSSION
Base Model Validation Seventeen corbels specimens with different details were designed and tested by [6] according to the objectives of the study. The parameters considered involved different volume ratio of SF, variant shear span-to-depth ratio, concrete strength, area of steel reinforcement, and the presence of horizontal stirrups. The corbel specimens were tested with vertical incremental load until failure. By considering the objectives of current study, only one specimen was selected for modelling purposes, which is specimen B7. The properties of specimen B7 are concrete compressive strength of 82.4 MPa, 0% of SF, span-to-depth ratio of 0.75, and two 16mm diameter reinforcement bars. Thus, elastic modulus of the plain concrete is 44.27 GPa, derived from [2] model while the Poisson’s Ratio was assumed as 0.2. The compressive and tension stress-strain relations derived from [2] and [16] models are implemented. The yield stress of reinforcement steel bars was given as 400 MPa while the values of Young’s Modulus and Poisson’s Ratio were assumed as 210 GPa and 0.3 respectively. Nonlinear FEA was performed and the result was tabulated as load-displacement curve. A few trial analyses had been run and the rectangular mesh shape with size of 10x10mm shows the best agreement of results. Figure 3 shows the comparison of load-displacement curves predicted by base model and from selected experimental data. The maximum deviation of base model from experimental model is 13.2%, which is in between 10-15%. This indicates that the prediction of base model has a reasonable good agreement with experimental data [25]. Thus, this confirmed the validity of the FEA model to predict the effects of SFRC on corbels.
Figure 3: Comparison of load-displacement curves.
Numerical Effects of SFRC on Corbel The study of the numerical effects of SFRC on corbels was carried out by increasing the SF volume ratio by Vf = 0%, 0.5%, 1.0%, 1.5%, and 2.0%. The compressive and tensile stress-strain relations for different SF volume developed from [12] and [13] models respectively were implemented. Strength. The results of analysis are summarised in Table 2. From the results, it shows that the ultimate shear load is increased drastically by 9.25% when SF is added into the concrete. The increase of ultimate shear capacity might due to the shear stress induced by increasing loads which absorbed by the fibres. The stress is distributed all over the structure by SF and reduced the stress acting on the critical parts of corbels. Besides, the ultimate shear load increases with an average value of 3.07% when the volume of SF increases by 0.5%. Thus, the increase of SF volume leads to the increase of energy needed to pull out the SF from concrete matrix [20], and results in greater load carrying capacity of corbels. Ductility. The ductility of corbel is assessed by ductility ratio. Values of ductility ratio of corbels is calculated by dividing the displacement at ultimate load with displacement at yield and the values are as summarised in Table 2. From the values, it shows an increasing trend when SF is added. The ductility ratio is increasing with an average value of 8.95% when the SF volume increase by 0.5%. Next, the model illustrates a decreasing trend in displacement of corbels at the loading of 208.73kN when the volume of SF increases. The point of interest was set at 208.73kN because that is the ultimate shear capacity of Reference Model and displacement data at this point for all models are available. The decrease of displacement indicates that larger loading is required to cause the same displacement in corbel with the increase of SF volume. Hence, it can be concluded that the addition of SF could improve the ductility of corbel. Stiffness. Stiffness of corbel is derived from the gradient of load-displacement curves (elastic part). The stiffness indexes for all the models are shown in Table 2. The significant increase in the stiffness index from plain concrete to SFRC corbel indicates the stiffness of corbel improved with the addition of SF. Besides, the stiffness indexes are increasing at an average value of 11.80% when the SF volume increases by 0.5%. Therefore, increasing SF volume will improve the stiffness of corbel.
050
100150200250
0 0.5 1 1.5 2 2.5 3 3.5
Load
(kN
)
Displacement (mm)
Hafez et al. (2012) Base Model

160
Failure Mode. The numerical cracking and crushing pattern of the corbel models are illustrated in Figure 4. The compressive stress (indicated by dark orange contour) while positive stress value shows tensile stress (indicated by dark yellow contour). From Figure 4, it is observed that all models exhibited tensile cracking at the region around bottom column-corbel interface and compressive crushing at the area around top column-corbel interface. Besides, it can also be observed that the tensile cracks zone becomes larger when the amount of SF increased. This shows the addition of more SF promotes the propagation of cracks as more microcracks were created due to the transferring of tensile stress thru the bridging effect of SF. By observing the crack and crush zone of base model, it shows that the corbel failed in bending-shear as there is an obvious crack that slices through column-corbel interface. Besides, the failure was also accompanied by brittle failure mode as the concrete at the region of top column-corbel crushed. However, by comparing the base model with other SFRC models, it clearly shows that the addition of SF reduced the area of compressive crushing zone significantly and completely removed the crack that slices through the column-corbel interface. Hence, it can be concluded that addition of SF altered the failure mode of corbel from bending-shear accompanied with brittle failure to flexural ductile failure mode.
Figure 4: Stress distribution and cracking zone: (a) Vf = 0%, (b) Vf = 0.5%, (c) Vf = 1.0%, (d) Vf = 1.5%, (e) Vf = 2.0%
Table 2: Summary results for models.
Model Definition Pult (kN)
ΔPult (%)
δult (mm) μ Increment
of μ (%) δ208.73 (mm) S.I Increment of S.I
(%) Case Study Model 210.00 - 3.01 1.03 - 2.97 75.13 - Reference Model 208.73 0 3.10 1.08 0 3.10 71.77 0
Model 1 228.03 9.25 1.04 1.46 35.19 0.85 202.78 182.54 Model 2 239.92 14.94 1.09 1.57 45.37 0.80 212.24 195.72 Model 3 243.19 16.51 1.08 1.66 53.70 0.76 216.19 201.18 Model 4 247.25 18.45 1.14 1.75 62.04 0.73 228.19 217.95
CONCLUSION
Based on the results and discussions, conclusions can be drawn as summarised below: 1. A reliable nonlinear FEA model to represent the behaviours of PRC corbels was developed by implementing
models from [2] and [16]. The capability of the model to predict the behaviours of PRC corbels subjected to vertical load only is validated with experimental data from [6].
2. Addition of SF caused the load-carrying capacity of corbels to increase drastically by 9.25% due to the distribution of excess stresses by discrete SF away from critical parts of the corbels. Besides, the load-carrying capacity of SFRC corbels increase by an average of 3.07% when SF volume increases by 0.5%. This is contributed by the pull-out strength of SF.
3. Corbels with SFRC can deform greater before failure compared to plain concrete corbel. This indicates the ductility of corbel is improved with the addition of SF and it is supported by the increasing values of ductility ratio. The ductility ratio increased with and average value of 8.95% when the SF volume increased by 0.5%. This indicates that SFRC corbels with higher volume of SF can deform greater before failure. This shows that the increasing volume of SF improved the ductility of SFRC corbels.
4. Addition of SF caused an increase of 182.54% in stiffness. Besides, the stiffness index is increasing with and average value of 11.80% when the SF volume increases by 0.5%. This indicates the SF can improve the stiffness of corbel.
(a) (b) (c) (d) (e)
161
5. Increase of SF volume enlarge the tensile crack zone in corbels due to the improved ability to propagate cracks by the bridging effect of SF and more microcracks are formed. Failure mode of corbels changed from bending-shear with brittle failure to flexural ductile failure mode with the presence of SF.
REFERENCES [1] Alcocer, S. M., Carranza, R. & Perez-Navarrete, D., 2000. Behaviour of A Precast Concrete Beam-Column
Connection. 12th World Conference on Earthquake Engineering, Issue 52, pp. 1-8. [2] Bouafia, Y., Iddin, A., Kachi, M. S. & Dumontet, H., 2014. Stress-Strain Relationship for The Confined
Concrete. Barcelona, 5th European Conference on Computational Mechanics (ECCM V). [3] Canha, R. M. F., Kuchma, D. A., Debs, M. K. E. & Souza, R. A. d., 2014. Numerical Analysis of Reinforced
High Strength Concrete Corbels. Engineering Structures, Volume 74, pp. 130-144. [4] Fattuhi, N. I., 1990. Column-Load Effect on Reinforced Concrete Corbels. Journal of Structural Engineering,
January, 116(1), pp. 188-197. [5] Ganesan, N., Indira, P. V. & Abraham, R., 2007. Steel Fibre Reinforced High Performance Concrete Beam-
Column Joints Subjected to Cyclic Loading. ISET Journal of Earthquake Technology , 44(3-4), pp. 445-456. [6] Hafez, A. M. A., Ahmed, M. M., Diab, H. & Drar, A. A. M., 2012. Shear Behaviour of High Strength Fiber
Reinforced Concrete Corbels. Journal of Engineering Sciences, July, 40(4), pp. 969-987. [7] Hawileh, R. A., Rahman, A. & Tabatabai, H., 2010. Nonlinear Finite Element Analysis and Modeling of a
Precast Hybrid Beam-Column Connection Subjected to Cyclic Loads. Applied Mathematical Modelling, Volume 34, pp. 2562-2583.
[8] Ibrahim, I. S. et al., 2014. Ultimate Shear Capacity and Failure of Shear Key Connection In Precast Concrete Construction. Malaysian Journal of Civil Engineering, pp. 414-430.
[9] Kim, K. S., Lee, D. H., Hwang, J.-H. & Kuchma, D. A., 2012. Shear Behaviour Model for Steel Fiber-Reinforced Concrete Members Without Transverse Reinforcements. Composites Part B: Engineering, 43(5), pp. 2324-2334.
[10] Korkmaz, H. H. & Tankut, T., 2005. Performance of a Precast Concrete Beam-to-Beam Connection Subject to Reversed Cyclic Loading. Engineering Structures, Volume 27, pp. 1392-1407.
[11] Kwak, H. G. & Filippou, F. C., 1990. Finite Element Analysis of Reinforced Concrete Structures Under Monotonic Loads, Berkeley, California: s.n.
[12] Lee, S.-C., Oh, J.-H. & Cho, J.-Y., 2015. Compressive Behaviour of Fiber-Reinforced Concrete with End-Hooked Steel Fibers. Materials, Volume 8, pp. 1442-1482.
[13] Lok, T. S. & Xiao, J. R., 1999. Flexural Strength Assessment of Steel Fiber-Reinforced Concrete. Journal of Materials in Civil Engineering, 11(3), pp. 188-196.
[14] Madandoust, R., Ranjbar, M. M., Ghavidel, R. & Shahabi, S. F., 2015. Assessment of Factors Influencing Mechanical Properties of Steel Fiber Reinforced Self-Compacting Concrete. Materials & Design, pp. 284-294.
[15] Mander, J. B., Priestley, M. J. N. & Park, R., 1984. Theoritical Stress-Strain Model for Confined Concrete. Journal of Structural Engineering, 114(3), pp. 1804-1826.
[16] Massicotte, A. E. E. B. & MacGregor, J. G., 1990. A Study of Combined Bending and Axial Load in Reinforced Concrete Members. ASCE Journal of Structural Engineering, 116:11(3039).
[17] Meskenas, A. et al., 2013. A New Technique for Constitutive Modeling of SFRC. Procedia Engineering, Volume 57, pp. 762-766.
[18] National Precast Concrete Association, 2008. The Little Green Book of Concrete - Precast Concrete for Sustainable Construction. s.l.:s.n.
[19] National Research Council, 2007. Guide for the Design and Construction of Fibre-Reinforced Concrete Structures. In: s.l.:s.n.
[20] Pajak, M. & Ponikiewski, T., 2013. Flexural Behaviour of Self-Compacting Concrete Reinforced with Different Types of Steel Fibers. Construction and Building Materials, Volume 47, pp. 397-408.
[21] Rudnov, V., Belyakov, V. & Moskovsky, S., 2016. Properties and Design Characteristics of The Fiber Concrete. Procedia Engineering, Volume 150, pp. 1536-1540.
[22] Sermet, F. & Ozdemir, A., 2016. Investigation of Punching Shear Behaviour of Steel and Polypropylene Fibre Reinforced Concrete Slabs Under Normal Load. Procedia Engineering, Volume 161, pp. 458-465.
[23] Soutsos, M., Le, T. & Lampropoulos, A., 2012. Flexural Performance of Fiber Reinforced Concrete Made with Steel and Synthetic Fibers. Construction and Building Materials, Volume 36, pp. 704-710.
[24] Thomas, J. & Ramaswamy, A., 2007. Mechanical Properties of Steel Fiber-Reinforced Concrete. Journals of Materials in Civil Engineering, 19(5), pp. 385-392.
[25] Yassin, A. Y. M., Noor, M. A. A. M., Kasiman, E. H. & Jamil, M. Z., 2013. Linear and Nonlinear Finite Element Analysis for Solids and Fluids (Unedited 1st Draft). s.l.:s.n.
162
The properties of bottom ash foamed concrete as thermal reduction for
decorative wall Che Muhammad Fatihi Hafifi Bin Che Wahid1, Eeydzah Binti Aminudin2
Faculty of Civil Engineering, Universiti Teknologi Malaysia, Malaysia [email protected]
Keywords: Bottom ash; Foamed Concrete, Thermal
ABSTRACT. Urban areas are usually warmer than their surrounding rural areas especially at the developed areas due to the building materials used. This large amount of heat will be causing the surrounding temperature to increase. On the other hand, agro-industrial by-products like fly ash (also known as Pulverised Fuel Ash, PFA) and bottom ash have been greatly produced and pollute the environment. These products are highly hazardous and involve complicated technology and high cost to dispose. Therefore, in order to produce a sustainable building material as well as reducing the waste product of coal fired electric generating power plants, coal bottom ash and fly ash is being altered into a high quality construction material to produce better thermal properties and higher solar reflectance value of wall. The aim of this research is to develop an acceptable mortar mixture with bottom ash and fly ash as additional material that can be used for building construction and analyse the effect of lightweight foam concrete in terms of compressive strength and thermal insulation. Bottom ash have make sieve analysis process first. Put it in oven-dry in 1 day at 105oC and sieving it by manual sieve with sieve size 5mm and 2mm. The bottom ash foam concrete produced with two different dimensions of 50×50×50mm and 102.5×215×65mm with varied additional percentage of PFA which were 0%, 10%, 20%, and 30%. Besides that, the bottom ash replacing the whole sand proportion. The 0% of PFA served as control for other sample. The samples with smaller dimension were tested for compressive strength for 7, 14 and 28 days in two method of curing air and water curing. While the samples with bigger dimension were tested for thermal camera for 28 days. All data were analyzed. Results showed the higher PFA content, the lower its surface temperature but varied in its strength. The production of bottom ash foam concrete with an additional 30% PFA is the optimum mix design for this research. Additional of PFA content gives the best result in reducing surface temperature and the best result in increased the compressive strength so it can be used for permanent constructions. The reaction composition in the PFA is suitable and has the additional potential in producing of bottom ash foam concrete.
INTRODUCTION
Foamed concrete is defined as a light cellular concrete which can be classified as a lightweight concrete (density of 400–1850 kg/m3) with random air-voids created from the mixture of foam agents in mortar. By using bottom ash to replace the sand proportion in foam concrete will lead to a lightweight, greater porosity with adequate strength and high thermal insulating of concrete. In this research, the fly ash will replace about 10%, 20% and 30% of the proportion of cement content, so this eventually will reduce the cost of making cement brick. Besides that, corrugated shape of bottom ash foam concrete can reflect sunlight energy to the atmosphere so lesser heat will be stored. These all characteristics will eventually create a decorative wall panel that can reflect the sunlight effectively and hence the surface temperature can be reduced by 20-25% which will in the end reduce UHI effect.
Problem Statement In construction, we need more concrete than any other material in this world especially for development countries. However, on the same time we are making concrete, we also emits huge amount of carbon dioxide (CO2) [1]. It releases green house gases, carbon dioxide (CO2), into the atmosphere during its manufacture. These green house gases will trap the infrared radiation and hence cause greenhouse effect which will increase the overall average temperature of the Earth. On the same time, urbanization process which develops the urban regions eventually leads to the formation of UHI where the urban areas have higher temperature compared to the rural areas. These two conditions eventually will create global warming to our Earth. Therefore, these are the obstacles and difficulties for us to overcome as the effects of UHI and global warming are getting serious and severe. Hence, in order to combat this issue, main building materials like concrete with better thermal performance needed to be made to replace the existing normal building materials.
Objectives The main objectives of the study are as follow:
1. To determine the characteristics of PFA as potential replacement in bottom ash foam concrete. 2. To investigate the optimum mix design of PFA for bottom ash foam concrete. 3. To study the engineering properties including the mechanical and thermal properties for bottom ash foam
concrete.
163
Scope of Study The study only focused on bottom ash foam concrete with PFA as cement replacement. Preparation of bottom ash foamed concrete with target density is 1200 kg/m3. The percent of the additional PFA is 0%, 10%, 20% and 30% in cement replacement. Curing process to be determined at 7, 14 and 28 day using sample ratio 1:3 and w/c ratio is 0.55. All laboratory process of formulation and fabrication will be done due the tests such as sieve analysis, density test, compressive strength test, water absorption and thermal camera tests will be carried out to obtain the strength and thermal reflecting of bottom ash foamed concrete.
LITERATURE REVIEW
Foam concrete is either a cement paste or mortar, classified as lightweight concrete, in which air-voids are entrapped in mortar by suitable foaming agent. Foamed concrete (air-entraining concrete) is categorized as lightweight concrete due to the existence of larger amounts of homogeneous air-voids inside the matrix through a suitable foaming agent. This method causes high flowability, lower unit weight, and minimal consumption of aggregate and excellent thermal conductivity [2].
Lightweight foam concrete is in class of aerated concrete. Aerated concrete can be classified according to the methods and agents used to introduce air in the concrete. Aerated concrete can be produced by introducing air entraining agent, gas forming chemicals and foaming agents. The factors such as foam agent specification, foam preparation method, material characteristics, mix design method, foam concrete production and its performance in fresh and hardened state are significantly important for the design of foamed concrete [2].The application of lightweight foamed concrete in civil engineering works is very broad as it can be used in almost every parts of building from the superstructure right down to the substructure.
Many researches has been conducted to improve the application of foam concrete as a buiding material. In order to enhance the properties of foam concrete, materials with good characteristic to foam concrete can be added in the mixture. Bottom ash can be used as a partial replacement of fine aggregates (sand) in concrete mix due to its properties like appearance and particle size distribution that almost similar to natural fine aggregate (sand). The color of bottom ash normally is in grey to black color. Its shape is quite angular and irregular sometimes, and has a porous surface structure. Its porous surface structure properties make bottom ash become less durable than normal aggregates. Bottom ash basically made up of silica, alumina, iron and a small quantity of calcium, sulphate and magnesium [3]. Moreover, bottom ash normally Is a well-graded material though they may have some variations in particle size from the same power plant. Therefore, this make the coal bottom ash particles have the interlocking characteristics which benefits the impossible to be used as a replacement of fine aggregates.
Basically in this study, the foam concrete will be made by cement, the fine aggregates (sand) will be replaced by bottom ash in order to increase the strength of the lightweight mortar and also improve the thermal insulating of the concrete. Then, all of the materials will be mixed together with sufficient water ratio so that a lightweight concrete (bottom ash foam concrete) with low thermal conductivity and low density.
The low density of cellular concrete make it suitable for precast decorative wall units which are easy to handle and transport from factory to the sites. The factors such as foaming agent, method of foam preparation, and supplementary materials affect thedensity of bottom ash foamed concrete. As with dense concrete, the compressive strength of bottom ash foamed concrete will depend on the density, initial water/cement ratio and cement content. Research show that there are differences between actual density and target density mainly due to the loss and breaking of foam bubbles during mixing [2].
Absorption of normal concrete is usually expressed as the increase in mass as a percentage of oven dry mass. Compressive strength of foamed concrete largely depends on the amount of gelled material, water-binder ratio, filler type and porosity. However, compressive strength and density of foamed concrete are a factor of porosity as the higher foam volume (i.e. lower gelled material) results in higher porosity and lower density and consequently lower compressive strength [4].
METHODOLOGY
The materials used in this study were cement, PFA, bottom ash, foaming agent and water. Bottom ash have make sieve analysis process first. Put it in oven-dry in 1 day at 105oC and sieving it by manual sieve with sieve size 5mm and 2mm. The percantage bottom ash was used is 50% size 2mm and 50% size 5mm respectively. For the sample preparation, the mix ratio used was 1:3 which represent cement to bottom ash and water cement ratio of 0.55% for bottom ash foam concrete production. However, the PFA introduced into cement mix is varied from 0%, 10%, 20% and 30%. The design calculation we use is according the spesific gravity method. This was done to determine the proportion that would give the most favourable result. The 0% served as control for other sample. Samples with dimension of 50mm × 50mm × 50mm were produced for compressive strength test and water absorption test. While a different dimension of 102.5mm × 215mm × 65mm were used to test the thermal camera.
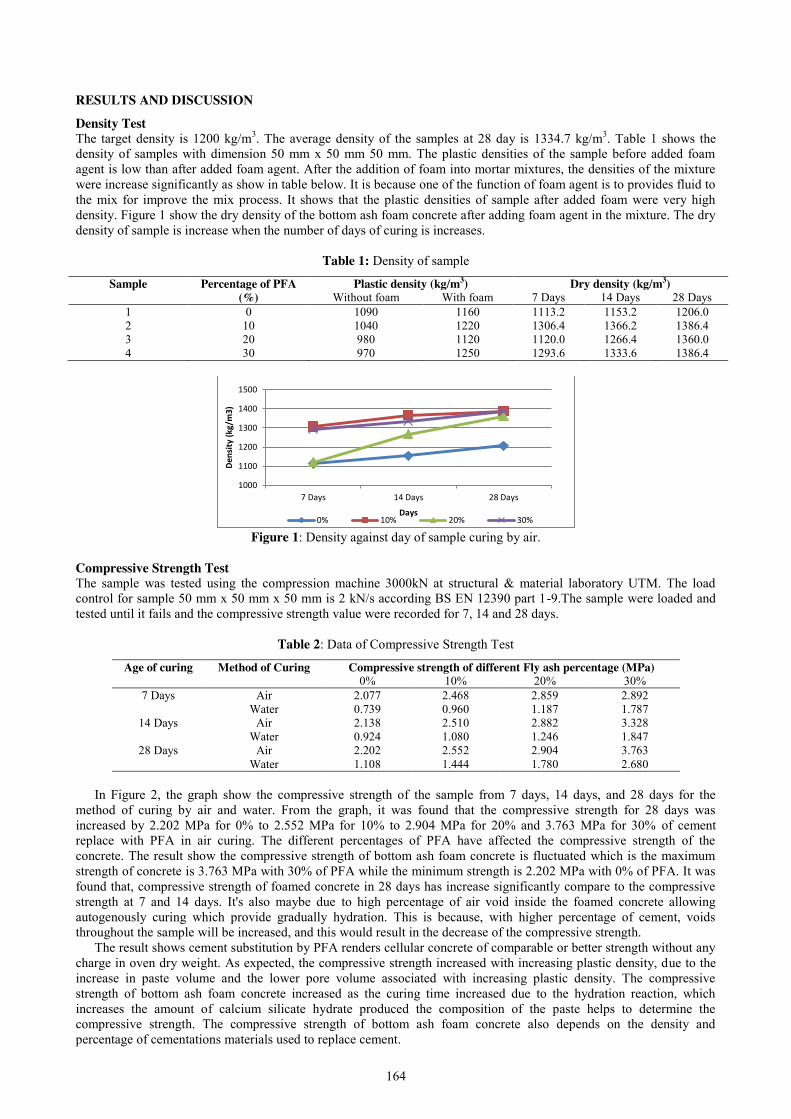
164
RESULTS AND DISCUSSION Density Test The target density is 1200 kg/m3. The average density of the samples at 28 day is 1334.7 kg/m3. Table 1 shows the density of samples with dimension 50 mm x 50 mm 50 mm. The plastic densities of the sample before added foam agent is low than after added foam agent. After the addition of foam into mortar mixtures, the densities of the mixture were increase significantly as show in table below. It is because one of the function of foam agent is to provides fluid to the mix for improve the mix process. It shows that the plastic densities of sample after added foam were very high density. Figure 1 show the dry density of the bottom ash foam concrete after adding foam agent in the mixture. The dry density of sample is increase when the number of days of curing is increases.
Table 1: Density of sample
Sample Percentage of PFA (%)
Plastic density (kg/m3) Dry density (kg/m3) Without foam With foam 7 Days 14 Days 28 Days
1 0 1090 1160 1113.2 1153.2 1206.0 2 10 1040 1220 1306.4 1366.2 1386.4 3 20 980 1120 1120.0 1266.4 1360.0 4 30 970 1250 1293.6 1333.6 1386.4
Figure 1: Density against day of sample curing by air.
Compressive Strength Test The sample was tested using the compression machine 3000kN at structural & material laboratory UTM. The load control for sample 50 mm x 50 mm x 50 mm is 2 kN/s according BS EN 12390 part 1-9.The sample were loaded and tested until it fails and the compressive strength value were recorded for 7, 14 and 28 days.
Table 2: Data of Compressive Strength Test
Age of curing Method of Curing Compressive strength of different Fly ash percentage (MPa) 0% 10% 20% 30%
7 Days Air 2.077 2.468 2.859 2.892 Water 0.739 0.960 1.187 1.787
14 Days Air 2.138 2.510 2.882 3.328 Water 0.924 1.080 1.246 1.847
28 Days Air 2.202 2.552 2.904 3.763 Water 1.108 1.444 1.780 2.680
In Figure 2, the graph show the compressive strength of the sample from 7 days, 14 days, and 28 days for the
method of curing by air and water. From the graph, it was found that the compressive strength for 28 days was increased by 2.202 MPa for 0% to 2.552 MPa for 10% to 2.904 MPa for 20% and 3.763 MPa for 30% of cement replace with PFA in air curing. The different percentages of PFA have affected the compressive strength of the concrete. The result show the compressive strength of bottom ash foam concrete is fluctuated which is the maximum strength of concrete is 3.763 MPa with 30% of PFA while the minimum strength is 2.202 MPa with 0% of PFA. It was found that, compressive strength of foamed concrete in 28 days has increase significantly compare to the compressive strength at 7 and 14 days. It's also maybe due to high percentage of air void inside the foamed concrete allowing autogenously curing which provide gradually hydration. This is because, with higher percentage of cement, voids throughout the sample will be increased, and this would result in the decrease of the compressive strength.
The result shows cement substitution by PFA renders cellular concrete of comparable or better strength without any charge in oven dry weight. As expected, the compressive strength increased with increasing plastic density, due to the increase in paste volume and the lower pore volume associated with increasing plastic density. The compressive strength of bottom ash foam concrete increased as the curing time increased due to the hydration reaction, which increases the amount of calcium silicate hydrate produced the composition of the paste helps to determine the compressive strength. The compressive strength of bottom ash foam concrete also depends on the density and percentage of cementations materials used to replace cement.
1000
1100
1200
1300
1400
1500
7 Days 14 Days 28 Days
Den
sity
(kg
/m3)
Days 0% 10% 20% 30%

165
Figure 2: Relationship between method of curing by air & water in graph of compressive strength against curing days.
Thermal Camera The result of thermal camera test for the samples of 28th day with different PFA content were shown in Table 3 below. This section will discuss about the surface temperature distributions of all sample. The thermal images of all sample were taken by thermal camera during the peak hour periods of the day, which had highest intensity of solar radiation, from 9.30 am until 6.30 pm on one days. The thermal images for each panel for hottest periods were presented in white, red, yellow, blue and violet respectively as shown in the figures. Temperature was indicated by the colour saturation at which higher colour saturation represented higher temperature at that place. These surface temperature distributions happened due to the difference solar intensity of direct sunlight and the orientation of the sunlight.
Table 3: Data of thermal Camera Test
PFA (%)
Temperature (oC) 9.30am 10.30am 11.30am 12.30am 1.30am 2.30am 3.30am 4.30am 5.30am 6.30am
0% 49.3 51.2 53.2 48.2 44.7 44.3 42.9 47.5 43.7 37.1 10% 46.6 49.9 52.4 47.2 43.7 43.2 41 47.1 43.5 36.6 20% 45.7 48.6 50.9 45.9 42.4 42.4 40.5 46.1 42.4 35.8 30% 43.9 46.8 49.2 44.5 41.4 41.4 39.1 45.3 40.5 35
Figures 3 show the thermal images of all samples. As mentioned by [5], the amount of solar radiation absorbed was
influenced by the surface of the material. Thus, it can deduce that uneven surfaces or the surface have a small surface area like a rocky surface had a more significant impact to the surface temperature distribution. Since the lesser the amount of solar radiation being absorbed by the wall, the lesser the heat energy it would reemit to the surroundings, thus it would less contribute to the increased of ambient temperature. Hence, UHI phenomenon would be less intense.
Figure 3: Ambient temperature against time
Table 3 and Figure 3 shows the graph of temperature of sample on 28 day of curing with 0%, 10%, 20% and 30% of
additional PFA content. Based on the graph above, it was found that the surface temperature was decreased with the increasing of PFA content. The temperature for 0% of PFA content was 53.2 0C. However, samples with 10%, 20% and 30% of PFA content were observed to decrease slightly compared to 0% of PFA content with surface temperature value of 52.4 0C, 50.9 0C, and 49.2 0C respectively. On of that, the 30% of PFA content result in the lowest value for temperature for the 28 days of curing. This finding was supported by A.Kadir,(2010). The author was reported that the PFA improved the insulation properties of temperature. PFA could be an additive that could improve the insulation properties. Relationship Between Compressive Strength and Thermal Camera Figure 4 below shows the relationship between compressive strength and thermal camera of sample with 0%, 10%, 20% and 30% of PFA as additional material in bottom ash foam concrete at the age of 28 days of curing and temperature when the maximum temperature recorded at 11.30 am.
0
1
2
3
4
7 Days 14 Days 28 Days
Com
pres
sive
str
engt
h (M
Pa)
Day of sample (Day) 0% (Water) 0% (Air) 10% (Water) 10%(Air)20% (Water) 20%mm (Air) 30% (Water) 30% (Air)
30
35
40
45
50
55
9.30am 10.30am 11.30am 12.30pm 1.30pm 2.30pm 3.30pm 4.30pm 5.30pm 6.30pm
Tem
pera
ture
(o C
)
Time
0% 10% 20% 30%

166
From the graph, it was found that the graph line for temperature was lower than the graph line for the compressive strength except for 0% of PFA content. It was obviously seen that the temperature for 0% of PFA content was higher while, the compressive strength was lower compared to 10%, 20% and 30% of PFA content.
Figure 4: Relationship between compressive strength and thermal camera
CONCLUSION
The chemical composition of PFA is suitable and has the potential additional in producing of bottom ash foam concrete. The surface of all of sample has a rough surface. Thus, the bonding between bottom ash and cement with additional PFA is give better result strengthening the brick wall. Furthermore, the presence of pores result for bottom ash foam concrete is can reducing the surface temperature. Besides that, different percentage of PFA gave different result of compressive strength. In conclusion, the 30% of PFA content gives the best result in reducing surface temperature and the best result in increased the compressive strength so it can be used for permanent constructions. On top of that, the strength has met the requirement of ASTM C109. Therefore, the 30% of PFA content is the optimum mix design for this research.
REFERENCES [1] Hamidah et al. Optimisation of Foamed Concrete Mix of Different Sand-Cement Ratio and Curing Conditions.
Cement and concrete Research. 2003 [2] Ehrlich, B. (2010, September 1). Environmental Building News. Retrieved October 2, 2013, from Reducing
Environmental Impacts of Cement and Concrete [3] K. Ramamurthy, E.K. Kunhanandan Nambiar, G. Indu Siva Ranjani, A classification of studies on properties
of foam concrete, Cem. Concr. Compos. 31 (6) (2009) 388–396 [4] Tommy Y. Lo, W.C. Tang, H.Z. Cui, The effects of aggregate properties on lightweight concrete, Build.
Environ. (2007).
2.202
2.552 2.904
3.763 53.2 52.4
50.9
49.2
47
48
49
50
51
52
53
54
0
0.5
1
1.5
2
2.5
3
3.5
4
0% 10% 20% 30%
Additional PFA (%)
Max
. Tem
pera
ture
s at
11.
30am
(0C
)
Com
pres
sive
str
engt
h (M
Pa)
Relationship between compressive strength and surface temperature on the 28th day of curing
Compressive strength Temperature

167
Performance of Geopolymer Concrete Consisting Glass as Fine Aggregate Replacement
Hasanah binti Kamaruddin, Mohd Azreen Mohd Ariffin Faculty of Civil Engineering, Universiti Teknologi Malaysia, Malaysia
Keywords: geopolymer concrete, fly ash, hydrated lime, glass, UTM
ABSTRACT. Geopolymer concrete is an ecofriendly and innovative construction material and also used as an alternative to Portland cement concrete. Production of geopolymer concretes intended to reduce the demand of ordinary Portland cement which is responsible for high carbon dioxide emission to the surrounding. The objectives of this research are to investigate the effect of waste glass to geopolymer concrete mixture, to produce the optimum mix design in addition to study the compressive, flexural and tensile strength of geopolymer concrete consisting glass as fine aggregate replacement. Three different mixes with ratio of fine glass to coarse aggregate of 30:70, 50:50 and 70:30 were produced to obtain the optimum mix design after testing for compressive strength test at 7 days. From the trial mix, the optimum mix design was found to be the mix with ratio of fine glass to coarse aggregate of 30:70. The mix design shows a comparable strength of 7, 14 and 28 days of compressive strength with normal geopolymer concrete using natural sand and shows a good performance in term of flexural and splitting tensile strength.
INTRODUCTION Concrete can be defined as materials that consist essentially of a binding medium within which are embedded
particles or fragments of aggregate. The wide range applications of concrete include in construction of buildings, dams roads, bridges and many more. However, the growing concern of the performance of existing concrete application, resource depletion and environmental sustainability has challenged the construction industries and researchers to seek and develop alternative materials in building construction. Waste materials that are characterized as recyclable materials are plastic, metal, glass, paper, wood, rubber etc. In this study, the material used to be analysed and designed as aggregate replacement is glass waste. This experimental research aims is to develop the use of glass waste as potential alternative aggregates into concrete mix. Problem Statement This research is inspired by the increase in opportunity to develop concrete production with various options of constituents that can be used in the mix design. The idea is to use waste glass as fine aggregate replacement in the production of geopolymer concrete. The benefits of using glass in concrete are to reduce the amount of glass thrown to the landfill and as alternative to decrease the consumption of natural sand besides targeted strength of concrete can be developed.
The existence of geopolymer concrete is an effort to introduce environmental friendly construction materials to the market. Geopolymer concretes use waste pozzolan to reduce the environmental impacts and to improve concrete performance. With that knowledge, geopolymer concrete with combination with waste glass as partial aggregate replacement in concrete will be produced. A study to investigate the effect of glass in the concrete and the concrete strength in term of compressive, flexural and splitting tensile are investigated.
Objectives
1. To investigate the effect of waste glass in geopolymer concrete mixture. 2. To produce the optimum mix design of geopolymer concrete consisting glass as fine aggregate replacement. 3. To study the compressive, flexural and splitting tensile strength of the gopolymer concrete consisting glass as
fine aggregate replacement.
Scope of Study The scope of this study is mainly confined to geopolymer concretes made with fly ash together with hydrated lime, glass as fine aggregate replacement, natural aggregate as coarse aggregate and alkaline solution which is sodium silicate and sodium hydroxide as activator. To be precise, this study will carry a trial mix design at different percentages ratio of glass as fine aggregate to coarse aggregate. Three different percentages ratio of the fine to coarse aggregates are 30:70, 50:50 and 70:30. Test on fresh and hardened state of concrete will be carried on order to achieve the objectives mention above.
168
LITERATURE REVIEW
Geopolymer concretes are synthesized by the reaction of solid aluminosilicate powder with alkali hydroxide or alkali silicate [1]. In order to reduce consumption and dependency on cement, utilization of pozzolanic materials as supplementary cementing materials has become the leading research interest in the area of cement and materials research. Pozzolan is a siliceous material that can be used as an inexpensive substitute for cement in concrete and mortar mixtures. The pozzolanic material used in this research is fly ash. Fly ash is a heterogeneous material of variable chemical composition that can effect the final geopolymer product.
The main parameter affecting the fly ash geopolymer mixtures are the composition of the raw materials, the concentrations of alkaline solutions used and the curing method [2]. There are lots of research done to investigate the physical and mechanical properties of the geopolymer fly ash mortars and cubes with different parameters being used as the guideline. The compressive strength of fly ash based geopolymer mortar depends on the strength of the geopolymer binder and excellent bonding between the geopolymer binder and aggregate [3]. Since geopolymer concrete produced by 100% fly ash as binder results in the need for setting time more than 24 hours, there are some modifications recommended to accelerate the setting time.
One of the materials that can be used to modified fly ash geopolymer concrete is hydrated lime. The addition of hydrated lime helps in improving the early age compressive strength of fly ash concrete [4]. Addition of small amount of calcium to alkali activated binder could accelerate setting time, however when the level of addition was high, the effects would be accelerating or retarding depends on the composition of activator [5]. With addition of hydrated lime, the workability of the concrete mixture was found to decrease but with present of superplasticizer, it helps to improve the workability. The presents of hydrated lime also conclude that the bond strength at both early and mature age can be enhanced [6].
Theoretically, glass is a fully recyclable material; it can be recycled without any loss of quality [7]. In its original form, glass comes as a balanced combination from three main raw natural materials: sand, silica, and limestone, in addition to a certain percentage of recycled waste glass utilized in the manufacturing process. Wasted glass as fine aggregate replacement in concrete may be designed to provide properties required for widely varying application to achieve sustainability and strength of concrete aspect in construction. In fresh state of concrete, it was reported that as the waste glass ratio increased, the slump is decreased [8].
METHODOLOGY The main objective of the research is to investigate the effects of waste glass as fine aggregate in geopolymer
concrete mixture, to produce optimum mix design of geopolymer concrete design consisting glass as fine aggregate replacement and to study the strength of the geopolymer concrete in term of compressive, flexural and splitting tensile strength. This research methodology consisted of several activities: material preparations, trial mix design and testing for fine glass, fresh and hardened state of concrete. Material Preparation In this study, low calcium fly ash will be used as binder in geopolymer concrete mix. This study also used hydrated lime to ensure a better and complete hydration of fly ash in the geopolymer concrete. The material used to replace the fine aggregate in concrete mix is waste glass. The waste glasses were obtained from one of glass manufacturing company located at Johor Bahru. The reason why only one location was chosen to collect the waste glass is to ensure the consistency of materials and the test results. The particle size grading of glass cullet should pass the nominal size for fine aggregate sieve depending on the effect desired. The crushing process of the glass involved two types of machineries that are jaw crusher and Los Angeles Abrasion machine so that desired size of particle could be obtained.
The coarse aggregate used in the study are natural coarse aggregate with maximum size of 10mm was used to suit the size of concrete cube, which was 100 mm x 100 mm x 100 mm. Alkaline solutions used are sodium silicate (Na₂ SiO₃ ) and sodium hydroxide (NaOH) solution. The ratio by mass of of Na₂ SiO₃ and NaOH is fixed to 2.5 at which concentration of 14 M of the solution is used. The alkaline solution should be mixed 24 hours before performing the mixing process to ensure that the alkaline solutions mixed properly and chemical reaction between the solutions was completed. Superplasticizer also used in order to produce a flowing concrete mixture to be used in heavily reinforced structures and in placements where adequate consolidation by vibration cannot be readily achieved. Moulds of cube sizing 100 x 100 x 100 mm, beam of 100 x 100 x 500 mm and cylinder of 150 x 300 mm were prepared to produce samples for the test requires for this study.
Table 12: Geopolymer Mix Design (Trial Mix)
Purpose Ratio fine glass to coarse
aggregate
Binder Alkaline Solution Aggregate Super-plasticizer
(kg/m³)
Water (kg/m³) FA
(kg/m³) HL
(kg/m³)
Na₂ SiO₃
(kg/m³)
NaOH (kg/m³)
Fine (kg/m³)
Coarse (kg/m³)
Control - 333 84 120 48 507 1268 7 29 Trial 1 30:70 333 84 120 48 533 1242 7 29 Trial 2 50:50 333 84 120 48 887.5 887.5 7 29
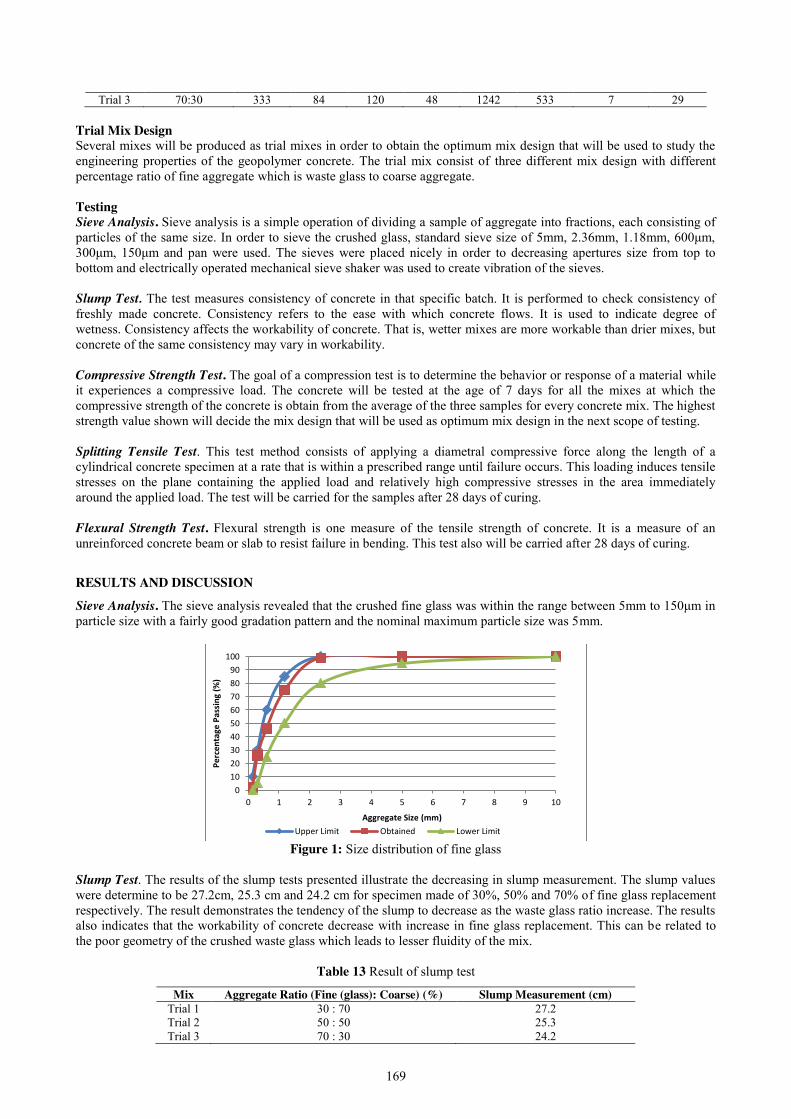
169
Trial 3 70:30 333 84 120 48 1242 533 7 29 Trial Mix Design Several mixes will be produced as trial mixes in order to obtain the optimum mix design that will be used to study the engineering properties of the geopolymer concrete. The trial mix consist of three different mix design with different percentage ratio of fine aggregate which is waste glass to coarse aggregate. Testing Sieve Analysis. Sieve analysis is a simple operation of dividing a sample of aggregate into fractions, each consisting of particles of the same size. In order to sieve the crushed glass, standard sieve size of 5mm, 2.36mm, 1.18mm, 600μm, 300μm, 150μm and pan were used. The sieves were placed nicely in order to decreasing apertures size from top to bottom and electrically operated mechanical sieve shaker was used to create vibration of the sieves. Slump Test. The test measures consistency of concrete in that specific batch. It is performed to check consistency of freshly made concrete. Consistency refers to the ease with which concrete flows. It is used to indicate degree of wetness. Consistency affects the workability of concrete. That is, wetter mixes are more workable than drier mixes, but concrete of the same consistency may vary in workability. Compressive Strength Test. The goal of a compression test is to determine the behavior or response of a material while it experiences a compressive load. The concrete will be tested at the age of 7 days for all the mixes at which the compressive strength of the concrete is obtain from the average of the three samples for every concrete mix. The highest strength value shown will decide the mix design that will be used as optimum mix design in the next scope of testing. Splitting Tensile Test. This test method consists of applying a diametral compressive force along the length of a cylindrical concrete specimen at a rate that is within a prescribed range until failure occurs. This loading induces tensile stresses on the plane containing the applied load and relatively high compressive stresses in the area immediately around the applied load. The test will be carried for the samples after 28 days of curing. Flexural Strength Test. Flexural strength is one measure of the tensile strength of concrete. It is a measure of an unreinforced concrete beam or slab to resist failure in bending. This test also will be carried after 28 days of curing.
RESULTS AND DISCUSSION
Sieve Analysis. The sieve analysis revealed that the crushed fine glass was within the range between 5mm to 150μm in particle size with a fairly good gradation pattern and the nominal maximum particle size was 5mm.
Figure 1: Size distribution of fine glass
Slump Test. The results of the slump tests presented illustrate the decreasing in slump measurement. The slump values were determine to be 27.2cm, 25.3 cm and 24.2 cm for specimen made of 30%, 50% and 70% of fine glass replacement respectively. The result demonstrates the tendency of the slump to decrease as the waste glass ratio increase. The results also indicates that the workability of concrete decrease with increase in fine glass replacement. This can be related to the poor geometry of the crushed waste glass which leads to lesser fluidity of the mix.
Table 13 Result of slump test
Mix Aggregate Ratio (Fine (glass): Coarse) (%) Slump Measurement (cm) Trial 1 30 : 70 27.2 Trial 2 50 : 50 25.3 Trial 3 70 : 30 24.2
0102030405060708090
100
0 1 2 3 4 5 6 7 8 9 10
Perc
enta
ge P
assi
ng (%
)
Aggregate Size (mm)
Upper Limit Obtained Lower Limit
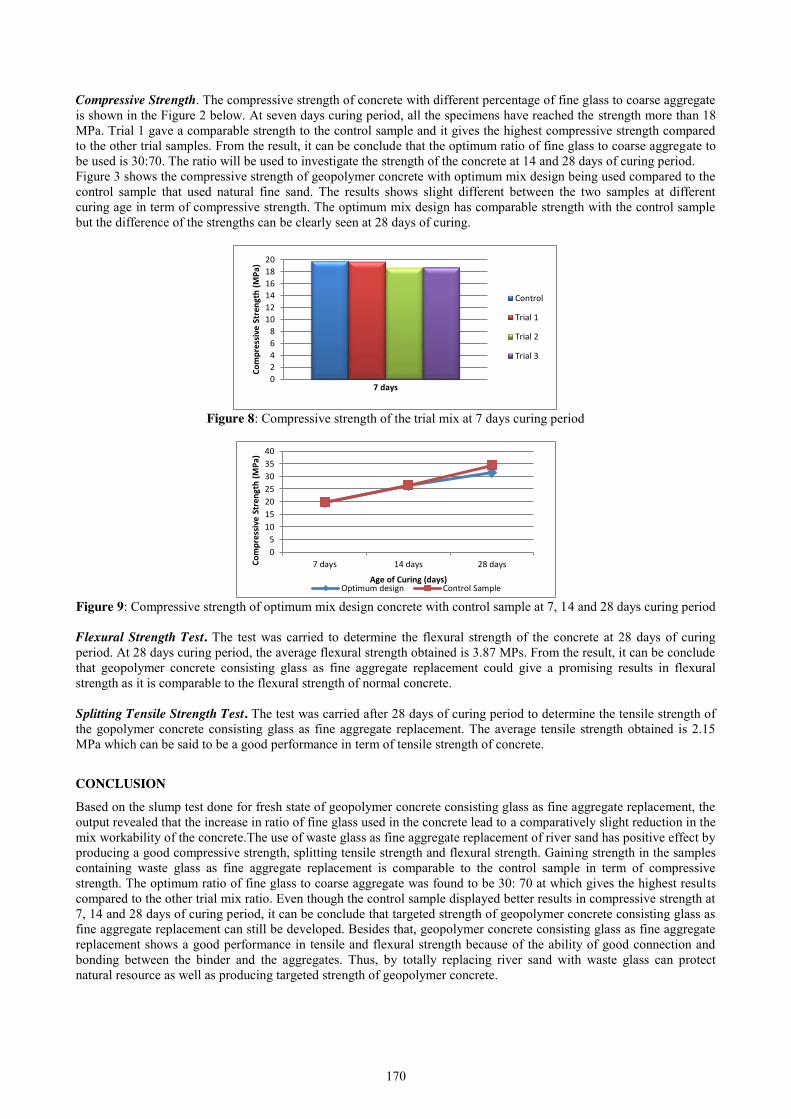
170
Compressive Strength. The compressive strength of concrete with different percentage of fine glass to coarse aggregate is shown in the Figure 2 below. At seven days curing period, all the specimens have reached the strength more than 18 MPa. Trial 1 gave a comparable strength to the control sample and it gives the highest compressive strength compared to the other trial samples. From the result, it can be conclude that the optimum ratio of fine glass to coarse aggregate to be used is 30:70. The ratio will be used to investigate the strength of the concrete at 14 and 28 days of curing period. Figure 3 shows the compressive strength of geopolymer concrete with optimum mix design being used compared to the control sample that used natural fine sand. The results shows slight different between the two samples at different curing age in term of compressive strength. The optimum mix design has comparable strength with the control sample but the difference of the strengths can be clearly seen at 28 days of curing.
Figure 8: Compressive strength of the trial mix at 7 days curing period
Figure 9: Compressive strength of optimum mix design concrete with control sample at 7, 14 and 28 days curing period Flexural Strength Test. The test was carried to determine the flexural strength of the concrete at 28 days of curing period. At 28 days curing period, the average flexural strength obtained is 3.87 MPs. From the result, it can be conclude that geopolymer concrete consisting glass as fine aggregate replacement could give a promising results in flexural strength as it is comparable to the flexural strength of normal concrete. Splitting Tensile Strength Test. The test was carried after 28 days of curing period to determine the tensile strength of the gopolymer concrete consisting glass as fine aggregate replacement. The average tensile strength obtained is 2.15 MPa which can be said to be a good performance in term of tensile strength of concrete.
CONCLUSION
Based on the slump test done for fresh state of geopolymer concrete consisting glass as fine aggregate replacement, the output revealed that the increase in ratio of fine glass used in the concrete lead to a comparatively slight reduction in the mix workability of the concrete.The use of waste glass as fine aggregate replacement of river sand has positive effect by producing a good compressive strength, splitting tensile strength and flexural strength. Gaining strength in the samples containing waste glass as fine aggregate replacement is comparable to the control sample in term of compressive strength. The optimum ratio of fine glass to coarse aggregate was found to be 30: 70 at which gives the highest results compared to the other trial mix ratio. Even though the control sample displayed better results in compressive strength at 7, 14 and 28 days of curing period, it can be conclude that targeted strength of geopolymer concrete consisting glass as fine aggregate replacement can still be developed. Besides that, geopolymer concrete consisting glass as fine aggregate replacement shows a good performance in tensile and flexural strength because of the ability of good connection and bonding between the binder and the aggregates. Thus, by totally replacing river sand with waste glass can protect natural resource as well as producing targeted strength of geopolymer concrete.
02468
101214161820
Com
pres
sive
Str
engt
h (M
Pa)
7 days
Control
Trial 1
Trial 2
Trial 3
05
10152025303540
7 days 14 days 28 daysCom
pres
sive
Str
engt
h (M
Pa)
Age of Curing (days) Optimum design Control Sample

171
REFERENCES
[1] Singh, B., Ishwarya, G., Gupta, M., & Bhattacharyya, S. (2015). Geopolymer Concrete : A Review of Some Recent Development. Construction and Building Materials, 78-90.
[2] Monita, O., & Hamid, N. (2011). Properties of Fly Ash Geopolymer Concrete Designed by Taguchi Method. Materials and Design, 191-198.
[3] Temuujin, J., Riessen, A., & MacKenzie, K. (2010). Preparation and Characterization of Fly Ash Based Geopolymer Mortars. Construction and Building Materials, 1906-1910.
[4] Barbhuiya, S., Gbagbo, J., Russel, M., & Basheer, P. (2009). Properties of Fly Ash Concrete modified with Hydrated Lime and Silica Fume. Construction and Buildings Materials, 3233-3239.
[5] Adam, A., Amiri, N., Suarnita, I., & Rupang, N. (2016). The Effect of Lime Addition on the Setting Time and Strengthof Ambient Cured Fly Ash Based Geopolymer Binder. MATEC Web of Conference (pp. 1-5). Indonesia: EDP Sciences.
[6] Looney, D., & Pavia, S. (2014). A Study of the Function of Hydrated Lime as an Admixture. Journals of Materials Science Research, 1-11.
[7] Siam, A. A. (2011). Properties of Concrete Mixes with Waste Glass. Gaza: The Islamic University of Gaza. [8] Z. Ismail, Z., & Al-Hashimi, E. (2009). Recycling of Waste Glass as a Partial Replacement for Fine Aggregate
in Concrete. Waste Management, 655-659.

172
Self-Healing Concrete-Potential Use of Effective Microorganism (EM) for Normal Concrete
Hasliza Amira Mohd Hashim1, Abdul Rahman Mohd.Sam2, Mohammadamin Azimi3
Faculty of Civil Engineering, Universiti Teknologi Malaysia, Malaysia [email protected]
Keywords: normal cement concrete; effective microorganism; self-healing concrete
ABSTRACT. Since the crack is the natural phenomenon occurred in concrete, many researchers have studied the self-healing concrete in order to make the service life of concrete longer. The aim of this study is to analyze the effect of EM on fresh and hardened properties of normal concrete. This study also focused on the potential of EM on self-healing concrete in two types of curing conditions, water curing and air curing. This study investigates between the non-crack and pre-crack concrete cubes. The tests conducted in this study include the optimum percentage of EM, compressive strength and Ultrasonic Pulse Velocity (UPV). From the result, it shows the increment in strength ratio for non-crack concrete at 7 days was 73% (CW), 75% (CA), 80% (EMW) and 75% (EMA) compared to 3 days strength ratio with 59% (CW), 62% (CA), 66% (EMW) and 67% (EMA). For the pre-crack concrete, it shows the strength ratio of EMW (88%) and EMA (86%) is higher compared to the CW (81%) and CA (75%). From the UPV result, the CW shows higher value of UPV which means the samples have faster travel speed followed by EMW, CA and EMA. From the water absorption result, CA and EMA show absorption of water was higher. CW shows the result constant from zero while the EMW shows the result started to increase at 42 seconds. In general, the use of EM in concrete has positive effect on the properties of concrete.
INTRODUCTION Concrete is one of the important materials in construction work. It is also widely used in construction due to its
strength, durability and low cost as compared to other construction materials (Khalid, 2016). However, concrete is very sensitive to crack formation (Tittelboom, 2013). It is quite vulnerable to cracking because of its inherent heterogeneity and the non-ideal service environments (Wang, 2012). When crack appeared in concrete it still can be repaired but when the wide crack happen it will cause the decrease in strength, durability and even the safety of the structure. Then, it requires to be repaired because a wide crack endangers the durability of the concrete.
In infrastructures, many of the concrete will suffer degradation and deterioration over time. This is due to permeation of water which affects the efficiency of the concrete (Muhammad, 2015). Some of the cracks are not visible and it cannot be seen by the naked eyes. The crack formation at micro and macro levels which create passage for dissolved particles in fluids, unwanted acidic gasses and water ingress are the causes of deterioration (Muhammad, 2016). This will affect the reinforcement then it will compromise its durability. Therefore, interaction between concrete and its environment determines its long term performance (Basheer, 2001). Generally, the normal repair methods follow the procedure of monitoring, detecting and repairing (Wang, 2012). Once the cracks are discovered, the repairing process will be performed. The repair agents like effective microorganism (EM) are applied from the outside and penetrate into the cracks (Wang, 2012). For this reason, inspection and maintenance techniques are increasingly drawing attention in construction (Muhammad, 2016). Nowadays, researchers try to find ways to overcome the concrete crack and deterioration.
Objectives The main objective of this research can be summarized as follows:
1. To design and produce the optimum mix proportions for concrete with EM. 2. To determine the performance of effective microorganism (EM) on the fresh and hardened properties of
concrete. 3. To investigate the effect of curing methods using water and air curing on the properties of EM concrete. 4. To evaluate the effect of EM on the crack healing in concrete using Ultrasonic Pulse Velocity method.
Scope of Study The scope of this study is focused on the self-healing concrete using the effective microorganism (EM). This study also focused on the experimental works in the laboratory. All the procedures of the laboratory works were in compliance with the specified and relevant standards. EM has been used by replacing water into the concrete mixes in certain amount to study the effect of EM on the mechanical properties of concrete. The limitations of this study including the type of cement used is Ordinary Portland Cement (OPC), the product of EM was supplied by one of the company in
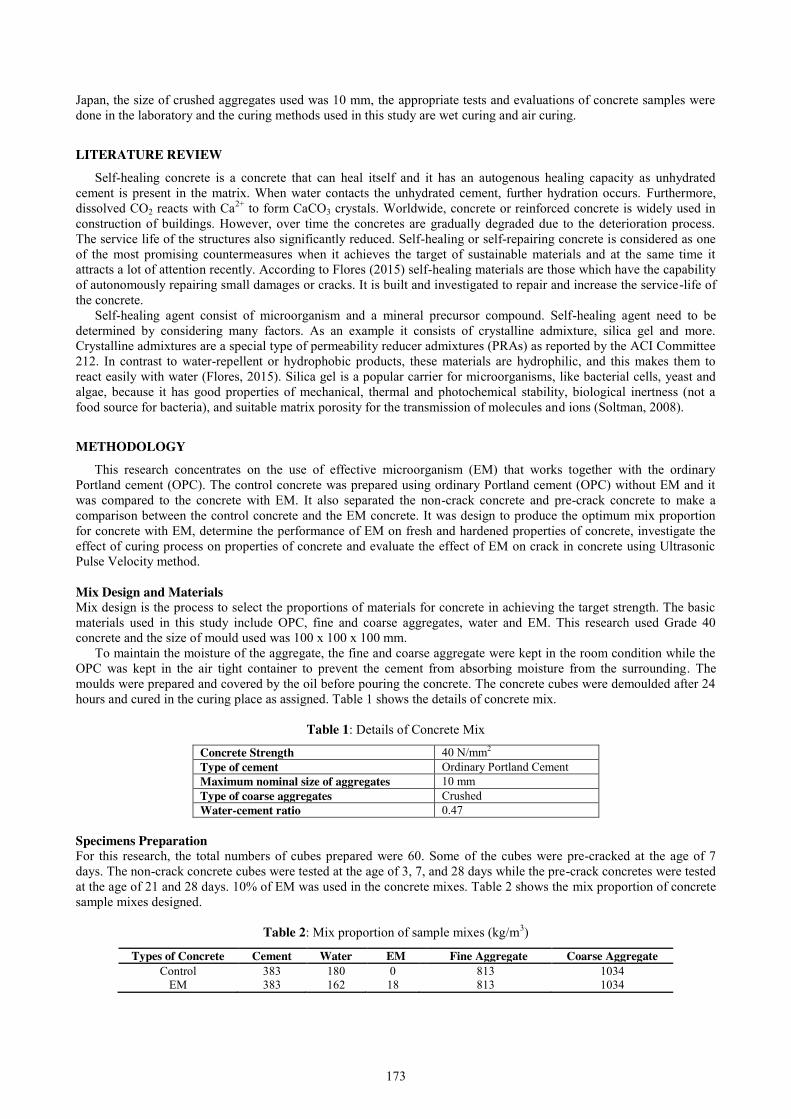
173
Japan, the size of crushed aggregates used was 10 mm, the appropriate tests and evaluations of concrete samples were done in the laboratory and the curing methods used in this study are wet curing and air curing.
LITERATURE REVIEW Self-healing concrete is a concrete that can heal itself and it has an autogenous healing capacity as unhydrated
cement is present in the matrix. When water contacts the unhydrated cement, further hydration occurs. Furthermore, dissolved CO2 reacts with Ca2+ to form CaCO3 crystals. Worldwide, concrete or reinforced concrete is widely used in construction of buildings. However, over time the concretes are gradually degraded due to the deterioration process. The service life of the structures also significantly reduced. Self-healing or self-repairing concrete is considered as one of the most promising countermeasures when it achieves the target of sustainable materials and at the same time it attracts a lot of attention recently. According to Flores (2015) self-healing materials are those which have the capability of autonomously repairing small damages or cracks. It is built and investigated to repair and increase the service-life of the concrete.
Self-healing agent consist of microorganism and a mineral precursor compound. Self-healing agent need to be determined by considering many factors. As an example it consists of crystalline admixture, silica gel and more. Crystalline admixtures are a special type of permeability reducer admixtures (PRAs) as reported by the ACI Committee 212. In contrast to water-repellent or hydrophobic products, these materials are hydrophilic, and this makes them to react easily with water (Flores, 2015). Silica gel is a popular carrier for microorganisms, like bacterial cells, yeast and algae, because it has good properties of mechanical, thermal and photochemical stability, biological inertness (not a food source for bacteria), and suitable matrix porosity for the transmission of molecules and ions (Soltman, 2008).
METHODOLOGY This research concentrates on the use of effective microorganism (EM) that works together with the ordinary
Portland cement (OPC). The control concrete was prepared using ordinary Portland cement (OPC) without EM and it was compared to the concrete with EM. It also separated the non-crack concrete and pre-crack concrete to make a comparison between the control concrete and the EM concrete. It was design to produce the optimum mix proportion for concrete with EM, determine the performance of EM on fresh and hardened properties of concrete, investigate the effect of curing process on properties of concrete and evaluate the effect of EM on crack in concrete using Ultrasonic Pulse Velocity method.
Mix Design and Materials Mix design is the process to select the proportions of materials for concrete in achieving the target strength. The basic materials used in this study include OPC, fine and coarse aggregates, water and EM. This research used Grade 40 concrete and the size of mould used was 100 x 100 x 100 mm.
To maintain the moisture of the aggregate, the fine and coarse aggregate were kept in the room condition while the OPC was kept in the air tight container to prevent the cement from absorbing moisture from the surrounding. The moulds were prepared and covered by the oil before pouring the concrete. The concrete cubes were demoulded after 24 hours and cured in the curing place as assigned. Table 1 shows the details of concrete mix.
Table 1: Details of Concrete Mix
Concrete Strength 40 N/mm2 Type of cement Ordinary Portland Cement Maximum nominal size of aggregates 10 mm Type of coarse aggregates Crushed Water-cement ratio 0.47
Specimens Preparation For this research, the total numbers of cubes prepared were 60. Some of the cubes were pre-cracked at the age of 7 days. The non-crack concrete cubes were tested at the age of 3, 7, and 28 days while the pre-crack concretes were tested at the age of 21 and 28 days. 10% of EM was used in the concrete mixes. Table 2 shows the mix proportion of concrete sample mixes designed.
Table 2: Mix proportion of sample mixes (kg/m3)
Types of Concrete Cement Water EM Fine Aggregate Coarse Aggregate Control 383 180 0 813 1034
EM 383 162 18 813 1034
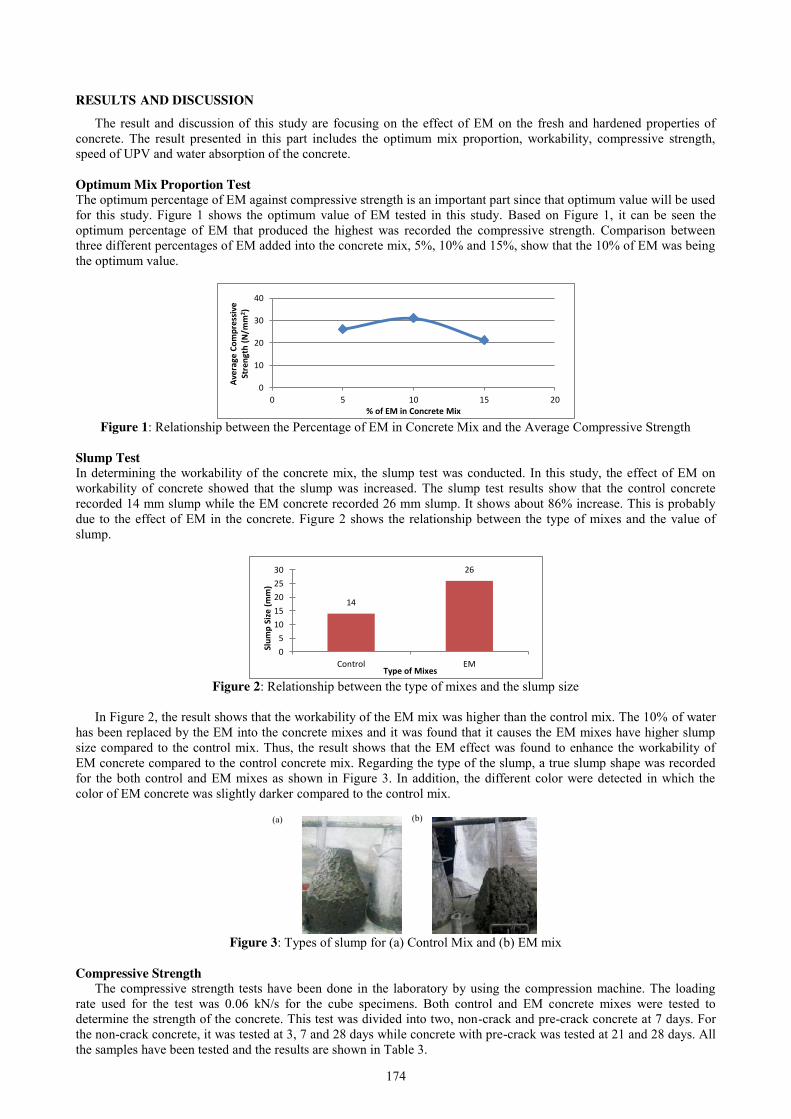
174
RESULTS AND DISCUSSION The result and discussion of this study are focusing on the effect of EM on the fresh and hardened properties of
concrete. The result presented in this part includes the optimum mix proportion, workability, compressive strength, speed of UPV and water absorption of the concrete. Optimum Mix Proportion Test The optimum percentage of EM against compressive strength is an important part since that optimum value will be used for this study. Figure 1 shows the optimum value of EM tested in this study. Based on Figure 1, it can be seen the optimum percentage of EM that produced the highest was recorded the compressive strength. Comparison between three different percentages of EM added into the concrete mix, 5%, 10% and 15%, show that the 10% of EM was being the optimum value.
Figure 1: Relationship between the Percentage of EM in Concrete Mix and the Average Compressive Strength
Slump Test In determining the workability of the concrete mix, the slump test was conducted. In this study, the effect of EM on workability of concrete showed that the slump was increased. The slump test results show that the control concrete recorded 14 mm slump while the EM concrete recorded 26 mm slump. It shows about 86% increase. This is probably due to the effect of EM in the concrete. Figure 2 shows the relationship between the type of mixes and the value of slump.
Figure 2: Relationship between the type of mixes and the slump size
In Figure 2, the result shows that the workability of the EM mix was higher than the control mix. The 10% of water
has been replaced by the EM into the concrete mixes and it was found that it causes the EM mixes have higher slump size compared to the control mix. Thus, the result shows that the EM effect was found to enhance the workability of EM concrete compared to the control concrete mix. Regarding the type of the slump, a true slump shape was recorded for the both control and EM mixes as shown in Figure 3. In addition, the different color were detected in which the color of EM concrete was slightly darker compared to the control mix.
Figure 3: Types of slump for (a) Control Mix and (b) EM mix
Compressive Strength
The compressive strength tests have been done in the laboratory by using the compression machine. The loading rate used for the test was 0.06 kN/s for the cube specimens. Both control and EM concrete mixes were tested to determine the strength of the concrete. This test was divided into two, non-crack and pre-crack concrete at 7 days. For the non-crack concrete, it was tested at 3, 7 and 28 days while concrete with pre-crack was tested at 21 and 28 days. All the samples have been tested and the results are shown in Table 3.
0
10
20
30
40
0 5 10 15 20
Ave
rage
Com
pres
sive
St
reng
th (
N/m
m2 )
% of EM in Concrete Mix
14
26
05
1015202530
Control EM
Slum
p Si
ze (
mm
)
Type of Mixes
(a) (b)
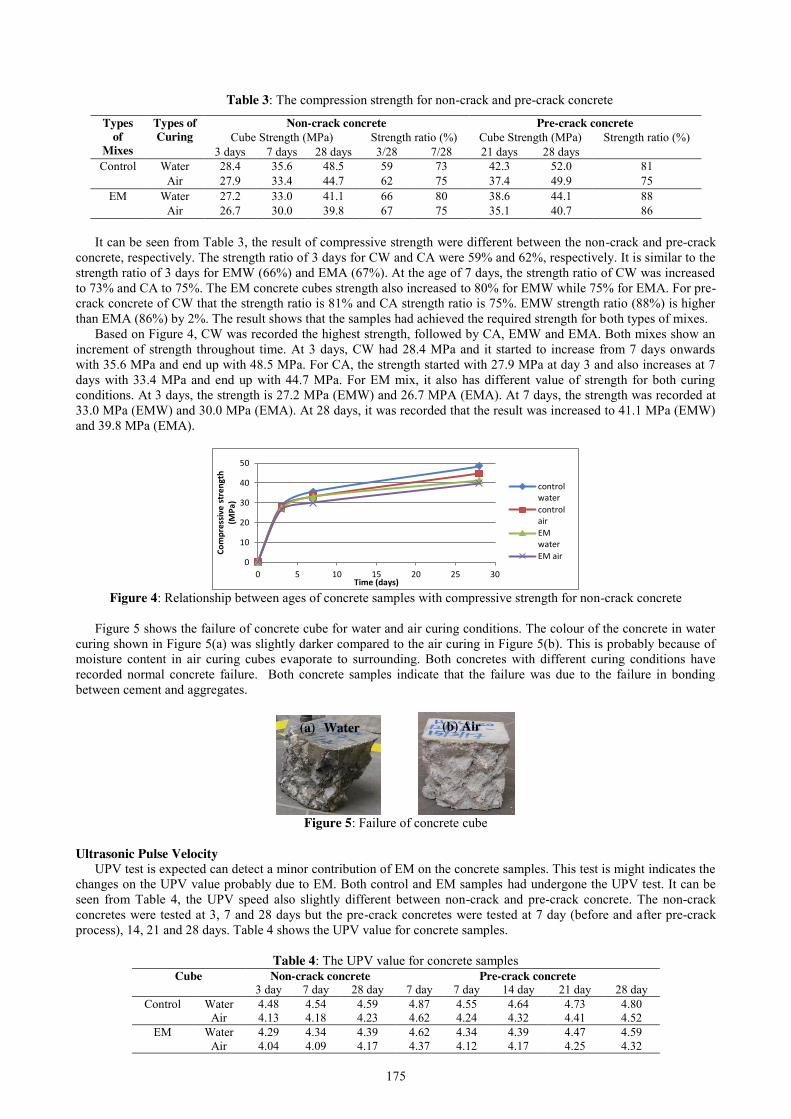
175
Table 3: The compression strength for non-crack and pre-crack concrete
Types of
Mixes
Types of Curing
Non-crack concrete Pre-crack concrete Cube Strength (MPa) Strength ratio (%) Cube Strength (MPa) Strength ratio (%)
3 days 7 days 28 days 3/28 7/28 21 days 28 days Control Water 28.4 35.6 48.5 59 73 42.3 52.0 81
Air 27.9 33.4 44.7 62 75 37.4 49.9 75 EM Water 27.2 33.0 41.1 66 80 38.6 44.1 88
Air 26.7 30.0 39.8 67 75 35.1 40.7 86
It can be seen from Table 3, the result of compressive strength were different between the non-crack and pre-crack concrete, respectively. The strength ratio of 3 days for CW and CA were 59% and 62%, respectively. It is similar to the strength ratio of 3 days for EMW (66%) and EMA (67%). At the age of 7 days, the strength ratio of CW was increased to 73% and CA to 75%. The EM concrete cubes strength also increased to 80% for EMW while 75% for EMA. For pre-crack concrete of CW that the strength ratio is 81% and CA strength ratio is 75%. EMW strength ratio (88%) is higher than EMA (86%) by 2%. The result shows that the samples had achieved the required strength for both types of mixes.
Based on Figure 4, CW was recorded the highest strength, followed by CA, EMW and EMA. Both mixes show an increment of strength throughout time. At 3 days, CW had 28.4 MPa and it started to increase from 7 days onwards with 35.6 MPa and end up with 48.5 MPa. For CA, the strength started with 27.9 MPa at day 3 and also increases at 7 days with 33.4 MPa and end up with 44.7 MPa. For EM mix, it also has different value of strength for both curing conditions. At 3 days, the strength is 27.2 MPa (EMW) and 26.7 MPA (EMA). At 7 days, the strength was recorded at 33.0 MPa (EMW) and 30.0 MPa (EMA). At 28 days, it was recorded that the result was increased to 41.1 MPa (EMW) and 39.8 MPa (EMA).
Figure 4: Relationship between ages of concrete samples with compressive strength for non-crack concrete
Figure 5 shows the failure of concrete cube for water and air curing conditions. The colour of the concrete in water
curing shown in Figure 5(a) was slightly darker compared to the air curing in Figure 5(b). This is probably because of moisture content in air curing cubes evaporate to surrounding. Both concretes with different curing conditions have recorded normal concrete failure. Both concrete samples indicate that the failure was due to the failure in bonding between cement and aggregates.
Figure 5: Failure of concrete cube
Ultrasonic Pulse Velocity
UPV test is expected can detect a minor contribution of EM on the concrete samples. This test is might indicates the changes on the UPV value probably due to EM. Both control and EM samples had undergone the UPV test. It can be seen from Table 4, the UPV speed also slightly different between non-crack and pre-crack concrete. The non-crack concretes were tested at 3, 7 and 28 days but the pre-crack concretes were tested at 7 day (before and after pre-crack process), 14, 21 and 28 days. Table 4 shows the UPV value for concrete samples.
Table 4: The UPV value for concrete samples
Cube Non-crack concrete Pre-crack concrete 3 day 7 day 28 day 7 day 7 day 14 day 21 day 28 day
Control Water 4.48 4.54 4.59 4.87 4.55 4.64 4.73 4.80 Air 4.13 4.18 4.23 4.62 4.24 4.32 4.41 4.52
EM Water 4.29 4.34 4.39 4.62 4.34 4.39 4.47 4.59 Air 4.04 4.09 4.17 4.37 4.12 4.17 4.25 4.32
0
10
20
30
40
50
0 5 10 15 20 25 30
Com
pres
sive
str
engt
h (M
Pa)
Time (days)
controlwatercontrolairEMwaterEM air
(a) Water (b) Air
176
Based on Figure 6, it shows the increment of UPV speed at 3, 7 and 28 days for mixes, control and EM. The result also shows that the UPV for CW was higher all 3 ages tested compare to CA, EMW and EMA. The EMA sample has the lowest speed but it shows an increase with time. Based on Figure 7, it shows that all samples were going through sudden dropped of UPV speed when the concrete was pre-crack process at 7 days. Although the UPV value was dropped when the pre-crack process, the speed started to increase when tested at 14, 21 and 28 days. Pre-crack concrete shows that CW is higher than CA, EMW and EMA.
Figure 6: Relationship between the UPV and time for non-crack concrete
Figure 7: Relationship between the UPV and time for pre-crack concrete
Water Absorption Water absorption result shows the time (√sec) versus absorption, I (mm). From the result, the CA and EMA samples show that the absorption of water was increasing. The CW sample shows the result constant from zero while the EMW shows the result started to increase at 42 seconds. This is probably due to moisture content from the air curing samples was evaporated to surrounding while curing time.
CONCLUSION From the result and analysis, it can be concluded that:
1. The EM has an effect in concrete since it increased the workability of the EM concrete compared to the control concrete. The use of EM increased the workability by 86%.
2. The optimum percentage value of EM to be included in the mix was 10%. 3. The type of curing method was affecting the strength of concrete. When comparing the strength of CW with
CA and EMW with EMA, it shows that the CW is higher than CA and EMW is higher than EMA. 4. The EM mix concrete sample color was darker compared to control mix. 5. The UPV result shows that the potential of EM to filling the crack happened when the UPV speed was increase
after the pre-crack process. 6. The water absorption, CA and EMA show absorption of water was higher compare to CW and EMW.
REFERENCES 1. Basheer (2001). Assessment of the durability of concrete from its permeation properties: A review. Construction
and Building Materials, 93-103. 2. Flores (2015). Self-healing capability of concrete with crystalline admixture in different environments.
Construction and Building Materials 86, 1-11. 3. Khalid (2016). Crack Healing in Concrete using Various Bio Influenced Self-Healing. Construction and Building
Materials, 349-357. 4. Muhammad (2015). A critical review on implemented. Waterproof performance of concrete, 80-90. 5. Muhammad (2016). Tests and Methods of evaluating the self-healing efficiency of concrete: A review.
Construction and Building Materials, 1123-1132. 6. Soltman (2008). Utilization of sol-gel ceramics for the immobilization of living microorganisms. J. Sol-Gel Science
Technology, 66-72. 7. Tittelboom (2013). Self-healing in cementitious materials-a review. Materials Volume 6, Issue 6, 2182-2217. 8. Wang (2012). Use of silica gel or polyurethane immobilized bacteria for self-healing concrete. Construction and
Building Materials, 532-540
0
1
2
3
4
5
0 5 10 15 20 25 30
UPV
(km
/s)
Time (days)
Control water
Control air
EM water
EM air
3.0
3.5
4.0
4.5
5.0
7 7 14 21 28
UPV
(km
/s)
Time (day)
Control Water
Control Air
EM Water
EM Air
177
The Effect on Reactive Silica Concrete Containing Eggshell Powder on Pozzolanic Reaction
Hazri Khalik1, Nur Hafizah A. Khalid2, Nur Nadhira Abdul Rasid3 Faculty of Civil Engineering, Universiti Teknologi Malaysia, Malaysia
Keywords: GPOFA; UPOFA, ESP; XRF, SEM, PSA, Strength Properties; XRD Analysis.
ABSTRACT. High amount of carbon dioxide (CO2) is emit in the production of Portland cement which can cause environmental problem. A concrete is considered sustainable if the amount of CO2 can be reduced. Additive such as pozzolanic materials can improve the long-term strength, enhance the durability of the concrete, and properties of concrete. The utilization of Palm Oil Fuel Ash (POFA) in a concrete production as a cement replacement can reduce the cost of using raw material in the construction industry. Pozzolanic materials of POFA have high potentially to be used as part of cementitious materials in concrete after some modification. This paper presents the investigation on the various characteristics of ground and unground POFA (POFA and UPOFA) and ESP under microstructure examination which are X-Ray fluorescence (XRF), scanning electron microscopy (SEM), and particle size analyzer (PSA). These tests were conducted to examine the POFA’s and ESP’s chemical properties, morphology image, and its fineness. Based on its characteristic, the potential use of POFA and ESP as a cement replacement in a concrete was investigated. Optimum mix proportion of POFA-ESP concrete was determined from compression test. After obtained the optimum mis proportion of the concrete, NC, GPOFA-ESP and UPOFA-ESP were through further investigation on their cementitious reaction under x-ray diffraction (XRD) test. It was found that the utilization of GPOFA and ESP as a cement replacement has produced a concrete having a higher compressive strength than normal concrete. The strength results revealed that the use of GPOFA and ESP can produce a silica concrete with high strength, good quality, and sustainable concrete. ESP in this study help in hydration of silica concrete after being physically modified whereas GPOFA leads to increase the C-S-H gel and hydration reaction. It can be concluded that GPOFA and ESP can be potentially utilized as a cement replacement in concrete after being subjected to some physical modifications and mixing it with appropriate mix design.
INTRODUCTION
Reusing the abundant waste materials such as palm oil fuel ash (POFA) and chicken eggshell (ES) has become possible for supplementary of cement in concrete. POFA is an important agricultural in Malaysia. Besides the production of crude palm oil, a large amount of solid waste is also an output from the palm oil industry. The usage POFA is very minimal and unmanageable, while its quantity increases and most of the POFA are disposed of as waste in landfills causing environmental problems. While, ES is an abundant waste materials with chemical composition nearly same as limestone. The use of chicken eggshell instead of lime in concrete can have benefits such as lowering the use cement, preserving natural lime and utilizing waste material.
Problem Statement Common normal concrete is a less dense due to the voids in the hardened packed-structure of concrete. By adding additive to the concrete such as pozzolanic and cementitious materials, it will change the strength and properties of concrete. Pozzolanic reactions are beneficial to the concrete because it can increase the quantity of the cementitious materials. Utilization of pozzolanic materials can also improve the long-term strength of concrete and reducing the permeability of the system. Both of this process can enhance the durability of the concrete. The selection materials need to have serious considerations since alite-belite reactivity occur in concrete.
The wastage of POFA from the palm oil industry was increasing eventually and lead to landfill problem as well. To overcome the issues, these pozzolanic materials of POFA have high potentially to be used as part of cementitious materials in concrete. Meanwhile, ES is aviculture waste from industrial byproduct which can pollute the environment and lead to bring serious environmental hazard. In increasing efforts to convert waste to wealth, the efficiency of converting ES to beneficial use becomes a way to solve aforementioned problem. The use of eggshell powder (ESP) in a concrete production can reduce the cost of using raw material and it can contribute to the construction industry.
Objectives The objectives of this study are:
1. To characterize the POFA and ESP under microstructural examination. 2. To determine optimum mix proportion of reactive silica concrete containing eggshell waste powder. 3. To investigate pozzolanic reaction of reactive silica concrete containing eggshell waste powder under X-Ray
Diffraction (XRD) examination.

178
Scope of Study In order to achieve the objectives of this study it will only be limited to these scopes of work:
1. Preparing the raw materials and designing the concrete mix with ground palm oil fuel ash (GPOFA), unground palm oil fuel ash (UPOFA) and eggshell powder (ESP) as their part of cementitious materials and the total replacement to the cementitious was limited to 20%
2. Characterize the raw materials under microstructural examination which are X-ray fluorescence (XRF), Scanning Electron Microscope (SEM), Particle Size Analyzer (PSA).
3. Determine the optimum mix proportion by determining the optimum compressive strength of concrete by using compression test.
4. Analyzing the reactivity of concrete containing POFA and ESP with X-Ray Diffraction (XRD).
LITERATURE REVIEW
Normal concrete is a composite material composed of coarse and fine aggregate bonded together with a fluid cement that hardens over time. Most concretes used are lime-based concretes such as Ordinary Portland Cement (OPC). The cement reacts chemically with the water to bind the materials together into a durable stone-like material that can be used in the construction of the building. Additives pozzolans as cementitious materials such as POFA and ESP are included in the mixture to improve the physical properties of the finished material.
POFA can be a cement replacement up to 80% with some modification and achieve higher strength than normal concrete [1]. The fineness size of POFA gives a better effect as a binder and filler in a concrete. The silica content of POFA is higher than OPC [2]. However, previous authors stated that POFA has different characteristics depending on its source due to the different ways of production including the combustion temperature used [3]. The high amount of silica can increase the strength and durability of the concrete. Therefore, POFA has to be processed before being used and sieved to get homogeneous size of POFA. ESP could be a good cement replacement since its chemical composition is similar to lime which has high content of calcium oxide (CaO). The presence of calcium carbonate (CaCO3) in egg shell it can be used as an alternative raw material in the production of wall tile materials [4]. ESP also can be used as an alternative for material reuse and waste recycling practices. The eggshell is considered as a pure-relatively natural carbonate-based material as its composition is similar to the lime [5]. The main component of avian eggshell is CaCO3 which is lead to the high amount of CaO content.
X-Ray Fluorescence (XRF) is technologies that ionize elements by emitting low power of x-rays into the sample and then reading the returning fluorescent x-ray signal. Characterization the chemical composition and chemical properties of OPC, ground palm oil fuel ash (GPOFA) and unground palm oil fuel ash (UPOFA) was conducted. The authors discovered that each sample has their own chemical composition. UPOFA has higher amount of silica dioxide (SiO2) compared to OPC and GPOFA [1]. The scanning electron microscope (SEM) is mainly use for the examination and analysis of microstructural characteristics of solid objects. GPOFA had a uniform spherical shaped particle while the UPOFA had a combination of spherical and irregular shaped with a porous cellular structure [6]. ESP have irregular shaped with a porous cellular structure [4].
Particle Size Analyzer (PSA) is an analytical technique by which the distribution of sizes in a sample of solid or liquid particulate material is measured. POFA as micro filler of polymer concrete shows that more 90% of UPOFA and GPOFA had passed through 300 and 45 μm sieve respectively [6]. ESP as bio-filler is feasible to test since the particle size of egg shell powder is highly similar to the commercial calcium carbonates [5]. The strength and quality of concrete is measured terms of its compressive strength. POFA concrete can gain maximum strength when 30% of the cement was replaced with POFA [7]. It is stated that the maximum strength gain occurred at the replacement is at level of 30% but further increase can reduce the strength of concrete. X-Ray Diffraction (XRD) is a laboratory apparatus usually used for identification of crystalline materials and analysis of unit cell dimensions. Result from XRD analysis that UPOFA contain high amount of calcium hydroxide (Ca(OH)2) because of the higher content of silicon dioxide (SiO2) available to react with Ca(OH)2 [1]. The component of eggshell which consist of calcium carbonate (CaCO3) can provide strength and durability of concrete [5]. The result represented diffraction peaks of a calcite (CaCO3) content.
METHODOLOGY
The main objective of the research is to obtain the optimum mix proportion of reactive silica concrete containing eggshell waste powder. In addition, investigation on pozzolanic reaction of reactive silica concrete containing eggshell waste powder had done under X-ray Diffraction (XRD) examnination. This research methodology consisted of 3 phase activities: characterizations of raw materials of POFA and ESP, properties of reactive silica concrete containing POFA and ESP, and reactivity of concrete containing POFA and ESP.
Preparation of POFA The POFA was collected from the southern part of Peninsular Malaysia. It was oven-dried at 100°C before being further divided into two portions which are UPOFA and GPOFA. Original POFA was sieved by using sieve shaker with sieve pan of 300 μm. In this stage, natural substances were separated from original POFA. The UPOFA was obtained directly by passing the POFA through the 300 μm sieve to separate their natural substances and homogenize the particles size. Meanwhile, the GPOFA was obtained by using laboratory grinding mill with rod bar to obtain finer filler.
179
Preparation of ESP Eggshell was collected at the frozen food industry in Jalan Bendahara, Johor Bahru, Johor. The eggshells are dry under the direct sun to make sure the eggshells are clean from any egg yolk residues. The abundant eggshells wastes are soaked into the water for the further cleaning process. The eggshells are then crushed using bare hands while in the water into small particles. The cleaned eggshells were then layered into trays. Finally, the eggshells were dried into the oven at a temperature of 100℃±5°C. After one day in the oven, the eggshells were taking out and left for normal ambient cooling process for one hour. ESP was obtained by using grinding machine to obtain finer particle. Characterizations of Raw Materials of POFA and ESP X-Ray Fluorescene. XRF is used to determine the elements present along with their relative concentrations. Chemical compositions of POFA can obtain under XRF machine. The XRF machine was able to give quick result of chemical composition of samples in liquid, solid or loose powder forms. Scanning Electron Microscope. SEM represents a high-performance method used to investigate the structure of the materials. The advantage of SEM is it can show much information, good resolution associated with high field depth, large and continuous range of magnifying. Magnifying SEM can up to 10.000 times with the field depth is 10 mm. GPOFA, UPOFA, and ESP was sowed onto the double cellophane and then attached on the coin. All specimens were coated beforehand using the gold sputter coater machine. Significant morphology image was captured immediately after the selections’ image has been made with sufficient magnifications. Particles Size Analyzer. For both GPOFA and UPOFA, this was done using the particle size analyzer using wetting method. The test was conducted using a particle size analyzer (PSA) machine with laser scattering technique. The sample was weighted about 1mg by using high accuracy balance. The sample was diluted with 2 mg of distilled water. The measurement of water is by using micro tube which the water was taken by using pipette. The dilution sample was sinocate into ultrasonic bath for 10 minutes at 40ºC. The dilution sample was place in cell about 2 to 5 microliters. Then the cell was inserting into the machine to run. Properties of Reactive Silica Concrete Containing POFA and ESP. Mix Proportion. The mix proportion for concrete containing GPOFA-ESP, and concrete containing UPOFA-ESP was tabulated. Normal concrete was designated as control specimen. GPOFA and UPOFA replacement was limited to 0%, 5%, 10%, 15%, and 20%. This was followed by preparation of materials before start the casting. Quality of concrete was monitored through trial mix and the workability of fresh concrete was tested under slump test. 11 design mixes of 132 concrete including normal concrete were tested. Tables 1 and 2 state the annotation and percent replacement of each type of concrete for GPOFA-ESP and UPOFA-ESP.
Table 1: Annotation and percent replacement of GPOFA-ESP
Concrete Type Mix Design Notation GPOFA (%) ESP (%)
GPOFA-ESP 20 0 G1 GPOFA-ESP 15 5 G2 GPOFA-ESP 10 10 G3 GPOFA-ESP 5 15 G4 GPOFA-ESP 0 20 G5
Normal Concrete 0 0 NC
Table 2: Annotation and percent replacement of UPOFA-ESP
Concrete Type Mix Design Notation GPOFA (%) ESP (%)
UPOFA-ESP 20 0 U1 UPOFA-ESP 15 5 U2 UPOFA-ESP 10 10 U3 UPOFA-ESP 5 15 U4 UPOFA-ESP 0 20 U5
Normal Concrete 0 0 NC Compression Test. A total of 132 concrete including normal concrete cube with dimensions of 100 mm x 100mm x 100mm was tested under compression test in order to determine the compressive strength for each of the mix proportion. The fresh concretes were left in the mould for 24 hours before being remolded and then subjected to water curing until the time to be tested. After curing, the specimens were tested by universal testing machine which has a capacity of 2000kN and the loading rate was set to 6kN/s. The test is conducted on concrete cube specimens at 1, 14, 28 and 56 days.
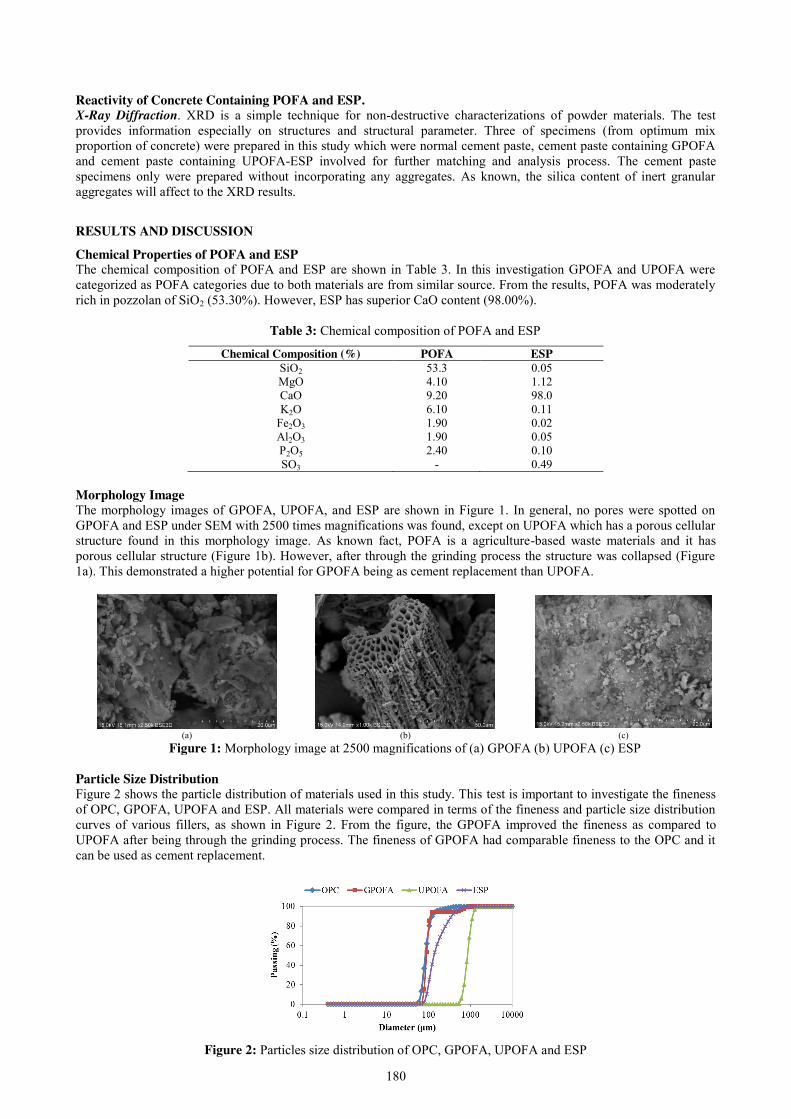
180
Reactivity of Concrete Containing POFA and ESP. X-Ray Diffraction. XRD is a simple technique for non-destructive characterizations of powder materials. The test provides information especially on structures and structural parameter. Three of specimens (from optimum mix proportion of concrete) were prepared in this study which were normal cement paste, cement paste containing GPOFA and cement paste containing UPOFA-ESP involved for further matching and analysis process. The cement paste specimens only were prepared without incorporating any aggregates. As known, the silica content of inert granular aggregates will affect to the XRD results.
RESULTS AND DISCUSSION
Chemical Properties of POFA and ESP The chemical composition of POFA and ESP are shown in Table 3. In this investigation GPOFA and UPOFA were categorized as POFA categories due to both materials are from similar source. From the results, POFA was moderately rich in pozzolan of SiO2 (53.30%). However, ESP has superior CaO content (98.00%).
Table 3: Chemical composition of POFA and ESP
Chemical Composition (%) POFA ESP SiO2 53.3 0.05 MgO 4.10 1.12 CaO 9.20 98.0 K2O 6.10 0.11
Fe2O3 1.90 0.02 Al2O3 1.90 0.05 P2O5 2.40 0.10 SO3 - 0.49
Morphology Image The morphology images of GPOFA, UPOFA, and ESP are shown in Figure 1. In general, no pores were spotted on GPOFA and ESP under SEM with 2500 times magnifications was found, except on UPOFA which has a porous cellular structure found in this morphology image. As known fact, POFA is a agriculture-based waste materials and it has porous cellular structure (Figure 1b). However, after through the grinding process the structure was collapsed (Figure 1a). This demonstrated a higher potential for GPOFA being as cement replacement than UPOFA.
(a) (b) (c)
Figure 1: Morphology image at 2500 magnifications of (a) GPOFA (b) UPOFA (c) ESP Particle Size Distribution Figure 2 shows the particle distribution of materials used in this study. This test is important to investigate the fineness of OPC, GPOFA, UPOFA and ESP. All materials were compared in terms of the fineness and particle size distribution curves of various fillers, as shown in Figure 2. From the figure, the GPOFA improved the fineness as compared to UPOFA after being through the grinding process. The fineness of GPOFA had comparable fineness to the OPC and it can be used as cement replacement.
Figure 2: Particles size distribution of OPC, GPOFA, UPOFA and ESP
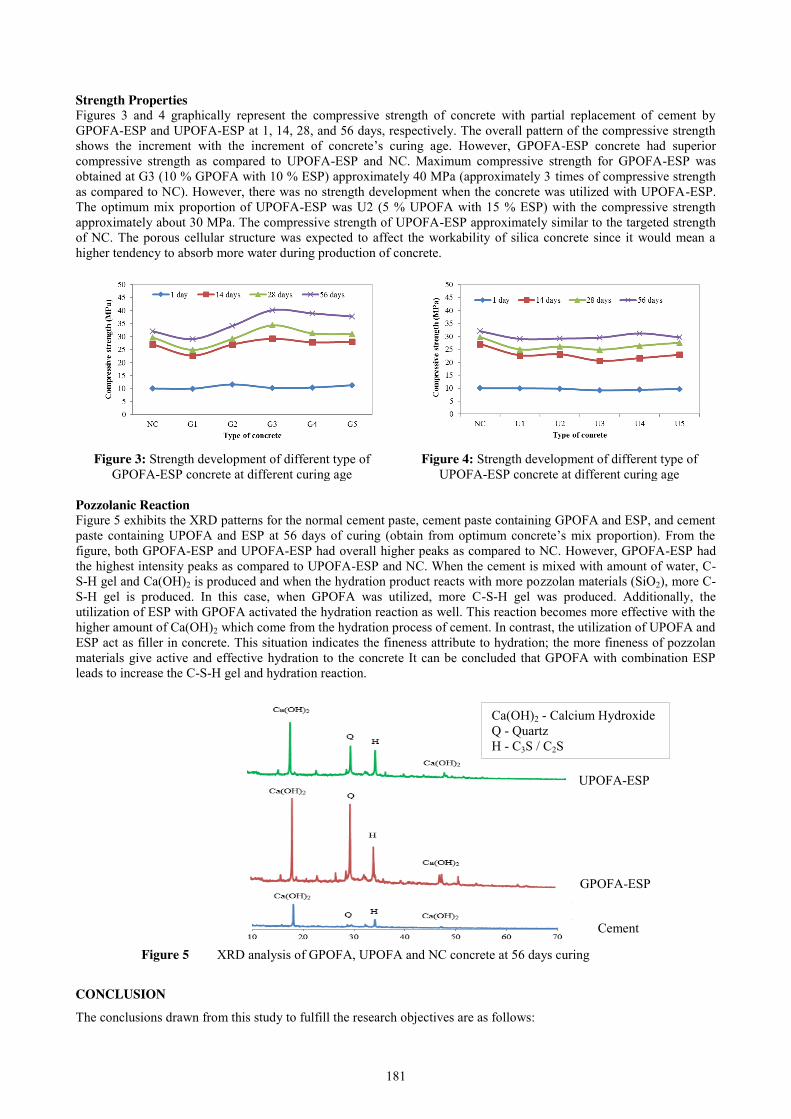
181
Strength Properties Figures 3 and 4 graphically represent the compressive strength of concrete with partial replacement of cement by GPOFA-ESP and UPOFA-ESP at 1, 14, 28, and 56 days, respectively. The overall pattern of the compressive strength shows the increment with the increment of concrete’s curing age. However, GPOFA-ESP concrete had superior compressive strength as compared to UPOFA-ESP and NC. Maximum compressive strength for GPOFA-ESP was obtained at G3 (10 % GPOFA with 10 % ESP) approximately 40 MPa (approximately 3 times of compressive strength as compared to NC). However, there was no strength development when the concrete was utilized with UPOFA-ESP. The optimum mix proportion of UPOFA-ESP was U2 (5 % UPOFA with 15 % ESP) with the compressive strength approximately about 30 MPa. The compressive strength of UPOFA-ESP approximately similar to the targeted strength of NC. The porous cellular structure was expected to affect the workability of silica concrete since it would mean a higher tendency to absorb more water during production of concrete.
Figure 3: Strength development of different type of
GPOFA-ESP concrete at different curing age Figure 4: Strength development of different type of
UPOFA-ESP concrete at different curing age Pozzolanic Reaction Figure 5 exhibits the XRD patterns for the normal cement paste, cement paste containing GPOFA and ESP, and cement paste containing UPOFA and ESP at 56 days of curing (obtain from optimum concrete’s mix proportion). From the figure, both GPOFA-ESP and UPOFA-ESP had overall higher peaks as compared to NC. However, GPOFA-ESP had the highest intensity peaks as compared to UPOFA-ESP and NC. When the cement is mixed with amount of water, C-S-H gel and Ca(OH)2 is produced and when the hydration product reacts with more pozzolan materials (SiO2), more C-S-H gel is produced. In this case, when GPOFA was utilized, more C-S-H gel was produced. Additionally, the utilization of ESP with GPOFA activated the hydration reaction as well. This reaction becomes more effective with the higher amount of Ca(OH)2 which come from the hydration process of cement. In contrast, the utilization of UPOFA and ESP act as filler in concrete. This situation indicates the fineness attribute to hydration; the more fineness of pozzolan materials give active and effective hydration to the concrete It can be concluded that GPOFA with combination ESP leads to increase the C-S-H gel and hydration reaction.
Figure 5 XRD analysis of GPOFA, UPOFA and NC concrete at 56 days curing
CONCLUSION
The conclusions drawn from this study to fulfill the research objectives are as follows:
Ca(OH)2 - Calcium Hydroxide Q - Quartz H - C3S / C2S
Cement
GPOFA-ESP
UPOFA-ESP
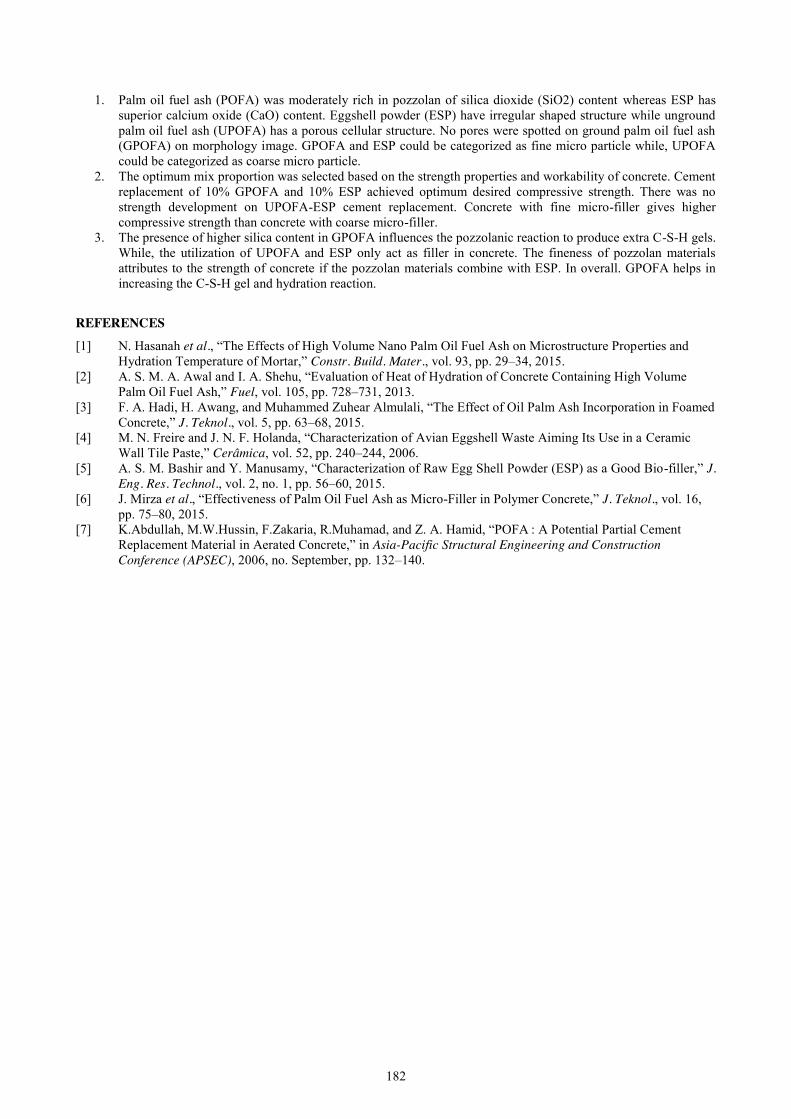
182
1. Palm oil fuel ash (POFA) was moderately rich in pozzolan of silica dioxide (SiO2) content whereas ESP has superior calcium oxide (CaO) content. Eggshell powder (ESP) have irregular shaped structure while unground palm oil fuel ash (UPOFA) has a porous cellular structure. No pores were spotted on ground palm oil fuel ash (GPOFA) on morphology image. GPOFA and ESP could be categorized as fine micro particle while, UPOFA could be categorized as coarse micro particle.
2. The optimum mix proportion was selected based on the strength properties and workability of concrete. Cement replacement of 10% GPOFA and 10% ESP achieved optimum desired compressive strength. There was no strength development on UPOFA-ESP cement replacement. Concrete with fine micro-filler gives higher compressive strength than concrete with coarse micro-filler.
3. The presence of higher silica content in GPOFA influences the pozzolanic reaction to produce extra C-S-H gels. While, the utilization of UPOFA and ESP only act as filler in concrete. The fineness of pozzolan materials attributes to the strength of concrete if the pozzolan materials combine with ESP. In overall. GPOFA helps in increasing the C-S-H gel and hydration reaction.
REFERENCES [1] N. Hasanah et al., “The Effects of High Volume Nano Palm Oil Fuel Ash on Microstructure Properties and
Hydration Temperature of Mortar,” Constr. Build. Mater., vol. 93, pp. 29–34, 2015. [2] A. S. M. A. Awal and I. A. Shehu, “Evaluation of Heat of Hydration of Concrete Containing High Volume
Palm Oil Fuel Ash,” Fuel, vol. 105, pp. 728–731, 2013. [3] F. A. Hadi, H. Awang, and Muhammed Zuhear Almulali, “The Effect of Oil Palm Ash Incorporation in Foamed
Concrete,” J. Teknol., vol. 5, pp. 63–68, 2015. [4] M. N. Freire and J. N. F. Holanda, “Characterization of Avian Eggshell Waste Aiming Its Use in a Ceramic
Wall Tile Paste,” Cerâmica, vol. 52, pp. 240–244, 2006. [5] A. S. M. Bashir and Y. Manusamy, “Characterization of Raw Egg Shell Powder (ESP) as a Good Bio-filler,” J.
Eng. Res. Technol., vol. 2, no. 1, pp. 56–60, 2015. [6] J. Mirza et al., “Effectiveness of Palm Oil Fuel Ash as Micro-Filler in Polymer Concrete,” J. Teknol., vol. 16,
pp. 75–80, 2015. [7] K.Abdullah, M.W.Hussin, F.Zakaria, R.Muhamad, and Z. A. Hamid, “POFA : A Potential Partial Cement
Replacement Material in Aerated Concrete,” in Asia-Pacific Structural Engineering and Construction Conference (APSEC), 2006, no. September, pp. 132–140.
183
Behaviour of Rice Husk - High Density Polyethylene (HDPE) Bio-composites Profile Decking Structure under Bending Load using Finite
Element Modelling Yit Soo Lim1, Jamaludin Mohamad Yatim2
Faculty of Civil Engineering, Universiti Teknologi Malaysia, Malaysia [email protected]
Keywords: Rice Husk-HDPE; Finite Element Analysis; 3-Point Bending Test; LUSAS.
ABSTRACT. Rice Husk-HDPE bio-composite is a material formed by a matrix and a reinforcement of rice husk ash. The agro-waste can be appropriately recycled by using rice husk as filler in composites materials which in turn can reduce the waste. Due to the bio-composites can be act as alternative materials in building and construction as well as their specific properties such as light weight and low cost, therefore it became the main driving forces for both manufacturer and consumer in adopting bio-composites. The key objectives of this research are to identify the deformation behavior of Rice Husk-HDPE bio-composites in relation to the changes of its cross-sectional pattern by bending it under point load using LUSAS software. The previous experimental results are used to make comparison with tfehat in Finite Element Analysis. From the research, the maximum deflection of the sample from finite element analysis are lesser as compared with the experimental results. Besides, the differeces of cross-sectional pattern on finite element model have different deflection under bending load /where the cross-section with more hollow part will have larger deflection with the same loading.
INTRODUCTION
Rice Husk-HDPE bio-composite is a material formed by a matrix and a reinforcement of rice husk ash [1]. By using rice husk as filler in composites materials in various polymer matrices, it would allow the agro-waste to be appropriately recycled and thus reduce the waste [2]. Commercial interest in manufacturing these products is driven because of the derivation of the polymers from renewable sources as well as by their specific properties including bio degradability. Therefore, bio-composites as alternative materials in building and construction is highly plausible with both light weight and low cost being the main driving forces for both manufacturer and consumer [3]. Problem Statement Due to significant increases in demand for wood and lignocellulosic resources, the global wood market is undergoing rapid changes, putting considerable and increasing pressure on the world’s remaining natural forests. Depletion of forest resources has long term effects on climate, soil conservation, biodiversity, and hydrological regimes [4].
Providing a new, environmentally engineered construction material to the industry can has the potential to make changes significantly in terms of reducing deforestation and for changing the way one thinks of wood materials in construction. Rice Husk-HDPE is a wood like bio-composite material which can replace the wide range of applications of wood. Further researches and studies on structural behavior of Rice Husk-HDPE bio-composites can help to diversify the application and reduce the usage of woods. This bio-composite material has many potential applications especially in construction which including formwork, scaffolding, temporary shelters and wall partitions [5]. Objectives The objectives of this study are:
1. To identify the deformation behavior of Rice Husk-HDPE bio-composites in relation to the changes of its cross-sectional pattern by bending it under point load using LUSAS software.
2. To verify the stress-strain graph of Rice Husk-HDPE bio-composites by carrying out tensile test using LUSAS software comparing with the experimental result.
3. To compare the test results between data from finite element modelling analysis with the experimental result. Scope of Study This research is carried out to study the deformation behavior of the Rice Husk-High Density Polyethylene (HDPE) Bio-composite deck under bending load. The dimension of model to be analyse is same as the experimental sample which is 300 mm length, 100 mm width and 30 mm height. The cross-sectional pattern of the model changes progressively in order to trace its deformation behavior. Model created by using finite element software are tested with 3-point bending and fixed support are applied to the model. The length of model being used for the bending test is fixed at 300 mm. The experimental result will be compared with modelling results from numerical finite element analysis.
184
LITERATURE REVIEW
In recent years, human being is paying more attention on the usage of natural fibers reinforced composites due to their lightweight, non-abrasive, combustible, non-toxic, low cost and biodegradable properties. The main benefits of composite materials are that they are very light but strong. In addition, structures that made up by using composites will have longer life span and little maintenance require during its service life. By selecting a suitable combination of reinforcement material and matrix, an advance material can be found that can suit the requirements of particular types of application. Besides, composites can be molded into complex shapes thus it provides design flexibility. Composites will also retain their size and shape no matter in hot or cool and dry or wet conditions. Wood, on the other hand, when there is a change in humidity, it will swell and shrink [6].
Other than that, the scientist nowadays increasing their attention on how to ensure the sustainability of the material systems. Emissions of greenhouse gases and resource depletion are rising awareness to all the material producers. One existing class of materials with good environmental credentials are green composites. Green composites which is also known as bio-composite is a biopolymer reinforced with natural fibers. Bio-composites are having large potential in construction sector which include production of green structural element such as column, beam, roof, staircase, decking and etc. [7]. Rice husk is one of the agricultural industrial residue generated as a byproduct during the process of rice milling. Just like any other lignocellulosic material, rice husk contains cellulose, hemicelluloses, and lignin. Composition by weight of rice husk as follows: cellulose 35%, hemicelluloses 25%, lignin 20%, and ash 17%.
According to the statistical data of the Food and Agriculture Organization (FAO), the worldwide annual paddy production is approximately 582 million tons. Large quantities of rice husks are available as waste from the rice milling industry. Rice husks are either used as bedding materials for animals, burned, or used for landfilling. However, mainly of the rice husks have not been fully utilized. Therefore, manufacturing of thermo-plastic polymer composites by using rice husks is attracting much attention and it has become the most important aspects to solve the problem of environmental pollution.
Rice husk has been used to fill high-density polyethylene, styrene butadiene rubber (SBR), polypropylene, and other thermo-plastic polymers. It can improve the bonding between rice husk fiber and plastic, coupling agents are most commonly used, for example maleic anhydride-grafted thermo-plastic. In addition, NaOH solution is added to chemically modify the surfaces of rice husks and acetylated them to improve their adhesion to the matrix [8].
The Finite Element Method (FEM) had been adopted in this research for analyzing the model. It is a very useful and advance computational tool. By using this method, a lot of complex structural engineering problems can be easily solved. Besides, FEM also had been widely used in thermal analysis, electromagnetic fields, and fluid mechanics. However, FEM involving large number of computations, therefore it requires a computer in order to analyzing the problem. For analyzing the model, it has been dividing model into an equivalent system which has smaller bodies or units called finite element that interconnected at points common to two or more elements in nodal points/ nodes and boundary lines/surface.
When numerical analyses were first introduced in engineering practice in the 1960s, it has been popular of using analysis methods such as boundary element method and finite difference. Over the time, because of the numerical efficiency, the Finite Element Method (FEM), it dominated the field of numerical analyses. Since FEM has wider applicability, it was difficult or impossible to employ to other types of analyses. FEM Is can be described as a versatile analysis tool that can be used for solving almost any type’s problems in engineering field. Due to this reason, the FEM has widespread adoption for increasingly diverse problems and are able to occupy the whole market of commercial analysis software.
Furthermore, FEM has several advantages that can help to solve problem in analyzing a model. First of all, it was easy to shaped irregularly geometry by using FEM. Besides, FEM also can handle general load conditions without any difficulty and it can vary the size of elements by introducing the coordinate systems. Last but not least, FEM has a dynamic effect where it can stimulate a real condition of element when loading was applied into an element and FEM can handle a nonlinear behavior which consider quite difficult to be analyzed [9].
LUSAS is one of the world's leading structural analysis systems. This system uses finite element analysis techniques to provide an accurate solution for all types of linear and nonlinear stress, dynamic, and thermal problems. The model geometry is entered in terms of features which are then discretized into finite element in order to perform the analysis. Increasing of the discretization of the features can increase in accuracy of the solution but with a corresponding increase in solution time and disk space required. The features in LUSAS form a hierarchy that is volumes are comprised of surfaces, which in turn are made up of lines or combined lines, which are defined by points [10]. The analysis procedures by using LUSAS will be discussed as detail under chapter – methodology.
METHODOLOGY The main objective of the research is to study performance and deformation behavior of Rice Husk-HDPE bio-
composite by using non-linear finite element analysis. In addition, the deformation of the Rice Husk-HDPE bio-composite deck under 3-point bending load test from the experimental result was compared with that finite element analysis result. This research methodology consisted of 4 key activities: simulate the 3d model using LUSAS, assign material properties and boundary condition, finite element analysis and parametric study.
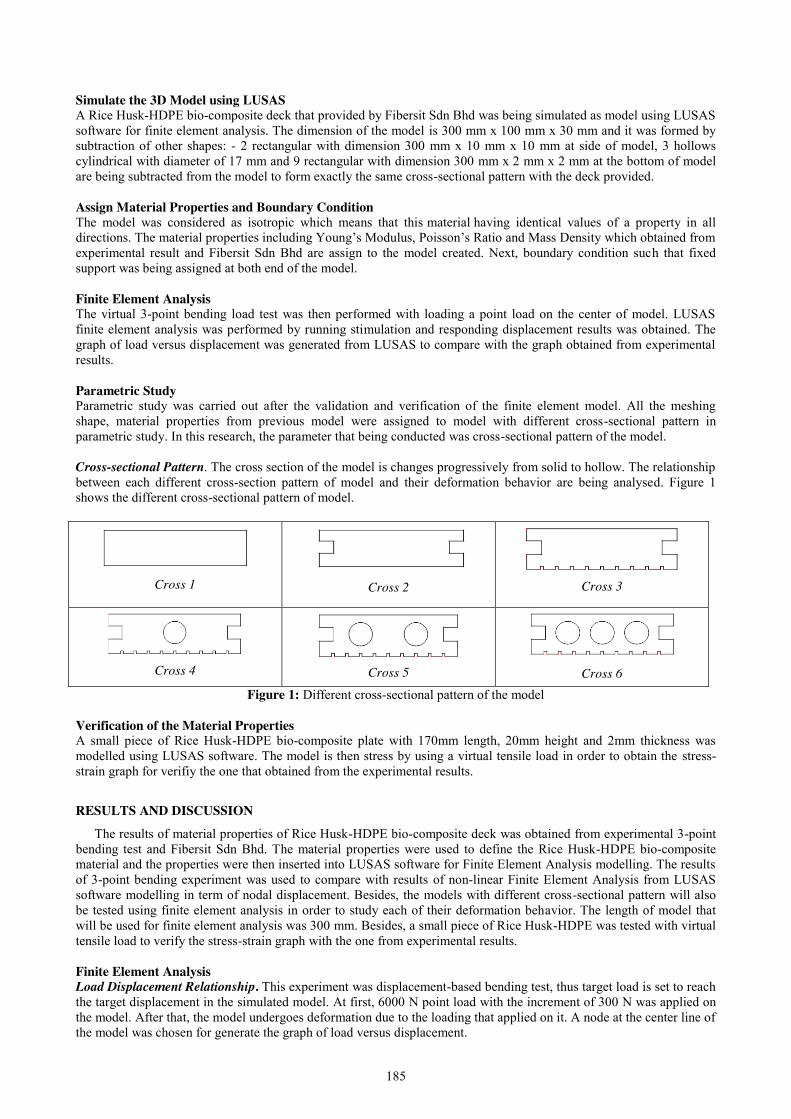
185
Simulate the 3D Model using LUSAS A Rice Husk-HDPE bio-composite deck that provided by Fibersit Sdn Bhd was being simulated as model using LUSAS software for finite element analysis. The dimension of the model is 300 mm x 100 mm x 30 mm and it was formed by subtraction of other shapes: - 2 rectangular with dimension 300 mm x 10 mm x 10 mm at side of model, 3 hollows cylindrical with diameter of 17 mm and 9 rectangular with dimension 300 mm x 2 mm x 2 mm at the bottom of model are being subtracted from the model to form exactly the same cross-sectional pattern with the deck provided. Assign Material Properties and Boundary Condition The model was considered as isotropic which means that this material having identical values of a property in all directions. The material properties including Young’s Modulus, Poisson’s Ratio and Mass Density which obtained from experimental result and Fibersit Sdn Bhd are assign to the model created. Next, boundary condition such that fixed support was being assigned at both end of the model. Finite Element Analysis The virtual 3-point bending load test was then performed with loading a point load on the center of model. LUSAS finite element analysis was performed by running stimulation and responding displacement results was obtained. The graph of load versus displacement was generated from LUSAS to compare with the graph obtained from experimental results. Parametric Study Parametric study was carried out after the validation and verification of the finite element model. All the meshing shape, material properties from previous model were assigned to model with different cross-sectional pattern in parametric study. In this research, the parameter that being conducted was cross-sectional pattern of the model. Cross-sectional Pattern. The cross section of the model is changes progressively from solid to hollow. The relationship between each different cross-section pattern of model and their deformation behavior are being analysed. Figure 1 shows the different cross-sectional pattern of model.
Cross 1
Cross 2
Cross 3
Cross 4
Cross 5
Cross 6
Figure 1: Different cross-sectional pattern of the model Verification of the Material Properties A small piece of Rice Husk-HDPE bio-composite plate with 170mm length, 20mm height and 2mm thickness was modelled using LUSAS software. The model is then stress by using a virtual tensile load in order to obtain the stress-strain graph for verifiy the one that obtained from the experimental results.
RESULTS AND DISCUSSION
The results of material properties of Rice Husk-HDPE bio-composite deck was obtained from experimental 3-point bending test and Fibersit Sdn Bhd. The material properties were used to define the Rice Husk-HDPE bio-composite material and the properties were then inserted into LUSAS software for Finite Element Analysis modelling. The results of 3-point bending experiment was used to compare with results of non-linear Finite Element Analysis from LUSAS software modelling in term of nodal displacement. Besides, the models with different cross-sectional pattern will also be tested using finite element analysis in order to study each of their deformation behavior. The length of model that will be used for finite element analysis was 300 mm. Besides, a small piece of Rice Husk-HDPE was tested with virtual tensile load to verify the stress-strain graph with the one from experimental results.
Finite Element Analysis Load Displacement Relationship. This experiment was displacement-based bending test, thus target load is set to reach the target displacement in the simulated model. At first, 6000 N point load with the increment of 300 N was applied on the model. After that, the model undergoes deformation due to the loading that applied on it. A node at the center line of the model was chosen for generate the graph of load versus displacement.

186
Figure 2 shows the graph of load versus displacement, the model had deflected when load was applied incrementally. The ultimate load and maximum deflection for the Rice Husk-HDPE deck that obtained from the experimental result was recorded. The same ultimate load was used for comparison of the maximum deflection of the simulated model due to the same loading.
Figure 2: Graph of load versus displacement from virtual 3-point bending load test
Comparison of Finite Element Method with Experimental Method. The length of 300mm Rice Husk-HDPE bio-composite deck are being tested in the lab. The experimental results show that with ultimate load of 5070N, the maximum deflection of the deck was 4.917mm. However, the same dimension of model is being simulated using LUSAS software and same material properties are assigned, the maximum deflection of the model was 4.563mm. The percentage of difference of the maximum deflection between the LUSAS finite element analysis and Experimental analysis was 7%.
The percentage different exists because of the ideal condition of materials in software analysis, while there was imperfection and fracture of materials in reality. Porous nature of Rice-Husk_HDPE bio-composite caused microcrack in the material which leaded to lose in strength to resist against bending load. Materials in software analysis were assumed to be in perfect condition and uniformly distributed strength over the whole model. Hence, poor condition of structure in 3-point bending experiment had leaded to larger deflection of structure compared to in Finite Element Analysis. From Figure 3, the largest deflection occurred in red colour zone while smallest deflection was showed by blue zone. Finite Element Analysis showed that the maximum stress was located at the middle of the model.
Figure 3: Deformation shape of model in Finite Element Analysis
Model’s Cross-sectional Pattern. Different cross-sectional pattern of simulated model as shown in Figure1 are undergoes finite element analysis. The length of each model was fixed at 300mm and are being tested by using virtual 3-point bending load. The deformation behavior of each model was recorded and the graph of load versus displacement are generated for comparison. Figure 4 shows the load vs displacement of each different cross-sectional model.
From the graph, it shows that the model with more hollow part will have larger deflection with the same loading. This happens because the weight of material of deck are being reduced when it was hollowed which will affect the stiffness of deck. However, the manufacturer chooses to make more hollow part to the deck because it can cut off cost quite much by reducing a little bit of stiffness of the deck. Besides, extreme temperature and moisture fluctuations can cause solid deck to expand or contract over time which sometimes cause warping. If hollow parts are introduced to the decks, it can increase their lifespan because hollow deck are less impervious to the changes.
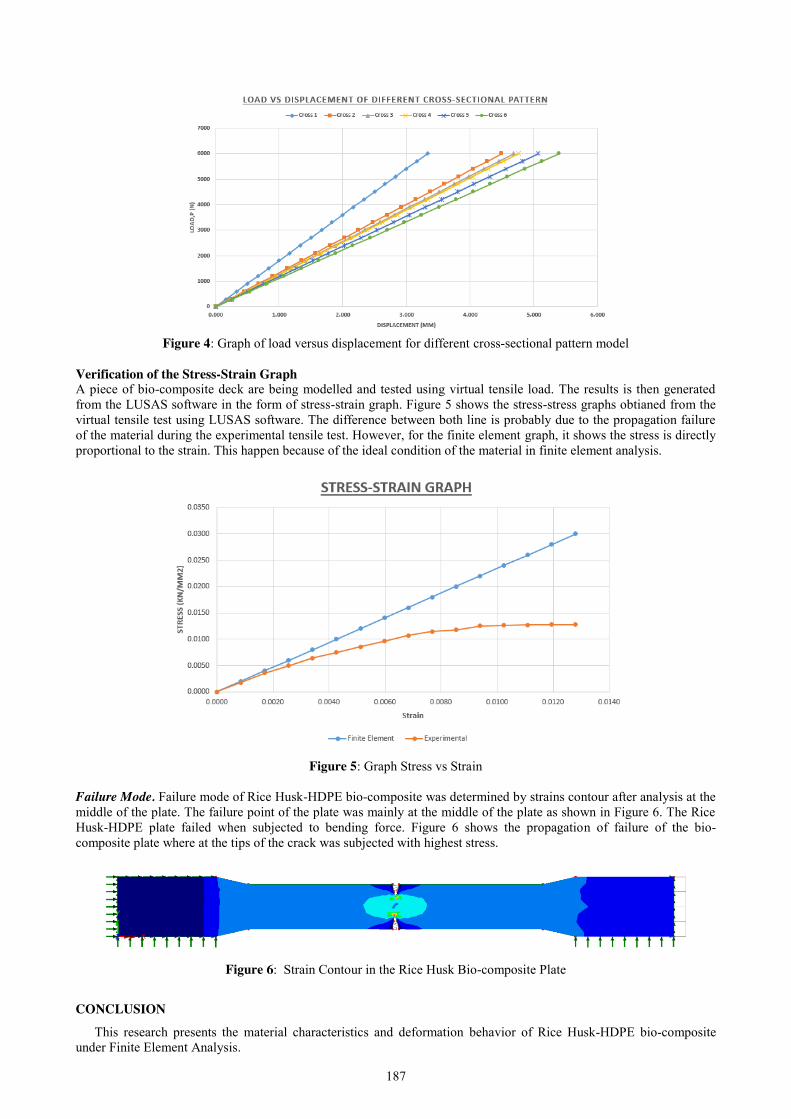
187
Figure 4: Graph of load versus displacement for different cross-sectional pattern model
Verification of the Stress-Strain Graph A piece of bio-composite deck are being modelled and tested using virtual tensile load. The results is then generated from the LUSAS software in the form of stress-strain graph. Figure 5 shows the stress-stress graphs obtianed from the virtual tensile test using LUSAS software. The difference between both line is probably due to the propagation failure of the material during the experimental tensile test. However, for the finite element graph, it shows the stress is directly proportional to the strain. This happen because of the ideal condition of the material in finite element analysis.
Figure 5: Graph Stress vs Strain
Failure Mode. Failure mode of Rice Husk-HDPE bio-composite was determined by strains contour after analysis at the middle of the plate. The failure point of the plate was mainly at the middle of the plate as shown in Figure 6. The Rice Husk-HDPE plate failed when subjected to bending force. Figure 6 shows the propagation of failure of the bio-composite plate where at the tips of the crack was subjected with highest stress.
Figure 6: Strain Contour in the Rice Husk Bio-composite Plate
CONCLUSION
This research presents the material characteristics and deformation behavior of Rice Husk-HDPE bio-composite under Finite Element Analysis.

188
1. From Finite Element Analysis, the model had deflected when load was applied incrementally. The experimental results show that with ultimate load of 5070N, the maximum deflection of the deck was 4.917mm. However, the same dimension of model is being simulated using LUSAS software and same material properties are assigned, the maximum deflection of the model was 4.563mm. The percentage of difference of the maximum deflection between the LUSAS finite element analysis and Experimental analysis was 7%.
2. From the graph of load versus displacement of different cross-sectional pattern, it shows that more hollow part on the model will have larger deflection with the same loading. This happens because the weight of material of deck are being reduced when it was hollowed and thus the stiffness will be affected.
3. The stress-stress graph that obtained from the virtual tensile test using LUSAS software and experiment are in different pattern. The difference between both graph is probably due to the propagation failure of the material during the experimental tensile test. However, for the finite element graph, it shows the stress is directly proportional to the strain. This happen because of the ideal condition of the material in finite element analysis.
REFERENCES
[1] Montesano, I. G. (2014). The biocomposite materials represent a new frontier as far as the field of building in relation to the environment and man. [Online]. Available: http://www.homexyou.com/design/biocomposite-materials/ [Accessed 20 November 2016].
[2] Rosa, S. M. L., Santos, E. F., Ferreira, C. A. and Nachtigall, S. M. B. (2009). Studies on the properties of rice-husk-filled-PP composites: effect of maleated PP. Materials Research, 12, 333-338.
[3] Arjmandi, R., Hassan, A., Majeed, K. and Zakaria, Z. (2015). Rice Husk Filled Polymer Composites. International Journal of Polymer Science, 2015, 32.
[4] Forestry. (2015). Natural Resources Canada [Online]. Available: http://www.nrcan.gc.ca/node/9321 [Accessed 20 Nov 2016].
[5] Morse, M. C. (2009). Anaerobic biodegradation of biocomposites for the building industry. Stanford University.
[6] RSC. (2016). Composite materials [Online]. Available: http://www.rsc.org/Education/Teachers/Resources/Inspirational/resources/4.3.1.pdf [Accessed 22 Nov 2016].
[7] Dicker, M. P. M., Duckworth, P. F., Baker, A. B., Francois, G., Hazzard, M. K. and Weaver, P. M. (2014). Green composites: A review of material attributes and complementary applications. Composites Part A: Applied Science and Manufacturing, 56, 280-289.
[8] Wang, W., Yang, X., Bu, F. and Sui, S. (2014). Properties of rice husk-HDPE composites after exposure to thermo-treatment. Polymer Composites, 35, 2180-2186.
[9] Huebner, K. H. (2001). The Finite Element Method for Engineers. [10] LUSAS (2004). LUSAS Modeller, Theory Manual.
189
Bond Stress between Deformed Steel Bar and Grout Mohamad Hafizuddin Marinamarican1, Ahmad Baharuddin Abd Rahman2
Faculty of Civil Engineering, Universiti Teknologi Malaysia, Malaysia [email protected]
Keywords: Grout; Bond; Slip; Deformed Steel; Pull Out.
Abstract: High strength material such as grout is prefered for the precast concrete connection and anchorage. There are many possible failures that can occur and one of it is due to weak bond. This paper is to study the bond stress develops between deformed steel as the reinforcement bar and grout as the confinement. 12 specimens have been tested using pullout test. Steel bar with diameter of 12mm, 16mm and 20mm have been used to study the effect of different bar size to the bond stress develop between steel bar and grout. 3 samples were prepared using mortar and 16mm steel bar for comparison to determine the effect of compressive strength to the bond stess. The paper also discussed the influence of the embedment length to the bond behaviour based on the failure mode of specimens.
INTRODUCTION Grout has is a high strength material in compression and has a high rate of strength gain. It is a material preferred to
be used in construction such as the connection of precast concrete in order to ensure it can behave similarly to the monolithic casting or conventional method and for anchorage purposes. So, the study on bond behaviour is important to avoid failure. Bond is a mechanism of interaction between the bar and its surrounding to transfer forces between both material along the embedded length of the bar which is consist of friction, adhesion and interlocking of bar and its surrounding [1];[2]. Pull out test has been used by many researchers to study the bond-slip response using different parameters [1]. The slip is the deformation between the bar and the confinement which rely mainly on the friction. An increased value of slip indicates larger part has been crushed locally [2].
Problem Statement Grout has the strength for compression but it is the same as the other materials for compression such as concrete, it has low capability to resist tension. In structural design, reinforcements are needed to take the tensile stress due to loadings applied on a building. Even though concrete has tensile strength, the strength does not being taken in design calculation as it has very small effect.
The grout will act as a medium to hold the members at their positions as in the design and it is viable to failure due to weak bond between the reinforcement and grout. Bond failure creates cracks radially around the reinforcement bar. Once the bond has failed, the gripping of the bar will become loose which may lead to structural failure. Objectives The objectives of this study are:
1. To determine the bond stress of deformed steel bar embedded in grout. 2. To determine the effect of different size of the bar on the bond stress. 3. To determine the effect of compressive strength of the grout on the bond stress.
Scope of the Study The scope of the study is to determine the bond behaviour of deformed steel bar embedded in grout by using pull out test method. The parameters taken count are different size of steel bar for the same type of specimens and different compressive strength for a same size of steel bar. The result will be discussed based on the load exerted on the specimens, slip and type of failure in order to achieve the objective of the study.
LITERATURE REVIEW
Based on previous researchs regarding to bond behaviour, there are a lot of parameters that affect the bond. The parameters involved in this study are properties of the bar, strength of grout/mortar and embedded length.The size of the bar influences the bond stress for concrete/grout. Bar with smaller diameter tends to have higher bond strength. A research [3] using concrete state that the smaller diameter bar tend to fail in less brittle mode or shear-pullout while bar with larger diameter fails in more brittle mode or splitting failure. In relation to the study which only considers the tensile capacity of the steel bar, a weak bar can cause the bar to fail first before reaching the maximum bond capacity. In addition, a bar with low tensile strength has lower yield strength which has tendency to cause the bar to yield before reaching maximum load. Yielded bar also can affect the bond stress of specimen.

190
Studies on bond show that the strength of concrete surrounding the bar affects the bond stress. A high strength concrete give higher bond stress compare to lower strength concrete. However, a sufficient cover must be provided to prevent splitting failure but not too much to prevent failure due to the bar.
The embedded length is another factor affecting bond behaviour. As recommended by RILEM an embedded length of 5db is to be used for conducting pullout test fro concrete. Many studies were done on normal strength concrete with long embedded length without having to cause the bar to yield and many studies also able to get pullout failure without bar to get yielded with 5db [8]. However, based on the result of previous research [7] that uses embedded length equal to 5db which specimen confined by 50MPa concrete, failed with bar yielded for steel bar 12mm and 16mm diameter.
The modes of failure normally found in bond behaviour study are bar yielding, bar fracture, splitting and pullout failure. Both failure of bar yielding and fracture are depend on strength of the bar while splitting failure depends on the confinement. However, the embedded length also plays a role since longer length will provides better gripping along the bar especially using ribbed bar. Pullout or radial is the failure to be achieved by researchers because it is the failure at which the bond strength has been reached without causing the bar to get yielded.
To summarize, the study is expected to get higher bond stress for specimen using steel bar with smaller diameter and also specimen with stronger compressive strength. The bond stress also expected to be high since grout will be used in the study. The embedded length will be reduced to 4db to prevent yielding of steel bar.
METHODOLOGY
Specimens Preparation A total of 12 specimens were prepared for the purpose of the study. Figure 1 shows the preparation of the specimens. Nine of the specimens were using Fosroc Conbextra GP which is high-flow and non-shrink cementitious grout. The product is conforming to the requirements of BS EN 1504-3 Class R4 and BS EN 1504-6: Anchoring of reinforcing steel bar. Another 3 specimens were prepared using mortar. The grout specimens were divided according to the size of deformed steel bars used which are 3 specimens for each size. The mortar specimens were prepared by using 16mm steel bar.
Figure 1: The preparation of specimens
PVC pipes with diameter of 110mm were used as the mould of the pullout samples [4]. The height of specimens is
two times the embedded length of the steel bar which is taken as four times diameter of the steel bar. Smaller PVC pipes were used as a mean to create the unbonded part of the specimens which is equal to embedded length. Silicon was used to prevent grout/mortar from flowing out though the pipe. For the purpose of compressive test, nine 50x50x50mm cubes were prepared for each specimen. Six of the cubes were meant for monitoring purposes because the test will be done once a compressive strength of at least 50MPa have been reached.
The grout was mixed as recommended by manufacturer which is 25kg with 4.5l water to achieve flowable state [4]. The mix of mortar was done according to EN 196-1 which is 1:3:0.5 (cement:sand:water) [5]. The size of sand used is 2.35mm. Table 1 shows the specifications for each specimen. The mass taken is equal to the volume of cylinder without removing the volume required for steel bar plus 5% wastage. The density of grout and mortar taken is 2080kg/m3 and 2250kg/m3 respectively. All samples were cured a day after the casting. The grout specimens using 16mm and 20mm steel bar were cured for 16 days while the other two groups were cured for 38 days. Table 1 shows the mix proportion of specimens.
Table 1: Mix proportion of specimens
Grout (12mm) Grout (16mm) Grout (20mm) Mortar (16mm) Grout (kg) 8.68 10.55 12.42 - Cement (kg) - - - 2.85 Sand (kg) - - - 8.56 Water (kg) 1.58 1.90 2.24 1.43
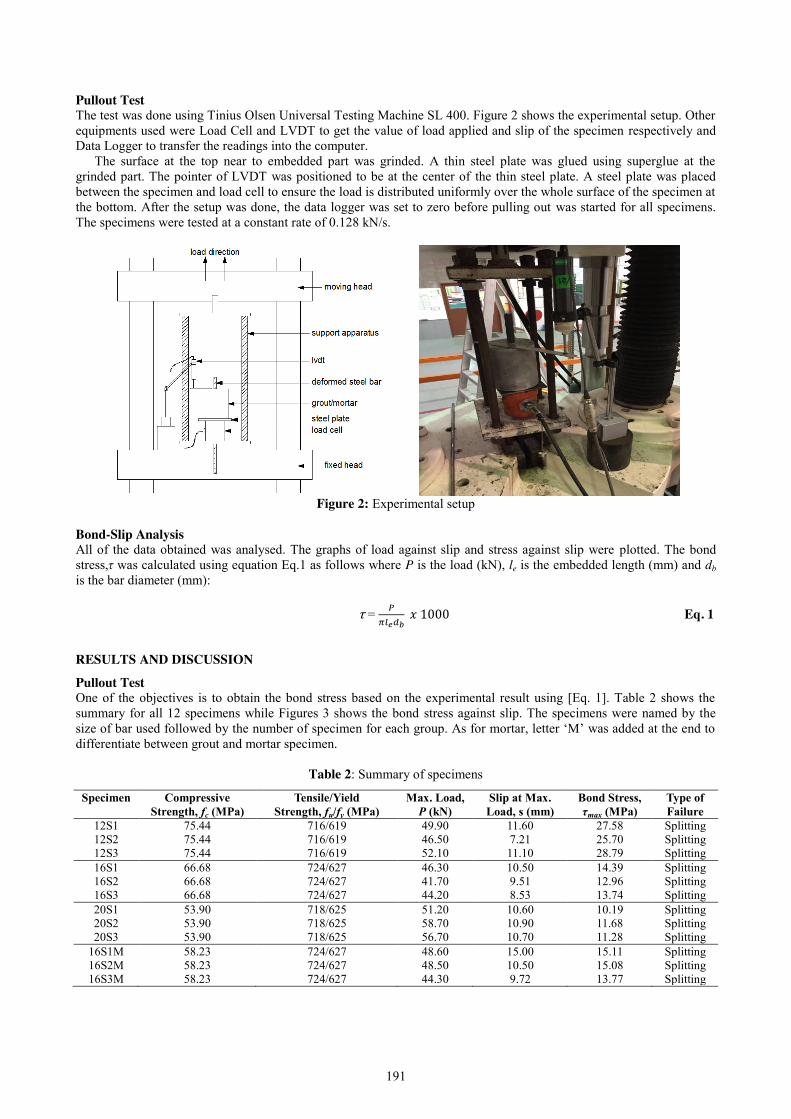
191
Pullout Test The test was done using Tinius Olsen Universal Testing Machine SL 400. Figure 2 shows the experimental setup. Other equipments used were Load Cell and LVDT to get the value of load applied and slip of the specimen respectively and Data Logger to transfer the readings into the computer.
The surface at the top near to embedded part was grinded. A thin steel plate was glued using superglue at the grinded part. The pointer of LVDT was positioned to be at the center of the thin steel plate. A steel plate was placed between the specimen and load cell to ensure the load is distributed uniformly over the whole surface of the specimen at the bottom. After the setup was done, the data logger was set to zero before pulling out was started for all specimens. The specimens were tested at a constant rate of 0.128 kN/s.
Figure 2: Experimental setup
Bond-Slip Analysis All of the data obtained was analysed. The graphs of load against slip and stress against slip were plotted. The bond stress,τ was calculated using equation Eq.1 as follows where P is the load (kN), le is the embedded length (mm) and db is the bar diameter (mm):
τ = 𝑃𝜋𝑙𝑒𝑑𝑏
𝑥 1000 Eq. 1
RESULTS AND DISCUSSION
Pullout Test One of the objectives is to obtain the bond stress based on the experimental result using [Eq. 1]. Table 2 shows the summary for all 12 specimens while Figures 3 shows the bond stress against slip. The specimens were named by the size of bar used followed by the number of specimen for each group. As for mortar, letter ‘M’ was added at the end to differentiate between grout and mortar specimen.
Table 2: Summary of specimens
Specimen Compressive Strength, fc (MPa)
Tensile/Yield Strength, fu/fy (MPa)
Max. Load, P (kN)
Slip at Max. Load, s (mm)
Bond Stress, τmax (MPa)
Type of Failure
12S1 75.44 716/619 49.90 11.60 27.58 Splitting 12S2 75.44 716/619 46.50 7.21 25.70 Splitting 12S3 75.44 716/619 52.10 11.10 28.79 Splitting 16S1 66.68 724/627 46.30 10.50 14.39 Splitting 16S2 66.68 724/627 41.70 9.51 12.96 Splitting 16S3 66.68 724/627 44.20 8.53 13.74 Splitting 20S1 53.90 718/625 51.20 10.60 10.19 Splitting 20S2 53.90 718/625 58.70 10.90 11.68 Splitting 20S3 53.90 718/625 56.70 10.70 11.28 Splitting
16S1M 58.23 724/627 48.60 15.00 15.11 Splitting 16S2M 58.23 724/627 48.50 10.50 15.08 Splitting 16S3M 58.23 724/627 44.30 9.72 13.77 Splitting
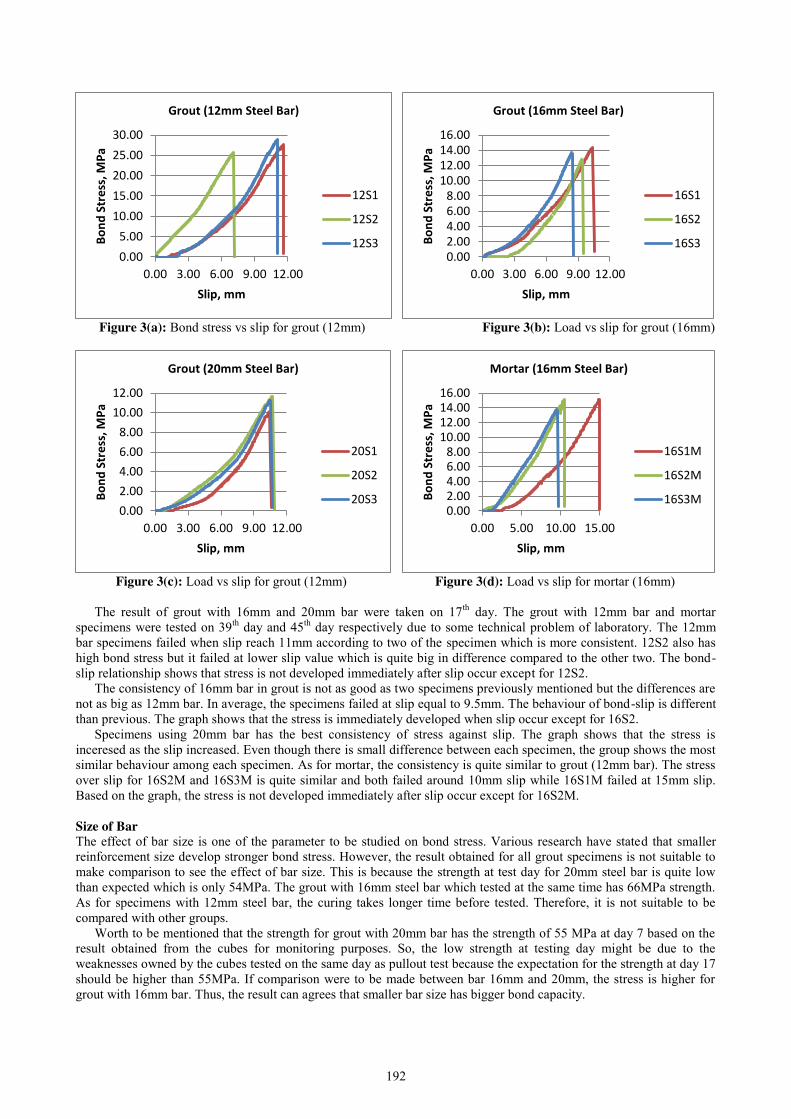
192
Figure 3(a): Bond stress vs slip for grout (12mm) Figure 3(b): Load vs slip for grout (16mm)
Figure 3(c): Load vs slip for grout (12mm) Figure 3(d): Load vs slip for mortar (16mm)
The result of grout with 16mm and 20mm bar were taken on 17th day. The grout with 12mm bar and mortar specimens were tested on 39th day and 45th day respectively due to some technical problem of laboratory. The 12mm bar specimens failed when slip reach 11mm according to two of the specimen which is more consistent. 12S2 also has high bond stress but it failed at lower slip value which is quite big in difference compared to the other two. The bond-slip relationship shows that stress is not developed immediately after slip occur except for 12S2.
The consistency of 16mm bar in grout is not as good as two specimens previously mentioned but the differences are not as big as 12mm bar. In average, the specimens failed at slip equal to 9.5mm. The behaviour of bond-slip is different than previous. The graph shows that the stress is immediately developed when slip occur except for 16S2.
Specimens using 20mm bar has the best consistency of stress against slip. The graph shows that the stress is inceresed as the slip increased. Even though there is small difference between each specimen, the group shows the most similar behaviour among each specimen. As for mortar, the consistency is quite similar to grout (12mm bar). The stress over slip for 16S2M and 16S3M is quite similar and both failed around 10mm slip while 16S1M failed at 15mm slip. Based on the graph, the stress is not developed immediately after slip occur except for 16S2M. Size of Bar The effect of bar size is one of the parameter to be studied on bond stress. Various research have stated that smaller reinforcement size develop stronger bond stress. However, the result obtained for all grout specimens is not suitable to make comparison to see the effect of bar size. This is because the strength at test day for 20mm steel bar is quite low than expected which is only 54MPa. The grout with 16mm steel bar which tested at the same time has 66MPa strength. As for specimens with 12mm steel bar, the curing takes longer time before tested. Therefore, it is not suitable to be compared with other groups.
Worth to be mentioned that the strength for grout with 20mm bar has the strength of 55 MPa at day 7 based on the result obtained from the cubes for monitoring purposes. So, the low strength at testing day might be due to the weaknesses owned by the cubes tested on the same day as pullout test because the expectation for the strength at day 17 should be higher than 55MPa. If comparison were to be made between bar 16mm and 20mm, the stress is higher for grout with 16mm bar. Thus, the result can agrees that smaller bar size has bigger bond capacity.
0.005.00
10.0015.0020.0025.0030.00
0.00 3.00 6.00 9.00 12.00
Bon
d St
ress
, MPa
Slip, mm
Grout (12mm Steel Bar)
12S1
12S2
12S30.002.004.006.008.00
10.0012.0014.0016.00
0.00 3.00 6.00 9.00 12.00
Bon
d St
ress
, MPa
Slip, mm
Grout (16mm Steel Bar)
16S1
16S2
16S3
0.002.004.006.008.00
10.0012.00
0.00 3.00 6.00 9.00 12.00
Bon
d St
ress
, MPa
Slip, mm
Grout (20mm Steel Bar)
20S1
20S2
20S30.002.004.006.008.00
10.0012.0014.0016.00
0.00 5.00 10.00 15.00
Bon
d St
ress
, MPa
Slip, mm
Mortar (16mm Steel Bar)
16S1M
16S2M
16S3M

193
Compressive Strength By comparing both groups of specimen using 16mm size of steel bar, there is difference in term of specimen’s strength and bond stresses developed. The grout specimens have higher strength which is 66MPa while mortar specimens have 58MPa of compressive strength. However, the bond stress induces in mortar specimens are a little bit higher. The experimental result obtained is not agrees with previous studies.
Mortar usually is used for architectural work. The compressive strength of the mortar is expected to be low for about 20 MPa and is the reason for choosing mortar to be compared with grout specimens. The high compressive strength and bond strength gained by mortar could be because of various factors. To be mentioned here is the time of curing process and testing was different for both groups. The grout specimens were cured for 16 days while the mortar specimens were cured for 44 days. The mortar cubes were cured a day after the casting and all the cubes were placed in the same container as cubes of grout. Therefore, the process of curing might caused the unexpected result.
Another theory for the high bond stress of mortar is the grout and mortar composition is different. The sand added in the mortar causing the texture inside the mortar to be different from the grout. So, it is possible that the fine aggregate in the mixture of mortar specimens plays the role for the unexpected result by increasing the interlocking between steel bar and the mortar in addition with specimen’s ages. The small improvement by the sand adds more resistance to the friction. To relate the hypothesis with the result, the effect of the texture of the mortar:
1. Based on 16S1M, the slip is the highest among all specimens. The result shows that the failure occurs at higher slip value which means the load exerted can be high as well before reaching the slip value.
2. Based on 16S2M and 16S3M which has better consistency of slip at maximum load compared to (a), the mortar adds more resistance to slip which allow more load to be exerted on the specimens before failure occur.
Splitting Failure All of the specimens fail in splitting mode, see Figure 4 for example of failed specimen. The reason for the failure is the reduction in embedment length. By reducing the length, the surface contact between the steel bar and its confinement also will be reduces which reducing the friction capacity. In addition, the total height of specimen also will be reduced.
Figure 4: Failure mode of specimens
Figure 5: The bond of longer and shorter embedment length
One of the advantages of using deformed steel bar is the bar is ribbed bar which can improve the gripping between
the bar and grout/mortar. However, due to the same reason of the reduction in embedment length means that the number of rib contacts with grout/mortar is less as illustrated in Figure 5. Based on previous study [6], the steel bar used in the study has >550 Mpa of tensile strength and average concrete strength of 50MPa and 28MPa for high strength and low strength concrete respectively. Steel bars 10mm, 12mm, 16mm and 20mm were used. The failure in high strength concrete is bar yielding for 10mm and 12mm, pullout failure for 16mm and splitting for 20mm. As for normal strength concrete, only 12mm and 16mm bars were used and the failure for both sizes is pullout failure. The specimens ware prepared using cube mould cube of 200mm.
Based on Prince and Singh [10], splitting failure mode was obtained for all specimens. The strength of concrete is within the range of 24~37 MPa, about 500MPa tensile strength and the size of bar used is 12mm, 16mm, 20mm and

194
25mm. The specimens in this research were using cylindrical shape of 100mm diameter. By comparing [6] and [10], the difference of failure mode obtained is might be due to the thickness of concrete that cover the steel bar.
The grout and steel bar used in this study are high strength material. For a cylindrical specimen with 110mm diameter, the embedment length of 4db is not suitable to test the bond between both materials. An embedment length of 5db is recommended for the test. However, larger embedment length might be needed for 20mm bar.
CONCLUSION
The study presents the bond of deformed steel bar embedded in grout and mortar using embedded length of 4db. The following conclusions can be drawn from the result obtained:
9. The embedded length of 5db should be used instead of 4db to determine the bond stress between deformed steel
bar and grout because of high tensile strength of the bar. However, longer embedment length might be required for 20 mm bar.
10. The bond stress induced in specimens using smaller bar size is greater than larger bar size. 11. The study cannot prove that higher strength confinement give higher bond stress based on comprasion between
grout and mortar with 16 mm diameter steel bar. 12. The average bond stress of 12 mm steel bar embedded in grout at typical maximum compressive strength of
Fosroc grout is about 27 MPa. The stress is expected to be higher using embedded length equal to 5db.
REFERENCES
[1] Tastani, S. P., & Pantazopolou S. J. (2009). Direct Tension Pullout Bond Test: Experimental Results. Journal of Structural Engineering, Vol. 136, No. 6.
[2] Moosavi, M., Jafari, A., & Khosravi, A. (2003). Bond of Cement Grouted Reinforcing Bars Under Constant Radial Force. Cement and Cocnrete Composite 27 (2005), 102-109.
[3] Bazant, Z. P., & Senner, S. (1988). Size Effect in Pullout Tests. ACI Materials Journal, no. 85-M38. [4] J. H. Ling, A.B.A. Rahman, I.S. Ibrahim, & Z.A. Hamid (2016). Tensile Capacity of Grouted Splice Sleeves.
Engineering Structures 111 (2016), 285-296. [5] Alberti, M. G., Enfedaque, A., Galvez, J. C., & Rerreras, A. (2016). Pull-out Behaviour and Interface Critical
Parameters of Polyolefin Fibres Embedded in Mortar and Self-Compacting Concrete Matrixes. Construction and Building Materials 112 (2016), 607-622.
[6] Baena, M., Torres, L., Turon, A., & Barris, C. (2009). Experimental Study of Bond Behaviour Between Concrete and FRP Bars Using a Pull-out Test. Composites: Part B 40 (2009), 784-797.
[7] AShtiani, M. S., Dhakal, R. P., & Scott, A. N. (2013). Post-yield Bond Behaviour of Deformed Bars in High-strength Self-compacting Concrete. Constrcution and Building Materials 44 (2013), 236-248.
[8] Hadi, M. N. (2008). Bond of High Strength Concrete with High Strength Reinforcing Steel. The Open Civil Engineering Journal, 2, 143-147.
[9] RILEM Technical Recommendations of the Testing and Use of Construction Material (1994). RC6 Bond Test for Reinforcement: Pull-out Test.
[10] Prince, M., J., R., & Singh, B. (2013). Bond Behaviour of Deformed Steel Bars Embedded in Recycled Aggregate Concrete. Construction and Building Materials 49 (2013), 852-862.
195
Compressive strength of concrete containing high volume of oil palm waste
Muhamad Faiz Abd. Rahim1, Abdullah Zawawi Awang2 Faculty of Civil Engineering, Universiti Teknologi Malaysia, Malaysia
Keywords: Palm Oil Fuel Ash; Palm Oil Clinker; Oil Palm Shell; Density Test; Compressive strength Test.
ABSTRACT. Concrete is the most important material and widely used in construction industry. Palm oil fuel ash (POFA), Palm oil clinker (POC) and Oil Palm Shell (OPS) is the lightweight materials and have a lower density compare to normal aggregates. POFA containing pozzolanic material can be used to enhance the characteristics and capabilities of the concrete. The objective of this study was to determine the compressive strength of concrete containing POFA, POC and OPS as cement, fine aggregate and coarse aggregate replacement respectively. 63 sample of mortar cubes and 45 samples of concrete were prepared and tested for compressive strength. The casting of the samples was devided into three phases which is phase 1 mortar with POFA as cement replacement, phase 2 mortar POC as fine aggregate replacement and phase 3 OPS as coarse aggregate replacement in concrete. Optimum replacement of every phases at 7 days will use in the next phase. In the phase 1, samples of mortar with 10% of POFA produce the optimum compressive strength at 7 days which is 27.12 kN/m². While 20% of POC replacement of mortar in phase 2 recorded 24.84 kN/m² of optimum compressive strength at 7 days. In phase 3, the higher addition of POC in concrete will decrease the density and compressive strength. It is because the higher rate of water absorption palm oil clinker produce lower compressive strength of concrete. The role of POFA as the pozzolanic material reacted only burst the early strength of mortar. Based on the result, the used of palm oil OPS as coarse aggregates replacement will highly reduce the strength of the concrete but the use of POFA can increase the strength of the concrete compare to normal concrete. Furthermore, the mixing design needs to be modified by using lightweight concrete mix design to produce the lightweight concrete.
INTRODUCTION
Concrete is composite material composed of coarse aggregate bonded together with a fluid cement that hardens over time. Due tp higher demand of concrete in construction industry, the used of concrete has been variously innovated to suit the needs along with current technology. POFA and POC is a waste product produce from the burning of palm oil shell in oil palm process while OPS obtained before the burning process. This waste product in various shapes and light in weight.
Problem Statement Nearly million tonnes of palm oil waste are produce annually by the industry cause the government needs to allocate more hectares of landfills for the disposal purpose. They spend a lot of money for disposal activities like transporting and maintenance. When there are many dumped area to locate the waste, it will affect our environment and ecosystem. Besides, cost using normal building materials is higher in production of concrete. To produce a normal concrete normally use gravel or crush aggregate. The process of crush aggregate by quarry needs cost to produce it. Hence, by recycling the waste material, it can reduce the dumped waste as well as to ensure environment sustainability.
To overcome the problem, this study is to produce a green concrete with high volume oil palm waste as the replacement of fine and coarse aggregate and the cement. The high amount of waste in this concrete can reduce the rate of waste that produce by industry. Besides, it can also reduce the cost of concrete production during the construction.
Objectives The objectives of this study are:
1. To determine the density of mortar containing POFA and POC and high volume of concrete containing POFA, POC and OPS.
2. To determine the optimum compressive strength of mortar with difference percentage of POC and POFA replacement in 7, 14 and 28 days in water curing.
3. To determine the compressive strength of concrete containing high oil palm waste at 7, 14 and 28 days of curing and study the relationship between density and compressive strength of the concrete.
Scope of Study The materials use in this study is palm oil waste that get from oil palm mill in Johor. This study focus on determine the density, slump test and compressive strength of normal-strength concrete produce by difference combination of POFA, POC and OPS in the 100mm x 100mm x 100mm of concrete cubes. Concrete was designed using DoE design method. Before the production of concrete, the mortar was produced to determine the optimum replacement of POFA as cement
196
and optimum replacement POC as fine aggregate after 7 days of curing. The optimum replacement of POFA and POC was used to design the concrete. The curing proses is using water proses only and testd after 7 days, 14 day and 28 days.
LITERATURE REVIEW Concrete is a main component in the building construction nowadays. Due to the modern technolog, many
researcher tried to produce a sustainable concrete which focus on the partially or completely replacement some of the content in concrete with waste materials.
Palm oil shell (OPS) is a waste product of oil palm fruit that process by industry. Palm oil shell come out with various shape and size. OPS has specific gravity with 1.22 while the fineness modulus is 5.72. The bulk density of compacted OPS is 683 kg/m3. The water absorption at 24 hours is from 10.65% to 9.70% [1]. Concrete containing 100% OPS as coarse aggregate replacement produce 28.1 MPa at 28 days which is achieved the minimum requirement of ASTM C330 structural lightweight concrete design [2].
POC is burnt oil palm shell in boiler combustion process. It was crushed and sieved to the desired particle sizes. Particles less than 5 mm are considered as fine aggregate and particles in the range of 5 mm to 14 mm are considered as coarse aggregate [3]. From the previous research, addition of POC as fine aggregate replacement can increase the strength of concrete. The optimum POC replacement is 20% replacement which is produce 53.96 MPa. It larger than 50 MPa which is can produce high strength concrete [4].
POFA is a burnt palm oil waste at 800 to 1000 °C and crush it until it become very small particles. POFA produce a large amount of silica that can produce C-S-H gel that can be used as cement replacement in the concrete. When high silica oxide content met with pozzolanic properties it potential to produce a strong and durable concrete [5]. From the study by [6], at the early age which is 3 and 7 day, the optimum POFA replacement at 15% replacement can achieve 37 MPa compressive strength. It show an extremely difference from the concrete containing normal concrete and 5% and 10% replacement of POFA. At 28-day, the normal concrete can achieve larger than 15% POFA concrete. It was show that POFA’s replacement will cause the increase in early strength in concrete but become slower at the later age.
The study from [7], OPS was use as coarse aggregate as fully replacement while POFA use cement replacement from 10%, 20%, 30%, 40% and 50% replacement. The strength were increase from 32MPa to 35MPa at 0% to 20% replacement but decreasing from 36MPa to 50MPa at 30% replacement to 50% replacement. Hence the optimum replacement is 20%. Other studies, after 28 days of curing, 25% POC replacement produce the highest strength which is 37.4 MPa. The strength development in the moisture condition with 0%, 12.5%, 25%, 37.5% and 50% replacement [8]. The hydration of cement and strength development can increase when present of internal water that is supplied by saturated lightweight fine aggregates. At 50% replacement the strength are very low because the concrete are too porous because the absorption of the water from the POC [9].
The improvement should be studied by adding the three materials which is POFA, POC and OPS in a concrete as cement, fine aggregate and coarse aggregate to become a high volume oil palm waste concrete. The studies would be included the impact on density and strength when those materials added. It is important to produce a sustainable concrete with huge number of waste recycled in the concrete.
METHODOLOGY
The research involved the test on density, slump and compressive strength of concrete containing high volume of oil palm waste which is POFA, POC and OPS. There are 3 phases involved in this experiment. Phase 1 POFA as cement replacement in mortar, phase 2 POC as fine aggregate replacement in mortar and phase 3 OPS as coarse aggregate replacement. The analysis on every test and mode of failure will be discuss.
Mortar The mixture of mortar are follow ASTM C1329 - Standard Specification for Mortar Cement. The control mortar was produce with 1:2.75 cement-sand ratio with the target strength is 40MPa. Table 1 shows the weight of each mixture.
Table 1: Weight of mixture in mortar design
In Phase 1, one control mortar with normal mixture of mortar, 10%, 15% and 30% percentage of POFA replacement
in mortar was produced. The mixture was placed in the 50mm x 50mm x 50mm cube and cured in the water for 7, 14 and 28 days of curing. After 7 days of curing, three samples from the control mortar and different percentage of POFA was tested to determine the density and compressive strength. The optimum compressive strength of different POFA replacement were used in Phase 2. In phase 2, there were 10%, 20% and 30% of POC will replace the natural sand as fine aggregate. The same step as phase 1 were conducted to get the results for fine aggregate replacement. The optimum POC replacement as fine aggregate was obtained and use in the concrete concrete design
mixture Weight (kg) cement 0.624
Fine aggregate 0.312 water 1.716

197
Concrete In phase 3, there are two type of mix which is control concrete and oil palm concrete with difference percentage of coarse aggregate replacement which are 0%, 10%, 20% and 30%. The compressive strength conducted as indicated in code of practice described early. Three cube specimens were cast for each testing day and give 3 samples of control concrete (CC) and 12 samples of oil palm concrete (OC) with difference percentage of OPS replacement. Table 2 shows the mixture of control concrete.
Table 2: Weight of mixture in mortar design
RESULTS AND DISCUSSION
The results were include the density and compressive strength of mortar and concrete for every stages and slump test for concrete in phase 3.
Phase 1: POFA as cement replacement in mortar The result from phase 1 was recorded in table 3. In 7 days of curing, the density was constant at 2160 kg/m² from control mortar until 15% replacement. At 20% replacement of POFA as cement replacement shows the highest density for all days of curing. At 14 days, the density decrease uniformly from 0% to 15% which is 2227 kg/m² until 2173 kg/m² and increase 2280kg/m² at 20% replacement. After 28 days of curing, the density of 0% decrease at 10% replacement and increase gradually at 10% to 20% of replacement.
The density of the curing ages is also not uniforms value because the amount of water loss due to hydration process is too small and does not affect the change in density. It is because of the error during compaction of the sample. Mixing for samples of 20% POFA replacement contain more fine aggregate because the error during weighed the fine aggregate.
Figure 1: Density of mortar with different replacement POFA and curing ages.
From the Figure 2, the compressive strength of sample with 10% replacement was the optimum compressive
strength which is 27.12 MPa at the 7 days curing compare to the other samples. The compressive strength are also higher than control mortar which is 24.27 MPa. At the 14 days of curing, the control mortar was produce the highest compressive strength compared to the other samples which is 36.02 MPa. Sample with 10% of POFA replacement produced 31.16 MPa lower than control mortar. At the 28 days, control mortar are still in the highest replacement which is 38.27 MPa. Mortar with 15% replacement was the lowest strength at this age which is 30.08 MPa. Sample with 10% replacement remined the highest replacement compared to the other replacement.
POFA can increase the strength at the early age which is 7 days. The strength increase when the curing days increase but it not too significant compared to conventional concrete. POFA containing pozzolanic chemical which is can produce C-S-L gel that can strengthen the bond between mixture due to the age of curing Phase 2: POC as fine aggregate replacement in mortar In phase 2, 10% POFA replacement was added in to the mortar as cement replacement. Density of samples with 10% replacement of POC was giving the highest density of all days of curing. At 7 day of curing, the density decreased when POC replaced by 10% to 30% which is 2240 kg/m³ to 2160 kg/m³. The density increased when replaced 10% POC in the mortar. At the 14 days, the density are also decrease due to the increase of percentage replacement. The density decrease from 2227 kg/m³ to 2113 kg/m³. It also same as in 28 days of curing. The density of the sample decreased because the density of POC is lower than density of sand. The lower density, the cause the lower volume of mortar. The
2160
2227 2227
2160
2200
2133 2160 2173
2200
2280 2280 2267
2050
2100
2150
2200
2250
2300
7 14 28
Dens
ity (k
g/m
³)
Curing Age (day)
0% 10% 15% 20%
mixture Weight (kg) Cement 3.42
Fine aggregate 6.12 Coarse aggregate 10.00
Water 1.85
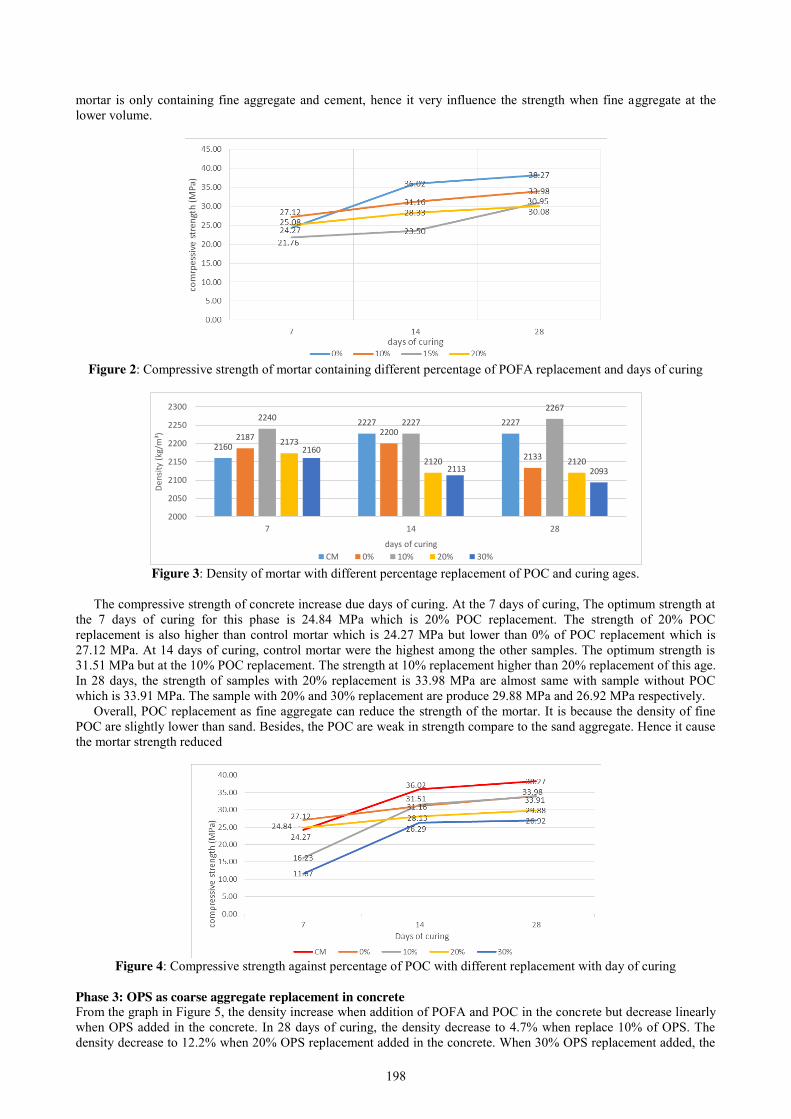
198
mortar is only containing fine aggregate and cement, hence it very influence the strength when fine aggregate at the lower volume.
Figure 2: Compressive strength of mortar containing different percentage of POFA replacement and days of curing
Figure 3: Density of mortar with different percentage replacement of POC and curing ages.
The compressive strength of concrete increase due days of curing. At the 7 days of curing, The optimum strength at
the 7 days of curing for this phase is 24.84 MPa which is 20% POC replacement. The strength of 20% POC replacement is also higher than control mortar which is 24.27 MPa but lower than 0% of POC replacement which is 27.12 MPa. At 14 days of curing, control mortar were the highest among the other samples. The optimum strength is 31.51 MPa but at the 10% POC replacement. The strength at 10% replacement higher than 20% replacement of this age. In 28 days, the strength of samples with 20% replacement is 33.98 MPa are almost same with sample without POC which is 33.91 MPa. The sample with 20% and 30% replacement are produce 29.88 MPa and 26.92 MPa respectively.
Overall, POC replacement as fine aggregate can reduce the strength of the mortar. It is because the density of fine POC are slightly lower than sand. Besides, the POC are weak in strength compare to the sand aggregate. Hence it cause the mortar strength reduced
Figure 4: Compressive strength against percentage of POC with different replacement with day of curing
Phase 3: OPS as coarse aggregate replacement in concrete From the graph in Figure 5, the density increase when addition of POFA and POC in the concrete but decrease linearly when OPS added in the concrete. In 28 days of curing, the density decrease to 4.7% when replace 10% of OPS. The density decrease to 12.2% when 20% OPS replacement added in the concrete. When 30% OPS replacement added, the
2160
2227 2227 2187 2200
2133
2240 2227 2267
2173
2120 2120 2160
2113 2093
2000
2050
2100
2150
2200
2250
2300
7 14 28
Dens
ity (k
g/m
³)
days of curing CM 0% 10% 20% 30%
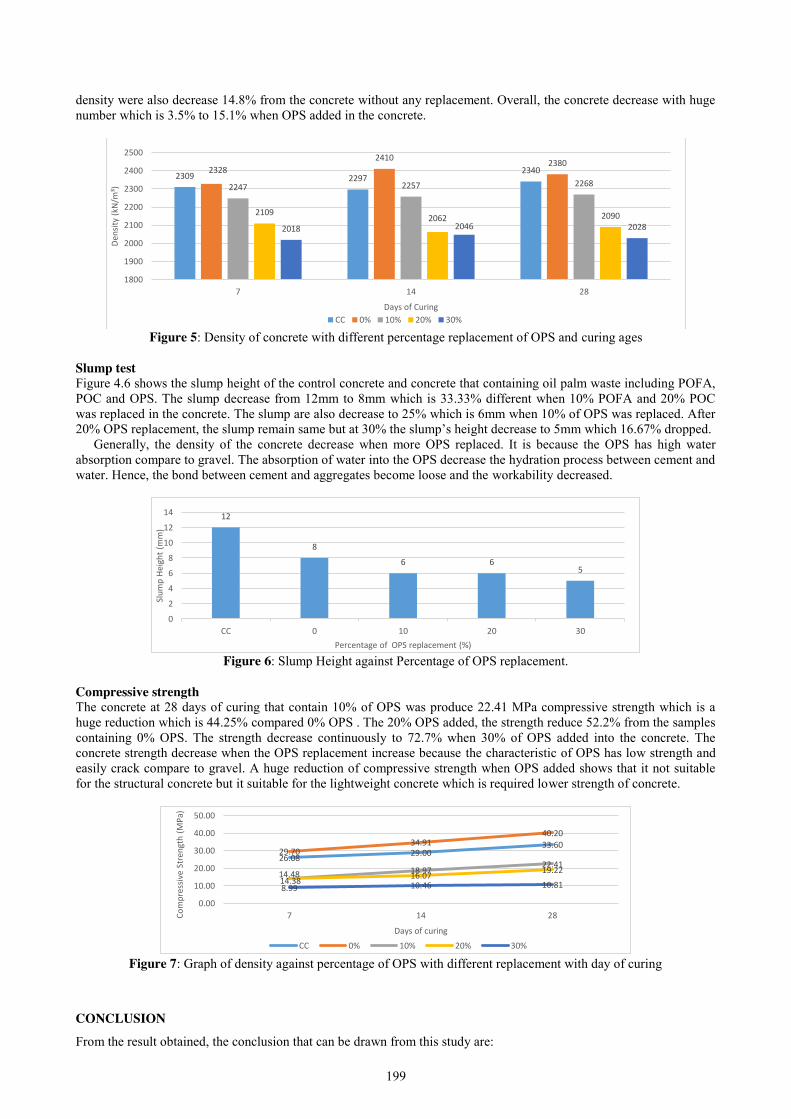
199
density were also decrease 14.8% from the concrete without any replacement. Overall, the concrete decrease with huge number which is 3.5% to 15.1% when OPS added in the concrete.
Figure 5: Density of concrete with different percentage replacement of OPS and curing ages
Slump test Figure 4.6 shows the slump height of the control concrete and concrete that containing oil palm waste including POFA, POC and OPS. The slump decrease from 12mm to 8mm which is 33.33% different when 10% POFA and 20% POC was replaced in the concrete. The slump are also decrease to 25% which is 6mm when 10% of OPS was replaced. After 20% OPS replacement, the slump remain same but at 30% the slump’s height decrease to 5mm which 16.67% dropped.
Generally, the density of the concrete decrease when more OPS replaced. It is because the OPS has high water absorption compare to gravel. The absorption of water into the OPS decrease the hydration process between cement and water. Hence, the bond between cement and aggregates become loose and the workability decreased.
Figure 6: Slump Height against Percentage of OPS replacement.
Compressive strength The concrete at 28 days of curing that contain 10% of OPS was produce 22.41 MPa compressive strength which is a huge reduction which is 44.25% compared 0% OPS . The 20% OPS added, the strength reduce 52.2% from the samples containing 0% OPS. The strength decrease continuously to 72.7% when 30% of OPS added into the concrete. The concrete strength decrease when the OPS replacement increase because the characteristic of OPS has low strength and easily crack compare to gravel. A huge reduction of compressive strength when OPS added shows that it not suitable for the structural concrete but it suitable for the lightweight concrete which is required lower strength of concrete.
Figure 7: Graph of density against percentage of OPS with different replacement with day of curing
CONCLUSION
From the result obtained, the conclusion that can be drawn from this study are:
2309 2297 2340 2328
2410 2380
2247 2257 2268
2109 2062 2090
2018 2046 2028
1800
1900
2000
2100
2200
2300
2400
2500
7 14 28
Dens
ity (k
N/m
³)
Days of Curing CC 0% 10% 20% 30%
12
8
6 6 5
0
2
4
6
8
10
12
14
CC 0 10 20 30
Slum
p He
ight
(mm
)
Percentage of OPS replacement (%)
26.08 29.00 33.60
29.70 34.91
40.20
14.48 18.97 22.41
14.38 16.07 19.22
8.99 10.46 10.81
0.00
10.00
20.00
30.00
40.00
50.00
7 14 28Com
pres
sive
Stre
ngth
(MPa
)
Days of curing
CC 0% 10% 20% 30%

200
1. Mortar containing 20% POFA replacement shows the highest density for every curing age which is 2280 kg/m³, 2280 kg/m³ and 2267 kg/m³ compare with other samples. The samples of mortar containing POC as fine aggregate decrease when higher percentage of POC replaced. In phase 3, the density decrease with 12.2% to 15.1% when OPS replaced from 10%, 20% and 30%. It shows that OPS can be used as lightweight concrete. For the slump test, the slump decrease linearly from 8mm to 5mm when OPS replaced. It shows that the OPS has higher water absorption that can decrease the workability of concrete.
2. The optimum compressive strength of mortar at 7 days of curing in phase 1 is 27.12 MPa at 10% POFA as cement replacement. In phase 2, 20% POC replacement produce the optimum compressive strength which is 24.84 MPa. Both compressive strength shows greater than control concrete which is 24.27 MPa.
3. The compressive strength of concrete containing POFA and POC in 28 days of curing increase from 33.6 MPa to 40.2 MPa for control concrete but decrease 44.25% when 10% OPS replaced in the concrete. The compressive strength decrease when the higher percentage of replacement increase. The higher percentage of strength different when 10% OPS added, it shows that OPS does not suitable for structural concrete but suitable for lightweight concrete.
REFERENCES
[1] Shafigh, P., Jumaat, M. Z., Mahmud. H., Hamid, N. A. A., (2012). Lightweight concrete made from crushed oil palm shell: Tensile strength and effect of initial curing on compressive strength. Construction and Building Materials, 252-258.
[2] Teo, D. C. L., Mannan, M. A., Kurian, V. J., (2006). Structural Concrete Using Oil Palm Shell (OPS) as Lightweight Aggregate. Turkish J. Eng. Env. Sci., 251-257.
[3] Mohammeda, B. S., Foo, W.L., Hossain, K. M. A., Abdullahi M. (2013). Shear strength of palm oil clinker concrete beams. Materials and Design, 270–276.
[4] Arunima V. R and Sreelekshmi S. (2016). Experimental Study on the Properties of Hardened Concrete Using Palm Oil Clinker as Repalcement Material for Fine Aggregate. International Journal of Scientific & Engineering Research, 37-41.
[5] Munir, A., Abdullah Huzaim., A., Sofyana I. S. (2015). Utilization of palm oil fuel ash (POFA) in producing lightweight foamed concrete for non-structural building material. Procedia Engineering, 739-746.
[6] Ahmad, M. H., Omar, R. C., Malek, M. A., Noor, N. M., Thiruselvam, S., (2008). Compressive Strength of Palm Oil Fuel Ash Concrete. ICCBT, 297 – 306.
[7] Khairunisa, M., Nurazzimah, Z., Mohammad, A. Z., Kusbiantoro, A., Saffuan, W.A,. (2015). Effect of mixing ingredient on compressive strength of oil palm shell lightweight aggregate concrete containing palm oil fuel ash. Procedia Engineering, 804 – 810.
[8] Shafigh, P,. Hilmi, M., Jumaat, M. Z,. Rasel, A., Syamsul. B., (2014). Structural lightweight aggregate concrete using two types of waste from the palm oil industry as aggregate. Journal of Cleaner Production, 187-196.
[9] Bentz, D.P., Lura, P., Roberts, J.W., 2005. Mixture proportioning for internal curing. ACI Concr. Int. 27 (2), 35-40.

201
The Hydration Effect on Reactive Silica Concrete Containing Eggshell Powder
Muhamad Fekry Murhazan1, Nur Hafizah A. Khalid2, Nur Nadhira Abdul Rasid3
Faculty of Civil Engineering, Universiti Teknologi Malaysia, Malaysia [email protected]
Keywords: Hydration; Palm oil fuel ash; Eggshell powder; Workability; Compressive strength
ABSTRACT. Hydration reaction is an exothermic reaction which heat is released during the hardening process of concrete until it achieved its stable low energy stated the hydration temperature describes the hardening behaviour of concrete. However, when the new materials were incorporated as cement replacement, the hydration behaviour change and need to be investigated. This paper presents the hydration effect on reactive silica concrete containing eggshell powder was investigated which reactive silica concrete is a concrete with pozzolanic material as its cement replacement. In this study, palm oil fuel ash (POFA) was used as cement replacement in the concrete mix. Some previous studies had proven that concrete with POFA as cement replacement was reducing the hydration temperature compared to normal concrete (NC) ) and limited study shows the hydration behaviour action from POFA and eggshell powder. Unfortunately, the workability and compressive strength of reactive silica concrete was detected to reduce with the increasing percentage of POFA as cement replacement. This problem happened due to the natural open cellulose structure of POFA. To address this problem, eggshell powder (ESP) was introduced. ESP in combination between two types of POFA which are ground and unground POFA (GPOFA and UPOFA) is introduced to observe its significant impact on the hydration temperature of reactive silica concrete. Initially, the optimum mix proportion was determined by two parameters; the workability and compressive strength of POFA-ESP concrete. The concrete with much higher workability, at the same time within the target slump range (60 to 180 mm) simultaneously had higher compressive strength of concrete is prioritized as optimum proportion. The overall compressive strength of concrete had shown the increment; GPOFA-ESP concrete gained superior compressive strength as compared to NC and UPOFA-ESP concrete. From optimization of mix proportion, NC (0% POFA and ESP), G3 (10% GPOFA with 10% ESP) and U2 (5% UPOFA with 15% ESP) were investigated further under hydration reaction test. The overall hydration temperature for GPOFA-ESP concrete was higher compared to NC and UPOFA-ESP concrete. As a conclusion, the workability and the compressive strength of the concrete could be the factors to determine the optimum mix proportion of concrete. In the case of hydration reaction of concrete, GPOFA took place to give a later strength to the concrete, while ESP took place as an activator to increase the hydration temperature. Both materials’ combinations are compatible as cement replacement.
INTRODUCTION
Originally, the components of concrete mixture are based on three elements. These are including cement basically from Ordinary Portland Cement (OPC), aggregates (course and fine aggregates), and water. Concrete emitted carbon dioxide (CO2) produced from cement and CO2 is one of the several causes of global warming. To reduce the amount of CO2, the cement content has to be reduced. So, years by years, the cement manufacturers came out with ideas of introducing concrete supplementary as a replacement to cement. One of the potential cement replacement used in industry is palm oil fuel ash (POFA). POFA rich in silica content which helps in reducing the hydration temperature of concrete mix. The reducing of cement content in a concrete mix partially reduced the calcium oxide content. Eggshell wastes which are abundantly disposed have almost 96-97% of calcium oxide and are naturally obtained. This material which can be turned into eggshell powder (ESP) is seen as a big potential to increase the calcium oxide content in the concrete mix.
Problem Statement The normal concrete mixture produced more heat during hydration process compared to concrete containing POFA. Hydration process is the process involving temperature-time relationship where the concrete mix starts to harden. High hydration temperature due to chemical reaction tends to produce shrink and porous concrete as well as produced more CO2 (greenhouse gas). ESP comes from egg shells wastes which generally abundant from a food industry which contain about 97% of calcium oxide (CaO) content. Eggshells wastes are a solid waste which is potentially contributed to the environmental problem if they are not managed properly. ESP is added in reactive silica concrete to increase the amount of calcium oxide in the mixture which has been reduced by POFA replacement. Therefore, POFA-ESP was utilized as concrete supplementary to reduce aforementioned problems. Objectives
202
The objectives of this study are: 1. To determine the optimum mix proportion of reactive silica concrete containing eggshell waste powder (ESP). 2. To investigate hydration temperature of reactive silica concrete containing eggshell waste powder (ESP).
Scope of Study In order to achieve the objectives of the study, this research will only focus on the mechanical properties of reactive silica concrete containing ESP. Thus, the study will only be limited to some scopes of work. Firstly, the raw materials have to be prepared and the concrete mix proportions have to be design. Ground POFA and unground POFA (GPOFA and UPOFA) were involved by incorporating together with ESP. After designing the concrete mix proportions, concretes will be casted and the slump test will be conducted right after the casting process. After concretes’ curing process was done, the compressive strength of concretes was conducted by using compression test. Lastly, the concretes’ hydration temperature was measured for every optimum concrete mix proportion.
LITERATURE REVIEW
Normal concrete (NC) are basically made up by Original Portland Cement (OPC), fine and course aggregates, and water. Normal concrete releases more CO2 to the environment and resulting to the superior temperature rise during hydration process. This could make NC become porous and shrink. As to reduce the aforementioned problems, POFA was recently added to the concrete mix as a cement replacement. POFA acts as a potential pozzolan that is capable in reducing the amount of cement used in concrete mix. The used of POFA as cement replacement had increased the compressive strength of concrete and reduced the overall hydration temperature based on the recent studies. A higher compressive strength could be achieved by using the finer POFA particles as they filled in the micro-voids in the microstructure of concrete. Concrete mix with POFA as a cement replacement is set to gain a maximum strength up to 20% replacement [1]. The pozzolanic reaction between POFA concrete and water produced extra calcium silicate hydroxide gels (C-S-H gels) which makes the mortar more durable and denser due to high silica content [2]. In other study, the chemical elements of POFA that it is moderately rich in silica content (59.62%) as compared to that of OPC (20.40%) [3]. In term of workability, concrete using OPC has higher workability than concrete using POFA as the replacement of OPC. In a recent study, a moderate slump value of 160, 115, 90, and 80mm for OPC, 50%, 60%, and 70% POFA concrete respectively was obtained [3]. The slump was reduced due to the POFA has natural open cellulose structure [4].
Eggshell is one of the sources of environmental pollution in the world which originated from poultries, hatcheries, and fast food industries. The eggshell wastes generation was 190000, 150000, and 110000 tonnes per annum in India, the United States and the United Kingdom, respectively. The values are expected to increase each year [5]. Eggshell powder (ESP) is another form eggshell wastes that have been grounded which are generally abundant waste that rich in calcium oxide (CaO) content. The replacement of cement containing natural CaO by eggshell waste in concrete provide advantages like natural filler in concrete by conserving natural lime and utilising waste material [5]. Previous studies also proved that concrete with eggshells powder replaced some amount of the cement has higher compressive strength than the normal concrete. Eggshell ashes were added to Ordinary Portland Cement (OPC) and lateritic reddish-brown soil and found that the compressive strength increased by 35% for specimens containing mixture of 8% weight of cement and 10% weight of eggshell powder compared to the control sample [6].
Hydration reaction is an exothermic reaction where heat is released during the hydration process. The higher the calcium value in the cement might be beneficial to the development of initial strength in concrete, but the higher heat developed due to chemical reactions produces unpleasant durability problems such as cracks and shrinkage in the concrete [3]. The addition of POFA in a concrete mixture as a supplementary and replacement of cement is believed to reduce the hydration temperature during hydration process. A closed observation has reported a reduction of 15% temperature in concrete blending 30% POFA from that in concrete with OPC alone [7]. The study supported the recent study which stated that regardless the size of POFA the use of this material could successfully reduce the total temperature rise compared to the normal OPC mortar [2]. Hydration reaction also affects by the used of eggshell powder as a supplementary in concrete mix. The optimum accelerating effect occurred by using the cement paste with the greatest eggshell powder content which is 2.5% of weight [8].
The main components of modern OPC are including calcium silicate phases, alite and belite. Alite (C3S) react relatively active with water and provide strength at the early age, while belite (C2S) is less reactive at the early age, but provide strength at the later age. Since C2S gives slower duration to the development of strength, cement with high C3S content are more suitable to be used but it give rise to the hydration temperature. The favour use of higher levels of supplementary cementitious materials alongside the higher CH contents of cements with higher C3S can significantly reduce concrete’s environmental footprint [9].
METHODOLOGY The main objective of the research is to investigate hydration temperature of reactive silica concrete containing
eggshell waste powder (ESP). The hydration temperature of the reactive silica concrete containing ESP was compared to the normal concrete (NC). This research methodology consisted of 5 key activities as below.
203
Preparation of Raw Materials The raw materials that need to be prepared for this study are palm oil fuel ash (POFA) and eggshell powder (ESP). Palm Oil Fuel Ash (POFA). POFA was obtained from the palm oil industry located at the southern state of Malaysia. The palm endocarp and mesocarp are undergoing a combustion process at high temperature of about 800 °C to 1000 °C to produce POFA. In this study, the POFA was divided into two types; unground POFA (UPOFA) and ground POFA (GPOFA). POFA was sieved to pass through 300 µm to obtain UPOFA. A laboratory grinding mill with rod bar was used to obtain GPOFA which is finer filler. Eggshell Powder (ESP). Eggshells were collected at the frozen food industry located in Jalan Bendahara, Johor Bahru, Johor. The abundant eggshells wastes were first dried directly to the sun. The eggshells wastes collected were then crushed by using industrial food grinder. After that, the crushed eggshells were washed by using tap water. The clean eggshells were then filled into trays and dried again in the oven. The temperature of the oven is set at 100 °C ± 5 °C 24 hours. After 24 hours in the oven, the eggshells were took out and left for cooling at 1 hour. The crushed and dried eggshells were finally ground by using industrial grinder to obtain the fine powder of eggshells. Design of Concrete Mix Proportion Particle Size Distribution. The purpose of obtaining the particle size distribution of raw materials is to get the finesses of the materials. From the initial finding, UPOFA had the biggest size of particle, followed by ESP, GPOFA, and OPC, consecutively. Mix Proportion of Reactive Silica Concrete Containing Eggshell Powder (ESP). 5 design mixes of GPOFA-ESP concrete and UPOFA-ESP concrete, respectively, including 1 design mix of NC were designed. For GPOFA-ESP concrete, the design mix of concrete were G1 (0% GPOFA with 20% ESP), G2 (5% GPOFA with 15% ESP), G3 (10% GPOFA with 10% ESP), G4 (15% GPOFA with 5% ESP) and G5 (20% GPOFA with 0% ESP). For UPOFA-ESP concrete, the design mix of concrete were U1 (0% UPOFA with 20% ESP), U2 (5% UPOFA with 15% ESP), U3 (10% UPOFA with 10% ESP), U4 (15% UPOFA with 5% ESP) and U5 (20% UPOFA with 0% ESP). Concrete’s Casting. Before the concrete was casted, the fine aggregates were sieved first to determine the grading of aggregates lie within the limit prescribed by the laboratory test standard. After that, the trial mix design of concrete was casted and cured for 28 days to show that the mix proportion for normal concrete used for the overall study achieves the targeted compressive strength (30 MPa for 28 days of curing age). Workability Test According to Standard Test Method for Slump of Hydraulic-Cement Concrete [10], the concrete workability was tested. To get the slump, the difference between the height of the mould and that of highest point of the specimen was being measured. The targeted slump for this study was between 60-180 mm. Compression Test The compression test of concrete mixture is carried out either in cube or cylinder according to Standard Test Method for Compressive Strength of Cylindrical Concrete Specimens [11]. A total of 132 hardened concrete specimens with cube dimension of 100 mm × 100 mm × 100 mm were tested under compression test. The concrete specimens were tested after through curing age of 1, 14, 28 and 56 days. The concrete specimens were tested by using universal testing machine (3000 kN) with loading rate of 6 kN/s. Hydration Reaction The testing was carried out by setting the thermocouple with the fresh concrete in a simple cubical plywood box. The cubical plywood box was insulated by polystyrene in each side of the box’s walls to avoid influenced from surrounding temperature. After that, the cubical concrete samples each from the optimum mix proportions obtained were casted in a mould and placed in the ready mould which located inside the box. Thermocouple was connected to the data logger; then the thermocouple was attached quarter depth of each of the test specimen to record the hydration activity. The hydration is set for 30 hours duration with the interval of 10 minutes for each data.
RESULTS AND DISCUSSION
The workability test was conducted to obtain the slump of the concrete mix. The compression test was conducted to determine the compressive strength of the concrete. The compressive strength of the concrete was compared to the workability of the concrete to determine the optimum concrete mix proportion. Then, the optimum concrete mix proportion was used to determine the hydration temperature. All tests implied for NC, GPOFA-ESP concrete, and UPOFA-ESP concrete. Finally, the results of the hydration effect on reactive silica concrete containing eggshell powder were obtained.
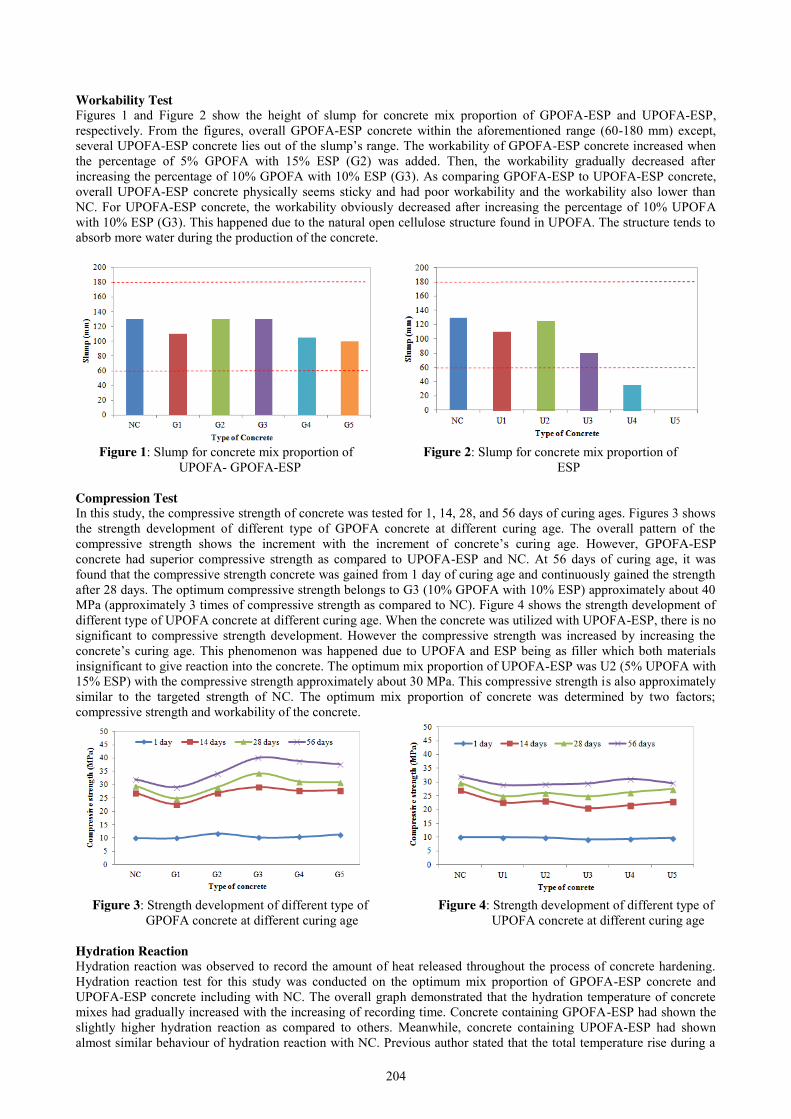
204
Workability Test Figures 1 and Figure 2 show the height of slump for concrete mix proportion of GPOFA-ESP and UPOFA-ESP, respectively. From the figures, overall GPOFA-ESP concrete within the aforementioned range (60-180 mm) except, several UPOFA-ESP concrete lies out of the slump’s range. The workability of GPOFA-ESP concrete increased when the percentage of 5% GPOFA with 15% ESP (G2) was added. Then, the workability gradually decreased after increasing the percentage of 10% GPOFA with 10% ESP (G3). As comparing GPOFA-ESP to UPOFA-ESP concrete, overall UPOFA-ESP concrete physically seems sticky and had poor workability and the workability also lower than NC. For UPOFA-ESP concrete, the workability obviously decreased after increasing the percentage of 10% UPOFA with 10% ESP (G3). This happened due to the natural open cellulose structure found in UPOFA. The structure tends to absorb more water during the production of the concrete.
Figure 1: Slump for concrete mix proportion of Figure 2: Slump for concrete mix proportion of UPOFA- GPOFA-ESP ESP Compression Test In this study, the compressive strength of concrete was tested for 1, 14, 28, and 56 days of curing ages. Figures 3 shows the strength development of different type of GPOFA concrete at different curing age. The overall pattern of the compressive strength shows the increment with the increment of concrete’s curing age. However, GPOFA-ESP concrete had superior compressive strength as compared to UPOFA-ESP and NC. At 56 days of curing age, it was found that the compressive strength concrete was gained from 1 day of curing age and continuously gained the strength after 28 days. The optimum compressive strength belongs to G3 (10% GPOFA with 10% ESP) approximately about 40 MPa (approximately 3 times of compressive strength as compared to NC). Figure 4 shows the strength development of different type of UPOFA concrete at different curing age. When the concrete was utilized with UPOFA-ESP, there is no significant to compressive strength development. However the compressive strength was increased by increasing the concrete’s curing age. This phenomenon was happened due to UPOFA and ESP being as filler which both materials insignificant to give reaction into the concrete. The optimum mix proportion of UPOFA-ESP was U2 (5% UPOFA with 15% ESP) with the compressive strength approximately about 30 MPa. This compressive strength is also approximately similar to the targeted strength of NC. The optimum mix proportion of concrete was determined by two factors; compressive strength and workability of the concrete.
Figure 3: Strength development of different type of Figure 4: Strength development of different type of GPOFA concrete at different curing age UPOFA concrete at different curing age Hydration Reaction Hydration reaction was observed to record the amount of heat released throughout the process of concrete hardening. Hydration reaction test for this study was conducted on the optimum mix proportion of GPOFA-ESP concrete and UPOFA-ESP concrete including with NC. The overall graph demonstrated that the hydration temperature of concrete mixes had gradually increased with the increasing of recording time. Concrete containing GPOFA-ESP had shown the slightly higher hydration reaction as compared to others. Meanwhile, concrete containing UPOFA-ESP had shown almost similar behaviour of hydration reaction with NC. Previous author stated that the total temperature rise during a

205
concrete hardening could be reduced by using POFA as cement replacement regardless of the fineness of POFA compared to NC [2]. Similar agreement from another study claimed that the reasons of reduction in hydration temperature in POFA concrete were caused by the reduced of cement percentage in the mix and the pozzolanic behaviour of POFA itself [12]. However, in contrast from this finding, the concrete containing GPOFA-ESP had slightly higher temperature rise during hydration process compared to NC and UPOFA-ESP concrete due to activator behaviour by ESP might contribute to increase the hydration reaction. It was found that the ESP seems compatible materials as a booster and activator if it was combine with GPOFA in concrete. This finding can be supported with compressive strength of G1 and U1 (solely 20% ESP) which the compressive strength insignificantly increased. However, when the material combined with GPOFA and ESP, the compressive strength was superior increased.
Figure 5: The development of hydration temperature
CONCLUSION
This research presents the hydration effect on reactive silica concrete containing eggshell powder. The conclusions below were made based on the objectives set in the early stage of the study.
1. The factors that contribute to the determination of optimum mix proportion are the workability and the compressive strength of the concrete.
2. In the case of hydration reaction of concrete, GPOFA took place to give a later strength to the concrete, while ESP took place as an activator to increase the hydration temperature. Both materials’ combinations are compatible as cement replacement.
REFERENCES
[1] M. A. Salam, M. Safiuddin, and M. Z. Jumaat, “Microstructure of Self-Consolidating High Strength Concrete Incorporating Palm Oil Fuel Ash,” Phys. Rev. Res. Int., vol. 3, no. 4, pp. 674–687, 2013.
[2] N. H. A. S. Lim, M. A. Ismail, H. S. Lee, M. W. Hussin, A. R. M. Sam, and M. Samadi, “The effects of high volume nano palm oil fuel ash on microstructure properties and hydration temperature of mortar,” Constr. Build. Mater., vol. 93, pp. 29–34, 2015.
[3] A. S. M. A. Awal and I. A. Shehu, “Evaluation of heat of hydration of concrete containing high volume palm oil fuel ash,” Fuel, vol. 105, pp. 728–731, 2013.
[4] N. H. A. Khalid, Binder and Micro-Filler Characterization and Properties of Palm Oil Fuel Ash Polymer Concrete. Johor Bahru: Universiti Teknologi Malaysia, 2015.
[5] A. Yerramala, “Properties of concrete with eggshell powder as cement replacement,” Indian Concr. J., pp. 94–102, 2014.
[6] U. N. Okonkwo, I. C. Odiong, and E. E. Akpabio, “The effect of eggshell ash on strength properties of cement-stabilized lateritic,” Int. J. Sustain. Constr. Eng. Tech., vol. 3, no. 1, pp. 18–25, 2012.
[7] V. Sata, C. Jaturapitakkul, and K. Kiattikomol, “Utilization of Palm Oil Fuel Ash in High-Strength Concrete,” J. Mater. Civ. Eng., vol. 16, no. 6, pp. 623–628, 2004.
[8] M. O. A. Mtallib and A. Rabiu, “Effect of Eggshells Ash (ESA) on the Setting Time of Cement,” Niger. J. Technol., vol. 28, no. 2, pp. 29–38, 2009.
[9] C. S. Hub, “Improving Concrete Sustainability Through Alite and Belite Reactivity,” Concr. Sci. Platf. White Pap., 2013.
[10] ASTM C143, Standard Test Method for Slump of Hydraulic-Cement Concrete. West Conshohocken: ASTM International, 2014.
[11] ASTM C39/C39M, Standard Test Method for Compressive Strength of Cylindrical Concrete Specimens. West Conshohocken: ASTM International, 2014.
[12] A. S. M. A. Awal and M. W. Hussin, “Effect of Palm Oil Fuel Ash in Controlling Heat of Hydration of Concrete,” Procedia Eng., vol. 14, pp. 2650–2657, 2011.
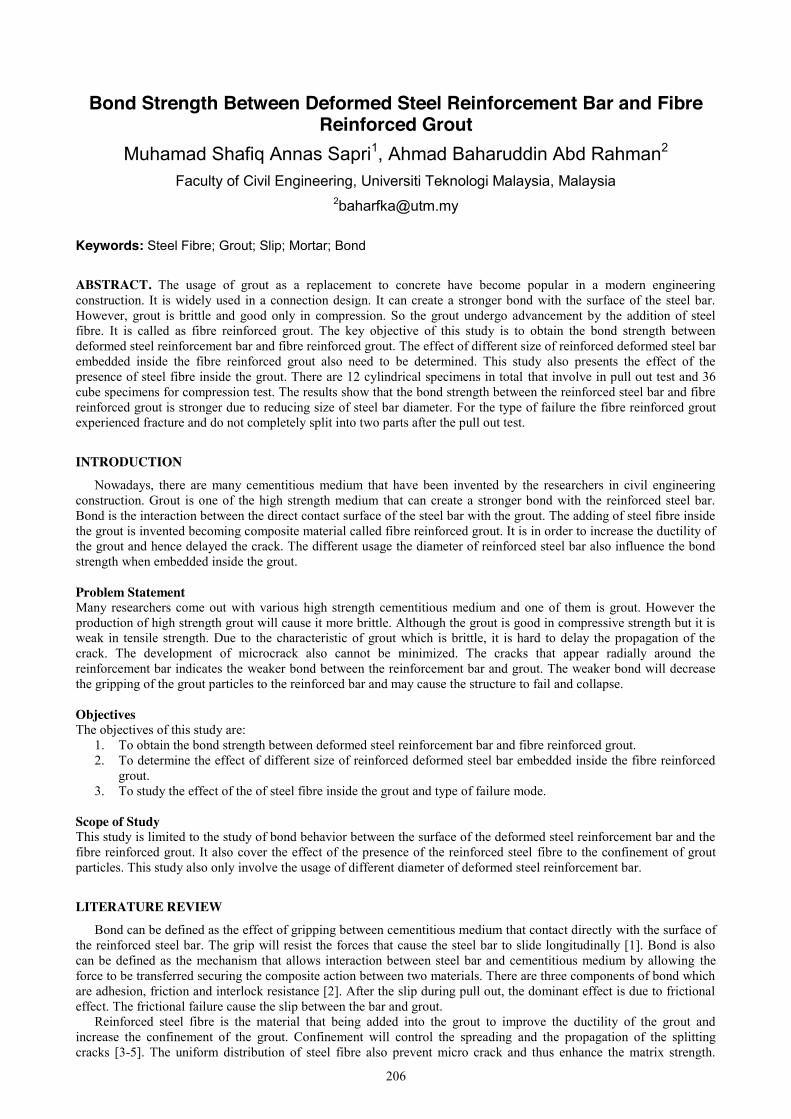
206
Bond Strength Between Deformed Steel Reinforcement Bar and Fibre Reinforced Grout
Muhamad Shafiq Annas Sapri1, Ahmad Baharuddin Abd Rahman2 Faculty of Civil Engineering, Universiti Teknologi Malaysia, Malaysia
Keywords: Steel Fibre; Grout; Slip; Mortar; Bond
ABSTRACT. The usage of grout as a replacement to concrete have become popular in a modern engineering construction. It is widely used in a connection design. It can create a stronger bond with the surface of the steel bar. However, grout is brittle and good only in compression. So the grout undergo advancement by the addition of steel fibre. It is called as fibre reinforced grout. The key objective of this study is to obtain the bond strength between deformed steel reinforcement bar and fibre reinforced grout. The effect of different size of reinforced deformed steel bar embedded inside the fibre reinforced grout also need to be determined. This study also presents the effect of the presence of steel fibre inside the grout. There are 12 cylindrical specimens in total that involve in pull out test and 36 cube specimens for compression test. The results show that the bond strength between the reinforced steel bar and fibre reinforced grout is stronger due to reducing size of steel bar diameter. For the type of failure the fibre reinforced grout experienced fracture and do not completely split into two parts after the pull out test.
INTRODUCTION
Nowadays, there are many cementitious medium that have been invented by the researchers in civil engineering construction. Grout is one of the high strength medium that can create a stronger bond with the reinforced steel bar. Bond is the interaction between the direct contact surface of the steel bar with the grout. The adding of steel fibre inside the grout is invented becoming composite material called fibre reinforced grout. It is in order to increase the ductility of the grout and hence delayed the crack. The different usage the diameter of reinforced steel bar also influence the bond strength when embedded inside the grout. Problem Statement Many researchers come out with various high strength cementitious medium and one of them is grout. However the production of high strength grout will cause it more brittle. Although the grout is good in compressive strength but it is weak in tensile strength. Due to the characteristic of grout which is brittle, it is hard to delay the propagation of the crack. The development of microcrack also cannot be minimized. The cracks that appear radially around the reinforcement bar indicates the weaker bond between the reinforcement bar and grout. The weaker bond will decrease the gripping of the grout particles to the reinforced bar and may cause the structure to fail and collapse.
Objectives The objectives of this study are:
1. To obtain the bond strength between deformed steel reinforcement bar and fibre reinforced grout. 2. To determine the effect of different size of reinforced deformed steel bar embedded inside the fibre reinforced
grout. 3. To study the effect of the of steel fibre inside the grout and type of failure mode.
Scope of Study This study is limited to the study of bond behavior between the surface of the deformed steel reinforcement bar and the fibre reinforced grout. It also cover the effect of the presence of the reinforced steel fibre to the confinement of grout particles. This study also only involve the usage of different diameter of deformed steel reinforcement bar.
LITERATURE REVIEW Bond can be defined as the effect of gripping between cementitious medium that contact directly with the surface of
the reinforced steel bar. The grip will resist the forces that cause the steel bar to slide longitudinally [1]. Bond is also can be defined as the mechanism that allows interaction between steel bar and cementitious medium by allowing the force to be transferred securing the composite action between two materials. There are three components of bond which are adhesion, friction and interlock resistance [2]. After the slip during pull out, the dominant effect is due to frictional effect. The frictional failure cause the slip between the bar and grout.
Reinforced steel fibre is the material that being added into the grout to improve the ductility of the grout and increase the confinement of the grout. Confinement will control the spreading and the propagation of the splitting cracks [3-5]. The uniform distribution of steel fibre also prevent micro crack and thus enhance the matrix strength.
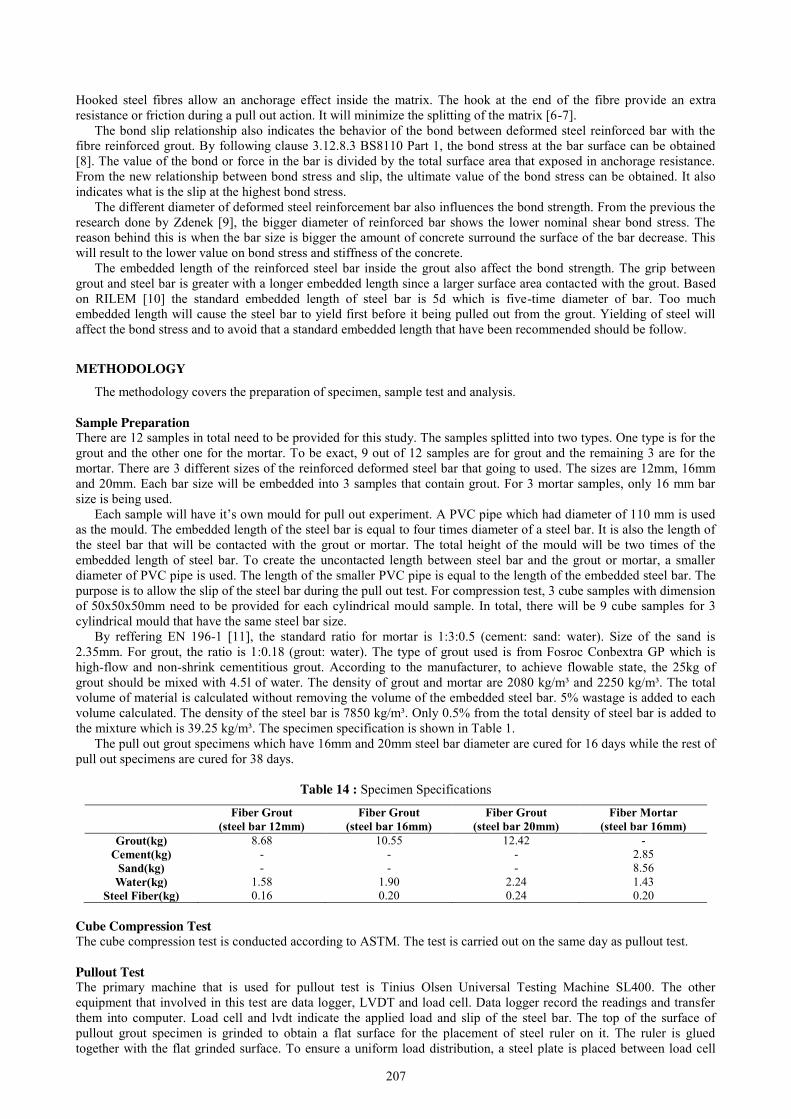
207
Hooked steel fibres allow an anchorage effect inside the matrix. The hook at the end of the fibre provide an extra resistance or friction during a pull out action. It will minimize the splitting of the matrix [6-7].
The bond slip relationship also indicates the behavior of the bond between deformed steel reinforced bar with the fibre reinforced grout. By following clause 3.12.8.3 BS8110 Part 1, the bond stress at the bar surface can be obtained [8]. The value of the bond or force in the bar is divided by the total surface area that exposed in anchorage resistance. From the new relationship between bond stress and slip, the ultimate value of the bond stress can be obtained. It also indicates what is the slip at the highest bond stress.
The different diameter of deformed steel reinforcement bar also influences the bond strength. From the previous the research done by Zdenek [9], the bigger diameter of reinforced bar shows the lower nominal shear bond stress. The reason behind this is when the bar size is bigger the amount of concrete surround the surface of the bar decrease. This will result to the lower value on bond stress and stiffness of the concrete.
The embedded length of the reinforced steel bar inside the grout also affect the bond strength. The grip between grout and steel bar is greater with a longer embedded length since a larger surface area contacted with the grout. Based on RILEM [10] the standard embedded length of steel bar is 5d which is five-time diameter of bar. Too much embedded length will cause the steel bar to yield first before it being pulled out from the grout. Yielding of steel will affect the bond stress and to avoid that a standard embedded length that have been recommended should be follow.
METHODOLOGY
The methodology covers the preparation of specimen, sample test and analysis. Sample Preparation There are 12 samples in total need to be provided for this study. The samples splitted into two types. One type is for the grout and the other one for the mortar. To be exact, 9 out of 12 samples are for grout and the remaining 3 are for the mortar. There are 3 different sizes of the reinforced deformed steel bar that going to used. The sizes are 12mm, 16mm and 20mm. Each bar size will be embedded into 3 samples that contain grout. For 3 mortar samples, only 16 mm bar size is being used.
Each sample will have it’s own mould for pull out experiment. A PVC pipe which had diameter of 110 mm is used as the mould. The embedded length of the steel bar is equal to four times diameter of a steel bar. It is also the length of the steel bar that will be contacted with the grout or mortar. The total height of the mould will be two times of the embedded length of steel bar. To create the uncontacted length between steel bar and the grout or mortar, a smaller diameter of PVC pipe is used. The length of the smaller PVC pipe is equal to the length of the embedded steel bar. The purpose is to allow the slip of the steel bar during the pull out test. For compression test, 3 cube samples with dimension of 50x50x50mm need to be provided for each cylindrical mould sample. In total, there will be 9 cube samples for 3 cylindrical mould that have the same steel bar size.
By reffering EN 196-1 [11], the standard ratio for mortar is 1:3:0.5 (cement: sand: water). Size of the sand is 2.35mm. For grout, the ratio is 1:0.18 (grout: water). The type of grout used is from Fosroc Conbextra GP which is high-flow and non-shrink cementitious grout. According to the manufacturer, to achieve flowable state, the 25kg of grout should be mixed with 4.5l of water. The density of grout and mortar are 2080 kg/m³ and 2250 kg/m³. The total volume of material is calculated without removing the volume of the embedded steel bar. 5% wastage is added to each volume calculated. The density of the steel bar is 7850 kg/m³. Only 0.5% from the total density of steel bar is added to the mixture which is 39.25 kg/m³. The specimen specification is shown in Table 1.
The pull out grout specimens which have 16mm and 20mm steel bar diameter are cured for 16 days while the rest of pull out specimens are cured for 38 days.
Table 14 : Specimen Specifications
Fiber Grout (steel bar 12mm)
Fiber Grout (steel bar 16mm)
Fiber Grout (steel bar 20mm)
Fiber Mortar (steel bar 16mm)
Grout(kg) 8.68 10.55 12.42 - Cement(kg) - - - 2.85
Sand(kg) - - - 8.56 Water(kg) 1.58 1.90 2.24 1.43
Steel Fiber(kg) 0.16 0.20 0.24 0.20 Cube Compression Test The cube compression test is conducted according to ASTM. The test is carried out on the same day as pullout test. Pullout Test The primary machine that is used for pullout test is Tinius Olsen Universal Testing Machine SL400. The other equipment that involved in this test are data logger, LVDT and load cell. Data logger record the readings and transfer them into computer. Load cell and lvdt indicate the applied load and slip of the steel bar. The top of the surface of pullout grout specimen is grinded to obtain a flat surface for the placement of steel ruler on it. The ruler is glued together with the flat grinded surface. To ensure a uniform load distribution, a steel plate is placed between load cell
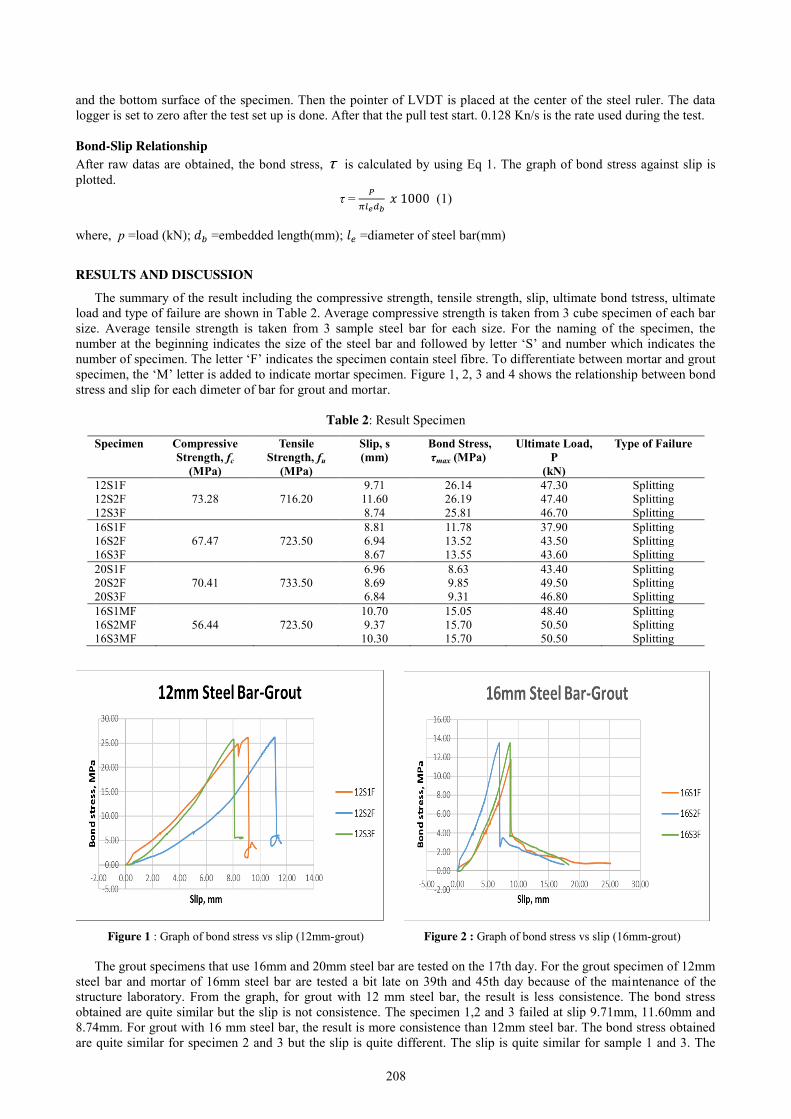
208
and the bottom surface of the specimen. Then the pointer of LVDT is placed at the center of the steel ruler. The data logger is set to zero after the test set up is done. After that the pull test start. 0.128 Kn/s is the rate used during the test. Bond-Slip Relationship After raw datas are obtained, the bond stress, τ is calculated by using Eq 1. The graph of bond stress against slip is plotted.
τ = 𝑃𝜋𝑙𝑒𝑑𝑏
𝑥 1000 (1)
where, p =load (kN); 𝑑𝑏 =embedded length(mm); 𝑙𝑒 =diameter of steel bar(mm)
RESULTS AND DISCUSSION
The summary of the result including the compressive strength, tensile strength, slip, ultimate bond tstress, ultimate load and type of failure are shown in Table 2. Average compressive strength is taken from 3 cube specimen of each bar size. Average tensile strength is taken from 3 sample steel bar for each size. For the naming of the specimen, the number at the beginning indicates the size of the steel bar and followed by letter ‘S’ and number which indicates the number of specimen. The letter ‘F’ indicates the specimen contain steel fibre. To differentiate between mortar and grout specimen, the ‘M’ letter is added to indicate mortar specimen. Figure 1, 2, 3 and 4 shows the relationship between bond stress and slip for each dimeter of bar for grout and mortar.
Table 2: Result Specimen
Specimen Compressive Strength, fc
(MPa)
Tensile Strength, fu
(MPa)
Slip, s (mm)
Bond Stress, τmax (MPa)
Ultimate Load, P
(kN)
Type of Failure
12S1F 9.71 26.14 47.30 Splitting 12S2F 73.28 716.20 11.60 26.19 47.40 Splitting 12S3F 8.74 25.81 46.70 Splitting 16S1F 8.81 11.78 37.90 Splitting 16S2F 67.47 723.50 6.94 13.52 43.50 Splitting 16S3F 8.67 13.55 43.60 Splitting 20S1F 6.96 8.63 43.40 Splitting 20S2F 70.41 733.50 8.69 9.85 49.50 Splitting 20S3F 6.84 9.31 46.80 Splitting 16S1MF 10.70 15.05 48.40 Splitting 16S2MF 56.44 723.50 9.37 15.70 50.50 Splitting 16S3MF 10.30 15.70 50.50 Splitting
Figure 1 : Graph of bond stress vs slip (12mm-grout) Figure 2 : Graph of bond stress vs slip (16mm-grout)
The grout specimens that use 16mm and 20mm steel bar are tested on the 17th day. For the grout specimen of 12mm
steel bar and mortar of 16mm steel bar are tested a bit late on 39th and 45th day because of the maintenance of the structure laboratory. From the graph, for grout with 12 mm steel bar, the result is less consistence. The bond stress obtained are quite similar but the slip is not consistence. The specimen 1,2 and 3 failed at slip 9.71mm, 11.60mm and 8.74mm. For grout with 16 mm steel bar, the result is more consistence than 12mm steel bar. The bond stress obtained are quite similar for specimen 2 and 3 but the slip is quite different. The slip is quite similar for sample 1 and 3. The
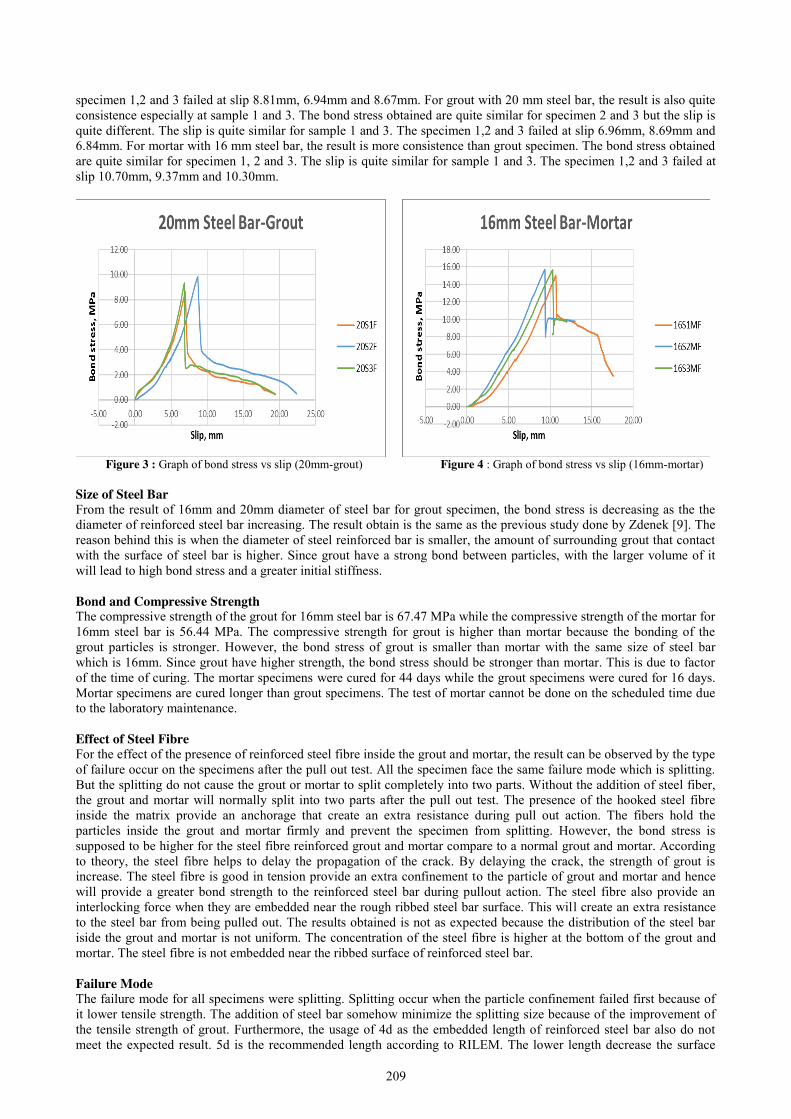
209
specimen 1,2 and 3 failed at slip 8.81mm, 6.94mm and 8.67mm. For grout with 20 mm steel bar, the result is also quite consistence especially at sample 1 and 3. The bond stress obtained are quite similar for specimen 2 and 3 but the slip is quite different. The slip is quite similar for sample 1 and 3. The specimen 1,2 and 3 failed at slip 6.96mm, 8.69mm and 6.84mm. For mortar with 16 mm steel bar, the result is more consistence than grout specimen. The bond stress obtained are quite similar for specimen 1, 2 and 3. The slip is quite similar for sample 1 and 3. The specimen 1,2 and 3 failed at slip 10.70mm, 9.37mm and 10.30mm.
Figure 3 : Graph of bond stress vs slip (20mm-grout) Figure 4 : Graph of bond stress vs slip (16mm-mortar) Size of Steel Bar From the result of 16mm and 20mm diameter of steel bar for grout specimen, the bond stress is decreasing as the the diameter of reinforced steel bar increasing. The result obtain is the same as the previous study done by Zdenek [9]. The reason behind this is when the diameter of steel reinforced bar is smaller, the amount of surrounding grout that contact with the surface of steel bar is higher. Since grout have a strong bond between particles, with the larger volume of it will lead to high bond stress and a greater initial stiffness. Bond and Compressive Strength The compressive strength of the grout for 16mm steel bar is 67.47 MPa while the compressive strength of the mortar for 16mm steel bar is 56.44 MPa. The compressive strength for grout is higher than mortar because the bonding of the grout particles is stronger. However, the bond stress of grout is smaller than mortar with the same size of steel bar which is 16mm. Since grout have higher strength, the bond stress should be stronger than mortar. This is due to factor of the time of curing. The mortar specimens were cured for 44 days while the grout specimens were cured for 16 days. Mortar specimens are cured longer than grout specimens. The test of mortar cannot be done on the scheduled time due to the laboratory maintenance. Effect of Steel Fibre For the effect of the presence of reinforced steel fibre inside the grout and mortar, the result can be observed by the type of failure occur on the specimens after the pull out test. All the specimen face the same failure mode which is splitting. But the splitting do not cause the grout or mortar to split completely into two parts. Without the addition of steel fiber, the grout and mortar will normally split into two parts after the pull out test. The presence of the hooked steel fibre inside the matrix provide an anchorage that create an extra resistance during pull out action. The fibers hold the particles inside the grout and mortar firmly and prevent the specimen from splitting. However, the bond stress is supposed to be higher for the steel fibre reinforced grout and mortar compare to a normal grout and mortar. According to theory, the steel fibre helps to delay the propagation of the crack. By delaying the crack, the strength of grout is increase. The steel fibre is good in tension provide an extra confinement to the particle of grout and mortar and hence will provide a greater bond strength to the reinforced steel bar during pullout action. The steel fibre also provide an interlocking force when they are embedded near the rough ribbed steel bar surface. This will create an extra resistance to the steel bar from being pulled out. The results obtained is not as expected because the distribution of the steel bar iside the grout and mortar is not uniform. The concentration of the steel fibre is higher at the bottom of the grout and mortar. The steel fibre is not embedded near the ribbed surface of reinforced steel bar. Failure Mode The failure mode for all specimens were splitting. Splitting occur when the particle confinement failed first because of it lower tensile strength. The addition of steel bar somehow minimize the splitting size because of the improvement of the tensile strength of grout. Furthermore, the usage of 4d as the embedded length of reinforced steel bar also do not meet the expected result. 5d is the recommended length according to RILEM. The lower length decrease the surface

210
area of the steel bar that contact with the grout and mortar. This will decrease the bond strength between steel bar and the matrix. The ribbed surface area of steel bar will cause crushing to the matrix particle due to the lack of bonding strength. The steel bar will easily pulled out from the matrix and indicate a lower bond stress at the surface of the embedded steel bar.
CONCLUSION
This study represents the bond strength between deformed steel reinforcement bar and fibre reinforced grout through the pullout experiment.
1. For every diameter of steel bar which are 12mm, 16mm and 20mm the value of bond strength between the deformed steel reinforcement bar and fibre reinforced grout and mortar are obtained successfully after the pullout test.
2. The bond stress inreases when the diameter of the reinforced steel bar decreases. This is due to the greater amount of grout and mortar that contact with the surface of the reinforced steel bar. Hence increase the bond stress exerted on the reinforced steel bar.
3. The presence of the steel fibre inside the grout and mortar prevent the matrix from splitting completely into 2 parts after the pullout action. This is due to the good confinement provided from steel bar to hold the matrix particle stronger. However the bond stress for fibre reinforced grout should be stronger compare to the normal grout because the steel fibre delayed the propagation of crack and create a stronger confinement between grout particle during pullout action. This is due to the ununiform distribution of steel fibre inside the grout and mortar. So the result obtain is not the same as the expected.
4. The usage of 4d as the embedded length of the reinforced steel bar inside the grout and mortar is not suitable to get the actual bond stress. The reduction of the surface area of reinforced steel that contact with the grout and mortar will reduce the bond stress exerted. When the steel bar is pulled out, the lack of the bond stress that hold the steel bar will cause crushing of grout particle at the area close to the ribbed surface of steel bar. So the actual bond stress cannot be obtained. As recommended in RILEM, 5d is the suitable embedded length for reinforced steel bar inside the grout so that more surface area of reinforced steel bar will contact with the matrix.
REFERENCES
[1] Gilkey HJ, Chamberlin SJ, Beal RW. Bond between concrete and steel, Reproduction in engineering report No.26. Iowa Eng Exp Station, Iowa State Coll Ames 1956. p. 25–147. [2] Cox, J.V., Herrmann, L.R.: Development of a Plasticity Bond Model for Steel Reinforcement, Mechanics of
Cohesive-Frictional Materials, (1998) John Wiley & Sons, Ltd., pp.155–180. [3] Einea A, Yamane T, Tadros MK. Grout-filled pipe splices for precast concrete construction. Precast/Prestr
Concrete I J 1995;40(1):82–93. [4] Moosavi M, Jafari A, Khosravi A. Bond of cement grouted reinforcing bars under constant radial pressure.
Cem Concr Compos 2005;27(11):103–9. [5] Soroushian P, Choi Ki-Bong, Park Gill-Hyun, Aslani Farhang. Bond of deformed bars to concrete: effects of
confinement and strength of concrete. ACI Mater J 1991;88(3):227–32. [6] A. Bentur, A.E. Naaman, S. Wu, N. Banthia, R. Baggott, W. Hansen, A. Katz, C. Leung, V. Li, B. Mobasher,
R. Robertson, P. Soroushian, H. Stang, L. Taerwe, Fiber-matrix interfaces, in: A.E. Naaman, H.W. Reinhards (Eds.), High Performance Fiber Reinforced Cement Composites 2, Proc. Int. RILEM Conf., E&FN SPON, England, 1996, pp. 149–192.
[7] M. Tuyan, H. Yazici, Pull-out behavior of single steel fiber from SIFCON matrix, Constr. Build. Mater. 35 (2012) 571–577.
[8] British Standard Institution, Structural Use of Concrete BS8110:Part 1: (1997): London, Clauses 3.12.8.3 and 3.12.8.4.
[9] BaZant, Zdenek, and Cao, Zhiping, "Size Effect in Shear Failure of Prestressed Concrete Beams," ACI JOURNAL, Proceedings V:83, No.2, Mar.-Apr. 1986, pp. 260-268.
[10] RILEM Technical Recommendations of the Testing and Use of Construction Material (1994). RC6 Bond Test for Reinforcement: Pull-out Test.
[11] EN 196-1. ‘‘Methods of Testing Cement – Part 1: Determination of Strength,”European Committee for Standardization, 2005.

211
Performance of Self-Curing Concrete with Palm Oil Clinker as Fine Aggregate Replacement
Nahirah Mohd Jainar1, Abdul Rahman Mohd. Sam2, Mohammadamin Azimi3
Faculty of Civil Engineering, Universiti Teknologi Malaysia, Malaysia [email protected]
Keywords: Palm Oil Clinker; Self-Curing Concrete; Palm Oil Clinker Concrete; Lightweight Aggregate
ABSTRACT. Palm Oil Clinker (POC) is a porous lightweight aggregate that has the ability to absorb additional water and internally stored due to the presence of small void inside the aggregate. In this study, POC aggregate was used as fine aggregate replacement in self-curing concrete. This study focused mainly on investigating the effect of replacement with POC on the mechanical properties of concrete under different curing condition. DOE menthod was adopted for the mix design to produce concrete Grade 40. The approach used in the mix deisgn involved POC replacement of 50% of the fine aggregates. The parameters investigated in this study include slump test for the fresh properties, as well as the compressive strength and ultra-pulse value (UPV) test at 3, 7, 28 days in three different curing conditions. Test results showed that POC exhibit comparable workability, acceptable compressive strength of – Mpa at 28 days and good UPV value. Thus, POC has a comparable potential to replace fine aggregate in self-curing concrete.
INTRODUCTION Nowadays, concrete curing problem has become one of the main problem in construction industry. The concrete
curing problem affected the hydration process of the concrete as the hydration process will affect the desired properties especially the strength of concrete. Researcher defined concrete curing as the maintaining of a satisfactory moisture content and temperature in concrete during its early stages so that desired properties (of concrete) may develop [1].
Self curing concrete involve the internal water curing that indicates the process by which small inclusions dispersed within the concrete hold the water during mixing and up to setting time and release it during cement hydration [2]. The most common self curing agent used in self curing concrete is lightweight aggregate (LWA). In this study, POC is chosen as a self curing agent and also as fine aggregate replacement. It is a light, solid, and fibrous material, which may be used as a potential lightweight aggregate for concrete [3]. Palm Oil Clinker (POC) also revealed to have a higher water absorption compared to natural aggregates, since the unit weight of the POC aggregate is approximately 25% lighter than river sand and 48% lighter than crushed granite stone [4]. Therefore, POC aggregate has the potential as a self curing agent. Problem Statement Proper and good concrete curing process in construction site has become problem for many construction project due to different temperature and weather in construction site. Properly cured concrete need to have enough amount of moisture in order to ensure the hydration process undergo properly. Moreover, curing also has a strong influence on the properties of hardened concrete includes increase in durability, strength, volume stability, abrasion resistance, impermeability and resistance to freezing and thawing [5].
Therefore, many researchers have come up with self curing agent material to promote internal curing based aggregate by using porous lightweight aggregate (LWA) as this type of aggregate can be formed by using industrial waste. In this study, POC will be used as a self-curing agent as it categorized as a porous lightweight aggregate (LWA). This type of aggregate is a by-product of agricultural waste from palm oil shell incineration. Since POC is abundant and have small commercial value in Malaysia, it has high potential to be converted into potential construction materials [6]. Objectives The objectives of this study are:
1. To determine the properties of POC as fine aggregates replacement. 2. To evaluate the performance of fresh and hardened properties of the self curing concrete with POC as fine
aggregates replacement. 3. To investigate the effect of curing condition on the self curing concrete with POC as fine aggregates
replacement. Scope of Study This research is carried out to study the performance of POC as a self curing agent in self curing concrete. It includes the properties of POC, curing age, curing conditions and fresh and hardened properties. The fresh and hardened
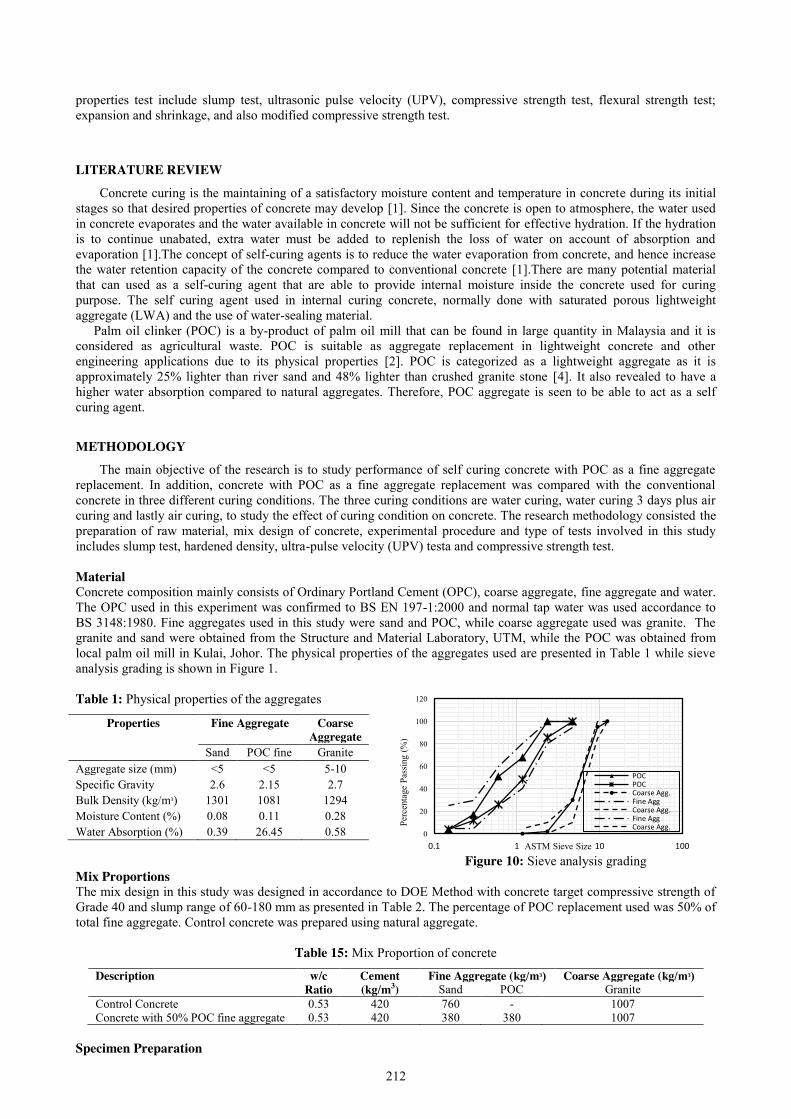
212
properties test include slump test, ultrasonic pulse velocity (UPV), compressive strength test, flexural strength test; expansion and shrinkage, and also modified compressive strength test.
LITERATURE REVIEW
Concrete curing is the maintaining of a satisfactory moisture content and temperature in concrete during its initial stages so that desired properties of concrete may develop [1]. Since the concrete is open to atmosphere, the water used in concrete evaporates and the water available in concrete will not be sufficient for effective hydration. If the hydration is to continue unabated, extra water must be added to replenish the loss of water on account of absorption and evaporation [1].The concept of self-curing agents is to reduce the water evaporation from concrete, and hence increase the water retention capacity of the concrete compared to conventional concrete [1].There are many potential material that can used as a self-curing agent that are able to provide internal moisture inside the concrete used for curing purpose. The self curing agent used in internal curing concrete, normally done with saturated porous lightweight aggregate (LWA) and the use of water-sealing material.
Palm oil clinker (POC) is a by-product of palm oil mill that can be found in large quantity in Malaysia and it is considered as agricultural waste. POC is suitable as aggregate replacement in lightweight concrete and other engineering applications due to its physical properties [2]. POC is categorized as a lightweight aggregate as it is approximately 25% lighter than river sand and 48% lighter than crushed granite stone [4]. It also revealed to have a higher water absorption compared to natural aggregates. Therefore, POC aggregate is seen to be able to act as a self curing agent.
METHODOLOGY The main objective of the research is to study performance of self curing concrete with POC as a fine aggregate
replacement. In addition, concrete with POC as a fine aggregate replacement was compared with the conventional concrete in three different curing conditions. The three curing conditions are water curing, water curing 3 days plus air curing and lastly air curing, to study the effect of curing condition on concrete. The research methodology consisted the preparation of raw material, mix design of concrete, experimental procedure and type of tests involved in this study includes slump test, hardened density, ultra-pulse velocity (UPV) testa and compressive strength test.
Material Concrete composition mainly consists of Ordinary Portland Cement (OPC), coarse aggregate, fine aggregate and water. The OPC used in this experiment was confirmed to BS EN 197-1:2000 and normal tap water was used accordance to BS 3148:1980. Fine aggregates used in this study were sand and POC, while coarse aggregate used was granite. The granite and sand were obtained from the Structure and Material Laboratory, UTM, while the POC was obtained from local palm oil mill in Kulai, Johor. The physical properties of the aggregates used are presented in Table 1 while sieve analysis grading is shown in Figure 1. Table 1: Physical properties of the aggregates
Properties Fine Aggregate Coarse Aggregate
Sand POC fine Granite
Aggregate size (mm) <5 <5 5-10 Specific Gravity 2.6 2.15 2.7 Bulk Density (kg/mᶟ) 1301 1081 1294 Moisture Content (%) 0.08 0.11 0.28 Water Absorption (%) 0.39 26.45 0.58
Figure 10: Sieve analysis grading
Mix Proportions The mix design in this study was designed in accordance to DOE Method with concrete target compressive strength of Grade 40 and slump range of 60-180 mm as presented in Table 2. The percentage of POC replacement used was 50% of total fine aggregate. Control concrete was prepared using natural aggregate.
Table 15: Mix Proportion of concrete
Description w/c Ratio
Cement (kg/m3)
Fine Aggregate (kg/mᶟ) Coarse Aggregate (kg/mᶟ) Sand POC Granite
Control Concrete 0.53 420 760 - 1007 Concrete with 50% POC fine aggregate 0.53 420 380 380 1007
Specimen Preparation
0
20
40
60
80
100
120
0.1 1 10 100
Perc
enta
ge P
assin
g (%
)
ASTM Sieve Size
POCPOCCoarse Agg.Fine AggCoarse Agg.Fine AggCoarse Agg.
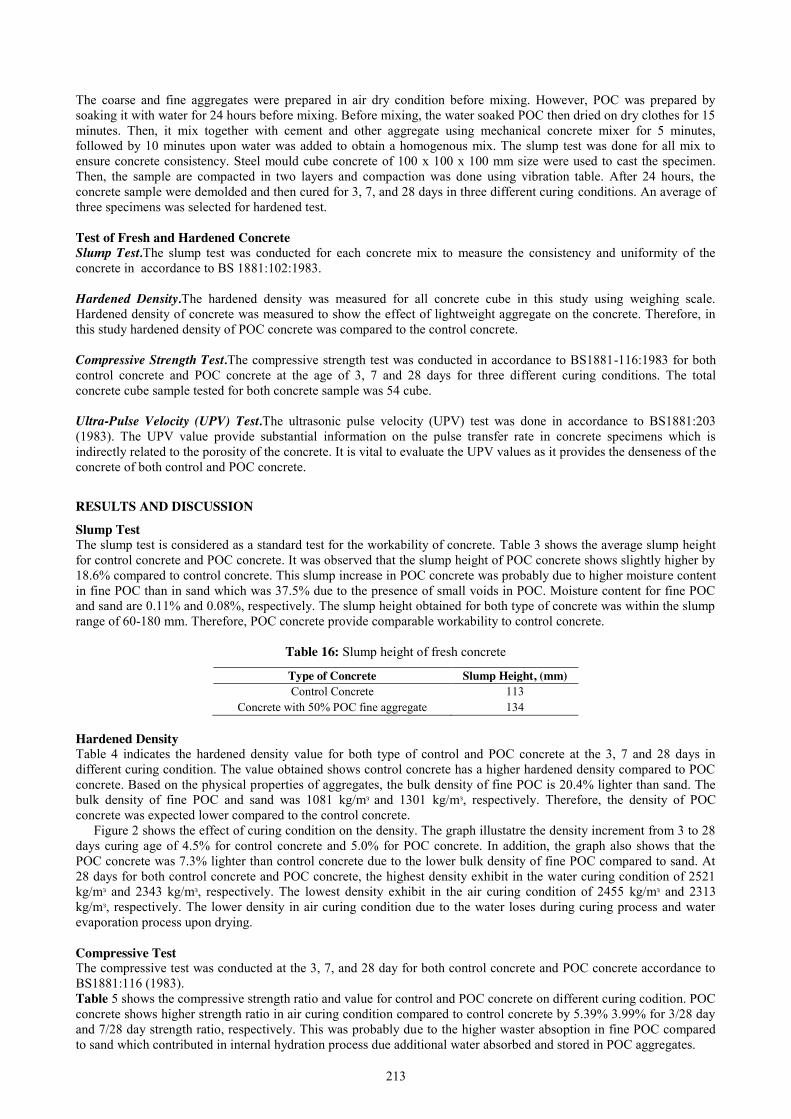
213
The coarse and fine aggregates were prepared in air dry condition before mixing. However, POC was prepared by soaking it with water for 24 hours before mixing. Before mixing, the water soaked POC then dried on dry clothes for 15 minutes. Then, it mix together with cement and other aggregate using mechanical concrete mixer for 5 minutes, followed by 10 minutes upon water was added to obtain a homogenous mix. The slump test was done for all mix to ensure concrete consistency. Steel mould cube concrete of 100 x 100 x 100 mm size were used to cast the specimen. Then, the sample are compacted in two layers and compaction was done using vibration table. After 24 hours, the concrete sample were demolded and then cured for 3, 7, and 28 days in three different curing conditions. An average of three specimens was selected for hardened test. Test of Fresh and Hardened Concrete Slump Test.The slump test was conducted for each concrete mix to measure the consistency and uniformity of the concrete in accordance to BS 1881:102:1983. Hardened Density.The hardened density was measured for all concrete cube in this study using weighing scale. Hardened density of concrete was measured to show the effect of lightweight aggregate on the concrete. Therefore, in this study hardened density of POC concrete was compared to the control concrete. Compressive Strength Test.The compressive strength test was conducted in accordance to BS1881-116:1983 for both control concrete and POC concrete at the age of 3, 7 and 28 days for three different curing conditions. The total concrete cube sample tested for both concrete sample was 54 cube. Ultra-Pulse Velocity (UPV) Test.The ultrasonic pulse velocity (UPV) test was done in accordance to BS1881:203 (1983). The UPV value provide substantial information on the pulse transfer rate in concrete specimens which is indirectly related to the porosity of the concrete. It is vital to evaluate the UPV values as it provides the denseness of the concrete of both control and POC concrete.
RESULTS AND DISCUSSION
Slump Test The slump test is considered as a standard test for the workability of concrete. Table 3 shows the average slump height for control concrete and POC concrete. It was observed that the slump height of POC concrete shows slightly higher by 18.6% compared to control concrete. This slump increase in POC concrete was probably due to higher moisture content in fine POC than in sand which was 37.5% due to the presence of small voids in POC. Moisture content for fine POC and sand are 0.11% and 0.08%, respectively. The slump height obtained for both type of concrete was within the slump range of 60-180 mm. Therefore, POC concrete provide comparable workability to control concrete.
Table 16: Slump height of fresh concrete
Type of Concrete Slump Height, (mm) Control Concrete 113
Concrete with 50% POC fine aggregate 134 Hardened Density Table 4 indicates the hardened density value for both type of control and POC concrete at the 3, 7 and 28 days in different curing condition. The value obtained shows control concrete has a higher hardened density compared to POC concrete. Based on the physical properties of aggregates, the bulk density of fine POC is 20.4% lighter than sand. The bulk density of fine POC and sand was 1081 kg/mᶟ and 1301 kg/mᶟ, respectively. Therefore, the density of POC concrete was expected lower compared to the control concrete.
Figure 2 shows the effect of curing condition on the density. The graph illustatre the density increment from 3 to 28 days curing age of 4.5% for control concrete and 5.0% for POC concrete. In addition, the graph also shows that the POC concrete was 7.3% lighter than control concrete due to the lower bulk density of fine POC compared to sand. At 28 days for both control concrete and POC concrete, the highest density exhibit in the water curing condition of 2521 kg/mᶟ and 2343 kg/mᶟ, respectively. The lowest density exhibit in the air curing condition of 2455 kg/mᶟ and 2313 kg/mᶟ, respectively. The lower density in air curing condition due to the water loses during curing process and water evaporation process upon drying. Compressive Test The compressive test was conducted at the 3, 7, and 28 day for both control concrete and POC concrete accordance to BS1881:116 (1983). Table 5 shows the compressive strength ratio and value for control and POC concrete on different curing codition. POC concrete shows higher strength ratio in air curing condition compared to control concrete by 5.39% 3.99% for 3/28 day and 7/28 day strength ratio, respectively. This was probably due to the higher waster absoption in fine POC compared to sand which contributed in internal hydration process due additional water absorbed and stored in POC aggregates.

214
Table 4: Hardened density value of control and POC concrete
Type of Concrete
Curing Condition
Age Hardened Density (kg/m³)
Control WC 3 2420 Mix
7 2488
28 2521
WC 3Days 3 2410
& AC 7 2471
28 2484
AC 3 2319
7 2454
28 2455
F50 POC WC 3 2228 Concrete
7 2277
28 2343
WC 3Days 3 2222
& AC 7 2247
28 2330
AC 3 2200
7 2245
28 2313
Figure 2: Relationship between of hardened density and curing time
Table 5: Compressive strength ratio of control and POC concrete
Type of Concrete Curing Condition
Age Compressive Strength (MPa)
Strength Ratio (%) 3/28 day 7/28 day
Control Mix WC 3 26.014 55.65 77.12
7 36.050
28 46.747
WC 3Days 3 26.014
60.22 78.34
& AC 7 33.842
28 43.200
AC 3 24.955
60.72 73.44
7 30.184
28 41.099
POC Concrete WC 3 24.184 57.95 73.14
7 30.522
28 41.733
WC 3Days 3 24.184
61.21 73.90
& AC 7 29.202
28 39.513
AC 3 24.126
63.93 76.37
7 28.822
28 37.740
Figure 11: Effect of compressive strength
on POC against curing time
Figure 4: Relationship of compressive strength against
UPV
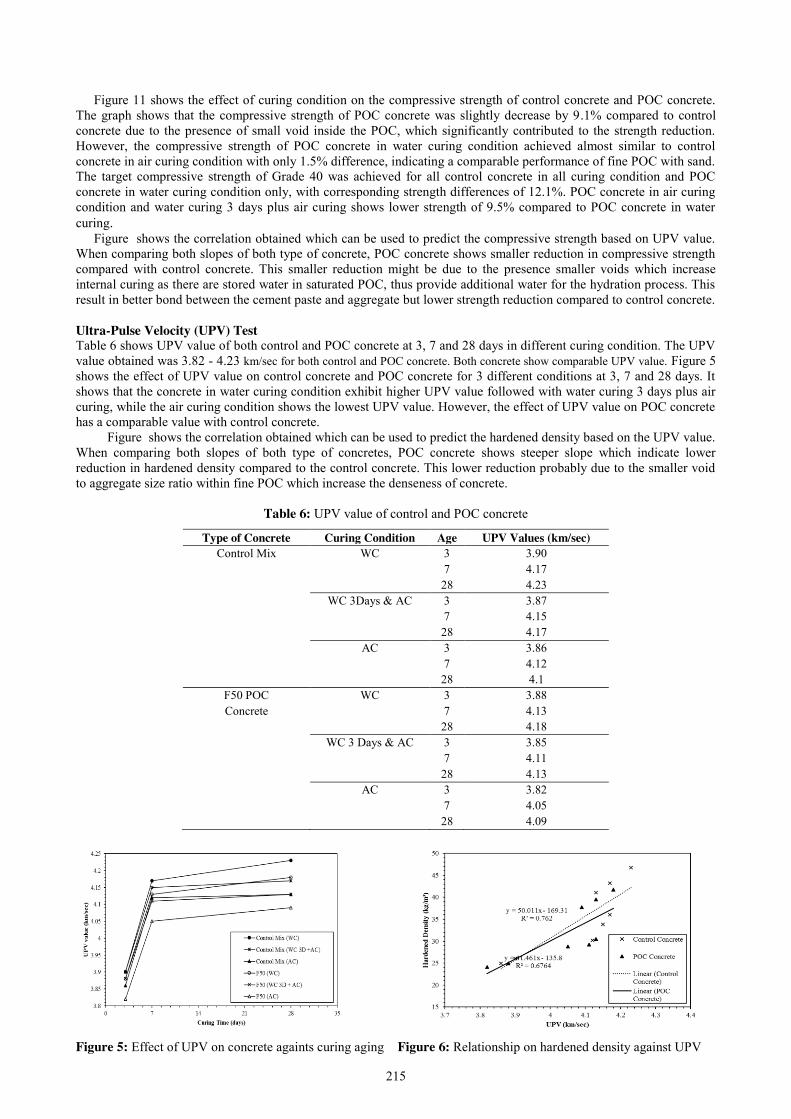
215
Figure 11 shows the effect of curing condition on the compressive strength of control concrete and POC concrete. The graph shows that the compressive strength of POC concrete was slightly decrease by 9.1% compared to control concrete due to the presence of small void inside the POC, which significantly contributed to the strength reduction. However, the compressive strength of POC concrete in water curing condition achieved almost similar to control concrete in air curing condition with only 1.5% difference, indicating a comparable performance of fine POC with sand. The target compressive strength of Grade 40 was achieved for all control concrete in all curing condition and POC concrete in water curing condition only, with corresponding strength differences of 12.1%. POC concrete in air curing condition and water curing 3 days plus air curing shows lower strength of 9.5% compared to POC concrete in water curing.
Figure shows the correlation obtained which can be used to predict the compressive strength based on UPV value. When comparing both slopes of both type of concrete, POC concrete shows smaller reduction in compressive strength compared with control concrete. This smaller reduction might be due to the presence smaller voids which increase internal curing as there are stored water in saturated POC, thus provide additional water for the hydration process. This result in better bond between the cement paste and aggregate but lower strength reduction compared to control concrete. Ultra-Pulse Velocity (UPV) Test Table 6 shows UPV value of both control and POC concrete at 3, 7 and 28 days in different curing condition. The UPV value obtained was 3.82 - 4.23 km/sec for both control and POC concrete. Both concrete show comparable UPV value. Figure 5 shows the effect of UPV value on control concrete and POC concrete for 3 different conditions at 3, 7 and 28 days. It shows that the concrete in water curing condition exhibit higher UPV value followed with water curing 3 days plus air curing, while the air curing condition shows the lowest UPV value. However, the effect of UPV value on POC concrete has a comparable value with control concrete.
Figure shows the correlation obtained which can be used to predict the hardened density based on the UPV value. When comparing both slopes of both type of concretes, POC concrete shows steeper slope which indicate lower reduction in hardened density compared to the control concrete. This lower reduction probably due to the smaller void to aggregate size ratio within fine POC which increase the denseness of concrete.
Table 6: UPV value of control and POC concrete
Type of Concrete Curing Condition Age UPV Values (km/sec) Control Mix WC 3 3.90
7 4.17
28 4.23
WC 3Days & AC 3 3.87
7 4.15
28 4.17
AC 3 3.86
7 4.12
28 4.1
F50 POC WC 3 3.88 Concrete
7 4.13
28 4.18
WC 3 Days & AC 3 3.85
7 4.11
28 4.13
AC 3 3.82
7 4.05
28 4.09
Figure 5: Effect of UPV on concrete againts curing aging Figure 6: Relationship on hardened density against UPV
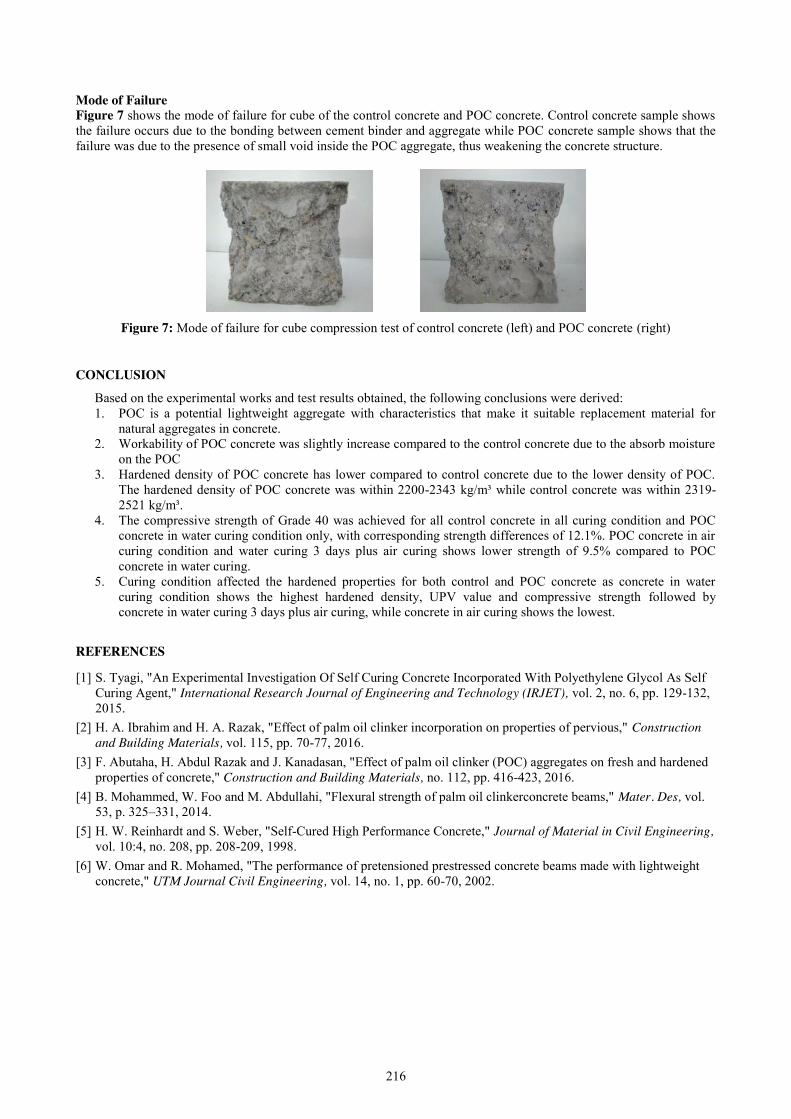
216
Mode of Failure Figure 7 shows the mode of failure for cube of the control concrete and POC concrete. Control concrete sample shows the failure occurs due to the bonding between cement binder and aggregate while POC concrete sample shows that the failure was due to the presence of small void inside the POC aggregate, thus weakening the concrete structure.
Figure 7: Mode of failure for cube compression test of control concrete (left) and POC concrete (right)
CONCLUSION Based on the experimental works and test results obtained, the following conclusions were derived: 1. POC is a potential lightweight aggregate with characteristics that make it suitable replacement material for
natural aggregates in concrete. 2. Workability of POC concrete was slightly increase compared to the control concrete due to the absorb moisture
on the POC 3. Hardened density of POC concrete has lower compared to control concrete due to the lower density of POC.
The hardened density of POC concrete was within 2200-2343 kg/m³ while control concrete was within 2319-2521 kg/m³.
4. The compressive strength of Grade 40 was achieved for all control concrete in all curing condition and POC concrete in water curing condition only, with corresponding strength differences of 12.1%. POC concrete in air curing condition and water curing 3 days plus air curing shows lower strength of 9.5% compared to POC concrete in water curing.
5. Curing condition affected the hardened properties for both control and POC concrete as concrete in water curing condition shows the highest hardened density, UPV value and compressive strength followed by concrete in water curing 3 days plus air curing, while concrete in air curing shows the lowest.
REFERENCES [1] S. Tyagi, "An Experimental Investigation Of Self Curing Concrete Incorporated With Polyethylene Glycol As Self
Curing Agent," International Research Journal of Engineering and Technology (IRJET), vol. 2, no. 6, pp. 129-132, 2015.
[2] H. A. Ibrahim and H. A. Razak, "Effect of palm oil clinker incorporation on properties of pervious," Construction and Building Materials, vol. 115, pp. 70-77, 2016.
[3] F. Abutaha, H. Abdul Razak and J. Kanadasan, "Effect of palm oil clinker (POC) aggregates on fresh and hardened properties of concrete," Construction and Building Materials, no. 112, pp. 416-423, 2016.
[4] B. Mohammed, W. Foo and M. Abdullahi, "Flexural strength of palm oil clinkerconcrete beams," Mater. Des, vol. 53, p. 325–331, 2014.
[5] H. W. Reinhardt and S. Weber, "Self-Cured High Performance Concrete," Journal of Material in Civil Engineering, vol. 10:4, no. 208, pp. 208-209, 1998.
[6] W. Omar and R. Mohamed, "The performance of pretensioned prestressed concrete beams made with lightweight concrete," UTM Journal Civil Engineering, vol. 14, no. 1, pp. 60-70, 2002.

217
Possibility of Using Seawater in Concrete Production Nur Balqis Idayu1, Mohammad Ismail2
Faculty of Civil Engineering, Universiti Teknologi Malaysia, Malaysia [email protected]
Keywords: seawater; fresh water; concrete; testing; mechanical strength; porosity
ABSTRACT. One of the requirements in making concrete is fresh water. However, in the future fresh water will be difficult to get and scarce. Hence, the use of fresh water only for primary needs. And it is important for the world of concrete construction to seriously study the possibility of using seawater in concrete production which can minimize usage of fresh water and help the areas that have problem caused by the growing scarceness of fresh water. Some research revealed that mixing seawater in concrete production can gives a high strength at an earlier age. Thus, the research need to be further investigate especially in using seawater as mixing water. This work aim at looking for possibility of using seawater in concrete. The key objective of this research was to investigate the behavior of fresh concrete incorporating seawater, in addition to investigate mechanical strength and porosity of concrete incorporating seawater. In this research, 70% of seawater replacement was analyzed and compared to control specimen, 0% of seawater. Laboratory test involved were slump test, compressive strength, flexural tensile strength, splitting tensile strength and vacuum saturation. Slump test was determined during its fresh and range of slump needs, which 10 – 30 mm. Mechanical testing were conducted at the age of 3, 28 and 60 days. For porosity test, testing conducted at age 28 and 60 days. From the research, all mechanical test of concretes mixed with seawater shows higher strength compared to control specimen. Besides, porosity of concrete mixed with seawater show lower percentage compared to control specimen. The result showed that seawater can be use as mixing water as it did not significantly affect the mechanical properties of concrete. In addition, porosity of concrete was lower.
INTRODUCTION
Mankind will soon be facing the grave danger of water scarcity and water shortage. In 2025, half of the mankind will be living in the areas where fresh water will not be enough [1]. The main reason for this problem is the growing population in the region. This means that there are more demand on the water supply. Almost every day water is used for day to day activities and will cause serious impact when using it on concrete production, especially in area where water difficult to get. Limiting water consumption is one of the effective methods to deal with the water crisis. There are many ways to limit the consumption of water, one of it is employing of seawater in concrete production. Besides, the production of one tonne of OPC can generates one tonne of CO2. Such high rates of emission of CO2 significantly contributes to global warming and climate change [2]. Due to the increasing cost of material, replacement of OPC with Ground Granulated Blast-furnace Slag can develop sustainable product and will reduce the cost of cement. Problem Statement One of the issues in the concrete production is limited amount of fresh water available as mixing water. In order to meet the demand of concrete required for constructional and building purposes, keeping in view the increasing scarcity of fresh water in the past few decades, it is becoming essential to try abundance available seawater replacing the fresh water used for mixing of concrete. Objectives The objectives of this study are:
1. To investigate the behavior of fresh concrete incorporating seawater. 2. To investigate mechanical strength and porosity of concrete incorporating seawater.
Scope of Study The scope of the study will focus on the use of seawater as the mixing water in concrete production. The percentage of seawater added into the concrete mixer are 0% (as control) and 70%. The mineral admixture used in this study are Ground Granulated Blast-furnace Slag (GGBS) with 50% GGBS replace OPC. Laboratory test involved in this research are compressive strength, flexural tensile strength, splitting tensile strength and vacuum saturation test. For hardened concrete, this mechanical properties are to be conducted at the age of 3, 28 and 60 days after curing process. For permeability test, vacuum saturation test will be conducted at age 28 and 60 days. Grade 30 (C30/35) is used as reference.

218
LITERATURE REVIEW
The use of seawater in concrete production is not new. Seawater can provide a solution to the problem caused by the growing scarceness of fresh water for concrete production [3]. Several studies was conducted and the compressive strength of concrete produced using seawater and GGBS cement, was being measured against that of the concrete produced using fresh water. The result shown that GGBS cement mixed with seawater has more strength compared to mix with fresh water [1]. The used of seawater also shows an increase in the early strength at 7th days [3] and [4]. The use of seawater reportedly can improve performance such as reduce water permeability, reduced drying shrinkage and reduce mean pore diameter [5].
Mixing seawater with replacement of 55% GGBS also gives a high strength in early age but cut off in strength gradually. High replacement of GGBS produces best strength and shows some good influences to the increases early strength of concrete [6]. Therefore, total pore volume with seawater decreased as compared to fresh water. Based on [7], the specimens were submerged into artificial seawater was being measured and the result of using blast-furnace slag or fly ash can reduce chloride ion diffusivity and oxygen permeability. This might be due to the presence of initial chloride content induced by seawater, and it might decrease the result of chloride concentration. Besides, chloride ion diffusivity of concrete using blast-furnace slag is smaller compared to OPC. Chloride ion diffusivity decreases when blast-furnace slag replacement ratio increases [5].
According to [8], the major problem that relates with concrete is its long term durability. Presence of sulphate attack on concrete has potential to cause a serious damage or structure failure. Also, action of seawater on concrete permeability can cause damaging effect on steel reinforcement. In effect, concrete can deteriorate [9] because of chemical composition from seawater may lead to cracking, spalling, increased permeability, and strength loss. The concrete permeability will increase by a day as the number and size of the pores increase [12]. There were several studies on the use of seawater in concrete, starting from 2011. The percentage of seawater added were 35% [1], 67% to 74% [7] and 51% [3]. Optimum percentage of seawater used from this research are from 30% to 70%.
METHODOLOGY
Slump test was determined during its fresh in the range of 10 – 30 mm. The mechanical test were tested at the age of 3, 28 and 60 days after curing process. Vacuum saturation test will be conducted at age 28 and 60 days for permeability test. The percentage of seawater used were 0% (as control) and 70%. The materials used in this study are GGBS and 50% of GGBS will replace the OPC. Ordinary Portland cement.The cement used was Ordinary Portland Cement. The cement is in dry powder form with the chemical compositions listed in Table 1.
Table 1: Chemical Composition of Portland cement
Chemical Composition Percentage Silica, SiO2 21.28 Alumina, Al2O3 5.60 Ferum Oxide, Fe2O3 3.36 Calcium Oxide, CaO 64.64 Magnesium Oxide, MgO 2.06 Sulphuric Anhydrite, SO3 2.14 Total Alkalis 0.05 Insoluble Residue, IR 0.22 Loss of Ignition, LOI 0.64 Silica Modulus 2.38 Lime Saturated Factor, LSF 0.92
Ground Granulated Blast-furnace Slag (GGBS).GGBS is a by-product of iron [10], which is production of iron in a blast furnace where iron ore, limestone and coke are heated to about 1500˚C [11]. Chemical composition of GGBS used on this project shown in Table 1.2.
Table 2: Chemical Composition of GGBS (mass%).
SiO2 Al2O3 Fe2O3 CaO MgO K2O Na2O SO3 LOI SiO2.Al2O3 30.8 10.9 0.64 51.8 4.57 0.36 0.45 0.06 0.22 2.82
Fresh Water.Water is vital for production of concrete. The clean mixing water used, free from any kind of chemical or organic material that can affect the properties of the resulting concrete adversely. Seawater.Sea water has high concentrations of various salts, hence a very bitter salty taste. The primary chemical constituents of seawater are ions of chloride, sodium, magnesium, calcium and potassium. Table 3 show the chemical composition of seawater used in this project.
219
Table 3: Chemical composition of seawater in Johor Bahru Specimen’s preparation.Mixing of fresh concrete was conducted according to BS 1881 : Part 125 : 1983. Table 4 show the design mix proportion 0% and 70% of seawater.
Table 4: The design mix proportion
Slump Test. Used to determine the workability of the fresh concrete. It consists of standard 16 mm diameter steel rod, 600 mm long, mould consisting of the frustum of a cone, measuring scale and rigid metal steel. The slump is measured by placing the cone besides the slump concrete and the temping rod is placed over the cone. The decrease in height of concrete to that of mould is noted with scale. Compression Strength Test. Compression test is used to measure the compression strength, 𝐹𝑐𝑢 of a concrete. 18 cubes of size 100 mm was placed in the Compression Testing Machine. The load was applied until the concrete cube failed. The average maximum load of 18 samples was recorded as compressive strength, 𝐹𝑐𝑢. Flexural Tensile Strength Test. Flexural strength is a measure of an unreinforced concrete beam or slab to resist failure in bending. The load was applied until the specimens failed. It is measured by loading of 100 mm x 100 mm x 500 mm. Splitting Tensile Strength Test. Standard mould is 150 mm diameter and 300 mm long. Draw diametrical lines on the two ends of the specimen to ensure that they are on the same axial place. Apply the load until the specimens failed. Vacuum Saturation Test. This test is used to determine the porosity of the respective concrete specimens. The permeability test is necessary to be carrying up in order to determine effect of sulphate on durability of concrete.
RESULTS AND DISCUSSION
The results of slump test, compressive strength test, flexural tensile test, splitting tensile test and permeability test that was replaced with 0% and 70% of seawater was analyzed.
Slump Test Concrete was tested during its fresh to ensure that concrete mix satisfies that specification of works. Slump test was to determine the workability or consistency of concrete mix.
Table 5: Slump Test
Percentages of seawater Slump of concrete (mm) 0% 0% 15 70% 70% 20
Compressive Strength Test The compressive strength of concrete grade 30 was carried out at ages 3, 28 and 60 days. From the results of compressive strength of concrete in Table 6, it can be seen that the compressive strength has increased by increment of curing period. The early strength of the 70% seawater replacement produced highest strength of 28.42 MPa. Compared to 0% of seawater replacement, the strength of concrete was 17.78 MPa. The result is similar to the findings of [3], who stated that the seawater increase the compressive strength at an earlier age compared to using fresh water. The strength
Chemical ion Concentration ppm, mg/l H20 975,000 Br 63 Ca 681 Cl 14,060 Fe 20 K 296
Mg 900 Na 7,000 P 1,090 S 619
Mix Proportion / Concrete Grade 0% Seawater 70% Seawater Cement (kg/m3) 255.6 255.6 Granulated Ground Blast Furnace (kg/m3) 255.6 255.6 Fresh Water/Seawater (kg/m3) 276/0 82.8/193.2 Fine Aggregate (kg/m3) 879 879 Coarse Aggregate (kg/m3) 1213.2 1213.2

220
gained for both replacement of seawater at 28 days is above 100%, which 30.24 MPa and 36.02 MPa. The strength for 0% and 70% of seawater replacement at 60 days increase in a gradual manner at strength of 31.26 MPa and 38.26 MPa.
Figure 1: Compressive strength for different replacement of seawater Flexural Tensile Test Flexural tensile strength test was done at a concrete age of 3 and 28 days. From Table 1.7, the flexure strength of 0% and 70% at age 3 were 1.27 MPa and 1.67 MPa, which strength of 70% was higher than 0%. At age 28, the strength was increase to 3.17 MPa and 4.72 MPa. The flexure strength of 70% increase by 64.6% as compared to 0% of seawater replacement.
Figure 2: Flexural Tensile strength vs period (Days) Splitting Tensile Test Split tensile strength test was carried out at age 3, 28 and 60 days. From Table 8, strength of 70% of seawater replacement was higher at age 3. The result was 1.30 MPa compared to 0%, 1.94 MPa. For concrete at age 28, the split tensile strength recorded were 1.80 MPa for control and 2.65 MPa for 70%. The strength of 0% and 70% of seawater replacement showed an increase at age 3 and 28 days were 27.8% and 26.8%. The strength for 0% and 70% of seawater replacement at 60 days increase at 2.34 MPa and 2.82 MPa.
Table 8: Splitting Test result at age 3, 28 and 60 days
Figure 3: Splitting Tensile strength vs period (Days) Vacuum Saturation Test Vacuum saturation test was carried out at the age of 28 and 60 days. The higher the replacement of seawater in concrete cause the low permeable porosity of concrete. It can be seen that the result for 28 days of 0% of seawater replacement was 9.76% compared to 70% of seawater replacement was only 7.53%. The result was similar to the findings of [1] and [5], who stated that total pore volume with seawater decreased as compared to fresh water and use of the seawater reportedly can improve performance such as reduce water permeability, reduced drying shrinkage and reduce mean pore diameter. But, the percentage of permeable porosity increase by increment of curing period. The percentage of permeable porosity at age 60 were 13.17% and 9.68%.
10
30
50
3 D A Y S 2 8 D A Y S 6 0 D A Y S
COM
PRES
SIVE
STR
ENG
TH
(MPA
)
CURING DAYS
C O M P R E S S I V E S T R E N G T H V S C U R I N G D A Y ( D A Y S )
0% 70%
012345
3 D A Y S 2 8 D A Y S
FLEX
URA
L TE
NSI
LE S
TREN
GTH
(MPA
)
CURING DAYS
F L E X U R A L T E N S I L E S T R E N G T H V S P E R I O D ( D A Y S )
0% 70%
Seawater Replacement
Compressive Strength (MPa) 3 Days 28 Days 60 Days
0% 17.78 30.24 31.26 70% 28.42 36.02 38.26
Seawater Replacement
Period of Curing
Flexural Tensile Strength (MPa)
0%
3 Days 1.27 28 Days 3.17
70%
3 Days 1.67 28 Days 4.72
Seawater Replacement
Period of Curing
Splitting Tensile Strength (MPa)
0%
3 Days 1.30 28 Days 1.80 60 Days 2.34
70%
3 Days 1.94 28 Days 2.65 60 Days 2.82
Table 6: Compressive strength of 0% and 70% of seawater
Table 7: Flexural Test result at age 3 and 28 days
1
2
3
3 D A Y S 2 8 D A Y S 6 0 D A Y S
SPLI
TTIN
G T
ENSI
LE
STRE
NG
TH (M
PA)
CURING DAYS
S P L I T T I N G T E N S I L E S T R E N G T H V S P E R I O D ( D A Y S ) 0% 70%
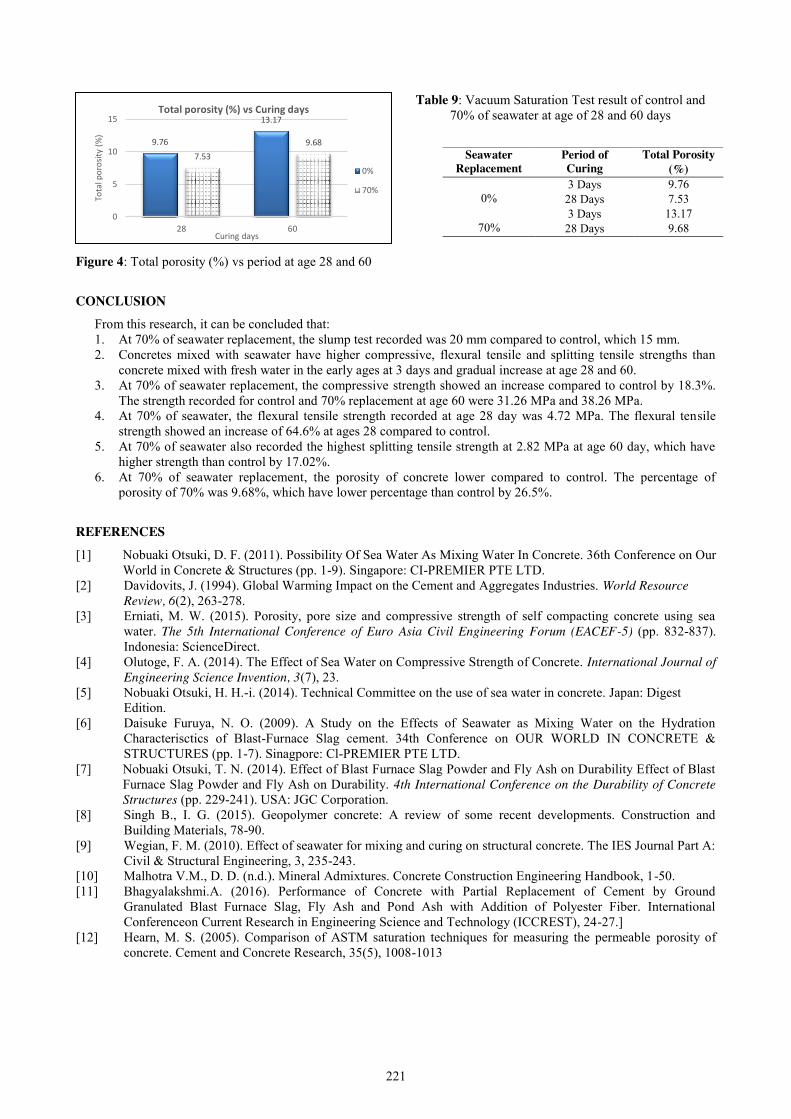
221
Table 9: Vacuum Saturation Test result of control and 70% of seawater at age of 28 and 60 days
Figure 4: Total porosity (%) vs period at age 28 and 60
CONCLUSION From this research, it can be concluded that: 1. At 70% of seawater replacement, the slump test recorded was 20 mm compared to control, which 15 mm. 2. Concretes mixed with seawater have higher compressive, flexural tensile and splitting tensile strengths than
concrete mixed with fresh water in the early ages at 3 days and gradual increase at age 28 and 60. 3. At 70% of seawater replacement, the compressive strength showed an increase compared to control by 18.3%.
The strength recorded for control and 70% replacement at age 60 were 31.26 MPa and 38.26 MPa. 4. At 70% of seawater, the flexural tensile strength recorded at age 28 day was 4.72 MPa. The flexural tensile
strength showed an increase of 64.6% at ages 28 compared to control. 5. At 70% of seawater also recorded the highest splitting tensile strength at 2.82 MPa at age 60 day, which have
higher strength than control by 17.02%. 6. At 70% of seawater replacement, the porosity of concrete lower compared to control. The percentage of
porosity of 70% was 9.68%, which have lower percentage than control by 26.5%.
REFERENCES
[1] Nobuaki Otsuki, D. F. (2011). Possibility Of Sea Water As Mixing Water In Concrete. 36th Conference on Our World in Concrete & Structures (pp. 1-9). Singapore: CI-PREMIER PTE LTD.
[2] Davidovits, J. (1994). Global Warming Impact on the Cement and Aggregates Industries. World Resource Review, 6(2), 263-278.
[3] Erniati, M. W. (2015). Porosity, pore size and compressive strength of self compacting concrete using sea water. The 5th International Conference of Euro Asia Civil Engineering Forum (EACEF-5) (pp. 832-837). Indonesia: ScienceDirect.
[4] Olutoge, F. A. (2014). The Effect of Sea Water on Compressive Strength of Concrete. International Journal of Engineering Science Invention, 3(7), 23.
[5] Nobuaki Otsuki, H. H.-i. (2014). Technical Committee on the use of sea water in concrete. Japan: Digest Edition.
[6] Daisuke Furuya, N. O. (2009). A Study on the Effects of Seawater as Mixing Water on the Hydration Characterisctics of Blast-Furnace Slag cement. 34th Conference on OUR WORLD IN CONCRETE & STRUCTURES (pp. 1-7). Sinagpore: Cl-PREMIER PTE LTD.
[7] Nobuaki Otsuki, T. N. (2014). Effect of Blast Furnace Slag Powder and Fly Ash on Durability Effect of Blast Furnace Slag Powder and Fly Ash on Durability. 4th International Conference on the Durability of Concrete Structures (pp. 229-241). USA: JGC Corporation.
[8] Singh B., I. G. (2015). Geopolymer concrete: A review of some recent developments. Construction and Building Materials, 78-90.
[9] Wegian, F. M. (2010). Effect of seawater for mixing and curing on structural concrete. The IES Journal Part A: Civil & Structural Engineering, 3, 235-243.
[10] Malhotra V.M., D. D. (n.d.). Mineral Admixtures. Concrete Construction Engineering Handbook, 1-50. [11] Bhagyalakshmi.A. (2016). Performance of Concrete with Partial Replacement of Cement by Ground
Granulated Blast Furnace Slag, Fly Ash and Pond Ash with Addition of Polyester Fiber. International Conferenceon Current Research in Engineering Science and Technology (ICCREST), 24-27.]
[12] Hearn, M. S. (2005). Comparison of ASTM saturation techniques for measuring the permeable porosity of concrete. Cement and Concrete Research, 35(5), 1008-1013
Seawater Replacement
Period of Curing
Total Porosity (%)
0%
3 Days 9.76 28 Days 7.53
70%
3 Days 13.17 28 Days 9.68
9.76
13.17
7.53 9.68
0
5
10
15
28 60
Tota
l por
osity
(%)
Curing days
Total porosity (%) vs Curing days
0%
70%
222
Behaviour of Rubber Concrete Cured in Seawater Nurul Syahirah Azhar1, Mohammad Ismail2
Faculty of Civil Engineering, Universiti Teknologi Malaysia, Malaysia [email protected]
Keywords: Rubber concrete, crumb rubber, rapid chloride permeability test, sea water, mechanical properties
ABSTRACT. Disposal of worn tires poses a major problem worldwide. The utilization of waste materials and by-products is a partial solution to environmental and ecological problems. One important recent development, in the field of concrete technology, is the utilization of waste materials and by-products in the construction industry, as aggregates in the production of various types of concrete. Rubber Concrete is produced by replacing a volume percentage of the traditional coarse aggregate with tyre-rubber particles. In this research the performance of concrete mixtures incorporating 5, 10 and 15 percent of discarded tyre rubber as coarse aggregate replacements was investigated. In the first set, different percentages of crumb rubber were replaced for coarse aggregates and in the second set optimum percent of crumb rubber replacement was compared with plain concrete. Selected hardened and durability test were performed and the results were analysed. The hardened tests included compressive strength, tensile strength and flexural strength. The durability test was rapid chloride permeability test. The results showed optimum compressive strength with up to 5 percent replacement, in first set and decreased in compressive strength as the amount of rubber particle increased. As for second set, the plain concrete give better result in compressive, flexural and tensile strength compared to optimum rubber concrete replacement.
INTRODUCTION Recently, the worldwide growth of the automobile industry and the increase in car use has tremendously boosted
tyre production. The European Union countries discarded 3.2 million tonnes of scrap tyres in 2009 [1]. Nowadays used tyres are used for all kinds of purposes. They are frequently used in onshore and offshore breakwaters, in retaining walls in harbors and estuaries to buffer the impact of ships, and in artificial reefs to improve fishing.
Construction officials in coastal areas have long been facing the challenge of building and maintaining durable concrete structures in a saltwater environment. Gradual penetration of sea salts and the subsequent formation of expansive and leachable compounds lead to disintegration of structural concrete. It is note that the usage of rubber in coastal area building can increase it durability, lower maintenance costs and most significantly, it increases the service life of the building. The main advantages of concrete containing tyre rubber are their greater resistance to chloride ion penetration. As a part of durability study, this paper describes the effect of sea water on compressive strength of rubber concrete when used as curing water. In this study, waste tyre was used as partial replacement of coarse aggregate in concrete. Problem Statement The rapid growth of the automobile industry increased not only in automobile production, but also the amount of industrial waste materials. Therefore, large quantities of waste materials and by-products are generated from manufacturing processes, service industries, and municipal solid wastes. As a result, solid waste management has become one of the major environmental concerns in the world. Those stockpiles are potential to serve as suitable breeding fields for mosquitoes and causes major public health threats that increase the likelihood of spreading disease [2] .Therefore, this study conducted to find a way to utilise rubber concrete in structural application, especially as coastal and offshore sea structures. Objectives The objectives of this study are:
1. To determine the optimum mix design for rubber concrete with different amounts of tyre-rubber particles as coarse aggregates replacement for application to structural concrete.
2. To investigate the mechanical properties of concrete containing tyre-rubber particles at fresh and hardened. 3. To evaluate the durability of rubber concrete based on chloride penetration.
Scope of Study In general, this research focused on the impact of tyre-rubber aggregate on the engineering properties of concrete. Coarse granular crumb rubber (5 to 8 mm) was used as tyre rubber aggregates in this study. The range of replacement level of coarse aggregate with the tyre-rubber aggregate was from 5% to 15%. Then, the amount of replacement was optimised based on the compressive strength. The result of optimum replacement later are compared to plain concrete.
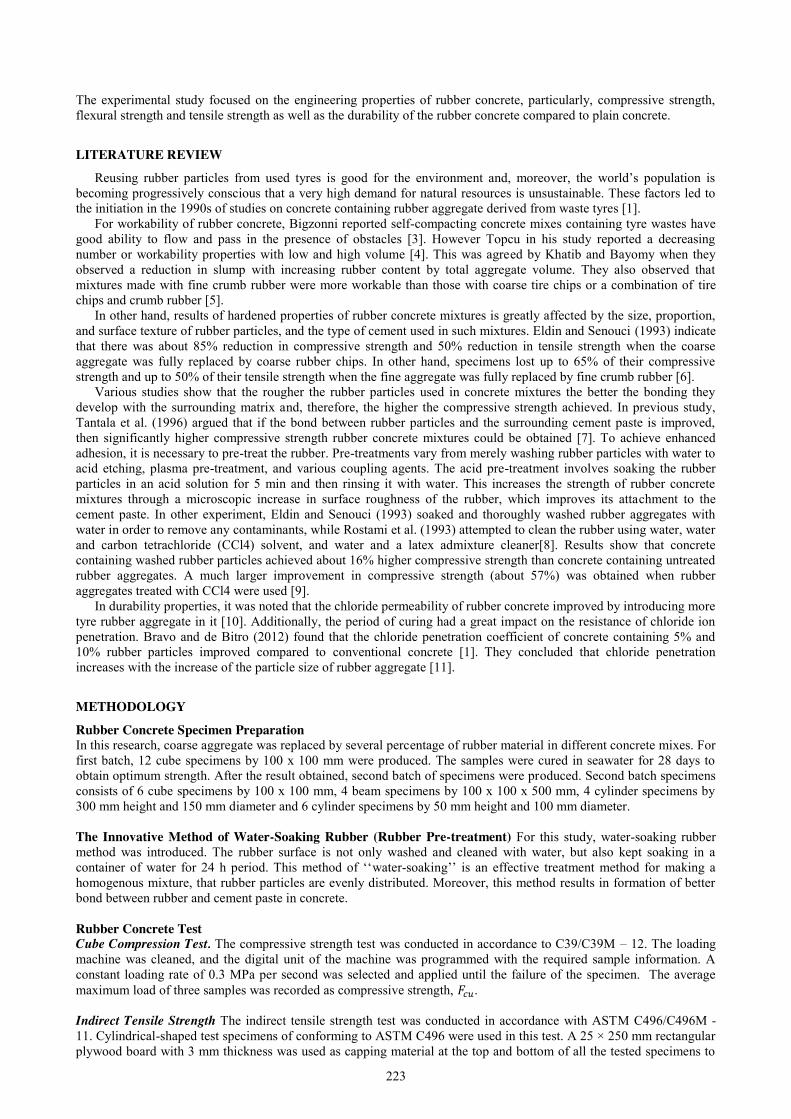
223
The experimental study focused on the engineering properties of rubber concrete, particularly, compressive strength, flexural strength and tensile strength as well as the durability of the rubber concrete compared to plain concrete.
LITERATURE REVIEW
Reusing rubber particles from used tyres is good for the environment and, moreover, the world’s population is becoming progressively conscious that a very high demand for natural resources is unsustainable. These factors led to the initiation in the 1990s of studies on concrete containing rubber aggregate derived from waste tyres [1].
For workability of rubber concrete, Bigzonni reported self-compacting concrete mixes containing tyre wastes have good ability to flow and pass in the presence of obstacles [3]. However Topcu in his study reported a decreasing number or workability properties with low and high volume [4]. This was agreed by Khatib and Bayomy when they observed a reduction in slump with increasing rubber content by total aggregate volume. They also observed that mixtures made with fine crumb rubber were more workable than those with coarse tire chips or a combination of tire chips and crumb rubber [5].
In other hand, results of hardened properties of rubber concrete mixtures is greatly affected by the size, proportion, and surface texture of rubber particles, and the type of cement used in such mixtures. Eldin and Senouci (1993) indicate that there was about 85% reduction in compressive strength and 50% reduction in tensile strength when the coarse aggregate was fully replaced by coarse rubber chips. In other hand, specimens lost up to 65% of their compressive strength and up to 50% of their tensile strength when the fine aggregate was fully replaced by fine crumb rubber [6].
Various studies show that the rougher the rubber particles used in concrete mixtures the better the bonding they develop with the surrounding matrix and, therefore, the higher the compressive strength achieved. In previous study, Tantala et al. (1996) argued that if the bond between rubber particles and the surrounding cement paste is improved, then significantly higher compressive strength rubber concrete mixtures could be obtained [7]. To achieve enhanced adhesion, it is necessary to pre-treat the rubber. Pre-treatments vary from merely washing rubber particles with water to acid etching, plasma pre-treatment, and various coupling agents. The acid pre-treatment involves soaking the rubber particles in an acid solution for 5 min and then rinsing it with water. This increases the strength of rubber concrete mixtures through a microscopic increase in surface roughness of the rubber, which improves its attachment to the cement paste. In other experiment, Eldin and Senouci (1993) soaked and thoroughly washed rubber aggregates with water in order to remove any contaminants, while Rostami et al. (1993) attempted to clean the rubber using water, water and carbon tetrachloride (CCl4) solvent, and water and a latex admixture cleaner[8]. Results show that concrete containing washed rubber particles achieved about 16% higher compressive strength than concrete containing untreated rubber aggregates. A much larger improvement in compressive strength (about 57%) was obtained when rubber aggregates treated with CCl4 were used [9].
In durability properties, it was noted that the chloride permeability of rubber concrete improved by introducing more tyre rubber aggregate in it [10]. Additionally, the period of curing had a great impact on the resistance of chloride ion penetration. Bravo and de Bitro (2012) found that the chloride penetration coefficient of concrete containing 5% and 10% rubber particles improved compared to conventional concrete [1]. They concluded that chloride penetration increases with the increase of the particle size of rubber aggregate [11].
METHODOLOGY
Rubber Concrete Specimen Preparation In this research, coarse aggregate was replaced by several percentage of rubber material in different concrete mixes. For first batch, 12 cube specimens by 100 x 100 mm were produced. The samples were cured in seawater for 28 days to obtain optimum strength. After the result obtained, second batch of specimens were produced. Second batch specimens consists of 6 cube specimens by 100 x 100 mm, 4 beam specimens by 100 x 100 x 500 mm, 4 cylinder specimens by 300 mm height and 150 mm diameter and 6 cylinder specimens by 50 mm height and 100 mm diameter. The Innovative Method of Water-Soaking Rubber (Rubber Pre-treatment) For this study, water-soaking rubber method was introduced. The rubber surface is not only washed and cleaned with water, but also kept soaking in a container of water for 24 h period. This method of ‘‘water-soaking’’ is an effective treatment method for making a homogenous mixture, that rubber particles are evenly distributed. Moreover, this method results in formation of better bond between rubber and cement paste in concrete. Rubber Concrete Test Cube Compression Test. The compressive strength test was conducted in accordance to C39/C39M – 12. The loading machine was cleaned, and the digital unit of the machine was programmed with the required sample information. A constant loading rate of 0.3 MPa per second was selected and applied until the failure of the specimen. The average maximum load of three samples was recorded as compressive strength, 𝐹𝑐𝑢. Indirect Tensile Strength The indirect tensile strength test was conducted in accordance with ASTM C496/C496M - 11. Cylindrical-shaped test specimens of conforming to ASTM C496 were used in this test. A 25 × 250 mm rectangular plywood board with 3 mm thickness was used as capping material at the top and bottom of all the tested specimens to

224
ensure uniform load distribution. A constant loading rate of 51 kN/min was selected and applied until the specimen was failed. Flexural Strength The test of flexural strength was conducted using the American Standard specification ASTM C348-08. Prism specimens were cast and cured according standard. The flexural strength test was conducted by applying vertical loads to the (100 × 100 × 500) mm beam. The loads were symmetrically applied at two points along the larger lateral axis of the beam. Prisms were loaded continuously and without shock at a predetermined constant loading rate of 0.06 ± 0.04 N/(mm2·s). . The test was acceptable if failure happened at 1/3 of the prism mean. Rapid Test on Resistance to Chloride Penetration. To investigate the durability of rubber concrete, a rapid chloride penetration test (RCPT) was conducted based on ASTM C1202 (2012). The 100 × 50 mm cylinders were prepared according to ASTM C39 (2009). The prepared specimens were fixed in-between two Plexiglas specimen cells, and high-viscosity sealant was applied to the edge of the specimen and cells. According to the standard ASTM C1202, the solution gradients are 3.0% (reagent grade) sodium chloride solution by mass in distilled water and 0.3 N (reagent grade) sodium hydroxide solution in distilled water. This test method involves the monitoring of the amount of electrical current that passed through slices of the 50 mm thick cylinders having 100 mm nominal diameter during a six-hour period.
RESULTS AND DISCUSSION
Compressive Strength Rubber Concrete The relationship between the compressive strength of concrete containing 5%, 10%, 15% crumb rubber aggregates with 28 days curing period as presented in Figure 1.
The usage of crumb rubber as replacement of coarse aggregates lowered the compressive strength of rubber concrete. This results also supported by previous study obtained by Eldin and Senouci (1993). They indicate that there was about 85% reduction in compressive strength when the coarse aggregate was fully replaced by coarse rubber chips [6]. The reason of reduction in compressive strength will be discussed in another part.
Based on the analysis of compressive strength, 5% crumb rubber (CR5) replacement shows the most significant effect on the compressive strength. Thus to this end, an optimum design mix proportion of rubber concrete (CR5) as shown in Table 1 was proposed for investigation in this study. On the other hand, OPC concrete with water/cement (w/c) ratio 0.5 was designed as control specimens (Table 2). The OPC specimens had the same consistency as CR5.
Figure 1: Compressive strength of rubber concrete at the age 28 days.
Table 1: Optimum mix proportions (kg/m3) of CR5
Table 2: Mix proportions (kg/m3)of OPC concrete (grade 30) Comparison between Compressive Strength for Control Concrete with 0% Rubber and Optimum Rubber Concrete CR5 The results of compressive strength test for control concrete with 0% rubber (CR) and optimum rubber concrete (CR5) was shown in the Figure 2. Based on the figure, the compressive strength of CR had increased by increment of curing period in seawater with 7, 28 and 60 days .While, the same trend of graph obtained for rubber concrete with optimum 5% crumb rubber (CR5). The figure shows compressive strength of rubber concrete with 5 % rubber (CR5) also had
38.38 31.603
22.476 16.846
05
1015202530354045
0% 5% 10% 15%Percentages of crumb rubber replacement
Cement Silica Fumes Water Fine Agg Coarse Agg Rubber Agg 377.74 66.66 213.33 688.9 981.73 51.67
Cement Silica Fumes Water Fine Agg Coarse Agg 377.74 66.66 213.33 688.9 1033.4
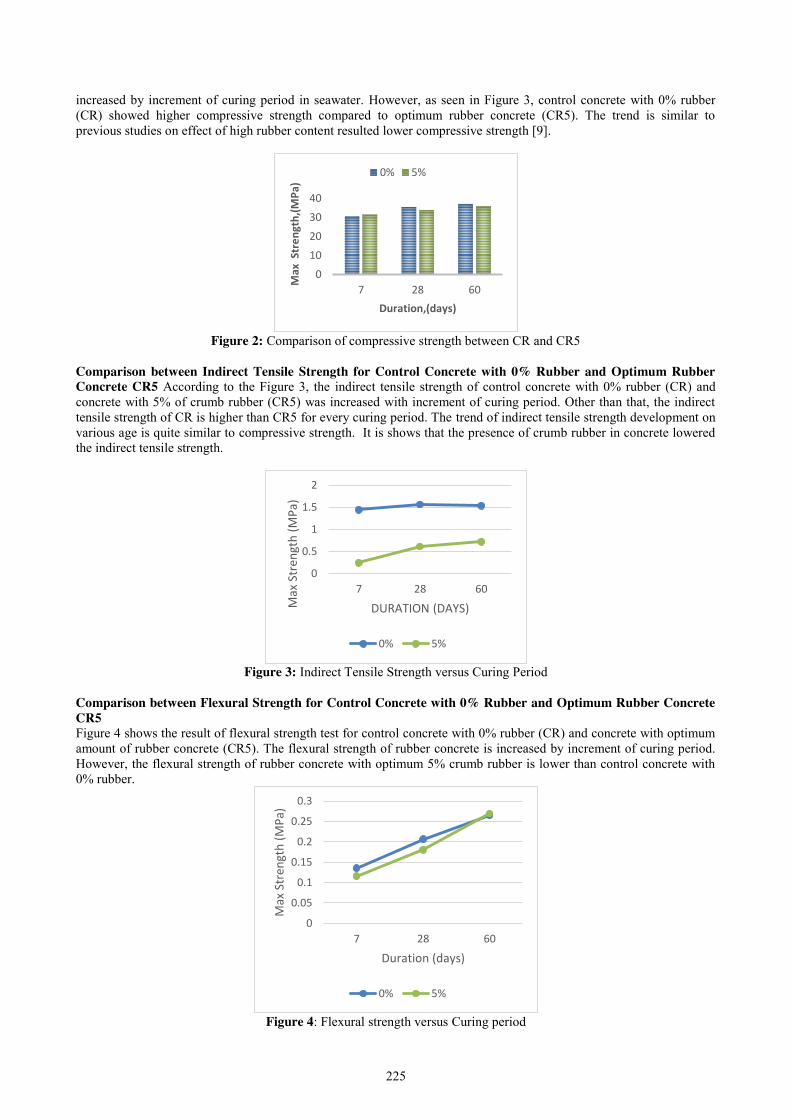
225
increased by increment of curing period in seawater. However, as seen in Figure 3, control concrete with 0% rubber (CR) showed higher compressive strength compared to optimum rubber concrete (CR5). The trend is similar to previous studies on effect of high rubber content resulted lower compressive strength [9].
Figure 2: Comparison of compressive strength between CR and CR5
Comparison between Indirect Tensile Strength for Control Concrete with 0% Rubber and Optimum Rubber Concrete CR5 According to the Figure 3, the indirect tensile strength of control concrete with 0% rubber (CR) and concrete with 5% of crumb rubber (CR5) was increased with increment of curing period. Other than that, the indirect tensile strength of CR is higher than CR5 for every curing period. The trend of indirect tensile strength development on various age is quite similar to compressive strength. It is shows that the presence of crumb rubber in concrete lowered the indirect tensile strength.
Figure 3: Indirect Tensile Strength versus Curing Period
Comparison between Flexural Strength for Control Concrete with 0% Rubber and Optimum Rubber Concrete CR5 Figure 4 shows the result of flexural strength test for control concrete with 0% rubber (CR) and concrete with optimum amount of rubber concrete (CR5). The flexural strength of rubber concrete is increased by increment of curing period. However, the flexural strength of rubber concrete with optimum 5% crumb rubber is lower than control concrete with 0% rubber.
Figure 4: Flexural strength versus Curing period
010
20
30
40
7 28 60M
ax S
tren
gth,
(MPa
) Duration,(days)
0% 5%
0
0.5
1
1.5
2
7 28 60
Max
Str
engt
h (M
Pa)
DURATION (DAYS)
0% 5%
0
0.05
0.1
0.15
0.2
0.25
0.3
7 28 60
Max
Str
engt
h (M
Pa)
Duration (days)
0% 5%
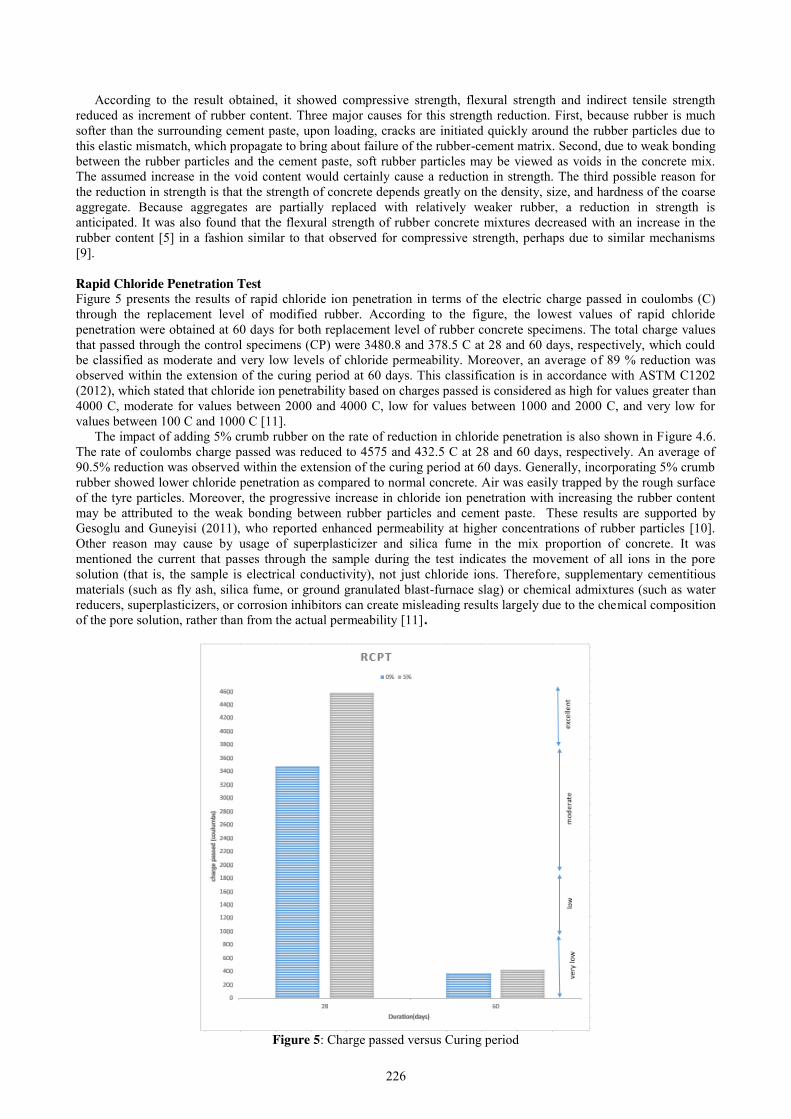
226
According to the result obtained, it showed compressive strength, flexural strength and indirect tensile strength reduced as increment of rubber content. Three major causes for this strength reduction. First, because rubber is much softer than the surrounding cement paste, upon loading, cracks are initiated quickly around the rubber particles due to this elastic mismatch, which propagate to bring about failure of the rubber-cement matrix. Second, due to weak bonding between the rubber particles and the cement paste, soft rubber particles may be viewed as voids in the concrete mix. The assumed increase in the void content would certainly cause a reduction in strength. The third possible reason for the reduction in strength is that the strength of concrete depends greatly on the density, size, and hardness of the coarse aggregate. Because aggregates are partially replaced with relatively weaker rubber, a reduction in strength is anticipated. It was also found that the flexural strength of rubber concrete mixtures decreased with an increase in the rubber content [5] in a fashion similar to that observed for compressive strength, perhaps due to similar mechanisms [9].
Rapid Chloride Penetration Test Figure 5 presents the results of rapid chloride ion penetration in terms of the electric charge passed in coulombs (C) through the replacement level of modified rubber. According to the figure, the lowest values of rapid chloride penetration were obtained at 60 days for both replacement level of rubber concrete specimens. The total charge values that passed through the control specimens (CP) were 3480.8 and 378.5 C at 28 and 60 days, respectively, which could be classified as moderate and very low levels of chloride permeability. Moreover, an average of 89 % reduction was observed within the extension of the curing period at 60 days. This classification is in accordance with ASTM C1202 (2012), which stated that chloride ion penetrability based on charges passed is considered as high for values greater than 4000 C, moderate for values between 2000 and 4000 C, low for values between 1000 and 2000 C, and very low for values between 100 C and 1000 C [11].
The impact of adding 5% crumb rubber on the rate of reduction in chloride penetration is also shown in Figure 4.6. The rate of coulombs charge passed was reduced to 4575 and 432.5 C at 28 and 60 days, respectively. An average of 90.5% reduction was observed within the extension of the curing period at 60 days. Generally, incorporating 5% crumb rubber showed lower chloride penetration as compared to normal concrete. Air was easily trapped by the rough surface of the tyre particles. Moreover, the progressive increase in chloride ion penetration with increasing the rubber content may be attributed to the weak bonding between rubber particles and cement paste. These results are supported by Gesoglu and Guneyisi (2011), who reported enhanced permeability at higher concentrations of rubber particles [10]. Other reason may cause by usage of superplasticizer and silica fume in the mix proportion of concrete. It was mentioned the current that passes through the sample during the test indicates the movement of all ions in the pore solution (that is, the sample is electrical conductivity), not just chloride ions. Therefore, supplementary cementitious materials (such as fly ash, silica fume, or ground granulated blast-furnace slag) or chemical admixtures (such as water reducers, superplasticizers, or corrosion inhibitors can create misleading results largely due to the chemical composition of the pore solution, rather than from the actual permeability [11].
Figure 5: Charge passed versus Curing period
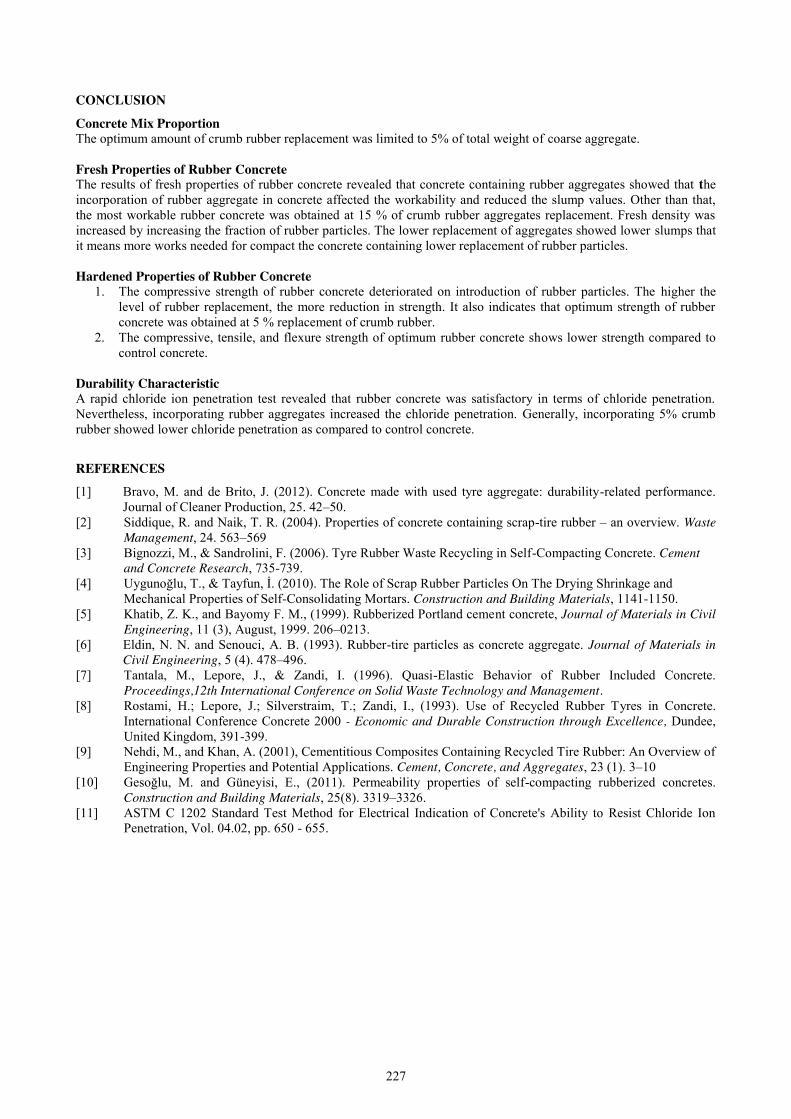
227
CONCLUSION
Concrete Mix Proportion The optimum amount of crumb rubber replacement was limited to 5% of total weight of coarse aggregate. Fresh Properties of Rubber Concrete The results of fresh properties of rubber concrete revealed that concrete containing rubber aggregates showed that the incorporation of rubber aggregate in concrete affected the workability and reduced the slump values. Other than that, the most workable rubber concrete was obtained at 15 % of crumb rubber aggregates replacement. Fresh density was increased by increasing the fraction of rubber particles. The lower replacement of aggregates showed lower slumps that it means more works needed for compact the concrete containing lower replacement of rubber particles. Hardened Properties of Rubber Concrete
1. The compressive strength of rubber concrete deteriorated on introduction of rubber particles. The higher the level of rubber replacement, the more reduction in strength. It also indicates that optimum strength of rubber concrete was obtained at 5 % replacement of crumb rubber.
2. The compressive, tensile, and flexure strength of optimum rubber concrete shows lower strength compared to control concrete.
Durability Characteristic A rapid chloride ion penetration test revealed that rubber concrete was satisfactory in terms of chloride penetration. Nevertheless, incorporating rubber aggregates increased the chloride penetration. Generally, incorporating 5% crumb rubber showed lower chloride penetration as compared to control concrete.
REFERENCES
[1] Bravo, M. and de Brito, J. (2012). Concrete made with used tyre aggregate: durability-related performance. Journal of Cleaner Production, 25. 42–50.
[2] Siddique, R. and Naik, T. R. (2004). Properties of concrete containing scrap-tire rubber – an overview. Waste Management, 24. 563–569
[3] Bignozzi, M., & Sandrolini, F. (2006). Tyre Rubber Waste Recycling in Self-Compacting Concrete. Cement and Concrete Research, 735-739.
[4] Uygunoğlu, T., & Tayfun, İ. (2010). The Role of Scrap Rubber Particles On The Drying Shrinkage and Mechanical Properties of Self-Consolidating Mortars. Construction and Building Materials, 1141-1150.
[5] Khatib, Z. K., and Bayomy F. M., (1999). Rubberized Portland cement concrete, Journal of Materials in Civil Engineering, 11 (3), August, 1999. 206–0213.
[6] Eldin, N. N. and Senouci, A. B. (1993). Rubber-tire particles as concrete aggregate. Journal of Materials in Civil Engineering, 5 (4). 478–496.
[7] Tantala, M., Lepore, J., & Zandi, I. (1996). Quasi-Elastic Behavior of Rubber Included Concrete. Proceedings,12th International Conference on Solid Waste Technology and Management.
[8] Rostami, H.; Lepore, J.; Silverstraim, T.; Zandi, I., (1993). Use of Recycled Rubber Tyres in Concrete. International Conference Concrete 2000 - Economic and Durable Construction through Excellence, Dundee, United Kingdom, 391-399.
[9] Nehdi, M., and Khan, A. (2001), Cementitious Composites Containing Recycled Tire Rubber: An Overview of Engineering Properties and Potential Applications. Cement, Concrete, and Aggregates, 23 (1). 3–10
[10] Gesoğlu, M. and Güneyisi, E., (2011). Permeability properties of self-compacting rubberized concretes. Construction and Building Materials, 25(8). 3319–3326.
[11] ASTM C 1202 Standard Test Method for Electrical Indication of Concrete's Ability to Resist Chloride Ion Penetration, Vol. 04.02, pp. 650 - 655.

228
Mechanical Properties of Lightweight Foamed Concrete with 0.5% Polycarboxylic Ether Superplasticizer
Shim Kan Chyau1, Tan Cher Siang2 Faculty of Civil Engineering, Universiti Teknologi Malaysia, Malaysia
Keywords: Lightweight Foamed Concrete, Compressive Strength, Flexural Strength, Splitting Tensile Strength, Polycarboxylic Ether
ABSTRACT. Lightweight foamed concrete (LFC) is a type of lightweight cellular concrete, created by blending conventional mortar with stable foam. However due to its low strength characteristics, it has very limited use in structural purpose. This research focuses on the mechanical properties of LFC with 0.5% polycarboxylic ether superplasticizer with targeted density of 1500 kg/m3. Cement-sand ratio used is 1:1. Trial mix is carried out to determine the optimum water content for the mix. Using the optimum water content, 3 types of LFC specimens which are the cube, prism and cylinder specimens are cast. They are then water cured before tested to obtain the respective compressive strength, flexural strength and splitting tensile strength. Results are compared with a controlled specimen of LFC. From the results, it can be concluded that 0.5% polycarboxylic ether superplasticizer effectively increased the mechanical properties of LFC.
INTRODUCTION
Lightweight foamed concrete (LFC) is a type of lightweight cellular concrete containing more than 25% of air content [1]. It is a mixture of typical cement mortar, mechanically blended with pre-formed foam, which is produced by foam generator. This addition of foam incorporates voids inside cement mortar and lowers its density. The more foam added, the lighter the concrete is produced [2]. The density of foamed concrete usually varies from 500 kg/m³ to 1600 kg/m³, but ultra-low density foamed concrete (down to 150 kg/m³) can also be successfully produced [3]. Most foamed concrete does not contain large aggregates, only fine sands as filler, and lots of voids. Addictive such as fly ash, ground granulated blastfurnace slag and silica fume is usually added to enhance its properties.
LFC is used in a wide range of construction applications such as void filling, trench reinstatement, soil stabilization, thermal and acoustic insulation, floor and roof screeds. Its properties which are flowability, self-compacting, thermal and acoustic insulating and low-density have made it attractive and useful in these applications. Problem Statement Conventional concrete has a high self-weight and is not environmental friendly. Lightweight concrete is then invented to reduce its density. However, foamed concrete is not used structurally due to its nature of low strength. For structural use, the grade of concrete must attain 25 MPa and higher. The normal strength for foamed concrete of density 1600 kg/m3 is only around 10 MPa [2].
Numerous attempts have been made to improve the performance of foamed concrete. Use of admixtures such as superplasticizer, fly ash, silica fume and also incorporation of fibres are studied to achieve satisfying performance in properties such as tensile strength, compression strength and lower drying shrinkage.
The use of superplasticizer is successful in producing high performance concrete. While in foamed concrete, the extent of how much superplasticizer helps in the improvement of its performance is unknown. As there might be compatibility problem between superplasticizer and foaming agent.
Objectives The objectives of this study are:
1. Determine the optimum water content of mortar with and without 0.5% superplasticizer respectively with 1:1 cement-sand ratio
2. Determine the compressive strength, flexural strength and tensile strength of lightweight foamed concrete of density 1500 kg/m3 with 0.5% superplasticizer.
3. Compare the improvement of compressive strength, flexural strength and tensile strength of foamed concrete using 0.5% superplasticizer with control specimen.
Scope of Study This study focuses on the effect of 0.5% polycarboxylic ether superplasticizer on mechanical properties of LFC. In this study, a 1:1 cement sand ratio is used. The targeted density of LFC is 1500 kg/m3 with tolerance of ±75 kg/m3. All the sand used in this study is normal river sand with grading 100% passing through 0.60 mm sieve. Trial mixes are done to determine the optimum water contents of mortar control specimen and mortar with 0.5% superplasticizer. Different water contents are tested and 3 cubes are cast for each of the water contents. Flow table test

229
is carried out to determine the property of fresh concrete. They are then water cured for 7 days to be tested for their compressive strengths.
Using the optimum water contents determined, LFC are cast. Compressive test, flexural test and split tensile test are done to test for mechanical properties of LFC. Then, the results are compared with the control specimen. For cube compression test, 3 sets of specimens are tested namely the 7-day and 28-day strength cube. For flexural test and splitting tensile test, 1 set of 28-day specimen is tested respectively. 1 set comprises of 3 specimens for all the tests. Hence, there will be 12 specimens of control specimens and LFC with 0.5% superplasticizer respectively, a total of 24 specimens.
LITERATURE REVIEW
Aerated concrete which was originally developed in Sweden in 1929 is a type of lightweight concrete that has a cellular structure similar to foamed concrete. It is produced by adding expanding agent into cement mortar. Aluminium powder, the most commonly used expanding agent in aerated concrete, reacts with calcium hydroxide in cement and water to produce hydrogen gas.
Lightweight aggregates can be of natural origins which mostly come from volcanic materials such as pumice, scoria and tuff. They can act as either fine or coarse aggregate depending on their sizes, and can also act as pozzolanic materials. Processed lightweight aggregates are derived from natural raw materials. Further improvement to combat the lower strength of lightweight aggregate concrete has led to the production of high strength lightweight aggregate concrete by using high strength cement mortar to complement the lower strength of lightweight aggregate.
Nearly all modern day air entraining agents are part of the chemical group called surfactants. There are 2 types of surfactants, namely the protein foaming agents and synthetic foaming agents. Protein foaming agent is based on refined animal products while synthetic foaming agent is derived from man-made chemicals such as in shampoo. Synthetic based foaming agents are generally less expensive and require considerably less energy to produce high quality foams, but they cannot match the performance of protein based foaming agents [2].
The pre-formed foam can be divided onto two categories- wet foam and dry foam. Wet foam is produced by spraying a solution of foaming agent (usually synthetic) and water over a fine mesh. The foam has a large "loose" bubble structure and tends to burst easily [2]. Stable dry type foam is produced by forcing a similar solution of foaming agent and water through a series of high-density restrictions whilst at the same time forcing compressed air into a mixing chamber. This type of foam is extremely stable.
Polycarboxylic Ether Superplasticizer is also known as high-range water reducer (up to 30% water reduction) which is a chemical admixture added to concrete mixture. Its main function is to act as dispersant, increasing the workability of concrete thereby reducing the water required without affecting workability. In small amounts, superplasticizer is able to affect many properties of concrete especially increased strength, workability, durability, and reduced permeability.
Sand is a crucial component, presents in almost any concrete mix. Sand also prevents excessive plastic shrinkage in mortar during setting as water evaporates [4]. In LFC, sand is the only solid component added into the mix. Different grading of sand added to concrete mix will have considerable effect on its properties such as flowability and strength. Fines content in a concrete mix will influence the viscosity of mortar [5]. 100% passing 0.60 mm sieve size sand contributed to the highest strength of cement mortar comparing to coarser sand [6].
METHODOLOGY
Materials Raw materials used in production of LFC are Ordinary Portland Cement (OPC), river sand, water, polycarboxylic superplasticizer and foaming agent. OPC used is Tasek Cement that is compliant to Type I Portland Cement as in per ASTM C150 [7]. River sand is all selectively sieved to 100% passing through 0.60 mm sieve. Only fine sand of diameter less than 0.60 mm is used. They are oven-dried at 105 degrees Celsius for at least 24 hours to remove any moisture inside beforehand for a better control of water content in the concrete mix. The type of superplasticizer used is polycarboxylic ether superplasticizer. Normal clean tap water and local synthetic foaming agent is used throughout this study.
Mix proportions 1:1 cement sand ratio is kept constant throughout this study for a constant comparison. In trial mix for control specimen, water content ranging from 0.42 to 0.50 is used with interval of 0.02. While for LFC with 0.5% superplasticizer, water content ranged from 0.32 to 0.36 is used, with interval of 0.01. From the optimum water contents, LFC are cast using the same proportions. Mixing Procedure Firstly, OPC, sand, water and superplasticizer were weighed according to the right proportion. Then, OPC and sand were dry mixed in a concrete mixer. Superplasticizer was then mixed in water to ensure thorough distribution and then added into concrete mixer. They were mixed together until uniform. Flow table test was then carried out on the wet mix to determine the consistency.
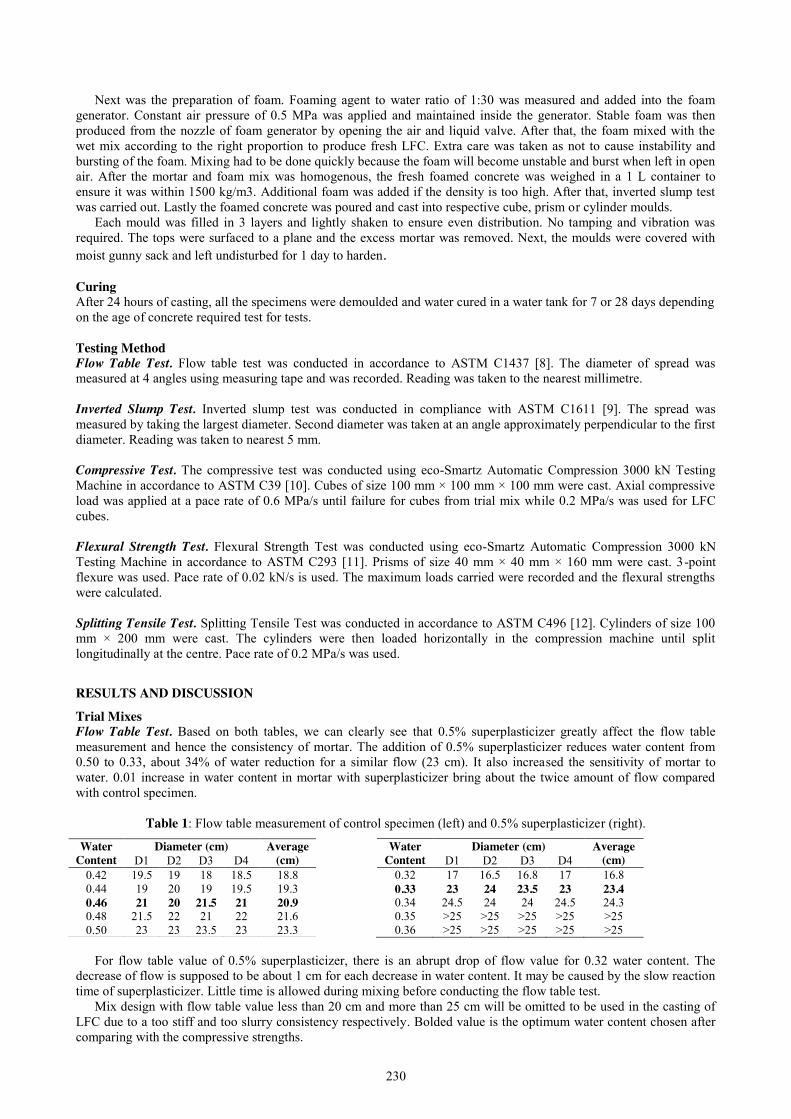
230
Next was the preparation of foam. Foaming agent to water ratio of 1:30 was measured and added into the foam generator. Constant air pressure of 0.5 MPa was applied and maintained inside the generator. Stable foam was then produced from the nozzle of foam generator by opening the air and liquid valve. After that, the foam mixed with the wet mix according to the right proportion to produce fresh LFC. Extra care was taken as not to cause instability and bursting of the foam. Mixing had to be done quickly because the foam will become unstable and burst when left in open air. After the mortar and foam mix was homogenous, the fresh foamed concrete was weighed in a 1 L container to ensure it was within 1500 kg/m3. Additional foam was added if the density is too high. After that, inverted slump test was carried out. Lastly the foamed concrete was poured and cast into respective cube, prism or cylinder moulds.
Each mould was filled in 3 layers and lightly shaken to ensure even distribution. No tamping and vibration was required. The tops were surfaced to a plane and the excess mortar was removed. Next, the moulds were covered with moist gunny sack and left undisturbed for 1 day to harden. Curing After 24 hours of casting, all the specimens were demoulded and water cured in a water tank for 7 or 28 days depending on the age of concrete required test for tests. Testing Method Flow Table Test. Flow table test was conducted in accordance to ASTM C1437 [8]. The diameter of spread was measured at 4 angles using measuring tape and was recorded. Reading was taken to the nearest millimetre. Inverted Slump Test. Inverted slump test was conducted in compliance with ASTM C1611 [9]. The spread was measured by taking the largest diameter. Second diameter was taken at an angle approximately perpendicular to the first diameter. Reading was taken to nearest 5 mm. Compressive Test. The compressive test was conducted using eco-Smartz Automatic Compression 3000 kN Testing Machine in accordance to ASTM C39 [10]. Cubes of size 100 mm × 100 mm × 100 mm were cast. Axial compressive load was applied at a pace rate of 0.6 MPa/s until failure for cubes from trial mix while 0.2 MPa/s was used for LFC cubes. Flexural Strength Test. Flexural Strength Test was conducted using eco-Smartz Automatic Compression 3000 kN Testing Machine in accordance to ASTM C293 [11]. Prisms of size 40 mm × 40 mm × 160 mm were cast. 3-point flexure was used. Pace rate of 0.02 kN/s is used. The maximum loads carried were recorded and the flexural strengths were calculated. Splitting Tensile Test. Splitting Tensile Test was conducted in accordance to ASTM C496 [12]. Cylinders of size 100 mm × 200 mm were cast. The cylinders were then loaded horizontally in the compression machine until split longitudinally at the centre. Pace rate of 0.2 MPa/s was used.
RESULTS AND DISCUSSION
Trial Mixes Flow Table Test. Based on both tables, we can clearly see that 0.5% superplasticizer greatly affect the flow table measurement and hence the consistency of mortar. The addition of 0.5% superplasticizer reduces water content from 0.50 to 0.33, about 34% of water reduction for a similar flow (23 cm). It also increased the sensitivity of mortar to water. 0.01 increase in water content in mortar with superplasticizer bring about the twice amount of flow compared with control specimen.
Table 1: Flow table measurement of control specimen (left) and 0.5% superplasticizer (right).
Water Content
Diameter (cm) Average (cm) D1 D2 D3 D4
0.32 17 16.5 16.8 17 16.8 0.33 23 24 23.5 23 23.4 0.34 24.5 24 24 24.5 24.3 0.35 >25 >25 >25 >25 >25 0.36 >25 >25 >25 >25 >25
For flow table value of 0.5% superplasticizer, there is an abrupt drop of flow value for 0.32 water content. The
decrease of flow is supposed to be about 1 cm for each decrease in water content. It may be caused by the slow reaction time of superplasticizer. Little time is allowed during mixing before conducting the flow table test.
Mix design with flow table value less than 20 cm and more than 25 cm will be omitted to be used in the casting of LFC due to a too stiff and too slurry consistency respectively. Bolded value is the optimum water content chosen after comparing with the compressive strengths.
Water Content
Diameter (cm) Average (cm) D1 D2 D3 D4
0.42 19.5 19 18 18.5 18.8 0.44 19 20 19 19.5 19.3 0.46 21 20 21.5 21 20.9 0.48 21.5 22 21 22 21.6 0.50 23 23 23.5 23 23.3
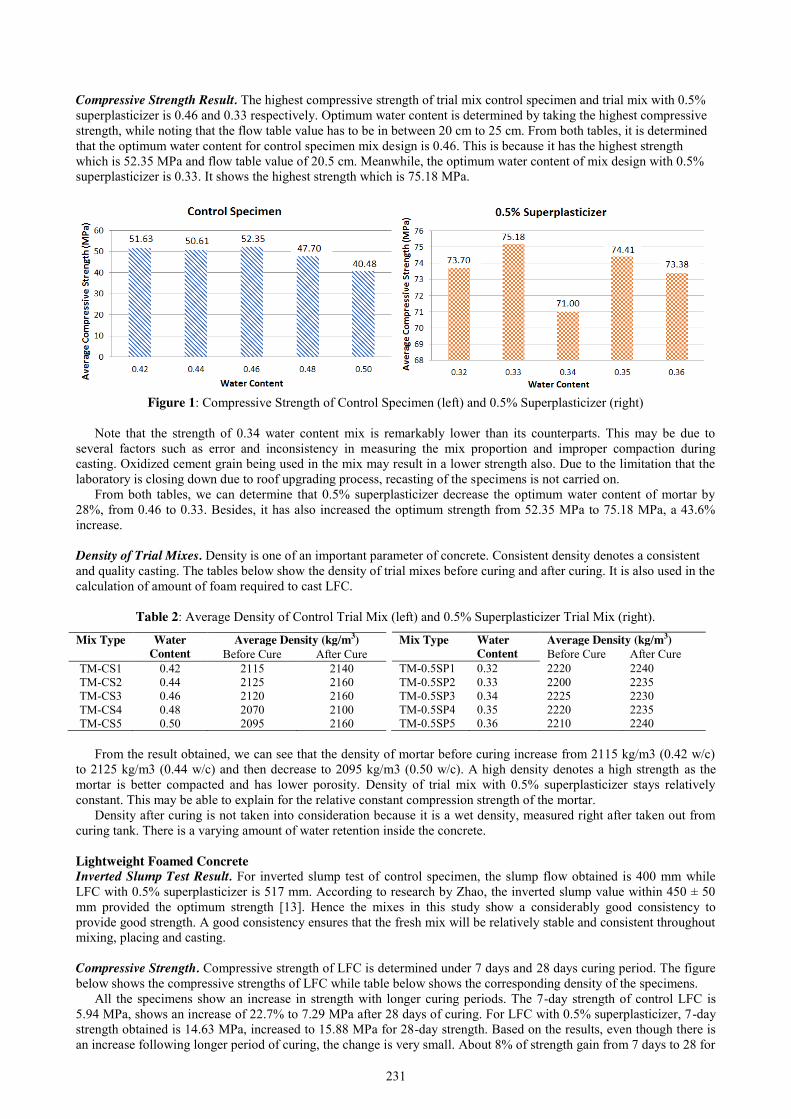
231
Compressive Strength Result. The highest compressive strength of trial mix control specimen and trial mix with 0.5% superplasticizer is 0.46 and 0.33 respectively. Optimum water content is determined by taking the highest compressive strength, while noting that the flow table value has to be in between 20 cm to 25 cm. From both tables, it is determined that the optimum water content for control specimen mix design is 0.46. This is because it has the highest strength which is 52.35 MPa and flow table value of 20.5 cm. Meanwhile, the optimum water content of mix design with 0.5% superplasticizer is 0.33. It shows the highest strength which is 75.18 MPa.
Figure 1: Compressive Strength of Control Specimen (left) and 0.5% Superplasticizer (right)
Note that the strength of 0.34 water content mix is remarkably lower than its counterparts. This may be due to
several factors such as error and inconsistency in measuring the mix proportion and improper compaction during casting. Oxidized cement grain being used in the mix may result in a lower strength also. Due to the limitation that the laboratory is closing down due to roof upgrading process, recasting of the specimens is not carried on.
From both tables, we can determine that 0.5% superplasticizer decrease the optimum water content of mortar by 28%, from 0.46 to 0.33. Besides, it has also increased the optimum strength from 52.35 MPa to 75.18 MPa, a 43.6% increase.
Density of Trial Mixes. Density is one of an important parameter of concrete. Consistent density denotes a consistent and quality casting. The tables below show the density of trial mixes before curing and after curing. It is also used in the calculation of amount of foam required to cast LFC.
Table 2: Average Density of Control Trial Mix (left) and 0.5% Superplasticizer Trial Mix (right).
Mix Type Water Content
Average Density (kg/m3) Before Cure After Cure
TM-0.5SP1 0.32 2220 2240 TM-0.5SP2 0.33 2200 2235 TM-0.5SP3 0.34 2225 2230 TM-0.5SP4 0.35 2220 2235 TM-0.5SP5 0.36 2210 2240
From the result obtained, we can see that the density of mortar before curing increase from 2115 kg/m3 (0.42 w/c) to 2125 kg/m3 (0.44 w/c) and then decrease to 2095 kg/m3 (0.50 w/c). A high density denotes a high strength as the mortar is better compacted and has lower porosity. Density of trial mix with 0.5% superplasticizer stays relatively constant. This may be able to explain for the relative constant compression strength of the mortar.
Density after curing is not taken into consideration because it is a wet density, measured right after taken out from curing tank. There is a varying amount of water retention inside the concrete. Lightweight Foamed Concrete Inverted Slump Test Result. For inverted slump test of control specimen, the slump flow obtained is 400 mm while LFC with 0.5% superplasticizer is 517 mm. According to research by Zhao, the inverted slump value within 450 ± 50 mm provided the optimum strength [13]. Hence the mixes in this study show a considerably good consistency to provide good strength. A good consistency ensures that the fresh mix will be relatively stable and consistent throughout mixing, placing and casting. Compressive Strength. Compressive strength of LFC is determined under 7 days and 28 days curing period. The figure below shows the compressive strengths of LFC while table below shows the corresponding density of the specimens.
All the specimens show an increase in strength with longer curing periods. The 7-day strength of control LFC is 5.94 MPa, shows an increase of 22.7% to 7.29 MPa after 28 days of curing. For LFC with 0.5% superplasticizer, 7-day strength obtained is 14.63 MPa, increased to 15.88 MPa for 28-day strength. Based on the results, even though there is an increase following longer period of curing, the change is very small. About 8% of strength gain from 7 days to 28 for
Mix Type Water Content
Average Density (kg/m3) Before Cure After Cure
TM-CS1 0.42 2115 2140 TM-CS2 0.44 2125 2160 TM-CS3 0.46 2120 2160 TM-CS4 0.48 2070 2100 TM-CS5 0.50 2095 2160
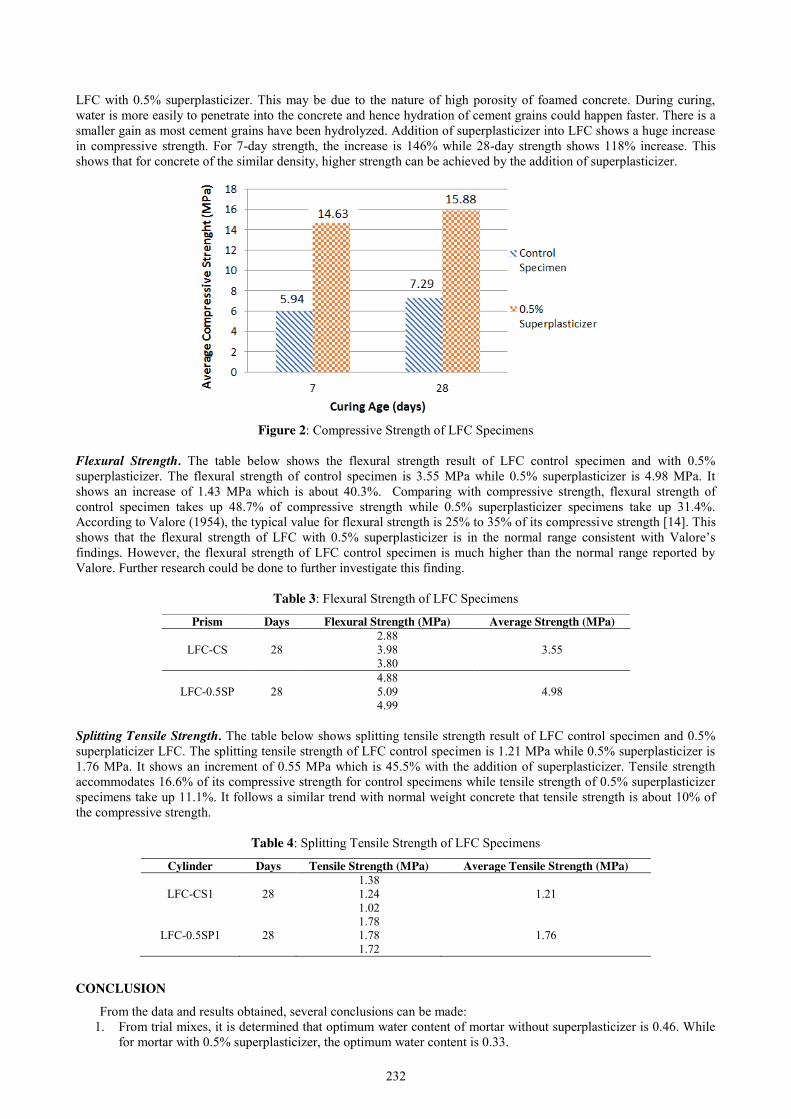
232
LFC with 0.5% superplasticizer. This may be due to the nature of high porosity of foamed concrete. During curing, water is more easily to penetrate into the concrete and hence hydration of cement grains could happen faster. There is a smaller gain as most cement grains have been hydrolyzed. Addition of superplasticizer into LFC shows a huge increase in compressive strength. For 7-day strength, the increase is 146% while 28-day strength shows 118% increase. This shows that for concrete of the similar density, higher strength can be achieved by the addition of superplasticizer.
Figure 2: Compressive Strength of LFC Specimens
Flexural Strength. The table below shows the flexural strength result of LFC control specimen and with 0.5% superplasticizer. The flexural strength of control specimen is 3.55 MPa while 0.5% superplasticizer is 4.98 MPa. It shows an increase of 1.43 MPa which is about 40.3%. Comparing with compressive strength, flexural strength of control specimen takes up 48.7% of compressive strength while 0.5% superplasticizer specimens take up 31.4%. According to Valore (1954), the typical value for flexural strength is 25% to 35% of its compressive strength [14]. This shows that the flexural strength of LFC with 0.5% superplasticizer is in the normal range consistent with Valore’s findings. However, the flexural strength of LFC control specimen is much higher than the normal range reported by Valore. Further research could be done to further investigate this finding.
Table 3: Flexural Strength of LFC Specimens
Splitting Tensile Strength. The table below shows splitting tensile strength result of LFC control specimen and 0.5% superplaticizer LFC. The splitting tensile strength of LFC control specimen is 1.21 MPa while 0.5% superplasticizer is 1.76 MPa. It shows an increment of 0.55 MPa which is 45.5% with the addition of superplasticizer. Tensile strength accommodates 16.6% of its compressive strength for control specimens while tensile strength of 0.5% superplasticizer specimens take up 11.1%. It follows a similar trend with normal weight concrete that tensile strength is about 10% of the compressive strength.
Table 4: Splitting Tensile Strength of LFC Specimens
Cylinder Days Tensile Strength (MPa) Average Tensile Strength (MPa)
LFC-CS1
28 1.38 1.24 1.02
1.21
LFC-0.5SP1
28
1.78 1.78 1.72
1.76
CONCLUSION
From the data and results obtained, several conclusions can be made: 1. From trial mixes, it is determined that optimum water content of mortar without superplasticizer is 0.46. While
for mortar with 0.5% superplasticizer, the optimum water content is 0.33.
Prism Days Flexural Strength (MPa) Average Strength (MPa)
LFC-CS
28 2.88 3.98 3.80
3.55
LFC-0.5SP
28
4.88 5.09 4.99
4.98
233
2. Compressive strength of LFC with 0.5% superplasticizer is 15.88 MPa. Flexural strength and tensile strength is 4.98 MPa and 1.76 MPa respectively.
3. Addition of 0.5% superplasticizer decrease the optimum water content of base mix mortar by 28%. Besides, it has also increased its optimum strength by 43.6% from 52.35 MPa to 75.18 MPa.
4. 0.5% superplasticizer has positive effect on mechanical properties of LFC. Compressive strength, flexural strength and tensile strength show increment of 118%, 40.3% and 45.5% respectively.
REFERENCES [1] Choo B.S & Newman, J. (2003). Advanced Concrete Technology. Butterworth-Heinemann: Elsevier Science. [2] Aldridge, D. (2005), Introduction to Foamed Concrete: What, Why, How? Used of Foamed Concrete in
Construction. [3] Jones, M. R., & McCarthy, A. (2005). Behaviour and Assessment of Foamed Concrete for Construction
Applications. Use of Foamed Concrete in Construction, 61-88. [4] Suryakanta (2014), What is The Function of Sand in Mortar? Retrieved from
http://civilblog.org/2014/10/27/what-is-the-function-of-sand-in-mortar/ [5] Westerholm, M., Lagerblad, B., Silfwerbrand, J., Forssberg, E. (2008), Influence of fine aggregate
characteristics on the rheological properties of mortars. Cement Concr Compos, 30(4), 274–82. [6] Lim, S. K., Tan, C. S., Chen, K. P., Lee, M. L., Lee, W. P., (2013). Effect of different sand grading on strength
properties of cement grout. Construction and Building Materials, 38, 348–355. [7] ASTM C150 / C150M-17, Standard Specification for Portland Cement, ASTM International, West
Conshohocken, PA, 2017, www.astm.org [8] ASTM C1437-15, Standard Test Method for Flow of Hydraulic Cement Mortar, ASTM International, West
Conshohocken, PA, 2015, www.astm.org [9] ASTM C1611 / C1611M-14, Standard Test Method for Slump Flow of Self-Consolidating Concrete, ASTM
International, West Conshohocken, PA, 2014, www.astm.org [10] ASTM C39/C39M-16, Standard Test Method for Compressive Strength of Cylindrical Concrete Specimens,
ASTM International, West Conshohocken, PA, 2016, www. astm.org [11] ASTM C293/C293M-15, Standard Test Method for Flexural Strength of Concrete (Using Simple Beam with
Centre-Point Loading), ASTM International, West Conshohocken, PA, 2015, www. astm.org [12] ASTM C496/C496M -11, Standard Test Method for Splitting Tensile Strength of Cylindrical Concrete
Specimens. ASTM International, West Conshohocken, PA, 2011, www. astm.org [13] Zhao, X., Lim, S.K., Tan, C.S., Li, B., Ling, T.C., Huang, R., Wang, Q. (2015), Properties of Foamed Mortar
Prepared with Granulated Blast-Furnace Slag. Materials, 8, 462-473. [14] Valore R.C. (1954). Cellular Concrete Part 2 Physical Properties. American Concrete Institute Journal, 25(10),
817-836

234
Effect of Coconut Fibres on the Mechanical Properties of the Concrete Tan Jia Yang1, Mohd. Yunus bin Ishak2
Faculty of Civil Engineering, Universiti Teknologi Malaysia, Malaysia [email protected]
Keywords: Coconut Fibres; Fibre Reinforced Concrete; Concrete Panel; Mechanical Testing
ABSTRACT. Concrete is the one of the most popular construction material due to its strength and durability. The major drawback of concrete is its low tensile strength. Coconut fibres are the agriculture waste that easily can be found in Malaysia abundantly and can be introduced in the concrete as green material as well as to increase the concrete’s tensile strength. In this study, the effect of 2% of coconut fibres based on the cement weight of uniform length of 35 mm are added to the concrete towards the compressive strength, split tensile strength, flexural strength and impact strength is being studied as compared to the control specimens. Standard mix of concrete Grade 25 with the designed slump of 30-60 mm is used throughout the study. The result shows that the workability and the compressive strength reduce with the addition of fibres in the concrete mix. However, split tensile strength, flexural strength and impact strength increase with the addition of of fibres in the concrete mix. The bending strength for the concrete panel of size of 650mm x 100mm x 25mm with different arrangement of continuous long coconut fibres is investigated too. There are two types of arrangement, which is arrange in longitudinal direction in planar form and in rope form. Both arrangement has shown positive increments with respect to plain concrete panel with 10.1% increases in planar form and 24.0% increases in rope form. Concrete panels with coconut fibre prone to be more ductile. Generally, coconut fibre increases the mechanical properties of the concrete mix except slightly reduction on compressive strength.
INTRODUCTION
Nowadays, concrete is one of the most famous construction material worldwide. Cement, coarse aggregate, fine aggregate, and water are normally present in the conventional concrete mix. Although the concrete contributes a lot to the strength of the structure as it is good in compression strength, concrete is weak in tensile strength due to its brittle characteristics which is consequently to be low toughness. The tensile strength is about one tenth of the compression strength. Therefore, the crack is easily formed in the concrete when it is subjected to tension. After taken the weakness of the concrete into account, fibre is added into concrete to increase the tensile strength of the concrete.
Problem Statement Coconuts trees grown and the coconut are produced in 92 countries worldwide. Almost 75% of world coconut production produced by Indonesia, Philippines, India and Malaysia. Every coconut fruit yields around 40 % of coconut husks containing 30 % of coconut coir, with the dust making up the rest [1]. Coconut shells are also one of the wastes from coconut. These coconut coir and coconut shells should find some ways to recycle or reuse to reduce the waste production from agriculture. So, the coconut fibres could be a great alternative to replace the synthetic fibres to improve the concrete strength. Globally, about 500 000 tonnes of coconut coir are produced annually. Most of the coir produced is exported in the form of raw fibre with smaller quantities are exported as mats and matting. Therefore, in this study the suitability of the coconut coir used in the construction to replace the synthesis fibre or even steel reinforcement bar will be studied.
Objectives The objectives of this study are:
1. To determine the effect of concrete compressive strength, tensile strength, and flexural strength after addition of 35 mm coconut fibres in random arrangement as compared to plain concrete.
2. To determine the effect of concrete panel bending strength after addition of same amount of continuous coconut fibres but with different arrangement of coconut fibre (in planar form and in rope form) as reinforcement in concrete as compared to plain concrete panel.
3. To evaluate the effect of coconut fibre reinforced concrete on impact resistance as compared to plain concrete.
Scope of Study The study focused on the effect of introducing the coconut coir fibres into the concrete to know the suitability of the coconut fibre implement in the real construction. The coconut coir is being cut into 35 mm length to serves as short fibre in concrete mix and glued into continuous fibre in planar form and in rope form to introduce into the concrete panel. The content of fibre added are 2% by the mass of the cement and no fibre (0%) is added to the control plain concrete where it serves as comparison base line for the fibre reinforced concrete. Concrete grade-25 are proposed throughout the research with no admixtures added to the mix in this research. The design concrete test will be performed at 28 days.
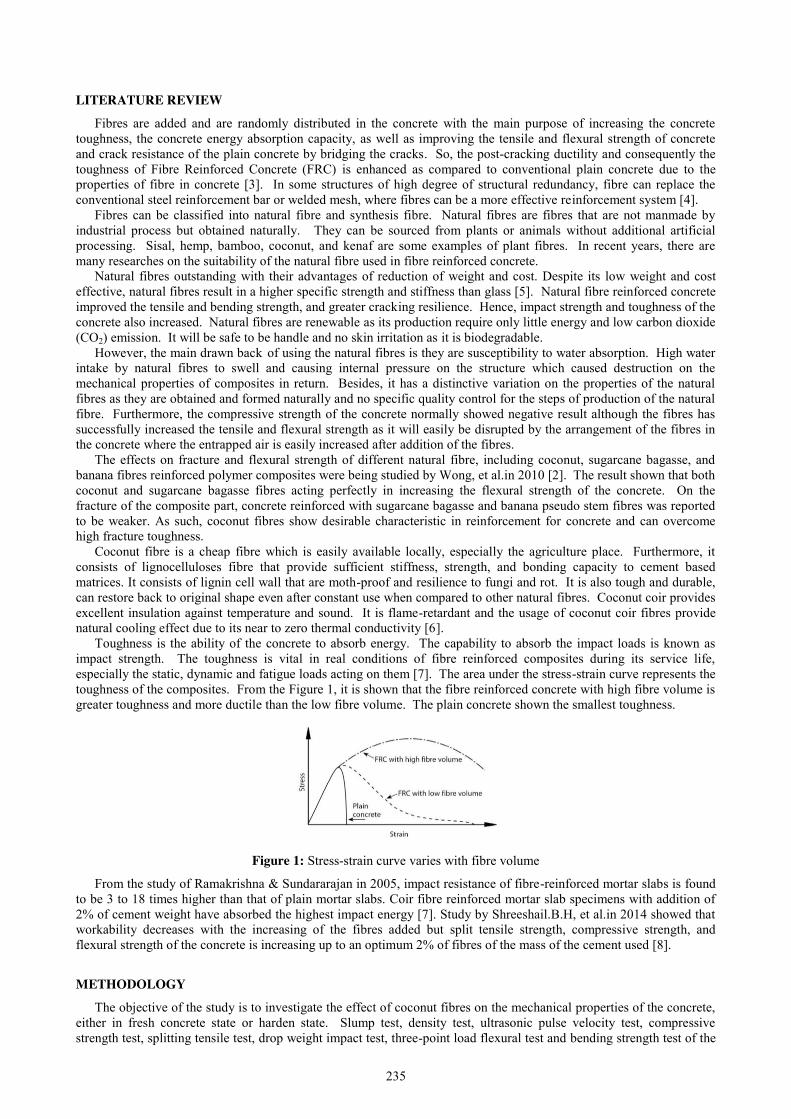
235
LITERATURE REVIEW
Fibres are added and are randomly distributed in the concrete with the main purpose of increasing the concrete toughness, the concrete energy absorption capacity, as well as improving the tensile and flexural strength of concrete and crack resistance of the plain concrete by bridging the cracks. So, the post-cracking ductility and consequently the toughness of Fibre Reinforced Concrete (FRC) is enhanced as compared to conventional plain concrete due to the properties of fibre in concrete [3]. In some structures of high degree of structural redundancy, fibre can replace the conventional steel reinforcement bar or welded mesh, where fibres can be a more effective reinforcement system [4].
Fibres can be classified into natural fibre and synthesis fibre. Natural fibres are fibres that are not manmade by industrial process but obtained naturally. They can be sourced from plants or animals without additional artificial processing. Sisal, hemp, bamboo, coconut, and kenaf are some examples of plant fibres. In recent years, there are many researches on the suitability of the natural fibre used in fibre reinforced concrete.
Natural fibres outstanding with their advantages of reduction of weight and cost. Despite its low weight and cost effective, natural fibres result in a higher specific strength and stiffness than glass [5]. Natural fibre reinforced concrete improved the tensile and bending strength, and greater cracking resilience. Hence, impact strength and toughness of the concrete also increased. Natural fibres are renewable as its production require only little energy and low carbon dioxide (CO2) emission. It will be safe to be handle and no skin irritation as it is biodegradable.
However, the main drawn back of using the natural fibres is they are susceptibility to water absorption. High water intake by natural fibres to swell and causing internal pressure on the structure which caused destruction on the mechanical properties of composites in return. Besides, it has a distinctive variation on the properties of the natural fibres as they are obtained and formed naturally and no specific quality control for the steps of production of the natural fibre. Furthermore, the compressive strength of the concrete normally showed negative result although the fibres has successfully increased the tensile and flexural strength as it will easily be disrupted by the arrangement of the fibres in the concrete where the entrapped air is easily increased after addition of the fibres.
The effects on fracture and flexural strength of different natural fibre, including coconut, sugarcane bagasse, and banana fibres reinforced polymer composites were being studied by Wong, et al.in 2010 [2]. The result shown that both coconut and sugarcane bagasse fibres acting perfectly in increasing the flexural strength of the concrete. On the fracture of the composite part, concrete reinforced with sugarcane bagasse and banana pseudo stem fibres was reported to be weaker. As such, coconut fibres show desirable characteristic in reinforcement for concrete and can overcome high fracture toughness.
Coconut fibre is a cheap fibre which is easily available locally, especially the agriculture place. Furthermore, it consists of lignocelluloses fibre that provide sufficient stiffness, strength, and bonding capacity to cement based matrices. It consists of lignin cell wall that are moth-proof and resilience to fungi and rot. It is also tough and durable, can restore back to original shape even after constant use when compared to other natural fibres. Coconut coir provides excellent insulation against temperature and sound. It is flame-retardant and the usage of coconut coir fibres provide natural cooling effect due to its near to zero thermal conductivity [6].
Toughness is the ability of the concrete to absorb energy. The capability to absorb the impact loads is known as impact strength. The toughness is vital in real conditions of fibre reinforced composites during its service life, especially the static, dynamic and fatigue loads acting on them [7]. The area under the stress-strain curve represents the toughness of the composites. From the Figure 1, it is shown that the fibre reinforced concrete with high fibre volume is greater toughness and more ductile than the low fibre volume. The plain concrete shown the smallest toughness.
Figure 1: Stress-strain curve varies with fibre volume
From the study of Ramakrishna & Sundararajan in 2005, impact resistance of fibre-reinforced mortar slabs is found to be 3 to 18 times higher than that of plain mortar slabs. Coir fibre reinforced mortar slab specimens with addition of 2% of cement weight have absorbed the highest impact energy [7]. Study by Shreeshail.B.H, et al.in 2014 showed that workability decreases with the increasing of the fibres added but split tensile strength, compressive strength, and flexural strength of the concrete is increasing up to an optimum 2% of fibres of the mass of the cement used [8].
METHODOLOGY
The objective of the study is to investigate the effect of coconut fibres on the mechanical properties of the concrete, either in fresh concrete state or harden state. Slump test, density test, ultrasonic pulse velocity test, compressive strength test, splitting tensile test, drop weight impact test, three-point load flexural test and bending strength test of the

236
concrete panel of fibre reinforced concrete (2% based on the cement weight) were being conducted in this study to compare with the control set of plain concrete mix. Coconut Fibre Preparation The coconuts were first collected from the coconut plantation and the coconut fibres were being extracted out manually from the coconut shell. The coconut fibres were rinsed in fresh water to remove foreign impurities. The cleaned fibres were left to dry at room temperature. The coconut fibre was then soaked with the coconut oil for 15 minutes to avoid from water absorption and dry it again. After treatment process on coconut fibres, the fibres were cut into uniform lengths of 35 mm for short fibres. For the continuous fibre but unidirectional, coconut fibres were glued to be continuous. The continuous fibres were then glued into planar form (Figure 2) and rope form (Figure 3) with the exactly same amount of fibres.
Figure 2: Continuous long coconut fibres in planar form Figure 3: Continuous long coconut fibres in rope form
Fibre Reinforced Concrete and Plain Concrete Laboratory Testing Slump Test. The slump test was carried out to determine the workability of the fresh concrete based on ASTM C143. First, the slump cone and the plate were located on a flat platform. The fresh concrete was filled into the cone and compacted in 3 layers. The top part of the cone was flaten. The slump cone was removed from the concrete by raising it in vertical direction. The value of slump was measured and checked whether it reached the designed slump value. Comparison of the workability of the plain fresh concrete with the 35mm short fibre added into concrete mix was made. Density Test. Density test of the concrete was carried out where the concrete cubes were weighted using weighting machine and the volume of the concrete cubes were calculated. Thus, the density of the concrete cubes can be obtained by dividing the mass of the concrete with the relative concrete volume as Equation 1.
Density = 𝑀𝑉 Eq. 1
UPV test. The UPV test was carried out with the direct transmission of ultrasonic pulse method. The receiver and transmitter were put at the both side of the concrete for ultrasonic pulse transmission. Grease was allocated between the specimens with the receiver and transmitter. The time taken for the pulse to transmits through the concrete was recorded and the velocity was calculated using Equation 2.
Ultrasonic Pulse Velocity = 𝐿
𝑡 Eq. 2
Cube Compression Test. The compressive strength test was done in the cube specimens of 100 mm x 100 mm x 100 mm. The cubes were tested at the age of 28 days. There were three specimens of plain concrete and three specimens of concrete mixes with 35 mm short fibres in random orientation. The result was calculated using the Equation 3.
Compressive Strength = 𝐹𝐴 Eq. 3
. Cylinder Split Tensile Test. The split tensile test was done in the cylindrical specimens of 150 mm x 300 mm based on ASTM C496. The cylindrical specimens were tested in 28 days. Comparison was made between cylindrical specimen of plain concrete and cylindrical specimen of concrete mixes with 35 mm short fibres in random orientation. The results were calculate using the Equation 4.
Tensile Strength = 2𝑃
𝜋𝐿𝐷 Eq. 4
Flexural Strength Test. The flexural test was done in the specimens of 100 mm x 100 mm x 500 mm based on ASTM C 78. The specimens were tested in 28 days. Comparison was made between specimen of plain concrete and specimen of concrete mixes with 35 mm short fibres. The result was calculate using the Equation 5.
Flexural Strength = 3𝐹𝑎
𝑏𝑑2 Eq. 5
Impact Strength Test. The impact test was carried out to compare the impact strength that can be absorbed in plain concrete and in discrete fibre length of 35 mm in the mix. The required size of the testing specimens were 150 mm in diameter and 64 mm height. The samples were placed on base plate within the positioning lugs with the finished faced up. The positioning bracket was then bolted in place and the hardened steel ball was placed on top of the specimen
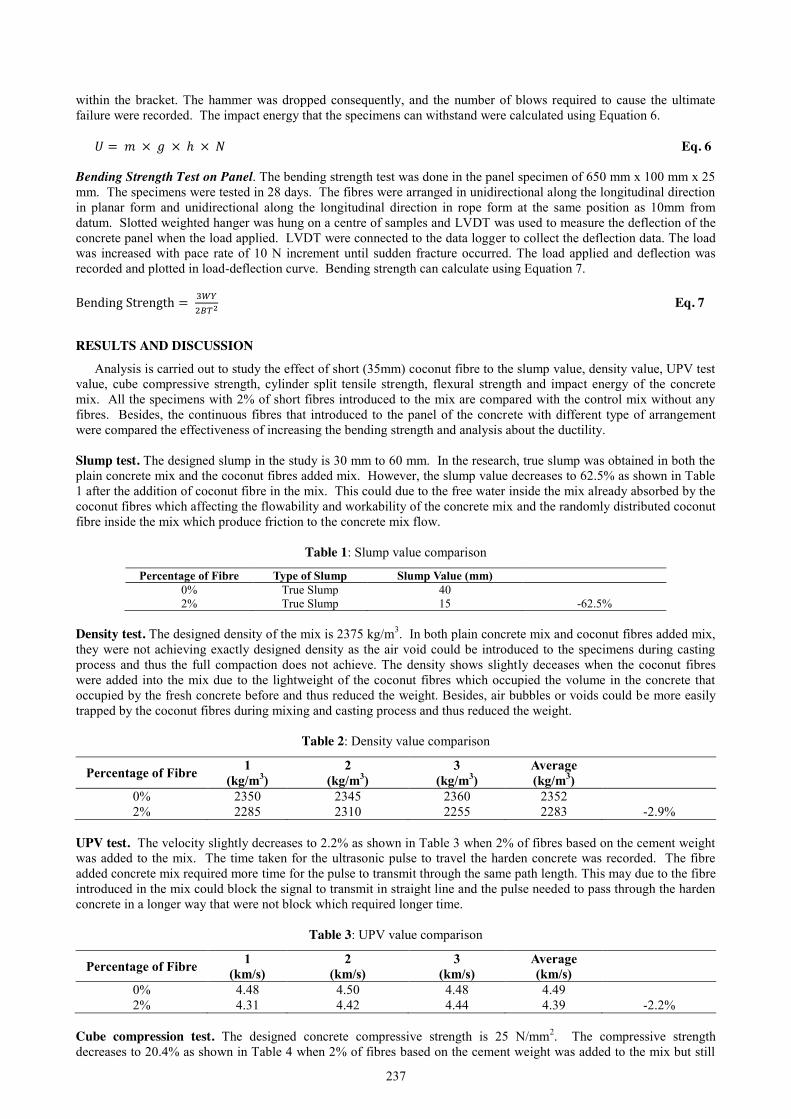
237
within the bracket. The hammer was dropped consequently, and the number of blows required to cause the ultimate failure were recorded. The impact energy that the specimens can withstand were calculated using Equation 6.
𝑈 = 𝑚 × 𝑔 × ℎ × 𝑁 Eq. 6
Bending Strength Test on Panel. The bending strength test was done in the panel specimen of 650 mm x 100 mm x 25 mm. The specimens were tested in 28 days. The fibres were arranged in unidirectional along the longitudinal direction in planar form and unidirectional along the longitudinal direction in rope form at the same position as 10mm from datum. Slotted weighted hanger was hung on a centre of samples and LVDT was used to measure the deflection of the concrete panel when the load applied. LVDT were connected to the data logger to collect the deflection data. The load was increased with pace rate of 10 N increment until sudden fracture occurred. The load applied and deflection was recorded and plotted in load-deflection curve. Bending strength can calculate using Equation 7. Bending Strength = 3𝑊𝑌
2𝐵𝑇2 Eq. 7
RESULTS AND DISCUSSION
Analysis is carried out to study the effect of short (35mm) coconut fibre to the slump value, density value, UPV test value, cube compressive strength, cylinder split tensile strength, flexural strength and impact energy of the concrete mix. All the specimens with 2% of short fibres introduced to the mix are compared with the control mix without any fibres. Besides, the continuous fibres that introduced to the panel of the concrete with different type of arrangement were compared the effectiveness of increasing the bending strength and analysis about the ductility. Slump test. The designed slump in the study is 30 mm to 60 mm. In the research, true slump was obtained in both the plain concrete mix and the coconut fibres added mix. However, the slump value decreases to 62.5% as shown in Table 1 after the addition of coconut fibre in the mix. This could due to the free water inside the mix already absorbed by the coconut fibres which affecting the flowability and workability of the concrete mix and the randomly distributed coconut fibre inside the mix which produce friction to the concrete mix flow.
Table 1: Slump value comparison
Percentage of Fibre Type of Slump Slump Value (mm) 0% True Slump 40 2% True Slump 15 -62.5%
Density test. The designed density of the mix is 2375 kg/m3. In both plain concrete mix and coconut fibres added mix, they were not achieving exactly designed density as the air void could be introduced to the specimens during casting process and thus the full compaction does not achieve. The density shows slightly deceases when the coconut fibres were added into the mix due to the lightweight of the coconut fibres which occupied the volume in the concrete that occupied by the fresh concrete before and thus reduced the weight. Besides, air bubbles or voids could be more easily trapped by the coconut fibres during mixing and casting process and thus reduced the weight.
Table 2: Density value comparison
Percentage of Fibre 1 (kg/m3)
2 (kg/m3)
3 (kg/m3)
Average (kg/m3)
0% 2350 2345 2360 2352 2% 2285 2310 2255 2283 -2.9%
UPV test. The velocity slightly decreases to 2.2% as shown in Table 3 when 2% of fibres based on the cement weight was added to the mix. The time taken for the ultrasonic pulse to travel the harden concrete was recorded. The fibre added concrete mix required more time for the pulse to transmit through the same path length. This may due to the fibre introduced in the mix could block the signal to transmit in straight line and the pulse needed to pass through the harden concrete in a longer way that were not block which required longer time.
Table 3: UPV value comparison
Percentage of Fibre 1 (km/s)
2 (km/s)
3 (km/s)
Average (km/s)
0% 4.48 4.50 4.48 4.49 2% 4.31 4.42 4.44 4.39 -2.2%
Cube compression test. The designed concrete compressive strength is 25 N/mm2. The compressive strength decreases to 20.4% as shown in Table 4 when 2% of fibres based on the cement weight was added to the mix but still
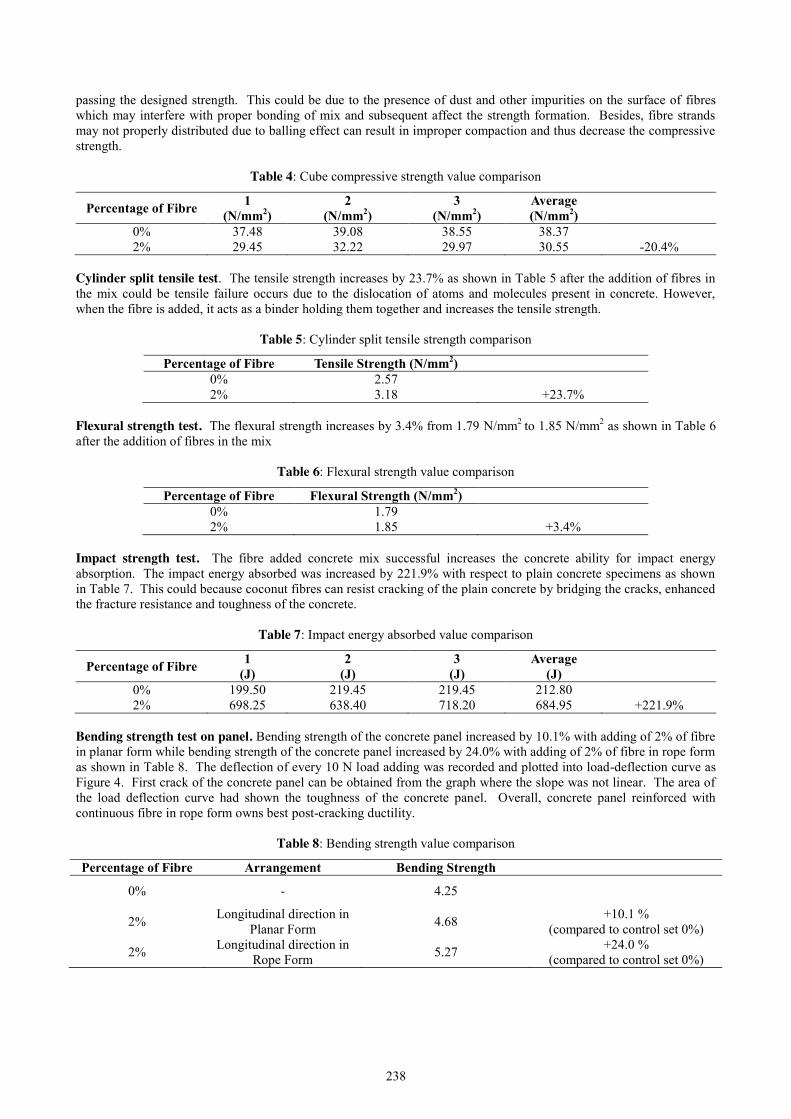
238
passing the designed strength. This could be due to the presence of dust and other impurities on the surface of fibres which may interfere with proper bonding of mix and subsequent affect the strength formation. Besides, fibre strands may not properly distributed due to balling effect can result in improper compaction and thus decrease the compressive strength.
Table 4: Cube compressive strength value comparison
Percentage of Fibre 1 (N/mm2)
2 (N/mm2)
3 (N/mm2)
Average (N/mm2)
0% 37.48 39.08 38.55 38.37 2% 29.45 32.22 29.97 30.55 -20.4%
Cylinder split tensile test. The tensile strength increases by 23.7% as shown in Table 5 after the addition of fibres in the mix could be tensile failure occurs due to the dislocation of atoms and molecules present in concrete. However, when the fibre is added, it acts as a binder holding them together and increases the tensile strength.
Table 5: Cylinder split tensile strength comparison
Percentage of Fibre Tensile Strength (N/mm2) 0% 2.57 2% 3.18 +23.7%
Flexural strength test. The flexural strength increases by 3.4% from 1.79 N/mm2 to 1.85 N/mm2 as shown in Table 6 after the addition of fibres in the mix
Table 6: Flexural strength value comparison
Percentage of Fibre Flexural Strength (N/mm2) 0% 1.79 2% 1.85 +3.4%
Impact strength test. The fibre added concrete mix successful increases the concrete ability for impact energy absorption. The impact energy absorbed was increased by 221.9% with respect to plain concrete specimens as shown in Table 7. This could because coconut fibres can resist cracking of the plain concrete by bridging the cracks, enhanced the fracture resistance and toughness of the concrete.
Table 7: Impact energy absorbed value comparison
Percentage of Fibre 1 (J)
2 (J)
3 (J)
Average (J)
0% 199.50 219.45 219.45 212.80 2% 698.25 638.40 718.20 684.95 +221.9%
Bending strength test on panel. Bending strength of the concrete panel increased by 10.1% with adding of 2% of fibre in planar form while bending strength of the concrete panel increased by 24.0% with adding of 2% of fibre in rope form as shown in Table 8. The deflection of every 10 N load adding was recorded and plotted into load-deflection curve as Figure 4. First crack of the concrete panel can be obtained from the graph where the slope was not linear. The area of the load deflection curve had shown the toughness of the concrete panel. Overall, concrete panel reinforced with continuous fibre in rope form owns best post-cracking ductility.
Table 8: Bending strength value comparison
Percentage of Fibre Arrangement Bending Strength
0% - 4.25
2% Longitudinal direction in Planar Form 4.68 +10.1 %
(compared to control set 0%)
2% Longitudinal direction in Rope Form 5.27 +24.0 %
(compared to control set 0%)

239
Figure 4: Load deflection curve with different arrangement of continuous long coconut fibres and plain concrete
CONCLUSION
Based on the result analysis and interpretation, comparison of mechanical properties between the plain concrete mix and the coconut fibre reinforced concrete mix was made. Objective of the study is achieved and few conclusion can be deduced from the experimental result as follow:
1. In slump test, the value of slump decreases as the fibre content increases. Hence, the workability is reduced by the introduction of coconut fibre into the concrete mix.
2. UPV result and density value are slightly affected and reduced to 2.2% and 2.9% respectively due to the present of the lightweight coconut fibre in the concrete specimens.
3. The addition of 2% of coconut fibres into the concrete reflected negatively on the cube compressive strength, where the reduction of 20.4% is observed. However, the fibres assist greatly for the cylindrical split tensile strength and flexural strength as fibres increases the 23.7% and 3.4% from the plain concrete specimen result.
4. From the dropped weight impact test, there is the most contribution of increment of 221.9% with the coconut fibres as compared to plain concrete. This is because coconut fibres can resist cracking of the plain concrete by bridging the cracks and enhance the fracture resistance.
5. The bending strength test of concrete panel shows encouraging result with the continuous long coconut fibres introduced into it in longitudinal direction. The fibres glued into planar form increased by 10.1% while the fibres in rope form increased by 24%. Even though both arrangement showed increment, fibres in rope form perform better and shows ductile properties by sustaining more loading and deflected more before failure.
REFERENCES
[1] Safar, Z. (2015, December 16). BIOENERGY CONSULT. Retrieved from Energy Potential of Coconut Biomass: http://www.bioenergyconsult. com/tag/uses-of-coconut-wastes/
[2] Wong, K., Nirmal, U. & Lim, B., 2010. Impact Behavior of Short and Continuous Fiber-Reinforced Polyester Composites. Journal of Reinforced Plastics and Composites, p. 3463–3474.
[3] Chandel, A., Shah, T., Shah, T. & Varde, D., Mar. - Apr. 2016. A Comparative Strength Study of Coir Fibre Reinforced Concrete (CFRC) Over Plain Cement Concrete (PCC). IOSR Journal of Mechanical and Civil Engineering (IOSR-JMCE), pp. 95-97.
[4] Prisco, M. d., Plizzari, G. & Vandewalle, L., 2009. Fibre Reinforced Concrete: New Design Perspectives. Materials and Structures, Volume 42, p. 1261–1281.
[5] M. Jawaid, H. A. K., 2011. Cellulosic/Synthetic Fibre Reinforced Polymer Hybrid Composites: A Review. Carbohydrate Polymers , Volume 86 , p. 1– 18.
[6] Dhandhania, V. & Sawant, S., 2014. Coir Fiber Reinforced Concrete. J Textile Sci Eng, 4(5). [7] Ramakrishna, G. & Sundararajan, T., 2005. Impact Strength of a Few Natural Fibre Reinforced Cement Mortar
Slab: A Comparative Study. Cement & Concrete Composites, Volume 27, pp. 547-553. [8] Shreeshail.B.H, Chougale, J., Pimple, D. & kulkarni, A., 2014. Effects of Coconut Fibres on the Properties of
Concrete. International Journal of Research in Engineering and Technology, 03(12), pp. 5-11.
0
50
100
150
200
250
300
350
400
0 0.05 0.1 0.15 0.2 0.25 0.3 0.35 0.4 0.45 0.5
Load
(N)
Deflection (mm)
Load Deflection Curve
0%
2% Plane
2% Bar
240
Mechanical Properties of Locally Treated Bamboo Teh Nor Shafiqqa binti Shakri1, Izni Syahrizal Ibrahim2 Faculty of Civil Engineering, Universiti Teknologi Malaysia, Malaysia
Keywords: Bamboos; Ultimate Stress; Modulus of Elasticity; Mechanical Properties
ABSTRACT. This study is done to study the mechanical properties of several species of bamboo. The chosen species are Gigantochloa Scortechinii (Buluh Semantan), Bambusa Vulgaris (Buluh Minyak) and Dendrocalamus Asper (Buluh Betung). Several tests were carried out such as compressive strength test, tensile strength test, shear strength test and static bending test. All the tests were done following the standard of ISO 22157- Determination of Physical and Mechanical Properties. Based on the test conducted, Buluh Semantan gives a highest compression stress, tensile strength and shear strength. The modulus of elasticity for tensile test and static bending test for Buluh Minyak is the highest meanwhile modulus of elasticity for compression test; Buluh Semantan shows a higher value than the other species. Overall, the compressive strength of bamboo is roughly situated between 50 and 65 N/mm2, the bending strength of bamboo species varies between 75 and 120 N/mm2, the tensile strength of bamboo is around 160 and 390 N/mm2 and the shear stress gives a value approximately 10 times lower than compressive strength and even 20 times lower than the tensile strength of the same bamboo species.
INTRODUCTION
Bamboos are the fastest growing woody plants in the world. It growth rate ranges from 30 centimeter to 1 meter in a day. In diverse climate across the world, there are 1450 species found but not all species can be used in construction. In 1970, the estimated total area of bamboo habitat in Peninsular Malaysia was about 20 000 ha but in year 2016, it has increases to 329 000 ha. However, as of 2017, there are very little information can be found saying that bamboo had been used as a construction material in Malaysia. Bamboo has been in wide usage since ancient time as a low-cost material for houses, bridges etc. Bamboos are renewable and unlimited, with its enormous number; Malaysia’s industries are using bamboo as handicraft, musical instruments and many more. It is also been used as temporary structures in other countries like China, India and Hong Kong. Even with the development of construction using bamboos, concrete is still the main construction materials chosen by developers. The bamboos are also hardly been used as a temporary structure in Malaysia. This may cause by the view saying that bamboos is a material mainly preferred by the poor and also the lack of structural design data and the exclusion from building codes.
Problem Statement Bamboo had many advantages but people did not realize its potential as a permanent structure in construction. This is due to lack of technical information about the local materials makes people use mainly industrialized materials as a main option in construction such as concrete. Concrete is widely used as a structural element in construction; it also has several disadvantages which will affect the environment. Cement in the concrete is one of the primary producers of carbon dioxide; a greenhouse gas which is not good to the environment. Concrete also can cause soil erosion, water pollution and flooding due to the creation of hard surface which contribute to surface runoff. The disadvantages stated before is also the reason of bamboo should be used as a substitute in construction material. Therefore, this study is to investigate the mechanical strength of the bamboos which will proved it’s potential as permanent structures instead of just as temporary structures.
Objectives The objectives of this study are:
1. To determine the mechanical properties of locally treated bamboo species. 2. To study the failure mode of treated bamboo under various loading arrangement.
Scope of Study The scope of this study is to study the mechanical strength and the mode of failure of the treated bamboo under various loading arrangement. Laboratory test was conducted on three different species of treated bamboo which are Buluh Minyak (Bambusa Vulgaris), Buluh Betung ( Dendrocalamus Asper) and Buluh Semantan (Gigantochloa Scortechinii). The test includes compressive strength test, tensile strength test, shear strength test and static bending test. The significance of study is to identify whether bamboos is suitable to be used as a structural element in construction.
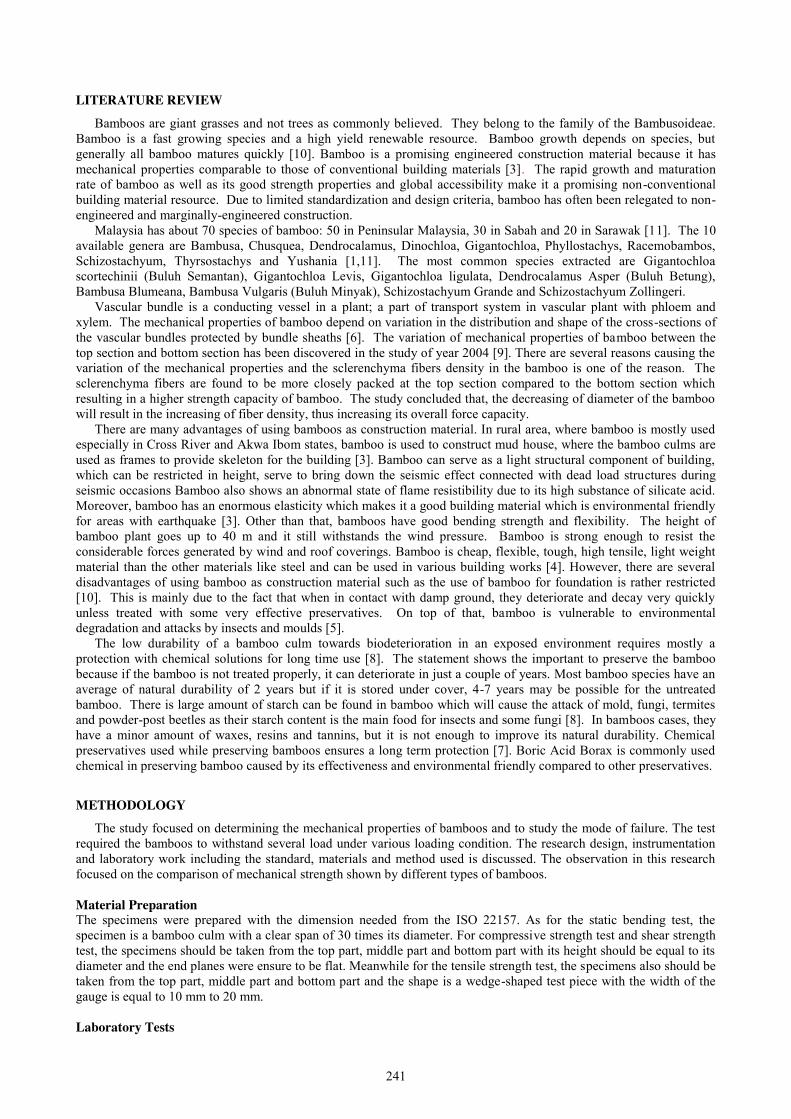
241
LITERATURE REVIEW
Bamboos are giant grasses and not trees as commonly believed. They belong to the family of the Bambusoideae. Bamboo is a fast growing species and a high yield renewable resource. Bamboo growth depends on species, but generally all bamboo matures quickly [10]. Bamboo is a promising engineered construction material because it has mechanical properties comparable to those of conventional building materials [3]. The rapid growth and maturation rate of bamboo as well as its good strength properties and global accessibility make it a promising non-conventional building material resource. Due to limited standardization and design criteria, bamboo has often been relegated to non-engineered and marginally-engineered construction.
Malaysia has about 70 species of bamboo: 50 in Peninsular Malaysia, 30 in Sabah and 20 in Sarawak [11]. The 10 available genera are Bambusa, Chusquea, Dendrocalamus, Dinochloa, Gigantochloa, Phyllostachys, Racemobambos, Schizostachyum, Thyrsostachys and Yushania [1,11]. The most common species extracted are Gigantochloa scortechinii (Buluh Semantan), Gigantochloa Levis, Gigantochloa ligulata, Dendrocalamus Asper (Buluh Betung), Bambusa Blumeana, Bambusa Vulgaris (Buluh Minyak), Schizostachyum Grande and Schizostachyum Zollingeri.
Vascular bundle is a conducting vessel in a plant; a part of transport system in vascular plant with phloem and xylem. The mechanical properties of bamboo depend on variation in the distribution and shape of the cross-sections of the vascular bundles protected by bundle sheaths [6]. The variation of mechanical properties of bamboo between the top section and bottom section has been discovered in the study of year 2004 [9]. There are several reasons causing the variation of the mechanical properties and the sclerenchyma fibers density in the bamboo is one of the reason. The sclerenchyma fibers are found to be more closely packed at the top section compared to the bottom section which resulting in a higher strength capacity of bamboo. The study concluded that, the decreasing of diameter of the bamboo will result in the increasing of fiber density, thus increasing its overall force capacity.
There are many advantages of using bamboos as construction material. In rural area, where bamboo is mostly used especially in Cross River and Akwa Ibom states, bamboo is used to construct mud house, where the bamboo culms are used as frames to provide skeleton for the building [3]. Bamboo can serve as a light structural component of building, which can be restricted in height, serve to bring down the seismic effect connected with dead load structures during seismic occasions Bamboo also shows an abnormal state of flame resistibility due to its high substance of silicate acid. Moreover, bamboo has an enormous elasticity which makes it a good building material which is environmental friendly for areas with earthquake [3]. Other than that, bamboos have good bending strength and flexibility. The height of bamboo plant goes up to 40 m and it still withstands the wind pressure. Bamboo is strong enough to resist the considerable forces generated by wind and roof coverings. Bamboo is cheap, flexible, tough, high tensile, light weight material than the other materials like steel and can be used in various building works [4]. However, there are several disadvantages of using bamboo as construction material such as the use of bamboo for foundation is rather restricted [10]. This is mainly due to the fact that when in contact with damp ground, they deteriorate and decay very quickly unless treated with some very effective preservatives. On top of that, bamboo is vulnerable to environmental degradation and attacks by insects and moulds [5].
The low durability of a bamboo culm towards biodeterioration in an exposed environment requires mostly a protection with chemical solutions for long time use [8]. The statement shows the important to preserve the bamboo because if the bamboo is not treated properly, it can deteriorate in just a couple of years. Most bamboo species have an average of natural durability of 2 years but if it is stored under cover, 4-7 years may be possible for the untreated bamboo. There is large amount of starch can be found in bamboo which will cause the attack of mold, fungi, termites and powder-post beetles as their starch content is the main food for insects and some fungi [8]. In bamboos cases, they have a minor amount of waxes, resins and tannins, but it is not enough to improve its natural durability. Chemical preservatives used while preserving bamboos ensures a long term protection [7]. Boric Acid Borax is commonly used chemical in preserving bamboo caused by its effectiveness and environmental friendly compared to other preservatives.
METHODOLOGY The study focused on determining the mechanical properties of bamboos and to study the mode of failure. The test
required the bamboos to withstand several load under various loading condition. The research design, instrumentation and laboratory work including the standard, materials and method used is discussed. The observation in this research focused on the comparison of mechanical strength shown by different types of bamboos. Material Preparation The specimens were prepared with the dimension needed from the ISO 22157. As for the static bending test, the specimen is a bamboo culm with a clear span of 30 times its diameter. For compressive strength test and shear strength test, the specimens should be taken from the top part, middle part and bottom part with its height should be equal to its diameter and the end planes were ensure to be flat. Meanwhile for the tensile strength test, the specimens also should be taken from the top part, middle part and bottom part and the shape is a wedge-shaped test piece with the width of the gauge is equal to 10 mm to 20 mm. Laboratory Tests
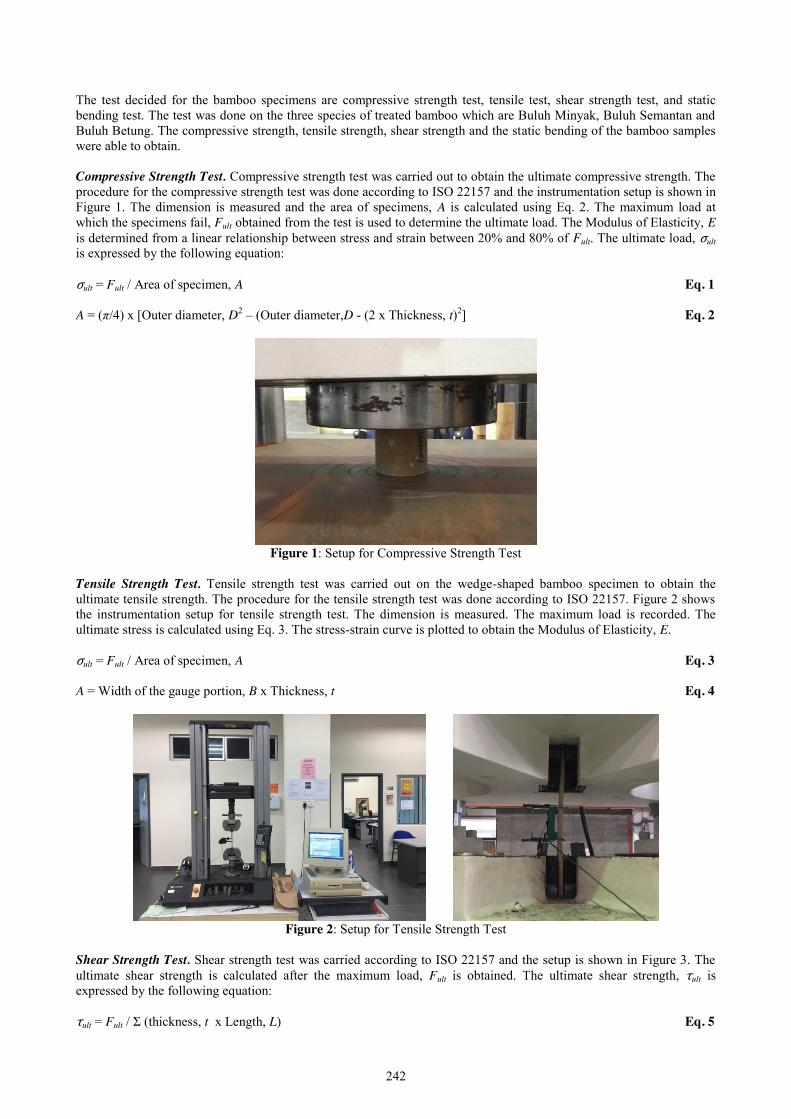
242
The test decided for the bamboo specimens are compressive strength test, tensile test, shear strength test, and static bending test. The test was done on the three species of treated bamboo which are Buluh Minyak, Buluh Semantan and Buluh Betung. The compressive strength, tensile strength, shear strength and the static bending of the bamboo samples were able to obtain. Compressive Strength Test. Compressive strength test was carried out to obtain the ultimate compressive strength. The procedure for the compressive strength test was done according to ISO 22157 and the instrumentation setup is shown in Figure 1. The dimension is measured and the area of specimens, A is calculated using Eq. 2. The maximum load at which the specimens fail, Fult obtained from the test is used to determine the ultimate load. The Modulus of Elasticity, E is determined from a linear relationship between stress and strain between 20% and 80% of Fult. The ultimate load, σult is expressed by the following equation: σult = Fult / Area of specimen, A Eq. 1 A = (π/4) x [Outer diameter, D2 – (Outer diameter,D - (2 x Thickness, t)2] Eq. 2
Figure 1: Setup for Compressive Strength Test
Tensile Strength Test. Tensile strength test was carried out on the wedge-shaped bamboo specimen to obtain the ultimate tensile strength. The procedure for the tensile strength test was done according to ISO 22157. Figure 2 shows the instrumentation setup for tensile strength test. The dimension is measured. The maximum load is recorded. The ultimate stress is calculated using Eq. 3. The stress-strain curve is plotted to obtain the Modulus of Elasticity, E. σult = Fult / Area of specimen, A Eq. 3 A = Width of the gauge portion, B x Thickness, t Eq. 4
Figure 2: Setup for Tensile Strength Test
Shear Strength Test. Shear strength test was carried according to ISO 22157 and the setup is shown in Figure 3. The ultimate shear strength is calculated after the maximum load, Fult is obtained. The ultimate shear strength, τult is expressed by the following equation: τult = Fult / Ʃ (thickness, t x Length, L) Eq. 5
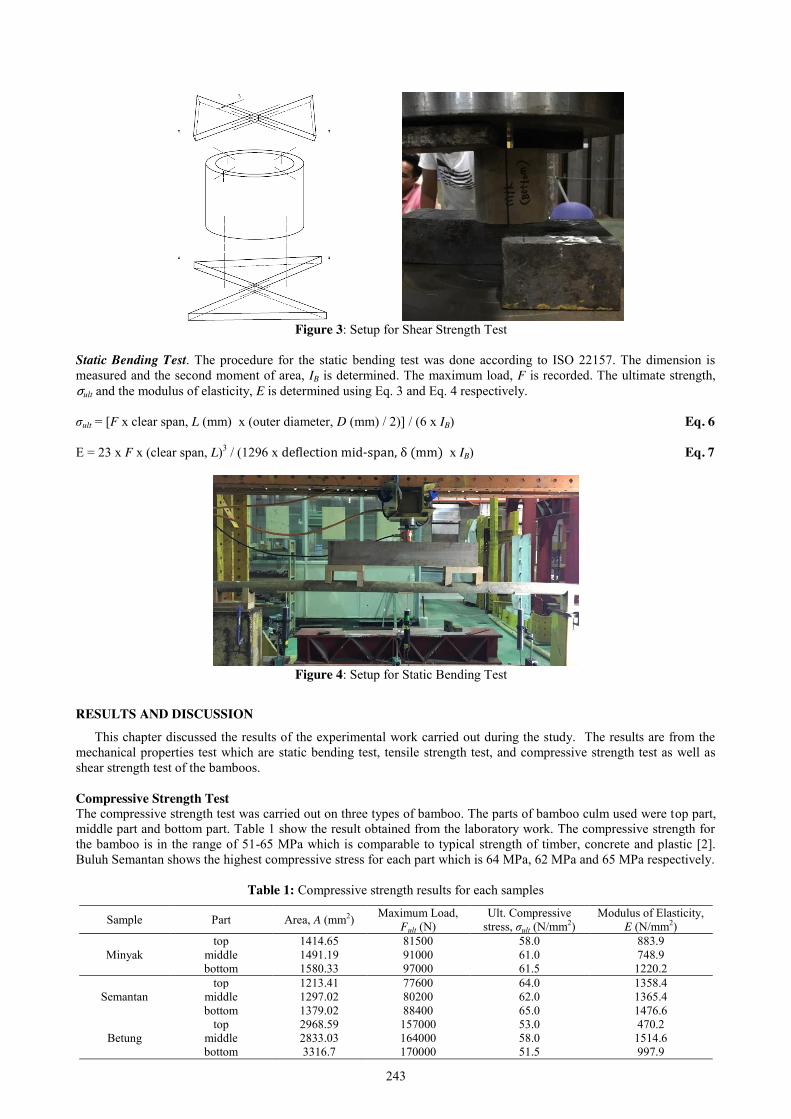
243
Figure 3: Setup for Shear Strength Test
Static Bending Test. The procedure for the static bending test was done according to ISO 22157. The dimension is measured and the second moment of area, IB is determined. The maximum load, F is recorded. The ultimate strength, σult and the modulus of elasticity, E is determined using Eq. 3 and Eq. 4 respectively. σult = [F x clear span, L (mm) x (outer diameter, D (mm) / 2)] / (6 x IB) Eq. 6 E = 23 x F x (clear span, L)3 / (1296 x deflection mid-span, δ (mm) x IB) Eq. 7
Figure 4: Setup for Static Bending Test
RESULTS AND DISCUSSION This chapter discussed the results of the experimental work carried out during the study. The results are from the
mechanical properties test which are static bending test, tensile strength test, and compressive strength test as well as shear strength test of the bamboos. Compressive Strength Test The compressive strength test was carried out on three types of bamboo. The parts of bamboo culm used were top part, middle part and bottom part. Table 1 show the result obtained from the laboratory work. The compressive strength for the bamboo is in the range of 51-65 MPa which is comparable to typical strength of timber, concrete and plastic [2]. Buluh Semantan shows the highest compressive stress for each part which is 64 MPa, 62 MPa and 65 MPa respectively.
Table 1: Compressive strength results for each samples
Sample Part Area, A (mm2) Maximum Load, Fult (N)
Ult. Compressive stress, σult (N/mm2)
Modulus of Elasticity, E (N/mm2)
Minyak top 1414.65 81500 58.0 883.9
middle 1491.19 91000 61.0 748.9 bottom 1580.33 97000 61.5 1220.2
Semantan top 1213.41 77600 64.0 1358.4
middle 1297.02 80200 62.0 1365.4 bottom 1379.02 88400 65.0 1476.6
Betung top 2968.59 157000 53.0 470.2
middle 2833.03 164000 58.0 1514.6 bottom 3316.7 170000 51.5 997.9
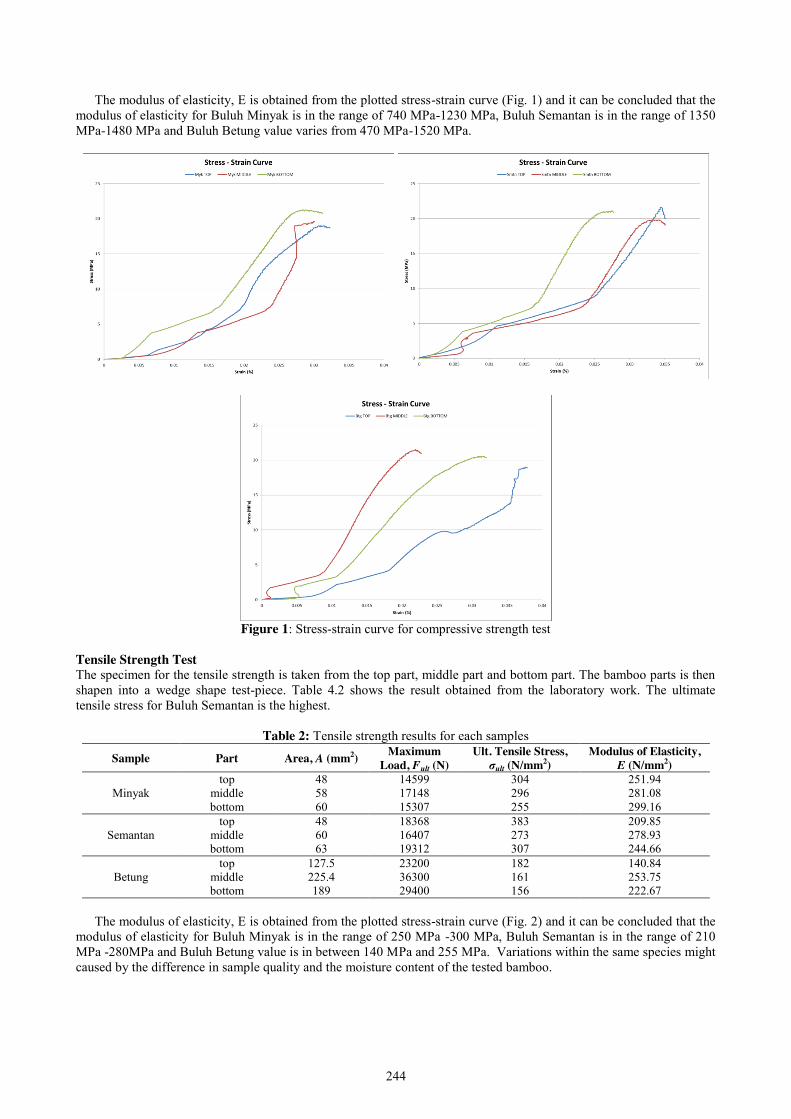
244
The modulus of elasticity, E is obtained from the plotted stress-strain curve (Fig. 1) and it can be concluded that the modulus of elasticity for Buluh Minyak is in the range of 740 MPa-1230 MPa, Buluh Semantan is in the range of 1350 MPa-1480 MPa and Buluh Betung value varies from 470 MPa-1520 MPa.
Figure 1: Stress-strain curve for compressive strength test
Tensile Strength Test The specimen for the tensile strength is taken from the top part, middle part and bottom part. The bamboo parts is then shapen into a wedge shape test-piece. Table 4.2 shows the result obtained from the laboratory work. The ultimate tensile stress for Buluh Semantan is the highest.
Table 2: Tensile strength results for each samples
Sample Part Area, A (mm2) Maximum Load, Fult (N)
Ult. Tensile Stress, σult (N/mm2)
Modulus of Elasticity, E (N/mm2)
Minyak top 48 14599 304 251.94
middle 58 17148 296 281.08 bottom 60 15307 255 299.16
Semantan top 48 18368 383 209.85
middle 60 16407 273 278.93 bottom 63 19312 307 244.66
Betung top 127.5 23200 182 140.84
middle 225.4 36300 161 253.75 bottom 189 29400 156 222.67
The modulus of elasticity, E is obtained from the plotted stress-strain curve (Fig. 2) and it can be concluded that the
modulus of elasticity for Buluh Minyak is in the range of 250 MPa -300 MPa, Buluh Semantan is in the range of 210 MPa -280MPa and Buluh Betung value is in between 140 MPa and 255 MPa. Variations within the same species might caused by the difference in sample quality and the moisture content of the tested bamboo.
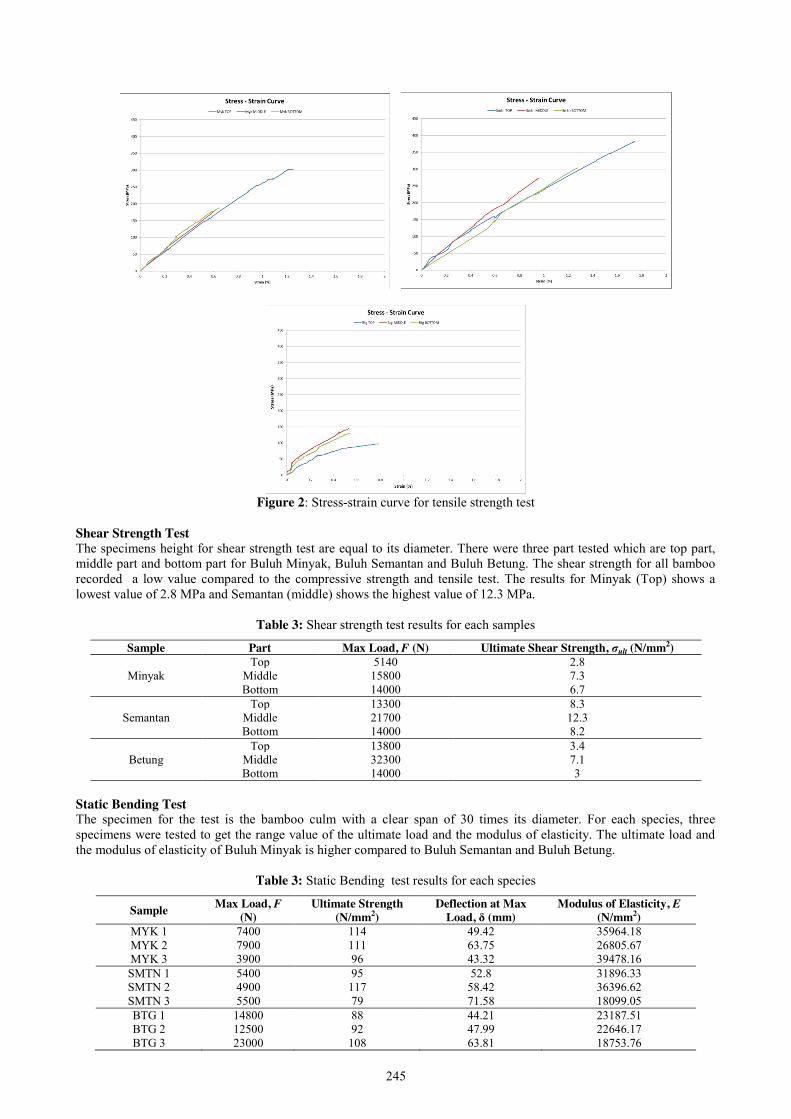
245
Figure 2: Stress-strain curve for tensile strength test
Shear Strength Test The specimens height for shear strength test are equal to its diameter. There were three part tested which are top part, middle part and bottom part for Buluh Minyak, Buluh Semantan and Buluh Betung. The shear strength for all bamboo recorded a low value compared to the compressive strength and tensile test. The results for Minyak (Top) shows a lowest value of 2.8 MPa and Semantan (middle) shows the highest value of 12.3 MPa.
Table 3: Shear strength test results for each samples
Sample Part Max Load, F (N) Ultimate Shear Strength, σult (N/mm2)
Minyak Top 5140 2.8
Middle 15800 7.3 Bottom 14000 6.7
Semantan Top 13300 8.3
Middle 21700 12.3 Bottom 14000 8.2
Betung Top 13800 3.4
Middle 32300 7.1 Bottom 14000 3
Static Bending Test The specimen for the test is the bamboo culm with a clear span of 30 times its diameter. For each species, three specimens were tested to get the range value of the ultimate load and the modulus of elasticity. The ultimate load and the modulus of elasticity of Buluh Minyak is higher compared to Buluh Semantan and Buluh Betung.
Table 3: Static Bending test results for each species
Sample Max Load, F (N)
Ultimate Strength (N/mm2)
Deflection at Max Load, δ (mm)
Modulus of Elasticity, E (N/mm2)
MYK 1 7400 114 49.42 35964.18 MYK 2 7900 111 63.75 26805.67 MYK 3 3900 96 43.32 39478.16 SMTN 1 5400 95 52.8 31896.33 SMTN 2 4900 117 58.42 36396.62 SMTN 3 5500 79 71.58 18099.05 BTG 1 14800 88 44.21 23187.51 BTG 2 12500 92 47.99 22646.17 BTG 3 23000 108 63.81 18753.76

246
Failure Mode Based on the test carried out, the mode of failure under various loading arrangement is observed. For compressive strength test, the cracking of the bamboo specimen is parallel to the direction of the applied loading. The mode of failure under compressive stress is shown in Figure 3.
Figure 3: Failure mode due to compressive stress.
Figure 4: Failure mode due to tensile stress.
For shear strength test, the cracking of the bamboo specimens is parallel to the direction of the applied loading. The cracking at the shear areas are clearly visible. The specimen before and after failure are shown in Figure 5.
(a) (b)
Figure 5: (a) Bamboo specimen before failure (b) Bamboo specimen after failure
For static bending test, the cracking of the bamboo is in the mid-span where the load is applied. The failure of the bamboo culm is shown in Figure 6.
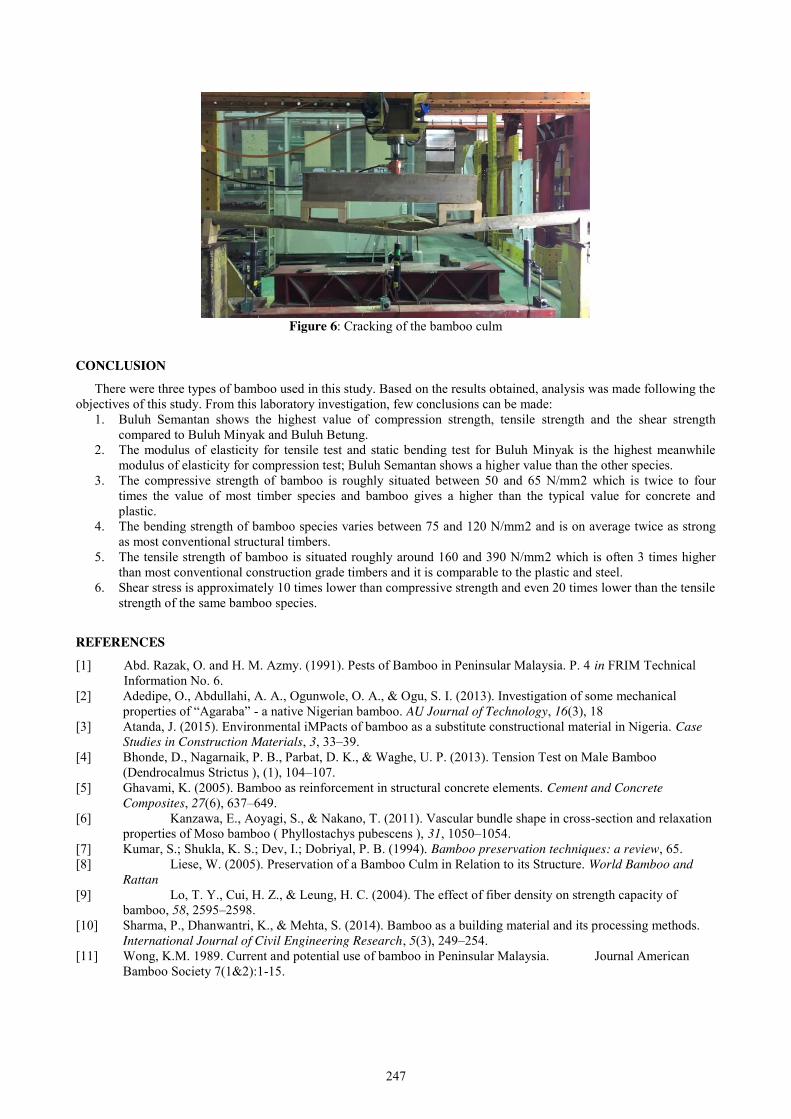
247
Figure 6: Cracking of the bamboo culm
CONCLUSION
There were three types of bamboo used in this study. Based on the results obtained, analysis was made following the objectives of this study. From this laboratory investigation, few conclusions can be made:
1. Buluh Semantan shows the highest value of compression strength, tensile strength and the shear strength compared to Buluh Minyak and Buluh Betung.
2. The modulus of elasticity for tensile test and static bending test for Buluh Minyak is the highest meanwhile modulus of elasticity for compression test; Buluh Semantan shows a higher value than the other species.
3. The compressive strength of bamboo is roughly situated between 50 and 65 N/mm2 which is twice to four times the value of most timber species and bamboo gives a higher than the typical value for concrete and plastic.
4. The bending strength of bamboo species varies between 75 and 120 N/mm2 and is on average twice as strong as most conventional structural timbers.
5. The tensile strength of bamboo is situated roughly around 160 and 390 N/mm2 which is often 3 times higher than most conventional construction grade timbers and it is comparable to the plastic and steel.
6. Shear stress is approximately 10 times lower than compressive strength and even 20 times lower than the tensile strength of the same bamboo species.
REFERENCES
[1] Abd. Razak, O. and H. M. Azmy. (1991). Pests of Bamboo in Peninsular Malaysia. P. 4 in FRIM Technical Information No. 6.
[2] Adedipe, O., Abdullahi, A. A., Ogunwole, O. A., & Ogu, S. I. (2013). Investigation of some mechanical properties of “Agaraba” - a native Nigerian bamboo. AU Journal of Technology, 16(3), 18
[3] Atanda, J. (2015). Environmental iMPacts of bamboo as a substitute constructional material in Nigeria. Case Studies in Construction Materials, 3, 33–39.
[4] Bhonde, D., Nagarnaik, P. B., Parbat, D. K., & Waghe, U. P. (2013). Tension Test on Male Bamboo (Dendrocalmus Strictus ), (1), 104–107.
[5] Ghavami, K. (2005). Bamboo as reinforcement in structural concrete elements. Cement and Concrete Composites, 27(6), 637–649.
[6] Kanzawa, E., Aoyagi, S., & Nakano, T. (2011). Vascular bundle shape in cross-section and relaxation properties of Moso bamboo ( Phyllostachys pubescens ), 31, 1050–1054.
[7] Kumar, S.; Shukla, K. S.; Dev, I.; Dobriyal, P. B. (1994). Bamboo preservation techniques: a review, 65. [8] Liese, W. (2005). Preservation of a Bamboo Culm in Relation to its Structure. World Bamboo and
Rattan [9] Lo, T. Y., Cui, H. Z., & Leung, H. C. (2004). The effect of fiber density on strength capacity of
bamboo, 58, 2595–2598. [10] Sharma, P., Dhanwantri, K., & Mehta, S. (2014). Bamboo as a building material and its processing methods.
International Journal of Civil Engineering Research, 5(3), 249–254. [11] Wong, K.M. 1989. Current and potential use of bamboo in Peninsular Malaysia. Journal American
Bamboo Society 7(1&2):1-15.
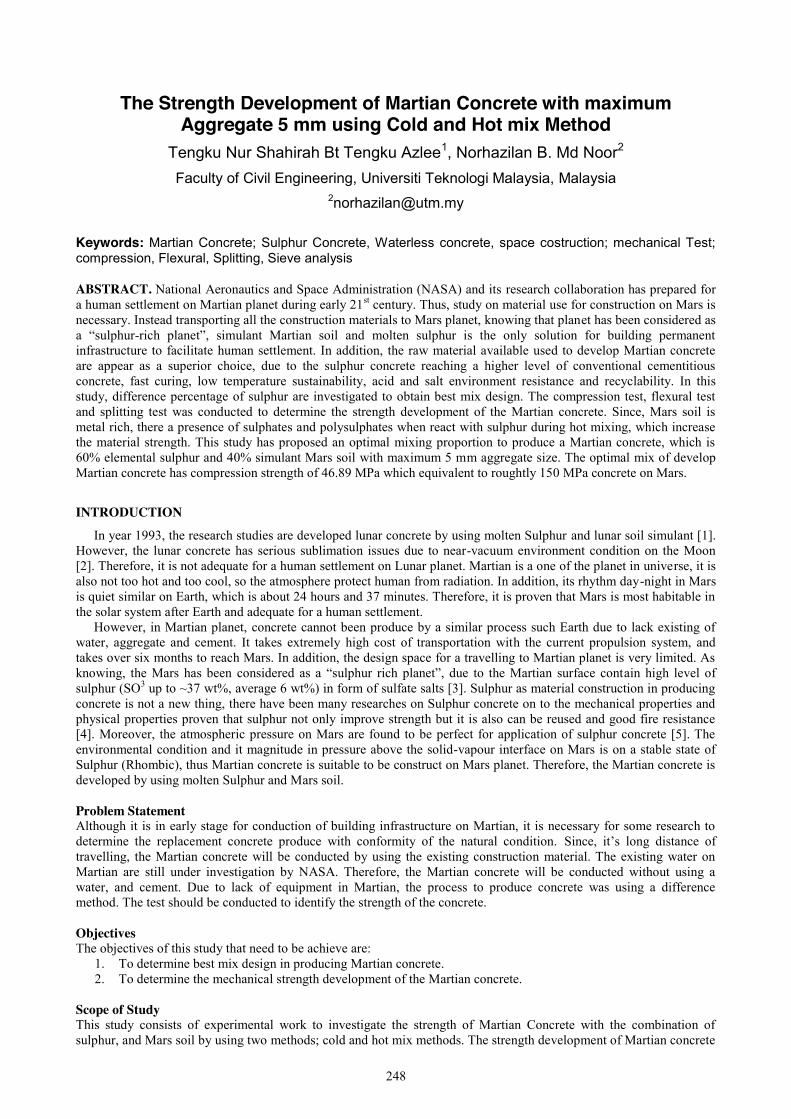
248
The Strength Development of Martian Concrete with maximum Aggregate 5 mm using Cold and Hot mix Method
Tengku Nur Shahirah Bt Tengku Azlee1, Norhazilan B. Md Noor2 Faculty of Civil Engineering, Universiti Teknologi Malaysia, Malaysia
Keywords: Martian Concrete; Sulphur Concrete, Waterless concrete, space costruction; mechanical Test; compression, Flexural, Splitting, Sieve analysis
ABSTRACT. National Aeronautics and Space Administration (NASA) and its research collaboration has prepared for a human settlement on Martian planet during early 21st century. Thus, study on material use for construction on Mars is necessary. Instead transporting all the construction materials to Mars planet, knowing that planet has been considered as a “sulphur-rich planet”, simulant Martian soil and molten sulphur is the only solution for building permanent infrastructure to facilitate human settlement. In addition, the raw material available used to develop Martian concrete are appear as a superior choice, due to the sulphur concrete reaching a higher level of conventional cementitious concrete, fast curing, low temperature sustainability, acid and salt environment resistance and recyclability. In this study, difference percentage of sulphur are investigated to obtain best mix design. The compression test, flexural test and splitting test was conducted to determine the strength development of the Martian concrete. Since, Mars soil is metal rich, there a presence of sulphates and polysulphates when react with sulphur during hot mixing, which increase the material strength. This study has proposed an optimal mixing proportion to produce a Martian concrete, which is 60% elemental sulphur and 40% simulant Mars soil with maximum 5 mm aggregate size. The optimal mix of develop Martian concrete has compression strength of 46.89 MPa which equivalent to roughtly 150 MPa concrete on Mars.
INTRODUCTION In year 1993, the research studies are developed lunar concrete by using molten Sulphur and lunar soil simulant [1].
However, the lunar concrete has serious sublimation issues due to near-vacuum environment condition on the Moon [2]. Therefore, it is not adequate for a human settlement on Lunar planet. Martian is a one of the planet in universe, it is also not too hot and too cool, so the atmosphere protect human from radiation. In addition, its rhythm day-night in Mars is quiet similar on Earth, which is about 24 hours and 37 minutes. Therefore, it is proven that Mars is most habitable in the solar system after Earth and adequate for a human settlement.
However, in Martian planet, concrete cannot been produce by a similar process such Earth due to lack existing of water, aggregate and cement. It takes extremely high cost of transportation with the current propulsion system, and takes over six months to reach Mars. In addition, the design space for a travelling to Martian planet is very limited. As knowing, the Mars has been considered as a “sulphur rich planet”, due to the Martian surface contain high level of sulphur (SO3 up to ~37 wt%, average 6 wt%) in form of sulfate salts [3]. Sulphur as material construction in producing concrete is not a new thing, there have been many researches on Sulphur concrete on to the mechanical properties and physical properties proven that sulphur not only improve strength but it is also can be reused and good fire resistance [4]. Moreover, the atmospheric pressure on Mars are found to be perfect for application of sulphur concrete [5]. The environmental condition and it magnitude in pressure above the solid-vapour interface on Mars is on a stable state of Sulphur (Rhombic), thus Martian concrete is suitable to be construct on Mars planet. Therefore, the Martian concrete is developed by using molten Sulphur and Mars soil. Problem Statement Although it is in early stage for conduction of building infrastructure on Martian, it is necessary for some research to determine the replacement concrete produce with conformity of the natural condition. Since, it’s long distance of travelling, the Martian concrete will be conducted by using the existing construction material. The existing water on Martian are still under investigation by NASA. Therefore, the Martian concrete will be conducted without using a water, and cement. Due to lack of equipment in Martian, the process to produce concrete was using a difference method. The test should be conducted to identify the strength of the concrete. Objectives The objectives of this study that need to be achieve are:
1. To determine best mix design in producing Martian concrete. 2. To determine the mechanical strength development of the Martian concrete.
Scope of Study This study consists of experimental work to investigate the strength of Martian Concrete with the combination of sulphur, and Mars soil by using two methods; cold and hot mix methods. The strength development of Martian concrete
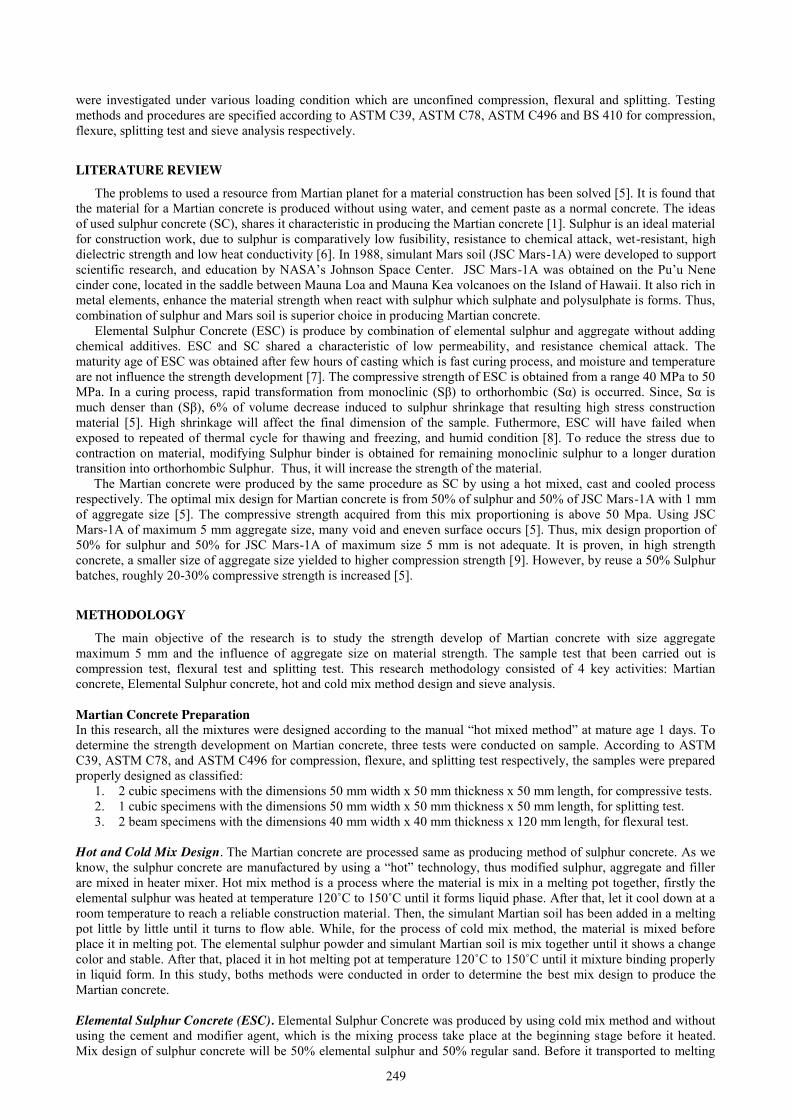
249
were investigated under various loading condition which are unconfined compression, flexural and splitting. Testing methods and procedures are specified according to ASTM C39, ASTM C78, ASTM C496 and BS 410 for compression, flexure, splitting test and sieve analysis respectively.
LITERATURE REVIEW
The problems to used a resource from Martian planet for a material construction has been solved [5]. It is found that the material for a Martian concrete is produced without using water, and cement paste as a normal concrete. The ideas of used sulphur concrete (SC), shares it characteristic in producing the Martian concrete [1]. Sulphur is an ideal material for construction work, due to sulphur is comparatively low fusibility, resistance to chemical attack, wet-resistant, high dielectric strength and low heat conductivity [6]. In 1988, simulant Mars soil (JSC Mars-1A) were developed to support scientific research, and education by NASA’s Johnson Space Center. JSC Mars-1A was obtained on the Pu’u Nene cinder cone, located in the saddle between Mauna Loa and Mauna Kea volcanoes on the Island of Hawaii. It also rich in metal elements, enhance the material strength when react with sulphur which sulphate and polysulphate is forms. Thus, combination of sulphur and Mars soil is superior choice in producing Martian concrete.
Elemental Sulphur Concrete (ESC) is produce by combination of elemental sulphur and aggregate without adding chemical additives. ESC and SC shared a characteristic of low permeability, and resistance chemical attack. The maturity age of ESC was obtained after few hours of casting which is fast curing process, and moisture and temperature are not influence the strength development [7]. The compressive strength of ESC is obtained from a range 40 MPa to 50 MPa. In a curing process, rapid transformation from monoclinic (Sβ) to orthorhombic (Sα) is occurred. Since, Sα is much denser than (Sβ), 6% of volume decrease induced to sulphur shrinkage that resulting high stress construction material [5]. High shrinkage will affect the final dimension of the sample. Futhermore, ESC will have failed when exposed to repeated of thermal cycle for thawing and freezing, and humid condition [8]. To reduce the stress due to contraction on material, modifying Sulphur binder is obtained for remaining monoclinic sulphur to a longer duration transition into orthorhombic Sulphur. Thus, it will increase the strength of the material.
The Martian concrete were produced by the same procedure as SC by using a hot mixed, cast and cooled process respectively. The optimal mix design for Martian concrete is from 50% of sulphur and 50% of JSC Mars-1A with 1 mm of aggregate size [5]. The compressive strength acquired from this mix proportioning is above 50 Mpa. Using JSC Mars-1A of maximum 5 mm aggregate size, many void and eneven surface occurs [5]. Thus, mix design proportion of 50% for sulphur and 50% for JSC Mars-1A of maximum size 5 mm is not adequate. It is proven, in high strength concrete, a smaller size of aggregate size yielded to higher compression strength [9]. However, by reuse a 50% Sulphur batches, roughly 20-30% compressive strength is increased [5].
METHODOLOGY
The main objective of the research is to study the strength develop of Martian concrete with size aggregate maximum 5 mm and the influence of aggregate size on material strength. The sample test that been carried out is compression test, flexural test and splitting test. This research methodology consisted of 4 key activities: Martian concrete, Elemental Sulphur concrete, hot and cold mix method design and sieve analysis. Martian Concrete Preparation In this research, all the mixtures were designed according to the manual “hot mixed method” at mature age 1 days. To determine the strength development on Martian concrete, three tests were conducted on sample. According to ASTM C39, ASTM C78, and ASTM C496 for compression, flexure, and splitting test respectively, the samples were prepared properly designed as classified:
1. 2 cubic specimens with the dimensions 50 mm width x 50 mm thickness x 50 mm length, for compressive tests. 2. 1 cubic specimens with the dimensions 50 mm width x 50 mm thickness x 50 mm length, for splitting test. 3. 2 beam specimens with the dimensions 40 mm width x 40 mm thickness x 120 mm length, for flexural test.
Hot and Cold Mix Design. The Martian concrete are processed same as producing method of sulphur concrete. As we know, the sulphur concrete are manufactured by using a “hot” technology, thus modified sulphur, aggregate and filler are mixed in heater mixer. Hot mix method is a process where the material is mix in a melting pot together, firstly the elemental sulphur was heated at temperature 120˚C to 150˚C until it forms liquid phase. After that, let it cool down at a room temperature to reach a reliable construction material. Then, the simulant Martian soil has been added in a melting pot little by little until it turns to flow able. While, for the process of cold mix method, the material is mixed before place it in melting pot. The elemental sulphur powder and simulant Martian soil is mix together until it shows a change color and stable. After that, placed it in hot melting pot at temperature 120˚C to 150˚C until it mixture binding properly in liquid form. In this study, boths methods were conducted in order to determine the best mix design to produce the Martian concrete. Elemental Sulphur Concrete (ESC). Elemental Sulphur Concrete was produced by using cold mix method and without using the cement and modifier agent, which is the mixing process take place at the beginning stage before it heated. Mix design of sulphur concrete will be 50% elemental sulphur and 50% regular sand. Before it transported to melting
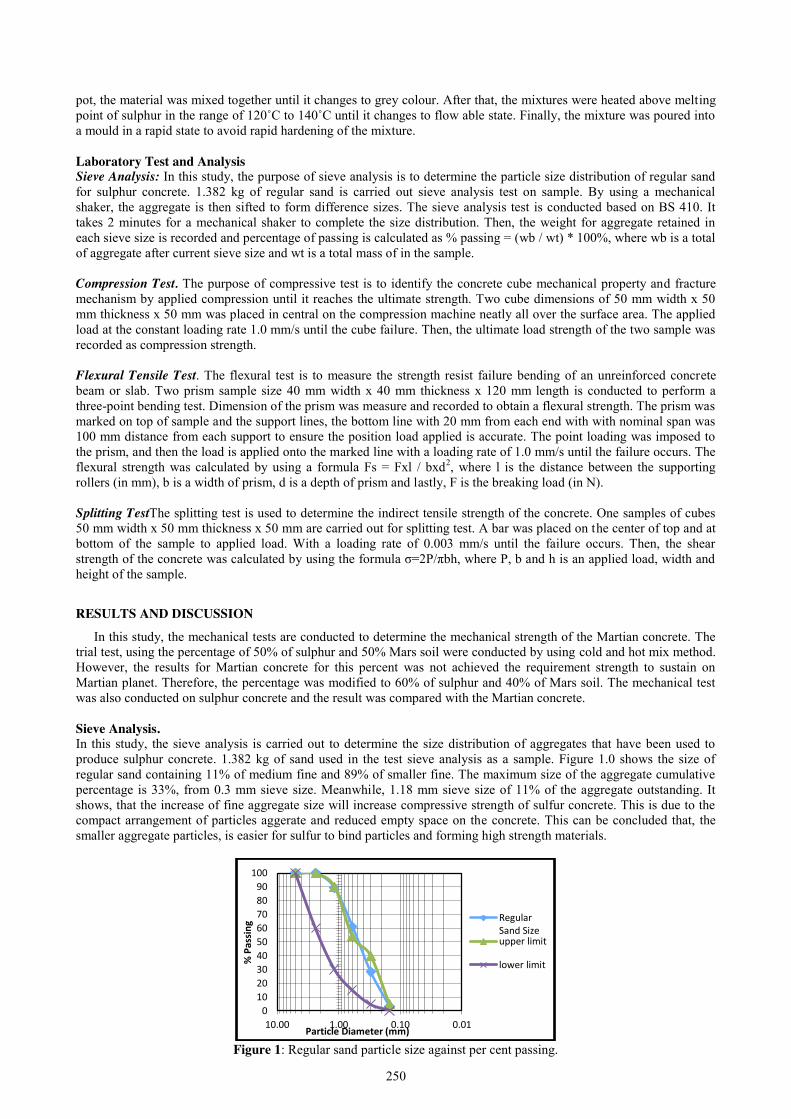
250
pot, the material was mixed together until it changes to grey colour. After that, the mixtures were heated above melting point of sulphur in the range of 120˚C to 140˚C until it changes to flow able state. Finally, the mixture was poured into a mould in a rapid state to avoid rapid hardening of the mixture. Laboratory Test and Analysis Sieve Analysis: In this study, the purpose of sieve analysis is to determine the particle size distribution of regular sand for sulphur concrete. 1.382 kg of regular sand is carried out sieve analysis test on sample. By using a mechanical shaker, the aggregate is then sifted to form difference sizes. The sieve analysis test is conducted based on BS 410. It takes 2 minutes for a mechanical shaker to complete the size distribution. Then, the weight for aggregate retained in each sieve size is recorded and percentage of passing is calculated as % passing = (wb / wt) * 100%, where wb is a total of aggregate after current sieve size and wt is a total mass of in the sample. Compression Test. The purpose of compressive test is to identify the concrete cube mechanical property and fracture mechanism by applied compression until it reaches the ultimate strength. Two cube dimensions of 50 mm width x 50 mm thickness x 50 mm was placed in central on the compression machine neatly all over the surface area. The applied load at the constant loading rate 1.0 mm/s until the cube failure. Then, the ultimate load strength of the two sample was recorded as compression strength. Flexural Tensile Test. The flexural test is to measure the strength resist failure bending of an unreinforced concrete beam or slab. Two prism sample size 40 mm width x 40 mm thickness x 120 mm length is conducted to perform a three-point bending test. Dimension of the prism was measure and recorded to obtain a flexural strength. The prism was marked on top of sample and the support lines, the bottom line with 20 mm from each end with with nominal span was 100 mm distance from each support to ensure the position load applied is accurate. The point loading was imposed to the prism, and then the load is applied onto the marked line with a loading rate of 1.0 mm/s until the failure occurs. The flexural strength was calculated by using a formula Fs = Fxl / bxd2, where l is the distance between the supporting rollers (in mm), b is a width of prism, d is a depth of prism and lastly, F is the breaking load (in N). Splitting TestThe splitting test is used to determine the indirect tensile strength of the concrete. One samples of cubes 50 mm width x 50 mm thickness x 50 mm are carried out for splitting test. A bar was placed on the center of top and at bottom of the sample to applied load. With a loading rate of 0.003 mm/s until the failure occurs. Then, the shear strength of the concrete was calculated by using the formula σ=2P/πbh, where P, b and h is an applied load, width and height of the sample.
RESULTS AND DISCUSSION
In this study, the mechanical tests are conducted to determine the mechanical strength of the Martian concrete. The trial test, using the percentage of 50% of sulphur and 50% Mars soil were conducted by using cold and hot mix method. However, the results for Martian concrete for this percent was not achieved the requirement strength to sustain on Martian planet. Therefore, the percentage was modified to 60% of sulphur and 40% of Mars soil. The mechanical test was also conducted on sulphur concrete and the result was compared with the Martian concrete. Sieve Analysis. In this study, the sieve analysis is carried out to determine the size distribution of aggregates that have been used to produce sulphur concrete. 1.382 kg of sand used in the test sieve analysis as a sample. Figure 1.0 shows the size of regular sand containing 11% of medium fine and 89% of smaller fine. The maximum size of the aggregate cumulative percentage is 33%, from 0.3 mm sieve size. Meanwhile, 1.18 mm sieve size of 11% of the aggregate outstanding. It shows, that the increase of fine aggregate size will increase compressive strength of sulfur concrete. This is due to the compact arrangement of particles aggerate and reduced empty space on the concrete. This can be concluded that, the smaller aggregate particles, is easier for sulfur to bind particles and forming high strength materials.
Figure 1: Regular sand particle size against per cent passing.
0102030405060708090
100
0.010.101.0010.00
% P
assi
ng
Particle Diameter (mm)
RegularSand Sizeupper limit
lower limit
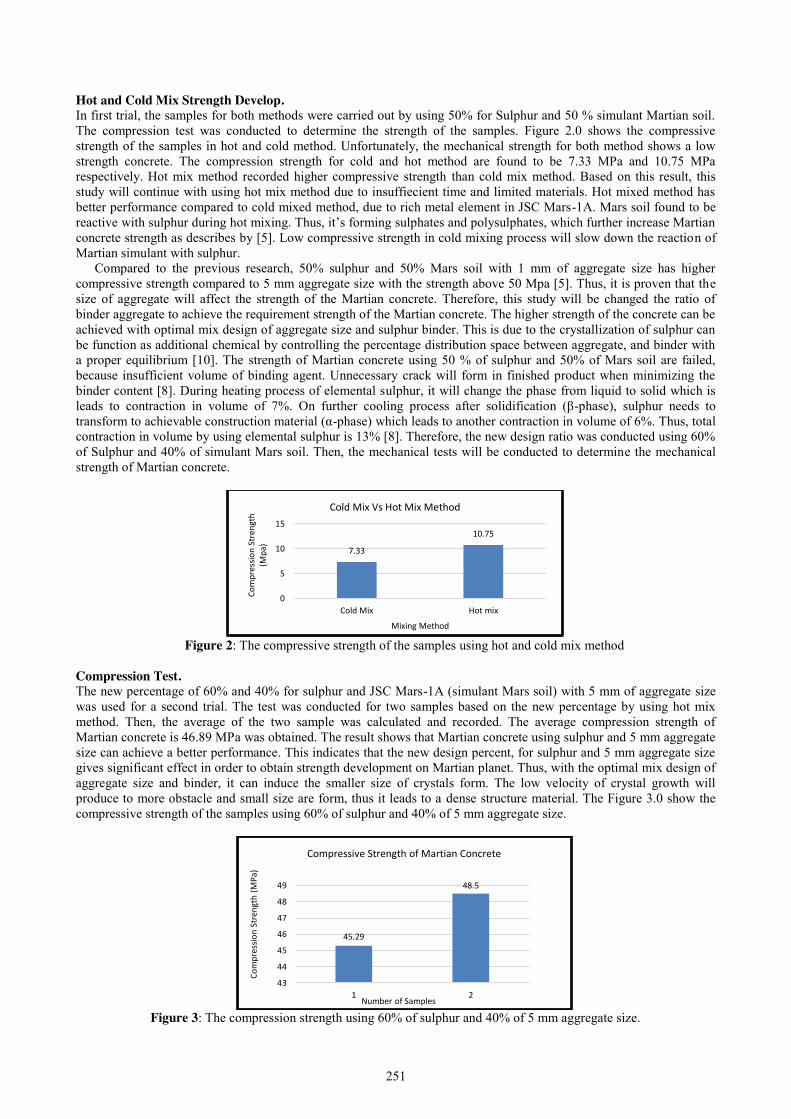
251
Hot and Cold Mix Strength Develop. In first trial, the samples for both methods were carried out by using 50% for Sulphur and 50 % simulant Martian soil. The compression test was conducted to determine the strength of the samples. Figure 2.0 shows the compressive strength of the samples in hot and cold method. Unfortunately, the mechanical strength for both method shows a low strength concrete. The compression strength for cold and hot method are found to be 7.33 MPa and 10.75 MPa respectively. Hot mix method recorded higher compressive strength than cold mix method. Based on this result, this study will continue with using hot mix method due to insuffiecient time and limited materials. Hot mixed method has better performance compared to cold mixed method, due to rich metal element in JSC Mars-1A. Mars soil found to be reactive with sulphur during hot mixing. Thus, it’s forming sulphates and polysulphates, which further increase Martian concrete strength as describes by [5]. Low compressive strength in cold mixing process will slow down the reaction of Martian simulant with sulphur.
Compared to the previous research, 50% sulphur and 50% Mars soil with 1 mm of aggregate size has higher compressive strength compared to 5 mm aggregate size with the strength above 50 Mpa [5]. Thus, it is proven that the size of aggregate will affect the strength of the Martian concrete. Therefore, this study will be changed the ratio of binder aggregate to achieve the requirement strength of the Martian concrete. The higher strength of the concrete can be achieved with optimal mix design of aggregate size and sulphur binder. This is due to the crystallization of sulphur can be function as additional chemical by controlling the percentage distribution space between aggregate, and binder with a proper equilibrium [10]. The strength of Martian concrete using 50 % of sulphur and 50% of Mars soil are failed, because insufficient volume of binding agent. Unnecessary crack will form in finished product when minimizing the binder content [8]. During heating process of elemental sulphur, it will change the phase from liquid to solid which is leads to contraction in volume of 7%. On further cooling process after solidification (β-phase), sulphur needs to transform to achievable construction material (α-phase) which leads to another contraction in volume of 6%. Thus, total contraction in volume by using elemental sulphur is 13% [8]. Therefore, the new design ratio was conducted using 60% of Sulphur and 40% of simulant Mars soil. Then, the mechanical tests will be conducted to determine the mechanical strength of Martian concrete.
Figure 2: The compressive strength of the samples using hot and cold mix method
Compression Test. The new percentage of 60% and 40% for sulphur and JSC Mars-1A (simulant Mars soil) with 5 mm of aggregate size was used for a second trial. The test was conducted for two samples based on the new percentage by using hot mix method. Then, the average of the two sample was calculated and recorded. The average compression strength of Martian concrete is 46.89 MPa was obtained. The result shows that Martian concrete using sulphur and 5 mm aggregate size can achieve a better performance. This indicates that the new design percent, for sulphur and 5 mm aggregate size gives significant effect in order to obtain strength development on Martian planet. Thus, with the optimal mix design of aggregate size and binder, it can induce the smaller size of crystals form. The low velocity of crystal growth will produce to more obstacle and small size are form, thus it leads to a dense structure material. The Figure 3.0 show the compressive strength of the samples using 60% of sulphur and 40% of 5 mm aggregate size.
Figure 3: The compression strength using 60% of sulphur and 40% of 5 mm aggregate size.
7.33
10.75
0
5
10
15
Cold Mix Hot mix
Com
pres
sion
Stre
ngth
(M
pa)
Mixing Method
Cold Mix Vs Hot Mix Method
45.29
48.5
43
44
45
46
47
48
49
1 2
Com
pres
sion
Stre
ngth
(MPa
)
Number of Samples
Compressive Strength of Martian Concrete
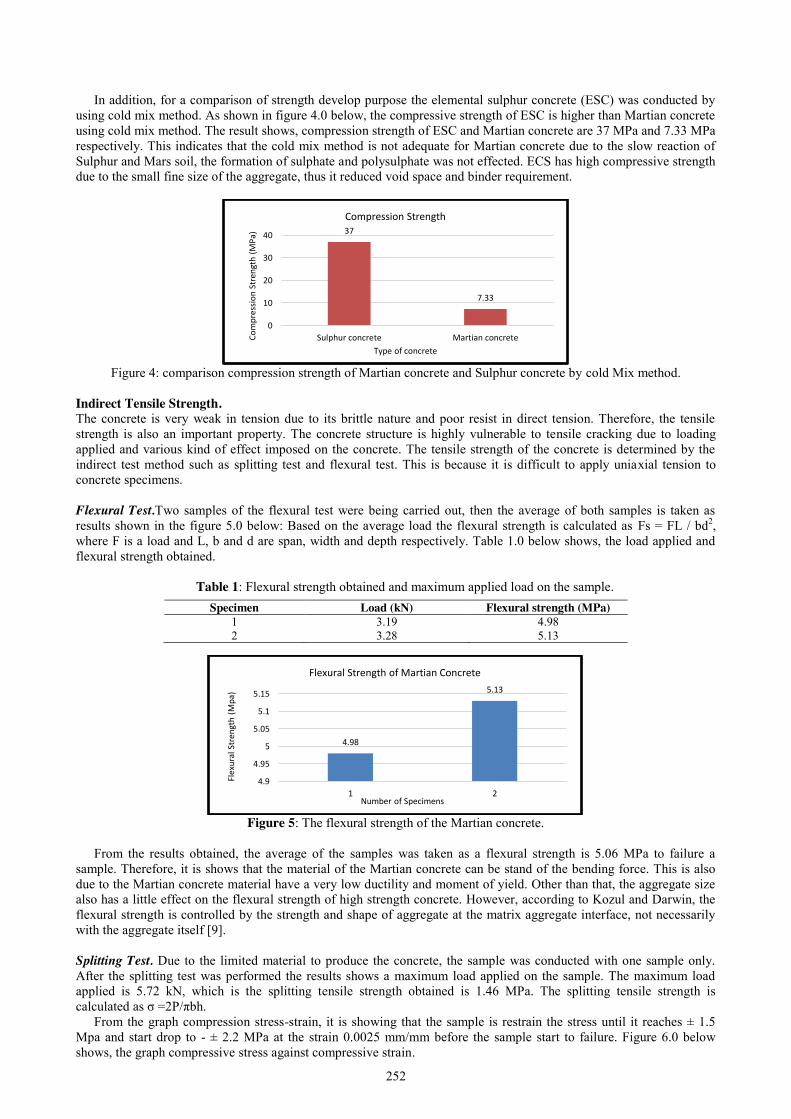
252
In addition, for a comparison of strength develop purpose the elemental sulphur concrete (ESC) was conducted by using cold mix method. As shown in figure 4.0 below, the compressive strength of ESC is higher than Martian concrete using cold mix method. The result shows, compression strength of ESC and Martian concrete are 37 MPa and 7.33 MPa respectively. This indicates that the cold mix method is not adequate for Martian concrete due to the slow reaction of Sulphur and Mars soil, the formation of sulphate and polysulphate was not effected. ECS has high compressive strength due to the small fine size of the aggregate, thus it reduced void space and binder requirement.
Figure 4: comparison compression strength of Martian concrete and Sulphur concrete by cold Mix method.
Indirect Tensile Strength. The concrete is very weak in tension due to its brittle nature and poor resist in direct tension. Therefore, the tensile strength is also an important property. The concrete structure is highly vulnerable to tensile cracking due to loading applied and various kind of effect imposed on the concrete. The tensile strength of the concrete is determined by the indirect test method such as splitting test and flexural test. This is because it is difficult to apply uniaxial tension to concrete specimens. Flexural Test.Two samples of the flexural test were being carried out, then the average of both samples is taken as results shown in the figure 5.0 below: Based on the average load the flexural strength is calculated as Fs = FL / bd2, where F is a load and L, b and d are span, width and depth respectively. Table 1.0 below shows, the load applied and flexural strength obtained.
Table 1: Flexural strength obtained and maximum applied load on the sample.
Figure 5: The flexural strength of the Martian concrete.
From the results obtained, the average of the samples was taken as a flexural strength is 5.06 MPa to failure a
sample. Therefore, it is shows that the material of the Martian concrete can be stand of the bending force. This is also due to the Martian concrete material have a very low ductility and moment of yield. Other than that, the aggregate size also has a little effect on the flexural strength of high strength concrete. However, according to Kozul and Darwin, the flexural strength is controlled by the strength and shape of aggregate at the matrix aggregate interface, not necessarily with the aggregate itself [9]. Splitting Test. Due to the limited material to produce the concrete, the sample was conducted with one sample only. After the splitting test was performed the results shows a maximum load applied on the sample. The maximum load applied is 5.72 kN, which is the splitting tensile strength obtained is 1.46 MPa. The splitting tensile strength is calculated as σ =2P/πbh.
From the graph compression stress-strain, it is showing that the sample is restrain the stress until it reaches ± 1.5 Mpa and start drop to - ± 2.2 MPa at the strain 0.0025 mm/mm before the sample start to failure. Figure 6.0 below shows, the graph compressive stress against compressive strain.
37
7.33
0
10
20
30
40
Sulphur concrete Martian concreteCom
pres
sion
Stre
ngth
(MPa
)
Type of concrete
Compression Strength
4.98
5.13
4.9
4.95
5
5.05
5.1
5.15
1 2
Flex
ural
Str
engt
h (M
pa)
Number of Specimens
Flexural Strength of Martian Concrete
Specimen Load (kN) Flexural strength (MPa) 1 3.19 4.98 2 3.28 5.13
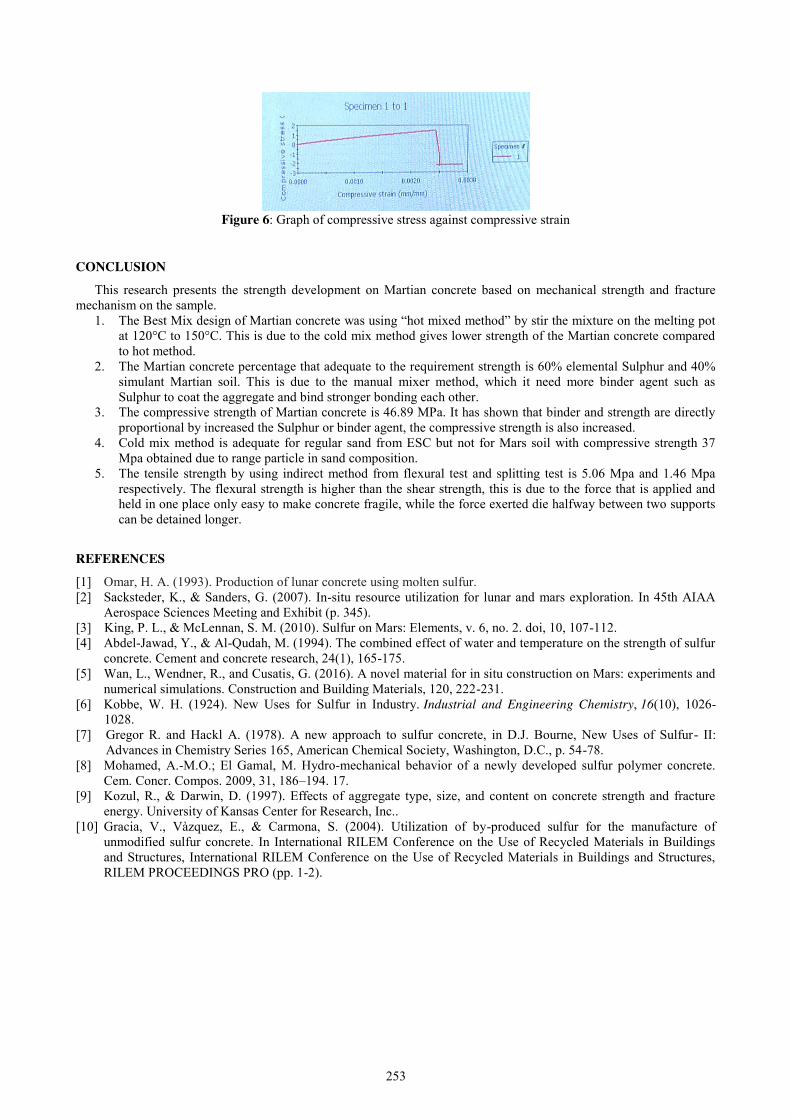
253
Figure 6: Graph of compressive stress against compressive strain
CONCLUSION
This research presents the strength development on Martian concrete based on mechanical strength and fracture mechanism on the sample.
1. The Best Mix design of Martian concrete was using “hot mixed method” by stir the mixture on the melting pot at 120°C to 150°C. This is due to the cold mix method gives lower strength of the Martian concrete compared to hot method.
2. The Martian concrete percentage that adequate to the requirement strength is 60% elemental Sulphur and 40% simulant Martian soil. This is due to the manual mixer method, which it need more binder agent such as Sulphur to coat the aggregate and bind stronger bonding each other.
3. The compressive strength of Martian concrete is 46.89 MPa. It has shown that binder and strength are directly proportional by increased the Sulphur or binder agent, the compressive strength is also increased.
4. Cold mix method is adequate for regular sand from ESC but not for Mars soil with compressive strength 37 Mpa obtained due to range particle in sand composition.
5. The tensile strength by using indirect method from flexural test and splitting test is 5.06 Mpa and 1.46 Mpa respectively. The flexural strength is higher than the shear strength, this is due to the force that is applied and held in one place only easy to make concrete fragile, while the force exerted die halfway between two supports can be detained longer.
REFERENCES
[1] Omar, H. A. (1993). Production of lunar concrete using molten sulfur. [2] Sacksteder, K., & Sanders, G. (2007). In-situ resource utilization for lunar and mars exploration. In 45th AIAA
Aerospace Sciences Meeting and Exhibit (p. 345). [3] King, P. L., & McLennan, S. M. (2010). Sulfur on Mars: Elements, v. 6, no. 2. doi, 10, 107-112. [4] Abdel-Jawad, Y., & Al-Qudah, M. (1994). The combined effect of water and temperature on the strength of sulfur
concrete. Cement and concrete research, 24(1), 165-175. [5] Wan, L., Wendner, R., and Cusatis, G. (2016). A novel material for in situ construction on Mars: experiments and
numerical simulations. Construction and Building Materials, 120, 222-231. [6] Kobbe, W. H. (1924). New Uses for Sulfur in Industry. Industrial and Engineering Chemistry, 16(10), 1026-
1028. [7] Gregor R. and Hackl A. (1978). A new approach to sulfur concrete, in D.J. Bourne, New Uses of Sulfur- II:
Advances in Chemistry Series 165, American Chemical Society, Washington, D.C., p. 54-78. [8] Mohamed, A.-M.O.; El Gamal, M. Hydro-mechanical behavior of a newly developed sulfur polymer concrete.
Cem. Concr. Compos. 2009, 31, 186–194. 17. [9] Kozul, R., & Darwin, D. (1997). Effects of aggregate type, size, and content on concrete strength and fracture
energy. University of Kansas Center for Research, Inc.. [10] Gracia, V., Vàzquez, E., & Carmona, S. (2004). Utilization of by-produced sulfur for the manufacture of
unmodified sulfur concrete. In International RILEM Conference on the Use of Recycled Materials in Buildings and Structures, International RILEM Conference on the Use of Recycled Materials in Buildings and Structures, RILEM PROCEEDINGS PRO (pp. 1-2).
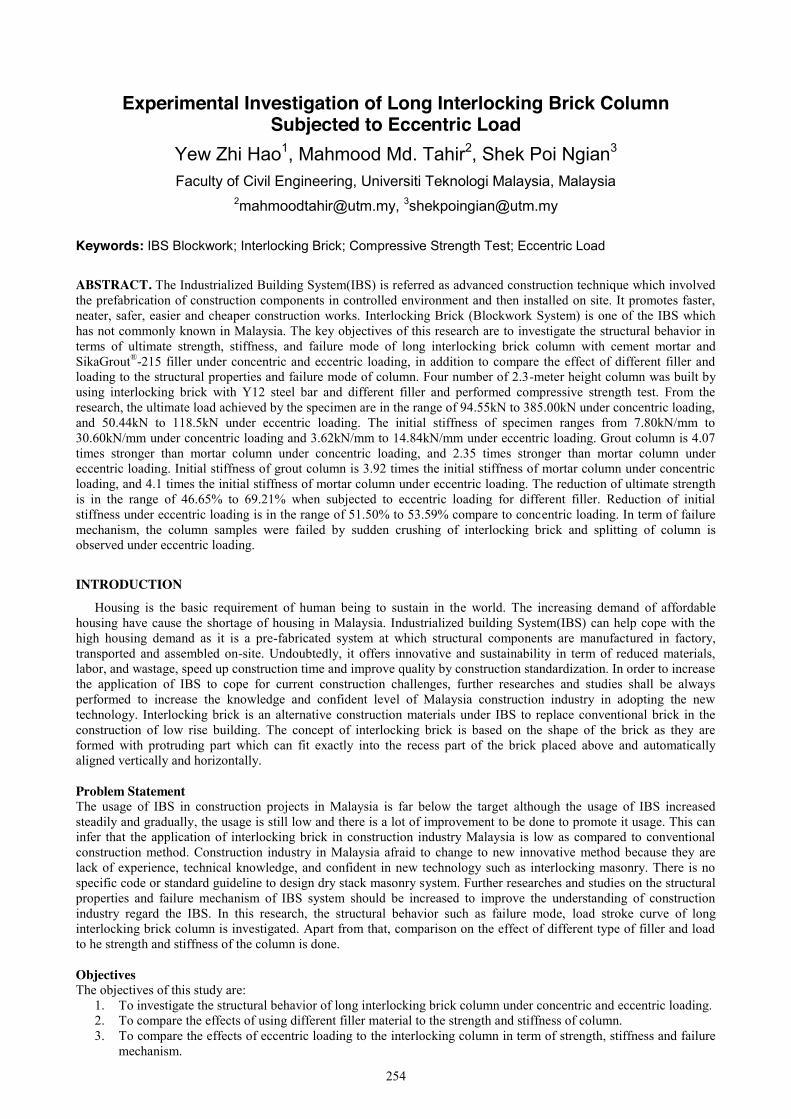
254
Experimental Investigation of Long Interlocking Brick Column Subjected to Eccentric Load
Yew Zhi Hao1, Mahmood Md. Tahir2, Shek Poi Ngian3 Faculty of Civil Engineering, Universiti Teknologi Malaysia, Malaysia
[email protected], [email protected]
Keywords: IBS Blockwork; Interlocking Brick; Compressive Strength Test; Eccentric Load
ABSTRACT. The Industrialized Building System(IBS) is referred as advanced construction technique which involved the prefabrication of construction components in controlled environment and then installed on site. It promotes faster, neater, safer, easier and cheaper construction works. Interlocking Brick (Blockwork System) is one of the IBS which has not commonly known in Malaysia. The key objectives of this research are to investigate the structural behavior in terms of ultimate strength, stiffness, and failure mode of long interlocking brick column with cement mortar and SikaGrout®-215 filler under concentric and eccentric loading, in addition to compare the effect of different filler and loading to the structural properties and failure mode of column. Four number of 2.3-meter height column was built by using interlocking brick with Y12 steel bar and different filler and performed compressive strength test. From the research, the ultimate load achieved by the specimen are in the range of 94.55kN to 385.00kN under concentric loading, and 50.44kN to 118.5kN under eccentric loading. The initial stiffness of specimen ranges from 7.80kN/mm to 30.60kN/mm under concentric loading and 3.62kN/mm to 14.84kN/mm under eccentric loading. Grout column is 4.07 times stronger than mortar column under concentric loading, and 2.35 times stronger than mortar column under eccentric loading. Initial stiffness of grout column is 3.92 times the initial stiffness of mortar column under concentric loading, and 4.1 times the initial stiffness of mortar column under eccentric loading. The reduction of ultimate strength is in the range of 46.65% to 69.21% when subjected to eccentric loading for different filler. Reduction of initial stiffness under eccentric loading is in the range of 51.50% to 53.59% compare to concentric loading. In term of failure mechanism, the column samples were failed by sudden crushing of interlocking brick and splitting of column is observed under eccentric loading.
INTRODUCTION
Housing is the basic requirement of human being to sustain in the world. The increasing demand of affordable housing have cause the shortage of housing in Malaysia. Industrialized building System(IBS) can help cope with the high housing demand as it is a pre-fabricated system at which structural components are manufactured in factory, transported and assembled on-site. Undoubtedly, it offers innovative and sustainability in term of reduced materials, labor, and wastage, speed up construction time and improve quality by construction standardization. In order to increase the application of IBS to cope for current construction challenges, further researches and studies shall be always performed to increase the knowledge and confident level of Malaysia construction industry in adopting the new technology. Interlocking brick is an alternative construction materials under IBS to replace conventional brick in the construction of low rise building. The concept of interlocking brick is based on the shape of the brick as they are formed with protruding part which can fit exactly into the recess part of the brick placed above and automatically aligned vertically and horizontally.
Problem Statement The usage of IBS in construction projects in Malaysia is far below the target although the usage of IBS increased steadily and gradually, the usage is still low and there is a lot of improvement to be done to promote it usage. This can infer that the application of interlocking brick in construction industry Malaysia is low as compared to conventional construction method. Construction industry in Malaysia afraid to change to new innovative method because they are lack of experience, technical knowledge, and confident in new technology such as interlocking masonry. There is no specific code or standard guideline to design dry stack masonry system. Further researches and studies on the structural properties and failure mechanism of IBS system should be increased to improve the understanding of construction industry regard the IBS. In this research, the structural behavior such as failure mode, load stroke curve of long interlocking brick column is investigated. Apart from that, comparison on the effect of different type of filler and load to he strength and stiffness of the column is done.
Objectives The objectives of this study are:
1. To investigate the structural behavior of long interlocking brick column under concentric and eccentric loading. 2. To compare the effects of using different filler material to the strength and stiffness of column. 3. To compare the effects of eccentric loading to the interlocking column in term of strength, stiffness and failure
mechanism.
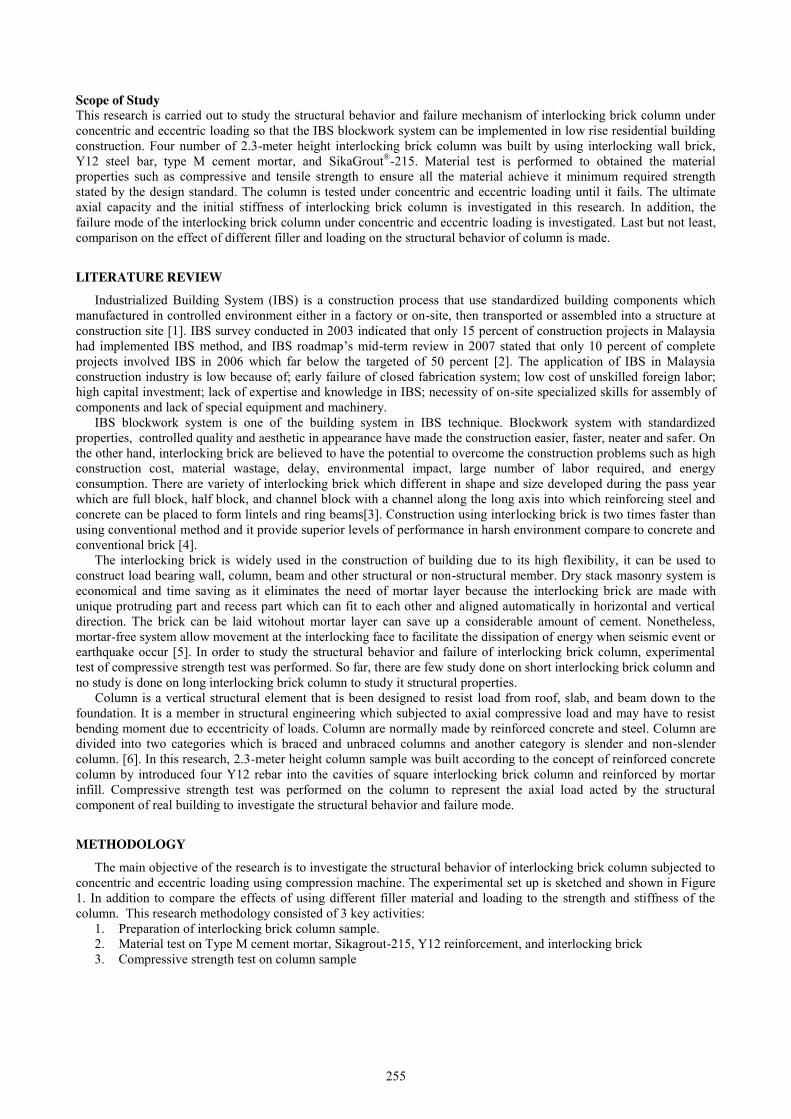
255
Scope of Study This research is carried out to study the structural behavior and failure mechanism of interlocking brick column under concentric and eccentric loading so that the IBS blockwork system can be implemented in low rise residential building construction. Four number of 2.3-meter height interlocking brick column was built by using interlocking wall brick, Y12 steel bar, type M cement mortar, and SikaGrout®-215. Material test is performed to obtained the material properties such as compressive and tensile strength to ensure all the material achieve it minimum required strength stated by the design standard. The column is tested under concentric and eccentric loading until it fails. The ultimate axial capacity and the initial stiffness of interlocking brick column is investigated in this research. In addition, the failure mode of the interlocking brick column under concentric and eccentric loading is investigated. Last but not least, comparison on the effect of different filler and loading on the structural behavior of column is made.
LITERATURE REVIEW Industrialized Building System (IBS) is a construction process that use standardized building components which
manufactured in controlled environment either in a factory or on-site, then transported or assembled into a structure at construction site [1]. IBS survey conducted in 2003 indicated that only 15 percent of construction projects in Malaysia had implemented IBS method, and IBS roadmap’s mid-term review in 2007 stated that only 10 percent of complete projects involved IBS in 2006 which far below the targeted of 50 percent [2]. The application of IBS in Malaysia construction industry is low because of; early failure of closed fabrication system; low cost of unskilled foreign labor; high capital investment; lack of expertise and knowledge in IBS; necessity of on-site specialized skills for assembly of components and lack of special equipment and machinery.
IBS blockwork system is one of the building system in IBS technique. Blockwork system with standardized properties, controlled quality and aesthetic in appearance have made the construction easier, faster, neater and safer. On the other hand, interlocking brick are believed to have the potential to overcome the construction problems such as high construction cost, material wastage, delay, environmental impact, large number of labor required, and energy consumption. There are variety of interlocking brick which different in shape and size developed during the pass year which are full block, half block, and channel block with a channel along the long axis into which reinforcing steel and concrete can be placed to form lintels and ring beams[3]. Construction using interlocking brick is two times faster than using conventional method and it provide superior levels of performance in harsh environment compare to concrete and conventional brick [4].
The interlocking brick is widely used in the construction of building due to its high flexibility, it can be used to construct load bearing wall, column, beam and other structural or non-structural member. Dry stack masonry system is economical and time saving as it eliminates the need of mortar layer because the interlocking brick are made with unique protruding part and recess part which can fit to each other and aligned automatically in horizontal and vertical direction. The brick can be laid witohout mortar layer can save up a considerable amount of cement. Nonetheless, mortar-free system allow movement at the interlocking face to facilitate the dissipation of energy when seismic event or earthquake occur [5]. In order to study the structural behavior and failure of interlocking brick column, experimental test of compressive strength test was performed. So far, there are few study done on short interlocking brick column and no study is done on long interlocking brick column to study it structural properties.
Column is a vertical structural element that is been designed to resist load from roof, slab, and beam down to the foundation. It is a member in structural engineering which subjected to axial compressive load and may have to resist bending moment due to eccentricity of loads. Column are normally made by reinforced concrete and steel. Column are divided into two categories which is braced and unbraced columns and another category is slender and non-slender column. [6]. In this research, 2.3-meter height column sample was built according to the concept of reinforced concrete column by introduced four Y12 rebar into the cavities of square interlocking brick column and reinforced by mortar infill. Compressive strength test was performed on the column to represent the axial load acted by the structural component of real building to investigate the structural behavior and failure mode.
METHODOLOGY
The main objective of the research is to investigate the structural behavior of interlocking brick column subjected to concentric and eccentric loading using compression machine. The experimental set up is sketched and shown in Figure 1. In addition to compare the effects of using different filler material and loading to the strength and stiffness of the column. This research methodology consisted of 3 key activities:
1. Preparation of interlocking brick column sample. 2. Material test on Type M cement mortar, Sikagrout-215, Y12 reinforcement, and interlocking brick 3. Compressive strength test on column sample
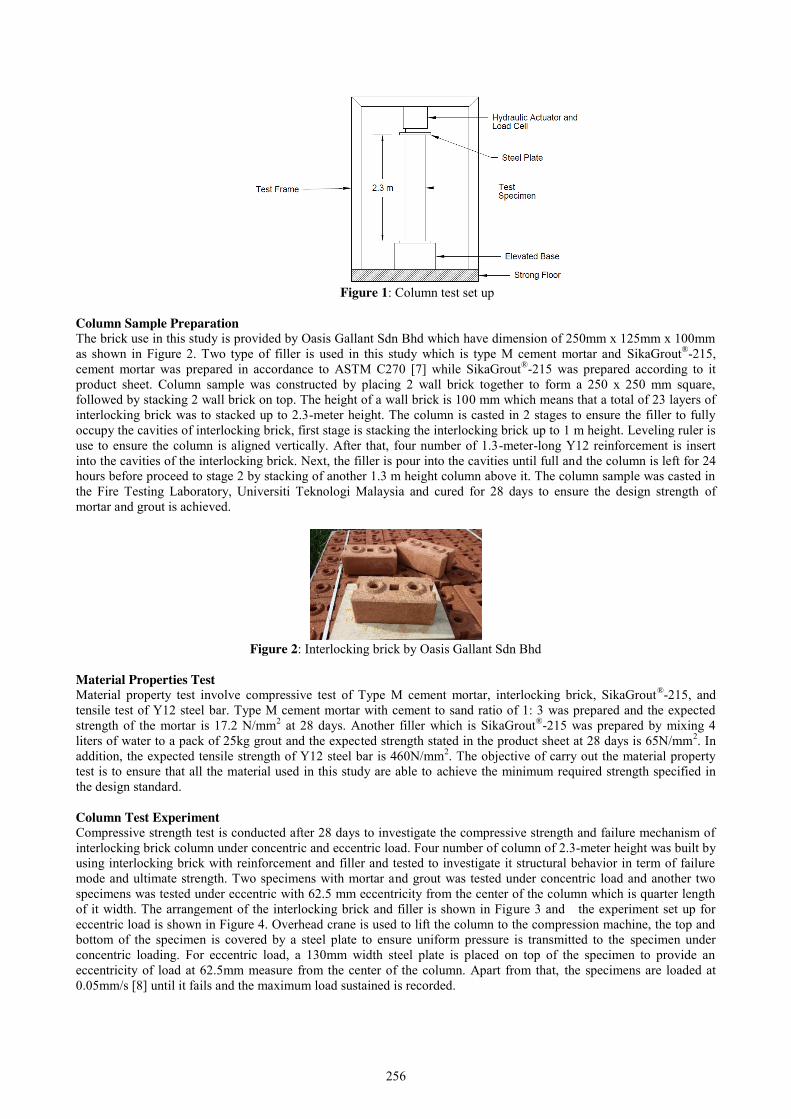
256
Figure 1: Column test set up
Column Sample Preparation The brick use in this study is provided by Oasis Gallant Sdn Bhd which have dimension of 250mm x 125mm x 100mm as shown in Figure 2. Two type of filler is used in this study which is type M cement mortar and SikaGrout®-215, cement mortar was prepared in accordance to ASTM C270 [7] while SikaGrout®-215 was prepared according to it product sheet. Column sample was constructed by placing 2 wall brick together to form a 250 x 250 mm square, followed by stacking 2 wall brick on top. The height of a wall brick is 100 mm which means that a total of 23 layers of interlocking brick was to stacked up to 2.3-meter height. The column is casted in 2 stages to ensure the filler to fully occupy the cavities of interlocking brick, first stage is stacking the interlocking brick up to 1 m height. Leveling ruler is use to ensure the column is aligned vertically. After that, four number of 1.3-meter-long Y12 reinforcement is insert into the cavities of the interlocking brick. Next, the filler is pour into the cavities until full and the column is left for 24 hours before proceed to stage 2 by stacking of another 1.3 m height column above it. The column sample was casted in the Fire Testing Laboratory, Universiti Teknologi Malaysia and cured for 28 days to ensure the design strength of mortar and grout is achieved.
Figure 2: Interlocking brick by Oasis Gallant Sdn Bhd
Material Properties Test Material property test involve compressive test of Type M cement mortar, interlocking brick, SikaGrout®-215, and tensile test of Y12 steel bar. Type M cement mortar with cement to sand ratio of 1: 3 was prepared and the expected strength of the mortar is 17.2 N/mm2 at 28 days. Another filler which is SikaGrout®-215 was prepared by mixing 4 liters of water to a pack of 25kg grout and the expected strength stated in the product sheet at 28 days is 65N/mm2. In addition, the expected tensile strength of Y12 steel bar is 460N/mm2. The objective of carry out the material property test is to ensure that all the material used in this study are able to achieve the minimum required strength specified in the design standard.
Column Test Experiment Compressive strength test is conducted after 28 days to investigate the compressive strength and failure mechanism of interlocking brick column under concentric and eccentric load. Four number of column of 2.3-meter height was built by using interlocking brick with reinforcement and filler and tested to investigate it structural behavior in term of failure mode and ultimate strength. Two specimens with mortar and grout was tested under concentric load and another two specimens was tested under eccentric with 62.5 mm eccentricity from the center of the column which is quarter length of it width. The arrangement of the interlocking brick and filler is shown in Figure 3 and the experiment set up for eccentric load is shown in Figure 4. Overhead crane is used to lift the column to the compression machine, the top and bottom of the specimen is covered by a steel plate to ensure uniform pressure is transmitted to the specimen under concentric loading. For eccentric load, a 130mm width steel plate is placed on top of the specimen to provide an eccentricity of load at 62.5mm measure from the center of the column. Apart from that, the specimens are loaded at 0.05mm/s [8] until it fails and the maximum load sustained is recorded.
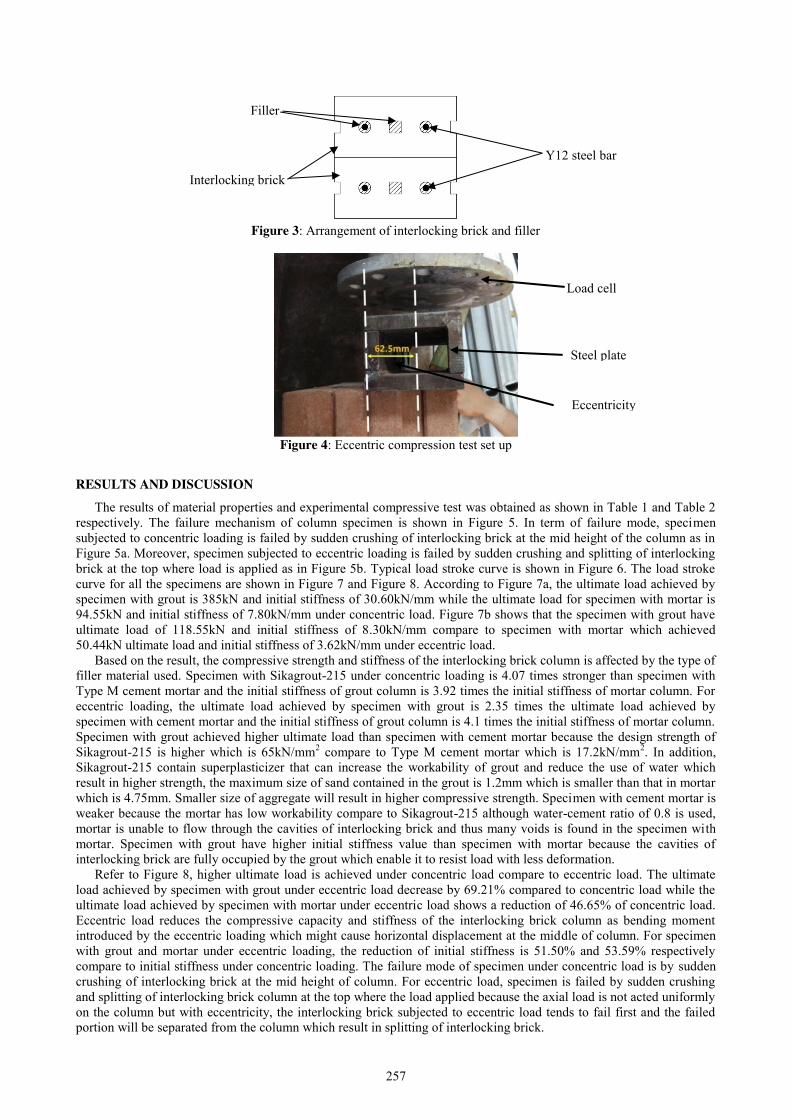
257
Figure 3: Arrangement of interlocking brick and filler
Figure 4: Eccentric compression test set up
RESULTS AND DISCUSSION The results of material properties and experimental compressive test was obtained as shown in Table 1 and Table 2
respectively. The failure mechanism of column specimen is shown in Figure 5. In term of failure mode, specimen subjected to concentric loading is failed by sudden crushing of interlocking brick at the mid height of the column as in Figure 5a. Moreover, specimen subjected to eccentric loading is failed by sudden crushing and splitting of interlocking brick at the top where load is applied as in Figure 5b. Typical load stroke curve is shown in Figure 6. The load stroke curve for all the specimens are shown in Figure 7 and Figure 8. According to Figure 7a, the ultimate load achieved by specimen with grout is 385kN and initial stiffness of 30.60kN/mm while the ultimate load for specimen with mortar is 94.55kN and initial stiffness of 7.80kN/mm under concentric load. Figure 7b shows that the specimen with grout have ultimate load of 118.55kN and initial stiffness of 8.30kN/mm compare to specimen with mortar which achieved 50.44kN ultimate load and initial stiffness of 3.62kN/mm under eccentric load.
Based on the result, the compressive strength and stiffness of the interlocking brick column is affected by the type of filler material used. Specimen with Sikagrout-215 under concentric loading is 4.07 times stronger than specimen with Type M cement mortar and the initial stiffness of grout column is 3.92 times the initial stiffness of mortar column. For eccentric loading, the ultimate load achieved by specimen with grout is 2.35 times the ultimate load achieved by specimen with cement mortar and the initial stiffness of grout column is 4.1 times the initial stiffness of mortar column. Specimen with grout achieved higher ultimate load than specimen with cement mortar because the design strength of Sikagrout-215 is higher which is 65kN/mm2 compare to Type M cement mortar which is 17.2kN/mm2. In addition, Sikagrout-215 contain superplasticizer that can increase the workability of grout and reduce the use of water which result in higher strength, the maximum size of sand contained in the grout is 1.2mm which is smaller than that in mortar which is 4.75mm. Smaller size of aggregate will result in higher compressive strength. Specimen with cement mortar is weaker because the mortar has low workability compare to Sikagrout-215 although water-cement ratio of 0.8 is used, mortar is unable to flow through the cavities of interlocking brick and thus many voids is found in the specimen with mortar. Specimen with grout have higher initial stiffness value than specimen with mortar because the cavities of interlocking brick are fully occupied by the grout which enable it to resist load with less deformation.
Refer to Figure 8, higher ultimate load is achieved under concentric load compare to eccentric load. The ultimate load achieved by specimen with grout under eccentric load decrease by 69.21% compared to concentric load while the ultimate load achieved by specimen with mortar under eccentric load shows a reduction of 46.65% of concentric load. Eccentric load reduces the compressive capacity and stiffness of the interlocking brick column as bending moment introduced by the eccentric loading which might cause horizontal displacement at the middle of column. For specimen with grout and mortar under eccentric loading, the reduction of initial stiffness is 51.50% and 53.59% respectively compare to initial stiffness under concentric loading. The failure mode of specimen under concentric load is by sudden crushing of interlocking brick at the mid height of column. For eccentric load, specimen is failed by sudden crushing and splitting of interlocking brick column at the top where the load applied because the axial load is not acted uniformly on the column but with eccentricity, the interlocking brick subjected to eccentric load tends to fail first and the failed portion will be separated from the column which result in splitting of interlocking brick.
Y12 steel bar
Filler
Interlocking brick
Steel plate
Load cell
Eccentricity
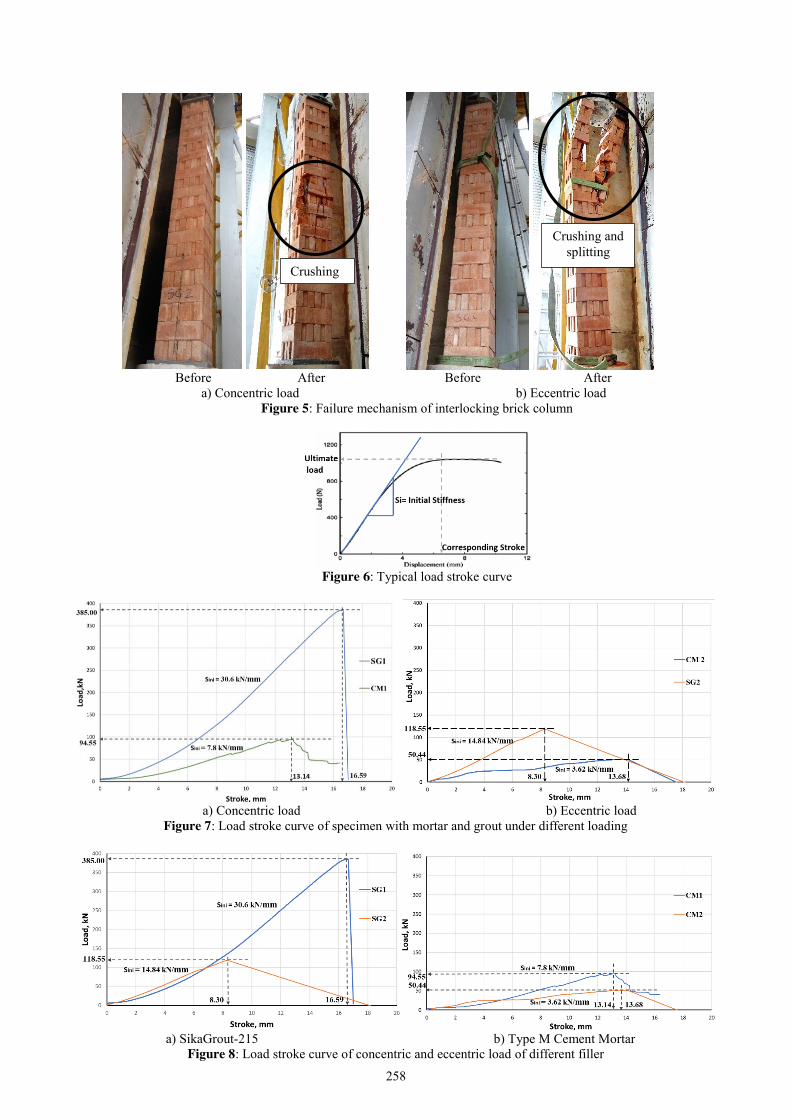
258
Before After Before After
a) Concentric load b) Eccentric load Figure 5: Failure mechanism of interlocking brick column
Figure 6: Typical load stroke curve
a) Concentric load b) Eccentric load
Figure 7: Load stroke curve of specimen with mortar and grout under different loading
a) SikaGrout-215 b) Type M Cement Mortar
Figure 8: Load stroke curve of concentric and eccentric load of different filler
Crushing
Crushing and splitting

259
Table 1: Materials properties
Specimen Compressive/ Tensile Strength (N/mm2) Mean Value (N/mm2)
Design Value (N/mm2) 1 2 3
SikaGrout-215 - 66.75 70.59 68.67 65.00 Mortar Type M 21.84 20.22 21.29 21.12 17.20 Interlocking Brick - 4.34 4.30 4.32 - Y12 Steel Bar 615 613 611 613 460
Table 2: Experimental result for column subjected to concentric and eccentric load
Type of load Specimen Maximum Load (kN) Maximum Stroke (mm) Initial Stiffness (kN/mm) Concentric SG1 385.00 16.59 30.60 CM1 94.55 13.14 7.80 Eccentric SG2 118.55 8.30 14.84 CM2 50.44 13.68 3.62
CONCLUSION
This research presents the compressive strength and failure mechanism of interlocking brick column subjected to concentric and eccentric loading. The following conclusion can be drawn:
1. Based on the experimental result of column test, interlocking brick column using Sikagrout-215 have higher compressive capacity than column using Type M cement mortar. The capacity of column using grout is 385.00kN under concentric load and 118.55kN under eccentric load. Compressive capacity of column using mortar is 94.55kN under concentric load and 50.44kN under eccentric load. The initial stiffness of specimen with grout under concentric is 30.60kN/mm and 14.84kN/mm under eccentric loading, and for specimen with mortar is 7.80kN/mm under concentric loading and 3.62kN/mm under eccentric loading. All of the column failed by sudden crushing of interlocking brick.
2. Ultimate load achieved by column with grout under concentric load is 4.07 times higher than column with mortar and the initial stiffness of grout column is 3.92 times the mortar column. For eccentric loading, the ultimate load achieved by grout column is 2.35 times the mortar column and the initial stiffness of grout column is 4.1 times the mortar column.
3. Eccentric loading decreases the ultimate load capacity of interlocking column. The ultimate load achieved by specimen with grout under eccentric load decrease by 69.21% compared to concentric load while the ultimate load achieved by specimen with mortar under eccentric load decrease by 46.65%. Initial stiffness of grout sample reduced by 51.50% and mortar column reduced by 53.59% under eccentric loading. The failure mode of specimen under concentric load is sudden crushing of interlocking brick at the mid height of column, while specimen under eccentric load is failed by sudden crushing and splitting of interlocking brick column at the top where the load applied.
REFERENCES
[1] CIDB. (2003). Industrialised Building Systems (IBS) Roadmap 2003-2010. [2] Kamarul Anuar, M. K., Mohamed Nor, A.A., Mohd Nasrun, M.D. (2014). IBS Survey 2010: Drivers, Barriers
and Critical Success Fastors in Adopting Industrialised Building System(IBS) Construction by G7 Contractors in Malaysia. Journal of Engineering Science and Technology, vol. 9, No. 4, 490-501.
[3] Nasly, M.A., Yassin, A.A.M., Zakaria, Z., Abdullah, K. (2009). Compressed Stabilised Earth as Load Bearing Interlocking Block. Regional Conference on Environmental and Earth Resources (RCER '09), 274-282.
[4] Shek, P. N., Lee, Y. H, (2015). Capacity of Interlocking Stub Column with Cement Mortar Infill Under Axial Compressive Load.
[5] Ali, M., Briet, R., Chouw, N., (2013). Dynamic Response of Mortar-free interlocking Structures.Construction and Building Materials (42). 168-189.
[6] Mohamad Salleh, Y., Ramli, A. (2015). Reinforced Concrete Design to Eurocode 2. [7] ASTM (American Society for Testing and Materials). C270: Standard Pecification for Mortar for Unit
Masonry. United States: ASTM. 2010. [8] Esfahani, M.R., Kianoush, M.R. (2004). Axial Compressive Strength of Reinforced Concrete Columns
Wrapped with Fibre Reinforced Polymers(FRP). Proc., 1st Conf. on Application of FRP Composites in Consruction and Rehabilitation of Structure, Building and Housing Research Center, Tehran.
Copyright © 2022 FDOKUMEN