
IGCESH-Proceedings-2018.pdf - SPS UTM - Universiti ...
954
-
Upload
khangminh22 -
Category
Documents
-
view
0 -
download
0
Transcript of IGCESH-Proceedings-2018.pdf - SPS UTM - Universiti ...


The 7th International Graduate Conference on Engineering, Science & Humanities Universiti Teknologi Malaysia, 13th – 15th August 2018
CONFERENCE PROCEEDINGS
“Sharing Visions and Solutions for Better Future”
Organized by:
UTM Postgraduate Student Society (PGSS-UTM), Universiti Teknologi Malaysia, Email: [email protected] Website: www.sps.utm.my/igcesh2018
In collaboration with School of Graduate Studies, Universiti Teknologi Malaysia Tel: +607-5537903 (office) Fax: +607-5537800 Email: [email protected] Website: www.sps.utm.my
ISBN: 978-967-2171-27-0

ORGANIZING COMMITTEE
PATRON Prof. Dr. Zaidatun Tasir
GENERAL CHAIR Assoc. Prof. Dr. Nazri Ali
CHAIRPERSON Mohamad Fadhli Rashid
VICE CHAIRPERSON Radhika Gunaji
SECRETARY I & II 1. Lam Ming Quan 2. Nur Hanum Hanafiah
TREASURER Teo Seng Chong
PROCEEDINGS & PUBLICATION
1. Ahmad Qushairi Mohammad (Advisor) 2. Siti Norziahidayu Amzee Zamri (Advisor) 3. Mohd Saiful Azimi Mahmud (Head) 4. Hazriq Izzuan Jaafar 5. Jam Shahzaib Khan 6. Nor Shahida Hasan 7. Rafat Riyadh Noormohammed Abdul-Razzaq 8. Paulson Eberechukwu Numan 9. Muhammad Ado 10. Heng Wei Wei 11. Mu’azu Jibrin Musa 12. Latha A/P Haridass 13. Loke Kok Foong
VENUE & EQUIPMENT 1. Ahmed Aliyu (Head) 2. Mohd Fathi Sariman 3. Nur Syuhadna Mohamad Aseri
PUBLICITY & PROMOTION 1. Muhammad Farhan Azmir (Head) 2. Abdulrahman Otuoze 3. Siti Nurhafizza Maidi 4. Nikk Adam Abdillah Kipalli

FOOD & BEVERAGES 1. Nurul Jannah Ismail (Head) 2. Nur Haziqah Che Marzuki 3. Aida Rasyidah Azman
EXCURSION 1. Amira Fadina Ahmad Fadzil (Head) 2. Hidayad Kamal
IT & COMMUNICATIONS 1. Nur Nabila Abdul Hamid (Head) 2. Ahmad Mustafa 3. Mohd Jamsyeer Khan Jalaludin Khan
ACTIVITY, PROTOCOL & EVENT MANAGEMENT
1. Ridhwan Reyaz 2. Mohd Fadhli Abd Rashid 3. Salam Ridha Oleiwi Aletba 4. Nur Azzanizawaty Yahya 5. Fathin Najihah Nor Mohd Hussin 6. Ayuna Sulekan 7. Nurhazirah Mohamad Yunos 8. Ratna Suffhiyanni 9. Wan Fadlun Wan Zakaria 10. Rajeh Almasradi
SPS SECRETARIAT SYSTEM & STUDENT DEVELOPMENT 1. Ms. Nur Hakimi Karsono 2. Ms. Nor Azfalela Jamaludin 3. Ms. Nur Fatihah Mustari IT & COMMUNICATION 1. Ms. Noor Aneza Atan 2. Mr. Muhammad Asraf Azizee FINANCE 1. Ms. Lily Suriayani Mahd 2. Ms. Sakhiriah Wakiman

SCIENTIFIC COMMITTEE
Dr. Mohd Asmadi Mohammed - Faculty of Engineering (Chemical and Energy Engineering)
Sr. Dr. Zuhaili Mohamad Ramly - Faculty of Built Environment and Surveying
Dr. Zuraini Ali Shah - Faculty of Engineering (Computing)
Dr. Balqis Omar - Faculty of Engineering (Civil Engineering)
Dr. Aini Zuhra Abdul Kadir - Faculty of Engineering (Mechanical Engineering)
Dr. Usman Ullah Sheikh - Faculty of Engineering (Electrical Engineering)
Dr. Najeb Jamaludin - Faculty of Science (Biosciences) Dr. Halimah Yusof - Faculty of Science Social and
Humanities Dr. Norhidayu Muhamad Zain - Faculty of Science Social and
Humanities Dr. Norah Md Noor - Faculty of Science Social and
Humanities Prof. Madya Dr. Anuar Ahmad - Faculty of Built Environment and
Surveying Dr. Fuaada Bt Mohd Siam - Faculty of Science Prof. Madya Dr Nor Azwadi Che Sidik
- Malaysia-Japan Institute of Technology
Dr. Mohd Zaki Hassan - Faculty of Technology and Informatics
Dr Obed Rashdi Syed - Azman Hashim International Business School

TABLE OF CONTENTS
ENGINEERING
ID TITLE PAGES
23 PALM KERNEL SHELL BASED ACTIVATED CARBON FOR DYE
REMOVAL: A SUMMARY OF RECENT STUDIES
Lee Lin Zhi and Muhammad Abbas Ahmad Zaini*
1-3
27 A MINI REVIEW OF BIPOLAR POLYMER MEMBRANE AS A
SELF-HUMIDIFIER FOR PROTON EXCHANGE MEMBRANE FUEL
CELL
S. S. Daud*, J. Jaafar, M. A. Norrdin and R. Sudirman
4-6
31 PREPARATION AND CHARACTERIZATION OF SLUDGE BASED
ADSORBENTS FOR DYE REMOVAL
Tang Shu Hui and Muhammad Abbas Ahmad Zaini
7-9
35 MODELLING OF LOW-DIMENSIONAL LATTICE HAMILTONIAN
FOR ELECTRONIC PROPERTIES OF SINGLE VACANCY DEFECT
GRAPHENE NANORIBBONS
Kien Liong Wong*, Wee Khang Chong and Michael Loong Peng Tan
10-12
59 GREEN ROADS AND HIGHWAY: INTRODUCTION OF
CATALYTIC METHANATION IN HIGHWAY INDUSTRY TO
UTILIZE GREENHOUSE GAS EMISSIONS
Thanwa Filza Nashruddin*, Md. Maniruzzaman A. Aziz, Wan Azelee Wan
Abu Bakar, Syed Anuar Faua’ad Syed Muhammad, You Kok Yeow and
Musa Mailah
13-15
72 MICROPLASTICS POLLUTION IN SKUDAI AND TEBRAU RIVER,
MALAYSIA
Shazani Sarijan, Shamila Azman* and Mohd Ismid Mohd Said
16-18
74 VENTRICULAR TACHYARRHYTHMIA PREDICTION METHODS
AND ITS PREDICTIVE PARAMETERS: A REVIEW
Chieng Thion Ming*, Hau Yuan Wen and Zaid Omar
19-21
80 MONITORING SLOPE USING ACCELEROMETER DEVICE
A.R. Bunawan, A.S.A. Rashid, A. Kassim, D.S.A. Ismail and K.N.M. Said
22-24
85 MODELLING OF VEHICLE OCCUPANT’S HEAD TILT
MOVEMENT IN MOTION SICKNESS STUDY USING
HAMMERSTEIN-WIENER SYSTEM
Sarah ‘A. Saruchi*, Mohd H. Mohammed Ariff, Hairi Zamzuri and
Nurhaffizah Hassan
25-27

101 A RESIDUAL FLEXURAL TENSILE STRENGTH AND FLEXURAL
TOUGHNESS OF MEDIUM STRENGTH OF STEEL FIBRE SELF-
COMPACTING CONCRETE
Nor Fazlin Zamri*, Roslli Noor Mohamed and Nur Hafizah A. Khalid
28-30
105 FABRICATION OF LOW-COST ALUMINIUM DROSS BASED
CERAMIC HOLLOW FIBRE MEMBRANES FOR PRE-TREATMENT
OF HYPERSALINE PRODUCED WATER
Mohd Haiqal Abd Aziz, Mohd Hafiz Dzarfan Othman, Mukhlis A
Rahman, Juhana Jaafar, A.F Ismail
31-33
106 GREENHOUSE ENVIRONMENT MAPPING USING A LOW-COST
LIDAR VIA ROBOT OPERATING SYSTEM
M.S.A. Mahmud*, M.S. Zainal Abidin and Z. Mohamed
34-36
108 A REVIEW ON REVERSE OSMOSIS MEMBRANES: IMPACTS OF
NANOFILLERS ON MEMBRANE SURFACE CHARACTERISTICS
AND SEPARATION PERFORMANCE
Z.C. Ng*, W.J. Laul and A.F. Ismail
37-39
109 THE EFFECT OF COMPRESSION RATIO BY DIFFERENT PISTON
HEAD SHAPE ON THE PERFORMANCE OF MOTORCYCLE
ENGINE
Adnan Katijan, Muhammad Zaidan Abdul Manaf and Azizul Hakim
Kamardin
40-42
116 FLUTTER ON A COMPOSITE FLAT PLATE
Nurul Z. Zaki*, Anis A. Ridhwan-Tan, Shuhaimi B. Mansor and Ainullotfi
Abdul-Latif
43-45
117 EMBRACING GREEN EXTRACTION TECHNIQUE OF
ORTHOSIPHON STAMINEUS FOR ENHANCEMENT OF
ANTIOXIDANT ACTIVITY
Ahmad Hazim Abdul Aziz, Muhammad Haziq Almar Mastaza, Ahmad
Syahmi Zaini, Mohd Azizi Che Yunus*
46-48
133 MYOCARDIUM STRUCTURAL CHARACTERIZATION IN
CARDIAC CTA IMAGES: CANNY EDGE DETECTION WITH
TEXTURE ANALYSIS
N.M. Salih*, D.E.O Dewi, N.A. Bakar and A. Yahya
49-51
136 SPATIAL AND TRANSPORTATION PLANNING FOR VIRTUAL
BIOCNG DERIVED FROM PALM OIL MILL EFFLUENT TO MEET
INDUSTRIAL ENERGY DEMAND
Ming Kwee Lee* and Haslenda Hashim
52-54
137 APPLICATION OF AUTO-TUNER FUZZY PID CONTROLLER ON
INDUSTRIAL CASCADE CONTROL
Nicholas Philip and Shafishuhaza Sahlan
55-57

139 FEASIBILITY STUDY OF CADMIUM ADSORPTION BY PALM OIL
FLY ASH (POFA) BASED LOW COST HOLLOW FIBRE
MEMBRANE
M.S.M. Yusof, Mohd Hafiz Dzarfan Othman*, Azeman Mustafa, Mukhlis
A rahman, Juhana Jaafar, Ahmad Fauzi Ismail
58-60
141 NON-PROBABILISTIC ARTIFICIAL NEURAL NETWORK WITH
MEASURED FREQUENCY RESPONSE FUNCTION DATA FOR
VIBRATION BASED DAMAGE DETECTION
Khairul H. Padil* and Norhisham Bakhary
61-63
145 FLAME RETARDANCY AND CORROSION RESISTANT EFFECT
OF GRAPHENE NANOPLATELETS ON EPOXY NANOCOMPOSITE
COATING
S. M. Kabeb, A. Hassan, Z. Mohamad, Z. Sharer, M. Mokhtar, F. Ahmad
64-66
146 DESIGN AUTOMOTIVE DRIVER SEAT ERGONOMICALLY FOR
MALAYSIAN ANTHROPOMETRY MEASUREMENT
Mugilan Muralitharan*, Syed Ahmad Helmi and Kamarulafizam bin
Ismail
67-69
147 DEVELOPMENT OF PALM STEARIN BASED-OIL THROUGH
TRANSESTERIFICATION MODIFICATION AS ALTERNATIVE
FEEDSTOCK LUBRICANT
Afifah, A.N., Syahrullail, S.*
70-72
148 DOES THE USE OF AUTOMATIC SEEDS GENERATION BENEFIT
SEGMENTATION OF KNEE CARTILAGE? DATA FROM THE
OSTEOARTHRITIS INITATIVE
Hong-Seng Gan, Aida Syafiqah Ahmad Khaizi*, Rasyiqah ‘Annani Mohd
Rosidi, Khairil Amir Sayuti, Muhammad Hanif Ramlee, Yeng-Seng Lee
73-75
150 INTERACTION AND PERFORMANCE ANALYSIS OF A TERNARY
MIXTURE DISTILLATION PROCESS
Muhammad Fakhrul Islam Zahran*, Nur Syamimi Jalil, Ahmad Nafais
Rahimi, Muhammad Afiq Zubir, Munawar Zaman Shahruddin, Kamarul
Asri Ibrahim, and Mohd Kamaruddin Abd Hamid
76-78
153 KINETIC ANALYSIS OF HORSE MANURE USING
THERMOGRAVIMETRIC ANALYSIS
Guo Ren Mong, Jo-Han Ngb, Farid Nasir Ani, Cheng Tung Chonga*
79-81
156 A NEW APPROACH IN EXTRACTING VIRTUAL INERTIAL
SUPPORT FROM SUPERCAPACITOR ENERGY STORAGE
Nor Shahida Hasan*, Norzanah Rosmin and Norjulia Mohamad Nordin
82-84

157 SPLIT RING-SLOT BASED MULTI-BAND METAMATERIAL
MICROWAVE ABSORBER
M.S. Sim*, K.Y. You, F. Esa, M.N. Dimon and N.H. Khamis
85-87
159 ETCHED MULTIMODE FIBER SENSOR FOR MAGNETIC SENSING
APPLICATION
Siti Sarah Osman*, Hazri Bakhtiar, Ganesan a/l Krishnan, Ahmad Fauzi
Ismail, Mohd Hafiz Dzarfan Othman, Mukhlis A Rahman
88-90
161 THE EVALUATION OF PARTICLE SIZE INFLUENCE ON THE
ADSORPTIVITY OF NATURAL ZEOLITE BASED ADSORPTIVE
MEMBRANE TOWARDS AMMONIA IN WASTEWATER
Mohd Ridhwan Adam, Mohd Hafiz Dzarfan Othman*, Mohd Hafiz Puteh,
A.F. Ismail, Mukhlis A. Rahman, Juhana Jaafar
91-93
168 CHARACTERIZATION OF NICKEL BASED CATALYSTS FOR
STEAM REFORMING OF BIOMASS TAR
Tan Ru Shien*, Tuan Amran Tuan Abdullah and Khairuddin Md Isa
94-96
172 DURIAN RIND AND HYDRO PAC-R FOR FLUID LOSS
IMPROVEMENT IN WATER-BASED MUD
Natalie Vanessa Boyou*, Issham Ismail, Wan Rosli Wan Sulaiman and
Norhafizuddin Husein
97-99
177 Al2O3/YSZ HOLLOW FIBRE MEMBRANE INCORPORATED WITH
IRON OXIDE FOR HEAVY METAL REMOVAL
Syafikah Huda Paiman, Mukhlis A Rahman*, Khairul Hamimah Abas,
Azian Abd Aziz, Ahmad Fauzi Ismail, Mohd Hafiz Dzarfan Othman,
Juhana Jaafar, Mohammad Noorul Anam Mohd Norddin
100-102
184 A REVIEW ON ZSM-5 ACIDITY MODIFICATION FOR
ENHANCEMENT OF BENZENE ALKYLATION
A.F.A. Rahman, A.A. Jalil*, S. Triwahyono, M. Mohamed, N.A.A. Fatah,
N.S. Hassan and N.F. Khusnun
103-105
185 OPTIMIZATION STUDY IN COAGULATION-FLOCCULATION
PROCESS FOR PALM OIL MILL EFFLUENT (POME) TREATMENT
BY USING RICE HUSK ASH
Nurhamieza Md Huzir, Shahrul Ismail, Nik Azmi Nik Mahmood, Noor
Azrimi Umor, Syed Anuar Faua’ad Syed Muhammad*
106-108
188 EFFECT OF PLANT-DERIVED NATURAL COAGULANT USING
CARICA PAPAYA SEEDS TO TREAT SURFACE WATER
Amir Hariz Amran*, Nur Syamimi Zaidi, Khalida Muda and Liew Wai
Loan
109-111

194 TUNGSTEN OXIDE INTERCALATED REDUCED GRAPHENE
OXIDE SENSOR FOR ANTHRACENE DETECTION
Wong Kar Chun, Goh Pei Sean*, Taniguchi Takaaki and Ismail Ahmad
Fauzi
112-114
195 PHOTOCATALYTIC CO2 REDUCTION TO METHANOL OVER
SILVER-LOADED GRAPHITIC CARBON NITRIDE
NANOCATALYST
W. Fadlun*, M. Tahir and Z. Y. Zakaria
115-117
200 PREPARATION OF REINFORCED HYDROXYL TERMINATED
NATURAL RUBBER BY ADDITION OF GRAPHENE OXIDE
Aina Shafinaz Md Basheer Khan*, Dahlia Anggraini, Siti Hajjar Che
Man and Norfhairna Baharulrazi
118-120
201 PLACEMENT OF BATTERY STORAGE SYSTEM USING PSO IN 9
RADIAL BUS SYSTEM
Hanis Farhah Jamahori* and Hasimah Abdul Rahman
121-123
203 ZEOLITE IMPROVEMENT IN ANAEROBIC DEGRADATION OF
LANDFILL LEACHATE
Mohammad Arif Budiman Pauzan*, Mohd Hafiz Puteh and Mohd Hafiz
Dzarfan Othman
124-126
204 DYNAMIC BRAIN CONNECTIVITY NETWORKS FROM EEG
Hadri Hussain, Chee-Ming Ting*, Ahmad Zubaidi Abdul Latif, Fuad
Numan, Alias Mohd Noor
127-129
206 DRUG-LOADED POLY-VINYL ALCOHOL ELECTROSPUN
NANOFIBERS FOR TRANSDERMAL DRUG DELIVERY SYSTEM:
MINI REVIEW ON RELEASE CHARACTERISTICS
Shafizah Sa’adon* and Saiful I. A. Razak
130-132
207 CLASSIFICATION OF SPORT ACTION USING DEEP LEARNING
APPROACH
Nur Azmina Rahmad*, Nur Anis Jasmin Sufri and Muhammad Amir
As’Ari
133-135
208 VISION BASED SYSTEM FOR BANKNOTE RECOGNITION USING
MACHINE LEARNING APPROACH
Nur Anis Jasmin binti Sufri*, Nur Azmina binti Rahmad and Muhammad
Amir bin As’ari
136-138
209 BUTLER MATRIX FOR BEAM-FORMING APPLICATION IN 5G
WIRELESS COMMUNICATION
Nor Azimah Mohd Shukor, Norhudah Seman, Nazleen Syahira Mohd
Suhaimi
139-141

210 SHEAR CAPACITY OF INTERNALLY CONFINED RC COLUMNS
WITH FRP STRIPS
Nur Hajarul Falahi Binti Abdul Halim, Sophia C. Alih and
Mohammadreza Vafaei
142-144
214 SYNTHESIS OF OXIDIZED STARCH NANOCRYSTAL FOR UREA
REMOVAL FROM AQUEOUS SOLUTION
Muhammad Nidzhom Zainol Abidin, Pei Sean Goh* and Ahmad Fauzi
Ismail
145-147
215 COMPARATIVE ANALYSIS OF FIELD HOCKEY ACTIVITY
THROUGH THE WEARABLE SENSOR BEHAVIOUR
N. Shahar*, M.A. As’ari, N.F. Ghazali and T.T. Swee
148-150
216 EFFECTS OF THE PROPELLER ADVANCE RATIO ON THE DELTA
WING UAV LEADING EDGE VORTEX
K.A. Kasim*, P. Segard*, S. Mat, S. Mansor and M.N. Dahalan
151-153
223 FABRICATION OF POROUS POLY ETHER SULFONE BY NON-
SOLVENT INDUCED PHASE SEPARATION (NIPS) TECHNIQUES
H. Junoh, J. Jaafar*, N. A. H. M. Nordin, A. F. Ismail
154-156
224 DESALINATION OF ZEOLITIC IMIDAZOLATE FRAMEWORK-8
(ZIF-8) HOLLOW FIBER MEMBRANE BY FORWARD OSMOSIS
Nizar Mu’ammar Mahpoz, Norfazliana Abdullah, Mohamad Zahir Mohd
Pauzi, Mukhlis A Rahman*, Mohd Hafiz Dzarfan Othman, Juhana Jaafar
and Ahmad Fauzi Ismail
157-159
226 MOCK CIRCULATORY LOOP CONSTRUCTION – A Review
Akmal Hakim Mohamad Hudzari, Muhammad Rashidi Abdul Kadir and
Ahmad Zahran Md. Khudzari
160-162
228 MICROWAVE-ASSISTED EXTRACTION OF POLYPHENOL FROM
MANGOSTEEN (GARCINIA MANGOSTANA L.) PERICARP AND
ITS ANTIOXIDANT ACTIVITY
Nor Azizah Mohammad, Dayang Norulfairuz Abang Zaidel*, Ida Idayu
Muhamad, Yanti Maslina Mohd Jusoh, Eraricar Salleh and Mariani
Abdul Hamid
163-165
232 DEVELOPMENT OF POLYMER THROUGH ULTRAVIOLET
PHOTO-CROSSLINKING
Farah H. Jamaludin
166-168
236 SYNTHESIS AND CHARACTERIZATION OF NOVEL FE DOPED
TNT NANOPARTICLE VIA HYDROTHERMAL TECHNIQUE
M N Subramaniam, P S Goh*, W J Lau and A F Ismail
169-171

247 PREPARATION AND CHARACTERIZATION OF UIO-66
SUPPORTED ON CERAMIC HOLLOW FIBER FOR WATER
PURIFICATION
Norfazliana Abdullah, Mukhlis A. Rahman*, Mohd Hafiz Dzarfan
Othman, Juhana Jaafar and A. F Ismail
172-174
248 EFFECT OF CONCRETE COMPRESSIVE STRENGTH TO THE
CONFINEMENT EFFECT UNDER CYCLIC LOAD
Jia-Yang Tan*, Chau-Khun Ma, Nazirah Mohd Apandi, Chin Chee
Loong, Abdullah Zawawi Awang and Wahid Omar
175-177
251 A REVIEW ON CONCRETE FILLED STEEL HOLLOW COLUMN
SUBJECTED TO FIRE LOADING
Z Nurizaty, A K Mariyana, P N Shek, M S Abdul Rahman and A M Mohd
Najmi, M Iqbal Khiyon
178-181
253 ENHANCING THE DIELECTRIC PROPERTIES AND THERMAL
CONDUCTIVITY OF PCM USING NANOMATERIAL
Nurul Humaira Muhd Zaimi* and Hasimah Abdul Rahman
182-185
255 EXPERIMENTAL STUDY OF TEMPERATURE EFFECT ON THE
MECHANICAL PROPERTIES OF GFRP
Z.P. Chow, Z. Ahmad and K.J. Wong
186-188
257 INVESTIGATING TIME-DOMAIN FEATURES COMBINATION IN
DETECTING THE COMMON SPORT ACTIVITY
Nurul Fathiah Ghazali*, Muhammad Amir As’ari, Norazman Shahar and
Hadafi Fitri Mohd Latip
189-191
261 NUMERICAL STUDIES ON TURBULENCE MODELLING OF
SYMMETRICAL AEROFOIL
Nurain Othman*, Iskandar Shah Ishak, Md Nizam Dahalan
192-194
262 WATER REUSE IN TOURISM COMPLEX: A LITERATURE
REVIEW
Norhidayah Binti Mohamad Shafee*, Mimi H. Hassim
195-198
263 OPTIMIZATION OF BLACK MULBERRY MICROWAVE-ASSISTED
EXTRACTION PROCESS
Farhani Ahmad, Yanti Maslina Mohd Jusoh*, Ida Idayu Muhamad,
Dayang Norulfairuz Abang Zaide and Nik Azmi Nik Mahmood
199-201
267 DRAG FORCE COMPARISON BETWEEN NUMERICAL
MODELLING AND EXPERIMENTAL MEASUREMENT OF A
CYLINDER
M Faizal Ahmad and Mohd Ridza Mohd Haniffah
202-205

268 ENERGY SAVING POTENTIAL FOR DISTILLATION COLUMNS
SEQUENCE OF 5-COMPONENT ALCOHOL MIXTURE USING
THERMAL PINCH ANALYSIS
Munawar Zaman Shahruddin*, Tan Xinyi, Ahmad Nafais Rahimi,
Muhammad Afiq Zubir, Muhammad Fakhrul Islam Zahran, Kamarul Asri
Ibrahim and Mohd Kamaruddin Abd Hamid
206-208
270 ENERGY SAVING POTENTIAL FOR DRIVING FORCE
DISTILLATION COLUMNS SEQUENCE OF 5-COMPONENT
ALCOHOL MIXTURE USING THERMAL PINCH ANALYSIS
Munawar Zaman Shahruddin*, Tan Xinyi, Ahmad Nafais Rahimi,
Muhammad Afiq Zubir, Muhammad Fakhrul Islam Zahran, Kamarul Asri
Ibrahim and Mohd Kamaruddin Abd Hamid
209-212
272 A REVIEW ON IN-LINE INSPECTION (ILI) PIGGING DATA
Tuan, M.T.M.* Yahaya, N. and Noor, M.N
213-215
273 SAR INTERFEROMETRY ANALYSIS FROM 2015 Mw 6.0
EARTHQUAKE IN RANAU, SABAH USING ALOS PALSAR-2
DATA
Janatul Aziera Abd Razak, Shuib bin Rambat, Abdul Rashid Mohd Shariff
216-218
274 IN SITU TRANSMISSION ELECTRON MICROSCOPE: DIRECT
OBSERVATION OF GRAPHITIZATION OF METAL DOPED
CARBON NANOFIBER
Mohd ‘Azizir-Rahim Mukri, Mohd Zamri Mohd Yusop*, Mohd Hafiz
Dzarfan Othman and Masaki Tanemura
219-221
275 PHYSICOCHEMICAL CHARACTERIZATION OF CHITOSAN
NANOPARTICLE-DIALLYL DISULFIDE COMPLEX
Muhamad Zulhilmi Zailani, Ahmad Fauzi Ismail* and Siti Hamimah
Sheikh Abdul Kadir
222-224
277 A REVIEW ON COAL ASH UTILIZATION IN SOIL IMPROVEMENT
Nadiah Jamaludin*, Nor Zurairahetty Mohd Yunus, Siti Norafida Jusoh,
Ahmed Mohammed Awad Mohammed, Zuriana Haron, Fauziah Kassim,
Kamarudin Ahmad
225-227
279 ISOLATION AND IDENTIFICATION OF PHOTOSYNTHETIC
BACTERIA FROM ANTARCTIC WITH ANTIBACTERIAL
ACTIVITY
Fatin Syahirah Othman*, Shaza Eva Mohamad, Koji Iwamoto and
Zaharah Ibrahim
228-230
281 TREATMENT OF ASPIRIN USING MODIFIED
POLYEHTYLINIMINE(PEI) WASTE TIRE BASED ADSORBENT
Dyg Khairunnisa Awg Zaini, Norzita Ngadi*, Muhd Asyiq Azman,
Khairudin Ahmad
231-233

288 EFFECTS OF К-CARRAGEENAN ON THE LOADING AND
RELEASE OF POLY(VINYL-ALCOHOL) HYDROGEL
Izzati Fatimah Wahab*, Nor Syuhada Azmi, Saiful Izwan Abd Razak and
Nadirul Hasraf Mat Nayan
233-236
289 DRUG LOADING OF HALLOYSITE NANOTUBES: DICLOFENAC
SODIUM AND BENZALKONIUM CHLORIDE
Izzati Fatimah Wahab* and Saiful Izwan Abd Razak
237-239
290 TWO COILS WIRELESS POWER TRANSFER SYSTEM
IMPEDANCE MATCHING MODELING ANALYSIS
Leong Kah Meng, Tan Tian Swee*, Tan Jia Hou, Sameen Ahmed Malik
240-241
293 DEVELOPMENT OF SYSTEMATIC METHODOLOGY AND
GENERATION OF AZEOTROPIC MIXTURE DATABASE FOR
EXTRACTIVE DISTILLATION COLUMN
Nur Aqila Naseri, Muhammad Afiq Zubir, Faizul Hakim Elidor and Mohd
Kamaruddin Abd. Hamid*
242-244
294 PROPERTIES OF POLYETHYLENE TEREPHTHALATE/
POLYBUTYLENE TEREPHTHALATE BLENDS
Muhammad Akmal Ahmad Saidi, Azman Hassan*, Mat Uzir Wahit and
Lai Jau Choy
245-247
295 NUMERICAL STUDY OF DRUG DEPOSITION IN HUMAN LUNGS
Musfirah Azmi, Muhammad Noor Harun and Syed Anuar Faua’ad Syed
Muhammad*
248-250
296 DEVELOPMENT OF 3D VIRTUAL REALITY SYSTEM FOR
INVESTIGATING MANUAL DEXTERITY ON SURGICAL SKILLS
Cham Ying Kit, Eileen Su Lee Ming*, Yeong Che Fai, Siti Nor Zawani
Ahmmad, Suneet Sood and Anil Gandhi
251-253
297 PLANTS LEAVES: NATURAL ADDITIVES IN WATER BASED
DRILLING FLUID
Nurul Jannah Ismail*, Abdul Razak Ismail, Mohd Hafiz Dzarfan Othman
and Nadiah Ibrahim
254-256
300 EFFECT OF PALM OIL FUEL ASH PRE-THERMAL TREATMENT
ON THE CHARACTERISTICS OF MEMBRANE PREPARED VIA
PHASE INVERSION/SINTERING TECHNIQUE
Zhong Sheng Tai, Mohd Hafiz Dzarfan Othman*, Ahmad Fauzi Ismail,
Mukhlis A Rahman, and Juhana Jaafar
257-259
303 A NOVEL PASSENGER VEHICLES WAKE ENERGY REUSE
METHOD TO OPTIMIZE THE GUIDE VANE FOR HIGHWAY
MICRO SAVONIUS WIND TURBINE
Mohamad Zahid Bin Mazlan*, Dr. Fazila Mohd. Zawawi
260-263

309 REFINED BLEACHED DEODORIZED PALM OIL QUALITY
PREDICTION USING KERNEL PRINCIPAL COMPONENT
REGRESSION
Nor Adhihah Rashid*, Azmer Shamsuddin, Nur Atikah Mohd Rosely,
Mohd Aiman Mohd Noor, Lelavathy Samikan Mazilamani, Mohd
Kamaruddin Abd Hamid and Kamarul Asri Ibrahim
264-266
310 TUFT FLOW VISUALIZATION INVESTIGATIONS OF UTM-LST
VFE-2 MODEL CONFIGURATIONS AT HIGH ANGLE OF
ATTACKS
Mazuriah Said, Masato Imai*, Shabudin Mat, Md. Nizam Dahala1 and
Shuhami Mansor
267-269
312 A SHORT REVIEW ON ANATOMY, BIOMECHANICS, AND
TREATMENT FOR ANTERIOR CRUCIATE LIGAMENT INJURY
Nur Afikah Zainal Abidin and Muhammad Hanif Ramlee*
270-273
313 A STUDY ON THE EFFECT OF DOPANT ON ZnO SURFACE FOR
ELECTRONIC PROPERTIES
Farzana Alam and S.M. Sultan
274-276
314 SYSTEMATIC DESIGN OF ENERGY EFFICIENT FLASH
SEPARATION PROCESS FOR MULTICOMPONENT MIXTURE
Faizul Hakim Elidor* , Muhammad Afiq Zubir, Beatrice Aavie Tang,
Nur Aqila Naseri, Muhammad Fakrul Islam Zahran , Ahmad Nafais
Rahimi , Munawar Zaman Shahruddin , Kamarul Asri Ibrahim and
Mohd. Kamaruddin Abd. Hamid
277-279
318 INDOOR TEMPERATURE PROFILE OF HEAT LAMP IN BROILER
HOUSE
K.X. Lau*, P.L. Leow, J.J. Jamian, R. Arsat, A.A.A. Abdeltawab, S.S.
Rahman, N.H.A. Khalid, A. Mohamed and I.A. Khalid
280-282
321 AN INSIGHT OF GROUNDWATER STATUS IN MALAYSIA
Vynotdni*and Edy Tonnizam Mohamad
283-285
338 STRUCTURAL AND MAGNETIC PROPERTIES OF ZINC DOPED
MAGNETITE NANOPARTICLES
Khong Nee Koo*, Ahmad Fauzi Ismail, Mohd Hafiz Dzarfan Othman and
Mukhlis A Rahman
286-288
339 SYSTEMATIC DESIGN OF ENERGY EFFICIENT FLASH COLUMN
SEPARATION PROCESSES
Muhammad Afiq Zubir, Beatrice Aavie Tang, Faizul Hakim Elidor, Nur
Aqila Naseri, Ahmad Nafais Rahimi, Muhammad Fakhrul Islam Zahran,
Munawar Zaman Shahruddin, Kamarul Asri Ibrahim and Mohd.
Kamaruddin Abd. Hamid*
289-291

342 PRODUCTION OF LACTOBACILLUS CASEI AS DIRECT-FED
MICROBIAL IN RICE BRAN EXTRACT: EFFECT OF INCUBATION
TIME AND INOCULUM SIZE
Siti Marsilawati Mohamed Esivan, Roslina Rashid* and Nor Athirah
Zaharudin
292-294
343 IMPROVING OLEIC ACID CONTENT IN USED COOKING OIL VIA
ENZYMATIC ACIDOLYSIS
Nor Athirah Zaharudin, Fatin Nur ‘Aliya Mohamad Ros, Roslina
Rashid*, Siti Marsilawati Mohamed Esivan, Norasikin Othaman, and Ani
Idris
295-297
344 GROWTH AND POLYHYDROXYBUTYRATE PRODUCTIVITY OF
GENETIC MODIFIED PHAEODACTYLUM TRICORNUTUM IN
RESPONSE TO BLUE WAVELENGTH CULTIVATION ON
POLYHYDROXYBUTYRATE SYNTHESIS PHASE
W. H. Lee and A. Idris
298-300
345 MUSCLE FIBRE TYPE CLASSIFICATION TECHNIQUE: A REVIEW
Maisarah Sulaiman*, Aizreena Azaman, Azli Yahya, Mohd Azuwan Mat
Dzahir and Husnir Nasyuha Abdul Halim
301-303
349 SEISMIC-RISK BASED ASSESSMENT IN RANAU REGION: DATA
COLLECTION AND PREPARATION
Izni Izzati Mohamad*, Mohd Zulkifli Mohd Yunus and Noor Sheena
Herayani Harith
304-306
351 ELECTROMYOGRAPHY IN GAIT SYMMETRY ASSESSMENT: A
METHODOLOGICAL REVIEW
Husnir Nasyuha Abdul Halim, Aizreena Azaman, Azli Yahya, Mohd
Azuwan Mat Dzahir and Maisarah Sulaiman
307-310
352 REFINED BLEACHED DEODORIZED PALM OIL QUALITY
PREDICTION USING NONLINEAR ITERATIVE PARTIAL LEAST
SQUARES
Mohd Aiman Mohd Noor*, Azmer Shamsuddin, Nur Atikah Mohd Rosely,
Nor Adhihah Rashid, Khu Wai Hoong, Mohd Kamaruddin Abd Hamid
and Kamarul Asri Ibrahim
311-313
354 DIFFERENCES IN CORTICO-CORTICAL FUNCTIONAL
CONNECTIVITY BETWEEN ARCHITECTURAL AND NON-
ARCHITECTURAL STUDENTS IN RELATION TO CREATIVE
THINKING: A CASE STUDY
Julia Bt. Mohd Yusof*, Norlaili Binti Mat Safri and Puspa Inayat Binti
Khalid
314-318

356 GADGET FOR TEXT AND LOCATION SHARING THROUGH
RADIO FREQUENCY
Hidhir Lutfi Isa*, Nurzarina Omar Sharif, Cheng Siong Lim, Michael
Loong Tan and Chee Wei Tan
319-321
360 ELEMENTS AND VARIABLES IN HOSPITAL PLANNING
Yahaya Hassan, Azli Yahya, Jasmy Yunus, Sarajul Fikri, Norhalimah
Idris and Husna Hamzah
322-324
362 A SHORT REVIEW OF EXTERNAL FIXATOR FOR PILON
FRACTURES: BIOMECHANICAL EFFECTS ON DIFFERENT
CONFIGURATIONS
Muhammad Hanif Ramlee*, Aishah Umairah Abd Aziz, Nur Afikah
Zainal Abidin, Hadafi Fitri Mohd Latip and Gan Hong Seng
325-328
366 MECHANICAL, THERMAL & MORPHOLOGICAL PROPERTIES OF
EPOXY AND EPOXY/KENAF COMPOSITES: EFFECTS OF
GRAPHENE CONTENT
Nurul Shuhadah Ibrahim, Azman Hassan*, Zurina Mohamad and M.
Jawaid
329-331
367 PREDICTION OF REFINED PALM OIL QUALITY USING KERNEL
PARTIAL LEAST SQUARES REGRESSION
Nur Atikah Mohd Rosely*, Azmer Shamsuddin, Nor Adhihah Rashid,
Mohd Aiman Mohd Noor, Lei Tze Yiing, Mohd Kamaruddin Abd Hamid
and Kamarul Asri Ibrahim
332-334
368 TOUGHNESS ENHANCEMENT OF POLY (LACTIC ACID)
NANOCOMPOSITE
M. Zurina* and A. N. A. Sahirah
335-337
376 POSITION ESTIMATION ERROR AND CONDITION NUMBER
CORRELATION ANALYSIS OF A MULTIANGULATION SYSTEM
Sa’id M. Yarima*, Ahmad Z. Sha’ameri and Abdulmalik S. Yaro
338-340
386 RELATIONSHIP BETWEEN KNOWLEDGE, ATTITUDE AND
PARENT SUPPORT WITH WORMS INFESTATION ON CHILDREN
Undang Ruhimat and Yane Liswanti
341-343
392 CARDIAC SEISMOCARDIOGRAPHY (SCG) ANALYSIS USING
ACCELEROMETER: A REVIEW
Ng Seng Hooi, Kamarulafizam Bin Ismail*, M. Mailah, Md Rizman Md
Lazim@Lazin
344-347
394 A REVIEW STUDY OF WETTABILITY ALTERATION BY
NANOSILICA AND POLYSILICON NANOPARTICLES
Wan Mohd Shaharizuan Mat Latif*, Wan Rosli Wan Sulaiman and
Ahmad Kamal Idris
348-350

401 NUMERICAL SIMULATION STUDY ON FOAM STABILITY USING
ELECTROKINETIC SIGNALS DURING ENHANCED OIL
RECOVERY PROCESS
Amni Haslinda Alpandi*, Mohd Zaidi Jaafar and Akhmal Sidek
351-353
405 SPACE OPTIMIZATION TECHNIQUE FOR MCKIBBEN SOFT
ACTUATOR USING PULLEY SYSTEM
Ahmad Athif Faudzi, Sii Zhi Ying, Mostafa Sayahkarajy
354-356
416 BENDING PERFORMANCE OF THIN SOFT MCKIBBEN
ACTUATOR
Mohd Firdaus Mohamed* and Ahmad Athif Faudzi
357-359
420 THE INTEGRATION OF ELECTRIC VEHICLE WITH POWER
GENERATION SECTOR: A SCENARIO ANALYSIS BASED ON
SUPPLY AND DEMAND IN MALAYSIA
Ahmad M. Idris, Ahmad F. Ramli, Zarina A. Muis*, Wai S. Ho
360-362
421 PRELIMINARY STUDY OF ENCAPSULATION OF GINSENG IN
POLY (LACTIC-CO-GLYCOLIC ACID) MICROCAPSULES
Siti Khadijah Lukman and Syafiqah Saidin*
363-366
423 THERMAL BEHAVIOUR STUDY OF MALAYSIA TYPE
BIOMASSES VIA THERMOGRAVIMETRIC ANALYSIS OF
PYROLYSIS (TGA-PYROLYSIS)
V. Balasundram, K. K. Zaman, N. Alias, N. Ibrahim*, R. Md. Kasmani,
M. K. A. Hamid and H. Hasbullah
367-369
424 GLOBAL KINETIC STUDY OF MALAYSIA TYPE BIOMASSES VIA
THERMOGRAVIMETRIC ANALYSIS (TGA)
V. Balasundram, K. K. Zaman, N. Alias, N. Ibrahim*, R. Md. Kasmani,
M. K. A. Hamid, H. Hasbullah
370-372
431 EFFICIENT EXTRACTION OF VANILLIN BY INORGANIC
MOLECULARLY IMPRINTING POLYMER USING SOL-GEL.
N.M. Safri, M. Md Salleh, H. Hussin, M. R. Zinalibdin, M. M. Sanagi
373-374
433 CARBOHYDRATE METABOLISM IN Lactobacillus reuteri STRAIN
DSMZ 20016
S. Shanmugaprakasham*, Roslinda Abd Malek, Daniel Joe Dailin and
Hesham Ali El-Enshasy
375-378
438 AN OVERVIEW OF “GREEN” TECHNIQUES TO CONTROL
MICROBIOLOGICALLY INFLUENCED CORROSION
Muhammad Khairool Fahmy Bin Mohd Ali*, Norhazilan Bin Md. Noor,
Astuty Binti Amrin, Nordin Bin Yahaya4, Shamila Azman, Akrima Abu
Bakar
379-381

439 FLEXIBILITY DESIGN OF AN INTEGRATED ALGAE-BASED
BIOREFINERY WITH PALM OIL MILL FOR BIOFUELS AND
ENERGY PRODUCTION
N. N. A. Hamid and J. S. Lim*
382-384
443 A NUMERICAL STUDY ON THE STIFFNESS OF SHIPPING
CONTAINER
Philip Chie Hui Ling* and Cher Siang Tan
385-387
448 SENSING MECHANISM FOR TRANSFORMER OIL
CHARACTERIZATION: A REVIEW
Siti Mahfuza Saimon*, Mohd Haniff Ibrahim and Muhammad Yusof
Mohd Noor
388-390
449 SURFACE MODIFICATION OF ALUMINA HOLLOW FIBER
MEMBRANE WITH ACTIVATED CARBON FOR P-CRESOL
ADSORPTION REMOVAL IN HAEMODIALYSIS APPLICATION
Sumarni Mansur, Mohd Hafiz Dzarfan Othman* and A. F. Ismail
391-392
451 OPEN TRAFFIC: AN OPENSOURCE SOLUTION TOWARDS
ANALYZING TRAFFIC CONGESTION
T. K. Sheng*, K. M Yusof, M. Ali, S. Manogaran
393-395
454 GRID CONVERGENCE STUDY FOR A SIMULATION OF ROD-
AIRFOIL FLOW
Siti Ruhliah Lizarose Samion*, Mohamed Sukri Mat Ali, Nur Haziqah
Shaharuddin and Con Doolan
396-398
456 APERTURE-COUPLED WIDEBAND DRA ARRAY AT 28GHz FOR
5G APPLICATIONS
Norshafina Shafie* and M. H. Jamaluddin*
399-401
458 STATE OF ART OF CARBON CAPTURE UTILISATION AND
STORAGE: INTEGRATION OF POWER PLANT & METHANATION
Siti Norlaila Faeizah Binti Mohd Rudin, Zarina Muis*, Haslenda Hashim
and Wai Shin Ho
402-404
463 SIMULATION OF AIRFLOW AND AIRBORNE PARTICLES
MOVEMENT INSIDE A HOSPITAL OPERATING ROOM
Keng Yinn Wong, Haslinda Mohamed Kamar* and Nazri Kamsah
405-407
470 TOTAL SUSPENDED SOLIDS REMOVAL BY HIGH GRADIENT
MAGNETIC SEPARATION USING STEEL WOOL AT DIFFERENT
VOLUME
Nur Sumaiyyah Supian*, Johan Sohaili2 Nur Suraya Kamsano
408-409
473 DEVOLEPMENT AND TESTING SWIRL ROTATING DETONATION
ENGINE
A. Dairobi G.*, M. A. Wahid
410-412

474 RECENT ADVANCES IN EXPERIMENTAL STUDIES ON
APPLICATIONS OF NANOFLUIDS IN MINICHANNEL FOR HEAT
TRANSFER ENHANCEMENT.
Nura Mu’az Muhammad, Nor Azwadi Che Sidik*
413-415
476 EFFECTIVENESS OF h-BN NANOPARTICLE AS OIL ADDITIVES
ON LIGHT VEHICLE ENGINE PERFORMANCE
Wan Mohd. Arif Aziz Japar, Tung Hao Kean, Hong Wei Xian and Nor
Azwadi Che Sidik
416-418
479 SUSTAINABLE TECHNOLOGIES FOR THE MANAGEMENT OF
PINEAPPLE WASTE IN JOHOR
Raja Safazliana Raja Sulong* and Zainul Akmar Zakaria
419-421
480 ASSESSING HOUSING AFFORDABILITY LEVEL USING MEDIAN
MULTIPLE INDEX
Aminah Md Yusof*, Julaida Johan, Chai Chang Saar and Abd Rahim
Abdul Hamid
422-424
482 CHALLENGES OF RESEARCH UNIVERSITIES: LITERATURE
ANALYSIS
Mohd Fathi Sariman*, Aminah Md. Yusof and Zaidatun Tasir
425-428

SCIENCE & TECHNOLOGY
ID TITLE PAGES
20 RESILIENCE OF RURAL SMALLHOLDERS TOWARDS
ACHIEVING SOCIOECONOMIC SUSTAINABILITY IN
KAMPUNG GOL, PAHANG
Mohamad Fadhli Rashid, Ibrahim Ngah
429-431
28 APPLICATION OF BOX BEHNKEN DESIGN TO OPTIMIZE THE
PARAMETERS FOR KENAF-POLYPROPELENE FOR NOISE
ABSORBER
A. R. A. Aziz*, S. A. Aziz
432-435
30 COLLABORATIVE PLANNING FOR URBAN LIVEABILITY:
THREE CASE STUDIES OF STRATEGIC PLANNING IN
METROPOLITAN AREAS
Khalid Zanudin*, Ibrahim Ngah and Siti Hajar Misnan
436-438
36 SUITABILITY OF NATIVE PLANTS FOR STINGLESS BEE
HONEY PRODUCTIVITY IN MALAYSIAN LANDSCAPE: A
REVIEW
Wan Saiful Nizam Wan Mohamad*, Ayub Awang and Khalilah Hassan
439-441
38 CHARACTERISTICS AND FATTY ACID COMPOSITION OF
VARIOUS NATURAL PLANT OIL BY USING FT-IR AND GC-MS
Salim N. A. Saber*, Hikmat A. Mohamad and Madzlan B. Aziz
442-445
39 BRANDING LANGKAWI ISLAND AS A GEOPARK
DESTINATION
Mohd Fadil Mohd Yusof*, Hairul Nizam Ismail and Ghazali Ahmad
446-448
49 REDUCTION OF PM2.5 EMISSION FROM A RETROFITTED
MULTICYCLONE
M. Dewika, M. Rashid*, J. NorRuwaida, M.P. Khairunnisa C.M.
Hasrizam, M.R Ammar
449-451
55 BEHAVIOR-BASED SAFETY AND SAFETY AWARENESS
RELATIONSHIP: A CASE STUDY AT CONSTRUCTION SITE
Nur Shahirah Yahya* and Hayati Habibah Abdul Talib
452-454
73 TOLERANCE COMPUTING TIME FOR SIMPLIFICATION
PROCESS USING FSA-SIMPLIFICATION
Nur Fatin Liyana Mohd Rosely *, Azlan Mohd Zain* and Abdullah
Hisham Omar
455-459

75 NONSTATIONARY WEEKLY CONSTRUCTION STOCK MARKET
PRICE USING NON-TRANSFORMED PRINCIPAL COMPONENT
TECHNIQUE
Yusrina Andu, Muhammad Hisyam Lee and Zakariya Yahya Algamal
460-463
76 RADIOLOGICAL DOSE ASSESSMENT DUE TO HYPOTHETICAL
NUCLEAR POWER PLANT OPERATION IN MERSING, JOHOR,
MALAYSIA
Nurlyana Omar* and Meng Hock Koh
464-467
77 THE DEVELOPMENT OF ANODE MATERIAL FOR MICROBIAL
FUEL CELL
Ummy Mardiana, Buchari, Henry Setiyanto and Christophe Innocent
468-470
81 PROPOSED TRACEABILITY MODEL WITH EFFORT
ESTIMATION TEST DURING REGRESSION TESTING USING
FUZZY DELPHI METHOD
Mazidah Mat Rejab*, Suriayati Chuprat and NurulHuda Firdaus Mohd
Azmi
471-474
88 DOMINATION POLYNOMIAL OF CONJUGATE GRAPH AND
CONJUGACY CLASS GRAPH OF DIHEDRAL GROUPS
Nabilah Najmuddin*, Nor Haniza Sarmin and Ahmad Erfanian
475-477
104 ASSESSMENT FOR ACOUSTIC EXTRACTION AND
CHARACTERIZATION OF PHENOLIC COMPOUNDS FROM
BUAH KUNING TELUR PULP
Yahya N.A*, Marzuki N. H. C and Wahab R.A.
478-481
112 OPTIMIZATION OF TWO-DIMENSIONAL GEL
ELECTROPHORESIS FOR ORTHOSIPHON STAMINEUS LEAF
PROTEOME ANALYSIS
M. L. Ng*, M.S. Shahir and Z. Rahmat
482-484
113 REVIEW ON PATHWAY TOPOLOGY-BASED MICROARRAY
ANALYSIS
Hui Wen Nies*, Mohd Saberi Mohamad, Zalmiyah Zakaria, Azurah A
Samah, Weng Howe Chan, and Safaai Deris
485-487
114 EVALUATION OF ANTIBACTERIAL AND ANTIOXIDANT
PROPERTIES OF VARIOUS SOLVENT EXTRACTS OF ALPINIA
GALANGA LEAVES
Intan Nursuraya Zakaria, Sayang Baba and Salehhuddin Hamdan*
488-490
115 OPTIMIZATION OF SPHEROID FORMATION OF HELA CELLS
USING COMBINATION OF HANGING DROP METHOD AND 96-
WELL PLATE COATED AGAROSE
Zurfarahanim Zolkemri*, Kartini Kabi, Sayang Baba and Salehhuddin
Hamdan
491-493

119 SHORT-TERM HYPOGLYCEMIC EFFECT OF MOMORDICA
CHARANTIA
Shi Yan Lee*, Shi-Hui Cheng, Mohamad Roji Sarmidi and Kian-Kai
Cheng
494-496
125 POTENTIAL SAFE AREAS FOR NUCLEAR POWER PLANT
SITING IN SAUDI ARABIA
Mohammed M. Damoom*, Suhairul Hashim, Mohammed S. Aljohani,
Muneer Saleh
497-499
126 AN APPROACH: REDUCING ANNEALING TIME OF OPTICAL
STIMULATED LUMINESCENCE DOSIMETER (OSLD) FOR
MEDICAL APPLICATION PURPOSE
R. S. Omar*, S. Hashim, S. K. Ghoshal, Y. Musa, A. Hashim, M.K.A.
Karim
500-503
132 EFFECT OF A NOVEL IMIDAZOL DERIVATIVE IONIC LIQUID
ON THE COBALT ELECTRODEPOSITION FROM ACIDIC
SULFATE BATH
Inam M.A. Omar*, Khadijah M. Emran, Siti A. Setu and Madzlan Aziz
504-507
134 TENSILE BEHAVIOUR OF POLYLACTIC ACID STRUT FOR 3D
FILAMENT PRINTING
M F Sadali and M Z Hassan
508-510
142 A PILOT STUDY OF CRITICAL ISSUES IN ENGINEERING,
PROCUREMENT AND CONSTRUCTION (EPC) CONTRACT IN
MALAYSIAN OIL AND GAS INDUSTRY
Naqiyatul Amirah Mohd Said, *Nur Emma Mustaffa and Hamizah
Liyana Tajul Ariffin
511-513
144 PSYCHOLOGICAL DETERMINANTS OF ENERGY
CONSERVATION BEHAVIOUR AMONG OFFICE BUILDING
USERS: A STRUCTURAL EQUATION MODELLING APPROACH
Razlin Mansor and Low Sheau-Ting*
514-517
149 THE MODELLING OF DNA SPLICING SYSTEMS WITH ONE
NON-PALINDROMIC RESTRICTION ENZYME
Nurul Izzaty Ismail*, Wan Heng Fong and Nor Haniza Sarmin
518-520
151 FACTOR AFFECTING SAFETY PRACTICES IN SMALL GRADE
CONTRACTORS
N. Yusof* and M. S. Misnan
521-523
152 LIFE ASSESMENT OF STREET LANTERN USING WEIBULL
PROBABILITY TECHNIQUE
Mohamad S. Ibrahim, Mohamad Z Hassan*, Nurul A Bani, Ikhwan
Ibrahim, Mohd Y. Daud, and Mohamad H. Ibrahim
524-526

155 A REVIEW OF MICRO-ECONOMIC DETERMINANTS OF REAL
ESTATE RESIDENTIAL PRICE IN ABUJA, NIGERIA
Musa Abubakar Alkali*, Ibrahim Sipan and Muhammad Najib Razali
and Zainab Toyin Jagun
527-529
158 COMPARISON OF MICROWAVE PLASMA ATOMIC EMISSION
SPECTROSCOPY AND GRAPHITE FURNACE ATOMIC
ABSORPTION SPECTROSCOPY FOR ANALYSIS OF TRACE
METALS
Ibrahim Sani Shabanda, Nor Kartini Abu Bakar and Sook Mei Khor
530-532
160 BRAIN ACTIVITY OF REASONING DURING INTELLIGENCE
QUOTINENT (IQ) TEST: A PRELIMINARY STUDY
Nurul F. Zainuddin*, Abdul H. Omar, Mohd N. Jamaluddin, Izwyn
Zulkapri, Arief R. Harris, Nik A. R. N. Mohd
533-535
162 OPTIMISATION OF ULTRASOUND ASSISTED EXTRACTION OF
ELAEIS GUINEENSIS LEAVES EXTRACT
Nissha Bharrathi Romes*, Roswanira Abdul Wahab and Siti Ernieyanti
Hashim
536-538
163 RATIONALIZING THE IRRATIONALITY OF OPEN DEFECATION
PRACTICE AMONG HOUSEHOLDS WITH TOILETS IN OGUN
STATE, NIGERIA
O. Olapeju, M. Rafee Majid
539-541
164 BIOMEDICAL DATA CLASSIFICATION USING WRAPPER
BASED SWARM INTELLIGENCE ALGORITHMS FOR FEATURE
SELECTION
Shamini Raja Kumaran*, Mohd Shahizan Othman and Lizawati Mi
Yusuf
542-544
166 ASSESSING PERCEPTIONS TOWARDS PUBLIC BUS SERVICE
AMONG THE CAR USERS IN ISKANDAR MALAYSIA
Jia Chyi Pung* and Safizahanin binti Mokhtar
545-547
169 DEVELOPMENT OF LATENT FINGERPRINTS ON NON-POROUS
OBJECT IMMERSED IN STAGNANT TAP WATER USING
Candida rugosa LIPASE
Aida Rasyidah Azman*, Syafianes Nadiela Zulkiflee, Naji Arafat Mahat,
Roswanira Abdul Wahab, Wan Azlina Ahmad and Hafezul Helmi
Hamzah
548-550
170 PREPARATION OF POLYCAPROLACTONE-POLY (VINYL
ALCOHOL) BLENDED FILM FROM GLACIAL ACETIC ACID-
WATER FOR POTENTIAL SCAFFOLD APPLICATION
Tan Yong Chee, Abdull Rahim Mohd Yusoff* and Nik Ahmad Nizam Nik
Malek
551-553

173 NEUTROPHIL MIGRATION AND GENE EXPRESSION OF il-1β
AND tnf-α AFTER MYRISTICIN EXPOSURE ON ZEBRAFISH
LARVAE
Tanendri Arrizqiyani, Marselina Irasonia Tan and Indra Wibowo
554-556
174 TOPOLOGICAL INDICES OF CONJUGACY CLASS GRAPH FOR
DIHEDRAL GROUPS
Nur Idayu Alimon*, Nor Haniza Sarmin and Ahmad Erfanian
557-559
175 PUBLIC PARTICIPATION ON URBAN OPEN SPACE
DEVELOPMENT IN MALAYSIA: AN OVERVIEW
Nurul Saadah Lokman*, Noorsidi Aizuddin Mat Noor
560-562
178 EXTRACTION AND CHARACTERIZATION OF
NANOCELLULOSE FROM OIL PALM BIOMASS
Fathin Najihah Nor Mohd Hussin*, Nursyafreena Attan and Roswanira
Abdul Wahab
563-565
179 HEAT AND MASS TRANSFER ON UNSTEADY FREE
CONVECTION FLOW BETWEEN TWO PARALLEL PLATES
WITH NEWTONIAN HEATING
Fasihah Zulkiflee*, Ahmad Qushairi Mohammad, Sharidan Shafie and
Arshad Khan
566-568
183 FILTERING AIRBORNE LIDAR DATA BY MODIFIED
PROGRESSIVE MORPHOLOGICAL METHOD
M. R. M. Salleh, M. Z. A. Rahman*, Z. Ismail and M. F. A. Khanan
569-572
187 EVALUATION OF INFORMATION RETRIEVAL METHODS FOR
REQUIREMENT TRACEABILITY
Rooster Tumeng*, Dayang N. A. Jawawi and Mohd Adham Isa
573-576
189 UNIQUE SIGNATURES OF HONEYS AS A MEANS TO
ESTABLISH PROVENANCE-A REVIEW
Syazwani Dzolin, Wan Aini Wan Ibrahim, Naji Arafat Mahat, Aemi
Syazwani Abdul Keyon, Zuhaimy Ismail
577-579
190 SOLID WASTE MANAGEMENT POLICIES AND PLANS IN
MALAYSIA TO IMPROVE WASTE SEPARATION AND
RECYCLING PRACTICE AMONG HOUSEHOLDS: A
LITERATURE REVIEW
Fitriyah Razali, Choong Weng Wai, and Dzurllkanian@Zulkarnain
Daud
580-582
191 INTEGRATION OF STRIDE-DREAD MODEL AND FDM FOR
THREAT ASSESSMENT IN HEALTHCARE CLOUD
APPLICATION
Nurbaini Zainuddin*, Rasimah Che Mohd Yusuff and Ganthan
Narayana Samy
583-587

193 METHOD VALIDATION FOR THE BEST PROTEIN FROM FRESH
AND COMMERCIALISED Moringa oleifera LEAF
Zetty Amirah Zulkifli and Zaidah Rahmat
588-591
196 STATIC WATSON-CRICK LINEAR GRAMMAR
Aqilahfarhana Abdul Rahman*, Wan Heng Fong, Nor Haniza Sarmin,
Sherzod Turaev and Nurul Liyana Mohamad Zulkufli
592-594
197 EFFECT ON CARBON AND NITROGEN SOURCE ON HIGH CELL
MASS PRODUCTION OF LACTOBACILLUS ACIDOPHILUS
USING ONE-FACTOR-AT-THE-TIME (OFAT)
Afif Najihah Kepli1 and Hesham A. El-Enshasy*
595-597
205 HEAT TRANSFER OF NEWTONIAN BLOOD FLOW IN A
STENOSED BIFURCATED ARTERY
Sabaruddin Ahmad Jamali*, Zuhaila Ismail and Norsarahaida Saidina
Amin
598-600
211 AN OVERVIEW OF THE AQUACULTURE FARM
TECHNOLOGIES
Fathi S., Rambat Shuib, Harun A.N. and Rahim Z.A.
601-603
213 PHYTOCHEMICAL INVESTIGATION AND ANTIOXIDANT
EVALUATION OF PELLACALYX AXILLARIS
Najwa Ahmad Kuthi* and Norazah Basar
604-606
219 FABRICATION OF FIBER BRAGG GRATING (FBG) USING
248NM KRF EXCIMER LASER
Nur Syahirah Sahidan, Hazri Bakhtiar, Ganesan Krishnan, Muhammad
Aizi Mat Salim, Ahmad Fauzi Ismail, Mohd Hafiz Dzarfan and Mukhlis
A. Rahman
607-608
220 DIGITAL URBAN SCREENS: THE RELATIONSHIP BETWEEN
PEOPLE’S ACTIVITIES AND MEDIA TECHNOLOGY AS A
SMART URBAN AMENITIES
Mariah Masykurah Ab Hadi*, Sharifah Salwa Syed Mahdzar
609-611
227 MICROWAVE ASSISTED EXTRACTION OF QUERCETINE FROM
CARICA PAPAYA L. FLOWERS
Iman Mukhaimin*, Enggar A. Saraswati and Rahma Ajizah
612-614
229 POTENTIAL USE OF UAV PHOTOGRAMMETRIC TECHNIQUES
FOR CADASTRAL MAPPING: A REVIEW
Room, M. H. M* and Ahmad, A.
615-617
230 TAPERED OPTICAL FIBER SENSOR FOR PETROL
ADULTERATION DETECTION
A.S. Mangsor*, M.S. Aziz and S. Daud
618-620

231 IOT BLOCKCHAIN FOR SMART CITY: A SURVEY
Massolihen Dasuki*, Mohd. Yazid Idris, Nik Mohd Habibullah, Abdul
Hadi Fikri, Mohd Rozaini Abd Rahim and Deris Stiawan
621-623
238 OUTPUT POWER AND EFFICIENCY IN LINEAR AND RING
CONFIGURATIONS OF CONTINUOUS WAVE ERBIUM DOPED
FIBER LASER
Rabi’atul ‘Adawiyah Binti Mat Yusoff, Yusof Munajat and Nabilah
Kasim
624-627
239 THE ROLES OF SOCIAL CAPITAL IN ENCOURAGING
COMMUNITY PARTICIPATION TOWARDS TURTLE
CONSERVATION
Khoirun Nisha Umar* and Norhazliza Abdul Halim
628-630
243 FEASIBILITY OF ZERO ENERGY BUILDING IN THE TROPICS:
CASE STUDY MALAYSIA
Kholoud Thabet*, Dr. Abdul Halim Bin Hussein
631-633
245 THE FORMATION OF KANGKAR: A FRONTIER CHINESE
SETTLEMENT IN JOHOR, MALAYSIA
H. C. Low*, R. N. Raja Shahminan and G. Mursib
634-636
254 IN-LINE CLADDED TAPERED FIBER OPTICS LIQUID
REFRACTOMETER
Nurfatin Musa, M. Safwan Aziz*, Ganesan Krishnan, Mundzir Abdullah,
M. Aizat Abu Bakar, Hazri Bakhtiar
637-639
256 ENERGY OF CAYLEY GRAPHS FOR DIHEDRAL GROUPS FOR
SPECIFIC SUBSET
Amira Fadina Ahmad Fadzil*, Nor Haniza Sarmin and Ahmad Erfanian
640-642
260 VEGETATIVE AND BIOCHEMICAL RESPONSES OF ELAEIS
GUINEENSIS TOWARDS NITROGEN-POTASSIUM FERTILIZER
Mohamed Redzuan Abbas, Leong Chia Ween, Fazilah Abd Manan*
643-645
266 LOGISTIC REGRESSION FOR EMPLOYABILITY RATES
MODELING AMONG GRADUATES FROM PUBLIC
UNIVERSITIES IN MALAYSIA
Tengku Salbiah Tengku Mohamed, Muhammad Hisyam Lee*
646-648
269 A NEW DIGITAL ID SYSTEM on INDONESIA VEHICLE USING
IoT
Slamet Winardi*, Sri Wiwoho Mudjanarko, Benediktus Anindito, Wahyu
Mulyo Utomo and Natalia Damastuti
649-651

280 SUCCESS FACTORS OF WOMEN ENTREPRENEURSHIP IN
ADAPTING CHALLENGES OF VULNERABILITY IN TOURISM
BUSINESS
Nurzafirah Dan* and Hairul Nizam Ismail
652-654
282 FLEA MARKET TOURISM: A REVIEW OF SPECIALISED
TOURISM MARKET MOTIVATION
Hazlina Aniza Mohd Hazlan, Hairul Nizam Ismail, Syed Muhammad
Rafy Syed Jaafar
655-657
283 REQUIREMENTS FOR BIM ADOPTION
Chiew Teng, Ng*, Siti Uzairiah binti Mohd Tobi and Mohammad Syazli
bin Fathi
658-660
286 STUDY OF EQUILIBRIUM AND PRE-EQUILIBRIUM NEUTRON
EMISSION FOR ORDINARY MUON CAPTURE
F. Othman*, I.H. Hashim*
661-663
287 A COMPARATIVE ANALYSIS OF PROPRIETARY GIS AND
FREE/OPEN SOURCE SOFTWARE ON LAND USE
CLASSIFICATION
Muhammad Azizol Ismail*, Ahmad Nazri Muhamad Ludin and Nafisa
Hosni
664-666
291 SECOND HOME PROGRAMMES DEVELOPMENT AND
MALAYSIA EXPERIENCE
Mohd Jamsyeer Khan*, Siti Hajar Misnan and Hairul Nizam Ismail
667-670
304 A STUDY OF THE QUALITY OF PROPERTY VALUATION
REPORT IN KADUNA METROPOLIS, NIGERIA
Bilkisu Adamu Aliyu* and Muhammad Hassan
671-673
306 AN INVESTIGATION INTO THE TRANSPORT LOGISTICAL
CHALLENGES IN THE DISTRIBUTION OF FARM INPUT
SUBSIDY PROGRAM: A CASEOF EAST BANK (MALAWI)
A. Gryson KC Msuku*, B. Dr. Zuhra Junaida Husny and C. Mohammed
AS Alzahrani
674-676
315 THE EFFECT OF TRANSPORTATION COST ON HOUSING
AFFORDABILITY: A REVIEW
Nur Adilah Binti Abdullah* and Foziah Binti Johar
677-680
316 THE PROPENSITY OF BUILDING INFORMATION MODELLING
AND INTEGRATED PROJECT DELIVERY IN BUILDING
CONSTRUCTION PROJECT
Rozana Mohamed Salleh, Nuremma Mustaffa and Nafisah Abdul
Rahman
681-684

317 THE IMPACT OF BUILDING INFORMATION MODELING
INTENSIVE TRAINING ON GRADUATES’ EMPLOYABILITY
AND CAREER DEVELOPMENT
Aimi Sara Ismail, Kherun Nita Ali, Noorminshah A. Iahad, Nur Emma
Mustaffa and Badiru Yunusa Yusuf
685-687
325 THE COMMUTING AND NON-COMMUTING GRAPHS FOR A
NON-ABELIAN 3-GROUP
A. Zulkarnain*, N. H. Sarmin and H. I. Mat Hassim
688-690
326 HOUSE-OWNERS’ ACCEPTANCE ON RETROFITTING SINGLE-
STOREY TERRACE HOUSE TO DOUBLE-STOREY IN THE
CONTEXT OF MALAYSIA.
Sk Sakif Saad* and Tareef Hayat Khan
691-694
331 SUBCRITICAL WATER EXTRACTION OF ANTHOCYANINS
FROM RED DRAGONFRUIT PERICARP (HYLOCEREUS
POLYRHIZUS)
Qifni Yasa’ Ash Shiddiqi, Febrianto Adi Nugroho, Iman Mukhaimin,
Sarah Haldien and Oi Parida
695-697
333 BIG DATA PROCESSING TECHNIQUES AND PLATFORMS: A
COMPREHENSIVE SURVEY
Aisha Shabbir*, Kamalrulnizam Abu Bakar
698-700
337 RANDOM WALK IN MALAYSIA EXTREME STOCK RETURN
Muhammad Fadhil Marsani* and Ani Shabri
701-703
347 MEASURING URBAN GOVERNANCE USING OBJECTIVE DATA:
A CASE STUDY OF KUALA LUMPUR, MALAYSIA
Soo Po Xuan* and Gabriel Hoh Teck Ling
704-706
348 ASSESSMENT OF RISK MANAGEMENT CAPABILITY OF
PRIVATE SECTOR PARTICIPANTS IN BUILD-OPERATE-
TRANSFER HIGHWAY PROJECTS IN NIGERIA
J. K. Fabi, R. A. Hamid* and M. Mustapa
707-709
350 ASSESSMENT OF MANGROVE SPECIES MAPPING AT UNESCO
GLOBAL GEOPARK, LANGKAWI
M. K. A. Halim*, A. Ahmad and H. M. Suhaimi
710-712
363 ASSESMENT OCCUPATIONAL NOISE EXPOSURE FOR
MANUFACTURING INDUSTRY
Mahendren Subramaniam, Mohamad Zaki Hassan*, Mohamad Haziq
Ibrahim, Mohd Yusof Daud, Sa’ardin A. Aziz and Shamsul Sarip
713-715

365 PROPOSED STRATEGY FOR GIS RE-IMPLEMENTATION IN
ELECTRICAL NETWORK DISTRIBUTION IN MALAYSIA – A
CASE STUDY OF CHERAS TNB DISTRIBUTION STATION
F. Mat Yatim*, Z. Majid and S. Amerudin
716-718
370 EXPLORING ALPHA GENERATION’S DEMAND ON
PRESCHOOL EDUCATION FOR CITY AS AN EDUTAINMENT
LEISURE DESTINATION
Nur Shahirah Rusman*, Hairul Nizam Ismail and Syed Muhammad Rafy
Syed Jaafar
719-721
371 EXPLORING FACTORS THAT CAN HINDER THE
IMPLEMENTATION OF PERFORMANCE INFORMATION
PROCUREMENT SYSTEM IN NIGERIA.
S. G. Buba*, R. Adul Hamid and Z. Mohamad Ramly
722-724
377 DETERMINATION OF TRICLOSAN CONCENTRATION IN
HANDSOAP PRODUCT WITH COLORIMETRY USING
DIAZOTATION METHOD
Ade Yeni. Aprillia*, R. Emran. Kartasasmita and Marlia Singgih.
Wibowo
725-728
378 VIRTUAL CONNECTIVITY IN MEDIATING MILLENNIALS
DESTINATION EMOTIONAL EXPERIENCE
Nur Shuhadah Mohd*, Hairul Nizam Ismail, Norliza Isa and Syed
Muhammad Rafy Syed Jaafar
729-731
379 SENIOR COHOUSING: EXPLORING MUSLIM PERCEPTION
TOWARDS THE ELEMENTARY AND PRACTICABILITY FOR
ACTIVE LIVING
N. Jumadi*, N.A Mat Noor, and A.A Bujang
732-734
381 FORMULATION AND CHARACTERIZATION SNE (SELF
NANOEMULSION) OF ASTAXANTHIN TRANSDERMAL GEL
WITH VARIOUS COMBINATION OF CREMOPHOR RH40 AND
PEG 400 AS SURFACTANT AND CO-SURFACTANT
Lusi Nurdianti, Indra, Devi Maryam
735-737
383 PHENOLIC CONTENT AND ANTIOXIDANT ACTIVITY OF THE
METHANOLIC EXTRACT OF MAREME LEAF (GLOCHIDION
BORNEENSE (MULL.ARG.) BOERL TO DPPH RADICAL USING
UV-VIS SPECTROPHOTOMETRY
I. Rahmiyani*, D.M. Komala and Khairunnisa
738-740
385 EFFICIENCY OF CLASSIFIERS FOR SECONDARY LEVEL
STUDENT PERFORMANCE
Nurshahirah Abdul Malik*, Mohd Shahizan Othman, and Lizawati Mi
Yusuf
741-743

387 INTEGRATION OF GENETIC ALGORITHM WITH FCEEMD
MODEL FOR FORECASTING WATER CONSUMPTION
Nuramirah Akrom* and Zuhaimy Ismail
744-746
388 WOMEN- FRIENDLY MOSQUE
Nur Farah Atikah Mohd Razif*, Raja Nafida Raja Shahminan, Norliza
Mohd Isa and Malsiah Hamid
747-749
389 STUDENT’S HABITS AND DIGITAL GAME PREFERENCES
AMONG YOUNG CHILDREN IN MALAYSIA: A CASE OF
DESIGNING AN EDUCATIONAL GAME
Rozana Binti Ismail*, Roslina Binti Ibrahim
750-752
390 VALIDATION OF COORDINATION STRATEGIES AND RELATED
INDICATORS IN GLOBAL SOFTWARE DEVELOPMENT
PROJECTS USING DELPHI TECHNIQUE ACTIVITIES
Anusuyah Subbarao* and Mohd Naz’ri Mahrin
753-755
391 A REVIEW OF MULTISPECTRAL IMAGERY FOR 3D MODELING
IN ROCK ART RECORDING
Khairulazhar Zainuddin*, Zulkepli Majid and Mohd Farid Mohd Ariff
756-758
395 ACTION DEGREE ON GROUPS
Suad Alrehaili* and Charef Beddani
759-761
396 EMERGENCY RESPONSE TIME IN MALAYSIA: ASSESSMENT
AND EFFECTIVENESS IN LANDSLIDE DISASTER
Mohamad Fazli Sardi and Khamarrul Azahari Razak
762-764
398 RURAL COMMUNITY ECONOMIC EMPOWERMENT THROUGH
TOURISM BUSINESS PARTNERSHIP: CASE STUDY OF SUKAU,
SABAH
Nur Fatimah Abdul Rahman* and Norhazliza Abdul Halim
765-767
418 APPLICATION AND ADAPTATION OF SEDIMENT
FINGERPRINTING APPROACH IN ASIAN COUNTRIES: A
REVIEW
Sugumaran, D, Annammala, K.V*, Yusoff, A.R.M, Yusop, Z, Mohammad
and N.A, Nainar, A
768-771
428 THE EFFECT OF MACROECONOMIC FACTORS ON THE
EXCESSIVE RETURNS OF ASIAN REITS
V. Elsa*, R. Muhammad, O. Mustafa and M. Hishamuddin
772-774
430 LOCAL HYPERTHERMIA AT 43oC REDUCED TUMOR
PROGRESSION IN EMT6 MURINE BREAST CANCER MODEL
W.F.A. Wan Mohd Zawawi, M.I. Salim, K. Jemon
775-777

432 ASSESSMENT OF THE INTERPOLATION TECHNIQUES TO
TRAFFIC NOISE POLLUTION MAPPING OF THE CAMPUS
TRENDING TOWARD THE ECO CAMPUS.
Parviz Ghojogh Najad*, Anuar Ahmad and Irina Safitri Zen
778-780
434 SAFETY ASSESSMENT OF ION AND ENERGY DOSE RATE FOR
TRANSMISSION X-RAY CARGO SCANNING SYSTEM
N. Ramlee*, I.H.Hashim, Y.S.YAP, A.A.Jasni, N.A.Zawawi,
N.F.M.Fadzillah, A.K.Ismail
781-782
440 EXTRACTION OF BROMELAIN FROM PINEAPPLE WASTE AND
PURIFICATION BY COLUMN CHROMATOGRAHY
Noor Khaleeda Arsad*, Azman Abd Samad, Wan Rosmiza Zana Wan
Dagang and Haryati Jamaluddin
783-785
441 TRANSACTION COST COMPONENTS IN BIM PROCUREMENT:
A PRELIMINARY STUDY
Toh Ka Bean*, Sr Dr. Muzani bin Mustapa and Sr Dr. Fara Diva binti
Mustapa
786-789
450 THE SUSTAINABILITY OF RURAL SETTLEMENT: REVIEW
Norhafiza Binti Abdullah*, Ainur Zaireen Zainudin and Khadijah
Hussin
790-793
452 A REVIEW OF SPATIO-TEMPORAL MODELS IN IDENTIFY
ABIOTIC FACTOR THAT AFFECTING PEST AND PLANT
DISEASE
MD Sabtu N*, N H Idris and M H I Ishak
794-796
453 LOW-COST UAV-BASED MULTISPECTRAL IMAGING SYSTEM
FOR COASTAL EROSION MONITORING – A REVIEW
Ahmad Razali Yusoff*, Zulkepli Majid, Mohd Farid Mohd Ariff, and
Norhadija Darwin
797-799
455 PRELIMINARY STUDY ON IN VIVO ANTI-CANCER ACTIVITY
OF CLINACANTHUS NUTANS ON MURINE CERVICAL CANCER
MODEL
N. A. Roslan*, N. A. Latif, LeV. Lim and K. Jemon
800-802
459 A SURVEY OF SURFACE RECONSTRUCTION FROM 3D POINT
CLOUD
Mohamad Nurfalihin Othman* and Habibollah Haron
803-805
471 ISOLATION, CHARACTERISATION AND IDENTIFICATION OF
CELLULOLYTIC Bacillus sp. CJ2 FROM RICE STRAW
Seng Chong Teo*, Chun Shiong Chong
806-809

478 EFFECTS OF ZINC DOPANT ON OPTICAL PROPERTIES OF
CI(S,Se)2 THIN FILMS FOR SOLAR CELL APPLICATIONS
Elham Mazalan*, Kashif Tufail Chaudhary, Nafarizal Nayan, Jalil Ali
and Elfa Rizan Rizon
810-813

SOCIAL SCIENCE
ID Title Pages
40 A REVIEW OF THE LINKAGE BETWEEN ORGANIZATIONAL
COMMUNICATION AND EMPLOYEES’ PERFORMANCE
Jen Ling Gan* and Halimah M. Yusof
814-816
56 CRITICAL SUCCESS FACTORS IMPLEMENTING
SUSTAIBAILITY IN HIGHER EDUCATION INSTITUTIONS
Nadzirah Zainordin*, Syuhaida Ismail
817-819
58 MALAYSIAN MINISTRY OF HIGHER EDUCATION (MOHE) AND
SELECTED PUBLIC UNIVERSITIES INITIATIVES IN ENHANCING
STUDENTS’ NON-TECHNICAL SKILLS
Aini Najwa Azmi*, Yusri Kamin, Muhammad Khair Noordin and Ahmad
Nabil Md. Nasir
820-822
62 HEADSCARF ISSUE AND CHALLENGE IN TURKEY
Nurhidayu Rosli*, Kamaruzaman Yusoff and Tamat Sarmidi
823-824
66 GAME ELEMENT IDENTIFICATION IN MOBILE LEARNING
GAME APP- A SYSTEMATIC REVIEW
Noor Asmina Mohd Rashid*, Shaharuddin Md Salleh and Norah Md
Noor
825-827
67 THE ORIGIN AND PURPOSE OF DHIMMAH (SUBSTRATUM OF
RESPONSIBILITY) ACCORDING TO THE EARLY LEGAL
THEORISTS.
Mohd Hilmi bin Ramli*
828-830
70 COMPUTER SELF-EFFICACY AND ACCEPTANCE OF E-
LEARNING: A MULTI-GROUP ANALYSIS BASED ON A
STRUCTURAL EQUATION MODEL AMONG UNIVERSITY
LECTURERS IN MALAYSIA.
Hii Puong Koh*, Chin Fei Goh
831-833
79 INNOVATION LEVEL OF ENGINEERING AND NON-
ENGINEERING UNIVERSITI TEKNOLOGI MALAYSIA (UTM)
UNDERGRADUATE STUDENTS
Nor Aisyah Che Derasid*, Aede Hatib Musta’ amal, Mohd Salehudin
Marji and Norzanah Rosmin
834-836
83 COLLABORATIVE CONSUMPTION OF APPAREL
Thoo Ai Chin*, Danny Poh Wai Chong, Umar Haiyat Abdul Kohar,
Zuraidah Sulaiman and Tan Liat Choon
837-839

92 HALAL LOGISTICS
Thoo Ai Chin*, Intan Nur Anisah Rosli, Mohamed Syazwan Ab Talib,
Zuraidah Sulaiman and Tan Liat Choon
840-842
93 INTERNET GIVING BEHAVIOUR
Thoo Ai Chin*, Malihah Mahmood, Lee Yoke Lai, Farrah Merlinda
Muharam and Tan Liat Choon
843-845
94 ELECTRONIC WASTE
Thoo Ai Chin*, Nor Syazana Masron, Lee Yoke Lai, Huam Hon Tat and
Norhayati Zakuan
846-848
95 SELF-SERVICE TECHNOLOGY
Thoo Ai Chin*, Wong Xiao Hong, Umar Haiyat Abdul Kohar, Norhayati
Zakuan and Tan Liat Choon
849-851
99 CORPORATE SOCIAL RESPONSIBILITY AND PURCHASE
INTENTION
Thoo Ai Chin*, Soh Xuan Ling, Tan Liat Choon, Huam Hon Tat and
Noraini Abu Talib
852-854
100 CONSPICUOUS CONSUMPTION
Thoo Ai Chin*, Yeo Kang Yu, Zuraidah Sulaian, Adaviah Mas’od and
Tan Liat Choon
855-857
107 PERCEPTION OF THE LEVEL OF PREPAREDNESS AMONG
VOCATIONAL COLLEGE LECTURERS ON THE
ENTREPRENEURIAL FIELD
Hanim Binti Zainal* and Mohammad Khata Bin Jabor
858-860
123 USING AREDKIT TO IMPROVE SPATIAL VISUALIZATION
SKILLS FOR ORTHOGRAPHIC PROJECTION
Marlissa Omar*, Dayana Farzeeha Ali, Mahani Mokhtar, Norarbaiyah
Yaacob, Nusaila Johari
861-864
135 A PROPOSED EXTENDED MCKNIGHT’S INITIAL TRUST MODEL
FOR B2C E-COMMERCE
Wong Chiet Bing*, Prof. Dr. Khalil Md Nor and Assoc. Prof. Dr. Ahmad
Jusoh
865-867
140 NETBALL TEAM LOYALTY
Thoo Ai Chin*, Pow Mei Foong, Mohd Shoki Md Ariff, Choi Sang Long
and Farrah Merlinda Muharram
868-870
165 INTERACTION IN PROBLEM BASED LEARNING ENVIRONMENT
TOWARDS CRITICAL THINKING SKILL: A FRAMEWORK
Wan Nur Tasnim Wan Hussin*, Jamalludin Harun and Nurbiha A.
Shukor
871-874

167 STUDENTS’ MOTIVATION TO LEARN, ACADEMIC
ACHIEVEMENT, AND ACADEMIC ADVISING: A META-
ANALYSIS
Sofiazianti Saleh*, Zakiah Mohamad Ashari Azlina Mohd Kosnin
875-877
180 INDUSTRY 4.0 CIVIL ENGINEER JOB SKILLS REQUIRED BY
EMPLOYERS IN MALAYSIA
Nurfazwin Ab Rasid* and Nor Fadila Amin
878-880
182 FACTORS INFLUENCING FOREIGN CONSUMERS INTENTION
TO PURCHASE HALAL PRODUCTS IN MALAYSIA
Misliyana Misnan*, Ong Choon Hee and Adriana Mohd Rizal
881-883
252 THE ROLES OF PUBLIC RELATIONS IN AN ENVIRONMENTAL
AWARENESS CAMPAIGN: A CASE STUDY OF SWM
ENVIRONMENT SDN BHD
Shahrul Amir A. Rahim*, Mohd. Nasir Markom and Syed Agil Alsagoff
884-886
258 THE INTERESTS OF ACTORS AND POWER RELATIONS IN THE
UTILIZATION OF MARINE RESOURCES PELABUHANRATU
Eva Royandi* Arif Satria Saharuddin
887-889
265 DISRUPTION OF CORPORATE MEMORY PRESERVATION
Nurul Syafiqah Suhaimi*, Kamaruddin Yusop and Yusof Boon
890-892
311 AUTONOMY NEEDS SUPPORT IN TEACHERS’ PROFESSIONAL
DEVELOPMENT ENGAGEMENT
Mohamed Nazry Bin Azmi* and Hadijah Binti Jaffri
893-895
332 E-LEARNING FOR ENHANCE CREATIVE THINKING IN HIGHER
EDUCATIONAL STUDENTS
Azri Syazwan Bin Atan* and Shafie Bin Rosli
896-898
340 THE EFFECT OF LOCAL ORIGINAL REVENUES, SPECIAL
ALLOCATION FUNDS, GENERAL ALLOCATION FUNDS ON THE
HUMAN DEVELOPMENT QUALITY AND THE MEDIATING ROLE
OF CAPITAL EXPENDITURE IN REGENCY AND CITIES IN
SOUTH KALIMANTAN PROVINCE – INDONESIA
Akhmad Yafiz Syam*, Fahmi Rizani, Lisandri, Muhammad Maladi
899-901
375 FORMULATION OF NON-FUNCTIONAL REQUIREMENT
FRAMEWORK FOR SOFTWARE PROJECT DEVELOPMENT: A
ROADMAP
Mariayee Doraisamy and Mohd Naz’ri Mahrin
902-904
384 MODEL STRATEGY FOR PERFORMANCE IMPROVEMENT
USING BALANCE SCORECARD ON COMPANY ON COMPANY
DISTRIBUTORS ELECTRICAL DISTRIBUTORS
Arasy Alimudin*, Sri Wiwoho Mudjanarko and Reswanda T Ade
905-907

410 TRACING THE JOURNEY OF KHAN JAHAN ALI FROM
BAROBAZAR TO BAGERHAT
Fatiha Polin* and Dhrubo Alam
908-910
412 SHAH WALI UL ALLAH AND FIVE SCIENCES COVERING
QURAN IN AL FAUZ AL KABIR
Naeem Ashfaq* and Hussin Bin Salamon
911-913

ENGINEERING

ENGINEERING 1
IGCESH2018
Universiti Teknologi Malaysia, Johor Bahru, Malaysia 13 -15 August 2018
PALM KERNEL SHELL BASED ACTIVATED CARBON FOR DYE
REMOVAL: A SUMMARY OF RECENT STUDIES
Lee Lin Zhi1 and Muhammad Abbas Ahmad Zaini*2
1, 2 Centre of Lipids Engineering & Applied Research, Ibnu-Sina Institute for Scientific and
Industrial Research, Universiti Teknologi Malaysia, 81310 UTM Johor Bahru, Johor, Malaysia
Department of Chemical Engineering, Faculty of Chemical & Energy Engineering, Universiti Teknologi Malaysia, 81310 UTM Johor Bahru, Johor, Malaysia
([email protected], Tel: +6 07 5535552)
ABSTRACT
Palm kernel shell is a promising candidate as the precursor for preparation of activated
carbon due to its granular structure, insolubility in water, chemical stability, high mechanical
strength and its local availability at almost no cost. It can be activated into high porosity
carbon in short time due to its high lignin content, low cellulose content and less fibrous
structure. This paper is aimed to provide a short summary on the different types of palm
kernel shell based activated carbon, the preparation strategies, the textural properties of the
synthesized materials for water pollutants removal. Besides, a case study to discuss the
adsorptive performance of the synthesized palm kernel shell based activated carbon on the
removal of rhodamine B from water are included to evaluate the feasibility of palm kernel
shell in the treatment of dyes wastewater.
Key words: Palm kernel shell, Activated carbon, Dye removal
INTRODUCTION
Most of the materials that are rich in carbon content and do not fuse in carbonization can be
used as the precursor of activated carbon. Oil palm waste such as palm kernel shell [1], palm
empty fruit bunch [2], palm frond [3] and palm trunk [4] are also potential precursor of AC.
These materials have little or no economic value and present a disposal problem to the
environment, but they are rich in carbon content and low ash content.
Malaysia is the second largest producer of palm oil in the world. The production of crude
palm oil in Malaysia is expected about 20 million tonnes in the year 2017 [5]. Besides the
production of crude palm oil, a large amount of solid waste is also an output from the palm
oil industry. For every 10 tonnes of crude palm oil produced during oil palm milling process,
5.2 tonnes fibre, 2.2 tonnes shell, 8.5 tonnes empty fruit bunch and other wastes are
generated. Among these, about 5.61 million tonnes of palm kernel shell (PKS) were
generated annually. The use of PKS as an adsorbent precursor is expected to greatly reduce
the inherent costs. Moreover, the issues revolving around the management of oil palm waste

ENGINEERING 2
Many researchers have studied the feasibility of PKS as alternative activated carbon (AC)
precursors. Generally, PKS is promising precursor to produce high quality of AC which has
specific surface area greater than 1000 m2/g [1,6]. Effective adsorption performances of
PKS-AC were investigated with the removal of dyes which indicate the feasibility of PKS-
AC in dyes wastewater treatment [7,8,9,10].
The present case study reports the evaluation of palm kernel shell based activated carbon
(PKSAC) as potential adsorbent for rhodamine B from water. PKSAC is prepared via ZnCl2
activation at 600oC for 2 h. Carbonized palm kernel shell (CHAR) is included to show the
effect of chemical activation onto palm kernel shell.
MAIN RESULTS
Table 1 shows the effect of chemical activation on the yield and textural properties of
synthesized materials. PKSAC displays a higher yield, suggesting the role of ZnCl2 as
superior dehydrating agent to inhibit the formation of tar. CHAR has a poor surface area
(208 m2/g) compared to PKSAC (1365 m2/g) because some of the pores are not well-
developed and blocked with tar. Therefore, PKSAC had better adsorption performance
due to its textural properties.
Table 1. Textural properties, yield and rhodamine B adsorption of palm kernel shell based
char (CHAR) and activated carbon (PKSAC).
Adsorbent CHAR PKSAC
BET surface area (m2/g) 208 1365
Total pore volume (cm3/g) - 0.587
Micropore volume (cm3/g) - 0.488
Microporosity (%) - 83.2
Average pore size (nm) - 1.89
Yield (%) 33.4 51.8
Maximum adsorption capacity (mg/g) 16.3 108
Figure 1. Equilibrium removal of rhodamine B by palm kernel shell activated carbon.
Lines were predicted by Langmuir (dotted), Freundlich (solid) and Redlich-Peterson
(dashed) models.
0
20
40
60
80
100
120
140
-100 0 100 200 300 400 500
Equilib
riu
m a
dso
rpti
on, Q
e
(mg/g
)
Equilibrium concentration, Ce (ppm)
Experimental data Langmuir Freundlich RP

ENGINEERING 3
The equilibrium adsorption data were analyzed using Langmuir, Frendlich and Redlich
Peterson (RP) models. The applicability of Langmuir model indicates the homogeneous
nature of monolayer coverage of rhodamine B molecule at the outer surface of PKSAC. This
is also supported by Redlich-Peterson.
CONCLUSION
Palm kernel shell is promising precursor to produce high quality of AC which has specific
surface area greater than 1000 m2/g. This paper highlights the promising role of palm kernel
shell based activated carbon as adsorbents in the removal of water pollutant. In case study,
ZnCl2 activated palm kernel shell carbon shows high surface area (1365 m2/g) and effective
adsorption of rhodamine B (108 mg/g).
Acknowledgment: The authors would like to express their appreciation for This work was
supported by tier 1 UTM-RUG no.18H50 and UTM Zamalah Scholarship.
REFERENCES
1. Hidayu, A.R. and Muda, N. Preparation and characterization of impregnated activated carbon from palm
kernel shell and coconut shell for CO2 capture. Procedia Engineering 148 (2016), 106-113. 2. Osman, N.B., Shamsuddin, N. and Uemura, Y. Activated carbon of oil palm empty fruit bunch (EFB); core
and shaggy. Procedia Engineering 148 (2016), 758-764.
3. Ahmad, A., Al-Swaidan, H.M. and Alghamdi, A.H. Production of activated carbon from raw date palm
fronds by ZnCl2 activation. Journal of the Chemical Society of Pakistan 37 (2015), 1081-1087.
4. Pal, A., Kil, H.S., Mitra, S., Thu, K., Saha, B.B., Yoon, S.H., Mivawaki, J., Miyazaki, T. and Koyama, S.
Ethanol adsorption uptake and kinetics onto waste palm trunk and mangrove based activated carbons.
Applied Thermal Engineering 22 (2017), 389-397.
5. Zainul, I.F. Thorny issues: Palm oil industry needs to improve production efficiencies. StarBiz (2017, 8
March), 1.
6. Ulfah, M., Raharjo, S., Hastuti, P. and Darmadji, P. The potential of palm kernel shell activated carbon as an
adsorbent for β-carotene recovery from crude palm oil. AIP Conference Proceedings 1755 (2016), 1-5.
7. Yong, Q.Z. and Zaini, M.A.A. Adsorption of rhodamine B by palm kernel shell adsorbents. Journal of Engineering and Technology 7 (2016), 1-16.
8. Ogunsile, B.O., Odesola, I.F., Oluwole, O. and Labulo, A.H. Production and characterization of activated
carbon from chemically treated agricultural Wastes. Journal of Applied Science Research 10 (2014), 29-35.
9. Lee, L.Z. and Zaini, M.A.A. Potassium carbonate-treated palm kernel shell adsorbent for congo red removal
from water. Jurnal Teknologi 75 (2015), 233-239.
10. Abechi, S.E., Gimba, C.E., Uzairu, A., Kagbu, J.A. and Ocholi, O.J. Equilibrium adsorption studies of
methylene blue onto palm kernel shell-based activated carbon. International Refereed Journal of Engineering
and Science 2 (2013), 38-45.

ENGINEERING 4
IGCESH2018
Universiti Teknologi Malaysia, Johor Bahru, Malaysia 13 -15 August 2018
A MINI REVIEW OF BIPOLAR POLYMER MEMBRANE AS A
SELF-HUMIDIFIER FOR PROTON EXCHANGE MEMBRANE FUEL
CELL
S. S. Daud*1, J. Jaafar2, M. A. Norrdin3 and R. Sudirman4
1, 2, 3 Advanced Membrane Technology Research Centre (AMTEC), Universiti Teknologi Malaysia,
81310 UTM Johor Bahru, Johor, Malaysia
([email protected], [email protected], [email protected]) 4 Faculty of Electrical Engineering, Universiti Teknologi Malaysia, 81310 UTM Johor Bahru, Johor,
Malaysia
ABSTRACT
PEMFC promises a clean and efficient energy for transportation application in where
hydrogen and oxygen are used as fuels for operation. However, the weaknesses of monopolar
PEMFC including severe water flooding phenomenon and membrane drying problem when
operating at high current density which ultimately degrade its performance. Recently,
researchers found that a bipolar membrane (BPM) is able to solve the water issue in PEMFC
due to its ability in generating water molecule at the intermediate layer. The performance of
BPM is highly depend on the types of membranes and other cell components materials,
fabrication technique, and cell system design in order to achieve excellent self-humidification
behaviour. Thus, the aims of this review are to discuss the application of BPM as an internal
humidifier for PEMFC, and to describe the development of BPMFC system design and
material of cell components based on current years latest reference. Up to now, the Nafion-
quaternary ammonium polysulphone BPM exhibits the highest cell performance (327 mW
cm-2) and manage to operate effectively under high current discharge. In this light, previous
works confirm that the BPM has the ability to self-humidify the membranes and solve the
water management issue in PEMFC.
Key words: Bipolar membrane, PEMFC, water management, water transport, humidifier
INTRODUCTION
Lately, the community’s awareness on the use of environmentally friendly energy sources for
industries, electricity, and transportation has increased. Fuel cells is an electrochemical
device that introduced by Sir William Robert Grove in the 19 century, which convert
chemical energy into electrical energy via redox reactions. The advantages of using PEMFC
as power sources, include its ability to produce high power density and efficiency, simple
design, low volume and weight because of thin membranes, low/zero emissions, silent
operation, suitability for discontinuous operations, quick start up (1-5s) and safe handling [1].
The flooding and membrane drying phenomenon is an important limiting factor of PEMFC
performance, thus, this review is focused on this issue. Moreover, water flooding and
membrane drying reduces the PEMFC power output, lifetime and stability. The presence of

ENGINEERING 5
excess water will result in the formation of the liquid water layer, degrade cell performance,
stability, and durability problems. The excess liquid water layer is usually formed at the
cathode and the gas diffusion layer. The weakness of a monopolar PEMFC is the need to
maintain proper membrane humidity at high current density. In recent years, to overcome the
water management issue in PEMFC, researcher have come out with internal humidifier based
on BPM that are cost effective and are less complex in their system design. Bipolar
membrane or also known as proton-anion exchange membrane has attracted much attention
among researchers due to its potential function of self-humidifying during operation because
of water formation at the intermediate layer (see Figure 1). Up to now, there are no available
commercial BPM with water generation configuration. So, the easiest method to develop
BPM is through composing CEM and AEM together via hot-pressed technique. The BPM
had been first develop in 2009 by Unlu et al. (2009) [2].
Figure 1. The basic structure of bipolar membrane fuel cell
BPMFC PERFORMANCE AND CURRENT ISSUE
Starting from Unlu et al.’s (2009) [2] study of proving the self-hydrating in fuel cell when
BPM was used, some of the researchers have continued the BPMFC study by investigating
MEA fabrication method, and novel materials for BPM and other cell components. Table 1
shows the past BPMFC studies. Although BPMFC had the potential to solve water flooding
and membrane drying problem but it still required modification on cell design and material
since its development was still in early stage and the previous study had claimed that their
proposed BPMFC faced some problems. Among of the problems are poor electrochemical
cell performance, material stability problem leading to membrane splitting at high current
discharge, and accumulation of water increase at junction layer as current density increased
and caused flooding.

ENGINEERING 6
Table 1. Summarization on BPMFC past studies
Study BPM Material Performance (Power Density)
[2] Nafion 212-Fluorenyl Poly(arylene
ether sulphone) 0.64 mW cm−2 at 50 ˚C
[3] Nafion-FUMAPEM FAA-3 8 mW cm−2 at 30˚ C
[4] Nafion 211- Quaternized Poly (2,6-
dimethyl 1,4-phenylene) oxide 110 mW cm−2
[5] Nafion 117- Polyphenylene oxide
with long-chain alkyl amine groups
Not state
[6] Nafion 117- Quaternary ammonium
polysulphone 327 mW cm−2 at 80˚ C
[7] Nafion 212- Sulfonated quaternary
ammonium polysulphone Not state
CONCLUSION
Flooding has become a bigger issue in PEMFC when operated at a high current density.
Many alternatives have been suggested to overcome this issue. A recent study found that
BPM could potentially humidify the membrane to keep it hydrated as it is being operated at
high current density. However, there are a limited number of studies conducted on this since
the fuel cell applications of BPM technology is still new. Many of polymer based membrane
has been proposed for determining the best, suitable and good compatibility to each other in
obtaining optimal cell performance. Challenges remain in improving the cell performance
and determining the relative importance of the AEM and CEM conductivity, and the
thickness, porosity, stability of membrane for long term operation, and compatibility between
CEM and AEM. In the future work, it recommends that a novel polymer material of CEM
should be proposed to replace Nafion membrane that have high hydrogen crossover and
investigate the compatibility state of material used to develop the membranes in order to
improve the BPMFC performance.
Acknowledgment: The authors are thankful to Universiti Teknologi Malaysia for generous
financial sponsorship under Zamalah Scholarship to support one of the authors (S.S.Daud).
REFERENCES
1. Bhattacharya, P.K. Water flooding in the proton exchange membrane fuel cell. Directions 15 (2015), 24-33.
2. Unlu, M., Zhou, J. and Kohl, P.A. Hybrid anion and proton exchange membrane fuel cells. J. Phys. Chem. C
113 (2009), 11416-11423. 3. Shen, W., Prasad, A.K. and Hertz, J.L. A non-flooding hybrid polymer electrolyte fuel cell. Electrochem.
Solid-State Lett 14 (2011), 121-123.
4. Arges, C.G., Prabhakaran, V., Wang, L. and Ramani, V. Bipolar polymer electrolyte interfaces for hydrogen-
oxygen and direct borohydride fuel cells. Int. J. Hydrogen Energy 39 (2014), 14312-14321.
5. McClure, J., Grew, K. and Chu, D. Experimental development of alkaline and acid-alkaline bipolar
membrane electrolytes. Electrochem. Soc. 69 (2015), 35-44.
6. Pemg, S., Lu, S., Zhang, J., Sui, P.C. and Xiang, Y. Evaluating the interfacial reaction kinetics of the bipolar
membrane interface in the bipolar membrane fuel cell. Phys. Chem. Chem. Phys 15 (2013), 11217-11220.
7. Li, Q., Gong, J., Peng, S., Lu, S., Sui, P.C., Djilali, N. and Xiang, X. Theoretical design strategies of bipolar
membrane fuel cell with enhanced self-humidification behavior. J. Power Sources 307 (2016), 358-367.

ENGINEERING 7
IGCESH2018
Universiti Teknologi Malaysia, Johor Bahru, Malaysia 13 -15 August 2018
PREPARATION AND CHARACTERIZATION OF SLUDGE BASED
ADSORBENTS FOR DYE REMOVAL
Tang Shu Hui1,2 and Muhammad Abbas Ahmad Zaini1,2*
1,2 Centre of Lipids Engineering & Applied Research (CLEAR), Ibnu-Sina Institute for Scientific &
Industrial Research (ISI-SIR), Universiti Teknologi Malaysia, 81310 UTM Johor Bahru, Johor,
Malaysia 2Faculty of Chemical & Energy Engineering, Universiti Teknologi Malaysia, 81310 UTM Johor
Bahru, Johor, Malaysia
(Email: [email protected], [email protected])
ABSTRACT
Adsorption is an efficacious wastewater treatment technique which has been widely used in
various industrial applications. However, the high operation cost involving commercial
activated carbon in industrial processes is the main drawback. Sewage sludge is an auspicious
raw material of activated carbon owing to its high carbon content, rich functional groups, low
cost, high availability and abundance. This paper aimed to evaluate the feasibility of
converting textile sludge into activated carbon by KI + KOH activation at 700 oC for 1 h. The
effect of different preparation methods on the properties of sludge-based adsorbents was
reviewed. The application of these adsorbents in the removal of dye was discussed. The results
from this study proved that the preparation of textile sludge based activated carbon via KI +
KOH activation is feasible and effective in the adsorption of dyes. This paper provides
further insight on the preparation methods of sludge-based adsorbents and dye wastewater
treatment using these adsorbents. Key words: Sludge, Adsorbent, Preparation, Adsorption, Dye removal
INTRODUCTION
Over the years, water pollution control has been a subject of great interest. In Malaysia, the
wide commercialization of textile industries due to high demands have led to establishment
of more than 200 textile factories. Textile manufacturing in Malaysia is one of the largest
sector producing hazardous chemical wastewater, in which it is responsible for 22% of the
overall volume industrial effluent generated [1]. Yet, improper handling of dye effluent often
results in a serious threat to the receiving water bodies. These residual dyes induce
microtoxicity to aquatic creatures and retard self-purification of water bodies. It is necessary
to separate these contaminants from the wastewater prior to its release into streams.
Nevertheless, the removal of dyes from effluents can be strenuous because most of them are
stable to light, heat and oxidizing agents and biologically non-degradable.
Adsorption is a superior dye removal approach in terms of efficiency, cost, simplicity of
design, ease of operation and insentivity to toxic substances [2,3]. Due to the expensive
commercial activated carbons, industrial sludge has been explored as sustainable and

ENGINEERING 8
economical source of activated carbon. The generation of large amount of sewage sludge and
its handling and disposal problems have become a critical environmental issue. Sewage
sludge is normally disposed via incineration and landfilling, but these methods are short term
solution as they are costly and could pose secondary pollution. Thus, the conversion of sludge
into activated carbon is an attractive approach that can reduce the pollution loads into the
environment.
In practice, the preparation of activated carbon can be carried out either chemical activation
or physical activation. Chemical activation prevails over physical activation due to its higher
surface area and pore development, short activation time, low activation temperature and
better yield. Thus, this study is aimed to evaluate the feasibility of converting textile sludge
into activated carbon by KI + KOH activation at 700 oC for 1 h. The present case study
reports the evaluation of sludge as potential adsorbents for removal of dyes from water.
MAIN RESULTS
Although sludge is high in carbon content and rich in surface functional groups, its high
ash content (>16% [2,3,4]) may impede pore development of pores during activation
process. Inorganic matters may clog the pores and decrease the surface area of the
adsorbent. Popular activating agents like KOH, ZnCl2 and K2CO3 are less effective in the
activation of ashy precursor [2,4,5]. The novel KI+KOH activating agent produced highly
microporous textile sludge based activated carbon (TSAC) with superior surface area of
984 m2/g as shown in Table 1. In contrast to KOH, KI+KOH had also proven to enhance
the yield and textural properties of TSAC, indicating the integrated effect of KI and KOH
[3,6]. KI is a mild salt with fire retardant property, whereas KOH is a strong base which
stimulates gasification. By combining KI and KOH, the stable iodide from KI may bond
to the pore walls and strengthens it to allow further pore drilling and pore formation
process whereby the metallic potassiums intercalate into the carbon matrices. In other
words, KI+KOH promotes strong carbon network structure by reducing the extent of
sample burnt off and volatilization rate. As a result, the yield and textural properties of
TSAC are improved compared to that of char as shown in Table 1.
Table 1. Yield and textural properties of char and textile sludge based activated carbon
(TSAC)
Sample Char TSAC
Yield (%) 15 22.4
BET surface area (m2/g) 11.86 984
Average pore diameter (nm) - 2.44
Pore volume (cm3/g) - 0.554
Micropore volume (cm3/g) - 0.352
Microporosity (%) - 63.6
Batch adsorption equilibrium studies were carried out at different concentration by using
malachite green dye as an adsorbate. From Figure 1, it can be seen that Langmuir
isotherm gave the best fit, suggesting a monolayer adsorption. The value of Redlich-
Peterson constant g is very close to 1, revealing an ideal Langmuir adsorption, thus
further confirms the good applicability of Langmuir isotherm.

ENGINEERING 9
Figure 1. Adsorption isotherms of MG on TSAC (experimental conditions: Co = 30-500
mg/L, contact time = 72 h, T = 25 oC, agitation speed = 120 rpm).
CONCLUSION
The conversion of sludge into adsorbents will not only mitigate the expensive sludge disposal
problem, but also cut down the environmental pollution by alleviating the need for landfilling
and sludge incineration. The KI + KOH activating agent improves yields and textural
properties of TSAC, thus increasing its MG adsorption capacity. This work showed that the
preparation of TSAC via KI+KOH activation is feasible. Hence, it is proposed that certain
areas such as KI+KOH activation of various precursor, stability and regeneration of sludge
based activated carbon and its application to real wastewater sample can be explored for
future studies.
Acknowledgment: The authors would like to express their appreciation for the support of
UTM Zamalah scholarship and Tier 1 UTM-RUG no. 18H50.
REFERENCES
1. Idris, A., Hashim, R., Abdul Rahman, R., Ahmad, W.A., Ibrahim, Z., Abdul Razak, P.R., Mohd Zin, H. and
Bakar, I. Application of Bioremediation Process for Textile Wastewater Treatment Using Pilot Plant.
International Journal of Engineering and Technology. (2007), 4(2), 228-234.
2. Hunsom, M. and Autthanit, C. Adsoprtive Purification of Crude Glycerol by Sewage Sludge-derived
Activated Carbon Prepared by Chemical Activation with H3PO4, K2CO3 and KOH. Chemical Engineering Journal. 229 (2013), 334-343.
3. Tang, S.H. and Zaini, M.A.A. Malachite green adsorption by potassium salts activated carbons derived from
textile sludge: Equilibrium, kinetics and thermodynamics studies. Asia‐Pacific Journal of Chemical
Engineering. (2017), 12(1), 159-172.
4. Kacan, E. Optimum BET surface areas for activated carbon produced from textile sewage sludges and its
application as dye removal. Journal of environmental management. 166(2016), 116-123. 5. Nunthaprechachan, T., Pengpanich, S. and Hunsom, M. Adsorptive Desulfurization of Dibenzothiophene by
Sewage Sludge-Derived Activated Carbon. Chemical Engineering Journal. 228 (2013), 263-271.
6. Tang, S. H. and Zaini, M. A. A. Isotherm studies of methylene blue adsorption onto potassium salts-
modified textile sludge. Jurnal Teknologi (Science & Engineering). (2015), 74(7), 57-63.
0
50
100
150
200
0 100 200 300 400
qe
(mg/g
)
Ce (mg/L)
LangmuirFreundlichRedlich-PetersonExperimental

ENGINEERING 10
IGCESH2018
Universiti Teknologi Malaysia, Johor Bahru, Malaysia 13 -15 August 2018
MODELLING OF LOW-DIMENSIONAL LATTICE HAMILTONIAN
FOR ELECTRONIC PROPERTIES OF SINGLE VACANCY DEFECT
GRAPHENE NANORIBBONS
Kien Liong Wong*1, Wee Khang Chong2 and Michael Loong Peng Tan3
1, 2, 3 Faculty of Electrical Engineering, UTM, Johor Bahru, Malaysia.
(E-mail: [email protected], [email protected], [email protected])
ABSTRACT
Graphene is now a popular material in the semiconductor industry thanks to its particular
physical and electronic characteristics, which include above-average conductivity [1]. A zero-
gap material, it combines linear dispersion with electron-hole symmetry and consequently
graphene sheet cannot be used in the creation of a logic device without induction of a
bandgap. Modelling and simulating graphene nanoribbons (GNRs) (graphene allotropes) are
therefore used to define electrical properties accurately and provide a benchmark for
experimental fabrication processes. This study will investigate 4-Zigzag GNRs (4-ZGNRs)’
electronic properties where the GNRs in question have single vacancy defects at varying
locations in the atomic structure; the method will to study single-neighbour tight binding
models based on NEGF (Non-Equilibrium Green’s Function) using numeric computation on
MATLAB. The simulations will use simplifying assumptions arising from tight binding
models including basis functions, plane wave approximation and Hamiltonian operator
discretisation [2]. The most significant concept in this single vacancy defect study is the
removal of tight binding energies in the Hamiltonian operator caused by missing atoms.
Hamiltonian operators are used to calculate dispersion relation and Green’s function in order
to arrive at electronic properties including sub-band structure and Green Function Density of
State (DOS). The conclusion of this study is that single vacancy defects at varying locations
in 4-ZGNRs’ atomic structure has no effect on the sub-band structure but, because
computation involves Hamiltonian operators, does have an effect on Green Function DOS.
Key words: Graphene Nanoribbons (GNRs), Non-Equilibrium Green’s Function (NEGF),
Hamiltonian, defect, tight binding.
INTRODUCTION
GNR manufacturing meets the requirements for new semiconductors as more interesting
electronic properties can be realised by modulating such of their structural parameters as
width, length, and edge orientation in addition to defects [3]. Defects can be useful
engineering tools as a nanoscale way of altering material properties to improve their
suitability for different applications. To identify the electronic properties of 4-ZGNRs that
showed single vacancy defects at varying places in the atomic structure, Hamiltonian matrix –
a solution of Schrödinger’s equation – is obtained. From this comes the specific system’s
description. Assumptions used for modelling a device are input to the Hamiltonian operator

ENGINEERING 11
based on a tight binding model. Collapsing 4-ZGNRs’ quasi-2D structure into an equivalent
1D matrix system using alpha and beta matrices generates a tight binding 4-ZGNR model.
Dispersion relation defines the energy/wave number relationship and is used in conjunction
with the operator to construct the system’s energy sub-band structure. Calculating DOS
allows understanding of the availability of energy states to be occupied [4]. Equation 1 shows
the use of NEGF in its construction. Vacancy defects are inevitable when 4-ZGNRs are
synthesised; they change the GNRs’ geometric structure and in this project will be described
by a Hamiltonian operator.
( )1
Im FDOS E Trace G
= (1)
where FG is retarded Green’s Function = ( )1
*E i I H−
+ − , η is a very small imaginary
value to block divergence of the inverse matrix, I is an identity matrix, and H is the
Hamiltonian operator matrix.
MAIN RESULTS
The location of the single defect is seen defined in terms of a row x column plane. Fig.1 (a)
and 2 (a) illustrate coordination in the case of 4-ZGNRs with length of 3. The normal 4-
ZGNR atomic structure has 24 carbon atoms, but introducing a single vacancy defect reduces
this to 23. In Fig. 1(a), a single carbon atom is absent at the 3nd row, 3rd column intersection,
while in Fig. 2(a) a single carbon atom is absent at the 3nd row, 1st column intersection.
Absent atoms are indicated by a red circle. Links to neighbouring carbon atoms are absent
around the missing carbon atom, and the normal tight bonding energies are not present in the
Hamiltonian operators.
Figure 1. (a) Atomic structure of 4-ZGNRs at length of 3 for defect location at 3nd row, 3rd
column (b) Sub-band plot and Green Function DOS plot of 4-ZGNRs as in (a).
(a) (b)

ENGINEERING 12
Figure 2. (a) Atomic structure of 4-ZGNRs at length of 3 for defect location at 3nd row, 1st
column (b) Sub-band plot and Green Function DOS plot of 4-ZGNRs as in (a).
Once obtained, the Hamiltonian operators are used to calculate dispersion relation and
Green’s function in order to find defective 4-ZGNRs’ electronic properties, which may
include sub-band structure and Green Function DOS (see Fig. 1(b) and 2(b)). Comparison of
both results shows that the sub-band structure is not affected by single vacancy defects
having different locations in 4-ZGNRs’ atomic structure, but that the different locations do
affect Green Function DOS. The two results have different peak numbers.
CONCLUSION
MATLAB was used to create an algorithm capable of generating tight binding models for 4-
ZGNRs possessing a single vacancy defect at varying atomic structure locations. The defined
defects conferred characteristics which were used to modify the Hamiltonian matrix
according to where tight binding energies had been removed. Defective 4-ZGNRs’ electronic
properties including Green Function DOS and sub-band structure were calculated. Changing
the location of the single vacancy defect on 4-ZGNRs’ atomic structure has no effect on the
sub-band structure but does have an effect on Green Function DOS because Green Function
DOS computation uses the Hamiltonian operator.
Acknowledgment: The authors acknowledge financial support from a UTM GUP Research
Grant (Vote no. Q.J130000.2523.14H27) that allowed the project to proceed smoothly. Kien
Liong would like to express his appreciation for the award of Zamalah PhD Scholarship from
the School of Graduate Studies UTM.
REFERENCES
1. M. L. P. Tan, Device and Circuit-level Models for Carbon Nanotube and Graphene Nanoribbon
Transistors.University of Cambridge, Ph.D. Thesis, 2011.
2. S. Datta, Nanoscale device modeling: the Green's function method. Superlattices and Microstructures
(2000), 253-278.
3. M. J. Allen, V. C. Tung, and R. B. Kaner, Honeycomb Carbon: A Review of Graphene. Chemical Reviews
(2009), 132-145. 4. S.-K. Chin, K.-T. Lam, D. Seah, and G. Liang, Quantum transport simulations of graphene nanoribbon
devices using Dirac equation calibrated with tight-binding π-bond model. Nanoscale Research Letters
(2012), 114.
(a) (b)

ENGINEERING 13
IGCESH2018
Universiti Teknologi Malaysia, Johor Bahru, Malaysia 13-15 August 2018
GREEN ROADS AND HIGHWAY: INTRODUCTION OF
CATALYTIC METHANATION IN HIGHWAY INDUSTRY TO
UTILIZE GREENHOUSE GAS EMISSIONS
Thanwa Filza Nashruddin*1, Md.Maniruzzaman A.Aziz
2 , Wan Azelee Wan Abu
Bakar3, Syed Anuar Faua’ad Syed Muhammad
4 , You Kok Yeow 5
, and Musa Mailah6
1, 2 Department of Geotechnics and Transportation, Faculty of Civil Engineering, Universiti Teknologi
Malaysia, 81310 UTM Skudai, Johor Bahru, MALAYSIA. (E-mail: [email protected]., [email protected])
3 Department of Chemistry, Faculty of Science, Universiti Teknologi Malaysia, 81310 UTM Skudai,
Johor Bahru, MALAYSIA.
(E-mail: [email protected]) 4Department of Bioprocess and Polymer Engineering, Faculty of Chemical and Energy Engineering,
Universiti Teknologi Malaysia, 81310 UTM Skudai, Johor Bahru, MALAYSIA.
(E-mail: [email protected]) 5Department of Communication Engineering, Faculty of Electrical Engineering, Universiti Teknologi
Malaysia, 81310 UTM Skudai, Johor Bahru, MALAYSIA.
(E-mail: [email protected]) 6 Department of Applied Mechanic and Design, Faculty of Mechanical, Universiti Teknologi
Malaysia, 81310 UTM Skudai, Johor Bahru, MALAYSIA.
(E-mail: [email protected])
ABSTRACT
In roads and highway industry, asphalt material was used extensively in road construction.
Hot mix asphalt (HMA) plant is the main manufacture industry to produce high quantity of
asphalt material. The final HMA mixture is produce after the aggregates mixed with the hot
asphalt cement. In fact, a lot of energy is need during HMA production. More than 97 % the
energy is spending in HMA plants due to the heating and drying of the aggregates process in
combustion devices. As a result, greenhouse gas (GHG) emission are releases to atmosphere.
Carbon dioxide (CO2) in GHG was the biggest threat to the environment which increase the
temperature of the earth. Mostly, the researchers mainly focused to find the solution with the
proposed of using the recycled materials and low temperature techniques to reduces the GHG
emissions in road construction. But, the researches how to reduce and recycled the GHG
emissions in HMA production have not been explore yet in detail. Therefore, introduction of
catalytic methanation as a new method in the HMA production was introduced as an effective
way to convert CO2 releases from HMA plants to the methane (CH4). Based on the
experimental result, by using Fourier transform infra-red (FTIR) with methanation system,
Ru/Cr/Mn (5:10:85)/Al2O3 calcined at 700°C was assigned as the potential catalyst because
of contribution 100% of CO2 conversion at 250°C reaction temperature. Thus, this study was
about to determine the flue gas composition produces in HMA production plant and to prove
the catalytic methanation technology as the new effective method in HMA production plants
which can convert CO2 in GHG emission to methane (CH4). Inconclusion, it is highly

ENGINEERING 14
advisable to adapt these alternatives as the green roads and highways industry.
Keywords: Hot mix asphalt plant, greenhouse gas, carbon dioxide, catalytic methanation,
natural gas.
INTRODUCTION
The final HMA mixture is being produces after the aggregates mixed with the hot asphalt
cement. In fact, a lot of energy is need during HMA production. More than 97 % of energy is
spending in HMA plants due to the heating and drying of the aggregates process in
combustion devices. As a result, GHG emissions are releases to atmosphere. The analysis for
asphalt pavements is complicated by the fact that, the asphalt cement or bitumen, has high
carbon content. The average carbon content of asphalt cement is about 82 percent, and
asphalt cement makes up about 5 percent of an asphalt pavement, with the rest being
aggregates (i.e. stone, sand, and gravel)[1].
The compulsory targets to reduce the greenhouse gases, initiated by the Kyoto protocol
encouraged a search for innovative techniques. Various technologies have been developed by
the road pavement industry to reduce the environmental impact: the use of reclaimed asphalt
pavement (RAP) to conserve the virgin aggregates [2], effective technique like warm mix
asphalt (WMA) for reduced the asphalt production temperatures [3] and recycling material to
give prolong the service life of a pavement [4]. Those technique are focused more to
sustainable environment during road construction. However, GHG is cannot be stopped.
Therefore, this study is looking at ways to use and convert CO2 to the higher value-added
product which is natural gas methane. In ordered to removed CO2 gas from HMA
production, the chemical conversion techniques which is catalytic methanation was the
effective way could provide for sustainable development. This process does not only create a
green and sustainable environment but produced valuable methane gas which can also be
used as a fuel to run turbine for electricity.
Thus, this study come out with two (2) mains of the objective which are, to determine the gas
composition produces in HMA production plant and to illustrate the advantages of catalytic
methanation as the new effective method in HMA production plants which can convert CO2
in GHG emission to the natural gas.
RESULTS
Hot Mix Asphalt (HMA): Gas emissions
Based on the Figure 1, the amount and composition of GHG emissions was collected by
using by using gas analyser (GA). Based on gas analyser reading. 5 types gas composition
have been detected from HMA plants, such as hydrocarbon, carbon dioxide, nitrogen, carbon
monoxide and air fuel oil.
Effect of Manganese (Mn) loading
Mn (100%)/Al2O3 catalyst gives only 4.42% conversion of CO2 at a reaction temperature of
400 °C. Meanwhile, the addition of Chromium (Cr) into the Mn/Al2O3 catalyst to form Cr/Mn
Al2O3 catalyst showed an enhance catalytic activity at the maximum studied reaction
temperatures of 400°C for the conversion of CO2 with 21.91%, 20.81%, 26.05% and 12.81%
for Cr/Mn (40:60)/ Al2O3, Cr/Mn (30:70)/ Al2O3, Cr/Mn (20:80)/ Al2O3, and Cr/Mn (10:90)/
Al2O3 respectively. This suggests that small amounts of Cr addition can play an important
role in the improvement of catalyst activity.

ENGINEERING 15
Figure 1: HMA plant and Gas analyser
Effect of different calcination temperature towards Mn base catalyst
Incorporating Cr and Ruthenium (Ru) into base catalyst Mn to form Ru/Cr/Mn/Al2O3 catalyst
calcined at 400°C and 700°C achieved 100% CO2 conversion at reaction temperature of
250°C and 300°C respectively whereas, Ru/Cr/Mn/Al2O3 catalysts at calcination 1000°C
showed 84.41% of CO2 conversion at reaction temperature of 250°C. The catalytic
performances of the catalysts were increased as the calcination temperature based oxide
loading reduced. Thus, by incorporating Cr and noble metals of Ru into Mn base catalyst,
they would enhance the catalytic activity.
CONCLUSION
Gas composition from HMA plants has been successful been detected by using RGA. Mostly,
gas that been releases to atmosphere are categorize as the GHG emissions. Therefore, this
study tries to convert and utilize CO2 emissions to the natural gas by applying chemical
conversion system. This method also can be called as catalytic methanation system. Catalytic
methanation system was a save which is catalyst can recycle and effective method that could
provide for sustainable development. Overall performance from the catalytic activity studies
can almost achieve 100% of CO2 conversion at low reaction temperature. However,
Ru/Cr/Mn (5:10:85)/Al2O3 calcined at 700°C was assigned as the potential catalyst because
of the contribution of 100% of CO2 conversion at the reaction temperature of 250°C.
ACKNOWLEDGEMENT
Without the support of Ministry of Education and Universiti Teknologi Malaysia (UTM), in
the form of a research grant (Vote No. 15H32 and 19H98), this study would not have been
possible. Author shall remain indebted to them for their generosity.
REFERENCES
1. Alliance., A.P., Carbon Footprint: How does asphalt stack up? (IM-46). 2010.
2. Ameri, M. and A. Behnood, Laboratory Studies to Investigate the Properties of CIR Mixes Containing Steel Slag as a Substitute for Virgin Aggregates. Construction and Building Materials, 2012. 26(1): p. 475-480.
3. Prowell, B.D., G.C. Hurley, and B. Frank, Warm-mix asphalt: Best practices. 2011: National Asphalt
Pavement Association Lanham, Md, USA.
4. Nicuţă, A.M. and R. Frunză, Environmental Impact Assessment for Traditional Versus Recycled Road
Asphalt Mixtures. Environmental Engineering & Management Journal (EEMJ), 2013. 12(3).

ENGINEERING 16
IGCESH2018
Universiti Teknologi Malaysia, Johor Bahru, Malaysia 13 -15 August 2018
MICROPLASTICS POLLUTION IN SKUDAI AND TEBRAU RIVER,
MALAYSIA
Shazani Sarijan, Shamila Azman* and Mohd Ismid Mohd Said
Department of Environmental Engineering, Faculty of Civil Engineering, Universiti Teknologi
Malaysia, Johor Bharu, Malaysia. (E-mail: [email protected], [email protected], [email protected])
ABSTRACT
The innovation of plastic goods to ease consumers’ daily use is indeed very helpful.
However, the utilisation of plastics worldwide has now become a threat to environment due
to the disability of synthetic polymers to completely degrade resulting in forming
microplastics (MPs) particle (<5 mm in size). The database on the occurrence of
microplastics in the marine environment has been reported by numerous studies, of which
includes the ingestion of MPs by several marine aquatic animals. Therefore, more efforts
should be carried out to investigate its occurrence in freshwater ecosystem. As of today, the
study on the presence of MPs in river is still scarce. In fact, the investigation on the
occurrence of MP in Malaysia water is also lacking. Thus, the present study compared the
presence of MPs between Skudai and Tebrau River. The investigation on the MPs occurrence
in both urban rivers is pertinent since these water ways are reported as polluted rivers in
Peninsular Malaysia. Sediment was collected by using box corer, dried at 50 °C, and then
soaked in 30% hydrogen peroxide (H2O2) for one week. Sodium chloride (ρ = 1.2 g/mL) was
added into a beaker containing sample for density separation and was then filtered. The
preliminary inspection of filtered particles was carried out under microscope and grouped
based on shape, colour, and size. Polymer identification was performed by using Attenuated
Total Reflection-Fourier-Transform Infrared Spectroscopy (ATR-FTIR). The results showed
that the density of MPs in Tebrau River is higher than of Skudai River. The dominant colour
category in Tebrau and Skudai River was blue and yellow, respectively. The characterisation
of different types of polymers was also compared for both rivers. The study postulates that
the occurrence of MPs in both rivers were derived from human trash since both locations are
well-known for fishing and close to industrial zone. Keywords: Microplastics, Urban river, Sediment, ATR-FTIR.
INTRODUCTION
Plastic debris floating at the surface water has now become one of the environmental issues
concerning its abundance and fate. Generally, most of this synthetic polymer is fragmented
into less than 5mm in size and is known as microplastics [1]. As of today, the comprehensive
database on its occurrence (i.e. distributions, category, types of polymer) in freshwater
environment is still scarce [2]. It was unanimously agreed that river acts as a major pathway
to transport most of the plastic materials from the land to the marine environment [3]. In fact,
a recent report has estimated 1.15 to 2.41 million tonnes of plastic waste is released to the
ocean annually [3] (Lebreton et al., 2017). However, in certain regions, not all plastic will be

ENGINEERING 17
transported into the sea as most of this polymer is captured by trash traps along the river and
subsequently affect the environmental health. Therefore, in this study, the investigation on the
abundance of microplastics in Skudai River and Tebrau River was carried out in September
2017. These rivers were selected since both locations are reported as the most polluted river
in Peninsular Malaysia due to high accumulation of garbage whereby the predominant waste
is plastics waste (Department of Environment and Department of Irrigation and Drainage
Malaysia, 2014). Both locations are also known for fishing and leisure activities in urban
area. In addition, the fact that the high population density in urban area has given a significant
impact to the environment is undeniable and the most notable matter is plastic trash. Thus,
this may potentially lead to the unhealthy environments via its continuous discharge into the
river.
Sediments were collected in September 2017 and oven dried at 50°C for 2 to 3 days. Next,
150 ml of 30% hydrogen peroxide (H2O2) was added. The reaction was then left stand for one
week. The remained H2O2 solution in Tebrau and Skudai sediment was filtered. The
remained sediment in the glass beaker was dried at 50 °C for overnight. Density separation
method by [4] was followed. Saturated sodium chloride (NaCl) was added into dried
sediment. The buoyant particles together with supernatant was then passed through a 1.2 μm
filter [2]. The observation of microplastics under microcope (45x magnification) were carried
out in accordance to the described procedure in [5]. The identification and confirmation of
particles counted from the sample matrix were carried out by using FTIR [6], [7]. The
polymers were identified based on functional group of the resulting spectra.
MAIN RESULTS
Microplastics were detected in both rivers where the average microplastics abundance in
Skudai and Tebrau River in September 2017 were 360±60 and 640±80 particles per kg,
respectively. Figure 1 showed different percentage of plastic particles shapes between studied
rivers. In Skudai River, fibre (50.96%) was the most frequent shape observed. Meanwhile,
fragment was the most dominant component in Tebrau River at 55.67%. Yellow was the
dominant colour in Skudai River with a proportion of 33.96% (Figure 2). In contrast, blue
(29.9%) was the most frequent colour observed in Tebrau River. Figure 3 showed large
microplastics (1000 to 5000 m) was the most dominant size observed from the sediment.
However, microplastics with a size range of 101 to 500 m was also dominant in Skudai
River.
Figure 1. Comparison on the abundance of plastic particles shape between Skudai and
Tebrau River.
50.94
13.21
35.85
34.02
10.31
55.67
0
20
40
60
80
100
Fibre Film Fragment
Per
cen
tage
(%)
Shape of Particle
Percentage of Plastic Particle Shape
Skudai River
Tebrau River

ENGINEERING 18
Figure 2. Different category of colours found in Skudai and Tebrau River.
Figure 3. Different size category found in Skudai and Tebrau River.
CONCLUSION
Both rivers are polluted with microplastic particles with the highest amount was observed in
Tebrau River. The high abundance of plastics particles in the rivers showed the importance of
regulation of plastics products and recycling plan. Indeed, the continuous input of plastics to
the river make the pollutant become constant, and this may possibly cause adverse effect to
aquatic biota through microplastics ingestion. As well as, the investigation on the presence of
persistent organic pollutant on microplastics should be also considered as to gain insight into
their transfer mechanism from plastic particles to aquatic living things.
Acknowledgment: The author(s) would like to express their appreciation for the support of
the sponsors of Zamalah Scholarship, Universiti Teknologi Malaysia.
REFERENCES
1. Van Sebille, E., Wilcox, C., Lebreton, L., Maximenko, N., Hardesty, B. D., Van Franeker, J. A., Eriksen,
M., Siegel, D., Galgani, F. & Law, K. L. A global inventory of small floating plastic debris. Environmental
Research Letters, 10(2015), 124006.
2. Wang, J., Peng, J., Tan, Z., Gao, Y., Zhan, Z., Chen, Q., & Cai, L. Microplastics in the surface sediments
from the Beijiang River littoral zone: Composition, abundance, surface textures and interaction with heavy
metals. Chemosphere, 171(2017), 248-258.
3. Lebreton, L. C., Van der Zwet, J., Damsteeg, J. W., Slat, B., Andrady, A., & Reisser, J. River plastic
emissions to the world's oceans. Nature Communications, 8(2017).
4. Thompson, R. C., Olsen, Y., Mitchell, R. P., Davis, A., Rowland, S. J., John, A. W., McGonigle, D., & Russell, A. E. Lost at sea: where is all the plastic?. Science, 304(2004), 838-838.
5. Peng, G., Zhu, B., Yang, D., Su, L., Shi, H., & Li, D. Microplastics in sediments of the Changjiang Estuary,
China. Environmental Pollution, 225(2017), 283-290.
6. Leslie, H. A., Brandsma, S. H., van Velzen, M. J. M., & Vethaak, A. D. Microplastics en route: Field
measurements in the Dutch river delta and Amsterdam canals, wastewater treatment plants, North Sea
sediments and biota. Environment International, 101(2017), 133-142.
7. Phillips, M. B., & Bonner, T. H. Occurrence and amount of microplastic ingested by fishes in watersheds of
the Gulf of Mexico. Marine Pollution Bulletin, 100(2015), 264-269.

ENGINEERING 19
IGCESH2018
Universiti Teknologi Malaysia, Johor Bahru, Malaysia 13 -15 August 2018
VENTRICULAR TACHYARRHYTHMIA PREDICTION METHODS
AND ITS PREDICTIVE PARAMETERS: A REVIEW
Chieng Thion Ming*1, Hau Yuan Wen2 and Zaid Omar3
1, 2 Faculty of Biosciences & Medical Engineering, Universiti Teknologi Malaysia, Johor, Malaysia
(E-mail: [email protected], [email protected]) 3 Faculty of Electrical Engineering, Universiti Teknologi Malaysia, Johor, Malaysia
(E-mail: [email protected])
ABSTRACT
A review of ventricular tachyarrhythmia prediction methods and its predictive parameters is
presented in this article. We aim to provide the reader with a preliminary discussion into the
area of arrhythmia prediction, as well as to briefly describe the basic morphology of the ECG
waveform. The comprehensive knowledge of the ECG predictive parameters which are
crucial to the development of the ventricular tachyarrhythmia prediction algorithm are
presented. Further, we also highlight the major contributions in the field through the most
recent literatures. Our focus in this article is on the ventricular tachyarrhythmias prediction
methods that aims to predict the occurrence of ventricle tachycardia and ventricle fibrillation
before its onset. Through prediction, the sufficient time for the preventive action to be taken
are allowed which further increase the patient’s survival rate.
Key words: Prediction, Predictive Parameters, Ventricular Tachyarrhythmia, Ventricle
Tachycardia, Ventricle Fibrillation
INTRODUCTION
Ventricular arrhythmia (VA) is the common problem met by the cardiologists in current
clinical daily practice [1-3]. The patient with VA may apparent with a variety of signs and
symptoms, such as palpitations, shortness of breath, chest pain, lightheadedness, weak pulse
and syncope. Yet, the most concern issue is having the risk of sudden cardiac death (SCD).
The main triggers of SCD are the occurrence of ventricular tachyarrhythmia (VTA), namely
ventricular tachycardia (VT) and ventricular fibrillation (AF) [4, 5]. VT refer to the heart rate
faster than 120 beats per minute, out of sync with the upper chambers and with at least three
irregular heartbeats in a row. If VT is left untreated, it may develop into VF. VF refer to the
condition where a very rapid and disorganized electrical activities initialized in the ventricles
causing it to quiver instead of contact normally. A series of rapid and ineffective contractions
of the ventricles results in immediate loss of cardiac output. Furthermore, insufficient blood
supply to the brain, heart and other part of organs can cause asystole and eventually ends with
SCD within few minutes if no immediate treatments are taken.
Based on the American Heart Association (AHA) statistical update-2016 [6], SCD is the
leading cause of death in United States, causing about 350,000 deaths each year. SCD is a
sudden, unexpected death due to the loss of heart function and is responsible for half of the

ENGINEERING 20
heart disease deaths [7]. SCD may occur in healthy person with no pervious symptoms of
cardiovascular disease (CVD) as well as patient with other medical conditions. However,
most of the SCD events do occurs in the general population with the rate ranging from 50-
100 per 100,000 population [8, 9, 10]. This reflects the major challenge in current cardiology
due to the absent of the powerful screening tool that capable to predict the occurrence of
VTA for the general population [11]. Accurate short-term VTA prediction prior to their
initiation allows enough time for the preventive action to be taken to avoid its occurrence and
further damage to the patients. Besides that, increases of the awareness of clinicians,
minimize the delay of medical care and enabling administration of preventive medication
could reduce the mortality from SCD and increase the survival rate of the patient dramatically
[12, 13]. Therefore, a reliable short-term VTA predictor is vital and essential in contributing
to more saving of lives and better healthcare for the general populations.
In this paper, we aim to provide the reader with the collective and comprehensive review of
the short-term VTA prediction methods as well as the potential predictive electrocardiogram
(ECG) parameters that have been proposed in the recent literature. We also briefly describe
the basic morphology of the ECG waveform and its working principle. In this way, the
authors able to guide the readers in better understanding and having explicit idea before
initiating their research. This article consists of five sections. It begins with an introduction to
the VTA in section one. Section two briefly describes the basic knowledge regarding the
ECG morphology. Section three review the ECG parameters that have promising prognostic
value to the occurrence of VTA event in the recent literature. Section four present the
pervious literatures that related to the short-term VTA prediction. Lastly, section five
concludes the paper with the discussion on the future direction of the VTA prediction.
CONCLUSION
In conclusion, this article has discussed thoroughly the morphology of the ECG waveform,
ECG and HRV features that demonstrated its prognostic value as well as the recent works
that related to the short-term VTA prediction. Accurate and precise VTA prediction would
provide useful alert to the clinicians prior to the occurrence of the life-threatening ventricular
arrhythmias. This allows enough time for the preventive action to be taken to avoid its
initiation and further damage to the patients. However, it remains an open and challenging
research area since there is yet to be a standard methodology that exists to handle various
targeted groups and clinical settings. From the literature review, most of the previous works
used HRV features in predicting the onset of the VTA events, while only Riasi et al. [14]
employs ECG morphological features yet achieving great prediction performance. This
encourage more investigation on the ECG morphological features to validate and affirm its
role in short-term VTA prediction. Thus, a better understanding and exploration on both ECG
morphological features and HRV features would contribute to the development of the reliable
short-term VTA predictor. In addition, the use of machine learning techniques such as ANNs
and SVM in recognizing and differentiating the fluctuating pattern of the selected features
just before the occurrence of VTA event between control and patient groups is a promising
methodology and trend in short-term VTA prediction field. It is hoped that the progressive
development in real-time, low computational cost and reliable short-term VTA predictor in
coming years shall contribute to the decreases of the mortality rate of cardiovascular diseases
and more saving of lives within general populations.

ENGINEERING 21
Acknowledgment: The authors would like to express their appreciation for the support of the
sponsors with ZAMALAH UTM.
REFERENCES
1. Bigger, J. T. Identification of patients at high risk for sudden cardiac death. The American journal of
cardiology, 54(9), (1984), 3D-8D.
2. Wellens, H. J., & Brugada, P. Treatment of cardiac arrhythmias: when, how and where?.Journal of the
American College of Cardiology, 14(6), (1989), 1417-1428.
3. Morganroth, J., & Bigger, J. T. Pharmacologic management of ventricular arrhythmias after the cardiac
arrhythmia suppression trial. The American journal of cardiology, 65(22), (1990), 1497-1503.
4. John, R. M., et al. Ventricular arrhythmias and sudden cardiac death. The Lancet, 380(9852), (2012), 1520-
1529.
5. Koplan, B. A., & Stevenson, W. G. Ventricular tachycardia and sudden cardiac death. In Mayo clinic proceedings, Elsevier 84(3), (2009), 289-29.
6. Mozaffarian, D., Benjamin, E. J., Go, A. S., Arnett, D. K., Blaha, M. J., Cushman, M., Turner, M. B.
Executive Summary: Heart Disease and Stroke Statistics 2016 Update. Circulation, 133(4), (2016), 447-454.
7. Zipes, D. P., & Wellens, H. J. Sudden cardiac death. Circulation, 98(21), (1998), 2334-2351.
8. Deo, R., & Albert, C. M. Epidemiology and genetics of sudden cardiac death. Circulation, 125(4), (2012),
620-637.
9. Chugh, S. S., Jui, J., Gunson, K., Stecker, E. C., John, B. T., Thompson, B., et al. Current burden of sudden
cardiac death: multiple source surveillance versus retrospective death certificate-based review in a large US
community. Journal of the American College of Cardiology, 44(6), (2004), 1268-1275.
10. Nichol, G., Thomas, E., Callaway, C. W., Hedges, J., Powell, J. L., Aufderheide, T. P., et al. Regional
variation in out-of-hospital cardiac arrest incidence and outcome. Jama, 300(12), (2008), 1423-1431. 11. Haugaa, K. H., Edvardsen, T., & Amlie, J. P. Prediction of life-threatening arrhythmias-still an unresolved
problem. Cardiology, 118(2), (2011), 129.
12. Sandroni, C., Ferro, G., Santangelo, S., Tortora, F., Mistura, L., Cavallaro, F., & Antonelli, M. In-hospital
cardiac arrest: survival depends mainly on the effectiveness of the emergency response. Resuscitation, 62(3),
(2004), 291-297.
13. Suraseranivongse, S., Chawaruechai, T., Saengsung, P., & Komoltri, C. Outcome of cardiopulmonary
resuscitation in a 2300-bed hospital in a developing country. Resuscitation, 71(2), (2006), 188-193.
14. Riasi, A., & Mohebbi, M. Prediction of ventricular tachycardia using morphological features of ECG signal.
In Artificial Intelligence and Signal Processing (AISP), (2015), 170-175.

ENGINEERING 22
IGCESH2018
Universiti Teknologi Malaysia, Johor Bahru, Malaysia 13 -15
August 2018
MONITORING SLOPE USING ACCELEROMETER DEVICE
A.R. Bunawan,A.S.A. Rashid, A. Kassim, D.S.A. Ismail and K.N.M. Said
Faculty of Civil Engineering, Universiti Teknologi Malaysia,
81310 UTM Skudai, Johor, MALAYSIA.
(E-mail: [email protected], [email protected], [email protected], [email protected], [email protected])
ABSTRACT
There are numerous sorts of instruments that have been utilized to monitor the high risk
slopes as a preventive precaution should a slope fail. Unfortunately, less instruments are
installed directly into the slope as a detection unit before the slope fails. Automatic Wireless
Accelerometer Monitoring System (AWAM) is an innovation in the slope monitoring system
and will be introduced in this research. By determining the limitations of previous monitoring
systems in slope monitoring, AWAM will overcome problems such as geomorphology
limitations, physical obstructions, different climate conditions and concurrent works at a site.
In addition, minimal human interaction is required since the sensors are automatic and placed
on the slope. This study demonstrates the AWAM system to monitor slope failures and the
effectiveness of the system as an early warning sign. It was presented in two parts; consist of
physical modeling calibration of the device and loading test in the laboratory to a numerical
modeling of the model simulated by using softwares such as Slope/W and Limitstate. The
monitoring device was confirmed to be able to be used as a monitoring system of soil
movements given that the device is moving in tilting modes. Physical modeling presented
promising results in correlation with the numerical modeling and the system test will
continue with a full scale modeling test.
Key words: Monitoring system, slope deformation, early warning sign, physical modeling,
numerical modeling
INTRODUCTION
Disasters involving life and property damage can occur during slope failure [1]. Fatality
related landslide events in Malaysia include the Kampar mudslide in 1996, Highland Tower
tragedy in 1999, Hulu Langat orphanage tragedy in 2011 and several others which claimed
many lives [2] [3].
In Malaysia the current practice to monitor slope work is often ignored due to the high cost of
implementation and maintenance of the equipment. Unfavorable region of monitoring is also
a main factor such as mountainous terrain, unpredictable weather conditions and some areas
which are inaccessible using basic transport.

ENGINEERING 23
This research is intended to provide a better alternative in slope monitoring system. While
focusing on monitoring the surface of the slope, this system will be self-sufficient and
wireless oriented thus should be suitable to be used in remote areas or large area of
monitoring. With a combination of accelerometers, gyrometer, a GPS system and wireless
uplink this product is intended to be a new way of slope monitoring system.
The device is to be named Automatic Wireless Accelerometer Monitoring System (AWAM).
The signal of slope movement will be calibrated with a small scale lab testing. AWAM will
detect ground movements in real time and gave out a warning when the site of the monitoring
shifted into a critical state thus acting as an early warning detection system for slope failure.
METHOD
The construction of slope was carried out in two main steps including filling and compacting.
The designed frame and geometry of the slope are as show in Figure 1.
Figure 1. Geometry for Slope Model
The location of AWAM device will be on top of slope surface (AWAM1) and the second one
will be in the middle of the slope surface (AWAM2). Finally, the load plate was placed in its
designated location and the box of the model was relocated to the test area under the
pneumatic cylinder. The LVDTs were installed on the frame attach with pneumatic cylinder
to record the vertical displacement of the soil. Data acquisition systems of the test included a
data logger to record and print the vertical load as well as vertical displacement in 1s interval.
Simultaneously, AWAM device will be set up and data will be recorded in 1s interval. A
pneumatic cylinder with an eight bar force will act as the load bearing on the model. The tests
will be carried out with the concept of load increment until failure.
RESULT
The result from LVDT and data logger was used to record the changes of soil in distance
(mm) and the Load Cell was used to measure the applied load. Figure 2 shows the
relationship between the load / stress on a soil material and the corresponding to the strain /
deformation record by LVDT.
Figure 2. Graph Stress vs Strain

ENGINEERING 24
The stress was increased by stages from 0 kN until it reached maximum loading of 8kN. The
slope failed when the load reaches stress value greater than 177.8 kPa as seen in Figure 3.
Figure 3. Ground Model Deformation after Loading Test
A model testing has been done in order to detect the signal from the AWAM device and have
yielded the following results.
Figure 4. AWAM vs Time
At 2/3 of the design load for the test which is on 18:30:25 at 102kPa, the device AWAM
detects a solid movement of the slope as seen in Figure 4. With this device, it can detect the
slope failure by detecting slight movements of the soil.
CONCLUSION
The concept of automatic and wireless system for monitoring device was introduced by using
accelerometer. Based on the results and analysis carried out, it can be concluded that the
AWAM device which was integrated with accelerometer can be used to detect soil
movements. These models show that the AWAM device is fully functional in monitoring and
creating awareness of slope failures and are probable to be operated in real life slope
monitoring system.
Acknowledgement: Appreciation goes to the Ministry of Science, Technology and
Innovation (MOSTI), Malaysia for SCIENCEFUND grant (SF1428-4S124).
REFERENCES
1. Ahmed, J., Ghazali, M.A., Mukhlisin, M., Alias, M.N. and Taha, M.R., 2011. Effectiveness of horizontal
drains in improving slope stability: a case study of landslide event in Putrajaya Precinct 9,
Malaysia. Unsaturated soils: theory and practice, pp.753-758.
2. Chowdhury, Robin, Phil Flentje, and Gautam Bhattacharya. Geotechnical slope analysis. 2009. CRC Press.
3. Jamaludin, S. &Hussien, A.N. 2006. Landslide hazard and risk assessment: The Malaysian experience. 10th
IAEG International Congress. Nottingham, United Kingdom, 6 – 10 September 2006.

ENGINEERING 25
IGCESH2018
Universiti Teknologi Malaysia, Johor Bahru, Malaysia 13 -15 August 2018
MODELLING OF VEHICLE OCCUPANT’S HEAD TILT
MOVEMENT IN MOTION SICKNESS STUDY USING
HAMMERSTEIN-WIENER SYSTEM
Sarah ‘A. Saruchi*1, Mohd H. Mohammed Ariff2 Hairi Zamzuri3and Nurhaffizah
Hassan4
1, 2, 3 Malaysia-Japan International Institute of Technology, Universiti Teknologi Malaysia, 54100
Kuala Lumpur, MALAYSIA.
(E-mail:[email protected], [email protected], [email protected]) 4 Faculty of Electrical Engineering, Universiti Teknologi Mara, Dungun, MALAYSIA.
(E-mail:[email protected])
ABSTRACT
Passengers are more prone to Motion Sickness (MS) than the drivers. The difference of their
severity level of MS is caused by their different head tilt movement with respect to the lateral
acceleration direction. Typically, when the vehicle is turning into a corner, the passengers
tend to tilt their heads according to the lateral acceleration direction. However, the driver
tends to tilt his/her head against the direction. It is easier to design any MS mitigation method
if the mathematical expression of their heads behaviour is known. Therefore, this study
proposed models which are representing the correlation between the head tilt movements of
the passengers and the driver with the lateral acceleration direction using Hammerstein-
Wiener modelling system. Experiment is set up to obtain the naturalistic data for the
modelling process. The best model is determined by varying the input output nonlinearities
estimators in the MATLAB’s System Identification Toolbox. Results show that the derived
models achieved in generating similar responses with the real data. With further study, the
proposed model are expected to contribute in MS minimization studies.
Key words: Hammerstein-Wiener, Head tilt movement, Motion sickness, Modelling, System
Identification
INTRODUCTION
Motion Sickness (MS) is an uncomfortable condition includes headache, nausea and
drowsiness which usually occurs during travelling in a moving vehicle [1]. It is well known
that the passengers experienced more MS compared to the driver. This is due to the different
head tilt movement by the passengers and the driver towards the lateral acceleration direction
in curve driving [2]. Normally, when negotiating a curve, the passenger’s head tilt
movements are in the same direction with the lateral acceleration while the driver’s head tilt
movement are opposite to the lateral acceleration direction. There are MS mitigation studies
which implemented the occupant’s head movements finding by developing a postural device
in passenger’s seat to minimize the passenger’s head tilt angle towards the lateral acceleration
direction [3], [4]. In our opinion, various kinds of strategies can be designed to reduce MS by
using the finding. However, the implementation will be convenient if the finding is expressed

ENGINEERING 26
mathematically. Thus, this study proposed to model the passenger’s and the driver’s head tilt
movements with respect to the lateral acceleration direction via Hammerstein-Wiener (H-W)
system. The H-W system is widely used in nonlinear System Identification (SI) field [5].
There are several input and output nonlinearity estimator that can be selected during the
modelling process. This study implemented try and error method to find the suitable
estimators which can constructed the best performance model. Then, to investigate the model
effectiveness, the generated estimated response from the derived model is compared to the
real experiment data, and their comparison error are calculated. For the modelling purposes,
an experiment with real scenario that provoked MS is set up to collect the naturalistic data.
MAIN RESULTS
The H-W modelling process is conducted by using SI Toolbox in MATLAB software.
During the process, several input and output nonlinearity estimators such as linear,
sigmoid, wavelet and polynomial are used. Table 1 tabulates the H-W modelling results
consists of Best Fit (BF), Final Prediction Error (FPE) and Mean Squared Error (MSE).
Table 1. H-W modelling results with different input-output nonlinearity estimators
Input
Estimator
Output
Estimator
BF (%) FPE MSE
P D P D P D
Linear Linear 65.31 64.23 12.06 4.283 11.99 4.260
Sigmoid 63.71 63.96 13.53 4.387 13.44 4.358
Wavelet 50.62 18.58 17.93 21.85 17.77 21.66
Polynomial 65.88 64.73 11.91 4.266 11.87 4.252
Sigmoid Linear 64.94 64.51 13.20 4.408 13.12 4.380
Sigmoid 61.62 64.01 14.83 4.398 14.72 4.365
Wavelet 63.95 26.16 13.65 18.60 13.52 18.41
Polynomial 66.15 65.31 12.44 4.312 12.39 4.293
Wavelet Linear 61.79 64.68 11.83 4.346 11.79 4.328
Sigmoid 65.58 65.21 12.36 4.351 12.30 4.329
Wavelet 64.39 64.80 12.17 4.300 12.09 4.263
Polynomial 68.88 64.88 12.62 4.366 12.60 4.357
Polynomial Linear 64.65 64.48 11.90 4.271 11.86 4.258
Sigmoid 65.57 65.11 12.35 4.354 12.30 4.335
Wavelet 64.37 64.86 12.17 4.302 12.09 4.274
Polynomial 65.76 66.32 12.42 4.442 12.41 4.437
*P=Passenger, D=Driver
The best model is determined by choosing the highest BF percentages. Based on Table 1, the
best passenger’s model is generated by the combination of wavelet and polynomial estimators
with 68.88%. On the other hand, the application of polynomial as both input and output
estimators managed to produce the best driver’s model with 66.32%.
Figure 1 shows the comparison results between the estimated and real experimental data.
Noted that the real data are labelled as unseen in the figure. Based on the results, the models
are able to produced similar estimated responses. The Root-Mean-Squared (RMS) error of
the comparison are calculated and presented in Table 2.

ENGINEERING 27
(a) Passenger’s model
(b) Driver’s model
Figure 1. Comparison results of unseen and estimated responses
Table 1. H-W modelling results with different input-output nonlinearity estimators
Error Model Passenger Driver
Comparison Error (RMS) 3.6618 3.4470
CONCLUSION
This study proposed the H-W nonlinear modelling method to model the correlation between
vehicle occupant’s head tilt movements with respect to the vehicle lateral acceleration
directions. The derived models are able to generate similar responses with the real data even
though the BF percentages are low (<70%). In our view, these models constitute a great
potential in MS minimization study. However, for the future works, it is encouraged to
improve the modelling to get better performance.
Acknowledgment: This work is funded by Ministry of Higher Education Research
University Grant, under Potential Academic Staff Grant Universiti Teknologi Malaysia of
Vote No: PY/2017/01140.
REFERENCES
1. C. T. Lin, S. F. Tsai, H. C. Lee, H. L. Huang, S. Y. Ho, and L. W. Ko, “Motion sickness estimation system,”
Proc. Int. Jt. Conf. Neural Networks, pp. 10–15, 2012.
2. T. Wada, H. Konno, S. Fujisawa, and S. S. Doi, “Can Passengers’ Active Head Tilt Decrease the Severity of
Carsickness?: Effect of Head Tilt on Severity of Motion Sickness in a Lateral Acceleration Environment,”
Hum. Factors J. Hum. Factors Ergon. Soc., vol. 54, no. 2, pp. 226–234, 2012. 3. H. Konno, S. Fujisawa, T. Wada, and S. Doi, “Analysis of Motion Sensation of Car Drivers and Its
Application to Posture Control Device,” SICE Annu. Conf., pp. 192–197, 2011.
4. S. Fujisawa, T. Wada, H. Konno, and S. Doi, “Analysis of Head-tilt Strategy of Car Drivers and Its
Application to Passenger ’ s Posture Control Device,” SICE J. Control. Meas. Syst. Integr., vol. 48, no. 1,
pp. 60–66, 2012.
5. J. Yan, B. Li, H. Ling, H. Chen, and M. Zhang, “Nonlinear State Space Modeling and System Identification
for Electrohydraulic Control,” vol. 2013, 2013.

ENGINEERING 28
IGCESH2018
Universiti Teknologi Malaysia, Johor Bahru, Malaysia 13 -15 August 2018
A RESIDUAL FLEXURAL TENSILE STRENGTH AND FLEXURAL
TOUGHNESS OF MEDIUM STRENGTH OF STEEL FIBRE SELF-
COMPACTING CONCRETE
Nor Fazlin Zamri*1, Roslli Noor Mohamed2 and Nur Hafizah A. Khalid3
1 Ph.D Student, Department of Structures and Materials, Faculty of Civil Engineering, 81310 Johor
Bahru, Johor, MALAYSIA.
(E-mail: [email protected]) 2,3 Senior Lecturer, Department of Structures and Materials, Faculty of Civil Engineering,81310 Johor
Bahru, Johor, MALAYSIA.
(E-mail: [email protected], [email protected])
ABSTRACT The addition of steel fibre in concrete altered its properties from brittle to ductile. Using self-
compacting concrete avoids use vibrating tools as it can consolidate under its own weight and
high workable concrete that can flow easily in reinforced structure. The aim for this paper is
to study the effect of addition of steel fibre in concrete on the flexural tensile strength and
flexural toughness of concrete. Four design mixes of steel fibre self-compacting concrete
(SFSCC) with different steel fibres contents, which are 0.5% (SFSCCC-0.5), 0.75% (SFSCC-
0.75),1.0%(SFSCC-1.0) and 1.25% (SFSCC-1.25) were designed, apart from normal SCC
acting as a control mix. Slump flow test was conducted to assess the self-compactibility of
fresh concrete mixture. Result shows that there is negative influence on the workability of
SFSCC with steel fibre content more than 1%. Test on hardened properties showed that the
highest residual strength and toughness of SFSCC is achieved by SFSCC with 0.75% steel
fibre content mix which is 5.44 MPa and 34.2 Joules respectively.
Key words: Self-compacting concrete, Steel fibre, Residual flexural tensile strength, Flexural
toughness
INTRODUCTION
Self-compacting concrete (SCC) is an innovative concrete mixture that can easily flow and
consolidate under its own weight and completely occupies the space of formwork. It also able
to form a dense and homogeneous hardened concrete with the same mechanical properties
and durability as normal vibrated concrete without any help of vibrator [1] [2].
Fibre concrete is defined as a composite material consist of Portland cement, aggregates, and
discrete discontinuous fibre such as steel fibre [3] [4]. Many research have been carried out in
order to understand the mechanical properties of steel fibre self-compacting concrete
(SFSCC)[5] [6]. It has been proved that the addition of steel fibre contribute in enhance the
tensile and flexural strength of concrete due to the fibre bridging affect, bridging the gap
between two sides of crack opening[7].

ENGINEERING 29
This paper aims to study the effect of addition of steel fibres on the residual flexural tensile
strength and flexural toughness of medium strength SCC. Medium strength SCC is
technically and economically competitive to be use in ready mixed industry as it has lower
cement content than SCC with high compressive strength value. [8]. Only few numbers of
study on the influence of steel fibres on residual strength of medium strength SFSCC.
Residual flexural tensile strength and flexural toughness test are important in order to predict
the residual strength and toughness index of the concrete and a part of the most fundamental
properties of concrete. An accurate prediction of toughness index of concrete will help to
estimate the contribution of steel fibres in improving shear strength of concrete.
MAIN RESULTS
The increment of fibre volume content in the mixture has negative influence on the slump
flow of concrete. As shown in Figure 1, it was observed that the shapes of flows were in
circular manner with no segregation for the plain SCC up to SFSCC-0.75 mix. While, for
SFSCC-1.25, a little accumulation of aggregate and fibres can be seen in the middle of the
slump flow and the shapes of flows were not in exactly circular shape.
(a)
(b)
Figure 1. Slump flow diameter for (a)
SCC and (b) SFSCC-1.25
Figure 2. Load deflection curve for residual
flexural tensile strength
Figure 3. Load deflection curve for flexural
toughness
In general, Figure 2 and Figure 3 shows the result of residual strength of concrete.
The different is the method of the test conducted, residual flexural tensile strength is
carried out based on (BS EN 14651-3:2005)[9] , while flexural toughness is carried out
based on (ASTM C1609/C1609M:2005)[10].Fibrous concrete such as SFSCC is
reinforced concrete section resist the tension forces due to the presence of steel fibers. As
shown in Figure 2 and 3, the deflection of SFSCC specimens showed non-linear load-
deflection characteristics after first crack occurrence. This presents a typical post-
cracking behavior of concrete which is proved that the residual strength of concrete is
remained before the concrete ultimately failed. In this study, SFSCC-0.75 shows higher
residual flexural tensile strength than other SFSCC mixes, which is 5.44 N/mm2. In
addition, from Figure 3, the toughness index can be produced by calculated based on the
total area under the load-deflection curve up to net deflection of L/150 the span length. In
this case, SFSCC with 0.75% steel fibres contents shows the highest toughness index
which is 34.2 Joules.
0
10
20
30
0 2 4 6
SC
C
Deflection
L oa
d
(k N )
0
10
20
30
0 1 2 3 4
Load
(k
N)
Deflection (mm)
SCC
SFSCC-
0.5

ENGINEERING 30
CONCLUSION
From the experimental study, it can conclude that the results of fresh concrete shows the
workability of concrete is decreased when the content of fibres more than 1%. In addition,
concrete mixture with 0.75% steel fibres content could be considered as optimum content of
steel fibres which shows highest residual flexural tensile strength and flexural toughness.
Acknowledgment: The authors are grateful to the ministry of Higher Education,
Malaysia(MOHE) and Research Management Centre(RMC), Universiti Teknologi
Malaysia(UTM) for sponsoring this project under a research university grant (RUG) No.
15H13. The authors are also thankful to University Teknologi Malaysia for sponsorship
under ZAMALAH Scholarship.
REFERENCES
1. The European Project Group, “The European Guidelines for Self-Compacting Concrete,” Eur. Guidel. Self
Compact. Concr., no. May, p. 63, 2005.
2. B. Persson, “A comparison between mechanical propel-ties of self-compacting concrete and the
corresponding properties of normal concrete,” Cem. Concr. Res., vol. 31, no. 2, pp. 193–198, 2001.
3. N. Van Chanh, “Steel fiber reinforced concrete,” JSCE-VIFCEA Jt. Semin. Concr. Eng., no. 1, pp. 108–
116, 2005.
4. ACI Committee 544, “State-of-the-Art Report on Fiber Reinforced Concrete Reported by ACI Committee 544,” ACI Struct. J., vol. 96, no. Reapproved, 2002.
5. S. Yehia, A. E. Douba, O. Abdullahi, and S. Farrag, “Mechanical and durability evaluation of fiber-
reinforced self-compacting concrete,” Constr. Build. Mater., vol. 121, pp. 120–133, 2016.
6. R. Madandoust, M. M. Ranjbar, R. Ghavidel, and S. Fatemeh Shahabi, “Assessment of factors influencing
mechanical properties of steel fiber reinforced self-compacting concrete,” Mater. Des., vol. 83, pp. 284–
294, 2015.
7. A. Khaloo, E. M. Raisi, P. Hosseini, and H. Tahsiri, “Mechanical performance of self-compacting concrete
reinforced with steel fibers,” Constr. Build. Mater., vol. 51, pp. 179–186, 2014.
8. I. Rodríguez Viacava, A. Aguado De Cea, and G. Rodríguez De Sensale, “Self-compacting concrete of
medium characteristic strength,” Constr. Build. Mater., vol. 30, pp. 776–782, 2012.
9. BS EN 14651, “Test method for metallic fibred concrete — Measuring the flexural tensile strength (limit of proportionality (LOP), residual),” Br. Stand. Inst., vol. 3, pp. 1–17, 2005.
10. C 1609/C 1609M-05, “C 1609/C 1609M-05 Standard Test Method for Flexural Performance of Fiber-
Reinforced Concrete ( Using Beam With Third-Point Loading ) 1,” Astm, pp. 1–8, 2005.

ENGINEERING 31
IGCESH2018
Universiti Teknologi Malaysia, Johor Bahru, Malaysia 13 -15 August 2018
FABRICATION OF LOW-COST ALUMINIUM DROSS BASED
CERAMIC HOLLOW FIBRE MEMBRANES FOR PRE-TREATMENT
OF HYPERSALINE PRODUCED WATER
Mohd Haiqal Abd Aziz1, Mohd Hafiz Dzarfan Othman*1, Mukhlis A Rahman1,
Juhana Jaafar1, A.F Ismail1
1 Advanced Membrane Technology Research Centre (AMTEC), Faculty of Chemical and Energy Engineering (FCEE), Universiti Teknologi Malaysia, 81310 UTM, Skudai, Johor, Malaysia..
(E-mail: [email protected], [email protected], [email protected], [email protected],
ABSTRACT
Handling and treating of the produced water using ceramic membrane is considered
promising, however, the higher cost of ceramic membranes discourage industries for large
scale application. The purpose of this work is to fabricate robust and low-cost alumina-spinel
composite hollow fibre membranes for pre-treatment of hypersaline oilfield produced wáter.
The hollow fibre membranes were prepared from a low-cost and abundantly available
aluminium dross waste powder (<36µm) at a concentration of 50 wt.% via phase inversion
and sintering technique. Prior to membrane fabrication, aluminium dross powder was
subjected to water leaching and calcination at 1000ºC for 9 hours, resulting alumina, Al2O3
and spinel, MgAl2O4 as the major constituents. Effects of sintering on the morphologies, pore
size distributions, mechanical properties and removal efficiencies of the alumina-spinel
composite hollow fiber membranes were investigated in details. As comparison to
commercial alumina membrane, these low cost membranes were successfully fabricated with
lower sintering temperatures with comparable mechanical strength due to the presence of
minor impurities of MgO and Fe2O3 as sintering additives, making this material as an
attractive option for low cost ceramic membrane. The performance of the alumina-spinel
composite membranes for the pre-treatment of hypersaline oilfield produced wáter showed a
promising result, which could be an alternative to the current availibility process.
Key words: ceramic membrane, hollow fibre, produced water, solid waste recycling
INTRODUCTION
Over the last few decades, ceramic membranes have caught wide attention in a broad range of
industrial applications especially in a harsh environment, mainly due to the process
robustness. Ceramic membrane is well-known to be excellent in mechanical strength, high in
chemical resistance, thermally stable, insensitive to swelling and ease of cleaning [1,2]. In
general, industrial oxides such as alumina, titania and zirconia are the common materials
utilized in ceramic membrane fabrication. Non-oxide ceramic materials like silicon nitride
and silicon carbide have also been documented by a number of studies to fabricate ceramic
membranes [2,3]. However, most of the materials are expensive in bulk and the application
cost of these membranes for industrial purpose is higher in comparison to polymeric

ENGINEERING 32
membrane [4]. Due to that, some efforts have been done to fabricate low-cost ceramic
membranes synthesized from natural occurring materials such as bauxite [5] and clays [6].
However, there are very limited number of studies on the possibilities of utilizing inorganic
industrial by-products for the development of ceramic membranes with potential applications
in water purification industries. The unique properties of aluminium dross such as abundantly
available and contain large fraction of alumina with a small quantity of the other trace of
metal oxides like magnesium oxide, MgO and iron oxide, Fe2O3 [5,7], making this material
an attractive option. It was found that the presence of MgO and Fe2O3 in aluminium dross act
as sintering additives by reducing the sintering temperature during the thermal process thus,
making aluminium dross a promising raw material for low cost ceramic membrane. It worth
to mention that among all the ceramic configurations, hollow fibre offer the highest packing
structures with surface-area-to-volume ratio of more than 9000 m2m-3, providing greater
separation area per unit volume of membrane element for filtration [8]. In this context, this
study is intended to fabricate low-cost alumina-spinel composite hollow fibre membranes via
phase inversion based extrusion technique with an air-gap of 5 cm and sintering process
(1200-1300ºC) using 50 wt.% loading of pre-treated aluminum dross powders as a ceramic
material. The effect of sintering temperatures and applied pressures on the performance of the
hollow fibre membranes were investigated through microfiltration of synthetic hypersaline
produced water.
MAIN RESULTS
As shown in Figure 1, the alumina-spinel composite hollow fibre membrane showed a typical
asymmetry structure of macro-voids at the inner edge and dense structures at the outer edge.
The naturally occurring phenomenon of macro-voids were originated from the lumen because
of the air gap presence during the extrusion process. The cause of macrovoids formation was
due to the instabilities interaction between the two immiscible fluids at the lumen interface,
which amplifies some of the waves by the acceleration, leading to solvent and non-solvent
exchange. The as-prepared alumia-spinel composite hollow fibre had an average porosity and
pore size of 43.04% and 0.07µm respectively.
Figure 1. a) Cross sectional SEM images, b) local enlarged cross-sectional SEM image, c)
fracture surface of the alumina-spinel composite hollow fibre membrane
CONCLUSION
In this study, alternative to expensive ceramic materials in particular aluminium dross waste
has succesfully been utilized to fabricate ceramic hollow fibre membrane. The utilization of
aluminium dross waste is expected to not only solve its environmental problems but also to
produce a low cost alumina-spinel composite hollow fibre membrane for highly efficient of
hypersaline oilfield produced water pretreatment.

ENGINEERING 33
Acknowledgment:
The authors gratefully acknowledge the financial support from the Ministry of Education
Malaysia under the Higher Institution Centre of Excellence Scheme (Project Number:
R.J090301.7846.4J192), Universiti Teknologi Malaysia under the Research University Grant
Tier 1 (Project Number: Q.J130000.2546.12H25) and Nippon Sheet Glass Foundation for
Materials Science and Engineering under Overseas Research Grant Scheme (Project number:
R.J130000.7346.4B218).
REFERENCES
1. Fung, Y.L.E. and Wang, H. Nickel aluminate spinel reinforced ceramic hollow fibre membrane. Journal of
Membrane Science 450 (2014), 418-424.
2. Zhang, J.W.; Fang, H.; Wang, J.W.; Hao, L.Y.; Xu, X. and Chen, C.S. Preparation and characterization of
silicon nitride hollow fiber membranes for seawater desalination. Journal of Membrane Science 450 (2014),
197-206.
3. Wit, D.P.; Kappert, E.J., Lohaus, T.; Wessling, M.; Nijmeijer, A. and Benes, N.E. Highly permeable and
mechanically robust silicon carbide hollow fiber membranes. Journal of Membrane Science 475 (2015),
480-487.
4. Koros, W.J. and Mahajan, R. Pushing the limits on possibilities for large scale gas separation: which strategies? Journal of Membrane Science 181 (2001), 181-196.
5. Li, L.; Chen, M.; Dong, Y.; Dong, X.; Cerneaux, S.; Hampshire, S.; Cao, J.; Zhu, L.; Zhu, Z. and Liu, J. A
low-cost alumina-mullite composite hollow fiber ceramic membrane fabricated via phase-inversion and
sintering method. Journal of the European Ceramic Society 36 (2015), 2057-2066.
6. Hubadillah, S.K.; Harun, Z.; Othman, M.H.D.; Ismail, A.F.; Salleh, W.N.W.; Basri, H.; Yunos, M.Z. and
Gani, P. Preparation and characterization of low cost porous ceramic membrane support from kaolin using
phase inversion/sintering technique for gas separation: Effect of kaolin content and non-solvent coagulant
bath. Chemical Engineering Research and Design. 112 (2016), 24-35.
7. Adeosun, S.O.; Sekunowo, O.I.; Taiwo, O.O.; Ayoola, W.A. and Machado, A. Physical and Mechanical
Properties of aluminum dross. Advances in Materials 3 (2014), 6-10.
8. Wei, C.C. and Li, K. Preparation and characterization of a robust and hydrophobic ceramic membrane via an improved surface grafting technique. Industrial & Engineering Chemistry Research 48 (2009), 3446-3452.

ENGINEERING 34
IGCESH2018
Universiti Teknologi Malaysia, Johor Bahru, Malaysia 13 -15 August 2018
GREENHOUSE ENVIRONMENT MAPPING USING A LOW-COST
LIDAR VIA ROBOT OPERATING SYSTEM
M.S.A. Mahmud*1, M.S. Zainal Abidin1 and Z. Mohamed1
1 Control and Mechatronics Department, Faculty of Electrical Engineering, Universiti Teknologi
Malaysia Skudai, Johor, Malaysia.
(E-mail: [email protected], [email protected], [email protected])
ABSTRACT
In agricultural robotic, the nature of the environment is very important for any type of
agricultural robotic research. The higher degree of environment complexity in agricultural
area encourage researchers to use expensive sensors in order to produce a reliable map data
inside the agricultural environment. This paper implements an inexpensive sensor called
RPLIDAR to produce a map inside a greenhouse environment. The experiment is executed
via Robot Operating System by implementing a Hector SLAM method to do the mapping. In
order to map the LIDAR data, Turtlebot platform is used. The map result was then compared
by using a simulated environment that is initially measured in detail and the result shows
higher degrees of similarities between the implementation of the sensor with the simulated
environment.
Key words: agricultural, mapping, Robot Operating System
INTRODUCTION
Nowadays, the application of mobile robot in agriculture has been applied widely especially
such as in greenhouses, orchards and vineyards. A lot of robotics research has been
conducted to solve the problem of autonomous motion planning and control of wheeled
mobile robots. To design an autonomous robotic system, a detailed information of the
environment is needed as the robot will traverse in a dynamic and complex agricultural area.
Several methods have been used to model the agricultural environment such as sonar,
machine vision and laser radar (LIDAR). However, the most common method implemented
in agriculture is using a machine vision a LIDAR because of its good compatibility with
agricultural environment.
Machine vision is a very versatile sensor and it is often implemented in mobile robot
navigation and guidance, plant or object detection and plant characteristics measurements that
including in many agricultural tasks. Usually, a machine vision system sensor consists of a
camera and Charged Couple Device (CCD) or a complementary metal oxide semiconductor
(CMOS). A machine vision device is a very inexpensive and powerful sensing tool however,
it must be combined with other sensors that is within a proper framework to be used in
certain application [1-2]. In addition, multiple camera positions and viewing angles are

ENGINEERING 35
recorded and it is called stereo vision. However, this system requires a stable lighting
condition to ensure the stability in the system and it is very difficult in agricultural area to
have a very stable lighting condition.
LIDAR sensor is used commonly for distance measurements, mapping and obstacle
avoidance and detection. This sensory system is found out to be a promising system in
mapping for its ability to accurately measure a relative vectorial position (distance and
direction) [3-4]. An algorithm was developed in [5] to build a detailed orchard maps for
precision agriculture application. It uses a 2D LIDAR sensor called (SICK LMS-291) to
compute the orchard map. It was mounted on a moving ground platform and was analyzed
using a hidden semi-markov model. The result shows promising results as it has an average
matching performance of 98.2% and 96.8% of localization and recognition using a data set
recorded in a difference of one full year. However, the expensive factors of LIDAR sensor
have limited the applicability in the development of the inexpensive mobile robot system.
This paper presents an application of inexpensive LIDAR sensor to compute an agricultural
map for robot navigation. It uses an inexpensive RPLIDAR A1 sensor that was mounted on a
Turtlebot platform. The result was then compared with the simulated environment that was
designed by taking the exact measurement of the environment. The mapping was computed
using a Robotic Operating System (ROS) platform run on an Intel Core i7 notebook.
MAIN RESULTS
Figure 1(a) shows the simulated environment computed using MATLAB Simulink3d. The
simulated environment was designed using a SOLIDWORKS by taking the exact
measurement of the real greenhouse environment. Figure 1(b) shows the computed
environment using RPLIDAR. It was computed by navigating the Turtlebot platform
throughout the greenhouse environment. The map was computed by combining laser and
odometry data using Monte Carlo Simultaneous Localization and Mapping (SLAM).
(a) (b)
Figure 1. Simulated and computed map
Based on Figure 1, it shows that the map computed using RPLIDAR has similarities in the
pattern of the environment. Therefore, it has been proven that the application of the low cost
RPLIDAR sensor is able to compute the greenhouse environment with an accuracy. In this
work, the accuracy of the environment is also tested by selecting the destination and the
mobile robot is able to navigate to the destination without colliding with obstacles. Therefore,
it can be proven that the computed map is reliable to be used as it is able to guide the mobile
robot without any collision.

ENGINEERING 36
CONCLUSION
This paper implements a low cost lidar sensor called RPLIDAR in greenhouse mapping
application. The sensor was mounted on a Turtlebot platform and the mobile robot has been
navigated throughout the greenhouse environment to compute the map based on the sensory
data. The result shows that the computed map has been found out to have the same pattern
with the simulated environment that was drawn by taking the exact measurement of the
environment. The computed map will then be used to design a navigation planner for the
future works.
Acknowledgment: The authors are grateful to the Universiti Teknologi Malaysia, the
Ainuddin Wahid Scholarship and the Ministry of Higher Education (MOHE), for their partial
financial support through their research funds, Vote No. R.J130000.7823.4F759.
REFERENCES
1. Hague, T., Marchant, J. A., and Tillet, N. D. Ground based sensing systems for autonomous agricultural
vehicles. Computers and Electronics in Agriculture 25(1-2), 11-28, 2000.
2. Fernandes, R., Salinas, C., Montes, H. and Sarria, J. Multisensory system for fruit harvesting robots. Experimental testing in natural scenarios and with different kinds of crops. Sensors 14(12), 23885-23904,
2014.
3. Bietresato, M., Carabin, G., Vidoni, R., Gasparetto, A., and Mazetto, F. Evaluation of a LiDAR-based 3D-
stereoscopic vision system for crop-monitoring applications. Computers and Electronics in Agriculture 124,
1-13, 2016.
4. Subramaniam, V., Burks, T. F., Arroyo, A. A. Development of machine vision and laser radar based
autonomous vehicle guidance systems for citrus grove navigation. Computers and Electronics in
Agriculture, 53(2), 130-143, 2006.
5. Underwood, J. P., Jagbrant, G., Nieto, J. I. and Sukarrieh, S. Lidar-based tree recognition and platform
localization in orchards. Journal of Field Robotics, 32(8), 1056-1074, 2015.

ENGINEERING 37
IGCESH2018
Universiti Teknologi Malaysia, Johor Bahru, Malaysia 13 -15 August 2018
A REVIEW ON REVERSE OSMOSIS MEMBRANES: IMPACTS OF
NANOFILLERS ON MEMBRANE SURFACE CHARACTERISTICS
AND SEPARATION PERFORMANCE
Z.C. Ng*1,2, W.J. Lau1,2 and A.F. Ismail1,2
1 Faculty of Chemical and Energy Engineering, Universiti Teknologi Malaysia,
81310 Skudai, Johor, MALAYSIA. 2Advanced Membrane Technology Research Centre (AMTEC), Universiti Teknologi Malaysia, 81310
Skudai, Johor, MALAYSIA.
(E-mail: [email protected], [email protected]; [email protected],
[email protected], [email protected]; [email protected])
ABSTRACT
One of the long-term challenges faced by the society is the endless demand of clean water
resources by the exponentially increasing human population. Membrane-based technology as
leading technology for aqueous-based separation has been widely practiced in most of the
water treatment industry. However, the current membrane technology is still limited by
several common challenges namely trade-off between water permeability and solute
selectivity, fouling and chlorine attack. The combination of membrane with advanced
nanotechnology has potentially given rise to a highly efficient thin film nanocomposite (TFN)
membrane, providing a wider perspective in studies and generating innovative recreation.
TFN reverse osmosis (RO) membrane incorporated with zeolite was first reported by a group
of membrane scientists from US in 2007. Because of the unique and significant improved
surface chemistry of RO membrane upon nanofiller incorporation, it had attracted significant
attention from membrane community. This review summarizes the studies of the RO
membranes incorporated with different types of nanofillers and discusses the impacts of
respective nanofillers on the RO membrane properties with respect to water permeability, salt
rejection, antifouling and antibacterial effect and chlorine resistivity. By providing the
overview of nanofillers studied, it is expected that such discovery can be translated into
innovative ideas and be beneficial to industries.
Key words: Reverse osmosis, thin film nanocomposite, nanofillers, water flux, fouling
INTRODUCTION
Water, an essential element of life, is nevertheless facing its scarcity following overgrowth
human population, extreme exploitation of water resources as well as water pollution.
According to the predictions of the United Nations, it was expected that approximately 2 to 7
billions of the population will have to face the consequences of water depletion [5]. In order
to ensure sustainable supply of fresh water, the development of cost-effective technologies is
required. Membrane-based technology is foreseen to play a major role in treating drinking
water and wastewater, also, desalinating seawater and brackish water due to its simplicity in

ENGINEERING 38
terms of operations and scaling up as well as more environmental friendly with no chemical
addition required or the involvement of phase change during the operation [6].
Reverse osmosis (RO), the-state-of-art technique for desalination, is capable of producing
high quality fresh water from water sources that are unsuitable for direct consumption such as
brackish and seawater. The first practical cellulose acetate asymmetric RO membrane was
introduced by Loeb and Sourirajan in the 1960s but is then predominated by polyamide (PA)
thin film composite (TFC) due to its higher chemical, thermal, mechanical and hydrolytic
stability [2]. TFC consists of primarily the ultrathin PA layer, porous substrate and non-
woven fabric whereby the PA layer and substrate can be independently tailored to improve its
selectivity and permeability [4]. However, challenges still exist in improving PA-TFC
membrane such as permeability and selectivity trade-off, susceptibility towards chlorine
attack as well as fouling. Despite several methods introduced for applying the selective layer
on substrate, interfacial polymerization (IP) technique captures the most attention which can
be proven by increasing research studies since its initiation.
Owing to the drawbacks of TFC membrane, thin film nanocomposite (TFN) is introduced.
TFN membrane emerges from the incorporation of nanofillers with specific functions into a
polymer film. Integration of nanofillers within polymer film can be performed by two main
routes, i.e., i) incorporation of nanofillers into the dope and dispersion in the polymer film by
phase inversion and ii) coating of nanofillers on the membrane surface by chemical
interactions or self-assembly by IP [1]. The incorporation of nanofillers not only capable of
tailoring membrane structure and its physicochemical properties but also introducing specific
functions for instance antibacterial, photocatalytic, etc [6]. The first invention of TFN
membrane was by Hoek and his coworkers in 2007 on embedding zeolite nanoparticles by IP
into polymer matrix of PA layer prepared from m-phenylenediamine (MPD) and trimesoyl
chloride (TMC) aiming to enhance water permeability at the same time maintaining its
significantly high solute rejection [3]. Such invention has given rise to further explorations of
the nanofillers’ potentials and its adaptation opportunities in enhancing membrane
performance in water treatment industry.
The major highlight of this review paper focuses on different types of nanofillers integrated
within RO membranes and its impacts on the properties of RO membrane since its
applications in 2007. Besides, the procedures involving the preparation of TFN membrane
will be briefly discussed. This review paper aims to provide an overview on nanofillers
studied for the recreation of greater opportunities on its development and applications in the
future.
CONCLUSION
The development of TFN membrane has proven not only to be a pre-eminent solution for
water permeability and solute selectivity trade-off but also introduces interesting properties
such as chlorine resistivity, antibacterial, antifouling, etc. However, comprehensive studies
are still mandatory on the dispersity of nanofillers in organic medium during IP and its
agglomeration or aggregation issue within polymer matrix, alignment problem of nanotubes
in the PA layer as well as their chemical interactions with the PA layer. Despite few
resolutions discovered on combatting such problems, more efforts are still required for the
development of a better and more stable TFN membrane as well as continuous exploration on
the potentials of nanofillers.

ENGINEERING 39
Acknowledgement: The first author wishes to acknowledge Zamalah Scholarship given by
Universiti Teknologi Malaysia for PhD studies.
REFERENCES
1. Goh, P. S., Matsuura, T., Ismail, A. F. and Hilal, N. Recent trends in membranes and membrane processes
for desalination. Desalination 391 (2016), 43–60.
2. Hong, S. P., Kim, I. C., Tak, T. and Kwon, Y. N. Interfacially synthesized chlorine-resistant polyimide thin
film composite (TFC) reverse osmosis (RO) membranes. Desalination 309 (2013), 18–26.
3. Jeong, B., Hoek, E. M. V, Yan, Y., Subramani, A., Huang, X., Hurwitz, G. and Jawor, A. Interfacial
polymerization of thin film nanocomposites : A new concept for reverse osmosis membranes. Journal of
Membrane Science 294 (2007), 1–7.
4. Lau, W. J., Ismail, A. F., Misdan, N. and Kassim, M. A. A recent progress in thin film composite membrane:
A review. Desalination 287 (2012), 190–199.
5. Subramani, A. and Jacangelo, J. G. Emerging desalination technologies for water treatment: A critical
review. Water Research 75 (2015), 164–187. 6. Yin, J. and Deng, B. Polymer-matrix nanocomposite membranes for water treatment. Journal of Membrane
Science 479 (2015), 256–275.

ENGINEERING 40
IGCESH2018
Universiti Teknologi Malaysia, Johor Bahru, Malaysia 13-15 August 2018
THE EFFECT OF COMPRESSION RATIO BY DIFFERENT PISTON
HEAD SHAPE ON THE PERFORMANCE OF MOTORCYCLE ENGINE
Adnan Katijan1, Muhammad Zaidan Abdul Manaf
2and Azizul Hakim Kamardin
3
1, 2 Dept. of Mechanical Engineering Technology, Universiti Teknikal Malaysia Melaka, Durian
Tunggal, Melaka, MALAYSIA. (E-mail: [email protected])
ABSTRACT
In an internal combustion engine, there are many reciprocating parts which are responsible
for giving motion to the engine. One of these parts is the piston which is a very important part
of the internal combustion engine. Piston acts as a transmitter of power generated from the
burning of fuel and air mixture in the combustion chamber. There are various types of piston
and some can be bought as an aftermarket product. The objective of this study is to examine
the engine performance in horsepower and torque which produced by the different shape of
piston head in an internal combustion engine. Three pistons with different head shapes -
standard, dome (high compression) and mug (low compression) were chosen for the study.
The experiments were carried out using a standard internal combustion engine of a Honda
EX5 motorcycle. The engine was run on a chassis dynamometer in order to measure its
torque and horsepower. Piston performance was evaluated based on the maximum available
torque and horsepower. The result shows that all three pistons produce different torque and
horsepower where domed piston head produces higher torque and horsepower followed by
standard and mug. It also showed that by changing the piston head shape, it can improve
torque and horsepower up to 5.69% and 19.4% respectively.
Keywords: Compression ratio, Standard piston, High compression piston, Low compression
piston
INTRODUCTION
To meet the emission regulations and increase the power of the engine, technology needs to
keep upgrading. One of the most promising research ways to improve the performance is by
changing the compression ratio [1] . A. Shaik et. all found in his study that compression ratio
is one of parameters that affect thermal efficiency and power of diesel engine [2] . The
compression ratio can be adjusted by changing the piston’s head shape. The clearance volume
of the engine is altered by changing the cavity volume of the cylinder head, piston head and
height. This modification permitted to have different values of clearance volume [3] which
results different compression ratio.
In the meantime, good combustion may be influenced by proper designing of the combustion
chambers [4] and piston head shape plays an important role in this overall design package.
Consequently, if different piston head shape can produce more torque and horsepower, it is

ENGINEERING 41
possible that smaller engine can be designed. Small engine means less weight which results
less fuel consumption.
Much research has been done on the shape of the piston head. Bawankar [5] found that
different piston head shapes produce different engine performances. M.N Channappagoudra
[6] investigated the effect of grooves on piston head on DI diesel engine performance and
showed that different piston head shapes produce different brake thermal efficiencies which
also means different power and torque [7].
MAIN RESULTS
Figure 1 shows the comparison of the highest torque and power produced in all of the
experiments. It shows that high compression piston produces the highest power at 9.28 bhp
followed by the standard piston, meanwhile, the low compression piston and standard piston
with 1.5 mm gasket recorded 8.42 bhp, 8.31 bhp and 7.77 bhp respectively. High compression
piston also produced the highest torque at 9.6 Nm followed by the standard piston at 9.4 Nm,
low compression ratio at 9.11 Nm and standard piston with a gasket at 9.06 Nm. Due to lowest
compression ratio, the least power and torque is produced by a standard piston with 1.5 mm
gasket. From the Figure 1 below, the difference between highest and lowest torque for all 4
experiments is 5.69% and 19.4% for power. This means that by just changing the piston head,
the torque and power can be improved up to 5.69% and 19.4% respectively.
Figure 1. Highest Power Produced
CONCLUSION
As explained previously, the compression ratio is the ratio between volume at bottom dead
center to volume at top dead center. Even though the power and torque produced are uneven,
the high compression piston produces the highest torque and power. This can be represented
by the compression ratio formula, rc= VD
VA=
Volume at BDC
Volume at TDC , which influences the torque and
horsepower of the engine. It also shows that engine performance can be increased just by
changing the piston head shape without the need for complicated modification.
8.427.77
8.31
9.289.4 9.06 9.119.6
0
2
4
6
8
10
12
Standard Piston Standard with
1.5 mm gasket
Low
compressionPiston
High
compressionPiston
Max Power Max Torque

ENGINEERING 42
This is important because if higher torque and horsepower can be produced for similar sized
engine, smaller sized engine with the similar or higher performance can be produced. In this
regard, Smaller sized engine means less weight and less fuel consumption. For future studies,
several experiments can be done, such as studying the air flow in the combustion chamber, the
temperature of engine, pollution and fuel consumption.
Acknowledgement: The authors would like to thank to Universiti Teknikal Malaysia Melaka
for all the facilities and equipment available during this project.
REFERENCES
1. Parlak, A., H. Yasar, and B. Sahin. Performance and exhaust emission characteristics of a lower compression
ratio LHR Diesel engine. Energy Conversion and Management 44 (2003), 163-175.
2. Shaik, A., N.S.V. Moorthi, and R. Rudramoorthy. Variable compression ratio engine: a future power plant
for automobiles-an overview. Proceedings of the Institution of Mechanical Engineers, Part D: Journal of
Automobile Engineering 221 (2007), 1159-1168.
3. Mali Anup D and Yavad Sanjay D. The Effect of Compression Ratio on Performance of 4-Stroke Spark
Ignition Engine. International Journal of Mechanical And Production Engineering 2 (2014), 35-38.
4. Zhao, S. Design the piston of internal combustion engine by Pro\Engeer. 2nd International Conference on
Electronic & Mechanical Engineering and Information Technology (EMEIT-2012), Published by Atlantis Press, Paris, France. 2012, 2163-2166.
5. Bawankar, C.S. and R. Gupta. Effects of piston bowl geometry on combustion and emission characteristics
on diesel engine: a cfd case study. International Journal of Research in Engineering and Technology
(IJRET) 5 (2016), 81 - 93.
6. Channappagoudra, M.N. Effect of Swirl on DI Diesel Engine Operated With Honge Biodiesel. Int. Journal
of Engineering Research and Applications 6 (2013), 595-601.
7. Fu, J., et al. Experimental investigation on the effects of compression ratio on in-cylinder combustion
process and performance improvement of liquefied methane engine. Applied Thermal Engineering 113
(2017), 1208-1218.

ENGINEERING 43
IGCESH2018
Universiti Teknologi Malaysia, Johor Bahru, Malaysia 13 -15 August 2018
FLUTTER ON A COMPOSITE FLAT PLATE
Nurul Z. Zaki*1, Anis A.Ridhwan-Tan2, Shuhaimi B. Mansor3 and
Ainullotfi Abdul-Latif4
1, 2 Department of Aeronautical, Automotive and Ocean Engineering, Universiti Teknologi Malaysia,
Johore, Malaysia.
(E-mail: [email protected], [email protected]) 3, 4 Department of Aeronautical, Automotive and Ocean Engineering, Universiti Teknologi Malaysia,
Johore, Malaysia.
(E-mail: [email protected], [email protected])
ABSTRACT
Flutter behaviour is one of the aeroelastic phenomena that must be avoided during the aircraft
designing process. Suitable material and parameters selection should be made in order to
increase the flutter speed beyond the maximum operational speed of the aircraft. The study of
flutter on a flat composite plate is carried out by comparing the flutter velocity obtained from
calculated data using Finite Element Analysis (FEA) and low speed wing tunnel testing with
variations of laminate orientation and number of laminate plies. The material used in the
study is carbon fibre fabric (Tenax-JHTS40 E13 3K 200tex) and technique of hand lay-up is
used during the fabrication process of wind tunnel model composite flat plate. The highest
flutter speed obtained from the experiments is 29.9 m/s at 0º laminate orientation with 8
laminate plies.
Key words: Flutter, Composite, Aeroelastic, Plate
INTRODUCTION
The first flutter phenomenon observed on an aircraft is in 1916 on a twin engine bomber
which the flutter phenomenon involved coupling of fuselage torsion mode and also
antisymmetric elevator rotation mode (Kehoe, 1995). Flutter phenomenon is not a failure
criterion but this can cause failure in aircraft and other structures. In aeroelastic phenomena
family, flutter phenomenon is the most important and it is also the most difficult phenomenon
to predict (Wright & Cooper, 2007).
Composite material have been studied widely by the researchers across the world due to its
high strength to weight ratio compared to conventional material such as metal. Composite
material can also be tailored in order to optimise the strength without any weight penalty by
changing the laminate orientation, number of laminate plies and material properties
(Stodieck, Cooper, Weaver, & Kealy, 2013).
A flat plate is modelled as UAV wing and the flutter velocity is obtained from the UTM Low
Speed Wind Tunnel (UTM-LSWT) testing. Initially the FEA analysis is set using the flat
plate model and the natural frequency of the bending and torsion is obtained from the

ENGINEERING 44
analysis. The stiffness of bending and torsion is then calculated by implementing the theory
of Binary Aeroelastic Model as shown in Equation 1 and 2.
𝐾𝑘 = (𝜔𝑛𝑘 × 𝜋 × 2)2 × 𝐼𝑘 (1)
𝐾𝜃 = (𝜔𝑛𝜃 × 𝜋 × 2)
2 × 𝐼𝜃 (2)
Where, 𝐾𝑘, 𝜔𝑛𝑘 , 𝐼𝑘 , 𝐾𝜃 , 𝜔𝑛𝜃 , 𝐼𝜃 is bending stiffness, bending natural frequency, bending
mass inertia, torsion stiffness, torsion natural frequency and torsion mass inertia. The
calculated bending and torsional stiffness is then compared with the stiffness obtained from
wind tunnel testing. The variations of laminate orientations and number of laminate plies is
applied during the wind tunnel testing as shown in Table 1 and Figure 1 shows the boundary
conditions of the study.
Table 1. Material assignment of FEA wing models.
Wing
Model
Composite material layup
Orientation (degree) Ply thickness (m) Total thickness (m)
1 [0/0/0/0] 0.0003 0.0012
2 [30/30/30/30] 0.0003 0.0012
3 [45/45/45/45] 0.0003 0.0012
Figure 1. Boundary conditions of wing model
MAIN RESULTS
Calculation of flutter speed has been done using three methods, which were theoretical
method, structural stiffness test and also from wind tunnel test. The flutter speed results
of each wing model was then compared in order to observe the trend of flutter speed as
shown in Table 2 and Figure 2.
Table 2. Comparison of flutter speed
Orientation Plies Flutter speed (m/s)
Theory Experimental Structural stiffness test
0° 8 34.80 29.90 27.5
30° 4 20.30 14.80 15.79
45° 4 24.50 13.50 24.30

ENGINEERING 45
Figure 2. Flutter speed
CONCLUSION
From this study, the flutter speed of carbon fibre composite material flat plate wing model
was determined. The flat plate wing model was used instead of aerofoil wing model due to
the objective of this study which is to compare the flutter speed of a flat plate from theoretical
analysis with wind tunnel test. The fabrication process for flat plate is much simpler and
cheaper compared to aerofoil shape. While the usage of composite material is to stimulate the
actual condition of UTM CAMAR which made from carbon fibre composite material. The
structural stiffness obtained from theoretical calculation and experiment vary from each other
mainly due to the fabrication process of the wing models. Thus, the flutter speed of wing
models obtained from by wind tunnel and theory were different. At the end, the flutter speed
obtained from each wing models does not exceed 40m/s which obeys the objective of this
study.
Acknowledgment: The authors would like to express their appreciation for the financial
support from Zamalah UTM scholarship.
REFERENCES
1. Kehoe, M. W. (1995). A historical overview of flight flutter testing. National Aeronautics and Space
Administration, 4720.
2. Stodieck, O., Cooper, J. E., Weaver, P. M., & Kealy, P. (2013). Improved aeroelastic tailoring using tow-
steered composites. Composite Structures, 106, 703-715.
doi:https://doi.org/10.1016/j.compstruct.2013.07.023
3. Wright, J. R., & Cooper, J. E. (2007). Introduction to aircraft aeroelasticity and loads: Chichester.

ENGINEERING 46
IGCESH2018
Universiti Teknologi Malaysia, Johor Bahru, Malaysia 13 -15 August 2018
EMBRACING GREEN EXTRACTION TECHNIQUE OF
ORTHOSIPHON STAMINEUS FOR ENHANCEMENT OF
ANTIOXIDANT ACTIVITY
Ahmad Hazim Abdul Aziz1,2, Muhammad Haziq Almar Mastaza2, Ahmad Syahmi
Zaini1,2 and Mohd Azizi Che Yunus*1,2
1 Centre of Lipids Engineering and Applied Research (CLEAR), Ibnu Sina Institute for Scientific and Industrial Research, Universiti Teknologi Malaysia, 81310 UTM Johor Bahru, Johor, MALAYSIA.
(E-mail: [email protected], [email protected]) 2 Faculty of Chemical and Energy Engineering, Universiti Teknologi Malaysia, 81310 UTM Johor
Bahru, Johor, MALAYSIA. (E-mail: [email protected], [email protected])
ABSTRACT
Orthosiphon stamineus (O. stamineus) or locally known as ‘misai kucing’ is a medicinal herb
originated from Southeast Asia countries and abundantly found in Malaysia and Indonesia.
Leaves of the herb are normally used while the other parts like stems are considered as waste.
Thus, this study was conducted to investigate the quality extract of O. stamineus by
quantifying antioxidant activity of the leaves and stems extract. Supercritical fluid extraction
was used to extract both parts of the herb and soxhlet extraction was conducted as
comparative study. Carbon dioxide was used as a solvent due to its low critical temperature
and pressure while ethanol was used as co-solvent to modify polarity of carbon dioxide.
Supercritical carbon dioxide (SC-CO2) extraction was carried out at different temperatures of
40 and 80 °C and different pressures of 100 and 300 bar. SC-CO2 extraction gave higher
antioxidant activity from both parts compared with Soxhlet extraction. Antioxidant activity
from the stems (90.45%) are slightly higher than the leaves (88.06%). Therefore, the stems
should not be treated as waste and can be fully utilized as the leaves to develop variety of
products from Orthosiphon stamineus.
Keywords: Supercritical carbon dioxide, Orthosiphon stamineus, misai kucing, antioxidant
activity
INTRODUCTION
Orthosiphon Stamineus (O. stamineus) commonly known as Misai kucing and Kumis kucing.
O. stamineus is widely grown in Southeast Asian and the tropical countries. It is an
herbaceous shrub which traditionally used as herbal tea for the treatment of kidney stone,
gout, high blood pressure, diabetes and hypertension [1]. The leaves of O. stamineus were
established to possess diuretic effect [2,3], anti-hypertensive activity [4] and antidiabetic
effect [5].
The massive amount of chemical compounds in plants that contribute to antioxidant activity
include phenolics, flavonoids, terpenoids, nitrogenous compounds and vitamins [6,7]. It is

ENGINEERING 47
proven that natural antioxidants possess anti-inflammatory, anti-carcinogenic, anti-bacterial
and anti-viral properties [8,9,10,11]. These evidence are associated with the presence of
secondary metabolites such as rosmarinic acid, eupatorin, tetramethoxyflavone (TMF) and
sinensetin [12].
In this study, supercritical fluid extraction with carbon dioxide (SC-CO2) was introduced to
extract O. stamineus. SC-CO2 is non-toxic, relatively inert, nonflammable and also possess
low critical pressure of 7.38 MPa and temperature of 31.1 °C. Both leaves and stems of O.
stamineus were used in this study for comparison since the stems normally considered as a
waste for the production of O. stamineus tea.
Therefore, the aim of this study was to investigate the antioxidant activity of the extract of
both leaves and stems of O. stamineus and compare with conventional method of Soxhlet
extraction.
MAIN RESULTS
Figure 1 exhibits the percentage of antioxidant activity of O. stamineus leaves and stems
extract by using two different extraction methods of Soxhlet extraction and SC-CO2
extraction. It can be seen that SC-CO2 extraction gave the highest percentage of
antioxidant activity about 88.06% and 90.45% in the extract of leaves and stems of O.
stamineus. Soxhlet extraction shows lower percentage of antioxidant activity due to its
exhaustive extraction and low solvent power.
Figure 1. Antioxidant activity of the O. stamineus leaves and stems extract by using Soxhlet
extraction and SC-CO2 extraction.
CONCLUSION
As a conclusion SC-CO2 extraction method at low pressure and high temperature of 10 MPa
and 80 °C is the best extraction method to obtain higher quality extract of O. stamineus. In
addition, this study proved that the stems contain significant and valuable compounds, so the
stems should be fully utilized to develop different variety of products in food and
nutraceutical industries.
0
10
20
30
40
50
60
70
80
90
100
Leaves Stems
An
tio
xid
ant
Act
ivit
y, %
Soxhlet Extraction SC-CO2 Extraction

ENGINEERING 48
Acknowledgment: The authors would like to express their appreciation for the support of the
sponsors with Project No R. J130000.7709.4J260.
REFERENCES
1. Heinrich, M. Plant Resources of South-East Asia No. 12 (1). Medicinal and Poisonous Plants 1:
Phytochemistry, 53 (2000), 619–620.
2. Beaux, D., Fleurentin, J. and Mortier, F. Effect of extracts of Orthosiphon stamineus benth, Hieracium
pilosella L., Sambucus nigra L. and arctostaphylos uva-ursi (L.) spreng. in rats. Phytotheraphy Research, 13
(1999), 222-225.
3. Olah, N.K., Radu, L., Mogosan, C., Hanganu, D. and Gocan, S. Phytochemical and pharmacological studies
on Orthosiphon stamineus Benth. (Lamiaceae) hydroalcoholic extracts. Journal of Pharmaceutical and
Biomedical Analysis, 33 (2003), 117-123.
4. Kazuyoshi, O., Takako, B. and Hirotaka, S. Antihypertensive substance in the leaves of Kumis Kucing (Orthosiphon aristatus) in Java Island. Journal of the Pharmaceutical Society of Japan, 120 (2000), 474–482.
5. Mohamed, E. A., Ahmad, M., Ang, L. F., Asmawi, M. Z. and Yam, M. F. Evaluation of α-Glucosidase
Inhibitory Effect of 50% Ethanolic Standardized Extract of Orthosiphon stamineus Benth in Normal and
Streptozotocin-Induced Diabetic Rats. Evidence-Based Complementary and Alternative Medicine, 2015, 1-6.
6. Cai, Y., Luo, Q., Sun, M. and Corke, H. Antioxidant activity and phenolic com-pounds of 112 traditional
Chinese medicinal plants associated with anticancer. Life Science, 74 (2004), 2157–2184.
7. Lin JK. and Weng MS. (2006) Flavonoids as Nutraceuticals. In: Grotewold E. (eds) The Science of
Flavonoids. Springer, New York, NY
8. Halliwell, B. Free radicals, antioxidant, and human disease: curiosity, causeor consequence? The Lancet, 344
(1994), 721–724.
9. Halliwell, B., Aeschbach, R., Löliger, J. and Aruoma, O. I. The characterization of antioxidants. Food and Chemical Toxicology, 7 (1995), 601–617.
10. Yang, C.S., Landau, J.M., Huang, M.T. and Newmark, H.L. Inhibition of carcino-genesis by dietary
polyphenolic compounds. Annual Review of Nutrition 21 (2001),381–406.
11. Sun, J., Chu, Y.F., Wu, Z.Z. and Liu, R.H. Antioxidant and antiproliferative activities of common fruits.
Journal of Agricultural and Food Chemistry 50 (2002), 7449–7454.
12. Singh, M. K., Gidwani, B., Gupta, A., Dhongade, H., Kaur, C. D., Kashyap, P. P., and Tripathi, D. K.
(2015). A Review of the Medicinal Plants of Genus Orthosiphon (Lamiaceae). International Journal of
Biological Chemistry, 9(6): 318-331.

ENGINEERING 49
IGCESH2018
Universiti Teknologi Malaysia, Johor Bahru, Malaysia 13 -15 August 2018
MYOCARDIUM STRUCTURAL CHARACTERIZATION IN CARDIAC
CTA IMAGES: CANNY EDGE DETECTION WITH TEXTURE
ANALYSIS
N.M. Salih*1, D.E.O Dewi2, N.A. Bakar3 and A. Yahya4
1, 2, 4 Faculty of Biosciences and Medical Engineering, Universiti Teknologi Malaysia (UTM), Johor
Bahru, MALAYSIA.
(E-mail: [email protected], [email protected], [email protected]) 3 Department of Radiology, Universiti Kebangsaan Malaysia Medical Centre (UKMMC), Selangor,
MALAYSIA.
(E-mail: [email protected])
ABSTRACT
Structural characterization of the normal left ventricular (LV) myocardium from cardiac
Computed Tomography Angiography (CTA) image may provide baseline information for a
potential LV disorder marker. Based on image processing, the characterization can be
achieved using statistical texture analysis. However, conventional statistical texture analysis
on small image region still suffers from low resolution and noises. This study proposed
Canny edge detection with texture analysis to characterize small LV apical myocardium
region and compared between systole and diastole phases. Suitable CTA images were chosen
from FOURDIX file in Dicom Image Library and Region of Interest (RoI) was defined for
the LV basal myocardium region. Canny edge detection methods were implemented to the
RoIs followed by Gray Level Co-occurrence Matrix (GLCM) based statistical texture
analysis. The texture features of systole and diastole RoIs were obtained and analyzed. The
result showed that Canny edge detection RoIs using threshold value of 0.4 produced better
texture differentiation between systole and diastole images compared to the original RoIs and
other threshold values.
Keywords: Myocardium, CT Angiography, Texture Analysis, Edge Detection
INTRODUCTION
The structural properties of myocardium may be altered due to cardiac abnormality and
diseases [1]. From the perspective of ECG-gating in CTA, structural characterization of the
myocardium image for systole and diastole phases may provide a potential marker for left
ventricular (LV) disorders. Based on the concept of image processing, the structural
characterization of CTA images can be realized using texture analysis. However, texture
analysis still has some drawbacks when dealing with small size Region of Interest (RoI) in
medical image [2]. Due to the drawback, several studies had analyzed the performance of
texture analysis together with edge detection method to obtain better medical image analysis.
Based on earlier work, it was proven that GLCM and edge detection method was successfully
implemented for bone fracture detection in X-ray and CT image [3]. Even though the proven

ENGINEERING 50
report of texture analysis with edge detection method for certain medical image is increasing,
the performance of such method on cardiac image is still not well investigated. This study
took the challenge to investigate the performance of GLCM based texture analysis with
Canny edge detection method for apical myocardium region in CTA image. In Canny edge
detection, threshold value plays as an important role in determining the output image. The
low and high thresholds need to be properly chosen as they are the key parameters to detect
and connect edges [4].
MAIN RESULTS
From Canny edge detection method, several edge detection RoIs were obtained with unique
representation based on different threshold values. Figure 1 shows the CTA image with
myocardium RoI position (black box), original apical myocardium RoI, and the resulting
image of Canny edge detection with threshold value of 0.1 for systole phase.
Figure 1. (a) CTA image, (b) original apical myocardium RoI, and (c) Canny edge
detection RoI with threshold value of 0.1
After Canny edge detection, the RoIs were analyzed using GLCM based texture analysis.
Figure 2 shows the contrast and energy texture features result for the Canny edge
detection RoIs with threshold value of 0.1 until 0.8. The graphs show the measurement
for systole and diastole phases. From the figure, threshold value of 0.4 and 0.5 produced
the highest gap between systole and diastole for both contrast and energy texture features.
Figure 2. Contrast and Energy features result for threshold value from 0.1 to 0.8
CONCLUSION

ENGINEERING 51
In this study, an improved methodology was proposed to characterize the structural properties
of LV apical myocardium using Canny edge detection and GLCM based texture analysis. The
most promising Canny operator’s threshold value for the proposed method was determined. It
is a proof of concept of the proposed methodology on normal structure in CTA image which
may serve as baseline information for future potential biomarker.
Acknowledgment: The authors would like to express their appreciation to School of
Graduate Studies, Universiti Teknologi Malaysia under Zamalah Scholarship and MOHE
under FRGS Grant R.J130000.7845.4F764. The authors would also like to express their
gratitude to Osirix for the FOURDIX dataset.
REFERENCES
1. Grossman, W. Diastolic dysfunction and congestive heart failure. Circulation, 81(2 Suppl), (1990), III1-7.
2. Osicka, T., Freedman, M. T., & Ahmed, F. Characterization of pulmonary nodules on computer tomography
(CT) scans: The effect of additive white noise on features selection and classification performance.
In Medical Imaging, (2007), 651245-651245.
3. Anu, T. C., Mallikarjunaswamy M. S., & Raman, R. Detection of Bone Fracture using Image Processing
Methods. International Journal of Computer Applications, (2015), 0975–8887.
4. Huo, Y. K., Wei, G., Zhang, Y. D., & Wu, L. N. An adaptive threshold for the canny operator of edge detection. In 2010 International Conference on Image Analysis and Signal Processing (IASP), IEEE, (2010),
371-374.

ENGINEERING 52
IGCESH2018
Universiti Teknologi Malaysia, Johor Bahru, Malaysia 13 -15 August 2018
SPATIAL AND TRANSPORTATION PLANNING FOR VIRTUAL
BIOCNG DERIVED FROM PALM OIL MILL EFFLUENT TO MEET
INDUSTRIAL ENERGY DEMAND
Ming Kwee Lee*1, and Haslenda Hashim2
1, 2 Process System Engineering Centre (PROSPECT), Faculty of Chemical and Energy Engineering,
Research Institute for Sustainable Environment (RISE), Universiti Teknologi Malaysia, Johor,
Malaysia. (E-mail: [email protected], [email protected])
ABSTRACT
Malaysia is the second biggest producer of palm oil in the world along with the palm oil mill
effluent (POME) that can be converted to become a reliable energy source. This study aims to
evaluate the economic feasibility of bioCNG from POME for industrial usage. Spatial
planning of bioCNG production and distribution is conducted to minimize the costs involved.
Two alternative industrial energy usage baselines that are grid extension scenario and bottling
of compressed natural gas from gas grid are compared to bioCNG from POME scenario. The
optimum pressure of bioCNG is determined to be 53.8 bar which is the pressure
corresponding to the least production cost under dew point pressure. The biogas upgrading
for bioCNG application in industries is assessed to be not cost effective when compared to
bioCNG without upgrading under dew point pressure. Cost advantage of bioCNG production
without upgrading over grid connection and bottling of compressed natural gas from gas grid
shows significantly cost benefit especially for industrial estates and locations that are far
away from natural gas grid connection. The demand of bioCNG on replacement of industrial
natural gas usage is higher than the POME generation. This shows that further study on
optimization of resource planning and bioCNG production from different feedstocks is
necessary.
Key words: BioCNG, POME, Spatial planning, Economic analysis, Industrial energy usage
INTRODUCTION
Malaysia is blessed with abundant resources of renewable energy (RE) which play an
important role to enhance energy security by reducing the consumption of conventional
energy and reducing emission. As the second world largest palm oil mill exporter in the
world, huge amount of POME generated in Malaysia. In year 2014, the potential power
generation from POME is 4,179,168 MWh. However, the power generation of commissioned
RE installation of biogas is 19,772.25 MWh in year 2014 [1]. This excess electricity from
undigested POME is 4,127,551.3 MWh which is not only wasted but also creates
environmental problems. Recently, economic growth of Malaysia increase rapidly along with
the increase in energy demand. Moreover, fossil fuel depletion makes the energy supply issue
to be more intense [2]. The annual growth of energy demand increases at a rate of 5 – 7 %
during next 20 years from 2004 [3].

ENGINEERING 53
Biogas for electrification, biofuel for transportation could be operationally less cost effective
due to scattered spatial distributions of palm oil mills which may cause logistic issue between
biogas resource availability and its demand. The logistic variables such as transportation,
collection, and storage may have substantial impact on its economic feasibility. There is
increasing concern for maximizing resource recovery and sustainable bio economy
development due to the abundantly available biomass feedstock. Biogas as fuel for
transportation has been pioneering tested by Sime Darby which the biogas is pressurized up
to 250 bar. Nevertheless, this high pressure may not be necessary for industrial usage as it
involves extra cost for compression.
The undigested POME or excess biogas from palm oil mills after on-site electricity
generation is proposed to be compressed to bioCNG for the purpose of storage and fuel
distribution to demand locations. In this study, bioCNG production from POME will be
assessed in term of economic feasibility for industrial usage.
MAIN RESULTS
Figure 1 shows the cost advantage of bioCNG production without upgrading over grid
extension. The GIS raster is produced by subtracting cost on grid extension by bioCNG
production cost without upgrading. Higher the positive value means the greater cost
advantage of bioCNG production without upgrading over grid extension. Figure 1 shows
positive value where the locations is far away from the natural gas grid. In these
locations, bioCNG production without upgrading is more cost effective than grid
extension. On the other hand, Figure 1 shows negative value where the location is near to
grid extension. In these locations, the investment costs on bioCNG production is higher
than grid extension.
Figure 1. Cost advantage of bioCNG production without upgrading over grid extension.

ENGINEERING 54
Figure 2. Cost advantage of bioCNG production without upgrading over bottling of
compressed natural gas.
Figure 2 shows the cost advantage of bioCNG production without upgrading over bottling
of compressed natural gas. The GIS raster is produced by subtracting cost on bottling of
compressed natural gas by bioCNG production cost without upgrading. Higher the
positive value means the greater cost advantage of bioCNG production without upgrading
over bottling of compressed natural gas. Figure 2 shows negative value where the
locations is far away from the palm oil mills but near the natural gas grid. In these
locations, bioCNG production without upgrading is less cost effective than bottling of
compressed natural gas. Overall, the cost advantage of bioCNG production without
upgrading over bottling of compressed natural gas is significant in Johor.
CONCLUSION
The spatial analysis model is successfully developed to evaluate the economic feasibility of
bioCNG application in industrial usage. The biogas upgrading for bioCNG application in
industries is assessed to be not cost effective when compared to bioCNG without upgrading
under dew point pressure. Cost advantage of bioCNG production without upgrading over grid
connection and bottling of compressed natural gas shows significantly cost benefit especially
for industrial estates and locations that are far away from natural gas grid connection. The
demand of bioCNG on replacement of industrial natural gas usage is higher than the POME
generation. This shows that further study on optimization of resource planning and bioCNG
production from different feedstocks is necessary.
Acknowledgment: The authors would like to express their appreciation for the support of
UTM Zamalah.
REFERENCES
1. SIRIM. Report for palm oil mill distribution in Malaysia. Johor Bahru, 2014.
2. Chua, S.C. and Oh, T.H. Review on Malaysia’s national energy developments: key policies, agencies,
programs and international involvements. Renewable and Sustainable Energy Reviews (2010), 2916-2925.
3. Lau, L.C., Tan, K.T., Lee, K.T. and Mohamed, A.R. A comparative study on the energy policies in Japan
and Malaysia in fulfilling their nations’ obligations towards the Kyoto Protocol. Energy Policy (2009), 4771-
4778.

ENGINEERING 55
IGCESH2018
Universiti Teknologi Malaysia, Johor Bahru, Malaysia 13 -15 August 2018
APPLICATION OF AUTO-TUNER FUZZY PID CONTROLLER ON
INDUSTRIAL CASCADE CONTROL
Nicholas Philip1, and Shafishuhaza Sahlan2
1, 2 Faculty of Electrical Engineering, Universiti Teknologi Malaysia, 81310 UTM Skudai, Johor,
Malaysia.
(E-mail: [email protected], [email protected])
ABSTRACT
In this paper, the effectiveness of a newly proposed optimized cascade control technique
utilizing fuzzy control applied to a furnace temperature model is presented. PID controllers
are widely used in the process industry due to its simplicity and robustness. To improve the
control scheme, cascade control is the apparent choice due to its wide application in critical
industries. This include heater temperature control, compressor capacity control, heat
exchanger temperature control and fractionation columns controls. From the results obtained,
it is observed that with changes to process transfer function, the proposed design has a better
adaptation and performance better than the conventional cascade PID control. The proposed
design utilizes Fuzzy Logic to continuously tune each term of the PID controller. The
performance of the proposed design is evaluated with respect to the conventional cascade
PID controller. To evaluate the performance of each controller, the system’s stability and
performance parameters such as rise time, overshoot, undershoot and settling time were
determined. The entire system design is modeled using MATLAB/ SIMULINK, with the
simulation results showing that the proposed fuzzy logic cascade controller has better
robustness and dynamic performance than the conventional controller.
Key words: PID (proportional-integral-derivative), Fuzzy Logic (FL), Cascade Control, Auto
tuning, Simulink.
INTRODUCTION
One of the best flexibility with the PID controllers is that by using two PID together, a better
dynamic performance can be achieved as compared with a single PID controller, also known
as cascade PID controller [1]. In this controller, the two PIDs are placed in such a way that
the setpoint of one PID is the output of the other PID. One of the PID controller works as the
inner loop controller which takes the output of the other PID controller which works as the
outer controller as its remote setpoint [2].
PID controllers works well with a linear system. Typically, various processes are non-linear,
hence frequent tuning of the parameters are required [3]. Non-linear condition comes from
the changes in the process itself, performance of equipment, as well as wear and tear of the
instrumentation. To manage this, the paper introduces an auto tuner fuzzy control for the PID
terms that allows for better adaptive control, thus avoiding the need for frequent tuning. In

ENGINEERING 56
order to show the effectiveness of the proposed controller, a transfer function of a furnace
temperature is utilized [4].
MAIN RESULTS
Auto-tuner cascade PID controller based on fuzzy logic (FL) Simulink system block is
shown in Figure 1. The value of the PID parameters Kp, Ki and Kd are tuned using signals
from fuzzy logic block. The fuzzy logic inputs are based on the error and change in error
between reference signals and output signals. The output of the simulation for comparison
are shown in Figure 2 and Figure 3. The detailed analysis of the performance is depicted
in Table 1.
Figure 1. Simulink Block Diagram for Fuzzy Logic Auto-Tuner Cascade Controller
Figure 2. Step Change Response Comparison for Conventional and Auto Tuner Cascade
Controller Process Transfer Function 1
Figure 3. Step Change Response Comparison for Conventional and Auto Tuner Cascade
Controller Process Transfer Function 2

ENGINEERING 57
Table 1. Comparison Table of Time Domain Specification and Performance Criteria
Transfer
Function
Controller
Type
Rise Time Settling
Time
%
Overshoot
%
Undershoot
1 FL Auto Tuner 1.031s 16.372s 11.798% 1.114%
Conventional 1.125s 19.641s 18.452% 0.912%
2 FL Auto Tuner 1.353s 21.035s 11.798% 1.343%
Conventional 1.385s 31.306s 17.059% 0.982%
Desirable dynamic performance characteristics for a good controller performance is having a
quick rise-time, minimum delay time, quick settling time, minimum overshoot and stable.
The FL Auto tuner also provides continuous tuning feature to maintain the controller
performance under changing process condition. This can be seen in the Table 1, having better
rise time, settling time and % overshoot. Further details will be provide in the detailed paper
to show the stability of the system in elimination of offset under non-linear process
conditions.
CONCLUSION
In this paper, the performance of the proposed auto-tuner cascade PID controller utilizing
fuzzy logic is compared with the conventional cascade PID controllers. To show the
effectiveness of the proposed control technique, transfer function of a furnace temperature
system is used. The results show the advantages of the fuzzy inference systems as compared
to conventional PID when different process transfer function is utilized. From the results of
the simulations, the auto-tuner cascade PID controller based on Fuzzy Logic have the
potential for further development to cover greater change in process condition and non-
linearity. Application in the process industrial via Distributed Control System (DCS) can be
further explored.
REFERENCES
1. Kumar, Pavan., Rajesh, Y.V., Yugandhar, Sadhu. and Srikanth, Viswaraju. Cascaded PID Controller Design
for Heating Furnace Temperature Control. IOSR Journal of Electronics and Communication Engineering
(IOSR-JECE), (2013), 2278-8735.
2. Zulfatman. and M.F.Rahmat. Application of Self-Tuning Fuzzy PID Controller on Industrial Hydraulic
Actuator using System Identification Approach International Journal on Smart Sensing and Intelligent
Systems (2009), Vol.2, No.2. 3. Firmansyah, Fajrin., Sulistyawan, Ivan Adela., Hadisupadmo, Sutanto. and Widyotriatmo.A. Temperature
Control for a Pasteurization Miniplant using Multiloop and Cascade Controllers International Conference on
Instrumentation, Control and Automation (ICA), 2016.
4. Murthy, B.V., Kumar, P.Y.V., Kumari, R.U.V., Fuzzy Logic Intelligent Controlling Concepts in Industrial
Furnace Temperature Process Control IEEE International Conference on Advanced Communication Control
and Computing Technologies (ICACCCT) (2012).
5. Dettori, S., Iannino, V., Colla, V. and Signorini, A. A Fuzzy Logic-Based Tuning Approach of PID Control
for Steam Turbines for Solar Applications. The 8th International Conference on Applied Energy (ICAE)
(2016), 480-485.
6. Anoop, C.T., Yogesh, V.H., and Shaj S. Comparative Analysis of Cascade Fuzzy Logic Controllers for
Boiler Water Level Control 2014 Annual IEEE India Conference (INDICON) (2016).

ENGINEERING 58
IGCESH2018
Universiti Teknologi Malaysia, Johor Bahru, Malaysia 13 -15 August 2018
FEASIBILITY STUDY OF CADMIUM ADSORPTION BY PALM OIL
FLY ASH (POFA) BASED LOW COST HOLLOW FIBRE
MEMBRANE
M.S.M. Yusof, Mohd Hafiz Dzarfan Othman*, Azeman Mustafa, Mukhlis A
Rahman, Juhana Jaafar, Ahmad Fauzi Ismail
Advance Membrane Technology Research Centre, Faculty of Chemical and Energy
Engineering, Universiti Teknologi Malaysia, 81310 UTM Johor Bahru, Johor, Malaysia
Email: [email protected]
ABSTRACT
Palm oil fuel ash (POFA) which is the waste products of combusted fibre of oil palm and
spent shell-based fuel from a boiler in milling plants was employed in this study as the main
precursor to produce novel adsorptive ceramic hollow fibre membranes. The performance of
the membranes fabricated using phase inversion-based extrusion technique and sintered at
1150°C was evaluated on its ability to remove cadmium (Cd (II)) heavy metal in water via
adsorption process. The properties of the membrane were characterized using N2 adsorption-
desorption analysis, field emission scanning electron microscopy-energy-dispersive X-ray
spectroscopy (FESEM-EDX) mapping, X-ray fluorescence (XRF), X-ray diffraction (XRD),
Fourier transform infrared spectroscopy (FTIR) and thermogravimetric (TGA) analyses while
adsorptivity activity was examined by batch adsorption studies. The adsorption test results
show that the quantity of hollow fibre used and water pH level significantly affected the
adsorption performance.These results are comparable to those reported by other studies and
hence demonstrate a promising alternative of low cost hollow fibre adsorbent membrane.
Keyword: Adsorption, POFA, hollow fibre membrane, heavy metal
INTRODUCTION
The study initiates the development of promising potential of POFA hollow fibre ceramic
membrane for Cd(II) removal in water as well as explore an advantage of hybrid process
(adsorption + filtration). Alteration on the adsorbent for the treatment is not implemented
concerning cost and consumption of energy throughout the entire treatment of heavy metals
removal. The study focuses on analysing POFA hollow fibre membrane’s adsorptive
mechanism and performance when utilized as an economically viable adsorbent. Batch
adsorption studies would be conducted to determine the characterization and adsorption
equilibrium model of heavy metals onto POFA hollow fibre membrane with the manipulation
of variables including adsorbent quantity, concentration of initial Cd(II), pH level of aqueous
solution, and contact time. Additionally, experimentation data and kinetic study conducted on
the adsorption mechanism as well as physicochemical analyses will be adopted to extensively
assess the behaviour of Cd(II) onto POFA hollow fibre membrane.

ENGINEERING 59
POFA powder and hollow fibres’ cadmium adsorption is illustrated in Figure 1. From the
figure, POFA in hollow fibres result in a faster adsorption than POFA in powder form.
During the first 30 minutes, adsorption process took place slowly and upon reaching 60
minutes mark, equilibrium was achieved. The difference in the adsorption time performance
of powdered form POFA could be attributed to its poor active sites and smaller surface area
compared to hollow fibres. The suspension placed in conical flask was not completely being
exposed to the cadmium solution as the powder tends to agglomerate with each other thus
fewer the exposure of adsorption site to attach the Cd(II).
Figure 1. Adsorption kinetic of cadmium in POFA powder and hollow fibre
Due to the highest efficiency of Cd adsorption shown (Figure 1), 3 POFA hollow fibres
membrane has been selected for a further study to examine the effect of pH on the adsorption
efficiency.
CONCLUSION
The study of POFA as a natural low-cost adsorbent for heavy metal Cd(II) adsorption from
aqueous solution via batch adsorption experiments have revealed several findings. Cd(II)
adsorption was speedier during the initial 30 minutes with as much as 80% of Cd(II) was
removed. From the experiment conducted, it was revealed through the findings that
maximum adsorption of Cd(II) by POFA took place at pH 4.0. In general, an increment in the
adsorbate pH level increased the capacity of adsorption. Greater Cd(II) was removed from the
aqueous solution as adsorbent dosage was elevated, however, the capacity for adsorption
decreased. POFA’s great quantity availability which can be accessed locally combined with
its speedier uptake and adsorption capability demonstrate its appeal as a low-cost adsorbent
that can be used in a variety of industrial applications with versatility.
Acknowledgment: The authors gratefully acknowledge the financial support from the
0
10
20
30
40
50
60
70
80
90
100
0 50 100 150
POFA hollow fibre
Treated POFA
Fresh POFA
Ca
dm
ium
re
mo
va
l (%
)
Time(minutes)

ENGINEERING 60
Ministry of Education Malaysia under the Higher Institution Centre of Excellence
Scheme (Project Number: R.J090301.7846.4J192) and Fundamental Research Grant
Scheme (Project Number: R.J130000.7846.4F972), Universiti Teknologi Malaysia
under the Research University Grant Tier 1 (Project number: Q.J130000.2546.16H40)
and Nippon Sheet Glass Foundation for Materials Science and Engineering under
Overseas Research Grant Scheme (Project number: R.J130000.7346.4B218).
REFERENCES
1. Xu, D., Tan, X., Chen, C. and Wang, X., 2008. Removal of Pb (II) from aqueous solution by oxidized
multiwalled carbon nanotubes. Journal of Hazardous Materials, 154(1), pp.407-416.
2. Ding, Z., Wan, Y., Hu, X., Wang, S., Zimmerman, A.R. and Gao, B., 2016. Sorption of lead and methylene
blue onto hickory biochars from different pyrolysis temperatures: Importance of physicochemical
properties. Journal of Industrial and Engineering Chemistry, 37, pp.261-267.

ENGINEERING 61
IGCESH2018
Universiti Teknologi Malaysia, Johor Bahru, Malaysia 13 -15 August 2018
NON-PROBABILISTIC ARTIFICIAL NEURAL NETWORK WITH
MEASURED FREQUENCY RESPONSE FUNCTION DATA FOR
VIBRATION BASED DAMAGE DETECTION
Khairul H. Padil*1 and Norhisham Bakhary1,2
1 Faculty of Civil Engineering, Universiti Teknologi Malaysia, 81310 UTM Skudai, Johor,
MALAYSIA.
(E-mail: [email protected], [email protected]) 2 Institute of Noise and Vibration, Universiti Teknologi Malaysia, City Campus, Jalan Semarak,
54100, Kuala Lumpur, MALAYSIA.
ABSTRACT
Artificial neural network (ANN) has become one of the most explored computational
approaches for vibration based damage detection based on its capability to relate the
nonlinear relationship between vibration parameters and damage location and severity. In
meantime, frequency response function (FRF) estimation has been proven effective as a
dynamics characteristic for damage detection due to no information leakage during data
extraction as compared to modal domain data. To this regard, ANN and FRF are chosen to
collaborate as a medium to interpret damage detection model. The main concern in using
FRF with ANN for damage detection is the size of the FRF data. A full-size of FRF data will
result in wide configuration range of the ANN input layer. Therefore, principal component
analysis (PCA) is used to reduce the size of the FRF data. However as the structures become
more complex and causing the increase FRF data size, the existence of uncertainties cannot
be neglected. Hence, this study proposed a combination of non-probabilistic method with
PCA to consider the problem of uncertainties in vibration based damage detection. The input
data for the network are the compressed real FRFs and the outputs are the elemental stiffness
parameter (ESP). To establish the relationship between the input parameters and output
parameters, Possibility of Damage Existence (PoDE) is designed for the undamaged and
damaged states. Stiffness Reduction Factor (SRF) is also used in order to represent the
changes of the stiffness parameter. A numerical model of 2-storey steel bookshelf is utilized
to demonstrate the efficiency of the method in improving the accuracy of the ANN and FRF
towards complex structure and the presence of noise. The result shows that the proposed
method is able to provide more efficient method in dealing with FRF and the existence of
uncertainties for damage detection.
Key words: Damage detection, Artificial Neural Network, Frequency response function, Non-
probabilistic
INTRODUCTION
Many approach in vibration based damage detection have been proven effective in providing
the location and severity of damage either in basic or complex structure. One the best method
is through artificial neural network (ANN). Most applications employed modal data (natural

ENGINEERING 62
frequencies, mode shapes and damping) as the input variables due to their high sensitivity
towards damage. Unfortunately, modal data suffers several limitations which led to
inaccuracy of damage detection results due to the key problem of insufficient information on
dynamic behaviour. Due to this reason, the use of frequency response function (FRF) in
damage detection is preferred recently as it provides sets of advantages including preventing
the leakage of information during data extraction and provides large amount of information
on the dynamic behaviour of a structure instead of only at specific frequencies. FRF can be
used directly without the need of data extraction, unlike modal domain data that undergo
numerical process of extraction.
However, since FRF involved broadband of information as well as large number of data, the
issues of uncertainty become more profound as the civil engineering structure became more
complex. There are two main elementary uncertainties, which are modelling error and
measurement noise. The most common method that can be used to reduce the effect of
uncertainties in damage detection is the probabilistic analysis [1, 2]. Despite its efficiency in
handling noisy data, probabilistic method suffers several setbacks such as, in real practice it is
not possible to obtain the probability density function due to the complexity uncertainty
sources and the probabilistic method also requires multiple sets of data for the analysis which
is very time consuming. Consequently, the non-probabilistic method is used to overcome the
drawbacks of statistical method [3, 4]. In the non-probabilistic analysis, both physical and
dynamic characteristic are measured using interval analysis. The non-probabilistic interval
analysis requires only the upper and lower bound of uncertain parameters. Thus, damage
detection of FRF data with uncertainties becomes more efficient and reliable.
This study proposed the non-probabilistic analysis to combine with principal component
analysis (PCA) in consideration of uncertainties for vibration based damage detection using
ANN and FRF. To this regard, the FRF data is compressed (DI) using PCA and implemented
as ANN input variables and Elemental Stiffness parameters (ESP) as the output variables.
The uncertainties are considered by calculating the lower and upper bound of the input
parameters (DI) based on interval mathematics to produce the lower and upper bound of the
output parameters (ESP). Therefore, two different types of ANNs are presented for upper and
lower bound of noisy input data. SRF and PoDE are later used to define the reduction of ESP
value and existence of damage. To provide a better indicator of damage existence, DMI is
adopted. The applicability of the proposed method is demonstrated through a numerical
model of 2-storey bookshelf. The results show that the proposed combination of non-
probabilistic method with PCA in ANN based on FRF data is able to provide the location and
severity of the damage.
MAIN RESULTS
The proposed method is applied by constructing two models of ANNs to predict the lower
bound and upper bound of ESP. 5% of errors are applied in training and testing data. Table 1
shows the calculated PoDE and DMI. The red bolted marks represent the damage segment of
the structure. From Table 1, it is observed that in both scenarios, higher PoDE are obtained at
the damage segment. For instance, scenario 1, higher PoDE values are obtained at segment
1,3, 4 and 7. The DMI values for these segment also higher compared to other segment
indicating that higher severity of damage occurred at these segment which are the true
damage locations with different severity condition. It is also observed that the DMI values are
close to the actual ESP values and able to indicate the severity of the damaged segment.
Therefore undamaged and damaged segments can be distinguished and the severity level of

ENGINEERING 63
the damaged segments can be assessed. These results exhibits that the proposed method
provides an improvement to the basic FRF in ANN method where it is able to provide more
meaningful damage severity indicator.
Table 1. PoDE and DMI for the six segment of the frame.
Segment
no.
Scenario 1 Scenario 2
PoDE (%) DMI (%) PoDE (%) DMI (%)
1 74.85 10.29 94.58 18.90
2 0.00 0.00 99.66 7.62
3 100.00 25.33 3.79 0.10
4 100.00 15.52 100.00 27.87
5 25.63 1.31 93.19 8.07
6 15.46 0.54 100.00 19.44
7 98.01 6.43 0.00 0.00
8 0.00 0.00 100.00 27.97
CONCLUSION
In this study, non-probabilistic ANN combining with PCA is proposed to counter the problem
concerning large size of data and noise consideration for FRF usage in ANN for damage
detection. Through non-probabilistic ANN method, the noise in DI data are considered to
bound together and required only two ANN model for upper and lower bound of interval
analysis. To establish the relationship between the input parameters and output parameters,
SRF and PoDE are designed for the undamaged and damaged states. The results show that
the proposed method is more efficient in dealing with large size of FRF data and uncertainties
as well as consume less computational time using FRF data with ANN compared to using
modal data with ANN and using PCA alone to deal with FRF data in ANN for vibration
damage detection.
Acknowledgment: The authors would like to thank the Ministry of Higher Education,
Malaysia, and Universiti Teknologi Malaysia (UTM) for their financial support through the
Fundamental Research Grant Scheme (4F800) and HICOE Research Grant (4J224).
REFERENCES
1. Muscolino, G. and Alderucci, T. Closed-form solutions for the evolutionary frequency response function of
linear systems subjected to separable or non-separable non-stationary stochastic excitations. Probabilistic
Engineering Mechanics, 40 (2015), 75-89.
2. Sarrafi, A. and Mao, Z. Probabilistic uncertainty quantification of wavelet-transform-based structural health
monitoring features. SPIE Smart Structures and Materials+ Nondestructive Evaluation and Health
Monitoring. (2016).
3. Wang, X., Xia, Y., Zhou, X, and Yang, C., Structural damage measure index based on non-probabilistic reliability model. Journal of Sound and Vibration, 333(5) (2014), 1344-1355.
4. Padil, K.H., Bakhary, N., and Hao, H., The use of a non-probabilistic artificial neural network to consider
uncertainties in vibration-based-damage detection. Mechanical Systems and Signal Processing, 83 (2017),
194-209.

ENGINEERING 64
IGCESH2018
Universiti Teknologi Malaysia, Johor Bahru, Malaysia 13 -15 August 2018
FLAME RETARDANCY AND CORROSION RESISTANT EFFECT
OF GRAPHENE NANOPLATELETS ON EPOXY NANOCOMPOSITE
COATING
S. M. Kabeb1, A. Hassan2, Z. Mohamad3, Z. Sharer4, M. Mokhtar5, F. Ahmad6
1 Faculty of Industrial Sciences & Technology, Universiti Malaysia Pahang
([email protected]) 2, 3, 4, 5 Department of Bioprocess and Polymer Engineering, Faculty of Chemical and Energy
Engineering, Universiti Teknologi Malaysia
([email protected], [email protected], [email protected], [email protected]) 6Department of Mechanical Engineering, Universiti Teknologi Petronas
ABSTRACT
Various concentrations of graphene nanoplatelets (GNP) i.e. 0.2, 0.4, 0.6, 0.8 and 1.0 wt. %
were incorporated into epoxy resin by sonication technique and mechanical agitation process.
Limiting oxygen index (LOI) test and thermogravimetric analysis (TGA) indicated that the
presence of GNP greatly enhanced the flame retardancy properties of the epoxy coating. Salt
spray results obtained suggested that the addition of GNP enhanced corrosion performance
and reducing the water absorption in comparison with pristine epoxy coating. Adhesion
(cross-cut test) revealed that the presence of GNP showed great adhesion to substrates.
Key words: Epoxy, nanocomposites, coatings
INTRODUCTION
Epoxy coatings have been developed over the years, due to their good barrier properties that
can protect metals from corrosion over long periods of time [1, 2]. However, pristine epoxy
coatings has low durability as anticorrosion coating due to the presence of holes and defects
which are permeable to oxygen, water and corrosive ions such as Cl- and H+ and SO2 4 [3].
Therefore, numerous types of additives such as inorganic pigments have been employed to
improve the barrier performance of these polymeric coatings [4-6]. The incorporation of fine
particles that is miscible into epoxy resin can occupy cavities by reducing the porosity and
zigzagging the diffusion path for deleterious species and consequently enhance the integrity
and durability of coatings [7, 8].
Graphene related material have attracted tremendous attention in various potential
applications including batteries [9], capacitors [10], nanocomposites [11], sensors [12] and
coatings for corrosion prevention [6, 13] due to its unique structure and extraordinary
electronic, thermal, mechanical and barrier properties. Previous studies have indicated that
graphene based coatings possess excellent anticorrosion barriers for metals [14-17]. Kirkland
et al. [14] reported that electrochemical response of graphene-coated nickel and copper,
where graphene layer proved experienced in improving anticorrosion performance of pure

ENGINEERING 65
metals. The capability of graphene to enhance oxidation resistance was demonstrated by
Chen et al. [18]. It help to create an air-tight ‘‘balloon’’ that presumably increase barrier
properties and impermeability to oxygen [19].
To the best of our knowledge, not many studies investigate the effect of graphene on
corrosion performance and flame retardancy of epoxy nanocomposite coating. One related
study by Alhumade et al. [20] which revealed the effect of different graphene nanosheets
(GNS) loading on corrosion performance of stainless steel Type 304. They found that, low
graphene loading up to 0.5 wt. % boost up the life cycle of stainless steel substrates due to the
barrier property of graphene, which limit the diffusion of corrosive agents to reach the metal
substrates. Nevertheless, the effect of GNS on flame retardancy is not discussed and
highlighted in their study.
In this work, epoxy resin type BE-188 and GNP nanofiller are prepared by stirring and bath
sonication before coated on mild steel plate. The anticorrosion performance and flame
retardancy properties of epoxy filled GNP nanocomposite coatings were evaluated by salt
spray and LOI test, respectively.
MAIN RESULTS
Table 1. Formulation of the EP-GNP nanocomposite coatings and their corresponding LOI
Figure 1. Surfaces appearance of mild steel plate coated with neat and EP-GNP coatings at
200 and 500 hours of salt spray test
CONCLUSION
Present study indicates that the incorporation of GNP nanoparticles filler enhanced the flame
retardancy and expands the durability of anticorrosion performance. LOI results shows that
GNP enhances the flammability properties and improve the char yield at 800 C as well as
decrease the maximum weight loss rate, suggesting improved the thermal stability. Results
obtained from salt spray test revealed that additional of GNP provide corrosion resistance

ENGINEERING 66
against electrolyte diffusion with the greatest increase in corrosion resistance was observed
for 0.8 wt. % GNP content. The water uptake and coefficient diffusion confirmed that GNP
might be acts as reservoirs for the storage and prolonged lease of corrosion inhibitor.
Acknowledgment: The author would like to thank the Universiti Teknologi Malaysia (UTM)
for funding this research under GUP grant No 12J81, 10H94 and 17H66.
REFERENCES
1. Pour-Ali, S., C. Dehghanian, and A. Kosari, In situ synthesis of polyaniline–camphorsulfonate particles in an epoxy matrix for corrosion protection of mild steel in NaCl solution. Corrosion Science. 85: (2014). 204-
214.
2. Atta, A.M., A.M. El-Saeed, G.M. El-Mahdy, and H.A. Al-Lohedan, Application of magnetite nano-hybrid
epoxy as protective marine coatings for steel. RSC Advances. 5(123): (2015). 101923-101931.
3. Popović, M., B. Grgur, and V. Mišković–Stanković, Corrosion studies on electrochemically deposited PANI
and PANI/epoxy coatings on mild steel in acid sulfate solution. Progress in organic coatings. 52(4): (2005).
359-365.
4. Zhang, X., F. Wang, and Y. Du, Effect of nano-sized titanium powder addition on corrosion performance of
epoxy coatings. Surface and Coatings Technology. 201(16): (2007). 7241-7245.
5. Shao, Y., C. Jia, G. Meng, T. Zhang, and F. Wang, The role of a zinc phosphate pigment in the corrosion of
scratched epoxy-coated steel. Corrosion Science. 51(2): (2009). 371-379.
6. Chen, C., S. Qiu, M. Cui, S. Qin, G. Yan, H. Zhao, L. Wang, and Q. Xue, Achieving high performance corrosion and wear resistant epoxy coatings via incorporation of noncovalent functionalized graphene.
Carbon. 114: (2017). 356-366.
7. Shi, G., M.Q. Zhang, M.Z. Rong, B. Wetzel, and K. Friedrich, Friction and wear of low nanometer Si 3 N 4
filled epoxy composites. Wear. 254(7): (2003). 784-796.
8. Hartwig, A., M. Sebald, D. Pütz, and L. Aberle. Preparation, characterisation and properties of
nanocomposites based on epoxy resins–An overview. in Macromolecular symposia. Wiley Online Library.
(2005)
9. Raccichini, R., A. Varzi, S. Passerini, and B. Scrosati, The role of graphene for electrochemical energy
storage. Nature materials. 14(3): (2015). 271-279.
10. Xia, H., C. Hong, B. Li, B. Zhao, Z. Lin, M. Zheng, S.V. Savilov, and S.M. Aldoshin, Facile Synthesis of
Hematite Quantum‐Dot/Functionalized Graphene‐Sheet Composites as Advanced Anode Materials for Asymmetric Supercapacitors. Advanced Functional Materials. 25(4): (2015). 627-635.
11. Mittal, G., V. Dhand, K.Y. Rhee, S.-J. Park, and W.R. Lee, A review on carbon nanotubes and graphene as
fillers in reinforced polymer nanocomposites. Journal of Industrial and Engineering Chemistry. 21: (2015).
11-25.
12. Vashist, S.K. and J.H.T. Luong, Recent advances in electrochemical biosensing schemes using graphene and
graphene-based nanocomposites. Carbon. 84: (2015). 519-550.
13. Prasai, D., J.C. Tuberquia, R.R. Harl, G.K. Jennings, and K.I. Bolotin, Graphene: corrosion-inhibiting
coating. ACS nano. 6(2): (2012). 1102-1108.
14. Kirkland, N.T., T. Schiller, N. Medhekar, and N. Birbilis, Exploring graphene as a corrosion protection
barrier. Corrosion Science. 56: (2012). 1-4.
15. Chang, C.-H., T.-C. Huang, C.-W. Peng, T.-C. Yeh, H.-I. Lu, W.-I. Hung, C.-J. Weng, T.-I. Yang, and J.-M. Yeh, Novel anticorrosion coatings prepared from polyaniline/graphene composites. Carbon. 50(14): (2012).
5044-5051.
16. Zhou, F., Z. Li, G.J. Shenoy, L. Li, and H. Liu, Enhanced room-temperature corrosion of copper in the
presence of graphene. ACS nano. 7(8): (2013). 6939-6947.
17. Yu, Y.-H., Y.-Y. Lin, C.-H. Lin, C.-C. Chan, and Y.-C. Huang, High-performance polystyrene/graphene-
based nanocomposites with excellent anti-corrosion properties. Polymer Chemistry. 5(2): (2014). 535- 550.
18. Chen, S., L. Brown, M. Levendorf, W. Cai, S.-Y. Ju, J. Edgeworth, X. Li, C.W. Magnuson, A. Velamakanni,
and R.D. Piner, Oxidation resistance of graphene-coated Cu and Cu/Ni alloy. ACS nano. 5(2): (2011). 1321-
1327.
19. Bunch, J.S., S.S. Verbridge, J.S. Alden, A.M. Van Der Zande, J.M. Parpia, H.G. Craighead, and P.L.
McEuen, Impermeable atomic membranes from graphene sheets. Nano letters. 8(8): (2008). 2458-2462.
20. Alhumade, H., A. Yu, A. Elkamel, L. Simon, and A. Abdala, Enhanced protective properties and UV stability of epoxy.

ENGINEERING 67
IGCESH2018
Universiti Teknologi Malaysia, Johor Bahru, Malaysia 13 -15 August 2018
DESIGN AUTOMOTIVE DRIVER SEAT ERGONOMICALLY FOR
MALAYSIAN ANTHROPOMETRY MEASUREMENT
Mugilan Muralitharan*1, Syed Ahmad Helmi2 and Kamarulafizam bin Ismail3
1, 2, 3 Faculty of Mechanical Engineering, Universiti Teknologi Malaysia, Johor, Malaysia.
(E-mail: [email protected], [email protected], [email protected]) 2 Centre for Engineering Education, Universiti Teknologi Malaysia, Johor, Malaysia.
ABSTRACT
Aesthetic value of the automotive car seat has been one of the selling point of each car
besides providing functions such as being safe, supportive as well provide comfort to the
occupants. Criteria that have been considered besides the aesthetic element are cushion foam
and self-adjustment factor. Ergonomics are not new issue to be brought up as most of the
existing seat design today have already practiced. Existing car seat manufacturers have
considered anthropometry data. The average upon 95th percentile of human measurement had
been deliberated. However, issues such as time spent driving and seat design issue have
arisen upon the search of comfort and rising of musculoskeletal disease such as back ache
pain. As a solution, this study would propose an automotive car seat design of ergonomic
evolution which would create comfort by manipulating the seat cushion foams. The proposed
seat cushion foam would be replacing the existing polymers with bean bag foam. This has
been inspired by the nature of bean bag, fitting up and providing comfort to the occupants of
various body sizes and shapes. Malaysian anthropometry measurement required for design of
car seat are obtained which are later compared with the existing seats of commercial vehicle.
The most appropriate design principle is used as reference. Pressure mapping of respondent
seating on the existing car seat are obtained by literature review. The most sensitive
compartments where discomfort have been experienced are studied and placed with sachets
filed with bean bag beads. This would be then tested over a few respondents by pressure mat
to figure if there were any changes in terms of comfort. This design of new car seat with a
manipulation cushion foam replaced with bean bag foam could be a niche to eliminate
discomfort to all range body sizes and shapes.
Key words: car seat, anthropometry, bean bag foam
INTRODUCTION
Automotive Industry could never be neglected by entire world as mode of travelling as well
transferring materials by road has been increasing day by day. Driver seat is very
complicated, and the main part of Automotive car seat are frame, padding, seat pan, head
restraints system, reclining mechanism with lever trim (seat cover), and suspension system,
as well seat belt, height adjustment, fore and aft adjustment which could be best illustrated in
Figure 1[2].

ENGINEERING 68
The best that a seat could do is to cause no discomfort. Concern of comfortable has always
been a big issue especially for those who involve mode of travelling as their job. Discomfort
in the definition of travelling can be best explained as sitting in one posture for a prolonged
duration[3]. Driving do require much patience as well energy to stay alert compared while
been driven. In this case best car seat has always been an option to provide comfort and
ergonomically fit the driver. Automotive car seat are products that are developed with four
primary functions; aesthetically pleasing, safe, supportive and be comfortable[1].
Figure 1. Cut Section of Driver Seat Components and Systems[2]
Shredded bean bag beads could be a solution to reduce pressure distribution over the entire
seat driver as bean bag beads are soft. By means we know that soft seat foams would be able
to convey the pressure been applied to be transferred according throughout the entire surface
area of contact as could been seen in Figure 2. This would result less impact in terms of
discomfort for the occupants of the seat. Thus, softer material replaced in existing car seat
could be a solution upon discomfort due to prolonged duration of driving.
Figure 2. Static interface pressure distribution measured on the rigid and soft seat surface[14]
CONCLUSION
In general, this study would be investigating on the comfort providence by manipulating one
of the parameter to develop the car seat. Consequently, commercial vehicle’s driver seat
design principle has been the reference for a new design been proposed to fit various body

ENGINEERING 69
shapes and sizes. This adjustability factor of the car seat according to Malaysian
anthropometry measurement could fulfil most cited parameter, comfort level. The second
most cited parameter, safety parameter has been considered with much concern to avoid
injury to the occupant. Thus, this proposed new design could be safe and comfort for the
driver besides being a solution for back ache injury due to prolonged duration of driving.
Acknowledgment: First and foremost, I would like to show my highest gratitude to the
Center for Engineering Education for the fund been provided over the VOT NO:
QJ13000.2426.03G99. As well, I would like to thanks NIOSH Johor, Ergonomic Department
for the help on the anthropometry data been given to conduct my research. As well, I would
like to thank Dr Zulhilmi bin Che Daud, the Head of Automotive lab for sponsoring a car seat
for me to complete this research accordingly.
REFERENCES
1. M. Kolich, Using failure mode and effects analysis to design a comfortable automotive driver seat, 2014;
Appl. Ergon., vol. 45, no. 4, pp. 1087–1096. 2. H. N. Kale and C. L. Dhamejani, Design parameters of driver seat in an automobile, 2015; Int. J. Res. Eng.
Technol., vol. 4, no. 6, pp. 448–452. 3. G. M. Sammonds, M. Fray, and N. J. Mansfield, Effect of long term driving on driver discomfort and its
relationship with seat fidgets and movements (SFMs), 2017; Appl. Ergon., vol. 58, pp. 119–127. 4. D. E. De Carvalho and J. P. Callaghan, Influence of automobile seat lumbar support prominence on spine
and pelvic postures : A radiological investigation, 2012; Appl. Ergon., vol. 43, no. 5, pp. 876–882.
5. X. Wu, S. Rakheja, and D. Boileau, Distribution of human } seat interface pressure on a soft automotive seat
under vertical vibration, 1999; vol. 24, pp. 545–557.
ENGINEERING 70
IGCESH2018
Universiti Teknologi Malaysia, Johor Bahru, Malaysia 13 -15 August 2018
DEVELOPMENT OF PALM STEARIN BASED-OIL THROUGH
TRANSESTERIFICATION MODIFICATION AS ALTERNATIVE
FEEDSTOCK LUBRICANT
Afifah, A.N.1, Syahrullail, S.*1
1Faculty of Mechanical Engineering, Universiti Teknologi Malaysia, 81310 Skudai, Johor, Malaysia.
(E-mail: [email protected], [email protected])
ABSTRACT
Vegetable oil has been received tremendous attention since the effect of greenhouse gas
emission and global warming triggered the awareness globally. However, such oil tend to
harden at room temperature. That limitation of vegetable oil could be mitigated through
chemical modification of the oil structure via transesterification method. In this study,
optimum parameter of transesterification process is investigated to obtain maximum
conversion of palm stearin triglyceride into the requisite lubricant. Tribological performance
of palm stearin-based oil will be evaluated using Fourball tribotester at standard condition.
From the chemical structure modification, palm stearin-based oil is expected to possess
excellent fluidity at cold temperature, higher onset temperature of oxidation, greatly capable
of providing sturdy lubrication film between two metal surfaces and able to sustain large load
carrying capacity.
Key words: Palm stearin, Lubricant, Alternative oil
INTRODUCTION
The critical state of the environment and the Earth’s resources have urged researcher to find
alternative feedstock to replace the current used of mineral oil as a main component in the
lubricating oil formulation. The source of new feedstock must be environmentally friendly,
biodegradable, and renewable. At the same time, physicochemical and tribological properties
of the feedstock must equal to or better than that of mineral oil. Vegetable oil which has high
biodegradability, less toxic and carcinogenic, is a promising candidate as a future feedstock
in lubricant oil. Besides that, chemical structure of vegetable oil which consists of fatty acid,
a polar group with long hydrocarbon chain, makes vegetable oil to interact strongly with the
metal surface by nature. However, the main obstacle for the vegetable oil to be directly used
is poor fluidity at low temperature and poor thermal-oxidative stability. These limitations
could be enhanced through modification of chemical structure of vegetable oil. The chemical
structure of vegetable oil could be modified by conducting transesterification process with the
presence of catalyst [1,2]. Transesterification is a process of converting triglyceride ester of
fatty acid into fatty acid methyl/ethyl ester. For castor oil, 94.0% of fatty acid methyl ester
(FAME) was obtained by Andrade et al. [3] at 35 ⁰C, 5.0 wt% of enzymes Eversa Transform,
6:1 alcohol to oil molar ratio and 5.0 wt% of water under reaction time of 8 hour. Other
investigation on castor oil conducted by Diaz et al. [4] showed that 88% of FAME was
produced when using Candida rugose as biocatalyst and trimethylolpropane (TMP) as acyl

ENGINEERING 71
acceptor. Lipase-catalyzed transesterification of basil oil resulted in 94.58% FAME yield
under optimum conditions of reaction at 47 ⁰C for 68 h, 6.0% w/w catalyst and methanol to
oil ratio of 10:1 [5]. Vipin et al. [6] carried out enzymatic transesterification of rubber seed
oil by using Rhizopus Oryzae lipase to produce rubber seed methyl ester. They investigated
the influenced of reaction parameters such as lipase concentration, reaction duration, type of
acyl acceptor and its concentration on the maximum yield of FAME. The authors found that
optimal conversion was significantly affect by the type of acyl acceptor compared with other
parameters. Ethyl acetate gave the maximum yield of 33.3% FAME compared with ethanol
of 31%. Apart from that, using a suitable acyl acceptor also could reduce the reaction time
from 48 hours to 24 hours. In another study, maximum conversion of 81.23% from rubber
seed oil was obtained when using immobilized Candida Antatrtica Lipase B (CAL B) as
biocatalyst and methanol as acyl acceptor [7]. Lai et al. [8] studied the influence of type of
lipase on the optimal yield of FAME. They found that for rice bran oil, Novozym 435
(Candida antarctica lipase immobilized on macroporous acrylic resin) was more effective to
in catalysing the transesterification process of such oil in comparison with IM 60
(Rhizomucor miehei lipase immobilized on macroporous anion-exchange resin) lipase. At
reaction time of 7 h, 98.74% and 74.06% of FAME were obtained using Novozym 435 and
IM 60, respectively. However, the maximum conversion of FAME from rice bran oil was
reduced to 92% when using ethanol as acyl acceptor and Thermomyces lanuginosus lipase in
the system as reported in [9]. The optimum conditions of that system were reaction
temperature of 20 ⁰C, 4:1 molar ratio of ethanol to oil and 4 % of water content. From the
previous research, it can be concluded that finding an optimum parameter during
transesterification process is very crucial to obtained maximum conversion of required
product. As palm oil is abundant in Malaysia, this research is designed to modify the
chemical structure of the palm stearin, a derivative of palm oil, by employing
transesterification process, in order to produce an adequate lubricating oil.
METHODOLOGY
The transesterification reactions will be carried out in a three-neck round-bottom flask
equipped with a stirrer, water-cooled condenser and immersed in a thermostat oil bath.
The reaction time is fixed for 5 hours. The influence of four different reaction parameters
were chosen for investigation: the reaction temperature, evaluated between 30 and 70 ⁰C;
types of alcohol, and its alcohol-to-oil molar ratio from 4.5 to 8.5; various type of
immobilized lipase, and its concentration ranging from 2 to 10 wt%. The sample is
centrifuged first to separate oil, by-product and lipase before subjected to chemical
analysis using HPLC, FTIR and HNMR method in order to identify the composition of
palm stearin methyl ester. Once maximum conversion has been achieved,
physicochemical properties of the palm stearin methyl ester such as pour point, kinematic
viscosity, viscosity index and oxidation stability are determined in according to ASTM
D97.93, ASTM D445.94, ASTM 2270.93 and ASTM D3895.97, respectively.
Acknowledgment: The authors would like to express their thanks to the Research
Management Centre (RMC) of Universiti Teknologi Malaysia for the Research University
Grant, GUP (17H96) and Ministry of Education of Malaysia and Ministry of Higher
Education for their support.

ENGINEERING 72
REFERENCES
1. Sharma, B.K. and Biresaw, G. Environmentally Friendly and Biobased Lubricants. CRC Press, 2016.
2. Demirbaş, A. Biodiesel fuels from vegetable oils via catalytic and non-catalytic supercritical alcohol
transesterifications and other methods: a survey. Energy conversion and Management 44 (2003), 2093-2109. 3. Andrade, T.A., Errico, M. and Christensen, K.V. Influence of the reaction conditions on the enzyme
catalyzed transesterification of castor oil: a possible step in biodiesel production. Bioresource technology
243 (2017), pp.366-374.
4. Diaz, P.A.B., de Araujo Kronemberger, F. and Habert, A.C. A pervaporation-assisted bioreactor to enhance
efficiency in the synthesis of a novel biolubricant based on the enzymatic transesterification of a castor oil
based biodiesel. Fuel 204 (2017), 98-105.
5. Amini, Z., Ong, H.C., Harrison, M.D., Kusumo, F., Mazaheri, H. and Ilham, Z. Biodiesel production by
lipase-catalyzed transesterification of Ocimum basilicum L.(sweet basil) seed oil. Energy Conversion and
Management 132 (2017), 82-90.
6. Vipin, V.C., Sebastian, J., Muraleedharan, C. and Santhiagu, A. Enzymatic transesterification of rubber seed
oil using Rhizopus Oryzae Lipase. Procedia Technology 25 (2016), 1014-1021.
7. Sebastian, J., Vipin, V.C., Muraleedharan, C. and Santhiagu, A.. Enzymatic Transesterification of Rubber Seed oil using Candida Antactica Lipase B. Journal of Advanced Engineering Research 4 (2017), 104-108.
8. Lai, C.C., Zullaikah, S., Vali, S.R. and Ju, Y.H. Lipase‐catalyzed production of biodiesel from rice bran oil.
Journal of Chemical Technology and Biotechnology 80 (2005), 331-337.
9. Choi, N., Kim, Y., Lee, J.S., Kwak, J., Lee, J. and Kim, I.H. Synthesis of fatty acid ethyl ester from acid oil
in a continuous reactor via an enzymatic transesterification. Journal of the American Oil Chemists' Society
93 (2016), 311-318.

ENGINEERING 73
IGCESH2018
Universiti Teknologi Malaysia, Johor Bahru, Malaysia 13 -15 August 2018
DOES THE USE OF AUTOMATIC SEEDS GENERATION BENEFIT
SEGMENTATION OF KNEE CARTILAGE? DATA FROM THE
OSTEOARTHRITIS INITATIVE
Hong-Seng Gan 1, Aida Syafiqah Ahmad Khaizi*2, Rasyiqah ‘Annani Mohd Rosidi 3,
Khairil Amir Sayuti4, Muhammad Hanif Ramlee5, Yeng-Seng Lee6 1, 2,3 Medical Engineering Technology Section, British Malaysian Institute, Universiti Kuala Lumpur,
53100 Gombak, Selangor,MALAYSIA.
(E-mail: [email protected], [email protected], rasyiqah.rosidi@ s.unikl.edu.my) 4 Department of Radiology, School of Medical Sciences, Universiti Sains Malaysia, 16150 Kubang
Kerian, Kelantan, MALAYSIA. (E-mail: [email protected])
5 Medical Devices and Technology Group (MEDITEG), Sports Innovation and Technology Centre
(SITC), Universiti Teknologi Malaysia, MALAYSIA. (E-mail: [email protected])
6 Department of Electronic Engineering Technology, Faculty of Engineering Technology, Universiti
Malaysia Perlis, MALAYSIA. (E-mail: [email protected])
ABSTRACT
Segmentation is an essential task in medical image analysis. To date, different computer-
aided segmentation models i.e. semiautomatic and automatic methods have been developed,
yet there is still much space of improvement. Furthermore, there is always a lack of training
data in medical imaging; in which the concern is compensated by excessive degree of manual
interaction practiced in semiautomatic segmentation models. In this works, we have
developed an automatic seed generation model within the random walk algorithm to reduce
the level of user’s interaction. Then, we analyze the performance of the proposed model
against conventional interactive practice by using normal and abnormal knee images of
different grades. The experiment was conducted by twenty volunteers who were blinded
throughout the experiment. Our results show that the implementation of auto seed generation
model benefits the semiautomatic segmentation model. We have observed ±35% of reduction
in number of clicks (reflects degree of user interaction) and ±37% decrease in total required
to complete the segmentation (reflects efficiency of model). Therefore, we can conclude the
model is able to provide robust interactive environment to be implemented in future
interactive segmentation models.
Key words: Seed Generation, Knee Cartilage, Random Walk
INTRODUCTION
Knee osteoarthritis (KOA) is a degenerative disease that affects more than 71 million people
globally [1]. For instance, the disease causes disability, especially among elderly people by
gradually degrade the knee cartilage [2]; contributing to severe socioeconomical impact.
Thus, several large scale osteoarthritis datasets such as the Osteoarthritis Initiative (OAI) and
the Multicenter Osteoarthritis Study (MOST) have been introduced to analyze the

ENGINEERING 74
progression of KOA. Segmentation is a common computer vision task and plays essential
role to extract knee cartilage from magnetic resonance image (MRI). Then, biomarkers such
as cartilage volume loss and cartilage thickness changes over time will be assessed to
understand the undergoing of this disease.
Interactive segmentation model is a fusion of manual interaction and computer segmentation
algorithms [3]. Manual interaction is usually presented in the form of scribbles, bounding box
or seeds to provide color, texture, location, and size information [4]. Meanwhile, numerous
computer algorithms such as graph cuts, shortest path and random walks have been
developed. Even though these algorithms are supervised by user’s interaction, it is not
without any shortcomings. One of the common problems associated with interactive
segmentation models is the excessive degree of user’s interaction in order to obtain
satisfactory results.
Random walk is a popular interactive segmentation method [5]. It is well-received because
the method allows multiclass segmentation and is robust to image noise [6]. Despite of its
advantages, random walks algorithm is also impeded with several drawbacks. The method is
sensitive to seed location and requires substantial amount of initial seed point due to global
features distribution [7]. As a result, random walk is reported to be laborious. The limitation
seriously discounts the method potential to be implemented on large scale image data.
In recognition to this, we propose to implement an automatic seed generation model within
the random walk algorithm. Random walk calculates the probability of each unlabeled pixel
to reach labeled seed point and assign unlabeled pixels to label class with highest probability.
The auto seed generation model is developed to produce background and foreground sedes by
using superpixel and Fuzzy C-Means to generate seeds on the targeted objects. The model
will replace manual seed placement but user can always edit the seeding pattern whenever
necessary. By doing so, we can reduce the degree of manual interaction that curtails the
potential of interactive random walk. The motivation of this paper is to evaluate the
performance of our automatic seed generation model against conventional interactive
seeding.
MAIN RESULTS
We have conducted an experiment to assess the degree of user interaction and efficiency of
auto seed generation model against conventional semiautomatic random walk segmentation.
Therefore, volunteers need to perform the experiment under two conditions i.e. random walk
with auto seed generation (denoted as C1) and random walks without auto seed generation
(denoted as C2). The experiment were iterated four times, with one week intervel, to enhance
the reliability of result. Volunteers were blinded throughout the experiment sessions. Overall,
we can observe obvious drop in number of clicks when we use auto seed generation model
along with random walk algorithm. The total numbers of clicks recorded from week 1 to week
4 under C1 are 96, 87, 67 and 53 respectively. While the total numbers of clicks under C2 for
four-week interval are 143, 126, 94 and 63 respectively. As a result, the drop in number of
clicks is an averaged ±35% over four weeks. Besides, we have observed that most of the
numbers of clicks concentrate on scribble of foreground objects and followed by background
objects; reflecting the significance of works to automate the labelling of both objects.
We also compared the averaged time taken to complete the knee cartilage segmentation. We
have observed greater efficiency with the implementation of auto seed generation model. The

ENGINEERING 75
total time taken of clicks recorded from week 1 to week 4 under C1 is 117, 97, 77 and 66
respectively. While the total time taken of clicks for C2 over four week are 152, 135, 126, and
100 respectively. As a result, the drop in time taken of clicks is an averaged ±37% over four
weeks. Therefore, it shows that auto seed generation is more efficient compared to without
auto seed generation.
CONCLUSION
The implementation of auto seed generation model has succeeded in reducing the level of
user interaction and improving the efficiency of segmentation. Our findings suggest future
work should focus on fine-tuning the model so it can recognize different types of foreground
objects.
Acknowledgment: The authors gratefully acknowledge the University Short Term Research
Grant (STRG) (Grnat number: str17015) provided by Centre of Research and Innovation
(CoRI) and Universiti Kuala Lumpur, British Malaysian Institute (UniKL BMI) in supporting
this study.
REFERENCES
1. Kubakaddi S., Ravikumar K., and Dg H. Measurement of cartilage thickness for early detection of knee
osteoarthritis (KOA). 2013 IEEE Point-of-Care Healthcare Technologies (PHT), 2013. 2. Pitikakis M.,Chincisan A., Magnenat-Thalmann N., Cesario L., Parascandolo P., Vosilla L., and Viano G.
Automatic measurement and visualization of focal femoral cartilage thickness in stress-based regions of
interest using three-dimensional knee models. International Journal of Computer Assisted Radiology and
Surgery, vol. 11, no. 5, pp. 721–732, (2015) K. Elissa, “Title of paper if known,” unpublished.
3. Duryea J., Neumann G., Brem M., Koh W., Noorbakhsh F., Jackson R., Yu J., Eaton C., and Lang P. Novel
fast semi-automated software to segment cartilage for knee MR acq uisitions, Osteoarthritis and Cartilage,
vol. 15, no. 5, pp. 487–492 (2007).
4. Hong-Seng G., TanTian S., Karim A.H.A., Sayuti K.A., Kadir M.R.A., Weng-Kit T. Medical Image Visual
Appearance Improvement Using Bihistogram Bezier Curve Contrast Enhancement:Data from the
Osteoarthritis Initiative. The World Scientific Journal,
vol. 2014, pp. 1-13, 2014.
5. Grady L.. Random Walks for Image Segmentation. IEEE Trans.Pattern Anal. Mach. Intell., vol. 28, pp. 1768-1783 (2006).
6. Hong-Seng G., Tan Tian S., Sayuti K. A. , Karim A. H. A., & Kadir M.R.A. Multilabel graph based
approach for knee cartilage segmentation: Data from the osteoarthritis initiative. 2014 IEEE Conference on
Biomedical Engineering and Sciences (IECBES). doi:10.1109/iecbes.2014.7047487, (2014).
7. Hong-Seng G., TanTian S., Liang-Xuan W., Weng-Kit T. & Sayuti K. A. Interactive knee cartilage
extraction using efficient segmentation software: Data from the Osteoarthritis Initiative. Bio-
Med.Mater.Eng.,24:3145-3157.PMID: 25227024,2014.

ENGINEERING 76
IGCESH2018
Universiti Teknologi Malaysia, Johor Bahru, Malaysia 13 -15 August 2018
INTERACTION AND PERFORMANCE ANALYSIS OF A TERNARY
MIXTURE DISTILLATION PROCESS
Muhammad Fakhrul Islam Zahran*1, Nur Syamimi Jalil1, Ahmad Nafais Rahimi1,
Muhammad Afiq Zubir1, Munawar Zaman Shahruddin1, Kamarul Asri Ibrahim1,2,
and Mohd Kamaruddin Abd Hamid1,2
1 Process Systems Engineering Centre (PROSPECT), Research Institute for Sustainable Environment
(RISE), Universiti Teknologi Malaysia, 81310 UTM Johor Bahru, Johor, MALAYSIA.
(E-mail: [email protected], [email protected], [email protected], [email protected], [email protected])
2 Department of Chemical Engineering, Faculty of Chemical and Energy Engineering, Universiti
Teknologi Malaysia, 81310 UTM Johor Bahru, Johor, MALAYSIA. (E-mail: [email protected], [email protected])
ABSTRACT
The objective of this study is to analyse the controllability of a driving force-based distillation
columns sequence for the separation a benzene, toluene, and p-xylene mixture. Primarily, a
methodology for this study is constructed, which consists of five hierarchical stages. In the
first stage, all possible distillation columns sequences are synthesised. Then, the sequences
are simulated under steady state conditions using Aspen HYSYS in the second stage. In the
third stage, the input-output interactions of the sequences are analysed by using relative gain
arrays (RGA). In the proceeding fourth stage, the sequences are simulated under dynamic
conditions. Finally, in the fifth stage, the controllers’ responses are analysed using MATLAB.
From this study, it is found that the driving force-based sequence has better overall
controllability than an alternative sequence.
Key words: Driving force algorithm, Relative gain array, aromatic mixture
INTRODUCTION
Distillation is known to be accountable for up to 50% of the operating costs of a plant
because of its energy consumption [1]. One approach to minimise the consumption is by
sequencing the distillation columns in such a way that would require the least amount of
duty for the entire separation. One sequencing method is the driving force approach,
which provides a simple algorithm and a graphical solution to the problem [2]. This
method has been found to provide a solution that is energy efficient [3], and sustainable
[4], compared to existing sequences. The control aspect of the solution is yet to be
studied.
There are several areas to cover when studying control properties of distillation
sequences. One of them is controller interaction, or input-output interaction. The way that
this interaction is analysed is through the application of relative gain array (RGA). The
RGA uses steady-state process gains knowledge [5] to determine the interactions between
possible input-output pairs. The closer the values in the array to 1 and 0, the less

ENGINEERING 77
interaction can be inferred for a process. Other ways to assess control properties include
measuring response errors, and response’s settling times.
To analyse the controllability of a driving force-based sequence, the RGA will be used to
measure the input-output interactions. The sequence’s controller reponses are analysed
using MATLAB in addition to the interaction analysis. Figure 1 shows the general
overview of the methodology.
Figure 1. The overall methodology.
MAIN RESULTS
Figure 2 shows the direct sequence, which is synthesised based on the driving force
algorithm and Table 1 shows the RGA values for the direct sequence. The symbols A, B,
and C represent benzene, toluene, and p-xylene respectively.
Figure 2. The direct sequence.
Table 1. RGA values for direct sequence
∆x/(∆Reflux rate or Duty) xd1 xb1 xd2 xb2
d1 0.0036 0.9964 0 0
b1 0.9964 0.0036 0 0
d2 0 0 1.0000 0
b2 0 0 0 1.0000
A,B,C
A
C
B

ENGINEERING 78
Based on the values, it can be said that the direct sequence has little interactions between the
input-output pairs, thus better controllability. Table 2 shows the differences between the ISE
values and settling times of both sequences.
Table 2. The ISE values and settling times for both sequences
Sequence Direct Indirect
Setpoint
Tracking
Disturbance
Rejection
Setpoint
Tracking
Disturbance
Rejection
Average error 0.3262 32.1333 253.4000 89.2333
Average settling time 4600 3800 3400 3800
From Table 2, the response errors of the direct sequence are much smaller than those of the
indirect sequence. Both sequences have an almost similar settling times, with the exception of
setpoint tracking, for which the direct sequence’s response settles slower than the indirect
sequence’s.
CONCLUSION
The controllability of a driving force based sequence has been successfully analysed by using
the five stage methodology. The results show that the driving force sequence, which is the
direct sequence is more controllable than the indirect sequence based on the input-output
interactions, error values, and settling time. Although the driving force sequence has a
slightly longer settling time, it is better than the latter sequence in the other remaining
aspects. For the separation of a benzene, toluene, and p-xylene mixture, this methodology is
capable in providing an energy efficient and controlable solution. Future studies may include
analysis of different separation units such as the flash column.
Acknowledgment: The authors would like to express their appreciation for the support of the
sponsors with Zamalah Scholarship UTM.
REFERENCES
1. Kiss, A. A., Landaeta, S. J. F. and Ferreira, C. A. I. Towards energy efficient distillation technologies–
Making the right choice. Energy 47(1) (2012), 531-542.
2. Bek-Pedersen, E., and Gani, R. Design and synthesis of distillation systems using a driving-force-based
approach. Chemical Engineering and Processing: Process Intensification 43(3) (2004), 251-262.
3. Rahimi, A. N., Mustafa, M. F., Zaine, M. Z., Ibrahim, N., Ibrahim, K. A., & Abd Hamid, M. K.
Hydrocarbon mixture fractionation direct sequence retrofitting and feed condition sensitivity analysis. Chemical Engineering Transactions 56 (2017), 787-792.
4. Zaine, M. Z., Mustafa, M. F., Ibrahim, N., Ibrahim, K. A., & Hamid, M. K. A. Minimum energy distillation
columns sequence for aromatics separation process. Energy Procedia 75 (2015), 1797-1802.
5. Lau, H., Alvarez, J., & Jensen, K. F. Synthesis of control structures by singular value analysis: Dynamic
measures of sensitivity and interaction. AIChE Journal 31(3) (1985), 427-439.

ENGINEERING 79
IGCESH2018
Universiti Teknologi Malaysia, Johor Bahru, Malaysia 13 -15 August 2018
KINETIC ANALYSIS OF HORSE MANURE USING
THERMOGRAVIMETRIC ANALYSIS
Guo Ren Mong1, Jo-Han Ng2,3,4, Farid Nasir Ani1, Cheng Tung Chong1,4,*
1 Faculty of Mechanical Engineering, Universiti Teknologi Malaysia, 81310 Skudai, Johor, Malaysia. 2 Faculty of Engineering and the Environment, University of Southampton Malaysia Campus
(USMC), 79200 Iskandar Puteri, Johor, Malaysia. 3 Energy Technology Research Group, University of Southampton, Southampton, Hampshire SO17
1BJ, United Kingdom. 4 UTM Centre for Low Carbon Transport in cooperation with Imperial College London, Universiti
Teknologi Malaysia, 81310 Skudai, Johor, Malaysia. [email protected], [email protected]
ABSTRACT
Horse manure is an organic waste that has the potential to be used as feedstock to convert
into bioenergy or by-products. The kinetics of the horse manure needs to be analysed to gain
insight into the pyrolysis process to enable the design of a process reactor.
Thermogravimetric analysis was performed on horse manure at four different heating rates
(1°C/min, 2°C/min, 5°C/min, 10°C/min). The data obtained wass evaluated using two
different types of isoconversional methods, namely Flynn-Wall-Ozawa (FWO) and
Kissinger-Akahira-Sunose (KAS). The temperature during the highest degradation rate fall
within the range of 290-329°C. The activation energy was determined to be 199.3 kJ/mol
and 200.2 kJ/mol for FWO and KAS respectively.
Key words: Horse Manure, Kinetics, Pyrolysis
INTRODUCTION
World modernisation and technology evolution have led to the increase of energy usage . The
current crude petroleum reservoir is depleting and alternative resource for energy production
is needed. Renewable green energy resources for instance wind, solar, hydro and biomass are
potential candidates. Biomass is naturally available and abundant Biomass contains energy
that could be derived via thermochemical conversion processes such as combustion,
gasification and pyrolysis. Animal waste is considered a type of biomass which could be
converted into products in the form of solid (bio-char), liquid (bio-oil) and gas (bio-gas)
through pyrolysis. Previous study on pyrolysis of horse manure is scarce. This paper aims to
investigate the kinetic properties of horse manure using thermogravimetric analysis (TGA) to
gain insight on the kinetic mechanism that occurs during pyrolysis.
The fresh horse manure was collected from the horse stable at the Universiti Technologi
Malaysia, Skudai. The manures were dried in a furnace at 120°C for 24 hours. The dried
manure was sent for TGA tests at four different rates (1°C/min, 2°C/min, 5°C/min,
10°C/min). Weight loss data obtained from TGA was analysed using two isoconversional
method, namely Flynn-Wall-Ozawa (FWO) method and Kissinger-Akahira-Sunose (KAS).

ENGINEERING 80
These two methods have been used in other studies to obtain the activation energy of the
sample[1, 2]. The activation energy provides information on the sample reactivity and
degradation behavior during decomposition under inert atmosphere subjected to heat.
The FWO method uses Doyle’s approximation to the temperature integral that gives the
equation:
ln (β𝑖) = ln(AαR
Eαg(α)) − 5.331 − 1.052
Eα
RTα𝑖 (1)
The KAS method applies the equation:
ln (𝛽𝑖
𝑇𝛼𝑖2 ) = ln (
AαR
Eαg(α)) −
Eα
RTα𝑖 (2)
For both methods, temperature data from each degree of conversion range between 0.15-0.7
are selected. Graphs of lnβi vs. 1000/Tα𝑖 (FWO) and graph of lnβ𝑖/Tα𝑖2 vs. 1000/Tα𝑖
(KAS) are plotted and activation energies are derived from the gradient of the straight line
plot.
RESULTS AND DISCUSSION
Values obtained from each conversion method are shown in Figure 1 using Eqs. (1) and
(2). Results shows that high correlation factor is obtained (R2 > 0.85). Changes in
activation energy during manure degradation are reflected in Figure 2, where complex
reaction or multi-step mechanism is present during devolatilization process [3]. The
activation energies obtained from FWO and KAS methods are 176.2-293.6 kJ/mol 175.6-
300.1kJ/mol, respectively. Compared to data from literature, the present activation energies
obtained is higher than swine manure (84-95kJ/mol) [4] and within the range of cattle manure
(42-527kJ/mol) [5].
(a) (b)
Figure 1. FWO (a) and KAS (b) plot of horse manure for different value of conversion. (axis
numbering , legend are ineligible), redraw.
0
0.5
1
1.5
2
2.5
3
1.6 1.7 1.8 1.9 2
Ln
β
1000/T (K^-1)
0.15 0.2 0.25 0.3 0.35 0.4
0.45 0.5 0.55 0.6 0.65 0.7
-13
-12.5
-12
-11.5
-11
-10.5
-10
1.6 1.7 1.8 1.9 2
Ln
(β/T
^2)
1000/T (K^-1)
0.15 0.2 0.25 0.3 0.35 0.40.45 0.5 0.55 0.6 0.65 0.7

ENGINEERING 81
Figure 2. Activation energy of horse manure at various conversion level obtained through
FWO and KAS methods. The FWO markers are blocked, change the markers size and
shape and make them clearer.
CONCLUSION
Horse manure has an average level of activation energy (175.6-300.1kJ/mol), indicating that
it is a potential feedstock for pyrolysis. Both FWO and KAS methods show similar profiles
of activation energy at different coversion level.
Acknowledgment: Financial support from the Malaysian Ministry of Higher Education and
Universiti Teknologi Malaysia (Research University Grant – Tier 1 vote no. 17H70) is
gratefully acknowledged.
REFERENCES
1. Fernandez-Lopez, M., Pedrosa-Castro, G. J., Valverde, J. L., and Sanchez-Silva, L. Kinetic analysis of
manure pyrolysis and combustion processes, Waste Management 58(2016), 230-240.
2. Abd-Elghany, M., Elbeih, A., and Hassanein, S. Thermal behavior and decomposition kinetics of rdx and
rdx/htpb composition using various techniques and methods, Central European Journal of Energetic
Materials 13(3)(2016), 714-735.
3. Islam, M. A., Asif, M., and Hameed, B. H. Pyrolysis kinetics of raw and hydrothermally carbonized karanj
(pongamia pinnata) fruit hulls via thermogravimetric analysis, Bioresour Technol 179(2015), 227-33.
4. Ro, K. S., Cantrell, K. B., Hunt, P. G., Ducey, T. F., Vanotti, M. B., and Szogi, A. A. Thermochemical
conversion of livestock wastes: Carbonization of swine solids, Bioresource Technology 100(2009), 5466–
5471. 5. Wu, H., Hanna, M. A., and D., J. Thermogravimetric characterization of dairy manure as pyrolysis and
combustion feedstocks, Waste Management & Research 30(10)(2012), 1066-1071.
0
50
100
150
200
250
300
350
0.0 0.1 0.2 0.3 0.4 0.5 0.6 0.7 0.8
Act
ivati
on
En
ergy, E
a (
kJ/m
ol)
Conversion, α
FWO KAS

ENGINEERING 82
IGCESH2018
Universiti Teknologi Malaysia, Johor Bahru, Malaysia 13 -15 August 2018
A NEW APPROACH IN EXTRACTING VIRTUAL INERTIAL
SUPPORT FROM SUPERCAPACITOR ENERGY STORAGE
Nor Shahida Hasan*1, Norzanah Rosmin1,2 and Norjulia Mohamad Nordin2
1 Centre of Electrical Energy Systems (CEES), Institute of Future Energy, Universiti Teknologi
Malaysia (UTM), 81310, Skudai, Johor Bahru, MALAYSIA.
(E-mail: [email protected], [email protected]) 2 Department of Electrical Power Engineering, Faculty of Electrical Engineering, Universiti
Teknologi Malaysia (UTM), 81310, Skudai, Johor Bahru, MALAYSIA.
ABSTRACT
This paper proposed a new approach that enables virtual inertial support from supercapacitor
during sudden load increase. Previously, a conventional synchronous generator is adapted
into the wind energy conversion system to supply the required inertial support, however its
slow behaviour may worsening the stability problem of the system during frequency event.
Here, this new approach regulates the charging and discharging process of SC to respond to
the change of the system frequency. This approach successfully reduces the frequency nadir
and ROCOF of the system frequency. It also able to avoid the second frequency dip during
frequency recovery time.
Key words: wind power fluctuation, virtual inertial support, frequency disturbance,
supercapacitor and dc/dc converter
INTRODUCTION
In recent years, wind energy had shown a great development in its generation system [1].
Integrating variable speed wind turbine into the grid system can reduce the frequency
response and power damping capability of wind turbine. This reduction can increase the
power difference between supply and load side and also could increase the initial rate of
change of frequency (ROCOF) [2, 3]. Synchronous Generator (SG) is one of the existing
frequency supports system that had been employed in wind energy conversion system
(WECS) for years [4-6]. During power unbalance between supply and load, SG will release
or absorb its stored kinetic energy to prevent transient frequency change. However, due to its
slow response in providing inertial support during frequency event, better inertial support
which also known as virtual inertial supports (VIS) that mimics the behaviour of SG are
widely proposed.
In rotating mass, the kinetic energy, (KE) is stored in rotor of wind turbine and normally it
will be controlled using active power filter (APC). There are supplement loops and gains
involved in this method which increased its complexity and operating time, particularly when
considering large scale wind power system [7]. In fact, the stored and released kinetic energy
is totally depends on the available wind blow. This situation will degrade the system inertial
support during underproduction wind speed. This APC also can increase the mechanical

ENGINEERING 83
stress of the generator because it will divert the maximum power point tracking (MPPT)
wind generator to its inertial support curves. Conversely, in VIS based DC link capacitor; the
KE support during frequency deviation will be extracted or absorbed by the DC-link
capacitor [5]. Unfortunately, the main drawback of this method is its energy sized. This
capacitor must be large enough to provide temporary inertial response during frequency
disturbance. In energy storage, (ES) based VIS, similar charging and discharging concept as
DC-link capacitor is applied. The difference is in their storage characteristics, such as power
and energy density, life cycle and capital cost. Not all ESs are applicable for VIS [8]. For
VIS application, ESs must have high power density to give fast response during frequency
change. Also, high energy density to provide endless inertial support in any sudden
frequency change and low capital cost to develop cost-effective inertial support [9]. Another
inertial support which non SG which also applicable for WECS is using offshore wind farm
[10]. By regulating DC-link voltage and frequency control of full converter wind turbine,
effective inertial response is successfully provided without any extra investment. The huge
problem in this proposed method is its involvement of large scale wind turbine. This is not
applicable for small scale wind turbine.
Hence, in order to avoid mechanical stress on generator system, enlarge DC link size and
slow respond time during frequency event, this research proposed energy storage to mimic
the behaviour of SG to provide VIS during frequency event. For VIS application, the ESs
must have high power density to give fast response during frequency change. Thus,
supercapacitor, (SC) is chosen in this research to provide limitless VIS. The propose
approach aims to improve the control technique of SC by regulating its charging and
discharging process based on every second change of frequency. This aim helps to increase
the SC performance regardless how sudden the load change. Several publications on
implementation of SC as VIS can be found in [11-13].
MAIN RESULTS
Figure 1 (a and b) shows the measured system frequency and ROCOF with and without the
presents of SC. It is observed that, with the presence of SC, during sudden load increase, the
frequency nadir of the system frequency improve from 58.2 Hz to 59.1Hz. Similar behavior
can be seen in evaluating the ROCOF.
Figure 1. Simulation results of (a) System Frequency, (b) ROCOF
CONCLUSION

ENGINEERING 84
This paper proposes a new approach in providing fast virtual inertial support during sudden
load change for wind PMSG systems using SC. The charging and discharging process of SC
is controlled to respond to every single change of frequency event. It proved that, during
sudden load change at second of 50, the SC not only able to reduce the frequency nadir and
ROCOF of the system frequency, but also successfully avoid second frequency dip during
frequency recovery process.
Acknowledgment: The authors would like to thank RMC, FKE and CEES, Universiti
Teknologi Malaysia and the Ministry of Higher Education of Malaysia for the financial
support provided under RUG (18H08) to carry out this research
REFERENCES
1. Vidyanandan KV and Nilanjan Senroy. Issues in the grid frequency regulation with increased penetration of
wind energy systems. in Engineering and Systems (SCES), 2012 Students Conference on. 2012. IEEE.
2. Wang Shuo, Jiabing Hu, Xiaoming Yuan, and Li Sun, On inertial dynamics of virtual-synchronous-controlled DFIG-based wind turbines. IEEE Transactions on Energy Conversion, 2015. 30(4): p. 1691-1702.
3. AEMO; and ElectraNet., Update to Renewable Energy Integration in South Australia, 2016.
4. Modi Nilesh and Ruifeng Yan. Low inertia power systems: Frequency response challenges and a possible
solution. in Power Engineering Conference (AUPEC), 2016 Australasian Universities. 2016. IEEE.
5. Li Y., Z. Xu, and K. P. Wong, Advanced Control Strategies of PMSG-Based Wind Turbines for System
Inertia Support. IEEE Transactions on Power Systems, 2016. PP(99): p. 1-1.
6. El Mokadem M, V Courtecuisse, C Saudemont, B Robyns, and J Deuse, Experimental study of variable
speed wind generator contribution to primary frequency control. Renewable Energy, 2009. 34(3): p. 833-
844.
7. Ye Hua, Wei Pei, and Zhiping Qi, Analytical modeling of inertial and droop responses from a wind farm for
short-term frequency regulation in power systems. IEEE Transactions on Power Systems, 2016. 31(5): p. 3414-3423.
8. Islam Atiqul, Sandeep Nimmagadda, Anitha Subburaj, and Stephen B Bayne, A Review of Frequency
Response Solution for Type-3 Wind Turbines Using Energy Storage Device. International Journal of
Renewable Energy Research (IJRER), 2016. 6(4): p. 1423-1434.
9. Silva-Saravia Horacio, Hector Pulgar-Painemal, and Juan Mauricio, Flywheel energy storage model, control
and location for improving stability: The Chilean case. IEEE Transactions on Power Systems, 2016.
10. Liu Hongzhi and Zhe Chen, Contribution of VSC-HVDC to frequency regulation of power systems with
offshore wind generation. IEEE Transactions on Energy Conversion, 2015. 30(3): p. 918-926.
11. Arani M. F. M. and E. F. El-Saadany, Implementing Virtual Inertia in DFIG-Based Wind Power Generation.
IEEE Transactions on Power Systems, 2013. 28(2): p. 1373-1384.
12. Suryana Rahmat. Frequency control of standalone wind turbine with supercapacitor. in Telecommunications
Energy Conference (INTELEC), 2011 IEEE 33rd International. 2011. IEEE. 13. Tan Yingjie, Kashem Muttaqi, Phil Ciufo, and Lasantha Meegahapola, Enhanced frequency response
strategy for PMSG based wind energy conversion system using ultracapacitor in remote area power supply
systems. IEEE Transactions on Industry Applications, 2016.

ENGINEERING 85
IGCESH2018
Universiti Teknologi Malaysia, Johor Bahru, Malaysia 13 -15 August 2018
SPLIT RING-SLOT BASED MULTI-BAND METAMATERIAL
MICROWAVE ABSORBER
M.S. Sim*1, K.Y. You2, F. Esa3, M.N. Dimon4 and N.H. Khamis5
1, 2, 4, 5 Faculty of Electrical Engineering, Universiti Teknologi Malaysia, Johor Bahru, MALAYSIA.
(E-mail: [email protected], [email protected], [email protected], [email protected]) 3 Faculty of Applied Science and Technology, Universiti Tun Hussein Onn Malaysia, Pagoh,
MALAYSIA.
(E-mail: [email protected])
ABSTRACT
In this paper, a split ring-slot structure-based metamaterial absorber is introduced and
investigated numerically and experimentally for horizontal and vertical configurations from 1
GHz to 9 GHz. The absorption performance is determined from the scattering parameters
obtained numerically using CST Microwave Studio. A comprehensive verification is done
experimentally by free space measurement using Vivaldi horn antennas with vector network
analyser. The experimental absorption spectra are in agreement with the simulated ones. For
horizontal configuration, the structure possesses dual-band absorption. The experimental
measurement result indicates that the metamaterial absorber achieves high absorption of 84.3
% at 6.24 GHz. The absorber in vertical configuration shows absorption at higher frequency,
which is 92.4 % at 8.4 GHz.
Key words: Metamaterials, Microwave Absorber, Split Ring Resonator
INTRODUCTION
Electromagnetic metamaterials are materials having periodic arrangements of identical unit
cells which possess unique electromagnetic properties not found in nature. The properties are
based on the size, shape and geometry of the structures of the elements. Metamaterial
received a great deal of research attention due to their potential applications in absorbers,
antennas and filters. Metamaterial absorbers are commonly being proposed as a metal-
dielectric-metal three layered structure due to ease of fabrication.
Most proposed metamaterials are based on metallic resonant structures which rely on strong
resonances and able to achieve high absorption. However, the absorption bandwidth of
resonance-based metamaterial is narrow. To overcome this problem, multi-band
metamaterials have been proposed by many researchers [1]-[3]. Multiband metamaterials can
be made by combining several structures of different geometrical parameters on a same plane
or by stacking them in different layers. The idea is supported by Yu and coworkers in which
four concentric rings are incorporated in a unit cell to achieve multi-band performance [4].
Similarly, Bhattacharyya and coworkers stacks rings of different size in layers and achieved
dual-band performance [5]. However, stacking the structures in layers increases the thickness
and limits its application.

ENGINEERING 86
In this paper, the design, fabrication and investigation of a split ring-slot based metamaterial
of thickness 1.58 mm are presented. Double circular split rings in a single unit cell which act
as electric resonators provides dual-band absorption. The slot structure at the back provides
magnetic resonances. The metamaterial in horizontal and vertical configuration have
absorption peaks at different frequencies.
METHODOLOGY
The proposed metamaterial absorber is a three-layered structure of thickness, t = 1.58 mm
and unit cell size, p = 16.8 mm as illustrated in Figure 1(c). Based on Figure 1(a), double
circular split rings with split gap, g = 0.8 mm, radius of the inner ring, r = 3.5 mm, width
of ring, w = 2.2 mm, gap distance between inner and outer ring, d = 0.3 mm forms the
front layer of the structure. Having values of horizontal size of slit, a = 2.4 mm and
vertical size of slit, b = 0.2 mm, the multi-width slot structure at the back layer (Figure
1(b)) has width, l = 10.8 mm and middle width, l-2a = 6.0 mm.
The unit cell is simulated using CST Microwave Studio. A prototype sample having area
of 200 × 200 mm2 and 11 × 11 unit cells is fabricated and investigated experimentally
using Vivaldi horn antenna and Keysight E5071C vector network analyzer by free space
measurement [6].
Figure 1. Unit cell design of the proposed metamaterial absorber
(a) front view; (b) back view; (c) side view.
MAIN RESULTS
Figure 2 shows the simulated and experimental absorption of the proposed metamaterial
absorber. For horizontal configuration as shown in Figure 2(a), the simulation result
shows that the metamaterial possesses dual-band absorption, which are 64.4 % at 3.04
GHz and 98.1 % at 5.83 GHz. The experimental results are in agreement with the
simulated result, showing two absorption peaks which are 64.4 % at 3.16 GHz and 84.3 %
at 6.24 GHz. The shift of the absorption peak to higher frequencies compared with the
simulated results is due to the fabrication discrepancies.
For vertical configuration as shown in Figure 2(b), the simulated result shows two
significant absorption peaks, which are 64.2 % at 7.80 GHz and 84.2 % at 8.57 GHz.
However, the experimental absorption occurs at 8.40 GHz which manages to absorb 92.4
% of the incident wave energy.

ENGINEERING 87
Figure 2. Simulated and experimental absorption of the metamaterial absorber in
(a) horizontal configuration; (b) vertical configuration.
CONCLUSION
We designed, fabricated and investigated a dual-band metamaterial based on split ring and
multi-width slot structure from 1 GHz to 9 GHz. The experimental measurement shows that
the proposed structure possesses strong absorption which are 84.3 % at 6.24 GHz for
horizontal configuration and 92.4% at 8.40 GHz for vertical configuration. The simulation
and experimental results are in agreement for the peak absorption. The multiband
metamaterials could be applied in microwave absorbing application in which changing its
horizontal and vertical configuration will shift the absorption peaks.
Acknowledgment: The authors would like to express their appreciation for the support of
Research University Grant (GUP) from Universiti Teknologi Malaysia under Project No
Q.J130000.2523.15H30 and the Ministry of Higher Education of Malaysia (MOHE).
REFERENCES
1. Tak, J., Jin, Y. and Choi, J. A dual‐band metamaterial microwave absorber. Microwave and Optical
Technology Letters 58 (2016), 2052-2057.
2. Singh, D. and Srivastava, V.M. Dual resonance shorted stub circular rings metamaterial absorber. AEU-
International Journal of Electronics and Communications 83 (2018), 58-66.
3. Yu, X., Song, Y., and Fan, S. Research on a multiband metamaterial absorber. InAIP Conference Proceedings 1890 (2017), 040102.
4. Wang, L., Hu, C., Wu, X., Xia, Z. and Wen, W. Multi-band metamaterial absorber with arbitrary
polarization and wide-incident angle. Applied Physics A 123 (2017), 651.
5. Bhattacharyya, S., Ghosh, S., Chaurasiya, D. and Srivastava, K.V. Bandwidth-enhanced dual-band dual-
layer polarization-independent ultra-thin metamaterial absorber. Applied Physics A 118 (2015), 207-215.
6. Sim, M.S., You, K.Y., Esa, F. and Chan, Y.L. Broadband metamaterial microwave absorber for X-Ku band
using planar split ring-slot structures. Progress in Electromagnetics Research Symposium- Fall (2017), 215-
221.

ENGINEERING 88
IGCESH2018
Universiti Teknologi Malaysia, Johor Bahru, Malaysia 13 -15 August 2018
ETCHED MULTIMODE FIBER SENSOR FOR MAGNETIC SENSING
APPLICATION
Siti Sarah Osman*1, Hazri Bakhtiar2, Ganesan a/l Krishnan , Ahmad Fauzi Ismail3,
Mohd Hafiz Dzarfan Othman, Mukhlis A Rahman.
Laser Centre, Universiti Teknologi Malaysia, Johor , Malaysia.
(E-mail: [email protected], [email protected], [email protected] ) AMTEC, Universiti Teknologi Malaysia, Johor , Malaysia.
(E-mail: [email protected], [email protected], [email protected])
ABSTRACT
A kind of magnetic field fiber optic sensor composed of magnetic composition surrounding a
segment of etched multi mode fiber is proposed. The fiber was etched using chemical
solution until it reach a certain thickness. Then, the fiber was coated with magnetic particles
surrounding the segment of fiber before exposed to magnetic field. The etched multimode
fiber sensor is easy to fabricate, simple and low cost. The intensity of light transmit was
changed by varying the magnetic field. Experimental results show that the fiber sensor has
more sensitive wavelength shift when increase the magnetic field.
Key words: Etched fiber, magnetic sensor, magnetic particles
INTRODUCTION
A magnetic sensor based on fiber optic has drawn much attention over the past few years due
advantages characteristic of fiber such as simplicity, high responsibility towards
measurement, high sensitivity, low-cost, compact in size and immune to electromagnetic
interference [1]. In the past years, many researchers used fiber optic in magnetic detection
with combination of sensitive magnetic material and different type of fiber. Wide potential
applications in many different fields such as medical, industrial and electrical power can used
fiber optic magnetic sensor [2-5].
An etched multimode fiber surrounded by magnetic particles to detect the presence of
magnetic field is proposed and demonstrated in this paper. Experimental results show output
intensity of light passing through the fiber sensor. The light source that used is in the range of
300 nm to 700 nm. The fiber is exposed to magnetic field over 20 minutes period. Both
experiments recorded changes of intensity of light.

ENGINEERING 89
MAIN RESULTS
The output intensity spectrum is shown in Figure 1; (a) is when fiber sensor is exposed
without magnetic field (b) with magnetic field. From both figures, the lowest intensity peak is
at 0 min, and the intensity increasing with the time. Both of the spectrum changes but the
rates of changes is slightly different.
(a) (b)
Figure 1. Output spectrum of spectrometer
Figure 2. Intensity vs time exposed
By comparing at the highest peak of both experiments, the rate of changes is shown in
Figure 2. The rates of changes are 664.2 a.u/nm and 2279 a.u/nm for without magnetic
and with magnetic field, respectively.
CONCLUSION

ENGINEERING 90
This paper described in detail a successful demonstration of etched multimode magnetic
sensor. The different rates of intensity change with and without the presence of magnetic
field is 1616 a.u/nm. The study shoes the sensor will find the application to detect the
presence of magnetic field and remote sensing applications.
Acknowledgment: The authors would like to express their appreciation for the support of the
sponsors with Project No Q.J130000.3009.01M03
REFERENCES
1. Ying, Yu, Rui Zhang, Guang-Yuan Si, Xin Wang, and Yuan-Wei Qi. "D-shaped tilted fiber Bragg grating
using magnetic fluid for magnetic field sensor." Optics 405 (2017): 228-232.
2. García-Miquel, H., D. Barrera, Rafael Amat, G. V. Kurlyandskaya, and S. Sales. "Magnetic actuator based
on giant magnetostrictive material Terfenol-D with strain temperature monitoring using FBG optical
sensor." Measurement 80 (2016): 201-206.
3. Dong, Shaohua, Shengli Pu, and Haotian Wang. "Magnetic field sensing based on magnetic-fluid-clad fiber-
optic structure with taper-like and lateral-offset fusion splicing." Optics Express 22, no. 16 (2014):
19108-19116
4. Yang, Minghong, Jixiang Dai, Ciming Zhou, and Desheng Jiang. "Optical fiber magnetic field sensors with TbDyFe magnetostrictive thin films as sensing materials." Optics express 17, no. 23 (2009): 20777-
20782.
5. Zheng, Yangzi, Xinyong Dong, Runguang Yang, Shuqin Zhang, Julian Chi Chiu Chan, and Perry Ping
Shum. "Magnetic field sensor with optical fiber bitaper-based interferometer coated by magnetic
fluid." IEEE Sensors Journal 14, no. 9 (2014): 3148-3151.

ENGINEERING 91
IGCESH2018
Universiti Teknologi Malaysia, Johor Bahru, Malaysia 13 -15 August 2018
THE EVALUATION OF PARTICLE SIZE INFLUENCE ON THE
ADSORPTIVITY OF NATURAL ZEOLITE BASED ADSORPTIVE
MEMBRANE TOWARDS AMMONIA IN WASTEWATER
Mohd Ridhwan Adam1, Mohd Hafiz Dzarfan Othman1, *, Mohd Hafiz Puteh2, A.F.
Ismail1, Mukhlis A. Rahman1, Juhana Jaafar1
1Advanced Membrane Technology Research Centre (AMTEC), Universiti Teknologi
Malaysia, 81310 UTM, Skudai, Johor, MALAYSIA. 2Faculty of Civil Engineering (FCE), Universiti Teknologi Malaysia, 81310 UTM, Skudai,
Johor, MALAYSIA.
(E-mail: [email protected], [email protected])
ABSTRACT
The ammonia uptake from the wastewater has gaining a great attention for the past decades.
The utilization of the natural zeolite in the ammonia adsorption has been greatly studied and
reported. In this study, the natural zeolite has been utilized to fabricate the hollow fibre
ceramic membrane (HFCM) for the ammonia adsorption in wastewater. The effect of the
particle size of natural zeolite towards the physicochemical properties of the HFCM was
investigated in this study. The produced HFCM was revealed that the particle size has
affected the physical properties of the membrane in terms of morphologies, water permeation
and the membrane performance in adsorbing the ammonia from the wastewater. The effective
ammonia removal was mainly attributed by the membrane water permeation to which is
highly depending on the compactness of the particles in the structure. The smallest natural
zeolite particle of 36 μm was found to be given the denser and compact structure and thus,
possessed the lowest water permeation of 52.94 L/m2.h and the highest ammonia adsorption
values of more than 90% rejection.
Key words: Ammonia removal, Adsorption, Natural zeolite, Hollow fibre ceramic membrane
INTRODUCTION
Ammonia is one of the known source of water pollution causes. It is commonly found in both
municipal and industrial wastewaters. The growth in industrial bases in coking, chemical
fertilizer, coal gasification, petroleum refining, pharmaceutical and catalyst has led to the
large production of ammoniacal wastewater [1]. The excessive presence of nitrogen
compound in wastewater is known to drive into significant pollution burden since it has
distinctive characteristics and could have leads to the depletion in dissolved oxygen required
for the aquatic life. Moreover, the excessive amount of nitrogen also could have attributed to
the toxic effects on fish, lowered the disinfection efficiency and speeded the corrosion of
metals and construction materials [2].
One of the best known solutions for tackling this issue is the separation and purification of
the wastewater. This requires the implementation of cutting-edge equipment such as

ENGINEERING 92
membrane separation technologies. Up to now, membrane technology is applied in a broad
range of application to separate individual components from mixtures of either liquids or
gases. The past periods have shown that membrane technology is applicable in removing
ammonia that contained in wastewater as a clean and effective way. This could be ascribed
by the high ammonia removal efficiency of membrane besides the compact design and low
energy cost as compared to that of conventional ammonia wastewater treatments such as air-
stripping, denitrification, coagulation and flocculation as well as biological treatment.
Most of the membranes used in treating the volatile contaminants containing wastewater are
mainly of inorganic ceramic materials. These materials possessed an outstanding durability of
high pressure and temperature, good stability in chemical, owned defouling property and long
last usability [3]. However, the needs in higher sintering temperature and expensive starting
materials such as alumina, zirconia, titania and others has led to the disparaging choice of
ceramic materials to be used as membrane [4, 5]. In consequence, the necessities in finding
the inexpensive of ceramic material to replace that of costly ceramics are in real demanding.
To our best knowledge, there are no similar reports have been done nor claimed on the
fabrication of natural zeolite hollow fibre ceramic membrane (HFCM) microfiltration for
ammonia containing water treatment. Thus, this work reports the fabrication of natural zeolite
HFCM and particularly focusing on the effect of natural zeolite particle size onto the
performance for the separation and treatment of ammoniacal containing wastewater.
MAIN RESULTS
The HFCM derived from different particle sizes of zeolite (36 μm, 50 μm and 75 μm) was
successfully fabricated using the ceramic dope suspension with the composition of 45 wt.%.
The composition of the suspension of the HFCMs was as follows;
Table 1. The dope suspension composition of the natural zeolite based HFCM
Content Zeolite Arlacel N-methyl-2-
pyrrolidone (NMP)
Polyethersulfone
(PESf)
Mass (g) 45 1 49 5
The morphology of the HFCM fabricated from different grades of the natural zeolite
particle size was examined using the scanning electron microscopy (SEM) analysis.
Figure 1 shows the morphologies of the HFCMs derived from the natural zeolite
fabricated through the phase inversion and sintering techniques. The morphologies
suggested that the HFCMs were composed of asymmetric structure that combining the
finger-like (void) structure in the inner part of the membrane with that of sponge-like
structure (dense) along the outer contour of the fabricated HFCM. From the images, the
membrane porousness has been more pronounced upon the increment in the zeolite
particle size. Additionally, the membrane thickness has been also decreased along with
the increased in the particle size of the zeolite.

ENGINEERING 93
Figure 1. The SEM micrographs of the cross-sectional HFCMs derived from different
natural zeolite particle size of (a) 36 μm; (b) 50 μm and (c) 75 μm, respectively.
CONCLUSION
The HFCM derived from different grades of natural zeolite particle size was successfully
fabricated using the phase inversión and sintering technique. The smallest particle size was
produced the thickess and strongest HFCM with the lowest water permeation and the highest
ammonia removal performance. The increase in the particle size will be eventually densified
the membrane that will be eventually reduced the water permeation and increased the
ammonia uptake from the feed solution.
Acknowledgment: The authors would like to express the gratitude to the Ministry of
Education Malaysia for the funding provided under the Higher Institution Centre of
Excellence Scheme (Project Number: R.J090301.7846.4J194) and UTM R&D Fund (Project
number: R.J130000.7746.4J230).
REFERENCES
1. Atkins Jr, P. F., Scherger, D. A., A review of physical-chemical methods for nitrogen removal from
wastewater. Proceedings of the Conference on Nitrogen As a Water Pollutant: Pergamon (2013), 713-719.
2. Shi, P., Wang, Q., Xu, Y., Luo, W., Corrosion behavior of bulk nanocrystalline copper in ammonia solution.
Materials Letters 65 (2011) 857-859.
3. Guizard, C., Ayral, A., Julbe, A., Potentiality of organic solvents filtration with ceramic membranes. A
comparison with polymer membranes. Desalination 147 (2002) 275-280.
4. DeFriend, K. A., Wiesner, M. R., Barron A. R., Alumina and aluminate ultrafiltration membranes derived
from alumina nanoparticles. Journal of Membrane Science 224 (2003) 11-28. 5. Masmoudi, S., Ben Amar, R., Larbot, A., El Feki, H., Ben Salah, A., Cot L. Elaboration of inorganic
microfiltration membranes with hydroxyapatite applied to the treatment of wastewater from sea product
industry. Journal of Membrane Science 247 (2005) 1-9.
a b c

ENGINEERING 94
IGCESH2018
Universiti Teknologi Malaysia, Johor Bahru, Malaysia 13 -15 August 2018
CHARACTERIZATION OF NICKEL BASED CATALYSTS FOR
STEAM REFORMING OF BIOMASS TAR
Tan Ru Shien*1, Tuan Amran Tuan Abdullah2 and Khairuddin Md Isa3
1, 2 Department of Chemical Engineering, Faculty of Chemical and Energy Engineering, Universiti
Teknologi Malaysia, 81310 Skudai, Johor, Malaysia.
(E-mail: [email protected], [email protected]) 3 School of Environmental Engineering, Universiti Malaysia Perlis, Kompleks Pusat Pengajian Jejawi
3, 02600 Arau, Perlis, Malaysia.
(E-mail: [email protected])
ABSTRACT
Hydrogen produced from the biomass gasification is considered as green energy carrier due
to its environmental friendly, sustainability and renewability characteristics. However, the tar
formation is a serious impediment for a completed biomass conversion to syngas. Hence, the
production of syngas is improved by means of catalytic steam reforming of tar into syngas.
With regard to industrial standpoint, application of Ni-based catalysts is more practical
because of their economic feasibility, although they are usually suffer from coke formation
which in turn leads to catalytic deactivation. Combinations of nickel with dolomite, Al2O3,
La2O3, CeO2 and ZrO2 as a main supports and dolomite as a promoter prepared by co-
impregnation method are proposed in the present study in order to achieve a high stability
and catalytic activity. The aim of this study is to find the optimum temperature of calcination
and reduction. The physical and chemical properties of the catalysts were characterized by
thermogravimetric analysis and temperature-programmed reduction as a baseline for
subsequent stages of catalyst preparation. The characterization results suggested that all the
catalysts should be calcined at a calcination temperature of 800 oC and followed by reduction
at 900 oC for Ni/dolomite/Al2O3 and 750 oC for the rest.
Key words: Ni-based Catalyst, Dolomite, Steam Reforming, Characterization
INTRODUCTION
Biomass gasification is a thermochemical process that converts organic substances from
agriculture and forestry into syngas rich in hydrogen (H2) and carbon monoxide along with a
small amount of carbon dioxide, methane and undesired by-product such as tar [1]. Tar is a
complex mixture of condensable aromatic and oxygenated hydrocarbons that condenses at
low temperature and subsequently lead to process-related problems [2]. For instance, filter
clogging, plugging of downstream equipment and coke deposition on the downstream
catalyst [3]. Besides, the formation of tar also represents a decrease in syngas production
since biomass is converted to tar instead of syngas. Hence, the physical removal and further
conversion of tar is essential in order to improve the production of syngas. Among the
existing hydrogen production technology, catalytic steam reforming is a well-developed and
attractive conversion technology that produces H2 rich gas by using hydrocarbon as feedstock
[4]. Ni-based catalysts have been widely employed in steam reforming because of its low

ENGINEERING 95
price and pronounced performance in O-H, C-H and C-C bonds rupture [5,6]. Unfortunately,
Ni-based catalysts usually suffer from deactivation by sintering and coke formation on the
active sites [3].
In this study, 10 wt.% Ni from nickel nitrate hexahydrate precursor was co-impregnated on
various oxide supports (dolomite, Al2O3, La2O3, CeO2 and ZrO2) and promoted by 10 wt.%
dolomite. Oxide support was used to disperse the catalytically active metal particles in order
to improve the ability of sintering resistance. Furthermore, dolomite which serves as a
promoter was added to catalyst to suppress the deposition of coke and improve the catalytic
activity per unit surface area. Apart from the purpose of coke suppression, dolomite also
plays an important role in CO2 sorption to promote the water-gas shift reaction which causes
H2 rich fuel gas production [7]. In order to develop catalyst with high stability and catalytic
activity, this study aims to identify the optimum temperature of calcination and reduction.
Thermogravimetric analysis (TGA) with air was performed for prior calcined catalyst to
determine the thermal stability and optimum calcination temperature. Besides, temperature-
programmed reduction of hydrogen (H2-TPR) analysis was performed to determine the
optimum reduction temperature and the reducibility of active metals on the support.
MAIN RESULTS
The thermal stability of prior calcined catalyst were evaluated by TGA in air condition up
to 900 oC as observed in Fig. 1, all of the Ni-based catalysts showed multiple step of
decomposition. This can be explained by the following pathway: thermal dehydration of
physically absorbed water and volatile impurities at temperature below 200 oC,
decomposition of nickel precursor to nickel oxide (NiO) at a temperature range over 200 oC and thermal decomposition of dolomite at temperature around 400-700 oC. From the
TGA profile, it can be seen that zero weight changes was observed at temperature above
800 oC, indicating that the decomposition of catalysts was completed. Thus, it was
suggested that all the catalysts should be calcined at an optimum calcination temperature
of 800 oC in order to ensure the complete NiO phase formation and stabilize the
mechanical properties of catalysts.
The reducibility of calcined catalysts was extensively characterized by H2-TPR up to
1000 oC as portrayed in Fig. 2. The catalyst reducibility determined by H2 consumption
follows the order: Ni/dolomite > Ni/dolomite/ZrO2 > Ni/dolomite/La2O3 >
Ni/dolomite/CeO2 > Ni/dolomite/Al2O3. Typically, at lower reduction temperature can
result in incomplete reduction of NiO to metallic Ni, while at a higher reduction
temperature catalyst tends to deactivate as result of agglomeration of metallic Ni. Hence,
determination of appropriate reduction temperature is essential. Therefore 750 oC was
selected as the reduction temperature for dolomite, La2O3, CeO2 and ZrO2 supported
catalysts. Due to the presence of less reducible species in Ni/dolomite Al2O3, the primary
reduction peak was shifted to higher temperature region. It suggests that higher reduction
temperature (900 oC) is needed for Ni/dolomite/Al2O3 to reduce the oxide species
completely.

ENGINEERING 96
Figure 1. Thermogravimetric curves of
prior calcined catalysts.
Figure 2. H2-TPR profiles of calcined
catalysts.
CONCLUSION
The preparations of catalysts such as Ni/dolomite, Ni/dolomite/Al2O3, Ni/dolomite/La2O3,
Ni/dolomite/CeO2 and Ni/dolomite/ZrO2 are suggested by using co-impregnation method
followed by calcination and reduction with the temperature determined by TGA and H2-TPR
characterization respectively. The optimum calcination temperature suggested is 800 oC for
all catalysts whereas the optimum reduction temperatures suggested are 900 oC for
Ni/dolomite/Al2O3 and 750 oC for the rest.
Acknowledgment: The authors acknowledge financial support from the Universiti Teknologi
Malaysia through Research University Grant (GUP Tier 1: 20H52).
REFERENCES
1. Kumar, A., Jones, D.D. and Hanna, M.A. Thermochemical biomass gasification: a review of the current
status of the technology. Energies 2 (2009), 556-581.
2. Li, C. and Suzuki, K. Tar property, analysis, reforming mechanism and model for biomass gasification - an
overview. Renewable and Sustainable Energy Review. 13 (2009), 594-604.
3. Vivanpatarakij, S. Rulerk, D. and Assabumrungrat, S. Removal of tar from biomass gasification process by
steam reforming over nickel catalysts. Chemical Engineering Transactions 37 (2014), 205-210.
4. Nahar, G. and Dupont, V. Hydrogen via steam reforming of liquid biofeedstock. Biofuels 3 (2012), 167-191.
5. Artetxe, M., Alvarez, J., Nahil, M.A., Olazar, M. and Williams, P.T. Steam reforming of different biomass
tar model compounds over Ni/Al2O3 catalysts. Energy Conversion and Management 136 (2017), 119-126. 6. Chitsazan, S., Sepehri, S., Garbarino, G., Carnasciali, M.M., and Busca, G. Steam reforming of biomass-
derived organics: Interactions of different mixture components on Ni/Al2O3 based catalysts. Applied
Catalysis B: Environmental 187 (2016), 386-398.
7. Sisinni, M., Di Carlo, A., Bocci, E., Micangeli, A. and Naso, V. Hydrogen-rich gas production by sorption
enhanced steam reforming of woodgas containing TAR over a commercial Ni catalyst and calcined dolomite
as CO2 sorbent. Energies 6 (2013), 3167-3181.
100 200 300 400 500 600 700 800 9000
20
40
60
80
100
W
eig
ht
Lo
ss
(%
)
Temperature (oC)
Ni/Dolomite/ZrO2
Ni/Dolomite/CeO2
Ni/Dolomite/La2O3
Ni/Dolomite/Al2O3
Ni/Dolomite
200 400 600 800 1000
Ni/Dolomite/Al2O
3
Ni/Dolomite
Ni/Dolomite/La2O
3
Ni/Dolomite/ZrO2
Ni/Dolomite/CeO2
H2 C
on
su
mp
tio
n (
a.u
.)
Temperature (oC)

ENGINEERING 97
IGCESH2018
Universiti Teknologi Malaysia, Johor Bahru, Malaysia 13 -15 August 2018
DURIAN RIND AND HYDRO PAC-R FOR FLUID LOSS
IMPROVEMENT IN WATER-BASED MUD
Natalie Vanessa Boyou*, Issham Ismail, Wan Rosli Wan Sulaiman and Norhafizuddin
Husein
Department of Petroleum Engineering, Faculty of Chemical and Energy Engineering, Universiti
Teknologi Malaysia, Johor, MALAYSIA. (E-mail: [email protected], [email protected], [email protected],
ABSTRACT
Excessive leakage of fluid into permeable zones during drilling operations is highly
undesirable. Solid build-ups along the wall of the wellbore would increase under these
circumstances and this would increase the chances of formation damage and high costs for
remedial treatments. This study focused on the performance of durian rind and hydro pac-R
as fluid loss additives in water-based mud. Static filtration tests were performed at ambient
temperature and 100-psi differential pressure according to API standard. Static aging tests
were also studied at temperatures of 120°F, 250°F, and 350°F for 16 hours. The filtration
control of drilling fluid with increasing concentration of fine size durian rind improved
from 18.8% to 25% when compared to basic mud. Keywords: Fluid loss control, water-based mud, Filtrate volume, Filtration test, Static aging test
INTRODUCTION
According to Wong (2009), the scientific name for durian is called Durio Zibethinus and so
far there are 27 species of recorded durians that are technically edible. Generally, only 20-
30% of the durians are edible and the rest are thrown as waste. Till today, there is still no
proper way of disposing the durian wastes. The published reports by the Department of
Statistics, Malaysia (2014) entitled “Supply and Utilization Accounts Selected Agricultural
Commodities” revealed that the average waste for durian in Malaysia between the year 2009
and 2013 was 9640.4 tonnes with 7.9% growth annually. This indicates that durian poses a
huge amount of waste that is not taken care of. The chemical composition of durian has a
high percentage of cellulose which can be divided into three components namely,
holocellulose, alpha cellulose and hemicellulose. This can be supported by Table 1 extracted
from Voon et al. (2006).
The study of durian rind as a fluid loss agent was conducted by comparing it with the
commercial fluid loss agent hydro pac-R. According to Scomi, the recommended treatment
for hydro pac-R was in the range of 0.5 to 1.5 lb/bbl. Therefore five concentrations were
studied to compare the performances of durian rind and hydro plug namely 0.5 lb/bbl, 0.75
lb/bbl, 1.0 lb/bbl, 1.25 lb/bbl, and 1.5 lb/bbl. The size of hydro pac-R was 44-74 microns
which is categorized as fine. Fluid loss test was conducted to study the potential of durian

ENGINEERING 98
rind as a fluid loss agent. These drilling muds were formulated and tested based on the
guidelines given in “Recommended Practice on Standard Field Procedure for Testing Drilling
Fluid, API RP 13 B-1” by American Petroleum Institute (2009).
MAIN RESULTS
Results showed improvements in terms of fluid loss when fluid loss agents of both durian
rind and hydro pac-R were added as compared to basic mud with zero concentration of
fluid loss agent (Figure 1). The increase of coarse size durian rind concentration was able
to improve fluid loss performance by 6.25% to 18.8% followed by fine size durian rind
with 18.8% to 25% and hydro pac-R with 37.5% to 56.25%. The fine durian rind
performed better than the coarse size durian rind because the fine durian rind was able to
plug small pores that prevented seepage to occur while coarse durian rind did not plug the
small pores because of its insignificant size.
Figure 1. Fluid losses of coarse hydro pac-R and fine durian rind
Results indicated that for every temperature tested, the trend declined when mud with
hydro pac-R was tested. Figure 2 also shows that mud with hydro pac-R performed the
best when compared to basic mud and mud with added durian rind of 1.0 lb/bbl optimum
concentration for every size. Figure 2 also shows that at room temperature and
temperatures of 120°F and 250°F after hot rolling, the trend seemed to have a similar
pattern. Results revealed that the higher the temperature, no matter what fluid loss agent
was added, a nominal increase in fluid loss was observed. This is because the mud
disintegrates and in turn lost its ability to reduce fluid loss. However, at temperature of
350°F after hot rolling, the trend gradually declined with increased in size of durian rind.
This result indicated that at high temperature, durian rind of smaller size disintegrated
much faster than durian rind of larger size. In other words, durian with coarse size
performed better than ultra-fine size durian rind at high temperature of 350°F.
0
2
4
6
8
10
12
14
16
18
0 0.25 0.5 0.75 1 1.25 1.5
Flu
id lo
sses
(ml)
Concentration (lb/bbl)
Fine
Coasre
Hydro Pac-R

ENGINEERING 99
Figure 2. Fluid losses of mud with hydro pac-R and durian rind at concentration 1.0
lb/bbl for mud after hot rolled at various temperatures
CONCLUSION
The optimum concentration to control fluid losses for durian rind and hydro pac-R was 1.0
lb/bbl. Durian rind was able to provide good fluid loss control when compared to basic mud.
However, Hydro pac-R performed the best in fluid loss control even in high temperatures.
With that said, durian rind could be further improved by chemically treating it for better fluid
loss control in wáter-based mud.
Acknowledgment: The authors would like to express their appreciation to the Ainuddin
Wahid Scholarship for the funding given to this research.
REFERENCES
1. American Petroleum Institute. (2009). Recommended Practice for Field Testing Water-based Drilling Fluid.
API-RP-13B-1. 4th Ed. Dallas: American Petroleum Institute.
2. Department of Statics. (2014). Supply and Utilization Accounts Selected Agricultural Commodities.
Malaysia. 3. Voon, Y.Y., Hamid, S.A.N., Rusul, G., Osman, A., and Quek, S.Y. (2006). Physicochemical, Micribiol and
Sensory Changes of Minimally Processed Durian. Journal of Postharvest Biology and Technology. Vol.42,
Issue 2.
4. Wong, W.W., Abbas, F.M.A., Azhar, M.E. (2009). Effect of Enzyme Treatments on Physical Properties of
Durian Aril and Durian Slurries. School of Industrial Technology, Universiti Sains Malaysia.
0
5
10
15
20
25
30
0 1 2 3 4 5 6 7
Flu
id lo
sse
s (m
l)
Type of mud
Room temp
120 F
250 F
350 F
Bas Hydr DR(UF)
DR(F)
DR(M)
DR(I)
DR(C)

ENGINEERING 100
IGCESH2018
Universiti Teknologi Malaysia, Johor Bahru, Malaysia 13 -15 August 2018
Al2O3/YSZ HOLLOW FIBRE MEMBRANE INCORPORATED WITH
IRON OXIDE FOR HEAVY METAL REMOVAL
Syafikah Huda Paiman1, Mukhlis A Rahman2*, Khairul Hamimah Abas3, Azian Abd
Aziz4, Ahmad Fauzi Ismail5, Mohd Hafiz Dzarfan Othman6, Juhana Jaafar7,
Mohammad Noorul Anam Mohd Norddin8
1, 2, 5, 6, 7, 8 Advanced Membrane Technology Research Centre (AMTEC), Universiti Teknologi
Malaysia 81310 Skudai Johor Malaysia.
(E-mail: [email protected], [email protected], [email protected], [email protected], [email protected],[email protected])
3 Faculty of Electrical Engineering, Universiti Teknologi Malaysia, 81310 Skudai, Johor, Malaysia.
(E-mail: [email protected]) 4 Language Academy, Universiti Teknologi Malaysia, 81310 Skudai, Johor, Malaysia.
(E-mail: [email protected])
ABSTRACT
This work presents the characterization and performance evaluation of dual-function ceramic
membranes for the adsorption and separation of heavy metal ions. Alumina/yttria-stabilized
zirconia (Al2O3/YSZ) hollow fibre membranes, fabricated by phase inversion and sintering
process were used as supports for the iron oxide (α-Fe2O3) deposition using in-situ
hydrothermal synthesis at different concentrations (0.05 M and 0.2 M) of iron precursor and
hydrothermal duration (24 h and 48 h). The membranes were characterized using the field
emission electron microscopy (FESEM), water permeation, solute rejection, x-ray diffraction
(XRD) and N2 absorption-desorption analysis. The adsorptive-separation performances were
studied in a batch adsorption process and a cross-flow filtration system. Heavy metal
concentrations were measured using atomic absorption spectrometer (AAS). The results
showed that α-Fe2O3 was successfully produced and incorporated across the membranes’
structure. A reduction in water flux was recorded with the deposition of α-Fe2O3. However,
the batch adsorption study showed that the deposition of α-Fe2O3 improved the adsorption
capacity of the membrane. The membrane prepared at concentration of 0.05 M for 24 h gave
the highest adsorption capacity of 15.29 mg/g at 50 mg/L. The adsorption-separation test
showed that the membrane was able to remove Pb (II) ions completely after 2 h.
Key words: ceramic membrane, hydrothermal, soft-templated, heavy metal removal, porous
iron oxide
INTRODUCTION
Water is the most essential compound on the earth for human activities. Proving clean
water is the prime requirement of the human being for their better health. However, water
pollution is increasing worldwide due to rapid growth of industry. Indeed, industrial
effluents are in fact the main anthropogenic sources of heavy metal ions in water such as
Pb (II) ions. Human exposure beyond the permissible limit can greatly leads to the life
time threatening diseases [1-2] as heavy metal is toxic, carcinogenic, non-biodegradable

ENGINEERING 101
and tens to accumulate in living organism [3]. Thus, the aim of this study is to remove
heavy metal ions from water through separation process of using ceramic hollow fibre
membrane.
In this work, Al2O3/YSZ hollow fibre membranes were fabricated using the phase
inversion and sintering process. Then, porous Fe2O3 were deposited on the Al2O3/YSZ
hollow fibre membranes using in-situ hydrothermal synthesis method with soft-template
assisted at different iron precursor’s concentration (0.05 M and 0.2 M) and at different
hydrothermal times (24 h and 48 h). Through this process, the Fe2O3 particles acted as an
adsorbent, while the Al2O3/YSZ hollow fibre membranes indirectly can act as the host or
support. This configuration strategy is to reduce the agglomeration of Fe2O3 particles
once dispersed in water [4]. Herein, by taking the advantages offered by both porous iron
oxide and Al2O3/YSZ hollow fibre membranes, a dual-function membrane for filtration
and adsorption for heavy metal removal in a single unit was introduced. The adsorption
performance of porous Fe2O3 was investigated under different pH, initial concentration of
Pb (II) and contact time. Filtration and adsorption studies were carried out on Al2O3/YSZ
hollow fibre membranes to examine the membranes’ capability in removing heavy metal
from aqueous solution.
MAIN RESULTS
An asymmetric structure of Al2O3/YSZ hollow fibre membranes consisting finger-like
and sponge-like structure were successfully produced through phase inversion and
sintering process. The deposition of porous Fe2O3 using in-situ hydrothermal process on
Al2O3/YSZ hollow fibre membranes can be seen in Figure 1. From the images, it can be
observed that the Fe2O3 particles were successfully deposited on the membranes’ surface.
Immersing the membranes in a hydrothermal solution without sealing both ends may be
attributed to this uniform deposition. The average weight loading of Fe2O3 on Al2O3/YSZ
hollow fibre for 0.2 M was 6 % whereas only 3.5 % of Fe2O3 was deposited for 0.05 M.
Upon deposition, the adsorption capacity for Pb (II) ions on membrane has improved. The
membrane deposited with Fe2O3 at concentration of 0.05 M for 24 h gave the highest
adsorption capacity of 15.29 mg/g at 50 mg/L. However, the water flux of the membrane
decreases after deposition. This may due to the reducing of the mean membrane pore
sizes with the Fe2O3 deposition. The separation performance using cross-flow filtration
system by using membrane F005-24 was able to remove Pb (II) ions completely after 2h
of operation.
Figure 1 The effect of initial concentration on the adsorption capacity of Fe2O3-Al2O3/YSZ
hollow fibre membrane (■) bare, (●) F005-24, (▲) F005-48, (▼) F02-24 and (♦) F02-48
20 30 40 50 60
2
4
6
8
10
12
14
16
Adso
rptio
n C
apac
ity (m
g/g)
Initial Concentration (mg/L)

ENGINEERING 102
CONCLUSION
In this work, the depositions of α-Fe2O3 particles on Al2O3/YSZ hollow fibre membranes
were carried out using an in-situ hydrothermal synthesis at different concentrations of iron
precursor (0.05 M and 0.2 M) and hydrothermal durations (24 h and 48 h). The FESEM
images confirmed the deposition of α-Fe2O3 particles across the membrane and supported by
the XRD results. A reduction in membrane’s pure water flux was observed after α-Fe2O3
deposition. However, the batch adsorption study for Pb(II) ions measured an increment in the
adsorption capacity of the membrane after α-Fe2O3 deposition. The adsorptive separation test
using Al2O3/YSZ hollow fibre membranes with F005-24 sample showed that after a 2h of
filtration process, the permeates contained less than 15lg/L of Pb (II) ions. The incorporation
of α-Fe2O3 particles highlighted the dual-function (adsorption and separation) of ceramic
membrane for heavy metal removal.
Acknowledgment: The authors gratefully acknowledge financial support from various
parties, namely, the Malaysia Ministry of Higher Education (MOHE) through FRGS
(0.J130000.7823.4F947), the Higher Institution Centre of Excellence (HICoE) Research
Grant (R.J090301.7846.4J178), and Universiti Teknologi Malaysia (UTM) through the
Research University grant (Q.J130000.2546.16H34). Appreciation also goes to UTM
Research Management Centre for both financial and technical support.
REFERENCES
1. Tamayo, M. y Ortiz et al. Maternal stress modifies the effect of exposure to lead during pregnancy and 24-
month old children’s neurodevelopment. Environment International 98 (2017) 191-197. 2. Barakat, M.A. New trends in removing heavy metal from industrial wastewater. Arabian Journal of
Chemistry 4 (2011), 361-377. 3. Tchounwou, P.B., Yedjou, C.G., Patlolla, A.K. and Sutton, D.J. Molecular, Clinical and Environmental
Toxicology 101 (2012) 133-164. 4. Zhang, L., Li, L. and Yang, C. Microwave-assisted synthesis of hierarchical mesoporous nano-
TiO2/cellulose composites for rapid adsorption of Pb2+. Chemical Engineering Journal 313 (2017), 1132-1141.

ENGINEERING 103
IGCESH2018
Universiti Teknologi Malaysia, Johor Bahru, Malaysia 13 -15 August 2018
A REVIEW ON ZSM-5 ACIDITY MODIFICATION FOR
ENHANCEMENT OF BENZENE ALKYLATION
A.F.A. Rahman1, A.A. Jalil2*, S. Triwahyono3, M. Mohamed4, N.A.A. Fatah5, N.S.
Hassan6 and N.F. Khusnun7
1, 2, 4, 5, 6, 7, 8 Department of Chemical Engineering, Faculty of Chemical and Energy Engineering,
(E-mail: [email protected], [email protected], [email protected], [email protected],
[email protected], [email protected]) 2Centre of Hydrogen Energy, Institute of Future Energy,
(E-mail: [email protected]) 3Department of Chemistry, Faculty of Science,
(E-mail: [email protected])
Universiti Teknologi Malaysia, 81310 UTM Johor Bahru, Johor, Malaysia.
ABSTRACT
The benzene alkylation with methanol is a great alternative for production of toluene and
xylene that are used as intermediates in the fine chemical industry. Previously, zeolite has
been widely used as a catalyst in a benzene alkylation due to their unique properties with
shape selectivity and good catalytic activity. However, the catalytic performance of zeolite is
affected by its high Brönsted acidity which led to low selectivity of toluene and xylene. In
order to overcome this problem, several modifications were performed to reduce the Brönsted
acidity. Based on previous work, the low Brönsted acidity was confirmed to improve the
catalytic activity of the catalyst by reducing undesired product formation such as methanol to
olefin and ethylbenzene (EB). Therefore, this paper aims to gather overview of the zeolite
acidity modification for the catalytic activity evaluation on benzene alkylation.
Keywords: ZSM-5, Brönsted acidity, Benzene alkylation, Acidity modification
INTRODUCTION
Toluene and xylene are widely used as intermediates in the chemical industry to obtain textile
fabric, plastics, detergents, etc [1-2]. These chemicals are generally obtained via naphtha
pyrolysis and catalytic reforming [2]. However, these processes are greatly depended on the
consumption of petroleum and have been called into question due to the shortage of
petroleum resources. Therefore, benzene methylation is regarded as a potential way to
produce toluene and xylene [3]. Presently, ZSM-5 has been extensively used in benzene
alkylation because of their unique advantages of highly selective, less toxic, environmentally
friendly and readily reproducible in catalytic reactions [4-5]. However, the high Brönsted
acidity of existence ZSM-5 has limits the production of toluene and xylene [2]. Thus, the
acidity modification of ZSM-5 has been intensely investigated to reduce the by-products in
benzene alkylation and improve the selectivity of desired products.

ENGINEERING 104
ACIDITY MODIFICATION OF ZSM-5
ZSM-5 has been generally known to possess strong Brönsted acid sites on its external and
internal surface sites [6-7]. In order to improve the catalytic activity of benzene alkylation
and increase the selectivity of desired products, it is necessary to reduce the Brönsted
acidity inside the ZSM-5 structures. A variety of modifications method have been adopted
in the alteration of Brönsted acidity to improve the catalytic selectivity in benzene
alkylation such as metals doping [8], adjustment of Si/Al ratio [9], and treatment with
acid [10]. It has been reported by [10] that the treatment of ZSM-5 with alkali and acid
has resulted in lower amount of Brönsted acidity and high selectivity of toluene and
xylene. Besides that, the Brönsted acidity in ZSM-5 can be altered by modifying the Si/Al
ratio of ZSM-5. According to [9], Brönsted acidity in ZSM-5 zeolite can be decreased by
increasing the Si/Al ratio, which further suppressed the side reaction of methanol. The
introduction of metals into the ZSM-5 was also found to be an effective method to adjust
the acidity of ZSM-5. For example, the introduction of Mg into ZSM-5 could decrease the
Brönsted acid by formation of MgOH+ (Lewis acid) at the expense of Brönsted acid [8].
Table 1 shows the performance of several zeolites with modified Brönsted acidity in
benzene alkylation. These results clearly shown that high selectivity of toluene and
xylene is dominated by the zeolite with low amount of Brönsted acid sites.
Table 1. Performance of modified zeolite for benzene alkylation
Catalyst Temp.
(K)
Brönsted
Acid Site
(µmolg-1)
Toluene
selectivity
(%)
Xylene
selectivity
(%)
EB
selectivity
(%)
Ref.
ZSM-5
3 wt% MgO/ZSM-
5
673
6.5
1.7
58.0
60.0
33.0
38.1
3.4
0.34 [8]
HZSM-5 (180a)
HZSM-5 (1800a) 673
4.2
0.7
22.3
27.5
19.6
24.9
1.9
0.06 [9]
ZSM-5-Pb
ZSM5-5-AT-OTc 673
4.2
1.7
21.5
25.8
11.8
20.8
3.96
0.5 [10]
aSi/Al ratio bparent calkaline/acid treatment
CONCLUSION
In summary, high yield of toluene and xylene by catalytic benzene alkylation using zeolites
with low Brönsted acidity has attracted many attentions to overcome the conventional
production method. Several modification methods such as metals doping, alkali/acid
treatment and alteration of Si/Al ratio has been proven to reduce the Brönsted acidity in
zeolites and hence, improved the selectivity of toluene and xylene via benzene alkylation.
Acknowledgment: The authors are grateful for the financial support by the Zamalah
Scholarchip and Fundamental Research Grant Scheme (Grant No. 17H46) from Universiti
Teknologi Malaysia.

ENGINEERING 105
REFERENCES
1. Hu, H., Lyu, J., Wang, Q., Zhang, Q., Cen, J., and Li, X. Alkylation of benzene with methanol over
hierarchical porous ZSM-5: synergy effects of hydrogen atmosphere and zinc modification. RSC Advances 5
(2015) 32679-32684.
2. Lyu, J., Hu, H., Tait, C., Rui, J., Lou, C., Wang, Q., Han, W., Zhang, Q., Pan, Z., and Li, X. Benzene
alkylation with methanol over phosphate modified hierarchical porous ZSM-5 with tailored acidity. Chinese
Journal of Chemical Engineering 25 (2017), 1187-1194.
3. Alabi, W., Jermy, R. and Al-Khattaf, S. Kinetics of toluene alkylation with methanol catalyzed by pure and
hybridized HZSM-5 catalysts. Chemical Engineering Journal 195 (2012), 276-288.
4. Ghiaci, M, Abbaspur, A., Arshadi, M. and Aghabarari, B. Internal versus external surface active sites in
ZSM-5 zeolite: Part 2: Toluene alkylation with methanol and 2-propanol catalyzed by modified and
unmodified H3PO4/ZSM-5. Applied Catalysis A: General 316 (2007), 32-46.
5. Teh, L.P., Triwahyono, S., Jalil, A.A., Mamat, C.R., Sidik, S.M., Fatah, N.A.A., Mukti, R.R., and Shishido,
T.T. Nickel-promoted mesoporous ZSM5 for carbon monoxide methanation. RSC Advances 5 (2015): 64651-64660.
6. Zhu, Z., Chen, Q., Xie, Z., Yang, W., and Li, C. The roles of acidity and structure of zeolite for catalyzing
toluene alkylation with methanol to xylene. Microporous and Mesoporous Materials 88 (2006), 16-21.
7. Setiabudi, H.D., Jalil, A.A. and Triwahyono, S. Ir/Pt-HZSM5 for n-pentane isomerization: Effect of iridium
loading on the properties and catalytic activity. Journal of Catalysis 294 (2012) 128-135.
8. Hu, H., Lyu, J., Cen, J., Zhang, Q., Wang, Q., Han, W., Rui, J. and Li, X. Promoting effects of MgO and Pd
modification on the catalytic performance of hierarchical porous ZSM-5 for catalyzing benzene alkylation
with methanol. RSC Advances 5 (2015), 63044-63049.
9. Hu, H., Lyu, J., Rui, J., Cen, J., Zhang, Q., Wang, Q., Han, W., and Li., X. The effect of Si/Al ratio on the
catalytic performance of hierarchical porous ZSM-5 for catalyzing benzene alkylation with methanol.
Catalysis Science & Technology 6 (2016): 2647-2652. 10. Wang, Q., Han, W., Hu, H., Lyu, J., Xu, X., Zhang, Q., Wang, H., and Li, X. Influence of the post-treatment
of HZSM-5 zeolite on catalytic performance for alkylation of benzene with methanol. Chinese Journal of
Chemical Engineering 25 (2017): 1777-1783.

ENGINEERING 106
IGCESH2018
Universiti Teknologi Malaysia, Johor Bahru, Malaysia 13 -15 August 2018
OPTIMIZATION STUDY IN COAGULATION-FLOCCULATION
PROCESS FOR PALM OIL MILL EFFLUENT (POME) TREATMENT
BY USING RICE HUSK ASH
Nurhamieza Md Huzir1, Shahrul Ismail2, Nik Azmi Nik Mahmood3, Noor Azrimi
Umor4, Syed Anuar Faua’ad Syed Muhammad5*
1,3,5 Department of Bioprocess and Polymer Engineering, Faculty of Chemical and Energy
Engineering, Universiti Teknologi Malaysia, UTM Skudai, 81310 Skudai, Johor, Malaysia.
(E-mail: [email protected], [email protected],*[email protected]) 2 School of Ocean Engineering, Universiti Malaysia Terengganu, 21030 Terengganu, Malaysia
(E-mail: [email protected]) 4 Department of Microbiology, Faculty of Applied Science, Universiti Teknologi MARA, 72000
UiTM Kuala Pilah, Negeri Sembilan, Malaysia
(E-mail: [email protected])
ABSTRACT
Palm oil mill effluent (POME) was regarded as biggest agro-industrial waste where it cause
severe environmental problem and require proper treatment. Currently, various pretreatment
process were applied to comply with the standard discharge limits. Coagulation-flocculation
process was one of the pretreatment which assists in the removal of suspended and dissolved
solids, colloids and organic matter present in POME. In this study, rice husk ash (RHA) were
used to explore its potential as a coagulant, in comparison with aluminium sulphate, alum for
pretreatment of POME. The important process parameters which were coagulants dosage,
initial pH and settling time were optimized using design of experiments (DOE). POME
treated with RHA yielded chemical oxygen demand (COD) and total solid (TS) removals up
to 49.55% and 80.13% respectively using the following optimum conditions: 4.75 g of RHA,
initial pH of 4.58 and settling time of 59.86 min. Meanwhile, alum at its optimum condition
(9.90 g alum, initial pH of 4.32 and settling time of 58.44 min) produce slightly higher
removals of chemical oxygen demand and total solid which were 52.08% and 87.75%
respectively. The results obtained shows that RHA capable to become alternative to alum and
efficiently treated POME at its natural pH by using small amount of dosage compared to the
treatment using alum.
Key words: Rice husk ash, Palm oil mill effluent, Coagulation-flocculation process, Response
surface methodology
INTRODUCTION
Oil palm industry contributes to one of the highest agricultural waste in Malaysia
especially POME [1-2]. POME is a thick brownish viscous liquid waste which is non-
toxic but has an unpleasant odor and also contains soluble materials that have a
detrimental impact to the environment [3]. The most common practice for POME
treatment nowadays is by biological processes which are anaerobic and aerobic ponding
system [4]. However, these systems need proper monitoring as the processes rely solely

ENGINEERING 107
on microorganisms to break down the pollutants [5]. Therefore, the pretreatment
technique is required in order to reduce the solid content as well as COD to produce more
potable water [6]. One of the pretreatment technique is by using coagulation-flocculation
process which is the most widely-used technique and has been practiced from ancient
times to pre-treat raw water and industrial wastewater [7-9]. This is due to its
applicability and high efficiencies in removal of COD, turbidity, colour and metals
depending on types of coagulant/flocculant [10]. Coagulants can be obtained from
chemical and natural based and POME can be treated using both categories. In
conventional wastewater treatment, coagulants from chemical based such as aluminium
sulphate (alum) are widely being used [11]. However, use of chemical coagulant in
POME treatment is not an appropriate choice due to aluminium content which associated
with human health problems [12-13]. This issue is proven by study conducted by Flaten
[14], which stated that excess usage of alum contributes towards Alzheimer’s disease if
ingested in the long run. Natural coagulants used to treat POME is a rice husk ash. In
recent year, researchers discovered potential applications of rice husk ash such as involve
in biochar production, as an activated carbon, water purification and also as a biofertilizer
[15]. In this study, the effectiveness of rice husk ash for pre-treatment of POME was
explored due to the low cost of material and accessibility of it by converting the waste
into valuable product.
MAIN RESULTS
Figure 1. Effect of dosage and pH on COD and TS removal
Figure 2. Effect of dosage and settling time on COD and TS removal

ENGINEERING 108
CONCLUSION
Completion of this study shows the potential of using RHA as natural coagulant in treatment
of POME with 49.55% COD removals and 80.13% TS removals at its optimum conditions.
Acknowledgment: The authors would like to express their appreciation for the support of the
sponsors providing Research University Grant (RUG) Tier 1.0 PY/2017/00463.
REFERENCES
1. Goh, C.S., et al., Bio-ethanol from lignocellulose: status, perspectives and challenges in Malaysia.
Bioresource Technology, 2010. 101(13): p. 4834-4841.
2. Sulaiman, F., et al., An outlook of Malaysian energy, oil palm industry and its utilization of wastes as useful
resources. Biomass and bioenergy, 2011. 35(9): p. 3775-3786.
3. Ibrahim, A.H., M.N.A.I. Dahlan, and A.F. Dasti, Comparative study on characterization of Malaysian palm
oil mill effluent. 2012.
4. Rupani, P.F., et al., Review of current palm oil mill effluent (POME) treatment methods: vermicomposting as
a sustainable practice. World Applied Sciences Journal, 2010. 11(1): p. 70-81.
5. Hassan, M.A.A. and M.H. Puteh, Pre-treatment of palm oil mill effluent (POME): A comparison study using chitosan and alum. Malaysian Journal of Civil Engineering, 2007. 19(2): p. 128-141.
6. Nilsson, C. and H. Dahlström, Treatment and Disposal Methods for Wastewater Sludge in the Area of
Beijing, China/Behandlings-och hanteringsmetoder för avloppsslam i Pekingområdet, Kina. 2005.
7. Fu, F. and Q. Wang, Removal of heavy metal ions from wastewaters: a review. Journal of environmental
management, 2011. 92(3): p. 407-418.
8. Tatsi, A., et al., Coagulation–flocculation pretreatment of sanitary landfill leachates. Chemosphere, 2003.
53(7): p. 737-744.
9. Verma, A.K., R.R. Dash, and P. Bhunia, A review on chemical coagulation/flocculation technologies for
removal of colour from textile wastewaters. Journal of environmental management, 2012. 93(1): p. 154-168.
10. Boumechhour, F., et al., Treatment of landfill leachate using Fenton process and coagulation/flocculation.
Water and Environment Journal, 2013. 27(1): p. 114-119. 11. Ahmad, A., S. Sumathi, and B. Hameed, Coagulation of residue oil and suspended solid in palm oil mill
effluent by chitosan, alum and PAC. Chemical Engineering Journal, 2006. 118(1-2): p. 99-105.
12. Bondy, S.C., The neurotoxicity of environmental aluminum is still an issue. Neurotoxicology, 2010. 31(5): p.
575-581.
13. Poddar, S., G. Talukder, and A. Sharma, Chromosome damage induced by ferric chloride in human
peripheral lymphocytes. International Journal of Human Genetics, 2004. 4(4): p. 261-264.
14. Flaten, T.P., Aluminium as a risk factor in Alzheimer’s disease, with emphasis on drinking water. Brain
research bulletin, 2001. 55(2): p. 187-196.
15. Pode, R., Potential applications of rice husk ash waste from rice husk biomass power plant. Renewable and
Sustainable Energy Reviews, 2016. 53: p. 1468-1485.

ENGINEERING 109
IGCESH2018
Universiti Teknologi Malaysia, Johor Bahru, Malaysia 13 -15 August 2018
EFFECT OF PLANT-DERIVED NATURAL COAGULANT USING
CARICA PAPAYA SEEDS TO TREAT SURFACE WATER
Amir Hariz Amran*1, Nur Syamimi Zaidi2, Khalida Muda3 and Liew Wai Loan4
1, 2, 3 Faculty of Civil Engineering, Universiti Teknologi Malaysia, 81310 UTM, Johor.
(E-mail: [email protected], [email protected], [email protected]) 4 Centre for Degree Programmes UTM School of Professional and Continuing Education
(UTMSPACE), 81310 UTM, Johor
(E-mail: [email protected])
ABSTRACT
Coagulation and flocculation are a solid segregation process that are widely used in
municipal water treatment. Dispersed colloidal particles agglomerate together forming larger
flocs via coagulation and clumps with each other by flocculation. Coagulant is applied during
these process, although chemical coagulant is a common use but these past years natural
coagulant has been discovered to be a better choice for municipal water treatment. Natural
coagulant is environmentally friendly and cost effective compared to chemical coagulant.
Therefore, this study will explore the use of natural coagulant derived from Carica Papaya
seed in water treatment. The objectives of this study are to characterize the physical
properties of carica papaya seed-derived natural coagulant, to determine the optimum
operating conditions of coagulation activity in treating synthetic water and to compare the
antibacterial properties of carica papaya seed-derived natural coagulant with other natural
coagulant in treating surface water. The optimum operating conditions in using carica papaya
seed-derived natural coagulant for surface water treatment as well as the antibacterial
property of carica papaya seed-derived natural coagulant will be obtained upon completion of
this study.
Key words: Coagulation, Flocculation, Natural coagulant, Antibacterial
INTRODUCTION
Coagulation and flocculation processes are widely used in water and wastewater treatment.
Its main objective is to remove suspended colloidal particles and to reduce turbidity in water
body [1]. The process usually takes place in a chemical reactor in which the influent water or
wastewater enter the basin and it is mix with coagulant agents using a mechanical mixer,
followed by sedimentation process to remove the particulate through gravity settling [2].
There are many types of coagulants available, often used are the chemical-based coagulants
such as alum and ferric salts [3]. However, there are also coagulants derived from plant-based
materials that are rising in popularity and perhaps eventually replace the use of chemical
coagulants in the near future.

ENGINEERING 110
PROBLEM STATEMENT
Carica papaya, commonly called papaya has been a popular fruit especially in tropical
country like Malaysia. It is estimated that Malaysia can produce about 72,000 tonnes of
papaya every year [4]. Consumption of papaya fruits results to mass production of food
wastes, particularly the discarded papaya peel/skin and seeds which is between 15 and 20%
of its weight [4]. Hence, actions need to be taken to minimize the quantity of food wastes
resulted from the consumption of papaya fruits. Nowadays, the use of natural coagulants in
water and wastewater treatment have been commonly practiced due to its various
environmental advantages [5]. Reviews and current practices indicated that the Moringa
oleifera seeds, Nirmali seeds, tannin and Opuntia ficus cactus are the most popular precursors
for natural coagulants production [1]. Continuing efforts to diversify the choice of natural
coagulants and to explore other potential natural coagulants would be beneficial in terms of
achieving the goal of waste minimization and seeking better treatment approaches. Therefore,
this study aims at developing an optimized natural coagulant using carica papaya seed to
perform coagulation in water treatment.
OBJECTIVES OF THE STUDY
The objectives of this study are to characterize the physical properties of carica papaya seed-
derived natural coagulant, to determine the optimum operating conditions of coagulation
activity in treating synthetic water using carica papaya seed-derived natural coagulant and to
compare the antibacterial properties of carica papaya seed-derived natural coagulant with
other natural coagulants.
SCOPE OF THE STUDY
The present study will be conducted at the Environmental Engineering Laboratory, Faculty of
Civil Engineering, Universiti Teknologi Malaysia (UTM). Synthetic water will be used for
determining the coagulation activity and water from a selected river will be used for
determining the antibacterial properties. The study comprises of natural coagulant
development using Carica papaya seed, optimization of the coagulation process, determining
its removal performances, and investigating its anti-microbiological properties. At the initial
stage of the study, Carica papaya seeds will be characterized through instrument analysis.
Then, natural coagulant will be derived and use in a jar test for coagulant process. The
optimum operating conditions will be determined via response surface methodology (RSM).
Finally, effluent samples will be examined for its E. coli pathogen removability.
METHODOLOGY
The raw seeds of carica papaya will be collected from a local fruiterer in Johor. The
processing method for carica papaya natural coagulant is from Yongabi et al. [6] where it will
be dried and grind to a powder. The natural coagulant obtained will be characterize for its
protein and functional group. Prior for preservation, the samples and the materials will be
stored in a cool room at a temperature of 4○C. The performance of the carica papaya natural
coagulant will be analysed using response surface methodology by jar test. The dosage of
coagulant used, pH and the initial turbidity will be the independent variables while the
turbidity and coagulation activity will be the dependent variables.

ENGINEERING 111
EXPECTED FINDINGS
Upon completion of this study, the expected findings would be obtaining a set of optimum
operating conditions in using carica papaya seed-derived natural coagulant for surface water
treatment as well as its optimum performance in surface water treatment. Besides that, the
antibacterial property of carica papaya seed-derived natural coagulant can be determined in
comparison with other natural coagulants.
CONCLUSION
In conclusion, there is a necessity to carry out research studies to obtain more information of
carica papaya plant-based natural coagulants to ultimately bring it for commercialization.
Besides that, there are much more that is unknown regarding plant-based natural coagulant
and how well it will replace chemical coagulant use commercially.
REFERENCES
1. Choy, S. Y., Prasad, K. M. N., Wu, T. Y., Raghunandan, M. E., & Ramanan, R. N. (2014). Utilization of
plant-based natural coagulants as future alternatives towards sustainable water clarification. Journal of
Environmental Sciences (China), 26(11), 2178–2189.
2. Hammer, M.J. and Hammer, Jr. M.J. (2004). Water and Wastewater Technology In: Wastewater Processing.
(5th ed). Pearson Prentice Hall: Ohio.
3. Fathinatul, N., & Nithyanandam, R. (2014). Wastewater Treatment by using Natural Coagulant. 2nd Eureca,
2–3. 4. Hameed, B. H. (2009). Evaluation of papaya seeds as a novel non-conventional low-cost adsorbent for
removal of methylene blue. Journal of Hazardous Materials, 162(2–3), 939–944.
5. .Abidin, Z. Z., Mohd Shamsudin, N. S., Madehi, N., & Sobri, S. (2013). Optimisation of a method to extract
the active coagulant agent from Jatropha curcas seeds for use in turbidity removal. Industrial Crops and
Products, 41(1), 319–323.
6. Yongabi, K. A., Lewis, D. M., & Harris, P. L. (2011). Indigenous plant based coagulants/disinfectants and
sand filter media for surface water treatment in Bamenda, Cameroon. African Journal of Biotechnology,
10(43), 8625–8629.

ENGINEERING 112
IGCESH2018
Universiti Teknologi Malaysia, Johor Bahru, Malaysia 13 -15 August 2018
TUNGSTEN OXIDE INTERCALATED REDUCED GRAPHENE
OXIDE SENSOR FOR ANTHRACENE DETECTION
Wong Kar Chun1, Goh Pei Sean*1, Taniguchi Takaaki2 and Ismail Ahmad Fauzi1
1 Advanced Membrane Technology Research Centre (AMTEC), Faculty of Chemical & Energy
Engineering (FCEE), Universiti Teknologi Malaysia (UTM), Johor, MALAYSIA.
(E-mail: [email protected], [email protected], [email protected]) 2 Functional Nanosheets Group, International Center for Material Nanoarchitectonics, National
Institute for Materials Science (NIMS), Ibaraki, JAPAN.
(E-mail: [email protected])
ABSTRACT
Polycyclic aromatic hydrocarbon (PAH) is persistent by-product from incomplete
combustion which is hazardous to human and the environment. Conventional approaches for
PAH detection require complicated sample preparation and analytical instrument which lack
portability. This study aimed to develop active material for electrochemical sensing of PAH
via a simple sonochemical method. First, tungstite (WO3·H2O) were synthesized and
simultaneously deposited on graphene oxide (GO) nanosheets in a sonicated chemical bath.
The obtained composite was then thermally treated to obtain tungsten oxide/reduced GO
(WO3-rGO). Working electrode for anthracene sensing were prepared by attaching the active
material onto glassy electrode carbon (GCE). Our results showed that WO3-rGO exhibited
better sensitivity and accuracy compared to rGO with detection range between 10pM and
0.1µM of anthracene. Intercalation of WO3 nanoplatelets prevented the restacking of
graphene sheets during thermal reduction which allowed more active sites on the rGO to be
utilized for sensing. This hybrid material which be facilely synthesized and made into
miniature electrochemical sensor can serve as a potential alternative to spectroscopic and
chromatographic methods and provides instantaneous on-site detection of PAHs.
Key words: graphene, tungsten oxide, electrochemical sensor, polycyclic aromatic hydrocarbon
INTRODUCTION
Polycyclic aromatic hydrocarbon (PAH) is an organic contaminant that can hardly be
metabolized; making it easily accumulated within the body of living organisms and hence the
food cycle [5]. More worrisome is the fact that this carcinogenic and mutagenic compound
has been found in air, soil and water bodies and it poses serious health hazard to human even
at low dosage (1-10µg/kg) [2-3]. Contemporary, detection of PAH relied on spectroscopic
and chromatographic methods which involve time-consuming sample preparation such as
extraction and pretreatment, required trained labor, expensive analytical instruments and lack
portability [4-5]. In recent year, electrochemical sensor has gain popularity for quantification
of chemical compound due to its affordability and simplicity. This compact and small sensor
is portable to provide instantaneous on-site analysis of target analytes [10]. Graphene, a two-
dimensional carbon sheet, is among the most widely studied material for electrochemical
sensing which promises rapid and sensitive detection. Nowadays, graphene is mass produced

ENGINEERING 113
via reduction of its oxide counterpart; graphene oxide (GO). However, the reduction process
often led to restacking of the carbon sheets which diminishes the surface area of graphene. In
this study, composite of tungsten oxide intercalated reduce graphene oxide (WO3-rGO) was
synthesized to overcome the problem of restacking. The hybrid was produce via chemical
deposition approach with the assistance of sonication to disperse the as-synthesized tungstite
(WO3·H2O) and supply the energy to heat up the solution. The obtained powder was
calcinated in air to simultaneously convert WO3·H2O into WO3 and reduce the GO. This
active material was then prepared into working electrode for anthracene (PAH of choice in
this study) sensing.
MAIN RESULTS
Figure 1. Current responses of (A) rGO/GCE and (B) WO3-rGO/GCE in N2 saturated 0.1M
lithium perchlorate (LiClO4) electrolyte containing different anthracene concentration (0 pM
to 100 µM). Scan range: -0.8V to +1.8V, scan rate: 10mV⸳s-1. Insets are the enlarged portion
of the peak current.
Figure 2. Plot of working electrode response over anthracene concentration. Orange box
indicated the anthracene concentration range which correlates linearly with the electrodes
responses. ΔI = I0 – Ic is the change or difference between the peak current of working
electrode at specific anthracene concentration (Ic) compared to that of blank solution (I0).

ENGINEERING 114
CONCLUSION
In the nutshell, WO3-rGO hybrid can be easily synthesized and showed promise for
electrochemical detection of anthracene at low concentration. With further work to ascertain
and finetune the selectiveness and reproducibility of the sensor, this material could be a
useful candidate for contaminant monitoring application.
Acknowledgment: The authors would like to express their appreciation for the financial
support provided by Nippon Sheet Glass Foundation (4B290).
REFERENCES
1. M. Tamayo y Ortiz, M.M. Téllez-Rojo, B. Trejo-Valdivia, L. Schnaas, E. Osorio-Valencia, B. Coull, D.
Bellinger, R.J. Wright, R.O. Wright, Maternal stress modifies the effect of exposure to lead during
pregnancy and 24-month old children’s neurodevelopment, Environ. Int. 98 (2017) 191–197. doi:10.1016/j.envint.2016.11.005.
2. M.A. Barakat, New trends in removing heavy metals from industrial wastewater, Arab. J. Chem. 4 (2011)
361–377. doi:10.1016/j.arabjc.2010.07.019.
3. P.B. Tchounwou, C.G. Yedjou, A.K. Patlolla, D.J. Sutton, Heavy Metal Toxicity and the Environment, Mol.
Clin. Environ. Toxicol. 101 (2012) 133–164. doi:10.1007/978-3-7643-8340-4.
4. J. Zhang, L. Li, Y. Li, C. Yang, Microwave-assisted synthesis of hierarchical mesoporous nano-
TiO2/cellulose composites for rapid adsorption of Pb2+, Chem. Eng. J. 313 (2017) 1132–1141.
doi:10.1016/j.cej.2016.11.007.
5. A.H. Arias, C. V Spetter, R.H. Freije, J.E. Marcovecchio, Polycyclic aromatic hydrocarbons in water,
mussels (Brachidontes sp., Tagelus sp.) and fish (Odontesthes sp.) from Bahía Blanca Estuary, Argentina,
Estuar. Coast. Shelf Sci. 85 (2009) 67–81. doi:10.1016/j.ecss.2009.06.008. 6. A. Al-Rashdan, M.I.H. Helaleh, A. Nisar, A. Ibtisam, Z. Al-Ballam, Determination of the Levels of
Polycyclic Aromatic Hydrocarbons in Toasted Bread Using Gas Chromatography Mass Spectrometry, Int. J.
Anal. Chem. (2010) 1–8. doi:10.1155/2010/821216.
7. G. Tuteja, C. Rout, N.R. Bishnoi, Quantification of polycyclic aromatic hydrocarbons in leafy and
underground vegetables: A case study around Panipat City, Haryana, India, J. Environ. Sci. Technol. 4
(2011) 611–620. doi:10.3923/jest.2011.611.620.
8. E. Gilgenast, G. Boczkaj, A. Przyjazny, M. Kamiński, Sample preparation procedure for the determination
of polycyclic aromatic hydrocarbons in petroleum vacuum residue and bitumen, Anal. Bioanal. Chem. 401
(2011) 1059–1069. doi:10.1007/s00216-011-5134-9.
9. J. Du, J. Xu, Z. Sun, C. Jing, Au nanoparticles grafted on Fe3O4 as effective SERS substrates for label-free
detection of the 16 EPA priority polycyclic aromatic hydrocarbons, Anal. Chim. Acta. 915 (2016) 81–89.
doi:10.1016/j.aca.2016.02.009. 10. F. Tan, L. Cong, N. Maria, J. Gao, X. Li, A. Mulchandani, An electrochemically reduced graphene oxide
chemiresistive sensor for sensitive detection of Hg2+ ion in water samples, J. Hazard. Mater. 320 (2016)
226–233. doi:10.1016/j.jhazmat.2016.08.029.

ENGINEERING 115
IGCESH2018
Universiti Teknologi Malaysia, Johor Bahru, Malaysia 13-15 August 2018
PHOTOCATALYTIC CO2 REDUCTION TO METHANOL OVER
SILVER-LOADED GRAPHITIC CARBON NITRIDE NANOCATALYST
W. Fadlun*1, M. Tahir 2 and Z. Y. Zakaria3
1,2,3 Department of Chemical Engineering, Faculty of Chemical and
Energy Engineering, Universiti Teknologi Malaysia (UTM),
81310 UTM Johor Bahru, Johor, MALAYSIA.
(E-mail: *[email protected])
ABSTRACT
Over past few decades, catalytic photoreduction of CO2 to hydrocarbon products has paid
much attention in scientific research as it capable to produce cleaner fuels. This research
focus on production of CH3OH from photoreduction of CO2 over Ag-doped-g-C3N4
nanocatalyst in the presence of water. The nanocatalysts were synthesized by thermal
treatment and wet-impregnation method. The performance of pure g-C3N4 and Ag-loaded g-
C3N4 nanocomposites for CO2 conversion with H2O to CH3OH were investigated under
visible light in a slurry photoreactor. The maximum production of CH3OH over 3 wt. %
Ag/g-C3N4 catalyst reached 789 μmol/g.cat corresponds to 1.23 folds, is considerably higher
than the amount yielded over the pure g-C3N4 (640 μmol/g.cat). The significant improvement
was evidently due to Ag nanoparticles can prevent the electron and holes pairs from
recombining effectively. The stability, reaction medium and effect of metal loading were
studied in order to understand the role of Ag/g-C3N4 towards production of CH3OH. The
reaction mechanism of Ag/g-C3N4 on the photocatalytic activity for CO2 conversion to
CH3OH is also presented.
Key words: CO2 photoreduction, Ag/g-C3N4 nanocatalyst, Slurry photoreactor, CH3OH, Visible
light
INTRODUCTION
Catalytic photochemically transforming CO2 to solar fuels has paid much significant attention
in research scientific as it is one of the best way to combat the global warming and depletion
of fossil fuels. Over past three decades, Inoue et al. [1] demonstrated photocatalytic CO2
reduction with H2O and main products reported were CH3OH, CH4, HCOOH and HCHO.
Since then, numerous attempts have been conducted in order to synthesize selective
photocatalytic systems for efficient CO2 photoreduction to hydrocarbon fuels such as TiO2
[2], ZnO [3], WO3 [4], SnO2, CdS, α-Fe2O3 [5], Cu2O [6], g-C3N4 [7], and SiC [8-9].
However, most of the semiconductors are a UV-light responsive photocatalyst and have very
poor yield of selective hydrocarbons. Thus, it is very important to synthesize novel developed
visible light responsive photocatalysts to efficiently transforming CO2 to solar fuels.
The H2O has been widely used as reducing agent to yield CH3OH as H2O can be functioned
at low temperature and atmospheric [10]. The photoreduction of CO2 by using H2O as

ENGINEERING 116
reductant are stated in Eq. (1). This indicated renewable fuels such as CH3OH can be
obtained in a single step process [11]. To implement the reduction of CO2 technique more
economic and industrial scalable, research should focusing on increasing the overall CO2
photoreduction efficiency and selectivity [12].
Figure 1. Methanol yield over different Ag-loaded g-C3N4 samples and bare g- C3N4
200 400 600 800 1000 1200 1400 1600 1800 2000
Inte
nsity
(a.u
)
Raman shift (cm-1)
g-C3N
4
Ag/g-C3N
4
(b)
Figure 2. FTIR spectra of g-C3N4 and Ag-loaded g-C3N4 samples
CONCLUSION
Photocatalytic CO2 reduction to CH3OH over Ag/g-C3N4 in a slurry photoreactor has been
successfully investigated. The yield rate of CH3OH was increased significantly by
introducing Ag in g-C3N4 sample. Ag found very efficient for preventing charges
recombination rate and increase absorption of visible light thus enhance the adsorption of
CO2 to the surface catalyst. The finding of this study can be explored further for the
production of other chemical and fuels under solar energy irradiation.
Acknowledgment: The authors would like to express their appreciation for the support from
Ministry of Higher Education (MOHE), Malaysia and Universiti Teknologi Malaysia (UTM)
for their financial funding through FRGS Grant Vote No 4F876.
0
100
200
300
400
500
600
700
800
900
0 1 2 3 4 5
Yie
ld o
f m
eth
ano
l (µ
mo
l/g.
cat)
Time (h)
g-C3N4
1% Ag/g-C3N4
3% Ag/g-C3N4
5% Ag/g-C3N4
Blank

ENGINEERING 117
REFERENCES
1. Inoue, T., et al. Photoelectrocatalytic reduction of carbon dioxide in aqueous suspensions of semiconductor
powders. Nature 277(1979), 637-638.
2. Tahir, M., B. Tahir, and N.Aslectivit.S. Amin. Gold-nanoparticle-modified TiO2 nanowires for plasmon-
enhanced photocatalytic CO2 reduction with H2 under visible light irradiation. Applied Surface Science
356(2015), 1289-1299.
3. Guo, X., H. Zhu, and Q. Li. Visible-light-driven photocatalytic properties of ZnO/ZnFe2O4 core/shell
nanocable arrays. Applied Catalysis B: Environmental 160 (2014), 408-414.
4. Lee, J., S.K. Kim, and Y. Sohn. Understanding photocatalytic coupled-dye degradation and photoelectrocatalytic water splitting and CO2 reduction over WO3/MoO3 hybrid nanostructures. Journal of
Industrial and Engineering Chemistry, (2018).
5. Jiang, Z., et al. A Hierarchical Z-Scheme alpha-Fe2O3/g-C3N4 Hybrid for enhanced photocatalytic CO2
reduction. Advanced Material, 30(2018), 10.
6. Wang, J.-C., et al. Enhanced photoreduction CO2 activity over direct z-scheme α-Fe2O3/Cu2O
heterostructures under visible light irradiation. ACS Applied Materials and Interfaces 7(2015), 8631-8639.
7. Adekoya, D.O., M. Tahir, and N.A.S. Amin. g-C3N4/(Cu/TiO2) nanocomposite for enhanced photoreduction
of CO2 to CH3OH and HCOOH under UV/visible light. Journal of CO2 Utilization 18(2017), 261-274.
8. Centi, G. and S. Perathoner. Opportunities and prospects in the chemical recycling of carbon dioxide to
fuels. Catalysis Today 148(2009), 191-205.
9. Zhang, Q.-H., et al. Photocatalytic reduction of CO2 with H2O on Pt-loaded TiO2 catalyst. Catalysis Today 148(2009), 335-340.
10. László, B. and J. Kiss. Photoreactions in CO2-CH4 system on metal modified titanate nanotubes. LAP-
Lambert Academic Publishing, 2016.
11. Carneiro, J.T., et al. The effect of water on the performance of TiO2 in photocatalytic selective alkane
oxidation. Journal of Catalysis 277(2011), 129-133.
12. Naik, B., S. Martha, and K. Parida. Facile fabrication of Bi2O3/TiO2-xNx nanocomposites for excellent visible
light driven photocatalytic hydrogen evolution. International Journal of Hydrogen Energy 36(2011), 2794-
2802.

ENGINEERING 118
IGCESH2018
Universiti Teknologi Malaysia, Johor Bahru, Malaysia 13 -15 August 2018
PREPARATION OF REINFORCED HYDROXYL TERMINATED
NATURAL RUBBER BY ADDITION OF GRAPHENE OXIDE
Aina Shafinaz Md Basheer Khan*1, Dahlia Anggraini2, Siti Hajjar
Che Man3 and Norfhairna Baharulrazi4
1,2,3,4 Department of Polymer and Bioprocess Engineering, Universiti Teknologi Malaysia, Johor
Bahru, Malaysia.
( E-mail: [email protected],
[email protected],[email protected],[email protected])
ABSTRACT
Natural rubber (NR) is a high molecular weight (mw) biopolymer which originated from
rubber tree and has been widely used in manufacturing industry. NR has greater advantages
over synthetic rubber due to its properties and less energy needed for processing. However,
NR which consist of C=C is sensitive towards oxidation and ozone. Thus, some modification
of NR is needed to enhance the properties of NR. Degradation of NR is one of the method
that produced lower mw and shorter polymeric chain that known as LNR. However, LNR has
not been widely used due to inactive end chain of LNR. Thus, TLNR is preferable due to
existing of functional group at the end chains of LNR. To date, various filler has been
incorporated into NR/elastomers in order to enhances NR properties. Thus, this research was
focusing on reinforcing of HTNR with the addition of GO via solution mixing. HTNR has
been successfully synthesized from DPNR via oxidative degradation method in the presence
of CAA and NABH4. Next, GO was incorporated into the HTNR in presence of THF. Two
different GO loading has been used which is 5% and 10% (w/w of HTNR). FTIR, GPC and
DSC have been used to characterize the DPNR, HTNR and HTNR-GO. The results from
GPC shows that HTNR has been successfully synthesized with low mw compared to DPNR.
While FTIR analysis confirmed the presence of hydroxyl and carbonyl groups with the peaks
observed at 3434 cm-1 and 1659 cm-1. Finally, the DSC analysis revealed the improved
thermal stability of the prepared HTNR-g-GO with increase in Tg from -60.49 ℃ (DPNR) to
-56.74 ℃ (HTNR-GO (5wt%)) and -56.82 ℃ (HTNR-GO (10wt%)). This shows that the
HTNR-GO has better properties than initial DPNR and can be a potential toughening material
for nanocomposite.
Key words: NR, HTNR, GO, HTNR-GO
INTRODUCTION
Natural rubber (NR) which originated from rubber tree having good properties and has been
used in wide range application such tires, glove, and so on. NR has many valuable and
attractive characteristic or properties such as high tensile strength, highly elastic, good impact
resistance, high resilience and excellence flexibility [1]. However, due to the presence of
C=C in polyisoprene chain, NR difficult to process, and easily degraded by ozone [2]. Thus,
some modification is needed to enhance the performance of NR. Addition of filler has been a

ENGINEERING 119
significant method for the NR property enhancement. Reinforcing fillers such as carbon
black, carbon nanotube, and montmorillonite have been reported to improve the mechanical
properties of NR. Besides the addition of filler onto NR matrix, liquid natural rubber (LNR)
can be good alternative due to its processing ease. LNR is degraded from NR with lower mw
and shorter polymeric chain. Telechelic liquid natural rubber (TLNR) is a special type of
LNR that contain functional groups which enable for further functionalization or chemical
reaction [2]. LNR on the other hand, only contains inactive chain end. Thus, in this research,
graphene oxide (GO) which act as a filler has been incorporated into hydroxyl terminated
natural rubber (HTNR) that been depolymerized from DPNR via oxidative degradation
method. The aim of this research is to provides a novel method for the development high
performance graphene/NR nanocomposite which can serve for various applications such as
automotive and structural. To achieve the aim, HTNR from DPNR was synthesized using
oxidative degradation method at 80 ℃ in the presence of CAA and NaBH4. Next, the
graphene oxide (GO) reinforce into HTNR has been conducted using tetrahydrofuran (THF)
as the solvent. The percentage of graphene oxide was for 5% and 10% by weight of HTNR in
order to obtain better thermal properties. Lastly, FTIR, DSC, and GPC were used to
characterised the HTNR and HTNR-GO.
MAIN RESULTS
Results from GPC shows that HTNR has been successfully degraded from DPNR due to its
lower Mn compared to DPNR. Mn of DPNR and HTNR were 693 658 g/mol and 68 916 g/mol,
respectively. While, FTIR was used to recognize functional groups that present in the DPNR,
HTNR and HTNR-GO. The infrared spectrum (IR) of DPNR, HTNR and HTNR-g-GO was
showed respectively in Figure 1(a), Figure 1 (b) and Figure 2.
Figure 1. The infrared spectrum (IR) of (a) DPNR and (b) HTNR
The IR results of DPNR from Figure 1(a) was used to observe the changes in IR of HTNR
and HTNR-GO. The existence of hydroxyl group can be seen in Figure 1(b) at the broad peak
of 3434 cm-1. At the peak 1127 cm-1 spectrum also illustrates the presence of the same
groups. Thus, with the presence of hydroxyl group, it has been proved that HTNR has been
successfully synthesized from DPNR. While, IR results of HTNR-GO are presented in Figure
2. From the figure, it shows the presence of O-H stretching at the peak of 3390 cm-1.
Existence of C=O stretching of carboxylic acid also presence at the peak of 1717cm-1. Lastly,
a) DPNR b) HTNR

ENGINEERING 120
at 1050 cm-1 proves the existence of C-O-C groups. The presence of epoxide and carboxylic
acid functional group has proven that GO was incorporated into HTNR.
Figure 2. Infrared spectrum (IR) of the prepared HTNR-g-GO
DSC was used to determine the glass transition temperature (Tg) of DPNR, HTNR and
HTNR-GO. The DSC analysis revealed the improved thermal stability of the prepared HTNR-g-
GO with increase in Tg from -60.49 ℃ (DPNR) to -56.74 ℃ (HTNR-g-GO (5wt%)) and -56.82
℃ (HTNR-g-GO (10wt%)).
CONCLUSION
The aim of this research is to provides a novel method for the development high performance
graphene/NR nanocomposite which can serve for various applications. From the result,
reinforcement of HTNR by GO addition is improve in term of physical properties compared to
pure DPNR. Thus, HTNR-GO can be used in further application as intermediate composite and
can be an effective method for the preparation of nanocomposite in the future.
REFERENCES
1. Azhar, N. H. A., Rasid, H. M., and Yusoff, S. F. M. (2016). Chemical modifications of liquid natural rubber.
Paper presented at the AIP Conference Proceedings.
2. Nor, H. M., and Ebdon, J. R. (1998). Telechelic liquid natural rubber: a review. Progress in polymer science,
23(2), 143-177.

ENGINEERING 121
IGCESH2018
Universiti Teknologi Malaysia, Johor Bahru, Malaysia 13 -15 August 2018
PLACEMENT OF BATTERY STORAGE SYSTEM USING PSO IN 9
RADIAL BUS SYSTEM
Hanis Farhah Jamahori*1 and Hasimah Abdul Rahman2
1,2 Centre of Electrical Energy Systems, Institute of Future Energy, Universiti Teknologi Malaysia,
81310 UTM Johor, Johor Bahru, MALAYSIA.
(E-mail: [email protected], [email protected])
ABSTRACT
The use of an ESS in an electrical power system is an effective way to store excess energy
and has huge advantages in integration with renewable energy (RE) sources. Thus, proper
technique is needed to locate and place ESS to obtain maximum benefit functions. This paper
consider Particle Swarm Optimization (PSO) technique to find the optimal placement and
sizing of battery storage system and the proposed technique is tested in IEEE 9 bus radial
distribution system for voltage drop and power loss reduction. The result shows a great
improvement in both objective function.
Key words: Battery storage, Particle swarm optimization, Voltage profile, Power loss
INTRODUCTION
Great efforts have been made in looking for feasible solutions to store excess energy from
Renewable Energy (RE) since the interest in this research area has rapidly grown as RE
industries begin to generate large-scale output of RE consumption. Effective and
affordable technology to cope with the intermittent RE sources will help to decrease or
eliminate the challenge. Energy storage systems (ESS), the interconnection with external
grids and load-shifting through demand control are examples of the feasible solutions [1].
Concerns arising due to the variability and intermittency of RE sources while integrating
with the power grid can be mitigated to an extent by incorporating a storage element
within the RE harnessing system [2].
ESS has been identified as one of the most promising approaches, and the rising issues
can be overcome by integrating the ESS element with the RE [3-4]. ESS is becoming a
crucial component in the distribution system, especially in the distribution system to
enhance the system’s reliability, efficiency and sustainability. In addition, ESS is able to
accommodate a high RE penetration level. Opportunities for substantial growth in RE
sources are driving the need for grid-storage with existing mandates set to deliver
tremendous growth in RE worldwide in order to enable a better-utilized grid and defer
significant transmission and distribution investment. Therefore, in order to increase the
aggregated value of an RE system so that energy can be managed and substantial, it is
important to ensure that ESS is well-placed in a distribution system [5].

ENGINEERING 122
Normally, the placement of ESS in DREG is obtained using optimization techniques. There
are various types of modern optimization techniques available, and the most commonly used
is the metaheuristic technique which has been extensively used in finding the optimal
location and sizing of ESS in DREG. A genetic algorithm (GA), simulated annealing (SA),
Artificial Bee Colony (ABC), Tabu Search (TS), particle swarm optimisation (PSO), Ant
Colony optimisation (ACO) and the hill climbing technique (HCT) are some of the existing
meta-heuristic techniques. This section has summarized the recent conventional optimal ESS
planning methods used in DREG, in order to provide a global overview. These
methodologies vary according to their objective function being solved such as; minimize
power losses, increase system reliability and efficiency, economic benefits and cost reduction
[6-9].
In this study, placement and sizing of battery storage are done using PSO technique aimed to
reduce the voltage drop and power loss. The proposed technique is tested on IEEE 9 bus
system.
MAIN RESULTS
The result shows great improvement in power loss and voltage drop reduction after BESS
is placed. The higher reduction is found to be at bus 1 and 3 using 50 KWh and 100 KWh
as shown in Table 1 and Table 2 respectively. Further study will be conducted to find the
effect of placement BESS along with Distributed Generation (such as PV and wind) and
the result will be compared to this main result.
Figure 1. Power loss profile without ESS placement
Figure 2. Voltage profile without ESS placement

ENGINEERING 123
Table 1. Result for 50 KWh of BESS
Voltage drop Power loss
Without BESS 13.4953 36.8394
With 1 BESS at location 3 (50 kwh) 9.36345 3.10488
With 2 BESS at location 1 (50 kwh) 6.79789 0.879812
Table 2. Result for 100 KWh of BESS
Voltage drop Power loss
Without BESS 13.4953 36.8394
With 1 BESS at location 3 (100 kwh) 9.92371 2.90393
With 2 BESS at location 1 (100 kwh) 6.29765 1.38904
CONCLUSION
It can be concluded that the desired results to reduce voltage drop and power loss by finding
the optimal sizing and location of BESS is achieved by using PSO method. The optimal
location and sizing of BESS is found to be at bus 1 and 3, with 50 KWh and 100 KWh
respectively.
Acknowledgment: The authors wish to thank the Ministry of Higher Education (MOHE)
Malaysia and Universiti Teknologi Malaysia (UTM) for the award of the grant that enabled
the research, leading to this article under the Research University Grant (vote no:
Q.J130000.2523.14H02).
REFERENCES
1. Ibrahim, H., A. Ilinca, and J. Perron, Energy storage systems—Characteristics and comparisons. Renewable
and Sustainable Energy Reviews, 2008. 12(5): p. 1221-1250.
2. Status of electrical energy storage systems, in urn no. 04/1878, D.r. DG/DTI/00050/00/00, Editor. 2004, UK
Department of Trade and Industry. p. 1-24.
3. Nair, N.-K.C. and N. Garimella, Battery energy storage systems: Assessment for small-scale renewable
energy integration. Energy and Buildings, 2010. 42(11): p. 2124-2130.
4. Hatziargyriou, N.D. and A.P.S. Meliopoulos. Distributed energy sources: technical challenges. in 2002
IEEE Power Engineering Society Winter Meeting. Conference Proceedings (Cat. No.02CH37309). 2002.
5. Rodrigues, E.M.G., et al., Energy storage systems supporting increased penetration of renewables in
islanded systems. Energy, 2014. 75: p. 265-280
6. Karanki, S.B., et al. Optimal location of battery energy storage systems in power distribution network for integrating renewable energy sources. in 2013 IEEE Energy Conversion Congress and Exposition. 2013.
7. Nick, M., et al. Optimal location and sizing of distributed storage systems in active distribution networks. in
2013 IEEE Grenoble Conference. 2013
8. Zheng, Y., et al., Optimal Allocation of Energy Storage System for Risk Mitigation of DISCOs With High
Renewable Penetrations. IEEE Transactions on Power Systems, 2014. 29(1): p. 212-220
9. Nick, M., R. Cherkaoui, and M. Paolone, Optimal Allocation of Dispersed Energy Storage Systems in Active
Distribution Networks for Energy Balance and Grid Support. IEEE Transactions on Power Systems, 2014.
29(5): p. 2300-2310

ENGINEERING 124
IGCESH2018
Universiti Teknologi Malaysia, Johor Bahru, Malaysia 13 -15 August 2018
ZEOLITE IMPROVEMENT IN ANAEROBIC DEGRADATION OF
LANDFILL LEACHATE
Mohammad Arif Budiman Pauzan*1, Mohd Hafiz Puteh2 and Mohd Hafiz Dzarfan
Othman3
1, 3Advanced Membrane Technology Research Centre (AMTEC), Universiti Teknologi Malaysia,
81310 Johor Bahru, Johor, Malaysia
(E-mail: [email protected], [email protected]) 2 Department of Environmental Engineering, Faculty of Civil Engineering, Universiti Teknologi
Malaysia, 81310 Johor Bahru, Johor, Malaysia.
(E-mail: [email protected])
ABSTRACT
Landfill leachate has been known for containing high concentration of harmful to the
environment as well to human’s health contaminant substances such as organics, ammonia,
and heavy metals. Microorganisms’ activity particularly methanogens in anaerobic digester
will be greatly affected due to these high toxic compounds. This research aims to investigate
the potential toxicity and biodegradability of leachate under methanogenic conditions using
batch microcosm assays i.e. anaerobic toxicity assays (ATA) technique and biochemical
methane potential (BMP) methods and to enhance the biodegradability of landfill leachate
using natural (clinoptilolite)and synthetic (Sigma 96096) zeolites in a modified batch
microcosm assays. Prior to this, adsorption studies of ammoniacal nitrogen (NH3-N) on
aforementioned zeolites, present in leachate were carried out using leachate sample collected
from Seelong Sanitary Landfill, Johor based on three parameters including dosage, particle
size, and percentage of leachate to distilled water. The results showed that the maximum
removal of NH3-N for clinoptilolite and Sigma 96096 were 90.61% and 56.67%,
respectively; with the dosage, particle size, and percentage of leachate to distilled water of 2
g/L, 50 mm and 50% for clinoptilolite, and for Sigma 96096 at 4 g/L, 150 mm and 50%,
respectively. Biodegradability assays were conducted on varied concentrations of leachate
using two anaerobic biomass from Indah Water Konsortium (IWK), Ulu Tiram, Johor and
KULIM Palm Oil Mill Effluent Treatment Plant (KULIM), Kulai, Johor. From ATA,
concentration of 10% with the addition of clinoptilolite using KULIM seeds shows the best
performance with value of Maximum Rate Ratio (MRR) is 0.99 indicates no significant
inhibition was recorded. From BMP, the highest percentage of conversion efficiency
recorded was by using IWK seed at concentration of 5% of leachate with the addition of
Sigma 96096 which is 43.03%. The findings from this study will be used to predict the
methane potential of leachate to be used in bigger reactor or incinerator.
Key words: Leachate, Zeolite, Adsorption, Anaerobic, Methane

ENGINEERING 125
INTRODUCTION
According to previous studies (Syafalni et al., 2012; Rafizul and Alamgir, 2012), leachate
has been known to be toxicant and brings contamination to not only ground water but the
environment itself. However, a few treatments including physical treatment such as air -
stripping, adsorption, etc., chemical treatment such as activated carbon and biological
treatment such as aerobic and anaerobic have been implanted to treat the leachate
especially in reducing the concentration of COD and ammonia in leachate before
discharging.
However, upon these treatments, biological treatment especially anaerobic treatment has
been attracted many researchers not only due to cost efficient and the methane gas
production in consequence of the anaerobic process itself have been promisingly
beneficial to the society to produce electricity and fuel source.
By using a simple and inexpensive method proposed by Owen et al. (1979), a method
called biochemical methane potential (BMP) was developed to investigate the potential of
leachate to be treated in anaerobic condition using mechanisms in anaerobic sludge or
biomass. Later, a defined media was added to act as nutrient supplier to the mechanisms
in the sludge. Volume of methane gas produced from the process was collected and
interpreted to investigate any constituents which affect the methane production. A method
also proposed by Owen et al. (1979) called anaerobic toxicity assay (ATA) uses the same
technique with BMP but with the addition of acetate and propionate.
Previous studies by Milan et al., (2001) and Montalvo et al., (2012) have found synergic
relation between zeolite in anaerobic digestion. The addition of zeolite was used as a tool
to in enhancing methane production from the leachate and seeds as well to reduce the
toxicity of the leachate.
Hence, a new modification to ATA and BMP by adding two different types of zeolites
using natural (Clinoptilolite) and synthetic zeolite (Sigma 96096) as well as using two
different sources of inoculum from domestic waste and agricultural waste were used in
this study to provide a new information based on the methane production and COD
reduction. This information will be used as a tool to improve the efficiency of methane
production in anaerobic digester to be used in landfill.
MAIN RESULTS
Figure 1 depicts the amount of methane collected from ATA and BMP for 30 days from two
different anaerobic biomass sources; (i) sewage treatment plant (IWK) and (ii) palm oil mill
effluent digester (KULIM). The concentrations of leachate chosen were 5, 10, 25, 50 and
100% of sample leachate from total concentration of leachate with remaining percentage
filled with defined media.

ENGINEERING 126
Figure 1. Anaerobic Toxicity Assay (ATA) of landfill leachate using KULIM seed for all
concentrations and Biochemical Methane Potential (BMP) of leachate using IWK seed for all
concentration.
CONCLUSION
Landfill leachate contains high concentration of toxic compounds such as ammonia which if
not be treated properly, may cause harm to environment. Anaerobic degradation has been
reported to be advantageous in leachate treatment due to its ability to produce substantial
amount of biogas specifically methane gas for energy recovery. However, due to high
ammonia concentration in leachate, it is hampering the methane production. A new
modification to ATA and BMP by adding two different types of zeolites using natural
(Clinoptilolite) and synthetic zeolite (Sigma 96096) as well as using two different sources of
inoculum from domestic waste and agricultural waste were used in this study to provide a
new information based on the methane production and COD reduction. This information will
be used as a tool to improve the efficiency of methane production in anaerobic digester to be
used in landfill.
Acknowledgment: The authors would like to express their appreciation for the support of the
sponsors with Project No 07J11, Centre for Environmental Sustainability and Water Security
(IPASA) and Advanced Membrane Technology Research Centre (AMTEC).
REFERENCES
1. Milan, Z., Sanchez, E., Borja, R., Weiland, P. and Cruz, M. (2001). Synergistic effects of natural and
modified zeolites on the methanogenesis of acetate and methanol. Biotechnology Letters. 23: 559–562.
2. Montalvo, S., Diaz, F., Guerrero, L., Sánchez, E., and Borja, R. (2005). Effect of particle size and doses of
zeolite addition on anaerobic digestion processes of synthetic and piggery wastes. Process
Biochemistry. 40: 1475–1481.
3. Owen, W.F., Stuckey, D.C., Healy. Jr., J.B., Young, L.Y., and McCarty, P.L. (1979). Bioassay for monitoring biochemical methane potential and anaerobic toxicity, Water Research. 13: 485-492.
4. Rafizul, I.M., and Alamgir, M. (2012). Characterization and tropical seasonal variation of leachate: Result
from landfill lysimeter studied. Waste Management. 32: 2080-2095.
5. Syafalni, Lim, H.K., Ismail, N., Abustan, I., Murshed, M.F., and Ahmad, A. (2012). Treatment of landfill
leachate by using lateritic soil as a natural coagulant. Journal of Environmental Management. 112: 353-359.

ENGINEERING 127
IGCESH2018
Universiti Teknologi Malaysia, Johor Bahru, Malaysia 13 -15 August 2018
DYNAMIC BRAIN CONNECTIVITY NETWORKS FROM EEG
Hadri Hussain1, Chee-Ming Ting *2, Ahmad Zubaidi Abdul Latif3, Fuad Numan4,
Alias Mohd Noor 5
1,2,4,5 Faculty of Biosciences and Medical Engineering, Universiti Teknologi Malaysia, Skudai,
MALAYSIA.
(E-mail: [email protected]) 3Universiti Sultan Zainal Abidin, 21300, Gong Badak, Kuala Terengganu, MALAYSIA.
ABSTRACT
The human brain is a part of the central nervous system originated from neuronal activation
in the cerebral cortex during the synaptic process which is typically measured by
electroencephalogram (EEG). The EEG signals for instances, have low amplitudes and are
typically obscured by various background noises and artefacts. Causality effects that one
region has on another needs to be analyze from the observed signals in order to learn the
underlying physiological process of the brain. Thus, the challenge is to develop reliable and
computationally efficient multivariate modeling approach with dynamic properties for better
modeling and analyzing the multidimensional dynamical brain. Multivariate vector
autoregressive (MVAR) modelling has been used to infer effective connectivity, using EEG
time series, the casual influence of one neuronal region exert on another, which involves the
directionality of information flow. Conventionally, these measures are fixed with time and
computed from MAR model with constant coefficients fitted over the entire time-course,
assuming static brain connectivity. This suggest that the MVAR parameter and hence the
connectivity matrices can be allowed to vary with time to better quantify the dynamics of
connectivity network. Thus, this study proposed a dynamic classification in hidden Markov
model (HMM). The continuous hidden states of the model could better describe these
continuously changing characteristics of EEG and thus improve the classification
performance. Preliminary results show, the window MVAR matric capture more information
from the EEG signals throughout the time hence the ability to see the connectivity between
region of the brain when compared with a stationary MVAR matric
Key words: Multivariate Vector Autoregressive, Hidden Markov Mode
INTRODUCTION
Biomedical signals derived from dynamical systems, which are singularly characterized by
very different behaviours and various degrees of complexity. Statistically, they are non-
stationary signal which exhibits in complex nonlinearities and non-Gaussian distributions for
example electroencephalogram (EEG) signals. The physiological background noise such as
eye movement and blinking, cardiac activity, muscle activity, respiration and skin potential
can affect the performance of the system.

ENGINEERING 128
In medical diagnosis, Doctor have been using EEG to assist them in Brain function disorder,
a good example would be seizures, and epilepsy. From the EEG signals captured by the
electrode the brain function disorder’s characteristic can be extracted in terms of its
frequency and amplitudes. EEG has become widely used in improving living quality
especially for disable person which known as brain-computer interfacing (BCI) system. The
BCI system performance in term of classification rate and computation effect depends on the
features and the classification technique chosen.
Brain Computer Interface (BCI) technology is a powerful communication tool between users
and systems. The advantage is it does not require any external devices or muscle intervention
to issue commands and complete the interaction. The research community has initially
developed BCIs with biomedical applications in mind, leading to the generation of assistive
devices [1]. They have facilitated restoring the movement ability for physically challenged or
locked-in users and replacing lost motor functionality. An important application of BCI has
encouraged research community to study the involvement of BCI in the life of non-paralyzed
humans through medical applications [2]
BCI systems are certainly useful for the disabled. However, in recent years, the focus has
shifted from this original objective to other application areas like biometrics, games, virtual
reality and indeed music (brain–computer music interface, or BCMI) [3].
MAIN RESULTS
Figure 1. Show the multi EEG signals with windowing VAR matric approaches to capture
the dynamic changes through time for a single trail
Figure 2. Show the stationary VAR matric of the EEG for a single trail

ENGINEERING 129
Figure 1. shows the EEG signals being windowed throughout the single trail. The window
was at 1% of the single trail and overlaps of 50%. The VAR matric represents the
connectivity between the channel at every widow shift. Hence capturing the dynamic changes
over time. Where else in Figure 2, shows a stationary VAR matric over a single trail.
Table 1. Show the differences of VAR windowing matric compared to stationary VAR
matric
CONCLUSION
The window VAR matric capture more information form the EEG signals throughout the
time hence the ability to see the connectivity between region of the brain when compared
with a stationary VAR matric.
Acknowledgment: The authors would like to express their appreciation for the support of the
sponsors, Project No (4L481) allocated and UTM Zamalah’s Scholarship.
REFERENCES
1. Maiorana, Emanuele, Daria La Rocca, and Patrizio Campisi. "On the permanence of EEG signals for
biometric recognition." IEEE Transactions on Information Forensics and Security 11.1 (2016): 163-175 2. C.-M. Ting, S. B. Samdin, S. Salleh, M. H. Omar, and I. Kamarulafizam, "An expectation-maximization
algorithm based Kalman smoother approach for single-trial estimation of event-related potentials," in Proc
Annu. Int. Conf. IEEE Eng. Med. Bio. Soc, pp. 6534-6538, 2012.
3. Jayarathne, Isuru, Michael Cohen, and Senaka Amarakeerthi. "BrainID: Development of an EEG-based
biometric authentication system." Information Technology, Electronics and Mobile Communication
Conference (IEMCON), 2016 IEEE 7th Annual. IEEE, 2016

ENGINEERING 130
IGCESH2018
Universiti Teknologi Malaysia, Johor Bahru, Malaysia 13 -15 August 2018
DRUG-LOADED POLY-VINYL ALCOHOL ELECTROSPUN
NANOFIBERS FOR TRANSDERMAL DRUG DELIVERY SYSTEM:
MINI REVIEW ON RELEASE CHARACTERISTICS
Shafizah Sa’adon*1 and Saiful I. A. Razak2
1 Faculty of Biosciences and Medical Engineering, Universiti Teknologi Malaysia, Johor,
MALAYSIA. 2 IJN-UTM Cardiovascular Engineering Centre, Institute of Human Centered Engineering, Universiti
Teknologi Malaysia, Johor, MALAYSIA. (E-mail: [email protected]*, [email protected])
ABSTRACT
Transdermal drug delivery system (TDDS) is designated to be applied through body surface
and delivers the active drug across the skin, into the systemic circulation. Thus, this mini
review is focusing on the release characteristic of the drugs-loaded Poly-vinyl Alcohol (PVA)
electrospun nanofiber mats. Several types of non-steroidal anti-inflammatory drug (NSAID)
of varying water solubility property were reviewed. Electrospinning method was used to
fabricate the PVA electrospun nanofiber mats that act as carriers of drugs for TDDS due to its
great ability to produce ultrafine fibers with average diameters in the sub-micrometer to
nanometer range. Drugs release assessment were performed and evaluated by using Franz
diffusion cell. Furthermore, this mini review reveals that the concentration of the drugs
played major role on both release rate and cumulative amount of drugs released from the
prepared drug-loaded PVA electrospun nanofiber mats. The rate of the drugs released from
the drug-loaded PVA mats increase with increasing of drug’s concentration. Overall, this
mini review on drugs release characteristics and the good correlation between drugs and PVA
electrospun nanofiber mats shows great potential promising deliverable drugs and one day
could be one of the best novel drug delivery system.
Key words: Electrospinning, Poly-vinyl Alcohol (PVA), Transdermal Drug Delivery System
(TDDS), Franz Diffusion Cell
INTRODUCTION
Several possible methods for introducing medication into the body include oral and
transdermal routes and injections. Over the last two decades there has been a resurgence of
interest on transdermal drug delivery into the systemic circulation because they are non-
invasive, inexpensive and can be self-administered with improved patient compliance.
Polymers are the backbone of transdermal delivery systems and advances in the field of
polymer science have facilitated the design of different transdermal delivery systems with
considerable flexibility using natural, synthetic and semisynthetic polymers to control the
release of drug through the intact skin [1-2]. Therefore, PVA is well-suited as a carrier for
many drugs [3-4]. Poly -vinyl alcohol (PVA) is a hydrophilic, semi-crystalline polymer with

ENGINEERING 131
good chemical and thermal stability. Hence, PVA is interesting here because of its
biocompatible, non-toxic; water permeable polymer with great electrospinnability is one of
such suitable polymers which are easily blended with natural polymers and crosslinked to
form hydrogels [3].
Electrospinning is the most cost effective one with simple tooling that utilizes electrostatic
forces to produce nanofibers of polymer with unique characteristics including ultrafine
structure, a large surface area to volume ratio, and a high porosity with a small pore size
ranging from submicron to nanometer sizes [5]. One of the obvious advantages of the
electrospinning process compared to conventional film-casting techniques is the highly
porous structure of electrospun fiber mats, which exhibit a much greater surface area that
could potentially allow drug molecules to diffuse from the matrix more effectively [6].
Electrospun nanofibers have been developed for skin tissue scaffolds, wound dressings as
well as drug delivery applications including Alzheimer drugs, antimicrobial and antifungal
drugs, proteins, cosmeceuticals and genes [7-9]. In this mini review, mats of PVA nanofibers
were prepared by electrospinning method and these electrospun fiber mats were used as
carriers of drugs for a TDDS.
MAIN RESULTS
The in vitro release experiments were performed using a Franz diffusion cell. The actual
amounts of the drug incorporated into PVA electrospun nanofiber mats were determined
prior to investigating their skin permeation characteristics. Table 1 shows the release
profiles of the drug-loaded PVA electrospun nanofiber mats.
Table 1. Release profiles of drug loaded PVA
Type of drugs-
loaded PVA
Concentration of
drugs (% wt.)
Cumulative
amount of drug
release (%)
Release rate References
Meloxicam
(MX)-PVA
2.5 6.0 0.24 % h-1/2 [4]
20.0 28.0 2.59 % h-1/2
Capsicum
Extract (CE)-
PVA
0.50 79.55 7.80 % min-1/2
[6] 2.00 76.00 13.01% min-1/2
Capsaicin
(CC)-PVA
0.025 69.0 5.25 % min-1/2 [10]
0.050 93.0 11.2 % min-1/2
From the data shows above, an increase in the drug’s concentration respectively in the
PVA electrospun nanofiber mats resulted in increase in cumulative amount and drugs
release rate. These data might be the result of the highly erosive nature of the PVA
nanofiber mats which also contributed to another observed behavior - a high susceptibility
for release in aqueous media [4]. Drugs can be released easily from the PVA electrospun
nanofiber mats and the drugs release patterns may be explained by polymer erosion [11].

ENGINEERING 132
CONCLUSION
The release characteristic of the drug-loaded PVA electrospun nanofiber mats was assessed
by the transdermal diffusion through Franz diffusion cell. The cumulative amount and release
rate of the drugs permeated from PVA electrospun was and increased when the drug’s
concentration was increased respectively. These results suggest a possibility for utilizing
drug-loaded PVA electrospun mats as TDDS.
Acknowledgment: The authors would like to acknowledge Ministry of Higher Education
Malaysia for funding through Fundamental Research Grant Scheme.
REFERENCES
1. Kiran, S, Vijender, S. and Alka, A. Natural Biodegradable polymer as matrices in transdermal drug delivery.
International Journal of drug development and research 2 (2011), 85-103.
2. Divyesh, P., Nirav, P., Meghal, P. and Navpree,t K. Transdermal Drug Delivery System: Review.
International Journal of Biopharmaceutical and Toxicological Research 1 (2011), 1-20.
3. Taepaiboon, P., Ruktanonchai,U. and Supaphol, P. Drug-loaded electrospun matsof poly(vinyl alcohol)
fibres and their release characteristics of four model drugs. Nanotechnology 17 (2006), 2317–2329.
4. Ngawhirunpat, T., Opanasopit, P., Rojanarata, T., Akkaramongkolporn, P., Ruktanonchai, U. and Supaphol,
P. Development of meloxicam- loaded electrospun polyvinyl alcohol mats as a transdermal therapeutic agent. Pharm Dev Technol 14 (2009), 70–79.
5. Paaver, U., Tamm, I., Laidmäe, I., Lust, A., Kirsimäe, K., Veski, P., Kogermann, K. and Heinämäki, J.
Soluplus Graft Copolymer: Potential Novel Carrier Polymer in Electrospinning of Nanofibrous Drug
Delivery Systems for Wound Therapy. Biomed. Res. Int. (2014), 1-7.
6. Opanasopit, P., Sila-On, W., Rojanarata, T. and Ngawhirunpat, T. Fabrication and properties of capsicum
extract-loaded PVA and CA nanofiber patches. Pharmaceutical Development and Technology 15 (2013),
1140-1147.
7. Arthanari, S., Mani, G., Jang, J.H., Choi, J.O., Cho, Y.H., Lee, J.H., Cha, S.E., Oh, H.S., Kwon, D.H. and
Jang, H.T. Preparation and characterization of gatifloxacin-loaded alginate/ poly (vinyl alcohol) electrospun
nanofibers. Artif. Cells Nanomed. Biotechnol. (2014), 1-6.
8. Gencturk, A., Kahraman, E., Gungor, S., Ozhan, G., Ozsoy, Y. and Sarac, A.S. Polyurethane/ hydroxypropyl
cellulose electrospun nanofiber mats as potential transdermal drug delivery system: characterization studies and in vitro assays. Artif. Cell Blood Sub. (2016), 1-11.
9. Esenturk, I., Balkan, T., Gungor, S., Sarac, A.S. and Erdal, M.S. Voriconazole-loaded electrospun
nanofibers as topical drug carriers. 7th European Dermatology Congress, Alicante, Spain (2016)
10. Ngawhirunpat, T., Rojanarata, T., Panomsuk, S. and Opanasopit, P. Fabrication of capsaicin loaded
polyvinyl alcohol electrospun nanofibers. Advanced Materials Research. 338 (2011), 42–45.
11. Kim, T.G., Lee, D.S. and Park, T.G. Controlled protein release from electrospun biodegradable fiber
mesh composed of poly(epsilon-caprolactone) and poly(ethylene oxide). Int J Pharm. 338 (2007), 276–
283.
ENGINEERING 133
IGCESH2018
Universiti Teknologi Malaysia, Johor Bahru, Malaysia 13 -15 August 2018
CLASSIFICATION OF SPORT ACTION USING DEEP LEARNING
APPROACH
Nur Azmina Rahmad*1, Nur Anis Jasmin Sufri2 and Muhammad Amir As’Ari3
1, 2 Faculty of Biosciences and Medical Engineering, Universiti Teknologi Malaysia, Johor Bahru,
MALAYSIA.
(E-mail: [email protected], [email protected]) 3 Sport Innovation and Technology Center (SITC), Institute of Human Centered Engineering (IHCE),
Universiti Teknologi Malaysia, Johor Bahru, MALAYSIA.
(E-mail: [email protected])
ABSTRACT
Image classification is one of computer vision application to identify the category of object in
the image. Deep learning which is a subtype of machine learning has becoming a research
interest in image classification technique compared to other conventional machine learning
approaches due its ability to provide outstanding result. In this paper, we focus on the
classification of badminton match data using pre-trained Alexnet Convolutional Neural
Network (CNN) for recognizing the badminton action. The images are categorized into two
classes: hit and non-hit which were extracted from Yonex All England Man Single Match
2017 broadcast video. 80 images (40 for hit and 40 for non-hit) have been fed into the
classifier. Finally, the performance of classifier was analysed by plotting its performance
accuracy in form of confusion matrix. The result shows that the classification accuracy is
81.3% which is quite high. In a conclusion, the pre-trained CNN is capable to be used in
recognizing action in badminton match which might be useful in badminton sport
performance technology.
Key words: Action recognition, Alexnet, Deep learning, Image classification
INTRODUCTION
Image classification has been used in many applications such as face recognition, biometric
recognition and remote sensing [1] due to the development of media and technology over the
decades. Basically, there are two major divisions in machine learning: supervised and
unsupervised. In supervised learning, model has the targeted output meanwhile for
unsupervised learning, there is no targeted output. Hence, the input must be clustered to
patterns the output.
Convolutional Neural Network (CNN) is one of a supervised classification technique. It
has taken place in many recent works with its simple but precise architecture. CNN falls
into deep learning classifier category in which it eliminates the manual features extraction
in machine learning pipelines. CNN model will automatically extracts the features of
image before classifying it into respective class [2]. The pipeline is similar with Artificial
Neural Network (ANN): input layer, hidden layer and output layer but the hidden layer of
CNN could consist up to hundreds of layer to improve its performance accuracy.

ENGINEERING 134
MAIN RESULTS
In this experiment, from the 80 images, 64 images were used for training while the
remaining 16 images were used for testing. Figure 1 shows the result of the classification
of 16 testing images which consists of 8 images for hit and 8 images for non-hit action.
Figure 1. Target and predicted action for 16 testing images
Figure 2 shows the confusion matrix of the classifier. From the figure, we can see that the
major contribution of the accuracy is from non-hit action. All 8 non-hit images are classify as
non-hit action while only 5 out of 8 hit images are classify as hit action.

ENGINEERING 135
Figure 2. Confusion matrix for pre-trained Alexnet CNN
CONCLUSION
Sport performance analysis is an important branch in sport practice. In order to analyze the
performance of athletes using notational analysis approach, the sport analyst will manually
recognize the action before doing the analysis. This study can contributes to the automatic
action recognition using the most simple and non-time consuming transfer learning method.
In the future, the experiment can be improved by classifying more action in badminton sport
instead of classifying the action into hit and non-hit.
Acknowledgment: The authors would like to express their appreciation to Universiti
Teknologi Malaysia for the support of the project through Zamalah Scholarship.
REFERENCES
1. Wu, S., Dong, L., Chen, H. and Zhan, J. Application of Image Classification Technology in Mangrove
Information Extraction. In 11th International Conference on Computational Intelligence and Security (CIS),
IEEE(2015),167-170. 2. O'Shea, K. and Nash, R. An Introduction to Convolutional Neural Network. CoRR 2(2015), 1-11.

ENGINEERING 136
IGCESH2018
Universiti Teknologi Malaysia, Johor Bahru, Malaysia 13 -15 August 2018
VISION BASED SYSTEM FOR BANKNOTE RECOGNITION USING
MACHINE LEARNING APPROACH
Nur Anis Jasmin binti Sufri*1, Nur Azmina binti Rahmad2 and
Muhammad Amir bin As’ari3
1, 2 Faculty of Biosciences and Medical Engineering, Universiti Teknologi Malaysia,
Johor Bahru, Malaysia.
(Email: [email protected], [email protected]) 3 Sport Innovation and Technology Center (SITC), Institute of Human Centered Engineering (IHCE),
Universiti Teknologi Malaysia, Johor Bahru, Malaysia.
(Email: [email protected])
ABSTRACT
The visually impaired people faced several difficulties to interpret their surroundings
especially in an unfamiliar environment or unpredictable setting. Lack of vision also impacts
on individual’s ability to carry out everyday activities for example groceries shopping.
Visually impaired people faced a problem in identifying and recognizing the different types
of the banknote. Many researchers had introduced an automated banknote recognition system
that can be divided into vision-based system and sensor-based system. The main aim of this
project was to develop an automated algorithm that can recognize and classify different types
of Malaysian banknote for visually impaired people primarily based on the banknote images
by using a diverse type of machine learning approaches. In this project, both sides on
Malaysian banknote images (RM1, RM5, RM10, RM20, RM50 and RM100) was captured by
using handphone camera. Feature extraction of the RGB values was done using MATLAB
Software. Three features called RB, RG and GB that are extracted from the RGB values were
used to the machine learning classification algorithms such as k-Nearest Neighbors (k-NN)
and Decision Tree Classifier (DTC), Support Vector Machine(SVM) and Bayesian
Classifier(BC) for recognizing each class of banknote. Ten-fold cross validation was used to
select the optimized k-NN, DTC, SVM and BC which was based on the smallest cross
validation loss. After that, the performance of optimizing k-NN, DTC, SVM and BC model
was presented in confusion matrix.
Key words: Banknote Recognition, RGB Values, Machine Learning, Cross Validation
INTRODUCTION
As stated in vision impairment and blindness fact sheet by World Health Organization [1], an
estimated 253 million people live with visual impairment where 36 million people are blind,
and another 217 million people have moderate to severe visual impairment. This project
focused in recognizing and classifying banknote which will help the visual. impaired people
in performing the groceries activities. The automated banknote recognition can be separated
into vision-based system [2] and sensor-based system [3]. However, most of studies on
vision-based system claimed having a higher percentage in term of accuracy.

ENGINEERING 137
Figure 1 shows the main process in this project. For data collection, six banknote sample
per class (RM1, RM5, RM10, RM20, RM50 and RM100) with total of 168 banknote images
were taken by using handphone camera under a controlled environment in horizontal and
vertical position for both sides of banknote. MATLAB tool called TrainingImageLabeler
were used to crop each of the banknote images in different regions (informative region only,
whole region only and combination of informative and whole region) as referred to Figure 2
to have wider and bigger set of data. For feature extraction, the red, green and blue intensity
average values from each of the banknotes were taken from the both cropped region and then,
RB, RG and GB features were calculated by using Equations (1) to (3) before recorded the
features obtained using Microsoft Excel.
RB = r̅ −b ̅ (1)
RG = r̅ −g ̅ (2)
GB = g ̅ − b ̅ (3)
Figure 1. Block Diagram
(a)
(b)
Figure 2. (a) Informative region (b) Whole region
Finally, machine learning classification model such as k-NN, DTC, SVM and BC were
used to recognize and classify the Malaysian Ringgit banknote based on the RB, RG and
GB features. In selecting the optimum Decision Tree Classifier (DTC) and evaluating the
performance others classification algorithm, cross validation with 10 folders was used to
formulate the confusion matrix that represent the performance(accuracy) of each
proposed classification model.
MAIN RESULTS
Overall, both k-NN and DTC managed to achieve 99.7% accuracy with RM50 class
provides the major contribution in reducing the performance of both classifiers. This is
due to one of the RM50 samples was predicted as RM1. Both SVM and BC succeeded to
achieve 100% accuracy as referred to Table 1.
Data Collection Features Extraction Classification Performance Evaluation

ENGINEERING 138
(a)
(b)
Figure 3. (a) The confusion matrix for k-NN and DTC using the combination region.
(b) The confusion matrix for SVM and BC using the combination region.
Table 1. The performance (accuracy) of machine learning classification model
Machine learning classification model
Accuracy
Informative
region
Whole
region
Combination
region
k Nearest Neighbor (k-NN) 99.4% 99.4% 99.7%
Decision Tree Classifier (DTC) 100% 100% 99.7%
Support Vector Machine (SVM) 100% 100% 100%
Bayesian Classifier (BC) 100% 100% 100%
CONCLUSION
In conclusion, a vision based automated algorithm that can recognize and classify Malaysian
Ringgit Banknote using k Nearest Neighbor (k-NN), Decision Tree Classifier (DTC), Support
Vector Machine (SVM) and Bayesian Classifier (BC) has been developed.
Acknowledgment: The authors would like to express their appreciation for the support
Universiti Teknologi Malaysia (UTM) for supporting this research.
REFERENCES
1. Organization, W.H. Vision impairment and blindness. 2017 October 2017 [cited 2017 14 November]; Fact
Sheet. Available from: http://www.who.int/mediacentre/factsheets/fs282/en/.
2. Sufri, N.J., et al., Image Based Ringgit Banknote Recognition for Visually Impaired. Journal of
Telecommunication, Electronic and Computer Engineering (JTEC), 2017. 9(3-9): p. 103-111.Schwartz, M. Guidelines for Bias-Free Writing. Indiana University Press, Bloomington, IN, USA, 1995.
3. Ghazali, N.F., et al., Wearable Device for Malaysian Ringgit Banknotes Recognition Based on Embedded
Decision Tree Classifier. Journal of Telecommunication, Electronic and Computer Engineering (JTEC),
2018. 10(1): p. 129-137.

ENGINEERING 139
IGCESH2018
Universiti Teknologi Malaysia, Johor Bahru, Malaysia 13 -15 August 2018
BUTLER MATRIX FOR BEAM-FORMING APPLICATION IN 5G
WIRELESS COMMUNICATION
Nor Azimah Mohd Shukor1, Norhudah Seman2, Nazleen Syahira Mohd Suhaimi3
1,2,3 Wireless Communication Centre, Universiti Teknologi Malaysia,
Johor Bahru, Johor, 81310 Malaysia.
(E-mail: [email protected], [email protected], [email protected])
ABSTRACT
Beam-forming network are anticipated to play a key role in 5G technology system. Butler
Matrix (BM) is one of the beam-forming network, which creates multiple fixed overlapping
beams to cover the designated angular area. The BM can be functioned to control the
capability of beam-forming and scanning. This article mainly focusing on two aspects, which
is the design technique and the performance achievable of the proposed design. Each of the
recent works is highlighted with specific performance enhancements that can be achieved
with the different approaches. The chosen configuration of BM is presented and its properties
are discussed. In addition, the selection of substrate used is one of the crucial aspect in
designing the BM.
Key words: 5G, Butler Matrix, beam-forming, wireless
INTRODUCTION
Recently, an advanced communication system with high performance devices is required for
future 5G technologies. It requires the devices with perfect wireless communication between
anything at anywhere and anytime. The 5G applications is suggested to be deployed in year
2020. The strong demand of 5G technology, which require 24/7 ubiquitously high-speed
connectivity may leads to excessive challenge to the researchers and engineers involving RF
and microwave components, antenna and networking planning.
Thus, the development of multiple-input and multiple-output (MIMO) systems is highly
demanding in network systems. In MIMO systems, several beam-forming networks have
been studied and employed. There are several beam-forming networks such as Rotman lens,
Reflector lens, Blass matrix and Butler Matrix [1]. However, by comparing to the other
beam-forming networks, BM has been widely used by many researchers. The Butler Matrix
design is considered to have the simplest configuration among others. Besides that, the BM
utilized minimum number of components. Furthermore, Butler Matrix has gained popularity
due to lower loss [2,4].
The BM was first introduced by Jesse Butler and Ralph Lowe in [3]. Basically, the
configuration of BM consists of passive components such as branch line coupler (BLC),
phase shifter and crossover [5-6]. The variation phase at the output ports can be obtained
since the input signal of BM is switchable at different input ports [5,7]. The multi-channel

ENGINEERING 140
operation for transport applications, particularly for roadside vehicle and inter-vehicle
communication can be provided by cascading the BM [8]. Meanwhile, the cascaded BM can
produced the narrow beam and broad beam output as presented in [8]. Since there is
possibilities of the receiver to increase the gain in the desired signal direction and reduce the
gain in interference direction, the narrow beam signals are suitable for long-range
communications [8]. Whilst, the broad-beam signals are used for short-range communication [8].
Butler Matrix Design
Since 5G technology is strongly demanding a network system with compact size, the BM
design requires a small size of passive component since BM is developed with three main
microwave components, which includes of BLC, phase shifter and crossover as shown in
Figure 1. Referring to Figure 1, the BM has four input ports and output ports denoted as P1-P4
and P5-P8, respectively. The output port is functioned as a feeding network to antenna
element to create beams.
In order to maintain the required specification of Butler Matrix, the designed passive
components must be able to tolerate with the certain losses after the combination with other
component and simultaneously. Therefore, well and wideband performance is expected.
Table 1 shows the parameters and specifications of the proposed individual components. The
proposed coupler, phase shifter and crossover are design by using single layer approach to
avoid the difficulties occurred during the fabrication process. These problem may affect the
performance of the measured response.
Table 1. The parameters and specifications of proposed individual components
Parameter Component
Coupler Phase Shifter Crossover
S11 (dB) ≤ -10 ≤ -10 ≤ -10
S21 (dB) -3 ± 1 0 ± 1 ≤ -10
S31 (dB) -3 ± 1 - 0
S41 (dB) ≤ -10 ≤ -10 ≤ -10
Phase Difference (degree) 90º ± 2 º 45º ± 5 -
The well-perform individual components across the designated frequency will be selected
to form the Butler Matrix design. Table 2 show the parameters and specifications of the 4
x 4 Butler Matrix design across the designated frequency band. Then, another crucial
aspect in designing each components is the selection of substrate. The transmission line
may experience several losses during the design process such as dielectric loss and
tangent loss factor may affect the performance of the design. Thus, the substrate with low
dielectric loss and low loss tangent is chosen throughout the research.

ENGINEERING 141
Figure 1. The configuration of 4 x 4
Butler Matrix
Table 2. The parameters and specifications of
4 x 4 Butler Matrix
Parameter Butler
Matrix
Sii (dB)
(i = 1, 2, 3, 4, 5 , 6 ,7 ,8) ≤ -10
Sij (dB)
(i = 5, 6, 7, 8 and j = 1, 2, 3, 4) -6
Phase Difference
between Output
Ports
Input Port 1 -45º
Input Port 2 -135º
Input Port 3 +135º
Input Port 4 +45º
CONCLUSION
In this article, through reviews have been presented, which include Butler Matrix, single-
section branch line coupler, phase shifter and crossover. It is started with the explanation of
basic concept of Butler Matrix. Then, followed by the literature review of the Butler Matrix,
and components that used to form a Butler Matrix. The chosen configuration has been
presented and a few techniques will be used to further improve the performance.
Acknowledgment: This work was supported by Ministry of Higher-Education Malaysia
(MOHE) and Universiti Teknologi Malaysia (UTM) through Prototype Research Grant
Scheme (PRGS) [Vote Number of 4L684]; Flagship Grant [Vote Number of 03G41] and
HiCoE Grant [Vote Number of 4J212].
REFERENCES
1. Yang, Q. L., Ban, Y. L., Kang, K. Kang, Sim, C. Y. D. and Wu, G. SIW Multibeam Array for 5G Mobile
Devices. IEEE Access, vol. 4, 2788 -2796.
2. Bantavis, P. I., Kolitsida, C., Jonsson,B. L. G., Empliouk, T. and Kyriacou, G. A. A Wideband Switched
Beam Antenna System for 5G Femtocell Application. International Symposium on Antenna Propagations &
USNC/USRI National Radio Science (2017), 929-930.
3. Butler,J. and Lowe, R. Beam-Forming Matrix Simplifies Design of Electronically Scanned Antennas.
Electronic Design (1961). vol. 9, 170-173.
4. Kalam, S. V.and Rathi, A. B. Optimum Design of 4X4 Symmetrically Structured Butler Matrix.
International Journal of Scientific Research Engineering and Technology (2016), vol. 5, 31-34. 5. Yang, Q. L., Ban, Y. L., Lian, J. W., Yu, Z. F. and Wu, B. SIW Butler Matrix with Modified Hybrid Coupler
for Slot Antenna Array. IEEE Access(2016), vol.4, 9561-9569.
6. Yang, Q. L., Ban, Y. L., Zhou, Q. Q. and Li, M. Y. Butler Matrix Beamforming Network Based on
Substrate Integrated Technology for 5G Mobile DevicesIEEE Asia-Pacific Conference on Antennas and
Propagation (2016), 413-414.
7. Hayashi, H., Hitko, D. A. and Sodini, C. G. Four-element planar Butler matrix using half-wavelength open
stubs. IEEE Microwave and Wireless Components Letters (2002), vol. 12, no. 3, 73-75.
8. Rahim, S. K. A., Muhammad, N. A. and Rahman, T. A. Beamforming Networks Using Reduced Size and
Cascaded Butler Matrices IEEE European Conference Antennas and Propagations (2010), 1-4.

ENGINEERING 142
IGCESH2018
Universiti Teknologi Malaysia, Johor Bahru, Malaysia 13 -15 August 2018
SHEAR CAPACITY OF INTERNALLY CONFINED RC COLUMNS
WITH FRP STRIPS
Nur Hajarul Falahi Binti Abdul Halim1, Sophia C. Alih2 and Mohammadreza
Vafaei3
1 Faculty of Civil Engineering, Universiti Teknologi Malaysia, 81310 Skudai, Johor, Malaysia.
(E-mail: [email protected]) 2 Faculty of Civil Engineering, Institute of Noise and Vibration, Universiti Teknologi Malaysia, 81310
Skudai, Johor, Malaysia. (E-mail: [email protected])
3 Faculty of Civil Engineering, Forensic Engineering Center, Universiti Teknologi Malaysia, 81310
Skudai, Johor, Malaysia.
ABSTRACT
Transverse reinforcement or stirrups play an important role in shear capacity and ductility
of RC elements like columns. Improper design and detailing of stirrups may lead to lower
shear resistance when columns are subjected to lateral loads like earthquake. Failure of
stirrups and large spacing between the transverse ties can cause buckling of longitudinal
reinforcement and shear failure in RC columns during earthquake. Due to this important
role, stringent requirements are given in seismic design codes for transverse
reinforcement in order to maintain the integrity of the structural element and provide
ductility to the structure. Usage of 135° hook and closely spaced stirrups in the potential
plastic hinge location is among the requirements set in design codes. However, in most
construction, these requirements are not adhered. Previous researches have shown the
advantages of using spiral transverse reinforcement in enhancing shear capacity of
column. FRP composites has also shown to increased overall capacity of column due to
its high strength to weight ratio. However, limited study has been conducted in the
application of FRP strips as transverse reinforcement in RC columns. This study
investigates the effect of using FRP strips in continuous spiral form to the shear capacity
of RC columns. Analytical calculations and non-linear numerical analysis are conducted
to determine the shear capacity of RC column with conventional stirrups and FRP strips.
Results from the analyses show an increase in the shear capacity of RC columns when FRP
strips are used as the transverse reinforcements.
Key words: RC columns, shear reinforcement, FRP
INTRODUCTION
Shear failures of RC column usually related to inadequate transverse reinforcement or
stirrups [1]. Inadequate shear reinforcement will not able to withstand large lateral
deformations caused by an earthquake. Thus, this will lead to brittle failure of columns or
even collapse of the whole structure. Current seismic design code has been provided to
enhance the shear resistance of RC columns such as 135° end hook and closed spacing

ENGINEERING 143
between stirrups. However, the seismic requirements usually were not followed in the
construction practices [2].
Previous researches have shown the advantages application of continuous spiral
reinforcement in enhancing the shear capacity of RC columns [3]. However, they are not
widely used on site. Meanwhile, FRP composites has broadly used to enhance the shear
capacity of RC columns in retrofitting and repairing the existing structures due to their
height strength to weight ratio [4]. However, there is very limited application and study of
FRP strips as transverse reinforcement in RC columns that has been conducted.
Therefore, this study is conducted to investigate the effect of FRP strips in a continuous
spiral to shear capacity of RC columns. Analytical prediction and non-linear numerical
analysis are conducted to investigate the increase in shear capacity of RC columns
confined with conventional stirrups and FRP strips spiral.
MAIN RESULTS
Table 1 shows the increase of shear capacity using FRP strips spiral compared with the
conventional carbon steel stirrups.
Table 1. Shear capacity of conventional steel stirrups and continuous spiral using FRP strips.
Figure 1 shows the result from FE modeling analysis.
Figure 1. Backbone curve of RC column confined with FRP strip spirals and conventional ties
0
5
10
15
20
0 20 40 60 80 100
Load
(kN
)
Displacement (mm)
FE model (steel) FE model (FRP)
Bar dia.
(mm)
Area of
bar
(mm2)
Equivalent
width of
FRP strips
(mm)
Area of
FRP strips
(mm2)
Shear
capacity, Vcs
for normal
lateral ties
(kN)
Shear
capacity, Vsf
for FRP strip
spirals
6 28.27 14 2.08 9 26
8 50.27 24 3.71 16 46
10 78.54 38 5.79 25 72

ENGINEERING 144
CONCLUSION
This study presents result from analytical calculation and non-linear numerical analysis on
shear capacity of RC columns using conventional stirrups and FRP strips continuous spiral as
shear reinforcement. Based on analytical calculations, FRP strips internally wrapped RC
column improved shear capacity by 80.6% compared with RC column using carbón steel
stirrups. On the other hand, based on numerical modeling analysis, increases the ultimate load
capacity and lateral displacement by 12.5% and 36.8%, respectively compared with low-
ductile column reinforced with conventional steel rebars. The large improvement in shear
capacity of using FRP strip as transverse reinforcement in RC columns is the column can
maintain its ultimate load carrying capacity until it reaches lateral displacement of 78 mm,
compared with sudden failure of column using conventional stirrups. This indicates a good
potential of using FRP strips as transverse reinforcement in RC columns.
Acknowledgment: The authors would like to express their appreciation for the support of the
sponsors with grant no. 4F716.
REFERENCES 1. Bokey PB, Pajgade PS. Lessons from Jan,26, 2001 Gujarat (India) Earthquake. 13th World Conference on
Earthquake Engineering; Vancouver, B.C., Canada2004.
2. Abraham J, Kiriu L, McKay S, Xie Y. Chi-Chi, Taiwan Earthquake Event Report. Chi-Chi Reconnaissance
Team; 2000.
3. Azimi M, Bin Adnan A, Sam AR, Tahir MM, Faridmehr I, Hodjati R. Seismic performance of RC beam-
column connections with continuous rectangular spiral transverse reinforcements for low ductility classes.
ScientificWorldJournal. (2014),2014:802605.
4. GangaRao HVS, Narendra T, Vijay PV. Reinforced Concrete Design with FRP Composites. Boca Raton:
CRC Press; 2006.

ENGINEERING 145
IGCESH2018
Universiti Teknologi Malaysia, Johor Bahru, Malaysia 13 -15 August 2018
SYNTHESIS OF OXIDIZED STARCH NANOCRYSTAL FOR UREA
REMOVAL FROM AQUEOUS SOLUTION
Muhammad Nidzhom Zainol Abidin1, Pei Sean Goh*2 and Ahmad Fauzi Ismail3
1 School of Graduate Studies, Universiti Teknologi Malaysia, 81310 Johor Bahru, MALAYSIA.
(E-mail: [email protected]) 2, 3 Advanced Membrane Technology Research Centre, Universiti Teknologi Malaysia, 81310 Johor
Bahru, MALAYSIA.
(E-mail: [email protected], [email protected])
ABSTRACT
This study aims to develop a nano-adsorbent, derived from potato starch for urea removal
from aqueous solution. Potato starch was hydrolysed using sulfuric acid, forming starch
nanocrystal (SNC). A chemical oxidation was then performed on the aqueous suspensions of
SNC by the addition of hydrogen peroxide in a closed-system (pH= 5.0, T= 32.5°C). The
modified SNC, now identified as oxy-SNC was characterized using scanning electron
microscopy and Fourier-transform infrared spectroscopy (FTIR). Urea adsorption study was
then conducted on the oxy-SNC. The percent removal of urea and the adsorption kinetic were
determined, where the results were compared with oxidized native starch, as a control. The
formation of platelet-like crystal was observed through the microscopic analysis while the
FTIR spectrum confirmed the presence of carbonyl groups formed in oxy-SNC. Based on the
urea adsorption study, the oxy-SNC exhibited 85.75% urea removal which was higher than
the oxidized native starch (77.29%). Oxy-SNC could serve as a promising material for urea
cleaning from a dialysis patient.
Key words: oxidized starch nanocrystal, urea removal, adsorption kinetic, dialysis
INTRODUCTION
Urea is the largest uremic toxin constituent among other uremic toxins in blood [1]. In human
excretory system, urea plays a part in carrying waste nitrogen where it finally ended up in the
urine of mammals. For various purposes, methods to capture nitrogenous waste compound
like urea have become an important prospect since this very small, water-soluble molecule is
hardly removed. Technique to reclaim water from urea have been developed based on
forward osmosis process [2]. Previously, many adsorptive materials, i.e. silica [1], activated
carbon [3] and oxidized starch have been developed as a simpler method to capture urea. The
materials were introduced either to be used as material for dialysis membrane or to reclaim
waste dialysis fluid during the dialysis operation [1,3].
In this study, starch nanocrystal (SNC) was synthesized from potato starch via acid
hydrolysis reaction, before undergoing chemical oxidation to form oxy-SNC. The SNC
was tested for its ability to adsorb urea. Adsorption kinetic was also established based on
the relationship between contact time and adsorption capacity. The finding demonstrated

ENGINEERING 146
that the reduced particle size of oxy-SNC has increased its total surface area, hence
improving its capacity for urea adsorption.
MAIN RESULTS
Figure 1 displays the images obtained from the scanning electron microscopy (SEM). The
SNC displayed a platelet-like shape and a size range between 0.7 and 3 µm. The larger
size of SNC was due to the self-aggregating tendency of SNC during water evaporation
[4].
Figure 1. SEM images of SNC at the magnification of (a) x10k and (b) x2k
Table 1 shows the removal percentage of urea from aqueous solution for oxy-SNC and
the control sample. The oxy-SNC exhibited a higher percent removal of urea than that of
oxidized native starch, suggesting that it has more carbonyl groups per gram to interact
with amino groups of urea.
Table 1. Percent removal of urea
Adsorbent Percent removal ± σ (%)
Oxy-SNC 85.75 ± 1.78
Oxidized native starch 77.29 ± 2.36
CONCLUSION
Based on the early findings, oxy-SNC has shown its credibility with an excellent 85.75%
removal of urea. The synthesis of oxy-SNC was one of many ways to modify native starch
into another functional material. With other system conditions, i.e. initial concentration, pH
and temperature were yet to be optimized, further study on this nanocrystal could be done
with focus to specific application, for example dialysis.
Acknowledgment: The authors would like to express their appreciation for the support of the
sponsors with Project No 01G46.

ENGINEERING 147
REFERENCES
1. Cheah, W.K., Sim, Y.L. and Yeoh, F.Y. Amine-functionalized mesoporous silica for urea adsorption.
Materials Chemistry and Physics 175 (2016), 151-157.
2. Talaat, K.M. Forward osmosis process for dialysis fluid regeneration. Artificial Organs 33 (2009), 1133-1135.
3. Kameda, T., Ito, S. and Yoshioka, T. Kinetic and equilibrium studies of urea adsorption onto activated
carbon: Adsorption mechanism. Journal of Dispersion Science and Technology DOI:
10.1080/01932691.2016.1219953.
4. Haaj, S.B., Thielemans, W., Magnin, A. and Boufi, S. Starch nanocrystals and starch nanoparticles from
waxy maize as nanoreinforcement: A comparative study. Carbohydrate Polymers 143 (2016), 310-317.

ENGINEERING 148
IGCESH2018
Universiti Teknologi Malaysia, Johor Bahru, Malaysia 13 -15 August 2018
COMPARATIVE ANALYSIS OF FIELD HOCKEY ACTIVITY
THROUGH THE WEARABLE SENSOR BEHAVIOUR
N. Shahar*1, M.A. As’ari2, N.F. Ghazali3 and T.T. Swee4
1, 2 Faculty of Biosciences and Medical Engineering, Universiti Teknologi Malaysia, Johor, Malaysia.
(Email: [email protected], [email protected]) 3 Faculty of Biosciences and Medical Engineering, Universiti Teknologi Malaysia, Johor, Malaysia.
(E-mail: [email protected])
ABSTRACT
Conquering the entire field hockey game by knowing a proper tactical strategy plan is
desirable by coaches and players. Notably one of the contributions towards a good tactical
plan is by having a notational data regarding such as number of passes and dribbles.
Currently, monitoring system using highly expensive technology video sensor (camera) is the
only option system for providing such notational data. The video analysis is truly time-
consuming due to the coaches and notational analysts have to repeat the playback to spot the
particular activity. Plus, this type of monitoring system is particularly available for elite
players only since the cost of developing the whole system is highly expensive. Therefore,
this paper proposes the implementation of unobtrusive and inexpensive wearable sensor in
recognizing field hockey activity. The purposes of this study are to investigate the feasibility
of sensor signal in representing passes and dribble as well as to recognize field hockey
activity using machine learning framework. Throughout the comparative analysis, results
show field hockey activities such as push pass, slap, hit and dribble using wearable sensors
mainly at chest and wrist are positively feasible. The performances of wearable sensors then
are evaluated using five different classification algorithms (decision tree, discriminant
analysis, support vector machine, K-NN and essemble tree). Across 10-fold cross validation a
Fine K-NN achieves the highest accuracy for both sensors, which are 97.3% at chest and
94.3% at wrist. Therefore, the feasibility of wearable sensor in interpreting field hockey
passes and dribble has been proven and the combination of machine learning and wearable
sensor offers a practical in recognizing field hockey activity.
Key words: Field hockey, Wearable sensor, Notational analysis, Activity recognition
INTRODUCTION
Recently, the utilization of miniature wearable sensor has greatly been growing in variety of
professional settings. The applications ranging from activity of daily living (ADL), tracking
to healthcare as the areas which benefitted this wearable sensor. Technology will always be
expanding and as for the current trend, any technology which is simple, portable and low cost
will definitely be demanded in market. Up to that, the wearable sensor fits the present trend
whereby it is small in size, low cost, portable and can be placed at any parts of human body
[1]. As the wearable sensor has brought a lot of convenience in many professions, it is
indirectly opened a new potential in sports study such as field hockey

ENGINEERING 149
As the work in [2], the analysis of mounted wearable sensor data particularly in stick
speed and ball control within field hockey sports was done for monitoring purpose.
Conversely the study in [3], applied the wearable sensors were applied in competition and
training for strategy as well as tactical planning. Studied by Mitchell et al. the wearable
sensor data was employed to classify dribble, standing tackle and ball hitting in field
hockey [4]. In corresponds to study in [4], the overall performance of classification in
field hockey events was 69.7%. Subsequently, this paper proposes to analyze the
feasibility of wearable sensor in distinguishing dribble and passing activity within the
field hockey.
Figure 1. a) Sensor placement at right wrist and chest b) 3D- axis of accelerometer
A collection of data was taken from four subjects of male field hockey player (15-17
years old). Each subject employed two sensors which is located at wrist and chest as
shown in Figure 1a and the axis direction of each sensor is illustrated in Figure 1b. Then,
the subject was asked to perform the dribbling and three types of passing activity which
are push pass, hitting and slap.
MAIN RESULTS
Figure 2. Comparative analysis of field hockey activity with chest-worn sensor
Figure 2 and Figure 3 illustrates the comparative analysis between dribble and passes
with sensor placement on chest and wrist respectively. In detail, by referring to Figure 2,
it could be identified that slap produces a higher amplitude than hit. This might be due to
a great movement of chest during slap event.

ENGINEERING 150
Figure 3. Comparative analysis of field hockey activity with wrist-worn sensor
In the meantime, Figure 3 reveals hit as higher amplitude as compared with slap with
sensor deployment on wrist. This contradicts to the signal generated as disclosed by
Figure 2. Consequently, this might be resulted from a powerful swing that required a
muscular movement at the area of wrist. On the other hand, from the results of both
sensors placement (on chest and wrist), it could be observed that signal generated by
dribbling activity rippling and can be considered as periodic signal due to the repeating
movement effects throughout the events. In addition, a non- periodic signal could be
witnessed from the effects of all types of passes for both sensors deployment on chest and
wrist.
CONCLUSION
In short, this study has successfully accomplished to evaluate and discriminate the generation
of signals in conjunction with passing and dribbling events. Based on the results, both sensor
placement on wrist and chest are very useful in interpreting the push pass and dribble events
of field hockey. In differentiate between three types of passes, both sensors are needed as the
signal generated from single sensor is less incapable in discriminating these activities.
Acknowledgment: A special appreciation is dedicated to my supervisor DR Muhammad
Amir As’ari for his guidance and assistance in the making of this paper. Not to forget, my
sponsorship, Zamalah UTM for their financial support throughout the study.
REFERENCES
1. Barbour, N and G. Schmidt, Inertial sensor technology trends. IEEE Sensors journal, 2001. 1(4): p. 332-339
2. Thiel, D.V., M. Tremayne, and D.A. James, Monitoring stick speed and ball control in field hockey drills
using a stick-mounted inertial accelerometer. Procedia Engineering, 2012. 34: p. 574-579.
3. White, A.D. and N.G. MacFarlane, Analysis of international competition and training in men's field hockey by global positioning system and inertial sensor technology. The Journal of Strength & Conditioning
Research, 2015. 29(1): p. 137-143.
4. Mitchell, E., A machine learning framework for automatic human activity classification from wearable
sensors. 2015, Dublin City University.

ENGINEERING 151
IGCESH2018
Universiti Teknologi Malaysia, Johor Bahru, Malaysia 13 -15 August 2018
EFFECTS OF THE PROPELLER ADVANCE RATIO ON THE DELTA
WING UAV LEADING EDGE VORTEX
K.A. Kasim*1, P. Segard*2, S. Mat, S. Mansor and M.N. Dahalan1
1, 3 Department of Aeronautical, Automotive and Offshore Engineering, Universiti Teknologi
Malaysia, Johor Bahru, MALAYSIA.
(E-mail: [email protected], [email protected], [email protected], [email protected]) 2 Graduate Students, EPF Graduate School of Engineering, Sceaux, FRANCE.
(E-mail: [email protected])
ABSTRACT
Delta wing is a triangular shaped planform that can be applied into the unmanned aerial
vehicle (UAV) or drone applications. However, the flow above delta wing is very
complicated and dominated by a very complex vortex structure on the upper surface of the
wing. More studies are need to be done to understand these flow phenomena. This paper
discusses an experiment study of active flow control applied on a generic 550 swept angle
sharp-edged delta wing model. For this case, a propeller has been placed in the trailing edge
of the wing. The experiments were performed in Universiti Teknologi Malaysia Low Speed
wind tunnel sized of 1.5 x 2.0 meter2 at the speeds of 20 m/s and 25 m/s. In order to
investigate the effects of rotating propeller on the vortex system above the wing, a very
intensive surface pressure measurement has been employed on the wing. The experiments
were divided into four configurations, i.e., experimental without propeller called as clean
wing configuration and followed by the experiment with 10″ and 9″ propellers for pusher-
propeller configuration. The final experiment was the experiment with 10″ propeller for
tractor-propeller configuration. The experimental data highlights an impact of propeller size
and its location on the vortex system of the delta-shaped UAV model. The results had
indicated that the vortex peak is increased when propeller is installed for both pusher and
tractor configurations. The results also indicate that pressure coefficient is increased when the
advanced propeller ratio increases.
Key words: Delta Wing UAV, Propeller, Surface Pressure, Vortex, Wind Tunnel Experiment
INTRODUCTION
Unmanned Aerial Vehicle (UAV) is an aerial vehicle that operating without pilot on board.
UAVs can overcome the limitations of piloted aircraft such unnecessary risk exposure
towards pilots and aircrews during rescue missions or surveillance operations [1]. UAVs can
be classified into fixed-wing, rotary-wing, ornithopter and entomopter based on their flying
principal [2]. Delta wing is categorized as fixed-wing UAVs. Currently, delta wing has been
implanted into the UAVs application [3-4]. The advantage of delta wing compared to
conventional wing is it can produce power more efficiently and lowering the wetted area to
the volume [5-6]. There were many research had been performed to enhanced the vortex
properties above the wing. One of them is by using rotating propeller, which the availability

ENGINEERING 152
of the data is limited currently. Propeller is more appropriate method for flow control above
delta winged UAV as propeller is seen to be the best propulsion system for fixed-wing UAV
[7]. Based on the research by [8-10], the stall angle of the UAV and flow above the wing is
improved if the propeller is installed on the wing. Thus, the aim of this project is to
investigate the effects of advanced propeller ratio on the vortex system above sharp-edged
non-slender delta wing UAV.
This project, the UAV model has been designed and fabricated locally in UTM Aerolab.
It has 55° sweep angle. The isometric drawing of the model is shown in Figure 1 below.
This model has been designed based on several previous delta winged UAVs available in
the market. The experiments were performed in 1.5m×2.0m×6m UTM-LST closed circuit
wind tunnel. The tests were performed at speeds of 20 m/s and 25 m/s that corresponding to
Reynolds number of 0.6×10⁶ and 0.8×10⁶ based on the mean aerodynamic chord (MAC) of
the wing model. In this experiment, brushless out-runner motor has been chosen to run the
propeller. In this project, the propeller speed was set at 4800 RPM for all test cases. Very
intensive surface pressure measurements were employed using electronic pressure scanner.
Figure 1. Generic delta wing UAV model.
MAIN RESULTS
This section discusses the results obtained from experimental surface pressure
measurement carried out in this project. To differentiate the propeller effect on vortex
performance, the data obtained from the clean wing configuration were compared with
the propeller configurations. Figure 2 shows the effect of propeller locations on the upper
surface of the wing. For most of the cases, the propeller installation has increase the Cp
on the upper surface. The propeller has increased the adverse pressure gradient in the
region and therefore influencing the vortex. When the airspeed is increased to 25 m/s,
there a nominal change in the vortex system observed. This finding can be related to the
higher value of advance ratio, J reducing the influence of propeller on vortex
enhancement above the wing.
CONCLUSION
The results presented in this paper show that the installation of the propeller has influenced
the vortex properties above the delta-shaped wing. It is found that the propeller advance ratio
has influenced the development of primary vortex above delta-winged model. Higher value
of J has reduced the influence of the vortex on the wing. The experimental work for this
project is still ongoing and some interesting data will be presented in the full paper later if
this paper is accepted.

ENGINEERING 153
Figure 2. Propeller effect on surface pressure.
Acknowledgment: This research was funded by a grant from Ministry of Higher Education
of Malaysia and Universiti Teknologi Malaysia (FRGS Grant R.J130000.7824.4F718). The
author, Khushairi Amri Kasim gratefully acknowledges the scholarship from UTM Zamalah
for his PhDs' study. The data presented, the statement made and views expressed are solely
the responsibility of the authors.
.
REFERENCES
1. Koma, A.Y., Afshar, S., Maleki, H., Mohammadshahi, D. and Shahi, H., Design and Fabrication of Delta
Wing Shape MAV, 10th WSEAS International Conference on Automotic Control, Modelling & Simulation,
27-30 May, Istanbul, (2008), 267-274.
2. Teli, S. N., et al. "Unmanned Aerial Vehicle For Surveillance." International Journal of Scientific &
Technology Research 3 (2014), 256-260. 3. Mieloszyk, J., & Galiński, C. Assessment of the concept of a propeller working in a slot in the middle of
wing of a micro air vehicle. Archive of Mechanical Engineering 60 (2013), 269-282.
4. Tajima, S., Akasaka, T., Kumon, M., & Okabe, K. Guidance Control of a Small Unmanned Aerial Vehicle
with a Delta Wing. Proceedings of Australasian Conference on Robotics and Automation. Sydney:
University of New South Wales, (2013).
5. Choi, S. and Ahn, J., A computational study on the aerodynamic influence of a pusher propeller on a MAV,
40th Fluid Dynamic Conference and Exhibit, 28 June - 1 July, Chicago, AIAA 2010-4741, (2010).
6. Galiński, C., Lawson, N., Żbikowski, R., and Warszawska, P., Delta Wing with Leading Edge Extension and
Propeller Propulsion for Fixed Wing MAV. 24th International Congress of the Aeronautical Science, 29
August- 3 September, Yokohama, (2004).
7. Galiński C and Mieloszyk J. Results of the Gust Resistance MAV Programme. 28th International Congress of the Aeronautical Sciences, 23-28 September, Brisbane, Australia, (2012).
8. Traub L.W. Effect of a Pusher Propeller on a Delta Wing. Aerospace Science and Technology 41(2016),
115-121.
9. Kasim, K. A., Mat, S., Ishak, I. S., and Said, M., Effects of propeller locations on the vortex system above
delta-shaped UAV model. 30th Congress of the International Council of the Aeronautical Sciences, 25-30
September, Daejeon, (2016).
10. Ahn, J. and Lee, D., Aerodynamic Characterstics of a Micro Air Vehicle and the Influence of Propeller
Location,31st AIAA Applied Aerodynamics Conference, 24-27 June, San Diego, AIAA2013-2165, (2013).

ENGINEERING 154
IGCESH2018
Universiti Teknologi Malaysia, Johor Bahru, Malaysia 13 -15 August 2018
FABRICATION OF POROUS POLY ETHER SULFONE BY NON-
SOLVENT INDUCED PHASE SEPARATION (NIPS) TECHNIQUES
H. Junoh1, J. Jaafar*1, N. A. H. M. Nordin2, A. F. Ismail1
1 Advanced Membrane Technology Research Centre (AMTEC), Universiti Teknologi Malaysia,
81310 UTM Skudai, Johor Bahru, MALAYSIA
Faculty of Chemical and Energy Engineering, Universiti Teknologi Malaysia, 81310 UTM Johor Bahru, MALAYSIA.
(E-mail: [email protected], [email protected], [email protected]) 2 Department of Chemical Engineering, Universiti Teknologi PETRONAS, 32610 Seri Iskandar,
Perak, MALAYSIA.
(E-mail: [email protected])
ABSTRACT
A porous poly ether sulfone (P-PES) was prepared by non-solvent induced phase separation
(NIPS) techniques by controlling the specific time intervals for the phase exchange to take
place in the membrane matrix. The evaporation time was varied from 0 to 5 minutes for each
casted membrane respectively. Water as coagulant bath was used in this study. These
membranes are then being characterized based on their morphological aspect using scanning
electron microscopy (SEM) and the desirable morphologies that tempt to increase the
performance of direct methanol fuel cell (DMFC) were finalized.
Key words: porous poly ether sulfone, morphology, non-solvent induced phase separation,
direct methanol fuel cell, evaporation time
INTRODUCTION
Over the last century, the introduction of porous materials has marked up the research and
development (R & D) in developing a new sophisticated morphological structure of the
polymer materials in direct methanol fuel cell (DMFC) applications. A few techniques such
as phase inversion process, sintering, stretching, electrospinning, track etching and template
leaching has been implemented in order to produce the porous membrane structure [1-2]. The
selection of these techniques was depended on the type of polymer as well as the desired final
structure [1]. It worth to note that, the porous membranes are defined as asymmetric
membranes and can be divided into another three-subgroup depending on the pore diameter
which are: (1) microporous (< 2 nm), (2) mesoporous (2 nm ~ 50 nm) and (3) microporous
(>50 nm) [3].
Phase inversion techniques has gained much attention due to its flexible method which can be
divided into few sub-techniques such as: (1) immersion precipitation, (2) thermal
precipitation, (3) precipitation by solvent evaporation and (4) precipitation from vapor phase
[1-2]. Immersion precipitation (dry/wet) method has been vigorously studied and their
potential in producing a porous membrane was proven. Non-fluorinated polymer such as poly
ether ether ketones (PEEK), poly (arylene ethers), polyesters, polyimides (PI), polystyrene

ENGINEERING 155
sulfonic acid, poly vinyl alcohol, poly (arylene ether sulfones), poly ether sulfone (PES),
polyphosphazene and polybenzimidazole [4] have been extensively studied in DMFC
application in past few years. Owing to the specialty possessed by poly ether sulfone (PES)
which are high chemical and thermal stabilities, good mechanical strength, high
hydrophilicity (Tg = 220˚C) and excellent hydrolytic stability makes it interest to be studied
as electrolyte in DMFC system [5]. However, the contribution of porous structure of PES in
DMFC application is yet to be studied and there is no report regarding on this membrane.
This happened due to the fact that pores of membrane can help methanol to transfer,
eventually decreasing the DMFC’s performance.
Even though, having said that, the introduction of new porous electrolyte membrane with a
nanoscales pores can increase the cell performance and physicochemical properties of
membranes as compared to dense electrolyte membrane. Jiang et al. [6] in their study have
suggested that, the porous structure of SPEEK does helped in collecting more water and
induced the proton transportation in conjunction with easier pathway given by the pores. This
proved when they found that the value for proton conductivity of porous SPEEK (58 ×10-3
Scm-1) is slightly higher than dense SPEEK (~49 ×10-3 Scm-1) membranes. As concerned, the
water uptake is a crucial criterion in proton. It was suggested that, the porous structure of
SPEEK does helped in collecting more water and induced the proton transportation in
conjunction with easier pathway given by the pores. Therefore, the objective of the present
study is to prepare a porous PES with different solvent evaporation time in order to study the
effect of porosity on membrane performance. The prepared membranes were then
characterized in terms of morphological structural by scanning electron microscopy (SEM).
MAIN RESULTS
Morphology of P-PES.
Figure 1. SEM image on cross-section of P-PES membrane at 0 min evaporation time
From Figure 1, it clearly seen that two different layers were obtained for P-PES at 0 min
evaporation time. This result was consistent with other researchers [7-8] with asymmetric
structure which define the dense skin layer and finger-like void support layer. As per
successfully introduction of pores on PES structure will provide easier pathway for proton
to transport via free water rather than Grotthuss mechanism process.

ENGINEERING 156
CONCLUSION
P-PES membranes with different solvent evaporation time were successfully fabricated using
non-solvent induced phase separation (NIPS) by setting their coagulant bath. Desirable
morphologies with controllable pore size and pores distribution were obtained. The new
electrolyte regarding porous structures can give an insight in increasing the performance of
direct methanol fuel cell (DMFC) due to higher proton channel provided.
Acknowledgment: The authors are thankful to Universiti Teknologi Malaysia for generous
financial sponsorship under Zamalah Scholarship to support one of the authors, i. e. Hazlina
Junoh.
REFERENCES
1. Bazzarelli, F., Giorno, L. and Piacentini, E. Porous Membrane. In Drioli, E. and Giorno, L. (Eds)
Encyclopedia of Membranes. Springer-Verlag Berlin Heidelberg. (2015), 1-3.
2. Hanafia, A., Faur, C., Deratani, A., Guenoun, P., Garate, H., et al., Fabrication of novel porous membrane from biobased water-soluble polymer (hydroxypropylcellulose). Journal of Membrane Science 526 (2016),
212-220.
3. Ladewig, B. and Al-Shaeli, M. N. Z. Fundamentals of Membrane Biorectors. Springer Nature Singapore Pte
Ltd. (2017), 13-37.
4. Jaafar, J., Ismail, A. F. and Matsuura, T. Preparation and barrier properties of SPEEK/Cloisite 15A®/TAP
nanocomposite membrane for DMFC application. Journal of Membrane Science (2009), 119-127.
5. Unnikrishnan, L., Nayak, S. K., Mohanty, S. and Sarkhel, G. Polyethersulfone membranes: The effect of
sulfonation on the properties. Polymer-Plastics Technology and Engineering (2010), 1419-1427.
6. Jiang, Y., Hao, J., Hou, M., Hong, S., Song, W., Yi., B. and Shao, Z. A novel porous sulfonated poly (ether
ether ketone)-based multi-layer composite membrane for proton exchange membrane fuel cell application.
Sustainable Energy Fuels 1 (2017), 1405-1413. 7. Richards, H. L., Baker, P. G. L. and Iwuoha, E. Metal Nanoparticle modified polysulfone membranes for use
in wastewater treatment: A critical review. Journal of Surface Engineered Materials and Advanced
Technology (2012), 183-193.
8. Sahebi, S., Phuntsho, S., Woo, Y. C., Park, M. J., Tijing, L. D., Hong, S. and Shon, H. K. Effect of
solphonated polyethersulfone substrate for thin film composite forward osmosis membrane. Desalination
(2016), 129-136.

ENGINEERING 157
IGCESH2018
Universiti Teknologi Malaysia, Johor Bahru, Malaysia 13 -15 August 2018
DESALINATION OF ZEOLITIC IMIDAZOLATE FRAMEWORK-8
(ZIF-8) HOLLOW FIBER MEMBRANE BY FORWARD OSMOSIS
Nizar Mu’ammar Mahpoz1, Norfazliana Abdullah1, Mohamad Zahir Mohd Pauzi1,
Mukhlis A Rahman*1, Mohd Hafiz Dzarfan Othman1, Juhana Jaafar1 and Ahmad
Fauzi Ismail1
1Advanced Membrane Technology Research Centre (AMTEC), Universiti Teknologi Malaysia,
81310, Johor. MALAYSIA.
(E-mail: [email protected])
ABSTRACT
Metal organic frameworks (MOFs) membranes, especially zeolitic imidazolate framework-8
(ZIF-8) membrane has been regarded as promising novel candidates for desalination. The
ZIF-8 was prepared on alumina hollow fiber support by in-situ growth using solvothermal
process at 60°C for 24 hr. Surface of the support was deposited by zinc oxide using sol-gel
Pechini method prior to membrane synthesis. Performance of prepared membrane was
evaluated by forward osmosis (FO) in terms of water flux, and salt rejection. FO system in
this study was in active layer facing feed solution (AL-FS) configuration. FO system with
feed solution and draw solution of deionized water and 100, 000 ppm (1.7 M) NaCl were
used, respectively was used for evaluating wáter flux. The same system was used to evaluate
salt rejection, this time 0.1 M NaCl was used as feed solution while 1.0 M dextrose solution
was used a draw solution. The result showed that ZIF-8 membrane exhibit relatively high
water flux of 13.3 kg/m2·h and moderate NaCl rejection at 52.1%. The moderate rejection is
associated with the defect in ZIF-8 membrane due to poor grain boundaries.
Key words: Metal organic framework, zeolitic imidazolate framework membrane, desalination,
forward osmosis
INTRODUCTION
Water scarcity is one of the burgeoning issue that threatening quality life of the humankind.
Thus, there is a need to find alternative water resources to supply enough water supply.
Seawater and brackish water offer additional and steady supply of water. However, these
water resources must have gone through process of removing salt, where desalination process
is needed. Membrane-based desalination process offer many advantages compared to
conventional technology which mainly used heat. In membrane-based desalination, forward
osmosis (FO) utilize lower pressure than reverse osmosis (RO) which require less energy
consumption. Hence, we developed composite membrane of microporous material supported
on ceramic hollow fiber to be used for desalination in FO system
Metal organic frameworks (MOFs) is a new class microporous material, consisting of metal
ions connected by organic linkers. Unique properties of MOF such as controllable ultra-small
pore aperture sizes, high adsorption affinities and high porosity make it suitable for various

ENGINEERING 158
separation process. Zeolitic imidazolate frameworks (ZIFs) is a subclass of MOF which
consist of zinc or cobalt ions and imidazole-based linker. Among ZIFs, ZIF-8 exhibit high
thermal and chemical stability and ultra-small aperture which promising for water
desalination by size exclusion.
In this study, ZIF-8 membrane is synthesized onto porous alumina hollow fiber by in-situ
growth via solvothermal process. Alumina hollow fiber was adopted as a support because of
its higher mechanical strength, low cost, thermal and chemical stability. Asymmetric alumina
hollow fiber supports were prepared using phase and inversion technique. Prior to ZIF-8
membrane synthesize, outer surface of alumina hollow fiber was deposited with zinc oxide by
sol-gel Pechini method to promoting the growth of ZIF-8. The modified support undergoes
solvothermal process at 60 °C at 24 h.
In this study, membrane performance was evaluated by forward osmosis (FO) system for a
duration of 1 h with active layer facing feed solution (AL-FS) configuration. To determine
water flux, FO system with feed solution and draw solution of deionized water and 100, 000
ppm (1.7 M) NaCl were used, respectively. The same system was used to evaluate salt
rejection, this time 0.1 M NaCl was used as feed solution while 1.0 M dextrose solution was
used a draw solution. Salt rejection was measured based on forward solute flux from feed to
the draw solution.
Figure 1 shows performance result of ZIF-8 membrane. ZIF-8 membrane exhibited high
water flux (13.3 kg/m2·h,) comparable to commercial FO-flat sheet membrane from
Hydration Technologies Inc. (HTI) at 8.5 – 18.6 kg/m2·h water flux (0.5 M NaCl as draw
solution, DI as feed solution) [1]. This due to molecular sieving effect of ZIF-8, which pore
aperture is larger than water molecules, allow water to pass across the membrane freely. In
addition, higher water of ZIF-8 is associated with its hydrophobic nature. This is because
hydrophobic ZIFs have demonstrated to produces higher water flux compare to hydrophilic
ZIFs [2]. In salt rejection FO configuration, ZIF-8 membrane display moderate Na+ and Cl-
ions rejection (52.1%). This resulted from poor grain boundaries of ZIF-8 membrane. The
presence of grain boundaries defect affecting the selectivity of the membrane, as they create a
pathway for ions to pass through the membrane via the boundaries between grain crystals.
However, this study demonstrated an improvement of ZIF-8 membrane for desalination,
which showed improvement of salt rejection from 6% using RO [3] to 52.1% when using FO
system.
MAIN RESULTS
Figure 1. Water flux and salt rejection of ZIF-8 membrane in FO
52.0
52.1
52.1
52.2
52.2
52.3
52.3
52.4
0
5
10
15
20
25
30
10 20 30 40 50 60
Salt
reje
cti
on
(%
)
Wate
r fl
ux (
kg
/m2·h
)
Operating time (min)

ENGINEERING 159
CONCLUSION
In conclusion, we developed ZIF-8 membrane on alumina hollow fibre support for
desalination application by FO using in-situ growth via solvothermal process. The membrane
showed high wáter flux and moderate rejection of NaCl. Moderate ions rejection was due to
grain boundaries defect, allowing Na+ and Cl- ions pass through the membrane. However, we
found an increase in salt rejection of ZIF-8 membrane in FO, compared to RO. As
consequent, ZIF-8 is suggested as a promising membrane material for desalination by FO,
however, improvements in membrane morphology to prepare well-intergrown, continuous
and thin membrane were needed to improve the performance in terms of water flux, reverse
solute flux and salt rejection.
Acknowledgment: The authors gratefully acknowledge financial support from various
parties, namely, the Malaysia Ministry of Higher Education (MOHE) through FRGS (0.
J130000.7823.4F947), the Higher Institution Centre of Excellence (HICoE) Research Grant
(R. J090301.7846.4J176), and Universiti Teknologi Malaysia (UTM) through the Research
University grant (Q. J130000.2546.16H34).
REFERENCES
1. G.T. Gray, J. R. McCutcheon, M. Elimelech. Internal concentration polarization in forward osmosis: role of
membrane orientation. Desalination 197 (2006), 1-8. 2. K. M. Gupta, K. Zhang, J. Jiang. Water desalination through Zeolitic Imidazolate Framework membranes:
significant role of functional groups. Langmuir 31 (2015), 13230-13237.
3. M. C. Duke, B. Zhu, C. M. Doherty, M. R. Hill, M. A. Carreon. Structural effects on SAPO-34 and ZIF-8
materials exposed to seawater solutions, and their potential as desalination membranes. Desalination 377
(2016) 128-137.
ENGINEERING 160
IGCESH2018
Universiti Teknologi Malaysia, Johor Bahru, Malaysia 13 -15 August 2018
MOCK CIRCULATORY LOOP CONSTRUCTION – A Review
Akmal Hakim Mohamad Hudzari1, Muhammad Rashidi Abdul Kadir2 and Ahmad
Zahran Md. Khudzari3
1 Faculty of Biosciences & Medical Engineering, Universiti Teknologi Malaysia, 81310,
Johor Bahru, MALAYSIA.
(E-mail: [email protected]) 2 Faculty of Mechanical Engineering, Universiti Teknologi Malaysia, 81310,
Johor Bahru, MALAYSIA
(E-mail: [email protected]) 3 IJN-UTM Cardiovascular Engineering Centre, Institute of Human Centered Engineering, Universiti
Teknologi Malaysia, 81310, Johor Bahru, MALAYSIA. (E-mail: [email protected])
ABSTRACT
Numerical analysis has been broadly utilized in investigating various parameters of newly
invented cardiovascular devices. Although the outcome from numerical method could
provide promising results, an association of in vitro investigation has to be conducted in order
to provide a good agreement and correct validation to that of in-silico method. Both of this
method is a basic investigation process before continuing with animal testing and finally in
human trial. In this writing, the in vitro testing methods using Mock Circulatory Loop (MCL)
are reviewed on its types and functions from its first existence until latest designs. There are
several types and functions of MCL development, depending on the medical device prototype
intent of use, from simple hydraulic loop until a more complex loop combining hydraulic and
computer interface. To start this review, the heart failure condition is discussed first followed
by treatment modalities, types of cardiovascular assist device, types and components of
MCL, and current literature. At the end of this review, an example of MCL developed by our
team member is presented. It is hoped that with this article, better MCL can be constructed in
the future.
Key words: Mock Circulatory Loop (MCL), cardiovascular assist device, in vitro testing
INTRODUCTION
Cardiovascular diseases; specifically, the heart failure (HF) has been reported to be a leading
cause of mortality in the world with almost 50% of death. In 2004, World Health
Organization has reported that, 30% of death rate was contributed by cardiovascular disease
and estimated to increase another 30 % in 2030 [1]. In Southeast Asia, the report has shown
that 9 million people suffering from HF with 6.7% prevalence contributed by Malaysian
population followed by 4.5% prevalence denoted in Singapore [2]. With this significant
number of HF population worldwide, the cardiovascular assist devices are also experiencing
an increasing demand to meet the needs of cardiovascular disease survivors.

ENGINEERING 161
In treating various kind of cardiovascular diseases, cardiovascular assist devices are the
alternative method for heart transplantation other than drug therapy and life style changing.
Different type of disease employed different kind of assist device used depending on its
restoring function. Some of the devices that usually used the MCL for in vitro testing
procedure are stent, mechanical heart valve and Left Ventricular Assist device (LVAD).
Functioned to partially replacing the physiology of failing heart, LVAD is an electro-
mechanical device that usually choose to be used for those suffering end stage HF wherein
the patients also contraindicated to transplant due to other health complications and refractory
to drug administration [3]. An intensive investigation should be conducted in order to address
patients with newly developed foreign-to-body devices.
One of the method to investigate the effectiveness of cardiovascular performances is called in
vitro testing using Mock Circulatory Loop (MCL). This mechanical form of experimental rig
was developed to simulate various physiological condition of native human heart [4]. The
development of this mechanical circulatory system has been initiated as early as in 1950s in
which the first MCL ever existed was created by McMillan et al. (1952) utilizing the actual
human heart connected to the circuit [5]. The more advance designs of MCL was developed
by many researchers from time to time that capable in simulating numerous physiological
cardiovascular parameters in respect to the needs of specific devices to be tested. The aim of
this article is to review as much as possible the designs of MCL development from its first
model to the one that have the latest and advance controlling system.
MAIN RESULTS
Table 1 shows one of the parameters that researchers usually simulate in their MCL
model.
Table 1. Comparison of compliance value parameters of MCL
Researchers Heart
Conditions
Compliance
Value (mL/mmHg)
(Timms et al., 2005a)
Normal 2.0 (aortic)
22.5 (Systemic Venous)
2.95 (Pulmonary Artery)
7.1 (Pulmonary Venous)
HF 1.2 (Aortic)
11.5 (Systemic Venous)
2.95 (Pulmonary Artery)
7.1 (Pulmonary Venous)
(Pantalos et al., 2004) Normal 1.3 (Not Specified)
HF 1.3 (Not Specified)
(Kolyva et al., 2010a) HF 0.94 (Not Specified)
(Ferrari et al., 2002) Recovering HF 1.8 (Total Arterial)
80 (Systemic Venous)
(Knierbein et al., 1992) Normal 1.33 (Not Specified)
(Donovan, 1975) Normal 1.0 (Systemic Arterial)
10 (Systemic Venous)
1.0 ((Pulmonary Artery)
5.0 (Pulmonary Venous)
(Rosenberg et at., 1981) Normal 1.55 (Systemic)
4.84 (Pulmonary)

ENGINEERING 162
(Liu et al., 2006) Normal 2.0 (Systemic Artery)
50 (Systemic Venous)
CONCLUSION
As a conclusion, Mock Circulatory Loop (MCL) has been utilized over decades and has
become a favourable platform for in vitro testing procedure that can provide a good
agreement to the numerical outcome analysis. The same goal was aimed by all researchers in
developing the MCL which was to reproduce various cardiac parameters to represent the
actual physiological cardiac values, although the components involved in the models were
not the same. MCLs have undergone a design evolution from a simple circulatory circuit to
much more complex and flexible configuration models associated with the suitable
combination of software and hardware components. Thus, the successful testing of
cardiovascular devices marks the impactful and practicability of MCL as an in vitro testing
platform prior to the clinical testing procedure. It is hope that this review can be a supportive
material for the future researchers to develop more advance MCL models.
Acknowledgment: The authors would like to thank all team members for helpful discussion
as well as their contributions in reviewing and editing this review topic.
REFERENCES
1. Mathers, C., The global burden of disease: 2004 update. 2008: World Health Organization.
2. Savarese, G. and L.H. Lund, Global Public Health Burden of Heart Failure. Cardiac Failure Review, 2017.
3(1): p. 7-11.
3. Doost, S.N., L. Zhong, and Y.S. Morsi, Ventricular Assist Devices: Current State and Challenges. Journal of
Medical Devices, 2017. 11(4): p. 040801-040801-11. 4. Lloyd-Jones, D.M., et al., Lifetime risk for developing congestive heart failure: the Framingham Heart
Study. Circulation, 2002. 106(24): p. 3068-3072.
5. McMillan, I., R. Daley, and M. Matthews, The movement of aortic and pulmonary valves studied post
mortem by colour cinematography. British heart journal, 1952. 14(1): p. 42.

ENGINEERING 163
IGCESH2018
Universiti Teknologi Malaysia, Johor Bahru, Malaysia 13 -15 August 2018
MICROWAVE-ASSISTED EXTRACTION OF POLYPHENOL FROM
MANGOSTEEN (GARCINIA MANGOSTANA L.) PERICARP AND
ITS ANTIOXIDANT ACTIVITY
Nor Azizah Mohammad1, Dayang Norulfairuz Abang Zaidel*1, Ida Idayu Muhamad1,
Yanti Maslina Mohd Jusoh1, Eraricar Salleh1 and Mariani Abdul Hamid2
1 Faculty of Chemical & Energy Engineering, Universiti Teknologi Malaysia, 81310 UTM, Johor
Bahru, Johor, MALAYSIA
(E-mail: [email protected], [email protected], [email protected],
[email protected], [email protected]) 2 Institute of Bioproduct Development, UTM, Johor Bahru, Johor, MALAYSIA
(E-mail: [email protected])
ABSTRACT
Fruit peels comprise a good source of numerous bioactive compounds. Various polyphenols
of mangosteen peel or pericarp shown a wide range of biological activities including anti-
tumour, cardioprotective, anti-diabetic and antioxidant that might lead to a high potential in
the prevention of diseases such as cardiovascular and carcinogenesis. To date, there are many
techniques in recovering biomolecules from food wastes. Mangosteen pericarp contains a
variety of phenolic compounds such as xanthones, catechins, procyanidins, and
anthocyanidins and other bioactive compounds. α-mangostin is a xanthones derivative that
particularly contributed to the most potent antioxidant. This study focuses on extracting and
quantifying polyphenols from mangosteen pericarp and analysing its antioxidant properties.
Microwave-assisted extraction was employed to extract polyphenol xanthones from
mangosteen pericarp powder (MP) at five different time; 15s, 30s, 60s, 90s, 120s and 150s.
Mangosteen pericarp extract (ME) was analysed by total phenolic content (TPC) and its
antioxidant activity according to DPPH and ABTS radical scavenging assay. ME extracted at
60s of time is contributed to the highest TPC (15.25 ± 0.90 mg GAE/g dry weight) and
antioxidant potential (DPPH: 63.46 ± 1.74 mg TE/g dry weight, ABTS: 92.00 ± 0.24 mg
TE/g dry weight). The microwave-assisted technique is a promising method for the extraction
of antioxidant compound.
Key words: Mangosteen pericarp, Microwave-assisted extraction, Antioxidant
INTRODUCTION
Mangosteen is listed among the selected fruits that shown a huge potential in augmenting
Malaysia income through international trade. Federal Agricultural Marketing Authority
(FAMA), Malaysia revealed a promising growth of the export rate of mangosteen at 454%,
and the import rate for about 226% [1]. Various secondary metabolites of mangosteen skin or
pericarp, especially xanthones shown a wide range of biological activities including anti-
tumour, cardioprotective, anti-diabetic and antioxidant that might lead to a high potential in
the prevention of diseases such as cardiovascular and carcinogenesis [2]. Mangosteen

ENGINEERING 164
pericarp are being eliminated after consuming its white, sweet and delicious aril. Fruit and
vegetable peels are the main kitchen or household waste. The production and preserving of
fruits and vegetables produce about 14.8% food wastes from food industry [3]. There are
many techniques in recovering biomolecules from food wastes. Most of conventional method
for extraction such as soxhlet method consumes high amount of solvent and long extraction
time. Microwave-assisted extraction (MAE) is an established method in the preparation of
antioxidant-rich plant extracts due to the low solvent consumption, less time consuming, and
fast energy transfer through the irradiation that allow better penetration of extracting solvent
within the matrix. In this attempt, utilization of mangosteen pericarp should be done by
extracting the bioactive compound, a polyphenol xanthones through microwave-assisted
extraction. Therefore, the aim of this study is to investigate the effects of time (s) on the total
phenolic content, TPC (mg Gallic Acid Equivalent, GAE/g dry weight) and DPPH radical
scavenging activity that will be reported as mg Trolox equivalent, TE/ g dry weight) of
mangosteen pericarp by using microwave-assisted extraction (MAE).
MAIN RESULTS
Figure 1. TPC (mg GAE/g) of mangosteen pericarp extract (ME) at five different time; 15s, 30s,
60s, 90s, 120s and 150s
Figure 2. DPPH radical scavenging activity (mg Trolox equivalent/g dry weight) of mangosteen
pericarp extract (ME) at five different time; 15s, 30s, 60s, 90s, 120s and 150s
Figure 3. ABTS radical scavenging activity (mg Trolox equivalent/g dry weight) of mangosteen
pericarp extract (ME) at five different time; 15s, 30s, 60s, 90s, 120s and 150s
Note: Values are mean ± SD of triplicate analysis from triplicate extracts; Means with different letters denote significant differences between the range in each factor.
bc ba
b b c
0.00
20.00
40.00
60.00
80.00
15 30 60 90 120 150DP
PH
rad
ical
scav
engin
g a
ctiv
ity
(mg T
rolo
x …
Time (s)

ENGINEERING 165
The influence of time (s) on TPC, DPPH and ABTS radical scavenging activity of
mangosteen pericarp extract (ME) using MAE were examined in single factor experiments.
The extraction process was initiated by fixing the solvent-to-solid ratio, S/S (40 mL/g),
solvent concentration (60% ethanol) microwave power (300W) and temperature (65°C), and
varying the time at 15s, 30s, 60s, 90s, 120s and 150s. As a result, at time of 60s, ME shown
the highest amount of TPC yield (Figure 1) and also had the strongest antioxidant potential
(Figure 2 and Figure 3). Then, 60s of time will be selected to further investigate the effect of
different level of microwave power; 300W, 400W, 500W, 600W, and 700W on TPC and
DPPH radical scavenging activity of ME.
Table 1. Antioxidant activity of mangosteen pericarp extract by two different extraction
methods
Antioxidant activity Microwave-assisted Water bath
DPPH
(mg Trolox equivalent/ g dry weight) 63.46 ± 1.74a 40.07 ± 1.90b
ABTS
(mg Trolox equivalent/ g dry weight) 92.00 ± 0.24a 51.87 ± 1.01b
CONCLUSION
The microwave-assisted extraction (MAE) of polyphenols from mangosteen pericarp shown a
high potential in revealing the antioxidant compound. MAE could be selected as preliminary
method to extract bioactive compound which then will be further used in any formulation to
develop food and nutraceutical bioactive ingredient. Thus, the natural antioxidant product
might be used as an alternative to commonly used synthetic antioxidant in food and
nutraceutical product.
Acknowledgment: The authors would like to acknowledge Ministry of Education Malaysia
and Universiti Teknologi Malaysia for the financial support from Research Grant
Q.J130000.2546.14H06 and Q.J130000.2546.16H78. The authors would also like to express
an appreciation for the support of the Zamalah Scholarship.
REFERENCES
1. LEMBAGA PEMASARAN PERTANIAN PERSEKUTUAN (FAMA). (2014). Statistik Utama Pemasaran
FAMA 2014.
2. Ibrahim, M. Y., Hashim, N. M., Mariod, A. A., Mohan, S., Abdulla, M. A., Abdelwahab, S. I., & Arbab, I.
A. a-Mangostin from Garcinia mangostana Linn: An updated review of its pharmacological properties.
Arabian Journal of Chemistry 9:3 (2016), 317–329.
3. Baiano, A. Recovery of biomolecules from food wastes - A review. Molecules, 19:9 (2014), 14821–14842.

ENGINEERING 166
IGCESH2018
Universiti Teknologi Malaysia, Johor Bahru, Malaysia 13 -15 August 2018
DEVELOPMENT OF POLYMER THROUGH ULTRAVIOLET
PHOTO-CROSSLINKING
Farah H. Jamaludin*1
1 Department of Biotechnology & Medical Engineering, Universiti Teknologi Malaysia, Johor Bahru,
MALAYSIA
(E-mail: [email protected],)
ABSTRACT
Polymers are one of the widely used biomaterial for various applications. Dependence of
polymeric biomaterials on petrochemical resource is an issue attracting growing concerns due
to the depletion of the resource leading to fluctuations in the price. Concurrently, thermal
processing of polymeric biomaterials are inefficient due to long processing time. Therefore,
the current trend applies photocuring for better product, commonly using ultraviolet (UV).
Key words: Biobased, ultraviolet, photocuring
INTRODUCTION
Polymers are one of the most advantageous biomaterials. Owing to the tunability of its
properties, polymers benefit wide ranges of biomedical applications such as scaffolds for
tissue engineering, cardiovascular devices and prostheses. Gained its popular ity during
the Second world war [1], research in polymer is now growing exponentially with
introduction of new, formulations, processing methods, and mechanisms for the benefit of
mankind. To date, consumption of polymeric biomaterials exceeds 8000 kilotons per year
with a compound annual growth rate up to 15-30% [2].
Thermosetting polyesters requires time-inefficient thermal crosslinking process with post-
polymerisation heating duration of 7 hours [18] to 2 weeks [13] at 120°C temperature.
On the contrary, a faster approach to produce crosslinked polymers is through photo-
induced crosslinking [19]. Photocrosslinking is the process whereby free radical
polymerization or cationic polymerization are initiated by ultraviolet (UV) or visible light
irradiation to form chemical crosslinks at the crosslinking sites producing photosets. This
crosslinking process could take as short as few seconds [20] to 10 minutes [11, 21]. To
date, photocrosslinking approach has been applied for the synthesis of scaffold for
vascular engineering [22], fabrication of wound healing hydrogels [23] and wound
dressings [24], and elastomer for cardiac tissue engineering [25].

ENGINEERING 167
MAIN RESULTS
Figure 1. FTIR spectrum of POSCI
Figure 2. a) Swelling ratio and b) gel fraction of POSCI upon exposure to different UV
curing time
CONCLUSION
This study is motivated to develop photoset through UV photocrosslinking.
Acknowledgment: The author would like to express their appreciation for the support of the
sponsors with Project No PY/2017/00481.

ENGINEERING 168
REFERENCES
1. Maitz, M.F., Applications of synthetic polymers in clinical medicine. Biosurface and Biotribology, 2015.
1(3): p. 161-176.
2. Yin, J. and S. Luan, Opportunities and challenges for the development of polymer-based biomaterials and medical devices. Regenerative Biomaterials, 2016. 3(2): p. 129-135.
3. Wool, R. and X.S. Sun, Bio-Based Polymers and Composites. 2011: Elsevier Science.
4. Gandini, A., The irruption of polymers from renewable resources on the scene of macromolecular science
and technology. Green Chemistry, 2011. 13(5): p. 1061-1083.
5. Garlotta, D., A literature review of poly (lactic acid). Journal of Polymers and the Environment, 2001. 9(2):
p. 63-84.
6. Hartmann, M., High molecular weight polylactic acid polymers, in Biopolymers from renewable resources.
1998, Springer. p. 367-411.
7. Albertsson, A.-C. and I.K. Varma, Recent developments in ring opening polymerization of lactones for
biomedical applications. Biomacromolecules, 2003. 4(6): p. 1466-1486.
8. Zia, K.M., et al., Recent developments and future prospects on bio-based polyesters derived from renewable
resources: a review. International journal of biological macromolecules, 2016. 82: p. 1028-1040. 9. Amsden, B., Curable, biodegradable elastomers: emerging biomaterials for drug delivery and tissue
engineering. Soft Matter, 2007. 3(11): p. 1335-1348.
10. Wang, Y., Y.M. Kim, and R. Langer, In vivo degradation characteristics of poly(glycerol sebacate). Journal
of Biomedical Materials Research Part A, 2003. 66A(1): p. 192-197.
11. Barrett, D.G., et al., One-step syntheses of photocurable polyesters based on a renewable resource.
Macromolecules, 2010. 43(23): p. 9660-9667.
12. Wang, Y., et al., A tough biodegradable elastomer. Nature Biotechnology, 2002. 20: p. 602.
13. Yang, J., A.R. Webb, and G.A. Ameer, Novel citric acid‐based biodegradable elastomers for tissue
engineering. Advanced Materials, 2004. 16(6): p. 511-516.
14. Sundback, C.A., et al., Biocompatibility analysis of poly(glycerol sebacate) as a nerve guide material.
Biomaterials, 2005. 26(27): p. 5454-5464. 15. Gao, J., et al., Poly (glycerol sebacate) supports the proliferation and phenotypic protein expression of
primary baboon vascular cells. Journal of Biomedical Materials Research Part A, 2007. 83(4): p. 1070-1075.
16. Sun, Z.-J., et al., The application of poly (glycerol–sebacate) as biodegradable drug carrier. Biomaterials,
2009. 30(28): p. 5209-5214.
17. Cai, W. and L. Liu, Shape-memory effect of poly (glycerol–sebacate) elastomer. Materials Letters, 2008.
62(14): p. 2171-2173.
18. Halpern, J.M., et al., A biodegradable thermoset polymer made by esterification of citric acid and glycerol.
Journal of Biomedical Materials Research Part A, 2014. 102(5): p. 1467-1477.
19. Amsden, B.G., et al., Synthesis and Characterization of A Photo-Cross-Linked Biodegradable Elastomer.
Biomacromolecules, 2004. 5(6): p. 2479-2486.
20. Huang, L., et al., Ultrafast Digital Printing toward 4D Shape Changing Materials. Advanced Materials,
2017. 29(7): p. 1605390-n/a. 21. Nijst, C.L., et al., Synthesis and characterization of photocurable elastomers from poly (glycerol-co-
sebacate). Biomacromolecules, 2007. 8(10): p. 3067-3073.
22. Dargaville, B.L., et al., Cross-Linked Poly(trimethylene carbonate-co-l-lactide) as a Biodegradable,
Elastomeric Scaffold for Vascular Engineering Applications. Biomacromolecules, 2011. 12(11): p. 3856-
3869.
23. Shahbuddin, M., et al., Glucomannan-poly(N-vinyl pyrrolidinone) bicomponent hydrogels for wound
healing. Journal of Materials Chemistry B, 2014. 2(6): p. 727-738.
24. Hsieh, H.-T., et al., Poly-Methyl Methacrylate/Polyvinyl Alcohol Copolymer Agents Applied on Diabetic
Wound Dressing. Scientific Reports, 2017. 7(1): p. 9531.
25. Davenport Huyer, L., et al., Highly Elastic and Moldable Polyester Biomaterial for Cardiac Tissue
Engineering Applications. ACS Biomaterials Science & Engineering, 2016. 2(5): p. 780-788.

ENGINEERING 169
IGCESH2018
Universiti Teknologi Malaysia, Johor Bahru, Malaysia 13 -15 August 2018
SYNTHESIS AND CHARACTERIZATION OF NOVEL FE DOPED
TNT NANOPARTICLE VIA HYDROTHERMAL TECHNIQUE
M N Subramaniam1, P S Goh*1, W J Lau1 and A F Ismail1
Advanced Membrane Technology Research Center,
Faculty of Chemical and Energy Engineering,
Universiti Teknologi Malaysia, 81310, Skudai, Johor, Malaysia
*Corresponding author: [email protected], Tel: +6075535807
ABSTRACT
In this study, a novel titania nanotube doped with iron nanoparticle was synthesized via
hydrothermal treatment, using titania nanotubes and iron oxide nanoparticles as the starting
materials. TNT were doped with Fe ions at different doping ratio (1:1, 1:2, 1:3, 1:4) of TNT
and Fe nanoparticles to produce Fe-TNT of different characteristics (M1, M2, M3, M4). The
nanoparticles were then characterised to study its morphology, crystallinity, wavelength
absorption changes and specific surface area changes. Morphological analysis using
transmission electron microscopy shows successful synthesis of Fe-TNT nanoparticles with
clear tubular structure, and large Fe atoms attached in/on TNT. XRD analysis exhibited peaks
in angles (2θ) at 24.9º, 35.9º, 48.3º and 62.7º, which represents the diffractions from (1 0 1),
(0 0 4), (2 0 0) and (2 0 4) planes of tetragonal anatase TiO2 respectively. Surface area
analysis showed that M3 has the largest surface area of 246.2301m2/g. This implies that M3
has a high number of active sites for adsorption and photocatalytic activity. UV-vis analysis
further shows that there is a shift in wavelength absorption from UV region to visible region
(400nm-700nm). This is due to the changes in lattice structure of TNT due to the
incorporation of Fe ions in the structure. The changes implemented on TNT, a known
photocatalyst due to Fe doping, would allow TNT-Fe to be responsive towards visible light
photocatalytic activation. In addition, its anatase crystallinity and high surface area also
augurs well to expect TNT-Fe to perform remarkably well as a photocatalyst with visible
light activation.
Key words: Photocatalyst, Titania nanotube, doping
INTRODUCTION
Research regarding wastewater treatment techniques has been in abundance due to the fact
that water resource in the world is being strained with the development of industries around
the world [1]. Water intense industries such as agriculture, textile [2] and factories require
large amount of water, and they produce large amounts of effluents which are polluted.
Techniques such as adsorption, coagulation and flocculation have shown promising results,
but they do not solve the issue, as they merely mitigate the pollutant into other forms. One
technique that has shown promising technique to both mitigate and eradicate the pollutants is

ENGINEERING 170
photocatalysis. Photocatalysis is the employment of a catalyst, commonly semiconductor in
nature [3] which is activated when irradiated with light source to produce highly reactive
radical species which degrades organic pollutants non-selectively. However, one limitation
exhibited by common photocatalyst such as titanium dioxide (TiO2) nanoparticles and titania
nanotubes (TNT) is that they are only activated under ultraviolet light irradiation. This can be
improved with the introduction of foreign atoms, metallic or non-metallic in nature into its
lattice structure, which enables the photocatalyst to respond towards visible light source [4].
The incorporation of foreign atoms also has shown to change other characteristics. In this
study, TNT was doped with Fe ions at different dopant ratio to produce novel Fe doped TNT
nanomaterials via hydrothermal method. The synthesized nanomaterials were then
characterized to study changes in characteristics using instruments such as transmission
electron microscopy, x-ray diffraction, UV-vis spectrophotometer and brunner-emmett-teller
surface area analysis.
MAIN RESULTS
Transmission electron microscopy micrographs were taken to study the morphological
characteristics. Figure 1 shows the TEM micrographs of all nanoparticles synthesized
during this study.
Figure 1. TEM micrographs of mixed metal oxides of different ratio (a) M1, (b) M2, (c), M3
(d) M4
All four figures captured showed the formation of nanotubes, which are decorated with Fe
nanoparticles at different quantity. The amount of Fe decorating in the surface of Titanium
nanotubes decrease as the amount of Fe ratio decreases. Still, the TEM images does not
clearly show the position of the Fe particles, as they may be decorated on the titanium
nanotubes, or entrapped inside the tubes during the rolling over phenomena [5] during
formation of titanium nanotubes as some images showing Fe particles perfectly situated
inside the tubes. Table 1 shows the BET results of all the synthesized nanoparticles.
Table 1. Surface Analysis Data of all the nanomaterials synthesized
Sample Specific
Surface Area
(SSA) (m2/g)
Average
Pore Width
(Å)
Surface Area of
Pores (m2/g)
Superficial
Surface Area
(m2/g)
Volume of
pores (cm3/g)
M1 142.0063 142.937 130.283 11.7233 0.5493
M2 187.0803 158.284 170.724 16.3563 0.7327
M3 246.2301 139.438 223.075 23.1551 0.7960
M4 210.4155 136.134 199.766 10.6495 0.7280

ENGINEERING 171
All the nanoparticles showed high values of specific surface area, with M3 showing the
highest specific surface area of 246.23 m2/g, while M1 showed the lowest surface area of 142
m2/g. The high surface area is because Fe ions which created a dissimilar grain boundaries
and disorders in the repetition of the lattice, which resulted in lower specific surface area. In
addition, the nanoparticles consist of low superficial surface area, with most of its surface
area is in the pore region, and lower average pore width with decreasing Fe dopant
concentration.
CONCLUSION
This study successfully synthesized TNT doped with Fe to produce a mix metal photocatalyst
which is responsive towards visible light. Hydrothermal method was able to incorporate Fe
ions into the lattice structure of TNT, hence changing the lattice structure to allow visible
light responsiveness. The nanomaterial also exhibited anatase crystallinity, which is similar to
the starting material of TNT, coupled with high surface area for M3 (246.23 m2/g). These
improvement in nanomaterial characteristics allows TNT-Fe photocatalyst to be able to
exhibit efficient photocatalytic activity with visible light responsiveness.
Acknowledgment: The authors would like to express their sincere gratitude towards
Ministry of Education for the Fundamental Research Grant Scheme (Vot no.: 4F306) and
Universiti Teknologi Malaysia for providing financial assistance in this project.
REFERENCES
1. T. Robinson, G. McMullan, R. Marchant, P. Nigam. Remediation of dyes in textile effluent: A critical review on current treatment technologies with a proposed alternative. Bioresource Technology 77 (2001)
247–255. doi:10.1016/S0960-8524(00)00080-8.
2. D. Chandran, A Review of the Textile Industries Waste Water Treatment Methodologies. International
Journal of Scientific & Engineering Research 7 (2016) 392–403.
3. C.W. Lai, J.C. Juan, W.B. Ko, S. Bee Abd Hamid. An overview: Recent development of titanium oxide
nanotubes as photocatalyst for dye degradation. International Journal of Photoenergy 2014 (2014).
doi:10.1155/2014/524135.
4. Y. Alivov, V. Singh, Y. Ding, L.J. Cerkovnik, P. Nagpal. Doping of wide-bandgap titanium-dioxide
nanotubes: optical, electronic and magnetic properties. Nanoscale 6 (2014) 10839–10849.
doi:10.1039/c4nr02417f.
5. M. Kitano, E. Wada, K. Nakajima, S. Hayashi, S. Miyazaki, H. Kobayashi, M. Hara. Protonated titanate nanotubes with Lewis and Brønsted acidity: Relationship between nanotube structure and catalytic activity.
Chemistry of Materials 25 (2013) 385–393

ENGINEERING 172
IGCESH2018
Universiti Teknologi Malaysia, Johor Bahru, Malaysia 13 -15 August 2018
PREPARATION AND CHARACTERIZATION OF UIO-66
SUPPORTED ON CERAMIC HOLLOW FIBER FOR WATER
PURIFICATION
Norfazliana Abdullah, Mukhlis A. Rahman* , Mohd Hafiz Dzarfan Othman, Juhana
Jaafar and A. F Ismail
Advanced Membrane Technology Research Centre (AMTEC),
Universiti Teknologi Malaysia, 81310 Skudai, Johor, Malaysia ([email protected], [email protected]*, [email protected],
[email protected] and [email protected])
ABSTRACT
This study was conducted to develop UiO-66 supported onto alumina hollow fiber
membrane. The support membrane were prepared using spinning based phase inversion and
sintering technique and further used for in-situ solvothermal synthesis of UiO-66. All
samples were characterized using SEM, AFM, EDX and performance studies. SEM/EDX
images were ensured the formation of polycrystalline layer of UiO-66 onto support
membrane. However, the performance study of acetic removal gave poor salute rejection of
less 15 % that might due to framework collapse structure occurred as acetic acid act as
modulator.
Key words: alumina, ceramic, MOF, UiO-66, solvothermal
INTRODUCTION
There are a numbers of MOF discovered by various researchers such as MIL, UiO-66, UiO-
67, UiO-68, HKUST, IR-MOF, ZIF and new MOFs, which distinguished by different ligands
and metals. To be used in water purification application, the most superior water stable MOFs
are the main aspect need to be considered. Among all the MOFs material, UiO-66 possess all
of benefiting characteristics and able to separate small particles in range of ~6 Å. The UiO-66
based Zr should acquire a remarkable water stability despite has favorable properties in term
of designable and functionalities. The expanding developed of MOFs growth onto the support
membranes is capture great attention. Ranjan and Tsapasis were successfully developed
HKUST that in-situ seeded growth method onto alumina support [1]. Recently, Li groups
were successfully prepared the UiO-66 deposited onto alumina hollow fiber membrane for
desalination and arsenic removal [2,3]. The findings were indicated of new era of MOF in
novel applications such as filtration, gas separation and etc. In this study, the UiO-66 is
desired to be supported onto the alumina support membrane. The prepared sample will be
regarded as composite membrane Alumina/ UiO-66 for water purification application that
acetic acid was used as pollutant sample.

ENGINEERING 173
MAIN RESULTS
Figure 1 shows the SEM images of alumina hollow fiber membrane that successfully
prepared using spinning based phase inversion followed by sintering process. The
outside, inside and wall thickness of alumina support membrane were 1.63 mm, 1.07 mm
and 280 µm, respectively. The AFM analysis provide 37.5 nm of surface roughness.
Meanwhile, the support membrane has good mechanical strength and high pure water
permeation of 82.82 MPa and 259.67 L/m2. h. bar. All the properties indicating alumina
hollow fiber membrane was excellent support membrane for UiO-66 growth.
Figure 1. FESEM images of alumina hollow fiber membrane. a) Cross section
b) Surface
Later, the alumina hollow fiber membrane were deposited with UiO-66 with different
concentration and time synthesis by using in-situ solvothermal synthesis. Figure 2 shows
SEM/EDX images for the Zr-AB24, Zr-AB48 and Zr-AB60, respectively. There were clearly
show that the formation of polycrystalline layer were presented onto alumina hollow fiber
membrane by applying multiple growth of UiO-66.
Figure 2. FESEM/EDX images of alumina/UiO-66. A) Surface b) Wall thickness and c)
EDX mapping of Al species and Zr species
All samples were subjected with acetic acid at initial concentration of 1 gL -1 for an hour.
Figure 3 depicts poor performance of less than 15 % of salute rejection of acetic acid.
This results might be due to acetic acid was function as modulator, causing deteriorate
framework structure of UiO-66. Surface modifications is require to enhance the
performance activity for better water purification applications.

ENGINEERING 174
Figure 3. Performance studies of acetic acid removal
CONCLUSION
The alumina hollow fiber membrane was successfully prepared using spinning based
inversion and sintering process. Later the UiO-66 was deposited onto the alumina hollow
fiber membrane using in-situ solvothermal synthesis. There were multiple growth were
applied in this work and successfully developed polycrystalline layer onto support membrane.
Herein, all samples gave poor performance of acetic acid removal that might be due to its
function as modulator. UiO-66 framework structures were deteriorated by acetic acid. To
enhance the performance activity, surface modification is required in future work.
Acknowledgment: The authors gratefully acknowledge financial support from various
parties, namely, Higher Institution Centre of Excellence (HICoE) Research Grant (R.
J090301.7846.4J176), and Universiti Teknologi Malaysia (UTM) through the Research
University grants (Q.J130000.2446.03G37, Q.J130000.2546.12H22). Appreciation also goes
to UTM Research Management Centre for both financial and technical support.
REFERENCES
1. Ranjan R. and Tsapatsis M. Microporous metal organic framework membrane on porous support using the
seeded growth method. Chemistry Materials 21 (2009), 4920–4924.
2. Liu X., Demir N.K., Wu Z, and Li K. Highly water-stable zirconium metal-organic framework uio-66
membranes supported on alumina hollow fibers for desalination. Journal of American Chemical Society 137
(2015), 6999–7002.
3. Wang C., Liu X., Chen J.P., Li K., Superior removal of arsenic from water with zirconium metal-organic
framework UiO-66., Scientific Report 5 (2015) 16613.
Zr-AB24 Zr-AB48 Zr-AB60
10
15
20
25
30
35
40
UiO-66 with different concentration and synthesis time
Pu
re w
ate
r flu
x (
L m
-2 h
-1)
0
20
40
60
80
100
Re
jectio
n (
%)

ENGINEERING 175
IGCESH2018
Universiti Teknologi Malaysia, Johor Bahru, Malaysia 13 -15 August 2018
EFFECT OF CONCRETE COMPRESSIVE STRENGTH TO THE
CONFINEMENT EFFECT UNDER CYCLIC LOAD
Jia-Yang Tan*1, Chau-Khun Ma 2, Nazirah Mohd Apandi 1, Chin Chee Loong 1,
Abdullah Zawawi Awang2 and Wahid Omar3
1 PHD Candidate, Department of Structure and Materials, Faculty of Civil Engineering, Universiti
Teknologi Malaysia, Skudai, MALAYSIA.
(E-mail: [email protected], [email protected], [email protected]) 2 Senior Lecturer, Department of Structure and Materials, Faculty of Civil Engineering, Universiti
Teknologi Malaysia, Skudai, MALAYSIA.
(E-mail: [email protected], [email protected]) 3 Office of Chancellery, Universiti Teknologi Malaysia, Skudai, MALAYSIA.
(E-mail: [email protected])
ABSTRACT
Earthquake is unpredictable natural disaster that can damage the concrete structure such as
building and bridge. It has the importance to ensure the structures able to resist seismic load
for safety of people. The damaged column needed to be repaired. Research and development
of rapid repair techniques have become significant for economic consideration. Confinement
is one of the popular and effective rapid repairing of damaged concrete under cyclic loading.
There are many parameters that can affect the confinement effect. In this paper, the effect of
concrete compressive strength parameter from the past researches are reviewed to facilitate
the research development in this field. The findings had proven that concrete compressive
strength is a significant parameter that affect the effectiveness of confinement repair works.
Key words: Confinement, Concrete Strength, Earthquake
INTRODUCTION
The natural power of earthquake is unpredictable and strong enough to damage the concrete
structure. More and more earthquakes have proved that reinforced concrete (RC) bridge piers
were fragile to seismic load. During strong earthquakes, reinforced concrete (RC) bridge
columns experience crushing and spalling of concrete, pull-out of longitudinal steel bars,
and buckling or fracture of longitudinal or transverse steel bars[1]. Damage to bridge
structures, which acts as main routes that are critical for emergency response during an
earthquake can have significant consequences[2].
The damaged bridge piers required either repair or demolition for reconstruction. If damaged
bridge piers could be repaired and rehabilitated rapidly, it would be more economical than
demolishing and reconstructing the bridges [3]. Rapid repair methods, especially external
confinement method have caught public attention recently due to their fast installation
and effectiveness in recover the serviceability of the structure. For instance, Fibre
Reinforced Polymer (FRP) [2] and Steel Strap Tensioning Method[4].

ENGINEERING 176
There are many parameters that will alter the confinement effect on the structure. In this
paper, the effect of concrete compressive strength on the confinement effect is being
highlighted. The influences on confinement effect between the high strength concrete or
normal strength concrete will be compared and discussed based on the past researchers’
work. The confinement effect can be considered as how far the strength and ductility
restored.
MAIN RESULTS
Table 1. Previous studies on effect of concrete compressive strength to the confinement
effect under cyclic load
Researcher (s)
Repair / Strengthening
Material Used Concrete Grade (MPa)
Findings
Del et al.,
(2017) [5]
Strengthening CFRP Low concrete
grade:
14.3 – 16.5 Medium concrete
grade:
23.9 – 36.4
CFRP configurations
increased from 56% to 67%
the original shear capacity of the short RC columns.
Xiao and Wu
(2003) [6]
Strengthening Steel jackets 45,57 and 60 Retrofit method combining a rectilinear steel jacket for
shear enhancement and
stiffeners for confinement of column shown to be very
effective for improving the
seismic behaviour of existing deficient columns
Valdmanis
et al.,
(2007) [7]
Strengthening CFRP 20, 40, 60, 80 and
100
With the use of Teflon
interlays to reduce friction,
the mode of failure changes from formation of shear
cones to column and a
decrease in strength is observed, somewhat more
for low strength concrete
than for higher-strength
concrete
Harajli
(2007) [8]
Repair Steel ties,
wire mesh,
and FRP
43 and 68 The loss in load resistance
and stiffness degradation are
expected to be more pronounced for HSC in
comparison with NSC.
Fukuyama
et al., (2000)[9]
Repair and
strengthening
Jacketing
with RC, steel plates,
CF sheets or
preformed CFRP plates
Range from 25 to
55
The equivalent concrete
strength is used to calculate maximum shear strength
using the proposed formula
match with experimental results.

ENGINEERING 177
CONCLUSION
The present study analysed and compared several findings that were developed to evaluate
the efficiency of confinement repairing technique in repairing damaged concrete members
with different concrete compressive strength. Confinement successfully increases the strength
and ductility of the repaired concrete under cyclic load. The findings had proven that concrete
compressive strength is a significant parameter that affect the effectiveness of confinement
repair works.
Acknowledgment: I would like to express my appreciation for the scholarship support from
Zamalah Universiti Teknologi Malaysia.
REFERENCES
1. Wu, R.-Y. and Pantelides, C. P. Rapid repair and replacement of earthquake-damaged concrete columns
using plastic hinge relocation. Composite Structures 180 (2017), 467-483.
2. He, R., Grelle, S., Sneed, L. H. and Belarbi, A. Rapid repair of a severely damaged RC column having fractured bars using externally bonded CFRP. Composite Structures 101 (2013), 225-242.
3. Sun, Z., Wang, D., Du, X. and Si, B. Rapid repair of severely earthquake-damaged bridge piers with
flexural-shear failure mode. Earthquake Engineering and Engineering Vibration 10 (2011), 553-567.
4. Ma, C. K., Awang, A. Z., Omar, W., Liang, M., Jaw, S. W. and Azimi, M. Flexural capacity enhancement of
rectangular high‐strength concrete columns confined with post‐tensioned steel straps: experimental
investigation and analytical modelling. Structural concrete 17 (2016), 668-676.
5. Zoppo, M. Del, Ludovico, M. Di, Balsamo, A., Prota, A. and Manfredi, G. FRP for seismic strengthening of
shear controlled RC columns: experience from earthquakes and experimental analysis. Composites Part B:
Engineering 129 (2017), 47-57.
6. Xiao, Y. and Wu, H.. Retrofit of reinforced concrete columns using partially stiffened steel jackets. Journal
of Structural Engineering 129 (2003), 725-732. 7. Valdmanis, V., De Lorenzis, L., Rousakis, T. and Tepfers, R. Behaviour and capacity of CFRP-confined
concrete cylinders subjected to monotonic and cyclic axial compressive load. Structural Concrete-London-
Thomas Telford Limited 8 (2007), 187.
8. Harajli, M. Cyclic response of concrete members with bond-damaged zones repaired using concrete
confinement. Construction and Building Materials 21 (2007), 937-951.
9. Fukuyama, K., Higashibata, Y. and Miyauchi, Y. Studies on repair and strengthening methods of damaged
reinforced concrete columns. Cement and Concrete Composites 22 (2000), 81-88.

ENGINEERING 178
IGCESH2018
Universiti Teknologi Malaysia, Johor Bahru, Malaysia 13 -15 August 2018
A REVIEW ON CONCRETE FILLED STEEL HOLLOW COLUMN
SUBJECTED TO FIRE LOADING
Z. Nurizaty1, A. K. Mariyana1, P. N. Shek1, M. S. Abdul Rahman1 and A. M.
Mohd Najmi1, M. Iqbal Khiyon1
1Faculty of Civil Engineering, Universiti Teknologi Malaysia, 81310 UTM Skudai, Johor,
Malaysia.
Corresponding author: [email protected]
ABSTRACT
Concrete filled Steel Hollow Column (CFS) is an innovation to resist fire loading without the
needs of fire protection layer. Hence, the extensive review on the performances of CFS
columns at elevated temperature is presented in different material in concrete mixture as steel
hollow filler. Three different types of concrete filling have been used by researchers such as
plain concrete (PC), reinforce concrete (RC) and Pozzolanic Concrete containing fly ash
(FC). Behaviour of the steel column subjected to fire loading are reviewed in terms of the
mechanical properties such as types of loading, bearing capacity and the fire resistance of the
element. A comparison of concrete filling materials that have been used to fill steel hollow
column from different parts of the world are presented. Research gap as well as
recommendations are also proposed. Hence, this review will provide information on
improving steel design code.
Key words: hollow steel column, concrete filling, Fire, Loading , Bearing Capacity
INTRODUCTION
In this paper, a review of Concrete Filled Steel Hollow Tubular (CFST) Column from recent
years has been discussed. This is followed by the factors that influence the fire resistance of
the hollow steel column and, how the need for CFST column is increasing in construction
industry when the filler of hollow steel column exist in various mixing material.
In recent years, steel-concrete composite column have gained more widespread usage as load
bearing constituents in construction industry around the world due to the benefits offered in
terms of mechanical behavior and construction properties over plain concrete or steel hollow
section (Lie and Chabot, 1992; Du et al., 2017; Shekastehband, Taromi and Abedi, 2017; Tao
et al., 2017; Wan, Zha and Dassekpo, 2017). Concrete filled steel hollow tubular (CFST)
column have been used widely as engineering structure that include large span, tower and
heavy load such as bridge, high-rise building and other engineering structure. China is one of
the countries that have great deal of research on concrete filled steel tubular and application
in their practices (Han, Li and Bjorhovde, 2014).

ENGINEERING 179
In the past, steel hollow column have been widely used in steel structure construction owing
to their high strength, ductility and light in weight. As for elevated temperature, steel offer
poor fire resistance due to high thermal conductivity characteristic which can spread heat
faster compared to concrete with low thermal conductivity and good insulating material (Han,
Chen and Xie, 2017; Wan, Zha and Dassekpo, 2017). Other than high thermal conductivity,
shape of the column also plays an important role as stated earlier by researchers, as elliptic
and circular shape of steel hollow section have higher fire resistance compared to square or
rectangular steel hollow column due to edge (Jamaluddin et al., 2013; Uenaka, 2014;
Mccann, Gardner and Qiu, 2015; Rodrigues and Laim, 2017).
This is because the edge of the column would experience double fire compared to smooth
surface of elliptic or oval hollow column(Rodrigues and Laim, 2017). Albeit, elliptic and
circular hollow column performed well during fire loading, it has low availability in
construction industries as contractors prefer to use square and rectangular hollow steel
column in practice (Rush et al., 2015). Thus, improvement on performances of square hollow
steel column is needed to overcome the problem regarding its properties, hence, filling
concept has been introduced to improve fire resistance of steel hollow column known as
concrete filled steel hollow (CFST) column (Han, Yang and Xu, 2003; Espinos et al., 2015).
The study focus is to improve fire performance of the column by introducing concrete filling
so that the application of fire protection can be abundant (Han et al., 2003; Rush et al., 2015).
It is well known that, steel would expand due to high thermal conductivity when it subjected
to fire loading compared to concrete which is 45 W/(m. ̊ C) (Han, Yang and Xu, 2003; Wang
and Li, 2009). Therefore, application of concrete as a filler would be better to reduce thermal
conductivity of the steel hollow column.
Researchers would prefer the use of plain concrete as concrete filling mixture composition of
Ordinary Portland Cement (OPC) with aggregate and water. However, production of OPC
releases harmful gases which might lead to environmental problem. One of the alternative is
to utilize industry by-products as alternative way to substitute OPC without neglecting its
strength. Hence, this study will discuss briefly three types concrete filling widely used in
construction practices which are Plain concrete (PC), Reinforce concrete (RC) and
Pozzolanic concrete used fly ash as pozzolan (FC) when subjected to fire loading.
RESULT
According to Rush et al. shape and size influence the heat of the steel column when
subjected to fire loading and fire protection layer does not give significant effect on concrete
filled steel hollow column (CFST) during fire loading as compared to cooling phase (Rush et
al., 2015). According to Han et al. buckling is typical failure mode of the CFST column and
tested column failed in stage losing bearing capacity due to axial contraction reaching
approximately 38mm; however the fire resistance of the protected column is much higher
compared to unprotected column (Han et al., 2003). Previous studies have shown conflicting
statements regarding protection layer behaviour, but concrete filler significantly help the
hollow steel tubular column to improve fire resistance of the column. But then, among few
types of the concrete filler, the normal concrete is most likely to have been used by researcher
as compared to pozzolanic concrete consisting fly ash. Figure 1, show the fire resistance of
(a) protected CFST and (b) unprotected CFST.

ENGINEERING 180
(a) (b)
Figure 1. show fire resistance of (a) protected CFST (b) unprotected CFST (Rush et al.,
2015)
CONCLUSION
In conclusion, this paper attempted to cover the types of concrete filling in the steel hollow
column which believe can improve fire performance of the steel hollow column.
Understanding fly ash performance in the concrete mixture can improve alkaline activation
which can improve resistance over chemical attack, good durability and high in strength of
the column. In addition, fly ash has been considered as waste product that can induce
environmental problem in future, hence an innovation is needed to cater to the environmental
issue and at same time can optimize usage of landfill. Rather than just dumping it to landfill,
replacing it with OPC will reduce emission of carbon dioxide during production of OPC.
Thus, this research have its own significant value to the environmental issue.
Acknowledgement: The authors would like to acknowledge the financial support provided
by the ZAMALAH Scholarship from Universiti Teknologi Malaysia the financial support to
the first author for her PhD study.
REFERENCES
1. Du, Y. et al. (2017) ‘Rectangular concrete-filled steel tubular beam-columns using high-strength steel:
Experiments and design’, Journal of Constructional Steel Research. Elsevier Ltd, 131, pp. 1–18. doi:
10.1016/j.jcsr.2016.12.016.
2. Espinos, A. et al. (2015) ‘Circular and square slender concrete-filled tubular columns under large
eccentricities and fire’, Journal of Constructional Steel Research. Elsevier Ltd, 110, pp. 90–100. doi:
10.1016/j.jcsr.2015.03.011. 3. Han, L.-H. et al. (2003) ‘Experimental Study and Calculation of Fire Resistance of Concrete-Filled Hollow
Steel Columns’, Journal of Structural Engineering, 129(3), pp. 346–356. doi: 10.1061/(ASCE)0733-
9445(2003)129:3(346).
4. Han, L. H., Li, W. and Bjorhovde, R. (2014) ‘Developments and advanced applications of concrete-filled
steel tubular (CFST) structures: Members’, Journal of Constructional Steel Research. Elsevier Ltd, 100, pp.
211–228. doi: 10.1016/j.jcsr.2014.04.016.
5. Han, L. H., Yang, Y. F. and Xu, L. (2003) ‘An experimental study and calculation on the fire resistance of
concrete-filled SHS and RHS columns’, Journal of Constructional Steel Research, 59(4), pp. 427–452. doi:
10.1016/S0143-974X(02)00041-X.
6. Han, S., Chen, Y. and Xie, W. (2017) ‘Behaviour of square hollow steel tubular (SHST) stub columns after
elevated temperature’, Journal of Constructional Steel Research. Elsevier, 136(December 2016), pp. 177–
192. doi: 10.1016/j.jcsr.2017.05.015. 7. Jamaluddin, N. et al. (2013) ‘An experimental study on elliptical concrete fi lled columns under axial
compression’, 87, pp. 6–16. doi: 10.1016/j.jcsr.2013.04.002.

ENGINEERING 181
8. Lie, T. T. and Chabot, M. (1992) ‘Experimental Studies on the Fire Resistance of Hollow Steel Columns
Filled with Plain Concrete’, National Research Council Canada, 611. doi: 10.4224/20358480.
9. Mccann, F., Gardner, L. and Qiu, W. (2015) ‘Experimental study of slender concrete- fi lled elliptical hollow
section beam-columns’, JCSR. Elsevier Ltd, 113, pp. 185–194. doi: 10.1016/j.jcsr.2015.06.013.
10. Rodrigues, J. P. C. and Laim, L. (2017) ‘Fire response of restrained composite columns made with concrete filled hollow sections under different end-support conditions’, Engineering Structures, 141, pp. 83–96. doi:
10.1016/j.engstruct.2017.02.073.
11. Rush, D. et al. (2015) ‘Furnace tests on unprotected and protected concrete filled structural hollow sections’,
Fire Safety Journal. Elsevier, 78, pp. 71–84. doi: 10.1016/j.firesaf.2015.07.007.
12. Shekastehband, B., Taromi, A. and Abedi, K. (2017) ‘Fire performance of stiffened concrete filled double
skin steel tubular columns’, Fire Safety Journal, 88(December 2016), pp. 13–25. doi:
10.1016/j.firesaf.2016.12.009.
13. Tao, Z. et al. (2017) ‘Experimental study on blind bolted connections to concrete-filled stainless steel
columns’, Journal of Constructional Steel Research. Elsevier Ltd, 128, pp. 825–838. doi:
10.1016/j.jcsr.2016.10.016.
14. Uenaka, K. (2014) ‘Thin-Walled Structures Experimental study on concrete fi lled elliptical / oval steel
tubular stub columns under compression’, Thin Walled Structures. Elsevier, 78, pp. 131–137. doi: 10.1016/j.tws.2014.01.023.
15. Wan, C. Y., Zha, X. X. and Dassekpo, J. B. M. (2017) ‘Analysis of axially loaded concrete filled circular
hollow double steel tubular columns exposed to fire’, Fire Safety Journal. Elsevier, 88(October 2015), pp.
1–12. doi: 10.1016/j.firesaf.2016.12.007.
16. Wang, W. Y. and Li, G. Q. (2009) ‘Fire-resistance study of restrained steel columns with partial damage to
fire protection’, Fire Safety Journal. Elsevier, 44(8), pp. 1088–1094. doi: 10.1016/j.firesaf.2009.08.002.

ENGINEERING 182
IGCESH2018
Universiti Teknologi Malaysia, Johor Bahru, Malaysia 13 -15 August 2018
ENHANCING THE DIELECTRIC PROPERTIES AND THERMAL
CONDUCTIVITY OF PCM USING NANOMATERIAL
Nurul Humaira Muhd Zaimi*1 and Hasimah Abdul Rahman2
1, 2 Centre of Electrical Energy Systems, Institute of Future Energy, Universiti Teknologi Malaysia,
81310 UTM Johor, Johor Bahru, MALAYSIA.
(E-mail: [email protected], [email protected])
ABSTRACT
Thermal energy storage systems using phase change materials (PCM) is a useful way to
improve the building thermal performance. The right use of PCM in the envelope can
minimize peak cooling loads, allow the use of smaller HVAC technical equipment for
cooling, and has the capability to keep the indoor temperature within the comfort range due to
smaller indoor temperature fluctuations. In previous studies conducted, Boron Nitride has
been chosen to be added to the Low Density Polyethylene to improve dielectric strength, as
well as dielectric constant for the polymer nanocomposite insulator. All the samples are
tested for dielectric properties with Dielectric Spectroscopy Measurement according to
ASTM D150, and AC breakdown test, in accordance to ASTM D149. Based on the results, it
can be seen that for the dielectric constant, the addition of 1wt% BN demonstrate a lower
permittivity compared to unfilled polymer .On the other hand, the incorporation of 3wt% and
5wt% BN has resulting in high permittivity than the unfilled polymer. For the decreasing of
dielectric constant is due to the disability of polymer chain nanocomposite to move freely
while for the increasing in permittivity is due to the effective permittivity of interfacial area is
dominant compared to filler and matrix. Next, for the breakdown strength of LDPE/1wt%
BN, at 63.2 % breakdown probability, it has higher dielectric strength compared to the
unfilled polymer. However, for the 3wt% and 5wt% BN, it has lower dielectric strength
compared to unfilled polymer. It is also revealed that, the improvement of dielectric strength
is due to the existence of nanoparticle has blocked the charge carrier from flowing and the
reduction of dielectric strength is due to the presence of agglomeration. Based on the results,
agglomeration is found, thus reducing the performance of nanomaterial against the behaviour
it should convey. Therefore, relating this result to the future works in this study,
agglomeration occurrence in nanomaterial in PCM is expected to be overcome through
surface modification of nanomaterial despite the difference in condition of experiment
conducted.
Key words: Nanomaterial, phase change material, thermal conductivity, dielectric properties
INTRODUCTION
Currently, due to the Urban Heat Island effect on Johor Bahru, temperatures in buildings have
been increasing especially during the day. On top of this, urban part of Johor experiences
temperature differences with the surrounding areas by 2°C for rainy day and could reach 4°C

ENGINEERING 183
during sunny day [1]. As a result, nanotechnology, as advanced and innovative technology,
are explored to achieve cooler Johor and widely applied in building industry to achieve
higher efficiency and performance. For instance, nanoparticles incorporated in phase change
materials which are applied for façades and building envelopes to improve the dielectric
properties, thermal properties and thereby reduce the cooling load. Nanotechnology not only
promote significant cooling load reduction effect, high building performance and energy
efficiency, but, moreover, introduce remarkable economical benefits in building and
construction industry. In 2006, the market demand of nano-enhanced building materials was
just $20 million while the market is expected to reach $400 million by this year, witnessing a
twenty-time remarkable increase within 10 years [2].
PCMs provide a large heat capacity over a limited temperature range and they could act like
an almost isothermal reservoir of heat. As the temperature increases, PCMs change phase
from solid to liquid. Since this reaction is endothermic, they absorb heat. When the
temperature decreases, PCMs change phase from liquid to solid. Nanotechnology is
nowadays one of the most important methods in the development of technology. Many
researches have been conducted on nanocomposites due to its enhanced properties as an
insulating material for high voltage equipment. Polymer nanocomposite is actually a new
improved insulating material due to the results of generation of insulating material with the
addition of nanoparticle. A study by Zulkifli et al. said that nanoparticle that has been added
to a matrix in order to enhance the properties of the material is called nanocomposite (2016)
[3]. Based on previous studies, it has been found that nanocomposite is chosen as the new
insulation due its excellent performance in electrical, mechanical and also chemical
properties. The addition of nanoparticle will actually enhance and improve the dielectric
properties such as dielectric breakdown of the insulator. A research survey by Ghouse et al,
states that by mixing the proper amount of nanoparticle in dielectric materials will result in an
improvement of breakdown strength and voltage endurance (2013) [4].
However, addition of nanoparticle could actually lead to agglomeration, resulting in a poor
thermal and dielectric properties of a material. Sarita states that the main problem in
producing monodispersed nanoparticles in a polymer matrix is agglomeration of
nanoparticles due to their specific surface area and volume effects. This problem can be
overcome by modification of the surface of the inorganic particles [5].
MAIN RESULTS
Based on the results, it can be seen that for the dielectric constant, the addition of 1wt% BN
demonstrate a lower permittivity compared to unfilled polymer .On the other hand, the
incorporation of 3wt% and 5wt% BN has resulting in high permittivity than the unfilled
polymer. For the decreasing of dielectric constant is due to the disability of polymer chain
nanocomposite to move freely while for the increasing in permittivity is due to the effective
permittivity of interfacial area is dominant compared to filler and matrix.

ENGINEERING 184
Figure 1. Frequency Variation of Permittivity of LDPE/BN nanocomposite
Next, for the breakdown strength of LDPE/1wt% BN, at 63.2 % breakdown probability, it has
higher dielectric strength compared to the unfilled polymer. However, for the 3wt% and
5wt% BN, it has lower dielectric strength compared to unfilled polymer. However, for the
3wt% and 5wt% BN, it has lower dielectric strength compared to unfilled polymer.
Figure 2. Probability Breakdown on AC test
CONCLUSION
This study shows that nanomaterial able to improve the termal conductivity and dielectric
properties of PCM. However, with the increase in particle loading, agglomeration will start to
exist, causing the average interparticle decrease and thus resulting in poor dielectric strength
and thermal conductivity. Thus, through surface modification, the agglomeration occurrence
in nanomaterial in PCM is expected to be overcome which resulting in a better dielectric and
thermal properties.
1.71.92.12.32.52.72.93.13.33.53.73.94.14.34.54.74.95.15.35.55.75.96.16.36.56.76.97.17.3
1.00E-02 1.00E-01 1.00E+00
Die
lect
ic C
on
stan
tFrequency (Hz)
PURE LDPE LDPE+1%BN
LDPE+3%BN LDPE+5%BN

ENGINEERING 185
Acknowledgment: The authors wish to thank the Ministry of Higher Education (MOHE)
Malaysia and Universiti Teknologi Malaysia (UTM) for the award of the grant that enabled
the research, leading to this article under the Research University Grant (vote no:
Q.J130000.2523.19H40).
REFERENCES
1. T. Kubota and D. R. Ossen, Spatial Characteristics of Urban Heat Island in Johor Bahru City, Malaysia,
Faculty of Built Environment, Universiti Teknologi Malaysia, 39-44.
2. M. Karlsson, Investigation of the dielectric breakdown strength of polymer nanocomposites, Uppsala University, Sweden, 2014.
3. N.H. Zulkifli, N. A. M Jamail, M. A. A. Azmi, M. I. H. Razali and N. A. A. N. Zarujhan. Effect of TiO2
Nanofiller on the AC and Impulse Characteristic for HV Application. ARPN Journal of Engineering and
Applied Sciences (2016), 10806-10813.
4. S. M. Ghouse, S. Venkatesh, R. Rajesh and S. Natarajan. Effects of SiO2and TiO2 Nano Fillers in Enhancing
the Insulation Breakdown Strength of Epoxy Nano Composite Dielectric under Divergent Electric Fields,” in
International Journal on Electrical Engineering and Informatics (2013), 501-518.
5. S. Kangoa, S. Kalia, A. Celli, J. Niguna, Y. Habibi, R. Kumar. Surface modification of inorganic
nanoparticles for development of organic–inorganic nanocomposites- A review. Progress in Polymer
Science 38 (2013), 1232–1261.

ENGINEERING 186
IGCESH2018
Universiti Teknologi Malaysia, Johor Bahru, Malaysia 13 -15 August 2018
EXPERIMENTAL STUDY OF TEMPERATURE EFFECT ON THE
MECHANICAL PROPERTIES OF GFRP
Z.P. Chow, Z. Ahmad and K.J. Wong
Faculty of Mechanical Engineering, Universiti Teknologi Malaysia, Johor Bahru, MALAYSIA.
(E-mail: [email protected], [email protected], [email protected])
ABSTRACT
The research aims to investigate the potential of GFRP to be used in high temperature
environment. The mechanical response of fiberglass composite was characterized at
temperatures ranging from 30°C to 110°C. Tensile tests with 0° and 90° fibre, compression
tests with 0° and 90° fibre and shear tests with 45° fibre orientation were conducted on the
fiberglass composite specimens. Stress-strain curve including modulus, maximum strength,
strain and deformation of fiberglass were examined. Fiberglass laminates showed escalating
decrease in tensile strength, linear decrease in compressive and drastic decrease in shear
properties as temperature increases. The modulus and strength were reduced at same degree
between 0° and 90° fibre orientation. Deformation gradually shifted from fibre breaking to
fibre pulling as the fibre matrix softens. Overall, effect of temperature on strength of GFRP
and delamination depends mainly on type of resin, followed by type of loading.
Key words: Temperature, Mechanical properties, Glass fibre, Composite
INTRODUCTION
A composite material is created when combining at least two or more base materials of
notably different properties. By doing so, desirable structural properties can be obtained
depending on the constituent materials which make up the composite. An innumerable
amount of research work has been carried out throughout the years to develop a vast variety
of composites in a range of applications such as building, defence, aeronautical, automotive,
or even household materials [1].
Fibre reinforced polymer (FRP) utilizes fibres as reinforcement that greatly improves overall
strength and toughness of composites. In recent years, advanced FRP made of aramid, glass
and carbon have been increasingly become the focus of researchers because of exceptional
strength-to-weight ratio, impact and crack resistance owing to the fibre reinforcement. Glass
fibre reinforced polymer (GFRP) has been used as substitute for conventional materials in
aeronautic industry and aerospace for its good strength-to-weight ratio, corrosion resistance
and long lifespan.
GFRP laminates has potential to act as thermal barriers or use at different temperatures, due
to glass having very high melting point and is a great insulator. There have been previous
studies elaborating on the possibility of using GFRP with other composites at higher
temperatures. Composite matrix becomes softer and less resistant at elevated temperatures,

ENGINEERING 187
depending on the glass transition temperature of the matrix. However, there are studies that
show improved impact resistance at increasing temperature [2]. According to study by
Badawy [3], during elevated temperature, the direction of fibre in relation to loading greatly
influences the failure mode of unidirectional GFRP.
The paper aims to evaluate the material properties of unidirectional GFRP at temperatures
below its glass transition temperature. S grade unidirectional GFRP with standard dimensions
was used in accordance to ASTM standard. Both 0° and 90° fibre direction samples were
tested under tensile and compression tests, while 45° cross plied samples were used to test
shear properties. To obtain ample data and repeatability, sets of 5 specimens each were
conducted at quasi-static rate at 30°C, 70°C and 110°C. Modulus, ultimate strength, ultimate
strain and Poisson’s ratio were obtained. The effects of temperature on the mechanical failure
and response of GFRP was then reported and explained.
MAIN RESULTS
In order to acquire the material properties of GFRP across different temperatures, a series
of mechanical tests were conducted based on ASTM standard. Figure 1 below shows the
average results collected from the tensile strength tests of 0° unidirectional GFRP fibre. It
can be seen that the tensile strength of GFRP only decreases slightly when the
temperature increases from 30°C to 70°C, but there was a drastic drop of both strength
and stiffness at 110°C.
Figure 1. Stress-strain relation of GFRP across the fiber direction at different
temperatures.
The table below shows the main results of the 5 properties tests. The results can generally
be categorized based on the type of test; tensile, compression and shear. For tensile test 0°
direction, the ultimate tensile strength decreases minimally from 750.67 MPa to
719.48MPa at 70°C but then falls drastically to 441.77MPa at 110°C. Similar response is
observed for 90° fibre direction as the strength at 110° is less than half of the middle
temperature.
On the other hand, compression tests present a linear curve of decreasing ultimate
strength in response to the rise of temperature. For both 0° and 90° fibre direction, there

ENGINEERING 188
was decrement of about 20% compressive strength at each increase of 40°C. Compressive
properties of GFRP perform relatively well compared to tensile and shear properties.
For ultimate shear strength, temperature plays a major effect as the shear strength
decreases greatly with every escalating temperature. From 30°C to 70°C, there was a
significant drop of 44% shear strength, and towards 110°C, GFRP has close to almost no
shear strength remaining. This is due to the slipping between adjacent layers caused by
softening and heating.
Table 1. Ultimate strength of GFRP at its corresponding stress direction and temperature
Temperature
°C
Tensile (MPa) Compression (MPa) Shear (MPa)
0° 90° 0° 90° -
30 750.67 58.40 816.53 168.51 94.93
70 719.48 52.88 658.42 128.44 52.57
110 441.77 20.79 551.52 94.74 6.54
CONCLUSION
The material properties of S grade GFRP are investigated across 3 temperatures, 30°C, 70°C
and 110°C. Tensile, compression and shear tests were carried out in accordance to ASTM. In
conclusion, properties of GFRP are significantly affected by effect of temperature. The
ultimate strength and modulus of GFRP is affected more by the type of loading and not so
much by the fibre direction, as percentage drop of strength is similar between 0° and 90°
fibre. Tensile and shear strength is very low upon reaching maximum temperature. It is
recommended to explore the material properties of different matrix with different glass
transition temperature and also different types of fibre reinforcement such as woven or
chopped strand fibres.
REFERENCES
1. Elanchezhian, C., Vijaya Ramnath, B. and Hemalatha, J. Mechanical behavior of glass and carbon fibre
reinforced composites at varying strain rates and temperatures. Procedia Materials Science 6 (2014), 1405-
1418.
2. Khalid, A.A., The effect of testing temperature and volume fraction on impact energy of composites. In
Materials & Design, (2006), 499-506.
3. Badawy, A.A.M., Impact behvior of glass fibers reinforced composite laminates at different temperatures.
Ain Shams Engineering Journal, (2012), 105-111.

ENGINEERING 189
IGCESH2018
Universiti Teknologi Malaysia, Johor Bahru, Malaysia 13 -15 August 2018
INVESTIGATING TIME-DOMAIN FEATURES COMBINATION IN
DETECTING THE COMMON SPORT ACTIVITY
Nurul Fathiah Ghazali*1, Muhammad Amir As’ari1,2, Norazman Shahar1, and
Hadafi Fitri Mohd Latip1,2
1 Faculty of Biosciences and Medical Engineering, Universiti Teknologi Malaysia, Johor Bahru,
MALAYSIA. 2 Sport Innovation and Technology Center (SITC), Institute of Human Centered Engineering (IHCE),
Universiti Teknologi Malaysia, Johor Bahru, MALAYSIA. (E-mail: [email protected], [email protected], [email protected],
ABSTRACT
Sport activity recognition topics has begun to be one of the researcher’s interest in this past
few years. In order to recognize the desired activities, choosing the most discriminative
features is the key to produce the best model in order to differentiate between one activity and
another. Thus, this paper aims to evaluate the most significant time-domain features that were
extracted from inertial sensor data in determining the common sport activity. The data was
collected on 10 individuals that perform common sport activity which is stationary, walking,
jogging, sprinting, and jumping while wearing the inertial sensor on chest. Four types time-
domain features which are mean, standard deviation, maximum and minimum value were
extracted and several different features combination were established before evaluating the
features using one of the machine learning approach which is Support Vector Machine
(SVM). From the result, the solely standard deviation and solely maximum value as features
combination recorded the highest accuracy which is 87.6%, compared to other solely tested
features. It indicates that the standard deviation and maximum value features combination are
the most dominance in representing the common sport activity recognition. Overall results
show that, all features combination that include standard deviation and maximum value
features is produced higher accuracy which is more than 88.0% than the features combination
without standard deviation and maximum values features.
Key words: Features, Accuracy, Machine Learning, Support Vector Machine
INTRODUCTION
Topics on sport activity recognition had received many attention and concerned from many
researchers nowadays. Generally, the sport activity recognition studies can contribute in
classifying activities from desired sport that can give benefit to the sport training industry
especially for coaches in their coaching process. For example, in badminton sport, the
analysis of chosen activity such as smash, clear, dropshot, net shot and others are important in
analysing the player’s performance [1] as the quantification of these activities can be used to
enhance the performance of player in term of tactical component [2].

ENGINEERING 190
In this sport recognition studies, the activity in sport can be divided into two types which is
common sport activity and specific sport activity. For common sport activity, it is defined as
basic sport movement such as walking, jogging, sprinting and jumping. In contrast, the
specific sport activity is defined as all activities that exist specifically in one type of sport.
For this paper, only the common sport activity is investigated. In order to recognize the
desired activities, choosing the most discriminative features is the key to produce the best
model in order to differentiate between one activity and another [3]. The process in
determining the features that will be used to train is crucial as it will extract the relevant and
useful information that represent the quantitative value that will allow the signal to be
compared between one activity and another.
In this paper, a machine learning based technique which is SVM classifier from the
Classification Learner App in MATLAB software was used to observe the accuracy of
several combination of time-domain features in detecting the common sport activity. SVM
classifier is chosen because according to many past researches in activity recognition
studies, SVM classifier usually provides the most accurate classification results in
detecting the desired activity [4-6].
MAIN RESULTS
Table 1-4 indicate the output accuracy from the different modelled SVM classifier which
is trained using different features combination. Overall, all tables indicate that standard
deviation and maximum value features are the most dominance features in representing
the common sport activity as the existing of both features in all features combination
produced high accuracy which is more than 88% as shown in Table 1 and 4. In contrast,
the feature combination without standard deviation and maximum value features will
resulted a significant drop in the accuracy to less than 88% as shown in Table 2 and 3,
whereby the worst case resulted is in the solely trained mean feature which is 56.7%.
Table 1. Accuracy of SVM Classifier Which is Trained Using All Features
Features Combination (use all features) Accuracy (%)
μ σ Max Min 91.2%
Table 2. Accuracy of SVM Classifier Which is Trained Using One Feature
Features Combination (remove 3 features) Accuracy (%)
μ 56.7
σ 87.6
Max 87.6
Min 84.6

ENGINEERING 191
Table 3. Accuracy of SVM Classifier Which is Trained Using Two Features Combination
Features Combination (remove 2 features) Accuracy (%)
μ σ 88.3
μ Max 88.1
μ Min 86.1
σ Max 89.7
σ Min 88.4
Max Min 88.4
Table 4. Accuracy of SVM Classifier Which is Trained Using Three Features Combination
Features Combination (remove 1 features) Accuracy (%)
μ σ Max 89.9
μ σ Min 89.1
μ Max Min 89.8
σ Max Min 89.9
CONCLUSION
This paper demonstrates that it is entirely feasible to accurately infer common sport activity
by using these four time-domain features. Based on the result, we can conclude that the most
significant features in detecting the common sport activity is standard deviation and
maximum value. Thus, in future research, these two features should be included to recognize
the desired activity as this study shows that they have high significance in producing high
accuracy in detecting the desired activity.
Acknowledgment: The authors would like to express their gratitude to Universiti Teknologi
Malaysia (UTM) for supporting this research and the Minister of Higher Education (MOHE),
Malaysia for supporting this research work under Research Grant No.
Q.J130000.2545.15H83.
REFERENCES
1. Phomsoupha, M. and G. Laffaye, The science of badminton: game characteristics, anthropometry,
physiology, visual fitness and biomechanics. Sports Med, 2015. 45(4): p. 473-95.
2. O'Donoghue, P., An introduction to performance analysis of sport. 2015.
3. Mitchell, E., D. Monaghan, and N.E. O'Connor, Classification of sporting activities using smartphone
accelerometers. Sensors (Basel), 2013. 13(4): p. 5317-37. 4. Cleland, I., et al., Optimal Placement of Accelerometers for the Detection of Everyday Activities. Sensors,
2013. 13(7): p. 9183.
5. Anik, M.A.I., et al., Activity Recognition of a Badminton Game Through Accelerometer and Gyroscope, in
19th International Conference on Computer and Information Technology. 2016: North South University,
Dhaka, Bangladesh.
6. Bayat, A., M. Pomplun, and D.A. Tran, A Study on Human Activity Recognition Using Accelerometer Data
from Smartphones. Procedia Computer Science, 2014. 34: p. 450-457.

ENGINEERING 192
IGCESH2018
Universiti Teknologi Malaysia, Johor Bahru, Malaysia 13 -15 August 2018
NUMERICAL STUDIES ON TURBULENCE MODELLING OF
SYMMETRICAL AEROFOIL
Nurain Othman*1, Iskandar Shah Ishak2, Md Nizam Dahalan3
Department of Aeronautics, Automotive, and Ocean Engineering, Faculty of Mechanical Engineering,
Universiti Teknologi Malaysia, 81310 Skudai, Johor, MALAYSIA. [email protected], *,[email protected], [email protected]
ABSTRACT
Airflow around aerofoils had always been an interesting subject for aerodynamicist over
decades since it plays a vital role to optimize the lift-to-drag ratio for any flying machine.
This research works aim to investigate the airflow around a symmetrical aerofoil of
NACA0012 by conducting numerical works using turbulence model in the hope to gain
further understanding of complex airflow surrounding the aerofoils. Simulations were run at
an angle of attack sweep with different turbulence modelling at three different Reynolds
numbers. The simulation results obtained are found to be in a good agreement with the
refereed journals. Subsequently, this testifies the Computational Fluid Dynamics (CFD)
modelling adopted in this research programme is viable for unsteady aerodynamic airflow
studies.
Key words: Turbulence Model, NACA 0012, CFD, Numerical Study
INTRODUCTION
In prospective years, there an important improvement of wind tunnel technologies. Most
of the data collected from an aerofoil produced by undergoing and continuous experiment
using a wind tunnel. However, the experiments demand cost which really expensive and
require continuous observation as well as needing a highly sensitive instruments. Updated
data and result for good and better aerodynamics characteristics are desired in the
engineering industry. Due to overpricing cost for wind tunnel testing, Computational
Fluid Dynamics (CFD) takes over as the solution. NACA 0012, mostly used in wind
turbine where it is commonly used types of blades. It is a symmetrical aerofoil that easier
to produce using SolidWorks software. Legitimately, NACA 0012 is academically used
in lots of research which make it easier to be compared to improvement and validation. A
good understanding of aerodynamics characteristic is essential, especially in
performance. CFD has advantages to show the flow demeanour at certain interest point in
flow field which might help to understand the selection of turbulence model based on the
flow and aerodynamic characteristics.

ENGINEERING 193
These research works involve two-dimensional study done on NACA 0012 airfoil
undergoing various turbulent models from low angle of attack to the stalling angle.
NACA 0012 in this paper was based on UIUC Airfoil Coordinate Database [1]. For
meshing, it was generated using ANSYS 15 Workbench with C-mesh and calculated
using various types of turbulent model. From extensive reading, CFD calculation usually
was done using 2D k-ω (shear stress transport) turbulent model [6]. The result of NACA
0012 from other established paper is available to be validated and compared.
Validation method was used where NACA 0012 without any control surfaces was
compared with the result from other previous researchers. In an upcoming paper,
Coefficient of Lift, Cl, and Coefficient of Drag, Cd graph of NACA 0012 at different
Reynolds number and angle of attack which later compared with the experimental data
from established researchers along with data for different turbulence model. It is a
leverage on CFD is that its ability to create and analyze the detail on the flow.
MAIN RESULTS
Mesh Study of NACA 0012 Airfoil
Mesh refinement Investigation
To establish the model which involves the number of element and suitable grid pattern
element sizes, and independent study will be carried out for NACA 0012 in a forthcoming
paper. From continuous reading, C-mesh configuration was chosen with certain
dimension where the flow was selected to be turbulent and steady with Reynold number
of 3 x 10⁶ [3]. Figure 2, shows the mesh with an element of 60,000 elements. The
boundary layer elements were programmed to adapt according to y+ values. Where this
method was adopted by LEAP Australia[3].
To ensure the method used in this study is valid, comparison of data and graph of
pressure coefficient of NACA 0012 with previous researchers [4,5] were done. For a
preliminary result, the simulation works of NACA 0012 without any control surface was
compared with the experimental results on pressure coefficient graph. Further CFD study is
going to be conducted at different angles of attack, turbulence model, and Reynolds number.
The progress of this research will be explained further in an upcoming paper. Figure 1
depicts a graph of pressure coefficient for NACA 0012 using the k-ω model with SST
(Shear stress transport) turbulence model.

ENGINEERING 194
Figure 1. Coefficient of Pressure at 10⁰ on different elements along the chord of
NACA 0012.
CONCLUSION
The various testing on NACA 0012 on different Reynold number and turbulence model can
significantly help to clarify the selection of turbulence model. Moreover, helps in
understanding the mathematical issues that involve each turbulence model and the
relationship between Reynolds number and turbulence model.
Acknowledgment: The authors would like to express their appreciation to UTM Aerolab for
the support of computer facilities and would like to thank UTM Zamalah for the sponsorship
of the studies.Authors were also indebted to Research University Grant (GUP) Tier 2 2017,
Vot Number Q.J130000.2624.14J20.
REFERENCES
1. Anon. (n.d.). UIUC Airfoil Data Site. Retrieved February 15, 2018, from http://m-
selig.ae.illinois.edu/ads/coord_database.html
2. Anon. (n.d.). NACA 0012 AIRFOILS (n0012-il). Retrieved February 21, 2018, from
http://airfoiltools.com/airfoil/details?airfoil=n0012-il
3. LEAP Australia. (n.d.). Computational Fluid Dynamics (CFD) Blog - LEAP Australia & New Zealand Tips & Tricks: Turbulence Part 2 – Wall Functions and Y+ requirements. Retrieved February 20, 2018,
from https://www.computationalfluiddynamics.com.au/tips-tricks-turbulence-wall-functions-and-y-
requirements/
4. WordPress. (n.d.). Contradictory 2d Circulation Theory | The Secret of Flight. Retrieved February 20, 2018,
from https://secretofflight.wordpress.com/contradictory-2d-circulation-theory/
5. Langley Research Center. (n.d.). Turbulence Modeling Resources. Retrieved from February 20,2018, from
https://turbmodels.larc.nasa.gov/naca0012_val.html
6. Inc, P.-C. (n.d.). Vision Aircraft designer. Retrieved from February 20,2018, from http://www.pro-
composites.com/VisionInfo2.html.

ENGINEERING 195
IGCESH2018
Universiti Teknologi Malaysia, Johor Bahru, Malaysia 13 -15 August 2018
WATER REUSE IN TOURISM COMPLEX: A LITERATURE
REVIEW
Norhidayah Binti Mohamad Shafee*1, Mimi H. Hassim2
1, 2 Faculty of Chemical Engineering and Energy Engineering, Universiti Teknologi Malaysia, Johor,
MALAYSIA.
(E-mail: [email protected], [email protected], [email protected])
ABSTRACT
This article explained the necessity of water reuse model in solving the water scarcity
problem. Water scarcity has become the ultimate challenge for the tourism complex owner as
the amount of freshwater consumption were seen to rose up dramatically each day. This
condition were greatly affected by climate change, resource availability at the respective
place, demographics and economic development. In order to overcome the reduction of
freshwater supply, water reuse has been practiced in many sectors for, water resources
efficiency planning. Several studies were reviewed and precisely, water saving can be
achieve with a proper water integration techniques, regardless of their locations, weather
conditions, number of tourist and specific touristic activities.
Key words: Water reuse, Water scarcity, Water integration, Tourism
INTRODUCTION
Rita (2014) claimed that people will suffer from water scarcity mostly due to climate change
and the extensive usage from developed countries. Researches and engineers confronts the
biggest challenge on how to find a solution for this matter (Ahmetović, Ibrić, Kravanja, &
Grossmann, 2000). Since the demand for freshwater consumption had increases exponentially
in many countries including Malaysia, it is beneficial to find a solution for optimizing the
usage of water as well as minimizing wastewater generation. Kavanagh (1999) stated that a
sustainable water management system at tourism complex must incorporate several important
elements, which are no losses in the freshwater supply, no accumulation of pollutants and no
disruption in the natural cycle of other materials in the water environment. Sustainable water
management strategy can be achieved through several conservation and recovery techniques,
such as water integration within process water networks by using pinch analysis,
mathematical programming or both (Ahmetović et al., 2000). Gundersen (2000) explained
process integration as a “Systematic and general methods for designing integrated production
systems, ranging from individual processes to total sites, with special emphasis on the
efficient use of energy and reducing environmental effects.” Process integration benefits in a
way of integrating both material usage and energy as well as minimizing the generation of
wastes and emissions (Mann, 1999).

ENGINEERING 196
Water reuse has become widely known as a part of sustainable water management strategy
for the enhancement of water supply resources and reducing pollution (Zhang, 2004). Water
reuse can be defined as “a series of two or more uses that occur due to the acts of man in
which a portion of the water originating from the first use and then used a second time has
not passed through an unconfined gaseous state between uses.” (Klooz, 1980). There were
several water reuse forms such as unplanned reuse, planned reuse, sequential reuse, recycle
reuse and potable reuse. Unplanned water reuse happens once the discharged water is
captured and put to use by subsequent users without planning. Planned water reuse happens
where there is repetitive use of water by the users which involve planning and coordination.
Sequential water reuse happens when the effluent that discharged into the water body is
diluted by natural forces, treated and used again for various intention. Potable water reuse
happens when the treated wastewater effluent is being used for human consumption or other
domestic purposes (Klooz, 1980). Esposito, Tsuchihashi, Anderson, & Selstrom (2005)
claimed that water reuse will increase the reliability in terms of water supply, decreasing the
wastewater discharge as well as maintaining the quality of water resources. Water reuse will
be a medium to lowering the stress on water resources which mostly due to population
growth, development and sprawl, inefficient water allocation and pricing, also over-allocation
of groundwater.
TYPES OF WATER REUSE MODEL AS REPORTED BY OTHER LITERATURE
(LOCAL)
Two case studies presented here were conducted in Malaysia. Currently, there is no research
regarding water reuse model prior to tourism in Malaysia, therefore, these two case studies
were the latest in edition for future reference.
The first case study was reported by Hashim, Abdul Manan, & Wan Alwi (2009) at Sultan
Ismail Mosque, Universiti Teknologi Malaysia. The optimal water network was designed by
using mathematical programming techniques. It involves the development of a Model for
Optimal Design of Water Network (MODWN) which are applicable for water operations that
involves multiple contaminants and utilities. Total of 1.37 t/day of minimum freshwater
flowrates was targeted. With the implementation of MODWN, both freshwater and
wastewater were expected to reduce effectively up to 95.3% and 64.7%, respectively. Five
years of payback period and total net annual saving of $ 5366 were expected. This model
have the capability to predict which water source that needs to be eliminated or reduced,
amount of external water source is needed for recycle or reuse, as well as maximizing the net
annual saving within desired payback period (Hashim et al., 2009).
The second case study was reported by Mah, Putuhena, Salim, & Lai (2008) at the semi-
detached house in Kuching, Sarawak. The number of houses is hypothesised ranging from
150 – 200 houses and was divided into seven stand-alone closed looping recycling systems.
The mathematical modelling for medium size system was developed. It is applicable to local
condition and can be replicate to a larger system. Mathematical modelling was developed
using the Wallingford Software model, InforWorks Water Supply (WS). The case study
aimed to explore the potential for greywater reclamation. The current discharge of greywater
to the street drains can be eliminated by recycling the purified greywater for toilet flushing,
irrigation and outside use. At first, nine houses were used as a pilot test and succeed. From
overall result, water demand for domestic users were reduced with an average of 40%, just by
using the recycling greywater process.

ENGINEERING 197
TYPE OF WATER REUSE MODEL SPECIFICALLY FOR TOURISM REPORTED
BY OTHER LITERATURE (INTERNATIONAL)
Two case studies presented here were conducted in Saudi Arabia and Italy, respectively.
Research regarding water reuse in tourism sector is lacking, even up to this date.
The first case study took place in the City of Mecca, Saudi Arabia. City of Mecca is widely
known as the religious city for Muslim community all around the world, to perform both
Umrah and Hajj. At specific months, the number of visitors can level up to three times higher
than normal. The average per capita consumption as reported, is nearly the country average
consumption. The country itself depends almost 98% of water supply from the desalination
plants. A probabilistic model was developed to quantify the uncertainties for number of
visitors, local population growth and selected explanatory variables (household size, monthly
mean of maximum daily temperature and average household income for local population). In
addition, their Ministry of Water had planned the water conservation measures to replace
some of the fixtures with those consuming less water. It is very applicable in hotels and
private residences of local population. This research is limited for a three year forecast
period, 2011 to 2013. Monte Carlo simulations (MCS) were carried out using @Risk in order
to obtain the distribution of total water use as well as to assess the uncertainties in the input
parameters. As a result, about 5% saving from water demand can be achieve in a short term
run, and about 24% in a long term run. For future saving, the Ministry planned to increase the
water tariffs, purposely for conservation measure as the current one might not suitable in
longer term (Almutaz, Ajbar, Khalid, & Ali, 2012).
Next, the second case study took place in the Romagna region of Northern Italy. The water
availability in this region were greatly affected by the concentration in time, space of tourist
as well as the specific water-demanding touristic activities. Correlation analysis was
conducted to study the influence of climate and touristic drivers toward the water demand.
The observation period started from year 2009 to 2015, and data were all collected within the
period of time. On a hot summer months, most of the residents stayed in the country which
increases the water consumption. The study concluded that the amount of water consumption
is proportional to the tourism factor, even though the factor itself is lacking of information
and documentation.
CONCLUSION
With a proper implementation of process integration techniques, water reuse is capable in
lowering water stress and water scarcity. However, there are very limited case study for
mathematical modelling which involves water reuse application in tourism area.
Acknowledgement: The financial support obtained from UTM Zamalah Scholarship is
gratefully acknowledged.
REFERENCES
1. Ahmetović, E., Ibrić, N., Kravanja, Z., & Grossmann, I. E. (2000). Water and Energy Integration: A
Comprehensive Literature Review of Non-Isothermal Water Network Synthesis.
2. Almutaz, I., Ajbar, A., Khalid, Y., & Ali, E. (2012). A probabilistic forecast of water demand for a tourist
and desalination dependent city : Case of Mecca , Saudi Arabia. DES, 294, 53–59.
https://doi.org/10.1016/j.desal.2012.03.010

ENGINEERING 198
3. Gundersen, T. (2000). A Process Integration PRIMER. Implementing Agreement on Process Integration,
(May), 90. Retrieved from http://ww2.eq.uc.pt/ensino/disciplinas/integracao/recursos-
didacticos/PI_Primer_0005.pdf
4. Hashim, H., Abdul Manan, Z., & Wan Alwi, S. R. (2009). Formulation of Mathematical Modelling for the
Design of Maximum Water Recovery. Universiti Teknologi Malaysia, 0024. https://doi.org/UTM/RMC/F/0024
5. Kavanagh, L. J. (1999). Water Management and Sustainability at Queensland Tourist Resorts. Tourism,
(June).
6. Klooz, D. & Hendricks, D.W., (1980), Planning Water Reuse: Development of Reuse Theory and the Input-
Output Model Vol. II: Application, Colorado Water Resources Research Institute.
7. Mah, D. Y. S., Putuhena, F. J., Salim, S., & Lai, S. H. (2008). Modelling of Greywater Reuse for Kuching,
Malaysia. Water Journal, 31–34.
8. Mann, J. G. (1999). Process Integration: Unifying Concepts, Industrial Applications and Software
Implementation. Retrieved from https://theses.lib.vt.edu/theses/available/etd-102199-
101855/unrestricted/Chapter_1.pdf
9. Rita, A. (2014). Domestic Water Reuse.
10. Zhang, C. (2004). A Study on Urban Water Reuse Management Modeling. Information Systems.

ENGINEERING 199
IGCESH2018
Universiti Teknologi Malaysia, Johor Bahru, Malaysia 13 -15 August 2018
OPTIMIZATION OF BLACK MULBERRY MICROWAVE-ASSISTED
EXTRACTION PROCESS
Farhani Ahmad1, Yanti Maslina Mohd Jusoh2,*, Ida Idayu Muhamad, Dayang
Norulfairuz Abang Zaidel and Nik Azmi Nik Mahmood
a1Faculty of Chemical and Energy Engineering, Universiti Teknologi Malaysia, 81310 Skudai, Johor,
Malaysia
(Email: [email protected], [email protected])
ABSTRACT
Black mulberry fruit contains high amount of anthocyanin which this phenolic compound is
scientifically known for its anti-diabetic, anti-oxidant and anti-aging properties. Recently,
black mulberry is cultivated in Malaysia for its leaves meanwhile its fruits are not fully
utilised. This underutilised mulberry fruit can be converted into mulberry extract which can
be made into functional ingredient due to its anthocyanin content. The main objective of this
study was to optimize the microwave-assisted extraction of black mulberry for obtaining
mulberry extract with the highest total anthocyanin content (TAC) and antioxidant capacity.
Extraction variables, namely microwave power (200-800W), time (5-15min), and solid to
liquid ratio (0.1–1.0g/ml) were studied and optimized using response surface methodology
(RSM). The TAC and antioxidant property of the extract were analysed using different buffer
and DPPH inhibition methods, respectively. From optimization, mulberry extract with
optimum TAC of 6.819 mg/g dry basis and DPPH inhibition of 96.5% was obtained using
microwave power 500W, time 10 min and solid to liquid ratio 0.55g/ml.
Key words: Black mulberry, anthocyanin, optimization, DPPH
INTRODUCTION
Black mulberry (Morus nigra) originated from middle east countries like Iran and Turkey and
it is planted planted for its commercial purpose in Mediterranean countries. Black mulberry
can be eaten raw or processed further into jam, natural dye, juice and alcoholic drink. Black
mulberry has created a phenomena in fruit markets and the food industry due to high
phytochemicals level and distinctive flavor[1][2]. Today, black mulberry is cultivated in
Malaysia for commercial purpose. They are marketed as raw fruit and ready to be eaten fresh.
This is because black mulberry is easy to be planted and does not require a low temperature
to survive. Various types of mulberry can be found in hypermarket shelf or nursery farm.
Black mulberry is demonstrated to contain high amount of polyphenols especially
anthocyanins [2]. Anthocyanin has many benefits towards human health including decreasing
the severity of chronic disease such as diabetes, hypertension, cardiac problem, obesity and
Alzheimer [3][4].
The aim of this study was to determine the optimum condition for microwave-assisted
extraction of black mulberry. The target of this study is to produce black mulberry extract

ENGINEERING 200
with high amount of anthocyanin and anti-oxidant property. This extract can be further
converted into valuable functional ingredient for food, beverage, cosmetic and health
supplement.
The major equipment used in this study were microwave extractor (MAS II, China),
spectrophotometer (Jenway Genova, United Kingdom) and freeze dryer (Alpha 1-2 LD plus,
Belgium). General microwave-assisted extraction, buffer and DPPH inhibition methods, were
the methods employed for extracting and determining TAC and antioxidant property of black
mulberry extract in this study.
MAIN RESULTS
Figure 1. Anthocyanin yield in response surface plots (Y) of Black Mulberry extract
influence by extraction time and power.
Table 1. Design of experiment table
Run Factor 1
A : Power
(Watt)
Factor 2
B : Time
(Minute)
Factor 3
C : Solid to
liquid (mg/ml)
R 1
(TAC)
R 2
(DPPH)
1 200.00 15.00 1.00 2.5 72
2 800.00 5.00 0.10 2.2 70.1
3 500.00 15.00 0.55 3.5 76
4 500.00 10.00 1.00 6 97
5 500.00 10.00 0.10 3.8 71
6 500.00 10.00 0.55 7.005 95
7 800.00 5.00 1.00 3 75
8 200.00 15.00 0.10 2.53 80
9 200.00 5.00 0.10 2 70.1
10 500.00 5.00 0.55 5.5 85

ENGINEERING 201
11 500.00 10.00 0.55 6.819 96.5
12 500.00 10.00 0.55 7.5 95.5
13 800.00 15.00 1.00 4 80
14 200.00 5.00 1.00 3 75
15 500.00 10.00 0.55 7.8 95.9
16 800.00 10.00 0.55 3.5 76
17 500.00 10.00 0.55 6.58 96
18 800.00 15.00 0.10 2.5 72
19 200.00 10.00 0.55 3.5 76
CONCLUSION
In conclusion, black mulberry extract with high total anthocyanin content and antioxidant
property can be obtained using optimized microwave-assisted extraction process at
power:500W , time:10 min and solid to liquid ratio: 0.55g/ml. Results for the study shows
that microwave power, extraction time and solid to liquid ratio have significant effect on the
content of anthocyanin and antioxidant property of the black mulberry extract.
Acknowledgment: The authors would like to extend gratitude to Ministry of Higher
Education Malaysia (MOHE) and Universiti Teknologi Malaysia (UTM) for the financial
support to conduct this study (GUP Tier 1 Grant No : PY/2017/01922). The authors would
also like to thank Mr. Nur Muhammad El-Qarni Md. Norodin, Mr. Yaa’kop Sabudin and Mr.
Hafzan Saidin for technical assistance.
REFERENCES
1. Dincer, C., Tontul, I., & Topuz, A. (2016). A comparative study of black mulberry juice concentrates by
thermal evaporation and osmotic distillation as influenced by storage. Innovative Food Science & Emerging
Technologies, 38, 57-64. 2. Fazaeli, M., Yousefi, S., & Emam-Djomeh, Z. (2013). Investigation on the effects of microwave and
conventional heating methods on the phytochemicals of pomegranate (Punica granatum L.) and black
mulberry juices. Food Research International, 50(2), 568-573.
3. Shih, P. H., Chan, Y. C., Liao, J. W., Wang, M. F., & Yen, G. C. (2010). Antioxidant and cognitive
promotion effects of anthocyanin-rich mulberry (Morus atropurpurea L.) on senescence-accelerated mice
and prevention of Alzheimer's disease. The Journal of nutritional biochemistry, 21(7), 598-605.
4. Yan, F., Dai, G., & Zheng, X. (2016). Mulberry anthocyanin extract ameliorates insulin resistance by
regulating PI3K/AKT pathway in HepG2 cells and db/db mice. The Journal of Nutritional Biochemistry, 36,
68-80.

ENGINEERING 202
IGCESH2018
Universiti Teknologi Malaysia, Johor Bahru, Malaysia 13 -15 August 2018
DRAG FORCE COMPARISON BETWEEN NUMERICAL
MODELLING AND EXPERIMENTAL MEASUREMENT OF A
CYLINDER
M Faizal Ahmad*1 and Mohd Ridza Mohd Haniffah1,2
1 Department of Water and Environmental Engineering, Faculty of Civil Engineering, Universiti
Teknologi Malaysia, Johor Bahru, Malaysia
(E-mail: [email protected], [email protected]) 2 UTM Centre for Industrial and Applied Mathematics (UTM-CIAM), Universiti Teknologi Malaysia,
Johor Bahru, Malaysia.
ABSTRACT
Flow around a smooth cylinder was investigated by numerical modelling at subcritical
Reynolds numbers ranged from 7.2 x 10³ to 1.8 x 10⁴ and compared to experimental work by
previous researchers. This study aims to compare the drag force between numerical
modelling to the experimental measurement with the closest condition and environment in
order to define the reliability of the numerical modelling used. The computational fluid
dynamics (CFD) modelling software applied for this research is a 3D commercial
computational software, FLOW-3D. Cartesian mesh type was used in the modelling setup
and all boundaries of the domain was specified according to experimental condition. The
free-stream velocity used was varied as 0.18, 0.29, 0.37 and 0.45 m/s, corresponding to
Reynolds number which are 7200, 11600, 14800 and 18000 respectively. The value of drag
coefficient simulation and experimental results differ between 35% to 42%; but still within
the range of other numerical results for seven CFD platforms by previous researchers.
Key words: Drag force, Cylinder, Numerical modelling
INTRODUCTION
Flow field over a circular cylinder in water has been a major research throughout 50 years
due to its relevant to many engineering applications. There are many examples of the
applications, for instance the circular piers in a river, marine piling, pipeline and cable on
seabed and etc. There has been a lot of researches on this flow field in order to understand the
behaviour of water flow over a circular cylinder to reduce drag force [1,2,3] and effect of
scouring [4,5,6]. Huang et al. [1] and Zhou et al. [2] observed reduction of drag force due to
surface texture changes by experimental works.
Apart from experimental modelling, numerical simulation are also applied actively on flow
around cylindrical objects; specifically to understand drag force. For example, Dey and Das
[7] investigates water flow around and extended triangular solid (thorn) attached to a square
cylinder. The simulation is accomplished by using the finite volume based commercial CFD
solver FLUENT 6.3. The percentage error validation between simulation values and literature
values by Sen et al. [8] was below than 5% error by comparing the drag coefficient values for
Reynolds number 100 and 0.05 blockage, indicating a good agreement. Qiu et al. [9]

ENGINEERING 203
numerically studied on drag and lift coefficients of a marine riser at high Reynolds numbers.
The purpose of their research was to benchmark the capabilities of CFD methods through
quantitative comparisons and validation studies against the model test results of a circular
cylinder. Seven CFD solvers which are FLUENT, SNUFOAM, CFDShip-IOWA, Code-S,
OpenFoam, Naoe-FOAM-SJTU and STAR-CCM+ were used to simulate the simulation by
using Reynolds Averaged Navier Stokes (RANS), Detached Eddy Simulation (DES) and
Large Eddy Simulation (LES). The simulation was varied according to Reynolds numbers
ranging from 6.31 x 10⁴ to 7.57 x 10⁵. Numerical predictions by LES are generally better than
those by Unsteady RANS and DES at most Reynolds numbers.
The main objective of this study is to investigate the capability of FLOW-3D by comparing
the mean drag coefficient from experimental work by Zhou et al. [2] using longitudinal
cylinder in a water channel. The model was design as close as possible to the experimental
work setup and conditions to reduce errors of the CFD results.
MODELLING SETUP
The models were setup in FLOW-3D, which solve the Navier-Stokes Equations via Finite
Volume method. Following the experimental setup by Zhou et al. [2], the channel was design
with 0.3 m width and 0.5 m height. The length of the channel was shortened into a meter in
order to reduce the simulation time. A cylinder with 0.04 m diameter and 0.4 m long was
located vertically at the middle and 0.25 m from the water inlet of channel.
Figure 1. Simulation setup of the experiment; where the boundary conditions are shown.
(P for pressure, W for wall, O for outflow and V for specified velocity)
The meshing was created for two sizes; the whole domain with a large meshing size and the
finer meshing nested in it to smooth out the shape of the cylinder. The activated physics was
gravity and turbulences model. The gravity was setup as -9.81 ms-2 at z-axis and the
simulation is calculated using k-epsilon turbulence model. The initial water level in the
simulation was set as 0.4 m height and using hydrostatic pressure. The boundary of the
meshing was setup closest to the experimental condition. The perimeter of the channel was
set as wall with no-slip condition and the outlet of the channel was set as outflow boundary.
At the top, pressure boundary was used to complete the boundary setup and the simulation
was calculated in gauge pressure system. The inlet was set as velocity boundary with 0.4 m
fluid elevation.
The free-stream velocity used was varied as 0.18, 0.29, 0.37 and 0.45 m/s, corresponding to
Reynolds number which are 7200, 11600, 14800 and 18000 respectively. The post processing
was done using FlowSight to extract the simulation data in order to get the fluid

ENGINEERING 204
(hydrodynamics) forces data. The hydrodynamic drag coefficient was calculated by using
Morison equation [3], (𝐶𝐷 =𝐹𝐷
0.5𝜌𝑈2𝐴) where ρ was fluid density, S is the projected frontal
area, U is the free-stream velocity and FD is the drag force computed by the numerical
simulation.
RESULTS AND DISCUSSION
Results show the variation of CD as a function of Reynolds number for both simulation
and experimental results. The CD value increases marginally with Reynolds number and
decreases after 1.5 x 10⁴ for both. The CD values of the FLOW-3D k-epsilon model are
found to be significantly lower than those of experimental value which maintains at 1.1.
As shown in Table 1, the CD values for the k-epsilon model are about 40% lower than that
of the experimental values.
Table 1. Relative error between experimental and simulation Re Mean drag coefficients Relative error (%)
Epx. (Zhou et al.) k-e model
7200 1.07554 0.62378 42
11600 1.10011 0.66723 39
14800 1.10658 0.71779 35
18000 1.10525 0.70130 37
The significant difference of drag coefficient between simulation and experimental may
be due to the assumptions made. The simulation assumes that the water level of the
channel is the same as the cylinder height. Because of this, the water was flowing over
the top of the cylinder that gives different water behaviour than water flowing around the
cylinder only.
Apart from that, the value of drag coefficient also changes according to the length over
diameter (L/D) ratio. According to Cengel and Cimbala [10], CD is 0.9 for L/D ratio of 10
and it is only valid for Reynolds numbers ranges from 1 x 10⁴ to 2 x 10⁵. Consequently,
the percentage errors of the k-epsilon model simulation is reduced to 31, 26, 20 and 24%
for the Reynolds numbers 7200, 11600, 14800 and 18000 respectively when compared to
the 0.9 value of CD.
According to Qiu et al. [9], the result of simulation varies depending on the turbulence
model and CFD platforms used. The relative errors were up to 50% for Reynolds numbers
ranges from 6.31 x 10⁴ to 2.52 x 10⁵, while the relative errors were above 50% for
Reynolds number ranges from 3.15 x 10⁵ to 7.57 x 10⁵. This indicates that relative errors
from the k-epsilon model simulation are still acceptable to compare with experimental
work by Zhou et al. [2].
CONCLUSION
Flow around a cylinder was numerically investigated at various Reynolds numbers in the
subcritical regime by using k-epsilon turbulence model. The relative errors of CD when
compared with experimental works by Zhou et al. [2] ranges from 35 - 42% for Reynolds
number ranging from 7.2 x 10³ to 1.8 x 10⁴. The simulation model is still reliable to
represent the water behaviour flow around a cylinder of Zhou et al. [2] experimental setup
by referring to Qiu et al. [9] numerical results which has higher relative errors.

ENGINEERING 205
Acknowledgement: This research was financially supported by Malaysia Ministry of
Higher Education (MOHE) under Fundamental Research Grant Scheme (FRGS) project
of Universiti Teknologi Malaysia R.J130000.7822.4F710. The first author would like to
acknowledge Universiti Teknologi Malaysia for the zamalah scholarship.
REFERENCES
1. Huang, S. VIV suppression of a two-degree-of-freedom circular cylinder and drag reduction of a fixed
circular cylinder by the use of helical grooves. Journal of Fluids and Structures, (2011), 1124-1133.
2. Zhou, B., Wang, X., Guo, W., Zheng, J., & Tan, S. K. Experimental measurements of the drag force
and the near-wake flow patterns of a longitudinally grooved cylinder. Journal of Wind Engineering and
Industrial Aerodynamics, (2015).
3. Morison, J., Johnson, J., & Schaaf, S. The Force Exerted by Surface Waves on Piles. Journal of
Petroleum Technology, (1950).
4. Elnikhely, E. Minimizing scour around bridge pile using holes. Ain Shams Engineering Journal,
(2017), 499-506.
5. Hamidi, A., & Siadatmousavi, S. Numerical simulation of scour and flow field for different
arrangements of two piers using SSIIM model. Ain Shams Engineering Journal, (2017). 6. Jiecheng, Y., Ying Min, L., Cheng-Hsien, L., & Yee-Meng, C. Numerical simulation of scour around a
submarine pipeline using computational fluid dynamics and discrete element method. Applied
Mathematical Modelling, (2018), 400-416.
7. Dey, P., & Das, A. Numerical analysis of drag and lift reduction of square cylinder. Engineering
Science and Technology, an International Journal, (2015), 758-768.
8. Sen, S., Mittal, S., & Biswas, G. Flow past a square cylinder at low Reynolds numbers. International
Journal Numerical Methods Fluids, (2011), 1160-1174.
9. Qiu, W., Lee, D.-Y., Lie, H., Rousset, J.-M., Mikami, T., Sphaier, S., et al. Numerical benchmark
studies on drag and lift coefficients of a marine riser at high Reynolds numbers. Applied Ocean
Research, (2017), 245-251.
10. Cengel, Y., & Cimbala, J. Fluid Mechanics: Fundamentals and Applications. The McGraw-Hill Companies, Inc. 2013.

ENGINEERING 206
IGCESH2018
Universiti Teknologi Malaysia, Johor Bahru, Malaysia 13 -15 August 2018
ENERGY SAVING POTENTIAL FOR DISTILLATION COLUMNS
SEQUENCE OF 5-COMPONENT ALCOHOL MIXTURE USING
THERMAL PINCH ANALYSIS
Munawar Zaman Shahruddin*1,2, Tan Xinyi2, Ahmad Nafais Rahimi2, Muhammad
Afiq Zubir2, Muhammad Fakhrul Islam Zahran2, Kamarul Asri Ibrahim2,3 and
Mohd Kamaruddin Abd Hamid2,3
1 Oil and Gas Engineering Center of Study, Faculty of Chemical Engineering, Universiti Teknologi
MARA, Shah Alam, Selangor, MALAYSIA.
(E-mail: [email protected]) 2 Process Systems Engineering Centre (PROSPECT), Research Institute for Sustainable Environment
(RISE), Universiti Teknologi Malaysia, 81310 UTM Johor Bahru, Johor, MALAYSIA.
(E-mail: [email protected], [email protected], [email protected], [email protected] )
3 Department of Chemical Engineering, Faculty of Chemical and Energy Engineering, Universiti
Teknologi Malaysia, 81310 UTM Johor Bahru, Johor, MALAYSIA.
(E-mail: [email protected], [email protected])
ABSTRACT
Distillation is a widely used separation process in chemical and petrochemical industries.
However, a conventional distillation columns sequence has well known for its low energy
efficiency. Therefore, the energy efficiency of a conventional distillation columns sequence
can be improved via heat integration using the thermal pinch analysis. This paper presents a
methodology to employ the thermal pinch analysis on a conventional distillation columns
sequence for potential energy saving. The direct sequence distillation process of 5-component
alcohol mixture has been selected as a case study in this paper. The proposed methodology
consists of three hierarchical steps which are simulation of the distillation columns sequence,
data extraction and thermal pinch analysis application. Based on the results, the thermal pinch
analysis has successfully increased the energy saving for the selected sequence and the
proposed methodology has a potential to be applied in any other related distillation columns
sequence.
Key words: Distillation Columns Sequence, Energy Saving, Thermal Pinch Analysis, Direct
Sequence
INTRODUCTION
Process separation via distillation is common in chemical and petrochemical industries. It is
quite understandable since distillation process can accommodate mass production with the
intended products purity. However, distillation column consumes a lot of energy since it is
accounted for more than 50 % of plant operating cost [1]. The situation is getting worse for a
case of multicomponent mixture which will surely involve the distillation columns sequence.
The most common way to solve this problem is via heat integration [2].

ENGINEERING 207
Heat integration via thermal pinch analysis has become a well-established method in
chemical and petrochemical industries since the introduction of its concept by Linnhoff
and Flower [3]. However, the approach involves the energy integration of distillation
column or distillation columns sequence with the process background. For instant, the
case study done by Dhole and Linnhoff [4] which integrates the distillation columns
sequence of 5-component alkane mixture with the background process. On the other hand,
according to Jain et. al [5], one of the available heat integration option for distillation
column is inter-column heat recovery (heat exchange among condensers/reboilers within
distillation column sequences) via thermal pinch analysis. By doing that, they had
achieved a range of 8 to 17 % overall cost savings for a case study of 4-component
aromatics. Therefore, by using the same concept of the thermal pinch analysis, the
potential energy saving within the distillation columns sequence for 5-component alcohol
mixture shall be addressed in this paper.
METHODOLOGY
The data for the case study selected can be found in Table 1. The case study was adopted
from Andrecovich and Westerberg [6]. The separation can be assumed as sharp separation
process with saturated inlet condition. The direct sequence of distillation columns has
been simulated in Aspen HYSYS V9 software and analyzed in terms of energy saving
from condensers and reboilers namely heating loads, cooling loads and total loads. Then
the data such as target and supply temperature and energy consumptions were extracted
for thermal pinch analysis application whereby the temperature gap between hot/cold
stream, ∆Tmin is fixed at 10 ℃. Then the problem table algorithm was constructed for
potential energy saving calculation based on the comparison between before and after
pinch analysis application.
Table 1. Feed compositions and input conditions for the selected case study [6]
Input conditions
Feed Compositions
(Mole Fractions)
Ethanol 0.25
Isopropanol 0.15
n-propanol 0.35
Isobutanol 0.10
n-butanol 0.15
Feed Flow [kgmole/s] 0.139
Pressure [kPa] 100
Recovery of Components 0.98
MAIN RESULTS
The sequences that had been analyzed can be found in Figure 1 and based on the analysis
via thermal pinch approach, it yield the results as shown in Table 2. Based on the results,
the saving recorded for heating, cooling and total loads are 11.89, 11.94 and 11.92 %
respectively. This can be a very good indication to support the fact that the thermal pinch
analysis can be very beneficial in enhancing the energy saving within distillation columns
sequence, in this case, direct sequence. In addition, the locat ion of pinch point is

ENGINEERING 208
determined by the arrangement of the sequence whereby it will create an opportunity for
heat exchange between hot and cold stream within the column [7].
Figure 1. Direct sequence of distillation columns in the case study
Table 2. Energy analysis of the case study
Load Base Case Pinch Saving
(108 kJ/h) (108 kJ/h) %
Heating 1.31 1.15 11.89
Cooling 1.30 1.15 11.94
Total 2.61 2.30 11.92
CONCLUSION
The thermal pinch analysis has been applied to the case study of 5-component alcohol
mixture with direct sequence of distillation column arrangement. Based on the results, the
application of thermal pinch analysis has been proved to further save the energy within the
distillation columns sequence with the amount of 11.9 % for overall energy saving. The effect
of distillation columns sequence and ∆Tmin towards the energy saving should be further
investigated for the thermal pinch analysis to be applied widely in any other distillation
columns sequence cases.
Acknowledgment: This research is financially supported by the Ministry of Higher
Education Malaysia via Skim Latihan Bumiputera (SLAB), Universiti Teknologi Malaysia
(UTM) Research University Grant Scheme (RUGS) (Q.J130000.2446.03G68 and
Q.J130000.2546.19H72).
REFERENCES
1. Cui, C., Yin, H., Yang, J., Wei, D., Sun, J. and Guo, C. Selecting suitable energy-saving distillation schemes:
Making quick decisions. Chemical Engineering and Processing: Process Intensification, 107 (2016), 138-
150.
2. Chew, K.H., Klemeš, J.J., Wan Alwi, S.R. and Abdul Manan, Z. Industrial implementation issues of Total
Site Heat Integration. Applied Thermal Engineering, 61 (2013), 17-25.
3. Linnhoff, B. and Flower, J.R. Synthesis of Heat Exchanger Networks: I. Systematic Generation of Energy
Optimal Networks. AlChE Journal, 24 (1978), 633-642.
4. Dhole, V.R. and Linhoff, B. Distillation column targetting. Computers & Chemical Engineering, 17 (1993),
549-560. 5. Jain, S., Smith, R. and Kim, J. Synthesis of heat-integrated distillation sequence systems. Journal of the
Taiwan Institute of Chemical Engineers, 43(2012), 525-534.
6. Andrecovich, M.J. and Westerberg, A.W.A Simple Bounding Sequences Synthesis Method Based on Utility
for Heat-Integrated Distillation. AlChE Journal, 31 (1985), 363-375.
7. Mustafa, M.F., Ibrahim, N., Abdul Samad, N.A.F., Ibrahim, K.A. and Hamid, M.K.A. Design of Energy
Efficient Distillation, PSE041, 1(2014), 1-9.
ABCDEA
BCDE
CDEE
B D
C
DE

ENGINEERING 209
IGCESH2018
Universiti Teknologi Malaysia, Johor Bahru, Malaysia 13 -15 August 2018
ENERGY SAVING POTENTIAL FOR DRIVING FORCE
DISTILLATION COLUMNS SEQUENCE OF 5-COMPONENT
ALCOHOL MIXTURE USING THERMAL PINCH ANALYSIS
Munawar Zaman Shahruddin*1,2, Tan Xinyi2, Ahmad Nafais Rahimi2, Muhammad
Afiq Zubir2, Muhammad Fakhrul Islam Zahran2, Kamarul Asri Ibrahim2,3 and
Mohd Kamaruddin Abd Hamid2,3
1 Oil and Gas Engineering Center of Study, Faculty of Chemical Engineering, Universiti Teknologi
MARA, Shah Alam, Selangor, MALAYSIA.
(E-mail: [email protected]) 2 Process Systems Engineering Centre (PROSPECT), Research Institute for Sustainable Environment
(RISE), Universiti Teknologi Malaysia, 81310 UTM Johor Bahru, Johor, MALAYSIA.
(E-mail: [email protected], [email protected], [email protected], [email protected] )
3 Department of Chemical Engineering, Faculty of Chemical and Energy Engineering, Universiti
Teknologi Malaysia, 81310 UTM Johor Bahru, Johor, MALAYSIA.
(E-mail: [email protected], [email protected])
ABSTRACT
Distillation columns sequence playing an important role in determining the energy efficiency
of the process. It become more challenging when dealing with multicomponent system
whereby there are many possible sequences to work with. For that purpose, the driving force
approach has been introduced and can be beneficial in determining the optimum sequence for
energy saving. Therefore, this study investigates on the possibility to further the energy
saving for driving force distillation columns sequence by using thermal pinch analysis. The
case study selected is 5-components alcohol mixture. The driving force sequence was
determined first by using driving force plot. The resulting sequence was then simulated and
the data from it was extracted for thermal pinch application. Lastly, the energy requirement
before and after pinch were compared for determination of energy saving in the process.
Based on the analysis, the thermal pinch analysis has been successfully improved the energy
efficiency of the driving force distillation columns sequence. It creates the opportunity to
employ the same strategy towards any other case studies.
Key words: Distillation Columns Sequence, Energy Saving, Thermal Pinch Analysis, Driving
Force Sequence
INTRODUCTION
Distillation columns arrangement or sequence is a paramount consideration for early stage
process design pertaining to the energy efficiency. The common term used to describe the
approach is Conceptual Process Synthesis (CPS). According to Seider et al. [1] the possible
sequences for distillation column system depend on the number of intended products or
components in the system. For instance, 10 components distillation will result-in 4,862

ENGINEERING 210
different sequences. The number will increase exponentially for more components thus make
it tedious for energy analysis to be carried out. Therefore, driving force approach has been
introduced for optimum solution to distillation columns sequence [2].
The study by Zaine et al. [3] proposed this method for the distillation of aromatic components
for the overall saving of 7 % compared to conventional sequence. Meanwhile the result by
using the same method for eleven hydrocarbon components showed further overall energy
saving at 19 % [4]. Another case study which involved with three alcohol components also
showed the same trend for the saving of 18 % total energy [5]. The case studies discussed
earlier proved that driving force approach has a potential to enhance the energy saving in
distillation columns sequence.
On the other hand, thermal pinch analysis has become a well-established method in the
heat integration of chemical and petrochemical industries which started from the research
works of Linnhoff and Flower [6]. Therefore, by using the same concept of the thermal
pinch analysis, the potential for further energy saving the driving force distillation
columns sequence for 5-component alcohol mixture will be addressed in this paper.
METHODOLOGY
The data for the case study selected can be found in Table 1. The case study was adopted
from Andrecovich and Westerberg [7]. The separation can be assumed as sharp separation
process with saturated inlet condition. Based on the data in Table 1, driving force
sequence was firstly determine. Then, the distillation columns sequence simulation was
carried out by using Aspen HYSYS V9 software and analyzed in terms of energy saving
from condensers and reboilers namely heating loads, cooling loads and total loads. Next,
the related data including target and supply temperature and energy consumptions were
extracted for thermal pinch analysis application. The temperature gap between hot/cold
stream, ∆Tmin for analysis is fixed at 10 ℃. Then the problem table algorithm was
constructed for potential energy saving calculation based on the comparison before and
after pinch analysis application.
Table 1. Feed compositions and input conditions for the selected case study [7]
Input conditions
Feed Compositions
(Mole Fractions)
Ethanol 0.25
Isopropanol 0.15
n-propanol 0.35
Isobutanol 0.10
n-butanol 0.15
Feed Flow [kgmole/s] 0.139
Pressure [kPa] 100
Recovery of Components 0.98
MAIN RESULTS
Based on the driving force plot as shown in Figure 1, the sequences that had been
analyzed can be found in Figure 2. The resulting analysis via thermal pinch approach is
summarized in Table 2.

ENGINEERING 211
Figure 1. Driving force plot for the components pairing in the case study
Figure 2. Driving force distillation columns sequence in the case study
Table 2. Energy analysis of the case study
Load Base Case Pinch Saving
(108 kJ/h) (108 kJ/h) %
Heating 1.29 0.84 35.08
Cooling 1.29 0.83 35.23
Total 2.58 1.67 35.15
The results in Table 2 shows that the energy saving for heating loads is 35.08 %, cooling
loads is 35.23 % and 35.15 % for total loads. Therefore, it can be said that the thermal
pinch analysis further the energy saving for driving force distillation columns sequence.
Reason-wise, the location of pinch point is determined by the arrangement of the
sequence that facilitates the existence of excess transferable heat between the utilities
within the distillation columns [8]. This proved that thermal pinch analysis works very
well with the driving force method for energy saving purpose.
CONCLUSION
This paper investigates the use of thermal pinch analysis for further the energy saving of the
driving force distillation columns sequence of 5-component alcohol mixture. The driving
force distillation columns sequence has been successfully simulated and based on energy
analysis, the application of thermal pinch analysis improved the energy efficiency of the
process by 35 %. The works can be further extended to other case studies which involved
more components and also complex components case studies as well.
0
0.02
0.04
0.06
0.08
0.1
0.12
0.14
0.16
0
0.04
0.08
0.12
0.16 0.
2
0.24
0.28
0.32
0.36 0.
4
0.44
0.48
0.52
0.56 0.
6
0.64
0.68
0.72
0.76 0.
8
0.84
0.88
0.92
0.96
1
y-x
x
Driving force curves
B/C
C/D
D/E
A/B
C
ABCDE
CDE
A
E
D
AB
A
BDE

ENGINEERING 212
Acknowledgment: This research is financially supported by the Ministry of Higher
Education Malaysia via Skim Latihan Bumiputera (SLAB), Universiti Teknologi Malaysia
(UTM) Research University Grant Scheme (RUGS) (Q.J130000.2446.03G68 and
Q.J130000.2546.19H72)..
REFERENCES
1. Seider, W., Seader, J. and Lewin, D. Product and Process Design Principles. New York: Wiley, 2004.
2. Bek-Pedersen, E. and Gani, R. Design and synthesis of distillation systems using a driving-force-based
approach. Chemical Engineering and Processing: Process Intensification, 43 (2004), 251-262.
3. Zaine, M.Z., Mustafa, M.F., Ibrahim, N., Ibrahim, K.A. and Hamid, M.K.A. Minimum Energy Distillation
Columns Sequence for Aromatics Separation Process. Energy Procedia, 75 (2015), 1797-1802.
4. Mustafa, M.F., Zaine, M.Z., Ibrahim, N., Ibrahim, K.A. and Hamid, M.K.A. Optimal Synthesis of Energy
Efficient Distillation Columns Sequence for Hydrocarbon Mixture Separation Process. Energy Procedia, 75
(2015), 1569-1574.
5. Mustafa, M.F., Samad, N.A.F.A., Ibrahim, K.A. and Hamid, M.K.A. Methodology Development for Designing Energy Efficient Distillation Column Systems. Energy Procedia, 61 (2014), 2550-2553.
6. Linnhoff, B. and Flower, J.R. Synthesis of Heat Exchanger Networks: I. Systematic Generation of Energy
Optimal Networks. AlChE Journal, 24(1978), 633-642.
7. Andrecovich, and A. W. Westerberg, "A Simple Bounding Sequences Synthesis Method Based on Utility
for Heat-Integrated Distillation," AlChE Journal, vol. 31, pp. 363-375, 1985.
8. Mustafa, M.F., Ibrahim, N., Samad, N.A.F.A., Ibrahim, K.A. and Hamid, M.K.A. Design of Energy Efficient
Distillation. PSE041, 1(2014), 1-9.

ENGINEERING 213
IGCESH2018
Universiti Teknologi Malaysia, Johor Bahru, Malaysia 13-15 August 2018
A REVIEW ON IN-LINE INSPECTION (ILI) PIGGING DATA
Tuan, M.T.M.*1 Yahaya, N. 2 and Noor, M.N.3
1,2,3 Department of Structure and Materials, Universiti Teknologi Malaysia, Skudai, MALAYSIA.
(E-mail: [email protected], [email protected], [email protected])
ABSTRACT
Pigging is a process of doing various maintenances of transmission pipelines by using
Pipeline Inspection Gauge (PIG). Pigging data can provide optimum information and help the
practitioners of the Pipeline Integrity Management System (PIMS) to predict the thickness of
the pipeline due to corrosion. However, the data is usually scattered and contains errors
which can interfere the prediction process in modelling. Therefore, this paper discusses
previous studies on issues related to the pigging data such as negative corrosion rate, and
measurement errors and their solutions. Improvements on existing procedure are also
discussed in this paper. The review will benefit those who are involved with the pipeline
integrity system. Keywords: Pigging data, Erroneous data, Pipeline integrity management system
INTRODUCTION
Pigging data is a vital component of maintenance system. It can provide information such as
corrosion behaviour, velocity, optimum interval and many more. Pigging data are substantial
in predicting the next in-line inspection and the condition of the pipeline. Often, researchers
focused on severe defects rather than small defects. However, defects growth is uncertain in
nature. Both categories of defect need to be studied because there are possibilities of
dramatical defects growth for small defects in the future [1].
ERRONEOUS IN PIGGING DATA
Good inspection data will result in a good pipeline assessment, but the error in the
inspection data is unlikely to be avoided. However, the error can be treated and it
eventually improves the accuracy of the assessment. Figure 1 shows the factors that cause
the erroneous in pigging data.
Corrosion length detection
Corrosion length has significant effect on assessment result. The length gives information
to estimate the severity of a defect [1]. The detection of corrosion length for short deep
defect is necessary, compared to long shallow defects [2]. It demonstrates that corrosion
length needs to be considered in analysing the extreme data.

ENGINEERING 214
Temporal and Spatial corrosion
Corrosion growth is of a random nature that implicates temporal and spatial corrosion.
The spatial corrosion means the growth paths of different defects are different but
possibly correlated [3]. If the defects are very close together, the tool accuracy decreases.
Based on the inspection report, in most cases, the vendors will combine the individual
defects as a group [2]. Each corrosion growth is different in manner. The combination of
the defects can cause errors but this can be resolved by introducing a new probabilistic
model to predict the corrosion growth.
Inspection tool accuracy
Characterization of accuracy is very important in distinguishing defects, components of
pipeline and non-relevant indications which cause a “False calls” indication. “False calls”
denote there is no defect or imperfection. Magnetic Flux Leakage (MFL) tools recognize
signals from pipeline features including non-relevant indications [2]. Besides that, the
speed of pig also plays an important role in reading the MFL signal. The conducted speed
must be in a certain range in order to maintain the high quality of measurement [1].
Internal condition of pipeline
Different internal condition of pipeline will produce error in measurement. The time of
inspection might be different between two inspections if the cleaning process of the pipeline
is not conducted properly. The cleaning process must be conducted for every inspection so
that the waste product such as wax will not disturb the measurement process [4].
Inspection vendor
Every vendor has different technologies in conducting the pigging process. Usually, the
inspection tools by different vendors use different tool construction, calibration and accuracy
[4].
Figure 1. Factors of erroneous in pigging data

ENGINEERING 215
CONCLUSION
The article explains arising issues in the area of pigging data that need to be paid attention to.
Thus, improvements in the procedure will be introduced and hopefully, it can be an
alternative to help the operators and researchers in enhancing the pipeline integrity
management system.
Acknowledgement: The authors would like to express appreciation to Development of
Intelligent Pipeline Integrity Management System Phase-1 using Ultra Long Range Acoustic
Technology or i-PIMS (R.J130000.7601.4C132) and UTM Zamalah for scholarship.
REFERENCES
1. Noor, N.M. A Generic Assessment Approach to the Analysis of Corrosion Data and Its Application to Reliability Assessment, Heriot-Watt University, Ph.D. Thesis, 2007.
2. Nestleroth, J.B. and Battlelle, B.T.A. Magnetix Flux Leakage (MFL) Technology for Natural Gas Pipeline
Inspection. USA : A Report for the Gas Research Institute (GRI).
3. Zhang, S. Development of Probabilistic Corrosion Growth Models in Applications in Integrity Management
Pipeline, Te University of Western Ontario, Ph.D. Thesis, 2014.
4. Noor, N.M. Reliability-Based Integrity Assessment of Offshore Pipeline Subjected to Internal Corrosion,
Universiti Teknologi Malaysia, Master. Thesis, 2002.

ENGINEERING 216
IGCESH2018
Universiti Teknologi Malaysia, Johor Bahru, Malaysia 13 -15 August 2018
SAR INTERFEROMETRY ANALYSIS FROM 2015 Mw 6.0
EARTHQUAKE IN RANAU, SABAH USING ALOS PALSAR-2 DATA
Janatul Aziera Abd Razak1, Shuib bin Rambat1, Abdul Rashid Mohd Shariff 2
1Disaster Preparedness & Prevention Centre (DPPC), Malaysian-Japan International Institute of
Technology (MJIIT), Universiti Teknologi Malaysia, Jalan Sultan Yahya Petra, 54100 Kuala Lumpur,
Malaysia (E-mail: [email protected], [email protected])
2 Department of Biological and Agricultural Engineering, Faculty of Engineering, Universiti Putra
Malaysia, 43400 UPM Serdang, Selangor, Malaysia (Email: [email protected])
ABSTRACT
The 2015 Sabah earthquake on June 5 at Mw 6.0 suggests that the faulty lines around the
tectonic landform in the region is active and, in future, the seismically active plate is capable
of generating an even greater earthquake in terms of its magnitude or intensity scale. Thus,
the main purpose of this study is to clarify the changes in the tectonic landform due to the
ground displacement that occurred from the 10 km depth-earthquake with the strong evidence
from the aftershocks within the seismic activity zone whereby geological hazard such as
mud-flood becoming more frequent. Two scenes from Alos Palsar-2, level 1.1 datasets
acquired on January 19, 2015 and June 22, 2015 were used to extract the deformation
patterns cause by the earthquake. A notable coherence distribution pattern was detected from
an image generated via interferometric SAR (InSAR) analysis of the pre and post-earthquake
SAR images which has been used for measuring a coherent deformation field in the study
area.
Key words: InSAR, earthquake, ground displacement
INTRODUCTION
An earthquake with maximum intensity has been categorized as very strong; VII
according to Mercalli intensity scale, the seismic waves generated on June 5 2015 with
the epicenter located at the coordinates of 5.987°N, 116.541°E (± 5.1 km) generated around
309 phases with the rupture duration lasting about forty-nine seconds [1], [2]. The data-sets
used were both acquired on ascending orbit with a range resolution at 4.29 m; azimuth
spacing at 3.42 degree and off-nadir angle of 36.64 degree. The objectives of this study was
to verify the extent of rupture zones from the ground motion and the travel distance of the
earthquake (EQ) energy propagation waves. Alos Palsar-2 raw data-sets obtained from JAXA
(Japan Aerospace Exploration Agency) were processed using ESA SNAP software covering
all the basic InSAR processing; 1) interferogram formation; 2) coherence estimation; 3)
topographic phase removal; 4) Goldstein phase filtering and 5) phase unwrapping. The final
result derive from the interferogram with uneven concentration of coherence distribution
through InSAR Alos Palsar-2 processing procedure that consists of prominent coherence
pattern in certain location and exhibit low coherence in other location. The low coherence is

ENGINEERING 217
due to the fact that the area is covered by vegetation and located in an equatorial region with
frequent rainfalls that caused a very large temporal baseline between the two acquisition that
mostly affect the vegetation areas [3],[4]. The unwrapped interferogram also displayed a
large topographic residual due to large elevation problems that cannot be remedial with a
coarse resolution of Digital Elevation Model (DEM). In this study to analyze the
characteristics of the seismic rupture originated from the 6.0 Mw earthquake, InSAR data
was used to show the seismic slip pattern and the results were discussed in terms of the
wrapped InSAR map and the coherence map produced supported by other seismic and
ground motion data [5], [6].
MAIN RESULTS
As shown in Figure 1, Peak Ground Acceleration (PGA) map layer obtained from USGS
was overlay with the coherence image generated from InSAR processing. Coherence
distribution pattern was clearly visible from the area around the 6.0 Mw earthquake and at
approximately 40 km from the south-east (SE) of the epicenter. The results indicate that
the rupture zones go beyond the boundary of even maximum PGA; between 9.2% g to
18% g, proving the instability of the mountainous area. Aside from the indicated areas;
interferometric coherence was significantly lost in the proximity of weak PGA, at a far
distance from the hypocentral area.
Figure 1. PGA layer obtained from USGS was overlay on a coherence image generated
from Alos Palsar-2 data-sets
CONCLUSION
The main purpose of this study to verify the existence of crustal deformation due to the
previous 6.0 Mw earthquake in Ranau is fairly achieved due to many constraints mostly
due to the noises presented either contributed by the data-sets; from the InSAR processing
or from the geolocation of the region under study. However, the analysis made using
merely InSAR results were not enough as further analyses using other form of data and
other InSAR processing techniques such as Persistent Scatterers (PS) and Small BAseline
Subset (SBAS) will provide a high coherence image with distinctive ground
displacement.

ENGINEERING 218
Acknowledgment: We would like to express our gratitude towards METI/JAXA, Japan, to
which the sources of our data-sets were acquired from, financial support from Malaysia-
Japan International Institute of Technology and our appreciation also goes the rest of our
colleagues who contribute disproportionately in this study.
REFERENCES
1. USGS (2015). M 6.0 - 14km WNW of Ranau, Malaysia. Retrieved from https://earthquake.usgs.gov/
earthquakes/eventpage/us20002m5s#moment-tensor?source=us&code=us_20002m5s_mww on December 4,
2017.
2. IRIS (2018). mww6.0 Borneo. Retrieved from http://ds.iris.edu/ds/nodes/dmc/tools/event/5149075 on
December 4, 2017.
3. Takada, Y., Kobayashi, T., Furuya, M., & Murakami, M. (2009). Coseismic displacement due to the
2008 Iwate-Miyagi Nairiku earthquake detected by ALOS/PALSAR: preliminary results. Earth, Planets
and Space, 61(4), e9-e12. 4. Exelis (2013). SBAS Tutorial. Retrieved from www.sarmap.ch/tutorials/sbas_tutorial _V_2_0.pdf on
November 24, 2016.
5. Bouchon, M. (1981), A simple method to calculate Green’s functions for elastic layered Media, Bull.
Seismol. Soc. Am., 71, 959–971
6. Delouis, B., Nocquet, J. M., & Vallée, M. (2010). Slip distribution of the February 27, 2010 Mw= 8.8 Maule
earthquake, central Chile, from static and high‐rate GPS, InSAR, and broadband teleseismic data.
Geophysical Research Letters, 37(17).

ENGINEERING 219
IGCESH2018
Universiti Teknologi Malaysia, Johor Bahru, Malaysia 13 -15 August 2018
IN SITU TRANSMISSION ELECTRON MICROSCOPE: DIRECT
OBSERVATION OF GRAPHITIZATION OF METAL DOPED
CARBON NANOFIBER
Mohd ‘Azizir-Rahim Mukri1, Mohd Zamri Mohd Yusop*1,2, Mohd Hafiz Dzarfan
Othman2 and Masaki Tanemura3
1 Department of Materials, Manufacturing and Industrial Engineering, Faculty of Mechanical
Engineering, Universiti Teknologi Malaysia 81310 Skudai, Johor, MALAYSIA.
(E-mail: [email protected], [email protected]) 2 Advanced Membrane Technology Research Centre, Universiti Teknologi Malaysia 81310 Skudai,
Johor, MALAYSIA. (E-mail: [email protected])
3 Department of Physical Science and Engineering, Nagoya Institute of Technology, Gokiso-cho,
Shouwa-ku, 466-844 Nagoya, JAPAN. (E-mail: [email protected])
ABSTRACT
The structural modification of crystallinity of ion induced copper (Cu) doped carbon
nanofiber (CNF) was observed carefully by in-situ transmission electron microscopy (TEM)
facilities during bias voltage on the CNF. The initial TEM observation of the Cu-doped CNF
showing that it was consist mixture of amorphous carbon and very fine crystalline Cu
structure which small Cu particles randomly dispersed and covered by amorphous carbon.
The fibrous solid amorphous structures of ion induced CNF significantly changes to single
crystalline encapsulated graphitic structure due to the Joule Heating with dramatic
improvement of graphitization of CNFs from amorphous to crystalline. The latter structure
significantly similar to multi-layered graphenes structure. Direct observation of in-situ TEM
results will provide very useful information about the graphene structure formation and the
critical information of solid phase reaction of graphene synthesis mechanism.
Key words: In-situ TEM observation, ion irradiation method, carbon nanofibers, joule heating
INTRODUCTION
The carbon nanomaterials such as carbon nanotubes (CNTs), CNFs and graphene have
attracted a significant interest as an efficient electron emitters due to their potential
application in the future flat panel displays, electron beam instruments, x-ray sources etc
[1-7]. There are several advantages of the carbon nanomaterials based electron emitter
such as very high aspect, sharp tip, chemical inertness etc. leading to restrain the applied
voltage to emit electrons even at very low vacuum pressure [8]. In general, CNTs and
graphene are usually synthesized at high temperature growth process [9-11]. On the
contrary, ion induced CNFs can be fabricated at low temperature even at room
temperature. Recent progresses have shown that ion induced CNFs can be directly
fabricated on a transparent polymer surface and copper plate also [12-13]. Due to

ENGINEERING 220
exceptional amorphous properties of CNFs, the fabrication of CNFs usually does not need
details information of temperature and annealing process. Graphene have similar
synthesis method like CNTs which usually require high temperature process. The growth
mechanism of CNTs and graphene still involve in details explanation in order to obtain
perfectly desired properties of CNTs and graphene. The observation of graphitic structure
of CNTs and graphene can be only performed under powerful microscope such as TEM
and scanning transmission electrons microscope (STEM). However, the growth formation
layer by layer of CNTs and graphene can be only observed by in situ TEM facilities that
require external piezo devices equipped in the special TEM holder. In the previous work,
we have discussed the formation of CNT from CNF using in situ facilities during field
emission process. We believed that the graphitic formation could be controlled by in situ
TEM facilities. Hence, in this work we challenged the direct observation of graphenes
layers formation from Copper (Cu) incorporated CNF using in situ TEM facilities.
MAIN RESULTS
Figure 1(a-c) show the TEM images of Cu incorporated CNFs. The Cu incorporated
CNFs was approximately 1 μm in length and 200 nm in diameter (Figure 1(a)). The inset
image shows the selected area electron diffraction (SAED) pattern of the Cu incorporated
CNF. From the SAED pattern results it shows that Cu incorporated CNF consist of
dominant diffraction spots of C 120, C 010, Cu 111 and Cu 220. Figures 1(b) shows the
fibrous structures of the Cu incorporated CNF in high magnification at the fiber part
revealing that dispersion of several polycrystalline nanostructures in the amorphous
carbon matrix. Further investigation of dark field images from SAED pattern indicated
that Cu particles dispersed randomly in the amorphous carbon structure.
CONCLUSION
In summary, significant structural transformation of a Cu incorporated CNF fabricated on Cu
foil was observed using in situ TEM facilities. After the applied bias voltage, the dramatic
change in the Cu incorporated CNF structure from fibrous amorphous and/or very fine
crystallites to single crystal encapsulated graphitic structure was observed. The randomly
dispersed Cu nanoparticles was agglomerated and formed into single crystalline structure
whilst amorphous carbon transformed into graphitic structure and covering the single
crystalline particle. Joule heating would be responsible for the structural change of the Cu
incorporated CNF.
Figure 1. (a) TEM image of the intact structure of Cu incorporated CNF before bias voltage.
(Inset show the selected area diffraction pattern). (b) The high magnification of TEM images
of the fiber show the polycrystalline structure dispersed in amorphous carbon. (c) The dark
field image shows the distribution of Cu particles in the carbon amorphous structure.

ENGINEERING 221
Acknowledgment: The authors would like to express their appreciation for the support of the
sponsors with UTM Zamalah Scholarship, HiCOE grant (R.J090301.7824.4J202), Flagship
grant (Q.J130000.2424.03G36), GUP Tier 1 grant (Q.J130000.2524.16H37) and Ministry of
Higher Education Malaysia (MOHE).
REFERENCES
1. Iijima, S., Helical Microtubules Of Graphitic Carbon, Nature, 354 (1991), 56.
2. Tanemura, M., Okita, T., Tanaka, J., Kitazawa, M., Itoh, K., Miao, L., Tanemura, S., Lau, S. P., Yang, H.
Y., Huang, L., Room-Temperature Growth and Applications of Carbon Nanofibers: A Review, IEEE Trans.
Nanotechnol., 5 (2006), 587.
3. Geim, A. K., Novoselov, K. S., The Rise Of Graphene, Nature Materials, 6 (2007), 183 – 191.
4. Wang, Q. H., Yan, M., Chang, R. P. H., Flat Panel Display Prototype Using Gated Carbon Nanotube Field
Emitters, Appl. Phys. Lett., 78 (2001), 1294.
5. de Jonge, N., Allioux, M., Oostveen, J. T., Teo, K. B., Milne, W. I., Low Noise and Stable Emission from
Carbon Nanotube Electron Sources, Phys. ReV. Lett., 94 (2005), 186807. 6. Cheng, Y., Zhang, J., Lee, Y. Z., Gao, B., Dike, S., Lin, W., Lu, J. P., Zhou, O., Development Of A Carbon
Nanotube Based Microfocus X-Ray Tube With Single Focusing Electrode, ReV. Sci. Instrum., 75 (2004),
3264.
7. Tan, T. T., Sim, H. S., Lau, S. P., Yang, H. Y., Tanemura, M., Tanaka, J., X-Ray Generation Using Carbon-
Nanofiber-Based Flexible Field Emitters, Appl. Phys. Lett., 88 (2006), 103105.
8. Rinzler, G., Hafner, J. H., Nikolaev, P., Lou, L., Kim, S. G., Tomanek, D., Nordlander, P., Colbert, D. T.,
Smalley, R. E., Unraveling Nanotubes: Field Emission from An Atomic Wire, Science, 269 (1995), 1550 –
1553.
9. Pan, Z. W., Xie, S. S., Chang, B. H., Wang, C. Y., Lu, L., Liu, W., Zhou, W. Y., Li, W. Z., Very Long
Carbon Nanotubes, Nature, 394 (1998), 631.
10. Ren, Z. F., Huang, Z. P., Xu, J. W., Wang, J. H., Bush, P., Siegal, M. P., Provencio, P. N., Synthesis Of Large Arrays Of Well-Aligned Carbon Nanotubes On Glass, Science, 282 (1998), 1105.
11. Tanemura, M., Iwata, K., Takahashi, K., Fujimoto, Y., Okuyama, F., Sugie, H., Filip, V., Growth Of
Aligned Carbon Nanotubes By Plasma-Enhanced Chemical Vapor Deposition: Optimization Of Growth
Parameters, J. Appl. Phys., 90 (2001), 1529.
12. Ghosh, P., Zamri, M. Y., Satoh, S., Subramanian, M., Hayashi, A., Hayashi, Y., Tanemura, M., Transparent
and Flexible Field Electron Emitters Based on Conical Nanocarbon Structures, J. Am. Chem. Soc., 132
(2010), 4034.
13. Ghosh, P., Zamri, M. Y., Ghosh, D., Hayashi, A., Hayashi, Y., Tanemura, M., Direct Fabrication Of Aligned
Metal Composite Carbon Nanofibers On Copper Substrate At Room Temperature And Their Field Emission
Property, Chem. Comm., 47 (2011), 4820 – 4822.

ENGINEERING 222
IGCESH2018
Universiti Teknologi Malaysia, Johor Bahru, Malaysia 13 -15 August 2018
PHYSICOCHEMICAL CHARACTERIZATION OF CHITOSAN
NANOPARTICLE-DIALLYL DISULFIDE COMPLEX
Muhamad Zulhilmi Zailani1, 2, Ahmad Fauzi Ismail*1 and Siti Hamimah Sheikh
Abdul Kadir3
1Advanced Membrane Technology Research Centre (AMTEC) (HiCOE), Faculty of
Chemical & Energy Engineering (FCEE),Universiti Teknologi Malaysia, 81310,Johor Bahru, Johor,
Malaysia. 2School of Graduate Studies, Universiti Teknologi Malaysia, 81310, Johor Bahru, Johor, Malaysia
(E-mail: [email protected], [email protected]*) 3 Faculty of Medicine, Institute of Medical Molecular and Biotechnology (IMMB), Universiti
Teknologi MARA (UiTM), Sungai Buloh, Selangor 47000, Malaysia.
(E-mail: [email protected])
ABSTRACT
Chitosan is a polyelectrolyte with reactive functional groups, gel-forming capability, high
adsorption capacity and biodegradability. In addition, it is innately biocompatible and
non-toxic to living tissues as well as having antibacterial, antifungal and antitumor
activity. These features highlight the suitability and extensive applications that chitosan
has in medicine. In this study, a chitosan biopolymer nanoparticles (CNPs) was
synthesize through ionic gelation method using sodium tripolyphosphate (TPP)
crosslinker. The nanoparticles is the mixed with diallyl disulfide (DADS) with ratio of
CNPs:DADS 1:1 and CNPs:DADS 1:2 to form complexes. The CNPs and CNPs-DADS
complexes formed was then characterized by Fourier-transform infrared spectroscopy
(FTIR), Thermogravimetric analysis (TGA), Scanning electron microscopy (SEM),
Scanning Electron Microscopy with Energy Dispersive X-ray Spectroscopy (SEM-EDX),
and Transmission electron microscopy (TEM). Result shows that the CNPs was
successfully synthesis. The CNPs-DADS complexes formation was confirmed through
SEM-EDX and TGA. Higher DADS content does not produced significantly different
compared to lower DADS content.
INTRODUCTION
For the past decades, numerous work has been done to assess the potential used of
chitosan in many biomedical applications. Chitosan is the biocompatible and
biodegradable natural biopolymer which derived from the exoskeleton of crustacean,
insect and fungi [1]. Chitosan composed of numerous fascinating characteristic such as
biocompatibility, non-toxicity, less allergenic, antitumor, antimicrobial, and antioxidant
properties [2].These advantages of chitosan have a potential to increase through
modifications. Diallyl disulfide (DADS) is an oil-soluble organosulfur compound derived
from garlic, and is known to be beneficial to human health [3]. Garlic and its organosulfur
compound can cause reduction of risk factors for cardiovascular diseases, reduction of
cancer risk, antioxidant effect, antimicrobial effect, and enhancement of detoxification
foreign compound [4], and also influence hemostatic balance [5]. Chitosan nanoparticles

ENGINEERING 223
(CNPs) can be produce by emulsion cross linking, spray-drying, reverse micellar method,
template polymerization, polyelectrolyte complex, and precipitation and ionotropic
gelation method [6]. In this study, chitosan nanoparticles was synthesised using Sodium
tripolyphosphate (TPP) cross-linker through ionic gelation method. The CNPs formed is
then mixed with the DADS to form Chitosan-DADS complexes.
MAIN RESULTS
Figure 1. FTIR spectroscopy of the chitosan nanoparticles (CNPs), CNPs-DADS complexes
ratio 1:1 (CNPD1), CNPs-DADS complexes ratio 1:2 (CNPD2).
Figure 2. SEM-EDX nanoparticles (CNPs), CNPs-DADS complexes ratio 1:1 (CNPD1),
CNPs-DADS complexes ratio 1:2 (CNPD2).
CNPs
CNPD2
CNPD1

ENGINEERING 224
CONCLUSION
Chitosan, with its exciting properties, is one of the most promising bio-based polymers for
drug delivery, tissue engineering, gene therapy and many more. The modification of the
chitosan give more advantages of its natural properties to be used in many fields. In this
study, chitosan nanoparticles (CNPs) was synthesized and reacted with diallyl disulfide
(DADS). The result shows that CNPs and DADs complexes formation was formed. The
formed particles will be further analyses to evaluate their biocompatible properties to as an
additives in haemodialysis membranes.
Acknowledgment: The authors would like to express their appreciation for the support of the
sponsors from Universiti Teknologi Malaysia under Flagship Program
(Q.J130000.2409.01G46).
REFERENCES
1. Dash, M., Chiellini, F., Ottenbrite, R.M. and Chiellini, E. Chitosan - A versatile semi-synthetic polymer in
biomedical applications. Progress in Polymer Science (Oxford), 36 (2011), 981–1014.
2. Cheung, R.C.F., Ng, T.B., Wong, J.H. and Chan, W.Y. Chitosan: An update on potential biomedical and
pharmaceutical applications. Marine Drug 13 (2015), 5156-5186. 3. Chang, L.S., Su, T.L., Yang, M.C. and Kung, F.C. Effect of Diallyl Disulfide Immobilization on the
Immunoreaction of Polysulfone Membranes. Textile Research Journal 80 (2009), 1038–1046.
4. Bayan, L., Koulivand, P.H. and Gorji, A. Garlic : a review of potential therapeutic effects. Avicenna Journal
of Phytomedicine 4 (2014), 1–14.
5. Chan, K.C, Yin, M.C and Chao, W.J. Effect of diallyl trisulfide-rich garlic oil on blood coagulation and
plasma activity of anticoagulation factors in rats. Food and Chemical Toxicology 45 (2007), 502–507.
6. Gomathi, T., Prasad, P.S., Sudha, P.N. and Anil, S. Size optimization and in vitro biocompatibility studies of
chitosan nanoparticles. International Journal of Biological Macromolecules. 104(B) (2017), 1794-1806.

ENGINEERING 225
IGCESH2018
Universiti Teknologi Malaysia, Johor Bahru, Malaysia 13 -15 August 2018
A REVIEW ON COAL ASH UTILIZATION IN SOIL IMPROVEMENT
Nadiah Jamaludin*1, Nor Zurairahetty Mohd Yunus2, Siti Norafida Jusoh3
Ahmed Mohammed Awad Mohammed4, Zuriana Haron5, Fauziah Kassim6,
Kamarudin Ahmad7
1, 2, 3, 4, 5 Faculty of Civil Engineering, Universiti Teknologi Malaysia, Johor, MALAYSIA.
(E-mail: [email protected], [email protected], [email protected],
[email protected], [email protected], [email protected], [email protected])
ABSTRACT
Malaysia is known as a developing country with increasing number of population, thus
increasing in demand for electricity. In 2010, 40% of electricity in Malaysia is generated by
coal power plants. Thus, there will be an abundance of coal ash that can be reused in order to
minimize the waste. Previous researchers have opted the use of these coal ash for stabilizing
problematic soils. This is one of the movements done in order to implement sustainability in
the construction field. Hence, this paper aims to review recent reutilization technique of coal
ash such as fly ash and bottom ash in soil improvement. In addition, the suitable method in
fully utilizing this waste in the geotechnical field is discussed. Based on extensive review, it
was found that fly ash and bottom ash is beneficial to enhance soil characteristics, thus
increasing its workability. Fly ash would reduce swelling and helps in increasing strength of
soil due to its pozzolanic properties while bottom ash could be used as a replacement of
construction materials. Hence, extensive research should be done on soil stabilized with coal
ash which would not only improve soil properties but also reduce waste generated by these
coal ash power plant.
Key words: Fly ash, Bottom ash, Sustainability, Soil stabilization
INTRODUCTION
There are several fuel sources such as coal, oil, natural gas or nuclear energy to produces
heat. [1] said that gas remains as the main fuel source for the generation industry but coal is
gaining favor in the electricity industry.
The increased rate of power plant produced coal ash in order to generate fuel causes
higher negative effects on the environment. The coal ash generated was deposited either
in a dry landfill over a vast area of land which is impossible in urban areas or in a special
pond for ash dumping which also has its shortcomings. From [2], Tanjung Bin power
plant generates about 180 tonnes of bottom ash and 1620 tonnes of fly ash from 18,000
tonnes of coal burning daily. Generally, when the coal is burned, about 80 to 90% of the
ash are recovered as Fly ash and the remaining 10% to 20% of coal ash burned is bottom
ash and found at the bottom of the furnace.
Commonly, fly ash is well known due to its commercial value in cement production and
concrete industry meanwhile bottom ash is reused as material replacement in geotechnical

ENGINEERING 226
works such as soil replacement and road embankment. However, there is still limited
efforts on reusing and recycling of bottom ash and fly ash as a stabilizer component in
soil stabilization method for the geotechnical industry. This is due to the lack of research
in terms of the physical properties, engineering properties of bottom ash-fly ash addictive
as stabilization elements.
The recycle or reuse of bottom ash and fly ash can contribute to a high rate of recycling
or disposal rate. This is due to the production rate of waste coal ash is much higher than
its recycle rate. This will affect the environment in a negative manner. By practicing the
application of bottom ash-fly ash mixture as a soil stabilizer agent, it can reduce the cost
of construction and simultaneously decrease the waste generation. Hence, this will be an
efficient approach to preserve the environment.
FLY ASH
Fly ash consists of fine particles in texture and varies between fine silts and fine sand [2].
Other than that, it consists of silt-sized particles which are spherical and typically ranged
between 0.001 to 2mm in size [3]. Thus, it tends to get easily blown away by wind when dry.
However, the fineness of fly ash is one of the important properties that helps in generating
pozzolanic reactivity which is due to the fine particles sizes of fly ash contribute to the high
specific area [4].
The colour of fly ash can be observed based on chemical composition as it commonly ranges
from gray to black in colour and has glassy appearance [5]. There are two categories of the
fly ash which are Class C, which is generally derived from sub-bituminous coals and consist
primarily of calcium alumino-sulfate glass, as well as quartz, tricalcium aluminate, and free
lime (CaO) and Class F which are typically found from bituminous and anthracite coals and
consist primarily of an alumino-silicate glass, with quartz, mullite, and magnetite also
present. [4], [6], [7]
BOTTOM ASH
Bottom ash is a coarser component of coal ash. It is granular and an incombustible by-
product of coal combustion when compared with fly ash. Besides, compared to fly ash
that found could be found floating from the power plant’s boiler, bottom ash is collec ted
from the bottom of furnaces due to its properties of high density and bigger in size.
Bottom ash is dark grey or black in colour and porous in nature. The main elements are
glass, magnetic metals, minerals, synthetic ceramic, paramagnetic metals and unburned
organic matter[5]. However, bottom ash is not quite as useful as fly ash and it commonly
disposed of off either dry or wet to an open area or artificial lagoon.
CONCLUSION
Based on previous studies, it could be concluded that there is an alarming need to reused or
reutilize waste coal ash for soil stabilization. Coal ash consists of fly ash and bottom ash. Fly
ash could dramatically reduce swelling and shrinkage characteristics. While bottom ash
could be reused as replacement of construction material such as road base material, fine
aggregate in concrete and structural fillers. Hence, both could be reused to enhance the
workability of soil while simultaneously reducing the abundance of coal ash waste.

ENGINEERING 227
Acknowledgment: The authors would like to express their deep gratitude to the Ministry of
Higher Education Malaysia and Universiti Teknologi Malaysia for providing financial
assistance under Research University Grant – Tier 1(Q.J130000.2522.19H57).
REFERENCES
1. Kamruzzaman, A. H., Chew, S. H. and Lee, F. H. Structuration and Destructuration Behavior of Cement-
Treated Singapore Marine Clay. Journal of Geotechnical and Geoenvironmental Engineering, 135(4),
(2009), pp. 573–589. 2. Marto, A. et al., 2013. Shear Strength Improvement of Soft Clay Mixed with Tanjung Bin Coal Ash.
APCBEE Procedia, 5, (2013), pp.116–122.
3. Latifi, N., Marto, A., Rashid, A. S. A. and Yii, J. L. J. Strength and Physico-chemical Characteristics of Fly
Ash–Bottom Ash Mixture. Arab. J. Sci. Eng., vol. 40, no. 9, (2015), pp. 2447–2455.
4. Ranjbar, N., Mehrali, M., Behnia, A. and Alengaram, U. J. Compressive strength and microstructural
analysis of fly ash/palm oil fuel ash based geopolymer mortar. J. Mater., vol. 59, (2014), pp. 532–539.
5. Huang, Y. , Bird, R. N. and Heidrich, O. A review of the use of recycled solid waste materials in asphalt
pavements. Resour. Conserv. Recycl., vol. 52, no. 1,(2007), pp. 58–73.
6. Kim, B., Prezzi, M. and Salgado, R. Geotechnical Properties of Fly and Bottom Ash Mixtures for Use in
Highway Embankments. J. Geotech. Geoenvironmental Eng., vol. 131, no. 7, (2005), pp. 914–924.
7. Nordin, N., Abdullah, M. M. A. B., Tahir, M. F. M., Sandu, A. V. and Hussin, K. Utilization of Fly Ash
Waste as Construction Material. Int. J. Conserv. Sci., vol. 7, no. 1,(2016), pp. 161–166. 8. Chimenos, J.M. et al. Characterization of the bottom ash in municipal solid waste incinerator. Journal of
Hazardous Materials, 64(3), (1999), pp.211–222.

ENGINEERING 228
IGCESH2018
Universiti Teknologi Malaysia, Johor Bahru, Malaysia 13 -15 August 2018
ISOLATION AND IDENTIFICATION OF PHOTOSYNTHETIC
BACTERIA FROM ANTARCTIC WITH ANTIBACTERIAL
ACTIVITY
Fatin Syahirah Othman*1, Shaza Eva Mohamad2, Koji Iwamoto3, and Zaharah
Ibrahim4
1, 2,3,5Malaysia-Japan International Institute of Technology , Universiti Teknologi Malaysia, 54100,
Kuala Lumpur , MALAYSIA.
(E-mail: [email protected], [email protected], [email protected]) 4 Faculty of Biosciences and Medical Engineering, Universiti Teknologi Malaysia, Johor,
MALAYSIA. (E-mail: [email protected])
ABSTRACT
The search for new antibiotics is on the rise because of the growing threat of antibiotic
resistance. Once the antibiotics failed to work, people are at risk of dying of common
infections, routine operations become difficult to perform; making millions of lives at risk. In
our study, it was found that photosynthetic bacteria can provide a good potential source of
another group of antimicrobial compounds known as photoantimicrobial compounds. This
psychrotrophic bacteria was isolated from Antarctic and grew well at temperature ranging
from 10oC to 30oC. This implies minimum energy usage by the bacteria contributing to
energy saving for its bioprocessing. The photosynthetic bacteria were successfully isolated
using acetate medium. The bacteria known as B1, was rod shape, Gram negative and possess
bacteriochlorophyll a and b that are usually found in photosynthetic bacteria. Generally,
growth of both gram negative and gram positive bacteria such as Escherichia coli and
Staphylococcus aureus were inhibited eventhough it was more effective towards
Staphylococcus aureus. Hence, it may be concluded the bacteria has the ability to produce
wide spectrum antibiotic. The bacteria were identified as Stenotrophomonas sp. via 16S
rRNA analysis.
Key words: Antarctic, antibacterial activity, bacteriochlorophyll, photosynthetic bacteria
INTRODUCTION
The Antarctic surrounding was reported to have a limited diversity of plants and animals but
highly diverse of microbial diversity (1). Antarctic also has a high frequency of pigment
production in ice cores, glaciers, or marine surface waters (2). Therefore, lack of microbial
studies in Antarctic makes it a valuable place for all types of scientific research (3). Recently,
there is a need to produce new antimicrobials due to the increase cases of antimicrobial
resistance bacteria. Photosynthetic bacteria can produce photoantimicrobial compounds
which are the alternative to the rising of antimicrobial resistance bacteria. Photosynthetic
bacteria seem to be another good potential source for the production of new antimicrobial
compounds which have been reported to have lower antimicrobial resistance. Hence, this

ENGINEERING 229
study will help to identify potential antibacterial activity of photosynthetic from Antarctic
marine water sample.
MATERIALS AND METHODS
For cell growth, sea water samples from the Schollaert Channel, Antarctic were
inoculated and grown in acetate (4) and succinate medium (5). Dilution streaking method
was employed to isolate pure bacterial culture from the mixed culture. Photosynthetic
pigment analysis was done to screen the presence of pigment such as bacteriochlorophyll
a and b, and caretonoid in the bacteria within a range of 200-1100 nm. For antibacterial
activity, liquid culture of isolated photosynthetic bacteria, Escherichia coli (Gram
negative bacteria) and Staphylococcus aureus (Gram positive bacteria) were used in this
analysis. 16srRNA sequence analysis was also conducted in this study.
MAIN RESULTS
This psychrotrophic bacteria was isolated from Antarctic and grew well at temperature
ranging from 10oC to 30oC. This implies minimum energy usage by the bacteria
contributing to energy saving for its bioprocessing. The isolated bacteria (B1) were a
gram negative bacteria and the cellular morphology was rods. From pigment analysis, the
bacteria has two main peaks at 800 and 850 nm that can be associated with the presence
of bacteriochlorophyll a and b (6) that indicate it was possibly a photosynthetic bacteria.
For antibacterial activity, control culture that did not contain any photosynthetic bacteria
showed 0 % of growth inhibition for both bacteria (E. coli and S. aureus). From this
analysis, B1 was more effective toward the inhibition of E.coli growth at the inoculum
concentration of B1 below than 25 %. Meanwhile, at inoculum concentration more than
25 %, B1 was more effective to both. Therefore, B1 has the potential to become a new
antibiotic possibly a wide spectrum antibiotic since it is effective for both Gram positive
and Gram negative bacteria.
B1 was found to be closely related to Stenotrophomonas maltophilia strain AM3-1 with
99% homology and Stenotrophomonas maltophilia JB5-1 with 99% homology. The strain
was then designated as Stenotrophomonas sp. SZB2. Stenotrophomonas maltophilia is a
gram negative purple photosynthetic bacteria (7).
CONCLUSION
B1 has the potential to become a new broad spectrum antibiotic effective to both Gram
positive and Gram negative that can be an alternative to the rising antimicrobial resistant
bacteria. B1 was identified under genus Stenotrophomonas, thus designated as
Stenotrophomonas sp. SZB2.
Acknowledgment: The authors fully acknowledged Ministry of Higher Education (MOHE),
Faculty of Biosciences and Biomedical Engineering and Universiti Teknologi Malaysia for
the approved fund which makes this important research viable and effective.

ENGINEERING 230
REFERENCES
1. Liu, B., Ertesvåg, H., Aasen, I. M., Vadstein, O., Brautaset, T. and Heggeset, T. M. B. Draft genome
sequence of the docosahexaenoic acid producing thraustochytrid Aurantiochytrium sp. T66. Genomics data
8 (2016), 115-116. 2. Barrientos-Díaz, L., Gidekel, M. and Gutiérrez-Moraga, A. (2008). Characterization of rhizospheric bacteria
isolated from Deschampsia antarctica Desv. World Journal of Microbiology and Biotechnology, 24, 2289-
2296.
3. Dieser, M., Greenwood, M. and Foreman, C. M. (2010). Carotenoid pigmentation in Antarctic heterotrophic
bacteria as a strategy to withstand environmental stresses. Arctic, Antarctic, and Alpine Research, 42, 396-
405.
4. Karr, E. A., Sattley, W. M., Jung, D. O., Madigan, M. T. and Achenbach, L. A. (2003). Remarkable diversity
of phototrophic purple bacteria in a permanently frozen Antarctic lake. Applied and Environmental
Microbiology, 69, 4910-4914.
5. Montano, G. L., Chan, J. S., Jarabelo, R. E., Pastor, A. B. I. and Dela Cruz, T. E. E. (2009). Isolation and
characterization of purple nonsulfur bacteria (PNSB) from a rice paddy soil in Bulacan, Philippines.
Philippine Journal of Systematic Biology, 3, 57-67. 6. Najib, M. and Ujang, Z. (2013). Morphological Characterization of Photosynthetic Microbial Granule from
Palm Oil Mill Effluent (POME).
7. Madukasi, E., Chunhua, H. and Zhang, G. (2011). Isolation and application of a wild strain photosynthetic
bacterium to environmental waste management. International Journal of Environmental Science &
Technology, 8, 513-522.
8. Allavi Subhraveti, Quang Ong, Tim Holland, Anamika Kothari, Ingrid Keseler, Ron Caspi, Peter D Karp,
and SRI International (2014, August 10). "Summary of Stenotrophomonas Maltophilia JV3, Version 20.0."
Summary of Stenotrophomonas Maltophilia JV3, Version 20.0. N.p.

ENGINEERING 231
IGCESH2018
Universiti Teknologi Malaysia, Johor Bahru, Malaysia 13 -15 August 2018
TREATMENT OF ASPIRIN USING MODIFIED
POLYEHTYLINIMINE(PEI) WASTE TIRE BASED ADSORBENT
Dyg Khairunnisa Awg Zaini.1, Norzita Ngadi*2, Muhd Asyiq Azman3, Khairudin
Ahmad4
1, 2 Chemical of Engineering, Universiti Teknologi Malaysia, Johor Bahru, MALAYSIA.
(E-mail: [email protected], [email protected]) 3 Chemical of Engineering, Universiti Teknologi Malaysia, Johor Bahru, Malaysia.
(E-mail: [email protected]) 4 Chemical of Engineering, Universiti Teknologi Malaysia, Johor Bahru, Malaysia.
(E-mail:[email protected])
ABSTRACT
A new adsorbent was synthesized using polyethylenimine (PEI) on the carbon black to
remove aspirin from aqueous solution. In this study, adsorption performance of modified
carbon black by polyethylenimine (PEI) on aspirin is investigated. Batch adsorption studies
were performed to evaluate the effects of contact time, pH solution, temperature and initial
concentration on the adsorption of aspirin. For this study, the carbon black obtained from the
pyrolysis of tire waste is used as a precursor for low-cost adsorbents. The carbon black is
treated by 1M of hydrochloric acid solution to remove ash and sulphur content. Then, the
treated carbon black is modified by impregnation with PEI in one to one weight ratio within
24 hours at 65°C and then cross linked with 1% (w/v) glutaraldehyde solution for one hour.
The adsorption rate of aspirin by modified carbon black is rapid from 20 minutes to 60
minutes and reach equilibrium. Hence, the optimum contact time for this study is 60 minutes
with 59.96% of aspirin removal and 29.98 mg/g adsorption capacity. The best performance
for pH solution, temperature and initial concentration were observed at pH 3 (26.1 mg/g),
30°C (26.9 mg/g) and 20 ppm (40.96 mg/g) respectively.
Key words: Aspirin, Adsorption, Polyethylenimine, Waste tire, Modified adsorbent
INTRODUCTION
Improper disposal of pharmaceutical waste might be hazardous that can contribute to the
contamination of water supplies. Biomedical waste in Malaysia is expected to reach 33000
tonnes per year by 2020 [1]. Many previous studies mentioned that traditional or
conventional wastewater treatment method are not sufficient as the pharmaceutical waste are
not completely removed [2]. There are several advanced treatment methods that can be used
to treat pharmaceutical waste such as autoclaving, ion-exchange, advanced oxidation process
and biological treatment [3]. However, adsorption has become the most efficient method to
treat pharmaceutical waste due to its cost effectiveness and simple design [4].
Disposal of tire waste become an issue because they are immune with biological degradation.
In this study, tire waste has become the precursor of low-cost adsorbent. The pyrolysis of tire

ENGINEERING 232
waste is producing carbon black which suitable for the low-cost adsorbent due to higher
carbon content. At the same time, the usage of solid product as an adsorbent can overcome
the problem of tire waste management.
The usage of current commercialized activated carbon is limited due to its high operating cost
which is consuming energy during the activation step. Due to this problem, this study is
conducted to explore new adsorbents which are cheaper and environmental-friendly. Tire
waste is highly abundant in Malaysia and can be one of the potential sources for low-cost
adsorbent. Hence, this study will explore on the modification of carbon black by
polyethylinimine (PEI) as the adsorbent on the adsorption of pharmaceutical compound
without any activation step.
There are two objectives of this research which are to modify carbon black by PEI and to
study the effect of various parameters on the adsorption of aspirin. The raw carbon black is
treated by 1M of hydrochloric acid (1000 ml) and then modified by PEI using one to one
weight ratio of carbon black to PEI. The adsorption studies were conducted on the effect of
contact time, effect of pH solution, effect of temperature and effect of initial concentration.
MAIN RESULTS
Figure 1 shows the effect of contact time on the removal of aspirin by modified-carbon
black with initial concentration of aspirin at 100 ppm, 0.1 g adsorbent dosage, at room
temperature and original pH. The experiment was conducted until 150 minutes that
shows the equilibrium time. Samples were collected and measured at 10 minutes interval for
the first 30 minutes and then 30 minutes interval after that till equilibrium time.
Figure 1. Effect of contact time on the adsorption of aspirin
The trend observed was increasing adsorption rate of aspirin with increasing of contact time until
it became equilibrium. The equilibrium contact time of adsorption aspirin was achieved in 60
minutes. It could be seen from the Figure 1 with rapid adsorption rate in the first 60 minutes and
after that it became constant. High percentage of removal was attained in 59.96% with 29.98
mg/g.
0.000
10.000
20.000
30.000
40.000
50.000
60.000
70.000
0 20 40 60 80 100 120 140 160
0.000
5.000
10.000
15.000
20.000
25.000
30.000
35.000
PER
ECEN
TAG
E R
EMO
VA
L O
F A
SPIR
IN ,
%
CONTACT TIME (MIN)
AD
SOR
PTI
ON
CA
PA
CIT
Y ,M
G/G
Effect of Contact Time

ENGINEERING 233
The rapid adsorption of aspirin in the early stage was attributed to the large number of vacant
sites which were still available at the surface of adsorbent. Thus, it had contributed high
adsorption at the initial stage. With the increasing of time, the active sites of adsorbent were fully
occupied by the solute molecules. Hence, it was increased the resistance of aspirin aggregation
diffused deeper into the adsorbent which has reduced the adsorption rate till achieved the
equilibrium stage.
CONCLUSION
The modified carbon black by PEI was used as low-cost adsorbent to remove aspirin from
aqueous solution. From the screening test, carbon black was treated with HCl to remove ash and
sulphur content and modified by PEI to improve the adsorption capacity. The adsorption of
aspirin was conducted based on effect of contact time from 10 to 150 minutes. The result
obtained shows the adsorption study has reached equilibrium time within 60 minutes. The best
removal of aspirin at this time is 59.96% with 29.98 mg/g adsorption capacity. As a conclusion,
the results obtained has proved that modified carbon black has an ability to adsorb aspirin
from aqueous solution which can be used practically in wastewater.
Acknowledgment: The authors would like to express their appreciation for the support of the
sponsors with Project No Q. J130000.2546.17H65 and Q. J130000.2646.14J29.
REFERENCES
1. Ambali, A. R., Bakar, A. N., and Merican, F. M. Environmental Policy in Malaysia: Biomedical Waste,
Strategies and Issues. Journal of Aministrative Science. 10, 2013.
2. Patneedi, C. B., and Prasadu, D. Impact of Pharmaceutical Waste on Human Life and Environment. Rasayan
Journal. 8 (2015), 67-70.
3. Pal, P., and Thakura, R. Pharmaceutical Waste Treatment and Disposal of Concentrated Rejects: A Review. International Journal of Engineering Technology Science and Research. 4 (2017), 2394-3386.
4. Rodrigues, L. A., da Saliva, M. L. C. P., Alvarez-Mendes, Coutinho, A. D. R., Thim, G. P. Phenol removal
from aqueous solution by activated carbon produced from avocado kernel seeds. Chemical Engineering
Journal. 174 (2011), 49-57.

ENGINEERING 234
IGCESH2018
Universiti Teknologi Malaysia, Johor Bahru, Malaysia 13 -15 August 2018
EFFECTS OF К-CARRAGEENAN ON THE LOADING AND
RELEASE OF POLY(VINYL-ALCOHOL) HYDROGEL
Izzati Fatimah Wahab*1, Nor Syuhada Azmi2, Saiful Izwan Abd Razak3 and Nadirul
Hasraf Mat Nayan4
1-3Faculty of Bioscience and Medical Engineering, Universiti Teknologi Malaysia, Johor,
MALAYSIA
(E-mail: [email protected], [email protected], [email protected]) 3IJN-UTM Cardiovascular Engineering Centre, Institute of Human Centred Engineering, Universiti
Teknologi Malaysia, Johor, MALAYSIA. 4Faculty of Engineering Technology, Universiti Tun Hussein Onn Malaysia, Panchor, Johor,
MALAYSIA.
ABSTRACT
Poly(vinyl alcohol) (PVA) makes good hydrogel-based medical devices. It poses good
mechanical properties, biocompatibility and biodegradability. К-carrageenan (К-CRG) is
a natural polymer with ability to form gel by manipulation of temperature. This paper
studied the effects of к-CRG on PVA hydrogel in drug delivery application. Freeze-
thawed hydrogels were loaded with methylene blue as drug model. Results show better
drug loading and delayed drug release after addition of CRG. Hydrogel containing 3% CRG
has the highest loading which its drug remaining is 1.618 A, whereas the release of drug model
decreased with increasing carrageenan content. The study proved that the presence of к-
CRG in PVA hydrogel may improves its drug delivery properties.
Key words: Hydrogel, Polyvinyl alcohol, Carrageenan, Freeze-thawing, Drug delivery
INTRODUCTION
Hydrogel is a water-swollen polymeric material that able to absorb water in its structure
without dissolving. These abilities are contributed by the hydrophilic functional groups on the
polymer backbone and the crosslinks between the network chains [1]. Hydrogel can be
prepared in several ways including physical cross-linking, chemical cross-linking, grafting
polymerization, and radiation cross-linking. Among these, physical cross-linking through
freeze-thawing is the most preferable in biomedical application because it does not require
any cross-linker agents that are toxic to human [2]. Freeze-thaw involves repeated cycles
of freezing at −20 °C and thawing at room temperature. This technique also did not
require extreme high or extreme low temperature in which are difficult to achieve, control
and maintain. Freeze-thawing promotes the formation of microcrystal in the structure [2].
It has better mechanical properties than hydrogels prepared by other method due to the
existence of crystalline regions that serve as physical crosslinks [3]. The increase in
number of freeze-thaw cycles reinforced existing crystals structure.

ENGINEERING 235
Poly(vinyl alcohol) (PVA) hydrogel has been widely used in many applications. For
instance, tissue scaffolds, cardiovascular graft, contact lenses, drug delivery system, and
artificial muscle and membranes [4]. PVA is a synthetic polymer that poses a good
mechanical properties, biocompatibility and biodegradability. К-carrageenan (К-CRG) is
a sulphated polysaccharide extracted from red seaweeds. It has large, highly flexible
molecules that curl up forming helical structures [5]. This gives them the ability to form a
variety of different gels at room temperature. Carrageenans are widely used in the food
and other industries as thickening and stabilizing agents [6]. Previously, PVA have been
incorporated with alginate, chitosan, starch, dextran, glucan, gelatin, poly (N-
isopropylacrylamide), and poly(vinyl pyrrolidone) [7]. They exhibited improved thermal
stability, biocompatibility, mechanical properties, and physicochemical properties.
Polymers either natural or synthetic have been extensively used as drug delivery device [8].
Both PVA and CRG have undergo numerous studies for drug delivery but none have
studied the relation of both blend to the loading and release properties [4,6].
Here, we sought to study the effects of к-CRG addition into PVA hydrogel to the loading
and release of drug model. Methylene blue (MB) was used as the drug model. К-CRG of
different concentrations were added to 60 ml of distilled water and stirred for 1 hour. The
temperature of к-CRG solution was brought to 90˚C, maintained for 10 minutes. Then at
60˚C, 4.5g of PVA was added gradually to avoid lumps. The temperature of the mixture
was brought down to 45˚C and then was poured into a clean petri dish and wrapped with
paraffin film. The petri dish was placed into a freezer (-20˚C). After 24 hours, the petri
dish was thawed at room temperature for another 24 hours. The process of freezing and
thawing was repeated for another 2 cycles. К-CRG was added at 0, 1, 3 and 5 % with
respect to PVA amount.
Loading of drug model MB was done by 24 hour immersion of hydrogel inside 60 mL
MB solution. After that, the MB solution was tested to ultraviolet -visible spectroscopy for
after loading absorbance reading. Next, the study of drug release was conducted within 1
and 5 days. The MB-loaded hydrogel was left submersed in 60 ml phosphate saline
solution at 37˚C. At predetermined time interval, 10 ml sample of the MB solution was
taken and be replaced with another 10 ml of fresh medium. By maintaining the volume,
sink condition of the system was kept constant. Samples were analysed by using
ultraviolet-visible spectroscopy.
MAIN RESULTS
Table 1. Concentration of MB solution after 24 hours hydrogel immersion
Hydrogel Drug remains after absorption by hydrogel (A)
PVA 3.936
PVA/CRG1 2.847
PVA/CRG3 1.618
PVA/CRG5 1.711

ENGINEERING 236
Figure 1. Release of methylene blue over time.
CONCLUSION
The study of к-CRG in PVA hydrogel will help to better understand the effects of polymer
blend hydrogel in drug delivery. Major advantages can benefits pharmacology application by
utilising hydrogel material in conducting extended drug delivery. This study proves that the
presence of к-CRG in PVA hydrogel may improves its loading efficiency and extend the
delivery of drug to optimized the drug efficacy in body.
Acknowledgment: The authors would like to express their appreciation for the support of the
the Ministry of Higher Education Malaysia for funding through Fundamental Research Grant
Scheme.
REFERENCES
1. Ahmed E. M. Hydrogel: preparation, characterization, and applications: A review. Journal of Advanced
Resesarch 6 (2015), 105-121.
2. Gulrez S. K. H., Al-Assaf S. and Phillips G. O. Hydrogels: Methods of preparation, characterisation and
applications. In Progress in molecular and Environmental Bioengineering - From Analysis and Modeling to
Technology Applications. Carpi A. (Ed). InTech, Croatia, 2011.
3. Hassan C. M. and Peppas N. A. Structure and applications of poly(vinyl alcohol) hydrogels produced by conventional crosslinking or by freezing/thawing methods. In Advances in Polymer Science. Springer,
Berlin, 2000.
4. Gajra B., Pandya S. S., Vidyasagar G., Rabari H., Dedania R. R. and Rao S. Poly vinyl Alcohol hydrogel
and its pharmaceutical and biomedical applications: A review. International Journal of Pharmaceutical
Research 4 (2012), 20-26.
5. Necas J. and Bartosikova L. Carrageenan: A review. Veterinarni Medicina 58 (2013), 187-205.
6. Prajapati V. D., Maheriya P. M., Jani G. K. and Solanki H. K. Carrageenan: A natural seaweed
polysaccharide and its applications. Carbohydrate Polymers 105 (2014), 97-112.
7. Kamoun E. A., Chen X., Eldin M. S. M. and Kenawy E. S. Crosslinked poly(vinyl alcohol) hydrogels for
wound dressing applications: A review remarkably blended polymers. Arabian Journal of Chemistry 8
(2015), 1-14.
8. Pillay V., Seedat A., Choonara Y. E., du Toit L. C., Kumar P. and Ndesendo V. M. K. A reivew of polymeric refabrication techniques to modify polymer properties for biomedical and drug delivery
applications. AAPS PharmSciTech 14 (2013), 692-711.
0
0.5
1
1.5
2
2.5
3
3.5
4
0 20 40 60 80 100 120 140
Ab
sorb
an
ce (
A)
Time (hour)
PVA
PVA/CRG1
PVA/CRG3
PVA/CRG5

ENGINEERING 237
IGCESH2018
Universiti Teknologi Malaysia, Johor Bahru, Malaysia 13 -15 August 2018
DRUG LOADING OF HALLOYSITE NANOTUBES: DICLOFENAC
SODIUM AND BENZALKONIUM CHLORIDE
Izzati Fatimah Wahab*1 and Saiful Izwan Abd Razak2
1-2Faculty of Bioscience and Medical Engineering, Universiti Teknologi Malaysia, Johor,
MALAYSIA
(E-mail: [email protected], [email protected]) 2IJN-UTM Cardiovascular Engineering Centre, Institute of Human Centred Engineering, Universiti
Teknologi Malaysia, Johor, MALAYSIA.
ABSTRACT
Halloysite nanotubes have been recognized as an alternative for carbon nanotubes as drug
carrier because they are more economic and less harmful to human and environment. They
possess unique chemical composition that allows loading of positively and negatively
charged active ingredients. Here, halloysite was successfully loaded with diclofenac sodium
and benzalkonium chloride by using vacuum suction method. The pore size distribution
showed decreasing lumen volume of nanotube after loading of drug models. The relationship
between halloysite to drug ratio and the loading of drug were studied in terms of entrapment
efficiency, loading capacity and adsorption capacity. Significant relation can be observed as
to have proper understanding on the loading optimization of drugs into halloysite.
Key words: Halloysite nanotube, Drug loading, HNT to drug ratio
INTRODUCTION
Halloysite nanotubes (HNTs) are natural-occurring clay material with many interesting
characteristics. Two-layered aluminosilicate mineral (Al2Si2O5(OH)4∙2H2O) constructing
HNT tubules are composed of tetrahedral Si-O and octahedral Al-OH. Their versatile
potentials are mainly due to the unique inner and outer surface chemistry, nanoscale lumen,
high aspect ratio, and eco-friendly characters. The contrasting chemical composition between
outer and inner surfaces is expected to affect the charges carried by the tubes at different pH
[1]. At low pH, the lumen carries positive charge while the outer surface carries negative.
These features of HNT offer promising application in delivering active compounds. HNTs
have been successfully loaded with several drug models like curcumin [2-3], 5-amino
salicylic acid [4-5], tetracycline hydrochloride [6-7], sodium d-pantothenate [8], 2-
(diphenylmethoxy)-N,N-dimethyletha-namine hydrochloride [9], doxorubicin [10-11],
and resveratrol [12]. Drug loading can be either inside lumen of HNT or grafted onto
HNT surface. Both were subjected to controlled release of drugs. One of the big
advantages of HNT is its possibility for directional release through tube ends. Compared to
carbon nanotubes (CNTs), HNTs cost lesser, non-toxic to human body and non-hazardous
to the environments [13-14].

ENGINEERING 238
In this study, we aim to observe the relationship between HNT to drug ratio and the
loading of drug. Two types of drugs were used as drug models. They are diclofenac
sodium (DS) as anionic drug and benzalkonium chloride (BKC) as cationic drug. Certain
amount of HNT powder was added to concentrated drug solution (1.98%) with 1 hour
stirring. The mixture was then transferred to vacuum desiccator for 15 minutes and cycled
back to atmospheric pressure for 5 minutes in order to replace the entrapped gas with the
saturated solution. This process was repeated two additional times to ensure optimum
loading. Next, the solution was centrifuged at 3000 rpm for 1 hour to remove the excess
drug. The supernatant was collected and analyzed via a UV spectrophotometer. The
HNT-drug powder was washed three times with distilled water and then air dried.
MAIN RESULTS
The pore size distribution displays a peak at 10 nm which indicates the lumen of HNT. HNT
has decreased in pore volume from 0.064 cm3/g to 0.042 cm3/g and 0.058 cm3/g for DS and
BKC respectively (Figure 1). Table 1 shows the effects of HNT to drug ratio to the
entrapment efficiency, loading capacity and adsorption capacity.
Figure 1. Pore size distribution of HNT, HNT-DS and HNT-BKC.
Table 1. Effects after loading of different ratios of HNT to drug amount
Drug type Ratio
(HNT:drug)
Entrapment
efficiency (%)
Loading
capacity (%)
Adsorption
capacity (mg/g)
DS
(anionic)
1:2 99.153 66.477 1983
1:1 99.162 49.79 991
3:2 99.160 39.798 661
BKC
(cationic)
1:2 97.079 66.005 1940
1:1 98.274 49.565 980
3:2 97.893 39.490 653
CONCLUSION
This study utilized vacuum suction to optimize the loading of 3 different ratios of HNT: drug
to better understand the effects on entrapment efficiency, loading capacity and adsorption
capacity. The loading can be affected by two main factors which are the entrapment sites
available and the concentration gradient. This will be a helping tool in order to achieve the
loading optimization of drugs into halloysite to fit desired application.
0
0.05
0.1
0.15
0.2
0.25
0 10 20 30 40 50 60 70 80 90 100
dV
/dlo
g(w
) P
ore
V
olu
me
(cm
³/g)
HNT

ENGINEERING 239
Acknowledgment: The authors would like to express their appreciation for the support of the
Ministry of Higher Education Malaysia for funding through Fundamental Research Grant
Scheme.
REFERENCES
1. Pasbakhsh P., Churchman G. J. and Keeling J. L. Characterisation of properties of various halloysites
relevant to their use as nanotubes and microfiibre fillers. Applied Clay Science 74 (2013), 47-57.
2. Cavallaro G., Lazzara G., Massaro M., Milioto S., Noto R., Parisi F. and Riela S. Biocompatible poly(N -isopropylacrylamide)-halloysite nanotubes for thermoresponsive curcumin release. Journal of Physical
Chemistry C 119 (2015), 8944–8951.
3. Massaro M., Amorati R., Cavallaro G., Guernelli S., Lazzara G., Milioto S., Noto R., Poma P. and Riela S.
Direct chemical grafted curcumin on halloysite nanotubes as dual-responsive prodrug for pharmacological
applications. Colloids and Surfaces B: Biointerfaces 140 (2016), 505–513.
4. Aguzzi C., Viseras C., Cerezo P., Salcedo I., Sánchez-Espejo R. and Valenzuela C. Release kinetics of 5-
aminosalicylic acid from halloysite. Colloids and Surfaces. B, Biointerfaces 105 (2013), 75–80.
5. Schmitt H., Creton N., Prashantha K., Soulestin J., Lacrampe M. F. and Krawczak P. Melt-Blended
Halloysite Nanotubes/Wheat Starch Nanocomposites as Drug Delivery System. Polymer Engineering and
Science 55 (2015), 573–580.
6. Qi R., Guo R., Shen M., Cao X., Zhang L., Xu J., Yu J. and Shi X. Electrospun poly(lactic-co-glycolic
acid)/halloysite nanotube composite nanofibers for drug encapsulation and sustained release. Journal of Materials Chemistry 20 (2010), 10622-10629.
7. Qi R., Guo R., Zheng F., Liu H., Yu J. and Shi X. Controlled release and antibacterial activity of antibiotic-
loaded electrospun halloysite/poly(lactic-co-glycolic acid) composite nanofibers. Colloids and Surfaces. B,
Biointerfaces 110 (2013), 148–155.
8. Lee I. W., Li J., Chen X. and Park H. J. Electrospun poly(vinyl alcohol) composite nanofibers with
halloysite nanotubes for the sustained release of sodium Ɒ-pantothenate. Journal of Applied Polymer
Science 133 (2016), 42900.
9. Zargarian S. S., Haddadi-Asl V. and Hematpour H. Carboxylic acid functionalization of halloysite nanotubes
for sustained release of diphenhydramine hydrochloride. Journal of Nanoparticle Research 17 (2015), 218.
10. Feitosa S. A., Palasuk J., Kamocki K., Geraldeli S., Gregory R. L., Platt J. A., Windsor L. J. and Bottino M.
C. Doxycycline-encapsulated nanotube-modified dentin adhesives. Journal of Dental Research 93 (2014), 1270–1276.
11. Lee Y., Jung G.-E., Cho S. J., Geckeler K. E. and Fuchs H. Cellular interactions of doxorubicin-loaded
DNA-modified halloysite nanotubes. Nanoscale 5 (2013), 8577–8585.
12. Vergaro V., Lvov Y. M. and Leporatti, S. Halloysite clay nanotubes for resveratrol delivery to cancer cells.
Macromolecular Bioscience 12 (2012), 1265–1271.
13. Sun L. and Mills D. K. Halloysite Nanotube - Based Drug Delivery System for Treating Osteosarcoma. In
36th Annual International Conference of the IEEE Engineering in Medicine and Biology Society, Instituteof
Electrical and Electronics Engineers (2014), 2920–2923.
14. Vergaro V., Abdullayev E., Lvov Y. M., Zeitoun A., Cingolani R., Rinaldi R., and Leporatti S.
Cytocompatibility and uptake of halloysite clay nanotubes. Biomacromolecules 11 (2010), 820–826.

ENGINEERING 240
IGCESH2018
Universiti Teknologi Malaysia, Johor Bahru, Malaysia 13 -15 August 2018
TWO COILS WIRELESS POWER TRANSFER SYSTEM
IMPEDANCE MATCHING MODELING ANALYSIS
Leong Kah Meng, Tan Tian Swee*, Tan Jia Hou, Sameen Ahmed Malik
Medical Device and Technology Group (MEDITEG),
Faculty of Biosciences and Medical Engineering (FBME), Universiti Teknologi Malaysia (UTM),
Skudai, Malaysia. (E-mail: [email protected], [email protected], [email protected],
ABSTRACT
In recent years, wireless charging is gaining attention and it is also getting commonly found
in charging and powering up implantable medical devices given the numerous advantages
such as mobility freedom and convenience. However, the utilization of the wireless charging
technology into this context is still very limited due to its low performance of efficiency.
When the transmitter and receiver coils size are being scaled down, the performance in terms
of transfer efficiency and transmissible distance is greatly reduced. Inefficient power transfer
means an improper powering of these biomedical devices, which can critically influence the
normal operations of the biomedical devices. For this reason, a proper impedance matching
technique has to be modeled to tackle the unequal impedance for both transmitter and
receiver circuit. It is achieved by firstly derive the formula of impedance for both transmitter
and receiver circuit. The derived formula will then be modeled and simulated using Agilent
ADS. Through this simulation, a set of parameter of frequency, inductance, capacitance and
resistance will be studied and fine-tuned to achieve optimum transmission range and
efficiency of power transfer. The optimum efficiency is expected to be above 50 percent. The
EMC and electromagnetic field will also need to be tested through experiments to make sure
it would not violate any safety regulations.
INTRODUCTION
There are several methods to transmit power wirelessly. For example, radio frequency (RF),
inductive coupling, laser, ultrasonic and magnetic resonant coupling. However, not all of
them are applicable when come to the applications with implantable biomedical devices. For
instance, RF is radiative and long term exposure might lead to human safety issues [1]. Some
of them like laser and RF, do require direct line-of-sight to operate [2]. Their transmission
path shall not be blocked by any foreign object. Furthermore, like the ultrasonic and inductive
coupling, sufficient power cannot be sent to the medical electronics due to low transfer
efficiency [3,4].
One obvious concern regarding the wireless power transfer is the safety issues related to
human exposure of electric, magnetic and electromagnetic fields (EMF). In general, 100 kHz
is a crossover the frequency below which the electrostimulation effects dominate, and above
which the heating effects dominate. For mid-range wireless power transfer (1-10 coil

ENGINEERING 241
diameter transfer distance), the majority of the work is conducted at or below 13.56 MHz.
Within this frequency range the heating effects of the human tissues become the concern for
this study. It also can measure with specific absorption rate (SAR).
Magnetic resonant coupling is yet to be the most prominent solution in this context. Yet, in
practical design, the impedance parameters have to be taken care. Otherwise, the performance
is about to be affected very much. In order to solve these problems, a wireless power
charging solution utilizing two coils magnetic resonant coupling together with advanced
impedance matching is being proposed.
MAIN RESULTS
Figure 1. Analysis result comparison between system with and without impedance
matching
Some preliminary result is being shown in the figure 1 above. Where a wireless charging
system with the proposed impedance matching significantly perform better than the system
without it. They are being verified by the simulations.
CONCLUSION
An impedance matching technique is being proposed here to make sure maximum power is
being transferred to the target object. At the same time, it is also seeking to mitigate the effect
of quality factor degradation in the wireless power transfer system.
Acknowledgment: The authors would like to express their appreciation for the support of the
sponsors with grant GUP 16h19.
REFERENCES
1. Beh, T. C., Kato, M., Imura, T., Oh, S. and Hori, Y. (2013). Automated impedance matching system for robust wireless power transfer via magnetic resonance coupling. IEEE Transactions on Industrial
Electronics. 60(9), 3689–3698.
2. Waters, B. H., Mahoney, B. J., Lee, G. and Smith, J. R. (2014). Optimal coil size ratios for wireless power
transfer applications. In IEEE International Symposium on Circuits and Systems (ISCAS). IEEE, 2045–
2048.
3. Cook, Nigel P., Hanspeter Widmer, and Lukas Sieber. "High efficiency and power transfer in wireless power
magnetic resonators." U.S. Patent 9,793,765, issued October 17, 2017.
4. Cook, Nigel P., Paul Meier, Lukas Sieber, Marc Secall, and Hanspeter Widmer. "Wireless energy transfer
using coupled antennas." U.S. Patent 9,634,730, issued April 25, 2017.

ENGINEERING 242
IGCESH2018
Universiti Teknologi Malaysia, Johor Bahru, Malaysia 13 -15 August 2018
DEVELOPMENT OF SYSTEMATIC METHODOLOGY AND
GENERATION OF AZEOTROPIC MIXTURE DATABASE FOR
EXTRACTIVE DISTILLATION COLUMN
Nur Aqila Naseri1, Muhammad Afiq Zubir1, Faizul Hakim Elidor1 and Mohd
Kamaruddin Abd. Hamid*1,2
1 Process Systems Engineering Centre (PROSPECT), Research Institute of Sustainable Environment
(RISE), Universiti Teknologi Malaysia, 81310 UTM Johor Bahru, Johor, MALAYSIA.
(E-mail: [email protected], [email protected], [email protected]) 2 Department of Chemical Engineering, Faculty of Chemical and Energy Engineering, Universiti
Teknologi Malaysia, 81310 UTM Johor Bahru, Johor, MALAYSIA. (E-mail: [email protected])
ABSTRACT
Extractive distillation column is commonly used in chemical process industries as the
separation method to separate azeotropic mixtures. Despite of the advantages that this process
holds, it also has its main shortcoming which this process cannot obtain a high purity of
product. However, this drawback can be recovered by using the driving force approach. This
paper presents the methodology development for designing energy efficient extractive
distillation column consisting of four primary stages. The first stage is the database
development for azeotropic mixtures. Then, conventional extractive distillation column will
be designed to determine the energy requirements and next the driving force method will be
applied to design the optimal extractive distillation column. Both of these two steps will be
simulated using Aspen HYSYS. Finally, the design will be analysed based on its economic,
feasibility and sustainability. By applying the proposed methodology, case studies from
literature and real industries can be verified and tested on its performance and an early
assumption can be made on the driving force approach to be deemed as a reliable source to
other researchers.
Key words: Extractive distillation column, Azeotropic mixtures, Driving force approach,
Energy efficient
INTRODUCTION
Separation of close boiling point and azeotropic mixtures by either extractive distillation or
azeotropic distillation is commonly used in chemical and petrochemical industries3. If
comparing azeotropic distillation with extractive distillation, the later can be more energy
efficient when thermally integrated sequences are used2.
In this paper, the concept of driving forces will be employed to develop a methodology or
guidelines for designing energy efficient extractive distillation separation process. The
driving force is a concept which focused on thermodynamics properties regarding the
separation of components1. By using the insights obtained through the analysis of the

ENGINEERING 243
driving forces, the integrated approach is proposed to make early decisions regarding
flowsheet configuration, design, control, operation, feasibility and sustainability.
Previous studies are more focus on ordinary distillation for the separation of ideal
mixtures and the sequence of the distillation column. Nowadays, there are few
systematics procedure and guidelines in designing extractive distillation separation unit in
chemical processes. The existing method is too complex to be understood and may lead to
infeasible design variables which lead to increase in the total cost which includes the
capital cost and operating cost. This method also will become a burden to industries
because of its lower separation efficiency. Hence, in order to solve the problem, a
systematic methodology for designing energy efficient extractive distillation for
azeotropic mixtures separation process is proposed.
METHODOLOGY
In this section, we discuss more details on the designing of systematic energy efficient
extractive distillation column for the azeotropic mixtures separation. The proposed
methodology consists of four layers of stages as shown in Figure 1. The database of
azeotrope will be generated on the information of their azeotropic temperature and
composition. This information will be collected via literature research. Next the
conventional extractive distillation column will be simulated to obtain the energy
requirements. Driving force approach will be used on the next stage so that the optimal
design of extractive distillation column can be design which is energy efficient. The last
stage is the analysis on both designs based on their economic, feasibility and
sustainability
Figure 1. Methodology for designing energy efficient extractive distillation column
CONCLUSION
Reviews have been done on previous research works so that research gap can be identified.
From the research gap, a methodology has been proposed and developed on the systematic
design of extractive distillation column in order to separate azeotropic mixtures which less
energy will be used than the existing design. The proposed methodology is made up of four
stages and each stage is interconnected with each other.
Stage 1: Generation of Binary Azeotrope Database
Stage 2: Conventional Extractive Distillation Column Design
Stage 3: Optimal Design of Extractive Distillation Column
Stage 4: Design Analysis

ENGINEERING 244
Acknowledgment: The authors would like to express their appreciation for the support from
Universiti Teknologi Malaysia (UTM) RUGS Projects (Q.J130000.2446.03G68 and
Q.J130000.2546.19H72)
REFERENCES
1. Bek-Pedersen, E., and Gani, R. (2004). Design and synthesis of distillation systems using a driving-force-
based approach. Chemical Engineering and Processing: Process Intensification, 43(3), 251-262.
2. Kossack, S., Kraemer, K., Gani, R., and Marquardt, W. (2008). A systematic synthesis framework for extractive distillation processes. chemical engineering research and design, 86(7), 781-792.
3. Vasconcelos, C., and Wolf-Maciel, M. (2000). Dynamic and control of high purity heterogeneous
azeotropic distillation process. Computer Aided Chemical Engineering, 8, 217-222.

ENGINEERING 245
IGCESH2018
Universiti Teknologi Malaysia, Johor Bahru, Malaysia 13 -15 August 2018
PROPERTIES OF POLYETHYLENE TEREPHTHALATE/
POLYBUTYLENE TEREPHTHALATE BLENDS
Muhammad Akmal Ahmad Saidi1, Azman Hassan*1,2, Mat Uzir Wahit1,2, and Lai
Jau Choy1
1 Department of Bioprocess and Polymer Engineering, Faculty of Chemical and Energy Engineering,
Universiti Teknologi Malaysia, 81310 Skudai, Johor, MALAYSIA.
(E-mail: [email protected], [email protected]) 2 Centre for Composite, Universiti Teknologi Malaysia, 81310 Skudai, Johor, MALAYSIA.
(E-mail: [email protected], [email protected])
ABSTRACT
Polyethylene terephthalate (PET) and polybutylene terephthalate (PBT) are commercial
polymers with various applications. The blending of PET and PBT has the advantage of fast
crystallization of PBT and the introduction of PET makes the blend cost effective (as PET is
less expensive compared to PBT). PET and PBT were blended together at different
concentration via twin screw extruder prior to injection molding. Mechanical tests were
carried out to obtain tensile strength, Young’s modulus, elongation at break, flexural strength,
and impact strength. Glass transition (Tg), melting (Tm) and crystallization (Tc) temperatures
were obtained using differential scanning calorimetry (DSC). Generally, PET has better
mechanical properties than PBT except for elongation at break and impact strength. PET/PBT
20/80 blend was found to have well balanced mechanical properties compared to other
PET/PBT blends. From the DSC results, it was observed that PET/PBT blends have single Tg
and double Tm indicating they are miscible in the amorphous region. The blends also have
single Tc peak, demonstrating synergistic effect in crystallization.
Key words: Polyethylene terephthalate, Polybutylene terephthalate, Polymer blend, Mechanical
properties, Thermal properties
INTRODUCTION
Polyethylene terephthalate (PET) is one of the commercially important low-cost polymers
due to its good mechanical performance, and thermal and chemical resistance. It has
applications in various areas, such as fibers, films and beverage containers. The limitations of
PET are low melt strength and slow rate of crystallization which limits the processing ability
of PET especially in injection molding [1-3].
Polybutylene terephthalate (PBT) is also commercially important with applications in various
industries such as automotive parts, electrical, electronic, and textile. It has similar thermal
and chemical resistance and mechanical properties compared to that PET but slightly better
impact strength. PBT has a faster rate of crystallization than PET which makes it the
preferred material for industrial scale molding [1,3,4].

ENGINEERING 246
Polymer blending is a method for obtaining new desirable property combinations without
having to synthesize novel structures, therefore time and cost effective. Due to these factors,
it has great scientific interest and has become an established technique in the development of
new polymeric materials. The properties of the resulting blend can be predicted on the basis
of miscibility and interaction of the components [5]. The blending of PET and PBT is an
example of a blend with excellent miscibility and intermolecular interaction.
Several researchers had reported the miscibility and mechanical properties of PET/PBT
blends [5-10]. Avramova [5] reported the miscibility appeared as a single glass transition
temperature (Tg) from the differential scanning calorimetry (DSC) data. This shows that
miscibility occurred only within the amorphous region. Similar results were reported by
Mishra and Deopura [6] and Szostak [7], and they also found that the tensile strength and
modulus of the blends lower than PET but higher than PBT.
However, there are still not enough studies reported on the mechanical and thermal properties
of PET/PBT blends. Thus, it is relevant to further investigate the effect of blending PET and
PBT at different concentrations. It is also of interest to discover one composition of PET/PBT
blend with balanced mechanical properties in term of stiffness and toughness.
MAIN RESULTS
Figure 4.1 shows the tensile strength of PET, PBT and PET/PBT blends at different ratios.
From the figure, it can be seen that the tensile strength of PET is 29 % higher than PBT. This
is consistent with previous studies [7,8]. A study reported by Szostak [7] showed that PET is
7% higher than PBT. PBT has lower tensile strength due to the longer butylene (C4H8) chain
that makes it more flexible compared to ethylene (C2H4) chain in PET.
Figure 1. Tensile strength of PET/PBT blends
It is also noted that the tensile strength of PET/PBT blends are lower than PBT with the
exception of PET/PBT 20/80 blend which has the highest values among the blends. The
former probably due to formation of phase separation and the latter would has less phase
separation. Similar trend reported by Mishra and Deopura [6] and Szostak [7]. Mishra and
Deopura [6] reported that phase separation is one of the reasons that lead to properties
deterioration.
60.6
36.443.4 44.1
52.647.0
0.0
10.0
20.0
30.0
40.0
50.0
60.0
70.0
0 20 40 60 80 100
Ten
sile
str
ength
(M
Pa)
PBT content (wt.%)

ENGINEERING 247
CONCLUSION
PET/PBT blends were successfully produced by blending PET and PBT together at different
ratios via twin screw extruder and injection molding. The mechanical properties of PET are
better than PBT with the exception of elongation at break and impact strength. The PET/PBT
20/80 blend has higher tensile, flexural and impact strength compared to other PET/PBT
blends. PET/PBT 20/80 blend was also found to have well balanced mechanical properties in
term of stiffness and toughness. PET and PBT are found to be miscible throughout the entire
composition range. The miscibility appeared as single Tg and double Tm peaks in the DSC
thermogram, indicating the miscibility only occurred in the amorphous region. Single Tc peak
was obtained for all blends demonstrating that there is synergistic effect where PBT acted as
nucleating site for PET and enhanced the crystallization of PET.
Acknowledgment: The authors would like to express their appreciations to Universiti
Teknologi Malaysia for providing the research and associated facilities.
REFERENCES
1. Stocco, A., Carrubba, V.L., Piccarolo, S., and Brucato, V. The Solidification Behavior of a PBT/PET Blend
Over a Wide Range of Cooling Rate. J. Polym. Sci.: Part B: Polym. Phys. 47 (2009), 799–810. 2. Su, J., Yang, G., Zhou, T., Gao, X., Wang, K., and Fu, Q. Enhanced Crystallization Behaviors of
Poly(Ethylene Terephthalate) via Adding Expanded Graphite and Poly(Ethylene Glycol). Colloid. Polym.
Sci. 291 (2013), 911–917.
3. Poulose, A.M., Piccarolo, S., Carbone, D., and Saeed Al-Zahrani, M. Influence of Plasticizers and Cryogenic
Grinding on the High-Cooling-Rate Solidification Behavior of PBT/PET Blends. J. Appl. Polym. Sci. 133
(2016), 43083.
4. Savadekar, N.R., Jadhav, K., Mali, M., and Mhaske, S.T. Effect of Maleic Anhydride Modified Olefinic
Elastomer and Plastomer on Impact Properties of PBT. Int. J. Plast. Technol. 18 (2014), 157-172.
5. Avramova, N. Amorphous Poly(Ethylene Terephthalate)/Poly(Butylene Terephthalate) Blends: Miscibility
and Properties. Polymer 36 (1995), 801-808.
6. Mishra, S. P. and Deopura, B. L. Fibers from poly(ethylene terephthalate) and poly(butylene terephthalate)
blends I. mechanical behavior. J. Appl. Polym. Sci. 33 (1987), 759-768. 7. Szostak, M. Mechanical and Thermal Properties of PET/PBT Blends. Mol. Cryst. Liq. Cryst. 416 (2004),
209-215.
8. Aravinthan, G. and Kale, D.D. Blends of Poly(Ethylene Terephthalate) and Poly(Butylene Terephthalate). J.
Appl. Polym. Sci. 98 (2005), 75–82.
9. Backson, S. C. E., Kenwright, A. M. and Richards, R. W. A 13C NMR study of transesterification in
mixtures of poly(ethylene terephthalate) and poly(butylene terephthalate). Polymer. 36 (1995), 1991-1998.
10. Backsona, S. C. E., Richards, R. W. and King, S. M. Small angle neutron scattering investigation of
transesterification in poly(ethylene terephthalate)-poly(butylene terephthalate) mixtures. Polymer. 40 (1999),
4205–4211.

ENGINEERING 248
IGCESH2018
Universiti Teknologi Malaysia, Johor Bahru, Malaysia 13 -15 August 2018
NUMERICAL STUDY OF DRUG DEPOSITION IN HUMAN LUNGS
Musfirah Azmi1, Muhammad Noor Harun2 and Syed Anuar Faua’ad Syed
Muhammad1*
1 Department of Bioprocess and Polymer Engineering, Faculty of Chemical and Energy Engineering,
Universiti Teknologi Malaysia, 81310 UTM Skudai, 81310 Skudai, Johor, Malaysia
(E-mail:[email protected], [email protected]) 2 SITC-Sport and Innovation Technology Center, Faculty of Biosciences and Medical Engineering,
Universiti Teknologi Malaysia, 81310 Johor Bahru, Johor, Malaysia
(E-mail: [email protected])
ABSTRACT
The first-line treatment of diseases, such as asthma or chronic obstructive pulmonary disease
(COPD) is obtained from inhaled medication. Its effectiveness depends on the amount of
drug deposited beyond the oropharyngeal region, the place where the deposition and the
uniformity of its distribution occurs. Apart from the breathing conditions, the geometry of the
airways, and the mucociliary clearance mechanisms, the size of the inhaled particle is
important to be considered to achieve the desired efficiency of drug deposition. The
deposition of particles in the small airways gets maximum attention from pharmaceutical
companies and is of great interest as it is related with a better control in patients receiving
these drugs. Computational fluid dynamics (CFD) was used in this study to investigate the
drug particle deposition in three-dimensional (3-D) model of the respiratory system under
different air flow rates (Q = 30 L/min, 45 L/min, 60 L/min and 100 L/min), particle size (1, 3,
5 and 10 µm) and particle density, ρ = 1300 kg/m3. The highest deposition efficiency occur at
highest flowrates 100 L/min and at smallest particle size 1.0 µm which increased the
deposition efficiency of 61.1% compared to other flowrates of 58.27%, 56.7% and 54.2%
(30, 45 and 60 L/min).
Key words: pulmonary drug delivery, particle deposition, lung airway, computational fluid
dynamics.
INTRODUCTION
Inhaled medications have accepted widely as the optimal route of administration of first-line
therapy for pulmonary diseases [1]. In order to achieve therapeutic effectiveness, the
appropriate amount of drug must be deposited past the oropharyngeal región [1-2].
Mathematical modelling of the deposition and distribution of inhaled aerosols in the lungs of
human beings is a key for making prediction of health risks related to the aerosols inhaled as
well as the therapeutic dose transported by inhaled pharmacological drugs [3]. Thus, the
knowledge of the complicated geometry of the respiratory system and the intricate motion of
air particles within the respiratory airways are needed to the mathematical modelling of
aerosol deposition simulated in the CFD software [4].

ENGINEERING 249
MAIN RESULTS
Based on the simulations results, the particle deposition were taken based on selected
boundary, (see Figure 1) upper part, first bifurcation (Zone 1), second bifurcation (Zone
2) and third bifurcation (Zone 3) and the outer boundary which the deepest part in lungs.
Figure 2 shows the trends of drug deposition occur at trachea (upper part), then slightly
increase at zone 1, decrease at zone 2 and sharply decrease at zone 3. However after a few
generation (outer boundary), the deposition of particle soar up. This condition can be
explained as the tidal volume and rate of respiratory influenced the lungs airflow. At the
upper part of lungs of the respiratory airway for any size of particle, the deposition rises
for as the air flow surges [5]. However, deposition of aerosols becomes slower when the
flow travels down a few last generations of airways as respiratory flow increased, time
taken of particles in airway is reduced, thus cause the Brownian movements become
slower [6]. In other words, these results agree with literature, which shows that particles
with large diameters are less likely to be deposited further into the lungs [7–10].
The result shows the deposition of drug is higher for smallest particle size compared to
bigger size in Figure 3. The deposition efficiency for 1.0µm in was 62% was slightly
highest compared to 35 %, 2 % and 0.41 % for 3.0 µm, 5.0 µm and 10.0 µm. The
deposition mechanism of micron particle is the most suitable for current inhalation
treatment as the particle is breathable fraction and deposited in the deeper lung regions
[1,11-12]. This study reveals that small particle size used had significantly produced high
yield of deposition efficiency in lungs compared to other particle size. Besides, higher
inhalation air flowrate was found to increase deposition efficiencies at compared to other
flowrates. Result in Figure 3 also presents that deposition efficiency increased from
58.27% to 61.1% when using 100 L/min compared to 30 L/min. This agree with other
Figure 3. Percent of Deposition Efficiency at Different Flowrates and Particle Size
Figure 1. The boundaries of
particle deposition
Figure 2. Percent of Particle Deposition at
Different Parts of Lungs

ENGINEERING 250
literature that higher the inhalation flow rate, the higher is the deposition of micron
particles [11,13-14].
CONCLUSION
The laminar flow model demonstrated the direct relationship between inhalation rate and
particle deposition in the tracheobronchial (TB) region. The highest deposition efficiency
occur at highest flowrates 100 L/min and at smallest particle size 1.0 µm which increased the
deposition efficiency of 61.1% compared to other flowrates of 58.27%, 56.7% and 54.2%
(30, 45 and 60 L/min).
Acknowledgment: We are thankful to the Ministry of Higher Education (MOHE) (Ref no.
PY/2015/05451) and UTM for giving the opportunity to conduct this study.
REFERENCES
1. N. R. Labiris and M. B. Dolovich, “Pulmonary drug delivery. Part I: Physiological factors affecting
therapeutic effectiveness of aerosolized medications,” Br. J. Clin. Pharmacol., vol. 56, no. 6, pp. 588–599,
2003.
2. A. F. Tena and C. Clarà, “Use of Computational Fluid Dynamics in Respiratory Medicine Aplicaciones de la
dinámica de fluidos computacional a la neumología,” Arch. Bronconeumol., vol. 51, no. 6, pp. 293–298,
2015.
3. Y. S. Cheng, “Mechanisms of Pharmaceutical Aerosol Deposition in the Respiratory Tract,” AAPS PharmSciTech, vol. 15, no. 3, pp. 630–640, 2014.
4. L. S. Ruzer and N. H. Harley, Aerosols Handbook, Measurement, Dosimetry, and Health Effects. 2005.
5. C. Darquenne, “Aerosol Deposition in Health and Disease,” J. Aerosol Med. Pulm. Drug Deliv., vol. 25, no.
3, pp. 140–147, 2012.
6. A. F. Tena and P. C. Clará, “Deposition of Inhaled Particles in Lungs,” Arch Bronchoneumol, vol. 48, no. 7,
pp. 240–246, 2012.
7. R. J. Thomas, “Particle size and pathogenicity in the respiratory tract,” Virulence, vol. 4, no. 8. 2013.
8. J. S. Patil and S. Sarasija, “Pulmonary drug delivery strategies: A concise, systematic review,” Lung India,
vol. 29, pp. 44–49, 2012.
9. H. Tandel, K. Florence, and A. Misra, “Protein and Peptide Delivery through Respiratory Pathway,” in
Challenges in Delivery of Therapeutic Genomics and Proteomics, 2011, pp. 429–479. 10. J. Heyder, “Deposition of Inhaled Particles in the Human Respiratory Tract and Consequences for Regional
Targeting in Respiratory Drug Delivery,” Proc. Am. Thorac. Soc., vol. 1, no. 4, pp. 315–320, 2004.
11. K. Inthavong, L. T. Choi, J. Tu, S. Ding, and F. Thien, “Micron particle deposition in a tracheobronchial
airway model under different breathing conditions,” Med. Eng. Phys., vol. 32, no. 10, pp. 1198–1212, 2010.
12. T. and Clarà, A. Fernández Tena, and P. Casan Clarà, “Depósito pulmonar de partículas inhaladas,” Archivos
de Bronconeumologia, vol. 48, no. 7. pp. 240–246, 2012.
13. M. Rahimi-Gorji, T. B. Gorji, and M. Gorji-Bandpy, “Details of regional particle deposition and airflow
structures in a realistic model of human tracheobronchial airways: Two-phase flow simulation,” Comput.
Biol. Med., vol. 74, pp. 1–17, 2016.
14. Z. Li, C. Kleinstreuer, and Z. Zhang, “Simulation of airflow fields and microparticle deposition in realistic
human lung airway models. Part I: Airflow patterns,” Eur. J. Mech. B/Fluids, vol. 26, no. 5, pp. 632–649,
2007.

ENGINEERING 251
IGCESH2018
Universiti Teknologi Malaysia, Johor Bahru, Malaysia 13 -15 August 2018
DEVELOPMENT OF 3D VIRTUAL REALITY SYSTEM FOR
INVESTIGATING MANUAL DEXTERITY ON SURGICAL SKILLS
Cham Ying Kit1, Eileen Su Lee Ming*1, Yeong Che Fai2, Siti Nor Zawani Ahmmad3,
Suneet Sood4 and Anil Gandhi4
1 Faculty of Electrical Engineering, Universiti Teknologi Malaysia, 81310 UTM Johor Bahru, Johor,
MALAYSIA.
(E-mail: [email protected], [email protected]) 2 Centre of Artificial Intelligence and Robotics (CAIRO), Universiti Teknologi Malaysia,
81310 UTM Johor Bahru, Johor, MALAYSIA.
(E-mail: [email protected]) 3 Malaysian Institute of Industrial Technology, Universiti Kuala Lumpur, Persiaran Sinaran Ilmu,
Bandar Seri Alam, 81750 Johor, MALAYSIA. (E-mail: [email protected])
4 Faculty of Medicine, Jeffrey Cheah School of Medicine and Health Sciences, Monash University,
80100 Johor Bahru, MALAYSIA. (E-mail: [email protected], [email protected])
ABSTRACT
Mastering surgical skills is very difficult and requires specialized training. Hence, surgeons need
a platform to train their own manual dexterity using computerized simulation instead of live
patient. manual dexterity test is one of the most widely used groups of surgeons and trainee,
and it has been extensively used for evaluating the manual abilities of a surgeon before they
operate on the live patients. In recent trending, virtual reality manual dexterity test simulation
is becoming essential for surgeons or trainee to train or evaluate their surgical skills. Thus,
with recent emerging technology, a manual dexterity test module using 3D virtual reality
system is proposed for acquiring the hand motions from surgeons and non-surgeons group
using haptic device. In this experiment setup, green target module will be used for
investigating the manual dexterity in between surgeons and non-surgeons group. For
hardware implementation, the 3D virtual reality scene displays in the test module is
developed by using Microsoft Visual Studio supported by OpenGL library and integrate with
Oculus Rift as a head mounted display. Subjects can view the 3D object through the head
mounted display and interact the scene using the Geomagic Touch as a haptic device.
Meanwhile, the haptic device tracks the hand motions of the surgeons for motion analysis.
Key words: Manual Dexterity, Surgical Skills, Virtual Reality, Head Mounted Display, Haptic
Device
INTRODUCTION
Conventional practice in the selection for surgical specialty and the subsequent stages of
surgical skill assessment rely heavily on expert surgeons using direct observation of
outcomes [1]. This is highly subjective and prone to inter and intra-raters’ variability [2].

ENGINEERING 252
More recently, there has been increasing interest to complement the subjective assessment
with more objective measures using sensor-based approach and computerised methods [3].
The purpose of this experiment setup is to integrate a computer-based assessment module
with a binocular head mounted display and haptic device for identifying benchmark values of
surgeons that could be used as metrics for objective assessment of surgical dexterity.
In an earlier study with five surgeons, there are few researchers had identified a custom-
developed virtual reality module, Green Target module, to be highly suitable as manual
dexterity test [4]. From previous VR set-up, 3D monitor is used as display unit, and the result
was able to identify statistically significant differences between surgeons and non-surgeons
group. The surgeons outperformed the student subjects in several parameters investigated:
motion path accuracy, motion path precision, economy of movement, motion smoothness,
end-point accuracy and end-point precision [4].
In this study, the experiment setup is improved by using a new head mounted display to
obtain highly accurate benchmark values for comparison. These benchmark values can then
be used to develop an intelligent manual dexterity assessment program to provide sensor-
based measurements and feedbacks to trainees on their dexterity level. The data and the
intelligent algorithm will be highly valuable in a surgical training simulator.
METHODOLOGY
In this experiment setup, green target module was developed using Microsoft Visual
Studio. With OpenGL library support, the graphics of virtual objects and scenes were
designed on the module. The user interface was then displayed on a binocular head
mounted display, Oculus Rift. Besides, the graphics card used together with this study is
the nVidia GeForce GTX 1060 which attached in Acer Predator Helios 300 for supporting
the head mounted display.
The Geomagic Touch haptic device from 3DSystems was used in this study for position
measurement during movement. The haptic feedback loop executed approximately 1000
times per second. This haptic device provided 6 degree of freedom (DOF) positional and
orientation sensing using digital encoders with nominal accuracy of 0.055 mm. Besides
that, 3-DOF force feedback can be provided with continuous force of 0.88 N and
maximum force of 3.3 N within 160x120x70mm3.
In this study, each subject will perform sets of experiment using their dominant hand
instead of right hand. Subjects required to grip the Geomagic Touch’s stylus with their
hands between fingers and thumb as if they were holding a pen. When the subject is ready
to start the experiment, a space button is pressed on the keyboard to set the brown sphere
(cursor) to overlap the starting point. At the same time, the one of the green targets
appeared, and data collection is begun. The cursor will be held at the starting point with
one second of haptic force. An indicator “Go” will appear on the display and the
convergent force at starting point is switched off. Now the subjects are free to start their
dexterity to control the cursor towards the target. Before reaching the target, the subjects
are required to prevent any collision to the obstacle during manual dexterity recording.
After reaching the target point, they need to hold the cursor at the target as consistently
and accurately as possible for three seconds. In this module, there are pre-set seven
targets with three repetitions for each target that need subjects to complete. No time limit
was imposed on the subject to complete all the 21 targets in one session.

ENGINEERING 253
Figure 1. Hardware implementation for the experiment setup.
Figure 2. Green target module displays on head mounted display.
CONCLUSION
In this experimental setup, the 3D virtual reality system is improved from 3D monitor (Acer
HS244HQ) to head mounted display (Oculus Rift) for viewing 3D virtual scene while the
manual dexterity test is executing. Although both display devices allow subjects to view the
3D virtual scene with different angles, but only Oculus Rift provides a closer view compared
to viewing 3D image from a monitor screen.
Acknowledgment: The authors would like to thank to Ministry of Higher Education
(MOHE) and Universiti Teknologi Malaysia (UTM) for supporting this research under
Fundamental Research Grant Scheme R.J130000.7823.4F900.
REFERENCES
1. S. Estrada, M. K. O’Malley, C. Duran, D. Schulz, and J. Bismuth, “On the development of objective metrics
for surgical skills evaluation based on tool motion,” Conf. Proc. - IEEE Int. Conf. Syst. Man Cybern., vol.
2014–Janua, no. January, pp. 3144–3149, 2014.
2. G. Islam, K. Kahol, B. Li, M. Smith, and V. L. Patel, “Affordable, web-based surgical skill training and
evaluation tool,” J. Biomed. Inform., vol. 59, pp. 102–114, 2016.
3. V. Datta, S. Mackay, M. Mandalia, and A. Darzi, “The use of electromagnetic motion tracking analysis to
objectively measure open surgical skill in the laboratory-based model,” J. Am. Coll. Surg., vol. 193, no. 5, pp. 479–485, 2001.
4. S. N. Z. Ahmmad, E. Su Lee Ming, Y. Che Fai, S. Sood, and A. Gandhi, “Objective measurement for
surgical skill evaluation,” J. Teknol., vol. 78, no. 7–5, pp. 145–152, 2016.
Head Mounted
Display
Haptic Device
(Movement Record)
Computer

ENGINEERING 254
IGCESH2018
Universiti Teknologi Malaysia, Johor Bahru, Malaysia 13 -15 August 2018
PLANTS LEAVES: NATURAL ADDITIVES IN WATER BASED
DRILLING FLUID
Nurul Jannah Ismail*1, Abdul Razak Ismail2,3, Mohd Hafiz Dzarfan Othman1,2 and
Nadiah Ibrahim2
1 Advanced Membrane Technology Research Centre (AMTEC), Universiti Teknologi Malaysia, Johor
Bahru 2 Department of Petroleum Engineering, Faculty of Chemical and Energy Engineering (FCEE),
Universiti Teknologi Malaysia, Johor Bahru 3 Institute for Oil and Gas (IFOG), Universiti Teknologi Malaysia, Johor Bahru
(Corresponding email: [email protected])
ABSTRACT
Drilling fluid is very crucial in drilling operation as it provides mean of lifting the cuttings
back to the surface and served many other necessary functions during drilling process.
Various types of additives are applied in various drilling fluids formulation to provide
different practical mud requirements such as density, viscosity, yield point, gel strength and
fluid loss. At present, PAC is one of the most commonly used fluid loss agents in drilling
fluid industry. Due to high cost of commercial fluid loss agents, there is necessity for study of
the cost effective fluid loss agents preferably from the local resources. This work presents an
investigation on aloe vera, hibiscus leaves and henna as a fluid loss agent in water based
drilling fluid formulation. The hibiscus leaves and henna used were grounded in powder
form, while aloe vera was in the liquid form. The rheological and fluid loss behavior was
compared with PAC. The evaluation was carried out by varying the weight of plants
additives into the muds that are 10, 20, 30 and 40 gram. The mud weight used is 11ppg. The
results indicate that all plants are not preferable in term of plastic viscosity and yield point
function because they exceed the acceptable values. Aloe vera and henna can be used to
provide necessary gel strength due to the small difference of initial and final gel strength. In
contrast with hibiscus leaves. Aloe vera, hibiscus leaves and henna exhibited an acceptable
fluid loss at low pressure low temperature and high pressure high temperature.
Key words: Drilling fluid, plant additive, fluid loss agent
INTRODUCTION
Drilling fluid or also known as mud is a fluid that is used in drilling operation. In making of
hole, drilling fluid is pumped or circulated from the surface, down the drill string, forced out
of the drill string through the drill bit and back to the surface via the annulus between the hole
and drill string. At present, polyanioniccellulose (PAC), a cellulose based fluid loss agent is
one of the most commonly used fluid loss agents in drilling fluid industry [1].
Several researchers have been conducted to study the effects of local plants as fluid loss
agents. Previous research conducted found that cashew and mango leaves extract are suitable

ENGINEERING 255
additives for the production of water based mud. Mango leaves extract shows higher
improvement of the rheological properties of the drilling mud. Use of plant extract also will
encourage local content development [2]. Another study conducted by [3] revealed that sago
and tapioca starches could achieve the viscosity produced by PAC. For a given mud
viscosity, it was found that sago mud could give comparable gel strength and yield point as
compared to PAC mud. Sago mud also produced thinner mudcake than PAC mud.
Furthermore, both starches were found to give comparable values of fluid loss.
METHODOLOGY
Mud samples with 11ppg mud weight were prepared according to Table 1. After ensuring the
accurate weight, raw materials were poured to mixing container and place in the mixer for
mixing until homogeneous. Mud samples were then placed in a rolling oven at 250° F for 16
hours. The rolling oven works by heating the samples as under constant circulation, to
simulate the drilling well resembling the same conditions mud be experiencing in the actual
drilling operation. After 16 hours of constant heating and circulation, aging cells were ejected
with caution since they were really hot and left in water bath to cool for 30 minutes. After
cooled to room temperature, the muds were ready for rheology and fluid loss analysis.
Table 1. Formulation of wáter based drilling fluid
Raw Material Function Quantity
(mud + Aloe
vera)
Quantity
(mud +
Hibiscus
leaves)
Quantity
(mud +
Henna)
Distilled water Base fluid 281.0 ml
Potassium Chloride (KCl)
Shale inhibitor 30.0 g
Caustic Soda
(Na2Co3)
pH control 0.2 g
Flowzan Viscosifier 1.2 g
PAC-UL Fluid loss agent 0.0 g, 2.0 g
PHPA Cutting encapsulator 1.0 g
OX-SCAV Polymer thermal
stability optimizer
1.5 g
Barite Weighing agent 125.0 g
Plant Additive Fluid loss agent,
Viscosifier
10g, 20g, 30g, 40g

ENGINEERING 256
RESULTS AND DISCUSSION
The Effects of Plants Leaves on Fluid Loss at LPLT
As API standard requires acceptable amount of fluid loss for water based drilling fluid is up
to 10 ml, value of higher than 10 ml is considered rejected as fluid loss agent. Aloe vera,
henna and hibiscus leaves have an acceptable fluid loss (less than 10 ml) in all the weights.
After hot roll, all of the muds have almost identical fluid loss volume and it can be concluded
that temperature does not give any effect to the muds.
The Effects of Plants Leaves on Fluid Loss at HPHT
At high pressure and high temperature, the volume of fluid loss is increased due to
degradation. However, aloe vera does not degrade because the fluid loss is almost identical to
before hot rolling. Hibiscus leaves and henna show increases in fluid loss but still within the
acceptable values.
CONCLUSION
Aloe vera, hibiscus leaves and henna are not preferable in term of plastic viscosity and yield
point because they exceed the acceptable range. Aloe vera and henna can be used to provide
necessary gel strength due to their small difference of initial and final gel strength, in contrast
with hibiscus leaves where it has big difference. Aloe vera, hibiscus leaves and henna are
good candidates for fluid loss agents because their fluid loss is still below 10 ml for both low
pressure low temperature and high pressure high temperature conditions.
REFERENCES
1. Samavati, R., Abdullah, N., Tahmasbi, N. K., Hussain, S. A., and Awang Biak, D. R. (2014). The Prospect
of Utilizing a Cassava Derivative (Fufu) as a Fluid Loss Agent in Water Based Drilling Muds. International
Journal of Chemical Engineering and Applications. 5 (2).
2. Omotioma, M., Ejikeme, P. C. N., and Mbah, G. O. (2014). Comparative Analysis of the Effects of Cashew and Mango Extracts on the Rheological Properties of Water Based Mud. Int. Journal of Engineering
Research and Applications. ISSN : 2248-9622, Vol. 4, Issue 10 (Part - 6), pp 56-61.
3. Ismail, I., and Idris, A. K. (1997). The prospect of utilizing local starches and fluid loss control agents in the
petroleum industry. Proc. Regional Symposium on Chemical Engineering Conf. Johor, Malaysia. 375-386.
4. API RP 13B1 (2003). Recommended Practice for Field Testing Water-Based Drilling Fluids. American
Petroleum Institute. (3rd ed.) Washington D.C.

ENGINEERING 257
IGCESH2018
Universiti Teknologi Malaysia, Johor Bahru, Malaysia 13 -15 August 2018
EFFECT OF PALM OIL FUEL ASH PRE-THERMAL TREATMENT
ON THE CHARACTERISTICS OF MEMBRANE PREPARED VIA
PHASE INVERSION/SINTERING TECHNIQUE
Zhong Sheng Tai1, Mohd Hafiz Dzarfan Othman*1, Ahmad Fauzi Ismail1, Mukhlis A
Rahman1, and Juhana Jaafar1
1 Advanced Membrane Technology Research Centre, Universiti Teknologi Malaysia, Skudai 81310,
Johor, MALAYSIA.
(E-mail: [email protected])
ABSTRACT
Ceramic membranes have been receiving much attention since the last decade due to their
outstanding intrinsic properties such as high thermal stabilities, excellent chemical and
microbiological resistance, and strong mechanical strength which enhance their service terms.
However, the common ceramic membranes such as alumnia, titania and zirconia are very
expensive due to the expensive material costs. Therefore, it is crucial to develop the ceramic
membranes fabricated from the alternative ceramic materials. Palm oil fuel ash (POFA) is a
by-product from the flourishing palm oil industry and abundant in amount. It is usually
disposed to open fields and poses serious threat to the environment and human health. POFA
is rich in silica and can be used as an alternative material for the manufacture of ceramic
membranes. However, POFA has high carbon content which would affect the characteristics
of the membrane. Thus, this work aims to study the effect of pre-thermal treatment on the
POFA powder towards the characteristics of the POFA based hollow fibre membrane. Prior
to the membrane fabrication, the POFA powder was pre-treated through calcination at the
temperatures ranging from 500 to 1000˚C. The powder was then used for the fabrication of
ceramic membrane through phase inversion/sintering technique. It was found that the
composition of silica was greatly enhanced after pre-treatment and the carbon was totally
burnt off at 700˚C. The SEM results demonstrated that the membrane morphological
structure became denser after pre-treated at elevated temperatures. However, grain size of the
ceramic particles was significantly larger after pre-treated at 900˚C and above causing drastic
decrease in porosity which would adversely affect the flux performance. The outcomes of this
work will be useful in enhancing the characteristics of the POFA based membrane and thus
could promote the use of POFA as an alternative material for the fabrication of ceramic
membrane.
Key words: Palm Oil Fuel Ash, Ceramic Membrane, Phase Inversion
INTRODUCTION
Membrane technology have been the first line choice for various separation applications such
as desalination, wastewater treatment etc. Much effort has been given in developing
membranes with robust performance in order to cater with the essential requirements of
various applications. There are two types of membranes which are commonly used for

ENGINEERING 258
separation applications, namely polymeric and ceramic membranes. Currently, polymeric
membranes are in the frontline of membrane technology due to their costs and availability.
On the other hand, ceramic membranes are starting to gain attention due to their outstanding
intrinsic properties such as high thermal, chemical and mechanical stabilities as well as anti-
fouling properties which enhance their service lifetime [1]. However, the commercialized
ceramic membranes such as alumina, titania and zirconia are very expensive due to their high
starting material costs and sintering temperatures [2]. Therefore, it is crucial to develop a
ceramic material using alternative ceramic material in order to reduce the overall costs.
Palm oil fuel ash (POFA) is the by-product from crude oil extraction process of the palm oil
industry [3]. POFA is rich in silica with porous texture and could be an alternative material
for the fabrication of ceramic membrane [4]. However, the presence of carbon content in
POFA would affect the characteristics of the ceramic membranes. This is due to the reason
that the carbon would be burnt off during the membrane sintering process, leaving the voids
at the ceramic membranes which would affect their mechanical strength [5]. Therefore, it is
crucial to pretreat the POFA before the membrane fabrication process to remove the
unwanted carbon. In this study, the POFA powder was pretreated through thermal process at
the temperatures ranging from 500 to 1000˚C and the membranes fabricated were
characterized.
MAIN RESULTS
Table 1. Chemical composition of POFA powder before and after pre-thermal treatment
Component
(wt%) Untreated 500˚C 600˚C 700˚C 800˚C 900˚C 1000˚C
SiO2 60.169 71.041 71.135 74.534 68.529 68.715 73.612
Al2O3 4.960 4.680 4.921 5.165 5.912 5.973 6.044
K2O 6.961 7.874 7.449 6.430 8.089 8.689 6.521
CaO 3.508 3.521 3.969 3.320 4.547 4.553 3.672
Fe2O3 2.788 2.770 2.882 3.089 3.21 3.837 3.805
MgO 2.421 3.380 3.919 3.352 4.389 3.217 2.775
P2O5 2.408 2.669 2.817 2.467 3.385 3.03 2.376
SO3 1.360 1.591 1.302 1.048 1.408 1.484 0.803
Cl 0.454 0.487 0.369 0.252 0.239 0.184 0.103
TiO2 0.143 0.151 0.171 0.153 0.167 0.207 0.174
Mn2O3 0.056 0.054 0.061 0.050 0.071 0.072 0.057
C 14.771 1.782 1.005 0.000 0.000 0.000 0.000

ENGINEERING 259
Figure 1. SEM images of the morphological structure of the ceramic membranes
fabricated from the POFA powder pretreated at different temperatures (a: untreated; b:
500˚C; c: 600˚C; d: 700˚C; e: 800˚C; f: 900˚C; g: 1000˚C)
CONCLUSION
The pre-thermal treatment of POFA could be effective in removing the unwanted carbon
which would give the membrane with better characteristics. This pre-treatment step is
essential to enhance the mechanical strength of POFA hollow fibre membranes which enables
them to be used in various separation applications. This study will be useful to provide an
alternative material for the fabrication of ceramic membrane which is more economically
competitive.
Acknowledgment: The authors gratefully acknowledge the financial support from the
Ministry of Education Malaysia under the Higher Institution Centre of Excellence Scheme
(Project number: R.J090301.7846.4J192), University Teknologi Malaysia under the Research
University Grant Tier 1 (Project number: Q.J130000.2546.12H25) and Kurita Water and
Environment Foundation Research Grant (Project number: 16P022).
REFERENCES
1. Vinoth Kumar, R., Kumar Ghoshal, A. and Pugazhenthi, G. Elaboration of novel tubular ceramic membrane
from inexpensive raw materials by extrusion method and its performance in microfiltration of synthetic oily
wastewater treatment. Journal of Membrane Science 490 (2015), 92-102.
2. Othman, M. H. D., Hubadillah, S. K., Adam, M. R., Ismail, A. F., Rahman, M. A. and Jaafar, J. Silica-Based
Hollow Fiber Membrane for Water Treatment In K. Ghasemzadeh (Ed.), Current Trends and Future
Developments on (Bio-) Membranes. Elsevier, 2017.
3. Altwair, N. M. and Kabir, S. Palm oil fuel ash (POFA): an environmentally-friendly supplemental
cementitious material for concrete production. In: Brameshuber, W., ed. International RILEM Conference on
Material Science, RILEM Publications SARL (2010), 113-126.
4. Shenvi, S. S., Isloor, A. M., Ahmad, A. L., Garudachari, B. and Ismail, A. F. Influence of palm oil fuel ash,
an agro-industry waste on the ultrafiltration performance of cellulose acetate butyrate membrane. Desalination and Water Treatment 57 (2016), 26414-26426
5. Ali, M. S., Hanim, M. A. A., Tahir, S. M., Jaafar, C. N. A., Mazlan, N. and Matori, K. A. The effect of
commercial rice husk ash additives on the porosity, mechanical properties, and microstructure of alumina
ceramics. Advances in Materials Science and Engineering 2017 (2017), 1-10.

ENGINEERING 260
IGCESH2018
Universiti Teknologi Malaysia, Johor Bahru, Malaysia 13 -15 August 2018
A NOVEL PASSENGER VEHICLES WAKE ENERGY REUSE
METHOD TO OPTIMIZE THE GUIDE VANE FOR HIGHWAY
MICRO SAVONIUS WIND TURBINE
Mohamad Zahid Bin Mazlan1*, Dr. Fazila Mohd. Zawawi2
Faculty of Mechanical Engineering,
Universiti Teknologi Malaysia,
81200 Skudai, Johor Bahru (E-mail: [email protected], [email protected])
ABSTRACT
The purpose of this study is to determine the maximum reached velocity to vertical axis wind
turbine created by fast moving vehicles by adding a curtain system to create low pressure and
to concentrate velocity at the middle of two-way highways using Computational Fluid
Dynamics simulation approach in ANSYS 18.2 software. Normal practice in numerical
investigation for moving car motion done by other researchers was by using User-Defined
Function and dynamic mesh option for re-meshing, smoothing and layering method.
However, in this study, the object motion done by using overset mesh a new features
provided by ANSYS release version 18 above and also profiles method was used for
translation motion. Overall mesh system consist of moving car mesh and background mesh
with guide vanes with simplify 2D geometry. Several effects such as guide vanes angle,
distance between guide vanes and guide vanes configuration were studied to determine the
best and optimum setting for guide vanes installation. From result, it is observed that the
wind direction from moving car is nearly equivalent to guide vane angles and velocity
increased to 50% at end of guide vanes tail compared to model with no guide vane
installation. The use of overset meshes makes the flow simulation process more efficient and
allows mesh motion without deformation or re-meshing. This approach has proven applicable
to moving-body problems using structured mesh topologies. The meshes associated with
them also move rigidly along with the body.
Key words: Wind Turbine, Moving Vehicle, Overset Mesh, Guide Vanes
INTRODUCTION
Presently world in general and Malaysia in particular is facing energy crisis despite the fact
that Malaysia is blessed with natural resources required for its generation. There is a need to
resolve the crisis as they are directly affecting all spheres of life. The government is trying to
explore economical renewable energy resources. One such renewable energy resource
available in abundance is wind. Different potential sites for harnessing wind energy in
Malaysia have already been identified by researchers. This paper aims at identifying the
additional wind energy generation sites alongside the highways due to natural wind and
vehicular generated vortices due to speeding.

ENGINEERING 261
In addition, with a highway network approximately of 49,935 km in total length, the
kinetic energy from the turbulent induced by the speeding passenger vehicles on highway
seems not negligible and is highly potential towards sustainable and renewable energy.
Average velocity of the aerodynamic wake of cruising vehicles is approximately 34 m/s
compared to the annual average wind speed in Malaysia, ranging 2 to 3 m/s [1,2].
Therefore, the Highway Micro Savonius Wind Turbine (HmSWT) system developed in
this project is aimed at harvesting energy from the wind induced by the speeding vehicles
along highway. The generated electricity from the HmSWT is expected to be used to
supply highway lighting systems.
Guide vanes in this project is referring to the type of curtain system used and there are
many type such as double wind tunnel, wind curtain, guide box tunnel, guide vane nozzle
and wind booster but still serve the purpose to direct wind stream to wind turbine blade
[3,4,5,6,7]. Guide vanes concept first proposed by Aljosa has wind panel-like but for this
project the shape is change to airfoil NACA 4412 to give flow acceleration [8]. Figure 1
shows the concept by Aljosa.
Figure 1. Guide vane panel by Aljosa
The work will include the numerical modelling and simulation for characterizing
aerodynamic of the both guide vane and HmSWT, kinetic energy induced from the
speeding vehicles, and predicting the wind data and later calculating the available power
potential at various operating conditions. The optimum turbine configuration located at
the highway medians will also be identified and be proposed with the estimate of total
power potential through the optimization process.
The expected output will be the computer-based tool for analysing and optimizing the
guide vane and HmSWT and optimum design configuration of a novel HmSWT. The
significance of the output from the research project is expected to be beneficial for
developing a novel micro Savonius Wind turbine (mSWT) for harvesting and recapturing
the maximum amount of wind energy from the automobiles running on the highways.
METHODOLOGY
Overset mesh can optimize simulation by developing structured mesh around individual
parts and supported moving cell zones without using re-meshing or smoothing that works
only with unstructured mesh. For a moving car motion, overset mesh is very useful
because it allows greater control of local mesh characteristics as the geometry moves
through the domain, because individual mesh zones need no deformation to accommodate
moving geometry. This method allow simplify model setup and optimization of local cell
types and quality also by having more structured mesh the computation time can be
decrease.

ENGINEERING 262
Moving car mesh have finer structured mesh cell compared to background mesh and both
meshing have quad shape and done separately. Background mesh consist of a row of
guide vanes that is locally set to triangles shape surrounding it to avoid mesh failure. Car
dimension is 4.3 meter long and 1.5 meter width, where guide vanes is 1 meter in length
for each. A total of 20 guide vanes present in the domain. Total domain size is 70 meter
long and 20 meter width and all the wall is set to pressure outlet.
After that, both mesh are combine in solver Fluent and overlapping each other to form a
complete mesh system as shown in Figure 2. Profiles method with only two line
command was used for moving car mesh with straight line motion, which is easier than
using complicated User-defined Function command. For solution models setting in
Fluent, only a handful options is supported such as only Coupled scheme for pressure-
velocity coupling, first order and second order spatial schemes and k-ԑ and standard k-ω
turbulence models. The simulation is in time transient.
Figure 2. Overall mesh system
MAIN RESULTS
The main purpose of this study is to investigate effectiveness of adding curtain system to
direct wind stream produce from speeding vehicles to wind turbine placed at highway
median. Figure 3 show the velocity contour of overset mesh result.
(a) (b)
Figure 3. Velocity contour overall mesh system (a) without guide vanes (b) with guide
vanes
The lack of trailing edge vortices maybe due to the solver model setting that is limited for
overset mesh. The sharp edge at the tail is due to insufficient refinement on background
mesh. Figure 3 also show the wind force produce by moving car flow through the guide
vanes with approximately 7 m/s to 10 m/s. From Figure 3 result, flow pass through with
no directed angle so the wind turbine cannot use fully the induced wind from moving
vehicle. For the model with guide vanes the wind flow was directed by the angle of guide
vanes directly toward the wind turbine. Figure 4 shows the graph comparison with and
without guide vanes installation.

ENGINEERING 263
Figure 4. Comparison graph with and without guide vanes
Figure 4 shows the highest velocity reading when moving car passing guide vanes row
and compared to velocity without guide vanes row installation at the same time step. The
graph velocity reading was taken along the yellow line shown in Figure 3. The guide
vanes setting is 35⁰ guide vane angle and 0.8 meter gap. Moreover, it is observed that by
adding guide vanes, the wind stream passing can increase to about 50% compare to
without guide vanes.
CONCLUSION
As a conclusion the main objective of this study is achieved. Overset mesh model is
successfully develop to analyse moving car motion without using re-meshing and smoothing.
The computational time reduced significantly as well as time to setup model. The mesh
generation also less labour intensive. The effect of installing guide vanes row can increase
50% of the wind flow to reach wind turbine blade so that wind turbine can operation at more
speed compare to natural wind speed.
For future research, the model can be in full scale with a wind turbine present in the domain
to calculate the performance of the wind turbine with the help of guide vanes installation and
also a full 3D simulation should be done to have more realistic result.
Acknowledgment: I wish to express my deepest appreciation to all those who helped me, in
one way or another, to complete this project. Special thanks to my project supervisor
Associate Professor Dr. Fazila Mohd. Zawawi all her patience, guidance and support during
the execution of this project. Through her expert guidance, I was able to overcome all the
obstacles that I encountered. A big thanks to my sponsor, Yayasan Sultan Iskandar to support
me while working on this project.
REFERENCES
1. Saqr, K.M., Musa, M.N., 2010. RANS simulation of the turbulent flow field in the vicinity of the Ahmed
reference car model. In: Mastorakis, N.E., Mladenov, V., Bojkovic, Z. (Eds.), New Aspects of Fluid
Mechanics, Heat Transfer and Environment. Wseas, Taipi, pp. 21–26.
2. Zaharim, A., Najid, S.K., Razali, A.M., Sopian, K., 2009. Wind speed analysis in the east coast of Malaysia.
European Journal of Scientific Research 32, 208–215.
3. Promdee, C., & Photong, C. (2016). Effects of Wind Angles and Wind Speeds on Voltage Generation of
Savonius Wind Turbine with Double Wind Tunnels. Procedia Computer Science, 86, 401-404.
4. Altan, B. D., Atılgan, M., & Özdamar, A. (2008). An experimental study on improvement of a Savonius rotor performance with curtaining. Experimental thermal and fluid science, 32(8), 1673-1678.
5. Irabu, K., & Roy, J. N. (2007). Characteristics of wind power on Savonius rotor using a guide-box tunnel.
Experimental Thermal and Fluid Science, 32(2), 580-586.
6. Son, S. W., Singh, P. M., & Choi, Y. D. (2013). Influence of guide vane shape on the performance and
internal flow of a cross flow wind turbine. Journal of the Korean Society of Marine Engineering, 37(2), 163-
169.
7. Korprasertsak, N., & Leephakpreeda, T. (2015). CFD-Based Power Analysis on Low Speed Vertical Axis
Wind Turbines with Wind Boosters. Energy Procedia, 79, 963-968.
8. Dimitrijevic, A. [aljosa7]. (2008, October 19). Highway wind energy. Retrieved February 27, 2018, from
https://www.youtube.com/watch?v=GBRyVjWfUdY
0
5
10
-10 0 10 20 30 40 50 60
Vel
oci
ty (m
/s)
Distance x (m)
With Guide Vanes
Wihout Guide Vanes

ENGINEERING 264
IGCESH2018
Universiti Teknologi Malaysia, Johor Bahru, Malaysia 13 -15 August 2018
REFINED BLEACHED DEODORIZED PALM OIL QUALITY
PREDICTION USING KERNEL PRINCIPAL COMPONENT
REGRESSION
Nor Adhihah Rashid*1, Azmer Shamsuddin1, Nur Atikah Mohd Rosely1, Mohd
Aiman Mohd Noor1, Lelavathy Samikan Mazilamani1, Mohd Kamaruddin Abd
Hamid2 and Kamarul Asri Ibrahim2
1 Process Systems Engineering Centre (PROSPECT), Research Institute of Sustainable Environment
(RISE), Universiti Teknologi Malaysia, 81310 UTM Johor Bahru, Johor, Malaysia.
(E-mail: [email protected], [email protected], [email protected], [email protected], [email protected])
2 Department of Chemical Engineering, Faculty of Chemical and Energy Engineering, Universiti
Teknologi Malaysia, 81310 UTM Johor Bahru Johor, Malaysia. (E-mail: [email protected], [email protected])
ABSTRACT
The purpose of this paper is to present the predictor development for the Refined Bleached
Deodorized Palm Oil (RBDPO) quality based on the non-linear Multivariate Statistical
Process Control (MSPC). In particular, the physical refining plant of palm oil consisting of
degumming, bleaching and deodorizing section is considered. Kernel Principal Component
Regression (KPCR) model is proposed to obtain the relationship coefficient between the
input and output variables. Then, the coefficient is used to predict the RBDPO quality from
the Crude Palm Oil (CPO) quality. Through the validation with the online data, the prediction
based on the KPCR model gives good prediction of the actual process due to the least
deviation error.
Key words: Quality Prediction, Palm Oil, Kernel Principal Component Regression
INTRODUCTION
Palm oil refinery process is a complex multivariable, time-varying and strong nonlinear
process. It possesses a number of features that lead to control problem of obtaining a desired
RBDPO standard quality (Table 1) by the end of the process. To rectify any possible
production of off-specification RBDPO, the refinery plants opt to go for the recycling
alternative to recycle and refine the product again, thus to prevent scrapping the product
altogether [1]. The loss of profit during recycle is expected nearly RM 159,900 per hour due
to the production and opportunity loss [2].
In current practice, the end product quality is only available by offline assay after the finish
of refinery process [3]. In short, a reliable process monitoring as well as precise quality
prediction and control are therefore necessary to ensure the safe and profitable operation of
the refinery processes. Several studies have been conducted on the quality prediction of
refined palm oil using artificial neural network [4]. Despite of the ability to predict the

ENGINEERING 265
process quality, monitoring the process behaviour is one of the fundamental in process
improvement and optimization, often overlooked by the previous workers. Therefore, this
study would like to highlight the MSPC models for designing better network architecture for
prediction of the physical and chemical properties of palm oil along with process behaviour
monitoring. There are 5 main stages for methodology as illustrated in Figure 1.
Table 1. The standard specification of RBDPO quality.
Quality Specification PORAM VIETNAM CHINA
Free Fatty Acid (FFA) < 0.10 < 0.10 < 0.07
Moisture Content
(MOIST)
< 0.10 < 0.10 < 0.10
Iodine Value (IV) 50-55 50-55 50-55
Figure 1. The flowchart of methodology.
MAIN RESULTS
A total number of 327 raw data of PORAM quality were collected within 8 hour interval of
sampling during industrial attachment. The data consist of 6 input variables (FFAin, MOISTin,
IVin, DOBIin, Bleaching Dosagein, and Vacuum Steam Pressurein) and 3 output variables
(FFAout, MOISTout, COLORout). Boxplot analysis was conducted to identify the optimum
sample size representing the population using the standardized data. The sample size of 25
was selected as an optimum sample size due to few outliers and most similar distribution
trend. The optimum sample sizes were autocorrelated to determine the optimum sampling
time where the first observation (first lag) fall below the threshold value which was then
multiplied with the original sampling time of 8 hour, to gets the optimum sampling time of 8
hours. The training data was sorted according to the optimum sampling time of 8 hours
interval thus, producing the standardized, sorted data.
The standardized, sorted data was cross-correlated to determine the processing time for the
refinery process. The processing time refers to the time taken for the CPO to transverse the
whole process and exit as RBDPO. The processing time was obtained by taking the longest
number of lags it takes to cross the zero y-axis and multiplying it with the optimum sampling
time. The longest lag was identified at the fourth observation (fourth lag) which was then
multiplied with 8 hours of the optimum sampling time, getting processing time of 32 hours.
The output variables of the standardized, sorted data were staggered according to the
processing lag, producing the standardized, sorted staggered of training data.
These data were fed into the prediction model namely Principal Component Regression
(PCR) and Kernel Principal Component Regression (KPCR) to obtain the relationship
coefficient. The performance of the prediction models was compared by identifying the
presence of deviations between the predicted output control charts and the actual output
control charts via crude observation. To obtain the precise error of deviations, Mean Squared
Error (MSE) was calculated for each of the variables. Figure 2(a) depicts that the KPCR
prediction model has the least deviation (lower MSE value) than the PCR prediction model.
• Data standardization
• Boxplot Analysis
STAGE 1
PRE - PROCESSING DATA
• Autocorrelation function
STAGE 2
OPTIMUM SAMPLING TIME IDENTIFICATION
• Cross - correlation function
STAGE 3
PROCESSING TIME IDENTIFICATION
• PCR and KPCR model
• Individual control chart
STAGE 4
DEVELOPMENT OF PREDICTION MODEL
• Testing (online) data
• MSE calculation
STAGE 5
VALIDATION AND VERIFICATION

ENGINEERING 266
This is because the refinery process was characterized with nonlinearity and time variance,
thus a nonlinear model such as KPCR can predict better. As a validation, the relationship
coefficients from both models were used directly to predict the testing (online) data.
Similarly, the MSE value of the KPCR model was lower than the PCR model as shown in
Figure 2(b). From the result, it was proven that the palm oil refinery process is non-linear
process. Therefore, it can be concluded that KPCR prediction model was more reliable in
predicting the RBDPO quality.
Figure 2. Graph of MSE for (a) Training data; (b) Testing data
CONCLUSION
By acquiring the CPO processing time and developing statistical prediction models via
regression methods, the quality of RBDPO can be effectively predicted ahead in time based
on the raw CPO data. If the predicted RBDPO does not meet the specifications, early
corrective measures can be carried out such as performing pre-treatments for the flawed CPO
batch before feeding it into the process. This can reduce the dependence of the recycling
streams to rework the off-spec product, thus the optimal plant performance can be fine-tuned
for the better smooth running and productivity.
Acknowledgment: The authors would like to express their appreciation for the support from
UTM RUGS Projects (Q.J130000.2446.03G68 and Q.J130000.2546.19H72).
REFERENCES
1. Rashid, N.A., Mohd Rosely, N.A., Mohd. Noor, M.A., Shamsuddin, A., Abd. Hamid, M.K. and Asti
Ibrahim, K. Forecasting of refined palm oil quality using principal component regression. Energy Procedia
142 (2017), 2977-2982.
2. Makky, M. and Soni, P. In situ quality assessment of intact oil palm fresh fruit bunches using rapid portable
non-contact and non-destructive approach. Journal of Food Engineering 120 (2014), 248-259.
3. Jia, R., Mao, Z., Wang, F. and He, D. Self-tuning final product quality control of batch processes using
kernel latent variable model. Chemical Engineering Research and Design 94 (2015), 119-130.
4. Tehlah, N., Kaewpradit, P. and Mujtaba, I.M. Artificial neural network based modelling and optimization of
refined palm oil process. Journal of Neurocomputing 216 (2016), 489-501.
0.0139 0.0122
0.0342
0.0111 0.0082
0.0247
0
0.005
0.01
0.015
0.02
0.025
0.03
0.035
0.04
FFA MOIST COLOR
Graph of MSE for Training data
PCR KPCR
0.0415
0.0244
0.0505
0.027
0.0095
0.0437
0
0.01
0.02
0.03
0.04
0.05
0.06
FFA MOIST COLOR
Graph of MSE for Testing Data
PCR KPCR
(a) (b)

ENGINEERING 267
IGCESH2018
Universiti Teknologi Malaysia, Johor Bahru, Malaysia 13 -15 August 2018
TUFT FLOW VISUALIZATION INVESTIGATIONS OF UTM-LST
VFE-2 MODEL CONFIGURATIONS AT HIGH ANGLE OF
ATTACKS
Mazuriah Said1, Masato Imai*2, Shabudin Mat1, Md. Nizam Dahalan1 and Shuhami
Mansor1
1 Department of Aeronautics, Automotive and Ocean Engineering, Universti Teknologi Malaysia,
Johor Bahru, MALAYSIA.
(E-mail: [email protected], [email protected], [email protected],
[email protected]) 2 Department of Mechanical Engineering, Tokyo University of Agriculture & Technology, Tokyo,
JAPAN.
(E-mail: [email protected])
ABSTRACT
This paper highlights the data obtained from the wing tunnel experiments of UTM VFE-2
model. The flow structure of the blunt-edged delta wing exhibits differently compared to
sharp-edged delta wing. The flow becomes more complicated when the leading edge of the
wing is blunt. The vortex on the blunt-edged wing is not originates in the apex region but at a
certain cord wise position based on angle of attack, Reynolds number, Mach number and
leading edge bluntness. The primary vortex moved upstream if the angle of attack is
increased. Currently, there is no data to verify either the primary vortex moved in the apex of
the wing if the angle of attack is further increased. This was due by several constraints to
perform experiment at higher angle of attack. Therefore, several experiments at high attack
angle has been performed in UTM Aerolab to determine whether the primary vortex moves
forward to the apex of the wing if the attack angle is increased to α=27°. During the
experiments, tuft methods were performed to visualize the flow characteristics above the
wing at Reynolds numbers of 1×10⁶ and 1.5×10⁶. The study has demonstrated interesting
flow physics above large radius-edged wing at high angle of attack. The first observation
from this current test was the flow characteristics become more sensitive to Reynolds number
and angle of attack on this particular wing. When the Reynolds number is increased from
1×10⁶ to 1.5×10⁶, the upstream progression of the primary vortex has been delayed. Another
observation is that even the primary vortex progresses upstream with the angle of attack, the
attached flow is still existed even the angle of attack is increased to α=27º.
Key words: Tuft flow visualization, Delta wing VFE-2, High angle of attack, Slender wing
INTRODUCTION
Mat, et al (2015) has performed a comprehensive flow visualization studies on blunt-edged
delta wing. In his observations, the flow attached to the surface of the wing at considerable
low angle of attack. At higher angle of attack, the flow in the leading edge region is fully
attached started from the apex to the trailing edge. The primary vortex is developed at certain

ENGINEERING 268
chord-wise position and progress upstream with angle of attack; however there is no data in
VFE-2 that indicate the vortex has progressed up to the Apex region with if the angle of
attack is further increased. Thus the main objective of this current experiment is to perform
the experiment at higher angle of attack (Said, et al, 2015).
METHODOLOGY
For further investigation, delta wing followed the original NASA AVT-113 profile has been
replicated and machined in UTM. The large-radius leading edge with the ratio of leading
edge radii over the wing mean aerodynamic chord is rLE/c = 0.0030 was used (Figure 1). The
experiments were conducted at two different values of Reynolds number with several angle
of attack varied from α = 0° to 27°. The experimental conditions are shown in Tables 1 and 2
below. In order to visualize the flow above the wing, tuft method was employed. Figure 2
shows the tuft setup in the wind tunnel. This method is done by using several arrays of
threads that had been tied to the net and then placed it in front of the model. The distance
between the thread is 2m long and the total 600 threads were used. The threads flow on the
model if the wind tunnel is run. This method can visualize the development of primary vortex
particularly in the leading edge region.
MAIN RESULTS
The sample images taken from the tuft experiments are shown in Figure 3 below. From the
figures, it can be noted that this technique can detect the formation of primary vortex
particularly in the leading edge. At α = 0º, flow is fully attached to the wing surface and the
primary vortex is not observed. When the angle of attack is increased to α = 10º, the vortex is
observed at certain chord wise position. Upstream of this point, the flow is still attached to
the surface. When the angle of attack is increased to anticipated α = 27º, the primary vortex
develops on the entire wing near to apex of the wing. It is unclear whether the primary vortex
is formed up to the apex of the wing to date. Some more experiments have been planned and
the data will be presented in the full paper soon.
Large-radius L.E Reynolds
number, Re 1×10
6 1.5×10
6
Angle of attack,
α [°] 0, 5,10, 15, 20, 27
Reynolds
number, Re Velocity, V [m/s]
1×10⁶ 17.9
1.5×10⁶ 26.8
Table 1. Experimental Condition
Table 2. Wind tunnel velocity
Figure 2. Setup of tuft method Figure 1. Delta wing
model geometry

ENGINEERING 269
(a) α = 0º for Re = 1×10⁶
(b) α = 10º for Re = 1×10⁶
(c) α = 27º for Re = 1×10⁶
(d) α = 0º for Re = 1.5×10⁶
(e) α = 10º for Re = 1.5×10⁶
(f) α = 27º for Re = 1.5×10⁶
Figure 3. Flow visualization at each angle of attack and velocity
CONCLUSION
The early result obtained here has speculated the attached flow is still developed in the apex
region even at higher angle of attack. This means that there still exists leading edge pressure
that caused the attached flow to happen. The results emphasis that the primary vortex of
blunt-edge wing will not behave as the sharp-edged wing even the angle of attack is increased
until α=27°. It is recommends to do more experiments with several different methods of flow
visualization to verify this uncertainty. The experiments at higher than α=27° also should be
conducted.
Acknowledgment: The research was sponsored by MOHE and UTM (FRGS Grant
R.J130000.7824.4F172 and R.J130000.7824.4F718). The first author gratefully
acknowledges the scholarship from UTM Zamalah for her PhDs' study. The data presented,
the statement made and views expressed are solely the responsibility of the authors.
REFERENCES
1. Hummel, D. (2008). Chapter 17 – The International Vortex Flow Experiment 2 (VFE-2): Objectives and
Overview. RTO-TR-AVT-113, Page 17-1 – 17-20. 2. Luckring, J.M. and Hummel, D. (2008). Chapter 24 – What Was Learned From The New VFE-2
Experiments. RTO-TR-AVT-113.
3. Mat, S., B., Green, R., Galbraith, R., and Coton, F. (2015). The Effect of Edge Profile on Delta Wing Flow.
Proceedings of the Institution of Mechanical Engineers, Part G: Journal of Aerospace Engineering.
4. Said, M., Mat, S., Mansor, S., Abdul-Latif, A., & Mat Lazim, T. (2015). Reynolds Number Effects on Flow
Topology Above Blunt-Edge Delta Wing VFE-2 Configurations. 53rd AIAA Aerospace Sciences Meeting
(pg. 1229).
5. Chu, J. and Luckring, J.M. (1996). Experimental Surface Pressure Data Obtained on 65° Delta Wing across
Reynolds Number and Mach number Ranges - Large-edged. NASA Technical Memorandum 4645.
6. Luckring, J.M. (2013). Initial Experiments and Analysis of Blunt-edge Vortex Flows for VFE-2
configurations at NASA Langley, USA. Aerospace Science and Technology. Vol. 24, Issue 1. Page 10-21.
7. Konrath, R., Klein, C., and Schröder, A. (2013). PSP and PIV Investigation on the VFE-2 Configuration in Sub- and Transonic Flow. Aerospace Science and Technology. Vol. 24, Issue 1. Page 22 - 31.
8. Fritz, W. (2013). Numerical Simulation of The Peculiar Subsonic Flow-field About The VFE-2 Delta Wing
with Rounded Leading Edge. Aerospace Science and Technology. Vol. 24, Issue 1. Page 45 - 55.

ENGINEERING 270
IGCESH2018
Universiti Teknologi Malaysia, Johor Bahru, Malaysia 13-15 August 2018
A SHORT REVIEW ON ANATOMY, BIOMECHANICS, AND
TREATMENT FOR ANTERIOR CRUCIATE LIGAMENT INJURY.
Nur Afikah Zainal Abidin1
and Muhammad Hanif Ramlee*2
1, 2 Medical Devices and Technology Group (MEDITEG)
Faculty of Biosciences and Medical Engineering (FBME), Universiti Teknologi Malaysia (UTM),
81310, Johor Baharu, Johor, MALAYSIA. (E-mail: [email protected], [email protected])
*corresponding author
ABSTRACT
The prevalence of anterior cruciate ligament (ACL) injuries that lead to recurrent instability
of knee joints keep on increasing every year. During the years, researchers in orthopaedic
area have carried out investigations on the complex function of ACL by applying mechanical
principles. This review paper aim to present the relevant biomechanical studies that provide
important data on the ACL by highlighting its anatomy, functions, and biomechanics.
Besides that, study tool used in biomechanical researches related with ACL is also introduced
in this literature. The available treatments for the ACL-deficient patients are also included
with the purpose of restoring the knee function. Keywords: anterior cruciate ligament, anatomy, functions, biomechanics, treatment
INTRODUCTION
One of the most common lower extremity’s injuries is ACL tear that. Since the ligament was
unable to control knee joint’s movement anymore, the deficient knee became unstable [1-3].
Fibres of the ligament might tear up due to excessive shear force exerted on the knee joint [4-
6]. There were approximately two million cases reported on ACL injuries for each year
worldwide [7, 8]. In relevance with the high prevalence, conservative and operative
approaches had been carried out accordingly to treat patients with ACL injuries. In addition
to that, surgeons and researchers need to understand the anatomy and biomechanical
properties of the ACL first in order to perform the treatments or studies on the ligament.
In this review, we highlighted the anatomy and physiology of ACL, biomechanics of
ACL, and treatments for patients with injured ACL. We believe that these highlighted
outcomes will be useful for conducting further research and as important additional
information for health practitioners in ACL treatment and rehabilitation. The aims of this
paper to provide the anatomy and physiology of intact ACL, show overview of
biomechanics of ACL and provide recent treatments for ACL injured patients.
Literature search engines used are IEEE Explore, PubMed/Medline, ScienceDirect, SAGE
Journal, Web of Science, and Google Scholar by using keywords of “Anterior Cruciate
Ligament” with the combinations of specific terms that include “anatomy”, “physiology”,

ENGINEERING 271
“biomechanics”, “treatment”, “non-operative”, “ACL reconstruction”. Besides that, we
investigated the review by filtering the criteria. The previous studies will be included
based on the following: (1) published in English; (2) studies should include
biomechanical aspects of ACL; (3) studies on treatments of ACL should be included. On
the other hand, we exclude the studies that with the following criteria: (1) Osteoarthritis
patient with ACL-deficient knee; (2) duplicate publications; (3) animal experiments.
MAIN RESULTS
Anatomy
The ACL consists of two main components known as posterolateral (PL) and
anteromedial (AM) bundles. These two bundles are named according to their insertion
site at the tibia [9]. The bundles of PL and AM initiate from lateral femoral condyle at the
posteromedial side. Meanwhile, the area that is anterior to intercondylar tibial eminence
is the site of insertion of both bundles. Figure 1 below shows the ACL bundle insertion
sites at the femur and tibia. Tibial insertion point of ACL has broad area to ensure the
intercondylar notch will not suffer from physiological impingement when the knee joint is
extended completely [9-11]. Bundle of AM has a mean length of 33 mm and PM bundle
is 18 mm [12, 13]. Meanwhile, the ACL in cadavers has an average overall width of 11
mm, which ranged from 7 mm to 17 mm, and it has an average cross-sectional area of 36
mm2 for women and 47 mm2 for men [9, 14]. In normal and healthy knee, ACL supports
the internal rotation and anterior tibial translation (ATT) in order to prevent the tibia from
moving anteriorly and inhibits the rotation of tibia with extreme ranges [15]. During
extension of knee, ATT value is low and it supports the leg in standing. On the other
hand, the ATT could increase during flexion when walking (maximum 3 mm) and when
an external anteroposterior load is applied (maximum 5.5 mm) [16].
\
Figure 1. Knee joint with ACL bundle insertion sites [11].
Biomechanics
Forces transmitted through bundles of ACL are affected by knee joint’s position. A universal
force-moment sensor (UFS) robotic testing tool is used to test ten knees of cadavers in a
study by Gabriel et al [17]. They investigated the allocation of forces in ACL bundles by
applying a 134 N as anterior tibial load, a 10 Nm valgus for combined rotatory load and 5
Nm torque of an internal tibia [17]. When the knee is flexed at 60o and 90o, the highest forces
is transferred through the bundle of AM while for the PL bundle, the force was greatest at full
extension of knee. However, the statistical data in stress at 15o of flexion between the 2
bundles was the same. Figure 2 below shows a robotic testing system that allow the knee
joint to move in six degrees of freedom for biomechanical studies.

ENGINEERING 272
Figure 2. Universal force-moment sensor (UFS) robotic testing system [18]
Treatments
The objective of treatment for ACL injured patients is to restore the stability of knee joint,
functions, minimize risk of complications and symptoms besides improving the life’s quality
[19]. Commonly, it is believed that operative treatment by means of ACL reconstruction
would fulfil the aforementioned objectives. However, not all patients with ACL-deficient
need to undergo reconstructive surgery. For ACL injured patients at which the knee could
function in an acceptable range under certain conditions, then conservative or non-operative
treatment is assumed to be rational. There are about 25% conservative treatment done by
70% surgeons, and there was only 5.7% out of 742 ACL injured patients reported that they
used conservative approach [20]. Non-operative treatment for ACL-deficient knee could be
effective for patients that are willing to refrain from high-risk and heavy activities as revealed
in several case series [21-24]. Patients that have isolated ACL injuries, mild pathologic laxity,
and low-risk activities might be treated successfully by conservative means [25]. Conversely,
operative treatment would probably the best approach for patients with high-risk activities,
desires to return to sports, marked anterior laxity, and suffer from other meniscal tears,
articular cartilage damages and disruption of other ligaments [26]. Although reconstruction of
ACL alone might not reduce the symptoms of pain, discomfort, and could cause arthrosis, it
would be indicated if instability of ACL-deficient knee causes a significant increase in pain
[27]. There has been an immense evolution of surgical approach for ACL reconstruction
during the past forty years. During 1970 until early 1980, autografts were first supplanted and
gradually, the development of ACL reconstruction replaced the ruptured ACL with autografts
and allografts [28]. Nowadays, arthroscopic techniques are used in operative treatment of
ACL injuries at which the procedures were performed by arthrotomy.
CONCLUSION
This literature reviews the anatomy, physiology, biomechanics and treatments available for
ACL injury. Patients with ACL-deficient knee might suffers from serious disability and
discomfort. As provided with a knowledge of anatomy, function and biomechanics of the
ACL, further research on ACL injuries and treatments should be performed in the future. The
surgeons should also make wise decisions with ACL-deficient patients of which approaches
are suitable and desirable for the benefits of patients.
Acknowledgement: We would like to thank our sponsor, UTM Zamalah Scholarship for
supporting our research.

ENGINEERING 273
REFERENCES
1. Laskowski, E.R., ACL Injury and Rehabilitation. Current Physical Medicine and Rehabilitation Reports,
2014. 2(1): p. 35-40.
2. Farber, J., et al., Treatment of Anterior Cruciate Ligament Injuries by Major League Soccer Team Physicians. Orthopaedic Journal of Sports Medicine, 2014. 2(11): p. 1-7.
3. Spindler, K.P. and R.W. Wright, Anterior Cruciate Ligament (ACL) Tear. The New England Journal of
Medicine, 2008. 359(20): p. 2135-2142.
4. Dai, B., et al., Anterior cruciate ligament injuries in soccer: Loading mechanisms, risk factors, and
prevention programs. Journal of Sport and Health Science, 2014. 3(4): p. 299-306.
5. Nagano, Y., et al., Biomechanical characteristics of the knee joint in female athletes during tasks associated
with anterior cruciate ligament injury. Knee, 2009. 16(2): p. 153-158.
6. Evans, S., J. Shaginaw, and A. Bartolozzi, Acl Reconstruction ‐ It's All About Timing. International Journal
of Sports Physical Therapy, 2014. 9(2): p. 268-273.
7. Sanders, T.L., et al., Incidence of Anterior Cruciate Ligament Tears and Reconstruction: A 21-Year
Population-Based Study. Am J Sports Med, 2016. 44(6): p. 1502-1507.
8. Hazle, C. and C. Duby, Anterior Cruciate Ligament Injury Diagnosis And Management In A Pediatric Patient: A Case Report. International Journal of Sports Physical Therapy, 2012. 7(6): p. 678-690.
9. Giuliani, J.R., K.G. Kilcoyne, and J.P. Rue, Anterior cruciate ligament anatomy: a review of the
anteromedial and posterolateral bundles. J Knee Surg, 2009. 22(2): p. 148-154.
10. Sidles, J.A., et al., Ligament length relationships in the moving knee. J Orthop Res, 1988. 6(4): p. 593-610.
11. Li, G., et al., In vivo elongation of the anterior cruciate ligament and posterior cruciate ligament during
knee flexion. Am J Sports Med, 2004. 32(6): p. 1415-1420.
12. Odensten, M. and J. Gillquist, Functional anatomy of the anterior cruciate ligament and a rationale for
reconstruction. J Bone Joint Surg Am, 1985. 67(2): p. 257-262.
13. Buoncristiani, A.M., et al., Anatomic double-bundle anterior cruciate ligament reconstruction. Arthroscopy,
2006. 22(9): p. 1000-1006.
14. Anderson, A.F., et al., Correlation of anthropometric measurements, strength, anterior cruciate ligament size, and intercondylar notch characteristics to sex differences in anterior cruciate ligament tear rates. Am J
Sports Med, 2001. 29(1): p. 58-66.
15. Freeman, M.A.R. and V. Pinskerova, The movement of the normal tibio-femoral joint. Journal of
Biomechanics, 2005. 38(2): p. 197-208.
16. Markolf, K.L., J.S. Mensch, and H.C. Amstutz, Stiffness and laxity of the knee--the contributions of the
supporting structures: A quantitative in vitro study. J Bone Joint Surg Am, 1976. 58(5): p. 583-594.
17. Gabriel, M.T., et al., Distribution of in situ forces in the anterior cruciate ligament in response to rotatory
loads. J Orthop Res, 2004. 22(1): p. 85-89.
18. Zantop, T., et al., Anterolateral rotational knee instability: role of posterolateral structures. Winner of the
AGA-DonJoy Award 2006. Arch Orthop Trauma Surg, 2007. 127(9): p. 743-752.
19. Renstrom, P.A., Eight clinical conundrums relating to anterior cruciate ligament (ACL) injury in sport:
recent evidence and a personal reflection. Br J Sports Med, 2013. 47(6): p. 367-372. 20. Delay, B.S., et al., Current practices and opinions in ACL reconstruction and rehabilitation: results of a
survey of the American Orthopaedic Society for Sports Medicine. Am J Knee Surg, 2001. 14(2): p. 85-91.
21. Bonamo, J.J., C. Fay, and T. Firestone, The conservative treatment of the anterior cruciate deficient knee.
Am J Sports Med, 1990. 18(6): p. 618-623.
22. Ciccotti, M.G., et al., Non-operative treatment of ruptures of the anterior cruciate ligament in middle-aged
patients. Results after long-term follow-up. J Bone Joint Surg Am, 1994. 76(9): p. 1315-1321.
23. Caborn, D.N. and B.M. Johnson, The natural history of the anterior cruciate ligament-deficient knee: A
review. Clin Sports Med, 1993. 12(4): p. 625-636.
24. Buss, D.D., et al., Nonoperative treatment of acute anterior cruciate ligament injuries in a selected group of
patients. Am J Sports Med, 1995. 23(2): p. 160-165.
25. Kannus, P. and M. Jarvinen, Nonoperative treatment of acute knee ligament injuries. A review with special reference to indications and methods. Sports Med, 1990. 9(4): p. 244-260.
26. Fithian, D.C., L.W. Paxton, and D.H. Goltz, Fate of the anterior cruciate ligament-injured knee. Orthop Clin
North Am, 2002. 33(4): p. 621-636.
27. Arendt EA, G.S., Patient selection for ACL reconstruction. Sports Med Arthrosc Rev, 1996. 4: p. 328-335.
28. Andersson, C., M. Odensten, and J. Gillquist, Knee function after surgical or nonsurgical treatment of acute
rupture of the anterior cruciate ligament: a randomized study with a long-term follow-up period. Clin
Orthop Relat Res, 1991. 264: p. 255-263.

ENGINEERING 274
IGCESH2018 Universiti Teknologi Malaysia, Johor Bahru, Malaysia 13 -15 August 2018
A STUDY ON THE EFFECT OF DOPANT ON ZnO SURFACE FOR
ELECTRONIC PROPERTIES
Farzana Alam and S.M. Sultan
Department of Electronic and Computer Engineering,
Faculty of Electrical Engineering, University Technology Malaysia, Skudai, Johor
Bahru(Email: [email protected], [email protected])
ABSTRACT
In this paper, we propose a ZnO based model to study the electronic characteristics of pure
and doped ZnO by first principles calculation. The Non-equilibrium Green’s Function and
Density Functional Theory were the techniques used to simulate the models. We observed
considerable reduction on the energy band gap and established that the dopant on pure ZnO
has a significant role on electronic behavior of a ZnO structure. Pure ZnO found to be
sensitive towards group III (Aluminum) and group VII element (Fluorine) by substituting a
single Zn and a single O atom rspectively from the bulk.
Key words: Band Structure, Density of State, Pure ZnO, Doped ZnO, DFT.
INTRODUCTION
ZnO has previously attracted researchers with its ultraviolet (UV) photonic devices namely
LED and Lasers and also involved in many other device applications such as transparent
electronics, piezoelectric devices, gas sensor, solar cells, spin electronics, etc. [1, 2]. Zinc
Oxide is an inanimate semiconducting composite of the group II (Zn) and the group VI (O)
with the formula ZnO. As One-dimensional (1-D) nanomaterials with wide direct bandgap of
3.34 eV and a large binding energy of 60 meV at room temperature (300 K), ZnO have drawn
a lot of attention due to their novel and unique properties and a wide range of applications
[3]. The large surface area of the ZnO structure makes them attractive for gas sensing, as it
can absorb the target gas at low concentrations [4].
Doping is the crucial way of directing semiconductor properties such as the band gap,
electrical conductivity. Several metals and nonmetals have been effectively used to dope ZnO
by numerous synthesis methods. The conductivity of ZnO including its polarity and related
materials need to be engineered controllably. Intentional n-type doping is relatively well
recognized and produces highly conductive n-type ZnO through the substitution of Zn by
group III elements (Al, Ga, In) and O by group VII elements (F, Cl and I) [5, 6]. However,
Group VII element Fluorine is a promising doping candidate due to its ionic radius which is
similar to oxygen (F-1 1.31 ˚A; O-2 1.38 ˚A). It is a proper additional impurity in the ZnO
structure to adapt a significant resistance change to create the ZnO structure highly
responsive sensor [7, 8].

ENGINEERING 275
Density functional theory (DFT) calculations are proficient to achieve electronic band
structure, electronic transport, optical and dielectric properties of ZnO based materials
ideally. This work attempts to study the effect of doping on the surface of the ZnO nanosheet
based on DFT combined with Non-equilibrium Green’s function (NEGF) technique. A
perfect graphene-like ZnO nanosheet and doped one were experimented through the
calculation to examine the band structures, band gap differences and density of states of the
both structure. The intension of the experiment was to analysis the influence of doping on
ZnO structure, which can be further developed to build a gas sensor device.
MAIN RESULTS
In the perfect ZnO sheet, a doping was introduced by replacing one single O atom with F to
explore the impact of group VII element on the properties of a ZnO sheet. The calculated Eg
values are showed on the table I and experimented structures are shown in figure 1 and 2, the
band structures are presented in figure 3 (pure) and 4 (doped).
Table 1: The Calculated Energy Band Gap for the Pure and F Doped ZnO Sheets
Figure 1. Pure and doped ZnO nanosheet
For the pure ZnO, first principle calculation generated a band gap of 2.035eV which is much
lower than the experimental value (3.34eV) due to a band gap problem of DFT [9]. For
example, Eg values were found by different approximation were calculated ranging from 1 eV
to 2.22 eV [10-12] which somehow satisfies the value of our experimental finding. From the
Eg value calculated (1.2eV and 1.3 eV) for F and Al doped ZnO there was a significant band
gap difference observed. Later on these built models were exposed to the CO gas molecule
to observe the sensitivity. Under the presence of CO all three models showed signification
drop on band gaps which is factor to calculate the sensitivity, as with the decreasing band gap
the sensitivity increases. Results are summarized in the Table 1.
Therefore, it can be concluded the electronic characteristic of ZnO is significantly controlled
by a group III and group VII dopants with a precise vacancy. Consequently these doped and
pure models can be developed as a gas sensor to check gas sensitivity in air. The main
electronic behavior of any structure is found around the EF area, which can generate high
conductivity in the structure.
Structure Eg (eV) Eg (eV) with CO gas
Perfect ZnO sheet 1 0.6
F doped ZnO 1.2 0.67
Al doped ZnO 1.3 0.69

ENGINEERING 276
CONCLUSION
A bulk and doped (Al, F) ZnO nanosheet were modeled by using NEGF and DFT techniques
in the ATK software package. The purpose of this study was to interpret the dopant effect on
the electronic structure of ZnO and apply the theory to sense gas molecule. For this above-
mentioned purpose, we applied a group III and group VII element by replacing a single atom
Zn and single O atom individually from the bulk ZnO nanosheet. We detected a significant
change in the band gap on the proposed models. This study extends further for gas sensing
device built on ZnO surface. From the current study, it is confirmed that ZnO structure can be
engineered by dopant properties to make it more conductive by reducing band gap.
Therefore, a doped ZnO structure has the prospect to be employed in assembling nano
structure devices.
Acknowledgement: The authors would like to acknowledge the financial support from
Research University grant of Universiti Teknologi Malaysia under Projects
Q.J130000.2723.19H33, Q.J130000.2523.14H63 and Ministry of Higher Education of
Malaysia.
REFERENCES
1. Ü. Özgür, Ya.I.Alivov, C.Liu, A.Teke, M.A.Reshchikov, S.Doğan,V.Avrutin, S.J.Cho, and H.Morkoç, A
comprehensive review of ZnO materials and devices, J. Applied Physics, 98,041301 (2005).
2. C.Jagadish and S.J.Pearton. Zinc Oxide Bulk, Thin Films and Nanostructures, Processing, Properties and
Application, Elsevier, Oxford, U.K. (2006).
3. A. Qurashi, N. Tabet, M. Faiz, and T. Yamzaki, Nanoscale Res. Lett. 4, 948 (2009).
4. R. Yousefi, Doped ZnO Nanostructures: Growth, Properties, and Applications, 2011
5. Laks, D.B., Van de Walle, C.G., Neumark, G.F. and Pantelides, S.T. Applied Physics Lettice”, 63, 1375.
(1993)
6. Zhang, S.B., Wei, S.-H. And Zunger, A. Overcoming doping bottlenecks in semiconductors and wide-gap
materials”. Physics B, 273–274, 976. (1999)
7. Sunanda C. Yadav, Head & Assit. Prof., Dept. of Physics, Miraj Mahavidyalaya, Miraj. Effect of Fluorine
doping on H2S gas sensing properties of Zinc Oxide thin films deposited by Spray CVD Technique, 416410,
Maharashtra, India
8. L. Li, H. Yang, H. Zhao et al., Hydrothermal synthesis and gas sensing properties of single-crystalline ultra-
long ZnO nanowires, Applied Physics A, vol. 98, no. 3, pp. 635–641, (2010).
9. X. Y. Feng, Zhe Wang, C.W. Zhang, and P.J. Wang, Electronic Structure and Energy Band of IIIA Doped
Group ZnO Nanosheets, School of Physics, (2013)
10. A. Janotti and C.G. Van de Walle, Oxygen vacancies in ZnO, (2005)
11. Y. Imai Akio Watanabe, Isao Shimono, Comparison of electronic structures of doped ZnS and ZnO
calculated by a first-principle pseudopotential method. March (2003).
12. S.Zh. Karazhanova,b, P. Ravindrana, U. Grossnerc, A. Kjekshusa, H. Fjellvag, B.G. Svenssonc, Strong
Coulomb correlation effects in ZnO (2006).

ENGINEERING 277
IGCESH2018
Universiti Teknologi Malaysia, Johor Bahru, Malaysia 13 -15 August 2018
SYSTEMATIC DESIGN OF ENERGY EFFICIENT FLASH
SEPARATION PROCESS FOR MULTICOMPONENT MIXTURE
Faizul Hakim Elidor*1 , Muhammad Afiq Zubir1, Beatrice Aavie Tang1, Nur Aqila
Naseri1, Muhammad Fakrul Islam Zahran1 , Ahmad Nafais Rahimi1 , Munawar
Zaman Shahruddin1 , Kamarul Asri Ibrahim1,2 and Mohd. Kamaruddin Abd.
Hamid1,2
1Process Systematic Engineering Centre (PROSPECT), Research Institute For Sustainable
Environment (RISE), University Teknologi Malaysia ,83100, UTM Johor Bahru, Johor, MALAYSIA.
(E-mail: [email protected] , [email protected] , [email protected] ,
[email protected]) 2Department of Chemical Engineering , Faculty of Chemical and Energy Engineering, University
Teknologi Malaysia, 83100 UTM Johor Bahru, Johor, MALAYSIA
(e-mail: [email protected], [email protected])
ABSTRACT
Separation processes are important in industries to obtain pure products after the reacting the
raw materials. Distillation, one of the most applied separation unit, is important in the
refining industry. But the design and synthesis of distillation columns can only be done
through the use of rigorous simulation and optimization. In contrast, the design of flash
separation would be easier because it does not have the requirement to calculate minimum
number of plates and reflux ratio, only pressure. Thus, a systematic design of flash separation
is proposed using a driving force algorithm and Aspen HYSYS to simulate a case study.
These designs are based on the developed flash separation framework and database. The
multicomponent hydrocarbon mixture sets are varied between 0.1 to 0.9 mole fraction and 2
atm to 40 atm respectively for the feed condition. The database of the hydrocarbon
multicomponent mixtures is developed through simulation using Microsoft Excel. In this
study, it can be concluded that it is easier to design a flash separation column using an
integrated database, which has been developed using the driving force method. This
framework will assist in identifying the optimal flash column design from the existing
distilation design by increasing the efficiency in terms of energy consumption based on
desired operation and product purity
Key words: Flash distillation, Driving force method, Multicomponent Hydrocarbon mixture
INTRODUCTION
Flash separation is one the easiest and simplest practiced separation processes as no
rectification is needed, compared to other distillation methods [1]. Flash separation works as
a single-stage equilibrium separator that has a lower energy consumption, is more
economical, and is easier to design than ordinary distillation. In petroleum industry, the
production of liquefied petroleum gas and the purification of nitrogen, oxygen and rare gases

ENGINEERING 278
use flash columns in the plants. The application of flash column for the separation of dry
petroleum sulphonate salts from non-sulphonated materials was invented by Bangs et al. [2].
In petrochemical industry, flash distillation is used in stripping processes between solvent and
water in waste water systems for solvent recovery due to its economical scale and low-grade
steam operation. Through modelling, simulation, and optimization, researches have been
focusing mainly on how to improve the performance of multi-stage flash desalination
processes.
The main objective of this study is to create a methodology for designing an optimal flash
column and producing a database for flash separation column design, which consists of
various pressures and mole fractions in the feed condition with product purities. As a
preliminary step, to determine the feed conditions of the hydrocarbon mixtures into the
flash, the driving force technique [3] needs to be applied in this research. Through
rigorous simulations in Aspen HYSYS V9, compositions and pressures will be the
manipulated values of the feed to determine the composition of components in both
vapour phase and liquid phase. The results are tabulated and a searching tool is made as a
tool for the preliminary design of flash separation column.
METHODOLOGY
Hydrocarbons from propane (C3) to nC-30 were listed based on the boiling
points in increasing order to conduct the split of multicomponent mixture. Fluid package in
Aspen HYSYS simulator was selected based on the properties of the mixture. The fluid
package selected was the commonly used package which is Antoine fluid package for ideal
condition. The multicomponent mixtures of hydrocarbon were set in different conditions, by
manipulating either the inlet pressure or inlet composition and fixed the other variable. The
composition of component was set to be in the range of 0.10 to 0.90 mole fraction.
Meanwhile, the pressure inlet of the saturated liquid mixture was set in the range of 2 atm to
40 atm. The mixtures were simulated rigorously using Aspen HYSYS V9. The results of
products composition (purity) were tabulated using Microsoft Excel.
EXPECTED RESULTS
The database for the flash column will be tabulated and recorded using Microsoft Excel
as shown in Figure 1. Below are some assumptions considered in this research:
1. Only sharp separation is considered for flash separation in this study.
2. Feed inlet of the flash column is saturated liquid.
3. The separation process occurred in flash column is under ideal condition.
4. The pressure drop between the top and bottom outlets is fixed at 0.011 atm, where
the bottom outlet pressure is set at 1.00 atm and the top outlet pressure is set at
0.989 atm.
5. Product is only considered pure when it reaches 0.99 mole fraction or 99% mole
percentage in the outlet stream.

ENGINEERING 279
Figure 1. Table for recording the data obtained
The manipulated values of the composition and pressure of the feed is expected to give
several patterns in designing the optimal flash distillation. In terms of the effect of pressure
on the database (purity) of flash distillation design, it is expected that when the pressure drop
in the flash separator is increased, the purity of products will increase as well. Meanwhile, for
the effect of composition on the purity of flash distillation, it is expected that when the
composition of the light key component is increased, the purity of products will increase.
There are also some economic analyses that will be done and it is expected that the separation
using flash column will consume less energy than the separation using other than flash
column, even though the product purities are the same.
CONCLUSION
In this study, it can be concluded that the design of flash separation is easier compared to the
design of distillation column. The methodology will be used as a tool, a database for the
separation of multicomponent hydrocarbon mixtures using flash column. This method was
limited to propane until c-30, and a pressure range of 101.3kPa to 4120kPa. The expected
result is that by using the proposed framework and database, plant designers will be able to
design optimal flash column based separation processes in an easy, practical, and systematic
manner.
Acknowledgment: The authors would like to express their appreciation for the support of the
sponsors with Zamalah Scholarship UTM.
REFERENCES
1. Wankat, P. C. (2006). Separation process engineering. UK: Pearson Education
2. Bangs, C. R., Louis, B. R., and Dwaine, A. H. (1943). U.S. Patent No. 2,316,670. Washington, DC: U.S.
Patent and Trademark Office
3. Gani, R., and Bek‐Pedersen, E. (2000). Simple new algorithm for distillation column design. AIChE Journal,
46(6), 1271-1274.

ENGINEERING 280
IGCESH2018
Universiti Teknologi Malaysia, Johor Bahru, Malaysia 13 -15 August 2018
INDOOR TEMPERATURE PROFILE OF HEAT LAMP IN BROILER
HOUSE
K.X. Lau*1, P.L. Leow2, J.J. Jamian2, R. Arsat2, A.A.A. Abdeltawab2, S.S. Rahman2,
N.H.A. Khalid3, A. Mohamed3 and I.A. Khalid4
1, 2 Faculty of Electrical Engineering, Universiti Teknologi Malaysia, Skudai, MALAYSIA.
(E-mail: [email protected], [email protected]) 3 Faculty of Civil Engineering, Universiti Teknologi Malaysia, Skudai, MALAYSIA.
(E-mail: [email protected]) 4Khalid Latiff Holding Sdn Bhd, 80350, Johor Bahru, Malaysia
ABSTRACT
Malaysia is one of the main suppliers for staple meat in Asia where the demands towards the
broiler products grow annually. As a tropical country, the annual temperature in Malaysia is
ranging from 24 °C to 38 °C. Broiler house normally built on the hill side with open-concept
experiences dynamic temperature change regarding on the outdoor temperature. Ambient
temperature is crucial to improve the production of broilers and profit of the nation.
Nowadays, utilization of heat lamps are popular in the broiler house to provide heat as the
ambient temperature needed by the broilers depends on the day of age. However, lacking of
knowledge and information on the heat lamp influences the performance and production of
broilers. Thus, this paper presents the indoor temperature profile of heat lamp to enhance the
recognition towards the suitable application of heat lamp for broiler house. The experimental
model mimicking broiler house (10 ft × 10 ft) was built with eight temperature sensors
positioned at eight different places. Four heat lamps, Philips 100 W incandescent bulb,
Phoenix 100 W incandescent bulb, Philips 150 W infrared bulb and Out Door Flood 300 W
fluorescent bulb are tested with different heights. Philips 150 W infrared bulb shows the most
uniform and widest coverage area until S3 among the four bulbs within the experimental
model.
Key words: Ambient temperature, Heat lamp, Coverage area
INTRODUCTION
Malaysia is one of the main provider for staple meat in Asia[1] and broiler is raised and grew
specifically for the meat. Malaysia is a tropical country that has the annual temperature range
from 24 °C to 38 °C and broiler houses are normally located on hill side in an open space.
Some open house design system of broiler house in Malaysia experience the dynamic
temperature change depends on the ambient temperature. High indoor temperature causes
heat stress of broilers and low indoor temperature causes the broilers to experience cold
stress. Some modern broiler house installs effective heating and cooling elements to provide
thermal comfort for broilers[2]. Ambient temperature required by broilers depends on their
age[3][4]. Table 1 shows the ambient temperature needed by broiler throughout a cycle.

ENGINEERING 281
Table 1. Ambient temperature required by broilers
Day of Age Ambient Temperature (°C)
1-3 34-36
4-14 32-33
15-21 29-30
22-35 22-28
36+ 21
Utilization of heat lamp to provide heat and maintain optimum temperature in the broiler
house becomes popular choice among the farm operators in Malaysia. However, lacking
information on the heat lamp affects the performance and production of broilers. Figure 1
shows the problem faced by the farm operator.
Figure 1. Chicks run away from the localized heat source
The experimental model mimicking broiler house (10 ft × 10 ft) was built with eight
temperature sensors labelled as S1to S8 and were positioned at eight spots across the model.
S1 was placed directly underneath the heat lamp. Four heat lamps, Philips 100 W
incandescent bulb, Phoenix 100 W incandescent bulb, Philips 150 W infrared bulb and Out
Door Flood 300 W fluorescent bulb are tested with different heights, 70cm-110cm. The
baseline temperature was set as 25 °C. Figure 2 shows the position of sensors in the
experimental model.
Figure 2. Position of sensors in the experimental model
heat lamp
Point of
sensor
S1
S2S3
S4
S5
S6
S7S8
10 ft
10 f
t

ENGINEERING 282
MAIN RESULTS
The statistical graph was used to analyze the temperature profile of heat lamps. Figure
shows the performance of each heat lamps.
Figure 3. Graph of temperature for four bulbs
As shown in Figure 3, Philips 150 W infrared bulb covers the most uniform and widest area
until S3 with 28 °C. Phoenix 120 W incandescent bulb localizes heat directly underneath S1
and temperature of 42 °C causes burnt towards the broilers. Out Door Flood 300 W
fluorescent bulb does not fulfil the ambient temperature required by broilers from day 1 to
day 14.
CONCLUSION
Indoor temperature profile of four heat lamps to suit the application for broiler house and
optimize the performance and production of broilers. Future work involves the real
application and real-time monitoring of Philips 150 W infrared bulb in the broiler house.
Acknowledgment: The authors would like to express their appreciation for the support of
Khalid Latiff Holding Sdn. Bhd (R.J130000.7623.4C157). The research is also funded by
UTM Research University Grant (Q.J130000.2523.15H88).
REFERENCES
1. Rasak and S.H. Performance of broiler contract farmers: A case study in Perak, Malaysia. UMK Procedia 1
(2014), 18–25. 2. Karla, Irenilza, R.G., Rodrigo, and F.C. Impact of different light sources on broiler rearing environment.
Eng. Agrícola Jaboticaba 34 (2014), 428–434.
3. Aborisade, David and O.S. Poultry house temperature control using Fuzzy-PID controller. International
Journal of Engineering Trends and Technology 11 (2014), 310–314.
4. Sainsbury and D.W.B. Livestock housing. In British Veterinary Journal 152 (2013), 225–298.

ENGINEERING 283
IGCESH2018
Universiti Teknologi Malaysia, Johor Bahru, Malaysia 13 -15 August 2018
AN INSIGHT OF GROUNDWATER STATUS IN MALAYSIA
Vynotdni*1, Edy Tonnizam Mohamad2
1 PHD Candidate, Department Geotechnics and Transportation, Faculty of Civil Engineering,
Universiti Teknologi Malaysia, Johor Bahru, MALAYSIA.
(E-mail: [email protected]) 2 Professor, Centre of Geotropik, Faculty of Civil Engineering, Universiti Teknologi Malaysia, Johor
Bahru, MALAYSIA.
(E-mail: [email protected])
ABSTRACT
The water demand is increasing rapidly worldwide. The urbanization, agriculture and climate
changes are the sources of growing water scarcity. This issue affects ecological systems,
economic growth, people and society. Unfortunately, the groundwater is not considered in
many city systems thinking including Malaysia. There are only a few states like Kelantan,
Selangor, Sabah and Sarawak actively using groundwater as the alternative or in conjunctive
to surface water. The common type of aquifers explored in Malaysia were alluvium,
limestone, sandstone, igneous and volcanic rocks. Moreover, the strategies to implement
groundwater resources in Malaysia according to Integrated Aquifer Systems Management
Report were discussed. However, unlike surface water, the departments and acts that are
directly related to groundwater are limited. Finally, this paper promotes usage of groundwater
as the alternative or in conjunctive to other water resources.
Key words: Groundwater, Malaysia, Water resources
INTRODUCTION
The rate of water demand has increased twice the rate of population growth in recent decades.
Urbanization, irrigated agriculture and industrialization are also some factors that contribute
to water scarcity [1]. It is predicted that there will be water deficit of 40% by 2030 under
current climate changes [2]. Water scarcity also directly influences economic growth besides
affecting ecological systems, people and society. Most of the countries worldwide are already
facing hitches to access safe and clean drinking water [3]. Asian countries are facing water
scarcity despite the fact that Asia has large water availability.
This water scarcity issue accentuates the negative impact on the development of a city. The
early finding shows that effective alternative steps such as exploring groundwater, utilize
marginal water resources, broaden water supply catchment area and invest in innovative
solutions and advanced technologies to manipulate natural water sources must be taken. The
importance of groundwater in supporting urban living and the impact of urbanism on natural
groundwater is being highlighted in current studies but unfortunately, the groundwater is not
considered in many city systems thinking [4]. This could be due to few misconceptions like
groundwater is a finite resource, uncertain, polluted, pricey to develop and maintain, hard to
extract and give unfavourable impact to the environment [5].

ENGINEERING 284
GROUNDWATER AVAILABILITY AND CONSUMPTION IN MALAYSIA
Malaysia is rich with groundwater as well as surface water. There is around 72% of
groundwater storage in Malaysia which means that the groundwater has a high potential to be
used as the alternative or in conjunctive to surface water [5]. However, there are only a few
states in Malaysia has exploited groundwater so far. The states are Kelantan, the major
exploiter, Selangor, Sabah and Sarawak [5]. The Kelantan uses groundwater for domestic,
industry and agriculture while Selangor uses it for industrial purpose. Meanwhile, in Sabah
and Sarawak, the groundwater is mostly used in coastal areas for domestic use [5].
Table 1. Type of aquifer and quantity being used in Malaysia [5]
Location Type of aquifer Quantity being used
Peninsular
Malaysia
Alluvium 50 to 100 m3/h/well
Limestone 50 m3/h/well
Fractured sandstone and volcanic rocks 30 m3/h/well
Fractured igneous rocks 20 m3/h/well
Sarawak Alluvium (near coastal area)
0.05 million m3/d Sedimentary basins
Fractured hard rocks
Sabah Quaternary and Recent alluvium 0.02 million m3/d
INTEGRATED AQUIFER SYSTEMS MANAGEMENT
Integrated Aquifer System Management is an approach to accomplish feasible management
of aquifers which can assure the sustainability of groundwater assessment, extraction and
management [6]. A national groundwater colloquium named ‘Groundwater Management in
Malaysia – Status and Challenges’ and five multi-stakeholder consultative workshops were
conducted in the year 2009. The Integrated Aquifer System Management Report has come up
with the strategies for implementation of groundwater in Malaysia. The strategies were
passing appropriate legislation to strengthen existing legal framework, identifying and
empowering a lead ministry or agency at federal level, establishing a National Groundwater
Research Centre under Ministry of Natural Resources and Environment, facilitating states to
play a leading role in groundwater management, establishing a standing committee on
groundwater within the purview of the National Water Resources Council, establishing
groundwater management committees at state level, developing detailed action plans and
changing public perceptions towards groundwater [6].
DEPARTMENTS AND REGULATIONS FOR GROUNDWATER
The water governance is defined as systems such as politics, social, economy and
administration are in place to regulate the development and management of water resources
and provision of water services at different levels of society [7]. The water acts are
established to support water governance. There are many departments and acts related to
water resource management. However, only a few are directly related to groundwater [5].
The active departments are Minerals and Geoscience Department, State Water Boards or
Authorities, Ministry of Health, Department of Environment, National Hydraulic Research
Institute of Malaysia and National Water Services Commission. Meanwhile, the enforced acts
are Geological Survey Act, Environmental Quality Act, Water Supply Enactment and
National Water Resources Policy.

ENGINEERING 285
CONCLUSION
In summary, Malaysia is rich which groundwater resource besides surface water. Still, only a
few states are actively exploring the resource. Unfortunately, there is a need to change
people’s and stakeholders’ perception towards groundwater. Many assume that groundwater
is not sustainable and the exploration could harm the environment. On the other hand, proper
training on managing groundwater sustainably has to be done. It was found out that the
government has recommended groundwater to be explored around 30% by the year 2030.
Finally, this paper strongly encourages the use of groundwater as an alternative or in
conjunctive to surface water in Malaysia. It also encourages the groundwater planning to be
included in urban planning in coming years.
Acknowledgment: The authors would like to express their appreciation for the scholarship
support of Zamalah Scholarship of Universiti Teknologi Malaysia.
REFERENCES
1. Lee, K. E., Mokhtar, M., Mohd Hanafiah, M., Abdul Halim, A., and Badusah, J. Rainwater harvesting as an
alternative water resource in Malaysia: potential, policies and development. Journal of Cleaner Production.
126 (2016). 218-222.
2. WWAP. The United Nations World Water Development Report 2015: Water for a Sustainable World.
(UNESCO, Paris, 2015).
3. Saimy, I. S. and Yusof, N. A. M. The Need for Better Water Policy and Governance in Malaysia. Procedia -
Social and Behavioral Sciences. 81 (2013). 371-375.
4. Bricker, S. H., Banks, V. J., Galik, G., Tapete, D., and Jones, R. Accounting for groundwater in future city visions. Land Use Policy. 69 (2017). 618-630.
5. Razak, Y. A. and Karim, M. H. A. Groundwater in the Malaysian Context. Groundwater Management in
Malaysia—Status and Challenges. Minerals and Geoscience Department Malaysia & Academy of
Sciences Malaysia (Year). 1-14.
6. Chand, F. Integrated Aquifer System Management (Academy of Sciences Malaysia, Kuala Lumpur, 2016).
15-31.
7. Jacobson, M., Meyer, F., Oia, I., Reddy, P., and Tropp, H. User's Guide On Assessing Water Governance.
(N.A., Denmark, 2013). 2-6.

ENGINEERING 286
IGCESH2018
Universiti Teknologi Malaysia, Johor Bahru, Malaysia 13 -15 August 2018
STRUCTURAL AND MAGNETIC PROPERTIES OF ZINC DOPED
MAGNETITE NANOPARTICLES
Khong Nee Koo*1, Ahmad Fauzi Ismail1, Mohd Hafiz Dzarfan Othman1 and
Mukhlis A Rahman1
1 Advanced Membrane Technology Research Centre (AMTEC), Universiti Teknologi Malaysia,
Skudai 81310, Johor, Malaysia.
(E-mail: [email protected], [email protected], [email protected],
ABSTRACT
Metal element doping has been widely used to modify or enhanced the magnetic properties of
Fe3O4 nanoparticles. In this paper, a series of colloidal ZnxFe3-xO4 nanoparticles with
different Zn contents of x varying from 0.0 to 1.0 were synthesized through chemical co-
precipitation method. The actual ratios of Zn to Fe in the substituted magnetite nanoparticles
were investigated by electron probe microanalysis (EPMA) and energy dispersion X-ray
spectrometry (EDS). The structural properties of the synthesized nanoparticles were
examined by powder X-ray diffraction (XRD), Mössbauer spectrum, Fourier-transform
infrared spectroscopy (FTIR), thermogravimetric analysis (TGA), dynamic light scattering
(DLS), transmission electron microscopy (TEM) and selected area electron diffraction
(SAED), while the magnetic properties of the synthesized nanoparticles were determined by
vibrating sample magnetometer (VSM). Structural characterization confirmed the formation
of cubic spinel structure with an average crystallite size in the range of 8 to 20 nm. Magnetic
studies indicated that the synthesized ZnxFe3-xO4 nanoparticles exhibited excellent
superparamagnetic properties without remanence magnetisation and coercivity. Moreover,
the results also showed a significant increase in magnetization saturation (Ms) of ZnxFe3-xO4
compared to non-doped Fe3O4 nanoparticles for relatively minor quantities of Zn substitution.
The findings revealed the optimum Zn cation concentration that gives the highest Ms value in
Zn doped Fe3O4 nanoparticles through chemical co-precipitation method.
Key words: Magnetite, Chemical co-precipitation, Structural characterization, Magnetic
properties
INTRODUCTION
As one of the most important nanostructured magnetic materials, Fe3O4 nanoparticles
have attracted much attention over the past decade owing to its unique and tunable
magnetic properties [1]. One of the remarkably advantages that the magnetic properties of
Fe3O4 are controlled by its particle size. Fe3O4 can exhibit superparamagnetism when its
particle size is smaller than the critical diameter (Dc) [2]. Different from the bulk
counterparts, Fe3O4 are no longer exhibit ferromagnetism but present superparamagnetism
with large response to the applied magnetic field and negligible remanence saturation

ENGINEERING 287
(Mr) and coercivity (Hc) [3]. Therefore, such a material can only be magnetized in the
presence of external magnetic field and demagnetized only with the removal of the
external magnetic field. A number of studies for superparamagnetic Fe3O4 have made
substantial progress in application of drug delivery [4], diagnostic magnetic resonance
imaging (MRI) [5], high density data storages [6], and optical fiber sensing system [7].
However, superparamagnetic Fe3O4 with relatively low magnetization saturation (Ms) has
always been a constraint for their practical applications [8]. To address these constraints,
metal element doping is the most effective method. In this case, the doped magnetite
materials are usually recorded as MFe2O4 where M represents various divalent metallic
elements including Zn, Co, Ni, Cu, Mn and Mg. In an attempt to explore the relationship
between magnetism and zinc doping, this paper deals with a series of ZnxFe3-xO4 (0 ≤ x
≤1), where x represents the amount of Zn doped into Fe3O4, prepared through the
chemical coprecipitation method. The focus of this study is concentrated on the
magnetization versus applied magnetic field for a series of Zn substituted Fe3O4
nanoparticles with different x.
MAIN RESULTS
The magnetic properties of Fe3O4 and Zn-doped Fe3O4 nanoparticles were determined using
VSM analysis, including the measurements of magnetization saturation (Ms), coercivity (Hc).
As shown in Figure 1, the result demonstrated the Ms values increased when zinc is
incorporated into the Fe3O4. The Fe3O4 and Zn0.2Fe2.8O4 nanoparticles showed
superparamagnetic properties with negligible Mr and Hc.
Figure 1. Magnetic Hysteresis (M-H) loops of Fe3O4 and Zn0.2Fe3O4.

ENGINEERING 288
CONCLUSION
The findings are important in revealing the optimum Zn cation concentration that gives the
highest Ms value in Zn doped Fe3O4 nanoparticles. The enhanced magnetic properties of Zn
doped Fe3O4 nanoparticles give superior performance in various applications, such as
increase the detection range of optical fiber sensor in magnetic field detection as well as
improve the MRI contrast record.
Acknowledgment: The authors would like to thank Universiti Teknologi Malaysia and
Ministry of Higher Education Malaysia for all support provided. This work was financially
supported by the Petronas Research Fund (PRF) (R.J130000.7609.4C112).
REFERENCES
1. Campos, E. A., Stockler Pinto, D. V. B., Oliveira, J. I. S. d., Mattos, E. D. C., & Dutra, R. D. C. L. Synthesis,
characterization and applications of iron oxide nanoparticles - a short review. Journal of Aerospace
Technology and Management 7 (2015), 267-276. 2. Ghazanfari, M. R., Kashefi, M., Shams, S. F. and Jaafari, M. R. Perspective of Fe3O4 Nanoparticles Role in
Biomedical Applications. Biochemistry Research International 32 (2016).
3. Sun, S. N., Wei, C., Zhu, Z. Z., Hou, Y. L., Venkatraman, S. S. and Xu, Z. C. Magnetic iron oxide
nanoparticles: Synthesis and surface coating techniques for biomedical applications. Chinese Physics B 23
(2014).
4. Mahmoudi, M., Sant, S., Wang, B., Laurent, S. and Sen, T. Superparamagnetic iron oxide nanoparticles
(SPIONS): Development, surface modification and applications in chemotherapy. Advanced Drug Delivery
Reviews 63 (2011), 24-46.
5. Busquets, M., Estelrich, J. and Sánchez-Martín, M. J. Nanoparticles in magnetic resonance imaging: From
simple to dual contrast agents. International Journal of Nanomedicine 10 (2015), 1727–1741.
6. Kim, T. H., Jang, E. Y., Lee, N. J., Choi, D. J., Lee, K. J., Jang, J. T., Choi, J. S., Moon, S. H., Cheon, J. Nanoparticle Assemblies as Memristors. Nano Lett. 9 (2009), 2229-2233.
7. Emmons, M. C., Kim, H. K. D., Carman, G. P. and Richards, W. L. Magneto-optic Field Coupling in Optical
Fiber Bragg Gratings. Optical Fiber Technology 18 (2012), 157 - 160.
8. Xuan, S., Wang, Y.J., Yu, J. C., Leung, K. C. Tuning the grain size and particle size of superparamagnetic
Fe3O4 microparticles. Chem. Mater. 21 (2009), 5079-5087.

ENGINEERING 289
IGCESH2018
Universiti Teknologi Malaysia, Johor Bahru, Malaysia 13 -15 August 2018
SYSTEMATIC DESIGN OF ENERGY EFFICIENT FLASH COLUMN
SEPARATION PROCESSES
Muhammad Afiq Zubir1, Beatrice Aavie Tang1, Faizul Hakim Elidor1, Nur Aqila
Naseri1, Ahmad Nafais Rahimi1, Muhammad Fakhrul Islam Zahran1, Munawar
Zaman Shahruddin1, Kamarul Asri Ibrahim1,2 and Mohd. Kamaruddin Abd.
Hamid*1,2
1 Process Systems Engineering Centre (PROSPECT), Research Institute of Sustainable Environment
(RISE), Universiti Teknologi Malaysia, 81310 UTM Johor Bahru, Johor, MALAYSIA.
(E-mail: [email protected], [email protected], [email protected], [email protected], [email protected], [email protected])
2 Department of Chemical Engineering, Faculty of Chemical and Energy Engineering, Universiti
Teknologi Malaysia, 81310 UTM Johor Bahru, Johor, MALAYSIA.
(E-mail: [email protected], [email protected])
ABSTRACT
Distillation column, one of the most applied separation unit, is important in the refining
industry. Compared to distillation column, the design of flash distillation would be easier as it
does not involve the calculation of minimum number of plates and reflux ratio, but only
pressure. A systematic design of flash distillation is developed by using driving force
algorithm, and Aspen HYSYS is used to simulate the case study. The feed composition and
pressure of binary hydrocarbon mixtures pairs C3-C4 up to C3-C30 are varied between 0.1 to
0.9 mole fraction and 2 atm to 40 atm, respectively. A database of hydrocarbon binary
mixtures is developed through Microsoft Excel simulation. In this study, it can be concluded
that it is easier to design a flash separation column using the proposed database that is
developed using the driving force method. It is capable of reducing the time taken by the user
and providing an operating condition which would fulfil the targeted purity of the products.
Key words: Flash separation, driving force method, relative separability database, hydrocarbon
mixture
INTRODUCTION
A flash separation column is more economic compared to other columns as its operation only
requires a single stage without the need of trays or stages and rectification. Flash separation is
used on a large scale in the petroleum industry, production of liquefied petroleum gas, and
also manufacturing and purification of nitrogen, oxygen, and rare gases. Flash separation was
used in the invention by Bangs et al. [1] in purification of petroleum sulphonates solution to
obtain dry petroleum sulphonate salts that are free from non-sulphonated materials. Besides,
in petroleum industry, flash distillation is also preferably used in the desalination process of
brackish water or ocean water due to its economical scale and low-grade steam operation [2].
Researches done on flash distillation were mainly focused on ways to improve the
performance of a multi-stage flash desalination process through modelling, simulation, and
optimization.

ENGINEERING 290
The aim of this study is to develop a database for flash separation column design, which
consists of various operating conditions with respect to the purity of product produced.
The driving force method [3] is adopted in this research and is used as a preliminary step
to determine the feed conditions of the hydrocarbons mixture going into the flash
separation columns. The various feed conditions are manipulated to determine the
composition of components in both vapour and liquid phases through rigorous
simulations in Aspen HYSYS V9. Tabulation is done to compile the data generated in
Excel and it can be used as a reference for flash separation design.
MAIN RESULTS
The Relative Separability Database shown in Figure 1 was developed and was recorded
using Microsoft Excel. The database consists of the design variables required to design a
flash separation column and the driving force values at each operating condition. The
assumptions used in this study are as follows:
1. Only sharp separation is considered in flash separation in this study.
2. Feed inlet of flash column is saturated liquid.
3. The separation process occurred in flash column is under ideal condition.
4. The pressure drop difference between the top and bottom outlets is fixed at 0.01007
atm, where bottom outlet pressure is set at 1.00 atm and the top outlet pressure is set
at 0.98993 atm.
5. Product is only considered pure when it reaches 0.99 mole fraction or 99 % mole
fraction at the outlet stream.
Table 1. Example of Relative Separability Database using Microsoft Excel
Based on the findings, the database developed has identified several patterns in designing
flash separation. The binary mixture that has a higher amount of light component tends to
achieve a higher purity of products at lower pressure. This is because the lower energy
(pressure) in the feed is sufficient to separate the huge amount of light component from the
liquid phase. Contrarily, high feed pressure and pressure drop resulted to decrease in purity of
light product because the heavy key component is more easily vaporised at higher pressures.
The database can shortlist several operating conditions that will fulfil user input for product

ENGINEERING 291
purities so that the user can easily choose without randomly testing any operating conditions
to achieve the desired purity. If the database does not provide any operating condition at a
given purity, then flash separation is not feasible to be used for that separation process and a
distillation column may be chosen instead.
CONCLUSION
In this study, it can be addressed that the design of flash separation is easier than distillation
column. Design of flash separation requires less design variables compared to distillation
column. The database proposed in this study consists of around 9600 combination of binary
mixture hydrocarbon pairs from C3-C4 up to C3-C30 varied from mole fraction 0.1 to 0.9
and pressure feed from 2 atm to 40 atm. By using the proposed database, users can identify
the operating condition that fulfils the required purities of products and design the flash
separation in a systematic manner. Due to a very huge combination, the design the flash
separation solely using a process simulator will take a considerable amount of time. Hence,
this database is capable of reducing the time taken to design flash separation. Since this study
is only carried out for binary mixtures, future research should be focused on the design of
flash separation for multicomponent mixtures and identify the effect of multicomponent
mixtures to the separation efficiency in flash separation.
Acknowledgment: The authors would like to express their appreciation for the support from
Zamalah Scholarship UTM and UTM RUGS Projects (Q.J130000.2446.03G68 and
Q.J130000.2546.19H72).
REFERENCES
1. Bangs, C. R., Louis, B. R., and Dwaine, A. H. (1943). U.S. Patent No. 2,316,670. Washington, DC: U.S.
Patent and Trademark Office 2. Shatat M. and Riffat S.B. (2012). Water desalination technologies utilizing conventional and renewable
energy sources. Retrieved on April 28th, 2017.
3. Gani, R., and Bek‐Pedersen, E. (2000). Simple new algorithm for distillation column design. AIChE Journal,
46(6), 1271-1274.

ENGINEERING 292
IGCESH2018
Universiti Teknologi Malaysia, Johor Bahru, Malaysia 13 -15 August 2018
PRODUCTION OF LACTOBACILLUS CASEI AS DIRECT-FED
MICROBIAL IN RICE BRAN EXTRACT: EFFECT OF INCUBATION
TIME AND INOCULUM SIZE
Siti Marsilawati Mohamed Esivan, Roslina Rashid* and Nor Athirah Zaharudin
Department of Bioprocess & Polymer Engineering, Faculty of Chemical and Energy Engineering,
Universiti Teknologi Malaysia, Skudai, MALAYSIA.
(E-mail: [email protected], [email protected], [email protected])
ABSTRACT
The production of direct-fed microbial is cost competitive. A commercial medium such as de
Man, Rogosa and Sharpe (MRS) is usually too costly. Thus, agro-waste such as rice bran is
utilized as an alternative carbon source in this production of direct-fed microbial. The aims of
this study were to evaluate the effect of incubation time and inoculum size on the viability of
Lactobacillus casei fermented in rice bran extract. The fermentations were conducted under
microaerophilic condition, at 37°C and initial pH value of 5.5. The inoculum size was varied
in between 1% (v/v) and 10% (v/v) and the incubation time was investigated in between 6
and 24 hours. Based on our statistical analysis, the effects of incubation time and inoculum
size are significant to the growth of direct-fed microbial L. casei fermented in rice bran
extract. Inoculum size more than 5% (v/v) shows a noticeable decrease in the viability of L.
casei. In this study, the optimum fermentation time and inoculum size are 12 hour and 5%
(v/v), respectively and the highest viability of 9.29 log cfu/ml was observed at the optimum
conditions.
Key words: Lactobacillus casei, fermentation, rice bran, inoculum size, direct-fed microbial
INTRODUCTION
Direct-fed microbial or also known as probiotics is referring to live microorganisms given to
the animal as one of the feed additives in order to replace antibiotic growth promoter used in
animal husbandry and it has been marketed in various forms such as in oral pastes, in carriers
to be mixed with feeds and in boluses [1] and the markets is currently expanding due to the
increase of interest in safety food. Lactobacillus sp. is amongst the well-known resident in
animals and human’s gastrointestinal tract [2] and is widely used as probiotics for humans
and direct-fed microbial produced for ruminant [3]. It is due to its broad ecological
distribution, which showed that this bacteria has a metabolic flexibility and drives it
applications widely in food and health industries [4]. This strain is also one of the most
commonly consumed and best-characterized probiotic species [5].
The physical parameters such as incubation time and inoculum size are known to exert
significant effect in the fermentation process [6, 7]. These parameters affecting the
fermentation performances in regards to the microbial growth rate, viability and biomass
yield [8, 9]. Incubation time relates to the growth stages or growth phases of a microbe.

ENGINEERING 293
Studies of the effect of incubation time also had been conducted by various researchers [2, 9]
in medium fermentation such as pumpkin waste and coconut water. Inoculum size or the
initial concentration of cell affects the duration of lag phase [10]. In low concentration, it
will prolonged the duration of lag phase, however in high concentration the inoculum leads to
the cell clumping and increase in sugar consumption and leads to premature stationary phase.
This study is the continuation of previous study [11] and its aim were to study the effect of
incubation time and inoculum size on the viability of Lactobacillus casei ATCC 393
incubated in rice bran extract.
MAIN RESULTS
The effects of incubation time and inoculum size on the cell growth of L. casei in rice
bran extract are shown as in Figure 1 and Figure 2.
Figure 1. The growth of L. casei at various incubation time under microaerophilic condition,
at 37°C, initial pH of 6.5 and 1% (v/v) of inoculum size
Figure 2. The growth profile of L. casei in rice bran extract at 37°C, pH 5.5 using various
inoculum concentration
One way ANOVA Test was conducted and it was found that the incubation time and
inoculum size have significant effect on the growth of L. casei incubated in rice bran
extract. The highest cell growth was observed at 12 hour incubation time and further
incubation shows the viability of L. casei was decreasing as shown in Figure 1. Different
inoculum size affects the initial cell concentration in the fermentation medium as shown
in Figure 2. In Figure 2, it can be seen that after 2 hours incubation the growth of L. casei
at different initial inoculum size drop to 1% to 7%, and the most noticeable drop was at

ENGINEERING 294
10% (v/v) inoculum size with 7% of the viability drop. The highest cell viability
concentration of 9.29 log cfu/ml was obtained when inoculum size of 5% (v/v) was used.
CONCLUSION
The effect of incubation time and inoculum size on the growth and cell biomass of L. casei
fermented in rice bran extract was studied. It was found that both parameters, incubation time
and inoculum size have significant effect on the growth of L. casei in rice bran extract. The
optimum incubation time was obtained at 12 hours and the optimum inoculum size was 5%
(v/v).
Acknowledgement: The authors would like to express their appreciation for the support of
Universiti Teknologi Malaysia for financial support under GUP grant (Vote no: 12H37 and
16H99) and to Kilang Beras Bernas Sungai Besar, Selangor for providing rice bran for the
study.
REFERENCES
1. U.S. FDA. Direct-fed microbial products. Section 689.100.
https://www.fda.gov/iceci/compliancemanuals/compliancepolicyguidancemanual/ucm074707.htm. (1995), Accessed September 26, 2017.
2. Hosseini Nezhad, M., Hussain, M.A., Britz, M.L. Stress responses in probiotic Lactobacillus casei. Crit.
Rev. Food Sci. Nutr. (2015), 55, 740–749.
3. McAllister, T.A., Beauchemin, K.A., Alazzeh, A.Y., Baah, J., Teather, R.M., Stanford, K. Review: The use
of direct fed microbials to mitigate pathogens and enhance production in cattle. Can. J. Anim. Sci. (2011),
91, 193–211.
4. Broadbent, J.R., Neeno-Eckwall, E.C., Stahl, B., Tandee, K., Cai, H., Morovic, W., Horvath, P.,
Heidenreich, J., Perna, N.T., Barrangou, R., Steele, J.L. Analysis of the Lactobacillus casei supragenome
and its influence in species evolution and lifestyle adaptation. BMC Genomics (201), 13, 533.
5. Hathout, A.S., Mohamed, S.R., El-Nekeety, A. a., Hassan, N.S., Aly, S.E., Abdel-Wahhab, M. A. Ability of
Lactobacillus casei and Lactobacillus reuteri to protect against oxidative stress in rats fed aflatoxins-
contaminated diet. Toxicon, (2011), 58, 179–186. 6. Anvari, M., Khayati, G., Rostami, S. Optimisation of medium composition for probiotic biomass production
using response surface methodology. J. Dairy Res. (2014), 81, 59–64.
7. Jamal, P., Idris, Z.M., Alam, M.Z. Effects of physicochemical parameters on the production of phenolic
acids from palm oil mill effluent under liquid-state fermentation by Aspergillus niger IBS-103ZA. Food
Chem. (2011), 124, 1595–1602.
8. Alonso, S., Herrero, M., Rendueles, M., Díaz, M. Physiological heterogeneity in Lactobacillus casei
fermentations on residual yoghurt whey. Process Biochem. (2014), 49, 732–739.
9. Lee, P.R., Boo, C.X., Liu, S.Q. Fermentation of coconut water by probiotic strains Lactobacillus acidophilus
L10 and Lactobacillus casei L26. Ann. Microbiol. (2013), 63, 1441–1450.
10. Ahmadi, N., Khosravi-Darani, K., Mohammad Mortazavian, A., Mashayekh, S.M. Effects of Process
Variables on Fed-Batch Production of Propionic Acid. J. Food Process. Preserv. (2017), 41, e12853. 11. Esivan, S.M.M., Rashid, R., Zaharudin, N.A. and Mahmood, N.A.N. Growth and survival of Lactobacillus
casei in rice bran and banana peel medium. Int. J. Nano and Biomaterials, (2016), 6, 151–161.

ENGINEERING 295
IGCESH2018
Universiti Teknologi Malaysia, Johor Bahru, Malaysia 13 -15 August 2018
IMPROVING OLEIC ACID CONTENT IN USED COOKING OIL VIA
ENZYMATIC ACIDOLYSIS
Nor Athirah Zaharudin1, Fatin Nur ‘Aliya Mohamad Ros1, Roslina Rashid*1, Siti
Marsilawati Mohamed Esivan1, Norasikin Othaman2, and Ani Idris1
1 Department of Bioprocess and Polymer Engineering, Faculty of Chemical and Energy Engineering,
Universiti Teknologi Malaysia, Skudai, MALAYSIA.
(E-mail: [email protected], [email protected], [email protected],
[email protected], [email protected]) 2 Department of Chemical Engineering, Faculty of Chemical and Energy Engineering, Universiti
Teknologi Malaysia, Skudai, MALAYSIA
(E-mail: [email protected])
ABSTRACT
A structured lipid with a high amount of oleic acid content was synthesized from lipase-
catalysed acidolysis reaction of used cooking oil (UCO) with oleic acid in the present of n-
hexane. Liquid lipase from Rhizomucor miehei was used in this study. The effects of reaction
temperature, enzyme loading, and substrate mole ratio were investigated. Incorporation of
oleic acid in UCO was determined based on peroxide, iodine, and acid values. Oleic acid
content in UCO before and after acidolysis was compared using gas chromatography (GC-
FID). Under optimal reaction conditions 4% (w/w) enzyme loading, 55°C reaction
temperature, 1:4 substrate mole ratio, 150 rpm agitation speeds and 12 hours reaction time) a
74.71% (v/v) oleic acid content was achieved with peroxide value of 6.19 meq/kg, iodine
value of 23.8 mg/mg and acid value of 8.97 g/g. The result shows that enzymatic acidolysis
reaction has improved the oleic acid content in UCO from 23.83% (v/v) to 74.71% (v/v). This
study provides an effective and sustainable process for the synthesis of enhanced quality oil,
which expected to be used as raw material for various oleochemicals products.
Key words: used cooking oil, lipase, oleic acid, enzymatic acidolysis
INTRODUCTION
Lipases can be employed in the modification of chemical structure of natural triacylglycerols
(TAGs) as to improve their physicochemical properties and/or their health benefits.
Structured lipids (SL) are defined as TAGs which have been chemically or enzymatically
modified to change the fatty acids composition and/or positional distribution in the glycerol
backbone [1]. Studies have also shown that enzymatically or chemically modified TAGs
exhibit similar or, in some cases, greater benefits compared to blended oils with similar fatty
acid compositions [2]. The products from modification of TAGs via enzymatic reaction are
cocoa butter equivalents, human milk fat substitutes, enriched oil with specific fatty acids,
low-caloric fats and plastic fats. The interest on lipase-catalyzed production of SL has
significantly improved due to benefits of enzymatic route compared to chemical-based
processes especially in the field of edible oils and fats [3].

ENGINEERING 296
Used cooking oil (UCO) is a cheap and abundant commodity, representing a product from a
blooming phenomenon of fast food centers and restaurants all over Malaysia. Sebayang et al.
[4] claimed that the total UCO generated from fast food franchise all over Malaysia reach
several thousand litres a day. Utilization of UCO for biodiesel and soap productions is well
explored. However, other utilization properties are still lacking in scientific investigation due
to limited chemical and physical functionalities. Therefore, enhancement of UCO via
enzymatic acidolysis reaction for the production of high oleic oil addresses crucial
environmental problems caused by its disposal as well as provides a solid foundation for
exploration and exploitation on its utilization properties especially for non-food industrial
application. High oleic oils have been utilized for the production of polyurethane, cosmetic
formulation, and lubricant oils.
In this study, UCO was incorporated with oleic acid via enzymatic acidolysis reaction in
the presence of lipase (Rhizomucor miehei) in n-hexane system as to obtain high oleic oil,
offering higher functionality and broad utilization properties. Effect of reaction
conditions including enzyme loading (4-8% w/w), reaction temperature (35°-65° C), and
substrate mole ratio (1:1-1:8 mol/mol) were investigated at constant agitation speed of
150 rpm for 12 hours. One factor at a time experiment was employed in this study.
Peroxide, iodine, and acid values of UCO before and after acidolysis reaction were
determined in order to find optimum conditions for high degree of oleic acid
incorporation. Then, the oil sample at optimum reaction parameters was run through gas
chromatography (GC-FID) for determination of final oleic acid content and was
compared with the oil sample before acidolysis reaction.
MAIN RESULTS
Table 1. Effect of reaction parameters on peroxide (PV), iodine (IV), and acid values
(AV)
Parameters
Chemical Properties
PV
(meq/kg) IV (g/100g)
AV
(mgKOH/mg)
Enzyme load (%w/w) 4 41.3 6.44 16.83
8 23.9 10.68 14.95
10 4.17 22.4 8.42
12 6.78 20.68 12.34
Temperature °C 35 18.04 8.98 16.83
45 16.69 13.56 14.03
55 7.6 23.8 8.98
65 14.34 18.6 13.7
Substrate mole ratio (mol/mol) 1:1 35.7 4.81 22.8
1:2 30.6 11.9 20.95
1:4 6.8 22.8 9.51
1:8 12.69 19.8 15.2

ENGINEERING 297
Figure 1. Oleic acid content (% v/v) before and after acidolysis reaction.
Result from Table 1 shown a significant effect of reaction parameters on PV, IV, and AV
of UCO. PV, IV, and AV experienced the increasing and decreasing trend at certain
reaction parameters. Initially, PV, IV, and AV of UCO before acidolysis reaction are 45.4
meq/kg, 3.46 g/100g, and 21.32 mgKOH/mg respectively. The optimum reaction
parameters for UCO acidolysis reaction are found at enzyme loading of 10% (w/w),
reaction temperature of 55° C and substrate mole ratio of 1:4 mol/mol (oil:oleic acid). At
optimum conditions, PV and IV have reduced to 6.8 meq/kg and 9.51 mgKOH/mg
respectively. However, IV has increased to 22.80 g/100g. Oleic acid has been successfully
incorporated in UCO as confirmed by GC-FID analysis that shows the increased in oleic acid
concentration from 23.83 % to 74.71% (v/v)
CONCLUSION
The optimum reaction conditions for enzymatic acidolysis of UCO were obtained at enzyme
loading of 10% (w/w), reaction temperature of 55° C and substrate mole ratio of 1:4 mol/mol
(oil:oleic acid) with constant agitation speed of 150 rpm for 12 hours in n-hexane system. At
optimum reaction condition UCO has peroxide value of 6.8 meq/kg, iodine value of 22.8
g/100g, and acid value of 15.2 mgKOH/mg. Acidolysis reaction effectively increased oleic
acid content from 23.83% to 74.71% (v/v) in modified UCO. The quality of the modified oil
is also improved by the decreased in peroxide and acid values as well as the increased in
iodine value.
Acknowledgment: The authors would like to express their appreciation for the support of the
sponsors Ministry of Higher Education and Universiti Teknologi Malaysia for Research
University Grant with Project No 12H37 and 16H99.
REFERENCES
1. Esteban, L., Jiménez, M.J., Hita, E., González, P.A., Martín, L., and Robles, A. Production of structured triacylglycerols rich in palmitic acid at sn-2 position and oleic acid at sn-1,3 positions as human milk fat
substitutes by enzymatic acidolysis. Biochemical Engineering Journal 54(2011), 62-69.
2. Araújo, M.E., Campos, P.R., Alberto, T.G., Contesini, F.J., and Carvalho, P.O. Synthesis of structured
triacylglycerols enriched in n-3 fatty acids by immobilized microbial lipase. Brazilian Journal of
Biotechnology 47(2016), 1006-1013.
3. Ferreira-Dias, S., Sandoval, G., Plou, F., and Valero, F. The potential use of lipases in the production of fatty
acid derivatives for the food and nutraceutical industries. Journal of Biotechnology 16(2013), 1-36.
4. Sebayang, D., Agustian, E., and Praptijanto, A. (2010). Transesterification of biodiesel from waste cooking
oil using ultrasonic technique. International Conference on Environment. 13-15 December. Penang,
Malaysia: ICENV, 1-9.
23.83
74.71
0
20
40
60
80
before acidolysis after acidolysis
Ole
ic a
cid
co
nce
ntr
ati
on
%
(v/v
)

ENGINEERING 298
IGCESH2018
Universiti Teknologi Malaysia, Johor Bahru, Malaysia 13 -15 August 2018
GROWTH AND POLYHYDROXYBUTYRATE PRODUCTIVITY OF
GENETIC MODIFIED PHAEODACTYLUM TRICORNUTUM IN
RESPONSE TO BLUE WAVELENGTH CULTIVATION ON
POLYHYDROXYBUTYRATE SYNTHESIS PHASE
W. H. Lee1 and A. Idris*2
1, 2 Institute of Bioproduct Development, Department of Bioprocess and Polymer Engineering, Faculty
of Chemical and Engineering, Universiti Teknologi Malaysia (UTM), 81310 UTM Johor Bahru,
Johor, MALAYSIA.
(E-mail: [email protected], [email protected])
ABSTRACT
Phaeodactylum tricornutum had been genetic modified to act as a low-cost and
environmental friendly expression system for polyhydroxybutyrate (PHB) synthesis. In this
study, blue wavelength had been selected as stress factor on PHB synthesis phase with the
aim of improving its productivity. The influence of wavelength shifting from white to blue on
the growth of Phaeodactylum tricornutum and PHB productivity was evaluated. During PHB
synthesis phase, the growth of white to blue light (WBL) culture was suppressed as to its
acclimatisation toward wavelength changes. Hence, the overall specific growth rate of WBL
culture was lower as compared to white light (WL) culture upon acclimation. The cells under
blue wavelength cultivation also exhibited lower PHB productivity due to significant
decrease on PHB accumulation by the cells from 4.32±0.18 % (WL culture) to 3.38±0.30 %
(WBL culture). The results suggested that blue wavelength did not improve the PHB
synthesis and productivity of the strain.
Key words: Genetically Modified, Phaeodactylum tricornutum, LED, Light Wavelength,
Polyhydroxybutyrate
INTRODUCTION
Polyhydroxybutyrate (PHB) is a naturally-occuring biopolyester synthesized by
microorganisms in response to physiological stress [1]. In 2011, Phaeodactylum tricornutum
has been genetically modified to express the genes encoding for the enzymes responsible for
PHB synthesis [2]. Currently, the enhancing strategy for this genetically modified strain has
yet to be established. According to previous studies, general energy consumption by
microalgae is more efficient with the use of monochromatic light such as blue and red as
compared to wide spectrum light [3]. Hence, this study involved blue wavelength in
cultivation as to investigate its effect on the cell growth and PHB synthesis.

ENGINEERING 299
MATERIALS AND METHODS
Genetic modified Phaeodactylum tricornutum strain was grown in f/2 medium containing 1.5
mM NH4+ and allowed to reach exponential phase under white light. The cells were harvested
and washed with nitrogen-free medium before re-cultured in 0.9 mM NO3- containing
medium for 7 days to induce PHB-producing genes expression [2]. The cultures were
subjected to (i) white fluorescence lamp as control of the cultivation and (ii) blue LED on
PHB synthesis phase. The growth analysis involved optical density method and cell count.
The PHB content of the cells was quantified by gas chromatography analysis.
MAIN RESULTS
Figure 1. Growth curve of P. tricornutum under white and blue wavelengths cultivations.
Generally, the cultivation of genetic modified Phaeodactylum tricornutum for production of
PHB was divided into two phases: growing phase and PHB-synthesis phase. Figure 1 shows
the growth curve of P. tricornutum under white light (WL) and white shifted to blue light
(WBL) cultivations. For both cultures, the growth revealed increasing trend and do not
achieve stationary growth phase. The growth curve depicted a slightly lower growth trend for
blue light cultivation as compared to white light cultivation. This is due to acclimation of the
cells toward blue wavelength.
Table 1. Maximum cell density, specific growth rate (𝜇) and division time (𝑘) of P.
tricornutum under white and white to blue wavelengths cultivation
Wavelength Max. Cell
Density (x107
cells/mL)
𝜇 (day-1) 𝑘 (day-1)
White 1.79±0.02 0.341±0.001 0.492±0.001
White to Blue 1.75±0.01 0.339±0.001 0.489±0.002

ENGINEERING 300
Table 1 summarized the maximum cell density, specific growth rate and cell division of WL
and WBL cultures. The growth of cultures under white and blue illuminations showed similar
trend from day 8 to 12. This proved that the cells able to grow under blue wavelength and
showed similar growth rate to WL culture after acclimation.
Table 2. Biomass productivity, PHB content and PHB productivity of P. tricornutum under
white and white to blue wavelengths cultivation
Wavelength Biomass
Productivity (g/L)
PHB Content (%) PHB Productivity
(mg/L/day)
White 1.165±0.015 4.32±0.18 4.2±0.225
White to Blue 1.155±0.010 3.38±0.30 3.253±0.259
Overall, the PHB productivity of WBL culture was significantly lower than WL culture as
summarized together with biomass productivity and PHB content in Table 2. The lower PHB
content in WBL culture suggested that the culture had changed the carbon partition for
different macromolecular in the cells upon blue wavelength acclimation. According to
Jungandreas et al. in 2014, cultures that pre-acclimated to different wavelengths (blue or red)
showed distinct changes in the macromolecular compositions (carbohydrate and protein) of
the cells [4]. Hence, during PHB synthesis phase, the newly assimilated carbon was
hypothesized to be directed into protein storage instead carbohydrate.
CONCLUSION
Genetic modified P. tricornutum was successfully cultivated and acclimated to blue
wavelength on PHB synthesis phase. However, the growth rate of blue light acclimated
culture was slower than white light culture. Blue wavelength had also changed the carbon
partition for different macromolecular which eventually lowered down the PHB content and
productivity of blue light acclimated culture.
Acknowledgment: This work was supported by the Ministry of Higher Education [grant
numbers 19H20. A special thanks is extended to Prof. Uwe Maier and Dr. Franziska Hempel
for providing the genetic modified Phaeodactylum tricornutum strain.
REFERENCES
1. Loo, C. Y. and Sudesh, K. Biosynthesis and native granule characteristics of poly(3-hydroxybutyrate-co-3-
hydroxyvalerate) in Delftia acidovorans. Int J Biol Macromol. 40 (2007), 466-477.
2. Hempel, F., Bozarth, A. S., Lindenkamp, N., Klingl, A., Zauner, S., Linne, U., Steinbuchel, A., and Maier,
U. G. Microalgae as bioreactors for bioplastic production. Microbial Cell Factories 10 (1) (2011), 81-86.
3. Wu, H. Effect of different light qualities on growth, pigment content, chlorophyll fluorescence, and antioxidant enzyme activity in the red alga Pyropia haitanensis (bangiales, rhodophyta). BioMed Research
International (2016), 8 pages.
4. Jungandreas, A., Schellenberger Costa, B., Jakob, T., von Bergen, M., Baumann, S., and Wilhelm, C. The
acclimation of Phaeodactylum tricornutum to blue and red light does not influence the photosynthetic light
reaction but strongly disturbs the carbon allocation pattern. PLoS ONE. 9(8) (2014), e99727.

ENGINEERING 301
IGCESH2018
Universiti Teknologi Malaysia, Johor Bahru, Malaysia 13 -15 August 2018
MUSCLE FIBRE TYPE CLASSIFICATION TECHNIQUE: A REVIEW
Maisarah Sulaiman*1, Aizreena Azaman2, 3, Azli Yahya2, Mohd Azuwan Mat
Dzahir4 and Husnir Nasyuha Abdul Halim1
1 Faculty of Bioscience and Medical Engineering, Universiti Teknologi Malaysia, Johor Bahru,
MALAYSIA.
(E-mail: [email protected], [email protected]) 2 Department of Biotechnology and Medical Engineering, Faculty of Biosciences and Medical
Engineering, Universiti Teknologi Malaysia, Johor Bahru, MALAYSIA
(E-mail: [email protected]) 3 Sport Innovation Technology Center, Universiti Teknologi Malaysia, Johor Bahru, MALAYSIA.
(E-mail: [email protected]) 4 Department of Applied Mechanics and Design, Faculty of Mechanical Engineering, Universiti
Teknologi Malaysia, Johor Bahru, MALAYSIA.
(E-mail: [email protected])
ABSTRACT
Skeletal muscle consist of two main types of muscle fibre; slow twitch (Type I) and fast
twitch (Type II) muscle fibre. For each individuals, one type may be predominated where
person with high composition of slow twitch muscle fibre is more suitable with endurance
related sport such as long distance running while high proportion of fast twitch muscle fibre
can be observed from sport which require strength like sprinting. The aim of this study is to
give an overview on the existing techniques used to identify and classify muscle fibre type. A
search of literature was performed to identify the research studies which explain various
techniques including bio signal processing technique to distinguish muscle fibre types. For
each technique, their advantages and limitations will be discussed in order to observe the
developments of all those methods. Finding shows that muscle fibre can be classified using
two main methods, either through invasive or non-invasive technique. For non-invasive
method, as surface electromyography (sEMG) is one approach that had been used, most of
the research are focusing on finding EMG features and parameters, but not much comparing
the performance of all features. Besides, there is also little studies discovering the appropriate
classification method to characterize fibre types. The classification of muscle fibre would be
useful if it can be embedded into talent identification process which able to categorize
individuals in terms of the suitability of different types of sport based on their dominant
muscle fibre type.
Key words: Fibre type, slow twitch, fast twitch, histochemical, electromyography
INTRODUCTION
Mental, physical, environmental and genetic are factors which may influence athlete
performances [1, 2]. For each individual, their performance may differ in terms of either
endurance, or strength capability and these abilities reflect to different types of sports. As

ENGINEERING 302
muscle fibre type distribution is largely determined by genetic factor, the biological
differences of muscle can be divided into two main types which known as slow twitch (Type
I) and fast twitch (Type II) muscle fibre [3]. The classification of these two types of muscle
fibres can be observed based on their diversity especially in morphological, histochemical,
contractile and fatigability properties of each muscle fibre [4, 5]. Essentially, human body
have the combination of both type of fibres, but for each muscle, one may be predominate
where the twitch contraction could vary between the muscles.
The characteristics of slow twitch muscle fibre is that it has high myoglobin content, and
capillary content compared to fast twitch muscle fibre [4]. Main properties which makes slow
twitch differs is because this muscle fibre contract more slowly compared to fast twitch
muscle fibre [5]. As slow twitch fibre generate ATP via aerobic metabolism, it is much more
efficient at using oxygen, thus this type of muscle fibre has high endurance level which make
it able to take longer time before fatigue. Therefore, slow twitch muscle is more suitable with
sport that require high endurance such as long distance running and cycling.
In reversal to slow twitch muscle fibre, fast twitch muscle fibre has low myoglobin and
capillary content which make it appears in white colour for some species [4]. Besides, it also
has the ability to generate more power with quick burst of speed in just a short period of time.
This is due to the contractile properties of fast twitch where it has shorter contraction time,
thus able to fire more energy rapidly in order to generate more force. Even though it has
quick contraction time, but in reversal to slow twitch, it has low resistance to fatigue [6].
Sports such as sprinting and jumping which require high power production in a short period
of time are more advantageous for person with dominant fast twitch muscle fibre.
Various approach had been used in finding the best technique to classify muscle fibre types.
The primary focus of this paper is to provide information on the available and previous
techniques along with their sample selection characteristics and their targeted muscle. Even
for the same method, there are various parameters that had been used to differentiate muscle
fibre types. A summary on how each method is performed will also been discussed and
compared.
MAIN RESULTS
To summarize the technique used for fibre type classification, there are two main approach
used; either by invasive or non-invasive technique. During the early phase of the muscle fibre
classification process, histochemical technique which require muscle biopsy is one of the
method that are widely used to measure the fibre composition in muscles and here, most of
them follow myosin adenosine triphosphatase (mATPase) staining procedure to characterize
fibre types. Besides histochemical analysis, electromyography is also one technique used
where parameters such as mean frequency, median frequency, and conduction velocity were
selected to indicate the differences between different fibres. As histochemical and invasive
EMG are conducted invasively, even though they able to show better accuracy as it detect the
fibre composition directly from muscle, but it has limitation where a proper and careful
consideration should be taken especially during conducting the experiment. For a non-
invasive technique, the use of surface EMG is a good approach since it did not require any
muscle sampling which involve muscle biopsy method. A linear correlation between surface
EMG features and muscle fibre area determined by histochemical technique indicate that
muscle fibre composition can be estimated non-invasively [7].

ENGINEERING 303
CONCLUSION
Slow twitch or fast twitch muscle fibres can be characterize by various techniques. However,
for non-invasive approach especially using surface EMG, further studies are necessary to
extend the existing research especially in finding the threshold value to characterize
individuals’ dominant muscle fibre. As the performances of all EMG features are compared,
appropriate classification method should also be explored in obtaining the best classifier to
characterize muscle fibre types.
REFERENCES
1. Lorenz, D.S., Reiman, M.P., Lehecka, B.J. and Naylor, A. What Performance Characteristics Determine
Elite Versus Nonelite Athletes in the Same Sport? Sports Health, 5(6)(2013), 542-547.
2. MacArthur, D.G. and North, K.N. Genes and human elite athletic performance. Human Genetics,
116(5)(2005), 331-339.
3. Kupa, E.J., Roy, S.H., Kandarian, S.C. and De Luca, C.J. Effects of Muscle-Fiber Type and Size on Emg
Median Frequency and Conduction-Velocity. Journal of Applied Physiology, 79(1)(1995), 23-32.
4. Scott, W., Stevens, J. and Binder–Macleod, S.A. Human Skeletal Muscle Fiber Type Classifications.
Journal of the American Physical Therapy Association, 81(11)(2001).
5. Qaisar, R., Bhaskaran, S. and Remmen, H.V. Muscle fiber type diversification during exercise and regeneration. Free Radical Biology and Medicine, 98(2016), 56-67.
6. Karp, J.R., Muscle Fiber Types and Training. Strength & Conditioning Journal, 23(5)(2001), 21.
7. Sadoyama, T., Masuda, T., Miyata, H. and Katsuka, S. Fibre conduction velocity and fibre composition in
human vastus lateralis. European Journal of Applied Physiology and Occupational Physiology, 57(6)(1988),
767-771.

ENGINEERING 304
IGCESH2018
Universiti Teknologi Malaysia, Johor Bahru, Malaysia 13 -15 August 2018
SEISMIC-RISK BASED ASSESSMENT IN RANAU REGION: DATA
COLLECTION AND PREPARATION
Izni Izzati Mohamad*1, Mohd Zulkifli Mohd Yunus2 and Noor Sheena Herayani
Harith 3
1, 2 Faculty of Civil Engineering, Universiti Teknologi Malaysia, Johor, MALAYSIA.
(E-mail:[email protected], [email protected]) 3 Faculty of Engineering, Universiti Malaysia Sabah, Sabah, MALAYSIA.
(E-mail:[email protected])
ABSTRACT
Earthquake is a natural disaster that can brings damage to properties and lives. Reported
damages from earthquake indicate vulnerability of existing buildings due to older building
design codes, poor design practices and poor code enforcement. To calculate the
vulnerability, few data were needed including primary and secondary data. In this study,
Ranau township area were studied. Ranau is located at the major quake zone and has high
probability to reaccurance of earthquake. In primary data collection, field survey was
conducted to obtained structural information of the buildings and to calculate its
vulnerability. Secondary data were gathered from government agencies. There were many
challenges during data collection including residents cooperation, limited access to properties
and time limitation. The data obtained will be prepared and process to be used in later
analysis. The preparation process including digitizing, data cleaning, and database
development. Proper data collection and preparation is the crucial stage as it will directed the
research towards great achievement and findings.
Key words: Seismic risk, data collection, data preparation
INTRODUCTION
Earthquake usually happens when rocks underground suddenly breaks along the faults
because of sudden release of energy which results in ground shaking. This energy is in form
of seismic wave. About 80% of earthquakes occur in the Pacific Rim due to a collision of
tectonic plates in the Earth’s crust. Malaysia is located near the Pacific Rim, a belt of seismic
activity running around the basin of the Pacific Ocean. Malaysia is close to the most two
seismically active plate boundaries, the inter-plate boundary between the Indo-Australian and
Eurasian Plates on the west and the inter-plate boundary between the Eurasian and
Philippines Sea Plates on the east. Major earthquakes originating from these plate boundaries
have been felt in Malaysia. Several potential active faults have been delineated and local
earthquakes in East Malaysia appear to be related to some of them [1].The most quake-prone
state of Sabah has three major quake zones, namely Central-North (Ranau) Zone, Labuk Bay-
Sandakan Basin Zone and Dent-Semporna Peninsula Zone. Figure 1 shows the faults nearby
Ranau region [2].

ENGINEERING 305
Figure 1. Green circle shows Ranau región; located in Central-North Zone [2]
Tragic incident that occur on 2015 at Mount Kinabalu, Sabah with 6.0 richer scales have
makes Malaysian aware of the seismic hazard and its potential to threaten the public safety,
welfare and damage the properties. These incidents have caused thousands of people in
several cities in low and moderate seismicity regions to flee their houses and even hospitals
because the majority of them felt insecure [3]. Even though the area is not in the radius, it
will have significant effect due to long period component of shear waves. The building
vulnerability is due to older building design codes, poor design practices and poor code
enforcement. Most of these buildings are currently operational and are required to be further
assessed and upgraded to minimize seismic damage and improve life safety [4].
STUDY AREA
This research is conducted at Ranau, specifically at Ranau town area. Ranau is situated
between 5°30’N to 6°25’N and 116°30’E to 117°5’E. Total population of Ranau is
94,092 peoples. It has hilly geographical structure and it is 1,176m above sea level. On 2015,
Ranau had encounter seismic event which kills 19 lives and cause great damage to the
buildings in the area. This incident shows the importance to determine the vulnerability and
to conduct assessment in the study area. Until now, Sabah is still receiving compression
forces from the interaction of three main tectonic plates. Although Sabah is 1,000 km away
from the collision of the plates, it still can experience the compression force [5].
This research is consist of four main stages which involve data collection and preparation,
seismic risk evaluation and analysis, production of vulnerability maps and prediction damage
model. This paper will focused on the first part of the research which is data collection and
preparation.
DATA COLLECTION
There are two types of data had been collected; primary and secondary data. Primary data is
information that collected specifically for the purpose of the research. Secondary data is data
that not self-collected and obtains through other organizations. In this research, primary data
had been collected through field survey called Rapid Visual Screening (RVS). Meanwhile,
secondary data obtained from Department of Survey and Mapping Malaysia is digital
topography map for study area.
Primary Data
Rapid visual screening (RVS) is a method to evaluate the vulnerabilities of the buildings
when an earthquake occurs. It is a visual evaluation using RVS form proposed. In this study,
FEMA 154 data collection form has been used. There are eight sequences in implementing

ENGINEERING 306
RVS of buildings. The selection of the form is based on the seismicity region. In this study,
moderate form had been used. In this form, the buildings details are filled up including the
address, no of stories, year built and it usage. To determine the score of the building, the
parameters evaluated including; the building type, no of stories, vertical irregularities, plan
irregularity, pre-code, post benchmark and soil types. After calculating all parameters, the
final score will determine either the building is vulnerable to seismic hazard or not.
Secondary Data
Digital topography map obtained will be processed accordingly by digitizing and building
database. The obtained digital map needs to be digitize to make it more precise and accurate
because this research focused on each buildings in town including residential, commercial
building, schools, and government buildings such as hospital and government office whereas
the maps obtains is more general. The database will be developed by combining the primary
data obtained and the processed digital topography map. After that, an interactive map will be
produced to ease the community in the study area to understand the risk and to gain
information regarding the buildings in their area.
CONCLUSION
The well-known statement "earthquakes don't kill people, buildings do" highlights the need to
make our communities more earthquakes resilient. By conducting the seismic-risk based
assessment, the buildings with high vulnerability can be detected and early precaution can be
taken. Proper data collection and preparation is very important as it will determine the results
of the research; its accuracy and reliabilities.
Acknowledgment: The authors would like to express their appreciation for the support of the
sponsors with Zamalah Universiti Teknologi Malaysia scholarship.
REFERENCES
1. Malaysian Meteorological Department (MET). Seismicity in Malaysia and around the region. Ministry of
Science, Technology and Innovation (MOSTI). (2016)
http://www.met.gov.my/web/metmalaysia/education/earthquakeandtsunami/seismicityinmalaysiaandaroundt
heregion
2. Leyu, C. H. Seismic and Tsunami Hazards and Risks Study in Malaysia. In: MOSTI (ed.) Summary for
Policy Makers (2009) in A.Adnan & N.S.H. Harith. Estimation of Peak Ground Acceleration of Ranau Based on Recent Earthquake Database, Seminar Bencana, Kota Kinabalu, Sabah (2015)
3. Tan, K.T. and Abdul Razak, H. Assessment of risk to school buildings resulting from distant earthquakes.
Jurnal of Procedia Engineering (2011) 14:2196-2204.
4. Tesfamariam, S. and Saatcioglu, M. Seismic risk assessment of reinforced concrete buildings using Fuzzy
Rule based modeling. The 14th World Conference on Earthquake Engineering. (2008)Beijing, China.
5. Tongkul, Felix. 7 things you should know about the Ranau earthquake. Astro Awani. (2015)
http://english.astroawani.com/malaysia-news/7-things-you-should-know-about-ranau-earthquake-61834

ENGINEERING 307
IGCESH2018
Universiti Teknologi Malaysia, Johor Bahru, Malaysia 13 -15 August 2018
ELECTROMYOGRAPHY IN GAIT SYMMETRY ASSESSMENT: A
METHODOLOGICAL REVIEW
Husnir Nasyuha Abdul Halim1, Aizreena Azaman 2,3, Azli Yahya2, Mohd Azuwan
Mat Dzahir4 and Maisarah Sulaiman1
1 Faculty of Bioscience and Medical Engineering, Universiti Teknologi Malaysia, Johor Bahru,
MALAYSIA.
(E-mail: [email protected], [email protected]) 2 Department of Biotechnology and Medical Engineering, Faculty of Biosciences and Medical
Engineering, Universiti Teknologi Malaysia, Johor Bahru, MALAYSIA
(E-mail: [email protected]) 3 Sport Innovation Technology Center, Universiti Teknologi Malaysia, Johor Bahru, MALAYSIA.
(E-mail: [email protected]) 4Department of Applied Mechanics and Design, Faculty of Mechanical Engineering, Universiti
Teknologi Malaysia, Johor Bahru, MALAYSIA
(E-mail: [email protected])
ABSTRACT
Gait symmetry assessment is one type of gait analysis that aims to observe changes or
deviation in gait due to pathological condition, effect of rehabilitation program or to give
insight on effect of gait on stability and fall-risk. Gait is described as symmetrical when there
is no difference in gait parameters statistically, measured bilaterally between left and right
limbs. The assessments of gait symmetry are measured by using spatiotemporal, kinetics,
kinematics parameters or electromyography (EMG) parameters. However, EMG-based
assessment for gait symmetry is not well explored compared to assessment using other gait
parameters. This review aims to compare research designs, methods and procedure of
previous studies that utilized EMG for gait symmetry analysis so that its consequences on the
results and findings of the studies will be identified to improve future gait symmetry
evaluation.
Key words: Gait analysis, Symmetry, Electromyography (EMG)
INTRODUCTION
Gait is defined as patterns or manner of locomotion from a point to a point such as walking,
running, hopping, and skipping as the result of limb movement across the body[1]. It
encompasses high interaction of central nervous system and musculoskeletal system to ensure
the body stay upright in stable manner during movement [2].
Gait analysis aims to provide or enhance the understanding on gait based on quantitative
measurement primarily for medical purpose and also for other purpose such as for sport
science[3]. One type of gait analysis is gait asymmetry assessment that measure deviation in
gait between right and limbs. Gait asymmetry assessment is able to give insight on effect of
pathological condition such as stroke, cerebral palsy, Parkinson’s disease, osteoarthritis and

ENGINEERING 308
other medical condition concerning on gait such as injury or orthoses usage [4]. It also gives
information on stability or risk of fall of able-bodied gait in healthy normal population.
Although not widely used compared to other gait parameters, electromyography (EMG); the
recording of muscle electrical activity also had been used in gait symmetry measurement [5].
The EMG is able to provide extended information on gait analysis as it describes muscle
activation, the process that initiate gait cycle.
In this review, method for data acquisition and data processing of EMG for gait analysis
will be compared based on previous studies. Aspect of study design such as subjects,
selected assessed muscles, gait procedure, and asymmetry measures methods will also be
discussed thoroughly. The search will be performed through electronic databases
(ScienceDirect, IEEE Xplore and Web of Science) to find research conducted from 1995 to
2018 with the keyword gait, symmetry, asymmetry combined with electromyography (EMG).
MAIN RESULTS
Figure 1 shows the number of journal articles and conference proceedings identified, the
numbers and reasons for exclusion and the total number of studies included in the final
review.
Figure 1. Flowchart of selecting journal articles and conference proceedings.
Based on the 18 journal articles and conference proceedings that are selected, most
studies assessed gastrocnemius[6-18] and tibialis anterior [6, 8-10, 12-21] muscles. Both
muscles are the prime mover responsible for actions at ankle joint where tibialis anterior
is part of anterior compartment that functioned for dorsiflexion movement while
gastrocnemius a part of posterior compartment muscles that responsible for plantar
flexion movement [22]. The recorded raw EMG signals’ sampling frequency varies
ranging from 500Hz to 1080 Hz but mostly sampled at 1000Hz [6-8, 13, 16, 18, 21, 23,
24]. The EMG signals are all processed by filter, mostly full wave rectified the signals
407 journal articles and conference proceedings were identified from
ScienceDirect, IEEE Xplore and Web of Science database
380 abstracts excluded:
• Subjects were not human
• Using needle EMG
• Do not assessed lower limb muscles
27 journal articles and conference
proceedings were assessed for eligibility
18 journal articles and conference
proceedings were included in the review
9 excluded:
• Though EMG were recorded, muscle activity
signal is not used for asymmetry assessment
• EMG were not taken during gait

ENGINEERING 309
[6, 8-13, 15, 18, 24] and were normalized temporally to 100% gait cycle [6, 8-10, 12, 13,
15-18] . Most studies concern on subjects with diseases that affect symmetry such as
stroke, osteoarthritis, and cerebral palsy and some compared with control group which is
healthy populations with comparable age range and body mass index. The symmetry
measures are either discrete measure such as symmetry ratio and Robinson index, or
complete gait cycles such as trend symmetry or statistical approaches such as ANOVA, t -
tests and autocorrelation. The selection of types of measures depend on the purpose of the
symmetry assessment. The EMG parameter used are mean, root mean square (RMS),
ensemble averaged of the muscle activity.
CONCLUSION
The aim of this review was to provide overview on previous studies that utilized EMG-based
assessment for gait symmetry analysis. From that, methods to conduct the studies could be
highlighted so that future research will acquire more reliable findings. Future research will be
able to compare and find the relationship of gait symmetry measures from EMG with other
method or technology in gait studies.
REFERENCES
1. Kirtley, C., Introduction, in Clinical Gait Analysis. 2006, Churchill Livingstone: Edinburgh. p. 5-14.
2. Sadeghi, H., et al., Symmetry and limb dominance in able-bodied gait: a review. Gait & Posture, 2000.
12(1): p. 34-45.
3. Muro-de-la-Herran, A., B. Garcia-Zapirain, and A. Mendez-Zorrilla, Gait Analysis Methods: An Overview of
Wearable and Non-Wearable Systems, Highlighting Clinical Applications. Sensors (Basel, Switzerland),
2014. 14(2): p. 3362-3394. 4. Cabral, S., et al., Inter-session agreement and reliability of the Global Gait Asymmetry index in healthy
adults. Gait & Posture, 2017. 51: p. 20-24.
5. Viteckova, S., et al., Gait symmetry measures: A review of current and prospective methods. Biomedical
Signal Processing and Control, 2018. 42: p. 89-100.
6. Schmidt, A., et al., Unilateral hip osteoarthritis: Its effects on preoperative lower limb muscle activation and
intramuscular coordination patterns. Gait & Posture, 2016. 45: p. 187-192.
7. Wang, W., et al. Post-stroke asymmetry of muscle contractions for knee flexion and extension during
walking. in 2016 9th International Congress on Image and Signal Processing, BioMedical Engineering and
Informatics (CISP-BMEI). 2016.
8. Wang, P. and K.H. Low. Qualitative evaluations of gait rehabilitation via EMG muscle activation pattern:
Repetition, symmetry, and smoothness. in 2009 IEEE International Conference on Robotics and Biomimetics
(ROBIO). 2009. 9. Higginson, J.S., et al., Muscle contributions to support during gait in an individual with post-stroke
hemiparesis. Journal of Biomechanics, 2006. 39(10): p. 1769-1777.
10. Bervet, K., et al., KeR-EGI, a new index of gait quantification based on electromyography. Journal of
Electromyography and Kinesiology, 2013. 23(4): p. 930-937.
11. Gardinier, E.S., et al., Knee Contact Force Asymmetries in Patients Who Failed Return-to-Sport Readiness
Criteria 6 Months After Anterior Cruciate Ligament Reconstruction. The American Journal of Sports
Medicine, 2014. 42(12): p. 2917-2925.
12. van Kammen, K., et al., Differences in muscle activity and temporal step parameters between Lokomat
guided walking and treadmill walking in post-stroke hemiparetic patients and healthy walkers. Journal of
NeuroEngineering and Rehabilitation, 2017. 14: p. 32.
13. Roetenberg, D., et al., Surface electromyography analysis for variable gait. Gait & Posture, 2003. 18(2): p. 109-117.
14. Barroso, F.O., et al., Combining muscle synergies and biomechanical analysis to assess gait in stroke
patients. Journal of Biomechanics, 2017. 63: p. 98-103.
15. Miller, R.A., et al., Components of EMG symmetry and variability in parkinsonian and healthy elderly gait.
Electroencephalography and Clinical Neurophysiology/Electromyography and Motor Control, 1996. 101(1):
p. 1-7.

ENGINEERING 310
16. Hwang, I.-S., et al., Electromyographic analysis of locomotion for healthy and hemiparetic subjects—study
of performance variability and rail effect on treadmill. Gait & Posture, 2003. 18(1): p. 1-12.
17. Fey, N.P., G.K. Klute, and R.R. Neptune, The influence of energy storage and return foot stiffness on
walking mechanics and muscle activity in below-knee amputees. Clinical Biomechanics, 2011. 26(10): p.
1025-1032. 18. De Visser, E., et al., Altered phase-transitions in tibialis anterior and medial gastrocnemius during walking
after limbsaving surgery. Clinical Neurophysiology, 2005. 116(12): p. 2741-2747.
19. Jeong, M.-G. and J.-H. Kim, Comparison of Both Legs EMG Symmetry during Over-Ground Walking and
Stair Walking in Stroke Patients. The Journal of Korean Physical Therapy, 2015. 27(4): p. 228-233.
20. Park, Y., et al. A gait imbalance evaluation system using multi-sensors. in 2016 IEEE Conference on
Computational Intelligence in Bioinformatics and Computational Biology (CIBCB). 2016.
21. Jansen, K., et al., Muscle contributions to center of mass acceleration adapt to asymmetric walking in
healthy subjects. Gait & Posture, 2013. 38(4): p. 739-744.
22. Marieb, E.N. and K. Hoehn, Human Anatomy & Physiology. 2013: Pearson.
23. Burnett, D.R., et al., Symmetry of ground reaction forces and muscle activity in asymptomatic subjects
during walking, sit-to-stand, and stand-to-sit tasks. Journal of Electromyography and Kinesiology, 2011.
21(4): p. 610-615. 24. Isakov, E., O. Keren, and N. Benjuya, Trans-tibial amputee gait: Time-distance parameters and EMG
activity. Prosthetics and Orthotics International, 2000. 24(3): p. 216-220.

ENGINEERING 311
IGCESH2018
Universiti Teknologi Malaysia, Johor Bahru, Malaysia 13 -15 August 2018
REFINED BLEACHED DEODORIZED PALM OIL QUALITY
PREDICTION USING NONLINEAR ITERATIVE PARTIAL LEAST
SQUARES
Mohd Aiman Mohd Noor*1, Azmer Shamsuddin1, Nur Atikah Mohd Rosely1, Nor
Adhihah Rashid1, Khu Wai Hoong1, Mohd Kamaruddin Abd Hamid2 and Kamarul
Asri Ibrahim2
1 Process Systems Engineering Centre (PROSPECT), Research Institute of Sustainable Environment
(RISE), Universiti Teknologi Malaysia, 81310 UTM Johor Bahru, Johor, Malaysia.
(E-mail: [email protected], [email protected], [email protected], [email protected])
2 Department of Chemical Engineering, Faculty of Chemical and Energy Engineering, Universiti
Teknologi Malaysia, 81310 UTM Johor Bahru Johor, Malaysia. (E-mail: [email protected], [email protected])
ABSTRACT
The purpose of this paper is to present the predictor development for the Refined Bleached
Deodorized Palm Oil (RBDPO) quality based on the nonlinear multivariate approaches of
Nonlinear Iterative Partial Least Squares (NIPALS). The palm oil physical refining plant
consists of degumming, bleaching and deodorizing section. NIPALS model framework
consists of NIPALS-PCR (Principal Component Regression) and NIPALS-PLS (Partial Least
Square) are to obtain the relationship coefficient between the input and output variables. The
coefficient is used to predict the RBDPO quality from the Crude Palm Oil (CPO) feed
quality. Through the validation with the online data, the prediction based on the NIPALS
models give good prediction of the actual process.
Key words: Quality Prediction, Palm Oil, Nonlinear Iterative Partial Least Square
INTRODUCTION
Palm oil refinery process is a complex multivariable, time-varying and strong nonlinear
process. It possesses a number of features that lead to control problem which are to obtain a
desired RBDPO standard quality (Table 1) by the end of the process. In current refinery
practice, plants recycle out-of-specification product and refine the product again, thus to
prevent scrapping the product altogether in the case of unexpected out-of-specification
quality product production [1]. The loss of profit during recycle is expected nearly RM
160,000 per hour due to the production and opportunity loss [2].
End product quality is only available by offline assay after the finish of refinery process [3].
Therefore, a reliable process monitoring and precise quality prediction and control are
necessary to ensure the safe and profitable refinery processes operations. Several studies have
been conducted on the quality prediction of refined palm oil using artificial neural network
[4] and linear partial least square [4]. Despite of the ability to predict the process quality, it is

ENGINEERING 312
known that palm oil refinery process is strong nonlinear process and justify the used of non-
linear approach such as NIPALS. In this work, comparison of nonlinear approach (NIPALS-
PLS and NIPALS-PCR) is compared to linear approach (PCR) to justify better approach in
predicting product quality.
Table 1. Standard Specification of RBDPO Quality
Quality Specification PORAM VIETNAM CHINA
Free Fatty Acid (FFA) < 0.10 < 0.10 < 0.07
Moisture Content
(MOIST)
< 0.10 < 0.10 < 0.10
Iodine Value (IV) 50-55 50-55 50-55
MAIN RESULTS
A total number of 327 raw data of PORAM quality were collected within 8 hour interval of
sampling during industrial attachment. The data consist of 6 input variables (FFAin, MOISTin,
IVin, DOBIin, Bleaching Dosagein, and Vacuum Steam Pressurein) and 3 output variables
(FFAout, MOISTout, COLORout). Data standardization is done to ensure all variables have
uniform range scale and satisfy central limit theorem. Process sampling time and residence is
conducted using autocorrelation plot and cross-correlation plot respectively before data fed
into NIPALS prediction model and to obtain the relationship coefficient [5].
The performance of the prediction models was determined by identifying the presence of
deviations between the predicted output control charts and the actual output control charts via
crude observation. Mean Squared Error (MSE) approach is selected to obtain precise error of
deviations. Table 2 shows both NIPALS-PLS and NIPALS-PCR prediction model have less
deviation (lower MSE value) than the PCR prediction model. This is because the refinery
process was characterized with nonlinearity and time variance, thus a nonlinear model can
predict better. The results were proven that the RBDPO is palm oil refinery process was a
non-linear process and it can be concluded that nonlinear prediction models were more
reliable in predicting the RBDPO quality.
Table 2. MSE for each regression method selected
Regression Method Mean Square Errors (MSE) for Each Parameter
FFA MOIST COLOR
PCR 0.0111 0.0082 0.0247
NIPALS-PCR 0.0032 0.0014 0.0033
NIPALS-PLS 0.0028 0.0014 0.0041
CONCLUSION
By acquiring the CPO processing time and developing statistical prediction models via non-
linear regression methods, RBDPO quality can be effectively predicted ahead in time based
on the raw CPO data. If the predicted RBDPO does not meet the specifications, early
corrective measures can be carried out such as increase bleaching dosage to reduce color
variable. This can reduce the dependence of recycling streams to rework off-spec product,
thus optimal plant performance can be fine-tuned for better smooth running and productivity.

ENGINEERING 313
Acknowledgment: The authors would like to express their appreciation for the support from
UTM RUGS Projects (Q.J130000.2446.03G68 and Q.J130000.2546.19H72).
REFERENCES
1. Mohd. Noor, M. A, Rashid, N. A., Mohd Rosely, N. A., Shamsuddin, A., Abd. Hamid, M. K. and Asri
Ibrahim, K. Quality prediction of refined palm oil quality using partial least square. Energy Procedia 142
(2017), 3002-3007.
2. Makky, M. and Soni, P. In itu quality assessment of intact oil palm fresh fruit bunches using rapid portable
non-contact and non-destructive approach. Journal of Food Engineering 120 (2014), 248-259.
3. Jia, R., Mao, Z., Wang, F. and He, D. Self-tuning final product quality control of batch processes using
kernel latent variable model. Chemical Engineering Research and Design 94 (2015), 119-130.
4. Tehlah, N., Kaewpradit, P. and Mujtaba, I. M. Artificial neural network based modeling and optimization of
refined palm oil process. Journal of Neurocomputing 216 (2016), 489-501. 5. Mohd Rosely, N. A., Mohd. Noor, M. A, Rashid, N. A., Shamsuddin, A., Abd. Hamid, M. K. and Asri
Ibrahim, K. Product sampling time and process residence time prediction of palm oil refining process.
Chemical Engineering Transactions 56 (2017), 1411-1416.

ENGINEERING 314
IGCESH2018
Universiti Teknologi Malaysia, Johor Bahru, Malaysia 13-15 August 2018
DIFFERENCES IN CORTICO-CORTICAL FUNCTIONAL
CONNECTIVITY BETWEEN ARCHITECTURAL AND NON-
ARCHITECTURAL STUDENTS IN RELATION TO CREATIVE
THINKING: A CASE STUDY
Julia Bt. Mohd Yusof*1, Norlaili Binti Mat Safri
2 and Puspa Inayat Binti Khalid
3
1Department of Polytechnic, Ministry of Education Malaysia, Presint 4, 62100 W.P Putrajaya,
Malaysia 1,2,3 Faculty of Electrical Engineering, Universiti Teknologi Malaysia, 81310 Skudai, Johor, Malaysia
(Email: [email protected], Email: [email protected], Email: [email protected])
*corresponding author (Julia Bt. Mohd Yusof)
ABSTRACT
This paper presents an investigation of the underlying brain process involved in creative
thinking (CT). The investigation is about directional of brain connectivity for creative
thinking between architectural student and non-architectural student. This study involved two
students from Faculty of Built Environment and Faculty of Electrical Engineering, Universiti
Teknologi Malaysia, Skudai, Johor. The participants were required to complete two sketches
of creative thinking task. The creative thinking task is guided by the Torrance Test for
Creative Thinking (TTCT). While sketching, the participants’ brain signals were captured
using Electroencephalography (EEG). Then, Partial Directed Coherence (PDC) was applied
to analyse the information pathway. The results show that there were significant differences
in both outputs: thinking product (participants’ sketches) and thinking process (brain
pathways).
Keywords: Creative thinking, Partial directional coherence, Electroencephalograph
INTRODUCTION
Creativity is a fundamental activity of human information processing [1]. It involves
imagination, problem solving skills and originality of ideas to create something new,
valuable, and effective [2] [3]. Every human has his/her own creativity through different
understanding and thinking process. Creativity is mostly related to various domains such as
poetry, music, writing, and drawing [4][5][6]. Creativity is a process of creative thinking
(CT); it is a higher level cognitive process and brain performance associated with neural
activity [7]. CT is an essential requirement in particular areas, especially in the field of
architecture [8]. Therefore, various assessments and measurements have been developed to
identify creative thinkers [9]. However, most of the measurements are subjective. The
marking or assessment methods according to certain criteria are customarily based on
aptitude test and interviews; the interviews are normally conducted by specialists in a
particular field.

ENGINEERING 315
Many researches have been conducted on the mechanism of the brain that interferes human
cognitive abilities such as language, poems, and music. However, a study of the creative
mechanism of the brain is still lacking. To understand the mechanisms of the brain and
cognitive thinking, information about cortico-cortical connections (brain information
pathway) are essential [11]. Therefore, this study was conducted to investigate the
differences in directional brain connectivity between architectural and non-architectural
students when performing creative thinking tasks.
EXPERIMENTAL METHODS
Two students participated in this study; one from Faculty of Built Environment and another
one from Faculty of Electrical Engineering, Universiti Teknologi Malaysia. The participants
were required to perform two creative thinking tasks (Figure 1). The tasks were based on the
Torrance Test for Creative Thinking (TTCT). For task 1, the participants were asked to use
their imagination and creativity to complete the drawing. For task 2, the participants were
required to fill in as many of the circles as possible with the sketch of recognisable objects.
Task 1 Task 2
Figure 1. Creative thinking task
The participants were given 3 minutes to complete each task and there were 3 minute gap
between the two tasks. This experiment was conducted in a quiet and comfortable room.
While performing the tasks, the participants' brain signals were captured by using
Electroencephalography (EEG). The cortical information pathway was extracted from the
captured brain signal using Partial Directed Coherence (PDC).
RESULTS
The differences in creative thinking of two students from different fields of study were
explored. By analyzing the brain signals using PDC, the pattern of brain’s routing
information between the two participants were extracted. It is important to note that
Participant A is non-architectural student and participant B is architectural student. It was
found that there were significant differences in sketches from the two participants.
Table 1 shows the sketches from task 1 by each participant. From the sketches it can be seen
that each participant has different imaginations and level of creativity. The sketch by
participant A highlighted the views around the house while participant B produced somewhat
abstract floral sketches. This may lead to a conclusion that the participant A just recalled
from his/her memory while participant B used a bit of his/her creativity and imagination to
complete task 1.
Table 2 shows the product from each participant for task 2. Similarly, differences in thinking
between the two participants were observed. Participant A was more likely to sketch
something that is easily recognizable while participant B filled the circles with abstract and

ENGINEERING 316
geometric sketches. In addition, participant A filled the circles in sequence while participant
B tried to complete the circles as much as possible in random order.
Table 1. Sketching for task 1
Task 1 Participant A Participant B
Table 2. Sketching for task 2
Task 2 Participant A Participant B
Table 3 shows the brain information pathway (thinking process) during task 1 for both
participants. For participant A, the source of information was from occipital area: O1 and O2.
Occipital area is known as primary visual cortex [12]. The information from the source (O1)
was spread to the temporal area (T6). The temporal lobe is responsible for short-term
memory as well as sorting new information. For source O2, the information was spread to
sensory motor integration (Cz, C2) and emotional memory (T4). It seems that participant A
just recalled from his/her memory to complete task 1.
For participant B, the information was spread from frontal (F7) to the temporal (T3, T5),
frontal (Fz), central (Cz), and parietal (Pz) areas. The frontal lobe is a front part of the brain.
F7 is the anterior portion in frontal lobe and also called as prefrontal cortex [13]. Prefrontal
cortex also named as the ‘executive of the brain’ and the ‘organ of the creativity’ [14][15].
Information also spread to verbal memory (T3) and visual memory (T5). T3 is related to
logical memory function, whereas T5 represents a logical understanding function. The
information has also spread to Pz area. Pz is located at the centre of parietal lobe. Pz is a
cognitive processing in the midline of the parietal lobe. This result indicates that participant
B has used some level of imagination and creativity to complete task 1.

ENGINEERING 317
Table 3. Brain information pathway during task 1
Participant A Participant B
Table 4 shows the brain connectivity of both participants while performing task 2. It shows
that participant A had two sources of information; frontal (F8) and temporal (T4) areas. The
information spread to temporal, parietal, central and occipital areas. F8 is an emotional
regulation and working memory area [13]. The second source (T4) is an emotional (non-
verbal) memory information. These pathways show that participant A mostly used emotional
and logical memory information while performing task 2.
The source of information for participant B, on the other hand, came from frontal (F4) área
and spread to other frontal areas (Fz, F8) and central áreas (C4, C3). Frontal area (F4) is
related to motor planning and located at the anterior of the premotor cortex área. This
indicates that participant B had utilized his/her organ of creativity (frontal lobe) [15] to
complete task 2.
Table 4. Brain information pathway during task 2
Participant A Participant B
Overall, this case study indicates that Participant B was more creative than participant A.
Unlike Participant B who had indicated some used of imagination and creativity, participant
A was absence of creative thinking and merely used emotional and memory to perform
creative thinking tasks.
CONCLUSION
Significant differences were found in both products: participants’ sketches (thinking product)
and brain pathways (thinking process). Therefore, this study concludes that in addition to
subjective measures (thinking product), it is feasible to use objective measures (thinking
process) to assess creativity. Further study with greater number of participants is worth
explored.
Fp1 Fp2
Cz
Fz
Pz
C4 T4T3
C3
F3
F7
F4
F8
O2O1
P4 T6T5 P3 `
Fp1 Fp2
Cz
Fz
Pz
C4 T4T3 C3
F3 F4
F8
O2O1
P4 T6T5 P3
F7
Fp1 Fp2
Cz
Fz
Pz
C4
T4
T3C3
F3
F7
F4
F8
O2O1
P4 T6T5 P3
Fp1 Fp2
Cz
Fz
Pz
C4 T4T3 C3
F3
F7
F4
F8
O2O1
P4 T6T5 P3

ENGINEERING 318
REFERENCES
1. M. A. Boden, “What Is Creativity ?,” Dimens. Creat., pp. 75–117, 1994
2. M. A. Boden, “Creativity in Education,” in Creativity in Education, 2001, pp. 95–102.
3. Irish National Teachers’, “Creativity and the Arts in the Primary School,” Discuss. Doc. Proc. Consult. Conf. Educ. 2009, pp. 1–142, 2009.
4. T. M. Amabile, “Effects of External Evaluation on Artistic Creativity.,” J. Pers. Soc. Psychol., vol. 37, no. 2,
pp. 221–233, 1979.
5. D. J. Running, “Creativity Research in Music Education: A review.,” Bull. Counc. Res. Music Educ., vol. 27,
no. 1, pp. 41–48, 2008.
6. D. J. Treffinger, G. C. Young, E. C. Selby, and C. Shepardson, Assessing Creativity: A Guide for Educators,
no. December. 2002.
7. Y. Wang, Y. Wang, S. Patel, and D. Patel, “A Layered Reference Model of The Brain (LRMB),” IEEE
Trans. Syst. Man Cybern. Part C Appl. Rev., vol. 36, no. 2, pp. 124–133, 2006.
8. M. A. Alomar, “Creativity in Architecture and Management,” 6th Asian Des. Conf., pp. 1–14, 2003.
9. N. K. Park, M. Y. Chun, and J. Lee, “Revisiting Individual Creativity Assessment: Triangulation in
Subjective and Objective Assessment Methods,” Creat. Res. J., vol. 28, no. 1, pp. 1–10, 2016. 10. R. Matsumoto, D. R. Nair, E. LaPresto, W. Bingaman, H. Shibasaki, and H. O. Lüders, “Functional
Connectivity in Human Cortical Motor System: A Cortico-cortical Evoked Potential Study,” Brain, vol. 130,
no. 1, pp. 181–197, 2007.
11. H. Z. B. Kosnan, N. Mat Safri, and P. I. Khalid, “Dynamic Features of Handwriting and Cortico-Cortical
Functional Connectivity During Basic Geometric Drawing Based on Gender,” 2015 Int. Conf. BioSignal
Anal. Process. Syst. ICBAPS 2015, pp. 112–117, 2015.
12. M. Semrud-Clikeman and P. A. T. Ellison, Child Neuropsychology: Assessment and Interventions For
Neurodevelopmental Disorders. Springer Science& Business Media, 2009.
13. T. Trans Cranial, “Cortical Functions,” Trans Crainial Technol., vol. 1, p. 66, 2012.
14. K. M. Heilman, “Possible Brain Mechanisms of Creativity,” Arch. Clin. Neuropsychol., vol. 31, no. 4, pp.
285–296, 2016. 15. J. M. Fuster, “Synopsis of Function and Dysfunction of The Frontal Lobe.,” Acta Psychiatr. Scand. Suppl.,
vol. 395, no. 2, pp. 51–7, 1999.

ENGINEERING 319
IGCESH2018
Universiti Teknologi Malaysia, Johor Bahru, Malaysia 13 -15 August 2018
GADGET FOR TEXT AND LOCATION SHARING THROUGH RADIO
FREQUENCY
Hidhir Lutfi Isa*1, Nurzarina Omar Sharif2, Cheng Siong Lim3, Michael Loong Tan4
and Chee Wei Tan5
1, 2, 3, 4, 5 Faculty of Electrical Engineering, Universiti Teknologi Malaysia,
81310 UTM Johor Bahru, Johor, Malaysia
(E-mail: [email protected], [email protected], [email protected],
[email protected], [email protected])
ABSTRACT
This project aims to create a gadget that can increase the capability of mobile phones to
function without relying on cell towers. Android smartphones were used as the mobile
phones. The developed gadget used BeagleBone Black as the processor and enabled the
smartphones to communicate with each other using radio frequency (RF) waves of 433MHz.
As for the connection between the gadget and phone, Bluetooth (BT) technology was used.
The gadget was compatible with all Android smartphones. The User Interface (UI) for the
gadget was developed using MIT App Inventor 2 and Mobile Atlas Creator (MOBAC). The
result demonstrated with two smartphones successfully exchange of messages with the
furthest transmission range of approximately 150m.
Keywords: BeagleBone Black, Radio Frequency, Global Positioning System, MIT App Inventor
2
INTRODUCTION
Mobile phone has become one of the main ways to communicate with other people. A mobile
phone makes it easier to send messages or to talk to people locally and globally. However,
mobile phones rely on cell towers for communication. In other words, if there is no cell tower
nearby, users have no mean of communication with the outside world. This can be seen when
a London citizen went missing on Tioman Island in 2014 [1]. There was no signal in the
rainforest and thus there was no way to locate where the victim was.
This disadvantage causes the mobile phones to be unsuitable for hikers or rescuers during
disaster. Remote areas such as the deep rainforest and area of disaster have limited number of
working cell towers. For example, many cell towers were destroyed during the disaster of
Superstorm Sandy [2]. The communication problem has motivated this project to create a
gadget that can increase the capability of mobile phones to function without relying on cell
towers.

ENGINEERING 320
MAIN RESULTS
The test was conducted by sending a message from one smartphone to another smartphone
through the developed gadget. One of the gadgets was fixed at one location while the other
was moved until the message cannot be received by both smartphones. Then, the locations of
both smartphones were recorded and the distance for the transmission range was calculated.
The transmission range for the gadget was tested inside Universiti Teknologi Malaysia
(UTM) at four different areas, namely closed, outdoor, open and urban areas. For the closed
area, the gadget was tested inside S10 building block while for outdoor, the gadget was tested
around Kolej Tuanku Canselor (KTC). As for the open area, the gadget was tested in UTM
Archery Range. Lastly, for the urban area, one of the gadgets was located inside S10 building
block while another gadget was located outside the building. Figures 1(a) till 1(d) show
respectively the open, closed, outdoor and urban areas chosen for the test setup.
To calculate the distance between two locations, Haversine Formula is used [3]. Equation (1)
shows the Haversine Formula. R is set as the radius of the earth, which is 6371km. From the
latitude (Lat1, Lat2) and longitude (Lon1, Lon2) of both locations, the distance, D can be
calculated. Figure 2 shows the calculated distance for the transmission range test, where three
tests were carried out at each test area.
Distance, (1)
where
(a) (b)
(c) (d)
Figure 1. Four different areas chosen for the test setup.
−••= −
a
aRD
1tan2 1
( ) ( )
••+
=
2sincoscos
2sin
221
2 LonLatLat
Lata

ENGINEERING 321
Figure 2. Tested transmission range for different areas.
CONCLUSION
Overall, the project has managed to fulfil its aims to create a gadget that can increase the
capability of mobile phones to function without relying on cell towers. From the transmission
range test, it can successfully transfer a message at the furthest transmision range
approximately 150m. This project can be extended for other mobile phones applications at
area without cell tower. The RF communication can be used to collect numerical data at a
remote area through mobile phones to overcome the conflict of communication between other
devices. It can also be developed into a useful communication device for rescue team.
Acknowledgment: The authors would like to acknowledge the financial support from
Fundamental Research Grant Scheme (vote no R.J130000.7823.4F314) of the Ministry of
Higher Education (MOHE), and Research University Grant (vote on Q.J130000.2523.13H20)
from Research Management Centre (RMC) of Universiti Teknologi Malaysia.
REFERENCES
1. Klemmer, R.S., Thomsen, M., Phelps-Goodman, E., Lee, R. and Landay, Londoner Gareth Huntley missing
in Malaysian jungle. BBC News. September 30 (2014), from http://www.bbc.com/.
2. Halverson, J. B. and Rabenhorst, T., Hurricane Sandy: The science and impacts of a superstorm.
Weatherwise, 66(2) (2013), 14-23.
3. Goodwin, H.B., The haversine in nautical astronomy. In US Naval Institute Proceedings, 36(2) (1910), 735-
746.

ENGINEERING 322
IGCESH2018
Universiti Teknologi Malaysia, Johor Bahru, Malaysia 13-15 August 2018
ELEMENTS AND VARIABLES IN HOSPITAL PLANNING
Yahaya Hassan1, Azli Yahya2, Jasmy Yunus3,
Sarajul Fikri4, Norhalimah Idris5 and Husna Hamzah6
1, 2, 3 Faculty of Biosciences & Medical Engineering (FBME), Universiti Teknologi Malaysia, Johor,
MALAYSIA.
(E-mail: [email protected], [email protected], [email protected]) 4Faculty of Built Environment (FAB), Universiti Teknologi Malaysia, Johor, MALAYSIA.
(E-mail: [email protected]) 5Faculty of Management (FM), Universiti Teknologi Malaysia, Johor, MALAYSIA.
(E-mail: [email protected]) 6Hospital Planning & Research, Healthcare Technical Services Sdn Bhd, Kuala Lumpur, MALAYSIA
(E-mail: [email protected])
ABSTRACT
Hospital is a place where the sick comes to seek for treatment from doctor. Hence, special
attention and provisions must be taken care off when designing and building the hospital, i.e.
the assurance that the place is safe, convenient, accessible and functional for all stakeholders
(e.g. patients, visitors and staffs). Designing a place which fulfil or satisfy those criteria are
proven to be difficult, but not entirely impossible. Extra effort is also needed when designing
such place to ensure it adheres with specific rules and regulations, especially when
incorporating latest technology in the design. This paper will be discussing the first part of
hospital planning and design, i.e. the elements and variables in hospital planning, which they
would be used to improve the sizing of hospital beds and services or area required in a certain
location serving a certain mass of population. Therefore, through analysis in identifying the
above items, it allows the development of an optimum design which would be able to project
the present and future needs of the hospital capacity.
Key words: Design, elements, hospital building, hospital planning, principles, variables
INTRODUCTION
There are three (3) levels of hospitals in Malaysia, i.e. (i) primary, (ii) secondary, and (iii)
tertiary. The first 2 levels are mainly provided by the government since 1960s, while the
tertiary level of hospital is mainly dominated by private entity. Malaysia’s Ministry of
Health (MoH) has recorded in Health Facts 2016 that there are 335 hospitals in Malaysia,
with a total of 58,050 beds in year 2015 to accommodate the Malaysia’s population at the
time, i.e. 30.485 million.

ENGINEERING 323
Table 1. Statistic of Malaysia Population and Hospitals in year 2015
Total Population in
Malaysia (2015)
30.5 million
Hospital Type Government Non-MoH Private Total
No of Hospitals 143 9 183 335
No of Hospital Bed 41,389 3,698 12,963 58,050
No of Outpatient
Attendances 58,883,654 2,162,307 3,932,361 64,978,322
No of Inpatient
Admission 2,526,205 150,832 1,064,718 3,741,755
Conversion Outpatient to
Inpatient 4.29% 6.98% 27.08% 5.76%
Ratio Bed No :
Population
1.90 : 1,000
MoH has set its future goal where 2.5 hospital beds would be available to 1,000 populations
in Malaysia. In other words, Malaysia requires 80,000 of hospital beds to support its current
population of 32.0 million in year 2017.
From the above table, it can be seen that Malaysia is currently experiencing shortage of beds
by 22,000 from its target to achieve the hospital bed to population ratio of 2.5 : 1,000. Many
developers have taken these opportunities to address the shortfall via intense development of
hospitals, ambulatory care centres and other health facilities’ in Malaysia.
However, the ideal bed number for each health facilities would depends on elements and
variables in the hospital planning and principals in hospital building design, to accommodate
developer’s business direction, and this paper would be discussing on this matter.
MAIN RESULTS
Through study done from developing for more than 20 hospitals, the followings are elements
and variables of hospital planning which have been identified to be the vital components
required to complete hospital planning. Elements are the components required to complete
hospital planning, while variables are the parameters identified that affects the outcome of
hospital planning. Therefore, through these elements and variables, it allows the development
of an optimum hospital planning to facilitate the design of hospital building.

ENGINEERING 324
Figure 1. The Elements and Variables in Hospital Planning
CONCLUSION
From the above findings, there is no denying that Malaysia is experiencing shortage of
hospital bed in order to achieve the targeted hospital bed to population ratio of 2.5 : 1,000.
This issue is currently being dealt with through the rapid development of the healthcare
facilities. Therefore, it is essential to identify the elements and variables in the hospital
planning as they would contribute to the development of an optimum design which would be
used to project the present and future needs of the hospital capacity.
Acknowledgement: I would like to thank Husna Hamzah, Dr Azli Yahya and the rest of the
team members for their help with the data cleaning and the writing of the visual basic script.
REFERENCES
1. Observations on planning and design of the hospital development.
2. Asian Development Bank, Key Indicators for Asia and The Pacific 2016 (47th Edition), 2016, pg 119.
3. Department of Statistics Singapore, Singapore in Figure 2017, (2017), pg 4, 27.
4. Ministry of Health Malaysia, Health Facts 2016, 2016.
5. McDermott, C and Stock G.N., Hospital Operations and Length of Stay Performance, International Journal
of Operations & Production Management, Vol. 27 (9) (2007), pg 1020-1042.
6. Nwagbara, V.C., Rasiah, R, Aslam, M.M, An Approach toward Public Hospital Performance Assessment,
Medicine, Vol. 95 (36) (2016), pg 1-6.
7. Yamaguchi, Y, Better Healing from Better Hospital Design, Harvard Business Review (online), 5 October 2015.
8. Cahnman, S.F., Design Guidelines for Short-Stay Patient Units: Outpatient Observation Prompts New
Thinking in Health Care Space Configuration, Health Facilities Management Magazine (online), 3 May
2017.

ENGINEERING 325
IGCESH2018
Universiti Teknologi Malaysia, Johor Bahru, Malaysia 13 -15 August 2018
A SHORT REVIEW OF EXTERNAL FIXATOR FOR PILON
FRACTURES: BIOMECHANICAL EFFECTS ON DIFFERENT
CONFIGURATIONS
Muhammad Hanif Ramlee*1, Aishah Umairah Abd Aziz 2,
Nur Afikah Zainal Abidin3, Hadafi Fitri Mohd Latip4 and Gan Hong Seng5
1, 2, 3 Medical Devices and Technology Group (MEDITEG)
1,4 Sports Innovation and Tehnology Centre (SITC)
Universiti Teknologi Malaysia
81310 Johor Bahru, Johor, MALAYSIA. 5British Malaysian Institute, Universiti Kuala Lumpur, 53100 Gombak, Selangor
(E-mail: [email protected], [email protected],
[email protected], [email protected], [email protected])
ABSTRACT
Tibial pilon fractures present a challenge in its treatment where they involve both soft tissue
problems and its potential in causing long term disabilities. The treatment of this injury is
still in controversial as discussed in the previous literatures. Different pilon fractures may
adopt different type of treatments and the choices include both internal and external fixators.
A proper application of this system allows bony stability as well as easy monitoring process
of soft tissue care. This article reviews the principles of external fixator in treating pilon
fractures including its configurations, overall construct stability, clinical applications,
fixation timing and complications related to the use of external fixator. This review provides
a solid reasoning from biomechanical view in the effort of choosing fixator components,
deciding optimum configurations and applying fixators to tailor the patient's need.
Key words: Pilon Fracture, External Fixator, Biomechanics, Configurations
INTRODUCTION
Pilon fractures can be referred to as traversing the weight bearing to the articular surface of
the distal tibia. The fractures are often associated with displaced articular fragments,
comminuted metaphyseal bone and injured soft tissue [1, 2]. These injuries account for 1% to
10% of lower limb tibial fractures and commonly occurred in males [3, 4]. In 1979, Ruedi
and Allgower proposed a classification on the basis of their own experiences and results
involving the articular surface and comminution of the fracture. Pilon fractures are classified
into three types; Type I that includes only intra-articular fracture of the distal tibial plafond,
Type II that involves a significant displacement without or minimal comminution on the
same fracture, and Type III in which the intra-articular is significantly comminuted with
displacement [5, 6]. This classification is commonly reported in the literature [7, 8].

ENGINEERING 326
The main aims of ankle injuries treatment especially in pilon fractures are to reconstruct the
fracture and to correct the anatomical conditions including the recreation of the joint surfaces,
early function and restoration of the ankle joint alignment [9, 10]. Normally, type I and type
II were treated with internal fixation with or without external fixation [11, 12]. The
treatments are easy and it gives a positive result without any complications [13, 14].
However, there are ongoing debate and new treatment approach towards type III fractures.
The use of internal fixation alone can cause difficulty to maintain a stable anatomic reduction
[15]. In order to overcome this problem, researchers use an external fixator to maintain a
stable anatomic position [16, 17]. Besides of its significant decrease in complication rates
when compared to plates or screws treatment, external fixator also helps in minimizing severe
soft tissue complications [18]. In addition, external fixation treatment would also achieve
excellent stability while maintaining a correct anatomic ankle position. But, a lack or poor in
stability of the external fixator can lead to pin infection and loosening in up to 50% of cases
as well as loss of anatomic reduction which causes complications such as malunion at the
metaphysic and articular surface with rates of up to 45% [14, 15].
This review is discussing about the configurations, overall construct stability, clinical
applications, time of fixation and failure or complications that related to the use of external
fixation in treating pilon fractures. A research of the published series on pilon fractures was
performed by using the ScienceDirect, Pubmed and Google Scholar search engine. The
following keywords were used: “ankle”, OR “distal tibial”, OR “pilon”, OR “plafond”, AND
“external fixation” OR “external fixator” OR “unilateral” OR “bilateral” OR “delta” OR
“articulated” OR “hybrid” OR “circular” OR “Ilizarov”.
MAIN RESULTS
Various configuration of external fixators have been made in order to meet the demand that
includes Monolateral/uniplanar, Multiplanar/biplanar/delta, Articulated/hinged, Hybrid and
Circular. Every configuration has its own pros and cons, and it is depending on the surgeon in
choosing what configuration gives the best result. A thing to be annotated, these
configurations have first to be stable. Stability of the external fixator is a factor of the final
outcome in which, a better stabilization of the limb caused by the application of external
fixator, may provide early motion that helps in promoting bone healing process [15]. A study
by Wehner et al. [19] shows that the fixation stiffness greatly influence the healing time
where the lowest fixation stability was observed to cause the longest healing time. However,
the use of internal fixation may only be possible occasionally if reduction and fixation are
stable [20]. Another element that is affecting the stability of the fiation is the material used.
Stainless steel is highly rigid but the use of titanium is believed to be superior because of its
higher flexibility that creates less stress risers and allows for earlier weight bearing [21].
For uniplanar, biplanar or delta configuration, the parameters that were found to mostly affect
the stiffness were the number of pins, the diameter of pins, the connecting rod (or side-bar)
separation distance, and the number of connecting rods [22]. The strength of the construct
may be increased by adding double bar/rod or adding additional set of pins in different plane
[23]. Increase in stiffness can also be made by increasing the pin number in any one segment
and bringing the connecting bar closer to bone [24]. Apart from that, for ring or circular and
hybrid configuration, it has been reported that the compression stiffness of Ilizarov construct
is lower compared to other systems and it is able to fix the smallest bone fracture fragments
from different planes with tensioned K-wires [15]. Ilizarov fixation is rigid enough to allow
early motion and partial weight bearing [25]. The stability of Ilizarov configuration are also

ENGINEERING 327
critically affected by the angle between wires, the number and diameter of wires, the tension
in the wires, and the ring size [26]. In another case, application of hybrid external fixation
was found to maintain the motion with the fixator in place, offer adequate stability for
fracture union and keeps the pins away from the fracture site [27]..
CONCLUSION
The main goal in treating pilon fractures is the prevention of any risk of complications. The
choice of treatment should be made according to subjective findings such as type of
fractures, patient’s age and health condition. As discussed, external fixators plays critical
role in the treating pilon fracture especially type III fracture. A proper use of external fixation
is critical as it accounts for many reasonable advantages. Hence, more study should be made
in order to verify and prove its practicality specifically from biomechanical view. The
knowledge gain will help surgeons to construct the frame according to the needs of each
patient.
Acknowledgment: The authors would like to express their appreciation for the support of the
sponsors with Project No Q.J130000.2745.02K78 and Q.J130000.2545.20H20 from
Universiti Teknologi Malaysia.
REFERENCES
1. Germann, C.A., et al., Orthopedic pitfalls in the ED: tibial plafond fractures. American Journal of
Emergency Medicine, 2005. 23: p. 357-362.
2. Borrelli, J.J. and E. Ellis, Pilon fractures: assessment and treatment. Orthopaedic Clinics of North America,
2002. 33(1): p. 231-245.
3. Matthews, S., (iii) Fractures of the tibial pilon. Orthopaedics and Trauma, 2012. 26(3): p. 171-175.
4. Sirkin, M. and R. Sanders, The treatment of pilon fractures. Orthopaedic Clinics of North America, 2001.
32(1): p. 91-102.
5. Anwar, R., K.W.R. Tuson, and S.A. Khan, Classification and Diagnosis in Orthopaedic Trauma. Vol. one. 2008, New York: Cambridge University Press. 200-205.
6. Hopton, B.P. and N.J. Harris, Fractures of the foot and ankle. Surgery, 2010. 28(10): p. 502-507.
7. Middleton, M. and A. Khaleel, Medium term outcome of acute definitive fixation of pilon fractures using an
ankle-spanning Ilizarov fixator. INJURY extra, 2011. 42(9): p. 131-132.
8. Fernandez-Hernandez, O., et al., Fractures of the tibial pilon. Long-term functional results. Revista
Espanola de Cirugia Octopedica y Traumatologia, 2007. 52: p. 152-160.
9. Liporace, F.A. and R.S. Yoon, An adjunct to percutaneous plate insertion to obtain optimal sagittal plane
alignment in the treatment of pilon fractures. The Journal of Foot and Ankle Surgery, 2012. 51: p. 275-277.
10. Mauffrey, C., et al., Tibial pilon fractures: A review of incidence, diagnosis, treatment and complications.
Acta Orthopaedica Belgica, 2011. 77(4): p. 432-440.
11. Encinas-Ullan, C.A., et al., Medial versus lateral plating in distal tibial fractures: A prospective study of 40 fractures. Revista Espanola de Cirugia Octopedica y Traumatologia, 2013. 57(2): p. 117-122.
12. Marcus, M.S., et al., Is there a role for intramedullary nails in the treatment of simple pilon fractures?
Rationale and preliminary results. INJURY, 2013.
13. Wall, O.R., R. Pinder, and A.A. Faraj, Ender's nail fixation of tibial pilon fractures- A safe, minimally
invasive approach for high risk patients in a small district general hospital. INJURY extra, 2007. 38(1): p.
8.
14. Redfern, D.J., S.U. Syed, and S.J.M. Davies, Fractures of the distal tibia: minimally invasive plate
osteosynthesis. INJURY, 2004. 35: p. 615-620.
15. Kapukaya, A., M. Subasi, and H. Arslan, Management of comminuted closed tibial plafond fractures using
circular external fixators. Acta Orthopaedica Belgica, 2005. 71(582-589).
16. Rammelt, S., et al., Joint preserving reconstruction of malunited pilon fractures. Fur & Sprunggelenk, 2012.
10: p. 62-72. 17. Nehme, A., et al., Arthroscopically assisted reconstruction and percutaneous screw fixation of a pilon tibial
malunion. The Journal of Foot and Ankle Surgery, 2007. 46(6): p. 502-507.

ENGINEERING 328
18. Friedl, W. and J. Gehr, F3.1 Plate and intramedullary/intraosseous osteosynthesis of pilon fractures.
INJURY, 2013. 44: p. S10.
19. Wehner, T., et al., Influence of the fixation stability on the healing time-A numerical study of a patient-
specific fracture healing process. Clinical Biomechanics, 2010. 25: p. 606-612.
20. Mawhinney, H.J.D., A strategy for the management of fractures of the tibial plafond. INJURY, 1997. 28(3): p. 241.
21. Pellegrini, M., et al., Minimally-invasive alternatives in the treatment of distal articular tibial fractures. Fur
& Sprunggelenk, 2012. 10: p. 37-45.
22. Burgers, P.T.P.W., et al., Rigidiity of unilateral external fixators-A biomechanical study. INJURY, 2011. 42:
p. 1449-1454.
23. Carroll, E.A. and L.A. Koman, External fixation and temporary stabilization of femoral and tibial trauma.
Journal of Surgical Orthopaedic Advances, 2011. 20(1): p. 74-81.
24. Giotakis, N. and B. Narayan, Stability with unilateral external fixation in the tibia. Strategies in Trauma and
Limb Reconstruction, 2007. 2(1): p. 13-20.
25. Kumar, P., G.K. Singh, and S. Bajracharya, Treatment of grafe IIIB opens tibial fracture by Ilizarov hybrid
external fixator. Kathmandu University Medical Journal, 2007. 5(2): p. 177-180.
26. Narayan, B. and D.R. Marsh, (iv) The Ilizarov method in the treatment of fresh fractures. Current Orthopaedics, 2003. 17: p. 447-457.
27. Babis, G.C., et al., Distal tibial fractures treated with hybrid external fixation. INJURY, 2010. 41: p. 253-
258.

ENGINEERING 329
IGCESH2018
Universiti Teknologi Malaysia, Johor Bahru, Malaysia 13 -15 August 2018
MECHANICAL, THERMAL & MORPHOLOGICAL PROPERTIES
OF EPOXY AND EPOXY/KENAF COMPOSITES : EFFECTS OF
GRAPHENE CONTENT
Nurul Shuhadah Ibrahim1, Azman Hassan1*, Zurina Mohamad1, M.Jawaid2
1 Department of Bioprocess and Polymer Engineering, Faculty of Chemical and Energy Engineering,
Universiti Teknologi Malysia (UTM), 81310 Skudai, Johor, Malaysia
(E-mail: [email protected] *, [email protected]) 2 Department of Biocomposite Technology, Institute of Tropical Forestry and Forest Products
(INTROP), Universiti Putra Malaysia (UPM), 43400 Serdang, Selangor, Malaysia
(E-mail: [email protected])
ABSTRACT
The objective of this study is to determine the effect of graphene content on epoxy/graphene
composite on the mechanical, thermal and morphological properties. The composites were
prepared via compression molding. The graphene content were varied from 0.5 to 1.5 phr for
epoxy/graphene composites preparation. The epoxy/graphene were investigated using
mechanical test, thermogravimetric analysis (TGA) and field scanning electron microscopy
(FESEM). The flexural modulus increased with increasing graphene content and reached the
maximum value of 6936 MPa at 1 phr of graphene content which is 50% higher than neat
epoxy. The flexural strength for epoxy/graphene was highest at 0.5 phr graphene content at
130 MPa which 8.3% higher than neat epoxy. From the TGA results, incorporation of
graphene into epoxy composites increased the char residue and thermal stability of the
composites at 0.5 phr graphene content. However, on further addition of graphene content up
to 1.5 phr, thermal stability of the nanocomposites decreased due to the poor dispersion of
graphene.
Key words: Nanocomposites, mechanical properties, graphene, epoxy/graphene, compression
moulding.
INTRODUCTION
Epoxy resins have been widely used as a matrix to produce advanced natural fiber reinforced
polymer composites. This is because of its high mechanical strength, high water resistance,
chemical resistance, good impregnation, better adhesion to fibers and ease of processing [1].
Besides these advantages, epoxy resin has a few limitation such as poor thermal properties,
poor fire retardant properties and low impact strength that need to be improved in many
applications such as electronic and electrical applications and transportation e.g. automobile,
trains and aircraft [2].
Over the past few decades, there has been a growing interest in the use of natural fibers in
polymer composites either it is in industrial applications and fundamental research. The
natural fiber composites are more environmental friendly, and actively being used in
transportation, building and construction industries, packaging and consumer products. The

ENGINEERING 330
most commonly used natural fibers are bast fibers such as hemp, jute, flax, sisal and kenaf [3-
5].
Kenaf (Hibiscus cannabinus L.) is annual fiber crop growing in temperate and tropical areas
which closely related to cotton and jute. Kenaf is well known as a cellulosic source with
economical and ecological advantages [5,6] and has the potential to be Malaysia’s next
industrial crop based on research findings of its technical potential. Kenaf have a lot of
advantages compared with other natural fibers since it has a short plantation cycle and
flexibility to environmental conditions [7]. Kenaf bast fiber has superior flexural strength
combined with its excellent tensile strength that makes it the material of choice for a wide
range of extruded, molded and non-woven products. Many research works have been
conducted on the kenaf fibers reinforced epoxy composites [8-10]. Yousif et al. [8] revealed
that the untreated kenaf fibers reinforced epoxy composites improved the flexural strength by
approximately 20 % compared to the neat epoxy resin. In a more recent study, Fiore et al.
[11] reported on the effect of chemical treatment of kenaf fibers on the mechanical properties
of epoxy resin composites.
In recent years, the researchers have proved that the incorporation of nanofiller in the
composites is actually able to further enhance the properties of polymer composites. One of
the well-known nanofiller is graphene. Graphene is a single-layer carbon nanofiller that
composed of sp2 hybrid carbon atoms aligned hexagonally in planar structures. Many
investigations have been conducted and nowadays, graphene nanoplatelets (GNPs) have
emerged as a new reinforcing filler for the enhancement of mechanical properties [11-13],
thermal properties [14,15], and barrier properties [16] of polymeric materials. A major factor
for the escalating applications of GNP in the production of polymer nanocomposites is the
lower cost of graphene, which is the precursor for GNP [17]. Results from various
researchers have also demonstrated that GNPs exhibited excellent conductivity and reduced
the percolation threshold of nanocomposites.
MAIN RESULT
Figure 1. Flexural strength and modulus of epoxy/GnP

ENGINEERING 331
Table 1. TGA and DTG value of epoxy/graphene composites
Graphene content (phr)
Temperature at 20% weight loss (oC)
Temperature at maximum rate of weight loss (oC) (Tmax)
Residue at 700 oC
Neat Epoxy 341.2 356.2 5.5
Epoxy/GnP 0.5 342.0 357.1 7.1
Epoxy/GnP 1.0 337.7 354.3 7.9
Epoxy/GnP 1.5 340.5 353.0 7.5
CONCLUSION
Epoxy/graphene and epoxy/TKF/graphene composites were prepared by casting and vacuum
bagging technique. Incorporation of 0.5 phr graphene into epoxy and epoxy/kenaf
composites significantly increased the flexural modulus of the composites from. In addition,
the flexural strength of the composites increased by incorporation of 0.5 phr graphene.
However, as graphene content increased from 1 to 1.5 phr, the flexural strength of
epoxy/kenaf and epoxy/TKF/graphene composites decreased. Finally it can be concluded that
the incorporation of 0.5 phr graphene showed the optimum content which is the best balance
result for both composites based on the mechanical properties.
Acknowledgement: The authors wish to acknowledge the Universiti Teknologi Malaysia
(UTM) and Research University Grant 12J81, sub-code: Q.J130000.2646.12J81 for financial
support.
REFERENCES
1. N. Saba, M. Jawaid, M. T. Paridah, and O. Y. Al-othman. A review on flammability of epoxy polymer,
cellulosic and non-cellulosic fiber reinforced epoxy composites. Polymes for Advanced Technologies. 2015. 1- 21.
2. M. Gao, W. Wu, and Y. Yan. Thermal degradation and flame retardancy of epoxy resins containing
intumescent flame retardant. Journal of Thermal Analysis and Calorimetry. 2009. 95(2): 605–608.
3. G. Huang, J. Gao, X. Wang, H. Liang, and C. Ge. How can graphene reduce the flammability of polymer
nanocomposites?. Materials Letters. 2012. 66(1): 187–189.
4. H. P. S. Abdul Khalil, P. Firoozian, M. Jawaid, H. M. Akil, and A. Hassan. Preparation of activated carbon
filled epoxy nanocomposites: Morphological and thermal properties. Journal Thermal Analysis Calorimetry.
2013. 113(2): 623–631.
5. V. K. Thakur and A. S. Singha. Natural fibres-based polymers: Part i - Mechanical analysis of pine needles
reinforced biocomposites. Bulletin of Materials Science. 2010. 33(3): 257–264.
6. H. M. Akil, M. F. Omar, A. A. M. Mazuki, S. Safiee, Z. A. M. Ishak, and A. Abu Bakar. Kenaf fiber reinforced composites: A review. Materials & Design. 2011. 32(8–9): 4107–412.
7. I. Zaman, T. T. Phan, H. C. Kuan, Q. Meng, L. T. Bao La, L. Luong, O. Youssf, and J. Ma. Epoxy/graphene
platelets nanocomposites with two levels of interface strength. Polymer. 2011. 52(7): 1603–1611.

ENGINEERING 332
IGCESH2018
Universiti Teknologi Malaysia, Johor Bahru, Malaysia 13 -15 August 2018
PREDICTION OF REFINED PALM OIL QUALITY USING KERNEL
PARTIAL LEAST SQUARES REGRESSION
Nur Atikah Mohd Rosely*1, , Azmer Shamsuddin1, Nor Adhihah Rashid1 , Mohd
Aiman Mohd Noor1, Lei Tze Yiing 1, Mohd Kamaruddin Abd Hamid2 and Kamarul
Asri Ibrahim2
1 Process Systems Engineering Centre (PROSPECT), Research Institute of Sustainable Environment
(RISE), Universiti Teknologi Malaysia, 81310 UTM Johor Bahru, Johor, Malaysia.
(E-mail: [email protected], [email protected], [email protected],[email protected], [email protected])
2 Department of Chemical Engineering, Faculty of Chemical and Energy Engineering, Universiti
Teknologi Malaysia, 81310 UTM Johor Bahru Johor, Malaysia. (E-mail: [email protected], [email protected])
ABSTRACT
The objective of this paper is to develop a prediction model using kernel partial least squares
(KPLS) regression technique which is used to forecast the quality of refined, bleached and
deodorized palm oil (RBDPO) in advanced before the refining process. The advantages of
prediction model are time and energy saving, cost reducing and no recycle process is needed.
Prediction models were built by using classical partial least squares (PLS) and KPLS
regression techniques and thus the comparison of reliability and effectiveness of both
methods were made. PLS regression is a multivariate statistical method in use of prediction,
which takes the relationship between input and output variables into consideration. In the
results, PLS regression method was found to be more efficient in predicting the RBDPO
quality in the real world as it achieved lower mean squared error (MSE) than KPLS
regression method while testing data was used. Even though MSE of KPLS prediction was
smaller for the training data, however testing data is considered to be more crit ical to make
decision in the real world. Through the plotting of control chart, the predicted values were
found to have high fitness with the actual values, especially for the KPLS prediction on
training data.
Key words: Quality prediction, partial least squares regression, kernel partial least squares
regression, autocorrelation, cross-correlation.
INTRODUCTION
Palm oil refinery process is a complex multivariable, time-varying and strong nonlinear
process. It possesses a number of features that lead to control problem which are to obtain a
desired RBDPO standard quality by the end of the process. To rectify any possible
production of off-specification RBDPO, the refinery plants opt to go for the recycling
alternative to recycle and refine the product again, thus to prevent scrapping the product
altogether [1]. The loss of profit during recycle is expected nearly RM 160,000 per hour due
to the production and opportunity loss [2].

ENGINEERING 333
In current practice, the end product quality is only available by offline assay after the finish
of refinery process [3]. In short, a reliable process monitoring as well as precise quality
prediction and control are therefore necessary to ensure the safe and profitable operation of
the refinery processes. Several studies have been conducted on the quality prediction of
refined palm oil using artificial neural network [4]. Despite of the ability to predict the
process quality, monitoring the process behaviour is one of the fundamental in process
improvement and optimization, often overlooked by the previous workers. Therefore, this
study would like to highlight the MSPC models for designing better network architecture for
prediction of the physical and chemical properties of palm oil along with process behavior
monitoring.
MAIN RESULTS
A set of 327 raw data of PORAM quality were collected within 8 hour interval of sampling
during industrial attachment. The data consist of 6 input variables (FFAin, MOISTin, IVin,
DOBIin, Bleaching Dosagein, and Vacuum Steam Pressurein) and 3 output variables (FFAout,
MOISTout, COLORout). Boxplot analysis was conducted to identify the optimum sample size
representing the population using the standardized data. The sample size of 25 was selected
as an optimum sample size due to few outliers and most similar distribution trend. The
optimum sample sizes were autocorrelated to determine the optimum sampling time where
the first observation (first lag) fall below the threshold value which then multiplied with the
original sampling time of 8 hour, to gets the optimum sampling time of 8 hours. The training
data was sorted according to the optimum sampling time of 8 hours interval producing the
standardized, sorted data.
The standardized, sorted data was cross-correlated to determine the processing time for the
refinery process. Processing time refers to the time taken for the CPO to transverse the whole
process, exit as RBDPO. The processing time was obtained by taking the longest number of
lags it takes to cross the zero y-axis and multiplying it with the optimum sampling time. The
longest lag was identified at the fourth observation (fourth lag) which then multiplied with 8
hours of optimum sampling time, getting processing time of 40 hours. The output variables of
the standardized, sorted data were staggered according to the processing lag, producing the
standardized, sorted staggered of training data.
These data were fed into the prediction model namely Partial Least Squares (PLS) and Kernel
Partial Least Squares (KPLS) to obtain the relationship coefficient. The performance of the
prediction models was determined by identifying the presence of deviations between the
predicted output control charts and the actual output control charts via crude observation. To
obtain the precise error of deviations, Mean Squared Error (MSE) was calculated. Figure 1(a)
depicts that the PLS prediction model has the least deviation (lower MSE value) than the
KPLS prediction model. Although the nonlinear model gives out the higher MSE value, the
difference in value is not too significant. Thus, for further analysis, control chart was plotted
and the trend was observed. From Figure 1(b), it can be seen that the trend of the predicted
value by KPLS fit the actual value better than the PLS.nThis is because the refinery process
was characterized with nonlinearity and time variance, thus a nonlinear model such as KPLS
can predict better. The results were proven that the RBDPO is palm oil refinery process was a
non-linear process. Therefore, it can be concluded that KPLS prediction model was more
reliable in predicting the RBDPO quality.

ENGINEERING 334
(a) (b)
Figure 1. (a) Graph of MSE between PLS and KPLS prediction model using testing data.
(b) Control chart of predicted value by PLS and KPLS.
CONCLUSION
By acquiring the CPO processing time and developing statistical prediction models via
regression methods, the quality of RBDPO can be effectively predicted ahead in time based
on the raw CPO data. If the predicted RBDPO does not meet the specifications, early
corrective measures can be carried out such as to perform pre-treatments for the flawed CPO
batch before feeding it into the process. This can reduce the dependence of recycling streams
to rework off-spec product, thus optimal plant performance can be fine-tuned for better
smooth running and productivity.
Acknowledgment: The authors would like to express their appreciation for the support from
UTM RUGS Projects (Q.J130000.2446.03G68 and Q.J130000.2546.19H72).
REFERENCES
1. Rashid, N. A., Mohd Rosely, N. A., Mohd. Noor, M. A., Shamsuddin, A., Abd. Hamid, M. K. and Asti
Ibrahim, K. Forecasting of refined palm oil quality using principal component regression. Energy Procedia
142 (2017), 2977-2982. 2. Makky, M. and Soni, P. In itu quality assessment of intact oil palm frsh fruit bunches using rapid portable
non-contact and non-destructive approach. Journal of Food Engineering 120 (2014), 248-259.
3. Jia, R., Mao, Z., Wang, F. and He, D. Self-tuning final product quality control of batch processes using
kernel latent variable model. Chemical Engineering Research and Design 94 (2015), 119-130.
4. Tehlah, N., Kaewpradit, P. and Mujtaba, I. M. Artificial neural network based modeling and optimization of
refined palm oil process. Journal of Neurocomputing 216 (2016), 489-501.

ENGINEERING 335
IGCESH2018
Universiti Teknologi Malaysia, Johor Bahru, Malaysia 13 -15 August 2018
TOUGHNESS ENHANCEMENT OF POLY (LACTIC ACID)
NANOCOMPOSITE
M. Zurina*1 and A. N. A. Sahirah2
1, 2 Department of Bioprocess and Polymer Engineering, Faculty of Chemical and Energy
Engineering, Universiti Teknologi Malaysia, 81310 UTM Johor Bahru, Johor, MALAYSIA.
(E-mail: [email protected], [email protected])
ABSTRACT
The biodegradable thermoplastic poly (lactic acid), PLA is low deformability that resulting
the PLA behaves quite glassy and brittle material and have restricted applications. PLA was
blending with epoxidized natural rubber, ENR and graphene as nanofiller to overcome the
brittleness which known as toughened PLA. The blending of the PLA with ENR and
graphene was done by melt mixing method using nano-single screw extruder with a screw
speed of 60 rpm. The ENR and graphene loading were varied from 0-30 wt% and 0.5-2.0 phr
respectively. The morphology and impact properties of the nanocomposites were
investigated. The morphology of the PLA/ENR showed a co-continuous morphology in PLA
matrix. The morphology of PLA/ENR/graphene nanocomposites, revealed a good dispersion
of graphene in a PLA/ENR matrix at 1 phr of graphene loading. The optimum impact
strength was recorded at 10 wt% of the ENR loading which is 104.6 J/m for the PLA/ENR
system. In the case of PLA/ENR/graphene system, the optimum impact strength was recorded
at 1 phr of graphene which is 219.5 J/m. The addition ENR and graphene in PLA have
enhance the toughness of the PLA matrix.
Key words: Poly (lactic acid), Epoxidized natural rubber, Graphene, Toughness
INTRODUCTION
Recently, world-wide are produced over 200 million tons of plastics each year and 40% of
them are used in short-life products such as packaging which is approximately 90% of the
total plastic production world-wide and most of the plastics are known as “hard to degrade”
materials [1, 2]. This rapid growth of the plastic production leads to the serious
environmental pollution due to the half of them are disposed to the environment within a
short period. Due to the environmental concerns, the plastic wastes problem can be solved by
using the bio-based polymer to substitute the conventional petroleum-based polymer.
PLA is one of the promising and commercially material on the market of bio-based polymer
that can replace the conventional petroleum-based polymer in packaging and other
engineering applications. PLA is a biodegradable aliphatic polyester that produced via
fermentation of the carbohydrate from the renewable agriculture sources [3, 4]. From the
mechanical properties, PLA is highly transparent that behaves as glassy and brittle material
that exhibit the tensile strength of 30 MPa to 50 MPa with an elongation at break between 1%
and 7% depends on its molecular weight. The brittleness and poor toughness of PLA has

ENGINEERING 336
limited its applications that need plastic deformation at high stress level [5, 6]. To overcome
the brittleness of the PLA, several methods can be utilized such as processing manipulation,
copolymerization, and blending with other polymer.
In fact, the ENR is the elastomeric material that has been modified from the natural rubber,
NR consists of the double functionality of crosslinking which are an epoxy group and double
bond that makes ENR is a polar material. The ENR can be used as toughening agent to the
rigid polymer composite since ENR has high impact strength and excellent resistance to
puncture and tear [7]. Pongtanayut et al. (2013) stated that there is partially compatibility
between PLA and ENR at 20 wt% of rubber composition where ENR act as stress
concentrators that enhance the fracture energy absorption of brittle PLA and resulting in
improving the toughness of the PLA [8]. According to Zhang et al. (2013), they reported that
the impact strength and elongation at break of 20 wt% ENR50/PLA and ENR20/PLA were
increased as compared to pure PLA and this is due to the good interfacial adhesion between
PLA and ENR [9]. In addition, Akbari et al. (2014) reported that the addition of 20 wt% of
ENR into the PLA/talc composites, improved the impact strength due to the ENR enhancing
the mobility of the PLA chains. [10].
Toughened PLA can be reinforced by graphene to trigger the significant enhancement in
mechanical properties at lower filler loading. Graphene is a carbon material consisting two
dimensional sheet with hexagonal packed lattice structure. Graphene shows several unique
properties such as tensile strength of 130 GPa, high Young’s modulus (~1.0 TPa), large
theroretical specific surface area (2630 m2 g-1), and good thermal conductivity (~5000 Wm-
1 K-1) [11]. Several studies have been demonstrated that graphene has high reinforcing
efficiency in the PLA. Norazlina et al. (2015) have found that PLA/graphene has created
good thermal stability by increasing diffusion pathway of the degradation of by-products such
as acidic species, metallic ions or residual products. The tensile strength of the poly (lactic
acid)/graphene nanoplatelets (PLA/GNP) has no much different as compared to neat PLA
which reported and proved by Pinto et al. (2015) [12, 13]. According to the She et al. (2014),
they found that as the graphene loading increases in the ENR matrix, the tensile strength of
the composites will be increases while the elongation at break will be lower due to the
reinforcing of the graphene in the ENR matrix [14].
This research has interest in toughening PLA which focused on incorporated of ENR and
graphene nanofiller to improve the toughness. The main objective of this research is to
develop a new toughened poly (lactic acid) reinforced by graphene nanocomposite with equal
or higher properties than synthetic thermoplastic.
MAIN RESULTS
Figure 1. The impact strength of the PLA/ENR and PLA/ENR/graphene nanocomposites

ENGINEERING 337
CONCLUSION
The toughness of the PLA can be improved by incorporating of ENR and graphene. The
impact strength of the 10 wt% of ENR added in the PLA shows a maximum value which is
104.6 J/m and then 1 phr of graphene was added into the blend, the impact strength increased
up to 219.5 J/m. The morphology of the PLA/ENR showed a co-continuous morphology and
PLA/ENR/graphene showed a good dispersion of graphene in the PLA/ENR matrix that
makes the improvement of the impact strength.
Acknowledgment: The author would like to thank the Universiti Teknologi Malaysia (UTM)
and the Ministry of Higher Education (MOHE), Malaysia for funding this research under
Fundamental Research Grant Scheme (FRGS/1/2017/TK05/UTM/02/4 /
R.J130000.7846.4F978).
REFERENCES
1. Li, W. C. and Tse, H. F. Plastic Waste in the Marine Environment: A Review of Sources, Occurrence and
Effects. Science of the Total Environment 566-567 (2016), 333-349.
2. Saad, J. M. and Williams, P. T. Catalytic Dry Reforming of Waste Plastics from Different Waste Treatment Plants for Production of Synthesis Gases, 2016.
3. Aghjeh, M. R., Nazari, M., Khonakdar, H. A., Jafari, S. H., Wagenknecht, U., and Heinrich, G. In Depth
Analysis of Micro-Mechanism of Mechanical Property Alternations in PLA/EVA/Clay Nanocomposites: A
Combined Theoretical and Experimental Approch. Materials and Design 88 (2015), 1277-1289.
4. Laurence, W. M. Permeability Properties of Plastics and Elastomers (3 ed.). USA: Elsevier Inc., 2012.
5. Xu, F., Ma, F., Hoch, M., Arnoldi, E., Cai, X., Dong, W., et al. Transparent Blown Films from Poly
(Lactide) and Poly (Ethylene-co-Vinyl Acetate) compounds: Structure and Property. Polymer Degradation
and Stability 129 (2016), 328-337.
6. Yang, Y., Tang, Z., Xiong, Z., and Zhu, J. Preparation and Characterization of Thermoplastic Starches and
Their Blends with Poly (Lactic Acid). International Journal of Biological Macromolecules 77 (2015), 273-
279. 7. Hazwani Syaza Ahmad, Hanafi Ismail, and Rashid, A. A. Tensile Properties and Morphology of Epoxidized
Natural Rubber/Recycled Acrylonitrile-Butadiene Rubber (ENR 50/NBRr) Blends. Procedia Chemistry 19
(2016), 359-365.
8. Pongtanayut, K., Thongpin, C., and Santawitee, O. The Effect of Rubber on Morphology, Thermal
Properties and Mechanical Properties of PLA/NR and PLA/ENR Blends. Energy Procedia 34 (2013), 888-
897.
9. Zhang, C., Wang, W., Huang, Y., Pan, Y., Jiang, L., Dan, Y., et al. Thermal, Mechanical and Rheological
Properties of Polylactide Toughened by Expoxidized Natural Nubber. Materials and Design 45 (2013), 198-
205.
10. Akbari, A., Jawaid, M., Hassan, A., and Balakrishnan, H. Epoxidized Natural Rubber Toughnened
Polylactic Acid/Talc Composites: Mechanical, Thermal, and Morphological Properties. Journal of Composite Materials 48(7) (2014), 769-779.
11. Bouakaz, B. S., Pillin, I., Habi, A., and Grohens, Y. Synergy between Fillers in
Organomontmorillonite/Graphene-PLA Nanocomposites. Applied Clay Science 116-117 (2015), 69-77.
12. Norazlina, H., and Kamal, Y. Graphene Modifications in Polylactic Acid Nanocomposites: A Review.
Polym. Bull. 72 (2015), 931–961.
13. Pinto, V. C., Ramosa, T., Alvesa, S., Xavierb, J., Tavaresa, P., Moreira, P. M. G. P., et al. Comparative
Failure Analysis of PLA, PLA/GNP and PLA/CNTCOOH Biodegradable Nanocomposites Thin Films.
Procedia Engineering 114 (2015), 635-642.
14. She, X., He, C., Peng, Z., & Kong, L. Molecular-Level Dispersion of Graphene into Epoxidized Natural
Rubber: Morphology, Interfacial Interaction and Mechanical Reinforcement. Polymer 55 (2014), 6803-6810.

ENGINEERING 338
IGCESH2018
Universiti Teknologi Malaysia, Johor Bahru, Malaysia 13 -15 August 2018
POSITION ESTIMATION ERROR AND CONDITION NUMBER
CORRELATION ANALYSIS OF A MULTIANGULATION SYSTEM
Sa’id M. Yarima*1, Ahmad Z. Sha’ameri2 and Abdulmalik S. Yaro3
1, 2, 3 Faculty of Electrical Engineering, Universiti Teknologi Malaysia, Johor, MALAYSIA.
(E-mail: [email protected], [email protected], [email protected])
ABSTRACT
The angulation algorithm of a Multiangulation system involves solving a least square (LS)
problem given the AOA measurements and the coordinates of the GRSs. The condition
number of the coefficient matrix of the LS problem gives an indication of how the AOA
estimation error is amplified to the estimated position of the target. In this paper, a correlative
analysis between the position estimation (PE) error obtained by angulation algorithm with the
condition number of the coefficient matrix is presented. The simulation result shows that
there is correlation between the condition number and the PE error at fixed AOA estimation
error value as they both varied with the target horizontal range and are invariant with the
target bearing.
Key words: AOA, PE error, Angulation algorithm, Condition number
INTRODUCTION
Multiangulation system is an example of a wireless positioning system that uses angle of
arrival (AOA) measurement estimated from the electromagnetic emission of a target detected
at each ground receiving station (GRS) with an angulation algorithm. Several methods to
estimate AOA measurements have been reported [1, 2], but in this research, it is assumed that
the AOA have already been estimated but contains error. The scope of this study is the
angulation algorithm used for position estimation (PE) of a target.
The angulation algorithm of the multiangulation system involves solving a least square (LS)
problem which has the position of the target as unknown [2, 3]. The condition number of the
coefficient matrix of the LS problem gives an indication of how the AOA error is amplified
to the solution of the LS problem that is location of the target [4]. Thus, in this paper, an
analysis is carried out to determine if there is a correlation between the condition number of
the coefficient matrix and the PE error obtained by the angulation algorithm. This is to
determine if the condition number can provide information on the amount of PE error at
certain target positions obtained by the angulation algorithm at fixed AOA error value.
METHODOLOGY
In this section of the paper, a brief description of the angulation algorithm is first presented
which is followed by the condition number calculation of the coefficient matrix. Let 𝜃𝑖 be the
AOA of the target located at (𝑥, 𝑦) obtained at the i-th GRS with coordinate (x𝑖 , y𝑖). The line

ENGINEERING 339
of bearing (LOB) in Eq. (1) presents the relationship between the target location, coordinate
of the GRS and the AOA.
i iy m x c= + . (1)
where is the gradient m𝑖 is tan(90-ϑ𝑖) and y𝑖 − x𝑖 tan(90-ϑ𝑖) is the y-axis intercept c𝑖.
The AOA errors at each GRS is assumed to be zero mean normal distribution with
probability density function as N(0,σ) [3]. The estimated AOA at i-th is therefore:
𝜃𝑖 = 𝜃𝑖 + N (0,σ). (2)
Substituting Eq. (2) into Eq. (1) for 𝑖 = 1 𝑡𝑜 4 gives four LOS equations represented in
matrix form as:
Ax = b. (3)
where A = [
− tan(90 − 𝜃1) 1− tan(90 − 𝜃2) 1− tan(90 − 𝜃3) 1− tan(90 − 𝜃4) 1
] , x= [x,y]T, b = [
− x1 tan(90 − ϑ1) + y1 − x2 tan(90 − ϑ2) + y2− x3 tan(90 − ϑ3) + y3− x4 tan(90 − ϑ4) + y4
]
The Eq. (3) is an overdetermined LS problem and is used in finding the location of the target
given the AOA estimated at each GRS by finding the pseudoinverse matrix solution. Matrix
A in Eq. (3) is known as the coefficient matrix. Taking the singular value decomposition
(SVD) of matrix A as follows:
A=U VT. (4)
where is known as the singular value diagonal matrix expressed as follows:
= [σ1 00 σ2
]. (5)
The condition number of matrix A denoted as K(A) is obtained as follows:
K(A) = 𝜎1
𝜎2. (6)
MAIN RESULTS
In this paper, the position root mean square error (RMSE) is used as the performance
measure. Mathematically, position RMSE based on N realization Monte Carlo simulation is
expressed as:
PErmse = 2 2
1
1(( ) ( ) )
N
i i
i
x x y yN =
− + − . (7)
where (x, y) and (𝑥𝑖 , 𝑦𝑖) respectively are the actual and estimated coordinate of target at the
i-iteration Monte Carlo simulation. The analysis is carried out for target within horizontal
range of 0 km to 200 km, bearing of 00 to 900 with AOA error standard deviation of 10 based
on a square 10 km GRS configuration.

ENGINEERING 340
Figure 1 and Figure 2 respectively shows the position RMSE and condition number of the
coefficient matrix of the LS problem based on Eq. (6). The position RMSE and condition
number both varies with the target position. They both increase with the target horizontal
range from 0 km to 200 km but are invariant with the target bearing. At target range of 100
km, the condition number of the coefficient matrix and the position RMSE are 20 and 1.5
respectively while at the range of 150 km they are 30 and 2.5 respectively. Furthermore,
result comparison shows a correlation between the position RMSE and condition number
distribution with the target position. Conclusively, with the knowledge of the condition
number, it is possible to have an idea of the amount of PE error obtained by the angulation
algorithm without given any AOA error value.
Figure 1. Condition number distribution Figure 2. Position RMSE distribution
CONCLUSION
In this paper, a correlative analysis between the condition number of the LS problem
coefficient matrix and the position RMSE obtained by the angulation algorithm is presented.
The analysis is carried out for target locations between 0 km to 200 km horizontal range and
00 to 900 horizontal bearing at an AOA error standard deviation of 10. Simulation result based
on 10 km GRS square configuration shows that there is a correlation in terms of distribution
of the condition number and position RMSE at the selected emitter position.
Acknowledgement: The authors are thankful to the Universiti Teknologi Malaysia for
providing the resource avenue to undertake this work.
REFERENCES
1. ITU-R, "handbook on spectrum monitoring," ITU Radiocommunication Bureau, Geneva, (2011), pp 267-
276.
2. Sha’ameri, A. Z., Yaro, A. S., Amjad, F. M. and Hamdi M. N. M. Performance Comparison of Emitter
Locating System for Low Level Airborne Targets. Defence S&T Technical Bulletin, 10, (2017), pp. 199-216.
3. Yaro, A. S. and Sha’ameri, A. Z., Mathematical Model of Position Estimation Error for a Multiangulation
System, International Graduate Conference on Engineering, Science and Humanities (IGCESH), University
Teknologi Malaysia (UTM), Skudai, Malaysia (2016), pp. 134-136.
4. Golub, G. H. and Loan, C. F. Matrix Computation 4th ed. (Academic Press, Baltimore, USA, 2014), pp 1-
780.

ENGINEERING 341
IGCESH2018
Universiti Teknologi Malaysia, Johor Bahru, Malaysia 13 -15 August 2018
RELATIONSHIP BETWEEN KNOWLEDGE, ATTITUDE AND
PARENT SUPPORT WITH WORMS INFESTATION ON CHILDREN
Undang Ruhimat*1 and Yane Liswanti*2
1 Undang Ruhimat, 2Yane Liswanti ’ Department of Health Analyst, Institute of Health Science Bakti
Tunas Husada Tasikmalaya, Tasikmalaya West Java, Indonesia. (E-mail: [email protected], [email protected])
ABSTRACT
The child is a future investment, while the child is a high-risk individual from various
diseases, including diseases of worms. On the other hand, parents have an important role to
the health status of children. In addition to adequate knowledge, good parental attitudes and
support have a great contribution to the health of children. Thus, the research aimed to find
out how far the relationship between knowledge, attitude and parental support to wormy
infestation in children. The object of research is the parents of primary school children
scattered in the work area Cibalong District Tasikmalaya. The research method is quantitative
with cross sectional approach.The results showed that there is a significant relationship
between knowledge, attitudes and support of parents with wormy infestation in children.
Multivariate analysis of logistic regression shows that parent attitude is the most dominant
variable / influential on wormy infestation in children, where OR attitude variable is 3.372,
meaning that respondents/parents who have good attitude tend to contribute 3,372 times
better than respondent/parents who have less good attitude.
Key Word: behavior, intestinal worms, children
INTRODUCTION
It cannot be denied again that the diseases caused by parasites mainly due to intestinal worms
are still a serious health problem. However, attention to this disease is still relatively less
included by the ranks of health workers though, the classic reason is still many health
problems other than worms that are considered more important. The above reason cannot be
justified because the worm disease from year to year is not missing tip and even tends to
increase.
Most commonly found in children of primary school age is soil transmitted helmint (Soil
Transmitted Helmint). Diseases of worms can result in declining health conditions, nutrition,
intelligence and productivity of children so that economically cause many losses, because it
can reduce the quality of human resources. In general, infection of worms affect the level of
intelligence, mental and school children's achievement. Deworming is still a serious problem
for all of us, we cannot stand idle about this one health problem, as our society together with
the government especially health workers together make efforts to prevent the development
of sporadic worms sporadically, the community must take an active role and take part in

ENGINEERING 342
dealing with worm problems, for example initiation to family members or the surrounding
community to keep the personal hygiene of beloved sons.
MAIN RESULTS
Figure 1. Summary of Bivariate Test Results Between Independent and Bound Variables
Table 1. Results of Logistic Regression Analysis Among Independent Variables with
Dependent Variables Infestation Worms In Children
Variabel B S.E. Wald Df Sig. Exp(B)
95,0% C.I.for
EXP(B)
Lower Upper
Knowledge -.999 .812 1.511 1 .037 .368 .075 1.810
Attitude 1.216 .620 3.850 1 .003 3.372 1.001 11.359
Parent support .381 .686 .308 1 .016 1.464 .382 5.615
Constant -4.583 2.555 3.217 1 .073 .010
CONCLUSION
The results of research on the relationship between knowledge, attitudes and parents support
to worms infestation in his third child has a significant relationship. Knowledge of parents
has a relationship between the disease and intestinal infestation in children, as well as
parental attitudes and support. Where the three variables are known that the attitude of
parents is the most dominant variable contribute to the occurrence of wormy infestation in
children. The results of this study indicate that the attitude of parents have a tendency of
3,372 times more contribute to the incidence of disease and wormy infestation in children.
p-V
alu
e
Bivariate Test Results

ENGINEERING 343
Acknowledgment: Our gratitude to all the people, friend and colleagues, that had helped
us in the research process from beginning to the end. Thank you.
REFERENCES
1. Akhsin Zulkoni, Parasitologi, Mulia Medika; Yogyakarta, 2010.
2. Bernadus Sandjaja, Buku parasitology Kedokteran, Bandung, Bina Cipta, 2007.
3. Departemen Parasitologi, FKUI, Parasitologi Kedokteran, Jakarta 2008.
4. Djaenudin Natadisastra dan Agoes Ridad, Parasitologi Kedokteran, EGC; Jakarta, 2005.
5. Inge Sutanto, Parasitologi Kedokteran, Edisi IV, FKUI; Jakarta, 2009.
6. Notoatmodjo, S. Promosi Kesehatan dan Ilmu Perilaku. Penerbit Rineka Cipta, Jakarta, 2007.

ENGINEERING 344
IGCESH2018
Universiti Teknologi Malaysia, Johor Bahru, Malaysia 13 -15 August 2018
CARDIAC SEISMOCARDIOGRAPHY (SCG) ANALYSIS USING
ACCELEROMETER: A REVIEW
Ng Seng Hooi1, Kamarulafizam Bin Ismail*1,2, M. Mailah2, Md Rizman Md
Lazim@Lazin3
1Centre for Biomedical Engineering, Institute of Human Centered Engineering, UTM,
2Department Applied Mechanics and Design, Faculty of Mechanical Engineering, UTM 3Department of Physiology, Pusat Pengajian Sains Perubatan (PPSM), Universiti Sains Malaysia
(E-mail: [email protected], [email protected])
ABSTRACT
This paper reviews the non-invasive cardiac diagnostic method using accelerometer.
Currently, the clinical cardiac diagnostic tools that are available are acoustic stethoscope,
electrocardiogram (ECG) and echocardiography. The ECG represents cardiac electrical
activities that provide important information to diagnosis disease such as myocardial
ischemia, infarction and arrhythmias. However, it is not very helpful to diagnoses cardiac
contractility dysfunction and valvular diseases. Echocardiography provides alternative
solution the problem. Based on the principle of ultrasound imaging, it can precisely capture
the heart images that works in real-time. Nevertheless, it comes with high operational cost
and requires a specialist who is expert and properly strained. It is also not immediately
available in most hospital and medical institutes. This review will emphasize on the
technological trends of devices that are able to capture heart related disease. The usage of
accelerometer has gained lots of attention as its ability to detect micro-vibration is
outstanding. It is placed on the surface of the chest and listens to the vibrations, which are
produced by the operations of the valves. The ability to pick up such information somehow
depends of many factors such as the sensor sensitivity, the sensor placement method, position
and the extraction algorithm used. Each of these factors will be discussed and compared.
Keyword: Seismocardiography, accelerometer, heart disease, cardiovascular
INTRODUCTION
Heart disease generally refer to abnormally structure in the blood vessels of heart which lead
to heart attack, chest pain or stroke. Some heart abnormal condition will affect heart’s
muscle, valves of rhythm also considered as forms of cardiovascular disease. Nowadays,
technology improvement has brought more advance method in detection of cardiovascular
disease including electrocardiogram (ECG), echocardiography, computerized tomography
(CT) scan, magnetic resonance imaging (MRI) help in diagnosing patient’s heart condition.
According to a study conducted by [1], ECG output is insufficient to bring information of
cardiac mechanical activities even it is composed of summation of cardiac electric signal. The

ENGINEERING 345
work by [2], [3], and [4] developed a new way in detecting heart rate and respiratory rate
using a single accelerometer. The position of accelerometer sensor attaching on human body
as shown in Figure 1.
Figure 1. Sensor module location [2]
The accelerometer used is ADXL204 model, a biaxial accelerometer placed above the heart
with its sensitivity is along the anteroposterior direction on the sagittal plane of human body
and another one is along the vertical direction. Experiment performed by [5] utilizing two
acceleration sensors to record heart vibrations. The sensor used is LIS3DSH, attaching
position is at the front and back of torso. Using IIR bandpass filter on the acceleration data to
eliminate noise outside of the respiration rate spectrum. Due to two accelerometer sensor or
single sensor only can get the heart rate signal but cannot get the source of signal from any
specific location of cardiac. Thus, a multi accelerometer sensor is implemented by [6] to
identify location-specific feature points in a cardiac cycle corresponding to the four valvular
auscultation locations. They used 4 accelerometer sensors (LIS331DLH) [7] positioning on
the surface of chest as shown in Figure 2
Figure 2. Accelerometer sensors arrangement and position.
From figure 2, 4 accelerometer sensor array is used to collecting SCG data from heart beat
vibration which will tranfer to computer to perform anlysis process by using Matlab software
to convert the acceleration data into frequency by using FFT algorithm. The data collected
will display as time domain in order to get the ventricular mapping.
MAIN RESULTS
The output data of accelerometer is an acceleration data which will be computed through
computer to get seismocardiogram (SCG) data. Heart rate signal with S1 and S2 phase will be
shown from the SCG data.
accelerometer

ENGINEERING 346
Figure 3. SCG signal compared with ECG signal [Mojtaba Jafari Tadi, 2016]
Figure 3 is the result of single accelerometer output signal which compared with ECG signal
to show the systole and diastole acceleration in time domain.
Figure 4. Synchronous several feature point from SCG spectrum to match with ECG signals
Figure 4 is one of the example output from multi-channel of SCG spectrum to show the
mechanical activity of each specific location like mitral, tricuspid, aortic and pulmonary
valve. There got six new feature points identified through multi-channel of SCG spectrum in
Table 1.
Table 1. Feature points identified through multi-channel of SCG spectrum
Feature points Identified location
Left ventricular lateral wall contraction peak velocity (LCV) Mitral valve
Septal wall contraction peak velocity (SCV) Tricuspid valve
Trans-aortic valvular peak flow (AF) Aortic valve
Transpulmonary peak flow (PF) Pulmonary valve
Trans-mitral ventricular relaxation peak flow (𝑀𝐹𝐸) and Trans-
mitral atrial contraction peak flow (𝑀𝐹𝐴)
Mitral valve
Those six feature points are the signal source which correspond to the heart chamber, valve
and blood flow which able to define QRS complex and QT interval as it similar to ECG
parameter (Wen-Yen Lin, 2016). SCG data represented as cardiac mechanical motion, which
help to diagnose of valvular heart disease.
CONCLUSION
Accelerometer has been widely used in the application of cardiac diagnosis. Literature has
shown that it has been utilized to enhance the diagnosis by using single as well as multiple
accelerometer sensors. Multi-channel SCG spectrum measurement system using multi
accelerometer sensor can be considered as advance technique in measuring the vibration
signal that is introduced by cardiac pumping activities. This will also help to get a much more
accurate signal with less time delay and signal attenuation. However, the quality of

ENGINEERING 347
information depends largely on the selection of the sensor that coupled with a sensitive
instrumentation system. The finding has shown a promising future of accelerometer to be
used as a non-invasive cardiac diagnostic system.
Acknowledgement: This study was supported by and implemented in University Technology
Malaysia (UTM). Appreciate to Dr Kamarulafizam who give us the guideline in doing this
research and provide the accessory required in working for this project.
REFERENCES
1. Direct, A. U. (2011). Limitation of ECG/EKG Machines. Retrieved from www.amperordirect.com:
https://www.amperordirect.com/pc/help-ecg-monitor/z-ecg-limitations.html 2. D. H. PHAN, S. B. (2008). Estimation of respiratory waveform and heart rate using an accelerometer. IEEE
EMBS Conference Vancouver (pp. 4916-4919). British Comlubia: IEEE.
3. MojtabaJafariTadi, T. M. (2014). Accelerometer-Based Method for Extracting Respiratory and Cardiac
Gating Information for Dual Gating during Nuclear Medicine Imaging. International Journal of Biomedical
Imaging , 1-10.
4. Mojtaba Jafari Tadi, E. T. (2016, September 28). A real-time approach for heart rate monitoring using a
Hilbert transform in seismocardiograms. Physiological Measurement, pp. 1885-1909.
5. Johan Vertens, F. F. (2015). Measuring Respiration and Heart Rate using Two Acceleration Sensors on a
Fully EmbeddedP latform. Proceedings of the 3rd International Congress on Sport Sciences Research and
Technology Support, 15-23.
6. Wen-Yen Lin, M. I.-C.-C.-C.-S.-Y.-C.-J.-C.-H.-Y. (2016). Identification of Location Specific Feature Points in a Cardiac Cycle Using a Novel Seismocardiography Spectrum System. IEEE Journal of Biomedical and
Health Informatics, 1-10.
7. He, F. I. (2006). Accelerometer-Based Method For Cardiac Function and Therpahy Assessment. United
States Patent Application Publication, 1-9.

ENGINEERING 348
IGCESH2018
Universiti Teknologi Malaysia, Johor Bahru, Malaysia 13 -15 August 2018
A REVIEW STUDY OF WETTABILITY ALTERATION BY
NANOSILICA AND POLYSILICON NANOPARTICLES
Wan Mohd Shaharizuan Mat Latif*1, Wan Rosli Wan Sulaiman2 and
Ahmad Kamal Idris3
1,2 Faculty of Chemical and Energy Engineering, Universiti Teknologi Malaysia,
Johor, MALAYSIA.
(E-mail: [email protected], [email protected]) 3 Faculty of Engineering, Universiti Teknologi Petronas, Perak, MALAYSIA.
(E-mail: [email protected])
ABSTRACT
The applications of nanoparticles as EOR agent have attracted a lot of attention among
researchers over the past decade, including wettability alteration. Generally, the lowest
residual oil saturation occurred at intermediate or neutrally wet, followed by water wet and
oil wet. Hence, wettability alteration is important in improving oil production rates,
production fluids ratio and reducing residual oil saturations, especially in naturally oil wet
carbonates, fractured formations and heavy-oil systems. There are several methods of
wettability alteration but the newly explored discipline is by using nanoparticles. Among
metal and non-metal nanoparticles, the best nanoparticles for wettability alteration are
nanosilica/SiO2 and three types of polysilicon nanoparticles (PSNP), which are hydrophobic
and lipophilic polysilicon nanoparticles (HLPN), lipophobic and hydrophilic polysilicon
nanoparticles (LHPN) and neutrally wet polysilicon nanoparticles (NWPN). The wettability
alteration not only affecting relative permeability and mobility ratio towards better sweep
efficiency, but it also affects the contact angle and capillary number towards better
displacement efficiency. Several factors such as nanoparticles concentration, selection of
nanoparticles size, surface modification and brine salinity were found to be significantly
associated with wettability alteration. Besides, other than NWPN, the neutrally wet can be
achieved by SiO2 and HLPN too, even at low concentration.
Key words: Wettability alteration, nanosilica, polysilicon nanoparticles, neutrally wet
INTRODUCTION
Nanotechnology has multiple high impact application in oilfield. With small size (1 to 100
nm) and high specific surface area per unit volume, the nanoparticles can be tailored to
contain specific optical, electrical or chemical properties to perform specific functions (Lau et
al., 2017). Nanoparticles enhance the oil recovery by several mechanisms-e.g., wettability
alteration, gas mobility reduction, oil viscosity reduction, interfacial tension (IFT) reduction,
increasing viscosity of displacing fluid, increasing disjoining pressure gradient, conformance
control and inhibiting clay swelling.

ENGINEERING 349
To study the effect of nanoparticles concentration on wettability alteration, Al-Anssari et al.
(2016) [1] had tested up to 4 wt% of SiO2 on oil wet calcite; and the result showed that
contact angle was reduced from 120o to 60o by 1 wt% of SiO2, and further reduced to 45o by
2 wt% of SiO2. However, the contact angle just slightly reduced beyond 3 wt% of SiO2. On
the other hand, Ortega et al. (2016) [2] had proved the effectiveness of SiO2 nanofluid in
wettability alteration and IFT reduction, where optimum concentration of SiO2 was 0.05 wt%
after experimental studies on sandstone rock of Ben Nevis Formation, Hebron field, Canadian
offshore. Other experiments that studied the effect of SiO2 and PSNP concentration effect on
wettability alteration are summarized in Table 1 below.
Table 1. Effect of SiO2 and PSNP concentration on wettability alteration.
Researcher
(year)
SiO2/PSNP Optimum
concentration
(wt %)
Contact angle
(before)
Contact angle
(after)
Hendraningrat and
Torsaeter (2014) [3]
SiO2 0.05 wt% 131o 110o
Roustaei and
Bagherzadeh (2015) [4]
SiO2 0.06 wt% 146o 50o
Al-Anssari et al. (2016)
[1]
SiO2 1 wt%
2 wt%
120o
60o
60o
45o
Ortega et al. (2016) [2] SiO2 0.01 wt%
0.05 wt%
51.4o
37.3o
37.3o
31.4o
Zhao et al. (2018) [5] SiO2 0.1 wt% 130o 50o
Roustaei et al. (2012) [6] NWPN NA 136o 82o
Binshan et al. (2002) [7] HLPN NA 60o 158o
Onyekonwu and Ogolo
(2010) [8]
HLPN 0.03 wt% 35o 90o
Shahrabadi et al. (2012)
[9]
HLPN 0.2 wt% 57o 85o
Ju and Fan (2009) [10] LHPN NA 120o 50o
Hendraningrat et al.
(2013) [11]
LHPN 0.05 wt%
0.1 wt%
54o
31o
31o
22o
Safari and Jamialahmadi
(2013) [12]
LHPN 0.1 wt% 124o 30o
Safari (2014) [13] LHPN 0.1 wt% 145o 30o
CONCLUSION
As shown by Table 1, the optimum concentration of nanofluid flooding for wettability
alteration is within the range of 0.05 to 0.1 wt%. It was also observed that the effect of
permeability reduction (blocking of pore network by particle aggregation) was more
dominant than wettability alteration effect when the tested concentration was beyond 0.1 wt%
[11]. Besides, when the concentration is beyond its optimum value, the retention and
aggregation of nanoparticles in porous media would have increases significantly [1]. Previous
studies also showed that wettability directly affects WAG and foam flooding, even though
studies at neutral wettability are still limited. The fact that Alkaline-Surfactant-Gas (ASG)
was more effective than Alkaline-Surfactant-Polymer (ASP) [14] and foam assisted water
alternating gas (FAWAG) was better than WAG in recovering oil [15], hence, it is highly
anticipated that ASG and FAWAG could be improved by SiO2 and PSNP too.

ENGINEERING 350
REFERENCES
1. Al-Anssari, S., Barifcani, A., Wang, S., Maxim, L. and Iglauer, S. Wettability Alteration of Oil Wet
Carbonate by Silica Nanofluid. Journal of Colloid and Interface Science 461 (2016), 435-442.
2. Ortega, D. J. S., Kim, H. B., James, L. A., Johansen, T. E. and Zhang, Y. The Effectiveness of SiO2
Nanoparticles as an Enhanced Oil Recovery Agent in Ben Navis Formation, Hebron Field, Offshore Eastern
Canada. Paper SPE 183546 presented at the Abu Dhabi International Petroleum Exhibition and Conference. November 7-10, 2016. Abu Dhabi, UAE.
3. Hendraningrat, L. and Torsaeter, O. Metal-Oxide Base Nanoparticles: Revealing Their Potential to
Enhanced Oil Recovery in Different Wettability Systems. Applied Nanoscience 5(2) (2014), 181-199.
4. Roustaei, A. and Bagherzadeh, A. Experimental Investigation of Silicon Dioxide Nanoparticles on Enhanced
Oil Recovery of Carbonate Reservoirs. Journal of Petroleum Exploration and Production Technology
5(2015), 27–33.
5. Zhao, M., Lv, W., Li, Y., Dai, C., Wang, X., Zhou, H., Zou, C., Gao, M., Zhang, Y. and Wu, Y. Study on the
Energy between Silica Nanoparticles and Surfactants for Enhanced Oil Recovery during Spontaneous
Imbibition. Journal of Molecular Liquids 261 (2018), 373-378.
6. Roustaei, A., Moghadasi, J., Bagherzadeh, H. and Shahrabadi, A. An Experimental Investigation of
Polysilicon Nanoparticles Recovery Efficiencies through Changes in Interfacial Tension and Wettability
Alteration. Paper SPE 156976 presented at the SPE International Oilfield Nanotechnology Conference. June 12-14, 2012. Noordwijk, The Netherland.
7. Binshan, J., Shugao, D., Zhian, L., Tiangao, Z., Xiantao, S. and Xiaofeng, Q. A Study of Wettability and
Permeability Change Caused by Adsorption of Nanometer Structured Polysilicon on the Surface of Porous
Media. Paper SPE 77938 presented at SPE Asia Pacific Oil and Gas Conference and Exhibition. October 8-
10, 2002. Melbourne, Australia.
8. Onyekonwu, M. O. and Ogolo, N. A. Investigating the use of Nanoparticles in Enhancing Oil Recovery.
Paper SPE 140744 presented at the 34th Annual SPE International Conference and Exhibition. July 31-
August 7, 2010. Tinapa-Calabar, Nigeria.
9. Shahrabadi, A., Bagherzadeh, H., Roustaei, A. and Golghanddashti, H. Experimental Investigation of HLP
Nanofluid Potential to Enhance Oil Recovery: A Mechanistic Approach. Paper SPE 156642 presented at
the SPE International Oilfield Nanotechnology Conference. June 12-14, 2012. Noordwijk, The Netherlands. 10. Ju, B. and Fan, T. Experimental Study and Mathematical Model of Nanoparticle Transport in Porous Media.
Powder Technology 192 (2009), 195-202.
11. Hendraningrat, L., Li, S. and Torsaeter, O. A Coreflood Investigation of Nanofluid Enhanced Oil Recovery
in Low Permeability Berea Sandstone. Paper SPE 164106 presented at the SPE Int. Symposium on Oilfield
Chemistry. April 8-10, 2013. The Woodlands, Texas, USA.
12. Safari, M. and Jamialahmadi, M. Effect of Polysilicon Nanoparticles on Enhanced Oil Recovery in Iranian
Oil Reservoir. Int. J. Nano Dimens. 3(3) (2013), 199-205.
13. Safari, M. Variations in Wettability Caused by Nanoparticles. Petroleum Science and Technology 32 (2014),
1505-1511.
14. Srivastava, M. Foam Assisted Low Interfacial Tension Enhanced Oil Recovery. University of Texas at
Austin, Ph.D. Thesis, 2010. 15. Borhan, H., Halim, N. H. and Ibrahim, J. M. M. An Investigation of Micro-Emulsion and Fine Foam
Induced by EOR Applications in Malaysia Fields. Paper IPTC-17762-MS presented at International
Petroleum Technology Conference. December 10-12, 2014. Kuala Lumpur, Malaysia.

ENGINEERING 351
IGCESH2018
Universiti Teknologi Malaysia, Johor Bahru, Malaysia 13 -15 August 2018
NUMERICAL SIMULATION STUDY ON FOAM STABILITY USING
ELECTROKINETIC SIGNALS DURING ENHANCED OIL
RECOVERY PROCESS
Amni Haslinda Alpandi*1, Mohd Zaidi Jaafar2 and Akhmal Sidek3
1, 2 Petroleum Engineering Department, Universiti Teknologi Malaysia, Skudai, MALAYSIA.
(E-mail: [email protected], [email protected]) 3 Petroleum Engineering Department, Universiti Teknologi Malaysia, Skudai, MALAYSIA.
(E-mail: [email protected])
ABSTRACT
Mathematical models in petroleum reservoir simulation are valuable tools in order to
visualizing the pattern of reservoir flow and estimating the production of oil. The enhanced
oil recovery (EOR), electrokinetic require a complex mathematical modelling to integrate
multiphase flow and process of the electrokinetic transport. Recent lab experiment conducted
by a researcher had been done to investigate the relationship between foam stability and
electrokinetic phenomena. In term of modelling, many studies have look the progression of
foam in the reservoir and few numerical studies also have been conducted to predict
electrokinetic potential variation in the water flooding process. Nevertheless, there is limited
study done which combine the foam stability and electrokinetic in the reservoir. Therefore,
few recent lab work will be compared with numerical result to fulfil the gap in this research
area. This study will be focusing on the development of numerical simulation for
electrokinetic transport and foam progression in foam assisted water alternating gas
(FAWAG) process by using COMSOL. The flowing fluid in FAWAG process can be
monitored by conducting this simulation study. Hence, the relationship between stability of
foam and the associated streaming potential signals also can be observed. Both simulation
and experimental result will be compare to ensure the improvement of model and theory can
be made.
Key words: Elektrokinetic, Foam Stability, Numerical Simulation, Streaming Potential
INTRODUCTION
This study aims to develop numerical simulation model to identify the relationship between
stability of foam and the signals of streaming potential which resulted from the flowing fluid
in FAWAG process. By performing this simulation studies, the application can be implement
in the real field which can give values to the oil and gas industry especially for a betterment
in term of efficiency and economic of EOR process [1].
A numerical simulation can be defined as a calculation which is run on a computer by the
implementation of a mathematical model as a program for a physical system. In order to
study the system behavior, numerical simulations are required. By using this method, the
performance of system which is complex for analytical solution could be estimate. Besides

ENGINEERING 352
that, numerical simulation also capable to be used as a tool to explore and gain the new
insights of new technology [2].
A set of methodologies has been develop to achieve the main objectives in this research. This
research focusing on the fundamental of governing equation of electrokinetic EOR model,
mass transport model of electrokinetic and coupling of electrical and pressure gradients. In
addition, governing equation of fluid dynamic such as foam, modelling of the multiphase
flow in porous media, fundamental studies on foam films properties and characteristics,
together with the rupture of films between bubbles under dynamic condition also will be
discover.
This study also will be covered a parameters affected on foam stability such as wáter
saturation, capillary pressure and surfactant concentration. The COMSOL used to develop a
model and run the simulation in order to investigate the correlation between the stability of
foam and the streaming potential signals in FAWAG process. Therefore, the result will be
compared with the outcome from the experimental work done by [3].
Foam is widely used in EOR displacement process to control mobility ratio and improve the
volumetric sweep efficiency. Stability of the foam film is a factor that effecting the efficiency
process of foam displacement [4]. However, this direct observation of foam stability in
laboratory using physical observation towards the foam bubble in a glass tube is not possible
to apply in reservoir. Therefore, a better alternative proposed by [5] which is using the
electrokinetic potential to measure indirect measurement of foam stability. Previously, a
detecting tool for the encroachment of water towards a production well has been
recommended using the measurement of electrokinetic potential [6]. By installing the
electrodes in downhole, the dynamics of electrically charged fluid in porous media can be
measured such as the formation and injected fluid [7].
EXPECTED RESULTS
The graph of voltage baseline for foam, gas, surfactant and brine as a function of time can be
obtain by performing this numerical simulation. One of the method for foam detection is
using voltage detection or electrokinetic signal. Pressure changes also taking into
consideration to measure the presence of foam. Therefore, the graph between voltage and
pressure different against time for different Sodium Dodecyl Sulphate (SDS) concentration
which are 2500 ppm, 5000 ppm, 7500 ppm, 10000 ppm and 12500 ppm is needed to ensure
the presence of foam. In the end of this research, the graph between output voltages against
time for different SDS concentration will be observe because this graph signifies the presence
of foam and its stability.
CONCLUSION
The key point from this research is numerical simulation study for foam progression in foam
assisted water alternating gas (FAWAG) and electrokinetic transport can be develop by using
COMSOL. Therefore, the stability of foam can be measure with the existence of streaming
potential signals. This expected simulation results by using numerical modeling will be
compare with the recent experimental result conducted by [3], [8] and [9] to fulfill the gap in
this research area. For the next step and future study, real field data can be used as input data
to observe the foam stability in real reservoir. In oil and gas industry, the product which

ENGINEERING 353
requires from production well is oil. By using real field data, oil must be generate first and
foam will displace oil instead of displacing brine.
Acknowledgment: The authors would like to thank Universiti Teknologi Malaysia and
anyone who involved directly or indirectly along the way to complete this research study.
This work was financially supported by Fundamental Research Grant Scheme (FRGS) Vote:
R.J130000.7846.4F954.
REFERENCES
1. A. Shabib-asl, M. A. Ayoub, A. F. Alta’ee, I. B. M. Saaid, and P. P. J. Valentim, “Comprehensive review of
foam application during foam assisted water alternating gas (FAWAG) method,” Res. J. Appl. Sci. Eng.
Technol., vol. 8, no. 17, pp. 1896–1904, 2014. 2. A. Hussein Sheik, H. C. H. Bandulasena, V. Starov, and A. Trybala, “Electroosmotic flow measurements in
a freely suspended liquid film: Experimhents and numerical simulations,” Electrophoresis, vol. 38, no. 20,
pp. 2554–2560, 2017.
3. S. Omar, M. Z. Jaafar, A. R. Ismail, and W. R. Wan Sulaiman, “Relationship between Foam Stability and
the Generated Electrokinetic Signals during FAWAG (Foam Assisted Water Alternating Gas) Processes,”
2014.
4. Y. Zeng et al., “Insights on Foam Transport from a Texture-Implicit Local-Equilibrium Model with an
Improved Parameter Estimation Algorithm,” Ind. Eng. Chem. Res., vol. 55, no. 28, pp. 7819–7829, 2016.
5. S. Omar, M. Z. Jaafar, A. R. Ismail, and W. R. Wan Sulaiman, “Monitoring Foam Stability in Foam Assisted
Water Alternate Gas (FAWAG) Processes Using Electrokinetic Signals,” SPE Enhanc. Oil Recover. Conf.,
2013. 6. M. D. Jackson, “Multiphase electrokinetic coupling: Insights into the impact of fluid and charge distribution
at the pore scale from a bundle of capillary tubes model,” J. Geophys. Res., vol. 115, no. B7, p. B07206,
2010.
7. M. Z. Jaafar, J. Vinogradov, M. D. J. Spe, J. H. Saunders, C. C. Pain, and I. C. London, “SPE 120460
Measurements of Streaming Potential for Downhole Monitoring in Intelligent Wells,” 2009.
8. K. Ma, J. L. Lopez-salinas, M. C. Puerto, C. a Miller, S. L. Biswal, and G. J. Hirasaki, “Estimation of
Parameters for the Simulation of Foam Flow through Porous Media . Part 1: The Dry-Out Effect,” Energy &
Fuels, vol. 27, pp. 2363–2375, 2013.
9. E. Walker, P. W. J. Glover, and J. Ruel, “A transient method for measuring the DC streaming potential
coefficient of porous and fractured rocks,” J. Geophys. Res. Solid Earth, vol. 119, no. 2, pp. 957–970, 2014.

ENGINEERING 354
IGCESH2018
Universiti Teknologi Malaysia, Johor Bahru, Malaysia 13 -15 August 2018
SPACE OPTIMIZATION TECHNIQUE FOR MCKIBBEN SOFT
ACTUATOR USING PULLEY SYSTEM
Ahmad Athif Faudzi1,2, Sii Zhi Ying1, Mostafa Sayahkarajy2
1Faculty of Electrical Engineering, Universiti Teknologi Malaysia, Johor Bahru, 81310 Malaysia
1, 2Centre for Artificial Intelligence and Robotics, Universiti Teknologi Malaysia, Johor Bahru, 81310 Malaysia
(E-mail: [email protected], [email protected])
ABSTRACT
This paper shows an implementation of pulley system to optimize the space for installation of
McKibben soft actuator. McKibben actuator has 20% contraction ratio at 0.3MPa pressure
that causes it to be length-dependent, resulting in difficulties in installing the actuator. In this
paper, we study the effects of using pulley system for its force characteristics and contraction
ratio. The result shows optimization of installation space and additional contraction ratio by
3.26% at the pressure of 0.35MPa with sufficient force. The space optimization method can
be used in robotic finger system to provide full finger flexion.
Key words: McKibben muscle, soft actuator, space optimization
INTRODUCTION
McKibben soft actuator was invented by Joseph McKibben in 1950s. Due to its lightweight
and characteristics which are like human muscles, it is widely used as biomimetic actuators in
prosthetic and rehabilitation applications such as hand rehabilitation assistive devices [1], [2].
It has a contraction ratio of 20% when supplied with 0.3MPa pressure. This becomes the
weakness of McKibben soft actuator where it is length dependent and not space-effective.
The issue is widen when used in hand assistive device where its functionality will be affected
by arm bending.
In this paper, pulley system is proposed to optimize the space consumption for the
installation of McKibben soft actuator. Pulley system can be used to change the direction
of force, force, and displacement required to move an object by using multiple pulleys. A
pulley system with pulleys was designed as shown in Figure 1 and 3D-printed from
VisiJet Green, which is a type of castable plastic, using Projet 1200.

ENGINEERING 355
Figure 1. Pulley Design and Measurement
MAIN RESULTS
With pulley system, the space of installation of a 43cm long soft actuator was reduced to
15 cm, which is around 35% of its original length. Some experiments were conducted to
analyze the effects of pulley system towards the contracting displacement and force
produced by the McKibben soft actuator. The length of the soft actuator in all the tests
was fixed to 43 cm. For both with and without pulley, the contracting displacement
increased linearly with the increase in pressure. At a pressure of 0.35 MPa, the soft
actuator without pulley had a contraction ratio of 23.02% but increased to 26.28% when
pulley system was implemented. This shows the proposed pulley system can improve the
contracting displacement. The characteristics of McKibben soft actuator when its surface
is in contact with the pulley results in reactive force acting towards the soft actuator,
forcing it for additional contraction. The pulley was then implemented and tested on
human finger with full finger flexion with a force of 221 N.
Figure 2. Effects of Pulley towards the Contracting Displacement

ENGINEERING 356
CONCLUSION
Pulley system is able to reduce the space of installation effectively. It is also able to improve
the contraction ratio by 3.26% at the pressure of 0.35MPa without affecting the force
produced. Considering these characteristics, pulley system can be a potential way to
optimize the installation space of McKibben soft actuators, especially on human assistive
devices. It is also suggested to modify the design of the pulley system to make it possible to
be implemented for all 5 fingers.
REFERENCES
1. Wu, J., Huang, J., Wang, Y. and Xing,K. A Wearable Rehabilitation Robotic Hand Driven by PM-TS
Actuators. Lect. Notes Comput. Sci. (including Subser. Lect. Notes Artif. Intell. Lect. Notes
Bioinformatics).2010. 440-450.
2. Tadano, K., Akai, M., Kadota, K. and Kawashima, K. Development of Grip Amplified Glove Using Bi-
Articular Mechanism with Pneumatic Artificial Rubber Muscle. Proceedings of the 2010 IEEE International
Conference on Robotics and Automation. May 3-7. 2010. 2363-2368.

ENGINEERING 357
IGCESH2018
Universiti Teknologi Malaysia, Johor Bahru, Malaysia 13 -15 August 2018
BENDING PERFORMANCE OF THIN SOFT MCKIBBEN ACTUATOR
Mohd Firdaus Mohamed*1 and Ahmad Athif Faudzi 2,3
1 Malaysia-Japan International Institute of Technology, Universiti Teknologi Malaysia,
Kuala Lumpur, 54100 Malaysia.
(E-mail: [email protected] ) 2 Faculty of Electrical Engineering, Universiti Teknologi Malaysia, Johor Bahru, 81310 Malaysia
3 Center for Artificial Intelligence and Robotics (CAIRO), Universiti Teknologi Malaysia,
Johor Bahru, 81310 Malaysia (E-mail: [email protected])
ABSTRACT
In recent years, the soft actuator is extensively grown in research. This robot is expected to
working side by side with human, flexible and adaptable. Therefore, must be soft, light, safe
and high compliance. In this regard, soft McKibben is of interest as an actuator in this
research and still under modification. This paper introduces a variant bending analysis using
soft McKibben actuator. A series of 2.0 mm width with high 120.0 mm McKibben actuator
was used to control the bending motion. The design consists of four McKibben actuators
arranged in parallel compacted with the tube. The bending behavior was evaluated using the
experimental test in a variety of pneumatic input pressure and length section. Based on the
analysis, the fabricated actuator successfully bends and moves according to the assigned
motion. The experiment shows the actuator starts bending at 90 KPa and the angle is
proportional to the increment of the input pressure. The bending angle starts from 4o to 19o
from 150 KPa to 250 KPa input pressure. FEM simulation was performed to evaluate and
verify the bending behaviors in an experimental test. With this performance, the McKibben
actuator can be applied in a wider use of the continuum manipulator.
Keywords: Pneumatic, McKibben, soft Actuator, Bending angle, Soft Robots
INTRODUCTION
The soft actuator is one of the recent promising technologies in various emerging applications
such as human-support robots, wearable power assist suits, robot hands for various works in
size and shape such as fruit-harvesting end-effectors and small animal handling robots [1].
Soft McKibben actuator is a tube-like actuator characterized by a decrement in length when
pressurized [2] which converts pneumatic pressure to contraction force. It has many
advantages over conventional pneumatic cylinders such as high force to weight ratio, variable
installation possibilities, no mechanical parts, lower compressed–air consumption and low
cost [3].
In this paper, we highlight the bending analysis with variant input pressure and length
section using 2.0 mm thin soft McKibben actuator. We described the developed actuators are
designed and describe the experimental result. We also investigate how the bending angle is
influenced and differentiate by FEM simulation also been discussed. With this investigation

ENGINEERING 358
and analysis, it can be designed for very specific purposes to realize robots that are very light
and very simple, safely contact with a human, highly compliance with environment and cost-
effective.
BENDING THIN SOFT MCKIBBEN ACTUATOR
We use thin soft McKibben as actuators that are pneumatically driven and have a much
bigger output force-to-weight ratio than conventional actuators. The soft McKibben actuator
is 2.0 mm in diameter and length of 120.0 mm. The design features have four soft McKibben
arrange in parallel and fixed with the polyethylene plastic outer body parts. The arrangement
of four actuators will introduce bending motion in 4 directions, x and y. These actuators are
attached by knitting method to the inner wall of the outer tube to ensure bending in
maximum. Fabricated rubber was used to make the end of actuator fit. Table 1 shows the
specification of the fabricated actuator.
Table 1. Specification of actuator
Specification Parameter
Pneumatic Artificial Muscle (PAM) 4 x McKibben type
Diameter 2.0 mm
Height 120.0 mm
MAIN RESULTS
Three difference pressure tests were conducted to analyze the bending performance of soft
actuator there are 150 KPa, 200 KPa, and 250 KPa. The test was conducted on all four-soft
actuator for a different direction. The bending performance was recorded and analyses in the
graph in Figure 1. The graph shows the bending angle performance on three different
pressure. The soft actuator starts to bend when the pressure is around 90 KPa, increasing
from to 5.1º , 11.1º and 19º by adding pressure by 50 KPa. The bending angle on four soft
actuator show almost identical in every pressure. This note that the design arrangement is
permitted. The McKibben soft actuator has non-linear characteristics in the initial stage,
however, continue with the linear property after 150 KPa of the supplied pressure.
Figure 1. Bending angle performance on 3 difference pressure
0
5.1
11.1
19
0
5
10
15
20
0 50 100 150 200 250 300
Ben
din
g a
ngle
º
Pressure KPa

ENGINEERING 359
CONCLUSION
The key innovation in the design is the use of thin soft McKibben as the actuators due to their
excellent performance recently in a lightweight, high power output and importantly
compliance and flexible. This feature leads to a new concept compared to most of the
conventional robots, which is highly restricted with predetermined motion. For future
research, a continuum manipulator with growing ability will develop to explore navigation of
the soft robot in a dynamic environment to be adopted in search and rescue operation.
REFERENCES
1. Suzumori, K., Endo, S., & Kanda, T. (2007). A Bending Pneumatic Rubber Actuator Realizing Soft-bodied
Manta Swimming Robot, (April), 10–14.
2. Andrikopoulos, G., Nikolakopoulos, G., & Manesis, S. (2011). A Survey on Applications of Pneumatic
Artificial Muscles, 1439–1446.
3. Hannaford, B., & Winters, J. (1990). Actuator Properties and Movement Control: Biological and
Technological Models. Multiple Muscle Systems: Biomechanics and Movement Organization, 101–120.

ENGINEERING 360
IGCESH2018
Universiti Teknologi Malaysia, Johor Bahru, Malaysia 13 -15 August 2018
THE INTEGRATION OF ELECTRIC VEHICLE WITH POWER
GENERATION SECTOR: A SCENARIO ANALYSIS BASED ON
SUPPLY AND DEMAND IN MALAYSIA
Ahmad M. Idris1, Ahmad F. Ramli1, Zarina A. Muis*1, Wai S. Ho1
1 Faculty of Chemical and Energy Engineering, Universiti Teknologi Malaysia,
81310 UTM Johor Bahru, Johor, MALAYSIA
(E-mail: [email protected], [email protected], [email protected], [email protected])
ABSTRACT
Electric vehicles (EV) had become very attractive recently. The advantages of electric
vehicles had been seen by society that it can be a new alternative in transportation sector.
Hence, this will cause the increase in EVs demand. Consequently, this will result in
electricity demand to increase as well. Thus, this paper aims to analyze how the power
generation sector can cater the increase in demand from the implementation of electric
vehicles. For the purpose of this study, Peninsular Malaysia had been taken as a case study.
Based on the projection data provided from government report, it can be seen that, the
electricity reserve margin without electric vehicle demand is between 22.54% to 26.18%.
With the fully implementation of electric vehicles in Peninsular Malaysia will be drop as low
as 13.11%. It also can be observed that; the total estimated cost would be RM 111,319,000
per year if 10,000 units of electric vehicles is added annually. This cost includes electricity
cost and infrastructure cost. This research will be very useful to government and town
planner since it shows the status and projection trend of power generation in Malaysia.
Key words: Electric Vehicle, Power Generation, Electricity Demand
INTRODUCTION
Electric vehicle had been seen as a future transportation as it is cleaner compared to
conventional vehicle. However, although electric vehicle emits zero emission from tail-pipe,
the electricity used to run EV had become a major concern since most of electricity
production are based on fossil fuel. Thus, renewable energy such as solar and wind were
introduced in order to cater the demand from electric vehicles. This will result for power
sector in getting cleaner every year and so an electric vehicle is cleaner every year. In
Malaysia, EV still at early stage in which the government still trying to formulate the best
policies to promote EV. Thus, this paper intends to study the effect of electric vehicle
towards power generation sector in term of supply, demand, and economic point of view.
METHODOLOGY
The data collection for this study was performed in three steps. The first step is the search
for relevant data involving EV and power generation in Peninsular Malaysia, the second
step is data screening, and the third step is data selection. The data was mainly collected

ENGINEERING 361
from National Electric Mobility Blueprint Report [1]. The assumptions considered in this
study are based on National Electric Mobility Blueprint and as follows:
- 100,000 units of EV and 125,000 charging stations target to be achieved in 2035
- EV will be implemented starting from the year 2018 with initial of 10,000 vehicles and
additional of 10,000 vehicles annually
- Charging station will be built from the year 2018 with initial of 10,000 charging stations
and additional of 10,000 charging stations annually
- Only motorcar EV are considered with Vehicle-to-Grid (V2G) technology
- Total cost include capital cost to purchase EV, electricity cost for EV, and cost for
building charging stations
MAIN RESULTS
As shown in Figure 1, with the implementation of EV, the total demand of electricity in
Peninsular Malaysia will increase up to 27505.31 MW in year 2035. On the other hand,
the reserve margin will drop as low as 13.11% from original reserve margin without EV
implantation (between 22.54% to 26.18%) due to the sudden increase of electricity
demand. However, the reserve margin is expected to stabilize again from year 2027 until
2035. However, this is considered as stable range since usually reserve margin need to be
stay between 10% to 20% [2] only to prepare for sudden increase of electricity demand.
The average total cost for the implementation of EV and to build charging station is RM3
million annually.
Figure 1. Annual growth projection for electricity generation and maximum demand
including electric vehicle demand in malaysia
0.00%
5.00%
10.00%
15.00%
20.00%
25.00%
30.00%
0
5000
10000
15000
20000
25000
30000
35000
2015
20
16
20
17
20
18
20
19
20
20
2021
20
22
20
23
20
24
20
25
20
26
20
27
20
28
20
29
20
30
20
31
20
32
20
33
2034
20
35
Res
erve
Mar
gin
(%)
Elec
tric
ity
(MW
)
Capacity (MW)Peak Demand (MW)Demand include EVOld Reserve MarginNew Reserve Margin

ENGINEERING 362
Figure 2. Annual total cost for the implementation of electric vehicle
CONCLUSION
As a conclusion, it can be seen that based on scenario for power generation in Malaysia, the
implementation of 100,000 units of EV on the road is possible. In fact, with the right
charging pattern, these amount of EV can improve overall energy efficiency for power
generation sector. Vehicle-to-Grid (V2G) technology also offer EV as a decentralized
generation as EV can act as energy storage. Thus, the next step is for the Government of
Malaysia to provide incentives or better policies to promote the EV usage in Malaysia.
Acknowledgment: The authors would like to express appreciation for the support of the
sponsors [Grant Number = Q.J130000.2446.03G61 and Q.J130000.2546.12H89].
REFERENCES
1. Ali, M. A., GreenTech Malaysia. National Electric Mobility Blueprint. Malaysian Green Technology
Corporation, 2015
2. Energy and Environmental Economics, Inc., Estimating the economically optimal planning reserve margin.
San Francisco, CA, USA, 2015.
0
500
1,000
1,500
2,000
2,500
3,000
3,500
4,000
4,500
20
15
2016
20
17
20
18
20
19
20
20
20
21
2022
20
23
20
24
20
25
20
26
20
27
20
28
2029
20
30
20
31
20
32
20
33
20
34
2035
Tota
l Co
st (
MM
YR)
Mill
ion
s

ENGINEERING 363
IGCESH2018
Universiti Teknologi Malaysia, Johor Bahru, Malaysia 13 -15 August 2018
PRELIMINARY STUDY OF ENCAPSULATION OF GINSENG IN
POLY (LACTIC-CO-GLYCOLIC ACID) MICROCAPSULES
Siti Khadijah Lukman1 and Syafiqah Saidin*1,2
1 Faculty of Biosciences and Medical Engineering, Universiti Teknologi Malaysia, Johor Bahru,
Johor, Malaysia. 2IJN-UTM Cardiovascular Engineering Centre, Universiti Teknologi Malaysia, Johor Bahru, Johor,
Malaysia.
(E-mail:[email protected], [email protected])
ABSTRACT
Panax Ginseng has been utilized for its multiple effects such as preventing tumor, treating
diabetes and cardiovascular disease and for antioxidant activities. These capabilities captured
our interest to encapsulate different amount of ginseng (30 mg and 60 mg) within poly
(lactic-co-glycolic acid) (PLGA) microcapsules by a double emulsion technique. The
microcapsules were characterized by using attenuated total reflectance-Fourier transform
infrared spectroscopy (FTIR) and scanning electron microscopy (SEM). The results of study
suggest that all of the microcapsules are successfully fabricated and ginseng also successfully
encapsulated in PLGA microcapsules when the chemical functionality of ginseng (O–H and
C=C bands) was found on both PLGA microcapsules contained 30 mg and 60 mg of ginseng.
The morphology of microcapsules is in spherical shape and smooth wall surface. On PLGA
microcapsules with 30 mg ginseng, the size of microcapsules is smaller compared to PLGA
only and more homogenous than PLGA and PLGA microcapsules with 60 mg. PLGA
microcapsules with 60 mg ginseng was also found agglomerated in some area. This
encapsulation of ginseng within PLGA microcapsules will be beneficial for development of
drug delivery and coating materials in the future.
Key words: Poly(lactic-co-glycolic acid), microcapsules, Panax ginseng
INTRODUCTION
Ginseng is one of the most widely used herbal medicines which belong to the genus Panax.
Panax ginseng contain major bioactive component known as ginsenosides [1]. Ginsenosides
can be divided into three groups: protopanaxadiols, protopanaxatriols and oleanane saponins
[2]. There are approximately 40 ginsenosides has been identified with each of them may have
different pharmacological effects [3]. This is why ginseng has become one of the most used
natural products for medical and dietary purposes. In medical applications, ginseng is
reported to have utilized to fight cancer and to prevent tumor as it has anti-cancer and anti-
tumor effects [4]. Besides, it has also been used for treating diabetes [5], cardiovascular
disease [6] and for antioxidant activities [7].
Poly(lactic-co-glycolic acid) (PLGA) which has been approved by Food and Drug
Administration (FDA) is one of the polymers used to encapsulate ginseng [8]. It has been

ENGINEERING 364
frequently utilized for tunable drug delivery system due to its degradation characteristic and
its possibilities to sustain drugs release [9]. The degradation characteristic of PLGA is
depending on the ratio of lactide/glycolide in the chemical structure of PLGA where higher
lactide will cause to low degradation rate [9-10]. Morever, PLGA is also reported in
encapsulating several drugs such as congo red [11], albumin from bovine serum [11] and
Alpha 1- antitrypsin (α1AT) [9].
The objective of this study was to encapsulate different amount of ginseng within PLGA
microcapsules. The encapsulation was based on the principle of double emulsion water-oil-
water. The PLGA, PLGA with 30 mg ginseng (PLGA-G30) and PLGA with 60 mg ginseng
(PLGA-G60) microcapsules were analyzed using attenuated total reflectance-Fourier
transform infrared spectroscopy (ATR-FTIR) and scanning electron microscopy (SEM).
MAIN RESULT
Chemical Composition Analysis
The chemical composition of the microcapsules was shown on ATR-FTIR spectra as shown
in Figure 1. Strong peaks of PLGA at 1746 cm-1 were recorded on all microcapsules due to
the presence of carbonyl C=O stretching vibration [12]. Other than that, the C–O peaks (1085
cm-1 and 1187 cm-1) and the C–H peaks (1452 cm-1 and 2850-3000 cm-1) were also noticed
which marked to the PLGA.
The ginsenoside was confirmed on both PLGA-G30 and PLGA-G60 microcapsules with a
detection of strong and broad peaks of O–H band and medium peaks of C=C stretch of alkene
at 3387 cm-1 and 1637 cm-1, respectively. Based on the results of ATR-FTIR, we confirmed
the presence of PLGA on all microcapsules while the presence of ginseng was clarified only
on the ginseng encapsulated PLGA microcapsules which are PLGA-G30 and PLGA-G60.
Figure 1. ATR-FTIR spectra of PLGA, PLGA with 30 mg ginseng and PLGA with 60 mg
ginseng.

ENGINEERING 365
Morphological Analysis
The morphologies of all microcapsules are shown in Figure 2 with magnification of 1000×
and 3000×. The SEM images show the PLGA microcapsules are well formed, non-porous,
smooth wall surface and in spherical shape. Theoretically, as the drug is loaded, the size of
microcapsules will be increased [13]. However, in this study, the size of microcapsules
decreased after the ginseng was incorporated into microcapsules might happened due to
utilization of high water-soluble drugs [14]. The addition of 30 mg ginseng resulted similar
morphology as PLGA but more uniform size than PLGA microcapsules. However, the
addition of more ginseng which was 60 mg caused agglomeration in some areas, not
homogenous and well-formed. The clear and smooth surface of microcapsules without
pimples also indicated that the ginseng was encapsulated inside the microcapsules [15].
Figure 2. SEM images of PLGA, PLGA-G30 and PLGA-G60 at 1000× and 3000×
magnification.

ENGINEERING 366
CONCLUSION
The ginseng was successfully encapsulated within PLGA microcapsules using a double
emulsion technique. The presence of ginseng inside the PLGA microcapsules was identified
by ATR-FTIR analysis where identical functional groups were not found on the PLGA
microcapsules only. All microcapsules except microcapsules with 60 mg were well-formed
with non-porous and smooth wall surface of spherical shape. The addition of ginseng cause
the size of microcapsules decrease and the addition of more ginseng cause agglomerated in
microcapsules formation.
REFERENCES
1. B.K. Shin, S.W. Kwon, and J.H. Park: J. Ginseng Res. Vol. 39 (2015), p. 287-298
2. J. Du, C.H. Cui, S.C. Park, J.K. Kim, H.S. Yu, F.X. Jin, et al: PLoS ONE. Vol. 9 (2014), p. e96914
3. J.H. Kim: J. Ginseng Res. Vol. 36 (2012), p. 16-26 4. S. Chen, Z. Wang, Y. Huang, S.A. O'Barr, R.A. Wong, S. Yeung, et al: Evid. Based Complement. Alternat.
Med. Vol. 2014 (2014), p. 13
5. M.J. Oh, H.J. Kim, E.Y. Park, N.H. Ha, M.G. Song, S.H. Choi, et al: J. Ginseng Res. Vol. 41 (2017), p. 52-
59
6. F. He, R. Guo, S.L. Wu, M. Sun, and M. Li: J. Cardiovasc. Pharmacol. Vol. 50 (2007), p. 314-320
7. C.H. Lee and J.H. Kim: J. Ginseng Res. Vol. 38 (2014), p. 161-166
8. S. Zhang, J. Liu, B. Ge, M. Du, L. Fu, Y. Fu, et al: Drug Dev. Ind. Pharm. (2017), p. 1-8
9. N. Pirooznia, S. Hasannia, A. S. Lotfi, and M. Ghanei: J. Nanobiotechnology. Vol. 10 (2012), p. 20
10. D.J. Hines and D.L. Kaplan: Crit. Rev. Ther. Drug Carrier Syst. Vo. 30 (2013), p. 257-276
11. L. Espanol, A. Larrea, V. Andreu, G. Mendoza, M. Arruebo, V. Sebastian, et al.: RSC Advances. Vol. 6
(2016), p. 111060-111069 12. Z. Miswan, S.K. Lukman, F.A. Abd Majid, M.F. Loke, S. Saidin, and H. Hermawan: Int. J. Pharm. Vol. 515
(2016), p. 460-466
13. N. Sharma, P. Madan, and S. Lin: Asian J. Pharmaceutical Sciences. Vol. 11 (2016), p. 404-416
14. H.A. Aziz, Y.T.F. Tan, and K.K. Peh: AAPS PharmSciTech. Vol. 13 (2012), p. 35-45
15. J. Jia, C. Wang, K. Chen, and Y. Yin: Chem. Eng. J. Vol. 327 (2017), p. 953-961

ENGINEERING 367
IGCESH2018
Universiti Teknologi Malaysia, Johor Bahru, Malaysia 13 -15 August 2018
THERMAL BEHAVIOUR STUDY OF MALAYSIA TYPE
BIOMASSES VIA THERMOGRAVIMETRIC ANALYSIS OF
PYROLYSIS (TGA-PYROLYSIS)
V. Balasundram1, K. K. Zaman1, N. Alias1, N. Ibrahim*1, R. Md. Kasmani1, M. K. A.
Hamid2 and H. Hasbullah2
1 Clean and Efficient Energy Research Group, Faculty of Chemical and Energy Engineering,
Universiti Teknologi Malaysia (UTM), 81310 UTM Johor Bahru, Johor, Malaysia.
(E-mail: [email protected], [email protected], [email protected],
[email protected], [email protected]) 2 Faculty of Chemical and Energy Engineering, Universiti Teknologi Malaysia (UTM), 81310
UTM Johor Bahru, Johor, Malaysia.
(E-mail: [email protected], [email protected])
ABSTRACT
The thermal behaviour of biomass samples such as empty fruit bunch (EFB), oil palm trunk
(OPT), rice husk (RH), coconut copra (CC), sawdust (SD), coconut shell (CS), sugarcane
bagasse (SB), and wood bark (WB) in Malaysia upon thermogravimetric analysis of pyrolysis
(TGA-pyrolysis) were studied. The effect of heating rate on thermal degradation of biomass
was evaluated at 40 °C/min (HR1) and 80 °C/min (HR2). Three reaction phases were
observed for all biomass samples as follows; Phase I of drying and evaporation of light
compounds (25 – 150 °C), Phase II of degradation of cellulose-hemicellulose components
(150 – 450 °C) and lastly Phase III of lignin degradation (450 – 700 °C). The leftover
remaining subsequent to 700 °C was labelled as solid residual. The degradation rate of
cellulose-hemicellulose (Phase II) for CS, CC, RH, and EFB samples were higher at HR2.
The highest volatile mass loss in Phase II was achieved by CC sample (81.9 %) at HR2.
Key words: Biomass, Thermogravimetric analysis, Pyrolysis, Heating rate
INTRODUCTION
Biomass is known as renewable energy resources with the highest potential to contribute to
the energy needs of modern society [1]. For this reason, biomass has widely gained attention
from researchers due to potential as a renewable energy resource, sustainability,
environmental concerns, and economic reflection [2]. In South East Asian countries,
specifically, Malaysia has established targets for the application of fuels generated from
biomass as an alternative source of fuel energy [3]. In Malaysia, biomasses are considered as
a sustainable feedstock due to approximately 76% of lands is covered by dense tropical
forests and agricultural fields [4]. The total biomass tests produced in Malaysia from all of
the three groups were assessed to be 168 million tons for every year, according to the report
published by National Biomass Strategy 2020 in the year 2011 [5].

ENGINEERING 368
Recently, Jayaraman and Gökalp [6] have called attention to that the pyrolysis of biomass is
the most encouraging innovation with modern points of view for higher yield of liquid fuel
(pyrolysis oil) that can be used as gasoline enhancers in the petrochemical business and
esteem included synthetic feedstock [8]. Thermogravimetric analysis (TGA) is the most
commonly applied for solid-phase thermal degradation studies [9]. In addition, the
comprehensive study on the effect of higher heating rate which much closer to conventional
pyrolysis condition on thermal degradation of Malaysian biomasses via TGA is still lacking
in the literature. For this reason, the present study aims to investigate the thermal degradation
characteristics of eight type of Malaysia’s biomass samples at two different heating rates
(HR); HR1 (40 °C/min) and HR2 (80 °C/min). The selected biomass samples are empty fruit
bunch (EFB), oil palm trunk (OPT), rice husk (RH), coconut copra (CC), coconut shell (CS),
wood bark (WB), sawdust (SD), and sugarcane bagasse (SB).
As shown in Figure 1, the thermal degradation of biomass can be divided as follows; Phase I
of evaporation of moisture and light compounds (25 – 150 °C), Phase II of degradation of
hemicellulose and cellulose components (150 – 450 °C) and lastly Phase III of lignin
degradation (450 – 700 °C). During Phase I, all types of biomass starts to degrade at a mass
loss of < 6 % (refer Figure. 1). Biomasses such as OPT, CS, CC, EFB, WB, and SD slightly
have a higher mass loss at HR2 than HR1 in Phase I. After Phase I, biomass continues to
degrade in Phase II. From Figure 1, it can be seen that during Phase II the degradation of CS,
CC, RH, and EFB samples were higher at HR2. These biomasses increased by 4.0 % to 12.5
% of mass loss when the heating rate is set at a higher value due to heterogeneous structure of
biomass.
Figure 1. TG volatile mass loss of biomasses at HR1= 40°C/min and HR2 = 80°C/min
Similarly, SB sample shows the mass loss has increased by 42.5 % from HR1 (50.3 %) to
HR2 (71.7 %). In contrast, for OPT, WB, and SD the degradation in Phase II was higher at
HR1. In addition, OPT has achieved higher mass loss of 75.1 % at HR1 than the mass loss of
64.3 % at HR2. SD sample has faced a slight reduction in a mass loss at HR2 (56.2%) as
compared to HR1 (58.6 %). Lastly, the WB has significantly decreased by 40.6 % from mass
loss of 68.4 % at HR1 to mass loss of 40.6% at HR2. RH sample almost has a similar mass
loss at HR1 (49.4 %) and HR2 (51.6 %). After Phase II, the biomass continues to degrade in
Phase III of lignin degradation. The leftover biomass after Phase III was considered as solid
residuals that have not been degraded within 25 – 700 °C The high content of solid residual
0
20
40
60
80
100
HR1 HR2 HR1 HR2 HR1 HR2 HR1 HR2 HR1 HR2 HR1 HR2 HR1 HR2 HR1 HR2
EFB OPT CS CC SB RH SD WB
Mas
s lo
ss (
%)
Biomass
Phase I Phase II Phase III Solid residual

ENGINEERING 369
(%) was achieved at HR1 for EFB, CS, and CC samples at 34.5 %, 32.0 % and 18.1 %
respectively.
CONCLUSION
TGA-pyrolysis on biomass samples (EFB, OPT, RH, CC, SD, CS, SB, and WB) was
successfully conducted at two different heating rates of 40 °C/min (HR1) and 80 °C/min
(HR2). Based on the TGA-pyrolysis experiments, it is suggested that the degradation of
cellulose-hemicellulose (Phase II) for CC, OPT, SB, and EFB samples were higher at HR2 of
more than 60 % of the mass loss. Hence, these biomasses were seemed to be a favour for the
production of maximum liquid oil through pyrolysis. The TGA-pyrolysis of WB and SD
generates higher solid residual left over at 42.7% and 34.1 % respectively that suggest for
higher potential in solid char production.
Acknowledgement: The authors would like to acknowledge the financial supports by
Universiti Teknologi Malaysia and Ministry of Higher Education (MOHE) of Malaysia
(Q.J130000.2546.20H18, R.J130000.7842.4F654, and Q.J130000.2546.14H48).
REFERENCES
1. Balasundram, V. Ibrahim, N. Kasmani, RMd. Hamid, MKA. Isha, R. Hasbullah, H. Ali, RR. Catalytic
pyrolysis of sugarcane bagasse over cerium (rare earth) loaded HZSM-5 zeolite. Energy Procedia 142 (2017), 901-808.
2. Balasundram, V. Ibrahim, N. Kasmani, RMd. Hamid, MKA. Isha, R. Hasbullah, H. Ali, RR. The Effect of
Catalyst Loading (Ni-Ce/Al2O3) on Coconut Copra Pyrolysis via Thermogravimetric Analyser. Chemical
Engineering Transactions 56 (2017), 901-906
3. Ng, F., Yew, F., Basiron, Y., Sundram, K. A Renewable Future Driven with Malaysian Palm Oil-based
Green Technology. Journal of Oil Palm & The Environment 2 (2011), 1-7.
4. Mekhilef, S. Saidur, R. Safari, A. Mustaffa, W. E. S. B. Biomass energy in Malaysia: Current state and
prospects. Renewable and Sustainable Energy Review 15 (2011), 3360-3370.
5. National Biomass Strategy: New Wealth Creation for Malaysia’s Palm Oil Industry (2011).
6. Jayaraman, K. Gökalp, I. Pyrolysis, combustion and gasification characteristics of miscanthus and sewage
sludge. Energy Conversion and Management 89 (2015), 83-91.
7. Galadima, A. Muraza, O. In situ fast pyrolysis of biomass with zeolite catalysts for bioaromatics/gasoline production: A review. Energy Conversion and Management 105 (2015), 338-354.
8. Balasundram, V. Ibrahim, N. Samsudin, MDM. Kasmani, RMd. Hamid, MKA. Isha, R. Hasbullah, H.
Thermogravimetric Studies on the Catalytic Pyrolysis of Rice Husk. Chemical Engineering Transactions 56
(2017), 427-432.

ENGINEERING 370
IGCESH2018
Universiti Teknologi Malaysia, Johor Bahru, Malaysia 13 -15 August 2018
GLOBAL KINETIC STUDY OF MALAYSIA TYPE BIOMASSES VIA
THERMOGRAVIMETRIC ANALYSIS (TGA)
V. Balasundram1, K. K. Zaman1, N. Alias1, N. Ibrahim*1, R. Md. Kasmani1, M. K. A.
Hamid2, H. Hasbullah2
1 Clean and Efficient Energy Research Group, Faculty of Chemical and Energy Engineering,
Universiti Teknologi Malaysia (UTM), 81310 UTM Johor Bahru, Johor, Malaysia.
(E-mail: [email protected], [email protected], [email protected],
[email protected], [email protected]) 2 Faculty of Chemical and Energy Engineering, Universiti Teknologi Malaysia (UTM), 81310
UTM Johor Bahru, Johor, Malaysia.
(E-mail: [email protected], [email protected])
ABSTRACT
The kinetic behaviour of biomass pyrolysis samples was successfully studied via
thermogravimetric analysis (TGA). The biomass samples are empty fruit bunch, oil palm
trunk, rice husk, coconut copra, sawdust, coconut shell, sugarcane bagasse, and wood bark.
The analysis was performed in a nitrogen atmosphere from 30 to 700 °C. The effect of
heating rate on kinetic behaviour of biomass two different high heating rates were evaluated
at 40 °C/min (HR1) and 80 °C/min (HR2). The kinetic parameters of biomass samples such
as pre-exponential factor (s-1), activation energy (kJ/mol), and reaction order (n) are
determined using one-step global kinetic model. The WB sample has the lowest activation
energy (38.14 kJ/mol), while CC was reported for the highest activation energy (145.42
kJ/mol). High positive activation energy at a higher heating rate (HR2 = 80 °C/min) than the
lower heating rate (HR1 = 40 °C/min) for biomass samples.
Key words: Biomass, Thermogravimetric analysis, Pyrolysis, Kinetic parameters
INTRODUCTION
Biomass is solid waste produced in large quantities which have no economic values [1].
Currently, the Malaysian government has established targets for conversion of biomass
wastes into fuels as an alternative source of fuel energy [2]. It is because, Malaysia is rich in
biomass sources such as agricultural wastes, forest residues, and municipal solid wastes [3].
Henceforth, many researchers agreed that thermochemical conversion known as pyrolysis is
the promising route to convert biomass wastes into valuable energy such as pyrolysis oil (bio-
fuel) [1-3]. Interestingly, this pyrolysis oil has wide applications as gasoline enhancers in the
petrochemical industry and as high-value added chemical feedstock [4]. Since pyrolysis is
about the thermal degradation of biomass in the absence of oxygen, thus it is important to
understand the kinetic behaviour of biomass pyrolysis. Thermogravimetric analysis (TGA) is
the most commonly applied analysis for solid-phase thermal degradation studies due to easy
handling and low cost system [5]. Other than that, the kinetic characteristics of biomass such
as activation energy, pre-exponential factor, and reaction order are important in forecasting
the thermal response of biomass sample [6]. TGA-pyrolysis applied the non-isothermal

ENGINEERING 371
condition to evaluate all the kinetic parameters, in which described by an Arrhenius equation
[7]. The comprehensive study on the kinetic analysis biomass pyrolysis at higher heating rate
on thermal degradation of Malaysian biomasses via thermogravimetric analysis (TGA) is still
lacking in the literature. For this reason, the present study aims to determine pyrolysis kinetic
characteristics such as pre-exponential (A), activation energy €, and reaction order (n) of
Malaysia’s biomass samples at two different heating rates (HR); HR1 (40 °C/min) and HR2
(80 °C/min). The selected biomass samples are empty fruit bunch (EFB), oil palm trunk
(OPT), rice husk (RH), coconut copra (CC), coconut shell (CS), wood bark (WB), saw dust
(SD), and sugarcane bagasse (SB).
Table 1. Kinetic parameters of biomass samples at HR1 (40 °C/min) and HR2 (80 °C/min)
Biomass Heating rate
(°C/min)
Pre-exponential
factor, A (s-1)
Activation energy,
Ea (kJ/mol)
Order of reaction,
n
CC 40 0.95 64.70 0.62
80 1.11 145.42 0.48
CS 40 0.85 68.46 0.46
80 0.91 98.82 0.41
EFB 40 0.78 79.86 0.37
80 0.89 101.52 0.38
OPT 40 0.89 65.71 0.50
80 0.90 83.99 0.44
RH 40 0.73 47.37 0.40
80 0.73 61.73 0.36
SD 40 0.81 49.99 0.45
80 0.81 66.00 0.40
SB 40 0.99 97.15 0.48
80 1.07 116.96 0.49
WB 40 0.62 38.14 0.37
80 0.64 51.19 0.34
The multiple-linear regression method is employed in Microsoft-Excel using Linest Function
to determine all the kinetic parameters. Hence, it was assumed that all biomass samples
follow the one-step global kinetic model. The calculated kinetic parameters for each biomass
at HR1 (40 °C/min) and HR2 (80 °C/min) are given in Table 1. As shown in Table 1, it was
observed that high positive activation energies are observed for all biomass samples at HR1
and HR2. This suggests that the pyrolysis reaction strongly depends on heating rate. The
activation energy of coconut copra (CC) drastically increased from HR1 (64.70 kJ/mol) to
HR2 (145.44 kJ/mol). The corresponding pre-exponential factor was found to be 0.95 s-1 at
HR1 and 1.11 s-1 at HR2. Alternatively, the reaction order for CC sample at HR1 and HR2
was found at 0.62 and 0.48 respectively. Similarly, in a coconut shell (CS), the activation
energy at HR1 was found to be lower (68.46 kJ/mol) than HR2 (98.82 kJ/mol). In addition,
the empty fruit bunch (EFB) shows a high positive activation energy at HR2 (101.52 kJ/mol),
while lower at HR1 (79.86 kJ/mol). TGA pyrolysis of OPT at a higher heating rate (HR2) has
an activation energy of 83.99 kJ/mol. Rice husk (RH) is indicated to have higher activation
energy (61.72 kJ/mol) for HR2 than HR1 at 47.37 kJ/mol. The activation energy for sawdust
(SD) at HR1 and HR2 was found to be 49.99 kJ/mol and 66.00 kJ/mol respectively. Lastly,
kinetic parameters of wood bark (WB) has lower activation energy at both HR1 (38.14

ENGINEERING 372
kJ/mol) and HR2 (51.19 kJ/mol) compared to other types of biomass (see Table 1). These
results suggest that this one-step global model method can be an effective tool for revealing
the kinetics of biomass pyrolysis.
CONCLUSION
Kinetic analysis via TGA-pyrolysis on biomass samples (EFB, OPT, RH, CC, SD, CS, SB,
and WB) was successfully conducted at two different heating rates of 40 °C/min (HR1) and
80 °C/min (HR2) in a nitrogen atmosphere. The results of the kinetic analysis provide a
crucial insight into the thermal degradation behaviour of Malaysia’s biomasses that could be
used as feedstock for industrial thermal conversion specifically pyrolysis.
Acknowledgement: The authors would like to acknowledge the financial supports by
Universiti Teknologi Malaysia and Ministry of Higher Education (MOHE) of Malaysia
(Q.J130000.2546.20H18, R.J130000.7842.4F654, and Q.J130000.2546.14H48).
REFERENCES
1. Balasundram, V. Ibrahim, N. Kasmani, RMd. Hamid, MKA. Isha, R. Hasbullah, H. Ali, RR. Catalytic
pyrolysis of sugarcane bagasse over cerium (rare earth) loaded HZSM-5 zeolite. Energy Procedia 142 (2017), 901-808.
2. Balasundram, V. Ibrahim, N. Kasmani, RMd. Hamid, MKA. Isha, R. Hasbullah, H. Ali, RR. The Effect of
Catalyst Loading (Ni-Ce/Al2O3) on Coconut Copra Pyrolysis via Thermogravimetric Analyser. Chemical
Engineering Transactions 56 (2017), 901-906
3. Ng, F., Yew, F., Basiron, Y., Sundram, K. A Renewable Future Driven with Malaysian Palm Oil-based
Green Technology. Journal of Oil Palm & The Environment 2 (2011), 1-7.
4. Galadima, A. Muraza, O. In situ fast pyrolysis of biomass with zeolite catalysts for bioaromatics/gasoline
production: A review. Energy Conversion and Management 105 (2015), 338-354.
5. Balasundram, V. Ibrahim, N. Samsudin, MDM. Kasmani, RMd. Hamid, MKA. Isha, R. Hasbullah, H.
Thermogravimetric Studies on the Catalytic Pyrolysis of Rice Husk. Chemical Engineering Transactions 56
(2017), 427-432.
6. Balasundram, V. Ibrahim, N. Kasmani, RMd. Hamid, MKA. Isha, R. Hasrinah, H. Ali, RR. Thermogravimetric catalytic pyrolysis and kinetic studies of coconut copra and rice husk for possible
maximum production of pyrolysis oil. Journal of Cleaner Production 167 (2017), 218-228.
7. Parthasarathy, P. Narayanan, K. S. Arockiam, L. Study on kinetic parameters of different biomass samples
using thermo-gravimetric analysis. Biomass and Bioenergy 58 (2013), 58-66.

ENGINEERING 373
IGCESH2018
Universiti Teknologi Malaysia, Johor Bahru, Malaysia 13 -15 August 2018
EFFICIENT EXTRACTION OF VANILLIN BY INORGANIC
MOLECULARLY IMPRINTING POLYMER USING SOL-GEL.
N.M. Safri2, M. Md Salleh1,2, H. Hussin, M. R. Zinalibdin3, M. M. Sanagi3
1Envibio Research Group, Sustainability Research Alliance, Universiti Teknologi Malaysia,
81310 Skudai, Johor, Malaysia, 2Faculty of Biosciences and Medical Engineering, Universiti Teknologi Malaysia, 81310
Skudai, Johor, Malaysia, 3Department of Chemistry, Faculty of Science, Universiti Teknologi Malaysia, 81310 UTM
Johor Bahru, Johor, Malaysia
(E-mail: [email protected])
ABSTRACT
Highly selective and efficient vanillin imprinted sol-gel silica based inorganic polymeric
sorbent will be synthesized via matrix imprinting approach for the recognition of vanillin in
biosample. Vanillin will be used as a template molecule, (3-aminopropyl)triethoxysilane
(APTES) as a functional monomer, triethoxysilane (TEOS) as a crosslinker and ammonium
hydroxide as the sol-gel catalyst. Non-imprinted sol-gel polymer will be developed with
under similar condition but in absence of template for comparison purpose. The
characteristics of these polymers will be evaluated based on adsorption capacity and binding
kinetics in both imprinted (MIP) and non-imprinted (NIP) as a control material. Equilibrium
binding experiments will be conducted to evaluate the performance of the MIP relative to
non-imprinted polymer (NIP). Compared with non-imprinted polymer particles, the prepared
vanillin-imprinted silica sorbent showed high adsorption, significant selectivity, and fast
binding capacity for vanillin. High performance liquid chromatography will be used to
determine the residual concentration of vanillin for successful imprinting.
Keywords: imprinted sol-gel, vanillin, high performance liquid chromatography
INTRODUCTION
As the vanilla has wide-ranging roles in various field in industry such as in food, beverage,
fragrance, and confectionery [1], it has been a significant element in various industry. Apart
from that, vanillin, a major phenolic compound in vanilla also show several medicinal values
such as an anti-oxidant, anti-inflammatory and antiapoptotic agent [2] which makes vanillin
as an extraordinary therapeutic tool in pharmaceutical development. Growing consumption
has lead to effective extraction of vanillin using molecularly imprinting polymer. In the last
decade, this approach has been introduced to isolate the target molecule from complex
matrix.
Molecularly imprinting polymer is one of the high advanced approach with formulation of
template molecule based on size, functional group, and shape of target molecule. Sol-gel

ENGINEERING 374
process is molecular imprinting polymer which are developed using inorganic material
(siloxane) with presence of acid or base-catalyzed hydrolysis via condensation of silane
monomers [3]. The polymer formed from sol-gel offers great extent of product with high
degree of purity and only requires low temperature during synthesis process [4]. Sol-gel
materials offer many advantages such as simple preparation,
In this work, molecular imprinting polymer will be prepared using vanillin as template. A
simple pure sol-gel synthetic will be adopted by using (3-aminopropyl) triethoxysilane
(APTES) as a functional monomer and triethoxysilane (TEOS) as a crosslinker. In addition,
the binding kinetics and adsorption capacity will be discussed.
RESULTS
The polymer will be characterized using FTIR to observe the band that attributed to the
characteristic of residual water and Si-OH stretching vibration. Furthermore, the performance
of MIP and NIP will be compared in terms of binding capacity and adsorption. Moreover,
Scatchard analysis will be used to assess MIP's characteristic towards vanillin. It is expected
that MIP will exhibit good adsorption capacity for vanillin due to the complementary of
binding sites. Besides, it is expected that MIP's selectivity will be higher compare to NIP
based on the mutuality of three-dimensional structure between the template molecule and
molecularly imprinted polymers.
CONCLUSION
In this study, the MIP will be formed by a sol-gel reaction using TEOS and APTES. Vanillin
will be used as a template, and vanillyl alcohol will be used as analogous compound. The
capability of MIP will be examined using these two compounds. To conclude, the result will
display the equilibrium between hydrophobic character and the number of hydroxyl group
involves in MIP contributes to attain high separation ability.
Aknowledgement: This work is funded by Ministry of science, technology and innovation.
Authors also thanks the UTM Zamalah for scholarships.
REFERENCES
1. S. Ramachandra Rao and G. a. Ravishankar, “Vanilla flavour: production by conventional and
biotechnological routes,” J. Sci. Food Agric., vol. 80, no. September 1999, pp. 289–304, 2000.
2. A. A. King, D. T. Shaughnessy, K. Mure, J. Leszczynska, W. O. War, D. M. Umbach, Z. Xu, D. Ducharme,
J. A. Taylor, D. M. Demarini and C. B. Klein, “Antimutagenicity of cinnamaldehyde and vanillin in human
cells : Global gene expression and possible role of DNA damage and repair,” vol. 616, pp. 60–69, 2007. 3. S. LeeH. Linand H. Chen, “Studies on the Preparation and Properties of Inorganic Molecularly Imprinted
Polymer ( MIP ) Based on Tetraethoxysilane and Silane Coupling Agents,” 2009.
4. M. J. ShinY. J. Shinand J. S. Shin, “Inorganic Molecularly Imprinted Polymer by Sol-Gel Process for
Recognition of Caffeine,” J. Org. Polym. Mater., vol. 3, no. January, pp. 1–5, 2013.

ENGINEERING 375
IGCESH2018
Universiti Teknologi Malaysia, Johor Bahru, Malaysia 13 -15 August 2018
CARBOHYDRATE METABOLISM IN Lactobacillus reuteri STRAIN
DSMZ 20016
S. Shanmugaprakasham*1,2, Roslinda Abd Malek1, Daniel Joe Dailin2 and Hesham Ali El-
Enshasy1,2,3
1 Institute of Bioproduct Development, Universiti Teknologi Malaysia (UTM), Skudai, Johor Bahru,
MALAYSIA.
(E-mail: [email protected], [email protected]) 2 Faculty of Chemical and Energy Engineering, Universit Teknologi Malaysia (UTM), Skudai, Johor
Bahru, MALAYSIA.
(E-mail: [email protected]) 3 City of Scientific Research and Technology Applications, New Burg Al Arab, Alexandria, EGYPT.
(E-mail: [email protected])
ABSTRACT
Probiotics referred to a group of living microorganisms which highly influence the human
health. Lactic acid bacteria such as Lactobacillus reuteri, are the most frequently described
effective probiotic strains for human consumption. Howbeit, most of the probiotics includes
L. reuteri are endogenous, found in the gastrointestinal tract of vertebrates, including humans,
rats, pigs and chickens. Like other members of lactobacilli, strains of L. reuteri are also
saccharolytic and plays vital role in carbohydrate metabolism in the colon. A number of
studies have highlighted on the carbohydrate utilization in L. reuteri strains. However, the
link between their phenotypic potential with their genes and the potential metabolic pathways
are poorly described. In this study, the L. reuteri strain DSMZ 20016 was tested for its ability
to metabolize different types of carbohydrates, includes monosaccharides, oligosaccharides
and polysaccharides. Growth and metabolic activity was evaluated based on final OD at
600nm and final pH. The available genomic sequence of strain DSMZ 20016 was analysed to
identify the genes responsible for the carbohydrate catabolic activities. Then, major metabolic
pathways have been evaluated. Strain DSM 20016 devotes a large portion of its genome to
the breakdown of carbohydrates. Lactic acid bacteria utilize a broad range of dietary
carbohydrates which escaped from digestion at upper part of gastrointestinal environment.
Addition to this, most of the lactic acid bacteria are adapted to degrade human indigestible
oligosaccharides and polysaccharides. L. reuteri strains are the most superior microorganism
with an ability to survive and persist in the gut of human. The data assembled in this study
provide significant information on the growth promoting range of carbohydrates and their
possible metabolic pathways. These may allow for the rational prediction of synbiotic
relationship between strain DSMZ 20016 and selected prebiotics.
Key words: Lactobacillus reuteri, carbohydrate metabolism, genome, heterofermentative
lactobacilli

ENGINEERING 376
INTRODUCTION
Lactobacillus is a genus comprise of Gram-positive, rod-shaped and non-spore forming
bacteria. The genus classified under phylum Firmicutes, class Bacilli and order
Lactobacillales [1,2]. They have been widely identified in decomposing plant material
and fruits, in dairy products, fermented meat and fish, cereals, beets, pickled vegetables,
potatoes, sourdough, silages, fermented beverages, juices and sewage. Meanwhile, in
human the Lactobacillus strains are mainly inhabit the oral cavity, ileum, colon, and in
the vagina [1]. Numerous strains belong to this group have been extensively studied and
hits the food markets for their probiotic properties. Lactobacillus recognised as an
alternate for usage of antibiotics to enhance protection against gastrointestinal diseases.
Besides, they have been applied as starter cultures in dairy and fermented food products,
partly due to their highly acidifying potential (lactic acid production) and antimicrobial
properties [1,2,3].
Among them, Lactobacillus reuteri is well-known probiotic strain with proven beneficial
effects, documented through clinical trials on humans. L. reuteri is a Gram-positive rod,
non-spore forming and non-motile bacterium. Like other members of Lactobacillus
genus, strains under this species are also facultative anaerobic and can be grown normally
in oxygen-limited conditions. Their optimum growth temperature was reported between
37 - 42 °C and the optimum growth pH were about 6.5. The strains of L. reuteri are
fastidious bacterium, with duplication times of less than an hour in optimized medium.
They able to fermenting sugars, amino acids, vitamins, nucleotides and can use several
external electron acceptors such as fructose, glycerol, nitrate, pyruvate, citrate and
oxygen. Metabolically, L. reuteri strains are belongs to the group of obligate hetero-
fermentative species [4,5,6].
Most L. reuteri strains identified from human gastrointestinal tract but also in the gut of
other organisms such as chicken, pig, dog and other mammals [4,1]. The growth and
metabolic activities of beneficial gastrointestinal microbiota are highly stimulated by a
wide range of indigestible carbohydrates. During digestion of food in human, most of the
simple carbohydrates will be reabsorbed into blood capillaries at ileum. The major form
of the carbohydrates that enter the large bowel are the dietary fibers as they not digested
at part of the alimentary canal. Utilization of these indigestible fibers and
oligosaccharides has been recognized as an important attribute of probiotics strains [6,7].
Gastrointestinal microorganisms include, L. reuteri produce various saccharolytic
enzymes to deploy these resources.
In the present study, we evaluated the carbohydrate utilization in L. reuteri strain DSM
20016 by using monosaccharides, oligosaccharides and polysaccharides. The data
gathered in this study provide a significant amount of complementary and comparative
information on the growth promoting carbohydrates. As the complete genome of strain L.
reuteri DSM20016 is available online (Accession number: CP000705) and to date no
studies reported on the carbohydrate metabolism (especially oligosaccharides). Thus, this
available data will be explored to understand the strain’s carbohydrate metabolism and
then utilized for fermentation medium development.

ENGINEERING 377
MAIN RESULT
Table 1. Carbohydrate utilization by L. reuteri strain DSMZ 20016
Carbon source Growth Final pH
Control + 6.20
Glycerol + 5.70
Xylose - 6.17
Glucose ++ 4.06
Fructose - 6.17
Galactose ++ 4.04
Mannitol - 6.18
Trehalose - 6.19
Maltose +++ 3.61
Sucrose +++ 4.10
Lactose +++ 3.65
Raffinose +++ 3.72
Soluble starch + 6.24
Tapioca starch - 6.47
Sago starch - 6.13
Corn starch - 6.33
Rice starch - 6.43
Wheat starch - 6.49
Molasses ++ 4.80 A ‘-’ sign indicates that final OD600 is below than
0.3; ‘+’ indicates final absorbance is 0.3 – 0.5;
‘++’ indicates the final absorbance is 0.5 – 0.8
and ‘+++’ indicates the final absorbance more
than 0.8.
CONCLUSION
The genome sequences from L. reuteri strain DSMZ 20016 and the other strains of L. reuteri
as well as the members of Lactobacillus has provide us valuable information on carbohydrate
utilization capabilities. This is fundamental for the adaptation of these bacteria in the
gastrointestinal environment and to intact with human host. Understanding on the metabolic
potential also enable us to provide selective growth conditions favouring the high biomass
optimization for strategy in bioprocessing. It is an important platform in fermentation of
lactobacilli where the bacterial growth, survival, signalling and fermentative processes are
regulated efficiently.
Acknowledgment: The authors would like to express their appreciation for the support of the
IBD-HICOE grant. The student author would like to extend this thanks to School of
Postgraduate Studies, Universiti Teknologi Malaysia (UTM) for the financial support of
Zamalah Ph.D. Scholarship session 2017/2018.
REFERENCES
1. Duar, R. M., Lin, X. B., Zheng, J., Martino, M. E., Grenier, T., Pérez-Muñoz, M. E. Lifestyles in transition:

ENGINEERING 378
evolution and natural history of the genus Lactobacillus. FEMS Microbiology Reviews. 41 (2017), S27-S48.
2. Claesson, M. J., Van Sinderen, D., and O'Toole, P. W. The genus Lactobacillus– a genomic basis for
understanding its diversity. FEMS Microbiology Letters. 269 (2007), 22-28.
3. Song, D., Ibrahim, S., and Hayek, S. Recent application of probiotics in food and agricultural science. In
Probiotics, In Tech Press (2012). 4. Hayek, S. A., Shahbazi, A., Worku, M., and Ibrahim, S. A. Enzymatic activity of Lactobacillus reuteri
grown in a sweet potato based medium with the addition of metal ions. SpringerPlus. 2 (2013), 465.
5. Alazzeh, A. Y., Ibrahim, S. A., Song, D., Shahbazi, A., and AbuGhazaleh, A. A. Carbohydrate and protein
sources influence the induction of α- and β-galactosidases in Lactobacillus reuteri. Food Chemistry. 117
(2009), 654-659.
6. Burgé, G., Saulou-Bérion, C., Moussa, M., Allais, F., Athes, V., and Spinnler, H.-E.. Relationships between
the use of Embden Meyerhof pathway (EMP) or Phosphoketolase pathway (PKP) and lactate production
capabilities of diverse Lactobacillus reuteri strains. Journal of Microbiology. 53 (2015), 702-710.
7. Goh, Y. J., and Klaenhammer, T. R. Genetic mechanisms of prebiotic oligosaccharide metabolism in
probiotic microbes. Annual Review of Food Science and Technology. 6 (2015), 137-156.

ENGINEERING 379
IGCESH2018
Universiti Teknologi Malaysia, Johor Bahru, Malaysia 13-15 August 2018
AN OVERVIEW OF “GREEN” TECHNIQUES TO CONTROL
MICROBIOLOGICALLY INFLUENCED CORROSION
Muhammad Khairool Fahmy Bin Mohd Ali*1, Norhazilan Bin Md. Noor2, Astuty Binti
Amrin3, Nordin Bin Yahaya4, Shamila Azman5, Akrima Abu Bakar6
1,2,4,5,6 Faculty of Civil Engineering, Universiti Teknologi Malaysia, Johor Bahru, Malaysia.
3UTM Razak School of Engineering and Advanced Technology, UTM Kuala Lumpur,
Malaysia.
(E-mail: 1*[email protected], [email protected], [email protected], [email protected], [email protected], [email protected])
ABSTRACT
Microbiologically influenced corrosion (MIC) is a serious problem in pipeline system that
results in costly repair and pipeline failure. Sulfate reducing bacteria (SRB) is one of the main
culprit and gives a great concern to oil and gas industries. The most preferable mitigation
method by most companies is through biocide consumption. Nevertheless, the chemical
solution is too expensive, it may create environmental problems by being too corrosive and
hazardous to the personnel. Application of Ultraviolet (UV) treatment has been used as an
alternative treatment for mitigation of bacteria in various industries including MIC risk in
pipeline system. However, UV radiation efficiency is often affected by poor quality effluents
due to suspended solids presence in the environment. In addition, UV-treated bacteria may
undergo photoreactivation process. Ultrasound (US) is often employed as a pre-treatment
process to improve UV disinfection efficiency. Aims of this work are to review the usage of
US sonication as pre-treatment to UV disinfection studies, pointing out both disinfection
mechanism as well as its effects on bacteria inactivation. Although combination of US with
UV treatment seems widely used and studied, it is scarcely found being explored for
disinfecting SRB in corroding pipeline system. Past researchers have proven the effectiveness
of the combination treatment in reducing particles size and combatting microorganism
growth in respective environment. Therefore, due to its promising effect in reducing or
replace toxic chemical usage, it is worth to study in detail for real application in future
especially for application in oil and gas industry. Besides preserving the environmental from
pollution, the integrity and reliability of the pipeline system could be prolonged.
Keywords: Microbiologically influenced corrosion, Pipeline, Ultraviolet radiation, Ultrasound
sonication

ENGINEERING 380
INTRODUCTION
The properties of pipeline networks structures are vulnerable to microbiologically influenced
corrosion (MIC) both internal and external of pipeline system. MIC is not a distinct type of
corrosion form, but rather is the influence by microorganism activity, with resulting biofilms
and metabolic products that enhances corrosion processes. The presence of microorganisms is
usually widespread in oil and gas production systems and microorganisms are thought to be
responsible for greater than 15 to 30% of pipeline systems failures [1]. Even though
numerous reports in the literature about the involvement of other microorganisms in the MIC
process, the oil industry still regards sulfate reducing bacteria (SRB) as the major culprits for
iron corrosion in anoxic environments [2]. Sulfate reducing bacteria (SRB) is an anaerobic
microorganism which release sulfides and produce hydrogen sulfide (H2S) from the obtained
energy by dissimilatory reduction of sulfate [3]. Presence of microorganism (e.g: SRB) and
corrosion by-product (such as H2S) in high level could result in reservoir souring [4],
plugging of the rock porosity leading to loss of production [5], formation of damage, and
decreased flow-line and pipeline efficiencies. Deterioration of steel pipelines due to MIC is a
major and serious problem, including loss in production, replacement of pipelines, vessels,
and environmental cleanup as the result of spills due to pipeline failures. MIC is estimated to
be responsible for as much as or more than 40% of all internal corrosion and the cost of MIC
to the oil and gas production were between $485 Billion and $1.5 Trillion US dollar annually
[6].
The preferable mitigation method by most oil and gas companies is biocide consumption.
Biocides are mixture of chemicals intended to disinfect, sterilize, and kill microorganisms.
Non-oxidizing biocide such as glutaraldehyde, quaternaries compound and etcetera are
commonly used biocide in oil and gas for mitigating bacteria growth. Unfortunately, most of
the biocide is consider as environmentally toxic and pose a danger to human health [7].
According to Concawe [8], the formulation of chemical biocides is specifically designed for
each oilfield, and within the oilfield, for each well, and for each well the recipe may vary
depending upon the time and the operation conditions. The market for biocides decreased
significantly in 2016 due to falling oil prices. This has the effect of oil service companies
cutting costs wherever possible and for biocides, this means not using biocides or moving to
cheaper types such as the oxidizing biocides. Associated with chemical disinfection
challenges have led the researchers and engineers to move from conventional chemical
disinfection to physical disinfection. Thus, a new mitigation method that is environmentally
friendly and cost effective in its operation urgently needs to be built.
There has been an increase in the application of Ultraviolet (UV) light as an alternative
disinfection method to toxic chemical biocide in various industries. UV disinfection has the
advantage that no detrimental by-products in treated sample, easy to manage and could
provide long term cost effective. The microbial inactivation by UV radiation is caused by
absorption of 254 nm wavelength light by nucleic acids and their constituents. This has
mutagenic effects and causes cell division retardation due to links between adjacent
molecules of pyrimidine in deoxyribonucleic acid (DNA), forming dimmers. Although UV
radiation is lethal to most of the microorganism provided with adequate dosage, UV
disinfection efficiency is often affected by poor quality effluents due to suspended solids
presence in the environment. This will increases the UV dose demand and restricts the
application of UV disinfection in turbid particle-rich sample. Besides, UV-treated bacteria
could undergo photoreactivation process. A potential way to solve the problem associates to
UV disinfection efficiency is to introduce Ultrasound (US) as pre-treatment to increase the

ENGINEERING 381
operating range of UV disinfection. Ultrasound does not provide the formation of toxic
compounds and easy to manage with low capital cost. Inactivation of bacteria and de-
agglomerate bacterial cluster by US sonication is through physical, mechanical and chemical
processes arises from the acoustic cavitation effect which will damage the microbial cell wall
which is lethal to the microbial cell.
CONCLUSION
Environmental and safety concerns have prompted researchers to find benign technique to
mitigate MIC, other than fully depending on toxic biocides treatment. Ultrasound and
Ultraviolet is applicable without using any chemicals; hence it can keep the environment
clean and safe, and it is also reliably not harm the health of personnel. Since the application
of combination treatment is rarely found for oil and gas industry and due to its promising
result, therefore it is worth for present study to investigate in detail the effect of US
sonication coupled with UV treatment for mitigating bacteria especially, sulfate reducing
bacteria (SRB). Thus, it is expected that these method could help in maintaining the integrity
and reliability of the pipeline structure. It is hoped that the physical treatment by using US
and UV will be the best alternative method for biocides application in the near future.
Acknowledgement: The work was financially supported by Universiti Teknologi Malaysia
and Zamalah Institutional Scholarship provided by Universiti Teknologi Malaysia.
REFERENCES
1. Fink, J. Bacterial control. In Petroleum Engineer’s Guide to Oil Field Chemicals and Fluids, Elsivier. (2015),
181–213.
2. Enning, D., Venzlaff, H., Garrelfs, J., Dinh, H. T., Meyer, V., Mayrhofer, K., Hassel, A. W., Stratmann, M.
and Widdel, F. Marine sulfate-reducing bacteria cause serious corrosion of iron under electroconductive
biogenic mineral crust. International Journal of Systematic and Evolutionary Microbiology, 14 (2012), 1772
– 1787.
3. Chang Y.J, Chang Y.T, and Hung C.H. Microbial community analysis of anaerobic bio-corrosion in different ORP profiles. International Biodeterioration and Biodegradation. 95 (2014), 93–101.
4. Eden, B., Laycock, P. J. and Fielder, M. Oilfield Resevoir Souring, (1993).
5. Enzien, M., Yin, B., Love, D., Harless, M. and E. Corrin. Improved microbial control programs for hydraulic
fracturing fluids used during unconventional shale-gas exploration and production, in: SPE International
Symposium on Oilfield Chemistry, The Woodlands, TX (2011), 1-10.
6. Campbell, C. Advances in testing and monitoring of biocides in oil and gas. In A. M. El-Sherik (Ed.), Trends
in Oil and Gas Corrosion Research and Technologies. Woodhead Publishing, Cambridge, (2017), 489–511.
7. Karlsson, J., Ytreberg, E., and Eklund, B. Toxicity of anti-fouling paints for use on ships and leisure boats to
non-target organisms representing three trophic levels, Environmental Pollution. 158(3) (2010), 681–687.
8. Conservation of Clean Air and Water in Europe (CONCAWE). (2008). Chemicals Used in Crude Oil
Production and Impact for Imported Crudes. Brussels. CONCAWE, 1-3. Retrieved from https://www.concawe.eu

ENGINEERING 382
IGCESH2018
Universiti Teknologi Malaysia, Johor Bahru, Malaysia 13 -15 August 2018
FLEXIBILITY DESIGN OF AN INTEGRATED ALGAE-BASED
BIOREFINERY WITH PALM OIL MILL FOR BIOFUELS AND
ENERGY PRODUCTION
N. N. A. Hamid1 and J. S. Lim*2
1, 2 Process Systems Engineering Centre (PROSPECT), Faculty of Chemical and Energy Engineering,
Universiti Teknologi Malaysia, 81310 UTM Johor Bahru, Johor, Malaysia.
(E-mail: [email protected], [email protected])
ABSTRACT
Algae-based biorefinery has the potential to provide sustainable and renewable alternative for
energy generation. There are various numbers of process alternatives routes available and
products that can be produced from an algae-based biorefinery. Flexible biorefinery design
may offer potential economic and environmental advantages over a system with fixed
production capacity. The aim of this study is to evaluate the flexibility design of an integrated
algae-based biorefinery with palm oil mill, where wastewater, excess electricity, CO2 from
the mill are supplied into the biorefinery. The flexibility design, quantified using a flexibility
index (FI), is determined based on the output capacities of various processing technologies of
residual algae. A study case of the integrated system is presented to demonstrate the
flexibility design of the biorefinery. Results show that the production of biodiesel, glycerol,
and biogas from the integrated biorefinery produce the highest FI of 0.69 with a total cost of
3.911 x 10⁶ USD.
Key words: Biorefnery, Algae, Flexibility, Palm Oil Mill
INTRODUCTION
Uncertainties in biofuels and energy markets require biomass to be utilised in an energy
efficient manner. Since there are various potential technological pathways and possible
products to be produced in a biorefinery, flexibility design plays an important role in
optimising the cost and operating performance of the biorefinery.
Svensson et al. (2014) investigated the flexibility potentials of pulp mills for optimal strategic
planning for investments on pulp mill energy and future biorefinery projects [3]. Ren et al.
(2016) evaluated the uncertainties of biofuel supply chain planning of multiple feedstocks to
bioethanol system and developed a bi-objective interval mix integer programming model for
biofuel supply chain design and decision making [2].
In this study, different residual algae processing technologies of various products production
are investigated to evaluate the flexibility of an integrated algae-based biorefinery. The
potential of flexibility design of the integrated biorefinery is determined based on the output
capacity and demand change of the products. The flexibility design is quantified as flexibility
index (FI), which represents the capability of the biorefinery to accommodate the fluctuating

ENGINEERING 383
trend in products demand. The FI is calculated based on the mathematical model introduced
by Kasivisvanathan et al. (2016) [1], where FI = 0 and FI = 1 at minimum and maximum
flexibility, respectively.
PROBLEM STATEMENT
Given a set of products, along with the baseline capacity and demand change of each product,
it is desired to identify the optimum operating capacity that maximises FI at a constrained
operating capacity range.
INTEGRATED ALGAE-BASED BIOREFINERY WITH PALM OIL MILL
Figure 1 illustrates the superstructure of the integrated algae-based biorefinery with palm
oil mill with a base capacity of 1000 t/y of dry algae production when operated at 100 %
under normal operation (baseline state). Wastewater (palm oil mill effluent (POME)),
excess electricity, and CO2 from the mill are used for algae growth and processing to improve
the economic and environmental aspects of the system. The flexibility design is evaluated
by calculating the FI [1] of the biorefinery when it produces biodiesel, glycerol, and the
products produced from each of the residual algae processing units (combustion,
fermentation, pyrolysis, or anaerobic digestion) at varying operating capacities.
Figure 1. Superstructure of the integrated algae-based biorefinery at baseline operation
MAIN RESULTS AND DISCUSSION
Table 1 shows the product demand change, FI, operating capacity, and total cost for each
process unit in the integrated biorefinery. The total cost includes capital, operation and
maintenance, and raw materials costs. Only the operation and maintenance costs are
considered for palm oil mill and anaerobic digestion since the algae-based biorefinery is
assumed to be integrated with existing palm oil mill and biogas plant. The optimum
operating capacity is calculated by varying and limiting the operating capacity from 80 %
- 120 % due to equipment limitation and determined when FI is maximum.
Palm oil
mill
Algae cultivation,
harvesting, and
oil extraction
Algal oil
(153 t/y)
Residual
algae
(689 t/y)
Transesterification
Biodiesel
(100 t/y)
Glycerol
(16.1 t/y)
Combustion
Fermentation
Pyrolysis
Anaerobic digestion
Electricity
(2060 MWh/y)
Ethanol
(163.2 t/y)
Bio-oil
(139.4 t/y)
Biochar
(66.2 t/y)
Biogas
(3.55 kt/y)
Electricity
(3.35 GWh/y)
POME
(0.291 Mt/y)
CO2
(1830 t/y)
Algae
(0.5 kg/m3)

ENGINEERING 384
Table 1. Total cost, FI, and optimum operating capacity of each process unit
Process unit Baseline total cost
(USD/y) (F = 0)
Demand
change of
product
FI
Optimum
operating
capacity (%)
Palm oil mill 23,889 - - -
Algae cultivation,
harvesting, and oil
extraction
3.645 x 10⁶
- - -
Transesterification
• Biodiesel
• Glycerol
230,809
• ± 3.5 t/y
• ± 0.55 t/y
• 0.63
• 0.65
80, 120
Combustion 35,350 ± 105 MWh/y 0.67 80, 120
Pyrolysis
• Bio-oil
• Biochar
381,022
• ± 23 t/y
• ± 3 t/y
• 0.55
• 0.63
80, 120
Fermentation 264,631 ± 6 t/y 0.54 80, 120
Anaerobic
digestion 19,043 ± 9.5 t/y 0.69 80, 120
Based on Table 1, algae processing for biodiesel, glycerol, and biogas production has the
maximum flexibility design with an FI of 0.69 at operating capacity of 80 % and 120 %. The
total biorefinery cost to produce the products is 3.911 x 10⁶ USD.
CONCLUSION
Flexibility design of an integrated algae-based biorefinery with palm oil mill has been
presented to evaluate the capacity of various residual algae processing units to meet the
product demand. The biorefinery is initially designed to operate under normal operation and
it is assumed that operating flexibility adjustments in terms of process units’ capacities can be
made when necessary to cater for new product demand. Based on the study, the production of
biodiesel, glycerol, and biogas from the biorefinery has the highest FI of 0.69 with a total cost
of 3.911 x 10⁶ USD.
Acknowledgment: The authors would like to express their appreciation for the financial
support of Universiti Teknologi Malaysia (UTM) with grant no. Q.J130000.2446.03G62 and
UTM Zamalah scholarship.
REFERENCES
1. Kasivisvanathan, H., Ng, D.K.S., Poplewski, G. and Tan, R.R. Flexibility Optimization for a Palm Oil-Based
Integrated Biorefinery with Demand Uncertainties. Industrial & Engineering Chemistry Research 55 (2016),
4035–4044.
2. Ren, J., An, D., Liang, H., Dong, L., Gao, Z., Geng, Y., Zhu, Q., Song, S. and Zhao, W. Life cycle energy
and CO2 emission optimization for biofuel supply chain planning under uncertainties. Energy 103
(2016), 151-166. 3. Svensson, E., Berntsson, T. and Strömberg, A.B. The value of flexibility for pulp mills investing in energy
efficiency and future biorefinery concepts. International Journal of Energy Research 38 (2014), 1864-1878.

ENGINEERING 385
IGCESH2018
Universiti Teknologi Malaysia, Johor Bahru, Malaysia 13 -15 August 2018
A NUMERICAL STUDY ON THE STIFFNESS OF SHIPPING
CONTAINER
Philip Chie Hui Ling*1 and Cher Siang Tan2
1 Faculty of Civil Engineering, Universiti Teknologi Malaysia, Johor, Malaysia.
(E-mail: [email protected]) 2 Forensic Engineering Centre, Institute for Smart Infrastructure and Innovative Construction,
Universiti Teknologi Malaysia, Johor, Malaysia.
(E-mail: [email protected])
ABSTRACT
The emerging of shipping container house can help to relief the challenging issue in provision
of dwelling in certain countries with overpopulation or surge of refugee. However, the
structural performance of shipping container which is initially designed for transportation
purpose is not well established. This paper aims to investigate the stiffness of shipping
container house by numerical approach. Finite element model of a shipping container is
generated and loaded in accordance to ISO specification. The results were compared with
previous research and recommendation on improvement is suggested.
Key words: Container house, finite element analysis, stiffness
INTRODUCTION
The influx of refugee from natural disaster or conflicts into developed countries together with
overpopulation trend in developing countries had led toward more challenging housing
supply [1]. Current provision of temporary housing had been associated with several issues
and unable to cater the increasing demand from market. An alternative housing solution is
essential to provide more comfortable accommodation to these people in shorter time with
lower construction cost.
ISO shipping container, been standardized steel box to be purposed for universal cargo
transportation, is one of the potential candidate to solve the housing problem. The shipping
container is designed to withstand harsh weathering and heavy loading over long distance
transportation. This makes it very durable and suitable for housing purpose. As the matter of
fact, modified shipping container had been used in construction industry for decades and
being popularized among architect and engineers in recent years [2].
Although the usage of container as building is not a whole new concept, its suitability for
living purpose, especially its structural behaviour for housing purpose is not thoroughly
investigated. It is important to know the structural response of container house for residential
purpose in engineering perspective as it is crucial to know the capacity of container house so
that suitable modification and reinforcement can be decided prior to construction stage.

ENGINEERING 386
This paper aims to investigate the stiffness of shipping container house through numerical
study. Commercial finite element analysis software ABAQUS/CAE [3] will be used to
stimulate the structural response of shipping container under loading in accordance to ISO
specification [4]. The results will be compared to previous research [5] and suggestion on
improvement of modelling will be generated.
MAIN RESULTS
Figure 1. Illustration on Loading Scenario 1, 2 and 3
Table 1. Comparison of result obtained with previous research
Giriunas et.al. Result obtained
Without wall With wall Without wall With wall
Loading Scenario 1- Stacking load on four (4) top corner
Maximum Force (kN) 717.3 942 750 400
Displacement (mm) 9.8 1.25 26.43 9.74
Stiffness (kN/mm) 73 754 28.4 41.07
% Difference - - -61% -95%
Loading Scenario 2- Lateral load on two (2) side top corner
Maximum Force (kN) 6.1 150 10 150
Displacement (mm) 36 4.2 21.5 4.64
Stiffness (kN/mm) 0.17 35.7 0.47 32.33
% Difference - - +176% -9%
Loading Scenario 3- Lateral load on two (2) front top corner
Maximum Force (kN) 13.7 75 20 100
Displacement (mm) 15.97 1.92 15.73 96.66
Stiffness (kN/mm) 0.86 39.1 1.27 1.03
% Difference - - +47% -97.35%
From the comparison made, the deformed shapes of the models are similar to the
Giriunas et. al. work for container without wall panel but there were large conflicts on
failure mode of container with wall. From observation, the side wall panel is not tied to
the top rail and bottom rail. This causes the stiffness of container gradually decreased as
the side wall does not contribute to overall stiffness of container. The shell-to-solid
coupling cannot tie the model and further investigation is required to troubleshoot the
issue.
In Giriunas et. al. work, the reinforcement had been done to avoid the abnormal stress
build up. Such reinforcement did not represent the actual situation of container in real

ENGINEERING 387
practice. Besides, the detail information of reinforcement was not provided inside the
thesis. Hence the author decided to abandon it in modelling and follow the original
design, which could be the major cause of difference between both results. Extra
reinforcement also explained the higher stiffness during the compression load.
CONCLUSION
The deployment of shipping container as residential house can help to relief the shortcoming
of suitable shelter for increasing population in some countries. From the numerical study
conducted in this research, finite element model of shipping container is generated and
loaded. The results showed that the numerical modelling is feasible, but the outcome of
analysis is highly dependent on the detail and accuracy of numerical model. More
comparison should be done to identify the cause of difference between both model.
Modification of model especially at shell-solid interface should be investigated for more
accurate result. Comparison with laboratory testing is encouraged to verify both models with
actual container.
Acknowledgment: The authors would like to express their appreciation for the support of
Malaysia Ministry of Higher Education (FRGS-4F834) and Universiti Teknologi Malaysia
(GUP 13H37 & 03G55).
REFERENCES
1. The UN Refugee Agency, Global Trends 2015. 2016, United Nations High Commissioner for Refugees.
2. Kotnik, J., Container Architecture: This Book Contains 6441 Containers. 2008, China: Page One Publising Pte Ltd.
3. Dassault Systèmes, Simulia Abaqus/CAE.
4. Institution, B.S., Series 1 freight containers —Specification and testing, in Part 1: General cargo containers
for general purposes. 2016, BSI Standards Limited.
5. Giriunas, K., H. Sezen, and R.B. Dupaix, Evaluation, modeling, and analysis of shipping container building
structures. Engineering Structures, 2012. 43: p. 48-57.

ENGINEERING 388
IGCESH2018
Universiti Teknologi Malaysia, Johor Bahru, Malaysia 13 -15 August 2018
SENSING MECHANISM FOR TRANSFORMER OIL
CHARACTERIZATION : A REVIEW
Siti Mahfuza Saimon*1, Mohd Haniff Ibrahim2 and Muhammad Yusof Mohd Noor3
1, 2, 3 Faculty of Electrical Engineering, Universiti Teknologi Malaysia, Johor Bahru, Johor,
MALAYSIA.
(E-mail: [email protected], [email protected], [email protected])
ABSTRACT
This review paper presents the achievements and present developments in fiber optic sensors
for measurement of ageing of transformer oil. These optical fiber sensors are based on the
variation of transformer oil refractive index (RI) and the amount of gases dissolved in the oil.
In the evolvements of the techniques to measure the ageing of transformer oil, fiber-optic
based sensors are preferred due to its inherent characteristics such as small size, lightweight
and immune towards electromagnetic interference (EMI). In the next section of this paper, a
miniature and compact fiber-optic RI sensor using Fabry-Perot interference is proposed. The
sensor head consists of an incident single-mode fiber (SMF) and a section of silica rod. The
sensor has the advantages of low cost, compact size and ease of fabrication.
Key words: Fiber optic, fiber optic sensor, refractive index, transformer oil
INTRODUCTION
Power transformer is an electrical device that transforms an input electrical energy with
certain magnitudes into another output power with different magnitudes [1]. One of the most
important components in a power transformer is the transformer oil or insulation oil. The
transformer oil protects the winding and core which are fully immersed inside the oil by
regulating the temperature in the transformer by conducting away the heat from its coils.
Hence, the oil needs to be monitored regularly to ensure that the oil quality is acceptable.
The conventional method for monitoring transformer oil degradation is by dielectric
breakdown voltage test. This test is used to observe the average breakdown voltage of
transformer oil by applying the voltage at power frequency until breakdown occurs at the
electrode immersed in the sample oil [7]. Besides that, when certain abnormal condition
occurred, some gases are produced and dissolved in the transformer oil, thus will reduce
the insulation integrity. Dissolve Gas Analysis (DGA) technique is one of the effective
methods for monitoring of power transformer that is used to detect the amount of
combustible gases dissolved in the oil [7].
Optical fibers can also be used as an alternative for detecting ageing transformer oil
because it does not emit sparks or cause short circuits, and not susceptible to noise and
other frequency components in the power system. There are several literatures addressed
the use of optical fiber sensors for measurement of ageing transformer oil using different

ENGINEERING 389
configurations such as those using fiber bragg grating (FBG) [4], long period grating (LPG)
[3] or ‘D’ shaped optical fiber [1].
The aim of this review paper is to give an overview about the present developments of
fiber optic sensor for the measurement of transformer oil degradation. In the next section,
a new configuration of fiber optic RI sensor based on silica rod structure will be
proposed.
MAIN RESULTS
Table 1 shows the summary of developed sensors to control the ageing of transformer oil
and its specifications. Different techniques and devices have been developed in previous
works, all these devices were portable, fast, robust and reusable. In [1], the authors
presented two optical fiber sensors for detecting ageing transformer oil based on
interferometry and Lossy Mode Resonance (LMR). For interferometer device, the end tip
of the single mode fiber was coated with tin-dioxide (SnO2) thin films using the sputtering
technique. For LMR device, indium-tin-oxide (ITO) thin films were deposited onto D
shaped optical fibers. The sensor developed in [2] involved the process of removing
cladding portion of measuring 2 cm length of multimode fiber. A sensor head employing
LPG and FBG was developed in [3] and [4], respectively. The sensor was immersed in
the transformer oil and the shift in wavelength was observed. In [5] and [6], the optical
sensors were developed to detect the dissolved hydrogen in transformer oil since
hydrogen is the key gas for partial discharge occurrence detection [7].
Table 1. Summary of developed sensors for transformer oil degradation measurement and its
specification
Reference No / Year
Sensor Head Configuration Analysis Technique
[1] / 2016 1) Interferometer Device
SnO2 coatings onto the end tip of SMF
2) LMR device
ITO coatings onto D-shaped fiber
Wavelength shift
response
[2] / 2017 Cladding-off Intensity response
[3] / 2015 Long Period Grating (LPG) Wavelength shift response
[4] / 2012 Fiber Bragg Grating (FBG) Wavelength shift
response
[5] / 2016 Palladium-chromium coatings onto FBG with ratios of 100:0 (Pd100) and 58:42 (Pd58Cr42)
Wavelength shift response
[6] / 2014 PTFE-Pd-capped Mg-Ti coatings onto multimode
fiber
Reflectance response
In this paper, we propose a new configuration of fiber optic RI sensor for determination
of ageing transformer oil based on an extrinsic Fabry-Perot (FP) interferometer sensor
formed by a section of silica rod and SMF. The fabrication of the sensor only involved
the fusion splicing of the silica rod to SMF. Figure 1 shows the structure of the proposed
sensor. The measurement of the ageing oil will be achieved by monitoring the wavelength
shift of the interference pattern in the reflection spectra for different value of transformer
oil RI since ageing transformer oil has higher RI compared to pure transformer oil [7].
This proposed sensor has the advantages of cost-effective, reusable, fast, portable, compact
size and ease of fabrication.

ENGINEERING 390
Figure 1. Structure of the proposed sensor.
CONCLUSION
This paper is focused to a review of the fiber optic sensors for the application of measurement
of transformer oil degradation. Firstly, we restrospect the fiber optic sensors that have been
developed from previous works. Finally, we propose a new configuration of fiber optic RI
sensor based on silica rod structure for future development.
Acknowledgment: The authors thank Universiti Teknologi Malaysia (UTM) and Malaysia
Ministry of Higher Education (MOHE) for supporting this research work under Fundamental
Research Grant Scheme (FRGS) grant no: 4F820.
REFERENCES
1. Zubiate, P., Corres, J. M., Zamarreno, C. R., Matias, I. R. and Arregui, F. J. Fabrication of Optical Fiber
Sensors for Measuring Ageing Transformer Oil in Wavelength. IEEE Sensors Journal (2016), 4798-4802.
2. Mahanta, D. K. and Laskar, S. Breakdown Voltage Based Transformer Oil Analysis Using Optical Fiber as
Sensor. 22nd Microoptics Conference (2017), 254-255.
3. Raad, B. R., Sonkar, R. K. and Kondekar, P. N. Determination of Transformer Oil Age Using Long Period
Grating. Workshop on Recent Advances in Photonics (2015). 1-4.
4. Onn, B.I., Arasu, P. T., Al-Qazwini, Y., Abas, A. F., Tamchek, N. and Moor, A. S. M. Fiber Bragg Grating
Sensor For Detecting Ageing Transformer Oil. 3rd International Conference on Photonics (2012). 110-113. 5. Samsudin, M. R., Shee, Y. G., Mahamd Adikan, F. R., Abdul Razak, B. B. and Dahari, M. Fiber Bragg
Gratings Hydrogen Sensor for Monitoring the Degradation of Transformer Oil. IEEE Sensors Journal
(2016), 2993–2999.
6. Mak, T., Westerwaal, R. J., Slaman, M., Schreuders, H., Van Vugt, A. W., Victoria, M. and Dam, B. Optical
fiber sensor for the continuous monitoring of hydrogen in oil. Sensors and Actuators, B: Chemical, 190,
(2014), 982–989.
7. Kumpalavalee, S., Suwanasri, T., Suwanasri, C. and Wattanawongpitak, S. Condition Evaluation of Power
transformers Using Dissolved Gas Analysis and Dielectric Breakdown Voltage Test. 5th International
Electrical Engineering Congress (2017), 1-4.

ENGINEERING 391
IGCESH2018
Universiti Teknologi Malaysia, Johor Bahru, Malaysia 13 -15 August 2018
SURFACE MODIFICATION OF ALUMINA HOLLOW FIBER
MEMBRANE WITH ACTIVATED CARBON FOR P-CRESOL
ADSORPTION REMOVAL IN HAEMODIALYSIS APPLICATION
Sumarni Mansur, Mohd Hafiz Dzarfan Othman* and A. F. Ismail
Advanced Membrane Technology Research Centre (AMTEC), Faculty of Chemical and Energy
Engineering (FCEE), Universiti Teknologi Malaysia, 81310 UTM, Skudai Johor, Malaysia
(E-mail: [email protected])
ABSTRACT
P-cresol are categorised as one of the protein bound uremic toxins. Protein bound uremic
toxins are strongly protein-bound and are difficult to remove with conventional
haemodialysis treatment. In this study, alumina ceramic hollow fiber membrane was pre-
coating with powdered activated carbon and evaluated for its ability to enhance the removal
of p-cresol in haemodialysis application. The alumina ceramic hollow fiber membrane was
fabricated via the dry-wet phase inversion separation technique. Meanwhile, activated carbon
was deposited on the surface of the fabricated membrane by using vacuum deposition
method. The different deposition time and concentration of activated carbon were
manipulated and studied. The physicochemical characteristic of the modified membrane was
analysed by using ATR-FTIR, SEM images and contact angle measurement. The
performance and clearance of the modified membrane was evaluated by using the pure water
flux and p-cresol rejection. The results from this studied indicated that deposition of activated
carbon on the surface of the alumina hollow fiber membrane decrease the pore size of the
membrane. Furthermore, the modified membrane improves the removal of p-cresol during
the ultrafiltration process.
Key words: Aluminium oxide, hollow fiber membrane, haemodialysis membrane, non-induced
phase inversion technique
INTRODUCTION
Membrane technology have been used to mimic the renal function and prolong the patient’s
life. The membrane of the haemodialysis is potted inside a module and is known as
haemodialyser, which is the heart of the haemodialysis system. The implementation of
membrane technology in blood purification applications has proven vital. In hollow fibre
ultrafiltration system, blood purification is achieved by regulating impure blood flow through
the lumen of hollow fibre membrane as the dialysate flows counter-currently outside the
lumen (Dahe et al., 2011). Uremic toxins like urea, creatinine etc. are filtered out from the
blood through the porous structure of the membrane. The membrane facilitates the filtration
without the loss of important blood proteins such as albumin (Dahe et al., 2011). Desirable
characteristics of such hollow fibre membranes include high flux, selectivity and
biocompatibility (Clark et al., 2002).

ENGINEERING 392
However, long term usage of the haemodialysis can cause multiple clinical complication such
as heart disease, bone disease, amyloidosis and nerve damage. These diseases have been
associated with the existence of the small molecule uremic toxins in renal patients especially
in cardiovascular events. Based on US Renal Data System (USRDS) annual data reports
(2007), cardiovascular disease (CVD) have been responsible for approximately half of the
death of the dialysed chronic kidney disease (CKD) population. Small and middle molecule
uremic toxins problems can be solved by increasing the pore size of the membrane, thus
increasing the flux of the membrane, applying convection and prolong the dialysis time.
However, convection and prolong the dialysis time does not improve the removal of the
protein bound uremic toxins.
Research and study on uremic toxins are barely discussed previously and are only attracted
the researcher attention since the early 2000. For example, a review study done by Neirynck
et al. (2013) shows that there is no single publication on uremic toxin indoxylsulfate in 1990,
but the number of publication regarding to this solute have exceeded 60 publications in 2011.
It is also found that most of the protein bound molecules are carcinogen and could affect the
renal patient’s mortality. Due to its affinity to the protein, this protein bound molecule is very
hard to be removed using conventional haemodialysis method.
To date, most researcher concentrated on the studies of removing protein bound molecules
using sorbent hemoperfusion method. This method involving adsorption process of molecules
to the surface of nanoporous adsorbents to remove toxic substances from the blood. Patient’s
blood is passed over the adsorbent by in direct contact or in conjunction with the
haemodialysis setup. However, many of the sorbents used were found to be bio-incompatible
where the sorbent can cause the platelet activation and increased the risk of clotting. In
addition, sorbent have a limited capacity and can become saturated, thus a risk factor for
fouling to occur.
Thus, in this study activated carbon coupled with alumina ceramic hollow fiber membrane
were used to mitigated this problem.
CONCLUSION
The results from this studied indicated that deposition of activated carbon on the surface of
the alumina hollow fiber membrane decrease the pore size of the membrane.
Acknowledgment: The authors would like to express their appreciation for the support of
Universiti Teknologi Malaysia under Flagship Program (Project number:
Q.J130000.2409.01G46). The authors would also like to thank Research Management Centre,
Universiti Teknologi Malaysia for the technical support.
REFERENCES
1. Dahe GJ, Teotia RS, Kadam SS, Bellare JR. The biocompatibility and separation performance of
antioxidative polysulfone/vitamin E TPGS composite hollow fiber membranes. Biomaterials.
2011;32(2):352–65.
2. Vanholder R, De Smet R, Glorieux G, Argilés A, Baurmeister U, Brunet P, et al. Review on uremic toxins:
Classification, concentration, and interindividual variability. Kidney Int. 2003;63(5):1934–43.
3. Neirynck N, Vanholder R, Schepers E, Eloot S, Pletinck A, Glorieux G. An update on uremic toxins. Int
Urol Nephrol. 2013;45(1):139–50.

ENGINEERING 393
IGCESH2018
Universiti Teknologi Malaysia, Johor Bahru, Malaysia 13 -15 August 2018
OPEN TRAFFIC: AN OPENSOURCE SOLUTION TOWARDS
ANALYZING TRAFFIC CONGESTION
T. K. Sheng*, K. M Yusof, M. Ali, S. Manogaran
Advance Telecommunications Technology (ATT) Research Group, Faculty of Electrical Engineering,
Universiti Teknologi Malaysia (UTM), Skudai, 81310 Johor, Malaysia
(E-mail: [email protected], [email protected], [email protected], [email protected])
ABSTRACT
The problem of traffic congestion has been a reflection of development and uncontrolled
urbanization in the cities. The situation prevails and yet there are few solutions than needed.
Traffic congestion has proven to be a bottleneck for major economies around the world. The
state of gridlock has been experienced by different parts of the world. Different tech firms
have come up with the solutions to tackle the ever increasing menace. Grab, a ride hailing
application in South-East Asia has worked on to create Open Traffic platform with the help
of the grant provided by the World Bank. The Open traffic targets to provide traffic related
data so that they can manage the data and analyse it. The open source nature of Open Traffic
provides a lucrative opportunity for the researchers and the several agencies to study the big
data. The Open Traffic initiative has able the related authorities to access the traffic related
data and come up with a feasible and long lasting solution to rectify the problem of the traffic
congestion. Although the platform tends to provide a solution but it is not yet known as it
should be. There is an urgent need to get acquainted with the platform and at a large level so
the country can reap the benefits the platform has to offer.
Key words: Open Traffic, big data, World Bank, Grab
OPEN TRAFFIC: A STEP TOWARDS TRAFFIC ANALYSIS
The 21st century has experienced an alarming increase in the uncontrolled urbanization. Most
of it owes to the industrial revolution and the rapid developments in the recent years. The
world has seen a drastic change in demographics for certain regions. The influx of people
from the countryside to the major cities has proven to create bottleneck for the governments
as the situation goes out of control in some Asian region [1].
Owing to the problems of traffic congestion many traffic applications have been developed
which work on android and iOS [2]. But in Asia, particularly in South-East Asia, Grab, a ride
hailing company has come forward with its open source platform called “Open Traffic”. The
Open Traffic platform was a result of the World Bank funding which was provided to Grab.
Since then the Open Traffic platform has provided an opportunity for the researcher and the
government to access the data and solve the problem for the future. The local government
agencies can avail the opportunity to enhance their preexisting technologies that are already

ENGINEERING 394
deployed for many years. The platform has a user friendly interface. The Open Traffic also
helps in data acquisition, as it is quite easier for the agencies to gather traffic related data. The
traditional methods of data are quite expensive or require extensive infrastructure.
Fortunately, the Open Traffic is quite the opposite. The Open Traffic relies on the data
provided by the driver’s GPS. This data is reliable as GRAB visualizes this data suing the
machine learning models. With the advent of Open Traffic, countries such as Philippines
have significantly reduced the problem of traffic congestion. This is a motivation for the
other countries where there are myriads of problem related with congestion.
The Open Traffic provides a user friendly interface for the people to access it. The Open
Traffic can be used by installing it on the system. The installation process of the Open traffic
is usually done in the Linux environment. The user has to follow a series of commands that
needs to be executed in Linux command window. The process includes the installation of
Java Development Tool Kit (JDK), Maven, Traffic Engine and an Open Street Map (OSM).
A small component of Open Traffic installation process is shown in figure 1.
Figure 1. Open Traffic Installation Process
The installation process targets the building of basic components of the system that includes
the extraction of the data by calling the OSM tiles, proceeding with the virtual detectors, and
estimating the travel time based on those virtual detectors [3]. The OSM tile is called only to
estimate the traffic speed and it also induces an increase in efficiency and the processing
speed. Following every approach clearly, the Open Traffic is installed and is ready to be used
[4]. At first the map will have no data, thus, the data has to be loaded in the map. After the
completion of the data loading process through the GPS, the OpenTraffic is now completely
ready to access the traffic data of a particular spot on the loaded map.

ENGINEERING 395
MAIN RESULTS
Once, the traffic of point of interest is capture the interface will look something as shown
in figure 2.
Figure 2. The interface of the Open Traffic
CONCLUSION
The Open Traffic is quite powerful tool to access the traffic data for the traffic congestion
analysis. It can be very useful for researchers who are analysing traffic behaviour for huge
amount of traffic data. Although, it requires an extensive installation process but the result is
much worth awaiting. The Open Traffic data can be used to predict the traffic nature in the
future by using the knowledge of big data and machine learning. The Open Traffic opens vast
avenues for researchers related with the field of big data analytics as it provides the data with
apparently no cost, which makes it quite attractive among the researchers and authorities.
REFERENCES
1. Traffic congestion and reliability: Trends and advanced strategies for congestion mitigation. Vol.6. Federal
Highway Administration, 2005. 2. Peter Samuel, Traffic Congestion: A Solvable Problem, Issue in Science and Technologies, Volume XV
Issue 3, Spring 1999.
3. S. Manogaran, M. Ali, K. M. Yusof, R. M. Suhaili, "Analysis of Vehicular Traffic Flow in the Major Areas
of Kuala Lumpur Utilizing Open Traffic", International Conference on Electrical and Electronic Engineering
2017 (IC3E 2017), Johor, 14-15 Aug 2017.
4. Holly Krambeck, Natasha Beschorner, et al. World Combining Taxi GPS Data and Open-Source Software
for Evidence-Based Traffic Management and Planning, Open Traffic, Report No: ACS15491, September
2015.

ENGINEERING 396
IGCESH2018
Universiti Teknologi Malaysia, Johor Bahru, Malaysia 13 -15 August 2018
GRID CONVERGENCE STUDY
FOR A SIMULATION OF ROD-AIRFOIL FLOW
Siti Ruhliah Lizarose Samion*1, Mohamed Sukri Mat Ali2, Nur Haziqah
Shaharuddin3 and Con Doolan4
1, 2, 3
Malaysia-Japan International Institute of Technology, University of Technology Malaysia.
54 100 Kuala Lumpur, MALAYSIA. (E-mail: [email protected], [email protected], [email protected])
4 School of Mechanical and Manufacturing Enginering, University of New South Wales.
AUSTRALIA.
(E-mail: [email protected])
ABSTRACT
The present work is a systematic approach for the grid convergence analysis in simulating
flow around a rod-airfoil. A rod-airfoil is a benchmark configuration for simulating Airfoil-
TurbulenceInteraction Noise (ATIN). The numerical simulation is modelled using two
numerical models to be compared. They are the unsteady Reynolds Averaged Navier-
Stokes (RANS). A minimum of three different grid resolutions are considered; the fine,
medium and coarse grids in order to investigate the grid independency. Richardson
extrapolation and Grid Convergence Index (GCI) are introduced to quantitatively evaluate
the grid independency. Based on the results between those three different grids, a
monotonic convergence criterion has been achieved. The reduction in GCI value indicates
that the grid convergence error has been significantly reduced, in which the fine grid has a
GCI value less than 10%.
Key words: Aerodynamic noise, airfoil, Acoustic analogy, Rod-Airfoil
INTRODUCTION
An airfoil is a common engineering geometry. Its application however especially in
the wind turbines, turbofan engines and the helicopter rotors induces generation of
airfoil- turbulence interaction noise (ATIN) [1,2,3]. The airfoil experiences fluctuating
lift as a results of unsteady pressure fluctuations as it interacts with the turbulence in a
flow and the airfoil leading edge is responsable for the ATIN [4]. The ATIN is
mostly noticeable at lower frequency due to larger turbulent structures are the ones
responsible in its generation mechanism [5].
The turbulence physics upstream of airfoil is an important feature in the ATIN study as it
plays the main role in the generating mechanism. Thus, it is much appreciated if
any investigation of ATIN reduction can correlate the upstream turbulent characters with
the reduction mechanism. In most investigations, the upstream turbulence is generated and
Conveyed downstream to the airfoil, to create the same condition to calculate ATIN [6, 7,
8]. Extensions of unsteady CFD techniques to the prediction of ATIN generated by

ENGINEERING 397
high Reynolds number flows in complex geometries have first to be benchmarked on
relevant test cases. Such a test case must be based on geometry that contains some
of the aerodynamic mechanisms encountered in ATIN applications, but remain simple
enough from the computational point of view in order to achieve parametric study purposes.
The rod-airfoil configuration is a relevant benchmark case for the ATIN investigation.
Jacob et al [9] was among the pioneer to introduce this rod-airfoil configuration. This is
because at high Reynolds numbers, the rod sheds the well-known von Karman vortex
street which acts as an oncoming disturbance onto the airfoil. Jacob et al. [9] highlighted
three strong dimensional effects responsible for spectral broadening around the rod
vortex shedding frequency in the subcritical regime, and identified that the airfoil
leading edge was the main contributor to the noise emission in a rod-airfoil configuration
due to vortex-structure interaction. Moreover, further understanding on the details of
the rod-airfoil interactions have been gained through numerical simulations too. Previous
studies [10,11,12,13,14,15] found good agreement between calculation and experiment
of ATIN. Hence, the current study aims to provide a systematic approach for grid
convergence study of flow around a rod-airfoil using Grid Convergence Index (GCI) that is
based on Richardson extrapolation.
MAIN RESULTS
Table 1 summarized the order of accuracy and GCI values of the cases. The
convergence ratio for both parameter (i.e. drag and lift) shows the refinement condition is
monotonic as the values is in the range of 0 < R < 1. The GCI value fine and
medium grid is relatively small compared to the GCI value between medium and
coarse grid. This proves the fine grid is nearly grid independent and further grid
refinement of the fine grid solutions will not give a great impact on the simulation
results.
Table 1. Order of accuracy and Grid Convergence Index for three grid resolutions based
on forces coefficient parameter
Parameter |ε32| |ε21| R p GCI32(%) GCI21(%) CL,rms 0.0531 0.004 0.0753 23.877 10.113 7.5723 CD,mean 0.023 0.01 0.4348 5.4848 23.000 9.9206
The decreased in percentage error for all the parameters shown in Figure 1 proves the grid independence of fine grid case in this study.
Figure 1. Percentage error for the Drag, Lift and Strouhal numbe

ENGINEERING 398
CONCLUSION
Grid convergence study of flow around rod-airfoil is numerically accessed based on the
Grid Richardson Index (GCI) and the Richardson Extrapolation (RE). Three cases of
different mesh grids are used in the study. Usage of excessive number of grid can
be prevented through a systematic mesh refining using RE and GCI method. The results of
current study has confirmed the fine grid is appropriate to be used for further analysis due
to the GCI value is around 7%. Flow visualization results has also captured similar
behaviour as previous studies. Hence the results of current study is proposed ready for
further progress.
Acknowledgment: The authors would like to express their appreciation for the support of
University of Technology Malaysia for the Ainuddin Wahid Scholarship.
REFERENCES
1. Amiet, RK. Acoustic radiation from an airfoil in a turbulent stream. Journal of Sound and
Vibrations 41 (1975) 407-420
2. Arbey, H and Bataille, J. Noise generated by airfoil profiles placed in a uniform flow. Journal of Fluid
Mechanics 134 (1983) 33-47.
3. Paterson, RW. and Amiet, RK. Acoustic radiation and surface pressure characteristics of an airfoil
due to incidence turbulence. 1976 NASA CR-2733
4. Blake, W.K. Mechanics of Flow-induced Sound and Vibration. 2 Vols. Academic Press. New York (1986)
5. Oerleman, S. and Migliore, P. Aeroacoustic Wind Tunnel Tests of Wind Turbine Airfoils. National
Aerospace Laboratory NLR, Emmeloord, The Netherlands (2004) 319
6. Jackson, R., Graham, JMR. and Maull. DJ. The lit on a wing in a turbulent flow. Aeronautical Quarterly
7. Jurdic, V. Effect of an angle of attack and airfoil shape on turbulence-interaction noise.
AIAA/CEAS Aeroacoustic Conference Meeting and Exhibit, 22-25 May (2005) 8. Bachmann, T., Klan. S., Baumgartner, W., Klaas, M., Schroder, W. and Wagner, H.
Morphometric characterization of wing feathers of the barn owl Tyto alba pratincola and pigeon Columbia
livia, Front Zoo 4 (2007) 1-15.
9. Jacob, MC, Boudet, J., Casalino, D., and Michard, M. A rod-airfoil experiment as benchmark for
broadband noise modeling. Theorotical and Computational Fluid Dynamics. 10 (2005) 171-196
10. Casalino, D., JHacob, M. and Roger, M. Prediction of Rod-Airfoil Interaction Noise using
Ffowccs-William Hawkings Analogy. AIAA Journal. 41 (2003) 2.
11. Sorguven, E., Magagnato, F., and Gabi, M. Acoustic prediction of a cylinder and airfoil
configuration at high Reynolds numbers with LES and FWH. ERCOFTAC Bulletic 58 (2003) 47-50.
12. Boudet, J., Grosjan, N. and Jacob, M. Wake-airfoil interactions as broadbandnoise source: A large eddy
simulation study. International Journal of Aeroacoustic 4 (1) (2005) 93-115.
13. Magaganato, F., Sorguven, E. and Gabi, M. Far-field noise prediction by large eddy simulation and
Ffowccs-Williams and Hawkings Analogy. AIAA 3206 (2003)
14. Grecshner, B., Thiele, F., Jacob, M. and Casalino, D. Prediction of sound generated by a rod- airfoil
configuration using EASMDES and the generalized Lighthill/FWH Analogy. Computers and Fluids 37
(4) (2008) 402-413.
15. Berland, J., Lafon, P., Crouzet, F., Daude, F. and Baily, C. Numerical insight into sound sources of a
rod-airfoil flow configuration using direct noise calculation. AIAA 3705 (2010)

ENGINEERING 399
IGCESH2018
Universiti Teknologi Malaysia, Johor Bahru, Malaysia 13 -15 August 2018
APERTURE-COUPLED WIDEBAND DRA ARRAY AT 28GHz FOR
5G APPLICATIONS
Norshafina Shafie*1 and M. H. Jamaluddin*1
1 Wireless Communication Centre, Universiti Teknologi Malaysia, Skudai, Malaysia
(E-mail: [email protected], [email protected])
ABSTRACT
This paper proposes a single element dielectric resonator antenna (DRA) for fifth generation
(5G) applications by improving the bandwidth of existing DRA and to design and simulate a
linear 3-elements DRA array for high gain improvement to achieve 5G requirement. The idea
is based on single rectangular DRA with aperture coupled (AC) feed. This configuration is
done with a rectangular slot cut in the ground plane and on the other side, a slot-fed
microstrip line is etched. By applying slots to the ground plane, it significantly improves the
bandwidth of the antenna. However, this achitecture does not meet the requirement of 5G
technology as it does not offer high gain. Thus, the main advantage of the proposed methods
is to provide high gain and wideband DRA. Plus, to increase the gain, DRA array
configuration is proposed. The idea is proven in two ways: analytically and by simulation.
Different slot sizes are introduced to the ground plane of the antenna to excite the dielectric
resonator (DR) with relative permittivity of 10 which contributes to a wideband operation.
The proposed single element DRA is mounted on a RT/Duroid 5880 (er = 2.2 and tan δ =
0.0009) substrate. The optimized single element DRA is then applied to design an array
structure for gain improvement. From the simulation work, it was found that the antenna
achieve approximately 10 GHz of impedance bandwidth and the gain increases from 6.73 dB
to 12.40 dB. Looking into the future, this work has potential for millimeter wave and 5G
applications.
Key words: DRA, wideband DRA, high gain, 5G
BACKGROUND
As a new generation of communication network, 5G has the advantage of high transmission
rate and spectrum resource utilization compared with the 4G network. Due to the increasing
needs for wider bandwidth and higher data rate [1-2], 5G is expected to use the millimeter
(mm-Wave) frequency bands. Careful consideration are needed to design the antenna at mm-
Wave frequencies [3].
DRA has received a lot of attention in the last two decades due to the attractive characteristics
such as high radiation efficiency, considerable bandwidth, low temperature coefficient and
low profile [4-7]. DRAs much lower loss and are a very good candidate to design the antenna
for microwave bands [8]. Study in [8] shows that gain is increased from 6.63 dB to 15 dB by
proposing a uniform linear antenna array with semi cylindrical DR fed by AC. Thus, in this

ENGINEERING 400
paper, an optimized unit cell DRA fed by AC is designed for wide bandwidth operation and
an array configuration is proposed.
METHODOLOGY
The single element design consist of three layers, which are the DRA, ground plane and
the substrate as shown in Figure 1. The dimension of the DRA is 2mm x 2mm x 3mm (W
x L x hd), with relative permittivity of 10. The DRA is placed on top of a ground plane
and substrate with dimension of 8mm x 8mm (W x L). The substrate used is RT/Duroid
5880 with height (hs) of 0.254mm. A rectangular feed is etched below the substrate with
the length of 0.7mm. Since this antenna is fed by using aperture couple, a rectangular slot
is cut through the middle of the ground plane for matching purposes. Finally, a linear 3
elements DRA array is designed for gain improvement.
Figure 1. Layers of proposed antenna design
FINDINGS
For single element DRA, parametric studies have been done to analyze the effect of slot
sizes on impedance bandwidth and gain. Table 1 shows the summary of simulated result
of gain and impedance bandwidth for optimum slot size.
Table 1. Impedance bandwidth and gain for optimum slot size
Slot Size (W x L) Impedance Bandwidth
(GHz) Gain (dB)
1.5 x 1.0 25.12 – 35.07 6.73
DRA array’s performance depends on the geometry and dimension of the DRA elements,
spacing between elements, number of elements, mode of operation and feed arrangement
[2]. Thus, in this paper, two of the cases are chosen for parametric studies which are the
number of elements, n and the element spacing, d. Theoretically, gain will increase if n
increases. Table 2 shows the summary of results based on n and gain.
Table 2. Simulated gain for different number of elements
No. of elements, n Gain (dB)
2 10.37
3 12.40
It is better to have a minimum number of elements that can provide sufficient gain for 5G
requirement which is at least 12 dB, because this will reduce the overall size of the antenna.
Therefore, after parametric studies, three elements is chosen for the array configuration for
this paper. Element spacing, d is the distance between elements. This parameter is important
to study the mutual coupling effect between the elements. Table 3 below shows the summary
results of element spacing and gain obtained.

ENGINEERING 401
Table 3. Simulated gain for different element spacing
Element spacing, d Gain (dB)
0.5 λ 10.71
0.6 λ 11.22
0.7 λ 11.75
0.8 λ 12.20
0.9 λ 12.40
λ 12.29
CONCLUSION
In this paper, a linear three elements DRA array with aperture-coupled feed operates at
28GHz is proposed. By analyzing the number of elements and the element spacing, an array
configuration with gain of 12.40 dB is obtained, which is sufficient for 5G applications. The
detailed result for return loss, impedance bandwidth, gain and radiation pattern of the antenna
for both unit cell and array configuration will be presented in the full paper later if this paper
is accepted.
Acknowledgment: The authors would like to express their appreciation to the Ministry of
Education Malaysia, Ministry of Science Technology and Innovation (MOSTI) and
Universiti Teknologi Malaysia (Vot 4J211, Vot 03G33, Vot 4S134 and Vot 13H26) for
sponsoring this work. The author, Norshafina binti Shafie acknowledges the scholarship from
UTM Zamalah for her Masters’ study, and also to Wireless Communication Centre (WCC)
for providing facilities and rendering neccesary technical assistance.
REFERENCES
1. Wells, J. Faster than fiber: The future of multi-Gb/s wireless. IEEE Microwave Magazine 10(3) (2009), 104-
112. 2. Wang, Y., Li, J., Huang, L., Jing, Y., Georgakopoulos, A., & Demestichas, P. 5G mobile: Spectrum
broadening to higher-frequency bands to support high data rates. IEEE Vehicular technology magazine, 9(3)
(2014), 39-46.
3. Rajagopal, S., Abu-Surra, S., Pi, Z., & Khan, F. Antenna array design for multi-gbps mmwave mobile
broadband communication. In Global Telecommunications Conference (GLOBECOM 2011), (2011) (pp. 1-
6). IEEE.
4. Petosa, A. (2007). Dielectric resonator antenna handbook, Artech House. Inc., Norwood, USA.
5. Pan, Y. M., & Leung, K. W., Wideband omnidirectional circularly polarized dielectric resonator antenna
with parasitic strips. IEEE Transactions on Antennas and Propagation, 60(6) (2012),2992-2997.
6. Petosa, A., & Ittipiboon, A. Dielectric resonator antennas: A historical review and the current state of the
art. IEEE Antennas and Propagation magazine, 52(5) (2010), 91-116. 7. Costanzo, S., Venneri, I., Di Massa, G., & Amendola, G. Hybrid array antenna for broadband millimeter-
wave applications. Progress In Electromagnetics Research, 83 (2008), 173-183. 8. Wee, F. H., Malek, M. F. B. A., Sreekantan, S., Al-Amani, A. U., Ghani, F., & You, K. Y., Investigation of
the characteristics of barium strontium titanate (BST) dielectric resonator ceramic loaded on array
antennas. Progress In Electromagnetics Research, 121 (2011), 181-213.

ENGINEERING 402
IGCESH2018
Universiti Teknologi Malaysia, Johor Bahru, Malaysia 13 -15 August 2018
STATE OF ART OF CARBON CAPTURE UTILISATION AND
STORAGE: INTEGRATION OF POWER PLANT & METHANATION
Siti Norlaila Faeizah Binti Mohd Rudin, Zarina Muis*, Haslenda Hashim and Wai
Shin Ho
Process System Engineering Centre (PROSPECT), Faculty of Chemical and Energy Engineering, Research Institute for Sustainable Environment (RISE), Universiti Teknologi
Malaysia, Johor, MALAYSIA.
(Email: [email protected], [email protected], [email protected],[email protected])
ABSTRACT
Greenhouse gaseous (GHG) emissions increment is driven by economic and population
growth which are getting higher. This has led to the increase of atmospheric concentration of
CO2. Due to this situation, carbon capture utilisation and storage (CCUS) seems to be
promising approach to reduce emission of CO2. Among all the carbon utilisation strategies
available, methanation is promising. In the perspective of integrated power plant with
methanation, the process is appropriate and relatively simpler due to availability of hydrogen
as its main constituent. Prior to the goal of abatement of greenhouse gases emission,
hydrogen production by using renewable energy technology which is electrolysis seems to be
one of the solution towards future energy security. Optinization of integrated power plant
with methanation is proposed in this paper.
Key words: Carbon capture and storage (CCS), Carbon Capture Utilization and Storage
(CCUS), Methanation, CO2 reduction
INTRODUCTION
Greenhouse gaseous (GHG) emissions increment is driven by economic and population
growth mainly from energy and industrial sector. Due to this situation, atmospheric
concentration of CO2 increased and contirbuted about 76% of the global greenhouse gases up
to 2010 [1]. In 2009, Prime Minister of Malaysia, Datuk Seri Najib Razak announced in
COP16 that Malaysia has adopted a voluntary indicator to reduce GHG emission intensity of
Gross Domestic Product (GDP) by up to 40% compared to an intensity level of 2005 by
2020. This ambitious target is essential for Malaysia since the country was one of the highest
contributors to GHG emission among other Asian countries after Singapore and Brunei.
Carbon capture and storage (CCS) is one of the promising technology to overcome GHG
emission which has been deployed in many industries such as oil and gas with enhanced oil
recovery method. However carbon capture utilisation and storage (CCUS) has more
advantageous and it differs from CCS technology in the terminology where the captured CO2
is utilised as various secondary resources with economic and environmental benefit instead of
directly sequestered in the geographical site.

ENGINEERING 403
Among all the CCUS strategies available, CO2 captured from large source or stationary
sources can be converted to a valueable energy source which is methane. In the perspective
of integrated power plant with methanation, the process is appropriate and relatively simpler
due to availability of hydrogen as its main constituent. Although the integrated power plant
with methanation is already mature in academia world, the dilemma of technologies selection
by decision makers in few stages which are technologies of carbon capture, electrolysis, and
also end user of methane makes the integration seems complex specifically in economic and
environmental term.
OVERVIEW OF CURRENT CCUS STATUS
The increasing levels of emission of greenhouse gases causing countries and researchers
around the world looking forward to renewable energy based systems. However, the excess
energy produced by most of the power plants is dumped to the environment, which adds to
the problem of global warming. The power plants including the ones from renewable sources
such as solar and wind around the globe are not equipped with energy storage systems. The
excess electricity produced by power plants during off peak hours is not stored and is dumped
into the environment. Storing this energy and using it for peak hours can prove beneficial
from both economics and environment point of view. Electrolysis is one of the solutions to
the energy storage. The hydrogen produced by electrolysis process can be utilized in
methanation reaction. Studies had been done by [2] on thermodynamics of direct
hydrogenation of CO2 from post combustion producing methane or methanol. CO2 proven to
be more attractive as the production of methanol requires higher pressure. Another advantage
of synthesizing methane from hydrogen is that it can be readily utilize as it can be fed directly
to the gas distribution system [3].
Previously, the methanation of carbon dioxide is not feasible due to expensive production of
hydrogen. However, with the integration of electrolysis, methanation and carbon dioxide
captured from power plant could economic and environmentally improvised the process.
Major challenge of deployment of integrated power plant with methanation is the dilemma
faces by decision makers on the technologies selection. Although optimization studies has
been done by few researchers in term of hydrogen distribution supplies, carbon capture and
utilization, there is a gap in the research area, that the researchers does not significantly
optimize the integration process in a whole.
FUTURE RECOMMENDATION
One of the solution to increase maturity of the integration of power plant with methanation
while utilizing carbon dioxide and hydrogen for energy storage is by optimizing the
integration process. The optimization could be beneficial not only in reducing carbon
emission but also useful for systematic energy planning which needs more research and
exploration. A model-based analysis of CO2 utilization in methanol synthesis plant is
developed by [4] with comprehensive model for CO2 integration in natural gas-based
methanol synthesis plant. On the other hand, [5] developed a multi-scale framework for
CCUS to minimize the cost while reducing stationary CO2 emissions in the United States.
Optimization of technology selection from electricity generation, carbon dioxide capture
technologies, hydrogen production by electrolysis, and also methanation reaction has not
been significantly studied by any researchers. Figure 1 shows the research boundary which
includes the selection of technology from electricity generation, carbon dioxide capture

ENGINEERING 404
technologies, hydrogen production by electrolysis, and also methanation reaction. This
process boundary might be expanded up to progress of review studies.
Figure 1. Integrated power plant with methanation research boundaries.
CONCLUSION
The first part of this paper, reviewed on the current status of CCUS technologies followed by
optimization model done by researchers. Recommendation for future exploration is proposed
in this paper which is optimization of integrated power plant with methanation.
Acknowledgment: The authors would like to acknowledge the financial support in the form
of research grant by UTM with grant no Q.J130000.2546.17H86 and express their
appreciation for the support of UTM Zamalah Scholarship.
REFERENCES
1. IPCC. Summary for Policymakers. Climate Change 2014: Synthesis Report. Contribution of Working
Groups I, II and III to the Fifth Assessment Report of the Intergovernmental Panel on Climate Change. (2014) http://doi.org/10.1017/CBO9781107415324
2. Miguel, C.V., Soria, M.A., Mendes, A., Madeira, L.M., Direct CO2 hydrogenation to methane or methanol
from post-combustion exhaust streams - a thermody-namic study. J. Nat. Gas Sci. Eng. (2015),22.
3. Gahleitner, G. Hydrogen from renewable electricity: An international review of power-to-gas pilot plants for
stationary applications. International Journal of Hydrogen Energy, 38(5), (2013). 2039–2061.
4. Milani, D., Khalilpour, R., Zahedi, G., & Abbas, A. A model-based analysis of CO 2 utilization in methanol
synthesis plant. Biochemical Pharmacology, (2015). 10, 12–22.
5. Hasan, M. M. F., First, E. L., Boukouvala, F., & Floudas, C. A. A multi-scale framework for CO2 capture,
utilization, and sequestration: CCUS and CCU. Computers and Chemical Engineering, (2015), 1–20.

ENGINEERING 405
IGCESH2018
Universiti Teknologi Malaysia, Johor Bahru, Malaysia 13 -15 August 2018
SIMULATION OF AIRFLOW AND AIRBORNE PARTICLES
MOVEMENT INSIDE A HOSPITAL OPERATING ROOM
Keng Yinn Wong1, Haslinda Mohamed Kamar*2 and Nazri Kamsah3
1, 2, 3 Faculty of Mechanical Engineering, Universiti Teknologi Malaysia, Skudai, MALAYSIA.
(E-mail: [email protected], *[email protected], [email protected])
ABSTRACT
This article presents the results of a numerical study to examine the transport of particles in
an operating room equipped with an Econoclean ventilation system. Its aims are to determine
the transport paths and the number of particles falling onto the operating table. Field
measurement was conducted to measure airflow velocity on three horizontal planes at a
different height from the floor under the present ventilation system. A simplified CFD model
of the operating room was developed and validated based on the measured air velocity
distribution. An SST k-ω turbulent flow model was used to simulate the airflow, while a
discrete phase model was used to simulate the movement of the airborne particles. The
effects of the standing posture of the surgical staff on the settlement of the particles on the
operating table were examined. Results show that under the present ventilation system, when
all the medical staff are standing upright, almost no airborne particles fall onto the operating
table. However, when the surgical staff bend forward at an angle of 45°, the number of
airborne particles that tend to fall onto the operating table increases. Adding an exhaust grille
to the operating room does not have any significant effects on the distribution of the airborne
particles. However, when a larger air supply diffuser is also used, more airborne particles are
transported towards the exhaust grilles, and more airborne particles accumulate below the
operating table.
Key words: Numerical method, Bacteria-carrying Particles, Hospital Operating Room (OR),
Surgical Site Infection, Air Supply System
INTRODUCTION
This article presents a numerical study to investigate the transport of airborne particles inside
an OR furnished with an Econoclean system in a private hospital in Malaysia. The phrase
“Econoclean system” refers to one of the classifications of the air cooling system for the OR.
The particles were assumed to be discharged from the exposed faces of the surgical staff at a
given mass flow rate. The first objective is to examine the transport paths and concentration
of the particles in the vicinity of the operating table. The second is to identify a ventilation
strategy that will improve the removal of the particles from the OR. A field measurement was
conducted to quantify the concentration of particles in the room under the present ventilation
system. A simplified model of the operating room was developed using Fluent Computational
Fluid Dynamics (CFD) software and validated for flow analysis. The CFD method has been
used by many researchers [1] & [2] as a tool to carry out flow analyses and predict airflow
patterns inside hospital ORs. The verification procedures were conducted according to
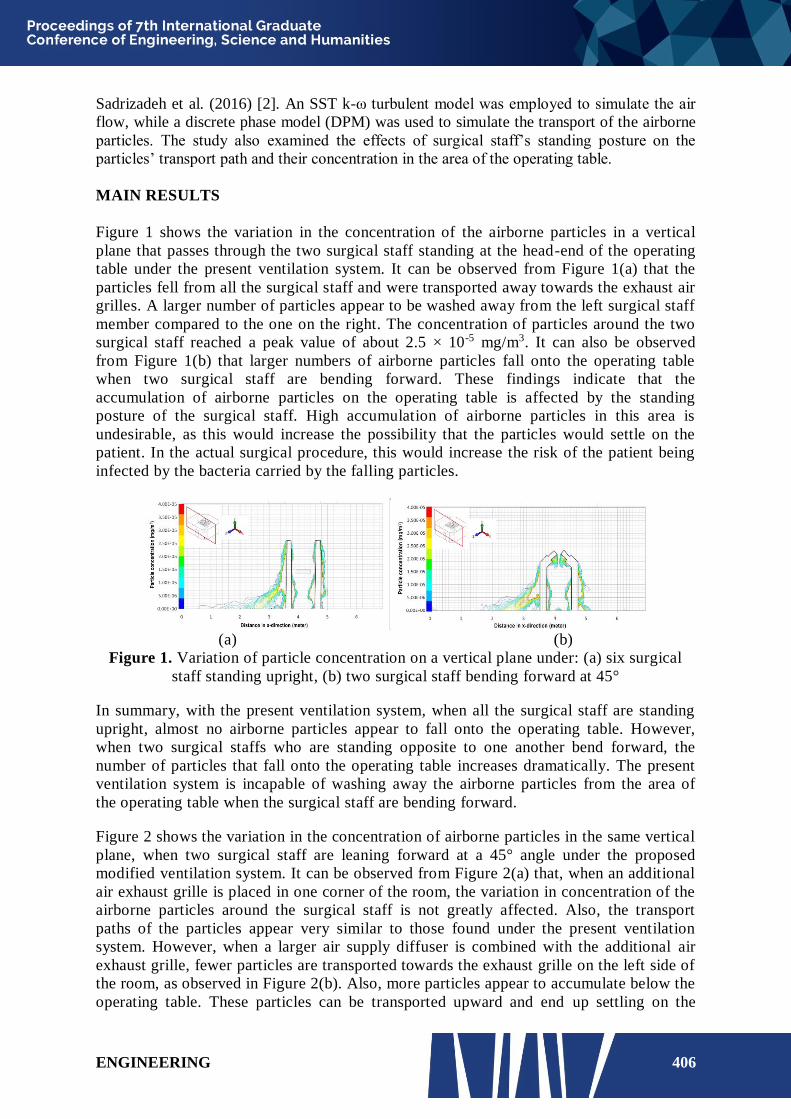
ENGINEERING 406
Sadrizadeh et al. (2016) [2]. An SST k-ω turbulent model was employed to simulate the air
flow, while a discrete phase model (DPM) was used to simulate the transport of the airborne
particles. The study also examined the effects of surgical staff’s standing posture on the
particles’ transport path and their concentration in the area of the operating table.
MAIN RESULTS
Figure 1 shows the variation in the concentration of the airborne particles in a vertical
plane that passes through the two surgical staff standing at the head-end of the operating
table under the present ventilation system. It can be observed from Figure 1(a) that the
particles fell from all the surgical staff and were transported away towards the exhaust air
grilles. A larger number of particles appear to be washed away from the left surgical staff
member compared to the one on the right. The concentration of particles around the two
surgical staff reached a peak value of about 2.5 × 10⁻⁵ mg/m3. It can also be observed
from Figure 1(b) that larger numbers of airborne particles fall onto the operating table
when two surgical staff are bending forward. These findings indicate that the
accumulation of airborne particles on the operating table is affected by the standing
posture of the surgical staff. High accumulation of airborne particles in this area is
undesirable, as this would increase the possibility that the particles would settle on the
patient. In the actual surgical procedure, this would increase the risk of the patient being
infected by the bacteria carried by the falling particles.
(a) (b)
Figure 1. Variation of particle concentration on a vertical plane under: (a) six surgical
staff standing upright, (b) two surgical staff bending forward at 45°
In summary, with the present ventilation system, when all the surgical staff are standing
upright, almost no airborne particles appear to fall onto the operating table. However,
when two surgical staffs who are standing opposite to one another bend forward, the
number of particles that fall onto the operating table increases dramatically. The present
ventilation system is incapable of washing away the airborne particles from the area of
the operating table when the surgical staff are bending forward.
Figure 2 shows the variation in the concentration of airborne particles in the same vertical
plane, when two surgical staff are leaning forward at a 45° angle under the proposed
modified ventilation system. It can be observed from Figure 2(a) that, when an additional
air exhaust grille is placed in one corner of the room, the variation in concentration of the
airborne particles around the surgical staff is not greatly affected. Also, the transport
paths of the particles appear very similar to those found under the present ventilation
system. However, when a larger air supply diffuser is combined with the additional air
exhaust grille, fewer particles are transported towards the exhaust grille on the left side of
the room, as observed in Figure 2(b). Also, more particles appear to accumulate below the
operating table. These particles can be transported upward and end up settling on the

ENGINEERING 407
operating table, which is not desirable. The concentration of particles around the two
surgical staff is reduced.
(a) (b)
Figure 2. Variation of particle concentration on a vertical plane with two surgical staffs
bend forward: (a) with additional air exhaust grille and (b) with the combination of
additional air exhaust grille and a large air supply diffuser.
CONCLUSION
A computational fluid dynamic method was used to carry out simulations to predict the airflow
distribution and the movement of airborne particles in a hospital operating room equipped with an
Econoclean ventilation system. The goal was to examine the effects of standing posture of the
surgical staff on the accumulation of airborne particles on the operating table. Results show that
under the present ventilation system, when all the medical staff are standing upright, almost no
airborne particles fall onto the operating table. However, when the surgical staff bend forward at
a 45° angle, the number of airborne particles that tend to fall onto the operating table increases.
Modifying the present ventilation system by adding an exhaust grille to the operating room does
not have any significant effects on the distribution of the airborne particles. However, when this
modification is combined with the use of a larger air supply diffuser, more airborne particles are
transported towards the exhaust grilles. The number of airborne particles falling onto the
operating table appears to be decreased, as a larger proportion of them are accumulating below
the operating table.
Acknowledgment: The authors would like to express their appreciation for the support of
Ainuddin Wahid Scholarship throughout this study under the Vot No. A.J10000.5900.06000.
REFERENCES
1. Villafruela, J.M.I.O., Jose J.F.S. Influence of human breathing modes on airborne cross infection risk.
Building and Environment 106(2016), 340-351.
2. Sadrizadeh, S.Sture, H.. Peter, V.N.. Three distinct surgical clothing systems in a turbulent mixing operating
room equipped with mobile ultraclean laminar airflow screen: A numerical evaluation. Science and
Technology for the Built Environment 22(2016), 337-345.

ENGINEERING 408
IGCESH2018
Universiti Teknologi Malaysia, Johor Bahru, Malaysia 13 -15 August 2018
TOTAL SUSPENDED SOLIDS REMOVAL BY HIGH GRADIENT
MAGNETIC SEPARATION USING STEEL WOOL AT DIFFERENT
VOLUME
Nur Sumaiyyah Supian*1, Johan Sohaili2 Nur Suraya Kamsano3
1, 2 Environmental Engineering of Civil Engineering, Universiti Teknologi Malaysia, Johor,
MALAYSIA.
(E-mail: [email protected], [email protected]) 3 Environmental Engineering of Civil Engineering, Universiti Teknologi Malaysia, Johor,
MALAYSIA..
(E-mail: [email protected])
ABSTRACT
Every living creatures including human, animals, trees and other various species on earth are
depending much from water. An increasing of water pollution from municipal and industrial
wastewater has become a challenge in wastewater treatment. Therefore, developing varies
techniques for water treatment has drawn research interest of scientists’ worldwide. Magnetic
field has been successfully applied for separation purposes in water and wastewater treatment
industries. This unique physical treatment helps to treat water without using any kind of
chemical as if can be harmful to human life or disruptive to the environment. An experiment
was carried out to determine total suspended solids removal by high gradient magnetic
separation using steel wool at different volume. Initially, the magnetic strength was N35
(1.4Tesla), flow rate was 1mL/s, and experiment took 24 hours of circulation time and data
recorded at 0, 1, 3, 5, 21, 24 hours. While, data were recorded according to the different
volume of steel wool was located in the experiment involving control parameter, non-
inverted magnet parameter and inverted magnet parameter. Therefore, magnetic field was
proven as one of the best physical treatment in order to treat wastewater.
Key words: High Gradient Magnetic Separation, Total Suspended Solid, Wastewater
INTRODUCTION
Various studies have revealed promising potentials of magnetic treatment in different fields
of environmental management [1]. There were several types of magnetic technologies which
widely known namely as permanents magnets, high gradient magnetic separation (HGMS) or
superconducting magnet. Sometimes, the combination with other techniques such as
magnetic seeding, electromagnetic devices and membrane filtration helps to increase the
performance to treat the sample even better. This study focuses on application of high
gradient magnetic separation by using different volume of steel wool on wastewater
treatment. The aim is to explore the possibility of steel wool as filter in enhancing the
performance of wastewater treatment. Several different volume of steel wool will be used on
a fixed flow rate, same magnetic strength in order to determine the most effective to treat
wastewater.

ENGINEERING 409
When magnetic field has been interrupted by steel wool whereas magnetic separation took
place, magnitude flux density varies gradually in that space. Therefore, higher magnetic
separation performance could be achieved by increasing the magnetic field and the gradient.
Stronger magnet could be used with the combination of steel wool matrix and changing
magnets polarities in order to have higher chances of stronger magnetic field [2]. Generally,
the gradient of the magnetic field around the matrix increases first with the increase of the
magnetic field and then keeps constant when the matrix reaches magnetization saturation [3].
When the magnetic field exceeds a certain value, the recovery can hardly increase or even
decreases with the increase of magnetic field.
MAIN RESULTS
Figure 1. Particles removal for 24 hours
Figure 1 has shown that particles removal keep decreasing within time. Between two
different magnetic positions, inverted magnetic (89.5%) has been proven to remove particles
effectively compared to non-inverted magnet (84.2%) position. Additionally, highest volume
of steel wool also has shown incredibly remove total suspended solids during 24-hours
circulation.
CONCLUSION
As a conclusion, high gradient magnetic separation has been proven to remove particles
which can reduce pollution rate in wastewater and also can apply as a treatment as well. This
physical treatment can be enhanced by using higher strength of magnet and steel wool
volume in order to remove higher rate of particles.
REFERENCES
1. Ali, Y., Samaneh, R., Zohre, R. and Mostafa, J., ‘Magnetic Water Treatment in Environmental Management
A Review of the Recent Advances and Future Perspectives’, Journal of Current World Environment, 9.3
(2014), 1008–16. 2. Baik S. K., Ha, D. W., Kwon, J. M. Lee, Y. J. and Ko. R. K., ‘Magnetic Force on a Magnetic Particle within
a High Gradient Magnetic Separator’, Journal of Physica C: Superconductivity and Its Applications, 484
(2013), 333–37 .
3. X. Zheng, Y. Wang and D. Lu, ‘A Realistic Description of Influence of the Magnetic Field Strength on
High Gradient Magnetic Separation’, Journal of Minerals Engineering, 79 (2015), 94–101
0 1 3 5 21 24 TSS
Rem
ova
l (%
)
hours

ENGINEERING 410
IGCESH2018
Universiti Teknologi Malaysia, Johor Bahru, Malaysia 13-15 August 2018
DEVOLEPMENT AND TESTING SWIRL ROTATING DETONATION
ENGINE
A. Dairobi G.*1, M. A. Wahid
2
1, 2 Faculty of mechanical Engineering, Universiti Teknologi Malaysia, Johor Bahru,
MALAYSIA. (E-mail: [email protected], [email protected])
*corresponding author
ABSTRACT
Rotating Detonation Engine (RDE) has an advantage on high thrust density, high-frequency
operation in order kHz for new generation engine. However, RDE still at infancy stage which
requires further study especially on mixing scheme. Therefore, the objective of this study is
to develop and tests the new RDE using swirl injection scheme. The research also involves
the investigation of the effects of injection pattern, reactant configuration and dimension
effect on detonation combustion characteristic as well. Current research focuses also on the
development of combustion technology, aiming at increasing combustion efficiency of thrust
production engine. A swirl RDE was developed for this experiment. Pressure, velocity and
visual data were collected for determination of successful and unsuccessful detonation.
Included is a discussion of the engine design, determination of successful and unsuccessful
detonation, and presentation of data collected on the swirl RDE. As a conclusion, RDE was
difficult to transit from deflagration to detonation due to the poor mixing between reactant.
Key words: RDE, Detonation, Swirl, Shock Wave
INTRODUCTION
The basic concept of RDE operation is detonation wave travel along the annulus combustion
chamber. The combustion chamber of RDE is usually a coaxial cylinder. The head end is
closed but drilled with a large number of micro nozzles or slits to inject fuel and oxidant into
the chamber. In experiments, the detonation wave in the chamber is usually initiated by a pre-
detonator attached tangentially to the chamber. While working, one or more detonation waves
lean on the head end and propagate in the circumferential direction. Behind the detonation
wave, burnt products are of high temperature and high pressure. Through a series of
expansion waves, these burnt products flow out of the downstream exit almost axially to
provide thrust. In addition, there is an oblique shock wave and a contact surface in the flow
field. During the propagating process of the detonation wave, combustible mixtures are
continuously injected into the chamber. They form a triangle combustible mixture layer and
are combusted by the detonation wave. The fundamental of this engine is to understand the
deflagration and detonation combustion mode [1,2,3].

ENGINEERING 411
RDE promised technology for the new generation of propulsion engine. Significant
progresses of RDE have been achieved in recent years. However, there are several challenges
be required to overcome and clarify for practical use. Therefore, in recent years, many
research institutions have been engaging in resolution of these challenges. Two main
interested issues on RDE are mixing and stability of the detonation. Sufficient mixing is
required for all combustion processes, especially for RDE. In practice, the mixing must
happen rapidly and in a short distance to sustain detonation waves. These requirements are
exacerbated by the high mass flow rates of RDE, the rapid propagating velocity of detonation
waves, and the high-pressure detonation products. Therefore, it needs to further clarify the
intake way, the mixing mode and the blending process of fuel and oxidant [2].
This study focuses on a new combustor that solves the problem (mixing and stability) by
achieving detonation combustion with high recirculation. A modified design is proposed for a
RDE combustor with a high recirculation for fast mixing. Therefore, the objective of this
study is to develop and tests the new RDE using swirl injection scheme. The research also
involves the investigation of the effects of injection pattern, reactant configuration and
dimension effect on detonation combustion characteristic as well. Current research focuses
also on the development of combustion technology, aiming at increasing combustion
efficiency of thrust production engine. A swirl RDE was developed for this experiment.
Pressure, velocity and visual data were collected for determination of successful and
unsuccessful detonation. Included is a discussion of the engine design, determination of
successful and unsuccessful detonation, and presentation of data collected on the swirl RDE.
RDE was developing using mild steel with capability to changeable the injection port. There
is three different way to mixing the reactant inside the RDE with main concern to generate
swirl mixing scheme. RDE experimental is designed to be operated and controlled through a
computer to prevent harm and shockwave that may be faced by the operator. Therefore, a
control room has been prepared in the HiREF laboratory for the operators to control the RDE.
A proper control room is required to protect the operators from the shock wave and loud
noise produced by RDE during operation. For the fuel supply, steel tube piping is used to
supply the fuel from tanks located outside the building.
MAIN RESULTS
RDE was successfully being operated at 10Hz frequency after numerous testing on the
various mass configurations. The fuel (hydrogen) and oxidizer (oxygen) were mixed at
stoichiometric condition as shown in Figures 1. The graph showed a negative reading due to
the vacuum stages after being detonated at the highest peak. The operating frequency of RDE
is 10Hz as shown in the graph. The average pressure for this mixtures are 9.87 bar with Mach
numbers of 2.43. The pressures of PDE are lower compared to the pressure calculated in a
single detonation by Saqr [4] due to several reasons. One of the reasons is that Saqr made an
assumption in his study that the single detonation was performed under a homogenous
condition with completely saturated reactants. The reactants inside RDE only had about 60
ms to saturate before it was ignited. Short period of saturation resulted into relatively
inhomogeneous mixture of reactants.

ENGINEERING 412
Figure 1. Detonation pressure produce from RDE.
During the experiment, pre-mixing of fuel and oxygen was not used. There was only post-
mixing applied in the combustion chamber by generating turbulent conditions. It produced
unsuccessful operation for mixtures low mass flow-rate. Even though the reactants under
incomplete mixing in a short period of 60ms for the mixing process, it was proven to be
sufficient to establish detonation waves inside the RDE.
CONCLUSION
RDE was successfully develop operate under swirl mixing scheme. RDE was difficult to
transit from deflagration to detonation due to the poor mixing between reactant. However,
due the increasing swirl number the performance of RDE was improved. The best result
shown RDE was detonate with 9.87 bar of pressure and 2.43 March number.
Acknowledgment: The authors would like to express their appreciation for the support of the
sponsors with Project No 17H98.
REFERENCES
1. PiotrWolański, “Detonative propulsion,” Proc. Combust. Inst., vol. 34, no. 1, pp. 125–158, Jan. 2013.
2. Zhou, R., Wu, D. and Wang, J. Progress of continuously rotating detonation engines Chinese J. Aeronaut.,
vol. 29 (2015), no. 1, pp. 15–29.
3. Wilson, D. R. and Lu, F. K. Summary of recent research on detonation wave engines at UTA,” Int. Work.
Detonation Propuls., (2011). 4. Lu, F. K and. Braun, E. M. Rotating detonation wave propulsion: experimental challenges, modeling, and
engine concepts,” J. Propuls. Power, vol. 30 (2011), no. 5, pp. 1125–1142.
5. Saqr, K. M., Kassem, H. I., Sies, M. M. and Wahid, M. A. Ideal detonation characteristics of biogas-
hydrogen and hydrogen peroxide mixtures. In International Conference on Theoretical and Applied
Mechanics, International Conference on Fluid Mechanics and Heat and Mass Transfer—Proceedings,
(2010) 69-72.

ENGINEERING 413
IGCESH2018
Universiti Teknologi Malaysia, Johor Bahru, Malaysia 13 -15 August 2018
RECENT ADVANCES IN EXPERIMENTAL STUDIES ON
APPLICATIONS OF NANOFLUIDS IN MINICHANNEL FOR HEAT
TRANSFER ENHANCEMENT.
Nura Mu’az Muhammad1,2, Nor Azwadi Che Sidik1, *
1 Faculty of Mechanical Engineering, Universiti Teknologi Malaysia, 81310 Skudai, Johor, Malaysia. (E-mail: [email protected])
2 Department of Mechanical Engineering, Kano University of Science and Technology, Wudil, Kano.
Nigeria (E-mail: [email protected])
ABSTRACT
Energy as the prime mover of industrial growth needs dynamic approach to its utilization and
sustenance. Nanofluid has been recognized as an advance engineering fluid capable of
providing outstanding heat transfer improvement than the conventional fluids, thereby
increasing thermal system productivity and ensure energy sustainability. This new
engineering fluid is usually produce by dispersion of nanoparticles into a base fluid. Just as
the evolvement and progresses in using nanofluid are recorded in literatures, also the medium
of its transportation is also receiving attention from researchers. Micro and minichannels are
the preferred media for transportation of nanofluids. In this paper, the various experimental
works on using nanofluids in minichannels are reviewed with emphasis on thermal
improvement achieved, types of configuration used and areas of engineering applications.
Finally, the challenges and discrepancies from the use of nanofluid in minichannels are
highlighted.
Key words: Minichannel, nanofluid, heat transfer, thermal conductivity, hydraulic diameter
INTRODUCTION
The quest for predominant working fluids for heat and mass transfer systems is on the
increase. Heat is usually generated during mechanical or electromechanical operations and to
ensure sustenance and reliability of the systems, effective means of heat dissipation under
extreme conditions like in heat exchanger or space constraint like in electronic semiconductor
devices must be sought up. Nanofluid is an innovative engineering fluid which compose of
nanometre-sized solid particles disperse in a base or carrier fluids (usually water, ethylene
glycol and oil) [1]. Nanofluids usually have particle sizes within 1 – 100 nm and have proven
to be an excellent engineering material for rapid heat transfer dissipation since its
revolutionary debut by Choi [2].
Just as the evolvement and progresses in using nanofluid are recorded in literatures, also the
medium of its transportation is also receiving attention from researchers. Micro (MC) and
minichannels (MiC) are the preferred media for transportation of nanofluids. It was observed
by Sujith et al. [3] that their heat transfer rate increase due to higher surface area to volume

ENGINEERING 414
ratio and absence of stratified flow, but with a drawback of increase in pressure drop, fouling
and instability of flow. Though, heat transfer enhancement is higher in microchannel than in
minichannel, but its smaller hydraulic diameter causes increase pumping power and pressure
drop, as well as cost intensive and more sophisticated manufacturing techniques,[4] thus,
minichannel still receives interest for utilisation in heat exchangers or heat sinks, as well as in
semiconductor devices. The most important parameters needed for efficient use of nanofluid
include among others: thermal conductivity, viscosity, pressure drop and flow rate. Many
researchers have shown remarkable achievement of nanofluids in their works, like in heat
exchangers [5], electronic cooling [6], thermo-electric generators (TEG) [7], solar energy
harvest and other applications.
Even though the afore-mentioned studies investigated the flow and heat transfer
characteristics in minichannel heat sinks, but there are discrepancies of results from the
authors, which can be attributed to lack of comparative results from similar works done by
other researchers. In this paper, the various experimental works on using nanofluids in
minichannels are reviewed with emphasis on thermal improvement achieved, types of
configuration used and areas of engineering applications. Finally, the challenges and
discrepancies from the use of nanofluid in minichannels are highlighted.
CONCLUSION
This study reviews the recent researches on the application of nanofluid in minichannel for
heat transfer augmentation with emphasis on experimental works conducted. Most of the
researches affirmed that heat transfer enhancement is directly proportional to nanofluid
concentration, but results varied from one research to another for a similar nanofluid. In
addition, despite effort by researchers to solve the effect of pressure drop and reduce the
pumping power requirement of nanofluid flowing in minichannels due to reduction of its
hydraulic diameter, yet still there is no specified concentration of nanofluid that can give a
certain amount of heat enhancement stated in any literature and there are various
configurations of minichannels employed giving distinct heat enhancement outcomes. Most
of the consulted literatures explicitly affirmed that use of nanofluid instead of conventional
fluid can enhance the heat efficiency in heat exchangers and electronic devices in most cases
by up to 50% thereby ensuring the system reliability and performance. Future works should
be expected to dwell on heat transfer mechanism of nanofluid in minichannel with emphasis
on optimum enhancement of its thermophysical properties, particularly thermal conductivity
and pressure drop, as well as design of different shapes of minichannel heat sinks that are
practicable and economically feasible.
Acknowledgment: The authors would like to express their appreciation for the support of the
sponsors Malaysia-Japan International Institute of Technology (MJIIT). UTM, Kuala
Lumpur. Malaysia
REFERENCES
1. Sidik, N.A.C., M.N.A.W.M. Yazid, and R. Mamat, Recent advancement of nanofluids in engine cooling system. Renewable and Sustainable Energy Reviews, 2017. 75: p. 137-144.
2. Choi, S.U.S. and J. Eastman, Enhancing thermal conductivity of fluids with nanoparticles. Vol. 66. 1995.
3. Sujith Kumar, C.S., et al., Effect of surfactant addition on hydrophilicity of ZnO-Al2O3 composite and
enhancement of flow boiling heat transfer. Experimental Thermal and Fluid Science, 2016. 70: p. 325-334.
4. Leela Vinodhan, V., K.S. Suganthi, and K.S. Rajan, Convective heat transfer performance of CuO–water
nanofluids in U-shaped minitube: Potential for improved energy recovery. Energy Conversion and
Management, 2016. 118: p. 415-425.

ENGINEERING 415
5. Zhou, J., et al., Influence of nanoparticle concentrations on flow boiling heat transfer coefficients of
Al2O3/R141b in micro heat exchanger by direct metal laser sintering. Chinese Journal of Chemical
Engineering, 2017.
6. Ghasemi, S.E., A.A. Ranjbar, and M.J. Hosseini, Experimental evaluation of cooling performance of circular heat sinks for heat dissipation from electronic chips using nanofluid. Mechanics Research Communications,
2017. 84: p. 85-89.
7. Li, Y.H., et al., Study on the performance of TEG with heat transfer enhancement using graphene-water
nanofluid for a TEG cooling system. Science China Technological Sciences, 2017. 60(8): p. 1168-1174.

ENGINEERING 416
IGCESH2018
Universiti Teknologi Malaysia, Johor Bahru, Malaysia 13 -15 August 2018
EFFECTIVENESS OF h-BN NANOPARTICLE AS OIL ADDITIVES
ON LIGHT VEHICLE ENGINE PERFORMANCE
Wan Mohd. Arif Aziz Japar1, Tung Hao Kean2, Hong Wei Xian3 and Nor Azwadi
Che Sidik4
1, 2, 3, 4 Malaysian-Japan International Institute of Technology (MJIIT), Universiti Teknologi Malaysia
(UTM), Kuala Lumpur, MALAYSIA.
(E-mail: [email protected], [email protected], [email protected],
ABSTRACT
Oil additives is a chemical compound that dispersed in mineral oil to improve its tribological
properties. High demand of oil additives has led to development of new additives such as
nanoparticles which can give great impact on lubrication system. In this study, 70 nm h-BN
nanoparticles with various concentrations (0.01 vol.% to 0.1 vol.%) have been dispersed in
the mixture of SAE 10W40 mineral oil, Bardal B1 additives and RBD palm oil by sonication
technique. The engine oil has been tested on Satria 1.5cc engine for performance analysis
using chassis dynamometer. The analysis was conducted for engine speed of 1500 rpm to
4500 rpm. The result shows that the presence of h-BN nanoparticles as oil additives has
increased the average torque and average power of the engine by 0.18% and 1.03%
respectively for concentration of 0.01 vol.% to 0.1 vol.%. The maximum enhancement of
engine performance can be obtained by 0.1 vol.% h-BN nanoparticles. It can be seen that the
ball bearing behaviour of h-BN nanoparticles that changes the friction situation from sliding
effect (dynamic friction) to rolling effect helps to reduce friction between rubbing surface and
thus improve the engine performance. Besides that, lamellar crystalline structure of h-BN
nanoparticles that serve as spacer has eliminated a direct metal-to-metal contact.
Key words: h-BN nanoparticle, engine performance, maximum torque, maximum power, light
vehicle engine.
INTRODUCTION
Nowadays, rapid development in automotive technology requires more efficient engine oil to
minimize friction power loss, excessive heat generation and the wear of contact surface, in
order to improve performance of automotive engine. Sliding friction due to direct contact
between components of engine contributes to component wear and thus reduce the
performance of engine [1, 2].
Tribological properties of lubricant play a main role to prevent direct contact between engine
component. In the recent year, there has been a dramatic increase in development of
advanced lubrication technology such as thin film coating, Nano lubricants and gas lubricant
which can improve tribological properties and thus enhance the performance of oil properties
[3]. There are three factors considered for selection of nanoparticles as oil additives such as

ENGINEERING 417
concentration, size and shape of nanoparticles. A recent study by Abdullah et al. [3] showed
that, low concentration of nanoparticles (0.2 vol.% - 3 vol.%) is enough to reduce coefficient
of friction (COF) and thus improve the tribological properties of the lubricant oil. In a study
conducted by Li et al. [4], it was shown that optimum concentration of ZiO2/SiO2
nanoparticles (0.1 wt%) have reduced friction coefficient by 16.24%. To determine the
effects of shape of nanoparticle, Hwang et al. [5] has conducted an experiment to investigate
the effect of shapes on COF. The result shows that fibrous shape has higher COF than
spherical shape because fibrous shaped nanoparticles tend to agglomerate and becomes
thicker than lubricant film which increases the COF of lubricant oil.
Studies above highlighted the effectiveness of nanoparticles as additives in conventional oil,
which can reduce friction and enhance protection against wear. Eco-friendly nanoparticles
such as h-BN has been investigated intensively by many researchers due to low cost and good
performance. Based on previous research [3], h-BN nanoparticles dispersed in SAE 15W40
mineral oil can improve the oil properties. The result showed that h-BN nanoparticles
increased viscosity index and Total Base Number (TBN) by 3% and 30% respectively.
However, investigation of h-BN nanoparticles as oil additives on real engine with chassis is
limited. For this reason, the main aim of this study is to analyze the effect of h-BN
nanoparticles as oil additives on actual vehicle engine performance. The present study fills a
gap in the literature by contributing the data of actual performance of Nano-oil-additives in
real car engine.
MAIN RESULTS
Figure 1 shows the engine performance result that obtained by chassis dynamometer test.
The graph shows that, when the volume concentration of h-BN nanoparticles is increased,
both average torque and power of the engine increase. Average torque and power of the
engine are increased by 0.18% and 1.03% respectively for the rpm of 1500 to 4500. The
highest average torque and power of the engine was obtained by dispersing 0.1vol.% h-
BN to the mixture of SAE 10W40 mineral oil, Bardal B1 additives and RBD palm.
Figure 1. Engine performance testing result from chassis dynamometer.

ENGINEERING 418
CONCLUSION
Throughout this experimental study, h-BN nanoparticles that have been widely studied has
been proved as a reliable additive to generate an eco-friendly Nano lubricant that applicable
in car engine. For further investigation, the thermophysical properties of the Nano lubricant
can be tested as the thermal conductivity of engine oil with h-BN nanoparticles as additive is
believed to be higher than pure engine oil. Besides, it is highly recommended to future
authors to study the effectiveness of h-BN nanoparticles as additive in heat transfer field as it
possesses great potential to assist the conventional coolant in cooling performance.
Acknowledgment: The authors would like to express their appreciation for the support of the
sponsors with Project No R.K130000.7343.4B314
REFERENCES
1. Ahmed Ali, M. K., Xianjun, H. R., Fiifi Turkson, R., and Ezzat, M. An analytical study of tribological
parameters between piston ring and cylinder liner in internal combustion engines. Proceedings of the
Institution of Mechanical Engineers, Part K: Journal of Multi-body Dynamics (2016), 329-349.
2. Lawrence, K. D. and Ramamoorthy. B. Multi-surface topography targeted plateau honing for the processing
of cylinder liner surfaces of automotive engines. Applied Surface Science 365 (2016), 19-30.
3. Abdullah, M. I. H. C., Abdollah, M. F. B., Amiruddin, H., Nuri, N. R. M., Tamaldin, N., Hassan, M., &
Rafeq, S. A. Effect of hBN/Al2O3 nanoparticles on engine oil properties. Energy Education Science and
Technology Part A: Energy Science and Research (2014), 3261-3268.
4. Li, W., Zheng, S., Cao B. and Ma S. Friction and wear properties of ZrO2/SiO2 composite nanoparticles.
Journal of Nanoparticle Research (2011), 2129-2137. 5. Hwang, Y., Lee, C., Choi, Y., Cheong, S., Kim, D., Lee, K., Lee, J. and Kim, S.H. Effect of the size and
morphology of particles dispersed in nano-oil on friction performance between rotating discs. Journal of
Mechanical Science and Technology (2011), 2853-2857.

ENGINEERING 419
IGCESH2018
Universiti Teknologi Malaysia, Johor Bahru, Malaysia 13 -15 August 2018
SUSTAINABLE TECHNOLOGIES FOR THE MANAGEMENT OF
PINEAPPLE WASTE IN JOHOR
Raja Safazliana Raja Sulong*1 and Zainul Akmar Zakaria2
1,2 Institute of Bioproduct Development, Universiti Teknologi Malaysia, 81310 UTM Johor Bahru,
Johor, Malaysia. (E-mail: [email protected], [email protected])
ABSTRACT
Pineapple plantation is one of the largest cultivation in Malaysia and Johor being as the top
pineapple producer. The massive production of pineapple has abandoned huge pineapple
waste that has become increasingly threatening environmental issue. Due to the
environmental problems caused by waste disposal, re-use of the wastes is preferred.
Therefore, the aim from this research study is to reduce the environmental problem and
generate sustainable value-added product. Pyrolysis has given the best solution to manage the
abundance of pineapple waste. Pyroligneous acid produced during the pyrolysis process has
the potential to apply in various applications and could serve as an alternative ecofriendly
source of natural antioxidant.
Key words: Biomass, Pineapple Plant Waste, Pyrolysis, Pyroligneous Acid, Environmental
Problem
INTRODUCTION According to Malaysian Pineapple Industry Board (MPIB) Malaysia, the pineapple has be
stated as the third most important fruit crop that is cultivated commercially throughout the
tropics and the subtropics parts of the world, with Malaysia producing 1.2% of the world’s
crop. Malaysia has been covered up to 14,700 hectares in 2015 with its annual production
reached approximately 452, 019 metric tons per annum. Meanwhile, Johor being as the top
pineapple producer generated almost 329, 954 metric tons of pineapple per year, solely
produced from some 9, 765 hectars of plantation areas [1]. Table 1 shows the total plantation
area and production of pineapple in Malaysia.
Table 1. Total plantation area and production of pineapple in Malaysia
Region 2013 2014 2015
Plantatio
n area
(Ha)
Productio
n (mt)
Plantatio
n area
(Ha)
Productio
n (mt)
Plantatio
n area
(Ha)
Productio
n (mt)
Peninsula
r
6,578 294, 161 6,905 276, 233 12, 131 383, 583
Sabah 1,315 22,363 1,380 55,219 763 14, 952
Sarawak 1,933 36,114 2,030 81,212 1,805 53, 484
Total 9, 827 352, 638 10, 316 412, 664 14, 700 452, 019

ENGINEERING 420
The massive production of pineapple together with the consumption and manufacturing
process of the edible parts of the fruit, has abandoned huge pineapple waste that has become
increasingly threatening environmental issue. The harvesting process of pineapple has
discarded the fruit deposits that consist mainly of the residual pulps, peels, stems, and leaves
which are not considered as valuable and desired due to deficient knowledge obtained on
their potential practicality [2]. Most of the fruit deposits are disposed poorly through open
field burning, landfill or incineration, and some are served as fertilizer or animal feeding.
These approaches however are not only appeared ineffective but are nonetheless lead to air
pollution [3]. Therefore, the conversion of this residue into value-added product is potentially
one of the promising alternatives to properly manage the wastes for default of environment’s
quality.
PINEAPPLE WASTE BIOMASS CONVERSION
Pyrolysis has become one of the solutions to properly manage the waste. Pyrolysis is thermal
decomposition of material at high temperature occurring with absence of oxygen. The main
product from pyrolysis is pyroligneous acid. Pyroligneous acid produced from the
condensation of smoke generated during biomass carbonization process has the potential to
use as a food additive [4], smoked flavor and aroma for food [5]. Table 2 show the
characterization of pineapple used as raw material for pyroligneous acid production.
Table 2. Characterization of pineapple leaves and steam used as raw material for
pyroligneous acid production. Data are presented as mean ± SD
Sample Component analysis Content (wt%)
Pineapple leaf Cellulose
Hemicellulose
Lignin
31.2 ± 2.39
13.6 ± 0.82
17.6 ± 0.77
Pineapple stem Cellulose
Hemicellulose
Lignin
49.2 ± 1.30
8.26 ± 2.10
5.42 ± 0.97
Sample Proximate analysis Content (wt%)
Pineapple leaf Moisture
Volatile matter
Fixed Carbon
Ash
4.65 ± 0.52
80.4 ± 0.24
11.2 ± 0.27
3.57 ± 0.00
Pineapple stem Moisture
Volatile matter
Fixed Carbon
Ash
7.92 ± 0.62
78.9 ± 0.28
8.24 ± 0.26
4.87 ± 0.82
Sample Ultimate analysis Content (wt%)
Pineapple leaf C
H
N
O
S
40.5 ± 0.19
6.91 ± 0.02
1.78 ± 0.06
50.3 ± 0.21
0.36 ± 0.06
Pineapple stem C
H
N
O
S
37.6 ± 0.05
6.69 ± 0.00
1.89 ± 0.04
52.7 ± 0.00
0.97 ± 0.00

ENGINEERING 421
CONCLUSION
The pineapple waste comprises of peels, stems, and leaves are the potential source of
polyphenolic compounds which functions as critical antioxidant that defense the body against
the damage related to oxidative stress. This study prominently addressed the importance and
the probability of transforming the polluting agents of by-product into economically valuable
end-product. Therefore, further scientific and technological methods are required to acquire
valuable products from pineapple wastes.
Acknowledgment: The authors would like to thank Universiti Teknologi Malaysia for the
Research University Grant (4J259).
REFERENCES 1. Malaysian Pineapple Industry Board (MPIB), 5th International Plantation Industry Conference & Exhibition
(IPiCEx2016), 2-4 November 2016, Johor Bahru
2. Zainuddin, M. F., Shamsudin, R., Mokhtar, M. N. and Ismail, Dahlan. Physicochemical properties of
Pineapple Plant Waste Fibers from the Leaves and Stems of Different Varieties. (2014) 3. Wan Mohd, A., and Zainuddin, Z. Pineapple leaf fiber (PALF): From Western to wealth, JURUTERA
Buletin, (2013) 18-20
4. C.L. Ho, C.Y. Lin, S.M. Ka, A. Chen, Y.L. Tasi, M.L. Liu, Y.C. Chiu, K.F. Hua, Bamboo vinegar decrease
inflammatory mediator expression and NLRP3 inflammasome activation by inhibiting reactive oxygen
species generation and protein kinase C-α/δ activation, PLoS ONE 8 (10) (2013) e75738
5. S. Mathew, Z.A. Zakaria, Pyroligneous acid- the smoky acidic liquid from plant biomass, Appl. Microbial.
Biotechnol. 99 (2015) 611-622.

ENGINEERING 422
IGCESH2018
Universiti Teknologi Malaysia, Johor Bahru, Malaysia 13 -15 August 2018
ASSESSING HOUSING AFFORDABILITY LEVEL USING MEDIAN
MULTIPLE INDEX
Aminah Md Yusof*1, Julaida Johan2, Chai Chang Saar3 and Abd Rahim Abdul
Hamid4
1, 2, 4 Faculty of Civil Engineering, Universiti Teknologi Malaysia, Johor, MALAYSIA.
(E-mail: [email protected], [email protected], [email protected]) 3 University of Reading Malaysia, Johor, MALAYSIA
(E-mail: [email protected])
ABSTRACT
Housing affordability is a worldwide problem. In Malaysia, housing affordability stems from
an extensive rise of house prices especially in cities such as Kuala Lumpur, Johor Bahru and
Penang. Existing developments are focus on high end units which the prices are beyond
reachable to certain groups. What is the affordable level for some Malaysians? This paper
computes the index for housing affordability for districts in Johor. It starts with a review on
housing affordability in measuring affordability led to the adoption of Median Multiple
Method. The Median Multiple Index utilises median house price and median income of
individual in the selected districts in Johore. The indexes computed reveal the severity of
housing affordability among potential house in all districts in state of Johor. The study also
reveals that the provision of affordable houses must begin with an effort of identifying the
right market for the houses to be provided in ensuring the houses developed for the intended
house buyers.
Key words: Affordability, index, Median Multiple and Johor
INTRODUCTION
Housing is a challenging industry as the developers are trying to build more units to cater
people needs. Affordability problem has been an issue and topic of discussion around the
globe. The paper presents three (3) main parts; literature review, data collection and main
results of a study on housing affordability. The review of issues related to housing with
particular reference to Malaysia from various sources intended to explore concept,
approaches and housing affordability indexes. Affordability is referring to the ability of a
person in providing something which is usually normally in terms of financial ability.
Aminah and Chai (2013) investigate affordability as defined by the relationship between
households’ housing expenditure and income. Affordable housing illustrates residential units
that total housing costs are deemed affordable to those with median income. There are several
techniques used to visualize affordability level such as Housing Affordability Mismatch,
Price to Income Ratio, Housing Affordability Index Ratio and Median Multiple Approach.
The availability of the data led to the adoption of Median Multiple in this study.

ENGINEERING 423
Information regarding housing in Malaysia derived from Ministry of Housing and Local
Government, National property Information Centre (NAPIC) and Department of Statistics
Malaysia. Additionally, primary data regarding respondents’ background and demographic
are obtained through a survey administered via standard from of questionnaire. A total of
391 respondents from 5 districts in Johor took part in the survey involving multi-racial, both
public and private sectors. Majority of the respondents are the young generation aged which
form perfect segment for potential young house buyers. The information and data gathered
are analysed and discussed in the main result.
MAIN RESULTS
Based on the median individual income and median house price, median multiple index is
developed using formulae;
Median Multiple Index (MMI) = (Median House Price) / (Median Gross Annual Income)
The scale of housing affordability is Rating Median Multiple
Severely Unaffordable 5.1 and over
Seriously Unaffordable 4.1 to 5.0
Moderately Unaffordable 3.1 to 4.0
Affordable Below than 3.0
Source: Cox and Pavletich (2014)
Based on real data which is segmented into districts, MMIs are developed as shown in
Table 1.0. The table shows that based on the respondents’ income and house prices in the
area, housing affordability problem is severe. The far it deviates from 3.0, the more
severe affordable problem. It shows that the respondents are in the region of severely
unaffordable as far as the current house prices are concern. The calculation is reversed to
determine what is the affordable house using MMI of 3.0. The price of RM112, 536 is
afforded by respondents in Johor Baharu, whilst only house of RM58,536 afforded by
respondents in Muar.
Table 1. Median Multiple Index (MMI) According to Districts
District Median
Price (RM)
Median
Income (RM)
Median
Multiple Index (MMI)
Severity Affordable
House Price (RM)
Types of
houses
Johor Bahru 260,000 3126 6.9 Severe 112,536 Med Cost
Pontian 189,000 1876 8.4 Severe 67,536 Low cost
Batu Pahat 244,000 2376 8.6 Severe 85,536 Medium Low
Muar 211,000 1626 10.8 Severe 58,536 Low
Kulai 184,000 2126 7.2 Severe 76,536 Low
The above table suggests that the level of affordability is differing from one district to
another. Despite the anticipation that Johor Bahru will be the worst in terms of affordability,
the problem is less severe compared to other districts. This may due to the high-income
respondents in the area. Severe housing affordability problem is contributed by low median
other districts.

ENGINEERING 424
The indexes outline the prices afforded by respondents in the districts under investigation. As
a result, it impliedly tells that higher end or high prices houses built by developers in the
districts are not reachable or afforded by the respondents.
CONCLUSION
The study concludes that efforts to address housing affordability problem should start with
identifying what is needed and afforded by potential buyers. The Median Multiple Index
(MMI) is useful in identifying level of affordability for an individual or households. This
paper demonstrates that measuring affordability should form an essential part of the housing
provision as it is able to identify the standard of affordability at micro level. This is useful for
policy makers, developers and financial institutions in establishing any policy regarding a
provision and delivery of affordable housing.
REFERENCES
1. Aminah, M.Y., and Chai,C.S (2013). An Analysis of Urban Poor and Housing Affordability in Kuala Lumpur, Malaysia. NAPREC Report
2. Aziz, W.N.A, W.A., Hanif, R.R., And Singaravello, K. (2011). Affordable Housing Within The Middle
Income Households in Malaysia: Challenge to Enter Homeownership. Australian Journal of Basic &
Applied Sciences, 5(8), 258-267
3. Cox, W., and Pavletich, H (2014). 10th Annual Demographia International Housing Affordability Survey:
2014 ratings for Metropolitan markets. Demographia Illinios: Wendell Cox Consultancy.
4. Department of Statistics (2015). Household Income and Basic Amenities Survey Report 2012 & 2014,
Department of Statistics, Malaysia.
5. Duan, M (2011). Investigation on Housing in Lanzhou, Northwest China. International Journal of Housing
Market and Analysis, 4(2), 180-190.

ENGINEERING 425
IGCESH2018
Universiti Teknologi Malaysia, Johor Bahru, Malaysia 13 -15 August 2018
CHALLENGES OF RESEARCH UNIVERSITIES:
LITERATURE ANALYSIS
Mohd Fathi Sariman*1, Aminah Md. Yusof
2 and Zaidatun Tasir
3
1, 3 School of Graduate Studies, UTM, Johor, MALAYSIA.
(E-mail: [email protected], [email protected]) 2, Faculty of Civil Engineering, UTM, Johor, MALAYSIA.
(E-mail: [email protected])
ABSTRACT
Research Universities (RU) is an institution devoted mainly to research and graduate studies.
In accomplishing its task discovering new knowledge, RUs were in the previleage of securing
higher research grant. However recently, current cut in public expenditure affected the
allocation to RUs. With higher expectation and lower allocation, RUs are facing various
challenges in maintaining their status. The biggest challenges is limited fund to ensure high
performance of research and teaching in the RUs.
Key words: Research University, Higher Education, challenges
INTRODUCTION
As Malaysia is gearing toward developed and high-income nation, the recruitment of first
class mind has become important agenda. Higher education has been a mechanism to achieve
this. The effort to achieve 60,000 PhD holders by 2023 form the main strategy to quality life
improvement for Malaysians which marks significant effort in graduate education. The nature
of graduate education has changed with the introduction of the knowledge society. The
Knowledge Society is characterized by the production and dissemination of knowledge and
said to be powered by the innovation. Universities especially research universities are
entrusted to play major role in empowering knowledge society. Research University (RU) is
‘an institution devoted mainly to research and graduate studies’ [1]. The Encyclopaedia of
Education defines RUs as “postsecondary institutions that devote a large portion of their
mission, resources, and focus to graduate education and research, other than that RU refers to
university with dual mission that is transmission of knowledge and production of new
knowledge [2]. Research Universities are institutions with high priority on the discovery of
new knowledge and the production of Ph.D. in a wide range of disciplines. [3]. There are four
stages in the development of Research Universities as documented in the United State of
America. Stage one started by The Germanic Influence. Stage two begin with the rise of
Federal sponsorship of Research during World War I and II. Stage 3 grows with the evolution
of the universities during late 1950s and throughout 1960s and 1970s that called the
emergence of the Multiversity. Stage 4 and the current stage of Research Universities is
Entreprenuerial University under Neoliberalism. [4]. Until recent year of 2017 there are 5 RU
in Malaysia out of 20 Public University. There are few types of tertiary institution in
Malaysia, which is Public University, Private University, University College, College,

ENGINEERING 426
Polytechnic and also Community College. The first four universities that successfully been
recognised as RU are Universiti Malaya (UM), Universiti Kebangsaan Malaysia (UKM),
Universiti Sains Malaysia (USM) and Universiti Putra Malaysia (UPM) in 2006. Universiti
Teknologi Malaysia (UTM) has been announced as RU in 2010 [2].
In order to sustain the RU Status, the scores of following aspect is taken into account for the
performance of postgraduate education delivery which are Curriculum and delivery of the
program, Research and Publication, Teaching and learning facilities, Financial Assistance,
Scholarship and Grants and Support Service. Universities are moving forwards to improve
the service delivery towards better University Rankings towards improving the quality
performance of postgraduate education delivery. This paper review challenges faced by
research universities with particular reference to RUs in Malaysia. A comprehensive analysis
of works and research in related subject is presented in the main result.
MAIN RESULTS
Table 1. Challenges: Research Universities according to country Malaysia Korea India
• Building Research Capacity
and competitiveness and
Research grant and funding
issue
• Developing monitoring
measures
• Increase publication and
• Changes in management
• Develop University – Industry
partnership
• International postgraduate
enrollment
• UG : PG ratio and Improving
quality graduate [5][6][7][8]
• Research Funding issue
• Build Talented Human Resource
• Changed Academic Culture
• Academic Governance
• Improve quality of research
• Establishing meritocracy in academia
[9]
• Gross enrolment ratio
• Political interference
• University education
and infrastructure
• Job market placement
• Industry oriented
research and
innovation
• Quality and
assessment of practices
• Inadequate financial
support. [10]
China Japan Taiwan
• Scientific research
competence
• Teaching level
• Fund and material resources
• Facilities for teaching and
research [11]
• Demographic challenges
• Attracting foreign students and talent
• Strained state public finance
• Policy intervention
• Common structural issue
• Institutional capacity. [12]
• Nurturing Quality
research and a
teaching campus
• Increases output of
top journal paper
• Scoring 20-30 world
class research funds
and Improving from autonomy to
accountability.
United Kingdom United States Germany
• Financial Independent
• Operating in the global market
• Rising student expectation
• Increasing cost and shifting
funding
• Add for new technology
• Attracting and retaining the
best talent
• Higher competition – increasing
competitor
• Increasing Research quality and
impact
• Compliance – by federal government
• Planning and decision support
• Value of the Research University
• Fragility of research administration
• Funding issue and Academic culture
• Intensifying research
• Identity and finance
• Anachronism of
faculty member,
administrator and
student
• International
competitive research
• Shortage of funding
• Increasing enrollment
• Stagnation of public

ENGINEERING 427
fund
• Inflexible teaching
load [17] [14]
Australia Singapore Brazil
• Empowering University
function through research and
scholarship
• Knowledge dissemination & application.
• Key administrative
• Develop University – industry
partnership
• Research infrastructures
• Composition of the faculty
• Federal budget support [15]
• Global talent war
• Accountability and Funding control
• Cultural difference between local and
foreign institution and talent
• Local sentiment to influx of foreign
talent
• Government control and intervention
[16]
• Funding issue
• Internationalization
• Transforming results
from scientific work into innovation and
technology
• Variability of
infrastructure and
quality of research
• Quality of researcher
[14]
The table shows that the challenges range from internal and external. One of the main
challenges is financial which seems to be pertinent to countries around the world.
CONCLUSION
The paper explores challenges experienced by research universities around the world. The
challenges include maintaining RU status which inspired the RUs to ensure the quality of
research and teaching as expected and evaluated. On common issue shared by all RUs is the
reduction of public finance and this has been major concern among the RUs which may affect
the RUs effort in priotising on the discovery new knowledge.
Acknowledgment: The authors would like to express their appreciation for the support of
Study Leave for (PNP) by Universiti Teknologi Malaysia.
REFERENCES
1. M. Steffensen, E. M. Rogers, and K. Speakman, “Spin-offs from research centers at a research university,” J. Bus.
Ventur., vol. 15, no. 1, pp. 93–111, 2000.
2. N. Ramli et al., “The concept of research university: The implementation in the context of Malaysian university
system,” Asian Soc. Sci., vol. 9, no. 5, pp. 307–317, 2013.
3. K. Mohrman, W. Ma, and D. Baker, “The research university in transition: The emerging global model,” High.
Educ. Policy, vol. 21, no. 1, pp. 5–27, 2008.
4. R. A. Rhoads, “The U.S. Research University as a Global Model: Some Fundamental Problems to Consider
Permalink,” Interact. UCLA J. Educ. Inf. Stud. 7(2), vol. 1, no. 2, 2011.
5. R. M. Majzub, “A Swot Analysis of Challenges Facing Research Universities,” in RCEE & RHEd2010 Kuching,
Malaysia, 2010, no. 7–9 June.
6. William G. Tierney and M. Sirat, “Challenges Facing Malasian Higher Education,” Int. High. Educ., vol. 1, no. 4, pp. 23–24, 2008.
7. N. M. Zain, V. Aspah, N. A. Mohmud, N. Abdullah, and M. Ebrahimi, “Challenges and Evolution of Higher
Education in Malaysia,” Int. J. Islam. Civiliz. Stud., vol. 4, no. 1, pp. 78–87, 2017.
8. F. H. Amran, I. K. A. Rahman, K. Salleh, S. N. S. Ahmad, and N. H. Haron, “Funding Trends of Research
Universities in Malaysia,” Procedia - Soc. Behav. Sci., vol. 164, no. August, pp. 126–134, 2014.
9. J. C. Shin and S. J. Lee, “Evolution of research universities as a national research system in Korea:
accomplishments and challenges,” High. Educ., vol. 70, no. 2, pp. 187–202, 2015.
10. K. S. Reddy, E. Xie, and Q. Tang, “Higher education, high-impact research, and world university rankings: A case
of India and comparison with China,” Pacific Sci. Rev. B Humanit. Soc. Sci., vol. 2, no. 1, pp. 1–21, 2016.
11. S. Wanbing, “An analysis of the issues in developing research universities in China,” J. Knowledge-based Innov.
China, vol. 5, no. 1, pp. 4–15, 2013. 12. A. Arimoto, “Declining symptom of academic productivity in the Japanese research university sector,” High.
Educ., vol. 70, no. 2, pp. 155–172, 2015.

ENGINEERING 428
13. D. F. Chang, F. Y. Nyeu, and H. C. Chang, “Balancing quality and quantity to build research universities in
Taiwan,” High. Educ., vol. 70, no. 2, pp. 251–263, 2015.
14. K. Amos, L. Bruno, and M. Parreira do Amaral, “The research university in context: The examples of Brazil and
Germany,” Int. Perspect. Educ. Soc., vol. 9, pp. 111–158, 2008.
15. W. B. Lacy, G. Croucher, A. Brett, and R. Mueller, Australian Universities at the Crossroads: Insights from Their Leaders and Implications for the Future. Melbourne Centre for the Study of Higher Education, 2017.
16. P. T. Ng, “The global war for talent: Responses and challenges in the Singapore higher education system,” J.
High. Educ. Policy Manag., vol. 35, no. 3, pp. 280–292, 2013.
17. D. P. Baker and G. Lenhardt, “The institutional crisis of the German research university,” High. Educ. Policy, vol.
21, no. 1, pp. 49–64, 2008.

SCIENCE & TECHNOLOGY

SCIENCE AND TECHNOLOGY 429
IGCESH2018
Universiti Teknologi Malaysia, Johor Bahru, Malaysia 13 -15 August 2018
RESILIENCE OF RURAL SMALLHOLDERS TOWARDS
ACHIEVING SOCIOECONOMIC SUSTAINABILITY IN KAMPUNG
GOL, PAHANG
Mohamad Fadhli Rashid1, Ibrahim Ngah2
1 Department of Urban and Regional Planning, Universiti Teknologi Malaysia, MALAYSIA.
(E-mail: [email protected]) 2 Centre for Innovative Planning and Development, Universiti Teknologi Malaysia, MALAYSIA.
(E-mail: [email protected])
ABSTRACT
The emerging economies countries like Malaysia, agricultural sector are the third largest
contributor to the national Gross Domestic Product (GDP) whereby the dominated
involvement of 60 percent of private estates with remaining 40 percent under the small
holding scheme. Only 11 percent is the independent smallholders whereby these groups
usually lives and works in rural areas. However, these rural smallholders often to face various
challenges in attaining socio-economic sustainability, especially limited resources of capital
and shortage of labour in agricultural sector. These smallholders are still carry out the
agricultural job traditionally which are based on farming and livestock activities in order for
them to survive and sustain in this globalization era. In this paper, we provide a background
of the rural smallholders in Kampung Gol, Pahang. In order to gain understanding on the real
issues and situations of the rural smallholders, in-depth interview of the smallholders is
important tools to be used in this study which include the survey of households. The results
show that the most of smallholders in this village are resilience in achieving their
socioeconomic sustainability despite the current situation of uncertain and unstable economic
of Malaysia.
Key words: Smallholders, Rural, Resilience, Socioeconomic, Agricultural
INTRODUCTION
Smallholders in Malaysia usually involved in the upstream sector which is agriculture [1].
They are just producers of raw material with small plots of land. Malaysia’s agricultural
sector is dominated by the private estates, comprising for 60 percent, while remaining 40
percent is under the small holding scheme. The small holding scheme in Malaysia is led by
the country’s federal land development authority (FELDA) established in 1956 [2]. It
accounts for 29 percent of all smallholders under the FELDA scheme whereas the remaining
11 percent under the independent smallholders. Majority of independent smallholder lives
and works in rural areas whereby they usually undertake agricultural activities such as rubber,
palm oil, fruits, vegetables and others [3] [4]. Most of independent smallholders involved in
upstream sector and they have never been involved in the downstream sector where more
income can be generated [5].

SCIENCE AND TECHNOLOGY 430
BACKGROUND OF RURAL SMALLHOLDERS IN KAMPUNG GOL
Kampung Gol in Jerantut district is an example
of a village in the more remote part in the
hinterland; that the smallholders livelihood
depending on rubber and palm oil, the main
commodity produced in rural Malaysia. (Figure
1). The boundary of Kampung Gol also includes
the area of Kampung Lik and few other dusun
with an area of 17.85 km2. Agriculture is the
main economic activity of the villagers covering.
Rubber and orchards were the older crops
cultivated and more recently palm oil was
cultivated on new land and also replacing the
rubber crop. A few people also did vegetable
gardening, farm animal and birds (Burung
Puyuh) for livelihood. Majority of households
were smallholders but some work in palm oil
plantations and multiple village jobs. The
government through FELCRA provided a scheme
(social safety net) where land of 8 acres each
were allocated to the participants; the cultivation
and management were all done by FELCRA. Today, eleven persons were partic ipants of
the earlier FELCRA scheme and in the newly launched FELCRA scheme almost all
married members aged 18 and above had joint the scheme but each were allocated 4 acres
of shared land.
METHODOLOGY
Based on the latest demographic data by Head of Village, currently there are 31 houses
build in Kampung Gol which inhabit by 162 people. The detailed observations and survey
of households conducted in Kampung Gol. A total of 25 respondents (n=25) participated
in the household survey/interview using questionnaire that took place at their homes (in
each households).
RESULTS AND DISCUSSIONS
Findings on Sustainability of Smallholders in Kampung Gol
1. Relatively large ownership of land that ensure enough income and attractive for
younger generation to remain in the village. A household in this village owned at
least 5 acres of land. On average if the villager planted the land with palm oil the
return yield will be around 3 tonnes per harvest (every 20 days). With the price of
palm oil RM450 per ton and the gross income will be around RM1350; net income
estimated about 2/3 of the gross income = RM900 for 20 days.
2. Opportunities to diversify income from off-farm job or working as labour in
plantation such as the FELCRA plantation. Plenty of resources such as the natural
environment that provide opportunities for eco-based tourism. In this village there is
an initiative that encourages a group of youth, educated female youths to run the
Benus Bird Camp.
3. Availability of land also provides opportunities for animal farming. In the village a
Kampung Gol
Figure 1: Location of Kampung
Gol, Pahang

SCIENCE AND TECHNOLOGY 431
few villagers did farm cattle. Two of them used the river reserve (Tembeling river
bank) for cattle grazing. We also found an entrepreneur (relatively young) that
successfully farm “Burung Puyuh” (Quail) within the backyard of the house.
4. The small number of the population could be potential threat to the sustainability of
the smallholders as if the parents becoming old and late, there might be problem for
replacement and managing the farms. Having strong leadership also important to
maintain the good contact with politicians and managing the youth; that the loyalty of
the youth to the leader is less based on blood relationship but more on efficiency and
performance.
CONCLUSION
Most of independent smallholders involved in upstream sector and they have never been
involved in the downstream sector where more income can be generated. One way of doing
this is through cooperatives, as this would give them vital access to land ownership, factories,
professional support, government assistance and others. In Kampung Gol, the role of
government is very important in providing various kind of support such as capital and
knowledge for the youth; providing good infrastructure including electricity, water supply,
asphalted road, grant for rubber planting; extension services and direct financial support such
as “safety net scheme” (FELCRA); free housing for the poor and the easy credit schemes
with subsidy for rural housing.
Acknowledgment: The authors would like to express their appreciation for the support of the
sponsors with Project No R-111-E00-147-112 (Asian Smallholders: Transformation and
Persistence).
REFERENCES
1. Abazue, C.M., Er, A.C., Alam, A.F. and Begum, H. Oil palm smallholders and its sustainability practices in
Malaysia. Mediterranean Journal of Social Sciences, 6.6 S4 (2015), 482-488.
2. Lembaga Kemajuan Tanah Persekutuan (FELDA). Info berkaitan sejarah FELDA terdahulu.
http://www.felda.net.my/index.php/felda/mengenai-felda. (Retrieved, 18 Januari, 2018) 3. Ngah, I., Saad, H. and Kamarudin, K.H. Socio Economic Transformation of Rice Cultivation Area in
Malaysia: A Case of Two Villages in Sabak Bernam. Rural Research & Planning Group (RRPG) 4th
International Meeting & Workshop. (2013).
4. Preston, D. and Ngah, I. Interpreting Rural Change in Malaysia, Singapore Journal of Tropical Geography,
33.3(2012), 351-364.
5. Simeh, A, and Ahmad, T.M.A.T. The case study on the Malaysian palm oil. Regional Workshop on
commodity export diversification and poverty reduction in South and South-East Asia, Bangkok. (2001).

SCIENCE AND TECHNOLOGY 432
IGCESH2018
Universiti Teknologi Malaysia, Johor Bahru, Malaysia 13-15 August 2018
APPLICATION OF BOX BEHNKEN DESIGN TO OPTIMIZE THE
PARAMETERS FOR KENAF-POLYPROPELENE FOR NOISE
ABSORBER
A. R. A. Aziz*1
, S. A. Aziz2
1,2 UTM Razak School of Engineering and Advanced Technology, Universiti Teknologi Malaysia,
Jalan Sultan Yahya Petra, 54100, Kuala Lumpur, MALAYSIA. (E-mail: [email protected], [email protected])
ABSTRACT
This journal discusses the application of Box Behnken design to plot the experiments to find
the noise absorption coefficient for Kenaf/Polypropylene sandwich sample with an overall
objective of optimizing the density, thickness, pressure and frequency. Response Surface
Methodology (RSM) has been embraced to express the yield parameters (reactions) that are
chosen by the input procedure parameters. RSM likewise evaluates the connection between
the variable input parameters and the comparing yield parameters. RSM outlines enable us to
evaluate association and even the quadratic/direct impacts, and henceforth, give us a thought
of the state of the reaction surface we are exploring. Box-Behnken configuration is having the
most extreme proficiency for an investigation including three components and three levels;
further, the quantity of tests directed for this is considerably lesser contrasted with a focal
composite outline. The proposed Box-Behnken configuration requires 24 trials of run for
information securing and displaying the reaction surface. Software’s were utilized to plan the
examination and randomize the runs. Regression model was created and its capability was
checked to foresee the yield esteems at about all conditions. Facilitate the model was
approved by performing tests, taking 24 sets of inputs. The yield parameters estimated
through tests (actual) are in great match with the anticipated esteems utilizing the model.
Utilizing Special Software’s, 2D and 3D plots were produced for the RSM evolved. Such
plots unequivocally give a thought of the overwhelming procedure variable over others and
the request of strength; facilitate the plots display the pattern of factors' in the process. This
research resulted in ascertaining the optimised set of noise absorber parameters for
Kenaf/Polypropylene sandwich sample, to get the optimum Noise Absorption Coefficient.
This work gains significance in the sense with minimum number of experiments, reliable
model has been generated, validated and further, the process has been optimised. Key words: Box-Behnken, Kenaf/Polypropylene, Noise Absorber
INTRODUCTION
Noise pollution is one of the foremost fears influencing anthropological life expectancy. As a
solution, to moderate the engendering of noise pollution and its unfavourable impacts is to
utilize a sound ingestion medium. To protect the environment, the natural fibre is mix with
the polymer to fabricate as a noise absorber. For the structure of polymer and nonwoven

SCIENCE AND TECHNOLOGY 433
textures utilized for sound protection, numerous parameters impact the capacity of the texture
to be a decent solid safeguard, much of the time the impact of these parameters is examined
by changing every parameter independently [1]. This, in any case, does not give adequate
data since it examines these parameters separately neglecting the intuitive impacts of these
parameters and sometimes even prompts conflicting conclusions as detailed in available
writing [2].
To overwhelm this issue of deluding elucidations, it is important to contemplate the
individual and intuitive impacts of various parameters all the while. Reaction surface
philosophy, which fuses outline of examinations, is extremely helpful in researching the
impacts of various factors at the same time [3]. The benefit of such a technique is, to the point
that the impact of different parameters can be known quantitatively and subjectively together
with their collaboration impacts. This strategy likewise takes into consideration the
expectation of the improved region including synchronous impacts of different parameters.
Box-Behnken factorial outline is an instrument that can be utilized to examine the concurrent
impact of various parameters [4]. Hence, this work is intended to analyse the consequence of
the controlled parameters and its effects to attain concentrated Noise Absorption Coefficient.
The parameters studied are density of the composition, thickness of the sandwich
composition, the pressure applied during compressing process and the frequency applied
during the test by suing the impedance tube test. A Box-Behnken factorial outline with three
factors, each changed at three levels (- 1, 0, +1), was chosen for the experiment. The sound
absorption co-efficient of the samples was measured according to the ISO 10534-2, ASTM E
1050 and ASTM E2611 standard acoustic testing instrument consisting of a horizontal
impedance tube, two microphones and a digital frequency analyser [5].
In this study the optimization approach provided by the Box–Behnken Design (BBD), which
is a response surface methodology (RSM) is proposed [4]. For applying the approach,
Design-Expert software (Version 11.0, Stat-Ease Inc., Minneapolis, USA), was used. On the
basis of the BBD, the process parameters (density of the mixture, the thickness of the
sandwich sample, the pressure applied to the sandwich sample and frequency exposed to the
sample) in the fabrication process could be optimized with a minimum number of
experimental runs. Objective of this work is to create a model for the forecast of noise
absorber sample by controlling three parameters which is the density of the mixture, the
thickness of the sample and the pressure applied to the sandwich sample by mixing between
the Kenaf fiber and the Polypropelene. Based on the experimental data, further the model was
validated with various values (frequency) and surface plots were generated to describe the
tendency of noise absorption coefficient, under specific combination of process parameters.
Ultimately it was useful in determining the influence of process parameters and the output
parameters, further enables in determining the optimum set of parameters in terms of noise
absorption coefficient.
RESULTS AND DISCUSSIONS
Noise Absorption experiments were conducted in Impedance Tube: (Larson Davis Model
CAL200 serial Number: 12525) for the set of input parameters under the 24 conditions given
by Box – Behnken design. Noise Absorption Coefficient were measured by the ACUPRA
Measurement System Software Version 4.20b during the experiment and the values were
recorded. The Noise Absorption Coefficient values evaluated as output parameters
(responses) for the 24 runs. The details of the solution by this matrix method are described in
[6]. Second order RSM representing the relationship between the ouput and the parameters,

SCIENCE AND TECHNOLOGY 434
which is the Noise Absorption Coefficient and the input process parameters, the Density,
Thickness, Compression Pressure and the applied of the frequency.
Two-sided Confidence = 95% Population = 99%
Table 1. Point prediction
Response Predicted
Mean
Predicted
Median Observed Std Dev SE Mean
95% CI
low for
Mean
95% CI
high for
Mean
95% TI low
for 99% Pop
95% TI
high for
99% Pop
NAC 0.486167 0.486167 0.198666 0.0405524 0.401289 0.571044 -0.285232 1.25757
Final Equation in Terms of Actual Factors
NAC = +0.345891 – (0.483333 x DENSITY) + (0.001963 x THICKNESS) + (0.003792 x
PRESSURE) + (0.000112 x FREQUENCY)
The calculation with regards to the genuine actual factors can be used to make predictions
about the reaction for given levels of each factor. Here, the levels should be resolved in the
first units for each factor. This condition ought not to be used to choose the relative impact of
each factor in light of the fact that the coefficients are scaled to suit the units of each factor
and the interlope isn't at the point of the design space.
Optimisation
Best solution satisfying the above criteria was obtained using the ‘Design Expert’ software,
which is given below and it has the overall desirability of 1.0.
Table 2. Best solution
Run Factor 1 Factor 2 Factor 3 Factor 4 Response
1
Desirability
SAMPLE DENSITY
(g/cm3)
THICKNESS
(mm)
PRESSURE
(TONNE)
FREQUENCY
(Hz)
NAC (%)
6/100 0.25 30 3 5000 0.856 1.0
CONCLUSION
In a nut shell, it can be said that Box Behnken design was positively accepted, achieved the
objectives and the tests were outlined picking the information factors for the designated
levels. Verification of the Fitness of each model using ANOVA technique, shows that all the
models can be utilised with assurance level of 0.95, for directing the design space. Set of
improved input parameters could be distinguished when considering density, thickness,
weight and recurrence according to Table 2. Surface plots produced demonstrate the pattern
of various reactions by changing the 2 input parameters keeping the third parameter
consistent. With diminished number of exploratory runs, genuinely persuading, coherent and
satisfactory outcomes have been gotten, which can be taken after for getting answer for the
shop-floor prerequisites. This has brought about sparing of extensive measure of time and
cash.

SCIENCE AND TECHNOLOGY 435
REFERENCES
1. Hao A, Zhao H, Jiang W, Chen JY 2012. “Kenaf fiber woven composites as automotive interior material:
mechanical, thermal, and acoustical performance”. In: Proceedings of society for the advancement of material
and process engineering (SAMPE). May 21–24, Baltimore, MD, Conference.
2. Hao A, Yuan L, Zhao H, Jiang W, Chen JY “Notch effects on the tensile property of kenaf/polypropylene
woven composites” In: Proceedings of American society of mechanical engineers IMECE2012-87108 Houston, TX, Conference November 9–15.
3. Montgomery D.C, Design and Analysis of Experiments, John Wiley and sons, New York, (1991).
4. V. N. Gaitonde & S. R. Karnik & B. Siddeswarappa, B. T. Achyutha, Integrating Box-Behnken design with
genetic algorithm to determine the optimal parametric combination for minimizing burr size in drilling of
AISI 316L stainless steel, Int Journal of Advanced Manufacturing Technology 37(2008),230–240.
5. Takahashi, Y.T. Otsuru and R. Tomiku, 2005. “In Situ Measurements Of Surface Impedance And Absorption
Coefficients Of Porous Materials Using Two Microphones And Ambient Noise, Applied Acoustics, 66: 845-
865.
6. M. Saadatania, G. Ebrahimi, and M. Tajvidi, 2008 “Comparing sound absorption characteristics of acoustic
boards made of Aspen particles and different percentage of wheat and barley straws.” Proceeding of 17th
World Conference on Nondestructive Testing, China.

SCIENCE AND TECHNOLOGY 436
IGCESH2018
Universiti Teknologi Malaysia, Johor Bahru, Malaysia 13 -15 August 2018
COLLABORATIVE PLANNING FOR URBAN LIVEABILITY:
THREE CASE STUDIES OF STRATEGIC PLANNING IN
METROPOLITAN AREAS
Khalid Zanudin*1, Ibrahim Ngah2 and Siti Hajar Misnan3
1, 3 Department of Urban and Regional Planning, Faculty of Built Environment, Universiti Teknologi
Malaysia, Skudai, MALAYSIA. 2 Centre for Innovative Planning and Development, Universiti Teknologi Malaysia, Skudai,
MALAYSIA
(E-mail: [email protected], [email protected], [email protected])
ABSTRACT
In addressing the impact of urbanisation, liveability has been vastly debated lead by the UN-
Habitat which saw the urban liveability is continuously highlighted in the New Urban
Agenda. Urban liveability concerns the fulfilment of urban community needs along with their
capacity to attain sustainable and quality living environment. Therefore, rhetorically,
participatory planning has been promoted as a measure to empower the community
participation and influence in the development planning. In reality, the participation in the
planning process has caused dilemmas to the decision-maker and influenced by dominant
actor hence benefitted certain community segments. Therefore, collaborative planning has
been upheld to inclusively address the interest of all community segments and other urban
actors through consensus building in strategic planning decision-making. The purpose of this
paper is to explore the empirical evidence of collaborative planning that has successfully
empowered the community participatory in the strategic planning, hence contributed to the
liveability of the metropolitan areas. The qualitative case study has been selected as the
method used in this paper. The selection of Melbourne, Vancouver and Helsinki as the case
studies is based on five liveable city indices (Economist’s Most Liveable Cities Index 2015,
Mercer’s Quality of Living Ranking 2017, Monocle’s Quality of Life Survey 2017, Deutsche
Bank’s Quality of Life Ranking 2017, and Asia Competitiveness Institute (ACI) Global
Liveable Cities Index 2012). A theoretical framework that corroborates the relationship
between collaborative planning and urban liveability is established from the case studies.
Substantively, this paper concluded that collaboration between multiple urban actors in public
process including strategic planning has contributed to a better decision made; henceforth
ensure the objective of participation is contented. This paper contributes to the continuous
debate of how collaborative planning can contribute to the empowerment of all community
segments, henceforth the liveability of the urban setting.
Key words: Collaborative planning, Urban liveability, Strategic planning, Metropolitan

SCIENCE AND TECHNOLOGY 437
INTRODUCTION
The impact of urbanization in shaping the urban area cannot be taken lightly following the
movement of human capitals, resources as well as markets between rural to urban areas,
causing the major cities become too concentrated [1]. With more than 70% of the world
population are projected to inhabit the urban area by 2050, thus it leaving the urban
governance with a daunting challenge to mitigate the effect of this state [1]. Consequently,
urban liveability has been continuously highlighted by the UN-Habitat as one of the key
challenges that need to be addressed by the urban governance [2].
Rhetorically, urban governance is responsible in providing efficient planning decision-
making concerning the development of urban land to promote quality living environment to
all stakeholders. This is possible to achieve through the participatory process. Nevertheless,
community, predominantly the low-income segment has less capacity to genuinely participate
in strategic planning in urban area, hence exerting their influence in planning decision due to
the hegemony of neoliberalism in the government development strategy. This can be related
to the scarcity of conventional participatory planning in educating and collaborating with the
community [3]; [4]. The purpose of this paper is to explore the empirical evidence of
collaborative planning that has successfully empowered the community participatory in the
strategic planning, hence contributed to the liveability of the metropolitan areas.
METHOD
This paper has focused on the qualitative case study as the research method. Empirical
evidences from three selected metropolitan areas have been reviewed to offer interesting
insights of the research question – How the practices of collaborative planning by urban
governance can contribute to the liveability of urban community? These case studies have
been selected among the most liveable cities according to the five indices; Economist’s Most
Liveable Cities Index 2015, Mercer’s Quality of Living Ranking 2017, Monocle’s Quality of
Life Survey 2017, Deutsche Bank’s Quality of Life Ranking 2017 and Asia Competitiveness
Institute (ACI) Global Liveable Cities Index 2012.
MAIN RESULT
The findings from these case studies affirm the potential of collaborative planning in
enhancing the capability of the community to participate and influence the strategic planning
decision made. It has been perceived using the key success for collaborative planning that has
been outlined by Gunton and Day [5] (Table 1). Therefore, the community empowerment
through collaborative planning will then lead to better planning decision, hence provide
greater liveable environment to all community segments.

SCIENCE AND TECHNOLOGY 438
Table 1. Success Collaborative Planning in Selected Case Studies
Key Success PMR GCAP HCP
Conditions that offer the opportunity for
collaboration to take place.
⚫
⚫
⚫
All interested stakeholders are well-represented. ⚫ ⚫ ⚫
Ground rules to be clear and comprehensive
throughout the process.
⚫
⚫
⚫
All community segments to be educated and access to
relevant information.
⚫
⚫
⚫
Accountability element to be incorporated in the
process including the stakeholder representative.
⚫
⚫
The process should be adaptive to possible variation. ⚫ ⚫
The process is facilitating by skilled staffs and free
from intervention.
⚫
⚫
⚫
Timeframe and alternative decision-making process
should be prepared.
⚫ ⚫ ⚫
Well-defined implementation plan comprises of clear
responsibilities, monitoring process together with
mitigation measure.
⚫
⚫
The implemented decision should be thoroughly
evaluated.
⚫
⚫
PMR – Plan Melbourne Refresh
GCAP – Vancouver Greenest City 2020 Action Plan
HCP – Helsinki City Plan 2016
CONCLUSION
This research paper contributes to the continuous debate on how collaborative planning able
to empower the community in urban planning. Conclusively, the paper has demonstrated
through the literature reviewed of collaborative planning as a medium to enhancing the
participation and influence of urban stakeholders including the community in the planning
process. It is via knowledge enhancement, persuasion to collaborate and build consensus
among the stakeholders.
Acknowledgment: This research is funded by Academic Training Scheme for Bumiputera
(SLAB) from Ministry of Higher Education Malaysia and Young Lecturer Scheme from
Universiti Teknologi MARA (UiTM).
REFERENCES
1. Giap, T. K., Thye, W. W., & Aw, G. (2014). A new approach to measuring the liveability of cities: the
Global Liveable Cities Index. World Review of Science, Technology and Sustainable Development, 11(2),
176.
2. UN-Habitat (2016). World cities report 2016. Urbanization and development. Emerging futures. Nairobi:
UN Habitat.
3. Mahjabeen, Z., Shrestha, K. K., & Dee, J. A. (2009). Rethinking Community Particiption in Urban Planning:
The Role of Disadvantaged Groups in Sydney Metropolitan Strategy. Australasian Journal of Regional
Studies, 15(1), 45.
4. Monno, V., & Khakee, A. (2012). Tokenism or political activism? Some reflections on participatory planning. International Planning Studies, 17(1), 85-101.
5. Gunton, T. I. & Day, J. (2003). The theory and practice of collaborative planning in resource and
environmental management. Environments, 31(2), 5.

SCIENCE AND TECHNOLOGY 439
IGCESH2018
Universiti Teknologi Malaysia, Johor Bahru, Malaysia 13 -15 August 2018
SUITABILITY OF NATIVE PLANTS FOR STINGLESS BEE HONEY
PRODUCTIVITY IN MALAYSIAN LANDSCAPE: A REVIEW
Wan Saiful Nizam Wan Mohamad*1, Ayub Awang2 and Khalilah Hassan3
1, 2, 3 Department of Architecture, Universiti Malaysia Kelantan, Kelantan, MALAYSIA.
(E-mail: [email protected], [email protected], [email protected])
ABSTRACT
Stingless bee honey is proven by clinical test as anticancer agents. The benefit made the
demand on its honey increase especially in Malaysia. The quality of the honey produced by
stingless bee is dependent on the certain plant species such as Antigonon leptopus or Mexican
creepers. However, the used of plants for stingless bee honey productivity in landscape
development ignored where the development focuses on the aesthetic values. The practice is
directed to the poor productivity of stingless bee honey. The aim of this study is to define the
issue on native plants for stingless bee as composition of plant material of Malaysian
landscape. The review is based on the articles identify from Sciencedirect database by using
native plants and stingless bee as keywords. The articles are from 1996 to 2018 in six
disciplines which are biological science, chemistry, medicine, neuroscience, materials
science, and environmental science. The analysis on the articles is according the theme that
related to the issues between native plants and stingless bee with landscape development. The
finding suggests that the studies on stingless bee discussed the issues on the biological and
medical aspects such as its habitat in tropical rain forest, behavior of finding food, the
characteristics and composition of its honey, and benefit of consuming the honey.
Meanwhile, studies on native plants focused on its use in providing the quality food and
habitat to local insects for the continuity of the species. The review found that the relation
between stingless bee and native plants related to the ecosystem of stingless bee in Malaysia
in producing high quality of honey for health. This study implies that the review presented
the potential of native plants for stingless bee production, which useful for rural and urban
landscape developments in Malaysia.
Key words: Landscape design, Stingless bees, Native plants
INTRODUCTION
Close to nature describes the important of environment to us. The development of landscape
is a way to improve our environments for quality of life in towns, cities or in rural area
(National Landscape Department, 2011). In Malaysia, landscape was introduced before
Malaysian Independence 1957. The landscape was designed by colonists which according to
their preferences that fits them (Abdul Malek, 2016). Nowadays, Hence, the landscape is
rapidly developed and mostly designed according to the foreign ideology where the foreign
plants is introduced (Abu Bakar, 2002). Accordingly, the development is found affecting the

SCIENCE AND TECHNOLOGY 440
nature of native plants and stingless bee productivity where the quality of honey production is
depend on the plants.
Figure 1. The systematic review in identifying the relevant articles
Therefore, the aim of this study is to define the issue on native plants for stingless bee as
composition of plant material of Malaysian landscape. The method in this study is according
to systematic review which involve in four stages; (a) identification, (b) screening, (c)
defining, and (d) outcomes. In identification stage, the study reviews the articles from
Sciencedirect database using keywords; (a) native plants and (b) stingless bee. The stage used
to identify the relevant articles related to the subjects in this study. While in screening and
defining, the articles are defined in six disciplines from 1996 to 2018 which are (a) biological
science, (b) chemistry, (c) medicine, (d) neuroscience, (e) materials science, and (f)
environmental science. Lastly, the outcome in defining the articles is identified and the
articles is used for data analysis. The analysis on the articles is according the theme that
related to the issues between native plants and stingless bee with landscape development.
MAIN RESULTS
Keywords of stingless bee and native plants directs this study to three major disciplines
which are biological science, environmental science, and medicine as shown in Figure 2.
Figure 2. Example of figure for the extended abstract

SCIENCE AND TECHNOLOGY 441
In biological science, this study suggests that the relationship of stingless bee and native
plants is formed in positive way. For instance, the relationship means that the native
plants influence the behavior of stingless bee in differentiating and finding their food
(Roselino and Hrncir, 2012). Meanwhile in environmental science, the review presents
the ecological behavior of stingless bee with native plants where the habitat of stingless
bee is influenced by the surrounding especially the plants (Skurski, Maxwell and Rew,
2013; Mc Cabe, Hrncir and Farina; 2015). Whereas in medicine, the review describes the
benefits of native plants and stingless bee honey for healing (Abdul Aziz et al., 2017;
Chandra, Yadav and Yadav, 2017). Accordingly, this study suggests that there is the
relation form between stingless bee and native plants in the review of the three disciplines
however, the evidence in describing the relation is still weak. Therefore, further
investigation on stingless bee and native plant is required to provide better solution in
plant material for landscape development.
CONCLUSION
Conceptually, native plants give the positive impact to the stingless bees in producing good
quality of honey in the structure profile. The suitability of honey in plants species with the
behavior of stingless bee in selecting the honey affect the honey production. Thus, the
landscape design by considering native plants indicates the good quality of honey production
by stingless bee. However, further investigation such as experimental test on the plants
species is required for the specific plants producing the good quality of structure profile.
Moreover, guidelines for landscape developments is required in the field of build
environment to produce the design that support the needs of local environment especially
stingless bee.
Acknowledgment: This study is funded by Universiti Malaysia Kelantan, UMK under Short
Term Grant Scheme, SGJP (R/SGJP/A12.00/01672A/001/2018/000510).
REFERENCES
1. National Landscape Department. National Landscape Policy: Malaysia Beautiful Garden Nation. Percetakan
National Malaysia Berhad, Kuala Lumpur, 2011.
2. Abdul Malek, N. Malaysian Parks and Landscape Design. International Islamic University Malaysia, 2016.
3. Abu Bakar, J. A Design Guide of Public Parks in Malaysia. Universiti Teknologi Malaysia Press. 2002.
4. Roselino, A.C. and Hrncir, M. Repeated unrewarded scent exposure influences the food choice of stingless
bee foragers, Melipona scutellaris. Animal Behavior 83 (2012), 755-762.
5. Skurski, T.C., Maxwell, B.D. and Rew, L.J. Ecological tradeoffs in non-native plant management. Biological Conservation 159 (2013). 292-302.
6. Mc Cabe S.I., Hrncir M. and Farina W.M. Vibrating donor-partners during trophallaxis modulate associative
learning ability of food receivers in the stingless bee Melipona quadrifasciata. Learning and Motivation 50
(2015). 11-21.
7. Abdul Aziz M.S., Giribabu N., Rao P.V. & Salleh N. Pancreatoprotective effects of Geniotrigona thoracica
stingless bee honey in streptozotocin-nicotinamide-induced male diabetic rats. Biomedicine &
Pharmacotherapy 89 (2017), 135-145.
8. Chandra R., Yadav S. & Yadav S. Phytoextraction potential of heavy metals by native wetland plants
growing on chlorolignin containing sludge of pulp and paper industry. Ecological Engineering 98 (2017),
134-145.

SCIENCE AND TECHNOLOGY 442
IGCESH2018
Universiti Teknologi Malaysia, Johor Bahru, Malaysia 13 -15 August 2018
CHARACTERISTICS AND FATTY ACID COMPOSITION OF
VARIOUS NATURAL PLANT OIL BY USING FT-IR AND GC-MS
Salim N. A. Saber*1, Hikmat A. Mohamad2 and Madzlan B. Aziz3
1, 2 Department of Chemistry, College of Education, University of Salahaddin. Erbil, IRAQ
(E-mail: [email protected], [email protected]) 3Department of Chemistry, Faculty of Science, University Technology Malaysia (UTM), Skudai,
Johor, MALAYSIA.
(E-mail: [email protected])
ABSTRACT
The properties and biological activities of oils are depended on fatty composition. This study
was carried out to evaluate the fatty acid composition of four different type of oils which are
made in Kurdistan (olive oil and ginger oil) and Malaysia (Coconut Oil and sunflower), by
using GC-MS and FT-IR. Base catalyst procedure has been used to transesterification
reaction for preparing fatty acid methyl ester (FAME). In IR spectra, C=O strong absorption
bans of oils at 1745 – 1746 cm-1 but C=O stretching of FAME is found at 1742 – 1743 cm-1.
The C-H in CH2-O which present in oil, found at 1376 – 1377 cm-1. However, the new signal
in FAME at 1435 – 1437 cm-1 which is regarded to C-H in O-CH3. The absorbance at 3008
cm-1 shows C-H in C=C-H stretching frequency, while this peak is not found in Virgin
Coconut Oil (VCO) because the most fatty acids in VCO are saturated fatty acids. The VCO
oil contains the highest percentage of Dodecanoic acid (46.2 %) and Tetradecanoic acid (18.6
%). All most fatty acid from olive oil is oleic acid (89%). On the other hand, the sunflower
and ginger oils contain the highest percentage of Linoleic acid (80.9 %) and (79.3 %)
respectively. Palmitic acid and Stearic acid are found in all type of oils with the different
ratio. The percentage of Palmitic acid and Stearic acid are between 5.3 % - 12.3, % and 2.8 %
- 5.3 % respectively. The result shows that the VCO, Olive, and Sunflower oil are main
sources of saturated fatty acid (SF), monounsaturated fatty acid (MSFA) and polyunsaturated
fatty acid (PUFA) respectively but ginger oil is relatively rich in saturated and unsaturated
fatty acids.
Key words: Fatty Acid Methyl Ester, Gas Chromatography Mass Spectrometry, Fourier-
transform infrared spectroscopy.
INTRODUCTION
Vegetable oils are the most significant nutrients and provide the energy to the human body.
The oil help body to absorb fat-soluble vitamin and vegetable oil can reduce the risk of
cardiovascular diseases. The main structure of oil is triglyceride which contains a single
glycerol with three fatty acids. The properties and biological activities of oils are depended
on fatty composition [1].Gas chromatography with the mass detector is the main technique to
determine fatty acids in a variety of samples [2]. FT-IR technique has been employ by

SCIENCE AND TECHNOLOGY 443
several researchers to check conversion oil to FAME. [3] , [4]. FT-IR technique has many
advantages such as powerful, simple, low cost and fast response. According to literature
information, there are no papers to show the fatty acid composition of oils which are made in
Kurdistan. The aim of this study is to determine the fatty acid composition of four different
type of oils which are made in Kurdistan ( olive oil and ginger oil) and Malaysia (Virgin
Coconut Oil and sunflower), by using GC-MS and FT-IR.
MATERIALS AND METHODS
Materials
Olive oil and Ginger oil were purchased in the local market in Kurdistan- Erbil/Iraq while the
Sunflower oil and Virgin Coconut oil (VCO) were purchased in the local market in Malaysia-
Johor Bahru. The standards of methyl linoleate (18:2), methyl oleate (18:1), methyl stearate
(18:0) were purchased from Sigma Aldrich-USA. All other chemicals were obtained from the
store at University Technology Malaysia (UTM).
Methods
The transesterfication of oils were synthesized according to reference [5] with slightly
modification. The fatty acid methyl ester of oil was synthesized by using NaOH as the
catalyst with methanol. The total mole ratio of methanol: oil: NaOH was 7: 1: 0.15. The
prepared sodium methoxide solution was added to the pre-heat oil and the mixture was heated
at 40C for 90 min with a reflux condenser at constant stirring. Then the reaction mixture was
added to the separation funnel and left to cool down. The two phases formed and the upper
layer contained FAME while the glycerol, excess methanol and un-reacted catalyst were in
the lower layer. After removing the lower layer, FAME was washed ten times with water and
each time the pH of the residual water was checked until obtaining neutral pH. The total
yields of FAMEs were between 86 – 97 % (w/w).
MAIN RESULTS
FT-IR Spectra
To visualize the convert the oil to FAME, FT-IR spectroscopy was used. IR-spectra of all Oil
and FAME are shown in figure 1. After analyses of spectra of Oils and FAME, show the
significant difference between these two molecules. In IR spectra, C=O strong absorption
bans of oils at 1745 – 1746 cm-1 but C=O stretching of FAME is found at 1742 – 1743 cm-1.
The both C=O regarded to C=O in the ester. The most important reign to detect differences
between Oil and FAME is 900 – 1400 cm-1. The C-H in CH2-O which present in oil, found at
1376 – 1377 cm-1 and this peaks are not found in FAME. However, it can be seen, the new
signal in FAME at 1435 – 1437 cm-1 which are regarded to C-H in O-CH3 and this peaks are
not found in oil. Other differences between oils and FAME are explained in the figure 2. The
signal for symmetric and asymmetric C–H stretching vibrations from methyl and methylene
group found rang 2960-2850 cm-1. The absorbance at 3008 cm-1 shows C-H in C=C-H
stretching frequency, while this peak is not found in VCO oil because the most fatty acids in
VCO saturated fatty acids [6].

SCIENCE AND TECHNOLOGY 444
Figure 1. IR- spectra of sunflower a-oil and b- FAME
Fatty acid composition
The GC-MS analysis was used to determine a fatty acid profile from oils. In gas
chromatogram, the individual peaks were analyzed and MS database was used to identify
fatty acids. The relative percentage of fatty acids which are shown in table 1, calculated
according to total ion chromatography and computerized integrator. The fatty acid
composition of sunflower, olive, VCO and Ginger oils are shown in table 1. 12 fatty acids
were determined as FAME and evaluated their compositions for each different sample. In
Mass spectra, the base peak (100%) of all saturated fatty acids is m/z = 74 and this base peak
related to CH3O-C(=OH+)-CH2 fragment which is McLafferty rearrangement. However, the
base peak of poly unsaturated fatty acid (PUFA) and methyl mono unsaturated fatty acid
(MUFA) are m/z = 67 and 55 respectively. m/z = 67 is related [CH2=CHCH=CH-CH2]+
fragment and m/z=55 is related to [CH2=CHCH2CH2]+ fragment.
Table 1. Fatty acid compositions oils
Fatty Acids (%) NO. of C Sunflower Olive VCO Ginger
Octaic acid C8:0 ------ ------ 7.1 ------
Decanoic C10:0 ------ ------ 6.4 0.11
Dodecanoic C12:0 ------ ------ 46.2 0.12
Tetradecanoic acid C14:0 ------ ------ 18.6 ------
Palmitic acid C16:0 11.8 5.13 9.3 12.3
Linoleic acid C18:n9,12 80.99 ------ ------ 79.3
Oleic acid C18:n9 ------ 89 7.6 ------
Oleic acid-12hydroxy C18:n9,12OH ------ ------ ------ 2.8
Stearic acid C18:0 5.03 2.8 3.3 4.12
Cis-13-Eicosenoic acid C21:1n13 0.38 1.3 ------ ------
Eicosenoic acid C20:0 0.47 0.6 ------ 0.44
Docosanoic acid C22:0 0.49 0.4 ------ 0.39
CONCLUSION
In conclusion, GC-MS and FT-IR are the suitable techniques to determine the fatty acid
composition from oil. The result shows that the VCO, Olive, and Sunflower oils are main
sours of saturated fatty acid (SF), mono unsaturated fatty acid (MSFA) and poly unsaturated
fatty acid (PUFA) respectively. This study has shown that Ginger oil is relatively rich in
saturated and unsaturated fatty acids.
Analyst 1366
Name
Sample 1366 By Analyst Date Sunday, November 12 2017
Description
4000 4003500 3000 2500 2000 1500 1000 500
81
-2-0
10
20
30
40
50
60
70
cm-1
%T
2927.50cm-11745.50cm-1
435.00cm-1
2855.00cm-11163.61cm-11464.22cm-1
3007.84cm-1 1238.96cm-1
1119.82cm-1 1098.15cm-1
722.97cm-1
1377.57cm-1
1418.00cm-1
1399.97cm-1
1031.74cm-1
967.11cm-1
913.96cm-1869.62cm-1
1654.03cm-1
3472.26cm-1
2730.82cm-1
2679.79cm-1
1571.20cm-1
2031.46cm-12323.75cm-1
1938.86cm-12 1 5 5 . 6 3 c m - 1
FAME-SUN
Name
Sample 1366 By Analyst Date Sunday, November 12 2017
Description
4000 4003500 3000 2500 2000 1500 1000 500
89
-2-0
10
20
30
40
50
60
70
80
cm-1
%T
435.00cm-1
2925.87cm-1
1743.71cm-12854.64cm-1
1171.30cm-11196.65cm-1
1435.99cm-1
1463.78cm-1
3008.10cm-1
1245.50cm-1
1361.68cm-1 723.27cm-1
1318.68cm-1
1120.33cm-1
1096.21cm-1
1017.23cm-1
1402.21cm-1
881.08cm-1
845.05cm-1
1654.95cm-1
3467.08cm-1 913.36cm-1
2680.18cm-1
2042.75cm-1
a b

SCIENCE AND TECHNOLOGY 445
Acknowledgment: The authors acknowledge the University of Salahaddin-Erbil to express their
appreciation for the support and of the sponsors this project. The authors wish to thank the
Department of Chemistry, Faculty of Science, University Technology Malaysia (UTM), for
providing necessary facilities.
REFERENCES
1. Kumar G., Kumeshini S. and Baojun X. Impact of consumption and cooking manners of vegetable oils on
cardiovascular diseases- A critical review. Trends in Food Science & Technology, 71, (2018) 132-154.
2. Myller C., Marcio M., David. P., Ines R., and Paulo S. Chromatographic analyses of fatty acid methyl esters
by HPLC-UV and GC-FID. Journal of the Brazilian Chemical Society, 23, no. 4, (2012) 763-769.
3. I. O. and V. A. FTIR studies of thermal stability of the oils and methyl esters from Afzelia africana and Hura
crepitans seeds. Renewable Energy, 96 (2016). 203-208.
4. Reada F., Refaat E., Nabila I., A. E. and Hend. A. Some azine and azole derivatives as antioxidant additives
for lithium lubricating grease. Egyptian Journal of Petroleum, 22, no. 1 (2013) 61-71.
5. Umer R., Muhammad I., Ibrahim. N., Saud A., Sammi U., Muhammad M. and Saira S. Synthesis and
characterization of poppy seed oil methyl esters. Chinese Journal of Chemical Engineering, vol. 24, no. 8
(2016) 1087-1096. 6. Anna S. and Howell E. Raman and FTIR microspectroscopic study of the alteration of Chinese tung oil and
related drying oils during ageing. Analytical and Bioanalytical Chemistry. 400, no. 4 (2011).

SCIENCE AND TECHNOLOGY 446
IGCESH2018
Universiti Teknologi Malaysia, Johor Bahru, Malaysia 13 -15 August 2018
BRANDING LANGKAWI ISLAND AS A GEOPARK DESTINATION
Mohd Fadil Mohd Yusof*1, Hairul Nizam Ismail 2 and Ghazali Ahmad 3
1, 3 Faculty of Hospitality, Tourism and Wellness, Universiti Malaysia Kelantan, Kota Bharu,
Kelantan, MALAYSIA.
(E-mail: [email protected], [email protected]) 2 Department of Urban and Regional Planning, Faculty of Built Environment, UTM Skudai, Johor
Bahru, MALAYSIA.
(E-mail: [email protected])
ABSTRACT
Geoparks are increasingly being promoted as geotourism destinations. A geopark status is
awarded by UNESCO for a qualified destination based on certain number of criteria. In
theory, geopark status creates several economic benefits such as new job opportunities in
tourism, more business activities and additional incomes especially to the local people.
Geoparks must also protect sites of ecological, archaeological, historical or cultural value.
Therefore, being a geopark destination should promote sustainable tourism practices among
local community. This paper discusses the issues and challenges of making a geopark status
as a destination brand to promote sustainable tourism. It briefly describes the process of
obtaining geopark status based on the experience with Langkawi Island, Malaysia which was
designated in 2007. Thirty five individuals were interviewed representing various important
stakeholders such as different level of managers of a development authority, National
Tourism Organization, tourism operators and local community concerning their expectations,
government initiatives, and acceptance towards promoting Langkawi Geopark as a brand.
Results indicate that most of the stakeholders support and accept the Langkawi Geopark as a
global brand that recognised by UNESCO. However, most of them are still confused about
the Geopark concept in terms of its implementations and the actions needed to protect the
brand. More concerted efforts are needed to create the Geopark brand awareness especially
among local community and business operators. It is necessary to educate these stakeholders
about the benefits of having the geopark status in order to use the brand to promote
sustainable tourism development on the island.
Key words: Geopark, destination brand, Langkawi, sustainable development, Malaysia
INTRODUCTION
Geotourism is a new type of niche tourism that emphasizes on geology and landscape [1] and
it requires tourists participation in a specific activity at a specific location [2]. The list of
geoparks locations are growing and currently the total number of listed geoparks is 120
located at 33 different countries [3]. Global Geoparks locations are mostly observed in
Europe and China but of lately they have spread out world widely across the continents.
Geotourism only attracts a particular market segment primarily those tourists who have
interests on spectacular, landscapes and and geological materials such as fossils and minerals

SCIENCE AND TECHNOLOGY 447
in-situ and in museums. As reported by [4], practicing geopark concept encourage a selected
destination to generate more income to the community through geotourism. Geopark also
promotes sustainable tourism development among local and regional communities [1].
Following the article from [5] on the World Heritage Site (WHS) as a designated destination
brand, this paper argues that a destination which has been awarded as a geopark status also
potentially become a successful brand. Therefore, the aim of this paper is to discuss the
concept of geopark as a destination brand that create unique values to a destination. Using
Langkawi Island, Malaysia, the 52nd Global Geopark in the world as a research context, this
paper explains the issues and challenges faced by the brand authority and its relevant
stakeholders in promoting the geopark status as a brand. Langkawi Island was declared as a
global geopark destination by the Global Geopark Network (GGN) since 2007.
MAIN RESULTS
In order to get the views from the multiple stakeholders towards Langkawi Geopark brand
received in 2007, it was decided to conduct field interviews with different stakeholders
groups such as senior officers of a DMO, tourism operators, local NGOs and community
leaders. All participants were selected based on their experience, knowledge and their
roles in supporting the brand from the internal stakeholders’ perspective. A total of thirty
five participants were contacted to participate in the study. Official letters were sent
through emails to senior managers’ in charge of tourism asking the person and other
related officers to participate in the study. A separate letter was sent to the CEO of the
development authority through his personal assistant also by email for the same purpose.
A follow up phone call was made a week after the email was sent to reconfirm the
interviews which would take place in Langkawi. Details number of the participants
representing the multiple groups of stakeholders are shown in Table 1.
Table 1. Details of participant interviewed Organization/Individuals Number
1. Government
• Langkawi City Municipal Council-Local authority
• Federal – LADA (Different level of managers from multiple divisions)
• Federal – Tourism Malaysia
• State Legislative Assembly Member
2. Tourism Associations (Industry and NGOs)
3. Tourism Operators (Attraction sites, hotels)
4. Local Residents and their Representatives
1
8
3
1
1
3
14
4
Total 35
Based on thematic data analysis, there are three themes that emerge from the data. The
following are the themes identified from Langkawi Geopark case study; high support both
from government organizations and the island community toward the Geopark as a brand;
lack of consistent effort by the brand authority to educate the Geopark brand among the
community; and increase engagement with the local community and operators to support
the brand.

SCIENCE AND TECHNOLOGY 448
CONCLUSION
The conflicts among various stakeholders in terms of brand acceptance are very much
highlighted in the branding literature. Different stakeholders have different perceptions and
interests towards the brand. However, as expected, the local community perceptions towards
the brand are indifferent. They would support any slogan proposed by the authority as long
as it make different to the tourist numbers and the business they are involved with.
Therefore, the authority needs to exert their roles in educating the general local community
about the important of the Geopark brand in developing a sustainable tourism development.
Local engagement with the Geopark programs and activities attitudes towards preserving the
environment and appreciating natural beauty of the island is one of criteria measured during
Geopark revalidation every four years. The attitudes of local people must change. However,
to change the attitudes of the local community let alone their behavior may take time.
Educating the public with the basic knowledge of environmental preservation is of utmost
important. The authority also has to actively promoting the Geopark brand at the grass root
level by organizing activities that require participation from the island community.
REFERENCES
1. Dowling, R. K. (2013). Global Geotourism – An Emerging Form of Sustainable Tourism. Czech Journal of
Tourism, 2(2), 59–79.
2. Hose, T. A. (2007). Geotourism in Almeria Province, southeast Spain. Tourism, 55(3), 259–276.
3. UNESCO (2016) “What is a UNESCO Global Geopark?” available at:
http://www.unesco.org/new/en/natural-sciences/environment/earth-sciences/unesco-global-
geoparks/frequently-asked-questions/what-is-a-unesco-global-geopark/ (Accessed 17 July 2016)
4. Turner, S. (2010). Promoting UNESCO Global Geoparks for sustainable development in the Australian-
Pacific region. Alcheringa : An Australasian Journal of Palaentology, 30(S1), 37–41. 5. Ryan, J., & Silvanto, S. (2010). World Heritage Sites: The Purposes and Politics of Destination Branding.
Journal of Travel & Tourism Marketing, 27(5), 533–545.

SCIENCE AND TECHNOLOGY 449
IGCESH2018
Universiti Teknologi Malaysia, Johor Bahru, Malaysia 13 -15 August 2018
REDUCTION OF PM2.5 EMISSION FROM A RETROFITTED
MULTICYCLONE
M. Dewika1, M. Rashid2*, J. NorRuwaida2, M.P. Khairunnisa2 C.M. Hasrizam2, M.R
Ammar 3
1 Centre of American Education, Sunway University, 47500 Subang Jaya, Selangor, MALAYSIA
(Email : [email protected]) 2Air Resources Research Laboratory, Malaysia Japan International Institute of Technology, 54100
UTM Kuala Lumpur, MALAYSIA (Email : [email protected], [email protected], [email protected] ,
[email protected]) 3AMR Environmental Sdn Bhd, 81110 Johor Bahru, MALAYSIA
(Email : [email protected])
ABSTRACT
This paper presents the comparison on the reduction of particulate matter less than 2.5µm
(PM2.5) emission from a retrofitted and non-retrofitted multicyclone. The multicyclone unit
was retrofitted with an additional suction stream attached to the dust hopper of the unit where
20% of the total volumetric air flowrate was extracted. The results showed that the
concentration of PM2.5 was reduced in the emission by 12 - 50% depending on the inlet
mass loading of the sample. The Computational Fluid Dynamics(CFD) simulation of the
experiment illustrates the particle movement in the dust hopper which further explained the
possibility on the reduction of PM2.5 emissions. The study suggests that the emission of
PM2.5 can be reduced by applying a suction stream at the dust hopper of a multicyclone
enhancing the performance of PM2.5 collection.
Key words: Multicyclone, PM2.5, Modify, Emission
INTRODUCTION
Multicyclone is an air pollution control device consist of small-diameter cyclones arranged in
parallel with a common gas inlet and outlet to clean contaminated industrial flue gas. It is
widely used due to its simplicity, low maintenance and low operating costs with wide range
of operating conditions[1–3]. It employs centrifugal force generated by a spinning gas stream
to separate the particulate matter from the carrier gas. Unfortunately, multi cyclone is
efficient to collect coarse rather than fine particulate size fraction. However, since the
existing multi cyclone has low performance on fine particulate emission, therefore it is being
retrofitted with a motivation of reducing the emission of particle especially those less than
2.5µm size fraction.
METHODS
Figure 1 presents the experimental setup of the pilot plant scale unit of a multi cyclone

SCIENCE AND TECHNOLOGY 450
system with modified component of an additional suction stream attached to the dust
hopper[4]. Sample of palm oil mill boiler fly ash (POMBFA) with particle of ≤100 µm was
tested at 20% suctions with respect to the total cyclone air volumetric flowrate which
corresponds at inlet velocity of 6m/s. Particle inlet mass loadings of 0.4 and 0.6 g/m3 were
applied under the experimental conditions. The size segregated particle mass concentration
was iso-kinetically measured at the stack emission of the pilot plant using Dekati™ following
the USEPA Method 17 where the emission of PM2.5 concentration was determined with and
without suction. In addition, the experimental data was fitted in CFD simulation to explain
the phenomena of the particle movement in the unit.
Figure 1. The Retrofitted Multicyclone Unit
RESULTS
Figure 2 presents the PM2.5 emission concentration of a retrofitted compared to non
retrofitted multicyclone at two inlet dust loadings at 20% suction which showed that there
was a reduction in PM2.5 concentration upon applying the suction stream. It is observed 12
to 50% of PM2.5 emission was reduced under the retrofitted condition and that the
application of a simple technique as in the experiment able to reduce fine particulate
emission.
Figure 2. PM2.5 Emission concentration at different inlet concentration at 20% suction

SCIENCE AND TECHNOLOGY 451
Fig 3 shows the velocity profile of PM2.5 between the two multicyclones which clearly
showed PM2.5 travel out from the dust hopper into the suction stream. PM2.5 tend to gain its
speed as it is nearing the suction stream hence verifying the reduction of PM2.5 emission
from the modified unit.
Figure 3. The PM2.5 velocity in the retrofitted and non-retrofitted multicyclone at inlet
loading of 0.4g/m3 at 20% suction
CONCLUSION
The presence of suction stream at the dust hopper of a retrofitted multi cyclone reduces
between 12 and 50% of PM2.5 emission concentration in the retrofitted unit. The application
of CFD as a simulation tool proved to be useful in explaining particle reduction in the
multicyclone. The finding suggests that a simple technique of applying the suction stream in
this case able to increase the collection of PM2.5 and eventually reduces fine particulate
emission from the unit.
Acknowledgment: The first author is a doctoral candidate at the Malaysia-Japan
International Institute of Technology (MJIIT), Universiti Teknologi Malaysia, sponsored by
the Ministry of Higher Education Malaysia under the MYBrain15 research fellowship.
REFERENCES
1. T. C. Hsiao, D. Chen, P. S. Greenberg, and K. W. Street, “Effect of geometric configuration on the
collection efficiency of axial flow cyclones,” J. Aerosol Sci., vol. 42, no. 2, pp. 78–86, 2011. 2. Dirgo, D. Leith, and D. Leitht, “Cyclone Collection Efficiency : Comparison of Experimental Results with
Theoretical Predictions,” Aerosol Sci. Technol., vol. 4, pp. 401–415, (1985).
3. A.-N. Huang et al., “Effect of cold air stream injection on cyclone performance at high temperature,” Sep.
Purif. Technol., vol. 183, pp. 293–303,(2017).
4. H. Norelyza, M. Rashid, S. Hajar, and A. Nurnadia, “MR-deDuster : A Dust Emission Separator in Air
Pollution Control,” J. Teknol., vol. 5, no. 68, pp. 21–24, 2014.

SCIENCE AND TECHNOLOGY 452
IGCESH2018
Universiti Teknologi Malaysia, Johor Bahru, Malaysia 13 -15 August 2018
BEHAVIOR-BASED SAFETY AND SAFETY AWARENESS
RELATIONSHIP: A CASE STUDY AT CONSTRUCTION SITE
Nur Shahirah Yahya*1 and Hayati Habibah Abdul Talib2
1, 2 UTM Razak School of Engineering and Advanced Technology,
Universiti Teknologi Malaysia,
Jalan Sultan Yahya Petra, 51400 Kuala Lumpur, Malaysia. (E-mail: [email protected])
ABSTRACT
According to Social Security Organisation and Department of Occupational Safety and
Health Malaysia, the construction sector is one of the critical sectors that contribute to the
highest number of accident cases. The number of contractors that been registered with
Construction Industry Development Board increasing from time to time and the accident and
incident cases also keep rising. In 1930, William Heinrich already comes out with a theory
that being called as behavior-based safety (BBS). According to the theory, accidents will not
suddenly happen unless it caused by the unsafe acts, unsafe conditions or both. This paper
will show the relationship of BBS and safety awareness at the construction site in Malaysia.
Either than that, further discussion towards the main cause of unsafe acts that contributes to
increasing the number of accident cases at the construction site. From the previous research
that been done, by applying BBS at the construction sites it can make the workers more
aware about their own safety, reduce the cost of hospitalization and treatment at the hospital,
produce the more quality of a product (the building that been build) and increase the
performance of work.
Key words: Behavior-based Safety, Safety Awareness, Construction, Unsafe Acts, Site
Employee
INTRODUCTION
In many countries, a major problem in public health is occupational accidents. Normally
it will involve employees and employers at the workplace that cannot hold and control the
situation. Malaysia also facing with the same problem. This is because from the previous
finding showed that number of accident in construction site was continuously happen and
sometimes increase from time to time. Thus, it shows that in Malaysia, this problem also
became as one of the major problem that cannot be void including stated the increasing
number of accidents and death of the works during working hours. This is truly can be
prove by the report from Social Security Organisation and Department of Occupational
Safety and Health Malaysia. According to Social Security Organisation, there is 317,895
accidents cases been reported under construction sector from the year 2012-2016. While
according to Department of Occupational Safety and Health Malaysia there are 5,246
accidents cases been reported under construction sector from January until October 2017.
Moreover, Department of Occupational Safety and Health Malaysia also recorded that
there is 246 accidents cases that been reported under the state of Selangor. Selangor is

SCIENCE AND TECHNOLOGY 453
one of the states that contributed highest number of accidents compared to other states.
Thus, this study will provide details of description on how to improve the individual
safety behavior and also reduce accident cases at the construction sites.
METHODOLOGY
The scope of this study will be focus on Non-Residential Construction for contractors
grade G7 around Selangor Malaysia. All the questionnaires will be answering by Safety
and Health Officer, Site Safety Supervisor, Safety Manager, Safety Engineer and other
Engineers and Supervisors that working at the construction sites. Data analyses were
performed using SPSS for all variables in the questionnaires. There are 9 variables that
been test in the behavior-based safety (BBS) questions and 4 variables been test in the
Safety Awareness questions. Each and every variable have different number of items in
the questions.
MAIN RESULTS
Bivariate correlations were computed to evaluate the relationship between Behavior
Based Safety (BBS) (independent variables) and safety awareness (dependent variables).
The entire hypothesis of this research indicates that they are positive relationship between
behavior-based safety (BBS) and safety awareness. The inter correlations were presented
in Table 1.
Table 1. Correlations of Behavior Based Safety and Safety Awareness.
Variables Behavior Based Safety Safety Awareness
Behavior Based Safety - 0.371**
Safety Awareness 0.371** -
According to Sulzer-Azaroff and Austin [1] reviewed 35 studies on the impact behavior
based safety and safety awareness on incidence rated and found that 32 reported reduction in
injuries following implementation of behavior based safety (BBS) system. From the finding it
shows that the awareness of construction workers increase the risk tolerance and, therefore,
the frequency and severity of accidents [2].
CONCLUSION
By having all the above data, it showed that there is relationship between Behavior Based
Safety (BBS) and Safety Awareness in order to reduce the number of accident and incident
cases at the construction sites. The action that need to be taken not only from the government
or the employer but the workers are the main character in reducing accidents because they are
the one that working in the construction site. Last but not least, everybody that involve in the
construction company must take a serious action regarding the behavior-based safety (BBS)
and safety awareness because it will give big impact to the company reputation and quality of
products that been produced.
Acknowledgment: Appreciation should be given to UTM Zamalah for the sponsorship that
been given. The authors thank the Universiti Teknologi Malaysia and IGCESH 2018
committee for giving the opportunity to participate in this conference. The invaluable
comments by the reviewers on this paper owned special thanks by the authors.

SCIENCE AND TECHNOLOGY 454
REFERENCES
1. Sulzer-Azaroff, B., Austin, J., 2000. Does BBS work. Prof. Saf. 45 (7), 19–24
2. V. Sousa., N. Almeida, L. Dias., 2014. Risk-based management of occupational safety and health in the
construction industry-Part 1: Background knowledge. 66, 75-86

SCIENCE AND TECHNOLOGY 455
IGCESH2018
Universiti Teknologi Malaysia, Johor Bahru, Malaysia 13 -15 August 2018
TOLERANCE COMPUTING TIME FOR SIMPLIFICATION
PROCESS USING FSA-SIMPLIFICATION
Nur Fatin Liyana Mohd Rosely *1, Azlan Mohd Zain*2
and Abdullah Hisham Omar3
1, 2 Applied Industrial Analytics, Faculty of Computing, Universiti Teknologi Malaysia, Johor,
MALAYSIA.
(E-mail: [email protected], [email protected]) 3 Faculty of Geoformation, Universiti Teknologi Malaysia, Johor, MALAYSIA.
(E-mail: [email protected])
ABSTRACT
Simplification process used to simplified map objects in cartographic generalization.
Tolerance value play important role in simplification process which it helped determines
either to preserve or reject points of map objects in a simplification process. A good
simplification process demanding fast computing time. The swarm intelligent, fish swarm
algorithm (FSA) is implemented in standard simplification and named as FSA-Simplification
in order to improve the performance of computing time. The implementation involved main
components in FSA which is FSA parameters. Based on the implementation, shows FSA-
simplification has reduced the computing time by 9% to 12% that leads to a better
simplification result compared to standard simplification. This proven that FSA-
Simplification gives better result performance for a simplification process.
Key words: Simplification Process, Fish Swarm Algorithm, Tolerance Value
INTRODUCTION
Cartography generalization is the process map data is manipulated which the essential
characteristics of objects from map are preserved even been represented in various scale
based on cartographic specifications. Simplification is the method offered in cartographic that
helps removing unnecessary details of object without destroying its essential characteristics
[13, 15, 18, 19]. Simplification determine point either to retain or reject and reject the
redundant points to ensure the best result of the object without destroying its essential shape
can be displayed (refer Figure 1) [9].
Figure 1. Simplification Method
In simplification process, the original characteristics of the object such as orientation,
convexity and structure are preserved [14]. Based on Figure 1, some points of the objects are
eliminated during the simplification process. As an example, before the simplification

SCIENCE AND TECHNOLOGY 456
process, the representation one of the objects in Figure 1 is . During the simplification
process, the curve lines of the object ( ) are eliminated because they are unnecessary
characteristics of the object, . After the result of simplification process for the is, .
The further discussion about the simplification process is discussed on the next section. In
simplification, line presentation also known as polyline and it is vector data model which XY
coordinate system as the fundamental unit. The XY coordinates are referring to points of
object or also as object characteristics [1] that indicate latitude and longitude of the object.
Based on it, the most suitable XY coordinates should be selected to serve best result from the
vector data model. Tolerance value is a must parameter in a simplification process. Followed
by the computing time. Based on previous studies, the focused on simplification outcome by
ignoring the computing time and the importance of the tolerance value. In order to conquer
the neglects, optimization method offer the solution. Generally, optimization techniques has
been conquered in many fields and swarm intelligent approach highly recommended
nowadays. Basically, Fish Swarm Algorithm (FSA) has the highest rank for the most
convince in handling optimization problem [2,12, 23]. FSA is a swarm intelligence
evolutionary computation technique proposed by Dr. Xiaolie Li inspired by the natural
schooling of fish which has higher plotting time. In this research, FSA is explored to
improve simplification process by concerned the process time. This research is considered as
a new contribution in cartographic as there is no attempt yet made based on FSA. Next
section will briefly discussed on FSA.
MAIN RESULTS
Experimental results are based on the roads Miri, Sarawak data from Jabatan Ukur dan
Pemetaan Malaysia (JUPEM). The roads represent the map object representative and
undergo simplification process with tolerance values, 10, 20, 30, 40, 50, 60, 70, 80, 90
and 100. The roads in Miri, Sarawak by ratio 1:1000 is displayed in polyline data type.
The experiment of simplification process using FSA-Simplification approach was done in
10 sets where each set involved 10 run times. Therefore, total experiments are 100 runs
times and fortunately by implementing try number, each set performed 10 runs times in
an experiment execution. As the result every experiment execution gives average
computing time for 10 run times. This means for 100 run times only 10 experiment
executions are needed. Table 1 and Table 2 record the final computing time of FSA-
Simplification with and without try_number by different tolerance value. Finally, the
best performance result between FSA-Simplification with and without try_number were
compared to Standard Simplification approach.
Table 1. Computing Time of FSA-Simplification with Different Tolerance Value
Tolerance Value (TV) Average Time (s)
10 0.51833
20 0.50343
30 0.49545
40 0.49159
50 0.49066
60 0.48865
70 0.48777
80 0.48322
90 0.48134
100 0.47853

SCIENCE AND TECHNOLOGY 457
Based on Table 1, final result of FSA-Simplification for a simplification process with
different tolerance value is recorded. The final computing time is based on the average
computing time for 100 runs times of experiments. Referring to Table 1, large value of
tolerance value takes longer time for a simplification process compare to small value of
tolerance value. As example tolerance value 10 takes 0.51833s and tolerance value 100 takes
0.47853. This explained the small value of tolerance demands high percentage of preserving
original map object points or characteristics and vice versa for large value of tolerance.
However, the essential points or characteristics of map object should been preserved so there
is a need to define quality of tolerance value. As mentioned earlier, in FSA-Simplification
try_number parameter is added to accelerate exeperiment execution of 100 runs. Here the The
results of computing time without the try-number (Refer Table 2).
Table 2. Computing Time Based on Different Tolerance Value without Try_Number
Tolerance Value (TV) Average Time (s)
10 0.55833
20 0.53343
30 0.52045
40 0.51059
50 0.49866
60 0.49065
70 0.48727
80 0.48572
90 0.48414
100 0.48135
Based on Table 1 and 2, clearly we can see FSA-Simplification with try-number variable can
produce simplification result in short time. However, the difference computing time of each
tolerance value between with and without try-number only in small second gap. Here are the
differences for tolerance 10 is 0.04000s, tolerance 20 is 0.03000s, tolerance 30 is 0.02500s,
tolerance 40 is 0.01900s, tolerance 50 is 0.00800s, tolerance 60 is 0.00900s, tolerance 70 is
0.01050s, tolerance 80 is 0.00250s, tolerance 90 is 0.00280s and tolerance 100 is 0.00282s.
Therefore, FSA-Simplification with try number is considered as good implementation to
shorten computing time. Then, the result of FSA-Simplification with try_number is compared
to Standard Simplification result. The result as shown in Table 3.
Table 3. Comparison Result Between Standard Simplification and FSA-Simplification Tolerance
Value (TV)
Performance
Difference (s)
Percentage of
differences (%)
Percentage the improve
performance (%)
10 0.055483 5.548300 9.669178
20 0.056579 5.657885 10.10321
30 0.060406 6.040623 10.86724
40 0.061457 6.145685 11.11241
50 0.061742 6.174169 11.17696
60 0.063177 6.317681 11.44867
70 0.061358 6.135801 11.17372
80 0.065485 6.548487 11.93444
90 0.06509 6.508995 11.91186
100 0.066748 6.674772 12.24105

SCIENCE AND TECHNOLOGY 458
CONCLUSION
Standard simplification can be considered as good practice for simplification process.
However, FSA-Simplification shows improvement in computing time by implementing FSA
in standard simplification. The percentage difference of computing time between standard
simplification and FSA-Simplification is from 5.548% to 6.675%. This also indicates the
performance improve from 9.670% to 12.241%. As stated, FSA consists of two main
components which are parameter and function. For future work, FSA can be considered to be
implemented in other polyline simplification. The implementations of FSA can be either in
fast total least square (FTLS), semantically enriched line simplification (SELF), douglas
peucker Algorithm (DPA) or others. However, for the purpose on improving the limitation
of FSA-Simplification, FSA in DPA is recommended.
Acknowledgment: Special appreciation to reviewers for useful advices and comments. The
authors greatly acknowledge the Research Management Centre, UTM and Ministry of Higher
Education Malaysia (MOHE) for financial support through the UTM Zamalah.
REFERENCES
1. Burrough, P. A., McDonnell, R. A. Principles of geographical information Systems 2011; Vol. 19988.
Oxford University Press. 2. El-said, S. A. Image quantization using improved artificial fish swarm algorithm. Soft Computing. 2014; pp.
1-13.
3. Fei, W., Xiao-Hao, X., Jing, Z. Application of artificial fish school and K-means clustering algorithms for
stochastic GHP. In Control and Decision Conference, 2009. CCDC'09. Chinese. 2009, June: pp. 4280-4283.
IEEE.
4. Gao, P., Liu, Z., Han, F., Tang, L., Xie, M. Accelerating the computation of multi-scale visual curvature for
simplifying a large set of polylines with Hadoop. GIScience & Remote Sensing. 2015; 52(3): 315-331.
5. Hu, T., Ren, X. Y., Lu, Y. M. Simplified calculation of distance measure in DP algorithm. In Fifth
International Conference on Graphic and Image Processing. 2014, January; pp. 906921. International Society
for Optics and Photonics.
6. selection. International Journal of Control and Automation. 2013; 6(5): 103-116.
7. Huang, Z. J., Wang, B. Q. A novel swarm clustering algorithm and its application for CBR retrieval. In Information Engineering and Computer Science (ICIECS), 2010 2nd International Conference on 2010,
December; pp. 1-5. IEEE.
8. Jelinek, A., Zalud, L., Jilek, T. Fast total least squares vectorization. Journal of Real-Time Image Processing.
2016; 1-17.
9. Lee, D. Automation of map generalization: The cutting-edge technology. Esri White Paper Series. 1996.
10. Liu, S., and Li, Y. An artificial fish swarm algorithm and its application. In 2015 International Conference
on Intelligent System Research and Mechatronics Engineering. Atlantis Press. 2015, April.
11. McMaster, R. B. Automated line generalization. Cartographica: The International Journal for Geographic
Information and Geovisualization. 1987; 24(2): 74-111.
12. Neshat, M., Sepidnam, G., Sargolzaei, M., Tosi, A. N. Artificial fish swarm algorithm: a survey of the state-
of-the-art, hybridization, combinatorial and indicative applications. Artificial Intelligence Review. 2012; 1-33.
13. Raheja, J. L., Kumar, U., Saravanan, K. C. Cartographic Generalization (Selection) For 2D Map of Urban
Area. International Journal of Computer Science & Information Technology. 2010; 2(1).
14. Sester, M. Generalization based on least squares adjustment. International archives of photogrammetry
and remote sensing, 33(B4/3; PART 4). 2000; 931-938.
15. Shea, K. S., McMaster, R. B. Cartographic generalization in a digital environment:When and how to
generalize. In Proceedings of AutoCarto. 1989, April; Vol. 9: pp. 56-67.
16. Stefanakis, E. SELF: Semantically enriched line simplification. International Journal of Geographical
Information Science. 2015; 29(10): 1826 1844.
17. Tao, L., Ai-ling, Q., Yuan-Bin, H., Xin-Tan, C. Feature optimization based on artificial fish-swarm
algorithm in intrusion detections. In Networks Security, Wireless Communications and Trusted Computing,
2009. NSWCTC'09. International Conference on 2009, April; Vol. 1: pp.542-545. IEEE.

SCIENCE AND TECHNOLOGY 459
18. Vangenot, C., Parent, C., Spaccapietra, S. Modelling and Manipulating Multiple Representations of spatial
data. In Advances in Spatial Data Handling. 2002; pp. 81-93. Springer Berlin Heidelberg.
19. Weibel, R. Generalization of spatial data: Principles and selected algorithms. In Algorithmic foundations of
geographic information systems. 1997; pp. 99-152. Springer Berlin Heidelberg.
20. Wu, S. T., Marquez, M. R. G. A non-self-intersection Douglas-Peucker algorithm. In Computer Graphics and Image Processing, 2003. SIBGRAPI 2003. XVI Brazilian Symposium on 2003, October; pp.60-66.
IEEE.
21. Yazdani, D., Nabizadeh, H., Kosari, E. M., Toosi, A. N. Color quantization using modified artificial fish
swarm algorithm. In AI 2011: Advances in Artificial Intelligence. 2011; pp. 382-391. Springer Berlin
Heidelberg.
22. Yiyue, W., Hongmei, L., Hengyang, H. Wireless sensor network deployment using an optimized artificial
fish swarm algorithm. In Computer Science and Electronics Engineering (ICCSEE), 2012 International
Conference on 2012, March; Vol. 2, pp. 90-94.IEEE.
23. Zhang, C., Zhang, F. M., Li, F., Wu, H. S. Improved artificial fish swarm algorithm. In Industrial
Electronics and Applications (ICIEA), 2014 IEEE 9th Conference. 2014, June; pp.748-753.

SCIENCE AND TECHNOLOGY 460
IGCESH2018
Universiti Teknologi Malaysia, Johor Bahru, Malaysia 13 -15 August 2018
NONSTATIONARY WEEKLY CONSTRUCTION STOCK MARKET
PRICE USING NON-TRANSFORMED PRINCIPAL COMPONENT
TECHNIQUE
Yusrina Andu1, Muhammad Hisyam Lee*2 and Zakariya Yahya Algamal3
1, 2 Department of Mathematical Sciences, Faculty of Science, Universiti Teknologi Malaysia, Johor,
MALAYSIA. (E-mail: [email protected], [email protected])
3 Statistics and Informatics Department, University of Mosul, Mosul, IRAQ.
(E-mail: [email protected])
ABSTRACT
The rapid urbanization has led the construction sector being one of the major sectors traded in
the stock market price worldwide. However, the majority of stock market price is
nonstationary. As the conventional approach in handling nonstationary is usually through
stationary transformation, nevertheless this may lead to the loss of data originality. To
overcome this, a more direct approach of non-transformed via principal component technique
is of interest. In this study, the nonstationary stock market price was reduced by using
generalized dynamic principal component (GDPC), which adapts Brillinger dynamic
principal component (BDPC) concept based on the reconstruction of the time series. The data
applied is derived from the most recent two-years (2016-2018) weekly observations of nine
stock market prices in construction sector of seven different countries. These countries
comprise of Hong Kong, Malaysia, New Zealand, Shanghai, Switzerland, Thailand and the
U.S. as to observe a wider scope of the construction sector stock market price across regions.
Stationarity test was first performed on the construction stock market price. Next, the
principal component analysis carried out were two-based, transformed using ordinary
principal component (OPC) and BDPC, whereas the non-transformed approach is GDPC.
Although one of the mean squared error for OPC showed lower value than BDPC, yet, it has
the highest value among the three techniques. Meanwhile, BDPC showed higher percentage
of explained variance in the first component, with an average difference of 25% as compared
to OPC. Notwithstanding, GDPC showed the highest explained variance in comparison with
the transformed approach with the lowest value is at 82.5%. Hence, overall, a non-
transformed technique may also achieve better result performance than the transformed
technique.
Key words: Generalized Dynamic Principal Component, Construction Stock Market Price,
Nonstationary, Non-transformed, Time series data
INTRODUCTION
Construction is one of the most important sectors that contributes positively to the growth and
development of a country by the construction of buildings and materials supplying. As a
matter of fact, the stock market price listed construction as one of the most leading sectors all

SCIENCE AND TECHNOLOGY 461
around the world. However, the majority of stock market price are nonstationary including
the construction stock market price caused by the interrelated factors[1], [2]. Over the years,
prior to analysis, most studies transformed the stock market price into stationary form. Some
of the common approach of stationary transformation are first difference [3], linear [4] and
also log-transformation [5]. Nonetheless, this action may cause the loss of data originality.
Throughout the years, several studies have been carried out on nonstationary time series via
principal component technique [6], [7]. Nevertheless, a direct application in handling
nonstationary is through non-transformed method, known as generalized dynamic principal
component (GDPC) [8] which was developed based on Brillinger dynamic principal
component (BDPC). The data of this study consist of nine stock market price listed under
the construction sector. This includes 1800.HK (Hong Kong), 3336.KL and 4677.KL
(Malaysia), FBU.NZ (New Zealand), 600170.SS and 600266.SS (Shanghai), IMPN.SW
(Switzerland), CCP.BK (Thailand) and STRL (U.S.). These stock market prices were
based on weekly observations of a two-year period from 1st January 2016 until 1st January
2018. Prior to analysis, stationarity test was performed as to ascertain the nonstationary
pattern of the series. It is worth noting that the stock market price is transformed to
stationary for OPC and BDPC, whereas GDPC uses the data directly without the
transformation. Figure 1 showed the weekly plotted construction stock market price.
Meanwhile, Table 1 showed the information criterion for the construction stock market price.
As well as the performance between the transformed and non-transformed principal
component technique based on the mean squared error (MSE) and percentage of explained
variance is shown in Table 2. Overall, the non-transformed method has better performance as
compared to the transformed method.
MAIN RESULTS
Figure 1. Nine weekly construction stock market price between 1st January 2016 to
1st January 2018
In Table 1, several lags were considered to reconstruct the construction stock market
price series and were tested using both Akaike information criterion (AIC) [9] and
Bayesian information criterion (BIC) [10]. Therefore, based on this, the model that is
chosen throughout consist of the original stock market price and lags k = 3.

SCIENCE AND TECHNOLOGY 462
Table 1. Information criteria of the construction stock market price
Stock Market Price AIC BIC
1800.HK 971.28 981.74
3336.KL 969.62 980.08
4677.KL 975.07 985.53
FBU.NZ 970.56 981.02
600170.SS 974.64 985.10
600266.SS 974.55 985.02
IMPN.SW 970.96 981.42
CCP.BK 975.75 986.21
STRL 974.78 985.24
From Table 2, the MSE for OPC recorded the highest value as compared to the other two
methods. Although BDPC showed lower MSE for IMPN.SW stock market price than in
GDPC, however, the remaining eight stock market price have the lowest MSE of all. Thus,
this suggest that the non-transformed method have better model performance than of the
transformed method.
Table 2. Mean squared error and the percentage of explained variance of transformed
and non-transformed method
MSE Percentage of Explained Variance
Stock Market Price OPC BDPC GDPC
OPC BDPC GDPC
1800.HK 13.042 6.240 0.082
57.1 83.3 93.4
3336.KL 1.135 1.714 0.002
59.9 87.2 89.6
4677.KL 10.962 1.378 0.001
57.5 67.7 94.7
FBU.NZ 11.387 4.091 0.066
50.9 82.4 95.8
600170.SS 7.180 3.556 0.011
59.3 94.7 85.4
600266.SS 11.420 1.786 0.211
50.3 76.6 88.9
IMPN.SW 6.520 2.573 2.914
52.1 79.1 93.9
CCP.BK 20.846 5.835 0.001
53.1 77.7 94.9
STRL 42.643 26.556 0.329
52.3 92.4 97.7
As for the purpose of demonstration, the percentage of explained variance is considered only
for the first component [11]. In Table 2, the average percentage of explained variance in the
transformed method OPC is almost 55%. Meanwhile in BDPC, only 600170.SS and
IMPN.SW construction stock market price have higher percentage of explained variance at
90% above. The lowest percentage of explained variance is at 67% for 4677.KL stock market
price in BDPC. Nevertheless, the non-transformed method had higher explained percentage
in all its nine-construction stock market price. Therefore, this indicate that much more
information can be obtained from the non-transformed method as compared to its
counterpart.
CONCLUSION
GDPC tackles the nonstationary that exist in the stock market price through the
reconstruction of the series via principal component technique. Furthermore, the non-
transformed approach had shown that it performs much better than of the transformed series
in both OPC and BDPC. As well as, it is also able to provide higher percentage of explained
variance in the first component of the construction stock market price. Therefore, the findings
indicates a non-transformed approach performs much better than the transformed method.

SCIENCE AND TECHNOLOGY 463
Thus, future study should be extended to other sectors in the stock market price as well.
Acknowledgment: The authors would like to express their appreciation for the support of the
sponsors with Project No 15H64.
REFERENCES
1. D. Zhong, X., & Enke, “Forecasting daily stock market return using dimensionality reduction.,” Expert Syst.
Appl., no. 67, pp. 126–139, 2017.
2. M. Göçken, M. Özçalici, A. Boru, and A. T. Dosdoʇru, “Integrating metaheuristics and Artificial Neural
Networks for improved stock price prediction,” Expert Syst. Appl., vol. 44, pp. 320–331, 2016.
3. B. Chatvorawit, P., Sattayatham, P., & Premanode, “Improving Stock Price Prediction with SVM by Simple
Transformation: The Sample of Stock Exchange of Thailand (SET),” Thai J. Math., vol. 14, no. 3, pp. 553–
563, 2016.
4. M. F. Sánchez, Miguel Ángel, Juan E. Trinidad, José García, “The effect of the underlying distribution in
Hurst exponent estimation,” PLoS One, vol. 10, no. 5, p. e0127824, 2015. 5. P. Caraiani, “Evidence of multifractality from emerging European stock markets,” PLoS One, vol. 7, no. 7,
p. e40693, 2012.
6. P. S. Souza Filho, J. B., & Diniz, “A Fixed-Point Online Kernel Principal Component Extraction
Algorithm,” IEEE Trans. Signal Process., 2017.
7. P. Zhao, X., & Shang, “Principal component analysis for non-stationary time series based on detrended
cross-correlation analysis,” Nonlinear Dyn., vol. 84, no. 2, pp. 1033–1044, 2016.
8. D. Peña and V. J. Yohai, “Generalized Dynamic Principal Components,” J. Am. Stat. Assoc., vol. 111, no.
515, pp. 1121–1131, 2016.
9. H. Akaike, “A new look at the statistical model identification,” IEEE Trans. Automat. Contr., vol. 19, no. 6,
pp. 716–723, 1974.
10. H. Akaike, “A Bayesian extension of the minimum AIC procedure of autoregressive model fitting,” Biometrika, vol. 66, no. 2, pp. 237–242, 1979.
11. M. Hörmann, S., Kidziński, Ł., & Hallin, “Dynamic functional principal components.,” J. R. Stat. Soc. Ser.
B (Statistical Methodol., vol. 77, no. 2, pp. 319–348, 2015.

SCIENCE AND TECHNOLOGY 464
IGCESH2018
Universiti Teknologi Malaysia, Johor Bahru, Malaysia 13 -15 August 2018
RADIOLOGICAL DOSE ASSESSMENT DUE TO HYPOTHETICAL
NUCLEAR POWER PLANT OPERATION IN MERSING, JOHOR,
MALAYSIA
Nurlyana Omar* and Meng Hock Koh
1Physics Department, Universiti Teknologi Malaysia, Skudai, Johor, MALAYSIA
(E-mail: [email protected], [email protected] )
ABSTRACT
Many countries around the world including Malaysia are considering adopting nuclear power
to cater to the increasing demand of electricity usage. In implementing a nuclear power plant
(NPP), strict regulations and guidelines by the International Atomic Energy Association
(IAEA) and International Commission on Radiological Protection (ICRP) need to be fulfilled
before any construction license is given for a new nuclear power program. One of the
assessment include the estimation of potential radiological risks to both humans and
environment from routine and accidental release of radioactive effluent from the NPP. In this
work, simulations of radionuclide dispersion from a hypothetical NPP site in Mersing, Johor
will be presented. The simulation is performed based on the Lagrangian atmospheric
dispersion model using the HYSPLIT software. The radioactive effluent release rate is
approximated to the value found in the Fukushima Dai-ichi accident in 2011. Meteorological
data of 2013 are utilized in this study. Simulation results shows that the dispersion of
radioactive effluent from the hypothetical NPP can potentially affect areas around Johor
Bahru district, Singapore and even some areas in Indonesia. Key words: Lagrangian dispersion model, Atmospheric dispersion, nuclear accident,
Emergency respond plan
INTRODUCTION
In 2014, a total of more than 2,400 billion kWh of electricity were produced around the globe
by using nuclear power [1]. Many countries around the world including Malaysia are
considering to adopt nuclear power to cater the increasing demand of electricity usage. The
pioneer nuclear power plant (NPP) in Malaysia is expected to generate 1000 kW of electricity
and is targeted to start operating in 2030 [2-3]. Researches have been performed to identify
potential sites for the construction of NPP throughout the whole of Peninsular Malaysia [4].
A major theme of their work is the radiological protection to human and environment in the
case of nuclear accident. The selected site(s) should adhere to strict regulations and
guidelines set by the International Atomic Energy Association (IAEA) and International
Commission on Radiological Protection (ICRP) [5,6].
One important method to assess the suitability of the NPP site is through the radionuclide
analysis performed using some dispersion models. Such research works have been performed
and reported for e.g. in the work of Ref. [7,8] in Mersing, Johor and Lumut, Perak using the

SCIENCE AND TECHNOLOGY 465
Gaussian Plume Model (GPM). Figure 1 summarizes the locations of potential NPP sites in
Malaysia whereby the dispersion analysis has been performed.
Figure 1. Potential NPP site in Peninsular Malaysia Ref. [9]. There are four candidate
NPP site, two in Selangor state and each one in Perak and Johor.
In the work of Ref. [7,8], the studies were performed using a rather simple simulation set-up
in that only the annual average wind speed and direction were considered. More realistic
simulation set-up is needed since these two parameters would not be able to provide an actual
representation in the event of an accident. Furthermore, the simple GPM approach do not
allow for fluctuation of wind direction and thus making it less relevant for real-time
assessment. Unlike Lagrangian model, this model taken into consideration of the
concentration due to the turbulence of the wind components, mean fluid velocity and also
molecular diffusion. The term Lagrangian means that the dispersion is carried out in
reference frame moving along with the trajectory [10-13].
The aims of this work is to determine the affected areas due to radioactive effluent emission
after a hypothetical nuclear accident in Mersing, Johor by using Lagrangian model. Second
emphasis is given to the variation in the dispersion pattern according to the month of
occurrence of the accident. Other than that, we will be assessing the dispersion pattern of
radioactive effluent in Peninsular Malaysia and neighboring countries if it is affected. This
paper is organized as per follows. Section 2 provides a general information regarding the
Lagrangian model and its application in HYSPLIT software. The analysis will be in Section 3
with the focus on the study area and methodological data. Results and discussion will be in
Section 4 and finally the conclusion for the analysis is given in Section 5.
MAIN RESULTS
In this work, we will share the deposition of Cs-137 from hypothetical NPP in Mersing,
Johor. The release rate is approximated to the value from the Fukushima Dai-ichi
accident. A sample of our results is shown in Figure 2 for a nuclide accident occurring in
January 2017. For this sample calculation we assume that the radionuclide is released into
the atmosphere at the rate of 1x10²⁰ Bq/sec for 3 hours from the start of the accident.

SCIENCE AND TECHNOLOGY 466
In our presentation we will show the deposition pattern for hypothetical accident that
occur in other months of 2017. More importantly the dose rate to the public will be
estimated from the dispersion pattern.
Figure.2 The movement of Cs-137 radionuclide effluent which was released from
hypothetical NPP in Mersing, Johor. The release of Cs-137 radionuclide effluent affects
Kalimantan, Indonesia within 5 days from the initial release day.
CONCLUSION
In this paper, we investigate the deposition of Cs-137 effluent which was released from
hypothetical NPP in Mersing Johor. The dispersion of the radionuclide was also found to
spread to more areas in Borneo Island and neighboring countries within 3 days from the
initial accident in the month of January. We estimated that the impact of dispersion will be
differ in each month due to the wind speed and direction especially in monsoon season
month. The dose rates due to the deposited radionuclide will be estimated for some major
countries in the region.
Acknowledgment: The authors would like to thank the Universiti Teknologi Malaysia for
providing the Potential Academic Staff (PAS) grant (grant number Q.J130000.2726.02K70)
for this research. Nurlyana appreciation also goes to the Universiti Teknologi Malaysia
(UTM) for the ZAMALAH financial support.
REFERENCES
1. Facts and Figues, Nuclear Generation by Country, World Nuclear Association Website (http://www.world-
nuclear.org/information-library/facts-and-figures/nuclear-generation-by-country.aspx), (2015) Extracted on

SCIENCE AND TECHNOLOGY 467
14 February 2018
2. PEMANDU, Chapter 6: Powering the Malaysian Economy with Oil, Gas and Energy Economic
Transformation Programme: A Roadmap for Malaysia, Jabatan Perdana Menteri (2010), 183-221
3. Basri, N., Ramli, A., Aliyu, A.S., Malaysia Energy Strategy Towards Sustainability: A Panoramic Overview
of The Benefits and Challenges, Renewable and Sustainable Energy Review (2015), 1094-1105 4. Basri, N., Ramli, A., Aliyu, A.S., Selection of Possible Candidate Area for Nuclear Power Plant In Johor,
Malaysia. Journal of Nuclear and Related Technologies (2012), 56-63
5. International Atomic Energy Agency (IAEA)., Site Survey and Site Selection For Nuclear Installations.
{IAEA Safety Standard Series,No.SSG-35 (2015).
6. Atomic Energy Licensing Board (AELB)., Guideline For Site Selection For Nuclear Power Plant. Atomic
Energy Licensing Board. (2011).
7. Shamsuddin, S. D., Basri, N., Omar, N., Koh, M. H., Ramli, A. T., Hassan, W.M.S.W., Radioactive
Dispersion Analysis For Hypothetical Nuclear Power Plant (NPP) Candidate Site In Perak State, Malaysia,
EPJ Web of Conferences (2017).
8. Shamsuddin, S. D., Basri, N., Omar, N., Koh, M. H., Development of Radionuclide Dispersion Modeling
Software Based On Gaussian Plume Model. MATEMATIKA (2017), 149-157.
9. Basri, N.A., Tinjuan dan Pemilihan Calon Tapak Loji Janakuasa Nukelar di Semenanjung Malaysia, Universiti Teknologi Malaysia, Ph.D. Thesis, 2018.
10. Leelossy, A., Molnar, F.Jr., Izsak, F., Havasi, A., Lagzi, I., Meszaros, R., Dispersion modeling of air
pollutants on the atmosphere: a review. Cen. Eur. J. Geosci (2014), 257-278.
11. Holmes, N.S., Morawska, L., A review of dispersion modelling and its application to the dispersion of
particles: An overview of different dispersion models available. Atmospheric Environment (2006), 5902-
5928.
12. Stohl, A., Forster, C., Frank, A., Seibert, P., Wotawa, G., Thehnical note: The lagrangian particle dispersion
model FLEXPART version 6.2. Atmos. Chem.Phys (2005), 2461-2474.
13. Baumann, R., Schlager, H., Lagrangian modeling of transport and dispersion of air constituents.
Atmospheric Physics. (2012), 381-399.

SCIENCE AND TECHNOLOGY 468
IGCESH2018
Universiti Teknologi Malaysia, Johor Bahru, Malaysia 13 -15 August 2018
THE DEVELOPMENT OF ANODE MATERIAL FOR MICROBIAL
FUEL CELL
Ummy Mardiana1, Buchari2, Henry Setiyanto2 and Christophe Innocent3
Chemistry Research Group,Institute of Health Science Bakti Tunas Husada, Tasikmalaya, INDONESIA
Analytical Chemistry Research Group, Bandung Techology of Institute,Bandung, INDONESIA
(E-mail: [email protected], [email protected]) Analytical Chemistry Research Group, Bandung Techology of Institute, Bandung, INDONESIA
(E-mail : [email protected])
Institut Européen des Membranes, Université de Montpellier, Montpellier, FRANCE (E-mail : [email protected])
ABSTRACT
New strategies are proposed for development of anode material for Microbial Fuel Cell
(MFC). The immobilization of mediator has been studied and applied in MFC based yeast
as biocatalyst. Neutral red has been choosen as mediator for electron transport in MFC. The
formation of polyneutral red layer at the surface at anode has been conducted using
electropolymerization and resulting anode modified were characterized by
chronoamperometry. Yeast in solution oxidized glucose and generates a current by direct and
mediated electrons transfer from yeast cells to the carbon electrode. The result substantiated
that immobilization by electropolymerization of mediator for MFC could be a promising
method to product green electricity and reduce the using of mediator in solution which could
give the contribution to environmental pollution.
Key words: Anode modification, immobilization, Neutral red, MFC, Bioenergy
INTRODUCTION
Energy, in any form, plays the most important role in the modern world. We need energy,
especially electrical energy in our daily needs of life. We have been completely dependent on
conventional energy sources such as coal and oil for quite a long time. This situation has
encouraged many researchers to exploit the renewable energy sources. The technology is
known as Microbial fuel cell (MFC). The production of energy from renewable substrates,
such as biomass, is important for creating sustainable energy production and reducing global
emissions of CO2 [1].
In this study, we focus to improve the MFC based yeast as biocatalyst through the synthesis
of anode material. As we know that yeast couldn’t transfere electron directly, so the present
of mediator is really needed. The indirect mode where the electrons transfer occurs from the
bio agent to the anode via a chemical used as mediator. A problem encountered is that energy
produced from yeast fuel cell is remaining too low, mainly due to the very low rate of

SCIENCE AND TECHNOLOGY 469
connection from MFC to electrode. With these perspectives in mind, we have been working
on the immobilization of the mediator, and neutral red (NR) used as redox mediator molecule
directly at the electrode by electropolymerization process.
To overcome this drawback, the mediator can be physically adsorbed onto the electrode;
however, this also leads to a low stability of the MFC due to a rapid loss of the mediator from
the anode surface upon cycling [2]. Finally, from a sustainable green energy power
production point of view, it becomes essential to develop systems working with electrons
carriers strongly immobilized at the electrode. The electropolymerization of NR will form a
NR polymeric film acting thus as a network including many electrons carriers that will
further prevent the mediator from leaching upon MFCs utilization cycles [3].
In this work, we present the conditions of electro generation of a polymer film of NR at the
surface of the anode of a yeast-based MFC. We are also comparing results obtained from the
anodic half-cell of the MFC that is composed of Saccharomyces cerevisiae as biocatalyst
both working directly in solution and entrapped within the PNR film. The development of the
PNR film aims in this context to improve the stability of the anodic part of the MFC.
MAIN RESULTS
The electropolymerization of NR at surface of carbon felt (CF) and graphite carbon (GC)
have been carried out by cyclic voltammetry. The cyclic voltammogram of NR leading to the
electropolymerization growth of PNR film after 15 scans.
Figure. 1 The cyclic voltammogram of PNR (15 scans) on (A) CF and (B) GC electrodes in 1 Mm
NR , 0.1 M KNO3 and 0.025 M PB pH 6 at the scan rate of 50 mV.s-1.

SCIENCE AND TECHNOLOGY 470
SEM images of the CF/PNR at surface of CF, are presented in figure below :
Figure 2. (A) The SEM images of carbon felt :(A) before polimerization of NR, (B) after deposited
of PNR layer. (C) EDX spectrum of CF before modified by PNR.
CONCLUSION
NR and its polymerized form PNR have been successfully used as anodic electrons carriers
for glucose oxidation. Electropolymerization of NR was conducted at carbon felt electrode by
cyclic voltammetry between -1.0 and 0.55 V vs. SCE. PNR has shown better properties of
electrons transfer than NR through the generation of a higher current density in the presence
of glucose and the yeast Saccharomyces cerevisiae in solution. Electropolymerization of NR
was also conducted in the presence of yeast to entrapp Saccharomyces cerevisiae within
PNR. Best results were obtained using a film of PNR deposited on CF and working with
yeast in suspension. The MFC built with the CF/PNR anode and working with yeast in
suspension delivered a power density of 6 mW.m-2 proving the interest to develop such
devices.
Acknowledgment: This work was funded by Grant of International Joint Collaboration
Research Institution from Higher Education Ministry of Indonesian (DIKTI) and partially
supported by Institute European des Membranes (IEM) Montpellier France.
REFERENCES
1. Mardiana U, Innocent C, Cretin M, Buchari B, Gandasasmita S. Yeast fuel cell: Application for desalination.
IOP Conference Series: Materials Sci and Eng, 107 (2016), 012049-53.
2. Lowy, D.A., Tender, L.M., Zeikus, J.G., Park, D.H., Lovley, D.R., Harvesting energy from the marine
sediment-water interface II. Kinetic activity of anode materials., Biosens. Bioelectron., 21 (2006), 2058–63.
3. Mardiana, U, Innocent, Jarrar H, C, Cretin,M, Buchari,B,Gandasasmita, S. Electropolymerized neutral red as
redox mediator for yeast fuel cell, Int J of electrochem. Sci., 10 (2015), 8886-98.

SCIENCE AND TECHNOLOGY 471
IGCESH2018
Universiti Teknologi Malaysia, Johor Bahru, Malaysia 13 -15 August 2018
PROPOSED TRACEABILITY MODEL WITH EFFORT
ESTIMATION TEST DURING REGRESSION TESTING USING
FUZZY DELPHI METHOD
Mazidah Mat Rejab*1, Suriayati Chuprat2 and NurulHuda Firdaus Mohd Azmi3
1, 2, 3 Advanced Informatic School (AIS), Universiti Teknologi Malaysia, Kuala Lumpur
(E-mail: [email protected], [email protected], [email protected])
ABSTRACT
Maintaining a software system consists of tasks such as fixing defects, adding new functions,
or modifying the software (software changes) to accommodate exceptional environments.
Then, the modified software system needs to be tested, to make sure the changes will not
having any destructive effects on the previously confirmed code. Regression testing is one of
the approaches which software tester used to test the software system. The traditional
regression testing strategy was to repeat all the previous tests and retesting all the features of
the program even for small modifications. However, there is still need to study on the
software traceability model of coverage analysis in software changes during regression
testing and test effort estimation on regression testing. Hence, the purpose of this research is
to improve software changes with traceability model and test effort estimation during
regression testing. Design and development phase is a phase that most critical research
approach design and development of a product. For design and development, this proposed
model will use the Fuzzy Delphi Method. From the model proposed it is expected to reduce
operational cost during the implementation of software maintenance. From the studies, it is
hoped that an efficient and improve solution to regression testing can be realized, thus, gives
the benefits to software testers and project manager manage the software changes task since it
is a critical part in software maintenance.
Key words: Test Effort Estimation, Regression Testing, Software Traceability, Software
Changes, Fuzzy Delphi Method
INTRODUCTION
Software testing is considered now as an important activity in software maintenance life
cycle. It is a practice frequently used to determine and improve software quality. Code and
requirement coverage information is largely used to focus on issues in software development
and maintenance phase. Software undergoes changes to the code and associated documents
due to a problem or need for improvement in functionalities [1]. These changes are
performed for different reasons, consisting of adding new functions, correcting a few errors
or for overall performance improvement. As subsequent versions of the software program are
created, coverage data is needed for those program for regression testing tasks. Updated
coverage data is also required for the impact analysis before implementing the real change.

SCIENCE AND TECHNOLOGY 472
RESEARCH OBJECTIVE AND BACKGROUND OF PROBLEM
Research objectives for this study are:-
1) To identify the characteristics of software traceability and test effort estimation in
regression testing for improving the software changes.
2) To develop Software traceability model for reducing operational cost during
regression testing using Fuzzy Delphi Method.
Software testing is a critical part in software lifecycle. In development of software, testing
phase financial records contribute as much as high of 50% of total development effort [2]. In
testing phase, a programing will tested in two ways, one is testing the source code from
program and one more is without source code, only requirement testing. In regression testing
phase, a coding tested start from the test case in control flow as the execution of the test cases
to finding the error. In the other word, regression testing is good contribution action of
development software and maintenance activity. Regression testing give a statement of
development software that no additional error show in the procedure of putting other error or
modification of software [3].
However, the regression testing phase possibility very expensive because this need require
execution of all the test case present in the test suit. The estimation determine as intelligent
anticipants of quantum or work that request to be performed and the resources like human,
equipment and time. This required show the work at the advanced date in defined
environment using specified method. The effort estimation test is an estimation of the testing
schedule, testing size, cost and effort for a software testing project in personnel environment
using separate method, techinique and tool [4]. Test effort estimation is that estimation of the
testing size, effort, cost and schedule for a software test project in an individual environment
using the distinct method, tool and technique, [4]. Aranha [5] claim the test effort is the
addition of the effort spends on test activity and the effort spends on the debug activity.
DATA COLLECTION PROCEDURE
This model is built around the functional requirement, design test, test case and source code
of the software system. A traceability approach is used to establish links between software
artifact. The proposed model and approach is explained in line with the existing model. This
highlight the importance of this study in finding change impact of any artifact on traceability,
regression testing test selecting & prioritization while working on software maintenance
phase and test effort estimation. A prototype toll will be developed after FDM analysis is
done.
Delphi Method is an approach that has been used and widely accepted to collect data for a
study based on the validation expert in a research study of Hsu [6]. The strength of this
method has also producing diversity technique in obtaining empirical data like Fuzzy Delphi
Method (FDM). Talk about FDM, is a method of measurement based on the modification
based on the Delphi Method. For the design development major component of this element,
the researcher has applied the approach of Fuzzy Delphi Method (FDM) where through the
group expert validating, assessing and reject and add every component and the element in the
new model developing. Choosing the expert is very important and should meet the
requirement of this study.

SCIENCE AND TECHNOLOGY 473
The selection of the number of experts for phase Fuzzy Delphi method (FDM) is a total of 12
people. This is based on the view of Adler [7], which pointed out that the number of experts
for Delphi technique was as many as 10 to 15 people if the expert can get an agreement in
each other. However, there is also an opinion stating that the minimum number of experts for
Delphi technique of five experts This is match argument Rowe and Wright [8] that the
number of experts can start from 5 to 20 people based on their areas of expertise. Jones and
Twiss [9] did suggest the number of experts involved in the Delphi method approach of 10-
50 experts.
The criteria and characteristics of this study involved in software engineering specialist in
software testing which is from academic and from industrial. Selection is also based on to the
Berliner [10] and [11] who argues that the expert is competent if they participated in a
particular field of consistently exceeding a period of 5 years. While there are the other
scholars pointed out that experts are highly skilled and experienced in the areas studied
[12],[13].Based on the discussion for selection the respondent for design and development
phase, the researcher list down the criteria for selecting the expect :
1) Lecture from IPTA had experienced 5 years in software engineering and specific
in software testing.
2) Senior Lecture had experienced 10 years in software engineering and specific in
software testing.
3) Software Tester from industrial had 5-year experience in software engineering
4) Information Technology Officer F41 and above from Government sector had 5-
year experience in Software engineering.
The process of data collection in this phase involved individual meetings between researchers
and expert. The purpose of the meeting is to ensure that all expert can meet face and run the
discussion about design and development model. The proposed of this model can out after
running the Fuzzy Delphi Method for the element in the proposed model that evaluate from
an expert.
CONCLUSION AND FUTURE WORK
This research will propose solution to help testing team, project manager, and another
stakeholder when the face to request changes in the maintenance phase. In conclusion, this
research proposed a software traceability model with test effort estimation duirng regression
testing. With using the Fuzzy Delphi Method duirng the design and development this
proposed model will ensure that the model will run smoothly. For the future work, the design
of the model based on the data get from the Fuzzy Delphi Method discussion within the
expert review.
REFERENCES
1. Bennett, K. H., & Rajlich, V. T. (2000, May). Software maintenance and evolution: a roadmap. In Proceedings of the Conference on the Future of Software Engineering (pp. 73-87). ACM
2. Sharma, A. (2013, December). Test effort estimation in regression testing. In Innovation and Technology in
Education (MITE), 2013 IEEE International Conference in MOOC (pp. 343-348). IEEE.
3. Kavitha, R., & Sureshkumar, N. (2010). Test case prioritization for regression testing based on the severity
of fault. International Journal of Computer Science and Engineering, 2(5), 1462-1466.
4. Bertolino, A. (2007, May). Software testing research: Achievements, challenges, dreams. In 2007 Future of
Software Engineering (pp. 85-103). IEEE Computer Society.

SCIENCE AND TECHNOLOGY 474
5. Aranha, E., & Borba, P. (2007, September). Test effort estimation models based on test specifications. In
Testing: Academic and Industrial Conference Practice and Research Techniques-MUTATION, 2007.
TAICPART-MUTATION 2007 (pp. 67-71). IEEE
6. Hsu, C. C., & Sandford, B. A. (2007). The Delphi technique: making sense of consensus. Practical
assessment, research & evaluation, 12(10), 1-8 7. Adler, M., & Ziglio, E. (1996). Gazing into the oracle: The Delphi method and its application to social
policy and public health. Jessica Kingsley Publishers.
8. Rowe, G., & Wright, G. (2011). The Delphi technique: Past, present, and future prospects – Introduction to
the special issue. Technological Forecasting and Social Change, 78(9), 1487–1490.
9. Jones, H. & Twiss, B.L. (1978). Forecasting Technology For Planning Decisions. New York: Macmillan
10. Berliner, D. C. (2004a). Expert teachers: Their characteristics, development, and accomplishments. In R.
Batllori i Obiols, A. E Gomez Martinez, M. Oller I Freixa & J. Pages i. Blanch (eds.), De la teori.an l‟aula:
Formacio del professorat ensenyament de las ciències socials (pp. 13-28). Barcelona, Spain:
Departament de Didàctica de la Llengua de la Literatura I de les Ciències Socials. Universitat Autònoma de
Barcelona. https://sportscoachuk.org/sites/default/files/Berliner%20 (2004) %20Expert%20Teachers.pdf
11. Berliner, D. C. (2004b). Describing the Behavior and Documenting the Accomplishments of Expert
Teachers. Bulletin of Science, Technology &Society, 24(3), 200-212. 12. Swanson, R.A. & Falkman, S.K. (1997). Training delivery Probelms and Solutions:
Identification of nivice trainer problems and expert trainer solutions. Human
Resource Development Quarterly, 8 (4), 305-314.
13. Dalkey, N. C., & Helmer, O. (1963). An experimental application of the Delphi method
to the use of experts. Management Science, 9(3), 458-467

SCIENCE AND TECHNOLOGY 475
IGCESH2018
Universiti Teknologi Malaysia, Johor Bahru, Malaysia 13 -15 August 2018
DOMINATION POLYNOMIAL OF CONJUGATE GRAPH AND
CONJUGACY CLASS GRAPH OF DIHEDRAL GROUPS
Nabilah Najmuddin*1, Nor Haniza Sarmin2 and Ahmad Erfanian3
1, 2 Department of Mathematical Sciences, Faculty of Science, Universiti Teknologi Malaysia, 81310
UTM Johor Bahru, Johor, MALAYSIA. (E-mail: [email protected], [email protected])
3 Department of Pure Mathematics, Faculty of Mathematics, Ferdowsi University of Mashhad, Azadi
Square, 9177948974 Mashhad, Razavi Khorasan, IRAN. (E-mail: [email protected])
ABSTRACT
A domination polynomial is a graph polynomial in which its coefficients are the number of
dominating sets in the graph. A graph of a group G is called a conjugate graph if the vertices
are non-central elements of G and two distinct vertices are adjacent if they are conjugate to
each other. Meanwhile, a conjugacy class graph of a group G is a graph in which its vertices
are the non-central conjugacy classes of G and two distinct vertices are connected if and only
if their class cardinalities are not coprime. The conjugate and conjugacy class graph of
dihedral groups can be expressed generally as a union of complete graphs on some vertices.
In this paper, the domination polynomial of the conjugate and conjugacy class graphs of the
dihedral groups are found.
Key words: Domination polynomial, Conjugate graph, Conjugacy class graph, Dihedral group
INTRODUCTION
A simple graph G = (V ,E) consists of non-empty set of vertices and a set of edges, E,
which is the unordered pair of vertices from V [1]. A complete graph K
n is a type of graph in
which it contains n vertices and each pair of distinct vertices is connected by an edge [2]. By
using the properties of graphs, the algebraic properties of groups can be studied. Two types of
graphs associated to groups that will be considered in this research are the conjugate graph
and the conjugacy class graph. A conjugate graph is a graph whose vertex set is the non-
central elements of a group and two distinct vertices are adjacent if they are conjugate [3]. A
conjugacy class graph is a graph whose vertex set is the non-central conjugacy classes and
two vertices are adjacent if their class cardinalities are not coprime [4]. A domination
polynomial [5] is a type of graph polynomial that stores combinatorics information of a graph
in which its coefficients are the dominating sets of a graph.
In this research, the domination polynomial of the conjugate graph and conjugacy class graph
of dihedral groups of order 2n with the group representation
D
2n= a, b : an = b2 = 1, bab = a-1 , where n ³ 3, n λ will be obtained. Samaila et al. [6]
have presented the conjugacy classes of dihedral group, that will be used in the computation
to obtain the general form for the conjugate graph of dihedral group, so that, the domination
V

SCIENCE AND TECHNOLOGY 476
polynomial can be constructed. Mahmoud et al. [7] have obtained the general form of the
conjugacy class graph of dihedral group as stated in the following.
Theorem 1 [7] The Conjugacy Class Graph of the Dihedral Groups
Let D
2n be dihedral groups of order 2n. The conjugacy class graphs of
D
2n are given as:
GD
2 n
cl =
Kn-1
2
È K1
Kn+2
2
Kn-2
2
È K2
ì
í
ïïï
î
ïïï
; n is odd
; n and n
2 are even
; n is even and n
2 is odd.
MAIN RESULTS
Theorem 2 The Conjugate Graph of the Dihedral Groups
Let be dihedral groups of order 2n. The conjugate graph of are given as:
GD
2 n
conj =
»i
n-12
K2È K
n ; n is odd
»i
n-22
K2È »
i
2
K n2
; n is even.
ì
í
ïï
î
ïï
Theorem 3 The Domination Polynomial of the Conjugate Graph of Dihedral Groups
Suppose that be dihedral groups of order , where , then the
domination polynomial of the conjugate graph of can be expressed as follows:
D GD
2 n
conj ;x( ) =
(1+ x)n+1
2 -1 ; n is odd
2x + x2( )n-2
2 (1+ x)n
2 -1æ
èç
ö
ø÷
2
; n is even.
ì
í
ïï
î
ïï
Theorem 4 The Domination Polynomial of the Conjugacy Class Graph of Dihedral
Groups
Suppose that be dihedral groups of order , where , then the
domination polynomial of the conjugacy class graph of can be expressed as follows:
D GD
2 n
cl ;x( ) =
x(1+ x)n-1
2 - x
(1+ x)n+1
2 -1
2x + x2( ) (1+ x)n-1
2 -1æ
èç
ö
ø÷
ì
í
ïïï
î
ïïï
; n is odd
; n and n
2 are even
; n is even and n
2 is odd.
D
2n D
2n
D
2n 2n n ³ 3, n λ
D
2n
D
2n 2n n ³ 3, n λ
D
2n

SCIENCE AND TECHNOLOGY 477
CONCLUSION
In this paper, the domination polynomial of the conjugate graph and conjugacy class graph of
the dihedral groups, are obtained and can be expressed depending on the parity of .
The domination polynomial of the conjugate graph of the dihedral groups is
when is odd, and when is even,
. Meanwhile, the domination polynomial of the
conjugacy class graph of the dihedral groups is when is odd,
and when and are even, . Lastly, when is even and is
odd, .
Acknowledgment: The first author would like to thank Universiti Sains Malaysia and the
Ministry of Higher Education for the full sponsorship given. This work was financially
supported by the Universiti Teknologi Malaysia and Ministry of Higher Education under the
Research University Grant (GUP) Vote No 13H79 and 13J82.
REFERENCES
1. Balakrishnan, R. and K. Ranganathan. A Textbook of Graph Theory. 2nd ed. Springer, NEW YORK. 2012.
2. Rosen, K.H. Discrete Mathematics and Its Applications. 7th ed. McGraw-Hill, NEW YORK. 2013.
3. Erfanian A. and Tolue B. Conjugate graph of finite groups. Discrete Mathematics, Algorithms and
Applications 4(2) (2012), 1-8. 4. Bertram, E. A., M. Herzog and A. Mann. On a Graph Related to Conjugacy Classes of Groups. Bulletin of
the London Mathematical Society 22(6) (1990), 569-575.
5. Alikhani, S. and Peng, Y.-H. Introduction to domination polynomial. Ars Combinatoria 114 (2014), 257-
266.
6. Samaila, D., Abba, B.I. and Pur, M.P. On the conjugacy classes, centers and representation of the groups S
n
and D
n. International Journal of Pure and Applied Science and Technology 15(1) (2013). 87-95.
7. Mahmoud, R., Sarmin, N.H. and Erfanian, A. The conjugacy class graph of some finite groups and Its
energy. Malaysian Journal of Fundamental and Applied Sciences 13(4) (2017) 659-665.
D
2n n
D G
D2 n
conj ;x( ) = 2x + x2( )n-1
2 (1+ x)n -1( ) n n
D GD
2 n
conj ;x( ) = 2x + x2( )n-2
2 (1+ x)n
2 -1æ
èç
ö
ø÷
2
D G
D2 n
cl ;x( ) = x(1+ x)n-1
2 - x n
n
n
2 D G
D2 n
cl ;x( ) = (1+ x)n+1
2 -1 n
n
2
D GD
2 n
cl ;x( ) = 2x + x2( ) (1+ x)n-1
2 -1æ
èç
ö
ø÷

SCIENCE AND TECHNOLOGY 478
IGCESH2018
Universiti Teknologi Malaysia, Johor Bahru, Malaysia 13 -15 August 2018
ASSESSMENT FOR ACOUSTIC EXTRACTION AND
CHARACTERIZATION OF PHENOLIC COMPOUNDS FROM BUAH
KUNING TELUR PULP
Yahya N.A*1, Marzuki N. H. C and Wahab R.A. 2
1,2 Department of Chemistry, Faculty of Science, Universiti Teknologi Malaysia, 81310 Johor Bahru,
MALAYSIA.
(E-mail: [email protected], [email protected])
ABSTRACT
Buah Kuning Telur (BKT) belonging to the Pouteria family remains as one of the least
recognized fruits in the world. This study reported on the phenolic compounds from the BKT
pulp that were acoustically extracted via an ultrasound-assisted technique. The extracted
compounds were subsequently characterized to determine their antioxidant properties,
followed by analyses of proximate and fatty acid composition. It was discovered that the PC
pulp extract has fourteen different types of fatty acids, dominated by palmitic acid (16:0),
myristic acid (14:0), oleic acid (18:1) and linoleic acid (18:2), respectively. Assessments on
the total phenolic content (TPC) and total flavonoid content (TFC) revealed that the PC
extract has 523.68 mg GAE/100 gm and 397.89 mg GAE/100 gm of fresh weight basis
(FWB), respectively. The IC50 of the PC extract showed 0.7982 µg/mL by 1,1-diphenyl-2-
picrylhydrazyl (DPPH) radical scavenging activity. High Performance Liquid
Chromatography (HPLC) revealed the presence of ~0.03 % (w/w) of polyphenolic gallic acid
in the extract of the PC pulp, with a high recovery value of validation data (109.84 %, R2 =
0.9995).
Key words: Buah Kuning Telur, ultrasound-assisted extraction, fatty acid composition,
proximate analysis
INTRODUCTION
Buah Kuning Telur (BKT) or known as ‘Pouteria campechiana’ of the Sapotaceae family
is native to Central America but can be found throughout the globe especially in humid
and subtropical area viz. Asia and South America. The BKT fruit is highly nutritious and
has a higher energy content, alongside other beneficial minerals such as calcium and pro-
vitamins i.e. niacin and carotene (pro-vitamin A) [1, 2]. This fruit can be vary in shape
ranging from being round to an unusual spindle berry, with a pointed apex [3]. The skin
of the fruit has a green hue when unripe, but turns yellow and softer once ripened [1]. The
pulp can be eaten fresh or processed into food ingredients viz. custards, ice cream and
marmalade. Among Malaysians, BKT fruit is basically unknown despite the myriad of
nutritional benefits [4].
Polyphenolic-based antioxidants viz. (+)-gallocatechin, (+)-catechin, (-)-epicatechin,
dihydromyricetin, (+)-catechin-3-O-gallate, and myricitrin were reported to be among the

SCIENCE AND TECHNOLOGY 479
chemical constituents in Pouteria species [5]. In view of such interesting an report, this
study focuses on the extraction of polyphenolic compounds using modern technique.
According to [4], appropriate steps must be taken during the extraction to prevent the loss
or decomposition of polyphenolic compounds. Herein, this study highlighted the use of
ultrasound-assisted extraction (UAE) technique to extract the polyphenolic compounds in
BKT pulps.
UAE technique was chosen in this study due to the efficiency process, related to the
acoustic cavitation phenomenon. Bubbles from the liquid medium are dynamically shaped
continuously, and the produced bubbles trigger more rarefaction cycles or collapses.
These cycles eventually implode and hit the surface of the solid matrix and disintegrate
the plant cells to liberate the bioactive compounds [6]. Herein, this research highlights the
extraction of BKT pulp using UAE and the characterization of the obtained plant extract.
MATERIALS AND METHODS
The study is divided into two main stages where the first stage revolves around the
acoustically-assisted preparation of BKT extract in 60% and 70% (v/v) ethanol:water
solutions. After homogenization, centrifugation and filtration, the BKT extract was stored at
4oC prior to analysis of anti-oxidant activity and physicochemical characterization.
MAIN RESULTS
Extraction and Characterization of BKT pulp
Table 1. Percentage yield of different
solvent concentration
Ethanol:Water (%) Yield (%)
60 69.10
70 62.85
Table 2. Antioxidant activities of BKT pulp extract
TPC (mg GAE/100 gm
FWB)
523.7
TFC (mg GAE/100 gm
FWB)
397.9
IC50 (µg/mL) 0.798
Table 3. Proximate analysis of BKT
pulp extract
Parameters Result (%)
Moisture 8.400
Ash 1.700
Protein 4.000
Fat 1.000
*Carbohydrate 84.90
*Energy Value
of Food
364.6 kcal/100g
Table 4. Fatty acid composition of BKT
pulp extract

SCIENCE AND TECHNOLOGY 480
DISCUSSIONS
This study reported a high yield of BKT pulp, as high as ⁓70 % which affirmed the efficacy
of the UAE to draw out the polyphenolic compounds enclosed within the cells of BKT pulp.
Ethanol was chosen as solvent as it has been deemed as a food-safe and non-toxic, in
conjunction with the possible decrease in emissions of volatile organic compounds to the
environment [7,8]. Data on TPC and TFC of BKT pulp obtained by UAE was revealed to be
higher as compared to that obtained by a conventional method, namely by continuous shaking
with only 152.45 mg GAE/100 gm FWB and 109.73 mg QE/100 gm FWB [9]. The study was
able to correlate the outcome of DPPH with IC50, which revealed to be 0.7982 µg/mL.
Stronger antioxidant activity was indicated as reflected in a lower value of IC50 [10].
The fatty acid composition result seen here is consistent with the observably rather rich and
slightly oily consistency of the fresh BKT pulp and the slightly viscous appearance of the
BKT extract, which viscosity lies somewhat between that of the palm oil and jojoba oil.
Other than that, proximate analysis showed that the pulp of the BKT is rich in carbohydrates
(84.9 %), consistent with reports indicating the fruit being a good source of food and storage
of energy. The pulp of the BKT fruit has found application in the food industry viz. pancakes,
jam, jelly, cupcakes and syrups [11]. Remarkably, despite the oily and rich consistency of the
fresh PC pulp, it is low in fat (1 %) and protein content (4.0 %), typically characteristic for
wild fruits.
CONCLUSION
Polyphenolic compounds were successfully extracted from BKT pulp using an acoustic
extraction technique to attain a percentage yield of 69.10% and 62.85% for the 60% and 70%
(v/v) ethanol:wáter solutions. Total phenolic content (TPC) and total flavonoid content (TFC)
revealed of the BKT extract gave a 523.68 mg GAE/100 gm and 397.89 mg GAE/100 gm of
fresh weight basis (FWB), respectively. The IC50 of BKT extract was 0.7982 µg/mL by 1,1-
diphenyl-2-picrylhydrazyl (DPPH) radical scavenging activity. Data on fatty acid
composition and proximate analysis revealed palmitic acid (16:0) and oleic acid (18:1) were
the predominant fatty acids; with carbohydrate (84.90%) as the main component. Hence, the
UAE method proposed in this study permits a rapid extraction of polyphenolic compounds.
Acknowledgment: The authors would like to express their appreciation for the support of the
sponsors with Project No Q.J130000. 2526.17H48.
REFERENCES
1. Kong. K. W., Khoo. H. E., Prasad. N. K., Chew. L. Y. & Amin. I. Total Phenolics and Antioxidant
Activities of Pouteria Campechiana Fruit Parts. Sains Malaysiana, 42 (2013), 123-127.
2. Mehraj, H., Sikder, R. K., Mayda, U., Taufique, T. and Jamal Uddin, A. F. M. Plant Physiology and Fruit
Secondary Metabolites of Canistel (Pouteria campechiana). World Applied Sciences Journal, 33 (2015),
1908-1914.
3. Lim, T. K. Pouteria campechiana. Edible Medicinal and Non-Medicinal Plants. Springer, Dordrecht, 2013.
4. Marzuki, N. H. C., Hamid, M. A. and Wahab, R. A. Assessment of Fatty Acid Composition and Response Surface Optimization of Ultrasonic-Assisted Extraction of Phenolic Compounds from Pouteria campechiana
Pulp. Malaysian Journal of Fundamental and Applied Sciences. 2017.
5. Ma. J., Yang. H., Basile. M. J. and Kennelly. E. J. Analysis of Polyphenolic Antioxidants from the Fruits of
Three Pouteria Species by Selected Ion Monitoring Liquid Chromatography-Mass Spectrometry. Journal of
Agricultural and Food Chemistry, 52 (2004), 5873-5878.

SCIENCE AND TECHNOLOGY 481
6. Gil-Chávez, G. J., Villa, J. A., Ayala-Zavala, J. F., Heredia, J. B., Sepulveda, D., Yahia, E. M. and
González-Aguilar, G. A. Technologies for Extraction and Production of Bioactive Compounds to be Used as
Nutraceuticals and Food Ingredients: An Overview. Comprehensive Reviews in Food Science and Food
Safety, 12 (2013), 5-23. 7. Ferreira-Dias, S., Valente, D. G. and Abreu, J. M. F. Comparison between ethanol and hexane for oil
extraction from Quercus suber L. fruits. Grasas y Aceitas, 54 (2003), 376-383.
8. Baümler, E. R., Carrín, M. E. and Carelli, A. A. Diffusion of tocopherols, phospholipids and sugars during
oil extraction from sunflower collets using ethanol as solvent. Journal of Food Engineering, 194 (2017), 1-8.
9. Adiyaman, P., Kanchana, S., Usharani, T., Ilaiyaraja, N., Kalaiselvan, A. and Anila Kumar, K. R.
Identification and Qualification of Polyphenolic Compounds in Underutilized Fruits (Star Fruit and Egg
Fruit) Using HPLC. Indian Journal of Traditional Knowledge, 15 (2016), 487-493.
10. Ismail. A., Azlan. A., Khoo. H. E., Prasad. K. N. & Kong. K. W. Antioxidant Assays Principles, Methods &
Analyses. Universiti Putera Malaysia Press. Serdang, Selangor. 2013.
11. Pushpakumara D.K.N.G. Underutilized fruit trees in Sri Lanka. World Agroforestry Centre, South Asia
Office, New Delhi, India. 2007.

SCIENCE AND TECHNOLOGY 482
IGCESH2018
Universiti Teknologi Malaysia, Johor Bahru, Malaysia 13 -15 August 2018
OPTIMIZATION OF TWO-DIMENSIONAL GEL
ELECTROPHORESIS FOR ORTHOSIPHON STAMINEUS LEAF
PROTEOME ANALYSIS
M. L. Ng*1, M.S. Shahir2 and Z. Rahmat3
1,3 Faculty of Biosciences and Medical Engineering, Universiti Teknologi Malaysia, Johor Bahru,
MALAYSIA. 2 Innovation and Commercialisation Centre, Universiti Teknologi Malaysia, Johor Bahru,
MALAYSIA.
(E-mail: [email protected], [email protected], [email protected])
ABSTRACT
Orthosiphon stamineus is a well-known traditional medicinal plant and has been used as folk
medicine for the treatment of diabetes and kidney diseases. Previous studies also reported that
the leaf possesses medicinal properties including antidiabetic, antioxidant, antibacterial and
so forth. However, leaf proteome remains unknown. The protein analysis of the plant is of
interest because proteins with medicinal properties could be unraveled and applied in food
authentication to assess the products’ quality. In this study, total protein from the plant leaves
were extracted using phenol/SDS buffer with three preliminary washes method, quantified
using Bradford assay and the protein quality were determine via SDS-PAGE followed by
two-dimensional gel electrophoresis (2D) to reveal the protein expression pattern of the O.
stamineus leaf. Presently, there is no established 2D protocol for O. stamineus. In order to
obtain better protein expression profiling of O. stamineus, several major conditions of 2D
were manipulated to establish optimized 2D protocol. The optimized conditions included
sonication of sample, sample cleanup and isoelectric focusing voltage. The present 2D
method is able to provide good quality with less streaking and approximately 100 focused
spots were detected and reproducibly. From 2D protein analysis, proteins with
pharmaceutical importance as well as protein marker may be discovered through protein
identification which may use in quality control perspectives as the production of herbal
products are increasing exponentially.
Key words: Orthosiphon stamineus, leaf proteome, gel electrophoresis, protein solubilization,
isoelectric focusing
INTRODUCTION
To date, proteomics have been widely employed in various studies due to the increased
recognition on the versatility of the protein. Proteomics can be defined as the protein analysis
of any living organisms on large scale in order to know the protein structures, functions,
abundance, protein-protein interactions and so on [1]. From literature review, proteomics has
many applications; it is used as a tool to examine the authenticity of food products such as
honey and fish while also involved in quality control of herbal drugs. Currently, much

SCIENCE AND TECHNOLOGY 483
vigilance is focused on protein studies from natural sources especially the plant due to
awareness that proteins from food have health-promoting activities. Plant bioactive proteins
and peptides exhibiting various pharmacological activities have been reported such as protein
from Moringa oleifera that possesses hypoglycemic and antioxidant activities [2].
2D is the most commonly used technique in proteomics to separate hundreds to thousands
of proteins or polypeptides based on isoelectric point (pI) during first dimension,
isoeletric focusing (IEF) step and molecular weight by sodium dodecyl sulphate
polyacrylamide gel electrophoresis (SDS-PAGE) during second dimension, where one
spot represents one protein. Besides, coupled to mass spectrometry, it is allowed for
protein identification purpose. Orthosiphon stamineus is a popular traditional medicinal
plant in many countries especially in Southeast Asia countries and some European
countries. It is generally known as Java tea and locally known as misai kucing. This plant
has been traditionally claimed able to treat human ailments such as diabetes, kidney
diseases, bladder inflammation, gout and so forth [3]. Meanwhile, the leaf has been
proven to exert various pharmacological activities including antidiabetic,
antihypertensive, antitumor, antioxidant, antiobesity, antibacterial, anti-inflammation,
diuretic and hepatoprotective activities from scientific evidences. However, the leaf
proteome of O. stamineus remains unreported to date. The aim of the study is to establish
an optimized 2D method for better protein analysis of the plant and provide O. stamineus
leaf proteome reference map that could be used for future studies such as identification of
the potential protein with medicinal values and protein markers for O. stamineus which is
useful in quality control perspectives. We anticipated that some proteins in the plant may
possesses medicinal values and potentially can be exploited to make an alternative drug.
MAIN RESULTS
In the study, the leaf protein were extracted using phenol/SDS buffer with three
preliminary washes method and quantified by Bradford assay followed by SDS-PAGE to
determine the protein quality. The extracted protein was further used to run 2D. During
the optimization stage, few parameters were modified such as sonication, samples cleanup
and without cleanup and different IEF voltage (4000 V, 5000 V, 8000 V) on IPG strips
pH 4-7, 7 cm. The gels were stained with CBB solution to visualize the protein spots.
In the present study, the sonication of sample, sample cleanup and 8000 V focusing
voltage were determined as the optimum factors for obtaining good quality of 2D gel of
O. stamineus with high resolution of protein spots and minimal streaking. The result was
shown in Figure 1. Non-protein contaminants in the sample such as salts, phenolic
compounds and lipids could compromise IEF step, sample cleanup is preferable to
remove interfering compounds and thus IEF in steady state can be achieved and more
focused spots can be obtained [4]. Cheng et al. also suggested that sample cleanup is able
to improve quality 2D gel [5]. Whilst, sonication of the protein is also considered as a
crucial step because it can make protein well solubilized in the buffer, improve the
resolution of 2D gel with minimal streaking and in agreement with Manadas et al.
findings [6]. Besides, 8000 focusing voltage has been identified as the preferably IEF
voltage for the plant. This finding is in parallel with other medicinal plants such as Piper
sarmentosum, Clematis chinensis and Gynura procumbens which identify 8000 V as the
best IEF method.

SCIENCE AND TECHNOLOGY 484
Figure 1. 2D gel of O. stamineus and marker is denoted by M.
CONCLUSION
In a nutshell, best resolution of leaf proteome for O. stamineus was achieved when sonication
and 2D clean up kit were used during sample preparation and 8000 focusing voltage was
applied during IEF step. Approximately 100 spots with less streaking were detected in the
gel.
Acknowledgment: The authors would like to thank Zamalah scholarship and UTM for the
financial assistance RUG under vote no 00K59.
REFERENCES
1. Ortea, I., O’ Connor, G. and Maquet, A. Review on proteomics for food authentication. Journal of
Proteomics 147 (2016), 212-225.
2. Paula, P.C., Sousa, D.O.B., Oliveira, J.T.A., Carvalho, A.F.U, Alves, B.G.T., Pereira, M.L., Farias, D.F.,
Viana, M.P., Santos, F.A., Morais, T.C. and Vasconcelos, I.M. Hypoglycemic and antioxidant effects in
alloxan-induced diabetic mice. Molecules 22 (2017), 271-286.
3. Akowuah, G.A., Ismail, Z., Norhayati, I. and Sadikun, A. The effects of different extraction solvents of varying polarities on polyphenols of Orthosiphon stamineus and evaluation of the free radical-scavenging
activity. Food Chemistry 93 (2005), 311-317.
4. Nandakumar, M.P, Shen, J., Raman, B. and Marten, M.R. Solubilization of trichloroacetic acid (TCA)
precipitated microbial proteins via NaOH for two-dimensional electrophoresis. Journal of Proteome
Research 2 (2003), 89-93.
5. Cheng, H.T, Hsieh, S.Y., Sung, C.M., Pai, B.C.J., Liu, N.J. and Chen, C.P. Optimizing Human Bile
Preparation for Two-Dimensional Gel Electrophoresis. BioMed Research International 2016 (2016), 1-6.
6. Manadas, B.J., Vougas, K., Fountoulakis, M. and Duarte, C.B. Sample sonication after trichloroacetic acid
precipitation increases protein recovery from cultured hippocampal neurons, and improved resolution and
reproducibility in two-dimensional gel electrophoresis. Electrophoresis 27 (2006), 1825-1831.
M

SCIENCE AND TECHNOLOGY 485
IGCESH2018
Universiti Teknologi Malaysia, Johor Bahru, Malaysia 13 -15 August 2018
REVIEW ON PATHWAY TOPOLOGY-BASED MICROARRAY
ANALYSIS
Hui Wen Nies*1, Mohd Saberi Mohamad2, Zalmiyah Zakaria1, Azurah A Samah1,
Weng Howe Chan1, and Safaai Deris3
1 Artificial Intelligence and Bioinformatics Research Group, Faculty of Computing,
Universiti Teknologi Malaysia, 81310, Skudai, Johor, MALAYSIA.
(E-mail: [email protected]; [email protected]; [email protected]; [email protected]) 2 Faculty of Bioengineering and Technology, Universiti Malaysia Kelantan, Jeli Campus,
Lock Bag 100, 17600 Jeli, Kelantan, MALAYSIA.
(E-mail: [email protected]) 3 Institute for Artificial Intelligence and Big Data, Universiti Malaysia Kelantan, City Campus,
Pengkalan Chepa, 16100 Kota Bharu, Kelantan, MALAYSIA. (E-mail: [email protected])
ABSTRACT
Cancer is a large group of diseases that spread and grow uncontrolled, which can influence
almost any parts of the body. Microarray analysis can improve the outcome of providing
biological insights on the genes. Pathway-based microarray analysis is to integrate pathways
data into microarray analysis. This microarray analysis aimed to extract biological
information of genes from pathways. However, only using pathways information and
ignoring gene interaction within pathways will make the methods less ideal. Pathway
topology-based microarray analysis used pathway topological information to identify
informative pathways. Multiple types of data on same samples set can be provided
underlying susceptibility and progression to disease. Thus, pathway topology-based
microarray analysis aimed to increase classification outcomes of the diseases and improve the
classification accuracy. Cancer patients can have earlier prepared to face the music if the
condition of patient is getting worse. Early detection of cancers can improve survival rate
and enhance quality of life.
Key words: Microarray Analysis, Pathway-based Microarray Analysis, Pathway Topology-
based Microarray Analysis, Cancer.
INTRODUCTION
Cancer is associated with abnormal alterations that lead to dysregulation of cellular
system [1]. Microarray analysis is commonly used to find applications in the diverse
areas of biology [2] and in the experimental molecular biology [3]. Microarray analysis
can measure gene expression level change in gene expression data [4-5]. Microarray
analysis can distinguish genes from poor and good response to treatment [6]. Pathway-
based microarray analysis has been applied to the study of complex diseases [7]. It is also
aimed to identify informative gene sets for a given pathway and to explore pathways that
are related to a specific phenotype [8-9]. Pathway-based microarray analysis can also
examine the statistical test on a group of related genes [10]. This microarray analysis can

SCIENCE AND TECHNOLOGY 486
categorize into Overrepresentation Analysis (ORA), Functional Class Scoring (FCS), and
Pathway Topology-based [11]. However, ORA and FCS didn’t consider pathway
topology information [11-12]. Besides, ORA and FCS also ignored posit ion and
interaction of genes [13]. Pathway topology-based microarray analysis aimed to exploit
pathways and topology information, which can reveal the novel biological insights [10].
Incorporation of topology information for the method using graph theory and
mathematical models [13]. This research focused to review on the existing methods for
pathway topology-based microarray analysis. The details of the methods were described
in the following section.
METHODS
Directed Random Walk (DRW) can infer a pathway activity with greater reproducibility
power [14]. The input data were used by DRW method including gene expression data,
pathways data, and directed graph [14]. The only parameter was used by DRW method is
restart probability (r) that sets to 0.7 [14].
Edge Set Enrichment Analysis (ESEA) is an edge-centric method to identify dysregulated
pathways [15]. This method can investigate changes of inherent biological relationship [15].
ESEA method integrated pathway structure and differential correlation among genes [15].
Interaction, regulation, modification, and binding between genes are belonging to pathway
structure [15].
Topology-Based Pathway Enrichment Analysis (TPEA) aimed to perform pathway
enrichment analysis [16]. TPEA method is also available at the CRAN website:
https://cran.r-project.org/web/packages/TPEA/ [16]. The method can identify reliable
disease-related pathways effectively [16].
CONCLUSION
Pathway-based microarray analysis can provide better performance in term of classification
[17]. This microarray analysis can also reduce the complexity of analysis from thousands of
genes to few hundreds of pathways [18]. Thus, doctors are already starting to use pathways
information to choose and combine the existing drugs more effectively.
Acknowledgment: The authors would like to express their appreciation for the support of
Universiti Teknologi Malaysia Zamalah.
REFERENCES
1. Vaske, C. J., Benz, S. C., Sanborn, J. Z., Earl, D., Szeto, C., Zhu, J., Haussler, D., and Stuart, J. M. Inference of patient-specific pathway activities from multi-dimensional cancer genomics data using PARADIGM.
Bioinformatics, 26(12) (2010), 237-245.
2. Gibson, G. Microarray analysis. PLoS Biology, 1(1) (2003), e15.
3. Brazma, A., and Vilo, J. Gene expression data analysis. FEBS letters, 480(1) (2000), 17-24.
4. Mohamad, M. S., Omatu, S., Deris, S., and Yoshioka, M. A Constraint and Rule in an Enhancement of
Binary Particle Swarm Optimization to Select Informative Genes for Cancer Classification. In: Li J. et al.
(eds) Trends and Applications in Knowledge Discovery and Data Mining. PAKDD 2013. Lecture Notes in
Computer Science, vol 7867. Springer, Berlin, Heidelberg. (2013a).
5. Mohamad, M. S., Omatu, S., Deris, S., Yoshioka, M., Abdullah, A., and Ibrahim, Z. An Enhancement of
Binary Particle Swarm Optimization for Gene Selection in Classifying Cancer Classes. Algorithms for
Molecular Biology, 8(15), 1-11. BioMed Central Ltd. (2013b).
6. Cruz-Rodriguez, N., Combita, A. L., Enciso, L. J., Quijano, S. M., Pinzon, P. L., Lozano, O. C., Castillo, J.

SCIENCE AND TECHNOLOGY 487
S., Li, L., Bareno, J., Cardozo, C., Solano, J., Herrera, M. V., Cudris, J., and Zabaleta, J. High expression of
ID family and IGJ genes signature as predictor of low induction treatment response and worst survival in
adult Hispanic patients with B-acute lymphoblastic leukemia. Journal of Experimental & Clinical Cancer
Research, 35(1) (2016), 1.
7. Jia, P., and Zhao, Z. Network-assisted analysis to prioritize GWAS results: principles, methods and perspectives. Human Genetics, 133(2) (2014), 125-138.
8. Kourou, K., Papaloukas, C., and Fotiadis, D. I. Gene-based pathway enrichment analysis of oral squamous
cell carcinoma patients. In 2016 IEEE-EMBS International Conference on Biomedical and Health
Informatics (BHI), (2016, February) pp. 360-363. IEEE.
9. Wei, H., and Zheng, H. R. A signaling pathway analysis method based on information divergence. In 12th
International Symposium on Operations Research and its Applications in Engineering, Technology and
Management (ISORA 2015), Luoyang, (2015, August) pp. 1-6. IEEE.
10. Wang, K., Li, M., and Hakonarson, H. Analysing biological pathways in genome-wide association studies.
Nature Reviews Genetics, 11(12) (2010), 843-854.
11. Bayerlová, M., Jung, K., Kramer, F., Klemm, F., Bleckmann, A., and Beißbarth, T. Comparative Study on
Gene Set and Pathway Topology-Based Enrichment Methods. BMC Bioinformatics, 16(1) (2015), 334.
12. Khatri, P., Sirota, M., and Butte, A. J. Ten Years of Pathway Analysis: Current Approaches and Outstanding Challenges. PLoS Computational Biology, 8(2) (2012), e1002375.
13. Mitrea, C., Taghavi, Z., Bokanizad, B., Hanoudi, S., Tagett, R., Donato, M., Voichita C., and Drăghici, S.
Methods and Approaches in the Topology-Based Analysis of Biological Pathways. Frontiers in Physiology,
4. (2013).
14. Liu, W., Li, C., Xu, Y., Yang, H., Yao, Q., Han, J., Shang, D., Zhang, C., Su, F., and Li, X. Topologically
Inferring Risk-Active Pathways Toward Precise Cancer Classification by Directed Random Walk.
Bioinformatics, 29(17) (2013), 2169-2177. Oxford University Press.
15. Han, J., Shi, X., Zhang, Y., Xu, Y., Jiang, Y., Zhang, C., Feng, L., Yang, H., Shang, D., Sun, Z., Su, F., Li,
C., and Li, X. ESEA: discovering the dysregulated pathways based on edge set enrichment analysis.
Scientific Reports, 5, (2015), 13044.
16. Yang, Q., Wang, S., Dai, E., Zhou, S., Liu, D., Liu, H., Meng, Q., Jiang, B., and Jiang, W. Pathway enrichment analysis approach based on topological structure and updated annotation of pathway. Briefings in
Bioinformatics. (2017).
17. Guo, X., Hao, Y., Kamilijiang, M., Hasimu, A., Yuan, J., Wu, G., Reyimu, H., Kadeer, N., and Abudula, A.
Potential predictive plasma biomarkers for cervical cancer by 2D-DIGE proteomics and Ingenuity Pathway
Analysis. Tumor Biology, 36(3) (2015), 1711-1720.
18. AlAjlan A., and Badr G. Data Mining in Pathway Analysis for Gene Expression. In: Perner P. (eds)
Advances in Data Mining: Applications and Theoretical Aspects. ICDM 2015. Lecture Notes in Computer
Science, vol 9165. Springer, Cham. (2015).

SCIENCE AND TECHNOLOGY 488
IGCESH2018
Universiti Teknologi Malaysia, Johor Bahru, Malaysia 13 -15 August 2018
EVALUATION OF ANTIBACTERIAL AND ANTIOXIDANT
PROPERTIES OF VARIOUS SOLVENT EXTRACTS OF ALPINIA
GALANGA LEAVES
Intan Nursuraya Zakaria1, Sayang Baba and Salehhuddin Hamdan*3
1, 2, 3 Department of Biological Science, Faculty of Biosciences and Medical Engineering,
University of Technology Malaysia, 81310, UTM Skudai, Johor, Malaysia
(E-mail: [email protected], [email protected], [email protected]*)
ABSTRACT
According to World Health Organization (WHO), food borne diseases caused by bacteria has
become a global concern as it can lead to serious health consequences. Therefore, medicinal
plants including Alpinia galanga have been garnered attention from the researchers for its
antibacterial potential. However, there is still lack of information about the mode of action of
this plant, which was either bacteriostatic or bactericidal. Therefore, the aim of the current
work is to evaluate the antibacterial and antioxidant activities of Alpinia galanga leaves
extracts against Staphylococcus aureus and Escherichia coli. The leaves of A. galanga were
extracted in hexane, acetone, ethanol and aqueous. The antibacterial activities were assessed
by disc diffusion method, followed by minimal inhibitory concentration (MIC) assay ranged
from 0.05 to 1.25 mg/ml and minimum bactericidal concentration (MBC) test. The
antioxidant potential of all extracts was determined by measuring total phenolic content
(TPC) and free radical scavenging potential by DPPH assay. Acetone extract of the plant
showed an antibacterial potential against S. aureus while no inhibition observed for E. coli.
The MIC value was 0.65 ± 0.39 mg/ml with bactericidal effect at 0.63 mg/ml. TPC of the
four extracts were different with acetone being the most efficient solvent while aqueous being
the least efficient one. The acetone extract also exhibit the strongest capability of DPPH
scavenging activity expressed in Ascorbic Acid Equivalent Antioxidant Capacity (AEAC)
with 2311.42 mg AA/100 g. Correlation coefficient between TPC and antioxidant capacity
was found to be R2 = 0.957 suggesting the major contribution of phenolic compounds of the
extract by 95% to the total antioxidant activity. The acetone extract of A. galanga was found
to be the only extract that exhibits the antibacterial activity against S. aureus with a
bactericidal potential.
Key words: antibacterial, antioxidant, Alpinia galanga, acetone
INTRODUCTION
WHO defines food-borne diseases (FBD) as “disease of infectious or toxic nature resulting of
food and water contaminated with bacteria or pathogens such as parasites and viruses”. The
illnesses were range from stomach upset to serious symptoms such as diarrhea, fever,
vomiting, abdominal cramps and dehydrations [1]. According to Newell et al. (2010), since
1960, the major causes of gastrointestinal diseases were associated with Salmonella spp.,
Shigella spp., Clostridium botulinum, Staphylococcus aureus and Escherichia coli. However,

SCIENCE AND TECHNOLOGY 489
the standard antibiotics that commonly used to treat the infectious food borne pathogens were
known to cause contagious side effects in a long term usage including antibiotic-associated
diarrhea, pseudomembranous colitis and increased susceptibility to subsequent disease [4].
For this reason, medicinal plants were reported to be an effective source of antibacterial
agents due to their potent pharmacological activities and low toxicity [9]. In this context,
Alpinia galanga was one of the Malaysian medicinal herbs that widely used as traditional
cure and also has the ability to treat diseases such as fungal skin infections, intestinal
infections, diabetes, bronchitis and rheumatism [10]. Recent studies showed that this plant
demonstrated antiproliferative [8], anticancer [5], antimicrobial [3] and gastroprotective
activity [6]. Besides that, this plant also known to contain polyphenols such as kaempferol,
quercetin, myricetin, isohamnetin, flavone C-glycosides and proanthocyanidins that regarded
as an important indication for its therapeutic purposes [10].
However, there is still lack of information about the antibacterial mode of action of this plant.
On the other hand, a broad range of extraction solvents were also known to affect the extent
of bioactivities of this plant [2]. Therefore, the present study was conducted to determine the
antibacterial (Table 1) and antioxidant activities (Table 2) of different extraction solvents of
A. galanga against selected food borne bacteria including S. aureus and E. coli.
MAIN RESULTS
Table 1. NIC, MIC and MBC values of Alpinia galanga acetone extract. Different case
letters indicate the significance difference (p < 0.05) by Tukey HSD test.
Bacteria tested NIC MIC MBC
Staphylococcus aureus 0.01 ± 0.01 0.65 ± 0.39a
(R2 = 0.996) 0.63a
Escherichia coli - - -
Table 2. Values of TPC and AEAC are means ± SD (n=3). Different case letters in each
sample indicate the significantly difference (p < 0.05) by one way ANOVA using Tukey
HSD test for multiple comparisons.
Table 3. The correlation coefficient by Pearson’s Correlation Coefficient
Assays Correlation R2
Total Phenolic Content
DPPH-Free Radical Scavenging Activity 0.957**
**Correlation is significant at the 0.01 level (2-tailed)
Solvent TPC
(mg GAE/100g)
AEAC
(mg AA/100g)
Hexane 931.11 ± 0.0a 2077.94b
Acetone 953.33 ± 0.0a 2311.42c
Ethanol 849.63 ± 0.0a 847.74d
Aqueous 834.81 ± 0.0a 228.04a

SCIENCE AND TECHNOLOGY 490
CONCLUSION
Acetone extract of A. galanga showed the greatest antibacterial potential against S. aureus
with a bactericidal mode of action. The TPC was found to positively correlate with the
antioxidant capacity of this plant. Therefore, the potential benefits of A. galanga as
antibacterial and antioxidant agents have been shown. Further investigations for examining
the antibacterial mechanisms at the single cell level of this plant extracts are required.
Acknowledgement: The authors would like to thank faculty of biosciences and medical
engineering, Universiti Teknologi Malaysia for them support.
REFERENCES
1. Akinyemi, K. O., Oluwa, O. K. & Omomigbehin, E. O. Antimicrobial activity of crude extracts of three
medicinal plants used in South-West Nigerian folk medicine on some food borne bacterial pathogens.
African Journal of Traditional, Complementary and Alternative Medicines 3(2006): 13-22.
2. Christapher, P. V., Parasuraman, S., Christina, J. M. A., Asmawi, M. Z. & Vikneswaran, M. Review on
Polygonum minus. Huds, a commonly used food additive in Southeast Asia. Pharmacognosy Res 7(2015): 1-
6.
3. Hsu, W., Simonne, A., Weissman, A. & Kim, J. Antimicrobial activity of greater Galangal Alpinia galanga
(Linn.) Swartz. Flower. Food Science and Biotechnology 19(2010): 873-880. 4. Keeney, K. M., Yurist-Doutsch, S., Arrieta, M. C. & Finlay, B. B. Effects of antibiotics on human
microbiata and subsequent disease. Annual Review of Microbiology 68 (2014): 217-235.
5. Lee, C. C. & Houghton, P. Cytotoxicity of plants from Malaysia and Thailand used traditionally to treat
cancer. Journal of Ethnopharmacology 100(2005): 237-243.
6. Matsuda, H., Pongpiriyadacha, Y., Morikawa, T., Ochi, M. & Yoshikawa, M. Gastroprotective effects of
phenylpropanoids from the rhizomes of Alpinia galanga in rats: structural requirements and mode of action.
European Journal of Pharmacology 471(2003): 59-67.
7. Newell, D. G., Koopmans, M., Verhoef, L., Duizer, E., Aidara-Kane, A., Sprong, H., Opsteegh, M.,
Langelaar, M., Threfall, J., Scheutz, F., Giessen, J. & Kruse, H. Food-borne diseases – The challenges of 20
years ago still persist while new ones continue to emerge. International Journal of Food Microbiology
139(2010): S3-S15.
8. Samarghandian, S., Hadjzadeh, M. A. R., Afshari, J. T. & Hosseini, M. Antiproliferative activity and induction of apoptotic by ethanolic extract of Alpinia galanga rhizome in human breast carcinoma cell line.
Complementary and Alternative Medicine 14(2014): 192.
9. Vaquero, R., Serravalle, T., Nadra, M. & Saad, S. Antioxidant capacity and antibacterial activity of phenolic
compounds from argentinian herbs infusions. Food Control 21(2010): 779-785.
10. Wong, L. F., Lim, Y.Y. & Omar, M. Antioxidant and antimicrobial activities of some Alpinia species.
Journal of Food Biochemistry 33(2009): 835-851.

SCIENCE AND TECHNOLOGY 491
IGCESH2018
Universiti Teknologi Malaysia, Johor Bahru, Malaysia 13 -15 August 2018
OPTIMIZATION OF SPHEROID FORMATION OF HELA CELLS
USING COMBINATION OF HANGING DROP METHOD AND 96-
WELL PLATE COATED AGAROSE
Zurfarahanim Zolkemri*1, Kartini Kabi2, Sayang Baba3 and Salehhuddin Hamdan4
1, 2, 3, 4 Faculty of Bioscience and Medical Engineering, Universiti Teknologi Malaysia, 81310, Johor
Bahru, Johor, Malaysia.
(E-mail: [email protected], [email protected], [email protected],
ABSTRACT
Spheroid is a three-dimensional (3D) culture model that has been widely adopted as an in
vitro tool for anticancer drug screening. Various method have been developed to generate 3D
culture model including hanging drop method. However, standard hanging drop method only
allows short term of culture and thus need specialized plate such as 96-well plate coated
agarose for further analysis of spheroid. Thus, the goal of this study was to optimize 3D
spheroid formation of HeLa cervical cancer cells using hanging drop method with the aid of
96-well plate coated agarose. The formation of spheroid in hanging drop method was
optimized by varying volume of cells per drop from 10 to 30 µL, sedimentation period from 1
to 4 days, and cell seeding concentration from 10000 to 70000 cells/mL. Following that, the
generated spheroids were further cultured in 96-well plate coated with agarose for assessment
of cell viability using alamar blue (AB) assay and measurement of diameter of spheroid using
images captured by optical microscopy. The parameters of hanging drop method to form
spheroid were subsequently optimized at 20 µL of cells per drop, and 4 days of sedimentation
period. In addition, it was demonstrated that all cell seeding concentration had the ability to
form spheroid. After spheroids being transferred into 96-well plate coated with agarose,
initial cell seeding concentration of 70000 cells/mL showed the formation of most ideal HeLa
spheroid with average diameter of 865.39 ± 40.13 µm in 15 days and 55.45 ± 2.74 % of cell
viability. In conclusion, the 3D HeLa spheroid formed with the optimized conditions may be
used as a model for evaluation of anti-cancer drug efficacy. Key words: Tumor spheroid, 3D culture, hanging drop method, agarose coating
INTRODUCTION
Three-dimensional (3D) tumor spheroids have been developed for nearly 30 years as an
alternative to two-dimensional (2D) monolayer culture for anticancer drug screening [1].
Although 2D monolayer is a valuable in vitro tool, monolayer unable to reflect multi-
dimensional structure and this provides unreliable data in response of cancer cells to
chemotherapeutics which can leads to a lack of efficacy in pre-clinical trial [2]. Tumor
spheroids able to satisfy this demand as it has the ability to reflect the microenvironment of
the native tumor in human body such as the production of extracellular matrix components,
and interaction of cell-cell and cell-matrix which are essential in tumor biology [3, 4]. The

SCIENCE AND TECHNOLOGY 492
presence of differential proliferation zones in spheroid structure also has been proven related
to resistance of chemotherapy drugs [5]. Therefore, incorporation of spheroid can recapitulate
mechanisms of drug resistant found in tumor cell and also uncover the new potential
therapies that would remain undiscovered in monolayer models [6].
The importance of tumor spheroid has led to the development of various 3D culture method to
generate tumor spheroids that are ideal for drug screening. Despite that, the complexity of the
advanced technology has hindered the development of method to produce spheroids that can be
easily accessible without the need of specialized equipment. Traditional method such as hanging
drop is simple, and cost-effective as it requires no growth factors. Hence, it is an
advantageous approach to form spheroids at huge amounts [7]. Despite of huge amounts of
spheroids can be produced and manipulated this way, the difficulty during media exchange
which can disturbs the integrity of droplets makes it impossible for long-term culture [8].
Therefore, the spheroid need to be recovered into specialized plate for further evaluation and
analysis. Previously, Friedrich et al. described the importance of agarose coating on the
surface of well plate in resisting cell adhesion which provided a long term culture of
spheroids (3 to 5 days) [9]. Moreover, 96-well plate coated agarose have been successfully
applied for generation of spheroid from cells suspension which further proved the
implementation of agarose coating to induce cell aggregation [10].
Recently, an approach using hanging drop method with the aid of 96-well plate coated
agarose have been successfully applied for spheroid formation of breast cancer cells [11].
However, technical information of this combined methods are not readily available in the
literature for wider range of cell lines, especially for cervical cancer cell. To address this
limitation, HeLa cervical cancer cell line was specifically used to study the application of
hanging drop method and 96-well plate to produce ideal spheroids for in vitro drugs
screening. Initially, the parameters of hanging drop method were optimized to allow the
formation of 3D spheroid of HeLa cervical cancer cells before the resultant spheroids were
transferred into 96-well plate coated with agarose. In order to further analyze the spheroids,
cell viability and diameter were measured for selection of the most ideal spheroid. The
spheroid selected from this study may provide more effective model for drug screening.
MAIN RESULTS
The parameters to form 3D HeLa spheroid via hanging drop method were optimized at 20
µL cells/drop and 4 days sedimentation period for all cell seeding concentration tested. It
was observed that initial cell seeding concentration did not influence the abil ity of cells in
forming spheroid. After 4 days of sedimentation period, the resultant spheroids were
successfully recovered into 96-well plate coated with agarose for further culture. Based
on Table 1, the spheroid with initial cell seeding of 70000 cells/mL was selected as the
most ideal in vitro model as it displayed cell viability more than 50% with average
diameter of 865.39 ± 40.13 µm on day 15 of growth.

SCIENCE AND TECHNOLOGY 493
Table 1. Cell viability and diameter of HeLa spheroid. Data are expressed as mean ±
standard deviation (n=3). Different letters indicate significant difference in cell viability and
diameter of spheroid at different cell seeding concentration (Tukey’s test, P < 0.05).
Cell seeding concentration
(cells/mL)
Optimum
growth (day)
Cell viability (%) Diameter (µm)
10000 15 45.84 ± 2.01a,b 623.75 ± 50.31a
30000 15 46.03 ± 3.05a,b 637.32 ± 7.58a
50000 15 48.85 ± 3.19a 684.52 ± 12.09a
70000 15 55.45 ± 2.74b,a 865.39 ± 40.13b
CONCLUSION
In conclusion, the spheroid with initial cell seeding concentration of 70000 cells/mL was
suggested to generate the most ideal spheroid for in vitro drugs screening with cell viability
of >50% and diameter of 865.38 ± 40.13 µm on day 15 of optimal growth.
Acknowledgment: This research did not receive any specific grant from funding agencies in
the public, commercial, or not-for-profit sectors.
REFERENCES
1. Khanna, S., Bhatt, A.N., and Dwarakanath, B.S. Multicellular Spheroid: 3-D Tissue Culture Model for
Cancer Research. Animal Biotechnology, 11 (2014), 195-210.
2. Edmondson, R., Broglie, J. J., Adcock, A. F., and Yang, L. Three-Dimensional Cell Culture Systems and
Their Applications in Drug Discovery and Cell-Based Biosensors. Assay and Drug Development
Technologies, 12(2014), 207–218.
3. Hickman, J. A., Graeser, R., de Hoogt, R., Vidic, S., Brito, C., Gutekunst, M., & van der Kuip, H. Three‐dimensional models of cancer for pharmacology and cancer cell biology: Capturing tumor complexity in vitro/ex vivo. Biotechnology journal, 9 (2014), 1115-1128.
4. Ravi, M., Paramesh, V., Kaviya, S., Anuradha, E., & Solomon, F. 3D cell culture systems: advantages and
applications. Journal of cellular physiology, 230 (2015), 16-26.
5. Kim, J. B. Three-dimensional tissue culture models in cancer biology. Paper presented at the Seminars in
cancer biology, 2005.
6. Antoni, D., Burckel, H., Josset, E., & Noel, G. Three-dimensional cell culture: a breakthrough in vivo.
International journal of molecular sciences, 16 (2015), 5517-5527.
7. Lin, R.Z., and Chang, H.Y. Recent advances in three-dimensional multicellular spheroid culture for
biomedical research. Biotechnology Journal, 3 (2008), 1172–1184.
8. Mehta, G., Hsiao, A. Y., Ingram, M., Luker, G. D., and Takayama, S. Opportunities and Challenges for use
of Tumor Spheroids as Models to Test Drug Delivery and Efficacy. Journal of Controlled Release : Official Journal of the Controlled Release Society, 164 (2012), 192–204.
9. Friedrich, J., Seidel, C., Ebner, R., and Kunz-Schughart, L. A. Spheroid-based drug screen: considerations
and practical approach. Nat. Protocols, 4(2009), 309–324.
10. Charoen, K. M., Fallica, B., Colson, Y. L., Zaman, M. H., & Grinstaff, M. W. Embedded Multicellular
Spheroids as a Biomimetic 3D Cancer Model for Evaluating Drug and Drug-device
Combinations. Biomaterials, 35(2014), 2264–2271.
11. Zhang, W., Li, C., Baguley, B. C., Zhou, F., Zhou, W., Shaw, J. P., & Liu, J. Optimization of the formation
of embedded multicellular spheroids of MCF-7 cells: How to reliably produce a biomimetic 3D model.
Analytical Biochemistry, 515 (2016), 47–54.

SCIENCE AND TECHNOLOGY 494
IGCESH2018
Universiti Teknologi Malaysia, Johor Bahru, Malaysia 13 -15 August 2018
SHORT-TERM HYPOGLYCEMIC EFFECT OF MOMORDICA
CHARANTIA
Shi Yan Lee*1, Shi-Hui Cheng2, Mohamad Roji Sarmidi 3 and Kian-Kai Cheng4
1 Innovation Centre in Agritechnology for Advanced Bioprocessing (ICA), Universiti Teknologi
Malaysia, Edu Hub Pagoh, 84600 Pagoh, Johor, MALAYSIA. (E-mail: [email protected])
2 School of Biosciences, University of Hottingham Malaysia Campus, Jalan Broga, 43500 Smenyih,
Selangor, MALAYSIA.
(E-mail: [email protected]) 3,4 Innovation Centre in Agritechnology for Advanced Bioprocessing (ICA), Universiti Teknologi
Malaysia, Edu Hub Pagoh, 84600 Pagoh, Johor, MALAYSIA.
(E-mail: [email protected], [email protected])
ABSTRACT
Type 2 diabetes mellitus (T2DM) is a metabolic disorder characterized by elevated blood
glucose level caused by insulin insensitivity. The treatment of T2DM relies on oral
antidiabetic agent for strict blood glucose level control to avoid the complications such as
cardiovascular diseases, kidney failure and diabetic retinopathy. However, the undeniable
side effects caused by the consumption of antidiabetic drugs such as weight gain, kidney
complication and liver diseases as well as the high expenses have become an issue in the
management of this disease. Momordica charantia (bitter melon) has become the subject of
biochemical and clinical studies through the rising interest in natural herb that aids blood
glucose management. However, the short-term hypoglycemic effect of the bitter melon
consumption in human body is yet to be studied. In this study, the fasting blood glucose level
of volunteers will be recorded and act as a base line for the following measurements. In brief,
the volunteers will be subjected to the consumption of 300 ml raw bitter melon juice
following overnight fast. Their blood glucose level will be monitored at time interval of every
15 minutes or 30 minutes for the duration of 90 minutes using a glucometer. The effect of
bitter melon juice consumption on blood glucose level on type 2 diabetes patients and healthy
individual might be different and the results may contribute to the application of bitter melon
on disease prognosis and blood glucose management.
Key words: diabetes, bitter melon, blood glucose level
INTRODUCTION
Diabetes Mellitus is a chronic, progressive disease which is estimated to affect
approximately 422 million people in the world (5.6 % of the world population) in the year of
2014 [1]. Diabetes is an important public health problem and it is targeted for action by world
leaders. The majority of people with diabetes are affected by type 2 diabetes mellitus
(T2DM). Malaysia has one of the highest number of T2DM patients in South East Asia
region. In fact, the 2015 National Health and Morbidity Survey [2] reported that 17.5 percent
of Malaysian population suffered from this disease, which means one out of six Malaysian

SCIENCE AND TECHNOLOGY 495
has T2DM. Out of this 17.5 percent of Malaysian population (3.5 million), only 1.66 millions
of them know they have the disease, while the remaining 1.84 millions are undiagnosed.
A number of risk factors associated with the development of T2DM have been identified.
These include, amongst others, aging, genetics, lifestyle, nutrition, and lack of physical
activity. Metabolic disorder that leads to hyperglycemia, which occur in isolation or in
combination, has been proposed for eight pathophysiological mechanisms underlying T2DM
[3]. These include (i) reduced insulin secretion from pancreatic β-cells, (ii) elevated glucagon
secretion from pancreatic α cells, (iii) increased production of glucose in liver, (iv)
neurotransmitter dysfunction and insulin resistance in the brain, (v) enhanced lipolysis, (vi)
increased renal glucose reabsorption, (vii) reduced incretin effect in the small intestine, and
(viii) impaired or diminished glucose uptake in peripheral tissues such as skeletal muscle,
liver, and adipose tissue. Currently available glucose-lowering therapies target one or more of
these key pathways.
T2DM has been associated with fatal complication such as cardiovascular diseases, kidney
failure, blindness, nerves system damage etc. To date, there is no definitive cure for this
particular progressive and dangerous disease. T2DM requires good management on diet and
life style of the patients as well as continuous medications to maintain the blood glucose level
of the patients. If T2DM is not well managed, complications develop will threaten health and
endanger life. Acute complications are a significant contributor to mortality, costs and poor
quality of life. T2DM patients have to rely on oral antidiabetic drugs such as metformin and
sulphonylureas or even insulin injection to lower the blood sugar level and prevent
complications.
As the expenses of the drugs can be an economic burden to most of the patients, it is very
difficult to manage T2DM. Insulin and oral hypoglycaemic agents are reported as generally
available in only a minority of low-income countries [1]. In fact, in many parts of the world,
especially the poor countries, their people cannot afford the oral antidiabetic agents and only
rely on plant-based remedy which is cost-effective and easily available [4]. Moreover, the
oral anti diabetic drugs are found to be the culprit of certain side effects such as weight gain,
kidney complications, liver disease etc [5]. Therefore, there is raising interests in
investigating a natural diet supplement to aid with the management of blood glucose level
throughout the last decades.
Bitter melon (Momordica charantia) is a fruit that is widely cultivated and available in Asia,
India, East Africa, and South America. It has been recognized as a herbal medicine which
possessed hypoglycemic effect through in vitro, animal studies and human studies [6,7,8]. It
has been proposed that bitter melon may reduce the blood glucose levels by stimulate insulin
secretion, improve glycogen storage, increase peripheral and skeletal muscle glucose uptake,
and inhibit adipocyte differentiation and suppress gluconeogenic enzymes that catalyzes the
breakdown of disaccharides into monosaccharaides [3, 9]. The active component with
hypoglycemic properties in bitter melon have been identified as saponins, charantins,
polypeptide-p, and vicine, lectin, triterpenes, and alkaloids [3,11].

SCIENCE AND TECHNOLOGY 496
MAIN RESULTS
Figure 1. Effect of consumption of 300ml bitter melon juice on healthy individual
CONCLUSION
Fresh bitter melon juice is safe to be consumed with confirmation of characterization
analysis. It will have immediate result in lowering blood glucose level. T2DM patients and
healthy individuals will show different respond towards the hypoglycemic effect of
Momordica charantia. The differences can be used as a prognosis method for T2D.
However, further study on the mechanistic pathway of the action of bitter melon should be
done to provide new insight for current medical practice.
Acknowledgment: Sincere appreciation to University of Nottingham Malaysia for
cooperation and financial support.
REFERENCES
1. WHO. Global Report on Diabetes. World Health Organization, Geneva, Switzerland, 2016.
2. Institute for Public Health (IPH). National Healthy and Morbidity Survey, Volume II: Non Communicable
Diseases, Risk Factors, and Other Health Problems. Ministry of Health Malaysia, Kuala Lumpur, 2015.
3. DeFronzo RA. From the Triumvirate to the Ominous Octet: A New Paradigm for the Treatment of Type 2
Diabetes Mellitus. Diabetes 58 (2009), 773-795.
4. Baby Joseph and D Jini. Antidiabetic effects of Momordica charantia (bitter melon) and its medicinal
potency. Asian Pacific Journal of Tropical Disease 3 (2013), 93-102.
5. Stein SA, Lamos EM and Davis SN. A review of the efficacy and safety of oral antidiabetic drugs. Expert
Opinion on Drug Safety 12 (2013), 153-175.
6. G. Selvakumar, G. Shathirapathiy, R. Jainraj, P. and Yuvaraj Paul. Immediate effect of bitter gourd, ash
gourd, Knol-khol juices on blood sugar levels of patients with type 2 diabetes mellitus: A pilot study. Journal of Traditional and Complementary Medicine 7 (2017), 526-531.
7. Mona F. Mahmoud, Fatma El Zahraa Z.El Ashry, Nabila N. El Maraghy and Ahmed Fahmy. Studies on the
antidiabetic activities of Momordica charantia fruit juice in streptozotocin-induced diabetic rats.
Pharmaceutical Biology 55 (2017), 758-765.
8. Sundar Poovitha and Madasamy Parani. In vitro and in vivo α-amylase and α-glucosidase inhibiting
activities of the protein extracts from two varieties of bitter gourd (Momordica charantia L.). BMC
Complementary and Alternative Medicine 16 (2016), 185.
9. Oishi Y, Sakamoto T, Udagawa H, Taniguchi H, Kobayashi-Hattori K, Ozawa Y and Takita T. Inhibition of
increases in blood glucose and serum neutral fat by Momordica charantia saponin fraction. Biosci Biotechnol
Biochem 71 (2007), 735-740.
10. Zhu Y, Dong Y, Qian X, Cui F, Guo Q, Zhou X, Wang Y, Zhang Y and Xiong Z. Effect of superfine
grinding on antidiabetic activity of bitter melon powder. Int J Mol Sci. 13(2012), 14203-14218.

SCIENCE AND TECHNOLOGY 497
IGCESH2018
Universiti Teknologi Malaysia, Johor Bahru, Malaysia 13 -15 August 2018
POTENTIAL SAFE AREAS FOR NUCLEAR POWER PLANT SITING
IN SAUDI ARABIA
Mohammed M. Damoom*1, Suhairul Hashim2, Mohammed S. Aljohani3, Muneer
Saleh4
*Corresponding author ([email protected]) 1, 2 Physics Department, Universiti Teknologi Malaysia, 81310 Skudai, Johor, Malaysia
(E-mail: [email protected], [email protected]) 3 Nuclear Engineering Department, King Abdulaziz University, Jeddah 21589, Saudi Arabia
([email protected]) 4 Nuclear Engineering Programme, Faculty of Chemical and Energy Engineering, Universiti
Teknologi Malaysia, Skudai 81310, Johor, Malaysia
ABSTRACT
Saudi Arabia is planning to establish its own nuclear power program. They are aiming to
generate 17 GW of electricity using nuclear power. Since disastrous nuclear accidents such as
Chernobyl in 1986 and the latest accident Fukushima in 2011, safety issue in NPP industries
has been highly considered. Defence In Depth (DID) is one of the most important concept in
nuclear safety. IAEA introduces NPP siting as a vital component of DID. There are many
conflicting criteria to choose suitable location for NPP (siting). Here we are investigating six
criteria: water sources; seismicity; population density; hazardous facilities vicinity; slope;
flood (wadis). The geological information system software known as ArcGIS was used to
screen out unsuitable areas for siting NPP. The results show that 60141 square kilometres on
western coast and 19861 square kilometres on eastern coast are fulfilling the water source
criteria. After applying the geological and demographical criteria these areas have subsided to
22,500 and 13,500 km2 on western and eastern coast respectively.
Key words: Nuclear power plant; siting; criteria; Saudi Arabia
INTRODUCTION
Saudi Arabia is planning to be one of the developed countries in the world. Since
electricity is the main driver for the modern life Saudi authorities are working to enhance
the electricity sector. Up to date Saudi Arabia mainly depends on fossil fuel to generate
electricity [1]. they are considering incorporation of nuclear power into national grid [2].
Investment in nuclear power is not like other power types. Because of radiological
hazards might be caused by utilizing nuclear power, thinking of this type of power plants
is controlled by restrictive regulations. There are many institutions that are interested in
these regulations such as International Atomic Energy Agency (IAEA) and United States
Nuclear Regulatory Committee (US-NRC). Both IAEA and US-NRC introduced the
concept of Defence In Depth (DID) [3]. A key component of the DID is selecting the safe
and proper location (siting) for NPPs.

SCIENCE AND TECHNOLOGY 498
Both IAEA and US-NRC have established NPP siting criteria. Generally, these criteria
are divided into two types. The first type is called exclusionary criteria. They must be
satisfied otherwise the site is not suitable. For example: seismic; slope; water; geological
faults. The second type is called discretionary criteria. This kind of criteria is used to
differentiate among potential sites. For instance: distance to transportation; ports; grid.
[4], [5].
ArcGIS was utilized to analyze and process all the six datasets [6]. Six exclusionary
criteria were employed to identify the potential safe areas for siting NPPs in Saudi
Arabia. The water criterion is shown in figure 1, blue strips delineate the areas where
distance from water resource meets the rules (distance ≤ 32 km [7]). The other five
exclusionary criteria and how much their effect on both western and eastern coasts are
presented in table 1. One can see from the table that the population criteria screened out
16% and 23% of western and eastern areas respectively. The second large challenge is
geological faults, it screened out 24% of western area.
The aforementioned table shows that 62% and 32% of western and eastern areas have
been deemed unsuitable for NPPs siting respectively. Figure 2 illustrates the viable areas
to host NPPs on western and eastern coasts. There are 22,500 km2 on the red sea (west)
and 13,500 km2 on Arabian Gulf (east) could be considered as potential safe lands for
NPPs siting.
MAIN RESULTS
Figure 1. Blue areas are delineating the areas of Saudi Arabia that satisfy the condition
of NPP site distance to water resource must be within 32 km
Table 1. The five exclusionary criteria that applied beside water criteria.
Criterion Reduction %
Western coast area Eastern coast area
Hazardous facilities 3.51 7.12
Geological faults 24.46 0
Flood (wadis) 10.16 0
Land slope 7.97 1.39

SCIENCE AND TECHNOLOGY 499
Population 16.38 23.41
Total 62.48 31.92
Figure 2. Green areas delineate potential suitable areas to host NPP sites in Saudi Arabia
CONCLUSION
Water resources are the main challenge for NPP siting in Saudi Arabia. Applying water
criteria shows that only 4% of Saudi Arabia’s total area, 2.15 million square kilometers,
potentially might be deemed suitable for NPP siting. After Appling the other five
exclusionary criteria, seismic limits; faults; slope; population density; flood, the suitable
siting areas declined from 80,000 to 36,000 km2 only (figure 2). From table 1 one can see that
population issue is the first challenge, then geological issues come as the second challenge.
REFERENCES
1. D. Gately, N. Al-Yousef, and H. M. H. Al-Sheikh, “The rapid growth of domestic oil consumption in Saudi
Arabia and the opportunity cost of oil exports foregone,” Energy Policy, vol. 47, no. November, pp. 57–68,
2012.
2. K.a.care, “King Abdullah City for Atomic and Renewable Energy : Strategy & Roadmap,” 2017. [Online].
Available: https://www.kacare.gov.sa/en/Pages/default.aspx.
3. International Atomic Energy Agency (IAEA), Fundamental Safety Principles. 2006.
4. USA-NRC, “General site suitablility criteria for nuclear power dtations,” 2014. 5. International Atomic Energy Agency (IAEA), Site Survey and Site Selection for Nuclear Installations.
International Atomic Energy Agency, 2015.
6. R. J. Belles, B. R. Blevins, S. W. Hadley, T. J. Harrison, W. C. Jochem, B. S. Neish, O. A. Omitaomu, and
A. N. Rose, “Application of Spatial Data Modeling and Geographical Information Systems ( GIS ) for
Identification of Potential Siting Options for Various Electrical Generation Sources,” 2011.
7. O. A. Omitaomu, B. R. Blevins, W. C. Jochem, G. T. Mays, R. Belles, S. W. Hadley, T. J. Harrison, B. L.
Bhaduri, B. S. Neish, and A. N. Rose, “Adapting a GIS-based multicriteria decision analysis approach for
evaluating new power generating sites,” Appl. Energy, vol. 96, pp. 292–301, 2012.

SCIENCE AND TECHNOLOGY 500
IGCESH2018
Universiti Teknologi Malaysia, Johor Bahru, Malaysia 13-15 August 2018
AN APPROACH: REDUCING ANNEALING TIME OF OPTICAL
STIMULATED LUMINESCENCE DOSIMETER (OSLD) FOR
MEDICAL APPLICATION PURPOSE
R. S. Omar*1, S. Hashim1,2, S. K. Ghoshal1, Y. Musa1, A. Hashim3, M.K.A. Karim4
1 Department of Physics, Faculty of Science, AOMRG, Universiti Teknologi Malaysia, 81310 Johor
Bahru, MALAYSIA.
(E-mail: [email protected], [email protected], [email protected], [email protected])
2 Centre for Sustainable Nanomaterials (CSNano), Ibnu Sina Institute for Scientific and Industrial
Research (ISI-SIR), Universiti Teknologi Malaysia, 81310 Skudai, Johor Bahru, MALAYSIA. (E-mail: [email protected])
3Secondary Standard Dosimetry Laboratory, Malaysia Nuclear Agency, 43000 Bangi, MALAYSIA.
(E-mail: [email protected]) 4Department of Physics, Universiti Putra Malaysia, 43400 Serdang, Selangor, MALAYSIA.
(E-mail: [email protected])
ABSTRACT
For single point dose measurements, the use of optically stimulated luminescence dosimeters
(OSLDs), nanoDots is gaining a remarkable interest due to availability and potential
attributes. In this paper, new methods to optically anneal the nanoDot™ OSLDs were
developed using five different light source namely; 40 W purple ultra-violet light (UV), 5 W
white light-emitting diode (LED), 100 W tungsten-halogen lamp (THL), 14 W compact
fluorescent lamp (CFL) and bright room office environment light (BRL) having steady
temperatures of 35 ºC, 25 ºC, 30 ºC, 27 ºC and 24 ºC respectively, while the OSL system
performance was evaluated via intrinsic measurements to ascertain the precision of the
microStar reader. The reader stability evaluated from the dark current (DRK), CAL and LED
counts were found to be 6.0 ± 0.9, 1677 ± 31, and 4657 ± 563, respectively, which were
rightly below the control limits of 30 (DRK), and ±10% of the mean (CAL and LED). The
regeneration rate of the OSL signal during the optical annealing procedure revealed that 14 W
CFL (Compact Fluorescent Lamp) gives the highest response with an average signal loss of
~93% in 60 minutes illumination time, compared to 92%, 90%, 87% and 44% signal loss
using UV light, LED, THL, and BRL, respectively. Two useful output were produced using
this method; (i) periodic output constancy introduced by variation of sensitivity among
different nanoDot™ OSL dosimeters, and (ii) reduced the annealing time when using the
pocket annealer (which only can only anneal one dosimeter at a time).
Keywords: optically bleaching, illumination, nanoDot™ OSL dosimeter, annealing, dose

SCIENCE AND TECHNOLOGY 501
INTRODUCTION
In medical physics, OSL technique is used to measure doses from ionizing radiation. It was
found to be useful in dating of sediments from acheological samples, as well as
measurements of accumulated radiation dose in patients, health personnel, and building
materials in regions of nuclear disaster [1]. Over the past decade, OSL has emerged as an
outstanding competitor not only to thermoluminescence dosimeters (TLDs), but to numerous
exceptional dosimetry systems. Even though, a large quantity of materials were synthesized
and studied for OSL, Al2O3:C material seemed to dominate the dosimetric applications [2].
Considering the different readouts mechanism provided, OSL techniques have an advantage
over the conventional TL technique [3, 4]. The effectiveness of different light sources to
liberate charges from deep trap centers in OSLDs during optical annealing was investigated
in this study. The effect of reducing optical annealing time seemed to be the resulting benefit
of this technique, owning to the fact that it unravel the dose limitation of the commercialised
pocket annealer.
METHODOLOGY
Irradiations were done with diagnostic x-ray beams consisting of RQT standard radiation
qualities using Philips Industrial Unit at the Malaysia Nuclear Agency. The nanoDot™
OSLDs (105 nanoDots; 21 per batch) were exposed to known dose of 8 mGy for 120 kVp
beam. The absorbed dose by the nanoDot™ OSLDs were measured using the microStar
reader (HA0008530A) after post-irradiation time of 24 hours, followed by optically anneal
the OSLDs with five different light sources as mentioned in the subsequent section. To
eliminate the effect of external light source, the illumination process was carried out in a dark
room environment, while the keeping the temperature constant.
OSL Dosimeters (nanoDot™)
The OSLDs used in this work are InLight® nanoDot™ dosimeters produced by Landauer Inc,
Glenwood, IL. It is the recent innovation in OSL dosimeters that makes use of the identical
OSL technology as Luxel©+ and InLight dots, and can be used for diagnostic radiology,
therapy, or any single point radiation measurement [5, 6]. The nanoDot™ dosimeters
material, that is primarily based on aluminium oxide crystals (Al2O3:C) is the key to the
achievement of OSL technology. Every nanoDot™ dosimeter has one OSL element in a
single slide and designed for storing the detector detail in a black light-tight case that protects
it from visible light wavelength, but at the same time allows the transmission of x-rays or
gamma-rays. Front of the nanoDot™ dosimeters has an alphanumeric sensitivity code and
serial number (e.g. DN093=0.93 sensitivity), while back of nanoDot™ dosimeters
additionally carries a 2D bar code. Its non-destructive readout characteristic allows for re-
analysis, statistics archiving and analysis for overall dose accumulation without post-
measurement correction factors required.
Pocket Annealer
Pocket annealer (HA0008529) is a portable device which is capable of cleaning up to 1 Gy
dose of the previous OSLD irradiation history. The advantages of this devices is that, it is
compact, lightweight and portable, which can be taken anywhere with the microStar reader. It
requires annealing time of 10 seconds to reset a dosimeter having dose of less tan 0.1 mSv or
mGy. However, the major limitations of pocket annealer are dose dependence (i.e. <0.1 Gy)

SCIENCE AND TECHNOLOGY 502
and ability to anneal only one dosimeter at a time.
MicroStar OSL Portable Reader
The microStar InLight® System (HA0008530A) is the smallest and potable InLight reader
available that offers you the choice to measure medical radiation doses in both patients and
personnel in addition to working environment, and Al2O3:C read out by OSL technology. It
offers readout for single-point nanoDot™ measurement without dosimeter preparation and
requires no nitrogen gas. The microStar reader can be used onsite, in the laboratory or within
the field to perform immediate and accurate radiation dose evaluation. An array of light
emitting diode (LED) is used in the readout process to optically stimulate the dosimeters, at
the same time, the detection and measurement of the emitted light from the OSL material is
performed by the photomultiplier tube (PMT) using a sensitivity photon counting system.
The quantity of light released in the optical stimulation process is directly proportional to the
radiation dose and the intensity of the stimulation light, and the use of strong beam
stimulation mode could eliminate approximately 0.5% of OSL signal. Detailed description of
the microStar operating procedure can be found in the user manual [7]. Table 1 list the
technical specifications of InLight® nanoDot™ dosimeters, pocket annealer and the
microStar InLight® System.
Optical Annealing (Illumination)
The optically anneal time reducing effect became the advantage of this approach in that may
solved the drawback of the commercialise pocket annealer. This possibly eliminates the
known dependence of OSLDs on the irradiation history and aids periodic recalibration of
each OSLD for accurate dosimetric measurements. Two beneficial output were produced
with the usage of this method; (i) periodic output constancy introduced via variation of
sensitivity among different nanoDot™ OSL dosimeters, and (ii) decreased the annealing time
when using the pocket annealer (which most effective can only anneal one dosimeter at a
time). Numerous light sources; 40 W purple ultra-violet light (UV), 5 W white light-emitting
diode (LED), 100 W tungsten-halogen lamp (THL), 14 W compact fluorescent lamp (CFL)
and bright room office environment light (BRL) having steady temperatures of 35 ºC, 25 ºC,
30 ºC, 27 ºC and 24 ºC respectively, were used to bleached the irradiated nanoDot™ OSLDs.
Every session consisted of a 15 minute lengths in 60 minutes illumination time.
RESULTS AND DISCUSION
This phase involved 2 part of data acquisition and discussion included the microStar
performance test and optical annealing (illumination) evaluation using five different types
of light sources.
CONCLUSION
The OSL system performance test have demonstrated a good reader stability within the
recommended control limits, which further ascertain it suitability for dose measurements.
Moreover, among the five light sources tested for optical annealing, CFL was found to
establish the best regeneration rate by illuminating larger portion of the initial dose in a
shorter time. Hence, the CFL source could serve as a good alternative to pocket annealer.

SCIENCE AND TECHNOLOGY 503
Acknowledgement: This work was supported by the Ministry of Higher Education Malaysia
and Universiti Teknologi Malaysia through Research University Grant Scheme (No. 17H79,
17H19, 18H68 and 03G72) and UTM Zamalah Scholarship.
REFERENCES
1. Mrozik, A., Marczewska, B., Bilski, P. and Gieszczyk, W. Investigation of OSL signal of resistors from
mobile phones for accidental dosimetry. Radiation Measurements, 152 (2014), 466–470.
2. Pradhan, A., Lee, J. and Kim, J. Recent developments of optically stimulated luminescence materials and
techniques for radiation dosimetry and clinical applications. Journal of Medical Physics, 33(3) (2008), 85–
89. 3. Bhatt, B. C. Thermoluminescence, optically stimulated luminescence and radiophotoluminescence
dosimetry: An overall perspective. Radiation Protection and Environment, 34(1) (2011), 6–16.
4. McKeever, S. W., and Moscovitch, M. On the advantages and disadvantages of optically stimulated
luminescence dosimetry and thermoluminescence dosimetry. Radiation protection dosimetry. 104(3) (2002),
263-270.
5. Jursinic, P. A. Characterization of optically stimulated luminescent dosimeters, OSLDs, for clinical
dosimetric measurements. Medical physics. 34(12) (2007), 4594-4604.
6. Al‐Senan, R. M., and Hatab, M. R. Characteristics of an OSLD in the diagnostic energy range. Medical
physics. 38(7) (2011), 4396-4405.
7. Landauer, N. MicroStar InLIght Systems User Manual. Tsukuba, Ibaraki, Japan, 2012.

SCIENCE AND TECHNOLOGY 504
IGCESH2018
Universiti Teknologi Malaysia, Johor Bahru, Malaysia 13 -15 August 2018
EFFECT OF A NOVEL IMIDAZOL DERIVATIVE IONIC LIQUID ON
THE COBALT ELECTRODEPOSITION FROM ACIDIC SULFATE
BATH
Inam M.A. Omar*1,2, Khadijah M. Emran2, Siti A. Setu1 and Madzlan Aziz1
1 Department of Chemistry, Faculty of Science, University Teknologi Malaysia, 81310 Johor Bahru,
Johor, MALAYSIA.
(Email: [email protected], [email protected], [email protected]) 2 Chemistry Department, Faculty of Science, Taibah University, Al Maddinah Al Mounwara, SAUDI
ARABIA.
(E-mail: [email protected])
ABSTRACT
The effects of a new ionic liquid additive 1-methyl-3-((2-oxo-2-(2,4,5
trifluorophenyl)amino)ethyl)-1H-imidazol-3-ium iodide (Im-IL) on electrodeposition of
cobalt on copper electrode from acidic sulfate solution was investigated. The voltammetric
behaviors of cobalt deposition in acidic bath containing Im-ILs were studied at a copper
working electrode. The extent of the inhibition of Co+2 ions deposition in the presence of Im-
IL increased with increasing ionic liquid concentration and led to more leveled and fine-
grained deposits, especially at low concentrations. The inhibition of cobalt reduction in the
presence of Im-IL ions was assumed to occur via adsorption which obeyed the Langmuir
adsorption isotherm. High cathodic current efficiency (CCE%) was observed in the absence
and presence of ionic liquid during cobalt electrodeposition. Scanning Electron Microscopy
(SEM) image showed smoother deposition of cobalt in presence of Im-IL (10-5 M) in sulfate
bath. This ionic liquid acts as additive can be considered as a good candidate for electroplated
soft Co films.
Key words: Imidazol derivative, ionic liquid, cobalt electrodeposition, sulfate bath
INTRODUCTION
Cobalt and its alloys are important engineering material used widely in many industrial
applications. This is due to their unique properties such as: high electrical, high strength,
thermal stability, heat conductive, higher hardness, corrosion resistance, good wear
resistance, good adhesion, optical, and their high catalytic characteristics [1]. Most solutions
used in electrodeposition of metals and alloys contain one or more inorganic or organic
additives that have specific functions in the deposition process. [2-5]. These additives affect
the deposition and crystal building processes as a adsorbate at the surface of the cathode.
Ionic liquids (ILs) are a fascinating group of new chemicals with the potential to improve
development in chemical technology, stimulating considerable research in the field. They are

SCIENCE AND TECHNOLOGY 505
organic salts that are liquids at ambient temperature and comprised entirely of organic cations
and organic/inorganic anions [5].
The present work aims to study the effect of a series of novel ionic liquid 1-methyl-3-(2-oxo-
2-((2,4,5 trifluorophenyl)amino)ethyle)-1H-imidazol-3-ium iodide (Im-ILs) on the
electrodeposition of cobalt from an aqueous acidic sulfate bath. In addition, the study aims to
throw more light on the kinetics and the mechanism of cobalt.
MAIN RESULTS
Potentiodynamic Cathodic Polarization (i/E) Curves
The potentiodynamic cathodic polarization (i/E) curves for cobalt electrodeposition were
measured in the presence and absence of different concentrations of ionic liquid (Im-ILs)
(10−3M - 10−6M) in the sulfate bath at pH 4.5 as shown in Figure 1. The data reveal that, in
general, the deposition of Cobalt from this solution is accompanied by a high polarization.
The presence of ionic liquid resulted in a marked shift in the polarization curves towards
more negative potential values, indicating an inhibition of Co+2 ions deposition. The extent of
the inhibition increased with increasing ionic liquid concentration.
Figure 1. Potentiodynamic cathodic polarization curves during Cobalt electrodeposition
in the absence and presence of different concentrations of Im-ILs at pH 4.5.
The additive molecules of ionic liquid Im-IL ions are thought to adsorb on the cathode
surface. The data is fitted by a Langmuir adsorption isotherm (Equation 1): 𝜃
1−𝜃= 𝐾𝐶 (1)
where K is the equilibrium constant of the adsorption reaction, C is the ionic liquid
concentration in the solution and θ is surface coverage. The equilibrium constant K was
evaluated to be 233 M−1 for the ionic liquid Im-IL suggesting a chemical adsorption [6].
Cyclic Voltammetry
The cyclic voltammetry measurements were carried out at a glassy carbon (GC) electrode
over a potential range of -1.2 to -1.2 VSCE with a scan rate of 100 mV/sec in the presence and
absence of ionic liquid Im-IL as shown in Figure 2.
The potential difference between the reduction potential of cobalt ions at "B" and the
crossover potential at "A" is a measure of the nucleation overpotential (NOP) for cobalt
deposition at the copper substrate. It is obvious that the addition of Im-IL increased the NOP
values as shown in Table 1. In addition, the reduction in the cathodic area, indicating an
inhibition of the electrodeposition process.

SCIENCE AND TECHNOLOGY 506
Figure 2. Cyclic voltammetric curves recorded at GC electrode in the absence (blank) and
presence of different concentrations of Im-IL (scan rate = 100 mV/sec).
Table 1. The nucleation overpotential (NOP) as a function of concentrations of Im-ILs.
[MTFP(AE)I]I / M (NOP) / mV
0 0.29 1 × 10⁻⁶ 0.32
1 × 10⁻⁵ 0.39
1 × 10⁻⁴ 0.4
5 × 10⁻⁴ 0.5
1 × 10⁻³ 0.6
Morphologies of Co Deposits in Im-IL Using Scanning Electron Microscopy
Figure 3 shows SEM image of cobalt deposition in the presence of Im-IL (10-3 M) in sulfate
bath.
Figure 3. SEM micrographs of cobalt coatings electrodeposited on copper foils obtained
from acid bath without Im-IL (a) and with 10-3 Im-IL (b).
CONCLUSION
A great shift in the polarization curves towards more negative potentials values is observed
during the electrodeposition of cobalt in the presence of the ionic liquid. Cyclic voltammetric
measurements showed that the addition of the ionic liquid increased the nucleation
overpotential indicating an inhibition of the electrodeposition process and obey the Langmuir
adsorption-isotherm.
(a) (b)

SCIENCE AND TECHNOLOGY 507
REFERENCES
1. Magdy, I. and Rasha, M. Noncrystalline cobalt coatings on copper substrates by electrodeposition from
complexing acidic glycine baths. Materials Chemistry and Physics 115 (2015), 222-232.
2. Allahyarzadeh, M.H., Roozbehani, B. and Ashrafi, A. Electrodeposition of high Mo content
amorphous/nanocrystalline Ni–Mo alloys using 1-ethyl-3-methyl-imidazolium chloride ionic liquid as an
additive. Electrochimica Acta 56 (2011), 10210-10216. 3. Fashu, S., Chang-dong, G.U., Jia-lei, Z., Mei-ling, H., Xiu-li, W. and Jiang-Ping, T.U. Effect of EDTA
and NH4Cl additives on electrodeposition of Zn−Ni films from choline chloride-based ionic liquid. Trans.
Nonferrous Met. Soc. China 25 (2015), 2054-2064.
4. Jiacheng, G., Xingwu, G., Shaohua, W., Zhicheng, Z., Jie, D., Liming, P. and Wenjiang, D. Effects of
glycine and current density on the mechanism of electrodeposition, composition and properties of Ni–Mn
films prepared in ionic liquid. Applied Surface Science 365 (2016), 31-37.
5. Qibo, Z. and Yixin, H. Ionic liquids as electrodeposition additives and corrosion inhibitors. Progress and
Developments in Ionic Liquids (2017), 136.
6. Mouanga, M., Ricq, L., Ismaili, L., Refouvelet, B. and Berçot, P. Behaviour of coumarin in chloride bath:
relationship with coumarin influence on zinc electrodeposition. Surface & Coatings Technology 201 (2007)
7143-7148.

SCIENCE AND TECHNOLOGY 508
IGCESH2018
Universiti Teknologi Malaysia, Johor Bahru, Malaysia 13 -15 August 2018
TENSILE BEHAVIOUR OF POLYLACTIC ACID STRUT FOR 3D
FILAMENT PRINTING
M F Sadali1 and M Z Hassan1*
1Razak School of Engineering and Advanced Technology,
Universiti Teknologi Malaysia, Kuala Lumpur, Malaysia. (E-mail: [email protected], [email protected])
ABSTRACT
Additive manufacturing is a recent technology that obtains to fabricate the complex and
lightweight components. The aim of this study is to ascertain the tensile behaviour of the
three different angles of strut including 45/45, 25/65 and 60/30 degrees. This Polylactic Acid
(PLA) structures are fabricated using desktop 3D filament printing. Following, the structure
experimentally tested using the universal testing machine at a crosshead displacement rate
1mm/min following ISO 527. The result demonstrates that the structure with the angle of
25/65 offered an outstanding performance than those tested in this study.
Keywords: Additive Manufacturing, Lattice structure, 3D printing
INTRODUCTION
Recently, additive manufacturing (AM) offers the possibility to manufacture complex parts
for the aircraft components in a short period of time [1-2]. Additive manufacturing is able to
create the complex freeform design including lattice structures [3] and optimization topology
that difficult to fabricate using traditional processes.
In this study, the specimen with different angles has been designed and tested using a tensile
test machine following the ISO 527 standard. The tensile behaviour results have been
presented in order to compare the optimum strength for the different angle of the lattice
structure.
MAIN RESULTS
Figure 1 shows the samples that fabricated using the Polylactic Acid (PLA) material. These
samples were designed with 3 different configuration angles such as 45/45, 25/65 and 30/60
degrees. In addition, the weight for each sample was approximately 8 grams.

SCIENCE AND TECHNOLOGY 509
(a)
(b)
(c)
Figure 1. Schematic diagram of (a) 45/45, (b) 25/65, and (c) 60/30 degrees of PLA structures
The stress-strain responses of the 45/45, 25/65, and 60/30 degrees of PLA structures in a
quasi-static loading rate are presented in Figure 2. Here, it was obtained that up to the peak
value of stress level, the stress-strain curves are reasonably linear and obey the Hooke’s law.
After the maximum, a large drop in the stress occurs. From Figure 2, it is clear that strut
structure with the angle 25/65 degree offers a greater tensile behaviour than those exhibits by
the two other structures.
Scale 1:1
Scale 1:1
Scale 1:1

SCIENCE AND TECHNOLOGY 510
Figure 2. A tensile stress-strain curve for 45/45, 25/65, and 60/30 degrees of PLA structures
CONCLUSION
In this paper, the commonly structure that design for different angle lattice structures were
studied. The strut with the angle of 25/65 degree has offered the highest mechanical
properties.
Acknowledgment: The appreciation is given to Universiti Teknologi Malaysia and Ministry
of Higher Education under Fundamental Research Grant Scheme, R.K130000.7840.4F880
and “Geran Universiti Penyelidik’ (GUP) Tier 1, (Q.K130000.2540.15H70) for financially
support provided throughout the course of this research project.
REFERENCES
1. Meisam Abdi, Ian Ashcroft and Ricky D. Wildman, Design Optimisation for an additively manufactured
automotive component. Powertrain Modeling and Control (PMC 2016), 1-20.
2. Tad Clarke. Print to perform: Digitally accelerating additive manufacturing. SIMULIA Community news,
Johnston, RI, USA, 2017
3. Abdul Hadi Azman, Frédéric Vignat and François Villeneuve, Design Configurations and Creation of Lattice Structures for Metallic Additive Manufacturing. 14 Colloque National AIP-Priméca 2015, 1-8.
4. Yunglong Tang, Guoying Dong et al., Lattice Structure esign and Optimization with Additive Manufacturing
Constraints. IEEE Transaction on Automation Science and Engineering (2017), 1545-5955.
0
5
10
15
20
25
30
35
40
45
0 0.01 0.02 0.03 0.04 0.05 0.06 0.07 0.08
Str
ess,
MP
a
Strain, %
25/65
60/30
45/4
5

SCIENCE AND TECHNOLOGY 511
IGCESH2018
Universiti Teknologi Malaysia, Johor Bahru, Malaysia 13 -15 August 2018
A PILOT STUDY OF CRITICAL ISSUES IN ENGINEERING,
PROCUREMENT AND CONSTRUCTION (EPC) CONTRACT IN
MALAYSIAN OIL AND GAS INDUSTRY
Naqiyatul Amirah Mohd Said1, *Nur Emma Mustaffa2 and Hamizah Liyana Tajul
Ariffin3
Department of Quantity Surveying, Universiti Teknologi Malaysia, Skudai, MALAYSIA.
(E-mail: [email protected], [email protected], [email protected])
ABSTRACT
Oil and gas sector is a highly fragmented, project-based industry and depending on a large
number of professions and processing requirements across the lifecycle. In Engineering,
Procurement and Construction (EPC) contract, the contractor has to deal with the owner and
a large number of sub-entities. Due to that, many issues have arisen among the stakeholders
in oil and gas projects. Because of these issues, it leads to delay in completion and budget
overrun. During the literature search, most of the papers mentioned about the issues happened
in oil and gas projects in other countries but not in Malaysia. This somehow hinder effort to
improve the issues of EPC contracting strategies in Malaysia. Hence, this research aims to
identify the current critical issues facing by Malaysian oil and gas industry. The research
applies the qualitative paradigm through pilot semi-structured interviews with the actual
practitioners. From the pilot interview conducted, the issues highlighted differs from both
client and contractor’s thoughts. This research offers a rich understanding in an unsaturated
area of EPC contract in Malaysia perspective and is expected to become the basis to support
the future strategy in enhancing the effectiveness of EPC contract in Malaysian oil and
gas industry.
Key words: EPC Contract, Oil and Gas Industry, Project Management
INTRODUCTION
Engineering, Procurement and Construction (EPC) is a common contracting arrangement
used to undertake construction works by private sector on large scale and complex oil and gas
industry [5]. Oil and gas industry are complex considering that projects demand relatively a
long period of time and huge capital investment [5]. To ensure the success of EPC
contracting process, a complete scope of definition is crucial [2]. However, many issues had
been addressed by other researchers on previous studies. Salama et al. [7] highlighted that
incomplete information in EPC contract is due to phase overlapping between Engineering
phase, Procurement phase and Construction phase. Yeo and Ning [8] agreed, due to phase
overlaps, involvement of suppliers in planning and design of long-lead equipment is low.
All issues aroused resulting in delayed completion, budget overrun, poor quality and the
subsequent barrage of claims and counter claims [8]. Chan and Kumaraswamy [1] in their

SCIENCE AND TECHNOLOGY 512
research mentioned that project changes and variations are the critical factors give rise to
project delay and failure. Ogunlana [6] reinforced Chan and Kumaraswamy’s by adding that
changes and rework are due to inflexibility and unresponsive of engineering and construction
industry to the needs of its customers.
The objective of this paper is to identify the critical issues of EPC contracting arrangements
face by Malaysian oil and gas industry. To investigate the critical issues, a pilot interview
with three oil and gas companies who do business in Malaysia had been conducted. Pilot
study is carry out to ensure the data is comprehensible and appropriate, and the questions are
well-defined, clearly understood and presented in a consistent manner [3]. The study
presented here is to obtain an in-depth understanding of the issues that take place in EPC
contract of Malaysian oil and gas industry.
MAIN RESULTS
From the pilot interview with three different oil and gas companies in Malaysia, it can be
deduced that different companies facing different problems in EPC contract. Each
respondent possesses their own thoughts as client and contractor. The problem identified
from the interview are divided into two groups as tabulated in Table 1 below.
Table 1. Issues Facing by Client and Contractor in EPC Contract
Client’s view Contractor’s view
1. Engineering Issue
2. Procurement Issue
1. Project Risk
2. Project Management Issue
3. Change Management Issue
Client’s representative highlighted two main issues that the company facing currently.
Petronas as a client usually facing issues in engineering stage of EPC contract.
Engineering is a part of planning; hence it plays a crucial role in the contract. If
engineering stage goes caput, the following phases will be facing problems as well. The
respondent stated that it is crucial to have a detailed information in design engineering
stage. However, problems still arise though a well-defined information is provided.
Prolong to that, client will be facing difficulty in procurement phase with the issuance of
change order and variation order by contractor. From the interview, the respondent
revealed that change order is usually caused by both owners and contractors include
errors in construction design plans, specifications and unforeseen conditions. The
respondent added, if the issues occurred, it is a troublesome for client’s side as the
process of approving the payment of extra works are complicated and time consuming.
While from contractor’s perspective, the respondents are concerned about project risks.
Successful projects may depend on how well project stakeholders address project risks.
However, the respondent from Sapura Energy has a thought that company did not seen
this tool to be fully utilized by Malaysian companies except for major banks and
financing institution. There is lack of communication and engagement with stakeholders
which lead to problems when executing the project. Project management is a basis of a
project and to complete the project within timeframe and budget, all key players must
work together. This is related to issue in change management highlighted by the
respondent. Most contract provisions have time bar, to change management or change
order clauses, to notify the client within a certain period once the contractor identify a

SCIENCE AND TECHNOLOGY 513
change. Stakeholder management should help address change management processes to
become more efficient. This is because all relevant data is properly engaged and
communicated with the rightful stakeholder. Therefore, the notices of delay and changes
to the EPC contract can be issued to the client within reasonable time.
CONCLUSION
Oil and gas industry is associated with a high degree of risk because of its nature, process,
activities, technological complexity and organization. Engagement with various
participants, such as designers, owners, suppliers, contractors and subcontractors
contribute to high volume of fundamental risks. In this era of oil and gas downturn, it is
vital to have a good contracting arrangement to ensure the process of a project runs
smoothly. Therefore, by analyzing the problems in EPC contract, it will help the
stakeholders to identify on which phases that issues frequently aroused. To address the
issues, researchers can come out with greater solutions to improve the EPC contract
especially via technological means as there is a limitation of technological
implementation in EPC contracting arrangement.
Acknowledgment: The authors would like to express their appreciation for the support to
Petronas Cari Gali, Sapura Energy and MMC Gamuda for their willingness to be interviewed.
REFERENCES
1. Chan, D.W.M. and Kumaraswamy, M.M. A Comparative Study of Causes of Time Overruns in Hong Kong
Construction Projects. International Journal of Project Management (1997), 15(1) 55-63.
2. Dumont, P.R., Gibson, G.E., Fish, J.R. Scope Management Using Project Definition Rating Index. Journal
of Management in Engineering (1997), 13(5) 54-60.
3. Lancaster, G.A., Dodd, S., Williamson, P.R. Design and Analysis of Pilot Studies: Recommendations for
Good Practice. Journal of Evaluation in Clinical Practice (2004), 10(2) 307-312.
4. McNair, D. EPC Contracts in the Oil and Gas Sector. International Best Legal Practice in Project and
Construction Agreements (2016). 5. Moreau, K. A. and Back, W. E. Improving the design process with information management. Automation in
construction, (2000), 10(1)127-140.
6. Ogunlana, S.O., Promkuntong, K. & Jearkjirm, V. Construction delays in a fast-growing economy:
Comparing Thailand with other economies. International Journal of Project Management (1996), 14(1), 37-
45.,6.
7. Salama, M., El Hamid, M. A. and Keogh, B. Investigating the causes of delay within oil and gas projects in
the U.A.E. In: Dainty, A (Ed) Procs 24th Annual ARCOM Conference, 1-3 September 2008, Cardiff, UK,
Association of Researchers in Construction Management (2008), 819-827.
8. Yeo, K.T., Ning, J.H. Integrating Supply Chain and Critical Chain Concepts in Engineer-Procure-Construct
(EPC) Projects. International Journal of Project Management (2002), 20(4) 253-262.

SCIENCE AND TECHNOLOGY 514
IGCESH2018
Universiti Teknologi Malaysia, Johor Bahru, Malaysia 13 -15 August 2018
PSYCHOLOGICAL DETERMINANTS OF ENERGY CONSERVATION
BEHAVIOUR AMONG OFFICE BUILDING USERS: A STRUCTURAL
EQUATION MODELLING APPROACH
Razlin Mansor1 and Low Sheau-Ting*
2
1,2 Department of Real Estate, Faculty of Geoinformation and Real Estate, Universiti Teknologi
Malaysia, Skudai, MALAYSIA. (E-mail: [email protected], [email protected])
ABSTRACT
Potential contribution of buildings to global warming over the next 100 years is highly
significant. Energy conservation is one of the vital components to address in term of
psychological behaviour among building users towards energy saving action. A specific
desired behaviour such as energy conservation behaviour is influencing by a set of
psychological determinants. Energy conservation behaviour among household often
influenced by monetary incentive shall not be generalized into office building context
whereby the users have no financial responsibility on its utilities expenses. Thus, this study
focuses to identify the psychological determinants of energy conservation behaviour among
office building users. A well-established theory, the Theory of Planned Behaviour is adopted
as the theoretical basis in this study to identify the set of psychological determinants of
energy conservation behavior in present context. There are five (5) psychological
determinants associated with energy conservation behaviour in office building context were
ascertained in previous studies. The psychological determinants including: Attitude,
Subjective Norm, PBC, Energy Knowledge and Past Experiences. A total of 126 convenience
samples has been gathered among the office building users in Kota Iskandar, Johor. The
causal relationship of the identified psychological determinants was examined using
Structural Equation Modeling assisted by SmartPLS-SEM software version 3.0. The results
showed that the psychological determinants that are significant towards energy conservation
behaviour among office building users are Subjective Norm, PBC and Past Experiences. The
findings of this study may serve as a basis reference for the management team to determine
the determinants that influence energy conservation behaviour among the office building
users. Key words: Psychological Determinants, Energy Conservation Behaviour, Theory of Planned
Behaviour, Structural Equation Modelling
INTRODUCTION
Energy sector represents the largest sources of emissions by far is accounted for almost 68%
of GHG worldwide [1] and buildings are responsible for almost 32% of total global final
energy use [2]. The participation of occupant plays an important role to reduce energy
consumption in buildings despite of technological measures [3]. However, changes towards
environmentally sustainable behaviour is much more complex to adopt [4] as energy

SCIENCE AND TECHNOLOGY 515
conservation behaviour required a voluntary behavioral change in order to sustain the
practice.
Theory of planned behavior (TPB) is one of classic theoretical model develop specifically for
individual behaviour study [5]. TPB consists of three psychological determinants, which are
Attitude, Subjective Norm and Perceived Behaviour Control (PBC). There are various
psychological determinants have been proven to have significant contributions in fostering
desired behaviour. However, similar set of psychological determinants in the household
context may not be effective in the office building context. This study has conducted a
systematic search on academic literature to explore and compile the psychological
determinants used to foster pro-environmental behaviour within different scopes of study. A
systematic search of relevant articles was undertaken on two databases (Web of Science and
Scopus). In total, there are five (5) psychological determinants were found positively
associated with energy conservation behaviour in office building context. These including:
Attitude, Subjective Norm, PBC, Energy Knowledge and Past Experiences. In detailed, the
determinants are associated with few underlying determinants which are environmental
concern, environmental belief, social norm, personal norm and public information.
This study adopts TPB as a fundamental basis in determining the psychological determinants
of energy conservation behaviour among office building users. Moreover, there are limited
literatures on the psychological determinants of energy conservation behaviour among office
building users in Malaysia. Thus, this research aims to identify the psychological
determinants of energy conservation behaviour among office building users and their causal
relationship in formulating energy conservation behaviour among office building users.
MATERIAL AND METHOD
This study has conducted a systematic search on academic literature to explore and compile
the psychological determinants used to foster pro-environmental behaviour within different
scopes of study. Overall search has identified a total of 70 journal articles that outlined
several psychological determinants which has been hypothesized and significantly correlated
with pro-environmental behaviour in various contexts. Based on the TPB theoretical model
and related previous studies, there are five (5) psychological determinants which commonly
mentioned in previous studies and associated with energy conservation behaviour in office
building context. The psychological determinants including: Attitude, Subjective Norm, PBC,
Energy Knowledge and Past Experience. The determinants are associated with some
underlying determinants that are likely to have indirect effects on the energy conservation
behaviour which are environmental concern, environmental belief, social norm, personal
norm and public information.
In this context of study, an elicitation study is conducted. A sample of 25 respondents among
office building users in Kota Iskandar were involved to answer a set of open-ended question
in a questionnaire form. Elicitation study is important to understand about people thoughts
and feelings on specific behaviour as people will not share the same thought and feelings on
certain behaviour. Inputs with high frequency were used to construct a final questionnaire for
this study. The final question was designed using 5-point Likert scale (1= Strongly Disagree,
2=Disagree, 3=Somehow Agree, 4=Agree, 5= Strongly Agree). After pre-test the
questionnaire, a total of 300 sets of revised questionnaires were distributed to the government
office building users in Kota Iskandar face-to-face. The final questionnaires were analyzed by

SCIENCE AND TECHNOLOGY 516
using Structural Equation Modelling (SEM) with assistance of Smart Partial Least Square
(SmartPLS) software as PLS-SEM has been widely used to investigate the causal
relationships among a set of determinants in various context. For instance, similar
methodology has been applied to determine the crucial relationship between two formative
factors which are psychological distance and environmental attachment in higher education
[6]. Other than that, study by [7] also applied smartPLS to determine the influence of
Attitude, Subjective Norm and Self-efficacy towards energy saving intention among students
in private university.
MAIN RESULTS
Table 1. Result of path coefficient T Statistics (|O/STDEV|) P Values
Attitude -> ECB (switching off unnecessary light) 1.23 0.22
Energy Knowledge -> ECB (switching off unnecessary light) 0.31 0.75
Environmental Belief -> Attitude 3.19 0.00
Environmental Concern -> Attitude 2.47 0.01
Past Experiences -> ECB (switching off unnecessary light) 2.74 0.01
PBC -> ECB (switching off unnecessary light) 1.93 0.05
Personal Norm -> Subjective Norm 2.55 0.01
Public Information_ -> Energy Knowledge 7.62 0.00
Social Norm -> SN 4.39 0.00
SN -> ECB (switching off unnecessary light) 2.08 0.04
Note: Subjective Norm (SN); Perceived Behavioural Control (PBC); Energy Conservation Behaviour (ECB)
Based on the results of SEM, all determinants had achieved the significant value of
Composite Reliability and AVE test. All variables considered as satisfied where the variables
had internal consistency and the discriminant validity has been proved. However, only three
psychological determinants were found to have significant relationship with energy
conservation behaviour, specifically turning off unnecessary light behavior among the office
building users in the Kota Iskandar as showed in Table 1. These including Past Experiences
(β: 0.23, p-value <0.05), Subjective Norm (β: 0.19, p-value <0.05) and Perceived Behavioural
Control (β: 0.22, p-value < 0.05). Past Experiences was found as the strongest psychological
determinants in formulating energy conservation behaviour among office building users in
Kota Iskandar.
CONCLUSIONS
In this study, the result indicates that office building users in Kota Iskandar have the
encouragement to conserve energy when the community approve their action on saving
energy and when the community apply the same action to consume energy efficiently. In
addition, the findings also indicated that office building users in Kota Iskandar believe that
they have personal responsibility to conserve energy in their office to reduce the
environmental impact.

SCIENCE AND TECHNOLOGY 517
REFERENCES 1. IEA. CO2 Emissions from Fuel Combustion Highlights. International Energy Agency, 2016. 2. IPCC. Climate Change 2014: Mitigation of Climate Change (Vol. 3). Cambridge University Press,
Cambridge, 2015. 3. Wang, Z., Zhang, B. and Li, G. Determinants of Energy-Saving Behavioral Intention among Residents in
Beijing: Extending the Theory of Planned Behavior. Journal of Renewable and Sustainable Energy, (2014),
6(5), 053127. 4. Lokhorst, A. M., Staats, H. and Van Iterson, J. Energy Saving in Office Buildings: Are Feedback and
Commitment-Making Useful Instruments to Trigger Change? Human Ecology: An Interdisciplinary
Journal, (2015), 43(5), 759-768. 5. Ajzen, I. The Theory of Planned Behavior. Organizational Behavior and Human Decision Processes,
(1991), 50(2), 179-211.
6. Fang, S.-C., Yu, T.-K., Yu, T.-Y. and Chang, I.-C. Psychological Distance and Pro-Environmental Behavior: An Application of Behavior Model to Emerging Contaminants in Higher Education. Journal of Baltic Science Education, (2016), 15(6).
7. Lee, J. and Tanusia, A. Energy Conservation Behavioural Intention: Attitudes, Subjective Norm and Self-efficacy. IOP Conference Series: Earth and Environmental Science, (2016), 012087.

SCIENCE AND TECHNOLOGY 518
IGCESH2018
Universiti Teknologi Malaysia, Johor Bahru, Malaysia 13 -15 August 2018
THE MODELLING OF DNA SPLICING SYSTEMS WITH ONE NON-
PALINDROMIC RESTRICTION ENZYME
Nurul Izzaty Ismail*1, Wan Heng Fong2 and Nor Haniza Sarmin3
1, 2, 3 Department of Mathematical Sciences, Faculty of Science, Universiti Teknologi Malaysia, 81310
UTM Johor Bahru, Johor, MALAYSIA.
(E-mail: [email protected], [email protected], [email protected])
ABSTRACT
The modelling of splicing systems is simulated by the process of cleaving and recombining
DNA molecules with the presence of a ligase and restriction enzymes which are biologically
called as endodeoxyribonucleases. The molecules resulting from DNA splicing systems are
known as splicing languages. Palindrome is a sequence of strings that reads the same forward
and backward. Research on generalisations of splicing languages in DNA splicing system
involving palindromic sequences for restriction enzymes has been done previously. In this
research, the splicing languages resulting from DNA splicing systems with one non-
palindromic restriction enzyme are determined using the notation from Head splicing system.
The generalisations of splicing languages for DNA splicing systems involving one non-
palindromic restriction enzyme for one and two non-overlapping cutting sites are presented in
the first and second theorems, respectively, which are proved using direct and induction
methods. The result from the first theorem shows a trivial string which is the initial DNA
molecule; while the second theorem determines a splicing language consisting of a set of
resulting DNA molecules from the respective DNA splicing system.
Key words: DNA, splicing system, splicing language, non-palindromic, restriction enzyme
INTRODUCTION
Splicing systems were introduced by Head in 1987 as a study between formal language
theory and molecular biology [1]. The splicing systems are initially known as Head
Splicing System, SH. In splicing systems, deoxyribonucleic acid (DNA) molecules mix
with a ligase and restriction enzymes which are also called as endodeoxyribonucleases that
allow the molecules to be cut and recombined [2]. A language, called the splicing
language, is then associated with three sets using formal language theory. The first set
consists of double stranded DNA (dsDNA) symbols generated from nitrogenous base
pairings: adenine (A) pairs with thymine (T), while cytosine (C) pairs with guanine (G) [3].
The second set is the set of initial DNA molecules [1]. Lastly, the third set consists of the
recombination behaviours allowed by formation rules of enzymatic activities [1]. The
rule for the cleavage pattern of restriction enzymes is denoted in term of a triple: left
context, crossing and right context [4].
The modelling of DNA splicing systems involving palindromic sequences has been
discussed by Head in [1]. Yusof has also studied and mentioned the definition of
palindromic string in DNA splicing systems [5]. Palindrome is a sequence of strings that

SCIENCE AND TECHNOLOGY 519
reads the same forward and backward [6]. Palindromic sequence can be recognized in the
strings of restriction enzymes. Previously, research on the generalisations of splicing
languages resulting from DNA splicing systems has been carried out involving
palindromic restriction enzyme [7]. As an extension of the previous research, the splicing
languages resulting from the modelling of DNA splicing systems with one non-
palindromic restriction enzyme are presented in this paper.
The definitions of a splicing system and a splicing language are stated in the following.
Definition 1 [1] (Splicing System and Splicing Language)
A splicing system S = (A, I, B, C) consists of a finite alphabet A, a finite set I of initial strings
in A*, and finite sets B and C of triples (c, x, d) with c, x and d in A*. Each such triple in B or
C is called a pattern. For each such triple the string cxd is called a site and the string x is
called a crossing. Patterns in B are called left patterns and patterns in C are called right
patterns. The language L = L(S) generated by S consists of the strings in I and all strings that
can be obtained by adjoining to ucxfq and pexdv whenever ucxdv and pexfq are in L and (c, x,
d) and (e, x, f) are patterns of the same hand. A language, L is a splicing language if there
exists a splicing system S for which L = L(S).
The aim of this research is to generalise the splicing languages in DNA splicing systems
involving one non-palindromic restriction enzyme for one and two non-overlapping
cutting sites.
MAIN RESULTS
In this research, the splicing languages from DNA splicing systems involving one non-
palindromic restriction enzyme are generalised using Head splicing system. The
generalisation of splicing languages resulting from DNA splicing systems with one
cutting site of a non-palindromic restriction enzyme is presented in Theorem 1.
Theorem 1
Given S = (A, I, B, C) is a splicing system in which A = {A,T C,G G,C TA} is the set of dsDNA
symbols, I = {𝑁1𝑁1 …𝑁1𝑋1𝑌𝑋2𝑁2𝑁2…𝑁2𝑁1′𝑁1
′…𝑁1′𝑋1
′𝑌′𝑋2′𝑁2
′𝑁2′ …𝑁2
′} is the set consisting of an initial string with one
cutting site of a non-palindromic restriction enzyme 𝑋1𝑌𝑋2𝑋1′𝑌′𝑋2
′ , set B = {𝑋1𝑋1′, 𝑌,𝑌′𝑋2𝑋2′ } is the set of
cleavage pattern for the restriction enzyme and set C is the null (Ø) set, the resulting splicing
language is 𝑁1𝑁1 …𝑁1𝑋1𝑌𝑋2𝑁2𝑁2…𝑁2𝑁1′𝑁1
′…𝑁1′𝑋1
′𝑌′𝑋2′𝑁2
′𝑁2′ …𝑁2
′
where 𝑁1𝑁1′, 𝑋1𝑋1′ , 𝑌𝑌′
𝑋2𝑋2′ and
𝑁2𝑁2′ denote arbitrary dsDNA symbol(s), 𝑁1
′, 𝑋1′ , 𝑌′ and 𝑋2
′ and 𝑁2′ are
complementaries for 𝑁1, 𝑋1, 𝑌, 𝑋2 and 𝑁2 respectively, 𝑌𝑌′
is the crossing, and
{𝑋1𝑌𝑋2𝑋1′𝑌′𝑋2
′ ,𝑋2′𝑌′𝑋1
′
𝑋2𝑌𝑋1} ∉ {
𝑁1𝑁1 …𝑁1𝑁1′𝑁1
′…𝑁1′ ,𝑁2𝑁2…𝑁2𝑁2′𝑁2
′…𝑁2′}
.
Next, the splicing languages from DNA splicing systems for two non-overlapping cutting
sites of a non-palindromic restrictions enzyme are generalised and given as Theorem 2.

SCIENCE AND TECHNOLOGY 520
Theorem 2
Given S = (A, I, B, C) is a splicing system in which A = {A,T C,G G,C TA} is the set of dsDNA
symbols, I = {𝑁1𝑁1 …𝑁1𝑋1 𝑌 𝑋2𝑀 𝑀…𝑀𝑋1 𝑌 𝑋2 𝑁2𝑁2…𝑁2𝑁1′𝑁1
′…𝑁1′𝑋1
′𝑌′𝑋2′𝑀′𝑀′…𝑀′𝑋1
′𝑌′𝑋2′𝑁2
′𝑁2′ …𝑁2
′} is the set consisting of an
initial string with two non-overlapping cutting sites of a non-palindromic restriction enzyme 𝑋1𝑌𝑋2𝑋1′𝑌′𝑋2
′ , set B = {𝑋1𝑋1′, 𝑌,𝑌′𝑋2𝑋2′} is the set of cleavage pattern for the restriction enzyme and set C
is the null (Ø) set, the resulting splicing language consists of strings of the form
𝑁1𝑁1 …𝑁1𝑁1′𝑁1
′…𝑁1′
𝑋1𝑌𝑋2𝑋1′𝑌′𝑋2
′ (𝑀 𝑀… 𝑀𝑀′𝑀′…𝑀′
𝑋1𝑌𝑋2𝑋1′𝑌′𝑋2
′)𝑛−1𝑁2𝑁2…𝑁2
𝑁2′𝑁2
′ …𝑁2′
where 𝑛 ∈ ℤ+, 𝑁1𝑁1′, 𝑋1𝑋1′ , 𝑌𝑌′
, 𝑋2𝑋2′ , 𝑀𝑀′ and
𝑁2𝑁2′ denote arbitrary dsDNA symbol(s), 𝑁1
′, 𝑋1′ , 𝑌′, 𝑋2
′ ,
𝑀′ and 𝑁2′, are complementaries for 𝑁1, 𝑋1, 𝑌, 𝑋2, 𝑀 and 𝑁2respectively,
𝑌𝑌′
is the crossing,
and {𝑋1𝑌𝑋2𝑋1′𝑌′𝑋2
′ ,𝑋2′𝑌′𝑋1
′
𝑋2𝑌𝑋1} ∉ {
𝑁1𝑁1 …𝑁1𝑁1′𝑁1
′…𝑁1′ ,𝑀 𝑀 … 𝑀𝑀′𝑀′…𝑀′,
𝑁2𝑁2…𝑁2𝑁2′𝑁2
′…𝑁2′}
.
CONCLUSION
In this research, the generalisations of splicing languages in DNA splicing systems involving
one non-palindromic restriction enzyme for one and two non-overlapping cutting sites are
given as Theorem 1 and 2 respectively. The results from this research contribute to the
evolution of idea in DNA splicing systems where the resulting DNA molecules can be
determined and predicted without actual wet lab experiments. For further research, splicing
languages from DNA splicing systems for more than one non-palindromic restriction enzyme
with same and different crossings can also be generalised.
Acknowledgment: The first author would like to thank UTM for funding her study at UTM
through Zamalah Scholarship. The second and third authors would also like to thank the
Ministry of Higher Education (MOHE) and Research Management Centre (RMC), Universiti
Teknologi Malaysia (UTM) for the financial funding through Research University Grant
Vote No. 13H18.
REFERENCES
1. Head, T. Formal Language Theory and DNA: An Analysis of the Generative Capacity of Specific
Recombinant Behaviors. Bulletin of Mathematical Biology. 49(1987), 737-759.
2. Kim, S. M. Computational Modelling for Genetic Splicing systems. SIAM Journal on Computing. 26(1997), 1284-1309.
3. Paun, G., Rozenberg, G. and Salomaa, A. DNA Computing: New Computing Paradigms. Springer -Verlag
Berlin Heidelberg, Germany, 1998.
4. Head, T. Splicing Representations of Strictly Locally Testable Languages. Discrete Applied Mathematics.
87(1998), 139-147.
5. Yusof, Y. DNA Splicing System Inspired by Bio Molecular Operation. Universiti Teknologi Malaysia,
Ph.D. Thesis, 2012.
6. Tomohiro, I., Inenaga, S. and Takeda, M. Palindrome Pattern Matching. Theoretical Computer Science,
483(2013), 162-170.
7. Fong, W. H. and Ismail, N. I. Generalisations of DNA Splicing Systems with One Palindromic Restriction
Enzyme. Malaysian Journal of Industrial and Applied Mathematics, 2017, Accepted.

SCIENCE AND TECHNOLOGY 521
IGCESH2018
Universiti Teknologi Malaysia, Johor Bahru, Malaysia 13-15 August 2018
FACTOR AFFECTING SAFETY PRACTICES IN SMALL GRADE
CONTRACTORS
N. Yusof*1 and M. S. Misnan
2
1, 2 Department of Quantity Surveying, Faculty of Built and Environment, Universiti Teknologi
Malaysia, Johor Bahru, Johor, MALAYSIA.
(E-mail: [email protected], [email protected])
ABSTRACT
This study was focused on small contractor. Small and medium enterprises (SMEs) are often
the main pillar of an economy. The total of small grade contractors in Malaysia registered by
Construction Industry Development Board (CIDB) is higher and increases for every year.
However, it is well known that construction project have many work related accidents and
injuries causes of minor accidents, ergonomics problems, out dated machinery, and lack of
awareness. The statistic of accidents at construction sites showed that Malaysian construction
industry is one of the critical sectors that need a huge and fast overhaul from the current site
safety practices. Moreover, the safety practice in small grade contractors is too far to achieve
the good safety performance in construction industry compare to large grade contractors. In
this study, a semi-structured question was developed to identify the factors that affecting
safety practice in small grade contractors. The data used in this study was collected through
the interview with manager in small grade contractors, Site Safety Supervisor (SSS), and
Safety and Health Officer (SHO). The finding of this paper was identified factors that
influence safety practice in small grade contractors such as poor Occupational Safety and
Health (OSH) management; small project value; financial constraint; lack of training and
knowledge on safety management; high competition; lack of communication; unsatisfactory
safety motivation; not exposed with good safety culture on site; the existing OSH framework
is fragmented; difficult in contract acquirement; do not have SSS, SHO or safety person in
charge; lack of OSH formal documentation; financial limitation and time constraints. The
critical factors lack of safety practice which are financial limitation and lack of training and
knowledge. In conclusion, small grade contractors faced for some factors that avoid applying
safety practice in their companies.
Key words: Factors, safety practice, small grade contractors, construction
INTRODUCTION
An increased risk for injuries is found in small contractor and is especially evident for the
construction industry ([1], [2], [3], [4], [5], [6], [7] and [8]). Some companies are typically
engaged small contractor as subcontractors in the construction industry. Subcontractor are
located at the lower end of the inter-organizational hierarchy in a construction project. In
addition, their ability to exert influence on decision making in the construction process is
limited. Previous research suggests that Australian small contractor companies may not

SCIENCE AND TECHNOLOGY 522
manage OHS risk as effectively as larger firms in the industry. In Queensland’s small
contractor employers have a poor understanding of their responsibilities under OHS law ([9]
and [10]). In another study of contractor company in Victoria, larger contractor employers
were found to view OHS as something to be integrated into their management systems ([5]
and [9]), whereas small contractor employers did not focus on systems of management and
believed OHS risks to be created by employees and therefore viewed risk control as the
responsibility of employees [9].
Relatively poor OHS management and outcomes in small grade contractors may be attributed
to characteristics that are typical of small grade contractors. This makes it more difficult for
them to create and maintain a safe and healthy work environment and to manage safety and
may explain why employees in small grade contractors are generally more frequently
exposed to hazardous situations and suffer more work-related injuries and illnesses than those
working in large grade contractors [1]. In addition, the safety problems in small grade
contractors are related to lack of adequate resources to address safety issues and lack of
knowledge of the contractor’s safety risks [4].
The safety activities in small grade contractors are include safety policy and objective
statement; training; inspections; risk assessments; safety responsibilities and employee
involvement in safety issues [4]. The contractors in small grade not apply all of safety
activities in their company because of some factors or barriers to implement it on site.
RESULTS
Figure 1 show the groups of respondents for this study. 11 respondents from randomly
small grade contractors were interviewed includes employer contractor G1 and G4 (1
person) respectively; 2 persons for employer contractor G2, G3 and SHO; and 3 persons
for SSS. Based on interviewed, some respondents are very agreed that the small grade
contractors are too far from safety practice in construction industry.
Figure 1. Group of respondents
The factors of influences safety practices in small grade contractors were analyzed and
the results are summarized in Figure 2. The critical factors that influence the safety
practice in small grade contractors are financial constraints (50%) and lack of t raining and
knowledge (40%). Poor OSH management; time constraints; and not exposed with good
safety culture (20%) respectively. Moreover, small project value; high competition; lack
of communication; unsatisfactory safety motivator; do not have SHO, SSS and safety
person in charge; and lack of OSH formal documentation (10%) respectively.
1 2
21
2
3
G1
G2
G3
G4
SHO

SCIENCE AND TECHNOLOGY 523
Figure 2. Factors affecting safety practices in small grade contractors
CONCLUSION
This study concludes that many factors influence safety practices in small grade contractors
in Malaysia. Some of these factors causes safety practice to be very poor. The critical factors
that affect safety practice are finance, lack of training and knowledge.
REFERENCES
1. Holte, A. K., Kjestveit, K., & Lipscomb, H. J. (2015). Company Size and Differences in Injury Prevalence
among Apprentices in Building and Construction in Norway. Safety Science, 71, 205–212.
https://doi.org/10.1016/j.ssci.2014.01.007
2. Dąbrowski, A. (2015). An investigation and analysis of safety issues in Polish small construction plants.
International Journal of Occupational Safety and Ergonomics, 21(4), 498–511. https://doi.org/10.1080/10803548.2015.1085206
3. Keller, B. M., & Cunningham, T. R. (2016). Firefighters as distributors of workplace safety and health
information to small businesses. Safety Science, 87, 87–91. https://doi.org/10.1016/j.ssci.2016.03.022
4. Kheni, N. A., Dainty, A. R. J., & Gibb, A. G. F. (2005). Health and Safety Management Practices of Small
Subcontractors. In 21st Annual ARCOM Conference (Vol. 1, pp. 7–9)
5. Cheng, C., Leu, S., Lin, C., & Fan, C. (2010). Characteristic Analysis of Occupational Accidents at Small
Construction Enterprises. Safety Science, 48(6), 698–707. https://doi.org/10.1016/j.ssci.2010.02.001
6. Nyirenda, V., Chinniah, Y., & Agard, B. (2015). Identifying key factors for an occupational health and
safety risk estimation tool in small and medium-size enterprises. IFAC-PapersOnLine, 28(3), 541–546.
https://doi.org/10.1016/j.ifacol.2015.06.137
7. Ozmec, M. N., Karlsen, I. L., Kines, P., Andersen, L. P. S., & Nielsen, K. J. (2015). Negotiating Safety Practice in Small Construction Companies. Safety Science, 71, 275–281.
https://doi.org/10.1016/j.ssci.2014.03.016
8. Sunindijo, R. Y. (2015). Improving Safety among Small Organisations in the Construction Industry : Key
Barriers and Improvement Strategies. In Procedia Engineering (Vol. 125, pp. 109–116). Elsevier.
https://doi.org/10.1016/j.proeng.2015.11.017
9. Holmes, Lingard, Y. and M. (1999). An Exploring Study of Meanings of Risk Control for Long Term and
Acute Effect Occupational Health and Safety Risks in Small Business Construction Firms. Safety Research,
30, 251–261.
10. Legg, S. J., Olsen, K. B., Laird, I. S., & Hasle, P. (2015). Managing Safety in Small and Medium
Enterprises. Safety Science, 71, 189–196. https://doi.org/10.1016/j.ssci.2014.11.007
0% 10% 20% 30% 40% 50%
Lack of formal…
No SHO, SSS or safety…
No good safety culture
Time constraints
Unsatisfactory safety…
Lack of communication
High competition
Lack of training and…
Financial limitation
Small project value
Poor OSH management

SCIENCE AND TECHNOLOGY 524
IGCESH2018
Universiti Teknologi Malaysia, Johor Bahru, Malaysia 13 -15 August 2018
LIFE ASSESMENT OF STREET LANTERN USING WEIBULL
PROBABILITY TECHNIQUE
Mohamad S. Ibrahim1, Mohamad Z Hassan1*, Nurul A Bani1, Ikhwan Ibrahim1, Mohd
Y. Daud1, and Mohamad H. Ibrahim1
1 UTM Razak School of Engineering and Advanced Technology, Universiti Teknologi
Malaysia, Jalan Sultan Yahya Petra, 54100 Kuala Lumpur (E-mail: *[email protected])
ABSTRACT
Predictive maintenance (PM) is the evaluation process of equipment by performing periodic
forecasting and identifying the life cycle period the equipment failure might be occurred. This
paper presents a Weibull’s statistical approach that predicted the life-cycle of highway street
lighting. Here, the historical data that collected from the maintenance checklist record of 250
and 400W streets lighting lanterns replacement report. The findings show that estimation of
survival rate of 250 and 400W bulb are 2.5 and 7.0 months period of operations respectively.
Key words: Predictive Maintenance, Weibull Analysis, Statistical Process Control
INTRODUCTION
Currently, in highly competitive in manufacturing and industry have increased the efficiency
of maintenance work in order to cut the cost and increase the equipment sustainability. Many
attempts have been made to evaluate the failure probability for both historical service lifetime
and condition monitoring variables.
The Weibull distribution is a good method to simulating failure probability of products [1-4].
Jeon and Sohn analysed the reliability of the data association rule and Weibull regression
analysis in order to find the significant pattern of failure for heavy duty diesel engine and
excavators [5].
This paper is presented the applicability a Weibull statistical approach for evaluating the
maintenance planning of the street lantern.
MAIN RESULTS
Figure 1 explained the established Weibull probability requiring a performance plot. As can
be seen from Figure 1, it shows that 99 percent of the 250 W and 400 W street lighting bulbs
can survive at least 893 and 2,520 hours respectively. If the operation of street lighting is 12
hours per day, the survival rates of 250 and 400 W lanterns that are obtained 2.5 and 7.0
months respectively.

SCIENCE AND TECHNOLOGY 525
(a)
(b)
Figure 1. Typical survival probability-hours plot of (a) 250 W and (b) 400 W of bulbs
CONCLUSION
The Weibull distribution is considerably a flexible and useful tool to measure maintenance
performance of a light bulb. This study has suggested that the life span of 250W and 400W
bulb are 2.5 and 7.0 months of operations respectively.
Acknowledgment: The appreciation is given to Universiti Teknologi Malaysia and Ministry
of Higher Education under Fundamental Research Grant Scheme, R.K130000.7840.4F880
and “Geran Universiti Penyelidik’ (GUP) Tier 1, (Q.K130000.2540.15H70) for financially
support provided throughout the course of this research project.
0
0.2
0.4
0.6
0.8
1
0 2000 4000 6000 8000
Surv
ival
Pro
bab
ilit
y
Hours
0
0.2
0.4
0.6
0.8
1
0 2000 4000 6000 8000
Su
rviv
al P
robab
ilit
y
Hours

SCIENCE AND TECHNOLOGY 526
REFERENCES
1. Robert B. A. (2010). The New Weibull Handbook: Reliability & Statistical Analysis for Predicting Life,
Safety, Risk, Support Costs, Failures, and Forecasting Warranty Claims, Substantiation and Accelerated
Testing, Using Weibull, Log Normal, Crow-AMSAA, Probit, and Kaplan-Meier Models.
2. Khaled M. N., Hordur G. G., & Mohamed Y. H. (2015). Using Weibull Analysis for Evaluation of Cost and
Schedule Performance. Journal of Construction Engineering and Management, 131, 12, 1257-1262
3. Lai, C. D., Murthy, D. N. P., & Xie, M. (2011). Weibull distributions. Wiley Interdisciplinary Reviews:
Computational Statistics, 3, 3, 282-287.
4. M Ibrahim, R Dolah, M Z Yusoff , M Salit and M Hassan Chemical treatment evaluation of tensile
properties for single Kenaf fiber. Journal of Advanced Research in Applied Mechanics 32, Issue 1 (2017) 9-
14
5. Jeon, J., & Sohn, S. Y. (2015). Product failure pattern analysis from warranty data using association rule and
Weibull regression analysis: A case study. Reliability Engineering and System Safety, 133, 176-183.

SCIENCE AND TECHNOLOGY 527
IGCESH2018
Universiti Teknologi Malaysia, Johor Bahru, Malaysia 13 -15 August 2018
A REVIEW OF MICRO-ECONOMIC DETERMINANTS OF REAL ESTATE
RESIDENTIAL PRICE IN ABUJA, NIGERIA
Musa Abubakar Alkali*1, Ibrahim Sipan2 and Muhammad Najib Razali3
and Zainab Toyin Jagun4
1, 2’ Department of Real Estate, University Technology Malaysia, Johor, MALAYSIA.
(E-mail: [email protected], [email protected]) 3,4’ Department of Real Estate, , University Technology Malaysia, Johor, MALAYSIA.
(E-mail: [email protected]; [email protected])
ABSTRACT
The nature of real estate is complex; specifically, it consist of numerous unique attributes
that influence its price. The price is determined by numerous attributes. The investors value
these attributes differently due to the heterogeneous nature of real estate. Therefore, the aim
of this paper, is to identify the major micro-economic determinants of real estate residential
price in Abuja, Nigeria. Therefore through extensive literature review, some major
determinants of real estate price were identified in order of significance, location,
neighborhood and structural attributes. These are the most significant attributes that
determines the price of real estate residential property within Abuja, Nigeria.
Key words: Residential property, Real estate market, Real estate price, Determinants of real
estate price
INTRODUCTION
Real estate investment is an emerging business in many countries of the world. Real estate
investment was thoroughly investigated to come up with solution faced by the transaction of
land and building. Real estate investment is strictly related to the housing price (Bello et al.
2017). Real estate markets are unique as “no two properties are the equal”. Determination of
real estate price is the consequence of the relations among sellers and buyers in a distinct
location [1].
According to [2]. real estate market like other economic sectors has its price setting method
which vary from the conservative supply and demand theoretical framework. It is tempered
with various features that are special to real estate, which includes location, property age and
availability of infrastructural facilities. Real estate is a significant asset which made important
contribution to the many households' total asset (Lee & Lee, 2009). [3]. However, real estate
price is thus regarded as a bundle of natural characteristics which produce utility
maximization for buyers. Structural, accessibility, neighborhood and location attributes
results in differentials between real estate price and affects the supply and demand flexibility
within precise submarkets [1].

SCIENCE AND TECHNOLOGY 528
MAIN RESULTS
The major determinants of real estate residential price were identified through extensive
literature review. 20 major features were identified and classified into the developed real
estate residential price determinants' framework under location, neighborhood and
structural, characteristics as shown in figure 1. below:
Figure 1. Framework of Real Estate Price Determinants (Adapted from Abidoye and Chan,
2016).
Location
Accessibility to school
Accessibility to shopping mall
Accessibility to place of work
Accessibility to CBD
Accessibility to public transport facility
Proximity to high way
Neighbourhood characteristics
Availability of electricity
Availability of pipe born water supply
Availability of waste disposal system
Availability of neighbourhood security
Age of the property
Number of bedrooms
Size of bedrooms
Number of bathrooms/toilets
Building Characteristics
Size of property
State of repair of the property
Availability of security fence
Location
Neighbourhood
Structural
Determinants of
real estate price

SCIENCE AND TECHNOLOGY 529
CONCLUSION
An effort was made to identified the real estate residential price determinants in Abuja city,
Nigeria through literature review. The study identified various determinants of real estate
residential prices within Abuja real estate market. Further, some major determinants were
identified and classified into the established framework of real estate residential price
determinants adapted from [4], under location neighborhood and structural attributes. These
factors are the major determinants of real estate price within Abuja real estate market.
Moreover, the knowledge of micro-economic determinants of real estate price is of great
importance to real estate investors, real estate agents banks, appraisers, tax assessors and
local authorities as well as general public.
Acknowledgment: The authors will like to acknowledged the Research University Grant
(GUP), Universiti Tecknologi Malaysia under Vot No: Q.J130000.2527.16H06 for
sponsoring this research work. Research facilities used at University Teknologi Malaysia are
also acknowledge.
REFERENCES
1. M. McCord, P.T. Davis, M. Haran, S. M. and D. M. (2012). Spatial variation as a determinant of house price
Incorporating a geographically weighted. Journal of Financial Management of Property and Construction,
17(1), 49–72
2. Kibunyi, D., Wagura Ndiritu, S., Carcel, H., & Gil-Alana, L. A. (2017). Real estate prices in Kenya: is there
a bubble? Journal of Housing and the Built Environment, 32(4), 787.
3. Lee, C. L., & Lee, C. L. (2009). Housing price volatility and its determinants. International Journal of
Housing Markets and Analysis, 2(3), 293–308.
4. Abidoye, R. B., & Chan, A. P. C. (2016). Critical determinants of residential property value: professionals’ perspective. Journal of Facilities Management, 14(3), 283–300.

SCIENCE AND TECHNOLOGY 530
IGCESH2018
Universiti Teknologi Malaysia, Johor Bahru, Malaysia 13 -15 August 2018
COMPARISON OF MICROWAVE PLASMA ATOMIC EMISSION
SPECTROSCOPY AND GRAPHITE FURNACE ATOMIC
ABSORPTION SPECTROSCOPY FOR ANALYSIS OF TRACE
METALS
Ibrahim Sani Shabanda1,2, Nor Kartini Abu Bakar1 and Sook Mei Khor1,3
1Department of Chemistry, Faculty of Science, University of Malaya, 50603 Kuala Lumpur,
Malaysia. ([email protected], [email protected]) 2Department of Pure and Applied Chemistry, Faculty of Science, Kebbi State University of Science
and Technology, PMB 1144, Aliero, Nigeria ([email protected]) 3University of Malaya Centre for Ionic Liquids (UMCiL), University of Malaya, 50603 Kuala
Lumpur, Malaysia ([email protected]).
ABSTRACT
The use of atmospheric nitrogen as a plasma gas for microwave plasma atomic emission
spectroscopy (MP-AES) is a great improvement in analytical world. This is because it has
better performance when compared with graphite furnace atomic absorption spectroscopy
(GFAAS), the maintenance cost is significantly reduced, it is multi-elemental in analysis, fast
analysis time and the nitrogen gas is non-flammable. In this work the performance of these
two instruments were evaluated for the analysis of cadmium (Cd), arsenic (As), chromium
(Cr) and lead (Pb) in soil matrices using hot plate aqua-regia digestion and the subsequent
digests were subjected to analysis by the two instruments. The limit of detection were usually
measured in the low µg/L range and the values for limit of detection measured by MP-AES
were observed to be better when compared with GFAAS.
Key words: MP-AES, GFAAS, Soil, Digestion and Trace metals
INTRODUCTION
The recent introduction of microwave plasma atomic emission spectroscopy (MP-AES) 4100
instrument by Agilent technologies which uses a new, simple, and relatively inexpensive
microwave plasma and atomic emission detector has improved the quality of analytical and
environmental chemistry, in that it is successfully been applied to spectroscopic analysis and
the quantification of several trace elements in soil matrix [1]. Plasma source emission
spectroscopy is a well-accepted approach to elemental analysis [2]. Various excitation
sources such as flame, spark discharge, electric arc discharge and inductively coupled plasma
have been used in emission spectroscopic system in order to produce excited atoms that will
emit light for the measurement of elements. However, MPEAS uses atmospheric nitrogen as
a microwave plasma gas which is its excitation source. Instead of gases that are supplied in
bottles or liquid storing system MP generates a self-sustained atmospheric pressure by
converting atmospheric nitrogen in to a source of energy which the plasma uses instead of
argon gas [3]. This makes it easy and less expensive to maintain as it is noted that gas supply

SCIENCE AND TECHNOLOGY 531
is one of the highest cost associated with elemental analysis. No gas leak risk which therefore
makes laboratory safe for work.
However, GFAAS is very slow in analysis when compared with MP in that it analyzed one
element at a time. This is because each element has its own lamp and there is a need to
thermally program the system to remove solvent and matrix components before atomization.
It is also expensive to maintain because it uses argon gas for cooling and cleaning of graphite
tube. It has a major nuisance associated with it, by taking longer time in the interval of
analysis 2-3 minutes per element for each sample [4]. In individual sample MP-AES can
determine more elements and within 15-30 seconds.
We present here the results on the performance of the MP 4100 that was used for the
determination of trace metals such as Cd, As, Cr and Pb in soil digested by aqua regia. A
sample matrix that is generally considered complex due to high acid and chloride content.
The results are compared with analysis of same digest solutions with GFAAS.
Instrumental: The MP-AES was an Agilent 4100 MP-AES equipped with a standard
glass concentric nebulizer and a double pass cyclonic spray chamber. A Czemy-Turner
monochromator and charge-coupled device detector uses emission line isolation and make
detection to be sequential. During the analysis the pump speed was kept at 15 rpm and the
Agilent SPS 3 was used for sample introduction. Analysis cycle consisted of 30 s rinsing
time with 2-5% nitric acid solution and was followed by 20 s time of sample uptake (fast
pump speed was set) then, it took 15 s stabilization time. At the beginning of each
analysis wavelength calibration were done. Before each analytical sequence the software
optimized both nebulizer pressure and the viewing angle. The integration time was set at
5 s for those trace elements.
The GFAAS used was an analytic Jena Model ZEE nit 650P from Germany with a
transversely heated graphite tube atomizer, using a Zeeman 2-field mode background
correction and additionally with deuterium background correction which is available in
the software Aspect LS version 1.4.1.0 and an auto sampler device for sample transport
with 1 wash cycle between runs. The drying of sample where the sample is evaporated at
a temperature slightly above the boiling point takes three steps of 80 o C, 90 o C and 110 o
C with 28.3, 23.3 and 14 s respectively, pyrolysis takes two steps of 350 o C and 1300 o C
in 24.8 and 13.2 s respectively, the temperature need to be high as it is at this stage the
sample matrix is thermally decomposed. Atomization took place at a very high
temperature 2300 o C in 5.7 s as the analytes here are evaporated and molecules are
splitted into atoms. Finally the temperature 2450 o C for clean-up where the inert gas
flows and removed all the evaporated compounds off the atomizer in 4.3 s. Single-beam
HCl lamp was used for the measurement of all the elements. Throughout the analysis
period the lamps were operated by default current. Argon gas was used for cooling
purpose.
Sample extraction: The digestion of soil sample was done in line with [5] which is in
accordance with International Organization for Standardization (ISO 11466). 0.5g of each
soil sample was weighed in to a digestion flask and 10 mL of acid mixtures of HNO3 +
HCl + HF in ratio 6: 2: 2 was added then covered with a watch glass. The mixture was
heated in a sand bath for 16 h then cooled at room temperature, filtered using a whatman
No 1 filter paper into a 50 mL volumetric flask using acidified ultrapure water and was
made to the mark. All solution were kept finally in a refrigerator at 4 o C prior to analysis
by MP-AES and GFAAS.

SCIENCE AND TECHNOLOGY 532
MAIN RESULTS
The detection limits as seen in the figure below revealed that MP-AES has better
performance to GFAAS
Figure 1. Showing the Limit of detection of MP and GFAAS.
CONCLUSION
The performance of MP-AES is revealed to be better than that of GFAAS and can be
compared to that of ICP source with respect to the simple matrices analysed. The MP-AES
also is more economical to maintain since it generates atmospheric nitrogen as the plasma gas
instead of cylindrical gases used by GFAAS. It may as well provide a cheaper alternative for
routine analysis in environmental samples to the traditional ICP.
Acknowledgment: The authors would like to express their appreciation for the support of the
UM PPP Grant with Project No PG023-2016A.
REFERENCES
1. Jankowski, K. J., & Reszke, E. (2010). Microwave Induced Plasma Analytical Spetrometry. The Royal
Society of Chemistry, www.rsc.org. 23-36. 2. Hammer, M. R. (2008). A magnetically excited microwave plasma source for atomic emission spectroscopy
with performance approaching that of the inductively coupled plasma. Spectrochimica Acta Part B: Atomic
Spectroscopy, 63(4), 456-464.
3. Karlsson, S., Sjoberg, V., & Ogar, A. (2015). Comparison of MP AES and ICP-MS for analysis of principal
and selected trace elements in nitric acid digests of sunflower (Helianthus annuus). Talanta, 135, 124-132.
4. Chirigiu, L., Popescu, R., Bubulica, M. V., & Popescu, A. (2012). Determination of Chromium, Cooper,
Iron, Zinc, Cadmium and Led by Graphite Furnace Atomic Absorption Spectrometry in Seven
Phytopharmaceutical Products. Revista De Chimie, 63(9), 874-876..
5. Nemati, K., Abu Bakar, N. K., Bin Abas, M. R., Sobhanzadeh, E., & Low, K. H. (2010). Comparative study
on open system digestion and microwave assisted digestion methods for metal determination in shrimp
sludge compost. J Hazard Mater, 182(1-3), 453-459.

SCIENCE AND TECHNOLOGY 533
IGCESH2018
Universiti Teknologi Malaysia, Johor Bahru, Malaysia 13 -15 August 2018
BRAIN ACTIVITY OF REASONING DURING INTELLIGENCE
QUOTINENT (IQ) TEST: A PRELIMINARY STUDY
Nurul F. Zainuddin*1, Abdul H. Omar2, Mohd N. Jamaluddin3, Izwyn Zulkapri4,
Arief R. Harris5, Nik A. R. N. Mohd6
1, 2, 3, 4 Faculty of Biosciences and Medical Engineering, Universiti Teknologi Malaysia, Johor,
MALAYSIA 2,3Sports Innovation and Technology Centre, Universiti Teknologi Malaysia, 81310 Johor Bahru,
Johor, MALAYSIA 5Centre of Biomedical Engineering, Universiti Teknologi Malaysia, 81310 Johor Bahru, Johor,
MALAYSIA 6Faculty of Mechanical Engineering, Universiti Teknologi Malaysia, Johor, MALAYSIA.
(E-mail: [email protected], [email protected], [email protected], [email protected], [email protected], [email protected])
ABSTRACT
Neurocognitive is a scientific approach to understand intelligence within the scope of
cognitive function in which it study an information processing associated with central
nervous system. The component of reasoning that includes within intelligence is constructed
in the intelligence quotinent (IQ) of Raven Standard Progressive Matrices (RSPM). Previous
researchers had come out with various techniques to analyse brain processing. Therefore, this
study intent to evaluate the changes of brain activity while the subject doing assessment of IQ
test by using electroencephalography (EEG) at different level of difficulty. The methodology
used in this preliminary study constructed with the evaluation of the changes brain activity
that employed (EEG) during assessment of IQ test. The analysis of brain activity will be
based on alpha (10-12Hz) and beta (13-15Hz) waves after underwent signal processing. The
result from this study will indicate that there is a different pattern of brain activity showed in
the alpha and beta waves at different level of difficulty from IQ test. Alpha power in this
study supported by previous studies about brain activity related to cognitive processing.
Key words: brain activity, intelligence, EEG, reasoning
INTRODUCTION
Individual differences in intelligence are usually measured using psychometric tests. It lead to
the various studies investigated the relationship between human’s IQ scores with their brain
activity and intelligence [1]. These tests cover cognitive domains such as reasoning,
processing speed, executive function, memory and spatial ability [2]. Previous study showed
that electrical signal detected by EEG could potentially reflects the functional relationship
among brain areas [3]. It was supported by [4] that describes the EEG was designing to gain
insight information of the brain during intelligence processes. The intelligence is recognized
in the term ‘general intelligence’, which is commonly designated ‘g’ [2]. Some individual
tests such as Raven’s Progressive Matrices test, which is used to assess non-verbal reasoning
are good indicators of general intelligence. Therefore, the aim of this study is to evaluate the

SCIENCE AND TECHNOLOGY 534
changes of alpha and beta waves that specifically retrieved different level of difficulty during
IQ test assessment.
METHODOLOGY
Procedure
This study purposely to get a preliminary data. There have 3 subjects with homogenous
group volunteer to participate in this study. Exclusion criteria for the participants were
color blindness or conditions related to neurological and central nervous system. Fluid
intelligence, g was tested by using Raven’s Standard Progressive Matrices (SPM). The
test consists of 30 trials from 5 sections that arranged with increasing the level of
difficulty. Particularly in this study, participant was asked to identify the missing element
that completes a pattern by pressing the appropriate key on a keyboard. The elements of
missing piece reflecting match problem, figure problem and analytical problem.
Participants were instructed to solve as many trials as possible within 10 minutes. Prior to
the test, the EEG will record 1 minute of eye close. The EEG will be recorded
continuously and the time duration of answering each section will be noted.
EEG recordings
The EEG was measured with Attys Scope product; wearable bioamplifiers of with one
differential channel. The electrode will be places on Fp1 and Fp2 with ground electrode
is placed at the ear lobe. The EEG signals were filtered between highpass 0.1 Hz and
lowpass 50 Hz. An additional 50 Hz notch filter was applied. Electrode impedances were
kept below 5 kΩ for the EEG. All signals were sampled at a frequency of 250 Hz with
resolution of 24bit. EEG data were preprocessed by removing drifts and low pass filtering
(50 Hz). The data were visually checked for artifacts, and artifact epochs caused by
muscle tension, eye blinks or eye movements were excluded from further analysis. The
accelerometer was used to detect movement artifact. The signals will be determine by
applying epoch towards specific section of IQ test, intensity and terrain from the
experiments. In a next step, EEG signals were filtered by applying Fast Fourier
Transform FFT filter for the alpha frequency band (8-12Hz) and beta frequency band (15-
30Hz).
RESULT
Result in figure 1 shows the value of power alpha and beta waves during IQ test that consists
of 5 section from easy to the most difficult level. Based on the graph, the value of power
increase from part A to part B. The pattern value of subject A and B almost similar
meanwhile subject C shows different pattern for the whole result. Nonetheless, all three
subjects demonstrates similar pattern of power value from part D to E.

SCIENCE AND TECHNOLOGY 535
Figure 1. Power of alpha and beta waves from five section of intelligence quotinent (IQ) test
DISCUSSION
This study extends the investigations of cognitive function that analysed by alpha and beta
power. Based on the result of alpha power subject B that score highest in IQ test displays the
low value of alpha power in which it refer to a condition that this subject was at higher
attention while having assessment of IQ test. In contrast to subject C that scored lowest IQ
test describes as going to a relaxation condition. It described that the subject comply
minimum reasoning capability as involved low level of brain processing. This pattern of
higher and lower of alpha power value was supported by previous theory and experimental
study concerning measurement alpha waves activity. As for the beta waves activity, highest
score of IQ test showed the lowest value of beta power activity. In summary, result from
alpha power in this study supported by previous studies about brain activity related to
cognitive processing.
Acknowledgment: The first author of this paper received fund from Zamalah, Universiti
Teknologi Malaysia (UTM).
REFERENCES
1. Lias, S., Sulaiman, N., Murat, Z. H. and Taib, M. N. IQ index using alpha-beta correlation of EEG Power
Spectrum Density (PSD). ISIEA 2010 - 2010 IEEE Symp. Ind. Electron. Appl. (2010), 612–616.
2. Deary, I. J. , Penke, L. and Johnson, W. The neuroscience of human intelligence differences. Nature Review
Neuroscience 11 (2010), 201–2011. 3. Jaušovec N. Differences in cognitive processes between gifted, intelligent, creative, and average individuals
while solving complex problems: An EEG study. Intelligence 28 3 (2000), 213–237.
4. Jaarsveld, S., Fink, A., Rinner, M., Schwab, D., Benedek, M. and Lachmann, T. Intelligence in creative
processes: An EEG study. Intelligence 49 (2015), 171–178.

SCIENCE AND TECHNOLOGY 536
IGCESH2018
Universiti Teknologi Malaysia, Johor Bahru, Malaysia 13 -15 August 2018
OPTIMISATION OF ULTRASOUND ASSISTED EXTRACTION
OF ELAEIS GUINEENSIS LEAVES EXTRACT
Nissha Bharrathi Romes*1, Roswanira Abdul Wahab2 and Siti Ernieyanti Hashim3
1,2,3 Chemistry Department, Universiti Teknologi Malaysia, Johor Bharu, MALAYSIA.
(E-mail: [email protected], [email protected])
ABSTRACT
Ultrasound assisted extraction (UAE) is a green extraction technique which has been widely
used to extract bioactive compounds from plant materials. UAE method is more efficient as
compared to other conventional methods, such as maceration and Soxhlet extraction. Herein,
UAE was employed in this study for the optimisation of extraction yield of Elaeis guineensis
leaves using response surface methodology. A four-factor-three-level Box-Behnken Design
(BBD) namely, solvent concentration; X1 (%), extraction time; X2 (min), solvent-to-solid
ratio; X3 (mL/g) and energy of sonication amplitude; X4 (%) were used to study the
efficiency of extraction yield. The highest yield (14.55%) was obtained under an optimised
conditions of 50% (v/v) ratio of ethanol-water, 55 min of extraction time, 35 mL/g solvent-to-
solid ratio and 60% ultrasound amplitude. The predicted model was significant (p < 0.05)
with a regression coefficient (R2) of 0.89. These results implied that the UAE is significantly
efficient for attaining a high extraction yield of the leaves of E. guineensis.
Key words: Ultrasound-assisted extraction, Ultrasound effects, Extraction efficiency, Response
Surface Methodology
INTRODUCTION
Ultrasound assisted extraction (UAE) is an alternative extraction method that is gaining
popularity for high yield extraction of phytoconstituents in plants, for use in phyto-
pharmaceuticals and cosmetics industries [1]. UAE effectively disrupts plant cell walls by
acoustic cavitation and facilitate solvent penetration, causing enhanced mass transfer of
solutes from plants cells to the outer liquid medium [2].
A four-factor-three-level Box-Behnken design (BBD) of response surface methodology
(RSM) was employed to study the UAE efficiency for the response, percentage yield. E.
guineensis leaves were collected, air-dried, cut into pieces and ground for homogenisation
followed by ultrasonication. The samples were centrifuged and the supernatant was
lyophilized. Yield of each extraction run was calculated and the highest percentage yield
of 14.55% was attained as tabulated in Table 1.
As depicted in Figure 1, solvent concentration is the dominant factor for a high extraction
efficiency, as 50% (v/v) ethanol-water mixture can exudate more compounds as compared
to 100% and 0% ethanol. Water acts as a swelling agent whereas ethanol attracts and

SCIENCE AND TECHNOLOGY 537
dissolves more polar compounds. Bubbles generated from acoustic cavitation of UAE
produce microjets that rupture the plant cell walls which facilitate diffusion of the solvent
into the cell walls increased. The use of a longer extraction time, 55 min improved
extraction yield due to the production of more microjets to disrupt plant structures. Based
on the ANOVA, the developed model was found to be significant (p < 0.05) at an F-value of
7.92. R2 value of the extraction yield is 0.8879.
MAIN RESULTS
Table 1. Extraction yields of E. guineensis leaves
Run X1 X2 X3 X4 Extraction
Yield (%)
1 100 30 15 60 4.65
2 0 30 15 60 6.56
3 50 5 35 60 12.35
4 0 30 25 100 3.04
5 50 30 25 60 11.03
6 50 30 25 60 11.84
7 50 5 25 100 9.54
8 50 30 35 100 13.51
9 0 5 25 60 6.92
10 0 30 25 20 5.07
11 0 30 35 60 6.27
12 50 30 25 60 10.99
13 50 55 35 60 14.55
14 100 55 25 60 6.16
15 100 30 25 20 3.77
16 50 5 15 60 7.98
17 50 55 25 20 12.38
18 100 30 35 60 5.39
19 50 30 15 20 9.01
20 50 30 25 60 11.42
21 50 30 15 100 6.97
22 0 55 25 60 4.8
23 100 30 25 100 5.68
24 50 30 25 60 11.91
25 50 55 15 60 6.69
26 100 5 25 60 6.43
27 50 30 35 20 13.93
28 50 55 25 100 9.71
29 50 5 25 20 12.36

SCIENCE AND TECHNOLOGY 538
Figure 1. Response surface plots showing the UAE generated extraction yields.
CONCLUSION
Data for UAE of E. guineensis performed using RSM were fitted to a quadratic model that
showed that the highest extraction yield under an optimised UAE condition was: 50% (v/v)
ethanol-water, 55 min, 35 mL/g solvent-to-solid ratio and 60% amplitude. Solvent
concentration has the highest influence on the UAE process, where the use of 50% (v/v)
ethanol-water mixture is adequately polar to extract polar compounds in E. guneensis yield,
achieved under a shorter time span. The experimental values of the extraction yield are 88%
in agreement with the predicted values of RSM. This technique also helps to reduce the
consumption of energy and hazardous solvents. Undoubtfully, UAE assist in the facile
bioaction of compounds in plants as compared to conventional extraction methods.
Acknowledgment: The study is supported by by the Fundamental Research Grant Scheme
from the Ministry of Higher Education Malaysia (QJ130000.2526.17H48) and UTM Zamalah
Scholarship.
REFERENCES
1. Caleja, C., Barros, L., Prieto, M., Barreiro, M. F., Oliveira, M. B. P. & Ferreira, I. C. Extraction of rosmarinic acid from Melissa officinalis L. by heat-, microwave-and ultrasound-assisted extraction
techniques: a comparative study through response surface analysis. Separation and Purification Technology
(2017).
2. Cai, Z., Qu, Z., Lan, Y., Zhao, S., Ma, X., Wan, Q., Jing, P. & Li, P. Conventional, ultrasound-assisted, and
accelerated-solvent extractions of anthocyanins from purple sweet potatoes. Food Chemistry 197 (2016),
266-272.

SCIENCE AND TECHNOLOGY 539
IGCESH2018
Universiti Teknologi Malaysia, Johor Bahru, Malaysia 13-15 August 2018
RATIONALIZING THE IRRATIONALITY OF OPEN DEFECATION
PRACTICE AMONG HOUSEHOLDS WITH TOILETS IN OGUN
STATE, NIGERIA
O. Olapeju1, M. Rafee Majid2
1Department of Urban and Regional Planning, Federal Polytechnic Ilaro, Ogun State, NIGERIA.
([email protected]) 2Centre for Innovative Planning and Development, Faculty of Built Environment, Universiti
Teknologi Malaysia, 81310 Johor Bahru, MALAYSIA.
ABSTRACT
Various studies aimed at unravelling the practice of open defecation established lack of
toilets as the major factor responsible for open defecation. However, the reality in most
countries like Nigeria where open defecation is still in practice is the fact that people who
have toilets in their homes are not precluded from the terrible sanitation culture. This paper
attempt to investigate latent factors that account for the seeming irrationality of seeking
recourse to open defecation when toilets are available. The study is limited to Ogun State,
Nigeria, where households are not in dearth of toilet facilities, but open defecation culture is
ironically still in practice.Using the multi-stage sampling approach, a total of 165
questionnaires were administered to representative households in the study area. This implies
that 55, 50, and 60 questionnaires were administered in Surulere, Ilaro I, and Sodeke/Sale‐Ijeun I,respectively,on the basis of ratio 1.1:1.0:1.23,which reflects the variance in population
of 1,250,435(33%),1,112,761(30%), and 1,387,944(37%) for Ogun East, Ogun West and
Ogun Central, respectively. The study found, among others, that HIEDQU (2), HIEDQU (4)
(The dummies of the categorical variables of the highest education attained by respondents),
and NRODHT(Neatness of Toilets as the reason households defecate in the open) at
significance levels of 0.016, 0.011, 0.10, were the only significant predictors in the logistic
regression model. The paper concludes that toilet provisioning without the adoption of
holistic infrastructural framework and policy enforcement would not suffice in the quest to
eradicating open defecation.
Keywords: Open Defecation, Toilets, Nigeria
INTRODUCTION
Sub-Saharan Africa accounts for 16 of the 24 countries where at least one person in five
cannot access improved sanitation services. In these countries, the proportion of population
sharing facilities is larger in the cities [1]. A study[2] had ranked Nigeria as the sixth worst
of the most people defecating in the open, with the average number of people defecating
(46,017,300) in its land mass of 923,770 square kilometres, put at 50 per square kilometre.
This is consistent with the 2017 findings of Joint Monitoring Programme — a body set up by
UNICEF and the World Health Organization as reported in [3] that 33% of people in Nigeria

SCIENCE AND TECHNOLOGY 540
do not have clean water, 67% do not have a decent toilet and 26% practice open
defecation. As reported in [4], Nigeria loses over 3 billion dollars to poor sanitation. This fact
is corroborated by [5] that persons practicing open defecation expend practically 2.5 days a
year finding a private location to defecate, leading to huge economic losses and proliferation
of unhealthy flies and pathogens. Diarrhoeal diseases related deaths in Nigeria reached
130,610 and 6.85% of total deaths [6]. Around 60,000 children under the age of five in
Nigeria die from diarrhoeal diseases essentially caused by the country’s poor levels of access
to water, sanitation and hygiene [3].
The gender perspective to sanitation is equally important. Women and girls are
disproportionately impacted by the rampant lack of access to clean water and adequate
sanitation. Apart from exposure to all variants of toilet infections in badly managed toilets,
they stand the risk of exposure to sexual harassment in their quest to finding an open place to
defecate [7, 8]. It had been established that a nexus exists between the lack of toilets and open
defecation [9, 10]. Like those in most Nigerian settlements, residents of Ogun state mostly
live in buildings without improved sanitary facilities. Improved toilet facilities are the safely
managed and environmentally friendly variants that are also unshared [11].There are sizeable
numbers of households who have the luxury of toilets, both improved and unimproved, who
still practice open defecation within the State.
The study aimed at investigating the significant factors accounting for why people with
toilets still defecate in the open, with the view of providing sustainable solutions to the open
defecation challenge. A total of 165 questionnaires were administered to representative
households in the study area. This implies that 55, 50, and 60 questionnaires were
administered in Surulere, Ilaro I, and Sodeke/Sale‐Ijeun I, respectively, on the basis of ratio
1.1:1.0:1.23, which reflects the variance in population of 1,250,435(33%), 1,112,761(30%)
and 1,387,944(37%) for Ogun East, West and Central, respectively. The multi-stage method
adopted, which several random processes enable eventual selection of suitable samples within
homogenous clusters, immensely reduced the chance of sampling error that could be
associated with the sample percentage. For bivariate analysis, chi-square (Pearson) statistics
was used to assess relationships between how household toilets are shared, income level of
households, and the education level of the household heads, with the level of significance at
<5%. Binary logistic regression was used to assess the significant predictor variables that best
explain why respondents with toilets still defecate in the open, and their odd ratios equally
determined.
RESULTS
The study shows that a significant association was found between how households’ toilets are
shared and the level of education of the representative households heads (P=0.00)
Furthermore, how households’ toilets are shared was significantly associated with the
economic class of households (P = 0.00).
Table 1. Relationships between how households’ toilets are shared and associated variables
Value df Asymp. Sig. (2-sided)
Pearson Chi-Square 1 62.826a 12 .000
Pearson Chi-Square 2 49.372a 9 .000
Logistic regression which assessed the impacts of key factors on the phenomenon of open
defecation by households who have toilets revealed that HIEDQU (2), HIEDQU (4) (The

SCIENCE AND TECHNOLOGY 541
dummies of the categorical variables of the highest education attained by respondents), and
NRODHT(Neatness of Toilets as the reason households defecate in the open) at significance
levels of 0.016, 0.011, 0.10, were the only significant predictors a lot of key information.
CONCLUSION
A different view to the open defecation phenomenon that can be of help to government policy
makers, NGOs and International stakeholders in the quest to eradicate open defecation and
ultimately meet sustainable development goal 6 and its target B. The critical point is that
toilet provisioning without the adoption of holistic infrastructural and policy framework
would not suffice in the quest to eradicating open defecation. Urban Planning is key to
ensuring building plans that can afford improved and unshared toilets are only considered
approvable by planning agencies. It can also be the instrument for discouraging open
defecation through proactive landscape planning of open spaces, mainstreaming of transport
terminals that integrate adequate toilet facilities in cities’ plans, and the equitable distribution
of public toilets in neighbourhoods. Moreover, water, electricity and the will to enforce
sanitation laws by municipal authorities should equally be ranked as imperative.
Acknowledgement: I profoundly appreciate the students of Urban and Regional Planning,
Federal Polytechnic Ilaro, Ogun State Nigeria for being helpful in the course of data
gathering for the study.
REFERENCES
1. WHO, 2017b. WHO Key facts[Online].Available at http://www.who.int/mediacentre/factsheets/fs297/en/,
[Accessed: 14 October 2017]. 2. WaterAid, 2016. Nigeria’s sanitation crisis [Online]. Available at
file:///C:/Users/HP/Downloads/Nigeriassanitationcrisis2016worldtoiletdaynigeriasupplement.pdf. [Accessed:
14 October 2017].
3. Thisday, 2017. New Statistics Reveal Huge Challenge on Water, Toilets for All in Nigeria. Available at:
https://www.thisdaylive.com/index.php/2017/07/27/new-statistics-reveal-huge-challenge-on-water-toilets-
for-all-in-nigeria/
4. Aung, T.T., 2017, Insufficient Toilets Pose Risk to Women and Girls [Online]. Available at:
https://www.irrawaddy.com/news/burma/insufficient-toilets-pose-risk-women-girls.html [Accessed: 11
November 2017].
5. Dailytrust, 2017, Nigeria loses $1bn to open defecation yearly – UNICEF [Online]. Available at:
https://www.dailytrust.com.ng/news/environment/nigeria-loses-1bn-to-open-defecation-yearly--
unicef/198994.html [Accessed: 14 October 2017]. 6. World Bank, 2012. The key messages Sanitation Data from 18 Countries in Africa [Online]. Available at:
http://siteresources.worldbank.org/INTAFRICA/Resources/economic-impacts-of-poor-sanitation-in-africa-
factsheet.pdf
7. WHO, 2017a. World Health Rankings Live Longer Live Better [Online].Available at
http://www.worldlifeexpectancy.com/nigeria-diarrhoeal-diseases [Accessed: 14 October 2017].
8. WaterAid, 2013. Women and WASH [Online]. Available at file:///C:/Users/HP/Downloads/Briefing Note
How can water sanitation and hygiene help realise womens rights and gender equality (1).pdf [Accessed: 14
October 2017].
9. Aung, T.T., 2017, Insufficient Toilets Pose Risk to Women and Girls [Online]. Available at:
https://www.irrawaddy.com/news/burma/insufficient-toilets-pose-risk-women-girls.html [Accessed: 11
November 2017]. 10. Ezekwe I.C, Odubo T.V, O.E. and A.I., 2011. Housing Sanitation and Faecal Sludge Management in Owerri
Nigeria. Journal of Geographic Thought (Journal of Department of Geography and Environmental
Management, University of Port Harcourt), 12(1&2), pp.89–102.
11. Oyesile, S. and Olapeju, O., 2012. Assessing_Fecal_Waste_Management_in_Ilar. Urban and Regional
Planning Review, 1&2(3), pp.163–170.
12. WHO/UNICEF JMP, 2017. Progress on Drinking Water, Sanitation and Hygiene. WHO Library
Cataloguing-in-Publication Data. World Health Organization[Online]. Available at:
http://www.wipo.int/amc/en/%0Ahttp://www.who.int/about/.

SCIENCE AND TECHNOLOGY 542
IGCESH2018
Universiti Teknologi Malaysia, Johor Bahru, Malaysia 13 -15 August 2018
BIOMEDICAL DATA CLASSIFICATION USING WRAPPER BASED
SWARM INTELLIGENCE ALGORITHMS FOR FEATURE
SELECTION
Shamini Raja Kumaran*1, Mohd Shahizan Othman2 and Lizawati Mi Yusuf3
1, 2, 3 Faculty of Computing, Universiti Teknologi Malaysia, Johor Bahru, Malaysia.
(E-mail: [email protected], [email protected], [email protected])
ABSTRACT
In recent years, the availability of biological and medical data has increased considerably.
Due to the range of low to high dimensional of biomedical data, it is always difficult to
extract the right information for the right person. By dealing with the dimensionality of data,
the learning algorithm might reduce the performance due to severe over fitting.
Unfortunately, this scenario will decrease the capability of learning algorithm in knowledge
extraction. Therefore, swarm intelligence (SI) algorithms act as a collective intelligence from
the groups of simple agents to gain higher classification accuracy. SI is an emerging
technology to simulate the evolution of the law of nature in biological communities with
robust characteristics. SI have a practical significance which aims to improve the deficiencies
and the performance of the algorithm. While wrapper method measures the features’
usefulness and wrapper-based feature selection used to remove the irrelevant and redundant
features for the quality of classification. Hence, this article would like to implement SI
algorithms on biomedical data and classified using support vector machine (SVM). The main
aim of this article is to provide a comparison between SI algorithms. Four SI algorithms used
in this research, Particle Swarm Optimisation (PSO), Cuckoo search (CS), Bee Colony (BC)
and Ant Colony Optimisation (ACO). Hereby, the proposed methods applied to public
datasets, namely, Parkinson, Breast Cancer and Orthopaedic datasets to handle various
dimensional datasets for classification. By comparison, wrapper-based CS-SVM showed
higher accuracy rate of 89.7%, 75.9% and 77.4% respectively for the stated datasets
compared to PSO (85.6%, 70.3% and 54.5%), BC (76.9%, 69.2% and 54.5%) and ACO
(76.9%, 69.2% and 54.5%). The results show that CS conducts its role for better
classification contributing the best feature subsets.
Keywords: Wrapper, Feature selection, Swarm intelligence algorithms, Biomedical data
INTRODUCTION
Biomedical data comprised of bioinformatics are poorly dealt due to errors linked to human
and management themselves [1]. Nevertheless, medical datasets are very often made up of
few components, usually represent patients that are characterized by a very high number of
features extrapolated from a set of medical analysis and examinations that are available today
[2]. The input of data uphold challenges for machine learning researchers or data scientists as
the input features complicate the problem and degrade the accuracy of classification solution.

SCIENCE AND TECHNOLOGY 543
Initially, the traditional methods struggle to achieve the objective of identifying the best
subset of features for biomedical data. Traditional methods used if-then rules to state
conditions of certain features [3] and it is proven the traditional methods are time-consuming
and tough to implement. Hence, the role of swarm intelligence (SI) algorithms are initiated to
assist the machine learning’s goal. SI algorithms are also powerful search algorithms that
revolve local and global search methods and have been successfully applied in many different
types of areas [4].
This research study would like to experiment biomedical data using PSO, ACO, BC, and CS.
Each SI algorithm presented in this study has its own structure and process of selecting
features. Nevertheless, the wrapper as feature selection method is infused in PSO, ACO, BC,
and CS, for the purpose of feature addition or deletion to compose the feature subsets. In this
article, wrapper approach also used as an evaluation function with the SI algorithm to
estimate the feature subsets and assist in searching for optimal results in the space of
dimension. Furthermore, Support Vector Machine (SVM) utilized as the classifier and will be
optimized by the SI algorithms. SVMs have been extensively utilized as classification tool
and it shows a huge success in terms of feature selection [5]. The three public datasets are
Parkinson, Breast Cancer, and Orthopaedic datasets and it is used for experimental analysis in
order to compare with wrapper based SI algorithms, namely, PSO, ACO, BC, and CS. The
results demonstrated that CS method able to achieve accurate classification results compared
to other SI algorithms. This research aims to provide lower dimensional datasets (100-350
instances and 10-25 features) as an initiative for biomedical field in order to get better
classification and choice feature subsets. The main results of this research study were
illustrated in the next section.
MAIN RESULTS
Figure 1 shows the accuracy results of the conducted experiments.
Figure 1. Accuracy rate based on wrapper based SI algorithm.
While Table 1 shows the initial characteristic of datasets with features and selected
number of features after processed with wrapper based PSO, ACO, BC and CS.
Per
cen
tage
(%
)
85.6
76.9 76.9
89.7
70.3 69.2 69.275.9
54.554.5 54.5
77.4
0
10
20
30
40
50
60
70
80
90
100
PSO ACO BC CS
Parkinson Breast Cancer Orthopaedic
Algorithms

SCIENCE AND TECHNOLOGY 544
Table 1. Before and after implementation of SI algorithms on biomedical data Datasets All Features Selected number of
features
Parkinson
(23 features)
Average, maximum and minimum vocal frequency,
several measures of variation in fundamental
frequency, Several measures of variation in amplitude,
Two measures of ratio of noise to tonal components in
the voice, Two nonlinear dynamical complexity
measures, Signal fractal scaling exponent, Three
nonlinear measures of fundamental frequency
variation, Health status (class)
PSO: 10; ACO: 10;
BC: 14; CS: 10.
Breast Cancer
(10 features)
Age, menopause, tumor-size, two type of nodes, degree
of malig., breast, breast quad, recurrence event (class)
PSO:4;ACO:5; BC:
5; CS:2
Orthopaedic
(7 features)
pelvic_incidence, pelvic_tilt,lumdar_lordosis_angle,
sacral_slope, pelvic_radis, degree_spondylolisthesis,
orthopaedic status (class)
PSO:3; ACO:3; C:3;
CS:1
CONCLUSION
This article used wrapper based SI algorithms and SVM as the classifier for feature selection
to determine the classification performance. The experimental results showed that wrapper
based CS had the highest accuracy rate compared to other SI algorithms. In future, the CS
algorithm can be enhanced for high dimensional based biomedical data (more than 1000
instances) for feature selection needs. This method also can potentially be applied to other
areas as well.
Acknowledgement: The authors would like to acknowledge the financial support from
School of Graduate Studies, Universiti Teknologi Malaysia (Zamalah Scholarship) and
Research University Grant (GUP), Tier 1 under the Vote No.16H69.
REFERENCES
1. Elsebakhi, E., Asparouhov, O., Berisha, A., Latenski, K., Schendel, E., Haque, A., & Al-Ali, R. Data Mining
Risk Score Models for Big Biomedical and Healthcare Data. Journal of Computer Science & Systems Biology 8(6) (2015), 365-372.
2. Kohli, M. D., Summers, R. M., & Geis, J. R. Medical Image Data and Datasets in the Era of Machine
Learning—Whitepaper from the 2016 C-MIMI Meeting Dataset Session. Journal of digital imaging 30(4)
(2017), 392-399.
3. Nápoles, G., Espinosa, M. L., Grau, I., Vanhoof, K., & Bello, R. Fuzzy Cognitive Maps Based Models for
Pattern Classification: Advances and Challenges. In Soft Computing Based Optimization and Decision
Models (2018), 83-98.
4. Rios, E., Ochi, L. S., Boeres, C., Coelho, V. N., Coelho, I. M., & Farias, R. Exploring parallel multi-GPU
local search strategies in a metaheuristic framework. Journal of Parallel and Distributed Computing 111
(2018), 39-55.
5. Bahari, N. I. S., Ahmad, A., & Aboobaider, B. M. (2014). Application of support vector machine for classification of multispectral data. In IOP Conference Series: Earth and Environmental Science 20 (1)
(2018), 1-8.

SCIENCE AND TECHNOLOGY 545
IGCESH2018
Universiti Teknologi Malaysia, Johor Bahru, Malaysia 13 -15 August 2018
ASSESSING PERCEPTIONS TOWARDS PUBLIC BUS SERVICE
AMONG THE CAR USERS IN ISKANDAR MALAYSIA
Jia Chyi Pung*1 and Safizahanin binti Mokhtar2
1, 2 Faculty of Built Environment, Universiti Teknologi Malaysia, Johor Bahru, MALAYSIA.
(E-mail: [email protected], [email protected])
ABSTRACT
Encouraging car users to bus use has been a central topic to control the deteriorating traffic
condition. In this light, Iskandar Regional Development Authority (IRDA) has deployed
extensive investments in order to improve public bus service on its connectivity, service t ime
and etc. Nevertheless, low bus ridership remains and car use is the main contributor of
vehicular activity. Under this premise, various scholars have highlighted distorted perceptions
towards bus use as a barrier to promote modal shift from car to bus use. An empirical study is
necessary to examine the factors that shape distorted perceptions towards bus use among the
car users in Iskandar Malaysia. Therefore, this research aims to assessing perceptions towards
public bus service among the car users in Iskandar Malaysia. In order to assess car users’
perceptions, online questionnaire survey was conducted with sample size of 102. Car users
who reside in residential neighbourhoods within 910 meters radius and nearby bus stops
along Trans Iskandar BeXTRA Route BET3 were targeted as key respondents. Findings from
descriptive analysis illustrate choice users (car users who use public bus service as an
alternative mode) perceive bus use more favourably than captive users (car users who do not
use public bus service as an alternative mode). Subsequently, Generalized Linear Model
(GLM) is utilized in order to identify variables that are significant to influence the probability
for using public bus service among the car users. Results from GLM show the significant
variables in relation to bus use are twofold: affective i.e. safety (from crimes) and
instrumental i.e. bus network, costs and bus stop facilities. Results of this research prove that
perceptions in relation to instrumental and affective variables are influential to promote
modal shift from car to bus use. Therefore, understanding car users’ perceptions may assist in
modal shift to bus use.
Key words: Transportation, Perceptions, Modal shift, Car users, Bus use
INTRODUCTION
Due to increase in GDP per capita and disposable income, car ownership has been growing
rapidly and car use has contributed extensively to fast growing motorisation rate with
different pace among developing countries. Under this light, Malaysia possesses high private
vehicle ownership. This situation has caused negative externalities environmentally, socially
and economically [3]. Due to this situation, public bus service is one of the solutions to
overcome the emerging car use. Major implementations have been undertaken in order to
improve bus ridership, especially in Iskandar Malaysia. However, public transport modal
share of Iskandar Malaysia was 10 percent in 2012 and perceptions towards public transport

SCIENCE AND TECHNOLOGY 546
among the community in Iskandar Malaysia was found least satisfactory out of all provision
of infrastructure [2]. Under this light, it has been proved that the distorted perceptions of
public bus service among the car users are significant barriers to bus use [1, 4, 6, 7, 8]. Public
transport is perceived as an undesired alternative for car use generally [5, 6]. An empirical
study is necessary to examine the factors that shape the distorted perceptions towards public
bus service among the car users in Iskandar Malaysia. Without addressing distorted
perceptions towards public bus service among the car users, bus ridership could be
deteriorating despite of the numerous efforts input by the authority. Unfavourable perceptions
towards public bus service among the car users has to be altered imperatively in order to
encourage sustainable traffic growth. Therefore, this research aims to assessing perceptions
towards public bus service among the car users in Iskandar Malaysia.
MAIN RESULTS
In this research, Generalized Liner Model (GLM) is utilized to examine the relationship
between a dependent variable (probability of using public bus service as an alternative
transport mode) and a set of nominal independent factors (perceived attributes of public
bus service and car use). The probability, P value that is smaller than significance level of
0.05 indicates significant relationship between the dependent and independent variables.
In this light, it could be explained as P values assist to identify the significant
independent variables.
With reference to Table 1, results from GLM show the significant perceived attributes
that could affect the possibility for car users’ to use public bus service as an alternative
transport mode. The results show safety (from crimes), network, and costs of bus and bus
stop facilities as significant variables.
Table 1. Variables in the GLM Model
Parameter
B
Std.
Error
95% Wald
Confidence Interval Hypothesis Test
Exp(B) Lower Upper
Wald
Chi-
Square df
P
value
(Intercept) -9.163 41992.
5994
-82313.145 82294.
820
.000 1 1.000 .000
[B_COST=0] -3.156 1.0715 -5.256 -1.056 8.677 1 .003 .043
[B_COST=1] 0b . . . . . . 1
[B_NETWORK=0] -3.947 1.6192 -7.120 -.773 5.941 1 .015 .019
[B_NETWORK=1] 0b . . . . . . 1
[B_SAFETY=0] -7.085 2.0795 -11.160 -3.009 11.607 1 .001 .001
[B_SAFETY=1] 0b . . . . . . 1
[B_BUS_STOP_
FACILITIES=0]
2.592 1.0931 .450 4.735 5.624 1 .018 13.358
[B_BUS_STOP_
FACILITIES=1]
0b . . . . . . 1
[C_COMFORT=0] -3.522 1.5159 -6.493 -.551 5.397 1 .020 .030
[C_COMFORT=1] 0b . . . . . . 1
[C_COST=0] -3.576 1.7751 -7.055 -.097 4.059 1 .044 .028
[C_COST=1] 0b . . . . . . 1

SCIENCE AND TECHNOLOGY 547
Instrumental and affective variables are identified to be significant to impact bus use
among the car users. This finding aligns with results of previous study, where the authors
affirmed that mode choice of bus use is affected by instrumental and affective motives
among the trip makers in Johor Bahru [4]. However, in view of current plans, policies and
guidelines, instrumental attributes are mentioned more extensively than affective
attributes. This finding highlights the lack of adoption of perceptions among the policy
makers.
CONCLUSION
Perceptions of public bus service among the car users are identified as a barrier for
encouraging bus use among them. Therefore, improving the perceptions of public bus service
among car users will be an effective way to enhance bus use. Safety, network, costs of bus
and bus stop facilities will have significant impact to enhance bus ridership among the car
users. Besides, cost and comfort of car use should serve as “push” factors to make driving
less attractive and contribute in encouraging bus use among the car users. According to these
variables, safety of bus use which is characterized as an affective variable possesses highest
significance level. Yet, current plans do not address it as extensive as other instrumental
variables. This could be due to lack of assessment on perception study. Thus, this research
calls for emphasis on perception study in order to achieve a sustainable transport growth in
Iskandar Malaysia.
REFERENCES
1. He, S. Y. and Thøgersen, J. The impact of attitudes and perceptions on travel mode choice and car
ownership in a Chinese megacity: The case of Guangzhou. Research in Transportation Economics 62
(2017), 57-67. Elsevier Ltd.
2. Iskandar Regional Development Authority (IRDA). Comprehensive Development Plan ii 2014-2025.
Iskandar Malaysia, 2014.
3. Kamba, A. N., Rahmat, R. A. O. K. and Ismail, A. Why Do People Use Their Cars: A Case Study In Malaysia. Journal of Social Sciences (2007), 117-122. Science Publications.
4. Loo, L. Y. L., Corcoran, J., Mateo-Babiano, D. and Zahnow, R. Transport mode choice in South East Asia:
Investigating the relationship between transport users’ perception and travel behaviour in Johor Bahru,
Malaysia. Journal of Transport Geography 46 (2015), 99-111. Elsevier Ltd.
5. Minhans, A., Shahid, S. and Ahmed, I. An Investigation Into Qualitative Differences Between Bus Users
and Operators for Intercity Travel in Malaysia. Penerbit UTM Press.
6. Steg, L. Can public transport compete with the private car? IATSS Research 27 (2003), 27-35.
7. Van, H. T., Choocharukul, K. and Fujii, S. The effect of attitudes toward cars and public transportation on
behavioural intention in commuting mode choice-A comparison across six Asian countries. Transportation
Research Part A 69 (2014), 36-44. Elsevier Ltd.
8. Wan, Q. K. and Lo, H. K. Effect of Attribute Perceptions on Mode Choice Behaviour in a Transit Market. Journal of the Eastern Asia Society for Transportation Studies 6 (2005), 1740 - 1750.

SCIENCE AND TECHNOLOGY 548
IGCESH2018
Universiti Teknologi Malaysia, Johor Bahru, Malaysia 13 -15 August 2018
DEVELOPMENT OF LATENT FINGERPRINTS ON NON-POROUS
OBJECT IMMERSED IN STAGNANT TAP WATER USING
Candida rugosa LIPASE
Aida Rasyidah Azman*1, Syafianes Nadiela Zulkiflee2, Naji Arafat Mahat3,
Roswanira Abdul Wahab4, Wan Azlina Ahmad5 and Hafezul Helmi Hamzah6
1, 2, 3, 4, 5 Department of Chemistry, Faculty of Science, Universiti Teknologi Malaysia, 81310 Skudai,
Johor, Malaysia
(E-mail: [email protected], [email protected], [email protected], [email protected], [email protected])
6 Criminal Investigation Department, Criminal Intelligence (D4), Royal Malaysia Police,
Kuala Lumpur, Malaysia
(Email: [email protected])
ABSTRACT
Waterways have been used for disposing evidence by perpetrators, especially during
homicide, rendering difficulties for forensic fingerprint investigators since water may destruct
the amino acid components of fingerprints. Although the use of small particle reagent for
visualising the lipid components of a fingerprint has been suggested, its use has been
associated with numerous human as well as environmental toxicities, and hence, must be
reduced. Therefore, this present research that developed a new environmentally-friendly
reagent (i.e. Lipase-Glutaraldehyde-Safranin, Lip-GA-Saf) for visualising latent fingerprint
on non-porous surface (aluminium foils) immersed for up to 4 weeks in stagnant tap water
acquires forensic significance. Results revealed that the quality of latent fingerprints
(Fingermark Quality Scale) developed using Lip-GA-SAF was statistically better in all the
four different durations of immersion than that of using SPR (p<0.05). Declining the quality
of fingerprint over longer period of immersion was also observed for both the Lip-GA-SAF
reagent and SPR developed fingerprints. Considering the better quality of fingerprints
developed using Lip-GA-SAF reagent, its usefulness in forensic practical caseworks appears
promising.
Keywords: latent fingerprints, non-porous objects, Candida rugosa lipase, forensic science
INTRODUCTION
The admissibility of fingerprints in the court of law has always been due its uniqueness,
persistency and systematic classifications of general ridge patterns [1]. In general,
fingerprints are made up of a mixture of intrinsic (water-soluble and lipid-soluble
components) and extrinsic (e.g. bacteria and dust) residues [2]. In view of forensic context,
fingerprints can be classified into 3 viz visible, plastic and latent [1]. Because of the hidden
nature of latent fingerprints, its visualisation is often a challenging task to the forensic
investigators [2]. Among many others, small particle reagent (SPR) has been routinely used
for visualising wet latent fingerprints on non-porous objects [3]. However, its formulation

SCIENCE AND TECHNOLOGY 549
mainly contains toxic compounds i.e. titanium dioxide [4] and molybdenum disulphide [5].
While titanium oxide is carcinogenic, molybdenum disulphide pose a great risk to the well-
being of the environment. Therefore, such harmful usage needs to be reduced. Taking into
consideration the possible adverse effects of these hazardous compounds, as well as the need
to visualise latent fingerprints for forensic purposes, development of an environmentally
benign alternative (i.e. Lipase-Glutaraldehyde-Safranin, Lip-GA-Saf reagent) is therefore,
deemed necessary. The research was aimed at visualising latent fingerprints on aluminium
foils immersed in a stagnant tap water for up to 4 weeks. Subsequently, the quality of
visualised fingerprints following the use of Lip-GA-SAF reagent was compared to that of the
routinely used SPR using the Fingermark Quality Scale (FQS) (Table 1) suggested by the
previous researches [6].
Table 1. The Fingermark Quality Scale suggested by the previous researches [6].
Grade Detail visualised
0 No visible prints
1 Poor quality, very few visible ridges
2 Poor quality, some ridge-details visible or partial mark with
limited characteristics
3 Reasonable quality, ridge-details and some characteristics visible,
identification possible
4 Good quality prints, ridge-details and characteristics visible,
probable identification
5 Excellent quality, very clear prints, identification assured.
MAIN RESULTS
This research investigated the feasibility of utilising Lip-GA-Saf reagent in visualising
latent fingerprints on aluminium foils immersed in a stagnant tap water for up to 4 weeks. It
is known that the quality of visualised fingerprints naturally deteriorates over time [6] and
this study too supports this conclusion. In general, results of median grading score for
both methods showed that, as the length of time immersion increased, the grading scores
of the visualised fingerprints decreased.
It was observed that the range of median qualities for fingerprints on aluminium foils
immersed in stagnant tap water for up to 4 weeks by Lip-GA-Saf reagent (1.00-4.00) was
categorically higher than that of SPR (0.00-4.00). The Lip-GA-Saf reagent provided clear
and identifiable fingerprints on aluminium foils attained up to two weeks. Although
development of fingerprint by both methods on aluminium foil that was immersed for 1
week recorded the same median (4.00), it is interesting to note that the grading ranges of
fingerprints developed using the Lip-GA-Saf reagent did not plunged below 3, unlike that
of the SPR which reached as low as 2 in the Week 2 (Table 2).
It was found that the differences in the median of fingerprint grading on aluminium foils
immersed in stagnant tap water using Lip-GA-Saf reagent were significantly better (p < 0.05)
when compared to that of SPR. Hence, the results clearly demonstrated the comparability of
the newly-developed Lip-GA-Saf reagent with that of SPR for forensic practical caseworks.

SCIENCE AND TECHNOLOGY 550
Table 2. Quality of fingerprint on non-porous surfaces (aluminium foil and glass slide)
immersed in stagnant tap water.
Notes: Kruskal-Wallis with the pairwise comparisons using the Mann-Whitney U test was used for comparing the
differences between group medians in tap water using the two methods. The data are presented as
median±interquatile range. The data in parentheses, ( ) indicated the range of the values. The symbols (*)
indicate the significant differences in the grading scale of fingerprint between the development of
fingerprint on surfaces using Lip-GTA-Saf when compared with development of fingerprint on aluminium
foils using SPR (p < 0.05).
CONCLUSION
In a nutshell, this present research explored the possibility of using greener biotechnological
route for developing latent fingerprint immersed in stagnant tap for providing an
environmentally friendly alternative to the commercially used but hazardous SPR reagent for
forensic investigation. In laboratory setting, Lip-GA-Saf reagent had successfully facilitated
the development of latent fingerprints on aluminium foils immersed for up to 4 weeks in
stagnant tap water. Interestingly, following the use of Lip-GA-Saf reagent, the quality of
developed fingerprints was statistically better (p < 0.05) when compared with that of SPR.
Such findings accentuate the possibility of using this newly developed biotechnological
method for practical casework application.
Acknowledgment: The authors are thankful to Universiti Teknologi Malaysia for providing
Research University Grants (QJ130000.2526.12H51 and QJ130000.2526.13H09) for
conducting a research project on visualisation of latent fingermarks on immersed non-porous
objects using lipase reinforced nanoconjugates. The authors are also thankful to the assistance
provided by the Central Criminal Registry for Malaysia and Singapore, Royal Malaysia
Police Headquarters, Bukit Aman
REFERENCES
1. Saferstein R. Fingerprints. Criminalistics. 10th ed. Upper Saddle River, NJ: Pearson (2011), 389-415.
2. Croxton, R.S., Baron, M.G., Butler, D., Kent, T., Sears, V.G. Variation in amino acid and lipid composition
of latent fingerprints. Forensic Science International 199 (2010), 93-102.
3. Kasper, S. P. Latent print processing guide. Elsevier, San Diego, CA, 2016.
4. Sirchie Safety Data Sheet. SPR200 Small Particle Reagent – White. Available online: http://d1zh4 ok0q8k7
dm.cloudfront.net/media/resourcecenter/item/s/p/spr200_3.pdf (accessed on 16 March 2017)
5. Sirchie Safety Data Sheet. SPR100 Small Particle Reagent – Dark. Available online: http://d1zh4ok0q8k7
dm.cloudfront.net/media/resourcecenter/item/s/p/spr100_1.pdf (accessed on 16 March 2017) 6. Rohatgi, R., Sodhi, G.S., Kapoor, A.K. Small particle reagent based on crystal violet dye for developing
latent fingerprints on non-porous wet surfaces. Egyptian Journal of Forensic Sciences 5 (2015), 162-165.
Immersion period Week 1 Week 2 Week 3 Week 4
Surface Development
method
Aluminium
foils
Lip-GA-Saf 4.00±2*
(3-5)
3.00±2*
(2-4)
1.00±5*
(0-5)
1.00±2*
(0-3)
SPR 4.00±1
(2-5)
2.00±2
(1-4)
1.00±1
(0-3)
0.00±2
(0-2)

SCIENCE AND TECHNOLOGY 551
IGCESH2018
UniversitiTeknologi Malaysia,Johor Bahru, Malaysia 13-15 August 2018
PREPARATION OF POLYCAPROLACTONE-POLY (VINYL
ALCOHOL) BLENDED FILM FROM GLACIAL ACETIC ACID-
WATER FOR POTENTIAL SCAFFOLD APPLICATION
Tan Yong Chee1, Abdull Rahim Mohd Yusoff*
2 and Nik Ahmad Nizam Nik Malek
3
1, 2Faculty of Science, UTM, Johor, MALAYSIA.
(E-mail: [email protected], [email protected]) 3Faculty of Bioscience and Medical Engineering, UTM, Johor, MALAYSIA.
(E-mail: [email protected])
ABSTRACT
A new binary solvent system for the preparation of blended poly(vinyl alcohol) (PVA)–
polycaprolactone (PCL) film via casting method is proposed. PCL is a biodegradable
polymer but its high hydrophobic property always punctures its diverse potential applications
in biomedical engineering. A binary solvent system constituting glacial acetic acid and water
with ratio 1:1 is introduced to blend the PCL and PVA for potential scaffold application. Two
different molecular weight of PCL, i.e. 10 kDa and 80 kDa, were used to study the effect of
molecular weight on the film formation through the binary solvent system. For comparison
purposes, PVA and PCL with a molecular weight of 10 kDa and 80 kDa, respectively, were
also obtained by a casting method. The solvent system study indicated that the binary solvent
system could only be used to prepare blended PVA-PCL (10 kDa) and PVA film. The PCL
(80 kDa) tends to aggregate when blended with PVA solution. All films were then evaluated
by ATR-FTIR and stability in an aqueous medium test. The ATR result illustrated that the
PVA-PCL blended film exhibited the properties of PVA and PCL by showing the peaks at
3285.37, 1720.06, 1557.68, 1241.69, 1172.94, 1078.58 and 1044.93 cm-1. The blended films
also gave a more stable property in the aqueous medium than the PVA film; this eventually
improves the application of PVA and PCL scaffolds. Key words: Polycaprolacton, Poly (Vinyl Alcohol), Glacial acetic acid, Scaffold
INTRODUCTION
Skin tissue regeneration is critical in treating patients with severe skin injury, but its
limitation always restricts to the compatibility of the type of material used to replace the
extensive skin loss. To date, there are two conventional methods used to heal the extensive
skin loss, i.e. tissue culture and skin grafting. The disadvantages of these two treatments are
slow healing process [1] and rely very much on the health of the patient [2, 3]. Thereby, the
study of scaffold engineering and its application as an alternative to treating patients with
extensive skin loss became gradually significant and widespread.
Polycaprolactone, PCL, as one of the earliest polymers synthesised by the Carothers group in
the early 1930s [4], has been widely used in various biomedical applications. For example, it
has been proven can act as a potential scaffold for the regeneration of bone tissue [5] and

SCIENCE AND TECHNOLOGY 552
nerve tissue [6]. However, its high hydrophobic property always restricts the biological
function because the property hinders the cell attachment and cell proliferation upon the
polymer [7]. Though this drawback can be solved by blending the PCL with a hydrophilic
polymer, the preparation of the blend polymer solution is very challenging because of the
solvent issue.
PCL is readily soluble in many organic solvents such as acetone, chloroform,
dichloroethane, dimethylformamide, hexafluoroisopropanol, methylene chloride,
tetrafluoroethylene, and pyridine [7, 8]. These organic solvents can dissolve the PCL
homogeneously, yet they are not a suitable solvent for hydrophilic polymers, such as
poly(vinyl alcohol), PVA. In 2014, Ferreira found out that the glacial acetic acid can be
used as a suitable solvent for dissolving PCL [8]. This finding gave an excellent
alternative for preparing PCL-hydrophilic polymer film because the majority of
hydrophilic polymer can be dissolved in the glacial acetic acid with absolute
concentration and the glacial acetic acid is less toxic compared to the aforementioned
organic solvents [7].
PVA is a hydrophilic polymer produced by the hydrolysis of poly(vinyl acetate). It has
excellent film-forming and physical properties such as biocompatible and high chemical
resistance [9]; in which making it as a suitable material for biomedical applications such as
contact lenses, artificial organs and drug delivery systems [10]. Nevertheless, the high
hydrophilic property makes it remarkably less stable when the contact in aqueous medium
[11]. This study introduce a new binary solvent system that is able to blend the hydrophobic
polymer, PCL and a hydrophilic polymer, PVA to produce a scaffold that is relatively stable
in the aqueous medium and can be used as a potential skin scaffold.
MAIN RESULTS
Table 1. The study of polymers in different solvent system
PVA PCL (10kDa) PCL (80kDa) PVA-PCL(10kDa) PVA-PCL(80kDa)
Glacial acetic acid X O © X X
Water © X X X X
Ratio 1:1 © X X © X
Keys: ©: can dissolve or mix and form film; O: can dissolve but cannot form film; X: cannot dissolve
or mix
a)
b)
c)
d)
Figure 1. (a) PCL(10 kDa) powder, (b) PVA film (c) PCL (80 kDa) film and (d) PCL(10
kDa)-PVA film.

SCIENCE AND TECHNOLOGY 553
Figure 2.ATR of PCL-PVA film, PVA film and PCL film.
CONCLUSION
This study proved that a binary solvent system containing glacial acetic acid and water with
ratio 1:1 can be a proper solvent system for preparing PCL(kDa)-PVA blended film by
casting method. The binary solvent is not suitable for blending PVA with high molecular
weight PCL (80kDa) because the high polydispersity of high molecular weight PCL tends to
aggregate with each other. Nonetheless, this finding is very paramount because it provide a
simple and inexpensive way to prepare a PCL-PVA blended film through less harmful
solvent system for potential scaffold application. The binary solvent system can also be used
to prepare PVA film.
Acknowledgement: The authors wish to thank Universiti Teknologi Malaysia for financial
support (Research University Grant, Q.J130000.2509.20H51) and Zamalah scholarship.
REFERENCES
1. Bloemen, M.C., Wal, M.B., Verhaegen, P.D., Nieuwenhuis, M.K., Baar, M.E., Zaijlen, P.P. and
Middelkoop, E. Clinical effectiveness of dermal substitution in burns by tropical negative pressure: A
multicenter randomized controlled trial. Wound Repair and Regeneration, 20(6) (2012), 797-805.
2. Grey, J.E., Harding, K.G. and Enoch, S. Venous and arterial leg ulcers. British Medical Journal, 332 (2006),
347-350.
3. Ho, C.H. and Bogie, K. The prevention and treatment of pressure ulcers. Physical Medicine & Rehabilitation
Clinics of North America, 18 (2007), 235-253.
4. Woodruff, M.A. and Hutmacher, D.W. (2010). The return of a forgotten polymer - Polycaprolactone in the 21st century. Progress in Polymer Science (Oxford), 35(10) (2010), 1217–1256.
5. Yilgor, P., Sousa, R.A., Reis, R.L., Hasirci, N. and Hasirci, V. 3D plotted PCL scaffolds for stem cell based
bone tissue engineering. Macromolecular Symposia, 269(1) (2008), 92–99.
6. Barbarisi, M., Marino, G., Armenia, E., Vincenzo, Q., Rosso, F., Porcelli, M. and Barbarisi, A. Use of
polycaprolactone (PCL) as scaffolds for the regeneration of nerve tissue. Journal of Biomedical Materials
Research - Part A, 103(5) (2015), 1755–1760.
7. Cossio, M. L.T., Giesen, L.F., Araya, G., Pérez-Cotapos, M.L.S., Vergara, R.L., Manca, M. and Héritier, F.
An alternative solvent system for the steady state electrospinning of polycaprolactone. Uma Ética Para
Quantos, XXXIII(2) (2012), 81–87.
8. Ferreira, J. L., Gomes, S., Henriques, C., Borges, J.P. and Silva, J. C. Electrospinning polycaprolactone
dissolved in glacial acetic acid: Fiber production, nonwoven characterization, and in Vitro evaluation. Journal of Applied Polymer Science, 131(22) (2014), 37–39.
9. Shao, C., Kim, H.Y., Ding, B. Lee, D.R. and Park, S.J. Fiber mats of poly(vinyl alcohol)/silica composite via
electrospinning. Materials Letters, 57 (2003), 1579– 1584.
10. Zhang, C., Yuan, X., Wu, L., Han, Y. and Sheng, J. Study on morphology of electrospun poly(vinyl alcohol)
mats. European Polymer Journal, 41 (2005), 423–432.
11. Paipitak, K., Pornpra, T., Mongkontalang, P., Techitdheera, W. and Pecharapa, W. Characterization of PVA-
Chitosan Nanofibers Prepared by Electrospinning. Procedia Engineering, 8 (2011), 101–105.

SCIENCE AND TECHNOLOGY 554
IGCESH2018
Universiti Teknologi Malaysia, Johor Bahru, Malaysia 13 -15 August 2018
NEUTROPHIL MIGRATION AND GENE EXPRESSION OF il-1β and
tnf-α AFTER MYRISTICIN EXPOSURE ON ZEBRAFISH LARVAE
Tanendri Arrizqiyani1, Marselina Irasonia Tan2 and Indra Wibowo3
1, 2 Institute of Health Science Bakti Tunas Husada Tasikmalaya, INDONESIA
Departement of Biotechnology, School of Life Sciences and Technology
Bandung Techology of Institute, INDONESIA (E-mail: [email protected], [email protected])
3 Departement of Biotechnology, School of Life Sciences and Technology
Bandung Techology of Institute, INDONESIA (E-mail: [email protected])
ABSTRACT
Inflammation is a biological response which is caused by the stimulus like pathogens that
cause cells and tissue damage. Inflammation can activation of neutrophils and production of
some proinflammatory cytokines such as IL-1β and TNF-α. In particular condition,
pathogen’s attack can induce continuity inflammation because of the over production of
proinflammatory cytokines. The aims of this research are to observe antiinflammatory
activity of myristicin as the active compound from nutmeg seed which is expected has
antiinflammatory activity. RLM and RTPCR are used for evaluating the anti-inflammatory
activity of myristicin in zebrafish larvae. The result shows that at the concentration of 0,3
µg/mL myristicin has the anti-inflammatory activity about 57% and be able to decrease the
gene expression of il-1β and tnf-α (1,19 and 1,40 times respectively). The decreasing of RLM
at the concentration of 0,3 µg/mLis predicted because of the antiinflammatory activity of
myristicin can inhibit the leukocyte (neutrophils) migration to site of inflammation. It is
supported by the decreasing of il-1β and tnf-α gene expression at the concentration of 0,3
mg/mL. Then, myristicin at the concentration of 0,3 µg/mL has anti-inflammatory activity
better than piroxicam (57%;28,90%). It can be concluded that myristicin at the concentration
of 0,3 µg/mL has potential as antiinflammatory agent in zebrafish larvae.
Key words: myristicin, antiinflammation, neutrophil, il-1β and tnf-α.
INTRODUCTION
One spice of Indonesian native plants are widely used in society is nutmeg. There are several
places of nutmeg producer, such as: Maluku, North Sulawesi, West Sumatra, Aceh, West
Java and Papua. The main content of nutmeg is myristicin. Traditionally, myristicin used to
treat diarrhea, stomach ache, cholera, stomach cramps and nausea [1-2]. Recently, it has been
reported that myristicin have antibacterial activity, antioxidant, hepatoprotective,
anticholinergic and anti-inflammatory. The anti-inflammatory activity of myristicin haven't
been studied so that researchers interested to test of the anti-inflammatory activity which is
expected owned by the myristicin.

SCIENCE AND TECHNOLOGY 555
We used seed of nutmeg and zebrafish larvae as variable in this research. There are steps of
this research, maintenance of zebrafish, isolation of myristicin, determination of the
Maximum Tolerance Concentration (MTC), exposure of four dpf zebrafish larvae (days post
fertilization) by various types of treatment groups, peroxidase staining, observation of
Relative Leukocyte Migration (RLM), RNA isolation and RTPCR.
In this research, we use animal models of zebrafish larvae with the age is four dpf (days post
fertilization) by reason of the age of larvae already begun to actively eat which supports the
application of the method imertion (mixing compounds into the medium zebrafish) such as in
this research. Four dpf of zebrafish larvae are transparent, it's facilitate to direct observation
of neutrophils, which is a distinct advantage for zebrafish compared with rat. The four dpf
size of zebrafish larvae are relatively small to facilitate the exposure of the various treatment
groups at the same time so that the acquisition of data relating to the efficacy of the active
compound will be quicker to obtain. In addition, the amount of active compound drug
candidates are required only in small amounts.
MAIN RESULTS
Figure 1. Visualization of peroxidase staining four dpf zebrafish larvae (days post
fertilization) that has been cut its tail on the various treatment groups. Black dots are
neutrophils. Observation area bounded by the red box. Red arrow: neutrophils and arrow
orange: pigment colours. Scale bar: 100 µm. A) Wild-type, B) Negative control (KN), C)
positive control (KP), D) M1, E) M2, F) M3.
The tails of zebrafish larvae was stained by peroxidase staining for identifiying migration of
leukocyte (Figure 1). The other hand, we observed of gene expression of Il-1β and tnf-α as a
marker for inflammation (Figure 2). According to this results (Figure 1 and 2) there are
correlation between migration of leukocyte and gene expression of Il-1β and tnf-α. Black
spots as a refered to leukocyte accumulation at the tail tips show decreased at the group M1-
M3. That’s result is supported by the decreasing of gne expression of Il-1β and tnf-α at the
same treatments.

SCIENCE AND TECHNOLOGY 556
(a) (b)
Figure 2. The gene expression of Il-1β (a) and tnf-α (b) based on the method RTPCR
on four dpf (days post fertilization) zebrafish larvae in the various treatment groups. 1
as a negative control, KP as the positive control.
CONCLUSION
Myristicin concentration 0.3 µg/mL has potential as an anti-inflammatory that is
characterized by low relative value leukocyte migration (RLM) and gene expression il-1β and
tnf-α.
Acknowledgment: This research was supported by Department of Biotechnology, School of
Life Sciences and Technology Bandung Technology of Institute.
REFERENCES
1. Da Silveira E Sá, R.D.C., Andrade, L.N., De Oliveira, R.D.R.B. and De Sousa, D.P. A review on anti-
inflammatory activity of phenylpropanoids found in essential oils. Molecules 19(2) (2014), 1459–1480.
2. Al-Jumaily, E.F. and Al-Amiry, M.H.A. Extraction and purification of terpenes from nutmeg (myristica
fragrans). Journal of Al-Nahrain University 15(3) (2012), 151–160.
3. Cordero-Maldonado, M.L., Siverio-Mota, D., Vicet-Muro, L., Wilches-Arizábala, I.M., Esguerra, C.V., de
Witte, P.A.M. and Crawford, A.D. Optimization and pharmacological validation of a leukocyte migration
assay in zebrafish larvae for the rapid in vivo bioactivity analysis of anti-inflammatory secondary
metabolites. PLoS ONE 8(10) (2013), e75404.

SCIENCE AND TECHNOLOGY 557
IGCESH2018
Universiti Teknologi Malaysia, Johor Bahru, Malaysia 13 -15 August 2018
TOPOLOGICAL INDICES OF CONJUGACY CLASS GRAPH
FOR DIHEDRAL GROUPS
Nur Idayu Alimon*1, Nor Haniza Sarmin2 and Ahmad Erfanian3
1, 2 Department of Mathematical Sciences, Faculty of Science, Universiti Teknologi Malaysia, Johor
Bahru, JOHOR.
(E-mail: [email protected], [email protected]) 3 Department of Pure Mathematics, Faculty of Mathematical Sciences, Ferdowsi University of
Mashhad, Mashhad, IRAN.
(E-mail:[email protected])
ABSTRACT
Assume 𝐺 is a non-abelian group. The dihedral group is the group of symmetries of regular
polygon, which includes rotations and reflections. Meanwhile, the conjugacy class graph of 𝐺
is defined as a graph with a vertex set represented by the non-central conjugacy classes of 𝐺.
Two distinct vertices are connected if they have a common prime divisor. Many topological
indices have been determined for simple and connected graphs in general but not graphs
related to groups. The main objective of this article is to find various topological indices
including the Wiener index, First Zagreb index and Second Zagreb index for the conjugacy
class graph of dihedral groups of order 2𝑛.
Key words: Wiener index, Zagreb index, Conjugacy class graph, Dihedral group
INTRODUCTION
Graph theory has very wide applications in chemistry. For instance, a graph can be
represented as a molecular structure where the vertices represent the atoms and the edges
represent the bond between the atoms. In addition, various topological indices have been used
to help chemists, mathematicians, clinicians, and many more in solving some problems
related to chemistry or biology. It can also be used to determine the chemical or biological
properties of some molecular structure. In [1], the Wiener index, First Zagreb index and
Second Zagreb index have been proven as tools for an efficient new drug design for anti-
cancer and anti-HIV diseases.
The Wiener index was developed by the American Chemist, Harold Wiener in 1947 which
defined as the sum of smallest distance between all vertices of the graph or the sum of the
half of the distances between every pair of vertices of graph, denoted by 𝑊(Γ𝐺) [2].
Meanwhile, the first Zagreb index, 𝑀1(Γ𝐺) is the sum of squares of the degrees of the
vertices, and the second Zagreb index, 𝑀2(Γ𝐺) is the sum of the products of the degrees of
pair of adjacent vertices of the graph [3].

SCIENCE AND TECHNOLOGY 558
The presentation of the dihedral groups, 𝐷2𝑛 is given in the following:
𝐷2𝑛 ≅< 𝑎, 𝑏|𝑎𝑛 = 𝑏2 = 1, 𝑎𝑏 = 𝑎−1 >,
where 𝑛 is a positive integer.
This research focuses on the dihedral groups of order 2𝑛 and their conjugacy class graph.
According to Mahmoud et al. in [4], the conjugacy class graph of all dihedral groups, 𝐷2𝑛
can be divided into three parts, stated in the following theorem.
Theorem 1 [4] Let 𝐺 be the dihedral group, 𝐷2𝑛 ≅< 𝑎, 𝑏|𝑎𝑛 = 𝑏2 = 1, 𝑎𝑏 = 𝑎−1 > of order
2𝑛 where 𝑛 ≥ 3, 𝑛 ∈ Ν and let Γ𝐺 be the conjugacy class graph of 𝐺. Then,
Γ𝐺 =
{
𝐾𝑛−1
2
∪ {𝑐𝑙(𝑏)} , 𝑛 odd
𝐾𝑛+2
2
, 𝑛 and 𝑛
2 even
𝐾𝑛−2
2
∪ 𝐾2 , 𝑛 even 𝑎𝑛𝑑 𝑛
2 odd
MAIN RESULTS
Based on the definition of the Wiener index, first Zagreb index and second Zagreb index,
they are applicable to the connected graph only. Thus, from Theorem 1, we only focus on
the second case for the dihedral group, 𝐷2𝑛 where 𝑛 and 𝑛
2 are even.
The Wiener index, first Zagreb index and second Zagreb index of the conjugacy class
graphs of dihedral groups are given in the following three theorems.
Theorem 2 Let 𝐺 be a dihedral group, 𝐷2𝑛 ≅< 𝑎, 𝑏|𝑎𝑛 = 𝑏2 = 1, 𝑎𝑏 = 𝑎−1 > of order 2𝑛
where 𝑛 and 𝑛
2 are even. Then, the Wiener index of the dihedral group is
𝑊(Γ𝐺) = (𝐾(𝐺) − |𝑍(𝐺)|)𝑘,
where 𝑛 = 4𝑘, 𝑘 ∈ Ζ+ , 𝐾(𝐺) is the number of conjugacy classes in 𝐺, and |𝑍(𝐺)| is the
number of central elements in 𝐺.
Theorem 3 Let 𝐺 be a dihedral group, 𝐷2𝑛 ≅< 𝑎, 𝑏|𝑎𝑛 = 𝑏2 = 1, 𝑎𝑏 = 𝑎−1 > of order 2𝑛
where 𝑛 and 𝑛
2 are even. Then, the first Zagreb index of dihedral group is
𝑀1(Γ𝐺) = 𝑛(𝑊(Γ𝐺))
where 𝑛 = 4𝑘, 𝑘 ∈ Ζ+ and 𝑊(Γ𝐺) is the Wiener index of the conjugacy class graph of 𝐺.
Theorem 4 Let 𝐺 be a dihedral group, 𝐷2𝑛 of order 2𝑛 where 𝑛 and 𝑛
2 are even. Then, the
second Zagreb index of dihedral group is
𝑀2(Γ𝐺) = 𝑘(𝑀1(Γ𝐺))
where 𝑛 = 4𝑘, 𝑘 ∈ Ζ+ and 𝑀2(Γ𝐺) is the first Zagreb index of the conjugacy class graph of
𝐺.
.

SCIENCE AND TECHNOLOGY 559
CONCLUSION
In this paper, some topological indices, which include the Wiener index, the first Zagreb
index and the second Zagreb index are found for the conjugacy class graphs of dihedral
groups.
Acknowledgment: The authors would like to express their appreciation for the support of the
sponsors; Ministry of Higher Education (MOHE) Malaysia and Research Management
Center (RMC), Universiti Teknologi Malaysia (UTM) Johor Bahru for the financial funding
through the Research University Grant (GUP) and Vote No. 13HJ9 and 13J82. The first
author is also indebted to Universiti Teknologi Malaysia (UTM) for her Zamalah
Scholarship.
REFERENCES
1. Senbagamalar, J. On Topological Indices of Molecular Graphs. University Chennai, Ph.D. Thesis, 2014.
2. Vijayabarathi, A. and Arijaneyulu, G.S.G.N. Wiener index of a graph and chemical applications.
International Journal of ChemTech Research 4 (2013), 1847-1853.
3. Das, K.C., Xu, K. and Nam, J. Zagreb indices of graphs. Frontier Mathematics China 10 (2015), 567-582.
4. Mahmoud, R., Sarmin, N.H., Erfanian, A. The conjugacy class graph of some finite groups and its energy.
Malaysian Journal of Fundamental and Applied Science 13 ( 2017), 659-665.

SCIENCE AND TECHNOLOGY 560
IGCESH2018
Universiti Teknologi Malaysia, Johor Bahru, Malaysia 13 -15 August 2018
PUBLIC PARTICIPATION ON URBAN OPEN SPACE
DEVELOPMENT IN MALAYSIA: AN OVERVIEW
Nurul Saadah Lokman*1, Noorsidi Aizuddin Mat Noor 2
1, 2 Department of Real Estate, Faculty of Geoinformation and Real Estate, Universiti Teknologi
MALAYSIA.
(E-mail:[email protected], [email protected]) 2 Innovation and Commercialisation Centre, Universiti Teknologi Malaysia 81310, UTM Johor Bahru,
MALAYSIA.
(E-mail: [email protected])
ABSTRACT
Diversity in the urban open space is being increasingly recognized as important. Urban open
space are one are the concept of public park consist nature and recreational purpose. It is a
one of an infrastructure that provided by the Local Authority (LA) and developer for public
use. Public participation is important in ensuring the provision of urban open spaces is user-
friendly. This paper is a review of research on urban open space development in Malaysia. A
brief description of the concept of urban open space and the important of urban open space on
public participation will be included. The purpose of this review to get a holistic view of
successful urban open space design and to cater for larger demographics in future planning of
urban open space in Malaysia. The article adopts a descriptive approach and not the specific
method. It focuses on providing a general review about the importance of urban open space.
Using the content analysis, the expected result should be the illustrated urban open space
concepts applied on real estate sector in Malaysia. This article provides a general review of
the points of view concerning the urban open space development through legislation and
planning and public participation
Key words: Urban Open Space, Demographic, Socioeconomic, Malaysia, Planning
INTRODUCTION
One of the alternatives that have been made by the stakeholders to ensure the sustainability
and balance of the urban area is the implementation of public recreation parks that are
conceptualized by urban forests. The urban forest is one of the public recreation parks
operated by Local Authorities (LA) and under the supervision of the Forest Research Institute
Malaysia (FRIM). Forest ecosystems provide some insightful and undirected benefits,
including recreational forest service [1,2]. It has several benefits that contribute to the quality
of life in the city, including environmental, ecological, socioeconomic and psychological
benefits [3]. The urban open space is one of the alternatives in emphasizing the benefits that
can be gained through recreational services.

SCIENCE AND TECHNOLOGY 561
The development of public recreation on urban open spacery has begun to be applied in Johor
and Kuala Lumpur. Increase population of urban residents led to increased demand for public
parks and green areas [4]. Based on the Malaysia Department of Statistics (Malaysia
Department of Statistics), the growth of the population of Malaysia has increased by 1 per
cent in 2016, which is 2 million to 3.3 million populations and is expected to increase to 12.8
million by 2040. Quality urban and green parks need to be consider as an outdoor space in a
neighborhood that is a place to relax and enjoy the city experience; places for diverse
activities such as passive and active recreation. Hence, community demands for more
sustainable planning and development need to take place in cities where society can live in
the comfort, security and enjoyment of a good public park [4].
Public recreation parks are developed and maintained to meet the needs of open space that
are of interest and can function and benefit the users. According to the Department of Town
and Country Planning (DTCP), the approach to the development of public parks and
landscapes is to provide an impact on the quality of the environment and to meet the needs of
the locals in order to achieve high quality of life. The development of recreational forest
landscape in Malaysia is implemented and managed by the Forestry Department.
PUBLIC PARTICIPATION
Urban open space plays a role as a medium of communication for the urban community [5].
Therefore, the involvement of community and government encourage collaboration in term of
social learning within the social organization and government agencies [6]. In Malaysia, the
involvement of Forest Research Institute Malaysia (FRIM), Local Authority (LA) and
community create a great collaboration. The main factor that can attract public participation
are good accessibility and linkage [7]. In order to effectively manage urban open space, there
are consideration that need to be consider such as public values, attitudes, belief and
perceptions when developing management strategies [8].
There are the similarities between the user of urban open space regarding demography,
activities, behaviors and preferences [9]. Mostly the visitor disagree if they need to pay the
entrance fees [23,24,25] and changing in tax policy more efficient than entrance fee [12].
Economics value shows public get different benefit depend on population density,
infrastructure and resource availability [13]. Public opinion is the main problem in urban
open space management. Methods of social choice theory should be use more frequently, it is
for make sure that urban open space are still relevant and important for public use [14].
Figure 1 shows the analytical framework illustrating potential focuses to cover the gap in
knowledge found public urban green space [15]. The implementation of urban open space
should be influence by user and administration. Hence, the public participation is one of the
decision-maker to make the successful of urban open space [16]
CONCLUSION
The urban open space is not a new concept either in Malaysia or other country; it has the
potential to growth especially in developing countries as it is one of the urban social
infrastructures. It is a subset of the infrastructure sector and plays an important role in
generating income for the economy. Infrastructure is one of the most important contributors
to the national economy. Growth and contraction in this sector have a direct relationship with
the country's growth. Emphasis on the effectiveness of urban open spaces is required to
increase public involvement [17]. Involvement of locals in the process of urban open space

SCIENCE AND TECHNOLOGY 562
development is considered important as it can make the user-friendly urban open space [14].
The forest in the city is a landscape development project that aims to make urban open spaces
a place of leisure and tourist attraction.
Acknowledgment: The authors would like to acknowledge Universiti Teknologi Malaysia
(UTM) especially ZAMALAH UTM for the endless assistance and financial funding during
the course of carrying out the study.
REFERENCES
1. K. N. Ninan and M. Inoue, “Valuing forest ecosystem services : What we know and what we dont,” Ecol.
Econ., vol. 93, pp. 137–149, 2013.
2. G. Kim, “Assessing urban forest structure, ecosystem services, and economic benefits on vacant land,”
Sustain., vol. 8, no. 7, 2016.
3. W. Kwadwo, “What are we missing ? Economic value of an urban forest in Ghana,” Ecosyst. Serv., vol. 5,
pp. 137–142, 2013.
4. S. Karuppannan, Z. M. Baharuddin, A. Sivam, and C. B. Daniels, “Urban Green Space and Urban
Biodiversity : Kuala Lumpur , Malaysia,” vol. 7, no. 1, pp. 1–16, 2014.
5. C. C. Konijnendijk, “Adapting forestry to urban demands - Role of communication in urban forestry in
europe,” Landsc. Urban Plan., vol. 52, no. 2–3, pp. 89–100, 2000. 6. K. Yamaki, “Urban Forestry & Urban Greening Role of social networks in urban forest management
collaboration : A case study in northern Japan,” Urban For. Urban Green., vol. 18, pp. 212–220, 2016.
7. S. R. Sakip, N. M. Akhir, and S. S. Omar, “Determinant Factors of Successful Public Parks in Malaysia
Determinant Factors of Successful Public Parks in Malaysia,” Procedia - Soc. Behav. Sci., vol. 170, no.
January, pp. 422–432, 2015.
8. J. W. R. Baur, J. F. Tynon, P. Ries, and R. S. Rosenberger, “Urban Forestry & Urban Greening Public
attitudes about urban forest ecosystem services management : A case study in Oregon cities ଝ,” Urban For.
Urban Green., vol. 17, pp. 42–53, 2016.
9. J. Aasetre, V. Gundersen, O. I. Vistad, and E. J. Holtrop, “Recreational preferences along a naturalness-
development continuum: Results from surveys in two unequal urban forests in Europe,” J. Outdoor Recreat.
Tour., vol. 16, no. March, pp. 58–68, 2016.
10. N. H. Salleh, “Kesanggupan membayar [willingness,” 2009.
11. R. Mavsar, D. Hodges, M. Kova, and L. Juvan, “Forest Policy and Economics Latent preferences of
residents regarding an urban forest recreation setting in Ljubljana , Slovenia ☆,” vol. 71, pp. 71–79, 2016.
12. P. Karanikola, T. Panagopoulos, and S. Tampakis, “Journal of Outdoor Recreation and Tourism Weekend
visitors â€TM views and perceptions at an urban national forest park of Cyprus during summertime,” J.
Outdoor Recreat. Tour., no. December 2015, pp. 1–10, 2016.
13. M. Schaafsma et al., “The importance of local forest benefits: Economic valuation of non-timber forest
products in the eastern Arc mountains in Tanzania,” Glob. Environ. Chang., vol. 24, no. 1, pp. 295–305,
2014.
14. M. Lakicevic, Z. Srdjevic, B. Srdjevic, and M. Zlatic, “Decision making in urban forestry by using approval
voting and multicriteria approval method (case study: Zvezdarska forest, Belgrade, Serbia),” Urban For.
Urban Green., vol. 13, no. 1, pp. 114–120, 2014. 15. H. Fors, J. F. Molin, M. A. Murphy, and C. Konijnendijk van den Bosch, “User participation in urban green
spaces - For the people or the parks?,” Urban For. Urban Green., vol. 14, no. 3, pp. 722–734, 2015.
16. X. Z. Shan, “Attitude and willingness toward participation in decision-making of urban green spaces in
China,” Urban For. Urban Green., vol. 11, no. 2, pp. 211–217, 2012.
17. E. Atmiş, “Development of urban forest governance in Turkey,” Urban For. Urban Green., vol. 19, pp. 158–
166, 2016.

SCIENCE AND TECHNOLOGY 563
IGCESH2018
Universiti Teknologi Malaysia, Johor Bahru, Malaysia 13 -15 August 2018
EXTRACTION AND CHARACTERIZATION OF NANOCELLULOSE
FROM OIL PALM BIOMASS
Fathin Najihah Nor Mohd Hussin*1, Nursyafreena Attan2 and Roswanira Abdul
Wahab3
1, 2 Department of Chemistry, Universiti Teknologi Malaysia, Johor Bahru, MALAYSIA.
(E-mail: [email protected], [email protected]) 3 Department of Chemistry, Universiti Teknologi Malaysia, Johor Bahru , MALAYSIA.
(E-mail: [email protected])
ABSTRACT
Nanocellulose materials are cellulose fibrils or crystals in nano-meter dimension, naturally
produced by microbes or derived from plants. These materials are equipped with many
interesting facets such as high surface area, transparency, light weight and excellent
biocompatibility. In this study, nanocellulose (NC) was extacted from oil palm fronds leaves
(OPFL) via a series of chemical treatments viz. bleaching, alkaline treatment and acid
hydrolysis. The morphological and physicochemical characteristics of the raw OPFL,
holocellulose, cellulose and nanocellulose were characterized using Fourier Transform
Infrared (FTIR) and later will be investigated using X-ray Diffraction (XRD),
Thermogravimetric analyser (TGA), and Field Emission Scanning Electron Microscopy
(FESEM). The results from FTIR show the absence of C=O peak at 1729.16 cm-1 which can
be attributed to the removal of hemicellulose and lignin from pure cellulose upon alkali
treatment, while bleaching assisted in delignification.
Key words: Oil palm fronds leaves, nanocellulose, biomass
INTRODUCTION
Oil palm or scientifically known as Elaeis guineensis is one of the Malaysia’s most essential
bio-products that helps bringing the changes to its agricultural and economical scenarios.
Malaysia has harnessed the benefits from the oil palm industry and has now become the most
crucial industry, globally [1]. Statistically, the amount of residues produced from this
industry shows a corresponding increase with the rapid development of palm oil production
in Malaysia, where approximately 50-70 tonnes of biomass wastes are generated per hectare
of oil palm plantation [2]. According to literature, tonnes of the biomass wastes produced
from the oil palm industry include empty fruit bunches (EFBs), fiber, shell, wet shell, palm
kernel, trunks and also fronds [2].Quality-wise, oil palm frond (OPF) has been considered as
number one waste, above all other oil palm biomasses.
The palm oil tree consists largely of three main biopolymers; cellulose (~30-50 % wt),
hemicelluloses (~19-45 % wt), and lignin (~15-35 % wt) [3]. The OPFL are a renewable
source cellulose to produce functionalized nanocellulose (NC) [4]. NC is a term referring to
cellulosic extracts or processed materials having nano-scale structural dimensions [5]. There

SCIENCE AND TECHNOLOGY 564
are three types of NC, viz. (i) cellulose nanocrystals (CNCs), (ii) cellulose nanofibrils (CNFs)
and lastly, (iii) bacterial cellulose.
Recently, the use of NC materials in wide range of applications has been explored. One of the
most extensively studied areas is polymer nanocomposites. Due to its minute size, NC seems
to exhibit high crystallinity and rigidity which can subsequently enhance the mechanical
properties of a reinforced composite as a filler material. In view of such potential
reinforcement agent, this paper aims to emphasize on the method use to extract NC from
OPFL and to reveal its morphological features.
MAIN RESULTS
Raw OPFL
Holocellulose
Nanocellulose Cellulose
Figure 1. Experimental procedures to extract NC from OPFL via a series of chemical
treatments
Chlorite bleaching
Acid hydrolysis
Alkali
treatment

SCIENCE AND TECHNOLOGY 565
Figure 2. FTIR spectra of a) raw OPFL, b) holocellulose, c) cellulose and d) NC
CONCLUSION
Extraction of OPFL using different combination of chemical treatments afforded NC as white
powder (mass: 0.5936 g, 29.68 %). The presence of NC was confirmed on a basis of FTIR
spectroscopy since the all the functional groups in the spectrum i.e. O-H (3332 cm-1), sp3 C-H
(2892 cm-1), and pyranose ring (1025, 663 cm-1) matched those in its molecular structure. For
future recommendation, the resultant NC will be characterized using different spectroscopic
and microscopic techniques to determine their structural characteristics and thermal
properties.
Acknowledgment: This work is financially supported by the fund from the Ministry of
Higher Education under the Fundamental Research Grant Scheme (R.J130000.7826.4F871).
REFERENCES
1. Awalludin, M.F., Sulaiman, O., Hashim, R., and Wan Nadhari, W.N.A. An overview of the oil palm
industry in Malaysia and its waste utilization through thermochemical conversion, specifically via
liquefaction. Renew Sust Energy Rev 50 (2015), 1469-1484.
2. Shuit, S.H., Tan, K., T. Lee., and Kamaruddin, A.H. Oil palm biomass as a sustainable energy source: A
Malaysia case study. Energy 34 (2009), 1225-1235.
3. Mood, S.H., Golfeshan, A.H., and Tabatabaei, M. Lignocellulosic biomass to bioethanol, a comprehensive
review with a focus on pretreatment. Renewable and Sustainable Energy Reviews 27 (2013), 77-93.
4. Mohaiyiddin, M.S., Lin, O.H., Owi, W.T., Chan, C.H., Chia, C.H., Zakaria, S., Akil, H.M. Characterization of nanocellulose recovery from Elaeis guineensis frond for sustainable development. Clean Technologies
and Environmental Policy 18 (2016), 2503-2512.
5. Abitbol, T., Rivkin, A., Cao, Y., Nevo, Y., Abraham, E., Ben-Shalom, T., Lapidot, S., and Shoseyov, O.
Nanocellulose, a tiny fiber with huge applications. Current Opinion in Biotechnology 39 (2016), 76-88.

SCIENCE AND TECHNOLOGY 566
IGCESH2018
Universiti Teknologi Malaysia,Johor Bahru, Malaysia 13 -15 August 2018
HEAT AND MASS TRANSFER ON UNSTEADY FREE
CONVECTION FLOW BETWEEN TWO PARALLEL PLATES WITH
NEWTONIAN HEATING
Fasihah Zulkiflee*1, Ahmad Qushairi Mohammad2,Sharidan Shafie3
and Arshad Khan4
1, 2,3 Department of Mathematical Sciences, Faculty of Science, Universiti Teknologi Malaysia,81310
UTM Johor Bahru, Johor, MALAYSIA.
(E-mail: [email protected] , [email protected],[email protected]) 3Department of Computer Science/IT, Sarhad University of Science & IT
Peshawar Khyber Pakhthunkhwa, PAKISTAN.
(E-mail: [email protected])
ABSTRACT
This paper studied the unsteady free convection flow between two parallel plates with
Newtonian heating and mass diffusion. Appropriate non-dimensional variables are used to
reduce the dimensional governing equation along with the imposed initial and boundary
conditions into dimensionless forms. The exact solutions for velocity, temperature and
concentration profiles are obtained using the Laplace transform technique. The corresponding
expressions for skin friction, Nusselt number and Sherwood number are also calculated. The
graphical results are displayed to illustrate the influence of various embedded parameters
such as Newtonian heating parameter, Schmidt number and Grashof number. The results
obtained show that the effect of Newtonian heating parameter increases the Nusselt number
but reduces the skin friction.
Key words: Free convection, Parallel plate, Newtonian heating, Mass diffusion, Laplace
Transform.
INTRODUCTION
The general area of natural or free convection in vertical parallel-plate channels for a single
phase has received a great deal of attention in previous years because there are many practical
applications involve natural convection heat transfer [1]. Generally, the problems of free
convection flows in parallel plate are usually modeled under the assumptions of constant
surface temperature, ramped wall temperature, or constant surface heat flux [2-4].
However, in many practical situations where the heat transfer from the surface is taken to be
proportional to the local surface temperature, the above assumptions fail to work. Such types
of flows are termed as conjugate convective flows, and the proportionally condition of the
heat transfer to the local surface temperature is termed as Newtonian heating [5].The
literature survey shows that research in Newtonian heating between two parallel plate are
very few [6]. The present study is an attempt to investigate free convection flow between two

SCIENCE AND TECHNOLOGY 567
parallel plate with Newtonian heating and mass diffusion. In this study, the equations of the
problem are first formulated and transformed into their dimensionless forms where the
Laplace transform method is applied to find the exact solutions for velocity, temperature and
concentration profiles.
MAIN RESULTS
Figure 1.Temperature profiles for different value of t.
Figure 2.Concentration profiles for different value of Sc number.
Figure 3.Velocity profiles for different value of Sc number.

SCIENCE AND TECHNOLOGY 568
CONCLUSION
In this paper, exact solutions of heat transfer of free convection flow between two parallel
plate with presence of Newtonian heating and mass diffusion are obtained by using Laplace
transform.The results obtained show that the velocity, mass and temperature are increased
with increasing Newtonian heating parameter. Further, the effect of Newtonian heating
parameter increases the Nusselt number but reduces the skin friction.The exact solutions
obtained in this study are significant not only because they are solutions of some fundamental
flows, but they serve as accuracy standardsfor approximate methods, whether numerical,
asymptotic, orexperimental.
Acknowledgment: The authors would like to express their appreciation for the support of the
sponsors from UTM Zamalah as well as the Research Management Centre, UTM and
Ministry of Higher Education (MOHE), Malaysia for the financial support through vote
numbers 13H74 and 15H80 for this research.
REFERENCES
1. Al-subaie, M. A., &Chamkha, A. J. Transient natural convection flow of a particulate suspension through a vertical channel (2004), 40, 707–713.
2. Narahari, M. Effects of thermal radiation and free convectioncurrentsontheunsteadyCouetteflowbetweentwo
vertical parallelplateswithconstantheat flux at oneboundary. WseasTransactionsonheat and mass transfer
(2010), 5(1), 21-30.
3. Narahari, M. Transient free convectionflowbetweenlong vertical parallelplateswithrampedwalltemperature at
oneboundary in thepresenceofthermalradiation and constantmassdiffusion. Meccanica (2012), 47(8), 1961-
1976.
4. Marneni, N. Transient free convectionflowbetweentowlong vertical parallelplateswithconstanttemperature
and massdiffusion. In ProceedingsoftheWorldCongressonEngineering (WCE), London, UK (2011), (11).
5. Lesnic, D., Ingham, D. B., Pop, I., &Storr, C.Free convection boundary-layer flow above a nearly horizontal
surface in a porous medium with newtonian heating (2004), 40, 665–672. 6. Hamza, M. M. Free convection slip flow of an exothermic fluid in a convectively heated vertical channel.
Ain Shams Engineering Journal. 2016.

SCIENCE AND TECHNOLOGY 569
IGCESH2018
Universiti Teknologi Malaysia, Johor Bahru, Malaysia 13 -15 August 2018
FILTERING AIRBORNE LIDAR DATA BY MODIFIED
PROGRESSIVE MORPHOLOGICAL METHOD
M. R. M. Salleh1, M. Z. A. Rahman*1, Z. Ismail1 and M. F. A. Khanan1
1 Department of Geoinformation, Faculty of Geoinformation and Real Estate, Universiti Teknologi
Malaysia, 81310 UTM Johor Bahru, Johor, MALAYSIA.
(E-mail: [email protected])
ABSTRACT
Airborne Light Detection and Ranging (LiDAR) has been very effectively used in collecting
terrain information over different scales of area. Inevitably, filtering the non-ground returns is
the major step of digital terrain model (DTM) generation and this step poses the greatest
challenge especially for tropical forest environment which consists of steep undulating terrain
and mostly covered by a relatively thick canopy density. The aim of this research is to assess
the performance of the Progressive Morphological (PM) algorithm after the implementation
of local slope value in the ground filtering process. The improvement on the PM filtering
method was done by employing local slope values obtained either using initial filtering of
airborne LiDAR data or ground survey data. The filtering process has been performed with
recursive mode and it stops after the results of the filtering does not show any improvement
and the DTM error larger than the previous iteration. The results show that percentage of tree
canopy cover and terrain slope have strong correlation with RMSE of DTM generated using
available PM filtering method. The revised PM filtering method has decreasing pattern of
DTM error with increasing filtering iterations with minimum ±0.520 m of RMSE value. The
results also suggest that spatially distributed slope value applied in PM filtering algorithm
either from LiDAR ground points or ground survey data is capable in preserving
discontinuities of terrain and correctly remove non-terrain points especially in steep area.
Key words: Airborne LiDAR, LiDAR Filtering, Progressive Morphology, Slope, Tropical Area
INTRODUCTION
Light Detection and Ranging (LiDAR) is an active remote sensing technique that is able to
map various activities of the earth’s surface and features such as vegetation and building,
which also provides digital terrain model (DTM) with up to sub-meter vertical accuracy [1].
LiDAR with high resolution data can be used in generating the DTM and digital surface
model (DSM) which is important to support wide range of applications such as engineering
projects, hydrology and floodplain management, corridor mapping. By applying suitable
processing technique, a high quality of DTM can be generated from LiDAR data [2][3][4].
Hence, an effective of LiDAR data processing is important to all applications. However, the
classification of point cloud also is known as LiDAR data filtering which focusing on the
ground and non-ground points separation are very crucial to most of the applications
[5][6][7]. LiDAR data filtering becomes more challenging especially at high relief area or
hybrid geographic features [8] and complex configuration with geometrical similarities of

SCIENCE AND TECHNOLOGY 570
ground and objects points [7][8][9][10][11]. Although dozens of filtering algorithms have
been developed to separate ground points from the land features, the difficulties in ground
points extraction still exist where most of the algorithms need specific condition to produce
good results [12][13]. The performance of LiDAR ground filtering methods is variable at
different areas and terrain surface [12][14]. This study focuses on the development of revised
Progressive Morphology (PM) algorithm which used spatially distributed slope value as one
of the parameter for ground point extraction.
METHODOLOGY
An existing PM filtering algorithm has been enhanced for airborne LiDAR data filtering over
tropical area. The improvement considers the effect of slope towards the performance of the
algorithm. The parameter of constant slope value be replaced with spatially distributed slope
value. Generally, PM algorithm requires some input values; i) cell size (c); ii) slope (s), iii)
initial elevation difference threshold (dho), iv) maximum elevation threshold (dhmax), v)
window base (b), and vi) iteration (k). All these parameters have their significant role in
filtering LiDAR data. Slope value is important in deriving the difference elevation threshold
(dhT) value for ground filtering procedure. The dhT value used in determining LiDAR point
clouds for each grid cell either belong to ground points or non-ground points (see equation 1).
Therefore, the local slope value (see equation 2) should be used in order to make sure the
filtering process produce accurately filtering results.
𝑑ℎ𝑇 = 𝑠(𝑤𝑘 − 𝑤𝑘−1)𝑐 + 𝑑ℎ𝑜 (1)
𝑑ℎ𝑇𝑖𝑗 = 𝑠𝑖𝑗(𝑤𝑘 −𝑤𝑘−1)𝑐 + 𝑑ℎ𝑜 (2)
The filtering process was performed iteratively. Each single process need to include the slope
value that generated from each iteration until the lowest error of LiDAR-derived DTM
obtained. The implementation of the algorithm in this study is explained as follows:
Implementation:
1. Slope map generation (rise/ run). 2. Extraction of slope value into LiDAR points. 3. Create a 2-D array A[m, n] for LIDAR points, p(x, y, z, s) 4. Determine series of wk using (4) or (5), where wk ≤ maximum window size. 5. dhT = dh0 6. for each window size wk
7. Pi = A[i;] (A[i;] represents a row of points at row i in A and Pi is a 1-D array) 8. Z Pi (Assign elevation values from P to a 1-D elevation array Z) 9. Zf = erosion(Z;wk) 10. Zf = dilation(Zf;wk) 11. Pf Zf (Replace z values of Pi with the values from Zf) 12. A[i;] = Pi (Put the filtered row of points Pi back to row i of array A) 13. dhT = s(wk – wk-1)c + dh0 [s represents a spatially distributed slope value] 14. end for window size loop 15. for i = 1 to m
16. for j = 1 to n 17. if (B[i;j](x) > 0 and B[i;j](y) > 0) 18. if (flag[i;j] = 0) 19. B[i;j] is a ground point 20. else 21. B[i;j] is a non-ground point 22. end for j loop 23. end for i loop

SCIENCE AND TECHNOLOGY 571
MAIN RESULTS
For the purpose of comparing the performance of revised PM algorithm with the other
prominent filtering algorithms (i.e. existing PM, ETEW, and ATIN), five type of assessments
have been assessed in measuring the performance of filtering methods (i.e. RMSE, Type I,
Type II and Total Error, and visual assessment). Table 1 shows the comparison between
revised PM algorithm and other prominent algorithms.
Table 1. Comparison of RMSE, Type I, Type II, Total errors and qualitative assessments of
revised PM and selected algorithms
Assessment
methods Existing PM ETEW ATIN Revised PM
RMSE (m) ±0.608 ±0.614 ±0.66 ±0.520
Type I Error (%) 31.22 27.00 23.56 29.17
Type II Error (%) 0.03 0.13 0.07 0.05
Total Error (%) 3.49 2.94 9.35 3.19
Visual Assessment
2 1 1 1
According to the Table 1, the results obtained using revised PM algorithms were compared
with those obtained using prominent filtering algorithms (i.e. existing PM, ETEW, ATIN).
The lowest RMSE value recorded from the revised PM algorithm was ±0.520m. Compared
with the RMSE values of other filtering algorithms, revised PM algorithm generated
promising and competitive results. Approximately 9 cm error was reduced. The quantitative
assessment shows a quite similar trend. The computed errors (over all the datasets) ranged
from 27 percent to 32 percent, 0 percent to 0.13 percent, and 2 percent to 10 percent for Type
I, Type II, and Total errors, respectively. Most of the filters focus on minimizing Type II
errors. In other words, filter parameters and procedure focusing on removing as many object
points as possible. In term of qualitative assessment, all the filtering algorithms produce
reasonable DTM quality. The best setting parameters should be used to produce a good result.
In general, revised PM capable in filtering the LiDAR data over vegetated tropical region by
applying spatially distributed slope value from LiDAR ground points.
.
CONCLUSION
Ground filtering is a fundamental issues in LiDAR processing which significantly affect the
quality of DTM and other LiDAR-related deliverables. However, this issue still not fully
solved especially at a complex terrain area. This study demonstrates a procedure or
improvement in filtering airborne LiDAR data using revised PM algorithm. The performance
of revised PM filtering method was evaluated using quantitatively and qualitatively
approaches. The results revealed that several significant advantages of revised PM method
where the error of LiDAR-derived DTM getting lower compare to the other prominent
algorithms.
Acknowledgment: This work is financed by Institutional Scholarship provided by Ministry
of Higher Education of Malaysia.

SCIENCE AND TECHNOLOGY 572
REFERENCES
1. C. W. Bater and N. C. Coops. Evaluating error associated with lidar-derived DEM interpolation. Computers
& Geosciences 35, (2) (2009), 289-300.
2. Z. Cui, K. Zhang, C. Zhang, J. Yan, and S.-C. Chen. A GUI based LIDAR data processing system for model generation and mapping. In Proceedings of the 1st ACM SIGSPATIAL International Workshop on
MapInteraction, Orlando, Florida (2013).
3. A. Rahmayudi and A. Rizaldy. Comparison of Semi Automatic DTM from Image Matching with DTM from
LIDAR. ISPRS-International Archives of the Photogrammetry, Remote Sensing and Spatial Information
Sciences (2016), 373-380.
4. M. S. Andersen, A. Gergely, Z. Al-Hamdani, F. Steinbacher, L. R. Larsen, and V. B. Ernstsen. Processing
and accuracy of topobathymetric LiDAR data in land-water transition zones. Hydrol. Earth Syst. Sci.
Discuss 2016, (2016), 1-40.
5. X. Liu. Airborne LiDAR for DEM generation: some critical issues. Progress in Physical Geography 32, (1)
(2008), 31-49.
6. Z. Cui. A Generalized Adaptive Mathematical Morphological Filter for LIDAR Data. Florida International
University, Ph.D. Thesis, 2013. 7. Y. Li, B. Yong, H. Wu, R. An, and H. Xu. An improved top-hat filter with sloped brim for extracting ground
points from airborne lidar point clouds. Remote Sensing 6, (12) (2014), 12885-12908.
8. Y. Li. Filtering Airborne Lidar Data by an Improved Morphological Method based on Multi-gradient
Analysis. ISPRS (2013), 191-194.
9. G. Sithole and G. Vosselman. Experimental comparison of filter algorithms for bare-Earth extraction from
airborne laser scanning point clouds. ISPRS Journal of Photogrammetry and Remote Sensing 59, (1–2)
(2004) 85-101.
10. K. Zhang and D. Whitman. Comparison of three algorithms for filtering airborne lidar data.
Photogrammetric Engineering & Remote Sensing 71, (3) (2005) 313-324.
11. J. L. Silván-Cárdenas and L. Wang. A multi-resolution approach for filtering LiDAR altimetry data. ISPRS
Journal of Photogrammetry and Remote Sensing 61, (1) (2006), 11-22, 12. X. Meng, N. Currit, and K. Zhao. Ground Filtering Algorithms for Airborne LiDAR Data: A Review of
Critical Issues. Remote Sensing, (2010), 833-860.
13. M. Uysal and N. Polat. Investigating Performance of Airborne Lidar Data Filtering with Triangular Irregular
Network (TIN) Algorithm. The International Archives of Photogrammetry, Remote Sensing and Spatial
Information Sciences 40, (7) (2014), 199-202.
14. Zhang, W., Qi, J., Wan, P., Wang, H., Xie, D., Wang, X., and Yan, G. (2016). An easy-to-use airborne
LiDAR data filtering method based on cloth simulation. Remote Sensing 8 (6), 501.

SCIENCE AND TECHNOLOGY 573
IGCESH2018
Universiti Teknologi Malaysia, Johor Bahru, Malaysia 13-15 August 2018
EVALUATION OF INFORMATION RETRIEVAL METHODS FOR
REQUIREMENT TRACEABILITY
Rooster Tumeng*1, Dayang N. A. Jawawi
2 and Mohd Adham Isa
3
1, 2, 3 Department of Software Engineering, Faculty of Computing, Johor Bahru, Malaysia.
(E-mail: [email protected], [email protected], [email protected])
ABSTRACT
Selecting the most suitable method to automate or semi-automate requirements to test
traceability recovery remains a challenge as research techniques developed are specific to
their controlled experiments. A common challenge for all of these techniques is when
requirement traceability links become obsolete as software undergo changes throughout its
deployment. Among the changes that occur during software deployment are requirements
specification modification and test cases additions. One of the most prominent methods used
by researchers in developing their tools in requirements to tests traceability is Information
Retrieval (IR) approach. Recent successful automated approaches for test traceability rely on
the analysis of textual information derived from documentation and test code using
Information Retrieval (IR) techniques. In this research, we present the empirical findings of
three controlled experiments on Latent Semantic Indexing and Random Projections. The
findings show that LSI performs with higher precision thus suggesting a higher number of
accurate traceable links retrieved. The findings is consistent for the three controlled
experiments suggesting its applicability on real case studies which will help software testers
in maintaining software evolution.
Key words: Information retrieval, Traceability, Requirements
INTRODUCTION
Software maintenance is a challenging task as software undergo modifications. Due to
corrections to many components in a software system, traceability between requirements to
software artefacts are sometimes lost. As this occurs, performing testing to whole software
has to be done. This will have a significant impact on the cost to perform such testing as a
retest all approach is time consuming [1]. In order to avoid such testing, it is imperative to
establish and enforce the integrity of traceability links between software artefacts [2,3,4]. In
performing testing, the most important thing to be generated is the test suite. As requirements
evolve and changes are performed on affected components, each test case in the existing test
suite needs to be traced back to these requirements. Apart from test suite, use cases (low level
requirements) and even source code are impacted as well when requirements change. In real
world industry, these artefacts reside in change request repositories. They provide developers
with a standardized organization of modification performed to software artefacts [5].
Software that undergo modification tends to become more complex than its first deployed
version. This is because, during the early stage of software development lifecycle,

SCIENCE AND TECHNOLOGY 574
requirements are normally insufficient and incomplete due to unclear business goals of the
system [6]. This means as the software undergo modification and its complexity increases,
the maintenance effort grows accordingly as well. There needs to be an effort made to reduce
resources invested in software maintenance. However, maintaining software traceability
cannot be a one man task, as an engineer has partial knowledge only [7]. Such a task is to
perform the tracing of traceable links between requirements specification document to other
software artefacts such as test cases, use cases and source code.
As these software artefacts are written in natural language (e.g., test cases, use cases,
comments on source code) that could be understood by the stakeholders of the software, it
leads to ambiguity as natural language comprises of synonymous words that refer to the same
subject. Researchers in recent years have started to grow interest in exploring the concept of
ontology as a part of specifying more complete and unambiguous requirements [8]. However,
the Requirements Engineering (RE) community still lacks knowledge on how ontologies are
applied effectively in the RE process that avoids ambiguity. Until then, we have to rely on
natural language. This significantly causes some manual or semi-manual effort in establishing
traceability links a long and difficult process for a complex systems. One of the solutions to
this problem is to apply information retrieval techniques to extract the semantics from the
requirements specification document that contains large amount of formal and information
being continuously produced and modified [9].
Different authors have proposed the usage of techniques such as Latent Semantic Indexing
[10], Vector Space Model [11], and probabilistic models [12, 13] to recover traceability links
between different types of software artefact. All these methods are based on the assumption
that a consistent dictionary exists between different artefacts to be traced, for instance,
between requirements and source code.
In this study, we evaluate Latent Semantic Indexing and Random Projections and report on
our experiment with three case studies to identify superior IR technique to be used in
traceability recovery. For the purpose of classification of case study, we mapped the system
in terms of different system size, number of software artefacts, and number of traceability
links. We performed investigations of precision and recall of each IR technique on each case
study. Such investigation set out to understand whether there is any correlation between the
different classification of the system and the effectiveness of the IR method being applied.
The empirical evaluation indicated that Latent Semantic Indexing has a higher potential to be
used as an IR method and is more effective in tracing requirements to software artefact with
high precision.
The paper is structured as follows. Section 2 elaborates a detailed background of related
works in IR techniques in software traceability. Section 3 describes the evaluation measures
used to evaluate the IR techniques of interest. Section 4 describes the setup of the experiment
including threats to the validity of our work. Section 5 discussed the results and its analysis.
Section 6 elaborates further on the discussion regarding the findings of the experiment.
Section 7 concludes the study.
MAIN RESULTS
In this section, we report the analysis of the results collected from the controlled
experiments of three case studies; MMS, Gantt and eTour. All these case studies applied
both Latent Semantic Indexing and Random Precisions. In general, the results show that

SCIENCE AND TECHNOLOGY 575
Figure 1. Latent Semantic Indexing F1 Measure Figure 2. Random Projection F1 Measure
different types of information retrieval methods vary in their recall, precision, and F1
measure.
For eTour LSI F1 measure (Figure 1), it performed the highest at ɛ = 0.80. In contrast to
MMS LSI F1, which performed the worst at ɛ = 0.80. This could be because the test cases
constructed in MMS case study were constructed at a high similarity with their respective
requirements.
This inherently results in no correct links retrieved at cosine weight lower than
approximately 0.9 or higher. For eTour, since the code component built depends on
function attributes and dependency library, it was able to retrieve more links at ɛ = 0.99.
This explains the trend for all precision levels of the three case studies: “The more
detailed the software artefact, the higher the traceability cosine similarity weight between
it and its respective software artefact”. In this case, test cases and source code are both
able to cause higher precision score.
In Figure 1, RP F1-measures both for MMS and Gantt are notably higher at ɛ = 0.80. This
is due to random projections throwing in some randomness in the cosine similarity
weight. Hence, even though some test cases or low level requirements have a lower
similarity in actual, they might get a higher cosine similarity weight as a result of random
weight assignment to queries. In comparison with Latent Semantic Indexing, Random
Projections (Figure 2) shows a consistent trend of the following; “As system size gets
larger, the F1 measure gets lower”. However, this might not reflect the true behaviour of
the methods as the case studies vary in functions and software artefacts used. The F1
measures both for MMS LSI (Figure 1) and MMS RP (Figure 2) at ɛ = 0.99 are
consistent. They both show that at cosine similarity weight, ɛ = 0.99, the F1 measure is
the highest, 27.3% and 66.7%, respectively. Surprisingly, at ɛ = 0.60, both LSI Gantt and
RP Gantt recorded the lowest F1 measure, both at 2.9%. They both record the lowest
precision levels as well.
In general, our results show that Latent Semantic Indexing had the most significant
positive effect in improving precision to significantly higher levels in all case studies. In
contrast, Random Projections had significantly lower precision levels. Based on this
observation, we conclude that Latent Semantic Indexing has the most potential as an IR-
based automated tracing.
CONCLUSION
In this study, we have investigated two IR approaches, LSI and RP in three case studies:

SCIENCE AND TECHNOLOGY 576
MMS, Gantt, and eTour. The findings of the experiment suggest that Latent Semantic
Indexing performed superiorly than Random Projections. Even though Random projections
throw in randomness in dimensionality reduction, the performance of the IR-technique is
largely sparse without a notable improvement in the scores of precision and recall.
Meanwhile, LSI provides more value to researchers aiming to establish traceability links for
their software projects. However, caution should be taken by software engineers in the case
of lower cosine similarity threshold as no single IR method is capable in detecting all
traceability links.
The IR technique seems to perform best when performed on requirements to test cases
(MMS) as compared to the other two case studies. In future, hybridization of IR techniques to
increase accuracy in traceability could be explored.
Acknowledgement: The authors fully acknowledge Zamalah UTM, Universiti Teknologi
Malaysia, and Ministry of Higher Education (MOHE) for financial support, which have made
this research endeavour possible. Additionally, the authors would like to express their
gratitude to members of Embedded Real Time Software Engineering lab for their continuous
support and feedbacks.
REFERENCES
1. Rothermel, G. and Harrold, M. J. Empirical Studies of a Safe Regression Test Selection Technique. IEEE
Transactions on Software Engineering. 24 (1998), 401-419.
2. Capobianco, G., Lucia A. D., Oliveto, R., Panichella, A., and Panichella, S. Improving IR-Based
Traceability Recovery via Noun-Based Indexing of Software Artifacts. Journal of Software: Evolution and
Process. 25 (2013), 743-762.
3. Regan, G., Biro, M., Flood, D., and McCaffery, F. Assessing Traceability—Practical Experiences and
Lessons Learned. Journal of Software: Evolution and Process. 27 (2015), 591-601.
4. Kuang, H., Mäder, P., Hu, H., Ghabi, A., Huang, L., Lü, J., and Egyed, A. Can Method Data Dependencies
Support the Assessment of Traceability Between Requirements and Source Code? Journal of Software:
Evolution and Process. 27 (2015), 838-866. 5. Cavalcanti, Y. C., Mota Silveira Neto, P. A., Machado, I. d. C., Vale, T. F., Almeida, E. S., and Meira, S. R.
d. L. Challenges and Opportunities for Software Change Request Repositories: A Systematic Mapping
Study. Journal of Software: Evolution and Process. 26 (2014), 620-653.
6. Ali, N. and Lai, R. A Method of Requirements Change Management for Global Software Development.
Information and Software Technology. 70 (2016), 49-67.
7. Ghabi, A. and Egyed, A. Exploiting Traceability Uncertainty among Artifacts and Code. Journal of Systems
and Software. 108 (2015), 178-192.
8. Dermeval, D., Vilela, J., Bittencourt, I. I., Castro, J., Isotani, S., Brito, P., and Silva, A. Applications of
Ontologies in Requirements Engineering: A Systematic Review of the Literature. Requirements
Engineering (2015), 1-33.
9. Borg, M., Runeson, P., and Ardö, A., Recovering from a Decade: A Systematic Mapping of Information
Retrieval Approaches to Software Traceability. Empirical Software Engineering. 19 (2014), 1565-1616. 10. Lucia, A. D., Fasano, F., Oliveto, R., and Tortora, G. Recovering Traceability Links in Software Artifact
Management Systems using Information Retrieval Methods. ACM Transactions on Software Engineering
and Methodology (TOSEM). 16 (2007), 13.
11. Hayes, J. H., Dekhtyar, A., and Sundaram, S. K. Advancing Candidate Link generation for Requirements
Tracing: The Study of Methods. IEEE Transactions on Software Engineering. 32 (2006), 4-19.
12. Antoniol, G., Canfora, G., Casazza, G., Lucia, A. D., and Merlo, E. Recovering Traceability Links between
Code and Documentation. IEEE Transactions on Software Engineering. 28 (2002), 970-983.
13. Cleland-Huang, J., Settimi, R., Duan, C., and Zou, X. Utilizing Supporting Evidence to Improve Dynamic
Requirements Traceability. In Proceedings of 13th IEEE International Conference on Requirements
Engineering, IEEE (2005), 135-144.

SCIENCE AND TECHNOLOGY 577
IGCESH2018
Universiti Teknologi Malaysia, Johor Bahru, Malaysia 13 -15 August 2018
UNIQUE SIGNATURES OF HONEYS AS A MEANS TO ESTABLISH PROVENANCE-A REVIEW
Syazwani Dzolin1, Wan Aini Wan Ibrahim1, 2, Naji Arafat Mahat1,
Aemi Syazwani Abdul Keyon1, Zuhaimy Ismail3
1Department of Chemistry, Faculty of Science, Universiti Teknologi Malaysia, 81310 UTM, Johor
Bahru, Johor, MALAYSIA 2Centre for Sustainable Nanomaterials, Institute of Scientific and Industrial Research, Universiti
Teknologi Malaysia, 81310 UTM, Johor Bahru, Johor, MALAYSIA 3Department of Mathematical Sciences, Faculty of Science, Universiti Teknologi Malaysia, 81310
UTM, Johor Bahru, Johor, MALAYSIA
(E-mail: [email protected])
ABSTRACT
Global consumer demands for high quality genuine honey are increasing continuously. The
ability to identify the geographical and botanical origins of honey would be of great
importance to the improvement of quality control, as well as protection of reputation and
confidence of the honey industry. The establishment of unique signatures of honey is one of
the potential approaches for honey provenance. A great deal of literature has been published
on honey authenticity and provenance. However, specific study focusing on the provenance
of honey, especially those of the stingless bee species is lacking, especially in Malaysia.
Consequently, this mini review is to highlight the presence of biomarkers in honeys for
establishing their provenance via the application of spectroscopy and chemometric
techniques.
Key words: Honey, Stingless bee, Provenance, Spectroscopy, Chemometric
INTRODUCTION
Bee honey is appreciated worldwide by old folk and modern practitioners as a natural,
nutritious product, mainly because of its therapeutic significance towards human health.
Honey is produced by bees collecting nectar from flowers and convert it into a sweet natural
product that is claimed to be healthier favourable nutritional option than plain sugar [1]. The
properties of honey such as aroma, color, composition and flavour depend generally on the
flowers, climate, geographical regions and honeybee species involved in its production [2, 3].
Honey is composed mainly of fructose and glucose (65%), water (18%), minimal protein and
lipid contents [4, 5]. It also consists different quantities of minerals ranging between 0.02
g/100 g and 1.03 g/100 g, with potassium being the most abundant element comprising
approximately one-third of the total mineral content [6-8]. Trace minerals such as potassium,
calcium, sodium, iron, copper, zinc and manganese play a critical role in biological systems
in which they maintain normal physiological systems and influence reproduction as catalyst
for various biochemical reactions [9]. Because of the presence of various chemical

SCIENCE AND TECHNOLOGY 578
compositions, honey has been found to significantly affect human nutrition, healing and
preventing illness. In addition to its medicinal benefits, presence of contaminants such as
pesticide residues and excessive amounts of minerals and heavy metals has been reported in
honey, accentuating the needs for producing safe honey for human consumption [10].
Normally, the composition of honey is closely related to its botanical origin and also the
geographical area in which it originated. The characteristics of soil and climate will
determine the floral that produce honey [11]. Contaminants are transferred from bees to
ripened honey and alter its unique composition and the high quality [14]. The surrounding
area of mines and steelworks, industrialized and urban areas or motorways with exhausts
from vehicles has usually reflected in much higher concentrations of trace metals such as Al,
Ba, Ca, Cd, Cr, Cu, Mg, Mn, Ni, Pb, Pd or Zn [12-16].
MAIN RESULTS
In this day and age, the development of analytical approaches and advanced statistical
techniques have gained interest for the determination of certain major and minor compounds
in honey to serve as the biomarkers for its geographical or botanical origin. Thus far, several
techniques have been used to analyze the compound composition of honeys. This mini review
focuses on the use of analytical approaches combined with chemometric techniques between
year 2000 and 2017 for honey provenance (geographical and botanical origins) based on the
presence of its biomarkers.
CONCLUSION
With globalization technologies, numerous studies have attempted to show the important
used of the spectroscopy coupled with the chemometric techniques to exhibit the biomarkers
of honeys according to their geographical and botanical origins. For now, it shows a great
advantage to solve several problems in this field. Creation of honey databases can be much
useful to help identify and quantify the upcoming data in order to monitor unexpected
changes or fraud performers based on the established honey fingerprinting. However, an issue
which dealing with the food policies, including legal requirements and standard need to take
into consideration. Therefore, this field of study needs more time and efforts to improve the
capability of technologies and develop databases for the determination of the honey
authentication and the provenance according to its unique signatures. In addition, from the
review, it can be concluded that the significant to highlight the type of bee species when
studying about provenance in order to compare and compile the results from worldwide
honey. To date, no comprehensive study in Malaysia has been conducted to establish
provenance of bee honeys according to their marker compounds especially from stingless bee
species.
REFERENCES
1. Vanhanen, A. Emmertz, L. P. and Savage, P. (2011). Mineral Analysis of Mono-Floral New Zealand Honey.
Food Chemistry. 128(1):236–240.
2. Escuredo, O., Dobre, I., Fernández-González, M., and Seijo, M. C. (2014). Contribution of Botanical Origin
and Sugar Composition of Honeys on the Crystallization Phenomenon. Food Chemistry. (149):84–90 3. Tornuk, F., Karaman, S., Ozturk, I., Toker, O. S., Tastemur, B., and Sagdic, O. (2013). Quality
Characterization of Artisanal and Retail Turkish Blossom Honeys: Determination of Physicochemical,
Microbiological, Bioactive Properties and Aroma Profile. Industrial Crops and Products. (46):124–131.
4. Silva, L. R., Videira, R., Monteiro, A. P., Valentão, P., and Andrade, P. B. (2009). Honey from Luso Region
(Portugal): Physicochemical Characteristics and Mineral Contents. Microchemistry Journal. (93):73–7.

SCIENCE AND TECHNOLOGY 579
5. Khalil, M. I., Motallib, M. A., Anisuzzaman, A., Sathi, Z. S., Hye, M., and Shahjahan, M. (2001).
Biochemical Analysis of Different Brands of Unifloral Honey Available at the Northern Region of
Bangladesh. Journal of Medical Science. (1):385–8.
6. Chakir, A., Romane, A., Barbagianni, N., Bartoli, D., and Ferrazzi, P. (2011). Major and Trace Elements in
Different Types of Moroccan Honeys. Australian Journal of Basic and Applied Sciences. 5(4):223–231. 7. Bogdanov, S., Haldimann, M., Luginbuhl, W., and Gallmann, P. (2007). Minerals in Honey: Environmental,
Geographical and Botanical Aspects. Journal of Apicultural Research. (46):269–75. Available from:
http://www.bee-hexagon.net
8. de Ferrer, B. S. G., de Rodriguez, O., Pena, J., Martinez, J., and Moran, M. (2004). Mineral Content of the
Honey Produced in Zulia State, Venezuela. Archivos Latinoamericanos de Nutricion. 54(3):346–348.
9. Staniškien, B., Matusevičius, P., and Budreckien, R. (2006). Honey s an Indicator of Environmental
Pollution. Environmental Research, Engineering and Management. 2(36):53–58.
10. Mckee, B. (2003). Prevention of Residues in Honey: A Future Perspective. Apiacta. (38):173–7.
11. Rashed, M. N. and Soltan, M. E. (2004). Major and Trace Elements in in Different Types of Egyptian Mono-
Floral and Non-Floral Bee Honeys. Journal of Food Composition and Analysis. (17):725-735.
12. Achudume, A. C. and Nwafor, B. N. (2010). The Ecological Assessment of Metals in Local Brands of
Honey in Southwest Nigeria. African Journal of Agricultural Research. 5(18):2608-2610. 13. Stankovska, E. Stafilov, T. and Šajn, R. (2008). Monitoring of Trace Elements in Honey from the Republic
of Macedonia by Atomic Absorption Spectrometry. Environment Monitor Assess. (142):117-126.
14. Tuzen, M. Silici, S. Mendil, D. and Soylak, M. (2007). Trace Element Levels in Honeys from Different
Regions of Turkey. Food Chemistry. 103(2), 325–330.
15. Floryszak-Wieczorek, F. Milczarek, G. Arasimowicz, M. and Ciszewski, A. (2006). Do Nitric Oxide Donors
Mimic Endogenous NO-Related Response in Plants? Planta. (224), 1363-1372.
16. Bratu, I. and Georgescu, C. (2005). Chemical Contamination of Bee Honey–Identifying Sensor of the
Environment Pollution. Journal of Central European Agriculture. (6):95–8.

SCIENCE AND TECHNOLOGY 580
IGCESH2018
Universiti Teknologi Malaysia, Johor Bahru, Malaysia 13 -15 August 2018
SOLID WASTE MANAGEMENT POLICIES AND PLANS IN
MALAYSIA TO IMPROVE WASTE SEPARATION AND
RECYCLING PRACTICE AMONG HOUSEHOLDS: A LITERATURE
REVIEW
Fitriyah Razali1, Choong Weng Wai2, and Dzurllkanian@Zulkarnain Daud3
1,2,3 Department of Real Estate, Faculty of Geoinformation and Real Estate, Universiti Teknologi
Malaysia, Skudai, MALAYSIA.
(E-mail: [email protected], [email protected], [email protected])
ABSTRACT
Malaysia had taken series of initiative to improve the nation solid waste management
policies. This paper aims to review the history of waste management in Malaysia, which the
main purpose is to explain the waste legislation and plans in Malaysia to improve waste
separation and recycling behaviour among households. Households are the primary source of
municipal solid waste and thus, they play an important role in increasing the recycling rates
in this nation This paper attempts to develop an overview of waste management policies in
Malaysia and summarize a timeline table of solid waste management and plans
transformation in Malaysia.
Key words: Waste management, waste separation, recycling, households behaviour
INTRODUCTION
In the era of globalization, the accumulation of solid waste is a critical issue for many
countries, including Malaysia [1]. Kuala Lumpur, the capital city of Malaysia, produces
approximately 3,500 tons of domestic and industrial wastes per day [2]. The trend of solid
waste generation expected to reach 30,000 tonnes per day in 2020 [3]. This shows the need
for waste separation, in order to reduce the amount of waste accumulated now for the better
future.
The municipal solid waste from household, business entities and institutions are managed
under the responsibility of the Local Authorities [4]. The solid waste management in
Malaysia, include various governmental agencies such as, Ministry of Urban Wellbeing,
Housing and Local Government (MHLG), National Solid Waste Management Department
better known as Jabatan Pengurusan Sisa Pepejal Negara (JPSPN), and Solid Waste and
Public Cleansing Management Cooperation (SWCorp)
From the year, late 1970s until now Malaysia had taken series of initiative that aims to
improve the waste separation and recycling practice among households. Although the main
disposal approach in Malaysia is still landfilling, with relatively low recycling rate of only
5%, there are still hope for Malaysia to improve in recycling activities if the involvement

SCIENCE AND TECHNOLOGY 581
among households increasing. This is because the contribution of solid waste from
households in Malaysia is among the highest.
FINDINGS
Towards Malaysia target to reach the recycling rate of 22% by 2020, there are new policies
and plans for transformation in solid waste management that being implement and planned to
be implemented in future. the following summarize the list of legislation and regulation of
Malaysia from the early year 1974 until the latest 2016.
Table 1. Solid Waste Management Policies and Plans Transformation in Malaysia
Legislation & regulation Year Agency Description
Street, Drainage and
Building Act 1974,
Environmental Quality Act
1974
Local Government Act 1976
1970s Local authorities
Street cleanliness and transporting
waste to assigned municipal
disposal sites
Action Plan for a Beautiful
and Clean Malaysia (ABC
Plan)
1988 Local authorities
Unfortunately, this plan was not
authorized and implemented, but
it did develop a future plan for
solid waste management in
Malaysia
Vision 2020 1991 Local authorities Malaysia set target to become a
developed nation by 2020
First National Recycling
Day 1993 Local authorities
Malaysia announced November
11th as National Recycling Day
Second National Recycling
Day 2000
Federalization &
Privatization
Since then, National Recycling
Day has become an annual
recycling event
National Strategic Plan
(NSP) 2005
Federalization &
Privatization
NSP was formulated to be use
until year 2020
Waste Minimization Master
Plan (WM-MP) 2006
Federalization &
Privatization Part of NSP framework
Solid Waste and Public Cleansing Corporation Act
2007 (Act 672)
2007 Federalization &
Privatization
Aims to standardized solid waste management and public cleansing
services in Malaysia
Solid Waste and Public
Cleansing Corporation Act
2007 (Act 673)
2011 Federalization &
Privatization
Two agencies are established
under this act, which are JPSPN
and SWCorp Malaysia
SWCorp Strategic Plan 2014 Federalization &
Privatization
Seven core strategies of solid
waste planning in Malaysia for
year 2014 until 2020 is introduced
Comprehensive
Action Plan of Solid Waste
Management 2015-2020
2015 Federalization &
Privatization
Aims to improve solid waste
management system

SCIENCE AND TECHNOLOGY 582
Separation at Source Initiative (SSI)
2016 Federalization &
Privatization
Mandatory for household to
practice waste separation at source started from 1st June 2016
Malaysia has put waste management as a priority action when the government, through The
Solid Waste Management and Public Cleanliness Corporation by launching the Separation at
Source Initiative (SSI) under Solid Waste and Public Cleansing Management Act 2007 (Act
672), effective in September 2015 [5]. This act aiming for the residents and retailers to
separate waste in their dwelling.
CONCLUSION
This paper have summarized the development of waste management and legislation in
Malaysia. Although the nation had taken series of action in waste separation, particularly to
reduce the waste accumulation among households. The household in Malaysia is still far
behind comparing to other countries in the engaging of waste separation behaviour and
recycling practice. Therefore, there is a need to introduce more specific waste management
and legislation in Malaysia which targeted to improve the waste separation and recycling
practice among households.
Acknowledgment: The authors would like to express their appreciation for the financial
support from Universiti Teknologi Malaysia under the Zamalah scholarship.
REFERENCES
1. Omran, A., Mahmood, A., Abdul Aziz, H., & Robinson, G. M. Investigating households attitude toward
recycling of solid waste in Malaysia: a case study. International journal of environmental research, 3(2), (2009), 275-288.
2. Bavani, M. and Phon, L. L. Using worms to reduce organic waste: DBKL to embark on a pilot project
soon. Saturday Metro, (2009), 5.
3. Aziz, H. A., Alias, S., Assari, F. and Adlan, M. N. The use of alum, ferric chloride and ferrous sulphate as
coagulants in removing suspended solids, colour and COD from semi-aerobic landfill leachate at controlled
pH. Waste Management & Research, 25(6), (2007), 556-565.
4. Ministry of Housing and Local Government: The Study of National Waste Minimization in Malaysia Final
Report. In cooperation with Japan International Cooperation Agency (JICA) July 2006.
5. Act 672. Solid Waste and Public Cleansing Management Act 2007 (Act 672) (2007). Malaysia.

SCIENCE AND TECHNOLOGY 583
IGCESH2018
Universiti Teknologi Malaysia, Johor Bahru, Malaysia 13-15 August 2018
INTEGRATION OF STRIDE-DREAD MODEL AND FDM FOR
THREAT ASSESSMENT IN HEALTHCARE CLOUD APPLICATION
Nurbaini Zainuddin*1, Rasimah Che Mohd Yusuff
2 and Ganthan Narayana Samy
3
1,2,3Advanced Informatic School (AIS), Universiti Teknologi Malaysia, Kuala Lumpur, MALAYSIA.
(E-mail: [email protected], [email protected], [email protected])
ABSTRACT
Despite of tremendous research in cloud computing, there is limited research in cloud risk
assessment especially in the field of healthcare. Complex task in identifying security risk in
cloud computing and high cost of risk assessment tool in the market are the limitation of risk
assessment implementation in cloud computing. The increased incident of security breach in
cloud healthcare also contribute to the needs of systematic approach in identifying risks and
threat in cloud computing. Therefore, the purpose of this study is to provide a systematic and
effective approach towards cloud risks assessment process in mitigating security risks in
healthcare cloud application. This study will integrate Microsoft STRIDE-DREAD model
with Fuzzy Delphi Method (FDM) during the risk assessment process. From this study, it is
expected that the systematic and effective process in risk assessment will benefit to
stakeholders and IT team in identifying and analysing security risk in cloud computing.
Keywords: Fuzzy Delphi, Threat model, Risk Assessment
INTRODUCTION
Emerging of cloud computing with flexibility, improve accessing data and cost saving makes
this technology popular and growing fast. As a result from emergence of cloud computing
bring interest to healthcare seeking for the cloud technology [1]. Previous study in Malaysian
healthcare shows that 93.1% of healthcare information management system in Malaysia are
not integrate with their own branch and only 6.9% are integrated [2].The low level of system
integration for information sharing and interchange illustrated that stifle utilisation of cloud
computing among the cloud users in the healthcare.
Most of cloud computing adoption study in healthcare highlighted that security is the major
barriers of cloud computing adoption [3][4][5]. Previous study reveal that with effective
cloud risk management methodology will bring confident to cloud customer in adopting
cloud computing [6]. Cloud risk assessment is one of the decision tools to gain understanding
on the security risks of cloud computing. Risk assessment can determine the probability of
occurrence, the impact and mitigation to safeguards from the impact. Cloud risk assessment
helps consumers to check the effectiveness of security control in their organizations so that
they can aware on the existence of risk and vulnerabilities [7].
Current traditional risk assessment method become frail to cloud computing due to
differences of standard, the way of managing asset and the characteristic of cloud computing

SCIENCE AND TECHNOLOGY 584
[8]. Lacking of dedicated standard in cloud risk assessment framework [9] and complex task
in identifying security risk in cloud computing require effective cloud security risk
assessment methodology [6].
The existence of gap in cloud risk assessment study has been highlighted by researchers
and there are limited number of study considering a systematic process in assessing and
managing risk in cloud computing [10]. Moreover, [11] suggested that cloud risks need to
be carefully evaluated before any engagement made.
RELATED WORK
Identifying existing literatures in cloud risk assessment model and their issues associated
revealed that there are few risk assessment methodologies used in assessing cloud
computing. Current risk assessment method such as OCTAVE, EBIOS and MEHARI are
not suitable for cloud computing [7]. Although, Maghrabi et al. [12] in his study using
OCTAVE in assessing cloud-based assets, this study integrate risk assessment with
Common Vulnerability Scoring System (CVSS). The Operationally Critical Threat, Asset
and Vulnerability Evaluation (OCTAVE) used to identify and managing information
security risks by analysing assets associated in the organization. OCTAVE suitable for
critical infrastructure services. However, these risk assessment and management approach
do not support cloud-specific risks [13].
Basically, analysing risk can be done in quantitative, qualitative or combination of both
approach. A quantitative risk and impact assessment framework (QUIRC) for instance,
assessing risk based on security objectives [14]. In another study, there is Semi-
Quantitative BLO-Oriented Cloud Risk Assessment (SEBCRA) which prioritize and
categorize risks based on business level objectives and the impact is determined by the
expert [15]. Nevertheless, single method prune to inaccuracy of evaluation results.
Therefore, several researchers explore the benefit of integrated method.
Ruo-xin et al. [16] has design security evaluation index system for audit and quantifying
cloud service level based on integration of Delphi, Analytic Hierarchy Process (AHP) and
Fuzzy Comprehensive Evaluation Algorithm (FCE). However, real example of analysis
not delivered in this research. Sen et al. [17] has proposed risk assessment framework for
wireless sensor networks (WSN) using attack graphs. In their research, Bayesian networks
were used to assess and analyse attacks on WSN while Attack Graph used to develop attack
pattern. Liu et al. [18] has presented the probabilistic risk assessment framework to assess
DoS (denial-of-service) in cloud computing. Their study demonstrated analysing risk using
Markov analysis and binary decision diagram. Although several study have been used in
order to reach the accuracy of evaluation result, it is still not user friendly, complicated and
difficult to realize in term of time and monetary view.
Risk Assessment and Threat Prioritization
Risk assessment is the process of identifying, estimating and prioritizing risks which requires
a careful analysis of threat and vulnerability information. It’s determine the extent to which
circumstances or events could adversely impact an organization and the likelihood that such
circumstances or event will occur [19]. Risk is the probability of problem cause by
vulnerabilities. Whereas threat is related to characteristics of assets and vulnerabilities is
relevant to the security controls in the organization [20]. Therefore, risk can be formulated
as:

SCIENCE AND TECHNOLOGY 585
Risk=Threat * Impact * Probability [20]
In Microsoft’s STRIDE Model, assets often called as a threat targets and being classified
based on acronym of every first letter of STRIDE (Spoofing, Tampering, Repudiation,
Information disclosure, Denial of service and Elevation of privilege) [21]. While DREAD
method is based on acronym of: damage potential, reproducibility, exploitability, affected
users, and discoverability. Microsoft uses STRIDE-DREAD model to analyse and rank the
threats based on their intensity [22]. Hence, this paper been organized in two stages:
• Determine and categorize threat using STRIDE model and rank using DREAD
method.
• Verify the rank of threat and evaluate the group consensus using FDM method
Determine and Categorize Threat
For each risks factors given in STRIDE, cloud users assign the value based on linguistic
value and range. These value is assign based on STRIDE-DREAD model from 1 to 10. Once
each threat recorded, the rank of threat will be calculate based on DREAD method. Table 1
depict the details linguistic value and range used. Although [23] claimed that Microsoft threat
modelling unable to model vulnerabilities, it is a fact that we not able to develop a
vulnerable-free system. However estimating risk factors is vital for an accurate vulnerability
assessment for the system [21].
Table 1. Linguistic Variables and Range in DREAD [24]
DREAD linguistic
Variables
Linguistic value and range
1-2 3-4 5-6 7-8 9-10
Damage Potential Negligence Slight Moderate Almost Catastrophic
Reproducibility Probably Likelihood Satisfy Critical Vital
Exploitability Least Slight Moderate Almost Extreme
Affected users Noticeable Satisfactory Average Disturbing Unbearable
Discoverability Least Slight Moderate Almost Extreme
Fuzzy Delphi Method
Fuzzy Delphi was derived from the weaknesses of traditional Delphi. One of the privation in
traditional Delphi method is that it requires repetitive or iteration survey of experts. Hence,
traditional Delphi become costly, time consuming and lower response rate from expert [25].
Fuzzy set theory was introduced to solve the fuzziness of human decision-making problem
and avoid misleading results. Fuzzy set theory allowed the conversion of linguistic variable to
triangular fuzzy number. In this study, FDM will be used to verify the rank in DREAD
method and to gather group consensus in evaluating risk in cloud computing. As seen in
Table 1 below, fuzzy set number will be assign to convert linguistic variables during the
assessment stage.

SCIENCE AND TECHNOLOGY 586
Table 2. Linguistic Classification Based on Rank
Linguistic
Variables
Scale in STRIDE-DREAD
(Range 1 to 10)
Fuzzy Scale
Very Low 1-2 (0,0,0.2)
Low 3-4 (0,0.2, 0.4)
Moderate 5-6 (0.2,0.4,0.6)
Serious 7-8 (0.4,0.6,0.8)
Critical 9-10 (0.6,0.8,1)
CONCLUSION
In this paper, the use of STRIDE-DREAD Model by Microsoft will be integrate with
FDM to assess and verify cloud application threat in healthcare. Wide range of
uncertainty cloud security issues required expert knowledge and experience people in
evaluating the risk [16]. Hence, FDM is the suitable approach in developing systematic
cloud risk assessment for Malaysian healthcare.
Acknowledgment: This work is financially supported by Ministry of Higher Education
(MOHE) Malaysia. The authors appreciatively thank to the Advance Informatics School,
Universiti Teknologi Malaysia (UTM).
REFERENCES
1. H. Sulaiman and A. I. Magaireah, “Factors affecting the adoption of integrated cloudbased e- health record in healthcare organizations: a case study of Jordan,” Inf. Technol. Multimed. (ICIMU), 2014 Int. Conf., pp.
102–107, 2014.
2. K. A. Ratnam, P. D. D. Dominic, and T. Ramayah, “A structural equation modeling approach for the
adoption of cloud computing to enhance the Malaysian healthcare sector systems-level quality
improvement,” J. Med. Syst., vol. 38, no. 8, 2014.
3. A. Aleem and C. Ryan Sprott, “Let me in the cloud: analysis of the benefit and risk assessment of cloud
platform,” J. Financ. Crime, vol. 20, no. 1, pp. 6–24, Dec. 2012.
4. K. Bernsmed, D. S. Cruzes, M. G. Jaatun, B. Haugset, and E. A. Gjaere, “Healthcare Services in the Cloud -
- Obstacles to Adoption, and a Way Forward,” in 2014 Ninth International Conference on Availability,
Reliability and Security, 2014, pp. 158–165.
5. N. Sultan, “Making use of cloud computing for healthcare provision: Opportunities and challenges,” Int. J.
Inf. Manage., vol. 34, no. 2, pp. 177–184, 2014. 6. C. B. T. Damenu, “Cloud Security Risk Management: A Critical Review,” 2015 9th Int. Conf. Next Gener.
Mob. Appl. Serv. Technol., pp. 370–375, 2015.
7. S. Drissi, S. Benhadou, and H. Medromi, “A new shared and comprehensive tool of cloud computing
security risk assessment,” Lect. Notes Electr. Eng., vol. 366, no. September, pp. 155–167, 2016.
8. S. Hasan Albakri, B. Shanmugam, G. Narayana Samy, N. Bashah Idris, and A. Ahmed, “Traditional
Security Risk Assessment Methods in Cloud Computing Environment: Usability Analysis,” 1st Int. Conf.
Recent Trends Inf. Commun. Technol. Tradit., no. November 2015, pp. 483–495, 2014.
9. M. Masky, “A novel Risk Identification Framework for Cloud Computing Security,” pp. 0–3, 2015.
10. S. Islam, S. Fenz, E. Weippl, and H. Mouratidis, “A Risk Management Framework for Cloud Migration
Decision Support,” 2017.
11. I. M. N. Brender, “Risk perception and risk management in cloud computing: Results from a case study of Swiss companies,” Int. J. Inf. Manage., vol. 33, no. 5, pp. 726–733, 2013.
12. L. Maghrabi, E. Pfluegel, and S. F. Noorji, “Designing utility functions for game-theoretic cloud security
assessment: A case for using the common vulnerability scoring system,” 2016 Int. Conf. Cyber Secur. Prot.
Digit. Serv. Cyber Secur. 2016, 2016.
13. M. S. T. Hecht, P. Smith, “Critical services in the cloud: Understanding security and resilience risks,” Proc.
2014 6th Int. Work. Reliab. Networks Des. Model. RNDM 2014, pp. 131–137, 2014.
14. P. Saripalli and B. Walters, “QUIRC: A Quantitative Impact and Risk Assessment Framework for Cloud
Security,” 2010 IEEE 3rd Int. Conf. Cloud Comput., pp. 280–288, 2010.

SCIENCE AND TECHNOLOGY 587
15. J. G. J. O. Fito, M. Macias, “Toward Business-driven Risk Management for Cloud Computing,” in 2010
International Conference on Network and Service Management, 2010, pp. 238–241.
16. G. S. Z. Ruo-xin, C. Xiao-jie, “Model for Cloud Computing Security Assessment Based on AHP and FCE,”
in International Conference on Computer Science & Education (ICCSE 2014), 2014, no. Iccse, pp. 197–
202. 17. S. M. A. Sen, “Risk Assessment in a Sensor Cloud Framework Using Attack Graphs,” IEEE Trans. Serv.
Comput., vol. 10, no. 6, pp. 942–955, 2017.
18. C. W. Q. Liu, L. Xing, “Framework of Probabilistic Risk Assessment for Security and Reliability,” in
Proceedings - 2017 IEEE 2nd International Conference on Data Science in Cyberspace, DSC 2017, 2017,
pp. 619–624.
19. M. Jouini and L. Ben Arfa Rabai, “Comparative Study of Information Security Risk Assessment Models for
Cloud Computing systems,” Procedia Comput. Sci., vol. 83, no. Fams, pp. 1084–1089, 2016.
20. L. B. A. Rabai, M. Jouini, A. Ben Aissa, and A. Mili, “A cybersecurity model in cloud computing
environments,” J. King Saud Univ. - Comput. Inf. Sci., vol. 25, no. 1, pp. 63–75, 2013.
21. P. Anand, J. Ryoo, H. Kim, and E. Kim, “Threat Assessment in the Cloud Environment – A Quantitative
Approach for Security Pattern Selection,” Imcom ’16, p. 8, 2016. 22. D. L. M. Howard, Writing Secure Code , Second Edition Additional Resources for Developers : Advanced
Topics and Best Practices Code Complete , Second Edition Software Estimation : Demystifying the Black
Art, no. December. 2002.
23. A. Amini, N. Jamil, A. R. Ahmad, and M. R. Z ’aba, “Threat Modeling Approaches for Securing Cloud
Computing,” J. Appl. Sci., vol. 15, no. 7, pp. 953–967, 2015.
24. A. Singhal and H. Banati, “Fuzzy Logic Approach for Threat Prioritization in Agile Security Framework
using DREAD Model,” vol. 8, no. 4, pp. 182–190, 2011.
25. A. Ishikawa, M. Amagasa, T. Shiga, G. Tomizawa, R. Tatsuta, and H. Mieno, “The max-min Delphi
method and fuzzy Delphi method via fuzzy integration,” Fuzzy Sets Syst., vol. 55, no. 3, pp. 241–253, 1993.

SCIENCE AND TECHNOLOGY 588
IGCESH2018
Universiti Teknologi Malaysia, Johor Bahru, Malaysia 13 -15 August 2018
METHOD VALIDATION FOR THE BEST PROTEIN FROM
FRESH AND COMMERCIALISED Moringa oleifera LEAF
Zetty Amirah Zulkifli1, Zaidah Rahmat1
1Department of Biotechnology and Medical Engineering, Faculty of Biosciences and Medical
Engineering, Universiti Teknologi Malaysia, 81310 Johor Bahru, Johor, MALAYSIA
(E-mail: [email protected], [email protected])
ABSTRACT
Tremendous findings on the remedial and therapeutic effects of Moringa oleifera led to the
blooming of this rich protein content product in the market where the most demanded leaf
product is in the dried and powdered forms. Even so, side by side protein content comparison
of this product with the fresh leaf is yet to be done. Thereupon, this study is an exquisite
platform to establish protein identification and production for the industry thus providing the
best option of Moringa oleifera for further application. In this study, two different extraction
method; Quick Buffer (QB) and Tris HCL buffer were tested on both fresh and
commercialised leaf of M. oleifera in order to validate the best extraction method. The
protein from both sample were first extracted using extraction buffer before its quantity and
quality were checked via Bradford Assay and Sodium Dodecyl Sulfate Polyacrylamide Gel
Electrophoresis (SDS-PAGE) respectively. In order to establish the best protein outcome, the
volume of the buffer and the weight of the starting material were optimized. As a result, Tris
HCL extraction buffer exhibit better protein quality and quantity compared to QB method.
Nevertheless, phenylmethylsulfonyl fluoride (PMSF) content in the buffer works
miraculously to enhance the quality of the extracted protein. Ultimately, both protein quality
and quantity of the commercialised leaf were similar to the fresh leaf even after drying and
powdering processes. Hence, the dried and powdered leaf product is a great option for
consumers with easier handling and storage precaution.
Key words: Fresh Moringa oleifera leaf, Commercialised Moringa oleifera leaf, Tris HCL
buffer, 1D SDS-PAGE
INTRODUCTION
Moringa oleifera (Moringaceae) is a herbal medicinal plant commonly called as drumstick
tree and known as “kelor”among Malaysians [1]. This high protein herb is increasingly
trending in market and demanded due to its tremendous health benefits such as antidiabetic,
antibacterial, antifungal and antioxidant [2-4]. Interestingly, commonly commercialised M.
oleifera leaf product is in dried and powdered form which leads to the emerging needs of its
protein content comparison with the fresh leaf. On the other hand, proteomic approach offer
both qualitative and quantitative analysis of the whole protein content in the plant by the
means of Bradford Assay and one dimensional (1D) SDS-PAGE. It has been widely applied
in various species of organisms including microbe, mammals and plant [5-6]. Ultimately, this
proteomic study on fresh and commercialised M. oleifera leaf was aimed to determine the

SCIENCE AND TECHNOLOGY 589
best protein extraction method and compare the protein quality and quantity of two different
leaf form by Bradford assay and 1D SDS PAGE before protein identification and protein
profiling can be established.
RESULTS AND DISCUSSION
The protein quantity and quality of M. oleifera fresh and commercialised leaf according to
Bradford assay and 1D gel electrophoresis were recorded in the Table 1 and Figure 1.
Bradford Assay
Table 1. Protein quantity assay of M. oleifera leaf
Extraction Buffer(ml)/
Sample(g)
Final
concentration
(µg/mL)±SEM
Total protein
amount
(μg)±SEM
Protein yield
(µg/mg)
±SEM
1)1mL QB/0.25g Fresh leaf 2525.783±14.47 1262.891±7.24 2.526±0.01
2)1mL QB/0.5g Fresh leaf 6073.86±28.41 3036.93±14.20 6.07±0.03
3)1.5mL QB/0.5g Fresh leaf 6151.52±3.79 6151.52±3.79 12.30±0.01
4)1mL QB/0.5g Comm. leaf 3191.04±14.93 1595.52±7.46 3.19±0.02
5)1.5mL QB/0.5g Comm. leaf 3231.84±1.99 3231.84±1.99 6.46±0.01
6)0.75mL Tris/0.5g Fresh leaf 1785.07±62.69 892.54±31.34 1.79±0.06
7)1mL Tris/0.5g Fresh leaf 2090.55±77.12 1045.27±38.56 2.09±0.08
8)0.75mL Tris/0.5g Comm. leaf 1189.55±22.39 594.78±11.19 1.189±0.02
9)1mL Tris/0.5g Comm. leaf 1796.02±81.10 898.01±40.55 1.80±0.08
1D SDS-PAGE
1 2 3 4 5 M 6 7 8 9
Figure 1. One dimensional gel electrophoresis of fresh and commercialised leaf
of M. oleifera where protein loaded at 10 µg per well
(M: Marker, 1-5: QB method, 6-9: Tris buffer (According to Table 1)).
From Table 1, the highest protein yield for both fresh and commercialised leaf was detected
in the sample of 500mg leaf in 1.5mL QB buffer while the least yield of protein for both leaf
was from the sample of 500mg leaf in 0.75ml Tris buffer. Contrastingly, Figure 1 shows that
the best protein quality for both fresh and commercialised leaf was produced from the sample
extracted using 500mg leaf and 1mL Tris buffer. Prominently, the use of Tris buffer was
proven to reduce the smearing problem found in the bands of QB and all four bands

SCIENCE AND TECHNOLOGY 590
correspond to the Tris HCL buffer produce higher number of distinct individual bands
compared to QB method which contradict to the previous findings that claims QB as the best
method for the M. oleífera leaf [7]. Besides, in every sample, bands indicated by the red
rectangular were the most intense band which reflect the most abundance protein. This is
expected to be the large subunit of Ribulose-1,5-bisphosphate carboxylase/oxygenase
(RuBisCo) with molecular weight of 50kDa [8-9].
Eventhough the procedure of extraction for both method were simple and similar, the content
of the buffer differ with each other in which the QB contains KPO4 (pH 7.8), EDTA, Triton
X-100, glycerol and dithiothreitol (DTT) whereas Tris buffer contains Tris HCL (pH 7.5),
DTT, and phenylmethylsulfonyl fluoride (PMSF). Hence, the most distinct feature of the Tris
buffer is the PMSF which the QB lacks. The PMSF is generally known as serine protease
inhibitor which Andrés-Colás & Van Der Straeten and Maranho et al., reported as a
successful degradation inhibitor of plant protein into smaller molecules of amino acids [10-
11]. In other word, the use of PMSF is ideal for the protein extraction of many plant part
including M. oleifera leaf where numerous low molecular weight individual bands were
produced.
Obviously, protein electrophoretic pattern of both fresh and commercialised leaf were
similar. They share distinct band formation at same molecular weight. Indeed, even though
previous study on other plants in particular Musa paradisiaca, Dioscorea rotundata and
Colocasia esculenta showed that the drying process affect and reduce their protein content
[12], the commercialised leaf of M. oleifera fascinatingly contain similar quality of protein
compared to the fresh leaf. This is probably due to the effect of the processing applied to it.
For an instance, drying process can affect the plant content differently according to the drying
temperature and method applied [13]. Likewise, Ayegba et al., reported that M. oleifera leaf
is best dried at 60ºC with the least loss of vitamins and protein content compared to other
drying methods and temperature [14].
CONCLUSION
The method validation for the best protein from fresh and commercialised leaf of M. oleifera
reveals that 1mL Tris HCL extraction buffer and 500mg starting material were the best
extraction method specifically for M. oleifera leaf resulting in the most excellent protein
quality in both sample. Indeed, the commercialised leaf still able to maintain its protein
quality which proved that the drying and powdering process did not reduce the protein
content unlike the other plants. Future study can be conducted to establish protein profiling
and phytochemical properties for both leaf type hence the protein expression and activity in
both sample can be compared. In addition, according to the findings of the study, processed
leaf is recommended as a good option for future product incorporating M. oleifera since it
provides easier handling and storing precautions compared to the fresh leaf.
Acknowledgment: The authors wish to express their gratitude to Universiti Teknologi
Malaysia and Zamalah Scholarship award for the platform to conduct this research.
REFERENCES
1. Anwar, F., and Bhanger, M. (2003). Analytical characterization of Moringa oleifera seed oil grown in
temperate regions of Pakistan. Journal of Agricultural and food Chemistry, 51(22), 6558-6563.
2. Dolly J., P. K. R., Amit K., Shikha M., and Geeta W. (2009). Effect of Moringa oleifera Lam. leaves
aqueous extract therapy on hyperglycemic rats. Journal of Ethnopharmacology, 123(3), 392-396.

SCIENCE AND TECHNOLOGY 591
3. Kamath, N., Swaminathan, R., and Desai, N. (2016). Antibacterial activity of Indian medicinal plant-
Moringa oleifera against MRSA and Klebsiella Spp.(ESBL) which are commonly isolated bacteria in
hospital environments. IJAR, 2(8), 515-517.
4. Torres C., Sanchez J., Osorio H., Sinagawa G., Aguirre A., Gutiérrez D., (2013). Moringa oleifera:
Phytochemical detection, antioxidants, enzymes and antifugal properties. International journal of experimental botany, 82, 193-202.
5. Farnusch Kaschani, C. G., Sherry N., Heather H., Benjamin F. C. and Renier A. L. (2009). Diversity of
Serine Hydrolase Activities of Unchallenged and Botrytis-infected Arabidopsis thaliana. Molecular &
Cellular Proteomics, 8, 1082-1093
6. Hui Y., Y. S., Yee F. S., Ting N. C., Seng T. N., Hong T. (2015). Shotgun proteomic analysis of tiger milk
mushroom (Lignosus rhinocerotis) and the isolation of a cytotoxic fungal serine protease from its sclerotium.
Journal of Ethnopharmacology, 174, 437-451.
7. Ramly, N. A. Evaluation of 1D and 2D gel-based proteome from fresh leaf of Moringa oleifera. Universiti
Teknologi Malaysia, Master. Thesis, 2016.
8. Usman, K. Protein Profiling of Orthosiphon stamineus. Universiti Teknologi Malaysia, Master. Thesis,
2014.
9. Ong, B. H. Heavy Metal Content and Protein Expression Profile of Melastoma malabathricum from Ex-mining Site. Universiti Teknologi Malaysia, Master. Thesis, 2017
10. Andrés-Colás, N., and Van Der Straeten, D. (2017). Optimization of non-denaturing protein extraction
conditions for plant PPR proteins. PLOS ONE, 12(11)
11. Maranho, R. C., Benez, M. M., Maranho, G. B., de Azevedo Fernandes, V. N., Gonela, A., Mangolin, C.
A., & da Silva Machado, M. d. F. P. (2018). Extraction of Total Protein from Axillary Buds of Sugarcane
(Saccharum spp.) for Proteomic Analysis. Sugar Tech, 20(1), 95-99.
12. Agoreyo B. O., A. O., Orukpe O. A., O.R. Osaweren and Owabor C. N. (2011). The Effects of Various
Drying Methods on the Nutritional Composition of Musa paradisiaca, Dioscorea rotundata and Colocasia
esculenta. Asian Journal of Biochemistry, 6, 458-464.
13. Dipika. A. M., and Krishna J., (2010). Effect of drying on nutritional and functional quality and
electrophoretic pattern of soyflour from sprouted soybean (Glycine max). J Food Sci Technol, 47(5), 482–487.
14. Ayegba C., M. O., Obigwa P., and Orijajogun J. (2017). Effect of Drying Temperature on Nutritional
Content of Moringa Oleifera Leave World Journal of Food Science and Technology, 1(3), 93-96.

SCIENCE AND TECHNOLOGY 592
IGCESH2018
Universiti Teknologi Malaysia, Johor Bahru, Malaysia 13 -15 August 2018
STATIC WATSON-CRICK LINEAR GRAMMAR
Aqilahfarhana Abdul Rahman*1, Wan Heng Fong2, Nor Haniza Sarmin3,
Sherzod Turaev4 and Nurul Liyana Mohamad Zulkufli5
1, 2, 3 Department of Mathematical Sciences, Faculty of Science, Universiti Teknologi Malaysia, Johor
Bahru, MALAYSIA.
(E-mail: [email protected], [email protected], [email protected]) 4, 5 Department of Computer Science, Faculty of Information and Communication Technology,
International Islamic University Malaysia, Kuala Lumpur, MALAYSIA.
(E-mail: [email protected], [email protected])
ABSTRACT
DNA computing, or more generally, molecular computing, is a recent development on
computations using biological molecules, instead of the traditional silicon-chips. Some
computational models which are based on different operations of DNA molecules have been
developed by using the concept of formal language theory. The operations of DNA molecules
inspire various types of formal language tools which include sticker systems, grammars and
automata. Recently, the grammar counterparts of Watson-Crick automata known as Watson-
Crick grammars which consist of regular, linear and context-free grammars, are defined as
grammar models that generate double-stranded strings using the important feature of Watson-
Crick complementarity rule. In this research, a new variant of static Watson-Crick linear
grammar is introduced as an extension of static Watson-Crick regular grammar. A static
Watson-Crick linear grammar is a grammar counterpart of sticker system that generates the
double-stranded strings and uses rule as in linear grammar. Here, static Watson-Crick
grammar differs from Watson-Crick grammar in term of the way each stranded string
generates the double-stranded strings. The main result of the paper is to determine some
computational properties of static Watson-Crick linear grammars. Next, the hierarchy
between static Watson-Crick languages, Watson-Crick languages, Chomsky languages and
families of languages generated by sticker systems are presented.
Key words: Sticker system, Computational power, Watson-Crick grammar, Linear grammar
INTRODUCTION
In DNA computing techniques, there are two fundamental features which are necessary to
overcome the limitation of traditional silicon-based computing technologies known as
Watson-Crick complementarity and massive parallelism of DNA strands. Historically, some
grammar models that were introduced did not use the fundamental feature of Watson-Crick
complementarity of DNA molecules [1-3]. Following that, a broad variety of dynamic
Watson-Crick grammars that use this fundamental feature have been proposed [4-7]. This
model produces each stranded string “independently” and do not fully illustrate the synthesis
of DNA molecules. In order to overcome the problem, the aim of this research is to introduce
a new variant of static Watson-Crick grammar known as a static Watson-Crick linear
grammar, which is an extension of static Watson-Crick regular grammar. A static Watson-

SCIENCE AND TECHNOLOGY 593
Crick linear grammar is a grammar counterpart of sticker system which uses Watson-Crick
complementarity feature of DNA molecules; starting from the incomplete double-stranded
sequence and iteratively using sticking operation until complete double-stranded sequence is
obtained.
In this research, some computational properties of static Watson-Crick linear grammars are
determined. The result shows that the family of static Watson-Crick linear grammar can
generate some non context-free languages. Besides, the family of arbitrary sticker languages
with no restriction is included in the family of static Watson-Crick linear grammars. On the
other hand, the result also shows that the family of Watson-Crick linear languages is included
in the family of static Watson-Crick linear languages.
MAIN RESULTS
In this section, the definition of a static Watson-Crick linear grammar, which is an extension
of static Watson-Crick regular grammar, is introduced in the following.
Definition 1 (Static Watson-Crick Linear Grammar)
A static Watson-Crick linear grammar is a 5-tuple where are
disjoint alphabets of nonterminal and terminal, respectively, is a symmetric
relation (Watson-Crick complementarity), is the start symbol (axiom) and is a
finite set of production rules in the form of
(i) where
and ;
(ii) where and ; or
(iii) where and .
The family of languages generated by a static Watson-Crick linear grammar is denoted as
SLIN. The elements in the set of all pairs of strings can be classified into
two different cases, either in the form of or . Next, the
relationship between the families of static Watson-Crick linear grammar with families in
Chomsky hierarchy, sticker system and also Watson-Crick grammar are determined. The
following lemma follows immediately from the definition above, where LIN indicates the
set of languages generated by linear grammars.
Lemma 1. LIN SLIN.
From Lemma 1, we have Theorem 1.
Theorem 1. LIN SLIN.
Next, Theorem 2 shows that static Watson-Crick linear grammars can generate some non-
context free languages.
Theorem 2. SLIN − CF .
In [4], the relationship between Watson-Crick linear grammar (WKLIN) and the family of
arbitrary sticker languages with no restriction ASL (n) has been established, where ASL (n)
WKLIN. Here, we show that ASL (n) can be simulated by SLIN in the following
proposition.
( )PSTNG ,,,, = TN,
TT
NS P
( ) ( ) 22221111 //// vuyxAyxvuS → ,SNA − ( ) ( )TRyxvu 1111 //
( ) ( )TLvuyx 2222 //
( ) ( )2211 // yxByxA→ SNBA −, ( ) ( ) ( )TLRyxyx
2211 /,/
( ) ( )2211 // yxByxA→ SNA − ( ) ( )TLRyx
11 /
vu / TT
// vu // =vu

SCIENCE AND TECHNOLOGY 594
Proposition 1. ASL (n) SLIN.
Next, the results show that the family of Watson-Crick linear languages is included in the
family of static Watson-Crick linear languages.
Lemma 2. WKLIN SLIN.
CONCLUSION
In this paper, we define a static Watson-Crick linear grammar, which is one of the variants of
static Watson-Crick grammars and determine its computational power in order to correlate
with other family of languages. This research can be further studied by defining other
variants of grammar which is useful for DNA based computing devices and algorithmic
techniques.
Acknowledgment: The first author would like to thank UTM Zamalah for funding her study
at UTM through Zamalah Scholarship. The second and third authors would also like to thank
the Ministry of Higher Education (MOHE) and Research Management Centre (RMC),
Universiti Teknologi Malaysia (UTM) for the financial funding through Research University
Grant Vote No. 13H18.
REFERENCES
1. Varun, R.K. and Gupta, S. Analyzing the ambiguity in RNA structure using probabilistic approach.
International Journal of Information Technology 5(1) (2012), 107-110.
2. Sutapa, D. and Mukhopadhyay, S. A Composite Method Based on Formal Grammar and DNA Structural
Features in Detecting Human Polymerase II Promoter Region. PLoS One 8(2) (2013), e54843.
3. Algwaiz, A., Ammar, R., & Rajasekaran, S. Framework for Data Mining of Big Data Using Probabilistic
Grammars. In e-Learning (econf), 2015 Fifth International Conference on. IEEE, (2015), 241-246.
4. Zulkufli, N.L.M., Turaev, S., Tamrin, M.I.M. and Al-Shaikhli, I.F. Computational Properties of Watson-
Crick Context-free Grammars. In: Proceedings of International Conference on Advanced Computer Science
Applications and Technologies – ACSAT (2015), 186-191.
5. Zulkufli, N.L.M., Turaev, S., Tamrin, M.I.M and Azeddine, M. Closure Properties of Watson-Crick Grammars. In AIP Conference Proceedings, AIP Publishing (2015), 040032.
6. Zulkufli, N.L.M., Turaev, S., Tamsin, M.I.M. and Messikh, A. Generative Power and Closure Properties of
Watson-Crick Grammars. Applied Computational Intelligence and Soft Computing 2016 (2016).
7. Zulkufli, N.L.M., Turaev, S., Tamsin, M.I.M. and Messikh, A. The Computational Power of Watson-Crick
Grammars: Revisited. In Bio-Inspired Computing-Theories and Applications, Springer, Singapore (2016),
215-225.

SCIENCE AND TECHNOLOGY 595
IGCESH2018
Universiti Teknologi Malaysia, Johor Bahru, Malaysia 13 -15 August 2018
EFFECT ON CARBON AND NITROGEN SOURCE ON HIGH CELL
MASS PRODUCTION OF LACTOBACILLUS ACIDOPHILUS USING ONE-FACTOR-AT-THE-TIME (OFAT)
Afif Najihah Kepli1 and Hesham A. El-Enshasy*2
1,2 Institute of Bioproduct Development, Universiti Teknologi Malaysia, 81310, Skudai,
Johor, Malaysia
(E-mail: [email protected], [email protected])
ABSTRACT
Lactobacillus acidophilus is one of the common probiotics that can give beneficial to the
human health especially to the host. L. acidophilus nature characteristic required complex
nutrition such as rich in carbon and nitrogen source. The effect of various sources of the
carbon and nitrogen can enhance the cell mass production of L. acidophilus. The growth was
examined using method One-Factor-at-the-Time (OFAT) and based on the observation,
glucose and yeast extract were selected as a stronger support for the growth of L. acidophilus
with cell dry weight 9.11 g L-1 and 2.74 g L-1, respectively. All experiment was run at 37°C
for 48 hours fermentation.
Key words: L.acidophilus, high cell mass, OFAT
INTRODUCTION
Probiotic products from Lactic acid bacteria (LAB) is one of the highest demands on the
market nowadays especially in pharmaceutical and food industry. According to the
FAO/WHO, probiotic are living microorganism that, when administered in sufficient
amounts it can confer a health benefit on the host [3]. Other than it can suppress the growth
of pathogens, prevention of diarrhea and constipation diseases, probiotics bacteria also can
act as a prevention of cancer and mutation activities in the human gut [4]. Among LAB,
Lactobacillus are widely used because mostly this genus considered as a GRAS (Generally
Recognized as Safe) species. Lactobacillus acidophilus is one of the species that can maintain
the human intestinal track with helps to restore the gut flora following antibiotics treatments
and can act as an antimicrobial agent. Since L. acidophilus is known as species that required
complex and fastidious nutrition [2]. Hence, the aim of this study is to produce high cell mass
production of L. acidophilus using different carbon and nitrogen sources. This study was
conducted using One-Factor-at-the-Time (OFAT) method.

SCIENCE AND TECHNOLOGY 596
MAIN RESULTS
Effect of different carbon sources on L.acidophilus growth was presented in the Figure 1.
Glucose showed as a higher result with 9.11 g L-1 followed by fructose and maltose. Glucose
is one of the carbon sources that can boost energy source and promote the cell growth for
L.acidophillus. Since L.acidophilus is a homofermentative organism, utilization of glucose
through Embden Meyerhof Parnas (EMP) pathway generate enough energy to promote the
cell growth [1] compare with others sources. Other than carbon, nitrogen sources also
affected the cell growth. In Figure 2 among nine nitrogen sources was tested, yeast extract
give the higher reading of cell growth with 2.74 g L-1 followed by soybean meal and beef
extract with 2.38 g L-1 and 2.30 g L-1, respectively.
Figure 1. Effect of different carbon sources on L.acidophilus growth
Figure 2. Effect of different nitrogen sources on L.acidophilus growth
0
2
4
6
8
10
0
2
4
6
8
10
No Carb
on
Sources
Sucrose
Lactose
Malto
se
Xylose
Fructo
se
Glucose
Glycero
l
Carbon Sources
Cel
l Dry
Wei
ght g
L-1
pH
0
2
4
6
8
10
0.0
0.5
1.0
1.5
2.0
2.5
3.0
Inorganic Nitrogen
Sources
Organic Nitrogen Sources
Sodium
Nitrate
Ammonium
Sulphate
Ammonium
CitrateUre
a
Soybean
Meal
Malt Extr
act
Beef Extr
act
Peptone
Yeast Extr
act
Nitrogen Sources
Cel
l Dry
Wei
ght g
L-1
pH

SCIENCE AND TECHNOLOGY 597
CONCLUSION
Therefore, it can be concluded that using One-Factor-at-the-Time (OFAT) method can
provide a suitable medium for L.acidophilus by knowing the suitable major nutrient to
promote the cell growth. For the future study, this method (OFAT) should be compare with
software method such as Response surface methodology (RSM).
Acknowledgment: Special thanks to Zamalah UTM, Harita Go Green Sdn. Bhd
(R.J130000.7609.4C063) and Institute of Bioproduct Development (IBD) for their support.
REFERENCES
1. Altermann, E., Russell, W. M., Azcarate-Peril, M. A., Barrangou, R., Buck, B. L., McAuliffe, O., & Lick, S.
(2005). Complete genome sequence of the probiotic lactic acid bacterium Lactobacillus acidophilus
NCFM. Proceedings of the National Academy of Sciences of the United States of America, 102(11), 3906-3912.
2. Salvetti, E., Torriani, S., & Felis, G. E. (2012). The genus Lactobacillus: a taxonomic update. Probiotics and
antimicrobial proteins, 4(4), 217-226.
3. Senz, M., van Lengerich, B., Bader, J. and Stahl, U., (2015). Control of cell morphology of probiotic
Lactobacillus acidophilus for enhanced cell stability during industrial processing. International journal of
food microbiology, 192, pp.34-42
4. Yari, M., Fooladi, J., & Motlagh, M. A. K. (2015). Microencapsulation and Fermentation of Lactobacillus
acidophilus LA-5 and Bifidobacterium BB-12. Applied Food Biotechnology, 2(4), 27-32.

SCIENCE AND TECHNOLOGY 598
IGCESH2018
Universiti Teknologi Malaysia, Johor Bahru, Malaysia 13 -15 August 2018
HEAT TRANSFER OF NEWTONIAN BLOOD FLOW IN A
STENOSED BIFURCATED ARTERY
Sabaruddin Ahmad Jamali *1, Zuhaila Ismail2 and Norsarahaida Saidina Amin3
1, 2, 3 Department of Mathematical Sciences, Faculty of Science, Universiti Teknologi Malaysia,
Johor, Malaysia.
(E-mail: [email protected] , [email protected], [email protected])
ABSTRACT
Stenosis is localized plaque that caused narrowing of the vessel wall and causing an
alternation in the flow structure which consequently reduced the fluid flow passing to the
other organs and tissues. Previous researchers have proved, that the formation of stenosis
could disturbed the normal hemodynamics in blood rheology. This study considered the
geometry of the bifurcated artery in the present a mild shape stenosis in the parent artery. The
blood vessel is modelled as a two-dimensional (2D) rigid wall since the wall of a disease
artery is reported to be less compliant and the blood flow is assumed to be Newtonian fluid,
incompressible, laminar, and steady. Numerical result is obtained by using finite element
method (FEM) and a Matlab code is developed to solve the problem. Results concerning the
effect of heat transfer influence on the blood flow characteristics such as the velocity profiles,
the streamlines pattern and the variation of wall shear stress are discussed.
Key words: Mild stenosis, Newtonian, 2D, Bifurcated artery and heat transfer
INTRODUCTION
Coronary artery disease is caused by atherosclerosis that occured due to stenosis which
formed as a result of fatty substances, cholesterol, cellular waste products, and smooth
muscle cells accumulation on the arterial wall, [1]. Stenosis is a localize plaque that cause the
narrowing on the vessel wall and causing a alternations in the flow structure which
consequently reduced the fluid flow passing to the other organs and tissues, [2] As the plaque
tend to rupture, an individual may suffered to the risk of cardiovascular disease such as heart
attack and stroke. The fruitful study of [3] have shown results of the pressure drop, velocity
profiles, and wall shearing stress for special geometries for Newtonian model of blood.
Furthermore, the effects of heat transfer in blood flow found to influenced the stenosis
deformation. Chakravarty and Sen [4] studied mathematical model that describes the heat and
mass transfer in blood flow through bifurcated arteries under stenotic condition. In this study,
we mainly concern on focus on laminar flow through bifurcated artery with the presence of
mild shape stenosis. The solution is obtained numerically by implementing FEM analysis
where the discretization of the governing equations is carried out by using Galerkin weighted
residual (GWR) method. Numerical computation will be performed based on the developed
algorithms in Matlab software that will be validated by using COMSOL Multiphysics 5.2, a
software based on the FEM.

SCIENCE AND TECHNOLOGY 599
MODEL CONSTRUCTION
The geometry of the stenosed bifurcated artery is modelled as a bifurcated channel as
proposed by Chakravarty and Mandal [5]. Let ( ),x y be the coordinates of a material point.
The outer wall, ( )1R x and inner wall, ( )2R x geometry is described by
( )( ) ( )( )
0 1
32
20 02 ' '01 2 0 3 0 3 4
2 2'
0 0 1 1 20
1 2 2 max
,0 ,0, 0 ,
4( ) ( ) ,
( ) , ,
( ) , cos
2 sec ( ) tan ,
m
a x d d l x xx x
a l x d x d d x d llR x R x r x x r x x x
a r r x x x x x r
r x x x x x s
+
− − − − +
= = − − +
+ − − − + − −
( )4 4 maxtan , ,x x x x x
+ −
where a and 1r are the radii of the mother and daughter artery.
0r and '
0r are the radii of
curvature for the lateral junction, 0l is the length of the stenosis at a distance d .
1x and 2 ,x is
location of the onset and offset of the lateral junction ,3x as the apex,
m is the maximum
height of stenosis at 0 6d l+ and
05 6d l+ , is half of the bifurcation angle.
( )'
2 1 0 0 1 0 3 2sin , ( 2 sec / (cos 1), sin 1 sin ,x x r r a r r x x= + = − ) − = − −
( )'
3 2 1 4 3 0, 2 sin 1 sin .x x q s r x x r= + = = + −
where q is taken as a small number lying in the range of 0.001 0.005q chosen for the
compatibility of the geometry.
GOVERNING EQUATIONS
The blood flow in the arterial bifurcation is considered to be in two dimensional, steady,
laminar, incompressible. The flowing blood is characterised by a Newtonian fluid model.
0,U V
X Y
+ =
2 2
2 2
1,
U U P U UU V
X Y X Re X Y
+ = − + +
2 2
2 2
1,
V V P V VU V
X Y X Re X Y
+ = − + +
2 2
2 2
1,U V
X Y RePr X Y
+ = +
The Prandtl number, Pr , and Reynolds number, Re :
/ , / ,pPr C k Re u L = =
where u and v represents the velocity of blood in x and y directions, pC denotes the specific
heat of blood, k is the thermal conductivity of blood, is temperature, is the density of
blood and p is the pressure distribution acting on the surface. At the inlet, a parabolic
velocity profile is imposed as: 2
max 2( , ) 1
yu x y u
a
= −
and ( , ) 0,v x y = at 0,x = and .a y a−
No-slip conditions along all the arterial walls:
( , ) 0, ( , ) 0.u x y v x y= =

SCIENCE AND TECHNOLOGY 600
A traction-free condition is applied at the outlet which can be stated as
( ) 0,p − + =n
where n represents a unit outward normal vector with the pressure point constraint, 0p = being
implemented at 0x = and 0.0075.y = −
MAIN RESULTS
Figure 1. Filled contour velocity and streamline pattern without effect of heat transfer
CONCLUSION
The flow of the blood has been governed by a Newtonian fluid model as the streaming blood
with the effect of heat transfer together with the effects of severity of stenosis. Based on the
expected result, it can be concluded that the axial velocity and pressure drop increases as the
severity of the stenoses increases while the streamlines shown an abnormal behaviour where
recirculation developes as the stenosis severity increases.
Acknowledgment: The authors would like to acknowledge Ministry of Higher Education
and Research Management Centre, Universiti Teknologi Malaysia for the financial support
through vote numbers 4F632, 13H28 and 03G53 for this research.
REFERENCES
1. Zaman, A., Ali, N., Sajid, M., Hayat, T. Effects of Unsteadiness and non-Newtonian Rheology on Blood Flow through a Tapered Time-Variant Stenotic Artery. AIP Advances. 2015. 5(3): 0371291-03712913.
2. Rabby, M.G., Shupti, S.P., and Molla, M.M. Pulsatile Non-Newtonian Laminar Blood Flows through
Arterial Double Stenoses. Journal of Fluids. 2014. 2014(757902): 1-13.
3. Luisa et al., Computational Techniques and Validation of Blood Flow Simulation. WSEAS
TRANSACTIONS on BIOLOGY and BIOMEDICINE, 2011. 8(4): p. 145-155.
4. S. Chakravarty and S. Sen, A Mathematical Model of Blood Flow and Convective Diffusion Processes in
Constricted Bifurcated Arteries. Korea- Australia Rheology Journal, 2006. 18(2): p. 51-65.
5. Chakravarty, S., and Mandal, P.K. An Analysis of Pulsatile Flow in a Model Aortic Bifurcation,
International Journal of Engineering Science. 1997. 35(4): 409-422.

SCIENCE AND TECHNOLOGY 601
IGCESH2018
Universiti Teknologi Malaysia, Johor Bahru, Malaysia 13 -15 August 2018
AN OVERVIEW OF THE AQUACULTURE FARM TECHNOLOGIES
Fathi S.1, Rambat Shuib2., Harun A.N.3 and Rahim Z.A.4
1, 2, 3, 4 Malaysia-Japan International Institute of Technology (MJIIT), Universiti Teknologi Malaysia
(UTM), Kuala Lumpur, MALAYSIA (Email: [email protected], [email protected], [email protected],
ABSTRACT
Aquaculture is an aquatic farming using selected farming systems based in inland, rural and
coastal area. Since 146.3 billion of aquaculture produced worldwide, the industry has become
a global demand seafood industry that has overtook wild-caught fish industry. Known as food
security to the worldwide, the achievement of aquaculture nowadays was due to the existence
of advanced technology in aquaculture. The implementation of technology plays important
roles in managing the industry development. Thus, this paper addresses the technology
implementation and their roles in aquaculture. The findings of this paper are expected to
acknowledge the Internet of Things (IoT) as a real-time monitoring system for future
recommendation.
Key words: Aquaculture, Aquaculture technologies, Internet of Things, Industrial Revolution
4.0
INTRODUCTION
Aquaculture is a farming fish including other aquatic animals that characterized by different
farming systems: extensive, semi-intensive or intensive, that either based in inland or rural
and coastal area1. The industry has become the fastest growing food industry since 19812 due
to technology growth. As a result of successful achievement in developing the technology of
genetics breeding program3, culture systems technology4, and aquaculture feed5, Malaysian
aquaculture contributes 8.9% to the total national agricultural gross domestic product (GDP)
that provides 1,753,900 million jobs for Malaysians6. Hence, the paper objective is to
highlight emerging technology in managing aquaculture system with emphasis on the
existence of Internet of Things (IoT), focusing on an integrated information technology tools
of sensors and mobile application
RESULT
Managing aquaculture using technology tools
As the world experiencing 4th Industrial Revolution, FAO has projected that the future of
aquaculture development depends on strengthening aquaculture management in
monitoring, control and surveillance through appropriate data collection mechanisms and
data management systems7 as study suggest it should be adaptable and cost efficient8.
Therefore, issues in gathering information only useful when there is technology

SCIENCE AND TECHNOLOGY 602
emergence in the industry. Technology implementation could boost aquaculture
management, particularly in various studies. The details of the previous and recent
technologies and their roles are described briefly:
Connecting players using efficient, interactive and profitable technology tools
Consequently, the technology-driven industry creates innovation tools to gather human and
machine. Thus, the roles of the Internet of Things (IoT) as the latest generation information
network enables seamless and continuous human-human, machine-to-machine and/or human-
to-machine communication9,10. Under the definition of IoT, the application of sensors and
mobile application have not been widely used in the fisheries industry. As a result, it is
important to understand the roles of sensors and mobile application as integrated aquaculture
management tools.
Sensors application could respond to a physical parameter (e.g pH and DO level) for
measurement of a physical quantity or for information transfer11 that distributed sensor nodes
responsible to collect data, analyze them, and route them to a (designated) sink point12. The
sink point may then communicate with the user via the Internet13. As mobile phone replacing
the traditional way of communicating and safety purpose14 the mobile phone increasingly
inexpensive and capable as mobile computing devices with Internet connectivity15.The
mobile internet was identified as potentially disruptive technologies due to the technology
capabilities to potentially transform or give impact to the global economics15 The mobile
internet could assist in decision making by delivering right and timely information16 and act
as marketing dissemination model15.
Under the vision of The Internet of Things (IoT), mobile web systems connected to the
network can be accessed and updated anywhere and anytime13. The mobile web system is a
wise platform to engage all stakeholders in agriculture sector16, however, the previous
application only benefits fisheries authorities. Thus, there is a strong need for improvements
in existing technology1 with a real-time platform that could engage all aquaculture
stakeholders in an interactive platform for keeping farm records, reporting, and marketing.
CONCLUSION
In conclusion, this study highlights the roles of technology application in aquaculture sectors.
Technology interference would help to solve several issues including improving decision

SCIENCE AND TECHNOLOGY 603
making of aquaculture players that connecting all the players in a platform using efficient,
interactive and profitable technology tools. Yet, none of the integrated mobile web services in
the Malaysian aquaculture could engage the stakeholders with effective, interactive,
profitable and agreeable to all parties. Therefore, it is suggested that integrated sensors and
mobile web technology could enhance collaboration and communication among stakeholders.
Acknowledgments: The authors would like to express heartfelt thanks to the Universiti
Teknologi Malaysia for providing Zamalah scholarship and other organization as research
financial assistance.
REFERENCES
1. P. Edwards, Aquaculture, 447, 2-14. (2015).
2. FAO, Production of crops processed, live animals, livestock primary, livestock processed. from Food and
Agriculture Organization (FAO)(2009). 3. H. B. Bentsen, B. Gjerde, A. E. Eknath, M. S. P. de Vera, R. R. Velasco, et al., Aquaculture, 468, 206-217.
(2017).
4. L. N. H. Norazmi. ImageJ : It's Application In Aquaculture Research MFS Seminar 2017: New Paradigms
For Aquaculture in Malaysia. Malaysia:(2017)
5. T. J. Carrier, S. D. Eddy, & S. Redmond, Aquaculture International, 25(1), 355-366. (2017).
6. DOSM, Selected Agricultural Indicators, Malaysia, 2016. Retrieved 6 March 2017, from Department of
Statistics Malaysia (2016).
7. V. Hongskul, Into the next millennium: fishery perspective (Working Paper). Retrieved 2 August 2017, from
Food and Agriculture Organization of the United Nations (1999).
8. T. C. Osmundsen, P. Almklov, & R. Tveterås, Aquaculture Econ. & Management, 1-21. (2017).
9. D. Minoli, Building the internet of things with IPv6 and MIPv6: The evolving world of M2M communications: John Wiley & Sons (2013).
10. A. Jian, G. Xiao-Lin & H. Xin. Int. Conf. on Electrical & Computer Engineering: Advances in Biomedical
Engineering. (2012).
11. G. Barrenetxea, F.Ingelrest, F.Schaefer & M.Vetterli. Wireless sensor networks for environmental
monitoring: The sensorscope experience. IEEE, 98-101.(2008).
12. S. Kazem, D.Minoli & T.Znati. Wireless Sensor Networks: Technology, Protocols, and Applications, New
Jersey, John Wiley & Sons, Inc. (2007).
13. A. N. Harun, The Application of Mobile Web and Devices for Environmental Surveillance on Construction
Sites in Malaysia. (Ph.D.), University of Salford Manchester, UK.(2015).
14. S. A. B. Ramli, S.Z. Omar, J. Bolong, J. L. D Silva, & H. A. M. Shaffril, Asian Soc. Sc, 9(5), 162. (2013).
15. J. Manyika, M. Chui, J. Bughin, R. Dobbs, P. Bisson, et al., Disruptive technologies: Advances that will
transform life, business, and the global economy (Vol. 180): McKinsey Global Institute San Francisco, CA (2013).
16. M. S. Hassan, H. A. M. Shaffril, B. A. Samah, M. S. S. Ali, & N. S. Ramli, American Journal of Agricultural
and Biological Sciences, 5(3), 389-396. (2010).

SCIENCE AND TECHNOLOGY 604
IGCESH2018
Universiti Teknologi Malaysia, Johor Bahru, Malaysia 13-15 August 2018
PHYTOCHEMICAL INVESTIGATION AND ANTIOXIDANT
EVALUATION OF PELLACALYX AXILLARIS
Najwa Ahmad Kuthi*1and Norazah Basar
2
1, 2 Department of Chemistry, Universiti Teknologi Malaysia, Johor Bahru, MALAYSIA
(E-mail: [email protected], [email protected])
ABSTRACT
Pellacalyx axillaris or locally known as bebuloh is a mangrove species belonging to the
Rhizophoraceae family. Till date, there has been only one phytochemical study on this
particular plant species and that without any documentation on its biological activities.
Therefore, the present work aims to reveal some other phytochemicals of therapeutic values
and to examine the antioxidant activity of different crude extracts from the twigs of P.
axillaris. Experimentally, different organic solvents i.e. n-hexane and methanol were used to
prepare crude extracts from dried twigs of P. axillaris. Phytochemical screening of the crude
twig extracts indicated the presence of terpenoids, carbohydrates, phenols, tannins,
anthraquinone glycosides, alkaloids and flavanoids. Chromatographic separation of the n-
hexane extract yielded a mixture of sterols; campesterol (1), stigmasterol (2), clerosterol (3)
and β-sitosterol (4), as colourless needles while purification of the methanolic extract
afforded two diarylheptanoids, namely 1,7-bis(4-hydroxyphenyl)hept-4-en-3-one (5) and
(5R)-hydroxy-1,7-bis-(4-hydroxyphenyl)-3-heptanone (6). Their structural elucidations were
done on spectroscopic bases i.e. Fourier Transform Infrared (FTIR) and Nuclear Magnetic
Resonance (NMR). The antioxidant evaluation via 2,2-diphenyl-1picrylhydrazyl (DPPH)
radical scavenging assay revealed that both of the extracts possessed antioxidant property,
and that the antioxidant capacity of the methanolic extract (IC50 = 5.21 μg/mL) was far more
significant in comparison to the n-hexane extract (IC50 = 752.9 μg/mL). Keywords: Rhizophoraceae, Pellacalyx axillaris, twigs
INTRODUCTION
Red mangrove, or else Rhizophoraceae comprised of about 16 genera with more than 100
species, covered most of tropical and subtropical areas of the world precluding the seasonal
regions (Graham, 1964). Mangrove forests in Malaysia contained 23 species belonging to
seven genera; Rhizophora, Ceriops, Bruguiera, Pellacalyx, Kandelia, Carallia, and
Gynotroches [1,2], Most of the species from this family played important roles in many
aspects of human life. For instance, the woods of R. mucronata were used as construction
timber, charcoal and firewood in Kenya [3]. Branches of R. apiculata have been used in
brush-pile fishing in Sri Lanka [4], while some of the species possess great remedial
properties, making them good candidates for alternative medicine.
The ethnobotanic importance of this family aroused when most of the Rhizophoraceae
species were traditionally used by indigenous populations to treat a variety of ailments and

SCIENCE AND TECHNOLOGY 605
(1) R = (3) R =
(2) R = (4) R =
conditions. For examples, the leaves of B. gymnorhiza were used to control blood pressure in
India [5] while the Chinese used the roots and barks extract to heal burns [6]. Interestingly,
the therapeutic potential of Rhizophoraceae species does support such ethnomedicinal claims
since most of them were known to contain numerous secondary metabolites e.g. terpenoids,
steroids, phenylpropanoids, lignans, glycosides, alkaloids, coumarins, flavonoids, phenolic
acid, and others, many of which displayed important biological properties including anti-
tumor [7], anti-inflammatory [8] and anti-diabetic activities [9]
Till date, there have not been many phytochemistry reports on the genus Pellacalyx except
for two phytochemical analyses of the barks and stems of P. saccadianus revealing the
presence of alkaloid [10,11], and only in 2016, a phytochemical investigation was done to the
species, resulted in the isolation of two new metabolites, along with six known constituents
[11]. Similarly, P. axillaris was also one of the species that received little attention among
researchers since there was only one paper reported on the isolation of a new tropane alkaloid
from the leaves of the species [12]. Therefore, P. axillaris was proposed in this study to
investigate several other phytochemicals as well as to evaluate the antioxidant property of
different crude extracts from the twigs of this species
MAIN RESULTS
Isolated Phytochemicals from P. axillaris
HO
H
H H
R
HO OH
O
HO OH
OOH
(5) (6)
Figure 1. Phytochemicals isolated from the twigs of P. axillaris.
Table 1. IC50 values of standards and different crude extracts from P. axillaris.
Samples DPPH IC50 (μg/mL)
Trolox 1.43
Butylated hydroxytoluene (BHT) 1.35
Methanol Extract 5.21
n-Hexane Extract 752.9

SCIENCE AND TECHNOLOGY 606
CONCLUSION
Prelimanry phytochemical screnning of P. axillaris twigs showed positive results for
terpenoids, carbohydrates, phenols, tannins, anthraquinone glycosides, alkaloids and
flavanoids. Purification of the n-hexane and methanol extracts afforded a mixture of sterols:
campesterol (1), stigmasterol (2), clerosterol (3) and β-sitosterol (4); and two
diarylheptanoids: 1,7-bis(4-hydroxyphenyl)hept-4-en-3-one (5) and (5R)-hydroxy-1,7-bis-(4-
hydroxyphenyl)-3-heptanone (6). The antioxidant activity screened by the free radical
scavenging assay revealed that the methanol leaves extract of P. axillaris contains higher
amount of phenolic compounds compared to that of the n-hexane extract, with an IC50 = 5.12
μg/mL. Further research on the crude methanolic extract and its isolates is necessary to
explore the bioactive components responsible for its high antioxidant capacity.
Acknowledgement: The authors would like to acknowledge Faculty of Science, Universiti
Teknologi Malaysia for providing the research facilities. Our appreciation also goes to
Zamalah UTM for granting one of us with scholarship (NAK).
REFERENCES
1. Abed, S. A., Sirat, H. M. and Taher, M. Total phenolic, antioxidant, antimicrobial activities and toxicity study of Gynotroches axillaris Blume (Rhizophoraceae). EXCLI Journal 12 (2013), 402-414.
2. Matthew, M. L., Endress, P. K., Schonenberger, J. and Friss, E. M. A comparison of floral structures of
Anisophylleacea and Cunoniaceae and the problem of their systematic position. Annals of Boany 88 (2001),
439-455.
3. Ahdouh-Guebas, F. D., Mathenge, C., Kairo, J. G., and Koedam, N. (2000). Utilization of mangrove wood
products around Mida Creek (Kenya) amongst subsistence and commercial users. Economic Botany 54(4)
(2000), 513–527.
4. Jayasuiya, P. M. A. The distribution and the species composition of the existing mangrove vegetation around
Chilay Lagoon. Vidyodaya Journal of Science 3(2) (1991), 103-113).
5. Mastaller, M. Mangroves, the forgotten forest between land and sea. Tropical Press Sdn. Bhd (1997), 200.
6. Bandaranayke, W. M. Boactivities, bioactive compounds and chemical constituents of mangrove plants.
Wetland Ecology and Management 10(6) (2002), 421-452. 7. Yang, Y., Zhang, Y.,, Liu, D., Li-Weber, M., Shao, B., and Lin, W. Dolabrane-diterpenes from the
mangrove plant Ceriops tagal with antitumor activities. Fitoterapia 10 (2015), 277-282.
8. Barik, R., Sarkar, R., Biswas, P., Bera, R., Sharma, S., Nath, S., Karmakar, S., and Sen, T. 5,7-Dihydroxy-2-
(3-hydroxy-4,5-dimethoxyphenyl)-chromen-4-one a flavone from Bruguiera gymnorrhiza displaying anti-
inflammatory activities. India Journal of Pharmacology 48(3) (2016), 304-311.
9. Adhikari, A., Ray, A., Das, A. K., and Sur, T. K. Antidiabetic and antioxidant activity of Rhizophora
mucronata leaves (Indian sundarban mangroves): an in vitro and in vivo study. An International Quarterly
Journal of Research in Ayurveda 37(1) (2016), 76-81.
10. Carrick, J., Chan, K.C., and Cheung, H.T. A new phytochemical survey of Malaya-chemical screening.
Chemical & Pharmaceutical Bulletin 16 (1968), 2438-2441.
11. Abed, S. A., Sirat, H. M., & Zulkifli, R. M. COX-2 inhibitors from the leaves of Pellacalyx saccardianus Scortech (Rhizophoraceae). Phytochemistry Letters 13 (2015), 20-29.
12. Arbain, D., Wiryani, R. D. and Sargent, M. V. A new tropane alkaloid from Pellacalyx axillaris. Australian
Journal of Chemistry 44(7) (1991), 1013 – 1015.
https://www.ncbi.nlm.nih.gov/pubmed/?term=Li-Weber%20M%5BAuthor%5D&cauthor=true&cauthor_uid=25936771

SCIENCE AND TECHNOLOGY 607
IGCESH2018
Universiti Teknologi Malaysia, Johor Bahru, Malaysia 13 -15 August 2018
FABRICATION OF FIBER BRAGG GRATING (FBG) USING 248NM
KRF EXCIMER LASER
Nur Syahirah Sahidan1, Hazri Bakhtiar2, Ganesan Krishnan3, Muhammad Aizi Mat
Salim4, Ahmad Fauzi Ismail5 ,Mohd Hafiz Dzarfan6 and Mukhlis A. Rahman7
1, 2, 3, 4 Laser Center, Ibnu Sina Institute for Scientific and Industrial Research, Universiti Teknologi
Malaysia
(E-mail: [email protected], [email protected], [email protected], [email protected]) 5, 6, 7 Advanced Membrane Technology Research Centre (AMTEC), Universiti Teknologi Malaysia.
(E-mail: [email protected], [email protected], [email protected] )
ABSTRACT
We demonstrate the fabrication of fiber Bragg Grating (FBG) by using 248 nm KrF excimer
laser. The FBG is produced when the core of the fiber is exposed to the intense ultraviolet
light. The spotlight generates a stable increase in the refractive index of the core of fiber to
produce a fixed index modulation in the direction of the exposure pattern and this fixed index
modulation is known as grating. The FBG is created with uniform grating made of SMF-28
fiber with 1557 nm of central wavelength, 3 cm length and 90% reflectivity. The technique
used to fabricate the FBG involve the exposure of fiber core to intense excimer laser radiation
through an optical phase mask located in close proximity of the fiber. The paper describes the
fabrication techniques and their characteristic studies.
Key words: Fiber Bragg grating , SMF, 248 nm KrF Excimer laser, Phase mask
INTRODUCTION
A Fiber Bragg Grating is revealing the core of SMF to a periodic model of passionate ultra
violet light. The spotlight generates a stable increase in the refractive index of the core of
fiber to produce a fixed index modulation in the direction of the exposure pattern and this
fixed index modulation is known as grating. At each periodic refraction small amount of light
is reflected. When the grating period is about half the input wavelength of light, all the
reflected light signals merge comprehensibly to one large reflection at a specific channel.
This is known as the Bragg condition (Dewra 2015).
FBGs are based on the principle of Bragg reflection. When light propagates by periodically
alternating regions of higher and lower refractive index, it is partially reflected at each
interface between those regions. If the spacing between those regions is such that all the
partial reflections add up in phase when the round trip of the light between the two reflections
is an integral number of wavelengths— the total reflection can grow to nearly 100%, even if
the individual reflections are very small (Phing 2007).
Fiber Bragg grating (FBG) has been of great interest in communications such as tunable
filter, in wavelength division multiplexing and demutiplexing (WDM/D), and as fiber sensors

SCIENCE AND TECHNOLOGY 608
such as temperature sensor, vibration sensor, pressure sensor and strain sensitivity (Tahir
2006).
RESULTS
The results for inscribing Bragg grating using 248 nm KrF excimer laser with a phase
mask technique are shown in Figure 1. Perturbation of the grating results in a shift in the
Bragg wavelength of the device which can be detected in either the reflected or
transmitted spectra. Figure 1 show the transmission spectrum of the fiber Bragg grating
that have been fabricate. The center wavelength of the grating transmission, 1557 nm was
measured by an optical spectrum analyzer.
Figure 1. Transmission spectrum of the FBG.
CONCLUSION
The use of UV laser source for fiber Bragg grating by phase mask writing has been
demonstrated. One of the techniques commonly used to inscribe Bragg grating in the core of
optical fibers uses a phase mask to spatially modulate and diffract the UV beam to form an
interference pattern. The interference pattern induces a refractive index modulation in the
core of the photosensitive fiber, which is a placed directly behind the phase mask. The phase
mask technique is relatively easy of fabricate, and makes the core grating an ideal candidate
for use in telecommunication and sensing applications such as temperature sensing and strain
sensing. Result of transmission spectrum and reflectivity of light in fiber Bragg grating have
been relationship with Bragg wavelength.
Acknowledgment: The authors would like to express their appreciation for the support of the
sponsors with Project No Q.J130000.3009.01M03.
REFERENCES
1. Dewra, Sanjeev. 2015. “Fabrication and Applications of Fiber Brag Grating- A Review.” Advanced
Engineering Technology and Application 15-25.
2. Phing, Ho Sze. 2007. “Fiber Bragg grating modeling, simulation and characteristics with different grating
lengths.” Journal of Fundamental Sciences.
3. Tahir, Bashir Ahmad. 2006. “Fabrication of fiber grating by phase mask and its sensing application.”
Journal of Optoelectronics and Advanced Materials 1604-1609.

SCIENCE AND TECHNOLOGY 609
IGCESH2018
Universiti Teknologi Malaysia, Johor Bahru, Malaysia 13 -15 August 2018
DIGITAL URBAN SCREENS: THE RELATIONSHIP BETWEEN
PEOPLE’S ACTIVITIES AND MEDIA TECHNOLOGY AS A SMART
URBAN AMENITIES
Mariah Masykurah Ab Hadi*1, Sharifah Salwa Syed Mahdzar2
1, 2 Department of Architecture, Faculty of Built Environment, Universiti Teknologi Malaysia, Johor,
MALAYSIA.
(E-mail: [email protected]*1, [email protected])
ABSTRACT
As world nowadays moving together with technology, likely architecture and media
technology is dissolving into each other, most of the buildings are turning into media
infrastructure, with big, large and massive facades, unlikely just simple concrete, and glass
façade many years back. The implementation of digital urban screens can be one of the
successful place-making approach, as has been displayed in many public spaces within the
city district. This article discusses on how the digital urban screen can be introduced as new
electronic landscape mediation, which currently have been projected as commercial
billboards. This paper aims to understand the appropriate use of digital urban screen as urban
feature in parts of the measure used by the local authority, stakeholders, and planners in
ensuring the successful function of public places in inner city of Johor Bahru. In doing so, the
paper investigates the relationship between the stationary activities of people of sitting,
talking and waiting, and the locality, wherein the digital urban screens are displayed.
Observation was carried out to count the numbers of people with the stationary activities at
selected time period. The preliminary results have shown that the locality of urban screen
affect the density of static activities. The finding is also supported by some literatures that
have proven that digital urban screen has the tendency to improve the liveability of public
places in urban fabric.
Keywords: Digital urban screen, urban space, new media, smart technology
INTRODUCTION
Rapid the urbanization in rising of technology as globally in the 90’s has been influencing big
cities around the world, in using digital urban screen models as an advertising or
communication mediums. Such trend of communicating to the large public has been the
preferred method adopted by the local authorities, urban designers and city planners alike.
Hence, the functionality of digital urban screen can be measured by the successful stationary
activities of people around the locality of digital urban screens itself.
The debate continues to challenge the provision of use and function of urban features and
amenities in the liveability of city centres. Question remains to the efficient method that
should be adopted in fostering the relationship between the use of screens, its locality to the
everyday pattern of movement and stationary (sit, talk, and meet) [1] activities of people in
the surrounding area.

SCIENCE AND TECHNOLOGY 610
Some research has found the significant influence of visual connectivity on the pattern of
people’s movement activities to the efficient use of the area wherein the screens are located.
However, more exploration is needed on the impact to the stationary behavioural activities of
people. This study aims to relate the movement and stationary activities to the visual
connectivity of people and thus promotes a more efficient way of how urban screen should be
installed and function appropriately. The development and implementation of the urban
screen as one of the key features for smart infrastructure elements could then be suggested for
the inner district of Johor Bahru City.
LITERATURE REVIEW
Lynch [2] mentioned, by underlining the effect of visual form of city on perception and
memory of physical space will make a city more understandable in qualities, as it may
present to the users. With the existence of urban screens, either in small or big screens types,
it not only affects the visual landscape of urban space, but it also influences the dynamic
activities and static activities or experience in urban spaces [3]. The activities and experience
may occur in urban space is directly affected by its surrounding, as a human sense, the visuals
are more dominant, especially with moving and colourful media displays, in this case.
Back to ancient histories, painted or carved wall inscriptions to attract attention were already
known in ancient Roman [4][5]. By that times, Romans are intending to use signboard as an
identification of craftsmen workshop and various services. The used of carved messages on
the wall for ancient time are same adaptation to advertise or to promote the knowledge and to
influence the public. However, the methods are still in used to promote same ideas to public
in this modernization era, such as billboards, urban screens etc.
In the last a few decades before, public spaces acquired a renewed visibility in urban planning
world. In urban planning, public space has historically been described as ‘open space’,
meaning the streets, parks and recreation areas, plaza and other publicly owned and managed
outdoor spaces. Generally, the public spaces exist somewhere in between the transitions from
one place to one place. The existence of public spaces will lead to social activities, with
majority of public participation. The public spaces provide temporal and spatial mechanisms
for generating and promoting various social interactions. With the introduction of
technologies such as digital urban screens within the public spaces at this points, urban
screens at public spaces are becoming increasingly embedded into our architecture for
advertising, art local information etc. As demand from the latest technology, for some
developers, broadcasters and commercial companies are intending to require large and digital
urban screens in civic squares, especially at public spaces. For them, the big screens are one
of effective ways to promote and influence the public in easy and smooth way. However, in
order to make it successful, the understanding issues of implementation for this technology
and its impact on place and the quality of public experience is the key. Somehow, there are a
lot of advantages that can be found by using these kinds of method based on economy and
surround demands; the advertises can be changed daily, different products are on-air based on
the seasons, the updated news can be aired for public information. As a part of rapid global
urbanisation using the urban screens in public spaces, selection of the placement gives the big
impacts to public experience, especially in term of human behaviours and human movements
[6].

SCIENCE AND TECHNOLOGY 611
METHODOLOGY
In this study, qualitative and quantitative data were collected simultaneously and merged
during the analysis phase to add dimension to the findings. As a part of the mixed-method
strategy, the inquiry employed a survey including direct observation (with extensive field
notes and photography, walk-by observation, and pedestrian counts to collect data on the
behaviour of people along the Segget River within the inner of the city centre. Data presented
in this study were collected along Jalan Wong Ah Fook, where the digital urban screens
located, in this study. The digital urban screens are located along the major one-way road and
one of highest the density of pedestrians’ movement inner the city centre of Johor Bahru. The
shopping malls, the tourisms, and the both pedestrians, automobiles movement as well as taxi
stands are the daily activities features within the street. In attribution to urban features, are the
wide walkaways on both sides of Jalan Wong Ah Fook. Besides that, the street consists of
many shophouses, commercial buildings, shopping complex buildings, hotels and public
buildings etc to fit the needs of people for daily uses.
RESULTS AND FINDINGS
The correlation will be found between the locality of digital urban screens and the density of
stationary activities of people, such as sitting, talking and waiting. The higher correlation
between the locality of digital urban screens and density of stationary activities, it shows the
successful functioning of digital urban screens.
EXPECTED FINDINGS
The correlation will be found between the locality of digital urban screens and the density of
stationary activities of people, such as sitting, talking and waiting. The higher correlation
between the locality of digital urban screens and density of stationary activities, it shows the
successful functioning of digital urban screens.
REFERENCES
1. S. S. S. Mahdzar, “Sociability vs Accessibility - Urban Street Life,” University College London, 2008.
2. K. Lynch, The Image of The City. Cambridge, Massachusetts: The MIT Press, 1960.
3. B. U. Lubis and L. Primasari, “The Relationship between People and Urban Screen in an Urban Space,”
Procedia - Soc. Behav. Sci., vol. 42, no. July 2010, pp. 223–230, 2012. 4. Gianni Ranaulo, Light Architecture - New Edge City. Italy: Birkhauser, 2001.
5. M. Struppek, “The social potential of Urban Screens,” Vis. Commun., vol. 5, no. 2, pp. 173–188, 2006.
6. A. Fatah gen. Schieck, C. Briones, and C. Mottram, “The Urban Screen as a Socialising Platform -
Exploring the Role of Place Within the Urban Space,” MEDIACITY - Situations, Pract. Encount., no. April
2015, pp. 285–305, 2008.

SCIENCE AND TECHNOLOGY 612
IGCESH2018
Universiti Teknologi Malaysia, Johor Bahru, Malaysia 13 -15 August 2018
MICROWAVE ASSISTED EXTRACTION OF QUERCETINE FROM
CARICA PAPAYA L. FLOWERS
Iman Mukhaimin*1, Enggar A. Saraswati2 and Rahma Ajizah3
1, 2, 3 Chemical Engineering Department, General Achmad Yani University, Cimahi, Indonesia.
(E-mail: [email protected]*, [email protected], [email protected])
ABSTRACT
Extract of quercetine from Carica papaya L flowers has conducted by microwave assisted
extraction (MAE) method. Dried flowers were prepared by grinded into 0,125 mm of particle
size. Dried flowers were exracted using metanol 80% (w/w) to determine influence of solid to
liquid, S/L, ratio (1:10, 1:15, 1:20), microwave power (120-400 W), and extraction time (1-5
minutes) on extraction process. Using phytochemical test by Mg-HCl-amyl alcohol, UV-Vis
and FTIR spectofotometer techniques, flavanoid and quercetine was detected by qualitative
and quantitative analysis. As a result, presence of flavanoid was characterized by the formation
of a brownish red-colored flavilium compound. Increasing extraction time, power, and solvent
will increase the extraction temperature. Consequently, quercetine yield will decrease when the
temperature extraction exceeds it’s temperature degradation. Highest quercetine yield, 0.214%,
was detected on methanol extract with solvent to material ratio (1:15), microwave power (400
Watt), and extraction time (4 minutes).
Key words: Carica papaya L. flowers, Quercetine, Microwave assisted extraction
INTRODUCTION
Quercetine is the most important flavanoid in papaya flowers due to high antitumor effects [1].
Quercetine usually extracted by conventional method such as maceration [2] and heat reflux
extraction [3]. Which have a number of disadvantages, such as the lengthly process, large
amounts of solvent volume, toxic residual in the product, low recovery and not economic.
Microwave assisted extractor (MAE) becomes the solution in this process. MAE has many
advantages such as faster extraction time, fewer samples and fewer solvents, and less high
temperatures. These advantages make the MAE widely used in extraction processes such as
Zingibrene extraction on ginger oil [4], alkaloid bioactive extraction compounds on Lotus
plumule [5] and Stephania sinica [6], extraction of flavanoids and alkaloids in Crotallia
sesciliflora [7]. However, MAE needs solvent which has ability to absorb microwave, namely
methanol [2] and ethanol [3]. Furthermore, solid to liquid ratios, extraction time, microwave
power, and temperature are factors that can affect the MAE extraction process [4].
In this study dried papaya flowers was extracted using metanol 80% (w/w) with several
variabels, namely solvent to material ratio, extraction time and microwave power, to
understand its influence on extraction process condition. The extract was analyzed
quantitatively by UV-Vis spectophotometer techniques. Whereas Mg-HCl-amyl alcohol was

SCIENCE AND TECHNOLOGY 613
used for flavanoid phytochemical test [8] and characterized by FT-IR spectophotometer
techniques for qualitative analysis.
MAIN RESULTS
Phytochemical test : Phytochemical test on methanol extract of Carica papaya flowers
with Mg-HCl-amyl alcohol reagents makes the color changed from brownish yellow into
brownish-brown liquid. Andersen & Markham, 2006 [9] suggested that brownish red color
showed a positive presence of flavonoid by the formation of flavilium salt compounds.
Effect of Extraction Time : Lenght of the extraction time will give oppurtunity the
solvent to absorb microwaves. So, it can increase temperature and time of contact .
However, Fig. 1.a indicate after four minute percent yield quercetine was deacreased. It
occurs due to the existing extraction temperature exceeded the degradation temperature of
quercetine. In addition, these results are consisten with Chan, 2014 [10] which said that the
Absorbed Energy Density (AED) in MAE is proportional with the heating time by
microwave (th).
Figure 1. Effect of (a) microwave power and (b) extraction time on yield quercetine.
Effect of Microwave Power : Microwave power related to total heat absorbed by the
solvent (Q) on calorimetric method [10]. This is proved on Figure 1(a) that indicate that
increasing microwave power will increase extraction temperature and percent yield
quercetine. At 400 watt, temperature extraction was at 68 ° C so it falls within the optimum
temperature range described previously and will increase percent yield quercetine.
Effect of Solid to Liquid (S/L) Ratio :Generally in conventional extraction techniques
higher volumes of solvent will increase recovery target, but in MAE the higher solvent
volume can provide lower recovery [11]. Figure 1(b), at S/L ratio 1:20 percent yield
quercetin compounds was decrease. It was due to excessive solvent on extraction process.
Excessive solvent leads to excessive swelling of the material that will cause excessive
thermal stress. Excessive thermal stress will adversely affect phytochemical compounds
[12]. Figure 1(a) and Figure 1(b) indicate that the highest percent yield quercetine of
Carica papaya L. flowers, 2.14%, was produced at S/L ratio 1:15, 400 watt extraction
time, and 4 minute extraction time.
FT-IR Analysis of Extract Carica papaya L. Flowers : FTIR is performed to prove
flavanoid stucture are consist of hydroxyl, methoxyl, glycosides derivative of flavon, with
two aromatic ring [13]. According to Figure 2 extracts were indicated contain quercetine
due to compose of hydroxyl, OH, group (3411 cm-1), carbonyl,C=O,group (1663.8 cm-1),
P1 = 120 watt
P2 = 200 watt
P3 = 280 watt
P4 = 400 watt
P4
B
P3
P4
P2
P1
(a) (b)

SCIENCE AND TECHNOLOGY 614
C=C aromatic ring (1608.8 cm-1), C-H aromatic ring (940.6; 821.4; 677; 602 cm-1), aryl
strain CO (1265 cm-1), and COC strain on ketones (1167 cm-1).
Figure 2. FT-IR spectra from Carica papaya L. flower extract.
CONCLUSION
Quercetine was successfully extracted from Carica papaya L. flower by Microwave assisted
extraction (MAE) techniques to maximize extract yield with shorter time extraction. Highest
quercetine yield, 0.214%, was detected on methanol extract with solvent to material ratio
(1:15), microwave power (400 W), and extraction time (4 min).
Acknowledgment: authors thank to LPPM General Achmad Yani University for financial
support
REFERENCES
1. Otsuki Noriko, Nam H. Dang, EmiKunagai, Akira Kondo, Satoshi Iwata,Chikao Morimoto. Aqueous extract
of Carica papaya LeavesExhibits Anti-Tumor Activity and Immunomodulatory Effects. Journal of
Ethnopharmacology 127. (2010). 760-767.
2. Akujobi CN, Ofodeme CN, EnweaniCA. Determination ofAntibacterial Activity of Carica papaya (Pawpaw)
Extracts. Nigerian Journal of Clinical Practice Vol. 13 (1) (2010).: 55-57.
3. Nirosha N and Manganalanayaki R. Antibacterial Activity of Leaves and Stem Extract of Carica papaya L. IJAPBC Vol. 2 (3) (2013).
4. Xiong W, Chen X, Guangping Lv, Hu De, Zhao J, Li S. Optimization of Microwave Assisted Extraction of
Vioactive Alkaloid From Lotus plumule Using Response Surface Methodology. Journal of Pharmaceutical
Analysis, (2017). S2095-1779(16)30053-3.
5. Xie D, Wanga Y, Kang Y , Hub Q, Su N, Huang J, Che C, Guo J. Microwave Assisted Extraction of Bioactive
Alkaloid from Stephanica sinica. Separation and Purification Technology 130 (2014) 173–181
6. Xunyou Tang a, Dan Zhu a,b, Wenbei Huai c, Wei Zhang c,⇑, Chujun Fu c, Xiujuan Xie a, Sisi Quan a,
Huajun Fan a. Simultaneous extraction and separation of flavonoids and alkaloids from Crotalaria sessiliflora
L. by microwave-assisted cloud-point extraction. Separation and Purification Technology, 175 (2017) 266–
273.
7. Julianti T, Oufir M, Hamburger. Quantification of the Antiplasmodial Alkaloid Carpaine in Papaya (Carica papaya) Leaves. Planta Med (2014); 80: 1138–1142
8. A’yun Q, Nikmati A. The Pytochemical Analysis of Papaya Leaf (Carica papaya L). Published on Seminar
Nasional Konservasi dan Pemanfaatan Sumber Daya Alam (2015).
9. Andersen , Ø. M., & Markham, K. R. FLAVONOIDS : Chemistry, Biochemistry and Applications. New York:
Taylor & Francis Group. (2006).
10. chan H-chung, Yussof R, and Ngoh G Optimization of Microwave-assisted Extraction Based on Absorbed
Microwave Power and Energy. Jour. Chemical Engineering Science. No.111 (2014). p.41-47
11. Maran, P. J., & Prakash, K. A. Process Variables Influence on Microwave Assisted Extraction of Pectin from
Waste Carica papaya L. Peel. International Journal of Biological Macromolecules. (2015).
12. Chen, Y., Xie, M.Y., Gong, X.F., Microwave Assisted Extraction Used for the Isolation of Total Triterpenoid
Saponins from Ganoderma atrum, Journal of Food Engineering, 81( 2007),:172- 170 13. Rocha-Santos, T., & Duarte, A. C. Comprehensive analytical chemistry. Volume 65, Analysis of marine
samples in search of bioactive compounds. (n.d.).

SCIENCE AND TECHNOLOGY 615
IGCESH2018
Universiti Teknologi Malaysia, Johor Bahru, Malaysia 13 -15 August 2018
POTENTIAL USE OF UAV PHOTOGRAMMETRIC TECHNIQUES
FOR CADASTRAL MAPPING: A REVIEW
Room, M. H. M* and Ahmad, A.
1, 2 Department of Geoinformatic, Faculty of Geoinformation & Real Estate, Universiti Teknologi
Malaysia, Skudai, Johor, MALAYSIA.
(E-mail: [email protected], [email protected])
ABSTRACT
A cadastral is an official record of information about land parcels. Cadastral surveying is
work involving determination of boundaries and area of a lot of land or more. There are many
techniques that have been employed for producing map of cadastral boundary around the
world. An example of these techniques are conventional survey, conventional
photogrammetry, satellite imagery and unmanned aerial vehicle (UAV) photogrammetry.
Among these technique, the most common used technique for cadastral mapping is
conventional survey. This technique was used for a long time ago and can provide very high
accurate output, however, it has constraints from the aspect of time consuming and expensive
cost. Rapid development around the world especially in developed countries cause the
changes of techniques for mapping cadastral boundaries. Therefore, mapping the cadastral
boundaries for update purpose needs to be performed regularly or many times. Due to the
development of robotic industry, UAV system which utilised robotic concept and system can
be used as a platform for data acquisition in the field of geospatial and photogrammetry.
UAV offers many advantages such as portable, rapid data acquisition, efficient, low-cost and
produces accurate results. All these advantages are suitable, valuable and significant for
cadastral mapping application. Development of UAV has grown very rapidly where many
new types and model of UAV were developed which can use many types of sensor. This
situation encourages the use of UAV in many applications especially for mapping
application. Therefore, this paper reviews the potential of UAV system used in cadastral
mapping by examining related research done around the world and at national level using
UAV system for cadastral mapping. This review will also focus on the quality of final output,
methodology used and hopefully it can be used as a guideline for future work on the
implementation of UAV system in cadastral mapping.
Key words: Photogrammetry, Cadastral, Mapping, Unmanned Aerial Vehicle System, Sensor.
INTRODUCTION
Unmanned aerial vehicle (UAV) can defined as a system used to capture the aerial
photograph or collect any information on the earth surface with no pilot on broad. According
to [1], UAV is a motorized aircraft system controlled remotely by remote control devices or
completely autonomous with aid of on-broad system of navigation and control station. UAV
can described as a device for collecting remote sensing data where it allow flexible
manoeuvre, produce high resolution image, can fly under cloud cover, easy to operate, rapid

SCIENCE AND TECHNOLOGY 616
data acquisition and low cost. Due to these advantages, UAV has been used in various
application such as mapping, monitoring, mining, scientific research, agriculture, archelogy
and others[2,3]. Over last few years, there are many types of UAV with special sensor such
as digital camera that have been produced by the manufactures around the world. Until today,
types of UAV available in the industry like Lidar UAV, multispectral UAV, thermal UAV,
hyperspectral UAV, compact digital camera UAV and RTK UAV. RTK UAV is the latest
system designed to generate a very high accurate output ranging to a few centimetres.
Manufacturing of RTK UAV create a chance and potential for UAV system to be used in
application like cadastral mapping. Accuracy and precision of final product are very
important aspect in this application where every measurement or survey must follow the
standard operating procedure (SOP) has been set by national surveying department and the
final output needs to checked and endorsed. There are various technique that can be used for
application of mapping cadastral boundary around the world. Among the techniques are
conventional survey, conventional aerial photogrammetry, high resolution satellite imagery
and UAV photogrammetry. In Malaysia, conventional survey is the most common technique
used to map the cadastral boundary from the colonial time until today. Conventional survey
such as total station and Global Navigation Satellite System (GNSS) can produce a very high
accuracy in term of generation the output in the form of points and lines, however they have
constraints from the aspect of time consuming and required expensive cost [4]. Therefore,
demand of fast and efficient surveying method caused a new method or system needs to be
explored to support and helps to fulfil that demand. The system can fulfil that requirement is
UAV photogrammetry [5,6,7].
UAV IN CADASTRAL MAPPING
UAV system has been found used in cadastral mapping in several countries such as in
Germany, Netherland, Switzerland and many more [8]. In generally, UAV system is able
to fulfil the standard accuracy of final output because it can produce the final output with
accuracy less than 5 centimetres [9]. Apart from that, 3D information can obtained from
UAV system where conventional survey is unable to provide this kind of information [5]
[10]. From 3D information, cadastral map will be equipped with additional information.
To use UAV system in cadastral mapping, there are several factor that should be
considered because these factors affect the accuracy of final output. Example of the
factors are camera model, number of ground control point, camera calibration process and
software types [9]. Apart from that, UAV system also can be used for verification process
of the cadastral border in Netherland [9]. The use of UAV system in cadastral mapping is
still new in Malaysia and it has great potential to be used in this country. Similarly, it can
be used in other countries that employed cadastral mapping.
CONCLUSION
This review aims to explore the potential use of UAV photogrammetry in mapping cadastral
boundary. As a conclusion, UAV system really has great potential to be used in cadastral
mapping due to the advantages offered by the system as compared to conventional method.
The national surveying department could benefited from UAV photogrammetry for
producing rapid, fast, low cost and accurate cadastral map.
Acknowledgment: Special thanks to Universiti Teknologi Malaysia, Faculty of
Geoinformation and Real Estate for supporting this study and providing the Zamalah
scholarship.

SCIENCE AND TECHNOLOGY 617
REFERENCES
1. Bailey, M. W. Unmanned aerial vehicle path planning and image processing for orthoimagery and digital
surface model generation. Vanderbilt University, Ph.D. Thesis, 2012.
2. Ahmad, A., Tahar, K. N., Udin, W. S., Hashim, K. A., Darwin, N. Hafis, M. Room, M., Hamid, N. F. A. Azhar, N. A. M. and Azmi, S. M. Digital aerial imagery of unmanned aerial vehicle for various applications.
Control System, Computing and Engineering (ICCSCE), IEEE International Conference (2013), 535–40.
3. Popescu, D. and Ichim, L. Image recognition in UAV application based on texture analysis. International
Conference on Advanced Concepts for Intelligent Vision Systems, Springer (2015), 693–704.
4. Harintaka, S., Susanto, A. and Hartono. Assessment of Low Cost Small Format Aerial Photogrammetry for
Cadastral Mapping (Case Study in Klaten Regency, Central Java, Indonesia), 7TH FIG Regional
Conference, (2009).
5. Manyoky, M. Theiler, P. Steudler, D. and Eisenbeiss, H. Unmanned aerial vehicle in cadastral applications,
ISPRS-international Arch. Photogramm. Remote Sens. Spat. Inf. Sci. 3822 (2011), 57–62.
6. Nex, F. and Remondino, F. UAV for 3D mapping applications: a review. Appl. geomatics 6 (2014), 1–15.
7. Colomina, I. and Molina, P. Unmanned aerial systems for photogrammetry and remote sensing: A review.
ISPRS J. Photogramm. Remote Sens. 92 (2014), 79–97. 8. Kędzierski, M., Fryśkowska, A., Wierzbicki, D. and Deliś, P. Cadastral Mapping Based on UAV Imagery.
15th International Scientific and Technical Conference ‘From Imagery to Map', Digital Photogrammetric
Technologies (2015), 12–15.
9. Rijsdijk, M. Hinsbergh, W. Witteveen, W. Buuren, G. H. M. Schakelaar, G. A. Poppinga, G. Persie, M. V.
and Ladiges, R. Unmanned aerial systems in the process of juridical verification of cadastral border. In Proc.
ISPRS 61 (2013), 325-331.
10. Watanabe, Y. and Kawahara, Y. UAV photogrammetry for monitoring changes in river topography and
vegetation. Procedia Eng. 154 (2016), 317–25.

SCIENCE AND TECHNOLOGY 618
IGCESH2018
Universiti Teknologi Malaysia, Johor Bahru, Malaysia 13 -15 August 2018
TAPERED OPTICAL FIBER SENSOR FOR PETROL
ADULTERATION DETECTION
A.S. Mangsor*1, M.S. Aziz2 and S. Daud3
1, 2,3 Laser Center, Ibnu-Sina Institute for Scientific and Industrial Research (ISI-SIR), Universiti
Teknologi Malaysia.
(E-mail: [email protected], [email protected], [email protected])
ABSTRACT
Detection of petroleum fuels adulteration is challenging because the petrol and its adulterant
is highly miscible in nature. It is required to ensure the purification of the petroleum in
compliance with the regulatory specifications. Spectroscopy of the petroleum sample can be
observed for determining the compositional variations of these fuels. Therefore, tapered
optical fiber for petroleum adulteration is demonstrated. A micro tapered fiber sensor allowed
us to detect the purity of the petrol with fast response time. The waist diameter is fabricated
in 36μm and 52μm with same length of tapered region in 10mm and effect on the sensitivity
of both sensors are compared. The sensor is useful as the construction itself is simple as well
as its operation, react safely with flammable fuels and it has high possibility to be improved
for a more compact and portable petrol measurement.
Key words: Tapered optical fiber, Petroleum sensor, Sensitivity
INTRODUCTION
Adulteration of petroleum products especially petrol has been always a big issue as it leads to
degradation of engine performance and it increases the ill effects on public health [1]. The
easy availability of kerosene and its property that miscible in petrol has making it
advantageous to be use in the unethical practice of adulteration of petrol [2]. The purification
of the petrol is now in doubt and method to detect these petrol adulterations must be done in
order to guarantee that the price of the petrol sold in the market is comparable with the
quality.
In recent years, we have witnessed variety of progress in the design and development of fiber
optical sensor functioned to detect the spectroscopy of different samples from industrial and
chemical products to help environmental control. Fiber optical sensor offer several
advantages than the conventional chemical sensing method as it is unaffected by
electromagnetic interference (EMI), thus making it possible to be apply in any EMI
environment, has potential in distributing sensing over long lengths of fiber and its capability
to conduct in safe operation while in hazardous environment [3].
In this study, tapered fiber from silica based multi-mode fiber is fabricated in two diameters
of the tapered region which are 36μm and 52μm. The active region of the tapered fiber will
be dipped into mixture of petrol and kerosene in the percentage from 0 to 50 percent. The
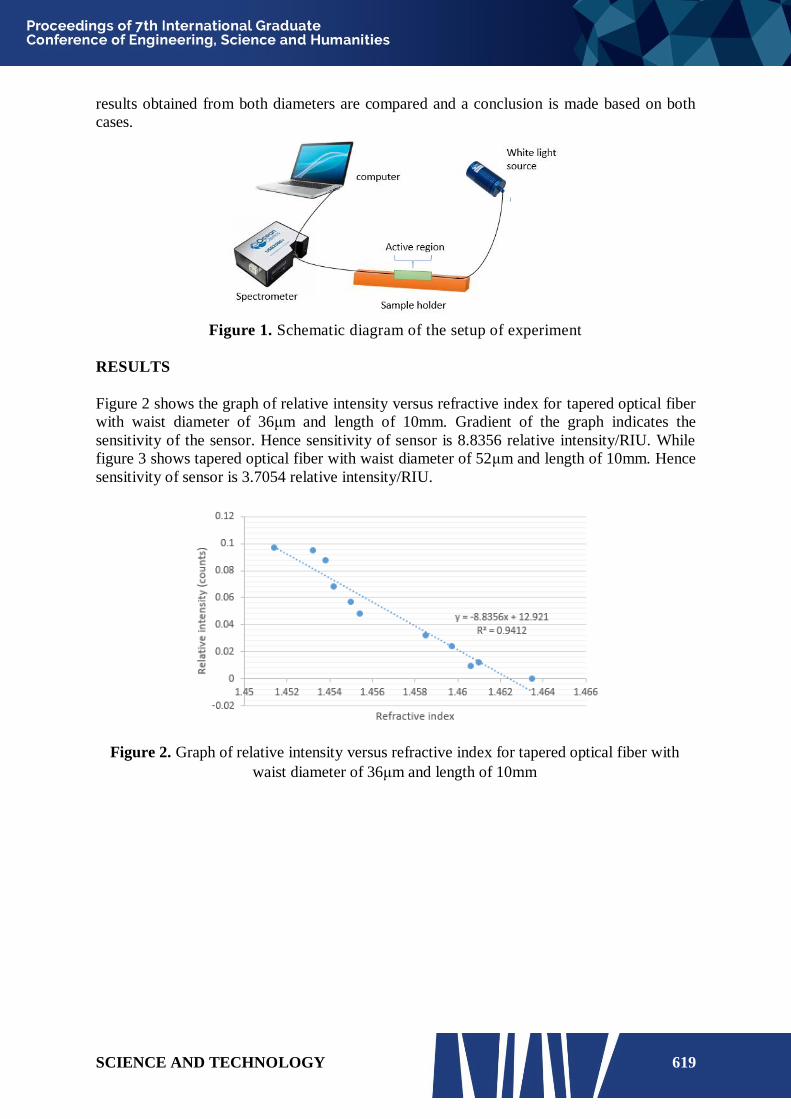
SCIENCE AND TECHNOLOGY 619
results obtained from both diameters are compared and a conclusion is made based on both
cases.
Figure 1. Schematic diagram of the setup of experiment
RESULTS
Figure 2 shows the graph of relative intensity versus refractive index for tapered optical fiber
with waist diameter of 36μm and length of 10mm. Gradient of the graph indicates the
sensitivity of the sensor. Hence sensitivity of sensor is 8.8356 relative intensity/RIU. While
figure 3 shows tapered optical fiber with waist diameter of 52μm and length of 10mm. Hence
sensitivity of sensor is 3.7054 relative intensity/RIU.
Figure 2. Graph of relative intensity versus refractive index for tapered optical fiber with
waist diameter of 36μm and length of 10mm

SCIENCE AND TECHNOLOGY 620
CONCLUSION
Results demonstrated that a tapered absorbance sensor was successfully developed to detect
various concentrations of kerosene in petrol. As the percentage of kerosene increases, the
relative intensity of the spectra decreases. Both graphs showed good decreasing pattern.
Sensitivity of tapered optical fiber increases when diameter of waist taper fiber smaller. Waist
diameter of 36μm has higher sensitivity compared to waist diameter of 52μm. Smaller
diameter introduced a greater loss therefore it will increase the absorption reaction between
tapered region and adulterated petrol.
Acknowledgment: The authors would like to express their appreciation for the support of the
sponsors with Project No 03G82.
REFERENCES
1. Anil Kumar Gupta, R.K. Sharma, A new method for estimation of automobile fuel adulteration, 2010.
2. D.R kulathunga, K.R.R. Mahanama, Fingerprinting diesel and petrol fuels for adulteration in Sri Lanka,
2013.
3. Sukhdev Roy, Fiber optic sensor for determining adulteration of petrol and diesel by kerosene, 1999.
4. Saad H. Girei, Atafat A. Shabaneh, Hong Ngee Lim, Mohd N. Hamidon, Mohd. A. Mahdi, Mohd H. Yaacob, Tapered optical fiber coated with graphene based nanomaterials for measurement of ethanol
concentrations in water, 2015.
Figure 3. Graph of relative intensity versus refractive index for tapered optical fiber with
waist diameter of 52μm and length of 10mm

SCIENCE AND TECHNOLOGY 621
IGCESH2018
Universiti Teknologi Malaysia, Johor Bahru, Malaysia 13 -15 August 2018
IOT BLOCKCHAIN FOR SMART CITY: A SURVEY
Massolihen Dasuki*1, Mohd. Yazid Idris1,2 , Nik Mohd Habibullah1, Abdul Hadi
Fikri3, Mohd Rozaini Abd Rahim1 and Deris Stiawan4
1Faculty of Computing, Universiti Teknologi Malaysia, Johor Bahru, Malaysia
2Media and Games Innovation Centre of Excellence (MaGIC-X), Universiti Teknologi Malaysia 3Faculty of Electrical Engineering, Universiti Teknologi Malaysia, Johor Bahru, Malaysia
4Department of Computer Engineering, Faculty of Computer Science, Universitas Sriwijaya,
Indonesia
(E-mail: [email protected], [email protected], [email protected], [email protected] [email protected], [email protected])
ABSTRACT
The combination Internet of Things (IoT) and blockchain could be the fundamental
technology for smart city. Implementation of blockchain on IoT can solve security challenge
on IoT peer-to-peer network communication and indirectly will robust the smart city
development, this is due to the blockchain security and preserving privacy characteristic.
Unfortunately, implementation of blockchain on IoT is still can be considered at the early
stage, where although it might increase IoT security capabilities, but it may lead to other non-
security issues. Our research goal is to investigate related issues for implementation of
blockchain on IoT which its might suitable for smart city such as smart healthcare, smart grid
and etc. As an initial step in our research process, we conducted a survey on the IoT and
blockchain to gather knowledge on the current uses of this technology and to describe its
current degree of privacy, security and scalability. We found several issues in the privacy,
security and scalability.
Key words: blockchain, Internet of Things, smart city
INTRODUCTION
IoT refers to interconnected object that allow people or things to be connected to each other’s
and every things have different characteristic that consist of of computation and storage
capabilities[1]. Modern concept of smart city is concerning to supervision plan for
infrastructure city’s asset and public service in purpose to increase the quality life of
citizens[2] .The connectivity element of IoT, make it suitable for development of smart city.
IoT connected devices have sensor that can collect and produce digital computation, which
useful to study and investigate the citizen life quality in every part of smart city[3].Although
IoT seem fit for smart city, there is drawback for this IoT or edge node to sharing data using
peer-to-peer (P2P) network. This is due to IoT connections will raise an issue of security,
where the connection may create leakage of privacy of user information[4]. The huge data
collected by IoT device, also create a reason why smart cities create a major risk to the
privacy of citizens. The collection and correlation of huge amounts of data allows the
formation of complete profiles for every aspect of citizen life [5] .Hence the implementation

SCIENCE AND TECHNOLOGY 622
IoT for smart city will be vulnerable to security attacks, so it is important to design an
effective solution.
An IoT security issue has urged worldwide researcher to combine this IoT and blockchain
technology. Blockchain technology seem capable to solve security issues for IoT, as
blockchain characteristic are distributed, transparent, persistent, and secure[6]. Blockchain is
distributed peer-to- peer network that can prevent the single point of failure situation [7] and
enable interaction for non-trusting members with each other without a trusted intermediary,
in a cryptographically verifiable method[8].
The goal of our research is to investigate related issues for blockchain and IoT
implementation for smart city. We assume the smart healthcare, smart grid and smart
governance can utilize the IoT and blockchain, where these smart clusters will be the great
improvement for quality of life for our society. In the paper we performed a survey to verify
whether documented use cases confirm this possibility and to investigate which are the main
factors that affect the levels of efficiency, security and scalability for the combination of IoT
and blockchain.
RESEARCH METHODOLOGY
To achieve the goal of our survey, we formulated the following research questions (RQ):
What is the degree of privacy (RQ1), security (RQ2) and scalability (RQ3) of the
blockchain to be implemented on IoT? To answer these questions, high-quality articles
published in conferences, symposiums, workshops, books, and journals related to the
research topic were used. As the subject of IoT blockchain implementations is just in its
early days, for some cases, the gray literature such, industry white papers, opinio n on
industry news and subject matter experts of the related topic was needed to be used as a
principle of this survey.
MAIN RESULTS
RQ1: Privacy: Although in cyprtocurrencies blockchain use public key as address
without personal data, user privacy still could be compromise. This attack could be done
by systematic monitoring of the unencrypted P2P network and analysis of the public
blockchain. Furthermore using cyrptocurrencies in online purchasing, it could be attack
through cookies for extract user purchasing history [9]. Hence IoT blockchain should
create a mechanism to secure this information such encrypting every data and information
that transferred by P2P network.
RQ2: Security. Proof of Work(PoW) in blockchain cyrptocurrencies is a security
technique for miner to do mining activity for verify a transaction [10]. This PoW use a lot
of computational process, where this lead to large energy consumption [11-12] . Hence
implementing blockchain directy into IoT is not suitable, because the computational
limitation that hold by IoT device.
RQ3: Scalability. Scalability for blockchain can be measure by metrics like maximum
throughput, latency, bootstrap time, cost per confirmed transaction(cpct)[13]. The
blockchian is a general append-only ledger blockchain, where the transaction constantly
growth and cannot be removed[14]. Hence this will lead to large storage consumption,
which not suitable IoT device which has limited capacities storage.

SCIENCE AND TECHNOLOGY 623
CONCLUSION
We assume combination IoT and blockchain seem a good mixture to enhance smart city
development. Unfortunately, this combination has a drawback that need to be solved. Our
future work is to develop a laboratory environment for blockchain implementation on IoT,
afterward simulation will be made to collect data. After data gathering complete an
improvement will be made to make the IOT blockchain technology suitable for smart city.
Acknowledgment: The authors would like to express their appreciation for the support of the
sponsors from Zamalah UTM Scholarship (Massolihen Dasuki).
REFERENCES
1. A. Rachedi, M. H. Rehmani, S. Cherkaoui, and J. J. P. C. Rodrigues, “Editorial IEEE Access Special
Section Editorial : The Plethora of Research In Internet of Things ( Iot ),” IEEE Access, vol. 4, pp. 9575–
9579, 2017.
2. S. Dustdar, S. Nastic, and O. Scekic, “A Novel Vision of Cyber-Human Smart City,” in 2016 Fourth IEEE
Workshop on Hot Topics in Web Systems and Technologies, 2016.
3. S. Ibba, A. Pinna, M. Seu, and F. E. Pani, “CitySense : blockchain-oriented Smart Cities,” in XP ’17
Proceedings of the XP2017 Scientific Workshops, 2017.
4. L. Jong-Hyouk and H. Kim, “Security and Privacy Challenges in the Internet of Things,” IEEE CONSUMER
ELECTRONICS MAGAZINE, no. July, pp. 134–136, 2017. 5. D. Eckhoff and I. Wagner, “Privacy in the Smart City – Applications , Technologies , Challenges and
Solutions,” IEEE Commun. Surv. Tutorials, pp. 1–28, 2017.
6. A. Songara and L. Chouhan, “Blockchain : A Decentralized Technique for Securing Internet of Things,” in
International Conference on Emerging Trends in Engineering Innovations & Technology Management
(ICET: EITM-2017), 2017, no. October.
7. Z. Zheng, S. Xie, H. Dai, X. Chen, and H. Wang, “An Overview of Blockchain Technology : Architecture ,
Consensus , and Future Trends,” in 2017 IEEE 6th International Congress on Big Data, 2017.
8. H. Es-samaali, A. Outchakoucht, and J. P. Leroy, “A Blockchain-based Access Control for Big Data,” Int. J.
Comput. Networks Commun. Secur., vol. 5, no. 7, pp. 137–147, 2017.
9. M. Conti, S. Member, S. K. E, and C. Lal, “A Survey on Security and Privacy Issues of Bitcoin.” 2017.
10. A. Dorri, M. Steger, S. S. Kanhere, and R. Jurdak, “BlockChain : A Distributed Solution to Automotive Security and Privacy,” IEEE Communications Magazine, no. December, pp. 119–125, 2017.
11. K. Rabah, “Overview of Blockchain as the Engine of the 4th Industrial Revolution,” Mara Res. J. Bus.
Manag., vol. 1, no. 1, pp. 125–135, 2016.
12. K. Suankaewmanee, D. T. Hoang, D. Niyato, S. Sawadsitang, P. Wang, and Z. Han, “Performance Analysis
and Application of Mobile Blockchain,” pp. 1–6.
13. K. Croman et al., “On Scaling Decentralized Blockchains ( A Position Paper ),” in On Scaling Decentralized
Blockchains - (A Position Paper). Financial Cryptography Workshops., vol. 5, pp. 106–125.
14. J. Herrera-Joancomartí and C. Pérez-Solà, “Privacy in Bitcoin Transactions: New Challenges from
Blockchain Scalability Solutions,” in Modeling Decisions for Artificial Intelligence, 2016, pp. 26–44.

SCIENCE AND TECHNOLOGY 624
IGCESH2018
Universiti Teknologi Malaysia, Johor Bahru, Malaysia 13 -15 August 2018
OUTPUT POWER AND EFFICIENCY IN LINEAR AND RING
CONFIGURATIONS OF CONTINUOUS WAVE ERBIUM DOPED
FIBER LASER
Rabi’atul ‘Adawiyah Binti Mat Yusoff1, Yusof Munajat2 and Nabilah Kasim3
1, 2, 3 Department of Physics, Universiti Teknologi Malaysia, Skudai Johor, MALAYSIA.
(E-mail:[email protected], [email protected], [email protected])
ABSTRACT
A continuous wave fiber laser operating at 1.5 micron wavelength region was demonstrated
utilizing erbium doped as the gain medium in both linear and ring configurations. The output
power and the efficiency of both linear and ring configurations of Erbium Doped Fiber (EDF)
laser were characterised. The laser threshold and the efficiency of linear and ring
configurations of EDF laser then were compared. In the linear configuration, the wavelength
division multiplexing (WDM) was used and Fiber Bragg Gratings (FBGs) was inserting at
both ends of the laser cavity. In the ring configuration, WDM and 3 dB output coupler are
used to complete the laser cavity. The slope efficiency for the linear configuration is 0.15 %
while for the ring configuration is 1.18 %. The laser threshold where the lasing occurred for
linear cavity is 88.8 mW and the laser threshold for ring cavity is 40.2 mW. The maximum
output power for both linear and ring configurations are 0.32 mW and 4.13 mW respectively.
Key words: Continuous wave laser, Erbium doped fiber, Output power, Efficiency
INTRODUCTION
Continuous wave, single frequency lasers are required in a wide range communication,
medical technologies, sensor and spectroscopic applications. In addition, with the system
integration and miniaturization is being emphasized [1,2,3], the device compatibility with
fiber and optical waveguide is essential. The miniature devices, diode pump, single frequency
(wavelength), narrow line width, solid state lasers are currently being commercially
manufactured in varied configurations. In order to design fiber laser compatible with size and
performance which is highly demand in market therefore study and research about fiber laser
configurations are crucially needed.
In this research work, a commercial erbium doped fiber (EDF) laser is used to generate
linear and ring laser cavity. This fiber configuration designs are optimized by increasing
the pump power. Therefore higher efficiency can be obtained hence better output power is
achieved.
In this experiment, the performance of the erbium doped fiber laser is investigated based
on two configurations; Linear and ring configuration. Linear cavity erbium doped fiber
laser is constructed using two fiber Bragg gratings (FBGs) at both ends of the cavity as
illustrated in Figure 1(a). 980 nm laser diode is used as pumping source to excite the gain

SCIENCE AND TECHNOLOGY 625
medium, 𝐸𝑟3+ for operating at 1550 nm [4]. A wavelength division multiplexing (WDM)
is used to combine the input pump and the 99.9 % reflected back to FBG. At the output,
another FBG is used to reflect 5.4 % of the laser back into the cavity. Both FBG used in
this linear configuration were custom made by Thorlabs for operation at 1550 nm. Figure
1(b) shows an image of the ring configuration used in this dissertation work. WDM is
also used to combine the pump signal and the circulating signal from the cavity. A
coupler 3 dB is placed after EDF to tap out the output. . The output spectrum and the
power of the laser signals are measured by using an optical spectrum analyser (OSA) and
the optical power meter (OPM) respectively.
Figure 1. (a)Linear configuration of EDF laser. (b)Ring configuration of EDF laser
The pump power as a function of injected current is given in the table as shown in Table 1.
Figure 2(a) exhibit the measure slope efficiency of linear cavity when linear configuration
EDF laser at pump wavelength of 980 nm. From the figure, the slope efficiency of linear
configuration is 0.23 %. Figure 2(c) shows the spectrum of laser threshold of EDF for linear
configuration. From both Figure 2(a) and Figure 2(b), they show that the linear cavity laser
has laser threshold where lasing occurred at input power 88.8 mW. Then, the output
spectrum of the EDF laser for linear configuration are checked by an OSA at different
injection current of laser diode as shown if Table 4.1. As shown in the Figure 1(c), the peak
power of the signals increases with the increment powers. The maximum (500 mA) output
power for linear configuration of EDF laser is 0.32 mW. The pump power as a function of
injected current is given in the table as shown in Table 2. Figure 3(a) exhibit the measure
slope efficiency of ring cavity when ring configuration EDF laser at pump wavelength of 980
nm. From the figure, the slope efficiency of ring configuration is 1.81%. Figure 3(b) shows
the spectrum of laser threshold of EDF for linear configuration. Figure 3(a) and figure 3(b)
show that the linear cavity laser has laser threshold where lasing occurred at input power 40.2
mW.
Figure 2. (a) Laser threshold and slope efficiency of linear configuration EDF laser at pump
wavelength of 980 nm. (b) Lasing spectrum for laser threshold of EDF for linear
configuration. (c) Lasing spectrum for different pump from EDF for linear configuration

SCIENCE AND TECHNOLOGY 626
Figure 3. (a) Laser threshold and slope efficiency of ring configuration EDF laser at pump
wavelength of 980 nm. (b) Lasing spectrum for laser threshold of EDF for ring configuration.
(c) Lasing spectrum for different pump from EDF for ring configuration
Then, the output spectrum of the EDF laser for ring configuration is checked by an OSA at
different injection current of laser diode as shown in Table 1. As shown in the Figure 3(c),
the peak power of the signals increases with the increment powers. The maximum (500 mA)
output power for ring configuration of EDF laser is 4.13 mW.
Table 1. Pump laser output power and EDF laser output power as a function of injection
current for linear configuration.
Injection current
(± 1 mA)
Pump laser output
power (± 0.1 mW)
Erbium doped fiber
laser output power
(± 0.01 mW)
300 129.0 0.12
350 153.4 0.17
400 177.8 0.22
450 202.2 0.27
500 226.1 0.32
Table 2. Pump laser output power and EDF laser output power as a function of injection
current for ring configuration.
Injection current
(± 1 mA)
Pump laser output
power (± 0.1 mW)
Erbium doped fiber
laser output power
(± 0.01 mW)
300 129.0 1.42
350 153.4 1.96
400 177.8 2.68
450 202.2 3.52
500 226.1 4.13
CONCLUSION
This experiment was successfully conducted with both linear and ring configuration. The rare
earth element which is 𝐸𝑟3+ ion is chosen in the research work to study the lasing properties
at 1.5 micron meter region [3,4]. For the linear configuration the wave division multiplexing
(WDM) and fiber Bragg gratings (FBGs) were inserted to the laser cavity at both ends as a
wavelength selective mirror. For the ring configuration WDM and 3 dB output coupler are
used to complete the laser cavity. The slope efficiency for linear configuration is 0.23% while
for the ring configuration is 1.81%. The laser threshold for linear cavity where lasing

SCIENCE AND TECHNOLOGY 627
occurred at input power 88.8 mW while the laser threshold for ring cavity is 40.2 mW. The
maximum output power for the linear cavity is 0.32 mW while the maximum output power
for ring cavity is 4.13 mW.
Acknowledgment: This work is financed by UTM Zamalah. Authors would like to thank the
anonymous referees for their valuable comments and suggestions
REFERENCES
1. Snitzer, E. Proposed fiber cavities for optical lasers. J. Appl. Phys 1961;32: 36-39
2. Walter Koechner. Solid State Laser Engineering. (6th ed.) United States of America: Springer 2006
3. Frank L. Pedrotti, S.J, Leno S. Pedrotti Introduction to Optics. (2nd ed.) Upper Saddle River, N.J. : Pearson
Prentice Hall 2006 ; 426
4. S.O. Kasap Optoelectronics and Photonics – Principle and Practice (2nd ed.) England; Pearson Education
Limited 2013

SCIENCE AND TECHNOLOGY 628
IGCESH2018
Universiti Teknologi Malaysia, Johor Bahru, Malaysia 13 -15 August 2018
THE ROLES OF SOCIAL CAPITAL IN ENCOURAGING
COMMUNITY PARTICIPATION TOWARDS TURTLE
CONSERVATION
Khoirun Nisha Umar*1 and Norhazliza Abdul Halim2
1Master Candidate, 2Senior Lecturer, Department of Urban and Regional Planning, Faculty of Built
Environment Universiti Teknologi Malaysia, Johor Bahru, MALAYSIA.
(E-mail: [email protected] , [email protected])
ABSTRACT
The rapid tourism development along the coastal area has led to the destruction of marine life
habitat especially sea turtle which are currently undergoing extinction. Hence, conservation
strategy need to be taken for its survival. However, the efforts in conserving the sea turtle
need to include the local community to take part. Social capital plays an important role in
encouraging residents to join the conservation process. There are not much research has been
done to tests social capital roles in encouraging the local community to involve in social
integration of environmental protection which have been identified as one of the key
components in Community Based Ecotourism (CBET). This paper is attempted to understand
the role of social capital in encouraging the turtle conservation effort among local
community. It provides a critical review of existing literature that is relevant to the research
area that explained about the importance of social capital which compressed cognitive and
structural social capital in triggering the local community involvement in turtle conservation
effort. This research adopt a participation observatory analysis in determining the influence
of cognitive and structural aspect of social capital towards community involvement in
conservation. The observation results showed that the social capital from cognitive aspect is
more influential to the local community compared to structural aspect.
Key words: Social Capital, Turtle Conservation, Community Participation, Cognitive,
Structural
INTRODUCTION
Nowadays, the population of the sea turtle have been decreased gradually. Hence,
conservation of this non-consumptive wildlife need to be done to prevent it from extinction.
The conservation effort not only need to be done by the local authority, but also need to
involve the local community as they are the guardian of that natural resources. Other than
various types of economic benefits, social capital would also contribute to the local
community involvement to conserve the sea turtle [1].
Putnam demonstrated that social capital specifically related with stronger relationships of
trust, shared norms, common rules, mutuality between neighbors, and approval of
environmental behaviors within a community [2]. Besides, social capital is different from
physical, financial and human capital because it is relatively abstract. It will always be

SCIENCE AND TECHNOLOGY 629
defined in terms of connectedness and the quantity of social relations within a given
population ([3], [4] and [5]). There are two dimensions of social capital which are cognitive
and structural aspect.
MAIN RESULTS
Social capital plays an important role in encouraging the community participation to
manage the common resources such as environment. Community participation can be
defined as a form of voluntary action where individuals deal with chance and
responsibilities of community [1]. It will give positive effect to the social and cultural
structure of community ([6], [7] and [8]).
Residents’ pro-environmental behavior or conservation effort that involve the local
community are closely related with social capital component which are religion,
responsibility and sense of trust in community managers [9]. It is also influenced by
ethics, valued, and dogma [10] and social capital can improve residents’ abilities to
manage natural resources sustainably.
Cognitive dimension of social capital that includes values, attitudes, norms and beliefs
([11, and [12]), and also the perceptions of support, reciprocity, sharing, and trust among
the local community ([4] and [11]) have different influence with structural social capital
on the conservation effort. Krishna and Shrader stated that structural dimension of social
capital was about the composition, practices, and scope of local-level institutions that
help to facilitate mutually beneficial collective action either formally or informally [12].
The observation results showed that cognitive social capital contribute more in
encouraging the involvement of local community to take part in the conservation process
compared to structural social capital.
CONCLUSION
Conservation is the most important process in saving the sea turtle life from any threat
especially from human. So, the empowerment of the social capital among the local residents’
is the best way to ensure that residents are willingly to take part in the conservation process.
It does not mean that only social capital element is important in attracting the residents to
support the conservation effert because other aspect also need to be taken into account.
Future research that can be done to fill in the gap of this research is about the economic
benefit influence towards turtle conservation.
Acknowledgment: The authors would like to express appreciation and thankful to University
Teknologi Malaysia for the Zamalah Sponsorship.
REFERENCES
1. Putnam, R.D. The prosperous community: social capital and public life. American Prospect, 4(13), (1993),
35-42
2. Ecclestone, K., & Field, J. Promoting social capital in a ‘Risk Society’: a new approach to emancipatory learning or new moral authoritarianism? British Journal of Sociology of Education, 24(3), (2003), 267-282.
3. Harpham, T., Grant, E., & Thomas, E. Measuring social capital within health surveys: Key issues. Health
Policy and Planning, 17(1), (2000), 106-111.
4. Putnam, R. D., Leonardi, R., & Nanetti, R.Y. Making democracy work: Civic traditions in modern Italy.
Princeton, NJ: Princeton University Press, 1993.

SCIENCE AND TECHNOLOGY 630
5. Liu, J., Qu, H., Huang, D. Chen, G., Yue, X., Zhao, X., Liang, Z. The role of social in encouraging residents’
pro-environmental behaviors in community-based ecotourism. Tourism Management 41, (2014), 190-201.
6. Boo, E. Ecotourism: The potentials and pitfalls. Washington, DC: World Wildlife Fund, 1990.
7. Brandon, K. Ecotourism and conservation: A review of key issues. Washington, DC: World Bank, 1996.
8. McLaren, M. Interpreting cultural differences: The challenge of intercultural communication. Dereham, UK: Francis, 1998.
9. Kempton, W., Boster, J. S., & Hartley, J. A. Environmental values in American culture. Cambridge, MA:
MIT Press, 1995.
10. Jantzi, T., Schelhas, J., & Lassoie, J. P. Environmental values and forest patch conservation in a rural Costa
Rican community. Agriculture and Human Values, 16(1), (1999), 29-39.
11. Jones, S. CBET the significance of social capital. Annals of Tourism Research, 32(2), (2005), 303-324.
12. Krishna, A., & Shrader, E. Cross cultural measures of social capital: A tool and results from India and
Panama. Social Capital Initiative Working Paper No.21. Washington, DC: World Bank, 2000.

SCIENCE AND TECHNOLOGY 631
IGCESH2018
Universiti Teknologi Malaysia, Johor Bahru, Malaysia 13 -15 August 2018
FEASIBILITY OF ZERO ENERGY BUILDING IN THE TROPICS:
CASE STUDY MALAYSIA
Kholoud Thabet*1, Abdul Halim Bin Hussein2
1, 2Architecture Department, Faculty of Built Environment, Johor Bahru, MALAYSIA.
(E-mail: [email protected], [email protected])
ABSTRACT
Being responsible for one-third of greenhouse gases emissions, the building sector is required
to develop suitable solutions to overcome this global issue. Therefore, many developed
countries have implemented the Zero Energy Building (ZEB) as the recommended model to
reduce carbon dioxide footprint. This took place in spite of the high cost of super insulation
and limited exposure to adequate sunshine in many parts of these countries. On the other
hand, the tropics naturally have an advantage in this aspect where the availability of sunlight
is all year round. Furthermore, there is no change in climate through seasons or significant
fluctuations in temperatures between day and night. Some tropical countries such as Malaysia
have taken a big step in green building construction. Nowadays, there is the Green Building
Index organization that rates these types of buildings. Moreover, the Feed-In -Tariff
programme facilitates the selling process of excess generated energy to the utility company.
This study aims to investigate the potential opportunity and challenges that might face the
adoption of Zero Energy Building as a typical archetype in Malaysia. The study has been
conducted through literature review. Furthermore, a comparison between high energy
efficient buildings in Malaysia and some ZEB examples in the tropics has been
accomplished. The climate consultant software was used to provide metrological data to
evaluate the design concepts and natural potentials. The study shows that the geographic
location of Malaysia justifies this approach. Besides this, the government supports efforts in
reducing greenhouse gases emissions. However, there is not enough studies or a valid
bioclimatic framework to adopt ZEB as a common affordable prototype in the face of all
prospective advantages.
Keywords: tropics, Zero Energy Building, energy consumption
INTRODUCTION
The geographic location imprints its character on any place. Malaysia is located in the
tropical zone. This strategic location provides the country with many noteworthy advantages
in constructing zero energy buildings. Moreover, the state has declared an international
commitment to reduce greenhouse gases emissions. According to the COP 21 in Paris “…
Malaysia intends to reduce its greenhouse gas (GHG) emissions intensity of GDP by 45% by
2030 relative to the emissions intensity of GDP in 2005.” [1]. Therefore, the country has
stepped forward in green building construction. Nevertheless, until this moment there is no
net zero energy building in the country.

SCIENCE AND TECHNOLOGY 632
Literature review was conducted to conduct a comparative analysis. The objective of this
analysis is to investigate the opportunities and challenges in implementing ZEB within the
Malaysian context. Two international ZEBs, that is Enerpos, in the University of la Reunion,
and BCA Academy in Singapore were studied to identify the framework for ZEB in the
Tropics. After that, two of the most efficient buildings in Malaysia: The Office Building of
the Green Energy Technology Corporation in Malaysia (Geo) and the Diamond Building
were also investigated to assess the current applications. The Climate Consultant software
provided the required meteorological data to correlate with the climate
MAIN RESULTS
The meteorological data shows that the climate condition can reduce the construction cost
for ZEB and increase the benefits of solar energy. Firstly, the country receives a natural
source of energy all year round. Secondly, the mean temperature is not far from the standard
thermal comfort range, which is from 23℃ to 26℃ [2]. Thus, the moderate mean
temperature can reduce the need for a high degree of insulation on all facades. Thirdly, there
is no extreme fluctuations in temperatures. Accordingly, the need for thermal mass to hold
the coolness from the night is intensely minimized.
The study reveals that in spite of the climate and governmental support, there is a gap in
research to establish a bioclimatic framework. Until now, there is no specific policy and
regulation related to development of ZEB[1]. This absence of clear guidelines affects the
quality of applications for zero energy buildings in Malaysia. The current applications
involve a collection of high-tech technologies of noticeable high cost to meet occupants
needs and reach the energy efficiency target.
There are several reasons that could contribute to a wrong estimation for the high cost of ZEB
aside from the absence of a bioclimatic framework, such as the selection of the pilot project’s
scale, location, type and class. The floor area of the GEO is 4000m2, which is huge and can
magnify the impact of any defect. Furthermore, the location of the building is in Kuala
Lumpur, whereas the best location to get the best potential of solar energy is in Penang or
Sarawak. Also, the building type plays a role. For example, schools have an advantage as a
pilot project because of the reduction in energy consumption during the summer vacation
while the energy production is still continuing. Finally, choosing a luxurious class building
for a pilot project can also augment the estimation of the cost.
CONCLUSION
Malaysia has a great opportunity to design and build an affordable and efficient zero energy
building. Challenges and problems can be overcome by conducting further studies to
establish a bioclimatic framework. Selecting the right pilot project’s type, location, scale and
class will provide accurate cost estimates for a ZEB. Adopting natural cooling and
dehumidification systems or even a mix between mechanical and natural cooling systems can
significantly reduce costs. More studies need to be undertaken to also ensure visual comfort
when using natural lighting in the ZEB. Successful examples in other tropical areas provide
very positive impressions for achieving the ZEB in Malaysia.

SCIENCE AND TECHNOLOGY 633
REFERENCES 1. S. A. Lojuntin, “JKR-UNDP BSEEP National Conference,” in Zero Energy Building (ZEB) in Malaysia,
2018, no. March.
2. O. Dr. Anish Kumar Roy, A. Rahim Mahmood, Balslev-olesen, S. Lojuntin, and C. K. Tang, “The 2005
World Sustainable Building Conference,” in Low Energy Office Building In Putrajaya, Malaysia. Case
Studies And Innovations Dr., 2005, vol. 2005, no. September, pp. 27–29.
3. A. Sciences, “Review of Building Energy Efficiency in the Hot and Humid Climate of Malaysia
Seyedehzahra Mirrahimi , 1 Mohd Farid Mohamed , 1 Nik Lukman Nik Ibrahim , 1 Wardah Fatimah
Department of Architecture , Faculty of Engineering , Universiti Kebangsaan Malaysia ,” vol. 14, no. 6, pp.
209–214, 2017.
4. F. Shafii and M. Z. Othman, “Proceedings of The Conference On Sustainable Building South-East Asia
(Sb07sea),” In The Design Of The Zero Energy Office Building For Pusat Tenaga Malaysia Poul, 2007, pp.
26–31.
5. S. Wittkopf, “Tropical,” no. 76 m, 2015.
6. S. M. Ashrae, “C a s e © University Of La Reunion’s Enerpos,” High Performing Buildings, Pp. 42–56,
2012.
7. P. E. By T.L. Chen, P.E., C.Eng., Fellow Ashrae; And Ahmad Izdihar, “C A S E © Mala Ysia Energy
Commission Headquarters (Diamond Building),” High Performing Buildings, Pp. 21–33, 2013.
8. H. Zhi And S. P. Rao, “The 3 Rd International Conference On Sustainable Future For Human Security
Active Energy Conserving Strategies Of The Malaysia Energy Commission Diamond Building,” Procedia
Environ. Sci., Vol. 17, Pp. 775–784, 2013.
9. P. E. Kristensen, “The Ptm Zeo Building,” No. April, Pp. 11–13, 2005.

SCIENCE AND TECHNOLOGY 634
IGCESH2018
Universiti Teknologi Malaysia, Johor Bahru, Malaysia 13 -15 August 2018
THE FORMATION OF KANGKAR:
A FRONTIER CHINESE SETTLEMENT IN JOHOR, MALAYSIA
H. C. Low*1, R. N. Raja Shahminan2 and G. Mursib3
1 Department of Architecture, Faculty of Built Environment, Universiti Teknologi Malaysia, 81310
UTM Johor Bahru, Johor, MALAYSIA.
(E-mail: [email protected],) 2 Center for the Study of Built Environment in the Malay World (KALAM), Faculty of Built
Environment, Universiti Teknologi Malaysia, 81310 UTM Johor Bahru, Johor, MALAYSIA.
(E-mail: [email protected]) 3 Institut Sultan Iskandar, Universiti Teknologi Malaysia, Jalan Sultan Yahya Petra, 54100 Kuala
Lumpur, MALAYSIA.
(E-mail: [email protected])
ABSTRACT
In the 19th century, Chinese immigrants were drawn to Johor via the entirely unique Kangchu
System that was only adapted in Johor which later contributed significantly to Johor
economic progress. This paper aims to delineate the riverine settlement for the Chinese
immigrants of pepper and gambier plantation cluster called “Kangkar”, a frontier Chinese
settlement in Johor formed under the establishment of Kangchu System. The pepper and
gambier plantation eventually evolved to rubber estate in the 1900s, and then pineapple and
oil palm estate in 1960s according to the needs. Till date, Malaysia is the world’s second
largest palm oil producer after Indonesia while Johor is the top in Peninsular Malaysia. This
marks the importance of Chinese as the frontier to modern Johor economic development. As
the formation of kangkar settlements were mainly ranged from 1844 to 1917, the historical
data was collected through content analysis of literature reviews, site visit, and interviews of
scholars. The special terms used were revealed such as Kangchu, kangkar, and “surat
sungai”. Under the implementation of Kangchu system, Johor was found more peaceful than
other states such as Selangor and Perak which encountered with inter-wars. Kangkar as a
unique Chinese living settlement which existed due to Kangchu System, plays important and
positive roles in Johor development in terms of economy, co-existence, and identity. It is
hence crucial to preserve the kangkar settlements by providing insight of guideline to sustain
and avoid further decline.
Key words: Kangkar, Chinese settlement, Johor, Kangchu
INTRODUCTION
The unstable and famine in southern China during early 19th century drove many Chinese to
leave the country to come over Malaya and Southeast Asia in making fortune. In Johor, the
Chinese immigrants were invited by Temenggung Daeng Ibrahim to help in pepper and
gambier cultivation through Kangchu System [1], [2]. Johor was the only region adapted
Kangchu system, the entirely unique and efficacious system of land-tenure as well as co-
operative gambier and pepper cultivation. Under this circumstance, a riverine settlement for

SCIENCE AND TECHNOLOGY 635
the Chinese immigrants of pepper and gambier plantation cluster called “Kangkar” was
formed [3]. Hence, this paper aims to delineate kangkar as the frontier Chinese settlement in
Johor which is unique in Malaysia.
Johor was a frontier opened by migrants, except for certain coastal areas [4]. It was estimated
only 5% of the land was developed before Kangchu System [5]. Under the implementation of
Kangchu System, Johor became the largest gambier producer in the world during 1880s
which marked its significant contribution to Johor economic progress [6], [7]. The pepper and
gambier plantation eventually evolved to rubber estate in the 1900s, and then pineapple and
oil palm estate in 1960s. Till date, Malaysia is the world’s second largest palm oil producer
after Indonesia while Johor is the top in Peninsular Malaysia [8]. This marks the importance
of Chinese as the frontier to modern Johor economic development. As the formation of
kangkar settlements were mainly ranged from 1844 to 1917, historical documentary was
opted as research method. Data was collected through content analysis of literature reviews,
site visit, and interviews of scholars.
MAIN RESULTS
Kangchu System had developed large part of virgin jungle into town and cultivated land in
Johor. The relationship between Kangchu System, Surat Sungai, and kangkar are illustrated
through Figure 1 which was further explained through findings below.
Figure 1. The virgin land of Johor was developed via Kangchu System.
Kangchu System
The Kangchu System was implemented by the Johor ruler Temenggung Daeng Ibrahim in
inviting the Chinese to develop Johor. It witnessed the vast hectares of virgin land being
opened up in Johor [6], [7]. A later Chinese observer described it as “an entirely unique and
perhaps efficacious system of land-tenure co-operative cultivation” [7]. Kangchu (lit. lord of
the river) was the name given to the Chinese headman of kangkar. They were the head of the
cultivation, the government’s administrator of the area, and held franchise on the revenue
monopolies over pawnbroking, gambling, prostitution and the sale of opium, spirits, and pork
[2].
Surat sungai or river document
Each Kangchu would have a surat sungai or River Document, basically an economic
document which comprised of a collection of contracts, or licenses [4]. This authorized them
to open pepper and gambier plantations within the watershed of a given river, stream or
tributary [9]. Trocki also opined that surat sungai offered a unique glimpse of the earliest
efforts by Malay rulers to organize a modern state.
Kangkar
Kangkar means the foot of the river in the Teochew dialect [2], [7]. It was the riverine
settlement for the Chinese immigrants of pepper and gambier plantation cluster [10]. Each

SCIENCE AND TECHNOLOGY 636
kangkar was governed by a semi-feudal Kangchu [7]. The Chinese settlers were expected to
work within the area granted as stated in surat sungai, not to interfere with any property,
land, cultivation, or village that already occupied by Malays [2]. This could be one of the
factors that Chinese and Malay live harmoniously in Johor [11].
A typical kangkar settlements comprised of a village, cultivated land and virgin jungle
recognized by the Malay authorities as granted to Kangchu in surat sungai. The size of each
kangkar varied in size, ranged from 2,500 acres to 20,000 acres of land. The town of kangkar
which was the administrative centre for all the upriver and interior settlements [9], would
made up of a Big House [2], pawnshop, opium, gambling, and prostitution concessions [6].
According to [2], the Big House known as “Tua Chu” refers to the Kangchu’s House where
two canes and a spear kept and given by the Johor ruler. It served as a local court, comprised
of a prison inside the house as well as dormitory that could accommodate nearly 100 people
[12].
CONCLUSION
Kangkar as the frontier of Chinese settlement which existed due to Kangchu System that only
occurred in Johor, is significant to historical buildings preservation and Chinese architectural
paradigm. Undeniably, it plays important and positive roles in Johor development in terms of
economy, co-existence, and identity. It is hence crucial to preserve the kangkar settlements by
providing insight of guideline to sustain and avoid further decline.
Acknowledgment: The authors would like to express their appreciation for the financial
support of the sponsor Zamalah Scholarship and Universiti Teknologi Malaysia (UTM)
through GUP Grant Tier 2.
REFERENCES
1. Trocki, C. A. (1975). Johor Archives & Kangchu System 1844-1910: A Bibliographic Essay. Malaysian
Branch of the Royal Asiatic, 48(Part 1).
2. Coope, A. E. (1936). The Kangchu System in Johore. Journal of the Malaysian Branch of the Royal Asiatic
Society, 14(3), 247–263. 3. Loh, P. (2017). My Johor Stories. Petaling Jaya: MPH Group Publishing Sdn Bhd.
4. Tachimoto, N. M. (1994). Coping with the Currents of Change: A Frontier Bugis Settlement in Johor,
Malaysia. Southeast Asian Studies, 32(2), 197–230.
5. Onn, H. J., Wu, W., & Su, K. S. (2013). The Historical Collection of Johor Ngee Heng 柔佛义兴史料集.
Johor Bahru: Johor Bahru Chinese Heritage Museum.
6. Pek, W. C. (2015). Transformation of the Chinese Society in Johor Bahru, Johor, 1855-1942 柔佛新山华人社会的变迁与整合: 1855-1942 (1st ed.). Johor Bahru: New Era College.
7. Jackson, J. C. (1968). Planters and Speculators: Chinese and European Agricultural Enterprise in Malaya,
1786-1921. Kuala Lumpur: University of Malaya Press.
8. Department of Statisctics. (2017). Percentage Share of Agriculture Sector by State, 2016. Retrieved February
27, 2018, from
https://www.dosm.gov.my/v1/index.php?r=column/cthemeByCat&cat=102&bul_id=VS9Gckp1UUpKQUF
WS1JHUnJZS2xzdz09&menu_id=TE5CRUZCblh4ZTZMODZIbmk2aWRRQT09
9. Trocki, C. A. (1976). The Origins of the Kangchu System 1740-1860. Journal of the Malaysian Branch of
the Royal Asiatic Society, 49(2), 132–155.
10. Begbie, P. J. (1967). The Malayan Peninsula. Oxford University Press. Oxford. 11. Lim, P. H. (2009). Johor 1855 - 1957 Local History, Local Landscapes. Singapore: Straits TImes Press.
12. Song, P. (2015). The Big House in Grisek. [online] My Sinchew. Available at:
http://www.mysinchew.com/node/106277/tid=13 [Accessed 26 Feb. 2018].

SCIENCE AND TECHNOLOGY 637
IGCESH2018
Universiti Teknologi Malaysia, Johor Bahru, Malaysia 13 -15 August 2018
IN-LINE CLADDED TAPERED FIBER OPTICS LIQUID
REFRACTOMETER
Nurfatin Musa2, M. Safwan Aziz*1,2, Ganesan Krishnan1,2, Mundzir Abdullah1,2,
M. Aizat Abu Bakar2, Hazri Bakhtiar1,2
1Laser Center, Ibnu Sina Institute for Scientific and Industrial Research,
Universiti Teknologi Malaysia, 81310 Skudai, Malaysia 2Department of Physcis, Faculty of Science, Universiti Teknologi Malaysia,
81310 Skudai, Malaysia (E-mail: [email protected], *[email protected], [email protected],
[email protected], [email protected], [email protected])
ABSTRACT
A simple tapered multimode fiber (TMMF) optic sensor is proposed and demonstrated as a
refractometer for liquid samples application. The working mechanism of such device is based
on the intensity modulated transmission of the tapered fiber when it is immersed in solutions
with increasing refractive index. The tapered fiber is fabricated using heat-pulling method to
achieve a waist diameter of 40, 50 and 75µm over the length of 18 mm. The performance of
the tapered fiber with different waist has been evaluated on samples of ethylene glycol
solution and glycerol. The obtained results show good correlation with the data provided by a
commercial refractometer. The main advantages of this sensor are the feasibility of using
fiber optics which enables miniaturization, easier to fabricate and handle while providing
high accuracy measurement.
Key words: Tapered multimode fiber (TMMF), intensity modulation, refractometer
INTRODUCTION
Fiber optics has attracted a great deal of attention in the field of sensors for various physical
and chemical parameters. Of the wide variety of available fiber optics sensors, fiber optics
refractometer is promising and attractive in chemical and biotechnological applications. This
is due to its advantages, such as simplicity, low-cost system, can work in hostile
environments due to electromagnetic interference immunity, and compact in size [1-2].
Refractometer based on tapered optical fiber is promising and attractive in chemical and
biotechnological applications. In this work, we study the effect of taper waist on the
performance of multimode tapered fiber refractometer based on intensity modulation of the
transmitted light.

SCIENCE AND TECHNOLOGY 638
y = -20121x + 30583R² = 0.74950
1000
2000
3000
4000
5000
1.321.331.341.351.361.371.381.39 1.4 1.411.421.43
Inte
nsi
ty (
cou
nts
)
Refractive Index (RIU)
F1-75µm
RESULTS AND DISCUSSION
Seven different media with different refractive index with range between 1.33 – 1.42 were
used. Three tapered multimode fiber (TMMF) were tested to determine its performance by
differ its waist diameter to 75 µm, 50 µm and 40 µm. Figure 1 shows same trend for each
TMMF which the light intensity modulated reduces as the refractive index of tested medium
increases.
Figure 1. Calibration curve for F1, F2, and F3
The performance of the TMMF was determined by calculating the intensity over refractive
index. TMMF with 40 µm of waist diameter shows larger value which is 75820 counts/RIU
compared to TMMF with 50 µm and 75 µm which are 44772 counts/RIU and 20121
counts/RIU, respectively. This value indicates the sensitivity of the tapered optical fiber.
y = -44772x + 64616R² = 0.9769
0
2000
4000
6000
1.321.331.341.351.361.371.381.39 1.4 1.411.421.43
Inte
nsi
ty (
cou
nts
)
Refractive Index (RIU)
F2-50µm
y = -75820x + 119348R² = 0.8793
10000
15000
20000
25000
1.32 1.34 1.36 1.38 1.4 1.42
Inte
nsi
ty (
cou
nts
)
Refractive Index (RIU)
F3-40µm

SCIENCE AND TECHNOLOGY 639
CONCLUSION
The taper waist affects the performance of the refractometer. The smaller the waist the more
sensitive the sensor. At smaller waist more light coupled into the surrounding media, due to
frustrated total internal reflection at the tapered region. This sensor is very suitable for
various refractive index measurement such as protein concentration and monitoring bacterial
growth.
Acknowlegment: I would like to express their appreciation for the support of the sponsors
with Project No Q.J130000.2526.18H67 under GUP UTM Tier 1.
REFERENCES
1. Krishnan, Ganesan, Noriah Bidin, Mundzir Abdullah, Muhammad Fakaruddin Sidi Ahmad, Mohammad
Aizat Abu Bakar, and Moh Yasin. "Liquid refractometer based mirrorless fiber optic displacement sensor."
Sensors and Actuators A: Physical 247 (2016): 227-233.
2. Fernandez-Vallejo, Montserrat, and Manuel Lopez-Amo. "Optical fiber networks for remote fiber optic
sensors." Sensors 12, no. 4 (2012): 3929-3951.

SCIENCE AND TECHNOLOGY 640
IGCESH2018
Universiti Teknologi Malaysia, Johor Bahru, Malaysia 13 -15 August 2018
ENERGY OF CAYLEY GRAPHS FOR DIHEDRAL GROUPS FOR
SPECIFIC SUBSET
Amira Fadina Ahmad Fadzil*1, Nor Haniza Sarmin
2 and Ahmad Erfanian
3
1, 2 Department of Mathematical Sciences, Faculty of Science, Universiti Teknologi Malaysia, Johor Bahru, MALAYSIA.
(E-mail: [email protected], [email protected]) 3 Department of Pure Mathematics, Faculty of Mathematical Sciences and Center of Excellence in
Analysis on Algebraic Structures, Ferdowsi University of Mashhad, Mashhad, IRAN. (E-mail: [email protected])
ABSTRACT
Let 𝐺 be a finite group and 𝑆 be a subset of 𝐺 where 𝑆 does not include the identity of 𝐺 and
is inverse closed. A Cayley graph of a group 𝐺 with respect to the subset 𝑆 is a graph where
its vertices are the elements of 𝐺 and two vertices 𝑎 and 𝑏 are connected if 𝑎𝑏−1 is in the
subset 𝑆. The energy of a Cayley graph is the sum of all absolute values of the eigenvalues of
its adjacency matrix. In this paper, we consider a specific subset 𝑆 = {𝑏, 𝑎𝑏,… , 𝑎𝑛−1𝑏} for
dihedral group of order 2𝑛, where 𝑛 ≥ 3 and find the Cayley graph with respect to the set.
We also calculate the eigenvalues and compute the energy of the respected Cayley graphs.
Finally, the generalization of the energy of the respected Cayley graphs is found.
Key words: Energy of graph, eigenvalues, adjacency matrix, Cayley graph, dihedral group
INTRODUCTION
There have been a grown of interests for many researchers to study on the energy of graph.
According to Woods [1], the study on the energy of general simple graphs was first defined
by Gutman in 1978 which are inspired from the Huckel Molecular Orbital (HMO) Theory
proposed in 1930s by Huckel. The Huckel Molecular Orbital Theory has been used by
chemists in approximating the energies related with 𝜋-electron orbitals in conjugated
hydrocarbon molecules.
In 2009, Li et al. [2] in their book stated that in the early days, when computers were not
widely available, the calculation of the HMO total 𝜋-electron energy was a serious problem.
In order to overcome the difficulty, a variety of approaches have been offered to calculate the
approximate calculation of the 𝜋-electron energy. Within the HMO approximation, the total
energy of the 𝜋-electrons, denoted by 𝜀 is then obtained which is by summing individual
electron energies. In conjugated hydrocarbons, the total number of 𝜋-electrons is equal to the
number of vertices of the associated molecular graph. After some considerations, they have
arrived at the definition of the energy 𝜀 which is the sum of the absolute values of the
eigenvalues of the molecular graph.

SCIENCE AND TECHNOLOGY 641
In 2004, Bapat and Pati [3] have proved that the energy of a graph is never an odd integer in
their research. Meanwhile, the properties that the energy of a graph is never the square root of
an odd integer has been proven by Pirzada and Gutman [4] in 2008. There are also a few
researchers who studied specifically the energy of unitary Cayley graphs (see [5], [6]).
The target of this study is to present the energy of the Cayley graphs associated to dihedral
groups for subset 𝑆 = {𝑏, 𝑎𝑏, … , 𝑎𝑛−1𝑏}. The procedure consists of finding the elements,
vertices and edges for the Cayley graphs of the dihedral groups, finding their isomorphisms,
building the adjacency matrix for the Cayley graph, finding the spectrum of the adjacency
matrix of the graphs and lastly calculating the energy of the graphs. Some properties and
general formula for the energy will also be presented at the end of the study.
PRELIMINARIES
The followings are some definitions that are used in this work.
Definition 1 [7] Dihedral Group
If 𝜋𝑛 is a regular polygon with 𝑛 vertices, 𝑣1, 𝑣2, . . . , 𝑣𝑛 and center 𝑂, then the symmetry
group Σ(𝜋𝑛) is called the dihedral group with 2𝑛 elements, and it is denoted by 𝐷2𝑛.
Definition 2 [8] Cayley Graph of a Group
Let 𝐺 be a finite group with identity 1. Let 𝑆 be a subset of 𝐺 satisfying 1 ∉ 𝑆 and 𝑆 = 𝑆−1;
that is, 𝑠 ∈ 𝑆 if and only if 𝑠−1 ∈ 𝑆. The Cayley graph 𝐶𝑎𝑦(𝐺; 𝑆) on 𝐺 with connection set
𝑆 is defined as follows:
• the vertices are the elements of 𝐺
• there is an edge joining 𝑔 and ℎ if and only if ℎ = 𝑠𝑔 for some 𝑠 ∈ 𝑆.
The set of all Cayley graphs on 𝐺 is denoted by 𝐶𝑎𝑦(𝐺).
Definition 3 [9] Adjacency Matrix
Let 𝐺 be a graph with 𝑉(𝐺) = {1,… , 𝑛} and 𝐸(𝐺) = {𝑒1, … , 𝑒𝑚}. The adjacency matrix of
𝐺 denoted by 𝐴(𝐺) is the 𝑛 × 𝑛 matrix defined as follows. The rows and the columns of
𝐴(𝐺) are indexed by 𝑉(𝐺). If 𝑖 ≠ 𝑗 then the (𝑖, 𝑗) −entry of 𝐴(𝐺) is 0 for vertices 𝑖 and
𝑗 nonadjacent, and the (𝑖, 𝑗) −entry is 1 for 𝑖 and 𝑗 adjacent. The (𝑖, 𝑖) −entry of 𝐴(𝐺) is 0 for
𝑖 = 1,… , 𝑛 We often denote 𝐴(𝐺) simply by 𝐴.
Definition 4 [9] Energy of Graph
For any graph Γ, the energy of the graph is defined as 𝜀(Γ) = ∑ |𝜆𝑖|𝑛𝑖=1 where 𝜆1, ⋯ , 𝜆𝑛are the
eigenvalues of the adjacency matrix of Γ.
MAIN RESULTS
In this section, our main results are presented. Lemma 1 is used in proving Theorem 1.
Lemma 1
Let 𝐷2𝑛 be dihedral group of order 2𝑛 where 𝑛 ≥ 3 and 𝑆 = {𝑏, 𝑎𝑏,… , 𝑎𝑛−1𝑏} is a subset of
𝐷2𝑛 . The Cayley graphs of 𝐷2𝑛 with respect to the set 𝑆, 𝐶𝑎𝑦(𝐷2𝑛 , 𝑆) are 𝐾𝑛,𝑛 . The
eigenvalues of 𝐶𝑎𝑦(𝐷2𝑛 , 𝑆) are 0 with multiplicity to 𝑛 − 2 and ±𝑛 with multiplicity 1.
Theorem 1
Let 𝐷2𝑛 be dihedral group of order 2𝑛 where 𝑛 ≥ 3 and 𝑆 = {𝑏, 𝑎𝑏,… , 𝑎𝑛−1𝑏} is a subset of

SCIENCE AND TECHNOLOGY 642
𝐷2𝑛 . The energy of the Cayley graph of 𝐷2𝑛 with respect to the set 𝑆, Ε(𝐶𝑎𝑦(𝐷2𝑛 , 𝑆)) are
2𝑛.
CONCLUSION
For conclusion, it has been found that the energy of Cayley graph of the dihedral group of
order 2𝑛 where 𝑛 ≥ 3 related to the subset 𝑆 = {𝑏, 𝑎𝑏,… , 𝑎𝑛−1𝑏} is 2𝑛.
Acknowledgement: The authors would like to express their appreciation for the support of
the sponsor; Ministry of Higher Education (MOHE) Malaysia and Research Management
Centre (RMC), Universiti Teknologi Malaysia (UTM) Johor Bahru for the financial funding
through the Research University Grant (GUP) Vote No. 13H79 and 13J82. The first author
would also like to express her appreciation to UTM for the financial support under Zamalah
Scholarship.
REFERENCES
1. Woods, C. My Favorite Application Using Graph Eigenvalues: Graph Energy. 2013.
2. Li, X., Shi, Y. and Gutman, I. Graph energy. Springer Science & Business Media. 2012.
3. Bapat, R. B. and Pati, S. Energy of a graph is never an odd integer. 2004.
4. Pirzada, S. and Gutman, I. Energy of a graph is never the square root of an odd integer. Applicable Analysis and Discrete Mathematics (2008), 118-121.
5. Foster-Greenwood, B. and Kriloff, C. Spectra of Cayley graphs of complex reflection groups. Journal of
Algebraic Combinatorics 44(1) (2016), 33-57.
6. Liu, X. and Li, B. Distance powers of unitary Cayley graphs. Applied Mathematics and Computation 289
(2016), 272-280.
7. Rotman, J. J. Advanced Modern Algebra. USA: Pearson Education. 2002.
8. Beineke, L. W. and Wilson, R. J. Topics in algebraic graph theory. Vol. 102. USA : Cambridge University
Press. 2004.
9. Bapat, R. B. Graphs and matrices. New York (NY): Springer. 2010.

SCIENCE AND TECHNOLOGY 643
IGCESH2018
Universiti Teknologi Malaysia, Johor Bahru, Malaysia 13 -15 August 2018
VEGETATIVE AND BIOCHEMICAL RESPONSES OF ELAEIS
GUINEENSIS TOWARDS NITROGEN-POTASSIUM FERTILIZER
Mohamed Redzuan Abbas1, Leong Chia Ween1, Fazilah Abd Manan*1
1Department of Biosciences and Health Sciences,
Faculty of Biosciences and Medical Engineering,
Universiti Teknologi Malaysia, 81310 UTM Skudai, Johor, Malaysia. (E-mail: [email protected], [email protected])
ABSTRACT
Oil Palm (Elaeis guineensis) is an important commercial crop in Malaysia that supplies one
of the most widely used edible oil worldwide, palm oil. However, one of the challenges that
is faced in the palm oil industry is determining the proportionate amount of fertilizer to be
used in achieving and maintaining optimal vegetative and biochemical properties. The study
aims to provide valuable insight in identifying the best quantity of nitrogen-potassium (NK)
fertilizer that stimulates the physical growth of E. guineensis as well as understanding its
effect on chlorophyll, tannins and alkaloids in its leaves. In this research, study plots planted
with oil palm plants were treated with three different treatment of NK fertilizer application
namely T1, T2, and T3, where the treatment corresponds to the control (T1), level 1 and level
2 NK fertilizer treatment (T2 & T3) respectively. Then, the plant’s vegetative growth is
measured directly and leaves samples were collected for laboratory tests. Based on the
conducted study, evidence indicates that T2 NK fertilizer treatment provided better overall
vegetative growth pattern, the highest photosynthetic pigments synthesized, and the most
distributed foliar tannins production compared to other treatments. The lowest chlorophyll
concentrations were found in T1 NK fertilizer treatment while tannins concentration found
the least in T3 treatment. Therefore, it can be concluded that T2 NK fertilizer treatment
provides the best amount of NK fertilizer for optimal vegetative and biochemical properties.
Key words: Oil palm, Fertilizer, Nitrogen, Potassium
INTRODUCTION
This study aims to provide some insight into the effects of inorganic NK fertilizer on
vegetative growth and the production of biochemical products and photosynthetic pigments
in the leaves of Elaeis guineensis. Firstly, study plots were created and planted with oil palm
treated with three different rates of NK fertilizer application (T1, T2, and T3) containing
varied amounts of Bayovar Rock Phosphate (BRP), Kieserite (KS), F’Bor, ammonium
sulphate (AS), and muriate of potash (MOP).

SCIENCE AND TECHNOLOGY 644
Table 1. Components in basal fertilizer and different rates of NK fertilizers supplemented to
E. guineensis in different treatments used in the study
Treatment
(Plot)
BRP,
kg/palm
KS, kg/palm F’Bor,
kg/palm
AS,
kg/palm
MOP,
kg/palm
T1 2.000 1.250 0.125 - -
T2 2.000 1.250 0.125 2.700 1.750
T3 2.000 1.250 0.125 5.400 3.500
Physical property analysis was conducted on site to determine the vegetative growth of the oil
palm plants. Leaf samples were also taken and analysed to deduce the effect of fertilizers on a
biochemical level. Photosynthetic related pigments on the leaves were extracted in 90% (v/v)
acetone (Otitoju and Onwurah, 2010), alkaloids in absolute acetone via cold maceration for
three days (Anupa et al., 2014) and tannins using acidified methanol (Mohammed and
Manan, 2015; Padma et al., 2013). The phytochemicals compounds were tested using
laboratory assays with Wagner’s reagent and Folin Ciocalteau’s reagent respectively.
MAIN RESULTS
From the conducted research, the results indicate that T2 fertilizer treatment is the most
suitable treatment overall. In terms of vegetative growth, T2 fertilizer treatment showed
better overall growth of the oil palm plants compared to other treatments as seen in Table 2.
Table 2. Vegetative Growth Measurements of E. guineensis for Different NK Fertilizer
Treatments. Data are mean ±standard error values (n=3)
Type of Treatment T1 T2 T3
Height of Seedling,
cm
343.50 ± 27.42 397.67 ± 6.69 348.33 ± 10.14
Girth Size, cm 193.33 ± 20.20 201.33 ± 16.29 184.67 ± 12.55
No. of Green Frond 22.00 ± 0.58
23.67 ± 1.20 23.67 ± 0.67
Length of Frond 9,
cm
235.83 ± 5.59 264.97 ± 2.55* 235.13 ± 8.63
No. of Pinnae in
Frond 9
101.00 ± 3.21 104.33 ± 5.17 105.67 ± 3.71
In terms of biochemical response, T2 NK fertilizer treatment showed the highest
photosynthetic pigments synthesized and the most distributed foliar tannins production
compared to other treatments with the lowest chlorophylls and tannins concentrations found
in T1 and T3 NK fertilizer treatment respectively.

SCIENCE AND TECHNOLOGY 645
Figure 1. Average foliar photosynthetic pigments concentrations of E. guineensis when treated
with different NK fertilizer treatments.
CONCLUSION
In conclusion, the research deduced that T2 fertilizer treatment provided the adequate amount
of nutrients to facilitate optimal growth and leading to better biochemical activity in respect
to chlorophyll, tannins and alkaloids production. This would enable better economical and
sustainable use of fertilizer in the palm oil industry that relies heavily on fertilizer use.
Acknowledgment: The authors would like to express their appreciation for the support and
contribution of Applied Agricultural Resources Sdn. Bhd (AAR) and GUP TIER1 grant
(Q.J130000.2545.13H92) throughout the duration of this research.
REFERENCES
1. Anupa, P., Vasanthakumari, B., and Citarasu, T. (2014). Qualitative phytochemical screening of leaf extracts
of Cissampelos pareira l. In different solvent system. International Journal of Bioassays, 3(10), 3399-3403.
2. Mohammed, S., and Manan, F. A. (2015). Analysis of total phenolics, tannins and flavonoids from Moringa
oleifera seed extract. Journal of Chemical and Pharmaceutical Research, 7(1), 132-135.
3. Otitoju, O., and Onwurah, I. (2010). Chlorophyll contents of oil palm (Elaeis Guineensis) leaves harvested
from crude oil polluted soil: a shift in productivity dynamic. Annals Biol. Res, 1, 20-27.
4. Padma, R., Parvathy, N., Renjith, V., Kalpana, P. R., and Rahate, P. (2013). Quantitative estimation of
tannins, phenols, and antioxidant activity of methanolic extract of Imperata cylindrica. Int J Res Pharm Sci,
4(1), 73-77.
0
5
10
15
20
25
T1 T2 T3
[Ph
oto
syn
thet
ic p
igm
ents
], m
g/g
NK Fertilizer Treatments
[Chlorophyll a], mg/g
[Chlorophyll b], mg/g
[Carotenoid], mg/g
[Total Chlorophyll], mg/g

SCIENCE AND TECHNOLOGY 646
IGCESH2018
Universiti Teknologi Malaysia, Johor Bahru, Malaysia 13 -15 August 2018
LOGISTIC REGRESSION FOR EMPLOYABILITY RATES
MODELING AMONG GRADUATES FROM PUBLIC UNIVERSITIES
IN MALAYSIA
Tengku Salbiah Tengku Mohamed1, Muhammad Hisyam Lee* 2
1, 2 Department of Mathematical Sciences, University of Technology Malaysia, Johor Bahru,
MALAYSIA.
(E-mail: [email protected], [email protected])
ABSTRACT
Graduate’s employability has become a concerning topic in Malaysia as the number of
graduates employed does not correspond to the number of graduates produced per year and
lower than its approximation. Thus, a tracer study involving investigation on graduates’
employability is a primary step in measuring the evenness between higher education and
industry demand. Accordingly, this study utilized a logistic regression method in
investigating factor that affecting graduate’s employability from a public university in
Malaysia. A recent data tracer study for the year 2016 from Ministry of Higher Education
was used to achieve the study objective. The analysis was carried out using conventional
variable selection methods in logistic regression approach which is forward selection,
backward elimination and stepwise. Part of the analysis, such multicollinearity and outlier
issue were address and removed from the dataset. The remaining observation then was
analysed and the result shows that graduate’s employability is dependent on graduate’s age,
study discipline, and CGPA. It was found that the age of graduates is the most influential
factor for graduates to get employed. Moreover, it shows that discipline in Science has the
highest market demand in Malaysia followed by Literature & Social Sciences, Information
Technology & Communication and, Technique. The model then was diagnosing, giving
47.20% correctly classified for graduate’s employability status and produce a high area
under the Receiver Operating Characteristics (ROC) curve with 0.853.
Key words: Logistic regression modelling, variable selection methods, tracer study, graduate’s
employability
INTRODUCTION
Tracer study is a follow-up study involving former participants of education programs. It is a
backward look investigation in identifying the impact that has been achieved on students who
have given a specific training [7]. This study is crucial especially universities to discover
their programmed effectiveness, trace on graduates’ employability, sharing information in job
opportunities and identify industry expected skills [4,5]. Presently, graduates in Malaysia are
facing a stiff competition in ensuring their first job as there are increase number of graduates
each year. In previous study related to graduate’s employability such study by Mmab Modise,
[2] indicates that non-traditional research model career workshop is another strategy to
reduce mismatch between labor market needs and graduate competencies by assist student in

SCIENCE AND TECHNOLOGY 647
discovering their capability, give inspiration and widen their horizon in holistic approach.
While study by Mugwisi [3] shows that Master of Science in Library and Information
Science programed have its market value and position assurance in Zimbabwe by applying
survey method. Conversely, the purpose of this study is to identify what are the factors that
could affect the graduate’s employability among graduates from public universities in
Malaysia involving 78,941 of graduates. Logistic regression is a favor method in this study as
it can serve both probabilistic outcomes along with classifying graduate's employability.
There are several factors have been considered to be included from student’s profile such as
gender, age, education level, states, university, discipline, CGPA, sponsor, entry
qualification, English and Malay grades. The analysis was carried out and use the maximum
likelihood estimator method as a parameter estimation. Generalized variation inflation factor
(GVIF) and Cook distance are the indicator to measure multicollinearity and outlier problems
respectively. Whereas the model will be diagnosed by popular method in logistic regression
area which is Akaike Information Criteria (AIC) for goodness of fit [6,1], prediction accuracy
and area under ROC. The Wald Chi-square statistics also will be applied in this study to test
the significant factors in logistic regression model.
MAIN RESULTS
Logistic regression equation for graduate’s employability was written below and Table 1
report the result of binary logistic regression.
Table 1. Binary Logistic Regression Results for Graduate’s Employability from Public
Universities in Malaysia
Factors Wald Odd Ratio Sig.
Constant 424.43 0.000 0.000
Age 463.66 4057.396 0.000
CGPA 252.35 0.009 0.000
Discipline
Literature & Social Science 70.48
Science 231.91 694.900 0.000
Technique 118.36 0.065 0.000
Information Technology & Communication (ICT) 23.80 6.384 0.000
Classification % correct 47.20%
Area under ROC 0.853
Part of the analysis, variables with highly correlated and outliers has been removed and
remaining factors with 46,198 observations were analyzed using logistic regression
method. Table 1 reports the outcome of logistic regression based on maximum likelihood
estimation and shows that graduate’s employability is dependent on their age, study
discipline and CGPA at 5% of significant level. Based on the result, increase in one year
of graduate’s age will be 4057.396 more likely for them to get hired. Meanwhile, Science
field has high market demand in the industry as stated, showing 694.90 more likely to get
employed compared to Literature and Science Social followed by Information
Technology & Communication and Technique respectively. Moreover, the result shows
CGPA of graduates also significantly affect graduate's employability in Malaysia.
)(709.4)(854.1
)(739.2)(5437.6)(308.84343.159)_ln(
CGPAICT
TechniqueScienceAgeemployedGraduates
−
+−++−=

SCIENCE AND TECHNOLOGY 648
Additionally, the benefits of this model are calculated using the AIC method and it shows
1052.60 of AIC value. Although the value is quite high the parsimony principal in
selecting best model still holds in terms of selecting the least number of factors.
Prediction of classification correctness then was measured by those three factors and
indicates that 47.20% of them are correctly classified for graduate’s employability status.
Besides that, the classification correctness was supported by area under ROC curve
showing the model are well separated the employed and unemployed graduates with
0.853.
CONCLUSION
In order to determine the essential factors that affecting graduate’s employability, such a
tracer study is a primary step needs to be done. Accordingly, the most recent data of tracer
study for the year 2016 was used by applying the appropriate method to achieve the
objective. By using logistic regression, the factors have been selected not only based on
appropriate variable selection method but also supported by Wald Chi-square statistics in
determining important factors. It shows that age, discipline of study, and CGPA of graduates
are the aspect that could influence graduate’s employability from public universities of
Malaysia.
Acknowledgment: The authors would like to express appreciation toward UTM Zamalah
scholarship for their encouragement to author to participate in this activity. This study was
partially funded by the Ministry of Higher Education, Malaysia through the Research
University Grant for Universiti Teknologi Malaysia (grant number 15H64).
REFERENCES
1. Liu, C., Shi, T. & Lee, Y. Two Tales of Variable Selection for High Dimensional Regression: Screening and
Model Building. Statistical Analysis and Data Mining 7(2) , (2014) 140-159
2. Modise, M. O. Career Workshop as a Non-Traditional Research Model for Enhanced Relationships between
Higher Education and the Labour Market. International Journal of Training and Development 20(2) (2016), 152-163.
3. Mugwisi, T., and Lawton, H. A Tracer Study of Master of Science in Library and Information Science
graduates from the National University of Science and Technology, Bulawayo, Zimbabwe. African Journal
of Library, Archives & Information Science 25(2) (2015), 173-183.
4. Noko, P., and Ngulube, P. A Vital Feedback Loop in Educating and Training Archival Professionals: A
Tracer Study of Records and Archives Management Graduates in Zimbabwe. Information Development
31(3) (2015), 270-283.
5. Sapaat, M. A., Mustapha, A., Ahmad, J., Chamili, K., and Muhamad, R. A Classification- Based Graduates
Employability Model for Tracer Study by MOHE. Communications in Computer and Information Science
(2011), 277-287.
6. Sato, T., Takano, Y., Miyashiro, R., & Yoshise, A. Feature Subset Selection for Logistic Regression Via Mixed Integer Optimization. Computational Optimization and Applications 64(3) (2016), 865–880.
7. Suryani, K., Khairudin, and Syahmidi, E. Online Tracer Study of Bung Hatta University. International
Journal of Geomate 13(37) (2017), 20-27.

SCIENCE AND TECHNOLOGY 649
IGCESH2018
Universiti Teknologi Malaysia, Johor Bahru, Malaysia 13-15 August 2018
A NEW DIGITAL ID SYSTEM on INDONESIA VEHICLE USING IoT
Slamet Winardi*1, Sri Wiwoho Mudjanarko
2, Benediktus Anindito
3, Wahyu Mulyo
Utomo4
and Natalia Damastuti5
1, 3, 4, 5 Faculty of Computer Science, Narotama University, Surabaya, INDONESIA.
(E-mail: [email protected], [email protected], [email protected], [email protected])
2 Faculty of civil engineering, Narotama University, Surabaya, INDONESIA.
(E-mail: [email protected])
ABSTRACT
The use of license plate has long been used as the identity of vehicles in Indonesia. It is used
according by district and city administration area. It is made of aluminum material. It has a
thickness of 1 mm, dimension 250 × 105 mm for motorcycle and dimensions of 395 × 135
mm for car. It uses police logo as copyright. The problem is the license plate is still non-
digital as vehicle identity. [1][6], have done the initial research of digital license plate. This
study aims to change the conventional license plate into a modern license plate. The use of
this modern license plate is part of the Internet of Things of today's transportation. Internet of
Things serves to identify vehicles while simultaneously identifying every vehicle on the
highway. Methodology of design of digital ID used Chip on vehicle . The vehicle chip
contained a large data of the identity of the vehicle owner. It was expected that monitoring
the code of vehicle region in an integrated manner with the help of internet network will be
more easily controlled. This research spawned the innovation of a digital vehicle ID number
of modern vehicles in Indonesia.
Keywords: Vehicle, License Plate, Digital ID, IoT
INTRODUCTION
According to the Central Bureau of Statistics, the growth of vehicles consisting of cars,
motorcycles, buses and trucks in July 2016 reached 124,348,224 units. [2] said that the rapid
growth of this vehicle contributed to congestion in the city. The large number of vehicles has
the potential to cause motorists to break traffic. The addition of roads 0.01 only increases
every year. Police are overwhelmed in the supervision and regulation of vehicles because the
number of officers and the number of vehicles on the highway is not balanced. To identify
vehicles on the road is still difficult because the vehicle ID system still uses a manual system
made of aluminum plate. Monitoring and identification equipment of each vehicle digitally is
essential to facilitate monitoring and regulation by police officers. Each vehicle is fitted with
a chip containing the identity of the vehicle and transmitted continuously while on the
highway through the Wi-Fi signal so that the identity of the vehicle is always identified on
the highway [3].

SCIENCE AND TECHNOLOGY 650
Identity and License Plate of Vehicle in Indonesia
In the Law of the Republic of Indonesia Number 22 Year 2009 on traffic and road transport,
it regulates about vehicle registration and license plate as the identity of vehicles that must be
registered. Article 64 through Article 70 and Article 78 regulate the process of registration
and identification of vehicles and issued certificate of ownership of vehicles, vehicle
registration number, and license plate as proof of identity of the vehicle. [4] states that the
forms of vehicle identity issued by the police are as follows:
Figure 1. Certificate of Ownership of Vehicles, Vehicle Registration Number, and License
Plate
MAIN RESULTS
Figure 2. Digitizing Process of Vehicle License Plate
Figure 3. New Digital ID System on Vehicle Using IoT

SCIENCE AND TECHNOLOGY 651
Figure 4. Vehicle Identification System with License Plate
CONCLUSION
After designing and testing the tool, it can be concluded from the new vehicle license plate
system in Indonesia using IoT as follows:
1. Facilitate the process of Identification of vehicles because the ID created digital
system stored in a chip.
2. In the event of a crucial problem; such as loss of vehicles, odd numbered restrictions,
and restrictions on fuel purchases; it will be easy to realize because it can use the
system for the identification process.
3. The vehicle ID is transmitted by a vehicle with a Wi-Fi signal so it can be monitored
at any time and certain locations by installing a motor vehicle ID scanner.
Acknowledgment: Thanks to Menristekdikti who has provided research grant funds so that
we can attend an international conference with the paper we send. Thanks also to the Rector
of Narotama University who has given our support to attend international conference.
REFERENCES
1. Mudjanarko, S. W. & Winardi, S. & Limantara, A. D. Pemanfaatan Internet of Things Sebagai Solusi
Manajemen Transportasi Kendaraan Sepeda Motor. Prosiding Seminar Nasional Aplikasi Teknologi & Prasarana Wilayah (ATPW), 5 Agustus, (2017) .Surabaya.
2. Mudjanarko, S. W., Harnen, 2013, Behaviour Model of Motor Cycle User in Selecting Parking Location
(Case study in Surabaya City of Indonesia), Journal of Basic and Applied Scientific Research, J. Basic. Appl.
Sci. Res., 3(7)842-846, (2013), ISSN 2090-4304.
3. Saputra, B., Winardi, S., Mudjanarko, S. W., & Inayati, I., Identitas Digital Kendaraan Bermotor Dengan
Chip Wemos Untuk Solusi Program Plat Nomor Genap Ganjil, Prosiding Seminar Nasional Ilmu Terapan
(SNITER) Universitas Widya Kartika, (2017), Surabaya, ISSN: 2597-7067 B03-1 – B03-8
4. Winardi, S., Kamisutara, M., Purworusmiardi, T., Sukoco, A., Mudjanarko, S. W., Internet of Things (IoT)
as Green City Economic Development Smart Transportation System, MATEC Web of Conferences,
(2017), EDP Sciences , Volume 138, pages 07015
5. Limantara, A. D., Krisnawati,L.D., Winardi, S., Mudjanarko, S.W., Solusi Pengawasan Kebijakan
Mengatasi Kemacetan Jalan dan Parkir Kota Berbasis Internet Cerdas, Prosiding Seminar Nasional Teknologi dan Rekayasa Informasi, Fakultas Ilmu Komputer Universitas Brawijaya, (2017), ISBN: 978-602-
50782-0-0, pages 1-6.
6. Mudjanarko, S.W., Winardi, S., Prasetijo, J., Harmanto, D., Chip Number Vehicle Applications as Part of
Internet of Thing (IoT), Sustainable Transportation Infrastructures Smart Driving Research Center (SDRC),
Penerbit UTHM, ISBN 978-967-2110-70-5, page 84

SCIENCE AND TECHNOLOGY 652
IGCESH2018
Universiti Teknologi Malaysia, Johor Bahru, Malaysia 13 -15 August 2018
SUCCESS FACTORS OF WOMEN ENTREPRENEURSHIP IN
ADAPTING CHALLENGES OF VULNERABILITY IN TOURISM
BUSINESS
Nurzafirah Dan*1 and Hairul Nizam Ismail2
1, 2 Department of Urban and Regional Planning, Faculty of Built Environment, Universiti Teknologi
Malaysia, 81310 Johor Bharu, Johor, MALAYSIA.
(E-mail: [email protected], [email protected])
ABSTRACT
Langkawi Island as an established tourism destination and is one of the well-known example
as to how women played an important role in economic development. In this case,
development of tourism business since 1980s, for women entrepreneur in Langkawi Island
has undergone several phases and encounter enormous pressure from various challenges
through their beginning operation. Obviously, the challenges make up from the issues of
vulnerability on seasonality, trends and shocks in either directly or indirectly and affecting
their local community livelihoods. Pertaining to the situation, this paper attempts to explore
success factors influencing women entrepreneurship in adapting the challenges from
vulnerability in tourism bussiness. Using the qualitative research method, in-depth and face to
face interviews were conducted with 13 representatives of successful women entrepreneurs,
which emphasizes their adaptation and response from this challenges. The result reveals
work-life balance and securing funding as key success factors in addition to internal attitude
and personal support. This indicates that women entrepreneurship in Langkawi are more
resilient in adapting vulnerability. The response allowed the women to independently serve
any circumstances and in this context that make them resilient to the changes on tourism
business and able to sustain for more than 2 or three generation. In this order, the success
factors will be examined and assist the effort to directing communities for participation of
women entrepreneurship in high income economies based.
Key words: Women Entrepreneurship, Success Factor, Adaptation, Vulnerability
INTRODUCTION
The changing gender roles with increasing participation of women in the workplace and in
leadership position, especially in tourism entrepreneurship has been given special attention in
the country [1]. Langkawi Island holds a wide scope of tourism products that can be
advertised as opportunities for local economic growth and women said to play an important
role in economic development as well as stabilize the economy during the recession period.
As tourism begins to be accepted as part of livelihood strategy, the seasonality, trends and
shocks of vulnerability become the greatest challenges faced by most tourism destinations
and has a significant influence on livelihood assets and outcomes [2]. Consequently, this was

SCIENCE AND TECHNOLOGY 653
observed in Langkawi as an established tourism destination after undergone several phases in
tourism development since 1980s.
In [3], understanding of vulnerabilities context encompasses seasonality, trends and shocks
and thus, resilience of women in tourism entrepreneurship is exceedingly significant. Within
this context, the issue remains as to how the business women’s community is able to adapt
and respond to the changing world economy and demand from the society within the context
of vulnerability. In terms of this challenges, Lai et al. stated that there are several factors that
contribute to the success of women entrepreneur such as self-confident personalities,
willingness to take risks, past working experience and innovative ideas when it comes into
resiliency [4]. Alam et al. also defined women entrepreneurs referred to their close family
members as their main source of financial, informational and emotional support, but later
on, there is a significant relationship between family supports and the success of a woman
entrepreneur ([4] and [5]).
In relation to above, this paper attempts to explore the success factors influencing women
entrepreneurship in adapting the challenge from seasonality, trends and shock to enhance
their participation in tourism entrepreneurship. The data derived from qualitative
approach design using emerging themes and employed thematic analysis. A semi-
structured questionnaire was utilized as a guideline and in-depth interviews attempted to
gain information from the purposive and snowball sampling of 13 successful women
entrepreneurs. The data collection focused on the major challenges of vulnerability
context that faced by the women entrepreneurs throughout their businesses and their
success factors to adapt it. As a result, the output will assist tourism development in
directing communities for participation of women entrepreneurship in high income
economies based and capable to sustain for more than 2 or three generation.
SELECTED RESULTS
The Interviews result attempt to gain information about their personal experience in
building businesses in adapting to seasonality, trends and shocks as shown in table 1.
Table 1. Success Factors of Women Entrepreneurship in Langkawi Island adapt to
Vulnerability Context
Sub-theme Theme Vulnerability Factor
Seasonality Trends Shocks
• Flexibility
• Independent
• Responsibility
• Daily Routine
Work-life
balance • Contribute in
yearly seasonal
event, business,
family
n/a • Deceases
• Unfamiliar work
environment
• Collective Money
• Gold Jewelry
• Family
Financial
Secure
Funding • Low season –
expenses to
survive
• Bank loan- avoid
financial
debt
• Financial Shocks
• Lack of
trust to pay
back loan
• Creativity
• Passionate
• Spontaneous
• Risk Taker
Internal
Attitude • Discount and
modification
due to low peak season
• Technology
in marketing
• Market
trends-pricing
n/a

SCIENCE AND TECHNOLOGY 654
• Family
• Spouse
• Child
• Peer/ Close
Friend
Personal Support
n/a • High of
competitive
• Unfamiliar
family matters
CONCLUSION
From the interview results, the following conclusion can be drawn as:
i. The earlier findings by Alam et al. which claimed that strong support from insiders,
such as parents and/or husbands is very important to the success of women
entrepreneurs. This notion also similarly by Lai et al., such as creativity, risk taker and
internal attitude also assist them in response to vulnerability context.
ii. The others two motivation and success factors found that an inbuilt quality of women
entrepreneurship which helps in contributing to the role of securing funding and add
value to family income. They are also prioritize their role as a wives, mothers and
homemakers. Being own boss, give them work-life balance to manage business and
family matters. The key success factors of women entrepreneurs are forming today
and the response allowed them to be independently serve any circumstances respond
to vulnerability context later making their entrepreneurship resilient and able to
sustain for more than 2 or three generation.
Acknowledgment: The authors would like to thank the previous research grant obtained under
the Research University Grants (GUP) Tier 1[grant no: Q.J130000.2521.17H30] for project fund
provided and Zamalah Scholarship Universiti Teknologi Malaysia (UTM) for the sponsorhip.
REFERENCES
1. Othman, N., Ismail, R., and Othman, N. Impact of globalization on entrepreneurship education and
entrepreneurial skills in higher education institutions. International Conference on Economics, Trade and Development 36(2) (2012), 84-89.
2. Willroth, P., Massmann, F., Wehrhahn, R., and Diez, R.J. Socio-economic vulnerability of coastal
communities in southern Thailand: the development of adaptation strategies. Natural Hazards Earth Syst.
Sci. 12 (2012), 2647–2658.
3. Masud, M.M., Kan, F., Yahaya, S.R.B., and Al-amin, A.Q. Livelihood assets and vulnerability context of
Marine Park Community. Development in Malaysia. Social Indic. Research 125 (2016), 771-792.
4. Lai, K.P., Nathan, R.J., Tan, K.S and Chan, B.B. Effect of innovation to success of female entrepreneurs.
Journal of Innovation Management in Small and Medium Enterprise (2010), 1-14.
5. Alam, S.S., Jani, M.F.M., and Omar, N.A. An empirical study of success factors of women entrepreneurs in
southern region in Malaysia. International Journal of Economics and Finance 3(2) (2011), 166-175.

SCIENCE AND TECHNOLOGY 655
IGCESH2018
Universiti Teknologi Malaysia, Johor Bahru, Malaysia 13-15 August 2018
FLEA MARKET TOURISM : A REVIEW OF SPECIALISED
TOURISM MARKET MOTIVATION
Hazlina Aniza Mohd Hazlan1, Hairul Nizam Ismail
2, Syed Muhammad Rafy Syed
Jaafar3
1 Master Candidate, 2 Associate Professor, 3 Senior Lecturer,
Department of Urban and Regional Planning, Faculty of Built Environment, Universiti Teknologi Malaysia, 81310 Johor Bahru, Johor, MALAYSIA.
(E-mail: [email protected], [email protected], [email protected])
ABSTRACT
This is a conceptual paper address the opportunity of flea market as a trend which begins to
receive recognition as one of tourism product; or in other word so called flea market tourism.
Nowdays, flea market capturing attention as one of the weekend activities for visitor and
tourist either inbound or outbound region. One of the most establish flea market in Malaysia
and listed in booklet titled Malaysia Flea Market Galore is an indoor flea market in Amcorp
Mall, Petaling Jaya. It has been selling antique, collectibles and used goods from various era.
However, while the rise of flea market tourism has been understood in developed country,
the research in the developed country such as Malaysia is still limited. Therefore, this paper
attended to examine the factors relevant to the motivation of this specialised tourism market.
Understanding of the characteristics of flea market in Malaysia context is very vital to
flourish the maximum experience in order to allowed the activities to occurred. As a result,
variable for flea market in creating demand and the need to capture the market can be fully
understood. The variable of factor discussed in this paper involve uniqueness of the market,
variety of products, leisure activities, treasure-hunting, affordable items and local cultures.
Thus, the distinctive features of the flea market tourism will be able to be promoted as a
complete tourism product.
Keywords: flea market tourism, motivation, specialised tourism
INTRODUCTION
In 2014, the 25th edition of the Malaysia Visitors Guide 2014 (25th edition of Malaysia
Visitors Guide) has turned the flea market into one of the tourist destinations available in
Malaysia. The most popular flea market and remains to this day is the flea market at Amcorp
Shopping Center located in Petaling Jaya, Selangor. In July 2017, once again the flea market
was introduced as a tourist destination in a booklet titled Malaysia Flea Market Galore
published by the Ministry of Tourism and Culture Malaysia. Malaysia has concentrated and
aware that flea market can have a huge impact on Malaysia's development.
According to some researchers who have looked at the flea market in terms of marketing,

SCIENCE AND TECHNOLOGY 656
they argue that flea market is categorized as second-class marketing system, where the flea
market is a very attractive business to study especially when it comes to economic recession.
[5]
In [2], the flea market can be defined as a closed or open range where traders sell various
items from non-partition booths. Sales activities can describe as informal due to lack of
regulations and does not required large cash transactions. While most of flea markets have
similarities to this definition, they are now in various forms, terms and regulations. It offers a
variety of different products with different customer target groups and is owned and operated
by various types of organizations.
LITERATURE REVIEW
Flea Market as An Interaction Place
The visitor’s intent to visit the flea market is due to factors of sale, social aspect and
background factors of the buyer [4]. Typically, in Malaysia, flea markets, night markets and
car boot sales have the same concept. In most of the flea market products sold are the same as
clothing, food, old items and handicrafts. However, the flea market has its own distinctive
features as the sale of antiques makes the flea market a unique place to visit and shopping for
middle and low-income visitors. The flea market also promotes interaction among local
communities and provides opportunities to meet each other.
Visitors Motivation on Flea Market
Table 1.0. This table shows the previous study
Author Element in characteristics
Ackerman dan Walker
(2012)
➢ Interesting environment
➢ The unique feature of a market.
➢ Diversity of goods.
➢ Negotiable.
➢ The goods sold are unique and attractive.
➢ Gathering with friends and family.
➢ Have interactions between buyers and sellers.
Petrescu dan Bhatli
(2013)
➢ Goods :
➢ Cheap items.
➢ Agreements and offers (deals and bargain)
➢ Variety products.
➢ Antique and unique items.
➢ Social Aspects :
➢ Be able to negotiate with traders.
➢ Variety of culture.
➢ Spending time with friends.
Ha (2014) ➢ Interesting environment
➢ Treasure-hunting
➢ Exciting and Surprising
➢ Goods have an attractive offer.
➢ Window-shopping.
Jaleel dan Nasir (2015) ➢ Attractive place and unique.
➢ Place for middle group
➢ Open air market

SCIENCE AND TECHNOLOGY 657
Zakariyah et al. (2016) ➢ Local products.
➢ Attractive and famous.
➢ Local cultures.
➢ Affordable items.
➢ Quality products.
➢ Interested in local residents.
➢ Provide specific facilities.
Recommendation For Flea Market Tourism
Based on the precious research of the flea market, many researchers point out about social,
product and environment aspects. Among the visitors, in the social aspects, they like to
interact with the seller and other visitors who share the same interests and experiences. The
products that offered in the flea market have their own uniqueness and antique features. The
environment also plays an important role in visiting the flea market because of the
interesting, fun and convenience place. It is also provide the enjoyment of activities to
visitors, friends and family members.
These three aspects are the main motivation for visitors visiting the flea market. The writer
can see that Malaysia is not widely studied about flea market in the field of tourism which
can give a true picture of the similarities and differences of flea market in Malaysia and
globally.
CONCLUSION
In Malaysia, flea market has become one of the tourist attractions over the weekend. It is also
a compulsory activity for the weekend for those who like antiques and used. The flea market
can be a new tourism product in the complex and potentially a tourism product in Malaysia
using the terms of Flea Market Tourism in the new field of tourism. This is because previous
researchers study the flea market as a business area, but do not see it as an innovative tourism
product to assist in regenerate the city.
Acknowledgement: The authors would be like to thank ZAMALAH Scholarship Universiti
Teknologi Malaysia (UTM) for the sponsorship for this study.
REFERENCES
1. Ackerman. D, Walker. K., (2012). Consumption of renao at a Taiwan night market, International Journal of
Culture, Tourism and Hospitality Research, Vol. 6 Issue: 3, pp.209-222,
https://doi.org/10.1108/17506181211246366.
2. Ha N.H. (2014). Buy, Sell and Chatter: A Case Analysis of a Lisbon Flea Market. Masters Degree in
Economics, Nova School of Business and Economic.
3. Hyder Jaleel, and Wan Mohd Nazdrol Wan Mohd Nasir, (2015) Marketing to the bottom of pramid -
consumer behavior at Flea Market. In: The Proceedings of The 4th International Seminar on
Entrepreneurship and Business (ISEB 2015). Faculty of Entrepreneurship and Business, UMK, pp. 492-467. ISBN 9789670955032
4. Petrescu, M. dan Bhatli, D. (2013). Consumer Behavior in Flea Markets and Marketing to the Bottom of the
Pyramid. Journal of Management Research. 13 (1), 55-63.
5. Sherry, J. F. (1990). A Sociocultural Analysis of a Midwestern American Flea Market. Journal of Consumer
Research. 17,13-28.
6. Zakariya K., Kamarudin Z. dan Harun N.Z. (2016). Sustaining the Cultural Vitality of Urban Public
Markets: A Case Study of Pasar Payang Malaysia. International Journal of Architectural Research, 10(1),
228-239.

SCIENCE AND TECHNOLOGY 658
IGCESH2018
Universiti Teknologi Malaysia, Johor Bahru, Malaysia 13 -15 August 2018
REQUIREMENTS FOR BIM ADOPTION
Chiew Teng, Ng*1, Siti Uzairiah binti Mohd Tobi2 and Mohammad Syazli bin Fathi3
1,2,3Razak School of Engineering and Advanced Technology, University Teknologi Malaysia, Kuala
Lumpur, Malaysia
(E-mail: [email protected], [email protected], [email protected]) 1Faculty of Built Environment, Tunku Abdul Rahman University College, Kuala Lumpur, Malaysia
(E-mail: [email protected])
ABSTRACT
Building Information Modelling (BIM) is the digital description model of a building,
managing all the information and a shared knowledge resource. BIM can enhance the
communication and collaboration among all of the construction practitioners, reduce reworks,
time and cost. However, the adoption of BIM in Malaysia context is still at a dissatisfactory
level. The main reason is lack of understanding and lack of clear guidance. This research
aims to provide an insight of the requirements for BIM adoption. Pilot interviews with 5
participants from different organisations have been carried out followed by multiple
embedded case studies to investigate the requirement for BIM adoption from the developers'
perspective. As a result, this research investigates the elements that the construction industry
stakeholders should consider when doing decision making.
Key words: BIM, Building, Construction Industry, Requirements, Malaysia
INTRODUCTION
What is BIM?
Building Information Modelling (BIM) is the process of creating a digital model of a building
and managing all the information before, during and after construction. The whole BIM
lifecycle process consists of conceptual design, detailed design, documentation, collaboration
and coordination, construction, prefabrication and facility management. BIM is not a
software but a methodology. BIM can be used to authorize data, manage data or to extract
data throughout the project lifecycle. Therefore, BIM is the digital description of every aspect
of the built asset. BIM is also a shared knowledge resource of information which can be
extracted, exchanged or network to support for decision making.
BIM has pave a new avenue to the construction industry in developing country like Malaysia.
It is a concept of “you build before you build”. BIM is a new approach to facilitate the
design, prefabrication and as built management, in which a digital representation of the
building process is used to assist the exchange and interoperability of data in digital format
[1, 2].

SCIENCE AND TECHNOLOGY 659
Problem statement
BIM has attracted much attention from the Architect, Engineering, Contractors, Operators and Owners (AECOO) from Malaysia construction industry during the last few years. The
BIM users can embrace wide spectrum of benefits by BIM adoption. However, the
implementation of BIM is still at a discouraging and dissatisfactory level in developing
countries especially Malaysia. According to [3], the implementation of BIM is facing many
difficulties such as fragmentation of BIM users, it is still unclear about how to apply BIM.
There is lack of detailed guidance in how BIM could be best utilised in order to gain the
optimum benefits [4]. Hence, this research is to explore the requirements and propose a
conceptual framework for right approach to initiate BIM implementation from stakeholders’
views and opinions.
RESEARCH METHODOLOGY
A pilot interview has been conducted by interviewing 5 BIM experts from both public and
private sectors. All the interviewees are very helpful and responsive. It takes about 1 and half
hours for every interview session. The interview is audio-record and the transcript been
produced. Accordingly, the data was gathered though the pilot interview. A content analysis
technique was used to better analysed the data collected. Content analysis is used as a tool to
discover and identify patterns of ideas from interview transcript. The discovered patterns are
then identified as the requirements of BIM adoption.
MAIN RESULTS
Figure 1. The Elements of Requirements for BIM Adoption

SCIENCE AND TECHNOLOGY 660
CONCLUSION AND WAY FORWARD
This research gives a insight of the right approach to initiate BIM implementation. It is very
important to have a better understand on the requirements of BIM implementation in
Malaysia Building Construction industry. Future works can more focus on the other
developing countries.
Acknowledgment: The authors would like to express their appreciation for the support of the
Centre for Construction Research from Faculty of Built Environment, Tunku Abdul Rahman
University College
REFERENCES
1. Zanni, M. A. Communication of sustainability information and assessment within BIM-enabled
collaborative environment. Loughborough University, Ph.D. Thesis, 2017
2. Alomari, K., Gambatese, J. and Anderson, J. Opportunities for Using Building Information Modeling to
Improve Worker Safety Performance. Safety, 3(1), (2017) 7
3. Nguyen, P. T., Nguyen, T. A., Truong, N., Ha, H. and Nguyen, T. N. Facilities management in high rise
buildings using building information modeling. International Journal of Advanced and Applied Sciences,
4(2), (2017) 1–9
4. Gerrish, T., Ruikar, K., Cook, M., Johnson, M., Phillip, M. and Lowry, C. BIM application to building
energy performance visualisation and managementChallenges and potential, Energy and Buildings. Elsevier
B.V. 144 (2017) 218–228

SCIENCE AND TECHNOLOGY 661
IGCESH2018
Universiti Teknologi Malaysia, Johor Bahru, Malaysia 13 -15 August 2018
STUDY OF EQUILIBRIUM AND PRE-EQUILIBRIUM NEUTRON
EMISSION FOR ORDINARY MUON CAPTURE
F.Othman*1, I.H.Hashim*1
1Department of Physics, Universiti Teknologi Malaysia, 81310 Johor Bahru, Malaysia;
(E-mail:[email protected],[email protected])
ABSTRACT
Neutron emission has been shown to be the majority reaction when a muon was captured on
nuclei. The isotope distribution associated with the number of neutron emission may provide
useful information to nuclear excitation energies of the target nuclei. The neutron emission
model for muon capture experiment has been developed in 2014 to explain the probability of
neutron emission and finally provide relative strength distribution of ordinary muon capture.
The present works undertake the study of equilibrium (EQ) and pre-equilibrium (PEQ)
neutron emission after muon capture. The influence of PEQ/EQ ration is observed. The
statistical calculations results are compared with the previous observation on neutron
emission from muon capture by 12C,28Si, 32S, 40Ca, 204Tl, 207Pb and 209Bi experiment.
Keywords: Neutron emission model, Nuclear excitation energy, Nuclear muon capture
INTRODUCTION
Muon capture rate relates with double beta decay. Muon will have the same response as
neutrino as they are in the same family which is lepton. To capture neutrino is not easy, we
can only use the available facility. Therefore, we capture muon as muon is heavier than an
electron and the capture probability is high. In order to study neutrino, we have β decay,
inverse β decay and muon capture process. For β decay and inverse β decay there already
many experiments on it. So, in this study we try to expose from muon side which does not
have many experiments on it. Ordinary muon capture (OMC) are alternatives to study the
nuclear matrix element (NME) of double beta decay experiment. In order to understand
its relationship and contribution towards double beta decay neutrino nuclear response, a
neutron statistical model has been developed in 2014[1]. In 2014, the statistical model is
designed by taking into consideration 15% ratio of pre-equilibrium (PEQ) to equilibrium
(EQ) neutron emission ration and excitation energy from 0 to 70 MeV. The calculation
has been compared with experimental data of 100Mo target using level density parameter 8
MeV. From observation, the first giant resonance (GR) peak EG1 is observed at 10 – 15
MeV, while EG2 at 28 – 32 MeV provides the best agreement with the experimental
observation in 100Mo target.

SCIENCE AND TECHNOLOGY 662
An extended study to determine the PEQ and EQ neutron emission ration effects towards
isotopic distribution after OMC on 100Mo, 109 Ag and 89Y has been done in 2016[2] using
the same neutron statistical model. Three relative strength distributions are proposed and
evaluation using χ2 analysis. The model with EG1 = 10 -15 MeV is the most suitable to
validate the experimental observation using 100Mo, 109 Ag and 89Y. The study concludes
that 30% PEQ to EQ ratio gives a realistic comparison with experimental observation.
The aim of present work is to address the influence of PEQ/EQ ratio based on comparison
with previous statistical model and experimental work of OMC on 12C, 28Si, 32S, 40Ca, 204Tl, 207Pb and 209Bi experiment.
MAIN RESULTS
Figure 1. EQ/PEQ versus A for different value of x coefficient
Figure 1 shows EQ/PEQ versus A for different x coefficient. When the atomic mass
number increasing, the EQ/PEQ ratio will be decreasing. Most neutron reaches
equilibrium after OMC on light nuclei while in heavy nuclei neutron evaporates much
faster in the PEQ stage. The Ʃχ2 analysis from the comparison of seven nuclei shows that
influence of pre-equilibrium neutron emission contribution after muon capture process is
0.1 for light nuclei and 0.01 for médium and heavy nuclei which reproduces the realistic
neutron emission spectra for 12<A<220. The best constant x for Carbon is 0.10 with Ʃχ2 =
6.8954, for Sillicon is 0.01 with Ʃχ2 = 26.5028, for Sulphur is 0.01 with Ʃχ2 = 0.6840, for
Calcium is 0.01 with Ʃχ2 = 0.8859, for Thallium is 0.01 with Ʃχ2 = 2.4998, for Lead is
0.01 with Ʃχ2 = 1.5430, and for Bismuth is 0.01 with Ʃχ2 = 0.01436.

SCIENCE AND TECHNOLOGY 663
CONCLUSION
This study shows that the influence of PEQ to EQ neutron emission contribution and its
excitation energy depends to its nuclear stability. Light nuclei often to have smaller PEQ
contribution compare to heavy nuclei. The best result EQ/PEQ is 0.1 for medium nuclei
and 0.06 for heavy nuclei based on the all plotting graph with seven different elements of
Carbon, Silicon, Sulphur, Calcium, Thallium, Lead and Bismuth.
Acknowledgement: The author would like to express her appreciation for the support of
Zamalah scholarship UTM. She also would like to acknowledge RCNP, Osaka University
and Billion Prima Sdn. Bhd (vot no:R.J130000.7626.4C153) for the funding of the E489
experiment.
REFERENCES
1. Hashim, I.H., A Study of Weak Nuclear Response by Nuclear Muon Capture. Osaka University, Ph.D.
Thesis, 2014.
2. Saroni, S. S. (2016). Development of Neutron Statistical Calculator for Muon Capture Reaction September
27, 2016 Universiti Teknologi Malaysia, Malaysia.

SCIENCE AND TECHNOLOGY 664
IGCESH2018
Universiti Teknologi Malaysia, Johor Bahru, Malaysia 13 -15 August 2018
A COMPARATIVE ANALYSIS OF PROPRIETARY GIS AND
FREE/OPEN SOURCE SOFTWARE ON LAND USE
CLASSIFICATION
Muhammad Azizol Ismail*1, Ahmad Nazri Muhamad Ludin2 and Nafisa Hosni3
1, 2, 3 Department of Urban and Regional Planning, Faculty of Built Environment, Universiti Teknologi
Malaysia, Johor, MALAYSIA.
(E-mail: [email protected], [email protected], [email protected])
ABSTRACT
Land use and land cover (LULC) is the basic assumption to identify the global ecology or
environmental changes. Thus, it is paramount to detect the nature and magnitude of these
changes in order to determine its direction of future expansion. To accomplish that, Remotely
Sensed data from Sentinel Satellite was acquired for the purpose of land cover classification
analysis in Iskandar Malaysia in year 2017. To execute land cover analysis, proprietary GIS
software (ArcGIS 10.3.1) and free/open source software (QGIS 3.0) were deployed. The sum
of 248 random points were established for the assessment purpose. The results showed
overall accuracy for ArcGIS and QGIS are 91% and 89% respectively. ArcGIS produced
better user accuracy in forest and agriculture land cover. Meanwhile, QGIS produced better
user accuracy in built-up and water features.
Key words: Land classification, FOSS4G, GIS, Remote Sensing, Urbanisation
INTRODUCTION
Cities are dynamic; this is because change is inevitable. These changes can be attributed to
one factor or the other depending on socio economic, political and climatic condition of a
given area. As the population of a given area increase, the demand for land cover such as
built up area also increase, while other land cover classes such as bare land, vegetation,
decreases as a result of the increased demand for built up area. Consequently, these changes
in most cases if not continuously monitored will associated with certain negativities, which
may affect not only the environment but also its inhabitants. However, an accurate and up-to-
date LULC information is necessary in understanding and assessing the environmental
consequences of such changes (Giri et al., 2005). Remote Sensing has the capability of
capturing such changes, extracting the change information from satellite data requires
effective and automated change detection techniques (Roy et al., 2002).
Many works related to LULC analysis have been conducted by using the proprietary software
such as ArcGIS, ERDAS Imagine, and ENVI. This decade, the Free and Open Source
Software for Geospatial (FOSS4G) has emerged to facilitate and coordinate geospatial
analysis. However, there is a lack of scientific studies on the use of FOSS4G in spatial
planning (Friedrich, 2014). Hence, this paper seeks to utilize remotely sensed data and GIS

SCIENCE AND TECHNOLOGY 665
tools to analyze the land cover taking Iskandar Malaysia (IM) as the case study. It is
necessary to systematically compare the possibilities of FOSS4G (QGIS) as an alternative to
the established proprietary software (ArcGIS) in the field of sustainable spatial planning. The
IM’s image satellite for the year of 2017 is downloaded from the United State Geological
Survey (USGS) website. In QGIS, supervised classification could be conducted using the
Orfeo Toolbox. Meanwhile in ArcGIS it is performed with the ArcGIS Spatial Analyst
extension through the Image Classification toolbar. The comparison are conducted to
investigate overall accuracy, user accuracy, and producer accuracy derived from ArcGIS and
QGIS.
MAIN RESULTS
The output are evaluated based on the below assessment:
i. Overall accuracy (%) = (Correctly classified pixels / Total number of pixels)
ii. User’s accuracy / commission error (%) = (Correctly classified pixels / Classified
total pixels?
• Commission error = 1 – user’s accuracy
iii. Producer’s accuracy / omission error (%) = (Correctly classified pixels / Reference
total pixels)
• Omission error = 1 – producer’s accuracy
a) For ArcGIS:
Table 1. Error matrix of unsupervised classification in ArcGIS
i) Overall accuracy
= 91%
Figure 1. Unsupervised classification in
ArcGIS Figure 2. Unsupervised classification in
QGIS

SCIENCE AND TECHNOLOGY 666
ii) User’s accuracy and producer accuracy
b) For QGIS
Table 1. Error matrix of unsupervised classification in QGIS
i) Overall accuracy
= 89 %
ii) User’s accuracy and producer accuracy
CONCLUSION
This decade shows the emerge of Free and Open Source Software. QGIS is one of the leading
FOSS4G software. This study investigates land cover analysis conducted in GIS proprietary
software ArcGIS and FOSS4G QGIS. ArcGIS shows higher overall accuracy which is 91%
compared to QGIS which is 89%. However, the deficit is small. In fact, QGIS produce better
user accuracy in classifying built-up and water features.
Acknowledgment: This work is financed by Zamalah/Institutional Scholarship provided by
Universiti Teknologi Malaysia and the Ministry of Higher Education of Malaysia.
REFERENCES
1. Friedrich, C. Comparison of ArcGIS and QGIS for applications in sustainable spatial planning. PhD diss.,
uniwien, 2014.
2. Giri, C, Zhu Z and Reed B. A comparative analysis of the Global Land Cover 2000 and MODIS land cover data sets. Remote Sensing of Environment 94 (2005), 123-132.
3. Roy D P, P E Lewis and C O Justice. Burned area mapping using multi-temporal moderate spatial resolution
data—A bi-directional reflectance model-based expectation approach. Remote Sensing of Environment 83
(2002) 263-286.

SCIENCE AND TECHNOLOGY 667
IGCESH2018
Universiti Teknologi Malaysia, Johor Bahru, Malaysia 13 -15 August 2018
SECOND HOME PROGRAMMES DEVELOPMENT AND MALAYSIA
EXPERIENCE
Mohd Jamsyeer Khan*1, Siti Hajar Misnan2 and Hairul Nizam Ismail3
1 PhD Candidate, 2 Senior Lecturer, 3 Associate Professor, Department of Urban and Regional
Planning, Faculty of Built Environment, Universiti Teknologi Malaysia (UTM), 81310 Johor Bahru,
Johor, MALAYSIA.
(E-mail: [email protected], [email protected], [email protected])
ABSTRACT
Second homes primarily used for leisure and recreation, which located away from the city.
The scenario changed over the years as there are a lot of programmes, namely second home
or international migration programmes around the world that promote and attract the
foreigners, not only to live in other countries but also giving the opportunities to invest in the
reporting economy. However, previous literature which has studied second home
programmes does not give overview of the programmes elsewhere, rather than focusing on
programme individually. In Malaysia context, Malaysian government has introduced
Malaysia My Second Home (MM2H) programme, an international residency scheme that
allows the foreigners to live in Malaysia on a long stay up to 10 years. These does not
exclude other countries to do so, as in Canada, Spain, Portugal, Singapore and Philippines.
Thus, the aim of this paper is to review comprehensively on the development of second
homes and second home programmes, to study the pattern behind the evolution, including
lessons from Malaysia experience. This paper explains range of historical developments of
second homes and second home programmes, in relation of international differences in
practice, and the connection with Malaysia experience, MM2H programme. Although this
paper will not provide in depth contribution on institutional theory, however it provides an
important foundation for further theoretical development, which also offers useful review for
case studies of practice.
Key words: Second Homes, Malaysia My Second Home (MM2H), Leisure, Property Investment,
Retirement Planning
INTRODUCTION
Second homes are homes which are located away from their primary homes, where they are
purposely owned to get away from the busyness and chaos of the city. Initially second homes
are built or purchased by the locals themselves for the reason of leisure and recreation [2].
Over times, where second homes are firstly introduced for the locals to have another home as
their vacation homes [4], the trends are changing its path where there have been programmes
those giving the opportunities for the foreigners to stay and live in other country as their
second home. The major factors behind this scenario are due to rapid rising in income which
leads with higher income disposal and high return on real estate investment [3].

SCIENCE AND TECHNOLOGY 668
Furthermore, not to discuss in this paper on the impact of the incoming foreigners into the
reporting nation but somehow the development of second homes through this kind of
programmes giving additional advantages to the nation, especially in terms of foreign direct
investment (FDI) [1]. However, although there are a lot of these programmes studied by
previous literature, few works are giving the overview on this kind of programmes
internationally, rather than only focusing on the programmes individually.
In the context of developing second home programme for the foreigners, Malaysia is not an
exception as Malaysia is now leading this kind of programme in Asia. In 2002, the
government of Malaysia, through Ministry of Tourism and Culture (MOTAC) has introduced
Malaysia My Second Home (MM2H), which is an international residency scheme that allows
foreigners to live in Malaysia on a long stay visa up to 10 years [6]. This is supported by
International Living (2018), where Malaysia is placed in top 5 world’s best place to retire.
It is found that there are three (3) main objectives behind international migration occurred
around the world, namely, i) recreation and leisure through holiday or vacation homes, ii)
retirement planning mainly from pension funds and, iii) investment through purchasing
property abroad (investment portfolio) [5][7][8][9][10]. Moreover, besides Malaysia, second
home programmes also been conducted in other countries through different approaches, such
as Golden Visa in Spain and Portugal, Vacation/ Secondary Homes Program in Canada,
Malta Global Residence Programme in Malta, etc. Every programme has its own aim and
benefits for the applicants and participants.
Thus, this paper aims to review comprehensively on the development of second homes and
second home programmes across timeline and countries, giving range of historical
development and international differences respectively. Besides, it is to study the pattern
behind the evolution, looking into various aspects on institutional structure, objectives and
packages the programmes offered, and lastly to examine it from the perspectives and position
of Malaysia My Second Home (MM2H) programme. It is recommended for further studies to
examine the implications of second home programmes to the economy, especially the
impacts of incoming foreigners to locality.
MAIN RESULTS
Figure 1 shows the evolution of second home development and researches’ focus over the
years. The development of second homes drastically increased since 1980’s after the
emerging of international migration programmes, in relation of international tourism
development those occurred around the world. However, the research on MM2H only started
around 10 years since the implementation of the programme itself, giving the gap of studies
made onto this type of programmes offered.
Nevertheless, Figure 2 indicates the second home and international migration programmes
around the world, where they are focused mainly in Asian countries due to the fact of
varieties of cultures, weather and stable political and economic structure.

SCIENCE AND TECHNOLOGY 669
Figure 1. Evolution of Second Homes development (Muller and Hall, 2004; Tress, 2002)
Figure 2. Second Home/ International Migration Programmes around the globe
CONCLUSION
Briefly, it is found that second homes development initiated in Nordic countries, where the
locals purposely use them for leisure and recreation, which experienced major developments
on 1980’s due to emerging of international migration programmes. Investment and retirement
planning as the factors behind the purchase of second homes came later. It also can be
deducted that every programme focused on different groups of people for distinct purposes,
namely retirees and elites for retirement planning and property investment respectively. The
comprehensive review on the second home programmes development is used as groundwork
for further theoretical development and offers useful background for case studies of practice.

SCIENCE AND TECHNOLOGY 670
Acknowledgment: The authors would like to express their appreciation and gratitude for the
sponsorship support to Universiti Teknologi Malaysia through ZAMALAH scholarship.
Furthermore, the publication of this paper would help on the completion of the author’s1
dissertation thesis.
REFERENCES
1. Arnett, G., (2014). Foreign direct investment: which countries get the most?. The Guardian. Retrieved from
https://goo.gl/55Xxa3 on 14th September 2017.
2. Farstad, M., & Rye, J. F. (2013). Second home owners, locals and their perspectives on rural development.
Journal of Rural Studies, 30, 41–51.
3. Huang, Y., & Yi, C. (2011). Second Home Ownership in Transitional Urban China. Housing Studies, 26(3).
4. Kyllesbech, S. (2009). Second homes: ‘House Lives’ across borders. ENHR 2009 – Workshop 12: Housing
and social theory.
5. Lundmark, L., & Marjavaara, R. (2013). Second Home Ownership: A Blessing for All? Scandinavian
Journal of Hospitality and Tourism, 13(4), 281–298. 6. MM2H, 2017. About MM2H Programme. Official Portal of Malaysia My Second Home Portal. Retrieved
from http://www.mm2h.gov.my on 11th September 2017.
7. Müller, D. K. (2011). The Internationalization of Rural Municipalities: Norwegian Second Home Owners in
Northern Bohuslän, Sweden. Tourism Planning and Development, 8(4), 433–445.
8. Müller, D. K. (2007). Second Homes in the Nordic Countries: Between Common Heritage and Exclusive
Commodity. Scandinavian Journal of Hospitality and Tourism, 7(3), 193–201.
9. Norris, M., & Winston, N. (2010). Second-Home Owners: Escaping, Investing or Retiring? Tourism
Geographies, 12(4), 546–567.
10. Rogers, D., & Koh, S. Y. (2017). The globalisation of real estate: The politics and practice of Foreign real
estate investment. International Journal of Housing Policy, 17(1), 1–14.

SCIENCE AND TECHNOLOGY 671
IGCESH2018
Universiti Teknologi Malaysia, Johor Bahru, Malaysia 13 -15 August 2018
A STUDY OF THE QUALITY OF PROPERTY VALUATION REPORT
IN KADUNA METROPOLIS, NIGERIA
Bilkisu Adamu Aliyu*1 and Muhammad Hassan2
1,2 Department of Estate Management and Valuation, Nuhu Bamalli Polytecnic, Zaria, NIGERIA.
(E-mail: [email protected], [email protected])
ABSTRACT
The study examines clients’ perception of the quality of valuation reports in Kaduna
metropolis with a view to examining their satisfaction level and thus improving on the quality
of the valuers’ reports. The survey method employ the use of self-administered questionnaire
coupled with interview to obtain the relevant data. A total of 15 Banks and 20 estate
surveying and valuation firms were studied. Data collected were analyzed using tables and
relative importance index. The result of the examination of 18 valuers’ reports in comparison
with the standard expected shows that valuers’ reports were meeting the standard. The result
also showed 53.3% of the banks are at least satisfied with overall contents of their valuation
reports. However the examination of clients’ needs revealed that they would prefer to see
more details on the reports. The result shows that “clients demand more information on the
larger property market and valuation calculation to convince them on how the valuers arrived
at the value; a portion stating the complexity of the market and the position of the property in
the market; more emphases on the analytical aspects of the valuation and the estate surveyors
and valuers should state how certain they are about the valuation figures”. The study
concluded that there should be greater understanding between the clients and estate surveyors
with respect to the needs of the clients in the area of valuation reports as well as greater
understanding of the limitation of the value figure.
Key words: Property Valuation, Valuation Report, Quality, Clients, Estate Surveyors and
Valuers
INTRODUCTION
The issue of professional valuation practice standards has recently been the focus of attention
in many parts of the world. In particular, the issue of the quality of valuation reports has also
been the focus of considerable international attention in recent years; particularly in Australia
and the UK. General issues of professional valuation standards and the quality of valuation
reports have been examined in these countries.
In Nigeria, the profession of valuation is regulated by the Nigerian Institution of Estate
Surveyors and Valuers (NIESV) and Estate Surveyors and Valuers Registration Board of
Nigeria (ESVARBON). The Professional Code of Conduct provides rules and guidance to
valuers, and a number of quality control mechanisms exist. However, because the valuation
market is highly competitive and according to Aluko (2007), when clients are not satisfied
with the quality of service received they might tend to look elsewhere to satisfy their
demands. This may lead to others who are not estate surveyors and valuers intruding into the

SCIENCE AND TECHNOLOGY 672
domestic domain of valuers in the country. In addition to this, it is particularly important that
the quality of valuation reports is assessed on a regular basis (Newell, 2005). This, according
to the author, is because of the significant change in the property industry in recent years
when related to valuation practice particularly in Australia, the Nigerian property industry is
no exception. As a result of this development, this study examines the external users’ (clients)
views of the quality of valuation reports in the Nigerian mortgage valuation practice.
MAIN RESULTS
The research addressed two study populations. The first was estate firms of estate surveyors
and valuers based in Kaduna metropolis, Nigeria. Kaduna is the headquarters of the old
Northern region of Nigeria and presently housing the highest number of valuation firms head
offices in that region. The sample frame of these firms was secured from the directory of the
Nigerian institution of estate surveyors and valuers, Kaduna state branch. Accordingly, a total
of 20 Estate Surveyors and Valuation firms in Kaduna metropolis were presented with
questionnaires in a cross-sectional survey. Respondents were selected based on a simple
random sampling frame work.
The second study population was the clients of estate surveyors and valuers in Kaduna
metropolis. Clients (users of valuation report) include Banks/Lending institutions (Mortgage
Valuation), Insurance Companies (Insurance Valuation), Kaduna State Valuation Office
(Rating Valuation), Internal Revenue (Probate Valuation), Property Developers
(Development Valuation) and Individuals. However, the study only covered the client of
Mortgage Valuation which in this case is Banks. The sample size of these Banks is 15 out the
24 Mega Banks licensed for operation in Nigeria as at July 2016 (Central Bank of Nigeria).
Accordingly, a total of 15 questionnaires were administered to these Banks based on a simple
random sampling. To measure the perception of driven factors, the paper employed ordinal
scale (Likert type) questioning. Such data were analysed using the relative importance index
(a form of weighted average ranking). The relative importance index (RII) of each factor was
determined using the following expression: RII = 𝛴𝑤𝑓/𝑁. Where:𝑤 = 𝑤𝑒𝑖𝑔ℎ𝑡, 𝑓 = 𝑓𝑟𝑒𝑞𝑢𝑒𝑛𝑐𝑦 of specific responses and 𝑁 = 𝑡𝑜𝑡𝑎𝑙 𝑓𝑟𝑒𝑞𝑢𝑒𝑛𝑐𝑦. Essentially, each point on the
ordinal scale is assigned a weight and the weight so assigned was multiply by the frequency
of responses for that scale. The resulting product was then divided by the total frequency.
CONCLUSION
The paper examined Clients’ (Banks) views of the quality of mortgage valuation reports in
Kaduna metropolis. The result showed that most of the banks are at least satisfied with the
overall content of their valuation reports but would prefer to see more of those things that
would guarantee the recovery of loan if the mortgage defaults in payment as at when due.
From the research, issues that fascinate the interest of the banks and which they would prefer
to see more in their reports but which most of the estate surveyors and valuers have not been
including in the reports include: State of the economy as at the date of valuation.
• Demand for property in the larger property market.
• Valuation calculations in order to appreciate how the valuers arrived at their values.
• There should be a portion stating the complexity of the market and also the position of the
property in the market.
• The estate surveyors and valuers should state how certain they are about the valuation
Figures given.

SCIENCE AND TECHNOLOGY 673
These findings were seen as having important implication on the overall quality of valuation
reports according to the clients. In meeting the needs and expectations of clients, the above
listed items need to be included in the report to curb them from looking elsewhere to satisfy
their needs.
The result also revealed that some valuers sometimes habitually give a minimalist response in
providing only what is specifically requested by clients that are in agreement with the
standard of the Nigerian Institution of Estate Surveyors and valuers.
In conclusion, the authors were with the opinion that even if professional guidance does not
require the addition of some particular information, this is not a defence against providing it
if a competent estate surveyor and valuer believe it should be provided. The converse is also
true. Nonprovision of an element required by professional guidance is not necessarily proof
of negligence. While there can be no doubt that adherence to the many excellent precepts of
the Guidance’s Note of the Nigerian Institution Estate Surveyors and Valuers will normally
be both a good practice and good riskavoidance on the part of the valuers, it will also be a
doubtful shield for valuers who fail to provide assistance which they, as competent estate
surveyors and valuers, generally known to be necessary to their clients. Situations where
valuers refuse to disclose information required by mortgage valuation clients or the provision
of information which the valuer knows or believes to be of no benefit to the clients without
comment to that effect may constitute abdication of professional responsibility and, as such, a
breach of the duty of care. If valuers are to provide the service expected of them, they must
establish not only what the client requires but also be able to satisfy their needs.
REFERENCES
1. Adair, A. and Hutchison, N. The reporting of risk in real estate appraisal property risk scoring. Journal of
Property investment and Finance 23(3): (2005), 254-268. 2. Aluko, B. T. Implications of the Current Trends in Mortgage Valuation Practice in Nigeria.
International Journal of Strategic Property Management, 11, (2007)1731.
3. Crosby, N. Valuation accuracy, variation and bias in the context of standards and expectations. Journal of
Property Investment and Finance 18(2): (2000) 130-161.
4. Newell, G. Client Perception of the Quality of Valuation Reports in Australia. Australian Property Journal.
(2005).
5. Newell, G and Barrett, V. “The Quality of Valuation Reports”. The Valuer, 31(2): (1990). 9698.
6. Newell, G. The Quality of Valuation of Valuation Reports of Australia. Sydney: The Appraisal Journal
(1999).
7. Ogunba, O. A. and Ajayi, C.A. “An Assessment of the Accuracy of Valuation ofValuations in the Residentia
l Property Market of Lagos”. The Estate Surveyor and Valuer.

SCIENCE AND TECHNOLOGY 674
IGCESH2018
Universiti Teknologi Malaysia, Johor Bahru, Malaysia 13 -15 August 2018
AN INVESTIGATION INTO THE TRANSPORT LOGISTICAL
CHALLENGES IN THE DISTRIBUTION OF FARM INPUT SUBSIDY
PROGRAM: A CASEOF EAST BANK (MALAWI)
A. Gryson KC Msuku*1, B. Dr. Zuhra Junaida Husny2 and C. Mohammed AS
Alzahrani3
1, 2 Faculty of Built Environment, UTM, JB, MALAYSIA.
(E-mail: [email protected], [email protected]) 3 Faculty of Built Environment, UTM, JB, MALAYSIA.
(E-mail: [email protected])
ABSTRACT
The market price of a product is determined by many factors. One of the factors that
influence the market price is the transport cost. Transport cost is the expense that is factored
in, to come up with a selling price of the product. Transport cost is passed on to the buyer for
moving the product closer to the consumer. The aim of this research, is therefore to find out
the transportation problems that had led to the late distribution of farm inputs in some of the
parts of Malawi. The area under study is called East Bank. It is an area located in the
Southern part of Malawi. In order to understand what is involved in this field of study,
secondary data had been compiled on some problems that are encountered during
transportation processes. But because this particular study involves distribution of farm
inputs, which is time sensitive, that is why it is very important to find out the cause of delays
in the distribution of the inputs. The findings of this research could assist in solving future
recurring problems in most parts of the world that rely on agriculture, as a source of food and
income.
Key words: Farm Input Subsidy Program, Transportation
INTRODUCTION
Transport is key to the success of Farm Input Subsidy Program distribution in Malawi.
However, for many years, there had been delays in the distribution of subsidies which lead to
low agricultural productivity. One of the affected areas is the East Bank region which is
located in the southern region of Malawi. This region is prone to floods from the Shire river,
which is the only outlet of lake Malawi. East bank, is the eastern part of the Shire river. The
place is impassable during the rainy season because of poor road infrastructure. This calls for
early distribution of farm inputs so that the farmers have access to the seeds and fertilizer
before the roads are damaged by the rains.
Transportation plays a major role in the efficient movement of products. Delivery of goods
and services on time would make the consumer use it during the time that he wants.
Perishable goods need to be delivered quickly before they lose their value and go bad.

SCIENCE AND TECHNOLOGY 675
An example could be vegetables and fruits. Many people would want to purchase them fresh.
Likewise, farm inputs like seeds and fertilizers must be procured on time ready for use.
People relying on rains are supposed to procure the seeds and fertilizers before the rains so
that as the growing season start, the farm inputs are ready. In Agro industries, logistics and
transport plays a major role to boost production as well as minimizing the cost of the final
product. That is why it is very important to coordinate logistics and Transportation.
Malawi, aim to eradicate extreme poverty and hunger in order to achieve the Millennium
Development Goals (MDGs). One of the strategies used, is through Farm Input Subsidy
Program (FISP) which if well executed could boost agricultural productivity.
PROBLEM STATEMENT
Transportation of fertiliser from national depots to the retail outlets in various parts of the
country is carried out by the private sector as there is no any participation of state owned
enterprises. Private transporters are selected through competitive bidding. However, over
the years there has been a delay in the distribution of farm inputs resulting in reaching the
intended beneficiaries late. Statements from government officials site transportation and
logistical challenges in the distribution process of FISP. The study therefore would like to
identify the logistical and transportation problems which result in the delay in the
distribution of farm inputs to some parts of Malawi.
RESEARCH GOALS AND OBJECTIVES
The main purpose of this study is to investigate the reasons why the farm inputs in the FISP
reach the intended beneficiaries late when this program is well funded and budgeted for.
Specific objectives include determining the reasons why farm inputs are delivered late and
why only the private sector transports the inputs. Another objective is to establish logistical
challenges associated with the distribution process and then coming up with solutions to
address them.
DATA COLLECTION
Agricultural officials in the Ministry of Agriculture and food Security, would be interviewed
with semi structured questions on the problems highlighted in the research. This would be
done in order to get rich data from them. A questionnaire with structured questions will also
be used to collect data from transporters involved in this program. Both open and close ended
questions will be used. Secondary data from literature will also form part of this research.
DATA ANALYSIS
Since this research involves both qualitative and quantitative data, Statistical Package for
Social Science (SPSS) will be used to analyse the data.
CONCLUSION
Transportation is one of the most important components in our everyday life. The price of
commodities constitutes a good percentage of the transportation cost making the product
costly. This calls upon solutions to solve transportation challenges in order to make product
prices lower. If the same principle is applied to farming, agricultural productivity would be

SCIENCE AND TECHNOLOGY 676
boosted if the farm inputs reach farmers on time so that farming is not hampered with late
planting and application of fertilizer.
Acknowledgement: The authors would like to thank God for the gift of life without which,
there could be no chance to writing. Research findings would assist in solving challenges
affecting humanity such that the results from this research could assist in transformation of
people’s lives to fight hunger.
REFERENCES
1. Abdi, H. N. (2004) ‘The influence of rural logistics and rural transport costs on farm income and poverty in
Kenya: the case of Kisumu and Nyandarua Districts, Kenya’, World Bank Report, p. 72
2. Adeoti, A. I., Oluwatayo, I. B. and Soliu, R. O. (2014) ‘Determinants of Market Participation among Maize
Producers in Oyo State, Nigeria’, British Journal of Economics, Management & Trade Original Research
Article British Journal of Economics Management & Trade, 4(47), pp. 1115–1127. 3. Asia Life Sciences (2018) ‘Market access and productivity of smallholder maize farmers in Lepelle-Nkumpi
Municipality, Limpopo Province, South Africa’, (1), pp. 35–38.
4. Chakwizira, J., Nhemachena, C. and Mashiri, M. (2010) ‘Connecting transport, agriculture and rural
development: Experiences from Mhlontlo local municipality integrated infrastructure atlas’, Proceedings of
the 29th Southern African Transport Conference (SATC), (August), pp. 209–223.
5. Chatterjee, L. and Tsai, C. (2000) ‘Transportation logistics in global value and supply chains’, … Report
Prepared for Bureau of Transportation …, pp. 1–17.
6. Daniela, nedelescu L. and Rujan Ovidiu (2004) ‘Why do logistics and Transport matter for development’,
(Ballou), pp. 34–39.
7. Development, F. M. for E. C. and (2001) ‘The Contribution of Transport to Rural Development’, Improving
the Accessibility of Rural Areas, 3, pp. 1–47. 8. Development, R. (2017) ‘Rural Transport for Agriculture and Rural Development and Agriculture
Transportation’.
9. Dorward, A., Chirwa, E. and Jayne, T. S. (2011) ‘The Malawi Agricultural Inputs Subsidy Programme,
2005/6 to 2008/9’, World Bank, 9(January), pp. 1–38.
10. Economic and Social Council (2011) ‘Transport logistics’.
11. FAO (2017) Impacts of modifying Malawi’s farm input subsidy programme targeting.
12. Forward, S. et al. (2014) ‘Challenges and barriers for a sustainable transport system – exploring the potential
to enact change’, (May), pp. 1–63.
13. Government of Malawi (2008) ‘Food Security Action Plan’.
14. Government of Malawi (2016) ‘Food Insecurity Response Plan’.
15. Grabara, J., Kolcun, M. and Kot, S. (2014) ‘The role of information systems in transport logistics’,
International Journal of Education and Research, 2(2), pp. 1–8. 16. Grazia Speranza, M. (2018) ‘Trends in transportation and logistics’, European Journal of Operational
Research. Elsevier B.V., 264(3), pp. 830–836. doi: 10.1016/j.ejor.2016.08.032.
17. Ifeanyi-Obi, C. C. et al. (2017) ‘Challenges faced by cocoyam farmers in adapting to climate change in
Southeast Nigeria’, Climate Risk Management. The Authors, 17, pp. 155–164. doi:
10.1016/j.crm.2017.04.002.
18. Kidder, B. (2006) ‘The Challenges of Rural Transportation’, pp. 10–19.
19. Piantanakulchai, M. and Saengkhao, N. (2003) ‘Evaluation of Alternatives in Transportation Planning using
Multi-stakeholders Multi-objectives AHP Modeling’, Proceedings of the Eastern Asia Society for
Transportation Studies, 4(2003), pp. 1613–1628.
20. Shively, Gerald E, Ricker-Gilbert, J. (2013) ‘Measuring the Impacts of Agricultural Input Subsidies in Sub-
Saharan Africa’, Purdue Policy Research Institute, 1(1). 21. Transportation Research Board (2013) ‘Critical Issues in Transportation’, Critical Issues in Transportation,
p. 16.
22. Tseng, Y., Yue, W. L. and Taylor, M. A. P. (2005) ‘The role of transportation in logistics chain’, Eastern
Asia Society for Transportation Studies, 5(June), pp. 1657–1672. doi: 10.1017/CBO9781107415324.004.
23. Yang, X. (2013) ‘A Review of Distribution Related Problems in Logistics and Supply Chain Research’,
International Journal of Supply Chain Management, 2(4), pp. 1–8.

SCIENCE AND TECHNOLOGY 677
IGCESH2018
Universiti Teknologi Malaysia, Johor Bahru, Malaysia 13 -15 August 2018
THE EFFECT OF TRANSPORTATION COST ON HOUSING
AFFORDABILITY: A REVIEW
Nur Adilah Binti Abdullah*1 and Foziah Binti Johar 2
1, 2 Urban and Regional Planning, Universiti Teknologi Malaysia, Johor Bahru, MALAYSIA.
(E-mail: [email protected], [email protected])
ABSTRACT
Housing affordability is usually measured based on the basis of income and direct costs such
as mortgage repayments and rents. One important cost that is not included in calculations is
transportation costs. However, there are leaking proof of the transportation costs impacts to
the housing affordability. A literature search was conducted for studies and reviews of the
transportation costs effect on housing affordability. There are some factors of transportation
costs that effect on housing affordability which is location of home and workplace, access to
public transport, car ownership and dependency and gas or fuel prices. The specific method
to calculate the housing affordability by including the transportation in the equation were
used to give an integrated affordability index and give some picture how the transportation
costs give an impact on affordability for selected area. Most studies reported findings that
generally supported the view that transportation costs have affect the housing affordability.
The finding provides consumers, policy makers and urban planners with the information
needed to make better decisions about which neighbourhoods are truly affordable.
Key words: Housing affordability, Transportation Cost, Affordability Index
INTRODUCTION
Globally, an increasing number of population shift towards urbanization in occurring. The
development of the housing growing faster in order to cater this number of population. Thus,
urban sprawl for the low-density expansion of the urban fringe has typified the contemporary
development of many cities such in Australia, North America and the British Isles (Mattingly
and Morrissey, 2014). The lower density urban forms tend to result in decreased accessibility,
longer average transport distances and greater private vehicle use. Furthermore, while
housing developments spreading out from the urban core tend to be newer and larger, then
transportation infrastructure makes car ownership necessity. In the other side, both housing
and transportation costs can be lower in the compact neighbourhoods within the urban core
because usually neighbourhoods in this area is smaller and older, but residents can more
easily get to jobs, shopping, and amenities by transit and walking.
Recent year, the value of land is being incorporated into the price of a home based on its
location and proximity to jobs and amenities but there is less interpret about the effect of
transportation costs associated with an efficient or inefficient location on these values.
Usually in outlying areas, the costs of a home are lower because land is cheaper but the
transportation costs can be much higher and can often surpass the savings on housing costs
(CNT, 2009). The cost of transportation currently not factored in to the housing affordability

SCIENCE AND TECHNOLOGY 678
has being considered to family budgets by given their choices to live father from jobs and the
pattern of development force them to use their cars more often to send or take their children
to school. Thus, the affordability of housing should be considered the transportation costs
related with where their home is located. It is the interaction between housing and location
that present a more meaningful measure of affordability.
Housing and transportation represent the two largest categories of household expenditure.
Table 1 show the shares of average annual average annual expenditures on selected major
components by composition of consumer unit 2016. From the table its show that housing and
transportation are the two largest expenditure for every class of family. Seem housing and
transportation expenditure are the most two largest components in our cost of living, it is
important that urban design and planning decisions are informed by robust evidence. This
review sought to broadly examine the effect of the transportations cost on housing
affordability and to provide a narrative summary for urban planners.
Table 1. Shared of average annual expenditure on selected major components by
composition of consumer unit, 2016
Item Married
couple only
Married
couple with
children
Other married
couple
consumer units
One parent
at least on
children
under 18
Single
person and
other
consumer
units
Food 11.8 12.9 14.5 14.8 12.4
Housing 30.5 31.8 30.5 38.0 36.7
Transportation 17.5 17.3 18.6 17.0 15.9
Healthcare 10.3 7.3 7.8 5.1 7.3
Personal
insurance and
pensions
11.1 12.5 11.6 7.5 8.9
Sources: Bureau of Labour Statistics, U.S. Department of Labour, 2017
Literature searches of electronic journal databases were conducted for studies and reviews of
the effect of transportation on housing affordability. The keywords used were “housing
affordability” and “transportation cost”. The inclusion criteria were studies and review
articles referring to transportation costs that incorporating into the housing affordability
consideration. Studies ad articles were excluded if they were the traditional measure to
calculate the housing affordability which is they do not include the transportation cost in the
equation. In this review, we focused on articles pertaining to high income countries as
different contextual factors are likely to affect the low and middle-income countries.
MAIN RESULTS
The factors of Transportation Cost that effect the housing affordability
Housing is considered affordable if the households spend 30 percent or less of a monthly
budget but transportation costs are often dramatically underestimated or ignored. Nationally,
transportation has been ranging from less than 10 percent of the average household’s
expenditure in transit-rich areas to nearly 25 percent in many other areas. Transportation cost
are influence by the neighbourhood. Neighbourhood characteristics impact how much they
spend on transportation and how many vehicles they owned. Housing is cheaper in areas that

SCIENCE AND TECHNOLOGY 679
lack new investment or it is located farther from the central business district while the
transportation cost for the household increase one moves farther out from urban centres
(CNT, 2006). The neighbourhood characteristics also can shape the transportation demand
driven by household income and size. So that, the factors of transportation costs effected the
have been collected from the various research and tabulated in the Table 2 below.
Table 2. The transportation factors that influence the housing affordability.
Factors Findings
Location Yates et al. 2006
• Purchaser may face higher transportation cost because they can only
afford houses on outskirts of the city
CNT,2008
• They are more compact and tend to have range of stores and
amenities in close proximity which can low dependent on transport.
Access to
public transport
Morris, 1981
• Identified that the low incomes and disable cannot afford cars and
have low access to public transport
Maher, 1994
• Disadvantages areas are deficient in terms of requiring residents to
use long public transport journeys to access the facilities
Car ownership
and dependency
Morris, 1981
• Recognised the link between increasing car dependency and the new
forms of social disadvantages
Motte. Baumvol et al., 2010
• Car dependent people were forced out of the inner city due to
property prices
CNT, 2006
• Larger and wealthier households tend to own more vehicles, select
more expensive models and drive more miles.
Gas and fuels
price
CNT, 2006
• The significant increase in recent gas prices has important impacts on
affordability
CONCLUSION
This paper demonstrates that when transportation costs are including in the calculation of
housing affordability is more accurate when location, public transport, car ownership and
Price of fuels are considered. This paper also gives a picture how the transportation cost gives
the impact to the housing affordability. The findings suggest that housing affordability should
take into account transports costs so that a strong empirical evidence base becomes available
to inform the development of policies affecting housing, transport and employment hubs.
Acknowledgment: The authors would like to express the appreciation for the support of the
sponsors from Fundamental Research Grant Scheme with Reference No: PY/2016/07121
REFERENCES
1. Bureau of Labour Statistics (2017) Consumer Expenditure 2016. U.S. Department of Labour.
2. Center for Transit-Oriented Development, & Center for Neighborhood Technology (2006). The affordability
index: A new tool for measuring the true affordability of a housing choice. Washington, DC.

SCIENCE AND TECHNOLOGY 680
3. Center for Transit-Oriented Development, & Center for Neighborhood Technology (2008). Housing +
Transportation Affordability in the San Antonio Metropolitan Region.
4. Center for Transit-Oriented Development, & Center for Neighborhood Technology (2009). Housing +
Transportation Affordability in Tucson Metropolitan Area, Pima County, and Pinal County.
5. Maher, C. (1994) Residential mobility, locational disadvantage and spatial inequality in Australian cities, Urban Policy and Research, 12(3), pp. 185–191.
6. Mattingly K. and Morrissey J. (2014) Housing and transport expenditure: Socio-spatial indicators of
affordability in Auckland. Cities 38, pp. 69-83.
7. Morris, J. (1981) Urban public transport, in: P. N. Troy (Ed.) Equity in the City. Sydney: George Allen and
Unwin.
8. Motte-Baumvol, B., Massot, M.-H. and Byrd, A. M. (2010) Escaping car dependence in the outer suburbs of
Paris, Urban Studies, 47(3), pp. 604–619.
9. Yates, J. and Gabriel, M. (2006) Housing affordability in Australia: housing affordability for low income
Australians. Research Paper No. 3, Australian Housing and Urban Research Institute, Melbourne.
10. Yates, J., Randolph, B. and Holloway, D. (2006) Housing affordability, occupation and location in
Australian cities and regions. Final Report No. 91, Australian Housing and Urban Research Institute,
Melbourne.

SCIENCE AND TECHNOLOGY 681
IGCESH2018
Universiti Teknologi Malaysia, Johor Bahru, Malaysia 13 -15 August 2018
THE PROPENSITY OF BUILDING INFORMATION MODELLING
AND INTEGRATED PROJECT DELIVERY IN BUILDING
CONSTRUCTION PROJECT
Rozana Mohamed Salleh1, Nuremma Mustaffa2 and Nafisah Abdul Rahman3
Department of Quantity Surveying, Universiti Teknologi Malaysia, MALAYSIA.
(E-mail: [email protected], [email protected], [email protected])
ABSTRACT
The Building Information Modelling (BIM) implementation is to create a centralised
knowledge sharing resource that contains all the necessary design and operational
information about the project. BIM is a collaborative approach and integrated project
delivery to design and delivery embraced by various construction teams in the construction
projects. Discussing in the context of the most suitable project delivery to be used, with
regards to the use of BIM, the Integrated Project Delivery (IPD) approach is highlighted as
the best methodology which correlate building procurement of the design-to-construction
business process through literature review analysis. IPD is developed as project delivery
system that integrates people in effective collaborative approach between the key players in
the project. BIM is going to be particularly beneficial for IPD, because the involvement of
the contractor, designers, consultants, constructors, sub-contractors and suppliers at earlier
stage should managed the project teams to achieve the project goals in terms of timely
schedule, life cycle costs, quality and sustainability. Therefore, this study is carried out to
investigate what are the factors which facilitate the IPD as the suitable approach for BIM
adoption in construction projects. This is basically a descriptive study and the methodology
used is essentially based on review of the literature in relation to BIM and IPD. The analysis
revealed that, propensity of adopting IPD project delivery and the adoption of BIM based on
these factors: improve the communication; closer collaboration; liability and legal
relationships are specifically determined; the quality outcome, cost effectiveness; and lastly, a
saving in overall time from conception to completion with reductions in design and
construction period.
Key words: Building Information Modelling, BIM, Integrated Project Delivery, IPD
INTRODUCTION
Building Information Modeling (BIM) is a technology that has improved the way structures
are designed and built (Weygant, 2011) and has been adopted in many countries whether
through government or industry initiatives (Mustaffa et al., (2017). Hardin (2009) opined
BIM as the virtual construction of the structure that contains an intelligent model in a single
server which can be shared among the project teams where McAdam (2010) agrees and states
that BIM is a collaborative approach to design and delivery embraced by various construction
teams in the construction projects such employers, engineers, architects, quantity surveyors
and contractors. Wei et al., (2013) states BIM provides a new working logic in construction

SCIENCE AND TECHNOLOGY 682
in terms of collaboration where project teams being able to work more collaboratively and
perform more effectively where project can be completed more efficiently. As a result, all
the stakeholders can benefit from time saving, cost saving and good quality. The idea is
further added by Eastman et al (2008), by stating that utilizing BIM technology has major
advantages for construction projects that save time, money, smoother and lead to better plan
of construction process, reduces the potential errors and conflict for the benefits all members
of the project teams. As highlighted by Rowlinson (2010) BIM application is to create a
central database where the acknowledged parties can give input on their expertise knowledge
technique that contains all the necessary design and operational information about the project.
He further added that the requirement of BIM adoption is driven by the potential for cost and
time savings resulting from less design clashes being determine prior post construction which
turn results in avoiding the time at large and cost overrun in the project.
In order for all the time efficiencies and cost saving that BIM technology can provide in a
construction project are to be reaped, it must be supported by a suitable delivery method and
procurement contracts. The purpose of this study is to investigate on the propensity of the
best methodology of project delivery system which can correlate with procurement adoption
for projects which adapt BIM concept. The procurement method has its own set of contracts
describes the rights, obligations and liability of the parties in construction project. It
generally is a transfer of risk from one party to another. Maizon et al (2006) indicates the
factors influencing the selection of procurement criteria are closely linked with project
objectives, both tangible, such as time and cost, and intangible, such as buildability and
relationship. The selection of any building procurement system is crucial to the attainment of
client objectives with respect of time, cost and quality. This study provides an overview on
what is the most suitable project delivery procurement in anticipating BIM implementation
projects.
In the view of Eastman et al. (2008), Integrated Project Delivery (IPD) with the application of
BIM could improve the traditional fragmented construction process. Compared to other
integrated procurement approaches such, as Design & Build, Constructing Management; the
IPD project delivery is more suitable to BIM implementation projects. According to Dal
Gallo and Wilson (2017) under IPD model, the Owner is part of the project teams where they
are essentially shares in the financial risks and rewards associated with financial budgeting
and work programming for the particular projects. All financial information is fully vetted
and made transparent between the project teams, and the owner gets to fully participate in
discussions in order to share their expertise in technical knowledge resulting in the best
benefits disseminated to all project teams where each disciplinary is able to achieve the
project goals in terms of timely working progress schedule, life cycle costs, quality and
sustainability (AIA, 2007).
STREAMLINING OF BIM IMPLEMENTATION WITH IPD PROJECT DELIVERY
Since BIM has the most likely characteristics with IPD; then it is more convincing that IPD is
the most suitable delivery method when adopting BIM in the building construction projects.
The principle of early and concurrent involvement throughout the project period, where the
project teams can assemble and integrate their knowledge and expertise at execution level of
the project making the propensity of both relationships is more applicable. As stated by Wei
Lu et al. (2013) the essence of BIM implementation is collaborative working process in
construction work that involves integrating of various disciplines at the early stage as from
the design phase until the completion of the project. Hence, IPD is going to be particularly

SCIENCE AND TECHNOLOGY 683
beneficial for BIM implementation because the involvement of all teams; where they can
assemble and integrate their knowledge at earlier stage. Based on that, in Eastman’s opinion
(2008) with regards to the use of BIM, the IPD approach is the best project delivery of the
design-to-construction business process. This is further added by Succar (2009), who
highlights that due the foreseeability of conflicts demonstrated during the design,
rectifications work can be avoided by the project teams where every discipline can be more
efficient as the works are more properly managed. As in BIM implementation, by
anticipating risks at earliest stage, mistakes can be eliminated and the contract management
and administration will become more effective and ensure time and cost saving of the project.
In addition, the IPD approach provides an excellent Project delivery system because of the
shares in the financial risks and rewards approach towards the design and construction phase.
MAIN RESULTS
Based on the findings found in the study, the efficiencies and cost saving that BIM
technology can provide in a construction project are considerably more advantages in the
context of IPD project delivery arrangements based on closer collaboration among designer
and contractors (Eastman, 2008). Incorporation of BIM into the contractual relationship, the
IPD project delivery approach provides an excellent opportunity to exploit BIM technology
because of the collaboration and integrated approach towards the design and construction at
the early stage. Supported by Mosey (2014) the process of entering contractual relationship
shows that, the early contractor involvement in procedure is more suited to BIM
implementation in construction project. The propensity of adopting IPD project delivery and
the adoption of BIM is expected of mitigating the problems encountered by the contracting
parties in the implementation of the project in the event when IPD and BIM being used in the
construction projects.
CONCLUSION
Ultimately, BIM is a usable technology for construction project and will continue to become
a better resource than previous technology that benefits the construction industry. BIM might
be a solution to technological developments in the IPD process. In this regard, by adopting
BIM in implementation of IPD process, it will bring project teams the ability to deliver
projects with cost savings, timely and more efficiently because all of their operations are
under the one roof. By combining the knowledge technique of the contractor with the
knowledge base of the designer teams, it begins to create a recipe for a successful project
delivery.
REFERENCES
1. American Institute of Architect (2007), Integrated Project Delivery: A Guide (Version 1), AIA California Council.
2. Eastman, C.; Teicholz, P.; Sacks, R.; Liston, K. (2008), BIM Handbook A Guide to Building Information
Modeling for Owners, Managers, Designers, Engineers, and Contractors: John Wiley & Sons, Inc.
3. Gallo, L.D., Wilson, O. (2017), Design Cost Data Report May – June 2017, Available at
https://www.hansonbridgett.com/-/media/Files/Publications/2017-06-moving-from-design-build.pdf -
Retrieved on 27.02.2018
4. Hardin, B. (2009), BIM and Construction Management: Proven Tools, Methods and Workflows,
Canada:Wiley Publishing Incorporated.
5. Lu, W., Zhang, D., and Rowlinson, S. (2013), BIM collaboration: a conceptual model and its characteristics
In: Smith, S.D and Ahiaga-Dagbui, D.D (Eds) Procs 29th Annual ARCOM Conference, 2-4 September
2013, Reading, UK, Association of Researchers in Construction Management, 25-34.

SCIENCE AND TECHNOLOGY 684
6. Maizon H., Melissa C.Y., Ng Chu Y., Ng Sock H., Shim Mong H., Tay Lee Y. (2006). Factors Influencing
the Selection of Procurement Systems By Clients. Proceeding of International Conference on Construction
Industry 2006, Padang, Indonesia, 21st June – 25th June page 1-10
7. McAdam, B. (2010), Building information modeling: the UK legal context, International Journal of Law in
the Built Environment 2(3), pp. 246–259. 8. Mosey, D. (2014), BIM and Related Revolution: A Review of the Cookham Wood Trial Project. Available
at http://www.scl.org.uk/bim-and-related-revolutions-review-cookham-wood-trial-project - Retrieved on
27.02.2018
9. Mustaffa N.E, Tajul Ariffin, H.L. and Mohamed Salleh, R. (2017) Experiences of Building Information in
Various Countries, 5th International Conference on Research and Innovation in Information System,
Langkawi; 16-17 July 2017.
10. Rowlinson, S., Collins, R., Tulli M.T and Jia, Y. (2010), Implementation of Building Information Modeling
(BIM) in Construction: A Comparative Case Study. AIP Conference Proceedings, 1233 (PART 1), pp.
572-577.
11. Weygant, R.S. (2011), BIM Content Development, USA: John Wiley & Sons Ltd.

SCIENCE AND TECHNOLOGY 685
IGCESH2018
Universiti Teknologi Malaysia, Johor Bahru, Malaysia 13 -15 August 2018
THE IMPACT OF BUILDING INFORMATION MODELING
INTENSIVE TRAINING ON GRADUATES’ EMPLOYABILITY AND
CAREER DEVELOPMENT
Aimi Sara Ismail1, Kherun Nita Ali2, Noorminshah A. Iahad3, Nur Emma Mustaffa4
and Badiru Yunusa Yusuf5
1, 2, 4 Department of Quantity Surveying, Universiti Teknologi Malaysia, Johor, MALAYSIA.
(E-mail: [email protected], [email protected], [email protected]) 3 Department of Information System, Universiti Teknologi Malaysia, Johor, MALAYSIA.
(E-mail: [email protected]) 5Department of Architecture, Ahmadu Bello University, Zaria, NIGERIA.
(E-mail: [email protected])
ABSTRACT
Building Information Modeling (BIM) is an emerging technological process which highly
promotes a better collaborative working environment in the Architecture, Engineering and
Construction (AEC) industry. It is essential that the Higher Education (HE) sector innovates
its education system to integrate between different disciplines in the AEC industry to
encourage the adoption of BIM. In conjunction with this, BIM Intensive Training was
conducted for a selected number of final year undergraduate students in Universiti Teknologi
Malaysia. They were assigned a real time construction project, utilizing BIM software
applications for model authoring, model review, 4D modelling and project coordination. It
was observed that the participants were able to overcome various challenges through
information sharing and team collaboration. A BIM coordination workflow was produced
during the training to assist them in organizing their work. Although their existing
knowledge of BIM and their skills using the software applications were quite limited, they
were capable in learning expeditiously as the assignment provided them with real-world
problems. A year after the training, it was discovered that more than half of the participants
believed that the training helped them to secure their employment and to perform their
current involvements in BIM-based projects. However, there are participants who could not
utilize the training as they are not involved in any BIM-based projects. This is because many
firms in Malaysia are still grounded to the conventional process. Hence, the establishment of
a dynamic and continuous collaboration between professionals and HE sector must be done
more vigorously to transform the traditional structure of AEC industry into a more
collaborative and technological approach.
Key words: Building Information Modeling, Collaborative working, Education

SCIENCE AND TECHNOLOGY 686
INTRODUCTION
Building Information Modeling (BIM) is becoming more prevalent in the Architecture,
Engineering and Construction (AEC) industry for information exchange and sharing [1]. It is
imperative that the construction players possess high proficiency in BIM and competence in
using relevant software applications as well as breaking through from their own silos to
create a better collaborative working practice. However, the current education practices
rarely adopt BIM in the academic teaching and learning process, where students from AEC
disciplines learn with limited integration between the disciplines [2].
This paper presents a study conducted on participants who were involved in BIM Intensive
Training. This training was conducted for a duration of two weeks at Universiti Teknologi
Malaysia, participated by 23 final year undergraduate students from AEC background.
Throughout the training, the participants were assigned a real time construction project,
utilizing Autodesk Revit 2015, AutoCAD 2014, Naviswork Manage 2015 and Microsoft
Project 2015. Observation method was carried out to analyse how the participants execute
the assignment, their team management, collaboration and problem-solving techniques. A
year later, telephone interviews with the participants were conducted to identify the impact of
the training to their employment and working environment.
MAIN RESULTS
Based on observation, it was evidently clear that the participants were driven to execute
the assignment based on definite project objectives. The participants work together
between different disciplines led by a BIM Manager appointed amongst the participants
while guided by the trainer and contractor of the project. They were able to produce a
BIM coordination workflow to organize their work as shown in Figure 1.
Throughout the training, we observed that the participants were faced by challenges to
perform their task. The most prominent challenge was their existing knowledge and skills
in Autodesk Revit and Naviswork Manage were very low. Therefore, huge efforts were
required from the participants to quickly learn the software while executing the tasks. In
addition to this, they also had limited understanding of BIM management, coordination
and collaboration. Fortunately, since they were required to deal with real-world problems
through the assignment, they could grasp the knowledge within a short period of time.
Another challenge was that the network could only cater for a limited number of users
causing difficulties in information sharing among team members. Nevertheless, the team
members found a solution by creating copies of the central model and working in small
groups based on their work disciplines and further collaborate the models to create a final
model.
Based on the telephone interviews a year after the training, it is revealed that 57% of the
participants claimed that the training has positive impact on their career while 43% stated
that the training does not contribute in their career advancement. Many of those who
believed the training brings positive impact to them, professed that it helped them to
secure their employment and was presented as an added value during the job interview.
The training also provides them leverage to accelerate the learning process at the start of
their employment and aids them with adequate knowledge of the correct BIM
implementation in projects. The other 43% of the participants declared that the training is
not beneficial because, one, they are not involved in any BIM-based projects, and two, the
companies have limited knowledge of BIM. This is due to the low adoption of BIM in

SCIENCE AND TECHNOLOGY 687
Malaysia which is at the rate of 10% compared to United States, United Kingdom and
Singapore [3].
Figure 1. BIM Coordination Workflow.
CONCLUSION
In conclusion, it can be summarized that the training has helped the students to have
thorough understanding on BIM as well as to prepare them for a BIM-based working
environment. However, there are still many firms in Malaysia which are yet to embrace
BIM and still grounded to the conventional ways. Hence, future works should concern on
the establishment of a dynamic and continuous collaboration between BIM-based
companies and Higher Education sector. This will eventually transform the traditional
structure of AEC industry into a more collaborative and technological approach.
Acknowledgment: The authors would like to thank Universiti Teknologi Malaysia(VOT
number: 15H96) for supporting this research.
REFERENCES
1. Eastman, C., Teicholz, P., Sacks, R., & Liston, K. (2011). BIM Handbook A Guide to Building Information
Modeling for Owners, Managers, Designers, Engineers, and Contractors (2nd Edition). New Jersey: John
Wiley & Sons.
2. Shelbourn, M. A., Macdonald, J., & Mills, J. (2016). Developing an International Framework for BIM
Education in the HE Sector. In 10th BIM Academic Symposium & Job Task Analysis Review (pp. 43–51).
Florida.
3. CIDB. (2015). Construction Industry Transformation Programme 2016-2020. Kuala Lumpur, Malaysia.

SCIENCE AND TECHNOLOGY 688
IGCESH2018
Universiti Teknologi Malaysia, Johor Bahru, Malaysia 13 -15 August 2018
THE COMMUTING AND NON-COMMUTING GRAPHS FOR A NON-
ABELIAN 3-GROUP
A. Zulkarnain*, N. H. Sarmin and H. I. Mat Hassim
Department of Mathematical Sciences, Faculty of Science, Universiti Teknologi Malaysia, Johor
Bahru, Johor, MALAYSIA.
(E-mail: [email protected], [email protected], [email protected])
ABSTRACT
A graph is a pair of a set of vertices and a set of edges. There are many types of graphs such
as the commuting graph and the non-commuting graph. From the graphs, other properties
such as the chromatic number, the dominating number and the diameter of the graphs can be
obtained. The aim for this research is to compute the commuting and the non-commuting
graph for a non-abelian 3-group and also to compute some properties of both graphs.
Key words: Commuting graph, Non-commuting graph, Chromatic number, Dominating
number, Diameter
INTRODUCTION
The set of vertices of a commuting graph consists of the non-central elements. Two distinct
vertices in a commuting graph are joined if they commute with each other [1]. Meanwhile,
the set of vertices of a non-commuting graph also consists of the non-central elements. Two
distinct vertices in a non-commuting graph are joined if they are not commutative [2]. The
chromatic number is the minimum number of colours needed, where all adjacent vertices
have different colours [3]. The dominating number is the minimum number of vertices
needed, given that the vertices are all adjacent [4]. The diameter of a graph is the shortest
path between any two vertices of the graph [5].
The following definitions have been used throughout this research.
Definition 1 [1] Let 𝐺 be a group and 𝑍(𝐺) is the center of 𝐺. A commuting graph is a
graph with 𝐺\𝑍(𝐺) as the vertices and two distinct vertices 𝑥 and 𝑦 are joined whenever
𝑥𝑦 = 𝑦𝑥. A commuting graph of a group 𝐺 is denoted by Γ𝐺𝐶 .
Definition 2 [2] Let 𝐺 be a group and 𝑍(𝐺) is the center of 𝐺. A non-commuting graph is
a graph with 𝐺\𝑍(𝐺) as the vertices and two distinct vertices 𝑥 and 𝑦 are joined whenever
𝑥𝑦 ≠ 𝑦𝑥. A non-commuting graph of a group 𝐺 is denoted by Γ𝐺𝑁𝐶 .
Definition 3 [3] A chromatic number, denoted as 𝜒(Γ), is a proper colouring or simply a
colouring of the vertices of 𝐺 in such a way that adjacent vertices have distinct colours. It is
also the minimal number of colours in a (vertex) colouring of 𝐺.

SCIENCE AND TECHNOLOGY 689
Definition 4 [4] A set 𝑆 of vertices of 𝐺 is a dominating set of 𝐺 if every vertex in 𝑉(𝐺) − 𝑆
is adjacent to some vertices in 𝑆. A dominating number of 𝐺, denoted as 𝛾(Γ), is the
cardinality of a minimum dominating set.
Definition 5 [5] The diameter of a connected graph, denoted as 𝑑𝑖𝑎𝑚(Γ) with 𝑛 vertices is
the maximum possible distance between any two vertices.
MAIN RESULTS
This section presents the results of the commuting graph and the non-commuting graph for a
non-abelian 3-group of order 27 along with some properties of the graphs, given in the
following theorems and propositions.
Theorem 1: Let 𝐺 =< 𝑥, 𝑦 ∶ 𝑥3 = 1 = 𝑦3, 𝑧 = [𝑥, 𝑦], 𝑧3 = 1, 𝑧𝑥 = 𝑥𝑧, 𝑧𝑦 = 𝑦𝑧 > be a non-
abelian 3-group of order 27. Then, the commuting graph of 𝐺 is the union of four complete
graphs with six vertices, namely Γ𝐺𝐶 =∪𝑖=1
4 𝐾6.
Proposition 1: Let 𝐺 =< 𝑥, 𝑦 ∶ 𝑥3 = 1 = 𝑦3, 𝑧 = [𝑥, 𝑦], 𝑧3 = 1, 𝑧𝑥 = 𝑥𝑧, 𝑧𝑦 = 𝑦𝑧 > be a
non-abelian 3-group of order 27. Then, the chromatic number of the commuting graph of 𝐺
is six, namely 𝜒(Γ𝐺𝐶) = 6.
Proposition 2: Let 𝐺 =< 𝑥, 𝑦 ∶ 𝑥3 = 1 = 𝑦3, 𝑧 = [𝑥, 𝑦], 𝑧3 = 1, 𝑧𝑥 = 𝑥𝑧, 𝑧𝑦 = 𝑦𝑧 > be a
non-abelian 3-group of order 27. Then, the dominating number of the commuting graph of 𝐺
is four, namely 𝛾(Γ𝐺𝐶) = 4.
Proposition 3: Let 𝐺 =< 𝑥, 𝑦 ∶ 𝑥3 = 1 = 𝑦3, 𝑧 = [𝑥, 𝑦], 𝑧3 = 1, 𝑧𝑥 = 𝑥𝑧, 𝑧𝑦 = 𝑦𝑧 > be a
non-abelian 3-group of order 27. Then, the diameter of the commuting graph of 𝐺 is
infinity, namely 𝑑𝑖𝑎𝑚(Γ𝐺𝐶) = ∞.
Theorem 2: Let 𝐺 =< 𝑥, 𝑦 ∶ 𝑥3 = 1 = 𝑦3, 𝑧 = [𝑥, 𝑦], 𝑧3 = 1, 𝑧𝑥 = 𝑥𝑧, 𝑧𝑦 = 𝑦𝑧 > be a non-
abelian 3-group of order 27. Then, the non-commuting graph of 𝐺 is the non-complete graph
of 24 vertices as given in the following:
Figure 1. The non-commuting graph for 𝐺

SCIENCE AND TECHNOLOGY 690
Proposition 4: Let 𝐺 =< 𝑥, 𝑦 ∶ 𝑥3 = 1 = 𝑦3, 𝑧 = [𝑥, 𝑦], 𝑧3 = 1, 𝑧𝑥 = 𝑥𝑧, 𝑧𝑦 = 𝑦𝑧 > be a
non-abelian 3-group of order 27. Then, the chromatic number of the non-commuting graph of
𝐺 is 24, namely 𝜒(Γ𝐺𝐶) = 24.
Proposition 5: Let 𝐺 =< 𝑥, 𝑦 ∶ 𝑥3 = 1 = 𝑦3, 𝑧 = [𝑥, 𝑦], 𝑧3 = 1, 𝑧𝑥 = 𝑥𝑧, 𝑧𝑦 = 𝑦𝑧 > be a
non-abelian 3-group of order 27. Then, the dominating number of the non-commuting graph
of 𝐺 is two, namely 𝛾(Γ𝐺𝐶) = 2.
Proposition 6: Let 𝐺 =< 𝑥, 𝑦 ∶ 𝑥3 = 1 = 𝑦3, 𝑧 = [𝑥, 𝑦], 𝑧3 = 1, 𝑧𝑥 = 𝑥𝑧, 𝑧𝑦 = 𝑦𝑧 > be a
non-abelian 3-group of order 27. Then, the diameter of the non-commuting graph of 𝐺 is
two, namely 𝑑𝑖𝑎𝑚(Γ𝐺𝐶) = 2.
CONCLUSION
The commuting graph for 𝐺 turned out to be the union of four complete graphs of six
vertices. As for the properties of the commuting graph of 𝐺, the chromatic number is six, the
dominating number is four and the diameter is infinity. The non-commuting graph is shown
to be a non-complete graph of 24 vertices. As for the properties of the non-commuting graph
of 𝐺, the chromatic number is 24, the dominating number is two and the diameter is two. For
further research, the same types of graph can be computed for the non-abelian 3-groups of
higher order.
Acknowledgment: This work was financially supported by Ministry of Higher Education
Malaysia and Universiti Teknologi Malaysia under the Research University Grant Scheme
(GUP) for Vote no. 13H79 and 13J82.
REFERENCES
1. Abdollahi, A., Akbari, S., and Maimani, H. R. Non-commuting graph of a group. Journal of
Algebra, 2006. 298(2): 468-492.
2. Akbari, S., Mohammadian, A., Radjavi, H., and Raja, P. On the diameters of commuting graphs. Linear
Algebra and its Applications, 2006. 418(1): 161-176.
3. Bollobas, B. Modern Graph Theory. USA: Springer. 1998.
4. Chartrand, G. and Zhang, P. Introduction to Graph Theory. New York, USA: McGraw-Hill. 2005.
5. Wilson, R. J. Introduction to Graph Theory. USA: Academic Press. 1972.

SCIENCE AND TECHNOLOGY 691
IGCESH2018
Universiti Teknologi Malaysia, Johor Bahru, Malaysia 13 -15 August 2018
HOUSE-OWNERS’ ACCEPTANCE ON RETROFITTING SINGLE-
STOREY TERRACE HOUSE TO DOUBLE-STOREY IN THE
CONTEXT OF MALAYSIA.
Sk Sakif Saad*1, and Tareef Hayat Khan
2
1Faculty of Built Environment, Universiti Teknologi Malaysia (UTM), Malaysia.
(E-mail: [email protected]) 2Pusat Kajian Alam Bina Melayu, (KALAM), Institute for Smart Infrastructure and Innovative
Construction (ISIIC), Universiti Teknologi Malaysia, Johor, Malaysia (E-mail: [email protected])
*corresponding author
ABSTRACT
Terrace houses are operationally defined as a row of connected housing units that share
common partition walls with neighbours at both sides. These partition walls are placed on the
property line and stipulate structural support to itself and the adjoining property. These walls
are rigid, and do not allow vertical extension. However, households need to extend their
habitable spaces at different stages of life. While both horizontal and vertical extension could
be the options, in the current scenario in Malaysia, terrace houses do not have much space to
extend horizontally. With the rigidity of partition wall, vertical additions appear to be a
dangerous attempt. However, they still have the potential to extend vertically through
retrofitting. So far, not much study has been done on this. Even more, single storey house-
owners’ acceptance about the retrofitting, which could be the basic platform for studying
retrofit, is not investigated at all. This study aimed to find out house-owners’ knowledge,
acceptance and requirements of retrofitting single-storey terrace house to double-storey.
Social data were collected from households living in single-story terrace houses in order to
find out their requirements for vertical extension. The social data were obtained from random
samples of 70 households living in single story terrace houses in Johor Bahru, Malaysia.
After statistical analysis it was found that residents have very little idea about vertical
extension but most of them think that it will be a good option to have if it is possible. They
have also pointed out some interesting space requirements they would have expected in the
extended upper storey. This study thus opened the door for further research of a structural
retrofit system that can be affordable and socially accepted. It can offer a better standard of
living especially for the low-income group without sacrificing financial loss.
Key words: Terrace house, Retrofitting, Acceptance, Knowledge
INTRODUCTION
Expansion of a house is a natural habit for humans [1]. It is even more common for low
income groups of people as they can hardly afford a bigger house [2]. However, after living
in a house for many years, if they can afford, and given a choice between moving to a better
house in new location and expanding their existing house, most of them would choose the
second option. One of the major reasons for expansion or transformation cited by Khan

SCIENCE AND TECHNOLOGY 692
(2015) is that most families move to advanced stages with the household owners becoming
old enough, and they do not want to move to a new neighbourhood, where they could lose
their sense of belonging, and their control over daily household life. New place means new
adjustment, and that may not be easy for older households. Therefore, expansion remains the
most popular option for such situation [2].
The aim of this study was to find out the house owners’ acceptance on retrofitting single-
storey terrace house to double-storey in the context of Malaysia.
METHOD
To get the results field survey was done. The survey was conducted on households of 70
single storey terrace houses in Malaysia through field survey. The sample size was expected
to be adequate as it satisfied established methods of sample size calculation. Considering the
population size as over 10,000, and with a 95% confidence level, confidence interval 10-12 is
adequate. The minimum sample size required is 67-74. The original number of respondents
were 73, but 3 of them were removed because of incomplete data. But, 70 could still be
considered as adequate [3]. A questionnaire was constructed based on the possible parameters
such as required number of rooms, required number of bedrooms, required number of other
facilities such as toilets or family spaces, and why they needed them in the upper floor
RESULTS
The first part of the questionnaire (Section A) contained the demographic data. From this part
the main focus was on the age range and on current employment. As it is seen from table 1
more than 45% respondents were in age 41-60 range, 31.42% in 21-40 range and only
22.85% in age 61-80 range. From the current employment statistics, it is noticed that more
than 51% respondents were service holders. Housewife and retired were equal with 20% and
only 8.57% were business men.
Table 1. Section A (Demographic Data)
Percentage 1. Age range
21-40 31.42
41-60 45.71
61-80 22.85
3. Current employment
Service 51.42 Business 8.57
House wife 20
Retired 20

SCIENCE AND TECHNOLOGY 693
Table 2. Section B (Social Data) Percentage
5. When did you buy the house
1971-1980 5.71 1981-1990 31.42
1991-2000 20
2001-2010 17.14
2011-2020 25.71
6. When did you move in?
1971-1980 5.71
1981-1990 28.57 1991-2000 20
2001-2010 20
2011-2020 25.71
7. Have you ever extended your
house?
Yes 82.85
No 17.14
9. Where did you extend?
Front only 14.28
Back only 14.28
Front and Back 42.85 Front+Back+side 8.57
Didn’t extend 20
10. Have you ever thought about
extending vertically (Adding one
floor)?
Yes 37.14
No 62.85 11. Do you think it is better to
have the option to extend
vertically if the cost is low
enough?
Yes 80
No 20
12. If budget allows, and you are
willing to extend vertical, do you
think you can tolerate the
hazards during the construction
time?
Yes 65.71
No 34.28
13. If yes, then how much time
you can roughly accept for
construction time?
1-2 months 40 3-4 months 20
5-6 months 17.1
>6 months 22.9 14. Have you ever thought of
leaving this neighbourhood?
Yes 28.6
No 71.4

SCIENCE AND TECHNOLOGY 694
The second part (Section B) contained social data of the respondents. Table 2 shows the
survey results. Question 5 and 6 were introductory questions where it was asked about the
year when the respondents bought the house and the year they move in. from the results it is
seen that almost all the respondents bought the house and moved in the same year. The most
important questions were 7-14. Question 7-11 will help to prove the necessity of this
research. Question 7-11 inquired about house extension. It is seen that more than 82%
respondents extended their house. Among them 42.85% extended in the front and back side.
14.28% respondents extended the front side of their house. Same amount of respondents
extended the back side. While asking about their thoughts on vertical extension 62.85% of the
respondents didn’t want to extend. Because most of them thought it was impossible to extend
one floor. It was proven in the next question and it is seen that 80% of the respondents
thought that it is better to have an option to extend vertically. Question 12 and 13 attempted
to provide support to achieve objective 3. Nearly 66% of the respondents are willing to
tolerate the hazards during the construction time. And among them 40% are willing to
tolerate the hazards for 1-2 months. 20% can tolerate 3-4 months, 17.1% respondents for 5-6
months and nearly 23% can tolerate more than 6 months. It is seen that 60% of the
respondents can tolerate the hazard for more than 3 months. And lastly the respondents were
asked if they are thinking of leaving the neighbourhood. And it is seen that more than 71% of
the respondents are not willing to leave the neighbourhood.
CONCLUSION
Expansion is an integral part of inhabitation. The current Malaysian terrace row houses do
not provide much option to expand horizontally. The owners have very little idea about
vertical extension. But if the renovation cost and time is within their tolerable range they are
willing to extend vertically. This study finds out the importance of vertical extension. Future
studies on this topic can be continued on investigating the renovation method, cost
management etc.
Acknowledgment: The authors sincerely acknowledge Research Management Center (RMC)
of Universiti Teknologi Malaysia (UTM), and the Ministry of Education (MOE) of the
Government of Malaysia for the funding of this research through research grant no.
Q.J130000.2421.03G20, R.J130000.7909.4S104, and Q.J130000.2521.12H71.
REFERENCES
1. Tipple, A.G., Extending themselves: User-initiated transformations of government-built housing in
developing countries. 2000: Liverpool University Press.
2. Khan, T.H., Living with transformation: Self-built housing in the city of Dhaka. Vol. 1. 2014: Springer. 3. CSR. Creative Research Systems. 2017 6th April 2017]; Available from:
http://www.surveysystem.com/sscalc.htm.

SCIENCE AND TECHNOLOGY 695
IGCESH2018
Universiti Teknologi Malaysia, Johor Bahru, Malaysia 13 -15 August 2018
SUBCRITICAL WATER EXTRACTION OF ANTHOCYANINS FROM
RED DRAGONFRUIT PERICARP (HYLOCEREUS POLYRHIZUS)
Qifni Yasa’ Ash Shiddiqi, Febrianto Adi Nugroho, Iman Mukhaimin , Sarah Haldien
and Oi Parida
Chemical Engineering Department, Universitas Jenderal Achmad Yani, Cimahi, INDONESIA.
(E-mail: [email protected])
ABSTRACT
The growing use of synthetic dyes as food colouring will lead to health problems. Therefore,
it is necessary to increase the use of natural dyes. Red dragonfruit pericarp has a fairly huge
amount of anthocyanin pigment in which anthocyanin is one source of natural dyes.
Extraction of anthocyanins from red dragonfruit pericarp using water at subcritical condition
(SWE) was observed at several temperatures of 105 oC, 115 oC and 125 oC. In addition to
observing temperature effect, the extraction times was also varied from 30 – 120 minutes.
Anthocyanins quantification were using PH Differential and UV-Vis spectrophotometry
method. The optimum yield of anthocyanins extracted was 32,23 mg/g dried sample at 125 oC and 90 minutes of extraction time. The extracted anthocyanins from red dragonfruit
pericarp were tested on food and produce the expected colour. The result of this research
indicates the great potential of red dragonfruit pericarp as a food colourant in the future.
Keywords: Red dragonfruit, Anthocyanins, Subcritical Water Extraction (SWE)
INTRODUCTION
In recent years, the significant increase of red dragonfruit consumption in Indonesia as a
result of health consciusness leads to the rise of its pericarp waste1. In fact, the pericarp of red
dragonfruit has a fairly huge content of anthocyanins, anthocyanins are the natural pigment
that provided red colour in red dragonfruit pericarp 2. Anthocyanins are pigments that found
in plants in blue, red, or purple pigments. In acidic environment, anthocyanin comes out as
red pigment while blue pigment occurs in base conditions Beside its function as a source of
natural dye or food colorant, anthocyanins are widely regarded as very worth phytochemical
compound because of its feasible health benefits such as a cardiovascular health protection
anti-microbial and anti-oxidant activities, antidiabetes, anticancer and anti-inflammatory
bioactive compound 3,4.
In this examination, anthocyanins were collected and separated from red dragonfruit pericarp
solute using water in subcritical condition and maintained the subcritical state of water in a
batch system utilizing teflon line-autoclave stainless steel extractor. Water is a decent solvent
to obtain anthocyanins from red dragonfruit pericarp through the reason that anthocyanin has
a characteristic to solve in water easily (water-soluble compound)5. Subcritical water
extraction (SWE) of red dragonfruit pericarp was operated at 105-125 oC for 30-120 minutes
and collected the 50 mL volume of extract in collection vial after the extraction was done.

SCIENCE AND TECHNOLOGY 696
The quantity of anthocyanin in the extract was analyzed using UV-Vis spectrophotometry
and pH differential method. Sample analysis processes were performed triplicates.
MAIN RESULTS
In SWE, the temperature of the water is raised above the boiling point at atmospheric
condition and pressure has enforced to keep the water in the liquid state. Furthermore,
water under subcritical condition suffers several properties alterations such as the
decrease of viscosity and surface tension, the rise of solute diffusion rate and compound
solubility. So, compared to the other extraction methods especially to the conventional
methods (soxhletation, maceration, and reflux), SWE method shows more speedy and
efficient to obtain the extract from its solute4,6.
Figure 1. Effect of extraction temperature to the content of anthocyanins from red
dragonfruit pericarp extract
As shown in Figure 1, the extraction temperature had a significant impact on the yield of
anthocyanin. The yield of anthocyanin rise with the increase of extraction temperature from
105°C to 115 and 125°C at the same extraction time. The quantity of anthocyanin extracted at
125 °C could reach 2-folds and 3-folds of that obtained at 115°C and 105°C respectively. It
described that anthocyanin was easier to be extracted in subcritical water at higher
temperature. In addition, the rise of subcritical water temperature made significant effect on
the decline of water dielectric constant from 50 to 38, which is getting near to the dielectric
constant of several organic solvents like methanol (ε=33) or ethanol (ε=25)6,7.
CONCLUSION
The extraction of anthocyanins from red dragonfruit pericarp using ssubcritical water
extraction was conducted at various temperatures from 105-125°C for 30-120 minutes in a
batch system. During subcritical water extraction process, there is a high chance to extract
anthocyanins from red dragonfruit pericarp because of high solubility of anthocyanins in
water. Besides, unique characterisrtics of water in these process enabling water act as a good
solvent. In this work, the highest yield of anthocyanins was reached at temperature 125°C

SCIENCE AND TECHNOLOGY 697
and 90 minutes of extraction time with amount of 32,23 mg/g dried sample. The result of this
research indicates the great potential of red dragonfruit pericarp as a food colorant in the
future and shows the exceptional performance of water as an enviromental-friendly solvent at
subcritical condition.
Acknowledgment: This study was supported by grant from LPPM Unjani through Hibah
Kompetitif Unjani 2017.
REFERENCES
1. Harjanti, R.S. Optimasi Pengambilan Antosianin dari Kulit Buah Naga Merah (Hylocereus polyrhizus)
Sebagai Pewarna Alami pada Makanan. Chemica Jurnal Teknik Kimia. 3 (2016), 39
2. Rebecca, O.P.S, Boyce, A.N., Ran, S. C. Pigment identification and antioxidant properties of red dragon fruit (Hylocereus polyrhizus). African Journal of Biotechnology 9 (2010), 1450-1454
3. Khoo, H.E., Azlan A., Tang, S.T., Lim , S.M. Anthocyanidins and anthocyanins: colored pigments as food,
pharmaceutical ingredients, and the potential health benefits. Food & Nutition Research.61 (2017), 1361779
4. Shiddiqi, Q.Y.A, Karisma, A.D., Machmudah, S., et al. Effect of Hydrothermal Extraction Condition on The
Content of Phenolic Compound Extracted from Rind of Mangosteen (Garcinia mangostana) and Its
Antioxidant Efficiency. IPTEK Journal of Technology and Sciences (2015), 25-30
5. Fang, J. Classification of fruits based on anthocyanin types and relevance to their health effects. Nutrition.
(2015), 1301-1306.
6. Machmudah, S., Shiddiqi, Q.Y.A., Kharisma, A.D., et al. Subcritical Water Extraction of Xanthone from
Mangosteen (Garcinia Mangostana Linn) Pericarp. Journal of Advanced Chemical Engineering (2015), 1-6
7. Kumar, M.S.Y., Dutta, R., Prasad, D., Misra, K. Subcritical water extraction of antioxidant compounds from Seabuckthorn (Hippophae rhamnoides) leaves for the comparative evaluation of antioxidant activity. Food
Chemistry 127 (2011), 1309-1316.

SCIENCE AND TECHNOLOGY 698
IGCESH2018
Universiti Teknologi Malaysia, Johor Bahru, Malaysia 13 -15 August 2018
BIG DATA PROCESSING TECHNIQUES AND PLATFORMS: A
COMPREHENSIVE SURVEY
Aisha Shabbir*1, Kamalrulnizam Abu Bakar2
Faculty of Computing, University Technology Malaysia, Skudai, Johor Malaysia
(E-mail: [email protected], [email protected])
ABSTRACT
Big data and its analysis are in the focus of current era of big data. The main production
sources of big data are social media like Facebook, twitter, emails, mobile applications and
the migration of manual to automatic of almost every entity. Currently, there is a need to
investigate and process complex and huge sets of information-rich data in all fields. This
paper provides a survey of big data issues and the effectual and efficient tools and
technologies which are needed to deal and process the remarkable amount of data. It revolves
around two important areas namely: clustering and scheduling.
Key words: Big data issues, Big data Clustering, Scheduling
INTRODUCTION
The landscape of science is changing dramatically. The far-reaching development of digital
technology in many fields i.e. social media, person to person communication and scientific
analysis has produced huge amount of data which is collectively known as ‘Big Data’. Such
data is growing enormously leading to difficulties in storing, processing and analyzing by
using traditional databases and conventional tools and techniques. The processing issue is
beginning to see an attainable horizon, yet at the same time has space to evolve. Thus, the
vital issue is not to store all of the data produced but to extract meaningful information and
process it efficiently on the given resources.
To address these issues, big data analytics is there to mine untapped information from huge
volume and variety of data. Several frameworks have been proposed for efficiently
processing big data. Some of widely used frameworks are Hadoop MapReduce, Dryad,
Spark, Dremel and Pregel [1]. The most well-known framework is MapReduce. MapReduce
is initially established by Google and it is designed for processing big data by exploiting the
parallelism among a cluster of machines.
The aim of this paper is to provide a comprehensive survey about the big data issues,
characteristics and techniques to solve the processing issues of big data clusters. Furthermore,
this study provides the comparison for the algorithms of the processing technique. The main
results and comparison are given in form of tables. Conclusion and future directions are
discussed in last. Thus, enables the reader to choose the appropriate selection of the technique
according to the available resources.

SCIENCE AND TECHNOLOGY 699
MAIN RESULTS
A brief recapitulation of some important techniques are as follows:
Big Data Computing Clusters
Big Data computing clusters is a new paradigm for big data analytics, enabling large scale
data management, sharing, and processing of large volumes of rapidly growing data [2].
The main objective of clustering is the division of unlabeled data into groups based on
conceptual or un-revealed attributes. Depending on the nature of the data or the purpose
of the cluster, various types have been developed as shown in Figure 1.
Figure 1. Big Data Clustering Types
Scheduling
Scheduling is one of the processing scheme which deals with the ordering, prioritization
and assignment of tasks to the relevant machines for execution. To find an optimal
schedule is termed as an NP-complete problem [3]. Minimum makespan, fairness, proper
handling of inter-dependent jobs are important factors for scheduling. Inappropriate
schedules will ultimately affect the overall system’s resources usage. Comparison of
some scheduling algorithms is shown in Table 1.
Table 1. Comparsion of Big Data Scheduling Algorithms
Author Algorithm
Name
Advantages Mode
Apache, (2008) FIFO Easy to understand and equally
easy to program
Non
Preemptive
Apache, (2008) Fair Fair distribution of resources. Preemptive
Apache, (2009) Capacity Effective utilization of the
resources by utilizing the idle
assets of cluster.
Non
Preemptive
Zaharia et al. (2010) Delay Simplicity of scheduling Preemptive
Loshchilov et al.,
(2013)
Learning Effective CPU and memory
utilization
Preemptive
Nita et al. (2015) MOMTH Flexibility to clients for
priority setting
Preemptive
Furthermore, a critical issue of straggling has been observed due to which the
performance of a big data computing cluster has been degraded badly. There could be few
causes for the task to be like a straggler for example if the job is distributed to a wrong
computational machine. Some researchers put forward some solutions to tackle the
stragglers. Comparison of these solution algorithms are given in Table 2.

SCIENCE AND TECHNOLOGY 700
Table 2. Comparison of Straggling Handling Algorithms
Authors Algorithm
Name
Method Replication
Overhead
Execution
Time
Google, (2008) GMRS - High No
Zaharia et al. (2008) LATE Reactive Moderate No
Ananthanarayanan et al.
(2013)
MANTRI Reactive Moderate Yes
Chen et al., (2010) SMAR Reactive High No
Sun et al., (2012) ESAMR Reactive Low Yes
Ananthanarayanan et al. (2013) DOLLY Proactive High No
Ananthanarayanan et al. (2014) GRASS - Moderate Yes
Ren et al. (2015) HOPPER Reactive High No
Fu et al., (2017) FARMS Proactive Highest -
CONCLUSION
Big data and its analytics is still in its initial stage but evolving at a great speed. Big data
clustering and scheduling are appearing one of the active research areas which plays a vital
role in the completion of big data processing and effectively utilizing the cluster resources.
To conclude, MapReduce based clusters has been appearing as the most effective big data
solutions. It empowers parallelism along with several low-end computing nodes. In addition,
there is no common task scheduling algorithm to accommodate and handle different type of
jobs at the same time. For the future research direction, the big data platform should be able
to handle different type of jobs for the processing of big data.
Acknowledgment: We are thankful to Universiti Teknologi Malaysia (UTM), for providing
us research environment, tools and technical support to accomplish this research work.
REFERENCES
1. Agneeswaran, Vijay Srinivas. Big Data Analytics Beyond Hadoop: Real-Time Applications with Storm,
Spark, and More Hadoop Alternatives. FT Press, 2014.
2. Thomas, Llewellyn DW and Aija Leiponen. "Big Data Commercialization." IEEE Engineering Management
Review 44, no. 2 (2016): 74-90.
3. Tang, Zhuo, Min Liu, Kenli Li, and Keqin Li. "An Optimized Mapreduce Workflow Scheduling Algorithm
for Heterogeneous Computing." The Journal of Supercomputing 72, no. 6 (2016): 2059-79.
4. Hadoop, Apache. Apache Hadoop. 2011/fifo/fair/capacity.
5. Zaharia, Matei, Dhruba Borthakur, Joydeep Sen Sarma, Khaled Elmeleegy, Scott Shenker, and Ion Stoica.
Delay Scheduling: A Simple Technique for Achieving Locality and Fairness in Cluster Scheduling.
Proceedings of the 5th European conference on Computer systems: ACM, 2010.
6. Loshchilov, Ilya, Marc Schoenauer, and Michele Sebag. "Kl-Based Control of the Learning Schedule for Surrogate Black-Box Optimization." arXiv preprint arXiv:1308.2655 (2013).
7. Nita, Mihaela-Catalina, Florin Pop, Ciprian Dobre, and Fatos Xhafa. "Momth: Multi-Objective Scheduling
Algorithm of Many Tasks in Hadoop." Cluster computing 18, no. 3 (2015): 1011-24.
8. Zaharia, Matei, Andy Konwinski, Anthony D Joseph, Randy H Katz, and Ion Stoica. Improving Mapreduce
Performance in Heterogeneous Environments. Vol. 8. Osdi, 2008.
9. Ananthanarayanan, Ganesh, Srikanth Kandula, Albert G Greenberg, Ion Stoica, Yi Lu, Bikas Saha, and
Edward Harris. Reining in the Outliers in Map-Reduce Clusters Using Mantri.vol 10 OSDI, 2010.
10.Ananthanarayanan, Ganesh, Ali Ghodsi, Scott Shenker, and Ion Stoica. Effective Straggler Mitigation:
Attack of the Clones. Vol. 13. NSDI, 2013.
11.Chen, Qi, Cheng Liu, and Zhen Xiao. "Improving Mapreduce Performance Using Smart Speculative
Execution Strategy." IEEE Transactions on Computers 63, no. 4 (2014a): 954-67.
12.Ananthanarayanan, Ganesh, Michael Chien-Chun Hung, Xiaoqi Ren, Ion Stoica, Adam Wierman, and Minlan Yu. "Grass: Trimming Stragglers in Approximation Analytics." (2014).

SCIENCE AND TECHNOLOGY 701
IGCESH2018
Universiti Teknologi Malaysia, Johor Bahru, Malaysia 13 -15 August 2018
RANDOM WALK IN MALAYSIA EXTREME STOCK RETURN
Muhammad Fadhil Marsani*1 and Ani Shabri2
1, 2 Department of Mathematic, Universiti Teknologi Malaysia, Skudai, Malaysia.
(E-mail: [email protected], [email protected])
ABSTRACT
In this study, we examine the behaviour of the Malaysian extreme share return by testing the
random walk hypothesis and exploring their stationarity. Block maxima method employed to
generate an extreme return for weekly and monthly series. The rationale for random walk
behaviour tested using Lo-MacKilay, Chow-Denning, and variance ratio tests based on a sum
of squares. The Augmented Dickey-Fuller and Kwiatkowski-Phillips-Schmidt-Shin test used
to identify the stationarity in the series meanwhile Mann-Kendall and Spearman's test utilised
to inspect the trend and correlation. Based on the result, the movement of KLCI extreme
share return for the weekly and monthly interval is predictable and non-stationary.
Key words: Extreme share returns, Block maxima method, Non-stationary, Random walk,
KLCI
INTRODUCTION
The random walk theory defined as the presence of erratic movements in the series. A
critical aspect of random walk in time series is the series are random and unpredictable.
Examine stationarity and random walk behaviour in share returns is crucial for the
investor to gain precise calculation and develops risk management. The impact of having
random walk in the time series analysis may lead to a spurious and unreliable result [1],
[2]. The random walk behaviour in share returns is first studied by [1] and discovered that
there is slight indication of autocorrelation in share returns, which mean the return series
simply can be projected. The view that predicted share return is supported by evidence of
return reversal effect and momentum effect [3], [4]. Later on, extensive studies on
random walk behaviour in share returns have been conducted, and some have established
that return predictability varies over time. The reasons for inconsistency in return due to
decision errors made by a market investor [5], and time-varying period as investor correcting
from alteration market circumstances [6], [7]. Recently, the different argument on random
walk behaviour in share returns see [8], [9], [10].
So far, however, there has been little discussion about the random walk and stationary
condition in extreme stock return. Thus, the rationale for the present study is to confirm
the movement of the financial markets whether extreme series is significantly fluctuating
or else. Our work is stimulated by increasing sign of uncertainty in the qualities of share
returns and swollen recognition of the effects when adopting efficient market hypothesis
while analysing the series. This study aims to evaluate return predictability in extreme share
return. The objective of our study is to confirming the random walk behaviour in KLCI

SCIENCE AND TECHNOLOGY 702
extreme return and secondly to detect the non-stationarity in the extreme series period using
stationarity tests and trend analysis. We use Lo-MacKilay, Chow-Denning, and variance ratio
tests based on a sum of squares to inspect the random walk while the primary instrument in
recognising the non-stationary is Dicky Fully, Phillips-Perron, and KPSS test to scan for unit
root and stationarity. Mann-Kendall and Spearman's analysis to inspect the trend and
correlation in the series.
Table 1. Stationarity and Random Walk test
ADF PP KPSS CD MK SPRM
daily -18.55** -63.90** 0.09 0.48 0.00*** -0.01*** week.max -7.65** -27.02** 0.86** 7.85*** -0.10*** -0.16*** week.min -7.62** -28.03** 1.53** 7.59*** 0.14*** 0.20*** month.max -4.18** -13.29** 0.54** 2.55*** -0.19*** -0.28*** month.min -3.40* -13.44** 0.74** 3.14*** 0.29*** 0.43*** significant of p-value at different = 0.01***,0.05** and 0.1*
MAIN RESULTS
Table. 1 displays the Augmented Dickey-Fuller (ADF) and Phillips Perron (PP) test to check
the existence of unit root, Kwiatkowski-Phillips-Schmidt-Shin (KPSS) to inspect the
stationarity. Chow-Denning test to scan for the random walk. Lastly, Mann-Kendall (MK)
and Spearman's (SPRM) test to examine the trend and correlation. The results for unit root
test using ADF and PP implies the rejection of 0H in overall interval is indicating the
presence of trend-stationarity in the sample and suggests random movement in share return.
For stationarity test using KPSS, 0H is rejected at all interval except for daily return
indicating the series is non-stationary. It can be inferred from the results that the series is
trend-stationarity with evidence of unit root, and stationarity test. Insignificant in KPSS test
for daily return-giving hint for a random walk since there is a contradiction in the result
obtained. While examine random walk using CD test, the result has support our previous
claim with insignificant of the p-value in daily return interval indicating the daily series
follow a random walk. Trend tests using MK SR exposed significant trend in all interval.
Nice to highlight that there is positive trend on extreme minimum and negative trend on
extreme maximum for both weekly and monthly interval. Further investigation using all
objective statistical including economic time-varying period tests will be present in the full
paper version.
CONCLUSION
A method comprising of the random walk, stationarity and trend tests used in this study to
examine the possible effects of extreme share return and series interval relationships. This
paper investigates stationarity behaviour and random walk process in extreme share returns.
The first contribution of this study is we have inspected the existence of the nonstationary in
Malaysian extreme stock return. Second, we confirm the extreme series is predictable with
evidence of rejecting random walk hypothesis in weekly and monthly extreme interval. Third,
we make use of economic factor in the analysis and found that the presence of random walk
during the crisis period. From the evidence of our result, we have justified that the movement
of Malaysia extreme share return in the weekly and monthly interval as trend-stationary and
predictable.

SCIENCE AND TECHNOLOGY 703
Acknowledgement: The authors would like to thank Universiti Sains Malaysia and the
Ministry of Higher Education for the scholarship handed.
REFERENCES
1. Fama, E. Efficient capital markets: A review of theory and empirical work. Journal of Finance 25(1970),
383-417.
2. Fama, E. Efficient capital markets: II. Journal of Finance 46(1991), 1575-1617.
3. Debondt, W. and R. Thaler. Does the stock market overreact?. Journal of Finance 40, (1985), 793-808.
4. Jegadeesh, N. and Titman, S. Returns to buying winners and selling losers: Implications for stock market
efficiency. Journal of Finance 48(1993), 65-91.
5. Malkiel, B.G. The efficient market hypothesis and its critics. Journal of Economic Perspectives 17(2003),
59-82. 6. Anatolyev, S. Nonparametric retrospection and monitoring of predictability of financial returns. Journal of
Business and Economic Statistics 27(2009) 149–160.
7. Lo, A.W. The adaptive markets hypothesis: Market efficiency from an evolutionary perspective. Journal of
Portfolio Management 30(2004), 15-29.
8. Park, C.H. and Irwin, S.H. What do we know about the profitability of technical analysis?. Journal of
Economic Surveys 21(2007), 786-826.
9. Yen, G.. and Lee, C.F. Efficient Market Hypothesis (EMH): Past, present and future. Review of Pacific Basin
Financial Markets and Policies 11(2008), 305-329.
10. Lim, K.P. and Brooks, R.D. The evolution of stock market efficiency over time: A survey of the empirical
literature. Journal of Economic Surveys 25(2011), 69-108.

SCIENCE AND TECHNOLOGY 704
IGCESH2018
Universiti Teknologi Malaysia, Johor Bahru, Malaysia 13 -15 August 2018
MEASURING URBAN GOVERNANCE USING OBJECTIVE DATA: A
CASE STUDY OF KUALA LUMPUR, MALAYSIA
Soo Po Xuan*1 and Gabriel Hoh Teck Ling2
1, 2 Urban and Regional Planning Department, Faculty of Built Environment, Universiti Teknologi
Malaysia, Johor Bahru, MALAYSIA.
(E-mail: [email protected], [email protected])
ABSTRACT
Over the past twenty years, it was recognised that good governance is important to achieve
the equitable and sustainable development which secure the common future. This is because
active, effective and fair governance helps promote the business development by putting in
place integrated policymaking capacity and ensuring stable and secure societies towards
sustainable development. Seeing this, hundreds of governance-indicator datasets have
emerged in response to the increasing demand. Stakeholders have relied heavily on these data
in making cross-border decisions. Nevertheless, it is argued that most of these data are
perception-based indicators; therefore, the decision made is bias and incorrect. Therefore, this
paper attempts to identify and explain the quality of governance for the Kuala Lumpur city
using an objective data-driven index called Governance and Legislation Index, under the UN-
Habitat’s City Prosperity Index. This paper employed content analysis on secondary data and
literature, heavily relying on statistical data from Kuala Lumpur City Hall, Election
Commission of Malaysia and the World Bank. Results have shown that governance in Kuala
Lumpur is a moderate solid factor (65.0) in contributing to the city’s prosperity. Compared to
other cities, Kuala Lumpur ranked 20 out of 47 selected cities. This shows that there is still
plenty of room Kuala Lumpur to improve its governance to remain competitive and
sustainable. In conclusion, even though the objective-based data is good as data produced
will not be bias, it should not be generalised to reflect the overall quality of governance.
There are many other governance related variables can only be obtained via perception-based
data. Seeing this, it is recommended that the GLI measured in this paper should be used
together with other subjective data to give a holistic, complete coverage of the overall quality
of governance of a city.
Keywords: Governance and Legislation Index (GLI), City Prosperity Index (CPI), Objective
data, Kuala Lumpur, Sustainability
INTRODUCTION
In the past two decades, there was a sudden increase of interest in the quality of governance,
especially in developing countries. It is recognised that good governance, where decision-
making and the implementation of policy is carried out effectively, transparently and
impartially [1], helps to ensure the development of economy and other resources is fairy
distributed among people from different classes. The growth of interest in the quality of

SCIENCE AND TECHNOLOGY 705
governance has further promoted the use of quantitative governance indicators. At such,
investors, policy makers and other stakeholders have heavily relied on these data to make
decisions. Nevertheless, it is found that there are some problems hindering the use of these
global governance indicators. For instance, it was argued that most of the governance-
indicator datasets are composite perceptions-based indicators [2]. Seeing this, the
computation of existing dataset is not transparent and is often bias in nature that consequently
affects the validity and reliability of the result.
In 2012, the UN-Habitat has introduced the City Prosperity Index (CPI) as a tool to measure
the achievement of the Sustainable Development Goals, in which Governance and
Legislation Index (GLI) aspects are crucial to be taken into account. Recognising the need to
have a balance between each dimension in a city, the CPI has place governance as the centre
of its conceptual matrix. Unlike most of the governance indicators, the computation of CPI
uses objective data, thus, help mitigating the problem of transparency and biasness. On the
ground of this, this paper attempts to identify and explain the quality of governance for the
Kuala Lumpur city using an objective data-driven index called the City Prosperity Index
(CPI). This paper employed content analysis on the secondary data and literature, heavily
relying on the statistical data from the World Bank, Kuala Lumpur City Hall (KLCH) and
Department of Statistics Malaysia (DOSM).
MAIN RESULTS
Results have shown that the GLI in Kuala Lumpur is a moderate solid factor (65.0) (See
Figure 1) in contributing to the city’s prosperity. This indicates that the GLI of Kuala Lumpur
is still trailing and is insufficient to help Kuala Lumpur to become a prosperous city.
Figure 1. GLI of Kuala Lumpur by sub-dimensions
Participation is the strongest sub-dimension of the three sub-dimensions under UGL (83.7)
[3]. This shows that there is a high likelihood that decisions and policy made in Kuala
Lumpur will reflect the will of a large number of individual. Next, the land use efficiency
(under Governance of Urbanisation sub-dimension – 65.7) in Greater Kuala Lumpur is 1.03
[4]. This shows the occurrence of urban sprawl. It reduces the capacity of city to generate
economies of scale and agglomeration, thus prevent the realisation of the potential that
urbanisation offers. Lastly, it is estimated that the tax collection of Kuala Lumpur contributed
to 42.1% of its total revenue in year 2017. In a prosperous city, city tends to have a higher
ability to generate its own revenue. On the other hand, the days to start a business in Malaysia
are 19 days [5]. The high number of days required signifies that there is excessive business
regulation which may affect the economic performance as it increases the costs of engaging
in the formal economy. These two variables have resulted in a Municipal Financing and
Institutional Capacity index of 45.68, making it the weak sub-dimension of GLI.
020406080
100Participation
Municipal
Financing
and
Institutional
Capacity
Governance
of
Urbanisation

SCIENCE AND TECHNOLOGY 706
When comparing with other cities, the GLI of Kuala Lumpur ranked number 20 out of 47
cities evaluated by the UN-Habitat in 2015 (see Figure 2). This shows that there is still plenty
of room Kuala Lumpur to improve its governance to remain competitive and sustainable.
Two Austrian cities, Melbourne and Sydney scored the highest with GLI of 93.9 and 92.4
respectively. On the other hand, Quito (37.5), Sao Paulo (33.8) and Fortaleza (30.9) are the
only three cities being “very weak” at their governance aspect. In terms of cities in South
East Asia, all three cities being evaluated Manila (51.7), Jakarta (45.4) and Bangkok (45.2)
have a GLI lower than Kuala Lumpur (GLI of other cities obtained from [6]).
Figure 2. GLI of Kuala Lumpur comparing to selected cities
CONCLUSION
In conclusion, using only objective data, the GLI of Kuala Lumpur is estimated to be
moderately solid at 65.0 and ranked number 20 amongst 47 selected cities worldwide. In
order to increase the competitiveness of Kuala Lumpur, all three sub-dimensions, especially
the municipality financing and institutional capacity of Kuala Lumpur should be improved.
This includes improving the own revenue collection of KLCH as well as reducing the days
needed to start a business.
Even though we come to understand that objective data is good in the sense that the data
produced is not bias, we should again be reminded that the objective data should not be
generalised to reflect the overall quality of governance. This is because there are many other
governance related variables, i.e. the confidence level of citizens towards the government and
the control of corruption of a city which can only be obtained via perception-based polls or
surveys. Seeing this, it is recommended that the GLI measured in this paper should be used
together with other subjective data, to give a better and complete coverage which thus helps
to draw a more holistic picture about the quality of governance of a city.
REFERENCES
1. Rothstein, B. & Teorell, J. What is quality of government? A theory of impartial government institution.
Governance 21(2008), 165-190.
2. Foresti, M., Wild, L., Takeuchi, L. R. and Norton, A. Governance targets and indicators for post 2015.
(Overseas Development Institute, London, 2014).
3. Suruhanjaya Pilihan Raya (SPR). Sistem pengurusan maklumat pilihan raya umum: Keputusan pilihan raya
umum. Retrieved from:
4. http://resultpru13.spr.gov.my/module/keputusan/paparan/paparan_Laporan.php
5. The World Bank. Malaysia economic monitor: Smart city. (The World Bank, Bangkok, 2011)
6. The World Bank. Time required to start a business (days). Retrieved from:
https://data.worldbank.org/indicator/IC.REG.DURS
7. Moreno, E. L., Murguía, R. O., and Lavagna, G. The City Prosperity Initiative: 2015 Global City Report.
(UN-Habitat, 2015).
- 20.0 40.0 60.0 80.0
100.0
Mel
bourn
e
Copen
hag
en
Mil
an
Man
ches
ter
Sto
ckholm
Kual
a…
Hel
sinki
Buen
os
Air
es
Med
elin
e
Kar
achi
Cap
e T
ow
n
Quit
o

SCIENCE AND TECHNOLOGY 707
IGCESH2018
Universiti Teknologi Malaysia, Johor Bahru, Malaysia 13 -15 August 2018
ASSESSMENT OF RISK MANAGEMENT CAPABILITY OF PRIVATE
SECTOR PARTICIPANTS IN BUILD-OPERATE-TRANSFER
HIGHWAY PROJECTS IN NIGERIA
J. K. Fabi1., R. A. Hamid2* and M. Mustapa3
1Department of Quantity Surveying, School of Environmental Studies, Federal Polytechnic,
Ilaro, Nigeria (Email: [email protected]) 2,3Department of Quantity Surveying, Faculty of Built Environment, Universiti Teknologi
Malaysia, Johor Bahru (Email: [email protected], [email protected])
ABSTRACT
Risks are inherent in construction projects but are more in BOT highway construction
projects due to large number of participants and many agreements involved. Therefore, there
is need to have adequate understanding of risk management capability of the parties to ensure
risks are properly and adequately managed. This paper seeks to assess the risk management
capability of the private sector participants executing BOT highway projects in Nigeria. This
study used questionnaire survey to elicit information from experts who are active
stakeholders in BOT highway construction in Nigeria. The population of the study comprises
of government officials, contractors, concessionaires, bankers, consultant engineers and
quantity surveyors, and academics. The study adopted stratified random sampling. Seventy-
two (72) responses were obtained from One hundred and ten (110) questionnaires
administered. The study adopted fuzzy synthetic evaluation (FSE) method in the analysis of
data because of its ability to handle multi attributes and multi criteria nature of the problems
to be solved. The result indicated that private sector participant’s culture and awareness, risk
management practice and application, risk management resources and risk management
process are: 0.637, 0.606, 0.602 and 0.581 respectively. This indicates that their risk
management capability is above average, though not excellent. The study concluded that
there is need for private sector participants to further improve their risk management
capability as being in the ‘managed’ level of risk management attribute requires further
improvement to operate at ‘optimized’ risk management attribute in order to reap the full
benefit of risk management.
INTRODUCTION
[1] defined maturity models “as systematic framework to carry out a comparative evaluation
(strategically leading the organization to continuous improvement, requiring a deep
understanding of the current position of an organization and the one that it aspires to be in the
future”. Maturity models have evolved over time. They consist of a few stages in which the
complexity level is increased from one to another in the searching for perfection [2]. In
particular, [3] described a risk maturity model as a tool designed for assessing the risk
management capability of an organization. He developed a formalized and systematic risk

SCIENCE AND TECHNOLOGY 708
management maturity models to assess current risk management capability of organizations.
[2] described a maturity model as a way for organizations to implement a formal approach to
risk management or as a reference to compare current practices held by the company. His
model was made up of four maturity levels (Naive, Novice, Normalized, and Natural) and
measured the four attributes: culture, process, experience and application [4]. [5] proposed a
model with five evaluation levels: initial, repeatable, defined, managed and optimized. All
these models are tools that allow an organization to implement formal risk management
processes and to set priorities for process improvement [2, 3].
Studies conducted by researchers and organisations such as [5], [6], [3] and [7] have
demonstrated the significance of employing formalised risk management maturity models in
measuring risk management process, culture, practice and resources. These studies developed
several risk management maturity models ‘RM3’ as tools to systematically assess risk
management capability of organisations on construction projects. Knowledge of the maturity
levels on each attribute helps to identify the areas of strengths and weaknesses of
organisations [3]. [8] examined the risk management capability of the contracting
organization handling DBB highway projects in the Nigerian construction sector. Their paper
adapted the technique, attributes and maturity levels of the existing ‘RM3’ to assess the risk
management capability of the highway contractors in Nigeria. Therefore, this paper aims at
assessing the risk management capability of private sector participants in Nigeria with a view
to bring about improvement in the management of risks in the construction industry.
MAIN RESULTS
Table 1 shows the computed attribute indices (AI) for the public party on the risk
management capability attributes. The result indicated that private party organization’s
culture and awareness, risk management practice and application, risk management resources
and risk management process are: 0.637, 0.606, 0.602 and 0.581 respectively.
Table 1. Attributes indices and risk management capability of private party
S/N Risk Management Capability Attributes Attribute Index (AI)
1 Organization culture and awareness 0.637
2 Risk management practice and application 0.606
3 Risk management resources 0.602
4 Risk management process 0.581
RMMI 0.607
Source: Authors (2017).
It could be deduced from Table 1 that the indices are greater than 0.50 but less than 0.75.
This implies that the maturity level of private party in all the attributes is “managed”. The
organization has developed and implemented a formal RM system. Projects use previous
experiences, especially for risk identification for each new project. Successes of previous
projects can be repeated. In general, the benefits of RM are understood in the upper levels of
the organization. Projects employ personnel with the required RM skills who have adequate
resources available to develop this process. The probability, impact and severity of risk
events are measured qualitatively. Consequent upon the maturity level of the private party in
the 4 attributes of risk management capability, the results of FSE evaluation also revealed
that the public party has a risk management maturity (RMMI) index of 0.607. This index is in
the same range with the risk management capability attributes. The organization has

SCIENCE AND TECHNOLOGY 709
developed and implemented a formal RM system. Hence, the private party operated at
‘Managed’ risk management maturity level.
CONCLUSION
The private sector participants are 100% ‘managed’ in all the attributes of risk management
capability. This is an indication that there is more awareness and they are proactive in risk
management because they know implication of running out of business in an economy that is
struggling to provide infrastructure for its citizens. There is room for improvement as the best
and last stage of the risk management maturity attribute is not yet achieved by the private
sector participants in Nigeria. The optimized stage brings about effective management of
risks and achievement of value for money which is the main goal of public-private
partnerships.
Acknowledgement: The authors would like to express their appreciation to UTM Johor
Bahru for supporting this research and to the experts who participated in the survey.
REFERENCES
1. Brookes, N & Clark, R. Using Maturity Models to Improve Project Management Practice POMS 20th
Annual Conference. POMS, May 1-4, 2009. Orlando, Florida USA (2009).
2. Hillson, D. Towards a Risk Maturity Model. The International Journal of Project and Business Risk
Management, 1(1), (1997) 35-45.
3. Hopkinson, M. M. The Project Risk Maturity Model: Measuring and Improving Risk Management
Capability, England, Gower Publishing Ltd. (2011).
4. Yeo, K. T. and Ren, Y. T. 'Risk management capability maturity model for complex product systems (CoPS)
projects', Systems Engineering, 12(4), (2009). 275–294.
5. Ren, Y. T. and Yeo, K. T. Risk Management Capability Maturity Model for Complex Product Systems
(CoPS) Projects. IEEE (2004) 6. Zou, P. X.; Chen, Y. & Chan, T. Understanding and improving your risk management capability:
Assessment model for construction organisations. Journal of Construction Engineering and Management,
ASCE (2010).
7. Mu, S., Cheng, H., Chohr, M. and Peng, W. Assessing risk management capability of contractors in subway
projects in mainland China. International Journal of Project Management, 32(3), (2014) 452–60.
8. Salawu, R. A. and Abdullah, F. Assessing Risk Management Maturity of Construction Organisations on
Infrastructural Project Delivery in Nigeria. Procedia-Social and Behavioural Sciences 172 (2016) 643 – 650

SCIENCE AND TECHNOLOGY 710
IGCESH2018
Universiti Teknologi Malaysia, Johor Bahru, Malaysia 13 -15 August 2018
ASSESSMENT OF MANGROVE SPECIES MAPPING AT UNESCO
GLOBAL GEOPARK, LANGKAWI
M. K. A. Halim*1, A. Ahmad2 and H. M. Suhaimi3
1, 2 Faculty of Geoinformation and Real Estate, Universiti Teknologi Malaysia, 81310 UTM Johor
Bahru, Johor, MALAYSIA.
(E-mail: [email protected], [email protected]) 3 Faculty of Civil Engineering, Universiti Teknologi Malaysia, 81310 UTM Johor Bahru, Johor,
MALAYSIA.
(E-mail:[email protected])
ABSTRACT
The global mangrove area has been decreasing over time due to the various kind of threats.
Therefore, the analysis of mangrove at level species is required notably for better sustainable
management and proper decision-making for conservation purpose. This study assesses the
accuracy of different classification methods to produce mangrove species map from
multispectral SPOT 7 satellite imagery over Kilim Karst Geoforest Park (KKGP), Langkawi,
Malaysia. Object-based image classification was used to extract the mangrove and non-
mangrove area and after that three different pixel-based classification techniques such as
minimum distance (MD), spectral angle mapper (SAM) and maximum likelihood
classification (MLC) were then used to classify mangrove area at species level. These three
supervised classification methods were performed in ENVI 5.2 software which involved the
selection of training areas. Two dominant mangrove species were found within study area
including from the genus of Rhizophoracae (i.e, Rhizophora muncronata and Rhizophora
apiculata) and other species such as Brugueira parviflora, Ceriops tagal and Xylocarpus
granatum were classified as one class. Then, classification accuracy was assessed by
comparing the classified results with the ground data collected for this study using confusion
matrix. Overall classification accuracy for the MLC method was approximately 90.76% and
its Kappa statistics was 0.85 shows a strong correlation between the classification and
validation data. The overall accuracy and Kappa statistics for SAM and MD classifiers
indicated lower results compared to MLC. As conclusion, it can be concluded that mangrove
species mapping using MLC classifier is more successful.
Keywords: Mangrove species, Classification, Supervised, SPOT 7
INTRODUCTION
Langkawi obtained geopark status from United Nations Educational, Scientific and Cultural
Organization (UNESCO) in July 2007. This title has boosted the number of tourists to visit
Langkawi from year to year as well as the development of coastal zone and tourism industry
also increase rapidly. Kilim Karst Geoforest Park (KKGP) which is situated in the northeast
region of Langkawi island has also received positive impacts from tourism activities all this
while. However, a number of problems have occurred related to environmental issues in this

SCIENCE AND TECHNOLOGY 711
area [1-5]. Riverbank erosion became worst year by year by the increasing of tourist volume
which are using the boat services. This problem does not cause riverbank erosion only but
also has given a negative impact on the mangrove ecosystem as shown in Figure 1. The
erosion of Kilim riverbank occurs because of the tourist boat activities which is directly cause
the disrupting for mangrove ecosystem and marine life. The speed of tourist boat would cause
the huge wave to crash down the riverbank and leads to mangrove trees collapse [6].
Therefore, this area should be monitored wisely so that these problems do not affect the
geopark status as well as the existing fragile environment. In order to ensure the sustainability
of mangrove ecosystem and its survival, it is vitally crucial to monitor this area by producing
mangrove species map with higher accuracy. Digital image classification plays important role
to produce mangrove map at species level with better accuracy. Recently, there are many
algorithms or techniques of digital image classification like supervised, unsupervised, pixel-
based and object-based classification available to be used. The main aim for this study is to
evaluate the accuracy of the mangrove species map produced by using various supervised
digital classification approaches for environmental management purposes to reduce the
problems stated above. The objectives of this research are to map mangrove species from
SPOT-7 imagery using three supervised classification approaches that are Maximum
Likelihood Classification (MLC), Minimum Distance (MD) and Spectral Angle Mapper
(SAM) and second, to evaluate the performance of methods used in producing mangrove
species map. The classified mangrove species map, produced by this study, can be used as
one of tool to improve environmental management such as the preservation of the natural
assets.
MAIN RESULTS
Figure 1. Mangrove species map produced using MLC, MD and SAM
Mangrove species maps of Kilim derived from SPOT 7 imagery using three different
supervised classification methods are successfully produced as shown in Figure 1. There
are three (3) mangrove species which are most abundant and can easily be identified along
Kilim River: Rhizophora Muncronata (RM) – in lightest green color, Rhizophora Apiculata
(RA) – in moderate green color and others (Brugueira Parviflora, Ceriops Tagal,
Xylocarpus Granatum, Xylocarpus Moluccensis and Acrostichum Aureum) – in dark
green color. The overall accuracy and Kappa statistics for mangrove species classification

SCIENCE AND TECHNOLOGY 712
using three different supervised classification methods are illustrated in Figure 1. According
to Figure 1, it shows that MLC approach get the highest accuracy which is approximately
90.76% with 0.85 of Kappa statistic followed by MD, 84.03% and SAM, 68.91% with 0.74
and 0.50 of Kappa values respectively. Based on [11], a common acceptable accuracy is 85%.
Therefore, only MLC approach has met the acceptable value. This shows that MLC method
can discriminate all mangrove species properly compared to MD and SAM classifier.
CONCLUSION
This work is carried out to evaluate the performance of different digital image classification
used to produce map of mangrove at species level. The mapping is successfully performed by
assessing the performance of MLC, MD and SAM supervised classification approaches on
SPOT 7 imagery. The results of MLC method indicated that this classifier method can
produce mangrove species map more accurately than MD and SAM algorithms. Furthermore,
overall accuracy and Kappa statistics values for MLC are higher than MD and SAM. Overall,
the presented results show that MLC method has significant capabilities and advantages in
classifying mangrove at species level for this area.
Acknowledgment: This work has been funded by Ministry of Higher Education, Malaysia
via TRGS grant Vot number: 4L855. The authors would like to thank LADA, Jabatan
Perhutanan Negeri Kedah, Koperasi Komuniti Kampung Kilim and all other team members
for their contributions and advices.
REFERENCES
1. Free Malaysia Today. Website: http://www.freemalaysiatoday.com/category/opinion/2016/05/27 /mangrove-
forest-in-kilim-geo-park-under-threat/
2. Post Magazine. Website: http://www.scmp.com/magazines/postmagazine/article/1577608/langkawi-victim-
its-own-success
3. R. Age. Website: http://rage.com.my/langkawi-getting-trashed/
4. Badaruddin, M. Effects of tourism activities and development on the physical environment of Kilim river, Langkawi, Malaysia. (2012) The Malaysian Forester 75(1): p. 81-86.
5. Tajam, J. and Kamal, M.L. Marine environmental risk assessment of Sungai Kilim, Langkawi, Malaysia:
Heavy Metal Enrichment Factors in Sediments as Assessment Indexes. (2013) International Journal of
Oceanography. Article ID 482451, http://dx.doi.org/10.1155/2013/482451.
6. Shahbudin, S., Zuhairi, A. and Kamaruzzaman, Y. Impact of coastal development on mangrove cover in
Kilim River, Langkawi Island, Malaysia. (2012) Journal of Forestry Research, 23(2), p.185-190.

SCIENCE AND TECHNOLOGY 713
IGCESH2018
Universiti Teknologi Malaysia, Johor Bahru, Malaysia 13 -15 August 2018
ASSESMENT OCCUPATIONAL NOISE EXPOSURE FOR
MANUFACTURING INDUSTRY
Mahendren Subramaniam1, Mohamad Zaki Hassan*1, Mohamad Haziq Ibrahim1,
Mohd Yusof Daud1, Sa’ardin A. Aziz1 and Shamsul Sarip1
1 UTM Razak School of Engineering and Advanced Technology, Universiti Teknologi Malaysia, Jalan Sultan Yahya Petra, 54100 KUALA LUMPUR
(E-mail: [email protected], *[email protected], [email protected],
[email protected], [email protected], [email protected])
ABSTRACT
In the past few decades, a rapid of industrialization by increasing the noise pollution and
provides a people's awareness to combat this issue. Here, apart from providing employment
opportunities to workers, manufacturing industry also produces disturbing noise that is
generated by various sources especially from the machinery. The aim of this study is to
determine the maximum noise hazard in the industry. Initially, the reading of noise exposure
at the manufacturing industry was achieved using the dosimeter. Then, criteria for a
recommended standard occupation noise exposure based on NIOSH (1998) noise working
safe condition were measured. In addition, noise exposure related to work time is also
proposed.
Keywords: Noise Level, Noise Pollution, Occupational Noise Hazard
INTRODUCTION
Noise is generally well-defined as any undesirable or unattractive sound. The ordinary human
ear and the nervous system have the extraordinary volume to accept and perceive sound.
Numerous diseases can impair or completely nullify normal hearing capabilities. Sensor
neural hearing loss is one such disease that occurs which hair cells of the inner ear
(stereocilia) lose their ability to transmit sound information to the brain. Noise-induced
hearing loss, which is damaging to stereocilia caused by exposures to hazardous levels of
noise, is the most common aetiology of sensor neural hearing loss [1]. Although there are
numerous sources of hazardous noise and types of hearing impairment, workplace noise
exposures are the best predictor of hearing impairment other than age.
In past studies regarding occupational noise hazard which extracted from Voorhees et. al. [2]
that indicates lower noise stages from different tank room also can cause problems regarding
to noise in aquaculture. Besides, Atmaca et. al. [3] found that noise levels in industries
including concrete traverse, cement, steel, and textile are above the permissible level of noise
85 dBA.
This study has focused on noise hazard exposure in manufacturing industry. The propose
noise exposure related to work time is also included.

SCIENCE AND TECHNOLOGY 714
MAIN RESULTS
Figure 1 show the noise level in four divisions in manufacturing industry including
polishing, quality control (QC), surface treatment and CNC & CAM departments. It can
be seen that CAM and CNC department significantly produced a highest noise level. I
addition, the range of noise exposure was found to be approximately 75 dBA at surface
treatment, QC and polishing departments.
Figure 1. Noise level traces for all departments
Table 1 displays the comparison of noise level recorded for the study compared to the
exposure level recommended by NIOSH. All departments show a high noise level which
exceeds than the recommended level. CAM and CNC department holds the highest level of
noise exposure followed by polishing department. Immediate action should be implemented
by the company to mitigate the noise level in all the departments.
Table 1. Comparisons of noise level survey following NIOSH guideline
Department LEX
(dBA)
Actual
Average Shift
Length (hr)/day*
Permitted Shift Length
(hr)/day
(NIOSH, 1998)
Polishing 74.32 11.20 > 25hr
CAM & CNC 114.01 11.20 > 2 hours 31 minutes
Quality Control 75.20 11.20 > 25hr
Surface Treatment 75.60 11.20 > 25hr
50
60
70
80
90
100
110
120
130
7
am
8
am
9
am
10
am
11
am
12
pm
1
pm
2
pm
3
pm
4
pm
No
ise
Lev
el (
dB
A)
Time
Polishing
Quality Control
Surface Treatment
CNC & CAM

SCIENCE AND TECHNOLOGY 715
CONCLUSION
The noise level indicates an excess of the permissible exposure limit as stipulated in the
NIOSH guideline. Remedial action need to be undertaken by the management on this matter.
Acknowledgment: The appreciation is given to Universiti Teknologi Malaysia and Ministry
of Higher Education under Fundamental Research Grant Scheme, R.K130000.7840.4F880
and “Geran Universiti Penyelidik’ (GUP) Tier 1, (Q.K130000.2540.15H70) for financially
support provided throughout the course of this research project.
REFERENCES
1. Rabinowitz PM, Galusha D, Slade MD, et al. Audiogram notches in noise-exposed workers. Ear Hear. 2006; 27:742–750.
2. Voorhees, J., and Barnes, M.E. Occupational Noise Levels in Two Fish Rearing Buildings at an Aquaculture
Facility. Occupational Diseases and Environmental Medicine (2017), 5, 58-66.
3. Atmaca, A., Peker, I. and Atlin, A. Industrial Noise and Its Effects on Humans. Polish Journal of
Environmental Studies (2005), 14 (6), 721-726.

SCIENCE AND TECHNOLOGY 716
IGCESH2018
Universiti Teknologi Malaysia, Johor Bahru, Malaysia 13 -15 August 2018
PROPOSED STRATEGY FOR GIS RE-IMPLEMENTATION IN
ELECTRICAL NETWORK DISTRIBUTION IN MALAYSIA – A
CASE STUDY OF CHERAS TNB DISTRIBUTION STATION
F. Mat Yatim*1, Z. Majid2 and S. Amerudin 3
1, 2 Faculty of Geoinformation and Real Estate, Universiti Teknologi Malaysia, 81310 UTM
Johor Bahru, Johor, MALAYSIA. (E-mail: [email protected], [email protected])
3 Faculty of Geoinformation and Real Estate, Universiti Teknologi Malaysia, 81310 UTM
Johor Bahru, Johor, MALAYSIA. (E-mail: [email protected])
ABSTRACT
Tenaga Nasional Berhad (TNB) Distribution has embarked on the development of a
Geographical Information System (GIS) since the year 2009. The scope of work is to map
and digitize all TNB distribution electrical assets and to systematically establish the
customer’s database. In this study, a review on the GIS implementation was carried out at the
Cheras TNB Distribution station. The aim of the study is to develop a revised strategy for a
successful GIS re-implementation in TNB Distribution electrical network based on the results
from the review process. The study was finally ended with the development and evaluation
of the proposed strategize plan for the re-implementation of four GIS components which are
system, data, business process and user. The proposed strategy will be used to determine the
effectiveness of the re-implementation strategies and to drive the future invasion of GIS
application to other TNB Distribution stations in Malaysia.
Key words: TNB – Tenaga Nasional Berhad, GIS-Geographic Information System, KSF-Key
Success Factors, Strategy, Re-implementation,
INTRODUCTION
Tenaga Nasional Berhad or TNB is one of the Malaysian Government Linked Companies
(GLCs). Tenaga Nasional Berhad is the largest electric utility company in Malaysia and also
the largest power company in Southeast Asia [1]. TNB's core activities are in the generation,
transmission and distribution of electricity, thus having three divisions which are Generation,
Transmission and Distribution. Cheras, TNB Distribution station will be the main focus for
this case study. This station has Network Asset Profile for Year 2017 as shown in Figure 1.
All these assets data i.e. spatial and non- spatial must be digitized inside GIS software for
asset registration and data management purposes.

SCIENCE AND TECHNOLOGY 717
Figure 1. Cheras TNB Distribution Network Asset Profile for Year 2017.
AIMS OF STUDY
The aim of the study is to develop a revised strategy for a successful GIS re-implementation
in TNB Distribution electrical network based on the results from the review process.
Therefore, the objectives of this research are:
i. To review and analyse the existing GIS implementation in TNB Distribution
ii. To develop and evaluate strategize plan for the re-implementation of four GIS
components which are System, Data, Business Process and Users
iii. To analyse the revise strategies effectiveness in the re-implementation of GIS in the
case study station.
SCOPE OF STUDY –MATERIALS AND METHODS
The scopes of study will focus in Cheras TNB Distribution station as the case study area for
the re-implementation of GIS. The GIS data used will be TNB Cheras existing data in GE
Small world from year 2009 to 2014. Materials below will be used during the case study: -
i. TNB’s 10 years GIS Master Plan
ii. 100 Gaps/issues report
iii. TNB's Audit Report 2014
iv. Survey report with TNB Cheras and GIS Project Team
v. GIS Utilization report by TNB ICT
vi. Functional Requirement Reports for the six (6) functions
vii. Literature review
viii. Benchmarking against leading practices
With reference to the above documents and existing GIS data in TNB Cheras, the review will
focus on the four (4) component of GIS which are System, Business Process, Data and User.
During the review period, current practices in GIS was reviewed, analysed and evaluated
based on current functions and GIS system architecture. Workshops, meetings, interviews
and sampling of data with core users i.e. TNB Cheras User, GIS Project Team (consist of GIS
TNB Distribution Project team and ICT team) were carried out. The identified strategies are
planned and developed in the re-implementation process. During the re-implementation
period, Project Management Methods and Agile Scrum Method are used for continuous
monitoring the effectiveness of the strategies during the re-implementation phase until project
deliverable.

SCIENCE AND TECHNOLOGY 718
MAIN FINDINGS AND BRIEF ANALYSIS OF THE STUDY
The main findings after the review based on the four components of GIS are:
i. Process:
Ambitious numbers of functions i.e. fifteen (15) that are being developed and will
be deployed with minimal stabilization period and steep learning curve.
ii. Systems and Tools:
Data model and system were highly customized
iii. Data management:
Challenges in execution of data collection and data digitization, Inadequate
enforcement of data maintenance, Inadequate tools to monitor data quality and etc.
iv. User (staff of TNB Cheras & GIS TNB Distribution Project):
Insufficient Project Champions, poor communication and etc.
To analyse the revise strategies effectiveness in the re-implementation of GIS, key
successful factor (KSF) need to be identified, developed and measured for the four GIS
components. The KSF can be carried out via survey, interview and audit.
CONCLUSION
System Usability Scale will be used for measuring the outcome of KSF. The outcome of the
overall survey will indicate the successfulness of the Project as shown in Figure2.
Figure 2. Summary of Key Success Factor
Acknowledgment: Our thanks to UTM, TNB ICT, TNB GIS Distribution Project Team,
SME and TNB Cheras Staff (users) in giving the best cooperation and team work.
REFERENCES
1. TNB Homepage website. 2017. 2. Martins, A. I., Rosa, A. F., Queirós, A., Silva, A., and Rocha, N. P. European Portuguese Validation of the
System Usability Scale (SUS). Procedia Computer Science. 2015. 67(Dsai), 293–300.
3. Longley, P.A., Goodchild, M.F., Maguire, M.F. and Rhind, D.W. Geographical Information System and
Science. 2nd Edition. West Sussex, England: John Wiley & Sons Ltd. 2005
4. Korte, G. B. The GIS book. 5th Edition. Albany, New York: Onword Press/Thomson Learning. 2001

SCIENCE AND TECHNOLOGY 719
IGCESH2018
Universiti Teknologi Malaysia, Johor Bahru, Malaysia 13 -15 August 2018
EXPLORING ALPHA GENERATION’S DEMAND ON PRESCHOOL
EDUCATION FOR CITY AS AN EDUTAINMENT LEISURE
DESTINATION
Nur Shahirah Rusman*1, Hairul Nizam Ismail2 and Syed Muhammad Rafy Syed
Jaafar3
1Master Candidate, 2Associate Professor and 3Senior Lecturer,
Department of Urban and Regional Planning, Faculty of Built Environment,
Universiti Teknologi Malaysia, Johor Bahru, MALAYSIA
(E-mail: [email protected], [email protected], [email protected])
ABSTRACT
There had been increasing number of child-centred destination established in the city with the
concept of edutainment as to fulfil the needs of alpha generation. Emphasizing on three
combined elements of personalized learning, fun and play, edutainment concept is seen as
new approach. This is to enhance lifelong learning for the future generation who heavily
depending on the advancement and incorporation of technologies to cultivate their intelligent
growth. Consequently, the establishment of demand from the preschool operators can be seen
through the growing number of excursion and field trip activities organized for children.
However, less was examined as to what extend the concept of city edutainment fit into the
needs of the educational purposes programs. Therefore, it is important to understand as to
how the existing informal educational settings should transform to meet the needs of the
alpha generation either by city population or outbound tourist. Hence, the understandings by
the city governance is a must in developing and evaluating policy related to edutainment as to
ensure the preferences for education-based infrastructures and learning meet the needs. Thus,
this paper will discuss the fundamental ability of the city that makes it qualify as edutainment
destination with the specific reference to the demand from preschool education in presenting
the alpha generation. This including the characteristics of alpha generation, the needs from
the preschool education and the city prospects as edutainment informal learning setting. In
this case, edutainment facilities are important elements for both urban planning and education
which indirectly contribute to the opportunity to explore real learning experience beyond the
classroom and shape a better quality of life for future generation.
Key words: Edutainment City, Preschool Education, Alpha Generation
INTRODUCTION
Recently, the tourism industry had been focusing on the provision of branded theme park and
waterpark destination to secure its position as Asia’s preferred family holiday destination.
Attractions such as LEGOLAND Malaysia, Movie Animation Park Studios and Nicklodeon
Lost Lagoon are one of the main tourism product used to promote tourism in Malaysia among
inbound and outbound tourists. However, behind the two alternatives, attention should also

SCIENCE AND TECHNOLOGY 720
be given to the new generation of indoor attractions. Looking at the increasing trends of the
provision of indoor attractions, it shows that there is a huge potential of the market to
contribute to the economic growth of the nation. According to [1], the new generation of
indoor attraction considers four major trends of new types of tourism attraction such as active
play, edutainment, lifestyle-driven and IP-based attraction. This paper will discuss more on
edutainment attraction as the trends on the provision of child-centered destination with the
concept of edutainment is growing especially in big cities such as Kuala Lumpur, Penang and
Johor Bahru. In Kuala Lumpur, several edutainment destinations include Kidzania,
Petrosains, Aquaria KLCC, Dinoscovery and Little Kingdom while in Johor Bahru, the
destination include Big Boss N’ Land, G-Kids Theme park and Fanpekka.
Since the tourism industry had shifted from labour-based to knowledge-based industry, the
needs of consumer ‘attitudes and expectations also change where learning had started to
becoming part of leisure time especially for the Generation Alpha. As a result, there are
several pre-schools who had started to organized excursion and field trip activities for the
students to gain experiential learning from the informal educational settings. However, less
was examined as to what extend the concept of city edutainment fit into the needs of the
educational purpose programs. Therefore, it is important to understand as to how the existing
informal educational settings should transform to meet the needs of the alpha generation
either by city population or outbound tourist. Thus, this paper will discuss the fundamental
ability of the city that makes it qualify as edutainment destination with the specific reference
to the demand from preschool education in presenting the alpha generation. This including
the characteristics of alpha generation, the needs from the preschool education and the city
prospects as edutainment informal learning setting.
FINDINGS
Early childhood education is currently improving to meet the needs of the preschool
students based on their preferences through the early childhood development
characteristics. One of the step taken by the preschool operator is by combining formal
and non-formal learning as it will diverse the learning experiences and helps the student
to gain more knowledge from different educational settings as well as improving the early
childhood development growth. The demand for non-formal learning can be seen from the
provision of fieldtrips and excursion activities conducted by the preschool operators to
the informal educational settings such as science center, museums and zoos. However,
due to the transition of generation, there is a slightly change in way of choosing
destination for the non-formal learning and informal learning. Generation Alpha is the
current generation where children started to turn to digital devices for learning,
interaction and play. Currently, they are more demanding in terms of the attraction’s
feature. They want more physical experience, fun, interactive and responsive environment
for them to experience effective non-formal and informal learning. Thus, it can be seen
from the increasing number in the provision of edutainment attraction especially in the
cities in form of location-based edutainment.
However, limited research had been done on the characteristics of edutainment leisure
destination that satisfy the needs of the early childhood level especially preschool student
in order for them to gain knowledge and enhance their development growth in out -of-
school settings. [2] and [3] had highlighted the characteristics of edutainment destination.
However, it does not being interpreted in terms of physical characteristic that will help in
designing and providing destination according to the needs of this new generation.

SCIENCE AND TECHNOLOGY 721
Therefore, further study need to be done on the physical characteristic of edutainment
leisure destination based on the needs of Generation Alpha to create a better function of
the city and at the same time benefits physical, economic and social development of the
city. There are several efforts had been made to describe edutainment in terms of physical
characteristics. However, it only limited to formal learning without taking into
consideration on how city can serve the inbound and outbound population and vistors in
terms of education embedded in leisure place.
CONCLUSION
In conclusion, the trends of edutainment attraction and the provision of excursion as well as
field trips activities among preschool students have triggered the needs to provide informal
educational settings that comply with the demand from the Generation Alpha. It does not
only provide learning but also create an environment for the students to be able to learn in the
most fun and enjoyable way. It is also one of the effective learning strategy to gain variety of
knowledge aside from fixed curriculum taught in school. Thus, edutainment facilities are
important elements for both urban planning and education where it will indirectly contribute
to the opportunity to explore real learning experience beyond the classroom and shape a
better quality of life for future generation. Hence, further study needs to be done on how city
can fit into the educational purpose programs through the information on physical
characteristic of edutainment and how it will influence physical settings, urban economic and
social development.
REFERENCES
1. The Park Data Base Analytics and Malaysian Association of Amusement Themepark and Family
Attractions. The Malaysian Attraction Benchmark Report (2015).
2. White, R. That’s Edutainment. Kansas City, MO. White Hutchinson Leisure and Learning Group. (2003).
3. Hussain, H., Embi, Z., C. and Hashim, S. A Conceptualized Framework For Edutainment. Informing
Science. (2003).

SCIENCE AND TECHNOLOGY 722
IGCESH2018
Universiti Teknologi Malaysia, Johor Bahru, Malaysia 13 -15 August 2018
EXPLORING FACTORS THAT CAN HINDER THE
IMPLEMENTATION OF PERFORMANCE INFORMATION
PROCUREMENT SYSTEM IN NIGERIA.
S. G. Buba*1,2, R. Adul Hamid 1 and Z. Mohamad Ramly1
1, Department of Quantity Surveying, Universiti Teknologi Malaysia, Johor, MALAYSIA. (E-mail: [email protected], [email protected], [email protected] )
2Department of Quantity Surveying, Kaduna State University, Kaduna, NIGERIA.
ABSTRACT
Procurement particularly in the construction industry is obviously important and cannot be
played down because it constitute every phase of a project delivery system. Procurement
involves the process of selecting vendors, establishing payment terms, strategic vetting, and
selection, the negotiation of contracts and actual purchasing of goods. The low-bid system
has remained the most popular procurement system globally and in Nigeria and lacks
transparency and accountability. Therefore, there is a need to stabilise the procurement
system in Nigeria by transferring the risk and control to contractors who must act in the best
interest of the client by the use of best value performance information procurement system in
selecting contractors. This paper aimed at exploring those factors that can act as a barrier to
the implementation of the innovative procurement system and their relative influence. A total
314 questionnaires were distributed to 5 professionals in the construction industry in Nigeria;
they are Architects, Quantity Surveyors, Civil Engineers, Builders and Services Engineers.
The data collected where presented and analysed using descriptive analysis: cross tabulation,
exploratory factor analysis and mean score ranking using statistical Package for Social
Sciences (SPSS) version 24 and Microsoft Excel respectively. Likert scaling was used to
measure the level of agreement of the respondents. The paper found out that the social factor,
Political factor, Procurement Environment factors and the cultural factor in the construction
industry ranked 1, 2, 3 and 4 respectively and these factors have a very strong relative
influence on hindering the implementation of BVPIPS in the Nigerian construction industry
as each has an average mean score value that is > 3.5. Therefore, there is the need to make
better these factors in the Nigerian construction industry so as to accommodate innovative
approaches such as BVPIPS to improve project delivery in Nigeria.
Keywords: Best Value Performance Information Procurement System (BVPIPS), Construction Industry, Project Delivery, Procurement and Nigeria
INTRODUCTION
For years past lots of changes has come about within the construction industry. Different
project delivery systems were proposed such as the traditional (low-bid), design-bid-build,
Construction Management at risk, etc. [1] The variants of procurement methods available
today where developed from the need to improve project delivery in construction, that is,
projects being completed within budget and time [2]. The procurement methods are being

SCIENCE AND TECHNOLOGY 723
emphasised particularly on optimising all the key performance indicators (KPI) involved in
project delivery these are: time, cost and quality [3]. Procuring projects in these constraints
has continually being a challenge to the design team, the contractors, and managers of
investments [4]. “Traditionally, the procurement approach used focuses on the low-bid
system which can be a timely process to produce the full contract documentation. [5]. This is
the most practised in Nigeria.
The importance of contractor selection is mostly underestimated and neglected in
construction [6]. Selecting a contractor is a risk management process for the fact that the
duly selected should be competent to bear portions of the risks in the project. As
construction projects become more complex, so also is the contractor selection process as
observed by [7]
There is the need to stabilise the procurement system in Nigeria by transferring the risk
and control to contractors who must act in the best interest of the client by the use of best
value performance information procurement system (BVPIPS) in selecting contractors.
This new initiative in best value procurement can bring about transparency and
accountability and the risk management orientation of the PIPS structure disengages
relationships, inaccurate expectations, bureaucratic and political actions [8]. The main
advantage of Best Value is that it identifies expertise as the only factor that can minimise
the risk of non-performance and any attempt to manage and control a contractor is
inefficient and costly” [9]. In the course of this study some factors have being identified
to be barriers or factors that can hinder the implementation of BVPIPS in the Nigerian
construction industry and have being ranked to show their relative influence to hindering
the implementation of BVPIPS.
MAIN RESULTS
From table 1 SF1 –SF4 are: Lack of flexibility to accommodate the adoption of BVP/PIPS,
Lack of BVP/PIPS knowledge, Absence of local BVP/PIPS guidelines, Lack of willingness
to accept changes and new innovations respectively. CF1-CF6 are: Inability of client to use
an Expert Contractor, Stakeholders resistance to accept new innovations, Lack of
commitment to implement BVP/PIPS, Lack of encouragement on the part of government,
Inadequate facilitation skills and training, Client and Contractors reluctance to self-
development and training regularly respectively. PEF1 –PEF4 are: Contractors’ non-
involvement from the beginning of the project, Difficulty in the involvement of decision
makers and other key partners in BVP/PIPS, Lack of BVP/PIPS experts, Lack of
transparency and accountability respectively and PF1 –PF2 are: Lack of political will of the
government and Lack of legislation which provides BVP/PIPS application in the construction
industry respectively.

SCIENCE AND TECHNOLOGY 724
Table 1. Mean Score Ranking of the Hindering Factors of PIPS Implementation
CONCLUSION
The findings indicated that all these hindering factors have a very strong relative influence on
hindering the implementation of BVPIPS in the Nigerian construction industry as each has an
average mean score value that is > 3.5 with the social factor, Political factor, Procurement
Environment factors and the cultural factor in the construction industry ranked 1, 2, 3 and 4
respectively. Therefore, there is the need to make better these factors in the Nigerian
construction industry so as to accommodate innovative approaches such as BVPIPS to
improve project delivery in Nigeria.
Acknowledgment: This is part of an on-going PhD research. Therefore, the authors would
like to thank the Kaduna State University, Nigeria and UTM IDF for the Support granted for
this programme.
REFERENCES
1. Dean Kashiwagi, Darshit Parmar, J.S., ‘Traditional Low-Bid Procurement System versus Performance Information Procurement System (PIPS) in Construction Industry’, in 20th Annual ARCOM Conference, ed.
by Heriot Watt University (Association of Researchers in Construction Management, 2004), pp. 1–3
2. Babatunde, S.O., opawole, A., Ujaddughe, I.C., ‘No TitleAn Appraisal of Project Procurement Methods in
the Nigerian Construction Industry’, Civil Engineering Dimension, 12 (2010), 1–7
3. Daniel, W.H., Construction Management (USA: John Wiley & Sons Inc., 2006)
4. Adesanya, O., ‘Project Procurement Paths’, The Journal of the Federation of Construction Industry, 23
(2008), 6–21
5. Cooperative Research Centre for Construction Innovation, Building Procurement Methods (Austrailia, 2004)
6. Turksi, Z., ‘Technology and Economics Development of Economy Built Journal on Sustainability’,
Encyclopedia Britannica, 2008
7. Li, Y.Chan, S. and Nie, X., Fuzzy Pattern Recognition Approach to Construction Contractor Selection (Hingham, MA, USA.: Kluwer Academic publishers, 2005)
8. Kashiwagi, Dean T. and A. Y. Adeyemi, ‘Moving Nigeria’s Project Procurement System to Best Value: A
Prescription’, Civil and Environmental Research, 6 (2014), 1–11 <www.iiste.org>
9. Kashiwagi, D., and Byfield, R., ‘Selecting the Best Contractor to Get Performance: On Time, on Budget,
Meeting Quality Expectations’, Journal of Facilities Management, 1 (2002), 103–16
Arch Q/S BuildingCivil
EngS Eng
MS MS MS MS MS
SOCIAL
SF1
1 SF2
SF3
SF4
CULTURAL
CF1
CF2
CF3
CF4
CF5
CF6
PROCURMENT ENVIRONMENT
PEF1
PEF2
PEF3
PEF4
POLITICAL
PF1
PF2
4.824
4.777
4.798
4.804
4.830
4.798
4.807
4.801
4.750
4.754
4.747
4.744
4.885
4.881
4.847
Average MS Per Item from professionals
4 4.811 24.824
3 4.802 3
4.770 42
S/No. Hindering Factors
Average
MS per
Factor
Factor
Ranking
4.855 1

SCIENCE AND TECHNOLOGY 725
IGCESH2018
Universiti Teknologi Malaysia, Johor Bahru, Malaysia 13 -15 August 2018
DETERMINATION OF TRICLOSAN CONCENTRATION IN
HANDSOAP PRODUCT WITH COLORIMETRY USING
DIAZOTATION METHOD
Ade Yeni. Aprillia*1, R. Emran. Kartasasmita2 & Marlia Singgih. Wibowo3
1,2 Ade Yeni., R. Emran’ Department of Phamacochemistry, Institute of Health Science Bakti Tunas
Husada Tasikmalaya, INDONESIA. Department of Pharmacochemistry, School of Pharmacy Bandung Institute of Technology, INDONESIA
(E-mail: [email protected], kartasasmita at fa.itb.ac.id)
3Marlia Singgih, Department of Pharmacochemistry, School of Pharmacy and Technology Bandung
Techology of Institute, INDONESIA. (E-mail: [email protected])
ABSTRACT
Liquid hand soap belongs to house hold product that may contain triclosan as an antiseptique
/ disinfectant. From the safety aspect, the concentration of triclosan should not be too high
because it may potentially cause skin irritation. However, this concentration should be high
enough to achieve disinfection efectivity and or inhibiton of microbe growth when the
preparation is used. The aim of this research was to obtain an analytical method to
determination of triclosan applicable for routine analysis of this compound in liquid hand
soap. Triclosan which is a phenolic compound with nucleophilic properties was reacted with
an electrophilic diazonium salt obtained from diazotation of 4-amino-1-naphthalenesulfonic
acid with nitrous acid. The reaction was an electrophilic aromatic substitution resulted in a
diazo dye giving maximum absorbance at 515 nm and hence could be measured
spectrophometrically. The method was validated and then applied for determination of
triclosan in liquid hand soap samples with simple formulation. Measurements of triclosan
standard solutions resulted in a calibration curve with a linear regression equation of y =
0.0560x – 0.2629 and r value of 0.9981. Instrumental limit of detection (LOD) and limit of
quantification (LOQ) were 1.22 and 3.63 mg/L, respectively, while intra- and inter-day
relative standard deviation (RSD) of the method were 0.16 and 0.26%, respectively.
Percentage recoveries of the method at the spike concentrations of 500, 1000, and 3000 mg/L
were 105.36, 105.36 and 103.86 %, respectively. The concentration of triclosan in liquid
hand soap samples number 7, 8, 9, were 998, 491 and 488 mg/L or equivalent to 99, 98 and
97 % of label claim. Based on overall results, it was concluded that an analytical method for
determination of triclosan in liquid hand soap with simple formulation was successfully
obtained and can be applied for routine determination of triclosan in this preparation.
Key words: Triclosan, Diazotation, Spectrofotometry UV-VIS, Handsoap

SCIENCE AND TECHNOLOGY 726
INTRODUCTION
Soap is one of the basic needs of the society in daily activities and included in the household
product. Soap works as a cleanser that function to separated and emulsifying oils and other
impurities. From its physical form, the most widely used soap is solid and liquid soap
products. Currently, liquid soap p is more used by the society than solid soap. In solid soap
products, the skin hands is often in direct contact with the product so it is prone to
contaminants (eg bacteria) and is susceptible to drought compared with liquid soap
preparations. In solid or liquid soap product, usually added antibacterial agent such as
Triclosan, Triclocarban, cresol, phenol and chloxylenol which function as an antiseptic or
disinfectant (Soehatmo, dkk. 2014).
In recent years liquid hand soap products containing triclosan as an antiseptic/disinfectant
tend to increase. This causes concerns about the dangers of triclosan that enter the
environment and the potential for negative impacts on human health and the environment. In
terms of safety, the levels of triclosan was not been too high because of the potential to cause
skin irritation however, the levels of these substances must be sufficient for the effectiveness
of disinfectants and/or microbial growth at the time of product used could be achieved
(Soehatmo, dkk. 2014).
Household Products containing biocide are widely circulated or used by the community.
However, supervision of the dosage of biocidal use and quality assurance of the product has
not been effectively carried out, especially in regard to laboratory product testing.
Meanwhile, law enforcement and quality control require a valid method of analysis. In this
connection, it is necessary to develop an analytical method for the determination of a biocide
agent containing the substance in a product. Liquid hand washing soap products Household
Health Supplies (PKRT) is widely used and can be added as triclosan biocide. Structurally
triclosan has physicochemical characteristics that can absorb ultraviolet light but its
absorptivity is weak so that if directly determined the sensitivity of the method becomes low.
On the other hand the formulation of liquid hand washing soap can be very complex so that
the matrix can also decrease the sensitivity and selectivity of the method. Chemically
triclosan is a phenol compound so that the absortivity of the compound can be increased
through the reaction of derivatization into a colored compound. The diazotation method is
commonly used for the derivatization of phenol compounds or aromatic amines into colored
compounds. The formation of colored compounds is common batochromic phenomena
accompanied by hipsochromik so that the absorptivity of the derivative compounds will also
increase. This study aims to obtain a method of determining triclosan level analysis which
can be used for routine analysis of the substance in liquid hand washing preparation.

SCIENCE AND TECHNOLOGY 727
MAIN RESULTS
Figure 1. Visible spectrum absorbation maximum of complex azo dye of 4-amino-1-
naphthalenesulfonic acid and tricolsan at 515 nm.
Table 1. Evaluation date of precision study
Precision
Meansured conc (mg/L) on
measurement to Precision Meansured conce (mg/L) on day to
1 2 3 1 2 3
intraday
14,0179 13,8393 13,8750
interday
14,1964 14,0714 14,0893
14,0607 13,8911 13,9179 14,2482 14,0696 14,0964
14,0232 13,8911 13,9179 14,2482 14,0696 14,0964
14,0786 13,9000 13,9071 14,2571 14,0786 14,1036
14,0804 13,9107 13,9214 14,2679 14,0893 14,1000
14,0804 13,9000 13,8964 14,2571 14,0786 14,0929
Median 14,0135 Median 14,1395
SD 0,0228 SD 0,0183
KV 0,1623 KV 0,2595
Table 2. Evaluation data of accuracy study
Spiked standar
(μg/Kg) Absorbation
(n=3) Meansured
concentration(μg/L) Percen recovery (%)
500 0,4113 526,70 105,36
1000 0,5237 1053,64 105,36
3000 1,3232 3115,67 103,86
Table 3. Analytical results of some personal care products
Sample Meansured
concentration(μg/L)
Sample Meansured
concentration(μg/L)
1 TD 6 TD
2 TD 7 998
3 TD 8 491 4 TD 9 488
5 TD 10 TD
CONCLUSION
This method can be used for routine liquid soap analysis so it can save operational cost. this
method can be developed for triclocarbons that have been banned by EFA.

SCIENCE AND TECHNOLOGY 728
REFERENCES
1. Cheng, C., Wang, Y., ,Chen H dan Ding, W (2011): Simplified Derivatizatio Method for Triclosan
Determination in Personal Care Product by GC-MS, Journal of The Chinese Chemical Society, 58. 49-52.
2. Kysliak, Olexander I., dan Smyk, Natuha I., (2010): Visual Spectroscopy Detection of Triclosan, Versita
Chemical Paper. 64(4) 523-527.
3. Lu, H., Ma, H., dan Tao, G., (2009): Spectrophotometric Determination of Triclosan in Pesonal Care Products, Spectrochimica Acta ,Part A.73 (2009) 854-857.
4. Witlock, L.R., Siggin, S., dan Smola, J.E., (1972): Spectrophotometric Analysis of Phenol and of Sulfonat
by Formation of an Azi Dye, Analytical Chemistry, Vol 44 No. 3 March 1972.
5. Wyllie, Graeme. R .A., (2009): Spectroscopic Determination of Triclosan. Concentration in a Series of
Antibacterial Soaps. A First – Year Undergraduate Laboratory Experiment, Journal of Chemical Education.

SCIENCE AND TECHNOLOGY 729
IGCESH2018
Universiti Teknologi Malaysia, Johor Bahru, Malaysia 13 -15 August 2018
VIRTUAL CONNECTIVITY IN MEDIATING MILLENNIALS
DESTINATION EMOTIONAL EXPERIENCE
Nur Shuhadah Mohd*1, Hairul Nizam Ismail2, Norliza Isa3 and Syed Muhammad
Rafy Syed Jaafar4
1 Department of Tourism Planning and Hospitality Management, Kulliyyah of Language and
Management, IIUM, Pagoh, MALAYSIA.
(E-mail: [email protected]) 2, 4 Department of Urban and Regional Planning, Faculty of Built Environment, UTM, Johor Bahru,
MALAYSIA.
(E-mail: [email protected], [email protected]) 3 Department of Landscape Architecture, Faculty of Built Environment, UTM, Johor Bahru,
MALAYSIA. (E-mail: [email protected])
ABSTRACT
Millennial is known to be the generations that strongly empowered by technologies that
apparently had altered the pattern of their consumption habits to shape a new form of tourist
market. The great incursion of technology on millennial does not only mediates the
experience formation at destination, instead provide added value and emotional impact
through its cognitive stimulation and experience co-creation possibilities. As the key
instrument for experience enhancement, mobile technologies support users' needs of on-site
information, virtually connect tourism providers and consumers, and unfold destination
uniqueness. These in turn allow co-creation of tourist experience through satisfaction of
millennial's addiction of connectivity. Virtual connectivity seems to create new form of
affective attachment, through which millennial are emotionally bonded to the place due to the
intensity of technological engagement. Consequently, instead of tourist-destination encounter
per se, technological experience is potentially classified as the third aspects that dictate
experience development, especially among millennial travellers. Existing literatures indicates
that millennial strong engagement with virtual platform is capable to manipulate their on-site
emotional experience, which apparently changing the conventional way of tourist
experiencing the destination. Nevertheless, the significant of millennial's technological
engagement towards their destination emotional experience is still open for debates.
Pertaining to this situation, this conceptual paper is attempted to understand the influence of
technology in the enhancement of emotional experience, specifically among millennial
travellers, in better understanding the evolving demand of the new generations tourist from
psychological perspective.
Key words: Virtual connection, technological engagement, emotional experience
INTRODUCTION
It is known that millennial are natively digital and demanding for constant connection with
virtual media, including social media and online services. Millennial are more likely to refer

SCIENCE AND TECHNOLOGY 730
to online sources as their "addiction to connectivity" give a form of enjoyment which
reflected through the constant sharing of real time experience during travel [1]. Unlike the
older generations, this new breed of travellers educating themselves through online
information and virtual connection, in having more control over their destination experience.
Their satisfaction subjected to the possibility of sharing of real-time travel experience to
friends and families as well as capturing 'instagram-worthy' photos and media to represent
memorable moments during travel. Şchiopu et al. [2] in their study highlighted that
communication and photo viewing and sharing became the main reason for millennial use of
social media platform during travel. This consequently reflects the value of on-site virtual
connectivity to this new generation tourist, which represents the significant of technological
engagement throughout their travel process.
Thriving importance of technology on interpretation of tourism destination extending the
need for development of mobile travel guide to better connect tourist with destination
virtually. With strong engagement of millennial towards virtual connection, the industry sees
technology-based services as giving value-added quality by offering interactivity and
entertainment that suit demand of the modern creative tourist [2]. The fact that travellers are
constantly in mobile and in instant need of precise information, making the use of mobile
virtual platform to be more essential than ever. Looking from the perspective of geographic
cognition, technological engagement significantly influence experience in two dimensions:
(1) sensory, affective and social experience and (2) cognitive and bodily experience [3],
which reflecting the development of emotional connection with destination through the sole
use of online source.
Although the enhancement of experience and experience co-creation has been studied widely,
limited research has been done to investigate technology-emotion relationship on experience
development [4]. This paper therefore is constructed to conceptually discuss how
technological engagement influence millennial emotional experience at destination and
developing a new form of technology-enhanced experience. For this purpose, this paper
reviewed the motivation and behaviour of millennial travellers to clarify the evolving
emotional experience of the new generation tourist, in relation to their strong and continuous
engagement of virtual media, as well as exploring its impact towards their on-site travel
behaviour and satisfaction. It then presents the correlation of technology engagement and
emotional experience, which conceptually generating the new dimension of experience
commonly known as technology enhanced experience.
MAIN RESULTS
Figure 1. Technology-emotion experience matrix (adapted from [5] and [6]).

SCIENCE AND TECHNOLOGY 731
CONCLUSION
This paper has provided discussion on the evolution of experience development resulted from
the millennial traveller’s behaviour and preference. Review of existing literature suggested
that on-site technological engagement develop emotional experience and improves
destination interaction. As limited studies discussing the direct influence of technological
usage on tourist emotion, this conceptual paper is thus directed to assess millennial constant
demand of virtual connectivity on their emotional connection to destination during travel.
The contribution of this paper is to clarify impact of on-site digital connection on intensity of
destination affective attachment, which suggests the need to optimally utilised virtual
platform to improve millennial destination engagement and positively manipulate emotional
experience. It is being expected from this study to provides implication for the development
and improvement of destination interpretation system, theoretically and practically.
REFERENCES
1. Şchiopu, A. F., Pădurean, A. M., Ţală, M. L. & Nica, A. M. The influence of new technologies on tourism consumption behavior of the millennials. Amfiteatru Econ. 18 (2016), 829–846.
2. Kounavis, C. D., Kasimati, A. E. & Zamani, E. D. Enhancing the tourism experience through mobile
augmented reality: Challenges and prospects. Int. J. Eng. Bus. Manag. 4 (2012), 1–6.
3. Tussyadiah, I. & Zach, F. in Information and Communication Technologies in Tourism 2011 279–291
(Springer Vienna, 2011). doi:10.1007/978-3-7091-0503-0_23
4. Zhang, H., Gordon, S., Buhalis, D. & Ding, X. Experience Value Cocreation on Destination Online
Platforms. J. Travel Res. 4728751773355 (2017). doi:10.1177/0047287517733557
5. Neuhofer, B., Buhalis, D. & Ladkin, A. A Typology of Technology-Enhanced Tourism Experiences. Int. J.
Tour. Res. 16 (2014), 340–350.
6. Neuhofer, B., Buhalis, D. & Ladkin, A. Experiences, Co-creation and technology: A conceptual approach to
enhance tourism experiences. in Tourism and Global Change: On the Edge of Something Big (2013), 546–555.

SCIENCE AND TECHNOLOGY 732
IGCESH2018
Universiti Teknologi Malaysia, Johor Bahru, Malaysia 13 -15 August 2018
SENIOR COHOUSING: EXPLORING MUSLIM PERCEPTION
TOWARDS THE ELEMENTARY AND PRACTICABILITY FOR
ACTIVE LIVING
N. Jumadi*1, N.A Mat Noor, 2 and A.A Bujang3
1, 2, 3 Department of Real Estate, Faculty of Geoinformation & Real Estate, Universiti Teknologi
Malaysia, 81310, UTM Johor Bahru, MALAYSIA 2 Institutes for Smart Infrastructure & Innovative Construction, Universiti Teknologi Malaysia, 81310
UTM Johor Bahru, Johor, MALAYSIA
(E-mail: [email protected], 2 [email protected], [email protected])
ABSTRACT
As at the dawn of the 21st century where citizens have problems in making their settlement to
be more aged friendly and the number of an ageing nation is kept increasing, a framework of
senior cohousing is emerged to introduce. In most European countries cohousing has been
established in housing, care and support options for senior residents. However least of
literature has detailed the implementation of this concept from the Muslim point of view. Due
to this concept is flexible in nature and can fit locality culture, therefore cohousing can be
used as a mechanism in promoting community living among Muslims while maintaining their
beliefs. The study concern is to integrate the elements of cohousing in the context of Muslim
elderly needs. A questionnaire survey was distributed to 411 of Muslim elderly within 10th
district of Johor to gain their point of view. A descriptive analyses and Likert scale were used
to tap the frequency level of cohousing elements followed by the suggestion of cohousing
framework. Finding suggests that the senior cohousing is significant to influence active living
among Muslim elderly. However, there is a certain element that needs to details in tuned to
the practicability for Muslim living. As such elements of religiosity and privacy are essential
to ponder in maintaining their spiritual needs. The outcome of this study will be useful for all
property practitioners, community and policymaker to enhance their understanding of
Muslim ageing and how it may support their active and independent living. As nowadays the
elders are healthier, financially stable and educated, their living option during retired should
be expanded. Senior cohousing may represent a good alternative living to be proposed for the
next ageing generation in Malaysia.
Key words: Cohousing, Muslim living, Active ageing, Muslim Ageing
INTRODUCTION
While discussing the specific relation between housing and elderly active living, it may
implicate a different view from numerous of a respected scholar. One of it is regarding
getting healthy living. As mentioned by Oswald & Wahl, (2004) housing and elderly have a
direct impact on the healthy life with support from environment and social-cultural. This
statement also supported by Iwarsson, et al, (2007) highlighted the close interrelation of both

SCIENCE AND TECHNOLOGY 733
and the importance of promoting the home environment. As the main objective of aged
environment devoted by the scholars is wanted this elderly stay independent in a healthy
environment within their place and community, therefore this study further enrolled the
housing option for elderly alternative living through community neighbourhood, called a
cohousing. Cohousing is one of the retirement home concepts which have been practised by a
number of European countries to eliminate social isolation and encourage independent living
among the elderly. Furthermore, with the increasing number of Malaysian ageing especially
Malay and Muslim community, the needs of housing concept that can meet the cultural and
compile with Islamic principles is great to be studied.
The idea of forming cohousing came from Denmark in the mid-1960s by an architect, with
only two communities arising from 1970 to 1973 [Maria, 2015]. The idea was accepted and
started to spread to other parts of Northern Europe, North America, Great Britain, Australia,
New Zealand and Japan [Kathryn, 2011; Ruiu, 2015; Williams, 2008]. Cohousing is currently
presumed as a better option to be considered in establishing a sustainable society since it
offers people to access and share the ownership in a communal place, supportive cohouser
members, and greater social responsibility for sustainability and to enjoy the meaning of
being a community. Meanwhile, the fundamental characteristics of cohousing are based on
these 6 elements; participatory process; neighbourhood design; common facilities; resident
management; absence of hierarchy; and lastly, the sixth criteria are no shared economy.
These elements are only a basic idea of Cohousing and not rigid to be followed as it may vary
depending on the suitability of the locality. Meanwhile, due to this concept is widely
applicable in western country; therefore, the practicability to implement towards Muslim
living can be questioned. Thus, the main objective of this study is to verify the significant
relation of active ageing and cohousing in perceiving Muslim active living. To extend this
objective, this research tries to propose senior cohousing elements that can fulfil the spiritual
needs of active ageing Muslim based on the mentioned elements. Data collected
quantitatively among Muslim elderly to tap their opinion and interest of study area.
MAIN RESULTS
Since this survey is objectively want to look at the applicability of cohousing elements
towards Muslim elderly living, therefore a questionnaire survey was conducted by used
random sampling. It was distributed among 411 of Muslim elderly within 10th district of
Johor to gain their point of view and analysed quantitatively through descriptive analysis.
Result reveals that there are no much differences of cohousing elements practicing
worldwide and Muslim requirement as its main characteristic and concept is similar to
Islamic neighborhood living. However, this study suggests that there should have priority in
maintaining the belief and local culture especially in terms of the design of neighbourhood
and privacy level. As such, in designing housing and neighborhood, the privacy and
modesty should supplement as a way of Islam. Spiritual and religious activity can be the
other part of main criteria in planning cohousing development as this activity may
influence active living among them. Figure 1 indicates the suggestion of cohousing
framework for Muslim active ageing.

SCIENCE AND TECHNOLOGY 734
Figure 1. Conceptual framework of Muslim cohousing
CONCLUSION
As the number of Malay and Muslim is expecting to reach over 20 million in the year 2050,
and Islam is Malaysia's official religion, it showed Muslim elderly will be the bigger market
in promoting cohousing since their number contributes more than half of total population.
Since this concept is new to Malaysian and there is least of literature on cohousing for
Muslim, therefore this study had proposed the variables that influence active ageing living
through cohousing for Muslim. Due to its practicability, and have a positive view from the
respective respondent, therefore it is suggested to detailing of its implementation and
development process to the next research. This implication of study will tap the interest of
housing industry to look over on the other alternative of ageing living especially for Muslim
where their needs may not be fully addressed before this.
REFERENCES
1. Iwarsson, S., Wahl, H. W., Nygren, C., Oswald, F., Sixsmith, A., Sixsmith, J., & Tomsone, S. Importance of
the Home Environment for Healthy Aging_ Conceptual and Methodological Background. The Gerontologist,
(2007), 47(1), 78–84,.
2. Kathryn McCamant, C. D. (2011). Creating Cohousing: Building Sustainable Community. New Society
Publishers.
3. Oswald, F., & Wahl, H. W. Housing and Health after life. Environmental Health, (2004), 19(3–4).
4. Ruiu, M. L. The effects of cohousing on the social housing system: the case of the Threshold Centre. Journal
of Housing and the Built Environment, (2015), 30(4),
5. Ruiu, M. L. The Social Capital of Cohousing Communities. Sociology, (2015)
6. Williams, J. Predicting an American future for cohousing. Futures, (2008).40(3), 268–286.
7. Rozhan, A., Yazid, M., Yunos, M., Kalsum, N., Isa, M., Fazamimah, N., & Ariffin, M. Analysis Of Islamic Safe City Planning Concept For A Better Living Environment, (2016), 11(3), 69–73.
Cohousing Muslim Active Ageing
Cohousing
Spirituality & Religiosity
• Participatory process
• Neighbourhood design
• Common facilities
• Resident management
• Non- Hierarchal structure decision
• No shared economy
• Spiritual and Religious activity
Islamic based design, Space for Religious activity, Privacy, Mosque
as a community centre
• Promoting active living
• Social bonding
• Contribute to spiritual needs
• Ensure that social, physical
and religious needs are met

SCIENCE AND TECHNOLOGY 735
IGCESH2018
University Teknologi Malaysia, Johor Bahru, Malaysia 13 -15 August 2018
FORMULATION AND CHARACTERIZATION SNE (SELF
NANOEMULSION) OF ASTAXANTHIN TRANSDERMAL GEL WITH
VARIOUS COMBINATION OF CREMOPHOR RH40 AND PEG 400
AS SURFACTANT AND CO-SURFACTANT
Lusi Nurdianti1, Indra2, Devi Maryam3
Institute of Health Science Bakti Tunas Husada Tasikmalaya, INDONESIA
(E-mail: [email protected])
ABSTRACT
Astaxanthin is a natural carotenoid with strong antioxidant characteristics (super antioxidant).
Methods of Self Nano Emulsifying Drug Delivery System (SNEDDS) used for the
manufacture of a drug delivery system in the form of nanoemulsion. The optimization of
SNE astaxanthin formula has been done by variation of ratio 1:1:1, 1:2:1, 1:4:1, 1:6:1, 1:8:1,
1:1:8, 1:1:6, 1:1:4, 1:1:2 (%, v/v). Sunflower oil as oil phase, Cremofhor RH40 and PEG 400
as surfactant and co-surfactant, the results showed that SNE astaxanthin formula on ratio of
1:8:1 produce a clear solution, was used to make SNE Astaxanthin. In the selected
astaxanthin SNE formulation ratio 1:8:1 and have it has physical stability with astaxanthin
nanoemulsion characteristic that is particle size 17.67 nm; indeks polidispersitas 0.437;
Potential zeta -5.38; and aggregate efficiency of 81.50%. SNE gel astaxanthin has a clear
visual appearance of orange, with a pH value of 5.5, homogeneous and has good scattering,
and stable based on cycling test. From the results of this study can be concluded that SNE
astaxanthin gel preparation is entered into the category of good and stable preparations.
Keywords: Astaxanthin, SNEEDS, Gel
INTRODUCTION
Astaxanthin is a natural carotenoid with strong antioxidant characteristics
(superantioxsidant), because it has not activity like as vitamin A and it is one of Xantofil
(Xanthophylls) group. Astaxanthin is a fat soluble pigment synthesized of plants and some
algae species (Winarsi, H. 2007). The bioavailability of some highly lipophilic carotenoids
are low. The values were varies start from less than 10% to over 50% of raw vegetables in
oil-containing preparations. The limited factor of the compounds absorption is the saturation
of carotenoids to enter the micelles of bile ducts in the gastrointestinal tract at high doses
(Parker, 1996).
The Increase of carotenoids bioavailability after administration along fat is because of
carotenoid conjugation into micelles of bile salt. The low levels of astaxanthin bioavailability
are due to the degradation of astaxanthin elimination in the gastrointestinal tract and the
possibility of first pass metabolism (Hye D.C., et al, 2010). Preparation of astaxanthin SNE

SCIENCE AND TECHNOLOGY 736
was intended to increase astaxanthin hydrophilicity and the stability of the compound, and
then the preparation of transdermal gels of the active ingredient compounds with nanometer
size was aimed to avoid first pass metabolism and increase the availability of medicinal
drugs in the body as a superantixidant source, therefore SNE Astaxanthin was made with
application on transdermal gel preparations.
Transdermal drug is a form of drug delivery system by paste the drug into the skin.
Transdermal drug delivery routes are an alternative route for some drugs, as they have several
advantages such as long-term drug effects, constant dose drug release, easy use, and reduced
frequency of drug delivery (Khan et al., 2012). From the above background, astaxanthin
formulation and characterization was made by using SNEDDS method to increase
astaxanthin hydrophilicity and the stability of the compound and then be formulated in
transdermal gel preparation form.
MAIN RESULTS
Figure 1. Visualization of SNE Astaxanthin with ratio (1:8:1)
Parameter Results
Average globul diameter(nm) 17.67
D10 10.20
D50 14.40
D90 21.70
Polidispersity index 0.078
Zeta potensial (mV) -5.38
entrapment efficiency(%) 81.50
Figure 2. The results of physical evaluation of mixed SNE astaxanthin optimization
Figure 3. The result of normal size distribution curve. Sun flower oil:Kolliphor RH40:PEG
400 (1:8:1).
Figure 4. The result of globul morphology of SNE Astaxanthin

SCIENCE AND TECHNOLOGY 737
Figure 5. The result of visual appearance SNE Astaxanthin
parameter result
Organoleptic Transparant
pH 5.5
Viscosity 9600 cps
Stability stable
Homogeneity homogeneous
Figure 6. The result of evaluation of transdermal gel SNE Astaxanthin
CONCLUSION
The best formula of SNE astaxanthin transdermal gel with the characteristic and the stability
requirements is the transdermal gel of SNE Astaxanthin with the ratio of the oil phase ratio:
surfactant: co-surfactant with a ratio of 1: 8: 1
Acknowledgment: a gratitude to RISTEK DIKTI who has funded a research grant and also
to the pharmacy school of ITB as a research partner that has helped much for the smoothness
of this research. do not forget I say many thanks to stikes bakti tunas husada Tasikmalaya as
a research institution.
REFERENCES
1. Parker, R.S. (1996). Absorption, metabolism, and transport of carotenoids. FASEB J., 10, 542-551.
2. Hye, D.C., Hee, E.K., Si, H.Y., Myung, G.L., & Wan, G.S. (2010). Pharmacokinetics and first pass
metabolism of astaxanthin in rats. British Journal of Nutrition, 105, 220-227. 3. Pouton, C.W. (2000). Lipid formulations for oral administration of drugs: non-emulsifying, self-emulsifying
and ‘self-microemulsifying’ drug delivery systems. Eur. J. Pharm. Sci, 11, S93-S98.
4. Meor Mohd Affandi, M.M.R., Julianto, T., & Majeed, A.B.A. (2012). Development of simple high
performance liquid cromatographic method for the determination of astaxanthin in human plasma. Food Sci.
Technol. Res., 107-113.
5. Gursoy, R.N., & Benita, S. (2004). Self-emulsifying Drug Delivery Systems (SEDDS) for improved oral
delivery of lipophilic drugs. Biomedicine & Pharmacotherapy, 58, 174.

SCIENCE AND TECHNOLOGY 738
IGCESH2018
Universiti Teknologi Malaysia, Johor Bahru, Malaysia 13 -15 August 2018
PHENOLIC CONTENT AND ANTIOXIDANT ACTIVITY OF THE
METHANOLIC EXTRACT OF MAREME LEAF (GLOCHIDION
BORNEENSE (MULL.ARG.) BOERL TO DPPH RADICAL USING UV-
VIS SPECTROPHOTOMETRY
I. Rahmiyani*1, D.M. Komala2 and Khairunnisa3
1 I.Rahmiyani, 2D.M Kemala and 3Khairunnisa, Department of Pharmacognosy, Institute of Health
Science Bakti Tunas Husada Tasikmalaya, Tasikmalaya West Java, Indonesia.
(E-mail: [email protected], [email protected] , [email protected])
ABSTRACT
In Indonesia mareme leaf is one of the potential herbal medicine that widely use as a
traditional medicine for diarrhea. The plant of Glochidion genus also have an antioxidant
activity and the phenol is one of the compounds that has this activity. The objective of the
study are to determine antioxidant activity using DPPH radical and the content of total
phenolic in methanolic extract of mareme leaf. The leaf was extracted using reflux methods
with gradient solvent (n-hexane, ethyl acetate and methanol). The results of the study showed
the qualitative determination of antioxidant activity of methanolic extract of mareme leaf that
using methanol:chloroform:ethyl acetate eluent (1:4:10) which is sprayed by DPPH was
produce a yellow patch with a purple background seen in visible light. Furthermore the
results quantitative determination showed the methanolic extract of mareme leaf produced
high antioxidant activity with IC50 4,457 (µg/ml), while ascorbic acid as a control produced
3,453 (µg/ml). The total phenolic content of methanolic extract of mareme leaf was
58.61±0.23 % (Tannic Acid Equivalent).
Key words: Leaf, Glochidion borneense (Mull.Arg.) Boerl.), antioxidant activity, DPPH, total
phenolic
INTRODUCTION
Mareme is one of the plants that belong to the familiy of Euphorbiaceae and belong to the
genus of Glochidion. In indonesia especially in Sunda Tribe this plant often consumed by
community as a fresh vegetables. Furthermore, this plant is widely use a an empirical
medicinal plant for diarrhea. In addition, based on Zafrul Azam research [1] from Dhaka
Bangladesh University, this plants showed an antioxidant activity (DPPH).
Antioxidants compound have an important role in health. The main character of antioxidants
compound are the ability to neutralize the free radical. Antioxidants compound that produced
by the plants such as vitamin C, vitamin E, karoten, phenolic group especially poliphenol
and flavonoid known to reduce of the disease [2]

SCIENCE AND TECHNOLOGY 739
Determination of antioxidant activity with DPPH free radical scavenging method was
aimed to measure total antioxidant capacity in extract by UV-Vis spectrophotometry [3]
while, total phenolic determination was performed by using Folin-Ciocalteu reagent and
tannic acid as a comparator. Total phenolic was calculated using a linear regression
equation of the calibration curve of tannic acid and calculated as a tannic equivalent of
100 grams of extract (g TAE / 100 g).
MAIN RESULTS
Figure 1. Antioxidant activity of methanolic extract of Mareme Leaf which is sprayed by
DPPH 0,2% with Thin Layer Chromatography
Table 1. IC50 values of methanol extracts and ascorbic acid
Sample Conc.(µg/ml) Inhibition (%) Linier
regresion
IC50
(µg/ml)
Activity
Ascorbic
acid
1
2
3
4 5
6
31.210
37.203
46.941
54.182 62.671
70.034
Y= 7.9357x
+ 22.597
R2 = 0.9977
3,453
Very Strong
Methanolic
extract
2
3
4
5
6
7
30.026
37.336
47.389
53.133
63.185
71.018
y = 8.2357x
+ 13.287
R² = 0.9968
4,457 Very Strong
Figure 2. Regresion linier curve of tannic acid
y = 0.0071x + 0.0376R² = 0.9971
0
0.2
0.4
0.6
0.8
0 50 100 150
Ab
sorb
ance
concentration (µg/mL)

SCIENCE AND TECHNOLOGY 740
Table 2. Result of Tannin determination from methanolic extract of Mareme Leaf
Concentration (µg/ml) absorbance Phenolic content (%)
150
0.660 52.81
0.661 58.53
0.663 58.87
58.61±0.23
CONCLUSION
The results showed the qualitative determination using TLC of antioxidant activity from
methanolic extract of mareme leaf that using methanol:chloroform:ethyl acetate eluent
(1:4:10) which is sprayed DPPH 0,2% produced a yellow patch with a purple background
seen in visible light. Furthermore the results quantitative determination showed the
methanolic extract of mareme leaf produce high antioxidant activity with IC50 4,457 (µg/ml),
while ascorbic acid as a control produced 3,453 (µg/ml). The total phenolic content of
methanolic extract of mareme leaf was 58.61±0.23 % (Tannic Acid Equivalent).
Acknowledgment: Our gratitude to all the people, friend and colleagues, that had helped us
in the research process from beginning to the end. Thank you.
REFERENCES
1. Azam Z.A.T.M. Antimicrobial, Antoiksidan and Cytotoxic Activites Of Glochidion multiloculare (Roxb. Ex
Willd.) Mull. Arg. (Euphorbiaceae). Journal Faculty Of Pharmacy University of Dhaka Bangladesh (2012).
2. Prakash, A., Rigelhof, F., and Miller, E. Antioxidant Activity, (2010). 3. Blois, M.S. Antioxidant Determination by The Use of Stable Free Radicals, Natuure 181 (1958), 1199-2000.

SCIENCE AND TECHNOLOGY 741
IGCESH2018
Universiti Teknologi Malaysia, Johor Bahru, Malaysia 13 -15 August 2018
EFFICIENCY OF CLASSIFIERS FOR SECONDARY LEVEL
STUDENT PERFORMANCE
Nurshahirah Abdul Malik*1, Mohd Shahizan Othman2, and Lizawati Mi Yusuf3
1, 2,3 Faculty of Computing, Universiti Teknologi Malaysia, Johor Bahru, Malaysia.
(E-mail: [email protected], [email protected], [email protected])
ABSTRACT
Secondary education is the final phase of education before pursuing into higher education or
career. This is closely linked to the performance of the students in achieving excellence and it
can be measured through the mastery of the subjects. In response to this necessity, different
machine learning techniques can be used to improve the student’s performance. Although
there are so many benchmarks, there are still very few experiments carried out on an initial
classification stage to determine the efficiency of classifiers. Therefore, this research aims to
conduct efficiency test on classifiers using student performance data for two subjects,
Mathematics and Portuguese from two Portugal secondary schools. The classifiers used in
this research are Random Forest (RF), Decision Tree (DT), Support Vector Machine (SVM)
and Deep Neural Network (DNN). All these classifiers have its own efficiency and have an
important role in identifying the set of populations based on the training dataset. The
efficiency of these classifiers was determined using accuracy and sensitivity rates. After the
application of this stated classifier, the accuracy rate results was 89.4% (DNN), 89.2% (RF),
87.8% (DT) and 89.4% (SVM) for Portuguese subject. While, for Mathematics, with the
accuracy of 94.9% (DNN), 95.4% (RF), 93.9% (DT) and 94.9% (SVM). By comparing the
accuracy rates, DNN, RF, and SVM have a good accuracy rate of classification and can be
used to further any research for prediction purposes in future. DNN is an artificial neural
network with multiple hidden layers between the input and output layers. RF operates by
constructing a multitude of decision trees at training time and class output. SVM based on the
concept of decision planes that define decision boundaries. Thus, this research conducted a
comparative performance analysis between the classifiers on the public dataset and proposed
an improvement of the classifier for prediction.
Keywords: classifiers, student performance, deep neural network, support vector machine,
random forest
INTRODUCTION
Education means a lesson learned by a student that includes the teaching and learning
process. Furthermore, education is an important factor for building a strong economy and
quality of life [1]. It involves practical ideas and activities in which the student is taught to
increase the knowledge and skills in shaping the way one thinks. Education plays a major role
in the development of a country. Most developing countries are of the opinion that national
development improved when education is prioritized. In addition to the importance of

SCIENCE AND TECHNOLOGY 742
national development, education also important in improving the quality of life of a person.
The issue of student performing excellently is very important in producing quality students.
Students' excellence is closely related to the mastery of subjects in high school. The process
of a student using specific criteria to evaluate and reflect on student own work known as
student performance. The student should be become more responsible for their own learning
and may be prepared to develop their own learning goals. According to [1], analysing and
modeling student performance is an important tool for educators, students, and decision-
makers. Therefore, most researchers have implemented machine learning technique in order
to monitor the student performance for prediction purposes. And, classification plays a huge
role in this process of prediction. However, the initial stage of identification of a good
classifier always an absent during the process. Therefore, this research would like to
implement four types of classifiers; Random Forest (RF), Decision Tree (DT), Support
Vector Machine (SVM) and Deep Neural Network (DNN). These classifiers will be trained
on the dataset. The classifiers will be tested by using all attributes contained in the sample
data and to test with the attributes. A brief explanation on each classifier are as follows; RT
has a direct relationship between the numbers of trees in the forest and based on the output
from RT, the larger the number of trees, the more accurate the result. While DT is a guide of
a progression of related decisions. It is a model that can be used as a decision-making tool,
for research analysis or strategy planning. The processes of finding the root node and splitting
the feature nodes make the RF look different than the DT. Furthermore, SVM operation is
finding the hyperplane that gives the largest minimum distance to the training data.
Application of DNN has earned attention in its ability to extract useful features automatically
as it is trained to do. This technique has achieved extremely high predictive accuracy in many
cases, on par with human performance [2]. To support the claim on DNN, predictive
execution using other classifiers for the sample data are taken into consideration especially in
term of accuracy and sensitivity. The next section will discuss the main results that obtained
via the classifiers.
MAIN RESULTS
In order to measure the efficiency of classifiers, accuracy and sensitivity rates are used as
the measurement for this study. In general, sensitivity indicates, how well the test predicts
one category while accuracy is expected to measure how well the test predicts both
categories [3]. Figure 1 and Figure 2 show the weighted average of performance
measurement of each classifier.
Figure 1. Accuracy rate of the classifiers on the data
94.9 95.4 93.9 94.9
89.4 89.2
87.8
89.4
84
86
88
90
92
94
96
DNN RF DC SVM
Mathematics Portuguese

SCIENCE AND TECHNOLOGY 743
Figure 2. Sensitivity rate of the classifiers on the data
CONCLUSION
This study used different types of classifiers on the student performance data at the level of
secondary education for two subjects. DNN, RF, SVM, and DT were compared in terms of
accuracy and sensitivity rates. The classifiers were tested for two different subjects, namely
Mathematics and Portuguese. As a result, RF had achieved an accuracy of 95.4% for
Mathematics subject. While DNN and SVM had achieved 89.4% for Portuguese data. This
shows that DNN, SVM and RF can be enhanced for the next phase of classification which is
prediction. For future work, from these classifiers, the classifiers can hybridize to proceed
toward prediction method that able to guide the students to further their study in higher
education future.
Acknowledgment: This work is supported by Universiti Teknologi Malaysia under Research
University Grant (GUP), Vote No. 15J11.
REFERENCES
1. Al-Obeidat, F., Tubaishat, A., Dillon, A., & Shah, B. (2017). Analyzing students’ performance using multi-
criteria classification. Cluster Computing, (March), 1–10.
2. Montavon, G., Samek, W., & Müller, K. R. (2018). Methods for interpreting and understanding deep neural
networks. Digital Signal Processing: A Review Journal, 73, 1–15.
3. Sensitivity, Specificity, Accuracy and the relationship between them. Retrieved February 28, 2018, from
http://www.lifenscience.com/bioinformatics/sensitivity-specificity-accuracy-and
94.9 85.4 85.5 94.989.483
71.789.4
0
20
40
60
80
100
DNN RF DC SVM
Mathematics Portuguese

SCIENCE AND TECHNOLOGY 744
IGCESH2018
Universiti Teknologi Malaysia, Johor Bahru, Malaysia 13 -15 August 2018
INTEGRATION OF GENETIC ALGORITHM WITH FCEEMD
MODEL FOR FORECASTING WATER CONSUMPTION
Nuramirah Akrom*1 and Zuhaimy Ismail2
1, 2 Department of Mathematical Sciences, Faculty of Sciences, Universiti Teknologi Malaysia, 81310,
Skudai, Johor, MALAYSIA.
(E-mail: [email protected], [email protected])
ABSTRACT
Forecasting water consumption is essential in order to manage the supply and demand the
water meets the requirement to the consumer. In this paper, an integration of genetic
algorithm with fast cardinal ensemble empirical mode decomposition (FCEEMD) model is
proposed to forecast monthly water consumption datasets. Genetic Algorithm method is
employed to directly optimized the free curve in cubic trigonometric cardinal spline
interpolation (CTCSI) and the stopping criterion parameters in (FCEEMD) model. This
approach has been validated on real monthly water consumption datasets, and the results
revealed the proposed method can achieve high forecast accuracy.
Key words: Forecasting, Genetic Algorithm, Fast Cardinal Ensemble Empirical Mode
Decomposition, Cubic Trigonometric Cardinal Spline Interpolation, Water Consumption
INTRODUCTION
Water consumption forecasting is one of the important task of water supplying companies to
ensure the demand and the consumption of water meets and balance the requirement by
consumer [1]. An accurate forecast can reduce the operational cost for the piping and
distribution system, thus indirectly maintain economic calculation [2]. Water consumption
forecasting model is developed for these purposes. Forecasting data gathered with such
integrated model is used to control, manage and modernize the existing water supply
framework in conjunction with to develop the newest element in the system [3]. A high
forecast accuracy system that employed in water supplying companies will additionally give
fast alert warning if any leakages in pipping and distribution system.
In the literature, there are numerous models developed to forecast water consumption.
Mostafavi et al., [4] proposed integrated urban metabolism analysis tools to predict water
consumption, they also used residential energy data as a proxy for water consumption
data. Walker et al., [5] implemented statistical methods and Artificial Neural Network
(ANN) to forecast domestic water consumption datasets that obtained from smart meter
reading. Lomet et al., [6] forecasted daily domestic hot water consumption using ARMA
model.
In this work, we developed and integrated model of GA with FCEEMD to forecast water
consumption in Malaysia. FCEEMD model was firstly popularized by Zhao et al., [7] is

SCIENCE AND TECHNOLOGY 745
employed to decomposed the original water consumption datasets into two Intrinsic Mode
Function (IMF). FCEEMD method is a kind of adaptive model is parametrized by spline
curve and stopping criterion. GA is used to locally optimized these parameters.
MAIN RESULTS
Figure 1 demonstrates the time series plot for the actual data and the forecasted data using
integrated GA-FCEEMD method.
Figure 1. The time series plot for the actual data and the forecasted data using GA-
FCEEMD method
Table 1 shows the forecast performances using GA-FCEEMD method.
Table 1. MAPE for water consumption using integrated GA-FCEEMD model
In-sample forecast
(MAPE)
Out-sample forecast
(MAPE)
3.0013 2.7320
CONCLUSION
This paper presented an integrated GA with FCEEMD model to forecast wáter consumption.
Firstly, we decomposed the original wáter consumption datasets into two IMFs. Then, we
local optimized the spline curve and stopping criterion parameters in FCEEMD model using
GA. Numerical experiment has demonstrated that by divided the curve spline interval and the
stopping criterion interval will increase the correctness of choosing the spline interval and the
stopping criterion interval value. The results demonstrates that the integration GA with
FCEEMD model can achieve high forecast accuracy.
Acknowledgment: This work was supported by the Tier 1, UTM Grant (Vote No:11H89)
and MyPhd Scholarship.

SCIENCE AND TECHNOLOGY 746
REFERENCES
1. Kozlowski, E., Kowalska, B., Kowalski, D. and Mazurkiewicz, D. Water demand forecasting by trend and
harmonic analysis. Archives of Civil and Mechanical Engineering 18(1) (2018), 140-148.
2. Mamo, T. G., Ilan, J. and Isam, S. Urban water demand forecasting using the stochastic nature of short term historical water demand and supply pattern. Journal of Water Resource and Hydraulic Engineering 2 (2013),
92-103.
3. Fontanazza, C. M., Notaro, V., Puleo, V. and Freni, G. Multivariate statistical analysis for water demand
modeling. Procedia Engineering 89 (2014), 901-908.
4. Mostafavi, N., Gandara, F. and Hoque, S. Predicting water consumption from energy data: Modeling the
residential energy and water nexus in the integrated urban metabolism analysis tool (IUMAT), Energy and
Buildings 158 (2018), 1683-1693.
5. Walker, D., Creaco, E., Vamvakeridou-Lyroudia, L., Farmani, R., Kapelan, Z. and Savić, D. Forecasting
domestic water consumption from smart meter readings using statistical methods and artificial neural
networks, Procedia Engineering 119 (2015), 1419-1428.
6. Lomet, A., Suard, F. and Cheze, D. Statistical modeling for real domestic hot wáter consumption forecasting,
Energy Procedia 70 (2015), 379-387. 7. Zhao, D., Huang, Z., Li, H., Chen, J. and Wang, P. An improved EEMD method base don the adjustable
cubic trigonometric cardinal spline interpolation, Digital Signal Processing 64 (2017), 41-48.

SCIENCE AND TECHNOLOGY 747
IGCESH2018
Universiti Teknologi Malaysia, Johor Bahru, Malaysia 13 -15 August 2018
WOMEN- FRIENDLY MOSQUE
Nur Farah Atikah Mohd Razif*1, Raja Nafida Raja Shahminan 2, Norliza Mohd Isa3
and Malsiah Hamid4
1, 2 Nur Farah Atikah Mohd Razif, Raja Nafida Raja Shahminan, Faculty of Built Environment,
Universiti Teknologi Malaysia, Skudai, Johor, MALAYSIA.
(E-mail: [email protected], [email protected]) 3 Norliza Mohd Isa, Faculty of Built Environment, Universiti Teknologi Malaysia, Skudai, Johor,
MALAYSIA.
(E-mail: [email protected]) 4 Malsiah Hamid, Faculty of Built Environment, Universiti Teknologi Malaysia, Skudai, Johor,
MALAYSIA. (E-mail: [email protected])
ABSTRACT
The mosque originates from the word “Mesjid”, meaning the place where people prostrate to
God. It is also referred to as House of God. Besides that, mosque also the place where
believers congregate, get to know each other and become a solid community. Nowadays,
people know that the importance of mosque as a community centre which will involve the
men and women but some of the mosques’ design still not women-friendly. That is the reason
of this research is conducted. The objective of this research is to identify the specific space
for women in the mosque. Besides that, to review factors that women are uncomfortable
while in mosque. Lastly, to produce guidelines that can be used in designing women-friendly
mosques. Generally, this research uses qualitative method including document analysis,
interviews and observation. The result of this research argues that some design of the existing
mosque does not emphasize women's space, making this space just an extra space which may
make the women feel uncomfortable. Therefore, this reseach was conducted to solve the
women’s issues while in the mosque and this will contribute to the women's friendly mosque
design guidelines.
Key words: Mosque, Friendly, Mosque
INTRODUCTION
Mosque is derived from Spanish word ‘mezquita’. While the Spanish term is translation of
the Arabic word ‘masdjid’ which originated from Aramaic ‘masgedha’. The root of ‘masdjid’
is ‘sajd’ which means ‘to prostrate’. Besides that, ‘mosque’, as understood in the present
architectural terminology, means ‘building’ for use by Muslims for the performance prayer.
Mosque is not only the place for performing prayer, it is used for variety purposes such as
place of education, shelter for homeless, accommodation for travelers and administrative
centre. Muslims need to revitalize the mosque as a center of the community. In the time of
Prophet Muhammad, peace be upon him, the mosque was a place where all were welcome,
all participated, and all contributed, regardless of their age, gender, ethnicity, and status.

SCIENCE AND TECHNOLOGY 748
The mosque was a central place of worship, education, political discussion, and social
interactions. In short, it was the place where community life happened. From surah [Al-
Ahzab 33:35], the Qur’an has established the spiritual and moral equality of men and women
in explicit and unequivocal terms. Both men and women, the Qur’an stresses, have the
obligation to develop themselves morally and spiritually, and to fulfill their social
responsibilities. The masjid is, and has always been, the center of moral and spiritual learning
and growth.
Likewise, the masjid is a public place for discussing issues of concern to Muslims, and to
respond to challenges facing the Muslim community. The Qur’an, surah [Al-Tawbah 9:71], is
also clear on the equal responsibility of both men and women for developing public good.
This can be described that promoting the common good and opposing evil are public duties
equally required from men and women, and the masjid is the place where Muslim men and
women can meet to plan community development and outline strategies to promote public
good.
Mosques, although often associated with men, many mosques which held activities that are
involved women. This situation is not weird nowadays because almost of us know that the
role of the mosque. There are few issues such as spaces for women in mosque is
uncomfortable. This is reason for this research is conducted.
This research aim is to ensure that the women that involve with activities in the mosque will
be comfortable and keep involve in the prayers or activities that be held in mosque. The
objectives of this research are to identify the specific space for women in the mosque, to
review factors that women are uncomfortable while in mosque and to produce guidelines that
can be used in designing women-friendly mosques.
Hopefully the outcomes of this research will contribute to the designers and architects to
produce mosque which is more women- friendly.
MAIN RESULTS
Table 1. List of Mosque and spaces
No Mosque Floor Plan
Spaces
Prayer
Area
Ablution
Area
Toilet Management
Area
Facilities
Area
Table 2. Characteristic of Women-Friendly Mosque
No. Spaces Characteristics
CONCLUSION
The conclusion of this research to provide examples and guidelines for the Women Friendly
Mosque which can help future architect in the construction of new mosque. This research
also will have a compilation of some mosques in Malaysia which is do not provide
comfortable space for women as was mentioned by ex- Director General of Islamic

SCIENCE AND TECHNOLOGY 749
Development Department of Malaysia (JAKIM), Datuk Wan Mohamad Sheikh Abdul Aziz
[Akhbar Utusan, 28 Mac 2012] which is nowadays there are still some mosque which
provided open ablution area that can provide uncomfortable situation for the women user.
Therefore, this research was conducted to examine some of the issues faced by women when
in the mosque and the results of this research will contribute to the women's friendly mosque
design guidelines.
Acknowledgment: I would to thank the sponsor and support from Grant Tier 2 with
Reference No: PY/2017/02069
REFERENCES
1. Mohammad Azrien Mohamed Adnan, (2011). Rahsia Pengimarahan Masjid Menurut Al-Quran dan Al-
Sunnah. Prosiding : Seminar Pengurusan Masjid Inovatif Peringkat Antarabangsa “Berinovasi dalam
Pengurusan Masjid”. Iain Ar-Raniry, Banda Aceh. 23-24 April.
2. Arman, Z, (2009). Mengimarahkan masjid sebagai nadi masyarakat. [online] Available at:
http://aki2004.wordpress.com/2009/11/20/mengimarahkan-masjid-sebagai-nadi-masyarakat/ [Accessed 20 Dec. 2017].
3. ARKIB. (2012 Mac 28). Prasarana di masjid, surau mesti mesra wanita. Utusan Online. Retrived September
10, 2017, from
http://ww1.utusan.com.my/utusan/info.asp?y=2012&dt=0328&pub=Utusan_Malaysia&sec=Johor&pg=wj_0
6.htmKlemmer, R.S., Thomsen, M., Phelps-Goodman, E., Lee, R. and Landay, J.A. Where do web sites
come from? Capturing and interacting with design history. In Proc. CHI 2002, ACM Press (2002), 1-8.
4. Hafsah Sakinah Yahya, Rekabentuk Masjid Mesra Wanita. Universiti Teknologi Malaysia, Sarjana Muda
Senibina. Tesis, 2009.
5. Siti Nurliyana Shariff, Masjid dan fungsi dalam integrasi sosial. Universiti Teknologi Malaysia, Sarjana
Senibina. Tesis, 2016.
6. Razaly, Mohamad Zaki, Sharinizam bin Mansor (2013). Peranan Wanita Dalam Pengimarahan Masjid
sebagai platform dakwah. Prosiding Konferensi Antarabangsa Borneo. UiTMcawagan Johor. April, 2013. 7. Mohamad Tajuddin Mohamad Rasdi, The Mosque As A Community Development Centre. Penerbit Universiti
Teknologi Malaysia, Skudai Johor, 1998.

SCIENCE AND TECHNOLOGY 750
IGCESH2018
Universiti Teknologi Malaysia, Johor Bahru, Malaysia 13 -15 August 2018
STUDENT’S HABITS AND DIGITAL GAME PREFERENCES
AMONG YOUNG CHILDREN IN MALAYSIA: A CASE OF
DESIGNING AN EDUCATIONAL GAME
Rozana Binti Ismail*1, Roslina Binti Ibrahim2
1, 2 Advanced Informatics School (AIS), Universiti Teknologi Malaysia (UTM) Kuala Lumpur.
(E-mail: [email protected], [email protected])
ABSTRACT
In a developed country like Malaysia, prominent technological devices that are use by most
people are the computer, the tablet, and the digital mobile hand phone. However, for full
implementation of such devices in teaching and learning in primary and secondary schools
are still distant when compared to higher education which at their best, fully utilises the
computer and other digital devices in the classroom. This has created a gap between these
two groups of educational levels. Primary school students prefer digital device usage to fulfil
their leisure time either at home or outside. However, their utilisation orientates towards
entertainment rather than for educational purposes. Correspondingly, game design is one
issue relevant to their preferences. Thus, the discussion on the preferences for game design is
based on sampled findings, where the study has taken place in three Islamic Religious
Primary Schools (KAFA) involving 287 students, from age 10 to 12 years old. The
presentation of this paper will begin with a brief explanation on the application of educational
games in the learning process and the problems that arise. The next section is the elaboration
on the methodology used, which includes interview sessions, purposive sampling and
triangulation design. The results from the investigation will be further elaborated in the
descriptive analysis. At the end of this paper, an outline of the input for the initial study stage
towards the next phase of Participatory Design (PD) process is frameworked.
Key words: Digital Game, Participatory Design, Educational Game
INTRODUCTION
In a developed country like Malaysia, full implementation of technology is more likely to
take place in the higher levels of education as compared to national and public schools. This
creates an inconsistency in the teaching and learning process. For example, primary school
students are much more likely to be attracted to digital gadgets such as the mobile phones,
tablets, PCs, or notebooks. Game is one of the most desired application hankered after by
students [1]; the purpose of playing can be for education or entertainment. Therefore, in this
study we will identify the student’s preferences for digital games based on the designs and
the focus of these games for educational [2] or for entertainment purpose. Accordingly,
several teachers have been interviewed for the study. We will retain on PDEduGame
framework, specifically for the initial study process. The investigation process was
highlighted in PDEduGame process framework.

SCIENCE AND TECHNOLOGY 751
METHODOLOGY
In this section, the methodology that is discussed has been compiled from a brief interview
session conducted with nine teachers from three different schools. Subsequently, the study
elucidates on how the purposive sampling, and eventually the triangulation design that is used
on the data, is procured. The question and answer study as to the student’s preferences on
educational game design is identified at the first phase in the PDEduGame process
framework [3]. The first phase of PDEduGame is the initial study, whereat the initial stage an
investigation is done using a survey on the digital game preferences among Islamic Religious
primary school (KAFA) students. The questionnaire was divided into three sections
comprising students’ habits towards digital game, their game design preferences, and
selection for design workshop. The research incorporates a questionnaire surveys secured
from 287 students and an interview with 9 teachers. The analysis of the data gained from
the surveys, is to be analysed using triangulation [5]–[7]. This is to confirm that the
designs preferred by the students are supported with the content that has been approved
by the teachers. Accordingly, these surveys and interviews will be the input for the game
workshop- the setup phase and game design phase. The use of Mechanics-Dynamics-
Aesthetics (MDA) Game Design Framework [8]–[10] will be considered in order to
secure higher engagement from the students.
FINDINGS
There are three sections that will be covered in the findings. The first part is a brief
summation on teachers’ perception on the digital game application for the learning
process. It has been decided that the game application could be practical for history
subject, since the examination results have recorded a slight decline in 2016 and 2017.
The time duration for history subject especially in KAFA schools is limited; there is only
a 30 minutes allocation for a few classes in a week. Thus, the technology usage in
classroom is also limited. Hence, there are some suggestions from the teachers that the
use of educational digital game should be carried out after school hours- at the students’
own leisure time at home. The second section is a short survey that has been conducted in
three KAFA primary schools. The first subsection of the survey is to identify students’
habits pertaining to digital games. From the survey, 55% of the students own a digital
device. Relatively, there are several reasons why they play digital games. The highest
percentage shows that they are seeking for something fun thing to do, and because the
game is challenging to them thus creates attention and engage longer. The second
subsection of the study focus on game design favourites. From the analysis, 38% prefers
puzzle-like games, while 47.7% states that the game should be fun, 43.6% looks for
challenges, and 27.9% wants illustrations with beautiful colours. The third section
pertains to the involvement for the game design workshop. In this section, the students
state whether they would agree to attend the upcoming event of a game design workshop.
68.3% (n=196) of the students are interested to participate, however, only 46% (n=132)
are willing to attend the workshop in the weekends.
DISCUSSION
The discussion covers the student’s habits towards digital games, their game design
preferences and the selection of students who are to attend a future game design workshop.
On the first part, excluding the 3.8% of students who do not play digital games there are
55.5% of students who own a digital device, 96.2% of them play digital games. Hence,

SCIENCE AND TECHNOLOGY 752
educational games for history subject can be implemented in primary schools; KAFA can be
considered one such school. Based on the statistics that are gathered, a total of 77.3% of
students play digital games under 3 hours. This indicates that parents have put a restriction on
their child’s digital game playing and it is already enforced at home. The second part
concerns game design preferences, where students are immensely appreciative of a fun game,
a challenging game, and a game with attractive visuals (illustration and colours). It has been
identified that a puzzle and maze type of genre is the most favoured by students. The third
part is students’ selection for a game design workshop. Students are chosen based on their
habits criteria, their game preferences, their willingness to participate in the design activities,
and their final examination results. 62.7% of students, who play games for more than 1 hour
up to 5 hours and above, will be considered for the selection.
CONCLUSION
Conclusively, there is more work to be done for consecutive levels in developing the
PDEduGame Framework. This study only covers the initial phase. Thus, it is suggested that
each output and finding from this first phase can be mapped for the consecutive phase.
Acknowledgment: We would like to thank 1) Universiti Teknologi Malaysia (UTM) Kuala
Lumpur, 2) University Research Grant: Vote No. 18H63.
REFERENCES
1. E. Y. Zhang and L. Loeb, “Mobile Applications : Games that Transform Education,” (2013) pp. 1–20.
2. M. Obrist, F. Förster, D. Wurhofer, M. Tscheligi, and J. Hofstätter, “Evaluating First Experiences with an
Educational Computer Game : A Multi-Method Approach 2 How to Investigate Children ’ s Experiences,”
(2011), pp. 26–36.
3. R. Ismail and R. Ibrahim, “PDEduGame : Towards Participatory Design Process for Educational Game
Design in Primary School,” IEEE Explor., (2017), pp. 1–6.
4. M. D. C. Tongco, “Purposive Sampling as a Tool for Informant Selection,” A J. Plants, People, Appl. Res.,
(2007) vol. 5, pp. 147–158. 5. B. L. Wilson, “Quantitative Qualitative Large-Scale Study,” (1985), vol. 9, no. 5, pp. 627–643.
6. E. Babbie, “Research Design,” Basics Soc. Res., (2010), p. 576.
7. R. Hunicke, M. LeBlanc, and R. Zubek, “MDA: A Formal Approach to Game Design and Game Research,”
Work. Challenges Game AI, no. August, (2004), pp. 1–4.
8. D. R. Marins, M. D. O. D. Justo, G. B. Xexéo, B. D. A. M. Chaves, and C. D’Ipolitto, “SmartRabbit: A
mobile exergame using geolocation,” Brazilian Symp. Games Digit. Entertain. SBGAMES, (2011), pp. 232–
240.
9. T. Siti, M. Tengku, and S. S. Salim, “A Conceptual Design for Children ’ s WebOPAC Interface : Graphic
Design Issues,” (2007), pp. 785–791.

SCIENCE AND TECHNOLOGY 753
IGCESH2018
Universiti Teknologi Malaysia, Johor Bahru, Malaysia 13 -15 August 2018
VALIDATION OF COORDINATION STRATEGIES AND RELATED
INDICATORS IN GLOBAL SOFTWARE DEVELOPMENT
PROJECTS USING DELPHI TECHNIQUE ACTIVITIES
Anusuyah Subbarao*1,3 and Mohd Naz’ri Mahrin2
1, 2 Advanced Informatics School, Universiti Teknologi Malaysia, Kuala Lumpur, MALAYSIA.
(E-mail: [email protected], [email protected]) 3 Faculty of Management, Multimedia University, Cyberjaya, MALAYSIA.
ABSTRACT
The purpose of this paper is to discuss the application of Delphi technique in formulating
evaluation model to assess the effectiveness of coordination processes in Global Software
Development(GSD) projects. This study employed a minimum of two-round modified Delphi
technique as a method to verify and validate the coordination strategies and related indicators
together with its description for the development of Evaluation Model in GSD Projects. The
Delphi technique is a research approach used to obtain consensus opinión from experts using
a series of questionnaires. This study was carried out with the purpose to obtain consensus
opinión from the experts on validating the coordination strategies and related indicators
together with its descriptions and ultimately to develop the Evaluation Model to assess the
coordination processes in GSD projects.
Key words: Global Software Development, Delphi technique, Coordination, Indicators
INTRODUCTION
The term Global Software Development (GSD) implies teams of knowledge workers located
in various parts of the globe developing commercially viable software. This globalization of
software development is in the form of collocated work and distributed work. In 2017, global
software spending is estimated to total $3.5 trillion according to Gartner [8]. The main reason
why information technology (IT) companies are doing this is to gain a strategic and economic
benefits [1].
For the past two decades, most of the IT companies have adapted GSD approach mainly
because various business motives such as access to large pool of competent developers, less
time taken for software development, reduce software development cost, less time taken to
market the software product and to produce better quality software [2] [3] [4] [5]. Despite of
having several advantages by adapting this GSD, IT companies do suffer in numerous ways
due to geographic, temporal, cultural and linguistic differences [6]. Consequences from these
differences, IT companies do suffer in term of communication and coordination and handling
them in GSD projects is a big challenge [7] because the project is distributed across the
countries.

SCIENCE AND TECHNOLOGY 754
Well-coordinated development is assumed to not only produce software faster, but also to
produce software of higher quality and at lower cost [11]. Effective coordination is a critical
factor in successful software projects [10]. Projects that performed well had better
coordination effectiveness compared to projects that has poor performed performance [9].
Proper coordination effectiveness is crucial in determining the software project successful. It
need to be assessed.
In line to this, development of Evaluation Model to assess the Effectiveness of Coordination
Processes in Global Software Development Projects could guide the project managers to
assess the coordination processes effectively between collocated and distributed team in GSD
environment. By using this proposed model, project managers could assess and manage the
coordination processes and the coordination strategies more effectively in GSD projects. This
paper delivers insights of the formulation of Evaluation Model to assess the Effectiveness of
Coordination Processes in Global Software Development Projects using Delphi Technique.
RESULTS
As for now, the research progress is in phase of questionnaire is already been distributed to 5
experts in GSD environment. Basically, the questionnaire is developed after consolidating
data from two main resources which are Systematic Review and semi structured interview.
These two sources were integrated using Grounded Theory. The questionnaire consists of 10
coordination processes, 36 coordination strategies for the identified coordination processes
and 167 indicators of the identified coordination strategies. Each of these outputs is described
rigorously using software measurement method. Given below are the sample questionnaire of
our research which was delivered to the experts.
The questionnaire is divided into three sections namely coordination processes,
coordination strategies for the coordination processes and the last section indicates indicators
related to the coordination strategies in GSD environment.
Table 1. Sample Questionnaire for Delphi Round One Sub-Section B1 COORDINATION PROCESS 1 : TEAM SETUP Description Setting up an ideal team which consist of geographically distributed teams and collocated team
members in GSD environment. Sub-Section
B1.1 COORDINATION STRATEGY 1: TEAM MEMBERS SELECTION
Description To be selected as a team member of a geographically distributed teams
Indicators Indicators are
titled correctly
(Yes/No)
If Yes, how impact the
indicator is for GSD project 1 2 3 4 5
1. TS1 Team Knowledge
TS2 Total number of technical skills
TS3 Type of gender
TS4 Type of skill or expertise
TS5 Able to handle cross functionality
TS6 Total number of years of experience
TS7 Build the trust
TS8 Competent and committed developers
TS9 Labor Cost

SCIENCE AND TECHNOLOGY 755
CONCLUSION
The detail process of Delphi is explained in this paper. It explained the entire Delphi
technique processes that is involved in this model validation. It discussed how the strategies
and indicators will be validated by GSD experts from various countries. In addition to that,
these indicators also were described according to ISO/IEC TR 9126:2003. Finally, all the
strategies and the relevant indicators will be analyzed before going for Delphi Round Two.
These rounds will be repeated till reach the experts consensus. This proposed model will be
used to assess the effectiveness of the coordination processes in GSD projects.
Acknowledgment: The authors would like to thank Universiti Teknologi Malaysia, Advance
Informatics School (AIS) and other individuals for their kind support. This work is supported
by UTM grant 16H64.
REFERENCES
1. Jiménez, M., Piattini, M., and Vizcaíno, A. 2009. Challenges and improvements in distributed software development: a systematic review. Adv. Soft. Eng. 2009, Article 3 (January, 2009).
DOI=http://dx.doi.org/10.1155/2009/710971.
2. Sˇmite, D., Wohlin, C., Feldt, R., & Gorschek, T. (2008). Reporting empirical research in global software
engineering: A classification scheme. In Proceedings of the 3rd international conference on global software
engineering, pp. 173–181
3. Kaur, P., & Sharma, S. (2014). Agile Software Development in Global Software Applications, 97(4), 39-43.
4. Ågerfalk, P.J., Fitzgerald, B., Olsson, H.H., and Ó Conchúir, E. 2008. Benefits of global software
development: the known and unknown. In Proceedings of the Software process, 2008 international
conference.
5. Ågerfalk, P. J., and Fitzgerald, B. 2006. Flexible and Distributed Software Processes: Old Petunias in New
Bowls? Commun. ACM. 49, 10(Oct 2006). 26-34. 6. D. Damian, D. Moitra, Guest editors’ introduction: global software development: how far have we come?,
IEEE Softw 23 (5) (2006) 17–19. Herbsleb, J.D., Moitra, D.: Global Software Development. IEEE Software
18(2), 16–20 (2001)
7. Ó Conchúir, E., Ågerfalk, P.J., Olsson, H.H., and Fitzgerald,B.2009. Global software development: where
are the benefits? Commun. ACM. 52, 8 (August 2009), 127-131.Offshoring: An Investigation of the Irish
Bridge. MIS Quarterly 32(2), 1–23 (2008).
8. The Economic Times (2017). (April 2017). Technology Report.[Online]
http://economictimes.indiatimes.com/news/industry/tech/ites/global-it-spending-to-grow-1-4-in-2017
gartner/articleshow/58109021.cms
9. Chang, A. S., & Shen, F.-Y. (2013). Effectiveness of coordination methods in construction projects. Journal
of Management in Engineering, 30(3), 04014008.
10. Strode, D. E., Hope, B. G., Huff, S. L., & Link, S. (2011). Coordination Effectiveness In An Agile Software Development Context. Paper presented at the PACIS.
11. Espinosa, J. A., Slaughter, S. A., Kraut, R. E., & Herbsleb, J. D. (2007). Team knowledge and coordination
in geographically distributed software development. Journal of management information systems, 24(1),
135-169.

SCIENCE AND TECHNOLOGY 756
IGCESH2018
Universiti Teknologi Malaysia, Johor Bahru, Malaysia 13 -15 August 2018
A REVIEW OF MULTISPECTRAL IMAGERY
FOR 3D MODELING IN ROCK ART RECORDING
Khairulazhar Zainuddin*1, Zulkepli Majid2 and Mohd Farid Mohd Ariff3
1 Jabatan Sains Ukur & Geomatik, Universiti Teknologi MARA cawangan Perlis, Arau, Perlis,
MALAYSIA (E-mail: [email protected])
2,3 Fakulti Geoinformasi dan Harta Tanah, Universiti Teknologi Malaysia, Skudai, Johor,
MALAYSIA. (E-mail: [email protected], [email protected])
ABSTRACT
Rock art documentation by using multispectral is becoming popular in the cultural heritage
domain. The multispectral camera is a camera with multi-lenses, which can take pictures of
an object by multi-wavelength at the same scene. Usually, the advantage of using
multispectral is it can detect an invisible object because it equipped with Near Infra-red (NIR)
band, which is useful in reflecting the invisible spectrum. However, in the application of rock
art documentation, multispectral imagery is only focused on radiometric analysis, although
multispectral images principally can be used for generation of orthophoto and digital surface
model. The generation of a 3D model of rock art documentation is usually combining
multispectral imagery with other 3D recording and modeling technique, i.e., close-range
photogrammetry by a digital camera and terrestrial laser scanning and involving various
equipment and processing pipeline. Thus, the multispectral imagery is not exploiting for 3D
modeling for both radiometric and 3D modeling in a single pipeline. This paper proposes the
use of multispectral imagery captured from low-cost miniature multispectral camera to
generate the 3D model without using different sensors for recording purpose.
Key words: Rock art recording, Multispectral camera, Photogrammetry, 3D Modeling
INTRODUCTION
Rock art paintings are prehistoric art drawing that has been painted by ancient people
thousands of years ago. These paintings are however suffering a constant degradation by
agents such as weather, wind, water, erosion and human vandalism [1]. As a result, these
paintings becoming faded, blurred and invisible to naked human eyes. For preservation,
any repairs or repainting on the faded areas will damage the originality of the painting.
Therefore, documenting the rock art painting is essential to preserve the motifs for
research, exhibitions, and future references [2].
To detect such invisible motifs, the infrared wavelength is able to penetrate beyond the
visible spectrum [3]. However, using only single wavelength or spectrum cannot
precisely analyze the type of pigment and color measurement, which can only detect by
multispectral imagery [4]. Multispectral imagery can acquire spatial and spectral
information of object or scene, and produced image cube, which contains a series of

SCIENCE AND TECHNOLOGY 757
different images with its spectral profile [5]. Therefore, using multispectral imagery is not
only able to detect invisible motifs, but it can distinguish different pigment and precisely
extracts its geometry. However, most of the documentation by multispectral imagery
only focuses on radiometric analysis, while neglected on geometric aspect [6]. Therefore,
the 3D model from other recording techniques combined with multispectral images to
record and document the geometry of the motifs [7].
MAIN RESULTS
Current methods of accurate geometric digital tracing and measurement are by using 3D
model generated from terrestrial laser scanning (TLS) and photogrammetry method.
However, TLS is not preferable in cultural heritage (CH) field due to expensive
equipment and heavy to mobilize for in-situ data recording and yet still become a
significant drawback in CH [2]. Therefore, the 3D modeling by photogrammetry is the
most suitable technique for CH documentation. Despite that, using photogrammetry is
limited to visible images, even some of the CH documentation applications aim is to
generate a photorealistic 3D model. In the case of the rock art painting, one of the
purposes of documentation is revealing faded or blurred images, thus only can be
acquired by NIR wavelength. The pigment of invisible rock art painting such as red and
white ochre reflect well at NIR if using correct value during recording [8]. Thus, the
photorealistic 3D model is not suitable for recording invisible motifs, moreover using
photorealistic 3D model is not able to precisely distinguish overlapped motifs [8].
The multispectral imagery, on the other hand, can reveal and distinguish the various type
of pigments, based on its wavelength. Thus, to trace the motifs by its pigment type
accurately, it should be done on a 3D model of a specific band. For example, the red
ochre is invisible while charcoal is seen clearly in NIR. Thus, motifs by charcoal can be
digitized for correct geometric recording on NIR 3D model. However, multispectral and
3D model processes in a different pipeline. Furthermore, the multispectral imagery is not
exploited to generate a 3D model in CH domain for use as a reference for accurate motifs
digital tracing.
Therefore, based on the literature, multispectral is not fully utilized for orthophoto and
3D modeling generation by processing it in a single pipeline. Table 1 shows various
methodology to accurately extract the hidden of faded motifs by using multispectral
imagery with other 3D data.
Table 1. Various methodology used in rock art recording No Author Data/ tools Methodology
1. (Torres-
Martínez et al.,
2017)
• Multispectral (mini MCA)
• Photogrammetry (DSLR –
Canon 5D)
• Faro Focus 120 TLS
Combining geometrical and radiometric
features from multispectral and DSLR with
TLS data.
2. (Pamart et al., 2017)
• Multispectral
• Technical Photography
• Photogrammetry
Direct multiband photogrammetric pipeline by combining both methodologies and
requirements of Photography and Close-Range
Photogrammetry techniques.
3. (Fritz et al.,
2016) • Multispectral
• Photogrammetry
Projected 2D tracing of the motifs into 3D
model generated by photogrammetry
4. (Alexopoulou
et al., 2013) • Multispectral
• Image enhancement
Using multispectral image cube with Principal
Component Analysis to reveal hidden writing
on the tomb

SCIENCE AND TECHNOLOGY 758
CONCLUSION
This paper provides a review of current documentation on rock art painting involving
geometric and radiometric recording. Most of the research documented the rock art motifs by
combining several data and processing pipeline. This paper, however, investigates to exploit
the multispectral imagery to generate the 3D model and enhance the faded painting by using
a single pipeline for accurate motifs extraction. By using this new method, the invisible
motifs can be extracted by enhancing the image, and at the same time use for 3D modeling
for accurate geometry documentation.
Acknowledgment: The authors gratefully acknowledge the Universiti Teknologi MARA and
Ministry of Education for their kind support of the scholarship under SLAB scheme [500-
BPD (BKK.14/3/2/3) (272760)].
REFERENCES
1. J. A. Torres-Martínez, L. J. Sánchez-Aparicio, D. Hernández-López, and D. González-Aguilera, “Combining
geometrical and radiometrical features in the evaluation of rock art paintings,” Digit. Appl. Archaeol. Cult.
Herit., vol. 5, no. March, pp. 10–20, 2017. 2. I. Domingo, V. Villaverde, E. López-Montalvo, J. L. Lerma, and M. Cabrelles, “Latest developments in rock
art recording: Towards an integral documentation of Levantine rock art sites combining 2D and 3D
recording techniques,” J. Archaeol. Sci., vol. 40, no. 4, pp. 1879–1889, 2013.
3. Cosentino, “Infrared Technical Photography for Art,” no. February, pp. 1–6, 2016.
4. H. Liang, “Advances in multispectral and hyperspectral imaging for archaeology and art conservation,”
Appl. Phys. A Mater. Sci. Process., vol. 106, no. 2, pp. 309–323, 2012.
5. S. Del Pozo et al., “Multispectral Imaging in Cultural Heritage Conservation,” ISPRS - Int. Arch.
Photogramm. Remote Sens. Spat. Inf. Sci., vol. XLII-2/W5, no. September, pp. 155–162, 2017.
6. F. Remondino et al., “Review of geometric and radiometric analyses of paintings,” Photogramm. Rec., vol.
26, no. 136, pp. 439–461, 2011.
7. C. S. Chane, A. Mansouri, F. S. Marzani, and F. Boochs, “Integration of 3D and multispectral data for cultural heritage applications: Survey and perspectives,” Image Vis. Comput., vol. 31, no. 1, pp. 91–102,
2013.
8. D. Sanz, “Rock Art Recording Methods: From Traditional to Digital,” Encyclopedia of Global Archaeology,
no. November. Springer New York, New York, NY, pp. 6351–6357, 2014.

SCIENCE AND TECHNOLOGY 759
IGCESH2018
Universiti Teknologi Malaysia, Johor Bahru, Malaysia 13 -15 August 2018
ACTION DEGREE ON GROUPS
Suad Alrehaili*1 and Charef Beddani2
1, 2 Department of Mathematics, Faculty of Science, Taibah University, Madinah, SAUDI ARABIA.
(E-mail: [email protected] , [email protected]) 1 Department of Mathematical Sciences, Faculty of Science, Universiti Teknologi Malaysia, Johor,
MALAYSIA.
ABSTRACT
The commutativity degree is the probability that a pair of elements chosen randomly from a
group commute. The concept of commutativity degree has been widely discussed by several
authors in many directions. . One of the important generalizations of commutativity degree is
the probability that a random element from a finite group 𝐺 fixes a random element from
a non-empty set 𝑆 that we call the action degree of groups. In this research, the concept of
action degree is further studied where some inequalities and bounds on the action degree of
finite groups are determined. A result in terms of the order of the group is obtained.
Moreover, a general relation between the action degree of a finite group 𝐺 and a subgroup 𝐻
is provided. Next, the action degree for the direct product of two finite groups is determined.
Finally, some relations between the action degree of a finite group 𝐺 that acts on a finite set 𝑆
and the sets 𝑍𝑠(𝐺) and 𝑆0(𝐺), where 𝑍𝑠(𝐺) is the set of all elements in 𝐺 that fixes all
elements in 𝑆 and 𝑆0(𝐺) is the set of all fixed points of the action.
Key words: Action degree, Commutativity degree, Finite groups
INTRODUCTION
There has been a growing interest by authors in the last years on the use of probability in
group theory. One of the most important aspects which has been studied is the probability
that two random elements (𝑥, 𝑦) in a finite group 𝐺 commute, denoted as 𝑃(𝐺) and it is used
to determine the abelianness of a group. It is called the commutativity degree of groups and
has been investigated by many authors. This concept was introduced in 1968 by Erdos and
Turan [1], where they worked on symmetric groups. The definition of commutativity degree
is given as follows:
Definition 1.1. Let 𝐺 be a finite group, the commutativity degree is the probability that two
random elements (𝑥, 𝑦) in 𝐺 commute, defined as follows:
𝑃(𝐺) =|{(𝑥, 𝑦) ∈ 𝐺 × 𝐺 | 𝑥𝑦 = 𝑦𝑥}|
|𝐺|2
In 1975, Sherman [4] defined the probability that a random element from a finite group 𝐺
fixes a random element from a non-empty set 𝑆, formally it is defined as follows:

SCIENCE AND TECHNOLOGY 760
Definition 1.2. [4] Let 𝐺 be a finite group that acts on a finite set 𝑆. The probability that
a random element from a group 𝐺 fixes a random element from the non-empty set 𝑆 is:
𝑎𝑑𝑠(𝐺) =|{(𝑥, 𝑠) ∈ 𝐺 × 𝑆 | 𝑥𝑠 = 𝑠}|
|𝑆| ∙ |𝐺|.
In this research, this probability is referred to as the action degree of finite groups.
Sherman [4] studied the probability that an automorphism fixes a group element, which
gives commutativity degree in a special case. He considered only the case for which 𝐺 is
a finite abelian group and A is its group of automorphism. Omer et al. [5] generalized the
commutativity degree by defining the probability that an element of a group 𝐺 fixes a set
S of size two, given in the following:
𝑃𝐺(𝑆) =|{(𝑔, 𝑠) ∈ 𝐺 × 𝑆 | 𝑔𝑠 = 𝑠}|
|𝑆| ∙ |𝐺|.
Where 𝑆 is a set of all subsets of commuting elements of 𝐺 of size two and 𝐺 acts on 𝑆 by
conjugation. The probability was found for symmetric groups and alternating groups in
[6] and some finite non-abelian groups including metacyclic 2-groups in [7]. In the same
year, El-sanfaz et al. [8] extended the work in [5] by restricting the order of the set 𝑆 for
dihedral groups. In this research, the general definition of action degree is considered
where some inequalities and bounds on the action degree of finite groups are determined.
MAIN RESULTS
In this section we present our main results and provide some inequalities and limiting
conditions on the action degree of finite groups.
Lemma 2.1. Let 𝐺 be a finite group that acts on a finite set 𝑆. Then:
𝑎𝑑𝑠(𝐺) ≥1
|𝐺|.
Proposition 2.2. Let 𝐺 be a finite group that acts on a finite set 𝑆 and 𝐻 is a subgroup of
𝐺. Then:
𝑎𝑑𝑠(𝐻) ≤ [𝐺:𝐻] 𝑎𝑑𝑠(𝐺).
Proposition 2.4. Let 𝐺 be a finite group that acts on a finite set 𝑆. Take 𝐻 be a subgroup
of 𝐺 and let 𝑆 be the set of all left cosets of 𝐻 in 𝐺. Then 𝐺 acts on S by 𝑔(𝑎𝐻) = (𝑔𝑎)𝐻
and:
𝑎𝑑𝑠(𝐺) =1
[𝐺:𝐻].
Proposition 2.5. Let 𝐻 and 𝐾 be two finite groups act respectively on finite sets 𝑆1 and 𝑆2
such that 𝑆1 ∩ 𝑆2 = ∅. Then 𝑎𝑑𝑠1×𝑠2(𝐻 × 𝐾) = 𝑎𝑑𝑠1(𝐻) ∙ 𝑎𝑑𝑠2(𝐾).
Proposition 2.6. Let 𝐺 be a finite group that acts on a finite set 𝑆 and 𝑍𝑠(𝐺) = {𝑔 ∈𝐺:𝑔𝑠 = 𝑠 ∀ 𝑠 ∈ 𝑆}. Then:

SCIENCE AND TECHNOLOGY 761
𝑎𝑑𝑠(𝐺) ≥|𝑍𝑠(𝐺)|
|𝐺|.
Proposition 2.7. Let 𝐺 be a finite group that acts on a finite set 𝑆 and 𝑆0(𝐺) is the fixed
points set. Then:
𝑎𝑑𝑠(𝐺) ≤1
2+|𝑆0(𝐺)|
2|𝑆|.
Proposition 2.8. Let 𝐺 be a finite group that acts on a finite set 𝑆 and 𝑆0(𝐺) is the fixed
points set. Then:
𝑎𝑑𝑠(𝐺) ≥|𝑆0(𝐺)|
|𝑆|.
Theorem 2.9. Let 𝐺 be a finite group that acts on a finite set 𝑆. Let 𝑎 =|𝑍𝑠(𝐺)|
|𝐺| and 𝑏 =
|𝑆0(𝐺)|
|𝑆|
Then: 𝑎𝑑𝑠(𝐺) ≥ 𝑎 + 𝑏 − 𝑎𝑏.
CONCLUSION
As a conclusion, some bounds and limiting conditions on the probability that a random
element from a finite group 𝐺 fixes a random element from a non-empty set 𝑆 are determined.
REFERENCES
1. Erdos, P. and Turan, P. On some problems of a statistical group theory. IV Acta Math. Acad Sci. Hungricae
19 (1968): 413-435.
2. Gustafson, W. H. What is the probability that two group elements commute? Am. Math. Mon. 80 no.9
(1973), 1031-1034.
3. MacHale, D. How commutative can a non-commutative group be? The Mathematical Gazette 58 (1974), 199-202.
4. Sherman, G. J. What is the probability an automorphism fixes a group element. Am. Math. Mon. 82 no.3
(1975), 261-264.
5. Omer, S. M. S., Sarmin, N. H., Erfanian, A. and Moradipur, K. The probability that an element of a group
fixes a set and the group acts on set by conjugation. International Journal of Applied Mathematics and
Statistics 32 no.2 (2013), 111-117.
6. Omer, S. M. S., Sarmin, N. H. and Erfanian, A. The probability that an element of a symmetric group fixes a
set and its application in graph theory. World Applied Sciences Journal 27 (2013), 1637-1642.
7. Omer, S. M. S., Sarmin, N. H. and Erfanian, A. Applications on graphs related to the probability that an
element of finite metacyclic 2-group fixes a set. International Journal of Mathematical Analysis 8 (2014),
1937-1944. 8. El-sanfaz, M. A., Sarmin, N. H. and Omer, S. M. S. The probability that an element of the dihedral groups
fixes a set. International Journal of Applied Mathematics and Statistics 52 (2015).

SCIENCE AND TECHNOLOGY 762
IGCESH2018
Universiti Teknologi Malaysia, Johor Bahru, Malaysia 13 -15 August 2018
EMERGENCY RESPONSE TIME IN MALAYSIA: ASSESSMENT AND
EFFECTIVENESS IN LANDSLIDE DISASTER
Mohamad Fazli Sardi1 and Khamarrul Azahari Razak1,2
1 UTM RAZAK School of Engineering and Advanced Technology,
University Teknologi Malaysia (UTM) Kuala Lumpur, MALAYSIA. 2 Disaster Preparedness and Prevention Center, Malaysia-Japan International Institute of Technology
(MJIIT), University Teknologi Malaysia (UTM) Kuala Lumpur, MALAYSIA.
(E-mail: [email protected], [email protected])
ABSTRACT
The number of landslide disaster is increasing in Malaysia and its impact is very significant
to livelihoods, socio-economic, physical and environment assets of people and businesses.
Historically, as recorded by Malaysia Public Work Department, a total of 440 landslides in
Malaysia for the period 1973 to 2007, while more landslides are not properly reported and
recorded. Emergency Response Planning (ERP) with right decision at the ‘initial stage’ of an
emergency plays a major role in reducing disaster impact. Response from the rescue team is
varied subjected to causes, hill-slope geomorphological processes and characteristics of each
landslide. Many ERP elements should be considered, e.g. data on specialized equipment and
organizations must be updated. This paper provides a better insight into the effective
emergency response preparedness in Malaysia. It also investigates the level of preparedness
of the rescue team and the community in the landslide prone area. Analysis of time series for
emergency response based on the Malaysia Civil Defence Force (MCDF) experienced
recorded of the classical and recent landslide in Hulu Kelang Selangor. The landslide was
caused by multiple internal and external factors, which mainly induced by inadequate design
of retaining structures and slopes. So far, 28 historical landslides were reported in the Hulu
Kelang area from 1990 to 2011 with 21 cases were triggered by rainfall. The results are
promising with respect to emergency response time and its effectiveness. This study also
addresses the issues and challenges of disaster preparedness and awareness carried out by
relevant stakeholders related to landslide emergency response. As a conclusion, this study
shows effectiveness emergency response preparedness is crucial for supporting an effective
early warning system coupled with enhanced public awareness and preparedness with
structured training programs.
Key words: Landslide, response time, ERT, emergency, civil defence
INTRODUCTION
Rapid development of urban area has increased the exposure and vulnerability which made
the appropriate slope failure preventive measures are quite challenging [1]. The landslides in
Hulu Kelang area have been intensively studied by previous researchers [2], [3] and [4]. Low
and Ali [5] has reported that a total of 28 historical landslide events in the Hulu Kelang area
from 1990 to 2011; of which, 21 cases have been identified as potentially triggered by

SCIENCE AND TECHNOLOGY 763
rainfall. This study has supported the Priority 4 of Sendai Framework for Disaster Risk
Reduction 2015-2030 [6] on enhancing the preparedness for effective response. It is also in
line with the National Slope Master Plan 2009-2023 (revised in 2016) [7].
RESULTS
Performance of MCDF Emergency Response Time (ERT) was measured by the achievement
of Key Performance Index (KPI) [8]. This study aims at providing better insight into the
effectiveness of the emergency response time by the MCDF in the Hulu Klang, Selangor. The
samples were taken as follows:- (i) classical incident: Highland Tower on December 11,
1993; and (ii) incident in Bukit Antarabangsa dated on December 6, 2008. These samples
were selected based on their unique variables that have similarities such as geographical area,
rainfall and monsoon season. In 2011, KPI of ERT set to 100%: ‘reached the scene not more
than 10 minutes for a distance of 10 kilometers from the Malaysia Emergency Response
System (MERS) 999 Operations Control Center (OCC)’. Yet according to statistics obtained
in 2011 indicated that the performance was reported at the level of 63 % which failed to reach
the target of 100%. KPI of ERT setting is too high and thus, not achieved the target. Later,
the new KPI ERT was set to 30 minutes for 2012. This option is based on the observation of
random achievements from the previous year. The statistics in 2012 has shown a significant
increase in the achievement of KPI ERT up to 87%, but still not achieved 100%.
Figure 1. Deployments of MCDF Personnel and Equipment
Figure 1 shows a response curve and the time lag between cases 1 and 2. The maximum
numbers of MCDF responders was 111 (∑ HR1) for Case 1 on Day 3; and 137 (∑ HR2) for
Case 2 on Day 2. Meanwhile the maximum numbers of MCDF equipment was 10 (∑E1): on
Day 5; and 15 (∑E2): on Day 3 for each case, respectively. It means, 72 hours response time
for MCDF personals reached their maximum numbers for Case 1, while only 48 hours
response time for Case 2. Deployment of response time for MCDF equipments was 120 and
72 hours for each case, respectively. It clearly showed a decrease response time by 34% for
deployment of personals and 41% for deployment of equipments.
Numbers of Days
Per
cen
tage
(%
)
ResponseHR1 & E2
ResponseE1
ResponseHR2
ERT
HR E
34% 41%

SCIENCE AND TECHNOLOGY 764
CONCLUSION
This study investigates the effectiveness of emergency response time for responders based on
some cases of landslides in Malaysia. Below are some recommendations for better
emergency response planning:-
• Implementing an appropriate standard operating procedure (SOP) and Emergency
Response Planning (ERP) will greatly enhance the following response activities: (i)
save lives and prevent injuries; (ii) minimize damage to property; (iii) effective
command and control; (iv) rapid systematic response; (v) quick return to normalcy;
and (vi) statutory requirement.
• Highlighting a Special Disaster and Emergency Response Team (SPIDER Team)
under Malaysia Civil Defence Force as one of the main rescue teams in any rescue
operations such as landslides, building collapses and other; and
• Empowering local community (e.g. residents and community leaders) in all activities
regarding to community preparedness is important to achieve high level of awareness
and readiness for any landslide disaster or emergency.
As a conclusion, this study demonstrates the assessment of response time and level of
preparedness for emergency response. This study provides a good input in designing an
effective early warning system. Also enhanced public awareness and structured training
programs for disaster preparedness are substantially required.
REFERENCES
1. Murakmi, S., et al. Development of historical landslide database in Peninsular Malaysia. in
Telecommunication Technologies (ISTT), 2014 IEEE 2nd International Symposium on. 2014. IEEE.
2. Sew, I.D.G.S. and I.T.Y. Chin, Landslides: Case Histories, Lessons Learned And Mitigation Measures.
Landslide, Sinkhole, Structure Failure: MYTH or SCIENCE, 2006.
3. Samah, F.A., Paper 10: Landslides in the Hillside Development in the Hulu Klang, Klang Valley Post-
Graduate Seminar Semester, 2007. Volume 2.
4. Mariappan, S., et al., Remedial Measures Adopted for Slope Failure at Bukit Antarabangsa, Malaysia.
Enecal Consultants Sdn Bhd, Jabatan Kerja Raya, Mohd Asbi & Associates, Kuala Lumpur, Malaysia, 2011.
5. Huat, L.T., F. Ali, and A.S. Ibrahim, An investigation on one of the rainfall-induced landslides in Malaysia.
Electronic Journal of Geotechnical Engineering, 2012. 17: p. 435-449. UNISDR, Sendai Framework for Disaster Risk Reduction 2015-2030. 2015: p. 32.
6. PWD, Review of The National Slope Master Plan 2016, Cawangan Kejuruteraan Cerun, Jabatan Kerja
Raya Malaysia. 2017. Second Issue 2016.
7. Sardi, M.F., Kajian Pencapaian Prestasi Pasukan Kecemasan JPAM Terhadap Penetapan Petunjuk Prestasi
Utama (KPI) Ambulance Emergency Response Time (AERT), Institut Tadbir Awam (INTAN) Bukit Kiara.
2012.

SCIENCE AND TECHNOLOGY 765
IGCESH2018
Universiti Teknologi Malaysia, Johor Bahru, Malaysia 13 -15 August 2018
RURAL COMMUNITY ECONOMIC EMPOWERMENT THROUGH
TOURISM BUSINESS PARTNERSHIP: CASE STUDY OF SUKAU,
SABAH
Nur Fatimah Abdul Rahman*1 and Norhazliza Abdul Halim2
1, 2 Fakulti Alam Bina, Universiti Teknologi Malaysia, Johor Bahru, MALAYSIA.
(E-mail: [email protected], [email protected])
ABSTRACT
Economic empowerment approach have a wide dispersal of benefits and contribute towards
rejuvenating the rural area especially through tourism business partnership local and private
sectors. The challenges facing tourism businesses in rural areas have long been recognised,
especially the lack of commercial viability For many years, the proactive partnership between
the public and private sectors together with local communities was a favoured method of
addressing the challenges faced by small-scale tourism businesses in a highly competitive
market. However the equitable distribution of economic benefits from such partnerships have
not materialised and local communities were often marginalised rather than empowered. The
root of problem in Sukau, Sabah is the local communities did not receive beneficial from the
existing tourism facilities from the tourism operators even though Sukau have been received
many tourist due to the uniqueness of Kinabatangan Wildlife Sanctuary. Hence, this paper
discusses the concept of economic empowerment for the local communities, the beneficial
business partnership between the local communities and private sectors as well as the
challenges facing to sustain the business partnership in tourism.
Key words: Community Empowerment, Economic, Business Partnership
INTRODUCTION
Empowerment has attracted the interest of those writing on tourism development.
Empowerment also can be viewed as either a precursor to, or as both a cause and effect of
community participation in tourism development [1]. The concept of empowerment has been
a mainstay of alternative development approaches, especially in the tourism sector. In the
context of tourism, empowerment refers to a process of enabling local communities to obtain
the authority to gather resources to meet their needs, make decisions, and take action and to
achieve social justice [2]. The concept is supported by tourism developers who inspire to a
bottom-up and participatory approach for development and those who are concerned about
the western conduct of development that has been destroying resources and values [5].
Economic empowerment approach have a wide dispersal of benefits and contribute towards
rejuvenating the rural area especially through tourism business partnership local and private
sectors.
The challenges facing tourism businesses in rural areas have long been recognised, especially
the lack of commercial viability [8; 6]. For many years, the proactive partnership between the

SCIENCE AND TECHNOLOGY 766
public and private sectors together with local communities was a favoured method of
addressing the challenges faced by small-scale tourism businesses in a highly competitive
market [3]. However the equitable distribution of economic benefits from such partnerships
have not materialised and local communities were often marginalised rather than empowered.
As tourism business come into the rural area, the communities did not receive beneficial
from the existing tourism facilities from the tourism operators even though Sukau have
been received many tourist due to the uniqueness of Kinabatangan Wildlife Sanctuary.
MAIN RESULTS
Economic empowerment as a process community live are transformed from a situation
where they have limited power and access to economic assets to a situation where they
experience economic advancement and their power and agency is enhanced in the
following areas [7]. Based on the definition it can be summarize, economic empowerment
are (1) The knowledge, individual capabilities (e.g. business skills or financial literacy),
sense of entitlement (understanding and recognition of their own subordination and their
own sense of rights), self-esteem, and self-belief to make changes in their lives, including
learning skills to get a job or start an enterprise (power within). (2) Economic decision-
making power within their community, and local economy (including markets) not just in
areas that are traditionally regarded as women’s realm but extending to areas that are
traditionally regarded as men’s realm (power to). (3) Access to and control over financial,
physical and knowledge-based assets, including access to employment and income-
generation activities (power over). (4) The ability to organize with others to enhance
economic activity and rights cooperatives, unions, group-based financial services,
marketing and learning opportunities (power with). Mode of community empowerment
with the partnership carried out through public institutions (business and non-business).
Such empowerment model consists of two types. First, the groups from community
develop their own partnerships with tourism businesses. Second, groups/organizations
and the community do partnerships under the coordination and mediated by village owned
enterprises [4].
CONCLUSION
The outcome of tis research aims to create a more efficient tourism environment for all
stakeholders through the business partnership which could benefit their economic capacities.
The development of community economic empowerment will be formulated using both
quantitative and qualitative methods. Approaches such as ‘Local Communities Readiness and
Willingness’ will be used in order to investigate the current tourism climate in the
Kinabatangan River región. Towards this end, having a better understanding of the
community economic empowermentprocess will help tourism planners in identifying gaps
and recommend the appropriate interventions.
REFERENCES
1. D.D. Perkins, B.B. Brown & R.B. Taylor. The ecology of empowerment: Predicting participation in
community organizations. Journal of Social Issue, 52,1, 85 (1996).
2. D.J. Timothy. Empowerment and stakeholder participation in tourism destination communities. In: A.
Church and T. Cole (Ed.) Tourism, Power and Space, London and New York: Routledge, 199-216 (2007).
3. Middleton, V.T..C. with Clarke, J. (2001) Marketing in Travel and Tourism (3rd edition). Oxford:
Butterworth Heinemann

SCIENCE AND TECHNOLOGY 767
4. Pradono P., Faisal B., Adriani Y., Rikeu R. & Fajriasanti R. Towards Model of Community Economic
Empowerment through Tourism Activities in Bogor Regency, West Java, Indonesia. International Journal of
Economics and Financial Issues, 2016, 6(S6) 46-49 (2016).
5. R. Scheyvens. Tourism for development: empowering communities, Essex, England, Pearson Education
Limited (2002). 6. Sharpley, R. Managing the countryside for tourism: a governance perspective. In L. Pender & R. Sharpley,
the Management of Tourism (pp. 175-187). New Delhi: SAGE Publications Ltd. (2005).
7. Vene Klasen, L. and Miller, V., 2002, ‘A New Weave of Power, People and Politics: The Action Guide for
Advocacy and Citizen Participation’, Practical Action Publishing.
8. Wilson, S. Fesenmaier, D. Fesenmaier, J. & Van Es, J. Factors for Success In Rural Tourism Development.
Journal of Travel Research, Vol. 40(2), 132-138. (2001).

SCIENCE AND TECHNOLOGY 768
IGCESH2018
Universiti Teknologi Malaysia, Johor Bahru, Malaysia 13 -15 August 2018
APPLICATION AND ADAPTATION OF SEDIMENT
FINGERPRINTING APPROACH IN ASIAN COUNTRIES: A REVIEW
Sugumaran, D1, Annammala, K.V1, 2*, Yusoff, A.R.M3, Yusop, Z1, 2, Mohammad and
N.A1, Nainar, A4
1 Department of Water and Environmental Engineering, Universiti Teknologi Malaysia, Johor Bahru,
Malaysia
(E-mail:[email protected], *[email protected]) 2 Centre for Environmental Sustainability and Water Security (IPASA), Faculty of Civil Engineering,
University Technology Malaysia (UTM) (Johor Bahru, 81310, Malaysia) 3 Ibnu Sina Institute for Scientific & Industrial Research, Universiti Teknologi Malaysia, Johor Bahru,
Malaysia 4 The University of Tokyo Forests, The University of Tokyo, Japan
ABSTRACT
Asia is the continent with highest sediment supply in the world, which results in adverse
impact to the ecosystem. Amongst the regions in this continent, Southeast Asia has recorded
as one of the highest sediment yield region due to human activities on land uses. Considering
to this sedimentation issues, sediment source fingerprinting approach has created an interest
among the researchers in tracing and estimating the sediment source contribution to the
environment, as it needed in soil conservation planning and watershed management. This
review identifies the percentage of sediment fingerprinting approaches that have applied in
this continent as based on regions. Besides, it also discusses on the common tracers that
regularly used in Asian countries in distinguishing the source of sediments. Moreover, it also
highlights the problems faced and conditions that requisites in applying this method in
tropical Asian countries
Keywords: Sedimentation, sediment fingerprinting, environmental tracers
INTRODUCTION
The transport and deposition of the sediments through the erosion process may result to a
detrimental impact to the ecosystem. This creates concern towards food security, human
health, regional climate, desertification, and environmental quality [1-4]. Among the many
sedimentation problems, environmental impact has become a serious issue in many different
spatial and temporal scales in Asian countries [5]. Thus, many recent research studies on
sedimentation was more focused in sediment source fingerprinting towards ecological and
conservational issues in determining the sediment source provenance and estimating its
relative proportion for a proper mitigation procedure. To best of our knowledge, there were
no literature reviews that have been published (until January 2018) focusing on the sediment
fingerprinting approaches specifically to Asia only. This paper reviews approximately 250
peer reviewed journal articles and of which 40% of the papers are to be of direct relevance to
Asian countries. These compilations includes the most recent studies on sediment
fingerprinting approach from the year of 2010 until 2018 and generally discuss on the

SCIENCE AND TECHNOLOGY 769
common tracer approaches that have applied in the Asia continent countries. Highlighting the
problems faced and key messages that will be helpful for ongoing and future researchers in
the region.
MAIN RESULTS
SEDIMENT SOURCE FINGERPRINTING APPROACH
Sediment source fingerprinting is an approach used to address the potential source/
sources of sediments and its contribution to any catchments or landscape using the
suitable fingerprinting properties and statistical model. Moreover, it also used in
understanding the historical process of sediment for past years. In sediment fingerprinting
studies, tracer selection is an important subject for identification and discrimination of the
potential sediment source. Mostly, fingerprinting studies are conducted according to
following steps: (1) sample collection and processing of the potential sediment source, (2)
chemical analysis for tracer selections and (3) application of suitable mixing model for
results analysis. The Figure 1 below indicates the percentage of sediment source
fingerprinting studies had conducted in Asian countries created based on the published
articles as mentioned above.
Figure 1. Percentage of sediment fingerprinting in Asia continent
SEDIMENT FINGERPRINTING INDICATORS
Sediment fingerprinting technology relies upon identifying significant differences in the
tracer properties from various sediment sources. The properties that can be used to
discriminate sources includes: (i) fallout radionuclides (137Cs, 7Be and 210Pbex) which
enable discrimination of surface, subsurface and cultivated sources, (ii) major and minor
element geochemistry, which is related to geological substrate but also modified by soil
formation processes and weathering and hence has potential to discriminate land-use, (iii)
mineral magnetic properties, which are sensitive to soil formation processes and
RUSSIA
TURKEY
IRAN
JORDAN
JAPAN
INDIA
NEPAL
BANGLADESH
CHINA
KYRZYSTAN
THAILAND LAOS
SOUTH KOREA
TAIWAN
INDONESIA
MALAYSIA >20 % 16-20 % 11-15 % 5-10 % 1-4 %

SCIENCE AND TECHNOLOGY 770
pollution, and (iv) contaminants from industrial or other anthropogenic activities e.g.
heavy metals.
Dating elements such as carbon, uranium and fallout radionuclides are common tracers
applied in Asia regions in understanding the sedimentation process. Among those tracers,
fallout radionuclides are widely employed in fingerprinting studies due to abundance on
the Earth surface, sufficient long half-life and ability to quantify the sediment origin
throughout the flood. These tracers are also very useful in discriminating between the
surface and subsurface material and in distinct between the cultivated and uncultivated
land [6-8]. The most frequent fallout radionuclide used are Pb-210, Cs-137and Be-7 [6].
Geochemical properties that includes rare earth metal, trace metal and heavy metals are
often used tracers in sediment fingerprinting studies. These tracers are selected for its
geochemical analysis due to its inexpensive cost, fast response and widely available
analytical instrumental techniques to produce essential information on different elements
composition in identifying and discriminating the sediment sources [9]. Besides, total
carbon, nitrogen and phosphorus are the elements that considered as organic properties. In
majority of the studies, total organic carbon and nitrogen were used as a parameter for
discriminating between organic matter of terrestrial and matter source, soil deposition
index and as indicator for determining the soil quality, fertility and productivity [10].
Moreover, magnetic properties and biomarkers also can be used as tracers in
fingerprinting studies. Soil magnetic properties has been applied in understanding the
sediment provenance in past and current decades [11] that resulting from rock weathering
and soil erosion. Countries such as China and Iran are often uses this property as one of
its parameter in sediment fingerprinting studies. Besides, biomarkers such as polycycl ic
aromatic hydrocarbon (PAH) are widely being used in fingerprinting studies particularly
for discovering the petroleum and different combustion sources. This frequently used in
determining the source of environmental pollution from oil spills [12].
CONCLUSION
Southeast Asia have highlighted as the highest sediment yield region in Asia continent
[13]. Nevertheless, the percentage of fingerprinting studies in this tropic region still
comparatively lower as compared to other part of Asia countries. The sed iment studies’
techniques using tracers did not verify our observations of substantial erosion and land
degradation in the upper catchment. However, it might cause of sediment flushing through
the dredged channels. Consequently, it is recommended to combine such methods with
sediment budgeting approaches to obtain results that are more reliable. Thus, more sediment
fingerprinting studies focusing to this region are required in order to take proper
mitigation procedure to minimize the sedimentation issues. Besides, this review also has
discussed on commonly used tracer properties in sediment fingerprinting studies. Among
those tracers, geochemical, chronology and organic properties are widely applied in
identification of the potential source of sediment and understanding the sedimentation
historical pattern.
Acknowledgment: The authors would like to thank Rasmussan Foundation for funding of
this research (Project Vot: 4B243) and Universiti Teknologi Malaysia for Zamalah
Scholarship.

SCIENCE AND TECHNOLOGY 771
REFERENCES
1. Goudie, A.S., & Middleton, N.J. Desert dust in the global system. Springer Science & Business Media.
(2006), 47-55.
2. Field, J.P., Belnap, J., Breshears, D.D., Neff, J.C., Okin, G.S., Whicker, J.J., Painter, T.H., Ravi, S., Reheis, M.C., & Reynolds, R.L. The ecology of dust. Frontiers in Ecology and the Environment, 8(8)
(2010), 423-430.
3. Ravi, S., D'odorico, P., Breshears, D.D., Field, J.P., Goudie, A.S., Huxman, T.E., Li, J., Okin, G.S., Swap,
R.J., Thomas, A.D., Van Pelt, S., Whicker, J.J., & Zobeck, T.M. Aeolian processes and the biosphere.
Reviews of Geophysics, 49(3) (2011).
4. Middleton, N.J. Desert dust hazards: A global review. Aeolian Research, 24 (2017), 53-63.
5. Dedkov, A.P., & Gusarov, A.V. Suspended sediment yield from continents into the World Ocean: spatial
and temporal changeability. Sediment Dynamics and the Morphology of Fluvial Systems. IAHS Publication,
396 (2006), 3-12.
6. Haddadchi, A., Ryder, D.S., Evrard, O., & Olley, J. Sediment fingerprinting in fluvial systems: review of
tracers, sediment sources and mixing models. International Journal of Sediment Research, 28(4) (2013),
560-578. 7. Huon, S., Evrard, O., Gourdin, E., Lefèvre, I., Bariac, T., Reyss, J.L., Des Tureaux, T.H.,
Sengtaheuanghoung, O., Ayrault, S., & Ribolzi, O. Suspended sediment source and propagation during
monsoon events across nested sub-catchments with contrasted land uses in Laos. Journal of Hydrology:
Regional Studies, 9 (2017), 69-84.
8. Gourdin, E., Evrard, O., Huon, S., Lefevre, I., Ribolzi, O, Reyss, J.L., Sengtaheuanghoung, O., Ayrault, S.
Suspended sediment dynamics in a Southeast Asian mountainous catchment: combining river monitoring
and fallout radionuclide tracers. Journal of Hydrology, 519 (2014), 1811-1823.
9. Koiter, A.J., Owens, P. N., Petticrew, E.L., & Lobb, D.A. The behavioural characteristics of sediment
properties and their implications for sediment fingerprinting as an approach for identifying sediment sources
in river basins. Earth-Science Reviews, 125 (2013), 24-42.
10. Miller, J. R., Mackin, G., & Miller, S.M. O. (2015). Geochemical Fingerprinting. Application of geochemical tracers to fluvial sediment. Springer, 2015, 11-51.
11. Avramidis, P., Nikolaou, K., & Bekiari, V. Total organic carbon and total nitrogen in sediments and soils: a
comparison of the wet oxidation–titration method with the combustion-infrared method. Agriculture and
Agricultural Science Procedia, 4 (2015), 425-430.
12. Wang, Z., Yang, C., Yang, Z., Brown, C.E., Hollebone, B.P., & Stout, S A. Petroleum biomarker
fingerprinting for oil spill characterization and source identification. In Standard Handbook Oil Spill
Environmental Forensics, 2 (2016), 131-254.
13. Wang, H., Saito, Y., Zhang, Y., Bi, N., Sun, X., & Yang, Z. Recent changes of sediment flux to the western
Pacific Ocean from major rivers in East and Southeast Asia. Earth-Science Reviews, 108(1-2) (2011), 80-
100.

SCIENCE AND TECHNOLOGY 772
IGCESH2018
Universiti Teknologi Malaysia, Johor Bahru, Malaysia 13 -15 August 2018
THE EFFECT OF MACROECONOMIC FACTORS ON THE
EXCESSIVE RETURNS OF ASIAN REITS
V. Elsa*1, R. Muhammad2, O. Mustafa3 and M. Hishamuddin4
Department of Real Estate, Faculty of Geoinformation and Real Estate, Universiti Teknologi
Malaysia, Johor Bahru, MALAYSIA.
(E-mail: [email protected], [email protected], [email protected] [email protected])
ABSTRACT
Asian REITs could be considered as one of the fastest growing assets in the world. Japan is
currently the biggest market in Asia and Asian REITs market is very much progressing to
expand with the emerging of two major regional economies, China and India. Previous
studies have proved that Asian REITs is able to show competitive advantage in most of
mixed-asset scenarios and have significant roles in improving efficient global REITs
portfolio returns. Similar with other type of portfolio investment, REITs also have high
interaction with macroeconomics factor such as inflation and interest rate. The financial
crises event also will give significant effect to the return of REITs. Previous findings have
shown that REITs is able to give remarkable return compare to other asset classes. Hence, the
aim of this research is to assess the situation on excessive returns of Asian REITs and the
impact from the macroeconomic factors to the Asian REITs’ return. The seven Asian
countries that will be analysed are Japan, South Korea, Singapore, Hong Kong, Taiwan,
Thailand and Malaysia. The data will be retrieved from the literature review and Datastream
from year 2000 to 2017. Factor Asset Pricing Model, Principal Component Analysis, Garch
(1,1) Model and Generalised Method of Moments techniques will be used to analyse the data.
This research is expected to find relationship between the macroeconomic factors and
excessive returns of Asian REITs.
Key words: Macroeconomic, REITs, Asian, Return Excessive
INTRODUCTION
Real Estate Investment Trusts (REITs) is a type of security that allows investors to access and
participate in trading in the immovable property market on major exchanges without having
to trade in physical assets. They can invest indirectly through companies which have assets
and income related to real estate investment, and is qualified as a REIT. The types real estate
include residential, industrial, retail, office, hospitality, logistics and any income generating
property. Real estate also offers a stable investment return and is a good hedge against
inflation. Unlike other listed real estate firms which commonly resell their real estate assets
post-development, REITs acquire and/or develop real estate with the objective of operating
them as part their investment portfolio [4]. From the beginning of US REITs in 1960, REITs
have expanded widely all over the world including Asia Pacific in the late 1980s and now
Asian REITs has become the second largest REIT market globally.

SCIENCE AND TECHNOLOGY 773
REITs have become a key component of the listed real estate markets, reaching a total market
capitalisation of USD 1.3 trillion in June 2017, which represents 41% of the global listed real
estate industry [3]. In recent years, investors are shifting towards Asian REITs and it is
experiencing a boom which is currently lead by Japan being the biggest Asian REITs market.
It is the fastest growing market in the world and has overtaken France and UK. It is also
expected to expand with the emerging of two major regional economies, China and India.
Since 2005, the average total returns in emerging markets have been higher than developed
markets (9.20% vs 6.74%) and more recently (7.80% vs 4.63%) over the past three years, and
28.40% vs 0.84% over the past year. The high returns have been confined almost exclusively
to emerging markets in the Asia Pacific region while emerging markets in Europe and the
Americas have posted negative returns [6]. The rapid growth of Asian property market can
provide opportunities for these global property securities fund to diversify their portfolio
geographically and enjoy the higher return. According to Yue (2011), Asian REITs
performed better than other key REIT markets in most of mixed-REITs scenarios, and saw
their significant roles in improving efficient global REITs portfolio returns [9]. In 2014, Asia
accounted for USD 7 trillion in investable real estate which was approximately 25% of the
global market. By 2020, this is expected to grow significantly to USD 17 trillion and be 35%
of the global market [7].
According to Richard Price, a CBRE Global Investor, the growth opportunities in Asia are
unique relative to almost all Western countries. This is because Asian REITs offer attractive
investment features and benefits including liquidity, diversification, high dividend yields, tax
transparency, strong corporate governance, high quality profesional real estate managers, low
management fees, low debt levels as well as unique features like Islamic REITs in Malaysia.
The real economy and its business cycles has been the subject of investigation of studies
trying to understand the factors that drive REITs returns. The performance of REITs are
measured by the returns and it is influenced by many factors mainly macroeconomic factors
such as long term interest rates, short term interest rates, inflation, gross domestic product,
construction index, production growth, exchange rates and consumption risk. Macroeconomic
studies the performance and behaviour of economy by analyzing the factors that influences
the REITs returns. Companies can use these factors and create a model to help them
strategized their investment.
This research seeks to identify whether Asian REITs is a promising investment vehicle for
global investors, which Asian country is most ideal for REITs investment and what
macroeconomic factors should be considered for maximum excessive returns. It is in the light
of the above that this research seeks to examine the excessive returns of Asian REITs in
macroeconomic factors.
EXPECTED RESULTS
This research is expected to find the macroeconomic factors that affect the excessive REITs
returns to build up literature knowledge on the REITs market from the Asian and Malaysian
market point of view. This research is also expected to discover the relationship between the
macroeconomic factors and excessive returns of Asian REITs. Based on the previous researches,
a positive relationship may be found between the variables [2][8]. Some macroeconomic factors
may have a higher significant relationship and higher correlation with the excessive returns
compared to other factors [1][5][8]. It is also expected to see how the macroeconomic factors
affect and determine the excessive returns. Furthermore, the investigation on the excess returns

SCIENCE AND TECHNOLOGY 774
rather than the nominal returns will provide information for an added value to the REITs
portfolio.
CONCLUSION
The main driver of this research is to evaluate the excessive returns of Asian REITs that is
affected by the macroeconomic factors. Asia is a large market and good investment
opportunity for investors. Therefore, this research will be useful for international investors to
better understand the potential portfolio returns of investing in the Asian REITs market and
help them choose which Asian country they should invest based on the current
macroeconomic factors. Lastly, this research will enhance knowledge of the Asian REITs and
its excessive returns and provide more information especially on the REITs market in order to
enhance the performance of REITs in Malaysia in the future years.
Acknowledgment: I thank the IGCESH organizers and my fellow authors who contributed
their effort, ideas, knowledge and expertise. I also thank UTM Zamalah for sponsorship to
help support my studies. This paper is part of Research University Grant (RUG) funded by
Universiti Teknologi Malaysia Vot No.19H67.
REFERENCES
1. Brooks, C. & Tsolacos, S. Linkages between Property Asset Returns and Interest Rates: Evidence for the
UK. Article in Applied Economics 33(2001), 711-719.
2. Conner, P. & Liang, Y. The Complex Interaction between Real Estate Cap Rates and Interest Rates. Article
in Briefings in Real Estate Finance 4 (2005), 185 – 197.
3. European Public Real Estate Association (EPRA) Global REIT Survey, 2017.
4. Kola, K. & Kodongo, O. Macroeconomic Risks and REITs Returns: A Comparative Analysis. Article in
Research in International Business and Finance 42 (2017), 1228-1243
5. Liow, H.K., Ibrahim, M.F. & Huang, Q. Macroeconomic Risk Influences on the Property Stock Market.
Journal of Property Investment and Finance 24 (2006), 295-323.
6. Mohamad, N.E. & Zolkifli, I.A. The Determinant Factors of Real Estate Investment Trust (REIT)'s Performance: Evidence from Asian REITs. Indonesian Capital Market Review. Journal of Finance and
Economics 6 (2014).
7. Newell, G. Asia Pacific Real Estate Association- APREA, 2012.
8. West, T. & Worthington, A.C. Macroeconomic Risk Factors in Australian Commercial Real Estate, Listed
Property Trust and Property Sector Stock Returns: A Comparative Analysis Using GARCH-M. Asian
Finance Association Annual Conference (2006), 1-18.
9. Yue, W. The Development of Real Estate Investment Trusts in Asia. University of Western Sydney, MRes.
Thesis, 2011.

SCIENCE AND TECHNOLOGY 775
IGCESH2018
Universiti Teknologi Malaysia, Johor Bahru, Malaysia 13-15 August 2018
LOCAL HYPERTHERMIA AT 43OC REDUCED TUMOR
PROGRESSION IN EMT6 MURINE BREAST CANCER MODEL
W.F.A. Wan Mohd Zawawi*1, M.I. Salim2, K. Jemon3
1 Department of Biosciences and Health Sciences, Faculty of Biosciences and Medical Engineering,
Universiti Teknologi Malaysia, 81310, Johor, Malaysia
(E-mail: [email protected]) 2 Department of Clinical Sciences, Faculty of Biosciences and Medical Engineering, Universiti
Teknologi Malaysia, 81310, Johor, Malaysia
(Email: [email protected]) 3 Cancer and Infectious Diseases Group, Health and Wellness Research Alliance, Universiti Teknologi
Malaysia, 81310, Johor, Malaysia
(Email: [email protected])
ABSTRACT
Local hyperthermia treatment has been used on solid tumor and has diverse heating approach.
The temperature of treatment could be as high 80oC (thermal ablation), or as low as fever
range temperature, 39-45oC. Hyperthermia is thought to directly kill the cells either by
inducing apoptosis or necrosis as well as by activating the immune cells. However, different
temperature, duration and frequency of treatment would give different therapeutic effects on
various cancer types. Relevant to this, local hyperthermia treatment optimization was
conducted prior choosing the best approach for heat induction in EMT6 tumor. Mice were
inoculated with 5 × 10⁵ EMT6 breast cancer cells on the right flank subcutaneously. Tumor
progression was monitored and measured thereafter by using digital caliper. On day 7 post-
inoculation, tumor of about 30 mm2 size were heated at 41oC and 43oC (±0.5oC) for 30
minutes by means of infrared radiation. The present study shows that local hyperthermia at
43oC slower tumor progression and prolonged the survival rate. Additionally, multiple
treatment further reduced the tumor growth in tumor-bearing mice. Keywords: Local hyperthermia, Tumor progression, Survival rate
INTRODUCTION
Hyperthermia has been widely demonstrated in many preclinical and clinical trials as a non-
invasive cancer treatment strategy. The fundamental of local hyperthermia is the induction of
heat by increasing the specific tumor region to a certain temperature, at which this elevated
temperature could weaken or kill the cancer cells as well as activating the immune system.
Hyperthermia is selective to cancerous cells thus causes no harm on normal cells since they
can maintain a normal body temperature [1]. Fever-range or mild temperature; 39oC – 41oC
and moderate hyperthermia; 41oC – 45oC have different effects in killing the tumor cells in
which both of these temperature range were chosen for current clinical practice since they are
readily attainable and tolerated [2].
However, the consistency of preferred temperature range and temperature doses towards

SCIENCE AND TECHNOLOGY 776
killing various types of cancer cells are remains controversial . This reflects that the anti
tumor efficacy is sensitive to small temperature difference and the effect is varied among
cancer types [3]. Therefore, present works focus on the optimization of local hyperthermia
treatment in EMT6 murine breast cancer model. The parameters involved were temperature
and frequency of the treatment to determine the optimum treatment conditions that could
slower the tumor progression and prolong the survival of tumor-bearing mice.
LOCAL HYPERTHERMIA TREATMENT OPTIMIZATION
Local hyperthermia at 43oC reduced tumor growth in tumor-bearing mice
The impact of heating tumor at 41oC and 43oC (±0.5oC) was tested by means of infrared
radiation (Hydrosun, Germany). Hyperthermia was applied for 30 min for both tested
temperature and the thermocouple that was inserted in the tumor center was used to
precisely monitor the temperature of the tumor. Tumor was heated locally so that the rest
of the body was not heated above normal body temperature.
Figure 1. Local hyperthermia at 43oC reduced tumor growth in tumour-bearing mice.
Line graph depicting the tumor growth in each group (top panel) and individual mice
(centre panel). Kaplan-Meier analysis showing the survival curve of mice (bottom panel)
A) 41oC treated mice (left panel). B) 43oC treated mice (right panel). **P<0.005 (student
t-test).
Results in Figure 1 shows that 30 min of local hyperthermia at 41oC produced no effect
on tumor growth at both once or twice of treatment. Meanwhile, tumor growth was
observed to be slower in 43oC treated mouse with significant decreased of tumor size by

SCIENCE AND TECHNOLOGY 777
30% in the group that was given treatment twice compared to untreated group. This result
indicates that 43oC is more efficient in slowering tumor progression compared to 41oC
and also prolonged the survival rate of mice (bottom panel).
Repeated heat induction at 43oC further reduce the tumour growth in tumor bearing
mice
To further confirm the performance of 43oC hypertermia treatment on EMT6 tumor
progression, mice were subjected to either 2X or 3X treatment every consecutive day.
Based on Figure 2 A, mice treated 3X demonstrated significantly slower tumor growth by
30% compared to 2X treatment and 40% compared to control. The survival of mice was
also prolonged as shown in Figure 2 C, with one mouse with completely disappeared
tumor after 12 days and lasts for more than 50 days thereafter. This indicates that this
three-times local hyperthermia treatment is sufficient in completely eradicating the tumor.
Figure 2. Repeated treatments at 43oC give better outcome in tumor reduction. A) Line
graph depicting the tumor growth for each group (2X, 3X and control). B) Tumor growth
for individual mice in each group. C) Percentage survival of tumor bearing-mice observed
over a period of 50 days after hyperthermia. ****P<0.0001 (student t-test).
CONCLUSION
Results to date indicate that local hyperthermia at 43oC for 30 min reduced tumor growth in
EMT6 murine breast cancer model and repeated treatment contributes to further reduction of
tumor progression.
Acknowledgement: This research was funded by the Ministry of Higher Education Malaysia
(FRGS grant no: 4F729). The author would like to thank Universiti Teknologi Malaysia for
awarding the Ainuddin Wahid Scholarship.
REFERENCES
1. Hegyi, G., Szigeti, G. P. & Szász, A. Hyperthermia versus Oncothermia: Cellular Effects in Complementary
Cancer Therapy. Evid. Based. Complement. Alternat. Med. 2013, (2013), 672873.
2. Dewhirst, M. W., Vujaskovic, Z., Jones, E. & Thrall, D. Re-setting the biologic rationale for thermal
therapy. 21, (2005), 779–790.
3. Toraya-Brown, S. & Fiering, S. Local tumour hyperthermia as immunotherapy for metastatic cancer. Int. J.
Hyperthermia 30, (2014), 531–9.

SCIENCE AND TECHNOLOGY 778
IGCESH2018
Universiti Teknologi Malaysia, Johor Bahru, Malaysia 13 -15 August 2018
ASSESSMENT OF THE INTERPOLATION TECHNIQUES TO
TRAFFIC NOISE POLLUTION MAPPING OF THE CAMPUS
TRENDING TOWARD THE ECO CAMPUS.
Parviz Ghojogh Najad *1, Anuar Ahmad
1 and Irina Safitri Zen
2
1Department of Remote Sensing, Faculty of Geoinformation and Real Estate, Universiti Teknologi
Malaysia, 81310 UTM Johor Bahru, Johor, Malaysia. (E-mail: [email protected], [email protected])
2Institute Sultan Iskandar (ISI), Department of Urban and Regional Planning, Faculty of Built Environment, Universiti Teknologi Malaysia, 81310 UTM Johor Bahru, Johor, Malaysia.
(E-mail: [email protected] )
ABSTRACT
Traffic noise covering nearly ⅔ of the total noise pollution in an urban region, this matter
must be considered seriously as they can have negative impact on the environment, the aim
of these of this study is to investigate the related issues and environmental impact of allowing
automobile driving in the campus and analysing the relationship between university campus
planning and traffic noise condition. for the objective of these study it has been planned to
use the measured noise pollution data for the UTM campus Johor Baharu, resulting data were
geostatistical analysed, with the comparison of different interpolation techniques to spatially
map noise levels at different location of the study area, where there are high noise levels that
exceed allowable noise limits, From finding of this research It is understood the volume of
traffic generated within campus are highly affected by the various activity based on land use
zoning & planning, and mostly high noise pollution recorded in bus stops and crowed areas
when it can be source of traffics also noise pollution ,the performance of two methods IDW
and Kriging was evaluated based on the magnitude and distribution of errors. with the help of
cross validation statistics and plots it’s showed that IDW creates better representation of
reality for measured Noise pollution levels, Noise map generated for practical applications it
can be useful to conduct regular assessments of the noise pollution in the study area.
Keyword: Ecomaps, Land use planning, Transportation, Traffic noise, Interpolation
INTRODUCTION
eco-campus means “environmental sustainability within the school”. It’s became common
goal and agenda to Universities worldwide to give favorable living and learning
environments for their peoples[4], UTM also one of the universities implemented many rules
and actions since 2010 to become sustainable campus which gives general guideline of
campus sustainability[2],one of the significant and powerful tool to make the sustainable
environment for any area particularly for campus area is physical development planning, it’s
forming and effecting Campus accessibility and connectivity since users need to have access
to universities utilities and amenities it’s make strong connection between transportation and
land use planning, the UTM main campus in Skudai, Johor where the study is conducted. was

SCIENCE AND TECHNOLOGY 779
classified as a combination of compact and dispersed development type. The compact inner
circle hence the Academic & Administration Zone in blue (Figure 1) consists of four
faculties, an administrative zone, mosque, library and main hall. to encourage pedestrianism
with easy accessibility and connectivity of the buildings at the initial development phase of
the campus. But Since, the UTM’s organization decided to construct new buildings the inner
circle known as the Knowledge Circle is surrounded by seventeen (17) hostels, ten (10)
faculties, staff residences, sports and recreational zones. Spatially when, UTM Leads to start
to make many new construction projects in the campus, red circle figure (2) but these new
constructions building not based on the Compaq development and easily accessible by foot,
bicycle, or public transit. [1]
_
Figure 1. (Arina ,2014) Figure 2. Harta Bina, UTM Skudai, 2017)
Its due to an increase vehicular traffic flow resulting from dispersed campus development
transportation demands in campus areas continue to increase rapidly It is shown in the table
(1) and (2) for year 2011 and
Table 1. Source:UTM Security Office, 2011 Table 2. Source: UTM Security Office, 2017
_
MAIN RESULTS
Secondary data of noise pollution for the 55 selected sites in the campus be recorded was
used, Longitude (y-coordinate) and latitude (x-coordinate) of the sampling sites were
determined using Garmin Global Positioning System (GPS) device. Noise pollutant
measurements and coordinates of locations were stored in excel format while the
shapefile of the present extent of the UTM campus is imported into the GIS environment
using ArcGIS 10.3 for quantification at unmeasured locations to understand how intense
the pollution is, ArcGIS Geostatistical Analyst allows us to create a statistically valid

SCIENCE AND TECHNOLOGY 780
prediction surface along with prediction uncertainties from a limited number of data
points[3] the present study aimed to evaluate accuracy of two interpolation methods
kriging and IDW for prediction of noise values in UTM campus. Each of the interpolation
methods create different noise maps based on the mathematics functions used.it shown in
Figure (3) to figure (4) and figure (5)
Figure 3. Figure 4. Figure 5.
Figure 6. Figure 7.
CONCLUSION
For these studies mostly, high noise pollution recorded in bus stops and crowed areas
when it can be source of traffics also noise pollution, the performance of two methods
IDW and Kriging was evaluated based on the magnitude and distribution of errors. with
the help of cross validation statistics and plots it’s showed that IDW creates better
representation of reality for the mean measured Noise pollution levels, figure 6 and
figure7Noise map for maximum noise recorded created with kriging they generated for
practical applications it can be useful to conduct regular assessments of the noise
pollution in the study area.
REFERENCES
1. Zen, I.S., Ahamad, R., Omar, W., 2014. The development and measurement of conducive campus
environment for Universiti Teknologi Malaysia (UTM) of campus sustainability. Jurnal Teknologi 68 (1).
2. Zen,I.S, and Masilah Bandil Rozana Zakariaidz Abdul LatifSaleh. "The UTM Sustainable Campus:
lnstitutionalize Sustainability,Workshop on Ul Greenmatric. Vol. 8.
3. Taghizadeh-Mehrjardi , Zare M, , Zare S, Mapping of noise pollution by different interpolation
4. methods in recovery section of Ghandi telecommunication Cables Company JOHE, Winter-spring 2013; 2
(1-2)
5. Gobinath Ravindran and R Nagendran (2010). Study on Need for Sustainable Development in
Educational Institutions, Journal of Urban and Environmental Engineering, 4(1). Pp. 29-36.

SCIENCE AND TECHNOLOGY 781
IGCESH2018
Universiti Teknologi Malaysia, Johor Bahru, Malaysia 13 -15 August 2018
SAFETY ASSESSMENT OF ION AND ENERGY DOSE RATE FOR
TRANSMISSION X-RAY CARGO SCANNING SYSTEM
N. Ramlee*1, I.H.Hashim2, Y.S.YAP3, A.A.Jasni4, N.A.Zawawi5, N.F.M.Fadzillah6,
A.K.Ismail7
1, 2 Physics Department, Universiti Teknologi Malaysia, Johor Bahru, Malaysia.
(E-mail: [email protected], [email protected]) 3 Physics Department, Universiti Teknologi Malaysia, Johor Bahru, Malaysia.
(E-mail: [email protected])
ABSTRACT
High energy x-ray is widely used in cargo inspection system to detect illicit materials at
countries border. Safety assessment should be the most concerned when cargo drivers need to
drive through the inspection area. This study perform safety assessment of ion dose and
energy dose produced by collimated low energy X-ray source up to 35 kV of anode voltage. 5
mm collimator result in larger ion dose rate than 2 mm collimator. This work, will discuss
which size of collimator is the most suitable for cargo scanning purpose to prevent large
amount of scattered beam receive by drivers during the procedure.
Key words: Collimator, Transmission X-ray, Energy spectrum
INTRODUCTION
Estimation of dose rate for radiation activities is vital for the safety assessment of radiation
facility. Dose received by driver during cargo scanning have been huge debate since some
scanning system employ high dose absorbed by the driver.
The aim of this research is to determine the effect of X-ray anode voltage towards ion and
energy dose rate when varied X-ray intensity beam is projected between parallel plate
capacitor region. This research also aim to determine the influence of collimator size upon
ion and energy dose rate using same parallel plate capacitor with 35 kV X-ray anode voltage
at 1mA.
High energy x-ray of cargo scanning is mainly focus on different attenuation coefficient of x-
ray corresponds to different materials through which it transmitted. Generally, the x-ray
intensity should be same in all the directions in vertical plane of the collimator. The estimated
x-ray attenuation upon various kinds of test object in the cargo yield clearer images. Thus the
scanned cargo requires a flattened pencil x-ray incident beam shape. Beam flattener is
necessary to produce uniform beam in vertical plane exiting the primary collimator. Further
experiments will be conducted after introducing a beam flattener of suitable material and
dimensions[3]. Further study of post collimator prototype are still in progress.

SCIENCE AND TECHNOLOGY 782
MAIN RESULTS
Safety assessment of driver dose rate have been simulated using capacitor plate and 35 kV X-
ray source. The purposed of the experiment is to calculate the ion dose rate produced by
different types of collimator used to filter the beam. Anode voltage of the x-ray source was
kept constant. Ionization current was plotted against varied capacitor voltage
Figure 1. Ionization current vs capacitor voltage of different size of collimator opening at
35KeV X-ray with anode voltage of 1mA.
Local Ion dose rate around parallel plate capacitor can be calculated using saturation value of
ionization current for each 2mm and 5mm collimator. The ion dose rate corresponds to
energy dose rate at the irradiated area which will tell the suitable size of collimator to be
introduced in the designed prototype of the primary collimator. Larger collimator delivers
more scattered beam than small collimator.
CONCLUSION
Safety assessment of driver dose rate have been simulated using capacitor plate and low
energy X-ray source of anode volatge up to 35 kV. Further experiment will be conducted
after introducing the prototype for the filter to get desired image of the test object.
Acknowledgment: Special thanks to UTM Zamalah Masters and School of Postgraduate
Studies UTM
REFERENCES
1. G. Jaenisch, S. Kolkoori, and C. Bellon, “Quantitative Simulation of Back Scatter X-ray Imag- ing and Comparison to Experiments,” pp. 1–11, 2016.
2. Y. Gil, Y. Oh, M. Cho, and W. Namkung, “Radiography simulation on single-shot dual-spectrum X-ray for
cargo inspection system,” Appl. Radiat. Isot., vol. 69, no. 2, pp. 389–393, 2011.
3. K. C. M. and L. M. G. Nishant Chaudhary, S. Acharya, Shiv Chandan, S. R. Ghodke, “Design, Development
And Characterization Of Primary Collimator For 6 MeV Electron Linac Based Cargo Scanner.”
0
10
20
30
40
50
60
70
80
90
100
0 100 200 300 400 500 600 700
Ic(n
A)
Uc (V)
Ionization current (Ic) vs anode voltage (Uc)
5mm
2mm

SCIENCE AND TECHNOLOGY 783
IGCESH2018
Universiti Teknologi Malaysia, Johor Bahru, Malaysia 13 -15 August 2018
EXTRACTION OF BROMELAIN FROM PINEAPPLE WASTE AND
PURIFICATION BY COLUMN CHROMATOGRAHY
Noor Khaleeda Arsad*1, Azman Abd Samad2, Wan Rosmiza Zana Wan Dagang3
and Haryati Jamaluddin4
1,2,3,4 Faculty Bioscience and Medical Engineering, University Technology Malaysia, Johor Bahru,
MALAYSIA.
(E-mail: [email protected], [email protected], [email protected],
ABSTRACT
Bromelain has potential and demand in worldwide applications especially in pharmaceutical
industries but commercial bromelain is very expensive due to high cost in extraction and
purification method. Pineapple wastes are proportionally increasing with the production of
pineapples concurrently. Pineapple waste not used in any production yet and has no
appropriate destinations. Waste disposal become growing problem as it usually prone to
microbial spoilage and serious environmental problems. Therefore, this study is to extract
bromelain in highest purified form from pineapple waste (crown and stem) from different
species in different cultivars at reduced cost. Furthermore, it is economically and
environmental friendly. Some studies have demonstrated that bromelain has potential in food,
cosmetic and pharmaceutical industries. Bromelain activity was determined by casein
digestion unit (CDU) and well diffusion method using skim milk and casein plate. Moris
shows the extremely high of bromelain activity in crown (11.852 ±0.555) U/ml while Yankee
shows the lowest bromelain activity in stem (0.580±0.091) U/ml. Crown has higher
bromelain content compared to stem. Bromelain also was tested with different protein
substrate such as fibrin to show the fibrinolytic activity. The purification method used is ion
exchange chromatography by using carboxymethy-cellulose (CMC), gel filtration, SDS-
PAGE and HPLC.
Key words: Bromelain, pineapple waste, purification
INTRODUCTION
Bromelain is a protease enzyme belonging to the cysteinepeptidase family that helps to
initiate proteolysis and pineapple is its main source. It has commercial value in the
pharmaceutical, textile, cosmetic, food and beverages and others. It helps to exfoliate,
rejuvenate the skin and act as cleansing agents (Costa et al., 2014). Besides that, it used as
meat tenderizing, in brewing and baking (Ketnawa et al., 2011). Meanwhile, leather and 2
textile industries used bromelain to soft the fibres and involve in detergent production. It also
helps in skin softening and detergent formulations. Pharmaceutical has a big potential which
contribute in dietry supplements, folk medicine and wound healer (Costa et al., 2014). In
clinical applications such as anti-inflammatory agents, anti-diarrhea, digestive aid, antitumor

SCIENCE AND TECHNOLOGY 784
agents, cardiovascular and circulatory disease, potential in surgical procedure and wound care
(Costa et al., 2009) and fibrinolytic agents (Ketnawa et al., 2012).
Commercial bromelain is very expensive due to limited pineapples and high cost in
extraction and purification method. Pineapples production will keep increasing to meet the
demand of bromelain and it will produce high amount of pineapple waste. Pineapple waste
not used in any production yet and has no appropriate destinations. Waste disposal become
growing problem as it can cause serious environmental problems. Therefore, this study
presents the extraction of bromelain from the waste for the worldwide application. Pineapple
is the main sources to extract the pure bromelain. In every part of pineapple such as leaves,
stem, core, crown and fruit have high bromelain content. Therefore, bromelain can be
extracted and purified from pineapple waste and it low-cost production. The aim for this
study is to determine bromelain contents in different parts of pineapple and compare from
different genus and cultivar. This study also to test the bromelain with different protein
substrates such as fibrin to shows the fibrinolytic activity presents. Lastly, to extract and
purify the bromelain presents in the pineapple waste.
MAIN RESULTS
Bromelain activity in pineapple waste (crown and stem) using Casein Digestion Unit
(CDU) and well diffusion method
Casein Digestion Unit (CDU) method used casein as a substrate and L-tyrosine as a
standard (Murachi, 1976). From the Figure 1 below, it is obvious that Moris shows the
extremely high of bromelain activity in crown (11.852 ±0.555) U/ml while Yankee shows
the lowest bromelain activity in stem (0.580±0.091) U/ml. For the Moris, the bromelain
activity in the crown approximately 8.6% high compare to the stem. Thus, it shows that
part of the plant influences the bromelain activity which means crown is the best part
containing high bromelain compared to the stem part. However, some researchers
recorded that the bromelain activity also depends on the type of cultivars. It shows that,
high bromelain can be obtained depends on the part of extracted plant and type of
cultivar.
Well diffusion method or casein/skimmed milk agar plate assays allow principally for
qualitative determinations of protease activity. Degradation of the enzyme substrate
(casein), incorporated in the agar plate was seen as the development of a t ransparent zone
in the plate. The proteolysis zone produced on the casein agar could be related to the
amount of protease presence in the crude extracted. However, it was clearly seen for all
replicates. The large diameter shows the high bromelain content. Crown and stem samples
of Madu, Philipine, Josapine, Moris, Yankee and MD2 showed the zone of proteolysis
and proved that the pineapple waste has high amount of bromelain especially stem
compared to the crown.

SCIENCE AND TECHNOLOGY 785
Figure 1. The bromelain activity presented in the crown and stem of pineapple waste.
Figure 2. The proteolysis zone produced on 1) the skim milk plate and 2) casein shows the
hydrolysis of casein in the sample
CONCLUSION
In conclusion, the bromelain content depend on the cultivar and the part of plants where it is
extracted. Crown of Moris cultivar recorded the highest bromelain content and supported by
the larger proteolysis zone detected on the casein and skim milk plate. Others have the
bromelain but in a small quantities when compared to the crown of Moris.
Acknowledgment: The authors would like to express the appreciation to Asma Agro Sdn
Bhd for their keen interest and supply of the sample in this study. Authors are also thankful to
Zamalah UTM for providing scholarship for the research students.
REFERENCES
1. Costa, H. B., Fernandes, P. M., Romão, W., & Ventura, J. A. (2014). A new procedure based on column
chromatography to purify bromelain by ion exchange plus gel filtration chromatographies. Industrial Crops
and Products,59, 163-168. doi:10.1016/j.indcrop.2014.04.042 Hatano, K. (1996). Nmr Structure Of
Bromelain Inhibitor Vi From Pineapple Stem. doi:10.2210/pdb1bi6/pdb
2. Ketnawa, S., Chaiwut, P., & Rawdkuen, S. (2012). Pineapple wastes: A potential source for bromelain
extraction. Food and Bioproducts Processing,90(3), 385-391. doi:10.1016/j.fbp.2011.12.006

SCIENCE AND TECHNOLOGY 786
IGCESH2018
Universiti Teknologi Malaysia, Johor Bahru, Malaysia 13 -15 August 2018
TRANSACTION COST COMPONENTS IN BIM PROCUREMENT: A
PRELIMINARY STUDY
Toh Ka Bean*1, Sr Dr. Muzani bin Mustapa2 and Sr Dr. Fara Diva binti Mustapa3
1, 2, 3 Department of Quantity Surveying, Universiti Teknologi Malaysia, Johor Bahru, MALAYSIA.
(E-mail: [email protected], [email protected], [email protected])
ABSTRACT
Construction industry which plays a crucial function in economy is famous for its unique
characteristics such as fragmentation, time lag and many more. Consequently, the industry
suffers problems relating to the unique characteristics such as disputes within the construction
parties. It was found that construction disputes incur high transaction costs which later affects
related parties and increase the overall project costs. This is due to the fact that transaction
costs are the costs that incurred from transaction activities within the construction industry.
Transaction cost economics or analysis is useful to be studied as it allow parties to have better
understanding on the benefits incurred in making economic exchange. The emerging
Building Information Modeling (BIM) technology is said to be beneficial in addressing
problems such as solving disputes and reducing overall project costs. Hence, BIM
procurement is seen to address the aforementioned issues. Transaction costs within other
procurement types such as traditional, design and build and Public Private Partnership (PPP)
has been previously studied. Hence, this research seeks to identify the transaction costs
incurred within the procurement with BIM adoption. This is a preliminary study employing
structured literature review to determine the components and activities within the transaction
costs and outlining the BIM procurement to study the activities involved within the BIM
implementation. The initial framework for transaction cost components in BIM procurement
was set up based on RIBA Plan of Work with BIM overlay. The components are categorised
into pre-contract and post-contract components and further breakdown into stages. It will be
the basis to develop a framework to provide a guideline among construction industry players
on the related transaction costs within the BIM procurement.
Key words: Transaction costs, Building Information Modeling (BIM), procurement,
Construction industry
INTRODUCTION
The special character of construction industry makes it an important sector to manipulate the
economy [1-3]. One of the special characteristics of the construction industry is its transient
nature [1] where the organization is temporary and will be disbanded at the end of
construction period [4]. Hence, there is a need for contractual obligations between parties to
safeguards interests. A contract documents acts as a binding obligation between two or more
construction parties, by conveying and outlining legal and technical information as well as
ideas among various parties involved within a project [5].

SCIENCE AND TECHNOLOGY 787
Any disputes within a construction project could affect the project’s time, quality and
subsequently increases construction costs [6]. An interesting research by [12] managed to
linked disputes and litigation with high transaction costs within construction projects. It was
reported that the value of disputes reaches RM 261 million in Asia region in 2016 [7]. A
research conducted by [8] managed to highlight the relationships between traditional
procurement and transaction costs where higher transaction costs found in traditional
procurement compared to other procurement types. Hence, it can be concluded that
uncertainty leads to disputes and consequently causes high transaction costs. Therefore, it is
alarming to learn that traditional procurement maintained the most frequent type of contract
used in Malaysian Construction Industry from 2015 to 2017 [9] despites of its many
drawbacks. One of the notable drawbacks is the separation between design and construction
phase, which later become the root cause to many problems in construction projects [10].
Interestingly, transaction costs analysis is said to be useful to study the benefits in making
economic exchange as well as studying the impacts of an organization with high performance
ambiguity [11]. Transaction costs (TCs) are costs incurred from transaction activities within
the construction industry [12] such as the search and information costs; bargaining and
decision costs; and policing and enforcements costs [13]. TCs allow construction parties to
have better understanding in the reasons of conflicts and disputes most likely occur during an
economic exchange such as contract incompleteness due to bounded rationality and
uncertainty, as well as opportunistic behaviour [14].
In response to technological change within the construction industry, Building Information
Modeling was introduced to be able to minimise the supply chain related costs [15],
discourage legal disputes and costly litigation [16]; facilitate construction firms in achieving
competitiveness, qualities and efficiency, profitable, providing collaborative and innovative
work nature [17], cost reduction, enhancement of control and time savings [18]. To date, BIM
have been adopted in several procurement types, such as PPP and has been proven to be
effective and efficient in improving the project outcome, especially value enhancement [19].
Since disputes are one of the notable factors that lead to high transaction costs, good
understanding and anticipation of disputes at earlier stage is beneficial. Managing conflicts
and disputes at early stage within a construction project by providing solution is central in
ensuring successful project completion. Therefore, this research seeks to study transaction
costs within the BIM adoption procurement. This research will determine the transaction cost
components in BIM procurement with the aim to provide a basic guideline to construction
players in drafting BIM contract.
MAIN RESULTS
Structured literature review on the transaction cost economics and BIM procurement have
managed to highlight the crucial components of transaction costs during the typical BIM
adoption construction project life cycle. Transaction costs can be categorised into pre-
contract and post-contract costs involving the search and information costs; bargaining and
decision costs; and policing and enforcements costs. Each pre-contract and post-contract
transaction costs is further breakdown into detailed stages based on RIBA plan of work
such as appraisal stage, and so on. Within each stage, activities relating to transaction
costs were identified to later determine the transaction costs. The BIM elements in
relation to procurement were identified and outline as a basis to identify the transaction

SCIENCE AND TECHNOLOGY 788
costs incurred. The expected outcome will help shaped the conceptual framework of this
research as illustrated in Figure 1.
Figure 1. Conceptual proposed framework for outlining Transaction Costs within BIM
procurement
CONCLUSION
It has been observed and noted that transaction costs within the traditional procurement is
higher compared to other procurement types such as design and build. Since BIM benefits the
construction industry in many ways including the reduction in overall project costs, it is
interesting to determine the transaction costs analysis within the BIM procurement to study
the benefits of BIM to construction industry generally and construction projects specifically.
Currently, no substantial number of research conducted to study the transaction costs analysis
within the BIM procurement. Therefore, this research is crucial in determining the transaction
costs inccured within the BIM procurement to determine the benefits of the procurement
among the related parties.
Acknowledgment: The authors would like to express their appreciation for the support of the
UTM scholarship and sponsors with Project No Q.J130000.2621.14J24.
REFERENCES
1. F. D. Mustapa. Managing Immigrant Construction Workers In Peninsular Malaysia: The Economic
Perspective, 2014.
2. CIDB Malaysia. Country Report Malaysia, 2017. 3. T. K. Chan and M. C. Theong. A Review of the Performance of the Malaysian Construction Industry (2013),
1–11.
4. Z. E. Kpamma, E. K. Asare, and E. N. Ankomah. Traces of Lean Construction Practices In The Indigenous
Building Culture of The Talensi of Northern Ghana. J. Constr. Proj. Manag. Innov. 7, no. 1 (2017), 1726–
1738.
5. C. M. Gofhamodimo. Construction Contracts: Procurement Methods in Botswana, 1999.
6. M. E. Thobakgale, C. O. Aigbavboa, and W. D. Thwala. Professional’s perception on the causes and effects
of disputes in the construction industry – a theoretical exploration. 6th Int. Conf. Humanit. Geogr. Econ.
(2014), 135–137.
7. Arcadis. Global Construction Disputes Report 2016. Contract Solut. (2016), 17.
8. M. Rajeh. Impacts of Procurement Systems on Transaction Costs: A Structural Equation Modelling
Methodology. Proc. 4th New Zeal. Built Environ. Res. Symp. 1829 (2014), 1–34. 9. Ministry of Finance Malaysia. Gross Domestic Product By Kind of Economic Activity. 2018 Econ. Rep.,
2018.
10. M. N. Mohd Nawi, N. Baluch, and A. Y. Bahauddin. Impact of Fragmentation Issue in Construction
Industry: An Overview. MATEC Web Conf. 15 (2014), 1009.
11. M.-C. Boudreau, R. T. Watson, A. J. W. Chen, M. Greiner, and P. Sclavos. The Benefits of Transaction Cost
Economics: The Beginning of A New Direction. Eur. Conf. Inf. Syst. (2007), 1124–1135.
12. H. Li, D. Arditi, and Z. Wang. Transaction Costs Incurred by Construction Owners. Eng. Constr. Archit.
Manag. 21, no. 4 (2014), 444–458.
Transaction Cost Analysis
Building Information
Modeling (BIM)
Transaction Cost
Economics (TCE) in BIM Procurement

SCIENCE AND TECHNOLOGY 789
13. O. E. Williamson. “The Economic Institutions of Capitalism: Firms, Markets, Relational Contracting. Univ.
Illinois Urbana-Champaign’s Acad. Entrep. Leadersh. Hist. Entrep. (1985), 61–75.
14. D. J. Yates. Conflict and Dispute in the Development Process: A Transaction Cost Economics Perspective.
Proc. 4th Pacific Rim Real Estate Soc. Conf. Perth, Aust. (1999), 1–14.
15. EC Harris. Supply Chain Analysis into the Construction Industry. A Report for the Construction Industrial Strategy, A Rep. Constr. Ind. Strateg. 145 (2013) 1–127.
16. D. Mosey et al. Enabling BIM Through Procurement And Contracts. A Research Report by the Centre of
Construction Law and Dispute Resolution, King’s College London, 2016.
17. M. Khalfan. Building Information Model and Supply Chain Integration: A Review. J. Econ. Bus. Manag. 3,
no. 9, 2015.
18. D. Bryde, M. Broquetas, and J. M. Volm. The Project Benefits of Building Information Modelling (BIM).
Int. J. Proj. Manag. 31 (2012), 971–980.
19. A. Ganah and G. A. John. Suitability of BIM for Enhancing Value on PPP Projects for the Benefit of the
Public Sector. PPP Int. Conf. 2013 Body Knowl. (2013), 347–356.

SCIENCE AND TECHNOLOGY 790
IGCESH2018
Universiti Teknologi Malaysia, Johor Bahru, Malaysia 13 -15 August 2018
THE SUSTAINABILITY OF RURAL SETTLEMENT: REVIEW
Norhafiza Binti Abdullah*, Ainur Zaireen Zainudin and Khadijah Hussin
Department of Land Administration and Development, Faculty of Geoinformasi and Real Estate,
University of Technology Malaysia, 81310 Johor Bahru. Johor, Malaysia.
(E-mail: [email protected], [email protected], [email protected])
ABSTRACT
Last few decades, the global transformation in urban development has taken place.
Malaysia’s rapid economic progress poses special challenges in many rural areas. One of the
challenges occur in rural area; migration. Rural-urban migration represents an essentially
spatial concomitant of the economic development of a region. It may result the declining
number of population in rural area. Nowadays, the phenomenon of the existence of vacant
and idle houses has taken place in the traditional village. This review paper examined articles
on sustainability development of rural settlements and the issues of rural depopulation. The
issue of rural depopulation might affect the community. This paper further discussed a
general and clear understanding on sustainability development of rural settlement that applies
in Malaysia and others countries by reviewing past research and the development plan that
relate to the sustainability of rural settlement. Further discussions will involve the issues in
rural areas according to rural settlement by reviewing past research. Key words: rural area, sustainability development, rural settlement, rural depopulation,
community
INTRODUCTION
In general, a rural area is a geographic area that is located outside towns and cities; have a
low population density and small settlements. Defining rural areas is the subject of on-
going debate. It is however fundamental to any meaningful planning or discussion
regarding this area. According to Oxford English Dictionary (1980), rural means living in
the country having standing qualities or manners of peasants or country-folk; engaged in
country occupation; agricultural postural, of pertaining to, or characteristics of the
country or country life as opposed town. According to Ferdinand Toennies (1855-1936),
the traditional rural society was characterized by relationships based on kinship, cohesion
and shared values which he equated with community. When community bonds slacken,
hard evidence will be seen in terms of schools, neighborhoods not working, our economy,
democracy and even our health and happiness which all depend on adequate stocks of
social capital [9].
In the context of housing settlement, Heylen (2006) in Ley, J. L. and Hashim, A. H. (2010)
argue that livability refers to the environmental conditions from the perspective of the
individual and is the subject of an evaluation of the quality of residential housing conditions.
In other words, livability include environmental characteristics that create attractive
residential neighborhoods and consisting of tangible and intangible aspects (Throsby,

SCIENCE AND TECHNOLOGY 791
2006, in Leby, J. L. and Hashim, A. H. (2010). With the common objective of making
rural area a place where its residents can continue to live peacefully in harmony with
others and the environment, while contributing substantially to the local and national
economy. The National Landscape Strategy (2002-2020) states that “The link between
both rural and urban areas is emphasized as inter-reliant. Human societies and economies
are interdependent: rural dwellers need urban settlements and vice versa to allow us work
to our best advantage – neither can function fully without the other”. However, rural
development has been excessively constrained by policies and regulations which lack
convincing evidence, and which fail to acknowledge and exploit rural strengths and
opportunities for sustainable development. Today, rural depopulation is impacting on the
entire fabric of rural society.
Table 1. Distribution of population by strata
STRATA
1991 2000 2010 2014
Total
(Million)
% Total
(Million)
% Total
(Million)
% Total
(Million)
%
Urban
9.38
51.0
14.43
61.9
20.12
71.0
22.18
73.7
Rural
9.00
49.0
8.84
38.1
8.21
29.0
7.96
26.3
Malaysia
18.38
100.0
23.27
100.0
28.33
100.0
30.10
100.0
Source: Jabatan Perangkaan Malaysia (2015)
Table 1 shows the distribution of population according to strata. It shows that, the
population of rural area decreasing year by year from 1991 until 2014. Nowadays, the
population in rural areas decline due to migration. Rural-urban migration represents an
essentially spatial concomitant of the economic development of a region [1]. Rural-urban
migration represents the movement of the society community from smaller town
(agricultural communities) to a larger town (non-agricultural communities). Fr. Harry
Bohan stated “The family and community are the basic building blocks of society”. The
decreasing number of population may result the leaving of their settlement.
RURAL SETTLEMENT
Settlement plays an important role in creating human civilization by providing space to
meet the needs of the inhabitants both in the present and the future time [10]. As a built
environment and a means of human activities, settlements transform over time. They are
required to provide spaces with attractive environments to live in, and in turn so that the
inhabitants would have a better living condition to achieve sustainability (Throsby, 2006,
in Leby, J, L and Hashim, A, H, 2010). Rural settlement (kampong settlement) can be
divided into two types. There is unplanned settlement, which is Malay traditional
kampong, fisherman kampong and others; and well-planned settlement, which is new
village, urban kampong and others. Both types of rural settlement are form from some
various physical elements like geography, landscape and others spatial elements. Rural
áreas are traditionally connected with agricultural activities [8].

SCIENCE AND TECHNOLOGY 792
SUSTAINABILITY
Sustainability is the capacity for continuance unto the long term development. Three
traditional pillars of sustainability consist of social, economic and environmental
consideration. Harris and Borer (2005) agreed that sustainable development need to address
social and economic as well as environmental considerations. According to Christopher and
Denis, the definition of rural sustainability can be defined as a continuous search for
development strategies (aimed at a general improvement in the human condition) to maintain
and produce healthy rural communities in which economic, socio-cultural, political and
environmental values are compatible and which respond to any imperatives in these
dimensions, at least in the long run.
Sustainable development most prominently entered the global political arena in 1987 in a
report from the United Nations Commission on Environment and Development, also known
as the Brundtland report. The report stated, ‘Humanity has the ability to make development
sustainable – to ensure that it meets the needs of the present without compromising the ability
of future generations to meet their own needs’ [13]. To achieve recovery and enhance the
quality of life for everyone (community) need to represent the holistic way in sustainable
development. Holistic way means that, by improving the status of disadvantaged people,
limiting waste and pollution, conserving natural resources, promoting cooperation and
efficiency, and revitalize economies [11].
In the sense, the definition of sustainability is not about a flourishing of human life or all
needs being met, but about the basic conditions that are necessary for the ecological and
social systems to not systematically degrade [7]. Maslow’s Hierarchy of Needs consept is
explained in a Pyramid, the foundation of which is all about surviving. The middle is
about thriving, and the top is about finding joy and fulfilment harm. These needs are met
via a safe place to live, job security and money in the bank.
CONCLUSION
As a conclusion, sustainable effort permanently improves living conditions, more
importantly, they start a long-term development process. Therefore, it is requested to identify
the locals needs, voice their demands, and helps them organize themselves so as to improve
their livelihood with the help of the financial, technical and human resources offered by
development projects, as well as their own. From this study, the final outcome is expected
to assist the responsible party in addressing this problem. Additionally, this study will
enable the parties to work with the agencies involved in organizing and designing a
traditional village planning more effectively and achieving sustainable development
objectives in rural areas (one of the aspiration Blueprint Rural Transformation 2016-
2020).
Acknowledgment: We would like to thank School of Graduate Studies (SPS), UTM for
assisting this study financially through Zamalah Scholarship.
REFERENCES
1. Akin L.M. (1970). Systems Approach to a Theory of Rural-Urban Migration. Geographical Analysis.
2. Brundtland, G.H. (1987). Our common future: Report of the World Commission on Environment and
Development. Oxford, UK: Oxford University Press.
3. IRDA (2004) Positive Planning for Rural Houses Seeking radical changes in rural planning policy.

SCIENCE AND TECHNOLOGY 793
4. Long et al. (2008). Analysis of Urban-Rural Land-Use Change during 1995-2006 and its Policy Dimensional
Driving Forces in Chongqing, China. Sensors, 8:681-699.
5. Liu et al. (2010). Progress and prospect on the study of rural hollowing in China. Geographical Research,
29[1]:35-42.
6. Liu et al. (2010). The process and driving forces of rural hollowing in China under rapid urbanization. Journal Geographic Science, 20[6]: 876-888.
7. Missimer, M., & Rob, K. (2017). A strategic approach to social sustainability e Part 1 : exploring the social
system, 140, 32–41. https://doi.org/10.1016/j.jclepro.2016.03.170
8. Parry, M. L. (1976). The abandonment of upland settlement in Southern Scotland. Scottish Geographical
Magazine, 92(1), 50-60. https:doi.org10.108000369227608736326
9. Putnam, R (2000) Bowling Alone, New York: Simon & Schuster Paperbacks.
10. P. Setijanti et al. (2015). Traditional settlement livability in creating sustainable living. Procedia – Social
and Behavioral Sciences 179(2015)204-211.
11. Rinus & Jasper (2013).
12. Transformasi Luar Bandar (2016-2020). Membandarkan Luar Bandar, KKLW.
13. World Commission On Environment And Development (1987). Our Common Future. [report of the] World
Commission on Environment and Development. Available at: http://www.un-documents.net/wced-ocf.htm.

SCIENCE AND TECHNOLOGY 794
IGCESH2018
Universiti Teknologi Malaysia, Johor Bahru, Malaysia 13 -15 August 2018
A REVIEW OF SPATIO-TEMPORAL MODELS IN IDENTIFY
ABIOTIC FACTOR THAT AFFECTING PEST AND PLANT DISEASE
MD Sabtu N*1, N H Idris2 and M H I Ishak3
1, 2 Department of Geoinformation, Faculty of Geoinformation and Real Estate Teknologi Malaysia,
81310 UTM, Johor, Malaysia.
(E-mail: [email protected], [email protected]) 3 Department of Control and Mechatronics, Faculty of Electrical Engineering, Universiti Teknologi
Malaysia, 81310 UTM, Johor,Malaysia.
(E-mail: [email protected])
ABSTRACT
Jackfruit is identified as targeted produced for premium fruit and vegetable (EPP 7).
Meanwhile in Johor, jackfruit is the third biggest fruit produced in 2016. Jackfruit contains a
lot of benefits which certainly good for living things and have been used in various sector
such as medicine, food, anti-bacterial and anti-oxidant, antifungal effect, immunomodulatory
effect and else. However, the existence of pests and diseases have threatened the productivity
of jackfruit plant particularly in tropical countries including Malaysia. There are many factors
that can affect the occurrence of pests and plant diseases of jackfruit such as shoot borers,
bark borers, mealy bug and scale insects, blossoms and fruit rots and bacterial die-back.
Several studies have been devoted to model the plant pests and diseases epidemiology,
though the contexts that focus in tropical environment and jackfruit plant are limited.
Therefore, this paper aims to identify available models that could use to define dispersal
pattern and relationship of the abiotic factors including major climatic variables with plant
pests and diseases occurrence data, particularly. in tropical climate using spatio-temporal
data. This paper could use as a basis to understand the epidemiological models in combating
pest and plant disease and to support towards the effective management of jackfruit pests and
diseases in tropical countries, particularly Malaysia.
Key words: Jackfruit, Pest & Plant Disease, Geospatial Modelling
INTRODUCTION
Jackfruit or known as Artocarpus Heterophyllus belong to the family Moracea and it is often
confused with the closely related species Artocarpus integer [1]. Jackfruit is plant in India,
Bangladesh, Philippines, Sri Lanka, Malaysia, Thailand, some extend in Brazil and
Queensland of Australia. In Malaysia, Johor is the third biggest producer of jackfruit in
Malaysia after Pahang and Negeri Sembilan [2]. Due to its globally high demand, the fruit is
culture as an alternative crop [3]. Furthermore, [4], reported that jackfruit is targeted for
Premium fruit and vegetables where the fruit aims to be exported to the Middle East and
Europe.

SCIENCE AND TECHNOLOGY 795
There is so much benefit from the fruit, tree, branches of jackfruit. Besides of the fruit is
enriched with a diverse of nutrient and the edible fruit can be consumed ripe or green for
vegetable, the tree as well can provide many other uses in environmental protection. In
Indonesia, the plants have been used by traditional folk medicine and it can be use as anti-
bacterial, anti-diabetic, anti-inflammatory, antioxidant and anti-helmintics [5]. Besides, the
fruit supply approximately 2 MJ energy per kg/wet weight of ripe perianth[6]. Phytonutrients
contain in jackfruit such as lignans, isflavones and saponins have the properties of anticancer,
antiulcer, antihypertensive and antiaging[7].
[8] stated that insect pest infestation is one of the cause behind declining production of
jackfruit. According to [3], some of the major pest and diseases in India include shoot borers,
bark borers, mealy bug and scale insects, blossoms and fruit rots and bacterial die-back. In
Malaysia, [9], reported that “Karat Buah” or known as Uredo artocarpi is the reason behind
the poor productivity of jackfruit whereby, 30 percent of production yield decreased each
year.
[10] stated that weather affecting the growth of jackfruit. Excessive rain, humidity and
temperature can affect the plant to get diseases such as leaf spot caused by Colletortrichum
gloeosportoides. [11]also reported from observation the trees showed symptoms more in
‘stressed’ as a result of nutrition imbalances, soil types and terrain conditions and injury after
or during rainy season, where humidity is relatively high.
Abreast with a vast of technology development, mapping and modelling loss of crop due to
pest and disease would be easier. Nowadays, the advancement of Geospatial make a lot of
things easier. Geospatial now are widely used in various sector whether to collect data, to
manage information, to store data, to keep track, for mapping, for prediction or to modelled
[12], used GIS spatial statistics method to study the pattern of pest spreading and its
relationship with spatial element such as drainage and type of soil. Meanwhile, [13] used
geostatistical methodology in mapping crop disease incidence. Therefore, this paper is
reviewing the role of geospatial model in identifying the abiotic factor that affect pest and
plant disease and abiotic factor which influence growth of pest and plant disease.
CONCLUSION
Jackfruit is a potential crop to be marketed worldwide due to its rich nutrition. However, the
existence of pests and plant diseases threatened the crops production. Therefore, there is a
need to understand behaviour and abiotic factors that can affect jackfruit plant pests and
diseases. Spatio-temporal models could support in managing the occurrence and monitoring
the epidemical of pests and disease and improve the production yield of the jackfruit industry.
Acknowledgment: The authors would like to express their appreciation for the support of the
sponsors with Project No Q. J130000.2527.17H13, University Technology Malaysia (UTM)
and Ministry of High Education (MOHE).
REFERENCES
1. Harb E M, Reda M, Alhady A A and Elsalam N A A 2015 In vitro Rapid Propagation of Jackfruit ( Artcarpus heterophyllus Lam .) Tissue Culture Unit , Department of Plant Genetic Resources , Ecology and
15 147–53
2. DOA D of A 2016 Fruit Crops Statistic 2016 Dep. Agric. Malaysia 1–180
3. Dalavi R B, Kamble S S, and Kawale T R, 2016 Efficacy of Ridomil in combating Fruit Rot of Jackfruit in
Sindhudurg and Kolhapur Districts of Maharashtra Imperial J. of Interdisciplinary Research. 5 1094-1096

SCIENCE AND TECHNOLOGY 796
4. Performance Management & Delivery Unit 2013 EPP7: Premium Fruits & Vegetables [Online] Available:
http://etp.pemandu.gov.my/Agriculture-@-Agriculture_-_EPP_7;_Premium_Fruits_and_Vegetables.aspx
[Accessed by March 2018]
5. Biworo A, Tanjung E, Iskandar, Khairina and Suhartono E 2015 Antidiabetic and Antioxidant Activity of
Jackfruit (Artocarpus Heterophyllus) Extract J. Med. Bioeng. 4 318–23 6. Jose Vazhacharickal P and John Mathew J 2017 Morphological diversity, nutritional quality and value
addition of jackfruit (Artocarpus heterophyllus) in Kerala Int. J. Innov. Res. Rev.
7. Swami S B, Thakor N J, Haldankar P M and Kalse S B 2012 Jackfruit and Its Many Functional Components
as Related to Human Health: A Review Compr. Rev. Food Sci. Food Saf. 11 565–76
8. Gapasin R M, Garcia R P, Christine T, Cruz C S De and Borines L M 2014 Fruit Bronzing : a New Disease
Affecting Jackfruit Caused by Pantoea stewartii ( Smith ) Mergaert et al . 31 17–31
9. Chowdhury M S M, Mazed H E M K and Irin I J 2015 Study on seedling diseases of jackfruit ( Artocarpus
heterophyllus L .) in Bangladesh 1 24–9
10. Chowdhury M S M and Hossain I 2012 Effects of temperature, rainfall and relative humidity on leaf spot of
jackfruit seedling and its eco-friendly management Agric. 9 126–36
11. Azmi, 2014 Rust-Like Symptoms and Rot on Jackfruit: A Combination of Disease and Abiotic Factors
International Tropical Fruits Network [Online] Available: http://www.itfnet.org/v1/2012/09/observations-on-the-occurrence-of-brown-specks-on-jackfruit-seeded-arils-%E2%80%93-a-combination-of-disease-and-
abiotic-factors/ [Accessed by February 2018]
12. Scott L M and Janikas M V, 2010 Spatial Statistics in ARCGIS Handbook of Applies Spatial Applies Spatial
Analysis, Software Tools, Methods and Applications, (Springer: Berlin)
13. Bouwmeester H, Heuvelink G B M and Stoorvogel J J 2016 Mapping crop diseases using survey data: The
case of bacterial wilt in bananas in the East African highlands Eur. J. Agron. 74 173–84

SCIENCE AND TECHNOLOGY 797
IGCESH2018
Universiti Teknologi Malaysia, Johor Bahru, Malaysia 13 -15 August 2018
LOW-COST UAV-BASED MULTISPECTRAL IMAGING SYSTEM
FOR COASTAL EROSION MONITORING – A REVIEW
Ahmad Razali Yusoff*1, Zulkepli Majid2,Mohd Farid Mohd Ariff3, and Norhadija
Darwin4
1, 2,3,4 Geospatial Imaging and Information Research Group, Department of Geoinformation,
Faculty of Geoinformation and Real Estate, Universiti Teknologi Malaysia, Skudai, Johor,
MALAYSIA. (E-mail: [email protected], [email protected], [email protected])
ABSTRACT
Coastal area changes mostly due to the storms and time lap by the coastal nature process
occur. Some studies have been carried out and further researches have been done to monitor
and investigate the erosion activities and the land cover classification along the coastline. The
low-cost UAV-based multispectral imagery is considered as a novel method for coastal
monitoring. Multispectral imagery camera is considered as low-cost if compare to the
hyperspectral camera and satellite imagery that is a high-cost sensor. The additional infrared
spectral band and Red-Edge with RGB spectral would be an improved method based on the
current research that only using visible light and RGB camera. Some updated reviews are
shown in this paper based on coastal monitoring studies and the gaps are defined for the
future research.
Key words: Coastal area, low-cost, UAV-based, multispectral imagery
INTRODUCTION
Coastal erosion is a natural catastrophe occurring because of the interactions of natural
processes and activities. It is widely believed that erosion occurs continuously along the
coastline because of a combination of both natural and human factors.
Monitoring or frequent data collection is important to measure and continuously monitor
coastal change and evaluate habitat along the coastal area. Repeat surveys can be costly,
time-consuming, and involve working in sensitive or restricted environments [1]. Future
more, the coverage area for monitoring and accessibility to the coastal erosion site are limited
in ground-based surveys area only. The variable terrain, vegetation, and habitat community,
and wave impacts can contribute to the issues of erosion, and overwash that making direct
measurements difficulties during the monitoring activities. Apart from that, to perform
monitor along the coastal site, a lot of survey works need to be carried out using multiple
techniques to assess change over a range of timescales [2]. Although there are remote sensing
methods that can overcome many of the ground survey limitations such as airborne LiDAR,
satellite imagery, and hyperspectral airborne [3], the platforms and data are expensive and
provide coverage at unsuitable temporal or spatial resolution for small-scale and specific site
monitoring.

SCIENCE AND TECHNOLOGY 798
The UAV technology has been developed and progressed rapidly from year to year especially
for mapping applications. Furthermore, UAV is the solution for the low budget project with
time constraints and low manpower rather than using satellites or manned aircraft with
expensive flight costs, time-consuming and weather-dependent data collection, restricted
maneuverability, limited availability, limited flying time and low ground resolution in
mapping process [4].
MAIN RESULTS
The recent researches based on coastal study motivate this novel research. The table below
shows the contribution of some research using various types of sensors using advanced
technology platforms such as satellite, Airborne, and UAV.
Table 1. Coastal studies using various sensors and platforms
Satellite Airborne UAV
Thematic mapper (TM)
satellite, SPOT, and
Egysat-1 images (El-Asmar
et al., 2014)
Multispectral Landsat
images (Temiz et al., 2015)
Satellite images of Landsat
TM, ETM and OLI (Misra
and Balaji, 2015)
Landsat data (Li, Wenyu,
and Peng Gong, 2013)
Time-based Satellite
images (Cellone, Carol, &
Tosi, 2016)
Landsat images (Temiz &
Durduran, 2016)
Hyperspectral Imagery
(Veenstra, Timothy and
James Churnside ,2012)
Titan Multispectral Mapping
Lidar (Fernandez-Diaz et al.,
2016)
High altitude images
(Cellone, Carol, & Tosi,
2016)
LiDAR dataset
(Radosavljevic et al., 2016)
Commercial Camera
(Papakonstantinou,
Topouzelis, &
Pavlogeorgatos, 2016)
UAV hyperspectral
monitoring (Yi Ma, Jie
Zhang, and Jingyu Zhang,
2016)
UAV-based RGB Camera
monitoring (Sturdivant et
al., 2017)
Visible camera mapping
(Turner, Harley, &
Drummond, 2016)
Visible camera mapping
(Gonçalves & Henriques,
2015)
Some current studies have been carried out and further researches have been done to monitor
and investigate the erosion activities and the land cover classification along the coastline such
as description at Table 1. The low-cost UAV-based multispectral imagery is considered as a
novel method for coastal monitoring. Multispectral imagery camera is considered as low-cost
if compare to the hyperspectral camera and satellite imagery that is a high-cost sensor.
The additional implementation of infrared and red-edge spectral band with RGB spectral
bands produce by the multispectral camera would be a gap study area for next study as some
current researchers are only using visible light and RGB camera mounted on UAV. For
example, [6] using the commercial camera to produce varieties of land cover classification
including vegetation, and habitat community. The unique of additional infrared and red-edge
spectral band with RGB spectral bands by the multispectral camera is the ability to classify
the health of the vegetation based on the assortment of the spectral band during the
processing and analysis. Moreover, a three-dimensional model can be generated by using
UAV image after performing digital image processing. In spite of this, The this approach that
using multispectral imagery would able to correct the sun glint and deriving spectral
signatures of debris and vegetation along the coastal area as suggested by [5,6].

SCIENCE AND TECHNOLOGY 799
CONCLUSION
This paper provides an overview of the some studies on the coastal monitoring based on
sensors, methods, and the advanced technology platform used. Multispectral imagery camera
is considered as a low-cost equipment as compared to the hyperspectral camera and satellite
imagery that is a high-cost sensor. The ability to detect vegetation health with additional
infrared and red-edge spectral band with RGB spectral bands would be an improved method
and a gap study based on the current research that only using visible light and RGB camera
for UAV-based coastal mapping. The optimized method and accurate data collection may be
a challenging future study with some mapping experiment and camera calibration at a certain
altitude. Hopefully, the future study of the novel method using multispectral camera for
coastal erosion monitoring can be useful for the government and private agencies to monitor
the coastal area, especially for decision-making purposes.
Acknowledgment: The authors gratefully acknowledge the Ministry of Education and
Universiti Teknologi Malaysia for their kind support and GUP research grant
(Q.J130000.2627.14J96).
REFERENCES
1. Mason, D.C.; Gurney, C.; Kennett, M. Beach Topography Mapping: A Comparison of Techniques. J. Coast.
Conserv, 6 (2000), 113–124.
2. Young, A.P.; Ashford, S.A. Application of Airborne LIDAR for Seacliff Volumetric Change and Beach-
Sediment Budget Contributions. J. Coast. Res. 22 (2006), 307–318.
3. Harley, M.D.; Turner, I.L.; Short, A.D.; Ranasinghe, R. Assessment and integration of conventional, RTK-GPS and image-derived beach survey methods for daily to decadal coastal monitoring. Coast. Eng, 58
(2011), 194– 205.
4. Biesemans, J., Everaerts, J., and Lewyckyj, N. PEGASUS: Remote sensing from a HALE-UAV. Paper
Presented at the ASPRS Annual Convention, 2005.
5. Apostolos Papakonstantinou, Konstantinos Topouzelis, and Gerasimos Pavlogeorgatos, The International
Archives of the Photogrammetry, Remote Sensing and Spatial Information Sciences, Volume XLI-B5, 2016,
XXIII ISPRS Congress, 12–19 July (2016), Prague, Czech Republic.
6. Sturdivant, E., Lentz, E., Thieler, E. R., Farris, A., Weber, K., Remsen, D., Henderson, R. UAS-SfM for
Coastal Research: Geomorphic Feature Extraction and Land Cover Classification from High-Resolution
Elevation and Optical Imagery. Remote Sensing. (2017), 9(10), 1020.

SCIENCE AND TECHNOLOGY 800
IGCESH2018
Universiti Teknologi Malaysia, Johor Bahru, Malaysia 13-15 August 2018
PRELIMINARY STUDY ON IN VIVO ANTI-CANCER ACTIVITY OF
CLINACANTHUS NUTANS ON MURINE CERVICAL CANCER
MODEL
N. A. Roslan*1, N.A. Latif 1,2, V. Limand3 K. Jemon1, 2
1 Faculty of Biosciences and Medical Engineering,
Universiti Teknologi Malaysia, 81310 Skudai, Johor.
(E-mail: [email protected], [email protected]) 2 Cancer and Infectious Diseases Research Group,
Health and Wellness Research Alliance, Universiti
Teknologi Malaysia, 81310 Skudai, Johor (E-mail: [email protected], [email protected])
3Advanced Medical and Dental Institute, Universiti
Sains Malaysia, Kepala Batas, Penang, Malaysia
(E-mail: [email protected])
ABSTRACT
Recently, there are growing interest in the application of Clinacanthus nutans (Belalai Gajah)
to treat various kinds of diseases, including cancer. However, limited studies have been
carried out to validate on its efficacy in vivo. The present study was carried out to investigate
the in vivo anti-cancer activity of C. nutans ethanolic leaf extract on murine cervical cancer
model, through repeated oral administration of C. nutans ethanolic extract at daily doses of
0.5, 10, 50 and 100 mg/kg body weight for 21 days consecutively. From the results, the
tumor growth in mice administered with C. nutans extract was observed to be slower as
compared to untreated control. Future works will focus on the immune adjuvant effect
through the evaluation of cytokine level profile of interferon-gamma as well as T cells
infiltration. Keywords: Clinacanthus nutans, ethanolic extract, cervical cancer (TC-1), anti-cancer
INTRODUCTION
Cancer is a disease resulting from the excessive growth and proliferation of cells [1]. This
disease is remarks through the presence of malignant mass formation with the ability to
invade and metastasize to other side of the body, thus endangering the patient. Cancer has
become a major public health problem since no actual cure has been found until today and is
estimated to affect approximately 14.1 million new cases and 8.2 million death around the
world in the year of 2012 [2].
To date, there are a number of currently available anti-cancer therapies like chemotherapy,
radiotherapy and surgery [3]. However, none of these treatments can definitely cure this
disease as some might relapse. This is due to its invasive property that is able to compromise
with the patients’ immune system, leading to a life threatening situation. Besides, all of these

SCIENCE AND TECHNOLOGY 801
treatments are expensive, thus contributing to the economic burden to most patients. In fact,
the treatments also are known to be associated with adverse effects such as toxicity risk,
infertility, bowel dysfunction, nausea, vomiting, alopecia, loss of appetite and depression [4,
5, 6].
Therefore, there is raising interest in investigating natural herb as an anti-cancer agent. C.
nutans (Belalai Gajah) has been used extensively as traditional remedies to treat various
illnesses as it is claimed to possess health promoting properties. This is proven through a
series of laboratory studies which has magnificently drawn public interest, leading to its
commercialization into products [7, 8, 9, 10].
However, there is limited report have been documented on its efficacy as an anti-cancer agent
in mouse model. Therefore, the objective of this study is to elucidate the potential capacity
of C. nutans as an anti-cancer agent through tumor progression and its effect to the
immune system through cytokine level profile of interferon-gamma and T cells
infiltration by ELISA and flow cytometry analysis respectively.
MAIN RESULTS
Oral Administration of C. nutans Extract Slows Tumor Growth in Tumor-Bearing Mice
The tumor growth was closely monitored by measuring the tumor size with digital caliper
throughout the study and is presented in Figure 1. From this study, the results showed that
C. nutans oral administration slows the tumor growth in tumor-bearing mice in a dose-
dependent manner. The mechanism of action of the plant is believed to be attributed by
anti-oxidant, anti-proliferative, anti-tumorigenic and immune adjuvant activity owned by
C. nutans [7,9].
Figure 1. Tumor progression of C57BL/6 mouse administered with C. nutans extract at
concentrations of 0.5, 10, 50 and 100 mg/kg body weight.
Results were expressed as mean ± SD, n=5.
CONCLUSION
C. nutans extract slows tumor progression in tumor-bearing mice, suggesting its effectiveness
as an anti-cancer agent. However, further study on its immune adjuvant effect is suggested in
order to provide better insight, particularly on its mechanism of action through the evaluation
of cytokine level profile of interferon-gamma and T cells infiltration.

SCIENCE AND TECHNOLOGY 802
Acknowledgement: This research was funded by the Universiti Teknologi Malaysia
Research University Grant (GUP) Tier 1 (No. 12H58). The author would like to thank
Zamalah scholarship for the financial assistant throughout the research project.
REFERENCES
1. Nezafat, N., Sadraeian, M., Rahbar, M.R., Khoshnoud, M.J., Mohkam, M., Gholami, A., Banihashemi, M.
and Ghasemi, Y. Production of a Novel Multi-Epitope Peptide Vaccine for Cancer Immunotherapy in TC-1
Tumor-Bearing Mice. Biologicals. 43 (2015), 11–17. 2. Torre, L.A., Bray, F., Siegel, R.L., Ferlay, J., Lortet-tieulent, J. and Jemal, A. Global Cancer Statistics, 2012.
CA a cancer J. Clin. 65 (2015), 87–108.
3. Sudhakar, A. History of Cancer, Ancient and Modern Treatment Methods Akulapalli. J Cancer Sci Ther.
(2010), 1–4.
4. Alicikus, Z.A., Yamada, Y., Zhang, Z., Pei, X., Hunt, M., Kollmeier, M., Cox, B. and Zelefsky, M.J. Ten-
Year Outcomes of High-Dose, Intensity-Modulated Radiotherapy for Localized Prostate Cancer. Cancer.
117 (2011), 1429–1437.
5. Resnick, M.J., Koyama, T., Fan, K.H., Albertsen, P.C., Goodman, M., Hamilton, A.S., Hoffman, R.M.,
Potosky, A.L., Stanford, J.L., Stroup, A.M., Horn, L.V. and Penson, D.F. Long-Term Functional Outcomes
after Treatment for Localized Prostate Cancer. N Engl J Med. 368 (2013), 436–445.
6. Chan, H.K. and Ismail, S. Side Effects of Chemotherapy among Cancer Patients in a Malaysian General
Hospital: Experiences, Perceptions and Informational Needs from Clinical Pharmacists. Asian Pacific J. Cancer Prev. 15 (2014), 5305–5309.
7. Yong, Y.K., Tan, J.J., Teh, S.S., Mah, S.H., Ee, G.C.L., Chiong, H.S. and Ahmad, Z. Clinacanthus nutans
Extracts Are Antioxidant with Antiproliferative Effect on Cultured Human Cancer Cell Lines. Evidence-
based Complement. Altern. Med. (2013).
8. Arullappan, S., Rajamanickam, P., Thevar, N. and Kodimani, C. In Vitro Screening of Cytotoxic,
Antimicrobial and Antioxidant Activities of Clinacanthus nutans (Acanthaceae) leaf extracts. Trop. J.
Pharm. Res. 13 (2014), 1455.
9. Huang, D., Guo, W., Gao, J., Chen, J. and Olatunji, J.O. Clinacanthus nutans (Burm. f.) lindau Ethanol
Extract Inhibits Hepatoma in Mice through Upregulation of the Immune Response. Molecules. 20 (2015),
17405–17428.
10. Khiru Nasir, N.A. and Mohd Bohari, S.P. Cytotoxicity Effects of Typhonium flagelliforme and Clinacanthus nutans on Breast Cancer Cells. J. Teknol. 77 (2015), 45–50.

SCIENCE AND TECHNOLOGY 803
IGCESH2018
Universiti Teknologi Malaysia, Johor Bahru, Malaysia 13 -15 August 2018
A SURVEY OF SURFACE RECONSTRUCTION FROM 3D POINT
CLOUD
Mohamad Nurfalihin Othman*1 and Habibollah Haron2
1, 2 Faculty of Computing, Universiti Teknologi Malaysia, Johor Bahru, Malaysia.
(E-mail: [email protected], [email protected])
ABSTRACT
Surface reconstruction is a main part of reverse engineering, where accuracy of the
reproduced engineering model is prioritized. Divided into three steps, raw data in the form of
3D point cloud is processed to produce digital model that can be virtually manipulated or
modified and backup. Depending on the quality of the data, the appropriate surface
representation to be used may differ. This paper introduces the process of surface
reconstruction as well as summarizing the conventional surface representation used in surface
reconstruction, along with advantages and disadvantages that accompanies each approach.
Key words: Surface Reconstruction, 3D Cloud Points, Surface Representation
INTRODUCTION
Surface reconstruction is the process of reproducing geometric based model based on existing
physical object [1]. The challenge lies in efficiently providing complete surface
representation from partial information of an object. A main part in reverse engineering,
surface reconstruction allows recovery of engineering models from actual object as digital
backup or in order to manipulate the object of interest virtually. Söderkvist [2] divides the
process of surface reconstruction in to three separate steps, namely Data Acquisition, Data
Organization and Surface Fitting.
Data Acquisition
Data acquisition is where 3D coordinates are measured from the surface of an object. To
acquire these coordinates, two methods categorized as active and passive are used. LiDAR
(Light Detection and Ranging) scanners and optical laser-based range scanners are
categorized as active method, whilst multi-view stereo is categorized as passive method.
These methods produces raw data in the form of unstructured data i.e. point cloud or
structured data i.e. ranged scans/image.
Unstructured data are set of 3D coordinates in x, y and z that represents the location of these
points on the surface of an object. Kazhdan et al. [3] states that the data of scanned objects
are mostly unstructured which causes point sampling to be non-uniform, where the distance
between each points are not constant. On the contrary, structured data contains the
connectivity information, the connectivity among each point that makes up triangular meshes
of an object [4].

SCIENCE AND TECHNOLOGY 804
Data Organization
Unstructured data is required to go through this step in order to obtain the connectivity of
each sample point, as reconstruction without such information may either produce undesired
results or require high computation. Most methods that calculate connectivity requires dense
dataset sampling, usually achieved by joining multiple view scans of the object, to preserve
the topology and geometry of the object.
However, this process may cause imperfections, such as non-uniform sampling, noisy data,
outliers, misaligned scans and missing data, to the corresponding point cloud. Additionally,
inputs such as surface normals, scanner information, and RGB imagery can be extremely
beneficial in assisting the reconstruction process [5].
Surface Fitting and Surface Representation
Fitting a surface can be achieved either through interpolation method, the surface need to
pass through the data points exactly, or approximation method, the surface is only required to
be close to the data points. Approximation method is preferred in reconstruction of
unstructured data as this method may compensate the deficiencies that come with 3D point
cloud. Taking into account the geometry and topology of the object, the surface can be
represented as either explicit surface or implicit surface [6].
MAIN RESULTS
Table 1 is a summarized description on the types of surface representation, categorized as
either explicit or implicit surface.
Table 1. Summarized description of surface representation Explicit
Parametric B-Spline Generalized from Bezier curve, a B-Spline polynomial
degree can be set independently of the number of control
points but with certain
limitations, and local control can be done on the shape of a
spline curve or surface
NURBS Generalization of both Bézier and B-splines surfaces, the reconstructed surface is smoother and NURBS can deal
with non-uniform data set
Triangulated Voronoi and Delaunay By forming the nearest connectivity among the nearest
neighboring points, the sample points are used to generate
the vertices of triangle meshes
Implicit
Least Square An approximation method to find a solution that is close to
the real solution of an undetermined problem, where the
error is defined as the difference between the data and the
value provided by the model
Poisson An implicit function which merges global and
local fitting schemes, that can create very smooth surfaces
Partial Differential Equation (PDE) A method that produces very good result in image
interpolation and compression, proven to be capable of
interpolating surface from sparsely unorganized point sets
Level Set A numerical and theoretical method for implicit surfaces, that can handle complex topology and noisy data

SCIENCE AND TECHNOLOGY 805
CONCLUSION
The application of each surface representation have advantages and disadvantages. For
explicit methods, B-Spline cannot handle objects with complicated shapes, NURBS faces
difficulty when processing noisy data and cannot accurately represent conic curve, and
Voronoi and Delaunay relies on the quality of input data and faces issue when handling noisy
or non-uniform data. Similarly for implicit methods, Least Square may face the issue of
overfitting the surface, Poisson may face the issue of oversmoothing the data, PDE is
computationally expensive to solve, and Level Set does not guarantee the conservation of
volume and shape over time.
REFERENCES
1. Guo G, Wu X, Wang MY, Wu J (2010) Fast implicit surface reconstruction method based on normal
constraints. In: Proceedings of the 2010 IEEE, international conference on mechatronics and automation,
August 4–7, 2010, Xi’an, China. pp 1783–1788.
2. Soderkvist, I. 1999. “Introductory overview of surface reconstruction methods”. In Technical Report 1999-
10, Lulea, , Sweden: Department of Mathematics, Lulea University of Technology
3. Kazhdan M, Bolitho M, Hoppe H (2006) Poisson surface reconstruction. Eurograph Symp Geom Process pp
61–70.
4. do Rêgo RLME, Araújo AFR (2010) A surface reconstruction method based on self-organizing maps and intrinsic delaunay triangulation. pp 1–8.
5. Berger M, Tagliasacchi A, Seversky L M, Alliez P, Guennebaud G, Levine JA, Sharf A, Silva CT (2017) A
survey of surface reconstruction from point clouds. Comput Graph Forum 36(1):301–329
6. Zhao HK, Osher S, Fedkiw R (2001) Fast surface reconstruction using the level set method. IEEE workshop
on variational and level set methods (VLSM’01). pp 194–201

SCIENCE AND TECHNOLOGY 806
IGCESH2018
Universiti Teknologi Malaysia, Johor Bahru, Malaysia 13 -15 August 2018
ISOLATION, CHARACTERISATION AND IDENTIFICATION
OF CELLULOLYTIC Bacillus sp. CJ2 FROM RICE STRAW
Seng Chong Teo*1, Chun Shiong Chong2
1, 2 Faculty of Biosciences and Medical Engineering,
Universiti Teknologi Malaysia, SKUDAI, MALAYSIA. (E-mail: [email protected], [email protected])
ABSTRACT
The importance of rice (Oryza sativa) by serving as the prime food source for the population
in Asia had brought about million tonnes of annual production and enormous concomitant
rice crop residues. Bioconversion of lignocellulosic materials through microbial enzymes to
produce fermentable sugars has attracted mass attention and extensive research. In this study,
the rice straw from a paddy field was used as a source of potential lignocellulose-degrading
bacteria. Among the seven bacteria isolated, strain CJ2 showing positive degradation on
CMC and BiX was selected and subsequently identified as Bacillus sp. based on 16S rRNA
gene sequence analysis. It was Gram-positive, endospore-forming, positive in catalase,
oxidase, gelatinase, amylase, casease, cellulases and xylanase production, while utilizing
lactose/sucrose and glucose as a source of carbon. Antibiotic resistance was exhibited
towards Penicillin G, Lincomycin, Polymyxin B, Novobioxin, Ampicillin and Carbenicillin.
Preliminary characterization of the cellulases produced by Bacillus sp. CJ2 revealed its
thermo-tolerant characteristic. This finding suggested the potential application in enzyme
cocktails for cellulosic materials degradation at high temperature.
Key words: Bacillus, Cellulases, Cellulolytic bacteria, Endoglucanase, Thermostable.
INTRODUCTION
Rice (Oryza sativa), one of the main cereal crop in the world, is cultivated in more than 148 million
hectares across 114 countries [1]. Rice is the key staple food for half the world’s population, about
95% of the rice crop was cultivated in Asia to fulfil the demand of the population. The total rice production back in 1960 was 150 million tonnes which increased to 662 million tonnes in 2008 [1]
and further increased to 741.3 million tonnes in 2014.
Rice straw as the crop residues constitutes about 40 to 60% of the dry weight of rice plants. For every tonne of harvested rice grain, approximately 1.35 tonnes of rice straw stays in the field as a by-
product. Therefore, rice straw serves as a highly potential source of native lignocellulosic biomas. As
a result, degradation of these compounds by microorganisms and soluble enzymes yields oligo sugars which are important source of carbon and energy in industrial application such as biofuel production.
The discovery of cellulolytic microorganisms for the conversion of this agricultural waste into
fermentable sugar can have substantial social and economic benefits. In this article, we demonstrate
the isolation of a cellulolytic Bacillus sp. CJ2 and the physiochemical properties of the cellulases produced.

SCIENCE AND TECHNOLOGY 807
In this research, the rice straw sample was first homogenized with sterile distilled water,
followed by serial dilution and grown on nutrient agar plates (pH 7.0) at 37C for 24 hours.
Seven morphologically distinct colonies were selected and further cultured until pure
bacterial culture is obtained. Cellulolytic activities of the colonies were assessed by the
ability to form halo zones on Mandel’s basal medium supplemented with 1% (w/v)
carboxymethylcellulose (CMC) and/or birchwood xylan (BiX). Bacterial colony which
showed positive degradation was further characterization using biochemical approach. The
bacterium was later identified to the genus level by using 16S rRNA gene sequence analysis.
The bacterial cellulases were extracted from the culture supernatant for characterization
MAIN RESULTS
CELLULOLYTIC BACTERIA CHARACTERISATION
Among the seven morphological distinct isolated strains, a creamy-white bacteria CJ2
which produced halo zones on 1% (w/v) carboxymethylcellulose (CMC) and birchwood
xylan (BiX) incorporated Mandel’s basal medium (Figure 1) by using qualitative plate
screening method [2, 3]. The bacterial strain was later suggested to be Bacillus sp. based on
bacterial 16S rRNA gene analysis.
Figure 1. Formation of clear halo zones by Bacillus sp. CJ2 after Congo Red and Lugol’s
iodine dye application respectively on Mandel basal solid media (pH 7.0) incorporated with
CMC (left) and BiX (right) after incubation at 37°C for 48 hours
Subsequent biochemical characterization revealed that Bacillus sp. CJ2 was Gram-
positive, facultative aerobes, endospores-forming, amylolytic, proteolytic, able to ferment
glucose, sucrose and lactose but unable to utilize citrate as sole carbon source (data not
shown). The optimum temperature for growth of Bacillus sp. CJ2 was at 37C in nutrient
broth (pH 7.0) as shown in Figure 2. The exponential growth rate of CJ2 was 0.40384 h-1
whereas the doubling time was 1.71638 h.
Figure 2. Growth profile of Bacillus sp. CJ2 at respective temperature for 12 hours

SCIENCE AND TECHNOLOGY 808
Antibiotics susceptibility analysis showed the formation of halo zones around the antibiotics
containing discs. As in Figure 3, formation of halo zones showed that the Bacillus sp. CJ2
was sensitive to the particular antibiotics, namely Gentamycin, Neomycin, Streptmycin, and
Erythromycin. On the contrary, it was resistant to Penicillin G, Lincomycin, Polymyxin B,
Novobioxin, Oleandomycin, Ampicillin and Carbenicillin.
Figure 3. Halo zones were formed based on the resistance ability of Bacillus sp. CJ2 towards
the particular antibiotics
CHARACTERISATION OF CRUDE CELLULASES
Figure 4. CMCase and FPase activity produced by the strain were stable up to 60C towards
the substrate CMC and Whatman No.1 filter paper respectively
Cellulases consist of endoglucanases and exoglucnaases. The production of both the enzymes
was quantitatively accessed by DNS assay [6]. As shown in Figure 4, the endoglucanase
activity produced by strain CJ2 was initially 100% and dropped to 69.4% (0.0327 U/mL),
76.4% (0.0368 U/mL), and 80.8% (0.0381 U/mL) after incubation at 4°C, 28°C, and 40°C
respectively. The highest activity was recorded at 50°C at 100% (0.0471 U/mL). The
enzyme maintained a relatively high activity (95.9%, 0.0452 U/mL) at 60°C.
The exoglucanases produced by strain CJ2 was apparently steady across the temperature
range. Enzyme activity of strain CJ2 exoglucanase was stable, which were 99.7% (0.0218
FPU/mL), 100.5% (0.0220 FPU/mL), 102.2% (0.0224 FPU/mL) and 100% (0.0219 FPU/mL)
at the respective temperature, despite a decline of activity at 60°C (90.4%, 0.0198 FPU/mL).

SCIENCE AND TECHNOLOGY 809
With such thermostability of the enzyme, it was suggested the potential application for
hydrolysis of cellulosic and hemicellulosic materials at high temperature, in addition to the
plant cellulose hydrolysis process at industrial-scale at an elevated temperature for pro-
longed period. Besides, it may also facilitate more effective and economic measures to
simultaneous saccharification and conversion of biomass to biofuels [7].
CONCLUSION
Cellulolytic bacteria Bacillus sp. CJ2 that was able to hydrolyse both CMC and BiX could be
suggested to be incorporated into micro-organisms cocktails to enhance synergistic effects in
applications of cellulosic waste management. Besides, preliminary characterisation of the
crude cellulases (endoglucanase and exoglucanase) produced by bacterial strain CJ2 and CJ7
revealed stable enzyme activity up to 60°C, which suggested the potential thermo-tolerant
ability of the enzymes. Therefore, bacterial thermo-tolerant cellulases could be used together
with fungal enzyme consortium to produce a cocktail of different enzymes for efficient
degradation and utilisation of cellulosic wastes
Acknowledgment: This work was financially supported by Universiti Teknologi Malaysia
RU grant (Grant number: 20H43).
REFERENCES
1. Kausar, H., et al., Isolation and screening of potential actinobacteria for rapid composting of rice straw.
Biodegradation, 2011. 22(2): p. 367-375.
2. Williams, A.G., Staining reactions for the detection of hemicellulose-degrading bacteria. FEMS
microbiology letters, 1983. 20(2): p. 253-258.
3. Wood, T.M. and K.M. Bhat, Methods for measuring cellulase activities, in Methods in enzymology. 1988,
Elsevier. p. 87-112.
4. Shemekite, F., et al., Coffee husk composting: an investigation of the process using molecular and non-
molecular tools. Waste management, 2014. 34(3): p. 642-652. 5. Gruner, E., A. von Graevenitz, and M. Altwegg, The API ZYM system: a tabulated review from 1977 to date.
Journal of microbiological methods, 1992. 16(2): p. 101-118.
6. Ghose, T., Measurement of cellulase activities. Pure and applied Chemistry, 1987. 59(2): p. 257-268.
7. Rastogi, G., et al., Characterization of thermostable cellulases produced by Bacillus and Geobacillus
strains. Bioresource technology, 2010. 101(22): p. 8798-8806.

SCIENCE AND TECHNOLOGY 810
IGCESH2018
Universiti Teknologi Malaysia, Johor Bahru, Malaysia 13 -15 August 2018
EFFECTS OF ZINC DOPANT ON OPTICAL PROPERTIES OF
CI(S,Se)2 THIN FILMS FOR SOLAR CELL APPLICATIONS
Elham Mazalan*1, Kashif Tufail Chaudhary2, Nafarizal Nayan3, Jalil Ali2 and Elfa
Rizan Rizon4
1,* Department of Physics, Faculty of Science, Universiti Teknologi Malaysia
(E-mail: [email protected]) 2 Laser Centre, Ibnu Sina Institute for Scientific and Industrial Research, Universiti Teknologi
Malaysia, Johor Bahru 81310, Malaysia
(E-mail: [email protected], [email protected]) 3 Microelectronics & Nanotechnology – Shamsuddin Research Centre, Institute of Integrated
Engineering, Universiti Tun Hussein Onn Malaysia, Parit Raja, Batu Pahat 86400, Johor, Malaysia
(E-mail: [email protected]) 4 Faculty of Electrical & Electronic Engineering, Universiti Tun Hussein Onn Malaysia, Parit Raja,
Batu Pahat 86400, Johor, Malaysia
(E-mail: [email protected])
ABSTRACT
In this study, a solution-processed approach based on binary thiol-amine solvents is reported
to fabricate chalcopyrite p-type CuIn(S,Se)2 thin film layer as solar cell absorber. Zinc is
introduced as dopant during precursor solution processing in order to enhance the optical
absorption on CI(S,Se)2 absorber thin films. The Zn-doped CI(S,Se)2 thin films are grown
through atomizer spray pyrolysis route on soda lime glass substrates followed by selenization
process. Five different zinc molar ratio (as 0.00 mol%, 1.25 mol%, 2.50 mol%, 3.75 mol%,
and 5.00 mol%) are incorporated in CI(S,Se)2 thin absorber layer to investigate the impact of
dopant on optical characteristics of the absorber layer. Optical spectra from Zn-doped
CI(S,Se)2 with different Zn molar ratio are recorded using UV-Vis-NIR spectrophotometer.
From the optical spectra, the optical band gap based on Tauc model is calculated. Results
show that the Zn as dopant significantly enhances the optical properties and enables to tune
the optical characteristics of CI(S,Se)2 thin absorber layer, especially for solar cell
applications.
Key words: CISSe Chalcopyrite, Zinc doping, Spray pyrolysis, solution processing
INTRODUCTION
Metal chalcogenides alloys based on ternary chalcopyrite copper indium diselenium (CISe2)
are promising candidate for thin film solar cells due to high absorption and direct band gap
[1,2]. Highest photoelectric conversion efficiency reported for CISe2-based is reached 22.6%
[3]. The use of CdS buffer layer for CIGS solar cell causes the environmental problems due
to the toxic nature of Cd [4]. Alternative Cd-free, ZnS buffer layers have been yielded high
efficiency and form metastable p-n heterojunction state in CIGS solar cell [5,6]. Previous
work shows that the properties of CISe-based thin films can be improved by optimizing the

SCIENCE AND TECHNOLOGY 811
doping factor [7,8]. Moreover, Zn-doped CISe2 can enhance the efficiency of solar cells by
controlling the carrier concentration of Zn-doped CISe2 layer, consequently improving VOC
and create better heterojunction state with ZnS buffer layer [9,10]. In this work, we report on
the preparation and deposition of Zn doped CI(S,Se)2 thin films based on thiol-amine solution
processing. Atomizer chromatography spray pyrolysis is used for deposition of Zn doped
CI(S,Se)2 thin films followed by selenization process. Deposited CI(S,Se)2 thin films with
different Zn molar ratio are investigated. The effects of Zn doping on the optical properties of
CISSe thin films are studied. All chemicals used in this work are used without purification.
The precursors Cu2S (Alfa Aesar, 99.999%) and In2S3 (Alfa Aesar, 99.999%), and doping Zn
elemental (Sigma-Aldrich, 99%), are dissolved in a mixture of binary solvent of 1,2-
ethylenediamine (EDA) (Sigma-Aldrich, 99%) and 1,2-ethanedithiol (EDT) (Sigma-Aldric,
99%).At first stage, CIS precursor solution is prepared by dissolved Cu2S and In2S3 in EDA
and EDT with targeted concentration is 0.2 M using one-pot approach [11], and divided into
5 vials once the precursor solution totally dissolved. The doping solution is prepared by
dissolving Zn in EDA and EDT with targeted concentration 0.2 M. The five different molar
ratio (0.00 mol.%, 1.25 mol.%, 2.50 mol.%, 3.75 mol.%, and 5.00 mol.%) are mixed with
five different vials of precursor solution. Zn-doped CIS2 thin films are deposited by spray
atomizer pyrolysis on the soda-lime-glass substrates followed by selenization process to form
Zn-doped CI(S,Se)2 thin films.
MAIN RESULTS
The optical properties of undoped and Zn-doped CI(S,Se)2 absorber thin films are
characterized using UV-Vis spectrophotometer. Figure 1 shows absorbance spectra of
CISSe thin films with various Zn molar ratio for spectral range of 300-1500 nm.
Figure 1. UV-Vis-NIR absorption spectra of undoped and Zn-doped CI(S,Se)2 absorber
thin films deposited at various Zn molar ratio
The absorption edges of undoped and Zn-doped CI(S,Se)2 are close to each other which
indicates band gap of thin films is approximately similar. In order to evaluate the band
gap energy of undoped and Zn-doped CI(S,Se)2 absorber thin films, Tauc plot analysis
[12], (αhν)2 is conducted and plotted against hν as shown in Figure 2. Values of
absorption coefficient, α is calculated by measuring absorbance and thickness of thin
films. Thickness of absorber thin films are obtained through surface profiler which are in

SCIENCE AND TECHNOLOGY 812
range 1.5 – 2.5 µm. Figure 2 inset shows the estimation relationship between band gap
and Zn molar ratio for undoped and Zn-doped CI(S,Se)2 and the estimated bandgap is
about 0.990 – 1.011 eV.
Figure 2. Tauc plot and estimation band gap (inset) of undoped and Zn-doped CI(S,Se)2
absorber thin films with various Zn molar ratio.
CONCLUSION
In this work, solution processing of zinc doping in CI(S,Se)2 absorber thin films based on
thiol-amine binary solvents is reported. Undoped and Zn-doped CI(S,Se)2 absorber thin films
are deposited by non-vacuum atomizer chromatography spray pyrolysis and followed by
selenization process. Various zinc molar ratio (0.00, 1.25, 2.50, 3.75, and 5.00 mol.%) are
doped in CI(S,Se)2. The UV-Vis spectral ansysis suggest that the optical properties of Zn-
doped CI(S,Se)2 are significant changes and the performance of the absorber thin films
improves..
Acknowledgment: The authors would like to express their appreciation to UTM for the
support and providing opportunity for Zamalah Scholarship. This research work is supported
by GUP project 16H42. One of the authors N. Nafarizal would like to acknowledge the
Ministry of Higher Education Malaysia for providing research funding under ERGS E025
and UTHM Contract Grant GPP U566 and IGSP U675.
REFERENCES
1. T. Tanaka, Y. Demizu, A. Yoshida, T. Yamaguchi, Preparation of Cu(In,Ga)2Se3.5 thin films by radio
frequency sputtering from stoichiometric Cu(In,Ga)Se2 and Na2Se mixture target, J. Appl. Phys. 81 (1997)
7619.
2. S.R. Thomas, C.-W. Chen, M. Date, Y.-C. Wang, H.-W. Tsai, Z.M. Wang, Y.-L. Chueh, Recent
developments in the synthesis of nanostructured chalcopyrite materials and their applications: A review,
RSC Adv. 6 (2016) 60643–60656. 3. M.A. Green, Y. Hishikawa, E.D. Dunlop, D.H. Levi, J. Hohl-Ebinger, A.W.Y. Ho-Baillie, Solar cell
efficiency tables (version 51), Prog. Photovoltaics Res. Appl. 26 (2018) 3–12.
4. Effect of impurities in the CdS buffer layer on the performance of the Cu(In, Ga)Se2 thin film solar cell, J.
Appl. Phys. 85 (1999) 6858.

SCIENCE AND TECHNOLOGY 813
5. T. Nakada, M. Mizutani, 18% efficiency Cd-free Cu(In, Ga)Se2 thin-film solar cells fabricated using
chemical bath deposition (CBD)-ZnS buffer layers, Japanese J. Appl. Physics, Part 2 Lett. 41 (2002) 7–10.
6. W.-J. Lee, H.-J. Yu, J.-H. Wi, D.-H. Cho, W.S. Han, J. Yoo, Y. Yi, J.-H. Song, Y.-D. Chung, Behavior of
Photocarriers in the Light-Induced Metastable State in the p-n Heterojunction of a Cu(In,Ga)Se 2 Solar Cell
with CBD-ZnS Buffer Layer, ACS Appl. Mater. Interfaces. 8 (2016) 22151–22158. 7. Y. Li, Y. Zhou, J. Luo, W. Chen, B. Yang, X. Wen, S. Lu, C. Chen, K. Zeng, H. Song, J. Tang, The effect of
sodium on antimony selenide thin film solar cells, RSC Adv. 6 (2016) 87288–87293.
8. K.F. Tai, D. Fu, S.Y. Chiam, C.H.A. Huan, S.K. Batabyal, L.H. Wong, Antimony Doping in Solution-
processed Cu2ZnSn(S,Se)4 Solar Cells, ChemSusChem. 8 (2015) 3504–3511.
9. S. Sho, Site selective doping of Zn for the p-type Cu(In,Ga)Se 2 thin film for solar cell application, Phys.
Status Solidi Curr. Top. Solid State Phys. 1600170 (2017) 6–10.
10. L. Larina, D. Shin, J.H. Kim, B.T. Ahn, Alignment of energy levels at the ZnS/Cu(In,Ga)Se2 interface,
Energy Environ. Sci. 4 (2011) 3487.
11. P. Arnou, C.S. Cooper, A. V. Malkov, J.M. Walls, J.W. Bowers, Solution-deposited CuIn(S,Se)2 absorber
layers from metal chalcogenides, in: IEEE 42nd Photovolt. Spec. Conf. PVSC, 2015.
12. J. Tauc, A. Menth, States in the gap, J. Non. Cryst. Solids. 8–10 (1972) 569–585.

SOCIAL SCIENCE

SOCIAL SCIENCE 814
IGCESH2018
Universiti Teknologi Malaysia, Johor Bahru, Malaysia 13-15 August 2018
A REVIEW OF THE LINKAGE BETWEEN ORGANIZATIONAL
COMMUNICATION AND EMPLOYEES’ PERFORMANCE
Jen Ling Gan*1 and Halimah M. Yusof
2
1, 2 Faculty of Management, Department of Human Resource Development, Universiti Teknologi
Malaysia, 81310 UTM Skudai, Johor, MALAYSIA.
(E-mail: [email protected], [email protected])
ABSTRACT
This article discussed the relationship between organizational communication and
employees’ performance. It was revealed that there are inconsistency of the findings in the
past studies. This has triggered a need for further exploration on the linkage between
organizational communication and employees’ performance. It is suggested that more
empirical researches to be conducted in the future to provide a more concrete evidences on
the linkage between organizational communication and employees’ performance. Keywords: Organizational Communication, Employees’ Performance, Review Paper
INTRODUCTION
Nowadays, in order to achieve the goals of organization, employees’ performance (EP) have
been put in the first place [1]. The accomplishment of organizations is much depending on
how poor or how excellent the EP is [2]. Among the factors that could affect EP,
organizational communication (OC) is known as one of the possible factor that could
contribute to EP [3]. OC happens when job scopes are explained, ideas are shared, and
information is distributed [3]. Besides information, employees’ thought, opinions, views,
feelings, and emotions are shared among the staffs of organizations as well [4]. It is
believed that in an organization, it is impossible to enhance EP without effective OC
because interaction between employees is needed [4]. Hence, it is claimed that OC is
crucial and dominant activity in organizations [5]. OC happens when the top management
design organizations’ plans, as well as decision execution [5]. Due to the rapid changes in
new era, two-way OC happens among top management and subordinates [6]. It is
believed that communication can enhance EP when top management and subordinates
reached mutual agreement through discussions [7]. However, there is a lacking of
researches that examined the linkage between OC and EP, hence, more empirical
evidences are needed [7, 8]. This paper intends to review the linkage between OC and EP
in recent years. OC is defined as the process of which the information of job is transferred
by organization to the employees [9]. OC is defined as the process where ideas, emotions,
and views are exchanged via letters, symbols, and words [10]. OC helps to make sure that
symbols are translated correctly, the symbols are meeting the meaning of words, and
knowing how effective the transmission is [11]. With effective OC, tasks and resources to
be carried out can be communicated [12]. OC can boost the process of come together,
work together, learn together, reflect together, and progress together [7]. On the other

SOCIAL SCIENCE 815
hand, EP is defined as the action which can be observed and measured in jobs that are related
to organizational goals [13]. Employees’ key performance indicators, productivity, and
amount of gained profit are known as EP [14]. Good EP is known as one of the pre-requisites
to have better career development, as well as being succeed in the market of labour [15].
Hence, employees tend to show engagement when their EP is observed in organizations [15].
METHODOLOGY
A comprehensive search on the journal databases was done on the topic of OC and EP.
Literature based on the recent studies was targeted for this review. Hence, we looked for the
articles dated between 2014 to 2018 from the databases such as Elsevier and Scopus. There
are five inclusions that we concerned when we did the searching of articles. The first
inclusion is, we included those studies which are empirical. Second, we included the studies
which were conducted on real corporate personnel sample because the linkage between the
variables will be focused on corporate personnel. Third, we included the topics which are
relevant to our variables. Fourth, we included the studies which their variable of EP was self-
rated instead of being rated by co-worker or superior. This is because we focus on self-rated
EP. Fifth, we included those studies which reported the reliability and validity of their
instruments due to it might affect the validity of the studies’ result.
MAIN RESULTS
Although communication is influential in organizations, there are limited studies
conducted to investigate the linkage between OC and EP [7, 8]. As reviewed from articles
that had done on the linkage between OC and EP, findings could be different due to
different dimensions on EP. “Job success” was used as the dimension of EP [16]. This
dimension revealed that there is low linkage between OC and EP. Conversely,
“competency and commitment” dimension has been used by [17]. They revealed that
there is high and significant linkage between OC and EP. From these studies, it can be
claimed that, by using different dimensions, it might affect the findings of the linkage.
Furthermore, some studies found out that there is a linkage between supervisory support
and training transfer [7, 18, 19, & 20]. This indicated that, when organizations clearly
communicate relevant information, such as choosing the right medium, the EP will be
improved with the clear instruction. However, in contrast, it was discovered that there is
no linkage between OC and EP [21]. It can be seen that the findings on linkage between
these two variables are not consistent from years to years. From both contrast findings, it
can be concluded that empirical past studies still were not able to provide clear idea of the
linkage between the OC and EP. These contradictory findings have made the linkage
remains ambiguous.
CONCLUSION
To summarize, effective OC is important to enhance EP, which will help to improve
organizational performance. However, there are inconsistent findings found in the previous
studies. These statements of problem had triggered the awareness of the need to conduct a
research in order to investigate the relationship between the variables among the employees.
It is expected that the finding from the future empirical studies will be able to guide the
corporate personnel in managing effective OC at corporates in order to perform excellently
among the employees. It is recommended that future studies should study thoroughly on the
linkage between the variables by examining the dimensions of OC and EP.

SOCIAL SCIENCE 816
Acknowledgement: Special thanks to Zamalah Universiti Teknologi Malaysia for the
financial assistance.
REFERENCES
1. Balyan, R. K., & Balyan, S. (2012). Human resource development Text & Cases. India: Himalaya Publishing
House.
2. Malik, M. A. R., Butt, A. N., & Choi, J. N. (2015). Rewards and employee creative performance:
Moderating effects of creative self‐efficacy, reward importance, and locus of control. Journal of
Organizational Behavior, 36(1), 59-74.
3. Susanty, A., Miradipta, R., & Jie, F. (2013). Analysis of the effect of attitude toward works, organizational
commitment, and job satisfaction, on employee’s job performance. European Journal of Business and Social
Sciences, 1(10), 15-24.
4. Tayo, P. and Olamigoke, A. (2006). Leadership Management and Challenges in a Globalized Economy 1st .ed. Institute of Business and Policy Development, Maryland Lagos.
5. Harris T.E. & Nelson, M.D. (2008).Applied Organizational Communication: Theory and Practice in a
global Environment, New York: Lawrence Erlbaum.
6. Bhatia, K., & Balani, M. (2015). Effective Internal Communication: A Crucial Factor Affecting Employees’
Performance. In Proceedings of International Conference on Management, Economics and Social Sciences,
Dubai, 135-142.
7. Femi, A. F. (2014). The Impact of Communication on Workers’ Performance in Selected Organisations in
Lagos State, Nigeria. IOSR Journal of Humanities and Social Science, 19(8), 75-82.
8. Chen, J. C., Silverthorne, C., & Hung, J. Y. (2006). Organization communication, job stress, organizational
commitment, and job performance of accounting professionals in Taiwan and America. Leadership &
organization Development journal, 27(4), 242-249. 9. Price, J. L. (1997). Handbook of organizational measurement. International Journal of Manpower 18(4-6),
303-558.
10. Von Krogh, G, Kazuo I., & Ikujiro N. (2000). Enabling Knowledge Creation: How to Unlock the Mystery of
Tacit Knowledge and Release the Power of Innovation. Oxford University Press.
11. Ince, M., Gül, H. (2011). The Role of the Organizational Communication on Employees‟ Perception of
Justice: A Sample of Public Institution from Turkey. European Journal of Social Sciences. 21 (1).
12. Kalla, H. K., (2005). “Integrated Internal Communications: A Multidisciplinary Perspective”, Corporate
Communications: An international Journal, 10(4), 302-314.
13. Ayatse, F. A. (2005). Management information system: A global perspective. Makurdi: Oracle.
14. Banerji, A. & Dayal, A. (2005). “A Study of Communication in Emergency Situations in Hospitals”, Journal
of Organizational Culture, Communications and Conflict 9(2), 35-45.
15. Campbell, J. P. (1990). Modeling the performance prediction problem in industrial and organizational psychology. In M. D. Dunnette & L. M. Hough (Eds.), Handbook of industrial and organizational
psychology (Vol. 1, 687–732). Palo Alto: Consulting Psychologists Press.
16. Kour, R., & Abrol, D. (2017). Impact of Leaders Communication Skills on Employees’ satisfaction And
Employees’ performance: A Study of Women Leaders in J&K Education Sector. Proceedings of
International Conference on Emerging Trends in Engineering, Technology, Science, and Management. 274-
283.
17. Atambo, W. N., & Momanyi, D. K. (2016). Effects of Internal Communication on Employee Performance:
A Case Study of Kenya Power and Lighting Company, South Nyanza Region, Kenya. Imperial Journal of
Interdisciplinary Research, 2(5).
18. Nabi, N. M., Foysol, K. M., & Adnan, S. M. (2017). The Role and Impact of Business Communication on
Employee Performances and Job Satisfactions: A Case Study on Karmasangsthan Bank Limited, Bangladesh. Arabian J Bus Manag Review, 7(301), 2.
19. Philip, N. U., Umoh, G. I., & Amah, E. (2016). Internal Organizational Communication and Employees’
Performance in Selected Banks in Port Harcourt. International Journal of Novel Research in Humanity and
Social Sciences, 3(3), 86-95.
20. Rahman, M. S., & Taniya, R. K. (2017). Effect of Employee Relationship Management (ERM) on Employee
Performance: A Study on Private Commercial Banks in Bangladesh. Human Resource Management
Research, 7(2), 90-96.
21. Tololiu, M. I. (2015). The Influences of Women Leadership, Organizational Culture, Working Climate and
Effective Communication on Employee’s Productivity at Pt. Bank Mandiri Area Manado. Jurnal EMBA:
Jurnal Riset Ekonomi, Manajemen, Bisnis dan Akuntansi, 3(3), 199-207.

SOCIAL SCIENCE 817
IGCESH2018
Universiti Teknologi Malaysia, Johor Bahru, Malaysia 13-15 August 2018
CRITICAL SUCCESS FACTORS IMPLEMENTING SUSTAIBAILITY
IN HIGHER EDUCATION INSTITUTIONS
Nadzirah Zainordin*1, Syuhaida Ismail2
1, 2 1 UTM Razak School of Engineering and Advanced Technology, Universiti Teknologi Malaysia,
KUALA LUMPUR, MALAYSIA.
(E-mail: [email protected], [email protected])
*corresponding author [email protected]
ABSTRACT
Sustainable development is a trend in the last few decades, which has been implemented all
over the globe due to its important role in society. In addition, Higher Education Institutions
are also actively working towards sustainability by implementing sustainability practices
within the institutions it selves. The reasons of implementing Sustainable Development
within the Higher Education Institutions are mainly to tackle the challenges facing by Higher
Education Institutions. Higher Education Institutions are ‘small cities’ which have serious
direct and indirect impacts on the environment due to their large population and various
complex activities in the institutions. No specific definition to define what is actually
sustainability in Higher Education Institutions. However, speaking about sustainability, it is
always referred to the main ideas of sustainable development, which are the three bottom line
ideas: economic, social and environment. Regardless the main idea of sustainability itself,
sustainability in Higher Education Institutions can be discussed in institutions’ goals policy,
as well as long-term perspective like operational within the institutions. This paper discusses
on the critical success factor for sustainability implementation in Highers Education
Institutions and it’s strategy.
Key words: Sustainability, higher education
INTRODUCTION
Sustainable development is important for management and protection of the environment, the
issues of sustainable development deal with wide range of factors within the local and global
level, making sustainable development as a common issue to different angle of business
sector (Bert et al., 2008). This in turn leads to different practices of work and it is often seen
in many cases of various organization (Chris et al., 2006). The World Commission on
Environment and Development (WCED) asserts that sustainable development requires the
simultaneous adoption of three themes, which include environmental quality, economic
prosperity and social equity (Chris et al., 2006). The attaches of the reasonable advancement
particular idea utilized within Brutland Report followed back in 1974 when the concept of
Sustainable Societies, was first used in World Council of Church in view of equitable
distribution. Those fundamental accomplishments of the Brutland Report have brought
maintainable advancement of the standard universal political agenda and straightforward

SOCIAL SCIENCE 818
meaning that was broadly cited worldwide (Lozano, 2008; Reid 1995). There are two main
issues in higher education institutions relating to the environmental factors, which are
reducing energy consumption and waste as well as turning the curriculum into green syllabus
(Roy et al., 2008).
Sustainability implementation in Higher Education Institutions its to ensure the organization
and management of the institutions in a proper and right track with respect to the
environment, social and economic. While there are undoubtedly some of Higher Educatio
Institutions that are already on their way to embodying some of the ideals, achieving change
at the majority of Higher Education Institutions around the world will require tremendous
effort (D. Ferrer-Balas et al., 2008).
Critical Success Factors for Sustainability Implementation in Higher Education
Institutions
It is expected that the sustainability assessment implementing in Higher Education
Institutions to have the momentum factors to make this assessment successfully implemented
with the contribution and participation of the Higher Education Institutions’ stakeholders.
This can be done by addressing the organizational issues, which includes values, visions,
philosophy, policy, employer’s empowerments and change management practices (Benn et
al., 2014; Linnenluecke et al., 2009; Henriques and Richardson, 2005). When addressing the
organizational change, organizations have a higher degree of control over internal changes
than over external stimuli of Higher Education Institutions (Lozano, 2013b).
By overcoming a few key constraints factors and a systematic change into a synergy plan
towards achieving sustainability as well as a change into the silo mentality, this can help to
promote synergies between Higher Education Institutions’ roles to faces the challengers
(Hugé et al., 2016; Shiel and Williams, 2015; Sterling et al., 2013; Exter et al., 2013; Wade
and Stone, 2010; Barlett, 2008; Whitfield, 2008). Therefore, in order to achieve significant
changes, all the respective stakeholders who attach directly and indirectly with Higher
Education Institutions should know how to play their roles.
REFERENCES
1. Abdul Ghapor. S., Abd Aziz. M., Abdul Razak. D., Abidin Sanusi. Z., (2015). Implementing Education for
Sustainable Development in Higher Education: Case Study of Albukhary International University Malaysia.
2. AASHE (2011). Techinical manual STARS.
3. AUA (2012). Alternative university appraisal model for ESD in Higher Education Institutions, pp 0-35.
4. Aziz, N., Zain, Z., Mafuzi, R.M.Z.R., Mustapa, A.M., Najib, N.H.M., Lah, N.F.N., Nifa, F.A.A., Nawi,
M.N.M., Hussain, A. (2016). Relative importance index (RII) in ranking of procrastination factors among
university students. AIP Conference Proceedings. 1761(1), 20022.
5. Bert J.M de Vries, Arthur C. Petersen (2008), Conceptualizing Sustainable Development- An Assessment
Methodology Connecting Values, Knowledge, Worldviews and Scenarios, Journal of Ecological Economics
68, pg. 1006-1019. 6. Benn, S., Dunphy, D., and Griffit, A., 2014. Organisational Change for Corporate Sustainability, third ed.
Routledge, London, England.
7. Brinkhurst, M., Rose, P., Maurice, G., and Ackerman, J. D., 2011. Achieving campus sustainability: top-
down, bottom-up, or neither? International Journal of Sustainability in Higher Education, 12(4), 338-354.
8. Bryman, A. 2015. Social Research Methods, Oxford University Press.
9. Calder, W., Blanco-Portela N., Benayas J., Pertierra L. R. and Lozano R., Towards the integration of
sustainability in Higher Education Institutions: A review of drivers of and barriers to organisational change
and comparison against those found of companies, Journal of Cleaner Production (2017), doi:
10.1016/j.jclepro.2017.07.252.
10. Clugston, R.M., (2003). International efforts to promote higher education for sustainable development.
Planning for higher education 31, 30-44.

SOCIAL SCIENCE 819
11. Cortese, A.D., 2003. The critical role of higher education in creating sustainable future. Planning for Higher
Education. Vol. 31 No. 3, pp.15-22.
12. Christian Rammel, Luis Velazquez, Clemens Mader (2015). Sustainability Assessment in Higher Education
Institutions. Rout;edge Hbook of Higher Education for Sustainable Development. Pg. 331.
13. Chris Sneddon, Richard B. Howarth, Richard B. Norgard (2006), Sustainable Development in a post-Brutland World, Journal of Ecological Economics, pg. 253-268.
14. Cortese, A.D., 2003. The critical role of higher education in creating sustainable future. Planning for Higher
Education. Vol. 31 No. 3, pp.15-22.
15. Creswell, J.W. (2009). Research Design : Qualitative, Quantitative, and Mixed Methods Approaches.
16. Creswell, J.W., Plano Clark, V.L. (2011). Designing and Conducting Mixed Methods Research.SAGE
Publications.
17. Creswell, J. W. 2013. Research Design: Qualitative, Quantitative, And Mixed Methods Approaches, Sage
Publications.
18. Cronbach, L. J. 1951. Coefficient Alpha and The Internal Structure of Tests. Psychometrika, 16, 297-334.

SOCIAL SCIENCE 820
IGCESH2018
Universiti Teknologi Malaysia, Johor Bahru, Malaysia 13 -15 August 2018
MALAYSIAN MINISTRY OF HIGHER EDUCATION (MOHE) AND
SELECTED PUBLIC UNIVERSITIES INITIATIVES IN ENHANCING
STUDENTS’ NON-TECHNICAL SKILLS
Aini Najwa Azmi*1, Yusri Kamin
2, Muhammad Khair Noordin
3 and
Ahmad Nabil Md. Nasir4
1, 2, 3, 4 Department of Technical and Engineering Education, Faculty of Education, Universiti
Teknologi Malaysia, 81310 UTM Skudai, Johor Bahru, Johor, MALAYSIA.
(E-mail: [email protected], [email protected], [email protected], [email protected])
ABSTRACT
Lack of non-technical skills becomes the main factor of unemployment happens among
university students. It has been recognized that non-technical skills are the main attributes for
fresh graduates in order to be hired by industries. In today’s Industrial Revolution 4.0 (IR
4.0), it has given a new impetus to educational transformation which is called as Education
4.0. IR 4.0 demands changes in the contents of not only in technical and engineering
education but also in all areas in education. Education 4.0 is expected to train student to be
creative and produce innovations, good in communication and collaborating skills, able to
learn independently and able to work with human and robots. There are a lot of initiatives
from government and many public institutions in Malaysia have been done in order to
increase the demanded skills which are needed in the era of IR 4.0. This paper is discussing
about initiatives and programs that have been done to university students to fulfil the demand
of IR 4.0 with the impacts and recommendations. It is written based on extensive secondary
data analysis. The result revealed that the changes cannot be done abruptly in redesigning the
whole higher education in Malaysia. However, the existed programs and planning for certain
universities and courses are the good start to make the gradual changes and to make sure the
graduates can meet the expectation of IR 4.0.
Key words: non-technical skills, Industry Revolution 4.0 (IR 4.0), Education 4.0, higher
education, review
INTRODUCTION
In the era of IR 4.0, employers demands fresh engineers with highly creative and critical
thinking. It will become to university responsible to fully switched from Education 3.0 to
Education 4.0 [1]. Graduates must be innovative and able to possess at least basic
entrepreneurial skills and have cognitive flexibility to deal with complexity. Graduates must
be able to work not only with human but also with robots. The need for better communication
and collaborative skills are still important regardless of revolutions and will be far more
important than ever. In addition, graduates must acquire self-learning skills to remain relevant
in the era of rapid changes [2]. IR 4.0 require human capital with adequate digital and data
literacy. In order to achieve these, a collaboration between university and industry is a must

SOCIAL SCIENCE 821
to come up with new interdisciplinary program.
In redesigning our higher education, Ministry of Higher Education of Malaysia (MOHE) has
done several initiatives to fulfill the demands of IR 4.0. The Minister of MOHE said that said
some of the initiatives that have gained the international community’s attention are the new
evaluation system - integrated cumulative grade point average (iCGPA), work-based learning
programme - 2U2I, the CEO @ Faculty programme; furthering higher studies using past
experience through Accreditation of Prior Experiential Learning, or APEL; and Massive
Open Online Courses, or MOOCs [3].
Malaysia Education Blueprint-Higher Education (2013-2025) [4] showed the increasing of
70% of student enrolment in universities over ten years to 1.1 million students and 30% of
enrolments at higher institution by Ministry of Higher Education such as higher institution,
community colleges and polytechnics. These data reflect an increase six-time enrolment for
bachelor's degree programs in the period of 1990 to 2010 by the year 2020. However, the
amount of highly educated workforce in the job market is only 25% where there is still
shortage of 4% based on the average 27.4% which is already set to achieve a high-income
country. Compared with countries such as Singapore, Korea, Finland, United States,
Australia and the United Kingdom have exceeded the average of having highly educated
workforce [5]. Malaysia and Hong Kong still showing a gap between 4 to 5% which have not
yet reached the stage of workforces which are knowledgeable and highly skilled. This
situation can be explained on how these shortages need to be solved even universities and
other institutions have produced many graduates every year. Based on these trends, the job
market is still requiring a highly educated workforce.
Employers always expect a new employee with multi-skills include hard skills and soft skills.
Hard skills include technical skills while soft skills include problem solving, communication
skill especially in English, able to work in team, high self-esteem and more. There are a lot of
criteria of employability skills will be discussed in this research. Many previous researchers
reported that fresh graduates are always lack of these three criteria [6]–[8] This will be a very
huge challenge to public universities in Malaysia in preparing a standard curriculum to
produce graduates with specialized skills to undergo employment in the industries.
Collaboration between university and industry will be one of the solutions in this research.
Although it is not new in Malaysia, but a very specific new framework will be built to create
a flow that can be referred by many parties to increase the employability skills among fresh
graduates, yet the unemployment issue can be slowly vanished. This framework will be a
platform for students in understanding their potential, the working field experiences and able
to increase their specific skills.
Fresh graduates step out from universities to the industries with hopes of getting employed
with their dream job. With degree scroll in hand, most expect to get a job as soon as they
graduate. However, an analysis of the recent past studies on job market and graduate
employment trend has clearly indicated that graduate unemployment appears to be an
impending problem. Malaysia Labour Force Survey defines the unemployed is a person who
are free for work but did not work during a reference period. He or she could actively search
for a job or even not. However, graduates who are pursuing their study are not included in
this situation [9].

SOCIAL SCIENCE 822
MAIN RESULTS
The main result of this paper is the analysis of the initiatives that have been done by
government in selected public universities in Malaysia. The recommendations will be coming
out after the analysis.
CONCLUSION
As conclusions, there are positive impacts of the initiatives done by government to the
students who are involved in the programs. Eventhough the redesigning of higher education
in Malaysia are still in progress for some plans and programs, but for sure the purpose is to
reduce the unemployment issue by equipting necessary skillls that are demanded by today’s
industry.
Acknowledgment: We would like to thank School of Graduate Studies (SPS), UTM for
assisting this study financially through Zamalah Scholarship.
REFERENCES
1. A. Benešová and J. Tupa, “Requirements for Education and Qualification of People in Industry 4.0,”
Procedia Manuf., vol. 11, no. June, pp. 2195–2202, 2017.
2. A. M. Harkins, “Leapfrog Principles and Practices: Core Components of Education 3.0 and 4.0,” Futur. Res.
Qual., vol. 24, no. 1, pp. 19–31, 2008.
3. “Malaysia Education Blueprint-Higher Education 2013-2025,” Kementeri. Pendidik. Malaysia, pp. 1–40,
2012. 4. M. Malaysia Education Blueprint, “Malaysia Education Blueprint 2013 - 2025,” Education, vol. 27, no. 1,
pp. 1–268, 2013.
5. M. I. Mahmud, J. Ahmad, W. Marzuki, and W. Ahmad, “Modul Kesediaan Kerjaya Berdasarkan Teori
Cognitive Processing (CIP),” no. 3, pp. 59–75, 2016.
6. M. Y. Husain, M. S. Rasul, R. Mustapha, S. A. Malik, R. Amnah, and A. Rauf, “Jurnal Teknologi Full paper
Tahap Kemahiran Employability Pelajar Kejuruteraan dari Perspektif,” vol. 1, pp. 31–39, 2013.
7. M. S. Rasul, R. A. Rose, and A. N. Mansor, “Employability skills indicator as perceived by manufacturing
employers,” Asian Soc. Sci., vol. 9, no. 8, pp. 42–46, 2013.
8. N. Muhammad Khair and et al, “Framework for Project-Based Learning ( PjBL ) in Providing Real World
Experience for Electrical Engineering Students Framework for Project-Based Learning ( PjBL ) in Providing
Real World Experience for Electrical Engineering Students,” Appl. Math. Inf. Sci., no. August, 2016.
9. H. L. Rahim and N. F. Mohd Lajin, “Social Entrepreneurship and Graduate Employability,” Int. Acad. Res. J. Soc. Sci., vol. 1, no. 1, pp. 33–40, 2015.

SOCIAL SCIENCE 823
IGCESH2018
Universiti Teknologi Malaysia, Johor Bahru, Malaysia 13 -15 August 2018
HEADSCARF ISSUE AND CHALLENGE IN TURKEY
Nurhidayu Rosli*1, Kamaruzaman Yusoff2 and Tamat Sarmidi3
1, 2 Faculty of Islamic Civilization, University Technology of Malaysia, Skudai, MALAYSIA.
(E-mail: [email protected], [email protected]) 3 Institute of West Asian Study, National University of Malaysia, Bangi, MALAYSIA.
(E-mail:[email protected])
ABSTRACT
The headscarf issue is a long-standing issue inside the secular Republic of Turkey. It has
started in 1982 when the military elite decided to take charge of institution of higher
education which made headscarf become their central focus and was seen as one of the threat
for secularization process inside Turkey. After that, the law banning the headscarf inside the
institution has been executed. This situation has worsened in 1997 when the next coup
occurred. As a result, thousands of female students quit school while some of them chose to
study outside Turkey. Therefore, this article is going to discuss the effort the Islamists group
has taken to lift the ban since then. Most importantly, the article focus is on the uplifting
process done by the AKP through democratization process. For this purpose, content
analysis of Today’s Zaman newspaper articles has been done to see the process. The findings
show a pattern inside Turkey’s political landscape. The early effort of the Islamist group and
even AKP failed when they tried to lift the ban using their own capacity as authoritative
figure through legal or constitutional amendment because the military would fight the effort.
However, when the AKP educate the people regarding basic rights and used referendum as a
medium to gain support for constitutional amendment or in other word through democratic
approach, they managed to lift the ban easily in 2010. Public consensus has been found the
best weapon for the government to face the military and thus realizing their islamization goal.
Key words: Democratization, Headscarf ban, Islamization, Human rights
INTRODUCTION
This article aims to discuss the process of lifting the headscarf ban in the higher education
institution through a democratization approach by the Justice and Development Party (AKP).
The process has been divided into four phases according to years -2008, 2009, 2010 and
2011. The method used to examine the process is content analysis of Today’s Zaman
newspapers’ articles [1, 2, 3, 4]. Below is the summary of findings (See Figure 1) based on
the comparing process during the content analysis (See Table 1).

SOCIAL SCIENCE 824
Table 1. Comparison between the Headscarf Issue and Democratization
Years/Frequency 02 03 04 05 06 07 08 09 10 11
Women,
headscarf and
rights
- 2 3 4 3 40 89 22 41 39
TOTAL 263
Source: Today’s Zaman
Table 2. Democratization and islamization issue in Today’s Zaman newspaper articles
Years/frequency 02 03 04 05 06 07 08 09 10 11
Democratization - - 1 1 1 8 8 37 28 14
Islamization - 1 - 1 - 3 3 5 6 3
TOTAL 120
Figure 1. Summary of findings in the headscarf ban lifting process
CONCLUSION
Based on the analysis regarding the process of lifting the headscarf ban in the higher
education institution, I have founded that decision-making process through the people’s
consensus has facilitated in solving the long-standing issue of headscarf ban. Therefore,
political education and consciousness are really important inside a society to offer a check-
and-balance in the government decision-making process.
Acknowledgment: The authors would like to express their appreciation for the support of the
Ainuddin Wahid Scholarship during my postgraduate undertakings.
REFERENCES
[1] Today’s Zaman (2008)
[2] Today’s Zaman (2009)
[3] Today’s Zaman (2010)
[4] Today’s Zaman (2011)
• 23-AKP and MHP have reached an agreement on how to abolish the ban on headscarf wearing in higher institution
• AKP faced the party closure case under anti-secularism allegation
2008
• AKP introduced democratization initiative
• The headscarf issue did not capture the media attention
• Democratization initiative is publicized
• 90 percent of the Turkish society support the referendum
• The constitution and Article No. 17 in YÖK is amended
• Democratization is less discuss
• Increase in political participation with another demand for women to allow wearing headscarf in the parliament
2009
2010
2011

SOCIAL SCIENCE 825
IGCESH2018
Universiti Teknologi Malaysia, Johor Bahru, Malaysia 13 -15 August 2018
GAME ELEMENT IDENTIFICATION IN MOBILE LEARNING
GAME APP- A SYSTEMATIC REVIEW
Noor Asmina Mohd Rashid*1, Shaharuddin Md Salleh2 and Norah Md Noor3
1, 2, 3 Faculty of Education, Universiti Teknologi Malaysia, Johor, MALAYSIA.
(E-mail: [email protected], [email protected], [email protected])
ABSTRACT
Mobile game applications are getting popular regardless of age. This is due to its diversity of
content and development goals that are relevant to the target audience. Furthermore, numbers
of mobile learning game apps available on the Google Apps Store and Apple Store sites for
various subjects and areas of education are growing. This review is made because despite the
rising number some mobile learning game apps are actually not effective for the reason that
the developer does not include proper game elements beside there is no educational theory
were applied and only for profit. This study takes meta- analysis approach to systematically
reviewing the articles published between 2012 and 2017 to identify the elements of the game
used in each mobile learning game development application. Major findings include the most
studies of mobile game learning application have different game elements according to the
level of the users’ education and the content of the app. These findings may provide insight
of researchers and educators into research related to development of mobile learning game
application for effective teaching and learning process.
Key words: Mobile game application, Game elements, Target user, Content of the mobile game
INTRODUCTION
Mobile games are a type of video game played through mobile phones such as
smartphones, tablets, IPhone, and Personal Digital Assistants (PDAs). It attracts the
majority of users as there are features that attract users to play mobile games such as
easy-to-use, lightweight, engaging videos, great audio, and more [1]. However, mobile
game applications are more attractive to users regardless of age because they are easily
downloaded from the Google Play Store and Apple Store sites for free. Various mobile
game applications can be found to suit the needs of users, whether for entertainment or
for mobile games applications in education.
Teachers and students now have the opportunity to use a variety of instructional and
learning tools developed by developers to help the education system grow and make
students' interest more educated regardless of where they are and at any time. The reason
that developers are actively involved in developing mobile game applications for
education is because of the interesting features and elements found in a game app that can
help students and teachers make them as a tool for teaching and learning [3] – [7].

SOCIAL SCIENCE 826
However, not all developers develop mobile learning game apps using the right game
elements for each developed app. When an inappropriate game element is inserted into
the game app, it will result in the learning objective behind the play activity may not be
achieved by the user, especially the students. Each game element that is included in the
application should have a specific purpose of helping users, especially students in the
learning process.
Unfortunately, there are some developers who make profits as the primary objective
rather than helping the learning process for the students. In addition, some developers do
not add educational theory into game applications to help users gain knowledge while
playing game apps. Hence, the purpose of this article is to review past studies related to
the development of mobile learning application apps to identify the elements of the game
used in each mobile learning game development application. This study takes meta-
analysis approach to systematically review the articles published between 2012 and 2017.
MAIN RESULTS
Searching through multiple electronic databases has been done between year 2005 and
2018, focus on the development of mobile learning game applications for kindergarten,
primary school, secondary school, and university level only. The terms that used in t he
journal searching process are "mobile game learning element" OR "mobile learning game
application development". 64,696 articles found from the searching had been filtered and
reduced to 22 relevance articles.
The review reveals the major findings include the most studies of mobile game learning
application have different game elements according to the level of the users’ education and
the content of the app. Based on literature, this paper has identified twelves game elements
that should be combine in a mobile game app or computer game to make learning through
playing game become more engaging and effective towards students [8]. Finding in Table
1 shows that each mobile learning game application have different game elements according
to its’ objective of development and type of game.
Table 1. Number of articles based on game elements
Game elements Number of articles
Challenge 15
Interactive 13
Fun 11
Outcome and feedback 11
Problem solving 11
Goals 8
Play 7
Rules 7
Adaptive 7
Interaction 7
Story 7
Win states 3
The most used of game elements is challenge element which is 15 from 22 articles using this
element to achieve their objectives. While the least game element included in the apps is Win

SOCIAL SCIENCE 827
States. Top five (5) game elements chosen by the articles review seems to be closely related
to the learning objective than gaming itself. This shows that priorities should be given to the
elements that support learning such as game challenge, interactive, fun, outcome and
feedback, and problem solving than other game elements such as game goals, game rules,
game story, and win states.
CONCLUSION
From the study, the findings may provide insight of researchers and educators into research
related to development of mobile learning game application for effective teaching and
learning process. The hope of this study, the developer of mobile game learning applications
can make this article a source of reference in developing game applications for educational
purposes so that any element of the game put into the application can benefit learning for the
users.
Acknowledgment: The sources of this article in available online.
REFERENCES
1. Y. Bulduklu, “Mobile games on the basis of uses and gratifications approach : A comparison of the mobile
game habits of university and high school students,” 2017.
2. G. Schwabe and C. Go, “Mobile learning with a mobile game : design and motivational effects,” no. March,
pp. 204–216, 2005.
3. Wardaszko, Marcin, and Błażej Podgórski. "Mobile learning game effectiveness in cognitive learning by
adults: A comparative study." Simulation & Gaming 48, no. 4 (2017): 435-454. 4. G. Schwabe and C. Go, “Mobile learning with a mobile game : design and motivational effects,” no. March,
pp. 204–216, 2005.
5. J. Huizenga, W. Admiraal, S. Akkerman, and G. Dam, “Mobile game-based learning in secondary
education : engagement , motivation and learning in a mobile city game,” pp. 332–344, 2009.
6. M. Rivadulla, J. L. De Jesus, and F. F. Balahadia, “PhilLoveHistory : Enhancing Knowledge in Philippine
History Using Mobile Game Application,” pp. 817–821, 2017.
7. Wongwatkit, S. Chookaew, K. Chaturarat, and C. Krutthakha, “An Interactive Story-based Mobile Game
Application to Diagnosing Learning Style and Learning Suggestion based on ILS Development and
Evaluation of The AdventureHero Game,” 2017.
8. M. Prensky, “Fun , Play and Games : What Makes Games Engaging,” Digit. Game-Based Learn., pp. 1–31,
2001.

SOCIAL SCIENCE 828
IGCESH2018
Universiti Teknologi Malaysia, Johor Bahru, Malaysia 13 -15 August 2018
THE ORIGIN AND PURPOSE OF DHIMMAH (SUBSTRATUM OF
RESPONSIBILITY) ACCORDING TO THE EARLY LEGAL
THEORISTS.
Mohd Hilmi bin Ramli*1
1, Centre for Advanced Studies on Islam, Science and Civilization (CASIS), Universiti Teknologi
Malaysia (UTM), MALAYSIA.
(E-mail: [email protected])
ABSTRACT
In any religion where the God is established as the grand ontological system of the
worldview, the meaning and purpose of responsibility (taklīf) is clear from where it is
derived. This is especially true in the case of the religion of Islām where the responsibility is
solely derived from God, and it is addressed exclusively to a natural person, the man.
However, the meaning and purpose of responsibility has been going through some
intellectual shift in the contemporary discourse where the responsibility as discussed by the
contemporary jurists has extended its meaning to a non-human being or non-man, such as
corporation, under the notion of the classical doctrine of dhimmah (substratum of
responsibility). This study intends to study their claim by investigating the origin and history
of the dhimmah which are immensly discussed by the early legal theorists (uṣūliyyūn). The
findings of the study will be able to provide an insightful legal and ethical framework on the
meaning and purpose of responsibility in Islām in the contemporary days. A semantic anaysis
of the term dhimmah and its related key terms indicate that dhimmah is truly a God’s
exclusive endowment for a man, and not for other entities other than man. In addition, it
points to the fact that dhimmah refers to the original convenant that the man’s soul has sealed
with God during the Primordial Covenant. The findings further indicate a new hierarchy of
responsibility of a man vis-à-vis the corporation can be established, where the former is
derived from religion, while the later is originated its existence from the state. This study will
provide a sound philosophical and metaphysical framework in the field of legal theorist in
Islām which is currently lacking and be greatly beneficial for the students of legal theorist as
well as philosophy of ethics.
Key words: Dhimmah, Taklīf, Man, Corporation, and Legal Theorist
INTRODUCTION
In any religion where the God is established as the grand ontological system of the
worldview, the meaning and purpose of responsibility (taklīf) is clear from where it is
derived. This is especially true in the case of the religion of Islām where the responsibility is
solely derived from God, and it is addressed exclusively to a natural person, the man.
However, the meaning and purpose of responsibility has been going through some
intellectual shift in the contemporary discourse where the responsibility as discussed by the
contemporary scholars and jurists has extended its meaning to a non-human being or non-

SOCIAL SCIENCE 829
man, which is known as legal person, or artifical person, or juristic person, such as
corporation, under the notion of the classical doctrine of dhimmah (substratum of
responsibility).
Scholars like Abdur Rahim, Ahmad Hassan, Taqi Usmani, and Mahdaa Zahraa argue that
modern legal person like ‘Islamic banks’ has the legal capacity, the dhimmah that able them
to acquire assets, sell assets, enter into financial transation, sue and to be sued. It is even
justified that these ‘Islamic banks’ are required to pay zakat because they have the duty to
serve the society. All these are done under the name of the legal person entity that mirror the
natural person, but in reality it is just a fictitious or artificial person. On the other hand, there
are scholars who argue that there is no legal person concept in Islām, like Joseph Schacht,
Timur Kuran, and Imran Khan Nyazee, because Islām only recognizes natural person.
This study intends to study both claims by investigating the origin and history of the
dhimmah which are immensly discussed by the early legal theorists (uṣūliyyūn), especially
during the period of 10 A.D – 11 A.D Centrury. Scholars during this period, for example, al-
Sarakhsī, al-Ghazālī, al-Bazdāwī, Ṣadr al-Sharī‘ah and Taftāzānī, were at the pinnacle of
Islamic intellectual, whom their works had tremendous influence in shaping the mind and
action of the Muslims those days, and even until today.
The semantic method anaysis of the term dhimmah and its related key terms will be
employed, as to derive the original and truth meaning of dhimmah. Among the earliest
definition of dhimmah by al-Zabīdī in Tāj al-‘Arūs, he defines dhimmah as obligation
(kafālah) and guarantee (ḍamān). The definition is based on the report by Saydina ‘Alī that
“My obligation is collateral and I am the manager of it” (dhimmatī rahīnah wa anā bihi
za‘īm). Al-Taftāzānī (d. 792 A.H/ 1390 A.D), a celebrated theologian, legal theorist,
grammarian, and metaphysician, in deliberating of the term dhimmah, it is a spiritual
covenant that the soul has sealed with God during the Primordial Covenant. It follows then
that by understanding the God’s injunction regarding the belief, legal practice as well as the
ethics as a Muslim in this world, it is addressed to the individual as well as the society. The
society, though it is conceived as a group or aggregate number of individuals, ultimately it is
composed of individuals. It is later, during the assessment of our deeds in the Hereafter, the
individual is solely responsible from his individual self, not as the community.
Therefore, this study can deductively argue that dhimmah is the attribute that God
conferred to a natural person only. There were no institutions in the past like Bayt al-Māl,
waqf, masjid and madrasah being given the status of legal person. Had it been given the
legal personality status, the scholars in the past would necessarily incorporate it in their
works, but it did not happen.
CONCLUSION
In conclusion, the findings of the study will be able to provide an insightful legal and ethical
framework on the meaning and purpose of responsibility in Islām in the contemporary days.
In light of the Fourth Industrial Revolution that is currently debated, the discussion of
dhimmah is furthermore extremely important as the basis of ethical framework. There is
already a question that is being discussed; can electronic agents like robot be granted legal
personality under Islamic Law? If it is being granted the legal personality, it assummes the
robot is already posessed the dhimmah, the legal capacity. This will change the nature of
responsibilties and subsequently the framework of ethics in the near future. That is the reason

SOCIAL SCIENCE 830
the study of dhimmah based on the original understanding and practice, which ultimately
based on the Revelation, as proposed in this study is extremely important.
Acknowledgment: The author would like to express his sincere appreciation for the support
of the sponsor, the UTM through the Zamalah Ph.D Scholarship.
REFERENCES
1. Usmani, Muhammad Taqi. An Introduction to Islamic Finance. Idara, New Delhi, India, 2005. 2. Mahmassani. S. Falsafat al-Tashrī‘ fī al-Islām, trans. Ziadeh, Farhat J. The Philosophy of Jurisprudence in
Islam. E. J. Brill, Leiden, 1961.
3. Carter, James Treat. The Nature of The Corporation As A Legal Entity: With Especial Reference To The
Law of Maryland. Unpublished Ph. D thesis. John Hopkins University, Baltimore, 1919.
4. Salmond, John W. Jurisprudence. 4th. Ed. London, Stevens and Haynes, 1913.
5. Singleton, W.E. Singleton. Entities and Real and Artificial Persons. Journal of the Society of Comparative
Legislation, New Series. Vol. 12, No. 2, 1912.
6. Davis, John P. Corporations: A Study of the Origin and Development of Great Business Combinations and
of their Relation to the Authority of the State, 2 Vols. New York & London, G.P. Putnam’s Sons, 1905.
7. Muḥammad, ‘Alī Juma‘ah. al-Ḥukm al-Shar‘īyy ‘ind al-Uṣūliyyīn. Dār al-Salām, Qāhirah, 2006.
8. Khadduri, Majid. The Islamic Conception of Justice. John Hopkins University, Baltimore, 1984.
9. Taftāzānī, Sa‘d ‘Umar Mas‘uddīn. Sharḥ al-Talwīḥ ‘alā Tawḍīḥ. 2 Vols. Dār al-Kutub al-‘Ilmīyyah. N.d 10. Taftāzānī, Sa‘d ‘Umar Mas‘uddīn. Sharḥ al-Maqāṣid. 2 Vols. N.d
11. Watt, W. Montgomery. Islamic Philosophy & Theology. Aldine Transaction, New Brunswick & London:,
2009.

SOCIAL SCIENCE 831
IGCESH2018
Universiti Teknologi Malaysia, Johor Bahru, Malaysia 13 -15 August 2018
COMPUTER SELF-EFFICACY AND ACCEPTANCE OF E-
LEARNING: A MULTI-GROUP ANALYSIS BASED ON A
STRUCTURAL EQUATION MODEL AMONG UNIVERSITY
LECTURERS IN MALAYSIA.
Hii Puong Koh*1, Chin Fei Goh2
1 Faculty of Management, Universiti Teknologi Malaysia, Johor, Malaysia.
(E-mail: [email protected]) 2 Faculty of Management, Universiti Teknologi Malaysia, Johor, Malaysia.
(E-mail: [email protected])
ABSTRACT
The scope of this study was to examine whether the acceptance of e-learning among
university lecturers is different because of different level of computer self-efficacy (CS). One
hundred fifth-three of lecturers in Universiti Teknologi Malaysia had completed a survey
questionnaire to give an input on the result of this study. Technology Acceptance Model
(TAM) was used as a theoretical framework for this study. A multi-group analysis method in
partial least squares was employed to relate differences between groups. The conclusion of
this study is subjective norm (SN), technological complexity (TC), and facilitating conditions
(FC) are proved significantly affect the adoption of e-learning without looking into the
differences among computer self-efficacy. However, when looking into the differences
among computer self-efficacy, high computer self-efficacy group shows not significant in the
causal effect between SN, TC and adoption of e-learning.
Key words: Computer self-efficacy, multi-group analysis, E-learning
INTRODUCTION
In this information age, e-learning becomes a new trend in education sector as it can deliver
the teaching in a more effective and efficient way. In the last decade, many universities used
e-learning system as a tool to support face-to-face teaching method. Although technology
supported teaching has become significant in education sector, fostering technology
acceptance among lecturers still remains a critical challenge [1].
Previous studies had investigated the possible variables that will influence the acceptance of
e-learning. In fact, most of the researchers used variable gender as a moderator to study on
how gender differences give effect to the adoption of e-learning [2]. However, there are less
studies addressed computer self-efficacy as a moderator to study the acceptance of any kind
of technologies, including e-learning.
The main objective of this study is to examine whether the adoption of e-learning in
university is different because of computer self-efficacy differences. In order to accomplish
this goal, the researcher developed a review of the literature on e-learning system and

SOCIAL SCIENCE 832
Technology Acceptance Model. Based on this review, the researcher proposed a research
model based on Technology Acceptance Model to measure the acceptance of e-learning by
respondents. Besides, the results of applying partial least squares analysis to the research
model for the entire sample, and the sub-samples of high and low computer self-efficacy are
presented. A t-test was used to examine if computer self-efficacy differences exist in the
different variables of the model, while a partial least squares multi-group test was used to
analyze differences between groups. Finally, the main conclusions are discussed.
MAIN RESULTS
Table 1. Path coefficients
Hypothesis
Path Original Sample (sig.)
High CSE (sig.)
Low CSE (sig.)
Parametricp value (sig.)
PLS-MGA
H4 BI -> CSU 0.000 0.000 0.000 0.665 0.325
H9 FC -> PEOU 0.001 0.136 0.001 0.437 0.770
H3 PEOU -> BI 0.001 0.007 0.178 0.168 0.090
H2 PEOU -> PU 0.000 0.000 0.000 0.495 0.241
H1 PU -> BI 0.000 0.000 0.000 0.312 0.166
H6 SN -> BI 0.083 0.490 0.000 0.002 0.999
H5 SN -> PU 0.015 0.115 0.361 0.618 0.300
H7 TC -> BI 0.042 0.327 0.001 0.008 0.008
H8 TC -> PEOU 0.000 0.001 0.003 0.472 0.766
Refer to table 1, the third column shows the significance value of each hypothesis without
looking the moderation effect. All hypotheses are supported except hypothesis 6. Column 4
and 5 show the significance value of each hypothesis from the perspective of high and low
computer self-efficacy. In parametric column, p-value less than 0.05 indicate statistical
difference of group-specific path coefficient. In the PLS-MGA column, p-value larger than
0.95 or p-value less than 0.05 denote a statistical difference of group-specific path coefficient.
Refer to the table, only hypotheses 6 and 7 fulfill the requirements of parametric p value and
PLS-MGA. Then, when looking into high and low computer self-efficacy columns, I found
out that only low computer self-efficacy group shows significant relationships among the
variables. On the other hand, high computer self-efficacy group does not show significant
relationships among the variables.
CONCLUSION
In this session, several contributions of this study are highlighted. Firstly, if we observe the
result without emphasising the differences between the high and low computer self-efficacy,
the three external variables which are included into TAM model are proved significantly
affect the adoption of e-learning. But, hypothesis 6 is not supported since its significance
value is greater tan 0.5.
However, when we examine the result from the perspective of high and low computer self-
efficacy groups, we found out that only hypothesis 6 and 7 are accepted. Not only that, only
low computer self-efficacy group shows significant relationships among the variables. On the
other hand, high computer self-efficacy group does not show significant relationships among
the variables. Therefore, we can conclude that lecturers will perceive subjective norm will
give positive effect to behavioural intention to use e-learning when they have low computer
self-efficacy. Besides, lecturers will also perceive that technological complexity will

SOCIAL SCIENCE 833
positively affect behavioural intention to use e-learning when they have low computer self-
efficacy.
However, why high computer self-efficacy group shows not significant in the hypotheses 6
and 7? The reason behind is those lecturer who has high computer self-efficacy actually
perceived that the e-learning is not complex to be used. Not only that, those lecturers who
have high computer self-efficacy actually will not be influenced by their colleagues to make
decision to use the e-learning system. They themselves will be the one to influence their
colleagues to use e-learning.
According to table 4, computer self-efficacy differences do not exist in other relations except
hypotheses 6 and 7. It means that those relations are not moderated by the variable computer
self-efficacy. For instance, for hypothesis 9 (facilitating conditions have positive effect to
perceived ease of use) is significant for the entire sample but not significant in sub-samples of
computer self-efficacy. The reason is both of the high and low computer self-efficacy groups
think it is important to have specific people to provide the guidance on how to use e-learning
so that they can perceived e-learning is easy to use. The same reason also falls on other
relations, which means both of the groups perceived that the relations are significant in order
to increase the adoption of e-learning system.
The main implications of this study are the focus of university to help lecturers who has low
computer self-efficacy to improve their computer skills. University can conducts several
levels of e-learning training to lecturers so that lecturers have confident to use e-learning. Not
only that, variable subjective norm also very important in promoting the acceptance of e-
learning. It helps university to realize that how important the “important figures” in helping
to nurture the culture of using e-learning. Head of departments or faculty deans can be the
“important figures”. For example, the “important figures” should get themselves aggressively
promoting the e-learning system. In result, lecturers will understand that how important and
useful the e-learning is and they will start use it.
Several directions for future research are suggested. Firstly, a longitudinal study can be
conduct to compare the different stages of the adoption of e-learning system. Secondly, the
sample size should be increased to around 200 to 250 to ensure the study’s generalizability.
Note that it is challenging to collect questionnaire from lecturers, so more than three months
are needed in the data collection process. Thirdly, future research can be conducted in a wider
scope. The wider scope of the future research may include other universities in Malaysia..
Acknowledgment: The authors would like to express their appreciation for the support of the
SPS UTM with Zamalah Scholarship.
REFERENCES
1. Hu, P. J.-H., Clark, T. H., & Ma, W. W., Examining technology acceptance by school teachers: a longitudinal study. Information & Management, 41(2)(2003), 227-241.
2. Hayashi, A., Chen, C., Ryan, T., & Wu, J., The role of social presence and moderating role of computer self
efficacy in predicting the continuance usage of e-learning systems. Journal of Information Systems
Education, 15(2)(2004), 139.
3. Burgos, D., Tattersall, C., & Koper, R., How to represent adaptation in e-learning with IMS learning design.
Interactive Learning Environments, 15(2)(2007), 161-170.
4. Chang, S. C., & Tung, F. C., An empirical investigation of students' behavioural intentions to use the online
learning course websites. British Journal of Educational Technology, 39(1)(2008), 71-83.

SOCIAL SCIENCE 834
IGCESH2018
Universiti Teknologi Malaysia, Johor Bahru, Malaysia 13-15 August 2018
INNOVATION LEVEL OF ENGINEERING AND NON-
ENGINEERING UNIVERSITI TEKNOLOGI MALAYSIA (UTM)
UNDERGRADUATE STUDENTS
Nor Aisyah Che Derasid,*1, Aede Hatib Musta’ amal
2 , Mohd Salehudin Marji
3, and
Norzanah Rosmin 4
1, 2, 3 Department of Technical & Engineering Education, Faculty of Education, Universiti Teknologi
Malaysia, 4 Department of Electrical Power, Faculty of Electrical Engineering, Universiti Teknologi Malaysia
(E-mail:[email protected])
ABSTRACT
UTM CSI works as a ‘one-stop-center’ to generate and promote innovation amongst students
on various fields of study in UTM faculties and it is very important for this center to know
the effectiveness of their innovative programs. Thus, this study aimed to identify the level of
innovation between engineering and non-engineering UTM undergraduate students. An
instrument consisted of three constructs; Human Capital Innovativeness, Culture
Innovativeness and Leadership Innovativeness were administered randomly to 223
respondents represent non-engineering students (N=117) and engineering students (N=106)
at Universiti Teknologi Malaysia (UTM). A total of 109 items were analyzed using
independent sample t-test showed that there is a statistically difference in the innovation
constructs between engineering and non-engineering students (p<0. 05) with engineering
students having higher scores. Results showed that engineering students gives positive
outcomes towards human capital, culture and leadership constructs. This shows that
engineering students are more innovative compared with non-engineering students. In
conclusion, a broad knowledge and understanding of science and engineering technology
help engineering students to think innovatively, experience them by sharing knowledge
through collaborative innovation and becoming increasingly important. Key words: innovation, independent sample t test, engineering students, and non-engineering
students)
INTRODUCTION
Universiti Teknologi Malaysia (also known as University of Technology, Malaysia or UTM)
is the oldest public engineering and technical university in Malaysia. The university
specializes in technical studies, with separate faculties for the engineering divisions such as
Civil, Mechanical, Electrical, Chemical and Biomedical engineering. It also has faculties for
Education, Pure Sciences, Management, and Human Resources Development. It is the
country's major source of graduate engineers and similar professionals. Since June 2010,
UTM will pursue academic excellence in line with the Government's recognition as a
Research University.

SOCIAL SCIENCE 835
The highlights of this paper explain differences of innovation level based on innovation
constructs between engineering and non-engineering UTM undergraduate students. Based on
previous article in [1], UTM-CSI has been facing a challenge in measuring the level of
innovation among UTM students since it is very important for the UTM-CSI to know how
the effectiveness of their innovative programs that involve students.
RESULTS
Further analysis is a comparative analysis of the level of innovation of students by groups;
engineering and non-engineering.
Table 1. T test Analysis based on the level of innovation by students’ majors
Construct
Mean Value
t df Sig (2-tailed) Engineering Students
Non- Engineering Students
Human Capital .8203 .7568 3.492 221 .001
Culture .8371 .7775 3.472 221 .001
Leadership .8349 .7757 3.475 221 .001
The Engineering Students group (N=106) and Non-Engineering Students group (N=117)
were associated with innovation construct. To test the hypothesis that these groups were
associated with statistically significantly different mean innovation constructs, an
independent t-test was performed.
Based on Table 1, an independent-samples t-test was conducted to compare for construct
Human Capital between two groups which are engineering students and non-engineering
students. There was a significant differences for Human Capital constructs for Engineering
Students (M=0.82, SD=0.12) and non-engineering students (M=0.76, SD=0.15) groups; t
(221)=3.49, p=. 001. Hypothesis of the study is as follow:
For Culture construct, there was a significant differences between Engineering Students
(M=0.84, SD=0.12) and non-engineering students (M=0.77, SD=0.14) groups; t (221)=3.47,
p=. 001.
Lastly, there was a significant differences for Leadership constructs for Engineering Students
(M=0.83, SD=0.11) and non-engineering students (M=0.77, SD=0.14) groups; t (221)=3.47,
p=. 001. This study found that the overall level of innovation had statistically significant
differences when compared with students’ majors; engineering students and non-engineering
students with the value (p<0. 05).
CONCLUSION
Thus, it can be concluded that the level of innovation among engineering students depends on
how they have been exposed with innovation programs or curricular throughout their study.
From first year of study, both engineering students and non-engineering students concerned
about additional innovative ways to create capacity. Apart from that, alternative approaches
have taken into consideration, which is educators who are interested in engaging in
innovation, support them to engage in such path and also investigate what is required.
Finally, activities organized were not only motivated by desire to support future innovation,

SOCIAL SCIENCE 836
but both of them involved in innovation. Given that the results were below high in this study,
it is also because these engineering students came from different background where some of
them already have experience with subject regarding to innovation and have been exposed to
innovation competition which contribute to the findings.
REFERENCES
1. Nor Aisyah, C. D., Aede Hatib, M., Nor Fadila, M. A., & Abdul Rashid, H. (2016). Content validity for
innovation level of UTM undergarduate students: A quantitative approach. Man in India, 96(1-2), 477-488.

SOCIAL SCIENCE 837
IGCESH2018
Universiti Teknologi Malaysia, Johor Bahru, Malaysia 13 -15 August 2018
COLLABORATIVE CONSUMPTION OF APPAREL
Thoo Ai Chin*1, Danny Poh Wai Chong2, Umar Haiyat Abdul Kohar3, Zuraidah
Sulaiman4 and Tan Liat Choon5
1, 2, 3, 4 Faculty of Management, Universiti Teknologi Malaysia, MALAYSIA
(E-mail: [email protected], [email protected], [email protected], [email protected]) 5 Faculty of Geoinformation and Real Estate, Universiti Teknologi Malaysia, MALAYSIA
(E-mail: [email protected])
ABSTRACT
With the advancement in information and communication technologies, collaborative
consumption enables people to acquire and offer or share goods and services through
community-based online services. Therefore, this paper aims to review the antecedents of
sustainability consumption, particularly for the collaborative consumption of used apparel.
The Theory of Reasoned Action (TRA) is used to examine one’s intention of swapping,
purchasing, or selling used clothing based on her or his attitude and subjective norms. The
result is expected to enlighten online retailers to provide peer-to-peer online platforms for
users to collaboratively consume apparel.
Key words: Collaborative Consumption, Attitude, Subjective Norms
INTRODUCTION
In the age of Web 2.0, a generational shift in consumer values and purchasing preferences has
created a new form of socio-economic activity. This is because the business activities in the
21st century are characterised by the practices of shared costs and economic cooperation or
access to products or services, as well as social motivations for participating in the sharing
economy [1]. Consumers eschew the ownership of goods and choose to pay for the short-
term experience of accessing them [2]. This sharing economy is interchangeably called as
access-based consumption [2], collaborative consumption [3], collaborative economy, on-
demand economy, peer-to-peer economy, zero-marginal cost economy, crowd-based
capitalism [4] or the mesh [5]. The ‘sharing-economy’ was introduced around since the early
2000s. However, the term started to gain popularity in 2007-08. There are five major
industries in sharing economy: online staffing, peer-to-peer lending and crowdfunding, peer-
to-peer accommodation, car sharing, and music and video streaming [6].
The term of collaborative consumption is commonly used in extant literatures and adopted in
this paper. According to [7], collaborative consumption is defined as a resource is acquired
and distributed by people with a charge or other compensation. Also, [8] found that
collaborative consumption is an economic model to allow people to access other’s ownership
of products and services through sharing, renting, trading or swapping, particularly for
underutilised assets or services. On the other hand, [9] argued that collaborative economy
opens multi-sided digital platforms and markets for individuals and businesses to access

SOCIAL SCIENCE 838
services and products. With the advancement in information and communication
technologies, collaborative consumption enables people to acquire and offer or share goods
and services through community-based online services [10]. Based on several studies, people
participate in collaborative consumption due to environmental sustainability [10], enjoyment
of the activity [10, 9], social benefits such as relational and communitarian [1, 11] as well as
economic gains [10, 9] in terms of allocative and profit-seeking [1].
Collaborative consumption is the economic backlash to hyper consumption, as well as
poverty and pollution alleviation [10]. For examples, Uber and Airbnb which offer ride-
sharing and home-sharing services are the most stand-out companies that have infiltrated
traditional marketplace and emerged as disruptive forces in long-established service
industries like taxi and hotel industry. Other peer-to-peer markets include bike-sharing
programs and online borrowing programs such as digital versatile discs (DVDs), fashion,
bags, or jewelry [2]. In fact, collaborative consumption is long practised between family
members and friends to swap clothes and other items using pooling resources [8]. Currently,
advanced web and mobile networks, as well as information infrastructures have facilitated the
collaborative economy that allows strangers to borrow and rent goods via the peer-to-peer
online platform. Through the Internet, interpersonal relationships can be built and it would be
able to support a new economic model based on partnership [5].
Despite the increased popularity of the sharing economy platforms in the world, studies about
collaborative consumption in Malaysia are very limited. Examples of studies in Malaysia
include car sharing of Uber [12] and peer-to-peer accommodation [13, 14]. Till now, no study
is about the online collaborative consumption of fashion goods such as apparel in Malaysia.
Therefore, this paper focuses on social-economic aspects and antecedents of the collaborative
consumption movement to swap donate, purchase, or sell used clothing using the Internet. As
stated by [4], there are three distinct systems in collaborative consumption: redistribution
markets, collaborative lifestyle, product service systems. Thus, this study investigates the
redistribution markets of apparel where the ownership of the product is transferred from one
individual to another.
THEORY OF REASONED ACTION (TRA)
The Theory of Reasoned Action (TRA) has been widely used to predict the antecedents of
sharing economy, likewise the participation in the collaborative consumption of apparel
[3]. According to TRA, an individual’s intention to perform her or his behaviour is dependent
on both attitude and subjective norms [15]. Attitude is defined as the belief and feelings of
herself or himself in either a positive or a negative way [15, 16, 17]. On the other hand, the
subjective norm is how an individual perceives that important others think that he or she
should or should not perform the behaviour [15, 18, 19]. For this study, attitude toward
collaborative consumption of apparel is about one has a positive evaluation on swapping,
purchasing, or selling used clothing using the Internet. Subjective norm is the perceived
social pressure to swap, purchase or sell used clothing [3]. Drawing on the idea of TRA,
this paper postulates two research objectives: 1) attitude toward the collaborative
consumption of apparel influences the behavioral intention of consuming used apparel; 2)
subjective norms concerning collaborative consumption of apparel influences the behavioural
intention of consuming used apparel.

SOCIAL SCIENCE 839
CONCLUSION
In Malaysia, this paper is the first study to review the antecedents of sustainability
consumption, particularly for the collaborative consumption of used apparel. Future research
is recommended to test the relationships between attitude toward the collaborative
consumption of apparel, subjective norms and behavioural intention of consuming used
apparel using empirical data. The result is expected to enlighten online retailers to provide
peer-to-peer online platforms for users to collaboratively consume apparel.
REFERENCES
1. Erickson, K. and Sorensen, I. Regulating the sharing economy. Internet Policy Review 5(2016). 2. Bardhi, F. and Eckhardt, G. Access-based consumption: the case of car sharing. Journal of Consumer
Research 39(2012), 881-898.
3. Johnson, K. K. P., Mun, J. M. and Chae, Y. Antecedents to internet use to collaboratively consume apparel.
Journal of Fashion Marketing and Management: An International Journal 20(2016), 370-382.
4. Selloni, D. CoDesign for Public-Interest Services. Springer International Publishing, 2017.
5. Gansky, L. The Mesh: Why the Future of Business is Sharing. Portfolio, New York, NY, 2010.
6. Lin, M. and Dula, C. Grab taxi: navigating new frontiers. Asian Management Insights, 3(2016), 40-45.
7. Belk, R. You are what you can access: sharing and collaborative consumption online. Journal of Business
Research, 67(2014) 1595-1600.
8. Botsman, R. and Rogers, R. What’s Mine Is Yours: The Rise of Collaborative Consumption. Harper
Business, New York, 2010. 9. Grybaite, V. and Stankeviciene, J. Motives for participation in the sharing economy – evidence from
Lithuania. Economics and Management 8(2016), 7-17.
10. Hamari, J., Sjoklint, M. and Ukkonen, A. The sharing economy: why people participate in collaborative
consumption. Journal of the Association for Information Science and Technology, 67(2016), 2047-2059.
11. Rowe, P. C. M. Beyond Uber and Airbnb: the social economy of collaborative consumption. Social Media +
Society (2017), 1-10.
12. Hawapi M. W., Sulaiman Z., Abdul. K., U., H. and Abu T., N. Effects of perceived risks, reputation and
electronic word of mouth (e-WOM) on collaborative consumption of Uber car sharing service. IOP
Conference Series: Materials Science and Engineering 215(2017), 1-9.
13. Razli, I. A., Jamal, S. A. and Zahari, M. S. M. Airbnb: An overview of a new platform for peer to peer
accommodation in Malaysia. Advanced Science Letters 23(2017a), 7829-7832.
14. Razli, I. A., Jamal, S. A. and Zahari, M. S. M. Perceived value in peer-to-peer (P2P) accommodation: a case of Airbnb. Journal of Tourism, Hospitality & Culinary Arts. 9(2017b), 213-224.
15. Ajzen, I. The theory of planned behavior. Organizational Behavior and Human Decision Processes
50(1991), 179-211.
16. Eagly, A. H. and Chaiken, S. The Psychology of Attitudes. Orlando, FL: Harcourt Brace, 1993.
17. Oldham, J. M. Attitude. Journal of Psychiatric Practice 18(2012), 229.
18. Fisher, W. A., Fisher, J. D. and Rye, B. J. Understanding and promoting AIDS-preventive behavior: insights
from the theory of reasoned action. Health Psychology 14(1995), 255-264.
19. Ham, M., Jeger, M. and Ivkovic, A. F. The role of subjective norms in forming the intention to purchase
green food. Economic Research-Ekonomska Istraživanja (2015), 738-748.

SOCIAL SCIENCE 840
IGCESH2018
Universiti Teknologi Malaysia, Johor Bahru, Malaysia 13 -15 August 2018
HALAL LOGISTICS
Thoo Ai Chin*1, Intan Nur Anisah Rosli2, Mohamed Syazwan Ab Talib3, Zuraidah
Sulaiman4 and Tan Liat Choon5
1, 2, 3, 4 Faculty of Management, Universiti Teknologi Malaysia, MALAYSIA
(E-mail: [email protected], [email protected], [email protected],
[email protected]) 5 Faculty of Geoinformation and Real Estate, Universiti Teknologi Malaysia, MALAYSIA
(E-mail: [email protected])
ABSTRACT
The rapid development of halal market has gained a worldwide attention. This implies that
the demand for halal certified services and products continue to rise. In fact, halal certified
food and products is spurring the growth of halal logistics. Many logistics companies in
Malaysia have committed to provide halal logistics services in order to serve the huge
demand of halal products locally and internationally. Halal logistics is a practice to plan,
execute and manage the flow and storage of halal certified raw materials, halal semi-finished
or halal finished products from suppliers to end customer in order to ensure full compliance
with the general principles of Shariah Law. Clearly, halal logistics is gaining traction as the
halal products may expose to the risk of contamination along the supply chain. As such, this
paper aims to review the concept of halal logistics in Malaysia as Malaysia was the pioneer in
introducing halal logistics standards and halal certification for logistics service providers.
Key words: Halal Logistics, Malaysia
INTRODUCTION
According to [1], Muslim population constitutes about 24% of the world population with 1.8
billion adherents. Globally, Islam is the second largest religion. In the coming decades,
Muslim population is expected to grow more rapidly. This means global halal market is
expanding fiercely not only in the food and beverage market but also in many other markets
[2] such as banking and finance, clothing, pharmaceutical items, cosmetics and personal care
products [3]. Evidently, food sector has the greatest potential for growth as the halal market is
currently valued at US$2.3 trillion [4].
In light of the growing halal market, Malaysia now is the world’s leading halal hub and has
become a role model among the Muslim countries [5]. Department of Islamic Development
Malaysia (JAKIM) was established in 1997 to focus on the halal market. JAKIM acts as the
coordinator to standardise and legitimate the Islamic law, as well as fine-tune and develop the
Islamic education. Also, JAKIM oversees the issuance of halal certification and increase
awareness of stakeholders including manufacturers, retailers, distributors, exporters,
importers and consumers about halal compliances [6].

SOCIAL SCIENCE 841
The rapid development of halal market has gained a worldwide attention. This implies
that the demand for halal certified services and products continue to rise [7]. In fact, halal
certified food and products is spurring the growth of halal logistics [8]. Many logistics
companies in Malaysia have committed to provide halal logistics services in order to
serve the huge demand of halal products locally and internationally. For an example,
Kontena Nasional is Malaysia’s first halal JAKIM certified logistics provider for halal
warehousing, transportation, and Samak service [9]. Clearly, halal logistics is gaining
traction as the halal products may expose to the risk of contamination along the supply
chain. As such, this paper aims to review the concept of halal logistics.
HALAL LOGISTICS
With the growth of the Muslim consumer market, various terminology and definitions
have been used for halal. The word of “halal” literally means permissible or lawful by
Islamic laws [10]. Halal in the Quran means lawful or permitted, hence halal food is
allowed to be consumed with no doubt [11]. [12] stated that halal is something approved
by Shari’ah in the perspective of religious, faith and spiritual while Thoyyib is something
about benefits or wholesome in terms of quality, safety, hygienic, clean, nutritious,
quality and pure in scientific. In Malaysia, halal is defined as things or actions approved
by Shariah law without penalty being imposed on the perpetrator [13]. However, in halal
food industry, [11] identified that halal symbolises hygiene, purity and quality.
On the other hand, logistics is one of the key activities in supply chain management
which integrates producers, manufacturers, retailers and customers [13]. As stated by
[14], logistics is used to simplify the movement and coordination of supply and demand
for the purposes of time and place utility. According to [15], halal logistics is defined as a
Shariah-compliant processes that handles and distributes goods throughout the entire
supply chain. In addition, halal logistics is a practice to plan, execute and manage the
flow and storage of halal certified raw materials, halal semi-finished or halal finished
products from suppliers to end customer in order to ensure full compliance with the
general principles of Shariah Law [16]. Halal logistics aims to avoid contamination
between haram and halal goods during the logistics procedures [17].
Malaysia was the pioneer in introducing halal logistics standards and halal certification for
logistics service providers. In Malaysia, Malaysian Standard for Halal Logistics (MS
2400:2010) is used by logistics companies to provide halal transport services such as
transportation, warehousing and retailing. The halal logistics services in compliance with
Shariah Law cover activities such as processing to handling, distribution, storage, display,
serving, packaging and labeling [18]
CONCLUSION
The concept of halal logistics has created a new business drive with the supply chain.
However, there are many challenges and practices of halal logistics certificate in Malaysia.
Till now, limited certified halal logistics providers cater for the halal demand. As such,
trainings and consultation services about halal logistics standards are important for them.
REFERENCES 1. Pew Research Centre (2015). Why Muslims are the world's fastest-growing religious group. Available at:
http://www.pewresearch.org/fact-tank/2017/04/06/why-muslims-are-the-worlds-fastest-growing-religious-
group/

SOCIAL SCIENCE 842
2. Abdul-Talib, A. N. and Abd-Razak, I. S. Cultivating export market oriented behavior in halal marketing:
Addressing the issues and challenges in going global. Journal of Islamic Marketing 4(2013), 187-197.
3. New Straits Times (2016). Global halal market growing bigger. Available at:
https://www.nst.com.my/news/2016/02/127261/global-halal-market-growing-bigger
4. Hong Kong Trade Development Council (2017). Malaysia: A leading global halal food hub. Available at: http://economists-pick-research.hktdc.com/business-news/article/Research-Articles/Malaysia-A-Leading-
Global-Halal-Food-Hub/rp/en/1/1X000000/1X0A92JB.htm
5. van der Westhuizen, J. Marketing Malaysia as a model modern Muslim state: The significance of the 16th
Commonwealth Games. Third World Quarterly 25(2004), 1277-1291.
6. Talib, M. S. A. Motivation and implementation of halal food certification on food manufacturers’
performance in Malaysia. Universiti Teknologi Malaysia, Ph.D. Thesis, 2017.
7. Pahim, K. M., Jemali, S. and Mohamad, S. J. A. N. S. The importance of training for halal logistics industry
in Malaysia. IEEE Symposium on Humanities, Science and Engineering Research, SHUSER 2012, Jun 24 -
Jun 27 2012, Kuala Lumpur, Malaysia, 2012.
8. Malaysian Reserve (2017). Halal logistics gaining ground as demand rises. Available at:
https://themalaysianreserve.com/2017/08/07/halal-logistics-gaining-ground-as-demand-rises/
9. Kontena Nasional (2018). Halal logistics: The way to move forward. Available at: http://www.kn.com.my/images/stories/halal_circular.pdf
10. Hassan, H. A study on awareness and perception towards halal foods among Muslim students in Kota
Kinabalu, Sabah. The Journal of Developing Areas (2016), 1-9.
11. Mathew, V. N., Abdullah, A. M. R. A. and Ismail, S. N. M. Acceptance on halal food among non-Muslim
consumers. Procedia Social and Behavioral Sciences 121(2014), 262-271.
12. Rahim, N. F., Shafii, Z. and Shahwan, S. Awareness and perception of Muslim consumers on halal
cosmetics and personal care products. International Journal of Business, Economics and Management
2(2015), 1-14.
13. Kamaruddin, R., Iberahim, H. and Shabudin, A. Willingness to pay for halal logistics: The lifestyle choice.
Procedia Social and Behavioral Sciences 50(2012), 722-729.
14. Talib, M. S. A. and Hamid, A. B. A. Halal logistics in Malaysia: a SWOT analysis. Journal of Islamic Marketing 5(2013), 322-343.
15. Talib, M. S. A. and Hamid, A. B. A. and Chin, T. A. Can halal certification influence logistics performance?
Journal of Islamic Marketing 7(2015), 461–475.
16. Latif, M. A. Malaysia standards on halal logistics. School of Food Science and Nutrition (2012), 1-36.
17. Fathi, E., Zailani, S., Iranmanesh, M. and Kanapathy, K. Drivers of consumers’ willingness to pay for halal
logistics. British Food Journal 118(2015), 464-479.
18. Tarmizi, H. A., Kamarulzaman, N. H., Latiff, I. A. and Rahman, A. A. Factors influencing readiness towards
halal logistics among food-based logistics players in Malaysia. UMK Procedia 1(2014), 42-49.

SOCIAL SCIENCE 843
IGCESH2018
Universiti Teknologi Malaysia, Johor Bahru, Malaysia 13 -15 August 2018
INTERNET GIVING BEHAVIOUR
Thoo Ai Chin*1, Malihah Mahmood2, Lee Yoke Lai3, Farrah Merlinda Muharam4
and Tan Liat Choon4
1, 2, 4 Faculty of Management, Universiti Teknologi Malaysia, MALAYSIA
(E-mail: [email protected], [email protected], [email protected]) 3 Faculty of Built Environment, Universiti Teknologi Malaysia, MALAYSIA
(E-mail: [email protected]) 4 Faculty of Geoinformation and Real Estate, Universiti Teknologi Malaysia, MALAYSIA
(E-mail: [email protected])
ABSTRACT
Nowadays, Internet is used as an online platform for increased charitable giving. The e-
philanthropy is transforming the charitable giving behaviour globally. Giving behaviour is
categorised into three different types such as being helpful to a stranger in need, donations of
money and time to volunteer. Malaysia is in the top 20 countries in all three giving
behaviours with index of 46 per cent. Also, religious belief is proven as a strong lubricant to
strengthen giving behaviour in Malaysia. Due to the rapid development of Internet
technology, Internet giving behaviour has become a new possibility for researching,
particularly in Malaysia. Therefore, this paper aims to develop a new research direction of
Internet giving behaviour by reviewing its concept and past studies.
Key words: Internet giving behaviour, Malaysia
INTRODUCTION
Internet has made life easier in terms of shopping, employment, e-commerce, banking and
communication. Nowadays, Internet is used as an online platform for increased charitable
giving. According to [1], giving behaviour is categorised into three different types such as
being helpful to a stranger in need, donations of money and time to volunteer. The [1]
showed that Malaysia is in the top 20 countries in all three giving behaviours with index of
46 per cent. This is proven that Malaysia helps the Rohingya refugees by building a field
hospital at the Kutupalong Refugee Camp, Bangladesh [2]. Evidently, [3] found that
Malaysians have strong positive attitudes towards charities and motivation for donations.
Furthermore, religious belief is a strong lubricant to strengthen giving behaviour in Malaysia.
Clearly, Internet has provided new avenues for altruism [4]. As highlighted by [5], empathy
is a key motivator for altruistic behaviour. Also, altruism attitude is motivated by an unselfish
concern for the welfare of others [6]. [7] conducted a systematic review of human altruism
theories. The theories categorise altruism into pseudo-altruism (selfishly-motivated) and true
(selfless) altruism. The pseudo-altruism is motivated by the attainment of internal rewards.
On the other hand, true (selfless) altruism is motivated by the goal to increase another’s
welfare without expected favours in return. As reported by [8,9], peer pressure triggers

SOCIAL SCIENCE 844
reluctant altruism in charitable giving. Essentially, individuals with peer influences will
donate higher amount of money.
In fact, Internet introduces a relatively new type of fundraising and donation techniques for
nonprofit organisations, which is called as e-philanthropy [10]. The e-philanthropy is
transforming the charitable giving behaviour globally. Due to the rapid development of
Internet technology, Internet giving behaviour has become a new possibility for researching,
particularly in Malaysia. Therefore, this paper aims to develop a new research direction of
Internet giving behaviour by reviewing its concept and past studies.
LITERATURE REVIEW
Research on Internet giving is scant. Several studies are found to investigate the factors
that influence the Internet giving behaviour. Thus far, two studies of giving behaviour are
found in Malaysia. According to [11], relative advantage, affect, facilitating conditions,
social factors, compatibility and complexity have positive impact on Internet giving
behaviour in Malaysia. On the other perspective, [12] found that intrinsic factors including
altruism and perceived behavioural control, and extrinsic factors (age, home ownership,
employment tax and medium of information) contribute to the act of giving to beggar.
There are some studies focuses on personal values as a driver for Internet giving. [13]
highlighted that open personality leads to the willingness to help on the Internet. Also,
benevolence and universalism values drive the willingness to donate to a charity. [14] found
that social media and networking are important to enhance voluntary engagement and money
contributions. However, as proven by [15], online donations are typically small and online
donors are willing to donate to health-related causes.
According to [4], many Internet based initiatives are used on behalf of the needs of other
people, animals, and the environment. For examples, Linux and Wikipedia depend on
expertise sharing and user-generated content. The Rainforest Site helps animals using a
click-to-donate format and Google.org uses meta-cooperative efforts to solve large-scale
Internet problems. Also, [16] found that there are increased trend of authors in academic
and non-academic fields to release their books for free digital distribution. The study
reveals that the free digital distribution has no negative impact on sales.
CONCLUSION
Internet proliferation has created many opportunities around the world. Particularly, the
Internet provides a new platform for people to express their empathetic feelings and support
those in need. This can be seen that online fundraising is fast growing in popularity in the
digital era. As such, it is worth to investigate the factors that motivate the Internet giving
behaviour. However, the ever-growing reliance on computers and the Internet has prompted
many online scams that trick victims to send money or give out their personal information.
Thus, future studies are urged to explore the Internet fraud together with the Internet giving
behaviour.
Acknowledgment: The authors wish to thank the Malaysian Ministry of Education (MOE),
Universiti Teknologi Malaysia (UTM) and Research Management Centre (RMC) for
financial support to this work through grants funding number Q.J130000.2629.15J63.

SOCIAL SCIENCE 845
REFERENCES
1. World Giving Index (2017). CAF World Giving Index 2017. Available at: http://www.cafonline.org/about-
us/publication/2017-publications/caf-world-giing-index-2017
2. The Star (2017). Malaysia to build field hospital at Rohingya refugee camp in Bangladesh. Available at http://www.thestar.com.my/news/nation/2017/10/16/malysia-to-build-field-hospital-at-rohingya-refudgee-
camp-inbangladesh/#fc0mZh5MZeuaTyHw.99
3. Teah, M., Lwin, M. and Cheah, I. Moderating role of religious beliefs on attitudes towards charities and
motivation to donate. Asia Pacific Journal of Marketing and Logistics 26(2014), 738-760.
4. Klisanin, D. Is the Internet giving rise to new forms of altruism? Media Psychology Review 3(2011), 1-11.
5. Klimecki, O. M., Mayer, S. V., Jusyte, A., Scheeff, J. and Schonenberg, M. Empathy promotes altruistic
behavior in economic interactions. Scientific Reports 6(2016), 1-5.
6. Dovidio JF, Piliavin JA, Schroeder DA, Penner LA. The social psychology of prosocial behavior. Mahwah,
NJ: Lawrence Erlbaum Associates; 2006.
7. Feigin,S., Owens, G. and Goodyear-Smith, F. Theories of human altruism: A systematic review. Annals of
Neuroscience and Psychology 1(2014), 1-9.
8. Reyniers, D. and Bhalla, R. Reluctant altruism and peer pressure in charitable giving. Judgment and Decision Making 8(2013), 7–15.
9. Hart, T. R. ePhilanthropy: using the Internet to build support. International Journal of Nonprofit and
Voluntary Sector Marketing 7(2002), 353-360.
10. Waters, R. D. Nonprofit organizations' use of the internet: A content analysis of communication trends on
the internet sites of the philanthropy 400. Nonprofit Management and Leadership 18(2007), 59-76.
11. Amin, H. Investigating drivers of Internet giving behaviour in Malaysia. Asia Pacific Journal of Marketing
and Logistics 28(2016), .256-277.
12. Awang, S. A., Borhan, J. T., Mohamad, M. T. and Muhammad, F. The scenario of giving to beggars: A
behavioural analysis among Malaysians. Labuan e-Journal of Muamalat and Society 11(2017), 39-50.
13. Kinnunen, S. P., Lindeman, M. and Verkasalo, M. Help-giving and moral courage on the Internet.
Cyberpsychology: Journal of Psychosocial Research on Cyberspace 10 (2016), 1-14. 14. Mano, R. Social media, social causes, giving behavior and money contributions. Computers in Human
Behavior 31(2014), 287–293.
15. Saxton, G. D. and Wang, L. The social network effect: The determinants of giving through social media.
Nonprofit and Voluntary Sector Quarterly 43 (2014), 850-868.
16. Hilton III, J. and Wiley, D. Free: Why authors are giving books away on the Internet. TechTrends 54(2010),
43-49.

SOCIAL SCIENCE 846
IGCESH2018
Universiti Teknologi Malaysia, Johor Bahru, Malaysia 13 -15 August 2018
ELECTRONIC WASTE
Thoo Ai Chin*1, Nor Syazana Masron2, Lee Yoke Lai3, Huam Hon Tat4 and
Norhayati Zakuan5
1, 2, 5 Faculty of Management, Universiti Teknologi Malaysia, MALAYSIA
(E-mail: [email protected], [email protected], [email protected]) 3 Faculty of Built Environment, Universiti Teknologi Malaysia, MALAYSIA
(E-mail: [email protected]) 4 Faculty of Business & Management, Southern University College, MALAYSIA
(E-mail: [email protected])
ABSTRACT
Electronic waste or e-waste is becoming an emerging issue around the globe due to the rapid
advancement in technology has caused many electrical and electronic equipment become
“trash” after a few short years of use. Disposed e-waste could cause widespread
environmental damages if the toxic substances in electronic items are not handled properly.
In fact, e-waste contains many recoverable and valuable elements such as copper and gold. In
Malaysia, public awareness about e-waste is low and Malaysia still lags badly behind in
having an efficient e-waste management system. Due to the emerging threat of e-waste to the
environment, this paper aims to introduce the topic of e-waste and review the current research
on e-waste.
Key words: Electronic waste, Malaysia
INTRODUCTION
The rapid advancement in technology has caused many electrical and electronic equipment
become “trash” after a few short years of use. Electronic waste or e-waste is becoming an
emerging issue around the globe [1]. According to [2], e-waste is defined as electronic
products that have reached the end of their useful life. [3] claimed that e-waste includes all
disposed items contained in an electronic chip. [4] found that the scraps of e-waste
encompass dumped or obsolete mobile phones, television sets, computers and computer
monitors. [5] further defined e-waste as “all obsolete or outdated computers, televisions, cell
phones, printers, PDAs, and thousands of other devices commonly used in offices, homes and
by people on the go”.
In recent years, e-waste is the fastest growing hazardous stream in the world [3]. According
to [6], about 40 million tonnes of e-waste are generated every year. Disposed e-waste could
cause widespread environmental damages if the toxic substances in electronic items are not
handled properly [7]. For an example, e-waste contains toxic heavy metals such as copper,
cadmium, lead, zinc and nickel can cause profound and permanent adverse health effects in
human [8].

SOCIAL SCIENCE 847
In fact, e-waste contains many recoverable and valuable elements such as copper and gold
[9]. In Malaysia, public awareness about e-waste is low [10] and Malaysia still lags badly
behind in having an efficient e-waste management system. The government of Malaysia
is urged to implement a regulatory framework for proper disposal of e-waste and
mechanism of take-back system from public [11]. Due to the emerging threat of e-waste
to the environment, this paper aims to introduce the topic of e-waste and review the
current research on e-waste.
LITERATURE REVIEW
In recent years, e-waste has gained growing attention of the researchers. [12] found that
there are 18 full recovery facilities and 128 partial recovery facilities are used to
segregate, dismantle and treat e-waste in Malaysia. However, the facilities face issues to
convert e-waste into a source material. As highlighted by [13], only 25% of e-waste is
recycled in formal recycling centers with proper occupational conditions for all e-waste
workers. Therefore, governmental policy is required for the worker protection.
On the other hand, [14] estimated the current and future quantity of e-waste in the
Philippines. The e-waste includes radios, televisions, refrigerators, washing machines and
air conditioners. The study highlighted that about 25 million units became unwanted
between 1995 and 2005. In a similar vein, [15] identified the e-waste problems and
estimated the growth of e-waste using linear regression technique. The study concluded
that end-of-life grows from a meager 159 million units in 1999 to a 615.2 million units in
2015. This implies that e-waste has become a looming crisis to the environment and
human.
Several studies confirm that e-waste creates environmental health issue in both developed
and developing countries. For instances, [8] found that heavy metals in e-waste can cause
harmful effects in human. [1] investigated the e-waste problems such cancer and
developmental and neurological disorders in India if the e-waste products are placed in
landfills. According to [16], informal e-waste recycling sites pose risks to pregnant women
and young children including perturbations of fetus and child neurodevelopment.
Undeniably, the demand on the use of electrical items is tremendous and unstoppable. As
such, many studies propose the use of e-waste reverse logistics for recycling and reuse
[17,18,19]. Recycling is vital to reduce e-waste through collection, processing,
remanufacturing and reuse [20]. In fact, e-waste recycling could generate potential revenues
through extraction of precious metals in order to ensure environmental sustainability.
CONCLUSION
Recycling is the key to reduce the devastating effects of e-waste. However, the lack of
awareness and appropriate skill of e-waste management are the causes of the rapidly
increasing amount of e-waste. Therefore, various parties including the government, non-
governmental organisations, private industries, schools and public should take initiatives to
reduce the harmful effects of e-waste.

SOCIAL SCIENCE 848
REFERENCES
1. Needhidasan, S., Samuel, M. and Chidambaram, R. Electronic waste – an emerging threat to the
environment of urban India. Journal of Environmental Health Science and Engineering (2014), 12-36.
2. Tocho, J. A. and Waema, T. M. Towards an e-waste management framework in Kenya. Info 15(2013), 99-113.
3. Khan, S. A. E-products, e-waste and the basel convention: Regulatory challenges and impossibilities of
international environmental law. Review of European Community & International Environmental Law
25(2016), 248-260.
4. Ladou, J., Md, and Lovegrove, S. Export of electronics equipment waste. International Journal of
Occupational and Environmental Health 14(2008), 1-10.
5. Davis, G. and Wolski, M. E-waste and the sustainable organisation: Griffith University’s approach to e-
waste. International Journal of Sustainability in Higher Education 10(2009), 21-32
6. The World Counts (2018). Tons of electric waste thrown out. Available at:
http://www.theworldcounts.com/counters/waste_pollution_facts/electronic_waste_facts#top-facts
7. Agrawal, S., Singh, R. K. and Murtaza, Q. Forecasting product returns for recycling in Indian electronics
industry. Journal of Advances in Management Research 11(2014), 102-114. 8. Singh, R., Gautam, N., Mishra, A. and Gupta, R. Heavy metals and living systems: An overview. Indian
Journal of Pharmacology 43(2011), 246-253.
9. He, Y. and Xu, Z. Recycling gold and copper from waste printed circuit boards using chlorination process.
RSC Advances 12(2015), 8957-8964.
10. The Star Online (2017a). More needs to be done about e-waste. Available at:
https://www.thestar.com.my/metro/metro-news/2017/10/26/more-needs-to-be-done-about-ewaste-greater-
public-awareness-needed-on-how-to-discard-old-electronic/
11. The Star Online (2017b). Tech trash piling up. Available at:
https://www.thestar.com.my/metro/community/2017/04/22/ewaste-harming-the-environment-malaysia-still-
far-behind-in-proper-disposal-of-mobile-gadgets-and-ot/
12. Suja, F., Rahman, R. A., Yusof, A. and Masdar, M. S. e-Waste Management Scenarios in Malaysia. Journal of Waste Management (2014), 1-7.
13. Perkins, B. S. D. N., Drisse, M. S. M-N. B., Nxele, M. S. T. and Sly, M. D. P. D. E-waste: A global hazard.
Annals of Global Health 80(2014), 286-295.
14. Peralta, G. L. and Fontanos, P. M. E-waste issues and measures in the Philippines. Journal of Material
Cycles and Waste Management 8(2006), 34-39.
15. Bhutta, M. K. S., Omar, A. and Yang, X. Electronic waste: A growing concern in today’s environment.
Economics Research International (2011), 1-8.
16. Chen, A., Dietrich, K. N., Huo, X. and Ho, S-m. Developmental neurotoxicants in e-waste: An emerging
health concern. Environmental Health Perspectives 119(2011), 431-438.
17. Debnath, B., Roychowdhury, P. and Kundu, R. Electronic components (EC) reuse and recycling – A new
approach towards WEEE management. Procedia Environmental Sciences 35(2016), 656-668.
18. Li, J., He, X. and Zeng, X. Designing and examining e-waste recycling process: methodology and case studies. Environmental Technology 38(2017), 652-660.
19. Neto, G. C. d. O., Correia, A. d. J. C. and Schroeder, A. M. Economic and environmental assessment of
recycling and reuse of electronic waste: Multiple case studies in Brazil and Switzerland. Resources,
Conservation and Recycling 127(2017), 42-55.
20. Bezzina, F. H. and Dimech, S. Investigating the determinants of recycling behaviour in Malta. Management
of Environmental Quality: An International Journal 22(2011), 463-485.

SOCIAL SCIENCE 849
IGCESH2018
Universiti Teknologi Malaysia, Johor Bahru, Malaysia 13 -15 August 2018
SELF-SERVICE TECHNOLOGY
Thoo Ai Chin*1, Wong Xiao Hong2, Umar Haiyat Abdul Kohar3, Norhayati Zakuan4
and Tan Liat Choon5
1, 2, 3, 4 Faculty of Management, Universiti Teknologi Malaysia, MALAYSIA
(E-mail: [email protected], [email protected], [email protected],
[email protected]) 5 Faculty of Geoinformation and Real Estate, Universiti Teknologi Malaysia, MALAYSIA
(E-mail: [email protected])
ABSTRACT
Self-service technologies (SST) have become prevalent in human daily life. SSTs are
technological interfaces that allow customers to perform the service on their own without
having to engage with employees of the organisation. Given the growing importance of self-
service, this paper aims to review past research and discover new agendas about the SSTs in
Malaysia. Recently, Malaysia has opened a first unmanned, self-service convenience store in
Subang Jaya. Also, Mcdonald’s Malaysia has launched self-service kiosks in Klang Valley
for customers to place customised orders and make payments on the machine. Therefore, it is
deemed worth to investigate the determinants and outcomes of customers’ use of SSTs in
Malaysia.
Key words: Self-service technologies, Malaysia
INTRODUCTION
Self-service technologies (SST) have become prevalent in human daily life. More and more
face-to-face service industries are replaced by SST, such as banking, tourism and hospitality,
food and beverages, retail and airlines. Recently, Amazon launched the first high-tech grocery
store that allows shoppers to scan their smartphone at a turnstile, pick out the items they want
and leave [1]. SSTs are technological interfaces that allow customers to perform the service
on their own without having to engage with employees of the organisation [2].
According to [3], there are four major categories of SSTs in use: telephone/ interactive voice
response systems, online/Internet-based interfaces, interactive kiosks, and video or compact
disc (CD) technologies. For examples, the telephone/interactive voice response systems
include checking order status and flight information. The online/Internet-based interfaces are
widely used in package tracking, retail purchasing and financial transactions. The interactive
free-standing kiosks provides services such as ATMs, hotel checkout and tourist information.
The video or compact disc (CD) technologies encompass tax preparation software and CD-
based training.
Given the growing importance of self-service, this paper aims to review past research and
discover new agendas about the SST in Malaysia. Recently, Malaysia has opened a first

SOCIAL SCIENCE 850
unmanned, self-service convenience store in Subang Jaya. The Irispay E-Concept Store
requires customers to download the Irispay application using their personal details and
scan the QR code on the products for payment [4]. Also, McDonald’s Malaysia has
launched self-service kiosks in Klang Valley for customers to place customised orders
and make payments on the machine. Therefore, it is deemed worth to investigate the
determinants and outcomes of customers’ use of SSTs in Malaysia.
LITERATURE REVIEW
Many extensive academic studies have explored the SSTs in terms of the different
industries, outcomes, determinants and motivations for SSTs adoption. [5] highlighted that
self-service technology service quality is critical to increase retail patronage. In a similar
vein, [6] compared users and non-users of SSTs at the exit of a grocery store, and found that
usage behaviour (i.e. usage frequency) and situational factors including coupons, basket size,
time pressure and queue length at the SSTs and staffed checkouts affect users to continue
utilising SSTs. In contrast, perceived behavioural control, perceived usefulness, need for
interaction, perceived ease of use and enjoyment are closely linked to non-users’ intention of
using SSTs. Most of these key drivers of non-users’ attitude toward the SST are aligned with
the study of [7].
[8] found that customers’ motivations to use SSTs include perceived crowdedness, time
pressure, companion’s effect, and other customers’ helping behaviors. Other motivations for
SST’s usage compose of convenience, access to lower prices, forced usage, eco-friendliness
and empathy for other customers as found by [9] in tourism sector.
[10] evaluated the outcomes of SST from customer perspective (word of mouth, trust and
loyalty) and business perspective (enterprise value and profitability) to provide guidelines for
future researchers and practitioners to better recognise the potential benefits and risks
associated with satisfied and dissatisfied SST customers. [3] found that customer satisfaction
using SSTs are closely linked to complaining behavior, word of mouth, customer attributions,
and re-patronage intentions. In addition, [11] concluded that SST enhances overall customer
satisfaction of a restaurant that uses SSTs in food ordering, billing statement, and calling
assistance of waiters.
There are some studies emphasise on business perspective. For examples, [12] focused on
SST adoption for a single multi-national financial services organisation and found that SST
as an alternative to service representative solutions. [13] proposed a framework consisting of
six phases to guide hoteliers in Singapore to adopt SSTs in hotels. The process starts with
defining the current service flow, establishing the risk and opportunity of using SSTs,
evaluating constraints and outcomes from using SSTs, testing and examining the types of
SSTs in market.
In Malaysia, limited studies are found in SST. For examples, [14] focused on consumer trial
of SST in the banking industry by investigating consumer readiness variables of role
clarity, motivation and ability as mediators for the relationships between various
established innovation characteristics and individual differences and the likelihood of
trial. [15] found that SSTs in tourism and hospitality industry include check-in kiosk in
hotels, hotel room booking using mobile application such as Agoda.com and booking.com,
navigation application such as WAZE for directions, Ticket Vending Machine (TVM) for
train, self-service kiosk for food ordering and tourism information.

SOCIAL SCIENCE 851
CONCLUSION
Nowadays, technology is gaining proliferation in the customer service industry. Customers
become familiar to interact with technology to create services through the use of SSTs. As
such, it is vital for providers of SSTs to understand how customers involvement in the
systems so that the firms can improve them by providing the goods and services faster, easier
and more convenient.
Acknowledgment: The authors wish to thank the Malaysian Ministry of Education (MOE),
Universiti Teknologi Malaysia (UTM) and Research Management Centre (RMC) for
financial support to this work through grants funding number Q.J130000.2629.15J63.
REFERENCES
1. CBCNews. Amazon’s 1st high-tech grocery store opens to the public (2018). Available at:
http://www.cbc.ca/news/technology/amazon-go-grocery-store-1.4497862
2. Robertson, N., Robertson, N., McDonald, H., McDonald, H., Leckie, C., Leckie, C., McQuilken, L. and McQuilken, L. Examining customer evaluations across different self-service technologies. Journal of
Services Marketing 30(2016), 88-102.
3. Meuter, M. L., Ostrom, A. L., Roundtree, R. I. and Bitner, M. J. Self-service technologies: Understanding
customer satisfaction with technology-based service encounters. Journal of Marketing 64(2000), 50-64.
4. Sinchew. Malaysia’s first self-service convenience store – five minutes shopping using QR code (2017).
Available at: http://www.sinchew.com.my/node/1714335
5. Lee, H-J. and Yang, K. Interpersonal service quality, self-service technology (SST) service quality, and retail
patronage. Journal of Retailing and Consumer Services 20(2013), 51-57.
6. Demoulin, N. T. M. and Djelassi, S. An integrated model of self-service technology (SST) usage in a retail
context. International Journal of Retail & Distribution Management 44(2016), 540-559.
7. Weijters, B., Rangarajan, D., Falk, T. and Schillewaert, N. Determinants and outcomes of customers' use of self-service technology in a retail setting. Journal of Service Research 10(2007), 3-21.
8. Poushne A. and Vasquez, A. Z. Self-service technologies (SST) or personal interaction. Society for
Marketing Advances, San Antonio, 2015.
9. Kelly, P. An interpretivist study of customer self-service technology usage and experiences in the tourism
sector. Dublin Institute of Technology, Ph. D. Thesis, 2015.
10. Taillon, B. J. and Huhmann, B. A. Strategic consequences of self-service technology evaluations. Journal of
Strategic Marketing (2017), 1-12.
11. Susianto, C. C. and Fachira, I. The influence of self service technology (SST) toward customer satisfaction.
Journal of Business and Management 4(2015), 728-742.
12. Considine, E. and and Cormican, K. Self-service technology adoption: An analysis of customer to
technology interactions. Procedia Computer Science 100(2016), 103-109.
13. Ong, L. I. Can self service technologies work in the hotel industry in Singapore? A conceptual framework for adopting self service technology. University of Nevada, Master of Hospitality Administration, 2010.
14. Chai, K. F. Self-service technology and internet banking: An investigation of consumers’ trial decision. University of Malaya, Master of Business Administration, 2008.
15. Ujang, A. H., Omar, A. R., Rani, I. A., Azmi, A., Kamal, S. B. M. and Abdullah, D. Factors influencing
consumer’s intention to use self service technology in tourism and hospitality industry. International
Academic Research Journal of Business and Technology 2(2016), 118-122.

SOCIAL SCIENCE 852
IGCESH2018
Universiti Teknologi Malaysia, Johor Bahru, Malaysia 13 -15 August 2018
CORPORATE SOCIAL RESPONSIBILITY AND PURCHASE
INTENTION
Thoo Ai Chin*1, Soh Xuan Ling2, Tan Liat Choon3, Huam Hon Tat4 and Noraini
Abu Talib5
1, 2, 5 Faculty of Management, Universiti Teknologi Malaysia, MALAYSIA (E-mail: [email protected], [email protected], [email protected])
3 Faculty of Geoinformation and Real Estate, Universiti Teknologi Malaysia, MALAYSIA
(E-mail: [email protected]) 4 Faculty of Business & Management, Southern University College, MALAYSIA
(E-mail: [email protected])
ABSTRACT
The influence of Corporate Social Responsibility (CSR) on consumers’ attitude and
behaviours has gained popularity from researchers since the late 1990s. Consumers become
increasingly conscious and their consumption decisions are dependent on the social
responsibilities of the companies. CSR is defined as a firm’s business operation for social and
environmental concerns by delivering economic, social and environmental benefits (Triple-
Bottom-Line-Approach) for all shareholders and stakeholders. In essence, CSR can create a
source of competitive advantage for firms. However, studies on the effect of CSR on
consumer purchase intention are still limited in Malaysia. As such, this paper aims to review
the concept of CSR and its impact on purchase intention.
Key words: Corporate social responsibility, Purchase intention, Malaysia
INTRODUCTION
Modern CSR has been captioned under many names, such as corporate responsibility,
corporate giving, corporate citizenship, corporate community involvement, corporate
philanthropy, corporate social marketing, community affairs, community relations,
community development and global citizenship [1]. In fact, there is no universal definition of
CSR due to its varying practices. The United Nations Industrial Development Organization
(UNIDO) defined CSR as a firm’s business operation for social and environmental concerns
by delivering economic, social and environmental benefits (Triple-Bottom-Line-Approach)
for all shareholders and stakeholders [2]. However, [3] defined CSR on behalf on The World
Business Council for Sustainable Development (WBCSD) as companies behave ethically
towards sustainable economic development and enhance the life quality of employees, their
families, the local community and society at large. Therefore, many studies attempt to
provide an overarching definition of CSR in order to guide corporations for societal norms
requirements and financial returns. According to [4], CSR is a business approach that
contributes wealth to its stakeholders through the integration of environmental and social
wellbeing. [5] analysed 37 definitions of CSR and found that the CSR definitions are

SOCIAL SCIENCE 853
categorised into five dimensions: environmental, social, economic, stakeholder and
voluntariness. Clearly, the definition from [2] covers these five dimensions.
The influence of Corporate Social Responsibility (CSR) on consumers’ attitude and
behaviours has gained popularity from researchers since the late 1990s [6]. Consumers
become increasingly conscious and their consumption decisions are dependent on the social
responsibilities of the companies. According to a survey by [7], ethical consumerism is
growing and half of the respondents indicated that they were willing to pay more for
companies committed to social responsibility. As highlighted by [8], more than half of the
respondents were willing to pay a premium for socially responsible products including
organic cotton, sustainable cotton, and US‐grown cotton shirts. In essence, CSR can create a
source of competitive advantage for firms [9]. However, studies on the effect of CSR on
consumer purchase intention are still limited in Malaysia. As such, this paper aims to review
the concept of CSR and its impact on purchase intention.
LITERATURE REVIEW
Purchase intention is defined as the plan to purchase a product or service in the future and
many studies show that CSR positively influences consumer attitudes and buying
intention. For examples, [10] found that purchase intentions are positively related to CSR
awareness and the willingness to pay premium price for CSR-based products/services. In
support, [11,12,13,14,15] highlighted that CSR has a direct impact on consumers’
purchase intention.
However, many studies examine the intervening mechanism between CSR and consumer
purchase intention. The mediating variables include consumer support for responsible
business [16], trust [6,17,18], and corporate competencies [6], perceived quality and
attitude toward the brand [19], corporate loyalty, advocacy, and a better quality of life
among consumers [20], consumer corporate identity [12], corporate image [11] and support
intention [21]. On the other hand, [14] found that country of origin moderates the
relationship between CSR and purchase intention.
CONCLUSION
Based on the literature review, CSR is one of the determining factors for consumers’
purchase intention. Evidently, firms need to achieve a balance of economic, environmental
and social imperatives in order to enhance consumers’ actual buying behaviour. This is
because profit of a firm is made by sales of products or services. Furthermore, the conscious
consumer is on the rise to support companies with sense of responsibility towards the
community and environment. Therefore, it is important to recognise the significant impact of
CSR on consumers’ purchase intentions.
Acknowledgment: The authors wish to thank the Malaysian Ministry of Education (MOE),
Universiti Teknologi Malaysia (UTM) and Research Management Centre (RMC) for
financial support to this work through grants funding number Q.J130000.2629.15J63.

SOCIAL SCIENCE 854
REFERENCES
1. Dodd, M. D. Corporate social responsibility and consumer purchase intention. Master Thesis. Ball State
University, 2009.
2. The United Nations Industrial Development Organization (UNIDO, 2018). What is CSR? Available at:
https://www.unido.org/our-focus/advancing-economic-competitiveness/competitive-trade-capacities-and-
corporate-responsibility/corporate-social-responsibility-market-integration/what-csr 3. Holmes, L. and R. Watts. Corporate social responsibility: Making good business sense. Geneva,
Switzerland: World Business Council for Sustainable Development, 2000)
4. Smith, R. E. Defining corporate social responsibility: A systems approach for socially responsible
capitalism. Master Thesis. University of Pennsylvania, 2011.
5. Dahlsrud, A. How corporate social responsibility is defined: An analysis of 37 definitions. Corporate Social
Responsibility and Environmental Management 15(2008), 1-13.
6. Xu, Y., Yu, W. and He, Y. Research review and prospect of corporate social responsibility and consumers’
purchase intention. Proceedings of the Seventh International Conference on Management Science and
Engineering Management, 675-686.
7. Nielsen (2013). Consumers who care.
Available at: http://www.nielsen.com/us/en/insights/reports/2013/consumers-who-care.html
8. Ha-Brookshire, J. E. and Norum, P. S. Willingness to pay for socially responsible products: case of cotton apparel. Journal of Consumer Marketing 28(2011), 344-353.
9. Saeed, M. M. and Arshad, F. Corporate social responsibility as a source of competitive advantage: The
mediating role of social capital and reputational capital. Journal of Database Marketing & Customer
Strategy Management 19(2012), 219-232.
10. Balcova, P. The impact of Corporate Social Responsibility on purchase intentions of Slovak consumers in
telecommunication industry. Master Thesis. International Hellenic University, 2012.
11. Huang, C-C., Yen, S-W., Liu, C-Y. and Huang, P-C. The relationships among corporate social
responsibility, service quality, corporate image and purchase intention. International Journal of
Organizational Innovation 6(2014), 68-84.
12. Jin, G. and Chen, D. The role of moral identity in consumers’ purchase intention with corporate social
responsibility. International Conference on Global Economy, Commerce and Service Science (GECSS 2014), 174-177.
13. Anim, P. A. and Cudjoe, A. G. The influence of CSR awareness on consumer purchase decision of a
telecommunication network in Ghana (A case of La Nkwantanag Madina Municipality). International
Journal of Scientific & Technology Research 4(2015), 8-16.
14. Ferreira, A. I. and Ribeiro, I. Are you willing to pay the price? The impact of corporate (ir) responsibility on
consumer behavior towards national and foreign brands. Journal of Consumer Behaviour 16(2017), 63-71.
15. Singh, R. and Malla, S. S. Does corporate social responsibility matter in buying behaviour? A study of
Indian consumers. Global Business Review 18(2017), 781-794.
16. Mulaessa, N. and Wang, H. The effect of corporate social responsibility (CSR) activities on consumers
purchase intention in China: Mediating role of consumer support for responsible business. International
Journal of Marketing Studies 9(2017), 73-81. 17. Kaur, P. The effect of CSR on Consumer’s buying behaviour. International Journal of Innovative Research
& Development 2(2013), 317-323.
18. Butt, I. Corporate social responsibility and consumer buying behavior in emerging market: A mixed method
study. International Journal of Business and Management 11(2016), 211-222.
19. Wongpitch, S., Minakan, N., Powpaka, S. and Laohavichien, T. Effect of corporate social responsibility
motives on purchase intention model: An extension. Kasetsart Journal of Social Sciences 37(2016), 30-37.
20. Amoroso, D. L. and Roman, F. Corporate social responsibility and purchase intention: the roles of loyalty,
advocacy and quality of life in the Philippines. The International Journal of Management 4(2015), 25-41.
21. Abdeen, A., Rajah, E. and Gaur, S. S. Consumers’ beliefs about firm’s CSR initiatives and their purchase
behaviour. Marketing Intelligence & Planning 34(2016), 2-18.

SOCIAL SCIENCE 855
IGCESH2018
Universiti Teknologi Malaysia, Johor Bahru, Malaysia 13 -15 August 2018
CONSPICUOUS CONSUMPTION
Thoo Ai Chin*1, Yeo Kang Yu2, Zuraidah Sulaian3, Adaviah Mas’od4 and
Tan Liat Choon5
1, 2, 3, 4 Faculty of Management, Universiti Teknologi Malaysia, MALAYSIA
(E-mail: [email protected], [email protected], [email protected], [email protected]) 5 Faculty of Geoinformation and Real Estate, Universiti Teknologi Malaysia, MALAYSIA
(E-mail: [email protected])
ABSTRACT
Conspicuous consumption is the purchase of goods and services where individuals signal
their social prestige rather than to satisfy their basic needs. Consumers in emerging markets
such as China, Russia and United Arab Emirates are continuing to drive luxury market
growth and have increased their spending stood at 70 percent. Affluent Chinese consumers
are expected to contribute 44 percent of the global luxury purchases by 2025 with one trillion
yuan. The conspicuous consumption of luxury goods has created opportunities for luxury
brands and retailers. As the luxury market continues to roar due to the increased international
travel and the emergence of the millennial luxury consumers, therefore, this paper aims to
review the past studies related to the conspicuous consumption and identify new research
agenda of conspicuous consumption in Malaysia.
Key words: Conspicuous Consumption, Luxury, Malaysia
INTRODUCTION
Consumers in emerging markets such as China, Russia and United Arab Emirates are
continuing to drive luxury market growth and have increased their spending stood at 70
percent [1]. Affluent Chinese consumers are expected to contribute 44 percent of the global
luxury purchases by 2025 with one trillion yuan [2]. The conspicuous consumption of luxury
goods has created opportunities for luxury brands and retailers.
Consumption is a defying phenomena occurring in a social context which people purchase
goods or services beyond their obvious use-value. Conspicuous consumption is one of the
main categories to defined distinctive consumption styles [3]. As defined by [4], conspicuous
consumption is the purchase of goods where individuals signal their social prestige, rather
than to satisfy their basic needs. Likewise, individuals conspicuously spend to display their
wealth [5]. According to [6], conspicuous consumption refers to an individual who aims to
access to a higher social class using excessive and competitive spending as well as luxury
leisure activities. Clearly, conspicuous consumption is commonly perceived as a means to
show ones social status through the lavish or wasteful spending of luxury goods. However,
there are individuals who use conspicuous consumption to signal sexual or social relevant
characteristics to others [7]. As the luxury market continues to roar due to the increased

SOCIAL SCIENCE 856
international travel and the emergence of the millennial luxury consumers [1], therefore, this
paper aims to review the past studies related to the conspicuous consumption and identify
new research agenda of conspicuous consumption in Malaysia.
LITERATURE REVIEW
According to [6], marketing and consumer behaviour literature found that conspicuous
consumption relates to purchase of luxury brands to signal social status, upward social
mobility and interpersonal relations. Also, [8] found that consumption of publicly visible
goods is affected by interpersonal influences. In support, as highlighted by [9],
consumers’ need for uniqueness, consumer susceptibility to interpersonal influence and
attention to social comparison information are closely related to conspicuous
consumption among students. Besides, individuals in a low-power state desire for luxury
products when they are in social exclusion [10].
There are many studies investigate the factors affecting conspicuous consumption and the
studies found that materialism is the dominant factor for conspicuous consumption
[11,12]. Drawing upon existing relevant literature, several studies compare conspicuous
consumption in different cultures, races and context factors. [13] found that Blacks and
Hispanics spend more money to acquire luxury goods such as clothing, jewelry, and cars
than Whites. On the other hand, [14] tested conspicuous behaviour in two different
cultures (individualist versus collectivist) and the study found that conspicuous
consumption is higher in individualist cultures. In addition, [15] concluded that context
factors including urban areas and areas with high inequality a relatively higher portion of
the income are related to conspicuous consumption.
However, there are studies provide evidence from new angles. For examples, [16]
investigated conspicuous consumption in relation to time. [17] found that showy spending
is one of the social signals for potential mates. It is proved that males spend on publicly
observable goods to attract females [18]. In fact, women are especially important to the
conspicuous consumption. With the significant improvement of the material standard-of-
living of societies, woman who possess the discretionary income have the economic
power to buy expensive items. Meanwhile, woman could play as an incentive for the
opposite gender to conspicuously consume [7].
CONCLUSION
Based on the extant literature, people spend lavishly to enhance social prestige and display
wealth rather than to cover basic needs. Millennials are found to reshape the luxury market.
According to a survey done by [19], by 2025, Millennials and Generation Z will be the key
players with 45% of the global luxury personal goods consumption. Therefore, future works
could make new inroads into understanding factors that lead Millennials and Generation Z to
engage in conspicuous consumption in Malaysia.
REFERENCES
1. Deloitte (2017). Global powers of luxury goods 2017: The new luxury consumer. 2. McKinsey & Company (2017). Chinese luxury consumers: More global, more demanding, still spending.
Available at: https://www.mckinsey.com/business-functions/marketing-and-sales/our-insights/chinese-
luxury-consumers-more-global-more-demanding-still-spending

SOCIAL SCIENCE 857
3. Firat, A., Kutucuoğlu, K. Y., Arikan Saltik, I. and Tunçel, O. Consumption, consumer culture and consumer
society. Journal of Community Positive Practices XIII(2013), 182-203.
4. Wu, Y., Eisenegger, C., Sivanathan, N., Crockett, M. J. and Clark, L. The role of social status and
testosterone in human conspicuous consumption. Scientific Reports 7(2017), 12260-12263.
5. Sivanathan, N. and Pettit, N. C. Protecting the self through consumption: Status goods as affirmational commodities. Journal of Experimental Social Psychology 46(2010), 564-570.
6. Patsiaouras, G. and Fitchett, J. A. The evolution of conspicuous consumption. Journal of Historical
Research in Marketing 4(2012), 154-176.
7. Memushi, A. Conspicuous consumption of luxury goods: Literature review of theoretical and empirical
evidences. International Journal of Scientific & Engineering Research 4(2013), 250-255.
8. O’Cass, A. and McEwen, H. Exploring consumer status and conspicuous consumption. Journal of Consumer
Behaviour 4(2004), 25-39.
9. Nasab, M. H., Shojaee, V. S. and Moshkdanian, F. Investigating factors affecting conspicuous consumption
among young people (Case Study: Students of Tehran University). International Research Journal of
Management Sciences 4(2016), 75-82.
10. Liang, S., Chang, Y. and Wang, J. Social exclusion and conspicuous consumption: The moderating effect of
power state. Social Behavior and Personality: An International Journal 45(2017), 321-330. 11. Podoshen, J. S. and Andrzejewski, S. A. An examination of the relationships between materialism,
conspicuous consumption, impulse buying, and brand loyalty. Journal of Marketing Theory and Practice
20(2012), 319-334.
12. Velov, B., Gojković, V. and Đurić, V. Materialism, narcissism and the attitude towards conspicuous
consumption. PSIHOLOGIJA 47(2014), 113-129.
13. Charles, K. K., Hurst, E. and Roussanov, N. Conspicuous consumption and race. The Quarterly Journal of
Economics 124(2009), 425-467.
14. Souiden, N., M’Saad, B. and Pons,F. A Cross-Cultural Analysis of Consumers’ Conspicuous Consumption
of Branded Fashion Accessories. Journal of International Consumer Marketing 23(2011), 329-343.
15. Wijnen, V. Conspicuous consumption: An empirical analysis of sub-Saharan Africa. Master Thesis,
Radboud University, 2017. 16. Bellezza, S., Paharia, N. and Keinan, A. Conspicuous consumption of time: When busyness and lack of
leisure time become a status symbol. Journal of Consumer Research 44 (2017), 118-138.
17. Sundie, J. M., Kenrick, D. T., Griskevicius, V., Tybur, J. M., Vohs, K. D. and Beal, D. J. Peacocks,
Porsches, and Thorstein Veblen: Conspicuous consumption as a sexual signaling system. Journal of
Personality and Social Psychology 100(2011), 664-680.
18. Collins, J., Baer, B. and Weber, E. J. Sexual selection, conspicuous consumption and economic growth.
Journal of Bioeconomics 17(2015), 189-206.
19. Bain & Company (2017). Global personal luxury goods market expected to grow by 2-4 percent to €254-
259bn in 2017, driven by healthier local consumption in China and increased tourism and consumer
confidence in Europe. Available at: http://www.bain.com/about/press/press-releases/global-personal-luxury-
goods-market-expected-to-grow-by-2-4-percent.aspx

SOCIAL SCIENCE 858
IGCESH2018
Universiti Teknologi Malaysia, Johor Bahru, Malaysia 13 -15 August 2018
PERCEPTION OF THE LEVEL OF PREPAREDNESS AMONG
VOCATIONAL COLLEGE LECTURERS ON THE
ENTREPRENEURIAL FIELD
Hanim Binti Zainal*1 and Mohammad Khata Bin Jabor2
1, 2 Faculty of Education, University of Technology Malaysia, UTM Skudai, MALAYSIA.
(E-mail:[email protected], [email protected])
ABSTRACT
Vocational Colleges nowadays have activities based on entrepreneurship education.
Entrepreneurship is one of the elements of teaching and learning opportunities for teachers
and students in particular to the actual experience in the business world, hence apply concepts
and theories learned as a business approach to real situations. Perceptions of preparedness
among lecturers viewed from the aspect of knowledge, practices and skills. A total of 100
lecturers from four Northern Regional Vocational College randomly selected to answer a
questionnaire that was given. The methods used to analyze data from Statistical package for
science social (SPSS). The major results shows the perception of the level of preparedness
among lecturers from the point of knowledge, practice and skills is at a high level in the
entrepreneurial field teaching. This is because most of the lecturers have been prepared to
implement the program of entrepreneurship, but there are constraints such as workload and
work in vocational college, which forced the lecturers to dominate over administrative duties
in the depictions program on entrepreneurship. In conclusion, this study showed no
significant difference in the availability of technical lectures on the entrepreneurial field
teaching in the Northern Region Vocational College.
Key words: Competency, Engagement with business, Entrepreneurship
INTRODUCTION
At the Vocational College, students are exposed to the entrepreneurial aspects in line with the
Vocational College’s own goal which targets graduates 10 percent to become entrepreneurs.
According to Van Aardt et al. (2008), entrepreneurship is an initiative, creating, building and
expanding a company or organization, establishing an entrepreneurial team and collecting
resources to find opportunities in the long-term market while Giacomin et al. (2010), the
government recognizes the importance of entrepreneurship education to be applied in the
national education system because the entrepreneurial activity is an important component of
economic growth, innovation and employment. ntrepreneurship education is an ideal field to
offer at a Vocational College to develop entrepreneurial elements and potentials in
Vocational College students who meet the needs of the community (Sluis et al 2004 & Din et
al 2005).
Hence, as instructors must be adequately equipped with knowledge, practice and skills to
enable them to play a role in the implementation of School Enterprise efficiency. This is

SOCIAL SCIENCE 859
supported by European Commission Enterprise and Industry (2009) stating that the main
challenge of the production of production-based and entrepreneurship education is to provide
competent and ready-to-use trainers in terms of practice, knowledge and skills.
MAIN RESULTS
Table 1 below shows a mean score about practice dimension among lecturers and for
detail explanation, referred in the text.
Table 1. Mean Score for Practice
3.97
High
Findings from a table above show that practice among lecturers in Alor Setar Vocational
College, Arau Vocational College and Kangar Vocational College have a high level of
readiness while lecturers at Sungai Petani 2 Vocational College are moderate. The
practice of a lecturer does not depend only on the place of service, but other factors can
also influence such skills and knowledge gained from programs, courses and workshops
conducted.
Table 2 below shows a mean score about knowledge dimension among lecturers and for
detail explanation, referred in the text.
Table 2. Mean Score for Knowledge
3.97
High
Dimension of knowledge shows the level of readiness of lecturers in Kangar Vocational
College, Alor Setar College and Sungai Petani 2 Vocational College is high while
lecturers in the Arau Vocational College are moderate. Possibility due to the relatively
small number of respondents obtained from the Arau Vocational College causes the mean
score for lecturer's readiness to the knowledge aspect is relatively low. This means that
the readiness of lecturers towards the entrepreneurship activities from the knowledge
dimension is good. This is supported by Kauchak and Enggan (1989) which states the
same thing where effective teaching requires extensive knowledge of subjects and has an
understanding of student learning aspects. The conclusion clearly demonstrates that
without a sufficient knowledge base, the lecturer can not translate into the form of
effective teaching and cannot teach maximally with minimal effort.
Table 3 below shows a mean score about skills dimension among lecturers and for detail
explanation, referred in the text.
Table 3. Mean Score for Skills
3.821 High
The findings from the skills aspect show the level of readiness of lecturers at Sungai
Petani 2 Vocational College and Alor Setar is high compared with lecturers in Kangar

SOCIAL SCIENCE 860
Vocational College and Arau Vocational College which are only at moderate level. The
skills that the lecturer possesses may depend on the academic qualifications it possesses
and the knowledge gained from the various programs and research conducted.
CONCLUSION
This entrepreneurship leads to the creation of job opportunities involving businesses.
Coaching and advice from lecturers about the entrepreneurship need to be improved so that
students can inculcate interest in the business environment. This interest is seen as a catalyst
and drive to the production of quality graduates with high self-esteem to become a successful
entrepreneur.
REFERENCES
1. Ahmad, A., Nazeri, A., Yusof, R., et. all., Entrepreneurship: A Handbook. Kuala Lumpur: Pearson Malaysia
Sdn Bhd, 2015.
2. Buang, N.A. & Yap, P.M. Kesediaan Guru-Guru Perdagangan Di Wilayah Persekutuan Dari Aspek Pengetahuan Kaedah Pengajaran Dan Sikap Terhadap Pengajaran Subjek Pengajian Keusahawanan”.
Universiti Teknologi Malaysia : Jurnal Teknologi, 37 (E) Dis. 2002:1-16.
3. Commission, E. Entrepreneurhip in Vocational Education and Training (2009) (pp. 1-46).
4. Din, M.S., et. all. The Development of Entrepreneurship and Enterprise in Higher Education in Malaysia.
Tesis PhD. University of Durham, 2005.
5. Giacomin, O., Janssen, F., Pruett, M., Shinnar, R. S., Llopis, F., Toney, B. Entrepreneurial intentions,
motivations and barriers: differences among American, Asian and European students. Int Entrep Manag J,
7, (2011), 219-238.
6. Van Aardt, I et al., Entrepreneurship and New Venture Management, edisi ke-3, Oxford University Press
Southern Africa : Cape Town, 2008.

SOCIAL SCIENCE 861
IGCESH2018
Universiti Teknologi Malaysia, Johor Bahru, Malaysia 13 -15 August 2018
USING AREDKIT TO IMPROVE SPATIAL VISUALIZATION
SKILLS FOR ORTHOGRAPHIC PROJECTION
Marlissa Omar*1, Dayana Farzeeha Ali2, Mahani Mokhtar3, Norarbaiyah Yaacob4,
Nusaila Johari5
1, 2,4,5 Department of Technical and Engineering, Faculty of Education, Universiti Teknologi Malaysia,
Johor Bahru, MALAYSIA.
(E-mail: [email protected], [email protected], [email protected],
[email protected]) 3 Department of Educational Foundation and Social Science, Faculty of Education, Universiti
Teknologi Malaysia, Johor Bahru, MALAYSIA.
(E-mail: [email protected])
ABSTRACT
Augmented reality has been widely used as a spatial visualization training tool in various
areas. The popularity is due to its ability to enhance users’ perception as well as increase the
users’ understanding towards complex concepts which cannot be explained using normal
environment. Students with low spatial visualization skills have difficulties in learning
orthographic projection. Orthographic projection is one of the main topics in Engineering
Drawing Course. The topic consists of highly spatial content which requires students to
perform visualization activities in order to complete any tasks. This paper presents an
application of augmented reality environment named AREDKit for improving spatial
visualization skills in orthographic projection teaching and learning. An augmented card
called AREDKit was designed and developed to allow manipulation of 3D virtual models
with the purpose to help students to perform visualization tasks during the process of teaching
and learning. Thirty students were involved in this study and their mental rotation skills were
measured using Purdue Spatial Visualization Test of Rotation (PSVT:R). Results indicated
that the use of AREDKit during orthographic projection’s teaching and learning produced a
significant impact on students’ mental rotation skills. Based on students’ positive feedback on
AREDKit, the results proved that it can be an effective spatial visualization tool. AREDKit is
also practical to be used in classrooms since it has low production cost. Furthermore, it has
easy to use functions which can be operated using smartphones.
Keywords: AREDKit, Spatial Visualization, Orthographic Projection, Mental Rotation
INTRODUCTION
The term augmented reality has been widely recognized by people all around the world.
Augmented reality is defined as a technology that allows virtual elements being embedded
into real environment that runs interactively in real time (Azuma et al., 2001; Martín-
Gutierrez, Trujillo, & Acosta-Gonzalez, 2013; Cuendet et al., 2013; Bower et al., 2013). It is
also defined as a system that supplements real world objects or environments with virtual
elements (Bacca et al., 2014). Augmented reality is a new technology that offers unique

SOCIAL SCIENCE 862
affordances to its users. It has been used in various field such as entertainments (Berryman,
2012; Liarokapis, Lister & White, 2002; Kesima & Ozarslanb, 2012), medicine (Berryman,
2012; Azuma et al., 2001), military (Berryman, 2012; Liarokapis, Lister & White, 2002),
engineering design and manufacturing (Azuma et al., 2001). Other than that, it is also been
used in education field due to its interactive elements.
Among all the advantages of augmented reality that has been identified by researchers, one of
its major advantages is the ability enhance visualization skills (Salinas, 2017; Hoe et al.,
2017). Visualization skills is the ability to mentally generate, manipulate and interprets three
dimensional images (Isham, 1997; Mohd Safarin & Muhammad Sukri, 2006; Martin-
Gutierrez et al.,2010). Learning engineering drawing specifically have some issue among
students. This is because most of students have difficulties in visualizing the objects
especially in orthographic projection topics. This topic mainly involves visualizing objects
while figuring the objects view from side views, front and top views. This topic require
students to use their visualization skills to enable them to see all the view perfectly and
clearly. Thus, it is important for teachers or lecturers to choose a right tools to help them see
the views and understand the concept clearly instead of using trial and error method to solve
the tasks given to them.
Understanding of the concept is important to help them in their studies since there will be
more complex courses in the future that requires them to use their visualization skills which
will involves even more complex shapes and objects. Other than that, mastering engineering
drawing among engineers is a priority since it is a predictor for their career success
(Shreeshail & Koti, 2016). This is because, failure in reading or interpreting the drawing will
cause issues in the designing and production process later on. According to Azodo (2017),
having a good skills in producing, reading and interpreting engineering drawing will reduce
the errors in the production process.
MAIN RESULTS
This study aim to determine the effect of using AREDKit in enhancing students’ spatial
visualization skills. Table 1 shows the differences between mean scores of PSVT:R pre-
test and post-test.
Table 1. The differences between mean scores of PSVT: R pre-test and post-test
Paired samples statistics
Mean N Std. Deviation Std. Error Mean
PSVT: R PRE 58.6676 30 25.15135 4.5920
PSVT: R POST 82.4444 30 15.10884 2.7584
Paired samples test
Paired Differences
t df Sig. (2-
tailed) Mean
Std.
Deviati
on
Std.
Error
Mean
95% Confidence
Interval of the
Difference
Lower Upper
PSVT: R
PRE-
POST
-23.7776 29.4567 5.3835 -34.7882 -12.7671 -4.417 29 .000

SOCIAL SCIENCE 863
The findings indicates a significant differences in students’ mental rotation skills after they
undergo the orthographic projection teaching and learning process using AREDKit. The
paired sample test showed that there is a significant increase in the pre-test and post-test of
PSVT:R (M=-23.7776, SD=29.4567) where the increase is significant at t(29)= -4.417,
p<0.05. This finding shows that AREDKit is proven to be an effective tool in enhancing
students’ mental rotation skills.
Other than that, this study also attempt to identify students’ perception towards using
AREDKit in Orthographic Projection teaching and learning process. Figure 1 shows students’
feedback on using AREDKit.
Figure 1. Students’ Feedback on Using AREDKit
Among all the feedback, it is shown that the statement where AREDKit can assists students
in the visualization tasks showed highest positive feedback among all the statements. This is
because the nature of AREDKit that implements an augmented reality learning environment
which enable students to actively manipulate virtual objects in real environment had
contributed to this finding. Other than that, it is also shown from the feedback that learning
using AREDKit increases students’ interest towards learning.
CONCLUSION
Understanding orthographic projection is proven to be difficult for some students especially
among those with low visualization skills. Teaching and learning process should be maximize
and new technology should be utilize effectively to ensure all students received fair amount
of knowledge transfer. Other than that, it is also to ensure an increase in students’
performance and skills. Augmented reality specifically has advantages towards increasing
students’ visualization skills. This study has showed that AREDKit is suitable to be used as
spatial visualization training tools as well as increase students’ interest towards learning
complex course. This is due to the significant difference in the mental rotation test that
researcher has distributed to the respondent before and after the teaching and learning process
using AREDKit. In conclusión, learning using AREDKit is effective towards enhancing the
quality of teaching and learning process and help maximize students’ learning experience.
REFERENCES
1. Salinas, P. Augmented Reality: Opportunity for Developing Spatial Visualization and Learning Calculus. In Mobile Technologies and Augmented Reality in Open Education (2017), 54-76. IGI Global.
2. Hoe, Z. Y., Lee, I. J., Chen, C. H., & Chang, K. P. Using an augmented reality-based training system to
promote spatial visualization ability for the elderly. Universal Access in the Information Society, (2017), 1-
16.
3. Mohd Safarin Nordin & Muhammad Sukri Saud. Kajian Awal Terhadap Kebolehan Ruang Pelajar- pelajar
Pengajian Kejuruteraan di Sekolah- sekolah Menengah Teknik. Paper presented at the 1st International
Malaysian Educational Technology Malaysian Convention, Senai, Johor Bahru. (2007).
4. Bacca, J., Baldiris, S., Fabregat, R., & Graf, S. Augmented reality trends in education: a systematic review
of research and applications. Journal of Educational Technology & Society, (2014), 17(4), 133.

SOCIAL SCIENCE 864
5. Martín-Gutierrez, J., Trujillo, R. E. N., & Acosta-Gonzalez, M. M. Augmented reality application assistant
for spatial ability training. HMD vs computer screen use study. Procedia-Social and Behavioral
Sciences, (2013), 93, 49-53.
6. Liarokapis, F., Petridis, P., Lister, P. F., & White, M. Multimedia augmented reality interface for e-learning
(MARIE). World Transactions on Engineering and Technology Education, (2002), 1(2), 173-176.

SOCIAL SCIENCE 865
7.
IGCESH2018
Universiti Teknologi Malaysia, Johor Bahru, Malaysia 13 -15 August 2018
A PROPOSED EXTENDED MCKNIGHT’S INITIAL TRUST MODEL
FOR B2C E-COMMERCE
Wong Chiet Bing*1, Prof. Dr. Khalil Md Nor2 and Assoc. Prof. Dr. Ahmad Jusoh 3
1, 2, 3 Faculty of Management, Universiti Teknologi Malaysia, Johor Bahru, MALAYSIA.
(E-mail: [email protected], [email protected], [email protected])
ABSTRACT
This paper primarily aims to develop a comprehensive model of initial trust by evaluating and
integrating trust determinants within the extended McKnight’s initial trust models. We have
first systematically identified initial trust determinants by comprehensively reviewed the
literature, and subsequently reclassified them by rigorously evaluated the properties of the
root constructs. Based on the review, six fundamental, theoretical constructs have partly been
identified to extend McKnight’s initial trust model. They are: (1) e-vendor reputation, (2)
product brand image, (3) product brand awareness, (4) website quality, (5) self-efficacy and
(6) individualism. This study contributes academically by providing a comprehensive
conceptual model, where the essential constructs are assembled together. Future empirical
validation is suggested at the end of this paper.
Key words: Initial Trust, E-Commerce, Business-to-Consumer, Trusting Belief, Trusting
Intention
INTRODUCTION
In a nature without human presence and sensory touch, buying in an online environment is
perceived as riskier than in-store shopping. If an e-retailer is unknown to a shopper, risk
increases. Customer will stop at buying stage, unless trust is initially established. If initial
trust is vital, then examining factors of which building this trust is necessary. McKnight and
colleagues are among the first to study initial trust and most importantly they have proposed
the broadly accepted theory for trust formation. They have successfully dealt with the
conceptual confusion in trust literature by decomposing a general term of trust into trusting
belief and intention [1]. Their other momentous research works include: (1) clarifying the
concept based on trust type [2], (2) extending the trust type typology [1], and (3) developing a
validated measurement and model with empirical support [3] and [4]. Their fundamental
trust-type typology is shown in Figure 1. This typology depicts the relationship among the
trust types. In online transaction context, the trusting beliefs in a web-vendor are influenced
by consumers’ institution-based trust and disposition to trust. Those beliefs, in turn, influence
their trusting intention towards that web-vendor.

SOCIAL SCIENCE 866
Disposition to Trust
Trusting Stance
Faith in Humanity
Institution based Trust
Situation Normality
Structural Assurance
Interpersonal based Trust
Trusting Beliefs
Competence
Benevolence
Integrity
Trusting Intention
Figure 1. McKnight’s Fundamental Trust Type Typology
Recent empirical studies have further extended McKnight’s trust building model by adding
various constructs from prominent theories as initial trust determinants. However, in these
studies, we found that there is still room for improvement. First, the extended constructs were
incorporated not in totally but separately in studies to extend McKnight’s initial trust model.
There is yet any study provides a complete set of determinants of initial trust. Second, not all
these constructs has been added to test their effect on both trusting belief and trusting
intention. Given that initial trust is theoretically, fundamentally consisting trusting beliefs and
intention [1], the roles played by these added constructs in building initial trust have not fully
been justified. Third, researches are beset by conflicting conceptualization of these
constructs. Consequently, it appears various constructs, even have been used interchangeably
in many studies, yet there is no agreement in term of labelling and definition. This study
attempts to improve their researches in this area. We seek (1) to identify the determinants of
initial trust by reviewing literature, (2) to classify the determinants by evaluating their
properties (i.e definition and measurement), and (3) to incorporate these constructs in
extending the McKnight’s initial trust model.
MAIN RESULTS
Based on the systematic review of literature, it is found that researches have extended
McKnight’s trust building model by adding 29 constructs as trust determinants. Surprisingly,
several constructs were found identical even though using different term. In total, six
fundamental constructs were identified to represent 29 constructs through a rigorous
properties (i.e. definition and measurement) evaluation and classification of these constructs.
These constructs are mostly drawn from prominent theories and concepts to empirically
examine their effects on initial trust (also known as interpersonal trust) that is centering in the
McKnight trust model. Of six constructs, four (e-vendor reputation, product brand image,
brand awareness, and website quality) have been added in McKnight’s initial trust models to
comprehensively assess its effect on trusting beliefs and trusting intention whereas the effects
of another two constructs (self-efficacy and individualism) on trusting beliefs are examined
but not on trusting intention. This study suggests the complete effect of self-efficacy and
individualism on initial trust which according to [1], primarily involves not only trusting
belief but also trusting intention. Thus, a direct effect of both constructs on trusting intention
is proposed. Finally, we proposed a comprehensive McKnight’s trust typology model by
assembled all fundamental determinants of initial trust from the extended models (see figure
2)

SOCIAL SCIENCE 867
Personality based Trust
Disposition to Trust
Trusting Stance
Faith in Humanity
Institution based Trust
Situation Normality
Structural Assurance
Trust building factors
E-vendor Reputation
Product Brand Image
Brand Awareness
Website Quality
Self-efficacy
Individualism
Interpersonal based Trust
Trusting Beliefs
Competence
Benevolence
Integrity
Trusting
Intention
Note: Constructs are added
to extend McKnight’s initial
trust model
Figure 2. The extended McKnight’s initial trust model
CONCLUSION
This paper contributes academically. First, several fundamental determinants of initial trust
were successfully identified by comprehensively evaluated the properties of various
constructs which have been used to extend McKnight’s trust typology model. They are (1)
perceived e-vendor reputation, (2) co-brand image, (3) co-brand awareness, (4) perceived
website quality, (5) self-efficacy, and (6) individualism. Second, we improve the research’s
work, by suggesting the complete effects of self-efficacy and individualism on initial trust
which is fundamentally consisting not only trusting beliefs but also trusting intention. Third,
we proposed a comprehensive McKnight’s trust typology model by assembled above all
determinants of initial trust to examine the effects of these determinants on trusting beliefs
and trusting intention. Our study is not free of limitation. A comprehensive model was
proposed, however it has yet been empirically validated. Hence, this is another area we seek
to address in future research. Acknowledgment: The authors would like to thank Zamalah Universiti Teknologi Malaysia
for their financial assistance. REFERENCES
1. McKnight, D. H. and Chervany, N. L. What trust means in e-commerce customer relationships: an
interdisciplinary conceptual typology. International Journal of Electronic Commerce 6 (2001), 35–59. 2. McKnight, D. H., Choudhury, V. and Kacmar, C. Developing and validating trust measures for e-commerce:
an intergrative typology. Information Systems Departments 3 (2002a), 334–359.
3. McKnight, D. H., Choudhury, V. and Kacmar, C. The impact of initial consumer trust on intentions to
transact with a web site: A trust building model. Journal of Strategic Information Systems 11 (2002b), 297–
323.
4. Mcknight, D. H., Cummings, L. L. and Chervany, N. L. Initial trust formation in new organizational
relationships. Acadamy of Management Review 23 (1998), 473–490.

SOCIAL SCIENCE 868
IGCESH2018
Universiti Teknologi Malaysia, Johor Bahru, Malaysia 13 -15 August 2018
NETBALL TEAM LOYALTY
Thoo Ai Chin*1, Pow Mei Foong2, Mohd Shoki Md Ariff3, Choi Sang Long4 and
Farrah Merlinda Muharram5
1, 2, 3, 5 Faculty of Management, Universiti Teknologi Malaysia, MALAYSIA
(E-mail: [email protected], [email protected], [email protected], [email protected]) 4 Raffles University Iskandar, Johor Bahru, Johor, MALAYSIA
(E-mail: [email protected])
ABSTRACT
Recently, Malaysia hosted the 29th Southeast Asian (SEA) Games in Kuala Lumpur and won
the gold medal in netball competition. Given the importance of brand management of sport
teams, the objective of this paper is to review the team loyalty in Malaysian netball fans.
Loyalty is one of the important elements for any of a long-term relationship and it should be
positioned at the centre of sport brand management. Many studies have conducted the team
loyalty in football clubs and professional soccer teams. However, there are limited studies to
explore the team loyalty of netball fans in Malaysia. Thus, this paper aims to fill the gap by
reviewing the antecedents of team loyalty in the context of netball fans in Malaysia. The
expected findings provide several implications to marketing managers of netball team on
ways to develop loyal sport fans.
Key words: Team loyalty, Netball, Malaysia
INTRODUCTION
According to [1], most of the firms focus on brand loyalty strategies to outperform their
competitors and generate sales. If loyal consumers attach to a particular brand, they will
ignore what competitors are doing to attract them. Thus, loyalty is an important element for a
long term relationship and should be applied in sport brand management. Generally, this
paper focuses on fans of netball in Malaysia. In Malaysia, netball is a team sport under the
management of Malaysia Netball Association (MNA). MNA was founded in the year of 1978
by Tengku Abdul Aziz Shah [2]. Additionally, MNA is under the International Federation of
Netball Association (IFNA) and also Asian Federation of Netball Association (AFNA). MNA
hosted the first Asian Netball Championship in 1985 and also the third Asian Youth Netball
Championship. Malaysian netball team is currently ranked third in Asia. Moreover, the
Malaysian youth netball team is Asian champion since 2004 until 2013 [2]. In 2016, Malaysia
crowned champion again in Asian region after 31 years. Also, this year 2017, Malaysia
hosted the 29th Southeast Asian (SEA) Games in Kuala Lumpur and won the gold medal in
the netball competition [3].
Income generation for sustainability is important to sport associations including MNA.
Netball game is not well recognized in Malaysia as there are no major sports events that
include netball as one of the participating sports. However, netball started to gain popularity

SOCIAL SCIENCE 869
after involving in major events such as SEA Games in Malaysia [2]. Thereafter, there are
many people in Malaysia started to find netball game genuinely entertaining to watch and feel
fully engaged. In fact, fans are the primary revenue source for sport teams. According to the
Pareto principle (20-80 rule), 20% of loyal fans provides 80% of income sources of sport. As
such, fan engagement and loyalty could ensure a long-term and sustainable profit of sport
clubs [4]. Fan loyalty creates value for the sport teams; however, MNA has not conducted
any loyalty programmes that could have led to generate substantial income for the netball
team. Furthermore, the information that has been made available to netball fans in MNA’s
social media is lacking and not up-to-date, thus opportunity to boost revenue streams is
missed in terms of ticket sales.
LITERATURE REVIEW
According to [5], sport team loyalty is essential in sport services because of the
dependency on team performance and deficiency of control on match outcome. Loyalty is
one of the important elements for any of a long-term relationship and it should be
positioned at the centre of sport brand management [1]. Loyalty can be defined as a
desirable benefit, based upon commitment to social values served by the organization [6].
Loyalty can be found in different perspectives: employee loyalty [7] and sport team
loyalty [1].
According to [8], team loyalty is firstly defined as “the relationships between a person’s
enthusiasms to show their loyal actions”. In the definition, it means that team loyalty
provokes the intention of customers to buy product or services which is linked to their
supported team. There is certainly importance of team loyalty in sport services because of
the uncontrollable match’s outcome, their team performance dependency, and specialty of
the teams [5,8]. Furthermore, loyalty focusing on social factors that able to provide an
impact on the relationship between sport consumers and a sport team [1]. Previous
research about team loyalty found that fans play an essential role to influence the team
value [9].
[8] found that sport attachment signifies a strong emotional connection that happens when
an individual gives symbolic, practical and emotional meanings towards a leisure objects
such as sport team [8,10]. One of the main variables in the prediction of sport
consumption is the team attachment because it focuses on the development of fans’
emotional connection with a sport team [8].
Also, researchers highlighted that involvement is a key influence in consumers’ choice of
products [11]. For sport team fans, when they feel involved in a team, they will most
likely purchase the sport products. This means that when fan involvement is high, the
interest and awareness of the product will be high, as well as high positive attitude
towards both the brand and the advertisements [12]. According to [13], professional
teams are considered as unique and strong brands with certain consumer or fan
associations. Clearly, fan associations view professional sport teams as a brand which
they can improve their inner self. In terms of self-expression of fans in professional
teams, fans develop psychological associations with their favourite sport teams; and fans
use the sport team as a way to express their own identity and perception [14].

SOCIAL SCIENCE 870
CONCLUSION
The review shows that team attachment, team involvement and team self-expression are
critical to netball team attachment in Malaysia. The review could be importance to future
researchers to use as baseline information in conducting empirical research. Also, the
findings will be significant to practitioners such as Malaysia Netball Association (MNA) and
policy makers. Marketers of MNA could target the netball fans as their consumers in order to
generate income. While there are so many loyal netball fans, they could sell t-shirts, netball
and also tickets for netball matches. For fans that are very loyal and feel attached to netball
team, they are willing to purchase anything that is related to the netball team. Furthermore,
meet and greet is one of the event that can be organized by MNA to generate income for the
sustainability of the association. Meanwhile, for the policy makers such as National Sports
Council (NSC) could leverage on netball fans in Malaysia to generate income by selling
tickets during major events like SEA Games.
REFERENCES
1. Tsiotsou, R. H. Sport team loyalty: Integrating relationship marketing and a hierarchy of effects. Journal of
Services Marketing 27(2013), 458-471.
2. Malaysia Netball Association (2017). Available at: www.pbjm.net.
3. Kuala Lumpur 29th SEA Games (2017). Available at: https://kualalumpur2017.com.my/seagames-
sport.cshtml?cid=1
4. Mullin, B. J., Hardy, S. and Sutton, W. A. Sport Marketing, 3rd Edition, Champaign, IL, 2007.
5. Mahony, D. F., Madrigal, R., and Howard, D. (2000). Using the psychological commitment to team (PCT)
scale to segment sport consumers based on loyalty. Sport Marketing Quarterly. 9(1): 15-25. 6. Hoffmann, E. A. Exit and voice: Organizational loyalty and dispute resolution strategies. Social Forces
84(2006), 2313-2330.
7. Susan L., Linda K. G. and Michael, B. Promoting worker loyalty: An empirical analysis. International
Journal of Manpower 36(2015), 169-191.
8. Funk, D. C. and James, J. D. The psychological continuum model: A conceptual framework for
understanding an individual’s psychological connection to sport. Sport Management Review 4(2006), 119-
150.
9. Zagnoli, P. and Radicchi, E. The football-fan community as a determinant stakeholder in value co-creation.
Sport in Society 13(2010), 1532-1551.
10. Beaton, A., Funk, D., and Alexandris, K. Operationalizing a theory of participation in physically active
leisure. Journal of Leisure Research 41(2009), 177-203.
11. Shamsher, R. and Chowdhury. R. A. Relationship of demographic characteristics with purchasing decision involvement: A study on FMCG laundry soaps. Journal of Business and Retail Management Research
6(2012), 78-89.
12. Lee, E., Hu, M. Y. and Toh, R. S. Are consumer survey results distorted? Systematic impact of behavioural
frequency and duration on survey response errors. Journal of Marketing Research 37(2000), 125-133.
13. Buhler, A., Chadwick, S. and Nufer, G. Relationship Marketing in Sports. Routledge, 2009.
14. Heere, B. and James, J. D. Stepping outside the lines: Developing a multi-dimensional team identity scale
based on social identity theory. Journal Sport Management Review 10(2007), 65-91.

SOCIAL SCIENCE 871
IGCESH2018
Universiti Teknologi Malaysia, Johor Bahru, Malaysia 13 -15 August 2018
INTERACTION IN PROBLEM BASED LEARNING ENVIRONMENT
TOWARDS CRITICAL THINKING SKILL: A FRAMEWORK
Wan Nur Tasnim Wan Hussin*1, Jamalludin Harun2 and Nurbiha A. Shukor3
Faculty of Education, Universiti Teknologi Malaysia, MALAYSIA.
(E-mail: [email protected], [email protected], [email protected])
ABSTRACT
Interaction among students is considered can educate students to engage in active learning
and enhance critical thinking skill. Critical thinking has been identified as one of the 21st
century skills that students need to succeed in society. The most operative way to help
students develop critical thinking skills is by engaging them in learning environment that
supports higher-order thinking activity. Among learning strategies, problem based learning is
thought to promote critical thinking. There is still limited research on how interaction in
problem based learning can promote students’ critical thinking skill. A theory building
methodology is used to create a new framework which we hope can be used by researchers to
examine and support multiple types of effective educational interactions and will help
practitioners to apply the elements of interaction in problem based learning environment to
foster students’ critical thinking skill.
Key words: Critical Thinking, Problem Based Learning, Interaction, Framework
INTRODUCTION
Interaction among students during the learning process plays an important role in improving
students' critical thinking skills [1-2]. However, there is lack of critical thinking during the
interaction process. Developing students’ critical thinking skills is regarded as important
educational goal in many societies around the world. However, previous studies reported that
the number of university students with critical thinking skills was minimal [3-4]. Problem
based learning (PBL) strategy is believed can train student to interact effectively and give
solution together to enhance their critical thinking. This learning approach helps students to
be more active during the learning process by learning solving real-world problems [5-6].
Hence, there is a need for a framework to improve critical thinking for effective interaction in
PBL.
LITERATURE REVIEW
There are five learner interaction types which are learner–interface, learner–self, learner–
content, learner–instructor and learner–learner [7]. Due to this study only focuses on
learner-learner interaction, interaction analysis model by Gunawardena et al. in 1997 was
chosen. The five coding schemes in interaction analysis model are: sharing and
comparing of information which means portraying new information to other members;

SOCIAL SCIENCE 872
discovery and exploration of dissonance or inconsistency among ideas, concepts or
statements which means answering and asking questions to clear the resource; negotiation
of meaning/co-construction of knowledge means that negotiating the meaning of terms);
testing and modification of proposed synthesis means testing against personal experience
and lastly, agreement statement/applications of newly-constructed meaning which means
utilizing and agree to the new idea) [8]. We added three effective interaction
characteristics suggested by Johnson and Johnson in 1996 in order to make interaction
more meaningful and active. The features are students respond to each other, students
exchange resources such as information and materials to each other and students provide
assistance and guidance to each other [9].
Development of critical thinking skills can improve the capability to generate decisions
and derive conclusions [10]. Among educational strategies, PBL is thought to promote
critical thinking [11]. PBL strategy can enhance student interaction [12]. Thus, we will
apply the five principles of PBL proposed by Graaff and Kolmos in 2003. These
principles are: the problem is the starting point in the learning process; learning is a
student-centered and teacher only guide to solve the problem; teachers should be creative
in providing issues that are relevant to the topic of teaching; students use the existing
experience during the learning process and current learning activities are the basis of the
learning process [13].
Interaction among students can foster critical thinking as they involve in act ive learning
by discussion, argue and making judgment. Facione Model in 1990 is selected for this
study because it focuses on testing thinking skills in a group interaction learning
environment. This model suggests 6 skills which are interpretation which means for
categorization, decoding significance, and express variety of experiences, beliefs,
judgments, and criteria [14]. Analysis means probing ideas, and analyzing arguments.
Inference means to find elements needed to form hypotheses; make conclusions; to
ponder relevant information and to deduce the consequences flowing from data,
statements, and speculating alternative. Evaluation means assessing the trustworthiness of
statements which are descriptions of a people’s experience, perception, and to assess the
logical strength of the actual inferential relationships among statements. Explanation
means affirming results, validating procedures and portraying arguments. And lastly, self-
regulation means self-correction and self-examination [14].
RESEARCH METHOD
Theory building is used in this study. Based on “Literature Review” subtopic in this
paper, the resulting operationalized conceptual framework can be visualized as Figure 1.
This framework is for designing learning environment to promote students’ critical
thinking skills.

SOCIAL SCIENCE 873
Figure 1. Framework of interaction in problem-based learning to promote critical thinking
DISCUSSION: THE INTERRELATIONSHIP OF INTERACTION, PBL AND
CRITICAL THINKING
From Figure 1, the effective interaction is in 2 ways of direction. When students respond
to each other and exchange resources, they will share and comparing information,
discover and explore the inconsistency ideas and co-construction of knowledge and vice
versa. When students provide assistance and guidance to each other, they can have
agreement statement and modification of proposed synthesis and vice versa. PBL in this
study is one of the elements in learning environment that trigger student to interact and
promote critical thinking. After students having effective interaction in PBL environment,
we need to know the performance of the students. From the interaction analysis, we can
evaluate students’ critical thinking skills based on interpretation, analysis, inference,
evaluation, explanation and self regulation from Facione Model in 1990. Theory building
is a systematic project which keeps on with expansion and improvement. This paper only
tackled the first and second phases. Thus, research to analyse the interaction process in
PBL to foster critical thinking can be the future work with the purpose of confirming this
framework.
CONCLUSION
Critical thinking is difficult to develop without the interaction. Due to this factor,
interaction in PBL is designed as the learning environment. Theory building method is
chosen as a methodology to design the effective interaction in PBL to promote critical
thinking skill framework. For effective interaction, the elements from Gunawardena et al.
in 1997 and Johnson and Johnson in 1996 are chosen, and for PBL, Graaff and Kolmos in
2003 is selected, and for critical thinking evaluation, the elements of Facione Model in
1990 is used in this study. Promoting student’s interaction in PBL environment and
fostering of critical thinking requires a proper framework that can assist educators to
understand on how to use the learning environment to maximize effective interaction
process and enhance critical thinking skills.

SOCIAL SCIENCE 874
Acknowledgment: The authors would like to express their appreciation for the support of the
sponsors of Universiti Teknologi Malaysia Zamalah Scholarship.
REFERENCES
1. Newman. D. R., Johnson, C., Cochrane. C., and Webb. B., “An Experiment in Group Learning Technology:
Evaluating Critical Thinking in Face-to-face and Computer-supported Seminars,” Interpersonal Computing and Technology Journal, (1996), 4(1), 57-74,
2. González-González, I. and Jiménez-Zarco, A. I., “Using Learning Methodologies and Resources in the
Development of Critical Thinking Competency: An Exploratory Study in a Virtual Learning Environment,”
Computers in Human Behavior, Retrieved on 19 December 2017, (2014).
3. Rodzalan, S. A., and Saat, M. M., “The Perception of Critical Thinking and Problem Solving Skill among
Malaysian Undergraduate Students,” Procedia-Social and Behavioral Sciences, (2015), 172, 725-732
4. Lechasseur, K., Lazure, G., and Guilbert, L., “Knowledge Mobilized by a Critical Thinking Process
Deployed by Nursing Students in Practical Care Situations: A Qualitative Study,” Journal of Advanced
Nursing, (2011), 67(9), 1930-1940,
5. Hmelo-Silver, C. E., Duncan, R. G., and Chinn, C. A., “Scaffolding and Achievement in Problem-based and
Inquiry Learning: A Response to Kirschner, Sweller, and Clark (2006),” Educational Psychologist, (2007), 42(2), 99-107
6. Ääri, R. L., Elomaa, L., Ylönen, M., and Saarikoski, M., “Problem-based Learning in Clinical Practice:
Employment and Education As Development Partners,” Nurse Education in Practice, (2008), 8(6), 420-427.
7. Chou, C., Peng, H., & Chang, C. Y., “The technical framework of interactive functions for course-
management systems: Students’ perceptions, uses, and evaluations,” Computers & Education, (2010), 55(3),
1004-1017.
8. Gunawardena, C. N., Lowe, C. A., & Anderson, T., “Analysis of global online debate and the development
of an interaction analysis model for examining social construction of knowledge in computer conferencing,”
Journal of Educational Computing Research, (1997), 17(4), 397-431,
9. Johnson, D. W. and Johnson, R. T., “Cooperation and the Use of Technology,” Handbook of Research for
Educational Communications and Technology: A Project of the Association for Educational Communications and Technology, (1996), 1017-1044.
10. Dwyer, C. P., Hogan, M. J., & Stewart, I., “An integrated critical thinking framework for the 21st century,”
Thinking Skills and Creativity, (2014), 12, 43-52.
11. Tiwari, A., Lai, P., So, M., & Yuen, K., “A comparison of the effects of problem‐based learning and
lecturing on the development of students' critical thinking,” Medical education, (2006), 40(6), 547-554.
12. Warren, S. J., Dondlinger, M. J., McLeod, J., dan Bigenho, C., “Opening the Door: An Evalation of Problem
Based Learning Game,” Computers & Education, (2012), 58 (1), 397-412.
13. Graaf, E. dan Kolmos, A., “Characteristics of Problem-based Learning,” International Journal of
Engineering Education, (2003), 19(5), 657-662.
14. Facione, P. A., “Critical thinking: A statement of expert consensus for purposes of educational assessment
and instruction - The Delphi Report. Berkeley”, CA: California Academic Press, (1990).
15. Vygotsky, L. S., “Mind in society: The development of higher psychological process,” Harvard University Pres, (1978).

SOCIAL SCIENCE 875
IGCESH2018
Universiti Teknologi Malaysia, Johor Bahru, Malaysia 13 -15 August 2018
STUDENTS’ MOTIVATION TO LEARN, ACADEMIC
ACHIEVEMENT, AND ACADEMIC ADVISING: A META-ANALYSIS
Sofiazianti Saleh*1, Zakiah Mohamad Ashari 2 Azlina Mohd Kosnin3
1, 2 Faculty of Education, Universiti Teknologi Malaysia (UTM), Malaysia
.([email protected], [email protected]) 3 Faculty of Education, Universiti Teknologi Malaysia (UTM), Malaysia
ABSTRACT
Investigating students’ motivation to learn especially among those with learning difficulties is
crucial particularly in tertiary academic setting. Universities need to retain their students and
reduce attrition. Keeping the students true to their academic calling can be daunting as they
come from various backgrounds (e.g. academic, language, family and culture). These diverse
and unique sets of challenges can pull the students off course as they may have difficulties
adapting, adjusting and coping with new learning and social environments. Recognising these
challenges may help universities to identify what affects students’ academic achievement. As
a form of student development support, universities’ academics are assigned as academic
advisors. The main roles of these academic advisors are to provide students academic advice,
assist in making goals, provide guidance and help them to achieve academically.
Nevertheless, not much is known on how academic advising can be the important link that
helps students to be motivated to learn, stay focused and achieve better throughout their
tertiary years. Hence, this study aims to identify students’ motivation to learn, their coping
strategies and their use of academic advising. After a meta-analysis analysis, there are three
critical areas of learning associated with the importance of academic advising identified.
They are (1) motivation levels; (2) learning difficulty and (3) academic achievement.
Key words: Students’ motivation, academic achievement, academic advising
INTRODUCTION
Every higher education institutions (HEIs) aims in providing students from diverse
backgrounds a favourable learning experience that could lead them not only to do well but
able to complete their studies on time and earn the coveted certificates, diploma, degree or
postgraduate degrees. However, the aim could not be reached by every student as they may
face challenges causing them to fail or drop out before they are able to complete their studies.
Perry et.al (2005) as in (Remsing, 2013) discovered that adolescents normally find transition
from secondary school to university traumatic as they need motivation and emotional support
when adapting themselves to many new and unfamiliar academic and social environments.
To help students with the support needed, academic advisors are tasked to assist and be the
students’ confidante and counsellors. However, more information is needed to find out more
on why academic advising is important in a student’s personal and academic development
throughout their years in the university. The findings are crucial as they can help HEIs to be a

SOCIAL SCIENCE 876
place where the students can learn, mature and grow but they can also help HEIs to provide
the academic support the students need. Therefore, this study aims to identify the students’
motivation to learn, their coping strategies and their use of academic advising as their link to
the university.
MOTIVATION TO LEARN
Seen as a form of force, motivation arouses interest and persistence among learners. It is
known to have the ability to initiate a learner’s reaction towards a task. Motivation, driven
either intrinsically or extrinsically, can be used in determining an individual’s behaviour.
(Richardson, Abraham, & Bond, 2012) are of the opinion that motivational processes cannot
be neglected in the field of education as it plays a fundamental role in instructive learning and
achievement which supports (Hamjah, Ismail, Rasit, & Rozali, 2011) who stated that
motivation is seen as the main factor that plays an important role in determining a student’s
achievement. In addition, motivation is also one of the main factors that could influence
students to be self-encouraged and aspired when performing learning activities. Devoid of
motivation, learning process is perceived as challenging as tremendous effort and
attentiveness are necessary when ensuring that students can achieve their goals.
ACADEMIC ACHIEVEMENT
Academic performance is a reference to education’s output and is mainly assessed with
regards to subject grades with examination. Various literature measures academic
performance as a course grade, Grade Point Average (GPA) or other form of scores based on
classroom tasks or assignments. (Arshad, Zaidi, & Mahmood, 2015) defined academic
performance as the outcome of education to the point which a student, teacher or institution
has achieved their educational goals.
ACADEMIC ADVISING
Academic advising occurs in circumstances where the learning institution’s appointed
representative gives insight or guidance related to academic, social or personal matters. The
insight given can be in the form of an advice, suggestion and the representative is seen as a
coach or mentor to the student (Kuhn, 2008). Nutt (2003) in (Parget, 2011) described
academic advising as the most important element of a successful learning institution’s effort
to educate and retain students. Based on this, academic advising should be seen as the heart
of students’ centred services and not just one of the optional services made available to the
students. An academic advisor who is able to bridge the gap between the students and the
learning institution as indicated by the research is can improve students’ retention and their
academic successes.
RESULTS AND FINDINGS
Based on the study’s meta-analysis, there are three critical areas of learning associated with
the importance of academic advising.

SOCIAL SCIENCE 877
Table 1. Students’ Motivation to Learn, Academic Achievement, and
Academic Advising
No Explication Study
1 Motivation to learn and academic
advising
There are positive
correlations between
students’ motivation to learn and academic
advising.
Hamjah, Ismail, Rasit, & Rozali,
(2011);Richardson,
Abraham, & Bond, (2012);Remsing,
(2013); Gnambs and
Hanfstingl (2015)
2 Learning difficulty among students
and academic advising
There are positive correlations between
learning difficulty
among students and how academic advising
helps them to cope
Hamjah, Ismail, Rasit, & Rozali,
(2011);Parget (2011);
(Remsing, 2013)
3 Academic achievement and academic
advising
There are significant
correlation between
academic achievement
and academic advising
Kuhn (2008); Hamjah,
Ismail, Rasit, & Rozali, (2011); Parget (2011)
CONCLUSION
Academic advising, along with teaching and learning, is the core to help students achieve the
fundamental academic goals. Academic advising is important as it helps students to: (1)
understand why they are in the university hence giving them the motivation needed to push
themselves forward; (2) understand the university’s curriculum therefore allowing them to
identify their own strengths and weaknesses and helping them to adapt accordingly; (3) guide
students as they struggle to adapt with the vibrant environment of campus life socially and
academically
REFERENCES
1. Arshad, M., Zaidi, S. M., & Mahmood, K. ( 2015). Self-Esteem & Academic Performance among University
Students . Journal of Education and Practice .
2. Gnambs, T., & Hanfstingl, B. (2015). The Decline of Academic Motivation during Adolescence:An
Accelerated Longitudinal Cohort Analysis on the Effect of Psychological Need. Educational Psychology .
3. Hamjah, S. H., Ismail, Z., Rasit, R. M., & Rozali, E. A. (2011). Methods of Increasing Learning Motivation
among Students. Procedia Social and Behavioral Sciences .

SOCIAL SCIENCE 878
IGCESH2018
Universiti Teknologi Malaysia, Johor Bahru, Malaysia 13 -15 August 2018
INDUSTRY 4.0 CIVIL ENGINEER JOB SKILLS REQUIRED BY
EMPLOYERS IN MALAYSIA
Nurfazwin Ab Rasid*1 and Nor Fadila Amin2
1, 2 Department of Technical and Vocational Education, Universiti Teknologi Malaysia, Skudai, Johor,
MALAYSIA.
(E-mail: [email protected], [email protected])
ABSTRACT
We are in the beginning of Fourth Industrial Revolution that will change the way of humans
live and work. Changes in the style of work in the 21st century happen to improve the
country's economy. The changing nature of work and employment in the fourth industrial
revolution force people to find the needs for well-developed skills for future job market.
Rapid changes in the world of work require university providers to strengthen their role in
producing highly skilled human capital to cater the industrial demands. Therefore, this study
attempts to look into civil engineering job skills and abilities that required for new generation
civil engineers in Malaysia. This paper aimed to review the lists of skills needed by the
employers for civil engineers in Malaysia. The findings presented for a necessary frameworks
of job skills to civil engineering students to prepare their abilities for the future job demand.
Key words: Job skills, Civil engineering graduates, Employers
INTRODUCTION
In 21st century, the improvement achieved by humans far beyond the development that has
been through thousands of years ago. In the fourth revolution, many experts see that the
essential task of human beings will be replaced by robotic energy, millions of people lost
their jobs especially in the manufacturing sector [1].
The early twenty-first century has seen the emergence of hugely disrupted economies and
business models, frequently encouraged by technological innovations [2], [3]. Hence, all
parties should be prepared with reskill so that the workers keep giving the contribution. In
Malaysia, engineering graduates have good fundamental engineering knowledge [4].
However, employers in Malaysia grumble on the graduate level job applicants are lack of
generic skills [5].
The study by Hassan [6] shows that there is a critical need for engineering programmes to
improve in all areas, especially in non-technical aspects of engineering education. Therefore,
this paper is to review the job skills that employers need for civil engineers in Malaysia. In
identifying the job skills is to use search of information such journals as well as through an
internet search. A review of relevant literature was used to gather the data for this study.
Review of relevant literature was used to collect data for this article. Relevant articles were
assessed or downloaded from on open access journals via prominent search engines such as

SOCIAL SCIENCE 879
google, alta vista and yahoo at http://www.google.com.my; http://www.altavista.com and
http: www.yahoo.com/ respectively. While, subscribed journals were accessed via Universiti
Teknologi Malaysia (UTM) library website at www.utm.my/spz. Related content information
from textbooks, journal articles, conference proceedings, discussion papers, reports and
policy documents have been read and analyzed to form part of this paper.
MAIN RESULTS
Based on the review, the list of job skills that employers need for civil engineers as shown
in Table 1.
Table 1. The review on job skills that employers need for civil engineers in Malaysia
Author(s), Year
Tec
hnic
al s
kil
ls
Pro
ject
Man
agem
ent
Com
mu
nic
atio
n
Skil
ls
Cre
ativ
ity
Cri
tica
l T
hin
kin
g
Tea
m W
ork
ing
Lea
der
ship
Vis
ual
izat
ion
Sk
ills
Anal
yti
cal
Th
ink
ing
Pro
ble
m S
olv
ing
Tim
e M
anag
emen
t
Skil
ls
Mat
hem
atic
al S
kil
ls
Dec
isio
n M
akin
g
Tawfiq B. A.
(2015) / / / / /
Alison D. (2018) / / / / /
Joanna Z. (2017) / / / / / / / / / / /
OHIO University
(2017) / / / / / / /
Jainudin, N. A., Francis, L., Tawie,
R., & Matarul, J.
(2015)
/ / / / /
National Academy of Engineering.
(2004)
/ / / / /
Besterfield-Sacre,
M., Ozaltin, N. O., Shartrand, A.,
Shuman, L. J., &
Weilerstein, P. (2011)
/ / /
Entika, C. L.,
Mohammad, S.,
Jabor, M. K., & Osman, S. (2017)
/ / / / / /
CONCLUSION
There is a most required skill in civil engineering career need to be considered. The review is
to conclude civil engineer jobs skill that most employers needed. The findings presented for a
necessary frameworks of industry 4.0 job skills to civil engineering students to prepare their
abilities for the future job demand. Therefore, students able to compete job demand in this
industry 4.0 revolution. Other than that, this framework helps universities in redesign and

SOCIAL SCIENCE 880
develop curriculum for civil engineering students to face work challenges in industry 4.0.
This study also beneficial to civil engineer fresh graduates, employees and employers as their
references. The results of the review could be used for future research. Future research could
identify the civil engineer job skills required by employers in others country. They could
make a comparison of the job skills needed by employer in different countries.
Acknowledgement: We would like to thank School of Graduate Studies (SPS), UTM for
assissting this study financially through Zamalah Scholarship.
REFERENCES
1. Jumain, F. “Revolusi industri lebarkan jurang kaya, miskin,” Sinar Harian, p. 1, June 12, 2017. [Online].
Available: http://www.sinarharian.com.my. [Accessed Nov. 2, 2017].
2. Tohmatsu, D.T. Digital Disruption: Short Fuse Big Bang?. Deloitte Touche Tomatsu Ltd, Australia (2012),
1-52.
3. Christensen, C. The innovator's dilemma: when new technologies cause great firms to fail. Harvard Business
Review Press, 2013.
4. Mohd.Sam, A.R. and Abu Bakar, S and Kassim, K.A. Inculcating Generic Skill for Civil Engineering
Students Through Final Year Project, Conference on Engineering Education (CEE 2004), 14-15.
5. Kamsah, M. Z. Developing Generic Skills in Classroom Environment: Engineering Students’ Perspective, Conference on Engineering Education (CEE 2004), 14-15.
6. Hassan, B., Mohd Zaidi, O., Zainal, M., Abang Abdullah, A.A., Badrulhisham, A.A., Abdul Hamid, H., Nik
Abdullah, N.M., Azmi, H. and Zaidi, M.R. “The Future of Engineering Education in Malaysia”, a report by
the Department if Institutions of Higher Education Management, Ministry of Higher Education,
Malaysia (2007).

SOCIAL SCIENCE 881
IGCESH2018
Universiti Teknologi Malaysia, Johor Bahru, Malaysia 13 -15 August 2018
FACTORS INFLUENCING FOREIGN CONSUMERS INTENTION TO
PURCHASE HALAL PRODUCTS IN MALAYSIA
Misliyana Misnan*1, Ong Choon Hee2 and Adriana Mohd Rizal 3
1, 2 Authors’ Azman Hashim International Business School, Universiti Teknologi Malaysia (UTM),
Johor Bahru, Malaysia. (E-mail: [email protected], [email protected])
3 Author’s Azman Hashim International Business School, Universiti Teknologi Malaysia (UTM),
Johor Bahru, Malaysia.
(E-mail: [email protected])
ABSTRACT
This paper discusses about the factors influencing foreign consumer’s intention to purchase
halal products in Malaysia. Halal food is a must for a Muslim person, and is also a priority for
non-Muslims especially in terms of hygiene. In this study also covers what is halal, halal
products and why this paper aim to focus on foreign consumers, In addition, in this paper also
proposes a conceptual framework independent variable such as halal awareness, halal
certificate and halal integrity. As a consumer purchasing intention is dependant variable. The
researcher also put a moderating variable, to know the string connection between these
variable. Further research, both empirical and non –empirical must be done to cover a several
issues regarding on halal product.
Key words: Halal product, foreign consumers, halal integrity, halal certificate, halal acceptance,
intention to purchase
INTRODUCTION
Our country is now on track to become a developed nation by 2020 [Ambali & Bakar 2014]
but, the government has created a new and better vision for the country, that is 'National
Transformation 2050' or TN50 is an ingenuity to plan Malaysia's future in the 2020 to 2050.
As of the viewpoint of becoming a developed nation, one of the TN50's agenda is to make
our country one of the global halal supply chain which a part of economic growth for
Malaysia. Based on views from previous researcher [Ambali & Bakar 2014] Halal food or
halal product is the most important and potential sector to be the economic power for both
domestic and globally.
In Arabic, halal is meant to stand "permissible" or “allowed”. Basically, it encompasses the
way of life and not just food as Muslims allowed to devour, although generally food is an
important component of the sustenance required to produce meaningful lives.[Golnaz et al.
2010] . In this halal context, most views though halal perspective in terms of food only
whereas halal can be broadly defined. Previous researcher, [Norafni@Farlina binti Rahim,
2015] halal industry includes food, non -food and services.

SOCIAL SCIENCE 882
In terms of nutrition, most of them think that halal food means food that does not contain
pork and liquor.[Yunus et al. 2010]. Instead the opposite word for halal is haram which
means totally not permitted and prohibited.[Yunus et al. 2010]
Based on current circumstances, a worldwide argument about the halal concept of the product
or food due to the identification as an option of guidelines for protection, purity and standard
of what we ingest and drink for every day. Products and food produced according to the
actual halal process can be accepted by Muslim consumers as well as non-Muslim
consumers. For Muslim consumers, food and products has met the necessities of Shariah law
is a claim in religion while for non-Muslim consumers, it is a symbol of protection, hygiene
and standard when the halal recognition process is controlled by the Holistic Halal Assurance
Management System [Yunus, Ariffin, & Rashid, 2014].
According to the previous study, there are studies focusing on halal products which produced
by the Non-Muslim manufacturer, nonetheless, the results are still uncertain. Therefore, this
study aims to investigate and determinants factors that can assure foreign consumers to buy
halal products which produced by Malaysia manufacturers. Halal awareness, Islamic brand
and product ingredients are used as the pre-determined factors in measuring consumer’s
purchase intention [Ambali & Bakar, 2014].
PROPOSED THEORETICAL FRAMEWORK
Figure 1. Conceptual framework of theory planned behavior with application consumer
purchasing intention to buy Halal Product in Malaysia
CONCLUSION
The conclusion is foreign consumers are a focus of attention owing to the increase of number
of foreign students in Malaysia. In fact KPT encourages universities to open its doors to
foreign students. The world’s Muslim population is expected to increase by 2030.
The acceptance of local halal products by foreign consumers will certainly stimulate our
gross domestic product and boost the economic performance of our country and go beyond
borders.
Acknowledgment: My sincere gratitude goes to Universiti Teknologi Malaysia (UTM) for
awarding me the UTM Zamalah PhD Scholarship. The scholarship award has been an
integral part that supports and sustains my research.
Acculturation
Halal Integrity
Halal Awareness
Halal Certificate
Consumer Purchasing
Intention

SOCIAL SCIENCE 883
REFERENCES
1. Ahmad, H., Hirawaty, N. & Abd, I., 2014. Factors influencing readiness towards halal logistics among food-
based logistics players in Malaysia. UMK Procedia, 1(October 2013), pp.42–49. Available at:
http://dx.doi.org/10.1016/j.umkpro.2014.07.006. 2. Ambali, A. R., & Bakar, A. N. (2014). People’s Awareness on Halal Foods and Products: Potential Issues
for Policy-makers. Procedia - Social and Behavioral Sciences, 121(September 2012), 3–25.
https://doi.org/10.1016/j.sbspro.2014.01.1104
3. Ajzen, I. (1985), “From Intentions to actions: A Theory of Planned Behavior”, Kuhl, J. And Beckmann, J.
(Eds), Action Control: From Cognition to Behavior, Springer, Heidelberg, pp. 11-39.
4. Ajzen, I. (1991), “The Theory of Planned Behavior”, Organizational Behavior and Human Decision
Processes, 50, 179-211.
5. Fischer, J. (2012), “Branding halal: A photographic essay on global Muslim markets”, Anthropology Today,
Vol. 28 No. 4, pp. 18–21.
6. Golnaz, R., Zainal, A. M. & Mad-Nasir, S. (2012), Assessment of Consumers’ Confidence on Halal
Labelled Manufactured Food in Malaysia,Social, Science. & Humanities. 20 (1), 33 – 42.
7. Golnaz, R., Zainal, A. M., Mad-Nasir, S. & Eddie-Chew, F. C. (2009). Concern of Halalness of Halal-Labelled Food Product among MuslimConsumer in Malaysia. Evaluation Selected Demographic Factors.
Economic and Technology Management Review, 4, 65-73.
8. Golnaz, R. et al., 2010. Non-muslims’ awareness of Halal principles and related food products in Malaysia.
International Food Research Journal, 17(3), pp.667–674.
9. Hrubes, D., Ajzen, I., and Daigle, J. (2001). Predicting Hunting Intentions and Behavior: An Application of
the Theory of Planned Behavior.Leisure Sciences, 23, 165-178.
10. Rahim, N., Shafii, Z. & Shahwan, S., 2015. Awareness and Perception of Muslim Consumers on Halal
Cosmetics and Personal Care Products. International Journal of Business, Economics and Management, 2(1),
pp.1–14.
11. Riaz, M.N. and Chaudry, M.M. (2004), Halal Food Production, CRC Press, Boca Raton, FL
12. Rajagopal, S., Ramanan, S., Visvanathan, R. and Satapathy, S. (2011), “Halal certification: implication for marketers in UAE”, Journal of Islamic Marketing, Vol. 2 No. 2, pp. 138–153.
13. Yunus, A., Chik, W. & Mohamad, M., 2010. The Concept of Halalan Tayyiba and Its Application in
Products Marketing : A Case Study at Sabasun HyperRuncit Kuala Terengganu , Malaysia. International
Journal of Business and Social Science, 1(3), pp.239–248.
14. Yunus, N. S. N. M., Ariffin, N. M., & Rashid, N. M. (2014). Muslim’s Purchase Intention towards Non-
Muslim’s Halal Packaged Food Manufacturer. Procedia - Social and Behavioral Sciences.
https://doi.org/10.1016/j.sbspro.2014.04.01
15. Zulfakar, M.H., Anuar, M.M. & Talib, M.S.A., 2014. Conceptual Framework on Halal Food Supply Chain
Integrity Enhancement. Procedia - Social and Behavioral Sciences, 121, pp.58–67. Available at:
http://linkinghub.elsevier.com/retrieve/pii/S1877042814011252.

SOCIAL SCIENCE 884
IGCESH2018
Universiti Teknologi Malaysia, Johor Bahru, Malaysia 13 -15 August 2018
THE ROLES OF PUBLIC RELATIONS IN AN ENVIRONMENTAL
AWARENESS CAMPAIGN: A CASE STUDY OF SWM
ENVIRONMENT SDN BHD
Shahrul Amir A. Rahim*1, Mohd. Nasir Markom2 and Syed Agil Alsagoff3
1, 2 Department of Human Resource Development, Faculty of Management,
Universiti Teknologi Malaysia, 81310 Johor Bahru, Johor, Malaysia
(E-mail: [email protected], [email protected]) 3 Department of Communication, Faculty of Modern Language and Communication,
Universiti Putra Malaysia, 40450 Serdang, Selangor, Malaysia
(E-mail : [email protected])
ABSTRACT
Conducting an environmental awareness campaign by using the qualitative research method
exemplifies how public relations (PR) can boost the impact towards audience’s behavior.
Generally, PR practitioners have their own strategies in delivering messages, but there are
certain roles that influence the audience’s behavior, attitude and mentality. This warrants
further investigation on the failure factors of current environmental awareness campaigns
which revolve around communication theories in obtaining more enlightening and reasonable
facts. This study examines the professionalism of PR practitioners and personnel using in-
depth interviews and content analysis by reviewing related documentation to understand
underlying dynamic practices. The findings will construct the real challenges that implicate
the PR practitioners’ role and the audience’s reaction towards environmental awareness
campaigns in Malaysia.
Key words: Public Relations, practitioner, professionalism, Environmental Awareness
Campaign
INTRODUCTION
The main goals of public relations are to basically create, maintain and protect an
organization's reputation, enhance its prestige and project a favorably positive image.
Effective public relations requires knowledge, based on analysis and understanding, of
various factors that shape public attitudes towards an organization. PR practitioners play a
vital role in an organization. Besides to upkeep the images and reputation, they are the key
individuals who strategic the planning and road map to achieve organizational goals. They
also need to play the role of ‘‘rational analytical planners’’, ‘‘decision makers’’, ‘‘issuers of
commands’’ and ‘‘incessant negotiators’’ in a drastic organizational change [1]
Discussion of the roles of public relations practitioners in organizations generally includes a
variety of functions. PR plays its part as a decision maker towards shaping the public’s
response to awareness campaigns [2]. They offers several explanations in comparing between

SOCIAL SCIENCE 885
the traditional PR roles as a gatekeepers, versus its professional public relations function as a
proficient communicators [3] [4]. These are some of the important roles that will give a direct
impact to audiences, particularly on environmental campaigns. Scholars have also highlighted
several latest issues on the professionalism or competencies of PR practitioners which are
essentially needed in order to face a complex and diverse world [5].
Public relations (PR) plays an important role especially in big organizations and businesses in
communicating to the audience. The role of PR has changed and evolved. Previously, it was
perceived as a tactical tool to influence media coverage as well as the proliferation of
communication. Eventually, the need to engage with multiple stakeholders and greater
demands for corporate transparency have cemented PR at the heart of strategic management
[6] Despite having facilities in place, the public have yet to fully embrace the notion of waste
separation. Public apathy is arguably the number one reason why “greening” efforts fail.
When it comes to plastic bags and waste separation, the government’s awareness campaigns
have not nailed the desired impact. Hence, we may need to try alternative means, including a
tougher approach to change people’s attitudes. [7].
There is a need to change human behaviour for the sake of protecting their environment or
contributing to having a healthy one. That is why the “go green” national campaigns of “No
Plastic Bag Day Campaign”, “3R Campaign (Reduce, Reuse, Recycle)”, “Environmental
Education” and numerous other similar efforts have been organized by non-governmental
organizations (NGO’s) such as the World Wildlife Fund (WWF) Malaysia or Malaysia
Nature Society (MNS). The effects of such programs on the public have been rather
significant but unfortunately, the impact has not been the same for the society as a whole [8].
Public relations, from the management role to fulfilling basic human needs, changes
awareness of public behavior and perceptions as to what PR practitioners actually do [9]. The
practitioners’ role enactment is recognized as one of the main areas of theory development
within public relations by exploring managerial roles with a particular focus on
professionalism. Previous research studied the connection between managerial role enactment
and participation in decision-making. The managerial role competencies across public
relations department are positively related to the participation of public relations in strategic
planning [10].
FINDINGS
The environmental awareness campaign is conducted because of the need to educate the
public and to increase involvement and participation from the audience or community in a
variety of activities towards conserving and protecting our beloved planet earth. There are as
a matter of fact many strategies available to conduct environmental awareness campaigns, be
it in school, industries, offices, shopping complexes, public places and housing areas.
Campaigns are any form of environment related activities which are organized with certain
target audiences such as tree planting, talks, forums, exhibitions, demonstrations, recycling,
saving natural resources and competitions. Their success is highly reliant on the organizers
that plan and run the campaigns. Normally, campaigns aspire to spark off symbiotic and
sustainable participation between the organizers, exhibitors, political personnel and residence
associations. In reality, there are so many types of campaigns that usually work closely with
local authorities through multiple strategies, primarily talk programs, briefings, competitions
and exhibitions.

SOCIAL SCIENCE 886
CONCLUSION
This study is to acquire a reliable and valid information by implementing a structured
research strategy. The PR roles in an environmental awareness campaign is a field of practice
by PR professionals that can only be effectively determined using a case study approach. It is
an individual experience, hence a background knowledge of hos it is planned and executed
will give more insight on the subject matter. The research findings will be able to give current
and different views regarding the importance of public relations strategies in disseminating
information to create effective public awareness campaigns. This research will benefit those
who are involved in PR and researchers who explore various PR activities to enhance public
awareness on environmental campaigns. As for future research, there is a need to study the
impact of using social media on environmental awareness campaign.
REFERENCES
1. Yi Luo : Effective Public Relations Leadership in Organizational Change: A Study of Multinationals in
Mainland China; Journal of Public Relations Research (2014); 26: pp. 134–160.
2. Ji Yeon Jeong et. al. : Core Elements for Organizational Sustainability in Global Markets: Korean Public
Relations Practitioners’ Perceptions of Their Job Roles; Sustainability (2017); 9(9): p1646.
3. Anne Gregory. et.al. : Editorial for Special Section on World Public Relations Forum Conference
‘Communication Across Cultures, WPRF (2016); Research colloquium call for papers. [Available at
http://www.worldprforum.com/until 29th May 2016].
4. Anne Gregory : Understanding public relations in the ‘sharing economy’; Public Relations Review
(2017);43:pp 4-13.Alison Theaker : What Is Public Relations? Chapter 1, The Public Relations Handbook,
Fifth Edition (2015); Routledge Taylor And Francis Group; London UK & NY 5. Dustin Manley : Laying the foundation for a global body of knowledge in public relations and
communications management, Public Relations Review (2017); 43:pp.56-70.
6. Mihaela Amalia Petrovici : E- Public Relations: Impact and Efficiency. A case study, ScienceDirect
Procedia, (2014) Procedia - Social and Behavioral Sciences 141 ( 2014 ) 79 – 84
7. Web article on what will it take to go green? The Star Online. Brian Martin; Friday, 26 Aug 2016, retrieved
31 December 2017 from https://www.thestar.com.my/opinion/columnists/on-your-side/2016/08/26/what-
will-it-take-to-go-green-so-far-various-campaigns-have-failed-to-change-peoples-attitudes
8. H Masoumeh : How Go Green Campaign Effects on Malaysian Intention towards Green Behaviour, Journal
of Applied Sciences (2015) , 15 (6): 929-933, 2015 ISSN 1812-5654© 2015 Asian Network for Scientific
Information ans
9. Alison Theaker : What Is Public Relations? Chapter 1, The Public Relations Handbook (2015)., Fifth
edition, Routledge Taylor and Francis Group, London UK & NY 10. Christian Fieseler et. al. : An inquiry into the transformation of the PR roles' concept; Corporate
Communications An International Journal (2015); Emerald Inside, DOI: 10.1108/CCIJ-02-2014-0013.

SOCIAL SCIENCE 887
IGCESH2018
Universiti Teknologi Malaysia, Johor Bahru, Malaysia 13 -15 August 2018
THE INTERESTS OF ACTORS AND POWER RELATIONS IN THE
UTILIZATION OF MARINE RESOURCES PELABUHANRATU
Eva Royandi*1 Arif Satria2 Saharuddin3
1 Student in Study Program Rural Sociology in Department of Communication and Community
Development Sciences, Faculty of Human Ecology, Bogor Agricultural University, Indonesia. 2 Lecturer in Department of Communication and Community Development Sciences, Faculty of
Human Ecology, Bogor Agricultural University, Indonesia. 3 Lecturer in Department of Communication and Community Development Sciences, Faculty of
Human Ecology, Bogor Agricultural University, Indonesia.
(Email: [email protected])
ABSTRACT
This study aims: First, analyze the interest groups in the management of marine resources.
Second, analyze the power for rights-based access to marine resources. Third, analyze the
power for structural and relational based access between groups of fishermen and fishermen
groups with PLTU managers in the utilization of marine resources. Research location in
Pelabuhanratu Sea Waters, Sukabumi, West Java, Indonesia. This study uses a qualitative
method. The results of the study provide an explanation that: First, interest groups or actors
residing in the study sites have different interests on marine resources, both indigenous
fishermen, migrant settlers (already settled), outside fishermen (non-permanent) , and
manager of Steam Power Plant (PLTU). Second, each group of fishermen has different types
of power mechanisms based on ownership rights as well as structural and relational based just
as technology, capital, authority, identity, knowledge, and social relations are different, thus
affecting the interests of fishermen groups on marine resources . PLTU has an interest for sea
transfortasi (bring coal), thus causing fishing zoning fishing is reduced and cause the
fishermen power is getting weaker. Indigenous fishermen who have a culture of catching fish
one day one night mostly have an interest in zoning 1, migrant fishermen in zoning 1, 2 and
3, while outside fishermen are in zoning 1 and 2.
Keywords: Power Relations, Actor, Access and political ecology
INTRODUCTION
Indonesia is the largest maritime and island nation in the world with 17,504 islands (BPS
2016). Indonesia as a maritime country because the territorial waters of Indonesia reached 5.8
million km2 or equal to 75% of the total area of Indonesia (BPS 2011). The marine area
consists of 0.3 million km2 of territorial sea, 2.95 million km2 of archipelagic waters, and the
Indonesian Exclusive Economic Zone (ZEEI) 2.55 million km2 (KKP 2015). Marine
problems in Indonesia can not be separated from the unrelated power relations marine
resources. The power relations among unequal actors is the impact of the politicized
environment (Bryant 1998). Political ecology is concerned with understanding how conflicts
arise from access to environmental resources through unequal economic and political

SOCIAL SCIENCE 888
systems, certainly related to power relationships between unequal actors in managing and
utilizing resources (Bryant 1998). Ribot and Peluso (2003) in access theory put power in the
context of economic political power, thus shaping the ability of actors to benefit from
resources. Access is defined as the ability to benefit from various things, including material
objects, people, institutions, and symbols. Ability is defined as power, this power is a
material, cultural and political-economic strand in the "collection" and "net" of power that
configure access to resources.
METHODS
Research Sites and Data Collection Techniques
The research was conducted at Pelabuhanratu Sea Watershed, Sukabumi Regency, West Java
Province. The selection of research sites is based on several socio-economic considerations
and characteristics of marine and fishery resources. The unit of analysis of this research is the
actors in a community that utilize and manage the marine resources. The technique of
selecting informants was done by Snow Ball Sampling, which was started from one key
informant then continued to other information until information and data saturated
(repeatedly and formed data pattern).
Data analysis
This research from the beginning set the use of qualitative approach, so the data analysis
using qualitative analysis. Qualitative data management uses an interactive model consisting
of three main things; first, data reduction; second, the presentation of data; and third, the
conclusion / verification. These three activities are intertwined activities before, during, and
after data collection in parallel form to develop common insights (Miles and Huberman
2014).
MAIN RESULTS
Utilization of Sea Resources Palabuhanratu
Table 3.3. explained in relation to important aspects in the selection of research sites. By
2016, the research process will be carried out from June to April 2016-2017, the timetable of
which is contained in Table1.
Table 1. Important Aspects of Research Areas in the marine of Palabuhanratu
No Important Aspects
The point Fishermen Community In Pelabuhanratu Sukabumi District West
Java.
1 Population Associated with ethnicity Ethnic Sunda, Ethnic Bugis, Ethnic
Java, Cirebon, and Sundanese Banten.
2 Ecology Related to the environment /
landscape
Sea and River
3 Typology of Fishermen
groups
Related to existing fishing groups 1. Peasant fisher 2. Post-peasant fisher
3. Commercial fisher
4. Industrial fisher
4 Livelihood System
Livelihood Fishing and Fish Cultivation
5 Power
Relation
Power relationships between actors Native Fishermen (Indigenous), Upland
Fishermen (settlers), and Fishermen

SOCIAL SCIENCE 889
from Outer (not settled). Fishermen with PLTU Manager.
6 Space
Utilization
First, Place Locations (including its
resources). Second, Fisherman
Community Knowledge (Resource Management). Third, Relations
between individuals / actors
(including history and culture).
1. Border areas of West Java and
Banten
2. The existence of seizure of space or fishing area of fisheries, and marine
areas.
3. Knowledge of fishermen based on
the ethnicity of each group of fishermen
4. There is a change in power relations
between groups of fishermen due to pressure from the presence of PLTU
Pelabuhanratu.
Source: Survey and Interview Results October 2017-February 2018.
CONCLUSION
The conclusion of this research is related to the research objectives are: First, to know interest
groups in the utilization and management of marine resources in Palabuhanratu. Second,
Terai with power relations, which identifies the power to access rights-based marine resource
ownership, owned by actors who participate in utilizing and managing marine resources.
Third, identify the power for structural and relational based access, both horizontal power
relations between groups of fishermen, and vertical between fishermen and PLTU
management. The government through PPN Palabuhanratu and the Office of Marine and
Fisheries of Sukabumi Regency has more authority to manage and utilize Palabuhanratu
marine resources. The management of PLTU Palabuhanratu, in addition to using power
connections or social relationships with fishermen in utilizing and managing marine
resources, but also using the power of authority, capital, technology and knowledge.
Begtupun, with Wisata Bahari which utilizes the power of its authority because it is
supported by the policy in the form of government regulation. Unlike large interest groups,
fishermen have more different types of power, so power networks, conflicts, negotiations and
contestation between actors can occur on an ongoing basis. Local fishermen are more
concerned with the power of identity, more migrants to capital, technology and knowledge
and social relationships ptron-client beruapa. Fishermen from outside take more use of
authority and social relations in accessing marine resources. However, power relations are
more conflict and contest than negotiations when fishermen from lauar are confronted by
local fishermen.
REFERENCES
1. Statistics Indonesia, Statistics of Marine and Coastal Resources. 2016. Badan Pusat Statistic Indonesia,
Jakarta, In, Indonesia. (2016). 2. Statistics Indonesia, Mapping of Marine and Fishery Potential Resources. Badan Pusat Statistic Indonesia,
Jakarta, In, Indonesia. (2011).
3. Marine and Fisheries Ministry. One Year Performance Report of the Ministry of Marine Affairs and
Fisheries. Marine and Fisheries Ministry, Jakarta, In, Indonesia. 2015.
4. Bryant RL and Bailey S. Third World Political Ecology. Routledge: London and New York. (1997).
5. Bryant RL. Power, Knowledge, and Political Ecology in the third world: a Review. Journal Proggress in
Pshysical Geography 22 (1998), 79-94.
6. Miles, M.B., A.M. Huberman dan J Saldana. Qualitative Data Analysis: A Methods Sourcebook. United
States of America (US): Arrizona State University. (2014).
7. Ribot CJ, Peluso NL. A Theory of Access. Rural Sociology, Vol. 68, No. 2, (2003), 153-181.

SOCIAL SCIENCE 890
IGCESH2018
Universiti Teknologi Malaysia, Johor Bahru, Malaysia 13 -15 August 2018
DISRUPTION OF CORPORATE MEMORY PRESERVATION
Nurul Syafiqah Suhaimi *1, Kamaruddin Yusop
2 and Yusof Boon
3
1, Department of Management and Administration, Faculty of Education, Universiti Teknologi
Malaysia, 81310 UTM
Johor Bahru, Johor, MALAYSIA. Department of Information Management, Faculty of Information Management, Univeristi Teknologi
Mara, 40450 UiTM Shah Alam, Selangor, MALAYSIA
(E-mail:[email protected], [email protected])
3 Department of Management and Administration, Faculty of Education, Universiti Teknologi
Malaysia, 81310 UTM
Johor Bahru, Johor, MALAYSIA.
(E-mail: [email protected])
ABSTRACT
Knowledge and information are both competitive assets that can enhance organizational
performance, help generate growth and profitability for the organization. In this regard, the
use of corporate memory system is crucial as it is able restore the “historical information and
knowledge” that can be used for decision making purposes. Corporate Memory consists of
both active and historical information in an organization that is worth to be shared, managed
and preserved for long term use. However, there are challenges in the effort to preserve the
corporate memory due to the variety of platforms used in the construction of corporate
memory and the advancement of Information Technologies (IT) used to implement the
Corporate Memory Management System (CMMS). Thus, this paper will discuss the context
of disruption of corporate memory preservation.
Keywords: Corporate Memory, Corporate Memory Management System (CMMS),
Information Technologies (IT)
INTRODUCTION
While every economy relies on knowledge as its base, the transformation begins from the
traditional industrial economy to a knowledge-based economy as knowledge become assets
rather that financial capital, land, and labour, which are the major source of the continued
economic growth. Knowledge is considered part of the production resources which must be
shared, applied and improved to generate creative ideas to a problem or challenges.
Knowledge can be classified as two type’s namely tacit and explicit knowledge[1] Tacit
knowledge is defined as the know-how, experiences or skill that are not been codified as it is
intangible and solely in the people minds and cannot be expressed by words or sentences [2].
As knowledge is increasingly being recognized as a vital organizational resource that
provides competitive advantage, many organizations are starting to take cognizant of the
importance of preserving their corporate memory [3].Corporate Memory (CM) refers to a
repository of knowledge in context, which refers to the rational and evolutionary nature of

SOCIAL SCIENCE 891
the multidisciplinary view of knowledge [4].Thus, knowledge management (KM) is needed
to allocate, manage and organize the knowledge assets along with its ability to improve
organizational processes [5]and[6].Knowledge management is a process that involve
acquiring, organizing, sustaining, applying, and sharing of knowledge of employees in form
of tacit and explicit.
However, there are challenges in preserving CM as organizations need to maintain and
sustain the knowledge and information that are stored. This is due to the different patterns of
CM namely (1) Document-based corporate memory; (2) Knowledge-based corporate
memory. Besides, the suitability of the Information Technologies (IT) being used to
implement the Corporate Memory Management System (CMMS) is also one of the
disruptions in preserving the corporate memory [7]. This is because it depends on the type of
corporate memory and the technology used in the implementation of CMMS. Thus, it will
affect the quality and access to the knowledge and information that been stored.
Thus, our paper focuses on four attributes that can measure the qualities of knowledge and
information: (1) level of knowledge, (2) structure of knowledge, and (3) domain specific.
Through this, several techniques been adopted to build a corporate memory where it
dependent on the available resources such as human specialists, existing paper-based or
electronic documents. Therefore, in this paper we propose a conceptual framework to get
clear point of view of this study.
CONCEPTUAL FRAMEWORK
Figure 1. Conceptual Framework of Disruption of Corporate Memory Preservation
In this framework, there are two types of variables, which are independent and dependent
variables. Thus, this study is to identify the factors that disrupted the corporate memory
preservation. Corporate Memory preservation is the dependent variable for this study.
Meanwhile, the independent variables are pattern of corporate memory (document-based
corporate memory and knowledge-based corporate memory) and Information Technologies
(IT) in Corporate Memory Management System (CMMS).

SOCIAL SCIENCE 892
CONCLUSION
As technology matures over time the constant need for technology replacement will disrupt
the process. The phenomenon of new technologies disrupting the information system isn't
new. With it come the same cycle of upgrade, learning curve, use, obsolescent and upgrade.
Similarly, for knowledge based corporate memory that relies heavily on experts input, the
reliance on the experts become a disruption as the experts leave the company or retire.
Technological factors that impact the continuation of corporate memory must be mitigated.
Among the possible method could be moving the corporate memory system content into
cloud services that provides high availability and service level agreement (SLA) and separate
the content availability against the platform which contains it. Secondly the pattern of
corporate memory must be mitigated by provide content protection against platform
obsolescent.
Acknowledgment: A special thank you to my supervisor Prof Dr Yusuf Boon , UTM Faculty
of Education and Mr. Kamaruddin Yusup as my colleague for their knowledge and their
contribution for this paper. Besides, thanks to Raja Zarith Sofiah Library for providing
adequate resources such as books, journal, online databases (Scopus, Emerald and other) and
online open access journal
REFERENCES 1. Nonaka, I.ve Takeuchi, H. The Knowledge Creating Company: How Japanese Companies Create the
Dynamics of Innovation, New York: Oxford University Press, (1995).
2. Polanyi, M. "The Tacit Dimension", Doubleday & Company, Inc., United States of America, (1983).
3. Grey, D. What is knowledge management? The Knowledge Management Forum, (1996). 4. Abecker, A. Corporate memories for knowledge management in industrial practice: prospects and
challenges. Journal of Universal Computer Science, 3(8), (1997),929-954.
5. Hansen, M. T., Nohria, N., & Tierney, T. What’s your strategy for managing knowledge. Knowledge
management: critical perspectives on business and management, 77(2), (2005),322.
6. Alavi, M., & Leidner, D. E. Review: Knowledge management and knowledge management systems:
Conceptual foundations and research issues. MIS quarterly, (2001),107-136.
7. Rowley, J. Towards a framework for information management. International Journal of Information
Management, 18(5), (1998),359– 369.

SOCIAL SCIENCE 893
IGCESH2018
Universiti Teknologi Malaysia, Johor Bahru, Malaysia 13 -15 August 2018
AUTONOMY NEEDS SUPPORT IN TEACHERS’ PROFESSIONAL
DEVELOPMENT ENGAGEMENT
Mohamed Nazry Bin Azmi*1 and Hadijah Binti Jaffri2
Faculty of Education, Universiti Teknologi Malaysia, Skudai, MALAYSIA.
(E-mail: [email protected])
ABSTRACT
In 2016, FrogAsia set up the Advocate Programme to promote the usage of Frog VLE among
teachers in the classroom across Malaysia. In an environment where most teacher
professional development (PD) programmes organised are compulsory and linked to the
government, the Advocate Programme somehow managed to gather teachers to maintain a
learning community of teacher advocates without obvious enforcement by any authority
figure. Grounded in the Self-Determination Theory, this study sought to explore the
autonomy supports the teachers’ experience in their engagement with the Advocate
Programme. Methods: A single-case, single-unit analysis case study design is used for this
study. One-on-one semi-structured interviews are conducted with six Gold Advocate teachers
to explore their experience of choices within their activities. Results: Twelve supports were
identified from the responses of the Gold Advocates. Of those, seven are considered to satisfy
their autonomy needs. These seven supports are inferred to be the important factors behind
the Gold Advocates’ voluntary engagement with the programme. Conclusions: Teachers’
experiences of autonomy are important for their motivation to engage in PD. Environments
that support such experiences should be considered in the development and implementation
of PD programmes.
Key words: Teacher professional development, Self-Determination Theory, Autonomy
INTRODUCTION
Most teacher professional development (PD) programmes in Malaysia are compulsory for
teachers and are initiated by the government (OECD, 2009). The motivation for Malaysian
teachers to engage in PD are usually extrinsic, e.g. enforcement by education authorities such
as district offices, or to fulfill requirements for career promotion (Jamil et al., 2007; Petras,
Jamil, and Mohamed, 2012). However, extrinsically motivated behaviour to learning may
lead to other unproductive behaviour such as passive compliance and is harder to sustain, for
example, due to lack of perseverance (Deci and Ryan, 1985, 2000; Ryan and Deci, 2000).
In 2016, FrogAsia, the service provider of the online learning platform, Frog VLE (Virtual
Learning Environment), in all public schools in Malaysia, set up the Advocate Programme, a
teacher learning community, to get teachers to learn, share and inspire each other in
integrating Frog VLE and technology in their teaching and learning practice. The programme
is joined on a voluntary basis. To be an Advocate, teachers have to attend a Frog Module

SOCIAL SCIENCE 894
Session organized by FrogAsia or other Advocates. These Advocates are awarded with
statuses based on their level of involvement in the programme. Gold Advocates are required
to 1) attend Frog Module Sessions, 2) conduct one Frog Module Session every month with at least
5 participants and 3) maintain at least one active online community (FrogAsia, n.d.).
As at the date of writing, there are 3,309 Silver Advocates and 1,009 Gold Advocates
(FrogAsia, n.d.). The Advocate Programme somehow managed to gather these teachers
across Malaysia to, not only learn, but also maintain a learning community of teachers
without obligation by the Ministry of Education for the teachers to participate in this
programme. This lack of significant extrinsic motivation, suggests that teachers who
participate with the Advocate Programme do so voluntarily, which is a rare phenomenon in
Malaysia. Has the lack of external controls on their choices driven them to engage actively in
the programme? Or is this an extreme presumption? According to the Self-Determination
Theory (SDT), autonomy is the most significant basic human psychological need, that when
satisfied, acts as nutriments to one’s internalisation of the values and regulation of an
extrinsically motivated behavior. The experience of autonomy is also nutriments to sustain
intrinsic motivation. Both internalised extrinsic motivation and intrinsic motivation are
associated with productive behaviours and general wellbeing (Deci and Ryan, 1985, 2000;
Ryan and Deci, 2000). To understand this voluntary PD engagement phenomenon, a study is
warranted.
Grounded by the SDT, this study sought to explore the autonomy supports the teachers’
experience in their engagement with the Advocate Programme within the context of a teacher
PD programme.
A single-case, single-unit analysis case study design is used for this study (Yin, 2009). One-
on-one semi-structured interviews were conducted with six Gold Advocate teachers to
explore their advocacy activities and their experience of choices. Gold Advocates represent
the highest level of voluntariness within the Advocate community due to their higher status
fulfilment criteria, i.e., critical-case sampling approach (Patton, 1990).
MAIN RESULTS
The participants reported twelve main supports that they experienced within their
Advocate activities. The following Table 1 lists and describes those supports:
Table 1. Main Supports Experienced by Participants
• Support 1
Freedom to choose activities
• Support 2
Positive feedback
• Support 3
School’s ICT infrastructure
• Support 4
Recognition from others
• Support 5
Teamwork
• Support 6
Frog Modules
• Support 7
Flexible teaching time
• Support 8
Guidance and resource support
• Support 9
Leadership authority support
• Support 10
Morale support
• Support 11
Camaraderie and like-mindedness
• Support 12
Sharing of knowledge

SOCIAL SCIENCE 895
Of these twelve supports, seven are considered to satisfy their autonomy needs. These seven
supports are inferred to be the important factors behind the Gold Advocates’ voluntary
engagement with the programme.
CONCLUSION
This study shows that teachers’ experiences of autonomy are important for their motivation to
engage in PD. PD developers should consider providing such support in developing and
implementing PD programmes to make learning among teachers autonomous. This can
reduce the provision of resources into enforcement and control. Future research should look
into other basic psychological needs (competence and relatedness) that these Advocates
experienced and make comparisons between the Advocates of different levels of activities.
REFERENCES
1. Jamil, H., Razak, N. A., Raju, R., and Mohamed, A. R. Teacher professional development in Malaysia:
Issues and challenges. Africa-Asia University Dialogue for Educational Development Network, (2007), 85-
102.
2. Petras, Y., Jamil, H., and Mohamed, A. R. How do teachers learn? A study on the policy and practice of
teacher professional development in Malaysia. KEDI Journal of Educational Policy, (2012), 9(1).
3. Deci, E. L. and Ryan, R. M. Intrinsic Motivation and Self- Determination in Human Behavior. Boston:
Springer US, (1985).
4. Deci, E. L., and Ryan, R. M. The" what" and" why" of goal pursuits: Human needs and the self-determination of behavior. Psychological Inquiry, (2000), 11(4), 227-268.
5. Ryan, R. M., and Deci, E. L. Self-determination theory and the facilitation of intrinsic motivation, social
development, and well-being. American Psychologist, (2000), 55(1), 68-78.
6. FrogAsia Sdn. Bhd. (n.d.). Retrieved from https://frogasia.com/hubs/guruadvokasi (Accessed on 22
November 2017)
7. Patton, M. Q. Qualitative evaluation and research methods / Michael Quinn Patton (2nd ed.). Newbury
Park, Calif.; London: Sage Publications. (1990).
8. Yin, R. K. Case study research : design and methods / Robert K. Yin (4th ed.). Thousand Oaks, Calif.: Sage
Publications. (2009).

SOCIAL SCIENCE 896
IGCESH2018
Universiti Teknologi Malaysia, Johor Bahru, Malaysia 13 -15 August 2018
E-LEARNING FOR ENHANCE CREATIVE THINKING IN HIGHER
EDUCATIONAL STUDENTS
Azri Syazwan Bin Atan*1 and Shafie Bin Rosli2
Faculty of Education, University Teknologi Malaysia, Skudai, Malaysia.
(E-mail: [email protected], [email protected])
ABSTRACT
This study was progress project to enhance the level of creativity using e-learning that been
developed for students in Faculty of Education University Technology Malaysia. The purpose
of this study is to examine the effectiveness of e-learning that been developed. This study
also examines how the learning process and creating learning analytic takes place on creative
thinking skills amongst higher education institutions. E-learning that been developed is an
integration of Problem-Based Learning methods and creativity problem solving model (CPS).
The students been involved are undergraduate students of the Faculty of Education who been
select using a purposive technique. This study is a pre-experimental study using a quantitative
and qualitative approach where students answer 6 items for pre-test and students will receive
intervention process before answering post-test, the questionnaire are implemented using
internal consistency technique. Minimum Cronbach Alpha value to be used is 0.6. The
sample time period in this pilot study are recorded and will be used to provide an appropriate
response time to a sample of the actual study. To obtain the qualitative data, students had to
discuss in the forum that will developed in e-learning to observe analytic learning. This study
is expected to produce a creative learning framework for university-level students.
Key words: E-learning, CPS, PBL, Creative Thinking
INTRODUCTION
E-learning in institutions of higher learning has long been established, but its use is still
limited to certain uses such as the purpose of uploading notes and making announcements.
Based on mobile and accessible methods of any e-learning provides a positive impact in
education that is capable of promising the potential and capabilities of lifelong learning that
covering any certain areas [2]. The development of e-learning has also made the provision of
learning materials can be browsed by users at any time [1]. Although many researchers
explain e-learning have a positive effect, however, there is a lack of research on the
development of creative thinking through E-learning.
Creativity is an important skill for students and it’s essential for the creation of skilled and
creative minded graduates, rather than just focusing on academic achievement. The need for
creativity is not only helpful in the aspect of the nation but also to focus on individuals.
Where the development of emotion, communication and job opportunities are through
encouragement of this creativity skill after their graduate [3].

SOCIAL SCIENCE 897
RESULT AND DATA ANALYSIS
Data been collect in wide rage for achieve research goal, to measure student creativity before
and after, a pre and posttest were conducted to answer a research question (a) the effective
using e-learning for enhancing creative in higher education students. The learning analytic
will be collect through log files, performance test, surveys and interviews.
As a study on going, the best approach for implementation in e learning.
Intervention
Analysis, Provides new ideas from ideas, the students are required to produce any process and
the probability that the problem can be processed makes the new solution through the ideas
given. Hypothesis, Improve the original process into a new process through a combination of
ideas. Incubation and synthesis, Students are required to disclose the function of the solution,
object, or process that has been produced.
Performance
Torrance Creative Thinking Test (TTCT) by Torrance (1967) will be used for performance
test. This method will capture the student performance on creativity aspect before and after
the intervention process and the test can be analyses base on TTCT method [2]. To measure
this skill, the TTCT questionnaire forms in the form of set A and set B are used for students
to measure creativity skill, there are six activities to be answered by the students through this
test form.
CONCLUSION
The research findings that archive in terms of creativity as measure by Torrance Creative
Thinking Test (TTCT) after engage using e-learning are better before intervention session.
By doing these it will show the effectiveness of e-learning system that been developed for
enhancing creative thinking among student. As these researches more deeply intend on
finding the effective of e-learning to enhance creativity, there is more likely area of learning
experience and other learning theory such as critical thinking can be on these system for
further research.

SOCIAL SCIENCE 898
The integration creativity able to be combined in e-learning, it is clear that e-learning is a
contextual learning tool and collaborative learning that support the digital literacy and
education literature. The creation of the learning environment to increase creativity skill
through e-learning is to enrich student with higher creativity skill with their current skill on
creativity. The empirical data that been collected through the system, and it will produce a
structure of learning analytic will bring need on the education in the future.
Acknowledgment: The authors would like to express their appreciation for the support of the
sponsors, Malaysia Ministry of Higher Education and Universiti Teknologi Malaysia through
Fundamental Research Grant Scheme (FRGS) with Project No R.J130000.78.31.4F952
REFERENCES
1. Ahmad Johari Sihes & Norbaizura Sani. Perlaksanaan E-Pembelajaran Di Kalangan Pelajar Fakulti
Pendidikan Dan Fakulti Kejuruteraan Mekanikal Universiti Teknologi Malaysia, Skudai. Journal of
Technical, Vocational & Engineering Educational Volume 3, (2011). 2. Fauziah Sulaiman. The Effectiveness of PBL Online on Physics Students ’ Creativity and Critical Thinking :
A Case Study at Universiti Malaysia Sabah. International Journal of Education and Research, 1(3), 1–18,
(2013).
3. Kreativiti, P., & Inovasi, D. A. N. Dalam Kalangan Pelajar Institusi Pengajian Tinggi : Kajian Ke Atas
Pelajar, (September 2015), 0–11, (2014).

SOCIAL SCIENCE 899
THE EFFECT OF LOCAL ORIGINAL REVENUES, SPECIAL
ALLOCATION FUNDS, GENERAL ALLOCATION FUNDS ON THE
HUMAN DEVELOPMENT QUALITY AND THE MEDIATING ROLE
OF CAPITAL EXPENDITURE IN REGENCY AND CITIES IN SOUTH
KALIMANTAN PROVINCE – INDONESIA
Akhmad Yafiz Syam*1, Fahmi Rizani2, Lisandri3, Muhammad Maladi4
1,3,4Accounting Department, Stie Indonesia Banjarmasin, Banjarmasin, INDONESIA
(E-mail: [email protected]) 2Economic and Business Faculty, Lambung Mangkurat University, Banjarmasin, INDONESIA
(E-mail: [email protected])
ABSTRACT
This study aims to examine and analyze how local original revenue, special allocation funds,
and general allocation funds affect the quality of human development through the role of
mediation of capital expenditures in Regency/ Cities in South Kalimantan Province -
Indonesia. The important contribution of this study is to provide a different perspective, to
see the government's financial performance for Sustainable Development Goals (SDG's) in
the context of the quality of human development in the region. Based on the results of the
structural equation model (SEM) test, it was found that role of capital expenditure
significantly mediating for the quality of human development, except between the general
allocation fund and the quality of human development. This indicates ineffective local
government performance in utilizing transfer funds for the development of human quality.
Key words: local original revenue, special allocation fund, general allocation fund, capital
expenditure, human development quality.
INTRODUCTION
The Paradigm of New Public Management (NPM) has influenced the process of changing
public sector organizations comprehensively in almost all part of the world. The emphasis of
NPM movement is on the implementation of decentralization, devolution, and modernization
of public service delivery [1]. The NPM is the concept of public awareness in the form of
autonomy, performance-based budgeting, productivity, efficiency and effectiveness of public
services [2], and oriented towards good governance and sustainable development [3-8].
The ability of a region to explore local original revenue depends on the ability of the region
to develop creativity and innovation which will affect the quality of governance and services
in the public sector, and the allocation together with special allocation fund and general
allocation fund in capital expenditures to meet the demands of development on facilities and
infrastructures [9]. This study aims to examine and analyze how regional original income,
special allocation funds, and general allocation funds affect on the quality of human
development through the role of mediation of capital expenditures in the Regency/Cities in
IGCESH2018
Universiti Teknologi Malaysia, Johor Bahru, Malaysia 13 -15 August 2018

SOCIAL SCIENCE 900
South Kalimantan Province, Indonesia. The contribution of this study primarily provides a
different perspective in viewing the financial performance of local governments in their role
towards sustainable development goals (SDG's) in the context of human development quality
in South Kalimantan.
MAIN RESULTS
Based on SEM-PLS test concluded that the three main indicators of quality and suitability of
the model have met the criteria. The value of Average path coefficient (APC) = 0.221, P =
0.004, means significant at 0.05 and Average R-squared (ARS) = 0.295, P <0.001, indicating
significant determinant coefficient at the 0.001 significance level. While the Average block
VIF (AVIF) = 1.537, it means acceptable because it meets the criteria are under 5. Similarly,
the value of GoF (goodness of fit) 0,544, including the category large> = 0.36. this suggests
that the proposed model is supported by relevant and reliable data.
Table 1. VAF Calculated
Indirect Effect Calculation Total Category
LOR→CE→HDI Indirect Effect = 0,22X0,14 LOR→CE: 0,22 CE → HDI; 0,14 Direct Effect:0,17
0,03 0,17 (+)
Total Effect 0,20 = 20 % Partial Mediating
SAF→CE→HDI Indirect Effect = 0,26X0,14 SAF→HDI: 0,26 CE → HDI; 0,14 Direct Effect:0,33
0,04 0,33 (+)
Total Effect 0,37 = 37 % Partial Mediating
GAF→CE→HDI Indirect Effect = 0,29X0,14 GAF→CE: 0,29 CE→ HDI; 0,14 Direct Effect:0,14
0,04 0,14 (+)
Total Effect 0,18 = 18 % Almost no role of mediation.
Based on the analysis with the VAF method above, it was found that capital expenditure can
act as partial mediation between local original revenue (LOR) and human development
(HDI), special allocation funds (SAF) and human development (HDI) influence, but
mediating between general allocation funds (GAF) to HDI is stated almost no role of
mediation [10];[11].
CONCLUSION
One measure of the quality of good government spending is the proportion of larger capital
expenditure allocations for overall local spending. The allocation of capital expenditure is
aimed at building infrastructure that impacts on the improvement of public services, which in
the long run improves the welfare and quality of human development. Based on the results of
the SEM-PLS model test, it was found that capital expenditure significantly had a role as
partials mediation of effect local original revenue, special allocation fund on quality of
human development, but not significantly mediated between general allocation fund on
quality of human development. This shows that general allocation fund is greater allocated
for government financing or operational expenditure, non-capital expenditures. The high
allocation of operational expenditures and other expenditures also indicates ineffective local

SOCIAL SCIENCE 901
government performance in utilizing transfer funds for the development of human quality. In
this regard, it is recommended to pay more attention to the absorption of the general
allocation fund budget to the allocation of capital expenditures, especially spending for
education, health, environmental services and empowerment programs that encourage local
productivity, to ensure the achievement of sustainable development goals (SDG's).
REFERENCES
1. Bogt, H.J.T., G.J.V. Helden, and B.V.D. Kolk, Challenging the NPM Ideas About Performance
Management: Selectivity and Differentiation in Outcome-Oriented Performance Budgeting. Financial
Accountability & Management, 2015. Volume 31(3 August 2015 ): p. 287–315. 2. Osborne, S.P., The new public governance: Emerging perspectives on the theory and practice of public
governance. (2010): Routledge.
3. Heather Barclay, I., et al., Sustainable Development Goals.: The International Planned Parenthood
Federation (IPPF), (2015).
4. WorldBank, Local Governance In Developing Countries. Public Sector Governance And Accountability
Series, ed. A. Shah. Washington, D.C.: THE WORLD BANK (2006).
5. A. Adams, C., S. Muir, and Z. Hoque, Measurement of sustainability performance in the public sector.
Sustainability Accounting, Management and Policy Journal, (2014), 5(1): p. 46-67.
6. Azeem Qureshi, M., Human development, public expenditure and economic growth: a system dynamics
approach. International Journal of Social Economics, (2009), 36(1/2): p. 93-104.
7. Ju, Y. and S.Y. Sohn, Development of a national competitiveness index based on a structural equation
model. Technology Analysis & Strategic Management, (2014), 26(5): p. 565-579. 8. Griggs, D., et al., Policy: Sustainable development goals for people and planet. Nature, (2013), 495(7441):
p. 305-307.
9. Jones, R. and M. Pendlebury, Public Sector Accounting. Sixth Edition ed. (2010), England: Prentice Hall.
10. Hair, J.F., C.M. Ringle, and M. Sarstedt, PLS-SEM: Indeed a silver bullet. Journal of Marketing theory and
Practice, (2011) 19(2): p. 139-152.
11. Hair Jr, J.F., et al., A primer on partial least squares structural equation modeling (PLS-SEM). (2014),
Washington, DC: Sage Publications.

SOCIAL SCIENCE 902
IGCESH2018
Universiti Teknologi Malaysia, Johor Bahru, Malaysia 13 -15 August 2018
FORMULATION OF NON-FUNCTIONAL REQUIREMENT
FRAMEWORK FOR SOFTWARE PROJECT DEVELOPMENT: A
ROADMAP
Mariayee Doraisamy1 and Mohd Naz’ri Mahrin2
1Information Management Division, Ministry of Defence Malaysia 2 Universiti Teknologi Malaysia, Kuala Lumpur ([email protected], [email protected])
ABSTRACT
Non-Functional Requirements play a vital role in software development. Non-Functional
Requirements describe the overall qualities or attributes of a developed software projects.
Non-Functional Requirements has a great influence on customer and user satisfaction with
the software products. Even though Non-Functional Requirements is very important but they
are often ignored. In fact, there is no standard of specifying, measuring and validating for the
Non-Functional Requirements in the software industries generally. Current studies show that
Non-Functional Requirements play a pivotal role in a successful development of any software
product. Most of time the Non-Functional Requirements are ignored by the software project
managers. Furthermore, there is no a formal way of defining, specifying and measuring the
Non-Functional Requirements in the software development especially at the Public Sector
like Malaysia. The ignorance of Non-Functional Requirements may causes failures of
software products at Public Sectors. Parallel to this, this study investigate the Non-Functional
Requirements in a software project development especially in the Public Sector like
Malaysia. Therefore, this paper presents on formulation of Non-Functional Requirement
Framework for Software Project Development which consists of Non-Functional
Requirements, Metrics and the Measurements. Generally, this will be a guideline for software
project managers to identify, test and measures related Non-Functional Requirements for
their software projects especially in the public sectors like Malaysia.
Keyword: Non Functional Requirements, Software Project Development
INTRODUCTION
Generally, software projects development comprises functional and non functional requirements
that determine its success and acceptability in the industry. Non-Functional Requirements
known as quality of service, technical requirements, cross-cutting, or quality attributes focus
on aspects that typically involve or cross-cut several functional requirements [1]. Even
though, Non-Functional Requirements are considered important and crucial to any software
project success but less attention is given compare than functional requirements [2]. Usually,
Non-Functional Requirements are related to functional requirements as well. It is often
related to the software project characteristics [3]. This is shows that Non-Functional
Requirements are very important for any software project development. Generally,

SOCIAL SCIENCE 903
identifying Non-Functional Requirements is not a simple task because software projects
development are vary from one to another For example, software projects are differs by its
complexity, size, scopes, budgets, resources and etc. And each type of roles in software
projects such as stakeholder, project manager, software developer and suppliers are having
different views on software projects[4][5].In relation to this, development of Non-Functional
Requirement Framework for Software Project Development could guide the software project
managers to have a successful software projects development. This paper delivers insights the
formulation of Non-Functional Requirement Framework for Software Project Development
by systematically.
This paper begins with the discussion of introduction on Non Functional Requirements and
Metrics. This is followed by providing step by step instructions on Formulation Non-
Functional Requirement Framework for Software Project Development. Finally, this paper
includes the conclusion and future work of this research.
FORMULATION
The formulation of Non-Functional Requirement Framework for Software Project
Development encompasses important phases which are identification of Non Functional
Requirements which consists of NFRs, metrics and measures and Development of Non-
Functional Requirement Framework for Software Project Development. Each phase carries
activities. A total number of four important activities are involved in this formulation. Figure
1 shows the step by step activity towards the formulation of Non-Functional Requirement
Framework for Software Project Development. Each phase and its activities are explained in
detail as below:
Phase 1: Identification of Non Functional Requirement and Metrics by SLR
Phase 2: Identification of Non Functional Requirement Framework and Metrics
in Malaysian Public Sector using Survey
Phase 3: Development of Non Functional Requirement Framework and Metrics
for Software Projects Development
Figure 1. Formulation Process of Non-Functional Requirement Framework
for Software Project Development Phases
Activity 1: Conducting Systematic Literature Review (SLR)
Investigating existing Non Functional Requirement and Metrics using Systematic Literature Review (SLR).
List of Non Functional Requirement and Metrics
for software projects development
Activity 2: Conducting Survey Investigating existing Non Functional Requirement and Metrics for Software Project Development using survey.
Activity 3: Integration of SLR output and Survey Output
Activity4: Identification of measures for each Non-Functional Requirement and Metrics
List of Non Functional Requirement and Metrics for
software projects development
Finalised Non-Functional Requirement Framework for
Software Project Development development

SOCIAL SCIENCE 904
CONCLUSION AND FUTURE WORK
This research shows the formulation process of Non-Functional Requirement Framework for
Software Project Development in detail. This framework is consists of Non Functional
Requirements, Metrics and Measurements. Therefore, this proposed framework will be a
useful measurement tool for software projects development especially during the requirement
and testing phases of software development. These identified metrics and the measures will
be used to form a prototype tool which can be guidance for software project managers during
software project development. This proposed framework will be validated by the software
project experts from Public Sector of Malaysia in future. We furthered our research with the
framework evaluation by the practitioners from Public Sector of Malaysia.
Acknowledgment: The authors would like to thank all individuals for their support and
cooperation who are either directly or indirectly involved in this project.
REFERENCES
1. Raj Kumar Chopra,Varun Gupta, Durg SinghChauhan, Experimentation on accuracy of non functional
requirement prioritization approaches for different complexity Projects. Perspectives in Science, Volume 8,
September 2016, Pages 79-82
2. Vikas Bajpai1, Ravi Prakash Gorthi. On Non-Functional Requirements: A Survey. IEEE Students’
Conference on Electrical, Electronics and Computer Science (2012).
3. Cristina Rosa Camacho, Sabrina Marczak,Daniela S. Cruzes. Agile Team Members Perceptions on Non-
Functional Testing Influencing Factors from an Empirical Study. 11th International Conference on
Availability, Reliability and Security, (2016).
4. Cooke-Davies, T “The real success factors on projects”. International Journal of Project Management,
(2002), 20, 185–190. 5. Müller, R., Turner, R. “The influence of project managers on project success criteria and project success by
type of project”. European Management Journal, 2007, 25 (4), 298–309.

SOCIAL SCIENCE 905
IGCESH2018
Universiti Teknologi Malaysia, Johor Bahru, Malaysia 13 -15 August 2018
MODEL STRATEGY FOR PERFORMANCE IMPROVEMENT USING
BALANCE SCORECARD ON COMPANY ON COMPANY
DISTRIBUTORS ELECTRICAL DISTRIBUTORS
Arasy Alimudin*1, Sri Wiwoho Mudjanarko2 and Reswanda T Ade3
1, 3 Departement of Management, Narotama University, Surabaya, Indonesia.
(E-mail: [email protected], [email protected]) 2 Civil Engineering, Narotama University, Surabaya, INDONESIA.
(E-mail: [email protected])
ABSTRACT
The turbulent and complex business environment demands that an organization keeps
updating its business travel map; take a strategic step that focuses the capabilities and
commitment of all personnel to realize the organization's ideal future. Innovative companies
use a balanced scorecard as a strategic management system that manages corporate strategy
on a continuous basis. The Strategy Model using balanced scorecard on the company's
electrical equipment distributor is a strategic and operational business plan that is developed
through the following steps: 1) description of vision and mission becomes the goal; 2)
description of objectives into strategic advice; 3) Strategic description becomes a strategic
initiative to achieve strategic objectives; 4) description of strategic initiatives into a program;
and 5) a description into the budget program. The goal to be achieved in this research is to
know the performance on the company's electrical equipment distributor in improving
profitability. The Balanced Scorecard analysis in the firm found that the financial perspective
score 5, the Customer Perspective 3.08, the Internal Business Process Perspective of 3.04,
and the Learning and Growth Perspective 2.7. Based on the results of the company score then
determine the strategy to increase sales volume by increasing customer satisfaction through
quality products with competitive prices, and increase the number of stock items. Optimizing
the profit earned, so as to increase the company's ability to return capital to shareholders, by
limiting the cost to the owner's personal needs.
Key words: Strategy, balanced scorecard, electrical equipment distributor, performance
INTRODUCTION
The turbulent and complex business environment demands that an organization keeps
updating its business travel map; take a strategic step that focuses the capabilities and
commitment of all personnel to realize the organization's ideal future. Innovative companies
use a balanced scorecard as a strategic management system that manages corporate strategy
on a continuous basis. The Company's Trafindo is a vertically integrated Distributor company
with export orientation. The Company's Trafindo is headquartered in Jakarta with operations
spread across Indonesia. The Company Trafindo activities are integrated from many
transformer demand for electricity. As one of Distributor in Eastern Indonesia. The Company

SOCIAL SCIENCE 906
must maintain product quality and Consumer Satisfaction. The ability to maintain Product
Quality and Customer Satisfaction is highly dependent on its performance. To have a
comprehensive work assessment, it can balance the financial and non financial aspects.
Therefore, the focus of the problem can be studied more deeply through this research, then
the required performance measurement is Balanced Scorecard Holistically, many things
happen in the business world, not to mention the company of electrical in Surabaya. Because
of the complexity of the problems that exist, the more comprehensive the related elements.
Based on the results of interviews and identification of problems that arise so far are: 1. How
is the quality and quality of goods; 2. How to Order Goods Specification; 3. What about the
price offer; 4. How the Level of Customer Satisfaction (customer satisfaction); 5. How to
Masterhip Market share (market share); 6. How Ability to retain old customers (customer
retention).
The goal to be achieved in this research is to know the performance on the company of
electrical equipment distributor in improving profitability. In this case measured by Balanced
Scorecard which includes four perspectives of financial perspective, customer perspective,
internal business process perspective and learning and growth perspective[1].
Data analysis technique used in this research is descriptive technique by looking at fact
data organization and analyze organizational performance based on perspectives that exist
in balanced scorecard. In this analysis described and described the condition of the
organization in the form of tables and simple analysis[2].
MAIN RESULTS
Table 1. BSC performance on Company of Distributor Electrical
Perspective Score Target
Achievement
financial 5.00 5.00 100%
customer 3.09 5.00 61.8%
internal business process 3.04 5.00 60.8%
learning and growth 2.77 5.00 55.4%
Key Performance Values 13.9 20 69.5%
In Table 1 it can be explained that the Balanced Scorecard analysis in the company of
distributor electrical found that the financial perspective score of 5 means 100%
achievement, the Perspective of 3.08 means reach 61.8%, the Internal Business Process
Perspective of 3.04 means achieved 60.8%, and the Learning and Growth Perspective 2.7
means reached 55.4%.
The results showed that to increase the sales volume so as to obtain optimal profit on an
ongoing basis the company of distributor electrical needs to Strategy model that can be
developed by company of distributor electrical with BSC model is as follows:
1. Formulation of vision, mission, and strategic goals of the company of distributor
electrical [3].
2. Formulation the company of distributor electrical strategy[4].

SOCIAL SCIENCE 907
3. Selection of the Strategic on the company of distributor electrical perspective and
strategic determination[5].
4. Determining the benchmarks of BSC of the company of distributor electrical [6].
5. The design drawings of BSC of the company of distributor electrical
6. Analysis of causal relationships
7. The depiction on the company of distributor electrical strategy chart
8. Analysis of the design of the Balanced Scorecard model[7]
CONCLUSION
The Balanced Scorecard analysis in the company of distributor electrical found that the
financial perspective score 5, the Customer Perspective 3.08, the Internal Business Process
Perspective of 3.04, and the Learning and Growth Perspective 2.7. Based on the results of the
company score then determine the strategy to increase sales volume by increasing customer
satisfaction through quality products with competitive prices, and increase the number of
stock items. Optimizing the profit earned, so as to increase the company's ability to return
capital to shareholders, by limiting the cost to the owner's personal needs.
Acknowledgment: The authors would like to The Electronic And Electrical Appliances
Industry Association of Indonesia (APIEI) Surabaya area their appreciation for the support of
with this Project.
REFERENCES
1. A. R. S. Kaplan, M. Lagace, R. S. Kaplan, and D. P, “Strategy Execution and the Balanced Scorecard,”
Harv. Bus. Rev., (2008), 1–3. 2. A. Sharma, “Implementing Balance Scorecard for Performance Measurement,” ICFAI J. Bus. Strateg.,
(2009), vol. 6, no. 1, 7–16.
3. J. Labarta, E. Ayguadé, and M. Valero, “BSC vision towards exascale,” Int. J. High Perform. Comput. Appl.,
(2009), vol. 23, no. 4, pp. 340–343.
4. D. P. N. Robert S. Kaplan, The Strategy-focused Organization: How Balanced Scorecard Companies Thrive
in the New Business Environment. Boston: Harvard Business School Press, (2001).
5. S. ANSARI, “The Execution Premium : Linking Strategy to Operations for Competitive Advantage,” Account. Rev., (2010), vol. 85, no. 4, pp. 1475–1477.
6. C. Schawel and F. Billing, “Balanced Scorecard (BSC),” in Top 100 Management Tools, (2009), pp. 34–36.
7. J. K. Khomba, “Conceptualisation of the Balanced Scorecard (BSC) model,” Int. J. Commer. Manag.,
(2015), vol. 25, no. 4, pp. 424–441.

SOCIAL SCIENCE 908
IGCESH2018
Universiti Teknologi Malaysia, Johor Bahru, Malaysia 13 -15 August 2018
TRACING THE JOURNEY OF KHAN JAHAN ALI FROM
BAROBAZAR TO BAGERHAT
Fatiha Polin*1and Dhrubo Alam2
1, 2 Research and Design, Bengal Institute for Architecture, Landscapes and Settlements, Dhaka,
BANGLADESH.
(E-mail:[email protected], [email protected])
ABSTRACT
According to the Department of Archaeology, Bangladesh, there is about 423 listed
archaeological sites in the country. But, there are many more yet to be unrevealed. Their true
value remains unseen to the world if not taken proper action and acknowledgement. Khan
Jahan Ali, on his famous journey from Khalifatabad (present day Bagerhat) to Champanagar
(currently in Barobazar, Jessore); he crossed quite a few remote areas and set up human
settlements. On his way he built roads, dug large water bodies for fresh supply of water,
established mosques and houses for the inhabitants. His unique construction style is quite
evident on the structures along the 112.7 km long road distinguished by an old earthen
embankment, traversing through (i) Barobazar, (ii) Murali-Qasba, (iii) Poyogram-Qasba and
(iv) Khalifatabad (Bagerhat) The road is still known as Khanjali Road. The first segment of
this road, known as Hakimpur-Barobazar road contains eleven sultanate mosques of which
only three has been documented properly by the authorities and the rests are barely
mentioned. This study aims to fill up this gap, explore more into the contribution of Khan
Jahan Ali on the four settlements he set up and their history by linking them with the
monuments.
Key words: Khan Jahan Ali, Shaṭ Gombuj Mosjid, sultani period of Bengal, Barobazar
INTRODUCTION
The history and the political boundary of Bengal is greatly determined by its geographical
position, like many other countries of the world. Being the largest deltaic region created
by the silt disposition of mighty rivers as Ganga, Brahmaputra and Meghna bestowed
highly fertile soil and life sustaining resources. Because of this natural fertility, kind
climate and fabled riches, Bengal has always attracted new settlers, traders and
conquerors [1, 2].
Traces of urban centers or large cities in Bengal have been found dating back more than
2,000 years. Though the economy was predominantly agricultural; the trades (especially
cotton and ‘Muslin’, a very fine piece of clothing), both internal and international also
flourished. Cities mainly started to take shape as a growth, production and trade center
and port. But there have also been administrative, military or even cities for educational
and knowledge gathering center[3].

SOCIAL SCIENCE 909
In eleventh century, the Turkish Ghaznavid ruler Sultan Mahmud (971-1030) proceeded
to the mainland India. Few centuries after his success, Ikhtiyar al-Din Muhammad
Bakhtiyar Khalji (died in 1206) made his way to Bengal in the beginning of thirteenth
century. Establishment of a muslim stronghold in Bengal certainly stirred several muslim
saints and sufis to come to preach here. Baba Adam Shahid of Dhaka, Shah Sultan Rumi
of Mymensingh, Makhdum Shah Dawlah Shahid of Pabna, Jalal-Din Tabrizi of Deotala
and Shah Jalal of Sylhet and last but not the least, Khan Jahan Ali of Bagerhat were few
of them[4].
MAIN RESULTS
Khan Jahan Ali of ‘Khalifatabad’ (present day Bagerhat) possessed the requisite qualities
to become both, a ruler and a successful administrator. Although little has been known
about his origin and there happen to be many ambiguous myths; there is no doubt about
his abilities. He was a prominent practitioner of sufism and was instrumental in
converting the locals. Even though, It is still unclear, what has brought him here; was it to
establish human settlements in the remote, inhospitable region of Bengal far away from
Delhi Sultanate or was he simply decided to live in peace here.
According to Professor Satish Chandra Mitra[5], Khan Jahan took a long voyage to
Bagerhat across Nadia along the river Bhairab, by crossing the mighty Ganges River and
appeared at Barobazar in Jessore. Thus Barobazar became the first township, among the
four townships: Barobazar, Murali Qashba, Poyogram Qasba and Khalifatabad
established by him in Bengal. Monuments of Khan Jahan Ali were mostly documented
and made available by the Department of Archeology of Bangladesh in form of different
reports.
Barobazar
The first settlement of Khan Jahan, Barobazar was laid out on an earlier Hindu-Budhist
township known as Champanagar, was named after the twelve (Baro) saints living prior to
Khan Jahan[6]. When he appeared there, the saints welcomed him wholeheartedly and it
is said that he offered his valuable judgment to dismiss quarrel between the locals. The
small township of Barobazar encompasses an area of about 6.44 km and still bears
significant structures like Gorar Mosque, Golakata Mosque, Jor-Bangla mosque and Pir
pukur mosque.
Murali-Qasba
Khan Jahan Ali settled next to a place called Murali-Qasba living from Barobazar. To
continue his missionary work, he left two of his dedicated followers there named Garib
Shah and Beram Shah. The mosque of Garib Sha near Jessore collectorate and the grave
of Beram Shah near Christian cemetery still bears this connection to that time. Actually
he divided his followers into two groups from this point; one group follows him to
Bagerhat and the another went straight to the Sundarbans.
Poyogram-Qasba
The township of Poyogram-Qasba was a new colony of Khan Jahan only about 32.2 km
away from Bagerhat[6]. There are still remainings of some old structures (two of them are
as large as Shait Gumbad mosque at Bagerhat among them) and ancient tanks.

SOCIAL SCIENCE 910
Khalifatabad (Bagerhat)
Khan Jahan Ali adorned his capital-city with numerous mosques (traditionally 360 in
number), bridges, roads, palaces and other public buildings in an astonishingly short span
of time. But the present day Bagerhat can be distinguished by about fifty monuments and
ponds mostly of which are extinct[7]. However there are two surviving monuments well
enough to describe the distinct style and significance of Khan Jahan possess by them. One
is the tomb of Khan Jahan Ali and the other is the Shait Gumbad mosque.
The Earthen Embankment
The earthen Embankment or Khanjali Jangal is a 112.7 Km long road connecting Jessore,
Khanpur, Kesabpur, Vidyanandakati, Maguraghona, Ataroi, Jeyala Baruihati, Tala,
Chapanghat, Khalin nagar, Gangarampur, Ghoshnagar, Kopilminu, Ramnathpur,
Gadaipur, Mathbari aniver and Paikgacha; crossed the Shibsa river and linked
Laxmikhola, Gajalia, Alatala and Masjidkur(in Amadi) and extended deep into the forest
as far as Amadi and Bedkashi[5].
CONCLUSION
The establishments of Khan Jahan Ali is an extraordinary example of an wise commander
and a noble man who spent years after years in remote southern Bengal and laid out well
planned settlements and infrastructures in that area. The distinct architectural style and
method of construction has given a unique characteristics to them. Though much confusion
prevails about his early life, the significance of this great warrior to the development of
southern Bangladesh is unparalleled. He has been compared with emperor Shahjahan and
termed as influential as him in that region by famous historian A K M Zakaria[3]. Although
UNESCO has inscribed the mosque city of Bagerhat (originally named as Khalifatabad) as a
world heritage site, very few know about the first and the other settlements from where he
began and continued his journey in this deltaic land. Here, an attempt has been taken to
narrate their history and remaining antiquities.
REFERENCES
1. Rashid, H., Geography of Bangladesh. (1977): University Press.
2. Brammer, H., physical geography of Bangladesh. 2012: The University Press Ltd. 3. Zakaria, A., Bangladesh-er Protnasampad. (2015), Dhaka: Dibya Prakash.
4. Khan, M.M., The muslim heritage of Bengal: the lives, thoughts and achievements of great muslim scholars,
writers and reformers of Bangladesh and West Bengal. (2013): Kube Publishing Ltd.
5. Mitra, S. and S.E. Mitra, Jessore-khulnar Itihas Vol. 1st. (1963), Gurudas Chattopadhyay And Sons,
Kolkota.
6. Ahmad, N., The buildings of Khan Jahan in and around Bagerhat. (1989): University Press.
7. Ahmed, N., Discover the monuments of Bangladesh. (1984): University Press.

SOCIAL SCIENCE 911
IGCESH2018
Universiti Teknologi Malaysia, Johor Bahru, Malaysia 13 -15 August 2018
SHAH WALI UL ALLAH AND FIVE SCIENCES COVERING QURAN
IN AL FAUZ AL KABIR
Naeem Ashfaq *1 and Hussin Bin Salamon2
1,2 Faculty of Islamic Civilization, Universiti Teknologi Malaysia.
(E-mail: [email protected], [email protected])
ABSTRACT
This study explores the contribution of Shah Wali Allah Dehlavi’s work on the Quran to
classify it into five categories (themes) using qualitative methodology known as thematic
analysis in today’s world of research, in his book Al-Fawz al-Kabir. This paper is an attempt
to show the contributions of Muslim scholars in the world of research by introducing or using
the research methodology which is used even in today’s modern world. A qualitative
comparative case study analysis was employed by reviewing both the approaches i.e.
thematic analysis and the approach applied by shah Wali Allah to find five sciences. The
result showed that both of the research approaches are similar. This study concludes that
[our] classical scholars have formulated and used the research methodologies which may be
applicable and relevant to the current research paradigms. It is recommended for the Muslim
researchers to review and analyze the work of Islamic classical scholars specifically their
research techniques to derive new research methodologies.
Key words: Quran, Shah Wali Allah, Al- Fauz Al- Kabir, Five Sciences, Thematic Analysis
INTRODUCTION
This study aims to introduce the work of Shah Wali Allah (SWH) on Quran by categorizing
Quran into five themes known as five sciences and to show that he used the thematic
analysis250 years ago. It provides a detailed information on how he performed this work
using Thematic Analysis, in his book “Al-Fawz al-Kabir”. SWH was an eminent Muslim
scholars, revolutionary thinker and a theologian of pre-modern India of subcontinent [1]. It is
concisely and valuable work on the principles of Qur'anic exegesis leads to the
comprehension of meaning of the Book of Allah [2].
SCOPE OF THE STUDY
This study is delimited to the first chapter of SWH’s book Al-Fawz al-Kabir which deals with
the explanation of five sciences enunciated in the Quran in which he employed qualitative
technique. This study intends to find out the relation between the research methodology used by
shah Wali Allah and the thematic analysis.

SOCIAL SCIENCE 912
OBJECTIVE OF THE STUDY
The main objective of the study is to explore the research work of [our] classical Islamic
scholars as to how they developed different research methodologies and used them. However,
the specific aims of the study are to:
• Analyze the research work of SWH on Quran to find out the relationship between the
research methodology employed by SWH and the thematic analysis;
• Introduce and show the research methodologies used by the classical Islamic scholars
for contemporary researchers;
• Motivate the contemporary Islamic researchers to formulate, develop and use these
research methodologies in their research work;
METHODOLOGY
For this study, a “qualitative comparative case study” was adopted. First, relevant literature,
publications and studies were reviewed to get in-depth information on contemporary research
methodology i.e. Thematic Analysis. Second, deep review of methodology employed by
SWH to define five themes (five sciences) of the Quran and his methodological approach to
thematic analysis.
MAIN FINDINGS AND BRIEF ANALYSIS OF THE STUDY
SWH, introduced a new dimension in the science of Tafsir. He emphasized a direct approach
to the Qur'an. After a comprehensive survey of the contents of the Qur'an, he categorized the
teachings of the Qur’an into five themes. This classification resolved many
misunderstandings of the Qur'an as well as a number of problems in the sequence of the
verses, their inter-relationship and thematic coherence. The significance underlying the
arrangement of the Quran covered by a set of five themes is as follows [3]:
The science of Injunctions )علم االحكام(
Under this theme there are incumbent, the recommended, the approved, the disapproved and
the forbidden, covering worships, social dealings, household economy, and state politics? Its
discussion is the responsibility of Jurists.
The science of Disputation )علم الجدل(
This theme deals with four groups of erring and misguided sects: the Jews, the Christians,
Polytheists, and lukewarm followers (munâfiqûn) and its discussion and analysis falls within
the jurisdiction of dialecticians.
The science of Divine Favors )علم التذكير بآالءهللا(
Reminding people of the benefits (conferred by or) of God? by explaining how heaven and
earth were created, and by pointing out that thanks to divine instruction man can acquire the
necessities of life by means of techniques required to control natural phenomena. This covers
explanation of the creation of the heavens and the earth, of the perfect attributes of Allah and
the guidance which the people received about necessities of life.

SOCIAL SCIENCE 913
The science covering the important events which Allah caused to take place, favoring
the obedient and punishing the disobedient. )علم التذكير بأ يّام هللا(
Reminding people of the Days of the Lord (Ayyâm Allâh)1, i.e. the lessons of history. This
theme covering the important events which Allah caused to take place, favoring the obedient
and punishing the disobedient.
The science relating to Death and what will follow it )علم التذكير بالموت وما بعَده)
This theme reminds human beings of the death, and what will follow it, the resurrection, the
gathering, the reckoning, the balance, the paradise, and the Hell.
CONCLUSION
This paper examines the similarity of the two qualitative research methodologies shows that the
classical Islamic scholars formulated and implemented research methodologies for instance SWH
in his monumental work on the Quran to cover the significance of the underlying arrangement
of the Holy Quran in his book Al-Fawz al-Kabir by a set of five sciences. This study not only
attempts to show his biography after research scholars as a great scholar of Islamic
civilization but also familiarize and motivate them through his contributions to the
development of science of research.
REFERENCES
1. S. W.-A. al-Dihlawi, "Anfas al-‘Arifin," ed: Delhi, (1917).
2. P. Hardy, The Muslims of British India (no. 13). Cambridge University Press, (1972).
3. J. M. S. Baljon, Religion and Thought of Shāh Walī Allāh Dihlawī: 1703-1762. Brill Academic Pub, (1986),
p. 221.

SOCIAL SCIENCE 914