Effects of unusually large seed crop on litterfall and nitrogen retranslocation in Himalayan oaks
Introduction
Litterfall production is a measure of forest produc-tivity (Bray & Gorham, 1964; Ramírez et al., 2007;Aceñolaza et al., 2010). In particular, the analysis oflitterfall has received great attention as an appropria-te tool to estimate overall forest productivity (SantaRegina et al., 1991; Haase, 1999; Carnevale and Lewis,
2001; Zamboni & Aceñolaza, 2004; Aceñolaza et al.,2006).
A large portion of the organic residues that reachthe soil is mineralized, including leaves, stems, flo-wers, fruits, and other plant structures that make uplitterfall, releasing bioelements that can be reabsorbedby plants. Such nutrient release is ultimately determi-ned by many variables as: genetic characteristics ofspecies, annual variation of chemical composition oflitterfall, microorganisms composition, and activityand environmental conditions; all these factors influen-
Temporal evolution of litterfall and potential bio-element return in a successional forest sequence of the Espinal Ecorregion,
Argentina
Carlos A. Mendoza1*, Juan F. Gallardo-Lancho2, Pablo G. Aceñolaza3, Maria-Belen Turrion4 and Valentin Pando5
1 FCyT. Universidad Autónoma de Entre Ríos. Empalme Neid. Villaguay 3240. Entre Ríos. Argentina.2 CSIC. IRNASa. Cordel de Merinas, 40. 37080 Salamanca, Spain. 3 CICyTTP-CONICET, FCA-UNER and
CEREGEO-UADER. Materi y España. 3105 Diamante (Entre Ríos), Argentina. 4 Área de Edafología y QuímicaAgrícola and Instituto Universitario de Gestión Forestal Sostenible. ETSII AA, Campus Palencia. University
of Valladolid. Avda. Madrid, 57. 34071 Palencia, Spain. 5 Departamento de Estadística e Investigación Operativa. University of Valladolid. ETSII AA. Campus Avda. Madrid, 57. 34071 Palencia, Spain
Abstract
Aim of study: The aim of this work was to assess the litterfall contribution and the return of bioelements of asuccessional forest sequence from the Mesopotamian Espinal (Argentina) which was associated with livestockproduction.
Area of study: Mesopotamian Espinal, Argentina.Material and methods: Litterfall samples were taken and a chemical characterization of their fractions was determined
in three stages: a) in the initial successional stage (IF); b) in an intermediate secondary forest (SF); and c) in a matureforest (MF).
Main results: The litterfall contribution of the three forests was 1,140 ± 98, 2,947 ± 154, and 2,911 ± 57 kg DM ha–1
yr–1; respectively. The IF showed a seasonal pattern of contribution with a peak occurring during summer (528 ± 85kg DM ha–1 yr–1), then decreasing during autumn, winter, and spring (241 ± 30, 165 ± 27, and 207 ± 29 kg DM ha–1
season–1, respectively). The SF showed a rather constant seasonal pattern (about 750 kg DM season–1). The MF showedsignif icant differences among seasons, the maximum and minimum contributions ranging between 846 ± 29 and598 ± 33 kg DM ha–1 season–1 in summer and spring, respectively. The litterfall leaves/branch ratio decreased asecological succession advanced, being lower as the forest gets more mature. As a consequence, this ratio can be usedas an indicator of maturity in the sequence. The potential return of bio-elements of the successional forest sequencewas proportional to the litterfall input, with a maximum amount of N in the Fabaceae species.
Research highlights: The litterfall assessment and the leaves/branch ratio allowed the characterization of thesuccessional stages in Xerophytic forest used for livestock production.
Key words: semi-xerophytic trees; tree production pattern; plant organ contribution; leaf/branch ratio; return ofbio-elements; tree nutrients.
* Corresponding author: [email protected]: 17-09-13. Accepted: 17-12-13.
Instituto Nacional de Investigación y Tecnología Agraria y Alimentaria (INIA) Forest Systems 2014 23(3): 411-424 http://dx.doi.org/10.5424/fs/2014233-05007 ISSN: 2171-5068
eISSN: 2171-9845
OPEN ACCESS
ce the release rate of nutrients in each forest ecosystem(Aceñolaza et al., 2009), determining its nutritionalstatus.
Nutrient inputs to the soil through litterfall, is knownas the potential return of bioelements (PRB), since theyenter the soil after litter mineralization (Martín et al.,1996; Gallardo et al., 1989). These authors also foundthat, in general, temporal variations of bio-element re-turn to the soil (via litterfall) follow an evolution si-milar to the pattern of litterfall contribution. Analy-zing the different fractions of litterfall allows us to findsome indicators of forest maturity. Martín et al. (1993)found that, as forest mature, the relationship betweenleaf and branch contribution tends to drop, even the leaf litter contribution increase, the branch productiongrows with a higher ratio.
The Mesopotamian Espinal has been recently mo-dified in several areas of Entre Ríos province, due tothe advance of the agricultural frontier, producing animportant reduction in forest area (Aceñolaza, 2000;Muñoz et al., 2005; Arturi, 2006; Maldonado et al.,2012) and leading to an increasingly heterogeneousland mosaic (Maldonado et al., 2012). Inappropriatelivestock management or forest exploitation for tim-ber production (mainly Prosopis nigra) or f irewood(Acacia caven and Prosopis affinis) had early trans-formed the native and primary forests into degradedor secondary forests. Deforestation and land abandon-ment have led to the development of a sequence of successional forest stages, with an initial stage domi-nated by a woodland of A. caven, followed by its co-lonization by P. affinis, and leading to a mature forestdominated by P. nigra, and thus, to the reestablishmentof a stable forest (Aceñolaza, 2000; Lewis et al., 2006).
In this study, we firstly hypothesize that the plantsuccession, as an ecological process, has a direct in-fluence on the litterfall production and, as a result, onthe potential nutrient return (PRB) in the forests of theMesopotamian Espinal; secondly, that leaf/branch ra-tio (L/B), as a characteristic of the litter production,increases as the ecological succession advances.
This work shows data about the contribution of litterfall and quantification of PRB in MesopotamiamEspinal forests, little-known issue until now. This sub-ject has also a practical interest, particularly because theforests studied are associated with extensive livestockproduction. Therefore, the aims of this work were to:
A) Estimate the inputs of litterfall in a degraded/ restored successional sequence of the Argentine Me-sopotamian Espinal eco-region.
B) Describe the seasonal pattern of litterfall pro-duction in these forests.
C) Quantify the potential return of bio-elementsper species and forest in the successional sequenceconsidered.
Material and methods
The Espinal is an Argentine eco-region located bet-ween 28° and 40° S latitude, to the South of the Cha-queño Park, covering approximately 330,000 km2
(Lewis et al., 2006) and forms an arch that surroundsthe Pampas Grassland eco-region. The MesopotamianEspinal, in Entre Ríos province, comprises forests be-longing to the Espinal phytogeographic Province, es-pecially in Ñandubay district (Cabrera, 1994).
Study area
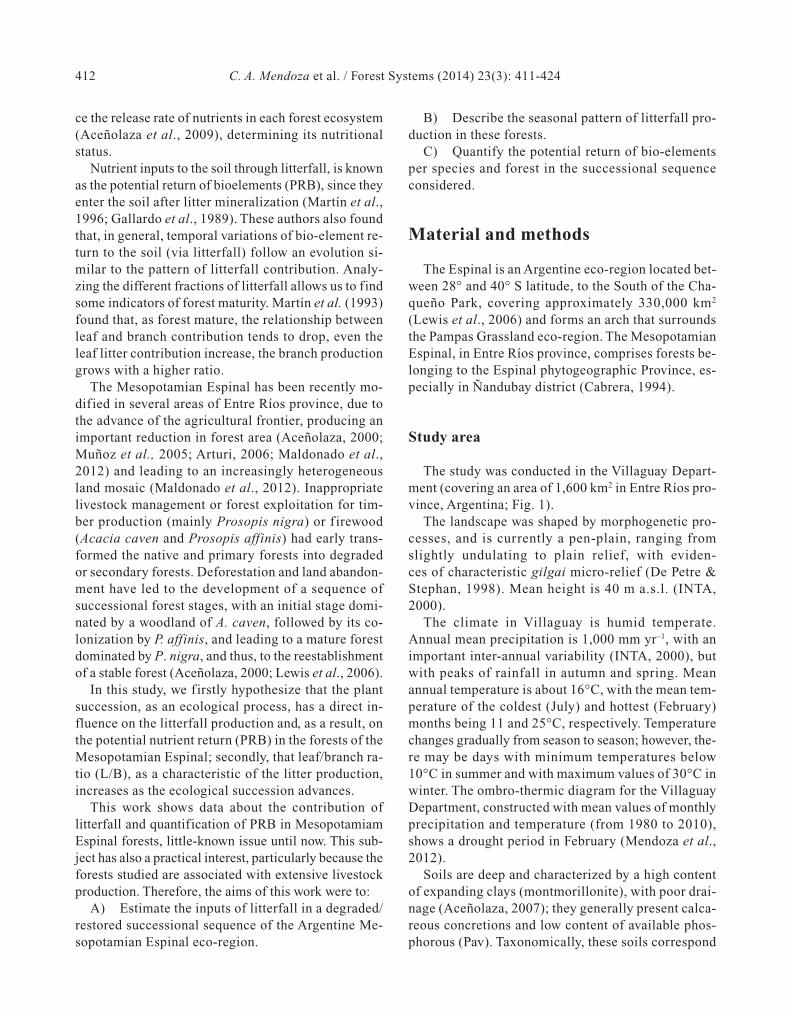
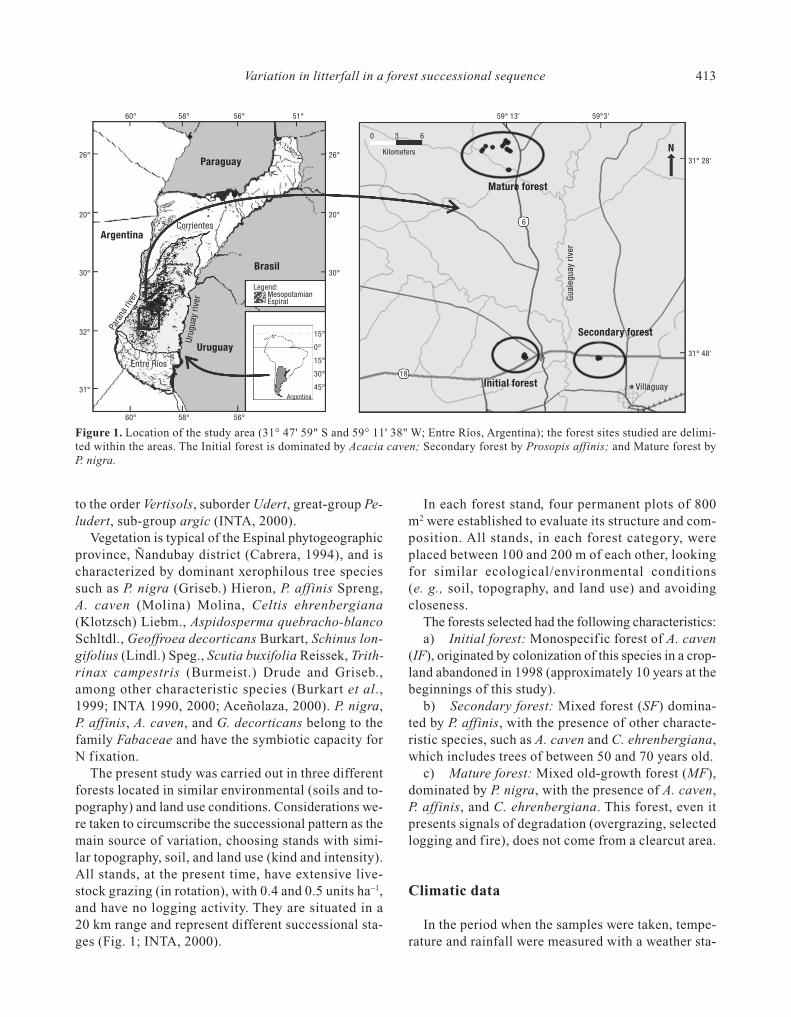
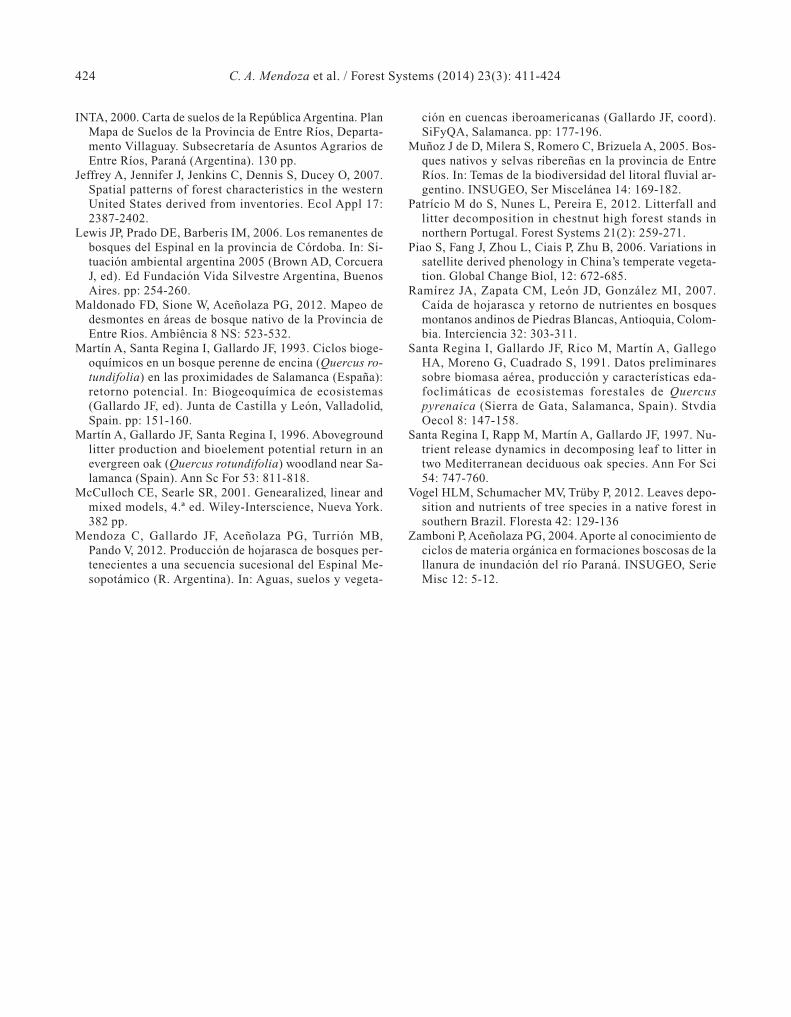
The study was conducted in the Villaguay Depart-ment (covering an area of 1,600 km2 in Entre Ríos pro-vince, Argentina; Fig. 1).
The landscape was shaped by morphogenetic pro-cesses, and is currently a pen-plain, ranging fromslightly undulating to plain relief, with eviden-ces of characteristic gilgai micro-relief (De Petre & Stephan, 1998). Mean height is 40 m a.s.l. (INTA,2000).
The climate in Villaguay is humid temperate. Annual mean precipitation is 1,000 mm yr–1, with animportant inter-annual variability (INTA, 2000), butwith peaks of rainfall in autumn and spring. Mean annual temperature is about 16°C, with the mean tem-perature of the coldest (July) and hottest (February)months being 11 and 25°C, respectively. Temperaturechanges gradually from season to season; however, the-re may be days with minimum temperatures below10°C in summer and with maximum values of 30°C inwinter. The ombro-thermic diagram for the VillaguayDepartment, constructed with mean values of monthlyprecipitation and temperature (from 1980 to 2010),shows a drought period in February (Mendoza et al.,2012).
Soils are deep and characterized by a high contentof expanding clays (montmorillonite), with poor drai-nage (Aceñolaza, 2007); they generally present calca-reous concretions and low content of available phos-phorous (Pav). Taxonomically, these soils correspond
412 C. A. Mendoza et al. / Forest Systems (2014) 23(3): 411-424
to the order Vertisols, suborder Udert, great-group Pe-ludert, sub-group argic (INTA, 2000).
Vegetation is typical of the Espinal phytogeographicprovince, Ñandubay district (Cabrera, 1994), and ischaracterized by dominant xerophilous tree speciessuch as P. nigra (Griseb.) Hieron, P. affinis Spreng, A. caven (Molina) Molina, Celtis ehrenbergiana(Klotzsch) Liebm., Aspidosperma quebracho-blancoSchltdl., Geoffroea decorticans Burkart, Schinus lon-gifolius (Lindl.) Speg., Scutia buxifolia Reissek, Trith-rinax campestris (Burmeist.) Drude and Griseb.,among other characteristic species (Burkart et al.,1999; INTA 1990, 2000; Aceñolaza, 2000). P. nigra,P. affinis, A. caven, and G. decorticans belong to thefamily Fabaceae and have the symbiotic capacity forN fixation.
The present study was carried out in three differentforests located in similar environmental (soils and to-pography) and land use conditions. Considerations we-re taken to circumscribe the successional pattern as themain source of variation, choosing stands with simi-lar topography, soil, and land use (kind and intensity).All stands, at the present time, have extensive live-stock grazing (in rotation), with 0.4 and 0.5 units ha–1,and have no logging activity. They are situated in a20 km range and represent different successional sta-ges (Fig. 1; INTA, 2000).
In each forest stand, four permanent plots of 800m2 were established to evaluate its structure and com-position. All stands, in each forest category, were placed between 100 and 200 m of each other, lookingfor similar ecological/environmental conditions (e. g., soil, topography, and land use) and avoidingcloseness.
The forests selected had the following characteristics:a) Initial forest: Monospecific forest of A. caven
(IF), originated by colonization of this species in a crop-land abandoned in 1998 (approximately 10 years at thebeginnings of this study).
b) Secondary forest: Mixed forest (SF) domina-ted by P. affinis, with the presence of other characte-ristic species, such as A. caven and C. ehrenbergiana,which includes trees of between 50 and 70 years old.
c) Mature forest: Mixed old-growth forest (MF),dominated by P. nigra, with the presence of A. caven,P. affinis, and C. ehrenbergiana. This forest, even itpresents signals of degradation (overgrazing, selectedlogging and fire), does not come from a clearcut area.
Climatic data
In the period when the samples were taken, tempe-rature and rainfall were measured with a weather sta-
Variation in litterfall in a forest successional sequence 413
Figure 1. Location of the study area (31° 47' 59" S and 59° 11' 38" W; Entre Ríos, Argentina); the forest sites studied are delimi-ted within the areas. The Initial forest is dominated by Acacia caven; Secondary forest by Prosopis affinis; and Mature forest byP. nigra.
Paraguay
ArgentinaCorrientes
60° 58° 56° 51° 59° 13' 59°3'
26°
20°
30°
32°
31°
15°
0°
15°
30°
45°
26°
20°
30°
31° 28'
31° 48'
60° 58° 56°
Para
na ri
ver
Entre Ríos
Urug
uay
river
Uruguay
Brasil
Secondary forest
Mature forest
N0 3 6
Kilometers
6
18
Gual
egua
y riv
er
VillaguayInitial forest
Legend:MesopotamianEspiral
Argentina
tion located in the study area. Mean monthly rainfalland temperature were calculated for the 2009-2010 pe-riod. Pearson’s correlation coefficient (r) was used asmeasure of magnitude of the linear association amongvariables (climatic factors and total litterfall produc-tion per species and forest).
Litterfall sampling
In the three forests selected, four randomly stands(20 × 20 m2) were evaluated as described before byMendoza et al. (2012). Within each stand, all indivi-dual trees were identified to the species level.
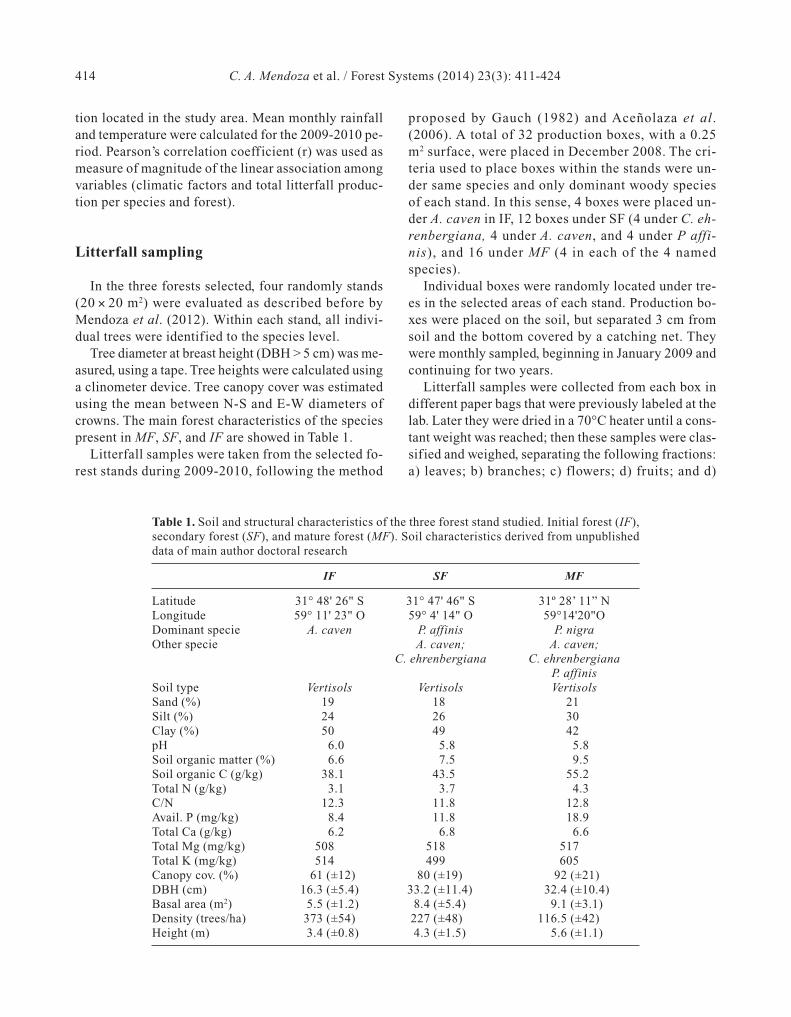
Tree diameter at breast height (DBH > 5 cm) was me-asured, using a tape. Tree heights were calculated usinga clinometer device. Tree canopy cover was estimatedusing the mean between N-S and E-W diameters ofcrowns. The main forest characteristics of the speciespresent in MF, SF, and IF are showed in Table 1.
Litterfall samples were taken from the selected fo-rest stands during 2009-2010, following the method
proposed by Gauch (1982) and Aceñolaza et al.(2006). A total of 32 production boxes, with a 0.25m2 surface, were placed in December 2008. The cri-teria used to place boxes within the stands were un-der same species and only dominant woody speciesof each stand. In this sense, 4 boxes were placed un-der A. caven in IF, 12 boxes under SF (4 under C. eh-renbergiana, 4 under A. caven, and 4 under P affi-nis), and 16 under MF (4 in each of the 4 namedspecies).
Individual boxes were randomly located under tre-es in the selected areas of each stand. Production bo-xes were placed on the soil, but separated 3 cm fromsoil and the bottom covered by a catching net. Theywere monthly sampled, beginning in January 2009 andcontinuing for two years.
Litterfall samples were collected from each box indifferent paper bags that were previously labeled at thelab. Later they were dried in a 70°C heater until a cons-tant weight was reached; then these samples were clas-sified and weighed, separating the following fractions:a) leaves; b) branches; c) flowers; d) fruits; and d)
414 C. A. Mendoza et al. / Forest Systems (2014) 23(3): 411-424
Table 1. Soil and structural characteristics of the three forest stand studied. Initial forest (IF),secondary forest (SF), and mature forest (MF). Soil characteristics derived from unpublisheddata of main author doctoral research
IF SF MF
Latitude 31° 48' 26" S 31° 47' 46" S 31º 28’ 11” NLongitude 59° 11' 23" O 59° 4' 14" O 59°14'20"ODominant specie A. caven P. affinis P. nigraOther specie A. caven; A. caven;
C. ehrenbergiana C. ehrenbergianaP. affinis
Soil type Vertisols Vertisols VertisolsSand (%) 19,0 18,0 21,0Silt (%) 24,0 26,0 30,0Clay (%) 50,0 49,0 42,0pH 6.0 5.8 5.8Soil organic matter (%) 6.6 7.5 9.5Soil organic C (g/kg) 38.1 43.5 55.2Total N (g/kg) 3.1 3.7 4.3C/N 12.3 11.8 12.8Avail. P (mg/kg) 8.4 11.8 18.9Total Ca (g/kg) 6.2 6.8 6.6Total Mg (mg/kg) 508,0 518,0 517,0Total K (mg/kg) 514,0 499,0 605,0Canopy cov. (%) 61 (±12) 80 (±19) 92 (±21)DBH (cm) 16.3 (±5.4) 33.2 (±11.4) 32.4 (±10.4)Basal area (m2) 5.5 (±1.2) 8.4 (±5.4) 9.1 (±3.1)Density (trees/ha) 373 (±54) 227 (±48) 116.5 (±42)Height (m) 3.4 (±0.8) 4.3 (±1.5) 5.6 (±1.1)
others (other plant material from other tree, shrub orherb species, excluding animal feces).
Results of annual litter production are expressed inkg of dry matter (DM) ha–1 yr–1.
Total litterfall, litterfall fraction, and moisture con-tent of each production box were determined per spe-cies and per forest as a function of time. Total litter-fall was calculated as the average of the annualaccumulation of litterfall production.
Collecting trays were placed under individual spe-cies. For referring the litterfall production to ha, an ad-justment of litter input values by tree should be per-formed, to f it the values measured to the actualcoverage of each species in the area. For this, the re-lative tree cover on each species (Mendoza et al., 2012)was multiplied by the litterfall (resulting kg MS ha–1
y–1). This allowed us to estimate the real contributionby species and site. In the forests more than one spe-cies are found, total contributions is obviously the sumof the relative contributions of each species.
Chemical analyses of litterfall samples
All plant samples were ground using a ball mill(Retsch, model MM301). These samples were thenweighed using a precision balance (± 0.001 g) and bur-ned in a muffle furnace (at least 500°C) for 5 h.
Ashes were digested with concentrated HCl and thendiluted with distilled water to a known volume. Ali-quots were taken to determine P, using the vanado-molybdate yellow procedure (Chapman & Pratt, 1979)and a spectrophotometer (Genesys, model 20). Ano-ther aliquot of the same acidic solution was used to de-termine Ca, Mg, K, S, Na, Fe, Al, Zn, Mn, and Cu bymeans of inductively coupled plasma emission spec-trometry (ICP-OES).
After the acid digestion of plant samples, N contentwas determined using a flow auto-analyzer (Bran+Luebbe AA3).
Quantification of potential return of bio-elements (PRB)
The amount of bioelements that potentially can re-turn to the soil through litterfall was determined bymultiplying the pooled mean annual litterfall produc-tion estimated during the study period by the mean che-mical composition of each plant residue. Then, PRB
was calculated for each fraction per species and perforest.
Statistical analyses
Temporal analysis included average litterfall pro-duction accumulated by month and season (summer:January-March, autumn: April-June, winter: July-Sep-tember, and spring: October-December).
Data were analyzed using a linear mixed modelanalysis of variance (McCulloch & Searle, 2001) withtwo between-subject factors in a hierarchical de-sign (forest and species nested within forest) and threewithin-subject factors of repeated measures (year, season, and month nested within season). The compa-rison between means was done by using Fisher’s Least Significant Difference (LSD) test.
For each fixed forest, year, and season, covarianceamong months is constant for a single species and equalfor all species. Therefore, the structure of variances ofthe mixed linear model was estimated using the restric-ted maximum likelihood method (Bartlett, 1937).
The model proposed allowed us to estimate the ac-tual contribution of the different forests as a functionof the entire forest tree cover and the relative cover perspecies in the three stands representative of the Meso-potamian Espinal (Mendoza et al., 2012).
Results
Total litter production in the forest systems
Total litterfall annual production
Mean forest litterfall contribution (Table 2) rangedbetween 1,140 kg DM ha–1 yr–1 in IF and 2,947 kg DMha-1 yr-1 in SF, showing no significant differences withMF (2,911 kg DM ha–1 yr–1 in MF, p > 0.05). However,both SF and MF differed statistically from IF (p < 0.05).
Total litterfall seasonal production
Comparison of forests seasonal patterns (Table2)showed signif icant differences among forests in summer (p < 0.05); SF and MF exhibited the greatestproduction, without significant differences betweenboth them (p > 0.05). The same pattern was observed
Variation in litterfall in a forest successional sequence 415
in autumn, SF and MF having the maximum produc-tion in summer and autumn.
IF, SF, and MF showed signif icant differences(p < 0.05) in total litterfall production in the three fo-rests in winter and spring. In winter, IF, SF, and MFproduced 165, 637, and 764 kg DM ha–1 season–1, res-pectively; however, in spring, SF showed maximumproduction, with values of 207, 755, and 598 kg DMha–1 season–1 for IF, SF, and MF, respectively (Ta-ble 2). The analysis of the temporal pattern exhibiteda maximum contribution in summer for IF (528 kgDM ha–1 season–1), with signif icant differences(p < 0.05) from the other seasons (Table 2). SF showsconstant production (p > 0.05). Finally, MF presen-ted significant differences among seasons (p < 0.05),with the maximum and the minimum seasonal litter-fall production ranging between 846 and 598 kg DMha–1 season–1 (summer and spring, respectively; Ta-ble 2).
Total litterfall production by species
Comparing the total litterfall production by species,the maximum contributions were found in A. caven
(IF), C. ehrenbergiana, and P. nigra (MF), without sig-nificant differences among them (p > 0.05); even thatthey were different compared to the minimum contri-bution of A. caven in the MF (Table 3).
Temporal litterfall pattern was analyzed consideringmean contribution per species (Table 3); these data arereferred to monthly means, and did not show a defini-te pattern.
As already mentioned, A. caven showed a decrea-sing seasonal production pattern in IF, with a maxi-mum value of 528 kg DM ha–1 season–1 in summer,which differed significantly from the other three sea-sons (p <0.05).
Production of P. affinis was constant and did not differ signif icantly among seasons in SF (p >0.05),whereas A. caven and C. ehrenbergiana showed oppo-site contribution patterns among seasons compared toP. affinis; this is the reason why, when both are consi-dered in combination, the total production follows anannual decreasing rate (Table 3).
Following the same trend, the contribution patternsof P. nigra and C. ehrenbergiana were complementaryin MF, i. e., they were opposite among seasons; the sa-me pattern was also observed between C. ehrenbergia-na and A. caven in SF. Whereas P. nigra had the ma-
416 C. A. Mendoza et al. / Forest Systems (2014) 23(3): 411-424
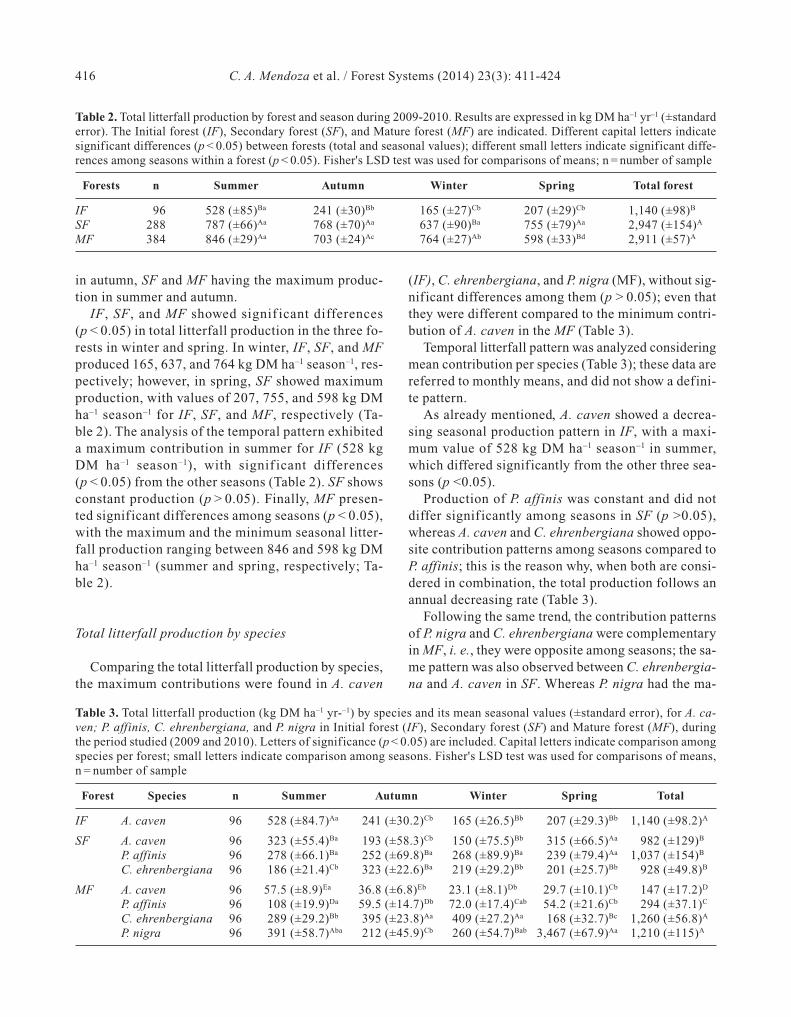
Table 2. Total litterfall production by forest and season during 2009-2010. Results are expressed in kg DM ha–1 yr–1 (±standarderror). The Initial forest (IF), Secondary forest (SF), and Mature forest (MF) are indicated. Different capital letters indicatesignificant differences (p < 0.05) between forests (total and seasonal values); different small letters indicate significant diffe-rences among seasons within a forest (p < 0.05). Fisher's LSD test was used for comparisons of means; n = number of sample
Forests n Summer Autumn Winter Spring Total forest
IF 96 528 (±85)Ba 241 (±30)Bb 165 (±27)Cb 207 (±29)Cb 1,140 (±98)B
SF 288 787 (±66)Aa 768 (±70)Aa 637 (±90)Ba 755 (±79)Aa 2,947 (±154)A
MF 384 846 (±29)Aa 703 (±24)Ac 764 (±27)Ab 598 (±33)Bd 2,911 (±57)A
Table 3. Total litterfall production (kg DM ha–1 yr-–1) by species and its mean seasonal values (±standard error), for A. ca-ven; P. affinis, C. ehrenbergiana, and P. nigra in Initial forest (IF), Secondary forest (SF) and Mature forest (MF), duringthe period studied (2009 and 2010). Letters of significance (p < 0.05) are included. Capital letters indicate comparison amongspecies per forest; small letters indicate comparison among seasons. Fisher's LSD test was used for comparisons of means,n = number of sample
Forest Species n Summer Autumn Winter Spring Total
IF A. caven 96 528 (±84.7)Aa 241 (±30.2)Cb 165 (±26.5)Bb 207 (±29.3)Bb 1,140 (±98.2)A
SF A. caven 96 323 (±55.4)Ba 193 (±58.3)Cb 150 (±75.5)Bb 315 (±66.5)Aa 982 (±129)B
P. affinis 96 278 (±66.1)Ba 252 (±69.8)Ba 268 (±89.9)Ba 239 (±79.4)Aa 1,037 (±154)B
C. ehrenbergiana 96 186 (±21.4)Cb 323 (±22.6)Ba 219 (±29.2)Bb 201 (±25.7)Bb 928 (±49.8)B
MF A. caven 96 57.5 (±8.9)Ea 36.8 (±6.8)Eb 23.1 (±8.1)Db 29.7 (±10.1)Cb 147 (±17.2)D
P. affinis 96 108 (±19.9)Da 59.5 (±14.7)Db 72.0 (±17.4)Cab 54.2 (±21.6)Cb 294 (±37.1)C
C. ehrenbergiana 96 289 (±29.2)Bb 395 (±23.8)Aa 409 (±27.2)Aa 168 (±32.7)Bc 1,260 (±56.8)A
P. nigra 96 391 (±58.7)Aba 212 (±45.9)Cb 260 (±54.7)Bab 3,467 (±67.9)Aa 1,210 (±115)A
ximum production in the summer-spring period, C. ehrenbergiana did in autumn-winter, with their ma-ximum and minimum values showing signif icant differences (p < 0.05; Table 3).
The comparison between productions of a singlespecies among forests showed that A. caven (both inMF and IF) also had a decreasing pattern (with a ma-ximum in summer); additionally, the maximum for A. caven in SF was in spring/summer.
P. affinis showed a constant production pattern inboth MF and SF; however, the recorded contributionwas lower in MF, probably due also to the competitionof dominant species in these forests (P. nigra and C. ehrenbergiana).
C. ehrenbergiana showed a production pattern typi-cal of deciduous species in both SF and MF, with peaks in autumn in both ecosystems.
Overall, comparison of litterfall productions showssignif icant differences among species and among seasons (Table 3).
Litterfall production by fractions
The comparison of litterfall production per fractionshowed that leaves contributed with unusually low values in all cases, exhibiting maximum values for C. ehrenbergiana in MF (mean of 652 kg DM ha–1 yr–1)and minimum values for A. caven in MF (mean 22 kg DMha–1 yr–1), with significant differences between them(p < 0.05; Table 4), ranging from 52 to 15% of the litterfall.
Branches showed very dissimilar contribution values,with a maximum of 710 kg DM ha–1 yr–1 produced by P.nigra and a minimum of 76 kg DM ha–1 yr–1 by A. caven
Variation in litterfall in a forest successional sequence 417
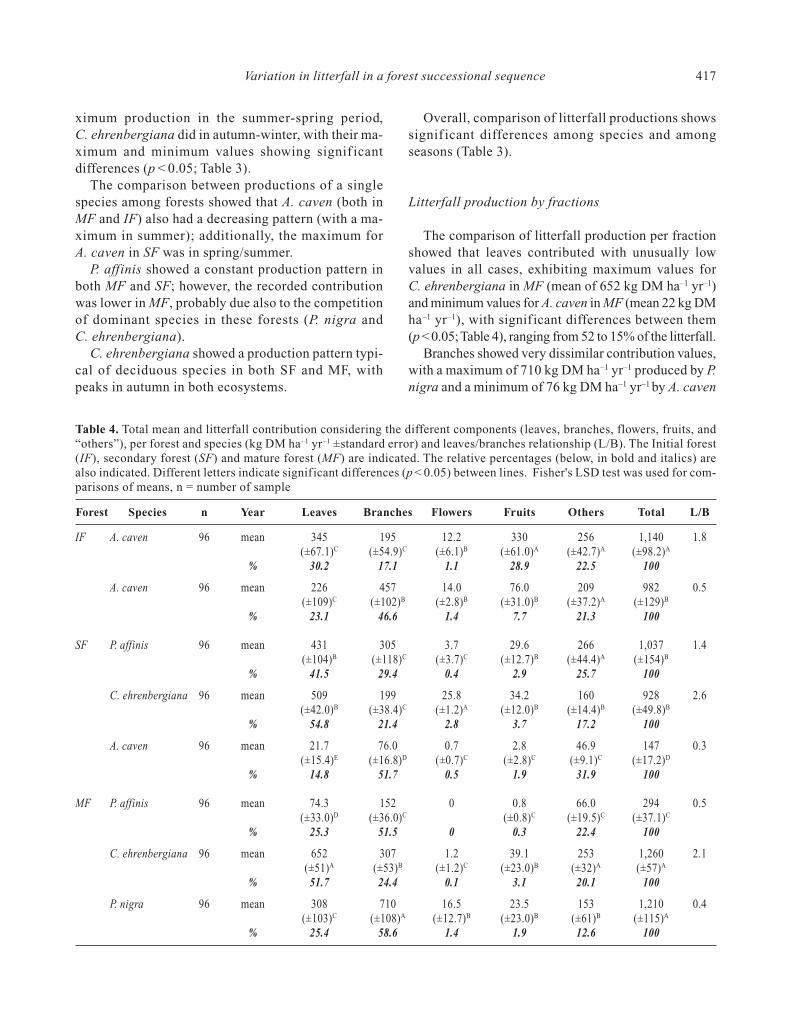
Table 4. Total mean and litterfall contribution considering the different components (leaves, branches, flowers, fruits, and“others”), per forest and species (kg DM ha–1 yr–1 ±standard error) and leaves/branches relationship (L/B). The Initial forest(IF), secondary forest (SF) and mature forest (MF) are indicated. The relative percentages (below, in bold and italics) arealso indicated. Different letters indicate significant differences (p < 0.05) between lines. Fisher's LSD test was used for com-parisons of means, n = number of sample
Forest Species n Year Leaves Branches Flowers Fruits Others Total L/B
IF A. caven 96 mean 345 195 12.2 330 256 1,140 1.8(±67.1)C (±54.9)C (±6.1)B (±61.0)A (±42.7)A (±98.2)A
% 30.2 17.1 1.1 28.9 22.5 100
A. caven 96 mean 226 457 14.0 76.0 209 982 0.5(±109)C (±102)B (±2.8)B (±31.0)B (±37.2)A (±129)B
% 23.1 46.6 1.4 7.7 21.3 100
SF P. affinis 96 mean 431 305 3.7 29.6 266 1,037 1.4(±104)B (±118)C (±3.7)C (±12.7)B (±44.4)A (±154)B
% 41.5 29.4 0.4 2.9 25.7 100
C. ehrenbergiana 96 mean 509 199 25.8 34.2 160 928 2.6(±42.0)B (±38.4)C (±1.2)A (±12.0)B (±14.4)B (±49.8)B
% 54.8 21.4 2.8 3.7 17.2 100
A. caven 96 mean 21.7 76.0 0.7 2.8 46.9 147 0.3(±15.4)E (±16.8)D (±0.7)C (±2.8)C (±9.1)C (±17.2)D
% 14.8 51.7 0.5 1.9 31.9 100
MF P. affinis 96 mean 74.3 152 0 0.8 66.0 294 0.5(±33.0)D (±36.0)C (±0.8)C (±19.5)C (±37.1)C
% 25.3 51.5 0 0.3 22.4 100
C. ehrenbergiana 96 mean 652 307 1.2 39.1 253 1,260 2.1(±51)A (±53)B (±1.2)C (±23.0)B (±32)A (±57)A
% 51.7 24.4 0.1 3.1 20.1 100
P. nigra 96 mean 308 710 16.5 23.5 153 1,210 0.4(±103)C (±108)A (±12.7)B (±23.0)B (±61)B (±115)A
% 25.4 58.6 1.4 1.9 12.6 100
(both in MF), with significant differences between them(p < 0.05; Table 4). These contributions represented 59and 52% of the total production, respectively.
Flowers were residual, with the most important pro-duction belonging to C. ehrenbergiana in SF (26 kgDM ha–1 yr–1), and differing statistically from the con-tribution of the other species to the total; this maxi-mum corresponded to the highest representation of theflower fraction among species (3%).
The highest fruit production corresponded to A. ca-ven in IF, with a mean of 330 kg DM ha–1 yr–1. Fruitsof A. caven represented 29, 7.7, and 1.9% in IF, SF,and MF, respectively (Table 4).
Finally, contribution of the fraction “other” was highest in P. affinis in SF, C. ehrenbergiana in MF,and A. caven in IF and SF (p > 0.05; Table 4), showingsignificant differences from the minimum production,which corresponded to C. ehrenbergiana in SF, and A. caven and P. affinis in MF.
This index L/B varied widely among species (Ta-bla 4), with high values of 2.1 and 2.6 recorded for C. ehrenbergiana in MF and SF, respectively; valuesof about 0.5 for A. caven in SF and MF, and P. affinisor P. nigra in MF; and intermediate values of 1.8 forA. caven in IF or 1.4 for P. affinis in SF.
Correlations between litterfall production and climatic parameters
The current analysis was conducted in forests of theMesopotamian Espinal and no significant correlations
were observed between monthly production and cli-matic factors, such as precipitation (r2 < 0.01; p > 0.72)and temperature (r2 = 0.01; p > 0.12).
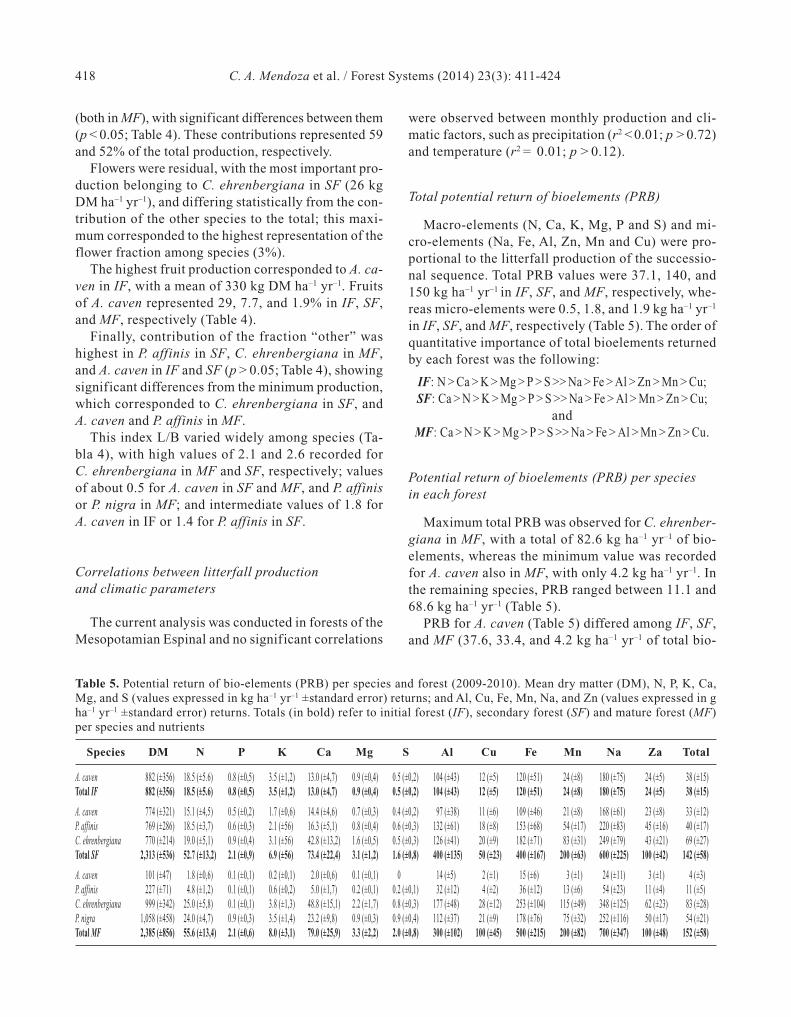
Total potential return of bioelements (PRB)
Macro-elements (N, Ca, K, Mg, P and S) and mi-cro-elements (Na, Fe, Al, Zn, Mn and Cu) were pro-portional to the litterfall production of the successio-nal sequence. Total PRB values were 37.1, 140, and150 kg ha–1 yr–1 in IF, SF, and MF, respectively, whe-reas micro-elements were 0.5, 1.8, and 1.9 kg ha–1 yr–1
in IF, SF, and MF, respectively (Table 5). The order ofquantitative importance of total bioelements returnedby each forest was the following:
IF: N > Ca > K > Mg > P > S >> Na > Fe > Al > Zn > Mn > Cu;SF: Ca > N > K > Mg > P > S >> Na > Fe > Al > Mn > Zn > Cu;
andMF: Ca > N > K > Mg > P > S >> Na > Fe > Al > Mn > Zn > Cu.
Potential return of bioelements (PRB) per species in each forest
Maximum total PRB was observed for C. ehrenber-giana in MF, with a total of 82.6 kg ha–1 yr–1 of bio-elements, whereas the minimum value was recordedfor A. caven also in MF, with only 4.2 kg ha–1 yr–1. Inthe remaining species, PRB ranged between 11.1 and68.6 kg ha–1 yr–1 (Table 5).
PRB for A. caven (Table 5) differed among IF, SF,and MF (37.6, 33.4, and 4.2 kg ha–1 yr–1 of total bio-
418 C. A. Mendoza et al. / Forest Systems (2014) 23(3): 411-424
Table 5. Potential return of bio-elements (PRB) per species and forest (2009-2010). Mean dry matter (DM), N, P, K, Ca,Mg, and S (values expressed in kg ha–1 yr–1 ±standard error) returns; and Al, Cu, Fe, Mn, Na, and Zn (values expressed in gha–1 yr–1 ±standard error) returns. Totals (in bold) refer to initial forest (IF), secondary forest (SF) and mature forest (MF)per species and nutrients
Species DM N P K Ca Mg S Al Cu Fe Mn Na Za Total
A. caven 882 (±356) 18.5 (±5.6) 0.8 (±0,5) 3.5 (±1,2) 13.0 (±4,7) 0.9 (±0,4) 0.5 (±0,2) 104 (±43) 12 (±5) 120 (±51) 24 (±8) 180 (±75) 24 (±5) 38 (±15)Total IF 882 (±356) 18.5 (±5.6) 0.8 (±0,5) 3.5 (±1,2) 13.0 (±4,7) 0.9 (±0,4) 0.5 (±0,2) 104 (±43) 12 (±5) 120 (±51) 24 (±8) 180 (±75) 24 (±5) 38 (±15)
A. caven 774 (±321) 15.1 (±4,5) 0.5 (±0,2) 1.7 (±0,6) 14.4 (±4,6) 0.7 (±0,3) 0.4 (±0,2) 97 (±38) 11 (±6) 109 (±46) 21 (±8) 168 (±61) 23 (±8) 33 (±12)P. affinis 769 (±286) 18.5 (±3,7) 0.6 (±0,3) 2.1 (±56) 16.3 (±5,1) 0.8 (±0,4) 0.6 (±0,3) 132 (±61) 18 (±8) 153 (±68) 54 (±17) 220 (±83) 45 (±16) 40 (±17)C. ehrenbergiana 770 (±214) 19.0 (±5,1) 0.9 (±0,4) 3.1 (±56) 42.8 (±13,2) 1.6 (±0,5) 0.5 (±0,3) 126 (±41) 20 (±9) 182 (±71) 83 (±31) 249 (±79) 43 (±21) 69 (±27)Total SF 2,313 (±536) 52.7 (±13,2) 2.1 (±0,9) 6.9 (±56) 73.4 (±22,4) 3.1 (±1,2) 1.6 (±0,8) 400 (±135) 50 (±23) 400 (±167) 200 (±63) 600 (±225) 100 (±42) 142 (±58)
A. caven 101 (±47) 1.8 (±0,6) 0.1 (±0,1) 0.2 (±0,1) 2.0 (±0,6) 0.1 (±0,1) 0 14 (±5) 2 (±1) 15 (±6) 3 (±1) 24 (±11) 3 (±1) 4 (±3)P. affinis 227 (±71) 4.8 (±1,2) 0.1 (±0,1) 0.6 (±0,2) 5.0 (±1,7) 0.2 (±0,1) 0.2 (±0,1) 32 (±12) 4 (±2) 36 (±12) 13 (±6) 54 (±23) 11 (±4) 11 (±5)C. ehrenbergiana 999 (±342) 25.0 (±5,8) 0.1 (±0,1) 3.8 (±1,3) 48.8 (±15,1) 2.2 (±1,7) 0.8 (±0,3) 177 (±48) 28 (±12) 253 (±104) 115 (±49) 348 (±125) 62 (±23) 83 (±28)P. nigra 1,058 (±458) 24.0 (±4,7) 0.9 (±0,3) 3.5 (±1,4) 23.2 (±9,8) 0.9 (±0,3) 0.9 (±0,4) 112 (±37) 21 (±9) 178 (±76) 75 (±32) 252 (±116) 50 (±17) 54 (±21)Total MF 2,385 (±856) 55.6 (±13,4) 2.1 (±0,6) 8.0 (±3,1) 79.0 (±25,9) 3.3 (±2,2) 2.0 (±0,8) 300 (±102) 100 (±45) 500 (±215) 200 (±82) 700 (±347) 100 (±48) 152 (±58)
elements, respectively), but showed the same descen-ding order of contribution of the following elementsto the total:
N > Ca > K > Mg > P > S >> Na > Fe > Al > Zn > Mn > Cu
P. affinis (Table 5) returned 39.6 kg ha–1 yr–1 in SFand 11.1 kg ha–1 yr–1 in MF of total bioelements; how-ever, there were differences in the amounts of nutrientreturn and in the order of importance of the total return.The descending order of element contribution in SF was:
N > Ca > K > Mg > P > S >> Na > Fe > Al > Mn > Zn > Cu
Whereas the descending order in MF was:
Ca > N > K > Mg > S > P >> Na > Fe > Al > Mn > Zn > Cu
The establishment of the primary forests generateddisplacement of N by Ca concerning the contributionof these two bioelements to the total PRB.
C. ehrenbergiana (Table 5) had maximum contribu-tion in SF and MF (82.6 and 68.6 kg ha–1 yr–1, respec-tively) and the elements followed the same descendingorder of contribution in both forests:
Ca > N > K > Mg > P > S >> Na > Fe > Al > Mn > Zn > Cu
Finally, P. nigra (Table 5) produced 54 kg ha–1 yr–1
in MF, with the bioelement contribution following des-cending order:
N > Ca > K > S > P > Mg >> Na > Fe > Al > Mn > Zn > Cu
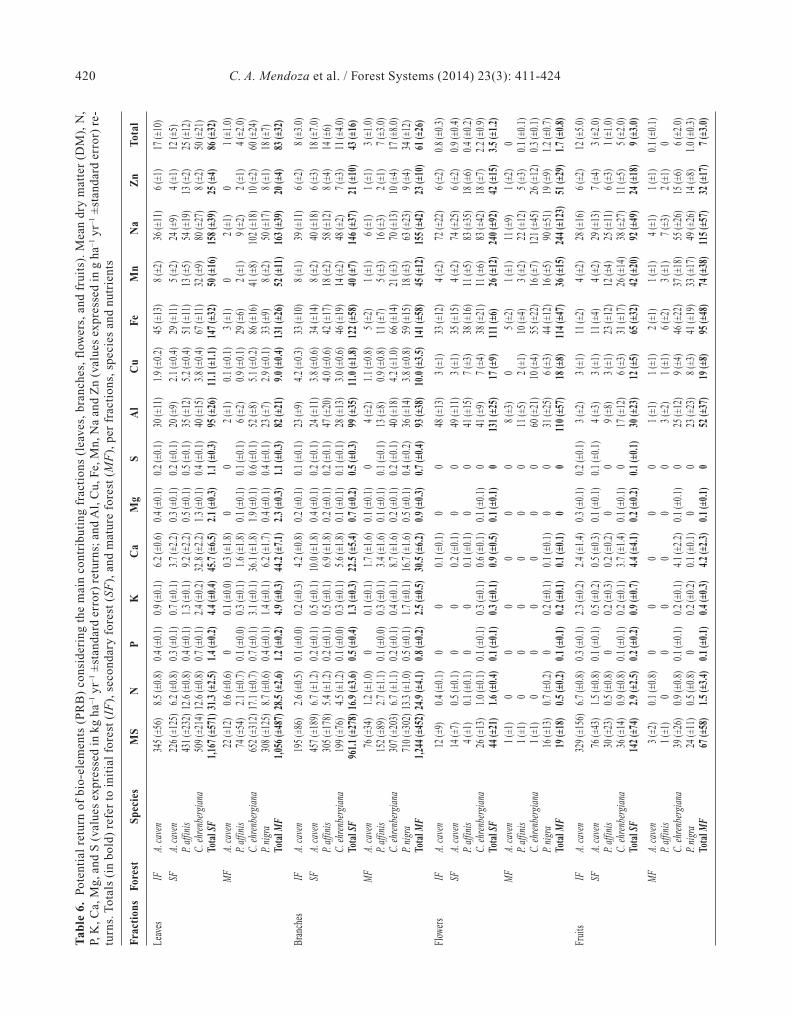
PRB considering litterfall fractions and distributionamong forests
The maximum contribution of the leaf fraction to the PRB was found in SF, with 86.4 kg ha–1 yr–1,whereas maximum PRB contribution of branches wasfound in MF, with only 60.6 kg ha–1 yr–1 (Table 6). PRBcontribution of flowers to the PRB was negligible, ran-ging from 0.8 to 3.5 kg ha–1 yr–1 in IF and SF, respec-tively, MF showing intermediate values. Fruits had amaximum contribution to PRB in IF (with 12.3 kg ha–1
yr–1), followed by SF and MF (with 9.0 and 6.7 kg ha–1
yr–1, respectively).The analysis of PRB values among species showed
that the minimum and maximum N return by leaveswas found in the leaf fraction in MF (0.6 and 17.1 kgN ha–1 yr–1 in A. caven and C. ehrenbergiana, respec-tively); obviously, the dominant factor seems to be pro-duction.
Branches had a minimum return of 1.2 kg N ha–1 yr–1
(A. caven in MF), reaching a maximum of 14.0 kg ha–1
yr–1 (P. nigra also in MF), according to the dominanceof the latter species.
Maximum N in flowers was found for P. nigra, theremaining species having a negligible contribution.
Finally, fruits had a maximum contribution of 6.7kg N ha–1 yr–1 for A. caven in IF.
In general, P return exhibited very low values (ran-ging between 0.7 and 0.1 kg P ha–1 yr–1; Table 6). Ma-ximum contribution of K, Ca, and Mg was providedby the leaf fraction of C. ehrenbergiana (both in SFand MF). K return of the fruit fraction was more thandouble the contribution of the leaf fraction for A. ca-ven in IF; branches contributed proportionally moreCa, whereas Al and Na were important in the flowerfraction.
P. affinis in SF showed an important Al returnthrough the branch and flower fractions, whereas Cu,Na, and Zn were only important in flowers, and Mn inbranches; the remaining elements were proportionalto the DM amount returned. In addition, in MF thisspecies made significant contributions of Al, Cu, Fe,Na, and Zn through flowers (Table 6).
Discussion
Annual forest litterfall contribution by species
The litterfall production in forests of the Mesopo-tamian Espinal studied are below the mean ones re-corded for warm-temperate forests, although higherthan those found in some meso-thermal subtropical fo-rests. Annual forest litterfall was somewhat lower thanthe mean global estimation (5,600 kg DM ha–1 yr–1;Brinson et al., 1980) for warm-temperate forests. How-ever, the three forests studied exceed the value of 300kg DM ha–1 yr–1 indicated by Carnevale and Lewis(2001) for other meso-thermal subtropical forests stu-died in northern Argentina.
In this study, we explored the hypothesis that litter-fall contribution increases as ecological succession pro-gresses. A significantly greater annual production, bothin SF and MF, than in IF was recorded. Maximum pro-duction was expected in MF, but the value found didnot differ significantly from SF, probably because thecanopy cover has become constant, with little variationbetween SF and MF. This fact partly conf irms ourhypothesis, since productivity of ecosystems of the Me-sopotamian Espinal became stable at the SF stage.
Variation in litterfall in a forest successional sequence 419
420 C. A. Mendoza et al. / Forest Systems (2014) 23(3): 411-424T
able
6.
Pote
ntia
l re
turn
of
bio-
elem
ents
(P
RB
) co
nsid
erin
g th
e m
ain
cont
ribu
ting
fra
ctio
ns (
leav
es, b
ranc
hes,
flo
wer
s, a
nd f
ruit
s). M
ean
dry
mat
ter
(DM
), N
,P,
K, C
a, M
g, a
nd S
(va
lues
exp
ress
ed in
kg
ha–1
yr–1
±st
anda
rd e
rror
) re
turn
s; a
nd A
l, C
u, F
e, M
n, N
a an
d Z
n (v
alue
s ex
pres
sed
in g
ha–1
yr–1
±st
anda
rd e
rror
) re
-tu
rns.
Tot
als
(in
bold
) re
fer
to i
niti
al f
ores
t (I
F),
sec
onda
ry f
ores
t (S
F),
and
mat
ure
fore
st (
MF
), p
er f
ract
ions
, spe
cies
and
nut
rien
ts
Frac
tion
sFo
rest
Spec
ies
MS
NP
KC
aM
gS
Al
Cu
FeM
nN
aZ
nTo
tal
Leav
esIF
A. ca
ven
345 (
±56)
8.5 (
±0.8
)0.
4 (±0
.1)
0.9 (
±0.1
)6.
2 (±0
.6)
0.4 (
±0.1
)0.
2 (±0
.1)
30 (±
11)
1.9 (
±0.2
)45
(±13
)8 (
±2)
36 (±
11)
6 (±1
)17
(±10
)SF
A. ca
ven
226 (
±125
)6.
2 (±0
.8)
0.3 (
±0.1
)0.
7 (±0
.1)
3.7 (
±2.2
)0.
3 (±0
.1)
0.2 (
±0.1
)20
(±9)
2.1 (
±0.4
)29
(±11
)5 (
±2)
24 (±
9)4 (
±1)
12 (±
5)P.
affin
is43
1 (±2
32)
12.6
(±0.
8)0.
4 (±0
.1)
1.3 (
±0.1
)9.
2 (±2
.2)
0.5 (
±0.1
)0.
5 (±0
.1)
35 (±
12)
5.2 (
±0.4
)51
(±11
)13
(±5)
54 (±
19)
13 (±
2)25
(±12
)C.
ehre
nber
gian
a50
9 (±2
14)
12.6
(±0.
8)0.
7 (±0
.1)
2.4 (
±0.2
)32
.8 (±
2.2)
1.3 (
±0.1
)0.
4 (±0
.1)
40 (±
15)
3.8 (
±0.4
)67
(±11
)32
(±9)
80 (±
27)
8 (±2
)50
(±21
)To
tal S
F1,
167 (
±571
)31.
3 (±2
.5)
1.4 (
±0.2
)4.
4 (±0
.4)
45.7
(±6.
5)2.
1 (±0
.3)
1.1 (
±0.3
)95
(±26
)11
.1 (±
1.1)
147 (
±32)
50 (±
16)
158 (
±39)
25 (±
4)86
(±32
)M
FA.
cave
n22
(±12
)0.
6 (±0
.6)
00.
1 (±0
.0)
0.3 (
±1.8
)0
02 (
±1)
0.1 (
±0.1
)3 (
±1)
02 (
±1)
01 (
±1.0
)P.
affin
is74
(±54
)2.
1 (±0
.7)
0.1 (
±0.0
)0.
3 (±0
.1)
1.6 (
±1.8
)0.
1 (±0
.1)
0.1 (
±0.1
)6 (
±2)
0.9 (
±0.1
)29
(±6)
2 (±1
)9 (
±2)
2 (±1
)4 (
±2.0
)C.
ehre
nber
gian
a65
2 (±3
12)
17.1
(±0.
7)0.
7 (±0
.1)
3.1 (
±0.1
)36
.1 (±
1.8)
1.9 (
±0.1
)0.
6 (±0
.1)
52 (±
8)5.
1 (±0
.2)
86 (±
16)
41 (±
8)10
2 (±1
8)10
(±2)
60 (±
24)
P. ni
gra
308 (
±125
)8.
7 (±0
.6)
0.4 (
±0.1
)1.
4 (±0
.1)
6.2 (
±1.7
)0.
4 (±0
.1)
0.4 (
±0.1
)23
(±7)
2.9 (
±0.1
)33
(±9)
8 (±2
)50
(±17
)8 (
±1)
18 (±
7)To
tal M
F1,
056 (
±487
)28.
5 (±2
.6)
1.2 (
±0.2
)4.
9 (±0
.3)
44.2
(±7.
1)2.
3 (±0
.3)
1.1 (
±0.3
)82
(±21
)9.
0 (±0
.4)
131 (
±26)
52 (±
11)
163 (
±39)
20 (±
4)83
(±32
)
Bran
ches
IFA.
cave
n19
5 (±8
6)2.
6 (±0
.5)
0.1 (
±0.0
)0.
2 (±0
.3)
4.2 (
±0.8
)0.
2 (±0
.1)
0.1 (
±0.1
)23
(±9)
4.2 (
±0.3
)33
(±10
)8 (
±1)
39 (±
11)
6 (±2
)8 (
±3.0
)SF
A. ca
ven
457 (
±189
)6.
7 (±1
.2)
0.2 (
±0.1
)0.
5 (±0
.1)
10.0
(±1.
8)0.
4 (±0
.1)
0.2 (
±0.1
)24
(±11
)3.
8 (±0
.6)
34 (±
14)
8 (±2
)40
(±18
)6 (
±3)
18 (±
7.0)
P. af
finis
305 (
±178
)5.
4 (±1
.2)
0.2 (
±0.1
)0.
5 (±0
.1)
6.9 (
±1.8
)0.
2 (±0
.1)
0.2 (
±0.1
)47
(±20
)4.
0 (±0
.6)
42 (±
17)
18 (±
2)58
(±12
)8 (
±4)
14 (±
6)C.
ehre
nber
gian
a19
9 (±7
6)4.
5 (±1
.2)
0.1 (
±0.0
)0.
3 (±0
.1)
5.6 (
±1.8
)0.
1 (±0
.1)
0.1 (
±0.1
)28
(±13
)3.
0 (±0
.6)
46 (±
19)
14 (±
2)48
(±2)
7 (±3
)11
(±4.
0)To
tal S
F96
1.1 (
±278
)16.
9 (±3
.6)
0.5 (
±0.4
)1.
3 (±0
.3)
22.5
(±5.
4)0.
7 (±0
.2)
0.5 (
±0.3
)99
(±35
)11
.0 (±
1.8)
122 (
±58)
40 (±
7)14
6 (±3
7)21
(±10
)43
(±16
)M
FA.
cave
n76
(±34
)1.
2 (±1
.0)
00.
1 (±0
.1)
1.7 (
±1.6
)0.
1 (±0
.1)
04 (
±2)
1.1 (
±0.8
)5 (
±2)
1 (±1
)6 (
±1)
1 (±1
)3 (
±1.0
)P.
affin
is15
2 (±8
9)2.
7 (±1
.1)
0.1 (
±0.0
)0.
3 (±0
.1)
3.4 (
±1.6
)0.
1 (±0
.1)
0.1 (
±0.1
)13
(±8)
0.9 (
±0.8
)11
(±7)
5 (±3
)16
(±3)
2 (±1
)7 (
±3.0
)C.
ehre
nber
gian
a30
7 (±2
03)
6.7 (
±1.1
)0.
2 (±0
.1)
0.4 (
±0.1
)8.
7 (±1
.6)
0.2 (
±0.1
)0.
2 (±0
.1)
40 (±
18)
4.2 (
±1.0
)66
(±14
)21
(±3)
70 (±
13)
10 (±
4)17
(±8.
0)P.
nigr
a71
0 (±3
02)
13.3
(±1.
0)0.
5 (±0
.1)
1.7 (
±0.1
)16
.7 (±
1.6)
0.5 (
±0.1
)0.
4 (±0
.2)
36 (±
14)
3.8 (
±0.8
)59
(±15
)18
(±3)
63 (±
23)
9 (±4
)34
(±12
)To
tal M
F1,
244 (
±452
)24.
9 (±4
.1)
0.8 (
±0.2
)2.
5 (±0
.5)
30.5
(±6.
2)0.
9 (±0
.3)
0.7 (
±0.4
)93
(±38
)10
.0 (±
3.5)
141 (
±58)
45 (±
12)
155 (
±42)
23 (±
10)
61 (±
26)
Flow
ers
IFA.
cave
n12
(±9)
0.4 (
±0.1
)0
00.
1 (±0
.1)
00
48 (±
13)
3 (±1
)33
(±12
)4 (
±2)
72 (±
22)
6 (±2
)0.
8 (±0
.3)
SFA.
cave
n14
(±7)
0.5 (
±0.1
)0
00.
2 (±0
.1)
00
49 (±
11)
3 (±1
)35
(±15
)4 (
±2)
74 (±
25)
6 (±2
)0.
9 (±0
.4)
P. af
finis
4 (±1
)0.
1 (±0
.1)
00
0.1 (
±0.1
)0
041
(±15
)7 (
±3)
38 (±
16)
11 (±
5)83
(±35
)18
(±6)
0.4 (
±0.2
)C.
ehre
nber
gian
a26
(±13
)1.
0 (±0
.1)
0.1 (
±0.1
)0.
3 (±0
.1)
0.6 (
±0.1
)0.
1 (±0
.1)
041
(±9)
7 (±4
)38
(±21
)11
(±6)
83 (±
42)
18 (±
7)2.
2 (±0
.9)
Tota
l SF
44 (±
21)
1.6 (
±0.4
)0.
1 (±0
.1)
0.3 (
±0.1
)0.
9 (±0
.5)
0.1 (
±0.1
)0
131 (
±25)
17 (±
9)11
1 (±6
)26
(±12
)24
0 (±9
2)42
(±15
)3.
5 (±1
.2)
MF
A. ca
ven
1 (±1
)0
00
00
08 (
±3)
05 (
±2)
1 (±1
)11
(±9)
1 (±2
)0
P. af
finis
1 (±1
)0
00
00
011
(±5)
2 (±1
)10
(±4)
3 (±2
)22
(±12
)5 (
±3)
0.1 (
±0.1
)C.
ehre
nber
gian
a1 (
±1)
00
00
00
60 (±
21)
10 (±
4)55
(±22
)16
(±7)
121 (
±45)
26 (±
12)
0.3 (
±0.1
)P.
nigr
a16
(±13
)0.
7 (±0
.2)
00.
2 (±0
.1)
0.1 (
±0.1
)0
031
(±25
)6 (
±3)
44 (±
12)
16 (±
5)90
(±51
)19
(±9)
1.2 (
±0.7
)To
tal M
F19
(±18
)0.
5 (±0
.2)
0.1 (
±0.1
)0.
2 (±0
.1)
0.1 (
±0.1
)0
011
0 (±5
7)18
(±8)
114 (
±47)
36 (±
15)
244 (
±123
)51
(±29
)1.
7 (±0
.8)
Frui
tsIF
A. ca
ven
329 (
±156
)6.
7 (±0
.8)
0.3 (
±0.1
)2.
3 (±0
.2)
2.4 (
±1.4
)0.
3 (±0
.1)
0.2 (
±0.1
)3 (
±2)
3 (±1
)11
(±2)
4 (±2
)28
(±16
)6 (
±2)
12 (±
5.0)
SFA.
cave
n76
(±43
)1.
5 (±0
.8)
0.1 (
±0.1
)0.
5 (±0
.2)
0.5 (
±0.3
)0.
1 (±0
.1)
0.1 (
±0.1
)4 (
±3)
3 (±1
)11
(±4)
4 (±2
)29
(±13
)7 (
±4)
3 (±2
.0)
P. af
finis
30 (±
23)
0.5 (
±0.8
)0
0.2 (
±0.3
)0.
2 (±0
.2)
00
9 (±8
)3 (
±1)
23 (±
12)
12 (±
4)25
(±11
)6 (
±3)
1 (±1
.0)
C. eh
renb
ergi
ana
36 (±
14)
0.9 (
±0.8
)0.
1 (±0
.1)
0.2 (
±0.1
)3.
7 (±1
.4)
0.1 (
±0.1
)0
17 (±
12)
6 (±3
)31
(±17
)26
(±14
)38
(±27
)11
(±5)
5 (±2
.0)
Tota
l SF
142 (
±74)
2.9 (
±2.5
)0.
2 (±0
.2)
0.9 (
±0.7
)4.
4 (±4
.1)
0.2 (
±0.2
)0.
1 (±0
.1)
30 (±
23)
12 (±
5)65
(±32
)42
(±20
)92
(±49
)24
(±18
)9 (
±3.0
)
MF
A. ca
ven
3 (±2
)0.
1 (±0
.8)
00
00
01 (
±1)
1 (±1
)2 (
±1)
1 (±1
)4 (
±1)
1 (±1
)0.
1 (±0
.1)
P. af
finis
1 (±1
)0
00
00
03 (
±2)
1 (±1
)6 (
±2)
3 (±1
)7 (
±3)
2 (±1
)0
C. eh
renb
ergi
ana
39 (±
26)
0.9 (
±0.8
)0.
1 (±0
.1)
0.2 (
±0.1
)4.
1 (±2
.2)
0.1 (
±0.1
)0
25 (±
12)
9 (±4
)46
(±22
)37
(±18
)55
(±26
)15
(±6)
6 (±2
.0)
P. ni
gra
24 (±
11)
0.5 (
±0.8
)0
0.2 (
±0.2
)0.
1 (±0
.1)
00
23 (±
23)
8 (±3
)41
(±19
)33
(±17
)49
(±26
)14
(±8)
1.0 (
±0.3
)To
tal M
F67
(±58
)1.
5 (±3
.4)
0.1 (
±0.1
)0.
4 (±0
.3)
4.2 (
±2.3
)0.
1 (±0
.1)
052
(±37
)19
(±8)
95 (±
48)
74 (±
38)
115 (
±57)
32 (±
17)
7 (±3
.0)
The three forests studied differed signif icantly interms of the contribution of leaf and branch fractions(the fractions of interest when characterizing forestsin a succession); therefore, the L/B ratio has beenused as an index of maturity in forests (Martín et al.,1993). The variation of L/B values is probably rela-ted to the dominance or development degree of eachspecies in each forest. While leaf contribution oftenlargely exceeds branch contribution in some tempe-rate forest ecosystems (Gallardo et al., 1989; Drakeet al., 2010), we found the opposite trend in the L/Bratio in the forests studied here in relation to the fo-rest successional stage (mean values of 1.8, 1.5, and0.8 for IF, SF, and MF, respectively, in the Mesopo-tamian Espinal). These results may be due to the factthat the species studied are xerophilous (with a lowL/B ratio), with slow growth and higher wood reten-tion in the plant.
In MF, A. caven was the species with higher bran-ches contribution, with an L/B ratio of 0.3; however,values of 0.5 were recorded in SF and 1.8 in IF. A. ca-ven is a colonizer species that may vary its proportionof branch production depending on the growing con-ditions and successional status. The species exhibitedlimited litterfall production and growth in MF due tothe dominance of P. nigra and C. ehrenbergiana, whichmight be associated with a low photosynthetic biomassand high proportion of senescent branches. By con-trast, in IF (colonized by A. caven) it had the lowestbranch contribution (17%), mostly due to the lack ofwoody competitors (and probably higher availabilityof nutrients), which was then translated into activegrowth with greater photosynthetic biomass and lowerproportion of senescent branches.
Likewise, P. affinis (which was dominant in SF) hadan L/B ratio of 1.4 and 0.5 in SF and MF, respectively(Table 4); this was related to the maturity of the trees,where the ratio L/B tended to decrease in the forestswith the most mature trees.
Maximum L/B values were detected in C. ehrenber-giana (2.6 in SF and 2.1 in MF, Table 4), especially in SF, indicating a more favorable competition with P. affinis than with P. nigra in MF.
The maximum contribution of fruits was recordedfor A. caven in IF, (representing 29, 8, and 2 % in IF,SF and MF, respectively) might be explained by thecapability to maximize fruit productivity to ensure areproductive success and colonization of this spe-cies under adverse conditions (Duran & Kattan, 2005; Harvey et al., 2007).
Annual contribution by the fraction named‘other’
The contribution of this fraction is difficult of esta-blish, by the majority of it could be associated with thepresence/absence of shrub species, mainly of the ge-nus Baccharis; a relatively high contribution of the“others” fraction (approximately 20 % of total produc-tion) can be expected in mixed forests (Aceñolaza etal., 2009), whose shrub layer has many species of theAsteraceae family.
The maximum contribution of the “others” fractioncorresponded to A. caven in SF, P. affinis in SF, andC. ehrenbergiana in MF; whereas the minimum wasrecorded for both A. caven and P. affinis in MF (Ta-ble 4). Those results might be attributed to the effectof competition for light and nutrients among speciesof shrub and those appearing in the different vegeta-tion layers (as in MF); this fact suggests a higher vul-nerability to invasion by A. caven in SF, which has inMF lower cover than P. nigra.
Seasonal pattern of litter production
Regarding the relationship between seasonal litter-fall production pattern and environmental variables,Aceñolaza et al. (2009) observed significant correla-tions between litterfall production and water level va-riation of the Paraná River in forests of its alluvial plainbasin (eastern Argentina). Nevertheless, climatic va-riables, considered as conditioning factors (such asprecipitation, wind, or temperature), did not influen-ce significantly the seasonal pattern of litterfall in ourstudy during the studied years.
The analysis of total contribution of species and forests per season allowed us to describe well definedpatterns. A peak of contribution was observed in sum-mer, which was significantly different from that of theremaining seasons (p < 0.05) for A. caven in IF and MF,and for P. affinis in MF (Table 3). This finding is in agre-ement with similar studies conducted in Mediterraneanforests, where summer droughts can accelerate leaf abs-cission, conditioning the annual pattern of leaf produc-tion of deciduous oak (Quercus pyrenaica) forests. Asimilar situation was also observed for oak (Q. rotundifolia) forests (Santa Regina et al., 1997; Piaoet al., 2006). The peak of production found in A. cavenin IF in summer could indicate that this species was af-fected by seasonal water deficit. Maximum contribu-
Variation in litterfall in a forest successional sequence 421
tion in summer is associated greater evapotranspiration,increasing water stress; this result is in agreement withresults reported by Santa Regina et al. (1997).
In agreement with Jeffrey et al. (2007), we obser-ved that litter contribution is a result of complemen-tary addition between P. nigra and C. ehrenbergianain MF, and between A. caven and C. ehrenbergiana inSF. Overall, individual production of species is res-ponsible for a constant contribution of organic resi-dues throughout the annual cycle in SF and MF, although some significant differences among seasonswere found.
These results show that maximum contribution inintermediate and advanced successional stages couldbe associated to the summer water deficit and speciesphenology characteristics (Mendoza et al., 2012).
PRB in the forest succession
As the chrono-sequence progressed, Ca replaced Nin order of importance, due to the decrease of the leguminous species in the colonizing process after the IF stage, and the contribution to return of Ca by C. erhenbergiana in both SF and MF; then, the influen-ce of the amount produced is much more importantthat the leaf concentration. The decline of Zn in SF andMF is noticeable, which is displaced by Mn, possiblybecause of presence of soil Ca (Table 1) and the limi-tation for plant absorption of Zn (Vogel et al., 2012)in IF. Another interesting process is the displacementof P by S in the MF; this fact indicates the importan-ce of P availability in the first stages of the forest es-tablishment.
PRB per species
In all three forests, A. caven showed the same orderof importance of the elements found in the litterfall(Table 5).
According the order indicated for PRB in forests, Nis the element of greatest potential return and showsthe importance of the N-fixing capacity of the speciesof the family Fabaceae (Vogel et al., 2012).
The same order of importance of the bio-elementswas observed for P. affinis in SF (Table 5), except thatN was displaced by Ca, and P by S (under similar soilconditions; Table 1). As indicated above, this changein order could be associated with limitations imposed
by dominant species, which conditions N biologicalfixation and P uptake.
C. ehrenbergiana in both SF and MF showed maxi-mum contribution of Ca (Table 5), which might be attributed to the presence of Ca carbonate phytoliths(Fernández et al., 2005) in leaves; therefore, leaf accumulation of cations means higher return.
P. nigra (Table 5) contributed with a maximum va-lue of N in MF, which was consistent with its biologi-cal fixing capacity. Another important factor observed(Table 5) was the high potential return of S and P (dis-placing Mg), whereas the remaining elements showedthe same order of importance described for A. caven.The higher potential returns of S and P might be attri-buted to a strong absorption of these elements and thelimitations for the other species (Vogel et al., 2012),as observed in P. affinis in MF.
PRB considering the litterfall fractions
PRB values found considering the litterfall fractionsshowed that the leaf fraction was not important for allthe species. As observed, leaf fractions have highercontributions on PRB of litterfall in some species thanin others (Table 6).
Hence, here L/B ratio could also considered an indexbecause it is related to the PRB values. The greatest leaf/total production ratio values were 0.55 and 0.52 inC. ehrenbergiana (SF and MF, respectively), which isconsistent with production of a deciduous species. Bycontrast, A. caven (a semi-deciduous species) showedlimited growth and development in MF, but only con-tributed with 15 % of leaves (Aceñolaza et al., 2010).
The highest PRB values pertaining to the leaf frac-tion of C. ehrenbergiana in SF; also a high value forbranches was found in P. nigra in MF (Table 6). Thisshows complementarity not only in the temporal con-tribution pattern between those species, but also in thetypes of fractions and could be used as a strategy forbio-element return (Patrício et al., 2012). As minera-lization in leaves is more rapid than in branches, bio-elements in leaf fraction of C. ehrenbergiana can beeasily released, unlike those included in the branchfraction of P. nigra (that are released at a lower rate),with consequences in the nutrition of both species.
Based on our data and analyses, we conclude that:— The productivity of the ecosystems of the Me-
sopotamian Espinal is rather low and becomes stablewhen the SF successional stage is established.
422 C. A. Mendoza et al. / Forest Systems (2014) 23(3): 411-424
— Seasonal evolution of litterfall production in theforest successional sequence is determined by the pro-duction rate of the dominant species, decreasing in IF,in general, after summer, and showing a constant pat-tern in SF, and some sporadic significant differencesin MF.
— The L/B ratio in forests seems to be a good in-dicator of the successional stage of semi-deciduous fo-rests of the Mesopotamian Espinal; i. e., the lower theL/B ratio, the higher the forest maturity.
— The contribution of flowers represents a verylow percentage of the total annual litterfall production(below 3 %).
— The highest litterfall production by fruit is associated with a colonization strategy (as observedfor A. caven in IF).
— Total PRB was proportional to litterfall produc-tion in the successional sequence studied, with maxi-mum N values found when leguminous species are do-minant; meanwhile C. ehrenbergiana shows thehighest contributions of Ca.
Acknowledgements
This work was partially funded by the PIDA-UA-DER-2009 and the PIP-CONICET grant belonging tothe third author. This paper was possible thanks to theErasmus Mundus Program, the Agreement between theUniversity of Valladolid (Spain) and the UADER, andthe six-month internship of the f irst author at the IRNASa/C.S.I.C., Salamanca (Spain).
References
Aceñolaza FG, 2007. Geología y recursos geológicos de laMesopotamia Argentina. Serie de Correlación Geológica22. 160 pp.
Aceñolaza PG, 2000. Variabilidad estructural de una comu-nidad forestal sobre suelos vérticos de la provincia de En-tre Ríos. Rev Fac Agron 20: 123-130.
Aceñolaza PG, Zamboni LP, Gallardo JF, 2006. Ciclos bio-geoquímicos de bosques de la llanura de inundación delrío Paraná (Argentina): aporte de hojarasca. In: Medioam-biente en Iberoamérica. Visión desde la física y la quími-ca en los albores del siglo XXI (Gallardo Lancho JF, ed).Badajoz (España). Sociedad Iberoamericana de Física yQuímica Ambiental 2: 529-536.
Aceñolaza PG, Zamboni LP, Gallardo JF, 2009. Aporte dehojarasca en bosques del predelta del río Paraná (Argen-tina). Bosque 30: 135-145.
Aceñolaza PG, Zamboni LP, Rodríguez EE, Gallardo JF,2010. Litterfall production in forests located at the Pre-delta area of the Paraná River (Argentina). Ann For Sci67: 311-320.
Arturi M, 2006. Situación ambiental en la ecorregión Espi-nal. In: La situación ambiental argentina 2005 (Brown A,Martínez Ortiz U, Acerbi M, Corcuera J, eds). Funda-ción Vida Silvestre Argentina, Buenos Aires. pp: 241-246.
Bartlett MS, 1937. Properties of suff iciency and statisti-cal tests. Proc Royal Soc London, Series A 16 (901): 268-282.
Bray JR, Gorham E, 1964. Litter production in forest of theworld. Advances Ecol Res 2: 101-157.
Brinson MM, Bradshaw HD, Holmes R and Elkins J, 1980.Litterfall, stemflow, and throughfall nutrient fluxes in analluvial swamp forest. Ecology 61: 827-835.
Burkart R, Bárbaro N, Sánchez O, Gómez D, 1999. Eco-regiones de la argentina. Administración de Parques Na-cionales. PRODIA, Buenos Aires. 43 pp.
Cabrera AL, 1994. Regiones Fitogeográficas Argentinas.Enciclopedia Argentina de Agricultura y Jardinería (1).Ed ACME, Buenos Aires. 85 pp.
Carnevale N, Lewis JP, 2001. Litterfall and organic matterdecomposition in a seasonal forest of the eastern Chaco(Argentina). Rev Biol Trop 49: 203-212.
Chapman HD, Prat PF, 1979. Métodos de análisis para sue-los, plantas y aguas. Ed Trillas. México. 195 pp.
De Petre A, Stephan S, 1998. Características pedológicas yagronómicas de los Vertisoles de Entre Ríos. Argentina.Facultad de Ciencias Agropecuarias Universidad Nacio-nal de Entre Ríos (Argentina). 65 pp.
Drake JE, Raetz LM, Davis SC, DeLucia EH, 2010. Hydrau-lic limitation not declining nitrogen availability causesthe age-related photosynthetic decline in loblolly pine (Pi-nus taeda L.). Plant, Cell and Environ 33(10): 1756-1766.
Duran SM, Kattan GH, 2005. A test of the utility of exo-tic tree plantations for understory birds and food resour-ces in the Colombian Andes. Biotropica 37: 129-135.
Fernández Honaine M, Zucol AF, Osterriedth M, 2005. Bio-mineralizaciones de sílice en Celtis tala (Celtidaceae).Boletín SAB 40(3-4): 229-239.
Gallardo JF, Santa Regina I, San Miguel C, 1989. Ciclos bio-geoquímicos en bosques de la Sierra de Bejar (Salaman-ca, España). 1. Producción de hojarasca. Rev Ecol BiolSol 26: 35-46.
Gauch HG, 1982. Multivariate analysis in community eco-logy. Cambridge Univ Press, Londres. 298 pp.
Haase R, 1999. Litterfall and nutrient return in seasonallyflooded and non-flooded forest of the Pantanal, MatoGrosso, Brazil. For Ecol and Manage 117: 129-147.
Harvey CA, González J, Villalobos M, 2007. Agrofores-try systems conserve species-rich but modified assem-blages of tropical birds and bats. Biodivers Conserv 16:2257-2292.
INTA, 1990. Carta de Suelos de la República Argentina, De-partamento La Paz (Entre Ríos). INTA, Subsecretaría de Asuntos Agrarios de Entre Ríos, Paraná (Argentina). 150 pp.
Variation in litterfall in a forest successional sequence 423
INTA, 2000. Carta de suelos de la República Argentina. PlanMapa de Suelos de la Provincia de Entre Ríos, Departa-mento Villaguay. Subsecretaría de Asuntos Agrarios deEntre Ríos, Paraná (Argentina). 130 pp.
Jeffrey A, Jennifer J, Jenkins C, Dennis S, Ducey O, 2007.Spatial patterns of forest characteristics in the westernUnited States derived from inventories. Ecol Appl 17:2387-2402.
Lewis JP, Prado DE, Barberis IM, 2006. Los remanentes debosques del Espinal en la provincia de Córdoba. In: Si-tuación ambiental argentina 2005 (Brown AD, CorcueraJ, ed). Ed Fundación Vida Silvestre Argentina, Buenos Aires. pp: 254-260.
Maldonado FD, Sione W, Aceñolaza PG, 2012. Mapeo dedesmontes en áreas de bosque nativo de la Provincia deEntre Rios. Ambiência 8 NS: 523-532.
Martín A, Santa Regina I, Gallardo JF, 1993. Ciclos bioge-oquímicos en un bosque perenne de encina (Quercus ro-tundifolia) en las proximidades de Salamanca (España):retorno potencial. In: Biogeoquímica de ecosistemas (Gallardo JF, ed). Junta de Castilla y León, Valladolid,Spain. pp: 151-160.
Martín A, Gallardo JF, Santa Regina I, 1996. Abovegroundlitter production and bioelement potential return in anevergreen oak (Quercus rotundifolia) woodland near Sa-lamanca (Spain). Ann Sc For 53: 811-818.
McCulloch CE, Searle SR, 2001. Genearalized, linear andmixed models, 4.ª ed. Wiley-Interscience, Nueva York.382 pp.
Mendoza C, Gallardo JF, Aceñolaza PG, Turrión MB, Pando V, 2012. Producción de hojarasca de bosques per-tenecientes a una secuencia sucesional del Espinal Me-sopotámico (R. Argentina). In: Aguas, suelos y vegeta-
ción en cuencas iberoamericanas (Gallardo JF, coord).SiFyQA, Salamanca. pp: 177-196.
Muñoz J de D, Milera S, Romero C, Brizuela A, 2005. Bos-ques nativos y selvas ribereñas en la provincia de EntreRíos. In: Temas de la biodiversidad del litoral fluvial ar-gentino. INSUGEO, Ser Miscelánea 14: 169-182.
Patrício M do S, Nunes L, Pereira E, 2012. Litterfall and litter decomposition in chestnut high forest stands in northern Portugal. Forest Systems 21(2): 259-271.
Piao S, Fang J, Zhou L, Ciais P, Zhu B, 2006. Variations insatellite derived phenology in China’s temperate vegeta-tion. Global Change Biol, 12: 672-685.
Ramírez JA, Zapata CM, León JD, González MI, 2007. Caída de hojarasca y retorno de nutrientes en bosquesmontanos andinos de Piedras Blancas, Antioquia, Colom-bia. Interciencia 32: 303-311.
Santa Regina I, Gallardo JF, Rico M, Martín A, GallegoHA, Moreno G, Cuadrado S, 1991. Datos preliminaressobre biomasa aérea, producción y características eda-foclimáticas de ecosistemas forestales de Quercus pyrenaica (Sierra de Gata, Salamanca, Spain). Stvdia Oecol 8: 147-158.
Santa Regina I, Rapp M, Martín A, Gallardo JF, 1997. Nu-trient release dynamics in decomposing leaf to litter intwo Mediterranean deciduous oak species. Ann For Sci54: 747-760.
Vogel HLM, Schumacher MV, Trüby P, 2012. Leaves depo-sition and nutrients of tree species in a native forest insouthern Brazil. Floresta 42: 129-136
Zamboni P, Aceñolaza PG, 2004. Aporte al conocimiento deciclos de materia orgánica en formaciones boscosas de lallanura de inundación del río Paraná. INSUGEO, SerieMisc 12: 5-12.
424 C. A. Mendoza et al. / Forest Systems (2014) 23(3): 411-424
Copyright © 2022 FDOKUMEN