Spatiotemporal variation in phyllostomid bat assemblages over a successional gradient in a tropical...
11
Journal of Tropical Ecology http://journals.cambridge.org/TRO Additional services for Journal of Tropical Ecology: Email alerts: Click here Subscriptions: Click here Commercial reprints: Click here Terms of use : Click here Spatiotemporal variation in phyllostomid bat assemblages over a successional gradient in a tropical dry forest in southeastern Brazil Luiz Alberto Dolabela Falcão, Mário Marcos do Espírito-Santo, Lemuel Olívio Leite, Raphael Neiva Souza Lima Garro, Luis Daniel Avila-Cabadilla and Kathryn Elizabeth Stoner Journal of Tropical Ecology / Volume 30 / Issue 02 / March 2014, pp 123 - 132 DOI: 10.1017/S0266467413000862, Published online: 02 January 2014 Link to this article: http://journals.cambridge.org/abstract_S0266467413000862 How to cite this article: Luiz Alberto Dolabela Falcão, Mário Marcos do Espírito-Santo, Lemuel Olívio Leite, Raphael Neiva Souza Lima Garro, Luis Daniel Avila-Cabadilla and Kathryn Elizabeth Stoner (2014). Spatiotemporal variation in phyllostomid bat assemblages over a successional gradient in a tropical dry forest in southeastern Brazil . Journal of Tropical Ecology, 30, pp 123-132 doi:10.1017/S0266467413000862 Request Permissions : Click here Downloaded from http://journals.cambridge.org/TRO, IP address: 186.206.185.148 on 09 Feb 2014
Transcript of Spatiotemporal variation in phyllostomid bat assemblages over a successional gradient in a tropical...

Journal of Tropical Ecologyhttp://journals.cambridge.org/TRO
Additional services for Journal of Tropical Ecology:
Email alerts: Click hereSubscriptions: Click hereCommercial reprints: Click hereTerms of use : Click here
Spatiotemporal variation in phyllostomid bat assemblages over asuccessional gradient in a tropical dry forest in southeastern Brazil
Luiz Alberto Dolabela Falcão, Mário Marcos do Espírito-Santo, Lemuel Olívio Leite, Raphael Neiva Souza Lima Garro, LuisDaniel Avila-Cabadilla and Kathryn Elizabeth Stoner
Journal of Tropical Ecology / Volume 30 / Issue 02 / March 2014, pp 123 - 132DOI: 10.1017/S0266467413000862, Published online: 02 January 2014
Link to this article: http://journals.cambridge.org/abstract_S0266467413000862
How to cite this article:Luiz Alberto Dolabela Falcão, Mário Marcos do Espírito-Santo, Lemuel Olívio Leite, Raphael Neiva Souza Lima Garro, LuisDaniel Avila-Cabadilla and Kathryn Elizabeth Stoner (2014). Spatiotemporal variation in phyllostomid bat assemblages overa successional gradient in a tropical dry forest in southeastern Brazil . Journal of Tropical Ecology, 30, pp 123-132doi:10.1017/S0266467413000862
Request Permissions : Click here
Downloaded from http://journals.cambridge.org/TRO, IP address: 186.206.185.148 on 09 Feb 2014

Journal of Tropical Ecology (2014) 30:123–132. © Cambridge University Press 2014doi:10.1017/S0266467413000862
Spatiotemporal variation in phyllostomid bat assemblages over asuccessional gradient in a tropical dry forest in southeastern Brazil
Luiz Alberto Dolabela Falcao∗,1, Mario Marcos do Espırito-Santo∗, Lemuel Olıvio Leite∗,Raphael Neiva Souza Lima Garro∗, Luis Daniel Avila-Cabadilla†,‡ and Kathryn Elizabeth Stoner§
∗ Departamento de Biologia Geral, Centro de Ciencias Biologicas e da Saude, Universidade Estadual de Montes Claros, Montes Claros-MG, Brazil, CP 126, CEP39401-089† Centro de Investigaciones en Ecosistemas, Universidad Nacional Autonoma de Mexico, Apartado Postal 27-3 (Xangari), Morelia, Michoacan 58089, Mexico‡ Escuela Nacional de Estudios Superiores Unidad Morelia, Universidad Nacional Autonoma de Mexico, Morelia, Michoacan, Mexico§ Department of Biological and Health Sciences, Texas A&M University-Kingsville, 700 University Blvd., MSC 158, Kingsville, TX 78363–8202
(Received 20 September 2012; revised 28 November 2013; accepted 29 November 2013; first published online 2 January 2014)
Abstract: The aim of this study was to investigate the spatiotemporal variation in richness, abundance, structure andcomposition of phyllostomid bats over a successional gradient in a tropical dry forest in south-eastern Brazil. Foursuccessional stages (pasture, early, intermediate and late) were sampled in the northern part of the state of MinasGerais. Bats were sampled using mist nets at three sites for each of the four successional stages (12 sites in total) duringeight periods between 2007 and 2009. A total of 537 individuals were captured (29 recaptured), distributed amongfour families and 22 species. Bat abundance and richness varied in space, being higher in the late-successional stage,and over time, being significantly lower during the dry season. When compared between guilds, only the abundanceof omnivores varied significantly during the sampled months. Our results demonstrate that areas of late-successionalstages showed higher bat richness and abundance in comparison with areas undergoing secondary succession. Ourresults also suggest the use of early-successional areas as flying routes by bats can lead to failure to detect differences inbat composition within successional gradients. We suggest future studies should assimilate landscape-level analysesinto their studies to better evaluate the effects of successional gradients on bat assemblages.
Key Words: Chiroptera, Phyllostomidae, secondary succession, secondary forests, trophic guilds
INTRODUCTION
Phyllostomidae are the most diverse bat family in theNeotropics (Gardner 2007), showing high diversity bothin terms of species richness and in ecological functions.These animals play crucial roles in maintaining ecosystemservices such as seed dispersal, plant pollination andcontrol of invertebrate populations. In addition, thisfamily can be used as a good bioindicator of theimpacts of habitat fragmentation and disturbance onanimal communities (Fenton et al. 1992; but see Cunto& Bernard 2012). Nevertheless, studies documentingvariation in bat communities and habitat structure duringthe successional process are rare, especially in tropical dryforests (TDFs sensu Sanchez-Azofeifa et al. 2005) (Castro-Luna et al. 2007, Mancina et al. 2007, Medellın et al. 2000;
1 Corresponding author. Email: [email protected]
but see Avila-Cabadilla et al. 2009). Changes in plantspecies composition and forest structure affect bats’ foodsupply and their movement capacity and thus have directimpacts on the maintenance of their ecological functionsin forest regeneration (Meyer & Kalko 2008).
There are only a few studies of bat assemblages inNeotropical TDFs (but see Avila-Cabadilla et al. 2009,Stoner 2005). Indeed, most of our knowledge about theseorganisms in the tropics comes from wet forests and likelyhas limited application to TDFs due to their particularcharacteristics. The marked seasonality of TDFs stronglyinfluences patterns of plant reproduction (Bullock 1995,Pezzini et al. 2008), thus limiting the availability offlowers and fruits to several animal groups, includingbats. Furthermore, the synchronous production of leaves,limited to about 6 mo y−1 (Murphy & Lugo 1986,Pezzini et al. 2008), has an indirect influence on thechiropterofauna because it affects the abundance ofinsects available as a food source for many insectivorous

124 LUIZ ALBERTO DOLABELA FALCAO ET AL.
bats. For instance, in a study conducted in two dry forestsin Costa Rica and Mexico, Stoner (2005) found significantdifferences in the species diversity of frugivorous andnectarivorous bats during different periods of the yearand suggested that this variation was due to fluctuationsin resource availability.
The aim of this study was to investigate thespatiotemporal variation in phyllostomid bat richness andabundance, and in the composition and structure of theirtrophic guilds, over a successional gradient in a TDF insouth-eastern Brazil. Specifically, we tested the followinghypotheses: (1) Abundance and richness of bats increasesover a successional gradient due to greater structuralcomplexity of the habitat. We predict that the proportionof frugivorous and insectivorous bats will be higher thanother guilds in late-successional stages due to the greaterstructural complexity found in areas in advanced stagesof TDF succession. (2) Abundance and richness of bats ishigher during the wet season than during the dry seasondue to greater resource availability. We predict thatfrugivorous bats will be more abundant in wet months dueto the higher availability of fleshy fruits in these months.
METHODS
Study area
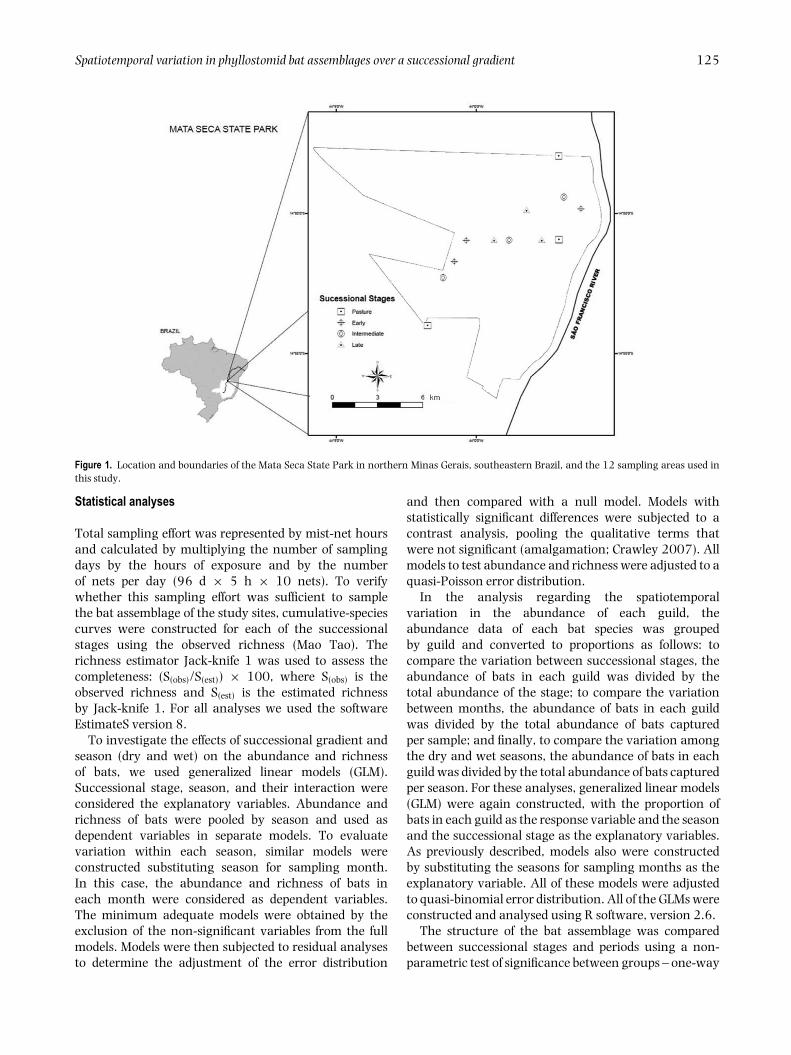
The study was conducted in and around the Mata SecaState Park (MSSP), a conservation area with restricteduse (equivalent to IUCN categories Ia and Ib), with anarea of 15 466 ha, located in the northern part of thestate of Minas Gerais, south-eastern Brazil (Figure 1).According to Koppen’s classification (Peel et al. 2007),the predominant climate of the region is Aw (tropicalsavannah), characterized by a pronounced dry seasonfrom April to September, and a rainy season from Octoberto March. In this climate type, there is at least onemonth with precipitation below 60 mm, and the meantemperature of the coldest month is above 18 ºC. In thestudy area, the mean annual temperature is 24 ºC, and themean annual precipitation is 871 mm (Antunes 1994).During this study, deviations from historical monthlymean temperature were observed for some months, andthe monthly precipitation ranged from 0 to 262 mm.
The typical vegetation of the park is seasonally drydeciduous forest on flat and nutrient-rich soils (IEF 2000).These areas are dominated by trees that lose up to 90–95%of their leaves during the dry season (Pezzini et al. 2008).The MSSP has a land-use history of extensive livestockgrazing from free-ranging cattle and horses, combinedwith plantations of corn, beans and tomatoes in two cent-ral plots of 80 ha each, as well as the selective extractionof timber (Madeira et al. 2009). Approximately 15% of thetotal area of the park is composed of abandoned pastures
in the early stages of succession, with the rest composedof either mature or secondary forests (IEF 2000).
For this study, four successional stages were selecteddetermined by time of abandonment after deforestation(Madeira et al. 2009): (1) pasture areas were characterizedby the presence of several species of grass used forlivestock (0–1 y since abandonment); (2) early stageswere comprised of herbaceous or shrub plants as themain component and contained sparse patches of tallerwoody vegetation forming a discontinuous canopy witha maximum height of 4–6 m (7–9 y since abandonment);(3) intermediate stages were characterized by thepresence of two vertical strata: the first composed offast-growing deciduous trees with a height of 10–20m forming a closed canopy, and the second stratumcomposed of a high diversity of lianas and adult treesbelonging to shade-tolerant species and juvenile trees(15–25 y since abandonment); and (4) late-successionalstages comprised three vertical strata: the first with treesof 15–30 m in height forming a closed canopy, the secondwith the presence of juvenile trees of different species andsizes, and the third stratum composed of understorey herband shrub species (>50 y since abandonment; Madeiraet al. 2009). In each stage, three different areas wereselected for sampling for a total of 12 sites in the MSSPand surrounding areas (Figure 1).
Animal capture
The study included eight samplings performed within2 y; four during the rainy season (R; February, April,December of 2008, March of 2009) and four during thedry season (D; May, September of 2007 and August,October of 2008). Sampling was always performed onnights with a new or crescent moon to minimize the effectsof lunar phobia (Morrison 1978). We captured bats usingten 12 × 2.5-m mist-nets per night in the selected areaand arranged along potential flight routes. The nets wereopened at dusk, remained open for 5 h and were monitoredevery 30 min. In every sampling period, each of the 12areas was sampled for one night.
The captured animals were processed recording thesex, age class, reproductive stage and forearm length,and were identified in the field using dichotomous keysand taxonomic descriptions (Gregorin & Taddei 2002,Medellın et al. 1997, Reis et al. 2007, Timm & LaVal 1998).Afterwards, bats were marked with an individuallynumbered forearm metallic ring and released at the siteof capture. Each individual was assigned to one of the fol-lowing guilds: frugivorous, insectivorous, nectarivorous,omnivorous, haematophagous and carnivorous, based ontheir principal diet item described in Brazil (Reis et al.2007). We used the classification of Gardner (2007) forbat families, subfamilies and genera.
Spatiotemporal variation in phyllostomid bat assemblages over a successional gradient 125
Figure 1. Location and boundaries of the Mata Seca State Park in northern Minas Gerais, southeastern Brazil, and the 12 sampling areas used inthis study.
Statistical analyses
Total sampling effort was represented by mist-net hoursand calculated by multiplying the number of samplingdays by the hours of exposure and by the numberof nets per day (96 d × 5 h × 10 nets). To verifywhether this sampling effort was sufficient to samplethe bat assemblage of the study sites, cumulative-speciescurves were constructed for each of the successionalstages using the observed richness (Mao Tao). Therichness estimator Jack-knife 1 was used to assess thecompleteness: (S(obs)/S(est)) × 100, where S(obs) is theobserved richness and S(est) is the estimated richnessby Jack-knife 1. For all analyses we used the softwareEstimateS version 8.
To investigate the effects of successional gradient andseason (dry and wet) on the abundance and richnessof bats, we used generalized linear models (GLM).Successional stage, season, and their interaction wereconsidered the explanatory variables. Abundance andrichness of bats were pooled by season and used asdependent variables in separate models. To evaluatevariation within each season, similar models wereconstructed substituting season for sampling month.In this case, the abundance and richness of bats ineach month were considered as dependent variables.The minimum adequate models were obtained by theexclusion of the non-significant variables from the fullmodels. Models were then subjected to residual analysesto determine the adjustment of the error distribution
and then compared with a null model. Models withstatistically significant differences were subjected to acontrast analysis, pooling the qualitative terms thatwere not significant (amalgamation; Crawley 2007). Allmodels to test abundance and richness were adjusted to aquasi-Poisson error distribution.
In the analysis regarding the spatiotemporalvariation in the abundance of each guild, theabundance data of each bat species was groupedby guild and converted to proportions as follows: tocompare the variation between successional stages, theabundance of bats in each guild was divided by thetotal abundance of the stage; to compare the variationbetween months, the abundance of bats in each guildwas divided by the total abundance of bats capturedper sample; and finally, to compare the variation amongthe dry and wet seasons, the abundance of bats in eachguild was divided by the total abundance of bats capturedper season. For these analyses, generalized linear models(GLM) were again constructed, with the proportion ofbats in each guild as the response variable and the seasonand the successional stage as the explanatory variables.As previously described, models also were constructedby substituting the seasons for sampling months as theexplanatory variable. All of these models were adjustedto quasi-binomial error distribution. All of the GLMs wereconstructed and analysed using R software, version 2.6.
The structure of the bat assemblage was comparedbetween successional stages and periods using a non-parametric test of significance between groups – one-way
126 LUIZ ALBERTO DOLABELA FALCAO ET AL.
Samples
0 5 10 15 20 25
Obs
erve
d ric
hnes
s (M
ao T
ao)
0
5
10
15
20
25
Mata Seca State Park Late Intermediate Early Pasture
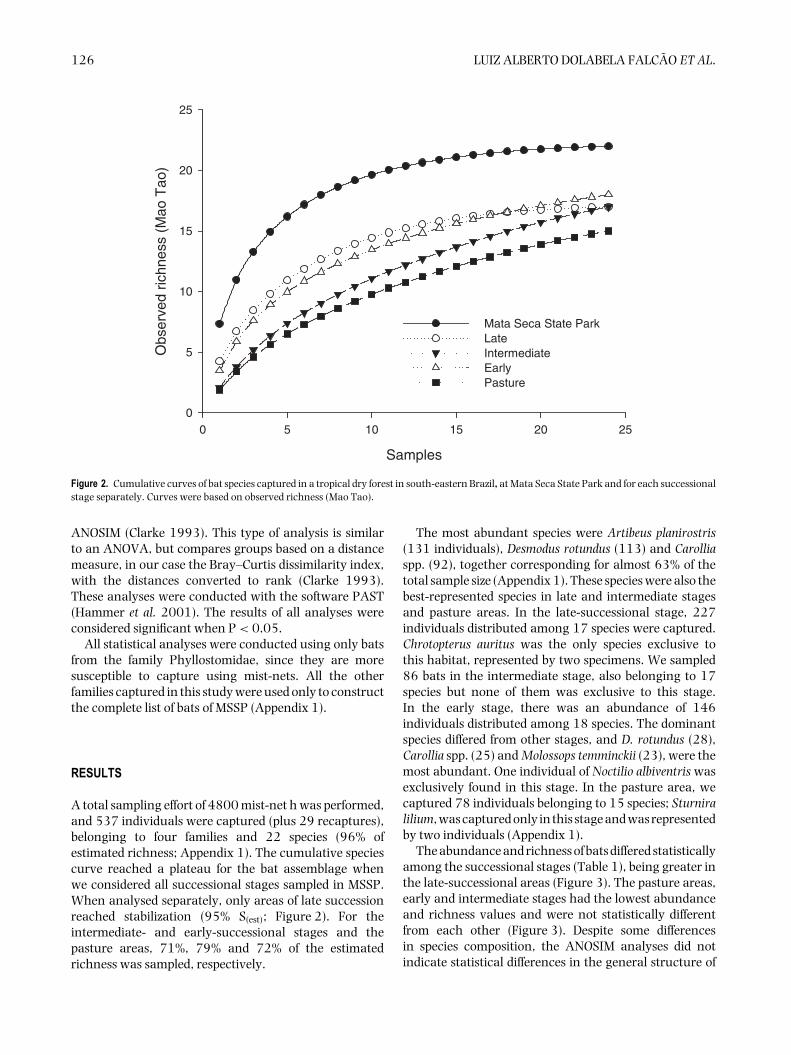
Figure 2. Cumulative curves of bat species captured in a tropical dry forest in south-eastern Brazil, at Mata Seca State Park and for each successionalstage separately. Curves were based on observed richness (Mao Tao).
ANOSIM (Clarke 1993). This type of analysis is similarto an ANOVA, but compares groups based on a distancemeasure, in our case the Bray–Curtis dissimilarity index,with the distances converted to rank (Clarke 1993).These analyses were conducted with the software PAST(Hammer et al. 2001). The results of all analyses wereconsidered significant when P < 0.05.
All statistical analyses were conducted using only batsfrom the family Phyllostomidae, since they are moresusceptible to capture using mist-nets. All the otherfamilies captured in this study were used only to constructthe complete list of bats of MSSP (Appendix 1).
RESULTS
A total sampling effort of 4800 mist-net h was performed,and 537 individuals were captured (plus 29 recaptures),belonging to four families and 22 species (96% ofestimated richness; Appendix 1). The cumulative speciescurve reached a plateau for the bat assemblage whenwe considered all successional stages sampled in MSSP.When analysed separately, only areas of late successionreached stabilization (95% S(est); Figure 2). For theintermediate- and early-successional stages and thepasture areas, 71%, 79% and 72% of the estimatedrichness was sampled, respectively.
The most abundant species were Artibeus planirostris(131 individuals), Desmodus rotundus (113) and Carolliaspp. (92), together corresponding for almost 63% of thetotal sample size (Appendix 1). These species were also thebest-represented species in late and intermediate stagesand pasture areas. In the late-successional stage, 227individuals distributed among 17 species were captured.Chrotopterus auritus was the only species exclusive tothis habitat, represented by two specimens. We sampled86 bats in the intermediate stage, also belonging to 17species but none of them was exclusive to this stage.In the early stage, there was an abundance of 146individuals distributed among 18 species. The dominantspecies differed from other stages, and D. rotundus (28),Carollia spp. (25) and Molossops temminckii (23), were themost abundant. One individual of Noctilio albiventris wasexclusively found in this stage. In the pasture area, wecaptured 78 individuals belonging to 15 species; Sturniralilium, was captured only in this stage and was representedby two individuals (Appendix 1).
The abundance and richness of bats differed statisticallyamong the successional stages (Table 1), being greater inthe late-successional areas (Figure 3). The pasture areas,early and intermediate stages had the lowest abundanceand richness values and were not statistically differentfrom each other (Figure 3). Despite some differencesin species composition, the ANOSIM analyses did notindicate statistical differences in the general structure of

Spatiotemporal variation in phyllostomid bat assemblages over a successional gradient 127
Table 1. Complete general linear models (GLM) constructed to test the effects of successional stage, season and sampling month on theabundance and richness of bats in a tropical dry forest in south-eastern Brazil. A quasi-Poisson error distribution was used in all models.
Response variable Explanatory variables df Deviance Residual df Residual deviance P
AbundanceStage 3 109 8 72.5 0.007Month 7 155 88 402 <0.001Stage × Month 21 44.8 64 251 0.91Season 1 22.1 94 535 0.06Stage × Season 3 16.4 88 412 0.34
RichnessStage 3 5.70 8 4.83 0.019Month 7 39.3 88 149 <0.001Stage × Month 21 13.4 64 106 0.983Season 1 3.66 94 185 0.145Stage × Season 3 8.44 88 146 0.130
Figure 3. Bat abundance and richness in 12 areas in four successional stages in a tropical dry forest in south-eastern Brazil. Different letters on barsindicate significant differences between successional stage for abundance and richness, respectively (average ± SE).
the bat assemblages between successional stages (P =0.129).
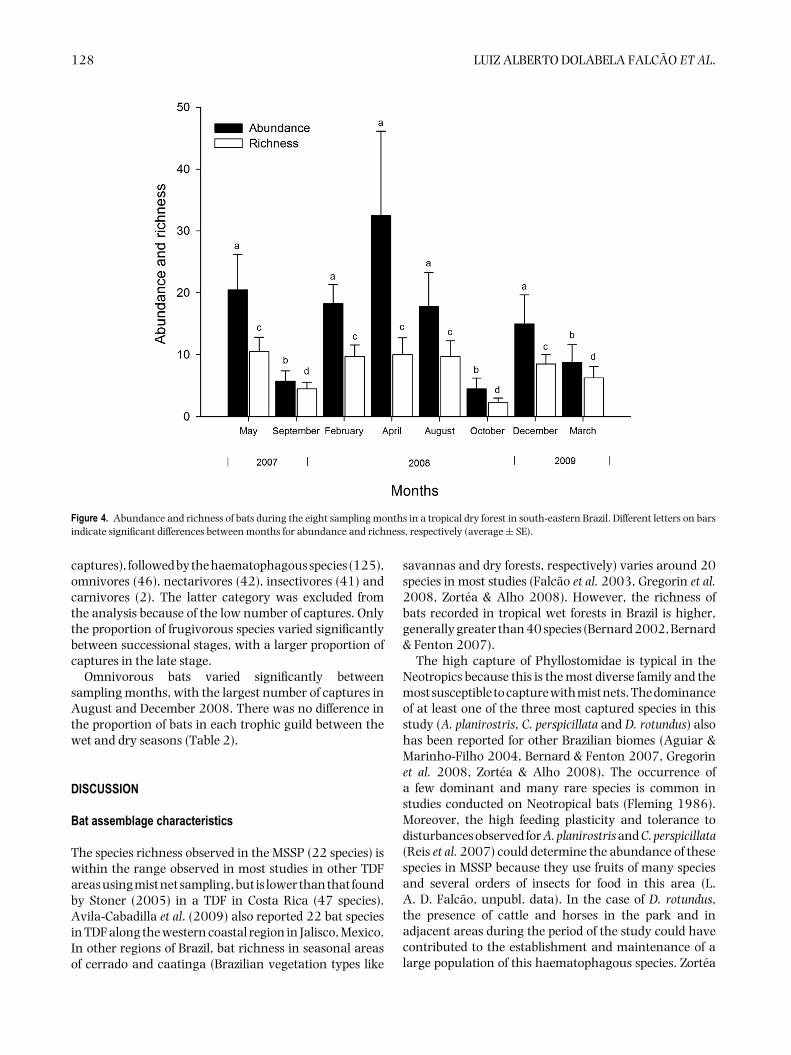
Bat species richness and abundance varied betweensampling months (Figure 4, Table 1). In general, therewas a lower abundance of bats in dry months, with asignificantly smaller number of captures at the end ofthe dry season (September and October) (Figure 4). Atthe beginning (May) and the middle (August) of the dryseason, the abundance of bats did not differ from thatobserved during the rainy season. A great variation in thenumber of captures was observed during the wet months.In March 2009, the abundance of bats was particularly
low, whereas the opposite was observed in April 2008,the month with the highest number of captures in thisstudy. Bat richness was also statistically lower at the end ofthe dry season (Figure 4) with little variation in the othermonths, even during the rainy season. In March 2009, wealso recorded a low richness despite being a rainy month.When the months were pooled by season, the abundanceand richness did not vary between the dry and wet seasons(Table 1). We did not detect temporal variation in batcomposition through the ANOSIM analysis (P = 0.801).
Regarding the trophic guilds of phyllostomid species,frugivorous bats were the most abundant (233
128 LUIZ ALBERTO DOLABELA FALCAO ET AL.
Figure 4. Abundance and richness of bats during the eight sampling months in a tropical dry forest in south-eastern Brazil. Different letters on barsindicate significant differences between months for abundance and richness, respectively (average ± SE).
captures), followed by the haematophagous species (125),omnivores (46), nectarivores (42), insectivores (41) andcarnivores (2). The latter category was excluded fromthe analysis because of the low number of captures. Onlythe proportion of frugivorous species varied significantlybetween successional stages, with a larger proportion ofcaptures in the late stage.
Omnivorous bats varied significantly betweensampling months, with the largest number of captures inAugust and December 2008. There was no difference inthe proportion of bats in each trophic guild between thewet and dry seasons (Table 2).
DISCUSSION
Bat assemblage characteristics
The species richness observed in the MSSP (22 species) iswithin the range observed in most studies in other TDFareas using mist net sampling, but is lower than that foundby Stoner (2005) in a TDF in Costa Rica (47 species).Avila-Cabadilla et al. (2009) also reported 22 bat speciesin TDF along the western coastal region in Jalisco, Mexico.In other regions of Brazil, bat richness in seasonal areasof cerrado and caatinga (Brazilian vegetation types like
savannas and dry forests, respectively) varies around 20species in most studies (Falcao et al. 2003, Gregorin et al.2008, Zortea & Alho 2008). However, the richness ofbats recorded in tropical wet forests in Brazil is higher,generally greater than 40 species (Bernard 2002, Bernard& Fenton 2007).
The high capture of Phyllostomidae is typical in theNeotropics because this is the most diverse family and themost susceptible to capture with mist nets. The dominanceof at least one of the three most captured species in thisstudy (A. planirostris, C. perspicillata and D. rotundus) alsohas been reported for other Brazilian biomes (Aguiar &Marinho-Filho 2004, Bernard & Fenton 2007, Gregorinet al. 2008, Zortea & Alho 2008). The occurrence ofa few dominant and many rare species is common instudies conducted on Neotropical bats (Fleming 1986).Moreover, the high feeding plasticity and tolerance todisturbances observed for A. planirostris and C. perspicillata(Reis et al. 2007) could determine the abundance of thesespecies in MSSP because they use fruits of many speciesand several orders of insects for food in this area (L.A. D. Falcao, unpubl. data). In the case of D. rotundus,the presence of cattle and horses in the park and inadjacent areas during the period of the study could havecontributed to the establishment and maintenance of alarge population of this haematophagous species. Zortea

Spatiotemporal variation in phyllostomid bat assemblages over a successional gradient 129
Table 2. Complete general linear models (GLM) constructed to test the effects of successional stage, season and month of sampling on theproportion of bat captures per trophic guild in a tropical dry forest in south-eastern Brazil. A quasi-binomial error distribution was used inall models.
Response variable (proportion) Explanatory variables df Deviance Residual df Residual deviance P
Frugivores Stage 3 0.26 8 0.12 <0.001Season 1 0.02 30 1.98 0.53Month 7 0.33 24 1.67 0.623
Nectarivores Stage 2 0.03 6 0.32 0.712Season 1 0.01 30 1.19 0.635Month 7 0.36 24 0.83 0.118
Insectivores Stage 3 0.16 8 1.06 0.717Season 1 0.01 30 0.94 0.577Month 7 0.24 24 0.71 0.278
Haematophages Stage 3 0.29 8 0.37 0.075Season 1 0.08 30 2.21 0.324Month 7 0.54 24 1.74 0.335
Omnivores Stage 3 0.48 8 0.52 0.052Season 1 0.05 30 1.48 0.395Month 7 0.71 24 0.81 0.002
& Alho (2008) also found a high abundance of this speciesin a cerrado area, which was attributed to the presence ofcattle and adequate refuge areas for this species, such ascaverns and rock crevices, which also are found in MSSP.
Successional differences
The stabilization of the cumulative species curve for MSSPindicates that the capture effort was sufficient to samplemost of the species in the region. However, when analysedper stage, only the late-successional areas showed aplateau in species accumulation, with a higher estimatedrichness than the other stages. Nevertheless, the actualnumber of species collected in all stages was similar, withthe exception of pasture areas. In their study of a palm-stand site, Moreno & Halffter (2000) showed that areaswhich are simpler in terms of vegetation structure aremore susceptible to ‘tourist’ bat species that are presentat the landscape scale but use these habitats occasionally.Thus, we believe that in heterogeneous areas with morecomplex mature habitats immersed within the landscape,sites in early stages of succession will show the samepattern without a clear tendency of richness stabilizationdue to these tourist species.
Differences in estimated number of species in both theaverage abundance and richness between stages couldbe related to their contrasting forest structures. Madeiraet al. (2009) detected a marked increase (76.8 times) inthe Holdridge Complexity Index from the early to thelate stage in the same study area. This index is basedon richness, basal area, density and height of plants,and is used as a measure of community complex. Thus,differences in the number of vertical strata and the densityand richness of trees and lianas can alter the probabilityof capture for some species, particularly rare ones (Williget al. 2007). The greater structural complexity observed
in the late-sucessional stage at the MSSP would offer ahigher amount and variety of resources relative to theearlier stages, thus supporting a greater abundance andrichness of bat species. Similar results were found by Avila-Cabadilla et al. (2009) in a TDF in Mexico, where batrichness also increased over successional stages.
In our study, areas of early succession had a highabundance of bats, similar to results reported by someother authors (Avila-Cabadilla et al. 2009, Castro-Lunaet al. 2007). This pattern may be found because earlystages possess more open vegetation and can be usedas flying routes between shelter and foraging areas formany transient species. It is likely that the lower captureobserved at the intermediate stage is related to the highdensity of lianas in those areas (Madeira et al. 2009),which could obstruct the flight of some bat species. Thelower abundance and richness of bats found in pastureareas also were recorded in a similar study conductedin a TDF in Chamela, Mexico (Avila-Cabadilla et al. 2009),and is probably related to the low structural complexityand resource scarcity. In addition, bats may avoid thesenon-forested areas to prevent predation risk (Henry et al.2007), and because they can detect mist nets in openareas more easily.
We did not verify differences between the foursuccessional stages based on composition and structure ofthe bat assemblages. Although areas in late-successionalstages in TDF can be considered more stable in terms ofresource availability (shelter and food) (Avila-Cabadillaet al. 2009), for bats, early stages of succession wouldbe more frequently utilized by transient species, thosewhich use these areas as flying routes (Moreno & Halffter2000). Moreover, other habitat characteristics, suchas landscape complexity, distance to conserved areas,and matrix structure should be more important for theoccurrence of a species in a given area (Avila-Cabadillaet al. 2012, Bernard & Fenton 2003, 2007).
130 LUIZ ALBERTO DOLABELA FALCAO ET AL.
In the present study, only the abundance of frugivorousbats varied significantly between stages, being moreabundant in the late stage of succession. Other studiesin tropical moist and humid forests show that pioneerspecies are an important resource for some frugivorousbat species, such as those of the genera Artibeus andCarollia (Aguiar & Marinho-Filho 2007, Bernard 2002)and, for this reason, frugivorous species can be moreabundant in early-successional stages. However, in TDFsthese successional stages are usually dominated by plantswith anemochoric and autochoric dispersal syndromes(Vieira & Scariot 2006), which do not produce foodresources for frugivorous bat species. It already has beenshown for the MSSP that areas of late-successional stageshave more species with zoochoric dispersal syndromesthan other stages (Pezzini et al. 2008). This resultcorroborates that of Avila-Cabadilla et al. (2009) in a TDFin Mexico, where late-successional habitats also providedmore feeding resources for frugivorous bats comparedwith other stages.
Temporal variation
Bat abundance and richness were lower at the end of thedry season, during the peak of resource scarcity in thestudy region. In TDFs, plant growth and reproduction arestrongly affected by water availability and thus tend togrow more and reproduce in the wet season (Murphy& Lugo 1986). Specifically in MSSP the zoochorousspecies have a fruiting peak during the wet season, unlikeanemochorous species (Pezzini et al. 2008). Similarly,Neves et al. (in press), found a higher abundance andrichness of herbivorous insects at the beginning of thewet season in MSSP. Temporal variation in the diversityof bats associated with resource availability also hasbeen reported for other studies (Avilla-Cabadilla et al.2009, Pereira et al. 2010, Stoner 2005). The studyarea is characterized by a mosaic of different vegetationtypes, which suggests that one mechanism to dealwith lower resource availability at this site could bemigration to adjacent areas, such as riparian habitats.This mechanism to deal with seasonal resource scarcityhas been documented in other studies of dry forest(Stoner 2001, 2005). However, the low abundanceof bats during one wet month (March 2009) in thepresent study indicates that strong variation occurs evenwithin the rainy season. Particularly, February 2009 wasabnormally dry (48.5 mm) with an average temperaturebelow the historical mean (21 ºC) (historical means forFebruary are 94.2 mm and 24.6 ºC). It is possible thatthe lower water availability and temperature reducedthe amount of insects, flowers and fruits in March, thusreducing the availability of resources for bats and causinga lower capture rate in that month. Thus, temporal
comparisons in bat diversity must take into accountstrong monthly and interannual variation in weatherconditions frequently observed in the semi-arid regionof Brazil, where TDFs are mostly located.
Only omnivorous bats varied statistically between thesampled months, being higher in August and December2008. It was expected that omnivorous bats wouldrespond less to the temporal variation in resources,given that their feeding plasticity is the greatest amongthe guilds analysed. The variation in the abundance ofomnivorous bats did not show a clear pattern and it ispossible that, for this guild, other factors affected theircapture. The group-foraging behaviour of Phyllostomusdiscolor (Sazima & Sazima 1977) could be one of the causesof a large number of captures in a single sampling nightduring some periods and thus affecting our results.
This paper reports the first study in Brazil to examinethe effects of ecological succession on bat assemblagesin a TDF. Our results indicated that mature forest showshigher abundance and richness of bats, probably due tothe higher structural complexity observed in this habitat.Our results also suggest the use of early successionalareas as flying routes by bats can lead to failure todetect differences in bat composition among successionalgradients. One way to ameliorate this effect and tobetter evaluate differences among bat assemblages amongsuccessional gradients is for future studies to assimilatelandscape-level analyses into their studies and to havelarger sample sites of the different successional gradientsseparated by larger distances.
ACKNOWLEDGEMENTS
This work was supported by Fundacao de Amparoa Pesquisa de Minas Gerais-FAPEMIG (CRA-2288/07and CRA APQ-3042-5.03/07), and the Inter-AmericanInstitute for Global Change Research (IAI-CRN II-021).We gratefully acknowledge FAPEMIG for a researchscholarship to L.O. Leite and M. M. Espırito-Santo. Thisstudy was in partial fulfilment of requirements for theMaster degree at Universidade Estadual de Montes Claros.We are especially grateful to Marcell Pinheiro and FlaviaAraujo for assistance in the field, and the staff of theState Forestry Institute (IEF) for logistical support. Wealso thank Carlos Magno Santos Clemente for producingthe map of the study area.
LITERATURE CITED
AGUIAR, L. M. D. S. & MARINHO-FILHO, J. 2004. Activity patterns of
nine phyllostomid bat species in a fragment of the Atlantic Forest in
southeastern Brazil. Revista Brasileira de Zoologia 21:385–390.
Spatiotemporal variation in phyllostomid bat assemblages over a successional gradient 131
AGUIAR, L. M. S. & MARINHO-FILHO, J. 2007. Bat frugivory
in a remnant of Southeastern Brazilian Atlantic forest. Acta
Chiropterologica 9:251–260.
ANTUNES, F. V. 1994. Climatic characterization – Caatinga of Minas
Gerais State. Informe Agropecuario 17:15–19.
AVILA-CABADILLA, L. D., STONER, K. E., HENRY, M. & ANORVE,
M. Y. A. 2009. Composition, structure and diversity of phyllostomid
bat assemblages in different successional stages of a tropical dry forest.
Forest Ecology and Management 258:986–996.
AVILA-CABADILLA, L. D., SANCHEZ-AZOFEIFA, G. A., STONER, K. E.,
ALVAREZ-ANORVE, M. Y., QUESADA, M. & PORTILLO-QUINTERO,
C. A. 2012. Local and landscape factors determining occurrence of
phyllostomid bats in tropical secondary forests. PloS One 7:e35228.
BERNARD, E. 2002. Diet, activity and reproduction of bat species
(Mammalia, Chiroptera) in Central Amazonia, Brazil. Revista
Brasileira de Zoociencias 19:173–188.
BERNARD, E. & FENTON, M. B. 2003. Bat mobility and roosts in
a fragmented landscape in Central Amazonia, Brazil. Biotropica
35:262.
BERNARD, E. & FENTON, M. 2007. Bats in a fragmented landscape:
species composition, diversity and habitat interactions in savannas
of Santarem, Central Amazonia, Brazil. Biological Conservation
134:332–343.
BULLOCK, S. H. 1995. Plant reproduction in neotropical dry forests.
Pp. 277–297 in Bullock, S. H., Mooney, H. A. & Medina, E. (eds.).
Seasonally dry tropical forests. Cambridge University Press, Cambridge.
CASTRO-LUNA, A. A., SOSA, V. J. & CASTILLO-CAMPOS, G. 2007.
Bat diversity and abundance associated with the degree of secondary
succession in a tropical forest mosaic in south-eastern Mexico. Animal
Conservation 10:219–228.
CLARKE, K. R. 1993. Non-parametric multivariate analyses of changes
in community structure. Australian Journal of Ecology 18:117–143.
CRAWLEY, M. J. 2007. The R book. John Wiley & Sons, Chichester. 942
pp.
CUNTO, G. C. & BERNARD, E. 2012. Neotropical bats as indicators
of environmental disturbance: what is the emerging message? Acta
Chiropterologica 14:143–151.
FALCAO, F. D. C., REBELO, V. F. & TALAMONI, S. A. 2003. Structure of a
bat assemblage (Mammalia, Chiroptera) in Serra do Caraca Reserve,
South-east Brazil. Revista Brasileira de Zoologia 20:347–350.
FENTON, M., ACHARYA, L., AUDET, D., HICKEY, M., MERRIMAN,
C., OBRIST, M., SYME, D. & ADKINS, B. 1992. Phyllostomid bats
(Chiroptera: Phyllostomidae) as indicators of habitat disruption in
the Neotropics. Biotropica 24:440–446.
FLEMING, T. H. 1986. The structure of neotropical bat communities: a
preliminary analysis. Revista Chilena de Historia Natural 59:135–150.
GARDNER, A. L. 2007. Order Chiroptera. Pp. 187–184 in Gardner,
A. L. (ed.). Mammals of South America. The University of Chicago
Press, Chicago.
GREGORIN, R. & TADDEI, V. A. 2002. Chave artificial para a
identificacao de molossıdeos brasileiros (Mammalia, Chiroptera).
Mastozoologıa Neotropical 9:13–32.
GREGORIN, R., CARMIGNOTTO, A. P. & PERCEQUILLO, A. R. 2008.
Quiropteros do Parque Nacional da Serra das Confusoes, Piauı,
nordeste do Brasil. Chiroptera Neotropical 14:366–383.
HAMMER, O., HARPER, D. A. T. & RYAN, P. D. 2001. PAST:
palaeontological statistic software package for education and data
analysis. Paleontologia Electronica 4:1–9.
HENRY, M., PONS, J.-M. & COSSON, J.-F. 2007. Foraging behaviour of
a frugivorous bat helps bridge landscape connectivity and ecological
processes in a fragmented rainforest. Journal of Animal Ecology
76:801–813.
IEF (Instituto Estadual de Florestas). 2000. Parecer tecnico para a criacao
do Parque Estadual da Mata Seca. Instituto Estadual de Florestas, Belo
Horizonte. 18 pp.
MADEIRA, B. G., ESPIRITO-SANTO, M. M., NETO, S. D., NUNES, Y. R. F.,
ARTURO SANCHEZ AZOFEIFA, G., WILSON FERNANDES, G. &
QUESADA, M. 2009. Changes in tree and liana communities along a
successional gradient in a tropical dry forest in south-eastern Brazil.
Plant Ecology 201:291–304.
MANCINA, C. A., GARCIA-RIVERA, L. & CAPOTE, R. T. 2007. Habitat
use by phyllostomid bat assemblages in secondary forests of the
“Sierra del Rosario” Biosphere Reserve, Cuba. Acta Chiropterologica
9:203–218.
MEDELLIN, R. A., ARITA, H. T. & SANCHEZ, H. O. 1997. Identificacion
de los Murcielagos de Mexico. Asociacion Mexicana de Mastozoologıa,
A.C., Publicaciones Especiales, 2.
MEDELLIN, R. A., EQUIHUA, M. & AMIN, M. A. 2000. Bat diversity and
abundance as indicators of disturbance in Neotropical rainforests.
Conservation Biology 14:1666–1675.
MEYER, C. F. J. & KALKO, E. K. V. 2008. Assemblage-level responses
of phyllostomid bats to tropical forest fragmentation: land-bridge
islands as a model system. Journal of Biogeography 35:1711–1726.
MORENO, C. E. & HALFFTER, G. 2000. Assessing the completeness of bat
biodiversity inventories using species accumulation curves. Journal
of Applied Ecology 37:149–158.
MORRISON, D. W. 1978. Lunar phobia in a Neotropical fruit bat,
Artibeus jamaicensis (Chiroptera: Phyllostomidae). Animal Behavior
26:852–855.
MURPHY, P. G. & LUGO, A. E. 1986. Ecology of tropical dry forest.
Annual Review of Ecology and Systematics 17:67–88.
NEVES, F. S., SILVA, J. O., ESPIRITO-SANTO, M. M. & FERNANDES,
G. W. (in press). Insect herbivores and leaf damage along successional
and vertical gradients in a tropical dry forest. Biotropica.
PEEL, M. C., FINLAYSON, B. L. & MCMAHON, T. A. 2007. Updated
world map of the Koppen-Geiger climate classification. Hydrology and
Earth System Sciences Discussions 4:439–473.
PEREIRA, M. J. R., MARQUES, J. T. & PALMEIRIM, J. M. 2010.
Ecological responses of frugivorous bats to seasonal fluctuation
in fruit availability in Amazonian forests. Biotropica 42:680–
687.
PEZZINI, F. F., BRANDAO, D. O., RANIERI, B. D., ESPIRITO-SANTO,
M. M., JACOBI, C. M. & FERNANDES, G. W. 2008. Polinizacao,
dispersao de sementes e fenologia das especies arboreas no Parque
Estadual da Mata Seca. MG – Biota 1:37–45.
REIS, N. R. D., PERACCHI, A. L., PEDRO, W. A. & LIMA, I. P. (eds.).
2007. Morcegos do Brasil. UEL Press, Londrina City. 253 pp.
SANCHEZ-AZOFEIFA, G. A., QUESADA, M., RODRIGUEZ, J. P., NASSAR,
J. M., STONER, K. E., CASTILLO, A., GARVIN, T., ZENT, E. L., CALVO-
ALVARADO, J. C., KALACSKA, M. E. R., FAJARDO, L., GAMON, J. A.

132 LUIZ ALBERTO DOLABELA FALCAO ET AL.
& CUEVAS-REYES, P. 2005. Research priorities for neotropical dry
forests. Biotropica 37:477–485.
SAZIMA, I. & SAZIMA, M. 1977. Solitary and group foraging: two
flower-visiting patterns of the lesser spear-nosed bat Phyllostomus
discolor. Biotropica 9:213–215.
STONER, K. E. 2001. Differential habitat use and reproductive patterns
of frugivorous bats in tropical dry forest of northwestern Costa Rica.
Canadian Journal of Zoology 79:1626–1633.
STONER, K. E. 2005. Phyllostomid bat community structure and
abundance in two contrasting tropical dry forests. Biotropica 37:591–
599.
TIMM, R. M. & LAVAL, R. K. 1998. A field key to the bats of Costa Rica.
Center of Latin American Studies 22:1–30.
VIEIRA, D. L. M. & SCARIOT, A. 2006. Principles of natural regeneration
of tropical dry forests for restoration. Restoration Ecology 14:11–
20.
WILLIG, M. R., PRESLEY, S. J., BLOCH, C. P., HICE, C. L., YANOVIAK, S.
P., DIAZ, M. M., CHAUCA, L. A., PACHECO, V. & WEAVER, S. C. 2007.
Phyllostomid bats of lowland Amazonia: effects of habitat alteration
on abundance. Biotropica 39:737–746.
ZORTEA, M. & ALHO, C. J. R. 2008. Bat diversity of a Cerrado habitat in
central Brazil. Biodiversity and Conservation 17:791–805.
Appendix 1. List of species, guilds, total abundance (n) and relative abundance (%) of bats captured in late, intermediate, early and pasturesucessional stages in Mata Seca State Park, South-Eastern Brazil. Frug: Frugivores; Ins: insectivores; Nec: nectarivores; Omn: omnivores; Hae:haematophagous; Carn: carnivores. Nomenclature follows Gardner (2007).
Successional stages
Taxa Guild Late % Intermediate % Early % Pasture % Total %
MolossidaeMolossops temminckii Ins. 3 0.56 4 0.74 23 4.28 2 0.37 32 5.96Molossus molossus Ins. 4 0.74 1 0.19 5 0.93
NoctilionidaeNoctilio albiventris Ins. – – 1 0.19 – 1 0.19
PhyllostomidaeArtibeus lituratus Frug. 4 0.74 1 0.19 3 0.56 – 8 1.49Artibeus planirostris Frug. 68 12.7 24 4.47 21 3.91 18 3.35 131 24.4Carollia spp. Frug. 37 6.89 13 2.42 25 4.66 17 3.17 92 17.1Chrotopterus auritus Carn. 2 0.37 – – – 2 0.37Desmodus rotundus Hae. 53 9.87 14 2.61 28 5.21 18 3.35 113 21.0Diphylla ecaudata Hae. 6 1.12 2 0.37 2 0.37 2 0.37 12 2.23Glossophaga soricina Nect. 13 2.42 8 1.49 9 1.68 – 30 5.59Lonchophylla dekeyseri Nect. 4 0.74 5 0.93 2 0.37 1 0.19 12 2.23Lophostoma brasiliense Ins. – 1 0.19 2 0.37 3 0.56Micronycteris sanborni Ins. 3 0.56 1 0.19 12 2.23 2 0.37 18 3.35Mimon bennettii Ins. 2 0.37 – 1 0.19 – 3 0.56Mimon crenulatum Ins. 4 0.74 2 0.37 1 0.19 7 1.30 14 2.61Phylloderma stenops Omn. 10 1.86 3 0.56 5 0.93 2 0.37 20 3.72Phyllostomus discolor Omn. 8 1.49 1 0.19 3 0.56 1 0.19 13 2.42Phyllostomus hastatus Omn. 7 1.30 4 0.74 1 0.19 1 0.19 13 2.42Sturnira lilium Frug. – – – 2 0.37 2 0.37Tonatia bidens Ins. – 1 0.19 2 0.37 – 3 0.56
VespertilionidaeLasiurus blossevillii Ins. 1 0.19 1 0.19 – – 2 0.37Myotis riparius Ins. 2 0.37 1 0.19 3 0.56 2 0.37 8 1.49
Total 227 42.3 86 16.0 146 27.2 78 14.5 537