Successional changes in plant composition over 15 years in a ...
8
RESEARCH Open Access Successional changes in plant composition over 15 years in a created wetland in South Korea Deokjoo Son 1 , Hyohyemi Lee 2 , Kang-Hyun Cho 3 , Jeong Hwan Bang 1 , Oh-Byung Kwon 4 and Eun Ju Lee 1* Abstract Backgrounds: The main purpose of this research was to assess changes in vegetation structure, wetland index, and diversity index for a 15-year-old created wetland in Jincheon, South Korea. The created wetland consists of four sub-wetlands: a kidney-shaped wetland, a ditch, an ecological pond, and a square wetland. Vegetation and water depth data were collected at each site in 1999 and 2013, and Shannon diversity and wetland indices were calculated. Results: The total number of plant species increased from 18 in 1999 to 50 in 2013, and the ecological pond in 1999 and the ditch in 2013 presented the highest diversity indices (2.5 and 3.2, respectively). Plant species were less diverse in 1999 than in 2013, presumably because these initial wetlands were managed periodically for water purification and installation of test beds. The proportion of wetland plants, including obligate wetland and facultative wetland species, decreased from 83 to 56%, whereas upland plants, including obligate upland and facultative upland species, increased from 17 to 44%. After ceasing water supply, water depth in all four sub-wetlands declined in 2013. Thus, upland plants established more readily at these sites, resulting in higher diversity and lower wetland indices than in 1999. Conclusions: The major floristic differences between 1999 and 2013 were an increase in the number of upland plants and a decrease in wetland species. Although wetland indices were lower in 2013, the created wetland performed important ecosystem functions by providing habitats for wetland and upland plants, and the overall species diversity was high. Keywords: Wetland creation, Ecological succession, Water depth, Wetland plants, Wetland index, Shannon diversity index, Species diversity Background Wetlands have various functions such as nutrient transpor- tation, clean water supply, habitats for flora and fauna, sedi- ment deposition, and buffers to climate changes (Hsu et al. 2011; Mitsch et al. 2012). Created wetlands are artificially designed and constructed to remove wastewater contami- nants (Hsu et al. 2011) and serve not only as mitigation wetland to compensate for wetland habitat loss (Mitsch and Day 2006) but also as a pollutant treatment system for the removal of surface runoff (Mitsch et al. 2005; Vymazal 2013). These treatment systems are devised to mimic natural wetland systems by applying wetland plants, soils, and microorganisms to eliminate contaminants from wastewater effluents (Kivaisi 2001). In addition, assem- blages and richness of waterfowl are influenced by charac- teristics of created wetlands (Choi et al. 2015). Thus, created wetlands attract much research interest. Wetland plants are considered as either obligate or facultative wetland species, according to wetland delinea- tions; are either partially or completely submerged in water during at least one stage of their growth; and must regularly encounter and tolerate anaerobic soils (Tiner 1991; Mitsch et al. 2012). Macrophytes are widely regarded as the main biological components of wetlands. They assimilate pollutants, act as catalysts for water purifi- cation (Hadad et al. 2006), and affect biodiversity in created wetlands (Hsu et al. 2011). Thus, due to their important roles in created wetlands, it is essential to inves- tigate the composition and role of wetland plants. * Correspondence: [email protected] 1 School of Biological Sciences, Seoul National University, Seoul 08826, South Korea Full list of author information is available at the end of the article Journal of Ecology and Environment © The Author(s). 2018 Open Access This article is distributed under the terms of the Creative Commons Attribution 4.0 International License (http://creativecommons.org/licenses/by/4.0/), which permits unrestricted use, distribution, and reproduction in any medium, provided you give appropriate credit to the original author(s) and the source, provide a link to the Creative Commons license, and indicate if changes were made. The Creative Commons Public Domain Dedication waiver (http://creativecommons.org/publicdomain/zero/1.0/) applies to the data made available in this article, unless otherwise stated. Son et al. Journal of Ecology and Environment (2018) 42:22 https://doi.org/10.1186/s41610-018-0084-1
-
Upload
khangminh22 -
Category
Documents
-
view
0 -
download
0
Transcript of Successional changes in plant composition over 15 years in a ...

RESEARCH Open Access
Successional changes in plant compositionover 15 years in a created wetland in SouthKoreaDeokjoo Son1, Hyohyemi Lee2, Kang-Hyun Cho3, Jeong Hwan Bang1, Oh-Byung Kwon4 and Eun Ju Lee1*
Abstract
Backgrounds: The main purpose of this research was to assess changes in vegetation structure, wetland index, anddiversity index for a 15-year-old created wetland in Jincheon, South Korea. The created wetland consists of foursub-wetlands: a kidney-shaped wetland, a ditch, an ecological pond, and a square wetland. Vegetation and waterdepth data were collected at each site in 1999 and 2013, and Shannon diversity and wetland indices were calculated.
Results: The total number of plant species increased from 18 in 1999 to 50 in 2013, and the ecological pond in 1999and the ditch in 2013 presented the highest diversity indices (2.5 and 3.2, respectively). Plant species were less diversein 1999 than in 2013, presumably because these initial wetlands were managed periodically for water purification andinstallation of test beds. The proportion of wetland plants, including obligate wetland and facultative wetland species,decreased from 83 to 56%, whereas upland plants, including obligate upland and facultative upland species, increasedfrom 17 to 44%. After ceasing water supply, water depth in all four sub-wetlands declined in 2013. Thus, upland plantsestablished more readily at these sites, resulting in higher diversity and lower wetland indices than in 1999.
Conclusions: The major floristic differences between 1999 and 2013 were an increase in the number of upland plantsand a decrease in wetland species. Although wetland indices were lower in 2013, the created wetland performedimportant ecosystem functions by providing habitats for wetland and upland plants, and the overall species diversitywas high.
Keywords: Wetland creation, Ecological succession, Water depth, Wetland plants, Wetland index, Shannon diversityindex, Species diversity
BackgroundWetlands have various functions such as nutrient transpor-tation, clean water supply, habitats for flora and fauna, sedi-ment deposition, and buffers to climate changes (Hsu et al.2011; Mitsch et al. 2012). Created wetlands are artificiallydesigned and constructed to remove wastewater contami-nants (Hsu et al. 2011) and serve not only as mitigationwetland to compensate for wetland habitat loss (Mitschand Day 2006) but also as a pollutant treatment system forthe removal of surface runoff (Mitsch et al. 2005; Vymazal2013). These treatment systems are devised to mimicnatural wetland systems by applying wetland plants, soils,and microorganisms to eliminate contaminants from
wastewater effluents (Kivaisi 2001). In addition, assem-blages and richness of waterfowl are influenced by charac-teristics of created wetlands (Choi et al. 2015). Thus,created wetlands attract much research interest.Wetland plants are considered as either obligate or
facultative wetland species, according to wetland delinea-tions; are either partially or completely submerged inwater during at least one stage of their growth; and mustregularly encounter and tolerate anaerobic soils (Tiner1991; Mitsch et al. 2012). Macrophytes are widelyregarded as the main biological components of wetlands.They assimilate pollutants, act as catalysts for water purifi-cation (Hadad et al. 2006), and affect biodiversity increated wetlands (Hsu et al. 2011). Thus, due to theirimportant roles in created wetlands, it is essential to inves-tigate the composition and role of wetland plants.
* Correspondence: [email protected] of Biological Sciences, Seoul National University, Seoul 08826, SouthKoreaFull list of author information is available at the end of the article
Journal of Ecologyand Environment
© The Author(s). 2018 Open Access This article is distributed under the terms of the Creative Commons Attribution 4.0International License (http://creativecommons.org/licenses/by/4.0/), which permits unrestricted use, distribution, andreproduction in any medium, provided you give appropriate credit to the original author(s) and the source, provide a link tothe Creative Commons license, and indicate if changes were made. The Creative Commons Public Domain Dedication waiver(http://creativecommons.org/publicdomain/zero/1.0/) applies to the data made available in this article, unless otherwise stated.
Son et al. Journal of Ecology and Environment (2018) 42:22 https://doi.org/10.1186/s41610-018-0084-1
Hydrological conditions are probably the most import-ant determinant of the type of wetland that can be estab-lished and the wetland processes that can be maintained(Mitsch and Gosselink 2000). In addition, the water re-gime is a crucial factor that determines the spatial-tem-poral diversity of wetland plants and also affects therichness and composition of plant communities (Makkayet al. 2008; Baart et al. 2010). Elements of the water re-gime include water depth, precipitation duration, rainfallfrequency, and periodic cycle of wet and dry seasons(Rea and Ganf 1994). In particular, water depth is an im-portant factor affecting species composition and plantcommunity formation (Casanova and Brock 2000) and isa critical determinant of plant species diversity (Chen etal. 2006).In wetlands, changes in floristic composition usually
result from (1) the devastation of existing vegetation bypathogens, herbivores, or human activity; (2) changes inenvironmental conditions of habitats such as fluctua-tions in water depth or nutrient levels; (3) interactionsamong plants via symbiosis or competition; and (4) inva-sion of aggressive species (van der Valk 1981). Wetlandsuccession involves floristic change as a function of time,and a spatial separation by water depth (Odland and delMoral 2002). Mitsch et al. (2012) concluded that plantrichness in created wetlands undergoes the greatest in-crease in the first 5 years after creation. Meanwhile, Coleet al. (2013) found that plant communities should bemonitored for longer than 5 years because changes re-main ongoing, and long-term monitoring of created wet-lands is needed to investigate trophic structure, nutrientflow, and the self-perpetuating processes of ecosystems(Moore et al. 1999).Despite the importance of created wetlands, scientific
understanding of their long-term succession is lacking(Mitsch et al. 2005). In South Korea, short-term studies(3–4 years) on created wetlands have been conducted,but longer-term studies for 10 years or longer are scarce(Kim and Myung 2008; Kim et al. 2011; Son et al. 2015).It is important to monitor the settlement patterns andchanges in wetland plants after construction of wetlands.The purpose of this study was to compare the floristicchanges in vegetation composition and wetland indicesdue to natural succession over a 15-year period in a cre-ated wetland in South Korea.
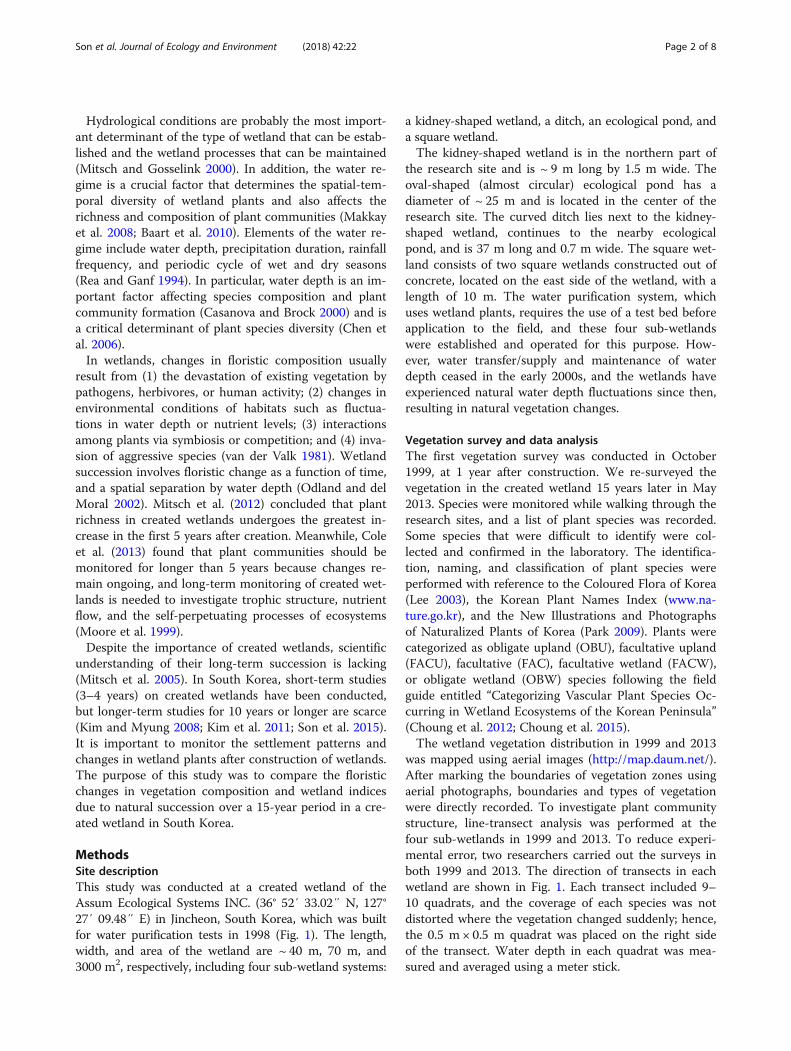
MethodsSite descriptionThis study was conducted at a created wetland of theAssum Ecological Systems INC. (36° 52′ 33.02″ N, 127°27′ 09.48″ E) in Jincheon, South Korea, which was builtfor water purification tests in 1998 (Fig. 1). The length,width, and area of the wetland are ~ 40 m, 70 m, and3000 m2, respectively, including four sub-wetland systems:
a kidney-shaped wetland, a ditch, an ecological pond, anda square wetland.The kidney-shaped wetland is in the northern part of
the research site and is ~ 9 m long by 1.5 m wide. Theoval-shaped (almost circular) ecological pond has adiameter of ~ 25 m and is located in the center of theresearch site. The curved ditch lies next to the kidney-shaped wetland, continues to the nearby ecologicalpond, and is 37 m long and 0.7 m wide. The square wet-land consists of two square wetlands constructed out ofconcrete, located on the east side of the wetland, with alength of 10 m. The water purification system, whichuses wetland plants, requires the use of a test bed beforeapplication to the field, and these four sub-wetlandswere established and operated for this purpose. How-ever, water transfer/supply and maintenance of waterdepth ceased in the early 2000s, and the wetlands haveexperienced natural water depth fluctuations since then,resulting in natural vegetation changes.
Vegetation survey and data analysisThe first vegetation survey was conducted in October1999, at 1 year after construction. We re-surveyed thevegetation in the created wetland 15 years later in May2013. Species were monitored while walking through theresearch sites, and a list of plant species was recorded.Some species that were difficult to identify were col-lected and confirmed in the laboratory. The identifica-tion, naming, and classification of plant species wereperformed with reference to the Coloured Flora of Korea(Lee 2003), the Korean Plant Names Index (www.na-ture.go.kr), and the New Illustrations and Photographsof Naturalized Plants of Korea (Park 2009). Plants werecategorized as obligate upland (OBU), facultative upland(FACU), facultative (FAC), facultative wetland (FACW),or obligate wetland (OBW) species following the fieldguide entitled “Categorizing Vascular Plant Species Oc-curring in Wetland Ecosystems of the Korean Peninsula”(Choung et al. 2012; Choung et al. 2015).The wetland vegetation distribution in 1999 and 2013
was mapped using aerial images (http://map.daum.net/).After marking the boundaries of vegetation zones usingaerial photographs, boundaries and types of vegetationwere directly recorded. To investigate plant communitystructure, line-transect analysis was performed at thefour sub-wetlands in 1999 and 2013. To reduce experi-mental error, two researchers carried out the surveys inboth 1999 and 2013. The direction of transects in eachwetland are shown in Fig. 1. Each transect included 9–10 quadrats, and the coverage of each species was notdistorted where the vegetation changed suddenly; hence,the 0.5 m × 0.5 m quadrat was placed on the right sideof the transect. Water depth in each quadrat was mea-sured and averaged using a meter stick.
Son et al. Journal of Ecology and Environment (2018) 42:22 Page 2 of 8

The importance value (IV) was determined for eachspecies (importance value = relative cover + relative fre-quency) as described previously (Schlising and Sanders1982), and diversity was calculated using the Shannondiversity index (Shannon and Weaver 1949). We evalu-ated changes in wetland index for the four sub-wetlandsover time using the community type wetland index(CTWI) (Son et al. 2015; Chu et al. 2016), which can beeffective for monitoring sites or comparing sites with en-vironmental differences (Coles-Ritchie et al. 2007), usingthe following equation:
CTWI ¼Xn
i¼1
RImpi �WIVi
where RImpi is the relative importance of species i in thecommunity type and WIVi (wetland indicator value) rangesfrom 1 to 100 for species i based on the degree of wetness,OBU = 1, FACU = 25, FAC = 50, FACW = 75, and OBW =100 (Coles-Ritchie et al. 2007; Choung et al. 2012).To examine the relationships between wetland index,
diversity, and water depth, regression analysis was con-ducted using seven datasets for the four sub-wetlandsfrom 1999 and 2013. The dataset for the square wetlandin 1999 was excluded because there were no plants; hence,we could not calculate wetland or diversity indices.
ResultsSurveyed floraA total of 18 species in 1999 belonging to 11 familiesand 13 genera were recorded at the four sub-wetlands.In the kidney-shaped wetland, only Typha angustifoliawas planted in 1998, and all other plants were physically
removed to control the water purification system. At15 years after wetland construction, there were 21 fam-ilies, 40 genera, and 50 species across the foursub-wetlands (Additional file 1). The ecological pond in1999 and the ditch in 2013 contained the largest numberof species (13 and 33, respectively).
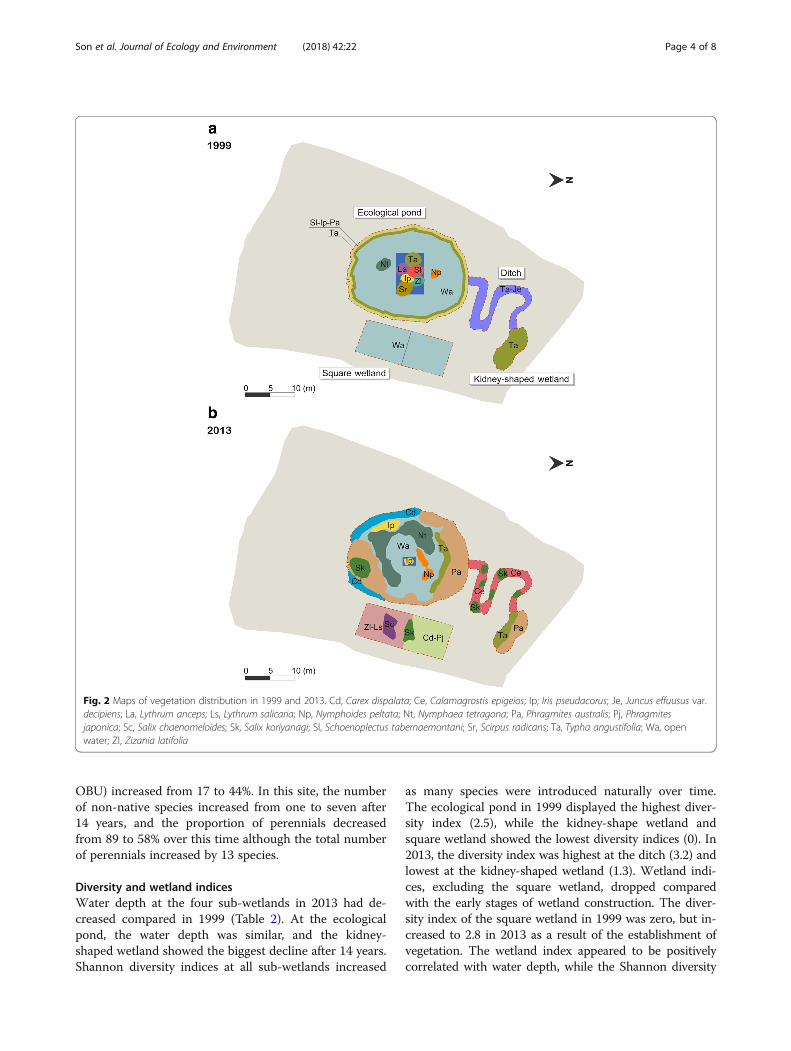
Vegetation distributionThe wetland vegetation distribution in 1999 and 2013was mapped using aerial images, focusing on dominantspecies (Fig. 2). The dominant species in 1999 was T.angustifolia at three of the four sub-wetlands with theexception of the square wetland where naturally estab-lished plants were eliminated for transplantation of seed-lings for test beds. The most abundant species in 2013were T. angustifolia (IV 0.464) and Phragmites australis(IV 0.255) at the kidney-shaped wetland, Calamagrostisepigeios (IV 0.157) and Carex dimorpholepis (IV 0.100)at the ditch, P. australis (IV 0.297) and T. angustifolia(IV 0.219) at the ecological pond, and Zizania latifolia(IV 0.115), Salix koriyanagi (IV 0.115), and Carex dispa-lata (IV 0.115) at the square wetland (Additional file 1).Thus, vegetation composition at the ditch and squarewetland shifted prominently in 14 years, and new specieswere observed including Carex spp., Phragmites spp.,and Salix spp. The size of floating vegetated islands atthe ecological pond became smaller over time, with onlyIris pseudacorus remaining.
Species compositionThe proportion of wetland plants (FACW and OBW)decreased from 83% in 1999 to 56% in 2013 (Table 1).By contrast, the percentage of upland plants (FACU and
Fig. 1 Location of the created wetland in Jincheon, South Korea
Son et al. Journal of Ecology and Environment (2018) 42:22 Page 3 of 8
OBU) increased from 17 to 44%. In this site, the numberof non-native species increased from one to seven after14 years, and the proportion of perennials decreasedfrom 89 to 58% over this time although the total numberof perennials increased by 13 species.
Diversity and wetland indicesWater depth at the four sub-wetlands in 2013 had de-creased compared in 1999 (Table 2). At the ecologicalpond, the water depth was similar, and the kidney-shaped wetland showed the biggest decline after 14 years.Shannon diversity indices at all sub-wetlands increased
as many species were introduced naturally over time.The ecological pond in 1999 displayed the highest diver-sity index (2.5), while the kidney-shape wetland andsquare wetland showed the lowest diversity indices (0). In2013, the diversity index was highest at the ditch (3.2) andlowest at the kidney-shaped wetland (1.3). Wetland indi-ces, excluding the square wetland, dropped comparedwith the early stages of wetland construction. The diver-sity index of the square wetland in 1999 was zero, but in-creased to 2.8 in 2013 as a result of the establishment ofvegetation. The wetland index appeared to be positivelycorrelated with water depth, while the Shannon diversity
Fig. 2 Maps of vegetation distribution in 1999 and 2013. Cd, Carex dispalata; Ce, Calamagrostis epigeios; Ip; Iris pseudacorus; Je, Juncus effuusus var.decipiens; La, Lythrum anceps; Ls, Lythrum salicaria; Np, Nymphoides peltata; Nt, Nymphaea tetragona; Pa, Phragmites australis; Pj, Phragmitesjaponica; Sc, Salix chaenomeloides; Sk, Salix koriyanagi; Sl, Schoenoplectus tabernaemontani; Sr, Scirpus radicans; Ta, Typha angustifolia; Wa, openwater; Zl, Zizania latifolia
Son et al. Journal of Ecology and Environment (2018) 42:22 Page 4 of 8
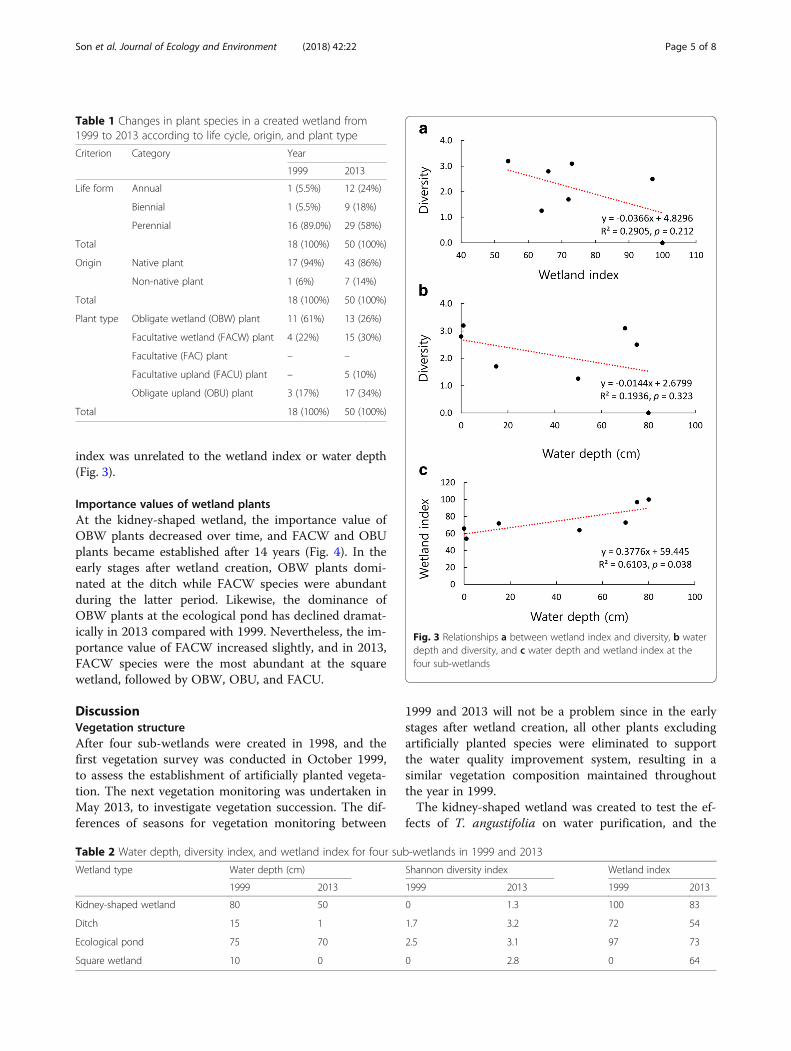
index was unrelated to the wetland index or water depth(Fig. 3).
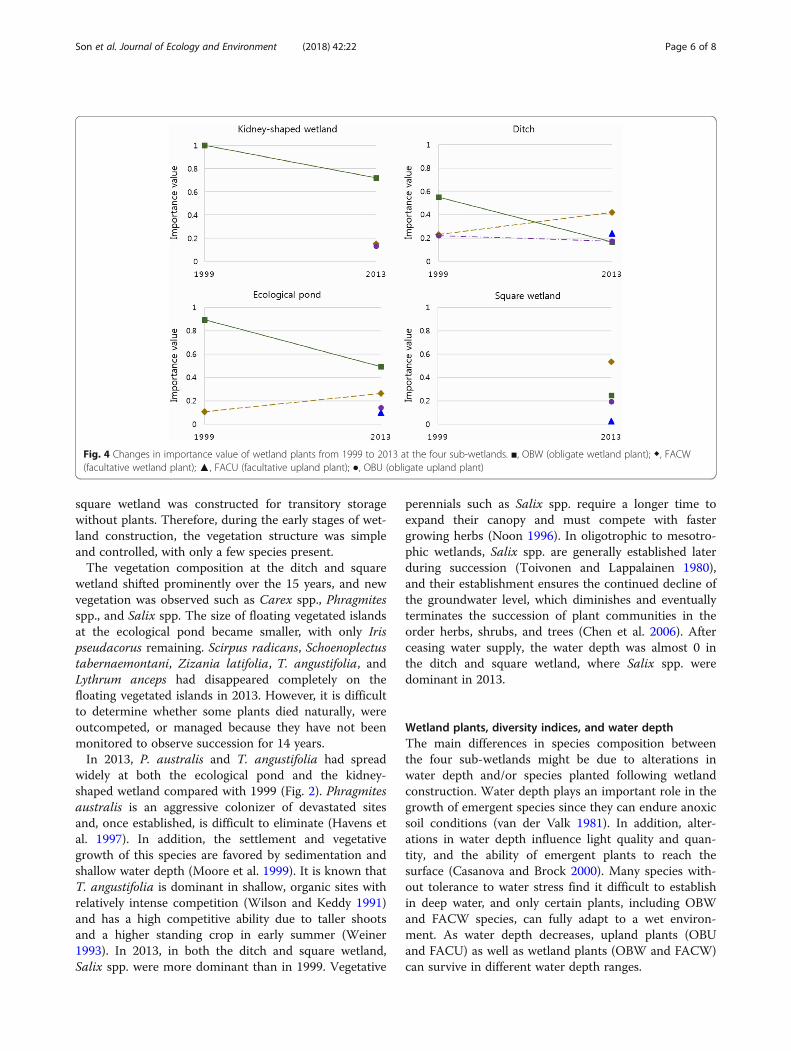
Importance values of wetland plantsAt the kidney-shaped wetland, the importance value ofOBW plants decreased over time, and FACW and OBUplants became established after 14 years (Fig. 4). In theearly stages after wetland creation, OBW plants domi-nated at the ditch while FACW species were abundantduring the latter period. Likewise, the dominance ofOBW plants at the ecological pond has declined dramat-ically in 2013 compared with 1999. Nevertheless, the im-portance value of FACW increased slightly, and in 2013,FACW species were the most abundant at the squarewetland, followed by OBW, OBU, and FACU.
DiscussionVegetation structureAfter four sub-wetlands were created in 1998, and thefirst vegetation survey was conducted in October 1999,to assess the establishment of artificially planted vegeta-tion. The next vegetation monitoring was undertaken inMay 2013, to investigate vegetation succession. The dif-ferences of seasons for vegetation monitoring between
1999 and 2013 will not be a problem since in the earlystages after wetland creation, all other plants excludingartificially planted species were eliminated to supportthe water quality improvement system, resulting in asimilar vegetation composition maintained throughoutthe year in 1999.The kidney-shaped wetland was created to test the ef-
fects of T. angustifolia on water purification, and the
Table 1 Changes in plant species in a created wetland from1999 to 2013 according to life cycle, origin, and plant type
Criterion Category Year
1999 2013
Life form Annual 1 (5.5%) 12 (24%)
Biennial 1 (5.5%) 9 (18%)
Perennial 16 (89.0%) 29 (58%)
Total 18 (100%) 50 (100%)
Origin Native plant 17 (94%) 43 (86%)
Non-native plant 1 (6%) 7 (14%)
Total 18 (100%) 50 (100%)
Plant type Obligate wetland (OBW) plant 11 (61%) 13 (26%)
Facultative wetland (FACW) plant 4 (22%) 15 (30%)
Facultative (FAC) plant – –
Facultative upland (FACU) plant – 5 (10%)
Obligate upland (OBU) plant 3 (17%) 17 (34%)
Total 18 (100%) 50 (100%)
Table 2 Water depth, diversity index, and wetland index for four sub-wetlands in 1999 and 2013
Wetland type Water depth (cm) Shannon diversity index Wetland index
1999 2013 1999 2013 1999 2013
Kidney-shaped wetland 80 50 0 1.3 100 83
Ditch 15 1 1.7 3.2 72 54
Ecological pond 75 70 2.5 3.1 97 73
Square wetland 10 0 0 2.8 0 64
Fig. 3 Relationships a between wetland index and diversity, b waterdepth and diversity, and c water depth and wetland index at thefour sub-wetlands
Son et al. Journal of Ecology and Environment (2018) 42:22 Page 5 of 8
square wetland was constructed for transitory storagewithout plants. Therefore, during the early stages of wet-land construction, the vegetation structure was simpleand controlled, with only a few species present.The vegetation composition at the ditch and square
wetland shifted prominently over the 15 years, and newvegetation was observed such as Carex spp., Phragmitesspp., and Salix spp. The size of floating vegetated islandsat the ecological pond became smaller, with only Irispseudacorus remaining. Scirpus radicans, Schoenoplectustabernaemontani, Zizania latifolia, T. angustifolia, andLythrum anceps had disappeared completely on thefloating vegetated islands in 2013. However, it is difficultto determine whether some plants died naturally, wereoutcompeted, or managed because they have not beenmonitored to observe succession for 14 years.In 2013, P. australis and T. angustifolia had spread
widely at both the ecological pond and the kidney-shaped wetland compared with 1999 (Fig. 2). Phragmitesaustralis is an aggressive colonizer of devastated sitesand, once established, is difficult to eliminate (Havens etal. 1997). In addition, the settlement and vegetativegrowth of this species are favored by sedimentation andshallow water depth (Moore et al. 1999). It is known thatT. angustifolia is dominant in shallow, organic sites withrelatively intense competition (Wilson and Keddy 1991)and has a high competitive ability due to taller shootsand a higher standing crop in early summer (Weiner1993). In 2013, in both the ditch and square wetland,Salix spp. were more dominant than in 1999. Vegetative
perennials such as Salix spp. require a longer time toexpand their canopy and must compete with fastergrowing herbs (Noon 1996). In oligotrophic to mesotro-phic wetlands, Salix spp. are generally established laterduring succession (Toivonen and Lappalainen 1980),and their establishment ensures the continued decline ofthe groundwater level, which diminishes and eventuallyterminates the succession of plant communities in theorder herbs, shrubs, and trees (Chen et al. 2006). Afterceasing water supply, the water depth was almost 0 inthe ditch and square wetland, where Salix spp. weredominant in 2013.
Wetland plants, diversity indices, and water depthThe main differences in species composition betweenthe four sub-wetlands might be due to alterations inwater depth and/or species planted following wetlandconstruction. Water depth plays an important role in thegrowth of emergent species since they can endure anoxicsoil conditions (van der Valk 1981). In addition, alter-ations in water depth influence light quality and quan-tity, and the ability of emergent plants to reach thesurface (Casanova and Brock 2000). Many species with-out tolerance to water stress find it difficult to establishin deep water, and only certain plants, including OBWand FACW species, can fully adapt to a wet environ-ment. As water depth decreases, upland plants (OBUand FACU) as well as wetland plants (OBW and FACW)can survive in different water depth ranges.
Fig. 4 Changes in importance value of wetland plants from 1999 to 2013 at the four sub-wetlands. ■, OBW (obligate wetland plant); ◆, FACW(facultative wetland plant); ▲, FACU (facultative upland plant); ●, OBU (obligate upland plant)
Son et al. Journal of Ecology and Environment (2018) 42:22 Page 6 of 8
Both OBW and FACW species are recognized as indi-cators of wetlands because these species are more oftenobserved in wetlands than in non-wetlands (Tiner 1991).During vegetation succession, the proportion of OBWplants apparently declined, while FACW, FACU, andOBU species increased (Table 1, Fig. 4). The portion ofwetland plants was reduced over time, but ~ 56%remained in 2013, demonstrating that the created wet-land performed the function of habitats for wetlandplants (Table 1). Under proper maintenance of waterdepth, created wetlands can greatly enhance biodiversity(Wiegleb et al. 2017).At lower water depth, upland species are likely to estab-
lish in created wetlands, and diversity indices rise as a con-sequence. The changes in diversity indices observed hereinsuggest that this artificial ecosystem continued to developand stabilize, in terms of terrestrialization, with sedimentdeposition and lower water depth (Table 2). Therefore, nat-urally introduced plant species exploit various ecologicalniches such as high and low ground, peripheral areas, andshallow and deep water (Pier et al. 2015).Although the diversity index at the kidney-shaped wet-
land in 1999 was the lowest, the wetland index was thehighest at this sub-wetland due to the abundance ofOBW species. It is possible that the relationship betweenwetland index and diversity was not significant (Fig. 3).The high diversity suggests that both wetland plants andvarious facultative and upland plants became establishedin the created wetlands. Therefore, the wetland index ofthe kidney-shaped wetland, which was influenced byOBW plants, mainly Typha angustifolia, was higher in1999 than any other sub-wetlands. Despite the high di-versity, in 2013, the wetland index of the ditch, whichcontained no more than 1 cm of water, was low, mainlydue to the abundance of upland species and fewer wet-land species. Consequently, the relationship betweenwetland index and diversity index is not always positive.
ConclusionCreated wetlands play a significant role in water qualityimprovement and habitat provision for flora and fauna. Inthis study, we compared vegetation structure and waterdepth in a created wetland over a 15-year period afterconstruction. Our results showed that total plant speciesincreased from 18 in 1999 to 50 in 2013, but diversity in-dices in the four sub-wetlands decreased following naturalsuccession. The proportion of wetland plants, includingOBW and FACW species, decreased from 83 to 56%,whereas values for upland plants, including OBU andFACU species, increased from 17 to 44%.Many natural wetland areas have been converted for
urban development or infrastructure to optimize economicoutputs (Ho and Richardson 2013), and this trend con-tinues. Without extensive scientific knowledge, wetland
rehabilitation may be inefficient and ineffective (Ortmann-Ajkai et al. 2018). To achieve greater biodiversity andwetland functions, heterogeneous environments must bemaintained in created wetlands, with emphasis on waterdepth, margin slope, and substrate type (Vivian-Smith1997; Shi et al. 2010).In the present study, we could not collect data on wet-
land environmental parameters such as sedimentation, ad-jacent seed source, substrate, water quality, and periodicalhydraulic cycle. In future studies, these factors should beintegrated for a better understanding of the complexitiesof wetland succession. Additionally, seasonal species com-position should be monitored, and the wetland should beconsidered not by itself, but in line with surrounding areasand conditions affecting wetland succession. Nevertheless,our current results provide baseline information on nat-ural succession in created wetlands, and insight into main-taining wetland functions.
Additional file
Additional file 1: Table S1. Changes in vegetation and importancevalue for the four sub-wetlands from 1999 to 2013. (DOCX 38 kb)
AbbreviationsCTWI: Community type wetland index; FAC: Facultative; FACU: Facultativeupland plant; FACW: Facultative wetland plant; OBU: Obligate upland;OBW: Obligate wetland
AcknowledgementsWe especially thank Josu G. Alday (Universitat de Lleida) for providing helpfulcomments to this paper. We also thank the anonymous reviewers.
Availability of data and materialsThe datasets are available from the corresponding author on reasonablerequest.
Authors’ contributionsDS conducted the field survey and wrote the manuscript. HL and KCconducted the field survey and examined the manuscript. JB conducted thefield survey and created the figures. OK participated in the design of the study.EL revised the manuscript. All authors read and approved the final manuscript.
Ethics approval and consent to participateNot applicable
Competing interestsThe authors declare that they have no competing interests.
Publisher’s NoteSpringer Nature remains neutral with regard to jurisdictional claims in publishedmaps and institutional affiliations.
Author details1School of Biological Sciences, Seoul National University, Seoul 08826, SouthKorea. 2National Institute of Ecology, Seocheon 33657, South Korea.3Department of Biological Sciences, Inha University, Incheon 22212, SouthKorea. 4Assum Ecological System INC, Anyang 14056, South Korea.
Son et al. Journal of Ecology and Environment (2018) 42:22 Page 7 of 8

Received: 31 August 2018 Accepted: 30 October 2018
ReferencesBaart I, Gschöpf C, Blaschke AP, Preiner S, Hein T. Prediction of potential
macrophyte development in response to restoration measures in an urbanriverine wetland. Aquat Bot. 2010;93:153–62.
Casanova MT, Brock MA. How do depth, duration and frequency of floodinginfluence the establishment of wetland plant communities? Plant Ecol.2000;147:237–50.
Chen Y-N, Zilliacus H, Li W-H, Zhang H-F, Chen Y-P. Ground-water level affectsplant species diversity along the lower reaches of the Tarim river, WesternChina. J Arid Environ. 2006;66:231–46.
Choi J-Y, Jang J-D, Jeong K-S, Joo G-J. Effects of habitat conditions in createdwetlands on sustaining wintering waterfowl in riverine plains, Nakdong River,South Korea. J. Ecol. Environ. 2015;38:343–52.
Choung Y, Lee WT, Cho K-H, Joo KY, Min BM, Hyun J-O, Lee KS. Categorizingvascular plant species occurring in wetland ecosystems of the KoreanPeninsula. Chuncheon: Center for Aquatic Ecosystem Restoration; 2012.
Choung Y, Lee WT, Cho K-H, Joo KY, Min BM, Hyun J-O, Lee KS, Lee K, Seo A. Statusof wetland vascular plant species in Korea. J Ecol Environ. 2015;38:541–4.
Chu YS, Cho H, Cho K-H. Response of vegetation to shoreline alternation in alarge reservoir. Ecol Resil Infrast. 2016;3:143–51 (in Korean).
Cole CA, Urban CA, Russo P, Murray J, Hoyt D, Brooks RP. Herbaceous plantcommunity composition in created wetlands over seven years in northernNew York, USA. Stud Hist Gard Des. 2013;33:235–47.
Coles-Ritchie MC, Roberts DW, Kershner JL, Henderson RC. Use of a wetlandindex to evaluate changes in riparian vegetation after livestock exclusion. JAm Water Resour As. 2007;43:731–43.
Hadad HR, Maine MA, Bonetto CA. Macrophyte growth in a pilot-scaleconstructed wetland for industrial wastewater treatment. Chemosphere.2006;63:1744–53.
Havens KJ, Priest I, Walter I, Berquist H. Investigation and long-term monitoring ofPhragmites australis within Virginia's constructed wetland sites. EnvironManag. 1997;21:599–605.
Ho M, Richardson CJ. A five year study of floristic succession in a restored urbanwetland. Ecol Eng. 2013;61:511–8.
Hsu C-B, Hsieh H-L, Yang L, Wu S-H, Chang J-S, Hsiao S-C, Su H-C, Yeh C-H, Ho Y-S, Lin H-J. Biodiversity of constructed wetlands for wastewater treatment.Ecol Eng. 2011;37:1533–45.
Kim C-H, Choi Y-E, Kim J-W, Myung H, Lee S-I. 3-year change of vegetation andlife form at the man-made wetland in Sinpyeoncheon city. Korean J EnvironEcol. 2011;25:57–64 (in Korean).
Kim C-H, Myung H. A 4-year follow-up survey of flora at the human-madewetlands along Boknaecheon of Juam Lake. J Korea Soc Environ RestorTechnol. 2008;11:25–37 (in Korean).
Kivaisi AK. The potential for constructed wetlands for wastewater treatment andreuse in developing countries: a review. Ecol Eng. 2001;16:545–60.
Lee TB. Coloured flora of Korea. Seoul: Hyang Mun Sa; 2003. (in Korean)Makkay K, Pick FR, Gillespie L. Predicting diversity versus community composition
of aquatic plants at the river scale. Aquat Bot. 2008;88:338–46.Mitsch WJ, Day JW. Restoration of wetlands in the Mississippi–Ohio–Missouri
(MOM) River Basin: experience and needed research. Ecol Eng. 2006;26:55–69.Mitsch WJ, Gosselink J. Wetlands. New York: John Wiley & Sons; 2000.Mitsch WJ, Zhang L, Anderson CJ, Altor AE, Hernández ME. Creating riverine
wetlands: ecological succession, nutrient retention, and pulsing effects. EcolEng. 2005;25:510–27.
Mitsch WJ, Zhang L, Stefanik KC, Nahlik AM, Anderson CJ, Bernal B, Hernandez M,Song K. Creating wetlands: primary succession, water quality changes, andself-design over 15 years. Bioscience. 2012;62:237–50.
Moore HH, Niering WA, Marsicano LJ, Dowdell M. Vegetation change in createdemergent wetlands (1988–1996) in Connecticut (USA). Wetl Ecol Manag.1999;7:177–91.
Noon KF. A model of created wetland primary succession. Landscape UrbanPlann. 1996;34:97–123.
Odland A, del Moral R. Thirteen years of wetland vegetation succession following apermanent drawdown, Myrkdalen Lake, Norway. Plant Ecol. 2002;162:185–98.
Ortmann-Ajkai A, Csicsek G, Hollós R, Magyaros V, Wágner L, Lóczy D. Twenty-years’ changes of wetland vegetation: effects of floodplain-level threats.Wetlands. 2018;38:591–604.
Park SH. New illustrations and photographs of naturalized plants of Korea. Seoul:Ilchokak Publishing Co. Ltd.; 2009. (in Korean)
Pier B, Dresser B, Lee J, Boylen C, Nierzwicki-Bauer S. Ecological analysis beforeand after planting in a constructed wetland in the Adirondacks. Wetlands.2015;35:611–24.
Rea N, Ganf GG. How emergent plants experience water regime in aMediterranean-type wetland. Aquat Bot. 1994;49:117–36.
Schlising RA, Sanders EL. Quantitative analysis of vegetation at the Richvalevernal pools, California. Am J Bot. 1982:734–42.
Shannon CE, Weaver W. The mathematical theory of communication. Illinois:University of Illinois press; 1949.
Shi J, Ma K, Wang J, Zhao J, He K. Vascular plant species richness on wetlandremnants is determined by both area and habitat heterogeneity. BiodiversConserv. 2010;19:1279–95.
Son D, Lee H, Lee EJ, Cho K-H, Kwon D. Flora and vegetation structure in a 15-year-old artificial wetland. Ecol Resil Infrast. 2015;2:54–63 (in Korean).
Tiner RW. The concept of a hydrophyte for wetland identification. Bioscience.1991;41:236–47.
Toivonen H, Lappalainen T. Ecology and production of aquatic macrophytes inthe oligotrophic, mesohumic lake Suomunjärvi, eastern Finland. Ann BotFennici. 1980;17:69–85.
Van der Valk A. Succession in wetlands: a Gleasonian approach. Ecology. 1981;62:688–96.
Vivian-Smith G. Microtopographic heterogeneity and floristic diversity inexperimental wetland communities. J Ecol. 1997;85:71–82.
Vymazal J. Plants in constructed, restored and created wetlands. Ecol Eng.2013;61:501–4.
Weiner SE. Long-term competitive displacement of Typha latifolia by Typhaangustifolia in a eutrophic lake. Oecologia. 1993;94:451–6.
Wiegleb G, Dahms H-U, Byeon W, Choi G. To what extent can constructedwetlands enhance biodiversity? Int J Environ Sci Dev. 2017;8:561–9.
Wilson SD, Keddy PA. Competition, survivorship and growth in macrophytecommunities. Freshw Biol. 1991;25:331–7.
Son et al. Journal of Ecology and Environment (2018) 42:22 Page 8 of 8