Forest floor mass, litterfall and nutrient return in Central Himalayan high altitude forests
16
Vegetatio 120: 33--48, 1995. 33 (~) 1995 Kluwer Academic Publishers. Printed in Belgium. Forest floor mass, litterfall and nutrient return in Central Himalayan high altitude forests S. C. Garkoti & S. E Singh Department of Botany, Kumaun University, Naini Tal - 263002, India Accepted5 April 1995 Key words: High elevation, Litter production, Turnover rate, Nutrient content, Nutrient use efficiency Abstract Dynamics of forest floor biomass, pattern of litter fall and nutrient return in three central Himalayan high elevation forests are described. Fresh and partially decomposed litter layer occur throughout the year. In maple and birch the highest leaf litter value was found in October and in low-rhododendron in August. The relative contribution of partially and more decomposed litter to the total forest floor remains greatest the year round. The total calculated input of litter was 627.7 g m -2 yr -1 for maple, 477.87 g m -2 yr -1 for birch and 345.9 g m -2 yr -1 for low- rhododendron forests. 49-61% of the forest floor was replaced per year with a subsequent turnover time of 1.6-2.0 yr. The annual nutrient return through litter fall amounted to (kg ha -1 yr -l) 25.5-56.1 N, 2.0-5.4 P and 9.9-23.3 K. The tree litter showed an annual replacement of 26-54% for different nutrients and it decreased towards higher elevation. The nutrient use efficiency in terms of litter produced per unit of nutrient was higher in present study compared to certain mid- and high-elevation forests of the central Himalaya. Introduction Litter fall represents an essential flow in organic production-decomposition cycles and is, in many ways a fundamental ecosystem process (Meentemeyer et al. 1982). It is one of the most important pathways through which nutrients are returned to the forest floor. Litter on the forest floor affects the moisture status, run-off pattern, and nutritional characters of the land. A considerable amount of data on aboveground lit- ter production exists for various parts of the world (Bray and Gorham 1964; Bonger et al. 1985; Klinge and Herrera 1983; Meentemeyer et al. 1982; Proc- tor 1983). The studies carried out in forests occur- ring at relatively low elevation of central Himalaya (300-2200 m) indicated faster turnover of litter nutri- ents than in temperate forests (Singh and Singh 1992). Moderate winters in tropical latitudes, and high rel- ative humidity and moist conditions are suggested to be some of the main reasons of rapid decomposition in these forests. We have studied three representative forest types (maple at 2750 m, birch at 3150 m and low- rhododendron at 3300 m) occurring in high elevations of central Himalaya with the main objectives of exam- ining how these forests differ from their counterparts in temperate latitudes and forests in low elevations in central Himalaya in relation to the dynamics of the forest floor, litter fall and nutrient return. On the basis of existing information we expect that though decline in temperature towards higher elevation would retard the litter turnover, the more favourable water balance due to higher precipitation effectiveness throughout the growing season (see MUller 1982) would compensate for the adverse effect of temperature. Material and methods Description of study area Three high elevation forests (viz.; maple, birch and low-rhododendron) were selected for litter fall and nutrient return estimation. The study sites are locat- ed in the northeastern part of the Central Himalaya between 79°401E and 80°501E long. and 30 ° 17'N and
Transcript of Forest floor mass, litterfall and nutrient return in Central Himalayan high altitude forests
Vegetatio 120: 33--48, 1995. 33 (~) 1995 Kluwer Academic Publishers. Printed in Belgium.
Forest floor mass, litterfall and nutrient return in Central Himalayan high altitude forests
S. C. Garkoti & S. E Singh Department o f Botany, Kumaun University, Naini Tal - 263002, India
Accepted 5 April 1995
Key words: High elevation, Litter production, Turnover rate, Nutrient content, Nutrient use efficiency
Abstract
Dynamics of forest floor biomass, pattern of litter fall and nutrient return in three central Himalayan high elevation forests are described. Fresh and partially decomposed litter layer occur throughout the year. In maple and birch the highest leaf litter value was found in October and in low-rhododendron in August. The relative contribution of partially and more decomposed litter to the total forest floor remains greatest the year round. The total calculated input of litter was 627.7 g m -2 yr -1 for maple, 477.87 g m -2 yr -1 for birch and 345.9 g m -2 yr -1 for low- rhododendron forests. 49-61% of the forest floor was replaced per year with a subsequent turnover time of 1.6-2.0 yr. The annual nutrient return through litter fall amounted to (kg ha -1 yr - l ) 25.5-56.1 N, 2.0-5.4 P and 9.9-23.3 K. The tree litter showed an annual replacement of 26-54% for different nutrients and it decreased towards higher elevation. The nutrient use efficiency in terms of litter produced per unit of nutrient was higher in present study compared to certain mid- and high-elevation forests of the central Himalaya.
Introduction
Litter fall represents an essential flow in organic production-decomposition cycles and is, in many ways a fundamental ecosystem process (Meentemeyer et al. 1982). It is one of the most important pathways through which nutrients are returned to the forest floor. Litter on the forest floor affects the moisture status, run-off pattern, and nutritional characters of the land.
A considerable amount of data on aboveground lit- ter production exists for various parts of the world (Bray and Gorham 1964; Bonger et al. 1985; Klinge and Herrera 1983; Meentemeyer et al. 1982; Proc- tor 1983). The studies carried out in forests occur- ring at relatively low elevation of central Himalaya (300-2200 m) indicated faster turnover of litter nutri- ents than in temperate forests (Singh and Singh 1992). Moderate winters in tropical latitudes, and high rel- ative humidity and moist conditions are suggested to be some of the main reasons of rapid decomposition in these forests. We have studied three representative forest types (maple at 2750 m, birch at 3150 m and low- rhododendron at 3300 m) occurring in high elevations
of central Himalaya with the main objectives of exam- ining how these forests differ from their counterparts in temperate latitudes and forests in low elevations in central Himalaya in relation to the dynamics of the forest floor, litter fall and nutrient return. On the basis of existing information we expect that though decline in temperature towards higher elevation would retard the litter turnover, the more favourable water balance due to higher precipitation effectiveness throughout the growing season (see MUller 1982) would compensate for the adverse effect of temperature.
Material and methods
Description o f study area
Three high elevation forests (viz.; maple, birch and low-rhododendron) were selected for litter fall and nutrient return estimation. The study sites are locat- ed in the northeastern part of the Central Himalaya between 79°401E and 80°501E long. and 30 ° 17'N and
34
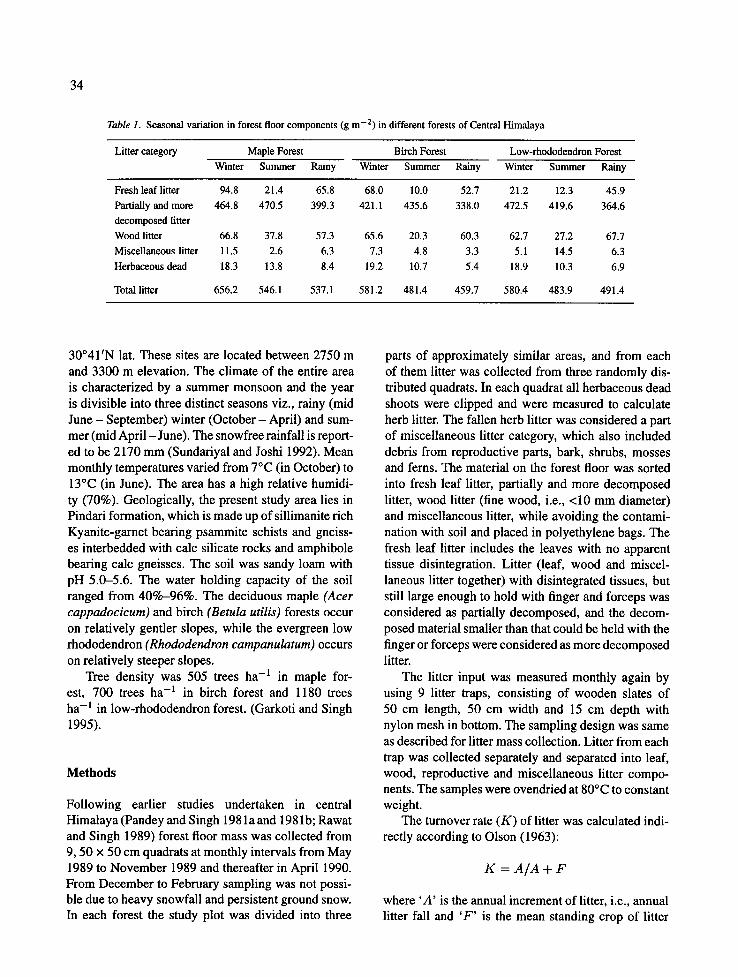
Table 1. Seasonal variation in forest floor components (g m -2) in different forests of Central Himalaya
Litter category Maple Forest Birch Forest Low-rhododendron Forest Winter Summer Ra iny Winter Summer Ra iny Winter Summer Rainy
Fresh leaf litter 94.8 21.4 65.8 68.0 10.0 52.7 21.2 12.3 45.9 Partially and more 464 .8 470.5 399.3 421.1 435.6 338.0 472.5 419.6 364.6 decomposed litter Wood litter 66.8 37.8 57.3 65.6 20.3 60.3 62.7 27.2 67.7 Miscellaneous litter 11.5 2.6 6.3 7.3 4.8 3.3 5.1 14.5 6.3 Herbaceous dead 18.3 13.8 8.4 19.2 10.7 5.4 18.9 10.3 6.9
Total litter 656.2 546.1 537.1 581.2 481.4 459.7 580.4 483.9 491.4
30°41'N lat. These sites are located between 2750 m and 3300 m elevation. The climate of the entire area is characterized by a summer monsoon and the year is divisible into three distinct seasons viz., rainy (mid June - September) winter (October - April) and sum- mer (mid April - June). The snowfree rainfall is report- ed to be 2170 mm (Sundariyal and Joshi 1992). Mean monthly temperatures varied from 7°C (in October) to 13°C (in June). The area has a high relative humidi- ty (70%). Geologically, the present study area lies in Pindari formation, which is made up of sillimanite rich Kyanite-garnet bearing psammite schists and gneiss- es interbedded with calc silicate rocks and amphibole bearing calc gneisses. The soil was sandy loam with pH 5.0-5.6. The water holding capacity of the soil ranged from 40%-96%. The deciduous maple (Acer cappadocicum) and birch (Betula utilis) forests occur on relatively gentler slopes, while the evergreen low rhododendron (Rhododendron campanulatum ) occurs on relatively steeper slopes.
Tree density was 505 trees ha -1 in maple for- est, 700 trees ha -1 in birch forest and 1180 trees ha -1 in low-rhododendron forest. (Garkoti and Singh 1995).
M e ~ o ~
Following earlier studies undertaken in central Himalaya (Pandey and Singh 198 la and 198 lb; Rawat and Singh 1989) forest floor mass was collected from 9, 50 x 50 cm quadrats at monthly intervals from May 1989 to November 1989 and thereafter in April 1990. From December to February sampling was not possi- ble due to heavy snowfall and persistent ground snow. In each forest the study plot was divided into three
parts of approximately similar areas, and from each of them litter was collected from three randomly dis- tributed quadrats. In each quadrat all herbaceous dead shoots were clipped and were measured to calculate herb litter. The fallen herb litter was considered a part of miscellaneous litter category, which also included debris from reproductive parts, bark, shrubs, mosses and ferns. The material on the forest floor was sorted into fresh leaf litter, partially and more decomposed litter, wood litter (fine wood, i.e., <10 mm diameter) and miscellaneous litter, while avoiding the contami- nation with soil and placed in polyethylene bags. The fresh leaf litter includes the leaves with no apparent tissue disintegration. Litter (leaf, wood and miscel- laneous litter together) with disintegrated tissues, but still large enough to hold with finger and forceps was considered as partially decomposed, and the decom- posed material smaller than that could be held with the finger or forceps were considered as more decomposed litter.
The litter input was measured monthly again by using 9 litter traps, consisting of wooden slates of 50 cm length, 50 cm width and 15 cm depth with nylon mesh in bottom. The sampling design was same as described for litter mass collection. Litter from each trap was collected separately and separated into leaf, wood, reproductive and miscellaneous litter compo- nents. The samples were ovendried at 80°C to constant weight.
The turnover rate (K) of litter was calculated indi- rectly according to Olson (1963):
K = A / A + F
where 'A ' is the annual increment of litter, i.e., annual litter fall and ' F ' is the mean standing crop of litter
t~ o~
6
7
o
N
r - ~ c 5 ~ c5
~ . ~ . ~ o. e-.
¢',1
o 6 d ~ t rq
o . ~ . ~ o. ~.
t'q
• - ~ =
- d
O
I
J
O z
(annual averaged across months). Turnover time (t) is the reciprocal of the turnover rate t = 1/k.
For each of the litter components (i.e., leaf, wood, etc.) nutrient concentration of litter was determined separately. For each of the components material col- lected in different months was mixed thoroughly to pre- pare a composite sample, which was divided into three parts, and analysed separately. Nitrogen concentra- tion was determined with N-auto analyzer. Phosphorus
35
was estimated colorimetrically. Potassium content was determined by flame photometry (Jackson 1958).
The nutrient concentration was multiplied by the weight of annual litter fall to compute the amounts of nutrients transferred to the forest floor. The nutrient use efficiency (NUE, Vitousek 1984; Lugo 1992) was calculated as the ratio of mass fall to nutrient in mass fall of a forest.
Results
Forest floor litter mass
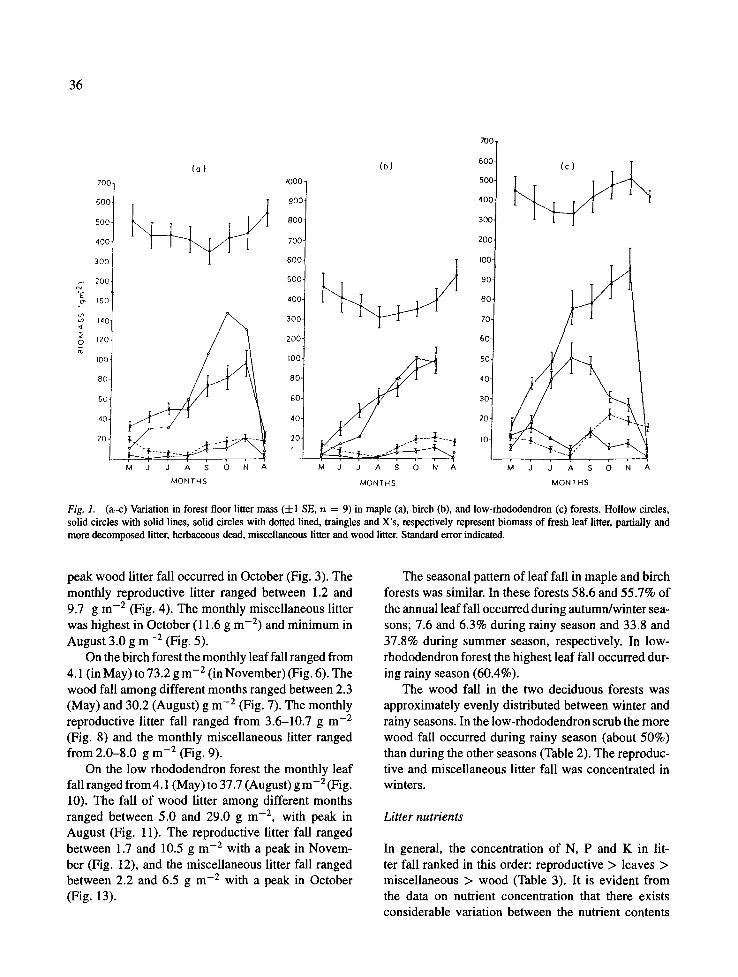
The maximum monthly fresh leaf litter mass declined uniformly and steeply with rise in elevation from 147.0 g m -2 in maple forest (in October) to 100.3 g m -2 in birch forest (in October) and 50.9 g m -2 in low- rhododendron forest (in August), whereas the min- imum monthly values were similar and very small (5.2-7.0 g m -2, Fig. la--c). Seasonal biomass of fresh leaf litter varied between 21.4-94.8 g m -2 in maple, 10.0-68.0 g m -2 in birch and 12.3--45.9 g m -2 in low- rhododendron forests (Table 1). Across the months in the standing crop of partially and more decomposed litter ranged from 352.5 to 538.4 g m -2 in maple for- est 313.6 to 518.4 g m -2 in birch forest and from 335.0 to 449.2 g m -2 in low-rhododendron scrub (Fig. l a - c).
The woody litter on all sites peaked in November and was similar (95.8-97.0 g m-2). The miscellaneous litter occurred with similar ranges (2.9-19.8; 1.4-11.8 and 1.6-16.7 g m -2, respectively in maple, birch and low-rhododendron forests). The herbaceous dead shoot mass was relatively small (Fig. la-c).
Litter fall
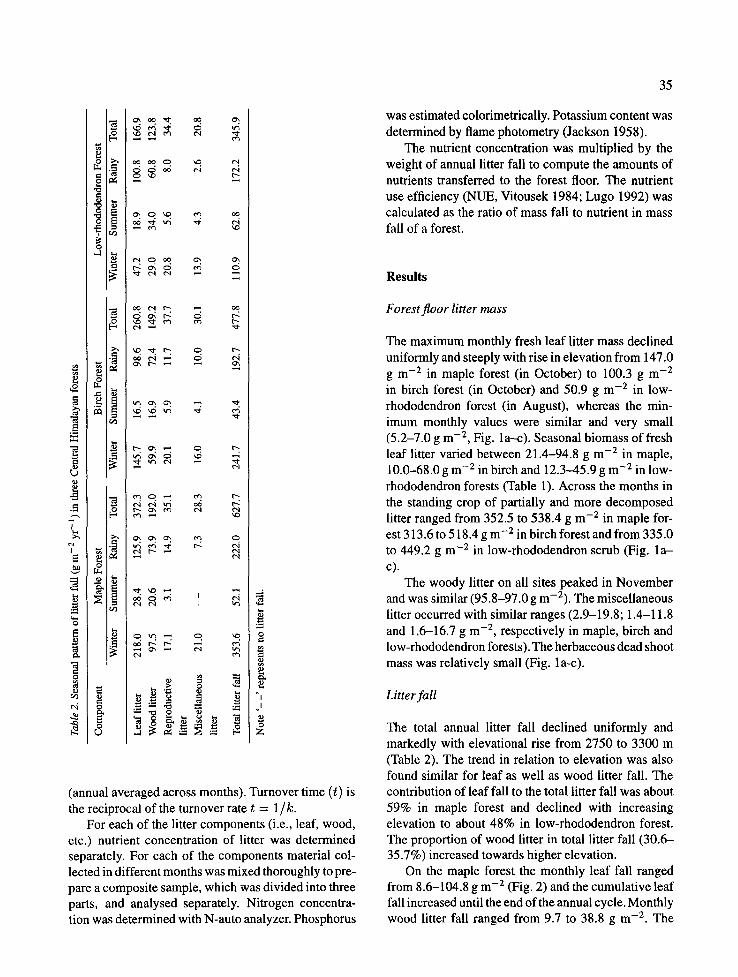
The total annual litter fall declined uniformly and markedly with elevational rise from 2750 to 3300 m (Table 2). The trend in relation to elevation was also found similar for leaf as well as wood litter fall. The contribution of leaf fall to the total litter fall was about 59% in maple forest and declined with increasing elevation to about 48% in low-rhododendron forest. The proportion of wood litter in total litter fall (30.6- 35.7%) increased towards higher elevation.
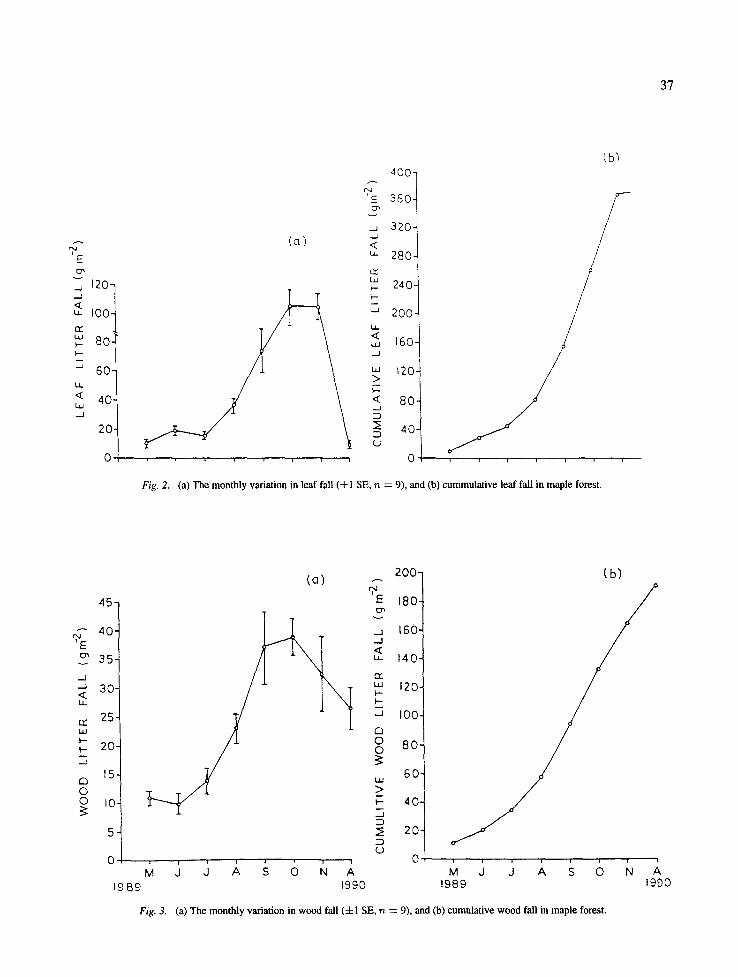
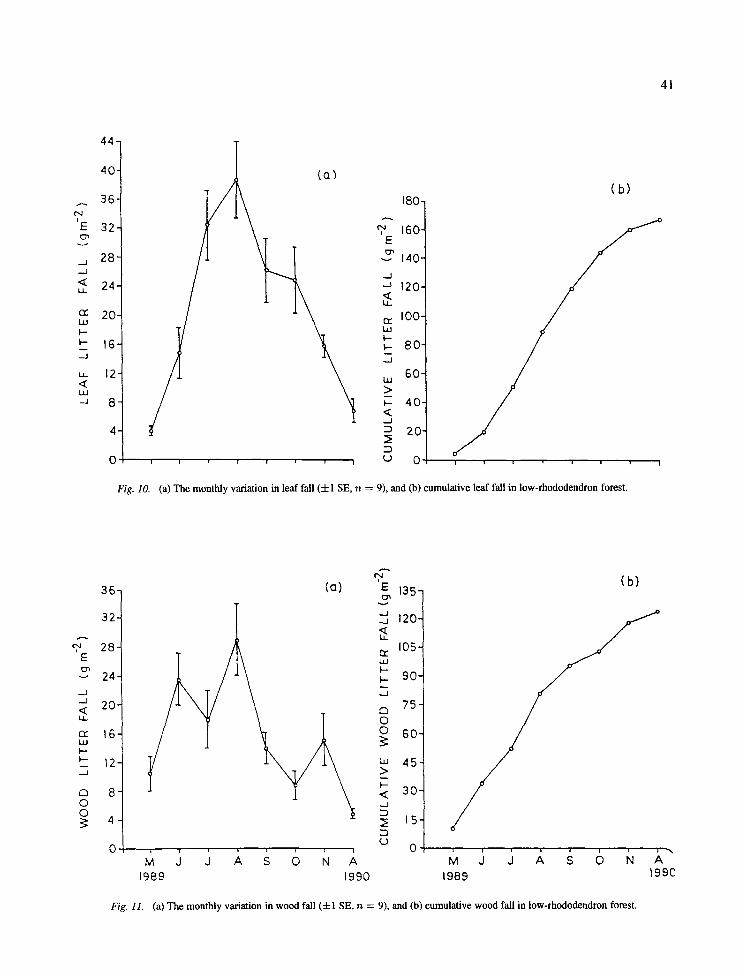
On the maple forest the monthly leaf fall ranged from 8.6-104.8 g m -2 (Fig. 2) and the cumulative leaf fall increased until the end of the annual cycle. Monthly wood litter fall ranged from 9.7 to 38.8 g m -2. The
'E
,<
O
MONTHS MONTHS
700
6 0 0
5OO
4OO-
300
200
~60
140
120
IOO
80.
60-
40-
20-
(a)
I000
900
800
700-
600-
500-
400-
(b)
300-
200-
60
t 0
20
M J J A S O N A M J J A S O N A , , , , . , ,
M J J A S O
MONTHS
700
6OO-
500-
4OO-
30O
2OO
IOO
90.
80,
70-
60-
50
4O
3O
20-
IO
36
Fig. 1. (a-c) Variation in forest floor litter mass (4-1 SE, n = 9) in maple (a), birch (b), and low-rhododendron (c) forests. Hollow circles, solid circles with solid lines, solid circles with dotted lined, traingles and X's, respectively represent biomass of fresh leaf litter, partially and more decomposed litter, herbaceous dead, miscellaneous litter and wood litter. Standard error indicated.
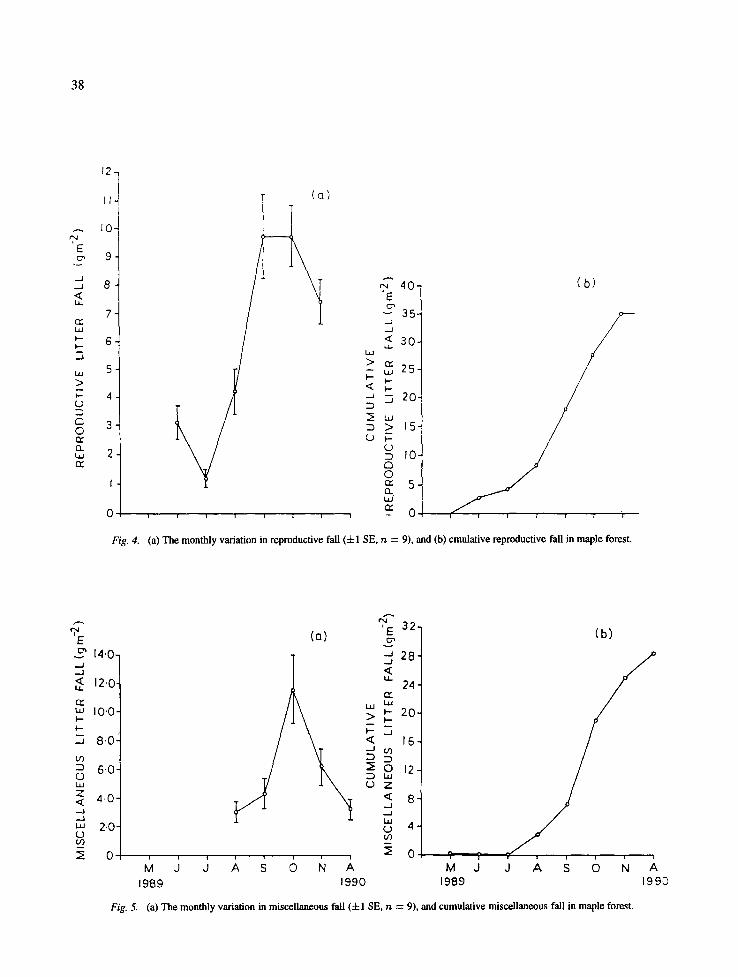
peak wood litter fall occurred in October (Fig. 3). The monthly reproductive litter ranged between 1.2 and 9.7 g m -2 (Fig. 4). The monthly miscellaneous litter was highest in October (11.6 g m -2) and minimum in August 3.0 g m -2 (Fig. 5).
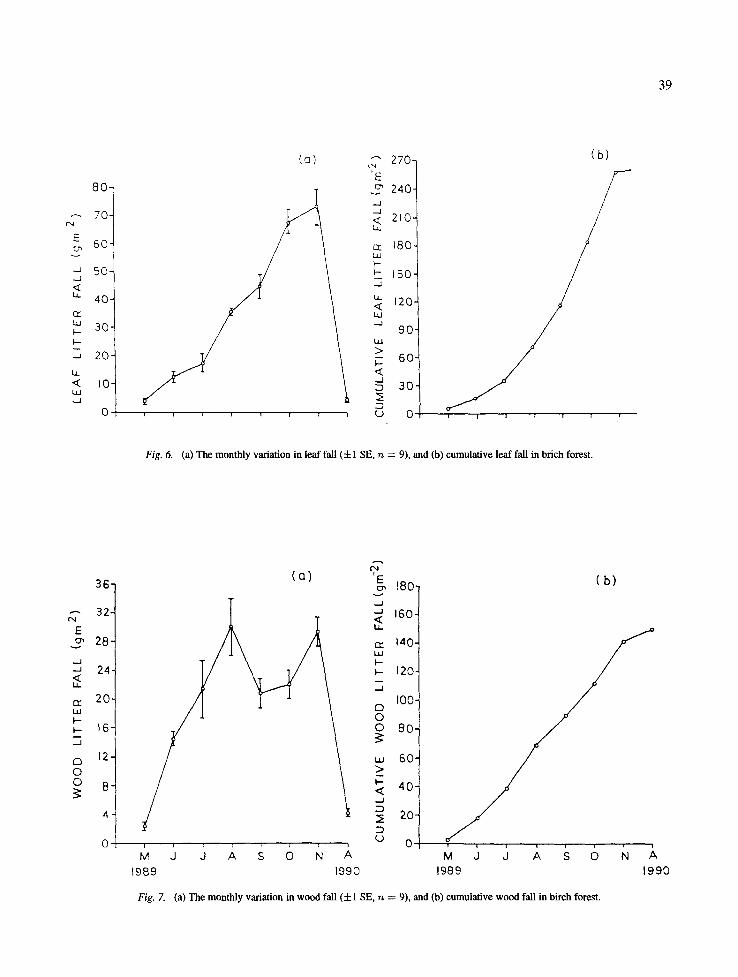
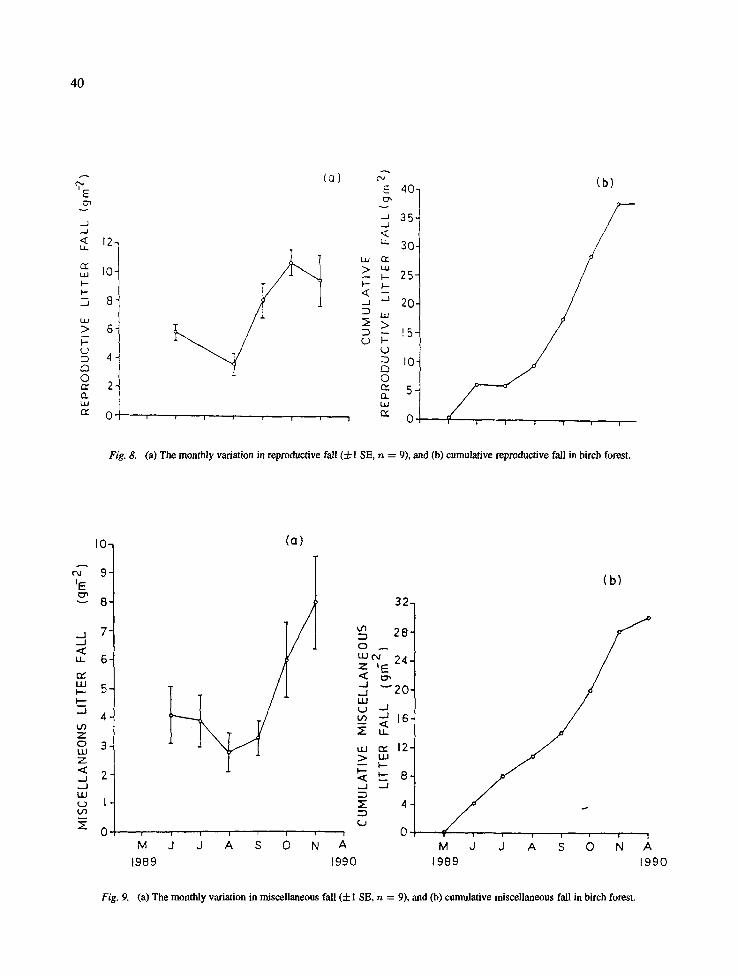
On the birch forest the monthly leaf fall ranged from 4.1 (in May) to 73.2 g m -2 (in November) (Fig. 6). The wood fall among different months ranged between 2.3 (May) and 30.2 (August) g m -2 (Fig. 7). The monthly reproductive litter fall ranged from 3.6-10.7 g m -2 (Fig. 8) and the monthly miscellaneous litter ranged from 2.0-8.0 g m -2 (Fig. 9).
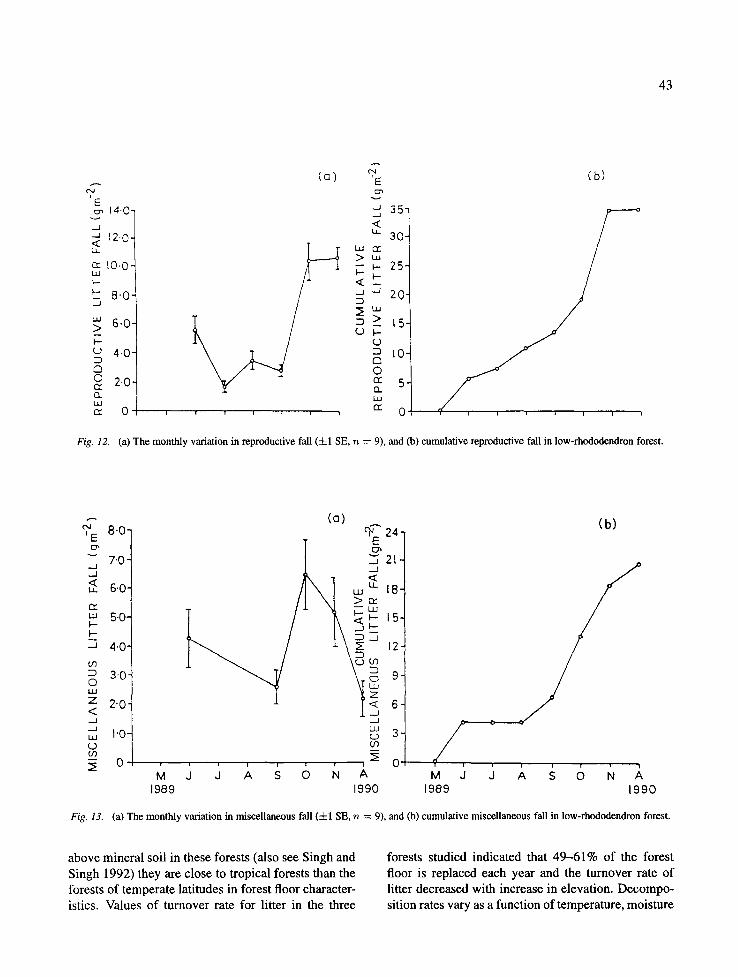
On the low rhododendron forest the monthly leaf fall ranged from 4.1 (May) to 37.7 (August) g m -2 (Fig. 10). The fall of wood litter among different months ranged between 5.0 and 29.0 g m -2, with peak in August (Fig. 11). The reproductive litter fall ranged between 1.7 and 10.5 g m -2 with a peak in Novem- ber (Fig. 12), and the miscellaneous litter fall ranged between 2.2 and 6.5 g m -2 with a peak in October (Fig. 13).
The seasonal pattern of leaf fall in maple and birch forests was similar. In these forests 58.6 and 55.7% of the annual leaf fall occurred during autumn/winter sea- sons; 7.6 and 6.3% during rainy season and 33.8 and 37.8% during summer season, respectively. In low- rhododendron forest the highest leaf fall occurred dur- ing rainy season (60.4%).
The wood fall in the two deciduous forests was approximately evenly distributed between winter and rainy seasons. In the low-rhododendron scrub the more wood fall occurred during rainy season (about 50%) than during the other seasons (Table 2). The reproduc- tive and miscellaneous litter fall was concentrated in winters.
Litter nutrients
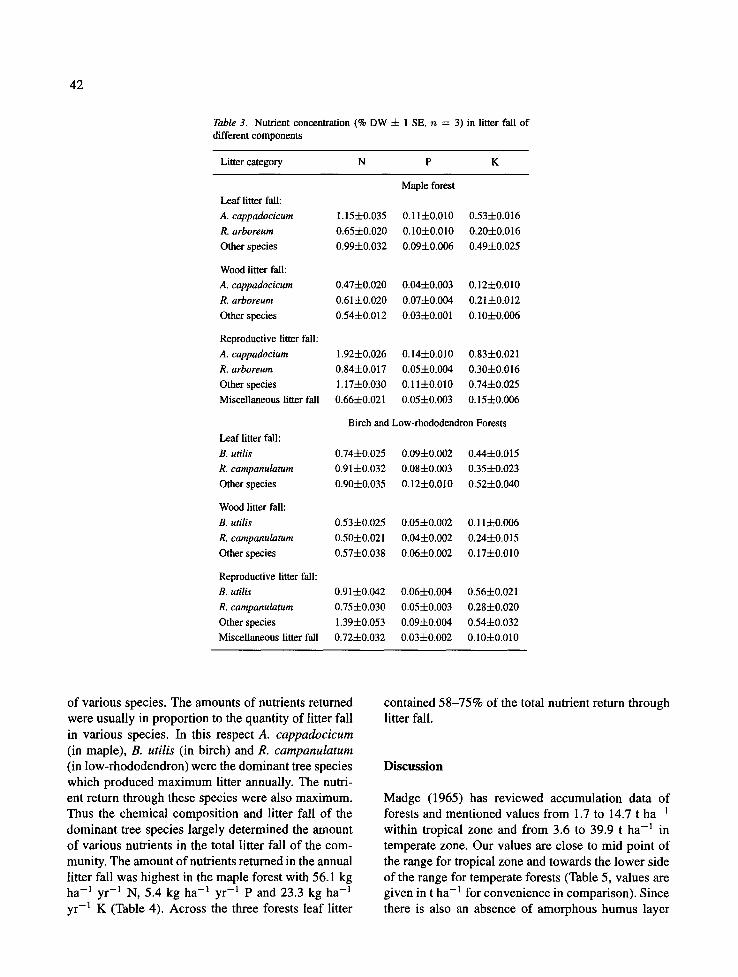
In general, the concentration of N, P and K in lit- ter fall ranked in this order: reproductive > leaves > miscellaneous > wood (Table 3). It is evident from the data on nutrient concentration that there exists considerable variation between the nutrient contents
37
E
.._1
< kL
"3
i ,
< k~
-.1
120-
I 00 "
801
6 0 -
40 '
20"
0
400 - < -
'E 360 - C~
320-
" 280- t Z L,IJ
240-
~ 2 0 0 - I.,i_ < ,,, 160- J
' " 120- _> I.---
< 80. J
~: 4 0 - 23 (..J
i i i 0
( b l
1 1 1 I I I 1
Fig. 2. (a) The monthly variation in leaf fall (4-1 SE, n ---- 9), and (b) cummulative leaf fall in maple forest.
v
_ J ._1 < I i
r.r' t,t I , - F-.- -q
r~ 0 0
45-
40-
35-
3 0
25 -
20 -
15-
10-
5
0
1 9 8 9
{b ) 2 0 0 - (a)
q~E 180.
-- 160. . . J < t, 140 '
i
5 12o' - i lO0-
i 80 -
,,, 6 0 -
>_ __ 40- _ J
20 - E3
i i i 0 i i 1 i !
M j ,J A ~ b . ~, M J J A S b 1990 1989
i i
N A 1990
Fig. 3. (a) The monthly variation in wood fall (4-1 SE, rz ----- 9), and (b) cumulative wood fall in maple forest.
38
fit E C7 '
. - J . J < h
r¢ i , i
I . - - I . - -
.._1
i , i
> I - -
o
O G hi
12-
t l -
10 -
9
8
7
6
5
4
3
2
I
0 I I I
( a )
4 0 - 'E o',
35- . _ J
< 3 0 . , t
LI..I
>52s. 7 : ~ "3 20"
D > 15-
(o D 10- (:3 O c,, 5 - ch i..d
"" 0
( b )
t i i i i i i
Fig. 4. (a) The monthly variation in reproductive fall (-4-1 SE, n = 9), and (b) cmulative reproductive fall in maple forest.
E 14.0-
. - , I , , . J
~ 12.o.
m I0 ' 0 . I---
I---
. J 8"0"
CO
D 6.0. o I L l
z < 4-0" ._J
.J
"' 2.0' o to m
0
(a) '~E 32.
v
" 2 8 " , , J
<
u. 24 .
t.u I~ > ~ 20 .
I - - - - I
< 16 .
~0 12 :~ ua o z
< 8 . J . . J
o 4 V )
i l l
M J J A ; 6 . ~ M J ,989 ,99o ,989
( b )
• l i i i i
J A S O N A 1990
Fig. 5. (a) The monthly variation in miscellaneous fall (4-1 SE, rt = 9), and cumulative miscellaneous fall in maple forest.
39
E
. . J d
t ,
Q:: I..u
I-.- I - -
...J
LI_
< t .~ d
8O
60
5 0 -
40 -
30"
20"
10-
0
( a ) ~ 2 7 0 -
2 4 0 : . . . ] ...J <~ 210 - L,t.
c~ 180-
I-- 150 -
u_ 120- U.I
-J 9 0 - I11
~_ 6 o .
. . . I ~ 3 0 -
. . . . . , , ~ ~ 0
(b)
i I i i i i ,
Fig. 6. (a) The monthly variation in leaf fall ( + 1 SE, n = 9), and (b) cumulative leaf fall in brich forest.
I'M
E v
-i < kl_
I - -
_..I
O O
36.
32-
28"
24'
20 '
12-
8 -
4 -
o
t"Nl
Ca) 'E t~ !80'
v ,,_I
160. ,< l . , l .
r,¢ 140. lad
I - -
F 120. -3
100.
O o 8O.
,,, 60. >_
4 0 ' ,< ,,.,J
~; 20.
¢,.) 0 i i i !
M J J A S 0 N A 1989 1990
( b )
i i i i i t l !
M J O A S O N A 1988 1990
Fig. 7. (a) The monthly variation in wood fall (4-1 SE, n = 9), and (b) cumulative wood fall in birch forest.
(o]
12-
I0 -
8
6
4
2
0
10-
(b)
>
< ._J
0
I I I I l " J I !
E 40 -
--J 3 5 - <
~" 30 -
25 - I-- -1
20-
- 15- b-
~ I 0 -
©
n lad
. , J ,.,J
< ii
e'x" LU
I- l- ._J
ILl >
%..,
C3 0
UJ ¢-¢
Fig. 8. (a) The monthly variation in reproductive fall (+1 SE, n = 9), and (b) cumulative reproductive fall in birch forest.
i
M
1989
ea 9 - 115
v 8 -
7- ._J ,< u.. 6 - r,- uJ
5" m .,,.J
4 - U O
z o 3 - u.J z ,< ..j 2 ,.J uJ
( 2 3
T ! I I I I |
M d J A S 0 N A 1989 1990
(a]
32-
28- 0
uJ ~ 2 4 -
.,,1 . ~ 2 0 -
m 16-
m ~ 12- ~. ua
< ,.- 8 - ,.-I ,,-J
3r 4 - :D
i i " ' i ' ~ i ~' / 0
J J A S 0 N A
1990
(b )
4 0
Fig. 9. (a) The monthly variation in miscellaneous fall (4-1 SE, n = 9), and (b) cumulative miscellaneous fall in birch forest.
41
'IE
, J
< i i
pr W
I-- I,-
.5
i i i
_ J
44-
40 j
36 ~
32-
28-
24-
20-
16-
12-
8
4
0
Fig. I0.
(o)
,N E I:7",
v
,--I J
14.
r r I,,,IJ
I,,- I,,-
J
h i
>
,,¢ - , J :D
:3 U i
180-
160-
140"
120-
100-
80"
60-
40-
20"
0
(b)
t i J i l l i
(a) The monthly variation in leaf fall (4-1 SE, n = 9), and (b) cumulative leaf fall in low-rhododendron forest.
~ 4 i
E
36-
32-
28-
v 24- J
" 20" i i
cr 16- i , i
I - -
_ 12- . . d
C3 8 0 0 N 4
0
(o) 'E t35 -
~ 120-
~ 105-
90- :'q
75-
~ 60-
~ 45 v- < 30
~ 15-
£)
MJ 3 k s o . k 1 9 8 9 1 9 9 0
(b )
M J J A ~ 6 ~ ,k" 1 9 8 9 1 9 9 0
Fig. 11. (a) The monthly variation in wood fall (+1 SE, n = 9), and (b) cumulative wood fall in low-rhododendron forest.
42
Table 3. Nutrient concentration (% DW 4- 1 SE, n = 3) in litter fall of different components
Litter category N P K
Leaf litter fall:
A. cappadocicum
R. arboreum
Other species
Wood litter fall:
A. cappadoc&um
R. arboreum
Other species
Reproductive litter fall:
A. cappadocium
R. arboreum
Other species
Miscellaneous litter fall
Leaf litter fall:
B. utilis R. campanulatum
Other species
Wood litter fall:
B. utilis
R. campanulatum
Other species
Reproductive litter fall:
B. utilis
R. campanulatum
Other species
Miscellaneous litter fall
Maple forest
1.154-0.035 0.114-0.010 0.534-0.016
0.654-0.020 0.104-0.010 0.204-0.016
0.994-0.032 0.094-0.006 0.494-0.025
0.474-0.020 0.044-0.003 0.124-0.010
0.614-0.020 0.074-0.004 0.214-0.012
0.544-0.012 0.034-0.001 0.104-0.006
1.924-0.026 0.144-0.010 0.834-0.021
0.844-0.017 0.054-0.004 0.304-0.016
1.174-0.030 0.114-0.010 0.74-4-0.025
0.664-0.021 0.054-0.003 0.154-0.006
Birch and Low-rhododendron Forests
0.744-0.025 0.094-0.002 0.444-0.015
0.914-0.032 0.084-0.003 0.354-0.023
0.904-0.035 0.124-0.010 0.52-4-0.040
0.534-0.025 0.054-0.002 0.114-0.006
0.504-0.021 0.044-0.002 0.244-0.015
0.574-0.038 0.064-0.002 0.174-0.010
0.914-0.042 0.064-0.004 0.564-0.021
0.754-0.030 0.054-0.003 0.284-0.020
1.394-0.053 0.094-0.004 0.544-0.032
0.724-0.032 0.034-0.002 0.104-0.010
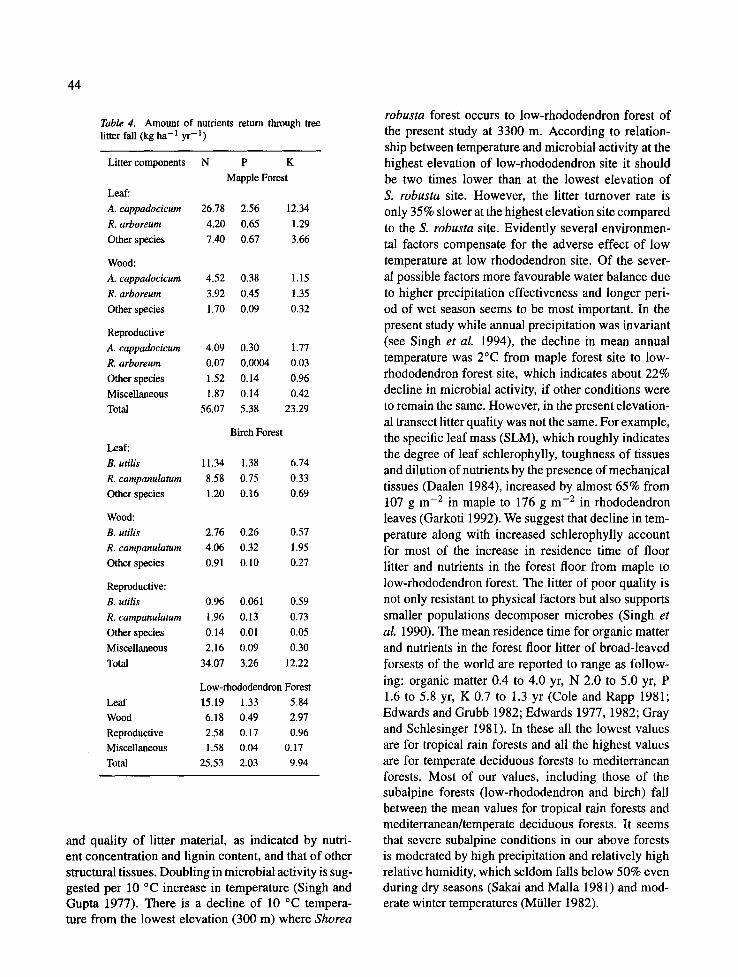
of various species. The amounts of nutrients returned were usually in proportion to the quantity of litter fall in various species. In this respect A. cappadocicum (in maple), B. utilis (in birch) and R. campanulatum (in low-rhododendron) were the dominant tree species which produced maximum litter annually. The nutri- ent return through these species were also maximum. Thus the chemical composition and litter fall of the dominant tree species largely determined the amount of various nutrients in the total litter fall of the com- munity. The amount of nutrients returned in the annual litter fall was highest in the maple forest with 56.1 kg ha -1 yr - t N, 5.4 kg ha -1 yr -1 P and 23.3 kg ha - l yr -1 K (Table 4). Across the three forests leaf litter
contained 58-75% of the total nutrient return through litter fall.
Discussion
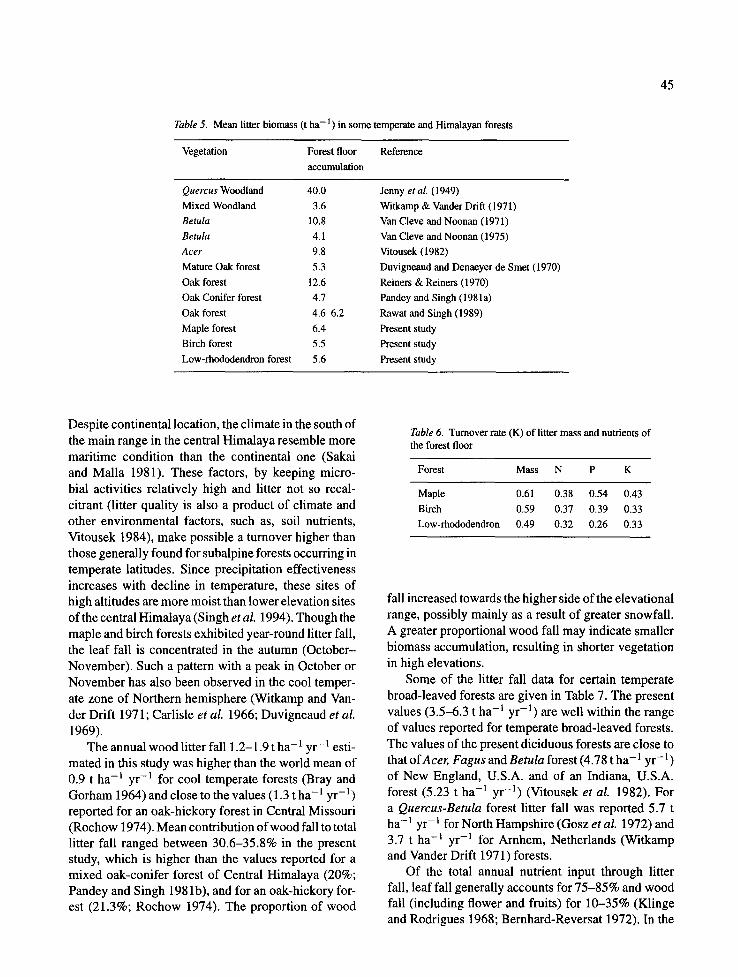
Madge (1965) has reviewed accumulation data of forests and mentioned values from 1.7 to 14.7 t ha - t within tropical zone and from 3.6 to 39.9 t ha -1 in temperate zone. Our values are close to mid point of the range for tropical zone and towards the lower side of the range for temperate forests (Table 5, values are given in t ha- 1 for convenience in comparison). Since there is also an absence of amorphous humus layer
(b)
'E 14"0-
. .d
12"0- < LL
c~ IO'O" I..IA
L 8 ' 0 . J
"' 6,0- > I--
U 4.0- :D O 0 2.0- r r " Q.. LIJ ,-,r 0
Fig. 12.
( a ) 'E
" 35-7 ._J
u_ 30 - L u r r
> ~ 25- < -- J ~ 20- D 2~uJ ~ > - t5- (-3 I--
m 10- Q © rr 5" Q .
rY i i i 1 ! I O
(a) The monthly variation in reproductive fall (:El SE, n = 9),
I
43
and (b) cumulative reproductive fall in low-rhododendron forest.
~-" 8.0- JE
7 '0 - J < ,, 6.0-
' " 5-0- F -
_a 4.0-
(,,9
D 3.0- 0 iii
z 2.0- < _ J ,,_.J ,,, I '0- t.) cO
Fig. 13.
24- (ca)
% . . .J
U J r '~
J _.J
(b)
21
18
15-
12
9
6
0 M J
1989 M J d A S O N J A S O
1989 1990 1990
(a) The monthly variation in miscellaneous fall (4-1 SE, n = 9), and (b) cumulative miscellaneous fall in low-rhododendron forest.
above minera l soil in these forests (also see Singh and
Singh 1992) they are c lose to t ropical forests than the
forests o f tempera te lat i tudes in forest f loor character-
istics. Values o f tu rnover rate for litter in the three
forests studied indicated that 4 9 - 6 1 % of the forest
f loor is replaced each year and the tu rnover rate o f
litter decreased with increase in e levat ion. D e c o m p o -
sition rates vary as a funct ion o f temperature , mois ture
44
Table 4. Amount of nutrients return through tree litter fall (kg ha- 1 yr- 1)
Litter components N P K
Mapple Forest
Leaf:
A. cappadocicum 2 6 . 7 8 2.56 12.34
R. arboreum 4.20 0.65 1.29
Other species 7.40 0.67 3.66
Wood:
A. cappadocicum 4.52 0.38 1.15
R. arboreum 3.92 0.45 1.35
Other species 1.70 0.09 0.32
Reproductive
A. cappadocicum 4.09 0.30 1.77
R. arboreum 0.07 0.0004 0.03
Other species 1.52 0.14 0.96
Miscellaneous 1.87 0.14 0.42
Total 56.07 5.38 23.29
Leaf:
B. utilis
R. campanulatum
Other species
Wood:
B. utilis
R. campanulatum
Other species
Reproductive:
B. utilis
R. campanulatum
Other species
Miscellaneous
Total
Leaf
Wood
Reproductive Miscellaneous
Total
Birch Forest
11.34 1.38 6.74
8.58 0.75 0.33
1.20 0.16 0.69
2.76 0.26 0.57
4.06 0.32 1.95
0.91 0.10 0.27
0.96 0.061 0.59
1.96 0.13 0.73
0.14 0.01 0.05
2.16 0.09 0.30
34.07 3.26 12.22
Low-rhododendron Forest
15.19 1.33 5.84
6.18 0.49 2.97
2.58 0.17 0.96
1.58 0.04 0.17
25.53 2.03 9.94
and quality of litter material, as indicated by nutri- ent concentration and lignin content, and that of other structural tissues. Doubling in microbial activity is sug- gested per 10 °C increase in temperature (Singh and Gupta 1977). There is a decline of 10 °C tempera- ture from the lowest elevation (300 m) where Shorea
robusta forest occurs to low-rhododendron forest of the present study at 3300 m. According to relation- ship between temperature and microbial activity at the highest elevation of low-rhododendron site it should be two times lower than at the lowest elevation of S. robusta site. However, the litter turnover rate is only 35% slower at the highest elevation site compared to the S. robusta site. Evidently several environmen- tal factors compensate for the adverse effect of low temperature at low rhododendron site. Of the sever- al possible factors more favourable water balance due to higher precipitation effectiveness and longer peri- od of wet season seems to be most important. In the present study while annual precipitation was invariant (see Singh et aL 1994), the decline in mean annual temperature was 2°C from maple forest site to low- rhododendron forest site, which indicates about 22% decline in microbial activity, if other conditions were to remain the same. However, in the present elevation- al transect litter quality was not the same. For example, the specific leaf mass (SLM), which roughly indicates the degree of leaf schlerophylly, toughness of tissues and dilution of nutrients by the presence of mechanical tissues (Daalen 1984), increased by almost 65% from 107 g m -2 in maple to 176 g m -2 in rhododendron leaves (Garkoti 1992). We suggest that decline in tem- perature along with increased schlerophylly account for most of the increase in residence time of floor litter and nutrients in the forest floor from maple to low-rhododendron forest. The litter of poor quality is not only resistant to physical factors but also supports smaller populations decomposer microbes (Singh et al. 1990). The mean residence time for organic matter and nutrients in the forest floor litter of broad-leaved forsests of the world are reported to range as follow- ing: organic matter 0.4 to 4.0 yr, N 2.0 to 5.0 yr, P 1.6 to 5.8 yr, K 0.7 to 1.3 yr (Cole and Rapp 1981; Edwards and Grubb 1982; Edwards 1977, 1982; Gray and Schlesinger 1981). In these all the lowest values are for tropical rain forests and all the highest values are for temperate deciduous forests to mediterranean forests. Most of our values, including those of the subalpine forests (low-rhododendron and birch) fall between the mean values for tropical rain forests and mediterranean/temperate deciduous forests. It seems that severe subalpine conditions in our above forests is moderated by high precipitation and relatively high relative humidity, which seldom falls below 50% even during dry seasons (Sakai and Malla 1981) and mod- erate winter temperatures (MUller 1982).
45
Table 5. Mean litter biomass (t ha- 1) in some temperate and Himalayan forests
Vegetation Forest floor Reference accumulation
Quercus Woodland 40.0 Jenny et al. (1949) Mixed Woodland 3.6 Witkamp & Vander Drift (1971) Betula 10.8 Van Cleve and Noonan (1971) Betula 4.1 Van Cleve and Noonan (1975) Acer 9.8 Vitousek (1982) Mature Oak forest 5.3 Duvigneaud and Denaeyer de Smet (1970) Oak forest 12.6 Reiners & Reiners (1970) Oak Conifer forest 4.7 Pandey and Singh ( 1981 a) Oak forest 4.645.2 Rawat and Singh (1989) Maple forest 6.4 Present study Birch forest 5.5 Present study Low-rhododendron forest 5.6 Present study
Despite continental location, the climate in the south of the main range in the central Himalaya resemble more maritime condition than the continental one (Sakai and Malla 1981). These factors, by keeping micro- bial activities relatively high and litter not so recal- citrant (litter quality is also a product of climate and other environmental factors, such as, soil nutrients, Vitousek 1984), make possible a turnover higher than those generally found for subalpine forests occurring in temperate latitudes. Since precipitation effectiveness increases with decline in temperature, these sites of high altitudes are more moist than lower elevation sites of the central Himalaya (Singh et al. 1994). Though the maple and birch forests exhibited year-round litter fall, the leaf fall is concentrated in the autumn (October- November). Such a pattern with a peak in October or November has also been observed in the cool temper- ate zone of Northern hemisphere (Witkamp and Van- der Drift 1971; Carlisle et al. 1966; Duvigneaud et al.
1969). The annual wood litter fall 1.2-1.9 t ha-1 y r - l esti-
mated in this study was higher than the world mean of 0.9 t ha -~ yr -1 for cool temperate forests (Bray and Gorham 1964) and close to the values (1.3 t ha - t y r - l ) reported for an oak-hickory forest in Central Missouri (Rochow 1974). Mean contribution of wood fall to total litter fall ranged between 30.6-35.8% in the present study, which is higher than the values reported for a mixed oak-conifer forest of Central Himalaya (20%; Pandey and Singh 198 lb), and for an oak-hickory for- est (21.3%; Rochow 1974). The proportion of wood
Table 6. Turnover rate (K) of litter mass and nutrients of the forest floor
Forest Mass N P K
Maple 0.61 0.38 0 .54 0.43 Birch 0.59 0.37 0 .39 0.33 Low-rhododendron 0.49 0.32 0.26 0.33
fall increased towards the higher side of the elevational range, possibly mainly as a result of greater snowfall. A greater proportional wood fall may indicate smaller biomass accumulation, resulting in shorter vegetation in high elevations.
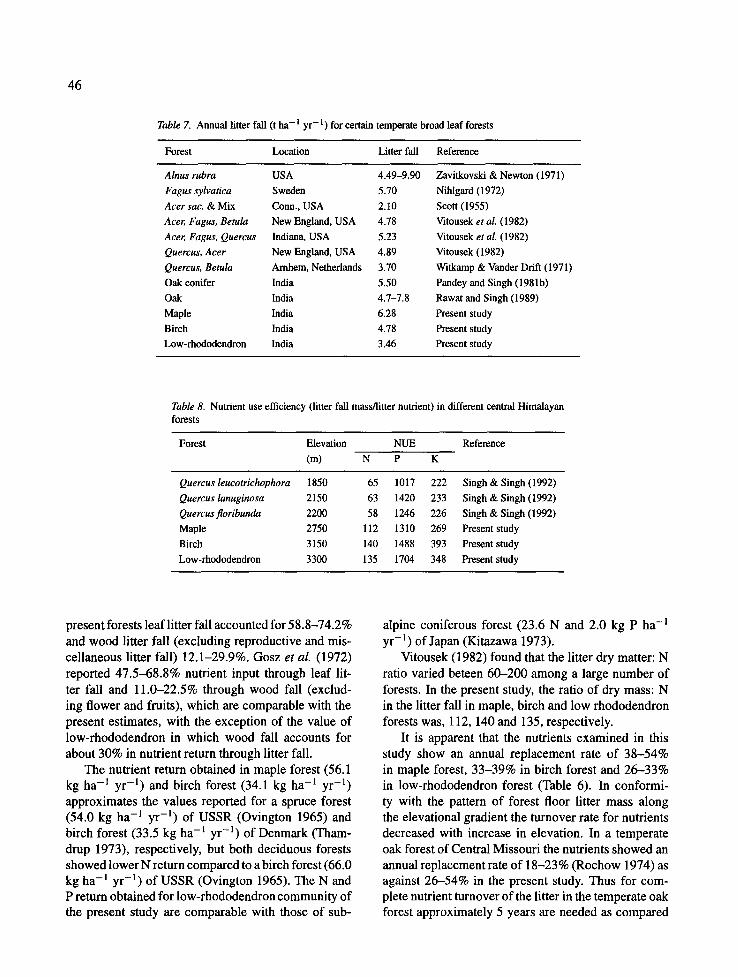
Some of the litter fall data for certain temperate broad-leaved forests are given in Table 7. The present values (3.5-6.3 t ha - l yr -1) are well within the range of values reported for temperate broad-leaved forests. The values of the present diciduous forests are close to that ofAcer, Fagus and Betula forest (4.78 t ha -1 yr - l ) of New England, U.S.A. and of an Indiana, U.S.A. forest (5.23 t ha -1 yr -1) (Vitousek et al. 1982). For a Quercus-Betula forest litter fall was reported 5.7 t ha - t yr - l for North Hampshire (Gosz et al. 1972) and 3.7 t ha - t yr - l for Arnhem, Netherlands (Witkamp and Vander Drift 1971) forests.
Of the total annual nutrient input through litter fall, leaf fall generally accounts for 75-85% and wood fall (including flower and fruits) for 10-35% (Klinge and Rodrigues 1968; Bernhard-Reversat 1972). In the
46
Tab/e 7. Annual litter fall (t ha -1 yr - l ) for certain temperate broad leaf forests
Forest Location Litter fall Reference
Alnus rubra USA 4.49-9.90 Zavitkovski & Newton (1971) Fagus sylvatica Sweden 5.70 Nihlgard (1972) Acer sac. & Mix Conn., USA 2.10 Scott (1955) Acer, Fagus, Betula New England, USA 4.78 Vitousek et al. (1982) Acer, Fagus, Quercus Indiana, USA 5.23 Vitousek et aL (1982) Quercus, Acer New England, USA 4.89 Vitousek (1982) Quercus, Betula Arnhem, Netherlands 3.70 Witkamp & Vander Drift (1971) Oak conifer India 5.50 Pandey and Singh (1981b) Oak India 4.7-7.8 Rawat and Singh (1989) Maple India 6.28 Present study Birch India 4.78 Present study Low-rhododendron India 3.46 Present study
Table 8. Nutrient use efficiency (litter fall mass/litter nutrient) in different central Himalayan forests
Forest Elevation NUE Reference (m) N P K
Quercus leucotrichophora 1850 65 1017 222 Singh & Singh (1992) Quercus lanuginosa 2150 63 1420 233 Singh & Singh (1992) Quercusfloribunda 2200 58 1246 226 Singh & Singh (1992) Maple 2750 112 1310 269 Present study Birch 3150 140 1488 393 Present study Low-rhododendron 3300 135 1704 348 Present study
present forests leaf litter fall accounted for 58.8-74.2% and wood litter fall (excluding reproductive and mis- cellaneous litter fall) 12.l-29.9%. Gosz et al. (1972) reported 47.5-68.8% nutrient input through leaf lit- ter fall and 11.0-22.5% through wood fall (exclud- ing flower and fruits), which are comparable with the present estimates, with the exception of the value of low-rhododendron in which wood fall accounts for about 30% in nutrient return through litter fall.
The nutrient return obtained in maple forest (56.1 kg ha - t yr - t ) and birch forest (34.1 kg ha - I yr -1) approximates the values reported for a spruce forest (54.0 kg ha - t yr - t ) of USSR (Ovington 1965) and birch forest (33.5 kg ha - t yr -1) of Denmark (Tham- drup 1973), respectively, but both deciduous forests showed lower N return compared to a birch forest (66.0 kg ha - l yr - t ) of USSR (Ovington 1965). The N and P return obtained for low-rhododendron community of the present study are comparable with those of sub-
alpine coniferous forest (23.6 N and 2.0 kg P ha - l yr -1) of Japan (Kitazawa 1973).
Vitousek (1982) found that the litter dry matter: N ratio varied beteen 60-200 among a large number of forests. In the present study, the ratio of dry mass: N in the litter fall in maple, birch and low rhododendron forests was, 112, 140 and 135, respectively.
It is apparent that the nutrients examined in this study show an annual replacement rate of 38-54% in maple forest, 33-39% in birch forest and 26--33% in low-rhododendron forest (Table 6). In conformi- ty with the pattern of forest floor litter mass along the elevational gradient the turnover rate for nutrients decreased with increase in elevation. In a temperate oak forest of Central Missouri the nutrients showed an annual replacement rate of 18-23% (Rochow 1974) as against 26--54% in the present study. Thus for com- plete nutrient turnover of the litter in the temperate oak forest approximately 5 years are needed as compared
to 1.9-4.4 years in present study. However, the nutrient replacement rates in present study are lower than the values reported for a mixed oak-conifer forests (54- 65%, Pandey and Singh 1981b), and for oak forest (64-84%, Rawat and Singh 1989).
In this study birch forest produced more litter per unit N and K compared to low-rhododendron and maple forests. Rhododendron was particularly efficient with P, and had high nutrient use efficiency (NUE) compared to birch and maple forests. However, all the forests of the present study were more efficient in nutri- ent use than certain high- and mid-elevation forests of central Himalaya (Table 8).
In conclusion, the rate of litter fall decreased with the increase in elevation of the forests studied. How- ever, the forest floor mass was relatively invariant, thus indicating that the litter disappearance was faster towards lower elevation. The amount of litter produc- tion, nutrient input to the forest floor and turnover rate of litter and nutrients set these forests in between the tropical and the true temperate forests. It appears, therefore that though the region of the present study lies in the tropical belt experiencing monsoon effects, it represents temperate conditions (low temperature, light, heavy snowfall, etc.) altitudinally, positioning it midway between tropical and temperate forests. Com- pared to forests of lower elevations of the central Himalaya (30(02200 m) these forests, however, show greater nutrient-use efficiencies with respect to litter production, both because of lower nutrient concentra- tions in tissues and withdrawal of nutrients from them during senescence.
References
Bernhard-Reversat, E 1972. Decomposition de la litiere de feuilles en foret ombrophile de basse cote- d'ivoire. Oecologia Plantarum 7: 279-300.
Bongers, E Engelen, D. & Klinge, H. 1985. Phytomass structure of natural plant communities on spodosols in southern Venezuela: the Bana Woodland. Vegetatio 63: 13-14.
Bray, J. R. & Gorhmam, E. 1964. Litter production in the forests of the world. Adv. Ecol. Res. 2: 101-157.
Carlisle, A., Brown, A. H. E & White, E. J. 1966. Litterfall, leaf production and effects of defoliation by Tortrix viridiana in a sessile oak (Quercus petraea) Woodland. J. Ecol. 54: 65-85.
Cole, D. W. & Rapp, M. 1981. Element cycling in forest ecosystems. pp. 341-409. In: D. E. Reiche (ed.), Dynamic properties of forest ecosystems. Cambridge University Press, London.
Daalen, J. C. V. 1984. Distinguishing features of forest species on nutrient poor soils in the southern Cape. Bothalia 15: 229-239.
Duvignead, P. & Denaeyer-De Smet, S. 1970. Biological cycling of minerals in temperate deciduous forests. In: Analysis of temper-
47
ate ecosystems. (D. E. Reiche ed.) Springer-Verlag, New York, pp. 195-225.
Duvigneaud, P., Denaeyer-De Smet, S., Ambros, P. & Tinperman, J. 1969. A percupre' lininaire sur les biomasses, la productivite et le cycle des elementes biogenes. Bull. Bot. Belg. 102: 317-323.
Edwards, P. J. 1977. Studies on mineral cycling in a montane rain forest in New Guinea. II. The production and disappearance of litter. Journal of Ecology 65:971-992.
Edwards, P. J. 1982. Studies on mineral cycling in a montane rain forest in New Guinea. V. Rates of cycling in through fail and litter fall. Journal of Ecology 70: 807-827.
Edwards, P. J. & Grub, P. J. 1982. Studies on mineral cycling in a montane rain forest in New Guinea. IV. Soil characteristics and the division of mineral elements between the vegetation and soil. Journal of Ecology 70: 649-666.
Garkoti, S. C. 1992. High altitude forests of Central Himalaya: Pro- ductivity and nutrient cycling. Ph.D. Thesis, Kumaun University, Naini Tal.
Garkoti, S. C. Singh, S. P. 1995. Variation in net primary productivity and biomass of forests in the high mountains of Central Himalaya; J. Veg. Sci. 3: 15-20.
Gosz, J. R., Likens, G. E. & Bormann, F. H. 1972. Nutrient con- tent of litter fall on Hubbard Brook Experimental Forest, New Hampshire. Ecology 53: 769-784.
Gray, J. T. & Schlesinger, W. H. 1981. Nutrient cycling in mediter- ranean type ecosystems, pp. 259-285. In: P. C. Miller (ed.), Resource use by Chapparal and Matorral. Springer-Verlag, New York.
Jackson, M. L. 1958. Soil Chemical Analysis. Prentice Hall, Inc., New Jersey, U.S.A., 498 p.
Kitazawa, Y. 1973. Structure and function of the subalpine conifer- ous forest ecosystem of M. T. Shiga, Central Japan. In: Kern, L. (ed.), Modelling forest ecosystems. Report of International Bio- logical Programme/P.T. Section, Oak Ridge National Laboratory, U.S.A., 114-122.
Klinge, H. & Herrera, S. 1983. Phytomass structure of natural plant communities on spodosols in southern Venezuela: The tall Ama- zon Caastinga forest. Vegetatio 53: 6-84.
Klinge, H. & Rodrigues, W. A. 1968. Litter production in a area of Amazonian terra frime forest. Parts I & II. Amazoniana 1: 287-302, 303-310.
Lugo, A. E. 1992. Comparison of tropical tree plantations with secondary forests of similar age. Ecol. Monogr. 62: 1--41.
Madge, D. S. 1965. Leaf fall and litter disappearance in tropical forests. Pedobiologia 5: 273-288.
Meentemeyer, V., Box, E. O. & Thompson, R. 1982. World patterns and amounts of terrestrial plant litter production. Bioscience 32: 125-128.
MUller, M. J. 1982. Selected climatic data for a global set of stan- dard stations for vegetation science. W. Junk, The Hague, The Netherlands.
Nihlgard, B. 1972. Plant biomass, primary production and distribu- tion of chemical elements in a beech and a planted spurce forest in southern Sweden. Oikos. 23: 69-81.
Olson, J. S. 1963. Energy storage and balance of producers and decomposers in ecological systems. Ecology 44:322-331.
Ovington, J. D. 1965. Organic production, turnover and mineral cycling. Biol. Rev. 40: 295-336.
Pandey, U. & Singh, J. S. 1981a. A quantitative study of forest floor, litterfall and nutrient return in an oak-conifer forest in Himalaya. I. Composition and dynamics of forest floor. Oecol. Gener. 2(1): 49-6 I.
48
Pandey, U. & Singh, J. S. 1981b. A quantitative study of forest floor, litteffall and nutrient return in an oak-conifer forest in Himalaya. II. Pattern of litter fall and nutrient. Oecol. Gener. 2(2): 83-99.
Proctor, J. 1983. Tropical forest litter fall. I. Problems of data com- paxison. In: Sutton, S. L., Whitmore, T. C. & Chadwick, A. C. (eds.), Tropical rain forest: Ecology and management. 267-273. Blackwell, Oxford.
Rawat, Y. S. & Singh, J. S. 1989. Forest floor biomass, litteffall and nutrient return in Central Himalayan Oak forests. Vegetatio 82: 113-125.
Reiners, W. A. & Reiners, N. M. 1970. Energy and nutrients dynam- ics of forest floors in three Minnesota forests. J. Ecol. 58: 497- 519.
Rochow, J. J. 1974. Litter fall relations in a Missouri forest. Oikos 25: 80-85.
Sakai, A. & Malla, S. B. 1981. Winter hardiness of tree species at high altitudes in the East Himalaya, Nepal. Ecology 62: 1288- 1298.
Scott, D. R. M. 1955. Amount of chemical composition of the organic matter contributed by over stroey vegetation to forest soil. Yale Sch, For. 62.
Singh, J. S. & Gupta, S. R. 1977. Plant decomposition and soil respiration in terrestrial ecosystems. Bot. Rev. 43: 449-528.
Singh, J. S. & Singh, S. P. 1992. Forests of Himalaya. Structure, Functioning and Impact of Man. Gyanodaya Prakashan, Nainital, India.
Singh, S. E, Adhikari, B. S. & Zobel, D. B. 1994. Biomass, produc- tivity, leaf longevity and forest structure in the central Himalaya. Ecol. Monogr. 64: 401-421.
Singh, S. E, Pande, K., Upadhayay, V. E & Singh, J. S. 1990. Fungal communities associated with the decomposition of a common leaf litter (Quercus leucotrichophora A. Camus) along an elevational transect in the central Himalaya. Biol. Fertil. Soils 9: 245-251.
Sundriyal, R. C. & Joshi, A. E 1992. Annual nutrient budget for an alpine grassland in the Garhwal Himalaya. J. Veg. Sci. 3: 21-26.
Thamdrup, H. M. 1973. The Danish IBP Woodland Project. In: Modelling forest ecosystems (ed. L. Kern). Report of IBP, E T. Section, Oak Ridge National Laboratory, U.S.A. 231-235.
Van Cleve, K. & Noonan, L. L. 1975. Litterfall and nutrient cycling in forest floor of birch and aspen stands in interior Alaska black spruce ecosystems. Can. J. For. Res. l 1: 258-273.
Vitousek, E 1982. Nutrient cycling and nutrient use efficiency. Amer. Nat. 119: 553-572.
Vitousek, E M. 1984. Litter fall nutrient cycling, and nutrient limi- tation in tropical forests. Ecology 65: 285-298.
Vitousek, E, Gosz, J. R., Grief, C. C., Melillo, J. M. & Reiners, W. A. 1982. A comparative analysis of potential nitrification and nitrate mobility in forest ecosystems. Ecol. Monogr. 52: 155-177.
Witkamp, M. & Vander Drift, J. 1971. Breakdown of forest litter in relation to environmental factors. Plant Soil 15:295-311.
Zavitkovski, J. & Newton, M. 1971. Litterfall and litter accumulation in red alder stands in western Oregon. Plant Soil 35: 257-268.