Forest floor mass, litterfall and nutrient return in Central Himalayan high altitude forests
Upload
independentCategory
view
3download
0
Phil. Trans. R. Soc. B (2008) 363, 1839–1848
doi:10.1098/rstb.2007.0031
Drought effects on litterfall, wood production andbelowground carbon cycling in an Amazon forest:
results of a throughfall reduction experiment
Published online 11 February 2008
Paulo M. Brando1,2,3,4,*, Daniel C. Nepstad1,2, Eric A. Davidson2,
Susan E. Trumbore5, David Ray2 and Plınio Camargo6
Electron1098/rst
One confate of t
*Autho214 BaGainesv
This isdistribut
1Instituto de Pesquisa Ambiental da Amazonia (IPAM ), Avenida Rui Barbosa, 136,68005-080 Santarem, Para, Brazil
2Woods Hole Research Center, 149 Woods Hole Road, Falmouth, MA 02543, USA3Department of Botany, 214 Bartram Hall, University of Florida, PO Box 118526,
Gainesville, FL 32611, USA4School of Natural Resources and Environment, University of Florida, Gainesville, FL 32611, USA
5Department of Earth System Science, University of California, Irvine, CA 92697-3100, USA6Centro de Energia Nuclear na Agricultura (CENA), 13400-970 Piracicaba, Brazil
The Amazon Basin experiences severe droughts that may become more common in the future. Littleis known of the effects of such droughts on Amazon forest productivity and carbon allocation. Wetested the prediction that severe drought decreases litterfall and wood production but potentially hasmultiple cancelling effects on belowground production within a 7-year partial throughfall exclusionexperiment. We simulated an approximately 35–41% reduction in effective rainfall from 2000through 2004 in a 1 ha plot and compared forest response with a similar control plot. Woodproduction was the most sensitive component of above-ground net primary productivity (ANPP) todrought, declining by 13% the first year and up to 62% thereafter. Litterfall declined only in the thirdyear of drought, with a maximum difference of 23% below the control plot. Soil CO2 efflux and its14C signature showed no significant treatment response, suggesting similar amounts and sources ofbelowground production. ANPP was similar between plots in 2000 and declined to a low of 41%below the control plot during the subsequent treatment years, rebounding to only a 10% differenceduring the first post-treatment year. Live aboveground carbon declined by 32.5 Mg haK1 through theeffects of drought on ANPP and tree mortality. Results of this unreplicated, long-term, large-scaleecosystem manipulation experiment demonstrate that multi-year severe drought can substantiallyreduce Amazon forest carbon stocks.
Keywords: above-ground net primary productivity; wood production; Amazon;drought; litterfall; global change
1. INTRODUCTIONThe fate of approximately 86–140 Pg of carbon
contained in the forests of the Amazon (Saatchi et al.2007) will depend, in part, upon the effect of drought
episodes on the amount and allocation of forest
biomass production. Several lines of evidences suggest
that Amazon drought episodes may be more common
and more severe in a warming world (Li et al. 2006).
One of the most important ways in which severe
droughts influence tropical forest carbon stocks is
through tree mortality. Droughts associated with
El Nino Southern Oscillation (ENSO) events elevated
tree mortality in East Kalimantan from a background
ic supplementary material is available at http://dx.doi.org/10.b.2007.0031 or via http://journals.royalsociety.org.
tribution of 27 to a Theme Issue ‘Climate change and thehe Amazon’.
r and address for correspondence: Department of Botany,rtram Hall, University of Florida, PO Box 118526,ille, FL 32611, USA ([email protected]).
1839
an open-access article distributed under the terms of the Creation, and reproduction in any medium, provided the original wor
of 2 to 26% yrK1 (Van Nieuwstadt & Sheil 2005), in
central Amazonia from 1.1 to 1.9% (Williamson et al.2000), Panama from 2 to 3% (Condit et al. 1995), and
Sarawak from 0.9 to 4.3–6.4% (Nakagawa et al. 2000).
(In one Panama forest, ENSO had no effect on tree
mortality; Condit et al. 2004.) Experimentally induced
drought in one hectare of an east-central Amazonian
forest permitted the identification of a threshold of
declining plant-available soil moisture and cumulative
canopy water stress beyond which canopy tree
mortality rose from 1.5 to 9% (Nepstad et al. 2007).
Responses of net primary productivity (NPP) and
its allocation during drought may have important
influences on carbon stocks, but they remain poorly
understood in moist tropical forests (Houghton 2005).
Seasonal and interannual variation in the NPP of moist
tropical forests is controlled mostly by changes in light
and soil moisture (Clark & Clark 1994). Hence, NPP
increases during ENSO events, when reduced cloud
cover increases photosynthetically active radiation
without provoking soil moisture deficits large enough
This journal is q 2008 The Royal Society
ive Commons Attribution License, which permits unrestricted use,k is properly cited.
1840 P. M. Brando et al. Throughfall reduction experiment
to inhibit photosynthesis. When soil moisture is inshort supply, NPP may decline and its relativeallocation among leaves, stems and roots may beaffected, but our understanding of these responses ispoor. Stem growth is expected to be the most sensitivecomponent of NPP to drought because it is low on thecarbon allocation hierarchy (Chapin et al. 1990).
The response of root production to drought is lessclear, in part owing to substantial methodologicalchallenge of mensuration (Trumbore et al. 2006). Soilrespiration, which integrates CO2 production from allbelowground sources, including root respiration andleaf litter decomposition, tends to be lower in the dryseason compared with the wet season (Davidson et al.2000, 2004; Saleska et al. 2003); this is probably largelydue to seasonal variation of heterotrophic respiration inthe litter layer. Responses to long-term droughttreatments may also include changes in root production.
We conducted a 7-year, partial throughfall exclusionexperiment in east-central Amazonia to examine forestresponses to a 35–41% effective reduction in annualrainfall. We quantified forest leaf area index (LAI),litterfall, wood production, soil respiration, and thed13C and D14C composition of CO2 emitted fromthe soil in 1 ha treatment and control plots to test thefollowing predictions:
(i) wood production is the most responsive com-ponent of aboveground NPP (ANPP) to drought,declining rapidly with the onset of drought stress,
(ii) litterfall increases initially through drought-induced leaf shedding, then declines to belownon-treatment levels as LAI stabilizes at a lowerlevel, and
(iii) soil CO2 efflux is affected by responses of multipleprocesses of heterotrophic and autotrophic respir-ation, which could have either accumulating orcancelling effects.
2. MATERIAL AND METHODS(a) Site description and treatment design
The experiment was carried out in the Tapajos National
Forest, Para, Brazil (2.8978 S, 54.9528 W). Annual precipi-
tation ranges from 1700 to 3000 mm and averages approxi-
mately 2000 mm, with a 6-month dry season ( July to
December) when rainfall rarely exceeds 100 mm per month.
Mean annual temperature is 288C (min 228C, max 288C). The
soil is deeply weathered Haplustox. The depth to water table at
a similar site 12 km away was O100 m, which means that the
stocks of soil water available to trees is recharged by rainfall.
The throughfall exclusion experiment was carried out in
two structurally and floristically similar 1 ha plots: an
‘exclusion plot’ (treatment) and a ‘control plot’. In the
exclusion plot, we diverted approximately 34–40% of annual
incoming precipitation (70% of throughfall) during the 6
month wet season from 2000 to 2004. Details of the
experimental design can be found in Nepstad et al. (2002).
Please see Hurlbert (1984) for more information on large-
scale unreplicated experiments.
Soil water at 11 m depth was measured monthly in five deep
soil shafts per plot between 1999 and 2005 using time domain
reflectometry (Jipp et al. 1998). Here we present volumetric
water content (VWC) for two depth intervals: 0–200 cm
(upper soil profile) and 200–1100 cm (deep soil profile).
Phil. Trans. R. Soc. B (2008)
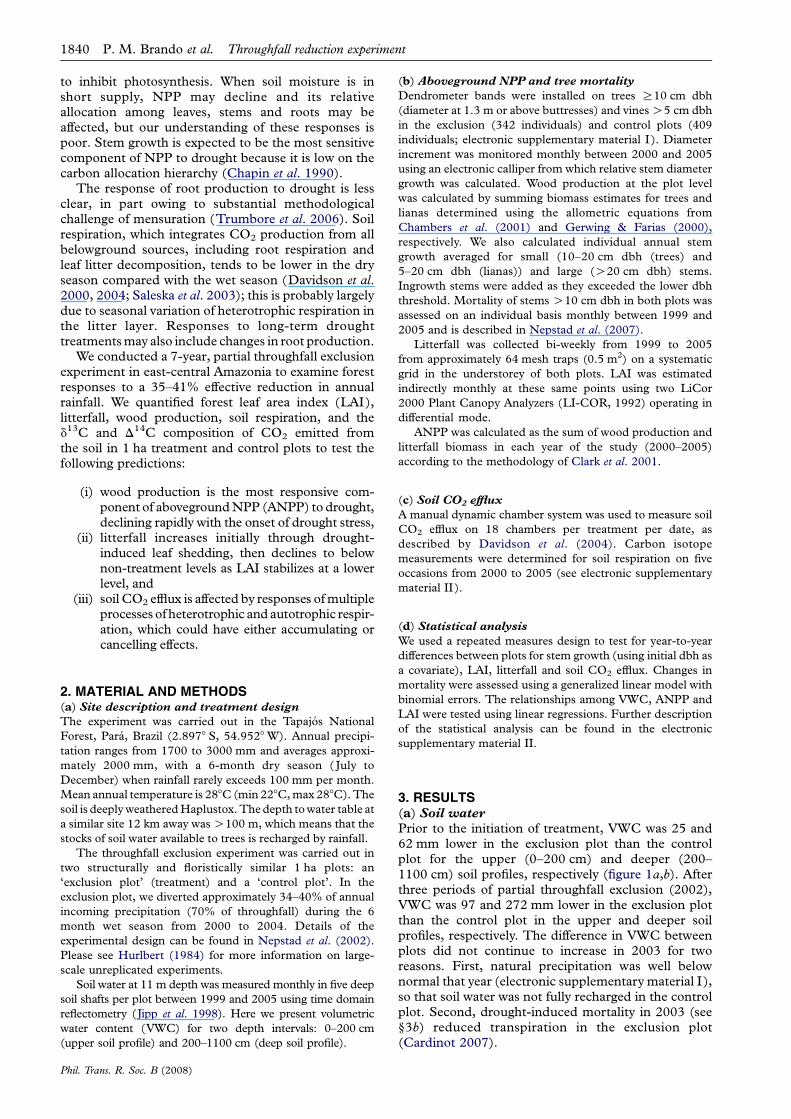
(b) Aboveground NPP and tree mortality
Dendrometer bands were installed on trees R10 cm dbh
(diameter at 1.3 m or above buttresses) and vines O5 cm dbh
in the exclusion (342 individuals) and control plots (409
individuals; electronic supplementary material I ). Diameter
increment was monitored monthly between 2000 and 2005
using an electronic calliper from which relative stem diameter
growth was calculated. Wood production at the plot level
was calculated by summing biomass estimates for trees and
lianas determined using the allometric equations from
Chambers et al. (2001) and Gerwing & Farias (2000),
respectively. We also calculated individual annual stem
growth averaged for small (10–20 cm dbh (trees) and
5–20 cm dbh (lianas)) and large (O20 cm dbh) stems.
Ingrowth stems were added as they exceeded the lower dbh
threshold. Mortality of stems O10 cm dbh in both plots was
assessed on an individual basis monthly between 1999 and
2005 and is described in Nepstad et al. (2007).
Litterfall was collected bi-weekly from 1999 to 2005
from approximately 64 mesh traps (0.5 m2) on a systematic
grid in the understorey of both plots. LAI was estimated
indirectly monthly at these same points using two LiCor
2000 Plant Canopy Analyzers (LI-COR, 1992) operating in
differential mode.
ANPP was calculated as the sum of wood production and
litterfall biomass in each year of the study (2000–2005)
according to the methodology of Clark et al. 2001.
(c) Soil CO2 efflux
A manual dynamic chamber system was used to measure soil
CO2 efflux on 18 chambers per treatment per date, as
described by Davidson et al. (2004). Carbon isotope
measurements were determined for soil respiration on five
occasions from 2000 to 2005 (see electronic supplementary
material II).
(d) Statistical analysis
We used a repeated measures design to test for year-to-year
differences between plots for stem growth (using initial dbh as
a covariate), LAI, litterfall and soil CO2 efflux. Changes in
mortality were assessed using a generalized linear model with
binomial errors. The relationships among VWC, ANPP and
LAI were tested using linear regressions. Further description
of the statistical analysis can be found in the electronic
supplementary material II.
3. RESULTS(a) Soil water
Prior to the initiation of treatment, VWC was 25 and62 mm lower in the exclusion plot than the controlplot for the upper (0–200 cm) and deeper (200–1100 cm) soil profiles, respectively (figure 1a,b). Afterthree periods of partial throughfall exclusion (2002),VWC was 97 and 272 mm lower in the exclusion plotthan the control plot in the upper and deeper soilprofiles, respectively. The difference in VWC betweenplots did not continue to increase in 2003 for tworeasons. First, natural precipitation was well belownormal that year (electronic supplementary material I),so that soil water was not fully recharged in the controlplot. Second, drought-induced mortality in 2003 (see§3b) reduced transpiration in the exclusion plot(Cardinot 2007).

2800
3200
3600
VW
C (
mm
)
(b)
(a)
VW
C (
mm
)
400
500
600
700
800
0
50
100
150
mm
2000 2001 2002
year
2003 2004 2005
(c)
Figure 1. Soil VWC integrated from (a) 0 to 200 cm and (b) 200 to 1100 cm and (c) daily precipitation. Measurements weretaken from August 1999 to December 2004. The shaded areas represent the periods of throughfall exclusion. The estimatedVWC if the entire soil profile had dried to values equal to the qr residual soil water van Geneuchten parameters for this soil (Belket al. 2007) is 430 and 1950 mm for the 0–200 and 200–1000 cm profiles, respectively. Black circles, control; grey circles,exclusion.
Throughfall reduction experiment P. M. Brando et al. 1841
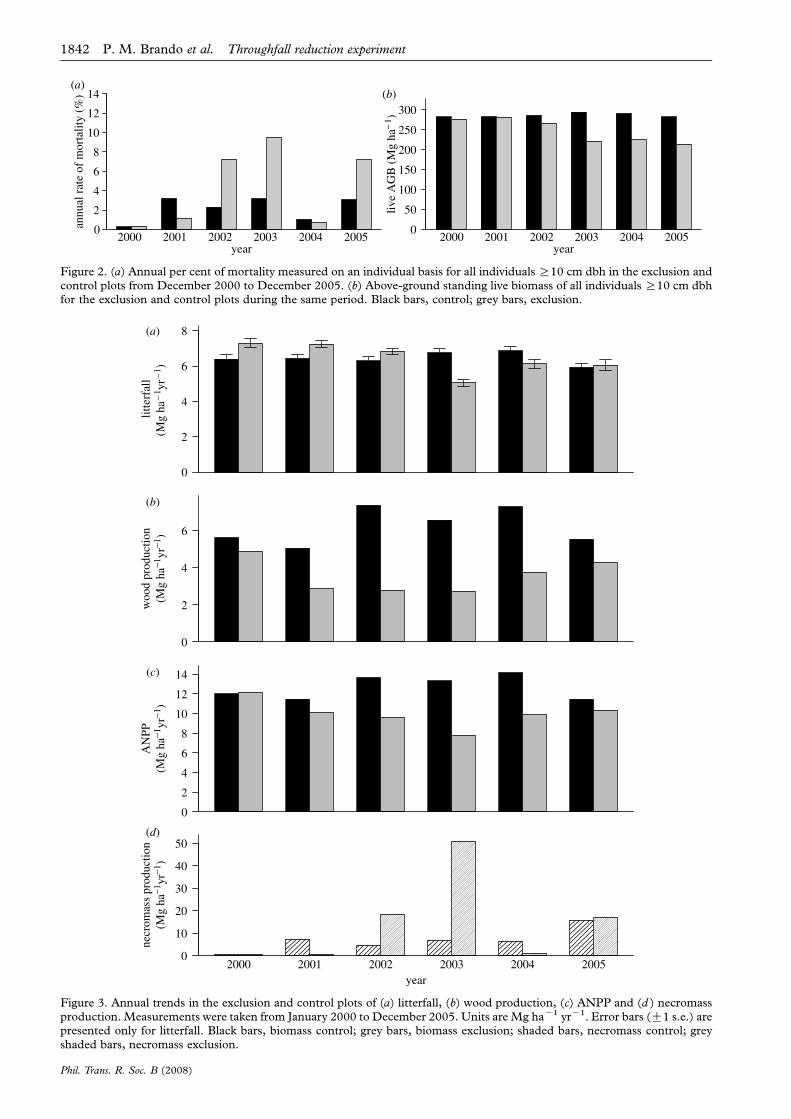
(b) Mortality and necromass
From 2000 to 2005, the annual mortality rate of
individuals higher than or equal to 10 cm dbh was
significantly higher in the exclusion plot (5.7% yrK1)
than in the control plot (2.4% yrK1); 2001 was an
exception to this general trend (figure 2a). The most
dramatic treatment effects were observed in 2002 and
2003, when the annual rate of mortality in the
exclusion plot reached 7.2 and 9.5% yrK1, respectively,
as reported in Nepstad et al. (2007). Mortality was also
significantly higher in the exclusion (7.2 yrK1) than the
control plot (3.1% yrK1) after the termination of the
experimental throughfall exclusion, in 2005.
The spike in treatment-induced mortality in 2002
and 2003 led to a 25% reduction in above-ground live
biomass (AGLB) in the exclusion plot relative to the
control plot (figure 2b), a difference that remained
stable after the exclusion treatment was terminated in
Phil. Trans. R. Soc. B (2008)
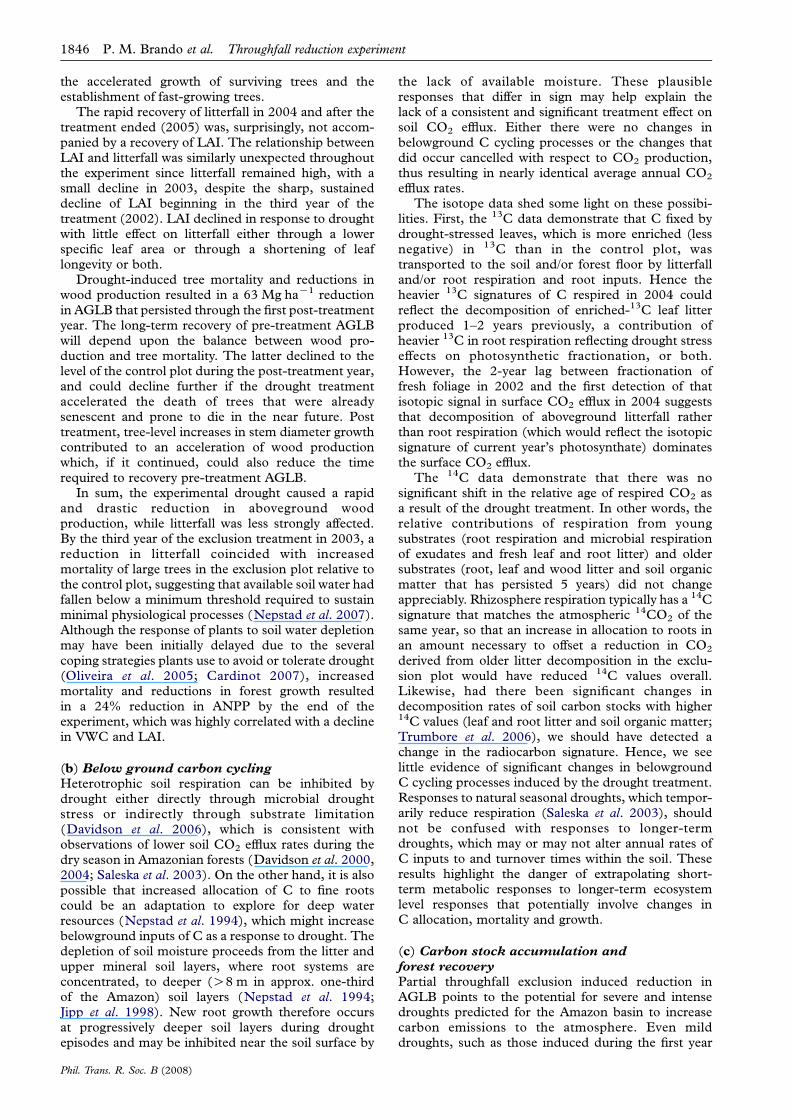
August 2004 and through the end of 2005. From 2000through 2005, 47 Mg haK1 more necromass [deadbiomass] was produced in the exclusion compared withthe control plot (figure 3d ).
(c) Stem growth and wood production
The treatment caused a reduction in relative stemdiameter growth of large individuals ( p!0.001) yethad no effect on smaller stems (figure 4a–c), whichwere growing less in the exclusion plot than the controlplot before the treatment was applied ( pZ0.322;figure 4b). Later, following the pulse in the mortalityof large trees in 2003, we observed increased stemgrowth in small individuals in the exclusion plot relativeto the control plot ( p!0.001). During this same period(2004–2005), stem growth was declining in the controlplot (figure 4a–c), perhaps as a lagged response to lowannual precipitation in 2003 (figure 1c).
annu
al r
ate
of m
orta
lity
(%)
0
2
4
6
8
10
12
14(a)
2000 2001 2002 2003year
2004 20052000 2001 2002 2003year
2004 2005
live
AG
B (
Mg
ha−1
)
0
50
100
150
200
250
300(b)
Figure 2. (a) Annual per cent of mortality measured on an individual basis for all individuals R10 cm dbh in the exclusion andcontrol plots from December 2000 to December 2005. (b) Above-ground standing live biomass of all individuals R10 cm dbhfor the exclusion and control plots during the same period. Black bars, control; grey bars, exclusion.
litte
rfal
l(M
g ha
–1 y
r –1 )
0
2
4
6
8(a)
woo
d pr
oduc
tion
(Mg
ha−1
yr−1
)
0
2
4
6
(b)
AN
PP(M
g ha
−1yr
−1)
0
2
4
6
8
10
12
14(c)
2000 2001 2002year
2003 2004 2005
necr
omas
s pr
oduc
tion
(Mg
ha−1
yr−1
)
0
10
20
30
40
50(d)
Figure 3. Annual trends in the exclusion and control plots of (a) litterfall, (b) wood production, (c) ANPP and (d ) necromassproduction. Measurements were taken from January 2000 to December 2005. Units are Mg haK1 yrK1. Error bars (G1 s.e.) arepresented only for litterfall. Black bars, biomass control; grey bars, biomass exclusion; shaded bars, necromass control; greyshaded bars, necromass exclusion.
1842 P. M. Brando et al. Throughfall reduction experiment
Phil. Trans. R. Soc. B (2008)

rela
tive
stem
dia
met
er g
row
th (
mm
−1in
d−1yr
−1)
0
2001 2002 2003
year
2004 2005
0.1
0.2
0.3
0.4
0.5control
exclusion
0
0.05
0.10
0.15
0.20
0.25
control
exclusion
0
0.05
0.10
0.15
0.20
0.25
0.30 control(a)
(b)
(c)
exclusion
Figure 4. Stem growth of individuals in the exclusion and control plots by different size classes: (a) O5 cm dbh (lianas)and O10 cm dbh (trees); (b) between 5 (lianas) or 10 (trees) and 20 cm dbh; and (c) O20 cm dbh. Error bars indicate Gs.e.(N is given by the number of individuals). Measurements were taken from December 1999 to December 2005. Annual stemgrowth was calculated as the difference in dbh measured between two sampling intervals (December of each year).
Throughfall reduction experiment P. M. Brando et al. 1843
Total wood production during the first exclusionperiod (2000) was 13% lower in the exclusion(4.87 Mg haK1 yrK1) than in the control plot(5.61 Mg haK1 yrK1). This difference increased overthe treatment period to 46, 63 and 58% in 2001, 2002and 2003, respectively (figure 3b). After the droughttreatment was removed in 2005, the difference inbiomass production between plots declined to 23% dueto an increase in individual tree growth (mostly smalltrees) in the exclusion plot and a decrease in growth inthe control plot.
(d) Litterfall and canopy dynamics
The drought treatment also reduced LAI over time(figure 5; p!0.001). Differences between plots in LAIwere small during the two first years of the study,followed by a larger drop in 2002 and remaining21–26% lower than the control plot through 2005.
Phil. Trans. R. Soc. B (2008)
Litterfall, which was higher in the exclusion plotthan in the control plot prior to the initiation of thetreatment, declined in the exclusion plot comparedwith the control plot. However, it was lower in theexclusion plot than in the control plot only in 2003(23%, p!0.001; figure 3a). During the last year of thetreatment (2004), differences in litterfall between plotswere reduced to 10%, and, after the drought stress wasremoved (2005), litterfall was 2% higher in theexclusion plot than in the control plot, indicating arelative increase in litterfall in the exclusion plotcompared with the control plot ( p!0.001).
(e) ANPP
ANPP progressively declined in the exclusion plotrelative to the control plot from 2000 to 2003: 12, 30and 41% lower in 2001, 2002 and 2003, respectively(figure 3c). In the last year of the treatment (2004) and

2000 2001 2002year
2003 2004 2005
LA
I (m
2 m
−2)
0
1
2
3
4
5
6
7
Figure 5. Annual trends in the exclusion and control plots ofLAI. Error bars indicate Gs.e. In 2005 LAI is represented by3 months of measurements. Black bars, control; grey bars,exclusion.
1844 P. M. Brando et al. Throughfall reduction experiment
in 2005, when the exclusion treatment was removed,ANPP differences between the plots were diminishedto 30 and 10% of the control, respectively. The averagereduction in ANPP from 2000 to 2005 was 21%,corresponding to a cumulative difference in biomassbetween plots of 17 Mg haK1.
(f ) Correlates of ANPP and LAI
Annual variations in VWC in the upper soil profile(0–200 cm) explained 51% of the variation in ANPPover the 6-year study period (figure 6a). Annualaverage LAI showed a strong positive linear relation-ship with VWC (R2: 92%; p!0.001; figure 6b) andANPP (R2: 49%; pZ0.006; ln(ANPP)ZK0.9995C0.8362!ln(LAI)).
(g) Soil CO2 efflux
The effect of the throughfall exclusion treatment onsoil CO2 efflux was not consistent among years orseasons. Although there was a significant treatment-by-year interaction ( p!0.001), the treatment-by-year-by-season interaction was not significant ( pZ0.65).When large pulses were measured, which wereprobably related to recent wetting events, they tendedto be higher in the control plot (figure 7a). Theexclusion plot had somewhat higher CO2 efflux rates onmost of the other dates during the exclusion treatmentyears. These differences largely cancelled, resulting innearly identical estimates of average annual CO2 effluxfrom the two plots during the 5-year exclusion period(12.8G1.0 Mg C haK1 yrK1 in the exclusion plot and12.8G1.3 Mg C haK1 yrK1 in the control plot).
The 13C signature of the soil CO2 efflux revealeda divergence between treatments in 2004, when the13CO2 increased (became less negative) in the exclu-sion plot (figure 7b). A similar difference in foliard13C had been observed for some species in 2002(J. Ometto & J. Ehleringer 2007, personal communi-cation). We also observed a similar difference in d13CO2
measured within the soil profile in 2003 (not shown),which would reflect allocation of fractionated C sub-strates to root respiration.
Phil. Trans. R. Soc. B (2008)
There were no differences between treatment plotsin 14CO2 signatures on any date (figure 7c), whichsuggests that the relative age of respired C substrateswas not altered by the exclusion treatment. Theseradiocarbon values are 10–25‰ greater than values forCO2 in ambient air sampled at the same time. Thisindicates that the C being respired is a mixture ofmodern C substrates with substrates that are 5–40years old and are more enriched in 14C due to the signalof atmospheric testing of nuclear weapons in the 1950sand 1960s (Trumbore et al. 2006).
4. DISCUSSION(a) Response and recovery of ANPP
The most striking result of this study was thedifferential response of wood production and litterfallto throughfall exclusion. Wood production in theexclusion plot was 13–62% below that of the controlplot during each of the five treatment years, whilelitterfall was substantially lower than the control plot(23%) only during the year of lowest rainfall, in 2003.The allocation of ANPP to wood and litterfall wastherefore highly sensitive to soil moisture availability.At the beginning of the experiment (2000), wood andlitterfall comprised 40 and 60%, respectively, of thetotal ANPP, while in the third year of the exclusion(2002), they were 29 and 71% of the ANPP,respectively. This finding provides an importantexception to the widely held assumption of drought-insensitive allocation of ANPP between litterfall andwood, as represented in many ecosystem models (e.g.Tian et al. 1998; Potter et al. 2001; Hirsch et al. 2004).These results also run contrary to the positive responseof LAI to short-term drought that has been postulatedfor Amazon forests based upon remotely sensed(MODIS) estimates of LAI (Huete et al. 2006; Myneniet al. 2007; Saleska et al. 2007). If such a positiveresponse is real and widespread, it may be overriddenas drought severity grows. However, it is important toremember that our throughfall exclusion treatment didnot simulate the higher radiation that is typicallyassociated with lower rainfall.
Litterfall and wood production recovered rapidlyfollowing cessation of the drought. Despite the death of9% of all trees R10 cm dbh in 2003, litterfall recoveredfully during the first post-treatment year (2005) andwood production, which was 42% of the control plotin 2003, climbed to 77% that of the control plot in2005. This rapid recovery is partially explained by thepositive growth responses observed for residual,surviving trees following the death of neighbouringindividuals, perhaps attributable to reduced compe-tition for light and soil moisture resources. LAIdeclined in the exclusion plot in 2003 and 2004,increasing light availability in the understorey; thedifference in VWC between exclusion and control plotsalso diminished, in part owing to reduced transpirationassociated with tree mortality (Cardinot 2007). Asecond litterfall recovery mechanism was the establish-ment of fast-growing trees in the exclusion plotunderstorey (P. Brando & D. Nepstad 2006, unpub-lished data). Increased soil nutrient availability associ-ated with tree mortality may have also contributed to

6.20
(a) (b)
6.25 6.30 6.35 6.40 6.45 6.50
2.1
2.2
2.3
2.4
2.5
2.6
VWC (mm); natural-log scale
AN
PP (
Mg
ha−1
yr −1
) ; n
atur
al-l
og s
cale
R2 = 0.51; p = 0.012ln(Y ) = –5.8271 + 1.2966 * ln(VWC)
500 550 600 650
4.5
5.0
5.5
6.0
VWC (mm)
LA
I (m
2 m
−2)
R2 = 0.92; p<<0Y = –1.596336 + 0.012206 * VWC
Figure 6. Relationships between annual mean VWC measured in the upper soil profile (0–200 cm) and (a) ANPP and (b) LAI.Data represent annual means from January 2000 to December 2004. Black circles, control; grey circles, exclusion.
60
80
100
120
140
1999 2000 2001 2002year
2003 2004 2005
ll
l
l l
l
l
ll l
–30
–28
–26
–24
–22
–20
ll
l
lll
ll
l
v
0
0.1
0.2
0.3
0.4
0.5
0.6
ll
l l l
l
l
l l l ll
ll l
l l ll
ll
l
ll
l
l
ll
l ll
l
l
l l
l l ll
l
ll
ll
ll
ll
l
l ll
l
l
(a)
(b)
(c)
Figure 7. Measurements of surface flux of (a) Carbon dioxide (CO2 (gC mK2 hK1)), (b) d13C and (c) D14C in the exclusion(grey) and control plots (black). The error bars represent standard errors of the mean.
Throughfall reduction experiment P. M. Brando et al. 1845
Phil. Trans. R. Soc. B (2008)
1846 P. M. Brando et al. Throughfall reduction experiment
the accelerated growth of surviving trees and theestablishment of fast-growing trees.
The rapid recovery of litterfall in 2004 and after thetreatment ended (2005) was, surprisingly, not accom-panied by a recovery of LAI. The relationship betweenLAI and litterfall was similarly unexpected throughoutthe experiment since litterfall remained high, with asmall decline in 2003, despite the sharp, sustaineddecline of LAI beginning in the third year of thetreatment (2002). LAI declined in response to droughtwith little effect on litterfall either through a lowerspecific leaf area or through a shortening of leaflongevity or both.
Drought-induced tree mortality and reductions inwood production resulted in a 63 Mg haK1 reductionin AGLB that persisted through the first post-treatmentyear. The long-term recovery of pre-treatment AGLBwill depend upon the balance between wood pro-duction and tree mortality. The latter declined to thelevel of the control plot during the post-treatment year,and could decline further if the drought treatmentaccelerated the death of trees that were alreadysenescent and prone to die in the near future. Posttreatment, tree-level increases in stem diameter growthcontributed to an acceleration of wood productionwhich, if it continued, could also reduce the timerequired to recovery pre-treatment AGLB.
In sum, the experimental drought caused a rapidand drastic reduction in aboveground woodproduction, while litterfall was less strongly affected.By the third year of the exclusion treatment in 2003, areduction in litterfall coincided with increasedmortality of large trees in the exclusion plot relative tothe control plot, suggesting that available soil water hadfallen below a minimum threshold required to sustainminimal physiological processes (Nepstad et al. 2007).Although the response of plants to soil water depletionmay have been initially delayed due to the severalcoping strategies plants use to avoid or tolerate drought(Oliveira et al. 2005; Cardinot 2007), increasedmortality and reductions in forest growth resultedin a 24% reduction in ANPP by the end of theexperiment, which was highly correlated with a declinein VWC and LAI.
(b) Below ground carbon cycling
Heterotrophic soil respiration can be inhibited bydrought either directly through microbial droughtstress or indirectly through substrate limitation(Davidson et al. 2006), which is consistent withobservations of lower soil CO2 efflux rates during thedry season in Amazonian forests (Davidson et al. 2000,2004; Saleska et al. 2003). On the other hand, it is alsopossible that increased allocation of C to fine rootscould be an adaptation to explore for deep waterresources (Nepstad et al. 1994), which might increasebelowground inputs of C as a response to drought. Thedepletion of soil moisture proceeds from the litter andupper mineral soil layers, where root systems areconcentrated, to deeper (O8 m in approx. one-thirdof the Amazon) soil layers (Nepstad et al. 1994;Jipp et al. 1998). New root growth therefore occursat progressively deeper soil layers during droughtepisodes and may be inhibited near the soil surface by
Phil. Trans. R. Soc. B (2008)
the lack of available moisture. These plausibleresponses that differ in sign may help explain thelack of a consistent and significant treatment effect onsoil CO2 efflux. Either there were no changes inbelowground C cycling processes or the changes thatdid occur cancelled with respect to CO2 production,thus resulting in nearly identical average annual CO2
efflux rates.The isotope data shed some light on these possibi-
lities. First, the 13C data demonstrate that C fixed bydrought-stressed leaves, which is more enriched (lessnegative) in 13C than in the control plot, wastransported to the soil and/or forest floor by litterfalland/or root respiration and root inputs. Hence theheavier 13C signatures of C respired in 2004 couldreflect the decomposition of enriched-13C leaf litterproduced 1–2 years previously, a contribution ofheavier 13C in root respiration reflecting drought stresseffects on photosynthetic fractionation, or both.However, the 2-year lag between fractionation offresh foliage in 2002 and the first detection of thatisotopic signal in surface CO2 efflux in 2004 suggeststhat decomposition of aboveground litterfall ratherthan root respiration (which would reflect the isotopicsignature of current year’s photosynthate) dominatesthe surface CO2 efflux.
The 14C data demonstrate that there was nosignificant shift in the relative age of respired CO2 asa result of the drought treatment. In other words, therelative contributions of respiration from youngsubstrates (root respiration and microbial respirationof exudates and fresh leaf and root litter) and oldersubstrates (root, leaf and wood litter and soil organicmatter that has persisted 5 years) did not changeappreciably. Rhizosphere respiration typically has a 14Csignature that matches the atmospheric 14CO2 of thesame year, so that an increase in allocation to roots inan amount necessary to offset a reduction in CO2
derived from older litter decomposition in the exclu-sion plot would have reduced 14C values overall.Likewise, had there been significant changes indecomposition rates of soil carbon stocks with higher14C values (leaf and root litter and soil organic matter;Trumbore et al. 2006), we should have detected achange in the radiocarbon signature. Hence, we seelittle evidence of significant changes in belowgroundC cycling processes induced by the drought treatment.Responses to natural seasonal droughts, which tempor-arily reduce respiration (Saleska et al. 2003), shouldnot be confused with responses to longer-termdroughts, which may or may not alter annual rates ofC inputs to and turnover times within the soil. Theseresults highlight the danger of extrapolating short-term metabolic responses to longer-term ecosystemlevel responses that potentially involve changes inC allocation, mortality and growth.
(c) Carbon stock accumulation and
forest recovery
Partial throughfall exclusion induced reduction inAGLB points to the potential for severe and intensedroughts predicted for the Amazon basin to increasecarbon emissions to the atmosphere. Even milddroughts, such as those induced during the first year

Throughfall reduction experiment P. M. Brando et al. 1847
of exclusion, can inhibit wood production and, hence,
the long-term pattern carbon storage in this forest
ecosystem. This finding has important implications
regarding reports that many Amazon forests appear to
be undergoing net carbon uptake (Grace et al. 1995;
Malhi et al. 1998; Phillips et al. 2002; Baker et al.2004)—a finding that has been met with some
scepticism (Clark 2002; Saleska et al. 2003).
Reductions of rainfall in regions of strong seasonal
drought, comprising nearly half of the Amazon’s forests
(Nepstad et al. 2004), may reduce wood production,
diminishing or reversing the net uptake of carbon from
these ecosystems. The long-term effect of the
63 Mg haK1 reduction in AGLB on aboveground
carbon stocks will depend upon the complex balance
between ABLG regrowth and the rate at which trees are
killed by the drought decompose. Many factors
influence ABLG re-accumulation, including tree
mortality rate, wood production rate and the wood
density of the trees that eventually replace those killed
by drought stress. Forests recovering from slash-and-
burn agriculture in the Venezuelan Amazon required
approximately two centuries to recover pre-disturbance
carbon stocks in part owing to shifts in species
composition (Saldarriaga et al. 1988). The decline of
LAI and AGLB observed in this study also suggests
that the positive feedback between drought and
fire may be stronger than previously hypothesized
(Nepstad et al. 2001), which could have large long-
term implications for carbon storage. Hence, even this
relatively long-term 5-year experimental manipulation
was not long enough to investigate the full effects of
climate change on the carbon stocks of Amazonian
forests. Nevertheless, we have demonstrated that
multi-year drought induced substantial losses of
aboveground biomass and productivity.
The authors thank J. Putz, M. Palumbo and an anonymousreviewer for commenting on this manuscript. Financialsupported was provided by NSF (no. DEB-0213011),NASA and LBA-ECO (no. NCC5-332, NCC5-686,NCC5-700, NNG06GE88A), USAID, CNPq and theGordon and Betty Moore Foundation. CAPES-Fulbrightprovided support for the first author’s doctorate. We thankIBAMA for providing access to the FLONA-Tapajosand, especially, the crew from IPAM and Embrapa whocontributed to data collection and analysis.
REFERENCESBaker, T. R. et al. 2004 Increasing biomass in Amazonian
forest plots. Phil. Trans. R. Soc. B 359, 353–365. (doi:10.
1098/rstb.2003.1422)
Belk, E. L., Markewitz, D., Rasmussen, T. C., Carvalho,
E. J. M., Nepstad, D. C. & Davidson, E. A. 2007
Modeling the effects of throughfall reduction on soil
water content in a Brazilian Oxisol under a moist tropical
forest. Water Resour. Res. 43, W08432. (doi:10.1029/
2006WR005493)
Cardinot, G. 2007 Tolerancia a Seca de Especies Arboreas de
uma Floresta Tropical: Resultados de um Experimento em
Larga Escala de Exclusao Artificial de Chuvas, p. 188.
PhD dissertation, Universidade Federal do Rio de Janeiro.
Chambers, J. Q., dos Santos, J., Ribeiro, R. J. & Higuchi, N.
2001 Tree damage, allometric relationships, and above-
Phil. Trans. R. Soc. B (2008)
ground net primary production in central Amazon forest.
Forest Ecol. Manage. 152, 73–84. (doi:10.1016/S0378-
1127(00)00591-0)
Chapin, F. S., Schulze, E. D. & Mooney, H. A. 1990 The
ecology and economics of storage in plants. Annu. Rev.
Ecol. Syst. 21, 423–447. (doi:10.1146/annurev.es.21.
110190.002231)
Clark, D. A. 2002 Are tropical forests an important
carbon sink? Reanalysis of the long-term plot data. Ecol.
Appl. 12, 3–7. (doi:10.1890/1051-0761(2002)012[0003:
ATFAIC]2.0.CO;2)
Clark, D. A. & Clark, D. B. 1994 Climate-induced annual
variation in canopy tree growth in a Costa-Rican
tropical rain-forest. J. Ecol. 82, 865–872. (doi:10.2307/
2261450)
Clark, D. A., Brown, S., Kicklighter, D. W., Chambers, J. Q.,
Thomlinson, J. R. & Ni, J. 2001 Measuring net primary
production in forests: concepts and field methods. Ecol.
Appl. 11, 356–370. (doi:10.1890/1051-0761(2001)011
[0356:MNPPIF]2.0.CO;2)
Condit, R., Hubbell, S. P. & Foster, R. B. 1995 Mortality-
rates of 205 neotropical tree and shrub species and the
impact of a severe drought. Ecol. Monogr. 65, 419–439.
(doi:10.2307/2963497)
Condit, R., Aguilar, S., Hernandez, A., Perez, R., Lao, S.,
Angehr, G., Hubbell, S. P. & Foster, R. B. 2004 Tropical
forest dynamics across a rainfall gradient and the impact of
an El Nino dry season. J. Trop. Ecol. 20, 51–72. (doi:10.
1017/S0266467403001081)
Davidson, E. A., Verchot, L. V., Cattanio, J. H., Ackerman,
I. L. & Carvalho, J. E. M. 2000 Effects of soil water
content on soil respiration in forests and cattle pastures of
eastern Amazonia. Biogeochemistry 48, 53–69. (doi:10.
1023/A:1006204113917)
Davidson, E. A., Ishida, F. Y. & Nepstad, D. C. 2004 Effects
of an experimental drought on soil emissions of carbon
dioxide, methane, nitrous oxide, and nitric oxide in a
moist tropical forest. Glob. Change Biol. 10, 718–730.
(doi:10.1111/j.1365-2486.2004.00762.x)
Davidson, E. A., Janssens, I. A. & Luo, Y. Q. 2006 On the
variability of respiration in terrestrial ecosystems: moving
beyond Q(10). Glob. Change Biol. 12, 154–164. (doi:10.
1111/j.1365-2486.2005.01065.x)
Gerwing, J. J. & Farias, D. L. 2000 Integrating liana
abundance and forest stature into an estimate of
total aboveground biomass for an eastern Amazonian
forest. J. Trop. Ecol. 16, 327–335. (doi:10.1017/
S0266467400001437)
Grace, J. et al. 1995 Carbon-dioxide uptake by an
undisturbed tropical rain-forest in Southwest Amazonia,
1992 to 1993. Science 270, 778–780. (doi:10.1126/
science.270.5237.778)
Hirsch, A. I., Little, W. S., Houghton, R. A., Scott, N. A. &
White, J. D. 2004 The net carbon flux due to deforestation
and forest re-growth in the Brazilian Amazon: analysis
using a process-based model. Glob. Change Biol. 10,
908–924. (doi:10.1111/j.1529-8817.2003.00765.x)
Houghton, R. A. 2005 Aboveground forest biomass and the
global carbon balance. Glob. Change Biol. 11, 945–958.
(doi:10.1111/j.1365-2486.2005.00955.x)
Huete, A. R., Didan, K., Shimabukuro, Y. E., Ratana, P.,
Saleska, S. R., Hutyra, L. R., Yang, W., Nemani, R. R. &
Myneni, R. 2006 Amazon rainforests green-up with
sunlight in dry season. Geophys. Res. Lett. 33, L06405.
(doi:10.1029/2005GL025583)
Hurlbert, S. H. 1984 Pseudoreplication and the design of
ecological field experiments. Ecol. Monogr. 54, 187–211.
(doi:10.2307/1942661)

1848 P. M. Brando et al. Throughfall reduction experiment
Jipp, P. H., Nepstad, D. C., Cassel, D. K. & De Carvalho,C. R. 1998 Deep soil moisture storage and transpiration inforests and pastures of seasonally-dry Amazonia. Clim.Change 39, 395–412. (doi:10.1023/A:1005308930871)
Li, W. H., Fu, R. & Dickinson, R. E. 2006 Rainfall and itsseasonality over the Amazon in the 21st century asassessed by the coupled models for the IPCC AR4.J. Geophys. Res. Atmos. 111, D02111. (doi:10.1029/2005JD006355)
Malhi, Y., Nobre, A. D., Grace, J., Kruijt, B., Pereira, M. G. P.,Culf, A. & Scott, S. 1998 Carbon dioxide transfer overa Central Amazonian rain forest. J. Geophys. Res. Atmos.103, 31 593–31 612. (doi:10.1029/98JD02647)
Myneni, R. B. et al. 2007 Large seasonal swings in leaf area ofAmazon rainforests. Proc. Natl Acad. Sci. USA 104,4820–4823. (doi:10.1073/pnas.0611338104)
Nakagawa, M. et al. 2000 Impact of severe drought associatedwith the 1997–1998 El Nino in a tropical forestin Sarawak. J. Trop. Ecol. 16, 355–367. (doi:10.1017/S0266467400001450)
Nepstad, D. C., de Carvalho, C. R., Davidson, E. A., Jipp,P. H., Lefebvre, P., Negreiros, G. H., Trumbore, S. &Vieira, S. 1994 The role of deep roots in the hydrologicaland carbon cycles of Amazonian forests and pastures.Nature 372, 666–669. (doi:10.1038/372666a0)
Nepstad, D. et al. 2001 Road paving, fire regime feedbacks,and the future of Amazon forests. Forest Ecol. Manage.154, 395–407. (doi:10.1016/S0378-1127(01)00511-4)
Nepstad, D. C. et al. 2002 The effects of partial throughfallexclusion on canopy processes, aboveground production,and biogeochemistry of an Amazon forest. J. Geophys. Res.107, 8085. (doi:10.1029/2001JD000360)
Nepstad, D., Lefebvre, P., Silva, U.L. da, Tomasella, J.,Schlesinger, P., Solorzano, L., Moutinho, P., Ray, D. &Benito, J. G. 2004 Amazon drought and its implicationsfor forest flammability and tree growth: a basin-wideanalysis. Glob. Change Biol. 10, 704–717. (doi:10.1111/j.1529-8817.2003.00772.x)
Nepstad, D. C., Tohver, I. M., Ray, D., Moutinho, P. &Cardinot, G. 2007 Mortality of large trees and lianasfollowing experimental drought in an amazon forest.Ecology 88, 2259–2269. (doi:10.1890/06-1046.1)
Oliveira, R. S., Dawson, T. E., Burgess, S. S. O. & Nepstad,D. C. 2005 Hydraulic redistribution in three Amazoniantrees. Oecologia 145, 354–363. (doi:10.1007/s00442-005-0108-2)
Phil. Trans. R. Soc. B (2008)
Phillips, O. L. et al. 2002 Changes in growth of tropical
forests: evaluating potential biases. Ecol. Appl. 12,
576–587. (doi:10.1890/1051-0761(2002)012[0576:CIG
OTF]2.0.CO;2)
Potter, C., Klooster, S., de Carvalho, C. R., Genovese, V. B.,
Torregrosa, A., Dungan, J., Bobo, M. & Coughlan, J. 2001
Modeling seasonal and interannual variability in ecosys-
tem carbon cycling for the Brazilian Amazon region.
J. Geophys. Res. Atmos. 106, 10 423–10 446. (doi:10.1029/
2000JD900563)
Saatchi, S. S., Houghton, R. A., Alvala, R. C. D. S., Soares,
J. V. & Yu, Y. 2007 Distribution of aboveground live
biomass in the Amazon basin. Glob. Change Biol. 13,
816–837.
Saldarriaga, J. G., West, D. C., Tharp, M. L. & Uhl, C. 1988
Long-term chronosequence of forest succession in the
upper Rio Negro of Colombia and Venezuela. J. Ecol. 76,
938–958. (doi:10.2307/2260625)
Saleska, S. R. et al. 2003 Carbon in Amazon forests:
unexpected seasonal fluxes and disturbance-induced losses.
Science 302, 1554–1557. (doi:10.1126/science.1091165)
Saleska, S. R., Didan, K., Huete, A. R. & da Rocha, H. R.
2007 Amazon forests green-up during 2005 drought.
Science 318, 612. (doi:10.1126/science.1146663)
Tian, H. Q., Melillo, J. M., Kicklighter, D. W., Mcguire,
A. D., Helfrich, J. V. K., Moore, B. & Vorosmarty, C. J.
1998 Effect of interannual climate variability on carbon
storage in Amazonian ecosystems. Nature 396, 664–667.
(doi:10.1038/25328)
Trumbore, S., Da Costa, E. S., Nepstad, D. C., De Camargo,
P. B., Martinelli, L. A., Ray, D., Restom, T. & Silver, W.
2006 Dynamics of fine root carbon in Amazonian tropical
ecosystems and the contribution of roots to soil respir-
ation. Glob. Change Biol. 12, 217–229. (doi:10.1111/
j.1365-2486.2005.001063.x)
Van Nieuwstadt, M. G. L. & Sheil, D. 2005 Drought, fire and
tree survival in a Borneo rain forest, East Kalimantan,
Indonesia. J. Ecol. 93, 191–201. (doi:10.1111/j.1365-
2745.2004.00954.x)
Williamson, G. B., Laurance, W. F., Oliveira, A. A.,
Delamonica, P., Gascon, C., Lovejoy, T. E. & Pohl, L.
2000 Amazonian tree mortality during the 1997 El Nino
drought. Conserv. Biol. 14, 1538–1542. (doi:10.1046/
j.1523-1739.2000.99298.x)
Copyright © 2022 FDOKUMEN