Structural and functional traits of Quercus ilex in response to water availability
BGD6, 863–893, 2009
Biogenic emissionsand water stress
A. V. Lavoir et al.
Title Page
Abstract Introduction
Conclusions References
Tables Figures
J I
J I
Back Close
Full Screen / Esc
Printer-friendly Version
Interactive Discussion
Biogeosciences Discuss., 6, 863–893, 2009www.biogeosciences-discuss.net/6/863/2009/© Author(s) 2009. This work is distributed underthe Creative Commons Attribution 3.0 License.
BiogeosciencesDiscussions
Biogeosciences Discussions is the access reviewed discussion forum of Biogeosciences
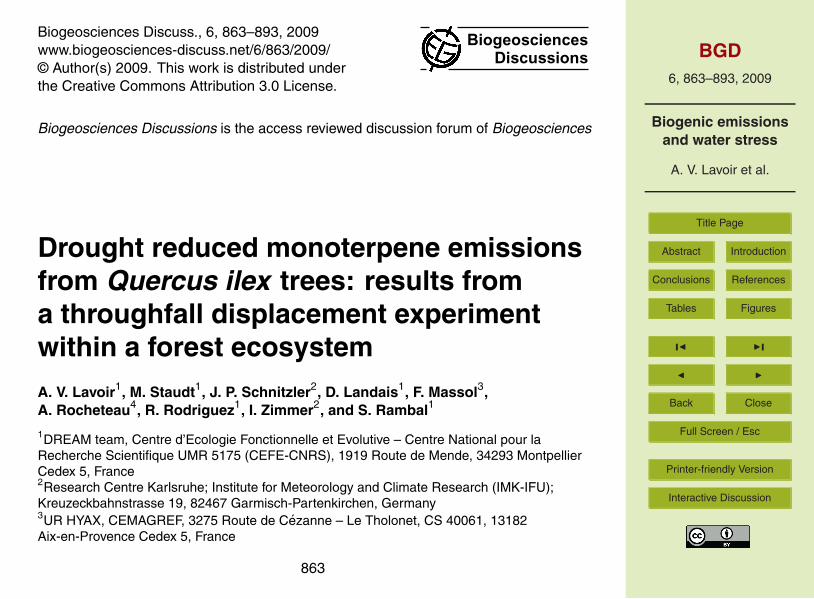
Drought reduced monoterpene emissionsfrom Quercus ilex trees: results froma throughfall displacement experimentwithin a forest ecosystemA. V. Lavoir1, M. Staudt1, J. P. Schnitzler2, D. Landais1, F. Massol3,A. Rocheteau4, R. Rodriguez1, I. Zimmer2, and S. Rambal1
1DREAM team, Centre d’Ecologie Fonctionnelle et Evolutive – Centre National pour laRecherche Scientifique UMR 5175 (CEFE-CNRS), 1919 Route de Mende, 34293 MontpellierCedex 5, France2Research Centre Karlsruhe; Institute for Meteorology and Climate Research (IMK-IFU);Kreuzeckbahnstrasse 19, 82467 Garmisch-Partenkirchen, Germany3UR HYAX, CEMAGREF, 3275 Route de Cezanne – Le Tholonet, CS 40061, 13182Aix-en-Provence Cedex 5, France
863
BGD6, 863–893, 2009
Biogenic emissionsand water stress
A. V. Lavoir et al.
Title Page
Abstract Introduction
Conclusions References
Tables Figures
J I
J I
Back Close
Full Screen / Esc
Printer-friendly Version
Interactive Discussion
4 CLIFA team, IRD (Institut pour la Recherche et le Developpement) – CEFE-CNRS, 1919Route de Mende, 34293 Montpellier Cedex 5, France
Received: 27 October 2008 – Accepted: 25 November 2008 – Published: 14 January 2009
Correspondence to: A. V. Lavoir ([email protected])
Published by Copernicus Publications on behalf of the European Geosciences Union.
864
BGD6, 863–893, 2009
Biogenic emissionsand water stress
A. V. Lavoir et al.
Title Page
Abstract Introduction
Conclusions References
Tables Figures
J I
J I
Back Close
Full Screen / Esc
Printer-friendly Version
Interactive Discussion
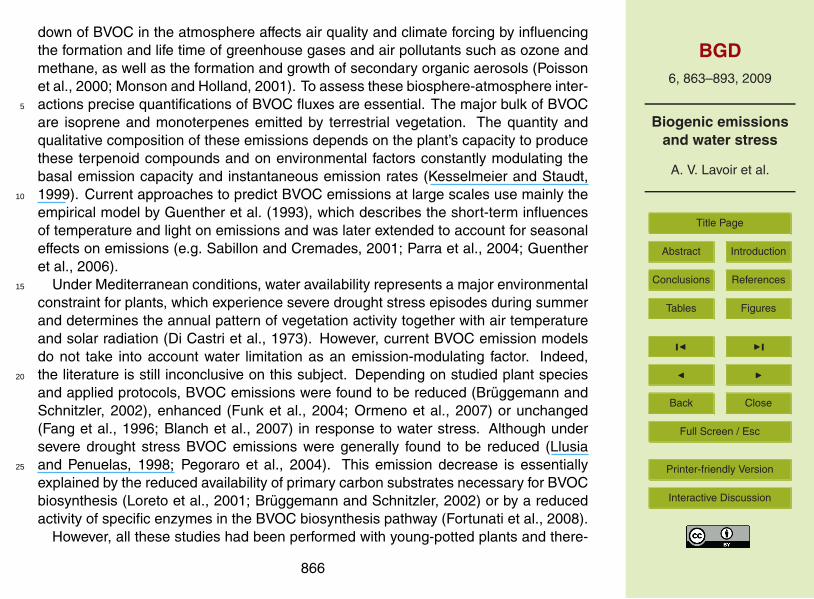
Abstract
The effects of water limitations on the emission of biogenic volatile organic compoundsare not well understood. Experimental approaches studying drought effects in naturalconditions are still missing. To address this question, a throughfall displacement ex-periment was set up in a natural forest of Quercus ilex, an evergreen Mediterranean5
oak emitting monoterpenes. Mature trees were exposed in 2005 and 2006 either toan additional drought, to irrigation or to natural drought (untreated control). In bothyears, absolute monoterpene emission rates as well as the respective standard fac-tors of the trees exposed to normal and additional drought strongly declined during thedrought periods. Monoterpene emissions were lower in year 2006 than in year 200510
(factor 2) due to a more pronounced summer drought period in this respective year.We observed a significant difference between the irrigation and additional drought orcontrol treatment: irrigated trees emitted 82% more monoterpenes during the droughtperiod 2006 than the trees of the other treatments. However, no significant effect onmonoterpene emission was observed between normal and additional drought treat-15
ments, despite a significant effect on leaf water potential and photochemical efficiency.During the development of drought, monoterpene emissions responded exponentiallyrather than linearly to decreasing leaf water potential. Emissions rapidly declined whenthe water potential dropped below −2 MPa and photosynthesis was persistently inhib-ited. Monoterpene synthase activities measured in vitro showed no clear reduction20
during the same period. From our results we conclude that drought significantly re-duces monoterpene fluxes of Mediterranean evergreen forest into the atmosphere dueto a sustained inhibition of photosynthetic carbon assimilation.
1 Introduction
Biogenic volatile organic compounds (BVOC) constitute a large family of molecules25
originating from many natural sources (Fuentes et al., 2000). The chemical break-
865
BGD6, 863–893, 2009
Biogenic emissionsand water stress
A. V. Lavoir et al.
Title Page
Abstract Introduction
Conclusions References
Tables Figures
J I
J I
Back Close
Full Screen / Esc
Printer-friendly Version
Interactive Discussion
down of BVOC in the atmosphere affects air quality and climate forcing by influencingthe formation and life time of greenhouse gases and air pollutants such as ozone andmethane, as well as the formation and growth of secondary organic aerosols (Poissonet al., 2000; Monson and Holland, 2001). To assess these biosphere-atmosphere inter-actions precise quantifications of BVOC fluxes are essential. The major bulk of BVOC5
are isoprene and monoterpenes emitted by terrestrial vegetation. The quantity andqualitative composition of these emissions depends on the plant’s capacity to producethese terpenoid compounds and on environmental factors constantly modulating thebasal emission capacity and instantaneous emission rates (Kesselmeier and Staudt,1999). Current approaches to predict BVOC emissions at large scales use mainly the10
empirical model by Guenther et al. (1993), which describes the short-term influencesof temperature and light on emissions and was later extended to account for seasonaleffects on emissions (e.g. Sabillon and Cremades, 2001; Parra et al., 2004; Guentheret al., 2006).
Under Mediterranean conditions, water availability represents a major environmental15
constraint for plants, which experience severe drought stress episodes during summerand determines the annual pattern of vegetation activity together with air temperatureand solar radiation (Di Castri et al., 1973). However, current BVOC emission modelsdo not take into account water limitation as an emission-modulating factor. Indeed,the literature is still inconclusive on this subject. Depending on studied plant species20
and applied protocols, BVOC emissions were found to be reduced (Bruggemann andSchnitzler, 2002), enhanced (Funk et al., 2004; Ormeno et al., 2007) or unchanged(Fang et al., 1996; Blanch et al., 2007) in response to water stress. Although undersevere drought stress BVOC emissions were generally found to be reduced (Llusiaand Penuelas, 1998; Pegoraro et al., 2004). This emission decrease is essentially25
explained by the reduced availability of primary carbon substrates necessary for BVOCbiosynthesis (Loreto et al., 2001; Bruggemann and Schnitzler, 2002) or by a reducedactivity of specific enzymes in the BVOC biosynthesis pathway (Fortunati et al., 2008).
However, all these studies had been performed with young-potted plants and there-
866
BGD6, 863–893, 2009
Biogenic emissionsand water stress
A. V. Lavoir et al.
Title Page
Abstract Introduction
Conclusions References
Tables Figures
J I
J I
Back Close
Full Screen / Esc
Printer-friendly Version
Interactive Discussion
fore the results cannot easily be extrapolated to natural conditions. Field-grown treeshave large root zones due to a rather unrestricted root growth and therefore have ac-cess to large soil water reserves. Hence, field-grown mature trees have more timeto adapt to water stress than potted plants, because water availability in the soil de-creases more slowly reaching critical values only after extended drought periods. To5
date, field studies investigating drought effects on BVOC emissions from adult treesare scarce, although water stress is often cited as a hypothesis to explain seasonaland inter-annual emission patterns observed under field conditions (Fuentes et al.,1999; Llusia and Penuelas, 2000; Funk et al., 2005). Field studies are lacking probablydue to the difficulty to manipulate water availability without generating undesired side10
effects at the soil-atmosphere interface and due to natural variations in climate andplant phenotype that affect emissions and therefore may veil potential small effects ofdrought on BVOC emissions. Guenther et al. (1999) compared isoprene emission fromtwo evergreen shrub species (Berberis trifoliata and Condalia hookeri) growing in irri-gated and non-irrigated plots in a subtropical savanna. They observed a diminution of15
stomatal conductance and photosynthesis in the non-irrigated plots without significantchanges in isoprene emission compared to the irrigated plots. In a comparable studywithin a mature Quercus ilex plantation in Southern France, Staudt et al. (2002) ob-served a 25% reduction of BVOC emission of water-stressed trees compared to con-trol trees. Yet, this study was made in a row of planted trees, whose root zones were20
artificially restricted by a trench and covered by a soil roof, which may not reflect realdrought conditions in natural forest ecosystems. At last, Gray et al. (2003) comparedmethyl butenol (MBO) emissions of Pinus Ponderosa mature trees on controlled andirrigated plots. The control plot sustained a natural drought period during the secondyear of the experiment and no effects were observed between both plots. As explana-25
tion, the authors suggested that the stress was not sufficiently severe to provoke stresssymptoms.
In the present study we describe the effects of different degrees of water-limitationon monoterpene (MT) emissions from mature Quercus ilex (L.) trees in a natural forest
867
BGD6, 863–893, 2009
Biogenic emissionsand water stress
A. V. Lavoir et al.
Title Page
Abstract Introduction
Conclusions References
Tables Figures
J I
J I
Back Close
Full Screen / Esc
Printer-friendly Version
Interactive Discussion
ecosystem. Q. ilex is considered as one of the strongest BVOC emitting species inthe Mediterranean basin (Kesselmeier et al., 1997), where it is regularly exposed tosevere summer drought. Its evergreen leaves produce large amounts of MT in a light-dependent process without storage in specific storage tissues or organs (Staudt andBertin, 1998). The specific objectives of the present field study were to investigate5
at the leaf level i) the effects of current drought conditions on the seasonal and inter-annual variation of MT emissions and ii) whether a reduction of the summer precipita-tion as predicted by the IPCC (2007) for the end of the century in the Mediterraneanbasin can substantially alter seasonal drought effects on monoterpene emissions. Forthis purpose, foliar MT emissions, activity of MT synthases, photosynthetic parameters10
and plant and soil water status were monitored during two consecutive years on differ-ent plots with respect to water availability: an untreated control plot exposed to naturaldrought conditions, an irrigated plot and a plot equipped with a rainfall exclusion systemsimulating future drought conditions.
2 Materials and methods15
2.1 Experimental sites
The study site is located 35km NW of Montpellier (Southern France) in the PuechabonState Forest (43 ◦44′29′′ N, 3 ◦35′45′′ E; elevation 270 m) on a flat plateau of limestonethat has been managed as a coppice for centuries (last clear cut in 1942). Soil textureis homogeneous in the 0–50 cm layer (39.6% clay and 14.1% sand) and belongs to20
the silty clay loam part of the USDA (United States Department of Agriculture) textu-ral triangle. Vegetation is dominated by Q. ilex trees forming a dense canopy (meanheight: 5.5 m) that is mainly composed of current and one-year-old leaves. A previousleaf demography study showed that 22% of the leaves fall after 1 year and 69% aftertwo years (average leaf life span: 23 months, Limousin, unpublished data). The cli-25
mate is typical Mediterranean with cool and wet winters and warm and dry summers.
868
BGD6, 863–893, 2009
Biogenic emissionsand water stress
A. V. Lavoir et al.
Title Page
Abstract Introduction
Conclusions References
Tables Figures
J I
J I
Back Close
Full Screen / Esc
Printer-friendly Version
Interactive Discussion
Mean annual temperature is 13.5 ◦C and mean annual precipitation is 872 mm. Rainfallhappens largely during autumn and winter with about 75% of the total rain occurringbetween September and April.
At this site, a rain exclusion experiment was set up in late winter 2003 as partof the European MIND project (Mediterranean terrestrial ecosystems and INcreasing5
Drought: vulnerability assessment) to evaluate the impact of changes in water inputas predicted for the current century (Mouillot et al., 2002; IPCC, 2007). A 20 m×20 marea was selected with uniform soil and canopy conditions and equipped with a scaf-fold providing access to the canopy. Within this area, two plots were selected: onefor a drought treatment and one as control. In the “dry” plot, 17 cm wide PVC gutters10
hung 1 m height to intercept the rain throughfall under the canopy. As a consequence,the net precipitation input is reduced by 27% in the dry plot compared to the “control”plot (Limousin et al., 2008). In the control plot, the PVC gutters were installed with theconvex side up to ensure that modifications in the microclimate were similar to those inthe dry plot. Thus, the control plot presented natural drought conditions while the dry15
plot increased drought conditions as predicted for the end of the century.Additional measurements were made on 10-year old Q. ilex saplings, which were
watered weekly (50 L m−2) during the experimental period. This plantation is locatedin Montpellier, close to the institute (43 ◦36′ N, 5 ◦53′ E), on a deep clay soil with goodwater availability. At this site annual mean temperature is 14.0 ◦C and annual mean20
precipitation 789 mm.
2.2 Experimental protocol
At Puechabon two field campaigns were conducted: from April to September 2005 andfrom May to December 2006. Measurements were made on three adult trees of eachtreatment. Soil water storage, predawn leaf water potential, leaf MT emissions, leaf25
CO2/H2O gas exchange and chlorophyll fluorescence were determined once a weekunder sun-lit conditions to minimize weather effects on MT emissions. In addition in2006, enzyme activities of MT synthases (mono-TPS) were determined from the same
869
BGD6, 863–893, 2009
Biogenic emissionsand water stress
A. V. Lavoir et al.
Title Page
Abstract Introduction
Conclusions References
Tables Figures
J I
J I
Back Close
Full Screen / Esc
Printer-friendly Version
Interactive Discussion
leaves used for emission measurements.In May 2005 (Day of the year: DOY 122–144) a mass outbreak of Gypsy moth
larvae (Lymantria dispar ) occurred at the Puechabon forest. The herbivory attack wasstopped by a treatment with Bacillus thuringiensis. Caterpillar larvae fed exclusivelyon young developing leaves. Therefore, measurements were performed on one-year-5
old leaves in 2005 and on current-year leaves in 2006. In order to check the potentialeffect of leaf age on monoterpene emissions, an additional experiment was conductedin 2007 in which one-year-old leaves were compared with current-year leaves on threetrees in the control plot. On each tree, three leaves per leaf age class were assayedfor monoterpene emission and the means were used for statistical analysis.10
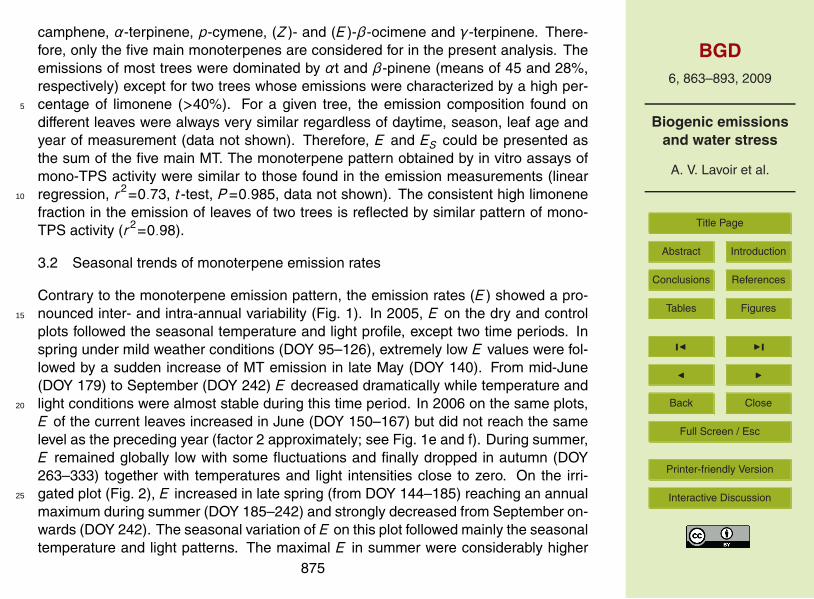
In the irrigated plot, leaf gas exchange, MT emission and mono-TPS activity weremonitored every other week from May to December 2006 on current leaves of threetrees. In addition, predawn leaf water potential was measured 3 times during the sum-mer period to check the irrigation efficiency. Minimum values were about −0.5 MPasuggesting that the trees never underwent water limitation.15
2.3 Plant and soil water status
Predawn leaf water potentials (ψpd ) were determined by a Scholander-type pressurechamber (PMS 1000, PMS Inst., Corvallis, OR, USA). Measurements were started onehour before sunrise and completed by dawn on two leaves of each tree. If the differencebetween them was greater than 0.2 MPa, a third leaf was measured.20
Soil water storage (SWS) was measured at 20 cm interval from 10 cm to 450 cm indepth using a neutron moisture gauge (CPN503 Campbell Pacific Int., Martinez, USA).In parallel it was evaluated with a soil water balance model (Rambal, 1993; Grote etal., 2009). The model simulates on a daily basis: transpiration, evapotranspiration anddeep drainage, SWS and ψpd . The evapotranspiration includes the evapotranspiration25
from soil under the plant canopy and the evapotranspiration of intercepted rain wa-ter. Comparison of measured against simulated SWS showed very good agreement,standard error of estimate being lower than 7% (n=35) (Rambal et al., 2003).
870
BGD6, 863–893, 2009
Biogenic emissionsand water stress
A. V. Lavoir et al.
Title Page
Abstract Introduction
Conclusions References
Tables Figures
J I
J I
Back Close
Full Screen / Esc
Printer-friendly Version
Interactive Discussion
2.4 Gas exchange measurements and monoterpene collection
CO2/H2O gas exchange measurements and MT trapping were done concomitantly insitu with a Li-Cor LI-6400 gas-exchange system (Clear Chamber bottom 6400-08, LI-COR Lincoln, Nebraska, USA). An ozone scrubber (eight layers of MnO2-coated cop-per nets) was placed in the air inlet of the system to avoid decomposition of ozone5
sensitive MT species (Calogirou et al., 1996). Leaf temperature was measured be-fore each measurement with an infrared thermometer and was hold constant at thistemperature during MT trapping by means of the Li-Cor 6400 chamber air-conditioningsystem. Leaf temperature and incident light were recorded during MT trapping.
Leaf gas exchange was measured at a constant flow rate inside the chamber10
(0.576 L min−1) and values were recorded when the photosynthesis reached steadystate. Afterwards, MT were trapped by directing a fraction of chamber air (10 min ata flow rate of 0.1 L min−1) through adsorption tubes (200 mg Tenax TA, Chrompack,Middelburg, The Netherlands) by means of a mass-flow controlled BVOC sampler. Ad-sorption tubes were stored at −4 ◦C until analysis. Recorded gas exchange rates were15
corrected afterwards for the enclosed leaf area as determined by a leaf area meter(Delta-T devices Ltd., Cambridge, UK).
2.5 Chlorophyll fluorescence measurements
The fluorescence parameter Fv/Fm is a measure of the PSII (photosystem II) pho-tochemical trapping efficiency under dark-adapted conditions (Maxwell and Johnson,20
2000): In darkness, all PSII reaction centres are in an “open state” and therefore, therate of photochemistry is not limited. PSII fluorescence was determined during dawnon three dark-adapted leaves per tree with a PAM 2000 fluorometer (Walz, Effeltrich,Germany) and calculated as following Fv/Fm (=(FM − F0)/FM ). Minimum fluorescenceF0 depends on the size of PSII chlorophyll antenna and on the functional integrity of25
PSII reaction centres. It was measured under weak red modulated irradiance. Themaximum fluorescence FM appeared when all PSII reaction centres are closed due
871
BGD6, 863–893, 2009
Biogenic emissionsand water stress
A. V. Lavoir et al.
Title Page
Abstract Introduction
Conclusions References
Tables Figures
J I
J I
Back Close
Full Screen / Esc
Printer-friendly Version
Interactive Discussion
to complete reduction of primary electron acceptors (QA) under a saturated pulse ofwhite light.
2.6 Monoterpenes analysis
The adsorption tubes were analysed by gas chromatography with flame ionisation de-tector (GC/FID) using a Chrompack CP9003 GC equipped with a Chrompack TCT40025
thermo-desorber (all Varian Inc., Palo Alto, USA). Occasionally, parallel MT analysiswas made with a GC/MS system (Varian CP3800/Saturn2000 MS plus a Perkin-ElmerTurbomatrix thermo-desorber) using similar analytical conditions as for the GC/FID in-strument (see Staudt and Lhoutellier, 2007).
Peaks were identified by comparing their mass spectra and retention times with those10
from authentic standards analysed under the same conditions. All GC systems werecalibrated using authentic standards (Fluka Chemie, Buchs, Switzerland; Roth, Karl-sruhe, Germany) diluted in methanol. 0.5 to 3 µL of standard solution was injected onthe head of the adsorption trap through a T-fitting equipped with a septum and purgedwith 300 mL pure N2 at a flow rate of 50 mL min−1. Precision as determined by repeated15
measurements of standards at realistic concentrations was within 5% for all consideredMT.
2.7 Monoterpene synthase activity
After measurements the enclosed leaf was frozen in liquid N2 and stored at −80 ◦C untilmono-TPS analysis as described in Fischbach et al. (2000). 250 mg of frozen leaves20
were homogenised in liquid N2, suspended in 6 mL extraction buffer (700 mM Mops/HClpH 7.3 containing 1.5% (v/v) PEG 1500, 1% (w/v) PVP-30, 8.3% (w/v) Dowex 1×2,20 mM MgCl2, antioxidants [200 mM ascorbic acid, 50 mM β-mercaptoethanol]) andstirred on ice for 20 min. After centrifugation (18 000g for 20 min), 2.5 mL of super-natant was desalted on PD-10 columns (GE Healthcare, Freiburg, Germany) with25
3.5 mL assay buffer (50 mM KPi, pH 7.3, with 10% (v/v) glycerol and antioxidants
872
BGD6, 863–893, 2009
Biogenic emissionsand water stress
A. V. Lavoir et al.
Title Page
Abstract Introduction
Conclusions References
Tables Figures
J I
J I
Back Close
Full Screen / Esc
Printer-friendly Version
Interactive Discussion
(10 mM Na-ascorbate, Na-disulfite, DTT, each)). Assays were run in gas-tight 2 mLvials with 91 µL of protein extracts, 4 µL MgCl2 (final conc. 20 mM) and 5 µL of GDP(final conc. 250 µM) for 60 min at 40 ◦C. Reactions were terminated by removing thereaction mixture and washing the gas-tight vials with 100 µL assay buffer. GC/FIDanalysis was performed according to Fischbach et al. (2000).5
2.8 Data treatments
Monoterpene emission rates were calculated as the difference between the MT con-centration (retention peak area divided by VOC sampling flow) in the chamber enclos-ing a shoot and MT concentration in an empty chamber multiplied by the inlet air flowand related to projected leaf area.10
To factor out immediate effects of actual light and temperature intensities, emissionrates were normalised to standard temperature (30 ◦C) and light conditions (photo-synthetic photon flux density (PPFD) 1000 µmol m−2 s−1) according to the algorithm ofGuenther et al. (1993) using the empirical parameters determined for Q. ilex by Staudtand Bertin (1998). Leaf temperature and incident light intensity during MT trapping15
were recorded and used for the determination of MT standard emission factors (ES ).A potential error in the normalisation could result from the use of inappropriate param-eter values, although the applied parameters have been developed specifically for Q.ilex emissions over a wide range of PPFD and temperature conditions. To check thesensibility of ES variability to parameter values additional normalisations were run us-20
ing global parameters suggested by Guenther et al. (1993) as well as parameter valuesobtained from a growth chamber study, in which Q. ilex plants have been acclimatisedto different light and temperature regimes (Staudt et al., 2003). Overall the use ofother parameters had little influence on ES variability. Results remained the same withrespect to seasonal variation and differences between treatments (data not shown).25
Hereafter emission rate (E ) refers to the measured emission under given environmen-tal conditions and standard emission factor (ES ) to normalised emission rates.
A student-test (Sigma stat) was used to check significant differences between the873
BGD6, 863–893, 2009
Biogenic emissionsand water stress
A. V. Lavoir et al.
Title Page
Abstract Introduction
Conclusions References
Tables Figures
J I
J I
Back Close
Full Screen / Esc
Printer-friendly Version
Interactive Discussion
emissions of 1-year-old and current-year leaves in 2007. No significant differenceswere found in either E or Es (P=0.3096 and P=0.152, data not shown).
Non-parametric MANOVAs (Multivariate ANOVA, adonis procedure, library vegan,R©, Vienna, Austria; See Anderson, 2001) were applied separately on the 2006 and2005 data of ES , mono-TPS activity, assimilation rate, ψpd and FV /FM to test the effects5
of the different treatments (control and dry in 2005, and control, dry and irrigated in2006).
In addition, to characterise the period for which the treatments had an impact on ESin 2006, data were subdivided into three periods defined according to a drought indexbased on the relative soil water content (see below). We fitted linear models on the10
data of each period assuming (or not) a treatment effect (Table 1). As an example,the reference model (1) took into account only the seasonality, without any treatmenteffect, to explain the variation of ES while the model 8 assumed a treatment effect forthe three tested periods. All the intermediates were tested (models 2–7). The infer-ence of each model was determined by the value of the AIC index (Akaike Information15
Criterion; see Burnham and Anderson, 2004). Because the data set of each periodwas unbalanced, the AIC index was corrected for the number of data per period as fol-lows: AICc=AIC+[(2k(k+1))/(n−k)], where AICc is the corrected AIC, n the numberof data and k the degree of freedom of each period. The model with the lowest AICcis considered as the best to explain the data set (procedure AIC lm, library nlme, R©,20
Vienna, Austria).
3 Results
3.1 Composition of monoterpene emission
The foliar emission of monoterpenes from all measured Q. ilex trees was dominatedby five compounds: α-pinene, β-pinene, sabinene, myrcene and limonene. Other ter-25
penoid compounds were found occasionally at trace concentrations, namely α-thujene,
874
BGD6, 863–893, 2009
Biogenic emissionsand water stress
A. V. Lavoir et al.
Title Page
Abstract Introduction
Conclusions References
Tables Figures
J I
J I
Back Close
Full Screen / Esc
Printer-friendly Version
Interactive Discussion
camphene, α-terpinene, p-cymene, (Z)- and (E )-β-ocimene and γ-terpinene. There-fore, only the five main monoterpenes are considered for in the present analysis. Theemissions of most trees were dominated by αt and β-pinene (means of 45 and 28%,respectively) except for two trees whose emissions were characterized by a high per-centage of limonene (>40%). For a given tree, the emission composition found on5
different leaves were always very similar regardless of daytime, season, leaf age andyear of measurement (data not shown). Therefore, E and ES could be presented asthe sum of the five main MT. The monoterpene pattern obtained by in vitro assays ofmono-TPS activity were similar to those found in the emission measurements (linearregression, r2=0.73, t-test, P=0.985, data not shown). The consistent high limonene10
fraction in the emission of leaves of two trees is reflected by similar pattern of mono-TPS activity (r2=0.98).
3.2 Seasonal trends of monoterpene emission rates
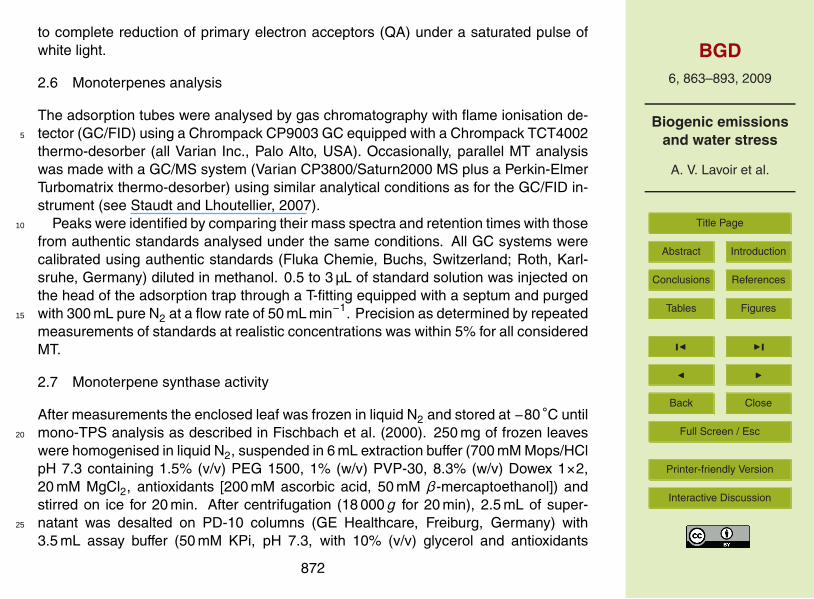
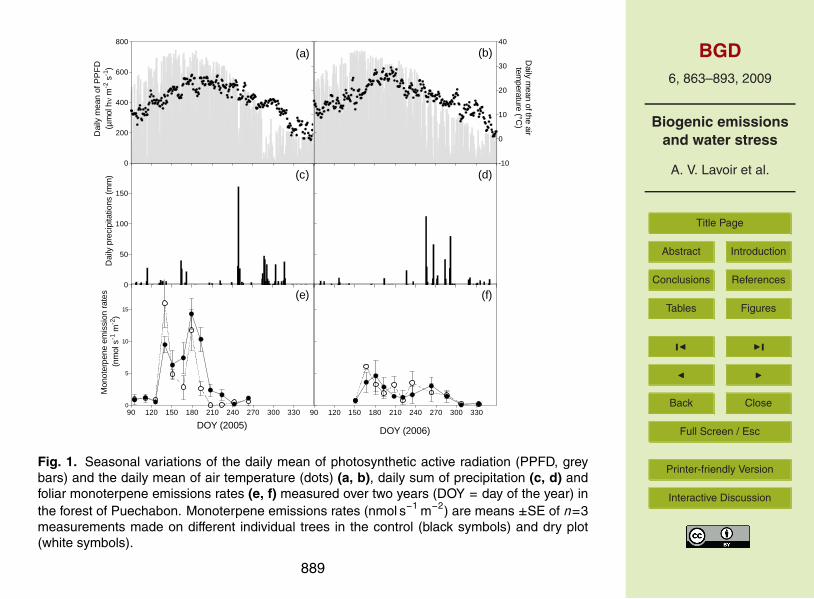
Contrary to the monoterpene emission pattern, the emission rates (E ) showed a pro-nounced inter- and intra-annual variability (Fig. 1). In 2005, E on the dry and control15
plots followed the seasonal temperature and light profile, except two time periods. Inspring under mild weather conditions (DOY 95–126), extremely low E values were fol-lowed by a sudden increase of MT emission in late May (DOY 140). From mid-June(DOY 179) to September (DOY 242) E decreased dramatically while temperature andlight conditions were almost stable during this time period. In 2006 on the same plots,20
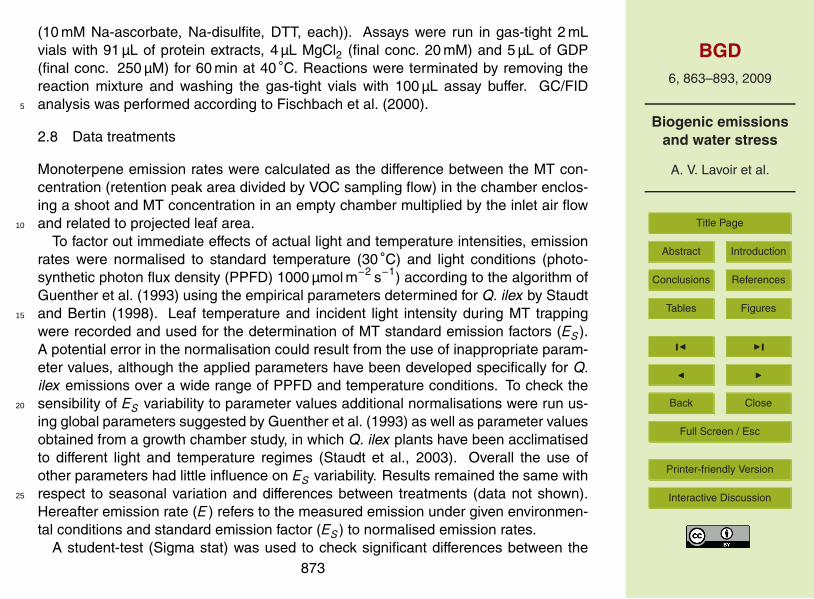
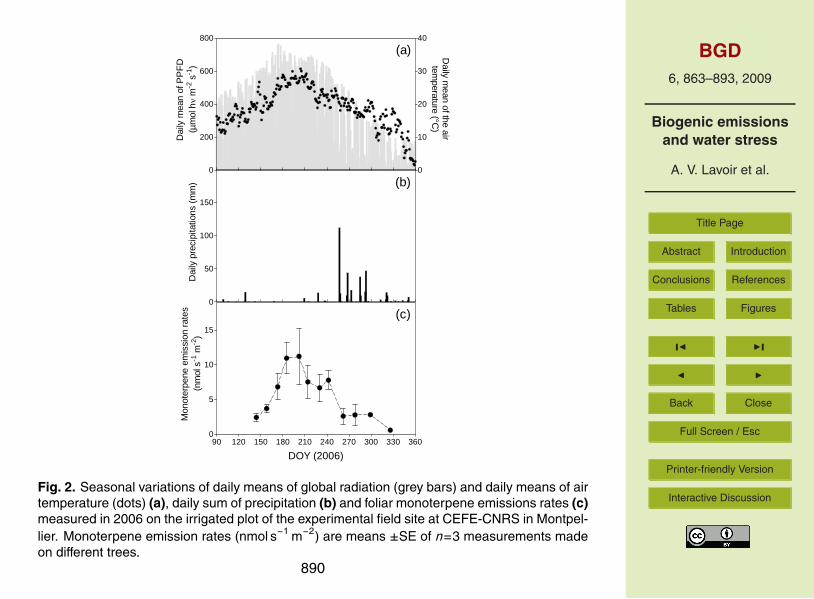
E of the current leaves increased in June (DOY 150–167) but did not reach the samelevel as the preceding year (factor 2 approximately; see Fig. 1e and f). During summer,E remained globally low with some fluctuations and finally dropped in autumn (DOY263–333) together with temperatures and light intensities close to zero. On the irri-gated plot (Fig. 2), E increased in late spring (from DOY 144–185) reaching an annual25
maximum during summer (DOY 185–242) and strongly decreased from September on-wards (DOY 242). The seasonal variation of E on this plot followed mainly the seasonaltemperature and light patterns. The maximal E in summer were considerably higher
875
BGD6, 863–893, 2009
Biogenic emissionsand water stress
A. V. Lavoir et al.
Title Page
Abstract Introduction
Conclusions References
Tables Figures
J I
J I
Back Close
Full Screen / Esc
Printer-friendly Version
Interactive Discussion
on the irrigated plot than those observed on the dry and control plot at the same time,although climate conditions (see Figs. 1b and 2a) as well as leaf temperatures andincident PPFD were similar (data not shown).
3.3 Seasonal trends of standard monoterpene emission factors
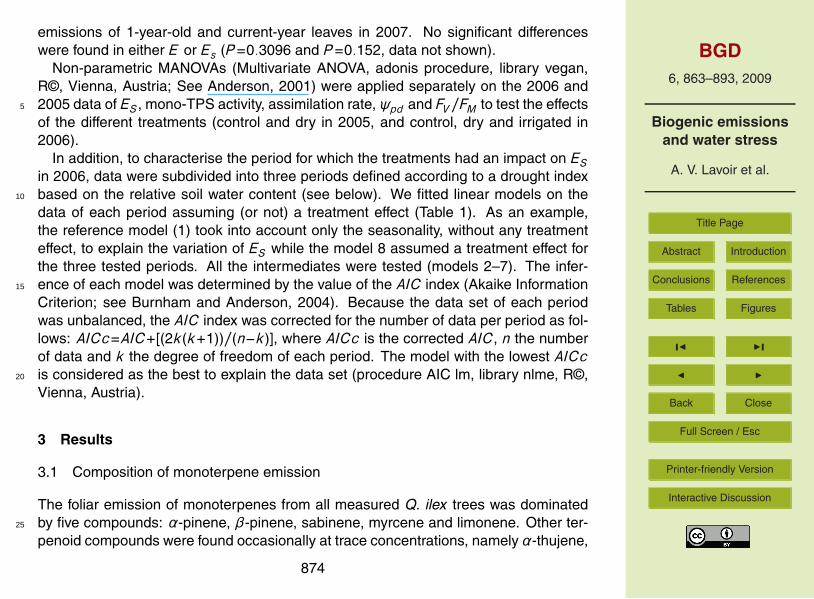
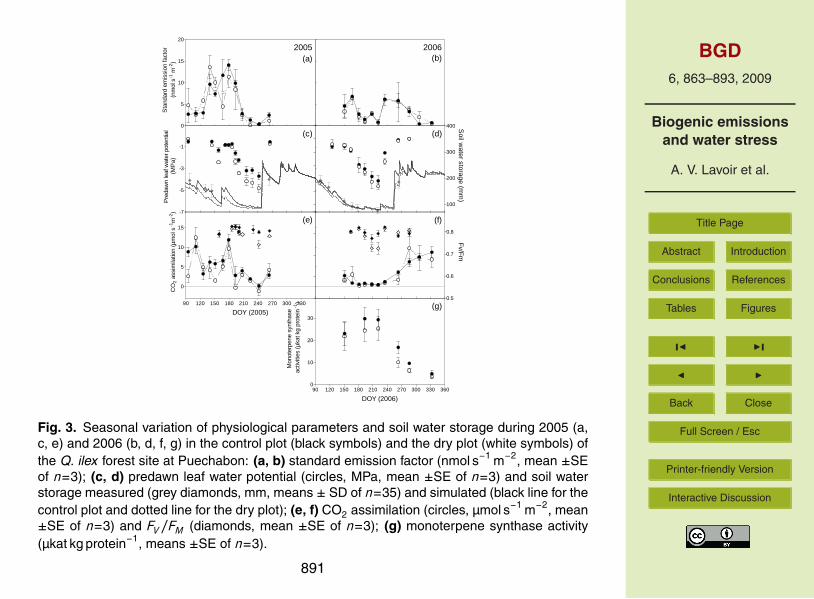
Standard monoterpene emission factors (≡basal emission capacity; ES ) on the dry and5
control plots were higher in 2005 than in 2006 (Fig. 3a, b) and presented a similar intra-annual variability than E . The periods of decreasing ES corresponded approximately tothe periods of decreasing E and were even more pronounced in summer 2006. In bothyears, ES temporary decreased between June and middle of August (DOY 180–240 in2005 and DOY 170–220 in 2006) by about 90%. There were no significant differences10
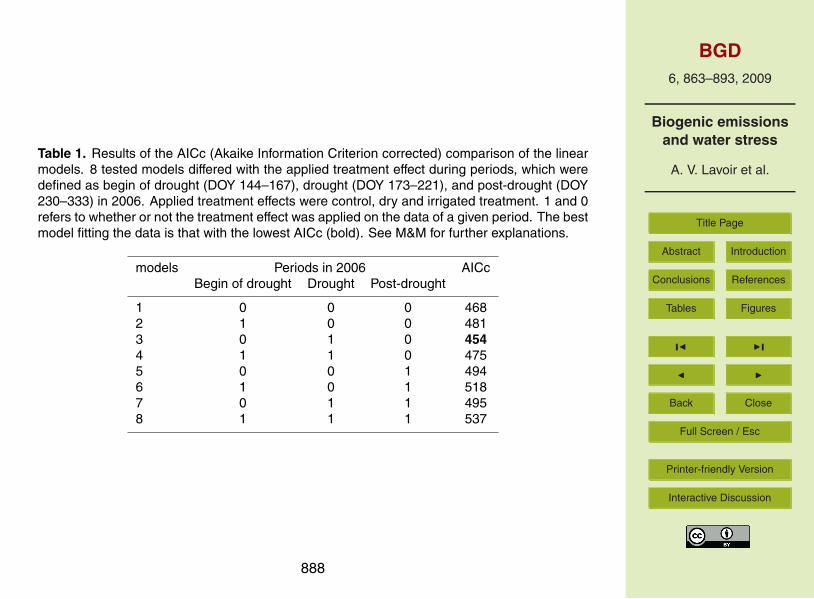
between the two treatments in Puechabon (P=0.09). However in 2006, ES measuredon the irrigated plot (Fig. 4a) was significantly higher (P=0.02) compared to the otherplots in Puechabon. To characterise this difference, treatment effects were tested withlinear models assuming three different periods of water effects on ES (Table 1). AICcof the reference model (1) was 468, above which models have to be considered as15
less suitable to fit the data. Among the tested models only the model 3 incorporat-ing a treatment effect exclusively during the “drought” period yielded a lower value ofAICc (454).
3.4 Plant and soil water status
At the Puechabon site, soil water status (SWS) values decreased during summer until20
a minimum of 80 mm in both years (Fig. 3c, d) and reached the field capacity (210 mm)after the autumnal rainfalls. Some rainfalls in June 2005 (DOY 164) caused a smalltemporary increase of SWS. In 2005, SWS was lower in the dry plot than in the controlplot during spring and summer (DOY 90–248). Differences between plots were lesspronounced in 2006.25
The predawn water potential (ψP D) decreased notably twice in 2005 (Fig. 3c): First
876
BGD6, 863–893, 2009
Biogenic emissionsand water stress
A. V. Lavoir et al.
Title Page
Abstract Introduction
Conclusions References
Tables Figures
J I
J I
Back Close
Full Screen / Esc
Printer-friendly Version
Interactive Discussion
in June (DOY 158) to −2.5 MPa on the dry plot and to −1.5 MPa on the control plot, andsecondly in July and August (DOY 179–242) to −5 MPa and to −4 MPa, respectively onthe dry and control plot. In 2006, ψP D reached −4.5 MPa in both plots in mid August(DOY 221; Fig. 3d). The difference between dry and control plots was significant in2005 and 2006 (for both year P <0.01), with smaller values in the dry plot.5
Thus, the data suggest the occurrence of three distinguished drought events in the2-years measurement period at Puechabon: a first moderate drought event in May–June 2005 (DOY 140–163), a stronger one lasting from July to September 2005 (DOY180–247) and another stronger one lasting from May to September 2006 (DOY 140–254).10
3.5 Photosynthesis and PSII status
During the first drought period in early summer 2005 (DOY 140–163) net assimilationrates (A; Fig. 3e) decreased more in the dry plot than in the control plot. In both plots, Arecovered after the June rainfalls but decreased again and more drastically during thesecond drought period (DOY 180–242), reaching negative values (respiration) in leaves15
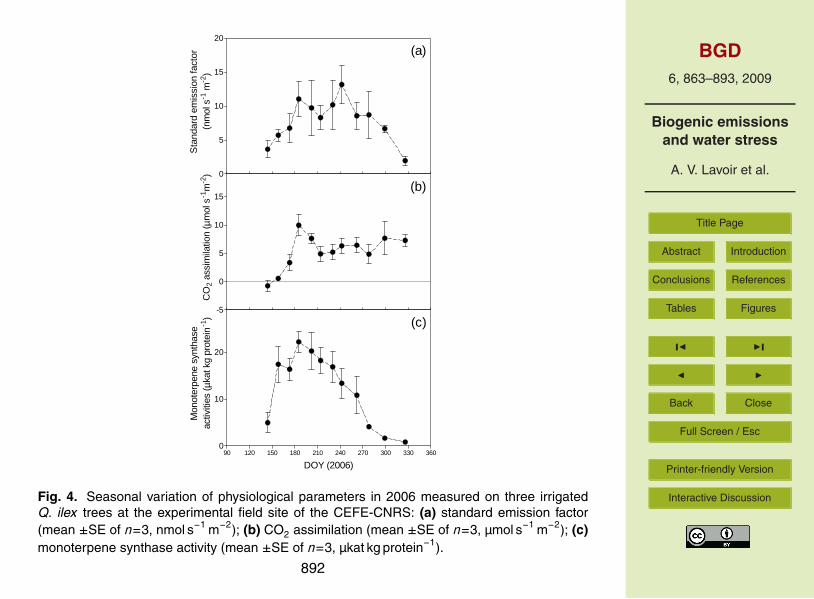
from the dry plot. In 2006, A was strongly reduced in leaves of both plots at Puechabonthroughout the summer period (DOY 151–235; Fig. 3f), recovered after the mid-Augustrainfalls (DOY 237) and reached its annual maximum under mild temperatures in fall(DOY 286–333). Oppositely in the irrigated plot, A increased in spring (DOY 144–185)and remained high during the whole experimental period (DOY 185–326; Fig. 4b).20
We observed no significant differences between dry and control plot leaves in 2005(P=0.14). However, a significant treatment effect was seen in 2006 (P=0.01) withhigher net assimilation rates of leaves from the irrigated plot compared to the othersduring the drought period.Fv/Fm values remained stable throughout 2005 and 2006 except at the end of the25
most severe drought periods (DOY 242 in 2005, DOY 221 in 2006) when they de-creased (Fig. 3e,f). In 2005 the Fv/Fm values were significantly lower in leaves fromthe dry plot than in control leaves (P <0.01) and remained lowered even after a rainfall
877
BGD6, 863–893, 2009
Biogenic emissionsand water stress
A. V. Lavoir et al.
Title Page
Abstract Introduction
Conclusions References
Tables Figures
J I
J I
Back Close
Full Screen / Esc
Printer-friendly Version
Interactive Discussion
event in September. During the drought in 2006, Fv/Fm values decreased again morein leaves subjected to additional drought compared to control leaves (P=0.04).
3.6 Seasonal variation of monoterpene synthase activities
In leaves from both treatments at Puechabon and from the irrigated site at Montpel-lier, in vitro mono-TPS activities followed a similar seasonal cycle in 2006 (P=0.23;5
Figs. 3g and 4c): mono-TPS activities increased after leaf development to a summerplateau and progressively declined during the fall and winter periods. No clear inhibi-tion of enzyme activities was detected during the drought period. Instead, remarkablebetween-tree variability was observed as reported in a previous study on mono-TPSactivity in Q. ilex leaves (Fischbach et al., 2002).10
3.7 Correlation analysis between monoterpene emission and plant water status
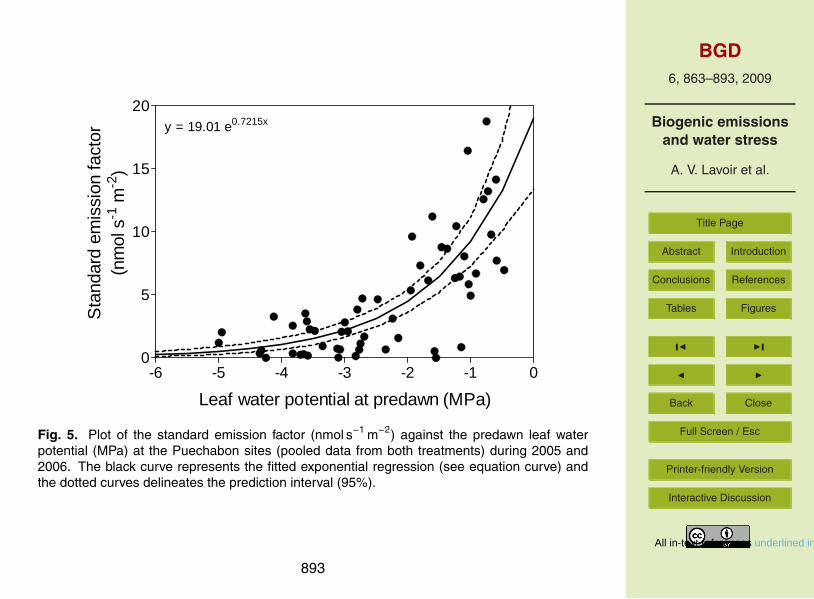
When data from both treatments and years were pooled, ES increased exponentiallywith ψP D (i.e. could be modelled as ES=a.exp(b.ψpd )+ error term, see Fig. 5; pro-cedure “gnls”, library “nlme”, R©, Vienna, Austria). To exclude the seasonal effect(emission start in spring and emission inhibition in fall), only the measurements made15
in summer were taken into account. We computed the 95% confidence prediction inter-val using an ordinary bootstrap method (500 replicates of the dataset were generatedand modelled using exponential models; procedure “gnls”, library “boot”, R©, Vienna,Austria). The delimited interval of prediction was larger at high ψpd (−1/0 MPa) com-pared to lower values (−5/−2 MPa).20
4 Discussion
We observed a strong inter-annual variation of MT emission rates (E ) as well as ofMT emission factors (ES ) at the Puechabon forest. In 2005 maximum ES of about15 nmol s−1 m−2 (30 µg h−1 g−1 leaf dry weight) were observed at the end of May and
878
BGD6, 863–893, 2009
Biogenic emissionsand water stress
A. V. Lavoir et al.
Title Page
Abstract Introduction
Conclusions References
Tables Figures
J I
J I
Back Close
Full Screen / Esc
Printer-friendly Version
Interactive Discussion
again at the end of June. These values agree with those reported in previous studiesfor the same species (respectively 40, 32 and 21 µg h−1 g−1 in Owen et al., 2001; Sabil-lon and Cremades, 2001; Staudt et al., 2002). However, in 2006 comparable valueswere found only on the irrigated plot in Montpellier but not in the Puechabon site, wheremaximum ES were about 7 nmol s−1 m−2 (16 µg h−1 g−1). This year-to-year difference5
at Puechabon might be due to variations in climate conditions, to the caterpillar attackin 2005 or to the resulting difference in the leaf age between the two measurementyears. The latter possibility can however be ruled out given that in 2006 similar largedifferences in ES appeared between the same leaf age class of the irrigated plot withina plantation and the forest site, and in 2007, no significant differences could be ob-10
served between 1-year and current-year leaves. Correspondingly, Staudt et al. (2003)found no increase of ES with increasing leaf age but rather a decrease or no changein ES of Q. ilex leaves. Similarly, Fischbach et al. (2002) observed lower enzymeactivities in 1-year-old than in current-year Q. ilex leaves. Another possibility is thatcaterpillar feeding in 2005 induced increased emissions in the non-attacked 1-year15
leaves. Staudt and Lhoutellier (2007) observed a slight temporary increase in the ESof Q. ilex saplings infested by Gypsy moth caterpillars. This increase lasted howeveronly a few days and therefore neither can explain the year-to-year difference in ESafter the caterpillar attack nor the site difference observed in 2006. Hence the yearand site specific differences in ES must be mainly related to variation in the prevail-20
ing climate conditions. Generally, year-to-year variations in temperature and light arerather small in Mediterranean climates, whereas the annual precipitation pattern canbe highly variable (Fig. 1), causing more or less pronounced drought periods through-out the year. In the present study annual PPFD and temperature patterns were indeedsimilar in both years and both locations but not the water limitation. Loreto et al. (2001)25
reported inter-annual variation of Q. ilex emissions up to a factor of ten, which theyattributed in part to variable water stress conditions. According to Granier et al. (2007)inter-annual variation in drought can be characterized by three indices describing thebeginning of drought, the drought duration and the drought intensity (daily drought du-
879
BGD6, 863–893, 2009
Biogenic emissionsand water stress
A. V. Lavoir et al.
Title Page
Abstract Introduction
Conclusions References
Tables Figures
J I
J I
Back Close
Full Screen / Esc
Printer-friendly Version
Interactive Discussion
ration weighted by water stress in equivalent days (EqD). In 2005 and 2006 the droughtperiod in the Puechabon forest began approximately at the same period (DOY 148 and140, respectively), but the rainfall event occurring in June 2005 limited drought durationto 84 days and drought intensity to 28 EqD. No comparable rainfall events happened inspring 2006 and therefore the drought period was longer (127 days) and more intense5
(48 EqD). Consequently ES did not reach an annual maximum during early summer2006 as observed during 2005 or at the irrigated plot in the same year.
The treatment effect characterized by MANOVA depended on the seasonal period.ES was significantly higher on the irrigated plot during the drought period (9.8± (SEM)3.6 nmol s−1 m−2 for the irrigated plot versus 1.8±1.1 nmol s−1 m−2 for the Puechabon10
plots in average), but it was similar at the three plots during the rest of the year. InPuechabon, all trees suffered from water limitation but the stress was more intensive onthe dry plot than on the untreated control plot. MANOVA results showed a significant ef-fect of the throughfall displacement treatment on plant water status and photosyntheticapparatus as reflected by lower ψpd and Fv/Fm on the dry plot in summers 2005 and15
2006. Despite the significant treatment effect on these physiological parameters, ESwas seemingly unaffected by the additional drought treatment, even though emissionswere undoubtedly inhibited by water stress. One major reason for this apparent dis-crepancy is that ES did not linearly respond to the plant water status but rather followedan exponential way (Fig. 5). Around the −2 MPa value, the curve showed an inflexion:20
Below this value ES seemed to be limited by the plant water status. Above, the increaseof the interval of prediction suggested that ES is controlled by other factors. Other studyalso recorded the existence of a threshold of water stress for the reduction of BVOCemissions (Pegoraro et al., 2004). Given that the exclusion displacement resulted onlyin a 25% SWS difference and that ψpd decreased rapidly from −1 to −4 MPa within25
one month in both plots, the periods during which ψpd of the dry trees has passed thethreshold while ψpd of the control trees has not, were brief and rare and hence werehardly ever detected in our measurements made twice per month.
The mechanisms responsible for this threshold response of emission to drought re-
880
BGD6, 863–893, 2009
Biogenic emissionsand water stress
A. V. Lavoir et al.
Title Page
Abstract Introduction
Conclusions References
Tables Figures
J I
J I
Back Close
Full Screen / Esc
Printer-friendly Version
Interactive Discussion
main to be elucidated. Water stress could affect emissions by altering the activity ofkey-enzymes within the specific MT biosynthesis pathway or by altering the availabil-ity of basic substrates entering this pathway. Our results showed seasonal patternsof mono-TPS activity similar in all plots without evidence for drought effects. Theseresults agree with previous studies on Q. ilex and Q. robur (Schnitzler et al., 1997; Fis-5
chbach et al., 2002) but not with a recent greenhouse study by Fortunati et al. (2008)reporting an inhibition of isoprene synthase activity in water-stressed poplar saplings.However, it cannot be ruled out that other key-enzymes of terpenoid biosynthesis up-stream in the MEP pathway could be affected in Q. ilex leaves during water stress suchas the deoxyxylulose-5-phosphate synthase (Wolfertz et al., 2004). Furthermore, the10
enzymatic activity determined in vitro does not necessarily reflect the activity in vivo.Especially under stress conditions the concentrations of substrates and co-factors orthe cellular pH may differ from in vitro conditions, which may potentially affect the ac-tivity status since mono-TPS activities display a very sharp pH optimum in vitro at 6.7(Fischbach et al., 2000). On the other hand, in the present study both in vitro and field15
emission measurements showed similar product patterns with consistent between-treedifferences suggesting that the in vitro assays indeed reproduced the foliar in vivo en-zyme activities.
Alternatively the drop in emissions in response to severe drought can mainly becaused by a lack of primary substrates coming from photosynthetic processes. Usu-20
ally the fraction of photosynthates (reduced carbon and reduction power) consumedin chloroplast terpenoid synthesis is rather small (Niinemets et al., 2004; Schnitzler etal., 2004) but may increase substantially under summer drought. As biosynthesis ofvolatile terpenoids competes with other, possibly more persistent metabolic sinks suchas carotenoid/xanthophyll biosynthesis, starch formation, or amino-acid biosynthesis,25
the availability of photosynthates may decrease under severe and extended drought asshown by Funk et al. (2004). In the present study the mean percentage of assimilatedcarbon emitted as MT was about 2.5% when A>2.5 µmol s−1 m−2 and was on averagedoubled during the drought periods with top values reaching more than 30%. Hence
881
BGD6, 863–893, 2009
Biogenic emissionsand water stress
A. V. Lavoir et al.
Title Page
Abstract Introduction
Conclusions References
Tables Figures
J I
J I
Back Close
Full Screen / Esc
Printer-friendly Version
Interactive Discussion
carbon assimilation was more severely affected by water stress than MT emissions,as it has been observed in previous studies (Llusia and Penuelas, 1998; Bruggemannand Schnitzler, 2002; Pegoraro et al., 2004). During summer drought, assimilationwas predominantly limited by increased diffusion resistance through stomatal closureand by high temperatures favoring photorespiration. In addition, metabolic limitations5
had likely impaired photosynthesis under the most severe drought conditions whena decrease in the maximum photochemical efficiency (predawn FV /FM ) was observedindicating a persistent, irreversible inhibition of PSII (Methy et al., 1997). Nevertheless,MT emissions were still detectable even when the carbon gain approached zero. Thisindicates that alternative carbon sources contribute to MT biosynthesis under stress as10
reported for isoprene biosynthesis (Affek and Yakir, 2003; Schnitzler et al., 2004).
5 Conclusions
In summary the present field study demonstrates that water limitation strongly reduceMT fluxes from Mediterranean oak forests. This negative impact was visible overtwo consecutive years with lower annual emission rates during the second year and15
over the seasons with a sharp emission decrease during summer when emissionswould otherwise reach their annual maximum. A bell-shaped seasonal evolution ofMT emissions, as reported in previous studies (e.g. Schnitzler et al., 1997; Staudt etal., 2002) was seen only at the irrigated plot, while the time course of emission at thenon-irrigated plots showed remarkable drops in emission coinciding with the periods20
of summer drought characterized by low ψpd , SWS and A. Q. ilex is known to bea very widespread, highly poly-morphological and drought tolerant tree species that isconsidered as the most important single BVOC source of the Mediterranean vegeta-tion (Kesselmeier et al., 1997; Sabillon and Cremades, 2001). Strikingly, substantialdrought-related diminutions in the foliar emissions of this species were observed not25
only on natural trees being subjected to an additional, partial exclusion of precipitationbut also on untreated trees to a similar extent and this during two successive years
882
BGD6, 863–893, 2009
Biogenic emissionsand water stress
A. V. Lavoir et al.
Title Page
Abstract Introduction
Conclusions References
Tables Figures
J I
J I
Back Close
Full Screen / Esc
Printer-friendly Version
Interactive Discussion
that were quite different with respect to occurrence and intensity of drought. We con-clude that drought-related reductions of MT emissions are highly relevant already underpresent climatic conditions and therefore should be considered in current large scaleemission estimations. To date, only a very few studies incorporate water stress effectsin BVOC emission estimations basically by applying an empirical decrease of Es to sim-5
ulate drought (Parra et al., 2004; Guenther et al., 2006). In an accompanying follow-upstudy we use the present data set to develop and validate a process-based modellingapproach that potentially allows predicting drought effects on emission at leaf level bymeans of a biochemical model of BVOC biosynthesis that is linked to photosynthesisand soil water model (Grote et al., 2009).10
Acknowledgements. This research was primarily supported by the French environmentalagency ADEME and the Languedoc-Roussillon regional council. We thank the DREAM team,Herve Bohbot, Christian Colin and Emmanuel Gritti for their help.
References
Affek, H. P. and Yakir, D.: Natural abundance carbon isotope composition of isoprene reflects15
incomplete coupling between isoprene synthesis and photosynthetic carbon flow, Plant Phys-iol., 131, 1727–1736, 2003.
Anderson, M. J.: A new method for non-parametric multivariate analysis of variance, AustralEcol., 26, 32–46, 2001.
Blanch, J., Penuelas, J., and Llusia, J.: Sensitivity of terpene emissions to drought and fertiliza-20
tion in terpene-storing Pinus halepensis and non-storing Quercus ilex, Physiol. Plantarum,131, 211–225, 2007.
Bruggemann, N. and Schnitzler, J. P.: Comparison of isoprene emission, intercellular isopreneconcentration and photosynthetic performance in water-limited oak (Quercus pubescensWilld. and Quercus robur L.) saplings, Plant Biology, 4, 456–463, 2002.25
Burnham, K. P. and Anderson, D. R.: Multimodel inference – understanding AIC and BIC inmodel selection, Sociol. Method. Res., 33, 261–304, 2004.
Calogirou, A., Larsen, B. R., Brussol, C., Duane, M., and Kotzias, D.: Decomposition of ter-penes by ozone during sampling on Tenax, Anal. Chem., 68, 1499–1506, 1996.
883
BGD6, 863–893, 2009
Biogenic emissionsand water stress
A. V. Lavoir et al.
Title Page
Abstract Introduction
Conclusions References
Tables Figures
J I
J I
Back Close
Full Screen / Esc
Printer-friendly Version
Interactive Discussion
Di Castri, F., Mooney, H., and Medecos, I.: Mediterranean type ecosystems: origin and struc-ture, Ecological studies, 7, Springer, Berlin, 1–405, 1973.
Fang, C. W., Monson, R. K., and Cowling, E. B.: Isoprene emission, photosynthesis, andgrowth in sweetgum (Liquidambar styraciflua) seedlings exposed to short- and long-termdrying cycles, Tree Physiol., 16, 441–446, 1996.5
Fischbach, R. J., Zimmer, I., Steinbrecher, R., Pfichner, A., and Schnitzler, J. P.: Monoterpenesynthase activities in leaves of Picea abies (L.) Karst. and Quercus ilex L, Phytochemistry,54, 257–265, 2000.
Fischbach, R. J., Staudt, M., Zimmer, I., Rambal, S., and Schnitzler, J. P.: Seasonal patternof monoterpene synthase activities in leaves of the evergreen tree Quercus ilex, Physiol.10
Plantarum, 114, 354–360, 2002.Fortunati, A., Barta, C., Brilli, F., Centritto, M., Zimmer, I., Schnitzler, J., and Loreto, F.: Isoprene
emission is not temperature-dependent during and after severe drought stress: a physiolog-ical and biochemical analysis, Plant J., 55, 4, 687–697, 2008.
Fuentes, J. D., Wang, D., and Gu, L.: Seasonal variations in isoprene emissions from a boreal15
aspen forest, J. Appl. Meteorol., 38, 855–869, 1999.Fuentes, J. D., Lerdau, M., Atkinson, R., Baldocchi, D., Bottenheim, J. W., Ciccioli, P., Lamb, B.,
Geron, C., Gu, L., Guenther, A., Sharkey, T. D., and Stockwell, W.: Biogenic hydrocarbons inthe atmospheric boundary layer: a review, B. Am. Meteorol. Soc., 81, 1537–1575, 2000.
Funk, J. L., Mak, J. E., and Lerdau, M. T.: Stress-induced changes in carbon sources for20
isoprene production in Populus deltoides, Plant Cell Environ., 27, 747–755, 2004.Funk, J. L., Jones, C. G., Gray, D. W., Throop, H. L., Hyatt, L. A., and Lerdau, M. T.: Variation in
isoprene emission from Quercus rubra: sources, causes, and consequences for estimatingfluxes, J. Geophys. Res.-Atmos., 110, 1–10, 2005.
Granier, A., Reichstein, M., Breda, N., Janssens, I. A., Falge, E., Ciais, P., Grunwald, T., Aubi-25
net, M., Berbigier, P., Bernhofer, C., Buchmann, N., Facini, O., Grassi, G., Heinesch, B.,Ilvesniemi, H., Keronen, P., Knohl, A., Kostner, B., Lagergren, F., Lindroth, A., Longdoz, B.,Loustau, D., Mateus, J., Montagnani, L., Nys, C., Moors, E., Papale, D., Peiffer, M., Pile-gaard, K., Pita, G., Pumpanen, J., Rambal, S., Rebmann, C., Rodrigues, A., Seufert, G.,Tenhunen, J., Vesala, I., and Wang, Q.: Evidence for soil water control on carbon and water30
dynamics in European forests during the extremely dry year: 2003, Agr. Forest. Meteorol.,143, 123–145, 2007.
Gray, D. W., Lerdau, M. T., and Goldstein, A. H.: Influences of temperature history, water stress,
884
BGD6, 863–893, 2009
Biogenic emissionsand water stress
A. V. Lavoir et al.
Title Page
Abstract Introduction
Conclusions References
Tables Figures
J I
J I
Back Close
Full Screen / Esc
Printer-friendly Version
Interactive Discussion
and needle age on methylbutenol emissions, Ecology, 84, 765–776, 2003.Grote, R., Lavoir, A. V., Zimmer, I., Rambal, S., Staudt, M., and Schnitzler, J. P.: Modeling
the drought impact on monoterpene fluxes from an evergreen Mediterranean forest canopy,Oecologia, in press, 2009.
Guenther, A., Archer, S., Greenberg, J., Harley, P., Helmig, D., Klinger, L., Vierling, L., Wil-5
dermuth, M., Zimmerman, P., and Zitzer, S.: Biogenic hydrocarbon emissions and land-cover/climate change in a subtropical savanna, Phys. Chem. Earth Pt. B., 24, 659–667,1999.
Guenther, A., Karl, T., Harley, P., Wiedinmyer, C., Palmer, P. I., and Geron, C.: Estimatesof global terrestrial isoprene emissions using MEGAN (Model of Emissions of Gases and10
Aerosols from Nature), Atmos. Chem. Phys., 6, 3181–3210, 2006,http://www.atmos-chem-phys.net/6/3181/2006/.
Guenther, A. B., Zimmerman, P. R., Harley, P. C., Monson, R. K., and Fall, R.: Isoprene andmonoterpene emission rate variability: Model evaluations and sensitivity analyses, J. Geo-phys. Res.-Atmos., 98, 12 609–12 617, 1993.15
IPCC: Contribution of working group I to the fourth assessment report of the intergovernmentalpanel on climate change, in: Climate Change 2007: the physical science basis, edited by:Press, C. U., Solomon, S., Qin, D., Manning, M., Chen, Z., Marquis, M., Averyt, K. B., Tignor,M., and Miller, H. L., Cambridge and New York, 254–315, 2007.
Kesselmeier, J., Bode, K., Hofmann, U., Muller, H., Schafer, L., Wolf, A., Ciccioli, P., Branca-20
leoni, E., Cecinato, A., Frattoni, M., Foster, P., Ferrari, C., Jacob, V., Fugit, J. L., Dutaur, L.,Simon, V., and Torres, L.: Emission of short chained organic acids, aldehydes and monoter-penes from Quercus ilex L. and Pinus pinea L. in relation to physiological activities, carbonbudget and emission algorithms, Atmos. Environ., 31, 119–133, 1997.
Kesselmeier, J. and Staudt, M.: Biogenic volatile organic compounds (VOC): An overview on25
emission, physiology and ecology, J. Atmos. Chem., 33, 23–88, 1999.Limousin, J., Rambal, S., Ourcival, J., and Joffre, R.: Modelling rainfall interception in a Mediter-
ranean Quercus ilex ecosystem: Lesson from a throughfall exclusion experiment, J. Hydrol.,357, 57–66, 2008.
Llusia, J. and Penuelas, J.: Changes in terpene content and emission in potted mediterranean30
woody plants under severe drought, Can. J. Bot., 76, 1366–1373, 1998.Llusia, J. and Penuelas, J.: Seasonal patterns of terpene content and emission from seven
Mediterranean woody species in field conditions, Am. J. Bot., 87, 133–140, 2000.
885
BGD6, 863–893, 2009
Biogenic emissionsand water stress
A. V. Lavoir et al.
Title Page
Abstract Introduction
Conclusions References
Tables Figures
J I
J I
Back Close
Full Screen / Esc
Printer-friendly Version
Interactive Discussion
Loreto, F., Fischbach, R. J., Schnitzler, J. P., Ciccioli, P., Brancaleoni, E., Calfapietra, C., andSeufert, G.: Monoterpene emission and monoterpene synthase activities in the Mediter-ranean evergreen oak Quercus ilex L. grown at elevated CO2 concentrations, Glob. ChangeBiol., 7, 709–717, 2001.
Maxwell, K. and Johnson, G. N.: Chlorophyll fluorescence – a practical guide, J. Exp. Bot., 51,5
659–668, 2000.Methy, M., Gillon, D., and Houssard, C.: Temperature-induced changes of photosystem II ac-
tivity in Quercus ilex and Pinus halepensis, Can. J. Forest Res., 27, 31–38, 1997.Monson, R. K. and Holland, E. A.: Biospheric trace gas fluxes and their control over tropo-
spheric chemistry, Annu. Rev. Ecol. Syst., 32, 547–576, 2001.10
Mouillot, F., Rambal, S., and Joffre, R.: Simulating climate change impacts on fire frequencyand vegetation dynamics in a Mediterranean-type ecosystem, Glob. Change Biol., 8, 423–437, 2002.
Niinemets, U., Loreto, F., and Reichstein, M.: Physiological and physicochemical controls onfoliar volatile organic compound emissions, Trends Plant Sci., 9, 180–186, 2004.15
Ormeno, E., Mevy, J. P., Vila, B., Bousquet-Melou, A., Greff, S., Bonin, G., and Fernandez, C.:Water deficit stress induces different monoterpene and sesquiterpene emission changes inMediterranean species. Relationship between terpene emissions and plant water potential,Chemosphere, 67, 276–284, 2007.
Owen, S. M., Boissard, C., and Hewitt, C. N.: Volatile organic compounds (VOCs) emitted from20
40 Mediterranean plant species: VOC speciation and extrapolation to habitat scale, Atmos.Environ., 35, 5393–5409, 2001.
Parra, R., Gasso, S., and Baldasano, J. M.: Estimating the biogenic emissions of non-methanevolatile organic compounds from the North Western Mediterranean vegetation of Catalonia,Spain, Sci. Total Environ., 329, 241–259, 2004.25
Pegoraro, E., Rey, A., Greenberg, J., Harley, P., Grace, J., Malhi, Y., and Guenther, A.: Effect ofdrought on isoprene emission rates from leaves of Quercus virginiana Mill, Atmos. Environ.,38, 6149–6156, 2004.
Poisson, N., Kanakidou, M., and Crutzen, P. J.: Impact of non-methane hydrocarbons on tropo-spheric chemistry and the oxidizing power of the global troposphere: 3-dimensional modeling30
results, J. Atmos. Chem., 36, 157–230, 2000.Rambal, S.: The Differential Role of Mechanisms for Drought Resistance in a Mediterranean
Evergreen Shrub – a Simulation Approach, Plant Cell Environ., 16, 35–44, 1993.
886
BGD6, 863–893, 2009
Biogenic emissionsand water stress
A. V. Lavoir et al.
Title Page
Abstract Introduction
Conclusions References
Tables Figures
J I
J I
Back Close
Full Screen / Esc
Printer-friendly Version
Interactive Discussion
Rambal, S., Ourcival, J. M., Joffre, R., Mouillot, F., Nouvellon, Y., Reichstein, M., and Ro-cheteau, A.: Drought controls over conductance and assimilation of a Mediterranean ever-green ecosystem: scaling from leaf to canopy, Glob. Change Biol., 9, 1813–1824, 2003.
Sabillon, D. and Cremades, L. V.: Diurnal and seasonal variation of monoterpene emis-sion rates for two typical Mediterranean species (Pinus pinea and Quercus ilex) from field5
measurements-relationship with temperature and PAR, Atmos. Environ., 35, 4419–4431,2001.
Schnitzler, J. P., Lehning, A., and Steinbrecher, R.: Seasonal pattern of isoprene synthaseactivity in Quercus robur leaves and its significance for modeling isoprene emission rates,Bot. Acta, 110, 240–243, 1997.10
Schnitzler, J. P., Graus, M., Kreuzwieser, J., Heizmann, U., Rennenberg, H., Wisthaler, A.,and Hansel, A.: Contribution of different carbon sources to isoprene biosynthesis in poplarleaves, Plant Physiol., 135, 152–160, 2004.
Staudt, M. and Bertin, N.: Light and temperature dependence of the emission of cyclic andacyclic monoterpenes from Holm oak (Quercus ilex L.) leaves, Plant Cell Environ., 21, 385–15
395, 1998.Staudt, M., Rambal, S., Joffre, R., and Kesselmeier, J.: Impact of drought on seasonal monoter-
pene emissions from Quercus ilex in southern France, J. Geophys. Res.-Atmos., 107(D21),15, 1–9, 2002.
Staudt, M., Joffre, R., and Rambal, S.: How growth conditions affect the capacity of Quercus20
ilex leaves to emit monoterpenes, New Phytol., 158, 61–73, 2003.Staudt, M. and Lhoutellier, L.: Volatile organic compound emission from Holm oak infested by
gypsy moth larvae: evidence for distinct responses in damaged and undamaged leaves, TreePhysiol., 27, 1433–1440, 2007.
Wolfertz, M., Sharkey, T. D., Boland, W., and Kuhnemann, F.: Rapid regulation of the methylery-25
thritol 4-phosphate pathway during isoprene synthesis, Plant Physiol., 135, 1939–1945,2004.
887
BGD6, 863–893, 2009
Biogenic emissionsand water stress
A. V. Lavoir et al.
Title Page
Abstract Introduction
Conclusions References
Tables Figures
J I
J I
Back Close
Full Screen / Esc
Printer-friendly Version
Interactive Discussion
Table 1. Results of the AICc (Akaike Information Criterion corrected) comparison of the linearmodels. 8 tested models differed with the applied treatment effect during periods, which weredefined as begin of drought (DOY 144–167), drought (DOY 173–221), and post-drought (DOY230–333) in 2006. Applied treatment effects were control, dry and irrigated treatment. 1 and 0refers to whether or not the treatment effect was applied on the data of a given period. The bestmodel fitting the data is that with the lowest AICc (bold). See M&M for further explanations.
models Periods in 2006 AICcBegin of drought Drought Post-drought
1 0 0 0 4682 1 0 0 4813 0 1 0 4544 1 1 0 4755 0 0 1 4946 1 0 1 5187 0 1 1 4958 1 1 1 537
888
BGD6, 863–893, 2009
Biogenic emissionsand water stress
A. V. Lavoir et al.
Title Page
Abstract Introduction
Conclusions References
Tables Figures
J I
J I
Back Close
Full Screen / Esc
Printer-friendly Version
Interactive Discussion
32
0
200
400
600
800
(a)
Dai
ly m
ean
of P
PFD
(µm
ol h
ν m
-2 s
-1)
-10
0
10
20
30
40
(b) Daily m
ean of the airtem
perature (°C)
90 120 150 180 210 240 270 300 3300
5
10
15
(e)
DOY (2005)
Mon
oter
pene
em
issi
on ra
tes
(nm
ol s
-1 m
-2)
90 120 150 180 210 240 270 300 330
(f)
DOY (2006)
0
50
100
150
Dai
ly p
reci
pita
tions
(mm
) (c) (d)
708
Figure 1 709
710
Fig. 1. Seasonal variations of the daily mean of photosynthetic active radiation (PPFD, greybars) and the daily mean of air temperature (dots) (a, b), daily sum of precipitation (c, d) andfoliar monoterpene emissions rates (e, f) measured over two years (DOY = day of the year) inthe forest of Puechabon. Monoterpene emissions rates (nmol s−1 m−2) are means ±SE of n=3measurements made on different individual trees in the control (black symbols) and dry plot(white symbols).
889
BGD6, 863–893, 2009
Biogenic emissionsand water stress
A. V. Lavoir et al.
Title Page
Abstract Introduction
Conclusions References
Tables Figures
J I
J I
Back Close
Full Screen / Esc
Printer-friendly Version
Interactive Discussion
33
711
0
200
400
600
800
0
10
20
30
40(a)
Dai
ly m
ean
of P
PFD
(µm
ol h
ν m
-2 s
-1)
Daily m
ean of the airtem
perature (°C)
90 120 150 180 210 240 270 300 330 3600
5
10
15
(c)
DOY (2006)
Mon
oter
pene
em
issi
on ra
tes
(nm
ol s
-1 m
-2)
0
50
100
150
(b)D
aily
pre
cipi
tatio
ns (m
m)
712
Figure 2713 Fig. 2. Seasonal variations of daily means of global radiation (grey bars) and daily means of airtemperature (dots) (a), daily sum of precipitation (b) and foliar monoterpene emissions rates (c)measured in 2006 on the irrigated plot of the experimental field site at CEFE-CNRS in Montpel-lier. Monoterpene emission rates (nmol s−1 m−2) are means ±SE of n=3 measurements madeon different trees.
890
BGD6, 863–893, 2009
Biogenic emissionsand water stress
A. V. Lavoir et al.
Title Page
Abstract Introduction
Conclusions References
Tables Figures
J I
J I
Back Close
Full Screen / Esc
Printer-friendly Version
Interactive Discussion
34
0
5
10
15
20
Sta
ndar
d em
issi
on fa
ctor
(nm
ol s
-1 m
-2)
2005(a)
2006(b)
-7
-5
-3
-1
(c)
Pre
daw
n le
af w
ater
pot
entia
l(M
Pa)
100
200
300
400(d)
Soil w
ater storage (mm
)
90 120 150 180 210 240 270 300 330
0
5
10
15(e)
DOY (2005)
CO
2 as
sim
ilatio
n (µ
mol
s-1
m-2
)
0.5
0.6
0.7
0.8
(f)
Fv/Fm
90 120 150 180 210 240 270 300 330 3600
10
20
30
(g)
DOY (2006)
Mon
oter
pene
syn
thas
e a
ctiv
ities
(µka
t kg
prot
ein
-1)
714
Figure 3 715
716
Fig. 3. Seasonal variation of physiological parameters and soil water storage during 2005 (a,c, e) and 2006 (b, d, f, g) in the control plot (black symbols) and the dry plot (white symbols) ofthe Q. ilex forest site at Puechabon: (a, b) standard emission factor (nmol s−1 m−2, mean ±SEof n=3); (c, d) predawn leaf water potential (circles, MPa, mean ±SE of n=3) and soil waterstorage measured (grey diamonds, mm, means ± SD of n=35) and simulated (black line for thecontrol plot and dotted line for the dry plot); (e, f) CO2 assimilation (circles, µmol s−1 m−2, mean±SE of n=3) and FV /FM (diamonds, mean ±SE of n=3); (g) monoterpene synthase activity(µkat kg protein−1, means ±SE of n=3).
891
BGD6, 863–893, 2009
Biogenic emissionsand water stress
A. V. Lavoir et al.
Title Page
Abstract Introduction
Conclusions References
Tables Figures
J I
J I
Back Close
Full Screen / Esc
Printer-friendly Version
Interactive Discussion
35
0
5
10
15
20
(a)
Sta
ndar
d em
issi
on fa
ctor
(nm
ol s
-1 m
-2)
-5
0
5
10
15(b)
CO
2 as
sim
ilatio
n (µ
mol
s-1
m-2
)
90 120 150 180 210 240 270 300 330 3600
10
20
(c)
DOY (2006)
Mon
oter
pene
syn
thas
eac
tiviti
es (µ
kat k
g pr
otei
n-1)
717
718
719
720
721
722
723
724
725
726
727
728
729
730
Figure 4731
Fig. 4. Seasonal variation of physiological parameters in 2006 measured on three irrigatedQ. ilex trees at the experimental field site of the CEFE-CNRS: (a) standard emission factor(mean ±SE of n=3, nmol s−1 m−2); (b) CO2 assimilation (mean ±SE of n=3, µmol s−1 m−2); (c)monoterpene synthase activity (mean ±SE of n=3, µkat kg protein−1).
892
BGD6, 863–893, 2009
Biogenic emissionsand water stress
A. V. Lavoir et al.
Title Page
Abstract Introduction
Conclusions References
Tables Figures
J I
J I
Back Close
Full Screen / Esc
Printer-friendly Version
Interactive Discussion
36
-6 -5 -4 -3 -2 -1 00
5
10
15
20y = 19.01 e0.7215x
Leaf water potential at predawn (MPa)
Sta
ndar
d em
issi
on fa
ctor
(nm
ol s
-1 m
-2)
732
733
734
735
736
737
738
739
Figure 5 740
741
Fig. 5. Plot of the standard emission factor (nmol s−1 m−2) against the predawn leaf waterpotential (MPa) at the Puechabon sites (pooled data from both treatments) during 2005 and2006. The black curve represents the fitted exponential regression (see equation curve) andthe dotted curves delineates the prediction interval (95%).
893
All in-text references underlined in blue are linked to publications on ResearchGate, letting you access and read them immediately.
Copyright © 2022 FDOKUMEN