Hollow multilayer photonic bandgap fibers for NIR applications
Upload
independentCategory
view
0download
0
lable at ScienceDirect
LWT - Food Science and Technology 60 (2015) 795e801
Contents lists avai
LWT - Food Science and Technology
journal homepage: www.elsevier .com/locate/ lwt
Determination of total phenolic compounds in yerba mate (Ilexparaguariensis) combining near infrared spectroscopy (NIR) andmultivariate analysis
C�atia N.T. Frizon a, *, Gabrieli A. Oliveira a, Camila A. Perussello a,Patrício G. Peralta-Zamora b, Ana M.O. Camlofski a, Überson B. Rossa c,Rosemary Hoffmann-Ribani a
a Graduate Program in Food Engineering, Department of Chemical Engineering, Federal University of Paran�a, 81531-980 Curitiba, PR, Brazilb Department of Chemistry, Federal University of Paran�a, 81531-990 Curitiba, PR, Brazilc Graduate Program in Forest Engineering, Federal University of Paran�a, 80210-170 Curitiba, PR, Brazil
a r t i c l e i n f o
Article history:Received 29 April 2014Received in revised form22 September 2014Accepted 11 October 2014Available online 19 October 2014
Keywords:Yerba matePhenolic compoundsNear infrared spectroscopyPrincipal component analysisPartial least squares regression
* Corresponding author.E-mail addresses: [email protected] (C.N.T. Fri
(G.A. Oliveira), [email protected] (C.A. P(P.G. Peralta-Zamora), [email protected]@gmail.com (Ü.B. Rossa), [email protected]
http://dx.doi.org/10.1016/j.lwt.2014.10.0300023-6438/© 2014 Elsevier Ltd. All rights reserved.
a b s t r a c t
A quick method to determine the content of phenolic compounds (TPC) in yerba mate based on nearinfrared spectroscopy (NIR) was studied aiming to provide reductions of cost and analysis time for themate industry without generating laboratory effluents. A total of 111 samples of yerba mate fromdifferent regions of the State of Paran�a, Brazil (Southeast, South Central and Metropolitan Area ofCuritiba) was analyzed by the Folin-Ciocalteu method. The average contents of TPC found were 84.82,133.31 and 37.00 mg g�1, respectively. The samples were separated into three groups (regarding thedifferent growing regions) using the principal component analysis (PCA). Models were developed usingpartial least squares (PLS) and some preprocessing strategies of the spectral data were evaluated. Thebest result was obtained by Multiplicative Scatter Correction (MSC) and first derivative with six latentvariables. The best model presented a correlation coefficient of 0.81 with a prediction error of 12%. Theresults showed that NIR can be applied as an efficient method for the assessment of TPC, which allowsclassifying samples in relation to its origin of planting, processing and agronomic practices applied,aiding the decision of referral and use of yerba mate in different final products.
© 2014 Elsevier Ltd. All rights reserved.
1. Introduction
Yerba mate (Ilex paraguariensis) is widely consumed in SouthAmerica as hot and iced tea, representing an important economicactivity in several countries within this region. Yerba mate leavescontain high concentrations of phenolic compounds, mainly tan-nins, flavonoids and phenolic acids (Bravo, Goya, & Lecumberri,2007; Vieira et al., 2008), which provide a significant amount ofantioxidants to the herb (Filip, Lolito, Ferraro, & Fraga, 2000),decreasing the oxidation of human low density lipoprotein (LDL)either in vitro or in vivo (Gugliucci, 1996; Gugliucci & Stahl, 1995).Martins and collaborators (2009) observed that rats fed with yerbamate presented lower quantities of thiobarbituric acid-reactive
zon), [email protected]), [email protected] (A.M.O. Camlofski),m (R. Hoffmann-Ribani).
substances in the liver, suggesting that the treatment with yerbamate extract protects unsaturated fatty acids from oxidation andcan especially protect the liver. According to Andersen and Fogh(2001), the yerba mate extract delayed gastric emptying in over-weight patients, reducing perception of satiety and leading to sig-nificant weight loss after 45 days. Arcari et al. (2009) demonstratedthat the treatment with yerba mate extract has an anti-obesityeffect on in vivo adipose tissue for it controls the expression ofvarious genes involved in the process of obesity, such as inflam-matory markers. Inflammation is a factor for many human healthdisorders such as cancer, cardiovascular diseases, obesity and dia-betes. Therefore, the high content of bioactive phenolic compoundsin yerba mate encourages its use in foodstuffs.
Currently, the determination of phenolic compounds is carriedout by several methods such as high performance liquid chroma-tography (HPLC) (Bert�e, Beurx, Spada, Slavador, & Ribani, 2011;Cardozo et al., 2007), gas chromatography (GC), or combinationsof these analyses with mass spectrometry (MS) (Jacques, Santos,Dariva, Oliveira, & Caramar~ao, 2007). These techniques are
C.N.T. Frizon et al. / LWT - Food Science and Technology 60 (2015) 795e801796
efficient for they provide rapid separation and quantification ofphenolic compounds. However, they require sophisticated andexpensive equipment, skilled labor and a variety of reagents.Another relevant method includes spectrophotometry since itrepresents a relatively simple method for quantifying phenoliccompounds of plants. The Folin-Ciocalteu assay (FC) bases on achemical reduction involving a reagent containing sodium molyb-date and sodium tungstate (Singleton & Rossi, 1965). The FC re-agents react with phenols, as well with other substances, such asascorbic acid, aromatic amines, sugars and xanthines (Prior, Wu, &Schaich, 2005). This procedure has been used by Mejia, Song, Heck,and Ramirez-Mares (2010) to assess the content of total poly-phenols in yerba mate tea. Turner, Cogoi, Isolabella, Filip, andAnesini (2011) evaluated the content of polyphenols in I. para-guariensis during the industrial processing. The main phenoliccompounds identified in the leaves were chlorogenic acids (5-O-caffeoylquinic, dicaffeoylquinic and 3, 4-isomers) and rutin flavo-noids (Filip, L�opez, Gibert, Cousio, & Ferraro, 2001; Mejia et al.,2010). As an alternative to replace the classical chemical analysis,near infrared spectroscopy (NIR) is a simple, fast and non-destructive method that measures the interaction of light withthe material, which is in turn determined by the vibration of thechemical bonds of the sample constituents (Pasquini, 2003). Inaddition, it exempts the use of reagents. This technique has beenapplied to determine the major phenolic acids in Radix SalviaMiltrorrhiza extracts (Li & Qu, 2010), the quality of green tea(Luypaert, Zhang, & Massart, 2003), the caffeine, theobromine andtheophylline contents in coffee (Huck, Guggenbichler, & Bonn,2005), the antioxidant content of bamboo leaves (Wu et al., 2012)and the content of total flavonoids in Ginkgo biloba leaves (Ji-Yonget al., 2012). NIR was also used by Cozzolino and collaborators(2010) to classify yerba mate samples according to its geograph-ical origin e Brazil, Argentina and Uruguay.
According to a recent survey of literature, to date no researchhas been reported using NIR for the determination of phenoliccompounds in yerba mate, which is relevant considering that thisanalysis can be inserted into the industrial production allowingimportant conclusions about the use of mate leaves. Within thiscontext, the aim of this work is to evaluate the potential of NIRcombined with chemometrics in order to quantify the phenoliccompounds in samples of yerba mate (I. paraguariensis) grown andprocessed in different regions of Paran�a, Brazil, such as Southeast,South Central and Metropolitan Area of Curitiba.
2. Materials and methods
2.1. Plant materials
In this study, 111 samples of yerba mate were collected fromindustries located in different zones of Paran�a: Metropolitan Areaof Curitiba (Region A: n ¼ 6, samples 1, 2, 3, 35, 36 and 37),Southeast (Region B: n ¼ 30, samples 4e34) and South Central(Region C: n ¼ 75, samples 38e111). Samples from region A arenative plants with higher leaf mass productivity due to breedingprograms conducted by Embrapa Florestas. The plants from regionB were cultivated under direct sunlight by small producers in theSouth Central zone. Samples from area C are plants intercroppedwith Eucalyptus and grown under different sunlight levels. Beforethe analyses, the samples from the South Central region and theMetropolitan Area of Curitiba were dried in a home microwaveoven operating at 2450MHz (Philco, model PMW-101) according tothe methodology described by Hansel, Domingos, Lima, andPasquini (2008). The leaves from the Southeast region, providedby a company located at the South-East of Paran�a, were industriallydried in a continuous belt for 4e6 h at a temperature between 100
and 110�C. In as much as the samples from regions A and C are partof experimental programs, they were not industrially dried, unlikethe mate leaves from region B. The samples from all three regionswere crushed in a bench mill (IKA A11, basic model), placed inpolypropylene bags and stored in a freezer until the analyses. It isworthwhile to say that the mate leaves from the three distinct re-gions differ also with respect to the agronomic practices and pro-cessing related to each zone.
In order to obtain a comparison between two spectrometers,and therefore evaluate the robustness of the coupled techniqueproposed herein, all the 111 samples were analyzed by the devicesTENSIONER (Bruker Optics, Ettlingen, Germany) e identified withthe numbers 01 Te111 T e and VERTEX (Bruker Optics, BrukerCorporation, Billerica, Massachusetts, USA) e identified with thenumbers 112 Ve222 V. Thus, sample one is represented by bothnumbers 01 T and 112 V.
2.2. Determination of total phenolic compounds
The extraction of total phenolic compounds (TPC) was per-formed according to the methodology described by Dutra,Hoffmann-Ribani, and Ribani (2010). 100 mL of water: ethanol1:1 (v/v) were added to 2 g of yerba mate and kept for 12 h at roomtemperature. Three extractions were conducted with 25 mL of 50%hydro-ethanolic solution under reflux for 30 min each, producing250mL of extract, which were then filtered. The content of TPC wasdetermined spectrophotometrically by the Folin-Ciocalteu proce-dure in agreement with the methodology published by Singleton,Orthofer, and Ravent�os-Lamuela (1999). In summary, 500 uL ofextract were mixed with 2.5 mL of Folin-Ciocalteu reagent (1:10)and 2.0 mL of a sodium carbonate (Na2CO3) solution (4% w/v). After120min of reaction in the absence of light at room temperature, theabsorbance was measured at 740 nm. The compound 5-caffeoylquinic acid (5-CQA), brand Sigma, was used as standard,and the results were expressed in mg of 5-CQA equivalent/g ofsample.
2.3. Analysis of near infrared spectroscopy
2.3.1. Acquisition of spectraThe samples were analyzed using two spectrometers with
different detectors: (a) TENSIONER 37 (Bruker Optics, Ettlingen,Germany), equipped with Fourier transform, integrating sphereand indium gallium arsenide (InGaAs) detector, which has a highdetection efficiency (D* ¼ 4.41010), and (b) VERTEX 70 (BrukerOptics e Bruker Corporation, Billerica, Massachusetts, USA),equipped with Fourier transform and deuterated L-alanine dopedtriglycine sulfate (DLaTGS) detector (D* ¼ 2.7 � 108). Both deviceswere controlled by the software OPUS (versions 6.0 and 6.5,respectively). The spectra of the yerba mate samples were collectedby both equipments in the near infrared region, from 10.000 cm�1
to 4.000 cm�1, operating in diffuse reflectance through 64 scans,with a resolution of 4 cm�1 and temperature controlled near 20�C.Reflectance data were stored as log (1/R), being R the reflectance.
2.3.2. Multivariate processingThe software Origin Pro 8.0 (Northampton, MA 01060, USA) was
used to construct arrays of spectral data. The spectra were pro-cessed in Matlab version 7.1 (Mathworks Inc.) using the packagePLS-toolbox 1.5 (Eigenvector Research Inc.) for chemometric anal-ysis. The principal component analysis (PCA) was used to reducethe dimensionality of the data set for some variables e calledprincipal components (PCs) -, which describe the largest varianceof the data analyzed. The technique provides a summary of the
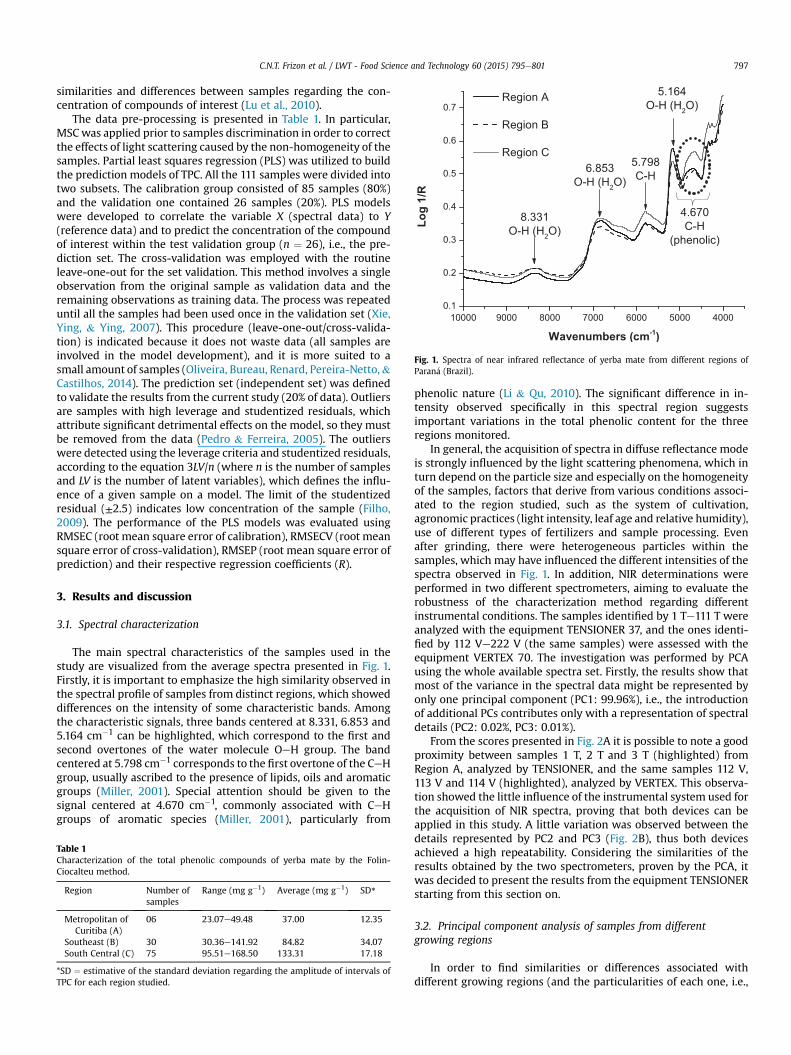
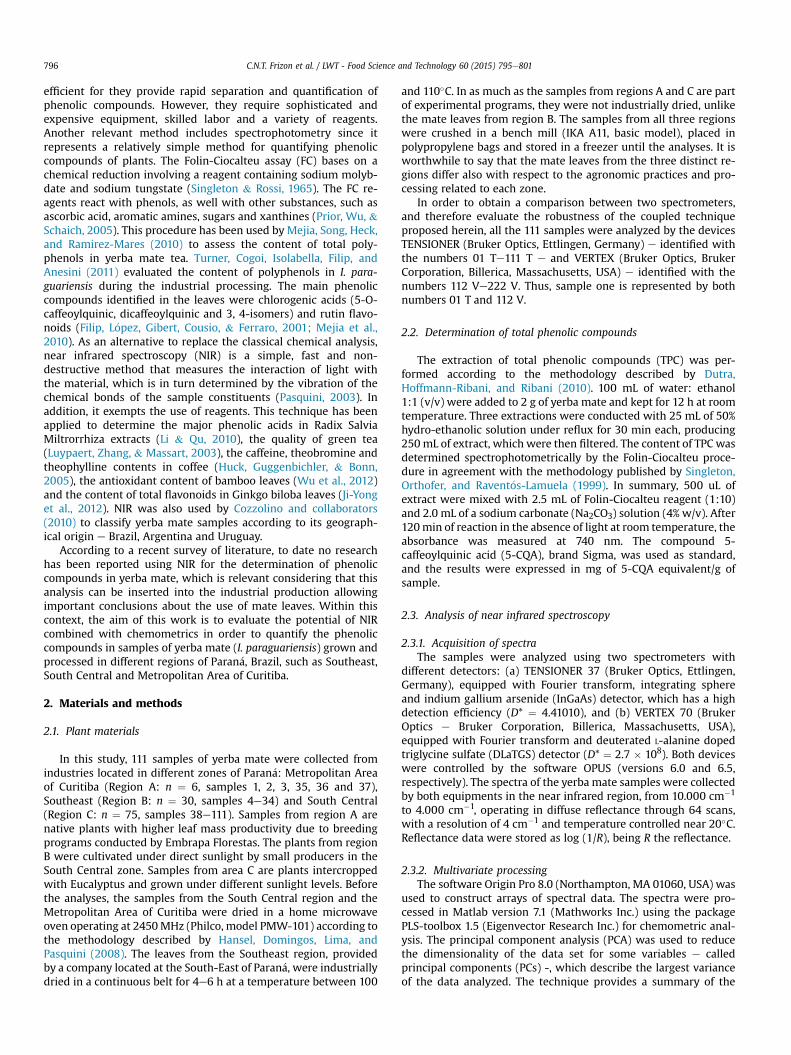
Fig. 1. Spectra of near infrared reflectance of yerba mate from different regions ofParan�a (Brazil).
C.N.T. Frizon et al. / LWT - Food Science and Technology 60 (2015) 795e801 797
similarities and differences between samples regarding the con-centration of compounds of interest (Lu et al., 2010).
The data pre-processing is presented in Table 1. In particular,MSCwas applied prior to samples discrimination in order to correctthe effects of light scattering caused by the non-homogeneity of thesamples. Partial least squares regression (PLS) was utilized to buildthe prediction models of TPC. All the 111 samples were divided intotwo subsets. The calibration group consisted of 85 samples (80%)and the validation one contained 26 samples (20%). PLS modelswere developed to correlate the variable X (spectral data) to Y(reference data) and to predict the concentration of the compoundof interest within the test validation group (n ¼ 26), i.e., the pre-diction set. The cross-validation was employed with the routineleave-one-out for the set validation. This method involves a singleobservation from the original sample as validation data and theremaining observations as training data. The process was repeateduntil all the samples had been used once in the validation set (Xie,Ying, & Ying, 2007). This procedure (leave-one-out/cross-valida-tion) is indicated because it does not waste data (all samples areinvolved in the model development), and it is more suited to asmall amount of samples (Oliveira, Bureau, Renard, Pereira-Netto,&Castilhos, 2014). The prediction set (independent set) was definedto validate the results from the current study (20% of data). Outliersare samples with high leverage and studentized residuals, whichattribute significant detrimental effects on the model, so they mustbe removed from the data (Pedro & Ferreira, 2005). The outlierswere detected using the leverage criteria and studentized residuals,according to the equation 3LV/n (where n is the number of samplesand LV is the number of latent variables), which defines the influ-ence of a given sample on a model. The limit of the studentizedresidual (±2.5) indicates low concentration of the sample (Filho,2009). The performance of the PLS models was evaluated usingRMSEC (root mean square error of calibration), RMSECV (root meansquare error of cross-validation), RMSEP (root mean square error ofprediction) and their respective regression coefficients (R).
3. Results and discussion
3.1. Spectral characterization
The main spectral characteristics of the samples used in thestudy are visualized from the average spectra presented in Fig. 1.Firstly, it is important to emphasize the high similarity observed inthe spectral profile of samples from distinct regions, which showeddifferences on the intensity of some characteristic bands. Amongthe characteristic signals, three bands centered at 8.331, 6.853 and5.164 cm�1 can be highlighted, which correspond to the first andsecond overtones of the water molecule OeH group. The bandcentered at 5.798 cm�1 corresponds to the first overtone of the CeHgroup, usually ascribed to the presence of lipids, oils and aromaticgroups (Miller, 2001). Special attention should be given to thesignal centered at 4.670 cm�1, commonly associated with CeHgroups of aromatic species (Miller, 2001), particularly from
Table 1Characterization of the total phenolic compounds of yerba mate by the Folin-Ciocalteu method.
Region Number ofsamples
Range (mg g�1) Average (mg g�1) SD*
Metropolitan ofCuritiba (A)
06 23.07e49.48 37.00 12.35
Southeast (B) 30 30.36e141.92 84.82 34.07South Central (C) 75 95.51e168.50 133.31 17.18
*SD ¼ estimative of the standard deviation regarding the amplitude of intervals ofTPC for each region studied.
phenolic nature (Li & Qu, 2010). The significant difference in in-tensity observed specifically in this spectral region suggestsimportant variations in the total phenolic content for the threeregions monitored.
In general, the acquisition of spectra in diffuse reflectance modeis strongly influenced by the light scattering phenomena, which inturn depend on the particle size and especially on the homogeneityof the samples, factors that derive from various conditions associ-ated to the region studied, such as the system of cultivation,agronomic practices (light intensity, leaf age and relative humidity),use of different types of fertilizers and sample processing. Evenafter grinding, there were heterogeneous particles within thesamples, which may have influenced the different intensities of thespectra observed in Fig. 1. In addition, NIR determinations wereperformed in two different spectrometers, aiming to evaluate therobustness of the characterization method regarding differentinstrumental conditions. The samples identified by 1 Te111 T wereanalyzed with the equipment TENSIONER 37, and the ones identi-fied by 112 Ve222 V (the same samples) were assessed with theequipment VERTEX 70. The investigation was performed by PCAusing the whole available spectra set. Firstly, the results show thatmost of the variance in the spectral data might be represented byonly one principal component (PC1: 99.96%), i.e., the introductionof additional PCs contributes only with a representation of spectraldetails (PC2: 0.02%, PC3: 0.01%).
From the scores presented in Fig. 2A it is possible to note a goodproximity between samples 1 T, 2 T and 3 T (highlighted) fromRegion A, analyzed by TENSIONER, and the same samples 112 V,113 V and 114 V (highlighted), analyzed by VERTEX. This observa-tion showed the little influence of the instrumental system used forthe acquisition of NIR spectra, proving that both devices can beapplied in this study. A little variation was observed between thedetails represented by PC2 and PC3 (Fig. 2B), thus both devicesachieved a high repeatability. Considering the similarities of theresults obtained by the two spectrometers, proven by the PCA, itwas decided to present the results from the equipment TENSIONERstarting from this section on.
3.2. Principal component analysis of samples from differentgrowing regions
In order to find similarities or differences associated withdifferent growing regions (and the particularities of each one, i.e.,
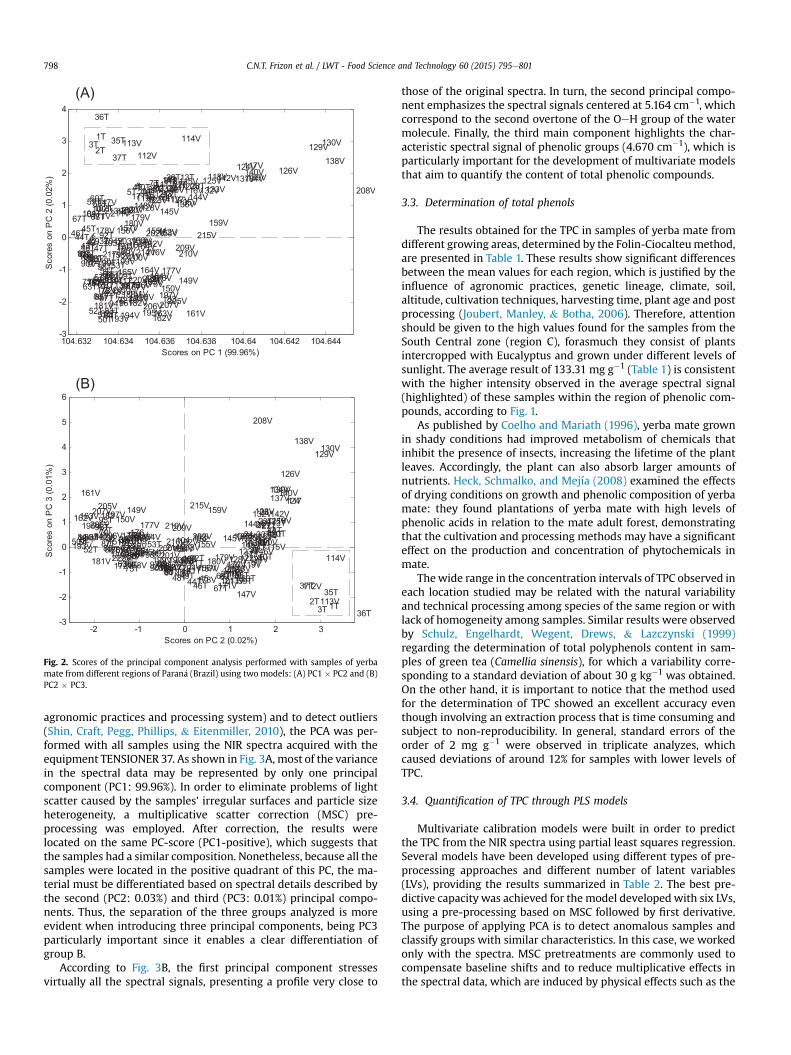
Fig. 2. Scores of the principal component analysis performed with samples of yerbamate from different regions of Paran�a (Brazil) using two models: (A) PC1 � PC2 and (B)PC2 � PC3.
C.N.T. Frizon et al. / LWT - Food Science and Technology 60 (2015) 795e801798
agronomic practices and processing system) and to detect outliers(Shin, Craft, Pegg, Phillips, & Eitenmiller, 2010), the PCA was per-formed with all samples using the NIR spectra acquired with theequipment TENSIONER 37. As shown in Fig. 3A, most of the variancein the spectral data may be represented by only one principalcomponent (PC1: 99.96%). In order to eliminate problems of lightscatter caused by the samples' irregular surfaces and particle sizeheterogeneity, a multiplicative scatter correction (MSC) pre-processing was employed. After correction, the results werelocated on the same PC-score (PC1-positive), which suggests thatthe samples had a similar composition. Nonetheless, because all thesamples were located in the positive quadrant of this PC, the ma-terial must be differentiated based on spectral details described bythe second (PC2: 0.03%) and third (PC3: 0.01%) principal compo-nents. Thus, the separation of the three groups analyzed is moreevident when introducing three principal components, being PC3particularly important since it enables a clear differentiation ofgroup B.
According to Fig. 3B, the first principal component stressesvirtually all the spectral signals, presenting a profile very close to
those of the original spectra. In turn, the second principal compo-nent emphasizes the spectral signals centered at 5.164 cm�1, whichcorrespond to the second overtone of the OeH group of the watermolecule. Finally, the third main component highlights the char-acteristic spectral signal of phenolic groups (4.670 cm�1), which isparticularly important for the development of multivariate modelsthat aim to quantify the content of total phenolic compounds.
3.3. Determination of total phenols
The results obtained for the TPC in samples of yerba mate fromdifferent growing areas, determined by the Folin-Ciocalteumethod,are presented in Table 1. These results show significant differencesbetween the mean values for each region, which is justified by theinfluence of agronomic practices, genetic lineage, climate, soil,altitude, cultivation techniques, harvesting time, plant age and postprocessing (Joubert, Manley, & Botha, 2006). Therefore, attentionshould be given to the high values found for the samples from theSouth Central zone (region C), forasmuch they consist of plantsintercropped with Eucalyptus and grown under different levels ofsunlight. The average result of 133.31 mg g�1 (Table 1) is consistentwith the higher intensity observed in the average spectral signal(highlighted) of these samples within the region of phenolic com-pounds, according to Fig. 1.
As published by Coelho and Mariath (1996), yerba mate grownin shady conditions had improved metabolism of chemicals thatinhibit the presence of insects, increasing the lifetime of the plantleaves. Accordingly, the plant can also absorb larger amounts ofnutrients. Heck, Schmalko, and Mejía (2008) examined the effectsof drying conditions on growth and phenolic composition of yerbamate: they found plantations of yerba mate with high levels ofphenolic acids in relation to the mate adult forest, demonstratingthat the cultivation and processing methods may have a significanteffect on the production and concentration of phytochemicals inmate.
Thewide range in the concentration intervals of TPC observed ineach location studied may be related with the natural variabilityand technical processing among species of the same region or withlack of homogeneity among samples. Similar results were observedby Schulz, Engelhardt, Wegent, Drews, & Lazczynski (1999)regarding the determination of total polyphenols content in sam-ples of green tea (Camellia sinensis), for which a variability corre-sponding to a standard deviation of about 30 g kg�1 was obtained.On the other hand, it is important to notice that the method usedfor the determination of TPC showed an excellent accuracy eventhough involving an extraction process that is time consuming andsubject to non-reproducibility. In general, standard errors of theorder of 2 mg g�1 were observed in triplicate analyzes, whichcaused deviations of around 12% for samples with lower levels ofTPC.
3.4. Quantification of TPC through PLS models
Multivariate calibration models were built in order to predictthe TPC from the NIR spectra using partial least squares regression.Several models have been developed using different types of pre-processing approaches and different number of latent variables(LVs), providing the results summarized in Table 2. The best pre-dictive capacity was achieved for the model developed with six LVs,using a pre-processing based on MSC followed by first derivative.The purpose of applying PCA is to detect anomalous samples andclassify groups with similar characteristics. In this case, we workedonly with the spectra. MSC pretreatments are commonly used tocompensate baseline shifts and to reduce multiplicative effects inthe spectral data, which are induced by physical effects such as the

Fig. 3. A) PCA scores (PC1 vs.PC2 vs.PC3) and B) loadings of the three principal components of the spectra of yerba mate from different regions of Paran�a (Brazil) pretreated by MSC.
C.N.T. Frizon et al. / LWT - Food Science and Technology 60 (2015) 795e801 799
non-uniform scattering throughout the spectrum, radiation wave-length, particle size and refractive index (Nicolai et al., 2007). Thefirst derivative is often used to improve the definitions of bandsthat are superimposed, to remove noise in the same spectral lineand/or to correct the baseline region (Osborne, 2000). By the otherhand, the PLS regression is constructed one by one in such a waythat the latent variables are oriented along directions of maximalcovariance between the spectral matrix X and the response vector Y(Naes, Isaksson, Fearn, & Davies, 2002). Therefore, at this stage thespectral data are correlated with the values obtained by the con-ventional analysis (Folin-Ciocalteu). As the samples are heteroge-neous, presenting average results of TPC of 37.0e133.3 mg g�1,consequently the spectra are also heterogeneous. Hence, the firstderivative preprocessing was added to the MSC, which allowed to
remove both additive and multiplicative effects in the spectra.Several other pre-processings were applied, but the best results areshown in Table 2.
In the test validation phase, the model provided a good agree-ment between real and predicted values, with a correlation coef-ficient of 0.81 (Fig. 4) and a RMSEP of around 12%. Although thisaverage value is quite close to that observed by Gallice,Messerschmidt, and Peralta-Zamora (2011) for the determinationof total phenols in wines, the largest difference between real andtarget values occur in samples of lower concentration of totalphenols (Fig. 4), which significantly increases the average predic-tion error. Additionally, it is important to emphasize that thedetermination of phenolic forms by Folin-Ciocalteu shows lowselectivity, mainly due to the false positives ascribed to non-
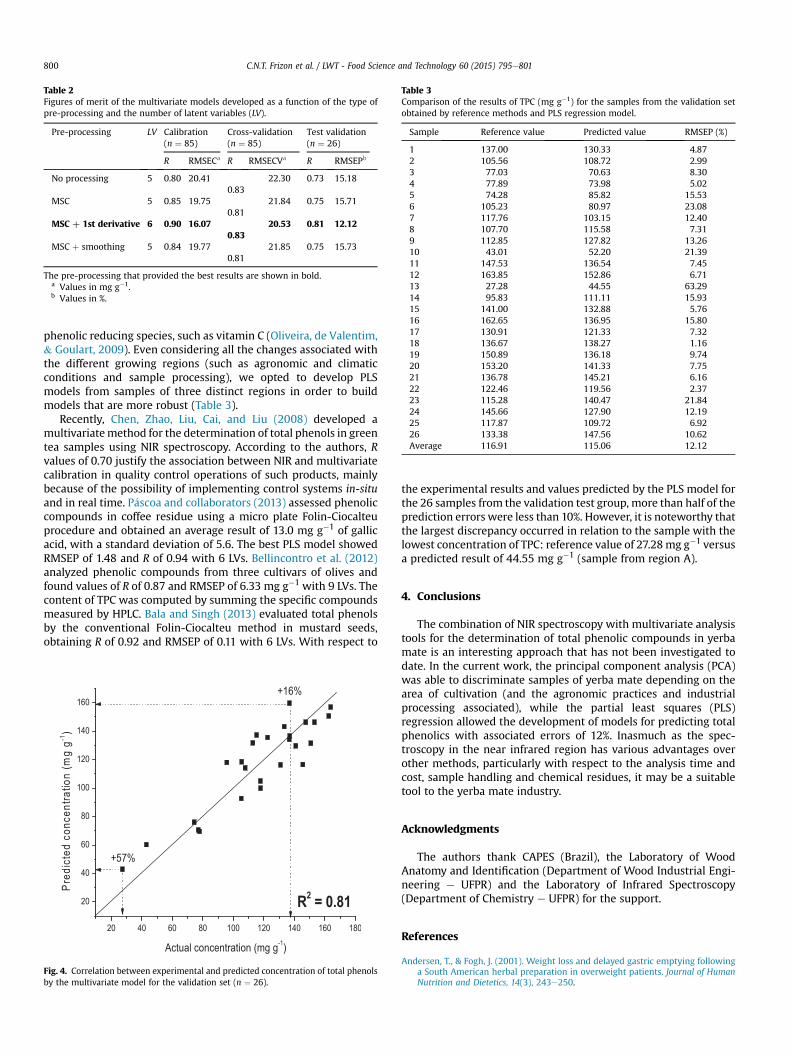
Table 3Comparison of the results of TPC (mg g�1) for the samples from the validation setobtained by reference methods and PLS regression model.
Sample Reference value Predicted value RMSEP (%)
1 137.00 130.33 4.872 105.56 108.72 2.993 77.03 70.63 8.304 77.89 73.98 5.025 74.28 85.82 15.536 105.23 80.97 23.087 117.76 103.15 12.408 107.70 115.58 7.319 112.85 127.82 13.2610 43.01 52.20 21.3911 147.53 136.54 7.4512 163.85 152.86 6.7113 27.28 44.55 63.2914 95.83 111.11 15.9315 141.00 132.88 5.7616 162.65 136.95 15.8017 130.91 121.33 7.3218 136.67 138.27 1.1619 150.89 136.18 9.7420 153.20 141.33 7.7521 136.78 145.21 6.1622 122.46 119.56 2.3723 115.28 140.47 21.8424 145.66 127.90 12.1925 117.87 109.72 6.9226 133.38 147.56 10.62Average 116.91 115.06 12.12
Table 2Figures of merit of the multivariate models developed as a function of the type ofpre-processing and the number of latent variables (LV).
Pre-processing LV Calibration(n ¼ 85)
Cross-validation(n ¼ 85)
Test validation(n ¼ 26)
R RMSECa R RMSECVa R RMSEPb
No processing 5 0.80 20.410.83
22.30 0.73 15.18
MSC 5 0.85 19.750.81
21.84 0.75 15.71
MSC þ 1st derivative 6 0.90 16.070.83
20.53 0.81 12.12
MSC þ smoothing 5 0.84 19.770.81
21.85 0.75 15.73
The pre-processing that provided the best results are shown in bold.a Values in mg g�1.b Values in %.
C.N.T. Frizon et al. / LWT - Food Science and Technology 60 (2015) 795e801800
phenolic reducing species, such as vitamin C (Oliveira, de Valentim,& Goulart, 2009). Even considering all the changes associated withthe different growing regions (such as agronomic and climaticconditions and sample processing), we opted to develop PLSmodels from samples of three distinct regions in order to buildmodels that are more robust (Table 3).
Recently, Chen, Zhao, Liu, Cai, and Liu (2008) developed amultivariatemethod for the determination of total phenols in greentea samples using NIR spectroscopy. According to the authors, Rvalues of 0.70 justify the association between NIR and multivariatecalibration in quality control operations of such products, mainlybecause of the possibility of implementing control systems in-situand in real time. P�ascoa and collaborators (2013) assessed phenoliccompounds in coffee residue using a micro plate Folin-Ciocalteuprocedure and obtained an average result of 13.0 mg g�1 of gallicacid, with a standard deviation of 5.6. The best PLS model showedRMSEP of 1.48 and R of 0.94 with 6 LVs. Bellincontro et al. (2012)analyzed phenolic compounds from three cultivars of olives andfound values of R of 0.87 and RMSEP of 6.33 mg g�1 with 9 LVs. Thecontent of TPC was computed by summing the specific compoundsmeasured by HPLC. Bala and Singh (2013) evaluated total phenolsby the conventional Folin-Ciocalteu method in mustard seeds,obtaining R of 0.92 and RMSEP of 0.11 with 6 LVs. With respect to
Fig. 4. Correlation between experimental and predicted concentration of total phenolsby the multivariate model for the validation set (n ¼ 26).
the experimental results and values predicted by the PLS model forthe 26 samples from the validation test group, more than half of theprediction errors were less than 10%. However, it is noteworthy thatthe largest discrepancy occurred in relation to the sample with thelowest concentration of TPC: reference value of 27.28mg g�1 versusa predicted result of 44.55 mg g�1 (sample from region A).
4. Conclusions
The combination of NIR spectroscopy with multivariate analysistools for the determination of total phenolic compounds in yerbamate is an interesting approach that has not been investigated todate. In the current work, the principal component analysis (PCA)was able to discriminate samples of yerba mate depending on thearea of cultivation (and the agronomic practices and industrialprocessing associated), while the partial least squares (PLS)regression allowed the development of models for predicting totalphenolics with associated errors of 12%. Inasmuch as the spec-troscopy in the near infrared region has various advantages overother methods, particularly with respect to the analysis time andcost, sample handling and chemical residues, it may be a suitabletool to the yerba mate industry.
Acknowledgments
The authors thank CAPES (Brazil), the Laboratory of WoodAnatomy and Identification (Department of Wood Industrial Engi-neering e UFPR) and the Laboratory of Infrared Spectroscopy(Department of Chemistry e UFPR) for the support.
References
Andersen, T., & Fogh, J. (2001). Weight loss and delayed gastric emptying followinga South American herbal preparation in overweight patients. Journal of HumanNutrition and Dietetics, 14(3), 243e250.
C.N.T. Frizon et al. / LWT - Food Science and Technology 60 (2015) 795e801 801
Arcari, D. P., Bartchewsky, W., dos Santos, T. W., Oliveira, K. A., Funck, A., &Pedrazzoli, J. (2009). Antiobesity effects of yerba mate extract (Ilex para-guariensis) in high-fat diet-induced obese mice. Obesity, 17(12), 2127e2133.
Bala, M., & Singh, M. (2013). Non-destructive estimation of total phenol and crudefiber content in intact seeds of rapeseedemustard using FTNIR. Industrial Cropsand Products, 42, 357e362.
Bellincontro, A., Taticchi, A., Servili, M., Esposto, S., Farinelli, D., & Mencarelli, F.(2012). Feasible application of a portable NIR-AOTF tool for on-field predictionof phenolic compounds during the ripening of olives for oil production. Journalof Agricultural and Food Chemistry, 60(10), 2665e2673.
Bert�e, K. A. S., Beurx, M. R., Spada, P. K. D. S., Slavador, M., & Hoffmann-Ribani, R.(2011). Chemical composition and antioxidant activity of yerba-mate (Ilexparaguariensis A.St.-Hil., Aquifoliaceae) extract as obtained by spray drying.Journal of Agricultural and Food Chemistry, 59(10), 5523e5527.
Bravo, L., Goya, L., & Lecumberri, E. (2007). LC/MS characterization of phenolicconstituents of mate (Ilex paraguariensis, St. Hil.) and its antioxidant activitycompared to commonly consumed beverages. Food Research International, 40,393e405.
Cardozo, J. R., Ferrarese-Filho, O., Filho, L. C., Ferrarese, M.de L. L., Donaduzzi, C. M., &Sturion, J. A. (2007). Methylxanthines and phenolic compounds in mate (Ilexparaguariensis St. Hil.) progenies grown in Brazil. Journal of Food Compositionand Analysis, 20(7), 553e558.
Chen, Q., Zhao, J., Liu, M., Cai, J., & Liu, J. (2008). Determination of total polyphenolscontent in green tea using FT-NIR spectroscopy and different PLS algorithms.Journal of Pharmaceutical and Biomedical Analysis, 46(13), 568e573.
Coelho, G. C., & Mariath, J. E. A. (1996). Inflorescences morphology of Ilex L.(Aquifoliaceae) species from Rio Grande do Sul, Brazil. Feddes Repertorium(Berlin), 107, 19e30.
Cozzolino, D., Restaino, E., & Fassio, A. (2010). Discrimination of yerba mate (Ilexparaguayensis St. Hil.) samples according to their geographical origin by meansof near infrared spectroscopy and multivariate analysis. Sensory & Instrumen-tation for Food Quality, 4(2), 67e72.
Dutra, F. L. G., Hoffmann-Ribani, R., & Ribani, M. (2010). Determination of phenoliccompounds by isocratic high performance liquid chromatographic methodduring storage of yerba-mate. Química Nova, 33(1), 119e123 (In Portuguese).
Filho, P. A. C. (2009). Rapid determination of sucrose in chocolate mass using nearinfrared spectroscopy. Analytica Chimica Acta, 631, 206e211.
Filip, R., Lolito, S. B., Ferraro, G., & Fraga, C. G. (2000). Antioxidant activity of Ilexparaguariensis and related species. Nutrition Research, 20(10), 1437e1446.
Filip, R., L�opez, P., Giberti, G., Coussio, J., & Ferraro, G. (2001). Phenolic compounds inseven South American Ilex species. Fitoterapia, 72(7), 774e778.
Gallice, W. C., Messerschmidt, I., & Peralta-Zamora, P. (2011). Multivariate spec-troscopic characterization of antioxidant potential of wine. Química Nova, 34(3),397e403 (In Portuguese).
Gugliucci, A. (1996). Antioxidant effects of Ilex paraguariensis: induction ofdecreased oxidability of human LDL in vivo. Biochemical and BiophysicalResearch Communications, 224(2), 338e344.
Gugliucci, A., & Stahl, A. J. (1995). Low density lipoprotein oxidation is inhibited byextracts of Ilex paraguariensis. Biochemistry and Molecular Biology International,35(1), 47e56.
Hansel, F. A., Domingos, D. M., Lima, K. M. G., & Pasquini, C. (2008). Grinding andsingeing/drying in a microwave oven in sensory rating of yerba mate in the nearinfrared region. Technical Communication Online, 203. Embrapa Florestas, ISSN1517e5030. Colombo- PR. (In Portuguese).
Heck, C. I., Schmalko, M., & de Mejía, G. (2008). Effect of growing and drying con-ditions on the phenolic composition of mate teas (Ilex paraguariensis). Journal ofAgricultural and Food Chemistry, 56, 8394e8403.
Huck, C. W., Guggenbichler, W., & Bonn, G. K. (2005). Analysis of caffeine, theo-bromine and theophylline in coffee by near infrared spectroscopy (NIRS)compared to high-performance liquid chromatography (HPLC) coupled to massspectrometry. Analytica Chimica Acta, 538, 195e203.
Jacques, R. A., Santos, J. G., Dariva, C., Oliveira, J. V., & Caramar~ao, E. B. (2007). GC/MScharacterization of mate tea leaves extracts obtained from high-pressure CO2extraction. Journal of Supercritical Fluids, 40(3), 354e359.
Ji-Yong, S., Xiao-Bo, Z., Jie-Wen, Z., Holmes, M., Kai-Liang, W., & Xue, W. (2012).Determination of total flavonoids content in fresh Ginkgo biloba leaf withdifferent colors using near infrared spectroscopy. Spectrochimica Acta Part A, 94,271e276.
Joubert, E., Manley, M., & Botha, M. (2006). Use of NIRS for quantification of man-giferin and hesperidin contents of dried green honey bush (Cyclopiagenistoides)plant material. Journal of Agricultural and Food Chemistry, 54(15), 5279e5283.
Li, W., & Qu, H. (2010). Rapid quantification of phenolic acids in Radix Salvia Mil-trorrhiza extract solutions by FT-NIR spectroscopy in transflective mode. Journalof Pharmaceutical and Biomedical Analysis, 52(4), 425e431.
Lu, X., Webb, M., Talbott, M., Van Eenennaam, J., Palumbo, A., & Linares-Casenave, J.(2010). Distinguishing ovarian maturity of farmed white sturgeon (Acipensertransmontanus) by Fourier transform infrared spectroscopy: a potential tool forcaviar production management. Journal of Agricultural and Food Chemistry,58(7), 4056e4064.
Luypaert, J., Zhang, M. H., & Massart, D. L. (2003). Feasibility study for the use ofnear infrared spectroscopy in the qualitative and quantitative analysis of greentea, Camellia sinensis (L.). Analytica Chimica Acta, 478(2), 303e312.
Martins, F., Suzan, A. J., Cerutti, S. M., Arcari, D. P., Ribeiro, M. L., & Bastos, D. H.(2009). Consumption of mate tea (Ilex paraguariensis) decreases the oxidationof unsaturated fatty acids in mouse liver. British Journal of Nutrition, 101(4),527e532.
Mejia, E. G., Song, Y. S., Heck, C. I., & Ramirez-Mares, M. V. (2010). Yerba Mate tea(Ilex paraguariensis): phenolics, antioxidant capacity and in vitro inhibition ofcolon cancer cell proliferation. Journal of Functional Foods, 2(1), 23e34.
Miller, C. E. (2001). Chemical principles of near infrared technology. InP. C. Williams, & K. H. Norris (Eds.), Near infrared technology in the agriculturaland food industries (2nd ed.). (pp. 19e39). St. Paul, MN: American Association ofCereal Chemist.
Naes, T., Isaksson, T., Fearn, T., & Davies, T. (2002). A user friendly guide to multi-variate calibration and classification. Charlton, Chichester, UK: NIR Publications.
Nicolai, B. M., Beullens, K., Bobelyn, E., Peirs, A., Saeys, W., & Theron, K. I. (2007).Non destructive measurement of fruit and vegetable quality by means of NIRspectroscopy: a review. Postharvest Biology and Technology, 46, 99e118.
Oliveira, G. A., Bureau, S., Renard, C. M. G. C., Pereira-Netto, A. B., & Castilhos, F.(2014). Comparison of NIRS approach for prediction of internal quality traits inthree fruit species. Food Chemistry, 143, 223e230.
Oliveira, A. C., de Valentim, I. B., & Goulart, M. O. F. (2009). Vegetals as naturalsources of antioxidants. Química Nova, 32(3), 689e702 (In Portuguese).
Osborne, B. G. (2000). Near-infrared spectroscopy in food analysis. In R. A. Meyers(Ed.), Encyclopedia of analytical chemistry (pp. 1e14). Chichester: John Wiley &Sons Ltd.
P�ascoa, R. N. M. J., Magalh~aes, L. M., & Lopes, J. A. (2013). FT-NIR spectroscopy as atool for valorization of spent coffee grounds: application to assessment ofantioxidant properties. Food Research International, 51(2), 579e586.
Pasquini, C. (2003). Near Infrared Spectroscopy: fundamentals, practical aspects andanalytical applications. Journal of the Brazilian Chemical Society, 14(2), 198e219.
Pedro, A. M. K., & Ferreira, M. M. C. (2005). Non destructive determination of solidsand carotenoids in tomato products by near-infrared spectroscopy and multi-variate calibration. Analytical Chemistry, 77, 2505e2511.
Prior, R., Wu, X., & Schaich, K. (2005). Standardized methods for the determinationof antioxidant capacity and phenolics in foods and dietary supplements. Journalof Agricultural and Food Chemistry, 53(10), 4290e4302.
Schulz, H., Engelhardt, U. H., Wegent, H., Drews, H., & Lapczynski, S. (1999).Application of near-infrared reflectance spectroscopy to the simultaneousprediction of alkaloids and phenolic substances in green tea leaves. Journal ofAgricultural and Food Chemistry, 47(12), 5064e5067.
Shin, E. C., Craft, B. D., Pegg, R. B., Phillips, R. D., & Eitenmiller, R. R. (2010). Che-mometric approach to fatty acid profiles in runner-type peanut cultivars byprincipal component analysis (PCA). Food Chemistry, 119(3), 1262e1270.
Singleton, V. L., Orthofer, R., & Ravent�os-Lamuela, R. M. (1999). Analysis of totalphenols and other oxidation substrates and antioxidants by means of Folin-Ciocalteu reagent. Methods in Enzymology, 299, 152e178.
Singleton, V., & Rossi, J. (1965). Colorimetry of total phenolics withphosphomolybdic-phosphotungstic acid reagents. American Journal of Enologyand Viticulture, 16, 144e158.
Turner, S., Cogoi, L., Isolabella, S., Filip, R., & Anesini, C. (2011). Evaluation of theantioxidant activity and polyphenols content of Ilex paraguariensis (mate)during industrialization. Advanced Journal of Food Science and Technology, 3(1),23e30.
Vieira, M. A., Rovaris, A. A., Maraschin, M., Simas, K. N., Pagliosa, C. M., & Podest�a, R.(2008). Chemical characterization of candy made of erva-mate (Ilex para-guariensis A. St. Hil.) residue. Journal of Agricultural and Food Chemistry, 56(12),4637e4642.
Wu, D., Chen, J., Lu, B., Xiong, L., He, Y., & Zhang, Y. (2012). Application of nearinfrared spectroscopy for the rapid determination of antioxidant activity ofbamboo leaf extract. Food Chemistry, 135(4), 2147e2156.
Xie, L. J., Ying, Y. B., & Ying, T. J. (2007). Quantification of chlorophyll content andclassification of non transgenic and transgenic tomato leaves using visible/nearinfrared diffuse reflectance spectroscopy. Journal of Agricultural and FoodChemistry, 55, 4645e4650.
Copyright © 2022 FDOKUMEN


![Marily LE NIR, Rememorări de istorie familială (I) [Recollections of Family History (I)]](https://static.fdokumen.com/doc/165x107/63152ace3ed465f0570b73e5/marily-le-nir-rememorari-de-istorie-familiala-i-recollections-of-family-history.jpg)