27. CENOZOIC EVOLUTION OF THE NEW JERSEY COASTAL PLAIN: CHANGES IN SEA LEVEL, TECTONICS, AND...
13
Miller, K.G., and Snyder, S.W. (Eds.), 1997 Proceedings of the Ocean Drilling Program, Scientific Results, Vol. 150X 361 27. CENOZOIC EVOLUTION OF THE NEW JERSEY COASTAL PLAIN: CHANGES IN SEA LEVEL, TECTONICS, AND SEDIMENT SUPPLY 1 Kenneth G. Miller, 2,3 James V. Browning, 2 Stephen F. Pekar, 2 Peter J. Sugarman 2,4 ABSTRACT The New Jersey Coastal Plain Drilling Project continuously cored three boreholes at Island Beach, Atlantic City, and Cape May, New Jersey. Sequence boundaries in the cores are expressed as physical surfaces, lithofacies breaks, and paraconformities (hiatuses) recognized using biostratigraphy and Sr-isotopic stratigraphy. By drilling along dip and strike profiles, we assembled a mosaic of 29 Paleocene to Miocene sequences and dated them using integrated magnetostratigraphy, biostratigraphy, and iso- topic stratigraphy. Correlation between major late middle Eocene to middle Miocene (42–10 Ma) onshore sequence boundaries and δ 18 O increases (inferred glacioeustatic lowerings) indicates that eustasy exerts a primary control on sequence boundaries. Onshore sequence boundaries also correlate with Miocene unconformities on the New Jersey shelf and slope, Oligocene to middle Miocene unconformities in Florida, early Oligocene unconformities in Alabama, and the sequence boundaries of Exxon. Such regional and interregional correlations support a eustatic control. However, early middle Eocene correlations between sequence boundaries and δ 18 O increases are equivocal, and it is not clear that glacioeustatic changes occurred at this time. In contrast, early Eocene sequence boundaries do not correlate with δ 18 O change, and we infer ice-free conditions at this time; nevertheless early Eocene sequence boundaries do correlate with those of Exxon, indicating that they may record global sea-level events. However, there is no known mechanism for explaining such large, rapid early Eocene eustatic variations other than gla- cioeustasy. Paleocene sequence boundaries apparently do not match the Exxon sequence boundaries, and further study of New Jersey Paleocene sequences is warranted. Regional and local tectonics resulted in differential preservation of sequences in the Mid-Atlantic Coastal Plain. For exam- ple, lower Miocene marine sequences are well represented in New Jersey, but are less complete in Maryland, whereas the con- verse is true for upper Miocene marine sequences. The tectonic mechanism responsible for this distributional pattern has not been established. In general, Miocene downdip sections in New Jersey are stratigraphically more complete than updip sections, reflecting a hinged margin with increased subsidence downdip. In contrast, Oligocene sequences have a patchy distribution: lower Oligocene sequences are better preserved updip at Island Beach, and middle Oligocene sequences are better preserved at Atlantic City than they are downdip at Cape May. These differences result from differential subsidence on the order of tens of meters and probably reflect migration of sediment supply and depocenters. Eocene sequences are widely distributed throughout the New Jersey Coastal Plain, reflecting high sea level and deposition in deep (>100 m) water. New Jersey Coastal Plain sequences were also influenced by sediment supply and climate. Low siliciclastic and high pelagic input during the early to middle Eocene resulted in carbonate silty clay deposition in association with warm regional and global climates. By the late Eocene, climatic cooling resulted in dominance by uniform siliciclastic clays onshore, although pelagic carbonate deposition dominated offshore. The entire margin was sediment starved in the early Oligocene. Siliciclastic input increased in the late Oligocene and again in the Miocene with a shift to deltaic sedimentation, perhaps related to hinter- land tectonics. Thus, the New Jersey Margin progressively evolved from an early to middle Eocene carbonate ramp, to a late Eocene mixed carbonate-siliciclastic ramp, to a sediment-starved region in the early Oligocene, to a ?late Oligocene to middle Miocene siliciclastic progradational margin with high sedimentation rates. We also note the progressive shallowing onshore from outer neritic (~185 m) environments in the early Eocene, to generally inner to middle neritic environments in the Oli- gocene, to inner neritic prodelta, marginal marine, and fluvial environments in the Miocene. INTRODUCTION The New Jersey Coastal Plain Drilling Project (Ocean Drilling Program [ODP] Leg 150X) drilled boreholes at Island Beach (total depth 1223 ft [372.7 m]; April-May, 1993; Miller et al., 1994a), At- lantic City (total depth 1452 ft [442.6 m]; June-August, 1993; Miller et al., 1994b), and Cape May (total depth 1500 ft [457.2 m]; March- April, 1994; Miller, et al., 1996a). Onshore drilling is part of the New Jersey Sea-level Transect. The Transect was designed to sample slope, shelf, and coastal plain sediments, primarily along a dip pro- file that is anchored on the seaward side by Deep Sea Drilling Project drilling on the lower slope and rise (Legs 93 and 95; Poag, Watts, et al., 1987; van Hinte, Wise, et al., 1987). The Transect includes drill- ing offshore by ODP Leg 150 slope drilling (Mountain, Miller, Blum, et al., 1994), Leg 174A shelf drilling (Summer 1997), and fu- ture shelf drilling (Fig. 1; see Miller and Mountain [1994] for discus- sion and history of the Transect). The primary goals of the New Jer- sey Sea-level Transect are (1) to date major “Icehouse” (Oligocene- Holocene) sequences, a time of known glacioeustatic change (Miller et al., 1991), (2) to compare the timing of these sequences with ages predicted from the oxygen isotopic proxy of glacioeustasy, (3) to es- timate the amplitudes and rates of the sea-level change, and (4) to evaluate sequence stratigraphic models (e.g., the systems tracts of Posamentier et al., 1988). One of the primary objectives of onshore drilling was to sample the updip equivalents of sequences (unconformity bounded units) found offshore (see Miller, Chapter 1, this volume, for summary). Onshore drilling also provided another setting in which to date se- quences sampled on the slope by Leg 150 (Mountain, Miller, Blum, et al., 1994) and to delineate facies relationships in a region sensitive 1 Miller, K.G., and Snyder, S.W. (Eds.), 1997. Proc. ODP, Sci. Results, 150X: College Station, TX (Ocean Drilling Program). 2 Department of Geological Sciences, Rutgers University, Piscataway, NJ 08855, U.S.A. [email protected] 3 Lamont-Doherty Earth Observatory of Columbia University, Palisades, NY 10964, U.S.A. 4 New Jersey Geological Survey, CN 427, Trenton, NJ 08625, U.S.A. 3UHYLRXV&KDSWHU 3UHYLRXV&KDSWHU 7DEOHRI&RQWHQWV 7DEOHRI&RQWHQWV ,1’(; ,1’(;
Transcript of 27. CENOZOIC EVOLUTION OF THE NEW JERSEY COASTAL PLAIN: CHANGES IN SEA LEVEL, TECTONICS, AND...
Miller, K.G., and Snyder, S.W. (Eds.), 1997Proceedings of the Ocean Drilling Program, Scientific Results, Vol. 150X
27. CENOZOIC EVOLUTION OF THE NEW JERSEY COASTAL PLAIN:CHANGES IN SEA LEVEL, TECTONICS, AND SEDIMENT SUPPLY1
Kenneth G. Miller,2,3 James V. Browning,2 Stephen F. Pekar,2 Peter J. Sugarman2,4
d Onshore middle. Suchquencentrast,ss events.n gla-y of New
xam- the con-has notections,ibution:served at
ens ofoughout
d highgionalhougiclastic hintero a late middleshore Oli-
33
ABSTRACT
The New Jersey Coastal Plain Drilling Project continuously cored three boreholes at Island Beach, Atlantic City, and CapeMay, New Jersey. Sequence boundaries in the cores are expressed as physical surfaces, lithofacies breaks, and paraconformities(hiatuses) recognized using biostratigraphy and Sr-isotopic stratigraphy. By drilling along dip and strike profiles, we assembleda mosaic of 29 Paleocene to Miocene sequences and dated them using integrated magnetostratigraphy, biostratigraphy, and iso-topic stratigraphy.
Correlation between major late middle Eocene to middle Miocene (42–10 Ma) onshore sequence boundaries anδ18Oincreases (inferred glacioeustatic lowerings) indicates that eustasy exerts a primary control on sequence boundaries. sequence boundaries also correlate with Miocene unconformities on the New Jersey shelf and slope, Oligocene toMiocene unconformities in Florida, early Oligocene unconformities in Alabama, and the sequence boundaries of Exxonregional and interregional correlations support a eustatic control. However, early middle Eocene correlations between seboundaries and δ18O increases are equivocal, and it is not clear that glacioeustatic changes occurred at this time. In coearly Eocene sequence boundaries do not correlate with δ18O change, and we infer ice-free conditions at this time; nevertheleearly Eocene sequence boundaries do correlate with those of Exxon, indicating that they may record global sea-levelHowever, there is no known mechanism for explaining such large, rapid early Eocene eustatic variations other thacioeustasy. Paleocene sequence boundaries apparently do not match the Exxon sequence boundaries, and further studJersey Paleocene sequences is warranted.
Regional and local tectonics resulted in differential preservation of sequences in the Mid-Atlantic Coastal Plain. For eple, lower Miocene marine sequences are well represented in New Jersey, but are less complete in Maryland, whereasverse is true for upper Miocene marine sequences. The tectonic mechanism responsible for this distributional pattern been established. In general, Miocene downdip sections in New Jersey are stratigraphically more complete than updip sreflecting a hinged margin with increased subsidence downdip. In contrast, Oligocene sequences have a patchy distrlower Oligocene sequences are better preserved updip at Island Beach, and middle Oligocene sequences are better preAtlantic City than they are downdip at Cape May. These differences result from differential subsidence on the order of tmeters and probably reflect migration of sediment supply and depocenters. Eocene sequences are widely distributed thrthe New Jersey Coastal Plain, reflecting high sea level and deposition in deep (>100 m) water.
New Jersey Coastal Plain sequences were also influenced by sediment supply and climate. Low siliciclastic anpelagic input during the early to middle Eocene resulted in carbonate silty clay deposition in association with warm reand global climates. By the late Eocene, climatic cooling resulted in dominance by uniform siliciclastic clays onshore, althpelagic carbonate deposition dominated offshore. The entire margin was sediment starved in the early Oligocene. Silicinput increased in the late Oligocene and again in the Miocene with a shift to deltaic sedimentation, perhaps related to-land tectonics. Thus, the New Jersey Margin progressively evolved from an early to middle Eocene carbonate ramp, tEocene mixed carbonate-siliciclastic ramp, to a sediment-starved region in the early Oligocene, to a ?late Oligocene toMiocene siliciclastic progradational margin with high sedimentation rates. We also note the progressive shallowing onfrom outer neritic (~185 m) environments in the early Eocene, to generally inner to middle neritic environments in thegocene, to inner neritic prodelta, marginal marine, and fluvial environments in the Miocene.
neillerges
es-) to
ts of
leits)y).se-m,itive
INTRODUCTION
The New Jersey Coastal Plain Drilling Project (Ocean DrillingProgram [ODP] Leg 150X) drilled boreholes at Island Beach (totaldepth 1223 ft [372.7 m]; April−May, 1993; Miller et al., 1994a), At-lantic City (total depth 1452 ft [442.6 m]; June−August, 1993; Milleret al., 1994b), and Cape May (total depth 1500 ft [457.2 m]; March−April, 1994; Miller, et al., 1996a). Onshore drilling is part of the NewJersey Sea-level Transect. The Transect was designed to sampleslope, shelf, and coastal plain sediments, primarily along a dip pro-file that is anchored on the seaward side by Deep Sea Drilling Project
1Miller, K.G., and Snyder, S.W. (Eds.), 1997. Proc. ODP, Sci. Results, 150X:College Station, TX (Ocean Drilling Program).
2Department of Geological Sciences, Rutgers University, Piscataway, NJ 08855,U.S.A. [email protected]
3Lamont-Doherty Earth Observatory of Columbia University, Palisades, NY 10964,U.S.A.
4New Jersey Geological Survey, CN 427, Trenton, NJ 08625, U.S.A.
UHYLRXV�&KDSWHUUHYLRXV�&KDSWHU 7DEOH�RI7DEOH�RI
drilling on the lower slope and rise (Legs 93 and 95; Poag, Watts, etal., 1987; van Hinte, Wise, et al., 1987). The Transect includes drill-ing offshore by ODP Leg 150 slope drilling (Mountain, Miller,Blum, et al., 1994), Leg 174A shelf drilling (Summer 1997), and fu-ture shelf drilling (Fig. 1; see Miller and Mountain [1994] for discus-sion and history of the Transect). The primary goals of the New Jer-sey Sea-level Transect are (1) to date major “Icehouse” (Oligoce−Holocene) sequences, a time of known glacioeustatic change (Met al., 1991), (2) to compare the timing of these sequences with apredicted from the oxygen isotopic proxy of glacioeustasy, (3) to timate the amplitudes and rates of the sea-level change, and (4evaluate sequence stratigraphic models (e.g., the systems tracPosamentier et al., 1988).
One of the primary objectives of onshore drilling was to sampthe updip equivalents of sequences (unconformity bounded unfound offshore (see Miller, Chapter 1, this volume, for summarOnshore drilling also provided another setting in which to date quences sampled on the slope by Leg 150 (Mountain, Miller, Bluet al., 1994) and to delineate facies relationships in a region sens
361
�&RQWHQWV�&RQWHQWV ,1'(;,1'(;
K.G. MILLER, J.V. BROWNING, S.F. PEKAR, P.J. SUGARMAN
38
39
40
72° W75 747677
1 234567 9B
902904
;;
; ;
8B
905
13B
7B
2000
m
1000
m
200
mLeg 174A
39° 30'
40° 00'
40° 30'
39° 00'
75° 30' 75° 00' 74° 30' 74° 00'
Atlantic City
IslandBeach
Allaire
DelawareBay
Cape May
New Jersey
Atlantic
Oce
an
Cretaceous t
o Eoce
ne outcrop
Miocene and yo
unger outcr
op
Limit o
f coasta
l plain
Delaware
Pennsylvania
Scale
0 5 10 15
0 10 20
mi
km
Leg 150 906
Future drilling
41° N
Cretaceous o
utcrop
Cenozoic o
utcrop
Pre-Cretace
ous
Cape May
Atlantic City
Island Beach
903 strike
dip
ACGS#4
Bass River
Belleplain
73
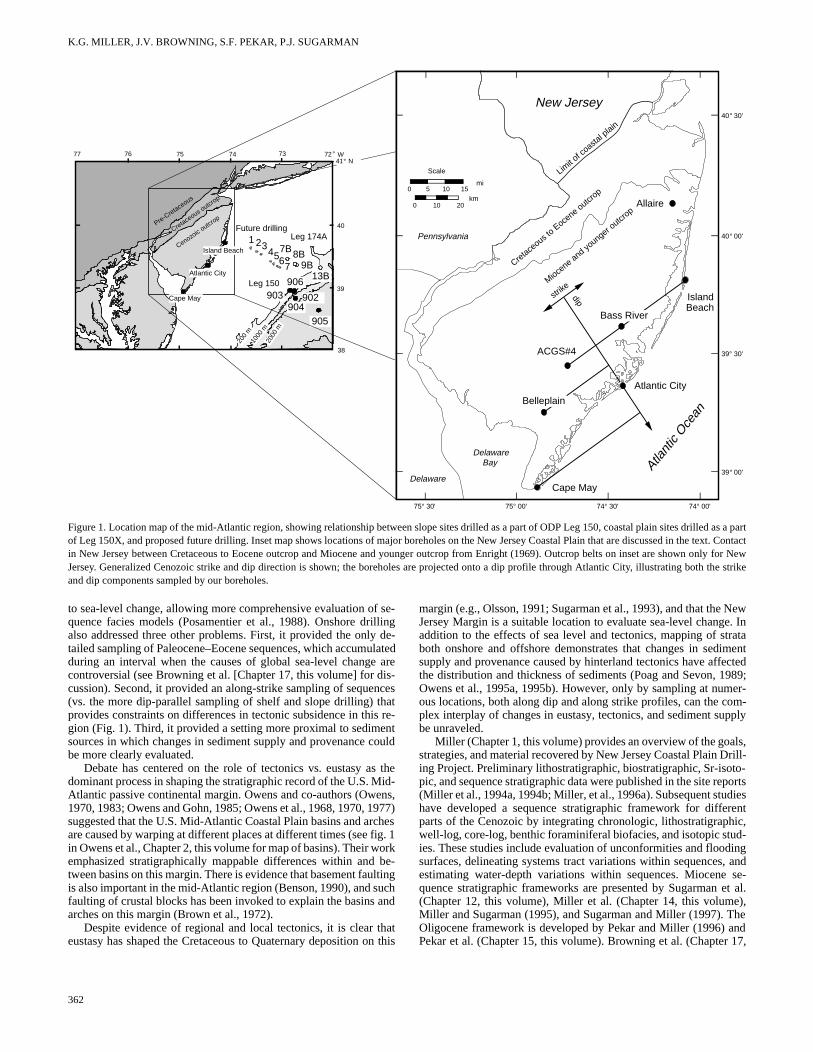
Figure 1. Location map of the mid-Atlantic region, showing relationship between slope sites drilled as a part of ODP Leg 150, coastal plain sites drilled as a partof Leg 150X, and proposed future drilling. Inset map shows locations of major boreholes on the New Jersey Coastal Plain that are discussed in the text. Contactin New Jersey between Cretaceous to Eocene outcrop and Miocene and younger outcrop from Enright (1969). Outcrop belts on inset are shown only for NewJersey. Generalized Cenozoic strike and dip direction is shown; the boreholes are projected onto a dip profile through Atlantic City, illustrating both the strikeand dip components sampled by our boreholes.
u
dnhseco
sMe9cfio
buu a
th
Newe. Intrataimentcted989;er-
om-pply
ls,Drill-to-portsdiesrentic,d-ing
, and se-et al.e),hend
17,
to sea-level change, allowing more comprehensive evaluation of se-quence facies models (Posamentier et al., 1988). Onshore drillingalso addressed three other problems. First, it provided the only de-tailed sampling of Paleocene–Eocene sequences, which accumduring an interval when the causes of global sea-level changecontroversial (see Browning et al. [Chapter 17, this volume] for cussion). Second, it provided an along-strike sampling of seque(vs. the more dip-parallel sampling of shelf and slope drilling) tprovides constraints on differences in tectonic subsidence in thigion (Fig. 1). Third, it provided a setting more proximal to sedimsources in which changes in sediment supply and provenance be more clearly evaluated.
Debate has centered on the role of tectonics vs. eustasy adominant process in shaping the stratigraphic record of the U.S. Atlantic passive continental margin. Owens and co-authors (Ow1970, 1983; Owens and Gohn, 1985; Owens et al., 1968, 1970, 1suggested that the U.S. Mid-Atlantic Coastal Plain basins and arare caused by warping at different places at different times (see in Owens et al., Chapter 2, this volume for map of basins). Their wemphasized stratigraphically mappable differences within andtween basins on this margin. There is evidence that basement fais also important in the mid-Atlantic region (Benson, 1990), and sfaulting of crustal blocks has been invoked to explain the basinsarches on this margin (Brown et al., 1972).
Despite evidence of regional and local tectonics, it is clear eustasy has shaped the Cretaceous to Quaternary deposition on this
362
latedare
is-cesat re-ntuld
theid-ns,77)
hesg. 1rke-
ltingchnd
at
margin (e.g., Olsson, 1991; Sugarman et al., 1993), and that theJersey Margin is a suitable location to evaluate sea-level changaddition to the effects of sea level and tectonics, mapping of sboth onshore and offshore demonstrates that changes in sedsupply and provenance caused by hinterland tectonics have affethe distribution and thickness of sediments (Poag and Sevon, 1Owens et al., 1995a, 1995b). However, only by sampling at numous locations, both along dip and along strike profiles, can the cplex interplay of changes in eustasy, tectonics, and sediment sube unraveled.
Miller (Chapter 1, this volume) provides an overview of the goastrategies, and material recovered by New Jersey Coastal Plain ing Project. Preliminary lithostratigraphic, biostratigraphic, Sr-isopic, and sequence stratigraphic data were published in the site re(Miller et al., 1994a, 1994b; Miller, et al., 1996a). Subsequent stuhave developed a sequence stratigraphic framework for diffeparts of the Cenozoic by integrating chronologic, lithostratigraphwell-log, core-log, benthic foraminiferal biofacies, and isotopic stuies. These studies include evaluation of unconformities and floodsurfaces, delineating systems tract variations within sequencesestimating water-depth variations within sequences. Miocenequence stratigraphic frameworks are presented by Sugarman (Chapter 12, this volume), Miller et al. (Chapter 14, this volumMiller and Sugarman (1995), and Sugarman and Miller (1997). TOligocene framework is developed by Pekar and Miller (1996) aPekar et al. (Chapter 15, this volume). Browning et al. (Chapter
SEA LEVEL, TECTONICS, AND SEDIMENT SUPPLY
e se-d ad-
ngehiconTheords
gin
e toorre-iated
this volume) and Browning et al. (Chapter 18, this volume) providean integrated framework for the Eocene of the New Jersey CoastalPlain including the Leg 150X boreholes, the Allaire borehole, and theACGS#4 borehole. Liu et al. (Chapter 19, this volume) evaluate thePaleocene sequences at Island Beach.
This paper synthesizes results of these sequence stratigraphicstudies and addresses Cenozoic changes in sea level, tectonics, andsediment supply. We provide an overview of the relationship be-tween New Jersey Coastal Plain sequences and two proxies of globalsea-level change: the benthic foraminiferal δ18O and Haq et al. (1987)records. Comparison of updip and downdip locations reveals minordifferences in tectonic subsidence history of the New Jersey CoastalPlain during the Cenozoic. Changes in sediment composition and ac-cumulation rate in the New Jersey Coastal Plain are related to region-al/global climate changes and variations in hinterland tectonics. Weconclude that although eustasy is the primary control on the forma-tion of sequences, the preservation and architecture of sequences areinfluenced by tectonics and sediment supply.
NEW JERSEY COASTAL PLAIN SEQUENCES
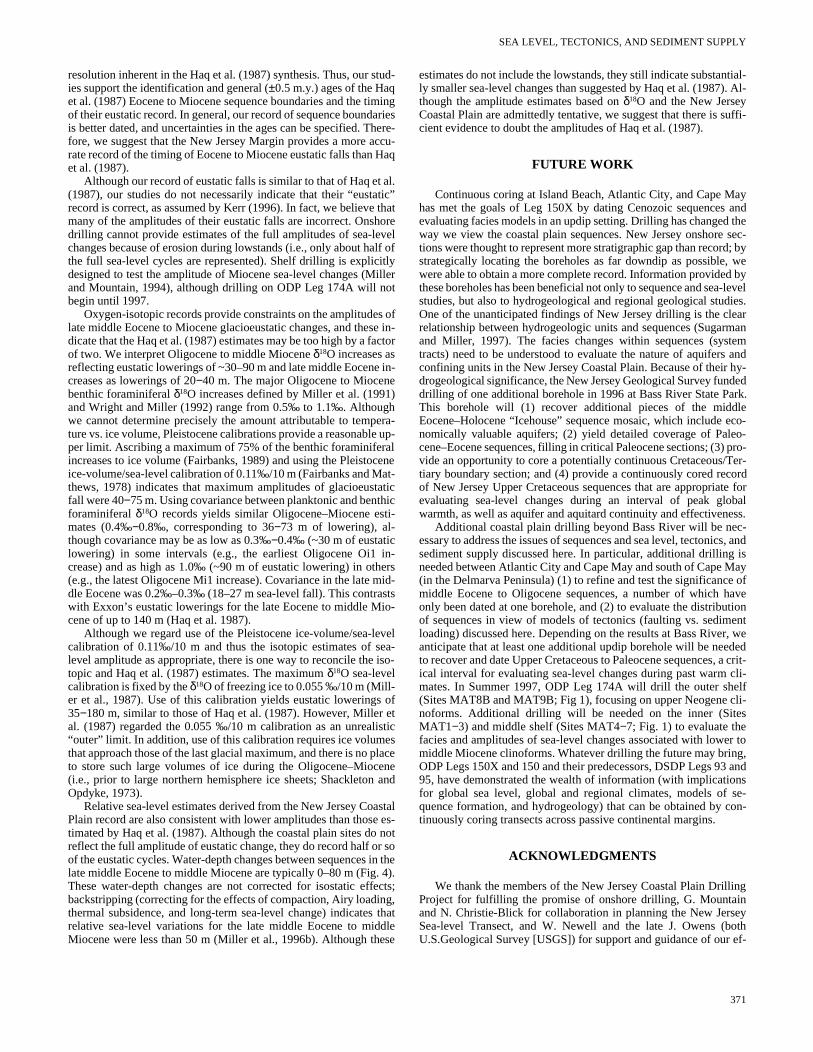
We compare (Fig. 2) Cenozoic sequences in the three Leg 150Xboreholes with continuously cored updip sections at Allaire StatePark (Fig. 1) and the ACGS#4 borehole (Fig. 1; Owens et al., 1988;Poore and Bybell, 1988; Miller et al., 1990; Sugarman et al., 1993;Browning et al., Chapter 17, this volume). Although not all sequenc-es are represented in any one borehole, by sampling at numerous lo-cations we have assembled a composite of 29 Paleocene to middleMiocene sequences (Fig. 2). Most sequences (20 of 29) are found inmore than one borehole examined here (Fig. 2).
Sequences are named alphanumerically from older to younger,with pa1−3 representing three Paleocene sequences, E1−11 repre-senting 11 Eocene sequences, O1−6 representing six Oligocene se-quences, and Kw0 to Kw-Cohansey representing nine lower to mid-dle Miocene sequences. Upper Miocene strata are difficult to date be-cause they are marginal-marine to estuarine, although dinocysts allowidentification and correlation of four upper Miocene sequences (Ch3−6; de Verteuil, Chapter 11, this volume) within the estuarine to near-shore deposits at Cape May. No definite Pliocene strata were identi-fied in the boreholes (tentatively recognized ?Pliocene strata at CapeMay [Miller, et al., 1996a] are now identified as uppermost middleand upper Miocene based on dinocysts; de Verteuil, Chapter 11, thisvolume). Pleistocene sections in these boreholes are also difficult todate, with only four radiocarbon dates (Miller et al., 1994a; Miller, etal., 1996a) and one interval of amino acid dates available (Wehmiller,Chapter 26, this volume). Because of problems in dating these upperNeogene sediments, we restrict our comparisons to Paleocene to mid-dle Miocene strata.
Paleocene sequences have been recovered only in one continu-ously cored site (Island Beach). Although these Paleocene sequencesare consistent with sequences reported elsewhere in the New JerseyCoastal Plain from outcrops and discontinuously sampled boreholes(Olsson and Wise, 1987b), further studies are needed to determinetheir age and regional distribution.
Lower to middle Eocene sequences are dated by integrated mag-netobiostratigraphy, with a resolution generally better than 0.5 m.y.(Browning et al., Chapter 17, this volume). The lower to middleEocene sequences shown here (Fig. 2) agree with previous studies ofNew Jersey Coastal Plain Eocene sequences (Olsson and Wise,1987b; Miller et al. 1990), but are more reliably tied to the Geomag-netic Polarity Time Scale. Previous studies had more limited chrono-stratigraphic resolution because of discontinuous sampling of bore-holes (Olsson and Wise, 1987b) and incomplete lower Eocene recov-ery (Miller et al., 1990).
Upper Eocene strata were first identified in the Cape May region(Brown et al., 1972; Poag, 1985), although the only well-recovered
and dated upper Eocene section prior to Leg 150X was obtained at theACGS#4 borehole (Owens et al., 1988; Poore and Bybell, 1988;Miller et al., 1990; Christensen et al., 1995). Browning et al. (Chapter18, this volume) recognize two distinct upper Eocene sequences(E10−11), above a stratigraphically mixed interval (Sequence E9)that may be age equivalent to the Chesapeake Bay impact event(Poag et al., 1994; Poag and Aubry, 1995). The ages of the upperEocene sequences E10 and E11 (Fig. 2) are only moderately wellconstrained (±0.5 m.y.), whereas the duration of Sequence E9 cannotbe estimated.
Prior to Leg 150X, Oligocene sequences were known only fromdiscontinuously cored boreholes (Olsson et al., 1980), rotary wells(Poag, 1985), and a poorly recovered section at the ACGS#4 bore-hole (Owens et al., 1988). Although Oligocene sequences recoveredby Leg 150X are relatively well dated by integrating Sr-isotopicstratigraphy with planktonic foraminiferal and nannofossil biostratig-raphy, there are still uncertainties in their identification and age. Forexample, although O4, O5, and O6 appear to be distinct sequencesseparated by disconformities, the hiatuses associated with the O5 andO6 sequence boundaries are not discernible within the 0.5- to 1.0-m.yresolution afforded by Sr-isotope stratigraphy and biostratigraphy.Therefore, it is possible to interpret Sequences O4−O6 as threeparasequences within one thick sequence (Pekar et al., Chapter 15,this volume). One lowermost Oligocene sequence (ML) has been re-ported only from the ACGS#4 borehole, and it is not certain whetherthis is a sequence distinct from O1. Sequence O4 has been reportedonly from one site (Cape May), and its regional and inter-regionalsignificance requires verification.
Applying Sr-isotopic stratigraphy and diatom biostratigraphy tothe continuously cored sections at ACGS#4 and Belleplain boreholes(Fig. 1), Sugarman et al. (1993) recognized, dated, and mapped threemajor lower to middle Miocene sequences (Kw1, Kw2, and Kw3,equivalent to East Coast Diatom Zones 1, 2, and 6, respectively).Subsequent studies conducted on Leg 150X boreholes (Miller et al.,1994a, 1994b; Miller, et al., 1996a; Miller et al., Chapter 14, this vol-ume; Miller and Sugarman, 1995; Sugarman and Miller, in press;Sugarman et al., Chapter 12, this volume) (1) identified a lowermostMiocene Kw0 sequence that is thin at Atlantic City and thick at CapeMay; (2) confirmed that the Kw1 sequence consists of two distinctsequences (Kw1a and Kw1b) at the ACGS and downdip boreholes(Fig. 2); (3) recognized an additional Kw1c sequence at Cape May;(4) subdivided the Kw2 sequence into Kw2a and Kw2b at downdipboreholes and identified the Kw2c sequence at Cape May; and (5)documented a Kw-Cohansey sequence at Cape May. De Verteuil(Chapter 11, this volume) uses dinocysts to split Kw2a into Kw2a′and Kw2a′′, Kw3 into Kw3a and Kw3b, and recognize one additionalupper middle Miocene sequence (Ch2) and four upper Miocene se-quences (Ch3–Ch6). These seven upper middle to upper Miocenquences have been identified only at the Cape May borehole, anditional sampling is required to establish their significance.
SEA LEVEL AND THE NEW JERSEYCOASTAL PLAIN
There are two principal ways to evaluate global sea-level chaon passive margins. The first relies on comparison of stratigraprecords both within and between regions, with the signal in commrepresenting eustasy (e.g., Vail et al., 1977; Haq et al., 1987). second relies on comparison of passive margin stratigraphic recwith other proxies for eustasy (e.g., δ18O or atoll records). We com-pare our results with the glacioeustatic proxy afforded by the δ18Orecord (Miller et al., 1991) and with a previous synthesis of marrecords (Haq et al., 1987).
Comparison among the boreholes (Fig. 2) shows that Eocenmiddle Miocene hiatuses associated with sequence boundaries clate from site to site. Sequence boundaries are generally assoc
363
K.G. MILLER, J.V. BROWNING, S.F. PEKAR, P.J. SUGARMAN
n
l M
wtisit-e
2
o
fo;ttuic
le
l a
ia
dh
i 2
rn
i
caoo r
. The1ab,le,
ta toatedntlye tose toela- Jer-sesear-ug-
also). Of se-ersey.y.
usesewaq et
und-ughr cor-intieslainocene
und-te a
pon-
esergetasys for
and the
ter-id-
io-er inribedcon- al.,4).andouth
sed-Jer-d theon- de-ins toon ofela-
n
with hiatuses that occur throughout the coastal plain (Fig. 2). Theonly exceptions are sequence boundaries at the bases of O5, O6,Kw1b, and Kw1c. There is no discernible hiatus associated with thebase of Kw1b. The hiatuses associated with O5, O6 and Kw1c areshort (<0.5 m.y.) and within the resolution afforded by Sr-isotopicstratigraphic resolution. Nevertheless, physical stratigraphy indicatesthat some time is not represented in the sediment record. Althoughthe hiatuses correlate from site to site, the updip sections are general-ly less complete than the downdip section. Correlation of hiatusesamong locations is consistent with a eustatic control, although otherrecords (e.g., other margins or δ18O) are needed to test for eustasy.
Deep-sea δ18O records provide a proxy for temperature and ice-volume/sea-level (glacioeustatic) changes during the middle Eoceneto Holocene “Icehouse World” (Miller et al., 1991) Glaciomarisediments near Antarctica and deep-sea δ18O records indicate thatlarge ice sheets have existed in Antarctica since the earliest Ocene (~33 Ma; Miller et al., 1991; Zachos et al., 1994); studiesBrowning et al. (1996, Chapter 17, this volume) have extendedrecord of large ice sheets back until the late middle Eocene (~45 Changes in ice volume cause changes in global seawater δ18O (δw)that are recorded by benthic and planktonic foraminifers, along variations in seawater temperature and local isotopic composiPrevious studies have separated ice-volume effects from local ipic and temperature changes by comparing benthic and low-lat(nonupwelling) planktonic foraminiferal δ18O records (e.g., Shackleton and Opdyke, 1973; Miller et al., 1991; and Wright and Mill1992).
Miller et al. (1991) and Wright and Miller (1992) identified 1Oligocene to Miocene benthic foraminiferal δ18O increases (all >0.5‰). These increases culminated in δ18O maxima that were used tdefine Zones Oi1−Oi2b and Mi1−Mi7 (Fig. 3). Six of the δ18O in-creases are also recorded by tropical or subtropical planktonic minifers, and each represents ~30−80 m of glacioeustatic loweringthe other six lack suitable low-latitude isotopic records but are inpreted to represent similar glacioeustatic lowerings. Further shas revealed that there are at least six to seven additional benthaminiferal δ18O increases: three to four in the Oligocene δ18O (Oi1a,Oi1b, Oi2b, and one possible increase “Oi2c”; Pekar and Mil1996; Pekar et al., Chapter 15, this volume; Fig. 3), one major mdle Miocene increase (Mi3b; Miller et al., 1996d), and three smaMiocene increases (Mi1aa, Mi1ab, Mi2a; fig. 5 in Sugarman etChapter 12, this volume). Insufficient planktonic δ18O data are avail-able to determine the amount of glacioeustatic lowering assocwith these increases.
No formal zonation of Eocene δ18O changes has been publisheHowever, Browning et al. (1996; Chapter 17, this volume) syntsized available benthic and low-latitude planktonic δ18O records andconcluded that there were three major increases in both records late middle Eocene that resulted from glacioeustatic lowerings of−40 m. They noted the possibility of two δ18O increases in the earlymiddle Eocene (Fig. 3), although δ18O records are still poor for thisinterval. There is no evidence for synchronous benthic-planktoforaminiferal δ18O increases during the Paleocene to early EoceBrowning et al. (Chapter 17, this volume) assume that this intelacked large ice sheets, although they noted that ice-volume charepresenting as much as 18 m of eustasy might not be detectedδ18O records.
Comparison of the timing of the inflections in the δ18O records (=inferred glacioeustatic lowerings) with New Jersey Coastal Plainquences and hiatuses associated with sequence boundaries (Fshows remarkably good correspondence for the late middle Eoto Miocene (for details see Miller et al. [Chapter 14, this volume] Sugarman et al. [Chapter 12, this volume] for Miocene comparisPekar et al. [Chapter 15, this volume] for Oligocene comparisand Browning et al. [Chapter 17, this volume] and Browning et[Chapter 18, this volume] for Eocene comparisons). In all but th
364
e
igo-bythea).
ithon.oto-ude
r,
ra-
er-dy for-
r,id-lerl.,
ted
.e-
n the0
nicne.valges
n the
se-ig. 3)enendns,ns,al.ee
cases, the inflections correlate with hiatuses between sequencesthree exceptions are for the three minor increases (Mi1aa, MiOi2c), the timings of which are poorly constrained. For exampSugarman et al. (Chapter 12, this volume) used Sr-isotopic dacorrelate New Jersey Miocene sequences directly to the best-dδ18O record at Site 747 and showed that Mi1aa and Mi1ab apparedo correlate with hiatuses. We conclude that late middle EocenMiocene sequence boundaries in New Jersey formed in responglacioeustatic lowerings. This is supported by interregional corrtions that show similar Miocene sequence boundaries on the Newsey slope (Miller et al., 1996d), similar Oligocene–Miocene hiatuin Florida (Sugarman et al., Chapter 12, this volume), and similar ly Oligocene breaks in Alabama (Miller et al., 1993; see fig. 5 in Sarman et al., Chapter 12, this volume).
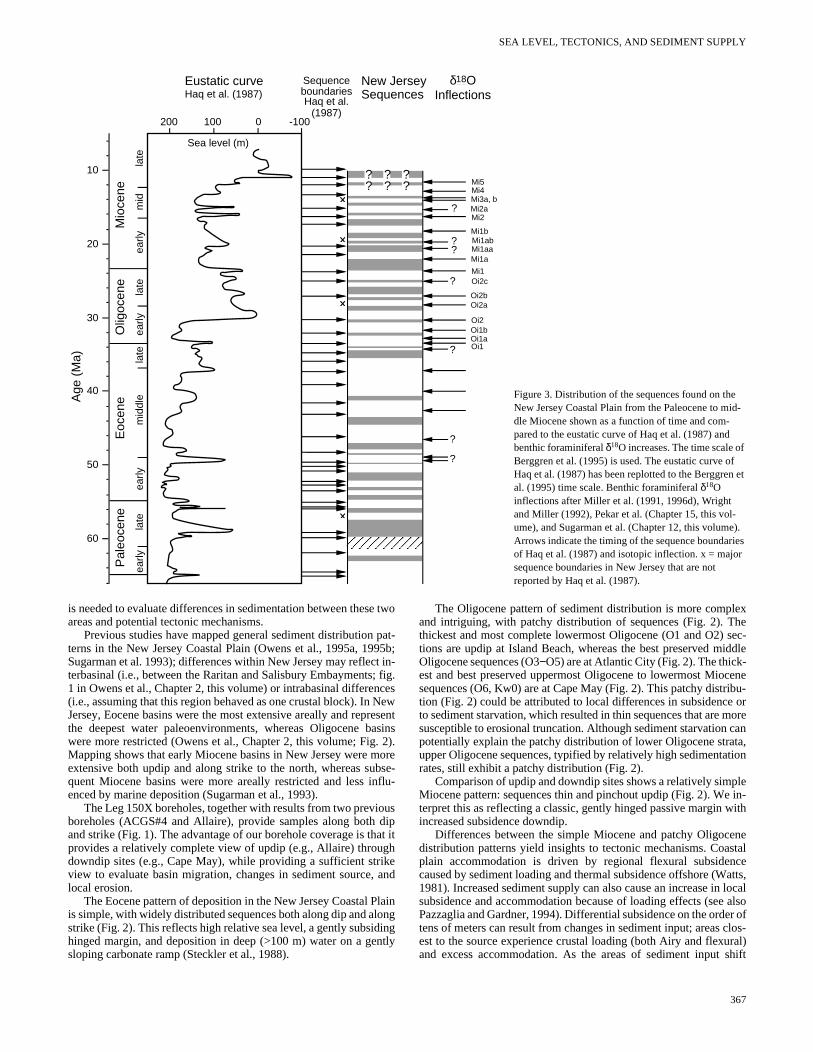
The sequence boundaries in the New Jersey Coastal Plaincompare well with the sequence boundaries of Haq et al. (1987the 23 Haq et al. (1987) middle Eocene to early late Miocenequence boundaries, 12 are confirmed as hiatuses on the New JCoastal Plain, six are consistent (short arrows, Fig. 3) within 0.5-mresolution, and five appear to be combined into two Eocene hiatin New Jersey. Only three middle Eocene to early late Miocene NJersey hiatuses lack corresponding sequence boundaries in the Hal. (1987) synthesis (x’s on Fig. 3). Early Eocene sequence boaries in New Jersey also agree well with Haq et al. (1987), althoPaleocene correlations between the two are less clear. The poorelation of Paleocene sequences may result from age uncertaand limited core coverage in New Jersey, and additional coastal pstudies are needed to evaluate the ages and significance of Palesequences.
Early Eocene correlations between New Jersey sequence boaries and Haq et al. (1987) are intriguing, because they indicaprobable eustatic control. However, the apparent lack of corresdence of early Eocene sequence boundaries with the δ18O changes(Fig. 3) indicates that it is unlikely that glacioeustasy caused thglobal lowerings. There is no known mechanism for explaining la(>30 m), rapid (<1 m.y.) eustatic changes other than glacioeus(Pitman and Golovchenko, 1983). We conclude that mechanismPaleocene–early Eocene changes are poorly known.
TECTONICS AND THE NEW JERSEYCOASTAL PLAIN
Owens and coauthors (Owens et al., Chapter 2, this volumereferences therein) documented shifting depositional patterns onMid-Atlantic Coastal Plain and ascribed these differences to inbasinal tectonics. For example, progressive downwarping of the mAtlantic region to the south is indicated by a shift from an early Mcene depocenter in New Jersey to a late Miocene depocentMaryland (Owens et al., 1988). These differences cannot be ascsolely to shifting sediment supply, because offshore New Jersey tains thick upper Miocene and younger deposits (Greenlee et1988; Poag and Sevon, 1989; Mountain, Miller, Blum, et al., 199Clearly, some differential subsidence is needed to explain this other differences between New Jersey and the region to the s(Owens et al., 1988).
Tectonic mechanisms that explain interbasinal differences in iment distribution (e.g., differences between Maryland and New sey) are speculative. Owens et al. (Chapter 2, this volume) termeprogressive shifting in basin depocenters the “rolling basins” ccept, but offered no causal mechanism for explaining the shiftingpocenters. Brown et al. (1972) ascribed differences between basactive tectonics (e.g., faulting of crustal blocks). Similarly Bens(1990) invoked crustal faulting to explain the patchy distributionOligocene deposits in Delaware and between New Jersey and Dware. Additional drilling in the Delaware–Maryland–Virginia regio
SEA LEVEL, TECTONICS, AND SEDIMENT SUPPLY
NN1
Age
(M
a)
P22
N5
N4
N6
N7
N8
N9
N10
N14N15
N12
NN2
NN3
NN4
NN5
NN6
NN7NN8NN9
For
am.
Nan
no.
NP25
C6C
C6B
late
mid
dle
early
C6A
C6
C5E
C5D
C6AA
C5C
C5B
C5ADC5AC
C5A
C5
Chrons
Pol
arity
Epo
chA
ge
C5ABC5AA
Olig
ocen
ela
te
10
12
14
16
18
20
22
24
Mio
cene
C13
C12
C11
C10
C9
C8
C7
P18
P19
P16
P21b
P20
P21a
C7A
NP24
NP23
NP22
NP21
NP19-20
early
26
28
30
32
34
updip
36NP18
P17
late
C15
C16
downdip
ACGS#4
??
AtlanticCity
CapeMay
?
Kw2c
Kw1c
Kw2c
Kw2b
Kw3
Kw2a
Kw1b
Kw0
Composite
?
?
O1
O2
O3
O4
O5
O6
E11
E10
P15
12r
11r
IslandBeach
??
??
??
Allaire
C17
Sedimentationrate
meters/m.y.0 8080Siliciclastic sand Carbonate
Silt and clay Glauconite
Eoc
ene
E9
Mi1
Mi1a
Mi1b
"Mi1aa?"
Mi2
Mi4
Mi5
"Mi3a"
Oi1
Oi2
Oi2b
unnamed
unnamed
Oi1a
Oi1b
"Mi1ab?"
Mi3
Dow
ndip
mor
e co
mpl
ete
Pat
chy
dist
ribut
ion
Kw-C
?
??
??
ML
Kw1a
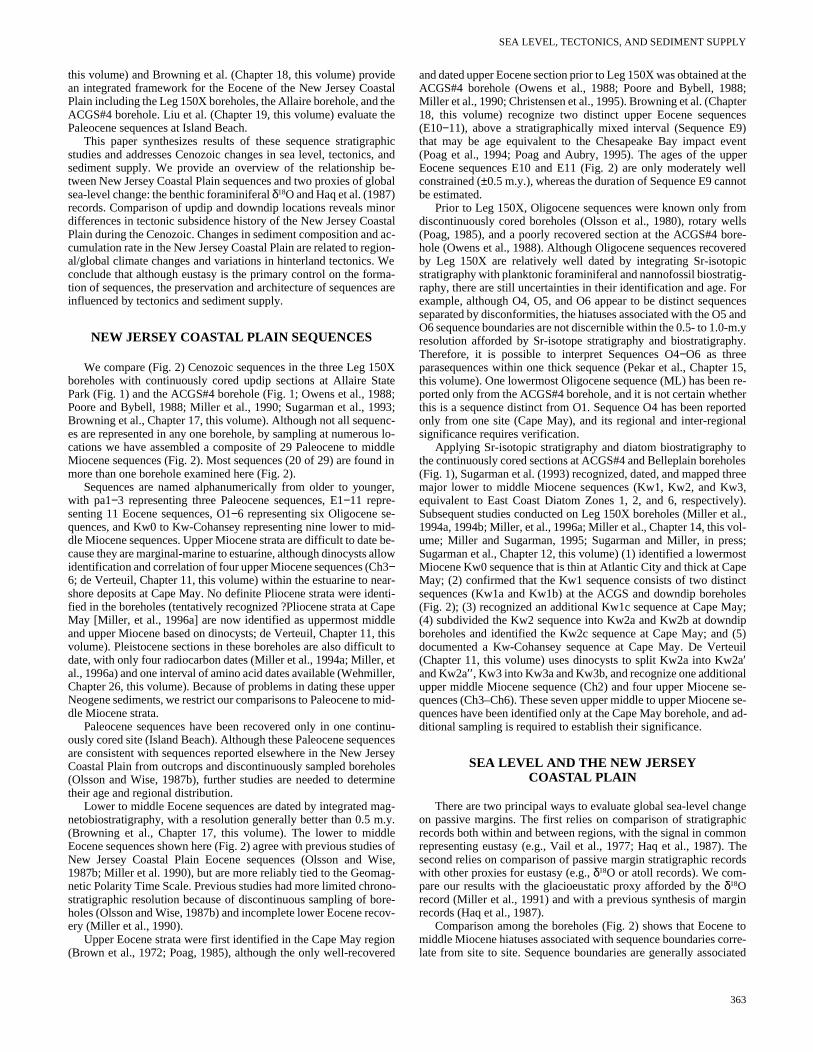
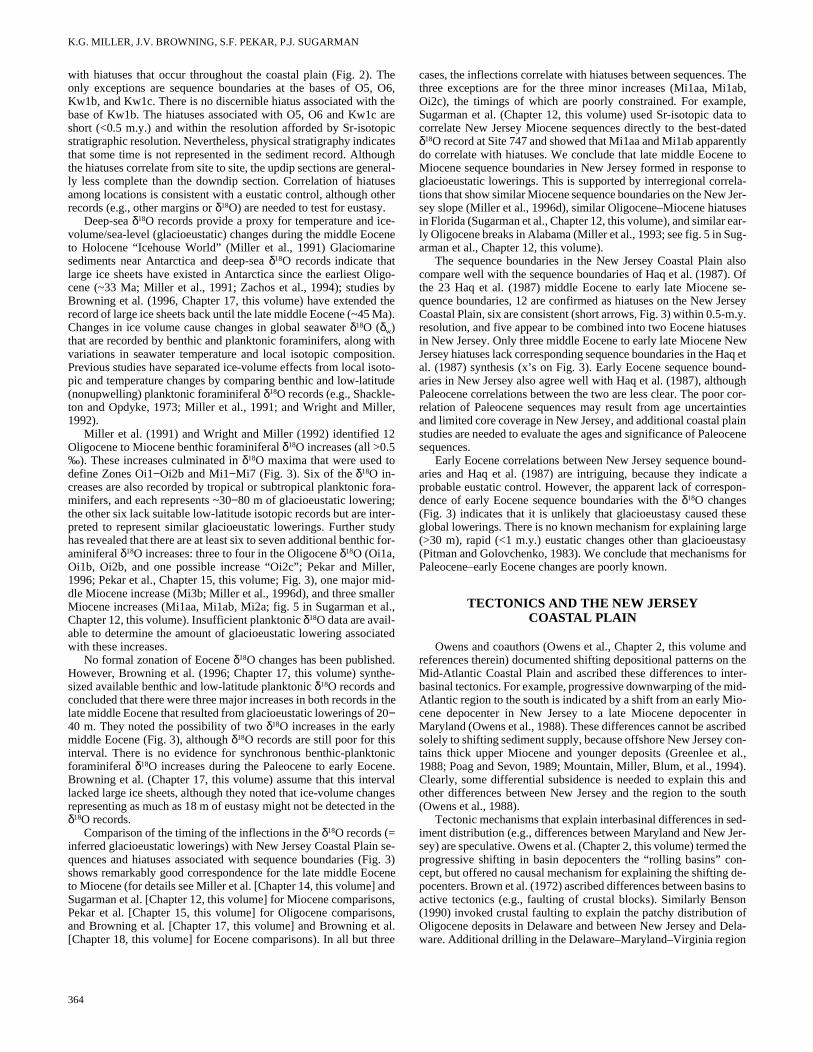
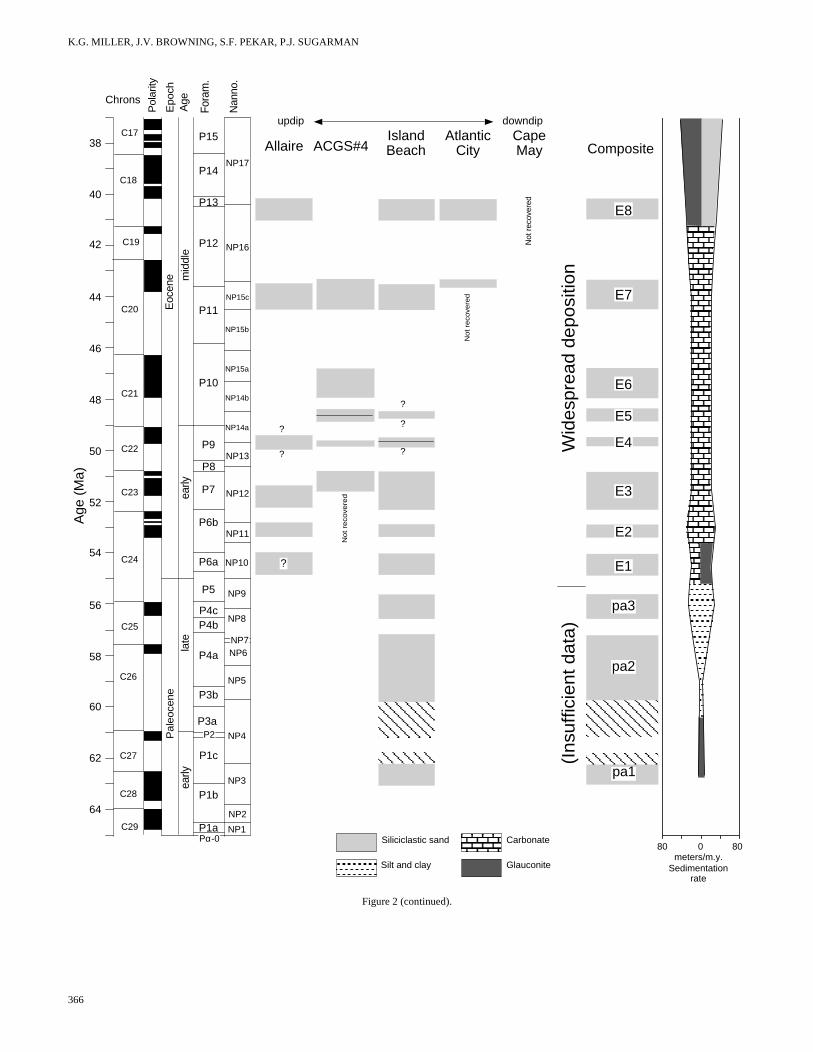
Figure 2. Distribution of the sequences found on the New Jersey Coastal Plain from (this page) the late Eocene to middle Miocene and (next page) the Paleo-cene to middle Eocene, shown as a function of time. Stippled pattern indicates time represented by sediments. Cross-hatched pattern indicates uncertainties inage. The time scale of Berggren et al. (1995) is used. Sedimentation rate is indicated with a “bulge” diagram, and the dominant lithologic components are indi-cated (see legend for component type). Oi1, Mi1, and so on are oxygen isotopic zones of Miller et al. (1991), Pekar and Miller (1996), and Miller et al. (Chapter13, this volume). Lines are drawn horizontally at the inflection in the δ18O records.
365
K.G. MILLER, J.V. BROWNING, S.F. PEKAR, P.J. SUGARMAN
meters/m.y.
38
40
NP17P14
Eoc
ene m
iddl
e
C17
C18
42
44
46
48
50
52
54
56
NP16
NP15c
NP15b
NP15a
NP14b
NP14a
NP13
NP12
NP11
NP10
NP9
NP8
P13
P12
P11
P10
P9
P8
P7
P6b
P6a
P5
P4c
early
C19
C20
C21
C22
C23
C24
C25
NP7NP6
NP5
NP4
NP3
NP2
NP1
58
60
62
64
P4b
P4a
P3b
P3aP2
P1c
P1b
P1aPα-0
C26
C27
C28
C29
Pal
eoce
ne
late
early
Not re
cove
red
Not re
cove
red
E1
E2
E3
E4
E5
E6
E7
E8
pa1
pa2
pa3
?
?
?
?
?
?
P15
updip downdip
ACGS#4Atlantic
CityCapeMay Composite
IslandBeachAllaire
Not
rec
over
ed
Age
(M
a)
Wid
espr
ead
depo
sitio
n(I
nsuf
ficie
nt d
ata)
Fora
m.
Nan
no.
Chrons
Pol
arity
Epo
chA
ge
0 8080Siliciclastic sand Carbonate
Silt and clay Glauconite Sedimentationrate
Figure 2 (continued).
366
SEA LEVEL, TECTONICS, AND SEDIMENT SUPPLY
Sea level (m)
10
20
30
40
50
60
Mio
cene
Olig
ocen
eE
ocen
eP
aleo
cene
early
mid
late
early
late
early
mid
dle
late
early
late
Eustatic curveHaq et al. (1987)
New JerseySequences
SequenceboundariesHaq et al.
(1987)-1000100200
Age
(M
a)
? ? ?? ? ?
?
?
??
?
?
?
δ18OInflections
18
Mi5Mi4
Mi2aMi2
Mi1b
Mi1aaMi1a
Mi1Oi2c
Oi2bOi2a
Oi2Oi1bOi1aOi1
Mi1ab
Mi3a, b
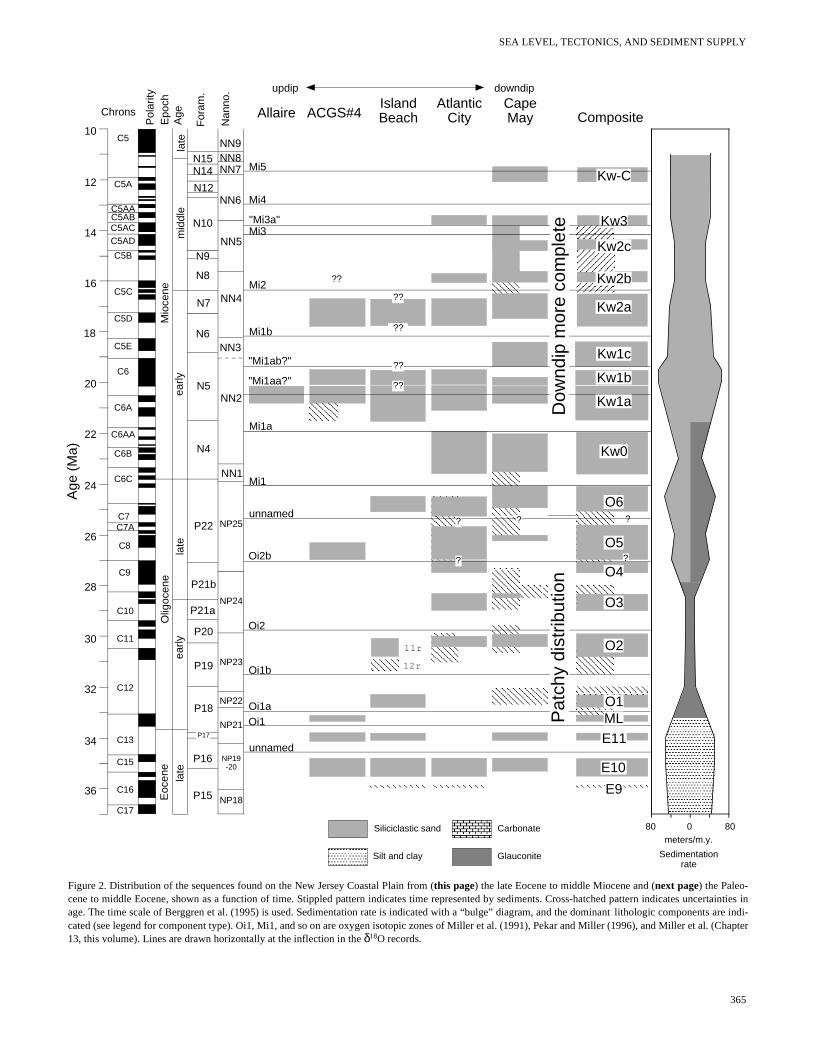
Figure 3. Distribution of the sequences found on the New Jersey Coastal Plain from the Paleocene to mid-dle Miocene shown as a function of time and com-pared to the eustatic curve of Haq et al. (1987) and benthic foraminiferal δ18O increases. The time scale of Berggren et al. (1995) is used. The eustatic curve of Haq et al. (1987) has been replotted to the Berggren et al. (1995) time scale. Benthic foraminiferal δ18O inflections after Miller et al. (1991, 1996d), Wright and Miller (1992), Pekar et al. (Chapter 15, this vol-ume), and Sugarman et al. (Chapter 12, this volume). Arrows indicate the timing of the sequence boundaries of Haq et al. (1987) and isotopic inflection. x = major sequence boundaries in New Jersey that are not reported by Haq et al. (1987).
is needed to evaluate differences in sedimentation between these twoareas and potential tectonic mechanisms.
Previous studies have mapped general sediment distribution pat-terns in the New Jersey Coastal Plain (Owens et al., 1995a, 1995b;Sugarman et al. 1993); differences within New Jersey may reflect in-terbasinal (i.e., between the Raritan and Salisbury Embayments; fig.1 in Owens et al., Chapter 2, this volume) or intrabasinal differences(i.e., assuming that this region behaved as one crustal block). In NewJersey, Eocene basins were the most extensive areally and representthe deepest water paleoenvironments, whereas Oligocene basinswere more restricted (Owens et al., Chapter 2, this volume; Fig. 2).Mapping shows that early Miocene basins in New Jersey were moreextensive both updip and along strike to the north, whereas subse-quent Miocene basins were more areally restricted and less influ-enced by marine deposition (Sugarman et al., 1993).
The Leg 150X boreholes, together with results from two previousboreholes (ACGS#4 and Allaire), provide samples along both dipand strike (Fig. 1). The advantage of our borehole coverage is that itprovides a relatively complete view of updip (e.g., Allaire) throughdowndip sites (e.g., Cape May), while providing a sufficient strikeview to evaluate basin migration, changes in sediment source, andlocal erosion.
The Eocene pattern of deposition in the New Jersey Coastal Plainis simple, with widely distributed sequences both along dip and alongstrike (Fig. 2). This reflects high relative sea level, a gently subsidinghinged margin, and deposition in deep (>100 m) water on a gentlysloping carbonate ramp (Steckler et al., 1988).
The Oligocene pattern of sediment distribution is more complexand intriguing, with patchy distribution of sequences (Fig. 2). Thethickest and most complete lowermost Oligocene (O1 and O2) sec-tions are updip at Island Beach, whereas the best preserved middleOligocene sequences (O3−O5) are at Atlantic City (Fig. 2). The thick-est and best preserved uppermost Oligocene to lowermost Miocenesequences (O6, Kw0) are at Cape May (Fig. 2). This patchy distribu-tion (Fig. 2) could be attributed to local differences in subsidence orto sediment starvation, which resulted in thin sequences that are moresusceptible to erosional truncation. Although sediment starvation canpotentially explain the patchy distribution of lower Oligocene strata,upper Oligocene sequences, typified by relatively high sedimentationrates, still exhibit a patchy distribution (Fig. 2).
Comparison of updip and downdip sites shows a relatively simpleMiocene pattern: sequences thin and pinchout updip (Fig. 2). We in-terpret this as reflecting a classic, gently hinged passive margin withincreased subsidence downdip.
Differences between the simple Miocene and patchy Oligocenedistribution patterns yield insights to tectonic mechanisms. Coastalplain accommodation is driven by regional flexural subsidencecaused by sediment loading and thermal subsidence offshore (Watts,1981). Increased sediment supply can also cause an increase in localsubsidence and accommodation because of loading effects (see alsoPazzaglia and Gardner, 1994). Differential subsidence on the order oftens of meters can result from changes in sediment input; areas clos-est to the source experience crustal loading (both Airy and flexural)and excess accommodation. As the areas of sediment input shift
367
K.G. MILLER, J.V. BROWNING, S.F. PEKAR, P.J. SUGARMAN
lewith
ajors ettions re-ate thel cli-eet.
pro-
dis-andre
LegSe-his15r
through autocyclical processes, the localized depocenters migrate.This can result in patchy preservation, especially if sediment input isvery localized, as appears to have been the case in the Oligocene.
Differential subsidence caused by switching of sediment supplycan explain localized differences in Oligocene deposition. Isopachmaps (fig. 13 in Pekar et al., Chapter 15, this volume) show that earlyOligocene sediment supply was highest near Island Beach. By themiddle Oligocene, the depocenter shifted to just south of AtlanticCity, resulting in preservation of Sequences O3 to O5 at AtlanticCity, which are poorly represented or absent downdip at Cape May.By the latest Oligocene to early Miocene (O6 and Kw0 time), the de-pocenter was closer to Cape May. These shifting loci of the thickest,most rapidly accumulating sediments resulted in excess accommoda-tion in the early Oligocene at Island Beach, in the middle Oligoceneat Atlantic City, and in the latest Oligocene to early Miocene at CapeMay. This progressive migration of basins to the south is similar tothe rolling basins documented for the Miocene of this region (Owenset al., 1988).
In the early Miocene (~21 Ma; Kw1a time), the depocenter shiftedseaward of the Leg 150X sites (e.g., see also Greenlee et al., 1992,Poag and Ward, 1993), causing increased flexural subsidencethroughout the coastal plain and more widespread early Miocenedeposition. Early Miocene sedimentation rates increased in the NewJersey Coastal Plain as the main loci of deltaic deposition progradedseaward of this region (Greenlee et al., 1988), causing increased flex-ural subsidence throughout the coastal plain. Backstripping results(correcting for the effects of compaction, Airy loading, thermal sub-sidence, and long-term sea-level change) confirm an interval of in-creased accommodation at all three Leg 150X sites between 21 and18 Ma, with excess subsidence continuing at Atlantic City and CapeMay until ~12 Ma (Miller et al., 1996b). By the late middle Miocene,deltas prograded to a position ~125-km seaward of the coastal plain(i.e., beneath the modern outer shelf), and their loading and flexuraleffects were minimal on the New Jersey Coastal Plain. This, togetherwith a long-term lowering of sea level, reduced accommodation bythe late Miocene, resulting in non-marine deposition or hiatuses inthe New Jersey Coastal Plain (Pazzaglia and Gardner, 1994)
Based on our comparisons of deposition within New Jersey, wesuggest that the fine-scale tectonic evolution of deposition in thecoastal plain is intricately tied to sediment supply caused by flexuraland loading effects. Although more active tectonics may have playeda role in interbasinal deposition, we lack the core coverage to evalu-ate such a mechanism in the mid-Atlantic region.
SEDIMENTATION AND THE NEW JERSEY COASTAL PLAIN
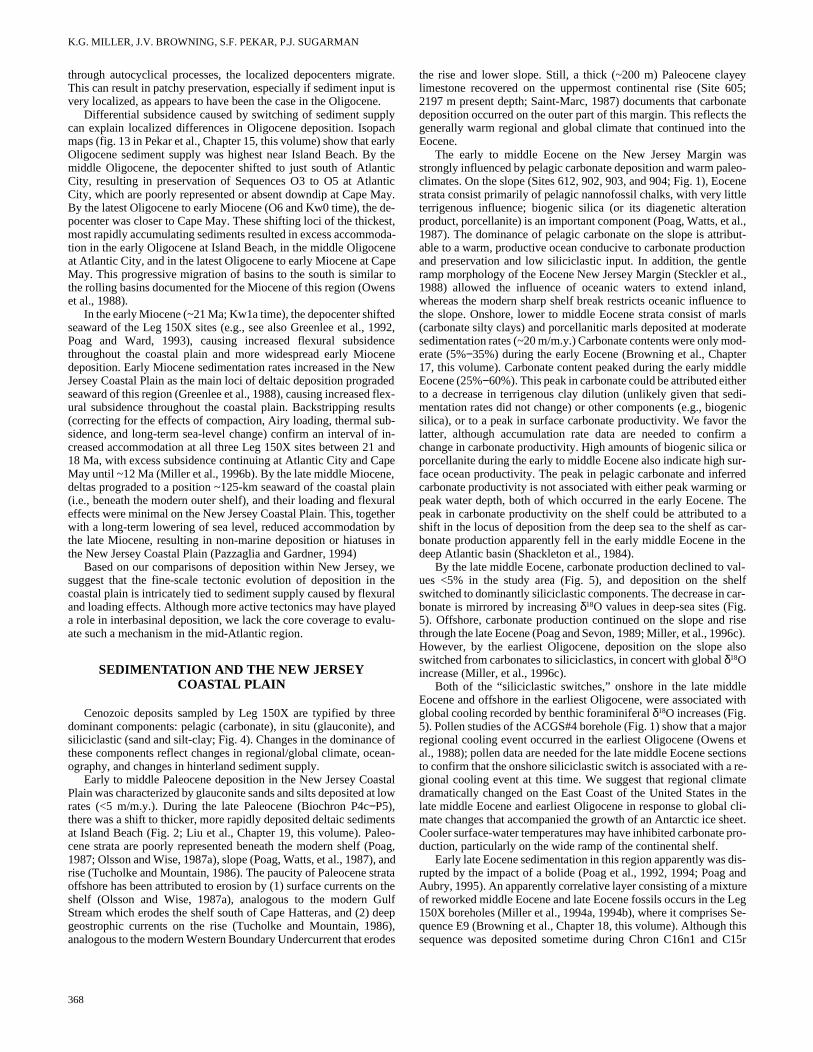
Cenozoic deposits sampled by Leg 150X are typified by threedominant components: pelagic (carbonate), in situ (glauconite), andsiliciclastic (sand and silt-clay; Fig. 4). Changes in the dominance ofthese components reflect changes in regional/global climate, ocean-ography, and changes in hinterland sediment supply.
Early to middle Paleocene deposition in the New Jersey CoastalPlain was characterized by glauconite sands and silts deposited at lowrates (<5 m/m.y.). During the late Paleocene (Biochron P4c−P5),there was a shift to thicker, more rapidly deposited deltaic sedimentsat Island Beach (Fig. 2; Liu et al., Chapter 19, this volume). Paleo-cene strata are poorly represented beneath the modern shelf (Poag,1987; Olsson and Wise, 1987a), slope (Poag, Watts, et al., 1987), andrise (Tucholke and Mountain, 1986). The paucity of Paleocene strataoffshore has been attributed to erosion by (1) surface currents on theshelf (Olsson and Wise, 1987a), analogous to the modern GulfStream which erodes the shelf south of Cape Hatteras, and (2) deepgeostrophic currents on the rise (Tucholke and Mountain, 1986),analogous to the modern Western Boundary Undercurrent that erodes
368
the rise and lower slope. Still, a thick (~200 m) Paleocene clayeylimestone recovered on the uppermost continental rise (Site 605;2197 m present depth; Saint-Marc, 1987) documents that carbonatedeposition occurred on the outer part of this margin. This reflects thegenerally warm regional and global climate that continued into theEocene.
The early to middle Eocene on the New Jersey Margin wasstrongly influenced by pelagic carbonate deposition and warm paleo-climates. On the slope (Sites 612, 902, 903, and 904; Fig. 1), Eocenestrata consist primarily of pelagic nannofossil chalks, with very littleterrigenous influence; biogenic silica (or its diagenetic alterationproduct, porcellanite) is an important component (Poag, Watts, et al.,1987). The dominance of pelagic carbonate on the slope is attribut-able to a warm, productive ocean conducive to carbonate productionand preservation and low siliciclastic input. In addition, the gentleramp morphology of the Eocene New Jersey Margin (Steckler et al.,1988) allowed the influence of oceanic waters to extend inland,whereas the modern sharp shelf break restricts oceanic influence tothe slope. Onshore, lower to middle Eocene strata consist of marls(carbonate silty clays) and porcellanitic marls deposited at moderatesedimentation rates (~20 m/m.y.) Carbonate contents were only mod-erate (5%−35%) during the early Eocene (Browning et al., Chapter17, this volume). Carbonate content peaked during the early middleEocene (25%−60%). This peak in carbonate could be attributed eitherto a decrease in terrigenous clay dilution (unlikely given that sedi-mentation rates did not change) or other components (e.g., biogenicsilica), or to a peak in surface carbonate productivity. We favor thelatter, although accumulation rate data are needed to confirm achange in carbonate productivity. High amounts of biogenic silica orporcellanite during the early to middle Eocene also indicate high sur-face ocean productivity. The peak in pelagic carbonate and inferredcarbonate productivity is not associated with either peak warming orpeak water depth, both of which occurred in the early Eocene. Thepeak in carbonate productivity on the shelf could be attributed to ashift in the locus of deposition from the deep sea to the shelf as car-bonate production apparently fell in the early middle Eocene in thedeep Atlantic basin (Shackleton et al., 1984).
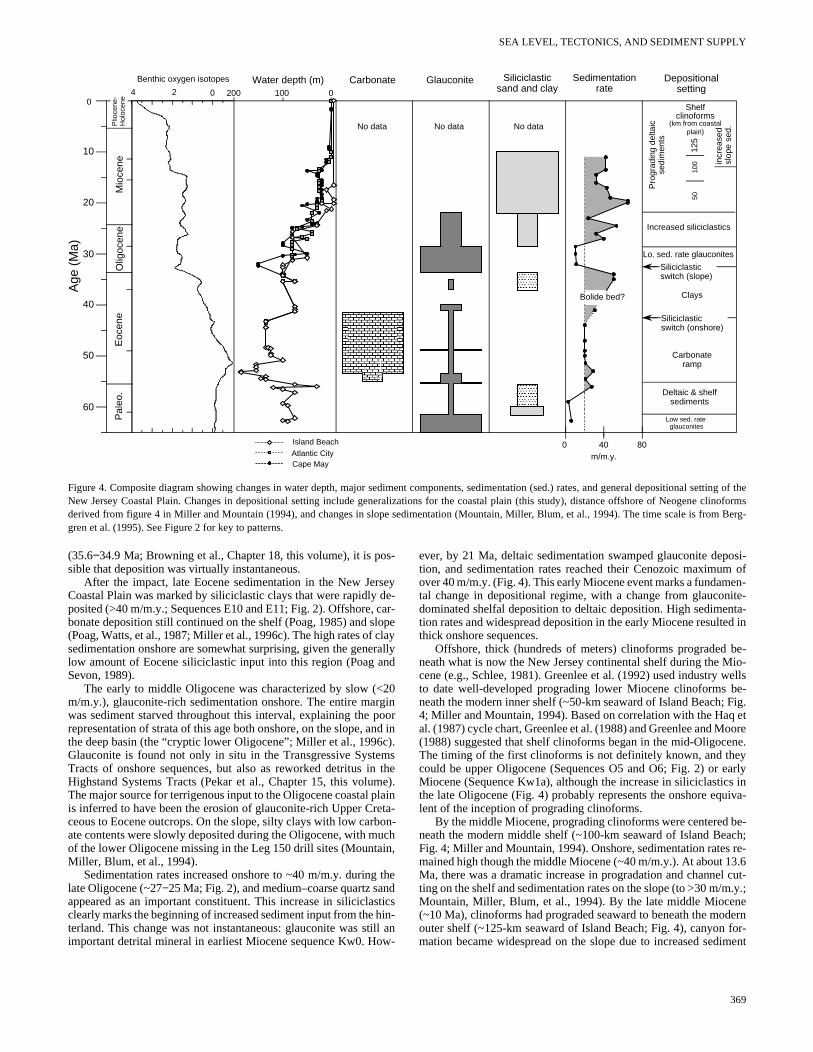
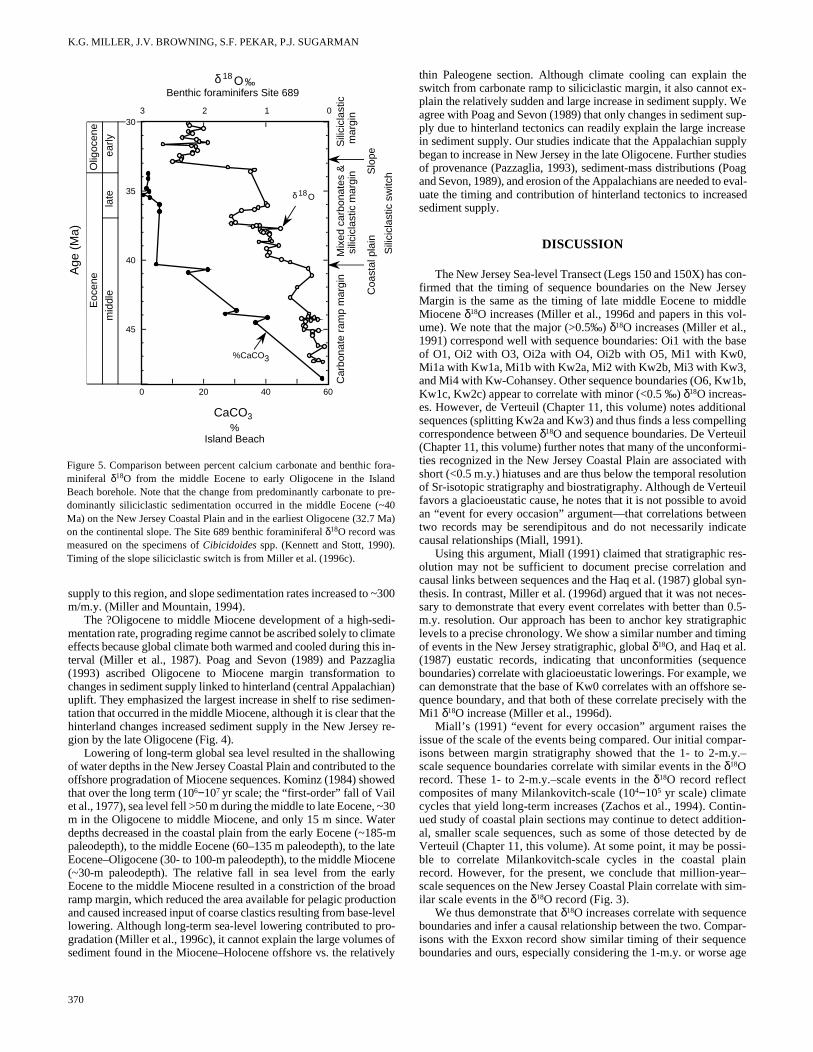
By the late middle Eocene, carbonate production declined to val-ues <5% in the study area (Fig. 5), and deposition on the shelfswitched to dominantly siliciclastic components. The decrease in car-bonate is mirrored by increasing δ18O values in deep-sea sites (Fig.5). Offshore, carbonate production continued on the slope and risethrough the late Eocene (Poag and Sevon, 1989; Miller, et al., 1996c).However, by the earliest Oligocene, deposition on the slope alsoswitched from carbonates to siliciclastics, in concert with global δ18Oincrease (Miller, et al., 1996c).
Both of the “siliciclastic switches,” onshore in the late middEocene and offshore in the earliest Oligocene, were associated global cooling recorded by benthic foraminiferal δ18O increases (Fig.5). Pollen studies of the ACGS#4 borehole (Fig. 1) show that a mregional cooling event occurred in the earliest Oligocene (Owenal., 1988); pollen data are needed for the late middle Eocene secto confirm that the onshore siliciclastic switch is associated with agional cooling event at this time. We suggest that regional climdramatically changed on the East Coast of the United States inlate middle Eocene and earliest Oligocene in response to globamate changes that accompanied the growth of an Antarctic ice shCooler surface-water temperatures may have inhibited carbonateduction, particularly on the wide ramp of the continental shelf.
Early late Eocene sedimentation in this region apparently was rupted by the impact of a bolide (Poag et al., 1992, 1994; Poag Aubry, 1995). An apparently correlative layer consisting of a mixtuof reworked middle Eocene and late Eocene fossils occurs in the150X boreholes (Miller et al., 1994a, 1994b), where it comprises quence E9 (Browning et al., Chapter 18, this volume). Although tsequence was deposited sometime during Chron C16n1 and C
SEA LEVEL, TECTONICS, AND SEDIMENT SUPPLY
01002000
10
20
30
40
50
60
Mio
cene
Olig
ocen
eE
ocen
eP
aleo
.P
lioce
ne-
Hol
ocen
e
Water depth (m)
Cape MayAtlantic CityIsland Beach
Siliciclasticsand and clay
Sedimentationrate
Glauconite
No data
Carbonate
No data No data
Deltaic & shelfsediments
Pro
grad
ing
delta
icse
dim
ents
0 40 80m/m.y.
Benthic oxygen isotopesA
ge (
Ma)
Carbonateramp
Clays
Lo. sed. rate glauconites
Increased siliciclastics
Siliciclasticswitch (slope)
Siliciclasticswitch (onshore)
Depositional setting
incr
ease
d sl
ope
sed.
50
100
125
Shelfclinoforms
(km from coastal plain)
Bolide bed?
Low sed. rate glauconites
4 2 0
Figure 4. Composite diagram showing changes in water depth, major sediment components, sedimentation (sed.) rates, and general depositional setting of theNew Jersey Coastal Plain. Changes in depositional setting include generalizations for the coastal plain (this study), distance offshore of Neogene clinoformsderived from figure 4 in Miller and Mountain (1994), and changes in slope sedimentation (Mountain, Miller, Blum, et al., 1994). The time scale is from Berg-gren et al. (1995). See Figure 2 for key to patterns.
einmprb
g
s tio
osi-m ofen-ite-nta-ed in
be-io-
wellsbe- Fig. etoore
ene.eyearlys inuiva-
be-ach; re-3.6l cut-m.y.;nedern
for-iment
(35.6−34.9 Ma; Browning et al., Chapter 18, this volume), it is pos-sible that deposition was virtually instantaneous.
After the impact, late Eocene sedimentation in the New JerseyCoastal Plain was marked by siliciclastic clays that were rapidly de-posited (>40 m/m.y.; Sequences E10 and E11; Fig. 2). Offshore, car-bonate deposition still continued on the shelf (Poag, 1985) and slope(Poag, Watts, et al., 1987; Miller et al., 1996c). The high rates of claysedimentation onshore are somewhat surprising, given the generallylow amount of Eocene siliciclastic input into this region (Poag andSevon, 1989).
The early to middle Oligocene was characterized by slow (<20m/m.y.), glauconite-rich sedimentation onshore. The entire marginwas sediment starved throughout this interval, explaining the poorrepresentation of strata of this age both onshore, on the slope, and inthe deep basin (the “cryptic lower Oligocene”; Miller et al., 1996Glauconite is found not only in situ in the Transgressive SystTracts of onshore sequences, but also as reworked detritus Highstand Systems Tracts (Pekar et al., Chapter 15, this voluThe major source for terrigenous input to the Oligocene coastal is inferred to have been the erosion of glauconite-rich Upper Cceous to Eocene outcrops. On the slope, silty clays with low carate contents were slowly deposited during the Oligocene, with mof the lower Oligocene missing in the Leg 150 drill sites (MountaMiller, Blum, et al., 1994).
Sedimentation rates increased onshore to ~40 m/m.y. durinlate Oligocene (~27−25 Ma; Fig. 2), and medium–coarse quartz saappeared as an important constituent. This increase in siliciclaclearly marks the beginning of increased sediment input from theterland. This change was not instantaneous: glauconite was simportant detrital mineral in earliest Miocene sequence Kw0. H
c).ms thee).
laineta-on-
uchin,
thendtics
hin-ll anw-
ever, by 21 Ma, deltaic sedimentation swamped glauconite deption, and sedimentation rates reached their Cenozoic maximuover 40 m/m.y. (Fig. 4). This early Miocene event marks a fundamtal change in depositional regime, with a change from glaucondominated shelfal deposition to deltaic deposition. High sedimetion rates and widespread deposition in the early Miocene resultthick onshore sequences.
Offshore, thick (hundreds of meters) clinoforms prograded neath what is now the New Jersey continental shelf during the Mcene (e.g., Schlee, 1981). Greenlee et al. (1992) used industry to date well-developed prograding lower Miocene clinoforms neath the modern inner shelf (~50-km seaward of Island Beach;4; Miller and Mountain, 1994). Based on correlation with the Haqal. (1987) cycle chart, Greenlee et al. (1988) and Greenlee and M(1988) suggested that shelf clinoforms began in the mid-OligocThe timing of the first clinoforms is not definitely known, and thcould be upper Oligocene (Sequences O5 and O6; Fig. 2) or Miocene (Sequence Kw1a), although the increase in siliciclasticthe late Oligocene (Fig. 4) probably represents the onshore eqlent of the inception of prograding clinoforms.
By the middle Miocene, prograding clinoforms were centeredneath the modern middle shelf (~100-km seaward of Island BeFig. 4; Miller and Mountain, 1994). Onshore, sedimentation ratesmained high though the middle Miocene (~40 m/m.y.). At about 1Ma, there was a dramatic increase in progradation and channeting on the shelf and sedimentation rates on the slope (to >30 m/Mountain, Miller, Blum, et al., 1994). By the late middle Mioce(~10 Ma), clinoforms had prograded seaward to beneath the moouter shelf (~125-km seaward of Island Beach; Fig. 4), canyonmation became widespread on the slope due to increased sed
369
K.G. MILLER, J.V. BROWNING, S.F. PEKAR, P.J. SUGARMAN
, a8
ecaroc-rsv
theex- We sup-aseplydiesoag
eval-sed
con-seydleol-
ase
1b,
nallingil
mi- withtionuilvoiden
cate
s-nd syn-es-
0.5-phicing
nce we se- the
epar-.y.–
tin-ion-by desi-inr–
sim-
epar-ce age
supply to this region, and slope sedimentation rates increased to ~300m/m.y. (Miller and Mountain, 1994).
The ?Oligocene to middle Miocene development of a high-sedi-mentation rate, prograding regime cannot be ascribed solely to climateeffects because global climate both warmed and cooled during this in-terval (Miller et al., 1987). Poag and Sevon (1989) and Pazzaglia(1993) ascribed Oligocene to Miocene margin transformation tochanges in sediment supply linked to hinterland (central Appalachian)uplift. They emphasized the largest increase in shelf to rise sedimen-tation that occurred in the middle Miocene, although it is clear that thehinterland changes increased sediment supply in the New Jersey re-gion by the late Oligocene (Fig. 4).
Lowering of long-term global sea level resulted in the shallowingof water depths in the New Jersey Coastal Plain and contributed to theoffshore progradation of Miocene sequences. Kominz (1984) showedthat over the long term (106−107 yr scale; the “first-order” fall of Vailet al., 1977), sea level fell >50 m during the middle to late Eocenem in the Oligocene to middle Miocene, and only 15 m since. Wdepths decreased in the coastal plain from the early Eocene (~1paleodepth), to the middle Eocene (60–135 m paleodepth), to thEocene–Oligocene (30- to 100-m paleodepth), to the middle Mio(~30-m paleodepth). The relative fall in sea level from the eEocene to the middle Miocene resulted in a constriction of the bramp margin, which reduced the area available for pelagic produand caused increased input of coarse clastics resulting from baselowering. Although long-term sea-level lowering contributed to pgradation (Miller et al., 1996c), it cannot explain the large volumesediment found in the Miocene–Holocene offshore vs. the relati
0123
35
40
45
Age
(M
a)O18δ
Benthic foraminifers Site 689
0 20 40 60
CaCO3%
Island Beach
Eoc
ene
Olig
ocen
e
late
mid
dle
early
Sili
cicl
astic
sw
itch
Coa
stal
pla
inS
lope
O18δ
%CaCO3
‰
Car
bona
te r
amp
mar
gin
Sili
cicl
astic
mar
gin
sili
cicl
astic
mar
gin
30
Mix
ed c
arbo
nate
s &
Figure 5. Comparison between percent calcium carbonate and benthic fora-miniferal δ18O from the middle Eocene to early Oligocene in the IslandBeach borehole. Note that the change from predominantly carbonate to pre-dominantly siliciclastic sedimentation occurred in the middle Eocene (~40Ma) on the New Jersey Coastal Plain and in the earliest Oligocene (32.7 Ma)on the continental slope. The Site 689 benthic foraminiferal δ18O record wasmeasured on the specimens of Cibicidoides spp. (Kennett and Stott, 1990).Timing of the slope siliciclastic switch is from Miller et al. (1996c).
370
~30ter5-m
lateenerlyad
tionlevelo- ofely
thin Paleogene section. Although climate cooling can explain switch from carbonate ramp to siliciclastic margin, it also cannot plain the relatively sudden and large increase in sediment supply.agree with Poag and Sevon (1989) that only changes in sedimentply due to hinterland tectonics can readily explain the large increin sediment supply. Our studies indicate that the Appalachian supbegan to increase in New Jersey in the late Oligocene. Further stuof provenance (Pazzaglia, 1993), sediment-mass distributions (Pand Sevon, 1989), and erosion of the Appalachians are needed touate the timing and contribution of hinterland tectonics to increasediment supply.
DISCUSSION
The New Jersey Sea-level Transect (Legs 150 and 150X) has firmed that the timing of sequence boundaries on the New JerMargin is the same as the timing of late middle Eocene to midMiocene δ18O increases (Miller et al., 1996d and papers in this vume). We note that the major (>0.5‰) δ18O increases (Miller et al.,1991) correspond well with sequence boundaries: Oi1 with the bof O1, Oi2 with O3, Oi2a with O4, Oi2b with O5, Mi1 with Kw0,Mi1a with Kw1a, Mi1b with Kw2a, Mi2 with Kw2b, Mi3 with Kw3,and Mi4 with Kw-Cohansey. Other sequence boundaries (O6, KwKw1c, Kw2c) appear to correlate with minor (<0.5 ‰) δ18O increas-es. However, de Verteuil (Chapter 11, this volume) notes additiosequences (splitting Kw2a and Kw3) and thus finds a less compelcorrespondence between δ18O and sequence boundaries. De Verteu(Chapter 11, this volume) further notes that many of the unconforties recognized in the New Jersey Coastal Plain are associatedshort (<0.5 m.y.) hiatuses and are thus below the temporal resoluof Sr-isotopic stratigraphy and biostratigraphy. Although de Vertefavors a glacioeustatic cause, he notes that it is not possible to aan “event for every occasion” argument—that correlations betwetwo records may be serendipitous and do not necessarily indicausal relationships (Miall, 1991).
Using this argument, Miall (1991) claimed that stratigraphic reolution may not be sufficient to document precise correlation acausal links between sequences and the Haq et al. (1987) globalthesis. In contrast, Miller et al. (1996d) argued that it was not necsary to demonstrate that every event correlates with better thanm.y. resolution. Our approach has been to anchor key stratigralevels to a precise chronology. We show a similar number and timof events in the New Jersey stratigraphic, global δ18O, and Haq et al.(1987) eustatic records, indicating that unconformities (sequeboundaries) correlate with glacioeustatic lowerings. For example,can demonstrate that the base of Kw0 correlates with an offshorequence boundary, and that both of these correlate precisely withMi1 δ18O increase (Miller et al., 1996d).
Miall’s (1991) “event for every occasion” argument raises thissue of the scale of the events being compared. Our initial comisons between margin stratigraphy showed that the 1- to 2-mscale sequence boundaries correlate with similar events in the δ18Orecord. These 1- to 2-m.y.–scale events in the δ18O record reflectcomposites of many Milankovitch-scale (104−105 yr scale) climatecycles that yield long-term increases (Zachos et al., 1994). Conued study of coastal plain sections may continue to detect addital, smaller scale sequences, such as some of those detected Verteuil (Chapter 11, this volume). At some point, it may be posble to correlate Milankovitch-scale cycles in the coastal plarecord. However, for the present, we conclude that million-yeascale sequences on the New Jersey Coastal Plain correlate withilar scale events in the δ18O record (Fig. 3).
We thus demonstrate that δ18O increases correlate with sequencboundaries and infer a causal relationship between the two. Comisons with the Exxon record show similar timing of their sequenboundaries and ours, especially considering the 1-m.y. or worse
SEA LEVEL, TECTONICS, AND SEDIMENT SUPPLY
at heva
citio
essefasee1)gpeleraca
tathti
ith mraio
lese i
-s r elise
pcen
ae r i
. 4feins dde
tial-). Al-
suffi-
ay and the sec-d; by, wed bya-leveldies.learrmantem
s andr hy-dedark.dleeco-
leo-) pro-Ter-cordte for
obaless.c-
ics, andg is Maye ofhaveutionentr, weded
, a crit- cli-elfli-
es
er tog,
3 andnsse-con-
llingineyboth ef-
resolution inherent in the Haq et al. (1987) synthesis. Thus, our stud-ies support the identification and general (±0.5 m.y.) ages of the Haqet al. (1987) Eocene to Miocene sequence boundaries and the timingof their eustatic record. In general, our record of sequence boundariesis better dated, and uncertainties in the ages can be specified. There-fore, we suggest that the New Jersey Margin provides a more accu-rate record of the timing of Eocene to Miocene eustatic falls than Haqet al. (1987).
Although our record of eustatic falls is similar to that of Haq et al.(1987), our studies do not necessarily indicate that their “eustrecord is correct, as assumed by Kerr (1996). In fact, we believemany of the amplitudes of their eustatic falls are incorrect. Onsdrilling cannot provide estimates of the full amplitudes of sea-lchanges because of erosion during lowstands (i.e., only about hthe full sea-level cycles are represented). Shelf drilling is explidesigned to test the amplitude of Miocene sea-level changes (Mand Mountain, 1994), although drilling on ODP Leg 174A will nbegin until 1997.
Oxygen-isotopic records provide constraints on the amplitudlate middle Eocene to Miocene glacioeustatic changes, and thedicate that the Haq et al. (1987) estimates may be too high by a of two. We interpret Oligocene to middle Miocene δ18O increases areflecting eustatic lowerings of ~30–90 m and late middle Eocencreases as lowerings of 20−40 m. The major Oligocene to Miocenbenthic foraminiferal δ18O increases defined by Miller et al. (199and Wright and Miller (1992) range from 0.5‰ to 1.1‰. Althouwe cannot determine precisely the amount attributable to temture vs. ice volume, Pleistocene calibrations provide a reasonabper limit. Ascribing a maximum of 75% of the benthic foraminifeincreases to ice volume (Fairbanks, 1989) and using the Pleistoice-volume/sea-level calibration of 0.11‰/10 m (Fairbanks and Mthews, 1978) indicates that maximum amplitudes of glacioeusfall were 40−75 m. Using covariance between planktonic and benforaminiferal δ18O records yields similar Oligocene–Miocene esmates (0.4‰−0.8‰, corresponding to 36−73 m of lowering), al-though covariance may be as low as 0.3‰−0.4‰ (~30 m of eustaticlowering) in some intervals (e.g., the earliest Oligocene Oi1crease) and as high as 1.0‰ (~90 m of eustatic lowering) in o(e.g., the latest Oligocene Mi1 increase). Covariance in the latedle Eocene was 0.2‰–0.3‰ (18–27 m sea-level fall). This contwith Exxon’s eustatic lowerings for the late Eocene to middle Mcene of up to 140 m (Haq et al. 1987).
Although we regard use of the Pleistocene ice-volume/sea-calibration of 0.11‰/10 m and thus the isotopic estimates of level amplitude as appropriate, there is one way to reconcile thetopic and Haq et al. (1987) estimates. The maximum δ18O sea-levelcalibration is fixed by the δ18O of freezing ice to 0.055 ‰/10 m (Miller et al., 1987). Use of this calibration yields eustatic lowering35−180 m, similar to those of Haq et al. (1987). However, Milleal. (1987) regarded the 0.055 ‰/10 m calibration as an unrea“outer” limit. In addition, use of this calibration requires ice volumthat approach those of the last glacial maximum, and there is noto store such large volumes of ice during the Oligocene–Mio(i.e., prior to large northern hemisphere ice sheets; ShackletoOpdyke, 1973).
Relative sea-level estimates derived from the New Jersey CoPlain record are also consistent with lower amplitudes than thostimated by Haq et al. (1987). Although the coastal plain sites doreflect the full amplitude of eustatic change, they do record half oof the eustatic cycles. Water-depth changes between sequenceslate middle Eocene to middle Miocene are typically 0–80 m (FigThese water-depth changes are not corrected for isostatic efbackstripping (correcting for the effects of compaction, Airy loadthermal subsidence, and long-term sea-level change) indicaterelative sea-level variations for the late middle Eocene to miMiocene were less than 50 m (Miller et al., 1996b). Although th
ic”thatoreellf oflyllert
of in-
ctor
in-
hra- up-lenet-ticic-
n-ersid-sts-
vela-
so-
oftticslaceneand
stal es-not son the).cts;
g,thatlese
estimates do not include the lowstands, they still indicate substanly smaller sea-level changes than suggested by Haq et al. (1987though the amplitude estimates based on δ18O and the New JerseyCoastal Plain are admittedly tentative, we suggest that there is cient evidence to doubt the amplitudes of Haq et al. (1987).
FUTURE WORK
Continuous coring at Island Beach, Atlantic City, and Cape Mhas met the goals of Leg 150X by dating Cenozoic sequencesevaluating facies models in an updip setting. Drilling has changedway we view the coastal plain sequences. New Jersey onshoretions were thought to represent more stratigraphic gap than recorstrategically locating the boreholes as far downdip as possiblewere able to obtain a more complete record. Information providethese boreholes has been beneficial not only to sequence and sestudies, but also to hydrogeological and regional geological stuOne of the unanticipated findings of New Jersey drilling is the crelationship between hydrogeologic units and sequences (Sugaand Miller, 1997). The facies changes within sequences (systracts) need to be understood to evaluate the nature of aquiferconfining units in the New Jersey Coastal Plain. Because of theidrogeological significance, the New Jersey Geological Survey fundrilling of one additional borehole in 1996 at Bass River State PThis borehole will (1) recover additional pieces of the midEocene–Holocene “Icehouse” sequence mosaic, which include nomically valuable aquifers; (2) yield detailed coverage of Pacene–Eocene sequences, filling in critical Paleocene sections; (3vide an opportunity to core a potentially continuous Cretaceous/tiary boundary section; and (4) provide a continuously cored reof New Jersey Upper Cretaceous sequences that are appropriaevaluating sea-level changes during an interval of peak glwarmth, as well as aquifer and aquitard continuity and effectiven
Additional coastal plain drilling beyond Bass River will be neessary to address the issues of sequences and sea level, tectonsediment supply discussed here. In particular, additional drillinneeded between Atlantic City and Cape May and south of Cape(in the Delmarva Peninsula) (1) to refine and test the significancmiddle Eocene to Oligocene sequences, a number of which only been dated at one borehole, and (2) to evaluate the distribof sequences in view of models of tectonics (faulting vs. sedimloading) discussed here. Depending on the results at Bass Riveanticipate that at least one additional updip borehole will be neeto recover and date Upper Cretaceous to Paleocene sequencesical interval for evaluating sea-level changes during past warmmates. In Summer 1997, ODP Leg 174A will drill the outer sh(Sites MAT8B and MAT9B; Fig 1), focusing on upper Neogene cnoforms. Additional drilling will be needed on the inner (SitMAT1−3) and middle shelf (Sites MAT4−7; Fig. 1) to evaluate thefacies and amplitudes of sea-level changes associated with lowmiddle Miocene clinoforms. Whatever drilling the future may brinODP Legs 150X and 150 and their predecessors, DSDP Legs 995, have demonstrated the wealth of information (with implicatiofor global sea level, global and regional climates, models of quence formation, and hydrogeology) that can be obtained by tinuously coring transects across passive continental margins.
ACKNOWLEDGMENTS
We thank the members of the New Jersey Coastal Plain DriProject for fulfilling the promise of onshore drilling, G. Mountaand N. Christie-Blick for collaboration in planning the New JersSea-level Transect, and W. Newell and the late J. Owens (U.S.Geological Survey [USGS]) for support and guidance of our
371
K.G. MILLER, J.V. BROWNING, S.F. PEKAR, P.J. SUGARMAN
tn
oo
eS
ro p
nc
to
g Nd
nt
-
pf a
s
e O
rror
or-
-rom
n,.,
o-
-nges
le. .
ew
,
.-J.,lbo,h,.,
S.,n,t-sea
s in
en,d
ne-ia-
eero-
New
s-
ene
nal
outh-lain.
forts. The USGS BERG drillers did an outstanding job in obtainingthe cores. The New Jersey Geological Survey supplied materials, per-sonnel, and logging support. Rutgers University provided space forinterim core storage and core analyses, field vehicles, and materials.R.K. Olsson (Rutgers) supplied unpublished data from other onshorewells and advice on planktonic foraminiferal studies. The NationalScience Foundation Continental Dynamic Program (L. Johnson, Pro-gram Director) and ODP (B. Malfait, Program Director) co-fundedthe onshore boreholes (Leg 150X) and, along with the JOIDES Plan-ning Committee, are to be commended for their flexibility and visionin authorizing Leg 150X as an ODP activity. The publications staff atODP was supportive throughout production of this and other Leg150X volumes. S. Snyder carefully edited all of the manuscripts sub-mitted to this volume by the Rutgers group; I thank him for servingas co-editor of this volume. Discussions with and reviews by W.Newell, W. Poag, and S. Snyder are greatly appreciated. Supportedby NSF Grants EAR92-18210 and EAR94-17108. This is LDEOcontribution 5688.
REFERENCES
Benson, R.N., 1990. Geologic and hydrologic studies of the Oligocene-Pleis-tocene section near Lewes, Delaware. Delaware Geol. Surv. Rep.,48:1−34.
Berggren, W.A., Kent, D.V., Swisher, C.C., III, and Aubry, M.-P., 1995. Arevised Cenozoic geochronology and chronostratigraphy. In Berggren,W.A., Kent, D.V., Aubry, M.-P., and Hardenbol, J. (Eds.), Geochronol-ogy, Time Scales and Global Stratigraphic Correlation. Spec. Publ.—Soc. Econ. Paleontol. Mineral., 54:129−212.
Brown, P.M., Miller, J.A., and Swain, F.M., 1972. Structural and stragraphic framework, and spatial distribution of permeability of the Atlatic Coastal Plain, North Carolina to New York. Geol. Surv. Prof. Pap.U.S., 796:1−79.
Browning, J.V., Miller, K.G., and Pak, D.K., 1996. Global implications lower to middle Eocene sequence boundaries on the New Jersey CPlain—The Icehouse cometh. Geology, 24:639−642.
Christensen, B.A., Miller, K.G., and Olsson, R.K., 1995. Eocene-Oligocbenthic foraminiferal biofacies and depositional sequence at the ACGborehole, New Jersey Coastal Plain. Palaios, 10:103−132.
Enright, R., 1969. The stratigraphy, micropaleontology, and paleoenvimental analysis of the Eocene sediments of the New Jersey coastal[Ph.D. dissert.]. Rutgers University, New Brunswick, NJ.
Fairbanks, R.G., 1989. A 17,000-year glacio-eustatic sea level record: ience of glacial melting rates on the Younger Dryas event and deep-ocirculation. Nature, 342:637−642.
Fairbanks, R.G., and Matthews, R.K., 1978. The marine oxygen isorecord in Pleistocene coral, Barbados, West Indies. Quat. Res., 10:181−196.
Greenlee, S.M., Devlin, W.J., Miller, K.G., Mountain, G.S., and FleminP.B., 1992. Integrated sequence stratigraphy of Neogene deposits,Jersey continental shelf and slope: comparison with the Exxon moGeol. Soc. Am. Bull., 104:1403−1411.
Greenlee, S.M., and Moore, T.C., 1988. Recognition and interpretatiodepositional sequences and calculation of sea level changes from sgraphic data—offshore New Jersey and Alabama Tertiary. In Wilgus,C.K., Posamentier, H., Ross, C.A., and Kendall, C.G.St.C. (Eds.), Sea-Level Changes: An Integrated Approach. Spec. Publ.—Soc. Econ. Paleontol. Mineral., 42:329−353.
Greenlee, S.M., Schroeder, F.W., and Vail, P.R., 1988. Seismic stratigraand geohistory analysis of Tertiary strata from the continental shelNew Jersey: calculation of eustatic fluctuations from stratigraphic dIn Sheridan, R.E., and Grow, J.A. (Eds.), The Atlantic Continental Mar-gin. Geol. Soc. Am., Geol. North Am. Ser., 437−444.
Haq, B.U., Hardenbol, J., and Vail, P.R., 1987. Chronology of fluctuatinglevels since the Triassic. Science, 235:1156−1167.
Kennett, J.P., and Stott, L.D., 1990. Proteus and Proto-oceanus: ancPaleogene oceans as revealed from Antarctic stable isotopic results:Leg 113. In Barker, P.F., Kennett, J.P., et al., Proc. ODP, Sci. Results, 113:College Station, TX (Ocean Drilling Program), 865−880.
Kerr, R.A., 1996. Ancient sea-level swings confirmed. Science, 272:1097−1098.
372
i--
fastal
ne#4
n-lain
flu-ean
pe
s,ewel.
ofrati-
hicoffta.
ea
stralDP
Kominz, M.A., 1984. Oceanic ridge volumes and sea-level change—an eanalysis. In Schlee, J.S. (Ed.), Interregional Unconformities and Hydro-carbon Accumulation. AAPG Mem., 36:37−58.
Miall, A.D., 1991. Stratigraphic sequences and their chronostratigraphic crelation. J. Sediment. Petrol., 61:497−505.
Miller, K.G., et al., 1996a. Proc. ODP, Init. Repts., 150X (Suppl.): CollegeStation, TX (Ocean Drilling Program).
Miller, K.G., Browning, J.V., Kominz, M.A., and Steckler, M., 1996b. Sealevel vs. tectonic controls on passive margin sedimentation: Results fthe New Jersey Coastal Plain Drilling Project. Geol. Soc. Am. Abstr.Progr., A-62.
Miller, K.G., Browning, J.V., Liu, C., Sugarman, P., Kent, D.V., Van FosseM., Queen, D., Goss, M., Gwynn, D., Mullikin, L., Feigenson, M.DAubry, M.-P., and Burckle, L.D., 1994a. Atlantic City site report. InMiller, K.G., et al., Proc. ODP, Init. Repts., 150X: College Station, TX(Ocean Drilling Program), 35−55.
Miller, K.G., Fairbanks, R.G., and Mountain, G.S., 1987. Tertiary oxygen istope synthesis, sea-level history, and continental margin erosion. Pale-oceanography, 2:1−19.
Miller, K.G., Kent, D.V., Brower, A.N., Bybell, L.M., Feigenson, M.D., Olsson, R.K., and Poore, R.Z., 1990. Eocene-Oligocene sea-level chaon the New Jersey coastal plain linked to the deep-sea record. Geol. Soc.Am. Bull., 102:331−339.
Miller, K.G., Liu, C., and Feigenson, M.D., 1996c. Oligocene to middMiocene Sr-isotopic stratigraphy of the New Jersey continental slopeInMountain, G.S., Miller, K.G., Blum, P., Poag, C.W., and Twichell, D.C(Eds.), Proc. ODP, Sci. Results, 150: College Station, TX (Ocean DrillingProgram), 97-114.
Miller, K.G., and Mountain, G.S., 1994. Global sea-level change and the NJersey margin. In Mountain, G.S., Miller, K.G., Blum, P., et al., Proc.ODP, Init. Repts., 150: College Station, TX (Ocean Drilling Program)11−20.
Miller, K.G., Mountain, G.S., Blum, P., Gartner, S., Alm Per, G., Aubry, MP., Burckle, L.H., Guerin, G., Katz, M.E., Christensen, B.A., Compton, Damuth, J.E., Deconinck, J.F., de Verteuil, L., Fulthorpe, C.S., HesseS.P., Hoppie, B.W., Kotake, N., Lorenzo, J.M., McCracken, S., McHugC.M., Quayle, W.C., Saito, Y., Snyder, S.W., ten Kate, W.G., Urbat, MVan Fossen, M.C., Vecsei, A., Sugarman, P.J., Mullikin, L., Pekar, Browning, J.V., Liu, C., Feigenson, M.D., Goss, M., Gwynn, D., QueeD.G., Powars, D.S., Heibel, T.D., and Bukry, D., 1996d. Drilling and daing New Jersey Oligocene-Miocene sequences: ice volume, global level, and Exxon records. Science, 271:1092−1095.
Miller, K.G., and Sugarman, P.J., 1995. Correlating Miocene sequenceonshore New Jersey boreholes (ODP Leg 150X) with global δ18O andMaryland outcrops. Geology, 23:747−750.
Miller, K.G., Sugarman, P., Van Fossen, M., Liu, C., Browning, J.V., QueD., Aubry, M.-P., Burckle, L.D., Goss, M., and Bukry, D., 1994b. IslanBeach site report. In Miller, K.G., et al., Proc. ODP, Init. Repts., 150X:College Station, TX (Ocean Drilling Program), 5−33.
Miller, K.G., Thompson, P.R., and Kent, D.V., 1993. Integrated late EoceOligocene stratigraphy of the Alabama coastal plain: correlation of htuses and stratal surfaces to glacioeustatic lowerings. Paleoceanography,8:313−331.
Miller, K.G., Wright, J.D., and Fairbanks, R.G., 1991. Unlocking the IcHouse: Oligocene-Miocene oxygen isotopes, eustasy, and margin sion. J. Geophys. Res., 96:6829−6848.
Mountain, G.S., Miller, K.G., Blum, P., et al., 1994. Proc. ODP, Init. Repts.,150: College Station, TX (Ocean Drilling Program).
Olsson, R.K., 1991. Cretaceous to Eocene sea-level fluctuations on the Jersey margin. Sediment. Geol., 70:195−208.
Olsson, R.K., Miller, K.G., and Ungrady, T.E., 1980. Late Oligocene trangression of middle Atlantic coastal plain. Geology, 8:549−554.
Olsson, R.K., and Wise, S.W., 1987a. Upper Maestrichtian to middle Eocstratigraphy of the New Jersey slope and coastal plain. In van Hinte, J.E.,Wise, S.W., Jr., et al., Init. Repts. DSDP, 93 (Pt. 2): Washington (U.S.Govt. Printing Office), 1343−1365.
————, 1987b. Upper Paleocene to middle Eocene depositiosequences and hiatuses in the New Jersey Atlantic Margin. In Ross, C.,and Haman, D. (Eds.), Timing and Depositional History of EustaticSequences: Constraints on Seismic Stratigraphy. Spec. Publ. CushmanFound. Foraminiferal Res., 24:99−112.
Owens, J.P., 1970. Post-Triassic tectonic movements in the central and sern Appalachians as recorded by sediments of the Atlantic coastal p
SEA LEVEL, TECTONICS, AND SEDIMENT SUPPLY
an9er
e
n
),
yhla
.
l.,
s
n.
Ure
rw
lgliss
nd
lei-d
of
on
all,
eo-g
ag-e
on
sin
al
on-r-
the
I,hy
ry,
.
y,
o-
In Fisher, G.W., Pettijohn, F.J., and Reed, J.C., Jr. (Eds.), Studies of Appa-lachian Geology: Central and Southern: New York (Interscience), 417−427.
————, 1983. The northwestern Atlantic Ocean margin. In Moullade, M.and Nairn, A.E.M. (Eds.), The Phanerozoic Geology of the World, II: TheMesozoic: New York (Elsevier), 33−60.
Owens, J.P., Bybell, L.M., Paulachok, G., Ager, T.A., Gonzalez, V.M., Sugarman, P.J., 1988. Stratigraphy of the Tertiary sediments in a foot-deep core hole near Mays Landing in the southeastern New JCoastal Plain. Geol. Surv. Prof. Pap. U.S., 1484.
Owens, J.P., and Gohn, G.S., 1985. Depositional history of the Cretacseries in the U.S. coastal plain: stratigraphy, paleoenvironments, andtonic controls of sedimentation. In Poag, C.W. (Ed.), Geologic Evolutionof the United States Atlantic Margin: New York (Van Nostrand Rein-hold), 25−86.
Owens, J.P., Minard, J.P., and Sohl, N.F., 1968. Cretaceous deltas inorthern New Jersey coastal plain, Trip B. Guidebook to Field Excur-sions, 40th Ann. Meeting: Flushing, NY (New York State Geol. Assoc.33−48.
Owens, J.P., Minard, J.P., Sohl, N.F., and Mello, J.F., 1970. Stratigraphthe outcroppping post-Magothy Upper Cretaceous formations in soutNew Jersey and northern Delmarva Peninsula, Delaware and MaryGeol. Surv. Prof. Pap. U.S., 674.
Owens, J.P., Sohl, N.F., and Minard, J.P., 1977. A Field Guide to Cretaceousand Lower Tertiary Beds of the Raritan and Salisbury Embayments, NewJersey, Delaware, and Maryland: Washington, D.C. (AAPG-Soc. EconPaleontol. Mineral.).
Owens, J.P., Sugarman, P.J., Sohl, N.F., and Orndorff, R.C., 1995a. Geomap of New Jersey: Southern Sheet. Open-File Rep.—U.S. Geol. Surv95−254.
Owens, J.P., Sugarman, P.J., Sohl, N.F., Parker, R., Houghton, H.H., Volkert,R.V., Drake, A.A., and Orndorff, R.C., 1995b. Geologic map of New Jer-sey: Central Sheet. Open-File Rep.—U.S. Geol. Surv., 95−253.
Pazzaglia, F.J., 1993. Stratigraphy, petrography, and correlation of late Ceno-zoic middle Atlantic Coastal Plain deposits: implications for late-stagepassive-margin geologic evolution. Geol. Soc. Am. Bull., 105:1617−1634.
Pazzaglia, F.J., and Gardner, T.W., 1994. Late Cenozoic flexural deformationof the middle U. S. Atlantic passive margin. J. Geophys. Res., 99:12143−12157.
Pekar, S.F., and Miller, K.G., 1996. New Jersey Oligocene “Icehousequences (ODP Leg 150X) correlated with global δ18O and Exxoneustatic records. Geology, 24:567−570.
Pitman, W.C., III, and Golovchenko, X., 1983. The effect of sea level chaon the shelf edge and slope of passive margins. Spec. Publ.—Soc. EconPaleontol. Mineral., 33:41−58.
Poag, C.W., 1987. The New Jersey transect: stratigraphic framework anddepositional history of a sediment-rich passive margin. In Poag, C.W.,Watts, A.B., et al., Init. Repts. DSDP, 95: Washington (U.S. Govt. Print-ing Office), 763−817.
————, 1985. Depositional history and stratigraphic reference sectioncentral Baltimore Canyon trough. In Poag, C.W. (Ed.), Geologic Evolu-tion of the United States Atlantic Margin: New York (Van Nostrand Rein-hold), 217−263.
Poag, C.W., and Aubry, M.-P., 1995. Upper Eocene impactites of the East Coast: depositional origins, biostratigraphic framework, and cortion. Palaios, 10:16−43.
Poag, C.W., Powars, D.S., Poppe, L.J., and Mixon, R.B., 1994. Metemayhem in Ole Virginny: source of the North American tektite strefield. Geology, 22:691−694.
Poag, C.W., Powars, D.S., Poppe, L.J., Mixon, R.B., Edwards, L.E., FoD.W., and Bruce, S., 1992. Deep Sea Drilling Project Site 612 boevent: new evidence of a late Eocene impact-wave deposit and a poimpact site, U.S. east coast. Geology, 20:771−774.
Poag, C.W., and Sevon, W.D., 1989. A record of Appalachian denudatiopostrift Mesozoic and Cenozoic sedimentary deposits of the U.S. miAtlantic continental margin. Geomorphology, 2:119−157.
3UHYLRXV�&KDSWHU3UHYLRXV�&KDSWHU 7DEOH�RI�7DEOH�RI�&
d45-sey
oustec-
the
ofernnd.
ogic
e”
ge
for
.S.la-
oidn
er,deible
indle
Poag, C.W., and Ward, L.W., 1993. Allostratigraphy of the U.S. middAtlantic continental margin—characteristics, distribution, and depostional history of principal unconformity-bounded Upper Cretaceous anCenozoic sedimentary units. Geol. Surv. Prof. Pap. U.S., 1542.
Poag, C.W., Watts, A.B., et al., 1987. Init. Repts. DSDP, 95: Washington(U.S. Govt. Printing Office).
Poore, R.Z., and Bybell, L.M., 1988. Eocene to Miocene biostratigraphy New Jersey core ACGS #4: implications for regional stratigraphy. Geol.Surv. Prof. Pap. U.S., 1829.
Posamentier, H.W., Jervey, M.T., and Vail, P.R., 1988. Eustatic controls clastic deposition, I. Conceptual framework. In Wilgus, C.K., Hastings,B.S., Ross, C.A., Posamentier, H.W., Van Wagoner, J., and KendC.G.St.C. (Eds.), Sea-Level Changes: An Integrated Approach. Spec.Publ.—Soc. Econ. Paleontol. Mineral., 42:109−124.
Saint-Marc, P., 1987. Biostratigraphic and paleoenvironmental study of Palcene benthic and planktonic foraminifers, Site 605, Deep Sea DrillinProject Leg 93. In van Hinte, J.E., Wise, S.W., Jr., et al., Init. Repts. DSDP,93: Washington (U.S. Govt. Printing Office), 539−547.
Schlee, J.S., 1981. Seismic stratigraphy of Baltimore Canyon Trough. AAPGBull., 65:26−53.
Shackleton, N.J., and Opdyke, N.D., 1973. Oxygen isotope and paleomnetic stratigraphy of equatorial Pacific core V28-238: oxygen isotoptemperatures and ice volumes on a 105 year and 106 year scale. Quat.Res., 3:39−55.
Shackleton, N.J., Hall, M.A., and Boersma, A., 1984. Oxygen and carbisotope data from Leg 74 foraminifers. In Moore, T.C., Jr., Rabinowitz,P.D., et al., Init. Repts. DSDP, 74: Washington (U.S. Govt. PrintingOffice), 599−612.
Steckler, M.S., Watts, A.B., and Thorne, J.A., 1988. Subsidence and bamodeling at the U.S. Atlantic passive margin. In Sheridan, R.E., andGrow, J.A. (Eds.), The Geology of North America (Vol. 2): The AtlanticContinental Margin. Geol. Soc. Am., 399−416.
Sugarman, P.J., and Miller, K.G., 1997. Correlation of Miocene globsequences and hydrostratigraphic units, New Jersey coastal plain. Sedi-ment. Geol., 108:3–18.
Sugarman, P.J., Miller, K.G., Owens, J.P., and Feigenson, M.D., 1993. Strtium-isotope and sequence stratigraphy of the Miocene Kirkwood Fomation, southern New Jersey. Geol. Soc. Am. Bull., 105:423−436.
Tucholke, B.E., and Mountain, G.S., 1986. Tertiary paleoceanography of western North Atlantic Ocean. In Vogt, P.R., and Tucholke, (Eds.). TheWestern North Atlantic Region, Geol. Soc. Am., Geol. of North Am. Ser.,M:631−650
Vail, P.R., Mitchum, R.M., Jr., Todd, R.G., Widmier, J.M., Thompson, S., IISangree, J.B., Bubb, J.N., and Hatlelid, W.G., 1977. Seismic stratigrapand global changes in sea level. In Payton, C.E. (Ed.), Seismic Stratigra-phy: Applications to Hydrocarbon Exploration. AAPG Mem., 26:49−221.
van Hinte, J.E., Wise, S.W., Jr., et al., 1987. Init. Repts. DSDP, 93 (Pts. 1 and2): Washington (U.S. Govt. Printing Office).
Watts, A.B., 1981. The U.S. Atlantic continental margin: subsidence histocrustal structure and thermal evolution, In Bally, A.W., Watts, A.B.,Grow, J.A., Manspeizer, W., Bernoulli, D., Schreiber, C., and Hunt, J.M(Eds.), Geology of Passive Continental Margins, AAPG Short CourseNotes, 19:2/1−2/75.
Wright, J.D., and Miller, K.G., 1992. Miocene stable isotope stratigraphSite 747, Kerguelen Plateau. In Wise, S.W., Jr., Schlich, R., et al., Proc.ODP, Sci. Results, 120: College Station, TX (Ocean Drilling Program),855−866.
Zachos, J.C., Stott, L.D., and Lohmann, K.C., 1994. Evolution of early Cenzoic marine temperatures. Paleoceanography, 9:353−387.
Date of initial receipt: 30 September 1996Date of acceptance: 20 December 1996Ms 150XSR-326
373
&RQWHQWVRQWHQWV ,1'(;,1'(;