24 • Number: 3 • Year: 2021 - Turkish Journal of Geriatrics
158
A e-ISSN: 1307-9948 www.turkgeriatri.org The Official Scientific Journal of Turkish Geriatrics Society Volume: 24 • Number: 3 • Year: 2021 GERIATRICS Turkish Journal of
-
Upload
khangminh22 -
Category
Documents
-
view
3 -
download
0
Transcript of 24 • Number: 3 • Year: 2021 - Turkish Journal of Geriatrics

A
e-ISSN: 1307-9948
www.turkgeriatri.org
The Official Scientific Journal of Turkish Geriatrics Society
Volume: 24 • Number: 3 • Year: 2021
GERIATRICSTurkish Journal of


Vladimir ANISIMOV RUSSIAJean-Pierre BAEYENS BELGIUMYitshal BERNER ISRAELHarrison BLOOM USAC.J. BULPITT UKRobert N. BUTLER USARoger Mc CARTER USAMark CLARFIELD ISRAELCyrus COOPER UKGaetano CREPALDI ITALYMichael FARTHING UKMarvin FORMOSA MALTAGhada El-Hajj FULEIHAN LEBANONDavid GELLER USABarry J. GOLDLIST CANADAMelvin GREER USARenato M. GUIMARAES BRASILGloria M. GUTMAN CANADACarol HUNTER-WINOGRAD USAAlfenso JC JENTOFT SPAINVladimir KHAVINSON RUSSIAJohn KANIS UKTom KIRKWOOD UKJean-Pierre MICHEL SWITZERLANDJohn E. MORLEY USARobert MOULIAS FRANCEDesmond O’NEILL IRELANDSokrates PAPAPOULOS HOLLANDMirko PETROVIC BELGIUMRussel REITER USARene RIZZOLLI SWITZERLANDEgo SEEMAN AUSTRALIAWalter O. SEILER SWITZERLANDAlan SINCLAIR UKRaymond C. TALLIS UKAdele TOWERS USAGuy VANDERSTRATEN BELGIUMAlan WALKER UKKen WOODHOUSE UKArchie YOUNG UK
Published four times (March, June,September, December) a year
CORRESPONDANCETurkish Geriatrics Societywww.turkgeriatri.orginfo@[email protected]
Date of Publication: 30 June 2021
EDITOR-IN-CHIEFYeşim GÖKÇE KUTSAL
EDITORIAL BOARD Önder İLGİLİ Orhan YILMAZ Sercan ÖZYURT
Alfonso CRUZ-JENTOFT Peter FERRY Clemens TESCH-ROEMER
Volume: 24 • Issue: 3 • Year: 2021
e-ISSN: 1307-9948
www.turkgeriatri.org
The official scientific journal of TurkishGeriatrics Society
MemberofIAGG
OWNEROn Behalf of Turkish Geriatrics SocietyYeşim GÖKÇE KUTSAL
EDITORIAL MANAGEROrhan YILMAZ
TECHNICAL ASSISTANCEErkam EVLİCE
Turkish Journal of Geriatrics is indexed in: Thomson Reuters Science Citation Index Expanded (SCI-Exp) and Social Sciences Citation Index (SSCI) since 2008.And also in Scientific and Technological Research Council of Turkey (TÜBİTAK), Turkish Academic Network and Information Center (ULAKBİM) regional TR index (TR dizin) since 1998.
INTERNATIONAL ADVISORY BOARD

TURKISH JOURNAL OF GERIATRICS
INFORMATION TO AUTHORShttp://www.geriatri.dergisi.org/static.php?id=7
TURKISH JOURNAL OF GERIATRICS
PUBLICATION POLICYTurkish Journal of Geriatrics is a peer-reviewed journal and is devoted to high standards of scientific rules and publication ethics. The Editors of the Journal accept to follow ‘Editorial Policy’ of the ‘Council of Sci-ence Editors’ ( www.councilscienceeditors.org/).
Any article published in the journal is also published in electronic format and is shown at http://www.turkger-iatri.org or http://www.geriatri.dergisi.org/
Instructions for authors are based on the report of International Committee of Medical Journal Editors (Last Version)- (Uniform Requirements for manuscripts Submitted to Biomedical Journals, www.icmje.org).
Editor in Chief: Prof. Yesim GOKCE-KUTSAL, MD
Owner: Turkish Geriatrics Society www.turkgeriatri.org
INSTRUCTIONS FOR AUTHORS Turkish Journal of Geriatrics is the official publication of Turkish Geriatrics Society and is published four times a year. Articles published in the journal are shown at http://www.turkgeriatri.org & http://www.geriatri.dergisi.org
Turkish Journal of Geriatrics is a peer-reviewed journal and is devoted to high standards of scientific rules and publication ethics. The Editorial Board Members of the Journal accept to follow ‘Editorial Policy’ of the ‘Council of Science Editors’ ( www.councilscienceeditors.org/) and the guidelines provided by the Com-mittee on Publication Ethics (COPE), the World Association of Medical Editors (WAME), the International Committee of Medical Journal Editors (ICMJE) for dealing with scientific misconduct, such as falsification of data, plagiarism, improprieties of authorship, violation of generally accepted research practices and redun-dant publication and duplicate publication.
Instructions for authors are based on the report of International Committee of Medical Journal Editors (Uni-form Requirements for manuscripts Submitted to Biomedical Journals, www.icmje.org).
Manuscripts must be original and not under consideration by another publication at the time of submission. The authors must ensure that they have read and understood the details noted in the publication policy of our journal. Failure to comply can lead to delays in the processing of the manuscript, or even rejection.
INSTRUCTIONS FOR AUTHORS
Official language of the journal is English. Turkish Journal of Geriatrics invites submission of Original Arti-cles based on clinical and laboratory studies. Review Articles are published only after the invitation from the Editorial Board.
Manuscripts and the necessary documents should be submitted online at: Online Manuscript Submis-sion.Authors are advised to keep a copy of their papers for reference. It is the responsibility of all authors to agree on the content of their paper before submission.
ii

TURKISH JOURNAL OF GERIATRICS
As recommended by TUBİTAK ULAKBIM, the authors should get their ORCID (Open Researcher and Con-tributor ID) numbers from the web address free of charge: http://orcid.orgPreparation of Manuscript Papers must be written in English. Authors should have their papers checked for linguistic accuracy by a native English speaker. For the language editing of the article and to get the “Formal Certificate of Lan-guage Control and Correction”, contact to the below addresses:
EDITAGE https://www.editage.com, WILEY https://www.wiley.com/en-tr, SCRIBENDI https://www.scribendi.com, AMERICAN JOURNAL EXPERTS http://www.journalexperts.com
The corrected manuscript should be sent to the journal after it has received the “formal certificate of language control and correction” – this certificate should be uploaded to journal on line system with the manuscript.
Articles published in the Turkish Journal of Geriatrics should be prepared in ethical rules. The ethical re-sponsibilities of the articles belong to the authors. For all the studies both conducted on human beings and animals as well as drug research, ethical committee approval should be taken and a signed copy of “Ethical Committee Approval” should be uploaded to the journal system.
The manuscripts will not be published without a copy of the “ethical committee approval” document. For all the studies conducted on human beings “Informed Consent” of all the participants of the study should be taken.
Authors should obey the rules in “Helsinki Declaration”, “Good Medical Practice Guidelines”, and “Good Laboratories Practice Guidelines”.Names of the patients, protocol numbers, etc which identify participants’ identities should not be used in the manuscript. If the editorial board finds necessary, the admitted articles will be reviewed not only by the scientific advisors, but by the ethical advisors of the journal as well. Authors submitting an article must accept this situation.
All of the articles submitted to the Turkish Journal of Geriatrics should fit to the “Information of authors” details. The assessment process will not start until this step is completed.
Via online submission 1) English Title, 2) Names, Surnames and Titles of the authors, 3) Institutions, 4) Pres-ent communication details should be loaded to the system. Original articles and Invited Reviews should be between 1500-3500 words (excluding Abstract). When a manuscript is submitted, authors must provide a word count for both the abstract and the text. Editors can request that authors shorten their papers further.
The text of observational and experimental articles should be divided into sections with the headings Intro-duction, Materials and Method, Results, and Discussion. Long articles may need subheadings within some sections (especially the Results and Discussion sections) to clarify their content. Invited reviews and editorials are likely to take their own relevant main headings.
Abstract. A structured abstract of not more than 250 words in English should be structured, including Intro-duction, Materials and Method, Results, and Conclusion. New and important observations or aspects of the study should be emphasized. Abstracts of the review articles should be a brief overview of the main points from the review. Abstracts should reflect the whole manuscript and the consistency between the text. No abbreviations should be used in this section.
Keywords. Up to six keywords should be provided that might be used by researchers searching biblio-graphic databases for the paper. The authors have to use terms from the Medical Subjects Headings list from Index Medicus.( www.nlm.nih.gov/mesh/MBrowser.html)
iii

Introduction. Acquaint the readers with the problem and with the findings of others. Quote the most perti-nent papers and state clearly the nature and purpose of the work.
Materials and Method. Your clinical, technical or experimental procedures should be clearly explained. Previously published papers related to methods should be cited. Ethical approval of the study should be mentioned here.
Results. Findings must be described without comment. A concise textual description of the data presented in tables, chats and figures should also be included.
Discussion. Comment on your findings and relate them to those from other authors. You should define their relevance to experimental research or clinical practice.
References. The author is responsible for the accuracy of the references. Citations in the text should be identified by numbers in standart brackets. The list of the references at the end of the paper should be given according to their first appearance in the text. Journal abbreviations should be used as listed in Index Medi-cus.
1-Articles from journals (with PMID numbers):Cruz Jentoft AJ, Sayer AA. Sarcopenia. Lancet 2019;393 (10191): 2636-46. (PMID: 31171417)
2-Articles from journals (without PMID numbers):Piers R, Albers G, Gilissen J, et al. Advance care planning in dementia: recommendations for healthcare professionals. BMC Palliative Care 2018;17(88):1-17.(DOI:10.1186/s12904-018-0332-2).
3-Articles in Turkish:Ozturk S. Clinical and Nuropathological Classification of Dementia. Turkish Journal of Geriatrics 2010; 13 (Suppl 3):15-19. (in Turkish)
Give PMID or DOI numbers if possible.
4-More than 6 authors will be mentioned with the three authors’ names:Groessl EJ, Kaplan RM, Rejeski WJ et al. Physical Activity and Performance Impact Long-term Quality of Life in Older Adults at Risk for Major Mobility Disability. Am J Prev Med 2019; 56 (1): 141-146. (PMID: 30573142).
5-Books:BG Katzung. Special Aspects of Geriatric Pharmacology, In:Bertram G. Katzung,Susan B. Masters, Anthony J. Trevor (Eds). Basic and Clinical Pharmacology. 10th edition, Lange, Mc Graw Hill, USA 2007, pp 983-90.
6-Articles or documents from electronic publications:World Health Organization. Global Health and Aging [e-book] NIH Publication; 2011. [Internet]. Available from: http://www.who.int/ageing/publications/ global_health.pdf. Accessed: 09.09.2019.
Access date, DOI or ID numbers of the articles should be mentioned. The UPDATED reference should be available in the referred web address.
Tables. Tables should be supplement not duplicate the text. Each table should be typed (double spaced) on a separate sheet and numbered consecutively with arabic numerals. Place explanatory matters in footnotes. Footnotes to tables should be indicated by lower-case superscript letters. Each table must be cited in text in consecutive order.
Illustrations. Illustrations should be limited to those essential for the text. The same results should be pre-sented as either graphs or tables not as both. All figures, whether photographs, graphs, or diagrams, should be numbered consecutively and shown in the text. The publisher reserves the right to reduce or enlarge
TURKISH JOURNAL OF GERIATRICS
iv
illustrations. Arrows, letters, and numbers should be inserted professionally.
Graphs, figures, and illustrations should be placed in the main text. And also separate files should be pre-pared for graphs, figures, and illustrations (each one on a separate file),
The authors should supply the electronic files for all figures and illustrations including photographs as gif or jpeg images with a minimum resolution of 600 dpi.
Micrographs should have an internal magnification marker; the magnification should also be stated in the caption. Legends must be brief, self-sufficient explanations of the illustrations in no more than four or five lines. Remarks such as “For explanation, see text” should be avoided. The legends should also be typed at the end of the text.
Screening resolution. The image should be at least 600 dpi resolution. For the web site resolution, 300 dpi is acceptable.
Measurements. Metric system should be used for all types of measurements.
Abbreviations and Symbols. Only standard abbreviations should be used in the main text. In the first use, long version of the abbreviation should be written. Abbreviations and Symbols should not be used in ab-stract and title sections.
Acknowledgement. Authors can thank to the persons, institutions, etc in this section.
Conflict of Interest. The authors should state whether there is a conflict of interest or not.
Review Articles. The journal is open only for “Invited Reviews”.
Besides their article, there are 5 important documents that the authors should send:
I- For all the articles Application Fee Receipt II- For all the studies signed copy of “Ethical Committee Approval Document” (including all the names
of the authors) (For all the studies conducted on human beings, “informed consent” of the partici-pants should be taken).
III- “Copyright Transfer Form” with all of the authors’ signatures,
IV- ”Author Contribution Form” with all of the authors’ signatures,
V- Copy of “Certificate of Language Control and Correction”.The manuscript cannot be sent out for review if the submissions are received without these 5 documents. These documents should be uploaded in related sections of the online system.
Attention ! Last Control Before Submission (Checklist for Submitted Articles)All of the articles submitted to the Turkish Journal of Geriatrics should fit to the “information of authors’ details in the below address:
http://geriatri.dergisi.org/static.php?id=7
The review process will not start until all the below steps are completed.
1-Letter of submission written for the chief editor.
2-E-mail address as well as postal address, official telephone number of the corresponding author.
3-Affiliations (in English) and ORCID numbers (http://orcid.org) of all the authors.
4-For the language editing of your article and to get the “Certificate of Language Control and Correction”, you can contact to:
EDITAGE https://www.editage.com, WILEY https://www.wiley.com/en-tr, SCRIBENDI https://www.
TURKISH JOURNAL OF GERIATRICS
v

scribendi.com, AMERICAN JOURNAL EXPERTS http://www.journalexperts.com
5-English heading.
6-English “structured” abstract (250 words at maximum).
7-Keywords in accordance with Medical Subjects Headings-MeSH List (up to 6 words) (https://meshb.nlm.nih.gov/search)
8-Article divided into appropriate sections.
9-All figures (with subtitles) and tables (with titles) cited (should be 5 at maximum)
10-Complete and accurate references (references should be 25 at maximum with the PMID numbers) written according to the rules and of the journal (http://geriatri.dergisi.org/static.php?id=7).
11-Original articles should not exceed 3500 words (excluding abstract).
In order to start the evaluation process, the below 5 documents should be sent through the online system for all the articles:
I- For all the articles Application Fee Receipt II- For all the studies signed copy of “Ethical Committee Approval Document” (including all the names
of the authors) (For all the studies conducted on human beings, “informed consent” of the partici-pants should be taken).
III- “Copyright Transfer Form” with all of the authors’ signatures,
IV- ”Author Contribution Form” with all of the authors’ signatures,
V- Copy of “Certificate of Language Control and Correction”.
TURKISH JOURNAL OF GERIATRICS
vi

viiwww.turkgeriatri.org
CONTENTS
Volume: 24 • Issue: 3 • Year: 2021
From the Editor in Chief ix Yeşim GÖKÇE KUTSAL
RESEARCH ARTICLES
Acute Coronary Syndrome in Geriatric Patients in an Intensive Care Unit 297Suzan KESKİN, Arzu Neslihan AKGÜN, Orçun ÇİFTÇİ, İbrahim Haldun MÜDERRISOĞLU
The Effects of Renal Insufficiency and Age on Mortality in Geriatric Patients with Non-ST-Segment Elevation Myocardial Infarction 303Pınar Demir GÜNDOĞMUŞ, Emrah AKSAKAL, Oğuzhan BİRDAL, İbrahim Halil TANBOĞA
The Effect of Obesity on Mortality in Geriatric Patients Followed in The İntensive Care Unit 315Gülsüm Oya HERGÜNSEL, Mehmet Süleyman SABAZ
The Effect of CIVID-19 Pandemic on Sarcopenia, Quality of Life and Pain: A One-Year Follow-Up Study 330Fulya BAKILAN, Merih ÖZGEN, Burcu ORTANCA, Onur ARMAĞAN, Ayşe EKİM, Funda Taşçıoğlu BERKAN, Fezan Şahin MUTLU
Evaluation of the Factors Prolonging the Discharge Home of Patients in a Palliative Care Center 342Gülten UTEBEY, Julide ERGİL
Myocardial Injury After Noncardiac Surgery in Geriatric Patients 351Döndü Genç MORALAR, Bedih BALKAN
Do Shock Index, Modified Shock Index, and Shock Index by Age Have a Predictive Value In Determining the Risk of Post-Spinal Hypotension in Elderly Patients? 359Gözde EROL, İsmail AYTAÇ, Betül GÜVEN AYTAÇ
Relationship Between the Prognostic Nutritional Index and All-Cause Mortality in Elderly Patients With Non-St Segment Elevation Myocardial Infarction 370Özge Çakmak KARAASLAN, Cem ÇÖTELİ, Hasan Can KÖNTE, Murat Oğuz ÖZİLHAN, Orhan MADEN
Sleep Quality in Patients Over 65 Years of Age in the Covid-19 Pandemic 381Ayşe KARAOĞULLARINDAN, Orhan GÖRGÜLÜ, Gökhan KURAN, Sanem Okşan ERKAN, Birgül TUHANİOĞLU
Valuation of the Relationship Between the End of Life Hospitalization Needs And Early Presenting to Palliative Care 391Ufuk ÜNLÜ, Nagihan YILDIZ ÇELTEK
Depression and Anxiety Levels in a Group of Elderly With Temporomandibular Disorders 397Ahmet Taylan ÇEBİ, Nihat YILMAZ, Fatih KARAYÜREK, Aydın GÜLSES
Relationships Between Parkinson’s Disease Dementia and 25-Hydroxy Vitamin D and Brain-Derived Neurotrophic Factor Levels 407Tuba EKMEKYAPAR, Yusuf TÜRKÖZ, Zeynep ERDEMLİ, Yasemin DEMİRTAŞ, Sibel ALTINAYAR

Using the Rotterdam CT Score to Predict Outcomes of Head İnjuries in the Geriatric Population 416Pınar Aydın ÖZTÜRK, Ünal ÖZTÜRK
Relationship of Daily Time Spent Outdoors With Sleep Quality and Emotional Well-Being Among Community-Dwelling Older Adults During Covid-19 Restrictions 424Kenan Eren ŞANSAL, Leyla Ataş BALCI, Fadime ÇINAR, Dilber KARAGÖZOĞLU ÇOŞKUNSU, Sezin Hatice TANRIÖVER, Mehmet Bengü ULUENGİN
Sexual Attitude Scale for Elderly People: A Reliability and Validity Study in Turkey 433Melisa EBEOĞLU, Rukiye KIZILTEPE, Nilgül Banu ÇENGELCİ ÖZEKES

Health problems that come to the fore in the older age group continue to attract attention not only in terms of mortality and morbidity, but also in terms of their social, psychological and economic dimensions as well. Unfortunately, these problems were often ignored during the pandem-ic process, and Covid-19 was kept at the forefront by the physicians, health professionals, the elderly and elderly relatives and caregivers in our country, as in the whole World. This situation has led to serious problems both in the control of chronic diseases and in the notification of newly emerging semptoms. As we have strongly emphasized in all our training activities raising awareness of the health professionals both in the therapeutic and preventive medicine area is quite important.I would like to thank our authors, scientific referees and editorial board of the journal and the technical team who enthusiastically continue
their work despite adverse conditions during the pandemic.
Yeşim Gökçe Kutsal
ix
FROM THE EDITOR IN CHIEF
www.turkgeriatri.org

x
297
Turkish Journal of Geriatrics
DOI: ....
2020; 23(): ...-...
CORRESPONDANCE
1 E
RESEARCH
Phone: +90
e-mail:
Received:
Accepted:
Turkish Journal of GeriatricsDOI: 10.31086/tjgeri.2021.2272021; 24(3): 297-302
CORRESPONDANCE
1 Başkent University Ankara Education and Training Hospital, Cardiology, Ankara, Turkey
ACUTE CORONARY SYNDROME IN GERIATRIC PATIENTS IN AN INTENSIVE CARE UNIT
RESEARCH
Suzan KESKİN1 . . . . . . . . . . . . . . .
Arzu Neslihan AKGÜN1 . . . . . . . . .
Orçun ÇİFTÇİ1 . . . . . . . . . . . . . . . .
İbrahim Haldun MÜDERRISOĞLU1
1 Suzan KESKİN
Başkent University Ankara Education and Training Hospital, Cardiology, Ankara, Turkey
Phone: +905399502736e-mail: [email protected]
Received: May 25, 2021 Accepted: Aug 30, 2021
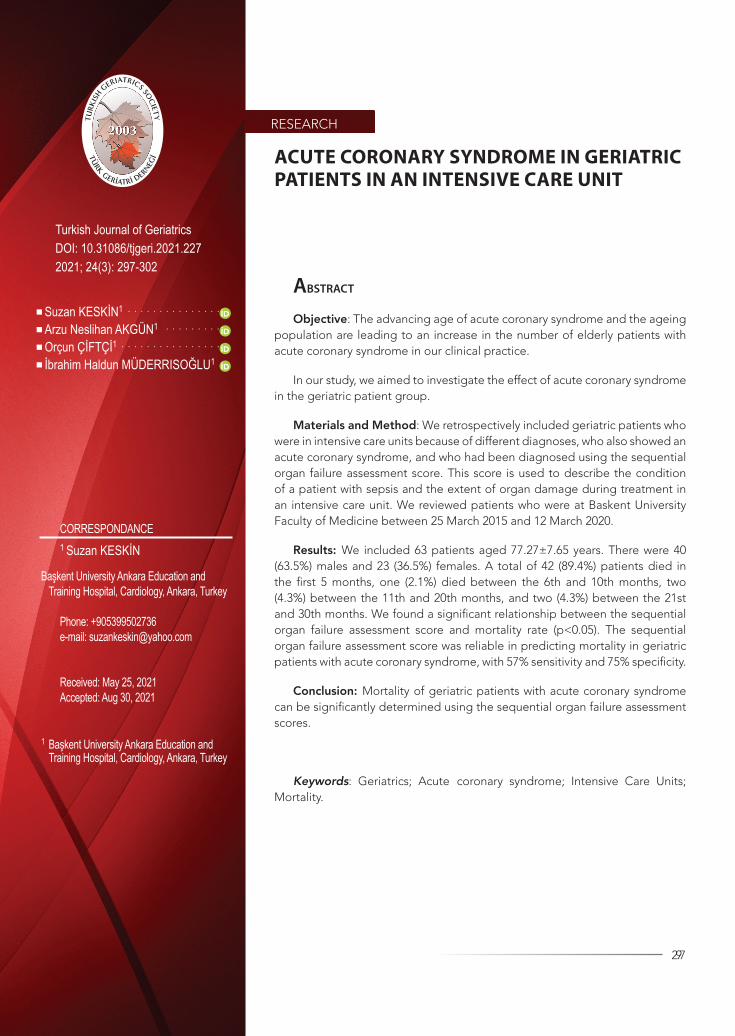
Objective: The advancing age of acute coronary syndrome and the ageing population are leading to an increase in the number of elderly patients with acute coronary syndrome in our clinical practice.
In our study, we aimed to investigate the effect of acute coronary syndrome in the geriatric patient group.
Materials and Method: We retrospectively included geriatric patients who were in intensive care units because of different diagnoses, who also showed an acute coronary syndrome, and who had been diagnosed using the sequential organ failure assessment score. This score is used to describe the condition of a patient with sepsis and the extent of organ damage during treatment in an intensive care unit. We reviewed patients who were at Baskent University Faculty of Medicine between 25 March 2015 and 12 March 2020.
Results: We included 63 patients aged 77.27±7.65 years. There were 40 (63.5%) males and 23 (36.5%) females. A total of 42 (89.4%) patients died in the first 5 months, one (2.1%) died between the 6th and 10th months, two (4.3%) between the 11th and 20th months, and two (4.3%) between the 21st and 30th months. We found a significant relationship between the sequential organ failure assessment score and mortality rate (p<0.05). The sequential organ failure assessment score was reliable in predicting mortality in geriatric patients with acute coronary syndrome, with 57% sensitivity and 75% specificity.
Conclusion: Mortality of geriatric patients with acute coronary syndrome can be significantly determined using the sequential organ failure assessment scores.
Keywords: Geriatrics; Acute coronary syndrome; Intensive Care Units; Mortality.
ABSTRACT

2021; 24(3): 297-302
298
INTRODUCTIONA simple but effective method for describing organ dysfunction or organ failure in critically ill patients is the sequential organ failure assessment (SOFA) score. The SOFA score was designed to provide insights into the acute morbidity of intensive care patients at the population level, but its use has ex-panded considerably in recent years. The SOFA score is now used at the individual patient level as a key criterion for diagnosing sepsis syndrome (1-4). Due to good medical treatment, the age of the population is increasing, which implies that acute coronary syndrome is now more common in geriat-ric patients (5).
Despite improvements in patient care and ad-vanced treatment modalities, mortality remains a significant problem in geriatric patients. Elderly pa-tients have a high risk of bleeding (6,7) and ischemic complications (8), among other conditions. For this reason, careful risk stratification for ischemic risk and bleeding risk must be carried out, taking into account the assessment of frailty, quality of life, care goals, and individual preferences (9). With the help of the SOFA score, we aimed to identify the surviv-al of elderly patients with acute coronary syndrome who were treated in the intensive care unit of our clinic.
MATERIALS AND METHODWe retrospectively included geriatric patients who were in the intensive care unit because of different diagnoses and who also showed an acute coronary syndrome at Baskent University Faculty of Medicine between 25 March 2015 and 12 March 2020.
We analysed the demographic, clinical and bi-ochemical data of these patients. We also applied the SOFA score to the patients. The sequential or-gan failure assessment score (SOFA score) is used to monitor a person’s condition or failure rate to de-termine the extent of organ function during a per-son’s stay in the intensive care unit (ICU). The score
is based on six different scores, each for the res-piratory, cardiovascular, liver, coagulation, kidney, and neurological systems. The SOFA score helps healthcare providers estimate the risk of morbidity and mortality from sepsis.
Statistics
We examined various demographic and clinical factors, including age, sex, age, coronary artery dis-ease, hyperlipidaemia, diabetes, hypertension, and this was followed by a ROC curve and Fisher’s Exact Test analysis to determine the independent predic-tors of mortality.
This study was approved by Baskent University Institutional Review Board (Project no: KA21/23) and supported by Baskent University Research Fund.
RESULTS
We included 63 patients aged 77.27±7.65 years. There were 40 (63.5%) males and 23 (36.5%) fe-males. The demographic and clinical properties of the study population are presented in Table 1. A to-tal of 47 (75.0%) patients died at a mean follow-up duration of 3.0+7.0 (range 0–30) months. Thirty-two (68.1%) of these patients died in the hospital, while 15 (31.9%) died outside the hospital.
In the first 5 months, 42 (89.4%) patients died, whereas one (2.1%) patient died in the 6th to 10th month (2.1%), two (4.3%) between the 11th and 20th month, and two (4.3%) between the 21th and 30th months.
The cut-off value was determined as 6.5 in the diagnosis of individuals with low and high SOFA. Based on this, we examined patients in two groups (SOFA low and SOFA high). For the cut-off value of SOFA of 6.5, the sensitivity value was 0.76.
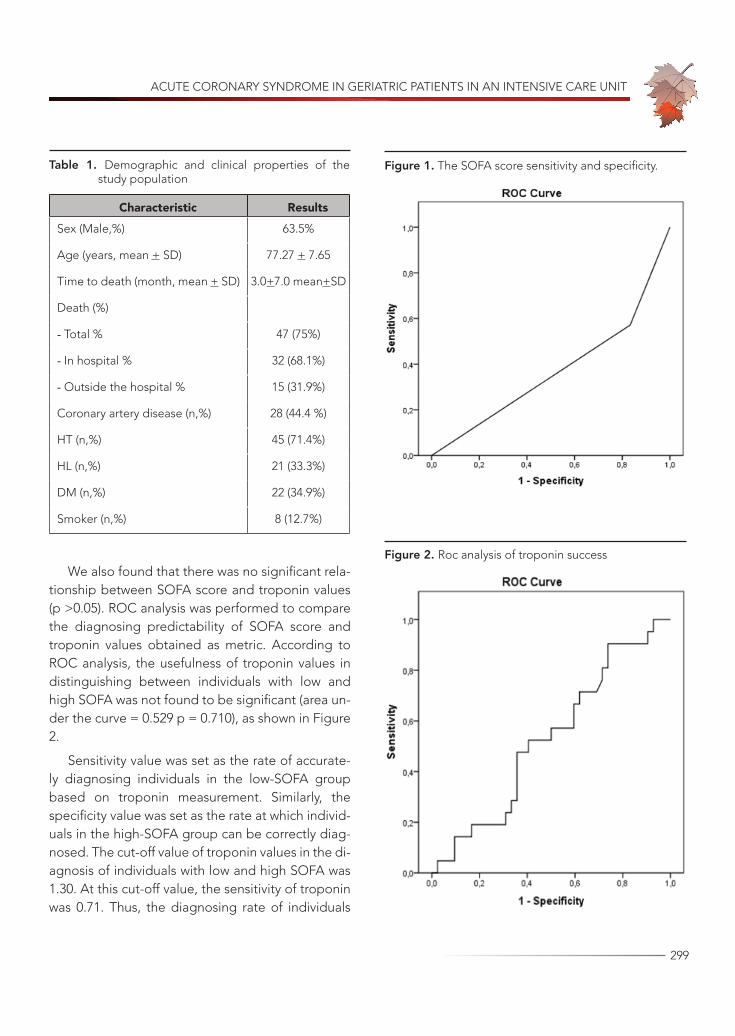
In our study, we found a significant relationship between SOFA score and mortality rate (p <0.05). The SOFA score was reliable for predicting mortality in geriatric patients with acute coronary syndrome, with 57% sensitivity and 75% specificity.
ACUTE CORONARY SYNDROME IN GERIATRIC PATIENTS IN AN INTENSIVE CARE UNIT
299
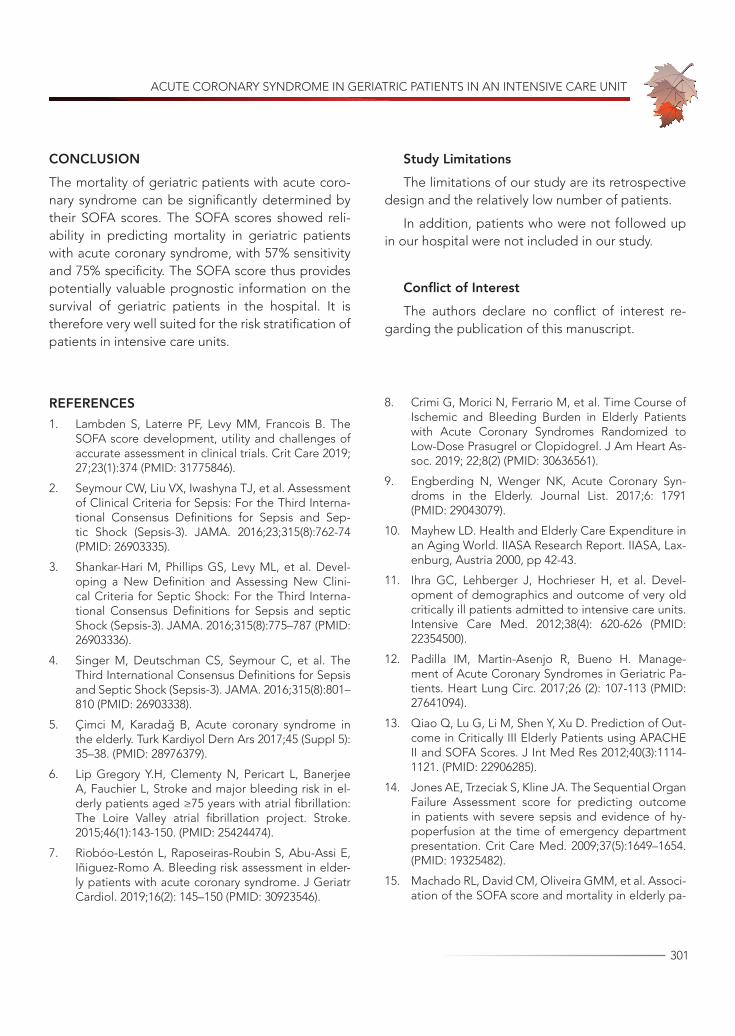
We also found that there was no significant rela-tionship between SOFA score and troponin values (p >0.05). ROC analysis was performed to compare the diagnosing predictability of SOFA score and troponin values obtained as metric. According to ROC analysis, the usefulness of troponin values in distinguishing between individuals with low and high SOFA was not found to be significant (area un-der the curve = 0.529 p = 0.710), as shown in Figure 2.
Sensitivity value was set as the rate of accurate-ly diagnosing individuals in the low-SOFA group based on troponin measurement. Similarly, the specificity value was set as the rate at which individ-uals in the high-SOFA group can be correctly diag-nosed. The cut-off value of troponin values in the di-agnosis of individuals with low and high SOFA was 1.30. At this cut-off value, the sensitivity of troponin was 0.71. Thus, the diagnosing rate of individuals
Table 1. Demographic and clinical properties of the study population
Characteristic ResultsSex (Male,%) 63.5%
Age (years, mean + SD) 77.27 + 7.65
Time to death (month, mean + SD) 3.0+7.0 mean+SD
Death (%)
- Total % 47 (75%)
- In hospital % 32 (68.1%)
- Outside the hospital % 15 (31.9%)
Coronary artery disease (n,%) 28 (44.4 %)
HT (n,%) 45 (71.4%)
HL (n,%) 21 (33.3%)
DM (n,%) 22 (34.9%)
Smoker (n,%) 8 (12.7%)
Figure 1. The SOFA score sensitivity and specificity.
Figure 2. Roc analysis of troponin success

2021; 24(3): 297-302
300
whose troponin measurement was lower than 1.30 was 71%.
Further, we found no significant relationship be-tween SOFA scores and CK-MB values (p >0.05). In this case, the sensitivity value was set as the rate of correctly diagnosing individuals in the low-SO-FA based on CK-MB measurement. The specificity value was set as the rate at which individuals in the high-SOFA group could be correctly diagnosed. The cut-off value of CK-MB values was determined as 2.45 in the diagnosis of individuals with low and high SOFA. At this cut-off value, the sensitivity of CK-MB was 0.71. This indicates that the rate of di-agnosing individuals whose CKMB value was lower than 2.45, who were diagnosed as SOFA-low, was 71%.
DISCUSSIONGeriatrics refers to the medical care of older adults, who are patients older than 65 years and have chronic illnesses, physical impairments and/or cog-nitive impairments. With the high quality of current medical treatment, the mean age of geriatric pa-tients has increased, with concurrent increases in the age of patients with acute coronary syndrome. For this reason, the treatment of very old patients has steadily increased (10,11) and has become com-mon practice.
Due to changes and the physiology of ageing, comorbidities, and expectations increase in the el-derly. Geriatric patients must be assessed individu-ally, as there can be significant differences between their chronological and biological ages (12). In this context, the SOFA score can be used to assess life expectancy. A simple but effective method for de-scribing organ dysfunction or organ defects for crit-ically ill patients (13).
In our study, we found a significant relationship between SOFA score and mortality rate (p <0.05). The SOFA score showed that it is reliable for pre-dicting mortality in geriatric patients with acute
coronary syndrome, with 57% sensitivity and 75% specificity.
Jones et al. (14) also showed that the SOFA score provides valuable prognostic information on survival in hospital. Machado et al. (15) showed that a mean SOFA average above 5 was associated with mortality in elderly patients with severe sepsis and septic shock. Janssens et al. (16) showed that SOFA scores provide important information on the de-gree and progression of organ dysfunction in medi-cal and cardiovascular patients.
ACS refers to a range of acute ischemic myo-cardial conditions. It includes unstable angina and myocardial infarction with or without ST segment elevation. ACS can lead to an increase in cardiac en-zymes (17), with an increase in the values of troponin and CK-MB. As part of our study, we carefully ex-amined the relationship between the troponin value and SOFA score and between the CK-MB value and SOFA score. We found that there was no significant relationship between SOFA score and troponin val-ues or CK-MB values (p > 0.05).
However, Mannam et al. (18) showed that the mortality in troponin-positive septic patients was significantly higher (45.4% versus 7.7%, p <0.04). Kang et al. (19) showed that elevated troponin lev-els were significantly associated with short-term and long-term mortality in patients with end-stage kidney disease with sepsis. For this reason, elevat-ed troponin levels should be carefully considered and monitored for undesirable results. Oliveira et al. (20) showed that the severity of septic disease was the only variable that was significantly associat-ed with death. Mehta et al. (21) showed that cardi-ac troponin is an independent predictor of hospital mortality.
Nevertheless, a skilful clinical assessment re-mains essential in every patient with suspected ACS and is particularly important in elderly patients who present with specific diagnostic challenges that need to be systematically considered.
ACUTE CORONARY SYNDROME IN GERIATRIC PATIENTS IN AN INTENSIVE CARE UNIT
301
CONCLUSIONThe mortality of geriatric patients with acute coro-nary syndrome can be significantly determined by their SOFA scores. The SOFA scores showed reli-ability in predicting mortality in geriatric patients with acute coronary syndrome, with 57% sensitivity and 75% specificity. The SOFA score thus provides potentially valuable prognostic information on the survival of geriatric patients in the hospital. It is therefore very well suited for the risk stratification of patients in intensive care units.
Study LimitationsThe limitations of our study are its retrospective
design and the relatively low number of patients.
In addition, patients who were not followed up in our hospital were not included in our study.
Conflict of Interest The authors declare no conflict of interest re-
garding the publication of this manuscript.
REFERENCES1. Lambden S, Laterre PF, Levy MM, Francois B. The
SOFA score development, utility and challenges of accurate assessment in clinical trials. Crit Care 2019; 27;23(1):374 (PMID: 31775846).
2. Seymour CW, Liu VX, Iwashyna TJ, et al. Assessment of Clinical Criteria for Sepsis: For the Third Interna-tional Consensus Definitions for Sepsis and Sep-tic Shock (Sepsis-3). JAMA. 2016;23;315(8):762-74 (PMID: 26903335).
3. Shankar-Hari M, Phillips GS, Levy ML, et al. Devel-oping a New Definition and Assessing New Clini-cal Criteria for Septic Shock: For the Third Interna-tional Consensus Definitions for Sepsis and septic Shock (Sepsis-3). JAMA. 2016;315(8):775–787 (PMID: 26903336).
4. Singer M, Deutschman CS, Seymour C, et al. The Third International Consensus Definitions for Sepsis and Septic Shock (Sepsis-3). JAMA. 2016;315(8):801–810 (PMID: 26903338).
5. Çimci M, Karadağ B, Acute coronary syndrome in the elderly. Turk Kardiyol Dern Ars 2017;45 (Suppl 5): 35–38. (PMID: 28976379).
6. Lip Gregory Y.H, Clementy N, Pericart L, Banerjee A, Fauchier L, Stroke and major bleeding risk in el-derly patients aged ≥75 years with atrial fibrillation: The Loire Valley atrial fibrillation project. Stroke. 2015;46(1):143-150. (PMID: 25424474).
7. Riobóo-Lestón L, Raposeiras-Roubin S, Abu-Assi E, Iñiguez-Romo A. Bleeding risk assessment in elder-ly patients with acute coronary syndrome. J Geriatr Cardiol. 2019;16(2): 145–150 (PMID: 30923546).
8. Crimi G, Morici N, Ferrario M, et al. Time Course of Ischemic and Bleeding Burden in Elderly Patients with Acute Coronary Syndromes Randomized to Low-Dose Prasugrel or Clopidogrel. J Am Heart As-soc. 2019; 22;8(2) (PMID: 30636561).
9. Engberding N, Wenger NK, Acute Coronary Syn-droms in the Elderly. Journal List. 2017;6: 1791 (PMID: 29043079).
10. Mayhew LD. Health and Elderly Care Expenditure in an Aging World. IIASA Research Report. IIASA, Lax-enburg, Austria 2000, pp 42-43.
11. Ihra GC, Lehberger J, Hochrieser H, et al. Devel-opment of demographics and outcome of very old critically ill patients admitted to intensive care units. Intensive Care Med. 2012;38(4): 620-626 (PMID: 22354500).
12. Padilla IM, Martin-Asenjo R, Bueno H. Manage-ment of Acute Coronary Syndromes in Geriatric Pa-tients. Heart Lung Circ. 2017;26 (2): 107-113 (PMID: 27641094).
13. Qiao Q, Lu G, Li M, Shen Y, Xu D. Prediction of Out-come in Critically III Elderly Patients using APACHE II and SOFA Scores. J Int Med Res 2012;40(3):1114-1121. (PMID: 22906285).
14. Jones AE, Trzeciak S, Kline JA. The Sequential Organ Failure Assessment score for predicting outcome in patients with severe sepsis and evidence of hy-poperfusion at the time of emergency department presentation. Crit Care Med. 2009;37(5):1649–1654. (PMID: 19325482).
15. Machado RL, David CM, Oliveira GMM, et al. Associ-ation of the SOFA score and mortality in elderly pa-

2021; 24(3): 297-302
302
tients with severe sepsis and septic shock. Crit Care. 2005;9(Suppl 2): P49. (DOI:10.1186/cc3593).
16. Janssens U, Graf C, Graf J, et al. Evaluation of the SOFA score: a single-center experience of a medical intensive care unit in 303 consecutive patients with predominantly cardiovascular disorders. Sequen-tial Organ Failure Assessment. Intensive Care Med. 2000;26(8):1037-1045. (PMID: 11030159).
17. James SK, Armstrong P, Barnathan E, et al. and GUS-TO-IV-ACS-Investigators. Troponin and C-reactive protein have different relations to subsequent mor-tality and myocardial infarction after acute coronary syndrome: A GUSTO-IV substudy. J Am Coll Cardiol. 2003;41(6) 916–924 (PMID: 12651034).
18. Mannam P, Devarakonda VS, Wittbrodt ET, et al. As-sociation of troponin I concentrations with outcomes
in sepsis. CHEST Journal. 2004; 86(5S): 126. Poster presentations. (DOI:10.1378/chest.126.4_Meeting-Abstracts.865S).
19. Kang EW, Na HJ, Hong SM, et al. Prognostic value of elevated cardiac troponin I in ESRD patients with sepsis Nephrol. Dial. Transplant 2009; 24 (5):1568-1573 (PMID: 19145004).
20. Oliveira NS, Silva VR, Castelo JS, et al. Serum level of cardiac troponin I in pediatric patients with sepsis or septic shock. Pediatr Crit Care Med. 2008; 9(4): 414-417 (PMID: 18843251).
21. Mehta NJ, Khan IA, Gupta V, et al. Cardiac troponin I predicts myocardial dysfunction and adverse out-come in septic shock. Int. J. Cardiol 2004; 95(1): 13-17(PMID: 15159032).

303
Turkish Journal of Geriatrics
DOI: ....
2020; 23(): ...-...
CORRESPONDANCE
1 E
RESEARCH
Phone: +90
e-mail:
Received:
Accepted:
Turkish Journal of GeriatricsDOI: 10.31086/tjgeri.2021.2282021; 24(3): 303-314
CORRESPONDANCE
1 Kırıkkale Yüksek İhtisas Hospital, Cardiology, Kırıkkale, Turkey
2 Erzurum Regional Training and Research Hospital, Cardiology, Erzurum, Turkey
3 Heart Center, Ataturk University Medical School, Cardiology, Erzurum, Turkey
4 Hisar Intercontinental Hospital, Cardiology, İstanbul, Turkey
THE EFFECTS OF RENAL INSUFFICIENCY AND AGE ON MORTALITY IN GERIATRIC PATIENTS WITH NON-ST-SEGMENT ELEVATION MYOCARDIAL INFARCTION
RESEARCH
Pınar DEMİR GÜNDOĞMUŞ1 . . . . .
Emrah AKSAKAL2 . . . . . . . . . . . . . .
Oğuzhan BİRDAL3 . . . . . . . . . . . . .
İbrahim Halil TANBOĞA4 . . . . . . . .
1 Pınar DEMİR GÜNDOĞMUŞ
Kırıkkale Yüksek İhtisas Hospital, Cardiology, Kırıkkale, Turkey
Phone: +903182151425e-mail: [email protected]
Received: Feb 24, 2021 Accepted: Aug 22, 2021
Objectives: Although renal insufficiency is associated with high mortality in patients with acute coronary syndrome, studies have often excluded patients of advanced age who have renal insufficiency. The present study aimed to determine the relationship between renal insufficiency and mortality predictors in patients with non-ST-segment elevation myocardial infarction (NSTEMI) who were aged 65 and older.
Methods: The study included 537 NSTEMI patients aged 65 years and over, who were followed up for at least 12 months, who were admitted to the hospital with the diagnosis of NSTEMI and underwent coronary angiography. Sociodemographic and clinical features, laboratory parameters, and clinical evaluation variables were recorded at the time of admission. The patients were divided into four groups according to their ages and creatinine clearance values.
Results: The mean age of the patients was 76.17 ± 6.64 years, and 256 (47.7%) of them were women. According to the applied multivariate age-stratified Cox regression analysis, independent predictors of one-year mortality were found to be creatinine clearance (p=0.005), left ventricular ejection fraction (p<0.001), and coronary revascularization (p=0.004).
Conclusion: Creatinine clearance, left ventricular ejection fraction, and coronary revascularization are robust and independent predictors of one-year mortality in NSTEMI patients.
Keywords: Non-ST Elevated Myocardial Infarction; Renal Insufficiency; Mortality; Acute Coronary Syndrome.
ABSTRACT

2021; 24(2): 303-314
304
INTRODUCTION
Non-ST segment elevation myocardial infarction (NSTEMI) is one of the leading causes of mortality and morbidity in patients aged 65 years and old-er, and these numbers are increasing daily (1, 2). Although there is a decrease due to improvements in reperfusion technology and pharmacology, this patient group’s mortality rate is heightened by their tendency toward ischemia and bleeding and in-creased frequency of comorbidities (3). Currently, the limited number of studies investigating mortal-ity predictors in NSTEMI patients and the narrow inclusion criteria for patients in this research hinders the ability to generalize these studies’ results to a patient population in clinical practice (1, 4, 5).
Renal insufficiency (RI) is quite common in hos-pitalized patients with acute coronary syndrome (ACS) and affects 43% of patients diagnosed with NSTEMI (6). The prevalence of RI increases with age, and arrhythmia and cardiovascular diseases are the leading causes of death in these patients (7). Recent studies have shown that when compared to younger patients, NSTEMI patients who are older than 75 years of age have more significant absolute risk reduction in terms of mortality and morbidity when appropriate follow-up and treatment strate-gies are applied (8). Nonetheless, the number of studies investigating the validity of this condition is limited since elderly NSTEMI patients with RI are more vulnerable and the pharmacokinetic proper-ties of the medications are varied (9, 10). While a significant number of studies dealing with this issue in Turkey show that RI may be a predictor for mortal-ity (11-13), there are studies showing the opposite (14-16). However, very few of these studies seem to focus on geriatric patients (11, 17). For this reason, it would be useful to investigate the relationship be-tween RI and mortality in this patient group that is likely to benefit from treatment. This study aimed to investigate the effect of RI on patients who had been hospitalized due to NSTEMI and were over
the age of 65 in order to determine the predictors of mortality in a one-year follow-up.
MATERIAL AND METHODSPatient population
The current study’s sample consisted of patients aged 65 years or older who were admitted to the hospital and diagnosed with NSTEMI and were per-formed coronary angiography between 2016 and 2020. The study was planned as an observational report of routine clinical practice. In accordance with the inclusion and exclusion criteria, the study included patients who were undergoing coronary angiography and were treated according to the rec-ommended guidelines and clinical approach. The patients’ diagnoses and treatments were made in accordance with the current guidelines (1, 4). The study included patients who were older than 65 years of age and who had been diagnosed with NSTEMI and underwent coronary angiography. Patients younger than 65 years of age, who lacked troponin elevation or had proven troponin elevation due to other causes, and who had malignancies, pri-mary arrhythmia, cardiogenic shock, cardiac arrest, a history of coronary bypass, or severe heart valve disease were excluded from the study. As a result, of the 593 patients who met the inclusion criteria, 56 were excluded, and a total of 537 patients with NSTEMI were included in the study. The approval for the study was obtained from the local ethics committee, and each stage of the study was carried out in accordance with the Helsinki Declaration.
Study Design and Clinical Evaluation
The study was designed as multicenter and pro-spective. Erzurum Regional Training and Research Hospital/Erzurum and Ministry of Health, 29 Mayıs State Hospital/Ankara participated in the study. Patients meeting the inclusion criteria were diag-nosed with NSTEMI according to current guidelines,

THE EFFECTS OF RENAL INSUFFICIENCY AND AGE ON MORTALITY IN GERIATRIC PATIENTS WITH NON-ST-SEGMENT ELEVATION MYOCARDIAL INFARCTION
305
and coronary angiography was applied appropriately (1,
4). Patients who met the exclusion criteria or did not meet
the inclusion criteria were excluded at this stage. The pa-
tients’ sociodemographic characteristics, echocardiog-
raphy and electrocardiography records, medical history,
angiography images, and laboratory parameters were re-
corded. After the participants were treated according to
the appropriate guidelines, they were followed up for at
least 12 months (Mean±SD: 543.25±232.39 days, Median:
562 days). Patients were followed up by medical records
or telephone. Patients for whom information could not be
obtained were excluded from the study. The data record-
ed in the dataset were statistically analyzed.
The centers participating in the study met the quality assessment criteria for the accuracy of lab-oratory measurements and follow-up of clinical lab-oratory measurement results. Routine biochemical and hematological tests of the participants were performed during their hospitalizations. Echocar-diographic examinations of the patients were per-formed using the Vivid 7 (General Electric-Vingmed, Milwaukee, WI, USA) device, and left ventriculary ejection fraction (LVEF) measurements were made according to the modified Simpson’s method. During follow-up of the patients, GRACE risk cal-culations were performed by the clinician who per-formed the follow-up. The coronary angiography images of the patients were examined, and SYN-TAX and Gensini scores were calculated by two ex-perienced cardiology specialists. The patients who were treated by coronary bypass or percutaneous methods after coronary angiography were defined as patients who underwent coronary revasculariza-tion. Creatinine clearance (CrCl) levels were calcu-lated using the Cockroft-Gault equation. For the purposes of this study, patients were divided into four categories: those who were 65–74 years of age and had CrCl levels of ≥ 60 ml/min; those who were 65–74 years of age and had CrCl levels of < 60 ml/min; those who were ≥ 75 years of age and had CrCl levels of ≥ 60 ml/min; and those who were ≥ 75 years of age and had CrCl levels of < 60 ml/min.
Follow-up controls were planned at the end of one month and one year. In cases of insufficient data, national or hospital records were used.
Statistical AnalysesThe descriptive analyses were presented as
numbers and percentages for categorical variables and as means and standard deviations for contin-uous variables. The Pearson Chi-square test was used to evaluate the categorical data from the group comparison. After the assessment of the parametric assumptions in the comparison of con-tinuous variables, one-way ANOVA and Tukey tests were used in post-hoc analysis. Kaplan-Meier plots were used to compare survival rates between the four groups. Then, in order to show the differences in hazard between the age groups, a stratified Cox regression model approach was used. Hazard ratios (HR) and associated 95% Confidential Intervals (CI) were presented to show the differences in mortality risk between the age groups. Special relationships between the potential predictors and survival were tested by using a univariate stratified Cox regres-sion. Variables that were statistically significant in univariate analyses were included in the multivariate models. Only existing variables were considered to be potential predictors. “Survival probability” was calculated for each patient, and its relationship with mortality predictors was examined by using the stratified Cox regression model. Statistical analyses of the data were performed using SPSS version 22 software (SPSS, Inc., Chicago, IL). A value of p ≤ 0.05 was considered statistically significant.
RESULTSThe mean age of the patients was 76.17 ± 6.64 years. At least 281 (52.3%) of the participants were male and 256 (47.7%) were female. In 101 (43.5%) of the 232 (43.2%) patients aged 65–74, CrCl lev-els were < 60 ml/min, and in 131 (56.5%) patients, CrCl levels were ≥ 60 ml/min. By comparison, in 256
2021; 24(2): 303-314
306
(83.9%) of the 305 (56.8%) patients aged 75 years and older, CrCl levels were < 60 ml/min, and in 49 (16.1%) patients, CrCl levels were ≥ 60 ml/min. Table 1 presents the comparison of the clinical features of the participants in the four study groups. Accord-ingly, we found statistical differences between the groups in terms of age (p < 0.001), gender (p < 0.001), smoking (p = 0.001), diabetes mellitus (p = 0.001), hypertension (p < 0.001), atrial fibrillation (p < 0.001), coronary artery disease (p < 0.001), per-cutaneous coronary intervention history (p < 0.001), and stroke history (p < 0.001). Statistical differences between the four groups were also found in ST-seg-ment deviation (p = 0.034), coronary revasculariza-tion (p = 0.014), LVEF (p = 0.028), and GRACE scores (p < 0.001). After patients were discharged, statis-tically significant differences were found between the groups’ use of warfarin (p < 0.001), new oral anticoagulant (p < 0.001), renin-angiotensin system blockers (p = 0.031), Beta-blockers (p = 0.008), and statin (p = 0.002). In addition, we found statistically significant differences between all causes of mortal-ity, one-month follow-up (p = 0.016), and one-year follow-up (p < 0.001).
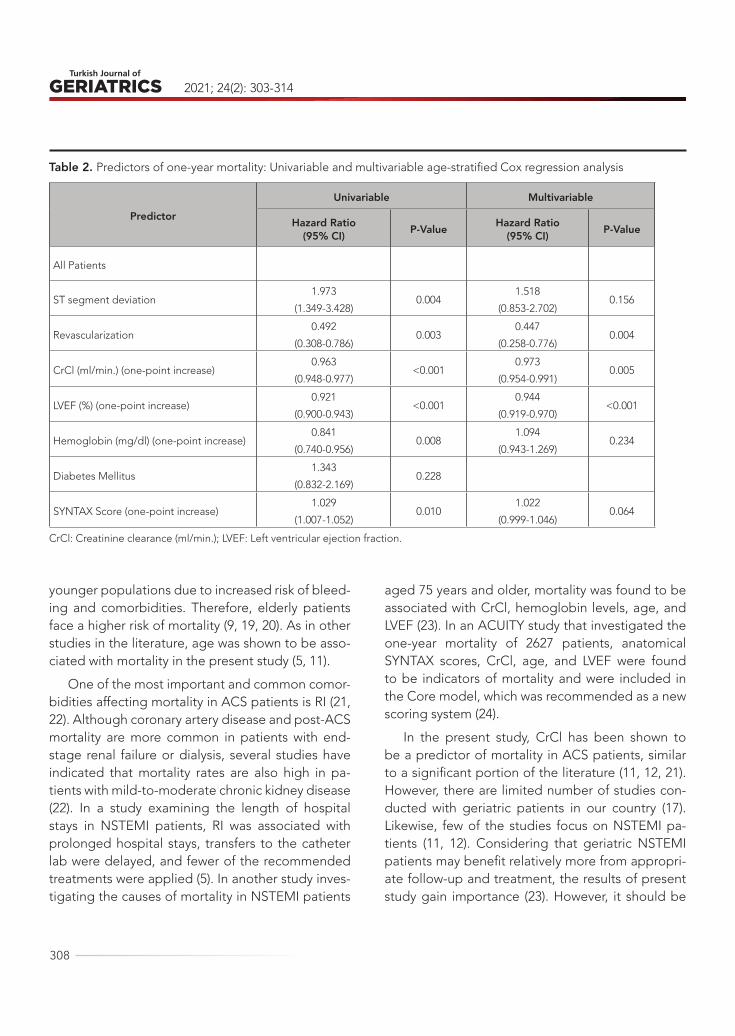
Mortality predictors for elderly NSTEMI patients were examined using the age-stratified Cox regres-sion model (Table 2). In the univariate model, the differences between ST-segment deviation (HR: 1.973, 95% CI: 0.1.349–3.428, p = 0.004), coronary revascularization (HR: 0.492, 95% CI: 0.308–0.786, p = 0.003), CrCl (HR: 0.963, 95% CI: 0.948–0.977, p < 0.001), LVEF (HR: 0.921, 95% CI: 0.900–0.943, p < 0.001), hemoglobin (HR: 0.841, 95% CI: 0.740–0.956, p = 0.008), and SYNTAX scores (HR: 1.029, 95% CI: 1.007–1.052, p = 0.010) were found to be statistical-ly significant. In the multivariate stratified Cox re-gression model, the differences between coronary revascularization (HR: 0.447, 95% CI: 0.258–0.776, p = 0.004), CrCl (HR: 0.973, 95% CI: 0.954–0.991, p = 0.005), and LVEF (HR: 0.944, 95% CI: 0.919–0.970, p < 0.001) were statistically significant (-2 Log Likeli-hood: 578.438). Figure 1 and Figure 2 present the
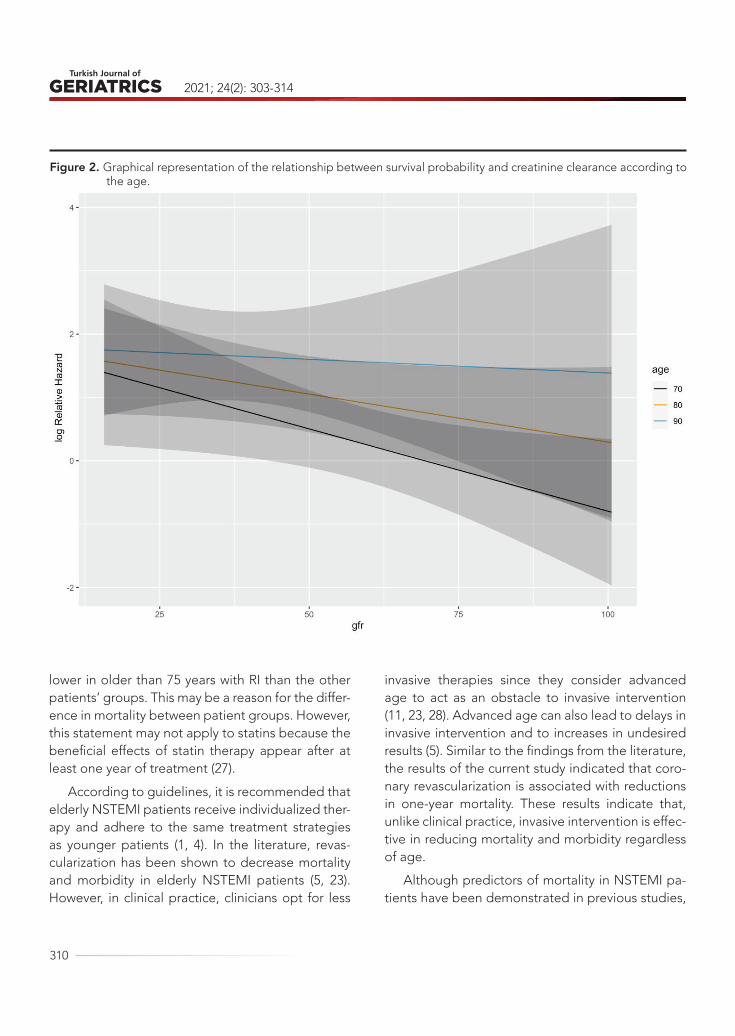
relationships between each patient’s survival prob-ability (calculated by multivariate stratified Cox regression analysis) and age, diabetes mellitus, gender, CrCl, hemoglobin, LVEF, coronary revas-cularization, ST-segment deviation, and SYNTAX scores. Figure 3 shows the one-year survival prob-ability curves according to the creatinine clearance (Adjusted to: age, gender, ST segment deviation, revascularization, LVEF, hemoglobin, diabetes mel-litus and SYNTAX).
DISCUSSION
The most prominent finding from the current study, which examined the relationship between renal failure and one-year mortality rates for all causes in NSTEMI patients aged 65 years and older, was that CrCl, LVEF, and coronary revascularization are inde-pendent predictors of one-year mortality, regard-less of age. We believe that the results of our study are important since they may be instructive for pre-dicting mortality in patients with NSTEMI aged 65 and over.
A number of atherosclerotic processes are ac-tivated due to the disruption of vascular elasticity, changes in coagulation and hemostasis mecha-nisms, endothelial dysfunction, and changes in re-generation capacity with aging or the addition of comorbidities. Moreover, an increasing majority of patients with ACS consist of patients aged 65 and older (18). These individuals are at a high risk of experiencing ischemic events and bleeding due to their higher rates of comorbidities. Although treat-ment guidelines recommend that elderly patients should be approached in a similar way to that of young patients, there are limited data regarding risk and treatment management for these patient groups since they are excluded in most randomized trials (5, 19). In elderly patients, admission to the hospital and diagnosis are delayed due to atypi-cal symptoms, and interventional or strong anti-aggregant treatments are performed less than in

THE EFFECTS OF RENAL INSUFFICIENCY AND AGE ON MORTALITY IN GERIATRIC PATIENTS WITH NON-ST-SEGMENT ELEVATION MYOCARDIAL INFARCTION
307
Table 1. Baseline characteristics of study subjects according to age and CrCl.
Variable Patients aged 65-74 years (n=232) Patients aged ≥75 years (n=305) P-Value
CrCl GroupsCrCl<60(n=101)
CrCl≥60(n=131)
CrCl<60(n=256)
CrCl≥60(n=49)
Age (years) (Mean±SD) 70.94±2.53 69.48±2.71* 81.29±4.88*# 78.10±3.02*#£ <0.001
Gender (female) 47 (46.5%) 35 (26.7%)* 157 (61.3%)*# 17 (34.7%)£ <0.001
Current Smoke 15 (14.9%) 31 (23.7%) 24 (10.5%)# 4 (8.2%)# 0.001
Diabetes Mellitus 43 (42.6%) 29 (22.1%)* 90 (35.2%)# 9 (18.4%)*£ 0.001
Hypertension 86 (85.1%) 73 (55.7%)* 187 (73.0%)*# 35 (71.4%)* <0.001
Atrial Fibrillation 20 (19.8%) 7 (5.3%)* 76 (29.7%)# 8 (16.3%)# <0.001
Prior CAD 60 (59.4%) 30 (22.9%)* 118 (46.1%)*# 21 (42.9%)# <0.001
Prior PCI 40 (39.6%) 4 (3.1%)* 52 (20.3%)*# 8 (16.3%)*# <0.001
Prior Stroke 0 (0) 1 (0.8%) 21 (8.2%)*# 0 (0) £ <0.001
ST segment deviation 28 (27.7%) 29 (22.1%) 13 (26.5%)# 92 (35.9%) 0.034
Coronary Revascularization 75 (74.6%) 99 (75.6%) 157 (61.3%)*# 32 (65.3%) 0.014
LVEF (%) (mean±SD) 49.23±10.29 51.14±8.56 50.18±9.67 53.91±8.20* 0.028
SYNTAX Score (mean±SD) 10.36±8.77 11.58±8.59 11.57±11.27 11.24±9.73 0.802
Grace Score (mean±SD) 130.08±17.61 120.36±13.30* 147.31±22.79*# 129.09±17.75£ <0.001
Gensini Score (mean±SD) 27.07±18.21 30.22±17.72 32.11±25.88 23.87±18.27 0.123
Hemoglobin (mean±SD) 12.30±2.02 13.73±2.09* 12.24±1.65# 14.07±1.49*£ <0.001
Creatinine (mean±SD) 1.77±1.25 0.98±0.19* 1.38±0.68*# 0.96±0.18*£ <0.001
Creatinine clearance (mean±SD) 44.43±12.66 77.91±13.56* 44.09±10.77# 68.16±6.82*#£ <0.001
Discharge Medications
Acetyl Salicylic Aside 81 (80.2%) 119 (90.8%) 211 (82.4%) 41 (83.7%) 0.104
Clopidogrel 81 (80.2%) 104 (79.4%) 205 (80.1%) 36 (73.5%) 0.763
Warfarin 24 (23.8%) 10 (7.6%)* 24 (9.4%)* 2 (4.1%)* <0.001
New oral anticoagulant 4 (4.3%) 0 44 (190%)*# 8 (24.2%)*# <0.001
RAS blockers 63 (62.4%) 82 (62.6%) 186 (72.7%)# 27 (55.1%)£ 0.031
Beta-Blockers 84 (83.2%) 115 (87.8%) 238 (93.0%)* 39 (79.6%)£ 0.008
Statin 57 (56.4%) 104 (79.4%)* 165 (64.5%)# 33 (67.3%) 0.002
Hospitalization days (mean±SD) 6.78±6.90 6.54±7.38 6.94±5.58 4.95±3.40 0.229
One-month mortality 8 (7.9%) 1 (0.8%)* 11 (4.3%) 0 (0) * 0.016
One-year mortality 9 (8.9%) 7 (5.3%) 49 (19.1%)*# 6 (12.2%) <0.001
CrCl: Creatinine clearance (ml/min.); SD: Standard deviation; CAD: Coronary Artery Disease; LVEF: Left ventricular ejection fraction; PCI: Percutaneous Coronary Intervention; RAS: Renin-angiotensin aldosterone system. The p-value indicates the statistical difference between the four groups.* P < 0.05, vs. Patients aged 65-74 years and CrCl<60# P < 0.05, vs. Patients aged 65-74 years and CrCl≥60£ P < 0.05, vs. Patients aged ≥75 years and CrCl<60
2021; 24(2): 303-314
308
younger populations due to increased risk of bleed-ing and comorbidities. Therefore, elderly patients face a higher risk of mortality (9, 19, 20). As in other studies in the literature, age was shown to be asso-ciated with mortality in the present study (5, 11).
One of the most important and common comor-bidities affecting mortality in ACS patients is RI (21, 22). Although coronary artery disease and post-ACS mortality are more common in patients with end-stage renal failure or dialysis, several studies have indicated that mortality rates are also high in pa-tients with mild-to-moderate chronic kidney disease (22). In a study examining the length of hospital stays in NSTEMI patients, RI was associated with prolonged hospital stays, transfers to the catheter lab were delayed, and fewer of the recommended treatments were applied (5). In another study inves-tigating the causes of mortality in NSTEMI patients
aged 75 years and older, mortality was found to be associated with CrCl, hemoglobin levels, age, and LVEF (23). In an ACUITY study that investigated the one-year mortality of 2627 patients, anatomical SYNTAX scores, CrCl, age, and LVEF were found to be indicators of mortality and were included in the Core model, which was recommended as a new scoring system (24).
In the present study, CrCl has been shown to be a predictor of mortality in ACS patients, similar to a significant portion of the literature (11, 12, 21). However, there are limited number of studies con-ducted with geriatric patients in our country (17). Likewise, few of the studies focus on NSTEMI pa-tients (11, 12). Considering that geriatric NSTEMI patients may benefit relatively more from appropri-ate follow-up and treatment, the results of present study gain importance (23). However, it should be
Table 2. Predictors of one-year mortality: Univariable and multivariable age-stratified Cox regression analysis
Predictor
Univariable Multivariable
Hazard Ratio(95% CI) P-Value Hazard Ratio
(95% CI) P-Value
All Patients
ST segment deviation 1.973
(1.349-3.428) 0.004
1.518
(0.853-2.702)0.156
Revascularization 0.492
(0.308-0.786)0.003
0.447
(0.258-0.776)0.004
CrCl (ml/min.) (one-point increase)0.963
(0.948-0.977)<0.001
0.973
(0.954-0.991)0.005
LVEF (%) (one-point increase)0.921
(0.900-0.943)<0.001
0.944
(0.919-0.970)<0.001
Hemoglobin (mg/dl) (one-point increase)0.841
(0.740-0.956)0.008
1.094
(0.943-1.269)0.234
Diabetes Mellitus1.343
(0.832-2.169)0.228
SYNTAX Score (one-point increase)1.029
(1.007-1.052)0.010
1.022
(0.999-1.046)0.064
CrCl: Creatinine clearance (ml/min.); LVEF: Left ventricular ejection fraction.

THE EFFECTS OF RENAL INSUFFICIENCY AND AGE ON MORTALITY IN GERIATRIC PATIENTS WITH NON-ST-SEGMENT ELEVATION MYOCARDIAL INFARCTION
309
considered that the results of present study will be useful in clarifying the relationship between CrCl and mortality, since there are few studies conduct-ed in Turkey on this patient group and some of these studies did not find a relationship between CrCl and mortality. Various factors may describe the relationship between mortality and RI in patients with geriatric NSTEMI. The most probable causes of this condition can include increased frequency of heart disease due to oxidative stress, vascular endothelial dysfunction, acceleration of cellular apoptosis, and the contribution of various immune
system disorders, in addition to factors related to atherosclerosis in RI patients, which may include li-pid disorders, hypertension, concomitant diabetes mellitus, or chronic inflammation processes (25). These patients may also experience higher rates of mortality due to the decreased frequency in which they undergo coronary revascularization or treat-ments involving antiaggregants, beta-blockers, RAS blockers, and statins, which are administered less often to patients with RI during hospitalization and after discharge (26). In our study, the rates of usage RAS blockers, beta-blockers in discharge are
Figure 1. Relative Hazard plots for the effects of predictors on mortality.
2021; 24(2): 303-314
310
lower in older than 75 years with RI than the other patients’ groups. This may be a reason for the differ-ence in mortality between patient groups. However, this statement may not apply to statins because the beneficial effects of statin therapy appear after at least one year of treatment (27).
According to guidelines, it is recommended that elderly NSTEMI patients receive individualized ther-apy and adhere to the same treatment strategies as younger patients (1, 4). In the literature, revas-cularization has been shown to decrease mortality and morbidity in elderly NSTEMI patients (5, 23). However, in clinical practice, clinicians opt for less
invasive therapies since they consider advanced age to act as an obstacle to invasive intervention (11, 23, 28). Advanced age can also lead to delays in invasive intervention and to increases in undesired results (5). Similar to the findings from the literature, the results of the current study indicated that coro-nary revascularization is associated with reductions in one-year mortality. These results indicate that, unlike clinical practice, invasive intervention is effec-tive in reducing mortality and morbidity regardless of age.
Although predictors of mortality in NSTEMI pa-tients have been demonstrated in previous studies,
Figure 2. Graphical representation of the relationship between survival probability and creatinine clearance according to the age.

THE EFFECTS OF RENAL INSUFFICIENCY AND AGE ON MORTALITY IN GERIATRIC PATIENTS WITH NON-ST-SEGMENT ELEVATION MYOCARDIAL INFARCTION
311
patients aged 75 years and older and patients with additional comorbidities such as chronic renal fail-ure were excluded from randomized controlled tri-als until the last few years. In spite of the fact that is recommended to receive similar treatments with other patients in this risky patient group among current treatment recommendations, both invasive and non-invasive treatment applications are insuffi-cient in real life. Because these patients have many comorbidities, multidrug using and some metabolic changes so the clinicians are far from applying the same treatment as younger patients (29). Our study draws attention to a group of patients with high
mortality and may be a warning to be more devoted in providing follow-up and treatment optimization in these patients.
Many studies have shown LVEF to be a consist-ent predictor of short- and long-term mortality in patients with ACS (30, 31). In addition, recommen-dations have been made to include LVEF in risk scoring systems, such as GRACE (32). In the pres-ent study, LVEF was found to be an important inde-pendent predictor of one-year mortality in elderly NSTEMI patients. Therefore, we recommend using the LVEF assessment, which is a parameter of echo-cardiographic measurement, as an easily accessible
Figure 3. The survival probability in patients according to the creatinine clearance.

2021; 24(2): 303-314
312
and noninvasive method during the follow-up and risk assessment of patients.
LimitationsOur study has some important limitations. First,
the follow-up period of our study was brief, and it presented all causes of mortality. It would be more beneficial to present cardiac-related mortality, spe-cifically. It is also worth noting that neglecting the factors that can affect mortality, such as possible complications due to invasive treatment, may have affected the results. In addition, clinicians may have taken different approaches in treating the patients. The study was also limited by discrepancies be-tween how clinics applied LVEF measurements and because some clinics did not discharge LVEF meas-urements.
CONCLUSIONElderly NSTEMI patients with RI are at high risk for mortality, and the administration of guideline-based therapies is controversial. CrCl, coronary revascu-larization, and LVEF are potent and independent predictors of one-year mortality of all causes. Our results support the available information in the literature and provide new insights into the risk assessment of this complex patient population. Considering these predictors together can prove useful during early risk assessments. In addition, careful application of guidelines for elderly NSTEMI patients with RI should be considered effective in reducing mortality. Future studies should focus on optimizing more aggressive treatments to manage mortality in this patient group.
Conflict of interest: None declared.
Funding: The authors received no financial sup-port for the research, authorship, and/or publica-tion of this article.
REFERENCES1. Amsterdam EA, Wenger NK, Brindis RG, et al. 2014
AHA/ACC guideline for the management of patients with non–ST-elevation acute coronary syndromes: a report of the American College of Cardiology/Amer-ican Heart Association Task Force on Practice Guide-lines. J Am Coll Cardiol 2014;64 (24):e139-e228.(PMID:25260718 )
2. Varghese T, Wenger NK. Non-ST elevation acute coronary syndrome in women and the elderly: re-cent updates and stones still left unturned. F1000Re-search 2018;7:1865. (PMID: 30631426)
3. Yaku H, Shiomi H, Morimoto T, et al. Comparison of Short- And Long-Term Mortality Between St-Seg-ment Elevation and Non-ST-Segment Elevation My-ocardial Infarction. J Am Coll Cardiol 2016;67(13):50. (DOI: 10.1016/s0735-1097(16)30051-1)
4. Roffi M, Patrono C, Collet J-P, et al. 2015 ESC Guide-lines for the management of acute coronary syn-dromes in patients presenting without persistent ST-segment elevation: Task Force for the Manage-ment of Acute Coronary Syndromes in Patients Pre-senting without Persistent ST-Segment Elevation of
the European Society of Cardiology (ESC). Eur Heart J. 2016; 37(3): 267-315. (PMID: 26320110)
5. Vavalle JP, Lopes RD, Chen AY, et al. Hospital length of stay in patients with non-ST-segment elevation myocardial infarction. Am J Med 2012;125(11):1085-94. (PMID: 22921886)
6. Baber U, Auguste U. Patients with chronic kidney dis-ease/diabetes mellitus: the high-risk profile in acute coronary syndrome. Curr Cardiol Rep 2013;15(8):386. (PMID: 23843182)
7. Anavekar NS, McMurray JJ, Velazquez EJ, et al. Re-lation between renal dysfunction and cardiovascular outcomes after myocardial infarction. N Engl J Med 2004;351 (13):1285-95. (PMID: 15385655)
8. Morici N, De Servi S, Toso A, et al. Renal dysfunc-tion, coronary revascularization and mortality among elderly patients with non ST elevation acute coro-nary syndrome. Eur Heart J Acute Cardiovasc Care 2015;4(5):453-60. (PMID: 25348274)
9. Gimbel M, Ten Berg J. Management of elderly pa-tients with a non-ST-segment-elevation acute cor-onary syndrome. Neth Heart J 2017;25(7-8):409-15.(PMID: 28516369)

THE EFFECTS OF RENAL INSUFFICIENCY AND AGE ON MORTALITY IN GERIATRIC PATIENTS WITH NON-ST-SEGMENT ELEVATION MYOCARDIAL INFARCTION
313
10. Llaó I, Formiga F, Solé AA, et al. Frequency of Re-nal Dysfunction and Frailty in Patients≥ 80 Years of Age With Acute Coronary Syndromes. Am J Cardiol 2019;123(5):729-35. (PMID: 30593340)
11. Gündoğmuş PD, Ölçü EB, Öz A, et al. The Effects of Percutaneous Coronary Intervention on Mortality in Elderly Patients with Non-ST-Segment Elevation My-ocardial Infarction Undergoing Coronary Angiogra-phy. Scott Med J 2020;65 (3):81-8. (PMID: 32772677)
12. Guclu K, Celik M. Prognostic Value of Inflammation Parameters in Patients With Non-ST Elevation Acute Coronary Syndromes. Angiology. 2020;71:825-30. (PMID: 32597198)
13. Kalyoncuoğlu M, Katkat F, Biter HI, Cakal S, Tosu AR, Can MM. Predicting One-Year Deaths and Major Ad-verse Vascular Events with the Controlling Nutritional Status Score in Elderly Patients with Non–ST-Elevat-ed Myocardial Infarction Undergoing Percutaneous Coronary Intervention. J Clin Med. 2021;10:2247. (PMID: 34067233)
14. Kırış T, Yazici S, Günaydin ZY, Akyüz Ş, Güzelburç Ö, Atmaca H, Ertürk M, Nazli C, Dogan A. The Prognos-tic Impact of In-Hospital Change in Mean Platelet Volume in Patients With Non–ST-Segment Elevation Myocardial Infarction. Angiology. 2016;67:690-6. (PMID: 26787684)
15. Yazıcı S, Kırış T, Ceylan US, Terzi S, Erdem A, Atasoy I, Emre A, Yeşilçimen K. Relation of Low T3 to One‐Year Mortality in Non–ST‐Elevation Acute Coronary Syndrome Patients. J Clin Lab Anal. 2017;31:e22036. (PMID: 27566539)
16. Alici G, Quisi A, Omer G, Harbalioğlu H, Allahver-diyev S, Yildirim A, Urgun ÖD, Mustafa G. Mortality Outcomes of Single-staged versus Multi-staged Complete Coronary Revascularization in Multivessel Non-ST Elevation Myocardial Infarction Patients. Duzce Med J. 2021. (DOI:https://doi.org/10.18678/dtfd.868952)
17. Atas H, Tigen K, Ozben B, Kartal F, Gurel E, Atas DB, Sari İ, Basaran Y. Short and Long Term Mortali-ty Predictors in Octogenarians with Acute Coronary Syndromes. Clin Invest Med. 2018:E43-E50. (PMID: 29959882)
18. Badimon L, Bugiardini R, Cubedo J. Pathophysiolo-gy of acute coronary syndromes in the elderly.Int J Cardiol 2016;222:1105-9. (PMID: 27499220)
19. Lattuca B, Kerneis M, Zeitouni M, et al. Elderly Pa-
tients with ST-Segment Elevation Myocardial Infarc-tion: A Patient-Centered Approach. Drugs Aging 2019;36(6):531-9. (PMID: 30953328)
20. Zaman MJ, Stirling S, Shepstone L, et al. The associ-ation between older age and receipt of care and out-comes in patients with acute coronary syndromes: a cohort study of the Myocardial Ischaemia National Audit Project (MINAP). Eur Heart J 2014;35(23):1551-8. (PMID: 24644310)
21. Morici N, De Servi S, Toso A, et al. Renal function estimation and one-year mortality in elderly patients with non-ST-segment elevation acute coronary syn-dromes. Int J Cardiol 2014;174 (1):127-8. (PMID: 24447752)
22. Asim M, Jeffrey RF. Management of acute coronary syndrome in patients with chronic kidney disease: if we don’t risk anything, we risk even more. Nephron Clin Pract 2011;119 (4):c333-c7. (PMID: 22135792)
23. Morici N, Savonitto S, Murena E, Antonicelli R, Pio-vaccari G, Tucci D, Tamburino C, Fontanelli A, Bo-lognese L, Menozzi M. Causes of death in patients ≥ 75 years of age with non–ST-segment elevation acute coronary syndrome. The American journal of cardiology. 2013;112:1-7.
24. Farooq V, Vergouwe Y, Généreux P, et al. Prediction of 1-year mortality in patients with acute coronary syndromes undergoing percutaneous coronary in-tervention: validation of the logistic clinical SYN-TAX (Synergy Between Percutaneous Coronary In-terventions With Taxus and Cardiac Surgery) score. JACC Cardiovasc Interv 2013;6 (7):737-45. (PMID: 23866185)
25. Jagieła J, Bartnicki P, Rysz J. Selected cardiovascular risk factors in early stages of chronic kidney disease. Int Urol Nephrol 2020;52:303-14. (PMID: 31955363)
26. Patti G, Ricottini E, Nenna A, et al. Impact of chron-ic renal failure on ischemic and bleeding events at 1 year in patients with acute coronary syndrome (from the Multicenter START ANTIPLATELET Regis-try). American J Cardiol 2018;122 (6):936-43. (PMID: 30057232)
27. Horodinschi R-N, Stanescu AMA, Bratu OG, et al. Treatment with statins in elderly patients. Medicina. 2019;55:721. (PMID: 15100205).
28. Llaó I, Ariza-Sole A, Sanchis J, et al. Invasive strategy and frailty in very elderly patients with acute coronary syndromes. EuroIntervention 2018;14(3):e336-e42. (PMID: 29616624)

2021; 24(2): 303-314
314
29. Usta C, Bedel A. Update on pharmacological treat-ment of acute coronary syndrome without persis-tent ST segment elevation myocardial infarction in the elderly. J Geriatr Cardiol 2017;14:457-64. (PMID: 28868074)
30. Brezinov OP, Klempfner R, Zekry SB, et al. Prognostic value of ejection fraction in patients admitted with acute coronary syndrome: a real world study. Medi-cine (Baltimore) 2017;96 (9:e6226). (PMID: 28248882)
31. Siontis GC, Branca M, Serruys P, et al. Impact of left ventricular function on clinical outcomes among pa-tients with coronary artery disease. Eur J Prev Cardi-ol 2019;26 (12):1273-84. (PMID: 30966820)
32. Li Y-m, Li Z-l, Chen F, et al. A LASSO-derived risk model for long-term mortality in Chinese pa-tients with acute coronary syndrome.J Transl Med 2020;18(1):1-9. (PMID: 32252780)

315
Turkish Journal of Geriatrics
DOI: ....
2020; 23(): ...-...
CORRESPONDANCE
1 E
RESEARCH
Phone: +90
e-mail:
Received:
Accepted:
Turkish Journal of GeriatricsDOI: 10.31086/tjgeri.2021.2292021; 24(3): 315-329
CORRESPONDANCE
1 Health Science University Bakırköy Dr. Sadi Konuk Training and Research Hospital, Anesthesiology and Reanimation, Istanbul, Turkey
2 Marmara University Pendik Training and Research Hospital, Department of Anesthesiology and Reanimation , Istanbul, Turkey
THE EFFECT OF OBESITY ON MORTALITY IN GERIATRIC PATIENTS FOLLOWED IN THE INTENSIVE CARE UNIT
RESEARCH
Gülsüm Oya HERGÜNSEL1 . . . . . .
Mehmet Süleyman SABAZ2. . . . . . .
1 Mehmet Süleyman SABAZ
Marmara University Pendik Training and Research Hospital, Department of Anesthesiology and Reanimation , Istanbul, Turkey
Phone: +905064415710e-mail: [email protected]
Received: Jul 06, 2021 Accepted: Aug 30, 2021
Introduction: This study was intended to evaluate the relationship between the presence of obesity in geriatric patients, which is becoming more and more common in the intensive care unit, with the intensive care process and mortality.
Materials and Method: In this retrospective study, data on 2,114 patients aged 65 and over who were followed in the intensive care unit between January 2013-January 2020 were obtained electronically and evaluated.
Results: Patients were divided into two groups of 1,632 (77.2%) non-obese and 482 (22.8%) obese patients. It was determined that acute kidney injury development was more common in obese patients (326; 67.6%) than non-obese patients (937; 57.4%) and obese patients required more frequent dialysis (p <0.05). It was determined that obese patients required more frequent mechanical ventilator support, had higher positive end-expiratory pressure and peak pressure Work of Breathing ventilator values, and had lower compliance (34 [29–41]) (p<0.05). Although obese patients were given fewer daily calories than non-obese patients, their mean blood glucose was higher (p <0.001). Obese patients (5.70 [2.43–12.31]) had longer intensive care durations than non-obese patients (4.41 [2.01–10.45]) (p <0.05). Finally, intensive care mortality was determined to be 37.6% (181) in obese patients and 36.0% (588) in non-obese patients (p>0.05).
Conclusion: Obese patients’ increased complication rate and duration of stay in the intensive care show that obesity increases intensive care morbidity in geriatric patients, but it has no relationship with mortality.
Keywords: Geriatrics; Aged; Obesity; Intensive Care Units; Body Mass Index; Respiration, Artificial.
ABSTRACT

2021; 24(3): 315-329
316
INTRODUCTION
Obesity, which is defined as abnormally increased fat accumulation that may adversely affect health, is accepted as an important public health problem and has an increasing prevalence worldwide (1). In recent years, the increase in the rate of obesity in the general population has had an effect on the profile of patients admitted to the intensive care unit (ICU), resulting in an increase in the number of obese patients (2). The management of obese pa-tients is difficult due to accompanying metabolic dysfunction, impaired glucose intolerance, and res-piratory and cardiovascular diseases (3). Concern-ing the drugs used in treatment, especially those with lipophilic properties, drug response may be altered due to increased fat mass (4). As a result of decreased vascular access due to large body habi-tus and affected blood pressure measurement ac-curacy, the frequency of invasive procedures, such as central venous access and intra-arterial cannula-tion, increases, and nursing care becomes difficult (4). Previous studies on obese patients in the ICU have determined that obesity prolonged the length of stay in the ICU (5,6). However, studies examin-ing the relationship between obesity and mortality in the ICU have yielded complicated results (5-8). Some studies reported an increase in mortality (7), while others found no difference in mortality (5). Nevertheless, some studies have revealed an obe-sity paradox, in which obesity is not harmful but, in fact, protective (6,8).
In recent years, a worldwide increase in obesity has been observed in the geriatric population (9). According to the estimates of the United Nations, it is predicted that the global elderly population, which was 9.0% in 2019, will increase to 11.7% in 2030 and 16% in 2050 (10). According to a study conducted in the United States, 37.5% of women over 60 and 39.4% of men over 60 were obese (9). Patients over the age of 65 constitute approximate-ly half of the ICU admissions (11). Moreover, the ICU readmission rate and mortality risk are higher in
this patient group (11). In addition to the increased prevalence of obesity in society, the increase in the number of geriatric patients has resulted in the development of a geriatric obese patient pro-file, which is becoming more prominent in ICUs. In geriatric patients, obesity has been associated with an increased risk of coronary heart disease due to diabetes mellitus, hypertension, dyslipidemia, and physical inactivity (12).
In addition to the rapid increase in the number of geriatric patients, the complicated results of studies investigating the mortality of obese patients may cause a paradox associated with the consequences of obesity in geriatric patients in the ICU. In order to resolved this paradox, our study is intended to determine the relationship between obesity and mortality in geriatric patients followed in an ICU in a large center and within a large sample.
MATERIALS AND METHODS
Data Center
This retrospective study was carried out in the ICU of a third-level training and research hospital in Is-tanbul, Turkey’s most populous city.
When a patient is admitted to the ICU, after re-moving his or her clothes and jewellery, the patient’s height and weight are measured by the nurse and recorded in the clinical decision support system. After the height and weight information is entered into the clinical decision support system, the system automatically calculates the body mass index (BMI) with the loaded algorithm and saves it in the pa-tient file. Due to the electronic ecosystem, all bed-side monitor information measured during the ICU follow-up of the patient, mechanical ventilation pa-rameters, laboratory examination results, extracor-poreal applications, and information on all infusions are transmitted from the utilized devices to the clin-ical decision support system.

THE EFFECT OF OBESITY ON MORTALITY IN GERIATRIC PATIENTS FOLLOWED IN THE INTENSIVE CARE UNIT
317
DATA COLLECTIONThe data on all patients followed up between Jan-uary 2013 and January 2020 from the EMRall-Qlin-ICUImdSoftMetavision Clinical Decision Support System used in the ICU were obtained and evaluat-ed through Structured Query Language (SQL) que-ries.
SampleDuring the study period, 9,544 patients were admit-ted to the ICU. After the exclusion of 7,430 patients from the study according to the exclusion criteria, the remaining 2,114 patients constituted the study population. All patients included in the study were divided into two groups according to the BMI crite-ria determined by the World Health Organization, including 1,632 (77.2%) patients with a BMI <30 kg/m2 and 482 (22.8%) patients with a BMI ≥ 30 kg/m2.
Inclusion criteriaThe study was intended to include all patients aged 65 and over who had spent more than 24 hours in intensive care.
Exclusion criteriaPatients younger than 65 (n: 4,864), those who were taken to the service within the first 24 hours after ICU admission (n: 980), those who developed mor-tality (n: 774), and those with missing data (n: 812) were excluded from the study.
Primary outcomeEvaluating the relationship between obesity and mortality in patients over 65 years of age who were followed in ICU was the primary aim of the study.
Secondary outcomeThe secondary aims of the study were to compare
patients’ comorbidities at admission, primary di-agnoses, calculated ICU scores, interventions, and treatments.
Ethical aspectsBefore beginning the research, ethics committee approval and institutional permission were obtained from the Bakırköy Dr. Sadi Konuk Training and Re-search Hospital Clinical Research Ethics Committee (Protocol code: 2021/218; Approval no: 2021-08; Approval date: 19.04.2021).
Evaluation of data (statistical analysis)The data collected in the study were evaluated us-ing SPSS 22.00 software. A Shapiro-Wilk test was used to test the distribution of the numerical data. Categorical variables were expressed in terms of frequencies and percentages. Numerical variables with a normal distribution were given as means ± standard deviations, while numerical data not conforming to a normal distribution were given as medians and interquartile intervals (IQRs). An in-dependent-samples t-test was used in comparing the numerical data, and a Mann-Whitney U-test was used when the assumptions of the t-test could not be met. The Chi-square test was used for compar-ing categorical variables, and Fisher’s exact test was used when the conditions of the Chi-square test were not met. A Kaplan-Meier survival analysis was used to determine the association between BMI groups and 28-day mortality. It was thought that the severity of acute illness and chronic health condi-tions might be different in these groups of patients. In order to avoid these differences potentially af-fecting results and provide better randomization, patients were divided into four quartiles according to their acute physiology and chronic health evalua-tion (APACHE) II scores (16, 17-23, 24–29, and ≤30). Additionally, receiver operating characteristic (ROC) curves were created to determine the differences in mortality risk between patients in each quartile. A

2021; 24(3): 315-329
318
p-value <0.05 was accepted as the level of signifi-cance.
RESULTSTable 1 shows the general characteristics of the patients, who were divided into two groups based on their BMI: non-obese and obese. Of the 2,114 patients, 1,632 (77.2%) were non-obese, and 482 (22.8%) were obese. The average age of the non-obese patients (77 [70–83]) was higher than that of the obese patients (75 [70–82]) (p <0.05). It was determined that the female gender (937; 57.4%) was more common in non-obese patients, where-as the male gender (376; 78.0%) was more common in obese patients (p <0.001). Median BMI values were 27.34 (25.39–28.69) in non-obese patients and 36.73 (33.20–41.62) in obese patients. The frequen-cy of comorbidity was similar between groups. The frequencies of diabetes mellitus and hypertension were increased in obese patients (p <0.05). An ex-amination of the admission diagnoses of the pa-tients in the ICU revealed that the most common admission diagnosis in both groups was sepsis. The rate of patients diagnosed with sepsis was similar between groups. The most common sepsis source in both groups was intraabdominal sepsis. Other common diagnoses in obese patients (due to chron-ic obstructive pulmonary disease (COPD), pneumo-nia, and other causes) were pulmonary diseases (95; 19.7%), postoperative follow-up (61; 12.7%), and cerebrovascular disease (47; 9.8%). While malig-nancy (129; 7.9%) was more common in non-obese patients than obese patients, diagnoses of COPD (37; 7.7%), renal-metabolic diseases (42; 8.7%), and hepatic cirrhosis (8: 1.7%) were more common in obese patients than non-obese patients (p <0.05) (Table 1).
The ICU scores, interventions, and treatments of the patients are shown in Table 2. The numbers of arterial catheters applied to the groups were simi-lar. More central venous catheters were applied to obese patients than to non-obese patients (502,
56.5%, p<0.05). There was no difference between the groups regarding the use of vasoactive drugs, antibiotics, and Total parenteral nutrition (TPN) (p>0.05). When the complications that developed in the ICU were examined, it was found that the rate of acute kidney injury (AKI) in obese patients (326; 67.6%) was higher that than in non-obese patients (937; 57.4%) (p<0.001). Obese patients (124; 25.7%) required dialysis more frequently than non-obese patients (318; 19.5%). Pressure sores were more common in obese patients (76; 15.8%) than non-obese patients (145; 8.9%) (p<0.001).
Mechanical ventilationWhile 68.4% (1,191) of non-obese patients required mechanical ventilator support, this rate increased to 74.3% (358) in obese patients (p<0.05). When mechanical ventilator parameters were examined, while positive end-expiratory pressure (5.6 [5.1–6.0]), peak pressure (14 [12–16]), and Work of Breathing ventilator (WOBv) (1.16 [0.99–1.31]) values were higher in obese patients, pulmonary compliance (34 [29–41]) was lower (p<0.05). There was no dif-ference in mean tidal volume between the groups, but tidal volume, in ml/kg adjusted for ideal weight, was higher in obese patients (p<0.001). Between the groups, FiO2, respiratory rate per minute, and mechanical power did not differ significantly (Table 2). Mechanical ventilation duration was higher in obese patients, but this difference was not statisti-cally significant (p>0.05).
Laboratory parametersThe laboratory parameters of the patients are given in Table 2. When blood gas values were examined, pCO2 was higher and PH was lower in obese pa-tients (p<0.05). In the two groups, PO2, HCO3, and lactate levels were similar (p>0.05). Fewer daily calo-ries could be given to obese patients (1,524 [1,382–1,697] than non-obese patients (1,652 [1,461–1,881]) (p<0.001). Despite lower calorie input, the mean

THE EFFECT OF OBESITY ON MORTALITY IN GERIATRIC PATIENTS FOLLOWED IN THE INTENSIVE CARE UNIT
319
Table 1. Characteristics of patients groups and admission diagnosis.
ParametersNon-Obese
n=1632 (%77.2)Obese n=482 (%22.8) P-value
Body mass index, median (IQR) (kg/m2) 27.34(25.39-28.69) 36.73(33.20-41.62)
Age (year) 77(70-83) 75(70-82) 0.026
65-74 668(40.9) 219(45.4) 0.427
75-84 613(37.6) 188(39.0) 0.759
≥85 351(21.5) 75(15.6) 0.055
Gender >0.001
Female 695(42.6) 376(78.0)
Male 937(57.4) 106(22.0)
Comorbidity 1512(92.6) 455(94.4) 0.184
Hypertension 839(51.4) 307(63.7) <0.001
Diabetes 422(25.9) 190(39.4) <0.001
Cerebrovascular disease 204(12.5) 46(9.5) 0.77
CAD 346(79.9) 87(18.0) 0.132
COPD 242(14.8) 86(17.8) 0.108
CRF 194(11.9) 73(15.1) 0.059
Malignancy 226(13.8) 54(11.2) 0.132
Hepatic disease 23(1.4) 8(1.7) 0.668
Psychiatric disorder 13(0.8) 6(1.2) 0.360
Dementia 147(9.0) 34(7.1) 0.178
Other 121(7.4) 32(6.6) 0.564
Admission diagnosis
Cerebrovascular disease 210(12.9) 47(9.8) 0.066
Cardiac 111(6.8) 34(7.1) 0.847
Pulmonary 266(16.3) 95(19.7) 0.080
Pneumonia 160(9.8) 43(8.9) 0.563
COPD 73(4.5) 37(7.7) 0.005
Pulmonary,
Other33(2.0) 15(3.1) 0.158
Renal-metabolic 96(5.9) 42(8.7) 0.027
Hepatic cirrhosis 11(0.7) 8(1.7) 0.044
Trauma 38(2.3) 15(3.1) 0.334
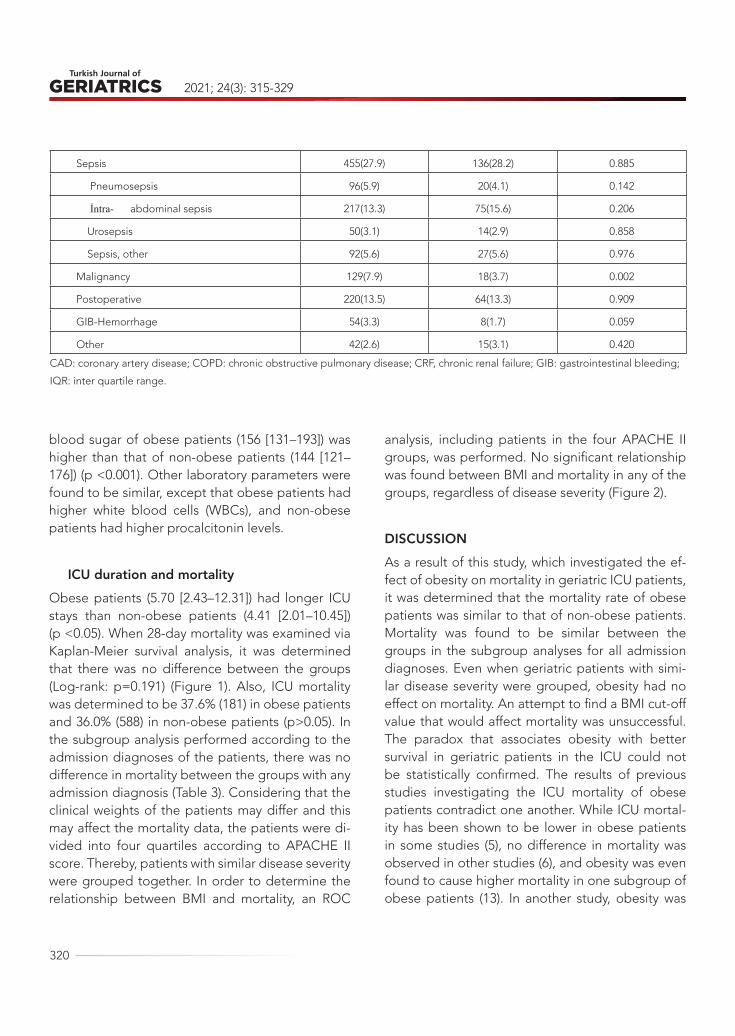
2021; 24(3): 315-329
320
blood sugar of obese patients (156 [131–193]) was higher than that of non-obese patients (144 [121–176]) (p <0.001). Other laboratory parameters were found to be similar, except that obese patients had higher white blood cells (WBCs), and non-obese patients had higher procalcitonin levels.
ICU duration and mortalityObese patients (5.70 [2.43–12.31]) had longer ICU stays than non-obese patients (4.41 [2.01–10.45]) (p <0.05). When 28-day mortality was examined via Kaplan-Meier survival analysis, it was determined that there was no difference between the groups (Log-rank: p=0.191) (Figure 1). Also, ICU mortality was determined to be 37.6% (181) in obese patients and 36.0% (588) in non-obese patients (p>0.05). In the subgroup analysis performed according to the admission diagnoses of the patients, there was no difference in mortality between the groups with any admission diagnosis (Table 3). Considering that the clinical weights of the patients may differ and this may affect the mortality data, the patients were di-vided into four quartiles according to APACHE II score. Thereby, patients with similar disease severity were grouped together. In order to determine the relationship between BMI and mortality, an ROC
analysis, including patients in the four APACHE II groups, was performed. No significant relationship was found between BMI and mortality in any of the groups, regardless of disease severity (Figure 2).
DISCUSSIONAs a result of this study, which investigated the ef-fect of obesity on mortality in geriatric ICU patients, it was determined that the mortality rate of obese patients was similar to that of non-obese patients. Mortality was found to be similar between the groups in the subgroup analyses for all admission diagnoses. Even when geriatric patients with simi-lar disease severity were grouped, obesity had no effect on mortality. An attempt to find a BMI cut-off value that would affect mortality was unsuccessful. The paradox that associates obesity with better survival in geriatric patients in the ICU could not be statistically confirmed. The results of previous studies investigating the ICU mortality of obese patients contradict one another. While ICU mortal-ity has been shown to be lower in obese patients in some studies (5), no difference in mortality was observed in other studies (6), and obesity was even found to cause higher mortality in one subgroup of obese patients (13). In another study, obesity was
Sepsis 455(27.9) 136(28.2) 0.885
Pneumosepsis 96(5.9) 20(4.1) 0.142
İntra- abdominal sepsis 217(13.3) 75(15.6) 0.206
Urosepsis 50(3.1) 14(2.9) 0.858
Sepsis, other 92(5.6) 27(5.6) 0.976
Malignancy 129(7.9) 18(3.7) 0.002
Postoperative 220(13.5) 64(13.3) 0.909
GIB-Hemorrhage 54(3.3) 8(1.7) 0.059
Other 42(2.6) 15(3.1) 0.420
CAD: coronary artery disease; COPD: chronic obstructive pulmonary disease; CRF, chronic renal failure; GIB: gastrointestinal bleeding;
IQR: inter quartile range.
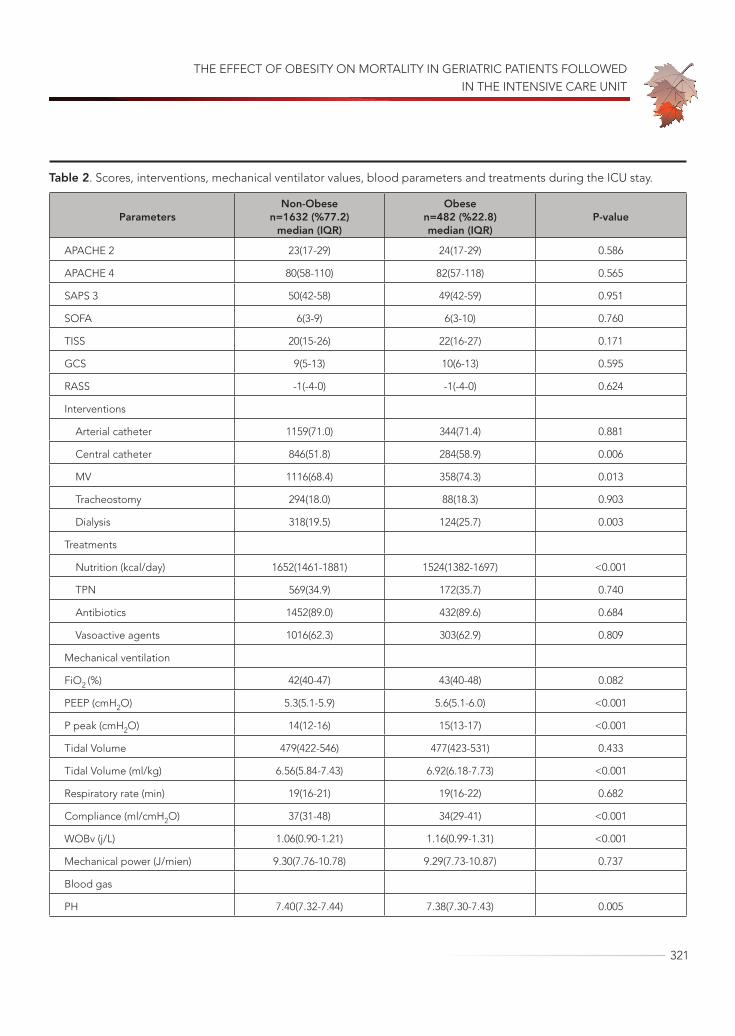
THE EFFECT OF OBESITY ON MORTALITY IN GERIATRIC PATIENTS FOLLOWED IN THE INTENSIVE CARE UNIT
321
Table 2. Scores, interventions, mechanical ventilator values, blood parameters and treatments during the ICU stay.
ParametersNon-Obese
n=1632 (%77.2)median (IQR)
Obese n=482 (%22.8)median (IQR)
P-value
APACHE 2 23(17-29) 24(17-29) 0.586
APACHE 4 80(58-110) 82(57-118) 0.565
SAPS 3 50(42-58) 49(42-59) 0.951
SOFA 6(3-9) 6(3-10) 0.760
TISS 20(15-26) 22(16-27) 0.171
GCS 9(5-13) 10(6-13) 0.595
RASS -1(-4-0) -1(-4-0) 0.624
Interventions
Arterial catheter 1159(71.0) 344(71.4) 0.881
Central catheter 846(51.8) 284(58.9) 0.006
MV 1116(68.4) 358(74.3) 0.013
Tracheostomy 294(18.0) 88(18.3) 0.903
Dialysis 318(19.5) 124(25.7) 0.003
Treatments
Nutrition (kcal/day) 1652(1461-1881) 1524(1382-1697) <0.001
TPN 569(34.9) 172(35.7) 0.740
Antibiotics 1452(89.0) 432(89.6) 0.684
Vasoactive agents 1016(62.3) 303(62.9) 0.809
Mechanical ventilation
FiO2 (%) 42(40-47) 43(40-48) 0.082
PEEP (cmH2O) 5.3(5.1-5.9) 5.6(5.1-6.0) <0.001
P peak (cmH2O) 14(12-16) 15(13-17) <0.001
Tidal Volume 479(422-546) 477(423-531) 0.433
Tidal Volume (ml/kg) 6.56(5.84-7.43) 6.92(6.18-7.73) <0.001
Respiratory rate (min) 19(16-21) 19(16-22) 0.682
Compliance (ml/cmH2O) 37(31-48) 34(29-41) <0.001
WOBv (j/L) 1.06(0.90-1.21) 1.16(0.99-1.31) <0.001
Mechanical power (J/mien) 9.30(7.76-10.78) 9.29(7.73-10.87) 0.737
Blood gas
PH 7.40(7.32-7.44) 7.38(7.30-7.43) 0.005

2021; 24(3): 315-329
322
PO2 (mmHg) 87.1(64.7-109.1) 84.4(63.3-106.7) 0.166
PCO2 (mmHg) 40.6(35.8-46.6) 42.9(38.0-49.8) <0.001
HCO3 (mEq/L) 24.3(20.8-27.7) 24.4(20.6-28.2) 0.608
Lactate (mmol/L) 1.78(1.33-3.11) 1.89(1.41-3.31) 0.068
Laboratory
Glucose (mg/dl) 144(121-176) 156(131-193) <0.001
Hemoglobin (g/dl) 9.64(8.71-10.96) 9.57(8.63-10.91) 0.174
Hematocrit (%) 30.26(27.19-34.09) 29.79(27.19-33.90) 0.437
Platelet (x109/L) 206(148-275) 218(160-287) 0.039
White blood cell (x109/L) 12,35(9.30-16.19) 13.54(10.09-17.28) <0.001
CRP (mg/L) 1.84(0.28-4.99) 2.11(1.01-5.15) 0.191
Procalcitonin (ug/L) 0.93(0.40-4.52) 0.72(0.35-3.35) 0.033
INR 1.20(1.07-1.43) 1.21(1.08-1.43) 0.715
APTT (sec) 32.3(27.0-41.5) 31.2(26.0-40.2) 0.066
AST (U/L) 31(20-57) 31(21-63) 0.490
ALT (U/L) 19(11-37) 20(13-40) 0.063
Creatinine (mg/dl) 0.70(0.47-1.08) 0.76(0.48-1.06) 0.630
Albümine (mg/dl) 2.80(2.33-3.30) 2.90(2.41-3.34) 0.105
Sodium (mmol/L) 139(136-143) 139(136-142) 0.305
Chlorine (mmol/L) 103(99-107) 103(99-107) 0.142
Potassium (mmol/L) 4.1(3.7-4.5) 4.0(3.7-4.4) 0.607
Magnesium (mg/dl) 1.98(1.80-2.19) 1.95(1.77-2.17) 0.057
Complications
AKI 937(57.4) 326(67.6) <0.001
Pressure sores 145(8.9) 76(15.8) <0.001
MV (day) 5.27(2.24-11.99) 5.29(2.48-13.81) 0.298
LOS ICU (day) 4.41(2.01-10.45) 5.70(2.43-12-31) 0.003
28-day mortality 549 (33.6) 162 (33.6) 0.990
ICU mortality 588(36.0) 181(37.6) 0.542
APACHE: acute physiology and chronic health evaluation; SAPS: simplified acute physiology; SOFA: sequential organ failure assessment; TISS: therapeutic intervention scoring system; GCS: glascow coma score; RASS: Richmond Agitation and Sedation Scale; MV: mechanic ventilation; TPN: total parenteral nutrition; FiO2: fraction of inspired oxygen; PEEP: positive end-expiratory pressure; WOBv: work of breathing ventilator; PCO2: partial pressure of carbon dioxide; PO2: partial pressure of oxygen; HCO3: bicarbonate; CRP: C-reactive protein; INR: international normalized ratio; APTT: activated partial thromboplastin time; AST: aspartate aminotransferase; ALT: alanine aminotransferase; AKI: acute kidney injury; LOS: length of stay; ICU: intensive care unit; IQR: inter quartile range.

THE EFFECT OF OBESITY ON MORTALITY IN GERIATRIC PATIENTS FOLLOWED IN THE INTENSIVE CARE UNIT
323
associated with a decrease in mortality in ICU pa-tients, but no reduction in mortality was found in geriatric obese patients in the same study (14). In a meta-analysis evaluating 32 studies conducted be-tween 1990 and 2013, in which 197,940 adults aged 65 and over were included, it was determined that the relationship between BMI and mortality formed a “U” shaped curve (15). With age, the curve shifts to the right and becomes flat. This change in the curve causes the standard BMI cut-off points to dif-fer in older adults as compared to younger popu-lations. These confusing results can be explained by the use of arbitrary obesity definitions, such as BMI> 28 and BMI> 31, in some studies; differenc-es in comorbidity burden between obese and non-
obese patients; and most importantly, the absence of a single obese patient phenotype. An obesity condition in which adults with dysmetabolic obesity, in which an increase in waist circumference is prom-inent, die at a younger age and those with a less metabolically active fat mass survive into older age may reflect the absence of this disease rather than representing a healthy state. Therefore, obesity may not have clear negative effects on the geriatric pop-ulation. The causes of this reversed epidemiological situation, which is called the obesity paradox, are not entirely clear (16). An increased energy reserve that can be consumed during disease can be use-ful in the “geriatric” population, where many acute and chronic diseases are normal, and adipose tissue
Table 3. Mortality rates of the groups according to the diagnosis of ICU admission.
Admission diagnosis Non-Obesen=1632 (%77.2)
Obese n=482 (%22.8) P-value
Cerebrovascular disease 61(29.0) 10(21.3) 0.281
Cardiac 42(37.8) 19(55.9) 0.062
Pulmonary 96(36.1) 35(36.8) 0.896
Pneumonia 66(41.3) 20(46.5) 0.535
COPD 19(26.0) 8(21.6) 0.612
Pulmonary, Other
11(33.3) 7 (46.7) 0.326
Renal-metabolic 39(40.6) 21(50) 0.307
Hepatic cirrhosis 7(63.6) 5(62.5) 0.663*
Trauma 11(28.9) 4(26.7) 0.577*
Sepsis 210(46.2) 65(47.8) 0.736
Pneumosepsis 41(42.7) 7(35) 0.524
Intra-abdominal sepsis
102(47.0) 33(44.0) 0.653
Urosepsis 15(30.0) 5(35.7) 0.683
Sepsis, other 52(56.5) 20(74.1) 0.101
Malignancy 40(31.0) 8(44.4) 0.255
Postoperative 38(17.3) 5(7.8) 0.063
GIB-Hemorrhage 29(53.7) 2(25.0) 0.128*
28-day mortality 549 (33.6) 162 (33.6) 0.990
ICU mortality 588(36.0) 181(37.6) 0.542
COPD: chronic obstructive pulmonary disease; GIB: gastrointestinal bleeding. *Fisher exact test
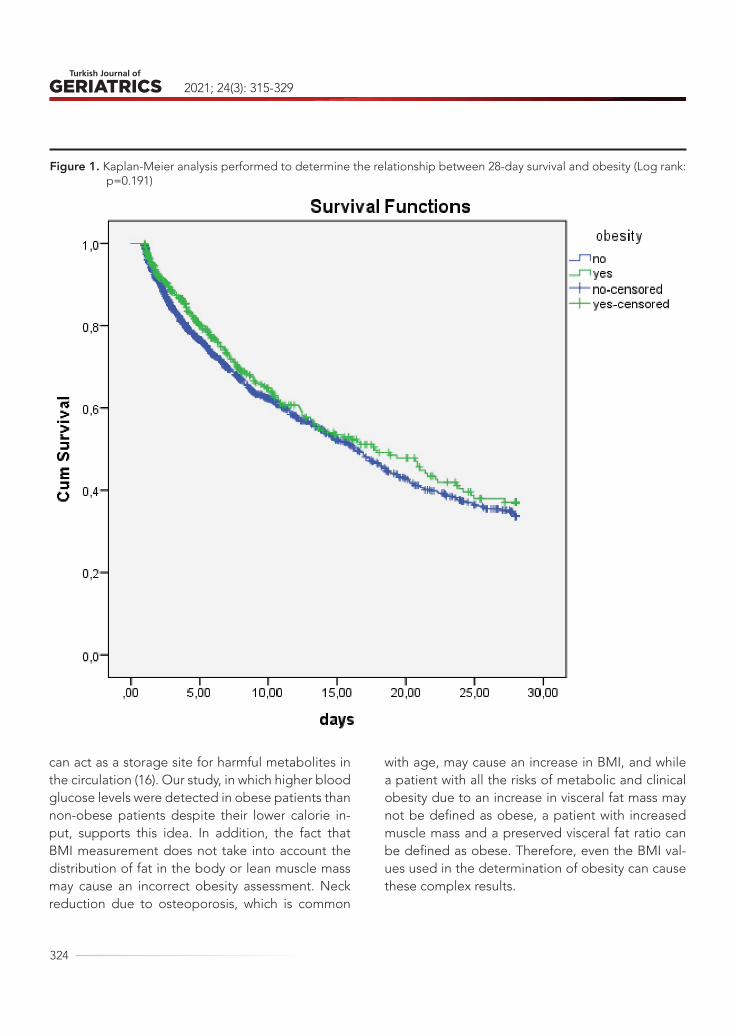
2021; 24(3): 315-329
324
can act as a storage site for harmful metabolites in the circulation (16). Our study, in which higher blood glucose levels were detected in obese patients than non-obese patients despite their lower calorie in-put, supports this idea. In addition, the fact that BMI measurement does not take into account the distribution of fat in the body or lean muscle mass may cause an incorrect obesity assessment. Neck reduction due to osteoporosis, which is common
with age, may cause an increase in BMI, and while a patient with all the risks of metabolic and clinical obesity due to an increase in visceral fat mass may not be defined as obese, a patient with increased muscle mass and a preserved visceral fat ratio can be defined as obese. Therefore, even the BMI val-ues used in the determination of obesity can cause these complex results.
Figure 1. Kaplan-Meier analysis performed to determine the relationship between 28-day survival and obesity (Log rank: p=0.191)
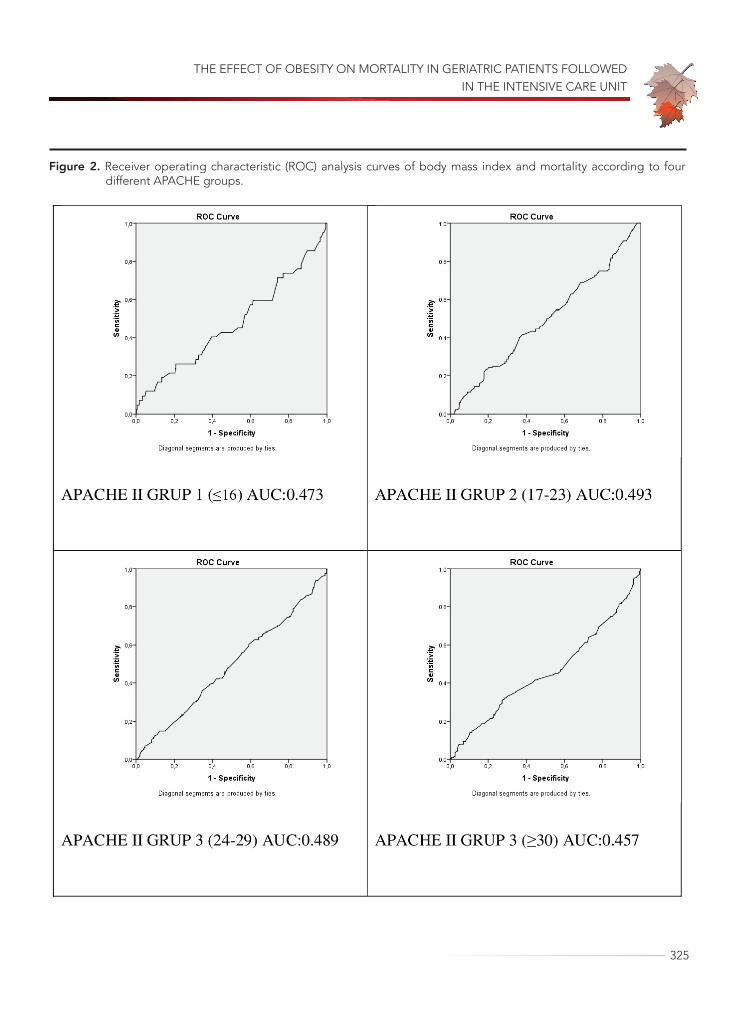
THE EFFECT OF OBESITY ON MORTALITY IN GERIATRIC PATIENTS FOLLOWED IN THE INTENSIVE CARE UNIT
325
Figure 2. Receiver operating characteristic (ROC) analysis curves of body mass index and mortality according to four different APACHE groups.

2021; 24(3): 315-329
326
The physiology of obesity and its comorbidi-ties are similar to those of aging and age-related diseases. Obesity and aging share a similar pheno-typical structure that can be defined by disruptions in genomic integrity, mitochondrial dysfunction, a weakened immune system, increased intracellular macromolecule accumulation, susceptibility to sys-temic inflammation, and changes in the composi-tion of the body and tissues (17). Also, both obesity and aging are associated with comorbidities, in-cluding diabetes mellitus, cardiovascular diseases, and some types of cancer (18). Our research results found that the prevalence of diabetes mellitus and hypertension increased in the obese geriatric pop-ulation, in accordance with the literature. Obesity and aging are characterized by the deterioration of homeostasis as a result of a gradual decrease in the function of various organs (19). The increased production of reactive oxygen species (ROS), which contributes to aging and obesity, causes oxidative damage and, eventually, DNA damage, which leads to telomere shortening and cell death (20). The re-sulting DNA damage plays a role in all pathologies associated with obesity and aging.
In our study, it was determined that geriatric obese patients required mechanical ventilation more frequently, but the duration of mechanical ventilation was similar to that observed for non-obese patients. Previous studies investigating the relationship between obesity and MV duration in patients have yielded controversial results (2,21). While the duration of mechanical ventilation was longer in obese patients than non-obese patients in one study (2), no such difference was found in an-other similar study (21). Our research results show that obese patients had higher ventilation pressures and lower compliance. These results are consistent with previous research. Although obese patients are ventilated with higher pressures on mechanical ventilators, they tend to have a lower functional re-sidual capacity and lung volume due to the chang-es in respiratory mechanics caused by increased
adipose tissue surrounding the chest wall (22). The decreased compliance found in obese patients can be explained by the fact that the mass burden of obesity makes the lungs more susceptible to ate-lectasis or increased alveolar wall tension due to the disrupted harmony between the lung and chest wall. Increased intra-abdominal pressure due to vis-ceral fat accumulation in the abdominal area may cause an increase in respiratory workload. In addi-tion, studies have determined that obese patients produce more carbon dioxide (23). This may explain the increased respiratory workload as well. In addi-tion to the increased workload caused by obesity, clinicians may be hesitant to admit geriatric obese patients to the ICU and attach them to a mechanical ventilator due to the muscle weakness seen in the geriatric population. However, studies have shown that the results of the use of mechanical ventilators in the geriatric patient group are comparable to those of non-geriatric patients and that ICU admis-sion should not be denied to geriatric patients (24).
In our study, the ICU follow-up duration was found to be significantly longer in obese geriatric patients as compared to non-obese geriatric pa-tients. Similar studies report that obesity increases the duration of ICU stay (5,6). In a meta-analysis of 23 studies, a trend toward an increase in ICU stay in obese patients was detected (6). In another me-ta-analysis of 14 studies, obesity was found to be as-sociated with increased ICU length of stay and du-ration of mechanical ventilation (5). However, there are studies that claim the opposite and find the average ICU duration of obese patients to be sim-ilar to that of non-obese patients (8). This may be explained by the fact that obese patients have dif-ferent phenotypes. There is not a single standard-ized obese patient profile in the ICU. Patients vary in terms of obesity class and comorbid disease bur-den. Also, some clinicians tend to think that obese patients may have worse outcomes. Therefore, the increased acceptance of obese patients who can be treated more easily in the intensive care unit and

THE EFFECT OF OBESITY ON MORTALITY IN GERIATRIC PATIENTS FOLLOWED IN THE INTENSIVE CARE UNIT
327
are not very critical may shorten ICU follow-up du-ration. On the other hand, vascular access problems are common in obese patients, and the frequency of using central catheters has increased in obese patients, as shown in our study. This may lead to infection development and catheter-related com-plications, prolonging the duration of ICU stay. In addition, increased AKI and pressure sore incidence in obese patients may have prolonged the duration of the ICU. Previous studies have shown that the prevalence of AKI in obese patients followed in the ICU is higher than in non-obese critically ill patients, and the frequency of AKI in critically ill patients in-creases with BMI (25). Although the pathophysiol-ogy of the development of increased AKI in obe-sity is not fully understood, increased renal blood flow and glomerular filtration rate due to changes in renal hemodynamics may lead to an increase in the filtration fraction, resulting in increased sus-ceptibility to injury. Obese ICU patients are at risk for increased intra-abdominal pressure, which can cause renal dysfunction due to both poor arterial perfusion and venous occlusion (25). As determined in this study in obese patients, the effects of more common comorbid diseases on kidney physiology should not be ignored. Another factor that may contribute to the effect of obesity on AKI is the dif-ficulty in assessing intravascular volume status and determining adequate fluid therapy or vasoactive drug dose. In addition, providing nursing care to obese patients is more difficult than providing care to normal-weight patients due to obese patients’ high body weight and large body surface area. The difficulty involved in position changes for these pa-tients creates the risk of pressure sores and lacer-ations of the skin. The disruption of the protective skin barrier may prolong stays in the ICU by increas-ing complications such as infection or bleeding in obese patients (4).
The strengths of the study are that it has a large sample and all the data is obtained from the clini-cal decision support system with electronic queries
for preventing data misses and human errors. There are some limitations of the study. First, having a sin-gle-center population prevents the generalization of the results despite the geographical diversity of the patients. The retrospective study design may create confounding factors and a risk of bias. In addition, the absence of data such as waist circum-ference or waist-hip ratio, to support the definition of obesity, may have affected the accuracy of the groups created according to BMI. The lack of regis-tration of IV fluids and diuretic treatments used be-fore ICU admission may have affected the BMI data by changing the weights of the patients measured in the ICU. Long-term follow-up results of patients who survived in the ICU could not be evaluated due to lack of data. There is a need for well-designed, randomized prospective studies that include geriat-ric obese patients at the center of the study in order to better understand the effect of obesity on the geriatric population in the ICU.
CONCLUSIONIt was determined that obesity does not make a difference in ICU mortality for geriatric patients. The obesity paradox in the ICU is supported by the lack of a difference in mortality when patients are grouped by admission diagnosis and disease sever-ity. According to our results, obesity increases ICU morbidity in geriatric patients, but it is not associ-ated with mortality. In an environment with limited resources, the careful selection of geriatric patients to be admitted to the ICU is important, and obese geriatric patients may have positive outcomes.
Conflict of Interest: The authors declare they have no conflict of interest.
Funding: The authors declared that this study re-ceived no financial support.

2021; 24(3): 315-329
328
REFERENCES1. Flegal KM, Carroll MD, Ogden CL, Curtin LR. Preva-
lence and trends in obesity among US adults, 1999-2008. JAMA 2010;303 (3): 235-41. (PMID: 20071471)
2. Robinson MK, Mogensen KM, Casey JD, et al. The relationship among obesity, nutritional status, and mortality in the critically ill. Crit Care Med 2015;43 (1): 87-100. (PMID: 25289931)
3. Porter Starr KN, McDonald SR, Weidner JA, Bales CW. Challenges in the Management of Geriatric Obesity in High Risk Populations. Nutrients 2016;8 (5): 262. (PMID: 27153084)
4. Winkelman C, Maloney B, Kloos J. The impact of obesity on critical care resource use and outcomes. Crit Care Nurs Clin North Am 2009;21 (3): 403-22. (PMID: 19840718)
5. Akinnusi ME, Pineda LA, El Solh AA. Effect of obe-sity on intensive care morbidity and mortality: a me-ta-analysis. Crit Care Med 2008;36 (1): 151-8. (PMID: 18007266)
6. Oliveros H, Villamor E. Obesity and mortality in criti-cally ill adults: a systematic review and meta-analysis. Obesity (Silver Spring). 2008;16 (3): 515-21. (PMID: 18239602)
7. Goulenok C, Monchi M, Chiche JD, Mira JP, Dhain-aut JF, Cariou A. Influence of overweight on ICU mortality: a prospective study. Chest 2004;125 (4): 1441-5. (PMID: 15078757)
8. Ni YN, Luo J, Yu H, et al. Can body mass index predict clinical outcomes for patients with acute lung injury/acute respiratory distress syndrome? A meta-analy-sis. Crit Care 2017;21 (1): 36. (PMID: 28222804)
9. Flegal KM, Kruszon-Moran D, Carroll MD, Fryar CD, Ogden CL. Trends in Obesity Among Adults in the United States, 2005 to 2014. JAMA 2016;315 (21): 2284-91. (PMID: 27272580)
10. United-Nations Department of economic and social affairs. Population Division. World Population age-ing 2019. Published by the United Nations; 2020. [Internet]. Available from: https://www.un.org/en/development/desa/population/publications/pdf/ageing/WorldPopulationAgeing2019-Report.pdf. Accessed: 01.05.2021.
11. Demirkıran H, Uzunoglu M, Erdivanlı B, et al. Preva-lence and clinical features of chronic critical illness in the elderly population in Turkey. Turkish Journal of Geriatrics 2020;23 (4): 501-508. (DOI: 10.31086 / tjgeri.2020.188).
12. Amarya S., Singh K., Sabharwal M. Health conse-quences of obesity in the elderly. J. Clin Gerontol Ger-iatr 2014;5: 63–67. (DOI: 10.1016/j.jcgg.2014.01.004).
13. Falagas ME, Athanasoulia AP, Peppas G, Karageor-gopoulos DE. Effect of body mass index on the out-come of infections: a systematic review. Obes Rev 2009;10 (3): 280-9. (PMID: 19243518)
14. Trivedi V, Jean RE, Genese F, et al. Impact of Obesi-ty on Outcomes in a Multiethnic Cohort of Medical Intensive Care Unit Patients. J Intensive Care Med 2018;33 (2): 97-103. (PMID: 27139008)
15. Winter JE, MacInnis RJ, Wattanapenpaiboon N, Nowson CA. BMI and all-cause mortality in older adults: a meta-analysis. Am J Clin Nutr 2014;99 (4): 875-90. (PMID: 24452240)
16. Oga EA, Eseyin OR. The Obesity Paradox and Heart Failure: A Systematic Review of a Decade of Evi-dence. J Obes 2016;2016: 9040248. (PMID: 26904277)
17. Tam BT, Morais JA, Santosa S. Obesity and ageing: Two sides of the same coin. Obes Rev 2020;21 (4): e12991. (PMID: 32020741)
18. Haslam DW, James WP. Obesity. Lancet 2005;366 (9492): 1197-209. (PMID: 16198769)
19. Barzilai N, Huffman DM, Muzumdar RH, Bartke A. The critical role of metabolic pathways in aging. Dia-betes 2012;61 (6): 1315-22. (PMID: 22618766)
20. Lee HC, Wei YH. Oxidative stress, mitochondrial DNA mutation, and apoptosis in aging. Exp Biol Med (Maywood) 2007;232 (5): 592-606. (PMID: 17463155)
21. Duane TM, Dechert T, Aboutanos MB, Malhotra AK, Ivatury RR. Obesity and outcomes after blunt trau-ma. J Trauma 2006;61 (5): 1218-21. (PMID: 17099532)
22. Salome CM, King GG, Berend N. Physiology of obesity and effects on lung function. J Appl Physiol (1985) 2010;108 (1): 206-11. (PMID: 19875713)
THE EFFECT OF OBESITY ON MORTALITY IN GERIATRIC PATIENTS FOLLOWED IN THE INTENSIVE CARE UNIT
329
23. De Jong A, Chanques G, Jaber S. Mechanical venti-lation in obese ICU patients: from intubation to ex-tubation. Crit Care 2017;21 (1): 63. (PMID: 28320439)
24. Añon JM, Gómez-Tello V, González-Higueras E, et al. Prognosis of elderly patients subjected to mechani-
cal ventilation in the ICU. Med Intensiva 2013;37 (3): 149-55. (in Spanish) (PMID: 22592112)
25. Schiffl H. Obesity and the Survival of Critically Ill Pa-tients with Acute Kidney Injury: A Paradox within the Paradox? Kidney Dis (Basel). 2020;6 (1): 13-21. (PMID: 32021870)

330
Turkish Journal of Geriatrics
DOI: ....
2020; 23(3): ...-...
CORRESPONDANCE
1 E
RESEARCH
Phone: +90
e-mail:
Received:
Accepted:
Turkish Journal of GeriatricsDOI: 10.31086/tjgeri.2021.2302021; 24(3): 330-343
CORRESPONDANCE
1 Eskişehir City Hospital, Physical Medicine and Rehabilitation, Eskişehir, Turkey
2 Eskişehir Osmangazi University, Department of Physical Medicine and Rehabilitation, Eskişehir, Turkey
3 Eskişehir Osmangazi University, Department of Biostatistics, Eskişehir, Turkey
THE EFFECT OF COVID-19 PANDEMIC ON SARCOPENIA, QUALITY OF LIFE AND PAIN: A ONE-YEAR FOLLOW-UP STUDY
RESEARCH
Fulya BAKILAN1 . . . . . . . . . . . . . . .
Merih ÖZGEN2 . . . . . . . . . . . . . . . .
Burcu ORTANCA1 . . . . . . . . . . . . . .
Onur ARMAĞAN2 . . . . . . . . . . . . . .
Ayşe EKİM1 . . . . . . . . . . . . . . . . . .
Funda Taşçıoğlu BERKAN2 . . . . . . .
Fezan Şahin MUTLU3 . . . . . . . . . . .
1 Fulya BAKILAN
Eskişehir City Hospital, Physical Medicine and Rehabilitation, Eskişehir, Turkey
Phone: +905057737335e-mail: [email protected]
Received: Jul 14, 2021 Accepted: Aug 30, 2021
Introduction: This study evaluated the effect of coronavirus disease 2019 pandemic on sarcopenia, quality of life and pain severity in elderly patients and investigated which patients were affected more from this pandemic (sarcopenic or not, males or females, and physically active or inactive).
Materials and Methods: A total of 225 elderly patients with SARC-F, visual analogue scale-musculoskeletal pain scores, handgrip strength, chair stand test, short form-36, demographic data and phone number records in July 2020 were included in this study. Follow-up was conducted in June 2021 with telephonic interviews. During follow-up, SARC-F, 10-point Likert pain scale, Short Form-36 and physical activity were evaluated.
Results: After one year of the COVID-19 pandemic, almost all short form-36 scores decreased; however, the pain and SARC-F scores did not show a significant change. Decrease in short form-36 scores were higher in patients without sarcopenia than in those with sarcopenia. Decrease in Short Form-36 scores were higher in women than in men. Increase in pain scores (active: p=0.851, inactive: p=0.005) and decrease in Short Form-36 scores, were higher in physically active patients than in physically inactive patients. SARC-F scores did not change in any of the study groups.
Conclusion: After one-year follow-up in elderly patients, quality of life decreased, severity of pain increased in physically inactive, and SARC-F was unaffected. Females, non-sarcopenic, and physically inactive patients were found to be more affected by the COVID-19 pandemic.
Keywords: COVID-19; Pain; Quality of life; Sarcopenia.
ABSTRACT

THE EFFECT OF COVID-19 PANDEMIC ON SARCOPENIA, QUALITY OF LIFE AND PAIN: A ONE-YEAR FOLLOW-UP STUDY
331
INTRODUCTIONIn December 2019, Wuhan city in China reported the first confirmed case of coronavirus disease 2019 (COVID-19), which subsequently caused worldwide outbreak. Consequently, a pandemic was declared by the World Health Organization (WHO). While it is important to focus on controlling COVID-19, it is also necessary to identify the long-term effects of the pandemic. COVID-19 has been shown to have substantial long-term impact on several organs of the musculoskeletal system, especially in the geri-atric population, because of restrictions and social isolation. One of the consequences of the COV-ID-19 pandemic has been a decrease in physical activity (1), which is a risk factor for pain (2), reduced quality of life (3), and sarcopenia (4). In addition, so-cial isolation and increased loneliness (5) can lead to anxiety and depression resulting in lower quali-ty of life in the elderly (6). Furthermore, decreased sunlight exposure, which is associated with lower vi-tamin D concentrations, is a risk factor for pain and sarcopenia (4).
According to the European Working Group on Sarcopenia in Older People (EWGSOP2), the SARC-F scale is recommended to identify cases of sarcopenia. If the results of SARC-F are negative, the patients are considered non-sarcopenic. In clini-cal practice, after a positive SARC-F score, low mus-cle strength is sufficient to start intervention (7).
Only a few studies have investigated the effects of COVID-19 pandemic on the musculoskeletal sys-tem (8,9). One of the studies reported increased sarcopenia rates in geriatric patients with diabetes (8). Another study reported pain augmentation in adults during the pandemic (9). Considering that the musculoskeletal system can be affected by many conditions, such as physical activity, sarcope-nia, and gender, evaluations should be made taking these conditions into account.
The aims of this one-year follow-up cohort study were as follows: 1) to evaluate the effect of the COV-ID-19 pandemic on sarcopenia using the SARC-F
scale, quality of life, and pain severity in geriatric patients; and 2) to investigate which patients were affected more when classified on the basis of the presence or absence of sarcopenia, sex, and being physically active or inactive.
MATERIALS AND METHODSThis cohort study was conducted in patients aged 60 years or older who were admitted to a physical medicine and rehabilitation outpatient clinic in July 2020. Patients with SARC-F scores, visual analog scale (VAS)-musculoskeletal pain scores, handgrip strength, chair stand test, short form-36 (SF-36), demographic data, and phone number records in July 2020 were included in this study. Follow-up was conducted via telephone interviews in June 2021. Patients with an additional chronic disease or sur-gery within one year; active cancer, cerebrovascu-lar stroke, and other neurological disorders, acute/subacute pain, active infection, active arthritis, impaired cognitive status, advanced hearing loss, those who ever had COVID-19 infection or under-went treatment in a hospital within the past one year and immobilised patients were excluded from the study.
In July 2020, 225 patients were evaluated in terms of demographic data (age; sex; weight; height; ed-ucation/working/family status; presence of con-current diseases, such as hypertension, diabetes mellitus, chronic obstructive pulmonary disease, thyroid problems; cane usage; smoking), VAS pain, SARC-F score, handgrip strength, chair stand test, and SF-36 by a physical medicine and rehabilitation specialist (face to face) in physical medicine and re-habilitation outpatient clinic. In June 2021, another physical medicine and rehabilitation specialist who was blind to 2020 records conducted telephone in-terviews with those patients. Any disease, such as cancer, infection, COVID-19 infection and surgery within one year; the rate of musculoskeletal pain with 10-point likert scale; SARC-F; SF-36; and regu-lar exercise were recorded via telephone interviews

2021; 24(3): 330-343
332
with patients themselves (10-15 minutes), without any visual interview. Telephone interviews were held those who were available at that time, appoint-ments were made those who were not available.
The VAS was used to measure general body musculoskeletal pain, which was assessed from 0 (no pain) to 10 (worst possible pain) (10). One year later, 10-point likert was used for general body mus-culoskeletal pain. The question for this measure-ment was the following: ‘‘How would you rate your general body pain on a 0–10 scale at the present time? Zero is no pain and ten is pain as bad as could be.’’
Quality of life assessment was performed using the SF-36 with 36 items on physical function, phys-ical role, emotional role, energy, body pain, men-tal health, general health, and social function. Each scale ranges from 0 (poor health) to 100 (perfect health) (11). Patients spent almostly an average of 5-10 minutes on answering the SF-36 by telephone.
Ambulation, strength, history of falls, rising from a chair, and stair climbing were evaluated using the SARC-F scale which assesses the risk of sarcopenia. A score lower than 4 was defined as non-sarcopen-ic. The chair stand test measures the time taken for five rounds of rising from the sitting position without using arms, and was defined as low when the time taken was >15s. Grip strength was measured with a hand-held dynamometer (Baseline, White Plains, New York, USA), and the cut-off thresholds were 32 kg for men and 22 kg for women). The chair stand test and grip strength were measured only in July 2020. Probable sarcopenia was defined according to the EWGSOP2 algorithm as having a low SARC-F score and low muscle strength (grip strength/chair stand test) (7).
Physical activity was assessed by asking patients to perform vigorous and moderate physical activity. Vigorous physical activities were defined as physi-cal effort resulting in faster breathing than normal. Moderate physical activities were defined as mod-erate physical effort resulting in somewhat faster
breathing than normal. Patients were asked the following questions: 1) ‘How many minutes do you spend on vigorous physical activity on an average day for one year?’; 2) ‘How many minutes do you spend on moderate physical activity on an average day for one year?’. According to the WHO guide-lines (12), at least 150 min of moderate and/or 75 min of vigorous physical activity per week for adults and elderly was defined as ‘regular physical activity’.
Verbal informed consent was provided by the patients before the telephonic interview. Ethics ap-proval was received from the local ethics committee 30/03/21-09 (25403353-050.99-181555).
Statistical AnalysisThe distribution of each continuous variable was
tested for normality using the Shapiro-Wilk test and is expressed as median value (%25-%75). Non-nor-mally distributed variables were performed using the Mann Whitney U and Wilcoxon Signed Ranks Test for continuous variables. The categorical vari-ables are expressed in frequencies and percentag-es. The Chi-square test was used to compare cate-gorical variables. A p-value < 0.05 was considered significant. All analyses were performed using the SPSS version 22.0 software (SPSS Inc., Chicago, IL, USA).
RESULTSOne patient died during the study period. Twenty (8.8%) patients with COVID-19 infection, six (2.6%) with an additional chronic disease (such as cancer, vision loss, cardiac disease, bone marrow disease), three (1.3%) who underwent surgery (discectomy, prostate), four (1.7%) with acute pain in the last month, and 30 (13.3%) who were not contacted by telephone were excluded. Finally, 161 patients (125 women, 36 men; mean age, 68.4 ± 6.2 years) who met the inclusion criteria were enrolled in our study. The demographic characteristics of the patients are presented in Table 1.

THE EFFECT OF COVID-19 PANDEMIC ON SARCOPENIA, QUALITY OF LIFE AND PAIN: A ONE-YEAR FOLLOW-UP STUDY
333
Comparison of patients between June 2020 and July 2021 showed that after approximately one year of COVID-19 pandemic, their SF-36 scores decreased except ‘role emotional’ (physical func-tion: p<0.001, role physical: p=0.007, bodily pain: p=0.011, energy: p<0.001, mental health: p<0.001, general health: p=0.006, social function: p=0.001). However, pain scores and SARC-F scores did not show a statistically significant change (Table 2).
Comparison of patients with and without sar-copenia showed that patients with sarcopenia had higher SARC-F and pain scores and lower SF-36 scores in both 2020 and 2021. In patients with probable sarcopenia, physical function and general health decreased after one year of COVID-19 pan-demic. In patients without sarcopenia, only SARC-F and pain scores and emotional role did not change; however, other parameters changed after one year of COVID-19 pandemic (physical function, p<0.001; physical role, p=0.024; bodily pain, p= 0.019; ener-gy, p<0.001; mental health, p<0.001; general health,
p=0.031; social function, p=0.004). On comparing patients with probable sarcopenia with those with-out sarcopenia, age (p=0.006) was found to be low-er and the rate of regular exercise (p=0.017) was higher in the no sarcopenia group (Table 3).
For female patients, most of the SF-36 scores (physical function, <0.001; physical role, p=0.019; energy, p=0.002; mental health, p<0.001; general health, p=0.014; social function, p=0.004) decreased within one year of the pandemic. For male patients, three of the SF-36 parameters decreased (physical function, p=0.004; energy, p=0.029; mental health, p=0.028). Comparison of patients according to sex showed that females were found to have significant-ly higher SARC-F and pain scores, whereas many of the SF-36 scores (physical function, physical role, emotional role, energy, mental health) were lower than those of males in both 2020 and 2021. How-ever, social function was similar between the two groups in both 2020 and 2021. On the other hand, females were found to have lower bodily pain and
Table 1. Demographic characteristics of patients
Frequenciesn (%)
Age (years) (median 25-75%) 67 (64-71)
Gender (female/male) 125 (77.6%) / 36 (22.4%)
Weight (kg) (median 25-75%) 76 (69.2-89)
BMI (median 25-75%) 29.3 (26.6-33.1)
Chronic diseases 135 (83.9%)
Working 8 (5%)
Education Primary school and lower 138 (85.7%)
High school and higher 23 (14.3%)
Family type Alone 22 (13.6%)
Nuclear family 104 (64.5%)
Extended family 35 (21.7%)
Cane usage 19 (11.8%)
Smoking 18 (11.2%)
(kg=kilograms, BMI=Body mass index)
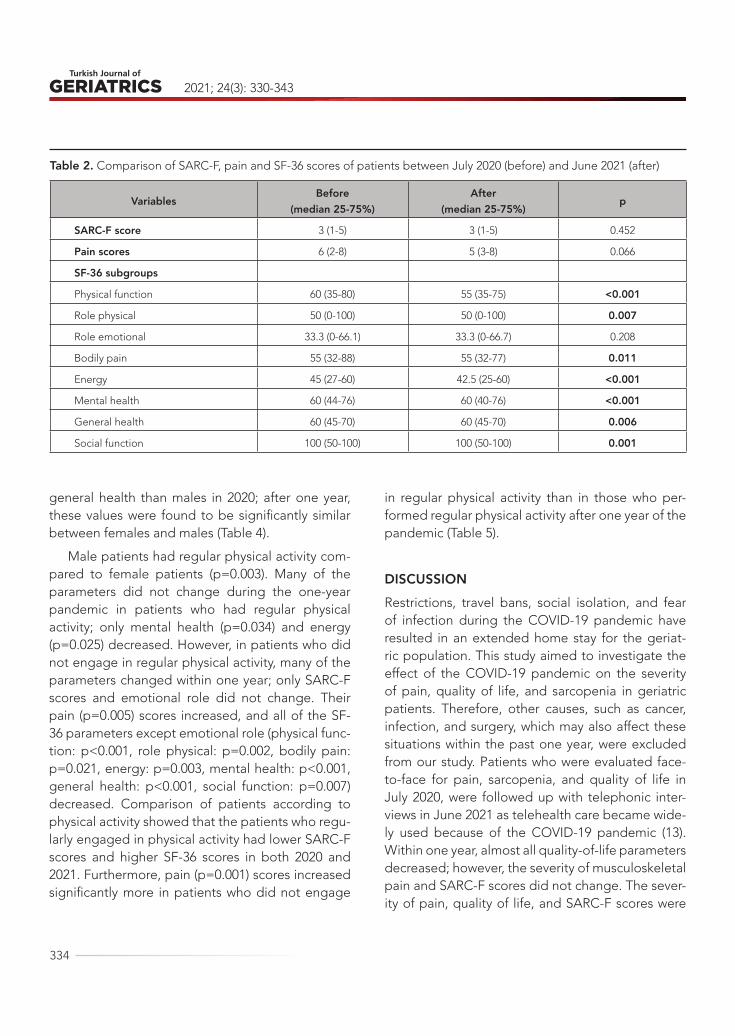
2021; 24(3): 330-343
334
general health than males in 2020; after one year, these values were found to be significantly similar between females and males (Table 4).
Male patients had regular physical activity com-pared to female patients (p=0.003). Many of the parameters did not change during the one-year pandemic in patients who had regular physical activity; only mental health (p=0.034) and energy (p=0.025) decreased. However, in patients who did not engage in regular physical activity, many of the parameters changed within one year; only SARC-F scores and emotional role did not change. Their pain (p=0.005) scores increased, and all of the SF-36 parameters except emotional role (physical func-tion: p<0.001, role physical: p=0.002, bodily pain: p=0.021, energy: p=0.003, mental health: p<0.001, general health: p<0.001, social function: p=0.007) decreased. Comparison of patients according to physical activity showed that the patients who regu-larly engaged in physical activity had lower SARC-F scores and higher SF-36 scores in both 2020 and 2021. Furthermore, pain (p=0.001) scores increased significantly more in patients who did not engage
in regular physical activity than in those who per-formed regular physical activity after one year of the pandemic (Table 5).
DISCUSSIONRestrictions, travel bans, social isolation, and fear of infection during the COVID-19 pandemic have resulted in an extended home stay for the geriat-ric population. This study aimed to investigate the effect of the COVID-19 pandemic on the severity of pain, quality of life, and sarcopenia in geriatric patients. Therefore, other causes, such as cancer, infection, and surgery, which may also affect these situations within the past one year, were excluded from our study. Patients who were evaluated face-to-face for pain, sarcopenia, and quality of life in July 2020, were followed up with telephonic inter-views in June 2021 as telehealth care became wide-ly used because of the COVID-19 pandemic (13). Within one year, almost all quality-of-life parameters decreased; however, the severity of musculoskeletal pain and SARC-F scores did not change. The sever-ity of pain, quality of life, and SARC-F scores were
Table 2. Comparison of SARC-F, pain and SF-36 scores of patients between July 2020 (before) and June 2021 (after)
VariablesBefore
(median 25-75%)After
(median 25-75%)p
SARC-F score 3 (1-5) 3 (1-5) 0.452
Pain scores 6 (2-8) 5 (3-8) 0.066
SF-36 subgroups
Physical function 60 (35-80) 55 (35-75) <0.001
Role physical 50 (0-100) 50 (0-100) 0.007
Role emotional 33.3 (0-66.1) 33.3 (0-66.7) 0.208
Bodily pain 55 (32-88) 55 (32-77) 0.011
Energy 45 (27-60) 42.5 (25-60) <0.001
Mental health 60 (44-76) 60 (40-76) <0.001
General health 60 (45-70) 60 (45-70) 0.006
Social function 100 (50-100) 100 (50-100) 0.001

THE EFFECT OF COVID-19 PANDEMIC ON SARCOPENIA, QUALITY OF LIFE AND PAIN: A ONE-YEAR FOLLOW-UP STUDY
335
Table 3. Comparison of age, physical activity levels, SARC-F, pain and SF-36 scores of both sarcopenia probable and no sarcopenia patients between July 2020 (before) and June 2021 (after)
VariablesSarcopenia probable
(median 25-75%) (n=35)
No sarcopenia (median 25-75%)
(n=126)p
Age (years) 70 (65-78) 67 (61.7-70) 0.006
Gender(female/male)n (%) 31(89%)/4(11%) 94(75%)/32(25%) 0.058
Regular physical activity n (%) 7 (20%) 53 (42%) 0.017
SARC-F Score Before 5 (4-8) 2.5 (1-4) <0.001
After 6 (4-7.25) 3 (1-4) <0.001
p 0.545 0.638
Pain scores Before 8 (6-8) 5 (0-7) <0.001
After 8 (5-9) 5 (2-8) <0.001
p 0.578 0.083
SF-36 subgroups
Physical function Before 30 (20-50) 70 (50-85) <0.001
After 25 (15-40) 65 (45-80) <0.001
p 0.008 <0.001
Physical role Before 0 (0-50) 75 (25-100) <0.001
After 0 (0-50) 75 (25-100) <0.001
p 0.131 0.024
Emotional role Before 0 (0-33.3) 66.7 (33.3-100) <0.001
After 0 (0-33.3) 66.7 (33-100) <0.001
p 0.414 0.317
Bodily pain Before 32.5 (22.5-55) 67 (45-90) <0.001
After 32.5 (10-55) 67 (45-78) <0.001
p 0.218 0.019
Energy Before 25 (20-40) 50 (35-65) <0.001
After 27.5 (15-40) 45 (30-65) <0.001
p 0.333 <0.001
Mental health Before 44 (32-60) 68 (52-80) <0.001
After 46 (36-57) 64 (44-76) <0.001
p 0.142 <0.001
General health Before 40 (30-55) 65 (50-70) <0.001
After 40 (28.7-60) 60 (50-70) <0.001
p 0.031 0.031
Social function Before 62.5 (25-100) 100 (59-100) 0.005
After 62.5 (34-100) 100 (50-100) 0.013
p 0.157 0.004(SF-36: Short form-36)

2021; 24(3): 330-343
336
Table 4. Comparison of age, SARC-F, pain and SF-36 scores of patients between July 2020 (before) and June 2021 (after) according to gender
VariablesFemale
(median 25-75%) (n=125)
Male (median 25-75%) (n=36) p
Regular physical activity (%) 39 (31.2%) 21 (58.3%) 0.003
Age (years) 67 (64-71) 67.5 (62.5-73) 0.722
SARC-F Score Before 4 (2-5) 1.5 (1-3.7) 0.001
After 4 (2-5) 2 (1-4) 0.004
P 0.725 0.325
Pain scores Before 6 (3-8) 4 (0-6.2) 0.008
After 5 (3.5-8) 5 (0.5-7.7) 0.037
P 0.240 0.086
SF-36 subgroups
Physical function Before 55 (30-72) 80 (65-95) <0.001
After 50 (30-70) 75 (55-90) <0.001
p <0.001 0.004
Physical role Before 50 (0-100) 100 (56-100) 0.001
After 50 (0-100) 87.5 (50-100) 0.002
P 0.019 0.165
Emotional role Before 33.3 (0-66.7) 66.7 (8-100) 0.016
After 33.3 (0-66.7) 66.7 (8-100) 0.006
p 0.193 1.000
Bodily pain Before 55 (32.5-77.5) 67 (55-90) 0.006
After 55 (32-77) 62 (45-90) 0.083
P 0.061 0.054
Energy Before 40 (25-55) 57 (41-75) <0.001
After 40 (21-55) 55 (45-72) <0.001
p 0.002 0.029
Mental health Before 60 (40-74) 76 (56-80) 0.005
After 56 (40-71) 72 (56-76) 0.005
p <0.001 0.028
General health Before 60 (40-70) 62 (55-75) 0.037
After 60 (40-70) 60 (50-73) 0.156
p 0.014 0.210
Social function Before 100 (50-100) 100 (78-100) 0.129
After 87.5 (50-100) 100 (53-100) 0.187
P 0.004 0.144
(SF-36: Short form-36)

THE EFFECT OF COVID-19 PANDEMIC ON SARCOPENIA, QUALITY OF LIFE AND PAIN: A ONE-YEAR FOLLOW-UP STUDY
337
Table 5. Comparison of age, SARC-F, pain and SF-36 scores of patients between July 2020 (before) and June 2021 (after) according to making regular physical activity or not.
Variables Regular physical activity (median 25-75%) (n=60)
No regular physical activity(median 25-75%) (n=101) p
Age (years) 67.5 (62.2-71) 67 (64-71) 0.564
Gender (female/male) (n) 39 / 21 86 / 15 0.003
SARC-F Score Before 2 (1-4) 4 (2-5) 0.003
After 2 (1-4) 4 (2-6) 0.001
p 0.761 0.259
Pain scores Before 5 (0-8) 6 (4-8) 0.059
After 4 (2-6) 6 (4-8) 0.001
p 0.851 0.005
SF-36 subgroups
Physical function Before 72.5 (50-85) 55 (30-70) 0.001
After 70 (45-85) 50 (30-70) <0.001
p 0.068 <0.001
Physical role Before 100 (25-100) 50 (0-100) 0.008
After 75 (25-100) 50 (0-75) 0.001
p 0.668 0.002
Emotional role Before 66.7 (0-100) 33.3 (0-66.7) 0.011
After 66.7 (33-100) 33.3 (0-66.7) 0.001
p 0.752 0.051
Bodily pain Before 67.5 (45-90) 55 (32.5-77.5) 0.057
After 67.5 (45-80) 55 (32-77) 0.061
p 0.247 0.021
Energy Before 50 (36.2-70) 40 (25-55) <0.001
After 50 (36-70) 35 (20-55) <0.001
p 0.025 0.003
Mental health Before 68 (44-80) 60 (44-76) 0.137
After 64 (44-76) 56 (40-72) 0.128
p 0.034 <0.001
General health Before 65 (50-75) 55 (40-67) 0.017
After 65 (51-73) 55 (40-65) 0.002
p 0.945 <0.001
Social function Before 100 (78-100) 87.5 (50-100) 0.013
After 100 (62-100) 75 (50-100) 0.014
p 0.102 0.007(SF-36: Short form-36)

2021; 24(3): 330-343
338
compared between female and male patients, pa-tients with and without sarcopenia, and physically active and inactive patients.
Decreased physical activity, protein intake, sun exposure, increased sitting-screen time, stress, anx-iety, and meal frequency have long-term adverse effects on muscle loss (4). To understand sarcopenic change, only the SARC-F score was used during the telephonic interview, and we could not perform grip strength and chair stand test measurements. The SARC-F scores were found to be similar between 2020 and 2021 in all study groups. A recent study in Japan reported that after the onset of the COV-ID-19 pandemic skeletal, muscle mass index had decreased in 56 geriatric diabetes patients com-pared to that before the pandemic with high mean follow-up duration (between the start and the end of the evaluation were 34 months) (8). The SARC-F is an inexpensive and practical method for evaluat-ing sarcopenia in geriatric patients, with a sensitiv-ity of 21% and specificity of 90% (14). It may not be appropriate to use SARC-F alone without objective measurements to evaluate annual changes in the geriatric population. We believe that there would have been a difference in our results if grip strength and chair stand test could be performed or the fol-low-up period was more than a year.
To the best of our knowledge, this is the first study to evaluate the effects of the COVID-19 pan-demic on pain, SARC-F, and quality of life by com-paring patients with and without sarcopenia ac-cording to the EWGSOP2 algorithm. Interestingly, in patients with sarcopenia, only general health and physical function decreased during the pandemic. Although all parameters were better in patients without sarcopenia in both 2020 and 2021, the pan-demic affected patients without sarcopenia more than those with sarcopenia. Almost all quality of life parameters decreased more than those of patients with sarcopenia within one year. Patients with sar-copenia already have impaired physical function, mobility, social isolation, and reduced quality of
life (15). Impaired physical function and mobility re-sult in reduced physical activity, as observed in our study. Therefore, their daily lives may not have been affected to a large extent because of the restrictions and social isolation during the pandemic.
This study did not investigate how physical ac-tivity levels change during the pandemic because previous studies have already reported worldwide reduction in levels of physical activity reduced dur-ing the COVID-19 pandemic (1). In Turkey, the rate of geriatric physical activity was previously report-ed to be 33% (16) during the COVID-19 pandem-ic, similar to the rate observed in our study (38%). These low rates are associated not only with the pandemic but also with the habits of Turkish peo-ple. Before the pandemic, Akturk et al. (17) reported the rate of physical activity in geriatric population to be 32%, which supports our findings. According to the WHO, at least 150 min of moderate-inten-sity physical activity or 75 min of vigorous-intensity physical activity per week is recommended (12). In-vestigating the factors related to the recommend-ed physical activity level showed that only energy and mental health were affected by the pandemic in patients who engaged in regular physical activity. On the other hand, musculoskeletal pain severity increased, and almost all quality-of-life parameters decreased in physically inactive patients. In addi-tion, SARC-F scores were lower in the physically active patients than in the inactive patients in both 2020 and 2021. This result showed that physical in-activity is related to increased pain, sarcopenia, and decreased quality of life, and it is important for the elderly population to gain and continue physical activity behaviours during a pandemic. In elderly individuals, walking programs have been shown to positively impact the quality of life (18). Web-based home exercise programs or outdoor walking pro-grams should be implemented, which can be useful for both increasing motivation and physical activity.
The relationship between quality of life and phys-ical activity in older people has been reported in a

THE EFFECT OF COVID-19 PANDEMIC ON SARCOPENIA, QUALITY OF LIFE AND PAIN: A ONE-YEAR FOLLOW-UP STUDY
339
systematic review (3). Physically inactive elderly indi-viduals are at an increased risk of cardiovascular dis-eases, cancer, falls, disability, functional limitation, cognitive decline, and depression. Consequently, they experience a lower quality of life (19). However, in our study, energy and mental health were affect-ed not only in physically inactive patients but also in physically active patients. The SF-36 mental health score was previously shown to be related to major depression in the elderly (20). Depressive symptoms were reported to be more prevalent compared to the pre-pandemic times (6). It has also been report-ed that both physical health and mental health of older people have been affected by the COVID-19 pandemic because of reduced physical activity, so-cial isolation, and fear of COVID-19 infection (5).
The importance of physical activity in the man-agement of pain has been highlighted in many studies (2), in which physical inactivity during the COVID-19 pandemic had a negative effect on pain severity among the elderly population. Similar to the findings of our study, but not in the elderly pop-ulation, decreased physical activity during the pan-demic was reported to be associated with pain aug-mentation in Japanese workers (9). Although pain severity in both male and female patients, as well as patients with and without sarcopenia, did not seem to be affected during the COVID-19 pandemic, the severity of pain was lower in women than in men and in patients with sarcopenia than in those with-out sarcopenia at both 2020 and 2021. Similar to our study, Zanin et al. reported a relationship between chronic pain and sarcopenia in 79 elderly women before the pandemic (21). Another study report-ed that women experience greater pain than men. Sex-based differences can be explained not only by hormonal differences and psychosocial factors, but also with sociodemographic factors (22).
Comparison of patients according to sex showed that not only pain severity but also SARC-F scores and quality of life in women was worse than in men in both 2020 and 2021. In addition, six of the eight
quality-of-life parameters were affected in women, while three of them affected men during the COV-ID-19 pandemic. This result is consistent with that of previous studies, and poor quality of life and sar-copenia are generally higher in women around the world (23). These results can be explained by the lower physical activity levels of women, as observed in the female patients in our study. Furthermore, the socioeconomic and sociodemographic differences may have influenced the results. In studies investi-gating the impact of the pandemic on both males and females, Japanese investigators found that su-icide deaths occurred more frequently in females since the onset of the pandemic (24). Another study reported that women had more musculoskeletal symptoms than men during the pandemic (25).
The main limitation of our study was evaluation of sarcopenia during follow-up without including objective measurements. The rating of muscu-loskeletal pain was done face to face interview in 2020, however one year later by telephone, they might not be equivalent, this was also a limitation of our study. In this pandemic, the Turkish elderly could not get outside for months, the questions asked in this study may not be sufficient to clearly reveal the troubles of this period, this is also another limitation of our study. However, to the best of our knowledge, our study is the first to evaluate the COVID-19 pan-demic on the severity of pain, SARC-F, and quality of life in older patients. The strength of our cohort study was reporting the one-year follow-up results of patients according to having sarcopenia/not, sex, and being physically active/inactive. Further studies are needed to investigate the effects of this pandemic on sarcopenia using objective measure-ments.
In conclusion, the following findings were ob-served after one-year follow-up of elderly patients during the COVID-19 pandemic: 1) their quality of life decreased; 2) patients without sarcopenia were affected more than those with sarcopenia in terms of decrease in quality of life; 3) females were affect-

2021; 24(3): 330-343
340
ed more than males in terms of decrease in quality of life; 4) physically inactive patients were affected from this pandemic more than physically active patients in terms of not only decrease in quality of life, but also increase in the severity of pain; and 5) SARC-F scores did not change in any study group. This pandemic has and will continue to affect the quality of life and cause multiple lifestyle changes
among older adults. Therefore, improving quality of life and increasing physical activities of older people are both economic and public health imperatives.
Conflict of InterestAll authors declare no conflict of interest.
REFERENCES1. Ammar A, Brach M, Trabelsi K, et al. Effects of COV-
ID-19 Home Confinement on Eating Behaviour and Physical Activity: Results of the ECLB-COVID19 In-ternational Online Survey. Nutrients 2020;12(6):1583. (PMID: 32481594)
2. Alzahrani H, Mackey M, Stamatakis E, et al. The as-sociation between physical activity and low back pain: A systematic review and meta-analysis of ob-servational studies. Sci Rep 2019; 9:8244. (PMID: 31160632)
3. Vagetti GC, Barbosa Filho VC, Moreira NB, et al. As-sociation between physical activity and quality of life in the elderly: a systematic review, 2000-2012. Braz. J. Psychiatry 2014; 36(1):76-88. (PMID: 24554274)
4. Kirwan R, McCullough D, Butler T, et al. Sarcopenia during COVID-19 lockdown restrictions: long-term health effects of short-term muscle loss. GeroSci-ence 2020; 42(6):1547-78. (PMID: 33001410)
5. Bailey L, Ward M, DiCosimo A, et al. Physical and mental health of older people while cocooning during the COVID-19 pandemic. QJM-INT J MED 2021; hcab015. (PMID: 33471128)
6. Meiring RM, Gusso S, McCullough E, et al. The effect of the COVID-19 pandemic movement restrictions on self-reported physical activity and health in New Zealand: A cross-sectional survey. Int. J. Environ. Res. Public Health 2021; 18(4):1719. (PMID: 33578964)
7. Cruz-Jentoft AJ, Bahat G, Bauer J, et al. Sarcope-nia: revised European consensus on definition and diagnosis. Age Ageing 2019; 48(1):16-31. (PMID: 30312372)
8. Hasegawa Y, Takahashi F, Hashimoto Y, et al. Effect of COVID-19 Pandemic on the Change in Skeletal Muscle Mass in Older Patients with Type 2 Diabetes:
A Retrospective Cohort Study. Int. J. Environ. Res. Public Health 2021; 18(8):4188. (PMID: 33920957)
9. Yoshimoto T, Fujii T, Oka H, et al. Pain Status and Its Association with Physical Activity, Psychological Stress, and Telework among Japanese Workers with Pain during the COVID-19 Pandemic. Int. J. Envi-ron. Res. Public Health 2021; 18(11):5595. (PMID: 34073863)
10. Gallagher EJ, Liebman M, Bijur PE. Prospective vali-dation of clinically important changes in pain sever-ity measured on a visual analog scale. Ann Emerg Med 2001;38:633–8. (PMID: 11719741)
11. Kocyigit H, Aydemir O, Fisek G, et al. Validity and reliability of Turkish version of short form 36: a study of patients with rheumatoid disorder. J Drug Ther 1999;12:102-6. (in Turkish)
12. Bull FC, Al-Ansari SS, Biddle S, et al. World Health Organization 2020 guidelines on physical activ-ity and sedentary behaviour. Br. J. Sports Med 2020;54:1451-62. (PMID: 33239350)
13. DiGiovanni G, Mousaw K, Lloyd T, et al. Develop-ment of a telehealth geriatric assessment model in response to the COVID-19 pandemic. Jour-nal of geriatric oncology 2020;11(5):761-3. (PMID: 32327321)
14. Ida S, Kaneko R, Murata K. SARC-F for screening of sarcopenia among older adults: a meta-analysis of screening test accuracy. JAMDA 2018;19(8): 685-9. (PMID: 29778639)
15. Landi F, Cherubini A, Cesari M, et al. Sarcopenia and frailty: from theoretical approach into clini-cal practice. Eur Geriatr Med. 2016; 7(3), 197-200. (DOI:10.1016/j.eurger.2015.12.015)
16. Demirdel E, Demirdel S, Karahan S, et al. The cons of COVID-19 restrictions on physical activity in the el-
THE EFFECT OF COVID-19 PANDEMIC ON SARCOPENIA, QUALITY OF LIFE AND PAIN: A ONE-YEAR FOLLOW-UP STUDY
341
derly; results of an online survey. Turkish J Geriatrics 2021; 24(1):32-40. (DOI: 10.31086/tjgeri.2021.197)
17. Aktürk Ü, Aktürk S, Erci B. The effects of depression, personal characteristics, and some habits on phys-ical activity in the elderly. Perspect Psychiatr Care 2019;55(1):112-8. (PMID: 30171700)
18. Sekerci YG, Bicer EK. The Effect of Walking Exercise on Quality of Life and Sleep in Elderly Individuals: Randomized Controlled Study. Turkish J Geriatrics 2019; 22(4):443-53. (DOI:10.31086/tjgeri.2020.123)
19. Cunningham C, O’Sullivan R, Caserotti P, et al. Con-sequences of physical inactivity in older adults: A systematic review of reviews and meta-analyses. SCAND J MED SCI SPOR 2020; 30(5): 816-827. (PMID: 32020713)
20. Bruce F, Marnin H, Rachel D. Validity of the SF-36 five-item Mental Health Index for major depression in functionally impaired, community-dwelling elder-ly patients. J Am Geriatr Soc 2005;53(11):1978-85. (PMID: 16274382)
21. Zanin C, Candido JB, Jorge MSG, et al. Sarcopenia and chronic pain in institutionalized elderly wom-
en. BrJP 2018;1(4):288-92. (DOI: 10.5935/2595-0118.20180055
22. Paller CJ, Campbell CM, Edwards RR, et al. Sex-based differences in pain perception and treatment. Pain medicine 2009;10(2):289-99. (PMID: 19207233)
23. Cherepanov D, Palta M, Fryback DG, et al. Gender differences in health-related quality-of-life are partly explained by sociodemographic and socioeconom-ic variation between adult men and women in the US: evidence from four US nationally representative data sets. Qual Life Res 2010;19(8):1115-24. (PMID: 20496168)
24. Nomura S, Kawashima T, Yoneoka D, et al. Trends in suicide in Japan by gender during the COVID-19 pandemic, up to September 2020. Psychiatry Res 2021; 295:113622. (PMID: 33290942)
25. Kirmizi M, Yalcinkaya G, Sengul YS. Gender differ-ences in health anxiety and musculoskeletal symp-toms during the COVID-19 pandemic. J Back Mus-culoskelet Rehabil 2021; 34(2):161-7. 1-7. (PMID: 33682695)
342
Turkish Journal of Geriatrics
DOI: ....
2020; 23(3): ...-...
CORRESPONDANCE
1 E
RESEARCH
Phone: +90
e-mail:
Received:
Accepted:
Turkish Journal of GeriatricsDOI: 10.31086/tjgeri.2021.2312021; 24(3): 342-350
CORRESPONDANCE
1 University of Health Sciences Diskapi Yildirim Beyazit Training and Research Hospital, Department of Anesthesiology and Reanimation, Ankara, Turkey
EVALUATION OF THE FACTORS PROLONGING THE DISCHARGE HOME OF PATIENTS IN A PALLIATIVE CARE CENTER
RESEARCH
Gülten UTEBEY1 . . . . . . . . . . . . . .
Julide ERGİL1 . . . . . . . . . . . . . . . . .
1 Gülten UTEBEY
University of Health Sciences Diskapi Yildirim Beyazit Training and Research Hospital, Department of Anesthesiology and Reanimation, Ankara, Turkey
Phone: +905327818811e-mail: [email protected]
Received: Aug 17, 2021 Accepted: Aug 30, 2021
Introduction: The need for palliative care increases with advanced age and chronic diseases. We evaluated the factors that prolong discharge from palliative care center to improve the efficient use of existing palliative care beds.
Materials and Methods: This retrospective study included patients discharged from a palliative care center. The demographic and clinical features of the two groups, differentiated by length of stay, were compared.
Results: This study included 103 patients Group 1, n = 56, aged 67.7 ± 16.4 years and Group 2, n = 47, aged 67.6 ± 14.1 years. The length of stay in the center was 12.4 ± 4.8 days for Group 1 and 42.4 ± 15.8 days for Group 2. The number of patients with heart failure was higher in Group 2 than in Group 1 (p = 0.006), and the number of patients receiving oral nutrition was higher in Group 1 (p = 0.031). The gastrostomy status of Group 2 was higher than that of Group 1 (p = 0.035). Grades 1 and 3-4 decubitus ulcers were more common in Group 1 than in Group 2 (p = 0.009), and the lowest sodium levels were lower in Group 1 (p = 0.033).
Conclusion: Anoxic brain injury as a referral diagnosis, presence of heart failure, and lower serum sodium levels were associated with a longer length of stay in palliative care center. It is important to determine the factors affecting long-term hospitalization and discharge so that more patients can benefit from inpatient palliative care services.
Keywords: Palliative Care; Length of Stay; Patient Discharge.
ABSTRACT
EVALUATION OF THE FACTORS PROLONGING THE DISCHARGE HOME OF PATIENTS IN A PALLIATIVE CARE CENTER
343
INTRODUCTION
Palliative care (PC) is defined as an approach that improves the quality of life of patients and their families when facing life-threatening diseases (1). The need for PC is growing due to the increases in the elderly population and the prevalence of chron-ic life-threatening diseases (2). Determining the fac-tors affecting the discharge of patients treated in a palliative care center (PCC) may contribute to the efficient use of existing PCC beds (3). The aim of this study was to evaluate the factors that prolong patients’ discharge from a PCC.
MATERIALS AND METHODS
Ethical approval and study protocol
This study was approved by the Instutional Ethical Committee of our university- affiliated training and research hospital in Ankara, Turkey (December 28, 2020, number 101/08, Chairperson: Professor GS; Clinicaltrials.gov identifier: NCT04755374). Written informed consent was obtained from all patients or their relatives. All procedures were performed in ac-cordance with the principles of the Declaration of Helsinki.
The records of patients referred to our universi-ty-affiliated training and research hospital’s PCC be-tween August 2018 and September 2020 and those who were discharged were evaluated retrospective-ly. Patients were excluded if their records were in-complete, they refused to participate in the study, they were transferred to intensive care, or they died.
Data sourcesThe data were obtained from the hospital com-
puterized database. The following data were re-corded: age, gender, body mass index, length of stay (LOS) in the PCC, diagnosis (cancer, cerebrovas-cular disease, Alzheimer’s disease/dementia, motor neurone disease, Parkinson’s disease, chronic ob-structive pulmonary disease [COPD], trauma, infec-
tion), a comorbid disease (hypertension, diabetes mellitus, heart failure, chronic kidney disease, epi-lepsy), performance assessed on the Karnofsky per-formance scale (KPS), clinical features (spontaneous breathing, tracheostomy, invasive home mechanical ventilation, oral nutrition, parenteral nutrition, gas-trostomy, decubitus ulcers, mobilization), education status of the patient and their caregiver, lowest and highest hemoglobin values, serum sodium (Na) lev-els, and white blood cell counts. The KPS measures a patient’s health status based on their self-care ca-pacity, ability to carry out daily tasks, and general functioning for survival. The KPS comprises 11 class-es, which progress from 0 (death) to 100 points (nor-mal condition without any disease) (4). The patients discharged home were grouped according to their LOS in the PCC as Group 1 (discharged in less than or equal to 21 days) or Group 2 (discharged after more than 21 days) and analyzed accordingly (5).
Data analysisStatistical analyzes were performed using IBM
SPSS for Windows Version 22.0 package program. Numerical variables are mean ± standard deviation or median [25–75. percentile] values and categor-ical variables were summarized with numbers and percentages. Parametric test assumptions (normal-ity and homogeneity of variances) were checked before comparing the groups in terms of numerical variables. Whether the numerical variables showed normal distribution was examined by Shapiro Wilks test. The homogeneity of the variances of the com-pared groups was examined using the Levene test. The difference between the two independent groups in terms of numerical variables was exam-ined using the t test in the independent groups if the parametric test conditions were met and with the Mann Whitney U test if they were not. Compar-ison of more than two groups in terms of numeri-cal variables was made with the Kruskal Wallis test. Whether there was a difference between the groups in terms of categorical variables was examined us-

2021; 24(3): 342-350
344
ing the chi-square test or Fisher’s exact test. The relationship between numerical variables was given by Spearman correlation coefficient. Multiple step-wise linear regression analysis was applied to deter-mine the factors determining the length of hospital stay. A value of p < 0.05 was accepted as statistically significant.
RESULTS During the 2-year study period, 197 patients were admitted to the PCC. Among them, 34 patients died, and 30 patients were transferred to inten-sive care unit; therefore , they were excluded from the study. Data from 103 patients (Group 1, n = 56; Group 2, n = 47) were included in the final analy-ses (Figure 1). All patients were referred from an intensive care unit. The LOS was 12.4 ± 4.8 (4–21) days and 41.4 ± 15.8 (22–90) days in Groups 1 and 2, respectively. The groups were comparable with respect to patient and caregiver characteristics, ex-cept for patient body mass index, which was higher in Group 2 (Table 1).
The frequencies of diagnoses and conditions of the patients are listed in Table 2. The number of pa-tients with heart failure was significantly higher in Group 2 than in Group 1 (14 [25.0%] vs. 25 [53.2%]; p = 0.006). More patients in Group 1 received oral nutrition (27 [48.2%]) than in Group 2 (12 [25.5%], p = 0.031), and the gastrostomy status of Group 2 pa-tients (28 [50.0%]) was higher than that of Group 1 patients (34 [72.3%], p = 0.035). Grades 1 and 3-4 decubitus ulcers were observed more frequently in Group 1 than in Group 2 (10 [17.9%] vs. 8 [17.0% ] patients and 7 [12.5%] vs. 2 [4.3%] patients, respec-tively; p = 0.009). There were no statistically signifi-cant differences in mobilization status (p = 0.057) or Karnofsky performance scale scores (p = 0.254) be-tween the groups (Table 2). The lowest recorded Na level was significantly lower in Group 1 than Group 2 (133.8 ± 4.95 mmol/L vs 135.8 ± 4.5 mmol/L; p = 0.033) (Table 3).
Multiple logistic regression was used to model LOS and patient characteristics. Compatibility tests with chi-square and pseudo R2 tests were used to test the compatibility of the model and explain the
Table 1. Comparison of patients characteristics between groups
Group 1Discharged
≤21 days (n=56)
Group 2Prolonged discharge
>21 days (n=47)
p value
Genderᵃ Female 26 (46.4) 20 (42.6) 0.845
Male 30 (53.6) 27 (57.4)
Age, ( years) ᵇ 67.7 ± 16.4 67.6 ± 14.1 0.971
BMI (kg/m²) ᵇ 25.4 ± 3.3 26.8 ± 3.0 0.029 ̽
Education Status of the Patient, ᵃ
Illiterate 11 (19.6) 8 (17.0)
0.586Primary school 22 (39.3) 24 (51.1)
High school 19 (33.9) 11 (23.4)
University 4 (7.1) 4 (8.5)
Education Status of the Patient’s Care giver, ᵃ
Illiterate 1 (1.8) 3 (6,4)
0.103Primary school 14 (25.0) 15 (31.9)
High school 34 (60.7) 18 (38.3)
University 7 (12.5) 11 (23.4)
ᵃ numbers (percentage), ᵇmean ± standard deviation, BMI: body mass index ̽ Statistically significant p values are highlighted.

EVALUATION OF THE FACTORS PROLONGING THE DISCHARGE HOME OF PATIENTS IN A PALLIATIVE CARE CENTER
345
Table 2. Comparison of diagnose, co-morbid disease and the clinical features between groups
Group 1Discharged≤21 days
(n=56)
Group 2Prononged discharge>21 days
(n=47)
p value
Cancer,ᵃ 8 (14.3) 6 (12.8) 1.000
Cerebrovascular disease, ᵃ 16 (28.6) 18 (38.3) 0.404
Alzheimer’s- Dementia, ᵃ 18 (32.1) 10 (21.3) 0.311
Anoxic brain injury, ᵃ 3 (5.4) 6 ( 12.8) 0.294
Motor neurone disease, ᵃ 1 (1.8) 1 (2.1) NA
Parkinson’s disease ,ᵃ 4 (7.1) 3 (6.4) 1.000
COPD, ᵃ 10 (17.9) 2 (4.3) 0.067
Trauma, ᵃ 7 (12.5) 6 (12.8) 1.000
Infection, ᵃ 5 (8.9) 9 (19.1) 0.223
Hypertension, ᵃ 35 (62.5) 31 (66.0) 0.874
Diabetes mellitus, ᵃ 18 (32.1) 17 (36.2) 0.825
Heart failure, ᵃ 14 (25.0) 25 (53.2) 0.006 ̽
Chronic kidney disease,ᵃ 4 (7.1) 5 (10.6) 0.729
Epilepsy, ᵃ 13 (23.2) 11 (23.4) 1.000
Number of patient having >1 co-morbidity, ᵃ 51(91.1) 43(91.5) 1.000
Number of patient having > 3 co-morbidity, ᵃ 9(16.1) 12(25.5) 0.346
Spontaneous breathing, ᵃ 47 (83.9) 32 (68.1) 0.097
Spontaneous breathing with tracheostomy, ᵃ 7 (12.5) 13 (27.7) 0.092
Invasive home mechanical ventilation, ᵃ 3 (5.4) 4 (8.5) 0.699
Oral nutrition, ᵃ 27 (48.2) 12 (25.5) 0.031 ̽
Parenteral nutrition, ᵃ 1 (1.8) 1 (2.1) NA
Gastrostomy present, ᵃ 28 (50.0) 34 (72.3) 0.035 ̽
Decubitus ulcers,ᵃ 27 (48.2) 32 (68.1) 0.067
Grade 1 10 (17.9) 8 (17,0)
0.009 ̽Grade 2 10 (17.9) 22 (46,8)
Grade 3-4 7 (12.5) 2 (4.3)
Mobilization 20 (35.7) 8 (17.5) 0.057
Karnofsky Performance Status,ᵇ 45 ± 8.5 43.6 ± 7.9 0.254
ᵃ numbers (percentage), ᵇmean ± standard deviation, COPD: chronic obstructive pulmonary disease, KPS: Karnofsky performance scale scores (0 to 100 points) ̽ Statistically significant p values are highlighted.
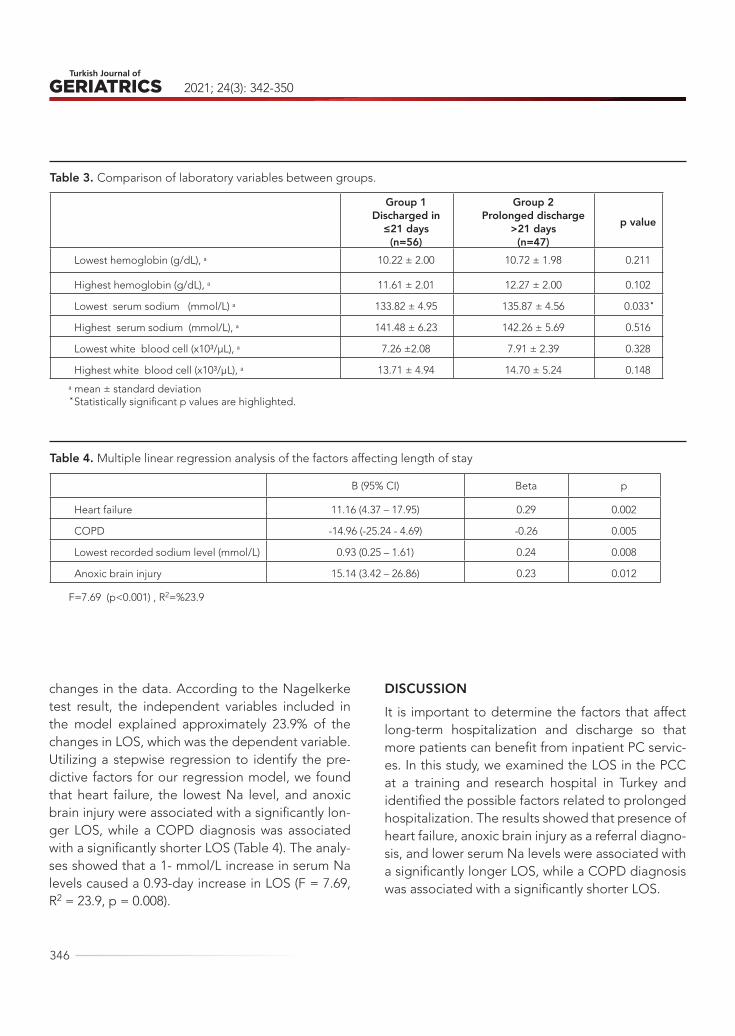
2021; 24(3): 342-350
346
changes in the data. According to the Nagelkerke test result, the independent variables included in the model explained approximately 23.9% of the changes in LOS, which was the dependent variable. Utilizing a stepwise regression to identify the pre-dictive factors for our regression model, we found that heart failure, the lowest Na level, and anoxic brain injury were associated with a significantly lon-ger LOS, while a COPD diagnosis was associated with a significantly shorter LOS (Table 4). The analy-ses showed that a 1- mmol/L increase in serum Na levels caused a 0.93-day increase in LOS (F = 7.69, R2 = 23.9, p = 0.008).
DISCUSSIONIt is important to determine the factors that affect long-term hospitalization and discharge so that more patients can benefit from inpatient PC servic-es. In this study, we examined the LOS in the PCC at a training and research hospital in Turkey and identified the possible factors related to prolonged hospitalization. The results showed that presence of heart failure, anoxic brain injury as a referral diagno-sis, and lower serum Na levels were associated with a significantly longer LOS, while a COPD diagnosis was associated with a significantly shorter LOS.
Table 3. Comparison of laboratory variables between groups.
Group 1Discharged in
≤21 days(n=56)
Group 2Prolonged discharge
>21 days(n=47)
p value
Lowest hemoglobin (g/dL), ᵃ 10.22 ± 2.00 10.72 ± 1.98 0.211
Highest hemoglobin (g/dL), ᵃ 11.61 ± 2.01 12.27 ± 2.00 0.102
Lowest serum sodium (mmol/L) ᵃ 133.82 ± 4.95 135.87 ± 4.56 0.033 ̽
Highest serum sodium (mmol/L), ᵃ 141.48 ± 6.23 142.26 ± 5.69 0.516
Lowest white blood cell (x10³/μL), ᵃ 7.26 ±2.08 7.91 ± 2.39 0.328
Highest white blood cell (x10³/μL), ᵃ 13.71 ± 4.94 14.70 ± 5.24 0.148
ᵃ mean ± standard deviation ̽ Statistically significant p values are highlighted.
Table 4. Multiple linear regression analysis of the factors affecting length of stay
B (95% CI) Beta p
Heart failure 11.16 (4.37 – 17.95) 0.29 0.002
COPD -14.96 (-25.24 - 4.69) -0.26 0.005
Lowest recorded sodium level (mmol/L) 0.93 (0.25 – 1.61) 0.24 0.008
Anoxic brain injury 15.14 (3.42 – 26.86) 0.23 0.012
F=7.69 (p<0.001) , R2=%23.9

EVALUATION OF THE FACTORS PROLONGING THE DISCHARGE HOME OF PATIENTS IN A PALLIATIVE CARE CENTER
347
PC is provided for a variety of serious illnesses and conditions for patients across a wide range of ages with the aim of increasing quality of life by pro-viding symptom control and decreasing suffering (1, 6). The capacity of PCCs and clinical experience in this field in Turkey is limited (3). Patients can be discharged home from PCCs when they are stable, symptom control is achieved, and family support is sufficient.
The diagnoses and clinical features of patients admitted to PCCs can affect their LOS (3). The pa-tients in the current study had multiple chronic dis-eases, and the mean KPS scores showed that most of the patients required considerable assistance and were disabled with the need for special care and assistance. The majority of patients were ad-mitted for diagnosis other than cancer. The most prevalent diagnoses were neurological disorders
Figure 1. Flowchart of patient enrolment in the study

2021; 24(3): 342-350
348
followed by COPD, trauma-related conditions, and infections. The most common comorbid diseases were hypertension, diabetes mellitus, heart failure, and epilepsy. We did not document the differences in comorbid diseases between the groups given the number of such diseases, which suggests that it is not the number of comorbid diseases but the se-verity of the comorbidity that has an impact on LOS.
Anoxic brain injury is a medical condition with devastating consequences caused by prolonged hypoxia (7). In a study investigating the LOS in a PCC of patients with traumatic brain injury, the mean LOS was 34.0 days (8). Notably, the LOS in the PCC was significantly higher among patients with a gastrostomy who were immobile and not fed orally.
Anemia can contribute to the symptoms of PC patients (9). Infection and decubitus ulcers are fac-tors that can affect PCC LOS (3), and urinary tract infections are common in PC patients (10). In a study reporting a mean 27.2 ± 30.9 day stay in a PCC, ad-vanced age, cancer, a diagnosis of hypoxic brain injury, the presence of hypertension, gastrostomy, parenteral nutrition, and infectious complications increased the LOS (3). In the patient group in our study, infection, anemia, and decubitus ulcers were not associated with a prolonged time to discharge.
Heart failure is more common with increasing age and is a worldwide public health problem (11). It is a complex clinical syndrome associated with vari-ous symptoms, including dyspnea, fatigue, periph-eral edema, and depression. Heart failure is one of the factors that affect PCC LOS (12). One study con-cluded that care pathways for the treatment of heart failure decreased mortality rates and the length of hospital stay, but no differences were observed in the readmission rates and hospitalization costs (13). In our study, patients with heart failure had a longer time to discharge from the PCC.
Hyponatremia is defined as a sodium level < 135 mmol/L (14). Hyponatremia management can improve the quality of life of patients with PC (15). Symptoms of hyponatremia may include nausea,
vomiting, headache, stupor, coma, seizures, fatigue, and cognitive impairment. Hyponatremia may be a contributing factor to the symptoms of PC patients (16) and is associated with increased mortality, prolonged hospital stay, and increased healthcare costs (17). Comorbid conditions may be the main cause of mortality in patients with severe hypona-tremia (18). In a study investigating the incidence of hyponatremia in patients referred for PC, 61.1% of patients with a malignant disease and 39.9% of those with a non-malignant disease were found to have hyponatremia (15). In hospitalized cancer pa-tients, hyponatremia may be the reason for long hospital stay (19). A study found a significant associ-ation between Na levels and length of hospitaliza-tion; for those discharged to their homes, the LOS was 16%–29% longer when the patients’ Na levels were below 135 mmol/L (14).
In the present study, the absolute value of the “lowest Na level” in the prolonged discharge group (Group 2) was well within normal ranges; howev-er, the fact that the LOS was higher in the patient group with the higher “lowest Na level” indicated that these patients needed to be hospitalized lon-ger to correct their hyponatremia. Therefore, our in-terpretation of the results pertaining to the LOS–Na level relationship was that in patients with hypona-tremia, a 1-mmol/L improvement in serum Na levels required a 0.93-day increase in LOS.
PC is difficult for patients with COPD because of its unpredictable disease course (20). In patients with COPD, PC is not limited to the terminal stage and can be provided at an early stage alongside cu-rative care (21).
This study has several limitations. First, it was a retrospective study, and the number of included patients was small. Second, we did not include the patients’ serum Na levels on admission in the analy-ses; therefore, we could not comment on this issue. Furthermore, patients’ medications and simultane-ous glucose levels during hyponatremia may have affected our results, but we did not include such

EVALUATION OF THE FACTORS PROLONGING THE DISCHARGE HOME OF PATIENTS IN A PALLIATIVE CARE CENTER
349
data in our analyses. Additionally, we did not strat-ify patients with COPD and heart failure according to disease severity, which may have affected our re-sults.
It is important to determine the factors that af-fect long-term hospitalization and discharge so that more patients can benefit from inpatient PC services. A better understanding of the factors that may cause prolonged hospitalization in PC units and the ability to cope with these problems may
help shorten the length of hospitalization.
In conclusion, we demonstrated that anoxic brain injury as a referral diagnosis, the presence of heart failure, and serum Na levels were associated with a significantly longer LOS in the PCC, while a COPD diagnosis was associated with a significantly shorter LOS.
Conflict of interest: The authors declare no conflicts of interest.
REFERENCES1. Radbruch L, De Lima L, Knaul F, et al. Redefining
Palliative Care-A New consensus-based definition. J Pain Symptom Manage 2020;60 (4): 754-764. (PMID: 32387576)
2. Meier DE. Palliative care in hospitals. J Hosp Med 2006;1 (1): 21-8. (PMID: 17219467)
3. Dincer M, Kahveci K, Doger C. An examination of factors affecting the length of stay in a palliative care center. J Palliat Med 2018; 21 (1): 11-15. ( PMID: 28622477)
4. Liem BJ, Holland JM, Kang MY, Hoffelt SC, Marquez CM. Karnofsky performance status assessment: res-ident versus attending. J Cancer Educ 2002;17 (3): 138-41. (PMID: 12243218)
5. Challis D, Hughes J, Xie C, Jolley D. An examination of factors influencing delayed discharge of older people from hospital. Int J Geriatr Psychiatry 2014;29 (2): 160-8. (PMID: 23661304)
6. Chahine LM, Malik B, Davis M. Palliative care needs of patients with neurologic or neurosurgical con-ditions. Eur J Neurol 2008;15 (12): 1265-72. (PMID: 19049542)
7. Pollock JM, Whitlow CT, Deibler AR, et al. Anoxic injury-associated cerebral hyperperfusion identified with arterial spin-labeled MR imaging. AJNR Am J Neuroradiol 2008; 29 (7): 1302-7. (PMID: 18451089)
8. Kahveci K, Dinçer M, Doger C, Yaricı AK. Traumatic brain injury and palliative care: a retrospective anal-ysis of 49 patients receiving palliative care during 2013-2016 in Turkey. Neural Regen Res 2017;12 (1): 77-83. (PMID: 28250751)
9. Neoh K, Gray R, Grant-Casey J, et al. National com-parative audit of red blood cell transfusion practice in hospices: Recommendations for palliative care practice. Palliat Med 2019;33 (1): 102-108. (PMID: 30260291)
10. Pereira J, Watanabe S, Wolch G. A retrospective review of the frequency of infections and patterns of antibiotic utilization on a palliative care unit. J Pain Symptom Manage. 1998;16 (6): 374-81. (PMID: 9879162)
11. Falk H, Ekman I, Anderson R, Fu M, Granger B. Older patients’ experiences of heart failure-an integrative literature review. J Nurs Scholarsh 2013;45 (3): 247-55. (PMID: 23617442)
12. Hjelmfors L, Strömberg A, Friedrichsen M, Martens-son J, Jaarsma T. Communicating prognosis and end-of-life care to heart failure patients: a survey of heart failure nurses’ perspectives. Eur J Cardiovasc Nurs 2014;13 (2): 152-61. (PMID: 24480779)
13. Kul S, Barbieri A, Milan E, Montag I, Vanhaecht K, Panella M. Effects of care pathways on the in-hospital treatment of heart failure: a systematic review. BMC Cardiovasc Disord 2012;25;12: 81. (PMID: 23009030)
14. Al Mawed S, Pankratz VS, Chong K, Sandov-al M, Roumelioti ME, Unruh M. Low serum so-dium levels at hospital admission: Outcomes among 2.3 million hospitalized patients. PLoS One 2018;22;13(3):e0194379. (PMID: 29566068)
15. Nair S, Mary TR, Tarey SD, Daniel SP, Austine J. Prevalence of Hyponatremia in Palliative Care Pa-tients. Indian J Palliat Care 2016;22 (1): 33-7. (PMID: 26962278)

2021; 24(3): 342-350
350
16. Filippatos TD, Makri A, Elisaf MS, Liamis G. Hypon-atremia in the elderly: challenges and solutions. Clin Interv Aging 2017;14;12: 1957-1965. (PMID: 29180859)
17. Nzerue CM, Baffoe-Bonnie H, You W, Falana B, Dai S. Predictors of outcome in hospitalized patients with severe hyponatremia. J Natl Med Assoc 2003; 95 (5): 335-43. (PMID: 12793790)
18. Krummel T, Prinz E, Metten MA, et al. Prognosis of patients with severe hyponatraemia is related not only to hyponatraemia but also to comorbidities and to medical management: results of an observation-
al retrospective study. BMC Nephrol 2016;22; 17 (1): 159. (PMID: 27770791)
19. Castillo JJ, Vincent M, Justice E. Diagnosis and man-agement of hyponatremia in cancer patients. Oncol-ogist 2012;17 (6): 756-65. (PMID: 22618570)
20. Curtis JR. Palliative and end-of-life care for patients with severe COPD. Eur Respir J 2008; 32 (3): 796-803. (PMID: 17989116)
21. Skilbeck J, Mott L, Page H, Smith D, Hjelmeland-Ah-medzai S, Clark D. Palliative care in chronic obstruc-tive airways disease: a needs assessment. Palliat Med 1998;12 (4): 245-54. (PMID: 9743823)
351
Turkish Journal of Geriatrics
DOI: ....
2020; 23(): ...-...
CORRESPONDANCE
1 E
RESEARCH
Phone: +90
e-mail:
Received:
Accepted:
Turkish Journal of GeriatricsDOI: 10.31086/tjgeri.2021.2322021; 24(3): 351-358
CORRESPONDANCE
1 Health Sciences University, Gaziosmanpaşa Education and Research Hospital, Anesthesia and Reanimation Clinic, İstanbul, Turkey
2 Health Sciences University,Mehmet Akif Ersoy Education and Research Hospital, Anesthesia and Reanimation Clinic, İstanbul, Turkey
MYOCARDIAL INJURY AFTER NONCARDIAC SURGERY IN GERIATRIC PATIENTS
RESEARCH
Döndü GENÇ MORALAR1 . . . . . . .
Bedih BALKAN1 . . . . . . . . . . . . . . .
1 Döndü Genç MORALAR
Health Sciences University, Gaziosmanpaşa Education and Research Hospital, Anesthesia and Reanimation Clinic, İstanbul, Turke
Phone: +905053737913e-mail: [email protected]
Received: Apr 10, 2021 Accepted: Sep 03, 2021
Background: Myocardial injury after noncardiac surgery is an independent predictor of mortality in the postoperative period, and the risk is higher in geriatric patients than it is for other groups. However, this condition is thought to be underdiagnosed. To obtain a diagnosis, measuring high-sensitivity cardiac troponin is critical during postoperative monitoring. This study aimed to evaluate the presence of myocardial injury after noncardiac surgery occurring in geriatric patients during the perioperative period.
Methods: This study included 259 patients over 65 years of age. A peak high-sensitivity cardiac troponin value of ≥ 0.03 ng/mL was accepted as a diagnostic criterion for myocardial injury after noncardiac surgery. The patients were divided into two groups—those who were diagnosed with myocardial injury after noncardiac surgery (Group A) and those who were not (Group B). Incidence rates, 30-day mortality rates, hospital stay durations, levels of urgency, and comorbidities were compared between the two groups.
Results: The mortality rate in Group A (25%) was significantly higher than that in Group B (5.8%; p < 0.001). In addition, the hospital stay duration was significantly longer in Group A. Finally, the rates of diabetes, coronary artery disease, and chronic renal failure were significantly higher in Group A.
Conclusions: The results of our study indicated that the mortality rate and hospital stay duration were significantly higher in geriatric patients with myocardial injury after noncardiac surgery. We think that high-sensitivity cardiac troponin values should be routinely monitored in the postoperative period in patients over 65 years of age for timely treatment of myocardial injury.
Keywords: Postoperative Complications; Troponin; Mortality; Geriatrics.
ABSTRACT
2021; 24(3): 351-358
352
INTRODUCTIONAfter noncardiac surgery, major adverse cardiac events are leading causes of morbidity and mortal-ity in patients (1). More than 200 million adults who undergo noncardiac surgery develop a myocardial injury each year, and this is estimated to result in 1 million deaths annually (2). Myocardial injury af-ter noncardiac surgery (MINS) is a relatively new term for postoperative myocardial injury, and it is thought to be underdiagnosed.
Diagnosis of MINS is difficult because patients are unable to describe certain symptoms, such as angina pectoris and dyspnea, because of analgesia, sedation, and intubation, as well as because chang-es in electrocardiography (ECG) are nonspecific (1, 3-5). Therefore, assessing high-sensitivity cardi-ac troponin (hs-cTnT) is critical for detecting acute myocardial injury (6-11). MINS is diagnosed from postoperative hs-cTnT elevation in the presence or absence of clinical symptoms. It is seen in 8%–22% of adults who undergo noncardiac surgeries, and it is an independent predictor of 30-day and 1-year mortality (7,12). Previous studies have investigated the role of hs-cTnT in perioperative myocardial is-chemic events and have demonstrated the prog-nostic function of postoperative hs-cTnT elevation (4, 13).
In a prospective study of more than 15,065 pa-tients who underwent noncardiac surgery, the pa-tients were screened within the first 3 days post-operatively for troponin elevation and ischemic symptoms. Although troponin elevation was ob-served in 8% of the patients, myocardial ischemic findings were detected in only half of this group (7). In a PErioperative ISchemic Evaluation (POISE) study, 5.0% of patients had a perioperative myocar-dial infarction, 65.3% of patients did not experience ischemic symptoms and the 30-day mortality rate was 11.6% (4).
Performing perioperative troponin follow-up can play a potentially critical role in improving patient outcomes (2). For this reason, routine monitoring
of cardiac troponin is recommended to identify pa-tients at risk for early postoperative cardiovascular events (14). This new definition has been recom-mended as a guide for timely diagnosis and inter-vention (15). Although studies have investigated this topic, no specific study has paired the issue of MINS with geriatric patients. Moreover, geriatric patients have insufficient cardiovascular compensation and extra concomitant comorbidities compared with other patients. For these reasons, we examined myocardial damage in geriatric patients during the perioperative period. The primary outcome was a comparison of mortality rates in patients with MINS diagnoses. The secondary outcomes were troponin levels, hospital stay durations, operation durations, comorbidities and their associations with MINS, and the rates of MINS in emergency cases.
METHODSThis study received ethical approval from the Clini-cal Research Ethics Committee of Bakırköy Dr. Sadi Konuk Education and Research Hospital (decision no. 2018/02/29). The study was retrospective, and no written consent was attempted. We included 259 American Society of Anesthesiologists (ASA) Score 1–3 patients older than 65 years of age who had undergone operations at the Bakırköy Dr. Sadi Konuk Education and Research Hospital between January 1, 2017, and January 1, 2018. Patient data, including troponin values, were reviewed and col-lected retrospectively from the hospital’s electronic database and death notification system, and their demographic data and accompanying diseases were recorded. The records were assessed, checked, and verified. The type, duration, and urgency of the operation were noted. Between January 1, 2017, and January 1, 2018, 1,180 patients underwent sur-gery at the Bakırköy Dr. Sadi Konuk Education and Research Hospital. We excluded patients with ASA 4 status who had undergone intracranial and cardio-vascular surgery and patients with incomplete data.
Because myocardial injuries typically occurred

MYOCARDIAL INJURY AFTER NONCARDIAC SURGERY IN GERIATRIC PATIENTS
353
within 3 days after the operation, hs-cTnT values were evaluated using the Elecsys 2010 Troponin T hs STAT test (Roche Diagnostics) for the first 3 days postoperatively. A peak hs-cTnT level of 0.03 ng/mL or higher was accepted as a diagnostic criterion for MINS.
The patients were divided into two groups—those diagnosed with MINS (Group A) and those who had no such diagnosis (Group B). The 30-day mortality rates, hospital stay durations, associations with comorbid diseases, and incidence rates of MINS in emergency cases were compared between the two groups.
Statistical method
Data are presented as mean ± standard devia-tion or median (range). The normality of distribution was measured with the Kolmogorov–Smirnov test. The Mann–Whitney U test was used to analyze the quantitative independent data, and the chi-square test or Fischer’s exact test was used to analyze the qualitative independent data. SPSS v22.0 was used for all analyses.
RESULTSThis study included 259 geriatric patients (116 [44.8%] women and 143 [55.2%] men). The mean patient age was 74.12 ± 7.3 years. The mean age of the patients with MINS (Group A) was 76.1 ± 7.7 years, whereas the mean age of the patients without a MINS diagnosis (Group B) was 72.8 ± 6.8 years. Thus, the mean age of Group A was signifi-cantly higher (p < 0.05). The demographic data of the patients participating in the study are shown in Table 1.
The highest troponin levels of the included pa-tients in the first 3 days postoperatively were con-sidered. Patients with hs-cTnT > 0.03 ng/mL were diagnosed as having MINS.
The mortality rate in Group A (25%) was signifi-cantly higher than that in Group B (5.8%; p < 0.05; Table 2). The mortality rates according to age dis-tribution are presented in Table 2. In addition, the hs-cTnT values were significantly different between the groups (Table 3).
The hospital stay duration in Group A was signif-icantly higher than that in Group B (p < 0.05; Table 4).
Table 1. Summary of patients’ demographic data
Mean ± SD
n (%)
Group A Group B p
Mean ± SD n (%)
Age 76.1 ± 7.7 72.8 ± 6.8 0.001a
Age groups
(years)
65–74 49 (47.1%) 105 (67.7%)
0.001b75–84 35 (33.7%) 39 (25.2%)
≥85 20 (19.2%) 11 (7.1%)
GenderFemale 52 (50.0%) 64 (41.3%)
0.167b
Male 52 (50.0%) 91 (58.7%)
aMann–Whitney U test, b Chi-square test or Fischer’s test
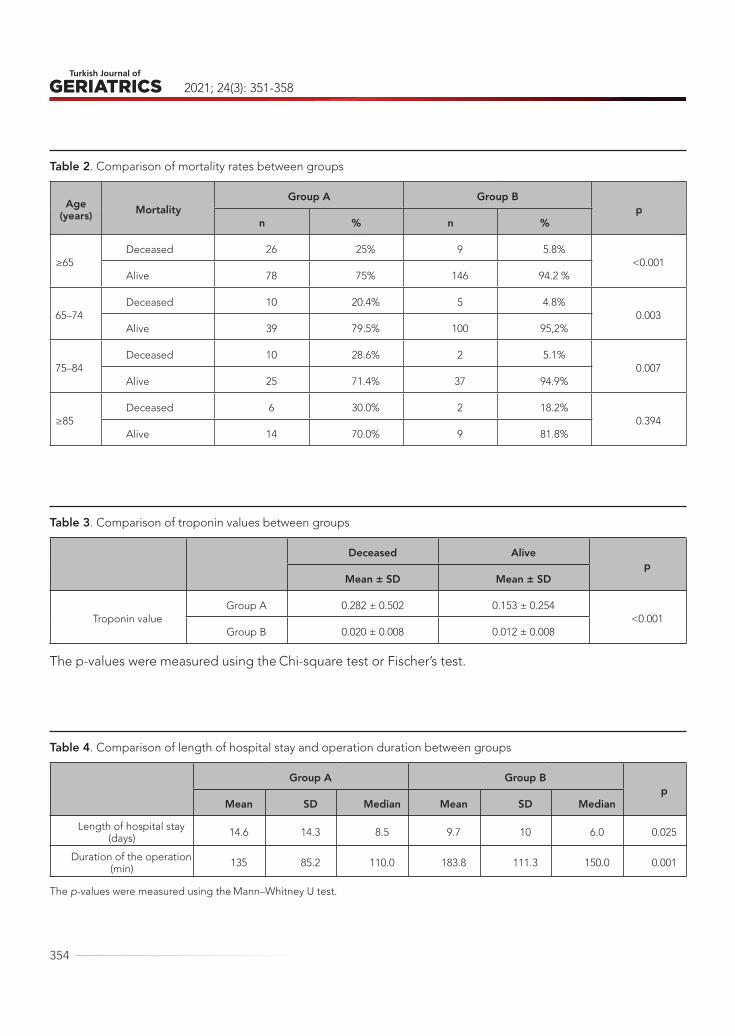
2021; 24(3): 351-358
354
Table 2. Comparison of mortality rates between groups
Age (years) Mortality
Group A Group Bp
n % n %
≥65Deceased 26 25% 9 5.8%
<0.001Alive 78 75% 146 94.2 %
65–74 Deceased 10 20.4% 5 4.8%
0.003Alive 39 79.5% 100 95,2%
75–84 Deceased 10 28.6% 2 5.1%
0.007Alive 25 71.4% 37 94.9%
≥85Deceased 6 30.0% 2 18.2%
0.394Alive 14 70.0% 9 81.8%
Table 3. Comparison of troponin values between groups
Deceased Alive p
Mean ± SD Mean ± SD
Troponin valueGroup A 0.282 ± 0.502 0.153 ± 0.254
<0.001Group B 0.020 ± 0.008 0.012 ± 0.008
The p-values were measured using the Chi-square test or Fischer’s test.
Table 4. Comparison of length of hospital stay and operation duration between groups
Group A Group Bp
Mean SD Median Mean SD Median
Length of hospital stay (days) 14.6 14.3 8.5 9.7 10 6.0 0.025
Duration of the operation (min) 135 85.2 110.0 183.8 111.3 150.0 0.001
The p-values were measured using the Mann–Whitney U test.
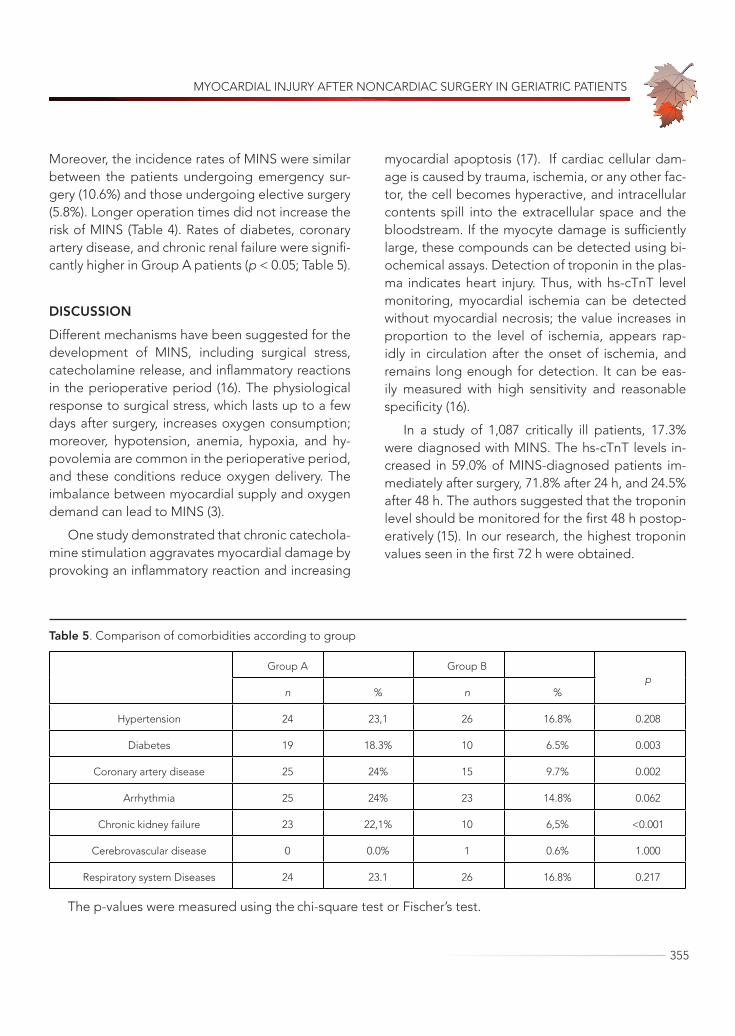
MYOCARDIAL INJURY AFTER NONCARDIAC SURGERY IN GERIATRIC PATIENTS
355
Moreover, the incidence rates of MINS were similar between the patients undergoing emergency sur-gery (10.6%) and those undergoing elective surgery (5.8%). Longer operation times did not increase the risk of MINS (Table 4). Rates of diabetes, coronary artery disease, and chronic renal failure were signifi-cantly higher in Group A patients (p < 0.05; Table 5).
DISCUSSIONDifferent mechanisms have been suggested for the development of MINS, including surgical stress, catecholamine release, and inflammatory reactions in the perioperative period (16). The physiological response to surgical stress, which lasts up to a few days after surgery, increases oxygen consumption; moreover, hypotension, anemia, hypoxia, and hy-povolemia are common in the perioperative period, and these conditions reduce oxygen delivery. The imbalance between myocardial supply and oxygen demand can lead to MINS (3).
One study demonstrated that chronic catechola-mine stimulation aggravates myocardial damage by provoking an inflammatory reaction and increasing
myocardial apoptosis (17). If cardiac cellular dam-age is caused by trauma, ischemia, or any other fac-tor, the cell becomes hyperactive, and intracellular contents spill into the extracellular space and the bloodstream. If the myocyte damage is sufficiently large, these compounds can be detected using bi-ochemical assays. Detection of troponin in the plas-ma indicates heart injury. Thus, with hs-cTnT level monitoring, myocardial ischemia can be detected without myocardial necrosis; the value increases in proportion to the level of ischemia, appears rap-idly in circulation after the onset of ischemia, and remains long enough for detection. It can be eas-ily measured with high sensitivity and reasonable specificity (16).
In a study of 1,087 critically ill patients, 17.3% were diagnosed with MINS. The hs-cTnT levels in-creased in 59.0% of MINS-diagnosed patients im-mediately after surgery, 71.8% after 24 h, and 24.5% after 48 h. The authors suggested that the troponin level should be monitored for the first 48 h postop-eratively (15). In our research, the highest troponin values seen in the first 72 h were obtained.
Table 5. Comparison of comorbidities according to group
Group A Group Bp
n % n %
Hypertension 24 23,1 26 16.8% 0.208
Diabetes 19 18.3% 10 6.5% 0.003
Coronary artery disease 25 24% 15 9.7% 0.002
Arrhythmia 25 24% 23 14.8% 0.062
Chronic kidney failure 23 22,1% 10 6,5% <0.001
Cerebrovascular disease 0 0.0% 1 0.6% 1.000
Respiratory system Diseases 24 23.1 26 16.8% 0.217
The p-values were measured using the chi-square test or Fischer’s test.
2021; 24(3): 351-358
356
In one study, the mortality rate was 16.9% among patients with peak TnT ≥ 0.30 mg/L (18). Van Waes et al. (12) prospectively screened 3,224 patients aged ≥ 60 years who underwent noncardiac sur-gery; postoperative myocardial injury was detected in 715 patients (22%). In our study, the incidence of MINS increased with age in geriatric patients.
Inhibition of platelet function or perioperative suppression of sympathetic effects of the compen-satory expansion of surgery has not been found to be beneficial in many clinical trials (19).
One study reported that myocardial injury devel-oped in one of seven patients over 65 years of age who had coronary artery disease, peripheral arterial disease, or stroke (20). In our study, older age and accompanying diseases, such as coronary artery disease, increased the risk of MINS.
In a prospective multicenter study including 3,387 patients undergoing noncardiac surgery, Sa-baté et al. (21) found that chronic renal failure was associated with major cardiac and cerebrovascular events. We also observed chronic renal failure more frequently in patients with MINS.
Few studies have evaluated the relationship between operation duration and MINS. Bae et al. (22) reported that the duration of surgery was as-sociated with MINS. In contrast, our data indicated that the operation duration did not increase with the development of MINS; in fact, MINS was more commonly noted in operations of shorter durations.
Studies have demonstrated that emergency op-erations are independent risk factors for MINS. In these operations, there is not enough preoperative evaluation or preparation because of their urgent nature, intraoperative hypotension and arrhythmia are more common, and blood transfusions are more frequently needed (15). However, the incidence of MINS in our study was similar in emergency and elective cases.
MINS is a frequent complication after noncardiac surgery; it is found early in routine clinical screening, and it has been shown to be associated with short- and long-term mortality (4, 5, 7, 23). In our study, mortality and morbidity rates were significantly higher in patients over 65 years of age who were di-agnosed with MINS compared with those who were not diagnosed with MINS. MINS was more common in patients with accompanying diabetes, coronary artery disease, and chronic renal failure.
Many studies have investigated the role of cardi-ac troponins in diagnosing perioperative myocardi-al ischemic events and shown the prognostic value of postoperative cardiac troponin elevation (4, 23). Different studies used different values, such as 0.1 ng/mL (5, 23) or 0.14 mg/L (20), to diagnose MINS. As a result, we think that hs-cTnT values should be routinely monitored postoperatively in patients over 65 years of age for early diagnosis and timely treatment. However, additional prospective studies are required on this topic.
Limitations of the studyThere are some limitations associated with this
study that should be mentioned. The study was ret-rospective, involved a single center study, and only included patients whose hs-cTnT values were avail-able in the medical records. Prospective studies with a large number of patients and different surgi-cal groups will overcome these limitations, provid-ing clearer information on the topic.
Conflicts of Interest: The authors declare no conflicts of interest.
Funding: No funding was received for this study.
Running Head: MINS in Geriatric Patients

MYOCARDIAL INJURY AFTER NONCARDIAC SURGERY IN GERIATRIC PATIENTS
357
REFERENCES1. Fleisher LA, Fleischmann KE, Auerbach AD, et al.
2014 ACC/AHA guideline on perioperative cardi-ovascular evaluation and management of patients undergoing noncardiac surgery: a report of the American College of Cardiology/American Heart Association Task Force on Practice Guidelines. Cir-culation 2014;130(24):e278–333 (PMID: 25085961)
2. Khan J, Alonso-Coello P, Devereaux PJ. Myocardi-al injury after noncardiac surgery. Curr Opin Cardi-ol 2014;29(4):307-311 (PMID: 25029449)
3. Landesberg G, Beattie S, Mosseri M, et al. Perioperative myocardial infarction. Circulation 2009;119(22):2936–44 (PMID: 19506125)
4. Devereaux PJ, Xavier D, Pogue J, et al.; POISE (PeriOperative ISchemic Evaluation) Investigators. Characteristics and short-term prognosis of periop-erative myocardial infarction in patients undergoing noncardiac surgery: a cohort study. Ann Intern Med 2011;154(8):523–8 (PMID: 21502650)
5. Devereaux PJ, Chan MT V, Alonso-Coello P, et al. Association between postoperative troponin levels and 30-day mortality among patients undergoing noncardiac surgery. JAMA 2012;307(24):2295–304 (PMID: 22706835)
6. Van Waes JA, Nathoe HM, de Graaff JC, et al.; Car-diac Health After Surgery (CHASE) Investigators. Myocardial injury after noncardiac surgery and its association with short-term mortality. Circulation 2013;127(23):2264–71 (PMID: 23667270)
7. Botto F, Alonso-Coello P, Chan MT, et al.; Vascular Events in Noncardiac Surgery Patients Cohort Eval-uation (VISION) Writing Group, on behalf of the Vas-cular Events in Noncardiac Surgery Patients Cohort Evaluation (VISION) Investigators. Myocardial inju-ry after noncardiac surgery: a large, international, prospective cohort study establishing diagnostic criteria, characteristics, predictors, and 30-day out-comes. Anesthesiology 2014;120(3):564–78 (PMID: 24534856)
8. Ekeloef S, Alamili M, Devereaux PJ, et al. Troponin elevations after non-cardiac, non-vascular surgery are predictive of major adverse cardiac events and mortality: a systematic review and meta-analysis. Br J Anaesth 2016;117(5):559–68 (PMID: 27799170)
9. Devereaux PJ, Biccard BM, Sigamani A, et al. As-sociation of postoperative high-sensitivity troponin levels with myocardial injury and 30-day mortality
among patients undergoing noncardiac surgery. JAMA 2017;317(16):1642–51 (PMID: 28444280)
10. Kristensen SD, Knuuti J, Saraste A, et al. 2014 ESC/ESA guidelines on non-cardiac surgery: cardiovas-cular assessment and management: The Joint Task Force on non-cardiac surgery: cardiovascular as-sessment and management of the European Soci-ety of Cardiology (ESC) and the European Society of Anaesth. Eur Heart J 2014;35(35):2383–431 (PMID: 25086026)
11. Thygesen K, Alpert JS, Jaffe AS, et al. Joint ESC/ACCF/AHA/WHF Task Force for Universal Definition of Myocardial Infarction; Authors/Task Force Mem-bers Chairpersons; Biomarker Subcommittee; ECG Subcommittee; Imaging Subcommittee; Classifica-tion Subcommittee; Intervention Subcommittee; Tri-als & Registries; ESC Committee for Practice Guide-lines (CPG); Document Reviewers. Third universal definition of myocardial infarction. J Am Coll Cardiol 2012;60(16):1581–98 (PMID: 22958960)
12. Van Waes JA, Grobben RB, Nathoe HM, et al. One-year mortality, causes of death, and cardiac interven-tions in patients with postoperative myocardial inju-ry. Anesth Analg 2016;123(1):29–37 (PMID: 27111647)
13. Devereaux PJ, Goldman L, Cook DJ, et al. Periop-erative cardiac events in patients undergoing non-cardiac surgery: a review of the magnitude of the problem, the pathophysiology of the events and methods to estimate and communicate risk. CMAJ 2005;173(6):627–34 (PMID: 16157727)
14. Thygesen K, Alpert JS, Jaffe AS, et al. Joint ESC/ACCF/AHA/WHF task force for the universal defi-nition of myocardial infarction. Third universal definition of myocardial infarction. Circulation 2012;126(16):2020–35 (PMID: 22923432)
15. Zhao XJ. Zhu FX, Li S, et al. Acute kidney injury is an independent risk factor for myocardial injury af-ter noncardiac surgery in critical patients. J Crit Care 2017;39:225–31 (PMID: 28202201)
16. Sun JZ. Maquire D. How to prevent periopera-tive myocardial injury: the conundrum continues. Am Heart J 2007;154(6):1021–8 (PMID: 18035070)
17. Hu A, Jiao X, Gao E, et al. Chronic beta-adrener-gic receptor stimulation induces cardiac apoptosis and aggravates myocardial ischemia/reperfusion injury by provoking inducible nitric-oxide synthase–mediated nitrative stress. J Pharmacol Exp Ther 2006;318(2):469–75 (PMID: 16574780)

2021; 24(3): 351-358
358
18. Iglesias PP, Ruano SD, Álvarez-García J. Myocardi-al injury after noncardiac surgery. Rev Esp Cardiol 2014;67(10):794–6 (PMID: 25205649)
19. Devereaux PJ, Mrkobrada M, Sessler DI, et al. Aspirin in patients undergoing noncardiac surgery. N Engl J Med, 2014;370(16):1494–503 (PMID: 24679062)
20. Puelacher C, Lurati Buse G, Seeberger D, et al. BASEL-PMI Investigators. Perioperative Myocar-dial Injury After Noncardiac Surgery: Incidence, Mortality, and Characterization. Circulation, 2018:20;137(12):1221–32 (PMID: 29203498)
21. Sabaté S, Mases A, Guilera N, et al. Incidence and
predictors of major perioperative adverse cardiac and cerebrovascular events in noncardiac surgery. Br J Anaesth 2011;107(6):879–90 (PMID: 21890661)
22. Bae MH, Lee JH, Yang DH, et al. Usefulness of sur-gical parameters as predictors of postoperative car-diac events in patients undergoing non-cardiac sur-gery. Circ J 2014;78:718–23. (PMID: 24351662)
23. Landesberg G, Shatz V, Akopnik I, et al. Association of cardiac troponin, CK-MB, and postoperative myo-cardial ischemia with long-term survival after major vascular surgery. J Am Coll Cardiol 2003;42(9):1547–54 (PMID: 14607436)

359
Turkish Journal of Geriatrics
DOI: ....
2020; 23(): ...-...
CORRESPONDANCE
1 E
RESEARCH
Phone: +90
e-mail:
Received:
Accepted:
Turkish Journal of GeriatricsDOI: 10.31086/tjgeri.2021.2332021; 24(3): 359-369
CORRESPONDANCE
1 Ankara City Hospital, Department of Anesthesiology and Reanimation, ANKARA, Turkey
DO SHOCK INDEX, MODIFIED SHOCK INDEX, AND SHOCK INDEX BY AGE HAVE A PREDICTIVE VALUE IN DETERMINING THE RISK OF POST-SPINAL HYPOTENSION IN ELDERLY PATIENTS?
RESEARCH
Gözde EROL1 . . . . . . . . . . . . . . . .
İsmail AYTAÇ1. . . . . . . . . . . . . . . . .
Betül GÜVEN AYTAÇ1. . . . . . . . . . .
1 İsmail AYTAÇ
Ankara City Hospital, Department of Anesthesiology and Reanimation, ANKARA, Turkey
Phone: +905056340369e-mail: [email protected]
Received: Apr 05, 2021 Accepted: Aug 29, 2021
Introduction: Intraoperative hypotension in the elderly, is associated with an increased risk of complications. Predicting intraoperative hypotension will help patients have better outcomes by providing early prevention and intervention. We investigated the predictive value of the shock index, modified shock index, and shock index by age to determine the risk of hypotension in elderly patients undergoing spinal anesthesia in minor elective surgeries.
Materials and Methods: Our prospective observational study included 128 patients aged ≥65 with ASA classifications of I-III undergoing minor elective surgeries under spinal anesthesia lasting <120 minutes. The patients’ preoperative shock index, modified shock index, and shock index by age values were calculated and recorded. Hypotension was defined as mean arterial pressure ≤ 65 mmHg on two consecutive measurements or < 25% of the baseline value. Hypotensive and normotensive patients’ preoperative shock index, modified shock index, and shock index by age values, as well as whether they were admitted to the post-anesthesia care unit, discharge time, and complication rates, were all compared.
Results: The incidence of intraoperative hypotension was 50% (n = 64). The modified shock index has predictive value for predicting hypotension (cut-off point of <0.73). Being female increased the risk of hypotension by 20.047 fold, and a 1-point increase in Charlson Comorbidity Index scores increased the risk of hypotension by 2.058 fold.
Conclusion: The modified shock index arrived at by dividing heart rate by mean arterial pressure, can be used to predict hypotension due to spinal anesthesia in elderly patients.
Keywords: Anesthesia, Spinal; Geriatrics; Hypotension.
ABSTRACT

2021; 24(3): 359-369
360
INTRODUCTIONThe vascular stiffening observed in the cardiac physiology, autonomic changes, and an increase in the incidence of systolic and diastolic dysfunction make the elderly susceptible to hypotension after anesthesia (1-3). Therefore, the most common intra-operative complication in the elderly is hypotension (4).
It has been shown that an intraoperative decrease of mean arterial pressure (MAP) to <80 mmHg for >10 minutes can disrupt tissue perfusion and cause organ damage (3). Even short-term systolic or MAP drops during noncardiac surgery may result in ma-jor cardiac and renal complications (5, 6). The use of preoperative fluid boluses (preloading) in minor surgeries has been shown to improve hemodynam-ic stability (7). While preoperative dehydration is a preventable factor, preloading therapy is risky and not recommended in elderly patients, due to the high prevalence of cardiac, respiratory, and renal comorbidities (8).
The shock index (SI) is a straightforward equa-tion obtained by dividing the heart rate (HR) by sys-tolic blood pressure. The shock index has a stand-ard range from 0.5 to 0.7. It increases in cases of acute hypovolemia and left ventricular dysfunction, and it aids in the early diagnosis of shock (9). The modified shock index (MSI) is a value arrived at by dividing HR by MAP. It indicates organ perfusion status better than systolic blood pressure (SBP) be-cause it includes the diastolic blood pressure pa-rameter when calculating MAP. The normal value of MSI is between 0.7 and 1.3 (10, 11). Because age has a negative impact on physiological reserve, a shock index by age (SIA) has been created for the elderly, and it is found by multiplying age and SI. If the SIA value is greater than 50, particularly in patients over 55, life-threatening shock may be observed. Addi-tionally, SI, MSI, and SIA are parameters that can be easily measured without the use of any special equipment in the estimation of mortality and mor-bidity (12-15). Pre-intubation SI, MSI, and SIA values
have been shown to be independent predictors of post-intubation hypotension in studies evaluating SI, MSI, and SIA to predict post-intubation hypo-tension (15, 16).
Hypovolemia and hypovolemic shock cannot be diagnosed solely based on heart rate or blood pres-sure parameters. Thus, the shock index should be investigated to determine whether it can be used as a clinical indicator of mortality (14, 17, 18).
Predicting intraoperative hypotension, taking early precautions, and intervening can also be ben-eficial in the elderly population. Our primary goal in this study is to determine whether SI, MSI, and SIA, as non-invasive parameters that can be measured using only heart rate and blood pressure parame-ters at the bedside, can predict post-spinal hypo-tension in patients over 65 years old undergoing elective transurethral interventions.
Our secondary goal is to investigate whether in-traoperative hypotension has any adverse effects by comparing pre-operative and post-operative blood tests, as well as whether the post-anesthesia care unit (PACU) was visited, the duration of hospital stay, and postoperative complications.
MATERIALS AND METHODSThis study began after the approval of the Turkish Ministry of Health, Ankara City Hospital, No. 1 Clini-cal Research Ethics Committee Presidency (approv-al number E1-20-787 dated 25/06/20). Clinical trial number (NCT04483765) was obtained. Our study is a prospective, observational study and was con-ducted in Ankara City Hospital between 01/07/2020 and 01/11/2020. Informed consent was obtained from all patients.
The study involved 128 patients ≥65 years old who had American Society of Anesthesiologists (ASA) risk scores of I–III, undergone elective tran-surethral bladder (TUR-B) and prostate resections (TUR-P) under spinal anaesthesia, and surgery times ≤120 minutes. The existence of valvular disease and
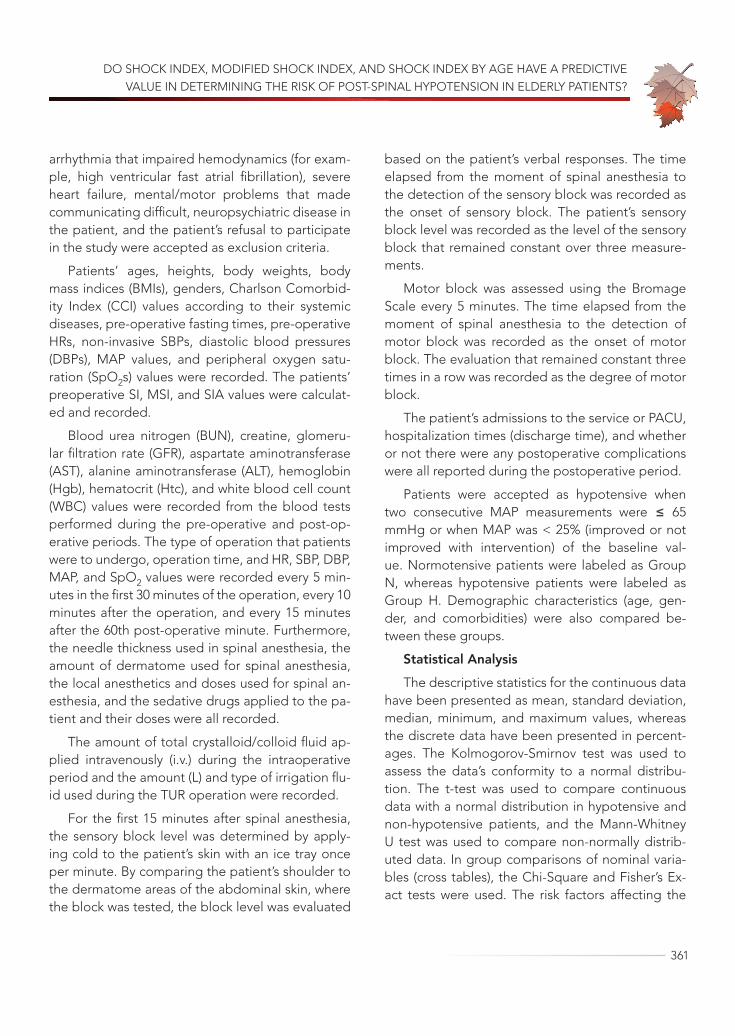
DO SHOCK INDEX, MODIFIED SHOCK INDEX, AND SHOCK INDEX BY AGE HAVE A PREDICTIVE VALUE IN DETERMINING THE RISK OF POST-SPINAL HYPOTENSION IN ELDERLY PATIENTS?
361
arrhythmia that impaired hemodynamics (for exam-ple, high ventricular fast atrial fibrillation), severe heart failure, mental/motor problems that made communicating difficult, neuropsychiatric disease in the patient, and the patient’s refusal to participate in the study were accepted as exclusion criteria.
Patients’ ages, heights, body weights, body mass indices (BMIs), genders, Charlson Comorbid-ity Index (CCI) values according to their systemic diseases, pre-operative fasting times, pre-operative HRs, non-invasive SBPs, diastolic blood pressures (DBPs), MAP values, and peripheral oxygen satu-ration (SpO2s) values were recorded. The patients’ preoperative SI, MSI, and SIA values were calculat-ed and recorded.
Blood urea nitrogen (BUN), creatine, glomeru-lar filtration rate (GFR), aspartate aminotransferase (AST), alanine aminotransferase (ALT), hemoglobin (Hgb), hematocrit (Htc), and white blood cell count (WBC) values were recorded from the blood tests performed during the pre-operative and post-op-erative periods. The type of operation that patients were to undergo, operation time, and HR, SBP, DBP, MAP, and SpO2 values were recorded every 5 min-utes in the first 30 minutes of the operation, every 10 minutes after the operation, and every 15 minutes after the 60th post-operative minute. Furthermore, the needle thickness used in spinal anesthesia, the amount of dermatome used for spinal anesthesia, the local anesthetics and doses used for spinal an-esthesia, and the sedative drugs applied to the pa-tient and their doses were all recorded.
The amount of total crystalloid/colloid fluid ap-plied intravenously (i.v.) during the intraoperative period and the amount (L) and type of irrigation flu-id used during the TUR operation were recorded.
For the first 15 minutes after spinal anesthesia, the sensory block level was determined by apply-ing cold to the patient’s skin with an ice tray once per minute. By comparing the patient’s shoulder to the dermatome areas of the abdominal skin, where the block was tested, the block level was evaluated
based on the patient’s verbal responses. The time elapsed from the moment of spinal anesthesia to the detection of the sensory block was recorded as the onset of sensory block. The patient’s sensory block level was recorded as the level of the sensory block that remained constant over three measure-ments.
Motor block was assessed using the Bromage Scale every 5 minutes. The time elapsed from the moment of spinal anesthesia to the detection of motor block was recorded as the onset of motor block. The evaluation that remained constant three times in a row was recorded as the degree of motor block.
The patient’s admissions to the service or PACU, hospitalization times (discharge time), and whether or not there were any postoperative complications were all reported during the postoperative period.
Patients were accepted as hypotensive when two consecutive MAP measurements were ≤ 65 mmHg or when MAP was < 25% (improved or not improved with intervention) of the baseline val-ue. Normotensive patients were labeled as Group N, whereas hypotensive patients were labeled as Group H. Demographic characteristics (age, gen-der, and comorbidities) were also compared be-tween these groups.
Statistical AnalysisThe descriptive statistics for the continuous data
have been presented as mean, standard deviation, median, minimum, and maximum values, whereas the discrete data have been presented in percent-ages. The Kolmogorov-Smirnov test was used to assess the data’s conformity to a normal distribu-tion. The t-test was used to compare continuous data with a normal distribution in hypotensive and non-hypotensive patients, and the Mann-Whitney U test was used to compare non-normally distrib-uted data. In group comparisons of nominal varia-bles (cross tables), the Chi-Square and Fisher’s Ex-act tests were used. The risk factors affecting the
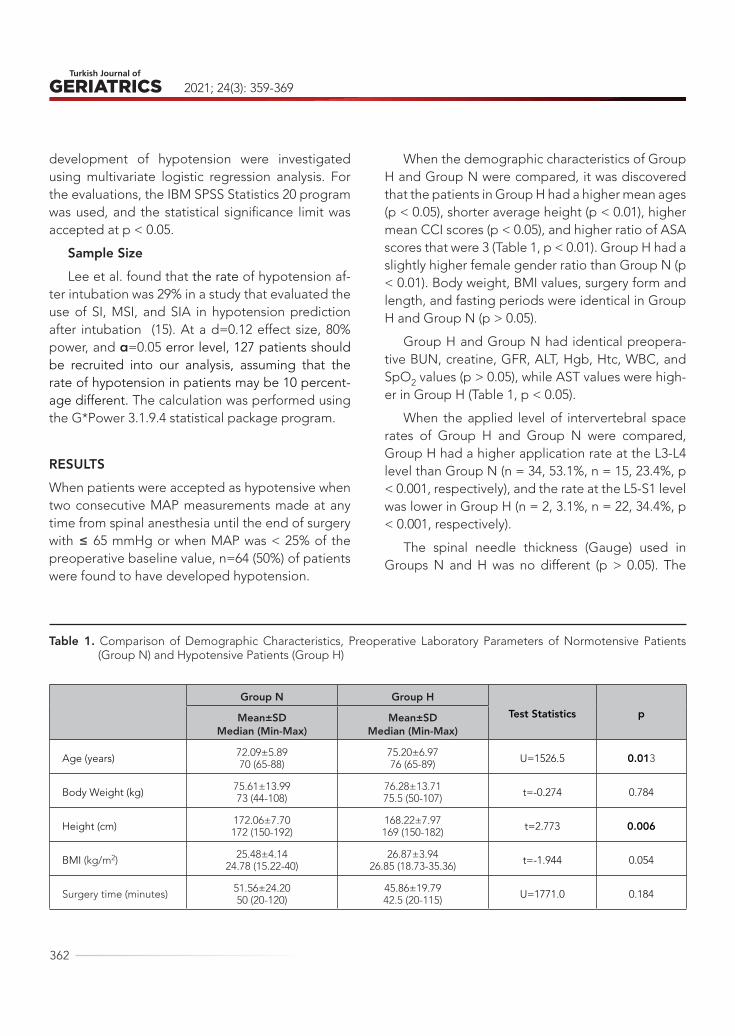
2021; 24(3): 359-369
362
development of hypotension were investigated using multivariate logistic regression analysis. For the evaluations, the IBM SPSS Statistics 20 program was used, and the statistical significance limit was accepted at p < 0.05.
Sample SizeLee et al. found that the rate of hypotension af-
ter intubation was 29% in a study that evaluated the use of SI, MSI, and SIA in hypotension prediction after intubation (15). At a d=0.12 effect size, 80% power, and α=0.05 error level, 127 patients should be recruited into our analysis, assuming that the rate of hypotension in patients may be 10 percent-age different. The calculation was performed using the G*Power 3.1.9.4 statistical package program.
RESULTSWhen patients were accepted as hypotensive when two consecutive MAP measurements made at any time from spinal anesthesia until the end of surgery with ≤ 65 mmHg or when MAP was < 25% of the preoperative baseline value, n=64 (50%) of patients were found to have developed hypotension.
When the demographic characteristics of Group H and Group N were compared, it was discovered that the patients in Group H had a higher mean ages (p < 0.05), shorter average height (p < 0.01), higher mean CCI scores (p < 0.05), and higher ratio of ASA scores that were 3 (Table 1, p < 0.01). Group H had a slightly higher female gender ratio than Group N (p < 0.01). Body weight, BMI values, surgery form and length, and fasting periods were identical in Group H and Group N (p > 0.05).
Group H and Group N had identical preopera-tive BUN, creatine, GFR, ALT, Hgb, Htc, WBC, and SpO2 values (p > 0.05), while AST values were high-er in Group H (Table 1, p < 0.05).
When the applied level of intervertebral space rates of Group H and Group N were compared, Group H had a higher application rate at the L3-L4 level than Group N (n = 34, 53.1%, n = 15, 23.4%, p < 0.001, respectively), and the rate at the L5-S1 level was lower in Group H (n = 2, 3.1%, n = 22, 34.4%, p < 0.001, respectively).
The spinal needle thickness (Gauge) used in Groups N and H was no different (p > 0.05). The
Table 1. Comparison of Demographic Characteristics, Preoperative Laboratory Parameters of Normotensive Patients (Group N) and Hypotensive Patients (Group H)
Group N Group HTest Statistics pMean±SD
Median (Min-Max)Mean±SD
Median (Min-Max)
Age (years) 72.09±5.8970 (65-88)
75.20±6.9776 (65-89) U=1526.5 0.013
Body Weight (kg) 75.61±13.9973 (44-108)
76.28±13.7175.5 (50-107) t=-0.274 0.784
Height (cm) 172.06±7.70172 (150-192)
168.22±7.97169 (150-182) t=2.773 0.006
BMI (kg/m2) 25.48±4.1424.78 (15.22-40)
26.87±3.9426.85 (18.73-35.36) t=-1.944 0.054
Surgery time (minutes) 51.56±24.2050 (20-120)
45.86±19.7942.5 (20-115) U=1771.0 0.184
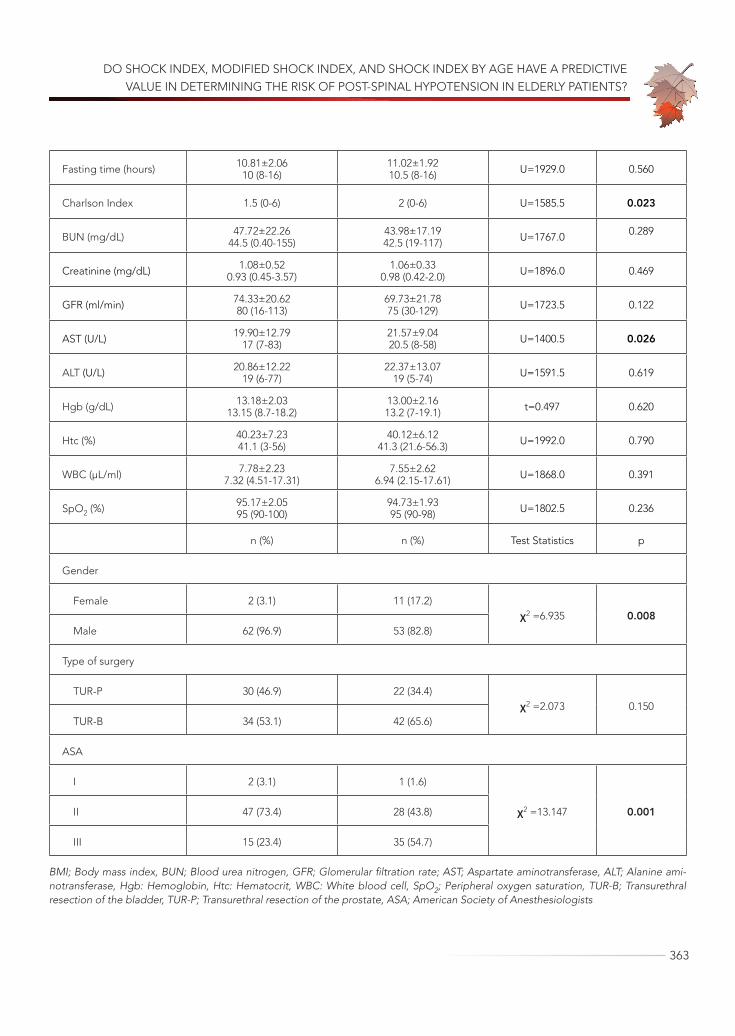
DO SHOCK INDEX, MODIFIED SHOCK INDEX, AND SHOCK INDEX BY AGE HAVE A PREDICTIVE VALUE IN DETERMINING THE RISK OF POST-SPINAL HYPOTENSION IN ELDERLY PATIENTS?
363
Fasting time (hours) 10.81±2.0610 (8-16)
11.02±1.9210.5 (8-16) U=1929.0 0.560
Charlson Index 1.5 (0-6) 2 (0-6) U=1585.5 0.023
BUN (mg/dL) 47.72±22.2644.5 (0.40-155)
43.98±17.1942.5 (19-117) U=1767.0 0.289
Creatinine (mg/dL) 1.08±0.520.93 (0.45-3.57)
1.06±0.330.98 (0.42-2.0) U=1896.0 0.469
GFR (ml/min) 74.33±20.6280 (16-113)
69.73±21.7875 (30-129) U=1723.5 0.122
AST (U/L) 19.90±12.7917 (7-83)
21.57±9.0420.5 (8-58) U=1400.5 0.026
ALT (U/L) 20.86±12.2219 (6-77)
22.37±13.0719 (5-74) U=1591.5 0.619
Hgb (g/dL) 13.18±2.0313.15 (8.7-18.2)
13.00±2.1613.2 (7-19.1) t=0.497 0.620
Htc (%) 40.23±7.2341.1 (3-56)
40.12±6.1241.3 (21.6-56.3) U=1992.0 0.790
WBC (µL/ml) 7.78±2.237.32 (4.51-17.31)
7.55±2.626.94 (2.15-17.61) U=1868.0 0.391
SpO2 (%) 95.17±2.0595 (90-100)
94.73±1.9395 (90-98) U=1802.5 0.236
n (%) n (%) Test Statistics p
Gender
Female 2 (3.1) 11 (17.2)χ2 =6.935 0.008
Male 62 (96.9) 53 (82.8)
Type of surgery
TUR-P 30 (46.9) 22 (34.4)χ2 =2.073 0.150
TUR-B 34 (53.1) 42 (65.6)
ASA
I 2 (3.1) 1 (1.6)
χ2 =13.147 0.001 II 47 (73.4) 28 (43.8)
III 15 (23.4) 35 (54.7)
BMI; Body mass index, BUN; Blood urea nitrogen, GFR; Glomerular filtration rate; AST; Aspartate aminotransferase, ALT; Alanine ami-notransferase, Hgb: Hemoglobin, Htc: Hematocrit, WBC: White blood cell, SpO2; Peripheral oxygen saturation, TUR-B; Transurethral resection of the bladder, TUR-P; Transurethral resection of the prostate, ASA; American Society of Anesthesiologists
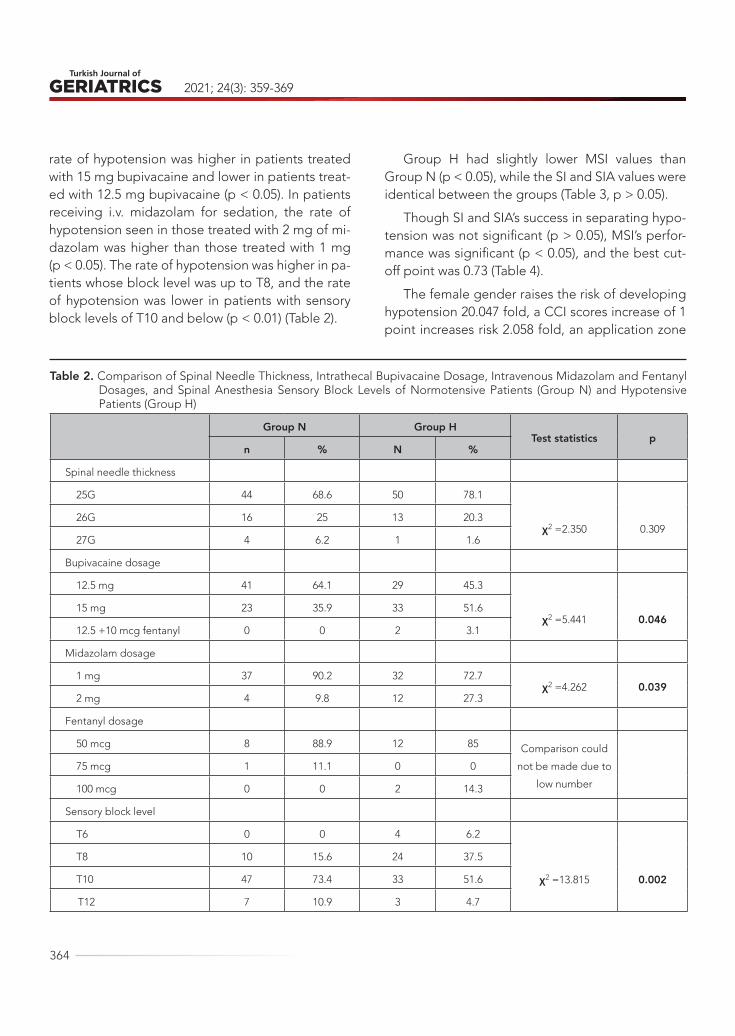
2021; 24(3): 359-369
364
rate of hypotension was higher in patients treated with 15 mg bupivacaine and lower in patients treat-ed with 12.5 mg bupivacaine (p < 0.05). In patients receiving i.v. midazolam for sedation, the rate of hypotension seen in those treated with 2 mg of mi-dazolam was higher than those treated with 1 mg (p < 0.05). The rate of hypotension was higher in pa-tients whose block level was up to T8, and the rate of hypotension was lower in patients with sensory block levels of T10 and below (p < 0.01) (Table 2).
Group H had slightly lower MSI values than Group N (p < 0.05), while the SI and SIA values were identical between the groups (Table 3, p > 0.05).
Though SI and SIA’s success in separating hypo-tension was not significant (p > 0.05), MSI’s perfor-mance was significant (p < 0.05), and the best cut-off point was 0.73 (Table 4).
The female gender raises the risk of developing hypotension 20.047 fold, a CCI scores increase of 1 point increases risk 2.058 fold, an application zone
Table 2. Comparison of Spinal Needle Thickness, Intrathecal Bupivacaine Dosage, Intravenous Midazolam and Fentanyl Dosages, and Spinal Anesthesia Sensory Block Levels of Normotensive Patients (Group N) and Hypotensive Patients (Group H)
Group N Group HTest statistics p
n % N %
Spinal needle thickness
25G 44 68.6 50 78.1
χ2 =2.350 0.309 26G 16 25 13 20.3
27G 4 6.2 1 1.6
Bupivacaine dosage
12.5 mg 41 64.1 29 45.3
χ2 =5.441 0.046 15 mg 23 35.9 33 51.6
12.5 +10 mcg fentanyl 0 0 2 3.1
Midazolam dosage
1 mg 37 90.2 32 72.7χ2 =4.262 0.039
2 mg 4 9.8 12 27.3
Fentanyl dosage
50 mcg 8 88.9 12 85 Comparison could
not be made due to
low number
75 mcg 1 11.1 0 0
100 mcg 0 0 2 14.3
Sensory block level
T6 0 0 4 6.2
χ2 =13.815 0.002
T8 10 15.6 24 37.5
T10 47 73.4 33 51.6
T12 7 10.9 3 4.7

DO SHOCK INDEX, MODIFIED SHOCK INDEX, AND SHOCK INDEX BY AGE HAVE A PREDICTIVE VALUE IN DETERMINING THE RISK OF POST-SPINAL HYPOTENSION IN ELDERLY PATIENTS?
365
level of L3-L4 increases risk by 199.594 fold as com-pared to L5-S1, and L4-L5 increases risk by 80.206 fold as compared to L5-S1 according to the logistic model developed with variables that influence the development of hypotension (Table 5).
In Group N, 9.4% of the patients (n = 6) and 20.3% of the patients in Group H (n = 13) were hos-pitalized in the PACU (p = 0.082). In terms of dis-charge time, there was no substantial difference between Groups N and H (3.55±5.34 and 4.59±6.48 respectively; p = 0.314).
The amount of intraoperative i.v. crystalloid ad-ministered and the amount of bladder irrigation fluids (mannitol, crystalloid) used did not vary be-
tween the groups, and no patients developed TUR syndrome (p = 0.810, p = 0.579 and p = 0.845, re-spectively).
Regarding preoperative patients with MSI val-ues greater than or less than 0.73, there were no differences in PACU admission (n = 10, 15.3% and n = 9 14.5%, p = 0.920, respectively) or postopera-tive complication rates (n = 5, 7.6% and n = 2, 3.2%, p = 0.279, respectively). Acute renal dysfunction was observed in four patients in the postoperative period in the MSI>0.73 group; dyspnea and short-term desaturation were seen in two patients, and bladder perforation was seen in one patient in the MSI≤0.73 group.
Table 3. Comparison of Preoperative Shock Index, Modified Shock Index and Shock Index by Age Values of Normoten-sive Patients (Group N) and Hypotensive Patients (Group H)
Preoperative Group N Group H
Test Statistics pMean ± SD
Median (Min-Max)Mean ± SD
Median (Min-Max)
Shock Index (SI) 0.55±0.100.55 (0.39–1.02)
0.52±0.120.51 (0.31–0.81) U=1730.0 0.129
Modified Shock Index (MSI) 0.78±0.130.78 (0.54–1.31)
0.73±0.170.71 (0.34–1.25) U=1616.0 0.039
Shock index by Age (SIA) 40.28±8.3439.38 (28.12–70.97)
39.20±8.4440.11 (21.20–55.33) U=2037.0 0.958
Table 4. Performance of Shock Index, Modified Shock Index, and Shock Index by Age Values in Distinguishing Between Hypotensive and Normotensive Patients*
AUC 95% CI p Treshold
Shock Index (SI) 0.578 0.478–0.677 0.130 -
Modified Shock Index (MSI) 0.605 0.507–0.704 0.040 ≤0.73
Shock index by Age (SIA) 0.503 0.402–0.604 0.958 -
*The power of Shock Index, Modified Shock Index, and Shock Index by Age values in discriminating between being hypotensive vs normotensive was evaluated via the area under the ROC curve (AUC). The best cut-off point was calculated using the Youden’s Index.
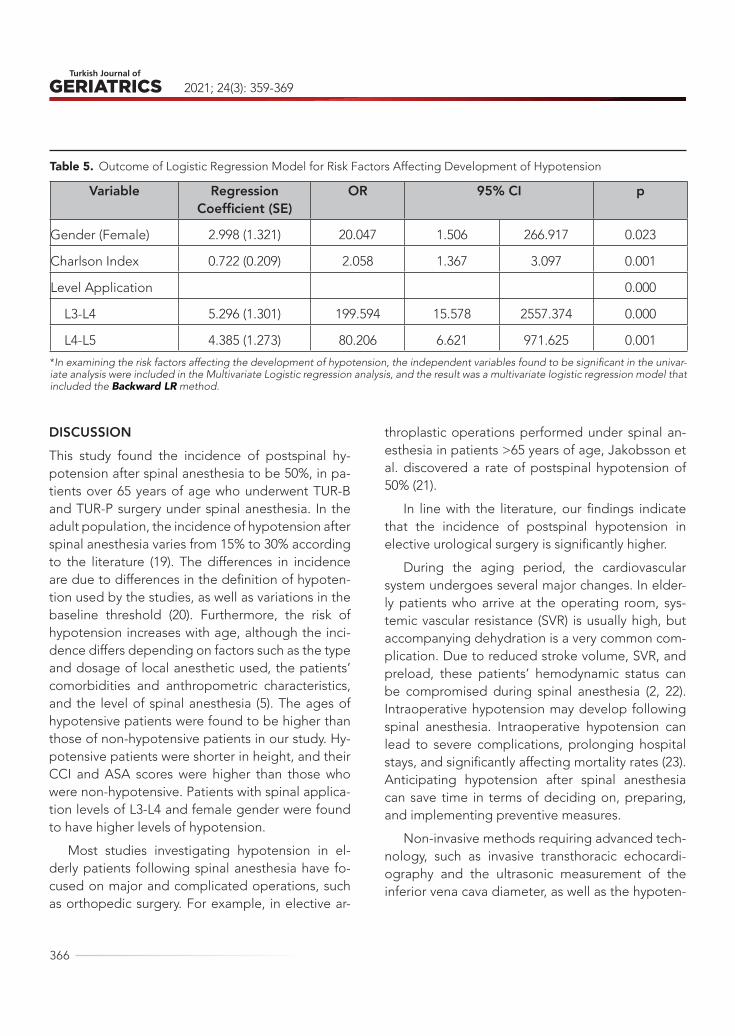
2021; 24(3): 359-369
366
DISCUSSIONThis study found the incidence of postspinal hy-potension after spinal anesthesia to be 50%, in pa-tients over 65 years of age who underwent TUR-B and TUR-P surgery under spinal anesthesia. In the adult population, the incidence of hypotension after spinal anesthesia varies from 15% to 30% according to the literature (19). The differences in incidence are due to differences in the definition of hypoten-tion used by the studies, as well as variations in the baseline threshold (20). Furthermore, the risk of hypotension increases with age, although the inci-dence differs depending on factors such as the type and dosage of local anesthetic used, the patients’ comorbidities and anthropometric characteristics, and the level of spinal anesthesia (5). The ages of hypotensive patients were found to be higher than those of non-hypotensive patients in our study. Hy-potensive patients were shorter in height, and their CCI and ASA scores were higher than those who were non-hypotensive. Patients with spinal applica-tion levels of L3-L4 and female gender were found to have higher levels of hypotension.
Most studies investigating hypotension in el-derly patients following spinal anesthesia have fo-cused on major and complicated operations, such as orthopedic surgery. For example, in elective ar-
throplastic operations performed under spinal an-esthesia in patients >65 years of age, Jakobsson et al. discovered a rate of postspinal hypotension of 50% (21).
In line with the literature, our findings indicate that the incidence of postspinal hypotension in elective urological surgery is significantly higher.
During the aging period, the cardiovascular system undergoes several major changes. In elder-ly patients who arrive at the operating room, sys-temic vascular resistance (SVR) is usually high, but accompanying dehydration is a very common com-plication. Due to reduced stroke volume, SVR, and preload, these patients’ hemodynamic status can be compromised during spinal anesthesia (2, 22). Intraoperative hypotension may develop following spinal anesthesia. Intraoperative hypotension can lead to severe complications, prolonging hospital stays, and significantly affecting mortality rates (23). Anticipating hypotension after spinal anesthesia can save time in terms of deciding on, preparing, and implementing preventive measures.
Non-invasive methods requiring advanced tech-nology, such as invasive transthoracic echocardi-ography and the ultrasonic measurement of the inferior vena cava diameter, as well as the hypoten-
Table 5. Outcome of Logistic Regression Model for Risk Factors Affecting Development of Hypotension
Variable Regression Coefficient (SE)
OR 95% CI p
Gender (Female) 2.998 (1.321) 20.047 1.506 266.917 0.023
Charlson Index 0.722 (0.209) 2.058 1.367 3.097 0.001
Level Application 0.000
L3-L4 5.296 (1.301) 199.594 15.578 2557.374 0.000
L4-L5 4.385 (1.273) 80.206 6.621 971.625 0.001
*In examining the risk factors affecting the development of hypotension, the independent variables found to be significant in the univar-iate analysis were included in the Multivariate Logistic regression analysis, and the result was a multivariate logistic regression model that included the Backward LR method.

DO SHOCK INDEX, MODIFIED SHOCK INDEX, AND SHOCK INDEX BY AGE HAVE A PREDICTIVE VALUE IN DETERMINING THE RISK OF POST-SPINAL HYPOTENSION IN ELDERLY PATIENTS?
367
sion prediction index obtained from arterial pulse waveform analysis, are used to predict hypotension (22, 24). However, in routine anesthetic practice, these techniques cannot be used in every case. In this study, we investigated whether SI, MSI, and SIA have predictive value for post-spinal hypotension in elderly patients and found that MSI can be used as a practical bedside test to predict hypotension after spinal anesthesia. According to our review of the lit-erature, studies of SI, MSI, and SIA concentrate on sepsis, trauma surgery, major orthopedic surgery, and obstetrics, and ours is the first study on this is-sue in elective minor urological surgery (9-18).
While SI and SIA were not found to be signifi-cant in predicting hypotension in our study, MSI was found to be significant in this regard. This index has a cut-off point of <0.73. Additionally, MSI reflects stroke volume and SVR. A high MSI (>1.3) suggests a low stroke volume and a low SVR, both of which are indicators of hypodynamic circulation. These patients’ decompensation was rapid, particularly in occult hemorrhagic situations. A low MSI (<0.7) suggests a high SVR and a hyperdynamic state in the patient, which may indicate severe conditions. As a potential predictor of mortality, a high or low MSI is a stronger parameter than HR, SBP, DBP, and SI alone (10, 11). Except in the absence of severe hy-povolemic or septic shock, we noticed that a cut-off point of <0.73 is a strong indicator of hypotension due to spinal anesthesia in minor elective surgeries.
After neuraxial blockade, vasodilatory changes that may affect cardiac performance are dependent on the patient’s initial sympathetic tone (a higher sympathetic tone equates to a greater hemody-namic change, particularly in the elderly) and the extent of sympathectomy (the level of the sensory block). The elderly have a different physiology than young patients regarding the hypotension caused by spinal anesthesia. Specifically, SVR drops by about 25%, central venous pressure drops by about 3 mmHg, and left ventricular end-diastolic pressure drops by about 20% at the T4-T6 sensory levels of
spinal anesthesia. Furthermore, elderly patients have a higher resting sympathetic tone than young-er patients, which explains why SVR drops so dra-matically after the sympathetic blockade (22). Given these physiological characteristics, it is reasonable to conclude that elderly patients with high SVR and low MSI values (<0.73) due to preoperative hyper-tension are more susceptible to the risk of hypoten-sion due to the effects of spinal anesthesia.
Increased block height is linked to advanced age. In elderly patients, the specific gravity of the cerebrospinal fluid increases as the volume of the fluid decreases. Furthermore, the nerve roots in the elderly tend to be more susceptible to local anes-thesia (25). Patients with a sensory block level of T8 or higher and a bupivacaine dose of more than 12.5 mg had a higher incidence of hypotension in our study.
We reasoned that the SIA values in our sample were insignificant because the study population did not include all adult age groups and only minor age changes in patients above 65 years of age had no effect on the index.
In our study, postoperative complication rates, postoperative biochemical data, PACU hospitaliza-tion, and discharge time did not vary between hy-potensive and normotensive patients. Long-term hypotension exposure is required for the develop-ment of postoperative adverse outcomes, accord-ing to the literature (3). It is possible that the lack of adverse outcomes in our study was due to effective fluid resuscitation and the use of necessary vaso-pressor therapy to avoid long-term hypotension.
One of our study’s limitations was that patients of the female gender (10.2%) were quite uncommon because the male gender is more common in the patient population for urological surgery. Despite the fact that we achieved the target sample size, research with a greater number of patients and dif-ferent minor surgeries performed under spinal an-esthesia in elderly patients would be more reliable for the value of SI, SIA, and MSI in predicting hy-

2021; 24(3): 359-369
368
potension. Similarly, the heterogeneity of the ratios of the spinal anesthesia administrations at different levels of the intervertebral space makes it difficult to discuss statistical significance. Moreover, our study design (being observational, not having a standard-ized anesthetic approach) was an other limitation itself.
CONCLUSIONAside from standard hemodynamic monitoring, non-invasive derivative monitoring methods such as SI, MSI, and SIA may predict hypotension in ger-
iatric patients due to their hemodynamically patho-physiological characteristics. In elderly patients, MSI based on MAP, which tests tissue perfusion, may be more significant in predicting hypotension.
Acknowledgements: Permissions have been obtained from the patients for presentation.
Funding: No funding was used for this study.
Conflict of interest statement: The authors state that they have no conflict of interest in this study.
REFERENCES1. Phillip B, Pastor D, Bellows W. et al. The prevalence of
preoperative diastolic filling abnormalities in geriat-ric surgical patients. Anesth Analg. 2003;97(5):1214-21. (PMID: 14570626)
2. Hofhuizen C, Lemson J, Snoeck M,et al. Spinal anes-thesia-induced hypotension is caused by a decrease in stroke volume in elderly patients. Local Reg An-esth. 2019;12:19-26. (PMID: 30881108)
3. Wesselink EM, Kappen TH, Torn HM, et al. Intraoper-ative hypotension and the risk of postoperative ad-verse outcomes: a systematic review. Br J Anaesth. 2018;121(4):706-21. (PMID: 30236233)
4. Kheterpal S, O’Reilly M, Englesbe MJ, et al. Preop-erative and intraoperative predictors of cardiac ad-verse events after general, vascular, and urological surgery. Anesthesiology. 2009;110(1):58-66. (PMID: 19104171)
5. Walsh M, Devereaux PJ, Garg AX, et al. Relationship between intraoperative mean arterial pressure and clinical outcomes after noncardiac surgery: toward an empirical definition of hypotension. Anesthesiol-ogy. 2013;119(3):507-15. (PMID: 23835589)
6. Sun LY, Wijeysundera DN, Tait GA, et al. Association of intraoperative hypotension with acute kidney inju-ry after elective noncardiac surgery. Anesthesiology. 2015;123(3):515-23. (PMID: 26181335)
7. Kratz T, Hinterobermaier J, Timmesfeld N, et al. Pre-operative fluid bolus for improved haemody-namic stability during minor surgery: a prospective-
ly randomized clinical trial. Acta anaesthesiologica Scandinavica. 2018;62(9):1215-22. (PMID: 29851024)
8. Minto G, Scott MJ, Miller TE. Monitoring needs and goal-directed fluid therapy within an enhanced re-covery program. Anesthesiol Clin. 2015;33(1):35-49. (PMID: 25701927)
9. Birkhahn RH, Gaeta TJ, Terry D, et al. Shock index in diagnosing early acute hypovolemia. Am J Emerg Med. 2005;23(3):323-6. (PMID: 15915406)
10. Singh A, Ali S, Agarwal A, et al. Correlation of shock index and modified shock index with the outcome of adult trauma patients: a prospective study of 9860 patients. N Am J Med Sci. 2014;6(9):450-2. (PMID: 25317389)
11. Liu YC, Liu JH, Fang ZA, et al. Modified shock index and mortality rate of emergency patients. World J Emerg Med. 2012;3(2):114-7. (PMID: 25215048)
12. Zarzaur BL, Croce MA, Fischer PE, et al. New vitals after injury: shock index for the young and age x shock index for the old. J Surg Res. 2008;147(2):229-36. (PMID: 18498875)
13. Kuhne CA, Ruchholtz S, Kaiser GM, et al. Mortality in severely injured elderly trauma patients--when does age become a risk factor? World J Surg. 2005;29(11):1476-82. (PMID: 16228923)
14. Kim SY, Hong KJ, Shin SD et al. Validation of the Shock Index, Modified Shock Index, and Age Shock Index for predicting mortality of geriatric trauma pa-tients in emergency departments. J Korean Med Sci. 2016;31(12):2026-32. (PMID: 27822945)

DO SHOCK INDEX, MODIFIED SHOCK INDEX, AND SHOCK INDEX BY AGE HAVE A PREDICTIVE VALUE IN DETERMINING THE RISK OF POST-SPINAL HYPOTENSION IN ELDERLY PATIENTS?
369
15. Lee K, Jang JS, Kim J, et al. Age shock index, shock index, and modified shock index for predicting postintubation hypotension in the emergency de-partment. The American journal of emergency med-icine. 2020;38(5):911-5. (PMID: 31345593)
16. Trivedi S, Demirci O, Arteaga G, et al. Evaluation of preintubation shock index and modified shock index as predictors of postintubation hypotension and other short-term outcomes. Journal of critical care. 2015;30(4):861. e1-. e7. (PMID: 25959037)
17. Bhandarkar P, Munivenkatappa A, Roy N, et al. Pat-tern and distribution of Shock Index and Age Shock Index Score among trauma patients in Towards Im-proved Trauma Care Outcomes (TITCO) Dataset. Bull Emerg Trauma. 2018;6(4):313-7. (PMID: 30402519)
18. Mutschler M, Nienaber U, Münzberg M, et al. The Shock Index revisited - a fast guide to transfusion requirement? A retrospective analysis on 21,853 pa-tients derived from the TraumaRegister DGU. Crit Care. 2013;17(4):R172. (PMID: 23938104)
19. Hartmann B, Junger A, Klasen J, et al. The incidence and risk factors for hypotension after spinal anes-thesia induction: an analysis with automated data collection. Anesth Analg. 2002;94(6):1521-9, table of contents. (PMID: 12032019)
20. Ngu JMC, Jabagi H, Chung AM, et al. Defining an intraoperative hypotension threshold in association
with de novo renal replacement therapy after car-diac surgery. Anesthesiology. 2020;132(6):1447-57. (PMID: 32205546)
21. Jakobsson J, Kalman S, Lindeberg-Lindvet M, et al. Is postspinal hypotension a sign of impaired cardiac performance in the elderly? An observational mech-anistic study. BJA: British Journal of Anaesthesia. 2017;119(6):1178-85. (PMID: 29040402)
22. Ceruti S, Anselmi L, Minotti B, et al. Prevention of arterial hypotension after spinal anaesthesia using vena cava ultrasound to guide fluid management. Br J Anaesth. 2018;120(1):101-8. (PMID: 29397116)
23. Sessler DI, Bloomstone JA, Aronson S, et al. Peri-operative Quality Initiative consensus statement on intraoperative blood pressure, risk and outcomes for elective surgery. Br J Anaesth. 2019;122(5):563-74. (PMID: 30916004)
24. Davies SJ, Vistisen ST, Jian Z, et al. Ability of an arterial waveform analysis-derived hypotension prediction index to predict future hypotensive events in surgical patients. Anesthesia & Analgesia. 2020;130(2):352-9. (PMID: 30896602)
25. Brull R, Macfarlane AJ, Chan VW. Spinal, Epidural, and Caudal Anesthesia, In: Ronald Miller, Lars Eriks-son, Lee Fleisher (Eds). Miller’s Anesthesia. 8th edi-tion, Elsevier, USA 2015, pp 1684-716.

370
Turkish Journal of Geriatrics
DOI: ....
2020; 23(3): ...-...
CORRESPONDANCE
1 E
RESEARCH
Phone: +90
e-mail:
Received:
Accepted:
Turkish Journal of GeriatricsDOI: 10.31086/tjgeri.2021.2342021; 24(3): 370-380
CORRESPONDANCE
1 Ankara City Hospital, Department of Cardiology, Ankara, Turkey
2 Kahramankazan State Hospital, Department of Cardiology, Ankara, Turkey
RELATIONSHIP BETWEEN THE PROGNOSTIC NUTRITIONAL INDEX AND ALL-CAUSE MORTALITY IN ELDERLY PATIENTS WITH NON-ST SEGMENT ELEVATION MYOCARDIAL INFARCTION
RESEARCH
Özge Çakmak KARAASLAN1 . . . . .
Cem ÇÖTELİ1. . . . . . . . . . . . . . . . .
Hasan Can KÖNTE2 . . . . . . . . . . . .
Murat Oğuz ÖZİLHAN1 . . . . . . . . . .
Orhan MADEN1. . . . . . . . . . . . . . . .
1 Özge Çakmak KARAASLAN
Ankara City Hospital, Department of Cardiology, Ankara, Turkey
Phone: +905377395670e-mail: [email protected]
Received: Feb 24, 2021 Accepted: Aug 22, 2021
Background: Patients over 65 years of age with non-ST segment elevation myocardial infarction are at higher risk of mortality and morbidity than younger patients. The prognostic nutritional index is a combined immunological-nutritional status score based on serum albumin levels and lymphocyte values. We evaluated the association between prognostic nutritional index value and all-cause mortality in elderly patients with non-ST segment elevation myocardial infarction. The current study presents the first evaluation of prognostic nutritional index in elderly patients with non-ST segment elevation myocardial infarction.
Methods: This was a retrospective observational study. The study population was divided into two groups according to their admission prognostic nutritional index. A prognostic nutritional index of 46 was determined as the optimal cut-off value to predict the primary endpoint, which was all-cause death during the follow-up period.
Results: Compared to patients with a prognostic nutritional index ≥ 46, those with a prognostic nutritional index < 46 were older (p < 0.001) and more often had a history of hypertension and known coronary artery disease (p = 0.001). All-cause mortality was significantly higher in the group with lower prognostic nutritional index (12.5% vs 4.8%; p = 0.007). The prognostic nutritional index predicted the primary endpoint, and this prediction was statistically significant (sensitivity 71%; specificity 67%). Univariate Cox regression analyses and multivariate Cox regression analyses showed that a cut-off level of prognostic nutritional index < 46 was significantly associated with the primary endpoint.
Conclusions: The prognostic nutritional index score was associated with all-cause mortality in elderly patients.
Keywords: Mortality; Non-ST Elevated Myocardial Infarction; Nutrition Assessment.
ABSTRACT

RELATIONSHIP BETWEEN THE PROGNOSTIC NUTRITIONAL INDEX AND ALL-CAUSE MORTALITY IN ELDERLY PATIENTS WITH NON-ST SEGMENT ELEVATION MYOCARDIAL INFARCTION
371
INTRODUCTION
The numbers and proportion of the population aged over 65 years are increasing due to extend-ed lifespans, health improvements and decreasing birth rates (1). Of those who die from ischaemic heart disease, 83% are over the age of 65 years. El-derly patients with non-ST-segment elevation myo-cardial infarction (NSTEMI) are at higher risk of mor-tality and morbidity than younger patients (2). The current guidelines recommend evaluating invasive treatments and considering personal characteris-tics, such as estimated life expectancy, comorbid-ities, quality of life and patient preference, after a careful risk/benefit evaluation in elderly patients with NSTEMI (3). Therefore, clinical scores for risk assessment are of great importance in choosing the appropriate treatment and evaluating mortality and morbidity risk in elderly patients with NSTEMI.
Malnutrition is an important risk factor for car-diovascular disease (CVD) in the elderly population and has a known association with a prolonged hos-pital stay, increased mortality and reduced quality of life (4-6). Malnutrition has been shown to associate with poor prognosis and mortality in cardiovascular disease, such as ST-segment elevation myocardial infarction (STEMI) and heart failure (7,8). Therefore, routine screening of the elderly population in terms of nutrition has been suggested (9). Nevertheless, evaluating nutritional status is not simple, as differ-ent components of malnutrition need to be consid-ered. The Prognostic Nutritional Index (PNI) reflects a combined score of an immunological nutritional status based on serum albumin levels and lympho-cyte values (10). This index is easy to calculate, as it requires only simple blood parameters and is a cost-effective method. Recent studies have shown that nutritional status evaluated by PNI is an inde-pendent prognostic factor in patients with differ-ent CVD (7,8). However, the association of PNI with mortality has not been reported in elderly patients with NSTEMI. Therefore, in this study, we evaluat-ed the association between the value of PNI and
all-cause mortality in elderly patients with NSTEMI. The current study presents the first evaluation of PNI in elderly patients with NSTEMI.
METHODSBetween March 2019 and August 2020, 404 consec-utively confirmed patients aged ≥ 65 with NSTEMI who were admitted to the emergency department of our institution were retrospectively evaluated. NSTEMI was determined by the appropriate guide-lines (11). Patients with an active infection, a histo-ry of chronic inflammatory disease, a known neo-plasm, severe hepatic disease, an advanced-stage renal disorder or missing clinical data, as well as individuals undergoing renal replacement therapy, were excluded from this study.
The PNI was calculated based on the serum al-bumin values and the total lymphocyte count ob-tained at admission: 10 × albumin (g/dl) + 0.005 × total lymphocyte count (permm3). The PNI was cal-culated for each participant. The study population (n = 376) was divided into two groups according to their admission PNI. The cut-off value of PNI to pre-dict the primary endpoint was evaluated by receiver operating characteristic (ROC) curve analysis. A PNI of 46 was determined as an optimal cut-off value to predict the primary endpoint. The study population groups were organised accordingly: PNI <46 (n = 128) and PNI ≥ 46 (n = 248).
The study protocol was reviewed and approved by the University of Health Sciences, Ankara City Hospital Ethics Committee in accordance with the Declaration of Helsinki (approval no; E1/21/1487, date; 03 February 2021).
NSTEMI was defined as the presence of cardiac biomarkers, such as cardiomyocyte necrosis and in-creased troponin T (cTnT) with clinically concordant myocardial ischaemia and without ST segment el-evation. The primary endpoint was all-cause death during the follow-up period. All-cause mortality was defined as death from any cause during hospitaliza-

2021; 24(3): 370-380
372
tion or after discharge during the follow-up period. The mortality data of the participants were obtained by the medical records, while the details and the causes of death were obtained from the National Survival Registry. Cardiovascular death was defined as death due to myocardial infarction, death due to heart failure, death due to malignant arrhythmia or sudden cardiac arrest because of other or unknown causes during hospitalization and after discharge.
The baseline clinical and demographic charac-teristics of the patients were gathered from the hos-pital’s medical database. Left ventricular ejection fraction (LVEF) was calculated using the modified Simpson method within 24 hours of admission (12). An electrocardiogram (ECG) was examined on ad-mission in the emergency unit, after the procedure and daily during the hospital stay. Venous blood samples from the antecubital vein were obtained using standardized EDTA blood tubes within 10–30 minutes of admission to the hospital. A complete blood count including the white blood cell (WBC), haemoglobin and lymphocyte levels was measured using an automated haematology analyzer system (Beckman Coulter Ireland, Inc, Galway, Ireland). Al-bumin levels were measured using the photometric method (DC 800; Beckman Coulter, Dublin, Ireland).
According to the ESC guidelines, an immediate invasive strategy was performed on patients with at least one very-high-risk NSTEMI criteria (11); all the remaining patients underwent coronary angiog-raphy (CAG) within 48 hours after admission with a diagnosis of NSTEMI. The heart team determined the appropriate revascularization strategy (percu-taneous coronary intervention or coronary artery bypass grafting) after CAG. For the patients whose coronary artery anatomy was not suitable for inter-vention treatment, pharmacological treatment was arranged. All the patients in the study received a loading dose of aspirin and a loading dose of P2Y12 receptor inhibitors on admission. The patients re-ceived 70–100 U/kg of intravenous unfractionated heparin before the procedure. The use of a glyco-
protein IIb/IIIa inhibitor (tirofiban) was at the discre-tion of the primary operator. Most of the percuta-neous coronary intervention (PCI) procedures were performed using a transradial approach; a trans-femoral approach was used on the patients who were not suitable for the transradial approach. The appropriate P2Y12 inhibitor therapy and 81–100mg aspirin per day were prescribed during the hospi-talization and at discharge according to the current guidelines (11).
All the data were analysed using the SPSS 22.0 Statistical Package Program for Windows (SPSS; IBM, Armonk, New York, USA). A Kolmogorov–Smirnov test was utilized for the assessment of the normality of distribution. Continuous variables were presented as mean ± standard deviation and me-dian with interquartile ranges and categorical vari-ables as the number of patients and percentages. A comparison between groups was made with a Stu-dent’s t-test for normally distributed variables and a Mann–Whitney U test for variables without nor-mal distribution. Categorical data from both groups were compared using the χ2 or Fisher’s exact test. Univariate and multivariate analyses with Cox pro-portional hazards regression were used to evaluate the association between PNI and all-cause mortality. Variables displaying p < 0.05 in the univariable anal-ysis were used in a multivariable logistic regression analysis. Survival estimates were calculated by the Kaplan–Meier method, and the log-rank tests were used for comparison. The ability of the PNI value to predict the primary endpoint was evaluated by ROC curve analysis and area under curve (AUC) values. The cut-off value was calculated according to the Youden index. A p-value < 0.05 (using a two-sided test) was accepted as significant.
RESULTInitially, a total of 404 consecutive NSTEMI patients aged ≥ 65 were considered for the study; 28 pa-tients were excluded because of having at least one of the exclusion criteria. Consequently, 376

RELATIONSHIP BETWEEN THE PROGNOSTIC NUTRITIONAL INDEX AND ALL-CAUSE MORTALITY IN ELDERLY PATIENTS WITH NON-ST SEGMENT ELEVATION MYOCARDIAL INFARCTION
373
patients were enrolled in the current study. In the study population, the mean age was 73 ± 7.1 years, the male gender ratio was 60%, and the mean fol-low-up time was 335 ± 117 days. The cut-off value of PNI for predicting the primary endpoint was 46 (sensitivity 71%, specificity = 67%) according to the Youden index. We divided the patients into two groups according to the PNI cut-off value; 128 pa-tients had a PNI score < 46, and 248 patients had a PNI ≥ 46. Demographic characteristics and clin-ical and laboratory values of the study population are presented in Table 1. Compared to the patients with PNI scores ≥ 46, those with PNI scores < 46 had an advanced age (p < 0.001) and had a history of hypertension (HT) (p = 0.008) and known coro-nary artery disease (CAD) (p = 0.001) more often. However, the histories of the patients were similar in terms of diabetes mellitus (DM), hyperlipidemia (HPL), previous heart failure and stroke. The pa-tients with a PNI score < 46 had significantly lower
blood albumin (p < 0.001), lower total cholesterol (p = 0.010), a lower glomerular filtration rate (p < 0.001), lower WBC counts (p = 0.012), lower haemo-globin levels (p < 0.001), lower lymphocyte counts (p < 0.001) and higher C-reactive protein (CRP) lev-els (p = 0.011) compared with those with a PNI score ≥ 46. No significant differences were noted in sys-tolic blood pressure (SBP), heart rate and LVEF at admission between the two groups. The patients in both groups had similar treatments with respect to aspirin, PY212 receptor inhibitors, B-blockers, stat-ins and angiotensin-converting enzyme (ACE) inhib-itors or angiotensin II receptor blockers. The ratio of diuretic therapy prescribed at discharge was higher in the low-PNI group (p = 0.009).
The ratios of patients who underwent coronary artery bypass grafting as a revascularization strate-gy, who underwent PCI, and who were followed up medically without invasive intervention were similar in both groups (Table 1).
Table 1. Baseline clinical, echocardiographic, and laboratory characteristics of patients stratified by values of the prog-nostic nutritional index.
Prognostic Nutritional İndex p value
<46 (n=128) ≥46 (n=248)
Age (year) 78± 12.7 70± 7.0 <0.001
Male, n (%) 68 (53.1) 160 (64.5) 0.032
Heart Rate, BPM 78± 11.0 78± 21.0 0.990
SBP, mmHg 120± 27.5 130± 16.3 0.062
LVEF, % 45± 10.0 45± 15.0 0.497
History, n (%)
Diabetes mellitus 76 (59.3) 128 (51.6) 0.152
Hypertension 96 (75) 152 (61.2) 0.008
Hyperlipidemia 20 (16.6) 48 (19.3) 0.373
History of heart failure 48 (37.5) 96 (38.7) 0.332
Known coronary artery disease 44 (34.3) 120 (48.3) 0.001
History of Stroke 16 (12.5) 16 (6.4) 0.053

2021; 24(3): 370-380
374
Admission Laboratory Variables
Creatinine (mg/dl) 0.8 ± 0.3 0.8 ± 0.3 0.180
Albumin (g/dl) 37.0 ± 2.0 41.4 ± 4 <0.001
Total cholesterol (mg/dL) 165 ± 50 171 ± 62 0.010
LDL (mg/dL) 104 ± 39 104 ± 45 0.297
eGFR (ml/min/1.73m²) 74 ± 31 87 ± 29 <0.001
WBC (x10³/ µL) 8.6 ± 3.0 9.35 ± 3.44 0.012
Hemoglobin (mg/dL) 13.1 ± 2.1 13.5 ± 2.1 <0.001
Lymphocyte (x10³/ µl) 0.97 ± 0.39 1.90 ± 0.64 <0.001
CRP 8.23 ± 39.89 5.71 ± 6.90 0.011
Troponin T (ng/mL) 3.222 ± 9.672 2.433 ± 8.165 0.671
Coronary Artery Disease, n (%)
Left Main 8 (6.2) 0 0.002
Left Anterior Descending 56 (43.7) 120 (48.3) 0.913
Left Circumflex 52 (40.6) 116 (46.7) 0.258
Right Coronary Artery 28 (21.8) 120 (48.3) 0.230
Angiographic Data, n (%)
Syntax Score 10 ± 8.7 9 ± 9.7 0.674
TIMI Thrombus Grade 4.0± 2.0 3.0 ± 1.8 0.683
Selection Of Revascularization, n (%)
Coronary Artery Bypass Grafting 8(6) 32(12.5) 0.128
Percutaneous Coronary Intervention 100(78.1) 188(75.8) 0.615
Non-İnterventional Treatment 20(15) 32(12) 0.469
Medications At Discharge, n (%)
Aspirin 127 (99.2) 244 (98.4) 0.505
B-blocker 116 (90.6) 228 (91.9) 0.328
Statins 120 (93.8) 236 (95.2) 0.180
ACEIs or ARBs 120 (93.8) 232 (93.5) 0.588
Diuretics 36 (28.1) 60 (24.2) 0.009
P2Y12 receptor inhibitors 125 (97.7) 242 (97.6) 0.964
SBP: Systolic Blood Pressure; LVEF: Left ventricular ejection fraction; LDL: Low-density lipoprotein cholesterol; eGFR: estimated glo-merular filtration rate; WBC: White blood cell; CRP: C-reactive protein; Syntax: SYNergy between PCI with TAXUS and Cardiac Surgery; TIMI: Thrombolysis in Myocardial Infarction; ACEI: Angiotensin-converting enzyme inhibitör; ARB: Angiotensin II receptor blockers

RELATIONSHIP BETWEEN THE PROGNOSTIC NUTRITIONAL INDEX AND ALL-CAUSE MORTALITY IN ELDERLY PATIENTS WITH NON-ST SEGMENT ELEVATION MYOCARDIAL INFARCTION
375
Table 2 presents the primary endpoint of the study according to the PNI values. During the fol-low-up period, all-cause death occurred in 28 of 376 subjects (7.4%). All-cause mortality was significantly higher in the group with lower PNI scores (12.5% vs. 4.8%; P = 0.007). Although the incidence of cardio-vascular death was higher in the low-PNI group, it was not statistically significant.
The ability of the PNI to predict the primary end-point was evaluated by ROC curve analysis. The AUC value of this analysis is presented in Figure 1 (AUC = 0.636, 95% CI = 0.502–0.771, p = 0.016). It was determined that the PNI predicted the primary endpoint, and this prediction was statistically signif-icant (Sensitivity 71%, specificity = 67%).
The patients were followed up for a mean pe-riod of 335 ± 117 days. The Kaplan–Meier analysis showed a significantly lower primary endpoint-free survival rate in patients with low PNI scores (log-rank, P = 0.008) (Figure 2).
Univariate Cox regression analyses showed that the SYNTAX score, known CAD, admission heart
rate, SBP, WBC and a cut-off level of PNI < 46 was significantly associated with the primary endpoint, as shown in Table 3. All-cause mortality had higher rates at lower PNI levels (hazard ratio: 0.328; 95% confidence interval 0.123–0.872; p = 0.025). Other multivariate independent predictors of mortali-ty were admission heart rate (hazard ratio, 1.060; 95% confidence interval, 1.029–1.093], P < 0.001), LVEF (hazard ratio, 0.938; 95% confidence interval, 0.887–0.991, P = 0.022) and WBC count (hazard ra-tio, 1.212; 95% confidence interval, 1.105–1.329, P < 0.001) (Table 3).
DISCUSSIONTo the best of our knowledge, this is the first study to investigate the prognostic value of PNI in patients aged ≥ 65 with NSTEMI. The major findings were as follows: the low PNI group had a higher all-cause mortality rate compared to the high-PNI group, even though both groups had similar medical histo-ries, such as DM, heart failure, previous stroke and HPL. HT and known CAD were more common in
Figure 1. Receiver-operating characteristic curve of the PNI for predicting primary endpoint.
Figure 2. Kaplan–Meier curve analysis of the composite primary endpoint.

2021; 24(3): 370-380
376
the low-PNI group. The PNI value was a significant independent predictor of all-cause death. Cumula-tive survival was significantly lower for the patients in the low-PNI group (PNI < 46) relative to the pa-tients in the high-PNI group (PNI ≥ 46). Thus, PNI on admission appears to be useful for risk stratification of elderly patients with NSTEMI.
It is known that elderly patients have an in-creased prevalence of poor prognostic factors, such as stroke, diabetes, congestive heart failure and HT
(13). In addition, elderly patients are often malnour-ished, and malnutrition contributes to poor prog-nosis by weakening the immune defences of elderly patients in the hospital (14). As a result of the in-creased risk profile, it may be useful to use different parameters in predicting prognosis.
PNI calculated with the albumin level and the lymphocyte count is used as an indicator of inflam-mation, immune function and nutritional level (15). Hypoalbuminemia is the result of inflammation, in-
Table 2. The Primary Endpoint of patients classified by prognostic nutritional index
PNI<46 (n=128) PNI≥46 (n=248) p value
All cause mortality 16(12.5) 12(4.8) 0.007
Cardiovascular death 8(6.2) 12(4.8) 0.563
Follow-up time, day 300±150 315±150 0.069
PNI: Prognostic Nutritional Index
Table 3. Univariate and Multivariate cox proportional hazard models for prediction of primary endpoint.
HR (95% CI) p value HR (95% CI) p value
SYNTAX Score 1.073 (1.037 – 1.111) <0.001 1.046 (0.988 – 1.107) 0.121
Known coronary artery disease 0.303 (0.133 – 0.687) 0.004 0.902 (0.517 – 1.573) 0.717
Heart Rate, BPM 1.087 (1.062 – 1.113) <0.001 1.060 (1.029 – 1.093) <0.001
SBP, mmHg 0.928 (0.909 – 0.947) <0.001 1.004 (0.974 – 1.035) 0.802
LVEF 0.916 (0.884 – 0.950) <0.001 0.938 (0.887 – 0.991) 0.022
Creatinine (mg/dl) 3.030 (0.918 – 10.005) 0.069
eGFR 0.987 (0.969 – 1.006) 0.176
Total cholesterol (mg/dL) 1.000 (0.992 – 1.009) 0.923
LDL (mg/dL) 1.002 (0.992 – 1.013) 0.681
WBC (x10³/ΜL) 1.214 (1.155 – 1.276) <0.001 1.212 (1.105 – 1.329) <0.001
Hemoglobin (mg/dL) 1.053 (0.868 – 1.277) 0.601
CRP 1.011 (0.999 – 1.024) 0.075
PNI<46 2.656 (1.256 – 5.614) 0.011 0.328 (0.123 – 0.872) 0.025
SYNTAX: SYNergy between PCI with TAXUS and Cardiac Surgery; SBP: Systolic Blood Pressure; LVEF: Left Ventricular Ejection Fraction; eGFR: Estimated Glomerular Filtration Rate; LDL: Low-density lipoprotein cholesterol; WBC: White blood cell; CRP: C-reactive protein;
PNI: Prognostic Nutritional Index

RELATIONSHIP BETWEEN THE PROGNOSTIC NUTRITIONAL INDEX AND ALL-CAUSE MORTALITY IN ELDERLY PATIENTS WITH NON-ST SEGMENT ELEVATION MYOCARDIAL INFARCTION
377
adequate protein and calorie intake in people with chronic disease. Inflammation and malnutrition re-duce the synthesis rate of albumin and increase the deterioration of albumin. Also, the transition of al-bumin into the extravascular space is increased. As a result, hypoalbuminemia is developed. The albu-min level decreases the result of both inflammation and malnutrition in chronic diseases (16,17). Albu-min increases the production of prostaglandin-D2 and indirectly causes the inhibition of platelet ag-gregation (18). Hypoalbuminemia increases blood viscosity and disrupts endothelial functions due to increased free lysophosphatidylcholine levels (19). Albumin is a commonly used measure for nutrition and has been demonstrated to relation with post-operative complications (20). Many reports have demonstrated an elevation of inflammatory markers in myocardial infarction (21) and there is increasing evidence that hypoalbuminemia on admission hos-pital is a powerful independent predictor of long-term mortality and acute heart failure development in STEMI patients (16).
The effects of malnutrition on the immune sys-tem are important. Malnourishment causes lym-phatic tissues to develop atrophy, impairs cellular immunity and reduces bactericidal leukocyte activi-ty. Interleukin (IL)-1 activity is suppressed in malnutri-tion. Impaired IL-1 activity leads to a decrease in the rate of lymphocyte generation (22). Lymphocytes have a crucial effect in regulating the inflammato-ry response at several stages of the atherosclerotic process (23). In acute coronary events, lymphocy-topenia is observed secondary to increased corti-costeroid level, and a higher lymphocyte count is considered a more suitable immune reaction and is seen as a stable inflammatory status (24). Lympho-cytopenia has been independently associated with major adverse cardiac events and death after myo-cardial infarction (25). Therefore, a PNI that has been calculated from the serum albumin and lymphocyte counts can predict the nutritional, inflammatory and immune status of elderly patients with NSTEMI.
Long-term mortality rates of NSTEMI have re-duced significantly in association with an increase in the frequency of care that includes early interven-tions (11). There are a few significantly accepted risk scores including TIMI risk score and GRACE score which present precious prognostic information. Age is a parameter for both the GRACE and TIMI risk score (26). Advanced age is accompanied by malnu-trition and lower albumin level. A total of 945 elderly patients with STEMI were evaluated during a 2-year follow-up, and malnutrition was detected in ap-proximately 55% of the participants (27). Therefore, considering that malnutrition increase with age, it can be expressed that data on the evaluation and importance of this in elderly patients with NSTEMI are limited. As presented in recent analyses, lower lymphocyte level is associated with higher mortality (28). PNI combines these two significant measure-ments and offers valuable prognostic information.
Initially, the PNI was presented to assess the im-munological and nutritional aspects of malignity patients (29). It has known that the PNI provides a stronger predictive power of mortality than do its components such as albumin and lymphocyte (30). Then, the PNI score was used as a predictive nutri-tional marker in patients with different cardiovascu-lar diseases, such as heart failure and STEMI (7,8). Basta et al. demonstrated that in elderly patients with STEMI, a lower PNI level was significantly as-sociated with poor prognosis (27). A recent retro-spective observational study of patients with STEMI shown a significant relationship between PNI and inhospital and long-term mortality (7,8). However, the analysis has been made in elderly STEMI pa-tients who underwent PCI (8). Therefore, this study has examined the association of PNI with all-cause mortality in elderly patients with NSTEMI.
In this study, we found that PNI was an indepen-dent predictor of mortality in elderly patients with NSTEMI. The current study has shown that the low PNI had a higher all-cause mortality rate compared to the high-PNI group, even though both groups
2021; 24(3): 370-380
378
had similar medical histories, such as DM, heart failure, previous stroke and HPL. A large number of comorbidities are related to nutritional status, and patients in the low PNI group had a higher prevalence of known CAD and previous HT. In this study, patients with low PNI tended to be older, had a higher level of CRP. This partly explains that in-creased inflammatory activity and decreased serum albumin level may be two of the underlying mecha-nisms of mortality in elderly patients with NSTEMI. In patients with low PNI, higher CRP levels also confirmed a negative relationship between PNI and CRP levels in the present study. A previous study has presented that the PNI was independently asso-ciated with cardiovascular outcomes after adjusting for traditional risk factors (31). Multivariate Cox haz-ard models showed that the PNI was independently associated with all-cause mortality after adjusting for risk factors. Therefore, PNI is appropriate to be used in elderly patients with NSTEMI since it is easy and simple to calculate with available practical pa-rameters and less likely to be affected by confound-ing clinical conditions in coronary artery disease pa-tients such as statin use. Consistent with previous findings (27,30) that low PNI were related to poor prognosis in patients with CAD, the present study more enlarges this association to a particular cohort
such as elderly patients with NSTEMI.
As a result of multivariate Cox regression anal-ysis, it was determined that low PNI and increased heart rate, high WBC, reduced LVEF were associat-ed with the primary endpoint. It has been reported that higher WBC has been used in the estimation of major adverse cardiovascular events in elderly pa-tients (32). In agreement with our study, the study by Kalyoncuoğlu et al. showed that reduced LVEF was an independent predictor of poor prognosis in elderly patients with NSTEMI (33).
This study had several limitations. The present study evaluated the PNI value at admission and did not assess its changes during the follow-up time. This was a retrospective, single-centre, observation-al study, in which information about the body mass index of patients was not obtained. The range of PNI values was relatively small. Additional assess-ments using nutritional indexes may supply benefi-cial information during the follow-up.
The PNI consists of simple objective measure-ments that can be easily obtained. Our findings suggest that the PNI score was found to be associ-ated with all-cause mortality in elderly patients with NSTEMI.
senting without Persistent ST-Segment Elevation of the European Society of Cardiology (ESC). Eur Heart J. 2016;37(3):267-315. (PMID: 26320110).
4. Charlton KE, Nichols C, Bowden S et al. Older re-habilitation patients are at high risk of malnutrition: evidence from a large Australian database. J Nutr Health Aging. 2010;14(8):622-8. (PMID: 20922337).
5. Evans C. Malnutrition in the elderly: a multifactori-al failure to thrive. Perm J. 2005;9(3):38-41. (PMID: 22811627).
6. Wyszynski DF, Perman M, Crivelli A. Prevalence of hospital malnutrition in Argentina: preliminary results of a population-based study. Nutrition. 2003;19(2):115-9. (PMID: 12591541).
REFERENCES1. Webster D, Celik O. Systematic review of Kinect ap-
plications in elderly care and stroke rehabilitation. J Neuroeng Rehabil. 2014;11:108. (PMID: 24996956).
2. Alexander KP, Roe MT, Chen AY et al. Evolution in cardiovascular care for elderly patients with non-ST-segment elevation acute coronary syndromes: results from the CRUSADE National Quality Improvement Initiative. J Am Coll Cardiol. 2005;46(8):1479-87. (PMID: 16226171).
3. Roffi M, Patrono C, Collet JP et al. 2015 ESC Guide-lines for the management of acute coronary syn-dromes in patients presenting without persistent ST-segment elevation: Task Force for the Manage-ment of Acute Coronary Syndromes in Patients Pre-
RELATIONSHIP BETWEEN THE PROGNOSTIC NUTRITIONAL INDEX AND ALL-CAUSE MORTALITY IN ELDERLY PATIENTS WITH NON-ST SEGMENT ELEVATION MYOCARDIAL INFARCTION
379
7. Keskin M, Hayıroğlu MI, Keskin T et al. A novel and useful predictive indicator of prognosis in ST-seg-ment elevation myocardial infarction, the prognos-tic nutritional index. Nutr Metab Cardiovasc Dis. 2017;27(5):438-46. (PMID: 28392077).
8. Narumi T, Arimoto T, Funayama A et al. Prognos-tic importance of objective nutritional indexes in patients with chronic heart failure. J Cardiol. 2013;62(5):307-13. (PMID: 23806549).
9. Pathirana AK, Lokunarangoda N, Ranathunga I et al. Prevalence of hospital malnutrition among cardiac patients: results from six nutrition screening tools. Springerplus. 2014;3:412. (PMID: 25143874).
10. Zencirkiran Agus H, Kahraman S. Prognostic nutri-tional index predicts one-year outcome in heart fail-ure with preserved ejection fraction. Acta Cardiol. 2020;75(5):450-55. (PMID: 31498720).
11. Collet JP, Thiele H, Barbato E et al. 2020 ESC Guide-lines for the management of acute coronary syn-dromes in patients presenting without persistent ST-segment elevation. Eur Heart J. 2020. (PMID: 32860058).
12. Schiller NB, Shah PM, Crawford M et al. Recom-mendations for quantitation of the left ventricle by two-dimensional echocardiography. American Soci-ety of Echocardiography Committee on Standards, Subcommittee on Quantitation of Two-Dimen-sional Echocardiograms. J Am Soc Echocardiogr. 1989;2(5):358-67. (PMID: 2698218).
13. Gurwitz JH, Osganian V, Goldberg RJ et al. Diag-nostic testing in acute myocardial infarction: does patient age influence utilization patterns? The Worcester Heart Attack Study. Am J Epidemiol. 1991;134(9):948-57. (PMID: 1951292).
14. Alzahrani SH, Alamri SH. Prevalence of malnutrition and associated factors among hospitalized elder-ly patients in King Abdulaziz University Hospital, Jeddah, Saudi Arabia. BMC Geriatr. 2017;17(1):136. (PMID: 28673255).
15. Chan AW, Chan SL, Wong GL et al. Prognostic Nutritional Index (PNI) Predicts Tumor Recurrence of Very Early/Early Stage Hepatocellular Carci-noma After Surgical Resection. Ann Surg Oncol. 2015;22(13):4138-48. (PMID: 25801356).
16. Oduncu V, Erkol A, Karabay CY et al. The prognostic value of serum albumin levels on admission in pa-tients with acute ST-segment elevation myocardial infarction undergoing a primary percutaneous coro-
nary intervention. Coron Artery Dis. 2013;24(2):88-94. (PMID: 23249632).
17. Ishida S, Hashimoto I, Seike T et al. Serum albumin levels correlate with inflammation rather than nutri-tion supply in burns patients: a retrospective study. J Med Invest. 2014;61(3-4):361-8. (PMID: 25264055).
18. Gresele P, Deckmyn H, Huybrechts E, Vermylen J. Serum albumin enhances the impairment of plate-let aggregation with thromboxane synthase inhibi-tion by increasing the formation of prostaglandin D2. Biochem Pharmacol. 1984;33(13):2083-8. (PMID: 6430299).
19. Joles JA, Willekes-Koolschijn N, Koomans HA. Hy-poalbuminemia causes high blood viscosity by in-creasing red cell lysophosphatidylcholine. Kidney Int. 1997;52(3):761-70. (PMID: 9291198).
20. Relles DM, Richards NG, Bloom JP et al. Serum blood urea nitrogen and serum albumin on the first postoperative day predict pancreatic fistula and major complications after pancreaticoduodenecto-my. J Gastrointest Surg. 2013;17(2):326-31. (PMID: 23225108).
21. Danesh J, Collins R, Appleby P, Peto R. Association of fibrinogen, C-reactive protein, albumin, or leuko-cyte count with coronary heart disease: meta-analy-ses of prospective studies. Jama. 1998;279(18):1477-82. (PMID: 9600484).
22. Zhang S, Wan Z, Zhang Y et al. Neutrophil count im-proves the GRACE risk score prediction of clinical outcomes in patients with ST-elevation myocardial infarction. Atherosclerosis. 2015;241(2):723-8. (PMID: 26132283).
23. Kurtul A, Murat SN, Yarlioglues M et al. Increased neutrophil-to-lymphocyte ratio predicts persistent coronary no-flow after wire insertion in patients with ST-elevation myocardial infarction undergoing pri-mary percutaneous coronary intervention. Clinics (Sao Paulo). 2015;70(1):34-40. (PMID: 25672427).
24. Onsrud M, Thorsby E. Influence of in vivo hydrocor-tisone on some human blood lymphocyte subpopu-lations. I. Effect on natural killer cell activity. Scand J Immunol. 1981;13(6):573-9. (PMID: 7313552).
25. Widmer A, Linka AZ, Attenhofer Jost CH et al. Me-chanical complications after myocardial infarction reliably predicted using C-reactive protein levels and lymphocytopenia. Cardiology. 2003;99(1):25-31. (PMID: 12589119).
26. Rossi L, Rosa EM, Guerra MB. GRACE risk score vs

2021; 24(3): 370-380
380
TIMI risk score. Arq Bras Cardiol. 2011;96(3):257; au-thor reply 57-8. (PMID: 21484071).
27. Basta G, Chatzianagnostou K, Paradossi U et al. The prognostic impact of objective nutritional indices in elderly patients with ST-elevation myocardial infarc-tion undergoing primary coronary intervention. Int J Cardiol. 2016;221:987-92. (PMID: 27441479).
28. Han YC, Yang TH, Kim DI et al. Neutrophil to Lym-phocyte Ratio Predicts Long-Term Clinical Out-comes in Patients with ST-Segment Elevation Myo-cardial Infarction Undergoing Primary Percutaneous Coronary Intervention. Korean Circ J. 2013;43(2):93-9. (PMID: 23508782).
29. Yang L, Xia L, Wang Y et al. Low Prognostic Nutri-tional Index (PNI) Predicts Unfavorable Distant Me-tastasis-Free Survival in Nasopharyngeal Carcinoma: A Propensity Score-Matched Analysis. PLoS One. 2016;11(7):e0158853. (PMID: 27399281).
30. Chen QJ, Qu HJ, Li DZ et al. Prognostic nutrition-al index predicts clinical outcome in patients with
acute ST-segment elevation myocardial infarction undergoing primary percutaneous coronary inter-vention. Sci Rep. 2017;7(1):3285. (PMID: 28607442).
31. Wada H, Dohi T, Miyauchi K et al. Prognostic impact of nutritional status assessed by the Controlling Nu-tritional Status score in patients with stable coronary artery disease undergoing percutaneous coronary intervention. Clin Res Cardiol. 2017;106(11):875-83. (PMID: 28634674).
32. Tonet E, Campo G, Maietti E et al. Nutritional sta-tus and all-cause mortality in older adults with acute coronary syndrome. Clin Nutr. 2020;39(5):1572-79. (PMID: 31324416).
33. Kalyoncuoğlu M, Katkat F, Biter HI et al. Predict-ing One-Year Deaths and Major Adverse Vascular Events with the Controlling Nutritional Status Score in Elderly Patients with Non-ST-Elevated Myocar-dial Infarction Undergoing Percutaneous Coro-nary Intervention. J Clin Med. 2021;10(11). (PMID: 34067233).

381
Turkish Journal of Geriatrics
DOI: ....
2020; 23(): ...-...
CORRESPONDANCE
1 E
RESEARCH
Phone: +90
e-mail:
Received:
Accepted:
Turkish Journal of GeriatricsDOI: 10.31086/tjgeri.2021.2352021; 24(3): 381-390
CORRESPONDANCE
1 Adana City Training and Research Hospital, Otolaryngology Head and Neck Surgery Clinic, Adana, Turkey
SLEEP QUALITY IN PATIENTS OVER 65 YEARS OF AGE IN THE COVID-19 PANDEMIC
RESEARCH
Ayşe KARAOĞULLARINDAN1 . . . .
Sanem Okşan ERKAN1 . . . . . . . . . .
Birgül TUHANİOĞLU1 . . . . . . . . . . .
Gökhan KURAN1 . . . . . . . . . . . . . .
Orhan GÖRGÜLÜ1 . . . . . . . . . . . . .
1 Ayşe KARAOĞULLARINDAN
Adana City Training and Research Hospital, Otolaryngology Head and Neck Surgery Clinic, Adana, Turkey
Phone: +905068449331e-mail: [email protected]
Received: May 27, 2021 Accepted: Aug 22, 2021
Introduction: While Covid-19 affects people of all ages, elderly patients are at the highest risk. The Covid-19 pandemic has caused sleep disorders and mental health problems as well as physical symptoms.
Materials and Methods: A total of 142 patients, 71 Covid-19 patients hospitalized in the quarantine service and 71 non-covid, were included in the study. Patients were divided into groups of hospitalized in the COVID-19 and non-COVID-19 wards and by age (under 65 and over). The Pittsburg Sleep Quality Index was used to assess sleep quality, the Beck Depression Index to measure the level of depressive symptoms, and the Beck Anxiety Index to measure the level of anxiety symptoms.
Results: The sleep quality of those hospitalized in the COVID-19 ward was worse, and their anxiety and depression symptom scores were higher (p = 0.003, p = 0.011, and p = 0.018). The sleep quality of patients over 65 years of age was significantly worse than that of patients under 65 years of age (p <0.001), and anxiety and depression symptom scores of patients over 65 years of age were significantly higher than those of patients under 65 years of age (p <0.01, p <0.01)
Conclusion: During the COVID-19 pandemic, anxiety and depression symptoms were observed and sleep quality was deteriorated in patients aged >65 years who were placed in quarantine. Hence, this group of patients should be closely monitored in terms of psychological disorders and sleep disorders. If necessary, psychological support and medical treatment should be provided.
Keywords: Covid-19; Pandemic; Anxiety; Depression; Sleep; Geriatrics.
ABSTRACT

2021; 24(3): 381-390
382
INTRODUCTION Toward the end of 2019, a new coronavirus disease (COVID-19) pneumonia emerged in Wuhan, China, and spread rapidly all over the world. It was even-tually announced a pandemic by the World Health Organization (WHO). COVID-19 causes physical and psychological problems due to the high risk of transmission and mortality, of the virus. While COV-ID-19 affects people of all ages, elderly patients are at the highest risk. Due to the COVID-19 pandemic, the mortality rate of those aged 80 years and above has increased five-fold compared to the global av-erage (1). Therefore, health strategies, such as social distancing, are especially important for preventing the spread of the coronavirus (2, 3).
In many countries, patients infected with COVID-19 are treated in isolation wards under strict quarantine conditions. Due to social isolation, un-certainty, physical symptoms, side effects of drugs, fear of infecting others, death of a family member, and negative news on social media, patients with COVID-19 may experience loneliness, anger, anxi-ety, depression, insomnia, and post-traumatic stress disorder (PTSD) (4). In addition, SARS-CoV-2 can di-rectly reach the brain, disrupt brain functions, and cause mental-psychological problems in patients (5). A recent study found that 96.2% of clinically stable COVID-19 patients experienced significant PTSD (6). Previous studies that followed patients infected with severe acute respiratory syndrome (SARS) in 2003 showed that the prevalence of PTSD among SARS survivors was 9.79% in the early recov-ery phase and 46.2% at 3 months after discharge, 38.8% at 12 months (7). Thus, post-pandemic men-tal distress may be persistent, even after the pan-demic is over.
Many studies have reported that patients have negative changes in their sleep patterns and sleep quality due to quarantine (8, 9). Few studies have assessed depressive symptoms and impaired sleep quality, especially in elderly patients, during quar-antine (10, 11). Some standardized questionnaires
are used to evaluate anxiety, depression, and sleep quality of patients. The most commonly used among these are the Beck Depression Index (BDI), Beck Anxiety Index (BAI), and Pittsburg Sleep Qual-ity Index (PSQI) (9).
In our study, we aimed to examine to what ex-tent the hospital quarantine applied during the Covid-19 pandemic affected the anxiety and de-pression symptoms and sleep quality of the patients and whether this effect changes with age.
MATERIALS AND METHODS This study was conducted on 71 patients diagnosed with COVID-19 and hospitalized in an isolated covid ward under quarantine conditions and 71 non-COVID-19 patients hospitalized in non-COVID-19 services, not under quarantine, in the Adana City Training and Research Hospital between February 15, 2021, and March 15, 2021. A total of 142 patients were enrolled in this study. Our study was approved by the ethics committee on January 13, 2021 (num-ber 1256). Written consent was obtained from all patients.
Patients were divided into two groups, i.e., hos-pitalized in the COVID-19 and non-COVID-19 ser-vices, and evaluated them separately according to age (under and above 65 years of age). Patients in the COVID service consisted of stable patients with PCR (+) results, no respiratory distress, and under medical treatment. Patients hospitalized in non-COVID-19 services included stable patients who were deemed suitable for medical treatment. Sleep quality was evaluated using the PSQI, anxiety symptoms using the BAI, and depression symptoms using the BDI. Those younger than 18 years of age, those with previous psychiatric illnesses and sleep disorders, and those who could not complete their questionnaires in their entirety were excluded from the study.
The PSQI was used to evaluate the sleep quality of each patient over the last month, and consistent
SLEEP QUALITY IN PATIENTS OVER 65 YEARS OF AGE IN THE COVID-19 PANDEMIC
383
and repeatable PSQI scores were used (12). The PSQI, which enables us to evaluate the sleep quali-ty, as well as the amount, presence, and severity of sleep disorders in individuals through 19 questions, was filled out by the same physician using a one-on-one interview with the patients. The PSQI consists of seven items evaluating subjective sleep quality, sleep latency, sleep duration, sleep efficiency, sleep disturbance, and use of sleeping pills; the obtained global score ranges from 0 to 21, with higher val-ues indicating poor sleep quality and high levels of sleep disturbance. A global score of 5 or above indicates that clinically, sleep quality is significantly worse. Its diagnostic sensitivity and specificity are 89.6% and 86.5%, respectively (12,13). Agargün et al. adapted the PSQI questionnaire for Turkish pa-tients (13).
The BDI was developed to measure the risk of depression, the level of depressive symptoms, and the change in severity in adults (Beck 1961). The Turkish validity and reliability study was conducted by Hisli (1989). It measures the physical, emotional, and cognitive symptoms of depression. This scale includes 21 symptom categories with four options each. The total score obtained from the inventory indicates the following: 0–9, normal; 10–18, mild symptoms; 19–29, moderate symptoms; and 30–63, severe depression symptoms (14).
The BAI is a self-assessment scale developed by Beck et al. (1988) to determine the frequency of anxiety symptoms experienced by individuals. It evaluates the frequency of anxiety symptoms ex-perienced by an individual. It is a self-rating scale, scored between 0 and 3, which consists of 21 items. The total score obtained from the inventory indicate the following: 0–7, normal state; 8–15, mild anxiety; 16–25, moderate anxiety; and 26–63, severe anxie-ty symptoms. Ulusoy et al. (1998) have conducted a Turkish validity and reliability study for this scale (15).
Statistical analyses were performed using SPSS 22.0. A chi-square test was used to compare the
findings according to sex. An independent sam-ple t-test, chi-square test, Fisher’s exact test, and Mann–Whitney U test were used to compare the findings of patients in COVID-19 and non-COV-ID-19 services and those under 65 years of age. A multiple linear regression analysis was performed to evaluate the relationship between PSQI, anxiety, and depression.
RESULTS A total of 142 patients, 71 hospitalized in the COV-ID-19 ward and 71 hospitalized in the non-COV-ID-19 ward were included in the study. A total of 88 patients were below 65 years of age, and 54 pa-tients were above 65. There were 60 female and 82 male patients.
The sex distributions of the patients hospitalized in the COVID-19 and non-COVID-19 services were homogeneous according to the cut-odd of 65 years of age (p = 0.070, p = 0.075, p = 0.431). There was no significant difference in terms of the mean age between those hospitalized in the COVID-19 ward (60.01 ± 11.5 (25–91)) and in the non-COVID-19 ward (60.46 ± 11.39 (28–86)) (p = 0.815). Similarly, sex dis-tribution was homogeneous (p = 1.00) in patients hospitalized in the COVID-19 (female [30 (42.3)]) and non-COVID-19 wards (female [30 (42.3)] ) (Table 1) .
In those hospitalized in the COVID-19 service, individuals aged 65 years or older had a higher PSQI score (equal to or over 5), positive Beck anx-iety score, and Beck depression symptoms than those aged <65 years (p = 0.026, p <0.001, p = 0.005, respectively). No significant relationship was found in the PSQI among those hospitalized in the non-COVID-19 ward and those aged ≥65 and <65 years (p> 0.05). In non-COVID-19 ward inpatients aged ≥65 years, the proportion of those with pos-itive Beck anxiety symptoms and positive Beck de-pression symptoms was higher than in those aged <65 years (p <0.001, p <0.001, respectively). The proportions of those aged ≥65 years, those with

2021; 24(3): 381-390
384
PSQI scores ≥5, and those with Beck anxiety and depression symptoms were higher than of those aged <65 years (p = 0.018, p <0.001, and p <0.001, respectively). Individuals under 65 years of age ad-mitted in the COVID-19 and non-COVID-19 wards had similar PSQI and anxiety and depression symp-toms (p> 0.05). The rate of PSQI values ≥5 was high-er in those aged ≥65 years and those hospitalized in the COVID-19 ward than in those hospitalized in the non-COVID-19 ward (p = 0.011 and p = 0.028, respectively). Among individuals aged ≤65 years, the rates of anxiety and depression did not differ between those who were hospitalized in the COV-ID-19 and non-COVID-19 wards (p> 0.05 and p> 0.05, respectively) (Table 2).
Component 7 (daytime functions), PSQI, anxiety, and depression differed between individuals under 65 and over 65 years of age in the COVID-19 ward (p <0.05). The sleep quality of patients over 65 years of age hospitalized in the COVID-19 ward was sig-nificantly worse than that of patients under 65 years of age (p = 002). Anxiety and depression symptom scores of patients over 65 years of age hospitalized in the COVID-19 ward were significantly higher than
those of patients under 65 years of age (p <0.01 and p = 0.05). Component 2 (sleep latency), Com-ponent 3 (sleep time), Component 4 (sleep efficien-cy), PSQI, anxiety, and depression differed between individuals <65 years of age and ≥65 years of age with non-COVID cervicitis (p <0.05). The sleep qual-ity of patients over 65 years of age hospitalized in a non-COVID service was significantly worse than that of patients under 65 years of age (p = 006). Anxie-ty and depression symptom scores of patients over 65 years of age hospitalized in the COVID-19 ward were significantly higher than those of patients un-der 65 years of age (p <0.01 and p <0.01).
Among those aged < 65 and ≥65 years, Com-ponent 1 (subjective sleep quality), Component 2 (sleep latency), Component 3 (sleep time), Compo-nent 4 (sleep efficiency), Component 5, (sleep dis-turbance), Component 7 (daytime functions), PSQI, anxiety, and depression were found to differ (p <0 05). The sleep quality of patients over 65 years of age was significantly worse than that of patients under 65 years of age (p <0.001), and anxiety and depression symptom scores of patients over 65 years of age were significantly higher than those of
Table 1: Sex and age distribution of patients hospitalized in Covid and non-Covid services,
Covid services Non-Covid services Total
<65 age (n:44)
≥65 age (n:27) Total (n:71) <65 age
(n:44)≥65 age
(n:27) Total (n:71) <65 age (n:88)
≥65 age (n:54) Total (n:142) pgroup
Mean±SD(min-max)
Mean±SD(min-max)
Mean±SD(min-max)
Mean±SD(min-max)
Mean±SD(min-max)
Mean±SD(min-max)
Mean±SD(min-max)
Mean±SD(min-max)
Mean±SD(min-max)
Age 53.23±8.14 (25-61)
71.07±6.41 (65-91)
60.01±11.5 (25-91)
53.68±8.13 (28-64)
71.52±5.93 (65-86)
60.46±11.39 (28-86)
53.46±8.09 (25-64)
71.30±6.12 (65-91)
60.24±11.40 (25-91) 0.815
Female 15 (34.1) 15 (55.6) 30 (42.3) 17 (38.6) 13 (48.1) 30 (42.3) 32 (36.4) 28 (51.9) 60 (42.3)
1.00
Male 29 (65.9) 12 (44.4) 41 (57.7) 27 (61.4) 14 (51.9) 41 (5.7) 56 (63.6) 26 (48.1) 82 (57.7)
page=0.075 page=0.431 page=0.070
Gender: Chi-Square test, Age:Independent Sample t test, page: Comparison of under 65 and over, pgroup: Comparison of covid service and non-covid service

SLEEP QUALITY IN PATIENTS OVER 65 YEARS OF AGE IN THE COVID-19 PANDEMIC
385
patients under 65 years of age (p <0.01, p <0.01). Among those under 65 years old who were hospi-talized in the COVID-19 ward and those who were hospitalized in the non-COVID-19 wards, Compo-nent 2 (sleep latency), Component 3 (sleep time), Component 5 (sleep disturbance), PSQI, anxie-ty, and depression differed significantly (p <0.05). Sleep quality was worse in patients under 65 years of age, and anxiety and depression symptoms in the COVID ward scores were higher (p = 0.030, p = 0.011, p = 0.008). Component 5 (sleep disturbance), Component 7 (daytime functions), and PSQI dif-fered between those hospitalized in the COVID-19 ward and those hospitalized in the non-COVID-19 ward among individuals aged 65 years and older (p <0.05). Sleep quality was worse in those aged 65 years and older who were hospitalized in the COV-ID-19 ward (p = 0.010). When all patients were eval-uated, component 2 (sleep latency), Component
3 (sleep time), Component 5 (sleep disturbance), PSQI, anxiety, and depression differed between those hospitalized in the COVID-19 ward and those hospitalized in the non-COVID-19 wards (p <0.05). The sleep quality of those hospitalized in the COV-ID-19 ward was worse, and their anxiety and depres-sion symptom scores were higher (p = 0.003, p = 0.011, and p = 0.018, respectively) (Table 3).
For the PSQI, when sleeping in the COVID-19 ward, age, sex, anxiety, and depression were as-sessed together, stay in the non-COVID-19 ward de-creased the PSQI score. An increase in the depres-sion score in patients aged of 65 years and above also increased the PSQI (p <0.05). These variables accounted for 30.9% of the PSQI (p <0.001).
Increased depression scores were accompanied by increased anxiety scores (p <0.05). This variable accounted for 55.8% of the anxiety scores (p <0.001).
Table 2: Comparison of PSQI, anxiety and depression symptoms of patients under 65 and over 65 years of age in covid service and non-covid service
Covid services Non- Covid services Total
p age
p age
<65
;gr
oup
p age
≥65;
grou
p
p gro
up
<65 age ≥65 age Total p age <65 age ≥65 age Total p age <65 age ≥65 age Total
n % n % n % n % n % N % n % n % n %
PSQI
<5 25 56.8 8 29.6 33 46.50.
026 32 72.7 16 59.3 48 67.6
0.23
9 57 64.8 24 44.4 81 57.0
0.01
8
0.11
8
0.02
8
0.01
1
≥5 19 43.2 19 70.4 38 53.5 12 27.3 11 40.7 23 32.4 31 35.2 30 55.6 61 43.0
Beck anxiety Index
anxiety symptoms - 22 50.0 2 7.4 24 33.8
<0.0
01 29 65.9 5 18.5 34 47.9
<0.0
01 51 58.0 7 13.0 58 40.8
<0.0
01
0.13
1
0.42
0
0.08
8
anxiety symptoms + 22 50.0 25 9.,6 47 66.2 15 34.1 22 81.5 37 52.1 37 42.0 47 87.0 84 59.2
Beck depression Index
depression symptom - 22 50.0 4 1.,8 26 6,6
0.00
5 29 65.9 6 22.2 35 49.3<0
.001 51 58.0 10 18.5 61 43.0
<0.0
01
0.13
1
0.72
8
0.12
7
depression symptom + 22 50.0 23 8.2 45 63.4 15 34.1 21 77.8 36 50.7 37 42.0 44 81.5 81 57.0
Chi-Square test, Fisher Exact test, page: Comparison of under 65 and over , page<65;group: Comparison of covid service and non-covid ser-vice under 65, page≥65;group: Comparison of covid service and non-covid service aged 65 and above, pgroup: Comparison of covid service and non-covid service , PSQI: Pitsburg Sleep Quality Index
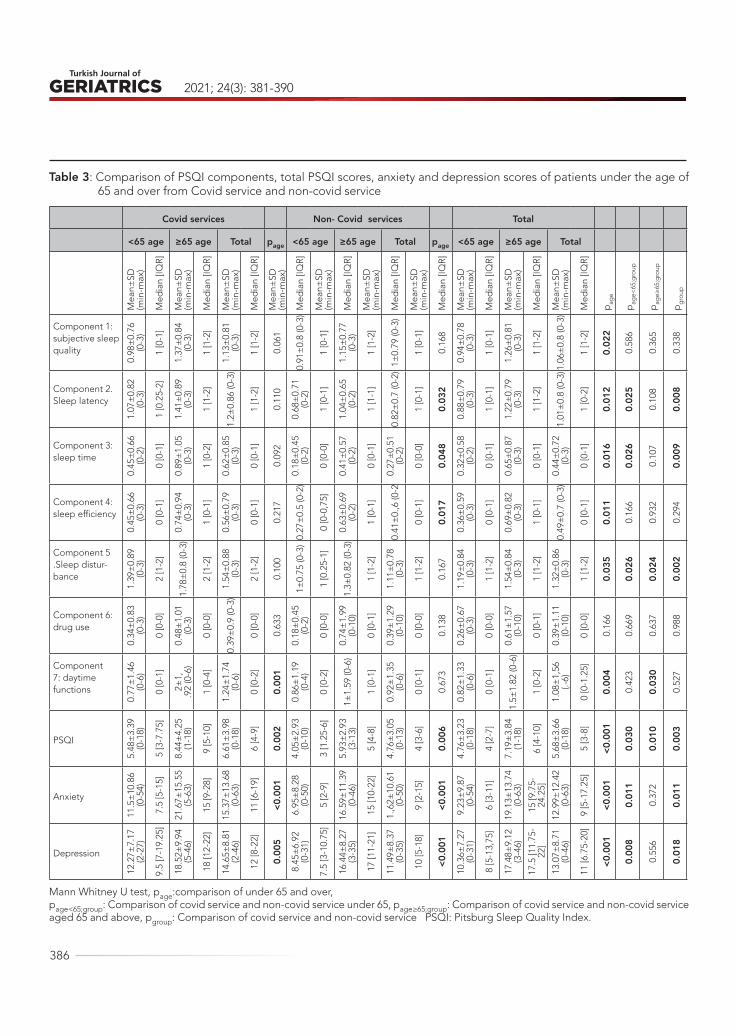
2021; 24(3): 381-390
386
Table 3: Comparison of PSQI components, total PSQI scores, anxiety and depression scores of patients under the age of 65 and over from Covid service and non-covid service
Covid services Non- Covid services Total
<65 age ≥65 age Total page <65 age ≥65 age Total page <65 age ≥65 age Total
Mea
n±SD
(min
-max
)
Med
ian
[IQR]
Mea
n±SD
(min
-max
)
Med
ian
[IQR]
Mea
n±SD
(min
-max
)
Med
ian
[IQR]
Mea
n±SD
(min
-max
)
Med
ian
[IQR]
Mea
n±SD
(min
-max
)
Med
ian
[IQR]
Mea
n±SD
(min
-max
)
Med
ian
[IQR]
Mea
n±SD
(min
-max
)
Med
ian
[IQR]
Mea
n±SD
(min
-max
)
Med
ian
[IQR]
Mea
n±SD
(min
-max
)
Med
ian
[IQR]
Mea
n±SD
(min
-max
)
Med
ian
[IQR]
pag
e
pag
e<65
;gro
up
pag
e≥65
;gro
up
pg
roup
Component 1: subjective sleep quality
0.98
±0.
76
(0-3
)
1 [0
-1]
1.37
±0.
84
(0-3
)
1 [1
-2]
1.13
±0.
81
(0-3
)
1 [1
-2]
0.06
1
0.91
±0.
8 (0
-3)
1 [0
-1]
1.15
±0.
77
(0-3
)
1 [1
-2]
1±0.
79 (0
-3)
1 [0
-1]
0.16
8
0.94
±0.
78
(0-3
)
1 [0
-1]
1.26
±0.
81
(0-3
)
1 [1
-2]
1.06
±0.
8 (0
-3)
1 [1
-2]
0.02
2
0.58
6
0.36
5
0.33
8
Component 2.Sleep latency
1.07
±0.
82
(0-3
)
1 [0
.25-
2]
1.41
±0.
89
(0-3
)
1 [1
-2]
1.2±
0.86
(0-3
)
1 [1
-2]
0.11
0
0.68
±0.
71
(0-2
)
1 [0
-1]
1.04
±0.
65
(0-2
)
1 [1
-1]
0.82
±0.
7 (0
-2)
1 [0
-1]
0.03
2
0.88
±0.
79
(0-3
)
1 [0
-1]
1.22
±0.
79
(0-3
)
1 [1
-2]
1.01
±0.
8 (0
-3)
1 [0
-2]
0.01
2
0.02
5
0.10
8
0.00
8
Component 3: sleep time
0.45
±0.
66
(0-2
)
0 [0
-1]
0.89
±1.
05
(0-3
)
1 [0
-2]
0.62
±0.
85
(0-3
)
0 [0
-1]
0.09
2
0.18
±0.
45
(0-2
)
0 [0
-0]
0.41
±0.
57
(0-2
)
0 [0
-1]
0.27
±0.
51
(0-2
)
0 [0
-0]
0.04
8
0.32
±0.
58
(0-2
)
0 [0
-1]
0.65
±0.
87
(0-3
)
0 [0
-1]
0.44
±0.
72
(0-3
)
0 [0
-1]
0.01
6
0.02
6
0.10
7
0.00
9
Component 4: sleep efficiency
0.45
±0.
66
(0-3
)
0 [0
-1]
0.74
±0.
94
(0-3
)
1 [0
-1]
0.56
±0.
79
(0-3
)
0 [0
-1]
0.21
7
0.27
±0.
5 (0
-2)
0 [0
-0,7
5]
0.63
±0.
69
(0-2
)
1 [0
-1]
0.41
±0.
,6 (0
-2
0 [0
-1]
0.01
7
0.36
±0.
59
(0-3
)
0 [0
-1]
0.69
±0.
82
(0-3
)
1 [0
-1]
0.49
±0.
7 (0
-3)
0 [0
-1]
0.01
1
0.16
6
0.93
2
0.29
4
Component 5.Sleep distur-bance
1.39
±0.
89
(0-3
)
2 [1
-2]
1.78
±0.
8 (0
-3)
2 [1
-2]
1.54
±0.
88
(0-3
)
2 [1
-2]
0.10
0
1±0.
75 (0
-3)
1 [0
.25-
1]
1.3±
0.82
(0-3
)
1 [1
-2]
1.11
±0.
78
(0-3
)
1 [1
-2]
0.16
7
1.19
±0.
84
(0-3
)
1 [1
-2]
1.54
±0.
84
(0-3
)
1 [1
-2]
1.32
±0.
86
(0-3
)
1 [1
-2]
0.03
5
0.02
6
0.02
4
0.00
2
Component 6: drug use
0.34
±0.
83
(0-3
)
0 [0
-0]
0.48
±1.
01
(0-3
)
0 [0
-0]
0.39
±0.
9 (0
-3)
0 [0
-0]
0.63
3
0.18
±0.
45
(0-2
)
0 [0
-0]
0.74
±1.
99
(0-1
0)
0 [0
-1]
0.39
±1.
29
(0-1
0)
0 [0
-0]
0.13
8
0.26
±0.
67
(0-3
)
0 [0
-0]
0.61
±1.
57
(0-1
0)
0 [0
-1]
0.39
±1.
11
(0-1
0)
0 [0
-0]
0.16
6
0.66
9
0.63
7
0.98
8Component 7: daytime functions
0.77
±1.
46
(0-6
)
0 [0
-1]
2±1,
.92
(0-6
)
1 [0
-4]
1.24
±1.
74
(0-6
)
0 [0
-2]
0.00
1
0.86
±1.
19
(0-4
)
0 [0
-2]
1±1.
59 (0
-6)
1 [0
-1]
0.92
±1.
35
(0-6
)
0 [0
-1]
0.67
3
0.82
±1.
33
(0-6
)
0 [0
-1]
1.5±
1.82
(0-6
)
1 [0
-2]
1.08
±1,
56
(.-6)
0 [0
-1.2
5]
0.00
4
0.42
3
0.03
0
0.52
7
PSQI
5.48
±3.
39
(0-1
8)
5 [3
-7.7
5]
8.44
±4.
25
(1-1
8)
9 [5
-10]
6.61
±3.
98
(0-1
8)
6 [4
-9]
0.00
2
4.05
±2.
93
(0-1
0)
3 [1
.25-
6]
5.93
±2.
93
(3-1
3)
5 [4
-8]
4.76
±3.
05
(0-1
3)
4 [3
-6]
0.00
6
4.76
±3.
23
(0-1
8)
4 [2
-7]
7.19
±3.
84
(1-1
8)
6 [4
-10]
5.68
±3.
66
(0-1
8)
5 [3
-8]
<0.0
01
0.03
0
0.01
0
0.00
3
Anxiety
11.5
±10
.86
(0-5
4)
7.5
[5-1
5]
21.6
7±15
.55
(5-6
3)
15 [9
-28]
15.3
7±13
.68
(0-6
3)
11 [6
-19]
<0.0
01
6.95
±8.
28
(0-5
0)
5 [2
-9]
16.5
9±11
.39
(0-4
6)
15 [1
0-22
]
1.,6
2±10
.61
(0-5
0)
9 [2
-15]
<0.0
01
9.23
±9.
87
(0-5
4)
6 [3
-11]
19.1
3±13
.74
(0-6
3)
15 [9
.75-
24.2
5]
12.9
9±12
.42
(0-6
3)
9 [5
-17.
25]
<0.0
01
0.01
1
0.37
2
0.01
1
Depression
12.2
7±7.
17
(2-2
7)
9.5
[7-1
9.25
]
18.5
2±9.
94
(5-4
6)
18 [1
2-22
]
14.6
5±8.
81
(2-4
6)
12 [8
-22]
0.00
5
8.45
±6.
92
(0-3
1)
7.5
[3-1
0.75
]
16.4
4±8.
27
(3-3
5)
17 [1
1-21
]
11.4
9±8.
37
(0-3
5)
10 [5
-18]
<0.0
01
10.3
6±7.
27
(0-3
1)
8 [5
-13,
75]
17.4
8±9.
12
(3-4
6)
17.5
[11.
75-
22]
13.0
7±8.
71
(0-4
6)
11 [6
.75-
20]
<0.0
01
0.00
8
0.55
6
0.01
8
Mann Whitney U test, page:comparison of under 65 and over,page<65;group: Comparison of covid service and non-covid service under 65, page≥65;group: Comparison of covid service and non-covid service aged 65 and above, pgroup: Comparison of covid service and non-covid service PSQI: Pitsburg Sleep Quality Index.

SLEEP QUALITY IN PATIENTS OVER 65 YEARS OF AGE IN THE COVID-19 PANDEMIC
387
Increased PSQI and anxiety scores also in-creased the depression score (p <0.05). These vari-ables accounted for 56.9% of the depression scores (p <0.001) (Table 4).
DISCUSSIONWhile medical complications are generally noted during the COVID-19 epidemic, the effects of SARS-CoV-2 on mental health and sleep quality should not be ignored. Considering that many psychiatric dis-orders were noted after the SARS-CoV-1 epidemic in 2002–2003, the effects of the SARS-CoV-2 epi-
demic on the mental health should be examined. In our study, we found that patients over 65 years of age generally had worse sleep quality and higher anxiety and depression symptom scores. Being in the COVID-19 ward directly affected sleep quality negatively, especially in patients over the age of 65 years, and caused sleep disturbances. In addition, we found that the anxiety and depression symp-toms of the patients in the COVID-19 ward were sig-nificantly higher than of those in the non-COVID-19 ward, especially in those aged >65 years.
In a meta-analysis on the effects of the COV-
Table 4: The relationship between PSQI, anxiety and depression scores, age, gender, service and each other
UnstandardizedCoefficients
StandardizedCoefficients t p
B Std. Error Beta
PSQIR2:0,309p<0,001
(Constant) 3.903 0.603 6.472 <0.001
Non-covid services -1.237 0.533 -0.170 -2.321 0.022
Age (≥65) 1.188 0.596 0.158 1.993 0.048
Sex (female) -0.644 0.539 -0.087 -1.194 0.235
Anxiety 0.045 0.031 0.154 1.444 0.151
Depression 0.125 0.044 0.297 2.815 0.006
AnxietyR2:0,558p<0,001
(Constant) -1.806 1.868 -0.967 0.335
Non-covid services -1.363 1.472 -0.055 -0.926 0.356
Age (≥65) 2.409 1.630 0.094 1.478 0.142
Sex (female) 2.842 1.453 0.113 1.956 0.053
Depression 0.877 0.098 0.615 8.908 <0.001
PSQI 0,334 0.231 0.098 1.444 0.151
Depression R2:0,569p<0,001
(Constant) 4.707 1.233 3.819 <0.001
Non-covid services -0.347 1.021 -0.020 -0.340 0.734
Age (≥65) 1.952 1.124 0.109 1.736 0.085
Sex (female) -0.402 1.019 -0.023 -0.394 0.694
PSQI 0.441 0.157 0.185 2.815 0.006
Anxiety 0.420 0.047 0.599 8.908 <0.001
p:Multiple Linear RegressionPSQI: Pitsburg Sleep Quality Index,

2021; 24(3): 381-390
388
ID-19 pandemic on mental health, 43 studies were examined, and only two of them evaluated patients infected with COVID -19. Of these 43 studies, 41 were conducted on healthcare workers and the general population. In the two studies on COVID-19 patients, high levels of post-traumatic stress symp-toms (PTSS) (96.2%) and significantly higher depres-sive symptoms (p = 0.016) were observed (16).
In a study by Zhang et al. in COVID-19 patients, 20.9% and 18.6% had symptoms of anxiety and de-pression, respectively. In Guo et al.’s study, 38.8%, 45.9%, and 54.1% of patients had symptoms of anx-iety, depression, and a sleep disorder, respectively. Finally, Dai et al. found symptoms of anxiety and depression and poor sleep quality in 18.6%, 13.4%, and 84.7% of patients, respectively (17, 8, 9). Female sex, having colleagues infected with COVID-19, poor sleep quality, more than two physical symp-toms of anxiety, having a family member infected with COVID-19, and more than two physical symp-toms of Covid-19 were identified as the greatest risk factors for depression (9, 17). In addition, the quar-antine period and some inflammatory markers may affect these parameters (17). In our study, 66.2%, 63.4%, and 53.3% of patients in the COVID-19 ward had symptoms of anxiety, depression, and sleep disturbances, respectively. Thus, the results of these studies on anxiety and depression and the factors affecting them are discrepant. In our study, being in quarantine and being over 65 years of age in-creased the symptoms of anxiety and depression and negatively affected the sleep quality. Our study was conducted in patients hospitalized in isolated COVID-19 wards. Patients were kept in quarantine in single rooms for an average of 10–14 days until their treatment was completed, and nobody could enter or leave the room except for the medical staff. In addition, communication was facilitated through room phones. There was only one companion al-lowed, especially for elderly patients who could not perform self-care. The patients remained secluded from their relatives, friends, and social circles dur-
ing their hospitalization periods. It is impossible for social isolation not to adversely affect the mental health of patients (18). Many studies have report-ed that curfew, quarantine, and isolation conditions increase the symptoms of anxiety and depression (18).
A previous study reported that COVID-19 pa-tients hospitalized with mild symptoms showed higher levels of depression, anxiety, and PTSS than non-COVID-19 controls (8). In our study, patients hospitalized in the COVID-19 ward showed a signif-icantly higher rate of anxiety and depression symp-toms than those hospitalized in non-COVID-19 wards; in addition, their sleep quality was worse. In our study, we did not assess PTSS but evaluated the sleep quality of the patients according to seven components of the PSQI and the total PSQI score. We found that the sleep quality of patients hospi-talized in the COVID-19 ward, especially those over 65 years of age, was worse. We found that these pa-tients had worse daytime functions. Moreover, they had difficulty staying awake during daily activities such as drinking, eating, and socializing; they also had reluctance in doing these activities regularly.
It was observed that COVID-19 patients showed higher symptoms of anxiety and depression in the first week of hospitalization, and that these symp-toms decreased 1 month following hospitalization (19). Some studies have reported mental health problems and changes in sleep quality, even after hospital discharge (20). Some studies have empha-sized the importance of social support after dis-charge, as well as during hospitalization (20). We followed the patients during hospitalization and did not assess them after discharge. COVID-19 patients should be followed up even after discharge, and if necessary, the duration of psychological support should be extended.
Bao et all, 49.8% of patients reported that psy-cho-education services provided in the hospital were useful (6). Given the detrimental impact of PTSS, appropriate psychological interventions and
SLEEP QUALITY IN PATIENTS OVER 65 YEARS OF AGE IN THE COVID-19 PANDEMIC
389
long-term follow-up evaluations for COVID-19 pa-tients should be urgently initiated. Healthcare pro-fessionals, particularly clinical nurses, should be aware of the psychological state of COVID-19 pa-tients and promote resilience to improve their men-tal health. Mental and physical health in the elderly is adversely affected by social isolation. Therefore, a multi-component program that includes exercise and psychological strategies is highly recommend-ed for this population during quarantine. In our study, psychiatric consultation was requested for patients with clinical psychological disturbances, and medical treatment was initiated if necessary. However, these were not recorded during the study and were excluded. Further studies are needed on patients aged >65 years who are admitted in the COVID-19 ward and need psychological support.
Ozamis et al. measured anxiety, stress, and de-pression levels in a sample of 976 adults using the Depression Anxiety and Stress Scale (DASS) during the COVID-19 pandemic. They observed higher levels of anxiety, depression, and stress, especially in people under 60 years of age and in those with chronic conditions (18). They also stated that the anxiety and depression symptoms of the patients increased after the quarantine order was given. The authors recommend psychological support to al-leviate the psychological effects of the pandemic. Similarly, we found that quarantine conditions in-creased the symptoms of anxiety and depression in our study. In our study, unlike the Ozamycin study,
anxiety and depression symptoms were found to be higher in the geriatric population. These differenc-es may be due to the study population, age of the patients, presence of chronic disease, quarantine status, hospitalization, and COVID-19 positivity.
This study had several limitations. We did not assess patients’ comorbid diseases and quarantine periods. In addition, we did not record anxiety and depression symptoms or the sleep quality of the pa-tients after discharge. Our study was conducted in a small population, and more extensive studies in larger populations may yield more robust conclu-sions.
CONCLUSIONDuring the COVID-19 pandemic, anxiety and de-pression symptoms were observed and sleep quali-ty was deteriorated in patients aged >65 years who were placed in quarantine. Hence, this group of pa-tients should be closely monitored in terms of psy-chological disorders and sleep disorders. If neces-sary, psychological support and medical treatment should be provided.
CONFLICT OF INTEREST STATEMENT: None
ACKNOWLEDGMENT: Thanks to Asena Ayça Özdemir from Mersin University Statistics Depart-ment for statistical analysis.
REFERENCES 1. Bialek S, Boundy E, Bowen V. et all. Severe Out-
comes Among Patients with Coronavirus Disease 2019 (COVID-19) — United States, February 12–March 16, 2020. MMWR Morb Mortal Wkly Rep. 2020;69(12):343-346. (PMID: 32214079)
2. Rudolph CW, Zacher H. “The COVID-19 Gener-ation”: A Cautionary Note. Work Aging Retire. 2020;XX(Xx):1-7. (DOI:10.1093/workar/waaa009)
3. Cudjoe TKM, Kotwal AA. “Social Distancing” Amid a
Crisis in Social Isolation and Loneliness. J Am Geriatr Soc. 2020 Jun; 68(6):E27-E29. (PMID: 32359072)
4. Zhou SJ, Zhang LG, Wang LL et all. Prevalence and socio-demographic correlates of psychological health problems in Chinese adolescents during the outbreak of COVID-19. Eur Child Adolesc Psychiatry. 2020 Jun;29(6):749-758. (PMID: 32363492)
5. Holmes EA, O’Connor RC, Perry VH et all. Multidis-ciplinary research priorities for the COVID-19 pan-demic: a call for action for mental health science. Lancet Psychiatry. 2020 Jun;7(6):547-560.(PMID:

2021; 24(3): 381-390
390
32304649)
6. Bo HX, Li W, Yang Y et all. Posttraumatic stress symptoms and attitude toward crisis mental health services among clinically stable patients with COV-ID-19 in China. Psychol Med. 2020 Mar 27:1-2. (PMID: 32216863)
7. U. Wesemann, N. Hadjamu, G. Willmund S. et all. Influence of COVID-19 on general stress and post-traumatic stress symptoms among hospitalized high-risk patients Psychol Med. 2020 Aug 14 :1–2.(PMID: 32794442)
8. Guo Q, Zheng Y, Shi J et all. Immediate psycholog-ical distress in quarantined patients with COVID-19 and its association with peripheral inflammation: A mixed-method study. Brain Behav Immun. 2020 Aug;88:17-27. (PMID: 32416290)
9. Dai LL, Wang X, Jiang TC et all. Anxiety and de-pressive symptoms among COVID-19 patients in Jianghan Fangcang Shelter Hospital in Wuhan, Chi-na. PLoS One. 2020 Aug 28;15(8):e0238416. (PMID: 32857826)
10. Sepúlveda-Loyola W, Rodríguez-Sánchez I, Pérez-Rodríguez P et all. Impact of Social Isolation Due to COVID-19 on Health in Older People: Mental and Physical Effects and Recommendations. J Nutr Health Aging. 2020;24(9):938-947. (PMID: 33155618)
11. Elezi F, Tafani G, Sotiri E, et all. Assessment of anxi-ety and depression symptoms in the Albanian gen-eral population during the outbreak of COVID-19 pandemic. Indian J Psychiatry. 2020 Sep;62(Suppl 3):S470-S475. (PMID: 33227057)
12. Buysse DJ, Reynolds CF 3rd, Monk TH et all. The Pittsburgh Sleep Quality Index: a new instrument for psychiatric practice and research. Psychiatry Res. 1989 May;28(2):193-213. (PMID: 2748771)
13. Agargun MY, Kara H, Anlar O. The validity and re-liability of Pittsburgh Sleep Quality Index. Turkish Psychiatry Rev 1996; 7(Suppl 2): 107-15. (in Turkish) [Internet] Available from: http://www.turkpsikiyatri.
com/en/default.aspx?modul=summary&id=210. Accessed:16.04.2020.
14. Wathelet M, Duhem S, Vaiva G et all. Factors As-sociated With Mental Health Disorders Among University Students in France Confined During the COVID-19 Pandemic. JAMA Netw Open. 2020 Oct 1;3(10):e2025591.( PMID: 33095252)
15. Ulusoy M, Sahin NH, Erkmen H. The Turkish version of the Beck Anxiety Inventory: Psychometric proper-ties. J Cogn Pschother 1998;12:163-72. (In Turkısh). [ Internet ] Avaliable from https://www.researchgate.net/publication/233792003_Turkish_Version_of_the_Beck_Anxiety_Inventory_Psychometric_Proper-ties
16. Vindegaard N, Benros ME. COVID-19 pandemic and mental health consequences: Systematic review of the current evidence. Brain Behav Immun. 2020 Oct;89:531-542. (PMID: 32485289)
17. Zhang J, Yang Z, Wang X et all. The relationship between resilience, anxiety and depression among patients with mild symptoms of COVID-19 in China: A cross-sectional study. J Clin Nurs. 2020 Nov;29(21-22):4020-4029. (PMID: 32702192)
18. Ozamiz-Etxebarria N, Dosil-Santamaria M, Pica-za-Gorrochategui M et all. . Stress, anxiety, and depression levels in the initial stage of the COV-ID-19 outbreak in a population sample in the northern Spain. Cad Saude Publica. 2020 Apr 30;36(4):e00054020. (PMID: 32374806)
19. Matalon N, Dorman-Ilan S, Hasson-Ohayon I et all.. Trajectories of post-traumatic stress symptoms, anx-iety, and depression in hospitalized COVID-19 pa-tients: A one-month follow-up. J Psychosom Res. 2021 Feb 16;143:110399. (PMID: 33618149)
20. Liu D, Baumeister RF, Veilleux JC et all. Risk factors associated with mental illness in hospital discharged patients infected with COVID-19 in Wuhan, Chi-na. Psychiatry Res. 2020 Oct;292:113297..( PMID: 32707218)

391
Turkish Journal of Geriatrics
DOI: ....
2020; 23(): ...-...
CORRESPONDANCE
1 E
RESEARCH
Phone: +90
e-mail:
Received:
Accepted:
Turkish Journal of GeriatricsDOI: 10.31086/tjgeri.2021.2362021; 24(3): 391-396
CORRESPONDANCE
1 Tokat Gaziosmanpaşa University School of Medicine, Family Medicine, Tokat, Turkey
VALUATION OF THE RELATIONSHIP BETWEEN THE END OF LIFE HOSPITALIZATION NEEDS AND EARLY PRESENTING TO PALLIATIVE CARE
RESEARCH
Ufuk ÜNLÜ1 . . . . . . . . . . . . . . . . . .
Nagihan YILDIZ ÇELTEK1 . . . . . . . .
1 Ufuk ÜNLÜ
Tokat Gaziosmanpaşa University School of Medicine, Family Medicine, Tokat, Turkey
Phone: +905417891808e-mail: [email protected]
Received: Apr 29, 2021 Accepted: Aug 22, 2021
Background: For a number of reasons, hospitalizations, and the need for intensive care increases during the last months of life in patients with life-threatening illnesses. We aimed to investigate the impact of the timing of presenting to palliative care on hospitalization (intensive care unit, palliative care and other departments inpatient services) during the end-of-life period and finally places of the death.
Methods: We conducted a retrospective analysis of the hospitalization data of adult patients who were treated in the Tokat Gaziosmanpaşa University Palliative Care Center and died between January 1, 2019, and June 30, 2020. Data that included the duration of time spent in inpatient care and the intensive care units at the end of life and the place of death were compared in relationship to their time of presentation to palliative care. Presentation timing was evaluated as early (>90 days before death) or late (<90 days before death) period.
Results: A total of 146 patients were included: 66.4% applied to the palliative care center in the late period and 33.6% in the early period. Their mean age was 67.4 years. The patients in the early-presenting group were found to have been hospitalized for less statistically significant time during the last six weeks of their lives (p = 0.002). However, the data do not show a statistically significant difference between the groups in terms of length of stay in the intensive care unit.
Conclusion: For cancer patients, earlier palliative care provides improvement in symptom control, increases their quality of life, decreases unnecessary hospitalizations.
Keywords: Palliative Care; Terminal Care; Hospitalization; Intensive Care Units; Death.
ABSTRACT
2021; 24(3): 391-396
392
INTRODUCTION
The number of patients in need of palliative care is increasing both in our country and throughout the world. This is a consequence of the prolonga-tion of life expectancy alongside increasing devel-opments in medical practice and the increase in the incidence of neurological diseases and cancer. The general principle of palliative care involves the rapid and holistic assessment of patients, including their physical, social, and spiritual needs, and treat-ment in order to higher life quality. Studies have demonstrated that earlier palliative care consulting increase the quality of life of the patients and re-duce the need for hospitalization and intensive care at the end of life as well (1).
Studies evaluating the early application of pallia-tive care reported that patients were more satisfied with the care and that they referred to emergency room care, hospitalization, and time in the intensive care unit (ICU) less frequently. On the other hand the fact that patients have additionally been shown to have better mood and quality of life and less depression was emphasized in the same study (2). These studies also accentuated that patients who are able to use palliative care services more effec-tively are more likely to die at home rather than in hospital (1,2). Another study showed that the quali-ty of life increased the most in cancer patients who started earlier palliative care (3).
The retrospective evaluation of subjects such as palliative care access timing, hospitalization periods in follow-up, intensive care needs, and the place of death are beginning to find a place in the literature. In this study, we aim to contribute to the literature by evaluating the impact of the timing of presenting to palliative care on total hospitalization (intensive care unit, palliative care and other departments in-patient services) during the end-of-life period and places of the death.
MATERIAL AND METHODSThe Tokat Gaziosmanpaşa University Palliative
Care Center provides holistic treatment services, including both outpatient and inpatient. The adult terminal stage cancer patients who were treated in our palliative care center (inpatient or outpatient) and who died between January 1, 2019, and June 30, 2020, constituted the universe of our study. There were 213 patients who met these criteria; 67 who had missing data in their patient records were excluded from the study. Our study was conducted using the data obtained by a retrospective scanning of 146 patient records whose information was ac-cessed completely. The patients in our study were examined in two groups: an early-presenting group (>90 days before death) and a late-presenting group (<90 days before death), based on the date of death. The 90-day limit was determined accord-ing to the definition of early palliative care specified in similar studies in the literature (4, 5). The groups were analyzed in relationship to the variables of age, gender, and hospitalization in the palliative care service, other department inpatient services, intensive care unit during the last six weeks of their lives and the places of death. In the comparative analysis, the length of stay in the hospital was evalu-ated as “never,” “short,” between one and 10 days, and “long” for more than 10 days.
Ethical approval for our study was obtained from the Tokat Gaziosmanpaşa University Ethics Com-mittee (20-KAEK-252).
The research data were analyzed with the SPSS v20 ready-made package program. Descriptive sta-tistics (percentage, mean, and standard deviation) were used in the evaluation of the demographic data. The Chi-square test was used for comparisons between groups. The statistical significance level was accepted as p < 0.05.

VALUATION OF THE RELATIONSHIP BETWEEN THE END OF LIFE HOSPITALIZATION NEEDS AND EARLY PRESENTING TO PALLIATIVE CARE
393
FINDINGSIn our study, 98 (67.1%) of the patients were male and 48 (32.9%) were female. Their mean age was 67.4 ± 11.8 years. (Table 1) When evaluated accord-ing to the time of the first application to palliative care, 97 (66.4%) patients were found to have applied during the late period and 49 (33.6%) applied in the early period. In the late-presenting patient group, the average hospital stay was 6.79 ± 8.92 days, and the average intensive care stay was 2.06 ± 5.15 days. In the early-presenting group, the mean hospital stay was 5.32 ± 7.21 days, and the average intensive care stay was 2.12 ± 4.18 days.
Regarding the comparisons of the hospitaliza-tions in the last six weeks of their lives, the patients in the early-presenting group were hospitalized for less statistically significant time (p = 0.002). When the total hospitalization stays were compared, it was seen that 38.8% of the patients in the early-present-ing patients group had no hospitalization at all, and this rate was 15.5% in the late-presenting patients group. It was observed that the long-term (>10 days) total hospitalization rate was significantly higher in the late-presenting patients group. In terms of inpa-tient treatment in palliative care and other clinical inpatient services, the patients in the early-present-ing group were found to have had less statistically significant need for treatment (p < 0.001). Similar to the total hospitalization rates, in the comparison of inpatient service stays, the rate of no hospitalization was higher in the early admission group (55.1%) than the late admission group (24.7%), and the long-term
hospitalization rate was found to be lower. Regard-ing comparison of palliative care inpatient service stay duration, it is seen that hospitalizations of the patients in the early-presenting group were shorter statistically significantly (p <0.05). However, the data do not show a statistically significant difference be-tween the groups in terms of length of stay in the ICU. Information regarding the hospitalizations of the groups is summarized in Table 2.
When the patients’ places of death were exam-ined, no statistically significant difference was found between the patient groups. However, although ap-proximately half (46.9%) of the patients in the ear-ly-presenting group died at home, it is noteworthy that this rate remained at 35% in the late-presenting group. The data regarding the place of death of the patients are summarized in Table 3.
DISCUSSIONIn our study which we investigated the impact
of presenting timing to the palliative care center on hospitalization status in the end of life and places of death, the patients who present to palliative care center in the early period were found to have been hospitalized for less statistically significant time dur-ing the last six weeks of their lives. However, the data showed that there was no statistically significant dif-ference between the groups in terms of length of stay in the intensive care unit. Similarly, a statistically significant difference was not found between the patient groups regarding places of death.
Table 1. Gender and age data of patients
Variables Early-presentingPatients Group
Late-presentingPatients Group Total
Gender
Malen (%) 37 (37.8) 61 (62.2) 98 (100)
Femalen (%) 12 (25) 36 (75) 48 (100)
Age (Mean ± SD) 67.8 ± 12.9 67.2 ± 12.3 67.4 ± 11.8

2021; 24(3): 391-396
394
Table 2. Hospitalization data
HospitalizationEarly-presentingPatients Group
n (%)
Late-presentingPatients Group
n (%)p
Inpatient Service Stay
Never(0 day) 27 (55.1) 24 (24.7)
<0.001Short
(0-10 day) 19 (38.7) 44 (45.3)
Long(>10 day) 3 (6.1) 29 (29.9)
Total 49 (100) 97 (100)
Palliative CareInpatient Service Stay
Never(0 day) 31 (63.3) 40 (41.2)
<0.05Short
(0-10 day) 15 (30.6) 45 (46.4)
Long(>10 day) 3 (6.1) 12 (12.4)
Total 49 (100) 97 (100)
ICU Stay
Never(0 day) 34 (69.4) 73 (75.2)
0.488Short
(0-10 day) 12 (24.5) 16 (16.5)
Long(>10 day) 3 (6.1) 8 (8.2)
Total 49 (100) 97 (100)
Total Hospitalization Stay
Never(0 day) 19 (38.8) 15 (15.5)
0.002Short
(0-10 day) 21 (42.8) 44 (45.3)
Long(>10 day) 9 (18.3) 38 (39.1)
Total 49 (100) 97 (100)
*The Chi-square test was used
Table 3. Places of Death Data
Groups
Place of Death n (%)
p
Home Inpatient Ser-vices ICU
Early-presentingPatients Group
23 (46.9) 11 (22.4) 15 (30.6)
0.09Late-presentingPatients Group
34 (35) 42 (43.3) 21 (21.6)

VALUATION OF THE RELATIONSHIP BETWEEN THE END OF LIFE HOSPITALIZATION NEEDS AND EARLY PRESENTING TO PALLIATIVE CARE
395
Due to a decrease in performance capacity and increased symptom burden in the last six months of life, hospital admissions are frequent in palliative care patients. For various reasons such as emer-gency room applications, hospitalizations, and the need for intensive care, the time spent in a hospital increases during the last months of life. Researchers are endeavoring to reduce this time. In the litera-ture, there is tremendous interest in studies directed toward reducing aggressive treatment approaches and hospitalization costs (6, 7). Hospitals and in-tensive care units, in particular, are not desirable places to die. Because of both the uneasiness that they feel regarding the discontinuation of treatment for the primary diagnosis and for a range of social and cultural reasons, patients and caregivers do not tend to prefer the palliative approach, consequent-ly, intensive care admissions increase at the end of life (8). Even so, studies have shown that the early initiation of palliative care relieves symptom burden and leads to fewer hospital admissions during the end-of-life period (9, 10).
In investigating the influence of palliative care timing on the hospitalization of our patients in the last six weeks of their lives, in our study, we ob-served that there were statistically significantly few-er hospitalizations into inpatient services and total hospitalizations (inpatient service + intensive care) in the patient group receiving palliative care during the early period. There was no significant difference between the two groups when considering the length of the stay in the intensive care unit in the last six weeks. Although no statistically significant difference was observed, when the patients’ places of death were evaluated, the rate of dying at home was found to be higher in the early palliative group in comparison to the late period group.
The study that Temel et al. (11) conducted in 2010 with patients with newly diagnosed metastat-ic non-small-cell lung cancer brought the timing of palliative care to the agenda. In this study, two pa-tient groups were compared who had been referred
to palliative care at the time of diagnosis and con-tinued with standard oncological treatment. Ran-domly assigned patients’ clinic data were recorded for three years. The patients who received palliative care concomitantly with the cancer diagnosis were hospitalized less, received less chemotherapy, and had a higher quality of life at the end of their lives. In the same study, the palliative care group was found to have lived four months longer than the control group (11). In their study with advanced cancer patients, especially in their investigation of the ef-fectiveness and timing of outpatient palliative care treatment, Blackhall et al. (9) showed that, although they applied to their centers in the last three to four months of their lives, the patients needed less hos-pitalization. The results of our study as earlier pallia-tive care decrease hospitalization at the end of life, are similar to those of others in the literature.
The Robbins et al. (4) in retrospective cohort study utilizing hospital and hospice administrative databases study, which investigated the effects of palliative care consultation timing, found that ear-ly stage patients whose palliative care admissions were 90 days before death had fewer hospitaliza-tions and that their intensive care needs especially decreased. In a retrospective cohort study by Ro-mano et al. (2), patients with advanced stage cancer were examined in two groups: those receiving ear-ly palliative care and those receiving standard on-cological treatment. These authors found that the control group had more statistically significant in-tensive care hospitalizations than the palliative care group. However, there was no difference between the groups when the duration of the intensive care stays and the intensive care procedures were eval-uated (2). In our study, no statistically significant difference was observed between the early and the late palliative care patient groups in the evaluation of the length of stay in the intensive care unit. The reason for this may be the low number of patients and variety of diagnosis of our patients.
Most individuals with life-threatening illnesses want to die at home rather than in a hospital. In this

2021; 24(3): 391-396
396
respect, the place of death can be considered as one of the quality indicators of end-of-life care (12). The Blackhall et al. (9) study found that the control group died in a hospital at a higher rate in compar-ison to the palliative care group. Similarly, the study by Romano et al. (2) found that the death rate in the hospital and intensive care units was reported to be lower in the patient group receiving early palliative care. Although no statistically significant difference was found between the early and the late palliative patient groups in our study, the rate of death at home was higher in the early-presenting palliative patient group in comparison to the late-presenting patient group.
The limitations of our study include the fact that our study was conducted in a single center, a small number of patients were included in the study.
CONCLUSIONThe findings in our study emphasized that, for ter-minal stage cancer patients who need frequent hospital referrals and hospitalizations due to severe symptom burden and deterioration in the quality of life, early contact with palliative care will result in improvement in symptom control, in a decrease in unnecessary hospital and intensive care hospitaliza-tions, an increase in the patient’s quality of life, and a decrease in medical expenses. These findings are in concurrence with those of the literature. There-fore, we feel that it is important that palliative care centers become widespread and that the number of competent palliative care teams be increased.
REFERENCES:1. Khandelwal N, Kross EK, Engelberg RA, et al.: Esti-
mating the effect of palliative care interventions and advance care planning on ICU utilization: a system-atic review. Crit Care Med 2015;43:1102–11. (PMID: 25574794)
2. Romano AM, Gade KE, Nielsen G, et al.: Early Palli-ative Care Reduces End-of-Life Intensive Care Unit (ICU) Use but Not ICU Course in Patients with Ad-vanced Cancer. The Oncologist 2017;22:318–323. (PMID: 28220023)
3. Gaertner J, Siemens W, Meerpohl JJ et al. Effect of specialist palliative care services on quality of life in adults with advanced incurable illness in hos-pital, hospice, or community settings: systematic review and meta-analysis. BMJ. 2017;358:j2925. (PMID:28676557)
4. Robbins SG, Hackstadt AJ, Martin S, Shinall MC Jr. Implications of Palliative Care Consultation Timing among a Cohort of Hospice Decedents. J Palliat Med. 2019;22(9):1129-1132. (PMID: 30864893)
5. Hui D, Kim SH, Roquemore J, et al.: Impact of tim-ing and setting of palliative care referral on quali-ty of end-of-life care in cancer patients. Cancer 2014;120:1743–1749. (PMID: 24967463)
6. Cook D, Rocker G. Dying with dignity in the inten-
sive care unit. N Engl J Med 2014;370(26):2506–14. (PMID: 24963569)
7. Parikh RB, Kirch RA, Smith TJ, Temel JS. Early spe-cialty palliative care–translating data in oncology into practice. N Engl J Med 2013;369(24):2347–2351. (PMID: 24328469)
8. Rothman DJ. Where we die. N Engl J Med 2014;370(26):2457–2460. (PMID: 24963563)
9. Blackhall LJ, Read P, Stukenborg G, et al.: CARE Track for Advanced Cancer: Impact and Timing of an Outpatient Palliative Care Clinic. J Palliat Med. 2016;19(1):57-63. (PMID: 26624851)
10. Zimmermanm C, Swami N, Krzyanowsla M, et al.: Early palliative care for patients with advanced can-cer: A cluster-randomized controlled trials. Lancet 2014;383(9930):1721–30.( PMID: 24559581)
11. Temel JS, Greer JA, Muzikansky A, et al.: Early pal-liative care for patients with metastatic non-small-cell lung cancer. N Engl J Med 2010;363(8):733–742. (PMID: 20818875)
12. Wright AA, Zhang B, Ray A, et al.: Associations be-tween end-of-life discussions, patient mental health, medical care near death, and caregiver bereave-ment adjustment. JAMA. 2008;300(14):1665–73. (PMID: 18840840)

397
Turkish Journal of Geriatrics
DOI: ....
2020; 23(): ...-...
CORRESPONDANCE
1 E
RESEARCH
Phone: +90
e-mail:
Received:
Accepted:
Turkish Journal of GeriatricsDOI: 10.31086/tjgeri.2021.2372021; 24(3): 397-406
CORRESPONDANCE
1 Karabük University, Department of Oral and Maxillofacial Surgery, Karabük, Turkey
2 Karabük University, Department of Otorhinolaryngology, Karabük, Turkey
3 Çankırı Karatekin University, Department of Periodontology, Çankırı, Turkey
4 Christian Albrechts University, Department of Oral and Maxillofacial Surgery, Kiel, Almanya
DEPRESSION AND ANXIETY LEVELS IN A GROUP OF ELDERLY WITH TEMPOROMANDIBULAR DISORDERS
RESEARCH
Ahmet Taylan ÇEBİ1 . . . . . . . . . . . .
Nihat YILMAZ2 . . . . . . . . . . . . . . . .
Fatih KARAYÜREK3 . . . . . . . . . . . .
Aydın GÜLSES4 . . . . . . . . . . . . . . .
3 Fatih KARAYÜREK
Çankırı Karatekin University, Department of Periodontology, Çankırı, Turkey
Phone: +905534067526e-mail: [email protected]
Received: May 31, 2021 Accepted: Aug 22, 2021
Introduction: The objective of this study was to assess stress and anxiety in a sample of elderly patients suffering from temporomandibular joint disorders who did not have previously diagnosed emotional disturbances. It is well known that patients presenting with temporomandibular joint disorders are more commonly affected by anxiety and depression. However, there is a lack of data regarding the prevalence of undiagnosed anxiety and emotional stress disorders among elderly patients with temporomandibular joint disorders.
Materials and Method: Clinical examination was performed using Research Diagnostic Criteria (Axis I). Patients with previously diagnosed and managed psychiatric and psychological disorders were excluded. Magnetic resonance imaging findings were also used to confirm the diagnosis. Beck Depression Inventory and Beck Anxiety Inventory forms were obtained to assess stress and anxiety levels.
Results: A total of 125 patients (103 [82.4%] women and 22 [17.6%] men) aged 60 to 87 (71.89 ± 10.39) years were included. The highest depression and anxiety scores were found among patients suffering from bruxism, followed by those with disc displacement without reduction and myofascial pain syndrome. All the patients showed significantly elevated depression levels.
Conclusion: The emotional health status of elderly patients with intra- and extra-articular temporomandibular joint disorders should be attentively assessed.
Key words: Anxiety; Depression; Temporomandibular Joint Disorder.
ABSTRACT
2021; 24(3): 397-406
398
INTRODUCTION
Temporomandibular joint disorders (TMDs) are fun-damentally painful, affecting the temporomandibu-lar joint (TMJ) together with the masticatory system and innervation of the head and neck (1), and they are detected at an incidence rate of about 25% in general society (1). Considering the complex mo-dality of the TMJ, the symptoms can be variable, including local or spreading pain in the TMJ or mas-ticatory muscles, crepitation, dislocation, or clicking on the movement of the TMJ, severe headache in the temporal region, and tinnitus (2). Even though TMD symptoms were seen in each age group and affect 90% of the general population at one or an-other life stage (3), TMDs were mostly determined between the third and fifth decades of life (4). How-ever, studies focusing on TMDs in elderly patients are limited (5).
The aetiological factors of TMDs could be bio-logical, environmental, social, emotional, and/or cognitive. Moreover, the effects of emotional sta-tus on the symptoms and prognosis of TMDs have been widely discussed and several studies have also shown that parafunctional habits, muscle hyperac-tivity, and micro-occlusal trauma could result from emotional stress disorders; thus, elevated stress, anxiety, and/or depression levels could correlate with TMD-related signs and symptoms (6).
The classification of TMDs was described at the International Research Diagnostic Criteria for Tem-poromandibular Dysfunction Consortium Network in 2013 (7) the Validation Project determined that the RDC/TMD Axis I validity was below the target sensitivity of ≥ 0.70 and specificity of ≥ 0.95. Con-sequently, these empirical results supported the development of revised RDC/TMD Axis I diagnos-tic algorithms that were subsequently demonstrat-ed to be valid for the most common pain-related TMD and for one temporomandibular joint (TMJ. TMDs were mainly subdivided into intra- and ex-
tra-articular pathologies. Among extra-articular manifestations, myofascial pain syndrome has been shown to be the most frequent cause of orofacial pain (42.0%), whereas disc displacement without reduction (32.1%) is the most common painful in-tra-articular pathology (7)the Validation Project determined that the RDC/TMD Axis I validity was below the target sensitivity of ≥ 0.70 and specific-ity of ≥ 0.95. Consequently, these empirical results supported the development of revised RDC/TMD Axis I diagnostic algorithms that were subsequent-ly demonstrated to be valid for the most common pain-related TMD and for one temporomandibular joint (TMJ. Besides, osteoarthrosis is suggested to be the magnetic resonance characteristic of TMJ disc displacement in elderly patients (5).
Over the last decades, the correlation between TMDs and emotional status has been widely stud-ied (6,8). It is well known that patients presenting with TMDs are more commonly affected by anxiety and depression (6). However, there seems to be a lack of data on the prevalence of undiagnosed anx-iety and emotional stress disorders among elder-ly patients with TMDs. Therefore, the objective of this study was to assess the level and prevalence of stress and anxiety in a sample of patients suffering from TMDs.
MATERIALS AND METHODS
This study was conducted in accordance with the Helsinki Declaration. Ethical approval was obtained from the Committee of Non-invasive Clinical Stud-ies (03 January 2018, 1/17). The patients were in-formed, and written consent forms were obtained.
Study Design
This study was conducted between April and December 2020; the study groups consisted of pa-tients who were referred to the Department of Oral

DEPRESSION AND ANXIETY LEVELS IN A GROUP OF ELDERLY WITH TEMPOROMANDIBULAR DISORDERS
399
and Maxillofacial Surgery with complaints of TMDs. The Research Diagnostic Criteria for TMDs (RDC/TMD) Axis I was applied to identify TMDs (7)the Validation Project determined that the RDC/TMD Axis I validity was below the target sensitivity of ≥ 0.70 and specificity of ≥ 0.95. Consequently, these empirical results supported the development of re-vised RDC/TMD Axis I diagnostic algorithms that were subsequently demonstrated to be valid for the most common pain-related TMD and for one temporomandibular joint (TMJ. According to The Research Diagnostic Criteria for TMDs (RDC/TMD) Axis I (7);
Group I: Muscle Disorders
• I. a. Myofascial Pain
• I. b. Myofascial Pain with Limited Opening
• I. c. Myofascial Pain with Referral
• I. d. Temporalis Tendonitis
Group II: Disc Displacements
• II. a. Disc Displacement with Reduction
• II. b. Disc Displacement without Reduction without Limited Opening
• II. c. Disc Internal Derangement with Reduc-tion with Transient Limited Opening
• II. d. Disc Internal Derangement without Re-duction with Limited Opening
Group III: Arthralgia/Arthritis/Arthrosis
• III. a. Arthralgia /Arthritis
• III. b. Osteoarthritis /Degenerative Joint Dis-ease
• III. c. Osteoarthrosis /Degenerative Joint Disease
Group IV: Temporomandibular Joint Hypermo-bility
• IV. a. Subluxation/Luxation
Group V: Tension-type Headache with Tempora-lis Muscle Tenderness
• V. a. Infrequent Episodic Tension-type Head-ache Involving the Temporalis Muscle
• V. b. Frequent Episodic Tension-type Head-ache Involving the Temporalis Muscle
• V. c. Chronic Tension-type Headache Involv-ing the Temporalis Muscle
Magnetic resonance imaging (MRI) findings were also used to confirm the diagnosis. The pa-tients were subdivided into five groups according to their diagnosis:
• Group I: Anterior disc displacement with re-duction
• Group II: Anterior disc displacement without reduction
• Group III: Bruxism
• Group IV: Myofascial pain syndrome
• Group V: Control group (patients who pre-sented with complaints other than TMDs)
Patients with previously diagnosed and man-aged psychiatric and psychological disorders such as depression, anxiety, and personality disorders, neurological disorders, Eagle syndrome, rheumato-logic disorders affecting the TMJ, and acute TMD symptoms and those younger than 60 years were excluded. Their socio-demographic data and Beck Depression Inventory (BDI) and Beck Anxiety Inven-tory (BAI) forms were obtained.
Briefly, the BDI consists of 21 questions quanti-fied by summing the scores between 0 and 3 ob-tained for each answer, which defines the depres-sion level (9). Values 0–9 are determined as normal, 10–18 mild, 19–29 moderate, and 30–63 severe depression. Similarly, the BAI is a Likert-type scale scored between 0 and 3, which consists of 21 items and is used to determine the frequency and level of anxiety symptoms (10). Values 0–7 are considered normal, 8–15 mild, 16–25 moderate, and 26–63 se-vere anxiety.
According to the answers and scores obtained from the forms and scales, the relationship deter-minants of anxiety and depression and parameters such as the classification of TMDs into two groups
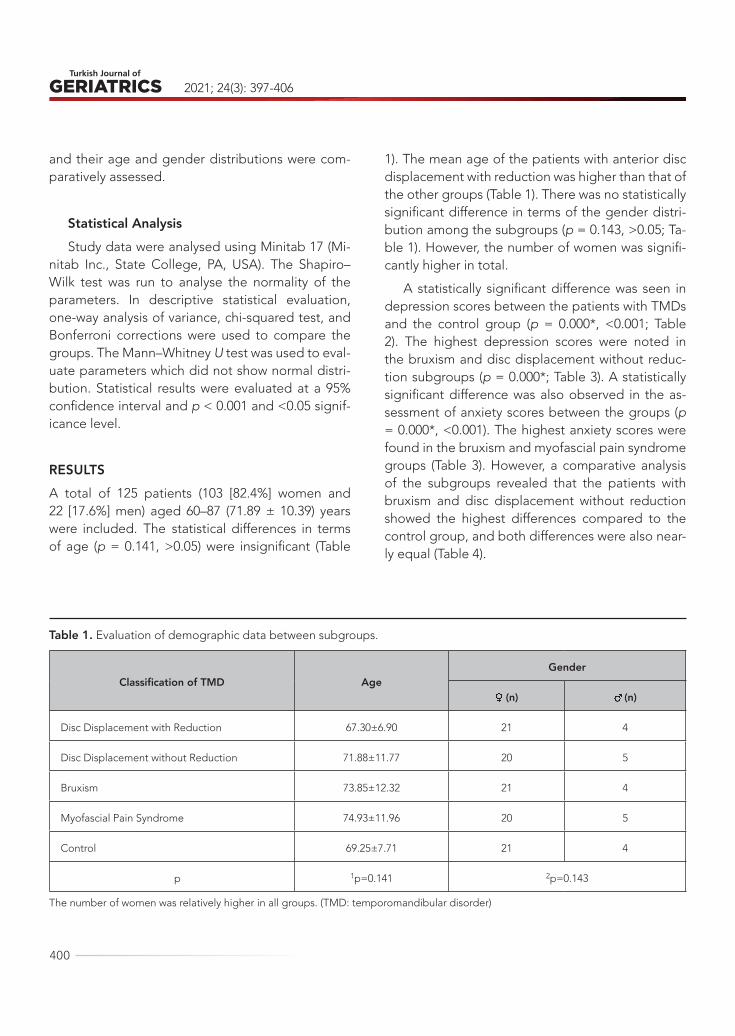
2021; 24(3): 397-406
400
and their age and gender distributions were com-paratively assessed.
Statistical AnalysisStudy data were analysed using Minitab 17 (Mi-
nitab Inc., State College, PA, USA). The Shapiro–Wilk test was run to analyse the normality of the parameters. In descriptive statistical evaluation, one-way analysis of variance, chi-squared test, and Bonferroni corrections were used to compare the groups. The Mann–Whitney U test was used to eval-uate parameters which did not show normal distri-bution. Statistical results were evaluated at a 95% confidence interval and p < 0.001 and <0.05 signif-icance level.
RESULTSA total of 125 patients (103 [82.4%] women and 22 [17.6%] men) aged 60–87 (71.89 ± 10.39) years were included. The statistical differences in terms of age (p = 0.141, >0.05) were insignificant (Table
1). The mean age of the patients with anterior disc displacement with reduction was higher than that of the other groups (Table 1). There was no statistically significant difference in terms of the gender distri-bution among the subgroups (p = 0.143, >0.05; Ta-ble 1). However, the number of women was signifi-cantly higher in total.
A statistically significant difference was seen in depression scores between the patients with TMDs and the control group (p = 0.000*, <0.001; Table 2). The highest depression scores were noted in the bruxism and disc displacement without reduc-tion subgroups (p = 0.000*; Table 3). A statistically significant difference was also observed in the as-sessment of anxiety scores between the groups (p = 0.000*, <0.001). The highest anxiety scores were found in the bruxism and myofascial pain syndrome groups (Table 3). However, a comparative analysis of the subgroups revealed that the patients with bruxism and disc displacement without reduction showed the highest differences compared to the control group, and both differences were also near-ly equal (Table 4).
Table 1. Evaluation of demographic data between subgroups.
Classification of TMD AgeGender
♀(n) ♂(n)
Disc Displacement with Reduction 67.30±6.90 21 4
Disc Displacement without Reduction 71.88±11.77 20 5
Bruxism 73.85±12.32 21 4
Myofascial Pain Syndrome 74.93±11.96 20 5
Control 69.25±7.71 21 4
p 1p=0.141 2p=0.143
The number of women was relatively higher in all groups. (TMD: temporomandibular disorder)
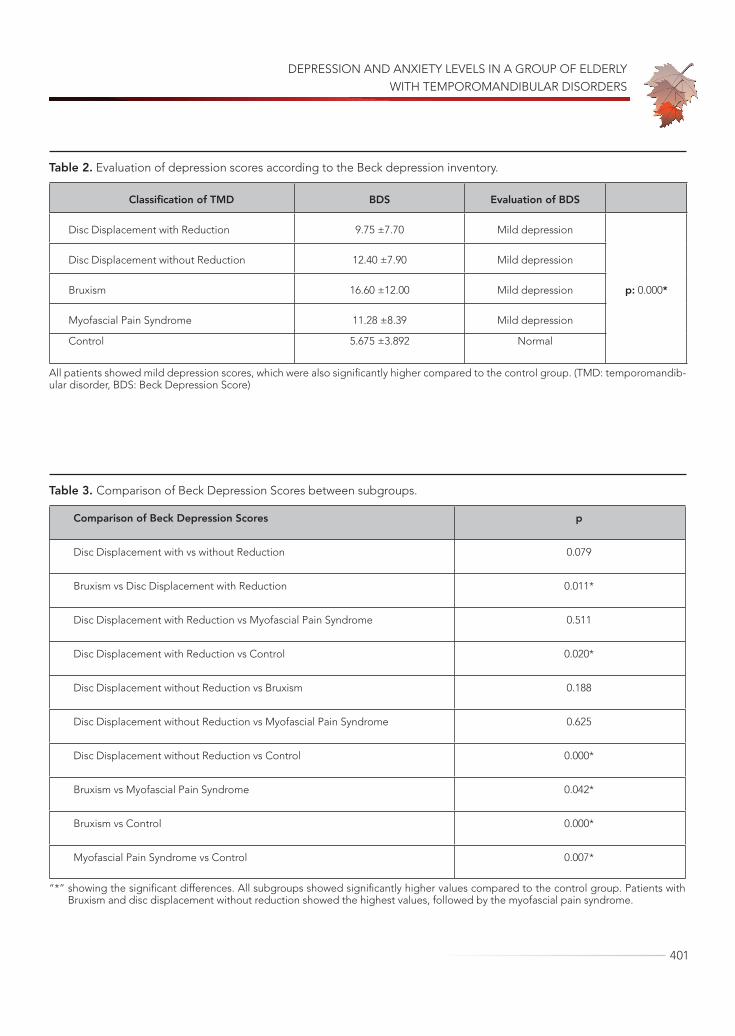
DEPRESSION AND ANXIETY LEVELS IN A GROUP OF ELDERLY WITH TEMPOROMANDIBULAR DISORDERS
401
Table 2. Evaluation of depression scores according to the Beck depression inventory.
Classification of TMD BDS Evaluation of BDS
Disc Displacement with Reduction 9.75 ±7.70 Mild depression
p: 0.000*
Disc Displacement without Reduction 12.40 ±7.90 Mild depression
Bruxism 16.60 ±12.00 Mild depression
Myofascial Pain Syndrome 11.28 ±8.39 Mild depression
Control 5.675 ±3.892 Normal
All patients showed mild depression scores, which were also significantly higher compared to the control group. (TMD: temporomandib-ular disorder, BDS: Beck Depression Score)
Table 3. Comparison of Beck Depression Scores between subgroups.
Comparison of Beck Depression Scores p
Disc Displacement with vs without Reduction 0.079
Bruxism vs Disc Displacement with Reduction 0.011*
Disc Displacement with Reduction vs Myofascial Pain Syndrome 0.511
Disc Displacement with Reduction vs Control 0.020*
Disc Displacement without Reduction vs Bruxism 0.188
Disc Displacement without Reduction vs Myofascial Pain Syndrome 0.625
Disc Displacement without Reduction vs Control 0.000*
Bruxism vs Myofascial Pain Syndrome 0.042*
Bruxism vs Control 0.000*
Myofascial Pain Syndrome vs Control 0.007*
“*” showing the significant differences. All subgroups showed significantly higher values compared to the control group. Patients with Bruxism and disc displacement without reduction showed the highest values, followed by the myofascial pain syndrome.
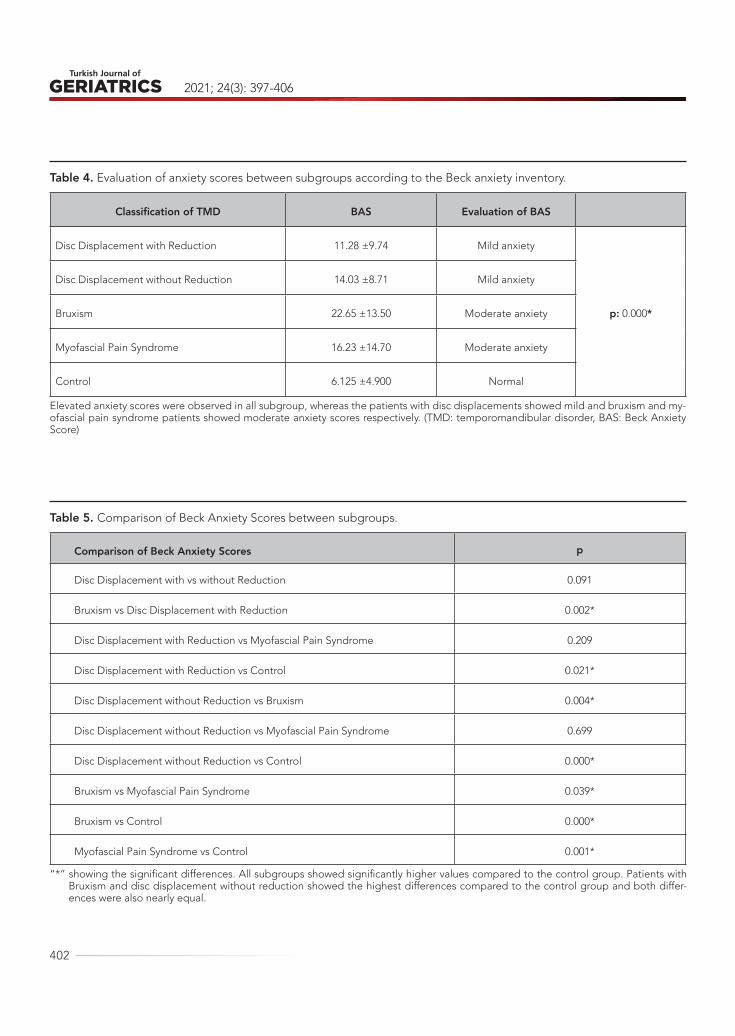
2021; 24(3): 397-406
402
Table 5. Comparison of Beck Anxiety Scores between subgroups.
Comparison of Beck Anxiety Scores p
Disc Displacement with vs without Reduction 0.091
Bruxism vs Disc Displacement with Reduction 0.002*
Disc Displacement with Reduction vs Myofascial Pain Syndrome 0.209
Disc Displacement with Reduction vs Control 0.021*
Disc Displacement without Reduction vs Bruxism 0.004*
Disc Displacement without Reduction vs Myofascial Pain Syndrome 0.699
Disc Displacement without Reduction vs Control 0.000*
Bruxism vs Myofascial Pain Syndrome 0.039*
Bruxism vs Control 0.000*
Myofascial Pain Syndrome vs Control 0.001*
“*” showing the significant differences. All subgroups showed significantly higher values compared to the control group. Patients with Bruxism and disc displacement without reduction showed the highest differences compared to the control group and both differ-ences were also nearly equal.
Table 4. Evaluation of anxiety scores between subgroups according to the Beck anxiety inventory.
Classification of TMD BAS Evaluation of BAS
Disc Displacement with Reduction 11.28 ±9.74 Mild anxiety
p: 0.000*
Disc Displacement without Reduction 14.03 ±8.71 Mild anxiety
Bruxism 22.65 ±13.50 Moderate anxiety
Myofascial Pain Syndrome 16.23 ±14.70 Moderate anxiety
Control 6.125 ±4.900 Normal
Elevated anxiety scores were observed in all subgroup, whereas the patients with disc displacements showed mild and bruxism and my-ofascial pain syndrome patients showed moderate anxiety scores respectively. (TMD: temporomandibular disorder, BAS: Beck Anxiety Score)
DEPRESSION AND ANXIETY LEVELS IN A GROUP OF ELDERLY WITH TEMPOROMANDIBULAR DISORDERS
403
All the TMD subgroups showed significant-ly higher depression and anxiety levels compared to the control group. The depression and anxiety scores among the subgroups revealed that the pa-tients with bruxism had the highest scores. Those with bruxism and disc displacement without reduc-tion showed the highest differences compared to the control group in the assessment of both depres-sion and anxiety levels (p = 0.000*).
DISCUSSIONThe role of psychological factors in the aetiology of TMDs cannot be ignored, as they play a great role in many painful conditions and parafunctional hab-its of the human body (11). Psychological disorders have also been defined as key factors in the devel-opment of TMDs by some authors (12). Therefore, the prevalence of anxiety and stress in patients with TMDs has been studied in the literature (13). How-ever, most studies have only focused on the prev-alence of psychological disorders among patients with TMDs. The strength of this research, this is the first study to focus on undiagnosed stress and anx-iety disturbances in elderly patients with TMDs, our knowledge.
Saeed and Riaz (14)TMD symptoms may be caused by different physiological and/or psychoso-cial factors. The purpose of this study is to deter-mine the level of depression in patients with TMD. These findings can guide the diagnosis, prevention, and treatment of TMDs. In a prospective study, par-ticipants were screened and underwent a baseline physical examination of the head and neck, con-ducted according to the protocol of Research Diag-nostic Criteria Axis I for Temporomandibular Disor-ders(RDC/TMD tried to determine the depression levels in patients with TMDs and stated that moder-ate depression was more frequent in these patients (i.e. 30.7%), followed by severe depression (22.0%), extreme depression (16.0%), and borderline clinical depression (10.0%). Bertoli and de Leeuw (15) re-ported elevated suicidal ideation, depression, and
anxiety levels among patients with TMDs, especial-ly in those with chronic muscle pain, compared to the general population. The current study results showed that patients with intra- and extra-articular TMJ pathologies presented with mild depression levels. Additionally, the assessment of anxiety lev-els revealed that the patients with intra-articular pathologies showed mild elevated anxiety levels, whereas those with extra-articular pathologies such as bruxism and myofascial pain syndrome showed moderate levels. Generally, both elevated stress and anxiety levels were in accordance with the ex-isting literature (16).
Surprisingly, a comparative analysis of both the anxiety and depression scores of patients suffering from TMDs with disc displacement without reduc-tion and the control group revealed nearly equal differences with the bruxism group. In the literature, an association between disc displacement with re-duction and quality of life has been stated previous-ly (17)43 were included in the present study. Fonse-ca’s anamnestic index was used for initial screening while axis I of the Research Diagnostic Criteria for Temporomandibular Disorders (RDC-TMD. Howev-er, studies focusing on the relation between TMJ disc displacement without reduction and elevated anxiety and/or depression levels are limited in terms of case studies (18). Considering the prevalence of the condition, this phenomenon might warrant fur-ther research.
Ogura et al (5) evaluated the magnetic resonance characteristics of TMJ disc displacement in elderly patients and stated that the incidence of disc dis-placement with osteoarthrosis was significantly high (41.9%). In the current study, to avoid undiagnosed rheumatologic conditions which could mimic TMD symptoms and obscure the perceptions of the pa-tients, those with osteoarthrosis of the TMJ were excluded from the study.
The BDI and BAI scales were developed by Beck et al (9) and are used to quantify depression and determine the frequency and level of anxiety
2021; 24(3): 397-406
404
symptoms (10). In the literature, the validity of both methods has been approved by several studies (19,20)pain threshold at pressure, pain vigilance, oral health-related quality of life (OHRQoL. In a re-cent study, Maślak-Bereś et al (20)as described by the Beck’s Depression Inventory (BDI have assessed the relationships between TMD/RDC clinical diag-noses and psycho-emotional status via the BDI and Perceived Stress Scale (PSS-10) and observed that in those with pain, the mean values on the BDI and PSS-10 scales were higher than those pain-free. Be-cause of the complex modality of the TMJ region, MRI is the gold standard for assessing the internal derangements of the TMJ. Therefore, the results of TMD studies based solely on RDC and clinical find-ings could be controversial. In the current study, the intra-articular derangements of the TMJ were also confirmed via MRI.
Another point to discuss is the similarities in the need for treatment of both TMD and psychological disturbances. TMD-related problems occur in 90% of the population at least once in a lifetime; howev-er, the need for treatment depends mainly on the pain perception and/or functional disturbances of a patient. Similarly, undiagnosed depression or el-evated stress levels are common mental disorders with a prevalence varying from 20% to 53% in dif-ferent decades of life (21), which could have a con-siderable effect on the health-related quality of life and satisfaction levels of patients. Additionally, it has also been proclaimed that there could be a sig-nificant delay in seeking treatment for the mental health of patients with TMD symptoms (22). Like pa-tients with TMDs, not all elderly patients with undi-agnosed depression or elevated stress levels need psychological evaluation and management; howev-er, it should be kept in mind that undiagnosed de-pression could also lead to several outcomes if not managed properly.
It is also well known that because of the ongo-ing COVID-19 pandemic, most elderly people are in social isolation, which could be a “serious public
health concern” because of their heightened risk of cardiovascular, autoimmune, neurocognitive, and mental health problems (23). Moreover, recent stud-ies have shown that social disconnection puts elder-ly people at greater risk of depression and anxiety (24)but less is known about the distinct contribu-tions of different aspects of isolation. We aimed to distinguish the pathways through which social dis-connectedness (eg, small social network, infrequent social interaction. As observed in the current study, the elevated anxiety and stress levels among elderly patients with TMDs might be related to their social disconnection due to the ongoing COVID-19 pan-demic; however, further comparative studies with long-term results are necessary to determine the exact relation.
This study has clearly shown that bruxism is the main condition, which might be correlated to ele-vated anxiety and stress levels and requires multi-disciplinary management. Many patients suffering from bruxism are also primarily seeking treatment from neurologists and/or psychiatrists. In the man-agement of bruxism, selective serotonin reuptake inhibitors (SSRIs) could be a feasible option to over-come elevated stress and anxiety levels. However, at this point, a well-described (still underreported) condition should be highlighted. SSRI-associated bruxism, which could occur as an adverse reaction to antidepressant therapy, is a rare entity which neurologists, psychiatrists, and dentists should be aware of. Besides, increased blood pressure and sleep-related bruxism warrant further research; thus, the relationship between sleep apnoea and hyper-tension has not yet been well documented. Consid-ering that systemic diseases and medication needs increase with age, dentists should properly review the medication of elderly patients with TMDs.
One might suggest that complete denture wear-ers are more likely to develop TMD symptoms; however, no robust association between prosthet-ic factors and TMD was found in the literature (25). Because of the controversies surrounding the asso-
DEPRESSION AND ANXIETY LEVELS IN A GROUP OF ELDERLY WITH TEMPOROMANDIBULAR DISORDERS
405
REFERENCES1. Scrivani SJ, Keith DA, Kaban LB. Temporomandibu-
lar disorders. N Engl J Med. 2008;359(25):2693–705. (PMID: 19092154)
2. Durham J, Newton-John TRO, Zakrzewska JM. Tem-poromandibular disorders. BMJ. 2015;350:h1154. (PMID: 25767130)
3. Manfredini D, Guarda-Nardini L, Winocur E, Piccotti F, Ahlberg J, Lobbezoo F. Research diagnostic cri-teria for temporomandibular disorders: a system-atic review of axis I epidemiologic findings. Oral Surg Oral Med Oral Pathol Oral Radiol Endod. 2011;112(4):453–62. (PMID: 21835653)
4. Yadav S, Yang Y, Dutra EH, Robinson JL, Wadhwa S. Temporomandibular Joint Disorders in Older Adults. J Am Geriatr Soc. 2018;66(6):1213–7. (PMID: 29719041)
5. Ogura I, Kaneda T, Mori S, Sakayanagi M, Kato M. Magnetic resonance characteristics of temporo-mandibular joint disc displacement in elderly pa-tients. Dento Maxillo Facial Radiol. 2012;41(2):122–5. (PMID: 22116131)
6. Calixtre LB, Grüninger BL da S, Chaves TC, Olivei-ra AB de. Is there an association between anxie-ty/depression and temporomandibular disorders in college students? J Appl Oral Sci Rev FOB. 2014;22(1):15–21. (PMID: 24626244)
7. Schiffman E, Ohrbach R, Truelove E et al. Diagnos-tic Criteria for Temporomandibular Disorders (DC/TMD) for Clinical and Research Applications: recom-mendations of the International RDC/TMD Consor-tium Network* and Orofacial Pain Special Interest Group†. J Oral Facial Pain Headache. 2014;28(1):6–27. (PMID: 24482784)
8. Fillingim RB, Ohrbach R, Greenspan JD et al. Psy-chological factors associated with development of
TMD: the OPPERA prospective cohort study. J Pain. 2013;14(12 Suppl):T75-90. (PMID: 24275225)
9. Beck AT, Ward CH, Mendelson M, Mock J, Erbaugh J. An inventory for measuring depression. Arch Gen Psychiatry. 1961;4:561–71. (PMID: 13688369)
10. Beck AT, Epstein N, Brown G, Steer RA. An inventory for measuring clinical anxiety: psychometric proper-ties. J Consult Clin Psychol. 1988;56(6):893–7. (PMID: 3204199)
11. Dreiman BB. Thoughts on the psychological com-ponent of TMJ/TMD syndrome. Oral Surg Oral Med Oral Pathol Oral Radiol Endod. 2011;112(5):555–6. (PMID: 21889373)
12. Kinney RK, Gatchel RJ, Ellis E, Holt C. Major psycho-logical disorders in chronic TMD patients: implica-tions for successful management. J Am Dent Assoc. 1992;123(10):49–54. (PMID: 1401593)
13. Chuinsiri N, Jitprasertwong P. Prevalence of self-reported pain-related temporomandibu-lar disorders and association with psychological distress in a dental clinic setting. J Int Med Res. 2020;48(9):300060520951744. (PMID: 32883120)
14. Saeed T, Riaz N. Level of Depression in Temporo-mandibular Disorder Patients. J Pak Dent Assoc. 2018;27(03):100–5. (DOI:10.25301/JPDA.273.100)
15. Bertoli E, de Leeuw R. Prevalence of Suicidal Idea-tion, Depression, and Anxiety in Chronic Tempo-romandibular Disorder Patients. J Oral Facial Pain Headache. 2016;30(4):296–301. (PMID: 27792796)
16. Resende CMBM de, Rocha LGD da S, Paiva RP de et al. Relationship between anxiety, quality of life, and sociodemographic characteristics and temporoman-dibular disorder. Oral Surg Oral Med Oral Pathol Oral Radiol. 2020;129(2):125–32. (PMID: 31784398)
17. Resende CMBM de, Alves AC de M, Coelho LT, Al-chieri JC, Roncalli AG, Barbosa GAS. Quality of life
ciation between TMD symptoms and edentulism, complete denture wearers were excluded from the study.
Patients with both intra- and extra-articular TMJ pathologies presented with elevated depression and anxiety levels, whereas those with bruxism, disc displacement without reduction, and myofascial
pain syndrome showed significantly higher anxiety and depression levels.
The literature is remarkably deficient in the evaluation of the relationship between TMD and the undiagnosed psychological status of a patient. Despite the limitations, the current study has con-firmed that this relation warrants further research.

2021; 24(3): 397-406
406
and general health in patients with temporoman-dibular disorders. Braz Oral Res. 2013;27(2):116–21. (PMID: 23459771)
18. Braga SP, Fiamengui LMSP, da Silveira VRS et al. Insights for temporomandibular disorders manage-ment: From psychosocial factors to genetics-A case report. Spec Care Dentist. 202;41(1):85–91. (PMID: 33152157)
19. Machado NAG, Costa YM, Quevedo HM et al. The association of self-reported awake bruxism with anxiety, depression, pain threshold at pressure, pain vigilance, and quality of life in patients un-dergoing orthodontic treatment. J Appl Oral Sci. 2020;28:e20190407. (PMID: 32236355)
20. Maślak-Bereś M, Loster JE, Wieczorek A, Loster BW. Evaluation of the psychoemotional status of young adults with symptoms of temporomandibular disorders. Brain Behav. 2019;9(11):e01443. (PMID: 31613063)
21. Kandola A, Lewis G, Osborn DPJ, Stubbs B, Hayes JF. Depressive symptoms and objectively measured
physical activity and sedentary behaviour through-out adolescence: a prospective cohort study. Lancet Psychiatry. 2020;7(3):262–71. (PMID: 32059797)
22. Kmeid E, Nacouzi M, Hallit S, Rohayem Z. Prev-alence of temporomandibular joint disorder in the Lebanese population, and its association with depression, anxiety, and stress. Head Face Med. 2020;16(1):19. (PMID: 32887633)
23. Armitage R, Nellums LB. COVID-19 and the con-sequences of isolating the elderly. Lancet Public Health. 2020;5(5):e256. (PMID: 32199471)
24. Santini ZI, Jose PE, York Cornwell E et al. Social dis-connectedness, perceived isolation, and symptoms of depression and anxiety among older Americans (NSHAP): a longitudinal mediation analysis. Lancet Public Health. 2020;5(1):e62–70. (PMID: 31910981)
25. Ribeiro JAM, de Resende CMBM, Lopes ALC, Fari-as-Neto A, Carreiro A da FP. Association between prosthetic factors and temporomandibular disor-ders in complete denture wearers. Gerodontology. 2014;31(4):308–13. (PMID: 23448239)

407
Turkish Journal of Geriatrics
DOI: ....
2020; 23(): ...-...
CORRESPONDANCE
1 E
RESEARCH
Phone: +90
e-mail:
Received:
Accepted:
Turkish Journal of GeriatricsDOI: 10.31086/tjgeri.2021.2382021; 24(3): 407-415
CORRESPONDANCE
1 Malatya Training and Research Hospital, Department of Neurology, Malatya, Turkey
2 Inonu University, School of Medicine, Department of Biochemistry, Malatya, Turkey
3 Malatya Training and Research Hospital, Department of Biochemistry, Malatya, Turkey
4 Inonu University, School of Medicine, Department of Neurology, Malatya, Turkey
RELATIONSHIPS BETWEEN PARKINSON’S DISEASE DEMENTIA AND 25-HYDROXY VITAMIN D AND BRAIN-DERIVED NEUROTROPHIC FACTOR LEVELS
RESEARCH
Tuba EKMEKYAPAR1 . . . . . . . . . . .
Yusuf TÜRKÖZ2 . . . . . . . . . . . . . . .
Zeynep ERDEMLİ3 . . . . . . . . . . . . .
Yasemin DEMİRTAŞ4 . . . . . . . . . . .
Sibel ALTINAYAR4. . . . . . . . . . . . . .
1 Tuba EKMEKYAPAR
Malatya Training and Research Hospital, Department of Neurology, Malatya, Turkey
Phone: +905321626986e-mail: [email protected]
Received: Apr 15, 2021 Accepted: Aug 24, 2021
Introduction: Parkinson’s disease dementia is an important condition that worsens the quality of life in approximately 30% of parkinson disease patients. Vitamin D deficiency and brain-derived neurotrophic factor have been implicated in the pathogenesis of alzheimer type dementia, parkinson’s disease, and many neurodegenerative diseases. The aim of this study was to investigate the relationship between cognitive impairment and 25-hydroxy vitamin D and brain-derived neurotrophic factor levels in parkinson’s disease dementia patients.
Materials and Method: 25-hydroxy vitamin D and brain-derived neurotrophic factor serum levels were evaluated in patients with parkinson’s disease dementia (n = 63) and healthy controls (n = 33). Brain-derived neurotrophic factor and vitamin D levels were examined using one sample t-tests, and multiple comparisons among independent groups were done using ANOVA post hoc Tukey’s test analysis. Wechsler Memory Scale and Mini-Mental State Examination were used to evaluate the cognitive functions of the groups. The disease levels of the patients were determined using the Hoehn and Yahr scale and the Unified Parkinson’s Disease Rating Scale.
Results: There was a significant negative correlation between the worsening of dementia and vitamin D levels (p = 0.009). However, there were significant negative correlations between the unified parkinson’s disease rating scale daily living activity and Hoehn and Yahr scales and vitamin D levels. No significant relationship was found between brain-derived neurotrophic factor and parkinson’s disease dementia (p = 0.983).
Conclusions: Vitamin D deficiency plays a role in cognitive loss in parkinson’s disease dementia. Vitamin D replacement can be used in dementia support treatment.
Keywords: Parkinson Disease; Dementia; Vitamin D; Brain-Derived Neurotrophic Factor.
ABSTRACT
2021; 24(3): 407-415
408
INTRODUCTION
Idiopathic Parkinson’s disease (IPD) is a progressive neurodegenerative disease that is accompanied by resting tremors, bradykinesia, rigidity, and postural disorders (1). Non-motor signs are also common in IPD but are mostly ignored. The incidence of IPD in all age groups ranges from 4.5 to 9 per 100,000 (2). Cognitive loss and dementia develop over the course of IPD in 30% of patients (3,4). Parkinson’s disease dementia (PDD) constitutes 0.5% of all de-mentia cases in people over the age of 65 and 3–4% of the dementia cases in all age groups (5,6). Symp-toms like rigidity and akinesia, recurring falls, and severe gait disorders are significant risk factors for slow-onset, severe cognitive deterioration (7). Fron-tal executive function disorders and memory errors are the main characteristics of the disease (7).
Vitamin D is a neuro-steroid hormone that has important roles in bone mineralization and the reg-ulation of the calcium-phosphorus balance (8). Vi-tamin D has significant effects on the brain and has various roles in the central nervous system, in cell proliferation and differentiation, neurotransmission, and neuroplasticity as well as neuroprotection (9).
Brain-derived neurotrophic factor (BDNF) is a member of the neurotrophin family and is found in several brain regions (10). BDNF mainly affects neuron development and regeneration and the structural health of major neural pathways and their functioning. A correlation has been found between low BDNF levels and alzheimer’s disease (11,12). It is believed that BDNF is also associated with other neurodegenerative diseases, including IPD (13).
The aim of this study was to investigate the rela-tionship between cognitive impairment and 25-hy-droxy vitamin D (25 (OH) vitamin D) and BDNF lev-els in PDD patients.
MATERIALS AND METHODS
Patient Selection
The study included 63 patients with IPD who were followed up in the Movement Disorders Clinic of the Department of Neurology, Inonu University, and 33 healthy individuals of similar age and education level without any neurological disease. There were no patients diagnosed with osteoporosis in either group. Individuals were diagnosed using their files and clinical evaluations. None of the participants were using vitamin D, multivitamins, or calcium or phosphate group drugs.
The specimens for measuring the BDNF levels of 13 patients had deteriorated, and these patients were excluded. Subjects who were on any vitamin replacement treatment, those with a bone metab-olism disease, such as osteoporosis, or a chronic systemic disease, were excluded. All subjects pro-vided informed consent before participating in the study, which was approved with a protocol code of 2016/23 by the Malatya Clinical Research Ethics Committee.
The personal and actual knowledge and long-term memory of all subjects were assessed using the Wechsler Memory Scale (WMS) 1; orientation was assessed with WMS 2; mental control and the ability to sustain attention were assessed with WMS 3; logical memory (momentary and long-term re-membering test) was assessed with WMS 4; and WMS R was used to assess simple and complex at-tention based on numbers and visual range. Prov-erb interpretation and similarity tests were used to assess abstract thinking (abstraction); planning skills were assessed by drawing clocks; structuring was assessed by shape copying; concentric circles were drawn to evaluate constructional praxis; and verbal conciseness functions were examined via word find-ing. For the patients who could not perform these tests due to cognitive loss, the Mini-Mental State
RELATIONSHIPS BETWEEN PARKINSON’S DISEASE DEMENTIA AND 25-HYDROXY VITAMIN D AND BRAIN-DERIVED NEUROTROPHIC FACTOR LEVELS
409
Examination (MMSE) was administered. In this test, participants answer 11 questions and can obtain a maximum of 30 points; scores of 20–24 points indi-cate mild cognitive disorder, 10–19 indicate mod-erate dementia, and less than 10 points, severe dementia. For the patients whose clinical dementia scores were calculated, orientation, memory, atten-tion, calculation, recall, language, motor function and perception, and visuospatial capacities were evaluated.
After undergoing the neurological examinations, the patients’ disease levels were determined using the Hoehn and Yahr (H&Y) scale and the Unified Par-kinson’s Disease Rating Scale (UPDRS).
Blood SamplesFasting blood samples were collected in
vacutainers and centrifuged at 3000 rpm for 10 min to obtain serum. The serum samples were frozen at –70°C until the BDNF and 25 (OH) Vitamin D levels were measured. Before the analysis, the frozen se-rum samples were slowly brought to room tempera-ture and stirred gently. The BDNF and 25(OH) vita-min D analyses were performed on the same day.
Biochemical Analysis of Serum BDNFThe serum BDNF levels of both groups were
measured using a commercial enzyme-linked immu-nosorbent assay (ELISA) kit (Boster Biological Tech-nology, Pleasanton, CA, USA) based on the manu-facturer’s instructions. This analysis is based on the ELISA method. The serum and standard samples were added to wells that were precoated with hu-man BDNF monoclonal antibodies and incubated for 90 min at 37°C. After incubation, the contents of the wells were removed by overturning the plate on a paper towel. After this, biotinylated polyclonal detection antibodies were added to each well and incubated for 60 min at 37°C. After incubation, the wells were washed three times to extract unbound biotinylated polyclonal antibodies. After this, an avi-
din-biotin-peroxidase complex was added to each well and incubated for 30 min at 37°C. After incuba-tion, the wells were washed three times to extract the unbound avidin-biotin-peroxidase complex. A tetramethylbenzidine (TMB) solution (chromogen) was then added to each well and incubated in the dark for 25–30 min at 37°C, and thus, the color of the fluid in the wells turned blue. The reaction was ended by adding a TMB stop solution (acidic stop solution), and the blue color finally turned yellow. The absorbance values of the yellow fluid were mea-sured at 450 nm using a microplate reader (Synergy H1 Hybrid Multi-Mode Reader; BioTek Instruments, Inc., Winooski, VT). The absorbance of the yellow color that was obtained was proportional to the lev-el of human BDNF found in the serum. The results are reported in units of pg/mL. The intra-assay and inter-assay coefficient of variation values of the test were < 4.5% and < 7.5%, respectively.
Biochemical Analysis of Serum Vitamin DThe serum vitamin D levels were analyzed using
high-performance liquid chromatography (HPLC) with a Shimadzu LC-10ADVP HPLC system (Shimad-zu Corporation, Kyoto, Japan), Immuchrom vitamin D3 controls, and an HPLC kit (Immuchrom GmbH, Heppenheim, Germany) while measuring the serum 25(OH) vitamin D levels. In summary, this method is based on subjecting samples to precipitation and extraction before they are injected into the HPLC system. The HPLC separation process was carried out with a ‘reverse phase’ C18, 150 × 4.6 mm parti-cle-size column (VertiSep GES; Vertical Chromatog-raphy Co., Ltd., Thailand) at 30°C at a 1 mL/min flow rate and using acetonitrile-water (99:1, v/v) as the mobile phase. The volume of the injected samples was 50 μl, and the HPLC separation process lasted for 15 min. Chromatograms were determined using a UV detector at 264 nm. The results were calcu-lated with the ‘in-house standard method’ via the integration of the peak regions. The results are re-ported as nmol/L. The coefficient of variation values

2021; 24(3): 407-415
410
of the test were < 2.5% and < 4.0% for intra-assay and inter-assay, respectively.
Statistical AnalysisStatistical analysis was performed using SPSS
v.17 software (SPSS Inc., Chicago, IL, USA). The data were analyzed using SPSS, and p < 0.05 was con-sidered significant. The differences between the groups in terms of age, education level, disease duration, age of disease onset, and 25(OH) vitamin D and BDNF levels were examined using a t-test. The differences in the gender ratios between the groups were calculated using the chi-square test. Analysis of variance (ANOVA) and the post hoc Tuk-ey’s test were used for multiple comparisons among independent groups, while the cognitive levels and H&Y stages of the groups were compared using the Pearson’s chi-square test. The Pearson’s correlation test was used to determine the correlation between the UPDRS score and 25(OH) vitamin D and BDNF levels.
RESULTSThe mean age of the patients was 65.54 ± 7.07 years versus 66.88 ± 5.37 years for the controls (p = 0.097).
There was no significant gender difference between the groups (p = 0.101). The normal range of the 25(OH) vitamin D levels for both groups was accept-ed as 75–250 nmol/L. The mean 25(OH) vitamin D level was 240.55 ± 89.01 nmol/L for the patients and 217.03 ± 68.71 nmol/L for the controls (p = 0.146). Similarly, there was no significant difference in the BDNF levels of the two groups (p = 0.604) (Table 1).
For the patients, the mean disease duration was 5.32 ± 3.75 years, and the mean age of disease on-set was 60.13 ± 7.12 years. Comparing the cogni-tive levels of the patients and UPDRS scores, the UPDRS-cognitive function score was significantly correlated with the stage of dementia (p < 0.001) (Table 2).
In PDD patients, there was a strong correlation between the worsening of cognitive function and a reduction in 25(OH) vitamin D levels (p = 0.009, Table 3). However, no significant relationship was found between the BDNF levels and cognitive lev-els of the patients (p = 0.983, Table 3).
There was also an inverse correlation between worsening H&Y stage and 25(OH) vitamin D levels (p = 0.046, Table 4). There was no significant rela-tionship between BDNF level and H&Y stage (p =
Table 1. Comparison of age, gender, 25(OH) vitamin D, and BDNF levels between patient and control groups
Patient group (n = 63) Control group (n = 33) F p
Age (years) 65.54 ± 7.07 66.88 ± 5.37 2.808 0.097*
Vitamin D (nmol/L) 240.55 ± 89.01 217.03 ± 68.71 2.147 0.146*
BDNF (pg/mL) 137.80 ± 12.08 137.22 ± 16.67 0.271 0.604*
Gender
Female 29 (%58.0) 21 (%42.0) 2.689 0.101¶
Male 34 (%73.9) 12 (%26.1)
*t-test,¶chi-square test
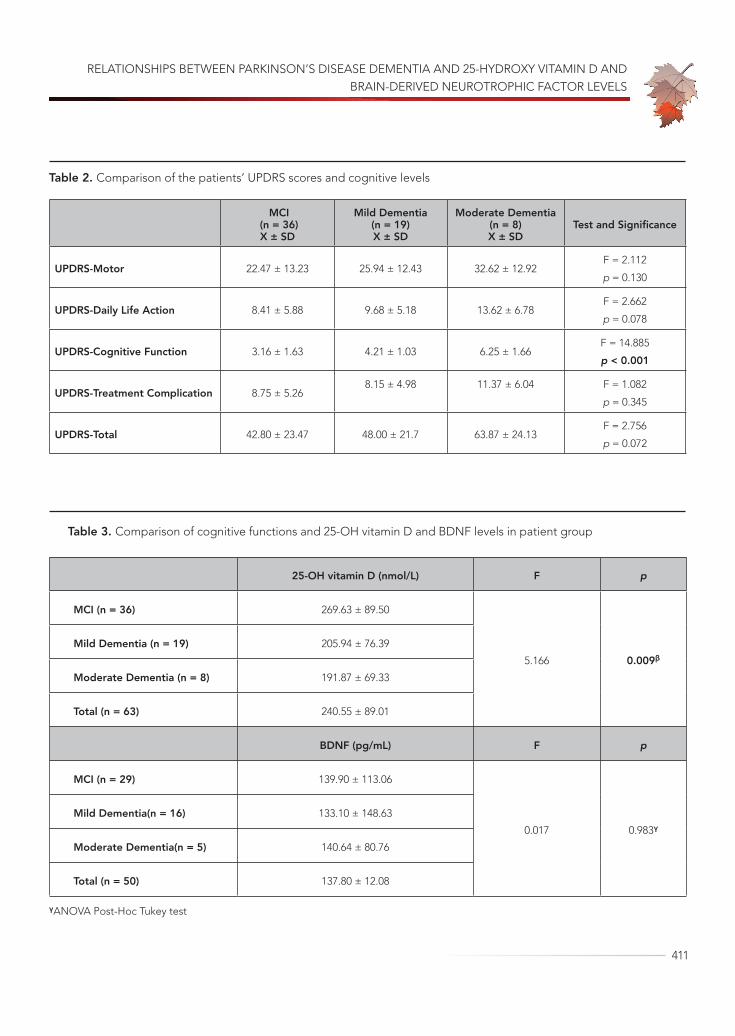
RELATIONSHIPS BETWEEN PARKINSON’S DISEASE DEMENTIA AND 25-HYDROXY VITAMIN D AND BRAIN-DERIVED NEUROTROPHIC FACTOR LEVELS
411
Table 2. Comparison of the patients’ UPDRS scores and cognitive levels
MCI (n = 36)X ± SD
Mild Dementia(n = 19)X ± SD
Moderate Dementia (n = 8)X ± SD
Test and Significance
UPDRS-Motor 22.47 ± 13.23 25.94 ± 12.43 32.62 ± 12.92F = 2.112
p = 0.130
UPDRS-Daily Life Action 8.41 ± 5.88 9.68 ± 5.18 13.62 ± 6.78F = 2.662
p = 0.078
UPDRS-Cognitive Function 3.16 ± 1.63 4.21 ± 1.03 6.25 ± 1.66F = 14.885
p < 0.001
UPDRS-Treatment Complication 8.75 ± 5.268.15 ± 4.98 11.37 ± 6.04 F = 1.082
p = 0.345
UPDRS-Total 42.80 ± 23.47 48.00 ± 21.7 63.87 ± 24.13F = 2.756
p = 0.072
Table 3. Comparison of cognitive functions and 25-OH vitamin D and BDNF levels in patient group
25-OH vitamin D (nmol/L) F p
MCI (n = 36) 269.63 ± 89.50
5.166 0.009β
Mild Dementia (n = 19) 205.94 ± 76.39
Moderate Dementia (n = 8) 191.87 ± 69.33
Total (n = 63) 240.55 ± 89.01
BDNF (pg/mL) F p
MCI (n = 29) 139.90 ± 113.06
0.017 0.983γ
Mild Dementia(n = 16) 133.10 ± 148.63
Moderate Dementia(n = 5) 140.64 ± 80.76
Total (n = 50) 137.80 ± 12.08
γANOVA Post-Hoc Tukey test

2021; 24(3): 407-415
412
0.375). When the UPDRS subscale scores of the pa-tients and their 25(OH) vitamin D and BDNF levels were compared, an inverse correlation was found between their daily life activities and vitamin D lev-els (p = 0.014, Table 5), while there was no signifi-cant relationship between the vitamin D and BDNF
levels and the other subscales. Accordingly, the re-lationship between low vitamin D levels and H&Y stage was stronger than low vitamin D levels rela-tionship with the UPDRS subscales, except for the daily life activities subscale.
Table 4. Comparison of H&Y stages and 25-OH vitamin D levels in patient group
25-OH vitamin D (nmol/L) F p
H&Y Stage 1 (n = 18) 267.05 ± 88.35
3.247 0.046µH&Y Stage 2 (n = 31) 247.38 ± 88.22
H&Y Stage 3 (n = 14) 191.35 ± 76.97
Total (n = 63) 240.55 ± 89.01
µANOVA Post-Hoc Tukey test
Table 5. Correlation analysis of patients’ UPDRS scores with vitamin D and BDNF levels
25-O
H
Vita
min
D
(nm
ol/L
)
BDN
F (p
g/m
l)
UPD
RS-
Mot
or
UPD
RS-D
aily
Li
fe A
ctiv
ity
UPD
RS-
Cogn
itive
Fu
nctio
n
UPD
RS-
Trea
tmen
t Co
mpl
icat
ion
UPD
RS-T
otal
25-OH Vitamin D (nmol/L) 1
BDNF (pg/ml) 0,016**(p = 0,912) 1
UPDRS-Motor -0,164**(p = 0,200)
-0,117**(p = 0,417) 1
UPDRS-Daily Life Activity -0,310**(p = 0,014)
-0,161**(p = 0,265)
0,823**(p < 0,001) 1
UPDRS-Cognitive Function -0,156**(p = 0,222)
-0,051**(p = 0,723)
0,602**(p < 0,001)
0,624**(p < 0,001) 1
UPDRS-Treatment Complication -0,157**(p = 0,219)
-0,081**(p = 0,575)
0,721**(p < 0,001)
0,658**(p < 0,001)
0,451**(p < 0,001) 1
UPDRS-Total -0,216**(p = 0,090)
-0,128**(p = 0,375)
0,969**(p < 0,001)
0,903**(p < 0,001)
0,667**(p < 0,001)
0,823**(p < 0,001)
1
** Pearson correlation test

RELATIONSHIPS BETWEEN PARKINSON’S DISEASE DEMENTIA AND 25-HYDROXY VITAMIN D AND BRAIN-DERIVED NEUROTROPHIC FACTOR LEVELS
413
DISCUSSIONVitamin D is a secosteroid that plays a role in the regulation of bone health physiology and calci-um-phosphorus homeostasis (14). Vitamin D lev-els were determined by measuring serum levels of 25(OH) vitamin D. In our study, we tried to obtain reliable results by examining the 25(OH) vitamin D levels, which has a half-life that can be extend-ed when blood samples are taken under protec-tion from light. Statistically, there was no significant difference between the 25(OH) vitamin D levels of the patients and those of the controls in this study. Both groups had mean 25(OH) vitamin D levels in the normal reference range. The lack of a differ-ence between our two groups might be explained by the fact that most of our patients lived in rural areas, were sufficiently exposed to sunlight, and consumed mostly organic foods, unlike individuals in developed countries or urban areas.
Vitamin D is a neurosteroid, and its deficiency has been the subject of research in the pathogen-esis of many neurological diseases. There are many studies that examine the relationship between cognitive loss and vitamin D deficiency, especial-ly in alzheimer’s disease. In a study of 412 Korean patients, Ahn et al. found a positive correlation be-tween vitamin D levels and MMSE scores (15). They also showed that physical activity affected vitamin D levels, and independence in physical activity might indirectly affect MMSE scores (15). Llewellyn et al. examined cognitive function in elderly individ-uals and reported a 0.3-point loss per year in the MMSE scores of those with vitamin D deficiencies (16). Peterson et al. obtained similar results, finding positive correlations between vitamin D levels and verbal conciseness and verbal memory (17). These studies have suggested that vitamin D has a posi-tive effect on cognitive function. There are few stud-ies that examine the relationship between PDD and vitamin D. In this study, our patients were divided into three groups according to their MMSE scores: mild cognitive impairment, mild dementia, and
moderate dementia. A positive correlation was ob-served between the MMSE scores of PDD patients and vitamin D deficiency. Although vitamin D levels were still in the normal reference range, a decrease in these levels might have contributed to the devel-opment of cognitive loss or dementia in PDD.
The relationship between the motor symptoms of parkinson’s disease and vitamin D has recently been a subject of research. It has been thought that there may be many factors affecting vitamin D de-ficiency in parkinson’s disease. Knekt et al. found a significant relationship between parkinson’s disease and vitamin D levels, which was affected by age, sex, marital status, education level, alcohol consump-tion, physical activity, smoking, and body mass in-dex (18). In another study, Evatt et al. examined the vitamin D levels of parkinson’s patients and healthy individuals and found that the vitamin D levels of parkinson’s patients were significantly lower (19).
Suzuki et al. also found significant correlations between the H&Y and UPDRS total and motor scores of individuals with a diagnosis of parkinson’s and the vitamin D receptor Fok1 genotype and low vitamin D levels (20). Similarly, in our study, there was a relationship between the H&Y and UPDRS-daily life activity scores of the patients and low vitamin D levels. We found a significant negative correla-tion between PDD and 25(OH) vitamin D levels and a negative correlation between the patients’ H&Y stages and their 25(OH) vitamin D levels. However, the only relationship between the UPDRS scores and 25(OH) vitamin D levels was for the daily life activities subscale.
In a meta-analysis, Zhou et al. stated that low vi-tamin D levels may contribute to the development of parkinson’s disease, but vitamin replacement does not have a significant effect on motor func-tion (21). However, Llewellyn et al. showed that early stage vitamin D replacement therapy is important in improving MMSE scores in elderly individuals (16). Accordingly, we think that although the measured 25(OH) vitamin D levels were in the normal range,

2021; 24(3): 407-415
414
supplementary treatment should be started when these scales worsen, which might slow the progres-sion of dementia rather than motor symptoms.
BDNF is a neurotrophin that contributes to the development and regeneration of neurons in the central and peripheral nervous systems (10). How-ells et al. determined that BDNF expression was de-creased in alzheimer’s, parkinson’s, and huntington’s disease, amyotrophic lateral sclerosis, and multiple sclerosis (13). Also, Laske et al. compared the se-rum and cerebrospinal fluid BDNF levels of patients with alzheimer’s disease, normal-pressure hydro-cephaly, and healthy individuals and found that the BDNF levels were significantly lower in both disease groups compared to the healthy individuals (22). In another study, researchers examined 47 parkinson’s patients and 23 healthy individuals and found that the serum BDNF levels were significantly lower in the patients (23). By contrast, Faria et al. examined 50 Alzheimer’s patients, 37 mild cognitive disorder patients, and 56 healthy individuals and found that the plasma BDNF levels were significantly higher in the alzheimer’s group (24). Hence, different results have been found regarding BDNF levels in various neurodegenerative diseases. In our study, there was no significant relationship between BDNF and PDD or disease stages. According to our current knowledge, BDNF is not suitable for predicting the course of neurodegenerative diseases. However, this needs to be clarified with larger, more compre-hensive studies. When evaluating the differences in the results of the different studies, we should note that neurotrophin synthesis is influenced by genet-ic, environmental, and infectious factors.
This study has some limitations. We had a low number of patients and controls. Our results should
be supported by studies with a larger number of pa-tients. The absence of any severe dementia in our study may affect the results.
In conclusion, a negative correlation was found between the H&Y stages, UPDRS-daily living activi-ties and PDD dementia levels and vitamin D levels. These results suggest that vitamin D has an import-ant role in cognitive functions in PDD. However, no significant difference was found in the BDNF levels between the PDD and healthy groups or based on the dementia stages of the PDD group. In this study, the idea that vitamin D affects dementia pathogen-esis and cognitive degeneration is supported, and early vitamin D replacement can contribute to de-mentia prevention. More comprehensive studies are needed on this subject.
AcknowledgementsWe would like to thank the Inonu University Sci-
entific Project Unit.
Financial supportThis study was supported by the Inonu University
Scientific Project Unit with project number 2016-75.
Conflicts of interestThere are no conflicts of interest.
Ethical approvalThis study, with a protocol code of 2016/23, was
approved by the Malatya Clinical Research Ethics Committee.
Informed consentWritten informed consent was obtained from all
individual participants included in the study.

RELATIONSHIPS BETWEEN PARKINSON’S DISEASE DEMENTIA AND 25-HYDROXY VITAMIN D AND BRAIN-DERIVED NEUROTROPHIC FACTOR LEVELS
415
REFERENCES1. Massano J, Bhatia KP. Clinical Approach to Parkin-
son’s Disease: Features, Diagnosis, and Principles of Management. Cold Spring Harb Perspect Med.2012; 2 (6): a008870. (PMID: 22675666).
2. Van Den Eeden SK, Tanner CM, Bernstein AL, et al. Incidence of Parkinson’s disease: variation by age, gender, and race/ethnicity. Am J Epidemiol 2003; 157 (11): 1015-22(PMID: 12777365).
3. Aarsland D, Zaccai J, Brayne C. A systematic re-view of prevalence studies of dementia inParkin-son’s disease. Mov Disord 2005; 20 (10): 1255-63. (PMID: 16041803).
4. Riedel O, Klotsche J, Spottke A, et al. Frequen-cy of dementia, depression, and other neuropsy-chiatric symptoms in 1,449 outpatients with Par-kinson’s disease. J Neurol 2010; 257 (7): 1073-82. (PMID: 20140443).
5. Williams-Gray CH, Foltynie T, Brayne CE, et al. Evo-lution of cognitive dysfunction in an incident Parkin-son’s disease cohort. Brain 2007; 130 (7): 1787-98. (PMID: 17535834).
6. Foltynie T, Brayne CE, Robbins TW, Barker RA. The cognitive ability of an incident cohort of Parking’s patients in the UK. The Cam-PaIGN study. Brain. 2004; 127 (3): 550-60. (PMID: 14691062).
7. Meireles J, Massano J. Cognitive Impairment and Dementia in Parkinson’s Disease: Clinical Features, Diagnosis, and Management. Frontiers in Neurology 2012; 3 (88): 1-15. (PMID: 22654785).
8. Grant WB. Epidemiology of disease risks in relation to vitamin D insufficiency. Prog Biophys Mol Biol 2006; 92 (1): 65-79. (PMID: 16546242).
9. Eyles DW, Burne THJ, John J McGrath JJ. Vitamin D, effects on brain development, adult brain function and the links between low levels of vitamin D and neuropsychiatric disease. Front Neuroendocrinol 2013; 34 (1): 47-64. (PMID: 22796576)
10. Wetmore C, Cao Y, Pettersson RF, et al. Brain-de-rived neurotrophic factor: subcellular compartmen-talization and interneuronal transfer as visualised with anti-peptide antibodies. Proc. Nall. Acad. Sci 1991; 88 (21): 9843-47. (PMID: 1946410).
11. Phillips HS, Hains JM, Armanini M, et al. BDNF mRNA is decreased in the hippocampus of individu-als with Alzheimer’s disease. Neuron 1991; 7 (5): 695-702. (PMID: 1742020).
12. Holsinger RM, Schnarr J, Henry P, et al. Quantitation of BDNF mRNA in human parietal cortex by competi-
tive reverse transcription-polymerase chain reaction: decreased levels in Alzheimer’s disease. Brain Res Mol Brain Res 2000; 76 (2): 347-54. (PMID: 10762711).
13. Howells DW, Porritt M, Wong JY, et al. Reduced BDNF mRNA expression in the Parkinson’s disease substantia nigra. Exp Neurol 2000; 166 (1): 127-35. (PMID: 11031089).
14. Hossein-Nezhad A, Holick MF. Vitamin D for Health: A Global Perspective. Mayo Clin Proc 2013; 88 (7): 720-55. (PMID: 23790560).
15. Ahn JD, Kang H. Physical Fitness and Serum Vita-min D and Cognition in Elderly Koreans. J Sports Sci Med 2015; 14 (4): 740-6. (PMID: 26664270).
16. Llewellyn DJ, Lang IA, Langa KM, et al. Vitamin D and Risk of Cognitive Decline in Elderly Persons. Arch In-tern Med 2010; 170 (13): 1135-41. (PMID: 20625021).
17. Peterson AL, Murchison C, Zabetian C, et al. Mem-ory, Mood, and Vitamin D in Persons with Parkin-son’s Disease. J Parkinsons Dis 2013; 3 (4): 547-55. (PMID: 24081441).
18. Knekt P, Kilkkinen A, Rissanen H, et al. Serum vitamin D and the risk of Parkinson’s disease. Arch Neurol 2010; 67 (7): 808-11. (PMID: 20625085).
19. Evatt ML, De Long MR, Khazai N, et al. Prevalance of Vitamin D Insufficiency in Patients With Parkinson Disease and Alzheimer Disease. Arch Neurol 2008; 65 (10): 1348-52. (PMID: 18852350).
20. Suzuki M, Yoshioka M, Hashimoto M, et al. Rand-omized, double-blind, placebo-controlled trial of vi-tamin D supplementation in Parkinson disease. Am J Clin Nutr. 2013; 97 (5): 1004-13. (PMID: 23485413).
21. Zhou Z, Zhou R, Zhang Z, et al. The Association Between Vitamin D Status, Vitamin D Supplemen-tation, Sunlight Exposure, and Parkinson’s Disease: A Systematic Review and Meta-Analysis. Med Sci Monit 2019; 25: 666-74. (PMID: 30672512).
22. Laske C, Stransky E, Leyhe T, et al. BDNF serum and CSF concentrations in Alzheimer’s disease, normal pressure hydrocephalus and healthy controls. J Psy-chiatr Res 2007; 41 (5): 387-94. (PMID: 16554070).
23. Scalzo P, Kümmer A, Bretas TL, et al. Serum levels of brain-derived neurotrophic factor correlate with mo-tor impairment in Parkinson’s disease. J Neurol 2010; 257 (4): 540-5. (PMID: 19847468).
24. Faria MC, Goncalves GS, Rocha NP, et al. Increased plasma levels of BDNF and inflammatory markers in Alzheimer’s disease. J Psychiatr Res. 2014; 53: 166-72. (PMID: 24576746).

416
Turkish Journal of Geriatrics
DOI: ....
2020; 23(3): ...-...
CORRESPONDANCE
1 E
RESEARCH
Phone: +90
e-mail:
Received:
Accepted:
Turkish Journal of GeriatricsDOI: 10.31086/tjgeri.2021.2392021; 24(3): 416-423
CORRESPONDANCE
1 University of Health Sciences, Diyarbakir Gazi Yasargil Education and Research Hospital, Neurosurgery, DİYARBAKIR, Turkey
2 University of Health Sciences, Diyarbakir Gazi Yasargil Education and Research Hospital, Neurology, DİYARBAKIR, Turkey
USING THE ROTTERDAM CT SCORE TO PREDICT OUTCOMES OF HEAD INJURIES IN THE GERIATRIC POPULATION
RESEARCH
Pınar Aydın ÖZTÜRK1 . . . . . . . . . .
Ünal ÖZTÜRK2 . . . . . . . . . . . . . . . .
2 Ünal ÖZTÜRK
University of Health Sciences, Diyarbakir Gazi Yasargil Education and Research Hospital, Neurology, DİYARBAKIR, Turkey
Phone: +905072053407e-mail: [email protected]
Received: Apr 21, 2021 Accepted: Sep 01, 2021
Introduction: Managing head traumas are quite different in the geriatric population than in other age groups due to patient comorbidities, decreased cerebral compliance, and antithrombotic use. The aim of this study was to examine head injuries in geriatric patients and investigate the effectiveness of the Rotterdam CT score in diagnosing and treating patients at the time of admission to facilitate head trauma management.
Methods: Demographic, clinical, and radiological data from head trauma cases in geriatric patients, along with each patient’s latest status, if our clinic followed up with them, were studied retrospectively.
Results: The mean admission Glasgow Coma Scale score was 12.89±3.134. Patients who had experienced a fall had a higher mean age (p=.004), while patients who had fallen from a height had a lower Glasgow Coma Scale score at the time of admission (p=.000) but higher mortality (p=.018). Patients had a mean Rotterdam CT score of 1.514 ± 1.153 at the time of admission. Mean Rotterdam CT scores were higher in patients who were hospitalized in the intensive care unit (p=.000), had a history of falling from a height (p=.000), and required surgery in the acute period (p=.005). Patients with comorbidity had longer hospitalization times (p=.042), while patients with high Rotterdam CT scores had low modified Glasgow outcome scores (p=.000).
Conclusion: We determined that the need for rehabilitation and long-term care and the possibility of mortality increase after head traumas in the geriatric population and Rotterdam CT score were a good indicator of the clinical situation and final status.
Keywords: Craniocerebral Trauma; Glasgow Outcome Scale; Brain Injuries, Traumatic.
ABSTRACT

USING THE ROTTERDAM CT SCORE TO PREDICT OUTCOMES OF HEAD INJURIES IN THE GERIATRIC POPULATION
417
INTRODUCTION
Advanced age increases the risk of complications and mortality from trauma due to increased comor-bidity and immobility (1). However, the risk of de-veloping intracranial events also increases even in minor traumas due to physiological changes in the brain, especially in the elderly (2–5).
The Glasgow coma scale (GCS) is a quick way to obtain information about a patient’s clinical condi-tion. However, such clinical scales may not provide sufficient information in the presence of diseases such as dementia and delirium, which are common in the elderly (6). This requires new methods for pa-tient management and outcome estimation.
Managing developing intracranial pathology is quite different in geriatric populations due to patient comorbidities, decreased cerebral com-pliance, and antithrombotic use. Neurological dis-eases can also affect the patient’s examination at the time of admission and can make it difficult to effectively manage treatment, follow-up, and imag-ing findings. The aim of this study was to examine cases of head trauma in geriatric patients to facili-tate trauma management. We also aimed to inves-tigate the effectiveness of the Rotterdam CT score in diagnosing and treating patients at the time of admission.
METHOD
This study was approved by the non-interventional clinical research ethics committee of the Universi-ty of Health Sciences, Gazi Yasargil Education and Research Hospital, under number 514 on July 24, 2020. Informed written consent was obtained from all patients, and the principles of the Declaration of Helsinki were followed.
The study included 142 patients over age 65 ad-mitted to the emergency department of our hos-pital between January 2017 and July 2020 after a
head trauma and who had undergone a computed tomography (CT) scan of the brain. We evaluated the relationship in geriatric patients between the Rotterdam CT score at the time of admission and the modified Glasgow outcome scores (mGOS) of the patient’s final status and attempted to deter-mine the factors affecting final status.
We recorded the patients’ age, sex, GCS at the time of admission, hospitalization services (clinic/intensive care), type of trauma, pathology detected in the CT, Rotterdam CT score at the time of ad-mission, surgeries, accompanying traumas, chronic subdural hematoma (cSDH), Markwalder score in patients with cSDH, comorbidities, antiaggregant/anticoagulant use, length of hospital stay, mGOS, and final status.
Statistical analysisThe data were evaluated in terms of averages,
numbers and percentages, and minima-maxima. We used bivariate correlations (Pearson’s R, Spear-man’s correlation, one-way ANOVA) to evaluate the correlation between data. Groups were analyzed primarily in terms of their suitability of normal dis-tribution. Analyses were performed using the Kol-mogorov-Smirnov normal distribution test, and we made graphs of conformity to normal distribution. Student’s t-test was used to compare normally dis-tributed variables, and the Mann-Whitney U test was used to analyze independent data that did not conform to a normal distribution. The chi-squared test was used for categorical data. SPSS for Win-dows (version 20.0) was used for analysis. A p-value of less than .05 was considered significant.
RESULTSDemographics
Of the patients in the study, 61.3% (87) were male and 38.7% (55) were female. The youngest patient
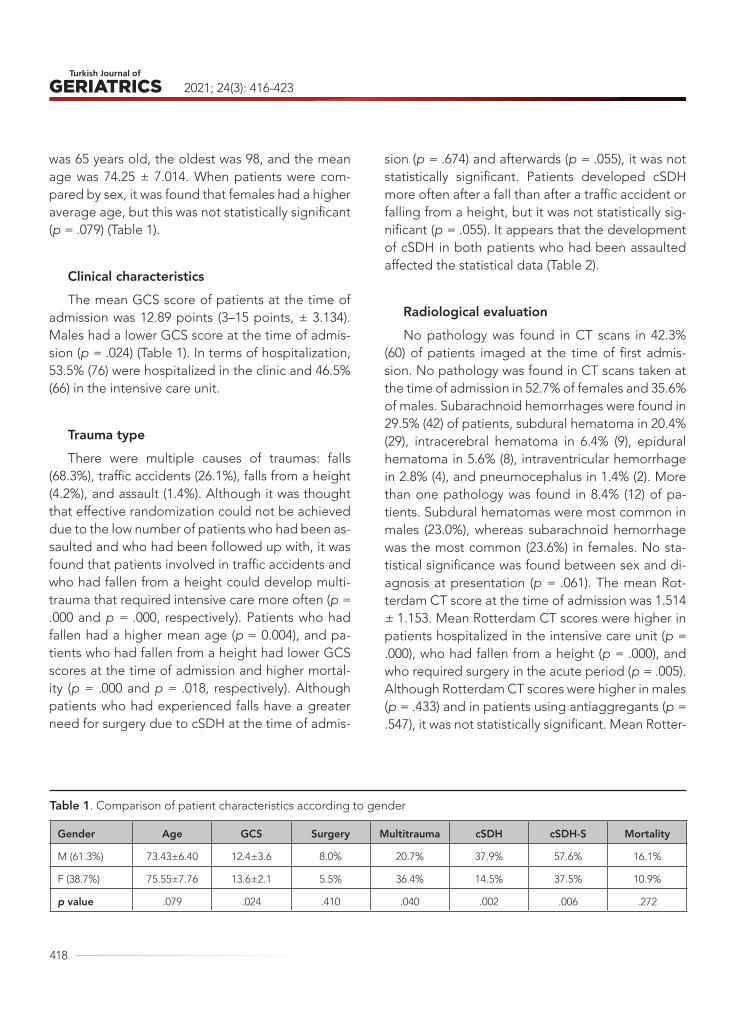
2021; 24(3): 416-423
418
was 65 years old, the oldest was 98, and the mean age was 74.25 ± 7.014. When patients were com-pared by sex, it was found that females had a higher average age, but this was not statistically significant (p = .079) (Table 1).
Clinical characteristicsThe mean GCS score of patients at the time of
admission was 12.89 points (3–15 points, ± 3.134). Males had a lower GCS score at the time of admis-sion (p = .024) (Table 1). In terms of hospitalization, 53.5% (76) were hospitalized in the clinic and 46.5% (66) in the intensive care unit.
Trauma typeThere were multiple causes of traumas: falls
(68.3%), traffic accidents (26.1%), falls from a height (4.2%), and assault (1.4%). Although it was thought that effective randomization could not be achieved due to the low number of patients who had been as-saulted and who had been followed up with, it was found that patients involved in traffic accidents and who had fallen from a height could develop multi-trauma that required intensive care more often (p = .000 and p = .000, respectively). Patients who had fallen had a higher mean age (p = 0.004), and pa-tients who had fallen from a height had lower GCS scores at the time of admission and higher mortal-ity (p = .000 and p = .018, respectively). Although patients who had experienced falls have a greater need for surgery due to cSDH at the time of admis-
sion (p = .674) and afterwards (p = .055), it was not statistically significant. Patients developed cSDH more often after a fall than after a traffic accident or falling from a height, but it was not statistically sig-nificant (p = .055). It appears that the development of cSDH in both patients who had been assaulted affected the statistical data (Table 2).
Radiological evaluationNo pathology was found in CT scans in 42.3%
(60) of patients imaged at the time of first admis-sion. No pathology was found in CT scans taken at the time of admission in 52.7% of females and 35.6% of males. Subarachnoid hemorrhages were found in 29.5% (42) of patients, subdural hematoma in 20.4% (29), intracerebral hematoma in 6.4% (9), epidural hematoma in 5.6% (8), intraventricular hemorrhage in 2.8% (4), and pneumocephalus in 1.4% (2). More than one pathology was found in 8.4% (12) of pa-tients. Subdural hematomas were most common in males (23.0%), whereas subarachnoid hemorrhage was the most common (23.6%) in females. No sta-tistical significance was found between sex and di-agnosis at presentation (p = .061). The mean Rot-terdam CT score at the time of admission was 1.514 ± 1.153. Mean Rotterdam CT scores were higher in patients hospitalized in the intensive care unit (p = .000), who had fallen from a height (p = .000), and who required surgery in the acute period (p = .005). Although Rotterdam CT scores were higher in males (p = .433) and in patients using antiaggregants (p = .547), it was not statistically significant. Mean Rotter-
Table 1. Comparison of patient characteristics according to gender
Gender Age GCS Surgery Multitrauma cSDH cSDH-S Mortality
M (61.3%) 73.43±6.40 12.4±3.6 8.0% 20.7% 37.9% 57.6% 16.1%
F (38.7%) 75.55±7.76 13.6±2.1 5.5% 36.4% 14.5% 37.5% 10.9%
p value .079 .024 .410 .040 .002 .006 .272
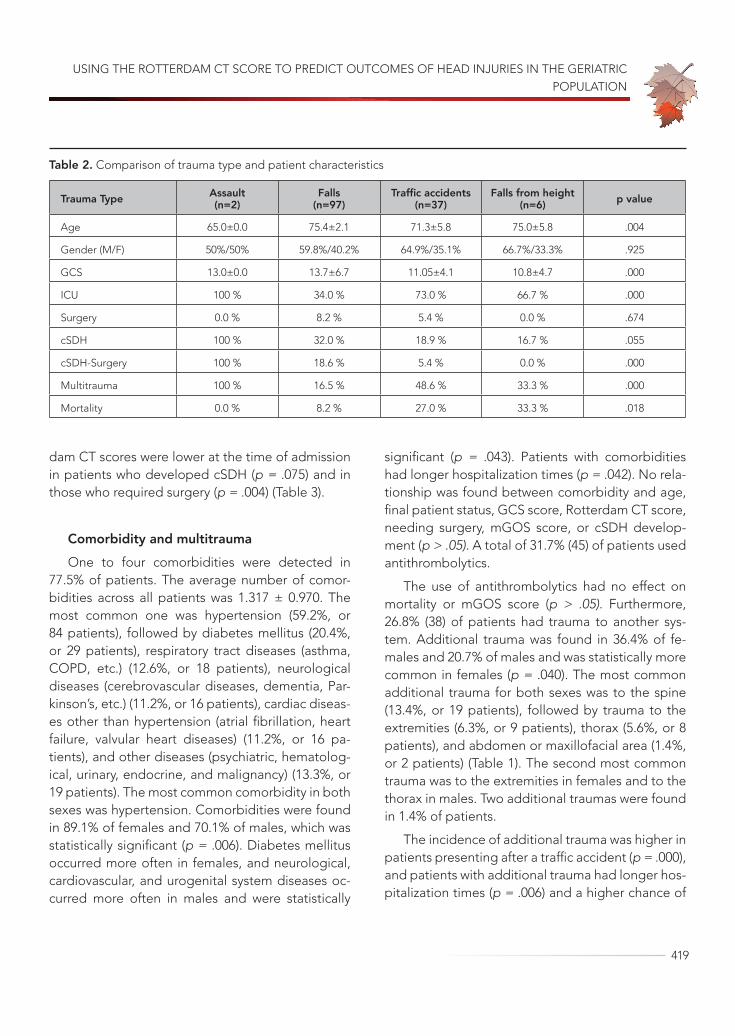
USING THE ROTTERDAM CT SCORE TO PREDICT OUTCOMES OF HEAD INJURIES IN THE GERIATRIC POPULATION
419
dam CT scores were lower at the time of admission in patients who developed cSDH (p = .075) and in those who required surgery (p = .004) (Table 3).
Comorbidity and multitraumaOne to four comorbidities were detected in
77.5% of patients. The average number of comor-bidities across all patients was 1.317 ± 0.970. The most common one was hypertension (59.2%, or 84 patients), followed by diabetes mellitus (20.4%, or 29 patients), respiratory tract diseases (asthma, COPD, etc.) (12.6%, or 18 patients), neurological diseases (cerebrovascular diseases, dementia, Par-kinson’s, etc.) (11.2%, or 16 patients), cardiac diseas-es other than hypertension (atrial fibrillation, heart failure, valvular heart diseases) (11.2%, or 16 pa-tients), and other diseases (psychiatric, hematolog-ical, urinary, endocrine, and malignancy) (13.3%, or 19 patients). The most common comorbidity in both sexes was hypertension. Comorbidities were found in 89.1% of females and 70.1% of males, which was statistically significant (p = .006). Diabetes mellitus occurred more often in females, and neurological, cardiovascular, and urogenital system diseases oc-curred more often in males and were statistically
significant (p = .043). Patients with comorbidities had longer hospitalization times (p = .042). No rela-tionship was found between comorbidity and age, final patient status, GCS score, Rotterdam CT score, needing surgery, mGOS score, or cSDH develop-ment (p > .05). A total of 31.7% (45) of patients used antithrombolytics.
The use of antithrombolytics had no effect on mortality or mGOS score (p > .05). Furthermore, 26.8% (38) of patients had trauma to another sys-tem. Additional trauma was found in 36.4% of fe-males and 20.7% of males and was statistically more common in females (p = .040). The most common additional trauma for both sexes was to the spine (13.4%, or 19 patients), followed by trauma to the extremities (6.3%, or 9 patients), thorax (5.6%, or 8 patients), and abdomen or maxillofacial area (1.4%, or 2 patients) (Table 1). The second most common trauma was to the extremities in females and to the thorax in males. Two additional traumas were found in 1.4% of patients.
The incidence of additional trauma was higher in patients presenting after a traffic accident (p = .000), and patients with additional trauma had longer hos-pitalization times (p = .006) and a higher chance of
Table 2. Comparison of trauma type and patient characteristics
Trauma Type Assault(n=2)
Falls(n=97)
Traffic accidents (n=37)
Falls from height(n=6) p value
Age 65.0±0.0 75.4±2.1 71.3±5.8 75.0±5.8 .004
Gender (M/F) 50%/50% 59.8%/40.2% 64.9%/35.1% 66.7%/33.3% .925
GCS 13.0±0.0 13.7±6.7 11.05±4.1 10.8±4.7 .000
ICU 100 % 34.0 % 73.0 % 66.7 % .000
Surgery 0.0 % 8.2 % 5.4 % 0.0 % .674
cSDH 100 % 32.0 % 18.9 % 16.7 % .055
cSDH-Surgery 100 % 18.6 % 5.4 % 0.0 % .000
Multitrauma 100 % 16.5 % 48.6 % 33.3 % .000
Mortality 0.0 % 8.2 % 27.0 % 33.3 % .018
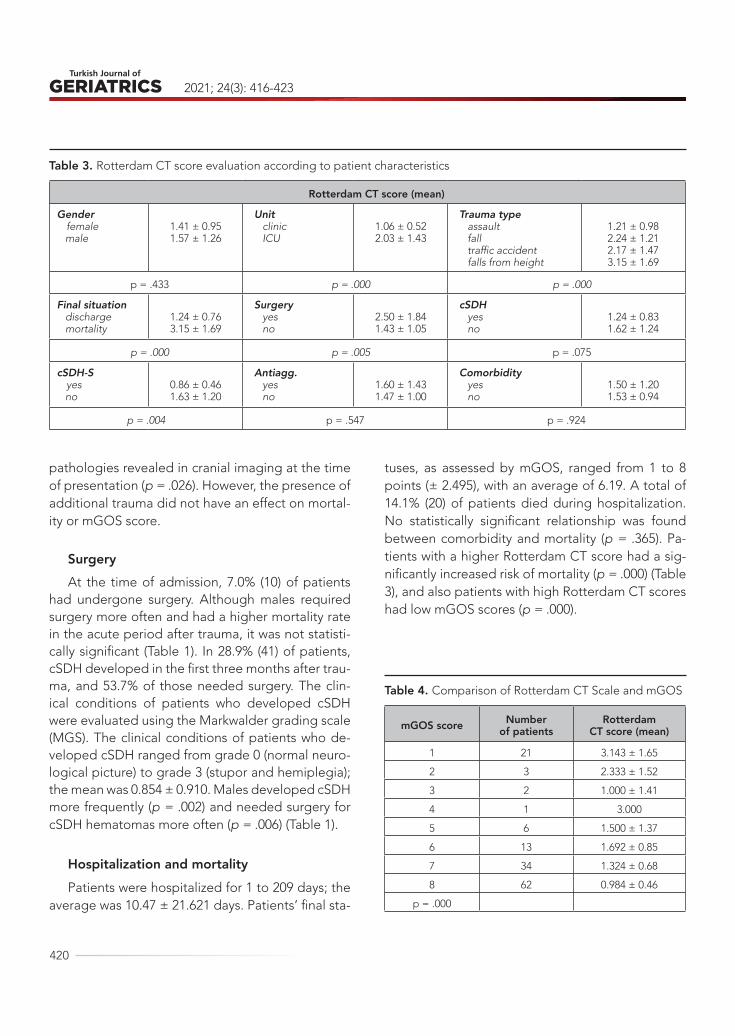
2021; 24(3): 416-423
420
pathologies revealed in cranial imaging at the time of presentation (p = .026). However, the presence of additional trauma did not have an effect on mortal-ity or mGOS score.
SurgeryAt the time of admission, 7.0% (10) of patients
had undergone surgery. Although males required surgery more often and had a higher mortality rate in the acute period after trauma, it was not statisti-cally significant (Table 1). In 28.9% (41) of patients, cSDH developed in the first three months after trau-ma, and 53.7% of those needed surgery. The clin-ical conditions of patients who developed cSDH were evaluated using the Markwalder grading scale (MGS). The clinical conditions of patients who de-veloped cSDH ranged from grade 0 (normal neuro-logical picture) to grade 3 (stupor and hemiplegia); the mean was 0.854 ± 0.910. Males developed cSDH more frequently (p = .002) and needed surgery for cSDH hematomas more often (p = .006) (Table 1).
Hospitalization and mortalityPatients were hospitalized for 1 to 209 days; the
average was 10.47 ± 21.621 days. Patients’ final sta-
tuses, as assessed by mGOS, ranged from 1 to 8 points (± 2.495), with an average of 6.19. A total of 14.1% (20) of patients died during hospitalization. No statistically significant relationship was found between comorbidity and mortality (p = .365). Pa-tients with a higher Rotterdam CT score had a sig-nificantly increased risk of mortality (p = .000) (Table 3), and also patients with high Rotterdam CT scores had low mGOS scores (p = .000).
Table 3. Rotterdam CT score evaluation according to patient characteristics
Rotterdam CT score (mean)
Gender female male
1.41 ± 0.951.57 ± 1.26
Unit clinic ICU
1.06 ± 0.522.03 ± 1.43
Trauma type assault fall traffic accident falls from height
1.21 ± 0.982.24 ± 1.212.17 ± 1.473.15 ± 1.69
p = .433 p = .000 p = .000
Final situation discharge mortality
1.24 ± 0.763.15 ± 1.69
Surgery yes no
2.50 ± 1.841.43 ± 1.05
cSDH yes no
1.24 ± 0.831.62 ± 1.24
p = .000 p = .005 p = .075
cSDH-S yes no
0.86 ± 0.461.63 ± 1.20
Antiagg. yes no
1.60 ± 1.431.47 ± 1.00
Comorbidity yes no
1.50 ± 1.201.53 ± 0.94
p = .004 p = .547 p = .924
Table 4. Comparison of Rotterdam CT Scale and mGOS
mGOS score Number of patients
Rotterdam CT score (mean)
1 21 3.143 ± 1.65
2 3 2.333 ± 1.52
3 2 1.000 ± 1.41
4 1 3.000
5 6 1.500 ± 1.37
6 13 1.692 ± 0.85
7 34 1.324 ± 0.68
8 62 0.984 ± 0.46
p = .000
USING THE ROTTERDAM CT SCORE TO PREDICT OUTCOMES OF HEAD INJURIES IN THE GERIATRIC POPULATION
421
DISCUSSIONCertain physiological changes that develop with age can cause hemorrhagic complications in head trauma, including cerebral atrophy (increased wall tension in the brain), hypertension (increased wall tension), reduced cerebral blood flow resulting in hypoxic brain injury, cerebrovascular atherosclero-sis, reduced cerebrovascular autoregulation, and increased superoxide production (2). Major compli-cations also increase with age, even in minor trau-mas (7–9). Although country-based studies of head trauma in the geriatric population in America (10) and Europe (11) have shown that head injuries are more common in females, our study was majority male. This is thought to be related to sociocultural restrictions on participation by females in social life as they age.
Nearly 80% of all traumas in the geriatric pop-ulation are mild head traumas (GCS score 13–15), but the geriatric population has a higher morbidity and mortality than young people do for both cra-nial traumas and other types (12). In our study, the average GCS score was 12.89 points (3–15 points, ± 3.134) and 76.1% of cases were mild head trau-mas. Of the head traumas, 10.5% were moderate and 13.4% were severe. Studies have shown that even in mild head injuries, both neurobehavioral and functional outcomes are affected (12). Also, el-derly patients have a greater need for rehabilitation and long-term care and a higher mortality rate from mild to moderate head trauma compared to young-er patients (13). While up to 60% of young people have a good outcome with mild to moderate head traumas, the rate for the elderly is only 20% (14). In our study, patients had good outcomes (as defined by their mGOS) more frequently (43.6%) than in the literature.
As patients age, they are at greater risk of de-veloping complications from minor traumas (15). Studies have shown that the most common cause of head trauma in the elderly is falls (falling down, tripping, etc.), followed by traffic accidents (16).
Although our study supports the literature when it comes to trauma type, it also found a higher mean age for patients who had experienced a fall (p = .004), which supports the potential of low-energy traumas to cause damage as age increases. How-ever, mortality was higher in high-energy traumas (most commonly falls from heights, followed by traffic accidents). An increased subdural distance in geriatric patients increases the risk of developing subdural hematoma by up to 45% (16). Although subdural hematomas were most commonly found in men in our study, the most common radiological finding was subarachnoid hemorrhage.
When evaluated radiologically, the mean Rot-terdam CT score was 1.514 ± 1.153. Mean Rotter-dam CT scores were higher in patients hospitalized in the intensive care unit (p = .000), who had fallen from a height (p = .000), and who required surgery in the acute period (p = .005), suggesting that the Rotterdam CT score might be more effective than GCS scores, as it is a radiological parameter that of-fers clinical clues and indications of final statuses in geriatric patients. It might also be used to support neurological findings in clinical evaluations of pa-tients with conditions such as dementia who cannot be examined effectively. In a study evaluating the effectiveness of the Rotterdam CT score in all age groups, it was found that the score correlated with trauma severity and outcome in the elderly (17). In our study, the Rotterdam CT score was found to be highly correlated with outcome (as defined by their mGOS) in the geriatric population (p = .000).
Comorbid diseases and medications used by the aged may increase the risk of falls (7), make it difficult to manage treatment after trauma, and cause prolonged hospitalizations (18). In particular, the use of antithrombolytics are associated with an increased risk of hemorrhagic complications (16). Of our patients, 77.5% had at least one comorbidity, and 31.7% took an antithrombolytic. Our study also found that comorbidity was more common in fe-male patients, and hospital stays were longer when
2021; 24(3): 416-423
422
comorbidities were present.
One study of head and other traumas in the geriatric population found that the most common extremity fractures and subsequent head traumas were observed in the geriatric population. The study stated that fragility increased with age and that all traumas were more common in females (11). Our study found that the incidence of additional trau-ma was higher in females, with spinal trauma being the most common additional trauma in both sex-es, suggesting that osteoporosis, the risk of which increases with age, may increase susceptibility to spinal trauma.
Although very few patients (7.0%) required sur-gery at the time of presentation, a relatively large number developed cSDH and required surgery (28.9%–53.7%). However, fewer patients needed surgery at the time of admission than suggested by the literature (16). Patients had a higher risk of de-veloping cSDH if they had experienced a fall, which was thought to be related to the fact that patients involved in traffic accidents or falls present with a worse clinical picture in the acute period and a higher mortality rate in the following period.
One study found similarities in demographics, injury mechanism and severity, and comorbidity but showed that the risk of death was four times high-er in the elderly than in young adults (11). In our study, in high-energy traumas, the presence of ICH/IVH in the CT scan at the time of admission, a low GCS score, and a high Rotterdam CT score were all found to be associated with mortality. The risk of mortality also increased in those whose pathol-ogies required surgery. On the other hand, low-en-ergy traumas, high GCS scores, low Rotterdam CT scores, normal CTs or SAH at the time of admission, and an absence of comorbidity were found to be
associated with good outcomes.
CONCLUSIONThe geriatric population has a greater need for re-habilitation and long-term care and higher mortali-ty after head traumas. The Rotterdam CT score is a radiological parameter that offers indications of the clinical picture in elderly people with dementia and similar neurological problems and can help predict final outcomes. Concomitant diseases and med-ications used by the elderly may increase the risk of falls, make it difficult to manage treatment after trauma, and cause prolonged hospitalizations. All in all, we concluded that diagnoses and treatment of head trauma in the geriatric population should be evaluated and followed up more closely and for a longer time than in other age groups.
AcknowledgementStatement of Ethics
The study was approved by the Ethics Com-mittee of University of Health Sciences, Diyarbakır Gazi Yasargil Education and Research Hospital. The study complied with the Declaration of Helsinki.
Disclosure StatementThe authors have no conflicts of interest to de-
clare.
Funding SourcesThis research did not receive any specific grant
from funding agencies in the public, commercial, or not-for-profit sectors.

USING THE ROTTERDAM CT SCORE TO PREDICT OUTCOMES OF HEAD INJURIES IN THE GERIATRIC POPULATION
423
REFERENCES1. Adams SD, Holcomb JB. Geriatric trauma. Curr Opin
Crit Care 2015;21(6): 520–6. (PMID:26539925)
2. Beedham W, Peck G, Richardson SE, Tsang K, Fer-tleman M, Shipway DJ. Head injury in the elderly – an overview for the physician. Clinical Medicine 2019;19(2): 177–84. (PMID: 30872306)
3. Adhiyaman V, Asghar M, Ganeshram KN, Bhowmick BK. Chronic subdural haematoma in the elderly. Postgrad Med J 2002;78(916): 71–5. (PMID:11807186)
4. Teunissen L, Rinkel G, Algra A, van Gijn J. Risk fac-tors for subarachnoid hemorrhage: a systematic re-view. Stroke 1996;27(3): 544–9. (PMID: 8610327)
5. Tobe EH. Geriatric traumatic brain injury: relationship to dementia and neurodegenerative disease. J Ger-ontol Geriatr Res 2016;5(2):292. (DOI: 10.4172/2167-7182.1000292)
6. Stein DM, Kozar RA, Livingston DH, et al. Geriatric traumatic brain injury – What we know and what we don’t. J Trauma Acute Care Surg 2018 Oct;85(4): 788-98. (PMID: 30256343)
7. Teo DB, Wong HC, Yeo AW, Lai YW, Choo EL, Mer-chant RA. Characteristics of Fall-Related Traumat-ic Brain Injury in Older Adults. Intern Med J 2018 Sep;48(9): 1048-55. (PMID: 29573078)
8. Korhonen N, Niemi S, Parkkari J, Sievänen H, Kannus P. Incidence of fall-related traumatic brain injuries among older Finnish adults between 1970 and 2011. JAMA 2013 May 8;309(18): 1891-2. (PMID: 23652518)
9. Harvey LA, Close JC. Traumatic brain injury in older adults: characteristics, causes and consequences. In-jury 2012 Nov;43(11): 1821-6. (PMID: 22884759)
10. Haring RS, Narang K, Canner JK, et al. Traumatic brain injury in the elderly: morbidity and mortality trends and risk factors. J Surg Res 2015 May 1;195(1): 1-9. (PMID: 25724764)
11. Gioffrè-Florio M, Murabito LM, Visalli C, Pergolizzi FP, Famà F. Trauma in elderly patients: a study of prevalence, comorbidities and gender differences. G Chir. 2018 Jan-Feb;39(1): 35-40. (PMID: 29549679)
12. Papa L, Mendes ME, Braga CF.Mild Traumatic Brain Injury Among the Geriatric Population. Curr Transl Geriatr Exp Gerontol Rep 2012 Sep 1;1(3): 135-42. (PMID: 23589783)
13. LeBlanc J, de Guise E, Gosselin N, Feyz M. Compar-ison of functional outcome following acute care in young, middle-aged and elderly patients with trau-matic brain injury. Brain Inj 2006 Jul;20(8): 779-90. (PMID: 17060145)
14. Rothweiler B, Temkin NR, Dikmen SS. Aging ef-fect on psychosocial outcome in traumatic brain injury. Arch Phys Med Rehabil 1998;79(8): 881–7. (PMID: 9710157)
15. Luukinen H, Viramo P, Herala M, et al. Fall-related brain injuries and the risk of dementia in elderly peo-ple: a population-based study. Eur J Neurol 2005 Feb;12(2): 86-92. (PMID: 15679695)
16. Suehiro E, Fujiyama Y, Kiyohira M, et al. Risk of De-terioration of Geriatric Traumatic Brain Injury in Pa-tients Treated with Antithrombotic Drugs. World Neurosurg 2019;127: e1221-e7. (PMID: 31009773)
17. Garza N, Toussi A, Wilson M, Shahlaie K, Martin R. The Increasing Age of TBI Patients at a Single Level 1 Trauma Center and the Discordance Between GCS and CT Rotterdam Scores in the Elderly. Front Neu-rol 2020 Feb 20;11: 112. (PMID: 32153493)
18. Zafar SN, Obirieze A, Schneider EB, et al. Outcomes of trauma care at centers treating a higher propor-tion of older patients: the case for geriatric trauma centers. J Trauma Acute Care Surg 2015;78(4): 852–9. (PMID: 25742246)

424
Turkish Journal of Geriatrics
DOI: ....
2020; 23(3): ...-...
CORRESPONDANCE
1 E
RESEARCH
Phone: +90
e-mail:
Received:
Accepted:
Turkish Journal of GeriatricsDOI: 10.31086/tjgeri.2021.2402021; 24(3): 424-432
CORRESPONDANCE
1 Yaşar University, Interior Architecture and Environmental Design, İzmir, Turkey
2 Bahçeşehir University, Physiotherapy and Rehabilitation, İstanbul, Turkey
3 Nişantaşı University, Nursing, İstanbul, Turkey
4 Fenerbahçe University, Physiotherapy and Rehabilitation, İstanbul, Turkey
5 Bahçeşehir University, Interior Architecture and Environmental Design, İstanbul, Turkey
RELATIONSHIP OF DAILY TIME SPENT OUTDOORS WITH SLEEP QUALITY AND EMOTIONAL WELL-BEING AMONG COMMUNITY-DWELLING OLDER ADULTS DURING COVID-19 RESTRICTIONS
RESEARCH
Kenan Eren ŞANSAL1 . . . . . . . . . .
Leyla ATAŞ BALCI2 . . . . . . . . . . . . .
Fadime ÇINAR3 . . . . . . . . . . . . . . .
Dilber KARAGÖZOĞLU ÇOŞKUNSU4 . . . . . . . . . . . . . . . . .
Sezin Hatice TANRIÖVER5 . . . . . . .
Mehmet Bengü ULUENGİN5 . . . . . .
1 Kenan Eren ŞANSAL
Yaşar University, Interior Architecture and Environmental Design, İzmir, Turkey
Phone: +905343659277e-mail: [email protected]
Received: Aug 08, 2021 Accepted: Sep 01, 2021
Introduction: Given the recent constraints imposed due to the ongoing COVID-19 pandemic and the importance of the daily light-dark cycle for entraining the human circadian system, it is possible to state that the elderly are likely to be at serious risk of experiencing sleep-related problems. Whilst reduced or limited time outdoors, and thus, exposure to diurnal bright light appear to be detrimental to sleep and emotional well-being in old age, further research is required to confirm this relationship.
Materials and Method: To build on earlier work, a two-week study was conducted in a sample of 79 community-dwelling older adults recruited by using snowball sampling method. Throughout the study, the participants were allowed to be outdoors from 10.00 a.m. to 1.00 p.m. on weekdays. Whilst the participants were performing their daily habitual activities, they were asked to keep an activity diary and report on their sleep quality and emotional well-being using two questionnaires.
Results: The results demonstrated that participants’ daily time spent outdoors (49.13 minutes on average) positively correlated with their perceived sleep quality and emotional well-being at various –– but significant –– levels (p<0.05). Moreover, significant negative correlations were identified between participants’ sleep quality and experienced emotional disturbances (p<0.001).
Conclusion: Based on the research findings, it is reasonable to conclude that spending momentary periods outdoors may have adverse consequences for the elderly. To maintain a healthy sleep-wake cycle and alleviate related emotional problems in old age, increasing outdoor time and diurnal bright light exposure should be encouraged.
Keywords: Aged; COVID-19; Emotions; Photoperiod; Sleep; Social Isolation.
ABSTRACT
RELATIONSHIP OF DAILY TIME SPENT OUTDOORS WITH SLEEP QUALITY AND EMOTIONAL WELL-BEING AMONG COMMUNITY-DWELLING OLDER ADULTS DURING COVID-19 RESTRICTIONS
425
INTRODUCTIONIn industrialised nations, urban adult populations spend a substantial portion (approximately 90%) of their day in buildings and other enclosed spaces, as evidenced by research on human activity patterns (1, 2). Inevitably, this type of lifestyle has led many people to perform most of their daily activities in dimly and artificially lit environments. Studies on diurnal light exposure patterns have provided em-pirical evidence that the daily duration of exposure to outdoor light levels >1,000 lx is about 90 minutes in young and middle-aged adults (3) and can be as short as 3 minutes in the institutionalised elderly (4). Given the COVID-19-related preventive measures, such as precautionary self-isolation and lockdown globally taken to mitigate the ongoing outbreak, it seems reasonable to expect that the elderly are likely more at risk of beginning to spend less time outdoors and being confined to indoor spaces that lack daylight. Thus, the question arises as to wheth-er these recent changes are inflicting an extra bur-den on the systemic health and well-being of the elderly.
Sleep is a biological need; it plays a major role in maintaining good health, including immunologic health, and quality of life (5). Elderly individuals with sleep problems are more prone to depression, car-diovascular diseases, cerebrovascular diseases, and hypertension (6). In humans, sleep is regulated by the reciprocal interaction between the homeostatic sleep drive, which tracks the amount of prior sleep, and the circadian system, which synchronises bod-ily processes with the 24-hour solar day (7). Whilst light is the most important exogenous stimulus for entraining the circadian system (8), its potency dra-matically decreases with age. It has been demon-strated that the steady decline in both crystalline lens transmittance and pupil area reduces the cir-cadian photoreception of a 65-year-old adult to roughly one-third of the amount in a young adult aged 25 (9). As light exposure becomes more criti-
cal to a healthy sleep-wake cycle, and thus, general well-being in old age, it is plausible to assume that the precautions against the COVID-19 pandemic and, unavoidably, reduced or limited diurnal light exposure outdoors may lead to serious sleep and sleep-related health problems in the elderly.
A critical review of the existing literature on this subject reveals that inconsistent or equivocal re-sults have been reported thus far. On one hand, several studies provide empirical evidence to dis-credit the assumption made about the inadequacy of light exposure and its implications. For example, Noi and colleagues (4) observed that, despite the significant difference between the length of morn-ing exposure to illuminances >1,000 lx in summer and winter, the actigraphic sleep metrics, subjective sleep quality, and emotional well-being of a small group of nursing home residents did not vary con-siderably with the season. On the other hand, other studies indicate that spending time outdoors and being exposed to daylight are of benefit to the el-derly (10–13). The issue with these latter studies is that the optimal duration or frequency of outdoor exposure cannot be determined. In a recent study, Corley and colleagues (10) demonstrated that using home gardens more often during lockdown, com-pared to the pre-lockdown period, was significant-ly associated with better sleep quality and mental health amongst a sample of community-dwelling elderly adults. Whilst this finding is in support of a previous study suggesting that increasing the daily duration of exposure to high illuminances is relat-ed to ameliorated sleep and depression in old age (11), it is not in complete accord with the results of two similar studies (12, 13). Unlike the others, these two studies, conducted in long-term care facili-ties, showed that being outdoors and exposed to daylight for only 30-40 minutes in the morning was potent enough to improve sleep quality and that longer or more frequent light exposure might not be required.
2021; 24(3): 424-432
426
Due to the lack of available evidence in the ex-isting literature, it is still unsafe to reach any conclu-sions on the possible link between low daily doses of light and experiencing sleep-related problems. Before we can achieve a more detailed understand-ing of the influence of light on the sleep-wake cycle of older adults, there is a necessity for additional research studies to yield more conclusive results. Therefore, to build on earlier work, the present study was conducted by recruiting a sample of com-munity-dwelling adults aged ≥65 over a two-week period. This paper reports the results of our study to test the following hypotheses:
Hypothesis 1. Older individuals spend only brief periods outdoors.
Hypothesis 2. Limited time outdoors, and thus, less exposure to daylight have an inverse relation-ship with initiating and maintaining nocturnal sleep and, as a direct consequence, perceived sleep qual-ity.
Hypothesis 3. Experiencing sleep difficulties is accompanied by emotional disturbance(s).
MATERIALS AND METHOD Participants
To minimise contact with the elderly as much as possible during the COVID-19 pandemic, the re-searchers utilised the snowball sampling method; this yielded a total of 98 community-dwelling el-ders residing in ten different cities in Turkey. Among them, nine volunteers failed to meet the inclusion criteria. Additionally, ten volunteers had difficulties in following the study protocol and withdrew from the study. The remaining participants, whose de-scriptive characteristics are given in Table 1, were:
a) aged ≥65;
b) literate;
c) cognitively intact. Approximately two weeks prior to the study, the cognitive functioning of the elderly volunteers was assessed by administering
a Turkish version of the Standardised Mini-Men-tal State Examination (SMMSE-T). The SMMSE-T, translated and validated by Güngen and colleagues (14), is composed of various questions and tests to measure performance across different cognitive ability domains. A SMMSE-T score of 30 indicates no impairment; a score of 23/24 is considered to be the cut-off for the diagnosis of mild dementia in the Turkish population. Volunteers who scored <24 were excluded to screen out individuals with dementia;
d) not concurrently using more than five pre-scribed medications or any medication for sleep and depression;
e) not in poor health, based on scores from a general health profile. For profiling purposes, all volunteers reported on their physical and mental health status by completing a Turkish version of the Short Form 36 (SF-36T). The SF-36T, reported to be valid and reliable by Pinar (15), is a 36-item, self-administered questionnaire assessing per-ceived changes in health and general health across eight domains. For each domain, raw item scores are converted, summed, and then transformed into a single score ranging from zero (the worst possible health state) to 100 (the best possible health state). Participants’ SF-36T scores were comparable to the normative data of Demiral and colleagues (16) for Turkish adults aged ≥65. The domains for which rel-atively low scores were obtained were social func-tioning (62.50 vs. 83.70) and role emotional (62.02 vs. 86.50); and
f) thoroughly informed about the study. As per the ethical clearance granted by Yaşar University Ethics Committee, written informed consent was obtained from each participant.
Sleep QualityA Turkish version of the Richards-Campbell
Sleep Questionnaire (RCSQ-T), shown to be relia-ble and valid by Özlü and Özer (17), was also com-

RELATIONSHIP OF DAILY TIME SPENT OUTDOORS WITH SLEEP QUALITY AND EMOTIONAL WELL-BEING AMONG COMMUNITY-DWELLING OLDER ADULTS DURING COVID-19 RESTRICTIONS
427
pleted daily by the participants to evaluate previ-ous night’s sleep. The RCSQ-T is a five-item, visual analogue scale measuring perceived sleep depth, latency, efficiency, and overall sleep quality. A total score, ranging from 0–100, is obtained by calculat-ing the mean score for all items. A high total score represents a high level of sleep satisfaction.
Daily ActivityTo measure time spent outdoors during daylight
hours, the participants kept a daily activity diary de-vised by the authors. The diary comprises a table in which all activities performed over a day are report-ed. In each row of the table, information on activi-ty definition, time, duration, and place is required.
Table 1. Descriptive characteristics of the participants (n=79)
Variable n %
GenderFemale 44 55.7
Male 35 44.3
Education Status
Literate 5 6.3
Primary school 22 27.8
Secondary school 4 5.1
High school 4 5.1
Graduate 32 40.5
Postgraduate 12 15.2
Chronic IllnessYes 55 69.6
No 24 30.4
Variable Mean SD Median Minimum Maximum
Age (years) 71.62 4.90 71 65 92
Body Mass Index (kg/m2) 26.78 3.56 26.43 20.96 34.37
SMMT-T Score 27.76 1.96 28 24 30
SF-36T Score
Physical functioning 75.88 20.44 80 0 100
Role physical 57.59 42.24 75 0 100
Bodily pain 61.44 25.83 62 0 100
General health 61.81 20.33 62 0 100
Vitality 59.93 19.00 60 10 100
Social functioning 62.50 31.39 62.50 0 100
Role emotional 62.02 41.93 66.66 0 100
Mental health 67.69 16.68 72 24 100
SMMT-T: Standardised Mini-Mental Test; SF-36T: Short Form 36; SD: Standard deviation
2021; 24(3): 424-432
428
Based on the contemporaneous sunrise and sunset hours at the activity location, the amount of out-door time for all daytime activities was calculated and used to obtain the cumulative total for a single day or daily time spent outdoors (DTSO).
Emotional Well-BeingA Turkish version of the Depression Anxiety
Stress Scale (DASS-42T), translated and demon-strated to be psychometrically sound by Uncu and colleagues (18), was used to assess participants’ emotional well-being. The DASS-42T is a self-ad-ministered instrument that is composed of three subscales measuring the negative emotional states of depression, anxiety and stress over the last seven days. Each subscale consists of 14 items rated on a four-point scale of severity. Subscale scores, varying between 0–42, are obtained by adding the scores for each subscale item. Scores greater than nine, seven, and 14 were reported to be indicative of de-pression, anxiety and stress, respectively.
ProcedureFrom 1–7 February 2021, the cognitive function-
ing and perceived health status of the consenting volunteers were evaluated by administering the SMMSE-T and SF-36T in person or online. Moreo-ver, data on volunteers’ sociodemographic charac-teristics, body weight, height, chronic illnesses, and medication use were also gathered in this period. Following the screening for participation, a bound folder containing the daily activity diary, RCSQ-T, and DASS-42T was posted to each participant. All participants were thoroughly informed about how to use the folder during the week prior to the study.
The study was conducted between 15 Febru-ary–1 March 2021. During this period, due to the precautions against the spread of COVID-19 and the related restrictions, adults aged ≥65 were only allowed to be outdoors from 10.00 a.m. to 1.00 p.m. on weekdays. This two-week period was considered
to be long enough to understand the possible ef-fects of imposed restrictions without jeopardising participant adherence, and, thus, it was employed for data collection. Throughout the study, the par-ticipants updated the activity diary daily from 15–28 February 2021 and filled in the RCSQ-T each morning between the second and last day of the study. On the eighth and last day, the DASS-42T was self-administered to gain an insight into par-ticipants’ emotional well-being over the first and second weeks of the study. Following the comple-tion of the study, participants either sent back the folders by post or scanned them to transfer their data electronically. Official permission was granted by the Republic of Turkey Ministry of Health for the study and its procedure (Application No: 2021-01-25T16_04_06).
Statistical AnalysisThe Kolmogorov-Smirnov test and normal-
ity plots were used to assess the normality of the data. Continuous variables were reported by using means, standard deviations, medians, minimum values, and maximum values. Categorical variables were presented by using absolute and relative fre-quencies. Spearman’s correlation coefficients were calculated to determine the relationships between participants’ self-reported data obtained over two weeks. According to Pallant’s (19) definition, the strength of these relationships was considered to be small, medium, and large for the ranges of 0.10–0.29, 0.30–0.49, and 0.50–1, respectively. All statisti-cal analyses were carried out by using the Statistical Package for the Social Sciences (version 22.0; SPSS Inc., Chicago, IL, USA). The level of significance was set at p<0.05.
RESULTSParticipants’ cumulative DTSO, RCSQ-T, and DASS-42T scores were calculated (see Table 2). It was ev-ident from the results that the average DTSO was

RELATIONSHIP OF DAILY TIME SPENT OUTDOORS WITH SLEEP QUALITY AND EMOTIONAL WELL-BEING AMONG COMMUNITY-DWELLING OLDER ADULTS DURING COVID-19 RESTRICTIONS
429
only 49.13 minutes; this was in support of Hypoth-esis 1. Whilst the participants did not report expe-riencing major sleep disturbances based on their RCSQ-T scores, they were mildly depressed, mod-erately anxious, and mildly stressed, according to their scores on the DASS-42T.
To test Hypothesis 2, the correlation of partici-pants’ DTSO scores with their RCSQ-T scores was also computed over the overall study period. The results were in support of the second hypotheses (Table 3). There was a weak –– but significant ––
positive correlation between their DTSO scores and perceived sleep quality (p<0.05). In addition, it was further identified that participants’ DTSO was found to inversely correlate with their depression, anx-iety, and stress scores at various –– yet significant –– levels (p<0.05). Moreover, participants’ RCSQ-T and DASS-42T scores significantly and negative-ly correlated with each other at moderate or high levels (p<0.001). These results were consistent with Hypothesis 3.
Table 2. Participants’ DTSO, RCSQ-T scores and DASS-42T scores (n=79)
Variable Mean SD Median Minimum Maximum
DTSO (minutes) 49.13 36.08 42.85 0 171.43
RCSQ-T Score 71.52 14.26 70 42.43 100
Depression Score 12.74 9.93 10.5 0 40
Anxiety Score 10.81 10.30 6.5 0 41.50
Stress Score 15.15 9.42 14 0 40
DTSO: Daily time spent outdoors; RCSQT: Richards-Campbell Sleep Questionnaire; DASS-42T: Depression Anxiety Stress Scale; SD: Standard deviation
Table 3. Correlations among participants’ DTSO, RCSQ-T scores and DASS-42T scores (n=79)
Variable DTSO RCSQ-T ScoreDepression
ScoreAnxiety Score Stress Score
DTSOr 1.000 0.288 -0.322 -0.370 -0.250
p - 0.010 0.004 0.001 0.026
RCSQ-T Scorer 0.288 1.000 -0.527 -0.475 -0.427
p 0.010 - <0.001 <0.001 <0.001
Depression Scorer -0.322 -0.527 1.000 0.856 0.853
p 0.004 <0.001 - <0.001 <0.001
Anxiety Scorer -0.370 -0.475 0.856 1.000 0.836
p 0.001 <0.001 <0.001 - <0.001
Stress Scorer -0.250 -0.427 0.853 0.836 1.000
p 0.026 <0.001 <0.001 <0.001 -
DTSO: Daily time spent outdoors; RCSQ-T: Richards-Campbell Sleep Questionnaire; DASS-42T: Depression Anxiety Stress Scale; r: Spearman’s rho

2021; 24(3): 424-432
430
DISCUSSIONOne of the aims of our study was to determine the time that the elderly participants spent outdoors to estimate the duration of their outdoor daylight ex-posure during the ongoing COVID-19 restrictions. It was shown that the average DTSO was approxi-mately 49 minutes during daylight hours –– in other words, on average, our sample spent only 3.4% of a day in outdoor light levels. This finding is consist-ent with those of other researchers; for example, Obayashi and colleagues (20) demonstrated that the duration of daytime light exposure to illumi-nances >1,000 lx was 50.3 minutes per day in a large sample of home-dwelling older adults. Given the importance of light to entrain the circadian system in humans, it is possible to expect that this limited exposure can induce or aggravate sleep disturbanc-es and produce sleep-related emotional problems in the elderly.
The question of whether there is a link between daily light exposure and sleep-related problems in the elderly remains unresolved. However, our re-sults indicate that there may be a significant asso-ciation between these variables, which is well worth considering. Even though our sample reported fewer difficulties with sleep initiation and mainte-nance than their peers living independently and in long-term care facilities (21), the participants’ DTSO significantly correlated with their sleep quality and their emotional state. Moreover, there were signif-icant negative correlations between the RCSQ-T and DASS-42T scores. These results confirm the findings of other studies (10, 11), which suggest that increased time spent outdoors and bright natural light exposure is beneficial to nocturnal sleep, and thus, emotional well-being in community-dwelling elders.
Although it is possible to state that a brief expo-sure period <1 hour can be potent enough to elicit a significant circadian response based on our results and those of other studies (12, 13), it is too soon to reach a conclusion about the optimal duration
of DTSO. Despite the relationship of participants’ DTSO with their sleep quality and DASS-42 scores, it is not possible to state with certainty whether increasing the length of exposure will yield much better results due to the correlational nature of this study. In this regard, the literature provides unclear evidence to confirm or refute this assertion. Whilst it has been demonstrated that there may be an up-per efficacious limit for daylight exposure (12), it has also been suggested that longer exposure periods are likely to be more effective (11, 22).
A major strength or contribution of this study is that it addresses an important gap in our knowl-edge by gathering data from elderly adults living in different regions of Turkey during the restrictions imposed on adults aged ≥65 due to COVID-19 pan-demic. Moreover, it assesses not only sleep but also emotional well-being of the participants. In addi-tion to these strengths, it should also be noted here that, in interpreting the above-mentioned results, two inherent weaknesses, or at least limitations, warrant consideration. Firstly, because of the ongo-ing pandemic and its impact on participant recruit-ment, the study population did not truly represent the entire age spectrum of elderly adults. Only two participants were older than 80 years at the time of data collection. Therefore, it is unclear to what ex-tent our results are valid for those in extreme old age. Secondly, approximately 70% of the sample had chronic diseases associated with old age and were on medication for these diseases. Whilst the participants were not using any antidepressants or sleep aids, they were taking medications such as β-blockers, which interfere with nocturnal sleep (23). Apart from its weaknesses or limitations, it is important to note here that employing actigraphy can also be considered for objectively delineating both sleep and light exposure patterns (24) in fu-ture studies and comparing their results with our RCSQ-T and DTSO results.
Even though further interdisciplinary research is required to fully apprehend the effects of time

RELATIONSHIP OF DAILY TIME SPENT OUTDOORS WITH SLEEP QUALITY AND EMOTIONAL WELL-BEING AMONG COMMUNITY-DWELLING OLDER ADULTS DURING COVID-19 RESTRICTIONS
431
spent outdoors on the older population, one can safely draw two main conclusions from the results discussed above. Firstly, it is reasonable to conclude that spending only brief periods outdoors is likely to be detrimental to sleep and emotional well-be-ing in the elderly. Before it was feasible to use elec-tric lighting to compensate for the lack of daylight in buildings and enable living indoors, the sun had been our primary source of light. Therefore, from an evolutionary perspective, older adults should be en-couraged to spend more time outdoors to reduce the extra burden on their health imposed by the
COVID-19 pandemic and the related precautions (i.e. social isolation). Secondly, given that spending time outdoors and being exposed to bright diurnal light may greatly benefit the elderly, we can be fairly certain that the successful incorporation of daylight into the built-environment is crucial for older adults, especially for those with mobility impairments.
Conflict of InterestThe authors declare no conflicts of interest.
REFERENCES1. Matz CJ, Stieb DM, Davis K et al. Effects of age, sea-
son, gender and urban-rural status on time-activity: Canadian Human Activity Pattern Survey (CHAPS 2). Int J Environ Res Public Health 2014;11(2):2108-2124. (PMID:24557523).
2. Schweizer C, Edwards RD, Bayer-Oglesby L et al. In-door time-microenvironment-activity patterns in sev-en regions of Europe. J Expo Sci Environ Epidemiol 2007;17(2):170-181. (PMID:16721413).
3. Kawinska A, Dumont M, Selmaoui B, Paquet J, Carri-er J. Are modifications of melatonin circadian rhythm in the middle years of life related to habitual patterns of light exposure? J Biol Rhythms 2005;20(5):451-460. (PMID:16267384).
4. Noi A, Roe J, Gow A, McNair D, Aspinall P. Seasonal differences in light exposure and associations with health and well-being in older adults: An exploratory study. HERD 2017;10(5):64-79. (PMID:29056090).
5. Grandner MA. Sleep, health and society. Sleep Med Clin 2017;12(1):1-22. (PMID:28159089).
6. Bloom HG, Ahmed I, Alessi CA et al. Evidence-based recommendations for the assessment and manage-ment of sleep disorders in older persons. J Am Geri-atr Soc 2009;57(5):761-789. (PMID:19484833).
7. Deboer T. Sleep homeostasis and circadian clock: Do the circadian pacemaker and the sleep homeostat influence each other’s functioning? Neurobiol Sleep Circadian Rhythms 2018;5:68-77. (PMID:31236513).
8. Blume C, Garbazza C, Spitschan M. Effects of light on human circadian rhythms, sleep and mood. Som-nologie 2019;23(3):147-156. (PMID:31534436).
9. Turner PL, Mainster MA. Circadian photoreception: Ageing and the eye’s important role in system-ic health. Br J Ophthalmol 2008;92(11)1439-1444. (PMID:18757473).
10. Corley J, Okely JA, Taylor AM et al. Home garden use during COVID-19: Associations with physical and mental wellbeing in older adults. Journal of En-vironmental Psychology 2021;73:1-8. (DOI:10.1016/j.jenvp.2020.101545).
11. Wallace-Guy GM, Kripke DF, Jean-Louis G, Langer RD, Elliott JA, Tuunainen A. Evening light exposure: Implications for sleep and depression. J Am Geriatr Soc 2002;50(4):738-739. (PMID:11982677).
12. Düzgün G, Durmaz Akyol S. Effects of natural sun-light on sleep problems and sleep quality of the el-derly staying in the nursing home. Holist Nurs Pract 2017;31(5):295-302. (PMID:28786887).
13. Şansal KE, Tanrıöver SH, Aka BT. Effects of outdoor natural light exposure on sleep quality in the elder-ly. Turkish Journal of Geriatrics 2020;23(1):138-146. (DOI:10.31086/tjgeri.2020.147).
14. Güngen C, Ertan T, Eker E, Yaşar R, Engin F. Relia-bility and validity of the Standardized Mini Men-tal State Examination in the diagnosis of mild de-mentia in Turkish population. Turk Psikiatri Derg 2002;13(4):273-281. (PMID:12794644).
15. Pinar R. Reliability and construct validity of the SF-36 in Turkish cancer patients. Qual Life Res 2005;14(1):259-264. (PMID:15789959).
16. Demiral Y, Ergor G, Unal B, et al. Normative data and discriminative properties of Short Form 36 (SF-36) in Turkish urban population. BMC Public Health

2021; 24(3): 424-432
432
2006;6:247. (PMID:17029646).
17. Özlü ZK, Özer N. Richard-Campbell Sleep Question-naire validity and reliability study. J Turk Sleep Med 2015;2(2):29-32. (DOI:10.4274/jtsm.02.008).
18. Uncu Y, Bayram N, Bilgel N. Job related affective well-being among primary health care physicians. Eur J Public Health 2007;17(5):514-519. (PMID:17185328).
19. J Pallant. SPSS Survival Manual: A step by step guide to data analysis using SPSS for Windows. 3th edition, Open University Press, England 2007.
20. Obayashi K, Saeki K, Iwamoto J, Ikada Y, Kurumatani N. Exposure to light at night and risk of depression in the elderly. J Affect Disord 2013;151(1):331-336. (PMID:23856285).
21. Haesler EJ. Effectiveness of strategies to manage sleep in residents of age care facilities. JBI Libr Syst Rev 2004;2(4):115-183. (PMID:27820000).
22. Hood B, Bruck D, Kennedy G. Determinants of sleep quality in the healthy aged: The role of physical, psy-chological, circadian and naturalistic light variables. Age Ageing 2004;33(2):159-165. (PMID:14960432).
23. Roepke SK, Ancoli-Israel S. Sleep disorders in the elderly. Indian J Med Res 2010;131:302-310. (PMID:20308755).
24. Ancoli-Israel S, Cole R, Alessi C, Chambers M, Moor-croft W, Pollak CP. The role of actigraphy in the study of sleep and circadian rhythms. Sleep 2003;26(3):342-392. (PMID: 12749557).

433
Turkish Journal of Geriatrics
DOI: ....
2020; 23(): ...-...
CORRESPONDANCE
1 E
RESEARCH
Phone: +90
e-mail:
Received:
Accepted:
Turkish Journal of GeriatricsDOI: 10.31086/tjgeri.2021.2412021; 24(3): 433-440
CORRESPONDANCE
1 Ufuk University, Psychology, ANKARA, Turkey
2 EgeUniversity,Psychology,İZMİR,Turkey
SEXUAL ATTITUDE SCALE FOR ELDERLY PEOPLE: A RELIABILITY AND VALIDITY STUDY IN TURKEY
RESEARCH
MelisaEBEOĞLU1 . . . . . . . . . . . . .
RukiyeKIZILTEPE2 . . . . . . . . . . . . .
NilgülBanuÇENGELCİÖZEKES2. .
1 MelisaEBEOĞLU
Ufuk University, Psychology, ANKARA, Turkey
Phone: +903125867417e-mail: [email protected]
Received:Mar08,2021Accepted: Aug 29, 2021
Introduction: The purposes of this study were to translate the Sexual Attitude Scale for Elderly People into Turkish and determine its psychometric characteristics.
Materials and Method: A total of 127 people aged between 60 and 86 years participated in this study. Participants completed Turkish versions of the Sexual Attitude Scale for Elderly People, Aging Sexuality Knowledge and Attitudes Scale, and Socio-demographic Information Form. Exploratory and confirmatory factor analyses were then conducted to investigate the construct validity. In addition, the relationship between the total score of the Sexual Attitude Scale for Elderly People and attitude sub-dimension of the Aging Sexuality Knowledge and Attitudes Scale was examined for concurrent validity. Finally, discriminant validity was assessed by investigating the effect of gender and active sex-life on the total score.
Results: Similar to the original structure, both the exploratory and confirmatory factor analyses revealed a 4-factor solution: volunteerism, significance, closeness, and communication. There was a significant relationship between the total score of the Sexual Attitude Scale for Elderly People and attitude sub-dimension of the Aging Sexuality Knowledge and Attitudes Scale. Further, a series of independent sample t-tests indicated significant differences in terms of gender and active sex-life. The Cronbach alpha coefficients were .95 for the total score and between .86 and .90 for the sub-dimensions.
Conclusion: The findings of this study indicated that the scale can be used as a reliable and valid measure in Turkey.
Key words: Aged; Sexuality; Factor Analysis, Statistical; Attitude.
ABSTRACT

2021; 24(3): 433-440
434
INTRODUCTION
Similar to other developmental stages, aging is a period characterized by physiological, behavioral, psychological, and social changes (1). Further, it is known that changes occurring during this period af-fect sexuality related to the psychological well-be-ing of the elderly. Because sexuality is an essen-tial dimension of human life and a right for every person, it is important to understand that sexuality does not end in old age and continues to be impor-tant for elderly people (2). However, it is generally assumed (due to various sexual myths) that the ma-jority of elderly people have lost their sexual desire or cannot perform physically (3). Today, it remains common for the elderly to be defined as lacking in sexual attraction and desire and for their sexuality to be seen as taboo (4, 5). In a study conducted in Turkey, these sexual myths were investigated, with one of the most widely held being “it is not appro-priate for the elderly to have sexual intercourse.” (3). Other myths include female sexuality ending after the menopause and sexuality only being for young people (6).
Especially in cultures where sexual myths are common, it is known that knowledge and attitudes towards sexuality (which are directly related to an active sex-life) are also affected (7). When the atti-tudes of elderly people towards their sexuality were examined, they were found to be generally positive. Further, elderly who had more positive attitudes tended to continue their sexual life actively (8). In their study on elderly people, Walker and Ephross found that the majority were tolerant of sexuality. Similarly, 80% of the participants stated that mas-turbation is an acceptable sexual activity for elderly women. It is also noteworthy that there is a consist-ent gender difference in the attitudes of the elderly towards their sexuality (9). For example, in a study conducted by Træen, Carvalheira, Hald, Lange, and Kvalem in Norway, Denmark, Belgium, and Portu-gal, elderly women were found to be more conserv-ative compared to elderly men (10). Similarly, Waite,
Laumann, Das, and Schumm found that elderly men have a more positive attitude towards their sexuality (11). Although there are some studies on attitudes towards the sexuality of the elderly, there is a lack of literature on this subject in Turkey. Moreover, in the few studies conducted on the sexuality of the elder-ly, the attitudes of health personnel, students study-ing in health-related departments, and family mem-bers of the elderly were frequently studied rather than the attitudes of elderly people themselves (12). Considering the perspectives of the elderly and try-ing to understand their views and needs about their sexuality will provide an opportunity to shape the services to be provided to the elderly and increase many positive developmental outcomes (13).
The Aging Sexuality Knowledge and Attitudes Scale (ASKAS) is frequently used in the literature to measure the attitudes of elderly people towards sexuality (14). However, it would be necessary to adapt this scale for a Turkish audience, since the scale is only translated and is used without inves-tigating its validity and reliability. Because ASKAS includes a large number of scale items, the Sexual Attitude Scale for Elderly People has emerged as an expedient and practical scale for both elderly peo-ple and researchers. Instead of evaluating attitudes as a single dimension, it is thought that evaluating the volunteering, meaningfulness, closeness, and communication dimensions will provide more infor-mation. Therefore, the aim of this study is to adapt the Sexual Attitude Scale for Elderly People scale developed by Park, Shin, and Cha for a Turkish audi-ence and examine its psychometric properties (15).
MATERIALS AND METHODS
Sample
The study sample consisted of 127 elderly people (aged ≥ 60 years) living in Izmir and Ankara. Partic-ipants who provide valid informed consent and un-derstand the purpose of the study were included in the study. The participants were recruited from
SEXUAL ATTITUDE SCALE FOR ELDERLY PEOPLE: A RELIABILITY AND VALIDITY STUDY IN TURKEY
435
the community; therefore, hospitalized older adults and nursing home residents were not included in the study.
MeasuresSocio-demographic Information Form: This
form was prepared by researchers to obtain the fol-lowing socio-demographic information: marital sta-tus, educational status, perceived socioeconomic level, chronic diseases, and sex-life.
ASKAS: This is used to evaluate the knowl-edge and attitudes of individuals towards sexuali-ty of the elderly and was translated into Turkish by Doğan, Demir, Eker, and Karim (16). The scale has two sub-dimensions (knowledge and attitude) and 61 items in total. The first 35 knowledge questions gather basic information and are coded as “yes”, “no”, and “don’t know”, whereas the attitude ques-tions are evaluated using a 7-point Likert type. Low scores in the knowledge dimension indicate that in-dividuals have a high level of knowledge about the sexuality of elderly people, while low scores in the attitude dimension suggest that individuals have a more permissive attitude in terms of attitudes to-wards the sexuality of the elderly. It is known that this scale is commonly used to evaluate knowledge and attitudes in our country (16, 17). In this study, the Cronbach’s alpha internal consistency coeffi-cients for the knowledge and attitude sub-dimen-sions were .91 and .92, respectively.
Sexual Attitude Scale for Elderly People: This scale was developed by Park, Shin, and Cha (15) to measure the attitudes of the elderly towards sexu-ality, which was then adapted into Turkish within the scope of this study. The scale consists of 18 items and is evaluated using a 5-point Likert scale (1 = Strongly disagree to 5 = Strongly agree). This scale has four sub-dimensions: volunteerism (6 items), significance (4 items), closeness (5 items), and com-munication (3 items). In the original study, the Cron-bach alpha coefficient was calculated as .93.
ProcedureParticipants were recruited using an appropriate
sampling method and snowball sampling, which are both non-random sampling methods. Data were collected between January 2019 and June 2019. Af-ter the purpose of the study was explained to the participants, their written informed consent was ob-tained. The scales were delivered to the participants in an envelope to reduce bias and took between 20 and 25 minutes to complete.
Translation of The Sexual Attitude Scale for Elderly People into Turkish
After obtaining the necessary permissions from the authors who developed the scale for the adap-tation study, the items of the scale were translated into Turkish by three research assistants who have command of English and Turkish. These transla-tions were reviewed by another faculty member and translated back into English. Finally, to examine the comprehensibility of the scale, the scale was ap-plied to some elderly people, the incomprehensible items were reorganized, and the scale was finalized.
Data AnalysisThe first task was to examine whether missing
data were randomly distributed. According to Lit-tle’s MCAR test, it was found that the missing data (chi-square = 6160.362, df = 6887, p > .05) were ran-domly distributed. Therefore, an average score was assigned to the missing data. The construct validity of the scale was then examined by exploratory and confirmatory factor analyses. Subsequently, a corre-lation analysis was performed to determine concur-rent validity and the relationship of the scale with ASKAS scores was examined. To evaluate the discri-minant validity, t-test analyses were performed and gender and active sex-life differences were exam-ined. Finally, Cronbach alpha coefficients were used to evaluate the internal consistency of the adapted scale. All analyses were performed using SPSS 22.00 and LISREL 8.80 programs.

2021; 24(3): 433-440
436
Ethical IssuesPermission for the study was obtained from the
Ufuk University Social and Human Sciences Scientif-ic Research and Publication Ethics Committee (ref-erence number: 2018-50).
RESULTSCharacteristics of the Sample
The age range of participants was 60–86 years (x̄ = 68.42, SD = 5.7), of which 61.4% (n = 78) were female and 38.6% were male. Further, 74% (n = 94) of the sample were married. Other demographic informa-tion about the sample is provided in Table 1.
Construct Validity The construct validity of the Sexual Attitude
Scale for Elderly Individuals was first evaluated by exploratory factor analysis. The Kaiser–Meyer–Olkin (KMO) coefficient and Bartlett Sphericity tests were then conducted to examine whether the data were suitable for conducting an exploratory factor analy-sis. The KMO coefficient of the scale was .93 and the Barlett Sphericity test was found to be significant at p < .001. Because the KMO coefficient was >.50 and the Barlett test was significant, this indicated the data set was suitable for conducting an explora-tory factor analysis (18). Similar to the original struc-ture of the scale, the number of factors was limited to four and equamax rotation was performed. The 4-factor structure explained 67.10% of the total var-iance. Within the scope of this study (as in the orig-inal scale), the first factor was voluntariness and the factor loads of the items ranged from .79 to .24. The factor loads of the items in the second factor (sig-nificance) varied between .74 and .30, while those in the third factor (intimacy) varied between .63 and .44. The factor loadings of the items in the final fac-tor (communication) varied between .88 and .57.
The construct validity of the adapted scale was examined by second-order confirmatory factor
analysis (CFA). In the first stage, first-order CFA was applied to the model, which consisted of 4 latent and 18 observed variables, as in the original. As a result of the first-order CFA, it was observed that the t values obtained for the factor loads of all items and the relationship between latent variables were statistically significant. In addition, the first-order CFA results indicated an acceptable model fit (c² = 189.57, p = .00, c² /df = 1.50, RMSEA = .063, NFI = .96, NNFI = .98, CFI = .99, IFI = .99, and SRMR =
Table 1. Sociodemographic characteristics of the sample (N = 127)
Variable Frequency %
Education level
Literate / Primary School 55 43.2
Secondary / High School 45 35.5
College and above 27 21.3
Perceived SES
Low 28 22
Middle 73 57.5
High 26 20.5
Chronic disease
Yes 66 52
No 61 48
Active sex-life
Yes 73 57.5
No 54 42.5
Frequency of sexual intercourse
2-3 times a week 5 3.9
1 time per week 18 14.2
Once in 2 weeks 21 16.5
1 per month 8 6.3
Several times a year 8 6.3
No 54 42.5
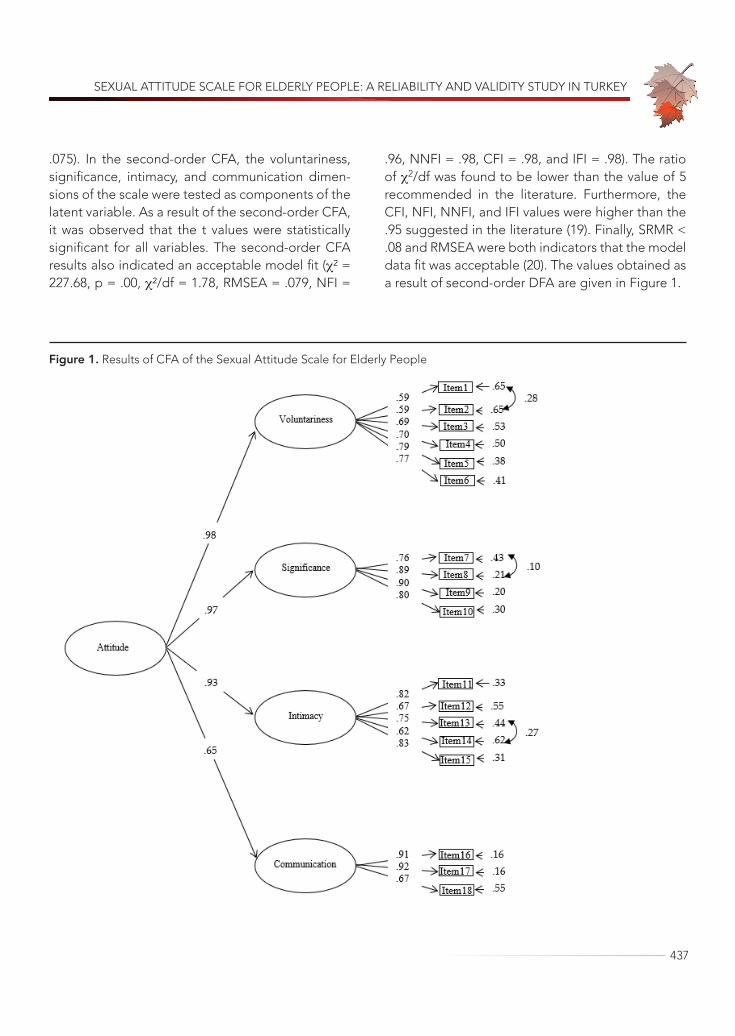
SEXUAL ATTITUDE SCALE FOR ELDERLY PEOPLE: A RELIABILITY AND VALIDITY STUDY IN TURKEY
437
.075). In the second-order CFA, the voluntariness, significance, intimacy, and communication dimen-sions of the scale were tested as components of the latent variable. As a result of the second-order CFA, it was observed that the t values were statistically significant for all variables. The second-order CFA results also indicated an acceptable model fit (c² = 227.68, p = .00, c²/df = 1.78, RMSEA = .079, NFI =
.96, NNFI = .98, CFI = .98, and IFI = .98). The ratio of c2/df was found to be lower than the value of 5 recommended in the literature. Furthermore, the CFI, NFI, NNFI, and IFI values were higher than the .95 suggested in the literature (19). Finally, SRMR < .08 and RMSEA were both indicators that the model data fit was acceptable (20). The values obtained as a result of second-order DFA are given in Figure 1.
Figure 1. Results of CFA of the Sexual Attitude Scale for Elderly People

2021; 24(3): 433-440
438
Concurrent ValidityTo investigate the concurrent validity of the
scale, the relationship between the attitude dimen-sion of ASKAS (which measures a similar structure) and Sexual Attitude Scale for Elderly People was in-vestigated. It was found that the concurrent validity was at an acceptable level and significant (r = -.57, p < .01).
Discriminant ValidityFor evidence of the discriminant validity of the
adapted scale, it was examined whether attitudes towards sexuality of the elderly differed according to gender. A significant difference was found ac-cording to gender in terms of attitude (t = -3.94, p < .001). The scores for attitude of men (x̄ = 68.71; SD = 12.93) were higher than for women (x̄ = 58.31; SD = 15.40). Accordingly, it can be stated that elderly men are more permissive in terms of attitudes towards sexuality. In addition, it was found that attitudes to-wards sexuality also differed according to whether participants had an active sex-life (t = 2.84, p < .01). Further, attitude scores for those who continue to have an active sex-life (x̄ = 65.55; SD = 14.92) were higher than for those who did not continue to have an active sex-life (x̄ = 57.96; SD = 14.87). In other words, it can be said that elderly people who con-tinue with an active sex-life are more permissive compared to those who do not continue with an ac-tive sex-life in terms of attitudes towards sexuality.
ReliabilityTo determine the reliability of the adapted scale,
the Cronbach alpha internal consistency coefficient was calculated. Accordingly, the Cronbach alpha internal consistency coefficient for the whole scale was found to be .95. In addition, the values were calculated as .86 for voluntariness, .90 for signifi-cance, .87 for intimacy, and .87 for communication.
DISCUSSIONThe aims of this study were to translate the Sexu-al Attitude Scale for Elderly People developed by Park, Shin, and Cha (15) into Turkish and determine its psychometric properties. First, exploratory and confirmatory factor analyses were conducted to ex-amine the construct validity of the scale. From these analyses, it was found that the scale preserved the 4-factor structure in our country in a similar way to the original study. In addition, it is thought that the relationship validity is acceptable since there is a statistically significant relationship between scale scores and the attitude sub-dimension of ASKAS. It is also assumed that the scale has concurrent validity when the relationship between scales that evaluate similar structures is high (21). Because there were significant differences of attitudes towards sexuality in terms of gender (16, 22) and active sex-life (23), discriminant validity was evaluated by demonstrat-ing the effect of gender and active sex-life on at-titudes towards sexuality based on these findings in the literature. The results indicate that attitude scores obtained from the scale differ significantly according to gender and active sex-life. Thus, the scale is thought to have discriminant validity. To determine the reliability of the adapted scale, the Cronbach alpha internal consistency coefficient was calculated. Accordingly, it is possible to say that the Sexual Attitude Scale for Elderly People is a reliable measurement tool for an elderly sample, since the Cronbach alpha internal consistency coefficients for both the scale and its sub-dimensions were >.70 (21).
In conclusion, the scale adapted within the scope of this study has sufficient psychometric properties for an elderly sample. Furthermore, adaptation of this scale is thought to be important in terms of contributing to studies on the sexuality of the elder-ly in our country. Although this study makes impor-tant contributions to the literature, there are some limitations. First, the number of participants was low
SEXUAL ATTITUDE SCALE FOR ELDERLY PEOPLE: A RELIABILITY AND VALIDITY STUDY IN TURKEY
439
and they were only recruited from Ankara and Izmir. Hence, the generalizability of the findings is limited due to these sampling characteristics. It is suggest-ed that working with a higher sample size and par-ticipants from different cities in future studies would contribute more to the literature. The second limi-tation of this study was collecting information from elderly people through self-report questionnaires. Considering this topic is taboo in our country, it should be remembered that participants might have provided biased (socially acceptable) answers. Finally, there is a need for studies that re-evaluate
the relationships between variables related to atti-tudes towards elderly sexuality using the adapted scale.
Acknowledgement: The research was suppor-ted by the Ege University Scientific Research Pro-jects Coordination (No: 17-EDB-011). The authors thank the Ege University Scientific Research Projects Coordination for supporting this study. The authors also grateful to the volunteer participants.
Conflict of Interest: We have no conflicts of in-terests to disclose.
REFERENCES1. Kalra G, Subramanyam A, Pinto C. Sexuality: desire,
activity and intimacy in the elderly. Indian J Psychia-try 2011;53(4):300-6. (PMID: 22303037)
2. Hajjar RR, Kamel HK. Sexuality in the nursing home, part 1: attitudes and barriers to sexual expression. J Am Med Dir Assoc 2003;4(3):152-6. (PMID: 12854989)
3. Özmen HE. Sexual myths and sexual dysfunc-tions. World Psychiatr 1999;3(Suppl 2):49-53. (in Turkish)
4. Bitzer J, Platano G, Tschudin S, Alder J. Sexual coun-seling in elderly couples. J Sex Med 2008;5(9):2027-43. (PMID: 18637999)
5. Weeks D. Sex for the mature adult: health, self-esteem, and countering ageist stereo-types. Sex Relation Ther 2002;17(3):231-40. (DOI: 10.1080/14681990220149031)
6. Astbury-Ward EM. Menopause, sexuali-ty and culture: is there a universal experience? Sex Relation Ther 2003;18(4):437-45. (DOI: 10.1080/14681990310001609787)
7. VB Agocha, M Asencio, CU Decena. Sexuality and culture, In:Deborah L. Tolman, Lisa M. Diamond, José A. Bauermeister, William H. George, James G. Pfaus, L. Monique Ward (Eds). APA handbooks in psychology®. APA handbook of sexuality and psy-chology, Vol. 2. Contextual approaches, American Psychological Association, USA 2014, pp 183-228.
8. DeLamater J, Moorman SM. Sexual behavior in later life. J Aging Health 2007;19(6):921-45. (PMID: 18165289)
9. Walker BL, Ephross PH. Knowledge and attitudes toward sexuality of a group of elderly. J Geron-tol Soc Work 1999;31(1-2):85-107. (DOI: 10.1300/J083v31n01_06)
10. Træen B, Carvalheira AA, Hald GM, Lange T, Kvalem IL. Attitudes towards sexuality in older men and wom-en across Europe: similarities, differences, and asso-ciations with their sex lives. Sex Cult 2019;23(1):1-25. (DOI: 10.1007/s12119-018-9564-9)
11. Waite LJ, Laumann EO, Das A, Schumm LP. Sexu-ality: Measures of partnerships, practices, attitudes, and problems in the National Social Life, Health, and Aging Study. J Gerontol B Psychol Sci Soc Sci 2009;64(1):56-66. (PMID: 19497930)
12. Gewirtz-Meydan A, Hafford-Letchfield T, Ayalon L et al. How do older people discuss their own sex-uality? A systematic review of qualitative research studies. Cult Health Sex 2019;21(3):293-308. (PMID: 29863969)
13. Gott M, Hinchliff S. How important is sex in lat-er life? The views of older people. Soc Sci Med 2003;56(8):1617-28. (PMID: 12639579)
14. White CB. A scale for the assessment of attitudes and knowledge regarding sexuality in the aged. Arch Sex Behav 1982;11(6):491-502. (PMID: 7159218)
15. Park H, Shin S, Cha H. Development and validation of a Sexual Attitude Scale for Elderly Korean People. J Korean Gerontol Nurs 2014;16(3):189-200. (DOI: 10.17079/jkgn.2014.16.3.189)
16. Doğan S, Demir B, Eker E, Karim S. Knowledge and attitudes of doctors toward the sexuality of older

2021; 24(3): 433-440
440
ria versus new alternatives. Struct Equ Modeling 1999;6(1):1-55. (DOI: 10.1080/10705519909540118)
21. RM Furr. Psychometrics: an introduction, 3th edition, Sage, California 2017.
22. Fisher L. Sex, romance, and relationships: AARP sur-vey of midlife and older adults [e-book] AARP; 2010. [Internet]. Available from: http://assets.aarp.org/rg-center/general/srr_09.pdf Accessed: 10.01.2021.
23. Wang TF, Lu CH, Chen IJ, Yu S. Sexual knowledge, attitudes and activity of older people in Taipei, Tai-wan. J Clin Nurs 2008;17(4):443-50. (PMID: 18205677)
people in Turkey. Int Psychogeriatr 2008;20(5):1019-27. (PMID: 18405397)
17. Şen S, Usta E, Aygın D, Sert H. Approaches of health professionals on aging and sexuality. Andrology Bul-letin 2015;17(60):64-7 (in Turkish)
18. BG Tabachnich, LS Fidell. Using multivariate statis-tics, 6th edition, Pearson, Boston 2013, pp 619-20.
19. RE Schumacker, RG Lomax. A beginner’s guide to structural equation modeling. 2nd edition, Lawrence Erlbaum, Hillsdale, New Jersey 2004, pp 85-88.
20. Hu LT, Bentler PM. Cutoff criteria for fit indexes in covariance structure analysis: conventional crite-

441

Turkish Journal of Geriatrics2021; 24(3)
From the Editor in Chief Yeşim GÖKÇE KUTSAL
Acute Coronary Syndrome in Geriatric Patients in an Intensıve Care UnitSuzan KESKİN, Arzu Neslihan AKGÜN, Orçun ÇİFTÇİ, İbrahim Haldun MÜDERRISOĞLU
The Effects of Renal Insufficiency and Age on Mortality in Geriatric Patients with Non-ST-Segment Elevation Myocardial Infarction
Pınar Demir GÜNDOĞMUŞ, Emrah AKSAKAL, Oğuzhan BİRDAL, İbrahim Halil TANBOĞA
The Effect of Obesity on Mortality in Geriatric Patients Followed in the İntensive Care UnitGülsüm Oya HERGÜNSEL, Mehmet Süleyman SABAZ
The Effect of Covid-19 Pandemic on Sarcopenia, Quality of Life and Pain: A One-Year Follow-Up StudyFulya BAKILAN, Merih ÖZGEN, Burcu ORTANCA, Onur ARMAĞAN,
Ayşe EKİM, Funda Taşçıoğlu BERKAN, Fezan Şahin MUTLU
Evaluation of the Factors Prolonging the Discharge Home of Patients in a Palliative Care Center Gülten UTEBEY, Julide ERGİL
Myocardial Injury After Noncardiac Surgery in Geriatric PatientsDöndü Genç MORALAR, Bedih BALKAN
Do Shock Index, Modified Shock Index, and Shock Index By Age Have a Predictive Value In Determining the Risk of Post-Spinal Hypotension in Elderly Patients?
Gözde EROL, İsmail AYTAÇ, Betül GÜVEN AYTAÇ
Relationship Between the Prognostic Nutritional Index and All-Cause Mortality in Elderly Patients With Non-St Segment Elevation Myocardial InfarctionÖzge Çakmak KARAASLAN, Cem ÇÖTELİ, Hasan Can KÖNTE, Murat Oğuz ÖZİLHAN, Orhan MADEN
Sleep Quality in Patients Over 65 Years of Age in the Covid-19 PandemicAyşe KARAOĞULLARINDAN, Orhan GÖRGÜLÜ, Gökhan KURAN, Sanem Okşan ERKAN, Birgül TUHANİOĞLU
Valuation of the Relationship Between the End of Life Hospitalization Needs And Early Presenting to Palliative Care
Ufuk ÜNLÜ, Nagihan YILDIZ ÇELTEK
Depression and Anxiety Levels in a Group of Elderly With Temporomandibular DisordersAhmet Taylan ÇEBİ, Nihat YILMAZ, Fatih KARAYÜREK, Aydın GÜLSES
Relationships Between Parkinson’s Disease Dementia and 25-Hydroxy Vitamin D and Brain-Derived Neurotrophic Factor Levels
Tuba EKMEKYAPAR, Yusuf TÜRKÖZ, Zeynep ERDEMLİ, Yasemin DEMİRTAŞ, Sibel ALTINAYAR
Using The Rotterdam CT Score to Predict Outcomes of Head İnjuries in the Geriatric PopulationPınar Aydın ÖZTÜRK, Ünal ÖZTÜRK
Relationship of Daily Time Spent Outdoors With Sleep Quality and Emotional Well-BeingAmong Community-Dwelling Older Adults During Covid-19 Restrictions
Kenan Eren ŞANSAL, Leyla Ataş BALCI, Fadime ÇINAR, Dilber KARAGÖZOĞLU ÇOŞKUNSU,Sezin Hatice TANRIÖVER, Mehmet Bengü ULUENGİN
Sexual Attitude Scale for Elderly People: A Reliability and Validity Study in TurkeyMelisa EBEOĞLU, Rukiye KIZILTEPE, Nilgül Banu ÇENGELCİ ÖZEKES