2021 WASHINGTON ANNUAL STATISTICAL BULLETIN
73
2021 WASHINGTON ANNUAL STATISTICAL BULLETIN Compiled by United States Department of Agriculture National Agricultural Statistics Service Northwest Regional Field Office Chris Mertz - Director Dennis Koong- Deputy Director Steve Anderson – Deputy Director P. O. Box 609 Olympia, Washington 98507 Phone: (360) 890-3300 Fax: 1-855-270-2721 e-mail: [email protected] NORTHWEST REGION STAFF Washington Alaska Bianca Pruneda Alan Funk Sue Benz Eric Stebbins Glen Goodrich Wendy Vance Christina Harlow Idaho Kyle Bowman Kelly Jefferson Randy Welk Mark Cerise Jessica Lemenager Benjamin Johnson Ann Clemon Scott Peterson Tyrell Doss Jennifer Reichert Oregon Kim Dunn Chris Singh Dave Losh Angelica Espino Mali Viste Gene Pierce U. S. Department of Agriculture National Agricultural Statistics Service Hubert Hamer, Administrator
-
Upload
khangminh22 -
Category
Documents
-
view
0 -
download
0
Transcript of 2021 WASHINGTON ANNUAL STATISTICAL BULLETIN
2021 WASHINGTON
ANNUAL STATISTICAL
BULLETIN
Compiled by
United States Department of Agriculture
National Agricultural Statistics Service
Northwest Regional Field Office
Chris Mertz - Director
Dennis Koong- Deputy Director
Steve Anderson – Deputy Director
P. O. Box 609
Olympia, Washington 98507
Phone: (360) 890-3300
Fax: 1-855-270-2721
e-mail: [email protected]
NORTHWEST REGION STAFF
Washington Alaska
Bianca Pruneda Alan Funk Sue Benz
Eric Stebbins Glen Goodrich
Wendy Vance Christina Harlow Idaho
Kyle Bowman Kelly Jefferson Randy Welk
Mark Cerise Jessica Lemenager Benjamin Johnson Ann Clemon Scott Peterson
Tyrell Doss Jennifer Reichert Oregon
Kim Dunn Chris Singh Dave Losh
Angelica Espino Mali Viste Gene Pierce
U. S. Department of Agriculture
National Agricultural Statistics Service
Hubert Hamer, Administrator
STATE SUMMARY Crop Acreage, Yield, Production, and Value .. 1
Washington’s Rank in the Nation’s Agriculture .................................... 2
Record Highs and Lows of Commodities ... .3-5 Farm Numbers ............................................ 6-7 Farm Labor ................................................. 8-9
PRICES:
Prices Received by Farmers ................... 10-13 Index of Prices Received and Paid ......... 14-15 Grazing Fees ............................................... 16
Cash Rent by County ................................... 17 Average Land Values per Acre .................... 18
FIELD CROPS:
Wheat (All, Spring, and Winter)............... 19-23 Barley ..................................................... 24-26 Oats ........................................................ 27-28
Corn (Grain and Silage) .......................... 29-31 Dry Edible Beans .................................... 32-33
Dry Edible Peas ........................................... 34 Lentils .......................................................... 34
Wrinkled Seed Peas .................................... 34 Potatoes ................................................. 35-36 Cold Storage........................................... 37-38
Sugarbeets .................................................. 38 Hops ....................................................... 39-40
Hay (All, Alfalfa, and Other) .................... 41-43 New Seedings of Alfalfa and Forage Crops ................................................... 42-43
Canola ......................................................... 43 Mint (Spearmint and Peppermint) ................ 44
VEGETABLES:
Acreage, Yield, Production, Price, and Value ............................................ 45-47 Asparagus ................................................... 45
Carrots ......................................................... 45 Green Peas ................................................. 46
Onions ......................................................... 46 Pumpkins ..................................................... 46
Sweet Corns ................................................ 47
FRUITS, NUTS, and BERRIES: Acreage, Yield, Production, Price, and Value 48-51
Berries ............................................................... 51 Refrigerated Storage.......................................... 51
FLORICULTURES: Floriculture .................................................... 52-57
LIVESTOCK and DAIRY:
Milk Cows and Milk Production .......................... 58 Marketing, Income, and Value of Production . 59-60 Cattle and Calves Inventory ............................... 60
Cattle and Calves Production and Income ......... 61 Cattle on Feed Inventory .................................... 62
Cattle Slaughtered ............................................. 63 Cattle and Calves Inventory by County ......... 64-65
Sheep and Lambs .............................................. 66 Wool .................................................................. 66 Goats ................................................................. 67
Poultry and Eggs .......................................... 67-68 Bees and Honey ................................................ 69
AQUACULTURE:
Trout ............................................................. 69-70 MARKETING YEAR DEFINITIONS ................... 71
TABLE OF CONTENTS
2021 Washington Annual Statistical Bulletin (October 2021) 1 USDA, National Agricultural Statistics Service - Northwest Regional Office
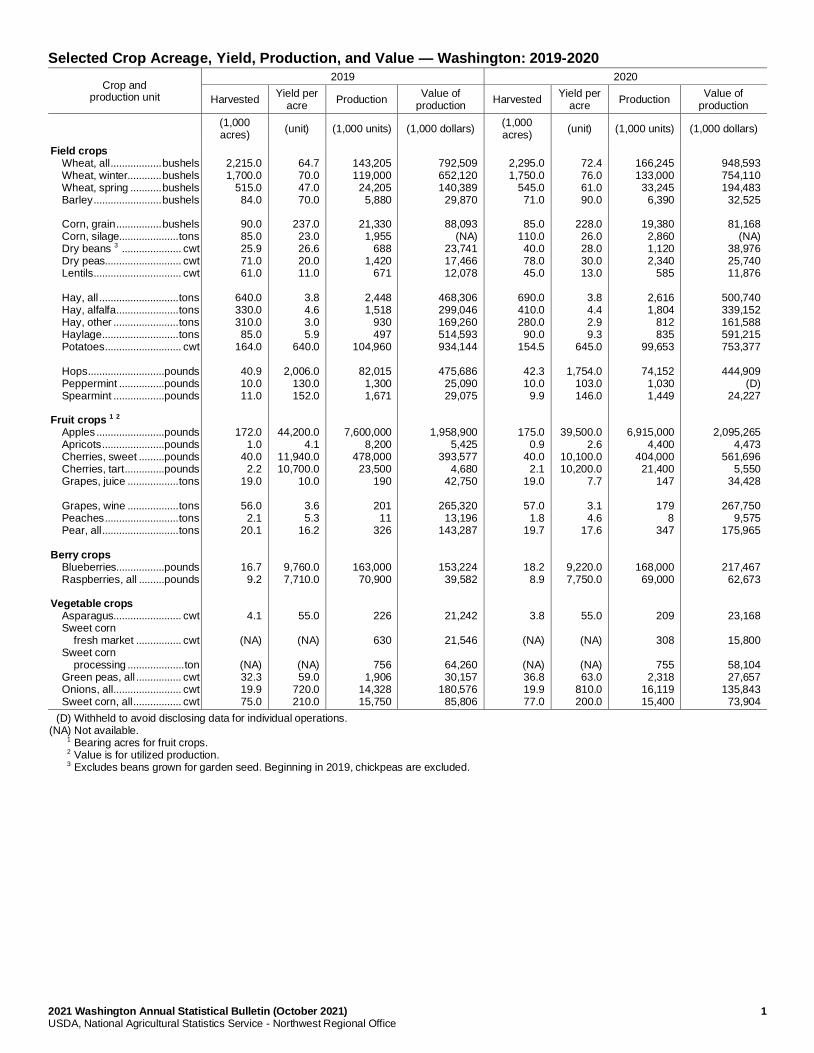
Selected Crop Acreage, Yield, Production, and Value — Washington: 2019-2020
Crop and production unit
2019 2020
Harvested Yield per
acre Production
Value of production
Harvested Yield per
acre Production
Value of production
(1,000 acres)
(unit) (1,000 units) (1,000 dollars) (1,000 acres)
(unit) (1,000 units) (1,000 dollars)
Field crops Wheat, all .................. bushels Wheat, winter............ bushels Wheat, spring ........... bushels Barley ........................ bushels Corn, grain ................ bushels Corn, silage..................... tons Dry beans 3 ..................... cwt Dry peas........................... cwt Lentils ............................... cwt Hay, all ............................ tons Hay, alfalfa ...................... tons Hay, other ....................... tons Haylage ........................... tons Potatoes ........................... cwt Hops ...........................pounds Peppermint ................pounds Spearmint ..................pounds Fruit crops 1 2 Apples ........................pounds Apricots ......................pounds Cherries, sweet .........pounds Cherries, tart ..............pounds Grapes, juice .................. tons Grapes, wine .................. tons Peaches .......................... tons Pear, all ........................... tons Berry crops Blueberries.................pounds Raspberries, all .........pounds Vegetable crops Asparagus........................ cwt Sweet corn fresh market ................ cwt Sweet corn processing .................... ton Green peas, all ................ cwt Onions, all ........................ cwt Sweet corn, all ................. cwt
2,215.0 1,700.0
515.0 84.0
90.0 85.0 25.9 71.0 61.0
640.0 330.0 310.0 85.0
164.0
40.9 10.0 11.0
172.0 1.0
40.0 2.2
19.0
56.0 2.1
20.1
16.7 9.2
4.1
(NA)
(NA) 32.3 19.9 75.0
64.7 70.0 47.0 70.0
237.0 23.0 26.6 20.0 11.0
3.8 4.6 3.0 5.9
640.0
2,006.0 130.0 152.0
44,200.0 4.1
11,940.0 10,700.0
10.0
3.6 5.3
16.2
9,760.0 7,710.0
55.0
(NA)
(NA) 59.0
720.0 210.0
143,205 119,000
24,205 5,880
21,330
1,955 688
1,420 671
2,448 1,518
930 497
104,960
82,015 1,300 1,671
7,600,000 8,200
478,000 23,500
190
201 11
326
163,000 70,900
226
630
756 1,906
14,328 15,750
792,509 652,120 140,389
29,870
88,093 (NA)
23,741 17,466 12,078
468,306 299,046 169,260 514,593 934,144
475,686
25,090 29,075
1,958,900 5,425
393,577 4,680
42,750
265,320 13,196
143,287
153,224 39,582
21,242
21,546
64,260 30,157
180,576 85,806
2,295.0 1,750.0
545.0 71.0
85.0
110.0 40.0 78.0 45.0
690.0 410.0 280.0 90.0
154.5
42.3 10.0
9.9
175.0 0.9
40.0 2.1
19.0
57.0 1.8
19.7
18.2 8.9
3.8
(NA)
(NA) 36.8 19.9 77.0
72.4 76.0 61.0 90.0
228.0 26.0 28.0 30.0 13.0
3.8 4.4 2.9 9.3
645.0
1,754.0 103.0 146.0
39,500.0 2.6
10,100.0 10,200.0
7.7
3.1 4.6
17.6
9,220.0 7,750.0
55.0
(NA)
(NA) 63.0
810.0 200.0
166,245 133,000
33,245 6,390
19,380
2,860 1,120 2,340
585
2,616 1,804
812 835
99,653
74,152 1,030 1,449
6,915,000 4,400
404,000 21,400
147
179 8
347
168,000 69,000
209
308
755 2,318
16,119 15,400
948,593 754,110 194,483
32,525
81,168 (NA)
38,976 25,740 11,876
500,740 339,152 161,588 591,215 753,377
444,909
(D) 24,227
2,095,265 4,473
561,696 5,550
34,428
267,750 9,575
175,965
217,467 62,673
23,168
15,800
58,104 27,657
135,843 73,904
(D) Withheld to avoid disclosing data for individual operations. (NA) Not available. 1 Bearing acres for fruit crops. 2 Value is for utilized production. 3 Excludes beans grown for garden seed. Beginning in 2019, chickpeas are excluded.
2 2021 Washington Annual Statistical Bulletin (October 2021) USDA, National Agricultural Statistics Service - Northwest Regional Office
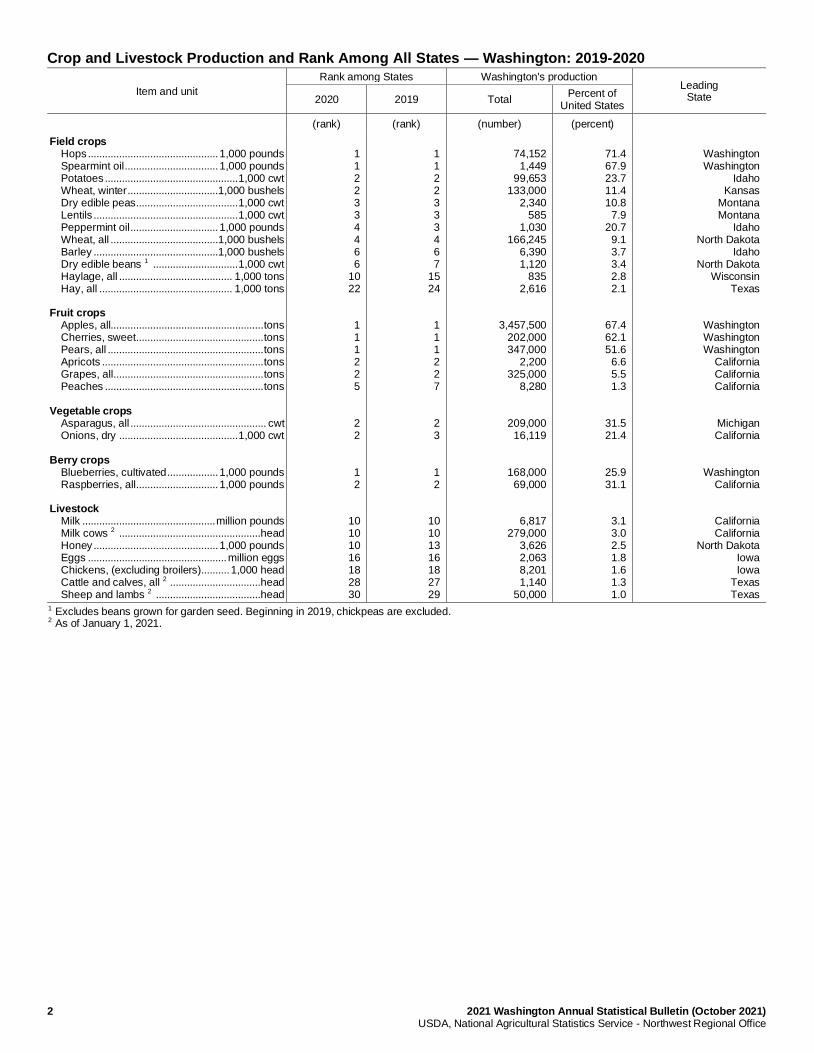
Crop and Livestock Production and Rank Among All States — Washington: 2019-2020
Item and unit
Rank among States Washington's production Leading
State 2020 2019 Total Percent of
United States
(rank) (rank) (number) (percent)
Field crops Hops .............................................. 1,000 pounds Spearmint oil ................................. 1,000 pounds Potatoes ............................................... 1,000 cwt Wheat, winter ................................1,000 bushels Dry edible peas .................................... 1,000 cwt Lentils ................................................... 1,000 cwt Peppermint oil ............................... 1,000 pounds Wheat, all ......................................1,000 bushels Barley ............................................1,000 bushels Dry edible beans 1 .............................. 1,000 cwt Haylage, all ........................................ 1,000 tons Hay, all ............................................... 1,000 tons Fruit crops Apples, all...................................................... tons Cherries, sweet ............................................. tons Pears, all ....................................................... tons Apricots ......................................................... tons Grapes, all ..................................................... tons Peaches ........................................................ tons Vegetable crops Asparagus, all ................................................ cwt Onions, dry .......................................... 1,000 cwt Berry crops Blueberries, cultivated .................. 1,000 pounds Raspberries, all ............................. 1,000 pounds Livestock Milk ............................................... million pounds Milk cows 2 ..................................................head Honey ............................................ 1,000 pounds Eggs ................................................. million eggs Chickens, (excluding broilers).......... 1,000 head Cattle and calves, all 2 ................................head Sheep and lambs 2 .....................................head
1 1 2 2 3 3 4 4 6 6
10 22
1 1 1 2 2 5
2 2
1 2
10 10 10 16 18 28 30
1 1 2 2 3 3 3 4 6 7
15 24
1 1 1 2 2 7
2 3
1 2
10 10 13 16 18 27 29
74,152
1,449 99,653
133,000 2,340
585 1,030
166,245 6,390 1,120
835 2,616
3,457,500 202,000 347,000
2,200 325,000
8,280
209,000 16,119
168,000 69,000
6,817 279,000
3,626 2,063 8,201 1,140
50,000
71.4 67.9 23.7 11.4 10.8
7.9 20.7
9.1 3.7 3.4 2.8 2.1
67.4 62.1 51.6
6.6 5.5 1.3
31.5 21.4
25.9 31.1
3.1 3.0 2.5 1.8 1.6 1.3 1.0
Washington Washington
Idaho Kansas
Montana Montana
Idaho North Dakota
Idaho North Dakota
Wisconsin Texas
Washington Washington Washington
California California California
Michigan California
Washington California
California California
North Dakota Iowa Iowa
Texas Texas
1 Excludes beans grown for garden seed. Beginning in 2019, chickpeas are excluded. 2 As of January 1, 2021.
2021 Washington Annual Statistical Bulletin (October 2021) 3 USDA, National Agricultural Statistics Service - Northwest Regional Office
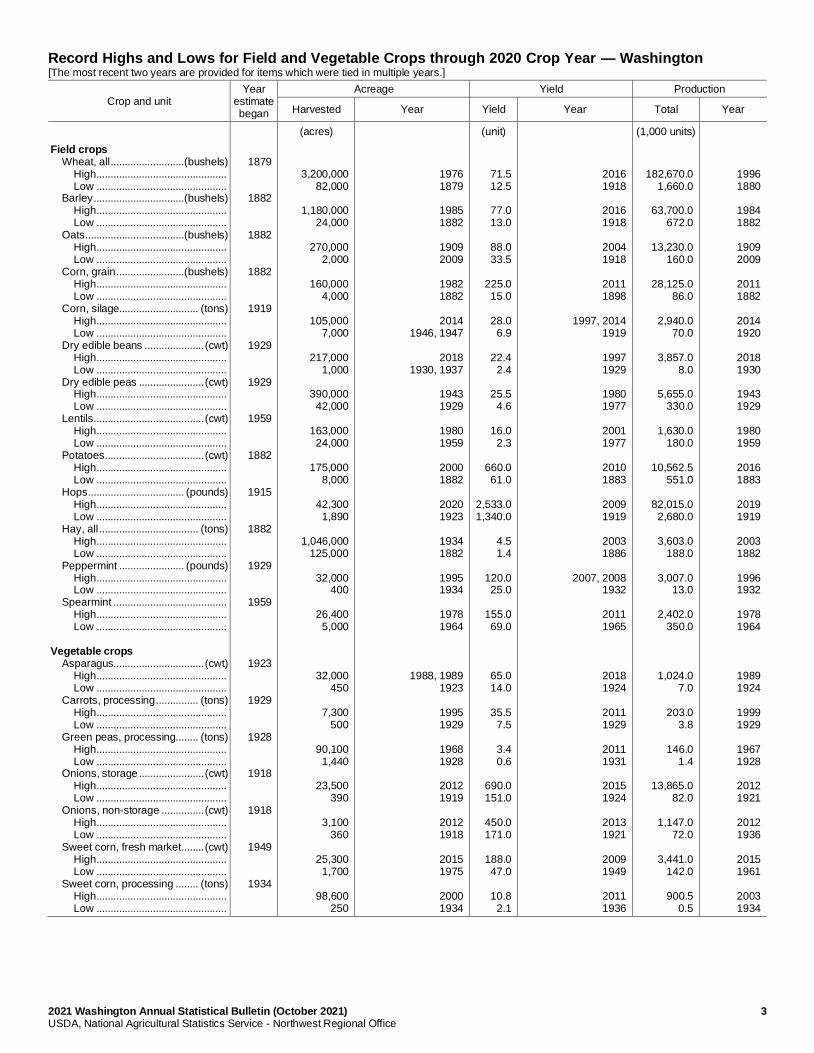
Record Highs and Lows for Field and Vegetable Crops through 2020 Crop Year — Washington [The most recent two years are provided for items which were tied in multiple years.]
Crop and unit Year
estimate began
Acreage Yield Production
Harvested Year Yield Year Total Year
(acres) (unit) (1,000 units)
Field crops Wheat, all ..........................(bushels) High.............................................. Low .............................................. Barley ................................(bushels) High.............................................. Low .............................................. Oats...................................(bushels) High.............................................. Low .............................................. Corn, grain ........................(bushels) High.............................................. Low .............................................. Corn, silage............................ (tons) High.............................................. Low .............................................. Dry edible beans ..................... (cwt) High.............................................. Low .............................................. Dry edible peas ....................... (cwt) High.............................................. Low .............................................. Lentils ....................................... (cwt) High.............................................. Low .............................................. Potatoes ................................... (cwt) High.............................................. Low .............................................. Hops .................................. (pounds) High.............................................. Low .............................................. Hay, all ................................... (tons) High.............................................. Low .............................................. Peppermint ....................... (pounds) High.............................................. Low .............................................. Spearmint ........................................ High.............................................. Low .............................................. Vegetable crops Asparagus................................ (cwt) High.............................................. Low .............................................. Carrots, processing ............... (tons) High.............................................. Low .............................................. Green peas, processing........ (tons) High.............................................. Low .............................................. Onions, storage ....................... (cwt) High.............................................. Low .............................................. Onions, non-storage ............... (cwt) High.............................................. Low .............................................. Sweet corn, fresh market ........ (cwt) High.............................................. Low .............................................. Sweet corn, processing ........ (tons) High.............................................. Low ..............................................
1879
1882
1882
1882
1919
1929
1929
1959
1882
1915
1882
1929
1959
1923
1929
1928
1918
1918
1949
1934
3,200,000 82,000
1,180,000
24,000
270,000 2,000
160,000
4,000
105,000 7,000
217,000
1,000
390,000 42,000
163,000
24,000
175,000 8,000
42,300
1,890
1,046,000 125,000
32,000
400
26,400 5,000
32,000 450
7,300
500
90,100 1,440
23,500
390
3,100 360
25,300
1,700
98,600 250
1976 1879
1985 1882
1909 2009
1982 1882
2014
1946, 1947
2018 1930, 1937
1943 1929
1980 1959
2000 1882
2020 1923
1934 1882
1995 1934
1978 1964
1988, 1989 1923
1995 1929
1968 1928
2012 1919
2012 1918
2015 1975
2000 1934
71.5 12.5
77.0 13.0
88.0 33.5
225.0 15.0
28.0
6.9
22.4 2.4
25.5
4.6
16.0 2.3
660.0 61.0
2,533.0 1,340.0
4.5 1.4
120.0 25.0
155.0 69.0
65.0 14.0
35.5
7.5
3.4 0.6
690.0 151.0
450.0 171.0
188.0 47.0
10.8
2.1
2016 1918
2016 1918
2004 1918
2011 1898
1997, 2014
1919
1997 1929
1980 1977
2001 1977
2010 1883
2009 1919
2003 1886
2007, 2008
1932
2011 1965
2018 1924
2011 1929
2011 1931
2015 1924
2013 1921
2009 1949
2011 1936
182,670.0 1,660.0
63,700.0
672.0
13,230.0 160.0
28,125.0
86.0
2,940.0 70.0
3,857.0
8.0
5,655.0 330.0
1,630.0
180.0
10,562.5 551.0
82,015.0
2,680.0
3,603.0 188.0
3,007.0
13.0
2,402.0 350.0
1,024.0 7.0
203.0
3.8
146.0 1.4
13,865.0
82.0
1,147.0 72.0
3,441.0
142.0
900.5 0.5
1996 1880
1984 1882
1909 2009
2011 1882
2014 1920
2018 1930
1943 1929
1980 1959
2016 1883
2019 1919
2003 1882
1996 1932
1978 1964
1989 1924
1999 1929
1967 1928
2012 1921
2012 1936
2015 1961
2003 1934
4 2021 Washington Annual Statistical Bulletin (October 2021) USDA, National Agricultural Statistics Service - Northwest Regional Office
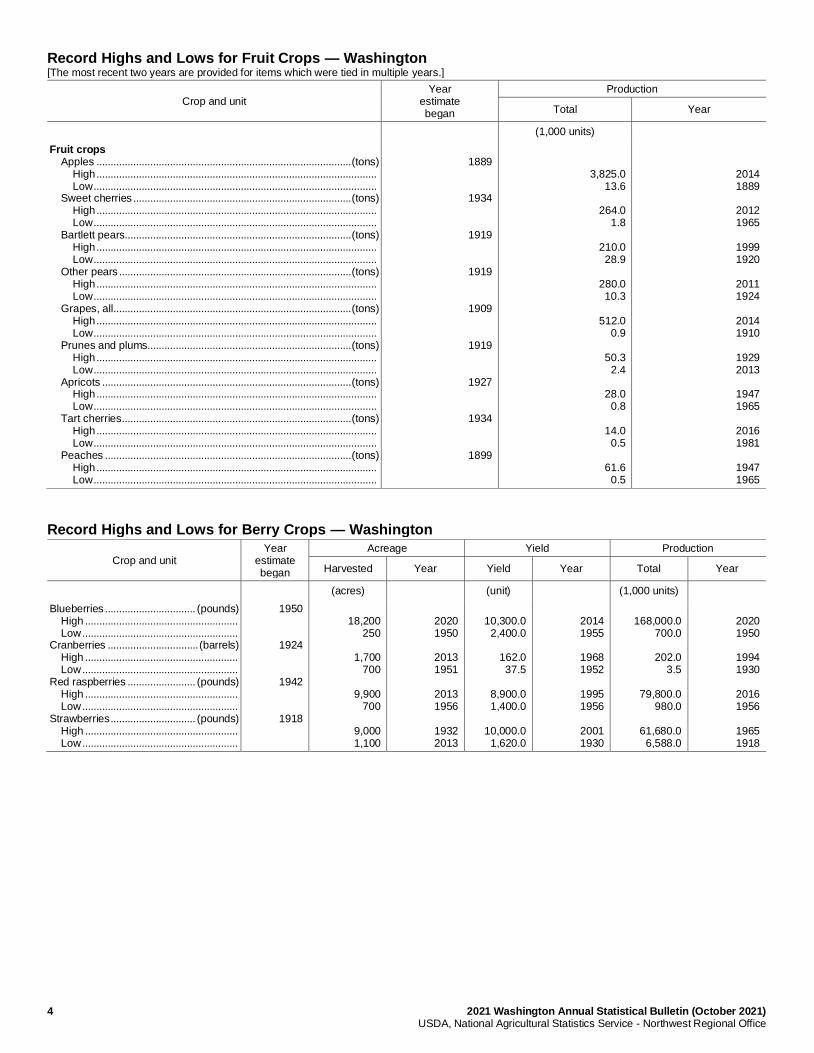
Record Highs and Lows for Fruit Crops — Washington [The most recent two years are provided for items which were tied in multiple years.]
Crop and unit Year
estimate began
Production
Total Year
(1,000 units)
Fruit crops Apples .......................................................................................... (tons) High ................................................................................................... Low .................................................................................................... Sweet cherries ............................................................................. (tons) High ................................................................................................... Low .................................................................................................... Bartlett pears................................................................................ (tons) High ................................................................................................... Low .................................................................................................... Other pears .................................................................................. (tons) High ................................................................................................... Low .................................................................................................... Grapes, all .................................................................................... (tons) High ................................................................................................... Low .................................................................................................... Prunes and plums........................................................................ (tons) High ................................................................................................... Low .................................................................................................... Apricots ........................................................................................ (tons) High ................................................................................................... Low .................................................................................................... Tart cherries ................................................................................. (tons) High ................................................................................................... Low .................................................................................................... Peaches ....................................................................................... (tons) High ................................................................................................... Low ....................................................................................................
1889
1934
1919
1919
1909
1919
1927
1934
1899
3,825.0 13.6
264.0
1.8
210.0 28.9
280.0 10.3
512.0
0.9
50.3 2.4
28.0
0.8
14.0 0.5
61.6
0.5
2014 1889
2012 1965
1999 1920
2011 1924
2014 1910
1929 2013
1947 1965
2016 1981
1947 1965
Record Highs and Lows for Berry Crops — Washington
Crop and unit Year
estimate began
Acreage Yield Production
Harvested Year Yield Year Total Year
(acres) (unit) (1,000 units)
Blueberries ................................ (pounds) High ...................................................... Low ....................................................... Cranberries ................................ (barrels) High ...................................................... Low ....................................................... Red raspberries ........................ (pounds) High ...................................................... Low ....................................................... Strawberries .............................. (pounds) High ...................................................... Low .......................................................
1950
1924
1942
1918
18,200
250
1,700 700
9,900
700
9,000 1,100
2020 1950
2013 1951
2013 1956
1932 2013
10,300.0
2,400.0
162.0 37.5
8,900.0 1,400.0
10,000.0
1,620.0
2014 1955
1968 1952
1995 1956
2001 1930
168,000.0
700.0
202.0 3.5
79,800.0
980.0
61,680.0 6,588.0
2020 1950
1994 1930
2016 1956
1965 1918
2021 Washington Annual Statistical Bulletin (October 2021) 5 USDA, National Agricultural Statistics Service - Northwest Regional Office
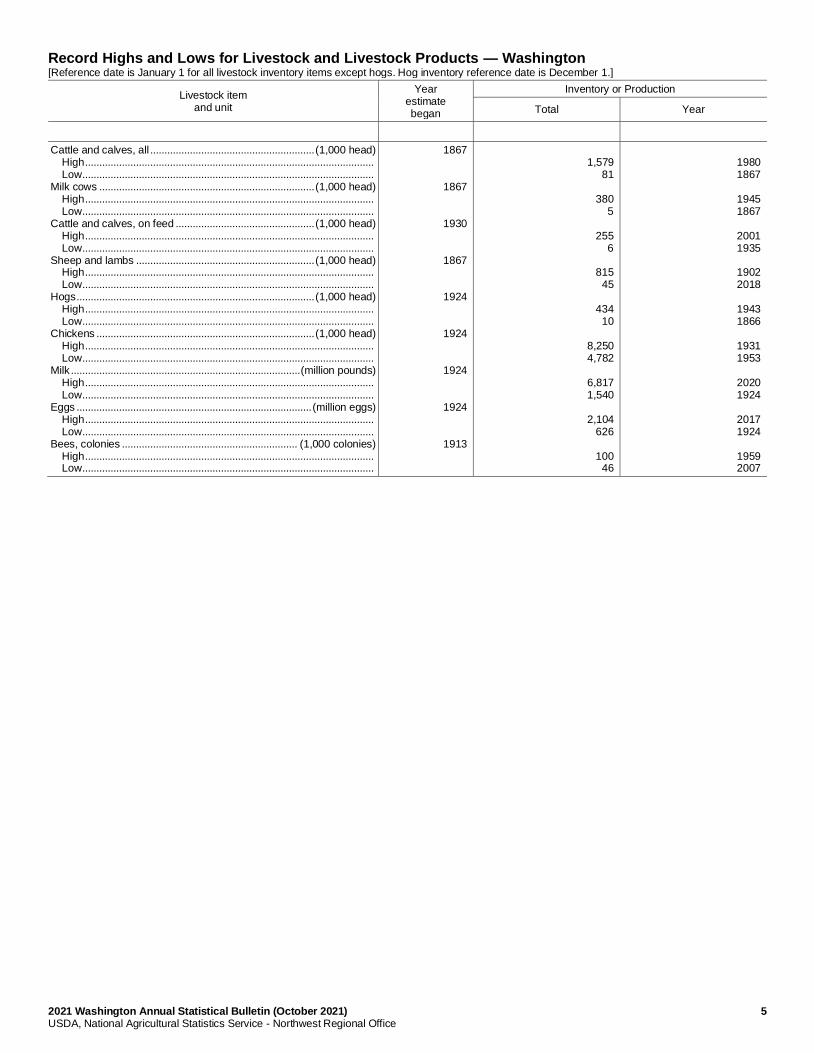
Record Highs and Lows for Livestock and Livestock Products — Washington [Reference date is January 1 for all livestock inventory items except hogs. Hog inventory reference date is December 1.]
Livestock item and unit
Year estimate began
Inventory or Production
Total Year
Cattle and calves, all .......................................................... (1,000 head) High ...................................................................................................... Low ....................................................................................................... Milk cows ............................................................................ (1,000 head) High ...................................................................................................... Low ....................................................................................................... Cattle and calves, on feed ................................................. (1,000 head) High ...................................................................................................... Low ....................................................................................................... Sheep and lambs ............................................................... (1,000 head) High ...................................................................................................... Low ....................................................................................................... Hogs .................................................................................... (1,000 head) High ...................................................................................................... Low ....................................................................................................... Chickens ............................................................................. (1,000 head) High ...................................................................................................... Low ....................................................................................................... Milk ................................................................................. (million pounds) High ...................................................................................................... Low ....................................................................................................... Eggs ................................................................................... (million eggs) High ...................................................................................................... Low ....................................................................................................... Bees, colonies .............................................................. (1,000 colonies) High ...................................................................................................... Low .......................................................................................................
1867
1867
1930
1867
1924
1924
1924
1924
1913
1,579
81
380 5
255
6
815 45
434
10
8,250 4,782
6,817 1,540
2,104
626
100 46
1980 1867
1945 1867
2001 1935
1902 2018
1943 1866
1931 1953
2020 1924
2017 1924
1959 2007
6 2021 Washington Annual Statistical Bulletin (October 2021) USDA, National Agricultural Statistics Service - Northwest Regional Office
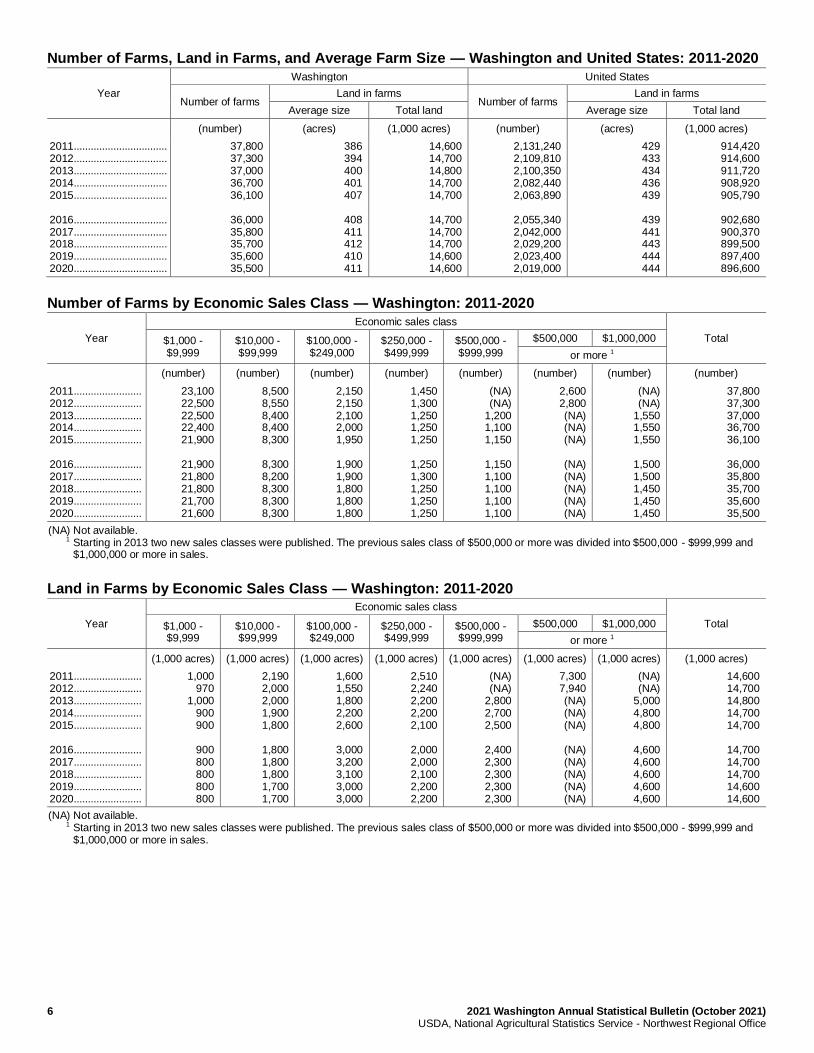
Number of Farms, Land in Farms, and Average Farm Size — Washington and United States: 2011-2020
Year
Washington United States
Number of farms Land in farms
Number of farms Land in farms
Average size Total land Average size Total land
(number) (acres) (1,000 acres) (number) (acres) (1,000 acres)
2011 ................................. 2012 ................................. 2013 ................................. 2014 ................................. 2015 ................................. 2016 ................................. 2017 ................................. 2018 ................................. 2019 ................................. 2020 .................................
37,800 37,300 37,000 36,700 36,100
36,000 35,800 35,700 35,600 35,500
386 394 400 401 407
408 411 412 410 411
14,600 14,700 14,800 14,700 14,700
14,700 14,700 14,700 14,600 14,600
2,131,240 2,109,810 2,100,350 2,082,440 2,063,890
2,055,340 2,042,000 2,029,200 2,023,400 2,019,000
429 433 434 436 439
439 441 443 444 444
914,420 914,600 911,720 908,920 905,790
902,680 900,370 899,500 897,400 896,600
Number of Farms by Economic Sales Class — Washington: 2011-2020
Year
Economic sales class
Total $1,000 - $9,999
$10,000 - $99,999
$100,000 - $249,000
$250,000 - $499,999
$500,000 - $999,999
$500,000 $1,000,000
or more 1
(number) (number) (number) (number) (number) (number) (number) (number)
2011 ........................ 2012 ........................ 2013 ........................ 2014 ........................ 2015 ........................ 2016 ........................ 2017 ........................ 2018 ........................ 2019 ........................ 2020 ........................
23,100 22,500 22,500 22,400 21,900
21,900 21,800 21,800 21,700 21,600
8,500 8,550 8,400 8,400 8,300
8,300 8,200 8,300 8,300 8,300
2,150 2,150 2,100 2,000 1,950
1,900 1,900 1,800 1,800 1,800
1,450 1,300 1,250 1,250 1,250
1,250 1,300 1,250 1,250 1,250
(NA) (NA)
1,200 1,100 1,150
1,150 1,100 1,100 1,100 1,100
2,600 2,800 (NA) (NA) (NA)
(NA) (NA) (NA) (NA) (NA)
(NA) (NA)
1,550 1,550 1,550
1,500 1,500 1,450 1,450 1,450
37,800 37,300 37,000 36,700 36,100
36,000 35,800 35,700 35,600 35,500
(NA) Not available. 1 Starting in 2013 two new sales classes were published. The previous sales class of $500,000 or more was divided into $500,000 - $999,999 and
$1,000,000 or more in sales.
Land in Farms by Economic Sales Class — Washington: 2011-2020
Year
Economic sales class
Total $1,000 - $9,999
$10,000 - $99,999
$100,000 - $249,000
$250,000 - $499,999
$500,000 - $999,999
$500,000 $1,000,000
or more 1
(1,000 acres) (1,000 acres) (1,000 acres) (1,000 acres) (1,000 acres) (1,000 acres) (1,000 acres) (1,000 acres)
2011 ........................ 2012 ........................ 2013 ........................ 2014 ........................ 2015 ........................ 2016 ........................ 2017 ........................ 2018 ........................ 2019 ........................ 2020 ........................
1,000 970
1,000 900 900
900 800 800 800 800
2,190 2,000 2,000 1,900 1,800
1,800 1,800 1,800 1,700 1,700
1,600 1,550 1,800 2,200 2,600
3,000 3,200 3,100 3,000 3,000
2,510 2,240 2,200 2,200 2,100
2,000 2,000 2,100 2,200 2,200
(NA) (NA)
2,800 2,700 2,500
2,400 2,300 2,300 2,300 2,300
7,300 7,940 (NA) (NA) (NA)
(NA) (NA) (NA) (NA) (NA)
(NA) (NA)
5,000 4,800 4,800
4,600 4,600 4,600 4,600 4,600
14,600 14,700 14,800 14,700 14,700
14,700 14,700 14,700 14,600 14,600
(NA) Not available. 1 Starting in 2013 two new sales classes were published. The previous sales class of $500,000 or more was divided into $500,000 - $999,999 and
$1,000,000 or more in sales.
2021 Washington Annual Statistical Bulletin (October 2021) 7 USDA, National Agricultural Statistics Service - Northwest Regional Office
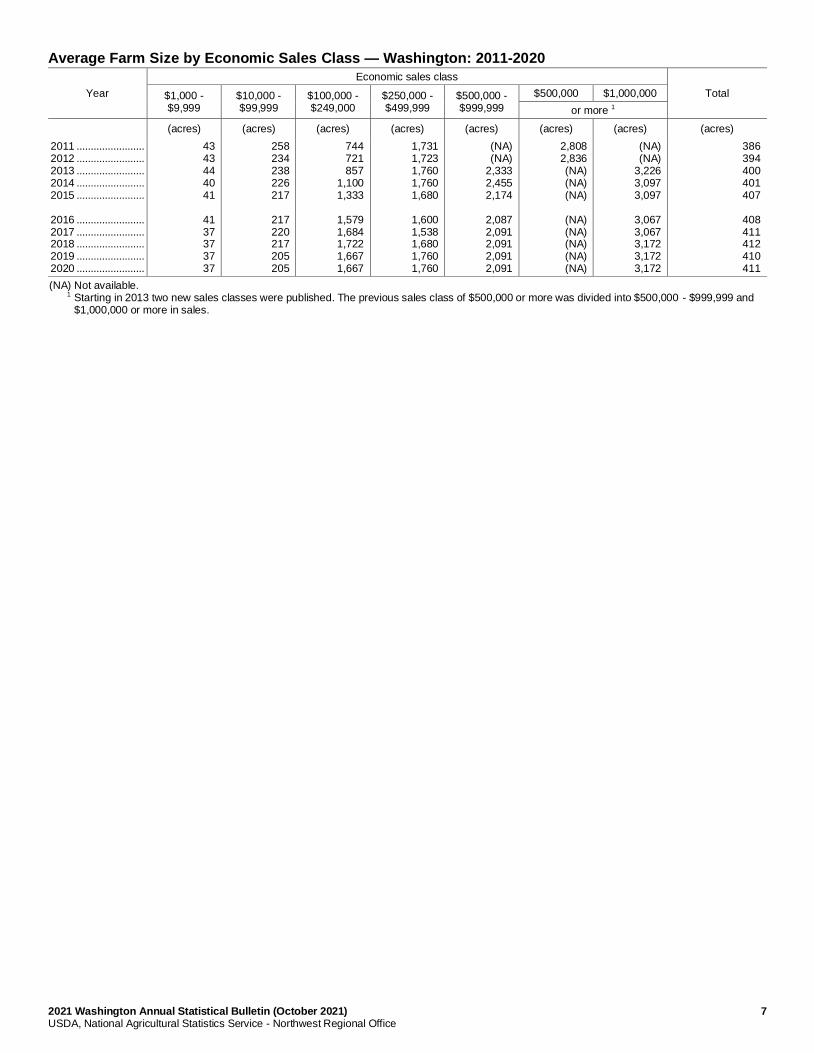
Average Farm Size by Economic Sales Class — Washington: 2011-2020
Year
Economic sales class
Total $1,000 - $9,999
$10,000 - $99,999
$100,000 - $249,000
$250,000 - $499,999
$500,000 - $999,999
$500,000 $1,000,000
or more 1
(acres) (acres) (acres) (acres) (acres) (acres) (acres) (acres)
2011 ........................ 2012 ........................ 2013 ........................ 2014 ........................ 2015 ........................ 2016 ........................ 2017 ........................ 2018 ........................ 2019 ........................ 2020 ........................
43 43 44 40 41
41 37 37 37 37
258 234 238 226 217
217 220 217 205 205
744 721 857
1,100 1,333
1,579 1,684 1,722 1,667 1,667
1,731 1,723 1,760 1,760 1,680
1,600 1,538 1,680 1,760 1,760
(NA) (NA)
2,333 2,455 2,174
2,087 2,091 2,091 2,091 2,091
2,808 2,836 (NA) (NA) (NA)
(NA) (NA) (NA) (NA) (NA)
(NA) (NA)
3,226 3,097 3,097
3,067 3,067 3,172 3,172 3,172
386 394 400 401 407
408 411 412 410 411
(NA) Not available. 1 Starting in 2013 two new sales classes were published. The previous sales class of $500,000 or more was divided into $500,000 - $999,999 and
$1,000,000 or more in sales.
8 2021 Washington Annual Statistical Bulletin (October 2021) USDA, National Agricultural Statistics Service - Northwest Regional Office
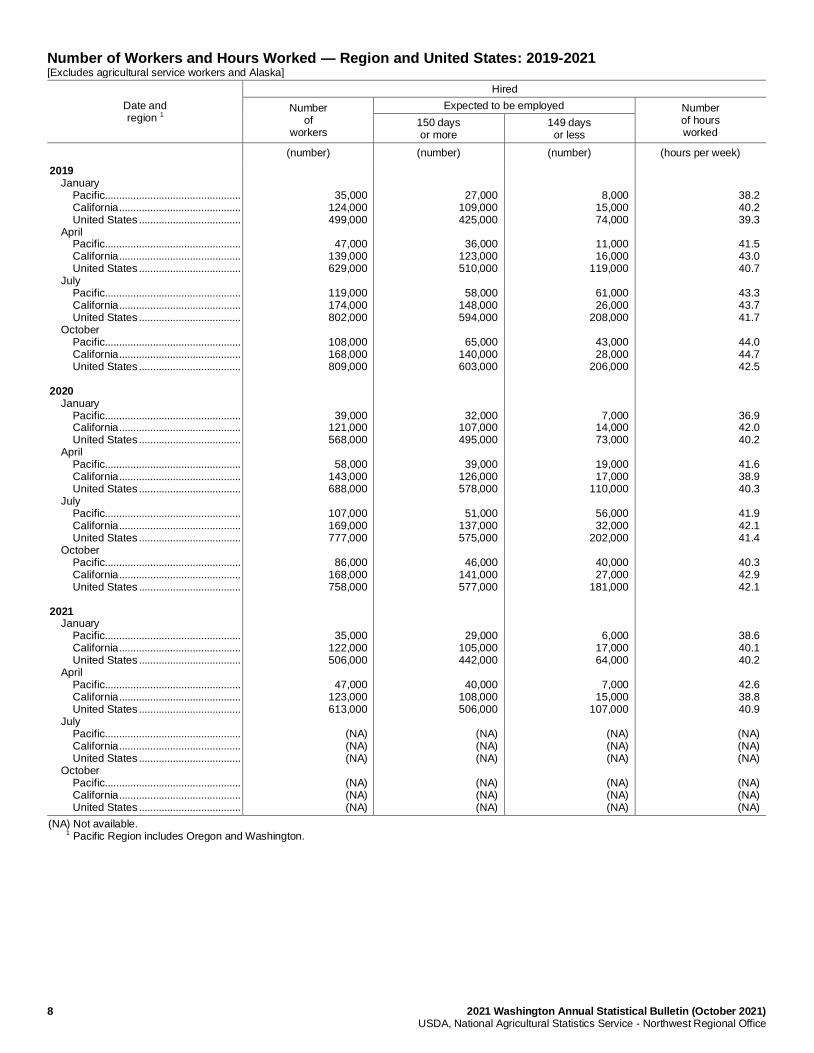
Number of Workers and Hours Worked — Region and United States: 2019-2021 [Excludes agricultural service workers and Alaska]
Date and region 1
Hired
Number of
workers
Expected to be employed Number of hours worked
150 days or more
149 days or less
(number) (number) (number) (hours per week)
2019 January Pacific................................................ California ........................................... United States .................................... April Pacific................................................ California ........................................... United States .................................... July Pacific................................................ California ........................................... United States .................................... October Pacific................................................ California ........................................... United States .................................... 2020 January Pacific................................................ California ........................................... United States .................................... April Pacific................................................ California ........................................... United States .................................... July Pacific................................................ California ........................................... United States .................................... October Pacific................................................ California ........................................... United States .................................... 2021 January Pacific................................................ California ........................................... United States .................................... April Pacific................................................ California ........................................... United States .................................... July Pacific................................................ California ........................................... United States .................................... October Pacific................................................ California ........................................... United States ....................................
35,000 124,000 499,000
47,000
139,000 629,000
119,000 174,000 802,000
108,000 168,000 809,000
39,000 121,000 568,000
58,000
143,000 688,000
107,000 169,000 777,000
86,000
168,000 758,000
35,000 122,000 506,000
47,000
123,000 613,000
(NA) (NA) (NA)
(NA) (NA) (NA)
27,000 109,000 425,000
36,000
123,000 510,000
58,000
148,000 594,000
65,000
140,000 603,000
32,000 107,000 495,000
39,000
126,000 578,000
51,000
137,000 575,000
46,000
141,000 577,000
29,000 105,000 442,000
40,000
108,000 506,000
(NA) (NA) (NA)
(NA) (NA) (NA)
8,000 15,000 74,000
11,000 16,000
119,000
61,000 26,000
208,000
43,000 28,000
206,000
7,000 14,000 73,000
19,000 17,000
110,000
56,000 32,000
202,000
40,000 27,000
181,000
6,000 17,000 64,000
7,000
15,000 107,000
(NA) (NA) (NA)
(NA) (NA) (NA)
38.2 40.2 39.3
41.5 43.0 40.7
43.3 43.7 41.7
44.0 44.7 42.5
36.9 42.0 40.2
41.6 38.9 40.3
41.9 42.1 41.4
40.3 42.9 42.1
38.6 40.1 40.2
42.6 38.8 40.9
(NA) (NA) (NA)
(NA) (NA) (NA)
(NA) Not available. 1 Pacific Region includes Oregon and Washington.
2021 Washington Annual Statistical Bulletin (October 2021) 9 USDA, National Agricultural Statistics Service - Northwest Regional Office
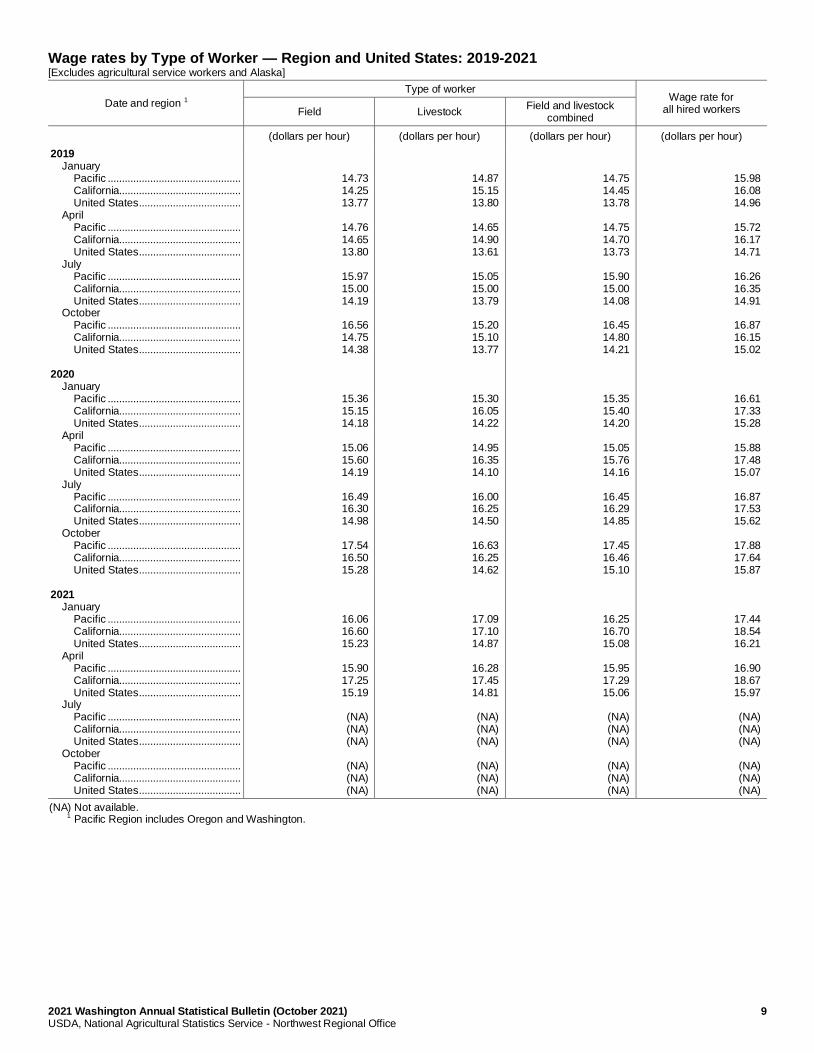
Wage rates by Type of Worker — Region and United States: 2019-2021 [Excludes agricultural service workers and Alaska]
Date and region 1
Type of worker Wage rate for
all hired workers Field Livestock Field and livestock
combined
(dollars per hour) (dollars per hour) (dollars per hour) (dollars per hour)
2019 January Pacific ............................................... California........................................... United States .................................... April Pacific ............................................... California........................................... United States .................................... July Pacific ............................................... California........................................... United States .................................... October Pacific ............................................... California........................................... United States .................................... 2020 January Pacific ............................................... California........................................... United States .................................... April Pacific ............................................... California........................................... United States .................................... July Pacific ............................................... California........................................... United States .................................... October Pacific ............................................... California........................................... United States .................................... 2021 January Pacific ............................................... California........................................... United States .................................... April Pacific ............................................... California........................................... United States .................................... July Pacific ............................................... California........................................... United States .................................... October Pacific ............................................... California........................................... United States ....................................
14.73 14.25 13.77
14.76 14.65 13.80
15.97 15.00 14.19
16.56 14.75 14.38
15.36 15.15 14.18
15.06 15.60 14.19
16.49 16.30 14.98
17.54 16.50 15.28
16.06 16.60 15.23
15.90 17.25 15.19
(NA) (NA) (NA)
(NA) (NA) (NA)
14.87 15.15 13.80
14.65 14.90 13.61
15.05 15.00 13.79
15.20 15.10 13.77
15.30 16.05 14.22
14.95 16.35 14.10
16.00 16.25 14.50
16.63 16.25 14.62
17.09 17.10 14.87
16.28 17.45 14.81
(NA) (NA) (NA)
(NA) (NA) (NA)
14.75 14.45 13.78
14.75 14.70 13.73
15.90 15.00 14.08
16.45 14.80 14.21
15.35 15.40 14.20
15.05 15.76 14.16
16.45 16.29 14.85
17.45 16.46 15.10
16.25 16.70 15.08
15.95 17.29 15.06
(NA) (NA) (NA)
(NA) (NA) (NA)
15.98 16.08 14.96
15.72 16.17 14.71
16.26 16.35 14.91
16.87 16.15 15.02
16.61 17.33 15.28
15.88 17.48 15.07
16.87 17.53 15.62
17.88 17.64 15.87
17.44 18.54 16.21
16.90 18.67 15.97
(NA) (NA) (NA)
(NA) (NA) (NA)
(NA) Not available. 1 Pacific Region includes Oregon and Washington.
10 2021 Washington Annual Statistical Bulletin (October 2021) USDA, National Agricultural Statistics Service - Northwest Regional Office
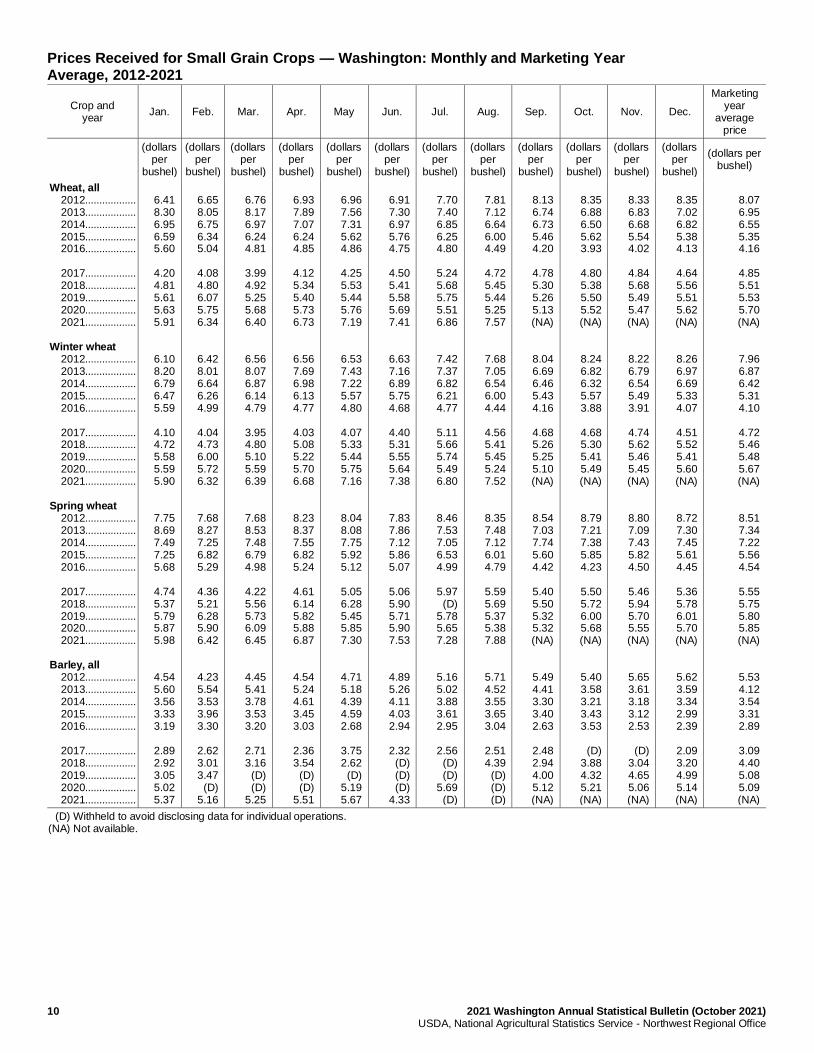
Prices Received for Small Grain Crops — Washington: Monthly and Marketing Year Average, 2012-2021
Crop and year
Jan. Feb. Mar. Apr. May Jun. Jul. Aug. Sep. Oct. Nov. Dec.
Marketing year
average price
(dollars
per bushel)
(dollars per
bushel)
(dollars per
bushel)
(dollars per
bushel)
(dollars per
bushel)
(dollars per
bushel)
(dollars per
bushel)
(dollars per
bushel)
(dollars per
bushel)
(dollars per
bushel)
(dollars per
bushel)
(dollars per
bushel)
(dollars per bushel)
Wheat, all 2012.................. 2013.................. 2014.................. 2015.................. 2016.................. 2017.................. 2018.................. 2019.................. 2020.................. 2021.................. Winter wheat 2012.................. 2013.................. 2014.................. 2015.................. 2016.................. 2017.................. 2018.................. 2019.................. 2020.................. 2021.................. Spring wheat 2012.................. 2013.................. 2014.................. 2015.................. 2016.................. 2017.................. 2018.................. 2019.................. 2020.................. 2021.................. Barley, all 2012.................. 2013.................. 2014.................. 2015.................. 2016.................. 2017.................. 2018.................. 2019.................. 2020.................. 2021..................
6.41 8.30 6.95 6.59 5.60
4.20 4.81 5.61 5.63 5.91
6.10 8.20 6.79 6.47 5.59
4.10 4.72 5.58 5.59 5.90
7.75 8.69 7.49 7.25 5.68
4.74 5.37 5.79 5.87 5.98
4.54 5.60 3.56 3.33 3.19
2.89 2.92 3.05 5.02 5.37
6.65 8.05 6.75 6.34 5.04
4.08 4.80 6.07 5.75 6.34
6.42 8.01 6.64 6.26 4.99
4.04 4.73 6.00 5.72 6.32
7.68 8.27 7.25 6.82 5.29
4.36 5.21 6.28 5.90 6.42
4.23 5.54 3.53 3.96 3.30
2.62 3.01 3.47
(D) 5.16
6.76 8.17 6.97 6.24 4.81
3.99 4.92 5.25 5.68 6.40
6.56 8.07 6.87 6.14 4.79
3.95 4.80 5.10 5.59 6.39
7.68 8.53 7.48 6.79 4.98
4.22 5.56 5.73 6.09 6.45
4.45 5.41 3.78 3.53 3.20
2.71 3.16
(D) (D)
5.25
6.93 7.89 7.07 6.24 4.85
4.12 5.34 5.40 5.73 6.73
6.56 7.69 6.98 6.13 4.77
4.03 5.08 5.22 5.70 6.68
8.23 8.37 7.55 6.82 5.24
4.61 6.14 5.82 5.88 6.87
4.54 5.24 4.61 3.45 3.03
2.36 3.54
(D) (D)
5.51
6.96 7.56 7.31 5.62 4.86
4.25 5.53 5.44 5.76 7.19
6.53 7.43 7.22 5.57 4.80
4.07 5.33 5.44 5.75 7.16
8.04 8.08 7.75 5.92 5.12
5.05 6.28 5.45 5.85 7.30
4.71 5.18 4.39 4.59 2.68
3.75 2.62
(D) 5.19 5.67
6.91 7.30 6.97 5.76 4.75
4.50 5.41 5.58 5.69 7.41
6.63 7.16 6.89 5.75 4.68
4.40 5.31 5.55 5.64 7.38
7.83 7.86 7.12 5.86 5.07
5.06 5.90 5.71 5.90 7.53
4.89 5.26 4.11 4.03 2.94
2.32
(D) (D) (D)
4.33
7.70 7.40 6.85 6.25 4.80
5.24 5.68 5.75 5.51 6.86
7.42 7.37 6.82 6.21 4.77
5.11 5.66 5.74 5.49 6.80
8.46 7.53 7.05 6.53 4.99
5.97
(D) 5.78 5.65 7.28
5.16 5.02 3.88 3.61 2.95
2.56
(D) (D)
5.69 (D)
7.81 7.12 6.64 6.00 4.49
4.72 5.45 5.44 5.25 7.57
7.68 7.05 6.54 6.00 4.44
4.56 5.41 5.45 5.24 7.52
8.35 7.48 7.12 6.01 4.79
5.59 5.69 5.37 5.38 7.88
5.71 4.52 3.55 3.65 3.04
2.51 4.39
(D) (D) (D)
8.13 6.74 6.73 5.46 4.20
4.78 5.30 5.26 5.13 (NA)
8.04 6.69 6.46 5.43 4.16
4.68 5.26 5.25 5.10 (NA)
8.54 7.03 7.74 5.60 4.42
5.40 5.50 5.32 5.32 (NA)
5.49 4.41 3.30 3.40 2.63
2.48 2.94 4.00 5.12 (NA)
8.35 6.88 6.50 5.62 3.93
4.80 5.38 5.50 5.52 (NA)
8.24 6.82 6.32 5.57 3.88
4.68 5.30 5.41 5.49 (NA)
8.79 7.21 7.38 5.85 4.23
5.50 5.72 6.00 5.68 (NA)
5.40 3.58 3.21 3.43 3.53
(D)
3.88 4.32 5.21 (NA)
8.33 6.83 6.68 5.54 4.02
4.84 5.68 5.49 5.47 (NA)
8.22 6.79 6.54 5.49 3.91
4.74 5.62 5.46 5.45 (NA)
8.80 7.09 7.43 5.82 4.50
5.46 5.94 5.70 5.55 (NA)
5.65 3.61 3.18 3.12 2.53
(D)
3.04 4.65 5.06 (NA)
8.35 7.02 6.82 5.38 4.13
4.64 5.56 5.51 5.62 (NA)
8.26 6.97 6.69 5.33 4.07
4.51 5.52 5.41 5.60 (NA)
8.72 7.30 7.45 5.61 4.45
5.36 5.78 6.01 5.70 (NA)
5.62 3.59 3.34 2.99 2.39
2.09 3.20 4.99 5.14 (NA)
8.07 6.95 6.55 5.35 4.16
4.85 5.51 5.53 5.70 (NA)
7.96 6.87 6.42 5.31 4.10
4.72 5.46 5.48 5.67 (NA)
8.51 7.34 7.22 5.56 4.54
5.55 5.75 5.80 5.85 (NA)
5.53 4.12 3.54 3.31 2.89
3.09 4.40 5.08 5.09 (NA)
(D) Withheld to avoid disclosing data for individual operations. (NA) Not available.
2021 Washington Annual Statistical Bulletin (October 2021) 11 USDA, National Agricultural Statistics Service - Northwest Regional Office
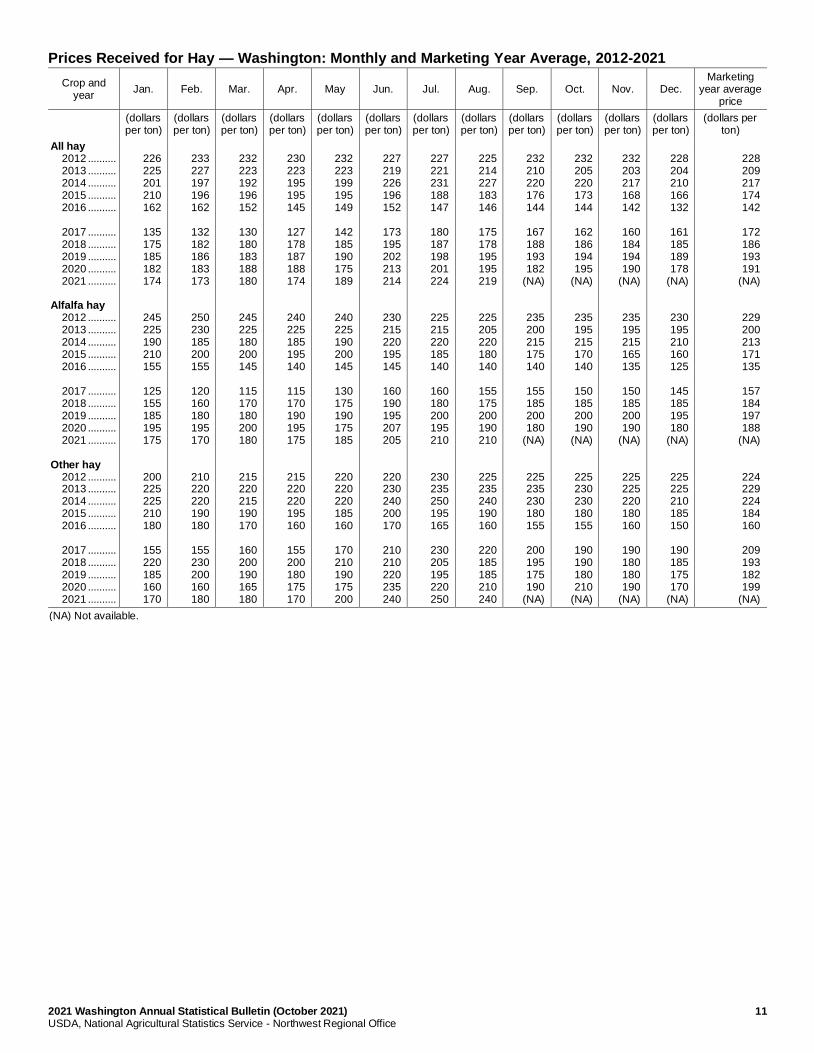
Prices Received for Hay — Washington: Monthly and Marketing Year Average, 2012-2021
Crop and year
Jan. Feb. Mar. Apr. May Jun. Jul. Aug. Sep. Oct. Nov. Dec. Marketing
year average price
(dollars per ton)
(dollars per ton)
(dollars per ton)
(dollars per ton)
(dollars per ton)
(dollars per ton)
(dollars per ton)
(dollars per ton)
(dollars per ton)
(dollars per ton)
(dollars per ton)
(dollars per ton)
(dollars per ton)
All hay 2012 .......... 2013 .......... 2014 .......... 2015 .......... 2016 .......... 2017 .......... 2018 .......... 2019 .......... 2020 .......... 2021 .......... Alfalfa hay 2012 .......... 2013 .......... 2014 .......... 2015 .......... 2016 .......... 2017 .......... 2018 .......... 2019 .......... 2020 .......... 2021 .......... Other hay 2012 .......... 2013 .......... 2014 .......... 2015 .......... 2016 .......... 2017 .......... 2018 .......... 2019 .......... 2020 .......... 2021 ..........
226 225 201 210 162
135 175 185 182 174
245 225 190 210 155
125 155 185 195 175
200 225 225 210 180
155 220 185 160 170
233 227 197 196 162
132 182 186 183 173
250 230 185 200 155
120 160 180 195 170
210 220 220 190 180
155 230 200 160 180
232 223 192 196 152
130 180 183 188 180
245 225 180 200 145
115 170 180 200 180
215 220 215 190 170
160 200 190 165 180
230 223 195 195 145
127 178 187 188 174
240 225 185 195 140
115 170 190 195 175
215 220 220 195 160
155 200 180 175 170
232 223 199 195 149
142 185 190 175 189
240 225 190 200 145
130 175 190 175 185
220 220 220 185 160
170 210 190 175 200
227 219 226 196 152
173 195 202 213 214
230 215 220 195 145
160 190 195 207 205
220 230 240 200 170
210 210 220 235 240
227 221 231 188 147
180 187 198 201 224
225 215 220 185 140
160 180 200 195 210
230 235 250 195 165
230 205 195 220 250
225 214 227 183 146
175 178 195 195 219
225 205 220 180 140
155 175 200 190 210
225 235 240 190 160
220 185 185 210 240
232 210 220 176 144
167 188 193 182
(NA)
235 200 215 175 140
155 185 200 180
(NA)
225 235 230 180 155
200 195 175 190
(NA)
232 205 220 173 144
162 186 194 195
(NA)
235 195 215 170 140
150 185 200 190
(NA)
225 230 230 180 155
190 190 180 210
(NA)
232 203 217 168 142
160 184 194 190
(NA)
235 195 215 165 135
150 185 200 190
(NA)
225 225 220 180 160
190 180 180 190
(NA)
228 204 210 166 132
161 185 189 178
(NA)
230 195 210 160 125
145 185 195 180
(NA)
225 225 210 185 150
190 185 175 170
(NA)
228 209 217 174 142
172 186 193 191
(NA)
229 200 213 171 135
157 184 197 188
(NA)
224 229 224 184 160
209 193 182 199
(NA)
(NA) Not available.
12 2021 Washington Annual Statistical Bulletin (October 2021) USDA, National Agricultural Statistics Service - Northwest Regional Office
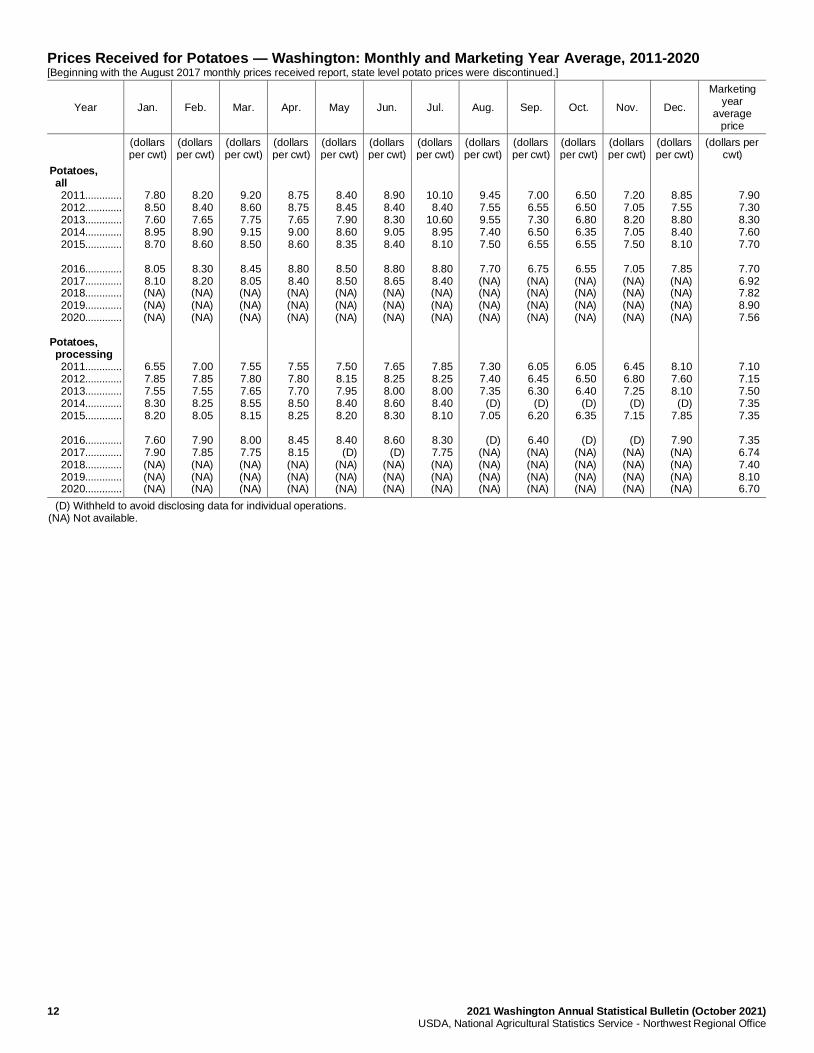
Prices Received for Potatoes — Washington: Monthly and Marketing Year Average, 2011-2020 [Beginning with the August 2017 monthly prices received report, state level potato prices were discontinued.]
Year Jan. Feb. Mar. Apr. May Jun. Jul. Aug. Sep. Oct. Nov. Dec.
Marketing year
average price
(dollars per cwt)
(dollars per cwt)
(dollars per cwt)
(dollars per cwt)
(dollars per cwt)
(dollars per cwt)
(dollars per cwt)
(dollars per cwt)
(dollars per cwt)
(dollars per cwt)
(dollars per cwt)
(dollars per cwt)
(dollars per cwt)
Potatoes, all 2011............. 2012............. 2013............. 2014............. 2015............. 2016............. 2017............. 2018............. 2019............. 2020............. Potatoes, processing 2011............. 2012............. 2013............. 2014............. 2015............. 2016............. 2017............. 2018............. 2019............. 2020.............
7.80 8.50 7.60 8.95 8.70
8.05 8.10 (NA) (NA) (NA)
6.55 7.85 7.55 8.30 8.20
7.60 7.90 (NA) (NA) (NA)
8.20 8.40 7.65 8.90 8.60
8.30 8.20 (NA) (NA) (NA)
7.00 7.85 7.55 8.25 8.05
7.90 7.85 (NA) (NA) (NA)
9.20 8.60 7.75 9.15 8.50
8.45 8.05 (NA) (NA) (NA)
7.55 7.80 7.65 8.55 8.15
8.00 7.75 (NA) (NA) (NA)
8.75 8.75 7.65 9.00 8.60
8.80 8.40 (NA) (NA) (NA)
7.55 7.80 7.70 8.50 8.25
8.45 8.15 (NA) (NA) (NA)
8.40 8.45 7.90 8.60 8.35
8.50 8.50 (NA) (NA) (NA)
7.50 8.15 7.95 8.40 8.20
8.40
(D) (NA) (NA) (NA)
8.90 8.40 8.30 9.05 8.40
8.80 8.65 (NA) (NA) (NA)
7.65 8.25 8.00 8.60 8.30
8.60
(D) (NA) (NA) (NA)
10.10 8.40
10.60 8.95 8.10
8.80 8.40 (NA) (NA) (NA)
7.85 8.25 8.00 8.40 8.10
8.30 7.75 (NA) (NA) (NA)
9.45 7.55 9.55 7.40 7.50
7.70 (NA) (NA) (NA) (NA)
7.30 7.40 7.35
(D) 7.05
(D)
(NA) (NA) (NA) (NA)
7.00 6.55 7.30 6.50 6.55
6.75 (NA) (NA) (NA) (NA)
6.05 6.45 6.30
(D) 6.20
6.40 (NA) (NA) (NA) (NA)
6.50 6.50 6.80 6.35 6.55
6.55 (NA) (NA) (NA) (NA)
6.05 6.50 6.40
(D) 6.35
(D)
(NA) (NA) (NA) (NA)
7.20 7.05 8.20 7.05 7.50
7.05 (NA) (NA) (NA) (NA)
6.45 6.80 7.25
(D) 7.15
(D)
(NA) (NA) (NA) (NA)
8.85 7.55 8.80 8.40 8.10
7.85 (NA) (NA) (NA) (NA)
8.10 7.60 8.10
(D) 7.85
7.90 (NA) (NA) (NA) (NA)
7.90 7.30 8.30 7.60 7.70
7.70 6.92 7.82 8.90 7.56
7.10 7.15 7.50 7.35 7.35
7.35 6.74 7.40 8.10 6.70
(D) Withheld to avoid disclosing data for individual operations. (NA) Not available.
2021 Washington Annual Statistical Bulletin (October 2021) 13 USDA, National Agricultural Statistics Service - Northwest Regional Office
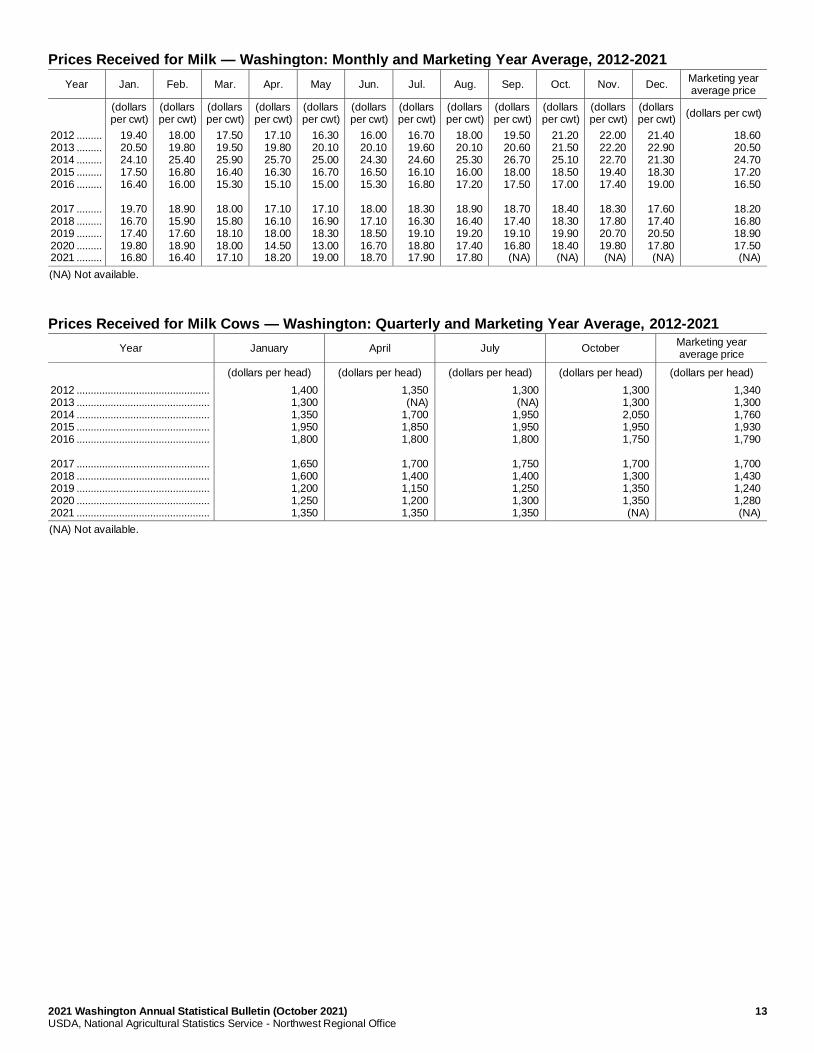
Prices Received for Milk — Washington: Monthly and Marketing Year Average, 2012-2021
Year Jan. Feb. Mar. Apr. May Jun. Jul. Aug. Sep. Oct. Nov. Dec. Marketing year average price
(dollars per cwt)
(dollars per cwt)
(dollars per cwt)
(dollars per cwt)
(dollars per cwt)
(dollars per cwt)
(dollars per cwt)
(dollars per cwt)
(dollars per cwt)
(dollars per cwt)
(dollars per cwt)
(dollars per cwt)
(dollars per cwt)
2012 ......... 2013 ......... 2014 ......... 2015 ......... 2016 ......... 2017 ......... 2018 ......... 2019 ......... 2020 ......... 2021 .........
19.40 20.50 24.10 17.50 16.40
19.70 16.70 17.40 19.80 16.80
18.00 19.80 25.40 16.80 16.00
18.90 15.90 17.60 18.90 16.40
17.50 19.50 25.90 16.40 15.30
18.00 15.80 18.10 18.00 17.10
17.10 19.80 25.70 16.30 15.10
17.10 16.10 18.00 14.50 18.20
16.30 20.10 25.00 16.70 15.00
17.10 16.90 18.30 13.00 19.00
16.00 20.10 24.30 16.50 15.30
18.00 17.10 18.50 16.70 18.70
16.70 19.60 24.60 16.10 16.80
18.30 16.30 19.10 18.80 17.90
18.00 20.10 25.30 16.00 17.20
18.90 16.40 19.20 17.40 17.80
19.50 20.60 26.70 18.00 17.50
18.70 17.40 19.10 16.80 (NA)
21.20 21.50 25.10 18.50 17.00
18.40 18.30 19.90 18.40 (NA)
22.00 22.20 22.70 19.40 17.40
18.30 17.80 20.70 19.80 (NA)
21.40 22.90 21.30 18.30 19.00
17.60 17.40 20.50 17.80 (NA)
18.60 20.50 24.70 17.20 16.50
18.20 16.80 18.90 17.50 (NA)
(NA) Not available.
Prices Received for Milk Cows — Washington: Quarterly and Marketing Year Average, 2012-2021
Year January April July October Marketing year average price
(dollars per head) (dollars per head) (dollars per head) (dollars per head) (dollars per head)
2012 ............................................... 2013 ............................................... 2014 ............................................... 2015 ............................................... 2016 ............................................... 2017 ............................................... 2018 ............................................... 2019 ............................................... 2020 ............................................... 2021 ...............................................
1,400 1,300 1,350 1,950 1,800
1,650 1,600 1,200 1,250 1,350
1,350 (NA)
1,700 1,850 1,800
1,700 1,400 1,150 1,200 1,350
1,300 (NA)
1,950 1,950 1,800
1,750 1,400 1,250 1,300 1,350
1,300 1,300 2,050 1,950 1,750
1,700 1,300 1,350 1,350 (NA)
1,340 1,300 1,760 1,930 1,790
1,700 1,430 1,240 1,280 (NA)
(NA) Not available.
14 2021 Washington Annual Statistical Bulletin (October 2021) USDA, National Agricultural Statistics Service - Northwest Regional Office
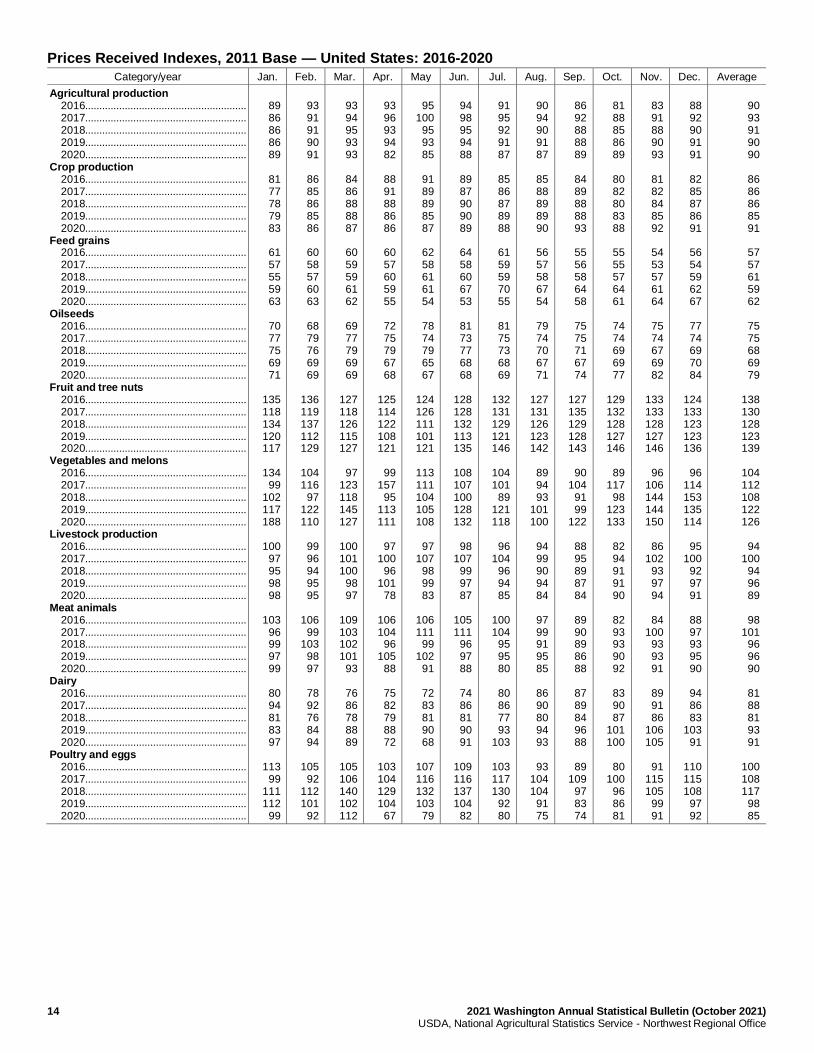
Prices Received Indexes, 2011 Base — United States: 2016-2020
Category/year Jan. Feb. Mar. Apr. May Jun. Jul. Aug. Sep. Oct. Nov. Dec. Average
Agricultural production 2016......................................................... 2017......................................................... 2018......................................................... 2019......................................................... 2020......................................................... Crop production 2016......................................................... 2017......................................................... 2018......................................................... 2019......................................................... 2020......................................................... Feed grains 2016......................................................... 2017......................................................... 2018......................................................... 2019......................................................... 2020......................................................... Oilseeds 2016......................................................... 2017......................................................... 2018......................................................... 2019......................................................... 2020......................................................... Fruit and tree nuts 2016......................................................... 2017......................................................... 2018......................................................... 2019......................................................... 2020......................................................... Vegetables and melons 2016......................................................... 2017......................................................... 2018......................................................... 2019......................................................... 2020......................................................... Livestock production 2016......................................................... 2017......................................................... 2018......................................................... 2019......................................................... 2020......................................................... Meat animals 2016......................................................... 2017......................................................... 2018......................................................... 2019......................................................... 2020......................................................... Dairy 2016......................................................... 2017......................................................... 2018......................................................... 2019......................................................... 2020......................................................... Poultry and eggs 2016......................................................... 2017......................................................... 2018......................................................... 2019......................................................... 2020.........................................................
89 86 86 86 89
81 77 78 79 83
61 57 55 59 63
70 77 75 69 71
135 118 134 120 117
134
99 102 117 188
100
97 95 98 98
103
96 99 97 99
80 94 81 83 97
113
99 111 112
99
93 91 91 90 91
86 85 86 85 86
60 58 57 60 63
68 79 76 69 69
136 119 137 112 129
104 116
97 122 110
99 96 94 95 95
106
99 103
98 97
78 92 76 84 94
105
92 112 101
92
93 94 95 93 93
84 86 88 88 87
60 59 59 61 62
69 77 79 69 69
127 118 126 115 127
97
123 118 145 127
100 101 100
98 97
109 103 102 101
93
76 86 78 88 89
105 106 140 102 112
93 96 93 94 82
88 91 88 86 86
60 57 60 59 55
72 75 79 67 68
125 114 122 108 121
99
157 95
113 111
97
100 96
101 78
106 104
96 105
88
75 82 79 88 72
103 104 129 104
67
95
100 95 93 85
91 89 89 85 87
62 58 61 61 54
78 74 79 65 67
124 126 111 101 121
113 111 104 105 108
97
107 98 99 83
106 111
99 102
91
72 83 81 90 68
107 116 132 103
79
94 98 95 94 88
89 87 90 90 89
64 58 60 67 53
81 73 77 68 68
128 128 132 113 135
108 107 100 128 132
98
107 99 97 87
105 111
96 97 88
74 86 81 90 91
109 116 137 104
82
91 95 92 91 87
85 86 87 89 88
61 59 59 70 55
81 75 73 68 69
132 131 129 121 146
104 101
89 121 118
96
104 96 94 85
100 104
95 95 80
80 86 77 93
103
103 117 130
92 80
90 94 90 91 87
85 88 89 89 90
56 57 58 67 54
79 74 70 67 71
127 131 126 123 142
89 94 93
101 100
94 99 90 94 84
97 99 91 95 85
86 90 80 94 93
93
104 104
91 75
86 92 88 88 89
84 89 88 88 93
55 56 58 64 58
75 75 71 67 74
127 135 129 128 143
90
104 91 99
122
88 95 89 87 84
89 90 89 86 88
87 89 84 96 88
89
109 97 83 74
81 88 85 86 89
80 82 80 83 88
55 55 57 64 61
74 74 69 69 77
129 132 128 127 146
89
117 98
123 133
82 94 91 91 90
82 93 93 90 92
83 90 87
101 100
80
100 96 86 81
83 91 88 90 93
81 82 84 85 92
54 53 57 61 64
75 74 67 69 82
133 133 128 127 146
96
106 144 144 150
86
102 93 97 94
84
100 93 93 91
89 91 86
106 105
91
115 105
99 91
88 92 90 91 91
82 85 87 86 91
56 54 59 62 67
77 74 69 70 84
124 133 123 123 136
96
114 153 135 114
95
100 92 97 91
88 97 93 95 90
94 86 83
103 91
110 115 108
97 92
90 93 91 90 90
86 86 86 85 91
57 57 61 59 62
75 75 68 69 79
138 130 128 123 139
104 112 108 122 126
94
100 94 96 89
98
101 96 96 90
81 88 81 93 91
100 108 117
98 85
2021 Washington Annual Statistical Bulletin (October 2021) 15 USDA, National Agricultural Statistics Service - Northwest Regional Office
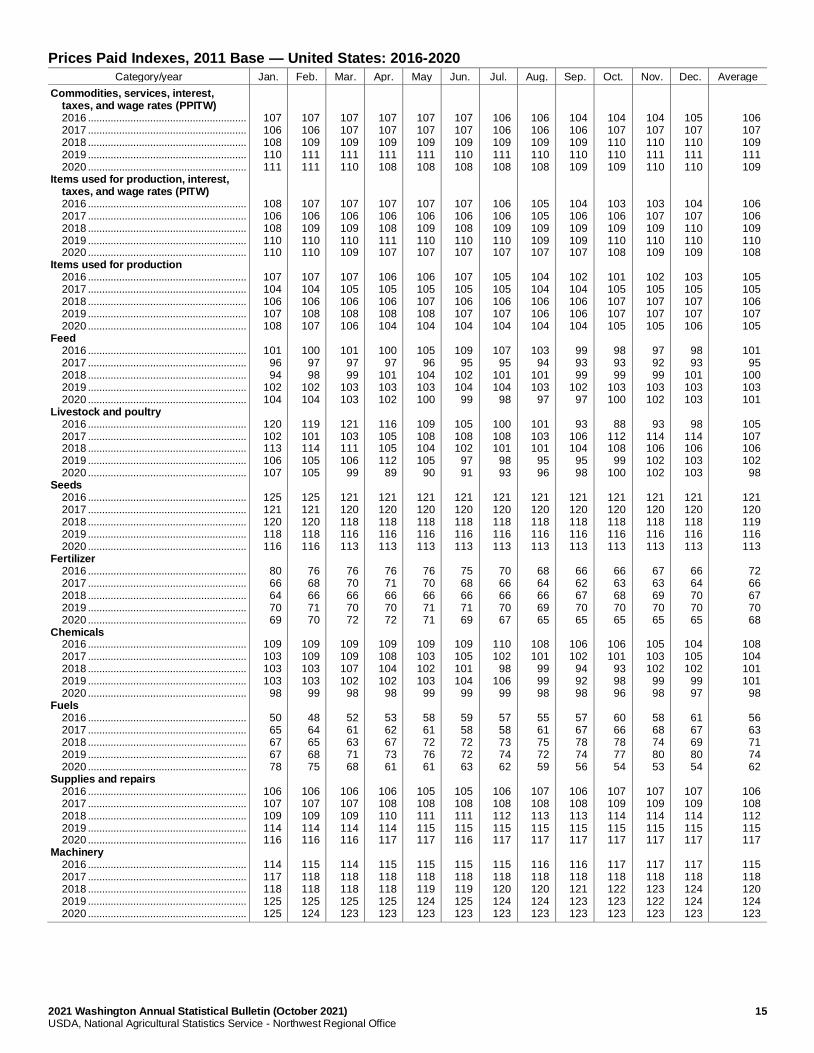
Prices Paid Indexes, 2011 Base — United States: 2016-2020
Category/year Jan. Feb. Mar. Apr. May Jun. Jul. Aug. Sep. Oct. Nov. Dec. Average
Commodities, services, interest, taxes, and wage rates (PPITW) 2016 ........................................................ 2017 ........................................................ 2018 ........................................................ 2019 ........................................................ 2020 ........................................................ Items used for production, interest, taxes, and wage rates (PITW) 2016 ........................................................ 2017 ........................................................ 2018 ........................................................ 2019 ........................................................ 2020 ........................................................ Items used for production 2016 ........................................................ 2017 ........................................................ 2018 ........................................................ 2019 ........................................................ 2020 ........................................................ Feed 2016 ........................................................ 2017 ........................................................ 2018 ........................................................ 2019 ........................................................ 2020 ........................................................ Livestock and poultry 2016 ........................................................ 2017 ........................................................ 2018 ........................................................ 2019 ........................................................ 2020 ........................................................ Seeds 2016 ........................................................ 2017 ........................................................ 2018 ........................................................ 2019 ........................................................ 2020 ........................................................ Fertilizer 2016 ........................................................ 2017 ........................................................ 2018 ........................................................ 2019 ........................................................ 2020 ........................................................ Chemicals 2016 ........................................................ 2017 ........................................................ 2018 ........................................................ 2019 ........................................................ 2020 ........................................................ Fuels 2016 ........................................................ 2017 ........................................................ 2018 ........................................................ 2019 ........................................................ 2020 ........................................................ Supplies and repairs 2016 ........................................................ 2017 ........................................................ 2018 ........................................................ 2019 ........................................................ 2020 ........................................................ Machinery 2016 ........................................................ 2017 ........................................................ 2018 ........................................................ 2019 ........................................................ 2020 ........................................................
107 106 108 110 111
108 106 108 110 110
107 104 106 107 108
101
96 94
102 104
120 102 113 106 107
125 121 120 118 116
80 66 64 70 69
109 103 103 103
98
50 65 67 67 78
106 107 109 114 116
114 117 118 125 125
107 106 109 111 111
107 106 109 110 110
107 104 106 108 107
100
97 98
102 104
119 101 114 105 105
125 121 120 118 116
76 68 66 71 70
109 109 103 103
99
48 64 65 68 75
106 107 109 114 116
115 118 118 125 124
107 107 109 111 110
107 106 109 110 109
107 105 106 108 106
101
97 99
103 103
121 103 111 106
99
121 120 118 116 113
76 70 66 70 72
109 109 107 102
98
52 61 63 71 68
106 107 109 114 116
114 118 118 125 123
107 107 109 111 108
107 106 108 111 107
106 105 106 108 104
100
97 101 103 102
116 105 105 112
89
121 120 118 116 113
76 71 66 70 72
109 108 104 102
98
53 62 67 73 61
106 108 110 114 117
115 118 118 125 123
107 107 109 111 108
107 106 109 110 107
106 105 107 108 104
105
96 104 103 100
109 108 104 105
90
121 120 118 116 113
76 70 66 71 71
109 103 102 103
99
58 61 72 76 61
105 108 111 115 117
115 118 119 124 123
107 107 109 110 108
107 106 108 110 107
107 105 106 107 104
109
95 102 104
99
105 108 102
97 91
121 120 118 116 113
75 68 66 71 69
109 105 101 104
99
59 58 72 72 63
105 108 111 115 116
115 118 119 125 123
106 106 109 111 108
106 106 109 110 107
105 105 106 107 104
107
95 101 104
98
100 108 101
98 93
121 120 118 116 113
70 66 66 70 67
110 102
98 106
99
57 58 73 74 62
106 108 112 115 117
115 118 120 124 123
106 106 109 110 108
105 105 109 109 107
104 104 106 106 104
103
94 101 103
97
101 103 101
95 96
121 120 118 116 113
68 64 66 69 65
108 101
99 99 98
55 61 75 72 59
107 108 113 115 117
116 118 120 124 123
104 106 109 110 109
104 106 109 109 107
102 104 106 106 104
99 93 99
102 97
93
106 104
95 98
121 120 118 116 113
66 62 67 70 65
106 102
94 92 98
57 67 78 74 56
106 108 113 115 117
116 118 121 123 123
104 107 110 110 109
103 106 109 110 108
101 105 107 107 105
98 93 99
103 100
88
112 108
99 100
121 120 118 116 113
66 63 68 70 65
106 101
93 98 96
60 66 78 77 54
107 109 114 115 117
117 118 122 123 123
104 107 110 111 110
103 107 109 110 109
102 105 107 107 105
97 92 99
103 102
93
114 106 102 102
121 120 118 116 113
67 63 69 70 65
105 103 102
99 98
58 68 74 80 53
107 109 114 115 117
117 118 123 122 123
105 107 110 111 110
104 107 110 110 109
103 105 107 107 106
98 93
101 103 103
98
114 106 103 103
121 120 118 116 113
66 64 70 70 65
104 105 102
99 97
61 67 69 80 54
107 109 114 115 117
117 118 124 124 123
106 107 109 111 109
106 106 109 110 108
105 105 106 107 105
101
95 100 103 101
105 107 106 102
98
121 120 119 116 113
72 66 67 70 68
108 104 101 101
98
56 63 71 74 62
106 108 112 115 117
115 118 120 124 123
16 2021 Washington Annual Statistical Bulletin (October 2021) USDA, National Agricultural Statistics Service - Northwest Regional Office
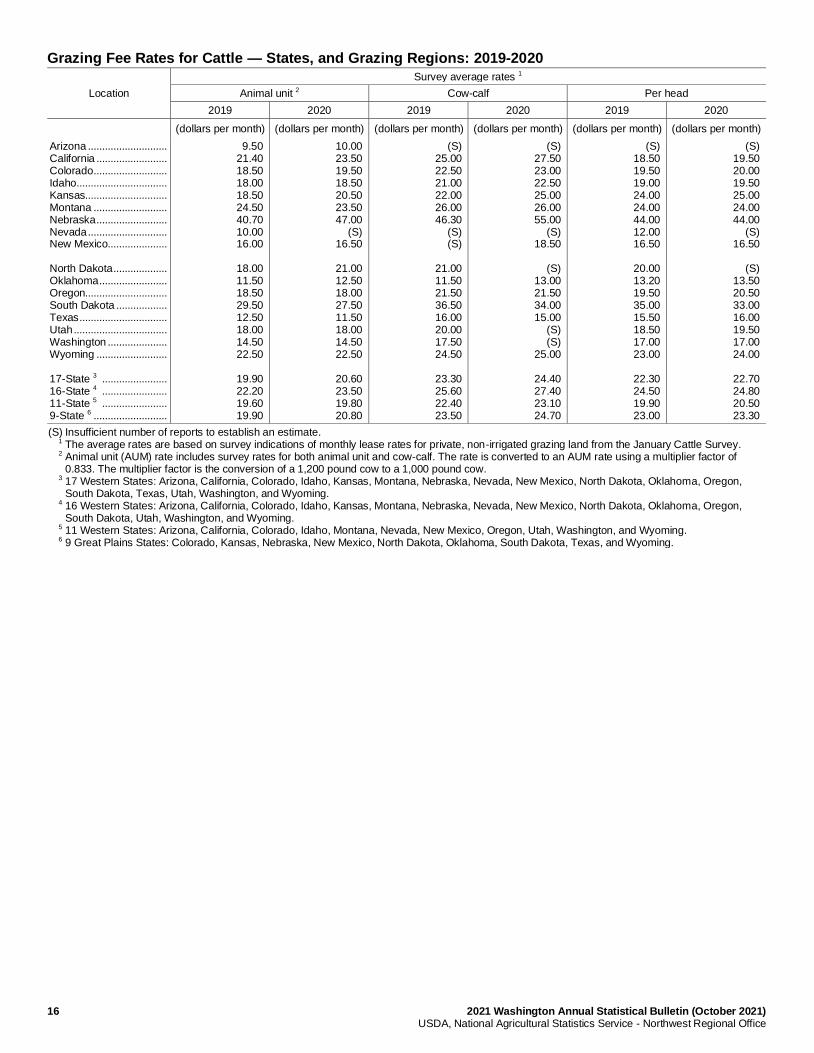
Grazing Fee Rates for Cattle — States, and Grazing Regions: 2019-2020
Location
Survey average rates 1
Animal unit 2 Cow-calf Per head
2019 2020 2019 2020 2019 2020
(dollars per month) (dollars per month) (dollars per month) (dollars per month) (dollars per month) (dollars per month)
Arizona ............................ California ......................... Colorado .......................... Idaho ................................ Kansas............................. Montana .......................... Nebraska ......................... Nevada ............................ New Mexico..................... North Dakota ................... Oklahoma ........................ Oregon............................. South Dakota .................. Texas ............................... Utah ................................. Washington ..................... Wyoming ......................... 17-State 3 ....................... 16-State 4 ....................... 11-State 5 ....................... 9-State 6 ..........................
9.50 21.40 18.50 18.00 18.50 24.50 40.70 10.00 16.00
18.00 11.50 18.50 29.50 12.50 18.00 14.50 22.50
19.90 22.20 19.60 19.90
10.00 23.50 19.50 18.50 20.50 23.50 47.00
(S) 16.50
21.00 12.50 18.00 27.50 11.50 18.00 14.50 22.50
20.60 23.50 19.80 20.80
(S) 25.00 22.50 21.00 22.00 26.00 46.30
(S) (S)
21.00 11.50 21.50 36.50 16.00 20.00 17.50 24.50
23.30 25.60 22.40 23.50
(S) 27.50 23.00 22.50 25.00 26.00 55.00
(S) 18.50
(S)
13.00 21.50 34.00 15.00
(S) (S)
25.00
24.40 27.40 23.10 24.70
(S) 18.50 19.50 19.00 24.00 24.00 44.00 12.00 16.50
20.00 13.20 19.50 35.00 15.50 18.50 17.00 23.00
22.30 24.50 19.90 23.00
(S) 19.50 20.00 19.50 25.00 24.00 44.00
(S) 16.50
(S)
13.50 20.50 33.00 16.00 19.50 17.00 24.00
22.70 24.80 20.50 23.30
(S) Insufficient number of reports to establish an estimate. 1 The average rates are based on survey indications of monthly lease rates for private, non-irrigated grazing land from the January Cattle Survey. 2 Animal unit (AUM) rate includes survey rates for both animal unit and cow-calf. The rate is converted to an AUM rate using a multiplier factor of
0.833. The multiplier factor is the conversion of a 1,200 pound cow to a 1,000 pound cow. 3 17 Western States: Arizona, California, Colorado, Idaho, Kansas, Montana, Nebraska, Nevada, New Mexico, North Dakota, Oklahoma, Oregon,
South Dakota, Texas, Utah, Washington, and Wyoming. 4 16 Western States: Arizona, California, Colorado, Idaho, Kansas, Montana, Nebraska, Nevada, New Mexico, North Dakota, Oklahoma, Oregon,
South Dakota, Utah, Washington, and Wyoming. 5 11 Western States: Arizona, California, Colorado, Idaho, Montana, Nevada, New Mexico, Oregon, Utah, Washington, and Wyoming. 6 9 Great Plains States: Colorado, Kansas, Nebraska, New Mexico, North Dakota, Oklahoma, South Dakota, Texas, and Wyoming.
2021 Washington Annual Statistical Bulletin (October 2021) 17 USDA, National Agricultural Statistics Service - Northwest Regional Office
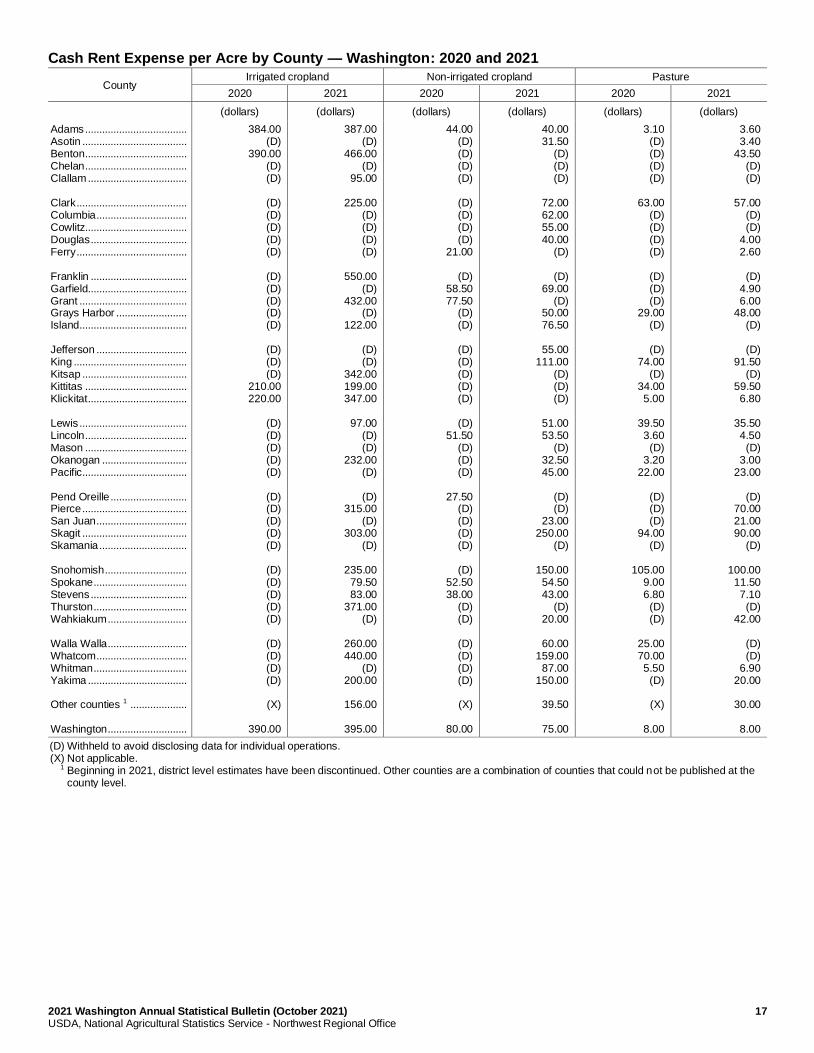
Cash Rent Expense per Acre by County — Washington: 2020 and 2021
County Irrigated cropland Non-irrigated cropland Pasture
2020 2021 2020 2021 2020 2021
(dollars) (dollars) (dollars) (dollars) (dollars) (dollars)
Adams .................................... Asotin ..................................... Benton .................................... Chelan .................................... Clallam ................................... Clark ....................................... Columbia ................................ Cowlitz.................................... Douglas .................................. Ferry ....................................... Franklin .................................. Garfield................................... Grant ...................................... Grays Harbor ......................... Island ...................................... Jefferson ................................ King ........................................ Kitsap ..................................... Kittitas .................................... Klickitat ................................... Lewis ...................................... Lincoln .................................... Mason .................................... Okanogan .............................. Pacific ..................................... Pend Oreille ........................... Pierce ..................................... San Juan ................................ Skagit ..................................... Skamania ............................... Snohomish ............................. Spokane ................................. Stevens .................................. Thurston ................................. Wahkiakum ............................ Walla Walla ............................ Whatcom ................................ Whitman ................................. Yakima ................................... Other counties 1 .................... Washington ............................
384.00 (D)
390.00 (D) (D)
(D) (D) (D) (D) (D)
(D) (D) (D) (D) (D)
(D) (D) (D)
210.00 220.00
(D) (D) (D) (D) (D)
(D) (D) (D) (D) (D)
(D) (D) (D) (D) (D)
(D) (D) (D) (D)
(X)
390.00
387.00 (D)
466.00 (D)
95.00
225.00 (D) (D) (D) (D)
550.00
(D) 432.00
(D) 122.00
(D) (D)
342.00 199.00 347.00
97.00
(D) (D)
232.00 (D)
(D)
315.00 (D)
303.00 (D)
235.00
79.50 83.00
371.00 (D)
260.00 440.00
(D) 200.00
156.00
395.00
44.00 (D) (D) (D) (D)
(D) (D) (D) (D)
21.00
(D) 58.50 77.50
(D) (D)
(D) (D) (D) (D) (D)
(D)
51.50 (D) (D) (D)
27.50
(D) (D) (D) (D)
(D)
52.50 38.00
(D) (D)
(D) (D) (D) (D)
(X)
80.00
40.00 31.50
(D) (D) (D)
72.00 62.00 55.00 40.00
(D)
(D) 69.00
(D) 50.00 76.50
55.00
111.00 (D) (D) (D)
51.00 53.50
(D) 32.50 45.00
(D) (D)
23.00 250.00
(D)
150.00 54.50 43.00
(D) 20.00
60.00
159.00 87.00
150.00
39.50
75.00
3.10 (D) (D) (D) (D)
63.00
(D) (D) (D) (D)
(D) (D) (D)
29.00 (D)
(D)
74.00 (D)
34.00 5.00
39.50 3.60
(D) 3.20
22.00
(D) (D) (D)
94.00 (D)
105.00
9.00 6.80
(D) (D)
25.00 70.00 5.50
(D)
(X)
8.00
3.60 3.40
43.50 (D) (D)
57.00
(D) (D)
4.00 2.60
(D)
4.90 6.00
48.00 (D)
(D)
91.50 (D)
59.50 6.80
35.50 4.50
(D) 3.00
23.00
(D) 70.00 21.00 90.00
(D)
100.00 11.50 7.10
(D) 42.00
(D) (D)
6.90 20.00
30.00
8.00
(D) Withheld to avoid disclosing data for individual operations. (X) Not applicable. 1 Beginning in 2021, district level estimates have been discontinued. Other counties are a combination of counties that could not be published at the
county level.
18 2021 Washington Annual Statistical Bulletin (October 2021) USDA, National Agricultural Statistics Service - Northwest Regional Office
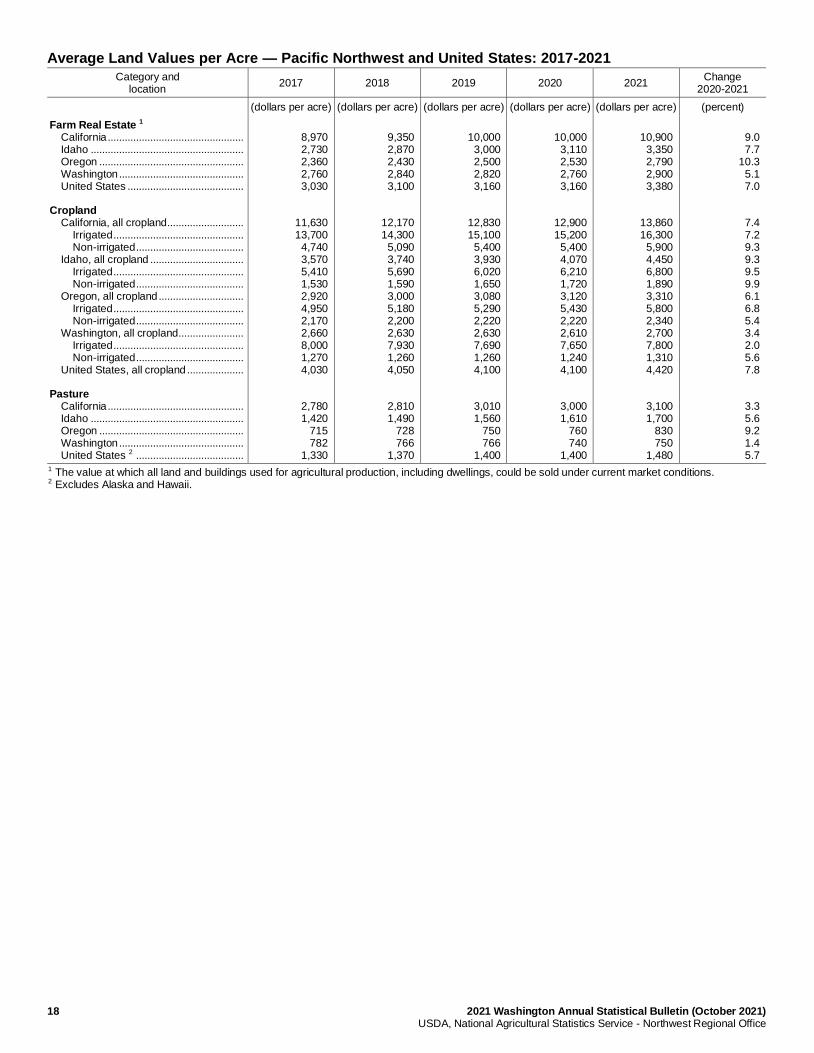
Average Land Values per Acre — Pacific Northwest and United States: 2017-2021
Category and location
2017 2018 2019 2020 2021 Change
2020-2021
(dollars per acre) (dollars per acre) (dollars per acre) (dollars per acre) (dollars per acre) (percent)
Farm Real Estate 1 California ................................................ Idaho ...................................................... Oregon ................................................... Washington ............................................ United States ......................................... Cropland California, all cropland ........................... Irrigated .............................................. Non-irrigated ...................................... Idaho, all cropland ................................. Irrigated .............................................. Non-irrigated ...................................... Oregon, all cropland .............................. Irrigated .............................................. Non-irrigated ...................................... Washington, all cropland ....................... Irrigated .............................................. Non-irrigated ...................................... United States, all cropland .................... Pasture California ................................................ Idaho ...................................................... Oregon ................................................... Washington ............................................ United States 2 ......................................
8,970 2,730 2,360 2,760 3,030
11,630 13,700
4,740 3,570 5,410 1,530 2,920 4,950 2,170 2,660 8,000 1,270 4,030
2,780 1,420
715 782
1,330
9,350 2,870 2,430 2,840 3,100
12,170 14,300
5,090 3,740 5,690 1,590 3,000 5,180 2,200 2,630 7,930 1,260 4,050
2,810 1,490
728 766
1,370
10,000
3,000 2,500 2,820 3,160
12,830 15,100
5,400 3,930 6,020 1,650 3,080 5,290 2,220 2,630 7,690 1,260 4,100
3,010 1,560
750 766
1,400
10,000
3,110 2,530 2,760 3,160
12,900 15,200
5,400 4,070 6,210 1,720 3,120 5,430 2,220 2,610 7,650 1,240 4,100
3,000 1,610
760 740
1,400
10,900
3,350 2,790 2,900 3,380
13,860 16,300
5,900 4,450 6,800 1,890 3,310 5,800 2,340 2,700 7,800 1,310 4,420
3,100 1,700
830 750
1,480
9.0 7.7
10.3 5.1 7.0
7.4 7.2 9.3 9.3 9.5 9.9 6.1 6.8 5.4 3.4 2.0 5.6 7.8
3.3 5.6 9.2 1.4 5.7
1 The value at which all land and buildings used for agricultural production, including dwellings, could be sold under current market conditions. 2 Excludes Alaska and Hawaii.
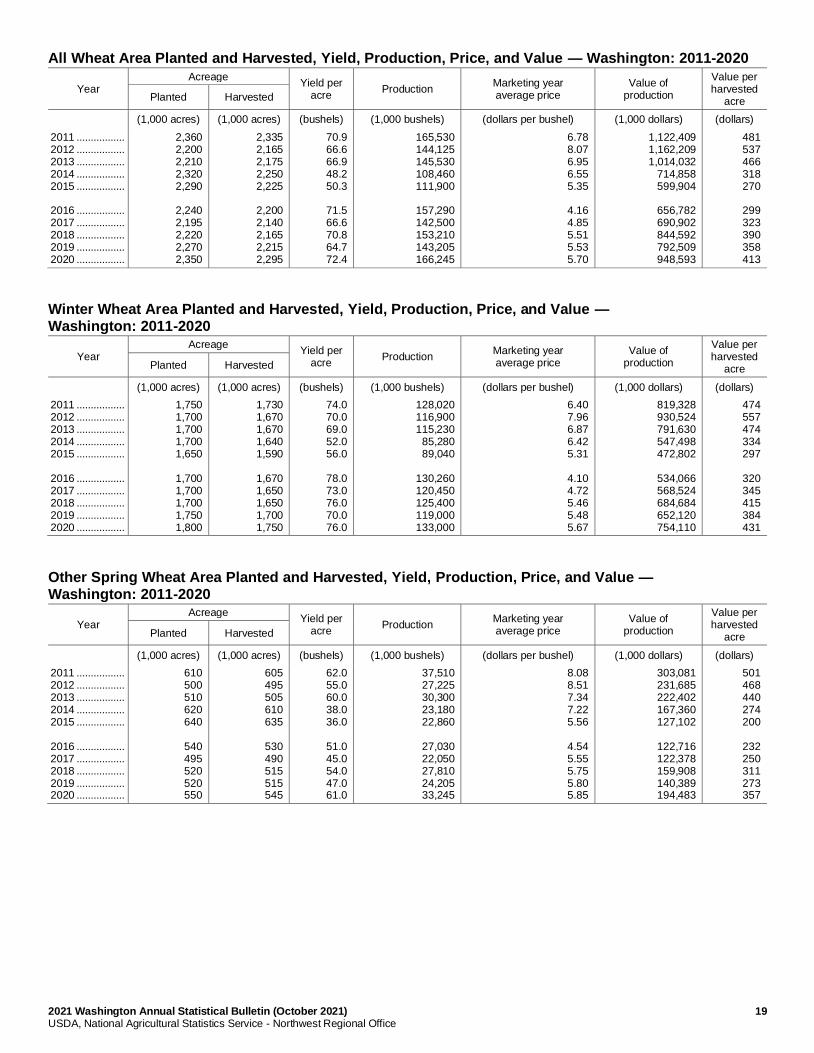
2021 Washington Annual Statistical Bulletin (October 2021) 19 USDA, National Agricultural Statistics Service - Northwest Regional Office
All Wheat Area Planted and Harvested, Yield, Production, Price, and Value — Washington: 2011-2020
Year Acreage
Yield per acre
Production Marketing year average price
Value of production
Value per harvested
acre Planted Harvested
(1,000 acres) (1,000 acres) (bushels) (1,000 bushels) (dollars per bushel) (1,000 dollars) (dollars)
2011 ................. 2012 ................. 2013 ................. 2014 ................. 2015 ................. 2016 ................. 2017 ................. 2018 ................. 2019 ................. 2020 .................
2,360 2,200 2,210 2,320 2,290
2,240 2,195 2,220 2,270 2,350
2,335 2,165 2,175 2,250 2,225
2,200 2,140 2,165 2,215 2,295
70.9 66.6 66.9 48.2 50.3
71.5 66.6 70.8 64.7 72.4
165,530 144,125 145,530 108,460 111,900
157,290 142,500 153,210 143,205 166,245
6.78 8.07 6.95 6.55 5.35
4.16 4.85 5.51 5.53 5.70
1,122,409 1,162,209 1,014,032
714,858 599,904
656,782 690,902 844,592 792,509 948,593
481 537 466 318 270
299 323 390 358 413
Winter Wheat Area Planted and Harvested, Yield, Production, Price, and Value — Washington: 2011-2020
Year Acreage
Yield per acre
Production Marketing year average price
Value of production
Value per harvested
acre Planted Harvested
(1,000 acres) (1,000 acres) (bushels) (1,000 bushels) (dollars per bushel) (1,000 dollars) (dollars)
2011 ................. 2012 ................. 2013 ................. 2014 ................. 2015 ................. 2016 ................. 2017 ................. 2018 ................. 2019 ................. 2020 .................
1,750 1,700 1,700 1,700 1,650
1,700 1,700 1,700 1,750 1,800
1,730 1,670 1,670 1,640 1,590
1,670 1,650 1,650 1,700 1,750
74.0 70.0 69.0 52.0 56.0
78.0 73.0 76.0 70.0 76.0
128,020 116,900 115,230
85,280 89,040
130,260 120,450 125,400 119,000 133,000
6.40 7.96 6.87 6.42 5.31
4.10 4.72 5.46 5.48 5.67
819,328 930,524 791,630 547,498 472,802
534,066 568,524 684,684 652,120 754,110
474 557 474 334 297
320 345 415 384 431
Other Spring Wheat Area Planted and Harvested, Yield, Production, Price, and Value — Washington: 2011-2020
Year Acreage
Yield per acre
Production Marketing year average price
Value of production
Value per harvested
acre Planted Harvested
(1,000 acres) (1,000 acres) (bushels) (1,000 bushels) (dollars per bushel) (1,000 dollars) (dollars)
2011 ................. 2012 ................. 2013 ................. 2014 ................. 2015 ................. 2016 ................. 2017 ................. 2018 ................. 2019 ................. 2020 .................
610 500 510 620 640
540 495 520 520 550
605 495 505 610 635
530 490 515 515 545
62.0 55.0 60.0 38.0 36.0
51.0 45.0 54.0 47.0 61.0
37,510 27,225 30,300 23,180 22,860
27,030 22,050 27,810 24,205 33,245
8.08 8.51 7.34 7.22 5.56
4.54 5.55 5.75 5.80 5.85
303,081 231,685 222,402 167,360 127,102
122,716 122,378 159,908 140,389 194,483
501 468 440 274 200
232 250 311 273 357
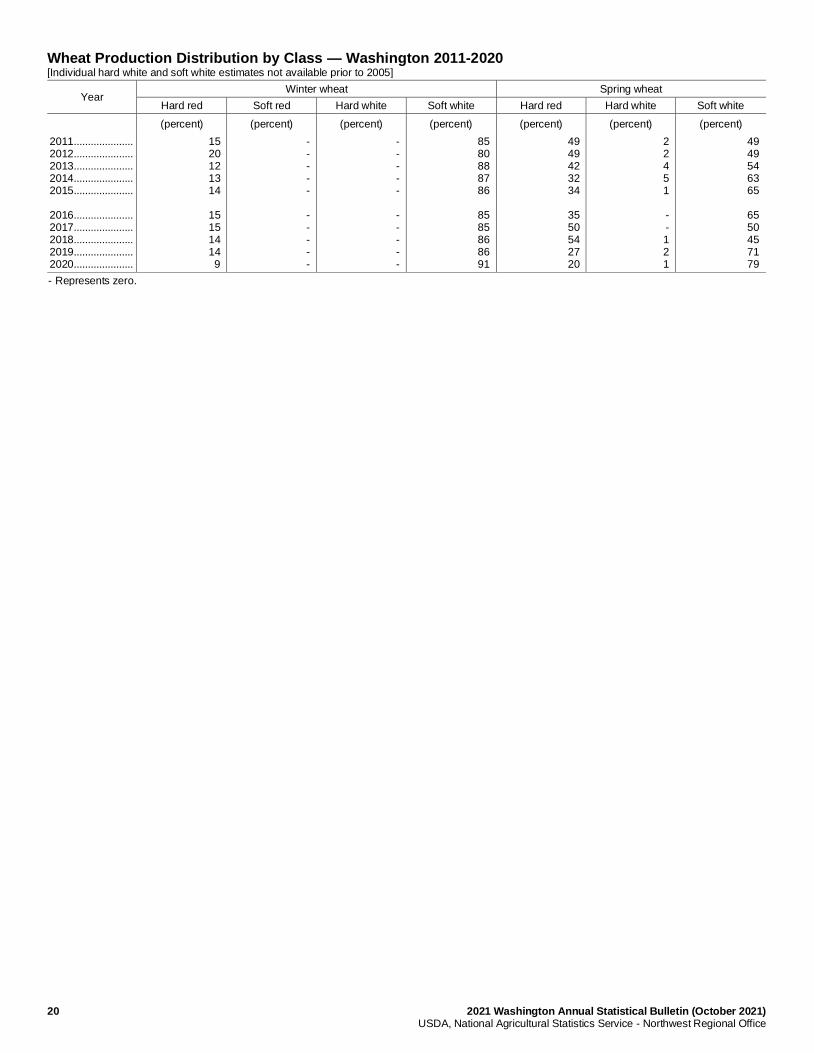
20 2021 Washington Annual Statistical Bulletin (October 2021) USDA, National Agricultural Statistics Service - Northwest Regional Office
Wheat Production Distribution by Class — Washington 2011-2020 [Individual hard white and soft white estimates not available prior to 2005]
Year Winter wheat Spring wheat
Hard red Soft red Hard white Soft white Hard red Hard white Soft white
(percent) (percent) (percent) (percent) (percent) (percent) (percent)
2011 ..................... 2012 ..................... 2013 ..................... 2014 ..................... 2015 ..................... 2016 ..................... 2017 ..................... 2018 ..................... 2019 ..................... 2020 .....................
15 20 12 13 14
15 15 14 14 9
- - - - -
- - - - -
- - - - -
- - - - -
85 80 88 87 86
85 85 86 86 91
49 49 42 32 34
35 50 54 27 20
2 2 4 5 1
- - 1 2 1
49 49 54 63 65
65 50 45 71 79
- Represents zero.
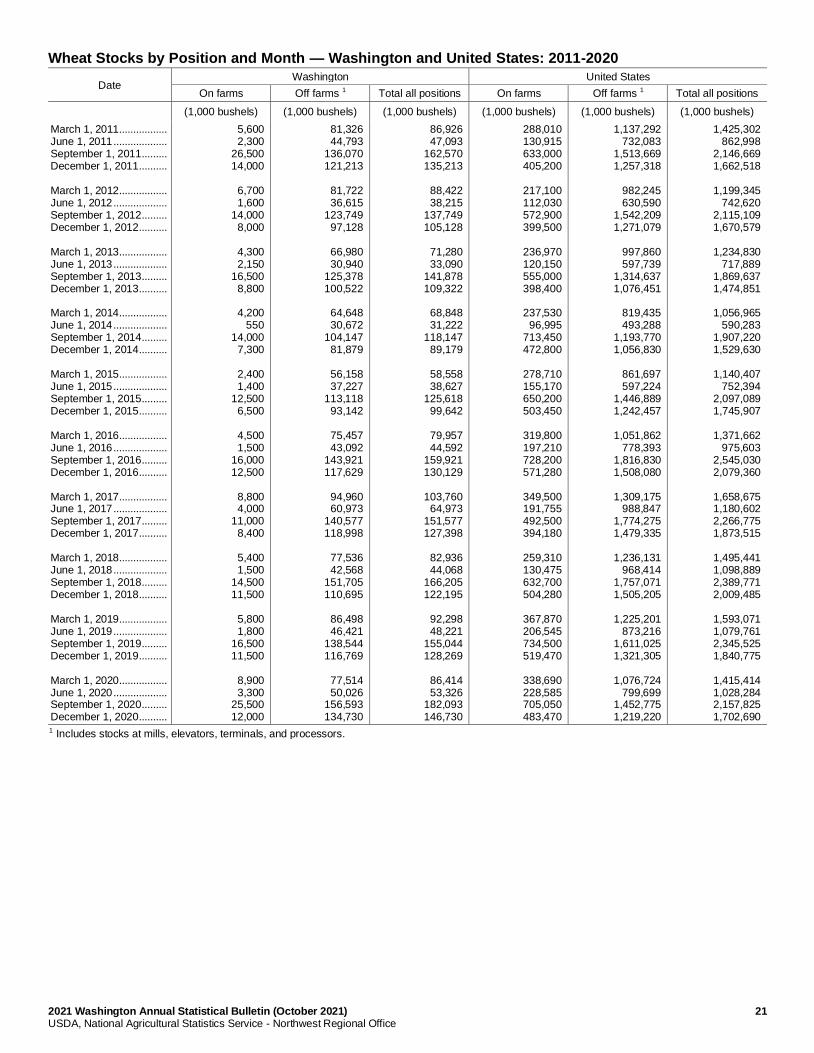
2021 Washington Annual Statistical Bulletin (October 2021) 21 USDA, National Agricultural Statistics Service - Northwest Regional Office
Wheat Stocks by Position and Month — Washington and United States: 2011-2020
Date Washington United States
On farms Off farms 1 Total all positions On farms Off farms 1 Total all positions
(1,000 bushels) (1,000 bushels) (1,000 bushels) (1,000 bushels) (1,000 bushels) (1,000 bushels)
March 1, 2011 ................. June 1, 2011 ................... September 1, 2011 ......... December 1, 2011 .......... March 1, 2012 ................. June 1, 2012 ................... September 1, 2012 ......... December 1, 2012 .......... March 1, 2013 ................. June 1, 2013 ................... September 1, 2013 ......... December 1, 2013 .......... March 1, 2014 ................. June 1, 2014 ................... September 1, 2014 ......... December 1, 2014 .......... March 1, 2015 ................. June 1, 2015 ................... September 1, 2015 ......... December 1, 2015 .......... March 1, 2016 ................. June 1, 2016 ................... September 1, 2016 ......... December 1, 2016 .......... March 1, 2017 ................. June 1, 2017 ................... September 1, 2017 ......... December 1, 2017 .......... March 1, 2018 ................. June 1, 2018 ................... September 1, 2018 ......... December 1, 2018 .......... March 1, 2019 ................. June 1, 2019 ................... September 1, 2019 ......... December 1, 2019 .......... March 1, 2020 ................. June 1, 2020 ................... September 1, 2020 ......... December 1, 2020 ..........
5,600 2,300
26,500 14,000
6,700 1,600
14,000 8,000
4,300 2,150
16,500 8,800
4,200
550 14,000
7,300
2,400 1,400
12,500 6,500
4,500 1,500
16,000 12,500
8,800 4,000
11,000 8,400
5,400 1,500
14,500 11,500
5,800 1,800
16,500 11,500
8,900 3,300
25,500 12,000
81,326 44,793
136,070 121,213
81,722 36,615
123,749 97,128
66,980 30,940
125,378 100,522
64,648 30,672
104,147 81,879
56,158 37,227
113,118 93,142
75,457 43,092
143,921 117,629
94,960 60,973
140,577 118,998
77,536 42,568
151,705 110,695
86,498 46,421
138,544 116,769
77,514 50,026
156,593 134,730
86,926 47,093
162,570 135,213
88,422 38,215
137,749 105,128
71,280 33,090
141,878 109,322
68,848 31,222
118,147 89,179
58,558 38,627
125,618 99,642
79,957 44,592
159,921 130,129
103,760
64,973 151,577 127,398
82,936 44,068
166,205 122,195
92,298 48,221
155,044 128,269
86,414 53,326
182,093 146,730
288,010 130,915 633,000 405,200
217,100 112,030 572,900 399,500
236,970 120,150 555,000 398,400
237,530
96,995 713,450 472,800
278,710 155,170 650,200 503,450
319,800 197,210 728,200 571,280
349,500 191,755 492,500 394,180
259,310 130,475 632,700 504,280
367,870 206,545 734,500 519,470
338,690 228,585 705,050 483,470
1,137,292 732,083
1,513,669 1,257,318
982,245 630,590
1,542,209 1,271,079
997,860 597,739
1,314,637 1,076,451
819,435 493,288
1,193,770 1,056,830
861,697 597,224
1,446,889 1,242,457
1,051,862
778,393 1,816,830 1,508,080
1,309,175
988,847 1,774,275 1,479,335
1,236,131
968,414 1,757,071 1,505,205
1,225,201
873,216 1,611,025 1,321,305
1,076,724
799,699 1,452,775 1,219,220
1,425,302 862,998
2,146,669 1,662,518
1,199,345
742,620 2,115,109 1,670,579
1,234,830
717,889 1,869,637 1,474,851
1,056,965
590,283 1,907,220 1,529,630
1,140,407
752,394 2,097,089 1,745,907
1,371,662
975,603 2,545,030 2,079,360
1,658,675 1,180,602 2,266,775 1,873,515
1,495,441 1,098,889 2,389,771 2,009,485
1,593,071 1,079,761 2,345,525 1,840,775
1,415,414 1,028,284 2,157,825 1,702,690
1 Includes stocks at mills, elevators, terminals, and processors.
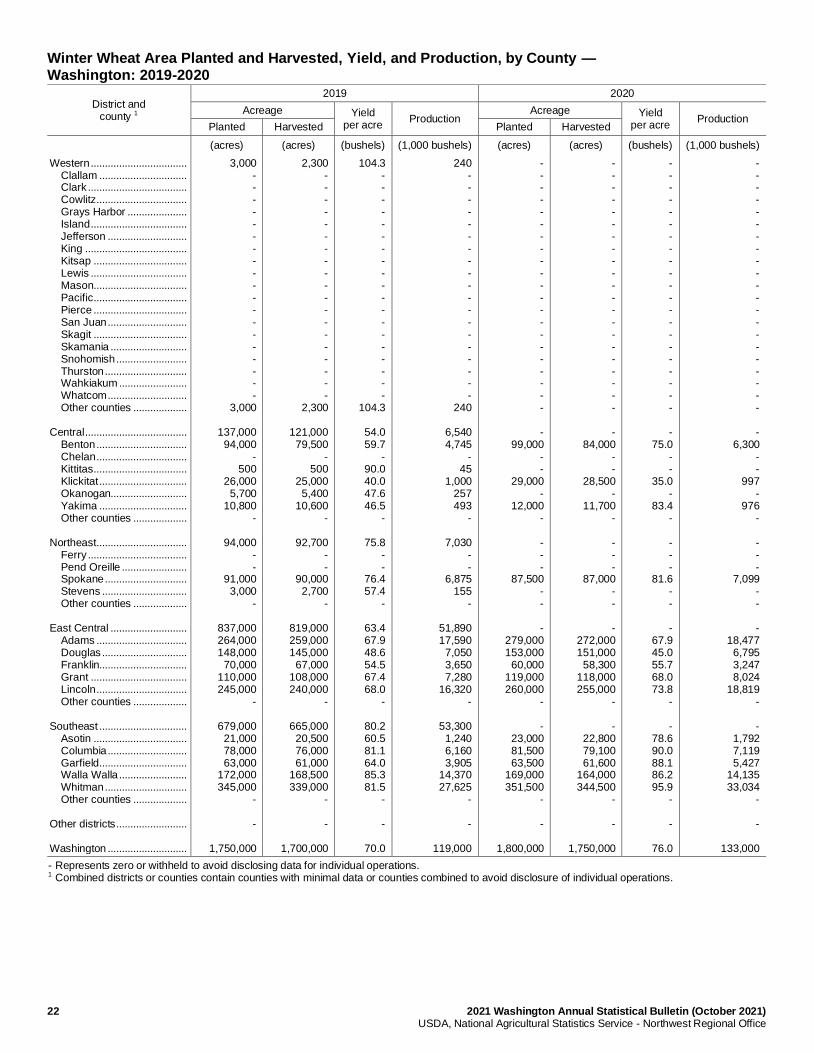
22 2021 Washington Annual Statistical Bulletin (October 2021) USDA, National Agricultural Statistics Service - Northwest Regional Office
Winter Wheat Area Planted and Harvested, Yield, and Production, by County — Washington: 2019-2020
District and county 1
2019 2020
Acreage Yield per acre
Production Acreage Yield
per acre Production
Planted Harvested Planted Harvested
(acres) (acres) (bushels) (1,000 bushels) (acres) (acres) (bushels) (1,000 bushels)
Western .................................. Clallam ............................... Clark ................................... Cowlitz ................................ Grays Harbor ..................... Island .................................. Jefferson ............................ King .................................... Kitsap ................................. Lewis .................................. Mason................................. Pacific ................................. Pierce ................................. San Juan ............................ Skagit ................................. Skamania ........................... Snohomish ......................... Thurston ............................. Wahkiakum ........................ Whatcom ............................ Other counties ................... Central .................................... Benton ................................ Chelan ................................ Kittitas................................. Klickitat ............................... Okanogan........................... Yakima ............................... Other counties ................... Northeast ................................ Ferry ................................... Pend Oreille ....................... Spokane ............................. Stevens .............................. Other counties ................... East Central ........................... Adams ................................ Douglas .............................. Franklin............................... Grant .................................. Lincoln ................................ Other counties ................... Southeast ............................... Asotin ................................. Columbia ............................ Garfield ............................... Walla Walla ........................ Whitman ............................. Other counties ................... Other districts ......................... Washington ............................
3,000 - - - - - - - - - - - - - - - - - - -
3,000
137,000 94,000
- 500
26,000 5,700
10,800 -
94,000 - -
91,000 3,000
-
837,000 264,000 148,000
70,000 110,000 245,000
-
679,000 21,000 78,000 63,000
172,000 345,000
-
-
1,750,000
2,300 - - - - - - - - - - - - - - - - - - -
2,300
121,000 79,500
- 500
25,000 5,400
10,600 -
92,700 - -
90,000 2,700
-
819,000 259,000 145,000
67,000 108,000 240,000
-
665,000 20,500 76,000 61,000
168,500 339,000
-
-
1,700,000
104.3 - - - - - - - - - - - - - - - - - - -
104.3
54.0 59.7
- 90.0 40.0 47.6 46.5
-
75.8 - -
76.4 57.4
-
63.4 67.9 48.6 54.5 67.4 68.0
-
80.2 60.5 81.1 64.0 85.3 81.5
-
-
70.0
240 - - - - - - - - - - - - - - - - - - -
240
6,540 4,745
- 45
1,000 257 493
-
7,030 - -
6,875 155
-
51,890 17,590
7,050 3,650 7,280
16,320 -
53,300 1,240 6,160 3,905
14,370 27,625
-
-
119,000
- - - - - - - - - - - - - - - - - - - - -
- 99,000
- -
29,000 -
12,000 -
- - -
87,500 - -
- 279,000 153,000
60,000 119,000 260,000
-
- 23,000 81,500 63,500
169,000 351,500
-
-
1,800,000
- - - - - - - - - - - - - - - - - - - - -
- 84,000
- -
28,500 -
11,700 -
- - -
87,000 - -
- 272,000 151,000
58,300 118,000 255,000
-
- 22,800 79,100 61,600
164,000 344,500
-
-
1,750,000
- - - - - - - - - - - - - - - - - - - - -
- 75.0
- -
35.0 -
83.4 -
- - -
81.6 - -
- 67.9 45.0 55.7 68.0 73.8
-
- 78.6 90.0 88.1 86.2 95.9
-
-
76.0
- - - - - - - - - - - - - - - - - - - - -
- 6,300
- -
997 -
976 -
- - -
7,099 - -
- 18,477
6,795 3,247 8,024
18,819 -
- 1,792 7,119 5,427
14,135 33,034
-
-
133,000
- Represents zero or withheld to avoid disclosing data for individual operations. 1 Combined districts or counties contain counties with minimal data or counties combined to avoid disclosure of individual operations.
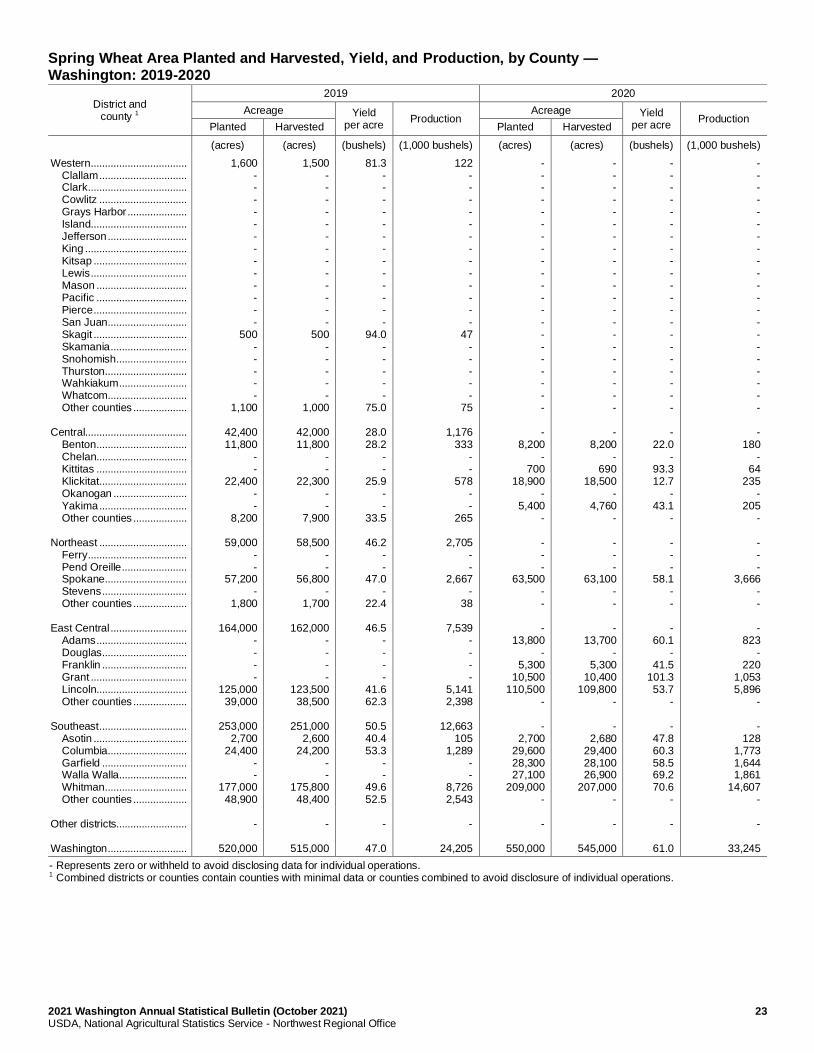
2021 Washington Annual Statistical Bulletin (October 2021) 23 USDA, National Agricultural Statistics Service - Northwest Regional Office
Spring Wheat Area Planted and Harvested, Yield, and Production, by County — Washington: 2019-2020
District and county 1
2019 2020
Acreage Yield per acre
Production Acreage Yield
per acre Production
Planted Harvested Planted Harvested
(acres) (acres) (bushels) (1,000 bushels) (acres) (acres) (bushels) (1,000 bushels)
Western .................................. Clallam ............................... Clark ................................... Cowlitz ............................... Grays Harbor ..................... Island.................................. Jefferson ............................ King .................................... Kitsap ................................. Lewis .................................. Mason ................................ Pacific ................................ Pierce ................................. San Juan ............................ Skagit ................................. Skamania ........................... Snohomish ......................... Thurston ............................. Wahkiakum ........................ Whatcom ............................ Other counties ................... Central.................................... Benton................................ Chelan................................ Kittitas ................................ Klickitat............................... Okanogan .......................... Yakima ............................... Other counties ................... Northeast ............................... Ferry ................................... Pend Oreille ....................... Spokane ............................. Stevens .............................. Other counties ................... East Central ........................... Adams ................................ Douglas .............................. Franklin .............................. Grant .................................. Lincoln................................ Other counties ................... Southeast ............................... Asotin ................................. Columbia ............................ Garfield .............................. Walla Walla ........................ Whitman ............................. Other counties ................... Other districts......................... Washington ............................
1,600 - - - - - - - - - - - - -
500 - - - - -
1,100
42,400 11,800
- -
22,400 - -
8,200
59,000 - -
57,200 -
1,800
164,000 - - - -
125,000 39,000
253,000
2,700 24,400
- -
177,000 48,900
-
520,000
1,500 - - - - - - - - - - - - -
500 - - - - -
1,000
42,000 11,800
- -
22,300 - -
7,900
58,500 - -
56,800 -
1,700
162,000 - - - -
123,500 38,500
251,000
2,600 24,200
- -
175,800 48,400
-
515,000
81.3 - - - - - - - - - - - - -
94.0 - - - - -
75.0
28.0 28.2
- -
25.9 - -
33.5
46.2 - -
47.0 -
22.4
46.5 - - - -
41.6 62.3
50.5 40.4 53.3
- -
49.6 52.5
-
47.0
122 - - - - - - - - - - - - -
47 - - - - -
75
1,176 333
- -
578 - -
265
2,705 - -
2,667 -
38
7,539 - - - -
5,141 2,398
12,663
105 1,289
- -
8,726 2,543
-
24,205
- - - - - - - - - - - - - - - - - - - - -
- 8,200
- 700
18,900 -
5,400 -
- - -
63,500 - -
- 13,800
- 5,300
10,500 110,500
-
- 2,700
29,600 28,300 27,100
209,000 -
-
550,000
- - - - - - - - - - - - - - - - - - - - -
- 8,200
- 690
18,500 -
4,760 -
- - -
63,100 - -
- 13,700
- 5,300
10,400 109,800
-
- 2,680
29,400 28,100 26,900
207,000 -
-
545,000
- - - - - - - - - - - - - - - - - - - - -
- 22.0
- 93.3 12.7
- 43.1
-
- - -
58.1 - -
- 60.1
- 41.5
101.3 53.7
-
- 47.8 60.3 58.5 69.2 70.6
-
-
61.0
- - - - - - - - - - - - - - - - - - - - -
- 180
- 64
235 -
205 -
- - -
3,666 - -
- 823
- 220
1,053 5,896
-
- 128
1,773 1,644 1,861
14,607 -
-
33,245
- Represents zero or withheld to avoid disclosing data for individual operations. 1 Combined districts or counties contain counties with minimal data or counties combined to avoid disclosure of individual operations.
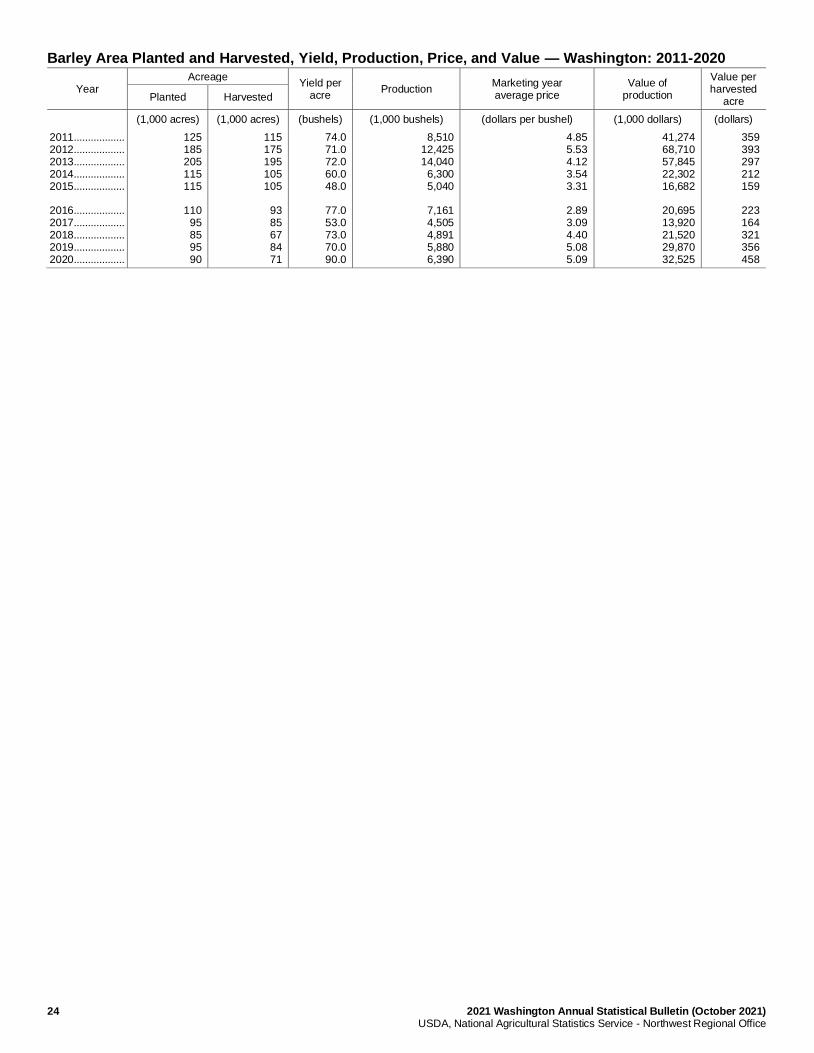
24 2021 Washington Annual Statistical Bulletin (October 2021) USDA, National Agricultural Statistics Service - Northwest Regional Office
Barley Area Planted and Harvested, Yield, Production, Price, and Value — Washington: 2011-2020
Year Acreage
Yield per acre
Production Marketing year average price
Value of production
Value per harvested
acre Planted Harvested
(1,000 acres) (1,000 acres) (bushels) (1,000 bushels) (dollars per bushel) (1,000 dollars) (dollars)
2011 .................. 2012 .................. 2013 .................. 2014 .................. 2015 .................. 2016 .................. 2017 .................. 2018 .................. 2019 .................. 2020 ..................
125 185 205 115 115
110
95 85 95 90
115 175 195 105 105
93 85 67 84 71
74.0 71.0 72.0 60.0 48.0
77.0 53.0 73.0 70.0 90.0
8,510 12,425 14,040
6,300 5,040
7,161 4,505 4,891 5,880 6,390
4.85 5.53 4.12 3.54 3.31
2.89 3.09 4.40 5.08 5.09
41,274 68,710 57,845 22,302 16,682
20,695 13,920 21,520 29,870 32,525
359 393 297 212 159
223 164 321 356 458
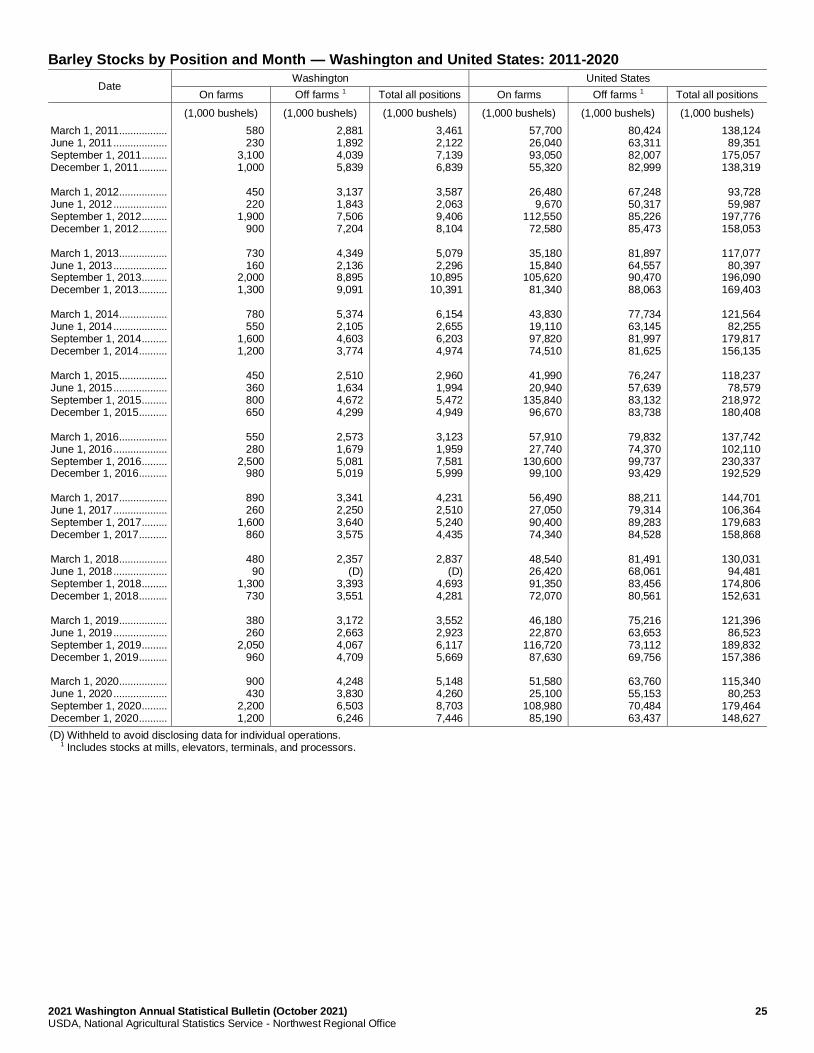
2021 Washington Annual Statistical Bulletin (October 2021) 25 USDA, National Agricultural Statistics Service - Northwest Regional Office
Barley Stocks by Position and Month — Washington and United States: 2011-2020
Date Washington United States
On farms Off farms 1 Total all positions On farms Off farms 1 Total all positions
(1,000 bushels) (1,000 bushels) (1,000 bushels) (1,000 bushels) (1,000 bushels) (1,000 bushels)
March 1, 2011 ................. June 1, 2011 ................... September 1, 2011 ......... December 1, 2011 .......... March 1, 2012 ................. June 1, 2012 ................... September 1, 2012 ......... December 1, 2012 .......... March 1, 2013 ................. June 1, 2013 ................... September 1, 2013 ......... December 1, 2013 .......... March 1, 2014 ................. June 1, 2014 ................... September 1, 2014 ......... December 1, 2014 .......... March 1, 2015 ................. June 1, 2015 ................... September 1, 2015 ......... December 1, 2015 .......... March 1, 2016 ................. June 1, 2016 ................... September 1, 2016 ......... December 1, 2016 .......... March 1, 2017 ................. June 1, 2017 ................... September 1, 2017 ......... December 1, 2017 .......... March 1, 2018 ................. June 1, 2018 ................... September 1, 2018 ......... December 1, 2018 .......... March 1, 2019 ................. June 1, 2019 ................... September 1, 2019 ......... December 1, 2019 .......... March 1, 2020 ................. June 1, 2020 ................... September 1, 2020 ......... December 1, 2020 ..........
580 230
3,100 1,000
450 220
1,900 900
730 160
2,000 1,300
780 550
1,600 1,200
450 360 800 650
550 280
2,500 980
890 260
1,600 860
480
90 1,300
730
380 260
2,050 960
900 430
2,200 1,200
2,881 1,892 4,039 5,839
3,137 1,843 7,506 7,204
4,349 2,136 8,895 9,091
5,374 2,105 4,603 3,774
2,510 1,634 4,672 4,299
2,573 1,679 5,081 5,019
3,341 2,250 3,640 3,575
2,357
(D) 3,393 3,551
3,172 2,663 4,067 4,709
4,248 3,830 6,503 6,246
3,461 2,122 7,139 6,839
3,587 2,063 9,406 8,104
5,079 2,296
10,895 10,391
6,154 2,655 6,203 4,974
2,960 1,994 5,472 4,949
3,123 1,959 7,581 5,999
4,231 2,510 5,240 4,435
2,837
(D) 4,693 4,281
3,552 2,923 6,117 5,669
5,148 4,260 8,703 7,446
57,700 26,040 93,050 55,320
26,480
9,670 112,550
72,580
35,180 15,840
105,620 81,340
43,830 19,110 97,820 74,510
41,990 20,940
135,840 96,670
57,910 27,740
130,600 99,100
56,490 27,050 90,400 74,340
48,540 26,420 91,350 72,070
46,180 22,870
116,720 87,630
51,580 25,100
108,980 85,190
80,424 63,311 82,007 82,999
67,248 50,317 85,226 85,473
81,897 64,557 90,470 88,063
77,734 63,145 81,997 81,625
76,247 57,639 83,132 83,738
79,832 74,370 99,737 93,429
88,211 79,314 89,283 84,528
81,491 68,061 83,456 80,561
75,216 63,653 73,112 69,756
63,760 55,153 70,484 63,437
138,124 89,351
175,057 138,319
93,728 59,987
197,776 158,053
117,077
80,397 196,090 169,403
121,564
82,255 179,817 156,135
118,237
78,579 218,972 180,408
137,742 102,110 230,337 192,529
144,701 106,364 179,683 158,868
130,031
94,481 174,806 152,631
121,396
86,523 189,832 157,386
115,340
80,253 179,464 148,627
(D) Withheld to avoid disclosing data for individual operations. 1 Includes stocks at mills, elevators, terminals, and processors.
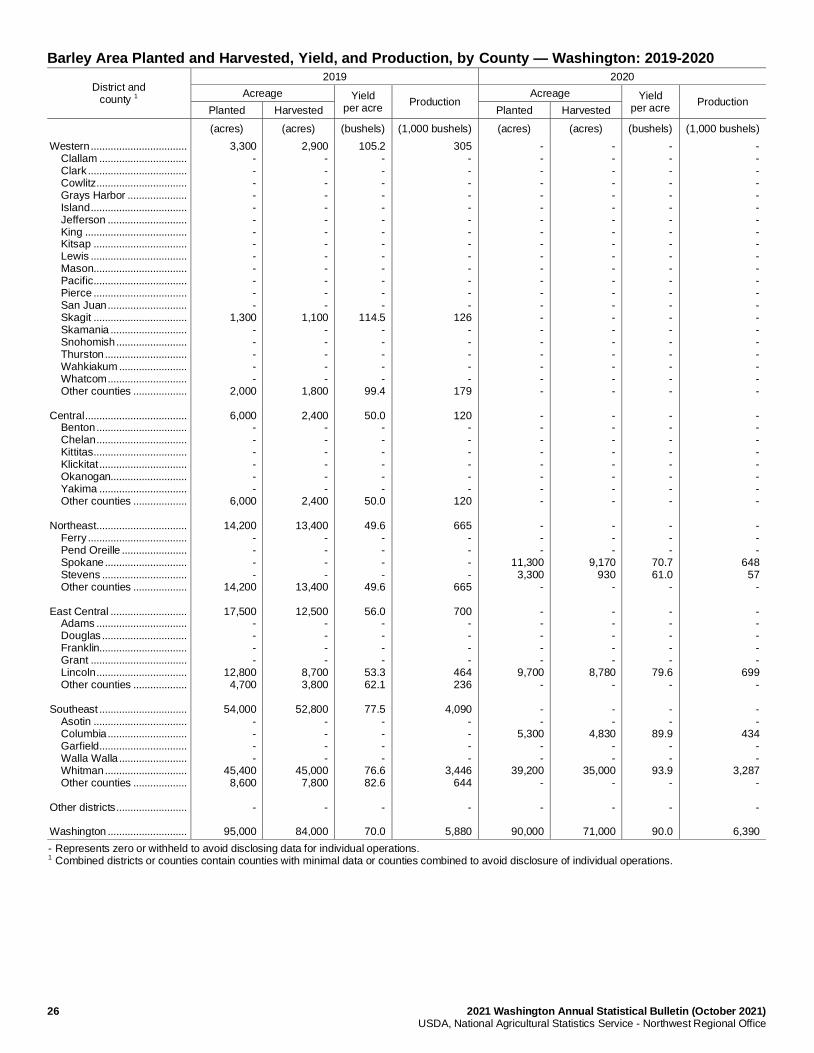
26 2021 Washington Annual Statistical Bulletin (October 2021) USDA, National Agricultural Statistics Service - Northwest Regional Office
Barley Area Planted and Harvested, Yield, and Production, by County — Washington: 2019-2020
District and county 1
2019 2020
Acreage Yield per acre
Production Acreage Yield
per acre Production
Planted Harvested Planted Harvested
(acres) (acres) (bushels) (1,000 bushels) (acres) (acres) (bushels) (1,000 bushels)
Western .................................. Clallam ............................... Clark ................................... Cowlitz ................................ Grays Harbor ..................... Island .................................. Jefferson ............................ King .................................... Kitsap ................................. Lewis .................................. Mason................................. Pacific ................................. Pierce ................................. San Juan ............................ Skagit ................................. Skamania ........................... Snohomish ......................... Thurston ............................. Wahkiakum ........................ Whatcom ............................ Other counties ................... Central .................................... Benton ................................ Chelan ................................ Kittitas................................. Klickitat ............................... Okanogan........................... Yakima ............................... Other counties ................... Northeast ................................ Ferry ................................... Pend Oreille ....................... Spokane ............................. Stevens .............................. Other counties ................... East Central ........................... Adams ................................ Douglas .............................. Franklin............................... Grant .................................. Lincoln ................................ Other counties ................... Southeast ............................... Asotin ................................. Columbia ............................ Garfield ............................... Walla Walla ........................ Whitman ............................. Other counties ................... Other districts ......................... Washington ............................
3,300 - - - - - - - - - - - - -
1,300 - - - - -
2,000
6,000 - - - - - -
6,000
14,200 - - - -
14,200
17,500 - - - -
12,800 4,700
54,000
- - - -
45,400 8,600
-
95,000
2,900 - - - - - - - - - - - - -
1,100 - - - - -
1,800
2,400 - - - - - -
2,400
13,400 - - - -
13,400
12,500 - - - -
8,700 3,800
52,800
- - - -
45,000 7,800
-
84,000
105.2 - - - - - - - - - - - - -
114.5 - - - - -
99.4
50.0 - - - - - -
50.0
49.6 - - - -
49.6
56.0 - - - -
53.3 62.1
77.5
- - - -
76.6 82.6
-
70.0
305 - - - - - - - - - - - - -
126 - - - - -
179
120 - - - - - -
120
665 - - - -
665
700 - - - -
464 236
4,090
- - - -
3,446 644
-
5,880
- - - - - - - - - - - - - - - - - - - - -
- - - - - - - -
- - -
11,300 3,300
-
- - - - -
9,700 -
- -
5,300 - -
39,200 -
-
90,000
- - - - - - - - - - - - - - - - - - - - -
- - - - - - - -
- - -
9,170 930
-
- - - - -
8,780 -
- -
4,830 - -
35,000 -
-
71,000
- - - - - - - - - - - - - - - - - - - - -
- - - - - - - -
- - -
70.7 61.0
-
- - - - -
79.6 -
- -
89.9 - -
93.9 -
-
90.0
- - - - - - - - - - - - - - - - - - - - -
- - - - - - - -
- - -
648 57
-
- - - - -
699 -
- -
434 - -
3,287 -
-
6,390
- Represents zero or withheld to avoid disclosing data for individual operations. 1 Combined districts or counties contain counties with minimal data or counties combined to avoid disclosure of individual operations.
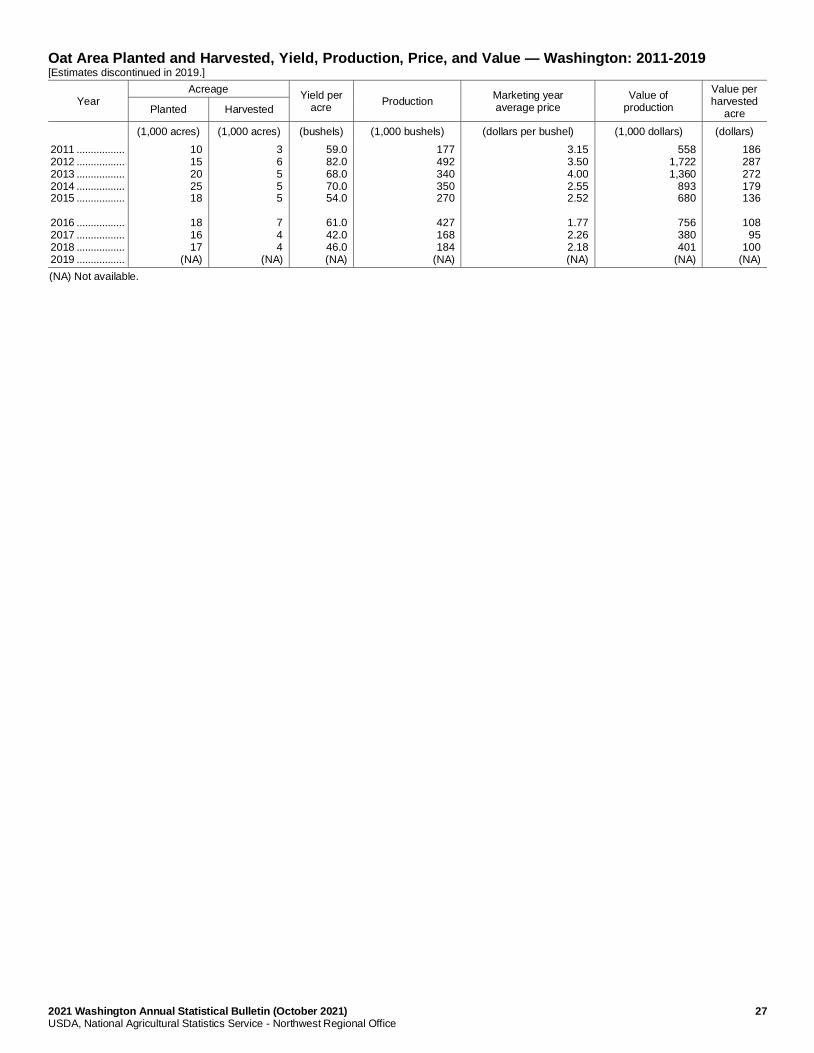
2021 Washington Annual Statistical Bulletin (October 2021) 27 USDA, National Agricultural Statistics Service - Northwest Regional Office
Oat Area Planted and Harvested, Yield, Production, Price, and Value — Washington: 2011-2019 [Estimates discontinued in 2019.]
Year Acreage
Yield per acre
Production Marketing year average price
Value of production
Value per harvested
acre Planted Harvested
(1,000 acres) (1,000 acres) (bushels) (1,000 bushels) (dollars per bushel) (1,000 dollars) (dollars)
2011 ................. 2012 ................. 2013 ................. 2014 ................. 2015 ................. 2016 ................. 2017 ................. 2018 ................. 2019 .................
10 15 20 25 18
18 16 17
(NA)
3 6 5 5 5
7 4 4
(NA)
59.0 82.0 68.0 70.0 54.0
61.0 42.0 46.0 (NA)
177 492 340 350 270
427 168 184
(NA)
3.15 3.50 4.00 2.55 2.52
1.77 2.26 2.18 (NA)
558 1,722 1,360
893 680
756 380 401
(NA)
186 287 272 179 136
108
95 100
(NA)
(NA) Not available.
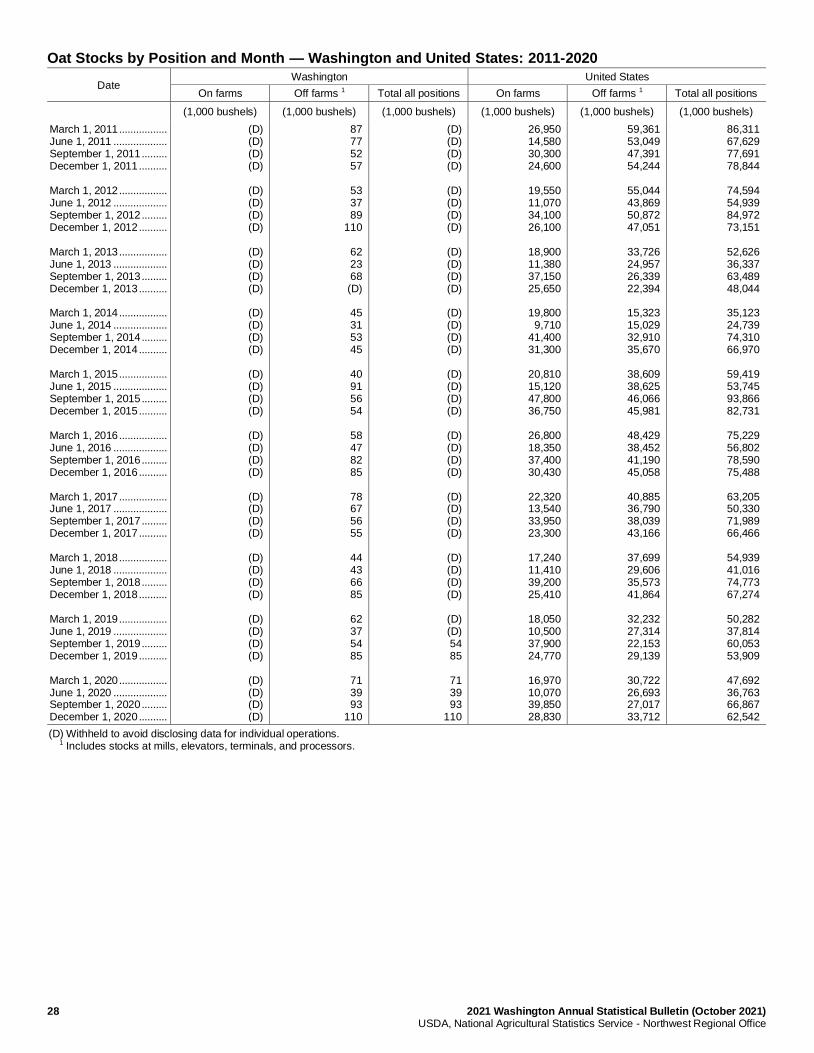
28 2021 Washington Annual Statistical Bulletin (October 2021) USDA, National Agricultural Statistics Service - Northwest Regional Office
Oat Stocks by Position and Month — Washington and United States: 2011-2020
Date Washington United States
On farms Off farms 1 Total all positions On farms Off farms 1 Total all positions
(1,000 bushels) (1,000 bushels) (1,000 bushels) (1,000 bushels) (1,000 bushels) (1,000 bushels)
March 1, 2011 ................. June 1, 2011 ................... September 1, 2011 ......... December 1, 2011 .......... March 1, 2012 ................. June 1, 2012 ................... September 1, 2012 ......... December 1, 2012 .......... March 1, 2013 ................. June 1, 2013 ................... September 1, 2013 ......... December 1, 2013 .......... March 1, 2014 ................. June 1, 2014 ................... September 1, 2014 ......... December 1, 2014 .......... March 1, 2015 ................. June 1, 2015 ................... September 1, 2015 ......... December 1, 2015 .......... March 1, 2016 ................. June 1, 2016 ................... September 1, 2016 ......... December 1, 2016 .......... March 1, 2017 ................. June 1, 2017 ................... September 1, 2017 ......... December 1, 2017 .......... March 1, 2018 ................. June 1, 2018 ................... September 1, 2018 ......... December 1, 2018 .......... March 1, 2019 ................. June 1, 2019 ................... September 1, 2019 ......... December 1, 2019 .......... March 1, 2020 ................. June 1, 2020 ................... September 1, 2020 ......... December 1, 2020 ..........
(D) (D) (D) (D)
(D) (D) (D) (D)
(D) (D) (D) (D)
(D) (D) (D) (D)
(D) (D) (D) (D)
(D) (D) (D) (D)
(D) (D) (D) (D)
(D) (D) (D) (D)
(D) (D) (D) (D)
(D) (D) (D) (D)
87 77 52 57
53 37 89
110
62 23 68 (D)
45 31 53 45
40 91 56 54
58 47 82 85
78 67 56 55
44 43 66 85
62 37 54 85
71 39 93
110
(D) (D) (D) (D)
(D) (D) (D) (D)
(D) (D) (D) (D)
(D) (D) (D) (D)
(D) (D) (D) (D)
(D) (D) (D) (D)
(D) (D) (D) (D)
(D) (D) (D) (D)
(D) (D) 54 85
71 39 93
110
26,950 14,580 30,300 24,600
19,550 11,070 34,100 26,100
18,900 11,380 37,150 25,650
19,800
9,710 41,400 31,300
20,810 15,120 47,800 36,750
26,800 18,350 37,400 30,430
22,320 13,540 33,950 23,300
17,240 11,410 39,200 25,410
18,050 10,500 37,900 24,770
16,970 10,070 39,850 28,830
59,361 53,049 47,391 54,244
55,044 43,869 50,872 47,051
33,726 24,957 26,339 22,394
15,323 15,029 32,910 35,670
38,609 38,625 46,066 45,981
48,429 38,452 41,190 45,058
40,885 36,790 38,039 43,166
37,699 29,606 35,573 41,864
32,232 27,314 22,153 29,139
30,722 26,693 27,017 33,712
86,311 67,629 77,691 78,844
74,594 54,939 84,972 73,151
52,626 36,337 63,489 48,044
35,123 24,739 74,310 66,970
59,419 53,745 93,866 82,731
75,229 56,802 78,590 75,488
63,205 50,330 71,989 66,466
54,939 41,016 74,773 67,274
50,282 37,814 60,053 53,909
47,692 36,763 66,867 62,542
(D) Withheld to avoid disclosing data for individual operations. 1 Includes stocks at mills, elevators, terminals, and processors.
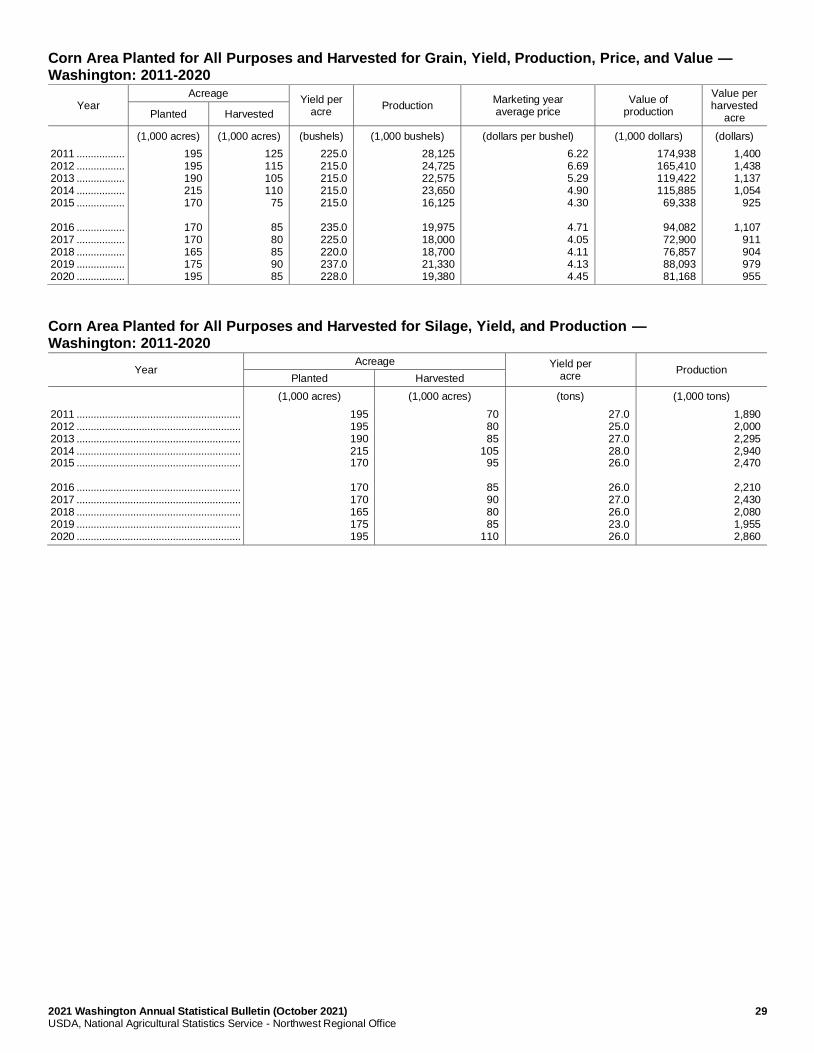
2021 Washington Annual Statistical Bulletin (October 2021) 29 USDA, National Agricultural Statistics Service - Northwest Regional Office
Corn Area Planted for All Purposes and Harvested for Grain, Yield, Production, Price, and Value — Washington: 2011-2020
Year Acreage
Yield per acre
Production Marketing year average price
Value of production
Value per harvested
acre Planted Harvested
(1,000 acres) (1,000 acres) (bushels) (1,000 bushels) (dollars per bushel) (1,000 dollars) (dollars)
2011 ................. 2012 ................. 2013 ................. 2014 ................. 2015 ................. 2016 ................. 2017 ................. 2018 ................. 2019 ................. 2020 .................
195 195 190 215 170
170 170 165 175 195
125 115 105 110
75
85 80 85 90 85
225.0 215.0 215.0 215.0 215.0
235.0 225.0 220.0 237.0 228.0
28,125 24,725 22,575 23,650 16,125
19,975 18,000 18,700 21,330 19,380
6.22 6.69 5.29 4.90 4.30
4.71 4.05 4.11 4.13 4.45
174,938 165,410 119,422 115,885
69,338
94,082 72,900 76,857 88,093 81,168
1,400 1,438 1,137 1,054
925
1,107 911 904 979 955
Corn Area Planted for All Purposes and Harvested for Silage, Yield, and Production — Washington: 2011-2020
Year Acreage Yield per
acre Production
Planted Harvested
(1,000 acres) (1,000 acres) (tons) (1,000 tons)
2011 .......................................................... 2012 .......................................................... 2013 .......................................................... 2014 .......................................................... 2015 .......................................................... 2016 .......................................................... 2017 .......................................................... 2018 .......................................................... 2019 .......................................................... 2020 ..........................................................
195 195 190 215 170
170 170 165 175 195
70 80 85
105 95
85 90 80 85
110
27.0 25.0 27.0 28.0 26.0
26.0 27.0 26.0 23.0 26.0
1,890 2,000 2,295 2,940 2,470
2,210 2,430 2,080 1,955 2,860
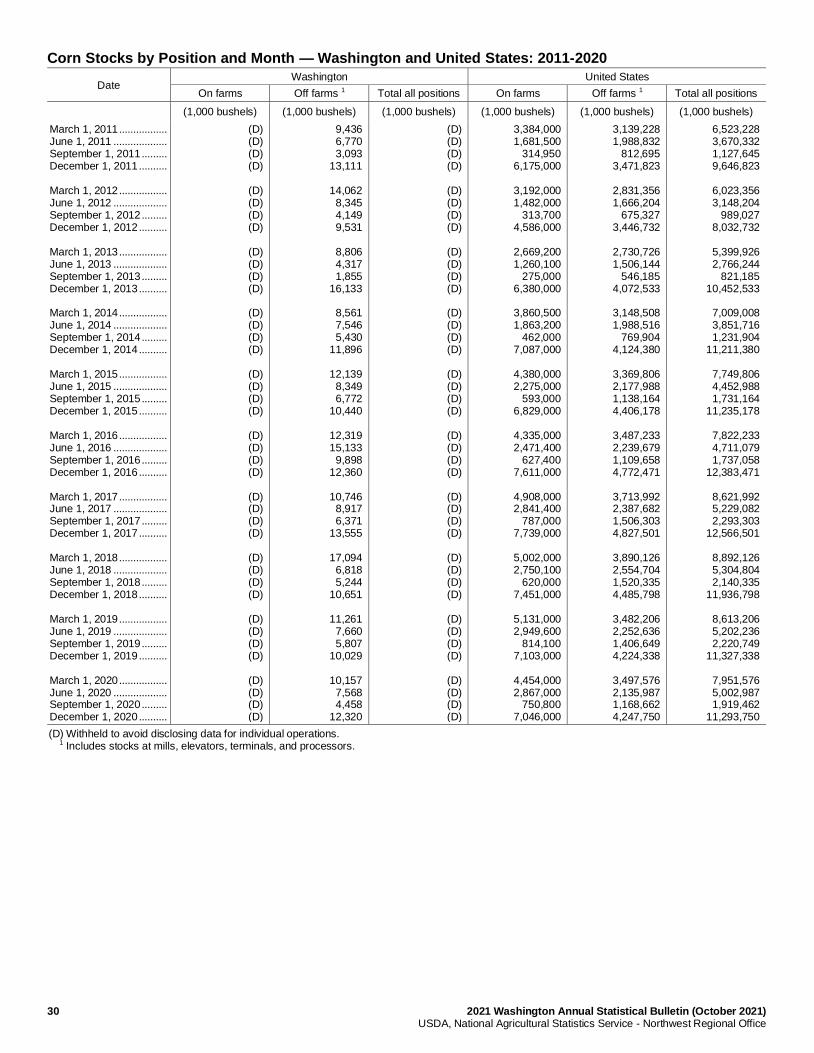
30 2021 Washington Annual Statistical Bulletin (October 2021) USDA, National Agricultural Statistics Service - Northwest Regional Office
Corn Stocks by Position and Month — Washington and United States: 2011-2020
Date Washington United States
On farms Off farms 1 Total all positions On farms Off farms 1 Total all positions
(1,000 bushels) (1,000 bushels) (1,000 bushels) (1,000 bushels) (1,000 bushels) (1,000 bushels)
March 1, 2011 ................. June 1, 2011 ................... September 1, 2011 ......... December 1, 2011 .......... March 1, 2012 ................. June 1, 2012 ................... September 1, 2012 ......... December 1, 2012 .......... March 1, 2013 ................. June 1, 2013 ................... September 1, 2013 ......... December 1, 2013 .......... March 1, 2014 ................. June 1, 2014 ................... September 1, 2014 ......... December 1, 2014 .......... March 1, 2015 ................. June 1, 2015 ................... September 1, 2015 ......... December 1, 2015 .......... March 1, 2016 ................. June 1, 2016 ................... September 1, 2016 ......... December 1, 2016 .......... March 1, 2017 ................. June 1, 2017 ................... September 1, 2017 ......... December 1, 2017 .......... March 1, 2018 ................. June 1, 2018 ................... September 1, 2018 ......... December 1, 2018 .......... March 1, 2019 ................. June 1, 2019 ................... September 1, 2019 ......... December 1, 2019 .......... March 1, 2020 ................. June 1, 2020 ................... September 1, 2020 ......... December 1, 2020 ..........
(D) (D) (D) (D)
(D) (D) (D) (D)
(D) (D) (D) (D)
(D) (D) (D) (D)
(D) (D) (D) (D)
(D) (D) (D) (D)
(D) (D) (D) (D)
(D) (D) (D) (D)
(D) (D) (D) (D)
(D) (D) (D) (D)
9,436 6,770 3,093
13,111
14,062 8,345 4,149 9,531
8,806 4,317 1,855
16,133
8,561 7,546 5,430
11,896
12,139 8,349 6,772
10,440
12,319 15,133
9,898 12,360
10,746
8,917 6,371
13,555
17,094 6,818 5,244
10,651
11,261 7,660 5,807
10,029
10,157 7,568 4,458
12,320
(D) (D) (D) (D)
(D) (D) (D) (D)
(D) (D) (D) (D)
(D) (D) (D) (D)
(D) (D) (D) (D)
(D) (D) (D) (D)
(D) (D) (D) (D)
(D) (D) (D) (D)
(D) (D) (D) (D)
(D) (D) (D) (D)
3,384,000 1,681,500
314,950 6,175,000
3,192,000 1,482,000
313,700 4,586,000
2,669,200 1,260,100
275,000 6,380,000
3,860,500 1,863,200
462,000 7,087,000
4,380,000 2,275,000
593,000 6,829,000
4,335,000 2,471,400
627,400 7,611,000
4,908,000 2,841,400
787,000 7,739,000
5,002,000 2,750,100
620,000 7,451,000
5,131,000 2,949,600
814,100 7,103,000
4,454,000 2,867,000
750,800 7,046,000
3,139,228 1,988,832
812,695 3,471,823
2,831,356 1,666,204
675,327 3,446,732
2,730,726 1,506,144
546,185 4,072,533
3,148,508 1,988,516
769,904 4,124,380
3,369,806 2,177,988 1,138,164 4,406,178
3,487,233 2,239,679 1,109,658 4,772,471
3,713,992 2,387,682 1,506,303 4,827,501
3,890,126 2,554,704 1,520,335 4,485,798
3,482,206 2,252,636 1,406,649 4,224,338
3,497,576 2,135,987 1,168,662 4,247,750
6,523,228 3,670,332 1,127,645 9,646,823
6,023,356 3,148,204
989,027 8,032,732
5,399,926 2,766,244
821,185 10,452,533
7,009,008 3,851,716 1,231,904
11,211,380
7,749,806 4,452,988 1,731,164
11,235,178
7,822,233 4,711,079 1,737,058
12,383,471
8,621,992 5,229,082 2,293,303
12,566,501
8,892,126 5,304,804 2,140,335
11,936,798
8,613,206 5,202,236 2,220,749
11,327,338
7,951,576 5,002,987 1,919,462
11,293,750
(D) Withheld to avoid disclosing data for individual operations. 1 Includes stocks at mills, elevators, terminals, and processors.
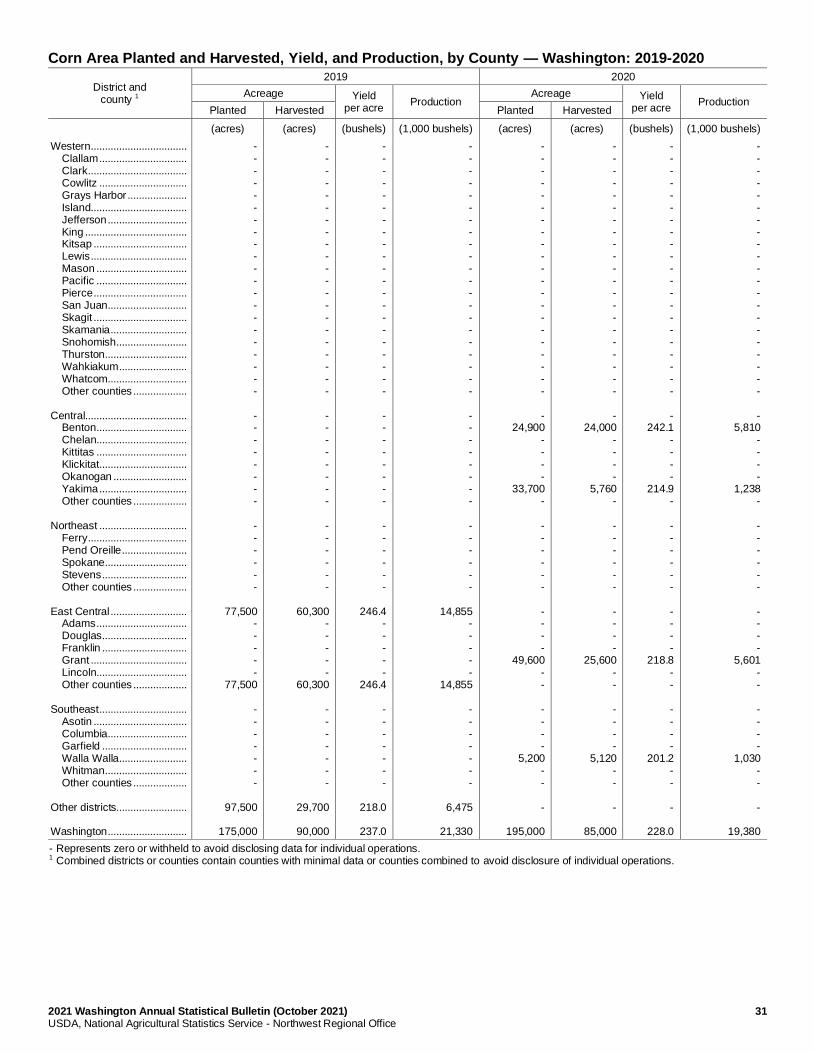
2021 Washington Annual Statistical Bulletin (October 2021) 31 USDA, National Agricultural Statistics Service - Northwest Regional Office
Corn Area Planted and Harvested, Yield, and Production, by County — Washington: 2019-2020
District and county 1
2019 2020
Acreage Yield per acre
Production Acreage Yield
per acre Production
Planted Harvested Planted Harvested
(acres) (acres) (bushels) (1,000 bushels) (acres) (acres) (bushels) (1,000 bushels)
Western .................................. Clallam ............................... Clark ................................... Cowlitz ............................... Grays Harbor ..................... Island.................................. Jefferson ............................ King .................................... Kitsap ................................. Lewis .................................. Mason ................................ Pacific ................................ Pierce ................................. San Juan ............................ Skagit ................................. Skamania ........................... Snohomish ......................... Thurston ............................. Wahkiakum ........................ Whatcom ............................ Other counties ................... Central.................................... Benton................................ Chelan................................ Kittitas ................................ Klickitat............................... Okanogan .......................... Yakima ............................... Other counties ................... Northeast ............................... Ferry ................................... Pend Oreille ....................... Spokane ............................. Stevens .............................. Other counties ................... East Central ........................... Adams ................................ Douglas .............................. Franklin .............................. Grant .................................. Lincoln................................ Other counties ................... Southeast ............................... Asotin ................................. Columbia ............................ Garfield .............................. Walla Walla ........................ Whitman ............................. Other counties ................... Other districts......................... Washington ............................
- - - - - - - - - - - - - - - - - - - - -
- - - - - - - -
- - - - - -
77,500 - - - - -
77,500
- - - - - - -
97,500
175,000
- - - - - - - - - - - - - - - - - - - - -
- - - - - - - -
- - - - - -
60,300 - - - - -
60,300
- - - - - - -
29,700
90,000
- - - - - - - - - - - - - - - - - - - - -
- - - - - - - -
- - - - - -
246.4 - - - - -
246.4
- - - - - - -
218.0
237.0
- - - - - - - - - - - - - - - - - - - - -
- - - - - - - -
- - - - - -
14,855 - - - - -
14,855
- - - - - - -
6,475
21,330
- - - - - - - - - - - - - - - - - - - - -
- 24,900
- - - -
33,700 -
- - - - - -
- - - -
49,600 - -
- - - -
5,200 - -
-
195,000
- - - - - - - - - - - - - - - - - - - - -
- 24,000
- - - -
5,760 -
- - - - - -
- - - -
25,600 - -
- - - -
5,120 - -
-
85,000
- - - - - - - - - - - - - - - - - - - - -
- 242.1
- - - -
214.9 -
- - - - - -
- - - -
218.8 - -
- - - -
201.2 - -
-
228.0
- - - - - - - - - - - - - - - - - - - - -
- 5,810
- - - -
1,238 -
- - - - - -
- - - -
5,601 - -
- - - -
1,030 - -
-
19,380
- Represents zero or withheld to avoid disclosing data for individual operations. 1 Combined districts or counties contain counties with minimal data or counties combined to avoid disclosure of individual operations.
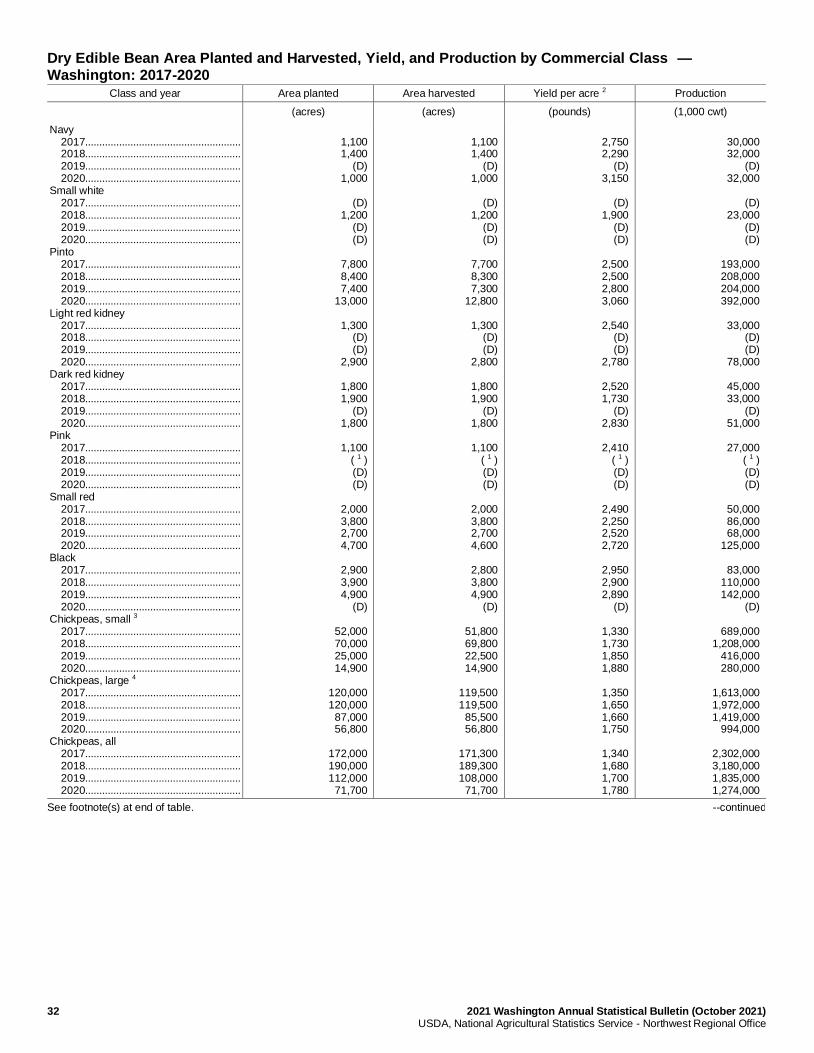
32 2021 Washington Annual Statistical Bulletin (October 2021) USDA, National Agricultural Statistics Service - Northwest Regional Office
Dry Edible Bean Area Planted and Harvested, Yield, and Production by Commercial Class — Washington: 2017-2020
Class and year Area planted Area harvested Yield per acre 2 Production
(acres) (acres) (pounds) (1,000 cwt)
Navy 2017....................................................... 2018....................................................... 2019....................................................... 2020....................................................... Small white 2017....................................................... 2018....................................................... 2019....................................................... 2020....................................................... Pinto 2017....................................................... 2018....................................................... 2019....................................................... 2020....................................................... Light red kidney 2017....................................................... 2018....................................................... 2019....................................................... 2020....................................................... Dark red kidney 2017....................................................... 2018....................................................... 2019....................................................... 2020....................................................... Pink 2017....................................................... 2018....................................................... 2019....................................................... 2020....................................................... Small red 2017....................................................... 2018....................................................... 2019....................................................... 2020....................................................... Black 2017....................................................... 2018....................................................... 2019....................................................... 2020....................................................... Chickpeas, small 3 2017....................................................... 2018....................................................... 2019....................................................... 2020....................................................... Chickpeas, large 4 2017....................................................... 2018....................................................... 2019....................................................... 2020....................................................... Chickpeas, all 2017....................................................... 2018....................................................... 2019....................................................... 2020.......................................................
1,100 1,400
(D) 1,000
(D)
1,200 (D) (D)
7,800 8,400 7,400
13,000
1,300 (D) (D)
2,900
1,800 1,900
(D) 1,800
1,100
( 1 ) (D) (D)
2,000 3,800 2,700 4,700
2,900 3,900 4,900
(D)
52,000 70,000 25,000 14,900
120,000 120,000
87,000 56,800
172,000 190,000 112,000
71,700
1,100 1,400
(D) 1,000
(D)
1,200 (D) (D)
7,700 8,300 7,300
12,800
1,300 (D) (D)
2,800
1,800 1,900
(D) 1,800
1,100
( 1 ) (D) (D)
2,000 3,800 2,700 4,600
2,800 3,800 4,900
(D)
51,800 69,800 22,500 14,900
119,500 119,500
85,500 56,800
171,300 189,300 108,000
71,700
2,750 2,290
(D) 3,150
(D)
1,900 (D) (D)
2,500 2,500 2,800 3,060
2,540
(D) (D)
2,780
2,520 1,730
(D) 2,830
2,410
( 1 ) (D) (D)
2,490 2,250 2,520 2,720
2,950 2,900 2,890
(D)
1,330 1,730 1,850 1,880
1,350 1,650 1,660 1,750
1,340 1,680 1,700 1,780
30,000 32,000
(D) 32,000
(D)
23,000 (D) (D)
193,000 208,000 204,000 392,000
33,000
(D) (D)
78,000
45,000 33,000
(D) 51,000
27,000
( 1 ) (D) (D)
50,000 86,000 68,000
125,000
83,000 110,000 142,000
(D)
689,000 1,208,000
416,000 280,000
1,613,000 1,972,000 1,419,000
994,000
2,302,000 3,180,000 1,835,000 1,274,000
See footnote(s) at end of table. --continued
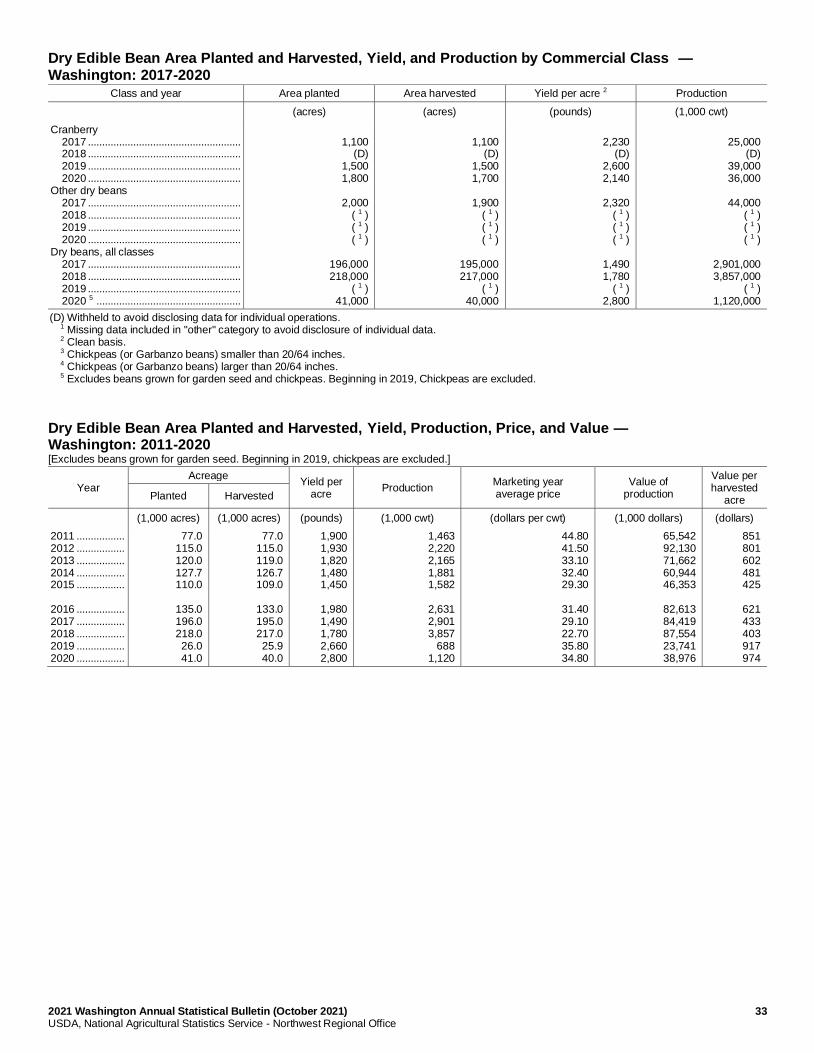
2021 Washington Annual Statistical Bulletin (October 2021) 33 USDA, National Agricultural Statistics Service - Northwest Regional Office
Dry Edible Bean Area Planted and Harvested, Yield, and Production by Commercial Class — Washington: 2017-2020
Class and year Area planted Area harvested Yield per acre 2 Production
(acres) (acres) (pounds) (1,000 cwt)
Cranberry 2017 ...................................................... 2018 ...................................................... 2019 ...................................................... 2020 ...................................................... Other dry beans 2017 ...................................................... 2018 ...................................................... 2019 ...................................................... 2020 ...................................................... Dry beans, all classes 2017 ...................................................... 2018 ...................................................... 2019 ...................................................... 2020 5 ...................................................
1,100
(D) 1,500 1,800
2,000
( 1 ) ( 1 ) ( 1 )
196,000 218,000
( 1 ) 41,000
1,100
(D) 1,500 1,700
1,900
( 1 ) ( 1 ) ( 1 )
195,000 217,000
( 1 ) 40,000
2,230
(D) 2,600 2,140
2,320
( 1 ) ( 1 ) ( 1 )
1,490 1,780
( 1 ) 2,800
25,000
(D) 39,000 36,000
44,000
( 1 ) ( 1 ) ( 1 )
2,901,000 3,857,000
( 1 ) 1,120,000
(D) Withheld to avoid disclosing data for individual operations. 1 Missing data included in "other" category to avoid disclosure of individual data. 2 Clean basis. 3 Chickpeas (or Garbanzo beans) smaller than 20/64 inches. 4 Chickpeas (or Garbanzo beans) larger than 20/64 inches. 5 Excludes beans grown for garden seed and chickpeas. Beginning in 2019, Chickpeas are excluded.
Dry Edible Bean Area Planted and Harvested, Yield, Production, Price, and Value — Washington: 2011-2020 [Excludes beans grown for garden seed. Beginning in 2019, chickpeas are excluded.]
Year Acreage
Yield per acre
Production Marketing year average price
Value of production
Value per harvested
acre Planted Harvested
(1,000 acres) (1,000 acres) (pounds) (1,000 cwt) (dollars per cwt) (1,000 dollars) (dollars)
2011 ................. 2012 ................. 2013 ................. 2014 ................. 2015 ................. 2016 ................. 2017 ................. 2018 ................. 2019 ................. 2020 .................
77.0 115.0 120.0 127.7 110.0
135.0 196.0 218.0 26.0 41.0
77.0 115.0 119.0 126.7 109.0
133.0 195.0 217.0 25.9 40.0
1,900 1,930 1,820 1,480 1,450
1,980 1,490 1,780 2,660 2,800
1,463 2,220 2,165 1,881 1,582
2,631 2,901 3,857
688 1,120
44.80 41.50 33.10 32.40 29.30
31.40 29.10 22.70 35.80 34.80
65,542 92,130 71,662 60,944 46,353
82,613 84,419 87,554 23,741 38,976
851 801 602 481 425
621 433 403 917 974
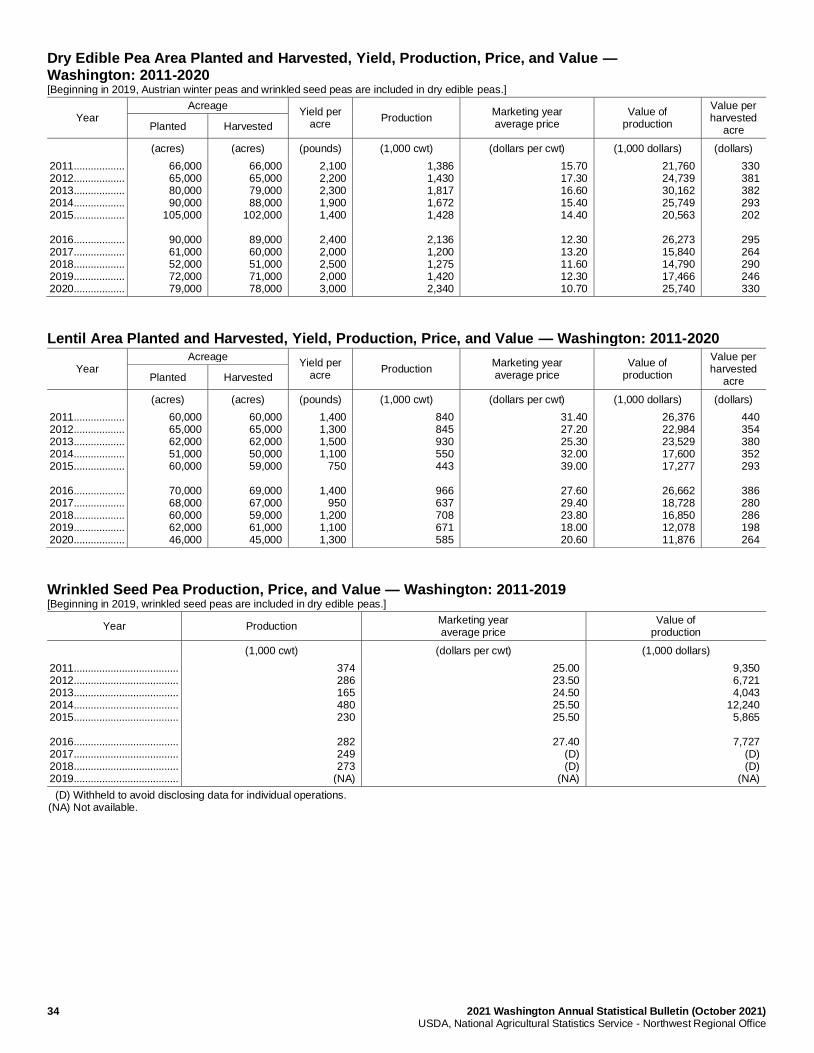
34 2021 Washington Annual Statistical Bulletin (October 2021) USDA, National Agricultural Statistics Service - Northwest Regional Office
Dry Edible Pea Area Planted and Harvested, Yield, Production, Price, and Value — Washington: 2011-2020 [Beginning in 2019, Austrian winter peas and wrinkled seed peas are included in dry edible peas.]
Year Acreage
Yield per acre
Production Marketing year average price
Value of production
Value per harvested
acre Planted Harvested
(acres) (acres) (pounds) (1,000 cwt) (dollars per cwt) (1,000 dollars) (dollars)
2011 .................. 2012 .................. 2013 .................. 2014 .................. 2015 .................. 2016 .................. 2017 .................. 2018 .................. 2019 .................. 2020 ..................
66,000 65,000 80,000 90,000
105,000
90,000 61,000 52,000 72,000 79,000
66,000 65,000 79,000 88,000
102,000
89,000 60,000 51,000 71,000 78,000
2,100 2,200 2,300 1,900 1,400
2,400 2,000 2,500 2,000 3,000
1,386 1,430 1,817 1,672 1,428
2,136 1,200 1,275 1,420 2,340
15.70 17.30 16.60 15.40 14.40
12.30 13.20 11.60 12.30 10.70
21,760 24,739 30,162 25,749 20,563
26,273 15,840 14,790 17,466 25,740
330 381 382 293 202
295 264 290 246 330
Lentil Area Planted and Harvested, Yield, Production, Price, and Value — Washington: 2011-2020
Year Acreage
Yield per acre
Production Marketing year average price
Value of production
Value per harvested
acre Planted Harvested
(acres) (acres) (pounds) (1,000 cwt) (dollars per cwt) (1,000 dollars) (dollars)
2011 .................. 2012 .................. 2013 .................. 2014 .................. 2015 .................. 2016 .................. 2017 .................. 2018 .................. 2019 .................. 2020 ..................
60,000 65,000 62,000 51,000 60,000
70,000 68,000 60,000 62,000 46,000
60,000 65,000 62,000 50,000 59,000
69,000 67,000 59,000 61,000 45,000
1,400 1,300 1,500 1,100
750
1,400 950
1,200 1,100 1,300
840 845 930 550 443
966 637 708 671 585
31.40 27.20 25.30 32.00 39.00
27.60 29.40 23.80 18.00 20.60
26,376 22,984 23,529 17,600 17,277
26,662 18,728 16,850 12,078 11,876
440 354 380 352 293
386 280 286 198 264
Wrinkled Seed Pea Production, Price, and Value — Washington: 2011-2019 [Beginning in 2019, wrinkled seed peas are included in dry edible peas.]
Year Production Marketing year average price
Value of production
(1,000 cwt) (dollars per cwt) (1,000 dollars)
2011 ..................................... 2012 ..................................... 2013 ..................................... 2014 ..................................... 2015 ..................................... 2016 ..................................... 2017 ..................................... 2018 ..................................... 2019 .....................................
374 286 165 480 230
282 249 273
(NA)
25.00 23.50 24.50 25.50 25.50
27.40
(D) (D)
(NA)
9,350 6,721 4,043
12,240 5,865
7,727
(D) (D)
(NA)
(D) Withheld to avoid disclosing data for individual operations. (NA) Not available.
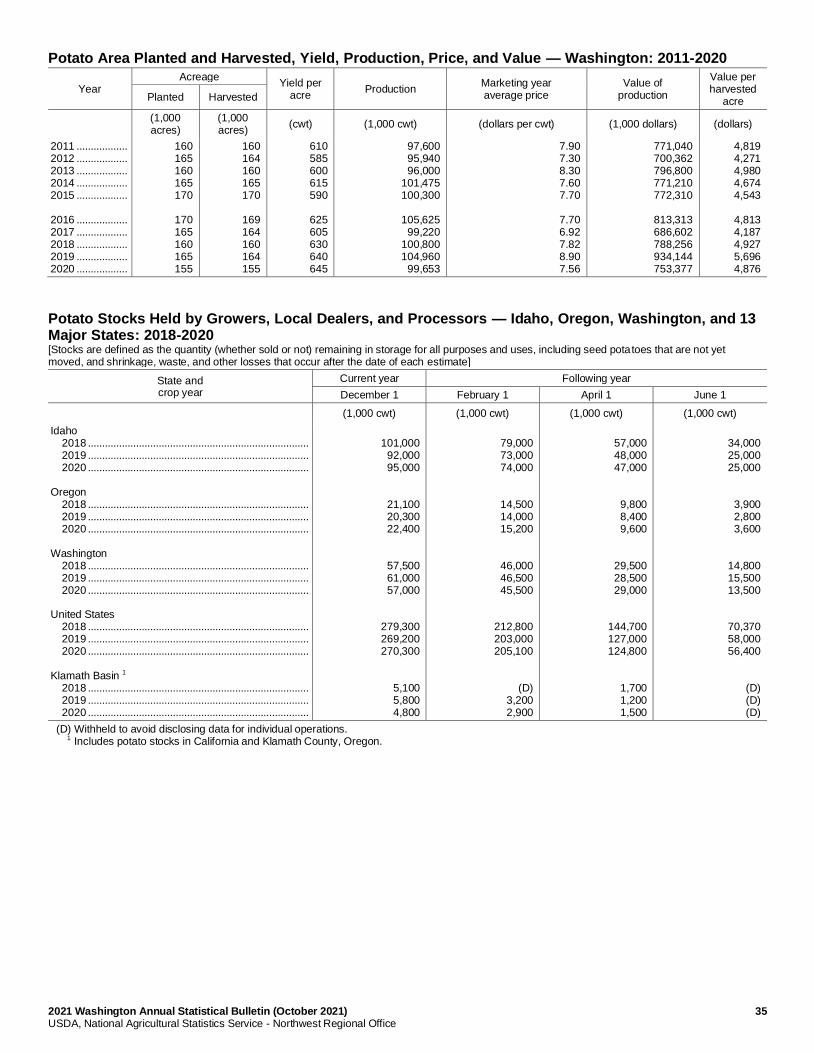
2021 Washington Annual Statistical Bulletin (October 2021) 35 USDA, National Agricultural Statistics Service - Northwest Regional Office
Potato Area Planted and Harvested, Yield, Production, Price, and Value — Washington: 2011-2020
Year Acreage
Yield per acre
Production Marketing year average price
Value of production
Value per harvested
acre Planted Harvested
(1,000 acres)
(1,000 acres)
(cwt) (1,000 cwt) (dollars per cwt) (1,000 dollars) (dollars)
2011 .................. 2012 .................. 2013 .................. 2014 .................. 2015 .................. 2016 .................. 2017 .................. 2018 .................. 2019 .................. 2020 ..................
160 165 160 165 170
170 165 160 165 155
160 164 160 165 170
169 164 160 164 155
610 585 600 615 590
625 605 630 640 645
97,600 95,940 96,000
101,475 100,300
105,625
99,220 100,800 104,960
99,653
7.90 7.30 8.30 7.60 7.70
7.70 6.92 7.82 8.90 7.56
771,040 700,362 796,800 771,210 772,310
813,313 686,602 788,256 934,144 753,377
4,819 4,271 4,980 4,674 4,543
4,813 4,187 4,927 5,696 4,876
Potato Stocks Held by Growers, Local Dealers, and Processors — Idaho, Oregon, Washington, and 13 Major States: 2018-2020 [Stocks are defined as the quantity (whether sold or not) remaining in storage for all purposes and uses, including seed potatoes that are not yet moved, and shrinkage, waste, and other losses that occur after the date of each estimate]
State and crop year
Current year Following year
December 1 February 1 April 1 June 1
(1,000 cwt) (1,000 cwt) (1,000 cwt) (1,000 cwt)
Idaho 2018 .............................................................................. 2019 .............................................................................. 2020 .............................................................................. Oregon 2018 .............................................................................. 2019 .............................................................................. 2020 .............................................................................. Washington 2018 .............................................................................. 2019 .............................................................................. 2020 .............................................................................. United States 2018 .............................................................................. 2019 .............................................................................. 2020 .............................................................................. Klamath Basin 1 2018 .............................................................................. 2019 .............................................................................. 2020 ..............................................................................
101,000
92,000 95,000
21,100 20,300 22,400
57,500 61,000 57,000
279,300 269,200 270,300
5,100 5,800 4,800
79,000 73,000 74,000
14,500 14,000 15,200
46,000 46,500 45,500
212,800 203,000 205,100
(D) 3,200 2,900
57,000 48,000 47,000
9,800 8,400 9,600
29,500 28,500 29,000
144,700 127,000 124,800
1,700 1,200 1,500
34,000 25,000 25,000
3,900 2,800 3,600
14,800 15,500 13,500
70,370 58,000 56,400
(D) (D) (D)
(D) Withheld to avoid disclosing data for individual operations. 1 Includes potato stocks in California and Klamath County, Oregon.
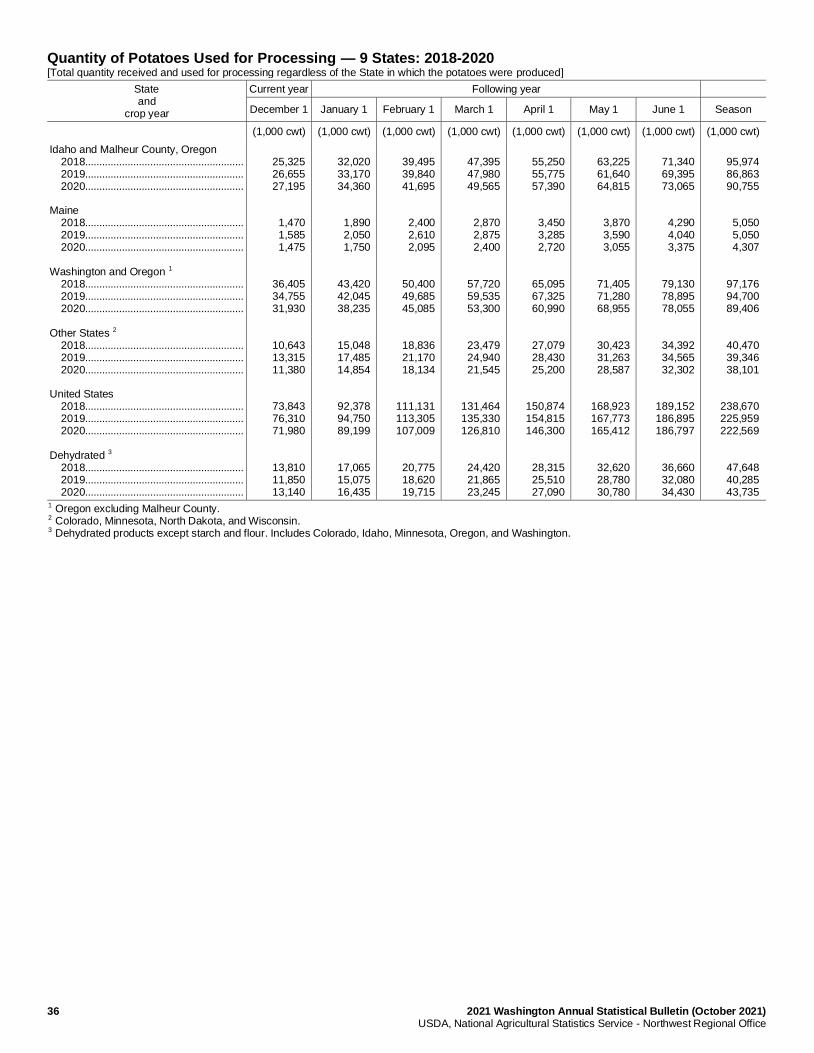
36 2021 Washington Annual Statistical Bulletin (October 2021) USDA, National Agricultural Statistics Service - Northwest Regional Office
Quantity of Potatoes Used for Processing — 9 States: 2018-2020 [Total quantity received and used for processing regardless of the State in which the potatoes were produced]
State and
crop year
Current year Following year
December 1 January 1 February 1 March 1 April 1 May 1 June 1 Season
(1,000 cwt) (1,000 cwt) (1,000 cwt) (1,000 cwt) (1,000 cwt) (1,000 cwt) (1,000 cwt) (1,000 cwt)
Idaho and Malheur County, Oregon 2018........................................................ 2019........................................................ 2020........................................................ Maine 2018........................................................ 2019........................................................ 2020........................................................ Washington and Oregon 1 2018........................................................ 2019........................................................ 2020........................................................ Other States 2 2018........................................................ 2019........................................................ 2020........................................................ United States 2018........................................................ 2019........................................................ 2020........................................................ Dehydrated 3 2018........................................................ 2019........................................................ 2020........................................................
25,325 26,655 27,195
1,470 1,585 1,475
36,405 34,755 31,930
10,643 13,315 11,380
73,843 76,310 71,980
13,810 11,850 13,140
32,020 33,170 34,360
1,890 2,050 1,750
43,420 42,045 38,235
15,048 17,485 14,854
92,378 94,750 89,199
17,065 15,075 16,435
39,495 39,840 41,695
2,400 2,610 2,095
50,400 49,685 45,085
18,836 21,170 18,134
111,131 113,305 107,009
20,775 18,620 19,715
47,395 47,980 49,565
2,870 2,875 2,400
57,720 59,535 53,300
23,479 24,940 21,545
131,464 135,330 126,810
24,420 21,865 23,245
55,250 55,775 57,390
3,450 3,285 2,720
65,095 67,325 60,990
27,079 28,430 25,200
150,874 154,815 146,300
28,315 25,510 27,090
63,225 61,640 64,815
3,870 3,590 3,055
71,405 71,280 68,955
30,423 31,263 28,587
168,923 167,773 165,412
32,620 28,780 30,780
71,340 69,395 73,065
4,290 4,040 3,375
79,130 78,895 78,055
34,392 34,565 32,302
189,152 186,895 186,797
36,660 32,080 34,430
95,974 86,863 90,755
5,050 5,050 4,307
97,176 94,700 89,406
40,470 39,346 38,101
238,670 225,959 222,569
47,648 40,285 43,735
1 Oregon excluding Malheur County. 2 Colorado, Minnesota, North Dakota, and Wisconsin. 3 Dehydrated products except starch and flour. Includes Colorado, Idaho, Minnesota, Oregon, and Washington.
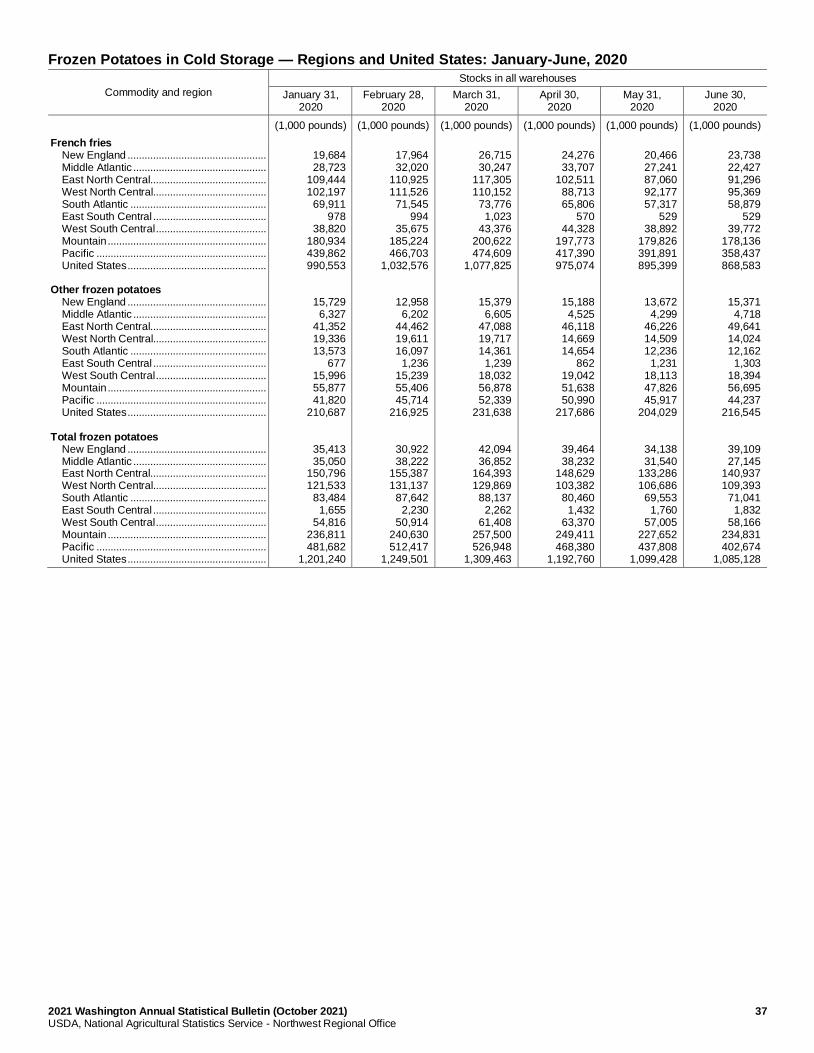
2021 Washington Annual Statistical Bulletin (October 2021) 37 USDA, National Agricultural Statistics Service - Northwest Regional Office
Frozen Potatoes in Cold Storage — Regions and United States: January-June, 2020
Commodity and region
Stocks in all warehouses
January 31, 2020
February 28, 2020
March 31, 2020
April 30, 2020
May 31, 2020
June 30, 2020
(1,000 pounds) (1,000 pounds) (1,000 pounds) (1,000 pounds) (1,000 pounds) (1,000 pounds)
French fries New England ................................................. Middle Atlantic ............................................... East North Central......................................... West North Central........................................ South Atlantic ................................................ East South Central ........................................ West South Central ....................................... Mountain ........................................................ Pacific ............................................................ United States ................................................. Other frozen potatoes New England ................................................. Middle Atlantic ............................................... East North Central......................................... West North Central........................................ South Atlantic ................................................ East South Central ........................................ West South Central ....................................... Mountain ........................................................ Pacific ............................................................ United States ................................................. Total frozen potatoes New England ................................................. Middle Atlantic ............................................... East North Central......................................... West North Central........................................ South Atlantic ................................................ East South Central ........................................ West South Central ....................................... Mountain ........................................................ Pacific ............................................................ United States .................................................
19,684 28,723
109,444 102,197
69,911 978
38,820 180,934 439,862 990,553
15,729 6,327
41,352 19,336 13,573
677 15,996 55,877 41,820
210,687
35,413 35,050
150,796 121,533
83,484 1,655
54,816 236,811 481,682
1,201,240
17,964 32,020
110,925 111,526
71,545 994
35,675 185,224 466,703
1,032,576
12,958 6,202
44,462 19,611 16,097
1,236 15,239 55,406 45,714
216,925
30,922 38,222
155,387 131,137
87,642 2,230
50,914 240,630 512,417
1,249,501
26,715 30,247
117,305 110,152
73,776 1,023
43,376 200,622 474,609
1,077,825
15,379 6,605
47,088 19,717 14,361
1,239 18,032 56,878 52,339
231,638
42,094 36,852
164,393 129,869
88,137 2,262
61,408 257,500 526,948
1,309,463
24,276 33,707
102,511 88,713 65,806
570 44,328
197,773 417,390 975,074
15,188 4,525
46,118 14,669 14,654
862 19,042 51,638 50,990
217,686
39,464 38,232
148,629 103,382
80,460 1,432
63,370 249,411 468,380
1,192,760
20,466 27,241 87,060 92,177 57,317
529 38,892
179,826 391,891 895,399
13,672 4,299
46,226 14,509 12,236
1,231 18,113 47,826 45,917
204,029
34,138 31,540
133,286 106,686
69,553 1,760
57,005 227,652 437,808
1,099,428
23,738 22,427 91,296 95,369 58,879
529 39,772
178,136 358,437 868,583
15,371 4,718
49,641 14,024 12,162
1,303 18,394 56,695 44,237
216,545
39,109 27,145
140,937 109,393
71,041 1,832
58,166 234,831 402,674
1,085,128
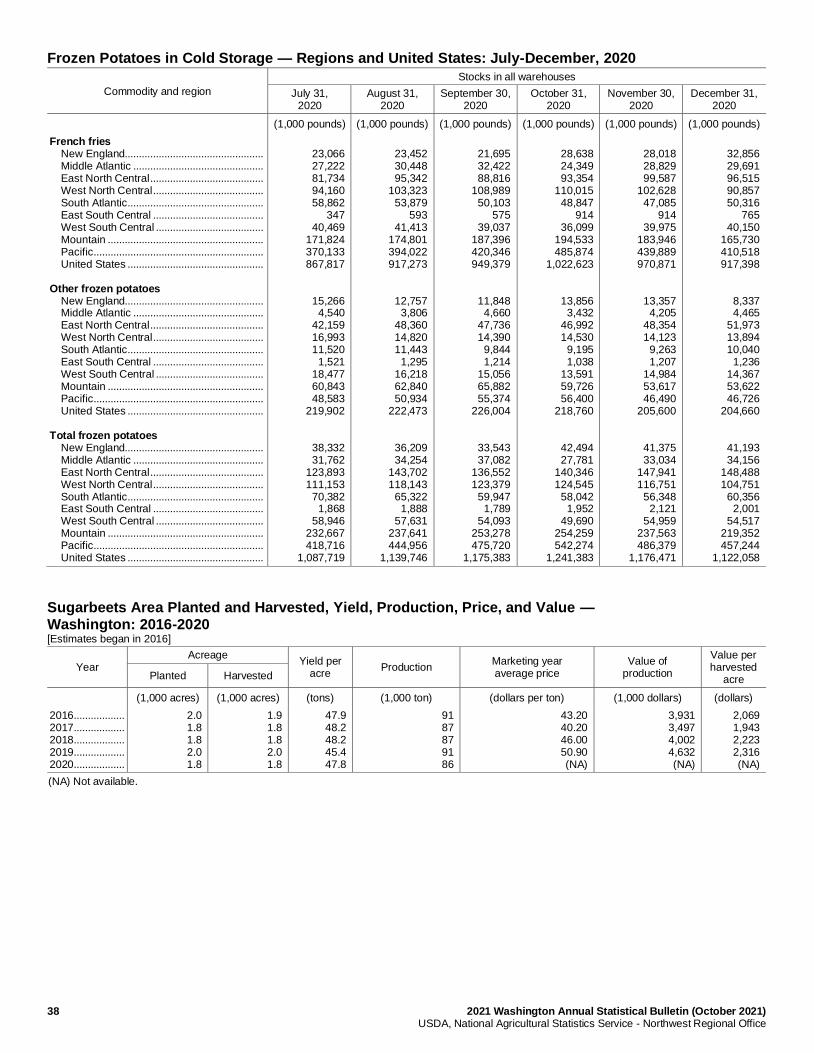
38 2021 Washington Annual Statistical Bulletin (October 2021) USDA, National Agricultural Statistics Service - Northwest Regional Office
Frozen Potatoes in Cold Storage — Regions and United States: July-December, 2020
Commodity and region
Stocks in all warehouses
July 31, 2020
August 31, 2020
September 30, 2020
October 31, 2020
November 30, 2020
December 31, 2020
(1,000 pounds) (1,000 pounds) (1,000 pounds) (1,000 pounds) (1,000 pounds) (1,000 pounds)
French fries New England................................................. Middle Atlantic .............................................. East North Central ........................................ West North Central ....................................... South Atlantic ................................................ East South Central ....................................... West South Central ...................................... Mountain ....................................................... Pacific ............................................................ United States ................................................ Other frozen potatoes New England................................................. Middle Atlantic .............................................. East North Central ........................................ West North Central ....................................... South Atlantic ................................................ East South Central ....................................... West South Central ...................................... Mountain ....................................................... Pacific ............................................................ United States ................................................ Total frozen potatoes New England................................................. Middle Atlantic .............................................. East North Central ........................................ West North Central ....................................... South Atlantic ................................................ East South Central ....................................... West South Central ...................................... Mountain ....................................................... Pacific ............................................................ United States ................................................
23,066 27,222 81,734 94,160 58,862
347 40,469
171,824 370,133 867,817
15,266 4,540
42,159 16,993 11,520
1,521 18,477 60,843 48,583
219,902
38,332 31,762
123,893 111,153
70,382 1,868
58,946 232,667 418,716
1,087,719
23,452 30,448 95,342
103,323 53,879
593 41,413
174,801 394,022 917,273
12,757 3,806
48,360 14,820 11,443
1,295 16,218 62,840 50,934
222,473
36,209 34,254
143,702 118,143
65,322 1,888
57,631 237,641 444,956
1,139,746
21,695 32,422 88,816
108,989 50,103
575 39,037
187,396 420,346 949,379
11,848 4,660
47,736 14,390
9,844 1,214
15,056 65,882 55,374
226,004
33,543 37,082
136,552 123,379
59,947 1,789
54,093 253,278 475,720
1,175,383
28,638 24,349 93,354
110,015 48,847
914 36,099
194,533 485,874
1,022,623
13,856 3,432
46,992 14,530
9,195 1,038
13,591 59,726 56,400
218,760
42,494 27,781
140,346 124,545
58,042 1,952
49,690 254,259 542,274
1,241,383
28,018 28,829 99,587
102,628 47,085
914 39,975
183,946 439,889 970,871
13,357 4,205
48,354 14,123
9,263 1,207
14,984 53,617 46,490
205,600
41,375 33,034
147,941 116,751
56,348 2,121
54,959 237,563 486,379
1,176,471
32,856 29,691 96,515 90,857 50,316
765 40,150
165,730 410,518 917,398
8,337 4,465
51,973 13,894 10,040
1,236 14,367 53,622 46,726
204,660
41,193 34,156
148,488 104,751
60,356 2,001
54,517 219,352 457,244
1,122,058
Sugarbeets Area Planted and Harvested, Yield, Production, Price, and Value — Washington: 2016-2020 [Estimates began in 2016]
Year Acreage
Yield per acre
Production Marketing year average price
Value of production
Value per harvested
acre Planted Harvested
(1,000 acres) (1,000 acres) (tons) (1,000 ton) (dollars per ton) (1,000 dollars) (dollars)
2016 .................. 2017 .................. 2018 .................. 2019 .................. 2020 ..................
2.0 1.8 1.8 2.0 1.8
1.9 1.8 1.8 2.0 1.8
47.9 48.2 48.2 45.4 47.8
91 87 87 91 86
43.20 40.20 46.00 50.90 (NA)
3,931 3,497 4,002 4,632 (NA)
2,069 1,943 2,223 2,316 (NA)
(NA) Not available.

2021 Washington Annual Statistical Bulletin (October 2021) 39 USDA, National Agricultural Statistics Service - Northwest Regional Office
Hop Area Harvested, Yield, Production, Price, and Value — Washington: 2011-2020
Location and year Area
harvested
Yield per acre
Production Price per
pound
Value of
production
Value per harvested
acre
(acres) (pounds) (1,000 pounds) (dollars) (1,000 dollars) (dollars)
2011 .................................... 2012 .................................... 2013 .................................... 2014 .................................... 2015 .................................... 2016 .................................... 2017 .................................... 2018 .................................... 2019 .................................... 2020 ....................................
23,320 22,696 27,097 28,858 32,158
37,444 38,648 39,170 40,880 42,269
2,200 2,047 2,025 1,936 1,849
1,748 2,046 1,984 2,006 1,754
51,308.1 46,465.6 54,877.7 55,861.1 59,453.3
65,446.6 79,083.8 77,727.7 82,014.9 74,151.5
3.06 3.10 3.37 3.73 4.71
5.84 5.80 5.50 5.80 6.00
157,003 144,043 184,938 208,362 280,025
382,208 458,686 427,502 475,686 444,909
6,733 6,347 6,825 7,220 8,708
10,207 11,868 10,914 11,636 10,526
Hop Stocks Held by Growers, Dealers, and Brewers — United States: 2012-2021
Year
March 1 September 1
Growers and dealers
Brewers Total
stocks Growers and
dealers Brewers
Total stocks
(1,000 pounds) (1,000 pounds) (1,000 pounds) (1,000 pounds) (1,000 pounds) (1,000 pounds)
2012 ........................ 2013 ........................ 2014 ........................ 2015 ........................ 2016 ........................ 2017 ........................ 2018 ........................ 2019 ........................ 2020 ........................ 2021 ........................
67,000 62,000 72,000 76,000 88,000
105,000 132,000 130,000 145,000 150,000
53,000 53,000 49,000 43,000 40,000
35,000 37,000 35,000 35,000 35,000
120,000 115,000 121,000 119,000 128,000
140,000 169,000 165,000 180,000 185,000
44,000 (NA)
47,000 46,000 49,000
64,000 74,000 78,000 94,000
100,000
52,000 (NA)
43,000 37,000 36,000
34,000 39,000 37,000 36,000 33,000
96,000 (NA)
90,000 83,000 85,000
98,000
113,000 115,000 130,000 133,000
(NA) Not available.
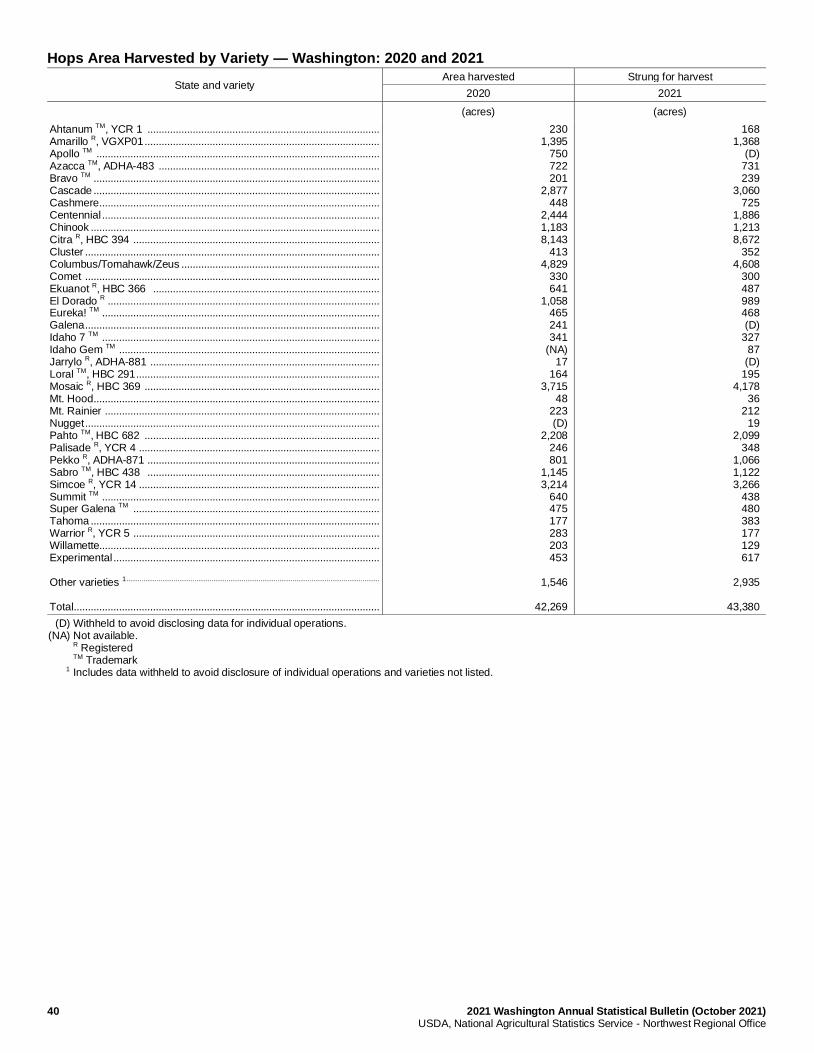
40 2021 Washington Annual Statistical Bulletin (October 2021) USDA, National Agricultural Statistics Service - Northwest Regional Office
Hops Area Harvested by Variety — Washington: 2020 and 2021
State and variety Area harvested Strung for harvest
2020 2021
(acres) (acres)
Ahtanum TM, YCR 1 .................................................................................. Amarillo R, VGXP01 ................................................................................... Apollo TM .................................................................................................... Azacca TM, ADHA-483 .............................................................................. Bravo TM ..................................................................................................... Cascade ..................................................................................................... Cashmere ................................................................................................... Centennial .................................................................................................. Chinook ...................................................................................................... Citra R, HBC 394 ....................................................................................... Cluster ........................................................................................................ Columbus/Tomahawk/Zeus ...................................................................... Comet ........................................................................................................ Ekuanot R, HBC 366 ................................................................................ El Dorado R ................................................................................................ Eureka! TM .................................................................................................. Galena ........................................................................................................ Idaho 7 TM .................................................................................................. Idaho Gem TM ............................................................................................ Jarrylo R, ADHA-881 ................................................................................. Loral TM, HBC 291 ...................................................................................... Mosaic R, HBC 369 ................................................................................... Mt. Hood ..................................................................................................... Mt. Rainier ................................................................................................. Nugget ........................................................................................................ Pahto TM, HBC 682 ................................................................................... Palisade R, YCR 4 ..................................................................................... Pekko R, ADHA-871 .................................................................................. Sabro TM, HBC 438 .................................................................................. Simcoe R, YCR 14 ..................................................................................... Summit TM .................................................................................................. Super Galena TM ....................................................................................... Tahoma ...................................................................................................... Warrior R, YCR 5 ....................................................................................... Willamette................................................................................................... Experimental .............................................................................................. Other varieties 1 ...................................................................................................................................... Total ............................................................................................................
230 1,395
750 722 201
2,877 448
2,444 1,183 8,143
413 4,829
330 641
1,058 465 241 341
(NA) 17
164 3,715
48 223 (D)
2,208 246 801
1,145 3,214
640 475 177 283 203 453
1,546
42,269
168 1,368
(D) 731 239
3,060 725
1,886 1,213 8,672
352 4,608
300 487 989 468 (D)
327 87 (D)
195 4,178
36 212
19 2,099
348 1,066 1,122 3,266
438 480 383 177 129 617
2,935
43,380
(D) Withheld to avoid disclosing data for individual operations. (NA) Not available. R Registered TM Trademark 1 Includes data withheld to avoid disclosure of individual operations and varieties not listed.
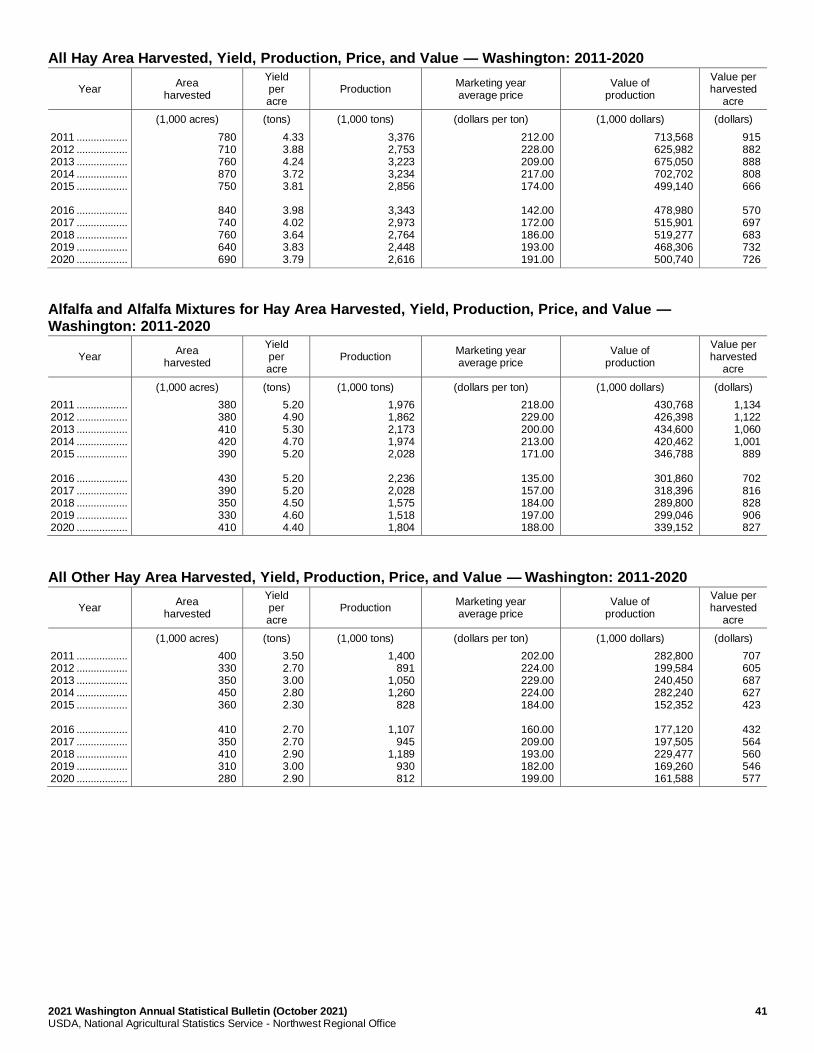
2021 Washington Annual Statistical Bulletin (October 2021) 41 USDA, National Agricultural Statistics Service - Northwest Regional Office
All Hay Area Harvested, Yield, Production, Price, and Value — Washington: 2011-2020
Year Area
harvested
Yield per acre
Production Marketing year average price
Value of production
Value per harvested
acre
(1,000 acres) (tons) (1,000 tons) (dollars per ton) (1,000 dollars) (dollars)
2011 .................. 2012 .................. 2013 .................. 2014 .................. 2015 .................. 2016 .................. 2017 .................. 2018 .................. 2019 .................. 2020 ..................
780 710 760 870 750
840 740 760 640 690
4.33 3.88 4.24 3.72 3.81
3.98 4.02 3.64 3.83 3.79
3,376 2,753 3,223 3,234 2,856
3,343 2,973 2,764 2,448 2,616
212.00 228.00 209.00 217.00 174.00
142.00 172.00 186.00 193.00 191.00
713,568 625,982 675,050 702,702 499,140
478,980 515,901 519,277 468,306 500,740
915 882 888 808 666
570 697 683 732 726
Alfalfa and Alfalfa Mixtures for Hay Area Harvested, Yield, Production, Price, and Value — Washington: 2011-2020
Year Area
harvested
Yield per acre
Production Marketing year average price
Value of production
Value per harvested
acre
(1,000 acres) (tons) (1,000 tons) (dollars per ton) (1,000 dollars) (dollars)
2011 .................. 2012 .................. 2013 .................. 2014 .................. 2015 .................. 2016 .................. 2017 .................. 2018 .................. 2019 .................. 2020 ..................
380 380 410 420 390
430 390 350 330 410
5.20 4.90 5.30 4.70 5.20
5.20 5.20 4.50 4.60 4.40
1,976 1,862 2,173 1,974 2,028
2,236 2,028 1,575 1,518 1,804
218.00 229.00 200.00 213.00 171.00
135.00 157.00 184.00 197.00 188.00
430,768 426,398 434,600 420,462 346,788
301,860 318,396 289,800 299,046 339,152
1,134 1,122 1,060 1,001
889
702 816 828 906 827
All Other Hay Area Harvested, Yield, Production, Price, and Value — Washington: 2011-2020
Year Area
harvested
Yield per acre
Production Marketing year average price
Value of production
Value per harvested
acre
(1,000 acres) (tons) (1,000 tons) (dollars per ton) (1,000 dollars) (dollars)
2011 .................. 2012 .................. 2013 .................. 2014 .................. 2015 .................. 2016 .................. 2017 .................. 2018 .................. 2019 .................. 2020 ..................
400 330 350 450 360
410 350 410 310 280
3.50 2.70 3.00 2.80 2.30
2.70 2.70 2.90 3.00 2.90
1,400 891
1,050 1,260
828
1,107 945
1,189 930 812
202.00 224.00 229.00 224.00 184.00
160.00 209.00 193.00 182.00 199.00
282,800 199,584 240,450 282,240 152,352
177,120 197,505 229,477 169,260 161,588
707 605 687 627 423
432 564 560 546 577
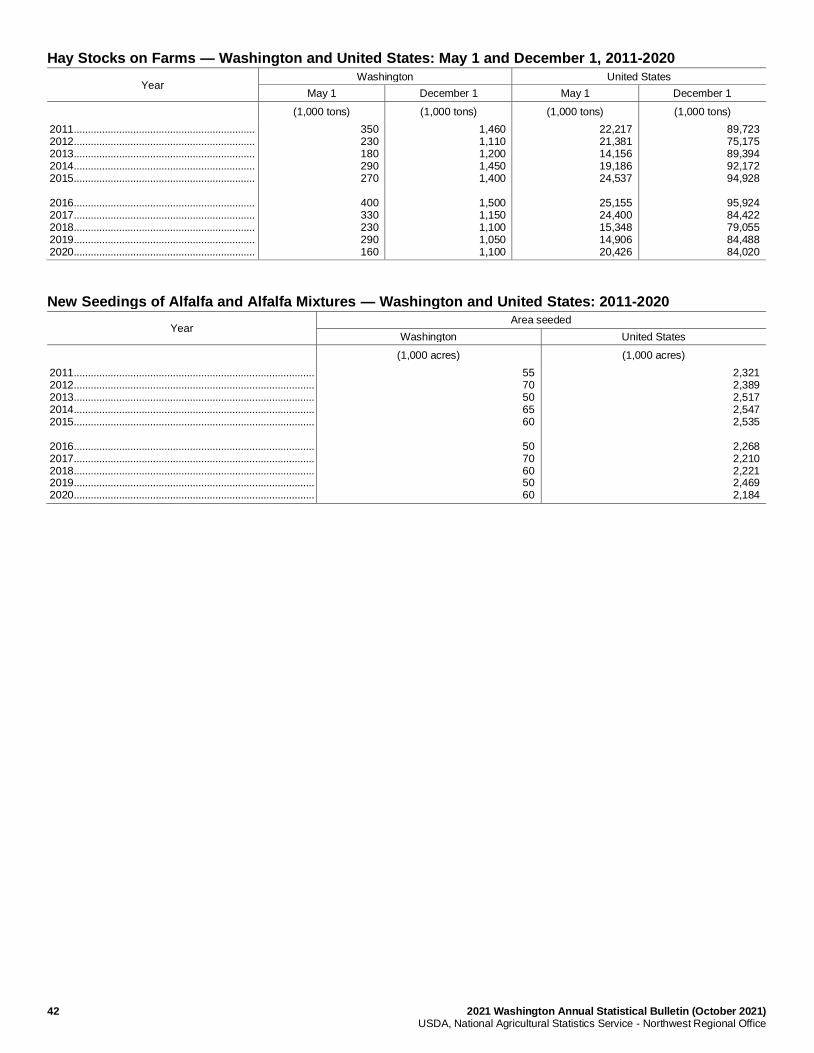
42 2021 Washington Annual Statistical Bulletin (October 2021) USDA, National Agricultural Statistics Service - Northwest Regional Office
Hay Stocks on Farms — Washington and United States: May 1 and December 1, 2011-2020
Year Washington United States
May 1 December 1 May 1 December 1
(1,000 tons) (1,000 tons) (1,000 tons) (1,000 tons)
2011 ................................................................ 2012 ................................................................ 2013 ................................................................ 2014 ................................................................ 2015 ................................................................ 2016 ................................................................ 2017 ................................................................ 2018 ................................................................ 2019 ................................................................ 2020 ................................................................
350 230 180 290 270
400 330 230 290 160
1,460 1,110 1,200 1,450 1,400
1,500 1,150 1,100 1,050 1,100
22,217 21,381 14,156 19,186 24,537
25,155 24,400 15,348 14,906 20,426
89,723 75,175 89,394 92,172 94,928
95,924 84,422 79,055 84,488 84,020
New Seedings of Alfalfa and Alfalfa Mixtures — Washington and United States: 2011-2020
Year Area seeded
Washington United States
(1,000 acres) (1,000 acres)
2011 ..................................................................................... 2012 ..................................................................................... 2013 ..................................................................................... 2014 ..................................................................................... 2015 ..................................................................................... 2016 ..................................................................................... 2017 ..................................................................................... 2018 ..................................................................................... 2019 ..................................................................................... 2020 .....................................................................................
55 70 50 65 60
50 70 60 50 60
2,321 2,389 2,517 2,547 2,535
2,268 2,210 2,221 2,469 2,184
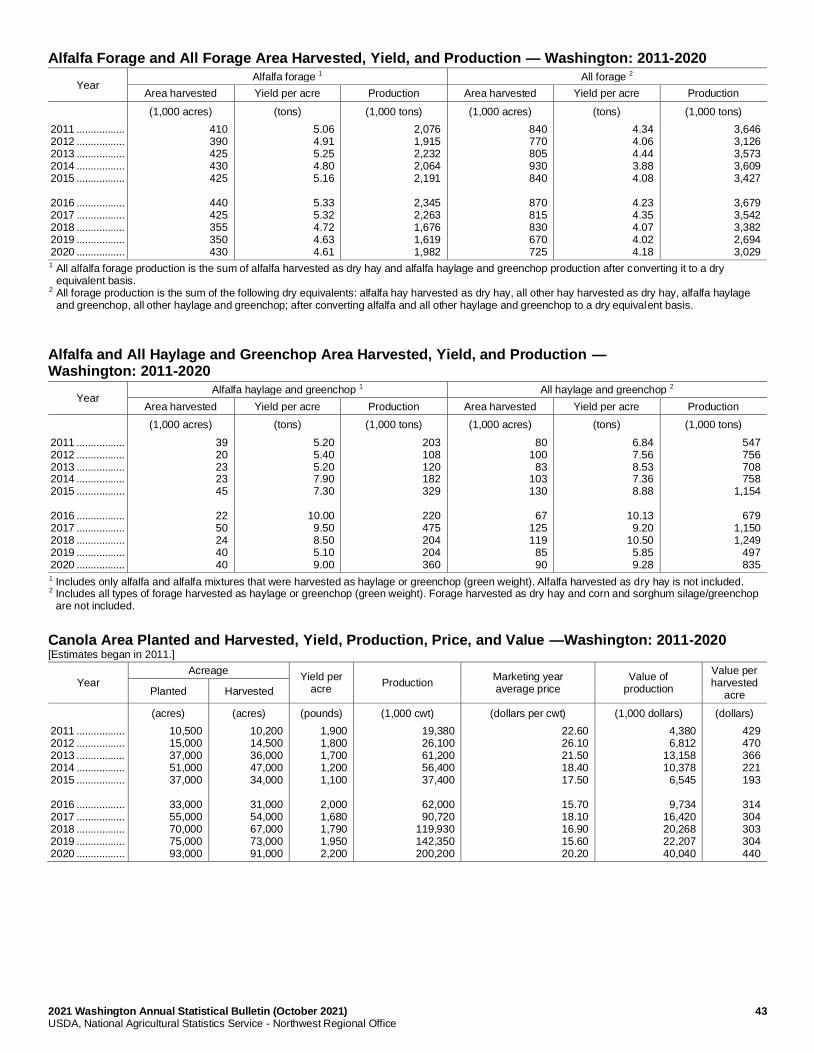
2021 Washington Annual Statistical Bulletin (October 2021) 43 USDA, National Agricultural Statistics Service - Northwest Regional Office
Alfalfa Forage and All Forage Area Harvested, Yield, and Production — Washington: 2011-2020
Year Alfalfa forage 1 All forage 2
Area harvested Yield per acre Production Area harvested Yield per acre Production
(1,000 acres) (tons) (1,000 tons) (1,000 acres) (tons) (1,000 tons)
2011 ................. 2012 ................. 2013 ................. 2014 ................. 2015 ................. 2016 ................. 2017 ................. 2018 ................. 2019 ................. 2020 .................
410 390 425 430 425
440 425 355 350 430
5.06 4.91 5.25 4.80 5.16
5.33 5.32 4.72 4.63 4.61
2,076 1,915 2,232 2,064 2,191
2,345 2,263 1,676 1,619 1,982
840 770 805 930 840
870 815 830 670 725
4.34 4.06 4.44 3.88 4.08
4.23 4.35 4.07 4.02 4.18
3,646 3,126 3,573 3,609 3,427
3,679 3,542 3,382 2,694 3,029
1 All alfalfa forage production is the sum of alfalfa harvested as dry hay and alfalfa haylage and greenchop production after converting it to a dry equivalent basis.
2 All forage production is the sum of the following dry equivalents: alfalfa hay harvested as dry hay, all other hay harvested as dry hay, alfalfa haylage and greenchop, all other haylage and greenchop; after converting alfalfa and all other haylage and greenchop to a dry equivalent basis.
Alfalfa and All Haylage and Greenchop Area Harvested, Yield, and Production — Washington: 2011-2020
Year Alfalfa haylage and greenchop 1 All haylage and greenchop 2
Area harvested Yield per acre Production Area harvested Yield per acre Production
(1,000 acres) (tons) (1,000 tons) (1,000 acres) (tons) (1,000 tons)
2011 ................. 2012 ................. 2013 ................. 2014 ................. 2015 ................. 2016 ................. 2017 ................. 2018 ................. 2019 ................. 2020 .................
39 20 23 23 45
22 50 24 40 40
5.20 5.40 5.20 7.90 7.30
10.00 9.50 8.50 5.10 9.00
203 108 120 182 329
220 475 204 204 360
80 100
83 103 130
67
125 119
85 90
6.84 7.56 8.53 7.36 8.88
10.13 9.20
10.50 5.85 9.28
547 756 708 758
1,154
679 1,150 1,249
497 835
1 Includes only alfalfa and alfalfa mixtures that were harvested as haylage or greenchop (green weight). Alfalfa harvested as dry hay is not included. 2 Includes all types of forage harvested as haylage or greenchop (green weight). Forage harvested as dry hay and corn and sorghum silage/greenchop
are not included.
Canola Area Planted and Harvested, Yield, Production, Price, and Value —Washington: 2011-2020 [Estimates began in 2011.]
Year Acreage
Yield per acre
Production Marketing year average price
Value of production
Value per harvested
acre Planted Harvested
(acres) (acres) (pounds) (1,000 cwt) (dollars per cwt) (1,000 dollars) (dollars)
2011 ................. 2012 ................. 2013 ................. 2014 ................. 2015 ................. 2016 ................. 2017 ................. 2018 ................. 2019 ................. 2020 .................
10,500 15,000 37,000 51,000 37,000
33,000 55,000 70,000 75,000 93,000
10,200 14,500 36,000 47,000 34,000
31,000 54,000 67,000 73,000 91,000
1,900 1,800 1,700 1,200 1,100
2,000 1,680 1,790 1,950 2,200
19,380 26,100 61,200 56,400 37,400
62,000 90,720
119,930 142,350 200,200
22.60 26.10 21.50 18.40 17.50
15.70 18.10 16.90 15.60 20.20
4,380 6,812
13,158 10,378
6,545
9,734 16,420 20,268 22,207 40,040
429 470 366 221 193
314 304 303 304 440
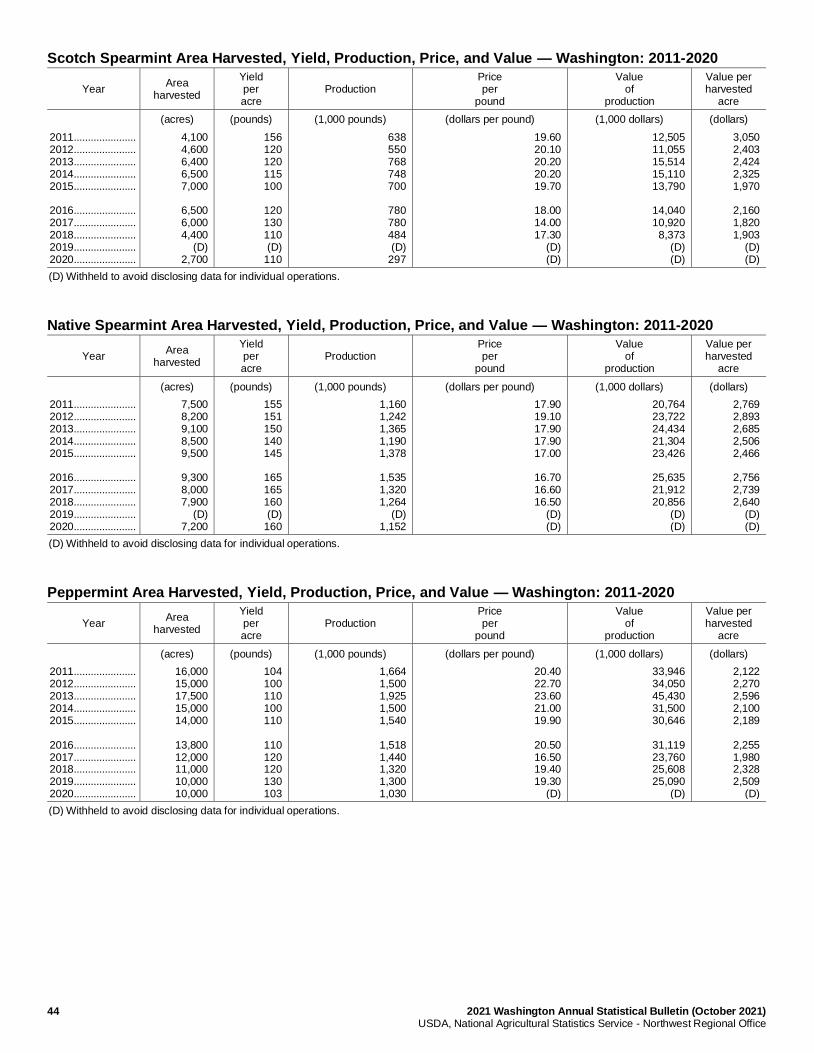
44 2021 Washington Annual Statistical Bulletin (October 2021) USDA, National Agricultural Statistics Service - Northwest Regional Office
Scotch Spearmint Area Harvested, Yield, Production, Price, and Value — Washington: 2011-2020
Year Area
harvested
Yield per acre
Production Price per
pound
Value of
production
Value per harvested
acre
(acres) (pounds) (1,000 pounds) (dollars per pound) (1,000 dollars) (dollars)
2011 ...................... 2012 ...................... 2013 ...................... 2014 ...................... 2015 ...................... 2016 ...................... 2017 ...................... 2018 ...................... 2019 ...................... 2020 ......................
4,100 4,600 6,400 6,500 7,000
6,500 6,000 4,400
(D) 2,700
156 120 120 115 100
120 130 110 (D)
110
638 550 768 748 700
780 780 484 (D)
297
19.60 20.10 20.20 20.20 19.70
18.00 14.00 17.30
(D) (D)
12,505 11,055 15,514 15,110 13,790
14,040 10,920
8,373 (D) (D)
3,050 2,403 2,424 2,325 1,970
2,160 1,820 1,903
(D) (D)
(D) Withheld to avoid disclosing data for individual operations.
Native Spearmint Area Harvested, Yield, Production, Price, and Value — Washington: 2011-2020
Year Area
harvested
Yield per acre
Production Price per
pound
Value of
production
Value per harvested
acre
(acres) (pounds) (1,000 pounds) (dollars per pound) (1,000 dollars) (dollars)
2011 ...................... 2012 ...................... 2013 ...................... 2014 ...................... 2015 ...................... 2016 ...................... 2017 ...................... 2018 ...................... 2019 ...................... 2020 ......................
7,500 8,200 9,100 8,500 9,500
9,300 8,000 7,900
(D) 7,200
155 151 150 140 145
165 165 160 (D)
160
1,160 1,242 1,365 1,190 1,378
1,535 1,320 1,264
(D) 1,152
17.90 19.10 17.90 17.90 17.00
16.70 16.60 16.50
(D) (D)
20,764 23,722 24,434 21,304 23,426
25,635 21,912 20,856
(D) (D)
2,769 2,893 2,685 2,506 2,466
2,756 2,739 2,640
(D) (D)
(D) Withheld to avoid disclosing data for individual operations.
Peppermint Area Harvested, Yield, Production, Price, and Value — Washington: 2011-2020
Year Area
harvested
Yield per acre
Production Price per
pound
Value of
production
Value per harvested
acre
(acres) (pounds) (1,000 pounds) (dollars per pound) (1,000 dollars) (dollars)
2011 ...................... 2012 ...................... 2013 ...................... 2014 ...................... 2015 ...................... 2016 ...................... 2017 ...................... 2018 ...................... 2019 ...................... 2020 ......................
16,000 15,000 17,500 15,000 14,000
13,800 12,000 11,000 10,000 10,000
104 100 110 100 110
110 120 120 130 103
1,664 1,500 1,925 1,500 1,540
1,518 1,440 1,320 1,300 1,030
20.40 22.70 23.60 21.00 19.90
20.50 16.50 19.40 19.30
(D)
33,946 34,050 45,430 31,500 30,646
31,119 23,760 25,608 25,090
(D)
2,122 2,270 2,596 2,100 2,189
2,255 1,980 2,328 2,509
(D)
(D) Withheld to avoid disclosing data for individual operations.
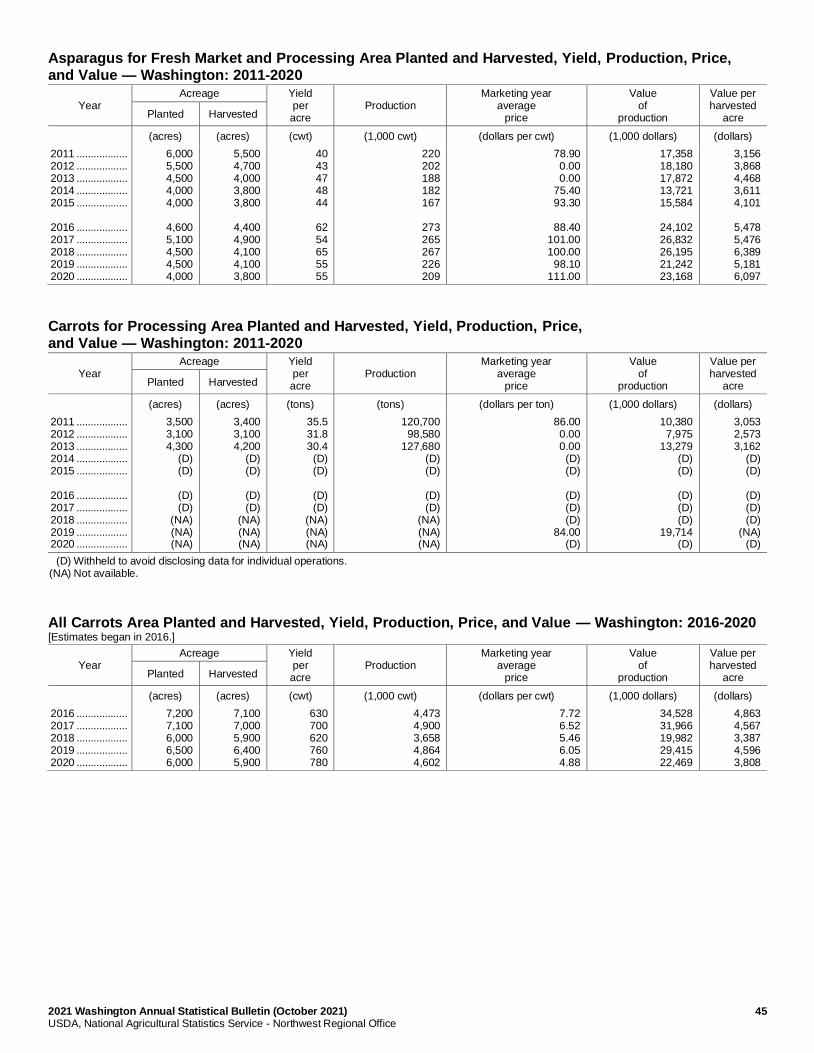
2021 Washington Annual Statistical Bulletin (October 2021) 45 USDA, National Agricultural Statistics Service - Northwest Regional Office
Asparagus for Fresh Market and Processing Area Planted and Harvested, Yield, Production, Price, and Value — Washington: 2011-2020
Year Acreage Yield
per acre
Production Marketing year
average price
Value of
production
Value per harvested
acre Planted Harvested
(acres) (acres) (cwt) (1,000 cwt) (dollars per cwt) (1,000 dollars) (dollars)
2011 .................. 2012 .................. 2013 .................. 2014 .................. 2015 .................. 2016 .................. 2017 .................. 2018 .................. 2019 .................. 2020 ..................
6,000 5,500 4,500 4,000 4,000
4,600 5,100 4,500 4,500 4,000
5,500 4,700 4,000 3,800 3,800
4,400 4,900 4,100 4,100 3,800
40 43 47 48 44
62 54 65 55 55
220 202 188 182 167
273 265 267 226 209
78.90 0.00 0.00
75.40 93.30
88.40
101.00 100.00
98.10 111.00
17,358 18,180 17,872 13,721 15,584
24,102 26,832 26,195 21,242 23,168
3,156 3,868 4,468 3,611 4,101
5,478 5,476 6,389 5,181 6,097
Carrots for Processing Area Planted and Harvested, Yield, Production, Price, and Value — Washington: 2011-2020
Year Acreage Yield
per acre
Production Marketing year
average price
Value of
production
Value per harvested
acre Planted Harvested
(acres) (acres) (tons) (tons) (dollars per ton) (1,000 dollars) (dollars)
2011 .................. 2012 .................. 2013 .................. 2014 .................. 2015 .................. 2016 .................. 2017 .................. 2018 .................. 2019 .................. 2020 ..................
3,500 3,100 4,300
(D) (D)
(D) (D)
(NA) (NA) (NA)
3,400 3,100 4,200
(D) (D)
(D) (D)
(NA) (NA) (NA)
35.5 31.8 30.4
(D) (D)
(D) (D)
(NA) (NA) (NA)
120,700 98,580
127,680 (D) (D)
(D) (D)
(NA) (NA) (NA)
86.00 0.00 0.00
(D) (D)
(D) (D) (D)
84.00 (D)
10,380 7,975
13,279 (D) (D)
(D) (D) (D)
19,714 (D)
3,053 2,573 3,162
(D) (D)
(D) (D) (D)
(NA) (D)
(D) Withheld to avoid disclosing data for individual operations. (NA) Not available.
All Carrots Area Planted and Harvested, Yield, Production, Price, and Value — Washington: 2016-2020 [Estimates began in 2016.]
Year Acreage Yield
per acre
Production Marketing year
average price
Value of
production
Value per harvested
acre Planted Harvested
(acres) (acres) (cwt) (1,000 cwt) (dollars per cwt) (1,000 dollars) (dollars)
2016 .................. 2017 .................. 2018 .................. 2019 .................. 2020 ..................
7,200 7,100 6,000 6,500 6,000
7,100 7,000 5,900 6,400 5,900
630 700 620 760 780
4,473 4,900 3,658 4,864 4,602
7.72 6.52 5.46 6.05 4.88
34,528 31,966 19,982 29,415 22,469
4,863 4,567 3,387 4,596 3,808
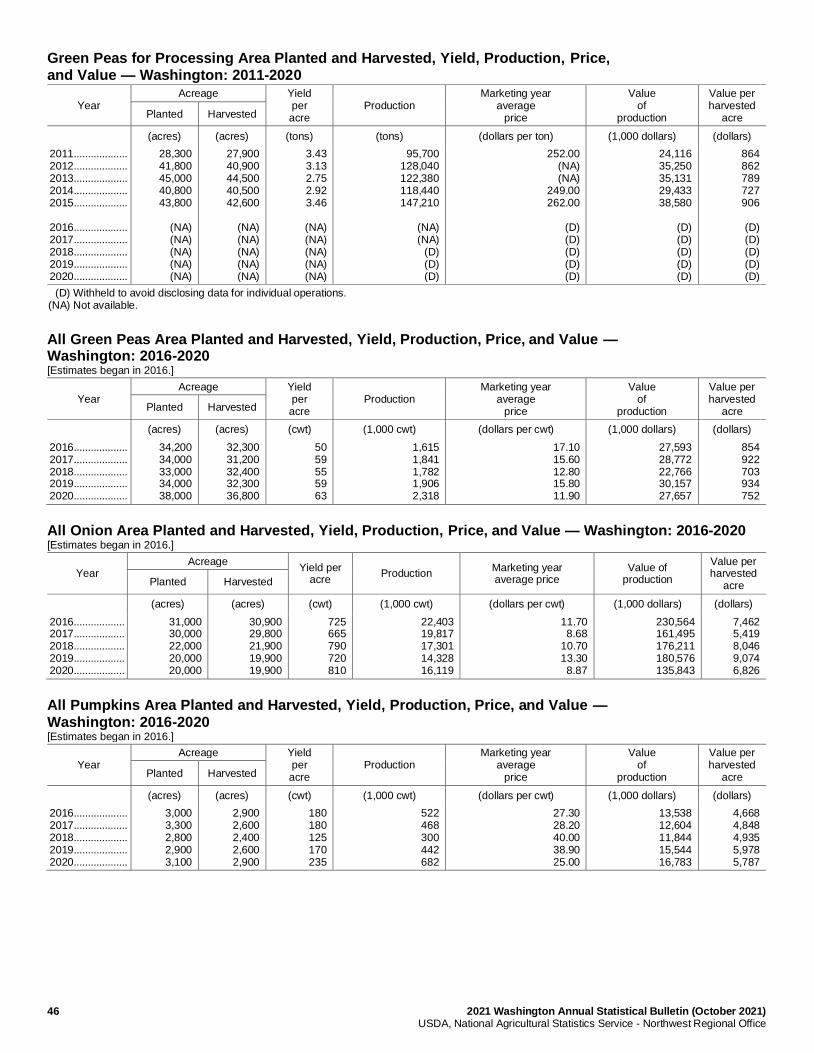
46 2021 Washington Annual Statistical Bulletin (October 2021) USDA, National Agricultural Statistics Service - Northwest Regional Office
Green Peas for Processing Area Planted and Harvested, Yield, Production, Price, and Value — Washington: 2011-2020
Year Acreage Yield
per acre
Production Marketing year
average price
Value of
production
Value per harvested
acre Planted Harvested
(acres) (acres) (tons) (tons) (dollars per ton) (1,000 dollars) (dollars)
2011 ................... 2012 ................... 2013 ................... 2014 ................... 2015 ................... 2016 ................... 2017 ................... 2018 ................... 2019 ................... 2020 ...................
28,300 41,800 45,000 40,800 43,800
(NA) (NA) (NA) (NA) (NA)
27,900 40,900 44,500 40,500 42,600
(NA) (NA) (NA) (NA) (NA)
3.43 3.13 2.75 2.92 3.46
(NA) (NA) (NA) (NA) (NA)
95,700 128,040 122,380 118,440 147,210
(NA) (NA)
(D) (D) (D)
252.00 (NA) (NA)
249.00 262.00
(D) (D) (D) (D) (D)
24,116 35,250 35,131 29,433 38,580
(D) (D) (D) (D) (D)
864 862 789 727 906
(D) (D) (D) (D) (D)
(D) Withheld to avoid disclosing data for individual operations. (NA) Not available.
All Green Peas Area Planted and Harvested, Yield, Production, Price, and Value — Washington: 2016-2020 [Estimates began in 2016.]
Year Acreage Yield
per acre
Production Marketing year
average price
Value of
production
Value per harvested
acre Planted Harvested
(acres) (acres) (cwt) (1,000 cwt) (dollars per cwt) (1,000 dollars) (dollars)
2016 ................... 2017 ................... 2018 ................... 2019 ................... 2020 ...................
34,200 34,000 33,000 34,000 38,000
32,300 31,200 32,400 32,300 36,800
50 59 55 59 63
1,615 1,841 1,782 1,906 2,318
17.10 15.60 12.80 15.80 11.90
27,593 28,772 22,766 30,157 27,657
854 922 703 934 752
All Onion Area Planted and Harvested, Yield, Production, Price, and Value — Washington: 2016-2020 [Estimates began in 2016.]
Year Acreage
Yield per acre
Production Marketing year average price
Value of production
Value per harvested
acre Planted Harvested
(acres) (acres) (cwt) (1,000 cwt) (dollars per cwt) (1,000 dollars) (dollars)
2016 .................. 2017 .................. 2018 .................. 2019 .................. 2020 ..................
31,000 30,000 22,000 20,000 20,000
30,900 29,800 21,900 19,900 19,900
725 665 790 720 810
22,403 19,817 17,301 14,328 16,119
11.70 8.68
10.70 13.30 8.87
230,564 161,495 176,211 180,576 135,843
7,462 5,419 8,046 9,074 6,826
All Pumpkins Area Planted and Harvested, Yield, Production, Price, and Value — Washington: 2016-2020 [Estimates began in 2016.]
Year Acreage Yield
per acre
Production Marketing year
average price
Value of
production
Value per harvested
acre Planted Harvested
(acres) (acres) (cwt) (1,000 cwt) (dollars per cwt) (1,000 dollars) (dollars)
2016 ................... 2017 ................... 2018 ................... 2019 ................... 2020 ...................
3,000 3,300 2,800 2,900 3,100
2,900 2,600 2,400 2,600 2,900
180 180 125 170 235
522 468 300 442 682
27.30 28.20 40.00 38.90 25.00
13,538 12,604 11,844 15,544 16,783
4,668 4,848 4,935 5,978 5,787
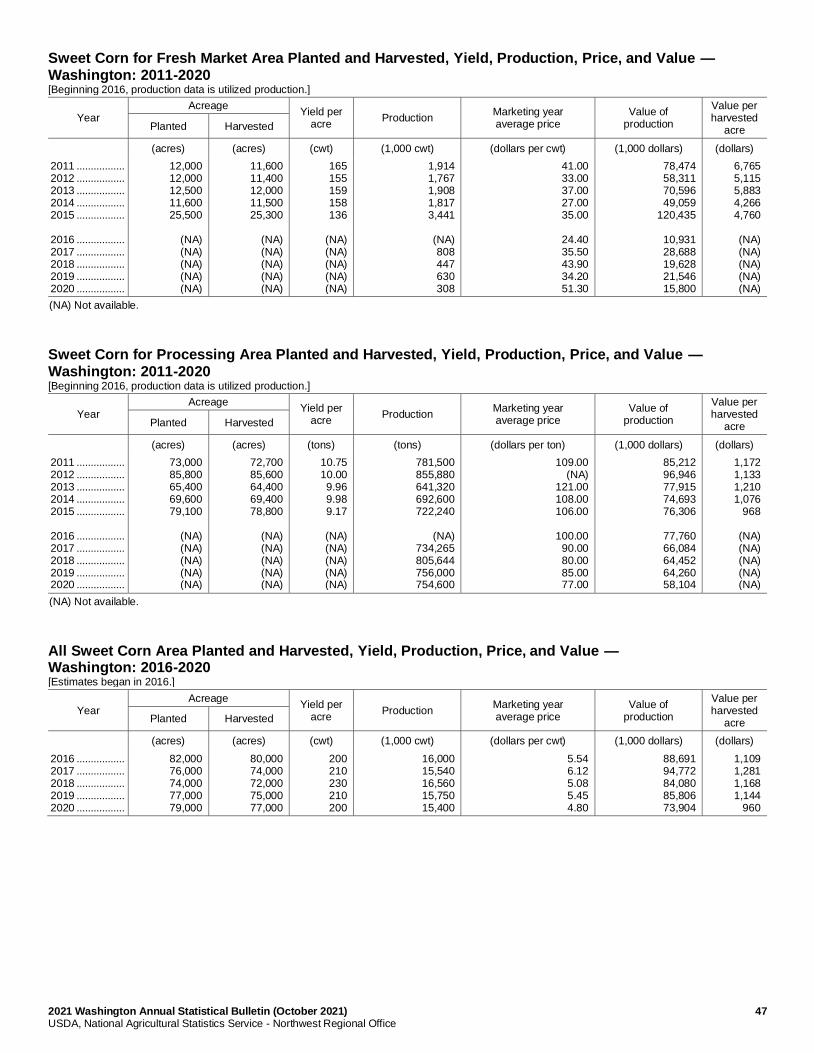
2021 Washington Annual Statistical Bulletin (October 2021) 47 USDA, National Agricultural Statistics Service - Northwest Regional Office
Sweet Corn for Fresh Market Area Planted and Harvested, Yield, Production, Price, and Value — Washington: 2011-2020 [Beginning 2016, production data is utilized production.]
Year Acreage
Yield per acre
Production Marketing year average price
Value of production
Value per harvested
acre Planted Harvested
(acres) (acres) (cwt) (1,000 cwt) (dollars per cwt) (1,000 dollars) (dollars)
2011 ................. 2012 ................. 2013 ................. 2014 ................. 2015 ................. 2016 ................. 2017 ................. 2018 ................. 2019 ................. 2020 .................
12,000 12,000 12,500 11,600 25,500
(NA) (NA) (NA) (NA) (NA)
11,600 11,400 12,000 11,500 25,300
(NA) (NA) (NA) (NA) (NA)
165 155 159 158 136
(NA) (NA) (NA) (NA) (NA)
1,914 1,767 1,908 1,817 3,441
(NA) 808 447 630 308
41.00 33.00 37.00 27.00 35.00
24.40 35.50 43.90 34.20 51.30
78,474 58,311 70,596 49,059
120,435
10,931 28,688 19,628 21,546 15,800
6,765 5,115 5,883 4,266 4,760
(NA) (NA) (NA) (NA) (NA)
(NA) Not available.
Sweet Corn for Processing Area Planted and Harvested, Yield, Production, Price, and Value — Washington: 2011-2020 [Beginning 2016, production data is utilized production.]
Year Acreage
Yield per acre
Production Marketing year average price
Value of production
Value per harvested
acre Planted Harvested
(acres) (acres) (tons) (tons) (dollars per ton) (1,000 dollars) (dollars)
2011 ................. 2012 ................. 2013 ................. 2014 ................. 2015 ................. 2016 ................. 2017 ................. 2018 ................. 2019 ................. 2020 .................
73,000 85,800 65,400 69,600 79,100
(NA) (NA) (NA) (NA) (NA)
72,700 85,600 64,400 69,400 78,800
(NA) (NA) (NA) (NA) (NA)
10.75 10.00 9.96 9.98 9.17
(NA) (NA) (NA) (NA) (NA)
781,500 855,880 641,320 692,600 722,240
(NA)
734,265 805,644 756,000 754,600
109.00 (NA)
121.00 108.00 106.00
100.00
90.00 80.00 85.00 77.00
85,212 96,946 77,915 74,693 76,306
77,760 66,084 64,452 64,260 58,104
1,172 1,133 1,210 1,076
968
(NA) (NA) (NA) (NA) (NA)
(NA) Not available.
All Sweet Corn Area Planted and Harvested, Yield, Production, Price, and Value — Washington: 2016-2020 [Estimates began in 2016.]
Year Acreage
Yield per acre
Production Marketing year average price
Value of production
Value per harvested
acre Planted Harvested
(acres) (acres) (cwt) (1,000 cwt) (dollars per cwt) (1,000 dollars) (dollars)
2016 ................. 2017 ................. 2018 ................. 2019 ................. 2020 .................
82,000 76,000 74,000 77,000 79,000
80,000 74,000 72,000 75,000 77,000
200 210 230 210 200
16,000 15,540 16,560 15,750 15,400
5.54 6.12 5.08 5.45 4.80
88,691 94,772 84,080 85,806 73,904
1,109 1,281 1,168 1,144
960
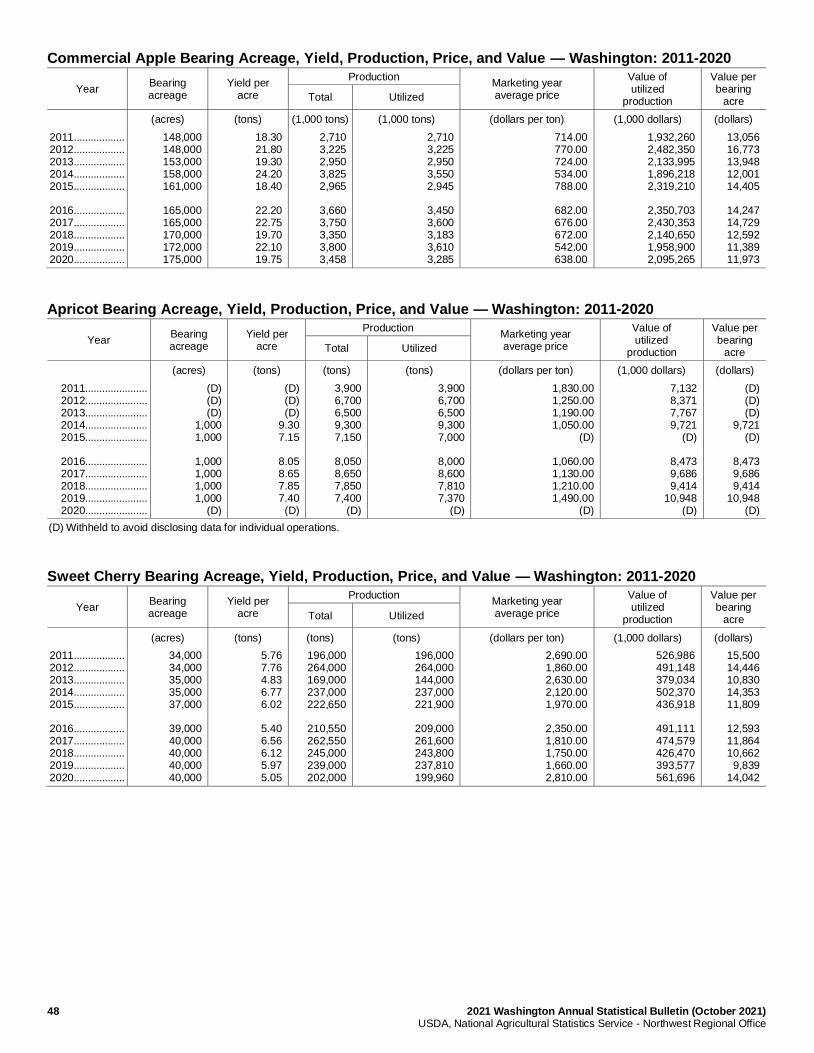
48 2021 Washington Annual Statistical Bulletin (October 2021) USDA, National Agricultural Statistics Service - Northwest Regional Office
Commercial Apple Bearing Acreage, Yield, Production, Price, and Value — Washington: 2011-2020
Year Bearing acreage
Yield per acre
Production Marketing year average price
Value of utilized
production
Value per bearing
acre Total Utilized
(acres) (tons) (1,000 tons) (1,000 tons) (dollars per ton) (1,000 dollars) (dollars)
2011 .................. 2012 .................. 2013 .................. 2014 .................. 2015 .................. 2016 .................. 2017 .................. 2018 .................. 2019 .................. 2020 ..................
148,000 148,000 153,000 158,000 161,000
165,000 165,000 170,000 172,000 175,000
18.30 21.80 19.30 24.20 18.40
22.20 22.75 19.70 22.10 19.75
2,710 3,225 2,950 3,825 2,965
3,660 3,750 3,350 3,800 3,458
2,710 3,225 2,950 3,550 2,945
3,450 3,600 3,183 3,610 3,285
714.00 770.00 724.00 534.00 788.00
682.00 676.00 672.00 542.00 638.00
1,932,260 2,482,350 2,133,995 1,896,218 2,319,210
2,350,703 2,430,353 2,140,650 1,958,900 2,095,265
13,056 16,773 13,948 12,001 14,405
14,247 14,729 12,592 11,389 11,973
Apricot Bearing Acreage, Yield, Production, Price, and Value — Washington: 2011-2020
Year Bearing acreage
Yield per acre
Production Marketing year average price
Value of utilized
production
Value per bearing
acre Total Utilized
(acres) (tons) (tons) (tons) (dollars per ton) (1,000 dollars) (dollars)
2011...................... 2012...................... 2013...................... 2014...................... 2015...................... 2016...................... 2017...................... 2018...................... 2019...................... 2020......................
(D) (D) (D)
1,000 1,000
1,000 1,000 1,000 1,000
(D)
(D) (D) (D)
9.30 7.15
8.05 8.65 7.85 7.40
(D)
3,900 6,700 6,500 9,300 7,150
8,050 8,650 7,850 7,400
(D)
3,900 6,700 6,500 9,300 7,000
8,000 8,600 7,810 7,370
(D)
1,830.00 1,250.00 1,190.00 1,050.00
(D)
1,060.00 1,130.00 1,210.00 1,490.00
(D)
7,132 8,371 7,767 9,721
(D)
8,473 9,686 9,414
10,948 (D)
(D) (D) (D)
9,721 (D)
8,473 9,686 9,414
10,948 (D)
(D) Withheld to avoid disclosing data for individual operations.
Sweet Cherry Bearing Acreage, Yield, Production, Price, and Value — Washington: 2011-2020
Year Bearing acreage
Yield per acre
Production Marketing year average price
Value of utilized
production
Value per bearing
acre Total Utilized
(acres) (tons) (tons) (tons) (dollars per ton) (1,000 dollars) (dollars)
2011 .................. 2012 .................. 2013 .................. 2014 .................. 2015 .................. 2016 .................. 2017 .................. 2018 .................. 2019 .................. 2020 ..................
34,000 34,000 35,000 35,000 37,000
39,000 40,000 40,000 40,000 40,000
5.76 7.76 4.83 6.77 6.02
5.40 6.56 6.12 5.97 5.05
196,000 264,000 169,000 237,000 222,650
210,550 262,550 245,000 239,000 202,000
196,000 264,000 144,000 237,000 221,900
209,000 261,600 243,800 237,810 199,960
2,690.00 1,860.00 2,630.00 2,120.00 1,970.00
2,350.00 1,810.00 1,750.00 1,660.00 2,810.00
526,986 491,148 379,034 502,370 436,918
491,111 474,579 426,470 393,577 561,696
15,500 14,446 10,830 14,353 11,809
12,593 11,864 10,662
9,839 14,042
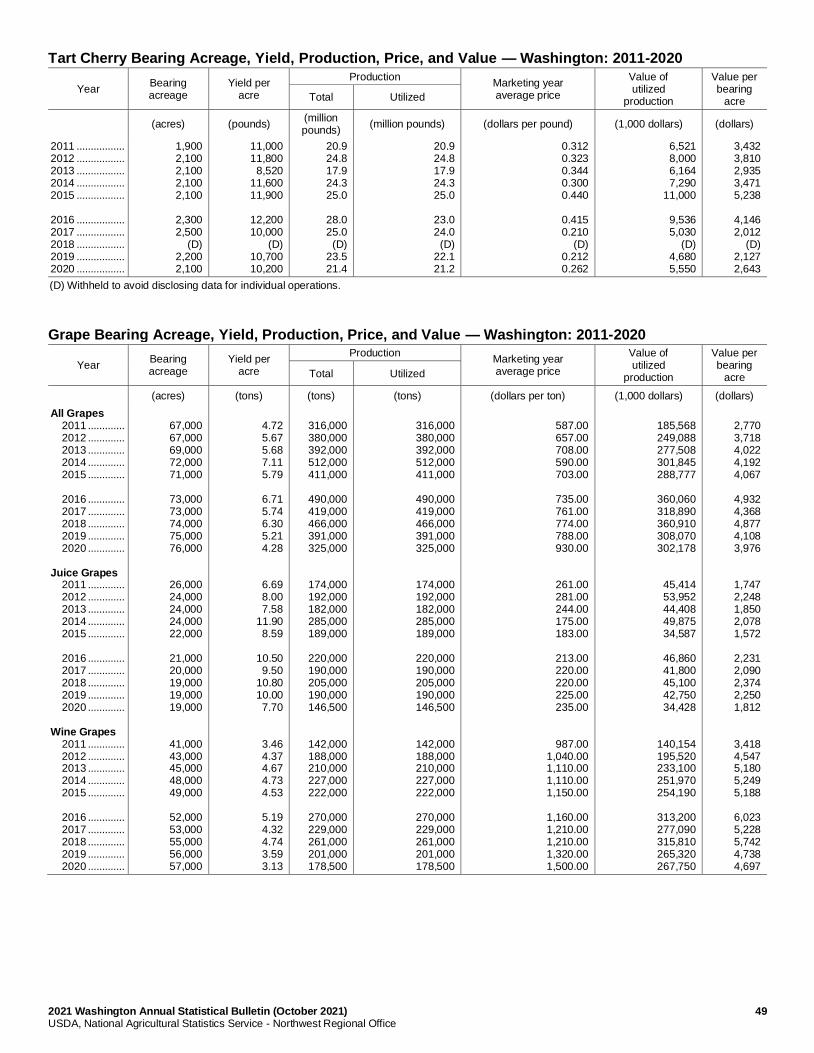
2021 Washington Annual Statistical Bulletin (October 2021) 49 USDA, National Agricultural Statistics Service - Northwest Regional Office
Tart Cherry Bearing Acreage, Yield, Production, Price, and Value — Washington: 2011-2020
Year Bearing acreage
Yield per acre
Production Marketing year average price
Value of utilized
production
Value per bearing
acre Total Utilized
(acres) (pounds) (million pounds)
(million pounds) (dollars per pound) (1,000 dollars) (dollars)
2011 ................. 2012 ................. 2013 ................. 2014 ................. 2015 ................. 2016 ................. 2017 ................. 2018 ................. 2019 ................. 2020 .................
1,900 2,100 2,100 2,100 2,100
2,300 2,500
(D) 2,200 2,100
11,000 11,800
8,520 11,600 11,900
12,200 10,000
(D) 10,700 10,200
20.9 24.8 17.9 24.3 25.0
28.0 25.0
(D) 23.5 21.4
20.9 24.8 17.9 24.3 25.0
23.0 24.0
(D) 22.1 21.2
0.312 0.323 0.344 0.300 0.440
0.415 0.210
(D) 0.212 0.262
6,521 8,000 6,164 7,290
11,000
9,536 5,030
(D) 4,680 5,550
3,432 3,810 2,935 3,471 5,238
4,146 2,012
(D) 2,127 2,643
(D) Withheld to avoid disclosing data for individual operations.
Grape Bearing Acreage, Yield, Production, Price, and Value — Washington: 2011-2020
Year Bearing acreage
Yield per acre
Production Marketing year average price
Value of utilized
production
Value per bearing
acre Total Utilized
(acres) (tons) (tons) (tons) (dollars per ton) (1,000 dollars) (dollars)
All Grapes 2011 ............. 2012 ............. 2013 ............. 2014 ............. 2015 ............. 2016 ............. 2017 ............. 2018 ............. 2019 ............. 2020 ............. Juice Grapes 2011 ............. 2012 ............. 2013 ............. 2014 ............. 2015 ............. 2016 ............. 2017 ............. 2018 ............. 2019 ............. 2020 ............. Wine Grapes 2011 ............. 2012 ............. 2013 ............. 2014 ............. 2015 ............. 2016 ............. 2017 ............. 2018 ............. 2019 ............. 2020 .............
67,000 67,000 69,000 72,000 71,000
73,000 73,000 74,000 75,000 76,000
26,000 24,000 24,000 24,000 22,000
21,000 20,000 19,000 19,000 19,000
41,000 43,000 45,000 48,000 49,000
52,000 53,000 55,000 56,000 57,000
4.72 5.67 5.68 7.11 5.79
6.71 5.74 6.30 5.21 4.28
6.69 8.00 7.58
11.90 8.59
10.50 9.50
10.80 10.00 7.70
3.46 4.37 4.67 4.73 4.53
5.19 4.32 4.74 3.59 3.13
316,000 380,000 392,000 512,000 411,000
490,000 419,000 466,000 391,000 325,000
174,000 192,000 182,000 285,000 189,000
220,000 190,000 205,000 190,000 146,500
142,000 188,000 210,000 227,000 222,000
270,000 229,000 261,000 201,000 178,500
316,000 380,000 392,000 512,000 411,000
490,000 419,000 466,000 391,000 325,000
174,000 192,000 182,000 285,000 189,000
220,000 190,000 205,000 190,000 146,500
142,000 188,000 210,000 227,000 222,000
270,000 229,000 261,000 201,000 178,500
587.00 657.00 708.00 590.00 703.00
735.00 761.00 774.00 788.00 930.00
261.00 281.00 244.00 175.00 183.00
213.00 220.00 220.00 225.00 235.00
987.00 1,040.00 1,110.00 1,110.00 1,150.00
1,160.00 1,210.00 1,210.00 1,320.00 1,500.00
185,568 249,088 277,508 301,845 288,777
360,060 318,890 360,910 308,070 302,178
45,414 53,952 44,408 49,875 34,587
46,860 41,800 45,100 42,750 34,428
140,154 195,520 233,100 251,970 254,190
313,200 277,090 315,810 265,320 267,750
2,770 3,718 4,022 4,192 4,067
4,932 4,368 4,877 4,108 3,976
1,747 2,248 1,850 2,078 1,572
2,231 2,090 2,374 2,250 1,812
3,418 4,547 5,180 5,249 5,188
6,023 5,228 5,742 4,738 4,697
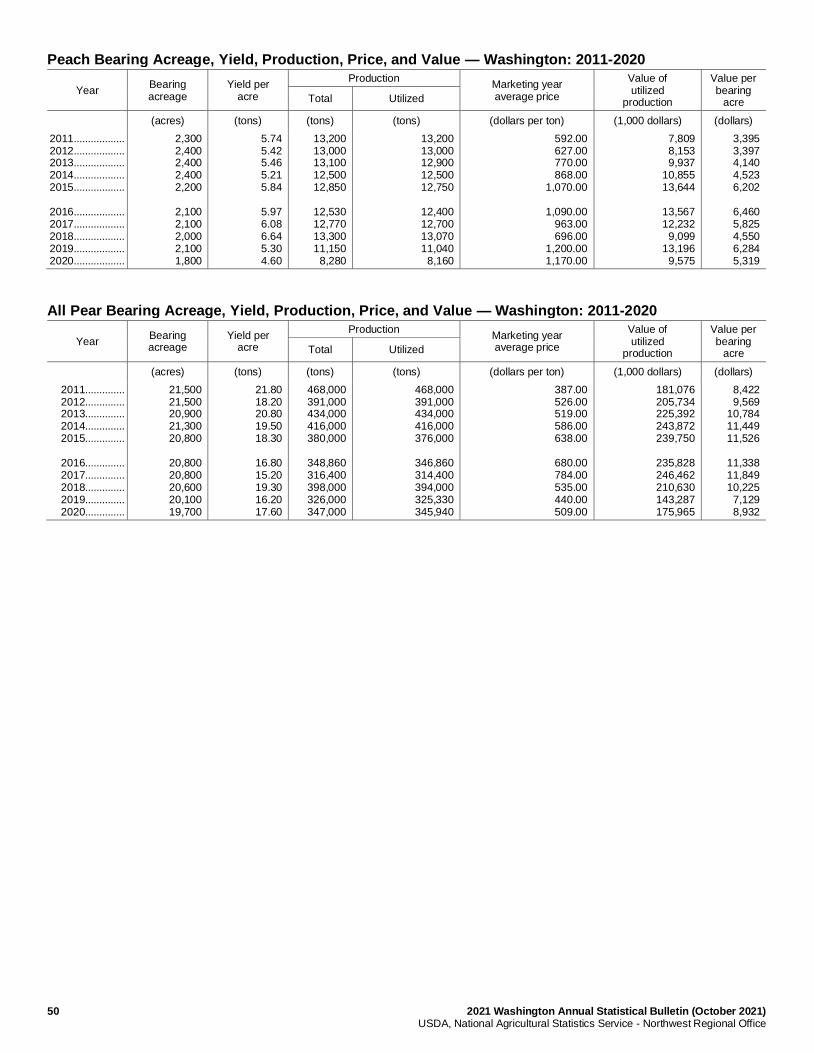
50 2021 Washington Annual Statistical Bulletin (October 2021) USDA, National Agricultural Statistics Service - Northwest Regional Office
Peach Bearing Acreage, Yield, Production, Price, and Value — Washington: 2011-2020
Year Bearing acreage
Yield per acre
Production Marketing year average price
Value of utilized
production
Value per bearing
acre Total Utilized
(acres) (tons) (tons) (tons) (dollars per ton) (1,000 dollars) (dollars)
2011 .................. 2012 .................. 2013 .................. 2014 .................. 2015 .................. 2016 .................. 2017 .................. 2018 .................. 2019 .................. 2020 ..................
2,300 2,400 2,400 2,400 2,200
2,100 2,100 2,000 2,100 1,800
5.74 5.42 5.46 5.21 5.84
5.97 6.08 6.64 5.30 4.60
13,200 13,000 13,100 12,500 12,850
12,530 12,770 13,300 11,150
8,280
13,200 13,000 12,900 12,500 12,750
12,400 12,700 13,070 11,040
8,160
592.00 627.00 770.00 868.00
1,070.00
1,090.00 963.00 696.00
1,200.00 1,170.00
7,809 8,153 9,937
10,855 13,644
13,567 12,232
9,099 13,196
9,575
3,395 3,397 4,140 4,523 6,202
6,460 5,825 4,550 6,284 5,319
All Pear Bearing Acreage, Yield, Production, Price, and Value — Washington: 2011-2020
Year Bearing acreage
Yield per acre
Production Marketing year average price
Value of utilized
production
Value per bearing
acre Total Utilized
(acres) (tons) (tons) (tons) (dollars per ton) (1,000 dollars) (dollars)
2011.............. 2012.............. 2013.............. 2014.............. 2015.............. 2016.............. 2017.............. 2018.............. 2019.............. 2020..............
21,500 21,500 20,900 21,300 20,800
20,800 20,800 20,600 20,100 19,700
21.80 18.20 20.80 19.50 18.30
16.80 15.20 19.30 16.20 17.60
468,000 391,000 434,000 416,000 380,000
348,860 316,400 398,000 326,000 347,000
468,000 391,000 434,000 416,000 376,000
346,860 314,400 394,000 325,330 345,940
387.00 526.00 519.00 586.00 638.00
680.00 784.00 535.00 440.00 509.00
181,076 205,734 225,392 243,872 239,750
235,828 246,462 210,630 143,287 175,965
8,422 9,569
10,784 11,449 11,526
11,338 11,849 10,225
7,129 8,932
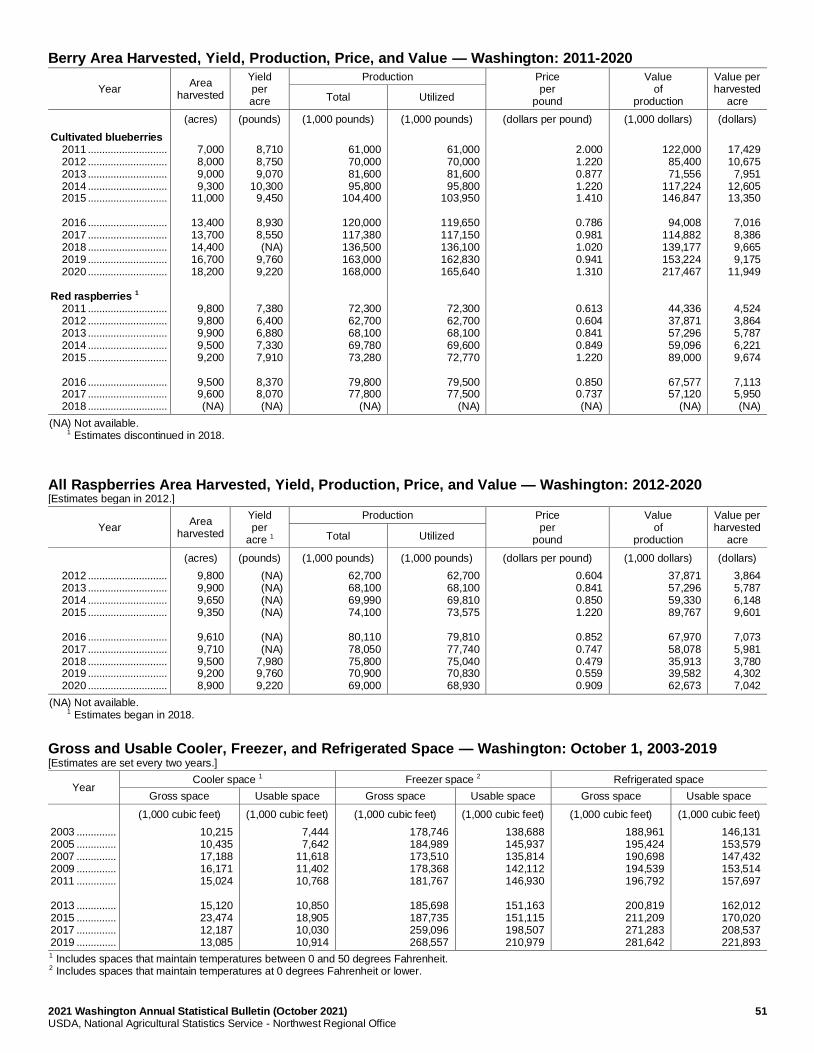
2021 Washington Annual Statistical Bulletin (October 2021) 51 USDA, National Agricultural Statistics Service - Northwest Regional Office
Berry Area Harvested, Yield, Production, Price, and Value — Washington: 2011-2020
Year Area
harvested
Yield per acre
Production Price per
pound
Value of
production
Value per harvested
acre Total Utilized
(acres) (pounds) (1,000 pounds) (1,000 pounds) (dollars per pound) (1,000 dollars) (dollars)
Cultivated blueberries 2011 ............................ 2012 ............................ 2013 ............................ 2014 ............................ 2015 ............................ 2016 ............................ 2017 ............................ 2018 ............................ 2019 ............................ 2020 ............................ Red raspberries 1 2011 ............................ 2012 ............................ 2013 ............................ 2014 ............................ 2015 ............................ 2016 ............................ 2017 ............................ 2018 ............................
7,000 8,000 9,000 9,300
11,000
13,400 13,700 14,400 16,700 18,200
9,800 9,800 9,900 9,500 9,200
9,500 9,600 (NA)
8,710 8,750 9,070
10,300 9,450
8,930 8,550 (NA)
9,760 9,220
7,380 6,400 6,880 7,330 7,910
8,370 8,070 (NA)
61,000 70,000 81,600 95,800
104,400
120,000 117,380 136,500 163,000 168,000
72,300 62,700 68,100 69,780 73,280
79,800 77,800
(NA)
61,000 70,000 81,600 95,800
103,950
119,650 117,150 136,100 162,830 165,640
72,300 62,700 68,100 69,600 72,770
79,500 77,500
(NA)
2.000 1.220 0.877 1.220 1.410
0.786 0.981 1.020 0.941 1.310
0.613 0.604 0.841 0.849 1.220
0.850 0.737 (NA)
122,000
85,400 71,556
117,224 146,847
94,008
114,882 139,177 153,224 217,467
44,336 37,871 57,296 59,096 89,000
67,577 57,120
(NA)
17,429 10,675
7,951 12,605 13,350
7,016 8,386 9,665 9,175
11,949
4,524 3,864 5,787 6,221 9,674
7,113 5,950 (NA)
(NA) Not available. 1 Estimates discontinued in 2018.
All Raspberries Area Harvested, Yield, Production, Price, and Value — Washington: 2012-2020 [Estimates began in 2012.]
Year Area
harvested
Yield per
acre 1
Production Price per
pound
Value of
production
Value per harvested
acre Total Utilized
(acres) (pounds) (1,000 pounds) (1,000 pounds) (dollars per pound) (1,000 dollars) (dollars)
2012 ............................ 2013 ............................ 2014 ............................ 2015 ............................ 2016 ............................ 2017 ............................ 2018 ............................ 2019 ............................ 2020 ............................
9,800 9,900 9,650 9,350
9,610 9,710 9,500 9,200 8,900
(NA) (NA) (NA) (NA)
(NA) (NA)
7,980 9,760 9,220
62,700 68,100 69,990 74,100
80,110 78,050 75,800 70,900 69,000
62,700 68,100 69,810 73,575
79,810 77,740 75,040 70,830 68,930
0.604 0.841 0.850 1.220
0.852 0.747 0.479 0.559 0.909
37,871 57,296 59,330 89,767
67,970 58,078 35,913 39,582 62,673
3,864 5,787 6,148 9,601
7,073 5,981 3,780 4,302 7,042
(NA) Not available. 1 Estimates began in 2018.
Gross and Usable Cooler, Freezer, and Refrigerated Space — Washington: October 1, 2003-2019 [Estimates are set every two years.]
Year Cooler space 1 Freezer space 2 Refrigerated space
Gross space Usable space Gross space Usable space Gross space Usable space
(1,000 cubic feet) (1,000 cubic feet) (1,000 cubic feet) (1,000 cubic feet) (1,000 cubic feet) (1,000 cubic feet)
2003 .............. 2005 .............. 2007 .............. 2009 .............. 2011 .............. 2013 .............. 2015 .............. 2017 .............. 2019 ..............
10,215 10,435 17,188 16,171 15,024
15,120 23,474 12,187 13,085
7,444 7,642
11,618 11,402 10,768
10,850 18,905 10,030 10,914
178,746 184,989 173,510 178,368 181,767
185,698 187,735 259,096 268,557
138,688 145,937 135,814 142,112 146,930
151,163 151,115 198,507 210,979
188,961 195,424 190,698 194,539 196,792
200,819 211,209 271,283 281,642
146,131 153,579 147,432 153,514 157,697
162,012 170,020 208,537 221,893
1 Includes spaces that maintain temperatures between 0 and 50 degrees Fahrenheit. 2 Includes spaces that maintain temperatures at 0 degrees Fahrenheit or lower.
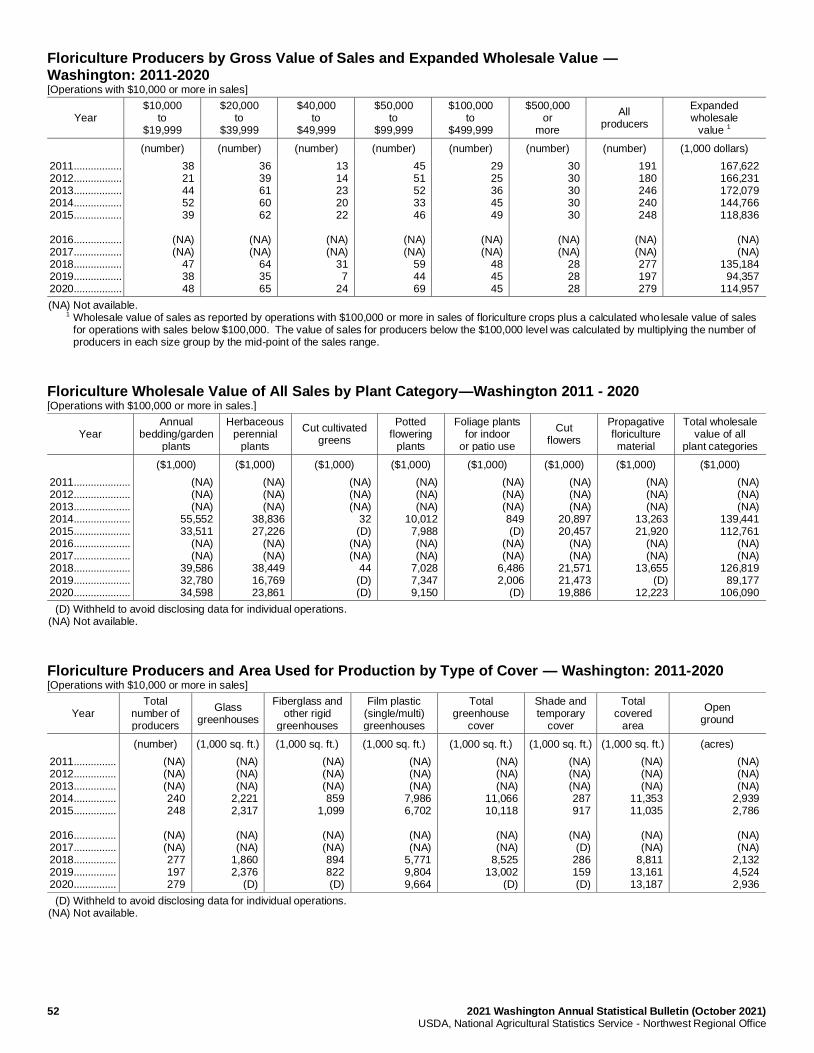
52 2021 Washington Annual Statistical Bulletin (October 2021) USDA, National Agricultural Statistics Service - Northwest Regional Office
Floriculture Producers by Gross Value of Sales and Expanded Wholesale Value — Washington: 2011-2020 [Operations with $10,000 or more in sales]
Year $10,000
to $19,999
$20,000 to
$39,999
$40,000 to
$49,999
$50,000 to
$99,999
$100,000 to
$499,999
$500,000 or
more
All producers
Expanded wholesale
value 1
(number) (number) (number) (number) (number) (number) (number) (1,000 dollars)
2011 ................. 2012 ................. 2013 ................. 2014 ................. 2015 ................. 2016 ................. 2017 ................. 2018 ................. 2019 ................. 2020 .................
38 21 44 52 39
(NA) (NA)
47 38 48
36 39 61 60 62
(NA) (NA)
64 35 65
13 14 23 20 22
(NA) (NA)
31 7
24
45 51 52 33 46
(NA) (NA)
59 44 69
29 25 36 45 49
(NA) (NA)
48 45 45
30 30 30 30 30
(NA) (NA)
28 28 28
191 180 246 240 248
(NA) (NA) 277 197 279
167,622 166,231 172,079 144,766 118,836
(NA) (NA)
135,184 94,357
114,957
(NA) Not available. 1 Wholesale value of sales as reported by operations with $100,000 or more in sales of floriculture crops plus a calculated wholesale value of sales
for operations with sales below $100,000. The value of sales for producers below the $100,000 level was calculated by multiplying the number of producers in each size group by the mid-point of the sales range.
Floriculture Wholesale Value of All Sales by Plant Category—Washington 2011 - 2020 [Operations with $100,000 or more in sales.]
Year Annual
bedding/garden plants
Herbaceous perennial
plants
Cut cultivated greens
Potted flowering
plants
Foliage plants for indoor
or patio use
Cut flowers
Propagative floriculture material
Total wholesale value of all
plant categories
($1,000) ($1,000) ($1,000) ($1,000) ($1,000) ($1,000) ($1,000) ($1,000)
2011 .................... 2012 .................... 2013 .................... 2014 .................... 2015 .................... 2016 .................... 2017 .................... 2018 .................... 2019 .................... 2020 ....................
(NA) (NA) (NA)
55,552 33,511
(NA) (NA)
39,586 32,780 34,598
(NA) (NA) (NA)
38,836 27,226
(NA) (NA)
38,449 16,769 23,861
(NA) (NA) (NA)
32 (D)
(NA) (NA)
44 (D) (D)
(NA) (NA) (NA)
10,012 7,988 (NA) (NA)
7,028 7,347 9,150
(NA) (NA) (NA) 849 (D)
(NA) (NA)
6,486 2,006
(D)
(NA) (NA) (NA)
20,897 20,457
(NA) (NA)
21,571 21,473 19,886
(NA) (NA) (NA)
13,263 21,920
(NA) (NA)
13,655 (D)
12,223
(NA) (NA) (NA)
139,441 112,761
(NA) (NA)
126,819 89,177
106,090
(D) Withheld to avoid disclosing data for individual operations. (NA) Not available.
Floriculture Producers and Area Used for Production by Type of Cover — Washington: 2011-2020 [Operations with $10,000 or more in sales]
Year Total
number of producers
Glass greenhouses
Fiberglass and other rigid
greenhouses
Film plastic (single/multi) greenhouses
Total greenhouse
cover
Shade and temporary
cover
Total covered
area
Open ground
(number) (1,000 sq. ft.) (1,000 sq. ft.) (1,000 sq. ft.) (1,000 sq. ft.) (1,000 sq. ft.) (1,000 sq. ft.) (acres)
2011 ............... 2012 ............... 2013 ............... 2014 ............... 2015 ............... 2016 ............... 2017 ............... 2018 ............... 2019 ............... 2020 ...............
(NA) (NA) (NA) 240 248
(NA) (NA) 277 197 279
(NA) (NA) (NA)
2,221 2,317
(NA) (NA)
1,860 2,376
(D)
(NA) (NA) (NA) 859
1,099
(NA) (NA) 894 822 (D)
(NA) (NA) (NA)
7,986 6,702
(NA) (NA)
5,771 9,804 9,664
(NA) (NA) (NA)
11,066 10,118
(NA) (NA)
8,525 13,002
(D)
(NA) (NA) (NA) 287 917
(NA)
(D) 286 159 (D)
(NA) (NA) (NA)
11,353 11,035
(NA) (NA)
8,811 13,161 13,187
(NA) (NA) (NA)
2,939 2,786
(NA) (NA)
2,132 4,524 2,936
(D) Withheld to avoid disclosing data for individual operations. (NA) Not available.
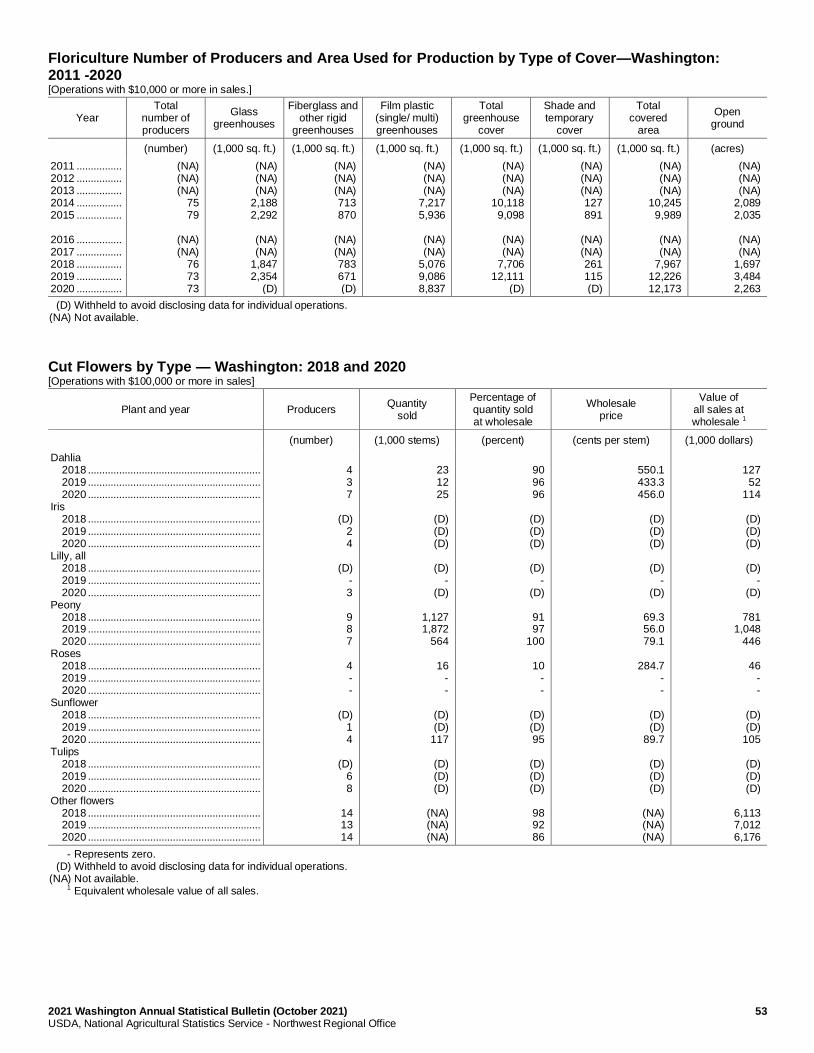
2021 Washington Annual Statistical Bulletin (October 2021) 53 USDA, National Agricultural Statistics Service - Northwest Regional Office
Floriculture Number of Producers and Area Used for Production by Type of Cover—Washington: 2011 -2020 [Operations with $10,000 or more in sales.]
Year Total
number of producers
Glass greenhouses
Fiberglass and other rigid
greenhouses
Film plastic (single/ multi) greenhouses
Total greenhouse
cover
Shade and temporary
cover
Total covered
area
Open ground
(number) (1,000 sq. ft.) (1,000 sq. ft.) (1,000 sq. ft.) (1,000 sq. ft.) (1,000 sq. ft.) (1,000 sq. ft.) (acres)
2011 ................ 2012 ................ 2013 ................ 2014 ................ 2015 ................ 2016 ................ 2017 ................ 2018 ................ 2019 ................ 2020 ................
(NA) (NA) (NA)
75 79
(NA) (NA)
76 73 73
(NA) (NA) (NA)
2,188 2,292
(NA) (NA)
1,847 2,354
(D)
(NA) (NA) (NA) 713 870
(NA) (NA) 783 671 (D)
(NA) (NA) (NA)
7,217 5,936
(NA) (NA)
5,076 9,086 8,837
(NA) (NA) (NA)
10,118 9,098
(NA) (NA)
7,706 12,111
(D)
(NA) (NA) (NA) 127 891
(NA) (NA) 261 115 (D)
(NA) (NA) (NA)
10,245 9,989
(NA) (NA)
7,967 12,226 12,173
(NA) (NA) (NA)
2,089 2,035
(NA) (NA)
1,697 3,484 2,263
(D) Withheld to avoid disclosing data for individual operations. (NA) Not available.
Cut Flowers by Type — Washington: 2018 and 2020 [Operations with $100,000 or more in sales]
Plant and year Producers Quantity
sold
Percentage of quantity sold at wholesale
Wholesale price
Value of all sales at wholesale 1
(number) (1,000 stems) (percent) (cents per stem) (1,000 dollars)
Dahlia 2018 ............................................................. 2019 ............................................................. 2020 ............................................................. Iris 2018 ............................................................. 2019 ............................................................. 2020 ............................................................. Lilly, all 2018 ............................................................. 2019 ............................................................. 2020 ............................................................. Peony 2018 ............................................................. 2019 ............................................................. 2020 ............................................................. Roses 2018 ............................................................. 2019 ............................................................. 2020 ............................................................. Sunflower 2018 ............................................................. 2019 ............................................................. 2020 ............................................................. Tulips 2018 ............................................................. 2019 ............................................................. 2020 ............................................................. Other flowers 2018 ............................................................. 2019 ............................................................. 2020 .............................................................
4 3 7
(D)
2 4
(D)
- 3
9 8 7
4 - -
(D) 1 4
(D)
6 8
14 13 14
23 12 25
(D) (D) (D)
(D)
- (D)
1,127 1,872
564
16 - -
(D) (D)
117
(D) (D) (D)
(NA) (NA) (NA)
90 96 96
(D) (D) (D)
(D)
- (D)
91 97
100
10 - -
(D) (D) 95
(D) (D) (D)
98 92 86
550.1 433.3 456.0
(D) (D) (D)
(D)
- (D)
69.3 56.0 79.1
284.7
- -
(D) (D)
89.7
(D) (D) (D)
(NA) (NA) (NA)
127
52 114
(D) (D) (D)
(D)
- (D)
781
1,048 446
46
- -
(D) (D)
105
(D) (D) (D)
6,113 7,012 6,176
- Represents zero. (D) Withheld to avoid disclosing data for individual operations. (NA) Not available. 1 Equivalent wholesale value of all sales.
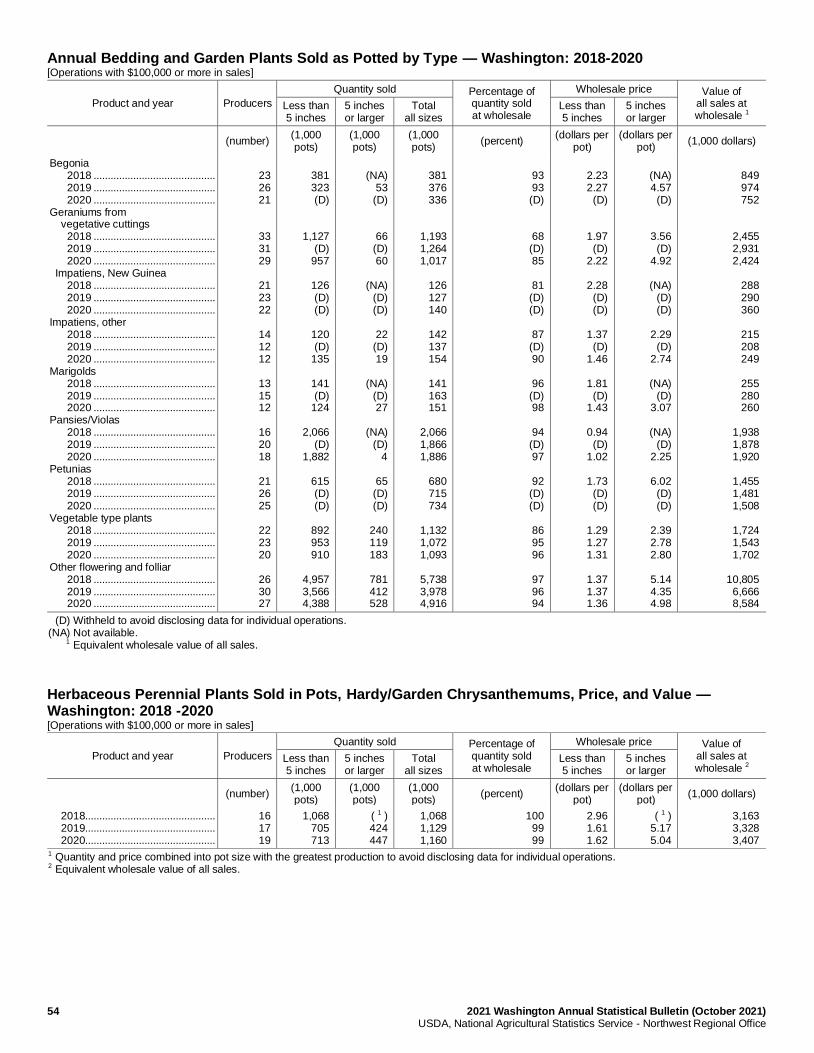
54 2021 Washington Annual Statistical Bulletin (October 2021) USDA, National Agricultural Statistics Service - Northwest Regional Office
Annual Bedding and Garden Plants Sold as Potted by Type — Washington: 2018-2020 [Operations with $100,000 or more in sales]
Product and year Producers
Quantity sold Percentage of quantity sold at wholesale
Wholesale price Value of all sales at wholesale 1
Less than 5 inches
5 inches or larger
Total all sizes
Less than 5 inches
5 inches or larger
(number) (1,000 pots)
(1,000 pots)
(1,000 pots)
(percent) (dollars per
pot) (dollars per
pot) (1,000 dollars)
Begonia 2018 ........................................... 2019 ........................................... 2020 ........................................... Geraniums from vegetative cuttings 2018 ........................................... 2019 ........................................... 2020 ........................................... Impatiens, New Guinea 2018 ........................................... 2019 ........................................... 2020 ........................................... Impatiens, other 2018 ........................................... 2019 ........................................... 2020 ........................................... Marigolds 2018 ........................................... 2019 ........................................... 2020 ........................................... Pansies/Violas 2018 ........................................... 2019 ........................................... 2020 ........................................... Petunias 2018 ........................................... 2019 ........................................... 2020 ........................................... Vegetable type plants 2018 ........................................... 2019 ........................................... 2020 ........................................... Other flowering and folliar 2018 ........................................... 2019 ........................................... 2020 ...........................................
23 26 21
33 31 29
21 23 22
14 12 12
13 15 12
16 20 18
21 26 25
22 23 20
26 30 27
381 323 (D)
1,127 (D)
957
126 (D) (D)
120 (D)
135
141 (D)
124
2,066 (D)
1,882
615 (D) (D)
892 953 910
4,957 3,566 4,388
(NA)
53 (D)
66 (D) 60
(NA)
(D) (D)
22 (D) 19
(NA)
(D) 27
(NA)
(D) 4
65 (D) (D)
240 119 183
781 412 528
381 376 336
1,193 1,264 1,017
126 127 140
142 137 154
141 163 151
2,066 1,866 1,886
680 715 734
1,132 1,072 1,093
5,738 3,978 4,916
93 93 (D)
68 (D) 85
81 (D) (D)
87 (D) 90
96 (D) 98
94 (D) 97
92 (D) (D)
86 95 96
97 96 94
2.23 2.27
(D)
1.97 (D)
2.22
2.28 (D) (D)
1.37
(D) 1.46
1.81
(D) 1.43
0.94
(D) 1.02
1.73
(D) (D)
1.29 1.27 1.31
1.37 1.37 1.36
(NA) 4.57
(D)
3.56 (D)
4.92
(NA) (D) (D)
2.29
(D) 2.74
(NA)
(D) 3.07
(NA)
(D) 2.25
6.02
(D) (D)
2.39 2.78 2.80
5.14 4.35 4.98
849 974 752
2,455 2,931 2,424
288 290 360
215 208 249
255 280 260
1,938 1,878 1,920
1,455 1,481 1,508
1,724 1,543 1,702
10,805
6,666 8,584
(D) Withheld to avoid disclosing data for individual operations. (NA) Not available. 1 Equivalent wholesale value of all sales.
Herbaceous Perennial Plants Sold in Pots, Hardy/Garden Chrysanthemums, Price, and Value — Washington: 2018 -2020 [Operations with $100,000 or more in sales]
Product and year Producers
Quantity sold Percentage of quantity sold at wholesale
Wholesale price Value of all sales at wholesale 2
Less than 5 inches
5 inches or larger
Total all sizes
Less than 5 inches
5 inches or larger
(number) (1,000 pots)
(1,000 pots)
(1,000 pots)
(percent) (dollars per
pot) (dollars per
pot) (1,000 dollars)
2018.............................................. 2019.............................................. 2020..............................................
16 17 19
1,068 705 713
( 1 ) 424 447
1,068 1,129 1,160
100 99 99
2.96 1.61 1.62
( 1 ) 5.17 5.04
3,163 3,328 3,407
1 Quantity and price combined into pot size with the greatest production to avoid disclosing data for individual operations. 2 Equivalent wholesale value of all sales.
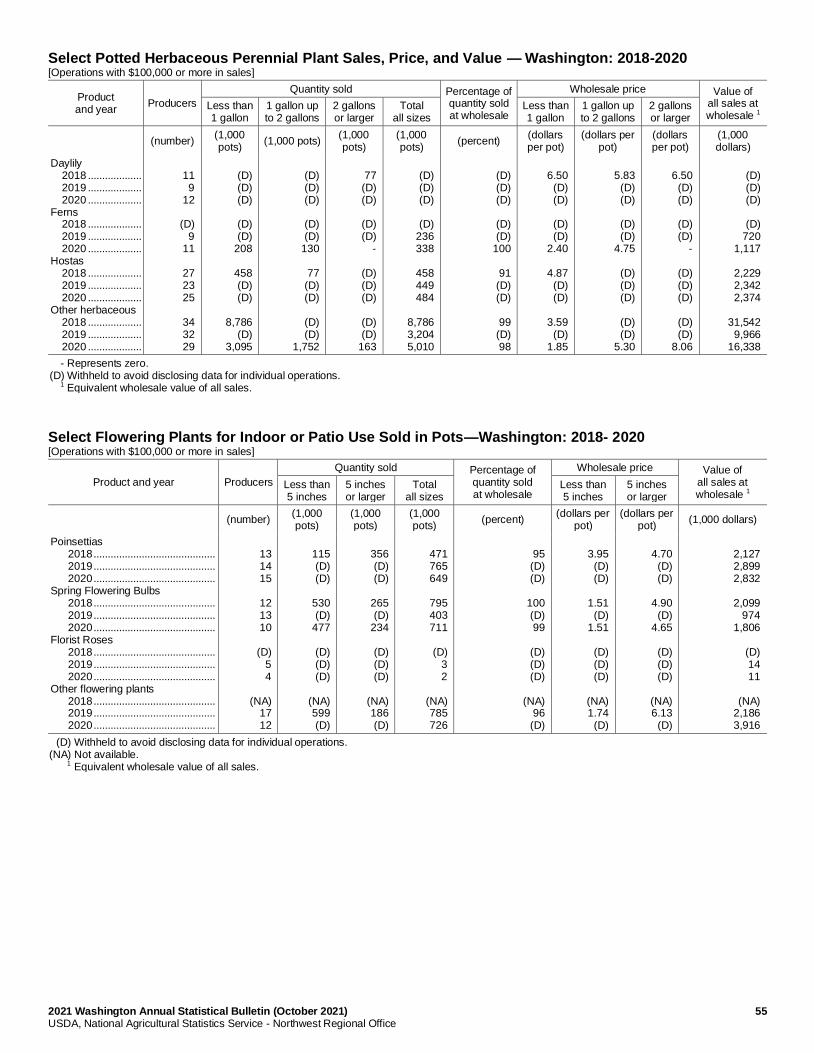
2021 Washington Annual Statistical Bulletin (October 2021) 55 USDA, National Agricultural Statistics Service - Northwest Regional Office
Select Potted Herbaceous Perennial Plant Sales, Price, and Value — Washington: 2018-2020 [Operations with $100,000 or more in sales]
Product and year
Producers
Quantity sold Percentage of quantity sold at wholesale
Wholesale price Value of all sales at wholesale 1
Less than 1 gallon
1 gallon up to 2 gallons
2 gallons or larger
Total all sizes
Less than 1 gallon
1 gallon up to 2 gallons
2 gallons or larger
(number) (1,000 pots)
(1,000 pots) (1,000 pots)
(1,000 pots)
(percent) (dollars per pot)
(dollars per pot)
(dollars per pot)
(1,000 dollars)
Daylily 2018 ................... 2019 ................... 2020 ................... Ferns 2018 ................... 2019 ................... 2020 ................... Hostas 2018 ................... 2019 ................... 2020 ................... Other herbaceous 2018 ................... 2019 ................... 2020 ...................
11 9
12
(D) 9
11
27 23 25
34 32 29
(D) (D) (D)
(D) (D)
208
458 (D) (D)
8,786
(D) 3,095
(D) (D) (D)
(D) (D)
130
77 (D) (D)
(D) (D)
1,752
77 (D) (D)
(D) (D)
-
(D) (D) (D)
(D) (D)
163
(D) (D) (D)
(D)
236 338
458 449 484
8,786 3,204 5,010
(D) (D) (D)
(D) (D)
100
91 (D) (D)
99 (D) 98
6.50
(D) (D)
(D) (D)
2.40
4.87 (D) (D)
3.59
(D) 1.85
5.83
(D) (D)
(D) (D)
4.75
(D) (D) (D)
(D) (D)
5.30
6.50
(D) (D)
(D) (D)
-
(D) (D) (D)
(D) (D)
8.06
(D) (D) (D)
(D)
720 1,117
2,229 2,342 2,374
31,542
9,966 16,338
- Represents zero. (D) Withheld to avoid disclosing data for individual operations. 1 Equivalent wholesale value of all sales.
Select Flowering Plants for Indoor or Patio Use Sold in Pots—Washington: 2018- 2020 [Operations with $100,000 or more in sales]
Product and year Producers
Quantity sold Percentage of quantity sold at wholesale
Wholesale price Value of all sales at wholesale 1
Less than 5 inches
5 inches or larger
Total all sizes
Less than 5 inches
5 inches or larger
(number) (1,000 pots)
(1,000 pots)
(1,000 pots)
(percent) (dollars per
pot) (dollars per
pot) (1,000 dollars)
Poinsettias 2018 ........................................... 2019 ........................................... 2020 ........................................... Spring Flowering Bulbs 2018 ........................................... 2019 ........................................... 2020 ........................................... Florist Roses 2018 ........................................... 2019 ........................................... 2020 ........................................... Other flowering plants 2018 ........................................... 2019 ........................................... 2020 ...........................................
13 14 15
12 13 10
(D)
5 4
(NA)
17 12
115 (D) (D)
530 (D)
477
(D) (D) (D)
(NA) 599 (D)
356 (D) (D)
265 (D)
234
(D) (D) (D)
(NA) 186 (D)
471 765 649
795 403 711
(D)
3 2
(NA) 785 726
95 (D) (D)
100 (D) 99
(D) (D) (D)
(NA)
96 (D)
3.95
(D) (D)
1.51
(D) 1.51
(D) (D) (D)
(NA) 1.74
(D)
4.70
(D) (D)
4.90
(D) 4.65
(D) (D) (D)
(NA) 6.13
(D)
2,127 2,899 2,832
2,099
974 1,806
(D) 14 11
(NA)
2,186 3,916
(D) Withheld to avoid disclosing data for individual operations. (NA) Not available. 1 Equivalent wholesale value of all sales.
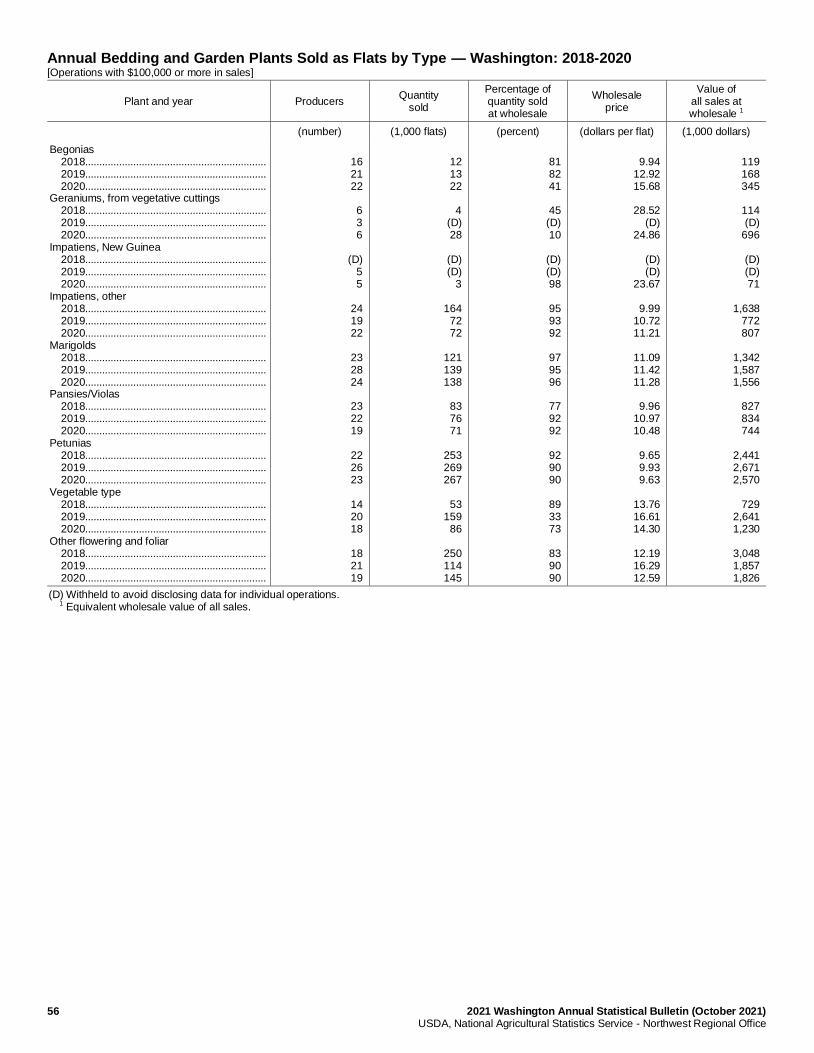
56 2021 Washington Annual Statistical Bulletin (October 2021) USDA, National Agricultural Statistics Service - Northwest Regional Office
Annual Bedding and Garden Plants Sold as Flats by Type — Washington: 2018-2020 [Operations with $100,000 or more in sales]
Plant and year Producers Quantity
sold
Percentage of quantity sold at wholesale
Wholesale price
Value of all sales at wholesale 1
(number) (1,000 flats) (percent) (dollars per flat) (1,000 dollars)
Begonias 2018................................................................ 2019................................................................ 2020................................................................ Geraniums, from vegetative cuttings 2018................................................................ 2019................................................................ 2020................................................................ Impatiens, New Guinea 2018................................................................ 2019................................................................ 2020................................................................ Impatiens, other 2018................................................................ 2019................................................................ 2020................................................................ Marigolds 2018................................................................ 2019................................................................ 2020................................................................ Pansies/Violas 2018................................................................ 2019................................................................ 2020................................................................ Petunias 2018................................................................ 2019................................................................ 2020................................................................ Vegetable type 2018................................................................ 2019................................................................ 2020................................................................ Other flowering and foliar 2018................................................................ 2019................................................................ 2020................................................................
16 21 22
6 3 6
(D)
5 5
24 19 22
23 28 24
23 22 19
22 26 23
14 20 18
18 21 19
12 13 22
4
(D) 28
(D) (D)
3
164 72 72
121 139 138
83 76 71
253 269 267
53
159 86
250 114 145
81 82 41
45 (D) 10
(D) (D) 98
95 93 92
97 95 96
77 92 92
92 90 90
89 33 73
83 90 90
9.94
12.92 15.68
28.52
(D) 24.86
(D) (D)
23.67
9.99 10.72 11.21
11.09 11.42 11.28
9.96
10.97 10.48
9.65 9.93 9.63
13.76 16.61 14.30
12.19 16.29 12.59
119 168 345
114 (D)
696
(D) (D) 71
1,638
772 807
1,342 1,587 1,556
827 834 744
2,441 2,671 2,570
729
2,641 1,230
3,048 1,857 1,826
(D) Withheld to avoid disclosing data for individual operations. 1 Equivalent wholesale value of all sales.
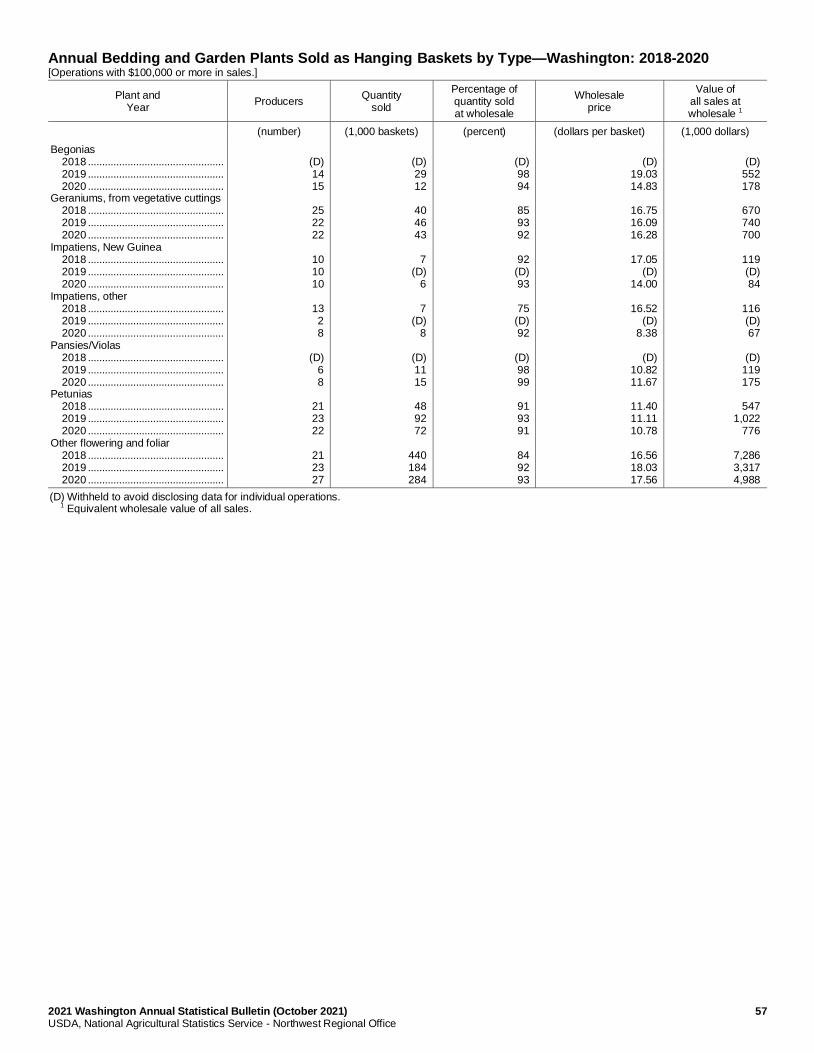
2021 Washington Annual Statistical Bulletin (October 2021) 57 USDA, National Agricultural Statistics Service - Northwest Regional Office
Annual Bedding and Garden Plants Sold as Hanging Baskets by Type—Washington: 2018-2020 [Operations with $100,000 or more in sales.]
Plant and Year
Producers Quantity
sold
Percentage of quantity sold at wholesale
Wholesale price
Value of all sales at wholesale 1
(number) (1,000 baskets) (percent) (dollars per basket) (1,000 dollars)
Begonias 2018 ................................................ 2019 ................................................ 2020 ................................................ Geraniums, from vegetative cuttings 2018 ................................................ 2019 ................................................ 2020 ................................................ Impatiens, New Guinea 2018 ................................................ 2019 ................................................ 2020 ................................................ Impatiens, other 2018 ................................................ 2019 ................................................ 2020 ................................................ Pansies/Violas 2018 ................................................ 2019 ................................................ 2020 ................................................ Petunias 2018 ................................................ 2019 ................................................ 2020 ................................................ Other flowering and foliar 2018 ................................................ 2019 ................................................ 2020 ................................................
(D) 14 15
25 22 22
10 10 10
13 2 8
(D)
6 8
21 23 22
21 23 27
(D) 29 12
40 46 43
7
(D) 6
7
(D) 8
(D) 11 15
48 92 72
440 184 284
(D) 98 94
85 93 92
92 (D) 93
75 (D) 92
(D) 98 99
91 93 91
84 92 93
(D)
19.03 14.83
16.75 16.09 16.28
17.05
(D) 14.00
16.52
(D) 8.38
(D)
10.82 11.67
11.40 11.11 10.78
16.56 18.03 17.56
(D)
552 178
670 740 700
119 (D) 84
116 (D) 67
(D)
119 175
547
1,022 776
7,286 3,317 4,988
(D) Withheld to avoid disclosing data for individual operations. 1 Equivalent wholesale value of all sales.
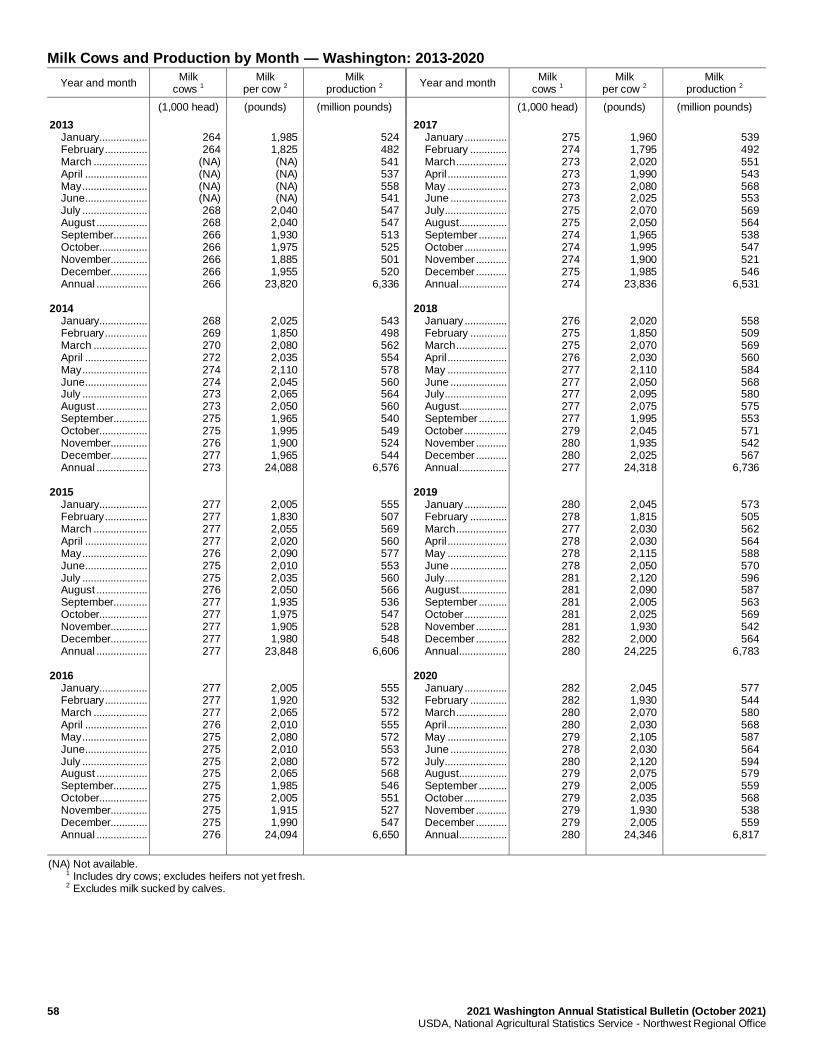
58 2021 Washington Annual Statistical Bulletin (October 2021) USDA, National Agricultural Statistics Service - Northwest Regional Office
Milk Cows and Production by Month — Washington: 2013-2020
Year and month Milk
cows 1 Milk
per cow 2 Milk
production 2 Year and month
Milk cows 1
Milk per cow 2
Milk production 2
(1,000 head) (pounds) (million pounds) (1,000 head) (pounds) (million pounds)
2013 January................. February ............... March ................... April ...................... May ....................... June ...................... July ....................... August .................. September............ October................. November............. December............. Annual .................. 2014 January................. February ............... March ................... April ...................... May ....................... June ...................... July ....................... August .................. September............ October................. November............. December............. Annual .................. 2015 January................. February ............... March ................... April ...................... May ....................... June ...................... July ....................... August .................. September............ October................. November............. December............. Annual .................. 2016 January................. February ............... March ................... April ...................... May ....................... June ...................... July ....................... August .................. September............ October................. November............. December............. Annual ..................
264 264
(NA) (NA) (NA) (NA) 268 268 266 266 266 266 266
268 269 270 272 274 274 273 273 275 275 276 277 273
277 277 277 277 276 275 275 276 277 277 277 277 277
277 277 277 276 275 275 275 275 275 275 275 275 276
1,985 1,825 (NA) (NA) (NA) (NA)
2,040 2,040 1,930 1,975 1,885 1,955
23,820
2,025 1,850 2,080 2,035 2,110 2,045 2,065 2,050 1,965 1,995 1,900 1,965
24,088
2,005 1,830 2,055 2,020 2,090 2,010 2,035 2,050 1,935 1,975 1,905 1,980
23,848
2,005 1,920 2,065 2,010 2,080 2,010 2,080 2,065 1,985 2,005 1,915 1,990
24,094
524 482 541 537 558 541 547 547 513 525 501 520
6,336
543 498 562 554 578 560 564 560 540 549 524 544
6,576
555 507 569 560 577 553 560 566 536 547 528 548
6,606
555 532 572 555 572 553 572 568 546 551 527 547
6,650
2017 January ............... February ............. March .................. April ..................... May ..................... June .................... July ...................... August ................. September .......... October ............... November ........... December ........... Annual ................. 2018 January ............... February ............. March .................. April ..................... May ..................... June .................... July ...................... August ................. September .......... October ............... November ........... December ........... Annual ................. 2019 January ............... February ............. March .................. April ..................... May ..................... June .................... July ...................... August ................. September .......... October ............... November ........... December ........... Annual ................. 2020 January ............... February ............. March .................. April ..................... May ..................... June .................... July ...................... August ................. September .......... October ............... November ........... December ........... Annual .................
275 274 273 273 273 273 275 275 274 274 274 275 274
276 275 275 276 277 277 277 277 277 279 280 280 277
280 278 277 278 278 278 281 281 281 281 281 282 280
282 282 280 280 279 278 280 279 279 279 279 279 280
1,960 1,795 2,020 1,990 2,080 2,025 2,070 2,050 1,965 1,995 1,900 1,985
23,836
2,020 1,850 2,070 2,030 2,110 2,050 2,095 2,075 1,995 2,045 1,935 2,025
24,318
2,045 1,815 2,030 2,030 2,115 2,050 2,120 2,090 2,005 2,025 1,930 2,000
24,225
2,045 1,930 2,070 2,030 2,105 2,030 2,120 2,075 2,005 2,035 1,930 2,005
24,346
539 492 551 543 568 553 569 564 538 547 521 546
6,531
558 509 569 560 584 568 580 575 553 571 542 567
6,736
573 505 562 564 588 570 596 587 563 569 542 564
6,783
577 544 580 568 587 564 594 579 559 568 538 559
6,817
(NA) Not available. 1 Includes dry cows; excludes heifers not yet fresh. 2 Excludes milk sucked by calves.
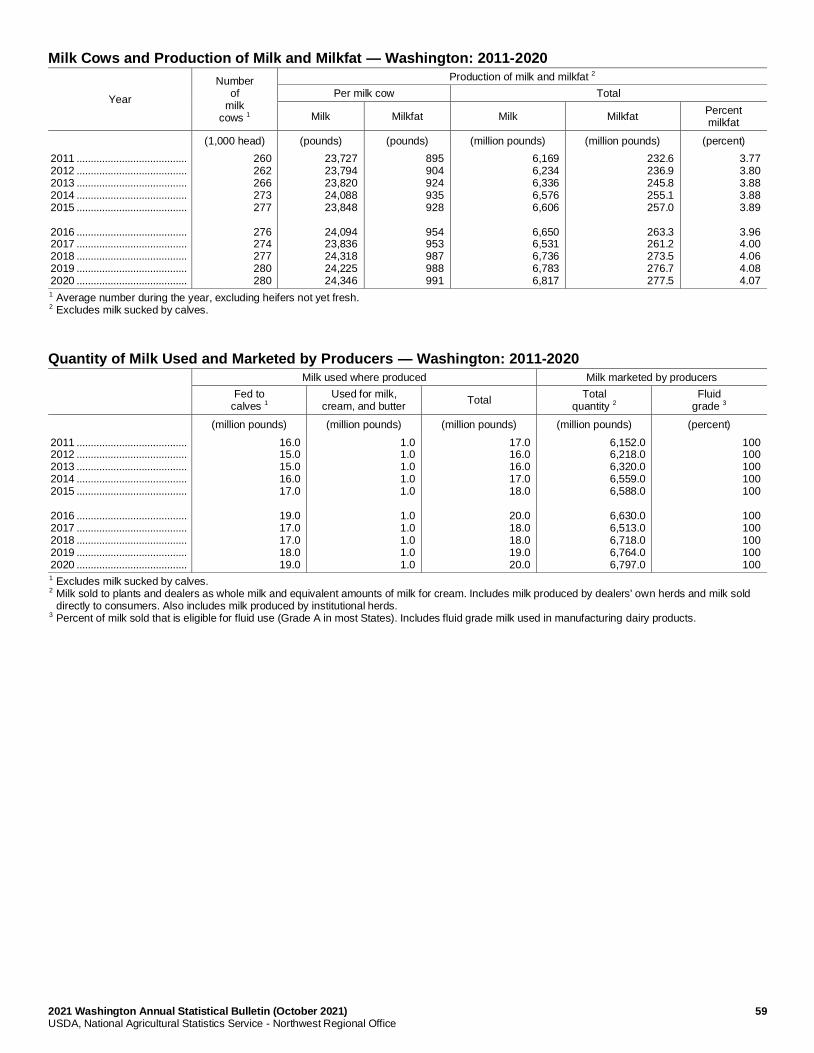
2021 Washington Annual Statistical Bulletin (October 2021) 59 USDA, National Agricultural Statistics Service - Northwest Regional Office
Milk Cows and Production of Milk and Milkfat — Washington: 2011-2020
Year
Number of
milk cows 1
Production of milk and milkfat 2
Per milk cow Total
Milk Milkfat Milk Milkfat Percent milkfat
(1,000 head) (pounds) (pounds) (million pounds) (million pounds) (percent)
2011 ....................................... 2012 ....................................... 2013 ....................................... 2014 ....................................... 2015 ....................................... 2016 ....................................... 2017 ....................................... 2018 ....................................... 2019 ....................................... 2020 .......................................
260 262 266 273 277
276 274 277 280 280
23,727 23,794 23,820 24,088 23,848
24,094 23,836 24,318 24,225 24,346
895 904 924 935 928
954 953 987 988 991
6,169 6,234 6,336 6,576 6,606
6,650 6,531 6,736 6,783 6,817
232.6 236.9 245.8 255.1 257.0
263.3 261.2 273.5 276.7 277.5
3.77 3.80 3.88 3.88 3.89
3.96 4.00 4.06 4.08 4.07
1 Average number during the year, excluding heifers not yet fresh. 2 Excludes milk sucked by calves.
Quantity of Milk Used and Marketed by Producers — Washington: 2011-2020
Milk used where produced Milk marketed by producers
Fed to calves 1
Used for milk, cream, and butter
Total Total
quantity 2 Fluid
grade 3
(million pounds) (million pounds) (million pounds) (million pounds) (percent)
2011 ....................................... 2012 ....................................... 2013 ....................................... 2014 ....................................... 2015 ....................................... 2016 ....................................... 2017 ....................................... 2018 ....................................... 2019 ....................................... 2020 .......................................
16.0 15.0 15.0 16.0 17.0
19.0 17.0 17.0 18.0 19.0
1.0 1.0 1.0 1.0 1.0
1.0 1.0 1.0 1.0 1.0
17.0 16.0 16.0 17.0 18.0
20.0 18.0 18.0 19.0 20.0
6,152.0 6,218.0 6,320.0 6,559.0 6,588.0
6,630.0 6,513.0 6,718.0 6,764.0 6,797.0
100 100 100 100 100
100 100 100 100 100
1 Excludes milk sucked by calves. 2 Milk sold to plants and dealers as whole milk and equivalent amounts of milk for cream. Includes milk produced by dealers' own herds and milk sold
directly to consumers. Also includes milk produced by institutional herds. 3 Percent of milk sold that is eligible for fluid use (Grade A in most States). Includes fluid grade milk used in manufacturing dairy products.
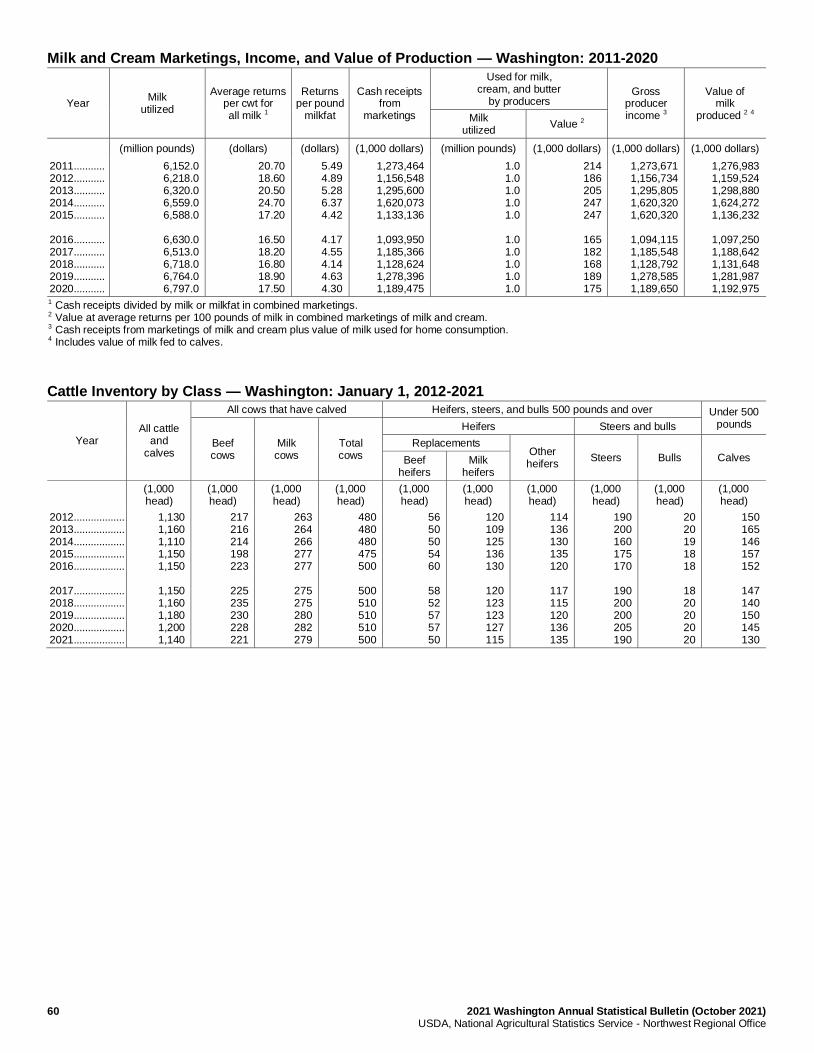
60 2021 Washington Annual Statistical Bulletin (October 2021) USDA, National Agricultural Statistics Service - Northwest Regional Office
Milk and Cream Marketings, Income, and Value of Production — Washington: 2011-2020
Year Milk
utilized
Average returns per cwt for all milk 1
Returns per pound
milkfat
Cash receipts from
marketings
Used for milk, cream, and butter
by producers Gross
producer income 3
Value of milk
produced 2 4 Milk utilized
Value 2
(million pounds) (dollars) (dollars) (1,000 dollars) (million pounds) (1,000 dollars) (1,000 dollars) (1,000 dollars)
2011 ........... 2012 ........... 2013 ........... 2014 ........... 2015 ........... 2016 ........... 2017 ........... 2018 ........... 2019 ........... 2020 ...........
6,152.0 6,218.0 6,320.0 6,559.0 6,588.0
6,630.0 6,513.0 6,718.0 6,764.0 6,797.0
20.70 18.60 20.50 24.70 17.20
16.50 18.20 16.80 18.90 17.50
5.49 4.89 5.28 6.37 4.42
4.17 4.55 4.14 4.63 4.30
1,273,464 1,156,548 1,295,600 1,620,073 1,133,136
1,093,950 1,185,366 1,128,624 1,278,396 1,189,475
1.0 1.0 1.0 1.0 1.0
1.0 1.0 1.0 1.0 1.0
214 186 205 247 247
165 182 168 189 175
1,273,671 1,156,734 1,295,805 1,620,320 1,620,320
1,094,115 1,185,548 1,128,792 1,278,585 1,189,650
1,276,983 1,159,524 1,298,880 1,624,272 1,136,232
1,097,250 1,188,642 1,131,648 1,281,987 1,192,975
1 Cash receipts divided by milk or milkfat in combined marketings. 2 Value at average returns per 100 pounds of milk in combined marketings of milk and cream. 3 Cash receipts from marketings of milk and cream plus value of milk used for home consumption. 4 Includes value of milk fed to calves.
Cattle Inventory by Class — Washington: January 1, 2012-2021
Year All cattle
and calves
All cows that have calved Heifers, steers, and bulls 500 pounds and over Under 500 pounds
Beef cows
Milk cows
Total cows
Heifers Steers and bulls
Replacements Other heifers
Steers Bulls Calves Beef heifers
Milk heifers
(1,000 head)
(1,000 head)
(1,000 head)
(1,000 head)
(1,000 head)
(1,000 head)
(1,000 head)
(1,000 head)
(1,000 head)
(1,000 head)
2012 .................. 2013 .................. 2014 .................. 2015 .................. 2016 .................. 2017 .................. 2018 .................. 2019 .................. 2020 .................. 2021 ..................
1,130 1,160 1,110 1,150 1,150
1,150 1,160 1,180 1,200 1,140
217 216 214 198 223
225 235 230 228 221
263 264 266 277 277
275 275 280 282 279
480 480 480 475 500
500 510 510 510 500
56 50 50 54 60
58 52 57 57 50
120 109 125 136 130
120 123 123 127 115
114 136 130 135 120
117 115 120 136 135
190 200 160 175 170
190 200 200 205 190
20 20 19 18 18
18 20 20 20 20
150 165 146 157 152
147 140 150 145 130
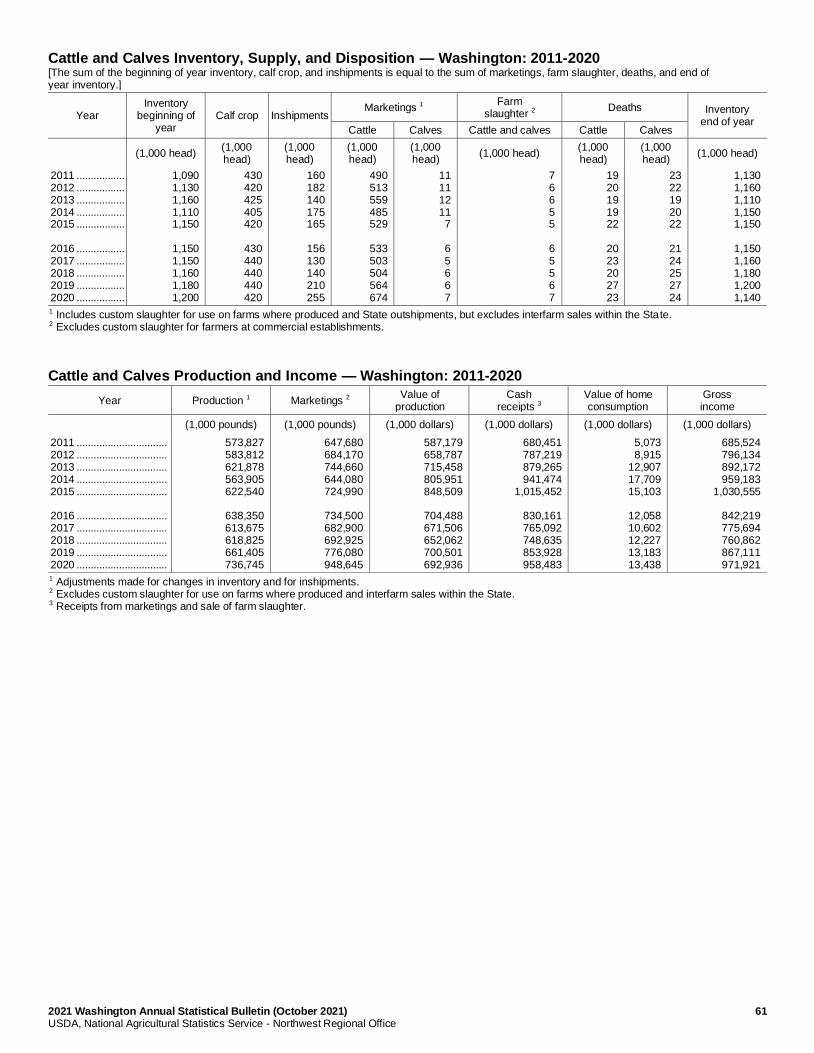
2021 Washington Annual Statistical Bulletin (October 2021) 61 USDA, National Agricultural Statistics Service - Northwest Regional Office
Cattle and Calves Inventory, Supply, and Disposition — Washington: 2011-2020 [The sum of the beginning of year inventory, calf crop, and inshipments is equal to the sum of marketings, farm slaughter, deaths, and end of year inventory.]
Year Inventory
beginning of year
Calf crop Inshipments Marketings 1
Farm slaughter 2
Deaths Inventory end of year
Cattle Calves Cattle and calves Cattle Calves
(1,000 head) (1,000 head)
(1,000 head)
(1,000 head)
(1,000 head)
(1,000 head) (1,000 head)
(1,000 head)
(1,000 head)
2011 ................. 2012 ................. 2013 ................. 2014 ................. 2015 ................. 2016 ................. 2017 ................. 2018 ................. 2019 ................. 2020 .................
1,090 1,130 1,160 1,110 1,150
1,150 1,150 1,160 1,180 1,200
430 420 425 405 420
430 440 440 440 420
160 182 140 175 165
156 130 140 210 255
490 513 559 485 529
533 503 504 564 674
11 11 12 11 7
6 5 6 6 7
7 6 6 5 5
6 5 5 6 7
19 20 19 19 22
20 23 20 27 23
23 22 19 20 22
21 24 25 27 24
1,130 1,160 1,110 1,150 1,150
1,150 1,160 1,180 1,200 1,140
1 Includes custom slaughter for use on farms where produced and State outshipments, but excludes interfarm sales within the State. 2 Excludes custom slaughter for farmers at commercial establishments.
Cattle and Calves Production and Income — Washington: 2011-2020
Year Production 1 Marketings 2 Value of
production Cash
receipts 3 Value of home consumption
Gross income
(1,000 pounds) (1,000 pounds) (1,000 dollars) (1,000 dollars) (1,000 dollars) (1,000 dollars)
2011 ................................ 2012 ................................ 2013 ................................ 2014 ................................ 2015 ................................ 2016 ................................ 2017 ................................ 2018 ................................ 2019 ................................ 2020 ................................
573,827 583,812 621,878 563,905 622,540
638,350 613,675 618,825 661,405 736,745
647,680 684,170 744,660 644,080 724,990
734,500 682,900 692,925 776,080 948,645
587,179 658,787 715,458 805,951 848,509
704,488 671,506 652,062 700,501 692,936
680,451 787,219 879,265 941,474
1,015,452
830,161 765,092 748,635 853,928 958,483
5,073 8,915
12,907 17,709 15,103
12,058 10,602 12,227 13,183 13,438
685,524 796,134 892,172 959,183
1,030,555
842,219 775,694 760,862 867,111 971,921
1 Adjustments made for changes in inventory and for inshipments. 2 Excludes custom slaughter for use on farms where produced and interfarm sales within the State. 3 Receipts from marketings and sale of farm slaughter.
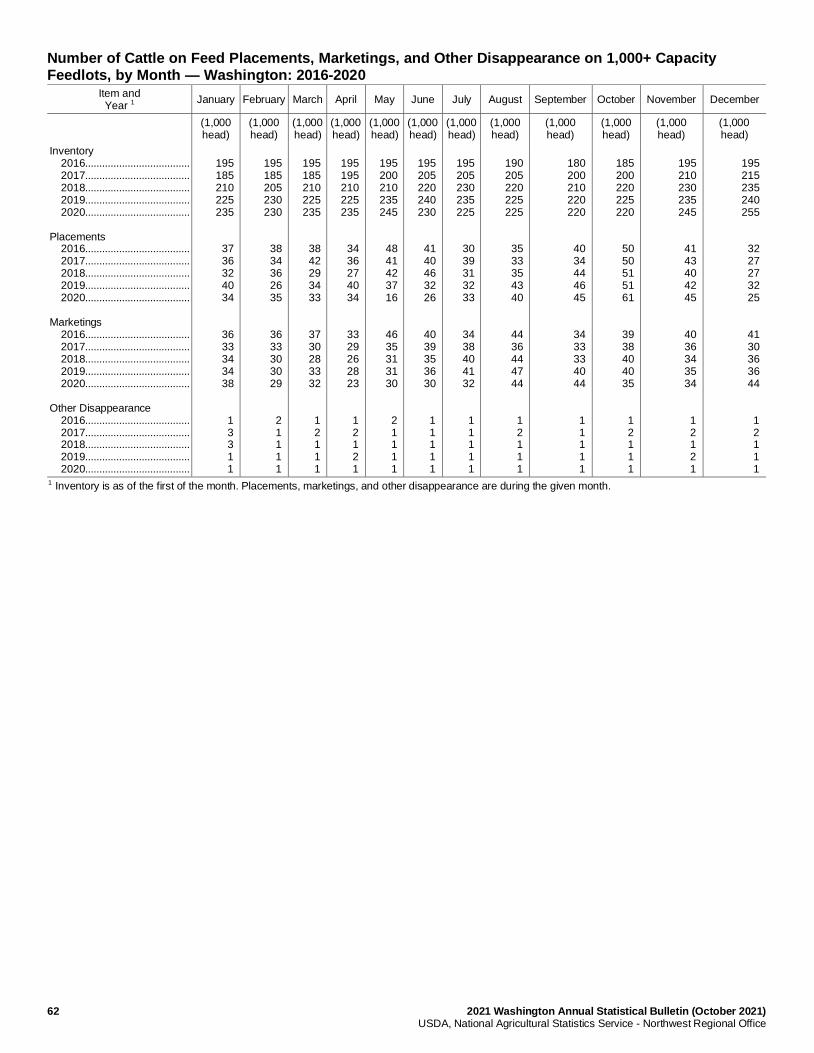
62 2021 Washington Annual Statistical Bulletin (October 2021) USDA, National Agricultural Statistics Service - Northwest Regional Office
Number of Cattle on Feed Placements, Marketings, and Other Disappearance on 1,000+ Capacity Feedlots, by Month — Washington: 2016-2020
Item and Year 1
January February March April May June July August September October November December
(1,000 head)
(1,000 head)
(1,000 head)
(1,000 head)
(1,000 head)
(1,000 head)
(1,000 head)
(1,000 head)
(1,000 head)
(1,000 head)
(1,000 head)
(1,000 head)
Inventory 2016..................................... 2017..................................... 2018..................................... 2019..................................... 2020..................................... Placements 2016..................................... 2017..................................... 2018..................................... 2019..................................... 2020..................................... Marketings 2016..................................... 2017..................................... 2018..................................... 2019..................................... 2020..................................... Other Disappearance 2016..................................... 2017..................................... 2018..................................... 2019..................................... 2020.....................................
195 185 210 225 235
37 36 32 40 34
36 33 34 34 38
1 3 3 1 1
195 185 205 230 230
38 34 36 26 35
36 33 30 30 29
2 1 1 1 1
195 185 210 225 235
38 42 29 34 33
37 30 28 33 32
1 2 1 1 1
195 195 210 225 235
34 36 27 40 34
33 29 26 28 23
1 2 1 2 1
195 200 210 235 245
48 41 42 37 16
46 35 31 31 30
2 1 1 1 1
195 205 220 240 230
41 40 46 32 26
40 39 35 36 30
1 1 1 1 1
195 205 230 235 225
30 39 31 32 33
34 38 40 41 32
1 1 1 1 1
190 205 220 225 225
35 33 35 43 40
44 36 44 47 44
1 2 1 1 1
180 200 210 220 220
40 34 44 46 45
34 33 33 40 44
1 1 1 1 1
185 200 220 225 220
50 50 51 51 61
39 38 40 40 35
1 2 1 1 1
195 210 230 235 245
41 43 40 42 45
40 36 34 35 34
1 2 1 2 1
195 215 235 240 255
32 27 27 32 25
41 30 36 36 44
1 2 1 1 1
1 Inventory is as of the first of the month. Placements, marketings, and other disappearance are during the given month.
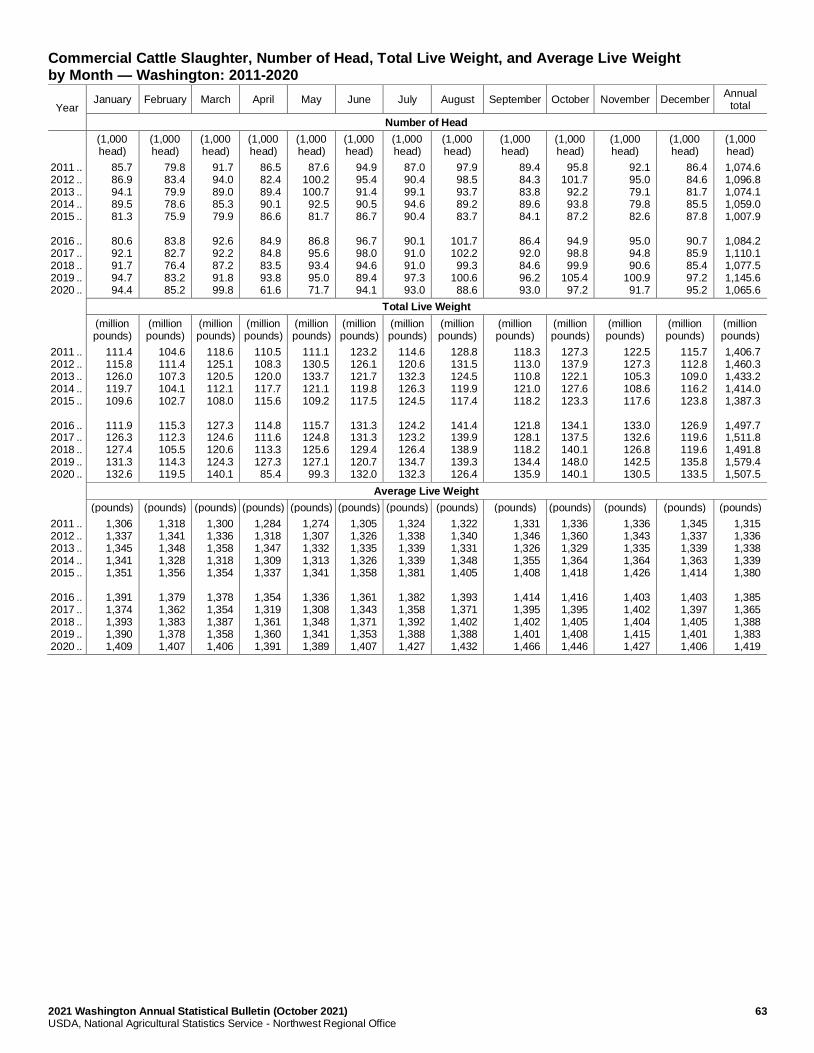
2021 Washington Annual Statistical Bulletin (October 2021) 63 USDA, National Agricultural Statistics Service - Northwest Regional Office
Commercial Cattle Slaughter, Number of Head, Total Live Weight, and Average Live Weight by Month — Washington: 2011-2020
Year January February March April May June July August September October November December
Annual total
Number of Head
(1,000 head)
(1,000 head)
(1,000 head)
(1,000 head)
(1,000 head)
(1,000 head)
(1,000 head)
(1,000 head)
(1,000 head)
(1,000 head)
(1,000 head)
(1,000 head)
(1,000 head)
2011 .. 2012 .. 2013 .. 2014 .. 2015 .. 2016 .. 2017 .. 2018 .. 2019 .. 2020 ..
85.7 86.9 94.1 89.5 81.3
80.6 92.1 91.7 94.7 94.4
79.8 83.4 79.9 78.6 75.9
83.8 82.7 76.4 83.2 85.2
91.7 94.0 89.0 85.3 79.9
92.6 92.2 87.2 91.8 99.8
86.5 82.4 89.4 90.1 86.6
84.9 84.8 83.5 93.8 61.6
87.6 100.2 100.7 92.5 81.7
86.8 95.6 93.4 95.0 71.7
94.9 95.4 91.4 90.5 86.7
96.7 98.0 94.6 89.4 94.1
87.0 90.4 99.1 94.6 90.4
90.1 91.0 91.0 97.3 93.0
97.9 98.5 93.7 89.2 83.7
101.7 102.2 99.3
100.6 88.6
89.4 84.3 83.8 89.6 84.1
86.4 92.0 84.6 96.2 93.0
95.8 101.7 92.2 93.8 87.2
94.9 98.8 99.9
105.4 97.2
92.1 95.0 79.1 79.8 82.6
95.0 94.8 90.6
100.9 91.7
86.4 84.6 81.7 85.5 87.8
90.7 85.9 85.4 97.2 95.2
1,074.6 1,096.8 1,074.1 1,059.0 1,007.9
1,084.2 1,110.1 1,077.5 1,145.6 1,065.6
Total Live Weight
(million pounds)
(million pounds)
(million pounds)
(million pounds)
(million pounds)
(million pounds)
(million pounds)
(million pounds)
(million pounds)
(million pounds)
(million pounds)
(million pounds)
(million pounds)
2011 .. 2012 .. 2013 .. 2014 .. 2015 .. 2016 .. 2017 .. 2018 .. 2019 .. 2020 ..
111.4 115.8 126.0 119.7 109.6
111.9 126.3 127.4 131.3 132.6
104.6 111.4 107.3 104.1 102.7
115.3 112.3 105.5 114.3 119.5
118.6 125.1 120.5 112.1 108.0
127.3 124.6 120.6 124.3 140.1
110.5 108.3 120.0 117.7 115.6
114.8 111.6 113.3 127.3 85.4
111.1 130.5 133.7 121.1 109.2
115.7 124.8 125.6 127.1 99.3
123.2 126.1 121.7 119.8 117.5
131.3 131.3 129.4 120.7 132.0
114.6 120.6 132.3 126.3 124.5
124.2 123.2 126.4 134.7 132.3
128.8 131.5 124.5 119.9 117.4
141.4 139.9 138.9 139.3 126.4
118.3 113.0 110.8 121.0 118.2
121.8 128.1 118.2 134.4 135.9
127.3 137.9 122.1 127.6 123.3
134.1 137.5 140.1 148.0 140.1
122.5 127.3 105.3 108.6 117.6
133.0 132.6 126.8 142.5 130.5
115.7 112.8 109.0 116.2 123.8
126.9 119.6 119.6 135.8 133.5
1,406.7 1,460.3 1,433.2 1,414.0 1,387.3
1,497.7 1,511.8 1,491.8 1,579.4 1,507.5
Average Live Weight
(pounds) (pounds) (pounds) (pounds) (pounds) (pounds) (pounds) (pounds) (pounds) (pounds) (pounds) (pounds) (pounds)
2011 .. 2012 .. 2013 .. 2014 .. 2015 .. 2016 .. 2017 .. 2018 .. 2019 .. 2020 ..
1,306 1,337 1,345 1,341 1,351
1,391 1,374 1,393 1,390 1,409
1,318 1,341 1,348 1,328 1,356
1,379 1,362 1,383 1,378 1,407
1,300 1,336 1,358 1,318 1,354
1,378 1,354 1,387 1,358 1,406
1,284 1,318 1,347 1,309 1,337
1,354 1,319 1,361 1,360 1,391
1,274 1,307 1,332 1,313 1,341
1,336 1,308 1,348 1,341 1,389
1,305 1,326 1,335 1,326 1,358
1,361 1,343 1,371 1,353 1,407
1,324 1,338 1,339 1,339 1,381
1,382 1,358 1,392 1,388 1,427
1,322 1,340 1,331 1,348 1,405
1,393 1,371 1,402 1,388 1,432
1,331 1,346 1,326 1,355 1,408
1,414 1,395 1,402 1,401 1,466
1,336 1,360 1,329 1,364 1,418
1,416 1,395 1,405 1,408 1,446
1,336 1,343 1,335 1,364 1,426
1,403 1,402 1,404 1,415 1,427
1,345 1,337 1,339 1,363 1,414
1,403 1,397 1,405 1,401 1,406
1,315 1,336 1,338 1,339 1,380
1,385 1,365 1,388 1,383 1,419
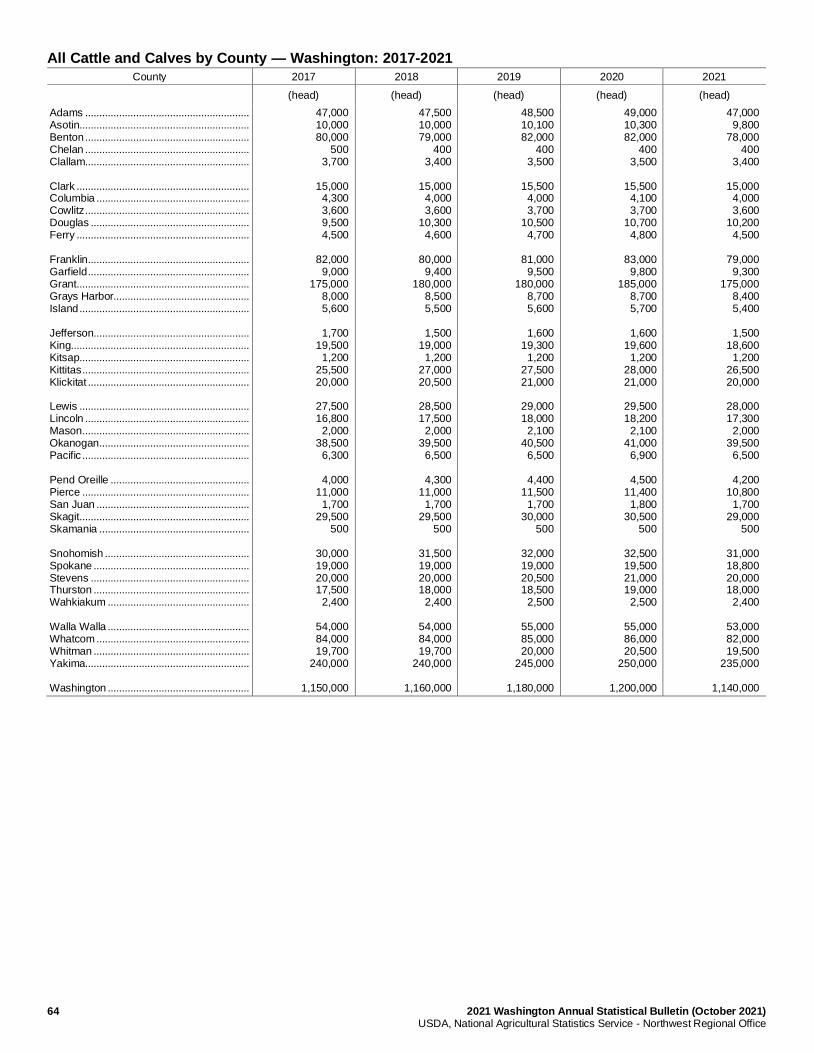
64 2021 Washington Annual Statistical Bulletin (October 2021) USDA, National Agricultural Statistics Service - Northwest Regional Office
All Cattle and Calves by County — Washington: 2017-2021
County 2017 2018 2019 2020 2021
(head) (head) (head) (head) (head)
Adams .......................................................... Asotin............................................................ Benton .......................................................... Chelan .......................................................... Clallam.......................................................... Clark ............................................................. Columbia ...................................................... Cowlitz .......................................................... Douglas ........................................................ Ferry ............................................................. Franklin ......................................................... Garfield ......................................................... Grant ............................................................. Grays Harbor................................................ Island ............................................................ Jefferson....................................................... King............................................................... Kitsap............................................................ Kittitas ........................................................... Klickitat ......................................................... Lewis ............................................................ Lincoln .......................................................... Mason ........................................................... Okanogan ..................................................... Pacific ........................................................... Pend Oreille ................................................. Pierce ........................................................... San Juan ...................................................... Skagit............................................................ Skamania ..................................................... Snohomish ................................................... Spokane ....................................................... Stevens ........................................................ Thurston ....................................................... Wahkiakum .................................................. Walla Walla .................................................. Whatcom ...................................................... Whitman ....................................................... Yakima.......................................................... Washington ..................................................
47,000 10,000 80,000
500 3,700
15,000
4,300 3,600 9,500 4,500
82,000
9,000 175,000
8,000 5,600
1,700
19,500 1,200
25,500 20,000
27,500 16,800
2,000 38,500
6,300
4,000 11,000
1,700 29,500
500
30,000 19,000 20,000 17,500
2,400
54,000 84,000 19,700
240,000
1,150,000
47,500 10,000 79,000
400 3,400
15,000
4,000 3,600
10,300 4,600
80,000
9,400 180,000
8,500 5,500
1,500
19,000 1,200
27,000 20,500
28,500 17,500
2,000 39,500
6,500
4,300 11,000
1,700 29,500
500
31,500 19,000 20,000 18,000
2,400
54,000 84,000 19,700
240,000
1,160,000
48,500 10,100 82,000
400 3,500
15,500
4,000 3,700
10,500 4,700
81,000
9,500 180,000
8,700 5,600
1,600
19,300 1,200
27,500 21,000
29,000 18,000
2,100 40,500
6,500
4,400 11,500
1,700 30,000
500
32,000 19,000 20,500 18,500
2,500
55,000 85,000 20,000
245,000
1,180,000
49,000 10,300 82,000
400 3,500
15,500
4,100 3,700
10,700 4,800
83,000
9,800 185,000
8,700 5,700
1,600
19,600 1,200
28,000 21,000
29,500 18,200
2,100 41,000
6,900
4,500 11,400
1,800 30,500
500
32,500 19,500 21,000 19,000
2,500
55,000 86,000 20,500
250,000
1,200,000
47,000 9,800
78,000 400
3,400
15,000 4,000 3,600
10,200 4,500
79,000
9,300 175,000
8,400 5,400
1,500
18,600 1,200
26,500 20,000
28,000 17,300
2,000 39,500
6,500
4,200 10,800
1,700 29,000
500
31,000 18,800 20,000 18,000
2,400
53,000 82,000 19,500
235,000
1,140,000
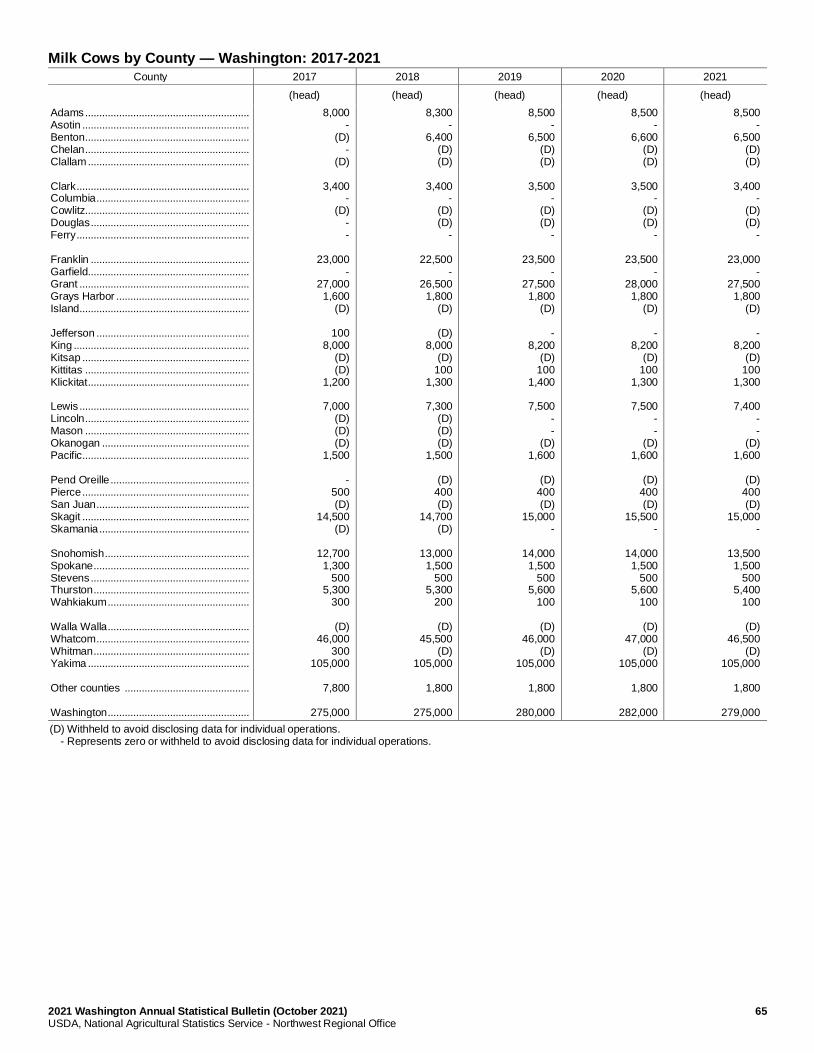
2021 Washington Annual Statistical Bulletin (October 2021) 65 USDA, National Agricultural Statistics Service - Northwest Regional Office
Milk Cows by County — Washington: 2017-2021
County 2017 2018 2019 2020 2021
(head) (head) (head) (head) (head)
Adams .......................................................... Asotin ........................................................... Benton .......................................................... Chelan .......................................................... Clallam ......................................................... Clark ............................................................. Columbia ...................................................... Cowlitz.......................................................... Douglas ........................................................ Ferry ............................................................. Franklin ........................................................ Garfield......................................................... Grant ............................................................ Grays Harbor ............................................... Island ............................................................ Jefferson ...................................................... King .............................................................. Kitsap ........................................................... Kittitas .......................................................... Klickitat ......................................................... Lewis ............................................................ Lincoln .......................................................... Mason .......................................................... Okanogan .................................................... Pacific ........................................................... Pend Oreille ................................................. Pierce ........................................................... San Juan ...................................................... Skagit ........................................................... Skamania ..................................................... Snohomish ................................................... Spokane ....................................................... Stevens ........................................................ Thurston ....................................................... Wahkiakum .................................................. Walla Walla .................................................. Whatcom ...................................................... Whitman ....................................................... Yakima ......................................................... Other counties ............................................ Washington ..................................................
8,000 -
(D) -
(D)
3,400 -
(D) - -
23,000 -
27,000 1,600
(D)
100 8,000
(D) (D)
1,200
7,000 (D) (D) (D)
1,500
- 500 (D)
14,500 (D)
12,700
1,300 500
5,300 300
(D)
46,000 300
105,000
7,800
275,000
8,300 -
6,400 (D) (D)
3,400
- (D) (D)
-
22,500 -
26,500 1,800
(D)
(D) 8,000
(D) 100
1,300
7,300 (D) (D) (D)
1,500
(D) 400 (D)
14,700 (D)
13,000
1,500 500
5,300 200
(D)
45,500 (D)
105,000
1,800
275,000
8,500 -
6,500 (D) (D)
3,500
- (D) (D)
-
23,500 -
27,500 1,800
(D)
- 8,200
(D) 100
1,400
7,500 - -
(D) 1,600
(D)
400 (D)
15,000 -
14,000 1,500
500 5,600
100
(D) 46,000
(D) 105,000
1,800
280,000
8,500 -
6,600 (D) (D)
3,500
- (D) (D)
-
23,500 -
28,000 1,800
(D)
- 8,200
(D) 100
1,300
7,500 - -
(D) 1,600
(D)
400 (D)
15,500 -
14,000 1,500
500 5,600
100
(D) 47,000
(D) 105,000
1,800
282,000
8,500 -
6,500 (D) (D)
3,400
- (D) (D)
-
23,000 -
27,500 1,800
(D)
- 8,200
(D) 100
1,300
7,400 - -
(D) 1,600
(D)
400 (D)
15,000 -
13,500 1,500
500 5,400
100
(D) 46,500
(D) 105,000
1,800
279,000
(D) Withheld to avoid disclosing data for individual operations. - Represents zero or withheld to avoid disclosing data for individual operations.
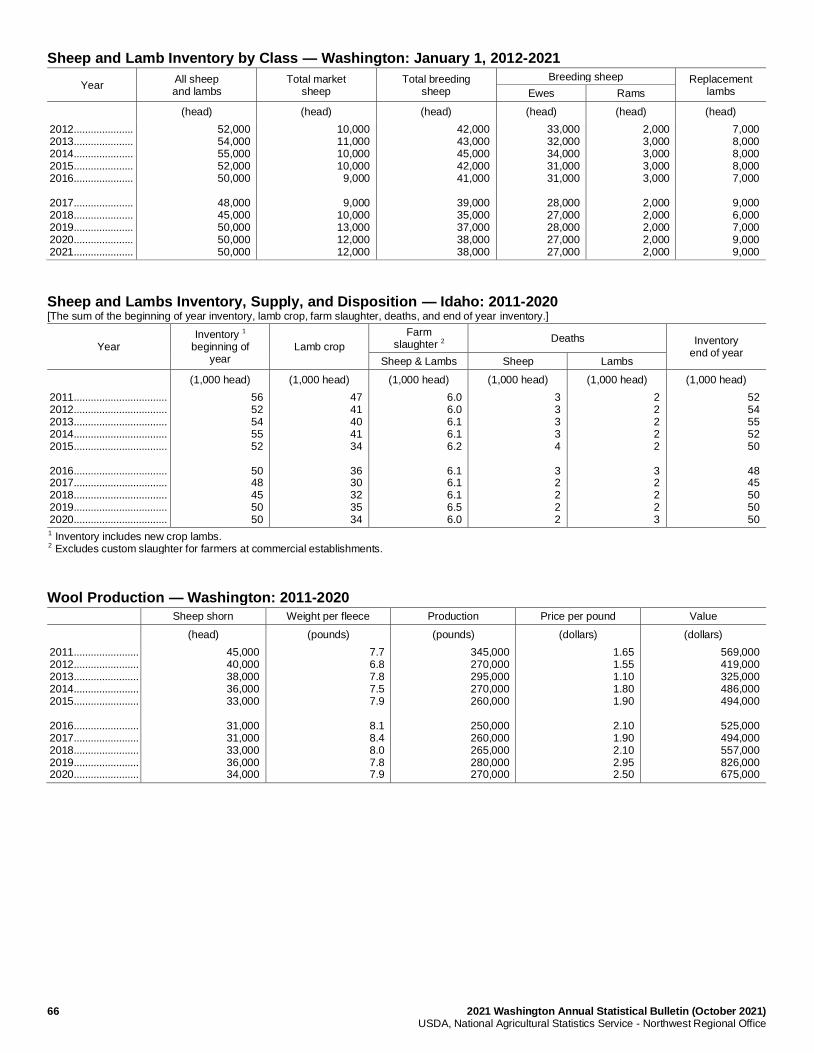
66 2021 Washington Annual Statistical Bulletin (October 2021) USDA, National Agricultural Statistics Service - Northwest Regional Office
Sheep and Lamb Inventory by Class — Washington: January 1, 2012-2021
Year All sheep and lambs
Total market sheep
Total breeding sheep
Breeding sheep Replacement lambs Ewes Rams
(head) (head) (head) (head) (head) (head)
2012 ..................... 2013 ..................... 2014 ..................... 2015 ..................... 2016 ..................... 2017 ..................... 2018 ..................... 2019 ..................... 2020 ..................... 2021 .....................
52,000 54,000 55,000 52,000 50,000
48,000 45,000 50,000 50,000 50,000
10,000 11,000 10,000 10,000
9,000
9,000 10,000 13,000 12,000 12,000
42,000 43,000 45,000 42,000 41,000
39,000 35,000 37,000 38,000 38,000
33,000 32,000 34,000 31,000 31,000
28,000 27,000 28,000 27,000 27,000
2,000 3,000 3,000 3,000 3,000
2,000 2,000 2,000 2,000 2,000
7,000 8,000 8,000 8,000 7,000
9,000 6,000 7,000 9,000 9,000
Sheep and Lambs Inventory, Supply, and Disposition — Idaho: 2011-2020 [The sum of the beginning of year inventory, lamb crop, farm slaughter, deaths, and end of year inventory.]
Year Inventory 1
beginning of year
Lamb crop
Farm slaughter 2
Deaths Inventory end of year
Sheep & Lambs Sheep Lambs
(1,000 head) (1,000 head) (1,000 head) (1,000 head) (1,000 head) (1,000 head)
2011 ................................. 2012 ................................. 2013 ................................. 2014 ................................. 2015 ................................. 2016 ................................. 2017 ................................. 2018 ................................. 2019 ................................. 2020 .................................
56 52 54 55 52
50 48 45 50 50
47 41 40 41 34
36 30 32 35 34
6.0 6.0 6.1 6.1 6.2
6.1 6.1 6.1 6.5 6.0
3 3 3 3 4
3 2 2 2 2
2 2 2 2 2
3 2 2 2 3
52 54 55 52 50
48 45 50 50 50
1 Inventory includes new crop lambs. 2 Excludes custom slaughter for farmers at commercial establishments.
Wool Production — Washington: 2011-2020
Sheep shorn Weight per fleece Production Price per pound Value
(head) (pounds) (pounds) (dollars) (dollars)
2011 ....................... 2012 ....................... 2013 ....................... 2014 ....................... 2015 ....................... 2016 ....................... 2017 ....................... 2018 ....................... 2019 ....................... 2020 .......................
45,000 40,000 38,000 36,000 33,000
31,000 31,000 33,000 36,000 34,000
7.7 6.8 7.8 7.5 7.9
8.1 8.4 8.0 7.8 7.9
345,000 270,000 295,000 270,000 260,000
250,000 260,000 265,000 280,000 270,000
1.65 1.55 1.10 1.80 1.90
2.10 1.90 2.10 2.95 2.50
569,000 419,000 325,000 486,000 494,000
525,000 494,000 557,000 826,000 675,000
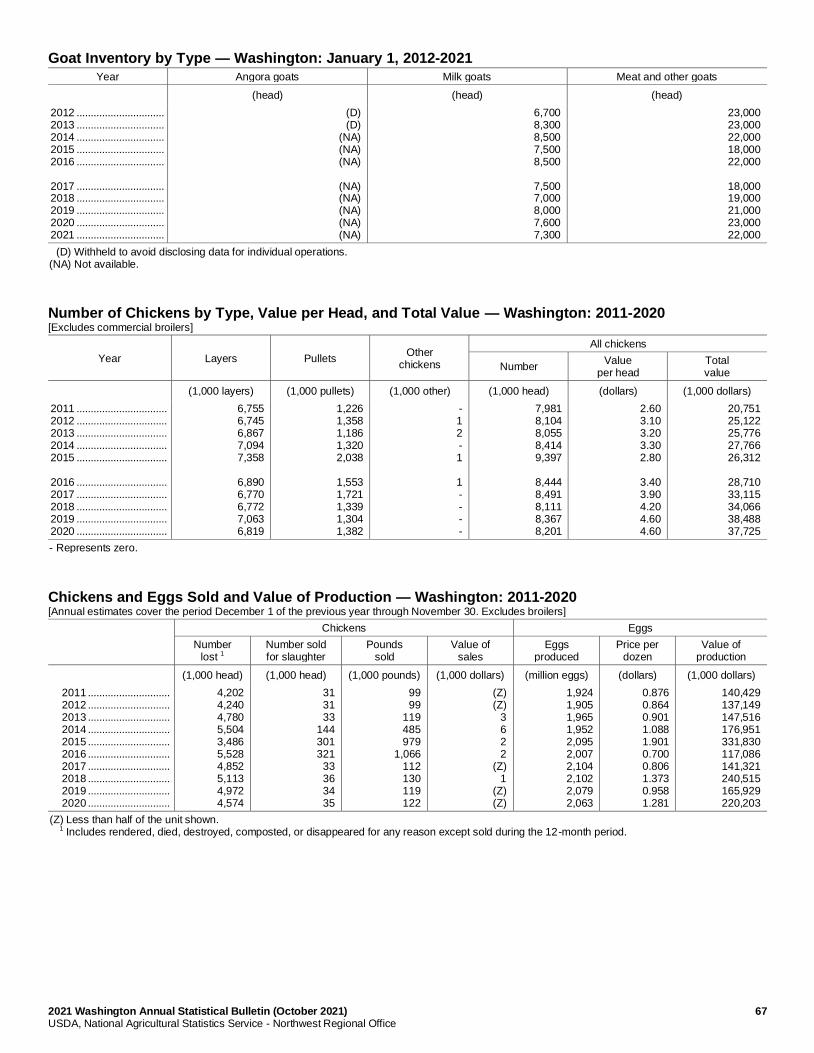
2021 Washington Annual Statistical Bulletin (October 2021) 67 USDA, National Agricultural Statistics Service - Northwest Regional Office
Goat Inventory by Type — Washington: January 1, 2012-2021
Year Angora goats Milk goats Meat and other goats
(head) (head) (head)
2012 ............................... 2013 ............................... 2014 ............................... 2015 ............................... 2016 ............................... 2017 ............................... 2018 ............................... 2019 ............................... 2020 ............................... 2021 ...............................
(D) (D)
(NA) (NA) (NA)
(NA) (NA) (NA) (NA) (NA)
6,700 8,300 8,500 7,500 8,500
7,500 7,000 8,000 7,600 7,300
23,000 23,000 22,000 18,000 22,000
18,000 19,000 21,000 23,000 22,000
(D) Withheld to avoid disclosing data for individual operations. (NA) Not available.
Number of Chickens by Type, Value per Head, and Total Value — Washington: 2011-2020 [Excludes commercial broilers]
Year Layers Pullets Other
chickens
All chickens
Number Value
per head Total value
(1,000 layers) (1,000 pullets) (1,000 other) (1,000 head) (dollars) (1,000 dollars)
2011 ................................ 2012 ................................ 2013 ................................ 2014 ................................ 2015 ................................ 2016 ................................ 2017 ................................ 2018 ................................ 2019 ................................ 2020 ................................
6,755 6,745 6,867 7,094 7,358
6,890 6,770 6,772 7,063 6,819
1,226 1,358 1,186 1,320 2,038
1,553 1,721 1,339 1,304 1,382
- 1 2 - 1
1 - - - -
7,981 8,104 8,055 8,414 9,397
8,444 8,491 8,111 8,367 8,201
2.60 3.10 3.20 3.30 2.80
3.40 3.90 4.20 4.60 4.60
20,751 25,122 25,776 27,766 26,312
28,710 33,115 34,066 38,488 37,725
- Represents zero.
Chickens and Eggs Sold and Value of Production — Washington: 2011-2020 [Annual estimates cover the period December 1 of the previous year through November 30. Excludes broilers]
Chickens Eggs
Number lost 1
Number sold for slaughter
Pounds sold
Value of sales
Eggs produced
Price per dozen
Value of production
(1,000 head) (1,000 head) (1,000 pounds) (1,000 dollars) (million eggs) (dollars) (1,000 dollars)
2011 ............................. 2012 ............................. 2013 ............................. 2014 ............................. 2015 ............................. 2016 ............................. 2017 ............................. 2018 ............................. 2019 ............................. 2020 .............................
4,202 4,240 4,780 5,504 3,486 5,528 4,852 5,113 4,972 4,574
31 31 33
144 301 321
33 36 34 35
99 99
119 485 979
1,066 112 130 119 122
(Z) (Z)
3 6 2 2
(Z) 1
(Z) (Z)
1,924 1,905 1,965 1,952 2,095 2,007 2,104 2,102 2,079 2,063
0.876 0.864 0.901 1.088 1.901 0.700 0.806 1.373 0.958 1.281
140,429 137,149 147,516 176,951 331,830 117,086 141,321 240,515 165,929 220,203
(Z) Less than half of the unit shown. 1 Includes rendered, died, destroyed, composted, or disappeared for any reason except sold during the 12-month period.
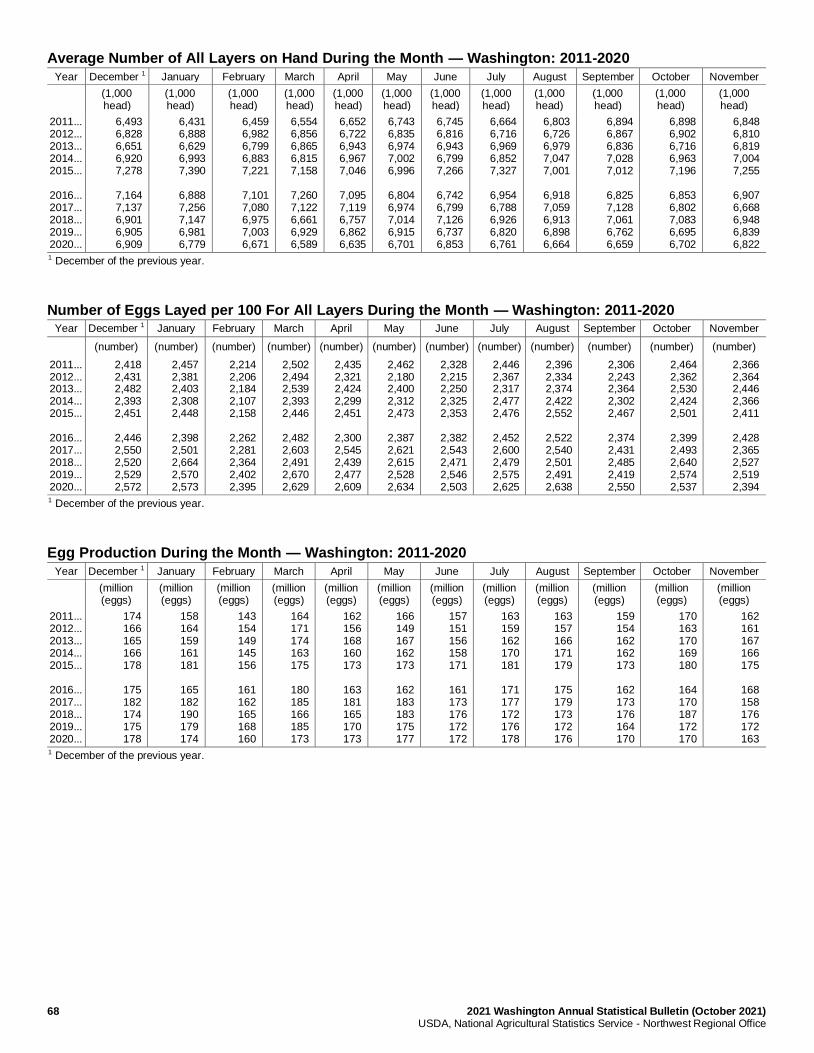
68 2021 Washington Annual Statistical Bulletin (October 2021) USDA, National Agricultural Statistics Service - Northwest Regional Office
Average Number of All Layers on Hand During the Month — Washington: 2011-2020
Year December 1 January February March April May June July August September October November
(1,000 head)
(1,000 head)
(1,000 head)
(1,000 head)
(1,000 head)
(1,000 head)
(1,000 head)
(1,000 head)
(1,000 head)
(1,000 head)
(1,000 head)
(1,000 head)
2011 ... 2012 ... 2013 ... 2014 ... 2015 ... 2016 ... 2017 ... 2018 ... 2019 ... 2020 ...
6,493 6,828 6,651 6,920 7,278
7,164 7,137 6,901 6,905 6,909
6,431 6,888 6,629 6,993 7,390
6,888 7,256 7,147 6,981 6,779
6,459 6,982 6,799 6,883 7,221
7,101 7,080 6,975 7,003 6,671
6,554 6,856 6,865 6,815 7,158
7,260 7,122 6,661 6,929 6,589
6,652 6,722 6,943 6,967 7,046
7,095 7,119 6,757 6,862 6,635
6,743 6,835 6,974 7,002 6,996
6,804 6,974 7,014 6,915 6,701
6,745 6,816 6,943 6,799 7,266
6,742 6,799 7,126 6,737 6,853
6,664 6,716 6,969 6,852 7,327
6,954 6,788 6,926 6,820 6,761
6,803 6,726 6,979 7,047 7,001
6,918 7,059 6,913 6,898 6,664
6,894 6,867 6,836 7,028 7,012
6,825 7,128 7,061 6,762 6,659
6,898 6,902 6,716 6,963 7,196
6,853 6,802 7,083 6,695 6,702
6,848 6,810 6,819 7,004 7,255
6,907 6,668 6,948 6,839 6,822
1 December of the previous year.
Number of Eggs Layed per 100 For All Layers During the Month — Washington: 2011-2020 Year December 1 January February March April May June July August September October November
(number) (number) (number) (number) (number) (number) (number) (number) (number) (number) (number) (number)
2011 ... 2012 ... 2013 ... 2014 ... 2015 ... 2016 ... 2017 ... 2018 ... 2019 ... 2020 ...
2,418 2,431 2,482 2,393 2,451
2,446 2,550 2,520 2,529 2,572
2,457 2,381 2,403 2,308 2,448
2,398 2,501 2,664 2,570 2,573
2,214 2,206 2,184 2,107 2,158
2,262 2,281 2,364 2,402 2,395
2,502 2,494 2,539 2,393 2,446
2,482 2,603 2,491 2,670 2,629
2,435 2,321 2,424 2,299 2,451
2,300 2,545 2,439 2,477 2,609
2,462 2,180 2,400 2,312 2,473
2,387 2,621 2,615 2,528 2,634
2,328 2,215 2,250 2,325 2,353
2,382 2,543 2,471 2,546 2,503
2,446 2,367 2,317 2,477 2,476
2,452 2,600 2,479 2,575 2,625
2,396 2,334 2,374 2,422 2,552
2,522 2,540 2,501 2,491 2,638
2,306 2,243 2,364 2,302 2,467
2,374 2,431 2,485 2,419 2,550
2,464 2,362 2,530 2,424 2,501
2,399 2,493 2,640 2,574 2,537
2,366 2,364 2,446 2,366 2,411
2,428 2,365 2,527 2,519 2,394
1 December of the previous year.
Egg Production During the Month — Washington: 2011-2020
Year December 1 January February March April May June July August September October November
(million (eggs)
(million (eggs)
(million (eggs)
(million (eggs)
(million (eggs)
(million (eggs)
(million (eggs)
(million (eggs)
(million (eggs)
(million (eggs)
(million (eggs)
(million (eggs)
2011 ... 2012 ... 2013 ... 2014 ... 2015 ... 2016 ... 2017 ... 2018 ... 2019 ... 2020 ...
174 166 165 166 178
175 182 174 175 178
158 164 159 161 181
165 182 190 179 174
143 154 149 145 156
161 162 165 168 160
164 171 174 163 175
180 185 166 185 173
162 156 168 160 173
163 181 165 170 173
166 149 167 162 173
162 183 183 175 177
157 151 156 158 171
161 173 176 172 172
163 159 162 170 181
171 177 172 176 178
163 157 166 171 179
175 179 173 172 176
159 154 162 162 173
162 173 176 164 170
170 163 170 169 180
164 170 187 172 170
162 161 167 166 175
168 158 176 172 163
1 December of the previous year.
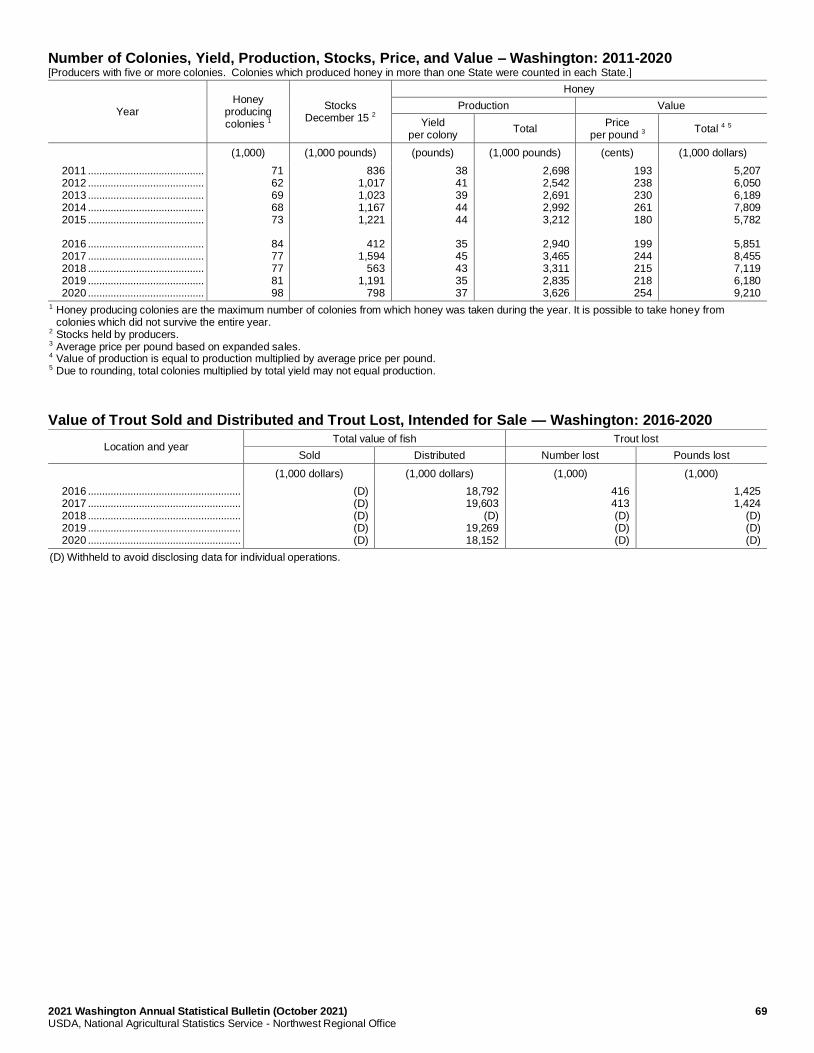
2021 Washington Annual Statistical Bulletin (October 2021) 69 USDA, National Agricultural Statistics Service - Northwest Regional Office
Number of Colonies, Yield, Production, Stocks, Price, and Value – Washington: 2011-2020 [Producers with five or more colonies. Colonies which produced honey in more than one State were counted in each State.]
Year Honey
producing colonies 1
Stocks December 15 2
Honey
Production Value
Yield per colony
Total Price
per pound 3 Total 4 5
(1,000) (1,000 pounds) (pounds) (1,000 pounds) (cents) (1,000 dollars)
2011 ......................................... 2012 ......................................... 2013 ......................................... 2014 ......................................... 2015 ......................................... 2016 ......................................... 2017 ......................................... 2018 ......................................... 2019 ......................................... 2020 .........................................
71 62 69 68 73
84 77 77 81 98
836 1,017 1,023 1,167 1,221
412
1,594 563
1,191 798
38 41 39 44 44
35 45 43 35 37
2,698 2,542 2,691 2,992 3,212
2,940 3,465 3,311 2,835 3,626
193 238 230 261 180
199 244 215 218 254
5,207 6,050 6,189 7,809 5,782
5,851 8,455 7,119 6,180 9,210
1 Honey producing colonies are the maximum number of colonies from which honey was taken during the year. It is possible to take honey from colonies which did not survive the entire year.
2 Stocks held by producers. 3 Average price per pound based on expanded sales. 4 Value of production is equal to production multiplied by average price per pound. 5 Due to rounding, total colonies multiplied by total yield may not equal production.
Value of Trout Sold and Distributed and Trout Lost, Intended for Sale — Washington: 2016-2020
Location and year Total value of fish Trout lost
Sold Distributed Number lost Pounds lost
(1,000 dollars) (1,000 dollars) (1,000) (1,000)
2016 ...................................................... 2017 ...................................................... 2018 ...................................................... 2019 ...................................................... 2020 ......................................................
(D) (D) (D) (D) (D)
18,792 19,603
(D) 19,269 18,152
416 413 (D) (D) (D)
1,425 1,424
(D) (D) (D)
(D) Withheld to avoid disclosing data for individual operations.
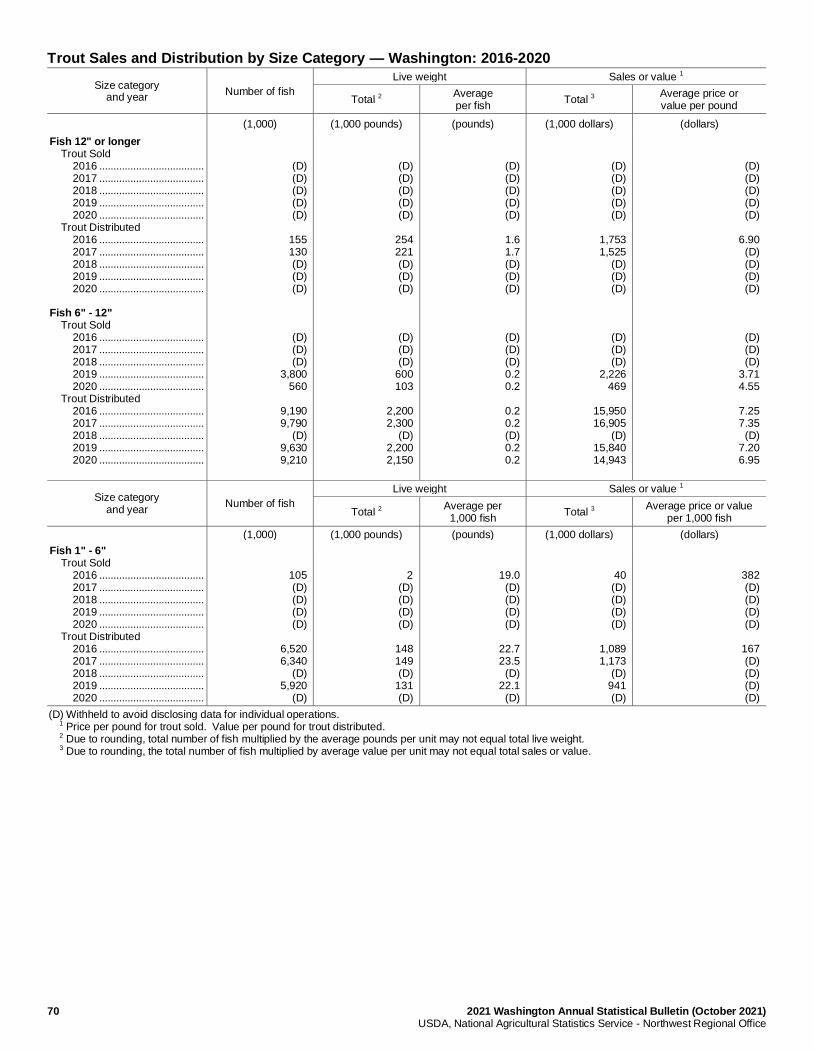
70 2021 Washington Annual Statistical Bulletin (October 2021) USDA, National Agricultural Statistics Service - Northwest Regional Office
Trout Sales and Distribution by Size Category — Washington: 2016-2020
Size category and year
Number of fish
Live weight Sales or value 1
Total 2 Average per fish
Total 3 Average price or value per pound
(1,000) (1,000 pounds) (pounds) (1,000 dollars) (dollars)
Fish 12" or longer Trout Sold 2016 ..................................... 2017 ..................................... 2018 ..................................... 2019 ..................................... 2020 ..................................... Trout Distributed 2016 ..................................... 2017 ..................................... 2018 ..................................... 2019 ..................................... 2020 ..................................... Fish 6" - 12" Trout Sold 2016 ..................................... 2017 ..................................... 2018 ..................................... 2019 ..................................... 2020 ..................................... Trout Distributed 2016 ..................................... 2017 ..................................... 2018 ..................................... 2019 ..................................... 2020 .....................................
(D) (D) (D) (D) (D)
155 130 (D) (D) (D)
(D) (D) (D)
3,800 560
9,190 9,790
(D) 9,630 9,210
(D) (D) (D) (D) (D)
254 221 (D) (D) (D)
(D) (D) (D)
600 103
2,200 2,300
(D) 2,200 2,150
(D) (D) (D) (D) (D)
1.6 1.7 (D) (D) (D)
(D) (D) (D) 0.2 0.2
0.2 0.2 (D) 0.2 0.2
(D) (D) (D) (D) (D)
1,753 1,525
(D) (D) (D)
(D) (D) (D)
2,226 469
15,950 16,905
(D) 15,840 14,943
(D) (D) (D) (D) (D)
6.90
(D) (D) (D) (D)
(D) (D) (D)
3.71 4.55
7.25 7.35
(D) 7.20 6.95
Size category and year
Number of fish
Live weight Sales or value 1
Total 2 Average per
1,000 fish Total 3
Average price or value per 1,000 fish
(1,000) (1,000 pounds) (pounds) (1,000 dollars) (dollars)
Fish 1" - 6" Trout Sold 2016 ..................................... 2017 ..................................... 2018 ..................................... 2019 ..................................... 2020 ..................................... Trout Distributed 2016 ..................................... 2017 ..................................... 2018 ..................................... 2019 ..................................... 2020 .....................................
105 (D) (D) (D) (D)
6,520 6,340
(D) 5,920
(D)
2 (D) (D) (D) (D)
148 149 (D)
131 (D)
19.0 (D) (D) (D) (D)
22.7 23.5
(D) 22.1
(D)
40 (D) (D) (D) (D)
1,089 1,173
(D) 941 (D)
382 (D) (D) (D) (D)
167 (D) (D) (D) (D)
(D) Withheld to avoid disclosing data for individual operations. 1 Price per pound for trout sold. Value per pound for trout distributed. 2 Due to rounding, total number of fish multiplied by the average pounds per unit may not equal total live weight. 3 Due to rounding, the total number of fish multiplied by average value per unit may not equal total sales or value.
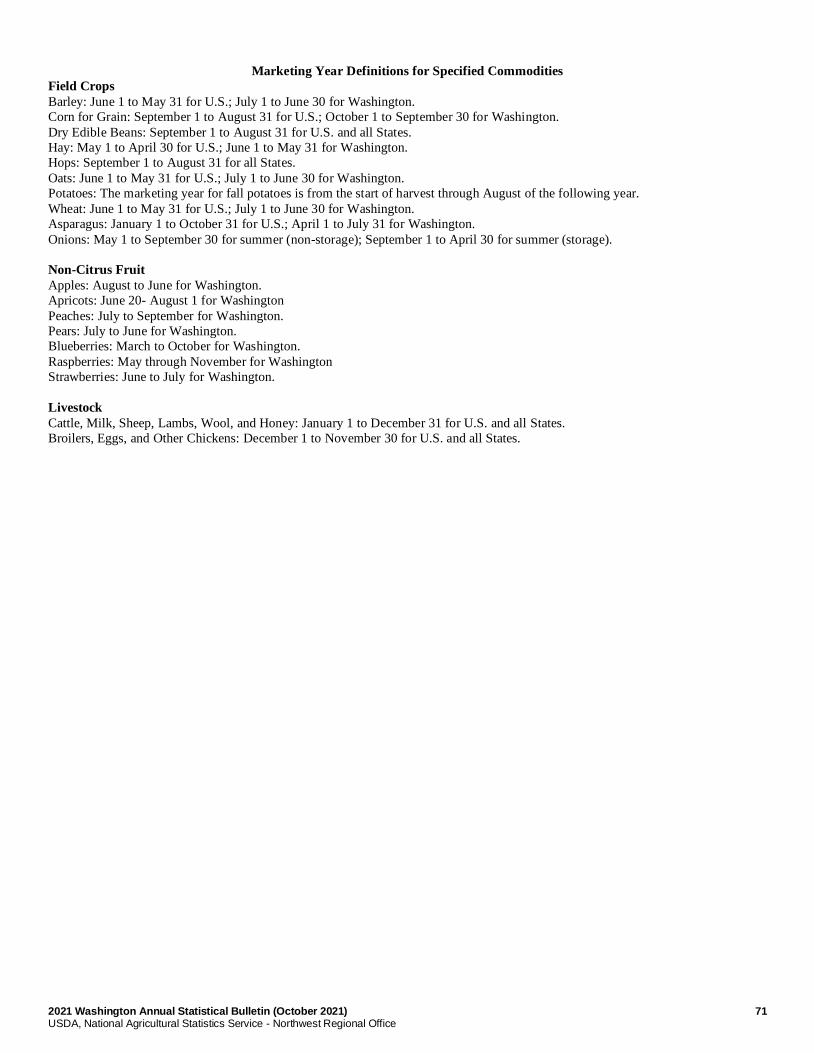
2021 Washington Annual Statistical Bulletin (October 2021) 71 USDA, National Agricultural Statistics Service - Northwest Regional Office
Marketing Year Definitions for Specified Commodities
Field Crops
Barley: June 1 to May 31 for U.S.; July 1 to June 30 for Washington.
Corn for Grain: September 1 to August 31 for U.S.; October 1 to September 30 for Washington.
Dry Edible Beans: September 1 to August 31 for U.S. and all States.
Hay: May 1 to April 30 for U.S.; June 1 to May 31 for Washington.
Hops: September 1 to August 31 for all States.
Oats: June 1 to May 31 for U.S.; July 1 to June 30 for Washington.
Potatoes: The marketing year for fall potatoes is from the start of harvest through August of the following year.
Wheat: June 1 to May 31 for U.S.; July 1 to June 30 for Washington.
Asparagus: January 1 to October 31 for U.S.; April 1 to July 31 for Washington.
Onions: May 1 to September 30 for summer (non-storage); September 1 to April 30 for summer (storage).
Non-Citrus Fruit
Apples: August to June for Washington.
Apricots: June 20- August 1 for Washington
Peaches: July to September for Washington.
Pears: July to June for Washington.
Blueberries: March to October for Washington.
Raspberries: May through November for Washington
Strawberries: June to July for Washington.
Livestock
Cattle, Milk, Sheep, Lambs, Wool, and Honey: January 1 to December 31 for U.S. and all States.
Broilers, Eggs, and Other Chickens: December 1 to November 30 for U.S. and all States.