CAPITAL MARKETS QUARTERLY STATISTICAL BULLETIN
22
JUNE 2020 1 | Page 2020 CAPITAL MARKETS QUARTERLY STATISTICAL BULLETIN SECOND QUARTER 2020 (Q2 - 2020) CAPITAL MARKETS DEVELOPMENT DIVISION
-
Upload
khangminh22 -
Category
Documents
-
view
7 -
download
0
Transcript of CAPITAL MARKETS QUARTERLY STATISTICAL BULLETIN
JUNE 2020
1 | P a g e
2020
CAPITAL MARKETS QUARTERLY STATISTICAL BULLETIN
SECOND QUARTER 2020 (Q2 - 2020)
CAPITAL MARKETS DEVELOPMENT DIVISION
JUNE 2020
2 | P a g e
FSRA
The Financial Services Regulatory Authority (FSRA) is an integrated
regulatory and supervisory authority for all non-bank financial
services providers in Eswatini. It was established in terms of Section
3 of the FSRA Act, 2010. The FSRA regulates and supervises credit &
savings institutions, insurance companies, retirement funds and
capital markets along with other non-bank financial institutions.
FSRA MISSION
We regulate and supervise financial services to protect
stakeholders and foster a stable financial system in Eswatini.
FSRA VISION
To be a world class regulator of financial services.
JUNE 2020
3 | P a g e
Contents 1. Introduction ..................................................................................................................... 5
1.2 Evolution of Total Assets ............................................................................................ 5
Figure 1 – Evolution of Total Assets .................................................................................... 6
1.3 Geographical Allocation of Total Assets ................................................................. 6
Figure 2 – Geographical Allocation of Total Assets ......................................................... 6
1.4 Source of Funds Managed in Eswatini Capital Markets ......................................... 6
Figure 3 – Capital Markets Source of Funds...................................................................... 7
2. Collective Investment Schemes .................................................................................... 7
2.1 Overview .................................................................................................................... 7
2.2 CIS Source of Funds ................................................................................................... 8
Figure 4 – CIS Source of Funds ........................................................................................... 8
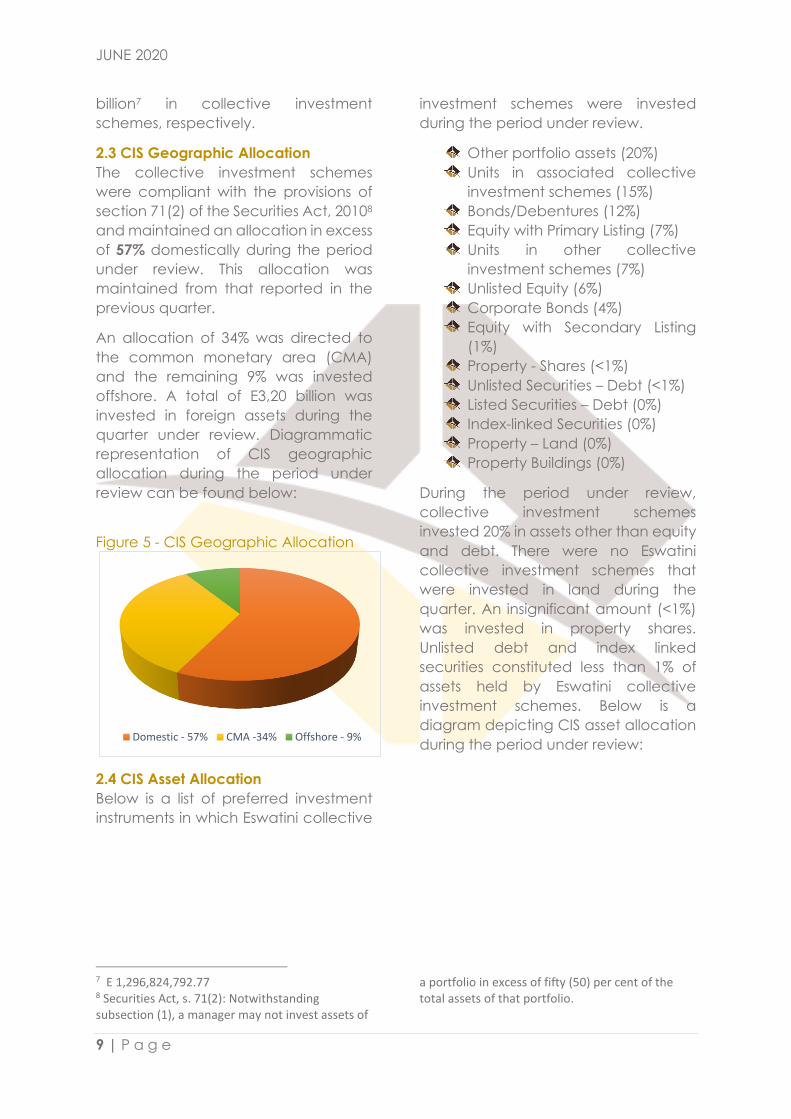
2.3 CIS Geographic Allocation ...................................................................................... 9
Figure 5 - CIS Geographic Allocation ............................................................................... 9
2.4 CIS Asset Allocation .................................................................................................. 9
Figure 6 – CIS Asset Allocation ........................................................................................... 0
Figure 7 – CIS Money Markets ............................................................................................ 0
3. Investment Advisory ...................................................................................................... 11
3.1 Overview .................................................................................................................. 11
3.2 Evolution of Assets under Advisory ......................................................................... 11
Figure 8 – Evolution of Assets Under Advisory ................................................................. 11
3.3 Geographical Allocation of Assets under Advisory .............................................. 13
Figure 9 - Geographical Breakdown of Assets Under Advisory ..................................... 13
3.4 Investment Adviser Source of Funds ...................................................................... 13
Figure 10 – Investment Adviser Source of Funds ............................................................ 13
4. Domestic Listed Securities ............................................................................................ 13
4.1 Market Capitalisation .............................................................................................. 14
Figure 11 – Market Capitalisation ’19 vs ‘20.................................................................... 14
4.2 ESE All Share Index ................................................................................................... 14
4.3 Capital Gains and Losses ....................................................................................... 14
4.4 Equity Turnover ........................................................................................................ 14
4.5 Corporate Bonds ..................................................................................................... 14
4.6 Government Bonds ................................................................................................. 16
4.7 Corporate Events on ESE ........................................................................................ 16
Annexure 1 – Licensed Entities ........................................................................................... 0
JUNE 2020
4 | P a g e
Annexure 2 .......................................................................................................................... 2
Table 1 - Capital Gains and Losses ................................................................................... 2
Table 2 – Value Traded ...................................................................................................... 2
Table 3 – Corporate Bonds ................................................................................................ 3
Table 4 – Government Bonds ............................................................................................ 4
Disclaimer: While reasonable care has been taken to prepare the Capital Markets Statistical
Bulletin, the Authority accepts no responsibility or liability whatsoever resulting from the use of
information contained herein. Further note that the FSRA has no objection to the material
contained herein being referenced, provided an acknowledgement of the same is made.
Any comments and/or suggestions on any of the statistics provided herein may be sent to
JUNE 2020
5 | P a g e
1. Introduction
Financial data reported in the Financial Services Regulatory Authority (“FSRA”) Capital
Markets Quarterly Statistical Bulletin has been sourced from licensees’ statutory returns
to the FSRA for the second quarter (“Q2-2020) ended 30 June 2020.
All the figures reported in the statutory returns and in this Bulletin are in Lilangeni
currency.
This document is divided into 4 chapters. Chapter 1 is an introductory section that
provides the overview of the Eswatini capital markets industry as a whole; Chapter 2
delves into the details regarding the activities of collective investment schemes during
the quarter under review; Chapter 3 describes activities in the investment advisory
space; and finally, Chapter 4 is a synopsis of activity of the Eswatini Stock Exchange,
the sole securities exchange in Eswatini, as at the end of Q2-2020.
1.1 Overview of the Eswatini Capital Market
The Eswatini capital markets industry comprises a total of twenty-six (27) licensed
entities. Licensees fall under the categories listed below and Annexure 1 of this
document:
Collective Investment Scheme Managers – seven (7)
Investment Advisers – sixteen (13)
Trustees – two (2)
Exempt Dealers – one (1)
Stockbrokers – three (3)
Securities Exchanges – one (1)
The aggregate value of assets that were managed on behalf of clients/investors
during the period under review was E23,99 billion1. This indicated a marginal increase
of 0.65% from the figure of E23,83 billion reported in March 2020.
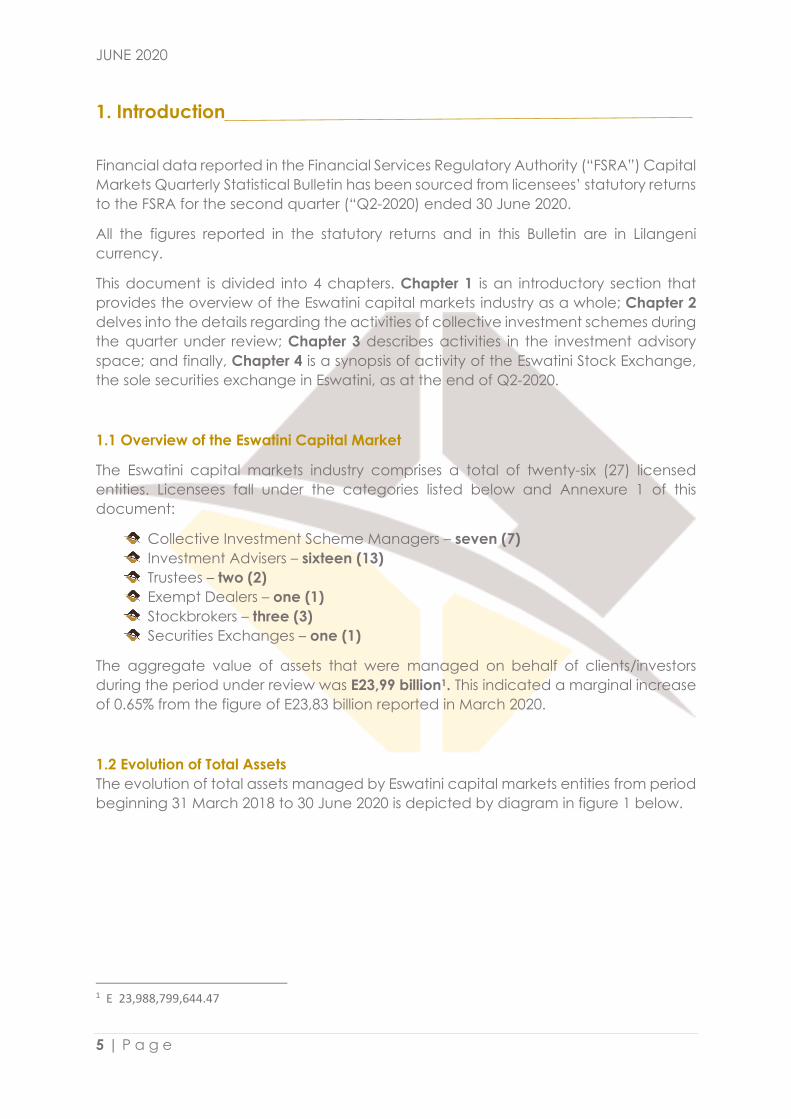
1.2 Evolution of Total Assets
The evolution of total assets managed by Eswatini capital markets entities from period
beginning 31 March 2018 to 30 June 2020 is depicted by diagram in figure 1 below.
1 E 23,988,799,644.47
JUNE 2020
6 | P a g e
Figure 1 – Evolution of Total Assets
The dip reported in Q1-2020 was due to
a non-renewal of a significant player2.
In Q2-2020, total assets in the domestic
capital market are beginning to rise
again.
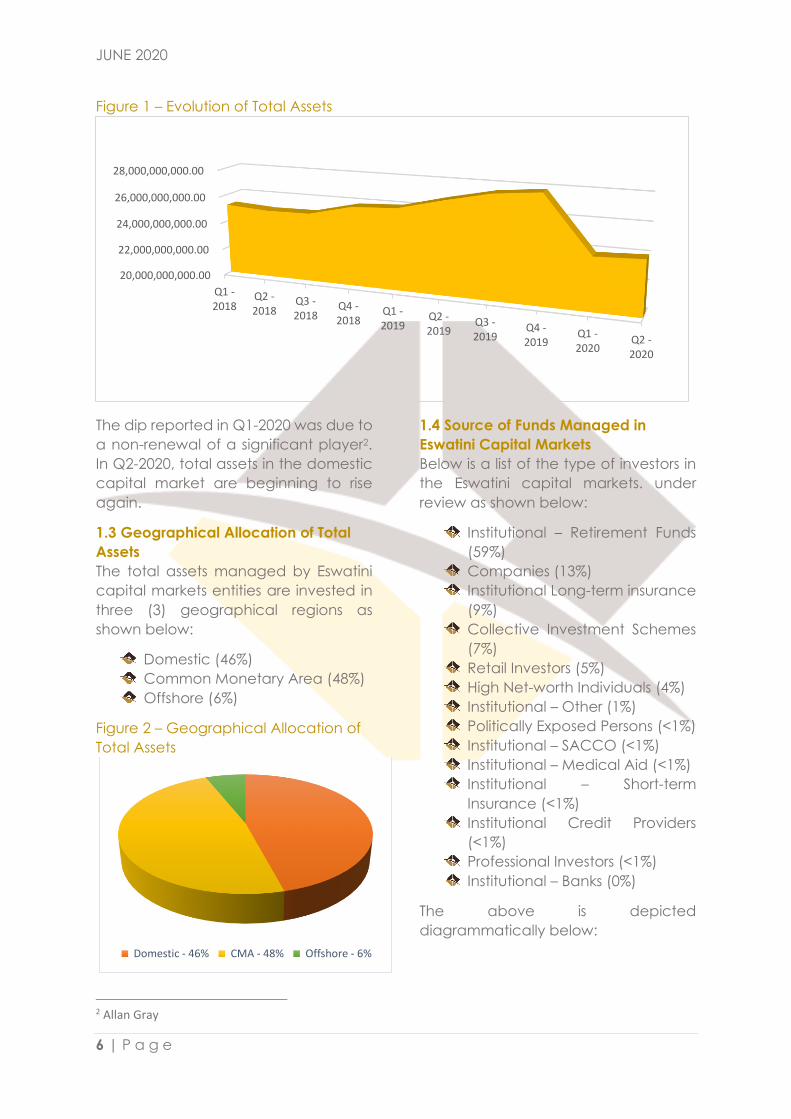
1.3 Geographical Allocation of Total
Assets
The total assets managed by Eswatini
capital markets entities are invested in
three (3) geographical regions as
shown below:
Domestic (46%)
Common Monetary Area (48%)
Offshore (6%)
Figure 2 – Geographical Allocation of
Total Assets
2 Allan Gray
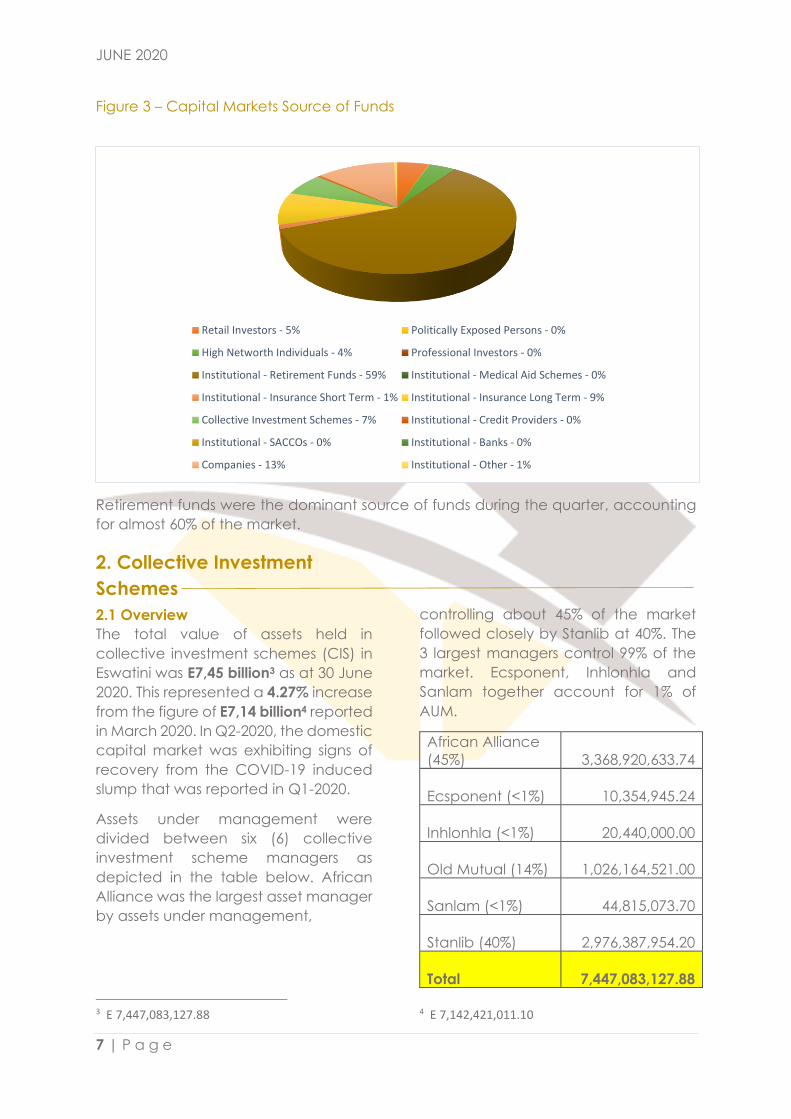
1.4 Source of Funds Managed in
Eswatini Capital Markets
Below is a list of the type of investors in
the Eswatini capital markets. under
review as shown below:
Institutional – Retirement Funds
(59%)
Companies (13%)
Institutional Long-term insurance
(9%)
Collective Investment Schemes
(7%)
Retail Investors (5%)
High Net-worth Individuals (4%)
Institutional – Other (1%)
Politically Exposed Persons (<1%)
Institutional – SACCO (<1%)
Institutional – Medical Aid (<1%)
Institutional – Short-term
Insurance (<1%)
Institutional Credit Providers
(<1%)
Professional Investors (<1%)
Institutional – Banks (0%)
The above is depicted
diagrammatically below:
20,000,000,000.00
22,000,000,000.00
24,000,000,000.00
26,000,000,000.00
28,000,000,000.00
Q1 -2018
Q2 -2018
Q3 -2018
Q4 -2018
Q1 -2019
Q2 -2019
Q3 -2019
Q4 -2019
Q1 -2020
Q2 -2020
Domestic - 46% CMA - 48% Offshore - 6%
JUNE 2020
7 | P a g e
Figure 3 – Capital Markets Source of Funds
Retirement funds were the dominant source of funds during the quarter, accounting
for almost 60% of the market.
2. Collective Investment
Schemes
2.1 Overview
The total value of assets held in
collective investment schemes (CIS) in
Eswatini was E7,45 billion3 as at 30 June
2020. This represented a 4.27% increase
from the figure of E7,14 billion4 reported
in March 2020. In Q2-2020, the domestic
capital market was exhibiting signs of
recovery from the COVID-19 induced
slump that was reported in Q1-2020.
Assets under management were
divided between six (6) collective
investment scheme managers as
depicted in the table below. African
Alliance was the largest asset manager
by assets under management,
3 E 7,447,083,127.88
controlling about 45% of the market
followed closely by Stanlib at 40%. The
3 largest managers control 99% of the
market. Ecsponent, Inhlonhla and
Sanlam together account for 1% of
AUM.
African Alliance
(45%)
3,368,920,633.74
Ecsponent (<1%)
10,354,945.24
Inhlonhla (<1%)
20,440,000.00
Old Mutual (14%)
1,026,164,521.00
Sanlam (<1%)
44,815,073.70
Stanlib (40%)
2,976,387,954.20
Total
7,447,083,127.88
4 E 7,142,421,011.10
Retail Investors - 5% Politically Exposed Persons - 0%
High Networth Individuals - 4% Professional Investors - 0%
Institutional - Retirement Funds - 59% Institutional - Medical Aid Schemes - 0%
Institutional - Insurance Short Term - 1% Institutional - Insurance Long Term - 9%
Collective Investment Schemes - 7% Institutional - Credit Providers - 0%
Institutional - SACCOs - 0% Institutional - Banks - 0%
Companies - 13% Institutional - Other - 1%
JUNE 2020
8 | P a g e
During the period under review, three
(3) collective investment scheme
managers managed over 98% of assets
under management.
2.2 CIS Source of Funds
The participants in Eswatini collective
investment schemes are classified into
fourteen (14) broad categories. Below
is a list of the categories of investors in
collective investment schemes
arranged in descending order by
proportion contributed to total assets
under management during the quarter
under review:
Companies (21%)
Institutional – Long-term
Insurance (16%)
Retail Investors (16%)
High Net-worth individuals (15%)
Institutional – Retirement Funds
(13%)
Collective Investment Schemes
(9%)
Institutional – Short-term
insurance (4%)
Institutional - Credit Providers
(1%)
Institutional SACCOs – (1%)
Institutional – Other (1%)
Politically Exposed Persons (<1%)
Institutional - Medical Aid
Schemes (<1%)
Institutional – Banks (0%)
Professional Investors (0%)
The above is depicted
diagrammatically below:
5 E 1,633,255,129.51
Figure 4 – CIS Source of Funds
As depicted in the figure above,
companies were the largest single
contributor to funds held in collective
investment schemes in Eswatini during
the quarter under review. Companies
invested over E1.63 billion5 in collective
investment schemes, all held with the
two out of three of the largest CIS
managers by AUM.
The next two largest investors, Long-
term insurance companies and retail
investors, held E1,29 billion6 and E1,30
6 E 1,286,196,953.14
Retail Investors - 16%
Politically Exposed Persons - 0%
High Networth Individuals - 15%
Professional Investors - 0%
Institutional - Retirement Funds - 13%
Institutional - Medical Aid Schemes - 0%
Institutional - Insurance Short Term - 4%
Institutional - Insurance Long Term - 16%
Collective Investment Schemes - 9%
Institutional - Credit Providers - 1%
Institutional - SACCOs - 1%
Institutional - Banks - 0%
Companies - 21%
Institutional - Other - 1%
JUNE 2020
9 | P a g e
billion7 in collective investment
schemes, respectively.
2.3 CIS Geographic Allocation
The collective investment schemes
were compliant with the provisions of
section 71(2) of the Securities Act, 20108
and maintained an allocation in excess
of 57% domestically during the period
under review. This allocation was
maintained from that reported in the
previous quarter.
An allocation of 34% was directed to
the common monetary area (CMA)
and the remaining 9% was invested
offshore. A total of E3,20 billion was
invested in foreign assets during the
quarter under review. Diagrammatic
representation of CIS geographic
allocation during the period under
review can be found below:
Figure 5 - CIS Geographic Allocation
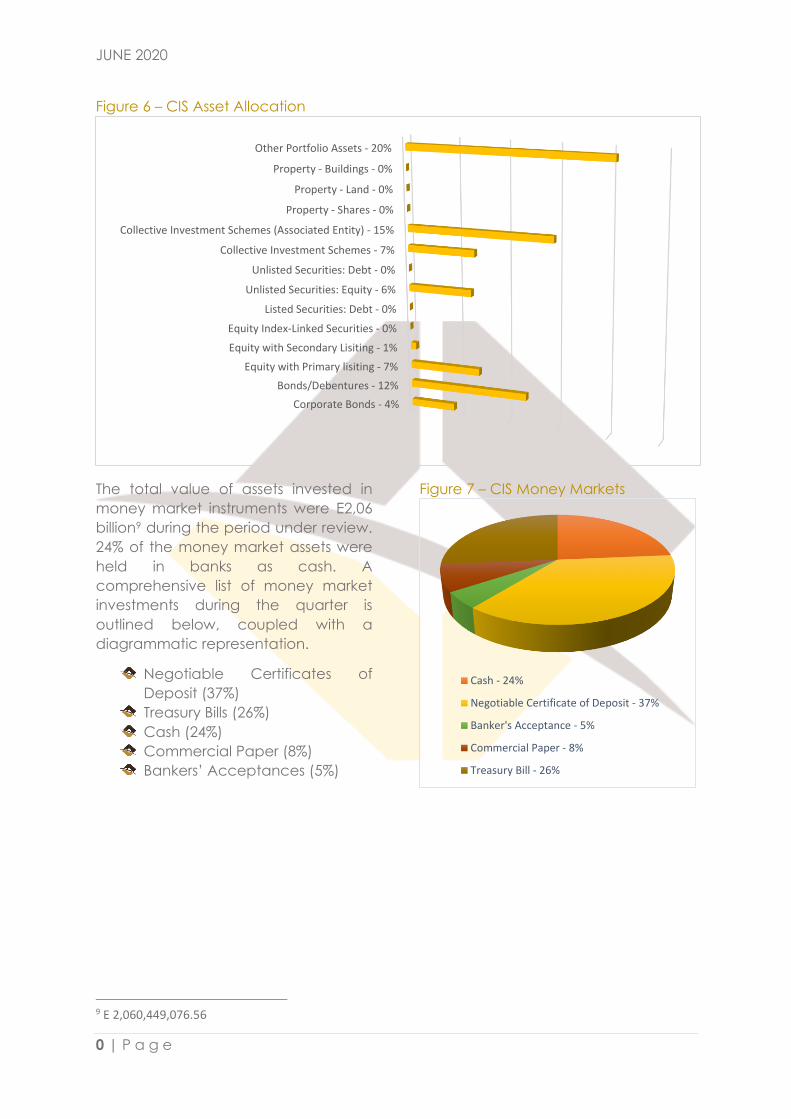
2.4 CIS Asset Allocation
Below is a list of preferred investment
instruments in which Eswatini collective
7 E 1,296,824,792.77 8 Securities Act, s. 71(2): Notwithstanding subsection (1), a manager may not invest assets of
investment schemes were invested
during the period under review.
Other portfolio assets (20%)
Units in associated collective
investment schemes (15%)
Bonds/Debentures (12%)
Equity with Primary Listing (7%)
Units in other collective
investment schemes (7%)
Unlisted Equity (6%)
Corporate Bonds (4%)
Equity with Secondary Listing
(1%)
Property - Shares (<1%)
Unlisted Securities – Debt (<1%)
Listed Securities – Debt (0%)
Index-linked Securities (0%)
Property – Land (0%)
Property Buildings (0%)
During the period under review,
collective investment schemes
invested 20% in assets other than equity
and debt. There were no Eswatini
collective investment schemes that
were invested in land during the
quarter. An insignificant amount (<1%)
was invested in property shares.
Unlisted debt and index linked
securities constituted less than 1% of
assets held by Eswatini collective
investment schemes. Below is a
diagram depicting CIS asset allocation
during the period under review:
a portfolio in excess of fifty (50) per cent of the total assets of that portfolio.
Domestic - 57% CMA -34% Offshore - 9%
JUNE 2020
0 | P a g e
Figure 6 – CIS Asset Allocation
The total value of assets invested in
money market instruments were E2,06
billion9 during the period under review.
24% of the money market assets were
held in banks as cash. A
comprehensive list of money market
investments during the quarter is
outlined below, coupled with a
diagrammatic representation.
Negotiable Certificates of
Deposit (37%)
Treasury Bills (26%)
Cash (24%)
Commercial Paper (8%)
Bankers’ Acceptances (5%)
9 E 2,060,449,076.56
Figure 7 – CIS Money Markets
Corporate Bonds - 4%
Bonds/Debentures - 12%
Equity with Primary lisiting - 7%
Equity with Secondary Lisiting - 1%
Equity Index-Linked Securities - 0%
Listed Securities: Debt - 0%
Unlisted Securities: Equity - 6%
Unlisted Securities: Debt - 0%
Collective Investment Schemes - 7%
Collective Investment Schemes (Associated Entity) - 15%
Property - Shares - 0%
Property - Land - 0%
Property - Buildings - 0%
Other Portfolio Assets - 20%
Cash - 24%
Negotiable Certificate of Deposit - 37%
Banker's Acceptance - 5%
Commercial Paper - 8%
Treasury Bill - 26%
JUNE 2020
11 | P a g e
3. Investment Advisory
3.1 Overview
Investment advisers advised on total
assets to the value of E16,54 billion10 as
at 30 June 2020. This represented a
marginal decrease of less than 1% from
the figure of E16,69 billion11 reported in
March 2020.
Assets under advisory were divided
between eight (8) investment advisers
as shown in the table below. Stanlib is
by far the largest investment adviser by
assets under advisement accounting
for 37% of the market; whereas, 14% is
controlled by African Alliance. The last
six (6) investment advisers advise more
than E1 billion respectively, with the
exception of BLZI, which accounts for
just 2% of the market.
African Alliance
(14%) 2,276,824,304.00
Aluwani (6%) 1,068,885,081.33
BLZI (2%) 256,606,585.65
Imbewu Yesive
(11%) 1,841,992,161.45
Inhlonhla (12%) 1,968,409,524.00
Old Mutual (9%)
1,437,327,123.66
Sanlam (9%) 1,523,232,229.08
Stanlib (37%) 6,168,439,507.42
Total 16,541,716,516.59
3.2 Evolution of Assets under Advisory
The general trend of assets under advisory in local capital markets is an upward trend
over the periods beginning in the first quarter of 2017 up to Q4-2019 as shown
diagrammatically in the figure below:
Figure 8 – Evolution of Assets Under Advisory
10 E 16,541,716,516.59
11 E 16,691,704,771.23
-
5,000,000,000.00
10,000,000,000.00
15,000,000,000.00
20,000,000,000.00
25,000,000,000.00
Q1 -2018
Q2 -2018
Q3 -2018
Q4 -2018
Q1 -2019
Q2 -2019
Q3 -2019
Q4 -2019
Q1 -2020
Q2 -2020
JUNE 2020
13 | P a g e
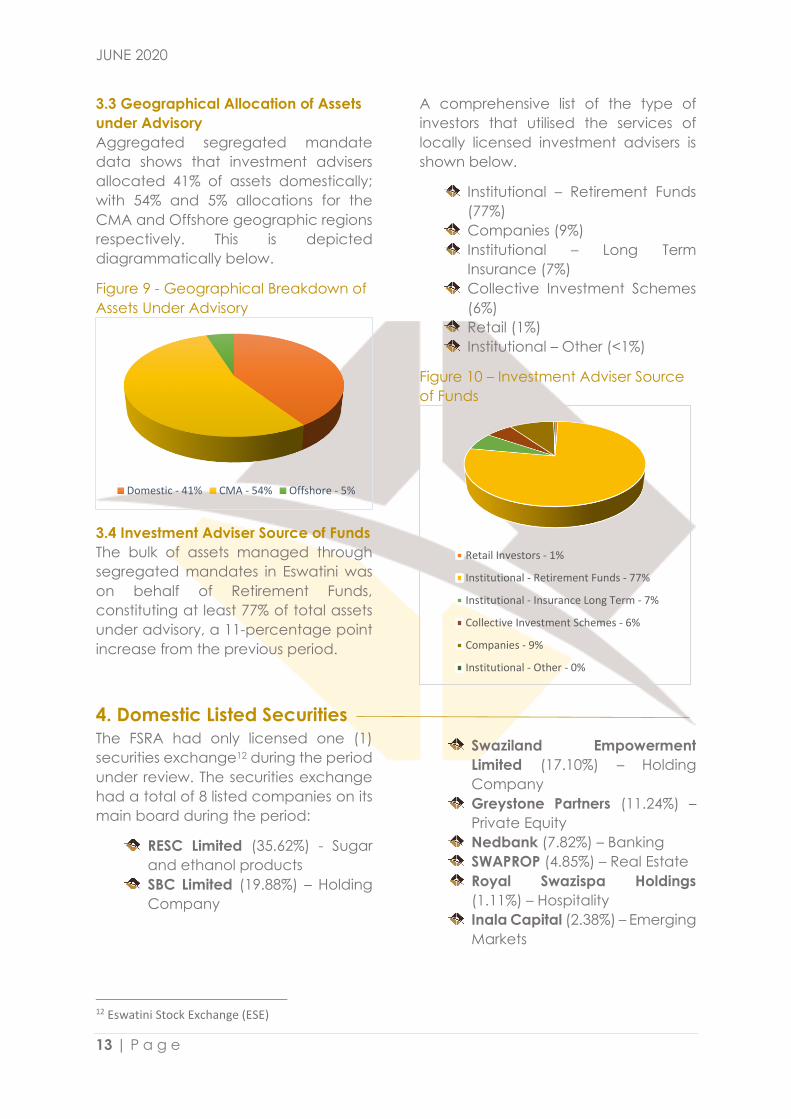
3.3 Geographical Allocation of Assets
under Advisory
Aggregated segregated mandate
data shows that investment advisers
allocated 41% of assets domestically;
with 54% and 5% allocations for the
CMA and Offshore geographic regions
respectively. This is depicted
diagrammatically below.
Figure 9 - Geographical Breakdown of
Assets Under Advisory
3.4 Investment Adviser Source of Funds
The bulk of assets managed through
segregated mandates in Eswatini was
on behalf of Retirement Funds,
constituting at least 77% of total assets
under advisory, a 11-percentage point
increase from the previous period.
A comprehensive list of the type of
investors that utilised the services of
locally licensed investment advisers is
shown below.
Institutional – Retirement Funds
(77%)
Companies (9%)
Institutional – Long Term
Insurance (7%)
Collective Investment Schemes
(6%)
Retail (1%)
Institutional – Other (<1%)
Figure 10 – Investment Adviser Source
of Funds
4. Domestic Listed Securities The FSRA had only licensed one (1)
securities exchange12 during the period
under review. The securities exchange
had a total of 8 listed companies on its
main board during the period:
RESC Limited (35.62%) - Sugar
and ethanol products
SBC Limited (19.88%) – Holding
Company
12 Eswatini Stock Exchange (ESE)
Swaziland Empowerment
Limited (17.10%) – Holding
Company
Greystone Partners (11.24%) –
Private Equity
Nedbank (7.82%) – Banking
SWAPROP (4.85%) – Real Estate
Royal Swazispa Holdings
(1.11%) – Hospitality
Inala Capital (2.38%) – Emerging
Markets
Domestic - 41% CMA - 54% Offshore - 5%
Retail Investors - 1%
Institutional - Retirement Funds - 77%
Institutional - Insurance Long Term - 7%
Collective Investment Schemes - 6%
Companies - 9%
Institutional - Other - 0%
JUNE 2020
14 | P a g e
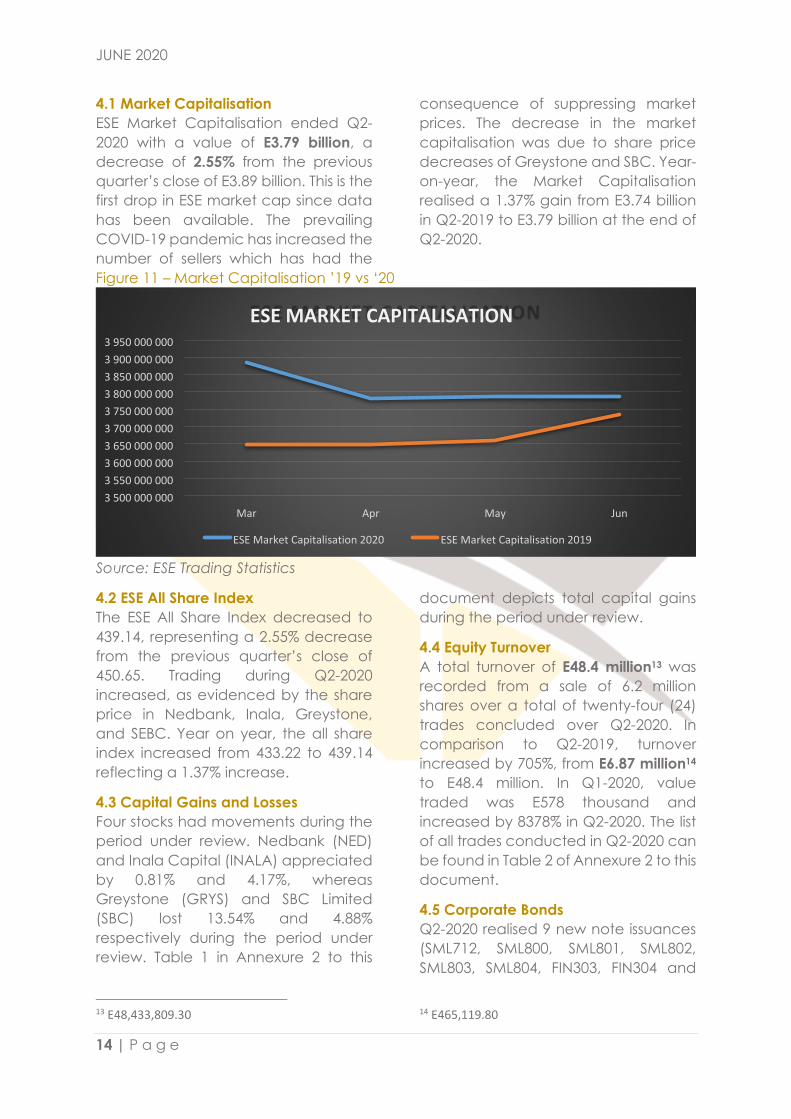
4.1 Market Capitalisation
ESE Market Capitalisation ended Q2-
2020 with a value of E3.79 billion, a
decrease of 2.55% from the previous
quarter’s close of E3.89 billion. This is the
first drop in ESE market cap since data
has been available. The prevailing
COVID-19 pandemic has increased the
number of sellers which has had the
consequence of suppressing market
prices. The decrease in the market
capitalisation was due to share price
decreases of Greystone and SBC. Year-
on-year, the Market Capitalisation
realised a 1.37% gain from E3.74 billion
in Q2-2019 to E3.79 billion at the end of
Q2-2020.
Figure 11 – Market Capitalisation ’19 vs ‘20
Source: ESE Trading Statistics
4.2 ESE All Share Index
The ESE All Share Index decreased to
439.14, representing a 2.55% decrease
from the previous quarter’s close of
450.65. Trading during Q2-2020
increased, as evidenced by the share
price in Nedbank, Inala, Greystone,
and SEBC. Year on year, the all share
index increased from 433.22 to 439.14
reflecting a 1.37% increase.
4.3 Capital Gains and Losses
Four stocks had movements during the
period under review. Nedbank (NED)
and Inala Capital (INALA) appreciated
by 0.81% and 4.17%, whereas
Greystone (GRYS) and SBC Limited
(SBC) lost 13.54% and 4.88%
respectively during the period under
review. Table 1 in Annexure 2 to this
13 E48,433,809.30
document depicts total capital gains
during the period under review.
4.4 Equity Turnover
A total turnover of E48.4 million13 was
recorded from a sale of 6.2 million
shares over a total of twenty-four (24)
trades concluded over Q2-2020. In
comparison to Q2-2019, turnover
increased by 705%, from E6.87 million14
to E48.4 million. In Q1-2020, value
traded was E578 thousand and
increased by 8378% in Q2-2020. The list
of all trades conducted in Q2-2020 can
be found in Table 2 of Annexure 2 to this
document.
4.5 Corporate Bonds
Q2-2020 realised 9 new note issuances
(SML712, SML800, SML801, SML802,
SML803, SML804, FIN303, FIN304 and
14 E465,119.80
3 500 000 000 3 550 000 000 3 600 000 000 3 650 000 000 3 700 000 000 3 750 000 000 3 800 000 000 3 850 000 000 3 900 000 000 3 950 000 000
Mar Apr May Jun
ESE MARKET CAPITALISATION
ESE Market Capitalisation 2020 ESE Market Capitalisation 2019
JUNE 2020
16 | P a g e
FIN305) worth E60 million, E50 million,
E50 million, E 20 million, E30 million, E30
million, E20 million, E 30 million and E60
million, respectively. On the other hand,
8 bonds matured during the Quarter
(FIN111, SML406, SML502, FIN201,
FIN203, SML606, FIN112 and SML503
worth E20 million, E20 million, E30.5
million, E10 million, E24 million, E24
million, E50 million and E50 million,
respectively. This saw the cumulative
corporate bonds outstanding as at
June 30, 2020 increase to E1.25 billion,
from the previous quarter’s outstanding
amount of E1.14 billion. This marked a
9.65% increase in total corporate bonds
outstanding. However, year-on-year,
total corporate bonds outstanding
decreased by 2.34% from E1.28 billion.
4.6 Government Bonds
During the period under review,
Government through the Central Bank
of Eswatini (CBE) listed 26 bonds with
different maturities, ranging from 3, 5, 7,
8, 9, and 10 years. Total outstanding
bonds as at June 30, 2020 stood at
E5.07 billion against E4.9 billion as at
March 31, 2020, reflecting a 3.47%
quarterly increase. One bond
commenced trading and three (3)
reopened during the period under
review. Year-on-year, total government
bonds outstanding increased by
61.99% from E3.13 billion as at June
2019.
4.7 Corporate Events on ESE
Select Limited’s Corporate
Bonds SML800 worth E50 million,
SML801 worth E50 million and
SML802 worth E20 million, and
FINCORP’s FIN303 worth E20
million commenced trading on
the ESE in April 2020.
FINCORP’s Corporate Bond
FIN111 worth E20 million and
Select Limited’s SML406 worth
E20 million and SML502 worth
E30.5 million matured during the
month of April 2020.
Government Infrastructure Bond
SGIFB007 with a nominal value of
E100 million re-opened on the
ESE during the month of April
2020.
Select Limited’s Corporate
Bonds SML803 worth E30 million
and SML804 worth E30 million
and FINCORP’s FIN304 worth E30
million commenced trading on
the ESE in May 2020.
FINCORP’s Corporate Bonds
FIN201 worth E10 million and
FIN203 worth E24 million and
Select Limited’s SML606 worth
E24 million matured during the
month of May 2020.
Government’s Plain Vanilla Bond
SG047 worth E12 million
commenced trading and no
Government Treasuries matured
during the month of May 2020.
Corporate Bonds SML712 worth
E51 million and FIN305 worth E60
million commenced trading on
the ESE in June 2020.
Corporate Bonds FIN112 worth
E50 million and SML503 worth E50
million matured during the
month of June 2020.
Government’s Plain Vanilla Bond
SG035 re-opened and
commenced trading during the
month of June 2020.
JUNE 2020
0 | P a g e
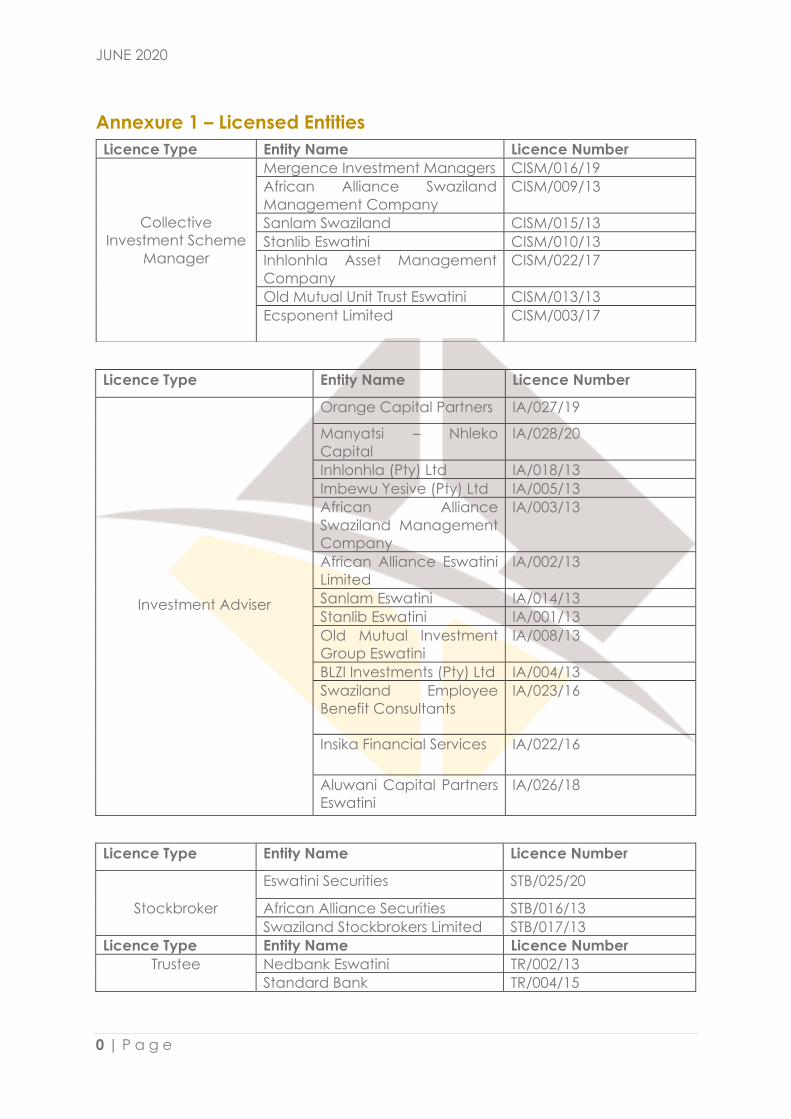
Annexure 1 – Licensed Entities
Licence Type Entity Name Licence Number
Orange Capital Partners IA/027/19
Manyatsi – Nhleko
Capital
IA/028/20
Investment Adviser
Inhlonhla (Pty) Ltd IA/018/13
Imbewu Yesive (Pty) Ltd IA/005/13
African Alliance
Swaziland Management
Company
IA/003/13
African Alliance Eswatini
Limited
IA/002/13
Sanlam Eswatini IA/014/13
Stanlib Eswatini IA/001/13
Old Mutual Investment
Group Eswatini
IA/008/13
BLZI Investments (Pty) Ltd IA/004/13
Swaziland Employee
Benefit Consultants
IA/023/16
Insika Financial Services IA/022/16
Aluwani Capital Partners
Eswatini
IA/026/18
Licence Type Entity Name Licence Number
Eswatini Securities STB/025/20
Stockbroker African Alliance Securities STB/016/13
Swaziland Stockbrokers Limited STB/017/13
Licence Type Entity Name Licence Number
Trustee Nedbank Eswatini TR/002/13
Standard Bank TR/004/15
Licence Type Entity Name Licence Number
Mergence Investment Managers CISM/016/19
Collective
Investment Scheme
Manager
African Alliance Swaziland
Management Company
CISM/009/13
Sanlam Swaziland CISM/015/13
Stanlib Eswatini CISM/010/13
Inhlonhla Asset Management
Company
CISM/022/17
Old Mutual Unit Trust Eswatini CISM/013/13
Ecsponent Limited
CISM/003/17
JUNE 2020
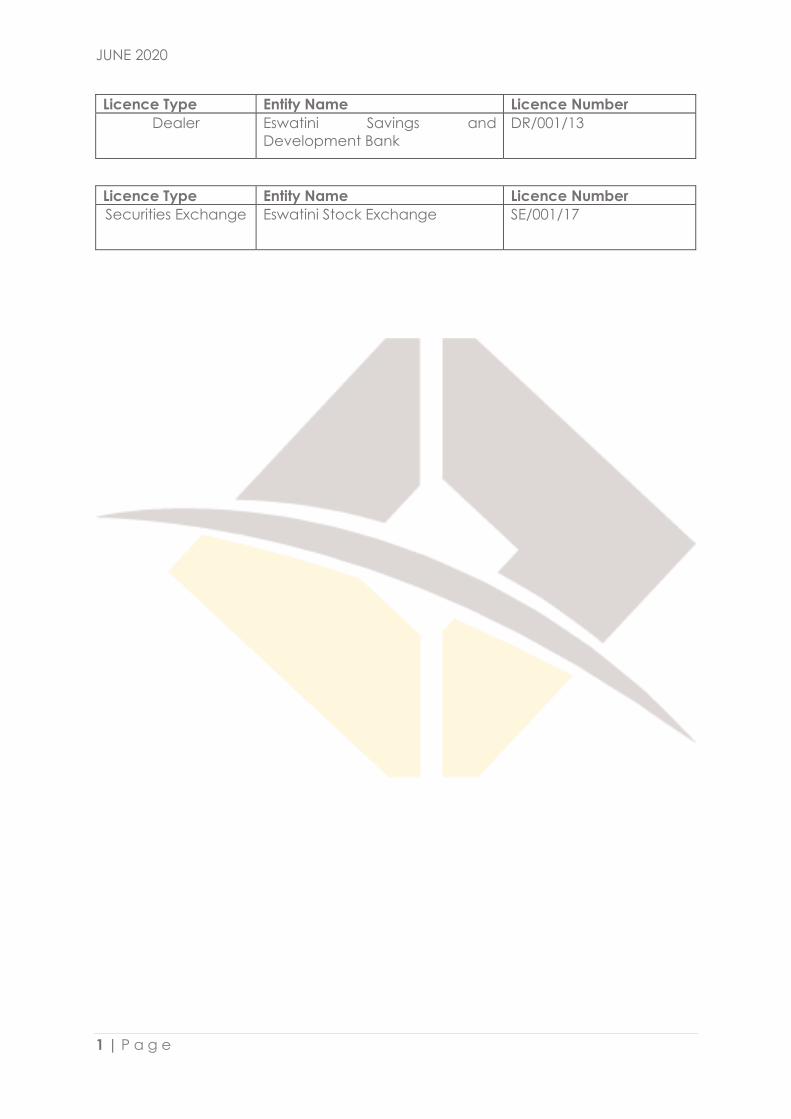
1 | P a g e
Licence Type Entity Name Licence Number
Dealer Eswatini Savings and
Development Bank
DR/001/13
Licence Type Entity Name Licence Number
Securities Exchange Eswatini Stock Exchange SE/001/17
JUNE 2020
2 | P a g e
Annexure 2
Table 1 - Capital Gains and Losses
COMPANY
SHARE
PRICE
SHARE PRICE
(%) MKT CAP (SZL)
NAME MAR 2020 JUN 20 GAINS
Nedbank Limited 1230 1240 0.81% 296 280 200
RSSC 1400 1400 0.00% 1 348 851 280
SEL 3500 3500 0.00% 647 500 000
SWAPROP 790 790 0.00% 183 743 335
Swazispa Holdings 600 600 0,00% 41 966 964
Greystone Partners 347 300 -13.54% 425 509 383
SBC Limited 820 780 -4.88% 752 622 000
Inala Capital 120 125 4.17% 89 992 500
TOTAL 3 786 565 662
Table 2 – Value Traded
Company Number of Shares Share Price Emalangeni
(CPS)
Date
Greystone Partners 1 000 330 3 300,00 2020/04/14
SBC Limited 6 400 780 49 920,00 2020/04/17
Greystone Partners 1 000 315 3 150,00 2020/04/23
SEL 33 000 3500 1 155 000,00 2020/04/28
Inala Capital 140 300 120 168 360,00 2020/04/28
Greystone Partners 15 000 300 45 000,00 2020/04/28
SBC Limited 1 600 780 12 480,00 2020/04/28
Greystone Partners 1 296 300 3 888,00 2020/05/06
SWAPROP Ltd 1 924 050 790 15 199 995,00 2020/05/06
SWAPROP Ltd 607 595 790 4 800 000,50 2020/05/06
SBC Limited 6 000 780 46 800,00 2020/05/12
SWAPROP Ltd 15 370 790 121 423,00 2020/05/19
Inala Capital 116 200 125 145 250,00 2020/05/19
SBC Limited 2 000 780 15 600,00 2020/05/19
SBC Limited 3500 780 27 300,00 2020/05/26
SEL 19 800 3500 693 000,00 2020/05/28
SBC Limited 5 000 780 39 000,00 2020/05/29
Nedbank Eswatini
Ltd
3 200 1240 39 680,00 2020/05/29
SBC Limited 1 500 780 11 700,00 2020/06/01
SWAPROP Limited 3 255 827 790 25 721 033,30 2020/06/01
JUNE 2020
3 | P a g e
Greystone Partners 1 000 300 3 000,00 2020/06/04
Inala Capital 48 000 125 60 000,00 2020/06/12
SBC Limited 4 350 780 33 930,00 2020/06/15
SEL 1 000 3500 35 000,00 2020/06/24
6 213 988 48 433 809,80
Table 3 – Corporate Bonds
Name ISIN Code Coupon Maturity Date Nominal
Value SZL
Select Limited SML408 SZD000551886 13,33 04-Jul-20 10 000 000,00
Select Limited SML501 SZD000551804 12,50 24-Feb-22 8 859 200,00
Select Limited SML504 SZD000551894 13,25 04-Jul-20 10 000 000,00
Select Limited SML505 SZD000551919 13,50 28-Jul-20 26 000 000,00
Select Limited SML506 SZD000551950 13,50 28-Oct-20 17 000 000,00
Select Limited SML507 SZD000551992 13,50 17-Nov-20 2 000 000,00
Select Limited SML508 SZD000552159 12,00 06-Aug-21 1 130 000,00
Select Limited SML600 SZD000551968 13,50 28-Oct-20 9 000 000,00
Select Limited SML601 SZD000551976 13,50 17-Nov-20 9 000 000,00
Select Limited SML603 SZD000552018 13,00 20-Dec-20 20 100 000,00
Select Limited SML604 SZD000552026 13,00 20-Dec-20 10 000 000,00
Select Limited SML605 SZD000552042 13,25 10-Apr-21 21 920 000,00
Select Limited SML607 SZD000552076 12,50 06-Jun-21 5 000 000,00
Select Limited SML609 SZD000552100 13,75 03-Aug-23 30 000 000,00
Select Limited SML610 SZD000552118 13,50 06-Aug-23 17 540 627,04
Select Limited SML611 SZD000552126 13,00 30-Oct-23 31 500 050,00
Select Limited SML612 SZD000552134 12,00 13-Dec-20 48 257 103,29
Select Limited SML613 SZD000552142 Floating 08-Apr-22 30 000 000,00
Select Limited SML614 SZD000552159 12,25 29-Jun-21 6 735 000,00
Select Limited SML700 SZD000552226 Floating 19-Feb-21 42 809 000,00
Select Limited SML702 SZD000552242 12,00 06-May-22 59 840 000,00
Select Limited SML703 SZD000552275 12,30 08-May-22 9 000 000,00
Select Limited SML704 SZD000552283 12,50 19-Jul-22 12 630 000,00
Select Limited SML705 SZD000552291 11,50 29-Jul-21 7 004 216,71
Select Limited SML706 SZD000552307 Floating 30-Aug-22 15 000 000,00
Select Limited SML707 SZD000552315 12,25 06-Sep-22 9 790 000,00
Select Limited SML708 SZD000552323 13,50 28-Oct-22 22 673 200,00
Select Limited SML709 SZD000552331 13,25 10-Nov-20 30 000 000,00
JUNE 2020
4 | P a g e
Select Limited SML710 SZD000552349 12,50 19-Nov-24 50 000 000,00
Select Limited SML711 SZD000552356 0,00 28-Nov-21 78 500 000,00
Select Limited SML712 SZD000552489 11,00 30-Jun-21 51 200 000,00
Select Limited SML800 SZD000552406 12,25 11-Jan-23 50 000 000,00
Select Limited SML801 SZD000552414 12,25 27-Mar-21 50 000 000,00
Select Limited SML802 SZD000552448 11,00 16-Apr-23 20 000 000,00
Select Limited SML803 SZD000552448 11,00 16-Apr-23 30 000 000,00
Select Limited SML804 SZD000552455 10,75 04-May-22 30 221 111,00
FINCORP FIN202 SZD000552034 14,00 30-Mar-23 48 000 000,00
FINCORP FIN204 SZD000552084 12,50 06-Jun-21 5 000 000,00
FINCORP FIN205 SZD000552091 11,85 06-Jul-20 6 338 938,32
FINCORP FIN207 SZD000552183 12,00 17-Oct-21 6 000 000,00
FINCORP FIN208 SZD000552191 12,00 08-Nov-21 9 000 000,00
FINCORP FIN209 SZD000552200 12,00 23-Nov-21 11 001 972,00
FINCORP FIN210 SZD000552218 Floating 16-Jan-24 30 000 000,00
FINCORP FIN211 SZD000552267 12,00 04-May-22 47 600 000,00
FINCORP FIN300 SZD000552372 12,25 29-Jan-23 5 119 375,00
FINCORP FIN301 SZD000552380 12,25 10-Feb-21 70 200 000,00
FINCORP FIN302 SZD000552398 12,50 10-Oct-22 20 584 658,00
FINCORP FIN303 SZD000552430 10,00 07-Apr-21 20 000 000,00
FINCORP FIN304 SZD000552463 10,75 04-May-22 30 221 111,00
FINCORP FIN305 SZD000552471 11,00 30-Jun-21 60 000 000,00
Table 4 – Government Bonds
Name ISIN Code Coupon Maturity
Date
Allocated
Amount (SZL)
Eswatini Government
SG017
SZG000441157 8,50 31-Oct-
20
100 000 000,00
REOPENING1 SG017 31-Oct-
20
100 000 000,00
REOPENING2 SG017 31-Oct-
20
51 100 000,00
Eswatini Government
SG018
SZG000441162 9,25 31-Jan-
24
100 000 000,00
REOPENING 1 SG018 31-Jan-
24
100 000 000,00
REOPENING 2 SG018 31-Jan-
24
23 440 000,00
REOPENING 3 SG018 31-Jan-
24
300 000 000,00

JUNE 2020
5 | P a g e
Eswatini Government
SG022
SZG000441207 Floating 25-Sep-
22
96 035 000,00
Eswatini Government
SG023
SZG000441215 8,75 30-Nov-
20
250 000 100,00
REOPENING 1 SG023 30-Nov-
20
76 390 000,00
Eswatini Government SG025 10,00 20-Jun-
21
178 050 000,00
REOPENING 1 SG025
20-Jun-
21
169 240 000,00
Eswatini Government SG026 SZG000441248 Floating 31-Aug-
23
178 650 000,00
Eswatini Government SG027 SZG000441256 10,75 31-Oct-
26
171 650 000,00
REOPENING 1 SG027 31-Oct-
26
100 500 000,00
REOPENING 2 SG027 31-Oct-
26
592 548 000,00
Eswatini Government SG029 10,50 28-Feb-
22
129 260 000,00
REOPENING 1 SG029
28-Feb-
22
0,00
Eswatini Government SG030 10,25 30-Jun-
24
134 495 000,00
Eswatini Government SG031 10,00 31-Jan-
25
150 000 000,00
REOPENING 1SG031
31-Jan-
25
400 000 000,00
Eswatini Government SG033 9,25 29-Jun-
23
95 150 000,00
REOPENING 1SG033 29-Jun-
23
60 000 000,00
REOPENING 2SG033 29-Jun-
23
43 100 000,00
REOPENING 3SG033 29-Jun-
23
0,00
Eswatini Government SG034 SZG000441363 9,75 29-Jun-
25
18 000 000,00
REOPENING 1 SG034 29-Jun-
25
50 000 000,00
REOPENING 2 SG034 29-Jun-
25
53 000 000,00
JUNE 2020
6 | P a g e
REOPENING 3 SG034 29-Jun-
25
0,00
Eswatini Government SG035 SZG000441371 10,25 29-Jun-
28
16 690 000,00
REOPENING 1 SG035 29-Jun-
28
50 070 000,00
REOPENING 2 SG035 29-Jun-
28
39 410 000,00
REOPENING 3 SG035 29-Jun-
28
7 190 000,00
Eswatini Government SG036 SZG000441389 9,00 31-Aug-
21
45 000 000,00
Eswatini Government SG039 SZG000441422 9,10 31-Jan-
22
2 230 000,00
REOPENING1 SG039 31-Jan-
22
10 000 000,00
REOPENING2 SG039 31-Jan-
22
45 000 000,00
REOPENING3 SG039 31-Jan-
22
6 170 000,00
Eswatini Government SG040 SZG000441430 9,40 31-Jan-
24
3 010 000,00
REOPENING1 SG040 31-Jan-
24
30 000 000,00
REOPENING2 SG040 31-Jan-
24
51 150 000,00
REOPENING3 SG040 31-Jan-
24
60 000 000,00
REOPENING4 SG040 31-Jan-
24
0,00
Eswatini Government SG041 SZG000441448 9,85 31-Jan-
26
3 000 000,00
REOPENING1 SG041 31-Jan-
26
25 000 000,00
REOPENING2 SG041 31-Jan-
26
41 000 000,00
REOPENING3 SG041 31-Jan-
26
34 000 000,00
REOPENING4 SG041 31-Jan-
26
0,00
REOPENING5 SG041 31-Jan-
26
5 090 000,00
Eswatini Government SG042 SZG000441455 10,25 31-Jan-
29
10 900 000,00
REOPENING1 SG042 31-Jan-
29
45 500 000,00
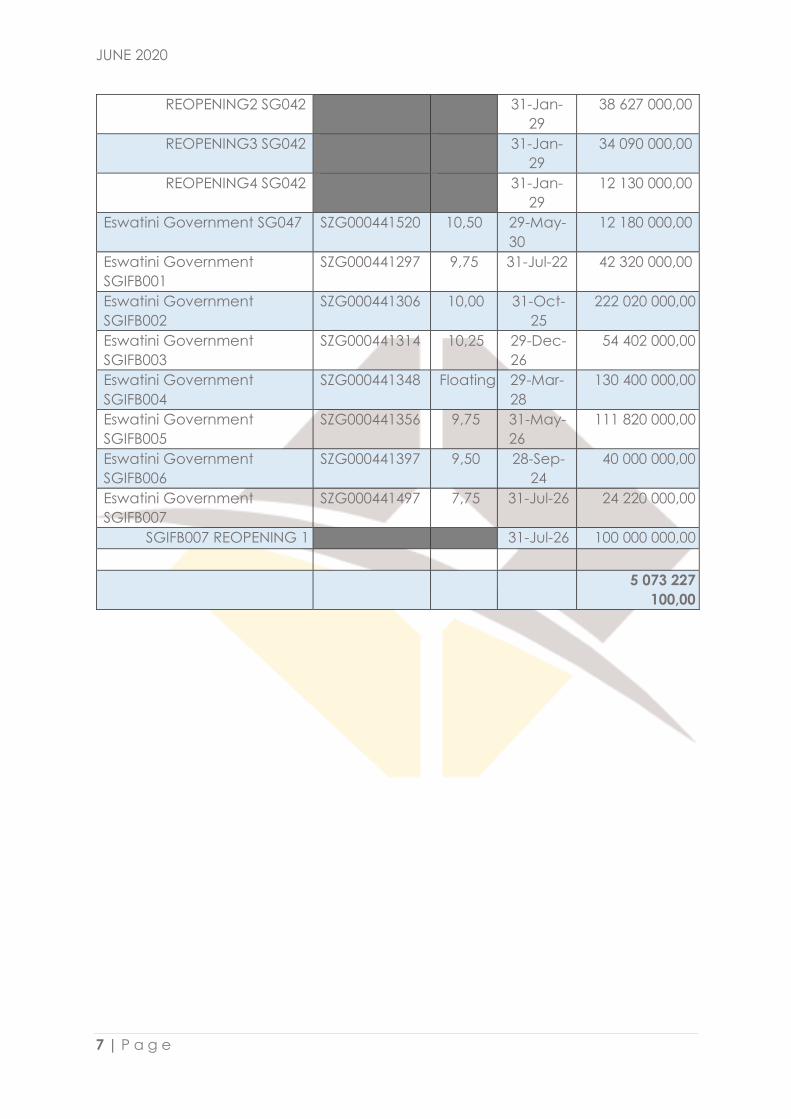
JUNE 2020
7 | P a g e
REOPENING2 SG042 31-Jan-
29
38 627 000,00
REOPENING3 SG042 31-Jan-
29
34 090 000,00
REOPENING4 SG042 31-Jan-
29
12 130 000,00
Eswatini Government SG047 SZG000441520 10,50 29-May-
30
12 180 000,00
Eswatini Government
SGIFB001
SZG000441297 9,75 31-Jul-22 42 320 000,00
Eswatini Government
SGIFB002
SZG000441306 10,00 31-Oct-
25
222 020 000,00
Eswatini Government
SGIFB003
SZG000441314 10,25 29-Dec-
26
54 402 000,00
Eswatini Government
SGIFB004
SZG000441348 Floating 29-Mar-
28
130 400 000,00
Eswatini Government
SGIFB005
SZG000441356 9,75 31-May-
26
111 820 000,00
Eswatini Government
SGIFB006
SZG000441397 9,50 28-Sep-
24
40 000 000,00
Eswatini Government
SGIFB007
SZG000441497 7,75 31-Jul-26 24 220 000,00
SGIFB007 REOPENING 1 31-Jul-26 100 000 000,00
5 073 227
100,00