2020-Barangay-General-Profile.pdf - City Planning ...
182
-
Upload
khangminh22 -
Category
Documents
-
view
1 -
download
0
Transcript of 2020-Barangay-General-Profile.pdf - City Planning ...


TABLE OF CONTENTS
Page
DISTRICT I
Poblacion -------------------------------------- 2 – 29
Talomo -------------------------------------- 31 – 45
DISTRICT II
Agdao -------------------------------------- 47 – 54
Buhangin -------------------------------------- 56 – 70
Bunawan -------------------------------------- 72 – 81
Paquibato -------------------------------------- 83 – 94
DISTRICT III
Baguio -------------------------------------- 96 – 103
Calinan -------------------------------------- 105 – 124
Marilog -------------------------------------- 126 – 137
Toril -------------------------------------- 139 – 163
Tugbok -------------------------------------- 165 - 179

Page 1
Poblacion District
Barangay 1-A Barangay 11-B Barangay 21-C Barangay 31-D
Barangay 2-A Barangay 12-B Barangay 22-C Barangay 32-D
Barangay 3-A Barangay 13-B Barangay 23-C Barangay 33-D
Barangay 4-A Barangay 14-B Barangay 24-C Barangay 34-D
Barangay 5-A Barangay 15-B Barangay 25-C Barangay 35-D
Barangay 6-A Barangay 16-B Barangay 26-C Barangay 36-D
Barangay 7-A Barangay 17-B Barangay 27-C Barangay 37-D
Barangay 8-A Barangay 18-B Barangay 28-C Barangay 38-D
Barangay 9-A Barangay 19-B Barangay 29-C Barangay 39-D
Barangay 10-A Barangay 20-B Barangay 30-C Barangay 40-D

General Profile, Poblacion District, Davao City, 2020
Development Indicators Brgy. 1-A Brgy. 2-A Brgy. 3-A Brgy. 4-A Brgy. 5-A Brgy.6-A
I. Demography
Population Projection 2020, OCPDC 3,477 4,021 415 1,886 12,813 2,335
Population, PSA 2015 census 3,103 3,589 370 1,683 11,436 2,084
Estimated Number of Households*, 2015 776 897 93 421 2,859 521
Population, PSA 2010 Census 3,038 2,953 399 1,706 11,232 2,046
Population, PSA 2007 Census 3,201 3,108 597 1,978 9,946 2,560
Population, PSA 2000 Census 3,000 3,312 488 1,619 9,530 1,923
Geography
Land Area, (in has), OCPDC-GIS 15.355 16.38 20.776 23.51 38.1 15.0
Distance from City Hall to Brgy. Proper, (in kms.), OCPDC-GIS
0.01 City Hall area 0.1 0.7 0.87 0.75
Number of Puroks, OCPDC-RSD 7 7 6 7 19 8
Boundaries, OCPDC-GIS
North 2A 3A 4A 10A 6A 7A
South 40-D 1-A 38D 3A Davao River 5A
East 40/39D 3A 34D 34D 6A 3A
West Davao River Davao River 2A 7A Davao River 5A
Locational Characteristics Riverbank Riverbank Inland Inland Riverbank Inland
Rural/Urban Classifications Urban Urban Urban Urban Urban Urban
Land Use, (in has.), OCPDC-GIS
Floodway Mitigation 14.574 4.422 - - 29.610 -
Low Density Residential - - - - - -
Medium Density Residential - - - - - -
High Density Residential - - - - 2.882 -
Institution 0.667 1.743 1.488 3.891 0.832 1.954
Special Institution - - - - - -
Minor Commercial 0.114 10.215 19.288 16.150 4.814 13.014
Page 2

General Profile, Poblacion District, Davao City, 2020
Development Indicators Brgy. 1-A Brgy. 2-A Brgy. 3-A Brgy. 4-A Brgy. 5-A Brgy.6-A
Major Commercial - - - - - -
Tourism Development - - - - - -
Parks and Recreation - - - 3.469 - -
Special Use - - - - - -
Open Space - - - - - -
Total 15.355 16.380 20.776 23.51 38.138 14.968
Soil Classification, CAOMatina Clay,Cabantian Clay &
Faraon Clay
Matina Clay,Cabantian Clay &
Faraon Clay
Matina Clay,Cabantian Clay &
Faraon Clay
Matina Clay,Cabantian Clay &
Faraon Clay
Matina Clay,Cabantian Clay &
Faraon Clay
Matina Clay,Cabantian Clay &
Faraon Clay
Elevation (in has.), OCPDC-GIS
>200 m 15.355 16.38 20.776 23.51 38.138 14.968
Slope (in has.), OCPDC-GIS
Level to Nearly Level (0-3%) 15.355 16.38 20.776 23.51 38.138 14.968
II. Economic Services
Commercial & Industrial Establishments, Bus. Bureau,
2019
Micro
Number 61 317 519 153 957 106
Total Capitalization (in million pesos) 7,254,750.00 38,176,400.00 74,849,336.35 19,473,224.06 56,804,963.63 12,089,000.00
Declared No. of Employees 120 1,063 1,976 488 1,136 232
Small
Number 21 131 248 58 57 55
Total Capitalization (in million pesos) 16,547,003.00 106,693,506.51 210,715,506.80 51,030,724.45 47,353,590.00 53,159,630.00
Declared No. of Employees 108 1,259 2,539 415 170 367
Medium
Number 10 85 139 42 7 28
Total Capitalization (in million pesos) 33,422,706.00 332,947,222.26 558,160,639.88 162,035,426.00 28,232,903.20 125,354,294.00
Declared No. of Employees 41 608 1,976 594 110 215
Large
Number 4 47 86 21 8 12
Total Capitalization (in million pesos) 51,726,921.00 1,144,657,994.97 3,740,034,011.05 25,761,551,514.15 112,606,632.20 496,151,928.18
Declared No. of Employees 35 632 1,650 866 195 577
Page 3
General Profile, Poblacion District, Davao City, 2020
Development Indicators Brgy. 1-A Brgy. 2-A Brgy. 3-A Brgy. 4-A Brgy. 5-A Brgy.6-A
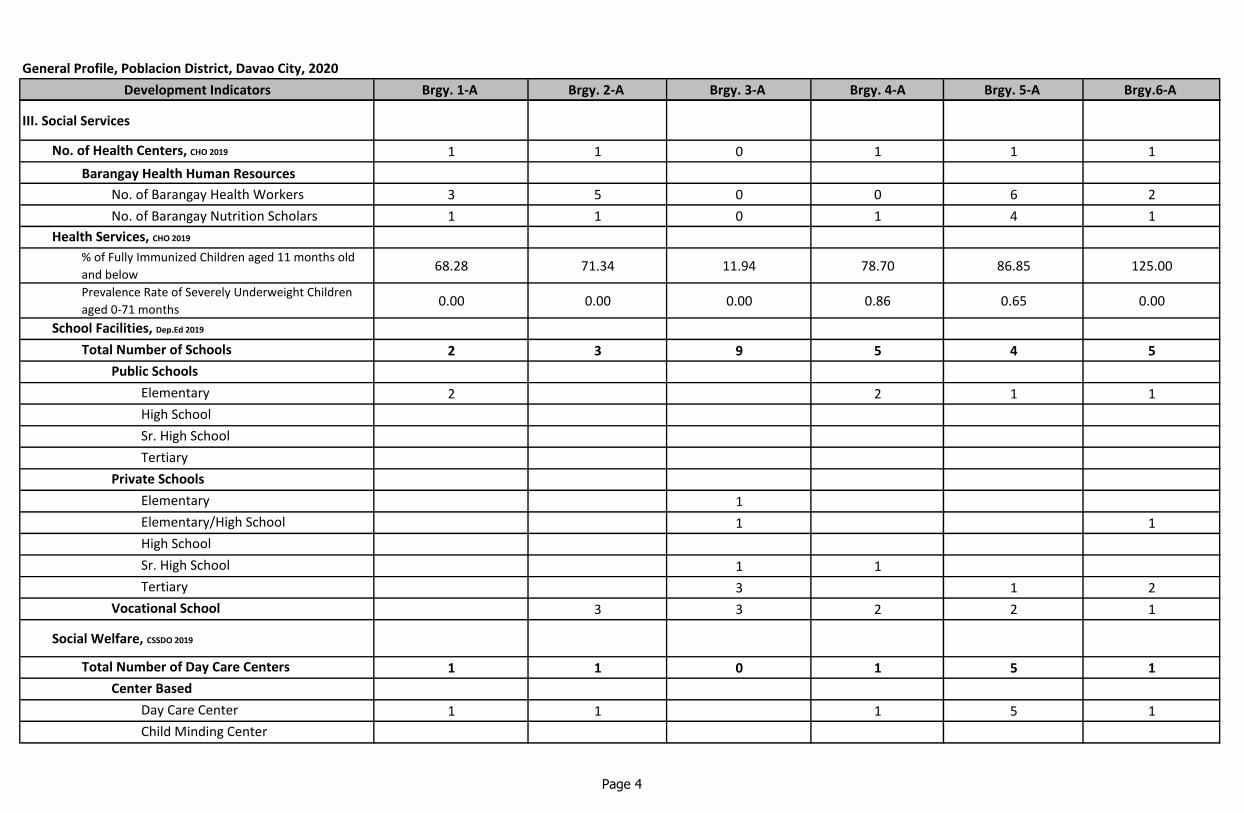
III. Social Services
No. of Health Centers, CHO 2019 1 1 0 1 1 1
Barangay Health Human Resources
No. of Barangay Health Workers 3 5 0 0 6 2
No. of Barangay Nutrition Scholars 1 1 0 1 4 1
Health Services, CHO 2019
% of Fully Immunized Children aged 11 months old
and below68.28 71.34 11.94 78.70 86.85 125.00
Prevalence Rate of Severely Underweight Children
aged 0-71 months0.00 0.00 0.00 0.86 0.65 0.00
School Facilities, Dep.Ed 2019
Total Number of Schools 2 3 9 5 4 5
Public Schools
Elementary 2 2 1 1
High School
Sr. High School
Tertiary
Private Schools
Elementary 1
Elementary/High School 1 1
High School
Sr. High School 1 1
Tertiary 3 1 2
Vocational School 3 3 2 2 1
Social Welfare, CSSDO 2019
Total Number of Day Care Centers 1 1 0 1 5 1
Center Based
Day Care Center 1 1 1 5 1
Child Minding Center
Page 4

General Profile, Poblacion District, Davao City, 2020
Development Indicators Brgy. 1-A Brgy. 2-A Brgy. 3-A Brgy. 4-A Brgy. 5-A Brgy.6-A
Home Based
Supervised Neighborhood play
PTOP
IV. Environmental Management
Garbage Disposal Practices, BC, OCPDC-RSD Collected Collected Collected Collected Collected Collected
MRF, CENRO
V. Infrastructure and Utilities
Power, DLPC 2019 DLPC DLPC DLPC DLPC DLPC DLPC
Number of Streetlights 53 70 75 112 217 63
Water System, DCWD, CEO, 2019
DCWD DCWD DCWD DCWD DCWD DCWD DCWD
VI. Local Government Administration
Membership of Barangay Council, BCCAD, 2017-2019
Barangay Captain Hon. Arnel B. Policarpio Hon. Carlos S. Garcia Hon. Teofilo Y. Guino-oHon. Rogelio A.
Nocom, Sr. Hon. Edgar R. Ibuyan
Hon. Franklin V.
Librado
Barangay Kagawad (7) Roy D. Tecson Nelda N. Naraval Ernesto II N. Macasaet Romaranje T. Nocom Gilbert P. Mata Sr. Ira D. Delos Reyes
Willy E. Bajao Clarife D. Tapanan Edwin S. Calustre Reynaldo P. Letran Rosario Cherrilyn E. Tee Jennifer P. Librado
Richie S. Gañac Jobert J. Dela Cruz Eduardo B. Tombo Nestor N. Mauhay Anthony D. Jacaria Allan A. Olaer
Alejandro P. Mata, Jr. Emilee A. Suplido Victoria O. Macasaet Danilo C. Juntilla Edgar P. Ibuyan, Jr. Zacaria C. Mala
Princess T. Alicaway Villa L. Gonzales Gabriel Roger F. Guino-o Eduard A. Comendador Edwin I. Ociones, Sr. Mayette T. Bulang
Lkuzminda G. Morales Marcelino C. Garado Jr. Kristieliza Mae G. Gaite Froilan M. Fernandez Jose R. Gecole, Jr. Romina C. Canonigo
Dominador P. Rodriguez, Jr.John Paul Rey M.
MacasantosAngelito Y. Guino-o Crismon C. Obregon Rowena L. Maula Arthur M. Macapugay
Sanggunian Kabataan Representative John Vincent S. De Villa Patricia Mae S. Ducusin Rodolfo Y. Piyaw, Jr. Crisolindo T. Peñales, Jr. Leah Ann V. Ramos*Average of four (4) members/household
Sources of data:PSA - Philippine Statistics Authority CSSDO - City Social Services & Development OfficeOCPDC-GIS - Office of the City Planning & Development Coordinator- Geographical Information System BC - Barangay CouncilOCPDC-RSD- Office of the City Planning & Development Coordinator- Research & Statistics Division BCCAD - Barangay Cultural Communities Affairs DivisionCAO - City Agriculturist's Office CEO - City Engineer's OfficeBus. Bureau - Business Bureau DCWD - Davao City Water DistrictCHO - City Health Office DLPC - Davao Light & Power CorporationDepEd - Department of Education CENRO - City Environment and Natural Resources Office
Page 5

General Profile, Poblacion District, Davao City, 2020
Development Indicators
I. Demography
Population Projection 2020, OCPDC
Population, PSA 2015 census
Estimated Number of Households*, 2015
Population, PSA 2010 Census
Population, PSA 2007 Census
Population, PSA 2000 Census
Geography
Land Area, (in has), OCPDC-GIS
Distance from City Hall to Brgy. Proper, (in kms.), OCPDC-GIS
Number of Puroks, OCPDC-RSD
Boundaries, OCPDC-GIS
North
South
East
West
Locational Characteristics
Rural/Urban Classifications
Land Use, (in has.), OCPDC-GIS
Floodway Mitigation
Low Density Residential
Medium Density Residential
High Density Residential
Institution
Special Institution
Minor Commercial
Brgy. 7 A Brgy. 8-A Brgy. 9-A Brgy. 10-A Brgy. 11-B Brgy. 12-B
4,464 12,409 6,384 7,578 2,130 941
3,984 11,075 5,698 6,764 1,901 840
996 2,769 1,425 1,691 475 210
4,334 8,859 4,848 4,613 1,647 990
4,345 6,902 6,081 1,894 1,363 974
4,184 5,961 5,737 3,438 1,153 1,267
22.5 179.8 27.5 28.636 9.566 17.536
0.93 1.34 1.52 1.74 1.92 1.80
9 11 10 8 7 8
9A 9A10A 11B 12B 19B
6A 5A7A 9A 10A 11B
4A 7A10A 11B 12B 13B
8A Davao River8A 9A 10A 10B
Inland Riverbank Inland Inland Inland Inland
Urban Urban Urban Urban Urban Urban
- 85.585 - - - -
- 28.932 5.029 2.564 - -
- - - - - -
- 6.468 - - - -
1.277 18.326 0.742 9.370 1.218
- - - - - -
21.187 17.682 21.712 16.702 9.566 16.318
Page 6

General Profile, Poblacion District, Davao City, 2020
Development Indicators
Major Commercial
Tourism Development
Parks and Recreation
Special Use
Open Space
Total
Soil Classification, CAO
Elevation (in has.), OCPDC-GIS
>200 m
Slope (in has.), OCPDC-GIS
Level to Nearly Level (0-3%)
II. Economic Services
Commercial & Industrial Establishments, Bus. Bureau,
2019
Micro
Number
Total Capitalization (in million pesos)
Declared No. of Employees
Small
Number
Total Capitalization (in million pesos)
Declared No. of Employees
Medium
Number
Total Capitalization (in million pesos)
Declared No. of Employees
Large
Number
Total Capitalization (in million pesos)
Declared No. of Employees
Brgy. 7 A Brgy. 8-A Brgy. 9-A Brgy. 10-A Brgy. 11-B Brgy. 12-B
- 0.598 - - - -
- - - - - -
- - - - - -
- 22.186 - - - -
- - - - - -
22.464 179.777 27.483 28.64 9.57 17.536Matina Clay,Cabantian Clay &
Faraon Clay
Matina Clay,Cabantian Clay
and Faraon Clay
Mtina Clay,Cabantian Clay,and
Faraon Clay
Matina Clay,Cabantian Clay and
Faraon Clay
Matina Clay,Cabantian Clay
and Faraon Clay
Matina Clay,Cabantian Clay
and Faraon Clay
22.464 179.777 27.483 28.636 9.566 17.536
22.464 179.777 27.483 28.636 9.566 17.536
151 67 184 245 122 51
21,581,804.80 7,146,000.00 26,076,000.00 32,614,700.00 17,054,276.40 9,427,500.00
395 81 639 643 334 196
83 17 111 131 88 57
73,888,815.82 14,913,602.50 97,853,947.73 112,803,629.51 76,299,659.85 45,308,423.45
847 46 638 700 384 398
55 9 52 68 45 23
211,082,665.80 44,870,385.00 210,329,866.02 272,186,633.00 183,452,105.10 80,540,262.00
479 33 552 829 1,069 261
21 6 20 28 16 12
401,594,108.50 158,600,000.00 377,625,326.93 432,742,621.59 1,274,734,232.17 4,359,635,868.66
678 370 955 358 169 266
Page 7

General Profile, Poblacion District, Davao City, 2020
Development Indicators
III. Social Services
No. of Health Centers, CHO 2019
Barangay Health Human Resources
No. of Barangay Health Workers
No. of Barangay Nutrition Scholars
Health Services, CHO 2019
% of Fully Immunized Children aged 11 months old
and below
Prevalence Rate of Severely Underweight Children
aged 0-71 months
School Facilities, Dep.Ed 2019
Total Number of Schools
Public Schools
Elementary
High School
Sr. High School
Tertiary
Private Schools
Elementary
Elementary/High School
High School
Sr. High School
Tertiary
Vocational School
Social Welfare, CSSDO 2019
Total Number of Day Care Centers
Center Based
Day Care Center
Child Minding Center
Brgy. 7 A Brgy. 8-A Brgy. 9-A Brgy. 10-A Brgy. 11-B Brgy. 12-B
0 1 0 1 1 1
3 6 4 4 0 2
2 5 2 2 1 1
50.97 76.53 84.44 33.28 53.42 162.83
0.00 0.15 0.30 0.63 0.00 0.00
4 10 9 2 1 3
1
1
1
1 3
1 3 1 1
2 2 2 1
2 1
1 2 2 1
2 5 3 1 0 1
2 3 3 1 1
Page 8

General Profile, Poblacion District, Davao City, 2020
Development Indicators
Home Based
Supervised Neighborhood play
PTOP
IV. Environmental Management
Garbage Disposal Practices, BC, OCPDC-RSD
MRF, CENRO
V. Infrastructure and Utilities
Power, DLPC 2019
Number of Streetlights
Water System, DCWD, CEO, 2019
DCWD
VI. Local Government Administration
Membership of Barangay Council, BCCAD, 2017-2019
Barangay Captain
Barangay Kagawad (7)
Sanggunian Kabataan Representative
Brgy. 7 A Brgy. 8-A Brgy. 9-A Brgy. 10-A Brgy. 11-B Brgy. 12-B
1
1
Collected Collected Collected Collected Collected Collected
DLPC DLPC DLPC DLPC DLPC DLPC
126 359 95 104 40 19
DCWD DCWD DCWD DCWD DCWD DCWD
Hon. Reolsyl E. Caingles Hon. Ariel L. Lagmay Hon. Roderico A. Llubit Hon. Mark Anthony C.
Cayetano
Hon. Martina Fe
ArabianaHon. Nelia C. Tumabang
Trifona S. Ente Adelaida O. Carupo Imee Therese O. Bisnar Armando A. AmancioMarijun M.
MonteverdeNelson M. abella
Reynaldo C. Italio Gemma P. Icoy Cyrus O. Zozobrado Luzviminda M. Borja Rogelio S. Sebuja, Jr. Noel S. Sadural
Laureta R. Javellana Danilo P. Apuya Sr. Katherine June A. Tuna Edison C. Villegas Jose Maria A. Jocom Salvio D. Amoy
Albert G. Musico Ruben M. Dongzal Arche P. Fuentes Estrellita V. MasinadingJorge Darwin V.
RodriguezMelanie L. Villanueva
Helen M. Octaviano Nelo P. Dagatan Suzette L. Rodriguez Marcho L. Ibañez Yolanda C. Ibay Archimedes S. Alcoseba
Raham G. ApdoroJosephine Medel-
RobertsonEleuterio F. Dela Cruz Jr. Edgardo A. Vergara Alfredo P. Francisco Renato A. Villegas
Franklin M. Coleta Miguel A. Awing Joseph Hyrish B. Apale Romeo P. Mamontayao Marites P. Arriba Marina N. Caballero
Judy Ann C. Orgonio Alexis Renee P. Pili Angelika D. Labora Arianne Mae A. Astronomo Aimeh C. Recla Noli Cyrle C. Lato*Average of four (4) members/household
Sources of data:PSA - Philippine Statistics Authority CSSDO - City Social Services & Development OfficeOCPDC-GIS - Office of the City Planning & Development Coordinator- Geographical Information System BC - Barangay CouncilOCPDC-RSD- Office of the City Planning & Development Coordinator- Research & Statistics Division BCCAD - Barangay Cultural Communities Affairs DivisionCAO - City Agriculturist's Office CEO - City Engineer's OfficeBus. Bureau - Business Bureau DCWD - Davao City Water DistrictCHO - City Health Office DLPC - Davao Light & Power CorporationDepEd - Department of Education CENRO - City Environment and Natural Resources Office
Page 9

General Profile, Poblacion District, Davao City, 2020
Development Indicators
I. Demography
Population Projection 2020, OCPDC
Population, PSA 2015 census
Estimated Number of Households*, 2015
Population, PSA 2010 Census
Population, PSA 2007 Census
Population, PSA 2000 Census
Geography
Land Area, (in has), OCPDC-GIS
Distance from City Hall to Brgy. Proper, (in kms.), OCPDC-GIS
Number of Puroks, OCPDC-RSD
Boundaries, OCPDC-GIS
North
South
East
West
Locational Characteristics
Rural/Urban Classifications
Land Use, (in has.), OCPDC-GIS
Floodway Mitigation
Low Density Residential
Medium Density Residential
High Density Residential
Institution
Special Institution
Minor Commercial
Brgy.13-B Brgy.14-B Brgy. 15-B Brgy. 16-B Brgy. 17-B Brgy. 18-B
478 1,316 3,239 941 908 2,053
427 1,175 2,891 840 810 1,832
107 294 723 210 203 458
154 1,127 2,700 560 774 1,561
176 1,054 2,784 868 1,044 1,694
265 921 2,534 724 875 1,605
11.257 18.411 31.542 5.527 5.627 19.8
1.81 2.08 2.54 2.62 2.61 2.49
3 4 8 6 6 6
18B 16B 16B Agdao Proper 18B 20B
12B 30C 27C 14B 16B 17B
14B 15B Agdao Proper 15B 16B/Agdao Agdao Proper
12B 13B 14B 17B 18B 19B
Inland Inland Inland Inland Inland Inland
Urban Urban Urban Urban Urban Urban
- - - - - -
- - - - - -
- - - - - -
- - - - - -
0.663 5.157 - - - 6.598
- - - - - -
10.107 4.266 5.269 5.627 10.876
Page 10

General Profile, Poblacion District, Davao City, 2020
Development Indicators
Major Commercial
Tourism Development
Parks and Recreation
Special Use
Open Space
Total
Soil Classification, CAO
Elevation (in has.), OCPDC-GIS
>200 m
Slope (in has.), OCPDC-GIS
Level to Nearly Level (0-3%)
II. Economic Services
Commercial & Industrial Establishments, Bus. Bureau,
2019
Micro
Number
Total Capitalization (in million pesos)
Declared No. of Employees
Small
Number
Total Capitalization (in million pesos)
Declared No. of Employees
Medium
Number
Total Capitalization (in million pesos)
Declared No. of Employees
Large
Number
Total Capitalization (in million pesos)
Declared No. of Employees
Brgy.13-B Brgy.14-B Brgy. 15-B Brgy. 16-B Brgy. 17-B Brgy. 18-B
- 7.647 31.542 0.258 2.309
0.487 1.341 - - - -
- - - - - -
- - - - - -
- - - - - -
11.257 18.41 31.542 5.527 5.627 19.783Matina Clay,Cabantian Clay and
Faraon Clay
Matina Clay,Cabantian Clay and
Faraon Clay
Matina Clay,Cabantian Clay
and Faraon Clay
Matina Clay,Cabantian Clay
and Faraon Clay
Matina Clay,Cabantian Clay
and Faraon Clay
Matina Clay,Cabantian Clay
and Faraon Clay
11.257 18.411 31.542 5.527 5.63 19.78
11.257 18.411 31.542 5.527 5.63 19.78
261 52 79 47 59 193
48,905,978.50 6,376,000.00 13,800,000.00 7,611,520.00 7,442,200.00 25,084,167.00
1,095 151 261 123 330 583
224 50 91 22 18 110
183,677,680.48 43,674,438.00 81,242,077.00 19,366,214.00 14,627,856.32 94,050,210.98
1,219 164 1,232 100 21 403
90 32 73 15 7 48
321,946,203.90 108,609,428.26 278,546,759.40 61,055,475.00 29,570,750.76 172,264,548.09
718 478 442 83 15 581
27 12 20 0 6 21
1,814,001,675.00 248,931,840.00 262,918,451.00 0.00 98,800,000.00 299,024,742.00
870 700 1,658 0 79 453
Page 11

General Profile, Poblacion District, Davao City, 2020
Development Indicators
III. Social Services
No. of Health Centers, CHO 2019
Barangay Health Human Resources
No. of Barangay Health Workers
No. of Barangay Nutrition Scholars
Health Services, CHO 2019
% of Fully Immunized Children aged 11 months old
and below
Prevalence Rate of Severely Underweight Children
aged 0-71 months
School Facilities, Dep.Ed 2019
Total Number of Schools
Public Schools
Elementary
High School
Sr. High School
Tertiary
Private Schools
Elementary
Elementary/High School
High School
Sr. High School
Tertiary
Vocational School
Social Welfare, CSSDO 2019
Total Number of Day Care Centers
Center Based
Day Care Center
Child Minding Center
Brgy.13-B Brgy.14-B Brgy. 15-B Brgy. 16-B Brgy. 17-B Brgy. 18-B
1 1 1 1 1 1
1 1 2 1 1 0
1 1 1 1 1 1
31.04 82.64 12.22 73.53 0.00 0.00
0.00 0.00 0.59 0.00 0.00 0.00
5 3 0 1 0 3
1
2 1
1
1
2
1 1 2
0 0 1 0 0 1
1 1
Page 12

General Profile, Poblacion District, Davao City, 2020
Development Indicators
Home Based
Supervised Neighborhood play
PTOP
IV. Environmental Management
Garbage Disposal Practices, BC, OCPDC-RSD
MRF, CENRO
V. Infrastructure and Utilities
Power, DLPC 2019
Number of Streetlights
Water System, DCWD, CEO, 2019
DCWD
VI. Local Government Administration
Membership of Barangay Council, BCCAD, 2017-2019
Barangay Captain
Barangay Kagawad (7)
Sanggunian Kabataan Representative
Brgy.13-B Brgy.14-B Brgy. 15-B Brgy. 16-B Brgy. 17-B Brgy. 18-B
Collected Collected Collected Collected Collected Collected
DLPC DLPC DLPC DLPC DLPC DLPC
50 71 86 33 29 49
DCWD DCWD DCWD DCWD DCWD DCWD
Hon. Ronnie A. Galan Hon. Genevieve G. Arcillas Hon. Fradilyn M. LabroHon. Benedicto O.
Ramento, Jr.Hon. Jose L. Gamolo Hon. Whelma L. Lozada
Robert C. Adlawan Sr Agnes S. Lira Roel C. ColanagCharles Warren D.
ChangBenjamin C. Placa Julius A. Limbo
Lorielyn G. Balote Jean Alah R. Diaz Francisco I. Labro, Jr. Lowell R. Yasay, Sr. Ricardo I. Sagrado Emma P. Gantes
Saantiago C. Gumanid, Jr. Emilia B. Fortuna Reynaldo R. Inayangan Tomas S. Abatayo Norma S. Baticura Nilo S. Mauricio
Danny Boy D. Maynabay Jose Arnel S. Maceda Edgar H. Amoguis Reynaldo J. Aba-a Lorna R. Mercadal John Anthony S. Virtucio
Nora L. Luchavez Nicolas B. Prado Antonio I. Labong, Jr. Lilibeth M. Payca Pepe J. Duo Gladys Grace F. Tan
Mauricio C. Soliman, Jr. Alejandro L. Baliong Ricky A. Dela Cruz Virgie A. Acuzar Joselyn M. Lu Melanio John II P. Raz
Andrew M. Dorado Andres B. Mondreza, Jr. Jeffrey C. Ilao, Jr. Yolanda G. Madarang Cristina Y. AbenionAndrescenia A.
Villahermosa
Ian Throy Gildore Wanda Satche Alliah I. Regner Jenessa F. Bucio Mark John A. Poliquit Randell R. Labadan Katreena R. Limbo*Average of four (4) members/household
Sources of data:PSA - Philippine Statistics Authority CSSDO - City Social Services & Development OfficeOCPDC-GIS - Office of the City Planning & Development Coordinator- Geographical Information System BC - Barangay CouncilOCPDC-RSD- Office of the City Planning & Development Coordinator- Research & Statistics Division BCCAD - Barangay Cultural Communities Affairs DivisionCAO - City Agriculturist's Office CEO - City Engineer's OfficeBus. Bureau - Business Bureau DCWD - Davao City Water DistrictCHO - City Health Office DLPC - Davao Light & Power CorporationDepEd - Department of Education CENRO - City Environment and Natural Resources Office
Page 13

General Profile, Poblacion District, Davao City, 2020
Development Indicators
I. Demography
Population Projection 2020, OCPDC
Population, PSA 2015 census
Estimated Number of Households*, 2015
Population, PSA 2010 Census
Population, PSA 2007 Census
Population, PSA 2000 Census
Geography
Land Area, (in has), OCPDC-GIS
Distance from City Hall to Brgy. Proper, (in kms.), OCPDC-GIS
Number of Puroks, OCPDC-RSD
Boundaries, OCPDC-GIS
North
South
East
West
Locational Characteristics
Rural/Urban Classifications
Land Use, (in has.), OCPDC-GIS
Floodway Mitigation
Low Density Residential
Medium Density Residential
High Density Residential
Institution
Special Institution
Minor Commercial
Brgy. 19- B Brgy.20-B Brgy. 21 C Brgy. 22-C Brgy. 23-C Brgy. 24-C
35,591 5,133 8,378 7,433 18,474 2,915
31,766 4,581 7,478 6,634 16,489 2,602
7,942 1,145 1,870 1,659 4,122 651
29,247 4,499 7,097 6,027 15,125 2,115
28,088 4,087 6,546 6,511 13,683 2,389
19,875 4,124 6,295 5,534 10,759 2,099
362.552 56.578 8.563 8.712 21.313 7.72
2.45 3.49 1.40 1.6 1.07 1.40
21 6 8 7 7 6
Maa Agdao Proper 22C 26C 26C 29C
12B 18B 31D 21C 22C 21C
18B Agdao Proper 22C 23C Davao Gulf 25C
10-A 19B 33D 25C 26C 32D
Riverbank Inland Coastal Coastal Coastal Inland
Urban Urban Urban Urban Urban Urban
88.06 - 5.304 0.373 - -
105.20 - - - - -
8.43 - - - - -
- - 0.732 3.504 0.052 -
7.10 1.242 - - 0.259 0.415
- - - - - -
42.49 22.509 - 3.561 0.222 7.305
Page 14

General Profile, Poblacion District, Davao City, 2020
Development Indicators
Major Commercial
Tourism Development
Parks and Recreation
Special Use
Open Space
Total
Soil Classification, CAO
Elevation (in has.), OCPDC-GIS
>200 m
Slope (in has.), OCPDC-GIS
Level to Nearly Level (0-3%)
II. Economic Services
Commercial & Industrial Establishments, Bus. Bureau,
2019
Micro
Number
Total Capitalization (in million pesos)
Declared No. of Employees
Small
Number
Total Capitalization (in million pesos)
Declared No. of Employees
Medium
Number
Total Capitalization (in million pesos)
Declared No. of Employees
Large
Number
Total Capitalization (in million pesos)
Declared No. of Employees
Brgy. 19- B Brgy.20-B Brgy. 21 C Brgy. 22-C Brgy. 23-C Brgy. 24-C
105.20 32.827 2.527 - 0.173 -
- - - - 0.098 -
- - - 0.034 20.467 -
5.98 - - - - -
0.10 - - 1.240 0.042 -
362.55 56.578 8.563 8.712 21.313 7.72Matina Clay,Cabantian Clay and
Faraon Clay
Matina Clay,Cabantian Clay and
Faraon Clay
Matina Clay,Cabantian Clay
and Faraon Clay
Matina Clay,Cabantian Clay
and Faraon Clay
Matina Clay,Cabantian Clay
and Faraon Clay
Matina Clay,Cabantian Clay
and Faraon Clay
362.552 56.578 8.563 8.712 21.313 7.72
362.55 56.58 8.56 8.71 21.313 7.72
577 459 43 66 37 66
74,459,336.80 68,416,420.04 3,216,000.00 4,790,000.00 4,085,000.00 9,520,659.00
2,412 1,073 42 85 68 233
289 298 12 8 9 30
248,234,362.34 252,132,985.22 12,448,918.00 6,065,201.00 6,974,822.49 25,070,307.00
1,904 1,534 27 11 51 92
178 183 4 2 1 19
690,065,680.77 698,141,846.75 13,560,788.00 5,381,503.30 2,000,000.00 71,229,428.35
2,111 1,745 11 13 1 86
78 49 1 0 0 2
17,221,546,891.00 4,851,985,933.99 10,500,000.00 0.00 0.00 28,100,000.00
2,111 1,012 310 0 0 65
Page 15

General Profile, Poblacion District, Davao City, 2020
Development Indicators
III. Social Services
No. of Health Centers, CHO 2019
Barangay Health Human Resources
No. of Barangay Health Workers
No. of Barangay Nutrition Scholars
Health Services, CHO 2019
% of Fully Immunized Children aged 11 months old
and below
Prevalence Rate of Severely Underweight Children
aged 0-71 months
School Facilities, Dep.Ed 2019
Total Number of Schools
Public Schools
Elementary
High School
Sr. High School
Tertiary
Private Schools
Elementary
Elementary/High School
High School
Sr. High School
Tertiary
Vocational School
Social Welfare, CSSDO 2019
Total Number of Day Care Centers
Center Based
Day Care Center
Child Minding Center
Brgy. 19- B Brgy.20-B Brgy. 21 C Brgy. 22-C Brgy. 23-C Brgy. 24-C
1 1 1 1 1 1
2 3 5 6 6 2
7 1 3 2 5 1
35.16 11.56 51.35 90.49 89.69 54.28
0.08 0.00 0.10 0.12 0.58 0.00
14 2 0 0 1 3
1 2 1
7
1 1
1 1
2
2 1
5 1 1 1 7 0
5 1 1 1 1
Page 16

General Profile, Poblacion District, Davao City, 2020
Development Indicators
Home Based
Supervised Neighborhood play
PTOP
IV. Environmental Management
Garbage Disposal Practices, BC, OCPDC-RSD
MRF, CENRO
V. Infrastructure and Utilities
Power, DLPC 2019
Number of Streetlights
Water System, DCWD, CEO, 2019
DCWD
VI. Local Government Administration
Membership of Barangay Council, BCCAD, 2017-2019
Barangay Captain
Barangay Kagawad (7)
Sanggunian Kabataan Representative
Brgy. 19- B Brgy.20-B Brgy. 21 C Brgy. 22-C Brgy. 23-C Brgy. 24-C
6
Collected/Compost Pit Collected Collected Collected Collected Collected
DLPC DLPC DLPC DLPC DLPC DLPC
920 217 81 74 74 64
DCWD DCWD DCWD DCWD DCWD DCWD
Hon. Loreto G. Nicolas Hon. Gina D. MurilloHon. Edmundo O.
Altizo, Sr.
Hon. Eduardo B.
Millondaga
Hon. Alimodin A.
Usman
Hon. Jupiter D. Jorgio,
Jr.
Eloisa Joyce F. Militar Jennifer D. Canda Danny R. Tupas Philip Roy P. Pansoy Mamerto B. Cadungog Alicia C. Solarte
Andres L. Recones Eduardo Jose B. Vergara Arthur M. Yap Virginia C. Espedilla Ronar L. Liza Danilo A. Cabarse
Mercedita E. Albiso Rogelio S. Libre Alberto M. Alegada Samuel C. Cabantug Abunoor M. Bucay Marilow O. Acay
Inocencio P. Yuson, Jr. Antonio D. Acosta Sarah V. Yap Rogil C. Rosello Nanding P. Pinto Cecile G. Cepada
Exequiel L. Tomines, Jr. Reynaldo D. Rada Bernardino M. Suba-an Thelma B. Lacaran Najib S. Abdulwahab Rowena S. Galo
Jenny Ann M. Nicolas Melanio L. Perges Violeta T. Alceso Ramon M. PadillaAmron Walid M.
PalawanLito A. Casquejo
Henry D. Padla Ramon L. Sims, Jr. Nora B. Ambray Orlando A. Inclino, Sr. Fatima S. Lao Ester E. Arro
Jesila C. Sumatra Clent Joseph A. Mamalias Angel Grace L. Dayola Kent Jones R. Angcajas Jaffar U. Marohomsalik Myrriel Joy A. Perocho*Average of four (4) members/household
Sources of data:PSA - Philippine Statistics Authority CSSDO - City Social Services & Development OfficeOCPDC-GIS - Office of the City Planning & Development Coordinator- Geographical Information System BC - Barangay CouncilOCPDC-RSD- Office of the City Planning & Development Coordinator- Research & Statistics Division BCCAD - Barangay Cultural Communities Affairs DivisionCAO - City Agriculturist's Office CEO - City Engineer's OfficeBus. Bureau - Business Bureau DCWD - Davao City Water DistrictCHO - City Health Office DLPC - Davao Light & Power CorporationDepEd - Department of Education CENRO - City Environment and Natural Resources Office
Page 17

General Profile, Poblacion District, Davao City, 2020
Development Indicators
I. Demography
Population Projection 2020, OCPDC
Population, PSA 2015 census
Estimated Number of Households*, 2015
Population, PSA 2010 Census
Population, PSA 2007 Census
Population, PSA 2000 Census
Geography
Land Area, (in has), OCPDC-GIS
Distance from City Hall to Brgy. Proper, (in kms.), OCPDC-GIS
Number of Puroks, OCPDC-RSD
Boundaries, OCPDC-GIS
North
South
East
West
Locational Characteristics
Rural/Urban Classifications
Land Use, (in has.), OCPDC-GIS
Floodway Mitigation
Low Density Residential
Medium Density Residential
High Density Residential
Institution
Special Institution
Minor Commercial
BRGY.25-C Brgy. 26- C Brgy.27-C Brgy.28-C Brgy. 29-C Brgy. 30-C
2,204 2,812 2,411 2,543 1,744 1,802
1,967 2,510 2,152 2,270 1,557 1,608
492 628 538 568 389 402
1,496 2,146 2,117 2,234 1,304 1,468
1,484 2,291 2,331 2,294 1,627 1,780
1,356 1,967 2,596 2,189 1,114 1,664
4.957 8.051 30.992 15.712 10.2 23.501
1.58 1.94 2.49 1.94 1.49 1.49
4 7 6 7 4 5
28C 27C Agdao Proper 27C 30C 14B
24C 22C 26C 25C 24C 28C & 29C
22C 23C Davao Gulf 26C 28C 27C
24C 28C 30C 24C 32D 32D
Inland Inland Coastal Inland Inland Inland
Urban Urban Urban Urban Urban Urban
- - - - - -
- - - - - -
- - - - - -
- - - - - -
- - - 7.726 0.389 -
- - - - - -
4.957 1.820 4.969 3.635 -
Page 18
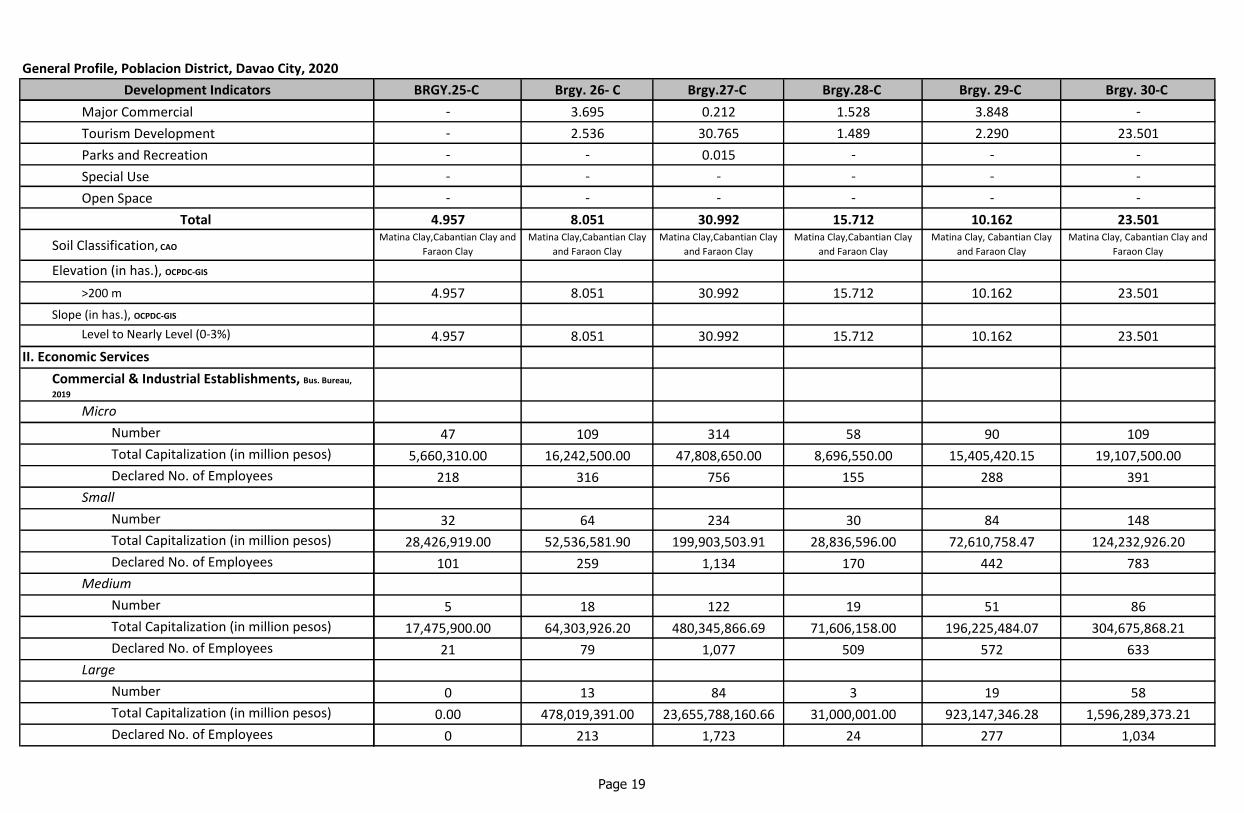
General Profile, Poblacion District, Davao City, 2020
Development Indicators
Major Commercial
Tourism Development
Parks and Recreation
Special Use
Open Space
Total
Soil Classification, CAO
Elevation (in has.), OCPDC-GIS
>200 m
Slope (in has.), OCPDC-GIS
Level to Nearly Level (0-3%)
II. Economic Services
Commercial & Industrial Establishments, Bus. Bureau,
2019
Micro
Number
Total Capitalization (in million pesos)
Declared No. of Employees
Small
Number
Total Capitalization (in million pesos)
Declared No. of Employees
Medium
Number
Total Capitalization (in million pesos)
Declared No. of Employees
Large
Number
Total Capitalization (in million pesos)
Declared No. of Employees
BRGY.25-C Brgy. 26- C Brgy.27-C Brgy.28-C Brgy. 29-C Brgy. 30-C
- 3.695 0.212 1.528 3.848 -
- 2.536 30.765 1.489 2.290 23.501
- - 0.015 - - -
- - - - - -
- - - - - -
4.957 8.051 30.992 15.712 10.162 23.501Matina Clay,Cabantian Clay and
Faraon Clay
Matina Clay,Cabantian Clay
and Faraon Clay
Matina Clay,Cabantian Clay
and Faraon Clay
Matina Clay,Cabantian Clay
and Faraon Clay
Matina Clay, Cabantian Clay
and Faraon Clay
Matina Clay, Cabantian Clay and
Faraon Clay
4.957 8.051 30.992 15.712 10.162 23.501
4.957 8.051 30.992 15.712 10.162 23.501
47 109 314 58 90 109
5,660,310.00 16,242,500.00 47,808,650.00 8,696,550.00 15,405,420.15 19,107,500.00
218 316 756 155 288 391
32 64 234 30 84 148
28,426,919.00 52,536,581.90 199,903,503.91 28,836,596.00 72,610,758.47 124,232,926.20
101 259 1,134 170 442 783
5 18 122 19 51 86
17,475,900.00 64,303,926.20 480,345,866.69 71,606,158.00 196,225,484.07 304,675,868.21
21 79 1,077 509 572 633
0 13 84 3 19 58
0.00 478,019,391.00 23,655,788,160.66 31,000,001.00 923,147,346.28 1,596,289,373.21
0 213 1,723 24 277 1,034
Page 19

General Profile, Poblacion District, Davao City, 2020
Development Indicators
III. Social Services
No. of Health Centers, CHO 2019
Barangay Health Human Resources
No. of Barangay Health Workers
No. of Barangay Nutrition Scholars
Health Services, CHO 2019
% of Fully Immunized Children aged 11 months old
and below
Prevalence Rate of Severely Underweight Children
aged 0-71 months
School Facilities, Dep.Ed 2019
Total Number of Schools
Public Schools
Elementary
High School
Sr. High School
Tertiary
Private Schools
Elementary
Elementary/High School
High School
Sr. High School
Tertiary
Vocational School
Social Welfare, CSSDO 2019
Total Number of Day Care Centers
Center Based
Day Care Center
Child Minding Center
BRGY.25-C Brgy. 26- C Brgy.27-C Brgy.28-C Brgy. 29-C Brgy. 30-C
1 1 1 1 1 1
2 1 3 4 2 2
1 1 1 1 1 1
35.91 43.96 45.14 81.67 28.36 30.19
0.00 0.00 0.00 0.00 0.00 0.00
0 0 4 6 4 10
4
1
1
1 1
1
1 1 1
1 3
1 2 5
0 1 3 2 0 1
1 2 2 1
1
Page 20

General Profile, Poblacion District, Davao City, 2020
Development Indicators
Home Based
Supervised Neighborhood play
PTOP
IV. Environmental Management
Garbage Disposal Practices, BC, OCPDC-RSD
MRF, CENRO
V. Infrastructure and Utilities
Power, DLPC 2019
Number of Streetlights
Water System, DCWD, CEO, 2019
DCWD
VI. Local Government Administration
Membership of Barangay Council, BCCAD, 2017-2019
Barangay Captain
Barangay Kagawad (7)
Sanggunian Kabataan Representative
BRGY.25-C Brgy. 26- C Brgy.27-C Brgy.28-C Brgy. 29-C Brgy. 30-C
Collected Collected Collected Collected Collected Collected
✓
DLPC DLPC DLPC DLPC DLPC DLPC
44 41 170 87 61 113
DCWD DCWD DCWD DCWD DCWD DCWD
Hon. Lito D. Maquiling Hon. Eddie M. IlaoHon. Estrella L.
Mendoza
Hon. Nelliegar C.
Unciano Hon. Ma. Estrella S. Ong Hon. Fidelo G. Almirante
Teresita D. Manloza Evangeline B. Batara Robert L. Mendoza Marilyn A. Fuentes Liza F. Cabrera Gina M. Alforque
Paul Jean P. Saberon Rolando P. Muyco Jr. Anselma F. Manuel Loreto R. Lacida Jr. Victoria F. Pamplona Teresita M. Almirante
Cirinia M. Dela Torre Kamar A. Alawaddin Mayjee A. Dela Cruz Ruben D. Gloria Clarito M. Jara Rolan C. Cabrera
Ronald E. Valenzona, Jr. Edgardo A. Inzon Leo P. Garcia Sr. Joel B. Parojinog Harley Y. Clapano Michael Brian V. Melgazo
Francis Lauro A. Feliciano Joen A. Loreto Cristian Mar P. Garcia Benford J. Sabrido Christopher A. Viacrusis Angelita A. Chua
Mary Jean D. Reyes Pablita G. Nasiad Rizza B. Sausora Eva J. Macas Eddie C. Fuentes Leonila Lim
Nerissa D. Acasio Arnelia C Capao Aurora G. Escasinas Juanito V. Pervendos Jr. Justin G. Banacia Belsam C. Lomboy
Charmine M. Palero Bryan Roy E. Villeza Ana Mae L. Pilar Kate S. Albindo Ma. Angelica L. Fernandez*Average of four (4) members/household
Sources of data:PSA - Philippine Statistics Authority CSSDO - City Social Services & Development OfficeOCPDC-GIS - Office of the City Planning & Development Coordinator- Geographical Information System BC - Barangay CouncilOCPDC-RSD- Office of the City Planning & Development Coordinator- Research & Statistics Division BCCAD - Barangay Cultural Communities Affairs DivisionCAO - City Agriculturist's Office CEO - City Engineer's OfficeBus. Bureau - Business Bureau DCWD - Davao City Water DistrictCHO - City Health Office DLPC - Davao Light & Power CorporationDepEd - Department of Education CENRO - City Environment and Natural Resources Office
Page 21

General Profile, Poblacion District, Davao City, 2020
Development Indicators
I. Demography
Population Projection 2020, OCPDC
Population, PSA 2015 census
Estimated Number of Households*, 2015
Population, PSA 2010 Census
Population, PSA 2007 Census
Population, PSA 2000 Census
Geography
Land Area, (in has), OCPDC-GIS
Distance from City Hall to Brgy. Proper, (in kms.), OCPDC-GIS
Number of Puroks, OCPDC-RSD
Boundaries, OCPDC-GIS
North
South
East
West
Locational Characteristics
Rural/Urban Classifications
Land Use, (in has.), OCPDC-GIS
Floodway Mitigation
Low Density Residential
Medium Density Residential
High Density Residential
Institution
Special Institution
Minor Commercial
Brgy. 31-D Brgy. 32-D Brgy. 33- D Brgy.34-D Brgy.35-D Brgy. 36-D
9,323 2,224 2,278 1,885 648 1,771
8,321 1,985 2,033 1,682 578 1,581
2,080 496 508 421 145 395
7,276 2,002 2,049 1,093 597 1,548
7,719 2,414 2,603 1,424 529 1,437
6,253 2,356 2,487 1,058 672 1,322
22.597 17.9 7.74 19.63 7.0 6.93
1.06 1.22 1.07 0.52 0.57 0.46
15 7 6 6 6 6
21C 29C 32D 32D 34D 33D
37D 34D 36D 35D 38D 38D
Davao Gulf 24C 24C 33D 36D 37D
36D 34D 35D 4A 3A 35D
Coastal Inland Inland Inland Inland Inland
Urban Urban Urban Urban Urban Urban
16.185 - - - - -
- - - - - -
- - - - - -
2.536 - - - - -
- 4.000 - 1.409 1.104 -
- - - - - -
3.876 13.544 7.740 17.884 5.879 6.930
Page 22

General Profile, Poblacion District, Davao City, 2020
Development Indicators
Major Commercial
Tourism Development
Parks and Recreation
Special Use
Open Space
Total
Soil Classification, CAO
Elevation (in has.), OCPDC-GIS
>200 m
Slope (in has.), OCPDC-GIS
Level to Nearly Level (0-3%)
II. Economic Services
Commercial & Industrial Establishments, Bus. Bureau,
2019
Micro
Number
Total Capitalization (in million pesos)
Declared No. of Employees
Small
Number
Total Capitalization (in million pesos)
Declared No. of Employees
Medium
Number
Total Capitalization (in million pesos)
Declared No. of Employees
Large
Number
Total Capitalization (in million pesos)
Declared No. of Employees
Brgy. 31-D Brgy. 32-D Brgy. 33- D Brgy.34-D Brgy.35-D Brgy. 36-D
- 0.159 - - - -
- 0.100 - - - -
- 0.084 - 0.337 - -
- - - - - -
- - - - - -
22.597 17.887 7.74 19.63 6.983 6.93Matina Clay, Cabantian Clay
and Faraon Clay
Matina Clay, Cabantian Clay
and Faraon Clay
Matina Clay, Cabantian Clay
and Faraon Clay
Matina Clay, Cabantian Clay
and Faraon Clay
Matina Clay, Cabantian Clay
and Faraon Clay
Matina Clay, Cabantian Clay and
Faraon Clay
22.597 17.89 7.74 19.63 6.983 6.93
22.597 17.89 7.74 19.63 6.983 6.93
69 204 93 400 205 93
5,963,774.00 27,014,000.00 11,489,640.00 51,038,366.52 23,425,750.00 12,498,524.00
103 506 329 1,855 395 204
14 77 55 153 69 32
11,865,000.00 66,914,977.00 50,642,612.60 124,958,374.00 54,889,042.30 29,126,783.00
30 364 230 1,133 306 145
2 39 22 71 36 20
7,100,000.00 145,623,922.66 81,533,789.00 257,913,752.70 132,166,501.00 71,898,861.14
6 366 116 1,017 189 94
0 12 7 36 21 3
0.00 20,672,337,968.11 138,173,973.35 4,074,491,341.00 10,642,369,355.20 72,516,865.74
0 404 57 641 539 19
Page 23

General Profile, Poblacion District, Davao City, 2020
Development Indicators
III. Social Services
No. of Health Centers, CHO 2019
Barangay Health Human Resources
No. of Barangay Health Workers
No. of Barangay Nutrition Scholars
Health Services, CHO 2019
% of Fully Immunized Children aged 11 months old
and below
Prevalence Rate of Severely Underweight Children
aged 0-71 months
School Facilities, Dep.Ed 2019
Total Number of Schools
Public Schools
Elementary
High School
Sr. High School
Tertiary
Private Schools
Elementary
Elementary/High School
High School
Sr. High School
Tertiary
Vocational School
Social Welfare, CSSDO 2019
Total Number of Day Care Centers
Center Based
Day Care Center
Child Minding Center
Brgy. 31-D Brgy. 32-D Brgy. 33- D Brgy.34-D Brgy.35-D Brgy. 36-D
1 0 0 0 0 1
7 7 1 4 2 0
4 2 1 1 1 1
88.60 131.19 78.17 91.87 145.02 67.03
0.38 0.00 0.86 0.00 0.00 0.00
0 4 1 4 8 0
1 1 1
2
1 3
2 1 3 2
2 1 1 0 1 1
2 1 1 1 1
Page 24

General Profile, Poblacion District, Davao City, 2020
Development Indicators
Home Based
Supervised Neighborhood play
PTOP
IV. Environmental Management
Garbage Disposal Practices, BC, OCPDC-RSD
MRF, CENRO
V. Infrastructure and Utilities
Power, DLPC 2019
Number of Streetlights
Water System, DCWD, CEO, 2019
DCWD
VI. Local Government Administration
Membership of Barangay Council, BCCAD, 2017-2019
Barangay Captain
Barangay Kagawad (7)
Sanggunian Kabataan Representative
Brgy. 31-D Brgy. 32-D Brgy. 33- D Brgy.34-D Brgy.35-D Brgy. 36-D
Collected Collected Collected Collected Collected Collected
✓ ✓
DLPC DLPC DLPC DLPC DLPC DLPC
109 126 74 98 22 49
DCWD DCWD DCWD DCWD DCWD DCWD
Hon. Joel L. LanderoHon. Rolando P.
Bantayan, Sr.
Hon. Wilfredo M.
MoscareHon. Erlan T. Guevarra Hon. George U. Balite Hon. Anita C. Bonjoc
Nathaniel G. Rapal Aurora L. Neniel Hilario P. Orillo Conrado B. Bonsobre Jr. Lilian G. Balite Arturo E. Bonjoc
Ervin Paul L. Enemenzo Rene C. Repito Arnel L. Mangin Elizabeth A. Gala Merelyn A. Gurang Emelda M. Reyes
Pedro A. Empasis Jr. Mateo L. Deligero Jr. Pacita P. Villares Edmundo P. Mamaril Aida A. Ponferrada Meriam M. Ranain
Jeremiah N. Caballero Noel S. Lomanta Isagani D. Rogando Caesar G. Paras Jesus M. Dela Cruz Josephine P. Canda
Cleo E. Jabilles Jr. Edwin C. Amigo Julius A. Soriano Frankie S. Abellana Ruel D. Lim Reynaldo D. Gales
Marlou G. Abarquez Angel T. Bantayan Welyn A. Moscare Elvin A. Cajuelan Eric John B. Uy Protacio L. Sienes
Cesar A. Puerto Jr. Judy-Ann B. Gierza Bhen Ayk O. Delgado Ellen S. Sunico Analie P. Serencio Ronald L. Soriano
Rhea Mae B. Ladroma Elmer A. Obelidhon Meriros D. De Leon Adilyn A. Romanos Kenneth Hudson A. Jayme *Average of four (4) members/household
Sources of data:PSA - Philippine Statistics Authority CSSDO - City Social Services & Development OfficeOCPDC-GIS - Office of the City Planning & Development Coordinator- Geographical Information System BC - Barangay CouncilOCPDC-RSD- Office of the City Planning & Development Coordinator- Research & Statistics Division BCCAD - Barangay Cultural Communities Affairs DivisionCAO - City Agriculturist's Office CEO - City Engineer's OfficeBus. Bureau - Business Bureau DCWD - Davao City Water DistrictCHO - City Health Office DLPC - Davao Light & Power CorporationDepEd - Department of Education CENRO - City Environment and Natural Resources Office
Page 25

General Profile, Poblacion District, Davao City, 2020
Development Indicators
I. Demography
Population Projection 2020, OCPDC
Population, PSA 2015 census
Estimated Number of Households*, 2015
Population, PSA 2010 Census
Population, PSA 2007 Census
Population, PSA 2000 Census
Geography
Land Area, (in has), OCPDC-GIS
Distance from City Hall to Brgy. Proper, (in kms.), OCPDC-GIS
Number of Puroks, OCPDC-RSD
Boundaries, OCPDC-GIS
North
South
East
West
Locational Characteristics
Rural/Urban Classifications
Land Use, (in has.), OCPDC-GIS
Floodway Mitigation
Low Density Residential
Medium Density Residential
High Density Residential
Institution
Special Institution
Minor Commercial
Brgy. 37-D Brgy. 38-D Brgy. 39-D Brgy. 40- D Total
7,552 1,686 5,762 2,730 195,087
6,740 1,505 5,143 2,437 174,121
1,685 376 1,286 609 43,535
5,819 1,487 4,106 2,057 156,450
5,990 1,292 4,165 1,752 153,005
5,309 1,074 3,557 1,443 133,639
7.1 9.0 12.8 10.017 1,186.22
0.49 0.49 0.27 0.42
8 6 12 6 306
33D 35D 38D 39D
Davao Gulf 39D 40D 39D
31D 36D Davao Gulf 39D
36D 3A 1A 39D
Inland Inland Inland Inland
Urban Urban Urban Urban
0.380 - 4.195 10.017 258.70
- - - - 141.72
- - - - 8.43
1.217 - - - 17.39
- 1.058 3.351 - 81.98
- 1.141 - - 1.14
5.511 6.805 5.004 - 367.55
Page 26

General Profile, Poblacion District, Davao City, 2020
Development Indicators
Major Commercial
Tourism Development
Parks and Recreation
Special Use
Open Space
Total
Soil Classification, CAO
Elevation (in has.), OCPDC-GIS
>200 m
Slope (in has.), OCPDC-GIS
Level to Nearly Level (0-3%)
II. Economic Services
Commercial & Industrial Establishments, Bus. Bureau,
2019
Micro
Number
Total Capitalization (in million pesos)
Declared No. of Employees
Small
Number
Total Capitalization (in million pesos)
Declared No. of Employees
Medium
Number
Total Capitalization (in million pesos)
Declared No. of Employees
Large
Number
Total Capitalization (in million pesos)
Declared No. of Employees
Brgy. 37-D Brgy. 38-D Brgy. 39-D Brgy. 40- D Total
- - - - 192.52
- - - - 62.61
- - 0.227 - 24.63
- - - - 28.17
- - - - 1.38
7.108 9.004 12.777 10.017 1,186.22Matina Clay, Cabantian Clay and
Faraon Clay
Matina Clay, Cabantian Clay and
Faraon Clay
Matina Clay, Cabantian Clay and
Faraon Clay
Matina Clay, Cabantian Clay and
Faraon Clay
7.108 9.004 12.78 10.017 1,186.22
7.108 9.004 12.78 10.017 1,186.22
106 97 139 49 7,054
12,914,800.00 12,419,921.55 12,382,500.00 7,129,022.00 885,452,464.80
157 1,449 307 62 21,250
18 31 31 20 3,310
12,578,089.50 26,524,618.00 25,524,475.25 16,200,000.00 2,819,904,369.58
269 360 88 137 20,580
11 30 15 8 1,770
34,340,000.00 133,252,887.77 47,009,149.00 26,668,047.91 6,767,127,635.19
21 840 49 61 18,701
0 9 4 9 775
0.00 212,483,542.81 173,058,357.00 476,005,000.00 126,293,151,367.75
0 52 12 56 19,060
Page 27

General Profile, Poblacion District, Davao City, 2020
Development Indicators
III. Social Services
No. of Health Centers, CHO 2019
Barangay Health Human Resources
No. of Barangay Health Workers
No. of Barangay Nutrition Scholars
Health Services, CHO 2019
% of Fully Immunized Children aged 11 months old
and below
Prevalence Rate of Severely Underweight Children
aged 0-71 months
School Facilities, Dep.Ed 2019
Total Number of Schools
Public Schools
Elementary
High School
Sr. High School
Tertiary
Private Schools
Elementary
Elementary/High School
High School
Sr. High School
Tertiary
Vocational School
Social Welfare, CSSDO 2019
Total Number of Day Care Centers
Center Based
Day Care Center
Child Minding Center
Brgy. 37-D Brgy. 38-D Brgy. 39-D Brgy. 40- D Total
1 0 1 0 31
9 2 6 2 119
2 1 2 2 69
60.91 105.58 86.69 83.33
0.12 0.34 0.16 0.00
3 2 0 0 135
15
1 3
1 3
1
1 19
13
1
17
21
2 42
1 1 2 1 56
1 1 1 1 46
1 2
Page 28

General Profile, Poblacion District, Davao City, 2020
Development Indicators
Home Based
Supervised Neighborhood play
PTOP
IV. Environmental Management
Garbage Disposal Practices, BC, OCPDC-RSD
MRF, CENRO
V. Infrastructure and Utilities
Power, DLPC 2019
Number of Streetlights
Water System, DCWD, CEO, 2019
DCWD
VI. Local Government Administration
Membership of Barangay Council, BCCAD, 2017-2019
Barangay Captain
Barangay Kagawad (7)
Sanggunian Kabataan Representative
Brgy. 37-D Brgy. 38-D Brgy. 39-D Brgy. 40- D Total
7
1
Collected Collected Collected Collected
DLPC DLPC DLPC DLPC
101 51 21 32 4,280
DCWD DCWD DCWD DCWD
Hon. Prime S. Atillo Hon. Mila P. Arabis Hon. Gary P. BarrigaHon. Felizardo D.
Villacampa
Anthony L. Dilla Helen A. Homol Circio A. Bajao Geonila C. Panio
Loveroy M. Avisado Robert T. Cepe Cheryll M. Rulida Noralyn M. Fernandez
Edna R. Duran Garizaldy M. Masayon Maria Luz R. Muñez Cirilo J. Ursabia
Angelico A. Polo III Fe C. Llevado Joven A. Clarde Alma C. Roxas
Roberto C. Aranas Norberto L. Fudalan Juvy U. Bas Clarita T. Fayloga
Romel C. Carig Merian H. Biongan Reynaldo V. Arañas Jesus O. Pepito
Numerieta L. Cua Rebecca P. Habla Lorry O. Boiser Julito B. Baylas
Kayla Jean B. Sitoy Rubie D. Pagal Joselito J. Tarranza Jr. Karla Mae Y. Esteron*Average of four (4) members/household
Sources of data:PSA - Philippine Statistics Authority CSSDO - City Social Services & Development OfficeOCPDC-GIS - Office of the City Planning & Development Coordinator- Geographical Information System BC - Barangay CouncilOCPDC-RSD- Office of the City Planning & Development Coordinator- Research & Statistics Division BCCAD - Barangay Cultural Communities Affairs DivisionCAO - City Agriculturist's Office CEO - City Engineer's OfficeBus. Bureau - Business Bureau DCWD - Davao City Water DistrictCHO - City Health Office DLPC - Davao Light & Power CorporationDepEd - Department of Education CENRO - City Environment and Natural Resources Office
Page 29
Page 30
Talomo District
Bago Aplaya Langub
Bago Gallera Ma-a
Baliok Magtuod
Bucana Matina Aplaya
Catalunan Grande Matina Crossing
Catalunan Pequeño Matina PAngi
Dumoy Talomo Proper

General Profile, Talomo District, Davao City, 2020
Development Indicators Bago Aplaya Bago Gallera Baliok Bucana Catalunan Grande Catalunan Pequeno
I. Demography
Population Projection 2020, OCPDC 17,835 19,471 18,083 94,074 36,370 25,556
Population, PSA 2015 census 15,918 17,378 16,140 83,964 32,461 22,809
Estimated Number of Households*, 2015 3,980 4,345 4,035 20,991 8,115 5,702
Population, PSA 2010 Census 14,658 14,751 13,769 78,352 30,068 19,996
Population, PSA 2007 Census 13,532 12,867 12,356 74,113 25,409 13,933
Population, PSA 2000 Census 11,634 11,045 6,840 58,082 14,608 9,069
Geography
Land Area, (in has), OCPDC-GIS 217.35 717.82 248.28 410.51 1,495.06 594.49
Distance from City Hall to Brgy. Proper, (in kms.), OCPDC-GIS
10.38 12.56 14.27 2.79 11.45 12.06
Number of Puroks, OCPDC-RSD 22 20 11 4 10 24
Boundaries, OCPDC-GIS
North Bago GalleraCatalunan
PequeñoBago Oshiro Matina Crossing Tacunan Catalunan Grande
South Davao Gulf Dumoy Lubogan Davao GulfMatina Pangi / Cat.
PequeñoBago Gallera
East Talomo Proper Talomo Proper Bago Gallera 40D Langub Catalunan Grande
West Dumoy Baliok Bankas Heights Matina Aplaya Cat. Pequeño / Mintal Bago Oshiro / Sto. Nino
Locational Characteristics Coastal Inland Inland Coastal Inland/ Riverbank Inland/Riverbank
Rural/Urban Classifications Urban Urban Urban Urban Urban Urban
Land Use, (in has.), OCPDC-GIS
Floodway Mitigation 39.476 143.764 - 183.241 66.472 82.210
Institution 3.333 8.126 0.021 8.449 13.844 7.472
Major Commercial 36.266 8.223 - 77.119 19.047 4.137
Minor Commercial - 7.872 - 27.018 - 5.421
High Density Residential 44.706 - 17.079 41.429 2.003 -
Medium Density Residential 2.362 124.953 82.896 - 1136.807 478.199
Low Density Residential 76.180 278.469 109.048 39.610 127.052 -
Socialized Housing - 17.636 2.999 12.665 40.078 -
Page 31

General Profile, Talomo District, Davao City, 2020
Development Indicators Bago Aplaya Bago Gallera Baliok Bucana Catalunan Grande Catalunan Pequeno
Light Industrial - 18.705 - - -
Infrastructure/Utilities 4.009 10.648 11.258 6.711 8.432 3.819
Prime Agricultural - - - - 35.271 -
Agricultural Non-Tillage - - - - - -
Planned Unit Development 0.205 74.044 2.108 - - -
Tourism Development - - - 2.629 - -
Urban Ecological Enhancement - - - - - -
Parks and Recreation 6.636 38.984 - - -
Conservation - - - - 31.120 -
Inland Water Zone - - - - - 2.777
Open Space 4.180 5.098 0.302 11.641 0.804 9.049
Special Use - - 3.861 - - -
Marginal - - - - 14.133 1.406
Total217.353 717.817 248.277 410.512 1495.063 594.49
Soil Classification, CAO Matina Clay Matina Clay Matina ClaySan Miguel Clay Loam,Matina Clay
Loam and Cabantian Clay LoamTugbok Clay Tugbok Clay
Elevation (in has.), OCPDC-GIS
>200 m 217.353 717.817 248.277 410.512 798.948 568.041
201 - 500 m 0 0 0 0 696.115 26.449
501-1,000m 0 0 0 0 0 0
Total 217.353 717.817 248.277 410.512 1495.063 594.49
Slope (in has.), OCPDC-GIS
M-Level to Nearly Level (0-3%) 217.353 620.449 82.406 410.512 0 8.28
N-Gently Sloping to Undulating Range (3-8%) 0 97.368 165.871 0 1411.062 586.21
O-Undulating to Unrolling Range (8-8%) 0 0 0 0 84.001 0
P-Rolling to Moderately Steep Range (18-30%) 0 0 0 0 0 0
Total 217.353 717.817 248.277 410.512 1495.063 594.49
Page 32

General Profile, Talomo District, Davao City, 2020
Development Indicators Bago Aplaya Bago Gallera Baliok Bucana Catalunan Grande Catalunan Pequeno
II. Economic Services
Commercial & Industrial Establishments, Bus. Bureau,
2019
Micro
Number 141 141 132 1,107 466 289
Total Capitalization (in million pesos) 15,314,100.00 16,262,350.00 13,380,000.00 140,194,380.00 53,713,750.00 33,595,569.00
Declared No. of Employees 374 265 174 2,818 785 425
Small
Number 71 41 25 545 128 64
Total Capitalization (in million pesos) 64,259,504.08 32,369,752.00 21,050,001.00 473,702,967.37 112,324,949.57 50,070,747.80
Declared No. of Employees 294 93 69 2,990 555 589
Medium
Number 41 12 7 279 42 24
Total Capitalization (in million pesos) 158,687,147.09 41,996,000.00 16,189,600.00 935,338,011.05 160,523,973.34 81,011,784.37
Declared No. of Employees 582 58 30 2,973 207 134
Large
Number 21 4 1 95 11 6
Total Capitalization (in million pesos) 357,716,669.00 43,200,000.00 19,050,000.00 3,060,305,114.03 189,939,040.00 111,883,524.00
Declared No. of Employees 772 83 15 6,051 175 427
III. Social Services
No. of Health Centers, CHO 2019 1 1 1 5 1 1
Barangay Health Human Resources
No. of Barangay Health Workers 10 11 10 20 13 11
No. of Barangay Nutrition Scholars 3 3 3 15 5 5
Health Services, CHO 2019
% of Fully Immunized Children aged 11 months old
and below93.74 110.75 100.10 13.20 63.10 68.70
Prevalence Rate of Severely Underweight Children
aged 0-71 months0.23 0.05 0.15 3.85 0.05 0.12
Page 33

General Profile, Talomo District, Davao City, 2020
Development Indicators Bago Aplaya Bago Gallera Baliok Bucana Catalunan Grande Catalunan Pequeno
School Facilities, Dep.Ed 2019
Total Number of Schools 7 8 5 31 17 9
Public Schools
Elementary 3 2 1 3 1 1
High School 1 1 1 1 1
Sr. High School 1 1 1 1
Private Schools
Elementary 2 6 3 2
Elementary/High School 3 1 2 5 7 3
High School
Sr. High School 1 3 1
Tertiary 2 3 2 1
Vocational School 9 1
Social Welfare, CSSDO 2019
Total Nunber of Day Care Centers 6 4 4 18 6 5
Center Based
Day Care Center 6 3 4 18 6 1
Home Based
Supervised Neighborhood play 1 4
ECCD Mobile
IV. Environmental Management
Garbage Disposal Practices, BC, OCPDC-RSD Collected Collected Collected Collected Collected / Composit Pit Collected
MRF, CENRO ✓ ✓
V. Infrastructure and Utilities
Power, DLPC 2019 DLPC DLPC DLPC DLPC DLPC DLPC
Number of Streetlights 554 511 545 1451 1077 645
Water System, DCWD, CEO, 2019
DCWD DCWD DCWD DCWD DCWD DCWD DCWD
Level I, (no. of units) 36 9 3 4
Level II, (no. of units)
Page 34

General Profile, Talomo District, Davao City, 2020
Development Indicators Bago Aplaya Bago Gallera Baliok Bucana Catalunan Grande Catalunan Pequeno
VI. Local Government Administration
Membership of Barangay Council, BCCAD, 2017-2019
Barangay CaptainHon. Isidro T. Dujali
Jr.
Hon. Chelo V.
CañaresHon. Ricky E. Liparanon Hon. Rolando T. Trajera Hon. January N. Duterte Hon. Rodrigo A. Tangaro
Barangay Kagawad (7) Cristito B. Lazaro Warlito A. Lao Antonio A. Tinasas Allan L. Linao Rodolfo Q. Abella Eric S. Raganas
Marlon F. Campos Rolando L. Vargas Ramon M. Parba Joyce M. Abellera Maria Chrystel B. Macahig Nicolas T. Nabasca, Jr.
Ronel T. Libradilla Rosalyn P. Peña Roque T. Bais Antonieta A. Apa Daniel E. Ampe Albert D. Baguilod
Gresco S. Bustamante Neil N. De Guzman Jimmy S. Mantos Roselia G. Panao Lowell M. Curato Wevima A. Panzoy
Buenaventura E.
JagutinEdwin A. Callao Leo Vince V. Crisologo Randy R. Ponteras Editha V. Caasi Mary L. Nicolas
Ronilo B. Seguilla Walter P. Paler Presencia R. Bandal Ruthy U. Gementiza Nicolasa P. Morata Apolinar H. Quines
Guillermo H.
BustamanteEster I. Bustamante Gaudiosa S. Bajala Dennis L. Bague Desiderio A. Lopez Abundio V. Duray, Jr.
Sanggunian Kabataan Representative Adrian L. Alagaban Raffy V. Saga John D. Fernaandez Rhea C. Olanolan Randy Jade S. Gumapac Joyce P. Nabasca
*Average of four (4) members/household
Sources of data:
PSA - Philippine Statistics Authority CSSDO - City Social Services & Development Office
OCPDC-GIS - Office of the City Planning & Development Coordinator- Geographical Information System BC - Barangay Council
OCPDC-RSD- Office of the City Planning & Development Coordinator- Research & Statistics Division BCCAD - Barangay Cultural Communities Affairs Division
CAO - City Agriculturist's Office CEO - City Engineer's Office
Bus. Bureau - Business Bureau DCWD - Davao City Water District
CHO - City Health Office DLPC - Davao Light & Power Corporation
DepEd - Department of Education CENRO - City Environment and Natural Resources Office
Page 35

General Profile, Talomo District, Davao City, 2020
Development Indicators
I. Demography
Population Projection 2020, OCPDC
Population, PSA 2015 census
Estimated Number of Households*, 2015
Population, PSA 2010 Census
Population, PSA 2007 Census
Population, PSA 2000 Census
Geography
Land Area, (in has), OCPDC-GIS
Distance from City Hall to Brgy. Proper, (in kms.), OCPDC-GIS
Number of Puroks, OCPDC-RSD
Boundaries, OCPDC-GIS
North
South
East
West
Locational Characteristics
Rural/Urban Classifications
Land Use, (in has.), OCPDC-GIS
Floodway Mitigation
Institution
Major Commercial
Minor Commercial
High Density Residential
Medium Density Residential
Low Density Residential
Socialized Housing
Dumoy Langub Maa Magtuod Matina Aplaya Matina Crossing
20,864 3,230 67,004 5,667 37,404 36,342
18,622 2,883 59,803 5,058 33,384 32,436
4,656 721 14,951 1,265 8,346 8,109
18,804 2,677 49,915 3,815 29,642 34,166
19,389 2,207 51,299 3,210 31,641 36,642
16,553 1,599 39,578 2,073 25,032 34,719
530.77 853.20 999.38 462.89 315.49 488.82
12.17 15.37 4.97 11.05 7.68 5.21
24 7 63 9 34 77
Baliok Magtuod Magtuod Waan Matina Crossing Matina Pangi
Davao Gulf Matina PangiMatina Crossing /
Matina AplayaMaa Davao Gulf Matina Aplaya
Bago Aplaya Magtuod Buhangin Proper Waan Bucana Bucana
Toril Proper Catalunan Grande Langub Langub Talomo Talomo Proper
Coastal Inland/Riverbank Inland/Riverbank Inland Coastal Inland/Riverbank
Urban Rural Urban Rural Urban Urban
- - 230.549 - - -
2.075 - 42.722 26.657 0.848 20.489
54.282 - 234.130 21.481 14.945 135.223
- - - - - 51.767
- - 107.281 170.080 37.035
0.069 69.958 99.921 84.473 39.467 135.722
400.743 246.653 140.318 175.499 19.153 76.829
- 8.899 20.102 - 18.405 0.058
Page 36

General Profile, Talomo District, Davao City, 2020
Development Indicators
Light Industrial
Infrastructure/Utilities
Prime Agricultural
Agricultural Non-Tillage
Planned Unit Development
Tourism Development
Urban Ecological Enhancement
Parks and Recreation
Conservation
Inland Water Zone
Open Space
Special Use
Marginal
Total
Soil Classification, CAO
Elevation (in has.), OCPDC-GIS
>200 m
201 - 500 m
501-1,000m
Total
Slope (in has.), OCPDC-GIS
M-Level to Nearly Level (0-3%)
N-Gently Sloping to Undulating Range (3-8%)
O-Undulating to Unrolling Range (8-8%)
P-Rolling to Moderately Steep Range (18-30%)
Total
Dumoy Langub Maa Magtuod Matina Aplaya Matina Crossing
0.707 - 0.684 - - -
10.608 1.946 3.706 0.011 14.652 1.786
- 15.449 - 36.344 - -
- 255.921 - 48.070 - -
11.725 - 0.479 - - -
- - 13.345 - -
- - 65.834 - - 4.491
- - - - - 18.478
- 228.359 2.202 0.048 - 3.034
39.784 - - - - -
10.777 - 0.205 - 37.937 3.911
- - 37.905 52.676 - -
- 26.014 - 17.632 - -
530.77 853.199 999.383 462.891 315.487 488.823
San Manuel Silty Clay Loam Cabantian Clay / Bolinao
Clay Cabantian Clay
Faraon Clay / Matina Clay /
Cabantian clay Matina Clay San Manuel Silty Clay Loam
530.77 316.271 999.383 238.379 315.487 410.654
0 526.314 0 210.851 0 78.169
0 10.614 0 13.662 0 0
530.77 853.199 999.383 462.892 315.487 488.823
528.2 0 495.316 0 315.487 423.501
2.57 107.255 0 0 0 65.26
0 629.816 1.292 98.697 0 0.061
0 116.128 502.776 364.194 0 0
530.77 853.199 999.384 462.891 315.487 488.822
Page 37
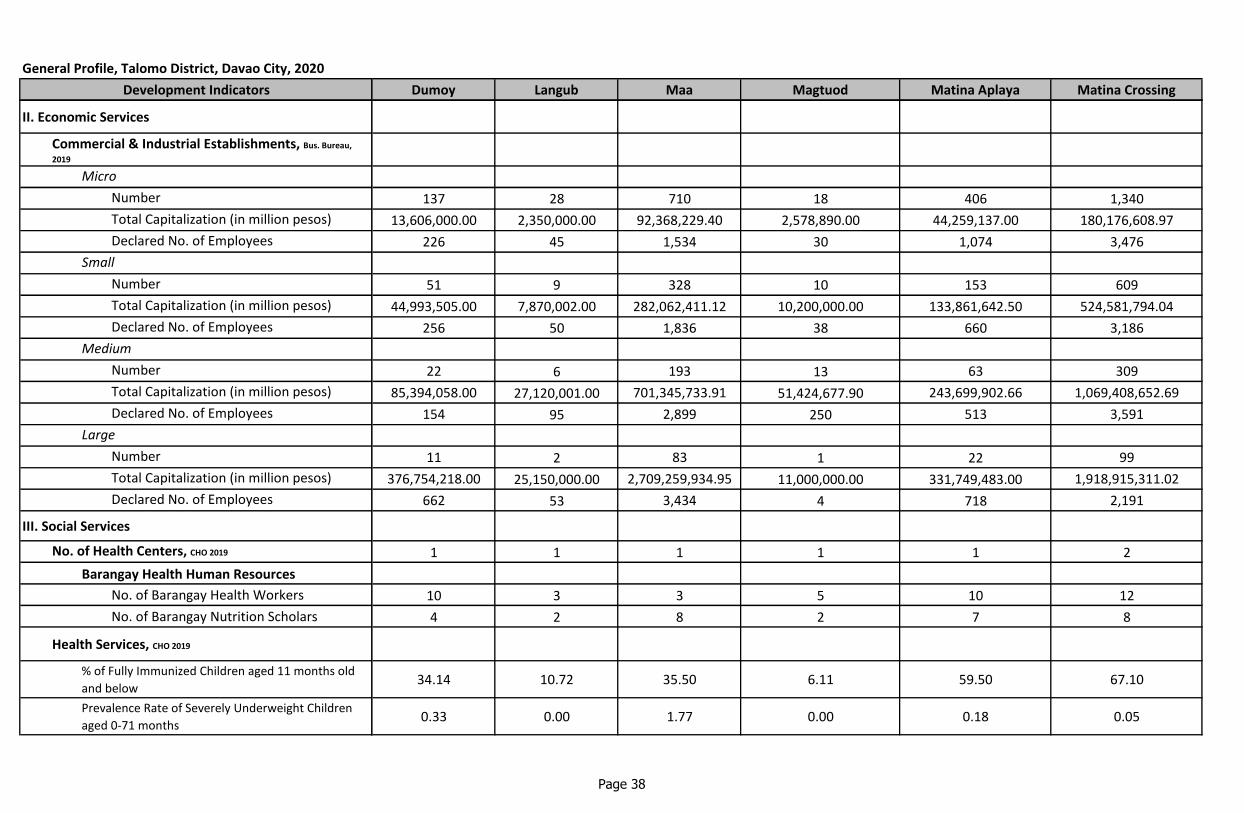
General Profile, Talomo District, Davao City, 2020
Development Indicators
II. Economic Services
Commercial & Industrial Establishments, Bus. Bureau,
2019
Micro
Number
Total Capitalization (in million pesos)
Declared No. of Employees
Small
Number
Total Capitalization (in million pesos)
Declared No. of Employees
Medium
Number
Total Capitalization (in million pesos)
Declared No. of Employees
Large
Number
Total Capitalization (in million pesos)
Declared No. of Employees
III. Social Services
No. of Health Centers, CHO 2019
Barangay Health Human Resources
No. of Barangay Health Workers
No. of Barangay Nutrition Scholars
Health Services, CHO 2019
% of Fully Immunized Children aged 11 months old
and below
Prevalence Rate of Severely Underweight Children
aged 0-71 months
Dumoy Langub Maa Magtuod Matina Aplaya Matina Crossing
137 28 710 18 406 1,340
13,606,000.00 2,350,000.00 92,368,229.40 2,578,890.00 44,259,137.00 180,176,608.97
226 45 1,534 30 1,074 3,476
51 9 328 10 153 609
44,993,505.00 7,870,002.00 282,062,411.12 10,200,000.00 133,861,642.50 524,581,794.04
256 50 1,836 38 660 3,186
22 6 193 13 63 309
85,394,058.00 27,120,001.00 701,345,733.91 51,424,677.90 243,699,902.66 1,069,408,652.69
154 95 2,899 250 513 3,591
11 2 83 1 22 99
376,754,218.00 25,150,000.00 2,709,259,934.95 11,000,000.00 331,749,483.00 1,918,915,311.02
662 53 3,434 4 718 2,191
1 1 1 1 1 2
10 3 3 5 10 12
4 2 8 2 7 8
34.14 10.72 35.50 6.11 59.50 67.10
0.33 0.00 1.77 0.00 0.18 0.05
Page 38

General Profile, Talomo District, Davao City, 2020
Development Indicators
School Facilities, Dep.Ed 2019
Total Number of Schools
Public Schools
Elementary
High School
Sr. High School
Private Schools
Elementary
Elementary/High School
High School
Sr. High School
Tertiary
Vocational School
Social Welfare, CSSDO 2019
Total Nunber of Day Care Centers
Center Based
Day Care Center
Home Based
Supervised Neighborhood play
ECCD Mobile
IV. Environmental Management
Garbage Disposal Practices, BC, OCPDC-RSD
MRF, CENRO
V. Infrastructure and Utilities
Power, DLPC 2019
Number of Streetlights
Water System, DCWD, CEO, 2019
DCWD
Level I, (no. of units)
Level II, (no. of units)
Dumoy Langub Maa Magtuod Matina Aplaya Matina Crossing
7 1 27 5 14 48
1 1 2 1 2 6
1 1 1
1 1 1
1 4 7 16
2 7 2 3 9
1
1 2 1 6
3 1
1 7 1 8
7 1 10 1 8 11
6 1 10 1 8 9
2
1
Collected Collected Collected Collected Collected Collected
✓
DLPC DLPC DLPC DLPC DLPC DLPC
341 113 1408 120 627 1748
DCWD DCWD DCWD DCWD
36 2 4
1 5
Page 39

General Profile, Talomo District, Davao City, 2020
Development Indicators
VI. Local Government Administration
Membership of Barangay Council, BCCAD, 2017-2019
Barangay Captain
Barangay Kagawad (7)
Sanggunian Kabataan Representative
Bus. Bureau - Business Bureau
CHO - City Health Office
DepEd - Department of Education
Dumoy Langub Maa Magtuod Matina Aplaya Matina Crossing
Hon. Jessie Mar Y.
CulasteHon. Leilani D. Bacalso
Hon. Pacito D. Cañete,
Jr.Hon. Jaime T. Gorre Hon. Nestor B. Cirunay Hon. Joel A. Santes
Vicente Melvin B.
CabatbatErlinda C. Oyoa Lyndon D. Banzon Deodita O. Cuizon Francisco C. Bonguyan, Jr. Conrado S. Encabo, Jr.
James P. Cabasan Esmeraldo S. Pamat Danilo M. Corias Juan L. Batulat Jimmy D. Poloquit Richard B. Duterte
Erwin Ian V. Baclaan Robert L. Julom Rique G. Barral Carmencita F. Dagpin Jerry S. Lumapac Ike Y. Yuson
Nanette C. Badad Venencio A. Bajenting Elfred M. Corias Alfredo S. Batulat Sharon Mae P. Castro Vince Amador B. Bacon
Katherine T. Masalunga Sara C. Bacus Dante P. Briones Romeo B. Torejas, Jr. Dan C. Reponte Gregorio M. Nadal
Arlene D. Adlawan Joseph Ryan E. Recto Ken Brian R. De Leon Marlon A. Lopez Timoteo V. Flores Lorence A. Cañada
Neri A. Maranga Bernie A. Pepito Martin E. Carillo Joselito B. Reoyan Wenceslao B. Inutan Allan S. Halog
Artemejohn Maynard Q.
MandalupeTracy Mae M. Antiola
Vic Lourenz T.
PantinopleAriane B. Sigue Phobee M. Canoy Rhesam Mae C. Quindoy
*Average of four (4) members/household
Sources of data:
PSA - Philippine Statistics Authority CSSDO - City Social Services & Development Office
OCPDC-GIS - Office of the City Planning & Development Coordinator- Geographical Information System BC - Barangay Council
OCPDC-RSD- Office of the City Planning & Development Coordinator- Research & Statistics Division BCCAD - Barangay Cultural Communities Affairs Division
CAO - City Agriculturist's Office CEO - City Engineer's Office
Bus. Bureau - Business Bureau DCWD - Davao City Water District
CHO - City Health Office DLPC - Davao Light & Power Corporation
DepEd - Department of Education CENRO - City Environment and Natural Resources Office
Page 40

General Profile, Talomo District, Davao City, 2020
Development Indicators
I. Demography
Population Projection 2020, OCPDC
Population, PSA 2015 census
Estimated Number of Households*, 2015
Population, PSA 2010 Census
Population, PSA 2007 Census
Population, PSA 2000 Census
Geography
Land Area, (in has), OCPDC-GIS
Distance from City Hall to Brgy. Proper, (in kms.), OCPDC-GIS
Number of Puroks, OCPDC-RSD
Boundaries, OCPDC-GIS
North
South
East
West
Locational Characteristics
Rural/Urban Classifications
Land Use, (in has.), OCPDC-GIS
Floodway Mitigation
Institution
Major Commercial
Minor Commercial
High Density Residential
Medium Density Residential
Low Density Residential
Socialized Housing
Matina Pangi Talomo Proper Total
20,258 66,864 469,022
18,081 59,678 418,615
4,520 14,920 104,654
13,625 58,414 382,652
10,200 53,212 360,010
6,234 47,034 284,100
584.12 642.95 8,561.14
8.38 9.57
14 79 398
Langub Catalunan Pequeno
Matina Crossing Davao gulf
Maa Matina Crossing
Catalunan Grande Bago Aplaya
Riverbank Coastal/Riverbank
Urban Urban
- 192.383 938.095
0.276 25.146 159.458
6.535 36.270 647.658
- - 92.078
2.927 160.192 582.732
254.954 134.753 2,644.534
135.827 31.093 1,856.474
1.240 37.047 159.129
Page 41

General Profile, Talomo District, Davao City, 2020
Development Indicators
Light Industrial
Infrastructure/Utilities
Prime Agricultural
Agricultural Non-Tillage
Planned Unit Development
Tourism Development
Urban Ecological Enhancement
Parks and Recreation
Conservation
Inland Water Zone
Open Space
Special Use
Marginal
Total
Soil Classification, CAO
Elevation (in has.), OCPDC-GIS
>200 m
201 - 500 m
501-1,000m
Total
Slope (in has.), OCPDC-GIS
M-Level to Nearly Level (0-3%)
N-Gently Sloping to Undulating Range (3-8%)
O-Undulating to Unrolling Range (8-8%)
P-Rolling to Moderately Steep Range (18-30%)
Total
Matina Pangi Talomo Proper Total
- - 20.096
2.464 11.482 91.532
- - 87.064
- - 303.991
- - 88.561
0.014 - 15.988
156.299 - 226.624
- 9.253 73.351
19.457 - 284.220
- - 42.561
4.129 5.330 93.363
- - 94.442
- - 59.185
584.122 642.9498,561.136
Cabantian Clay / San Manuel Silty
Clay LoamHydrosol
320.929 619.792 6,712.61
263.193 23.157 1,824.25
0 0 24.28
584.122 642.949 8,561.14
111.85 331.86 3,545.21
148.163 311.09 2,894.85
300.19 0 1,114.06
23.919 0 1,007.02
584.122 642.95 8,561.14
Page 42
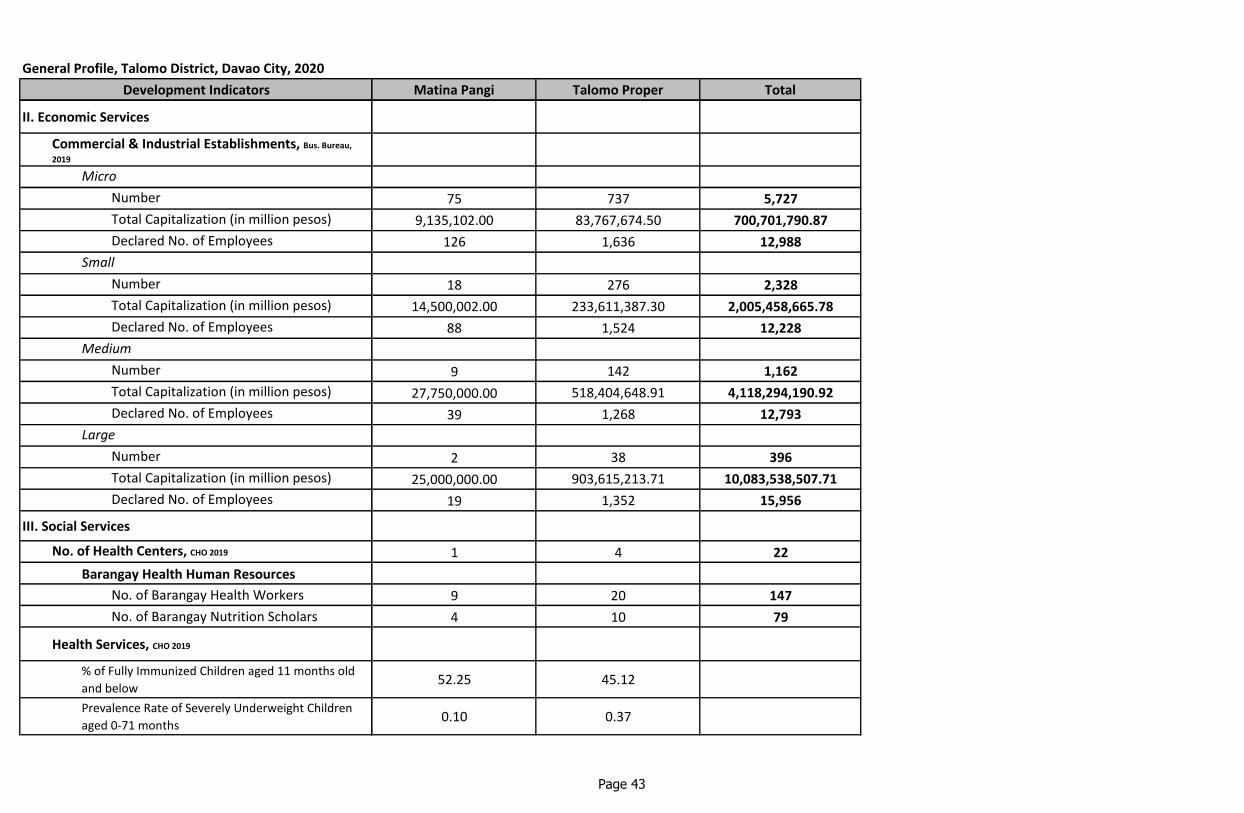
General Profile, Talomo District, Davao City, 2020
Development Indicators
II. Economic Services
Commercial & Industrial Establishments, Bus. Bureau,
2019
Micro
Number
Total Capitalization (in million pesos)
Declared No. of Employees
Small
Number
Total Capitalization (in million pesos)
Declared No. of Employees
Medium
Number
Total Capitalization (in million pesos)
Declared No. of Employees
Large
Number
Total Capitalization (in million pesos)
Declared No. of Employees
III. Social Services
No. of Health Centers, CHO 2019
Barangay Health Human Resources
No. of Barangay Health Workers
No. of Barangay Nutrition Scholars
Health Services, CHO 2019
% of Fully Immunized Children aged 11 months old
and below
Prevalence Rate of Severely Underweight Children
aged 0-71 months
Matina Pangi Talomo Proper Total
75 737 5,727
9,135,102.00 83,767,674.50 700,701,790.87
126 1,636 12,988
18 276 2,328
14,500,002.00 233,611,387.30 2,005,458,665.78
88 1,524 12,228
9 142 1,162
27,750,000.00 518,404,648.91 4,118,294,190.92
39 1,268 12,793
2 38 396
25,000,000.00 903,615,213.71 10,083,538,507.71
19 1,352 15,956
1 4 22
9 20 147
4 10 79
52.25 45.12
0.10 0.37
Page 43

General Profile, Talomo District, Davao City, 2020
Development Indicators
School Facilities, Dep.Ed 2019
Total Number of Schools
Public Schools
Elementary
High School
Sr. High School
Private Schools
Elementary
Elementary/High School
High School
Sr. High School
Tertiary
Vocational School
Social Welfare, CSSDO 2019
Total Nunber of Day Care Centers
Center Based
Day Care Center
Home Based
Supervised Neighborhood play
ECCD Mobile
IV. Environmental Management
Garbage Disposal Practices, BC, OCPDC-RSD
MRF, CENRO
V. Infrastructure and Utilities
Power, DLPC 2019
Number of Streetlights
Water System, DCWD, CEO, 2019
DCWD
Level I, (no. of units)
Level II, (no. of units)
Matina Pangi Talomo Proper Total
1 35 215
1 6 31
4 12
4 11
7 48
8 52
1
6 21
12
27
2 14 97
2 13 88
1 8
1
Collected Collected
DLPC DLPC
327 1394 10,861
DCWD DCWD
1 95
6
Page 44

General Profile, Talomo District, Davao City, 2020
Development Indicators
VI. Local Government Administration
Membership of Barangay Council, BCCAD, 2017-2019
Barangay Captain
Barangay Kagawad (7)
Sanggunian Kabataan Representative
Bus. Bureau - Business Bureau
CHO - City Health Office
DepEd - Department of Education
Matina Pangi Talomo Proper Total
Hon. Benjamin T. Badon Hon. Bendor A. Calamba
Carmelo A. Arana Rosalia A. Cantoja
Julito G. Reston Hermoso M. Matuguinas
Ananias F. Singcol Leonilo B. Dulla, Jr.
Allan R. Melorin Marcelino E. Bernadas
Jimmy R. Fernandez Norlie M. Gabriel
Eustaquio A. Sanico Jr. Fundador V. Josol
Percival L. Berongoy Francisco V. Josol
Anelito E. Boldadora Bridget Erika L. Dahlgren
*Average of four (4) members/household
Sources of data:
PSA - Philippine Statistics Authority CSSDO - City Social Services & Development Office
OCPDC-GIS - Office of the City Planning & Development Coordinator- Geographical Information System BC - Barangay Council
OCPDC-RSD- Office of the City Planning & Development Coordinator- Research & Statistics Division BCCAD - Barangay Cultural Communities Affairs Division
CAO - City Agriculturist's Office CEO - City Engineer's Office
Bus. Bureau - Business Bureau DCWD - Davao City Water District
CHO - City Health Office DLPC - Davao Light & Power Corporation
DepEd - Department of Education CENRO - City Environment and Natural Resources Office
Page 45

Page 46
Agdao District
Agdao Proper Leon Garcia
Centro R. Castillo
Paciano Bangoy San Antonio
Vicente Duterte Ubalde
Tomas Monteverde W. Aquino
Lapu-lapu

General Profile, Agdao District, Davao City, 2020
Development Indicators Agdao Proper Centro San JuanGov. Paciano
Bangoy
Gov. Vicente
Duterte
Kapt. Tomas
MonteverdeLapu lapu
I. Demography
Population Projection 2020, OCPDC 9,968 17,463 9,878 9,976 6,404 13,151
Population, PSA 2015 census 8,897 15,586 8,816 8,904 5,716 11,738
Estimated Number of Households*, 2015 2,224 3,897 2,204 2,226 1,429 2,935
Population, PSA 2010 Census 7,811 14,398 9,717 9,072 5,813 10,094
Population, PSA 2007 Census 8,653 13,960 10,750 8,829 6,011 9,882
Population, PSA 2000 Census 9,611 12,035 11,851 7,464 5,863 8,463
Geography
Land Area, (in has), OCPDC-GIS 38.288 43.48 81.47 52.016 19.521 59.99
Distance from City Hall to Brgy. Proper, (in kms.), OCPDC-GIS
3.39 4.85 3.97 3.99 0.39 5.50
Number of Puroks, OCPDC-RSD 10 14 14 13 12 10
Boundaries, OCPDC-GIS
North W. Aquino R. Castillo Pampanga Centro/San Juan Agdao Proper V. Hizon
South L. Garcia / T. Monteverde L. Garcia / T.Monteverde Agdao Proper Davao Gulf Poblacion Centro
East Leon Garcia Davao Gulf W. Aquino Centro L. Garcia Davao Gulf
West Poblacion District San Antonio Poblacion District W.Aquino Poblacion District R.Castillo
Locational Characteristics Inland Coastal Inland Coastal Inland Coastal
Rural/Urban Classifications Urban Urban Urban Urban Urban Urban
Land Use, (in has.), OCPDC-GIS
Institution 0.260 1.171 1.446 2.936 - 0.462
Major Commercial 32.449 - 64.883 2.235 0.629 -
Minor Commercial - - 14.769 - - -
High Density Residential 1.280 20.707 - 25.721 - 22.744
Light Industrial 4.299 17.535 - 17.259 - 34.359
Tourism Development - - - - 18.892 -
Parks & Recreation - - 0.372 - - -
Open Space - 4.067 3.865 - 2.428
Total 38.288 43.480 81.470 52.016 19.521 59.993
Page 47

General Profile, Agdao District, Davao City, 2020
Development Indicators Agdao Proper Centro San JuanGov. Paciano
Bangoy
Gov. Vicente
Duterte
Kapt. Tomas
MonteverdeLapu lapu
Soil Classification, CAO Cabantian and Faraon Clay Cabantian and Faraon Clay Cabantian and Faraon Clay Cabantian & Faraon Clay Cabantian & Faraon Clay Cabantian & Faraon Clay
Elevation (in has.), OCPDC-GIS
>200 m 38.288 43.48 81.47 52.016 19.521 59.993
Slope (in has.), OCPDC-GIS
Level to Nearly Level (0-3%) 38.288 43.48 81.47 52.016 19.521 59.993
II. Economic Services
Commercial & Industrial Establishments, Bus. Bureau,
2019
Micro
Number 584 74 250 80 111 100
Total Capitalization (in million pesos) 48,123,250.00 7,590,500.00 38,576,581.00 8,903,000.00 14,816,750.00 10,688,710.00
Declared No. of Employees 1,256 110 757 184 328 181
Small
Number 146 16 180 43 58 59
Total Capitalization (in million pesos) 118,769,073.40 15,367,384.60 161,238,447.90 38,172,008.36 50,447,311.00 47,430,904.00
Declared No. of Employees 669 65 1247 226 220 177
Medium
Number 62 5 120 35 18 35
Total Capitalization (in million pesos) 218,633,117.50 21,046,000.00 461,921,566.08 130,571,838.29 71,031,312.00 143,209,305.65
Declared No. of Employees 406 80 1130 295 153 351
Large
Number 23 12 42 18 10 12
Total Capitalization (in million pesos) 907,793,787.69 350,960,385.08 1,151,105,722.00 251,350,001.00 208,776,500.00 208,124,810.00
Declared No. of Employees 321 359 979 989 101 255
III. Social Services
No. of Health Centers, CHO 2019 1 1 1 1 1 1
Barangay Health Human Resources
No. of Barangay Health Workers 3 15 7 5 4 6
No. of Barangay Nutrition Scholars 3 3 2 2 2 3
Page 48

General Profile, Agdao District, Davao City, 2020
Development Indicators Agdao Proper Centro San JuanGov. Paciano
Bangoy
Gov. Vicente
Duterte
Kapt. Tomas
MonteverdeLapu lapu
Health Services, CHO 2019
% of Fully Immunized Children aged 11 months old
and below108.66 70.24 60.93 66.09 79.67 90.23
Prevalence Rate of Severely Underweight Children
aged 0-71 months0.09 0.20 0.00 0.10 0.97 1.05
School Facilities, Dep.Ed 2019
Total Number of Schools 3 1 9 8 1 2
Public Schools
Elementary 1 1 1 1
High School
Sr. High School
Private Schools
Elementary 2 1 1 1
Elementary/High School 3 1
High School
Sr. High School 2 2
Tertiary 2
Vocational School 1 1 3
Social Welfare, CSSDO 2019
Total Number of Day Care Centers 3 7 3 2 1 4
Center Based
Day Care Center 3 7 3 2 1 4
Home Based
Supervised Neighborhood play
IV. Environmental Management
Garbage Disposal Practices, BC, OCPDC-RSD Collected Collected Collected Collected Collected Collected
MRF, CENRO ✓
V. Infrastructure and Utilities
Power, DLPC 2019 DLPC DLPC DLPC DLPC DLPC DLPC
Number of Streetlights 135 205 379 114 84 170
Page 49

General Profile, Agdao District, Davao City, 2020
Development Indicators Agdao Proper Centro San JuanGov. Paciano
Bangoy
Gov. Vicente
Duterte
Kapt. Tomas
MonteverdeLapu lapu
Water System, DCWD, CEO, 2019
DCWD DCWD DCWD DCWD DCWD DCWD DCWD
VI. Local Government Administration
Membership of Barangay Council, BCCAD, 2017-2019
Barangay Captain Hon. Jose D. Tamayo, Jr. Hon. Rene I. Estorpe Hon. Jovito G. SalazarHon.Remedios A. Dela
LuzHon. Robert M. Diaz
Hon. Romeo B. Evangelista,
Jr.
Barangay Kagawad (7) Rodolfo A. Cagatin Nonato L. Bolos Chito M. Cañeda Neri L. Pasaje Merlyn D. Badilla Syreen Grace J. Icoy
Aisan John F. Tamayo Ronald N. Agua Alberto L. Ogdamin Lolita G. De Guzman Roberto C. Solon Felix L. Laping
Felixberto E. Godoy, Jr. Richard G. Rin Judith P. Albor Ernie I. Alterdo Victor P. Francisco Elbern Mark S. Almoroto
Dhian Karlo E. Godoy Harry A. Araneta Adelfo c. Café Vicente S. Salas Leomar S. Sacon Lyndon B. Aque. Jr.
Melchor F. Macabenta, Jr. Danilo J. Nangcas Sofia J. Gonzaga Allan E. Bustillo Jose Roy S. De Lara Samuel A. Libre, Jr.
Isabelo V. Peñalosa Edmar S. Angon Alberto S. Ventula Grace M. Fajardo James Michael L. Lee Cristopher D. Tan
Clarita V. Reyes Eric S. Sulla Ronel O. Dela Cruz Danilo G. Jada-ong Rosela B. Elegin Reynaldo I. Diaz
Sanggunian Kabataan Representative Marianne Antonette S.
MacabentaRonalice S. Ramos Ain Patrick H. Ponte Chery Nette E. Bongosia Reynald B. Banua Paolo Dominic A. Rodriguez
*Average of four (4) members/household
Sources of data:
PSA - Philippine Statistics Authority CSSDO - City Social Services & Development Office
OCPDC-GIS - Office of the City Planning & Development Coordinator- Geographical Information System BC - Barangay Council
OCPDC-RSD- Office of the City Planning & Development Coordinator- Research & Statistics Division BCCAD - Barangay Cultural Communities Affairs Division
CAO - City Agriculturist's Office CEO - City Engineer's Office
Bus. Bureau - Business Bureau DCWD - Davao City Water District
CHO - City Health Office DLPC - Davao Light & Power Corporation
DepEd - Department of Education CENRO - City Environment and Natural Resources Office
Page 50

General Profile, Agdao District, Davao City, 2020
Development Indicators
I. Demography
Population Projection 2020, OCPDC
Population, PSA 2015 census
Estimated Number of Households*, 2015
Population, PSA 2010 Census
Population, PSA 2007 Census
Population, PSA 2000 Census
Geography
Land Area, (in has), OCPDC-GIS
Distance from City Hall to Brgy. Proper, (in kms.), OCPDC-GIS
Number of Puroks, OCPDC-RSD
Boundaries, OCPDC-GIS
North
South
East
West
Locational Characteristics
Rural/Urban Classifications
Land Use, (in has.), OCPDC-GIS
Institution
Major Commercial
Minor Commercial
High Density Residential
Light Industrial
Tourism Development
Parks & Recreation
Open Space
Total
Leon Garcia Sr. Rafael Castillo San Antonio Ubalde Wilfredo Aquino TOTAL
15,296 6,479 11,547 3,323 11,095 114,581
13,652 5,783 10,306 2,966 9,903 102,267
3,413 1,446 2,577 742 2,476 25,567
12,641 6,339 12,211 2,775 8,535 99,406
12,140 5,645 11,532 2,666 8,518 98,586
10,368 5,203 10,052 2,604 7,883 91,397
19.028 44.538 89.875 9.981 72.263 530.453
2.82 5.34 4.41 5.09 5.15
12 14 12 7 10 128
Agdao Proper Pampanga Pampanga Pampanga Lanang
Poblacion Ubalde V. Duterte Centro Agdao Proper
Davao Gulf Lapu-lapu Ubalde Centro San Antonio
T. Monteverde San Antonio W.Aquino San Antonio Bangoy
Coastal Inland Inland Inland Inland
Urban Urban Urban Urban Urban
- - 0.434 - 4.638 11.347
9.127 6.087 44.992 - 53.137 213.539
- - - - - 14.769
- 19.324 38.076 5.656 14.488 147.996
3.248 19.127 6.373 4.325 - 106.525
2.903 - - - - 21.795
- - - - - 0.372
3.750 - - - - 14.11
19.028 44.538 89.875 9.981 72.263 530.453
Page 51

General Profile, Agdao District, Davao City, 2020
Development Indicators
Soil Classification, CAO
Elevation (in has.), OCPDC-GIS
>200 m
Slope (in has.), OCPDC-GIS
Level to Nearly Level (0-3%)
II. Economic Services
Commercial & Industrial Establishments, Bus. Bureau,
2019
Micro
Number
Total Capitalization (in million pesos)
Declared No. of Employees
Small
Number
Total Capitalization (in million pesos)
Declared No. of Employees
Medium
Number
Total Capitalization (in million pesos)
Declared No. of Employees
Large
Number
Total Capitalization (in million pesos)
Declared No. of Employees
III. Social Services
No. of Health Centers, CHO 2019
Barangay Health Human Resources
No. of Barangay Health Workers
No. of Barangay Nutrition Scholars
Leon Garcia Sr. Rafael Castillo San Antonio Ubalde Wilfredo Aquino TOTAL
Cabantian & Faraon Clay Cabantian & Faraon Clay Cabantian & Faraon Clay Cabantian & Faraon Clay Cabantian & Faraon Clay
19.028 44.538 89.875 9.981 72.263 530.453
19.028 44.538 89.875 9.981 72.263 530.453
55 105 206 76 134 1,775
5,040,000.00 15,704,024.60 30,395,566.36 7,646,000.00 18,870,750.00 206,355,131.96
57 369 439 134 386 4,201
6 87 151 26 111 883
3,600,001.00 83,757,578.00 136,632,517.52 20,172,935.04 101,801,734.45 777,389,895.27
13 562 607 100 724 4,610
2 54 145 11 89 576
7,283,286.00 185,316,599.94 469,375,927.33 38,372,359.11 337,320,798.30 2,084,082,110.20
11 681 3,274 54 739 7,174
0 42 39 8 39 245
0.00 731,061,328.20 1,347,653,654.03 382,410,000.00 622,221,408.30 6,161,457,596.30
0 824 859 560 1002 6,249
1 1 1 1 1 11
5 4 3 7 4 63
4 2 2 1 2 26
Page 52

General Profile, Agdao District, Davao City, 2020
Development Indicators
Health Services, CHO 2019
% of Fully Immunized Children aged 11 months old
and below
Prevalence Rate of Severely Underweight Children
aged 0-71 months
School Facilities, Dep.Ed 2019
Total Number of Schools
Public Schools
Elementary
High School
Sr. High School
Private Schools
Elementary
Elementary/High School
High School
Sr. High School
Tertiary
Vocational School
Social Welfare, CSSDO 2019
Total Number of Day Care Centers
Center Based
Day Care Center
Home Based
Supervised Neighborhood play
IV. Environmental Management
Garbage Disposal Practices, BC, OCPDC-RSD
MRF, CENRO
V. Infrastructure and Utilities
Power, DLPC 2019
Number of Streetlights
Leon Garcia Sr. Rafael Castillo San Antonio Ubalde Wilfredo Aquino TOTAL
48.66 37.51 64.12 95.24 88.71
0.67 1.27 0.15 0.90 0.00
3 1 3 2 6 39
1 1 6
1 1
1 1
5
1 1 6
1 1
1 1 6
1 3
1 1 1 2 10
3 1 4 1 2 31
2 1 4 1 2 30
1 1
Collected Collected Collected Collected Collected
DLPC DLPC DLPC DLPC DLPC
178 105 196 172 251 1,989
Page 53

General Profile, Agdao District, Davao City, 2020
Development Indicators
Water System, DCWD, CEO, 2019
DCWD
VI. Local Government Administration
Membership of Barangay Council, BCCAD, 2017-2019
Barangay Captain
Barangay Kagawad (7)
Sanggunian Kabataan Representative
Leon Garcia Sr. Rafael Castillo San Antonio Ubalde Wilfredo Aquino TOTAL
DCWD DCWD DCWD DCWD DCWD
Hon. Lita C. Empis Hon.Richard B. Salas Hon.Eduardo I. Alterado Hon. Glicerio A. LeonorHon. Gregorio L. Obial,
Jr.
Tommy S. Rica Yolanda S. Masanguid Roger T. Galido Jaime B. Liquido Kenneth Renegado
Mauro R. Ignacio Agustin S. Catarun Jr. Bibiana C. Sator Jocelyn T. Aguilar Rebecca C. Sator
Ciriaco T. Jorolan, Jr. Rosalia R. Lacida Carlito T. Luayon Edgardo S. Moso Cristina O. Fabian
Joel B. Crisanto Nikki Luther L. Corong Roal A. Laurel Desiderio A. Ibarra Emelda A. Olivar
Arturo V. Uy Reneto S. Roble Nomerian S. Capuyan Jezly C. Peliño Jose P. Loreto
Alvin L. Vibora Deogracia M. Pasco Victor T. Librado Denever P. Bungabong Miguel B. Aquino
Gomburza T. Monacillo Henry Y. Haw Rizaldy C. Melgazo Nicolas S. Soriano Allan J. Lagria
Ariane Jane N. Sagusara Ella May L. DulinMary Trexie T.
VillafuerteAlwin L. Roble May Ann M. Omaña
*Average of four (4) members/household
Sources of data:
PSA - Philippine Statistics Authority CSSDO - City Social Services & Development Office
OCPDC-GIS - Office of the City Planning & Development Coordinator- Geographical Information System BC - Barangay Council
OCPDC-RSD- Office of the City Planning & Development Coordinator- Research & Statistics Division BCCAD - Barangay Cultural Communities Affairs Division
CAO - City Agriculturist's Office CEO - City Engineer's Office
Bus. Bureau - Business Bureau DCWD - Davao City Water District
CHO - City Health Office DLPC - Davao Light & Power Corporation
DepEd - Department of Education CENRO - City Environment and Natural Resources Office
Page 54

Page 55
Buhangin District
Angliongto Indangan
Acacia Mandug
Buhangin Proper Pampanga
Cabantian Sasa
Callawa Tigatto
Communal Waan
Hizon
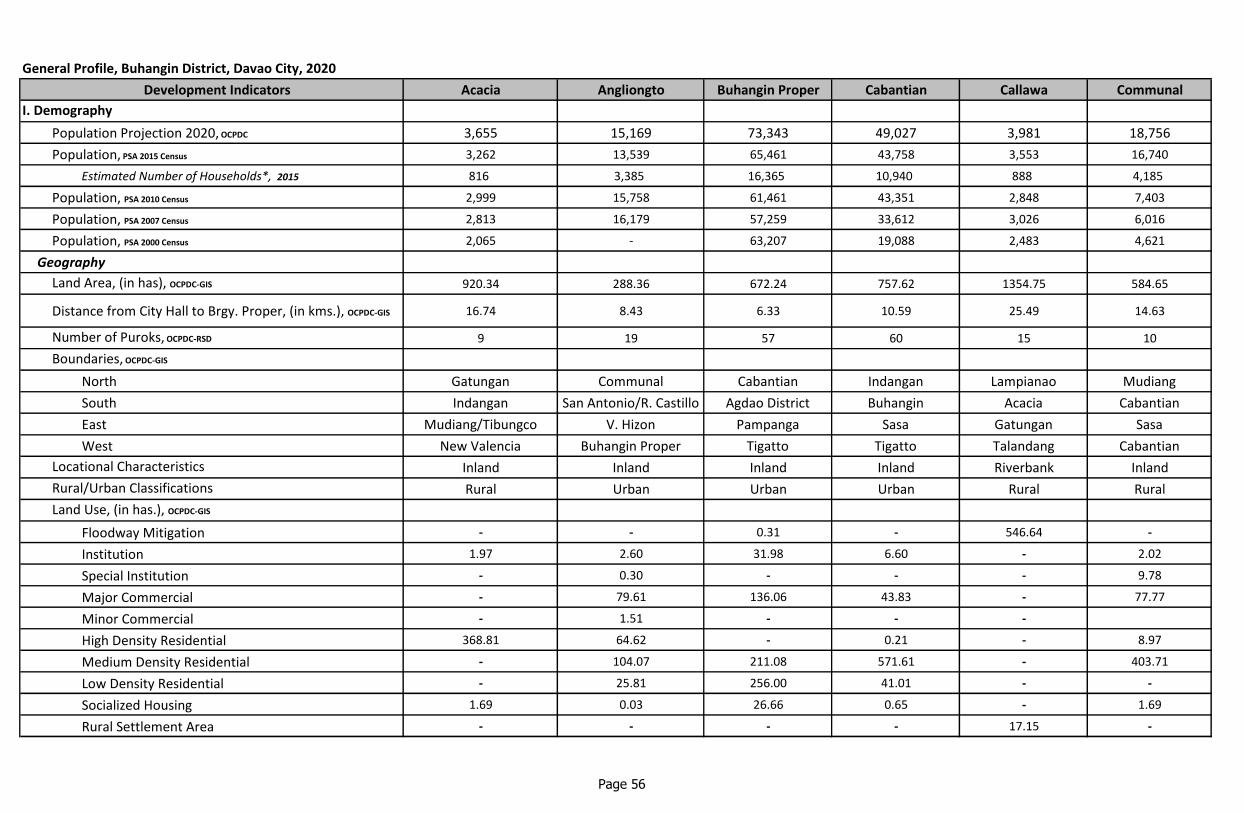
General Profile, Buhangin District, Davao City, 2020
Development Indicators Acacia Angliongto Buhangin Proper Cabantian Callawa Communal
I. Demography
Population Projection 2020, OCPDC 3,655 15,169 73,343 49,027 3,981 18,756
Population, PSA 2015 Census 3,262 13,539 65,461 43,758 3,553 16,740
Estimated Number of Households*, 2015 816 3,385 16,365 10,940 888 4,185
Population, PSA 2010 Census 2,999 15,758 61,461 43,351 2,848 7,403
Population, PSA 2007 Census 2,813 16,179 57,259 33,612 3,026 6,016
Population, PSA 2000 Census 2,065 - 63,207 19,088 2,483 4,621
Geography
Land Area, (in has), OCPDC-GIS 920.34 288.36 672.24 757.62 1354.75 584.65
Distance from City Hall to Brgy. Proper, (in kms.), OCPDC-GIS 16.74 8.43 6.33 10.59 25.49 14.63
Number of Puroks, OCPDC-RSD 9 19 57 60 15 10
Boundaries, OCPDC-GIS
North Gatungan Communal Cabantian Indangan Lampianao Mudiang
South Indangan San Antonio/R. Castillo Agdao District Buhangin Acacia Cabantian
East Mudiang/Tibungco V. Hizon Pampanga Sasa Gatungan Sasa
West New Valencia Buhangin Proper Tigatto Tigatto Talandang Cabantian
Locational Characteristics Inland Inland Inland Inland Riverbank Inland
Rural/Urban Classifications Rural Urban Urban Urban Rural Rural
Land Use, (in has.), OCPDC-GIS
Floodway Mitigation - - 0.31 - 546.64 -
Institution 1.97 2.60 31.98 6.60 - 2.02
Special Institution - 0.30 - - - 9.78
Major Commercial - 79.61 136.06 43.83 - 77.77
Minor Commercial - 1.51 - - -
High Density Residential 368.81 64.62 - 0.21 - 8.97
Medium Density Residential - 104.07 211.08 571.61 - 403.71
Low Density Residential - 25.81 256.00 41.01 - -
Socialized Housing 1.69 0.03 26.66 0.65 - 1.69
Rural Settlement Area - - - - 17.15 -
Page 56

General Profile, Buhangin District, Davao City, 2020
Development Indicators Acacia Angliongto Buhangin Proper Cabantian Callawa Communal
Heavy Industrial - - - - - -
Medium Industrial 1.10 - - - - -
Light Industrial - 5.06 - - - 38.07
Infrastructure/Utilities - 0.15 - 12.00 - 6.01
Prime Agricultural - - - - 0.06 -
Agricultural Non-Tillage 546.76 - - - 790.90 -
Planned Unit Development - - - 80.00 - -
Parks and Recreation - - - - - 24.46
Conservation - 1.45 - - - 3.32
Easement/Buffer - 0.67 - - - 1.62
Open Space - 2.50 1.22 1.72 - 7.24
Special Use - - 8.92 - - -
Marginal - - - - - -
Total 920.34 288.36 672.24 757.62 1,354.75 584.65
Soil Classification, CAO Cabantian & Faraon Clay Cabantian Clay Cabantian & Faraon Clay Cabantian & Faraon Clay Cabantian Clay Bolinao Clay
Elevation (in has.), OCPDC-GIS
>200 m 918.63 288.36 672.24 757.62 1,269.19 584.65
201 - 500 m 1.71 - - - 85.56 -
Total 920.34 288.36 672.24 757.62 1,354.75 584.65
Slope (in has.), OCPDC-GIS
Level to Nearly Level (0-3%) 5.69 254.75 244.68 58.79 791.14 0.00
Gently Sloping to Undulating Range (3-8%) 111.65 33.61 323.98 469.53 0.00 293.50
Undulating to Unrolling Range (8-8%) 787.33 0.00 103.58 229.30 316.40 291.15
Steep Range (30-50%) - - - - - -
Total 920.34 288.36 672.24 757.62 1,354.75 584.65
II. Economic Services
Commercial & Industrial Establishments, Bus. Bureau, 2019
Micro
Number 14 403 1,354 690 22 152
Total Capitalization (in million pesos) 2,040,000.00 54,410,800.00 180,683,061.00 83,757,397.00 2,244,500.00 15,946,280.00
Page 57

General Profile, Buhangin District, Davao City, 2020
Development Indicators Acacia Angliongto Buhangin Proper Cabantian Callawa Communal
Declared No. of Employees 21 1,109 2,490 1,329 85 221
Small
Number 8 220 535 238 1 53
Total Capitalization (in million pesos) 6,020,001.00 188,238,815.16 454,406,874.32 210,707,317.33 550,000.00 49,978,339.00
Declared No. of Employees 41 1,548 2,338 1,214 4 162
Medium
Number 0 139 282 76 0 39
Total Capitalization (in million pesos) 0.00 512,730,412.15 1,064,365,266.92 263,501,508.62 0.00 140,868,502.00
Declared No. of Employees 0 1,477 2,991 658 0 245
Large
Number 0 69 82 37 0 20
Total Capitalization (in million pesos) 0.00 4,279,159,931.23 30,832,391,864.64 469,796,680.60 0.00 545,740,513.70
Declared No. of Employees 0 3,285 3,408 636 0 1,160
III. Social Services
No. of Health Centers, CHO 2019 1 1 2 1 1 1
Barangay Health Human Resources
No. of Barangay Health Workers 2 1 5 3 5 5
No. of Barangay Nutrition Scholars 1 2 9 5 2 3
Health Services, CHO 2019
% of Fully Immunized Children aged 11 months old and
below85.24 47.93 61.84 61.24 95.67 74.63
Prevalence Rate of Severely Underweight Children aged 0-
71 months0.44 0.29 0.16 0.04 0.19 0.14
School Facilities, Dep.Ed 2019
Total Number of Schools 1 15 52 11 3 2
Public Schools
Elementary 1 1 5 2 1 1
High School 1 1 1 1
Page 58

General Profile, Buhangin District, Davao City, 2020
Development Indicators Acacia Angliongto Buhangin Proper Cabantian Callawa Communal
Sr. High School 1 1 1 1
Private Schools
Elementary 3 16 4 1
Elementary/High School 3 14 1
High School
Sr. High School 2 7 1
Tertiary 1 1
Vocational School 3 7 1
Social Welfare, CSSDO 2019
Total Number of Day Care Centers 2 3 25 7 5 5
Center Based
Day Care Center 1 1 23 7 3 3
Home Based
Supervised Neighborhood play 1 2 2 2 2
IV. Environmental Management
Garbage Disposal Practices, BC, OCPDC-RSD Collected Collected CollectedCollected /
Composit PitCollected Collected
MRF, CENRO ✓
V. Infrastructure and Utilities
Power, DLPC 2019 DLPC DLPC DLPC DLPC DLPC DLPC
Number of Streetlights 119 576 1,746 1,202 126 381
Water System, DCWD, CEO, 2019
DCWD DCWD DCWD DCWD DCWD
Level I, (no. of units) 1 18 4
Level II, (no. of units) 4 4
VI. Local Government Administration
Membership of Barangay Council, BCCAD, 2017-2019
Barangay Captain Hon. Marlito C. LaranHon. JJ Caesar C.
Bongcawil
Hon. Claudia C.
SalvadorHon. Nilo C. Cabiles
Hon. Renante G.
Gumahin, Sr. Hon. Mark Q. Galvez
Barangay Kagawad (7) Ricky H. Lauron Mario A. Bentulan James C. Salvador Richlyn N. Justol Nelda T. Sabijon Benjamin B. Gura
Page 59

General Profile, Buhangin District, Davao City, 2020
Development Indicators Acacia Angliongto Buhangin Proper Cabantian Callawa Communal
Jefry T. Ganoria Nestor B. Sepe Francisco V. Gamad Joselito D. Ongcay Rene D. Fuentes Yolly L. Lozano
Arnold B. Saraga Reynaldo C. Bernolo, Sr.Alexa Danielle c.
DayanghirangLamberto V. Cagatin Felipe A. Anding Jr. Teresita C. Cawaling
Elenita C. Labrador Leonora G. Dulla Gladdys A. Mainit Arnold E. Morado Maridol M. Gumahin Jason A. Cayunda
Rosamelba B. Villanueva Rodrigo B. Dialogo Vicente Y. Longakit, Sr. Nestor V. Cangmaong Ariel G. Lacida Lanito S. Soliva
Rachelle L. Ganoria Romeo S. Bayaton Lowel J. Tatad Juvy A. Vidamo Mark Jorn M. CarreonMary Grace M.
Bernardo
Rodolfo J. Arañez Erlinda I. Silvosa Daniel B. Gatchalian Rodrigo T. Regidor Noel D. DagmilGregorio D.
Dacaldacal
Sanggunian Kabataan Representative Raymart M. Introso Grace May A. AmigoChristopher P.
Pastoral
Katherine Faye A.
GadorLlyod N. Albarracin Harhby I. Monte
*Average of four (4) members/household
Sources of data:
PSA - Philippine Statistics Authority CSSDO - City Social Services & Development Office
OCPDC-GIS - Office of the City Planning & Development Coordinator- Geographical Information System BC - Barangay Council
OCPDC-RSD- Office of the City Planning & Development Coordinator- Research & Statistics Division BCCAD - Barangay Cultural Communities Affairs Division
CAO - City Agriculturist's Office CEO - City Engineer's Office
Bus. Bureau - Business Bureau DCWD - Davao City Water District
CHO - City Health Office DLPC - Davao Light & Power Corporation
DepEd - Department of Education CENRO - City Environment and Natural Resources Office
Page 60

General Profile, Buhangin District, Davao City, 2020
Development Indicators
I. Demography
Population Projection 2020, OCPDC
Population, PSA 2015 Census
Estimated Number of Households*, 2015
Population, PSA 2010 Census
Population, PSA 2007 Census
Population, PSA 2000 Census
Geography
Land Area, (in has), OCPDC-GIS
Distance from City Hall to Brgy. Proper, (in kms.), OCPDC-GIS
Number of Puroks, OCPDC-RSD
Boundaries, OCPDC-GIS
North
South
East
West
Locational Characteristics
Rural/Urban Classifications
Land Use, (in has.), OCPDC-GIS
Floodway Mitigation
Institution
Special Institution
Major Commercial
Minor Commercial
High Density Residential
Medium Density Residential
Low Density Residential
Socialized Housing
Rural Settlement Area
Hizon Indangan Mandug Pampanga Sasa Tigattto
12,621 16,657 15,231 16,113 58,694 40,768
11,265 14,867 13,594 14,381 52,386 36,387
2,816 3,717 3,399 3,595 13,097 9,097
11,883 9,133 13,234 14,480 56,697 14,533
12,966 6,269 12,362 13,646 52,432 13,631
- 3,264 12,004 32,715 40,640 11,053
218.66 1474.13 969.19 117.51 767.66 761.31
8.44 14.52 14.06 8.44 9.76 10.46
12 15 28 14 76 16
Pampanga Acacia Acacia Sasa Panacan Mandug
Lapu-Lapu Cabantian Tigatto Lapu-lapu Pampanga Maa
Davao Gulf Panacan Indangan Davao Gulf Davao Gulf Buhanigin Proper/Cabantian
Angliongto Mandug New Carmen Buhangin Communal Waan
Coastal Inland Riverbank Coastal Coastal Riverbank
Urban Rural Rural Rural Urban Urban
- - 212.10 - - 294.53
0.95 1.29 4.81 3.08 13.12 1.02
- - - - - -
34.82 24.46 - 25.12 55.31 1.79
1.17 - - - 0.01 -
12.28 380.15 - - 68.27 127.12
21.92 473.54 122.70 61.80 192.91 66.00
113.38 - 17.30 0.07 0.01 114.69
- 33.48 - - 0.11 -
- - - - - -
Page 61

General Profile, Buhangin District, Davao City, 2020
Development Indicators
Heavy Industrial
Medium Industrial
Light Industrial
Infrastructure/Utilities
Prime Agricultural
Agricultural Non-Tillage
Planned Unit Development
Parks and Recreation
Conservation
Easement/Buffer
Open Space
Special Use
Marginal
Total
Soil Classification, CAO
Elevation (in has.), OCPDC-GIS
>200 m
201 - 500 m
Total
Slope (in has.), OCPDC-GIS
Level to Nearly Level (0-3%)
Gently Sloping to Undulating Range (3-8%)
Undulating to Unrolling Range (8-8%)
Steep Range (30-50%)
Total
II. Economic Services
Commercial & Industrial Establishments, Bus. Bureau, 2019
Micro
Number
Total Capitalization (in million pesos)
Hizon Indangan Mandug Pampanga Sasa Tigattto
- - - 22.12 51.29 -
- - - - -
4.35 64.51 - 160.01 -
- 12.25 - 0.49 192.83 8.40
- - 111.76 - - -
- 394.11 299.63 - - 56.71
23.39 85.29 200.90 - - 90.69
- 0.41 - - - -
- - - - 6.52 -
0.01 3.20 - 0.61 13.56 -
6.41 1.44 - 4.23 13.72 0.37
- - - - 0.00 -
- - - - - -
218.66 1,474.13 969.19 117.51 767.66 761.31
Cabantian Clay Cabantian Clay Cabantian /Faraon Clay Cabantian /Faraon Clay Cabantian Clay Cabantian Clay
218.66 1,460.18 969.19 117.51 767.66 761.31
- 13.95 - - - -
218.66 1,474.13 969.19 117.51 767.66 761.31
218.66 95.30 746.08 113.16 476.82 525.96
0.00 751.43 82.39 4.35 290.84 190.89
0.00 494.96 0.00 - - 44.46
- - 34.21 - - -
218.66 1,474.13 969.19 117.51 767.66 761.31
208 206 104 187 566 205
26,011,640.00 22,583,500.01 11,795,518.62 20,120,354.88 67,040,377.14 23,065,400.00
Page 62

General Profile, Buhangin District, Davao City, 2020
Development Indicators
Declared No. of Employees
Small
Number
Total Capitalization (in million pesos)
Declared No. of Employees
Medium
Number
Total Capitalization (in million pesos)
Declared No. of Employees
Large
Number
Total Capitalization (in million pesos)
Declared No. of Employees
III. Social Services
No. of Health Centers, CHO 2019
Barangay Health Human Resources
No. of Barangay Health Workers
No. of Barangay Nutrition Scholars
Health Services, CHO 2019
% of Fully Immunized Children aged 11 months old and
below
Prevalence Rate of Severely Underweight Children aged 0-
71 months
School Facilities, Dep.Ed 2019
Total Number of Schools
Public Schools
Elementary
High School
Hizon Indangan Mandug Pampanga Sasa Tigattto
480 321 261 406 1,591 348
127 65 24 70 260 53
115,526,616.00 55,374,149.67 20,748,861.00 64,626,004.00 238,288,954.22 42,933,012.75
796 298 63 317 1,528 166
67 17 4 61 180 12
256,457,602.76 62,599,555.00 10,700,001.00 258,813,188.00 649,857,050.20 38,958,000.08
658 78 22 944 1,479 118
27 6 2 52 123 10
634,450,613.84 137,344,900.00 20,750,000.00 3,393,888,413.75 43,051,646,557.72 117,572,501.00
426 201 6 1,540 3,407 138
1 1 1 4 1 1
5 6 6 4 22 8
2 2 3 4 13 5
89.35 90.27 92.22 80.73 71.20 70.85
0.00 0.74 1.02 0.27 0.72 0.63
4 5 9 4 18 5
1 1 4 1 4 1
1 1 1
Page 63

General Profile, Buhangin District, Davao City, 2020
Development Indicators
Sr. High School
Private Schools
Elementary
Elementary/High School
High School
Sr. High School
Tertiary
Vocational School
Social Welfare, CSSDO 2019
Total Number of Day Care Centers
Center Based
Day Care Center
Home Based
Supervised Neighborhood play
IV. Environmental Management
Garbage Disposal Practices, BC, OCPDC-RSD
MRF, CENRO
V. Infrastructure and Utilities
Power, DLPC 2019
Number of Streetlights
Water System, DCWD, CEO, 2019
DCWD
Level I, (no. of units)
Level II, (no. of units)
VI. Local Government Administration
Membership of Barangay Council, BCCAD, 2017-2019
Barangay Captain
Barangay Kagawad (7)
Hizon Indangan Mandug Pampanga Sasa Tigattto
1 1 1
2 1 2 2 3 1
1 1 2
1
1 2
2
1 1 4
2 2 4 4 22 6
2 1 4 4 18 6
1 4
Collected / Composit
PitCollected Collected Collected Collected Collected
✓
DLPC DLPC DLPC DLPC DLPC DLPC
386 249 359 974 1,087 499
DCWD DCWD DCWD
6 11 4
2 4 4
Hon. Erico R. TaliliHon. Armando C.
AbapoHon. Rey V. Ototan
Hon. Constancio S.
TiongcoHon. Jerry L. Licarte Hon. Lito B. Lapitan
Eufracio C. Uy Eduardo G. Balaga Alex Richard E. Dajao Aida R. Balaman Juanito E. Flores, Jr. Larry N. Lapitan
Page 64

General Profile, Buhangin District, Davao City, 2020
Development Indicators
Sanggunian Kabataan Representative
Bus. Bureau - Business Bureau
CHO - City Health Office
DepEd - Department of Education
Hizon Indangan Mandug Pampanga Sasa Tigattto
Cristita B. Santander Gina A. Tulo Elmer V. Ototan Lydia D. Navarro Leopoldo L. Alce Mardonio E. Amarillo
Delfin R. Compoc Josephine B. Piquero Maria Lutz A. Mongas Yvonne P. Sampaga Michelle P. Cabreros Rolando C. Bicong
Arseca A. Marilao Oscar P. Sedigo Richard Jim C. Navales Loidaliza C. Aringoy Noel A. Aban Leopoldo C. Baguio
Gilbert R. Paulin Edmon A. Albaran Eduardo III C. Yaranon Willard Z. ClaroMaria Celyn N.
PadPadJovanie L. Podador
Mark Martin V.
GentapanPeregrina G. Sombilon Jolly K. Halilio Rodilla C. Uba-ob Manolito E. Malones Raul C. Bicong
Dexter I. Yambao Virgiliol P. Gravador Nil Dwight B. Mitra Louie P. Gonzales Lowel L. Alunday Anthony P. Tecson
Apple A. Manginlaud Hanah D. Darama Jane Kyla R. Quiamco Welce John C. Ramos Laira S. Lapitan
*Average of four (4) members/household
Sources of data:
PSA - Philippine Statistics Authority CSSDO - City Social Services & Development Office
OCPDC-GIS - Office of the City Planning & Development Coordinator- Geographical Information System BC - Barangay Council
OCPDC-RSD- Office of the City Planning & Development Coordinator- Research & Statistics Division BCCAD - Barangay Cultural Communities Affairs Division
CAO - City Agriculturist's Office CEO - City Engineer's Office
Bus. Bureau - Business Bureau DCWD - Davao City Water District
CHO - City Health Office DLPC - Davao Light & Power Corporation
DepEd - Department of Education CENRO - City Environment and Natural Resources Office
Page 65

General Profile, Buhangin District, Davao City, 2020
Development Indicators
I. Demography
Population Projection 2020, OCPDC
Population, PSA 2015 Census
Estimated Number of Households*, 2015
Population, PSA 2010 Census
Population, PSA 2007 Census
Population, PSA 2000 Census
Geography
Land Area, (in has), OCPDC-GIS
Distance from City Hall to Brgy. Proper, (in kms.), OCPDC-GIS
Number of Puroks, OCPDC-RSD
Boundaries, OCPDC-GIS
North
South
East
West
Locational Characteristics
Rural/Urban Classifications
Land Use, (in has.), OCPDC-GIS
Floodway Mitigation
Institution
Special Institution
Major Commercial
Minor Commercial
High Density Residential
Medium Density Residential
Low Density Residential
Socialized Housing
Rural Settlement Area
Waan Total
4,398 328,413
3,925 293,118
981 73,280
3,179 256,959
2,654 232,865
2,379 193,519
436.97 9323.39
13.26
14 345
Mandug -
Maa -
Tigatto -
Magtuod -
Riverbank -
Rural
166.11 1,219.68
4.93 74.36
- 10.08
1.50 480.27
- 2.68
- 1,030.42
2,229.34
59.84 628.09
- 64.31
- 17.15
Page 66

General Profile, Buhangin District, Davao City, 2020
Development Indicators
Heavy Industrial
Medium Industrial
Light Industrial
Infrastructure/Utilities
Prime Agricultural
Agricultural Non-Tillage
Planned Unit Development
Parks and Recreation
Conservation
Easement/Buffer
Open Space
Special Use
Marginal
Total
Soil Classification, CAO
Elevation (in has.), OCPDC-GIS
>200 m
201 - 500 m
Total
Slope (in has.), OCPDC-GIS
Level to Nearly Level (0-3%)
Gently Sloping to Undulating Range (3-8%)
Undulating to Unrolling Range (8-8%)
Steep Range (30-50%)
Total
II. Economic Services
Commercial & Industrial Establishments, Bus. Bureau, 2019
Micro
Number
Total Capitalization (in million pesos)
Waan Total
- 73.41
- 1.10
- 271.99
3.91 236.04
- 111.82
183.28 2,271.39
5.41 485.66
- 24.87
- 11.28
- 19.67
0.13 38.98
0.00 8.93
11.87 11.87
436.97 9,323.38
Cabantian Clay -
436.97 9,222.18
- 101.21
436.97 9,323.39
278.11 3,809.13
- 2,552.16
- 2,267.19
- 34.21
436.97 9,323.39
25 4,136
3,730,000.00 513,428,828.65
Page 67

General Profile, Buhangin District, Davao City, 2020
Development Indicators
Declared No. of Employees
Small
Number
Total Capitalization (in million pesos)
Declared No. of Employees
Medium
Number
Total Capitalization (in million pesos)
Declared No. of Employees
Large
Number
Total Capitalization (in million pesos)
Declared No. of Employees
III. Social Services
No. of Health Centers, CHO 2019
Barangay Health Human Resources
No. of Barangay Health Workers
No. of Barangay Nutrition Scholars
Health Services, CHO 2019
% of Fully Immunized Children aged 11 months old and
below
Prevalence Rate of Severely Underweight Children aged 0-
71 months
School Facilities, Dep.Ed 2019
Total Number of Schools
Public Schools
Elementary
High School
Waan Total
51 8,713
2 1,656
1,305,000.00 1,448,703,944.45
4 8,479
3 880
8,000,000.00 3,266,851,086.73
21 8,691
1 429
20,264,667.86 83,503,006,644.34
24 14,231
1 17
9 81
1 52
84.34
1.82
3 132
1 24
1 8
Page 68

General Profile, Buhangin District, Davao City, 2020
Development Indicators
Sr. High School
Private Schools
Elementary
Elementary/High School
High School
Sr. High School
Tertiary
Vocational School
Social Welfare, CSSDO 2019
Total Number of Day Care Centers
Center Based
Day Care Center
Home Based
Supervised Neighborhood play
IV. Environmental Management
Garbage Disposal Practices, BC, OCPDC-RSD
MRF, CENRO
V. Infrastructure and Utilities
Power, DLPC 2019
Number of Streetlights
Water System, DCWD, CEO, 2019
DCWD
Level I, (no. of units)
Level II, (no. of units)
VI. Local Government Administration
Membership of Barangay Council, BCCAD, 2017-2019
Barangay Captain
Barangay Kagawad (7)
Waan Total
1 8
35
22
1
13
4
17
3 90
3 76
14
Collected
DLPC
94 7,798
10 54
4 22
Hon. Jaynor Nicolas
Macadawan
Abdullah B. Tarbang
Page 69
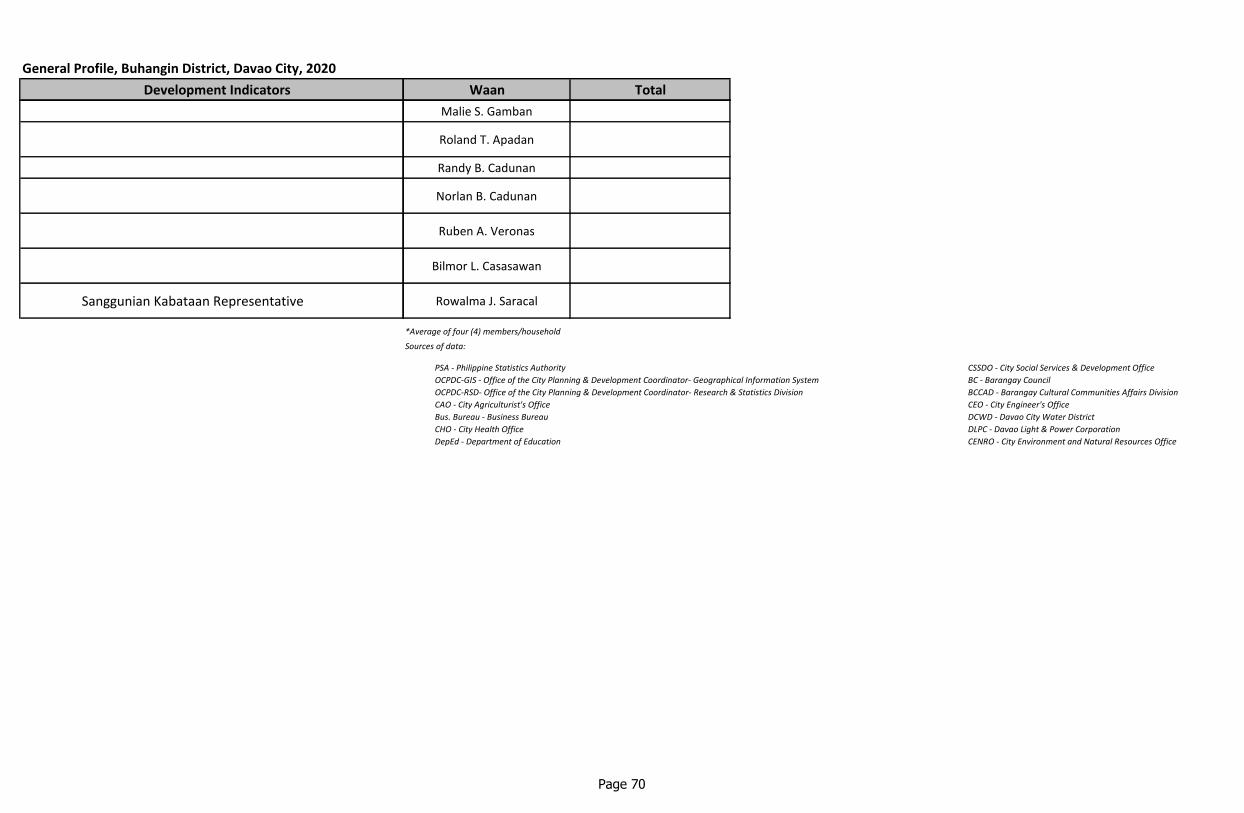
General Profile, Buhangin District, Davao City, 2020
Development Indicators
Sanggunian Kabataan Representative
Bus. Bureau - Business Bureau
CHO - City Health Office
DepEd - Department of Education
Waan Total
Malie S. Gamban
Roland T. Apadan
Randy B. Cadunan
Norlan B. Cadunan
Ruben A. Veronas
Bilmor L. Casasawan
Rowalma J. Saracal
*Average of four (4) members/household
Sources of data:
PSA - Philippine Statistics Authority CSSDO - City Social Services & Development Office
OCPDC-GIS - Office of the City Planning & Development Coordinator- Geographical Information System BC - Barangay Council
OCPDC-RSD- Office of the City Planning & Development Coordinator- Research & Statistics Division BCCAD - Barangay Cultural Communities Affairs Division
CAO - City Agriculturist's Office CEO - City Engineer's Office
Bus. Bureau - Business Bureau DCWD - Davao City Water District
CHO - City Health Office DLPC - Davao Light & Power Corporation
DepEd - Department of Education CENRO - City Environment and Natural Resources Office
Page 70
Page 71
Bunawan District
Bunawan Proper Mudiang
Gatungan Panacan
Ilang San Isidro
Lasang Tibungco
Mahayag

General Profile, Bunawan District, Davao City, 2020
Development Indicators Alejandro Navarro (Lasang) Bunawan Poblacion Gatungan Ilang Mahayag
I. Demography
Population Projection 2020, OCPDC 11,454 26,324 1,333 27,951 7,066
Population, PSA 2015 census 10,223 23,495 1,190 24,947 6,307
Estimated Number of Households*, 2015 2,556 5,874 298 6,237 1,577
Population, PSA 2010 Census 8,854 20,950 981 18,380 4,914
Population, PSA 2007 Census 8,770 20,545 895 15,592 4,509
Population, PSA 2000 Census 7,462 18,204 721 9,775 1,803
Geography
Land Area, (in has), OCPDC-GIS 626.581 769.183 887.01 570.598 803.808
Distance from City Hall to Brgy. Proper, (in kms.), OCPDC-
GIS27.10 22.36 26.17 15.90 23.12
Number of Puroks, OCPDC-RSD 11 31 6 17 13
Boundaries, OCPDC-GIS
North Davao del Norte San Isidro/Lasang Davao Del Norte Tibungco San Isidro
South Bunawan/Davao Gulf Mahayag Mahayag Panacan Tibungco
East Davao Gulf Davao Gulf Mahayag/Tibungco Davao Gulf Bunawan
West San Isidro San Isidro/Mahayag callawa Mudiang Gatungan
Locational Characteristics Coastal/Riverbank Coastal Inland Coastal Inland
Rural/Urban Classifications Urban Urban Rural Urban Urban
Land Use, (in has.), OCPDC-GIS
Institution 3.961 6.566 0.603 2.759 6.001
Special Institution - - - - -
Major Commercial 12.120 61.360 - - 5.640
Minor Commercial 3.483 11.870 - - -
High Density Residential - 46.895 12.630 136.025 -
Medium Density Residential 62.764 63.090 - - 0.018
Low Density Residential 109.991 40.117 - - -
Socialized Housing 24.350 25.801 0.232 9.050 24.772
Heavy Industrial 344.890 246.716 - - 9.987
Medium Industrial 27.345 185.463 18.968 320.449 434.287
Light Industrial - - - - -
Page 72

General Profile, Bunawan District, Davao City, 2020
Development Indicators Alejandro Navarro (Lasang) Bunawan Poblacion Gatungan Ilang Mahayag
Agro-Industrial - - 202.520 - 260.898
Infrastructure/Utilities 9.755 11.947 3.988 19.661 40.636
Prime Agricultural - - 23.021 - -
Agricultural Non-Tillage - - 616.856 47.420 15.313
Planned Unit Development - - - 8.683 -
Parks and Recreation - 15.556 - - -
Easement/Buffer 6.381 5.177 - 5.861 -
Open Space 21.541 48.625 8.189 20.690 6.256
Special Use - - - - -
Total 626.581 769.183 887.007 570.598 803.808
Soil Classification, CAO San Miguel Silty Clay Loam San Miguel Silty Clay Loam Faraon Clay Faraon Clay Faraon Clay
Elevation (in has.), OCPDC-GIS
>200 m 626.581 769.183 887.007 570.598 803.808
Slope (in has.), OCPDC-GIS
Level to Nearly Level (0-3%) 472.066 470.745 - 209.040 2.389
Gently Sloping to Undulating Range (3-8%) 154.515 298.438 1.541 148.149 667.324
Undulating to Unrolling Range (8-8%) - - 646.255 213.409 134.094
Rolling to Moderately Steep Range (18-30%) - - 239.211 - -
Total 626.581 769.183 887.007 570.598 803.808
II. Economic Services
Commercial & Industrial Establishments, Bus. Bureau, 2019
Micro
Number 69 148 1 96 20
Total Capitalization (in million pesos) 8,018,258.00 17,207,500.00 50,000.00 11,384,600.00 1,552,500.00
Declared No. of Employees 115 343 1 315 31
Small
Number 19 55 0 36 17
Total Capitalization (in million pesos) 15,426,001.00 44,962,320.50 0.00 33,565,858.40 15,462,500.00
Declared No. of Employees 76 230 0 122 82
Page 73

General Profile, Bunawan District, Davao City, 2020
Development Indicators Alejandro Navarro (Lasang) Bunawan Poblacion Gatungan Ilang Mahayag
Medium
Number 17 31 0 20 6
Total Capitalization (in million pesos) 58,781,421 119,093,323.00 0.00 75,301,565.76 22,534,734.00
Declared No. of Employees 207 328 0 444 43
Large
Number 21 24 0 27 7
Total Capitalization (in million pesos) 354,683,600.00 1,602,217,682.00 0.00 10,776,614,223.27 182,111,247.55
Declared No. of Employees 391 1,085 0 1,234 409
III. Social Services
No. of Health Centers, CHO 2019 1 1 1 1 1
Barangay Health Human Resources
No. of Barangay Health Workers 4 18 2 11 1
No. of Barangay Nutrition Scholars 2 5 1 4 1
Health Services, CHO 2019
% of Fully Immunized Children aged 11 months old and
below 66.07 68.20 85.33 57.51 74.19
Prevalence Rate of Severely Underweight Children
aged 0-71 months 0.27 0.23 1.10 0.34 0.00
School Facilities, Dep.Ed 2019
Total Number of Schools 8 11 1 4 3
Public Schools
Elementary 3 4 1 1 1
High School 1 1 1
Sr. High School 1 1 1
Private Schools
Elementary 1 1 2
Elementary/High School 2
Sr. High School 2 1
Tertiary 1
Vocational School 1
Page 74

General Profile, Bunawan District, Davao City, 2020
Development Indicators Alejandro Navarro (Lasang) Bunawan Poblacion Gatungan Ilang Mahayag
Social Welfare, CSSDO 2019
Total Number of Day Care Centers 5 8 1 9 4
Center Based
Day Care Center 4 7 1 5 4
Home Based
Supervised Neighborhood play 1 4
PTOP 1
IV. Environmental Management
Garbage Disposal Practices, BC, OCPDC-RSD Collected Collected Burying Collected Collected / Composit Pit
MRF, CENRO ✓ ✓
V. Infrastructure and Utilities
Power, DLPC 2019 DLPC DLPC DLPC DLPC DLPC
Number of Streetlights 233 415 114 278 95
Water System, DCWD, CEO, 2019
DCWD/BAWASA BAWASA
Level I, (no. of units) 2 5 5 38 2
Level II, (no. of units) 4 3 2 5
VI. Local Government Administration
Membership of Barangay Council, BCCAD, 2017-2019
Barangay Captain Hon. Allan P. Simo-ag Hon. Ronnie O. Odeña Hon. Anabelle M. Mangitngit Hon. Amado T. Babao Hon. Eufemia V. Baquirel
Barangay Kagawad (7) Rey C. Joven Kristofer D. Gomez Herky C. Abad Alvin G. Besinan Jerry L. Rebusa
Ronel P. Simo-ag Dario C. Bantan Glenda P. Lascuña Lito d. Padilla Alibaba T. Dela torre
Cirilo E. Labastida Eusebio M. Lanos Abundio A. Cenita Anita T. Diesta Jeovanni B. Labriga
Beatriz P. Camara Ricardo I. Abregana Anacleto C. Luyahan Godofredo T. Babao Joseph M. Sarile
Ramil B. LibadisosRoque Bernardino III V.
BosqueFrancisco M. Banate Walter R. Hugo Normalita N. Fortones
Page 75

General Profile, Bunawan District, Davao City, 2020
Development Indicators Alejandro Navarro (Lasang) Bunawan Poblacion Gatungan Ilang Mahayag
Ruben G. Albano Sandy V. Baquirel Dominador C. Lapiz Magdalena W. Dicang William T. Ruiz
Jay T. Pagay Gilberto R. Giray, Jr. Reynante T. Libre Susana S. Tulabing Calvin B. Divinagracia
Sanggunian Kabataan RepresentativeWilliam G. Ganzon, Jr. Sanny Cris A. Saucejo Raymond R. Montibon Tesalonica N. Adlaon Benjie P. Sugui
*Average of four (4) members/household
Sources of data:
PSA - Philippine Statistics Authority CSSDO - City Social Services & Development Office
OCPDC-GIS - Office of the City Planning & Development Coordinator- Geographical Information System BC - Barangay Council
OCPDC-RSD- Office of the City Planning & Development Coordinator- Research & Statistics Division BCCAD - Barangay Cultural Communities Affairs Division
CAO - City Agriculturist's Office CEO - City Engineer's Office
Bus. Bureau - Business Bureau DCWD - Davao City Water District
CHO - City Health Office DLPC - Davao Light & Power Corporation
DepEd - Department of Education CENRO - City Environment and Natural Resources Office
Page 76
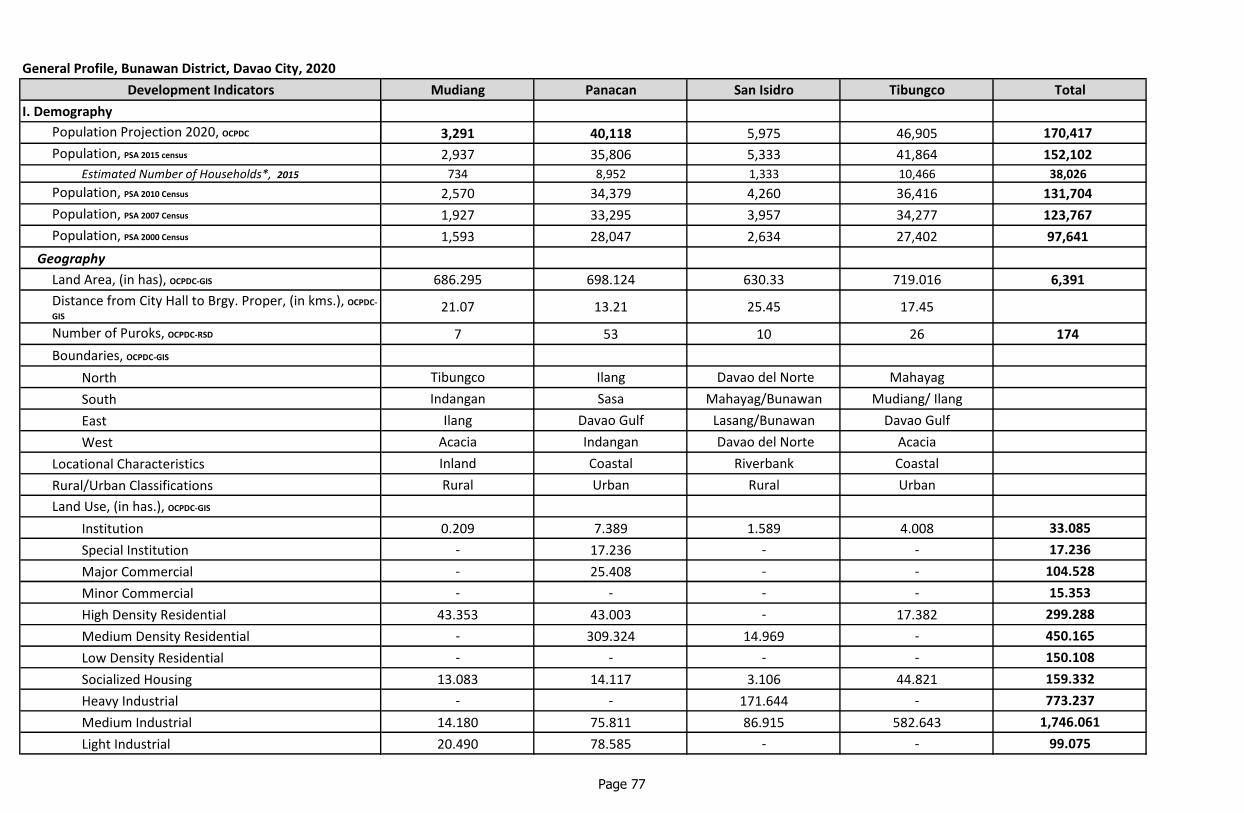
General Profile, Bunawan District, Davao City, 2020
Development Indicators
I. Demography
Population Projection 2020, OCPDC
Population, PSA 2015 census
Estimated Number of Households*, 2015
Population, PSA 2010 Census
Population, PSA 2007 Census
Population, PSA 2000 Census
Geography
Land Area, (in has), OCPDC-GIS
Distance from City Hall to Brgy. Proper, (in kms.), OCPDC-
GIS
Number of Puroks, OCPDC-RSD
Boundaries, OCPDC-GIS
North
South
East
West
Locational Characteristics
Rural/Urban Classifications
Land Use, (in has.), OCPDC-GIS
Institution
Special Institution
Major Commercial
Minor Commercial
High Density Residential
Medium Density Residential
Low Density Residential
Socialized Housing
Heavy Industrial
Medium Industrial
Light Industrial
Mudiang Panacan San Isidro Tibungco Total
3,291 40,118 5,975 46,905 170,417
2,937 35,806 5,333 41,864 152,102
734 8,952 1,333 10,466 38,026
2,570 34,379 4,260 36,416 131,704
1,927 33,295 3,957 34,277 123,767
1,593 28,047 2,634 27,402 97,641
686.295 698.124 630.33 719.016 6,391
21.07 13.21 25.45 17.45
7 53 10 26 174
Tibungco Ilang Davao del Norte Mahayag
Indangan Sasa Mahayag/Bunawan Mudiang/ Ilang
Ilang Davao Gulf Lasang/Bunawan Davao Gulf
Acacia Indangan Davao del Norte Acacia
Inland Coastal Riverbank Coastal
Rural Urban Rural Urban
0.209 7.389 1.589 4.008 33.085
- 17.236 - - 17.236
- 25.408 - - 104.528
- - - - 15.353
43.353 43.003 - 17.382 299.288
- 309.324 14.969 - 450.165
- - - - 150.108
13.083 14.117 3.106 44.821 159.332
- - 171.644 - 773.237
14.180 75.811 86.915 582.643 1,746.061
20.490 78.585 - - 99.075
Page 77

General Profile, Bunawan District, Davao City, 2020
Development Indicators
Agro-Industrial
Infrastructure/Utilities
Prime Agricultural
Agricultural Non-Tillage
Planned Unit Development
Parks and Recreation
Easement/Buffer
Open Space
Special Use
Total
Soil Classification, CAO
Elevation (in has.), OCPDC-GIS
>200 m
Slope (in has.), OCPDC-GIS
Level to Nearly Level (0-3%)
Gently Sloping to Undulating Range (3-8%)
Undulating to Unrolling Range (8-8%)
Rolling to Moderately Steep Range (18-30%)
Total
II. Economic Services
Commercial & Industrial Establishments, Bus. Bureau, 2019
Micro
Number
Total Capitalization (in million pesos)
Declared No. of Employees
Small
Number
Total Capitalization (in million pesos)
Declared No. of Employees
Mudiang Panacan San Isidro Tibungco Total
- - - - 463.418
16.162 34.706 22.652 22.901 182.408
- - - - 23.021
577.042 5.519 306.217 36.213 1,604.580
- 40.687 - - 49.370
- 0.784 - - 16.340
1.774 4.784 - 0.404 24.381
0.002 29.982 23.241 8.947 167.473
- 10.789 - 1.697 12.486
686.295 698.124 630.333 719.016 6,390.945
Faraon Clay Faraon Clay Faraon Clay Faraon Clay
686.295 698.124 630.333 719.016 6,390.945
- 213.951 0.119 49.834 1,418.145
- 337.106 569.046 411.512 2,587.632
686.295 147.067 61.168 257.670 2,145.958
- - - - 239.211
686.295 698.124 630.333 719.016 6,390.945
9 389 5 303 1,040
780,000.00 46,864,400.00 562,000.00 32,674,900.00 119,094,158.00
11 1,042 3 1,967 3,828
1 155 4 94 381
986,257.00 137,488,539.95 3,700,000.00 83,220,808.00 334,812,284.85
7 705 33 571 1,826
Page 78
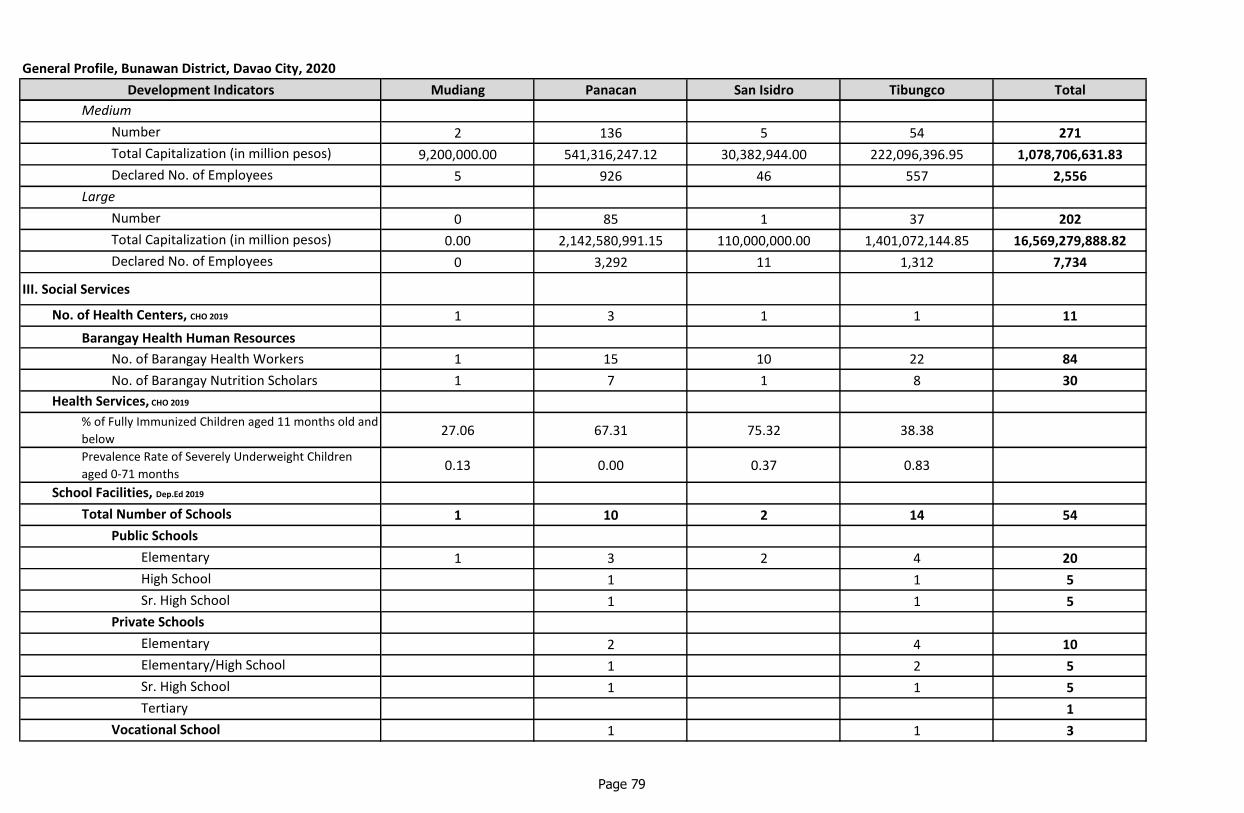
General Profile, Bunawan District, Davao City, 2020
Development Indicators
Medium
Number
Total Capitalization (in million pesos)
Declared No. of Employees
Large
Number
Total Capitalization (in million pesos)
Declared No. of Employees
III. Social Services
No. of Health Centers, CHO 2019
Barangay Health Human Resources
No. of Barangay Health Workers
No. of Barangay Nutrition Scholars
Health Services, CHO 2019
% of Fully Immunized Children aged 11 months old and
below
Prevalence Rate of Severely Underweight Children
aged 0-71 months
School Facilities, Dep.Ed 2019
Total Number of Schools
Public Schools
Elementary
High School
Sr. High School
Private Schools
Elementary
Elementary/High School
Sr. High School
Tertiary
Vocational School
Mudiang Panacan San Isidro Tibungco Total
2 136 5 54 271
9,200,000.00 541,316,247.12 30,382,944.00 222,096,396.95 1,078,706,631.83
5 926 46 557 2,556
0 85 1 37 202
0.00 2,142,580,991.15 110,000,000.00 1,401,072,144.85 16,569,279,888.82
0 3,292 11 1,312 7,734
1 3 1 1 11
1 15 10 22 84
1 7 1 8 30
27.06 67.31 75.32 38.38
0.13 0.00 0.37 0.83
1 10 2 14 54
1 3 2 4 20
1 1 5
1 1 5
2 4 10
1 2 5
1 1 5
1
1 1 3
Page 79

General Profile, Bunawan District, Davao City, 2020
Development Indicators
Social Welfare, CSSDO 2019
Total Number of Day Care Centers
Center Based
Day Care Center
Home Based
Supervised Neighborhood play
PTOP
IV. Environmental Management
Garbage Disposal Practices, BC, OCPDC-RSD
MRF, CENRO
V. Infrastructure and Utilities
Power, DLPC 2019
Number of Streetlights
Water System, DCWD, CEO, 2019
DCWD/BAWASA
Level I, (no. of units)
Level II, (no. of units)
VI. Local Government Administration
Membership of Barangay Council, BCCAD, 2017-2019
Barangay Captain
Barangay Kagawad (7)
Mudiang Panacan San Isidro Tibungco Total
1 16 4 10 58
1 14 4 9 49
2 1 8
1
Burying Collected Burying Collected
DLPC DLPC DLPC DLPC
108 1038 53 719 3,053
BAWASA
2 4 34 31 123
4 1 3 22
Hon. Ricardo P. Cadotdot Hon. Doce L. Apostol Hon.Jessie G. Empis Hon. Merjade D. Calvo
Rommel A. Caumanday Arnolfo L Apostol Basildy C. Delica Jonard C. Dayap
Linen A. Andalan Ericson D. Batican Fernando M. Caymo Robert II B. Calvo
Joeann M. Gusihan Orlando M. Caday Hajija D. Mamantas Art Joseph R. Deles
Leonardo A. Gabito Reyvan L. Abad Ali A. Tarapan Ramiro L. De Guia
Josefino B. Labandero Ruben B. Aringo Mario M. Sampawan Welfredo T. Calag
Page 80

General Profile, Bunawan District, Davao City, 2020
Development Indicators
Sanggunian Kabataan Representative
Mudiang Panacan San Isidro Tibungco Total
Adelina C. Apao Mary Jean E. Basalan Jessie M. Lumantas Marlon L. Banluta
Mercilyn L. Osorio Roseller V Bantugan Erwin A. Piatos Josefino A. Nayre
Ariel M. Ortega Ryan Jay B. Calsa Bobels E. Caymo Lorence T. De Guia
*Average of four (4) members/household
Sources of data:
PSA - Philippine Statistics Authority CSSDO - City Social Services & Development Office
OCPDC-GIS - Office of the City Planning & Development Coordinator- Geographical Information System BC - Barangay Council
OCPDC-RSD- Office of the City Planning & Development Coordinator- Research & Statistics Division BCCAD - Barangay Cultural Communities Affairs Division
CAO - City Agriculturist's Office CEO - City Engineer's Office
Bus. Bureau - Business Bureau DCWD - Davao City Water District
CHO - City Health Office DLPC - Davao Light & Power Corporation
DepEd - Department of Education CENRO - City Environment and Natural Resources Office
Page 81

Page 82
Paquibato District
Colosas Pandaitan
Fatima Paquibato Proper
Lumiad Paradise Embac
Mabuhay Sumimao
Malabog Salapawan
Mapula Tapak
Pañalum

General Profile, Paquibato District, Davao City, 2020
Development Indicators Colosas Fatima Lumiad Mabuhay Malabog
I. Demography
Population Projection 2020, OCPDC 5,301 3,924 1,740 1,190 12,118
Population, PSA 2015 census 4,731 3,502 1,553 1,062 10,816
Estimated Number of Households*, 2015 1,183 876 388 266 2,704
Population, PSA 2010 Census 4,912 2,969 1,441 1,055 10,015
Population, PSA 2007 Census 4,433 3,306 1,421 943 10,973
Population, PSA 2000 Census 4,148 2,501 1,239 952 10,706
Geography
Land Area, (in has), OCPDC-GIS 13,201.076 3,093.726 3,206.090 1,421.059 8,268.791
Distance from City Hall to Brgy. Proper, (in kms.), OCPDC-
GIS70.90 49.44 62.22 66.13 47.01
Number of Puroks, OCPDC-RSD 31 17 13 6 40
Boundaries, OCPDC-GIS
North Davao del Norte Mabuhay Mapula Paradise Embac Paquibato Proper
South Davao del NortePanabo City/
Davao del Norte
Salapawan/Pandaitan/
Paradise Embac
Panabo City,Davao del
NorteFatima/Mabuhay
East Brgy.Pandaitan Lampiano Paquibato/ Marilog Fatima Megkawayan
West Brgy. Mapula Sumimao Gumitan Pañalum/Malabog Malamba/Bantol
Locational Characteristics Riverbank Inland Inland Riverbank Riverbank
Rural/Urban Classifications Rural Rural Rural Rural Rural
Land Use, (in has.), OCPDC-GIS
Floodway Mitigation 184.540 6.261 22.354 0.733 -
Landslide Mitigation - - - - -
Rural Resettlement Area 78.519 76.774 85.655 78.519 78.519
Prime Agricultural - - - - 11.168
Agricultural Non-Tillage 7,073.406 2,310.620 1,077.808 955.163 6,427.175
Forest 733.384 - 488.140 - 971.239
Conservationn 4,060.172 99.637 885.840 58.332 386.507
Marginal 1,071.055 600.434 646.293 328.312 394.183
Total 13,201.076 3,093.726 3,206.090 1,421.059 8,268.791
Page 83

General Profile, Paquibato District, Davao City, 2020
Development Indicators Colosas Fatima Lumiad Mabuhay Malabog
Soil Classification, CAO Camansa Sandy Loam Camansa Sandy Loam Camansa Sandy Loam Tugbok Clay Tugbok Clay
Elevation (in has.), OCPDC-GIS
>200 m 3,614.104 2,926.025 193.090 1,247.034 35.384
201 - 500 m 7,941.035 167.701 1,525.620 174.025 4,965.713
501-1,000m 1,645.937 - 1,478.423 - 3,186.956
1,001 - 1,500 m - - 8.957 - 80.738
Total 13,201.076 3,093.726 3,206.090 1,421.059 8,268.791
Slope (in has.), OCPDC-GIS
Level to Nearly Level (0-3%) 248.952 - - 395.622 -
Gently Sloping to Undulating Range (3-8%) 113.741 387.761 - 95.776 226.370
Undulating to Unrolling Range (8-8%) 1,040.380 750.871 - 126.618 668.320
Rolling to Moderately Steep Range (18-30%) 2,625.652 724.891 194.880 791.778 1,258.470
Steep Range (30-50%) 5,308.428 1,230.202 2,147.510 11.265 4,124.510
Very Steep Range (>50%) 3,863.922 - 863.700 - 1,991.120
Total 13,201.076 3,093.726 3,206.090 1,421.059 8,268.791
II. Economic Services
Commercial & Industrial Establishments, Bus. Bureau, 2019
Micro
Number 32 13 3 11 40
Total Capitalization (in million pesos) 537,000.00 532,700.00 54,900.00 2,350,000.00 3,186,328.00
Declared No. of Employees 6 6 3 26 40
Small
Number 0 1 0 4 3
Total Capitalization (in million pesos) 0.00 568,700.00 0.00 2,500,000.00 2,750,000.00
Declared No. of Employees 0 4 0 11 24
Medium
Number 0 0 0 0 0
Total Capitalization (in million pesos) 0.00 0.00 0.00 0.00 0.00
Declared No. of Employees 0 0 0 0 0
Page 84

General Profile, Paquibato District, Davao City, 2020
Development Indicators Colosas Fatima Lumiad Mabuhay Malabog
Large
Number 0 0 0 0 0
Total Capitalization (in million pesos) 0.00 0.00 0.00 0.00 0.00
Declared No. of Employees 0 0 0 0 0
III. Social Services
No. of Health Centers, CHO 2019 2 1 1 1 1
Barangay Health Human Resources
No. of Barangay Health Workers 9 11 4 5 15
No. of Barangay Nutrition Scholars 2 3 2 1 4
Health Services, CHO 2019
% of Fully Immunized Children aged 11 months old and
below28.93 92.01 99.48 91.44 88.50
Prevalence Rate of Severely Underweight Children aged
0-71 months1.01 1.54 1.52 1.92 0.63
School Facilities, Dep.Ed 2019
Total Number of Schools 8 5 2 2 15
Public Schools
Elementary 6 2 2 2 10
High School 1 1 1
Sr. High School 1 1 1
Private Schools
Elementary 1 2
Elementary/High School 1
Social Welfare, CSSDO 2019
Total Number of Day Care Centers 5 2 1 2 16
Center Based
Day Care Center 5 2 1 2 14
Home Based
Supervised Neighborhood play 2
PTOP
Page 85

General Profile, Paquibato District, Davao City, 2020
Development Indicators Colosas Fatima Lumiad Mabuhay Malabog
IV. Environmental Management
Garbage Disposal Practices, BC, OCPDC-RSD Burying Burning / Burying Burying Burying Burying
MRF, CENRO ✓
V. Infrastructure and Utilities
Power, DLPC 2019 DLPC DLPC DLPC DLPC DLPC
Number of Streetlights 16 36 40 35 46
Water System, DCWD, CEO, 2019
DCWD/BAWASA BAWASA BAWASA BAWASA BAWASA
Level I, (no. of units) 1 1 1
Level II, (no of units) 3 2 1 3 8
VI. Local Government Administration
Membership of Barangay Council, BCCAD, 2017-2019
Barangay Captain Hon. Antonio B. Bellera Hon. Rommel R. Cozo Hon. Celso C. Bughao Hon. Edwin S. Candia Hon. Jessielito C. Areja
Barangay Kagawad (7) Nilo C. Montañez Enrico E. Gucor Marites C. Matua Ronilo M. Guerra Gunter Gil M. Tripoli
Roland W. Cabizares Emelita A. Miñas Benjie S. Matua Joh Rey N. Cabungcag Noel B. Edaño
Nilo S. Costan Morieto L. Jaboc Antonieta M. Magnanao Judith Q. Serapio Alma P. Novo
Eduardo Dominguez, Jr. J-Ar M. Abad Pepito M. Antinado Lorenzo P. Pagao Sr. Jacinto M. De Asis, Jr.
Fernando T. Tarle Richard T. Teves Emiliana R. Sumog-oy Marites P. Manceras Bernardo A. Andas
Dante M. Talledo, Sr. Robert R. Punay, Jr. Ronie C. Binigian Gervase B. Colecha Fely O. Areja
Merlinda P. Bacus Marcelino G. Alia Romeo V. Mirafuentes Marister P. Macasantos Roberto M. Mande
Sanggunian Kabataan Representative Phil Francis A. Cabizares Cheng C. Dandoy Rey Name D. Bagayo Baby Jane N. Dela Cerna Elbie Love M. Salutillo
*Average of four (4) members/household
Sources of data:
PSA - Philippine Statistics Authority CSSDO - City Social Services & Development Office
OCPDC-GIS - Office of the City Planning & Development Coordinator- Geographical Information System BC - Barangay Council
OCPDC-RSD- Office of the City Planning & Development Coordinator- Research & Statistics Division BCCAD - Barangay Cultural Communities Affairs Division
CAO - City Agriculturist's Office CEO - City Engineer's Office
Bus. Bureau - Business Bureau DCWD - Davao City Water District
CHO - City Health Office DLPC - Davao Light & Power Corporation
DepEd - Department of Education
Page 86

General Profile, Paquibato District, Davao City, 2020
Development Indicators
I. Demography
Population Projection 2020, OCPDC
Population, PSA 2015 census
Estimated Number of Households*, 2015
Population, PSA 2010 Census
Population, PSA 2007 Census
Population, PSA 2000 Census
Geography
Land Area, (in has), OCPDC-GIS
Distance from City Hall to Brgy. Proper, (in kms.), OCPDC-
GIS
Number of Puroks, OCPDC-RSD
Boundaries, OCPDC-GIS
North
South
East
West
Locational Characteristics
Rural/Urban Classifications
Land Use, (in has.), OCPDC-GIS
Floodway Mitigation
Landslide Mitigation
Rural Resettlement Area
Prime Agricultural
Agricultural Non-Tillage
Forest
Conservationn
Marginal
Total
Mapula Pañalum Pandaitan Paquibato Proper Paradise Embac Salapawan
3,222 2,051 4,523 2,795 2,974 2,557
2,876 1,831 4,037 2,495 2,654 2,282
719 458 1,009 624 664 571
2,284 1,713 3,366 2,104 2,368 1,716
2,184 1,438 2,029 2,124 2,349 1,850
1,820 1,224 2,794 1,845 2,028 929
8,957.469 1,131.410 4,078.585 3,511.002 2,743.467 2,779.907
65.98 59.26 57.86 56.42 65.64 66.42
22 12 15 13 11 8
Salapawan/ Tapak Colosas/Pandaitan Colosas/Pandaitan Lumiad Pandaitan Colosas
Salapawan/Pandaitan/
Paradise EmbacCarmen,Davao del Norte Carmen,Davao del Norte
Paradise Embac /
Pañalum
Carmen,Davao del
NORTEColosas
Lumiad Paradise Embac Paradise Embac Malabog Mabuhay Mapula/Pandaitan
Gumitan Mapula/Paradise Embac Mapula/Paradise Embac Malabog Pañalum Tapak/Mapula
Riverbank Riverbank Riverbank Riverbank Riverbank Riverbank
Rural Rural Rural Rural Rural Rural
0.254 136.562 - 182.871 104.289 -
196.240 - - - - -
71.260 56.205 77.260 145.176 - -
- - 85.086 - 33.747
3,328.321 844.724 2,252.193 3,051.107 1,326.241 463.385
3,050.765 - 482.175 23.594 167.020 1,667.110
2,170.016 84.139 525.511 87.628 34.461 649.412
140.613 9.780 656.360 20.626 1,077.709
8,957.469 1,131.410 4,078.585 3,511.002 2,743.467 2,779.907
Page 87

General Profile, Paquibato District, Davao City, 2020
Development Indicators
Soil Classification, CAO
Elevation (in has.), OCPDC-GIS
>200 m
201 - 500 m
501-1,000m
1,001 - 1,500 m
Total
Slope (in has.), OCPDC-GIS
Level to Nearly Level (0-3%)
Gently Sloping to Undulating Range (3-8%)
Undulating to Unrolling Range (8-8%)
Rolling to Moderately Steep Range (18-30%)
Steep Range (30-50%)
Very Steep Range (>50%)
Total
II. Economic Services
Commercial & Industrial Establishments, Bus. Bureau, 2019
Micro
Number
Total Capitalization (in million pesos)
Declared No. of Employees
Small
Number
Total Capitalization (in million pesos)
Declared No. of Employees
Medium
Number
Total Capitalization (in million pesos)
Declared No. of Employees
Mapula Pañalum Pandaitan Paquibato Proper Paradise Embac Salapawan
Camansa Sandy Loam Tugbok Clay Cabantian Clay Tugbok Clay Cabantian Clay Cabantian Clay
330.262 478.017 3,319.670 765.712 1,294.204 238.019
3,548.855 653.393 758.915 1,512.556 1,449.263 2,498.916
4,544.279 - - 1,232.734 - 42.972
534.073 - - - - -
8,957.469 1,131.410 4,078.585 3,511.002 2,743.467 2,779.907
- - 31.961 - 185.230 -
4.241 24.311 1.249 328.245 318.781 -
412.388 54.354 21.338 5.770 - 68.750
3,790.590 172.945 1,548.269 891.845 1,243.943 -
4,750.249 840.394 1,654.815 2,146.375 865.332 1,953.024
- 39.407 820.953 138.768 130.180 758.134
8,957.469 1,131.410 4,078.585 3,511.002 2,743.467 2,779.907
7 4 11 12 1 0
444,900.00 580,000.00 577,100.00 857,500.00 125,000.00 0.00
8 8 6 8 0 0
0 2 0 2 0 0
0.00 1,000,000.00 0.00 2,000,000.00 0.00 0.00
0 2 0 5 0 0
0 0 0 0 0 1
0.00 0.00 0.00 0.00 0.00 2,088,000.00
0 0 0 0 0 0
Page 88

General Profile, Paquibato District, Davao City, 2020
Development Indicators
Large
Number
Total Capitalization (in million pesos)
Declared No. of Employees
III. Social Services
No. of Health Centers, CHO 2019
Barangay Health Human Resources
No. of Barangay Health Workers
No. of Barangay Nutrition Scholars
Health Services, CHO 2019
% of Fully Immunized Children aged 11 months old and
below
Prevalence Rate of Severely Underweight Children aged
0-71 months
School Facilities, Dep.Ed 2019
Total Number of Schools
Public Schools
Elementary
High School
Sr. High School
Private Schools
Elementary
Elementary/High School
Social Welfare, CSSDO 2019
Total Number of Day Care Centers
Center Based
Day Care Center
Home Based
Supervised Neighborhood play
PTOP
Mapula Pañalum Pandaitan Paquibato Proper Paradise Embac Salapawan
0 1 0 0 0 1
0.00 10,500,000.00 0.00 0.00 0.00 30,000,000.00
0 5 0 0 0 1
1 1 1 1 1 1
5 7 5 5 5 7
2 2 1 2 1 1
42.97 65.10 91.86 49.55 99.81 50.29
0.00 1.67 0.00 0.93 0.00 0.47
2 1 4 4 3 3
2 1 3 1 1 3
1 1 1
1 1
1
4 5 6 2 2 2
3 4 4 2 2 2
1 1
1 1
Page 89

General Profile, Paquibato District, Davao City, 2020
Development Indicators
IV. Environmental Management
Garbage Disposal Practices, BC, OCPDC-RSD
MRF, CENRO
V. Infrastructure and Utilities
Power, DLPC 2019
Number of Streetlights
Water System, DCWD, CEO, 2019
DCWD/BAWASA
Level I, (no. of units)
Level II, (no of units)
VI. Local Government Administration
Membership of Barangay Council, BCCAD, 2017-2019
Barangay Captain
Barangay Kagawad (7)
Sanggunian Kabataan Representative
Mapula Pañalum Pandaitan Paquibato Proper Paradise Embac Salapawan
Burying Burying Burying Burying Burying Burying
DLPC DLPC DLPC DLPC DLPC OFF-GRID
20 31 47 263 63 0
BAWASA BAWASA BAWASA BAWASA
1
1 1 3 2 4 1
Hon. Flora D.
ManyawronHon. Analou L. Trespeses Hon. Lorenzo T. Verzano
Hon. Meljoseph P.
Escobidal
Hon. Alfredo S.
Balansag Hon. Tatang M. Campuan
Wendilyn P. Beron Rosita E. Muaña Rowil V. Canlobo Adonis L. Blanco Romeldo R.Barwado Alvin L. Onsad
Gemma B. Gallo Tranquilino T. Mamad Ronald F. Daga-as Rommel B. Rodriguez Lino C. Sarmiento Saidon I. Kayugan
Jaime A. Manyawron Florante A. Navarette, Jr. Fabian A. Samorano, Sr. Renato J. Cabrera Marilyn F. Villegas Ador B. Aguio
Raul L. Pelayo Rodillo J. Arcejo Leobeth G. Enriquez Alberto L. Paig Roberto O. Montealto Merlyn M. Salag
Roel L. Roslinda Nestor E. Labrador Mariolito B. Tinay Elvira P. Andales Gabby B. Balansag Lorenzo D. Pendio
Alejandro R. Andales Reydante B. Lanticse Claudine V. Baguio Nepthalie T. Antonio Mencho T. Anonas Dodoy M. Ambas
Joven S. Diez Rayben A. Salasa Edgardo P. Batucan Virgelio B. Amoguis Chito T. Antonio, Sr. Rontie M. Vistal
Jonathan L. Anlingcao Mary Joy S. Pojas Rica B. Gelicame Mark Daniel S. Lanoy Direca Fe G. Moreño Jerick A. Adang
*Average of four (4) members/household
Sources of data:
PSA - Philippine Statistics Authority CSSDO - City Social Services & Development Office
OCPDC-GIS - Office of the City Planning & Development Coordinator- Geographical Information System BC - Barangay Council
OCPDC-RSD- Office of the City Planning & Development Coordinator- Research & Statistics Division BCCAD - Barangay Cultural Communities Affairs Division
CAO - City Agriculturist's Office CEO - City Engineer's Office
Bus. Bureau - Business Bureau DCWD - Davao City Water District
CHO - City Health Office DLPC - Davao Light & Power Corporation
DepEd - Department of Education
Page 90

General Profile, Paquibato District, Davao City, 2020
Development Indicators
I. Demography
Population Projection 2020, OCPDC
Population, PSA 2015 census
Estimated Number of Households*, 2015
Population, PSA 2010 Census
Population, PSA 2007 Census
Population, PSA 2000 Census
Geography
Land Area, (in has), OCPDC-GIS
Distance from City Hall to Brgy. Proper, (in kms.), OCPDC-
GIS
Number of Puroks, OCPDC-RSD
Boundaries, OCPDC-GIS
North
South
East
West
Locational Characteristics
Rural/Urban Classifications
Land Use, (in has.), OCPDC-GIS
Floodway Mitigation
Landslide Mitigation
Rural Resettlement Area
Prime Agricultural
Agricultural Non-Tillage
Forest
Conservationn
Marginal
Total
Sumimao Tapak TOTAL
1,867 5,891 50,153
1,666 5,258 44,763
417 1,315 11,191
1,404 4,351 39,698
1,302 3,914 38,266
1,451 3,633 35,270
2,539.790 10,406.750 65,339.122
53.23 76.85
14 25 227
Malabog Talaingod, Davao del Norte
Fatima Colosas
Dominga/ Dalagdag Mapula
Lamanan/ Megkawayan Malamba
Inland Riverbank
Rural Rural
0.021 71.562 709.447
- 252.164 448.404
78.519 76.691 903.097
433.323 - 563.324
1,665.923 4,899.138 35,675.204
- 1,446.273 9,029.700
259.464 3,593.055 12,894.174
102.540 67.867 5,115.772
2,539.790 10,406.750 65,339.122
Page 91

General Profile, Paquibato District, Davao City, 2020
Development Indicators
Soil Classification, CAO
Elevation (in has.), OCPDC-GIS
>200 m
201 - 500 m
501-1,000m
1,001 - 1,500 m
Total
Slope (in has.), OCPDC-GIS
Level to Nearly Level (0-3%)
Gently Sloping to Undulating Range (3-8%)
Undulating to Unrolling Range (8-8%)
Rolling to Moderately Steep Range (18-30%)
Steep Range (30-50%)
Very Steep Range (>50%)
Total
II. Economic Services
Commercial & Industrial Establishments, Bus. Bureau, 2019
Micro
Number
Total Capitalization (in million pesos)
Declared No. of Employees
Small
Number
Total Capitalization (in million pesos)
Declared No. of Employees
Medium
Number
Total Capitalization (in million pesos)
Declared No. of Employees
Sumimao Tapak TOTAL
Tugbok Clay Tugbok clay
669.826 - 15,111.346
1,869.964 2,899.730 29,965.686
- 6,486.336 18,617.638
- 1,020.684 1,644.452
2,539.790 10,406.750 65,339.122
2.240 - 864.006
- 16.456 1,516.930
159.050 - 3,307.839
420.420 196.461 13,860.145
1,397.730 3,586.827 30,016.662
560.350 6,607.006 15,773.540
2,539.790 10,406.750 65,339.122
0 76 210
0.00 2,790,500.00 12,035,928.00
0 5 116
0 0 12
0.00 0.00 8,818,700.00
0 0 46
0 0 1
0.00 0.00 2,088,000.00
0 0 0
Page 92

General Profile, Paquibato District, Davao City, 2020
Development Indicators
Large
Number
Total Capitalization (in million pesos)
Declared No. of Employees
III. Social Services
No. of Health Centers, CHO 2019
Barangay Health Human Resources
No. of Barangay Health Workers
No. of Barangay Nutrition Scholars
Health Services, CHO 2019
% of Fully Immunized Children aged 11 months old and
below
Prevalence Rate of Severely Underweight Children aged
0-71 months
School Facilities, Dep.Ed 2019
Total Number of Schools
Public Schools
Elementary
High School
Sr. High School
Private Schools
Elementary
Elementary/High School
Social Welfare, CSSDO 2019
Total Number of Day Care Centers
Center Based
Day Care Center
Home Based
Supervised Neighborhood play
PTOP
Sumimao Tapak TOTAL
0 0 2
0.00 0.00 40,500,000.00
0 0 6
1 1 14
4 8 90
2 1 24
79.48 17.63
4.35 2.59
5 4 58
3 3 39
1 7
1 6
1 4
2
2 18 67
2 4 47
14 18
2
Page 93

General Profile, Paquibato District, Davao City, 2020
Development Indicators
IV. Environmental Management
Garbage Disposal Practices, BC, OCPDC-RSD
MRF, CENRO
V. Infrastructure and Utilities
Power, DLPC 2019
Number of Streetlights
Water System, DCWD, CEO, 2019
DCWD/BAWASA
Level I, (no. of units)
Level II, (no of units)
VI. Local Government Administration
Membership of Barangay Council, BCCAD, 2017-2019
Barangay Captain
Barangay Kagawad (7)
Sanggunian Kabataan Representative
Sumimao Tapak TOTAL
Burying Burying
DLPC DLPC
40 0 637
BAWASA BAWASA
4
3 4 36
Hon. Bebot T. Niño Hon. Rolly G. Latawan
Luegie T. Robleda Pablo S. Diwan
Edwin T. Niño Romeo L. Lusad
Rosalina V. Niñeza Damaso S. Onsilag
Jaypherd G. Villejo Jhing B. Dalag
Rebecca T. Niño Ronnie M. Cayuga
Erny C. Estor Narciso M. Manlangan
Jovelita B. Olaer Lorna L. Bayantong
Mariel V. Monta Remran D. Onsad
*Average of four (4) members/household
Sources of data:
PSA - Philippine Statistics Authority CSSDO - City Social Services & Development Office
OCPDC-GIS - Office of the City Planning & Development Coordinator- Geographical Information System BC - Barangay Council
OCPDC-RSD- Office of the City Planning & Development Coordinator- Research & Statistics Division BCCAD - Barangay Cultural Communities Affairs Division
CAO - City Agriculturist's Office CEO - City Engineer's Office
Bus. Bureau - Business Bureau DCWD - Davao City Water District
CHO - City Health Office DLPC - Davao Light & Power Corporation
DepEd - Department of Education
Page 94

Page 138
Toril District
Alambre Crossing Bayabas Sibulan
Atan-awe Daliao Sirawan
Bangkas Heights Daliaon Plantation Tagluno
Baracatan Eden Tagurano
Bato Kilate Tibuloy
Bayabas Lizada Toril Proper
Binugao Lubogan Tungkalan
Camansi Marapangi
Catigan Mulig

General Profile, Toril District, Davao City, 2020
Development Indicators Alambre Atan-Awe Bankas Heights Baracatan Bato
I. Demography
Population Projection 2020, OCPDC 2,252 1,254 8,595 3,244 11,212
Population, PSA 2015 census 2,010 1,119 7,671 7,671 10,007
Estimated Number of Households*, 2015 503 280 1,918 1,918 2,502
Population, PSA 2010 Census 1,620 1,060 7,191 2,561 7,133
Population, PSA 2007 Census 1,294 1,003 7,017 2,460 6,112
Population, PSA 2000 Census 1,122 946 4,987 2,600 4,416
Geography
Land Area, (in has), OCPDC-GIS 327.41 330.88 247.27 1,131.61 851.61
Distance from City Hall to Brgy. Proper, (in kms.), OCPDC-GIS 23.93 33.91 22.69 20.37
Number of Puroks, OCPDC-RSD 7 8 16 9 18
Boundaries, OCPDC-GIS
North Mulig Baracatan Bago Oshiro Tibuloy Alambre
South Bato Baracatan Lubogan Prov.of Davao Del Sur Marapangi
East Bankas Heights Prov.of Davao Del Sur Baliok Binugao Lubogan
West Tagluno Sibulan Sibulan Tan-Awe Bayabas
Locational Characteristics Lipadas River Riverbank Lipadas River Inland Riverbank
Urban/Rural Classifications Rural Rural Rural Rural Rural
Land Use, (in has.), OCPDC-GIS
Floodway Mitigation 28.28 - 18.06 - 96.11
Landslide Mitigation - - - - -
Institution 2.94 1.65 2.38 2.68 2.49
Major Commercial - - - - -
Minor Commercial - - - - -
High Density Residential - - 60.32 - -
Medium Density Residential 158.36 - 156.14 - 360.82
Low Density Residential - - - - -
Socialized Housing - - 8.66 - 5.42
Rural Settlement Area - 13.45 - 65.48 -
Page 139

General Profile, Toril District, Davao City, 2020
Development Indicators Alambre Atan-Awe Bankas Heights Baracatan Bato
Heavy Industrial - - - - -
Medium Industrial - - - - -
Light Industrial - - 1.19 - 3.19
Agro-Industrial - - - 84.34 -
Infrastructure/Utilities 5.53 - - - 14.13
Prime Agricultural 126.13 269.44 - 964.09 177.30
Agricultural Non-Tillage 5.68 - - 8.93 18.71
Forest - - - - -
Planned Unit Development - - - - -
Tourism Development - - - 5.44 -
Inland Water Zone - - - - -
Conservation - 46.34 - - 152.86
Easement/Buffer - - - - -
Open Space 0.49 - 0.52 0.65 0.57
Special Use - - - - -
Marginal - - - - 20.01
Total 327.41 330.88 247.27 1,131.61 851.61
Soil Classification, CAO Tugbok Clay San Miguel Loam Clay Tugbok Clay San Miguel Loam Clay Tugbok Clay
Elevation (in has.), OCPDC-GIS
<200 m 256.56 247.27 126.84 750.90
201 - 500 m 70.85 75.56 588.08 100.71
501 - 1,000 m 255.32 416.69
1,001 - 1,500 m
Total 327.41 330.88 247.27 1,131.61 851.61
Slope (in has.), OCPDC-GIS
M-Level to Nearly Level (0-3%) - - - 0.28 -
N-Gently Sloping to Undulating Range (3-8%) 327.41 - 247.27 66.81 388.88
O-Undulating to Unrolling Range (8-8%) - 0.66 - 406.85 227.08
P-Rolling to Moderately Steep Range (18-30%) - 330.22 - 657.67 223.90
Q-Steep Range (30-50%) - - - - 11.74
R-Very Steep Range (>50%) - - - - -
Page 140

General Profile, Toril District, Davao City, 2020
Development Indicators Alambre Atan-Awe Bankas Heights Baracatan Bato
Total 327.41 330.88 247.27 1,131.61 851.60
II. Economic Services
Commercial & Industrial Establishments, Bus. Bureau, 2019
Micro
Number 11 1 23 11 35
Total Capitalization (in million pesos) 1,154,000.00 216,000.00 1,820,000.00 1,543,800.00 3,658,000.00
Declared No. of Employees 20 1 31 34 50
Small
Number 1 0 4 4 17
Total Capitalization (in million pesos) 1,000,000.00 0.00 4,028,140.00 3,785,600.00 15,400,000.00
Declared No. of Employees 33 0 5 13 114
Medium
Number 0 0 2 0 10
Total Capitalization (in million pesos) 0.00 0.00 4,500,000.00 0.00 36,170,000.00
Declared No. of Employees 0 0 5 0 62
Large
Number 1 0 0 1 0
Total Capitalization (in million pesos) 10,500,000.00 0.00 0.00 10,500,000.00 0.00
Declared No. of Employees 30 0 0 8 0
III. Social Services
No. of Health Centers, CHO 2019 1 1 1 1 1
Barangay Health Human Resources
No. of Barangay Health Workers 4 4 6 3 8
No. of Barangay Nutrition Scholars 1 1 2 1 1
Health Services, CHO 2019
% of Fully Immunized Children aged 11 months old and
below76.86 71.01 88.05 42.70 48.96
Page 141

General Profile, Toril District, Davao City, 2020
Development Indicators Alambre Atan-Awe Bankas Heights Baracatan Bato
Prevalence Rate of Severely Underweight Children aged 0-
71 months0.00 0.00 0.90 0.79 0.40
School Facilities, Dep.Ed 2019
Total Number of Schools 1 1 2 7 2
Public Schools
Elementary 1 1 2 2 1
High School 1
Sr. High School 1
Private Schools
Elementary 1
Elementary/High School
High School 1
Sr. High School 1
Tertiary
Vocational School 1
Social Welfare, CSSDO 2019
Total Number of Day Care Centers 1 1 2 3 7
Center Based
Day Care Center 1 1 2 3 3
Home Based
Supervised Neighborhood play 4
IV. Environmental Management
Garbage Disposal Practices, BC, OCPDC-RSD Burying Burying Collected Burying Collected
MRF, CENRO ✓
V. Infrastructure and Utilities
Power, DLPC 2019 DLPC DLPC DLPC DLPC DLPC
Number of Streetlights 86 50 288 96 234
Water System, DCWD, CEO, 2019
DCWD/BAWASA BAWASA BAWASA DCWD BAWASA
Level I, (no. of units)
Page 142

General Profile, Toril District, Davao City, 2020
Development Indicators Alambre Atan-Awe Bankas Heights Baracatan Bato
Level II, (no. of units) 2 1 1 7
VI. Local Government Administration
Membership of Barangay Council, BCCAD, 2017-2019
Barangay Captain Hon. Rosa Q. Cabila Hon. Julico A. Batawan Carmelita M. Babao Hon. Danilo A. Darvin Sr. Hon. Alfredo D. Cabreros
Barangay Kagawad (7) Alexander S. Resane Kenneth Jay A. Atan Ruel L. Betonio Erika Jane U. Sala Hernane C. Cabreros
Virgilio B. Millang Ruel B. Ansal Elsie B. Amad Perlita M. Abenoja Eduardo T. Comidoy
Rose Amor C. Ortega Johnny B. Lanzo Candido P. Borja Jr. Alfredo D. Braga II Teresita R. Danao
Jerold A. Jordan Juanito B. Edo Efren R. Pamolino Shirley U. Deiparine Romello D. Entero Jr.
Manolo G. Leonor Andres B. Atan Angelo C. Gerondio Nolie P. Lao Cristita E. Eredia
Edna D. Roales Benjamin L. Lumayog Arvin L. Genabe Philipe L. Advincula Jr. Raymundo O. Solis
Donato R. Delponso Jessel O. Atan Angelou J. Nisnisan Milane L. Atan Jimmy R. Cabañas
Sanggunian Kabataan RepresentativeJohn Lloyd P. Rezane Pejay O. Ybañez Julius S. Magno John Rey H. Presores
*Average of four (4) members/household
Sources of data:
PSA - Philippine Statistics Authority CSSDO - City Social Services & Development Office
OCPDC-GIS - Office of the City Planning & Development Coordinator- Geographical Information System BC - Barangay Council
OCPDC-RSD- Office of the City Planning & Development Coordinator- Research & Statistics Division BCCAD - Barangay Cultural Communities Affairs Division
CAO - City Agriculturist's Office CEO - City Engineer's Office
Bus. Bureau - Business Bureau DCWD - Davao City Water District
CHO - City Health Office DLPC - Davao Light & Power Corporation
DepEd - Department of Education
Page 143

General Profile, Toril District, Davao City, 2020
Development Indicators
I. Demography
Population Projection 2020, OCPDC
Population, PSA 2015 census
Estimated Number of Households*, 2015
Population, PSA 2010 Census
Population, PSA 2007 Census
Population, PSA 2000 Census
Geography
Land Area, (in has), OCPDC-GIS
Distance from City Hall to Brgy. Proper, (in kms.), OCPDC-GIS
Number of Puroks, OCPDC-RSD
Boundaries, OCPDC-GIS
North
South
East
West
Locational Characteristics
Urban/Rural Classifications
Land Use, (in has.), OCPDC-GIS
Floodway Mitigation
Landslide Mitigation
Institution
Major Commercial
Minor Commercial
High Density Residential
Medium Density Residential
Low Density Residential
Socialized Housing
Rural Settlement Area
Bayabas Binugao Camansi Catigan Crossing Bayabas
3,349 7,769 1,332 3,411 12,874
2,989 6,934 1,189 3,044 11,490
747 1,734 297 761 2,873
2,606 6,074 1,172 2,698 12,349
2,394 5,572 1,043 2,966 12,241
1,972 4,410 765 2,621 12,495
1,201.36 483.32 363.18 2,401.89 223.35
24.88 17.38 27.02 27.06 17.38
8 8 3 11 16
Kilate Sirawan Manambulan Bayabas Lubogan
Catigan Prov.of Davao Del Sur Tungkalan Tibuloy Lizada
Bato Shore Line Mulig Marapangi Toril Pob.
Eden Tibuloy Daliaon Plantation Sibulan Marapangi
Riverbank Riverbank / Coastal Inland Inland Lipadas River
Rural Rural Rural Rural Urban
3.21 33.14 25.13 - 71.15
- - - - -
- 2.68 - 44.46 9.22
2.24 - - - 42.73
- - - - 43.76
- - - - -
26.64 - - - 49.66
- - - - -
- - - - 2.02
78.52 - - 0.84 -
Page 144

General Profile, Toril District, Davao City, 2020
Development Indicators
Heavy Industrial
Medium Industrial
Light Industrial
Agro-Industrial
Infrastructure/Utilities
Prime Agricultural
Agricultural Non-Tillage
Forest
Planned Unit Development
Tourism Development
Inland Water Zone
Conservation
Easement/Buffer
Open Space
Special Use
Marginal
Total
Soil Classification, CAO
Elevation (in has.), OCPDC-GIS
<200 m
201 - 500 m
501 - 1,000 m
1,001 - 1,500 m
Total
Slope (in has.), OCPDC-GIS
M-Level to Nearly Level (0-3%)
N-Gently Sloping to Undulating Range (3-8%)
O-Undulating to Unrolling Range (8-8%)
P-Rolling to Moderately Steep Range (18-30%)
Q-Steep Range (30-50%)
R-Very Steep Range (>50%)
Bayabas Binugao Camansi Catigan Crossing Bayabas
- 57.70 - - -
- 94.33 - - -
- 26.23 - - 0.18
- 237.63 - - -
1.45 9.05 - - 3.43
624.06 - 294.79 46.05 -
189.88 - - 12.53 -
- - - - -
- - - 0.50 0.70
7.38 - - 2250.47 -
- 3.33 - - -
204.78 - 40.15 43.50 -
- - - - -
- 19.23 - - 0.50
- - - - -
63.20 - 3.11 3.54 -
1,201.36 483.32 363.18 2,401.89 223.35
Tugbok Clay Tugbok Clay San Miguel Loam Tugbok Clay Tugbok Clay
154.97 483.32 0.00 6.23 223.35
883.02 0.00 363.18 1,096.34 -
163.38 0.00 0.00 1,032.20 -
267.13 -
1,201.36 483.32 363.18 2,401.89 223.35
- 403.22 - - 223.35
69.86 80.10 147.86 - -
247.39 - 145.61 395.36 -
859.23 - - 1,985.71 -
24.88 - - - -
- - 69.70 20.82 -
Page 145

General Profile, Toril District, Davao City, 2020
Development Indicators
Total
II. Economic Services
Commercial & Industrial Establishments, Bus. Bureau, 2019
Micro
Number
Total Capitalization (in million pesos)
Declared No. of Employees
Small
Number
Total Capitalization (in million pesos)
Declared No. of Employees
Medium
Number
Total Capitalization (in million pesos)
Declared No. of Employees
Large
Number
Total Capitalization (in million pesos)
Declared No. of Employees
III. Social Services
No. of Health Centers, CHO 2019
Barangay Health Human Resources
No. of Barangay Health Workers
No. of Barangay Nutrition Scholars
Health Services, CHO 2019
% of Fully Immunized Children aged 11 months old and
below
Bayabas Binugao Camansi Catigan Crossing Bayabas
1,201.36 483.32 363.17 2,401.89 223.35
16 30 6 1 237
1,774,000.00 3,437,500.00 105,000.00 75,000.00 29,921,625.00
33 151 0 2 518
7 20 1 0 92
6,748,514.00 16,841,251.00 1,000,000.00 0.00 73,629,016.82
18 122 4 0 425
2 14 0 0 49
4,000,000.00 51,625,001.00 0.00 0.00 153,681,502.30
9 145 0 0 245
1 22 1 1 8
10,500,000.00 9,877,536,392.00 10,000,000.00 10,000,000.00 130,131,280.78
0 1,078 0 0 167
1 1 1 1 1
7 10 2 4 4
1 2 1 1 3
187.54 70.03 100.25 100.08 54.94
Page 146

General Profile, Toril District, Davao City, 2020
Development Indicators
Prevalence Rate of Severely Underweight Children aged 0-
71 months
School Facilities, Dep.Ed 2019
Total Number of Schools
Public Schools
Elementary
High School
Sr. High School
Private Schools
Elementary
Elementary/High School
High School
Sr. High School
Tertiary
Vocational School
Social Welfare, CSSDO 2019
Total Number of Day Care Centers
Center Based
Day Care Center
Home Based
Supervised Neighborhood play
IV. Environmental Management
Garbage Disposal Practices, BC, OCPDC-RSD
MRF, CENRO
V. Infrastructure and Utilities
Power, DLPC 2019
Number of Streetlights
Water System, DCWD, CEO, 2019
DCWD/BAWASA
Level I, (no. of units)
Bayabas Binugao Camansi Catigan Crossing Bayabas
0.00 0.00 0.00 0.00 0.36
1 3 3 3 8
1 1 1 2 2
1 1 1 1
1 1 1
2
2
1 2 1 3 6
1 1 1 3 4
1 2
Collected Collected Burying Burying Collected
✓
DLPC DLPC DLPC DLPC DLPC
183 134 62 109 251
BAWASA BAWASA BAWASA DCWD
Page 147

General Profile, Toril District, Davao City, 2020
Development Indicators
Level II, (no. of units)
VI. Local Government Administration
Membership of Barangay Council, BCCAD, 2017-2019
Barangay Captain
Barangay Kagawad (7)
Sanggunian Kabataan Representative
Bayabas Binugao Camansi Catigan Crossing Bayabas
9 4 1 4
Hon. Porferio D. Parac Hon. Remegio D. Saniel Hon. Allan T. Padin Hon. Sonny T. Mansilagan Hon. Terso Abrantes
Pedro H. Guirigay Michael B. Lausa Perlita G. Aguimatang Wiljem R. Razonable Herman P. Catague Sr.
Marifel M. Estoquia Arlinda J. Daro Flordeliza C. Abenoja Marcelina B. Bual Antonio R. Sasuman
Crisanto Niño L. Paña Neil Greg H. Saniel Reden G. Lequido Romeo L. Lumbayon Salvador D. Cadavas Jr.
Mamerto P. Lupas Jr. Esperidion C. Algabre Daniel L. Evangelio III Domingo S. Blanco Jr. Julieta Juliana P. Bautista
Girlie M. Postanes Alfredo J. Comiso Jr. Miguel A. Camilotes Joseph Rex A. Estobio Sherwin P. Maganda
Sergia L. Sitoy Danilo A. Calinawan Sr. Roberto P. Gido Jesus A. Mansilagan Arnold Jay E. Languido
Grace A. Parac Roldan G. Gonzales Rodelyn A. Sanchez Raphael B. Amad Enrico B. Racho
Sharlene Kaye E. Lumanas Quennie B. Tubog Jasper James S. Dalisay Alice G. Payot Bejay M. Dajay
*Average of four (4) members/household
Sources of data:
PSA - Philippine Statistics Authority CSSDO - City Social Services & Development Office
OCPDC-GIS - Office of the City Planning & Development Coordinator- Geographical Information System BC - Barangay Council
OCPDC-RSD- Office of the City Planning & Development Coordinator- Research & Statistics Division BCCAD - Barangay Cultural Communities Affairs Division
CAO - City Agriculturist's Office CEO - City Engineer's Office
Bus. Bureau - Business Bureau DCWD - Davao City Water District
CHO - City Health Office DLPC - Davao Light & Power Corporation
DepEd - Department of Education
Page 148

General Profile, Toril District, Davao City, 2020
Development Indicators
I. Demography
Population Projection 2020, OCPDC
Population, PSA 2015 census
Estimated Number of Households*, 2015
Population, PSA 2010 Census
Population, PSA 2007 Census
Population, PSA 2000 Census
Geography
Land Area, (in has), OCPDC-GIS
Distance from City Hall to Brgy. Proper, (in kms.), OCPDC-GIS
Number of Puroks, OCPDC-RSD
Boundaries, OCPDC-GIS
North
South
East
West
Locational Characteristics
Urban/Rural Classifications
Land Use, (in has.), OCPDC-GIS
Floodway Mitigation
Landslide Mitigation
Institution
Major Commercial
Minor Commercial
High Density Residential
Medium Density Residential
Low Density Residential
Socialized Housing
Rural Settlement Area
Daliao Daliaon Plantation Eden Kilate Lizada
23,668 3,601 2,672 1,467 22,534
21,124 3,214 2,385 1,309 20,112
5,281 804 596 327 5,028
19,993 3,324 2,309 1,193 16,725
18,533 2,693 2,176 1,177 16,006
18,142 2,434 1,671 980 11,604
194.55 1,036.93 773.77 644.9 436.16
185.82 31.21 29.87 27.25 20.15
23 9 9 7 23
Dumoy Manuel Guianga Tagluno Tagluno Crossing Bayabas
Lizada Tungkalan Bayabas Bayabas Sirawan
Shore Line Camansi Bayabas Bato Daliao
Toril Poblacion Mt. Apo National Park Mt. Apo National Park Tagurano Marapangi
Coastal Inland Inland Inland Coastal
Urban Urban Urban Rural Urban
- - - - 74.32
- - - - -
8.68 - - - -
8.76 - - - 37.35
- - - - -
1.60 - - - 261.05
86.98 - - - -
16.78 - - - -
- - - - 5.29
- - - 78.52 -
Page 149

General Profile, Toril District, Davao City, 2020
Development Indicators
Heavy Industrial
Medium Industrial
Light Industrial
Agro-Industrial
Infrastructure/Utilities
Prime Agricultural
Agricultural Non-Tillage
Forest
Planned Unit Development
Tourism Development
Inland Water Zone
Conservation
Easement/Buffer
Open Space
Special Use
Marginal
Total
Soil Classification, CAO
Elevation (in has.), OCPDC-GIS
<200 m
201 - 500 m
501 - 1,000 m
1,001 - 1,500 m
Total
Slope (in has.), OCPDC-GIS
M-Level to Nearly Level (0-3%)
N-Gently Sloping to Undulating Range (3-8%)
O-Undulating to Unrolling Range (8-8%)
P-Rolling to Moderately Steep Range (18-30%)
Q-Steep Range (30-50%)
R-Very Steep Range (>50%)
Daliao Daliaon Plantation Eden Kilate Lizada
- - - - -
- - - - 29.54
49.48 - - - 0.06
- - - - -
9.74 - - - 10.53
- 379.34 0.01 358.15 -
- 8.71 - 21.44 -
- - - - -
- - 104.69 - 0.33
- - 660.96 0.18 -
- - - - 8.75
- 436.52 8.11 77.34 -
1.43 - - - -
11.10 - - - 8.68
- - - - 0.26
- 212.36 - 109.27 -
194.55 1,036.93 773.77 644.90 436.16
San Manuel Silty Clay Loam San Miguel Clay loam Tugbok Clay Tugbok Clay Tugbok Clay
194.55 - - 41.04 436.16
- 38.04 3.53 580.50 -
- 933.55 684.75 23.37 -
- 65.34 85.49 - -
194.55 1,036.93 773.77 644.90 436.16
194.55 - - - 436.16
- - - 35.02 -
- 500.67 85.00 405.46 -
- - 613.34 135.41 -
- 14.05 - 69.01 -
- 522.21 75.43 - -
Page 150

General Profile, Toril District, Davao City, 2020
Development Indicators
Total
II. Economic Services
Commercial & Industrial Establishments, Bus. Bureau, 2019
Micro
Number
Total Capitalization (in million pesos)
Declared No. of Employees
Small
Number
Total Capitalization (in million pesos)
Declared No. of Employees
Medium
Number
Total Capitalization (in million pesos)
Declared No. of Employees
Large
Number
Total Capitalization (in million pesos)
Declared No. of Employees
III. Social Services
No. of Health Centers, CHO 2019
Barangay Health Human Resources
No. of Barangay Health Workers
No. of Barangay Nutrition Scholars
Health Services, CHO 2019
% of Fully Immunized Children aged 11 months old and
below
Daliao Daliaon Plantation Eden Kilate Lizada
194.55 1,036.93 773.77 644.90 436.16
125 4 8 1 99
13,779,400.00 1,055,540.00 280,000.00 300,000.00 8,795,000.00
193 14 7 2 184
40 4 1 1 38
33,079,248.23 3,930,000.00 500,000.00 550,000.00 31,206,620.00
127 22 0 9 716
21 0 0 0 14
68,852,527.00 0.00 0.00 0.00 53,800,001.00
233 0 0 0 82
3 1 2 1 14
51,500,000.00 10,500,000.00 32,050,000.00 10,500,000.00 236,412,801.00
304 9 72 26 967
2 1 1 1 2
8 6 3 5 6
4 1 1 1 3
64.36 92.03 125.85 53.94 41.48
Page 151

General Profile, Toril District, Davao City, 2020
Development Indicators
Prevalence Rate of Severely Underweight Children aged 0-
71 months
School Facilities, Dep.Ed 2019
Total Number of Schools
Public Schools
Elementary
High School
Sr. High School
Private Schools
Elementary
Elementary/High School
High School
Sr. High School
Tertiary
Vocational School
Social Welfare, CSSDO 2019
Total Number of Day Care Centers
Center Based
Day Care Center
Home Based
Supervised Neighborhood play
IV. Environmental Management
Garbage Disposal Practices, BC, OCPDC-RSD
MRF, CENRO
V. Infrastructure and Utilities
Power, DLPC 2019
Number of Streetlights
Water System, DCWD, CEO, 2019
DCWD/BAWASA
Level I, (no. of units)
Daliao Daliaon Plantation Eden Kilate Lizada
0.85 0.00 1.32 0.00 0.13
4 2 4 1 3
2 2 1 1 1
1 1
1 1
2
1
10 2 1 1 10
10 2 1 1 10
Collected Collected Collected Burying Collected
DLPC DLPC DLPC DLPC DLPC
316 28 39 60 431
DCWD BAWASA BAWASA BAWASA DCWD
Page 152

General Profile, Toril District, Davao City, 2020
Development Indicators
Level II, (no. of units)
VI. Local Government Administration
Membership of Barangay Council, BCCAD, 2017-2019
Barangay Captain
Barangay Kagawad (7)
Sanggunian Kabataan Representative
Daliao Daliaon Plantation Eden Kilate Lizada
1 4 1
Hon. Rodolfo B. Te Hon.Generoso S. Bacalso Hon. Virgilio I. Sitoy Hon. Lorenzo D. Balagat Jr Hon. Remegio C. Licera
Lolito O. Sucayre Alberto I. Sitoy II Arnel S. Elepante Russel C. America Virginia M. Diaz
Christopher Ryan B. Maboloc Simeon D. Maglinte Joselito A. Soqullo Mamerto M. Cuyag Mardonio R. Calacat
Genaro M. Oberez Jr. Dennis T. Enriquez Remercris A. Ao Joji C. Agle Richard H. Licera
Joven Anthony C. Mulat Soriel N. Yamashita Rex D. Bayocboc Jeser M. Mendez Oswaldo G. Lao
Rodel S. Granada Teresita H. Barriga Manolito A. Ogos Crispin N. Apag Raymonselito P. Ismael
Joseph N. Dumogho Amparo O. Bacalando Leo A. Antolihao Daniel P. Marata Jr. Efrelina O. Reyes
Raymond M. Zapanta Eugenio S. Ellaga Roselyn S. Olayon Jaime L. Tinio Francisco P. Anay
Maria Estrella P. Aquino Jeffrey G. Gozon Junzen C. Montebon Chaidelyn M. Galicto Raphsan A. Moreno
*Average of four (4) members/household
Sources of data:
PSA - Philippine Statistics Authority CSSDO - City Social Services & Development Office
OCPDC-GIS - Office of the City Planning & Development Coordinator- Geographical Information System BC - Barangay Council
OCPDC-RSD- Office of the City Planning & Development Coordinator- Research & Statistics Division BCCAD - Barangay Cultural Communities Affairs Division
CAO - City Agriculturist's Office CEO - City Engineer's Office
Bus. Bureau - Business Bureau DCWD - Davao City Water District
CHO - City Health Office DLPC - Davao Light & Power Corporation
DepEd - Department of Education
Page 153

General Profile, Toril District, Davao City, 2020
Development Indicators
I. Demography
Population Projection 2020, OCPDC
Population, PSA 2015 census
Estimated Number of Households*, 2015
Population, PSA 2010 Census
Population, PSA 2007 Census
Population, PSA 2000 Census
Geography
Land Area, (in has), OCPDC-GIS
Distance from City Hall to Brgy. Proper, (in kms.), OCPDC-GIS
Number of Puroks, OCPDC-RSD
Boundaries, OCPDC-GIS
North
South
East
West
Locational Characteristics
Urban/Rural Classifications
Land Use, (in has.), OCPDC-GIS
Floodway Mitigation
Landslide Mitigation
Institution
Major Commercial
Minor Commercial
High Density Residential
Medium Density Residential
Low Density Residential
Socialized Housing
Rural Settlement Area
Lubogan Marapangi Mulig Sibulan Sirawan
13,620 7,719 2,775 2,778 8,000
12,156 6,889 2,477 2,479 7,140
3,039 1,722 619 620 1,785
9,719 6,128 2,101 2,365 5,792
8,744 5,534 2,693 1,865 6,021
7,200 3,289 2,450 2,463 5,010
208.96 703.76 998.88 1,699.90 963.7
19.79 20.14 23.98 38.34 22.23
18 11 8 15 16
Bankas Heights Bato Manambulan Mt. Apo Nat. Park/Catigan Marapangi
Crossing Bayabas Sirawan Alambre Province of Davao del Sur Binugao
Baliok Crossing Bayabas Bago Oshiro Catigan/Baracatan/Atan-awe Lizada
Bato Bayabas / Catigan Camansi Mt. Apo Nat. Park Catigan
Lipadas River Lipadas River Inland Inland Riverbank / Coastal
Urban Rural Rural Rural Rural
64.17 121.12 84.38 - 11.88
- - - 131.17 -
2.51 0.02 2.51 - 17.15
16.44 0.65 - - -
- - - - 16.66
- 10.18 22.93 - 9.27
104.71 167.17 475.43 - 175.96
- - - - -
- - - - -
- - - - -
Page 154

General Profile, Toril District, Davao City, 2020
Development Indicators
Heavy Industrial
Medium Industrial
Light Industrial
Agro-Industrial
Infrastructure/Utilities
Prime Agricultural
Agricultural Non-Tillage
Forest
Planned Unit Development
Tourism Development
Inland Water Zone
Conservation
Easement/Buffer
Open Space
Special Use
Marginal
Total
Soil Classification, CAO
Elevation (in has.), OCPDC-GIS
<200 m
201 - 500 m
501 - 1,000 m
1,001 - 1,500 m
Total
Slope (in has.), OCPDC-GIS
M-Level to Nearly Level (0-3%)
N-Gently Sloping to Undulating Range (3-8%)
O-Undulating to Unrolling Range (8-8%)
P-Rolling to Moderately Steep Range (18-30%)
Q-Steep Range (30-50%)
R-Very Steep Range (>50%)
Lubogan Marapangi Mulig Sibulan Sirawan
- - - - -
- - - - 54.28
13.74 34.44 - - 72.00
- - - - 356.49
1.95 16.43 14.19 - 43.70
- 52.80 399.44 258.49 171.69
- - - 27.15 -
- - - 422.59 -
- 131.08 - - 0.20
- 118.10 - 15.73 3.76
- - - - 14.35
- 45.28 - 794.10 -
- - - - 2.79
0.81 6.49 - - 13.52
4.63 - - - -
- - - 50.67 -
208.96 703.76 998.88 1,699.90 963.70
Tugbok Clay Tugbok Clay Tugbok Clay Tugbok Clay Tugbok Clay
208.96 650.34 418.21 - 944.40
- 53.42 580.67 1.64 19.30
- - - 937.94 -
- - - 760.32 -
208.96 703.76 998.88 1,699.90 963.70
110.65 160.87 - - 291.74
98.31 314.55 998.88 - 552.77
- - - - 75.59
- 228.34 - 1,410.95 43.60
- - - 63.52 -
- - - 225.43 -
Page 155

General Profile, Toril District, Davao City, 2020
Development Indicators
Total
II. Economic Services
Commercial & Industrial Establishments, Bus. Bureau, 2019
Micro
Number
Total Capitalization (in million pesos)
Declared No. of Employees
Small
Number
Total Capitalization (in million pesos)
Declared No. of Employees
Medium
Number
Total Capitalization (in million pesos)
Declared No. of Employees
Large
Number
Total Capitalization (in million pesos)
Declared No. of Employees
III. Social Services
No. of Health Centers, CHO 2019
Barangay Health Human Resources
No. of Barangay Health Workers
No. of Barangay Nutrition Scholars
Health Services, CHO 2019
% of Fully Immunized Children aged 11 months old and
below
Lubogan Marapangi Mulig Sibulan Sirawan
208.96 703.76 998.88 1,699.90 963.70
117 13 15 5 19
12,794,500.00 2,040,000.00 1,570,000.00 384,000.00 1,375,304.00
192 41 21 20 45
31 8 5 0 9
27,483,191.85 5,880,001.00 4,673,800.00 0.00 7,734,561.00
169 36 7 0 43
18 3 3 0 5
53,091,213.59 9,399,660.00 12,300,000.00 0.00 15,025,001.00
304 13 15 0 109
5 2 0 0 8
135,500,000.00 180,100,200.00 0.00 0.00 104,711,450.00
42 342 0 0 241
1 1 1 1 1
6 5 6 4 8
2 2 1 1 2
77.35 73.69 71.28 12.46 24.73
Page 156

General Profile, Toril District, Davao City, 2020
Development Indicators
Prevalence Rate of Severely Underweight Children aged 0-
71 months
School Facilities, Dep.Ed 2019
Total Number of Schools
Public Schools
Elementary
High School
Sr. High School
Private Schools
Elementary
Elementary/High School
High School
Sr. High School
Tertiary
Vocational School
Social Welfare, CSSDO 2019
Total Number of Day Care Centers
Center Based
Day Care Center
Home Based
Supervised Neighborhood play
IV. Environmental Management
Garbage Disposal Practices, BC, OCPDC-RSD
MRF, CENRO
V. Infrastructure and Utilities
Power, DLPC 2019
Number of Streetlights
Water System, DCWD, CEO, 2019
DCWD/BAWASA
Level I, (no. of units)
Lubogan Marapangi Mulig Sibulan Sirawan
0.33 0.48 0.00 3.15 1.03
6 2 3 1 5
1 1 1 1 3
1 1
1 1
1
2
1
1
1
3 3 3 3 3
2 1 3 2 3
1 2 1
Collected Collected Burning / Burying Burning / Burying Collected
✓ ✓
DLPC DLPC DLPC DLPC DLPC
187 108 89 69 198
DCWD BAWASA BAWASA
1
Page 157

General Profile, Toril District, Davao City, 2020
Development Indicators
Level II, (no. of units)
VI. Local Government Administration
Membership of Barangay Council, BCCAD, 2017-2019
Barangay Captain
Barangay Kagawad (7)
Sanggunian Kabataan Representative
Lubogan Marapangi Mulig Sibulan Sirawan
2 3 3 5
Hon. Levi G. Fortuna Hon. Angelita G. Pizarro Hon. Carlos J. Clarion Hon. Cristine Rose P. Abalayan Hon. Khalil A. Deporos
Julieta P. Ehilla Felix V. Sarigumba Marilyn D. Clarion Hernan E. Ambe Ebrahem P. Coring
Buenaventura M. Barnes Elbin S. Cansico Dionesia P. Labang Erlinda A. Gomia Marcelino T. Baba
Aquilino D. Fortuna Joemar A. Galicia Sr. Rosalie M. Lopez Judel L. Abe Eddie C. Abubacar
Victorio John D. Sexcion Jr. Carlos M. Jenisan Jorge A. Peresores Joel B. Ontic Nestor M. Gilves Jr.
Marcelo P. Ramos Evelyn R. Cagape Marites E. Alcantara Rosita P. Abalayan Asmani S. Salilin
Ericjohn L. Abear Orlando A. Lumanas Petronilo L. Te Lumaway R. Anto Khalil A. Catao
Mario S. Lariosa Rogelio U. Otoc Fermin M. Estomago Glenboy T. Utay Sr. Hapis M. Samuel
Eulogio C. Gerasmio III Rodney A. Malayao Doreen Grace T. Rupinta Nico A. Balido Bai Ayesha S. Catao
*Average of four (4) members/household
Sources of data:
PSA - Philippine Statistics Authority CSSDO - City Social Services & Development Office
OCPDC-GIS - Office of the City Planning & Development Coordinator- Geographical Information System BC - Barangay Council
OCPDC-RSD- Office of the City Planning & Development Coordinator- Research & Statistics Division BCCAD - Barangay Cultural Communities Affairs Division
CAO - City Agriculturist's Office CEO - City Engineer's Office
Bus. Bureau - Business Bureau DCWD - Davao City Water District
CHO - City Health Office DLPC - Davao Light & Power Corporation
DepEd - Department of Education
Page 158
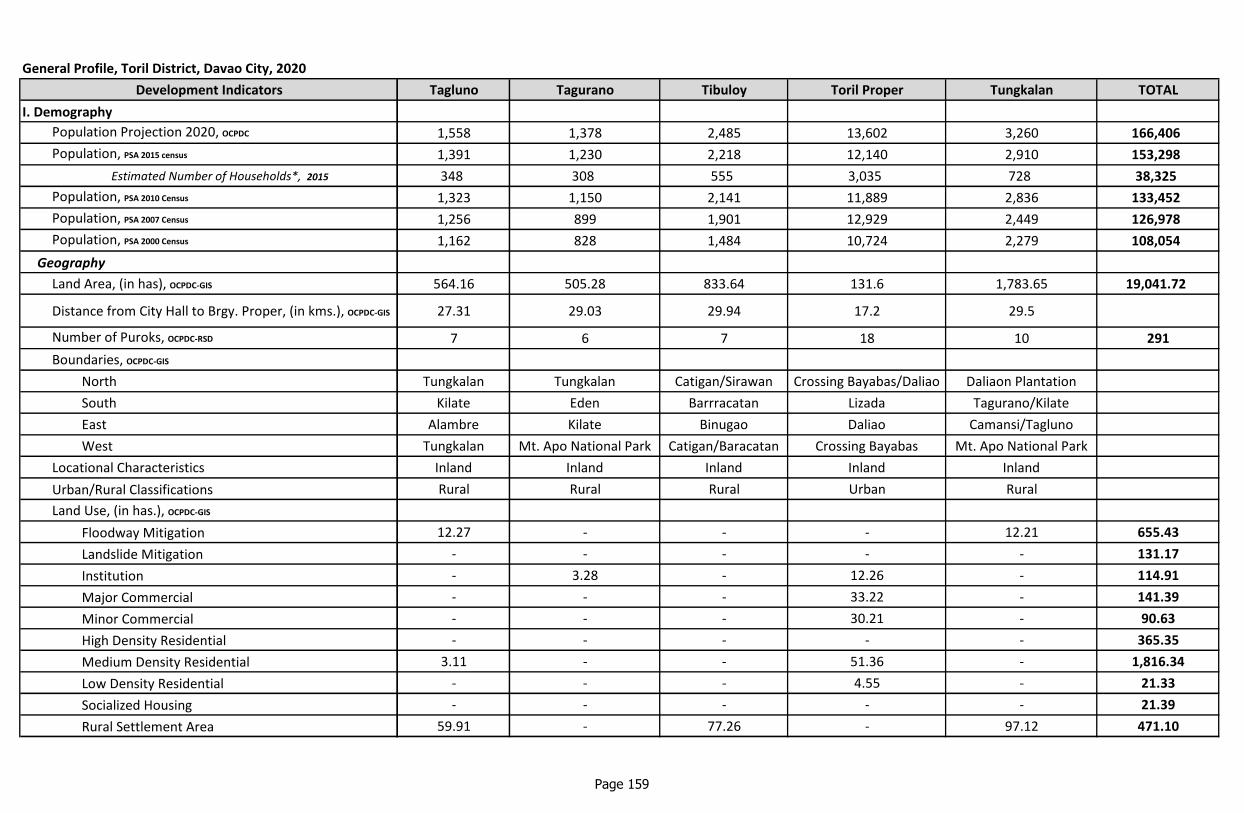
General Profile, Toril District, Davao City, 2020
Development Indicators
I. Demography
Population Projection 2020, OCPDC
Population, PSA 2015 census
Estimated Number of Households*, 2015
Population, PSA 2010 Census
Population, PSA 2007 Census
Population, PSA 2000 Census
Geography
Land Area, (in has), OCPDC-GIS
Distance from City Hall to Brgy. Proper, (in kms.), OCPDC-GIS
Number of Puroks, OCPDC-RSD
Boundaries, OCPDC-GIS
North
South
East
West
Locational Characteristics
Urban/Rural Classifications
Land Use, (in has.), OCPDC-GIS
Floodway Mitigation
Landslide Mitigation
Institution
Major Commercial
Minor Commercial
High Density Residential
Medium Density Residential
Low Density Residential
Socialized Housing
Rural Settlement Area
Tagluno Tagurano Tibuloy Toril Proper Tungkalan TOTAL
1,558 1,378 2,485 13,602 3,260 166,406
1,391 1,230 2,218 12,140 2,910 153,298
348 308 555 3,035 728 38,325
1,323 1,150 2,141 11,889 2,836 133,452
1,256 899 1,901 12,929 2,449 126,978
1,162 828 1,484 10,724 2,279 108,054
564.16 505.28 833.64 131.6 1,783.65 19,041.72
27.31 29.03 29.94 17.2 29.5
7 6 7 18 10 291
Tungkalan Tungkalan Catigan/Sirawan Crossing Bayabas/Daliao Daliaon Plantation
Kilate Eden Barrracatan Lizada Tagurano/Kilate
Alambre Kilate Binugao Daliao Camansi/Tagluno
Tungkalan Mt. Apo National Park Catigan/Baracatan Crossing Bayabas Mt. Apo National Park
Inland Inland Inland Inland Inland
Rural Rural Rural Urban Rural
12.27 - - - 12.21 655.43
- - - - - 131.17
- 3.28 - 12.26 - 114.91
- - - 33.22 - 141.39
- - - 30.21 - 90.63
- - - - - 365.35
3.11 - - 51.36 - 1,816.34
- - - 4.55 - 21.33
- - - - - 21.39
59.91 - 77.26 - 97.12 471.10
Page 159

General Profile, Toril District, Davao City, 2020
Development Indicators
Heavy Industrial
Medium Industrial
Light Industrial
Agro-Industrial
Infrastructure/Utilities
Prime Agricultural
Agricultural Non-Tillage
Forest
Planned Unit Development
Tourism Development
Inland Water Zone
Conservation
Easement/Buffer
Open Space
Special Use
Marginal
Total
Soil Classification, CAO
Elevation (in has.), OCPDC-GIS
<200 m
201 - 500 m
501 - 1,000 m
1,001 - 1,500 m
Total
Slope (in has.), OCPDC-GIS
M-Level to Nearly Level (0-3%)
N-Gently Sloping to Undulating Range (3-8%)
O-Undulating to Unrolling Range (8-8%)
P-Rolling to Moderately Steep Range (18-30%)
Q-Steep Range (30-50%)
R-Very Steep Range (>50%)
Tagluno Tagurano Tibuloy Toril Proper Tungkalan TOTAL
- - - - - 57.70
- - - - - 178.15
- - - - - 200.51
- - 117.05 - - 795.51
4.62 - - - - 134.75
416.43 2.90 634.24 - 905.98 6,081.33
35.76 0.00 - - 269.93 598.72
- - - - - 422.59
- - - - - 237.50
- 476.62 2.66 - 0.58 3,541.88
- - - - - 26.43
32.06 22.40 - - 447.20 2,350.64
- - - - - 4.22
- - 2.43 - - 64.99
- - - - - 4.89
- 0.08 - - 50.63 512.87
564.16 505.28 833.64 131.60 1,783.65 19,041.72
Tugbok Clay Tugbok Clay Tugbok clay San Manuel Silty Clay Loam Tugbok Clay
109.43 - 270.32 131.60 - 5,654.44
454.73 7.98 447.43 - 470.47 5,835.44
- 491.00 115.89 - 1,139.55 6,193.63
- 6.30 0.00 - 173.63 1,358.20
564.16 505.28 833.64 131.60 1,783.65 19,041.71
- - 1.25 131.60 - 1,953.67
279.32 - 191.84 - 62.70 3,861.58
119.46 149.26 375.39 - 1,331.81 4,465.59
165.37 227.35 265.15 - 125.78 7,272.02
- 118.74 - - 99.91 401.85
- 9.94 - - 163.45 1,086.98
Page 160

General Profile, Toril District, Davao City, 2020
Development Indicators
Total
II. Economic Services
Commercial & Industrial Establishments, Bus. Bureau, 2019
Micro
Number
Total Capitalization (in million pesos)
Declared No. of Employees
Small
Number
Total Capitalization (in million pesos)
Declared No. of Employees
Medium
Number
Total Capitalization (in million pesos)
Declared No. of Employees
Large
Number
Total Capitalization (in million pesos)
Declared No. of Employees
III. Social Services
No. of Health Centers, CHO 2019
Barangay Health Human Resources
No. of Barangay Health Workers
No. of Barangay Nutrition Scholars
Health Services, CHO 2019
% of Fully Immunized Children aged 11 months old and
below
Tagluno Tagurano Tibuloy Toril Proper Tungkalan TOTAL
564.15 505.29 833.63 131.60 1,783.65 19,041.69
0 1 4 881 21 1,684
0.00 200,000.00 975,000.00 87,029,818.85 2,106,570.70 176,390,058.55
0 1 4 1,497 0 3,061
1 0 4 235 27 550
1,500,000.00 0.00 3,160,001.00 198,469,794.81 33,443,045.91 474,042,785.62
8 0 13 1,001 205 3,090
0 1 0 109 1 252
0.00 2,000,000.00 0.00 414,215,874.20 2,499,900.00 881,160,680.09
0 3 0 793 0 2,018
1 1 1 31 1 106
116,250,800.00 10,500,000.00 10,500,000.00 1,445,273,097.62 10,500,000.00 12,413,466,021.40
202 20 29 1,665 162 5,364
1 1 1 2 1 28
5 3 4 4 4 129
1 1 1 2 1 38
88.84 107.64 87.58 47.63 87.98
Page 161

General Profile, Toril District, Davao City, 2020
Development Indicators
Prevalence Rate of Severely Underweight Children aged 0-
71 months
School Facilities, Dep.Ed 2019
Total Number of Schools
Public Schools
Elementary
High School
Sr. High School
Private Schools
Elementary
Elementary/High School
High School
Sr. High School
Tertiary
Vocational School
Social Welfare, CSSDO 2019
Total Number of Day Care Centers
Center Based
Day Care Center
Home Based
Supervised Neighborhood play
IV. Environmental Management
Garbage Disposal Practices, BC, OCPDC-RSD
MRF, CENRO
V. Infrastructure and Utilities
Power, DLPC 2019
Number of Streetlights
Water System, DCWD, CEO, 2019
DCWD/BAWASA
Level I, (no. of units)
Tagluno Tagurano Tibuloy Toril Proper Tungkalan TOTAL
0.49 1.85 0.71 0.56 0.27
1 1 1 21 2 88
1 1 1 2 1 34
1 1 11
1 9
8 14
2 4
1
3 5
1 3
3 7
2 1 2 3 3 77
2 1 2 3 1 64
2 13
Burying Burying Burying Collected Burying
DLPC DLPC DLPC DLPC DLPC
2 64 81 279 110 3,554
BAWASA DCWD/BAWASA
1
Page 162

General Profile, Toril District, Davao City, 2020
Development Indicators
Level II, (no. of units)
VI. Local Government Administration
Membership of Barangay Council, BCCAD, 2017-2019
Barangay Captain
Barangay Kagawad (7)
Sanggunian Kabataan Representative
Tagluno Tagurano Tibuloy Toril Proper Tungkalan TOTAL
1 3 2 3 57
Hon. Renato A.
Hernando Hon. Joel P. Relator
Hon. Raul S.
Remperas Hon. Lilibeth L. Al-ag
Hon. Hipolito L.
Castañares
Gil Jhon D. Pombo Danilo A. Camarillo Linda P. Pabe Gina A. Ching Jhoan L. Macaso
Marjorie M. Unana Lamberto T. Aguilar Dennis E. Pendon Sherly O. Dante Dexter M. Batadlan
Virgilio Sumunong Willy K. Yano Analiza G. Remperas Dante M. Lantayona Alnurfo A. Guabong
Dorita L. Ticoy Nicanor G. Aguilar Vanjo L. Manga Hermio P. Obeso Ariel L. Venus
Nilda G. Serrano Glicerio G. Gomez Jr. Manuelito S. Acle Olivita A. Alvaro Erdsan M. Cariaga
Jonathan L. Bolo Alex S. Serada Severa R. Bañadera Leonard Rose L. Te Arnold L. Cadavas
Demetria P.
MandalunesVirgilio D. Lerio Leticia S. Yañez Edgar D. Al-ag Zoilo D. Saturinas
Jason C. Bolo Lady Noreen V. Razo Vernane M. Alorro Kiara Kassandra S. PantoJereh Joseph M.
Paglinawan
*Average of four (4) members/household
Sources of data:
PSA - Philippine Statistics Authority CSSDO - City Social Services & Development Office
OCPDC-GIS - Office of the City Planning & Development Coordinator- Geographical Information System BC - Barangay Council
OCPDC-RSD- Office of the City Planning & Development Coordinator- Research & Statistics Division BCCAD - Barangay Cultural Communities Affairs Division
CAO - City Agriculturist's Office CEO - City Engineer's Office
Bus. Bureau - Business Bureau DCWD - Davao City Water District
CHO - City Health Office DLPC - Davao Light & Power Corporation
DepEd - Department of Education
Page 163

Page 95
Baguio District
Baguio Proper Malagos
Cadalian Tambobong
Carmen Tawan-tawan
Gumalang Wines

General Profile, Baguio District, Davao City, 2020
Development Indicators Baguio Proper Cadalian Carmen Gumalang Malagos
I. Demography
Population Projection 2020, OCPDC 5,216 2,741 2,416 5,693 7,310
Population, PSA 2015 census 4,655 2,446 2,156 5,081 6,524
Estimated Number of Households*, 2015 1,164 612 539 1,270 1,631
Population, PSA 2010 Census 3,885 2,290 1,946 4,849 5,933
Population, PSA 2007 Census 3,941 2,165 1,919 4,131 4,560
Population, PSA 2000 Census 3,067 1,862 1,681 3,869 4,463
Geography
Land Area, (in has), OCPDC-GIS 848.740 628.150 806.010 1,572.780 1,210.590
Distance from City Hall to Brgy. Proper, (in kms.), OCPDC-
GIS34.28 38.57 43.36 34.72 31.57
Number of Puroks, OCPDC-RSD 14 10 9 12 8
Boundaries, OCPDC-GIS
North Wines Tawan Tawan Mt. Apo National Park Tamugan / Lamanan Gumalang / Lacson
South Cawayan Tamayong Tamayong Wines / Malagos Cawayan
East Malagos Cawayan / Baguio Proper Tamayong Lacson Calinan Proper/Wangan
West Tawan Tawan/Cadalian Mt. Apo National Park Mt. Apo National Park Tamugan Wines / Baguio Proper
Locational Characteristics Riverbank Inland Inland Riverbank Riverbank
Rural/Urban Classifications Urban Rural Rural urban Urban
Land Use, (in has.), OCPDC-GIS
Floodway Mitigation 0.360 - - 21.250 225.710
Landslide Mitigation - - - - -
Medium Density Residential - - - - 0.070
Rural Settlement Area 76.110 76.070 49.170 79.120 78.520
Prime Agricultural 470.520 324.100 72.900 1,132.720 723.600
Agricultural Non-Tillage 68.190 56.660 117.320
Conservation 242.190 95.770 590.080 201.310 57.030
Special Use - - - - 0.010
Marginal 59.560 132.210 25.670 81.720 8.330
Total 848.740 628.150 806.010 1,572.780 1,210.590
Page 96

General Profile, Baguio District, Davao City, 2020
Development Indicators Baguio Proper Cadalian Carmen Gumalang Malagos
Soil Classification, CAO TugbokClay Tugbok Clay Tugbok Clay Tugbok Clay Tugbok Clay
Elevation (in has.), OCPDC-GIS
>200 m - - - 25.175 82.909
201 - 500 m 660.817 20.142 - 1,547.605 1,127.681
501-1,000m 187.923 608.008 420.760 - -
1,001 - 1,500 m - - 385.250 - -
Total 848.740 628.150 806.010 1,572.780 1,210.590
Slope (in has.), OCPDC-GIS
Level to Nearly Level (0-3%) - - - 339.789 -
Gently Sloping to Undulating Range (3-8%) - - - 194.376 -
Undulating to Unrolling Range (8-8%) 793.170 456.588 67.953 872.420 1,124.872
Rolling to Moderately Steep Range (18-30%) - - - 108.983 -
Steep Range (30-50%) - - 17.674 57.212 7.661
Very Steep Range (>50%) 55.570 171.562 720.382 - 78.057
Total 848.740 628.150 806.010 1,572.780 1,210.590
II. Economic Services
Commercial & Industrial Establishments, Bus. Bureau, 2019
Micro
Number 36 13 7 25 38
Total Capitalization (in million pesos) 2,975,000.00 834,500.00 330,000.00 1,470,000.00 2,264,500.24
Declared No. of Employees 42 7 6 11 78
Small
Number 9 4 2 7 6
Total Capitalization (in million pesos) 8,900,000.00 2,240,001.00 1,000,002.00 5,550,000.00 7,120,000.00
Declared No. of Employees 100 21 13 21 70
Medium
Number 4 0 1 2 4
Total Capitalization (in million pesos) 10,600,000.00 0.00 5,700,000.00 8,720,000.00 15,760,000.00
Declared No. of Employees 182 0 8 147 173
Page 97

General Profile, Baguio District, Davao City, 2020
Development Indicators Baguio Proper Cadalian Carmen Gumalang Malagos
Large
Number 0 1 0 4 2
Total Capitalization (in million pesos) 0.00 61,699,844.00 0.00 79,457,131.00 28,994,914.00
Declared No. of Employees 0 0 0 188 4
III. Social Services
No. of Health Centers, CHO 2019 2 1 1 1 2
Barangay Health Human Resources
No. of Barangay Health Workers 7 8 9 8 9
No. of Barangay Nutrition Scholars 2 2 2 2 3
Health Services, CHO 2019
% of Fully Immunized Children aged 11 months old and
below69.23 55.95 94.17 40.83 70.37
Prevalence Rate of Severely Underweight Children
aged 0-71 months0.34 1.92 1.61 0.76 1.82
School Facilities, Dep.Ed 2019
Total Number of Schools 4 1 1 4 1
Public Schools
Elementary 1 1 1 1 1
High School 1 1
Sr. High School 1 1
Private Schools
Elementary 1
Vocational School 1
Social Welfare, CSSDO 2019
Total Number of Day Care Centers 3 2 2 6 4
Center Based
Day Care Center 2 2 2 6 3
Home Based
Supervised Neighborhood play 1
PTOP 1
Page 98

General Profile, Baguio District, Davao City, 2020
Development Indicators Baguio Proper Cadalian Carmen Gumalang Malagos
IV. Environmental Management
Garbage Disposal Practices, BC, OCPDC-RSD Collected / Burying Burying Burying Burying Collected / Burying
MRF, CENRO ✓ ✓
V. Infrastructure and Utilities
Power, DLPC 2019 DLPC DLPC DLPC DLPC DLPC
Number of Streetlights 153 61 50 231 239
Water System, DCWD, CEO, 2019
DCWD/BAWASA BAWASA BAWASA BAWASA
Level II, (no. of units) 2 1 1 4 1
VI. Local Government Administration
Membership of Barangay Council, BCCAD, 2017-2019
Barangay Captain Hon. Joselito A. Cajes Hon. Aristides P. Cajes Hon. Alfredo B. Austral Sr. Elena S. Acain Hon. Arnel A. Liong
Barangay Kagawad (7) Grace D. Cajes Cesar A. Abas Virgelia R. Cresencio Michael D. Taperla Lydia A. Liong
Vicente M. Tar Jr. Allan I. Martinez Socrates R. Estomata Jennifer E. Porgarillas Jonas E. Banguis
Karen C. Mendez Rogelio L. Gumban Rustico A. Rosales Flordiliza S. Canubas Angelito M. Oxales
Gerald M. Dumandan Roman M. Miraflores Julito P. Cajes Francis M. Balucos Dennis P. Agad
Arsenio T. Mahumot Jr. Jack L. Angco Julieto G. Angco Carlos L. Malik Alexander C. Alaya-an
Antonio C. Tey Leonard P. Cabang Jean S. Delina Nolan B. Enoc Luzviminda D. Deatras
Arsenio M. Masaglang Reynaldo B. Busalanan Walter F. Dublico Hannah Jessel G. Escalante Elysees R. Agad
Sanggunian Kabataan Representative Edriele Mae P. Ordista Jommel D. Porlares Laurence Dave P. Pacot Elisa C. Baslan
*Average of four (4) members/household
Sources of data:
PSA - Philippine Statistics Authority CSSDO - City Social Services & Development OfficeOCPDC-GIS - Office of the City Planning & Development Coordinator- Geographical Information System BC - Barangay CouncilOCPDC-RSD- Office of the City Planning & Development Coordinator- Research & Statistics Division BCCAD - Barangay Cultural Communities Affairs DivisionCAO - City Agriculturist's Office CEO - City Engineer's OfficeBus. Bureau - Business Bureau DCWD - Davao City Water DistrictCHO - City Health Office DLPC - Davao Light & Power CorporationDepEd - Department of Education
Page 99

General Profile, Baguio District, Davao City, 2020
Development Indicators
I. Demography
Population Projection 2020, OCPDC
Population, PSA 2015 census
Estimated Number of Households*, 2015
Population, PSA 2010 Census
Population, PSA 2007 Census
Population, PSA 2000 Census
Geography
Land Area, (in has), OCPDC-GIS
Distance from City Hall to Brgy. Proper, (in kms.), OCPDC-
GIS
Number of Puroks, OCPDC-RSD
Boundaries, OCPDC-GIS
North
South
East
West
Locational Characteristics
Rural/Urban Classifications
Land Use, (in has.), OCPDC-GIS
Floodway Mitigation
Landslide Mitigation
Medium Density Residential
Rural Settlement Area
Prime Agricultural
Agricultural Non-Tillage
Conservation
Special Use
Marginal
Total
Tambobong Tawan-tawan Wines TOTAL
6,715 4,357 3,506 37,952
5,993 3,889 3,129 33,873
1,498 972 782 8,468
5,243 3,463 2,775 30,384
4,394 3,349 2,796 27,255
3,613 3,216 2,608 24,379
1,230.050 974.390 791.780 8,062.490
48.67 37.59 37.34
33 20 15 121
Suawan / Tamugan Tambobong / Wines Gumalang
Mt. Apo National Park Cadalian Baguio Proper/Tawan-Tawan
Wines / Tawan Tawan Baguio Proper Malagos
Suawan Mt. Apo National Park Tambobong
Riverbank Riverbank Riverbank
Rural Rural Rural
- - 128.650 375.970
13.200 - - 13.200
- - - 0.070
78.050 78.520 74.530 590.090
11.560 673.180 484.750 3,893.330
875.320 1,117.490
199.460 222.690 103.850 1,712.380
- - - 0.010
52.460 - - 359.950
1,230.050 974.390 791.780 8,062.490
Page 100

General Profile, Baguio District, Davao City, 2020
Development Indicators
Soil Classification, CAO
Elevation (in has.), OCPDC-GIS
>200 m
201 - 500 m
501-1,000m
1,001 - 1,500 m
Total
Slope (in has.), OCPDC-GIS
Level to Nearly Level (0-3%)
Gently Sloping to Undulating Range (3-8%)
Undulating to Unrolling Range (8-8%)
Rolling to Moderately Steep Range (18-30%)
Steep Range (30-50%)
Very Steep Range (>50%)
Total
II. Economic Services
Commercial & Industrial Establishments, Bus. Bureau, 2019
Micro
Number
Total Capitalization (in million pesos)
Declared No. of Employees
Small
Number
Total Capitalization (in million pesos)
Declared No. of Employees
Medium
Number
Total Capitalization (in million pesos)
Declared No. of Employees
Tambobong Tawan-tawan Wines TOTAL
Tugbok Clay Tugbok Clay Tugbok Clay -
- - - 108.084
656.599 152.798 735.194 4,900.835
573.451 821.592 56.586 2,668.321
- - - 385.250
1,230.050 974.390 791.780 8,062.490
- - - 339.789
- - - 194.376
0.000 440.678 580.181 4,335.863
637.890 247.895 152.123 1,146.891
207.209 10.440 59.476 359.673
384.951 275.377 - 1,685.898
1,230.050 974.390 791.780 8,062.490
8 10 7 144
790,000.00 815,000.00 380,655.88 9,859,656.12
202 12 3 361
1 1 2 32
540,000.00 1,400,000.00 1,130,000.00 27,880,003.00
4 6 7 242
0 1 0 12
0.00 2,613,720.00 0.00 43,393,720.00
0 0 0 510
Page 101

General Profile, Baguio District, Davao City, 2020
Development Indicators
Large
Number
Total Capitalization (in million pesos)
Declared No. of Employees
III. Social Services
No. of Health Centers, CHO 2019
Barangay Health Human Resources
No. of Barangay Health Workers
No. of Barangay Nutrition Scholars
Health Services, CHO 2019
% of Fully Immunized Children aged 11 months old and
below
Prevalence Rate of Severely Underweight Children
aged 0-71 months
School Facilities, Dep.Ed 2019
Total Number of Schools
Public Schools
Elementary
High School
Sr. High School
Private Schools
Elementary
Vocational School
Social Welfare, CSSDO 2019
Total Number of Day Care Centers
Center Based
Day Care Center
Home Based
Supervised Neighborhood play
PTOP
Tambobong Tawan-tawan Wines TOTAL
0 1 1 9
0.00 50,000,000.00 89,850,266.00 310,002,155.00
0 13 0 205
1 1 1 10
14 9 10 74
3 2 2 18
59.66 47.68 37.04
0.27 1.00 0.99
6 4 1 22
3 2 1 11
1 1 4
1 1 4
1 2
1
4 6 4 31
1 4 2 22
3 2 6
2 3
Page 102

General Profile, Baguio District, Davao City, 2020
Development Indicators
IV. Environmental Management
Garbage Disposal Practices, BC, OCPDC-RSD
MRF, CENRO
V. Infrastructure and Utilities
Power, DLPC 2019
Number of Streetlights
Water System, DCWD, CEO, 2019
DCWD/BAWASA
Level II, (no. of units)
VI. Local Government Administration
Membership of Barangay Council, BCCAD, 2017-2019
Barangay Captain
Barangay Kagawad (7)
Sanggunian Kabataan Representative
Tambobong Tawan-tawan Wines TOTAL
Burying Burying Burying
DLPC DLPC DLPC
42 56 34 866
BAWASA BAWASA BAWASA
2 2 3 16
Hon. Exequil M. Salandao Hon. Ricardo A. Gierran Hon. Margie B. Binobo
Andy L. Bustamante Sr. Jimmy A. Enoch Nesson S. Binobo
Merilyn B. Bayok Danilo L. Gumapac Reynaldo E. Ong
Romeo E. Bualan Pedro B. Bolasito Jr. Helen A. Vosotros
Arnold M. Gelicame Jose E. Salvo Jr. Nerisa B. Tejero
Rudy M. Marquezo Lilibeth G. Salido Alex A. Anung
Roy T. Sandad Randy C. Legaspi Luzviminda A. Molo
Ruben L. Maguan Arhon L. Delprado Ludencio V. Cayog Jr.
Desiree L. Gariando Roel A. Lebe Ronalyn C. Biaca
*Average of four (4) members/household
Sources of data:
PSA - Philippine Statistics Authority CSSDO - City Social Services & Development OfficeOCPDC-GIS - Office of the City Planning & Development Coordinator- Geographical Information System BC - Barangay CouncilOCPDC-RSD- Office of the City Planning & Development Coordinator- Research & Statistics Division BCCAD - Barangay Cultural Communities Affairs DivisionCAO - City Agriculturist's Office CEO - City Engineer's OfficeBus. Bureau - Business Bureau DCWD - Davao City Water DistrictCHO - City Health Office DLPC - Davao Light & Power CorporationDepEd - Department of Education
Page 103
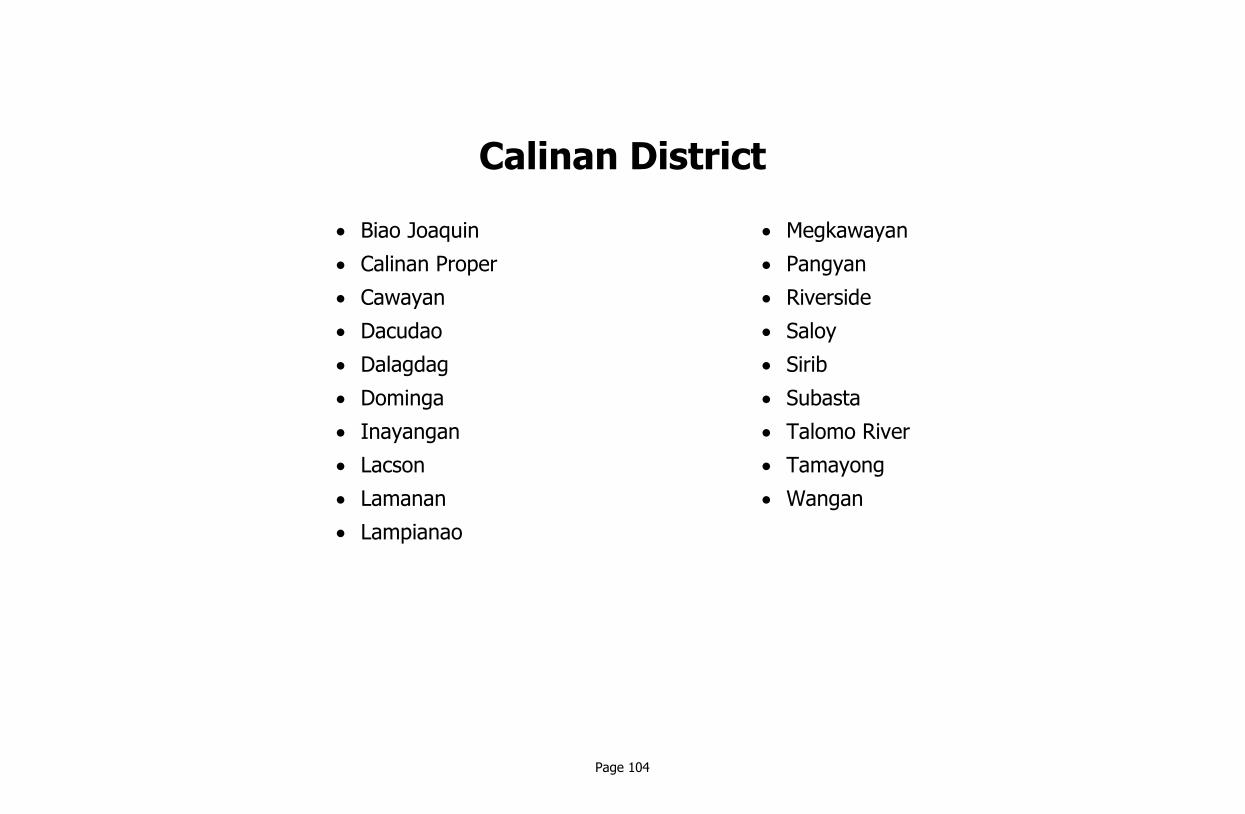
Page 104
Calinan District
Biao Joaquin Megkawayan
Calinan Proper Pangyan
Cawayan Riverside
Dacudao Saloy
Dalagdag Sirib
Dominga Subasta
Inayangan Talomo River
Lacson Tamayong
Lamanan Wangan
Lampianao

General Profile, Calinan District, Davao City, 2020
Development Indicator Biao Joaquin Calinan Proper Cawayan Dacudao Dalagdag Dominga Inayangan
I. Demography
Population Projection 2020, OCPDC 2,565 25,828 2,571 4,950 1,046 1,801 5,414
Population, PSA 2015 census 2,289 23,052 2,295 4,418 934 1,607 4,832
Estimated Number of Households*, 2015 572 5,763 574 1,105 234 402 1,208
Population, PSA 2010 Census 1,767 22,979 2,186 4,206 841 1,218 4,058
Population, PSA 2007 Census 1,674 20,492 1,973 3,862 869 1,525 3,954
Population, PSA 2000 Census 1,453 20,049 1,679 3,292 899 1,460 3,875
Geography
Land Area, (in has), OCPDC-GIS 551.620 830.550 805.450 1,247.050 535.120 602.110 1,420.540
Distance from City Hall to Brgy. Proper, (in kms.), OCPDC-GIS 30.09 27.18 34.34 31.32 43.78 39.72 39.23
Number of Puroks, OCPDC-RSD 10 38 10 12 9 12 32
Boundaries, OCPDC-GIS
North Pangyan Dacudao Baguio / Malagos Dominga Sumimao Sumimao Megkawayan
South Biao Guianga Wangan SiribCalinan / Tal.
River
Lampianao /
PangyanDacudao Lamanan
East Talandang Tal. River Wangan / Subasta Pangyan Fatima Dalagdag Sumimao
West Talomo River Malagos Cadalian Lacson Dominga Lamanan Saloy
Locational Characteristics Inland Inland Riverbank Riverbank Riverbank Riverbank Inland
Rural/Urban Classificiations Rural Urban Rural Rural Rural Rural Rural
Land Use, (in has.), OCPDC-GIS
Floodway Mitigation - 675.700 31.890 15.830 31.830 0.600 -
Landslide Mitigation - - - 26.760 - - -
Institution - - - 1.820 - - -
Medium Density Residential - 4.700 - - - - -
Low Density Residential - 0.460 - - - - -
Rural Settlement Area 70.230 - 78.520 12.330 68.900 - 10.010
Light Industrial - 0.180 - - - - -
Agro-Industrial - 124.130 - 0.110 - - -
Page 105

General Profile, Calinan District, Davao City, 2020
Development Indicator Biao Joaquin Calinan Proper Cawayan Dacudao Dalagdag Dominga Inayangan
Prime Agricultural 381.670 4.500 605.480 917.710 27.960 133.200 21.810
Agricultural Non-Tillage 98.610 - - 39.490 371.740 295.620 842.080
Conservation - - 89.560 133.040 34.690 172.050 532.680
Open Space - 3.810 - - - - -
Special Use - 3.940 - - - - -
Marginal 1.110 13.130 - 99.960 - 0.640 13.960
Total 551.620 830.550 805.450 1,247.050 535.120 602.110 1,420.540
Soil Classification, CAO Tugbok Clay Tugbok Clay Tugbok Clay Tugbok Clay Tugbok Clay Tugbok Clay Tugbok Clay
Elevation (in has.), OCPDC-GIS
>101 m - - - - 5.850 - -
101 - 300 m - A 91.108 782.389 0.000 1,230.181 376.180 361.400 159.380
301 - 500 m - Upland / B 460.512 48.161 758.526 16.869 153.090 240.710 1,176.060
501 - 1,000 m - Hillyland / C - - 46.924 - - - 85.100
1,001 - 1,500 m - Low Elevation Highland / D - - - - - - -
1,501 - 5,000 m - Medium Elevation Highland - - - - - - -
Total 551.620 830.550 805.450 1,247.050 535.120 602.110 1,420.540
Slope (in has.), OCPDC-GIS
Level to Nearly Level (0-3%) - 240.621 - 292.919 335.729 85.116 1.100
Gently Sloping to Undulating Range (3-8%) 551.620 322.555 - 912.629 10.751 113.221 0.000
Undulating to Unrolling Range (8-8%) - 267.374 719.987 34.402 26.653 - 16.541
Rolling to Moderately Steep Range (18-30%) - - - - 20.100 - 360.493
Steep Range (30-50%) - - - 7.100 66.508 215.339 794.298
Very Steep Range (>50%) - - 85.463 - 75.379 188.434 248.109
Total 551.620 830.550 805.450 1,247.050 535.120 602.110 1,420.540
II. Economic Services
Commercial & Industrial Establishments, Bus. Bureau, 2019
Micro
Number 4 744 7 15 2 0 2
Total Capitalization (in million pesos) 359,000.00 75,743,200.00 859,500.00 1,013,065.00 270,000.00 0.00 460,000.00
Page 106

General Profile, Calinan District, Davao City, 2020
Development Indicator Biao Joaquin Calinan Proper Cawayan Dacudao Dalagdag Dominga Inayangan
Declared No. of Employees 4 1,236 21 8 5 0 4
Small
Number 3 210 0 5 4 0 3
Total Capitalization (in million pesos) 1,800,001.00 170,452,603.70 0.00 6,211,501.00 4,500,000.00 0.00 3,756,840.00
Declared No. of Employees 19 863 0 13 14 0 5
Medium
Number 1 91 1 9 0 0 0
Total Capitalization (in million pesos) 2,000,000.00 325,587,144.94 5,227,335.00 31,055,940.00 0.00 0.00 0.00
Declared No. of Employees 6 740 0 6 0 0 0
Large
Number 2 18 3 5 0 0 0
Total Capitalization (in million pesos) 21,250,000.00 292,706,127.22 167,027,482.31 58,500,000.00 0.00 0.00 0.00
Declared No. of Employees 97 1,084 473 152 0 0 0
III. Social Services
No. of Health Centers, CHO 2019 1 2 1 1 1 1 1
Barangay Health Human Resources
No. of Barangay Health Workers 6 10 8 7 4 6 10
No. of Barangay Nutrition Scholars 2 8 1 2 1 2 2
No. of Health Centers, CHO 2019
% of Fully Immunized Children aged 11 months old and
below90.65 93.26 100.02 79.93 75.6 85.14 65.78
Prevalence Rate of Severely Underweight Children aged 0-
71 months1.01 0.24 0.93 1.19 0.00 0.52 0.73
School Facilities, Dep.Ed 2019
Total Number of Schools 1 17 1 3 1 2 4
Public Schools
Elementary 1 2 1 1 1 2 2
High School 1 1 1
Page 107

General Profile, Calinan District, Davao City, 2020
Development Indicator Biao Joaquin Calinan Proper Cawayan Dacudao Dalagdag Dominga Inayangan
Sr. High School 1 1 1
Private Schools
Elementary 2
Elementary/High School 5
Sr. High School 4
Tertiary 1
Vocational School 1
Social Welfare, CSSDO 2019
Total Number of Day Care Centers 1 15 2 2 1 2 7
Center Based
Day Care Center 1 12 1 2 1 1 7
Child Minding Center 1
Home Based
Supervised Neighborhood play 1 1
PTOP 1 1
IV. Environmental Management
Garbage Disposal Practices, BC, OCPDC-RSD Collected Collected Burying CollectedCollected /
BuryingBurying Burying
MRF, CENRO ✓
V. Infrastructure and Utilities
Power, DLPC 2019 DLPC DLPC DLPC DLPC DLPC DLPC DLPC
Number of Streetlights 104 613 87 150 15 44 20
Water System, DCWD, CEO, 2019
DCWD/BAWASA DCWD BAWASA BAWASA BAWASA BAWASA
Level I, (no. of units) 2
Level II, (no. of units) 5 3 2 2 2 3
VI. Local Government Administration
Membership of Barangay Council, BCCAD, 2017-2019
Barangay CaptainHon. Grecie P.
Cañedo
Hon. Ursicio M.
Ungab
Hon. Frederic A.
Villarino
Hon. Cesario P.
Darunday
Hon. Rogelio O.
Dela Cruz
Hon. Ivy Marie L.
LumandasHon. Lilia D. Ruta
Page 108

General Profile, Calinan District, Davao City, 2020
Development Indicator Biao Joaquin Calinan Proper Cawayan Dacudao Dalagdag Dominga Inayangan
Barangay Kagawad (7) Pedrito P. Cañedo Pedrito C. Angco Josenito L. Samson Jefrey E. Tabuena Reynante E. Lansoy Menandro G. Gruba Noel C. Aragon
Perla R. RomitaresLeonardo G.
CamelotesIrish Jean P. Cubol Editha D. Jumarito Jose R. Badil Annabella U. Loma Gilbert D. Ruta
Emelee T. BadalTrisha Ann J.
VillafuerteMojen A. Jammang Francis C. Atay Gracelyn G. Tubo
Romeo R. Delos
ReyesMarilou T. Verceles
Alberto B. Lampa Geomarey P. PepitoAngelo Gabriel P.
Nareno
Alejandrino P.
VelascoEdwin A. Tangub
May John M. Ampo-
an
Jenevy S.
Comendador
Timoteo S. Balicat
Jr.Noel P. Fermendoza
Ranulfo M.
Gayanoche Sr. Arman V. Rosete Tita A. Libuan Allan M. Ungab Daniel M. Orong Jr.
Ryan A. Alfar Joel V. Junsay Francisco L. Villarino Oswaldo T. Aragon
Sr.Lorena C. Corador Romel P. Villegas Luisa E. Requizo
Judith N. Seniel Antonio J. Quiamco Arden Joey E. Endil Arnel R. Balambao Gaspar P. Apostol Jr. Efren G. Arañas Noel P. Sabijon Sr.
Sanggunian Kabataan Representative Joy C. LamanilaoTrixy Marie A.
MacaraegJovito C. Aleo Jr.
Kimberly Janne D.
BautistaJudine A. Cases Marjorie M. Banan Warren E. Cono
*Average of four (4) members/household
Sources of data:
PSA - Philippine Statistics Authority CSSDO - City Social Services & Development Office
OCPDC-GIS - Office of the City Planning & Development Coordinator- Geographical Information System BC - Barangay Council
OCPDC-RSD- Office of the City Planning & Development Coordinator- Research & Statistics Division BCCAD - Barangay Cultural Communities Affairs Division
CAO - City Agriculturist's Office CEO - City Engineer's Office
Bus. Bureau - Business Bureau DCWD - Davao City Water District
CHO - City Health Office DLPC - Davao Light & Power Corporation
DepEd - Department of Education
Page 109

General Profile, Calinan District, Davao City, 2020
Development Indicator
I. Demography
Population Projection 2020, OCPDC
Population, PSA 2015 census
Estimated Number of Households*, 2015
Population, PSA 2010 Census
Population, PSA 2007 Census
Population, PSA 2000 Census
Geography
Land Area, (in has), OCPDC-GIS
Distance from City Hall to Brgy. Proper, (in kms.), OCPDC-GIS
Number of Puroks, OCPDC-RSD
Boundaries, OCPDC-GIS
North
South
East
West
Locational Characteristics
Rural/Urban Classificiations
Land Use, (in has.), OCPDC-GIS
Floodway Mitigation
Landslide Mitigation
Institution
Medium Density Residential
Low Density Residential
Rural Settlement Area
Light Industrial
Agro-Industrial
Lacson Lamanan Lampianao Megkawayan Pangyan Riverside
6,580 5,084 947 3,378 2,280 6,106
5,873 4,538 845 3,015 2,035 5,450
1,468 1,135 211 754 509 1,363
4,466 3,343 760 2,766 1,725 5,108
4,559 3,055 632 2,516 1,731 4,628
3,561 3,395 621 1,845 1,509 3,635
896.960 2,094.880 935.540 1,844.950 708.970 514.850
31.42 36.01 44.24 43.88 32.49 23.72
13 26 10 23 6 13
Lamanan Inayangan Dalagdag/Fatima Paquibato Dalagdag Talomo River
Malagos Lacson / Dacudao Callawa Inayangan Talandang Los Amigos
Dacudao Dominga Fatima Malabog / Sumimao Lampianao Biao Guianga
GumalangTamayong /
GumalangPangyan Saloy Dacudao Wangan
Riverbank Riverbank Riverbank Inland Riverbank Riverbank
Rural Rural Rural Rural Rural Urban
114.760 14.150 113.840 - 34.280 130.920
- - - - 108.100 -
- - - - - -
- - - - - 208.560
- - - - - 0.010
55.320 105.100 52.240 57.590 57.610 -
- - - - - -
- - - - - 3.140
Page 110

General Profile, Calinan District, Davao City, 2020
Development Indicator
Prime Agricultural
Agricultural Non-Tillage
Conservation
Open Space
Special Use
Marginal
Total
Soil Classification, CAO
Elevation (in has.), OCPDC-GIS
>101 m
101 - 300 m - A
301 - 500 m - Upland / B
501 - 1,000 m - Hillyland / C
1,001 - 1,500 m - Low Elevation Highland / D
1,501 - 5,000 m - Medium Elevation Highland
Total
Slope (in has.), OCPDC-GIS
Level to Nearly Level (0-3%)
Gently Sloping to Undulating Range (3-8%)
Undulating to Unrolling Range (8-8%)
Rolling to Moderately Steep Range (18-30%)
Steep Range (30-50%)
Very Steep Range (>50%)
Total
II. Economic Services
Commercial & Industrial Establishments, Bus. Bureau, 2019
Micro
Number
Total Capitalization (in million pesos)
Lacson Lamanan Lampianao Megkawayan Pangyan Riverside
470.470 395.520 3.160 22.410 417.630 153.930
136.750 1,161.290 766.300 1,349.430 52.760 -
94.540 391.420 - 367.790 - -
- - - - - -
- - - - - 18.290
25.120 27.400 - 47.730 38.590
896.960 2,094.880 935.540 1,844.950 708.970 514.850
Tugbok Clay Tugbok Clay Tugbok Clay Tugbok Clay Tugbok Clay Tugbok Clay
- - 346.589 - 88.101 -
197.737 415.953 531.193 29.499 587.068 349.051
699.223 1,678.927 57.758 1,244.936 33.800 165.799
- - - 570.515 - -
- - - - - -
- - - - - -
896.960 2,094.880 935.540 1,844.950 708.970 514.850
40.753 360.979 261.976 - 0.095 -
427.434 666.912 41.401 - 507.518 514.850
306.007 213.434 521.311 547.600 1.000 -
- 35.086 - 462.850 - -
122.766 703.823 110.852 720.400 200.357 -
- 114.646 - 114.100 - -
896.960 2,094.880 935.540 1,844.950 708.970 514.850
15 2 6 4 1 40
1,515,000.00 77,500.00 500,000.00 865,000.00 100,000.00 2,330,200.00
Page 111

General Profile, Calinan District, Davao City, 2020
Development Indicator
Declared No. of Employees
Small
Number
Total Capitalization (in million pesos)
Declared No. of Employees
Medium
Number
Total Capitalization (in million pesos)
Declared No. of Employees
Large
Number
Total Capitalization (in million pesos)
Declared No. of Employees
III. Social Services
No. of Health Centers, CHO 2019
Barangay Health Human Resources
No. of Barangay Health Workers
No. of Barangay Nutrition Scholars
No. of Health Centers, CHO 2019
% of Fully Immunized Children aged 11 months old and
below
Prevalence Rate of Severely Underweight Children aged 0-
71 months
School Facilities, Dep.Ed 2019
Total Number of Schools
Public Schools
Elementary
High School
Lacson Lamanan Lampianao Megkawayan Pangyan Riverside
7 1 7 5 4 54
5 1 0 1 3 5
4,350,002.00 1,200,000.00 0.00 500,000.00 4,000,000.00 4,730,000.00
14 1 0 4 81 35
0 2 0 0 1 7
0.00 7,550,000.00 0.00 0.00 5,000,000.00 23,430,001.00
0 71 0 0 12 57
3 0 0 0 3 4
45,500,000.00 0.00 0.00 0.00 77,600,000.00 67,983,915.00
49 0 0 0 61 64
1 1 1 1 1 1
6 10 4 6 4 8
2 2 1 2 1 2
131.54 79.77 52.24 71.74 82.44 101.25
1.36 0.37 0.00 3.88 0.00 0.00
1 4 1 3 1 1
1 2 1 1 1 1
1 1
Page 112

General Profile, Calinan District, Davao City, 2020
Development Indicator
Sr. High School
Private Schools
Elementary
Elementary/High School
Sr. High School
Tertiary
Vocational School
Social Welfare, CSSDO 2019
Total Number of Day Care Centers
Center Based
Day Care Center
Child Minding Center
Home Based
Supervised Neighborhood play
PTOP
IV. Environmental Management
Garbage Disposal Practices, BC, OCPDC-RSD
MRF, CENRO
V. Infrastructure and Utilities
Power, DLPC 2019
Number of Streetlights
Water System, DCWD, CEO, 2019
DCWD/BAWASA
Level I, (no. of units)
Level II, (no. of units)
VI. Local Government Administration
Membership of Barangay Council, BCCAD, 2017-2019
Barangay Captain
Lacson Lamanan Lampianao Megkawayan Pangyan Riverside
1 1
4 4 2 2 4 2
4 4 2 1 4 2
1
Collected Collected / Burying Burying Burying Burying Collected
✓ ✓
DLPC DLPC DLPC DLPC DLPC DLPC
160 108 9 44 74 210
BAWASA BAWASA BAWASA BAWASA
1 1 1
1 3 2 1 3
Hon. Nilo H. ForroHon. Nicanor C.
PepitoHon. Nestor D. Mutia Hon. Glenn C. Escovilla
Hon. Bartolome C.
Carillo
Hon. Eduardo T. Bocboc
Sr.
Page 113

General Profile, Calinan District, Davao City, 2020
Development Indicator
Barangay Kagawad (7)
Sanggunian Kabataan Representative
Lacson Lamanan Lampianao Megkawayan Pangyan Riverside
Minda Ley T. Ruben Imelda Y. Orayle Carmelita C. Albeso Joseph P. Moranta Jayson B. Baguio Jocelyn E. Alcaria
Lucita A. Acana Evelyn S. Galanida Normelita F. Mamalis Nenita S. Villadores Rhodora A. Albacite Liza S. Auman
Noel E. Galang, Jr Roque B. Poliquit Jr. Emerlita C. Pore Anecito A. Sampuang Mariano R. Bañados Regino P. Ching
Armando O. Ongcoy Wilfrido R. Escala Renante Boy R. Babiera Roberto C. Navarro Vergelio L. Banac Rene F. Cutamora
Ricky N. Barbanida Nora C. Muñez Hilarion C. Caminse Mamerto A. Satingasin Edwin C. Agbon Abraham C. Seniel
Reynaldo L. Lobrigas Romeo T. Actoy Jeredel B. Arcala Marivic G. Genturales Felipe G. Lagumbay Nick N. Dulalas
Esterlina E. Tagalog Tarsito B. Revil Argie C. Ruiz Rolando L. Escobar Danny P. Guatno Johny Dumanayos
Arnel John S. AgdipaDiane Cristine G.
TeranteCeletino C. Yana Clark Jovani D. Pamat Jomar C. Sensil Richard M. Robin
*Average of four (4) members/household
Sources of data:
PSA - Philippine Statistics Authority CSSDO - City Social Services & Development Office
OCPDC-GIS - Office of the City Planning & Development Coordinator- Geographical Information System BC - Barangay Council
OCPDC-RSD- Office of the City Planning & Development Coordinator- Research & Statistics Division BCCAD - Barangay Cultural Communities Affairs Division
CAO - City Agriculturist's Office CEO - City Engineer's Office
Bus. Bureau - Business Bureau DCWD - Davao City Water District
CHO - City Health Office DLPC - Davao Light & Power Corporation
DepEd - Department of Education
Page 114

General Profile, Calinan District, Davao City, 2020
Development Indicator
I. Demography
Population Projection 2020, OCPDC
Population, PSA 2015 census
Estimated Number of Households*, 2015
Population, PSA 2010 Census
Population, PSA 2007 Census
Population, PSA 2000 Census
Geography
Land Area, (in has), OCPDC-GIS
Distance from City Hall to Brgy. Proper, (in kms.), OCPDC-GIS
Number of Puroks, OCPDC-RSD
Boundaries, OCPDC-GIS
North
South
East
West
Locational Characteristics
Rural/Urban Classificiations
Land Use, (in has.), OCPDC-GIS
Floodway Mitigation
Landslide Mitigation
Institution
Medium Density Residential
Low Density Residential
Rural Settlement Area
Light Industrial
Agro-Industrial
Saloy Sirib Subasta Talomo River Tamayong
2,366 5,825 4,079 7,670 8,149
2,112 5,199 3,641 6,846 7,273
528 1,300 910 1,712 1,818
1,884 4,887 3,466 5,660 5,782
1,699 4,843 2,771 5,130 5,184
1,761 4,492 2,640 3,449 3,266
2,291.361 2,152.646 1,215.880 810.910 1,925.200
46.63 37.53 33.08 29.00 35.44
15 22 8 14 8
Malabog Cadalian / Cawayan Wangan Pangyan Carmen / Cadalian
LamananDaliaon Plantation / Mt.
Apo National ParkTagakpan Riverside Mt. Apo National Park
Megkayawan / InayanganSubasta / Tagakpan /
Manuel GuiangaBalengaeng Biao Joaquin Sirib
Malabog Tamayong Cawayan / Sirib Calinan ProperCarmen / Mt. Apo
National Park
Inland Inland Inland Inland Inland
Rural Rural Rural Rural Rural
- - - 97.130 -
- 0.024 - -
- - - 0.980 -
- - - 13.610 -
- - - - -
78.519 78.519 77.420 16.160 76.040
- - - - -
- - - 0.010 -
Page 115

General Profile, Calinan District, Davao City, 2020
Development Indicator
Prime Agricultural
Agricultural Non-Tillage
Conservation
Open Space
Special Use
Marginal
Total
Soil Classification, CAO
Elevation (in has.), OCPDC-GIS
>101 m
101 - 300 m - A
301 - 500 m - Upland / B
501 - 1,000 m - Hillyland / C
1,001 - 1,500 m - Low Elevation Highland / D
1,501 - 5,000 m - Medium Elevation Highland
Total
Slope (in has.), OCPDC-GIS
Level to Nearly Level (0-3%)
Gently Sloping to Undulating Range (3-8%)
Undulating to Unrolling Range (8-8%)
Rolling to Moderately Steep Range (18-30%)
Steep Range (30-50%)
Very Steep Range (>50%)
Total
II. Economic Services
Commercial & Industrial Establishments, Bus. Bureau, 2019
Micro
Number
Total Capitalization (in million pesos)
Saloy Sirib Subasta Talomo River Tamayong
- 1,172.584 1,046.740 674.110 512.420
1,968.138 421.494 - - 78.230
218.841 397.204 91.720 - 1,258.510
- - - - -
- - - - -
25.863 82.821 8.910 -
2,291.361 2,152.646 1,215.880 810.910 1,925.200
Tugbok Clay Tugbok Clay Tugbok Clay Tugbok Clay Tugbok Clay
- - - - -
- - 88.731 709.117 -
2,080.681 424.756 1,127.149 101.793 15.135
210.680 1,514.452 - - 980.784
- 213.438 - - 820.706
- - - - 108.575
2,291.361 2,152.646 1,215.880 810.910 1,925.200
- - - 266.390 -
197.704 - 52.384 544.520 -
204.094 1,815.398 1,163.496 - 622.851
300.705 - - - -
1,464.106 273.277 - - 558.334
124.752 63.972 - - 744.014
2,291.361 2,152.646 1,215.880 810.910 1,925.200
1 13 13 30 23
50,000.00 1,313,000.00 1,737,500.00 3,804,268.82 3,400,586.00
Page 116

General Profile, Calinan District, Davao City, 2020
Development Indicator
Declared No. of Employees
Small
Number
Total Capitalization (in million pesos)
Declared No. of Employees
Medium
Number
Total Capitalization (in million pesos)
Declared No. of Employees
Large
Number
Total Capitalization (in million pesos)
Declared No. of Employees
III. Social Services
No. of Health Centers, CHO 2019
Barangay Health Human Resources
No. of Barangay Health Workers
No. of Barangay Nutrition Scholars
No. of Health Centers, CHO 2019
% of Fully Immunized Children aged 11 months old and
below
Prevalence Rate of Severely Underweight Children aged 0-
71 months
School Facilities, Dep.Ed 2019
Total Number of Schools
Public Schools
Elementary
High School
Saloy Sirib Subasta Talomo River Tamayong
0 9 12 58 33
1 4 6 10 8
500,000.00 3,843,000.51 5,590,000.00 10,660,000.00 4,750,000.00
5 266 155 192 21
0 1 3 3 1
0.00 3,000,000.00 8,767,000.00 6,700,000.00 5,938,278.50
0 24 29 9 13
0 1 1 1 1
0.00 26,649,794.00 10,500,000.00 15,000,000.00 262,333,325.00
0 0 322 20 12
1 1 1 2 2
3 11 7 6 7
1 3 1 2 3
117.04 78.12 98.2 96.08 87.4
0.00 0.00 0.44 0.49 0.10
5 5 2 2 4
3 3 1 1 1
1 1 1
Page 117

General Profile, Calinan District, Davao City, 2020
Development Indicator
Sr. High School
Private Schools
Elementary
Elementary/High School
Sr. High School
Tertiary
Vocational School
Social Welfare, CSSDO 2019
Total Number of Day Care Centers
Center Based
Day Care Center
Child Minding Center
Home Based
Supervised Neighborhood play
PTOP
IV. Environmental Management
Garbage Disposal Practices, BC, OCPDC-RSD
MRF, CENRO
V. Infrastructure and Utilities
Power, DLPC 2019
Number of Streetlights
Water System, DCWD, CEO, 2019
DCWD/BAWASA
Level I, (no. of units)
Level II, (no. of units)
VI. Local Government Administration
Membership of Barangay Council, BCCAD, 2017-2019
Barangay Captain
Saloy Sirib Subasta Talomo River Tamayong
1 1 1
1 1
1
6 6 3 2 3
2 3 2 2 3
3 2 1
1 1
Collected / Burying Collected / Burying Collected / Burying Collected Collected / Burying
DLPC DLPC DLPC DLPC DLPC
21 169 193 245 60
BAWASA BAWASA BAWASA
1 2
2 1 6 6 1
Hon. Garry C. Gencianos Hon. Marcelina S. Antogop Hon. Vicente C. Enoc Hon. Ana Liza D. Paglas Benjie E. Gantalao
Page 118

General Profile, Calinan District, Davao City, 2020
Development Indicator
Barangay Kagawad (7)
Sanggunian Kabataan Representative
Saloy Sirib Subasta Talomo River Tamayong
George T. Dinampo Godofredo G. Ferrer Marilyn B. Lanciano Carmelito L. Gamad Gregorio C. Canada
Nestor E. Pineda Jimmuel B. Sahidan Renie O. Mahipos Luzminda G. Mangmang Ajam J. Asta
Rodolfo P. Bocton Sr. Teddy A. Dugasan Stanley V. Omo Neil L. Opendo Federico S. Ilando
Alejandro B. Enriquez Romeo A. Tan Frederic B. Urquiza Allan E. Amoy Macario T. Labawan
Roberto S. Villapaz Jr. Luz R. Lagudas Michelle S. Gumban Rogelio V. Ohidor Larry L. Polestico
Edmer L .Tac-on Rodolfo M. Datas Rolando G. Egan Corsino B. Anaviso Taib A. Arabe
Gagiel D. Razon Jannel B. Tan Pablo U. Sullano Guillermo L. Aranjuez Michael Christian U. Marcial
Justin A. Gulay Charis Joy C. Corgeo Rhevine A. Rosales Leonieljun D. Aresco
*Average of four (4) members/household
Sources of data:
PSA - Philippine Statistics Authority CSSDO - City Social Services & Development Office
OCPDC-GIS - Office of the City Planning & Development Coordinator- Geographical Information System BC - Barangay Council
OCPDC-RSD- Office of the City Planning & Development Coordinator- Research & Statistics Division BCCAD - Barangay Cultural Communities Affairs Division
CAO - City Agriculturist's Office CEO - City Engineer's Office
Bus. Bureau - Business Bureau DCWD - Davao City Water District
CHO - City Health Office DLPC - Davao Light & Power Corporation
DepEd - Department of Education
Page 119

General Profile, Calinan District, Davao City, 2020
Development Indicator
I. Demography
Population Projection 2020, OCPDC
Population, PSA 2015 census
Estimated Number of Households*, 2015
Population, PSA 2010 Census
Population, PSA 2007 Census
Population, PSA 2000 Census
Geography
Land Area, (in has), OCPDC-GIS
Distance from City Hall to Brgy. Proper, (in kms.), OCPDC-GIS
Number of Puroks, OCPDC-RSD
Boundaries, OCPDC-GIS
North
South
East
West
Locational Characteristics
Rural/Urban Classificiations
Land Use, (in has.), OCPDC-GIS
Floodway Mitigation
Landslide Mitigation
Institution
Medium Density Residential
Low Density Residential
Rural Settlement Area
Light Industrial
Agro-Industrial
Wangan Total
6,522 103,162
5,821 92,075
1,455 23,019
4,742 81,844
4,927 76,024
4,196 67,077
1,181.460 22,566.047
31.39
19 300
Calinan Proper
Subasta
Riverside
Malagos / Cawayan
Riverbank
Rural
128.010 1,388.940
- 134.884
- 2.800
2.800 229.670
- 0.470
75.540 970.048
- 0.180
- 127.390
Page 120

General Profile, Calinan District, Davao City, 2020
Development Indicator
Prime Agricultural
Agricultural Non-Tillage
Conservation
Open Space
Special Use
Marginal
Total
Soil Classification, CAO
Elevation (in has.), OCPDC-GIS
>101 m
101 - 300 m - A
301 - 500 m - Upland / B
501 - 1,000 m - Hillyland / C
1,001 - 1,500 m - Low Elevation Highland / D
1,501 - 5,000 m - Medium Elevation Highland
Total
Slope (in has.), OCPDC-GIS
Level to Nearly Level (0-3%)
Gently Sloping to Undulating Range (3-8%)
Undulating to Unrolling Range (8-8%)
Rolling to Moderately Steep Range (18-30%)
Steep Range (30-50%)
Very Steep Range (>50%)
Total
II. Economic Services
Commercial & Industrial Establishments, Bus. Bureau, 2019
Micro
Number
Total Capitalization (in million pesos)
Wangan Total
974.670 7,935.974
- 7,581.932
- 3,782.045
0.120 3.930
0.320 22.550
- 385.234
1,181.460 22,566.047
Tugbok Clay
- 440.540
267.655 6,176.643
913.805 11,397.690
- 3,408.455
- 1,034.144
- 108.575
1,181.460 22,566.047
- 1,885.677
96.481 4,959.979
1,084.898 7,545.046
- 1,179.234
- 5,237.162
0.081 1,758.949
1,181.460 22,566.047
15 937
3,045,000.00 97,442,819.82
Page 121

General Profile, Calinan District, Davao City, 2020
Development Indicator
Declared No. of Employees
Small
Number
Total Capitalization (in million pesos)
Declared No. of Employees
Medium
Number
Total Capitalization (in million pesos)
Declared No. of Employees
Large
Number
Total Capitalization (in million pesos)
Declared No. of Employees
III. Social Services
No. of Health Centers, CHO 2019
Barangay Health Human Resources
No. of Barangay Health Workers
No. of Barangay Nutrition Scholars
No. of Health Centers, CHO 2019
% of Fully Immunized Children aged 11 months old and
below
Prevalence Rate of Severely Underweight Children aged 0-
71 months
School Facilities, Dep.Ed 2019
Total Number of Schools
Public Schools
Elementary
High School
Wangan Total
39 1,507
10 279
9,394,000.00 236,237,948.21
32 1,720
1 121
5,753,879.74 430,009,579.18
15 982
0 42
0.00 1,045,050,643.53
0 2,334
1 22
11 134
2 40
66.73
0.13
5 63
1 27
1 9
Page 122

General Profile, Calinan District, Davao City, 2020
Development Indicator
Sr. High School
Private Schools
Elementary
Elementary/High School
Sr. High School
Tertiary
Vocational School
Social Welfare, CSSDO 2019
Total Number of Day Care Centers
Center Based
Day Care Center
Child Minding Center
Home Based
Supervised Neighborhood play
PTOP
IV. Environmental Management
Garbage Disposal Practices, BC, OCPDC-RSD
MRF, CENRO
V. Infrastructure and Utilities
Power, DLPC 2019
Number of Streetlights
Water System, DCWD, CEO, 2019
DCWD/BAWASA
Level I, (no. of units)
Level II, (no. of units)
VI. Local Government Administration
Membership of Barangay Council, BCCAD, 2017-2019
Barangay Captain
Wangan Total
1 9
4
6
4
1
2 3
3 71
3 57
1
9
4
Collected / Burying
DLPC
84 2,410
1 9
2 45
Hon. Danilo M. Ababon
Page 123

General Profile, Calinan District, Davao City, 2020
Development Indicator
Barangay Kagawad (7)
Sanggunian Kabataan Representative
Wangan Total
Ricardo E. Mondigo
Cynthia C. Pondoyo
Shirley C. Bolastig
Anecita D. Agod
Samuel P. Tadle Jr.
Cornelio D. Abella
Fertuliano V. Alquizar
Jannille Lou L. Cagay
*Average of four (4) members/household
Sources of data:
PSA - Philippine Statistics Authority CSSDO - City Social Services & Development Office
OCPDC-GIS - Office of the City Planning & Development Coordinator- Geographical Information System BC - Barangay Council
OCPDC-RSD- Office of the City Planning & Development Coordinator- Research & Statistics Division BCCAD - Barangay Cultural Communities Affairs Division
CAO - City Agriculturist's Office CEO - City Engineer's Office
Bus. Bureau - Business Bureau DCWD - Davao City Water District
CHO - City Health Office DLPC - Davao Light & Power Corporation
DepEd - Department of Education
Page 124

Page 125
Marilog District
Baganihan Magsaysay
Bantol Malamba
Buda Marilog Proper
Dalag Salaysay
Datu Salumay Suawan (Tuli)
Gumitan Tamugan
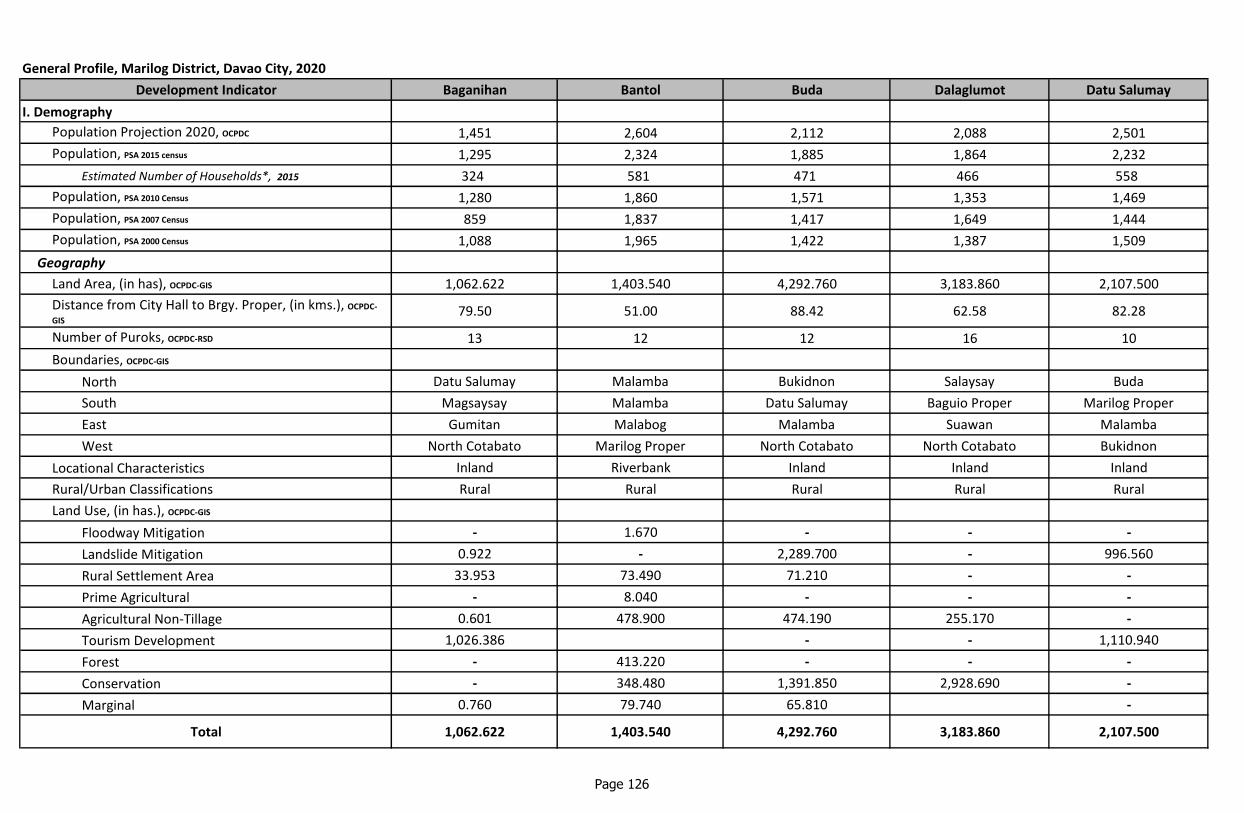
General Profile, Marilog District, Davao City, 2020
Development Indicator Baganihan Bantol Buda Dalaglumot Datu Salumay
I. Demography
Population Projection 2020, OCPDC 1,451 2,604 2,112 2,088 2,501
Population, PSA 2015 census 1,295 2,324 1,885 1,864 2,232
Estimated Number of Households*, 2015 324 581 471 466 558
Population, PSA 2010 Census 1,280 1,860 1,571 1,353 1,469
Population, PSA 2007 Census 859 1,837 1,417 1,649 1,444
Population, PSA 2000 Census 1,088 1,965 1,422 1,387 1,509
Geography
Land Area, (in has), OCPDC-GIS 1,062.622 1,403.540 4,292.760 3,183.860 2,107.500
Distance from City Hall to Brgy. Proper, (in kms.), OCPDC-
GIS79.50 51.00 88.42 62.58 82.28
Number of Puroks, OCPDC-RSD 13 12 12 16 10
Boundaries, OCPDC-GIS
North Datu Salumay Malamba Bukidnon Salaysay Buda
South Magsaysay Malamba Datu Salumay Baguio Proper Marilog Proper
East Gumitan Malabog Malamba Suawan Malamba
West North Cotabato Marilog Proper North Cotabato North Cotabato Bukidnon
Locational Characteristics Inland Riverbank Inland Inland Inland
Rural/Urban Classifications Rural Rural Rural Rural Rural
Land Use, (in has.), OCPDC-GIS
Floodway Mitigation - 1.670 - - -
Landslide Mitigation 0.922 - 2,289.700 - 996.560
Rural Settlement Area 33.953 73.490 71.210 - -
Prime Agricultural - 8.040 - - -
Agricultural Non-Tillage 0.601 478.900 474.190 255.170 -
Tourism Development 1,026.386 - - 1,110.940
Forest - 413.220 - - -
Conservation - 348.480 1,391.850 2,928.690 -
Marginal 0.760 79.740 65.810 -
Total 1,062.622 1,403.540 4,292.760 3,183.860 2,107.500
Page 126

General Profile, Marilog District, Davao City, 2020
Development Indicator Baganihan Bantol Buda Dalaglumot Datu Salumay
Soil Classification, CAO Tugbok Clay Miral Clay Loam Tugbok Clay Kidapawan Clay Kidapawan Clay
Elevation (in has.), OCPDC-GIS
201 - 500 m - 1,256.16 89.69 - 54.94
501 - 1,000 m 453.63 147.38 3,013.84 1,538.85 989.72
1,001 - 1,500 m 608.99 - 1,189.24 1,630.98 1,062.84
1,501 - 5,000 m - - - 14.03 -
Total 1,062.62 1,403.54 4,292.76 3,183.86 2,107.50
Slope (in has.), OCPDC-GIS
Level to Nearly Level (0-3%) - - - - -
Gently Sloping to Undulating Range (3-8%) - 241.43 - - -
Undulating to Unrolling Range (8-8%) - 116.92 - - -
Rolling to Moderately Steep Range (18-30%) - 270.81 - 229.61 -
Steep Range (30-50%) 486.54 606.94 993.45 372.86 526.96
Very Steep Range (>50%) 576.09 167.44 3,299.31 2,581.39 1,580.54
Total 1,062.62 1,403.54 4,292.76 3,183.86 2,107.50
II. Economic Services
Commercial & Industrial Establishments, Bus. Bureau, 2019
Micro
Number 15 10 21 4 3
Total Capitalization (in million pesos) 950,000.00 1,046,111.00 1,920,500.00 93,800.00 360,000.00
Declared No. of Employees 11 11 35 0 5
Small
Number 2 0 5 0 2
Total Capitalization (in million pesos) 3,000,000.00 0.00 4,470,000.00 0.00 1,550,000.00
Declared No. of Employees 2 0 16 0 10
Medium
Number 0 0 0 0 1
Total Capitalization (in million pesos) 0.00 0.00 0.00 0.00 3,500,000.00
Page 127

General Profile, Marilog District, Davao City, 2020
Development Indicator Baganihan Bantol Buda Dalaglumot Datu Salumay
Declared No. of Employees 0 0 0 0 20
Large
Number 0 0 0 0 0
Total Capitalization (in million pesos) 0.00 0.00 0.00 0.00 0.00
Declared No. of Employees 0 0 0 0 0
III. Social Services
No. of Health Centers, CHO 2019 1 1 1 1 2
Barangay Health Human Resources
No. of Barangay Health Workers 3 5 3 6 4
No. of Barangay Nutrition Scholars 1 2 1 2 2
Health Services, CHO 2019
% of Fully Immunized Children aged 11 months old and
below92.06 87.39 107.72 104.21 79.12
Prevalence Rate of Severely Underweight Children aged
0-71 months1.90 0.00 0.38 5.40 2.01
School Facilities, Dep.Ed 2019
Total Number of Schools 1 2 3 1 4
Public Schools
Elementary 1 2 1 1 2
High School 1 1
Sr. High School 1 1
Private Schools
Elementary
Elementary/High School
Sr. High School
Social Welfare, CSSDO 2019
Total Number of Day Care Centers 1 3 4 2 5
Center Based
Day Care Center 1 2 3 1 3
Home Based
Page 128

General Profile, Marilog District, Davao City, 2020
Development Indicator Baganihan Bantol Buda Dalaglumot Datu Salumay
Supervised Neighborhood play 1 1 1 2
IV. Environmental Management
Garbage Disposal Practices, BC, OCPDC-RSD Burying Burying Burying Burying Burying
MRF, CENRO
V. Infrastructure and Utilities
Power, DLPC 2019 DLPC DLPC DLPC DLPC DLPC
Number of Streetlights 0 0 0 0 0
Water System, DCWD, CEO, 2019
DCWD/BAWASA BAWASA BAWASA BAWASA
Level I, (no. of units)
Level II, (no. of units) 3 3 1 1 6
VI. Local Government Administration
Membership of Barangay Council, 2017-2019, BCCAD
Barangay Captain Hon. Arnold S. Angit Hon. Edwin B. Fiel Hon. Delfin M. Galecia Jr. Hon. Oscar B. Labawan Hon. Amado M. Mansabid
Barangay Kagawad (7) Jhoel D. Siawan Alex l. Mahinay Ruben T. Rabanes Ronie A. Orog Lito M. Mansamo
Ricky I. Anggob Bernardino C. Regidor Carlos A. Omaña Jr. Noel S. Lorenton Conrado T. Tenaja Jr.
Pepe D. Laglagan Emerjun E. Magolintang Jethrone B. Roble Ismael D. Lambayon Ponciano A. Betil
William L. Carpio Myrna M. Labora Genalyn T. Hizo Jaime M. Tomas Merilyn L. Uayan
Normelita R. Mariñas Salimar S. Panugo Jerry L. Golbin Maricris B. Palomar Arnel C. Mansabid
Carlos S. Torres Budoy M. Adimat Vincent M. Dayaganon Reynold L. Binobo Elvero A. Molanta
Benilou A. Bardago Jose G. Cinco Bernadette G. Tan Avelino M. Tomas Jr. Pilar A. Burang
Sanggunian Kabataan Representative Angelou S. Rubio Bernard Allan L. Regidor Aljon B. Roble Luther T. Lomonday Ronald M. Manlumin-ao*Average of four (4) members/household
Sources of data:
PSA - Philippine Statistics Authority CSSDO - City Social Services & Development Office
OCPDC-GIS - Office of the City Planning & Development Coordinator- Geographical Information System BC - Barangay Council
OCPDC-RSD- Office of the City Planning & Development Coordinator- Research & Statistics Division BCCAD - Barangay Cultural Communities Affairs Division
CAO - City Agriculturist's Office CEO - City Engineer's Office
Bus. Bureau - Business Bureau DCWD - Davao City Water District
CHO - City Health Office DLPC - Davao Light & Power Corporation
DepEd - Department of Education
Page 129

General Profile, Marilog District, Davao City, 2020
Development Indicator
I. Demography
Population Projection 2020, OCPDC
Population, PSA 2015 census
Estimated Number of Households*, 2015
Population, PSA 2010 Census
Population, PSA 2007 Census
Population, PSA 2000 Census
Geography
Land Area, (in has), OCPDC-GIS
Distance from City Hall to Brgy. Proper, (in kms.), OCPDC-
GIS
Number of Puroks, OCPDC-RSD
Boundaries, OCPDC-GIS
North
South
East
West
Locational Characteristics
Rural/Urban Classifications
Land Use, (in has.), OCPDC-GIS
Floodway Mitigation
Landslide Mitigation
Rural Settlement Area
Prime Agricultural
Agricultural Non-Tillage
Tourism Development
Forest
Conservation
Marginal
Total
Gumitan Magsaysay Malamba Marilog Proper Salaysay
1,967 2,717 5,450 18,137 4,965
1,756 2,425 4,864 16,188 4,431
439 606 1,216 4,047 1,108
1,219 2,347 3,661 14,545 3,936
1,206 2,065 3,347 14,255 3,288
843 2,288 4,375 13,966 3,188
5,727.670 5,830.150 11,074.120 18,031.840 4,467.690
83.06 59.59 50.33 49.21 53.92
10 18 34 45 19
Malamba Baganihan Bukidnon Malamba Magsaysay
Bantol Salaysay Marilog Proper Salysay Dalag
Mapula Marilog Proper Tapak Gumitan Marilog Proper
Marilog Proper North Cotabato Buda Magsaysay North Cotabato
Riverbank Inland Riverbank Riverbank Inland
Rural Rural Rural Rural Rural
- - 0.550 - -
14.080 383.240 2,455.500 3,166.870 28.010
- 78.490 76.480 71.680 72.880
- 82.700 27.180 - -
1,673.430 3,245.800 3,250.670 8,424.970 2,353.460
- - - 0.030 -
2,023.110 791.660 406.690 877.290 -
1,922.860 677.360 4,707.640 3,612.530 1,943.450
94.190 570.900 149.410 1,878.470 69.890
5,727.670 5,830.150 11,074.120 18,031.840 4,467.690
Page 130

General Profile, Marilog District, Davao City, 2020
Development Indicator
Soil Classification, CAO
Elevation (in has.), OCPDC-GIS
201 - 500 m
501 - 1,000 m
1,001 - 1,500 m
1,501 - 5,000 m
Total
Slope (in has.), OCPDC-GIS
Level to Nearly Level (0-3%)
Gently Sloping to Undulating Range (3-8%)
Undulating to Unrolling Range (8-8%)
Rolling to Moderately Steep Range (18-30%)
Steep Range (30-50%)
Very Steep Range (>50%)
Total
II. Economic Services
Commercial & Industrial Establishments, Bus. Bureau, 2019
Micro
Number
Total Capitalization (in million pesos)
Declared No. of Employees
Small
Number
Total Capitalization (in million pesos)
Declared No. of Employees
Medium
Number
Total Capitalization (in million pesos)
Gumitan Magsaysay Malamba Marilog Proper SalaysayMiral Clay Loam/San Miguel Clay
LoamMiral Clay loam Miral Clay loam Miral Clay loam Miral Clay loam
3,051.72 9.17 6,171.97 4,827.36 746.16
2,675.95 4,509.88 4,851.99 9,891.70 3,710.61
- 1,311.10 50.16 3,312.78 10.92
- - - - -
5,727.67 5,830.15 11,074.12 18,031.84 4,467.69
- - 6.44 - -
- - 273.07 - -
- - 600.60 - -
- 1,383.79 1,556.27 1,575.92 1,190.87
2,417.67 2,325.21 2,363.22 10,831.95 1,804.97
3,310.00 2,121.16 6,274.52 5,623.97 1,471.85
5,727.67 5,830.15 11,074.12 18,031.84 4,467.69
0 2 11 108 10
0.00 170,000.00 1,225,000.00 6,205,200.00 214,500.00
0 1 15 72 3
0 0 4 11 1
0.00 0.00 2,940,000.00 10,750,001.00 700,000.00
0 0 9 33 1
0 0 1 4 1
0.00 0.00 2,850,000.00 8,595,000.00 2,100,000.00
Page 131

General Profile, Marilog District, Davao City, 2020
Development Indicator
Declared No. of Employees
Large
Number
Total Capitalization (in million pesos)
Declared No. of Employees
III. Social Services
No. of Health Centers, CHO 2019
Barangay Health Human Resources
No. of Barangay Health Workers
No. of Barangay Nutrition Scholars
Health Services, CHO 2019
% of Fully Immunized Children aged 11 months old and
below
Prevalence Rate of Severely Underweight Children aged
0-71 months
School Facilities, Dep.Ed 2019
Total Number of Schools
Public Schools
Elementary
High School
Sr. High School
Private Schools
Elementary
Elementary/High School
Sr. High School
Social Welfare, CSSDO 2019
Total Number of Day Care Centers
Center Based
Day Care Center
Home Based
Gumitan Magsaysay Malamba Marilog Proper Salaysay
0 0 4 16 5
0 0 0 0 1
0.00 0.00 0.00 0.00 10,500,000.00
0 0 0 0 330
1 1 1 2 1
4 7 5 20 4
2 2 3 7 4
85.46 72.82 40.84 58.36 70.73
12.31 0.29 0.70 2.15 1.26
4 2 9 21 8
4 2 6 19 4
1 2 1
1
1
2
1
2 5 9 21 6
1 2 7 11 3
Page 132

General Profile, Marilog District, Davao City, 2020
Development Indicator
Supervised Neighborhood play
IV. Environmental Management
Garbage Disposal Practices, BC, OCPDC-RSD
MRF, CENRO
V. Infrastructure and Utilities
Power, DLPC 2019
Number of Streetlights
Water System, DCWD, CEO, 2019
DCWD/BAWASA
Level I, (no. of units)
Level II, (no. of units)
VI. Local Government Administration
Membership of Barangay Council, 2017-2019, BCCAD
Barangay Captain
Barangay Kagawad (7)
Sanggunian Kabataan Representative
OCPDC-GIS - Office of the City Planning & Development Coordinator- Geographical Information System
OCPDC-RSD- Office of the City Planning & Development Coordinator- Research & Statistics Division
CAO - City Agriculturist's Office
Bus. Bureau - Business Bureau
CHO - City Health Office
DepEd - Department of Education
Gumitan Magsaysay Malamba Marilog Proper Salaysay
1 3 2 10 3
Burying Burying Burying Burying Burying
✓
OFF-GRID DLPC DLPC DLPC DLPC
0 0 33 425 0
BAWASA BAWASA BAWASA
3 2 3 6 3
Abonio B. Pandia Hon. Rolando L. Mansi Hon. Alan M. Astilla Sr. Hon. Purificacion A. Suyko Hon. Roberto A. Itdang, Sr.
Abdul Fata S. Abbas Reslie L. Mansi Lilane A. Nantes Leonilo P. Suyko Herminio P. Laidan
Hermanie P. Banayao Maria Jane L. Duyan Romeo S. Inog Elsie A. Revillas Pascual I. Amad Sr.
Norma A. Ramirez Rodabie E. Espiritu Marilyn L. Embac Josephine L. Paquibot Corazon C. Arañas
Romeo L. Ramirez Jina G. Anunciado Samuel M. Ale Catherine C. Lim Pedro E. Elog
Gorgonio A. Sayad Manuel L. Uboc Jr. Rolando L. Agton Mario D. Caminade Celso K. Gurrea
Dominador S. Embac Sr. Zenaida B. Ticong Erlinda D. Tabilog Erlinda L. Suam Nonoy O. Saligan
Amerah B. Abbas Cornelio G. Amora Jr. Emely D. Tibayan Sergio A. Lastimado Ronaldo M. sumahay
Leonard P. Gil Alfha D. Pandian Cherry Ann I. Ompar Jayrick A. Pradilla*Average of four (4) members/household
Sources of data:
PSA - Philippine Statistics Authority CSSDO - City Social Services & Development Office
OCPDC-GIS - Office of the City Planning & Development Coordinator- Geographical Information System BC - Barangay Council
OCPDC-RSD- Office of the City Planning & Development Coordinator- Research & Statistics Division BCCAD - Barangay Cultural Communities Affairs Division
CAO - City Agriculturist's Office CEO - City Engineer's Office
Bus. Bureau - Business Bureau DCWD - Davao City Water District
CHO - City Health Office DLPC - Davao Light & Power Corporation
DepEd - Department of Education
Page 133

General Profile, Marilog District, Davao City, 2020
Development Indicator
I. Demography
Population Projection 2020, OCPDC
Population, PSA 2015 census
Estimated Number of Households*, 2015
Population, PSA 2010 Census
Population, PSA 2007 Census
Population, PSA 2000 Census
Geography
Land Area, (in has), OCPDC-GIS
Distance from City Hall to Brgy. Proper, (in kms.), OCPDC-
GIS
Number of Puroks, OCPDC-RSD
Boundaries, OCPDC-GIS
North
South
East
West
Locational Characteristics
Rural/Urban Classifications
Land Use, (in has.), OCPDC-GIS
Floodway Mitigation
Landslide Mitigation
Rural Settlement Area
Prime Agricultural
Agricultural Non-Tillage
Tourism Development
Forest
Conservation
Marginal
Total
Suawan Tamugan TOTAL
5,138 9,357 58,487
4,586 8,351 52,201
1,147 2,088 13,050
3,631 8,253 45,125
3,726 7,625 42,718
3,268 7,437 42,736
4,571.980 1,132.320 62,886.052
43.52 38.65
27 18 234
Salaysay Malamba
Tambobong Gumalang
Tamugan Lamanan
Dalag Suawan
Riverbank Riverbank
Rural Rural
- 20.880 23.100
107.290 15.460 9,457.632
55.030 78.520 611.733
16.570 546.940 681.430
2,232.110 83.620 22,472.921
- - 2,137.356
10.660 - 4,522.630
2,150.320 266.910 19,950.090
- 119.990 3,029.160
4,571.980 1,132.320 62,886.052
Page 134

General Profile, Marilog District, Davao City, 2020
Development Indicator
Soil Classification, CAO
Elevation (in has.), OCPDC-GIS
201 - 500 m
501 - 1,000 m
1,001 - 1,500 m
1,501 - 5,000 m
Total
Slope (in has.), OCPDC-GIS
Level to Nearly Level (0-3%)
Gently Sloping to Undulating Range (3-8%)
Undulating to Unrolling Range (8-8%)
Rolling to Moderately Steep Range (18-30%)
Steep Range (30-50%)
Very Steep Range (>50%)
Total
II. Economic Services
Commercial & Industrial Establishments, Bus. Bureau, 2019
Micro
Number
Total Capitalization (in million pesos)
Declared No. of Employees
Small
Number
Total Capitalization (in million pesos)
Declared No. of Employees
Medium
Number
Total Capitalization (in million pesos)
Suawan Tamugan TOTAL
Miral Clay loam Tugbok Clay
1,800.89 1,132.32 19,140.37
2,380.98 - 34,164.53
390.11 - 9,567.12
- - 14.03
4,571.98 1,132.32 62,886.05
- 478.67 485.11
- 137.51 652.01
0.57 121.61 839.70
1,392.27 104.18 7,703.71
1,457.91 290.35 24,478.03
1,721.23 - 28,727.50
4,571.98 1,132.32 62,886.05
10 32 226
288,600.00 2,096,000.00 14,569,711.00
4 22 179
2 0 27
2,500,000.00 0.00 25,910,001.00
1 0 72
0 1 8
0.00 2,000,000.00 19,045,000.00
Page 135

General Profile, Marilog District, Davao City, 2020
Development Indicator
Declared No. of Employees
Large
Number
Total Capitalization (in million pesos)
Declared No. of Employees
III. Social Services
No. of Health Centers, CHO 2019
Barangay Health Human Resources
No. of Barangay Health Workers
No. of Barangay Nutrition Scholars
Health Services, CHO 2019
% of Fully Immunized Children aged 11 months old and
below
Prevalence Rate of Severely Underweight Children aged
0-71 months
School Facilities, Dep.Ed 2019
Total Number of Schools
Public Schools
Elementary
High School
Sr. High School
Private Schools
Elementary
Elementary/High School
Sr. High School
Social Welfare, CSSDO 2019
Total Number of Day Care Centers
Center Based
Day Care Center
Home Based
Suawan Tamugan TOTAL
0 3 48
3 2 6
35,500,000.00 40,850,000.00 86,850,000.00
32 178 540
1 1 14
6 9 76
2 4 32
54.87 75.03
2.08 0.00
6 9 70
4 6 52
1 1 8
1 1 5
1 2
2
1
7 12 77
3 6 43
Page 136

General Profile, Marilog District, Davao City, 2020
Development Indicator
Supervised Neighborhood play
IV. Environmental Management
Garbage Disposal Practices, BC, OCPDC-RSD
MRF, CENRO
V. Infrastructure and Utilities
Power, DLPC 2019
Number of Streetlights
Water System, DCWD, CEO, 2019
DCWD/BAWASA
Level I, (no. of units)
Level II, (no. of units)
VI. Local Government Administration
Membership of Barangay Council, 2017-2019, BCCAD
Barangay Captain
Barangay Kagawad (7)
Sanggunian Kabataan Representative
OCPDC-GIS - Office of the City Planning & Development Coordinator- Geographical Information System
OCPDC-RSD- Office of the City Planning & Development Coordinator- Research & Statistics Division
CAO - City Agriculturist's Office
Bus. Bureau - Business Bureau
CHO - City Health Office
DepEd - Department of Education
Suawan Tamugan TOTAL
4 6 34
Burying Burying / Composit Pit
DLPC DLPC
53 175 686
BAWASA
3 3
3 9 43
Hon. Loreto E. Amoy Hon. Diomedes E. Dela Cruz
Ruperto O. Angac Mila S. Relampagos
Teodora G. Amoy Reyna M. Lantajo
Venus O. Liawan Juanito A. Ayog Jr.
Joel A. Bangunan Sr. Erwin Q. Ambo Sr.
Martin A. Elid Reniel Giefred N. Lim
Rosenda E. Agbu Edwin L. Kawaling
Marivel D. Aloy Ernesto N. Gutierrez Jr.
Romeo P. Libuit Jr. John Lenon T. Carsano*Average of four (4) members/household
Sources of data:
PSA - Philippine Statistics Authority CSSDO - City Social Services & Development Office
OCPDC-GIS - Office of the City Planning & Development Coordinator- Geographical Information System BC - Barangay Council
OCPDC-RSD- Office of the City Planning & Development Coordinator- Research & Statistics Division BCCAD - Barangay Cultural Communities Affairs Division
CAO - City Agriculturist's Office CEO - City Engineer's Office
Bus. Bureau - Business Bureau DCWD - Davao City Water District
CHO - City Health Office DLPC - Davao Light & Power Corporation
DepEd - Department of Education
Page 137

Page 164
Tugbok District
Angalan Manambulan Sto. Niño
Bago Oshiro Manuel Guianga Tacunan
Balengaeng Matina Biao Tagakpan
Biao Escuela Mintal Talandang
Biao Guianga New Carmen Tugbok Proper
Los Amigos New Valencia Ula

General Profile, Tugbok District, Davao City, 2020
Development Indicators Angalan Bago Oshiro Balengaeng Biao Escuela Biao Guianga Los Amigos Manambulan
I. Demography
Population Projection 2020, OCPDC 2,773 13,369 2,337 3,691 4,105 10,893 2,981
Population, PSA 2015 census 2,475 11,932 2,086 3,294 3,664 9,722 2,661
Estimated Number of Households*, 2015 619 2,983 522 824 916 2,431 665
Population, PSA 2010 Census 2,465 8,305 2,041 3,009 2,962 5,221 2,611
Population, PSA 2007 Census 2,373 8,366 1,644 3,012 3,187 4,123 2,624
Population, PSA 2000 Census 2,259 4,633 1,849 2,338 2,295 3,575 1,995
Geography
Land Area, (in has), OCPDC-GIS 481.31 637.28 478.85 1,284.2 500.91 445.49 768.5
Distance from City Hall to Brgy. Proper, (in kms.), OCPDC-GIS
21.65 17.35 27.03 27.61 25.57 22.05 21.45
Number of Puroks, OCPDC-RSD 15 10 7 8 10 12 8
Boundaries, OCPDC-GIS
NorthBalengaeng / Los
AmigosMintal / Sto. Niño Wangan Talandang Balengaeng Riverside Angalan
South ManambulanBaliok / Bago
GalleraAngalan New Carmen Riverside Tugbok Proper Tugbok Proper
EastTugbok Proper / Los
AmigosCat. Pequino Los Amigos Tacunan Ula Ula Mulig
West Tagakpan Mulig Toril Tagakpan Biao Guianga Biao Escuela Balengaeng Manuel Guianga
Locational Characteristics Inland Inland Inland Inland Inland Riverbank Inland
Rural/Urban Classifications Rural Rural Rural Rural Rural Urban Rural
Land Area, (in has), OCPDC-GIS
Floodway Mitigation - - - - - 65.93 15.67
Institution - 330.48 - - - 2.33 -
Special Institution - - - - - -
Major Commercial - 7.82 - - - 18.48 -
High Density Residential - - - - - - -
Medium Density Residential 19.33 281.55 0.87 - 64.33 335.38 -
Socialized Housing - 10.05 - - - 16.58 -
Page 165

General Profile, Tugbok District, Davao City, 2020
Development Indicators Angalan Bago Oshiro Balengaeng Biao Escuela Biao Guianga Los Amigos Manambulan
Rural Settlement Area 64.58 - 13.94 82.65 - - 78.52
Heavy Industrial - - - - - 2.02 -
Light Industrial - - - - - 1.23 -
Infrastructure/Utilities - 6.18 - - - - -
Prime Agricultural 397.29 - 450.80 1181.72 436.58 3.22 641.97
Agricultural Non-Tillage - - - 10.25 - - -
Parks and Recreation - - - - - - -
Waste Management Treatment Utilization Disposal - - - - - - -
Planned Unit Development - - - - - - -
Conservation - - 13.24 - - - 8.05
Open Space 0.11 1.20 - - 0.32 -
Special Use - - - - - - -
Marginal - - - 9.56 - - 24.33
Total 481.31 637.28 478.85 1,284.18 500.91 445.49 768.54
Soil Classification, CAO Tugbok Clay Tugbok Clay Tugbok Clay Tugbok Clay Tugbok Clay Tugbok Clay Tugbok Clay
Elevation (in has.), OCPDC-GIS
>100 m 84.98 437.53 96.82 858.67 74.86 435.71 -
101 - 300 m 396.33 199.75 382.03 425.51 426.05 9.78 768.54
301-500m - - - - - - -
501 - 1,000 m - - - - - - -
Total 481.31 637.28 478.85 1,284.18 500.91 445.49 768.54
Slope (in has.), OCPDC-GIS
Level to Nearly Level (0-3%) - - - - - - -
Gently Sloping to Undulating Range (3-8%) 54.68 637.28 42.97 1,268.14 500.91 442.01 317.62
Undulating to Unrolling Range (8-8%) 426.63 - 435.88 16.04 - 3.48 450.92
Rolling to Moderately Steep Range (18-30%) - - - - - - -
Steep Range (30-50%) - - - - - - -
Very Steep Range (>50%) - - - - - - -
Total 481.31 637.28 478.85 1,284.18 500.91 445.49 768.54
Page 166

General Profile, Tugbok District, Davao City, 2020
Development Indicators Angalan Bago Oshiro Balengaeng Biao Escuela Biao Guianga Los Amigos Manambulan
II. Economic Services
Commercial & Industrial Establishments, Bus. Bureau,
2019
Micro
Number 13 19 11 14 16 78 4
Total Capitalization (in million pesos) 1,745,000.00 2,425,000.00 575,000.00 895,000.00 1,243,800.00 7,862,500.00 175,000.00
Declared No. of Employees 16 33 8 16 49 139 2
Small
Number 3 5 0 5 1 14 1
Total Capitalization (in million pesos) 2,000,000.00 4,250,000.00 0.00 4,500,000.00 1,500,000.00 11,460,002.00 1,000,000.00
Declared No. of Employees 12 18 0 60 0 72 40
Medium
Number 1 0 1 3 0 5 0
Total Capitalization (in million pesos) 2,000,001.00 0.00 3,000,000.00 10,200,000.00 0.00 14,110,801.00 0.00
Declared No. of Employees 16 0 3 44 0 24 0
Large
Number 1 0 1 3 1 3 0
Total Capitalization (in million pesos) 10,000,000.00 0.00 10,500,000.00 35,000,000.00 30,000,000.00 31,500,001.00 0.00
Declared No. of Employees 12 0 20 232 22 265 0
III. Social Services
No. of Health Centers, CHO 2019 1 1 1 1 1 1 1
Barangay Health Human Resources
No. of Barangay Health Workers 7 5 4 3 6 9 4
No. of Barangay Nutrition Scholars 1 2 1 1 2 3 2
Health Services, CHO 2019
% of Fully Immunized Children aged 11 months old
and below98.08 25.90 141.76 68.35 96.38 71.74 86.26
Prevalence Rate of Severely Underweight Children
aged 0-71 months0.28 0.38 1.74 0.27 0.00 0.72 0.29
Page 167

General Profile, Tugbok District, Davao City, 2020
Development Indicators Angalan Bago Oshiro Balengaeng Biao Escuela Biao Guianga Los Amigos Manambulan
School Facilities, Dep.Ed 2019
Total Number of Schools 1 1 1 3 1 4 3
Public Schools
Elementary 1 1 1 1 1 2 1
High School 1 1 1
Sr. High School 1 1 1
Tertiary
Private Schools
Elementary
Elementary/High School
Sr. High School
Vocational School
Social Welfare, CSSDO 2019
Total Number of Day Care Centers 2 2 3 1 1 4 1
Center Based
Day Care Center 2 2 3 1 1 4 1
Child Minding Center
Home Based
Supervised Neighborhood play
IV. Environmental Management
Garbage Disposal Practices, BC, OCPDC-RSD Burying Collected Burying Burying Burying Collected Collected
MRF, CENRO
V. Infrastructure and Utilities
Power, DLPC 2019 DLPC DLPC DLPC DLPC DLPC DLPC DLPC
Number of Streetlights 110 293 43 96 69 144 84
Water System, DCWD, CEO, 2019
DCWD/BAWASA BAWASA BAWASA DCWD BAWASA
Level II, (no. of units) 4 2 4 4 1 4
Page 168

General Profile, Tugbok District, Davao City, 2020
Development Indicators Angalan Bago Oshiro Balengaeng Biao Escuela Biao Guianga Los Amigos Manambulan
VI. Local Government Administration
Membership of Barangay Council, BCCAD, 207-2019
Barangay Captain Hon. Rogelio T. IcoHon. Jonah C.
MacarayoHon. Daniel M. Orong Hon. Romeo F. Lao
Hon. Eduard B.
Adolfo
Hon. Roberto A.
Ballarta
Hon. Cris A.
Pecasion
Barangay Kagawad (7)Allan S. Algabre
Gerardo L. Canque Concepcion J. Bacaro Archer T. Ramos Alicia S. Pinco Aileen C. NatinoLorelyd Dianne D.
Celebrar
Romeo J. BonggoMerlinda C. Cabug-os Regino B. Loremas Cecil P. Aguilar Ariel P. Neri Ruel C. Ceballos Billy C. Abarsolo
Rogelio G. Capul Mark Malaya O.
Peregrino
Catherine Meg P.
RemondeRyan V. Adlawan Jenny T. Carlotsa
Simeon H. Alejaga
Sr.
Emilio B.
Asumbrado
Nora C. LorenoMaria Luisa E. Lapayag Roberto G. Navales Reynaldo A. Bolo Lolita A. Tecson
Angelico T.
Santander Jr.Jay R. Pazon
Renante P. LegaspiJose Amor R. Yabes Marivic G. Demecillo Velvet E. Verdida
Satornina P.
Caballero
Anna Liezl G.
DeliquiñaNelson B. Suyman
Rose V. GonzagaAlfonso C. Canceran Jr. Naracel B. Restauro
Reynaldo H.
Dayondon
Anthony R.
Remotigue IIIRaymundo P. Pupa
Roland H.
Asumbrado
Ma. Elena Fe T. TapingMarife P. Bonghanoy Norvel B. Taoy Jaime C. Casona Josie S. Osorio Adonis J. Santander Rossana S. Nacario
Sanggunian Kabataan RepresentativeLiezyl G. Garcia John Albert G. Lacida Roy M. Mullon Raul M. Reusora Jr. Kimberly S. Bibat
Rowen E.
Sampadong
Ana Katrina B.
Modina
*Average of four (4) members/household
Sources of data:
PSA - Philippine Statistics Authority CSSDO - City Social Services & Development Office
OCPDC-GIS - Office of the City Planning & Development Coordinator- Geographical Information System BC - Barangay Council
OCPDC-RSD- Office of the City Planning & Development Coordinator- Research & Statistics Division BCCAD - Barangay Cultural Communities Affairs Division
CAO - City Agriculturist's Office CEO - City Engineer's Office
Bus. Bureau - Business Bureau DCWD - Davao City Water District
CHO - City Health Office DLPC - Davao Light & Power Corporation
DepEd - Department of Education
Page 169

General Profile, Tugbok District, Davao City, 2020
Development Indicators
I. Demography
Population Projection 2020, OCPDC
Population, PSA 2015 census
Estimated Number of Households*, 2015
Population, PSA 2010 Census
Population, PSA 2007 Census
Population, PSA 2000 Census
Geography
Land Area, (in has), OCPDC-GIS
Distance from City Hall to Brgy. Proper, (in kms.), OCPDC-GIS
Number of Puroks, OCPDC-RSD
Boundaries, OCPDC-GIS
North
South
East
West
Locational Characteristics
Rural/Urban Classifications
Land Area, (in has), OCPDC-GIS
Floodway Mitigation
Institution
Special Institution
Major Commercial
High Density Residential
Medium Density Residential
Socialized Housing
Manuel Guianga Matina Biao Mintal New Carmen New Valencia Sto.Niño Tacunan
7,211 2,029 14,820 2,942 1,881 22,524 14,311
6,436 1,811 13,227 2,626 1,679 20,103 12,773
1,609 453 3,307 657 420 5,026 3,193
6,088 1,340 12,518 1,961 1,516 18,395 3,093
6,028 1,649 11,137 1,720 1,443 17,581 2,975
4,717 1,352 9,094 1,541 1,147 17,032 2,305
901.32 1,578.2 752.19 1,107.9 954.12 147.32 906.7
26.69 25.25 15.25 39.69 37.15 14.15 21.57
14 6 21 7 7 23 10
Tagakpan New Carmen Tugbok Proper New Valencia Callawa Cat. Grande Matina Biao
Manambulan Magtuod Bago Oshiro Langub New Carmen Bago Oshiro Langub
Daliaon Plantation Tacunan Sto. Niño Mandua Acacia / Mandug Cat. Pequino Catalunan Grande
New Carmen Ula Mulig Toril Biao Escuela Talandang Mintal Tugbok Proper
Inland Riverbank Riverbank Riverbank Riverbank Inland Inland
Rural Rural Urban Rural Rural Urban Rural
- - 11.49 100.07 176.31 0.02 -
- - 208.04 - - 6.38 3.72
- - 212.09 - - 0.09 -
- - 72.20 - - 9.53 -
- - - - 119.92
- 72.60 235.08 - - 87.79 8.42
- - - - - 41.91 0.00
Page 170

General Profile, Tugbok District, Davao City, 2020
Development Indicators
Rural Settlement Area
Heavy Industrial
Light Industrial
Infrastructure/Utilities
Prime Agricultural
Agricultural Non-Tillage
Parks and Recreation
Waste Management Treatment Utilization Disposal
Planned Unit Development
Conservation
Open Space
Special Use
Marginal
Total
Soil Classification, CAO
Elevation (in has.), OCPDC-GIS
>100 m
101 - 300 m
301-500m
501 - 1,000 m
Total
Slope (in has.), OCPDC-GIS
Level to Nearly Level (0-3%)
Gently Sloping to Undulating Range (3-8%)
Undulating to Unrolling Range (8-8%)
Rolling to Moderately Steep Range (18-30%)
Steep Range (30-50%)
Very Steep Range (>50%)
Total
Manuel Guianga Matina Biao Mintal New Carmen New Valencia Sto.Niño Tacunan
78.52 91.79 - 66.02 74.43 - -
- - - - - - -
- - - - - - -
- 21.95 7.67 - - - 30.11
578.95 783.31 0.09 184.00 164.45 - 689.50
- 408.86 - 688.84 538.93 - 15.43
- 4.96 - - - - 15.06
- 2.84 - 15.42 - - -
- - - 14.12 - - -
83.10 - - - - - -
- - 5.53 - - 1.60 -
- - - - - - -
160.75 191.85 - 39.46 - - 24.54
901.32 1,578.16 752.19 1,107.93 954.12 147.32 906.70
Tugbok Clay Tugbok Clay Tugbok Clay Tugbok Clay Tugbok Clay Tugbok Clay Tugbok Clay
- 326.74 35.85 711.81 594.62 109.74 148.14
- 1,193.23 568.69 388.88 359.50 37.58 758.56
301.71 58.19 147.65 7.24 - - -
599.61 - - - - - -
901.32 1,578.16 752.19 1,107.93 954.12 147.32 906.70
- - - 172.20 229.08 - -
- 565.60 752.19 198.83 213.43 147.32 718.07
804.14 652.66 - - 248.60 - 188.63
- 359.90 - 695.40 142.93 - -
- - - 41.49 120.08 - -
97.18 - - - - - -
901.32 1,578.16 752.19 1,107.93 954.12 147.32 906.70
Page 171

General Profile, Tugbok District, Davao City, 2020
Development Indicators
II. Economic Services
Commercial & Industrial Establishments, Bus. Bureau,
2019
Micro
Number
Total Capitalization (in million pesos)
Declared No. of Employees
Small
Number
Total Capitalization (in million pesos)
Declared No. of Employees
Medium
Number
Total Capitalization (in million pesos)
Declared No. of Employees
Large
Number
Total Capitalization (in million pesos)
Declared No. of Employees
III. Social Services
No. of Health Centers, CHO 2019
Barangay Health Human Resources
No. of Barangay Health Workers
No. of Barangay Nutrition Scholars
Health Services, CHO 2019
% of Fully Immunized Children aged 11 months old
and below
Prevalence Rate of Severely Underweight Children
aged 0-71 months
Manuel Guianga Matina Biao Mintal New Carmen New Valencia Sto.Niño Tacunan
27 6 557 5 1 156 184
2,753,565.00 800,000.00 48,933,011.80 725,000.00 200,000.00 15,857,225.00 19,121,000.00
49 15 820 8 3 279 276
11 1 117 1 1 20 26
9,180,002.00 650,000.00 99,202,598.96 500,000.00 550,000.00 16,807,500.00 21,160,002.00
293 3 416 32 2 61 121
4 0 45 0 0 8 6
11,600,001.00 0.00 156,463,464.41 0.00 0.00 34,823,000.00 27,701,250.00
12 0 245 0 0 45 22
1 1 10 0 1 4 1
262,333,325.00 21,000,000.00 115,520,001.00 0.00 10,800,000.00 126,636,691.75 20,060,000.00
11 9 128 0 6 268 2
1 1 1 1 1 1 1
9 4 10 3 3 13 12
2 1 5 2 2 5 4
78.88 80.42 98.79 102.54 68.36 70.27 53.22
0.00 0.44 0.49 2.04 0.00 0.25 0.13
Page 172

General Profile, Tugbok District, Davao City, 2020
Development Indicators
School Facilities, Dep.Ed 2019
Total Number of Schools
Public Schools
Elementary
High School
Sr. High School
Tertiary
Private Schools
Elementary
Elementary/High School
Sr. High School
Vocational School
Social Welfare, CSSDO 2019
Total Number of Day Care Centers
Center Based
Day Care Center
Child Minding Center
Home Based
Supervised Neighborhood play
IV. Environmental Management
Garbage Disposal Practices, BC, OCPDC-RSD
MRF, CENRO
V. Infrastructure and Utilities
Power, DLPC 2019
Number of Streetlights
Water System, DCWD, CEO, 2019
DCWD/BAWASA
Level II, (no. of units)
Manuel Guianga Matina Biao Mintal New Carmen New Valencia Sto.Niño Tacunan
4 1 14 1 2 3 6
1 1 1 1 2 1 1
1 1 1 1
1 1 1 1
2
1 5 3
2
1
1
3 1 10 1 2 8 2
3 1 9 1 2 8 2
1
Burning / Burying Burning / Burying Collected Burying Burying Collected Collected
DLPC DLPC DLPC DLPC DLPC DLPC DLPC
234 91 339 9 67 447 139
BAWASA DCWD DCWD DCWD
4 3 4 3 4
Page 173

General Profile, Tugbok District, Davao City, 2020
Development Indicators
VI. Local Government Administration
Membership of Barangay Council, BCCAD, 207-2019
Barangay Captain
Barangay Kagawad (7)
Sanggunian Kabataan Representative
Manuel Guianga Matina Biao Mintal New Carmen New Valencia Sto.Niño Tacunan
Hon.Ruel L. Ayog Hon. Hilario D.
Malaki II
Hon. Rey Amador
M. Bargamento
Hon. Jerry T.
Ceballos
Hon. Delia T.
Saturinas
Hon. Carlos T. Del
RosarioHon. Arnold L. Asobe
Vanessa S. Ayog Jonathan V. FurogEduardo C.
SantanderFelicisima I. Indolos Elsa A. Taga-an Romeo F. Alberca Elvira I. Renoy
Cirilo T. Batingal Catalino F. Auza Arman S. Rios Beatriz I. CeballosEdsel Rey S.
FernandezAselo T. Torrejos Fe Jesusa R. Casona
Marcelo C. Lupiba Myraniña T. CoronelRonald Allan T.
Martinez
Cherrel D.
Albarracin
Roberto P.
Ombajen
Purificacion S.
TolentinoCatalino A. Genayas Jr.
Ronald L. Ayog Antonio C. Autida Zenaida G. Baluran Jeorge C. BalberoJustiniano P.
RemorozaJesus C. Lumayag Jr. Orlando A. Morales
Allanvin L. Priego Nelson H. PiañarRizalino C.
Sobrepeña
Jusiamel S.
Amandoron Lavenia A. Mose
Daisy Jean G.
EscobarAlgen A. Dela Peña
Veronica B. Tima Doroteo S. SuicoFe Theresa B. De
GuzmanJonalyn D. Deala
Gorgonio L. Laput
Jr.Nestor T. Ombajin Diolina A. Galupo
Gloria P. Payan Almario L. Aban Anabel T. BauzonMel James B.
Bañados
Bartolome M.
Digdig Jr.Lourdes D. Anito Angelito M. Galeos
Jayson S. OnggonaReynaldo Jay-ar A.
Tecong
Kendall Joyce T.
AbrioEdsil B. Gumalawe Jerryc M. Agbon
Jhon Louis G.
ValentinMiguel Q. Cuizon Jr.
*Average of four (4) members/household
Sources of data:
PSA - Philippine Statistics Authority CSSDO - City Social Services & Development Office
OCPDC-GIS - Office of the City Planning & Development Coordinator- Geographical Information System BC - Barangay Council
OCPDC-RSD- Office of the City Planning & Development Coordinator- Research & Statistics Division BCCAD - Barangay Cultural Communities Affairs Division
CAO - City Agriculturist's Office CEO - City Engineer's Office
Bus. Bureau - Business Bureau DCWD - Davao City Water District
CHO - City Health Office DLPC - Davao Light & Power Corporation
DepEd - Department of Education
Page 174
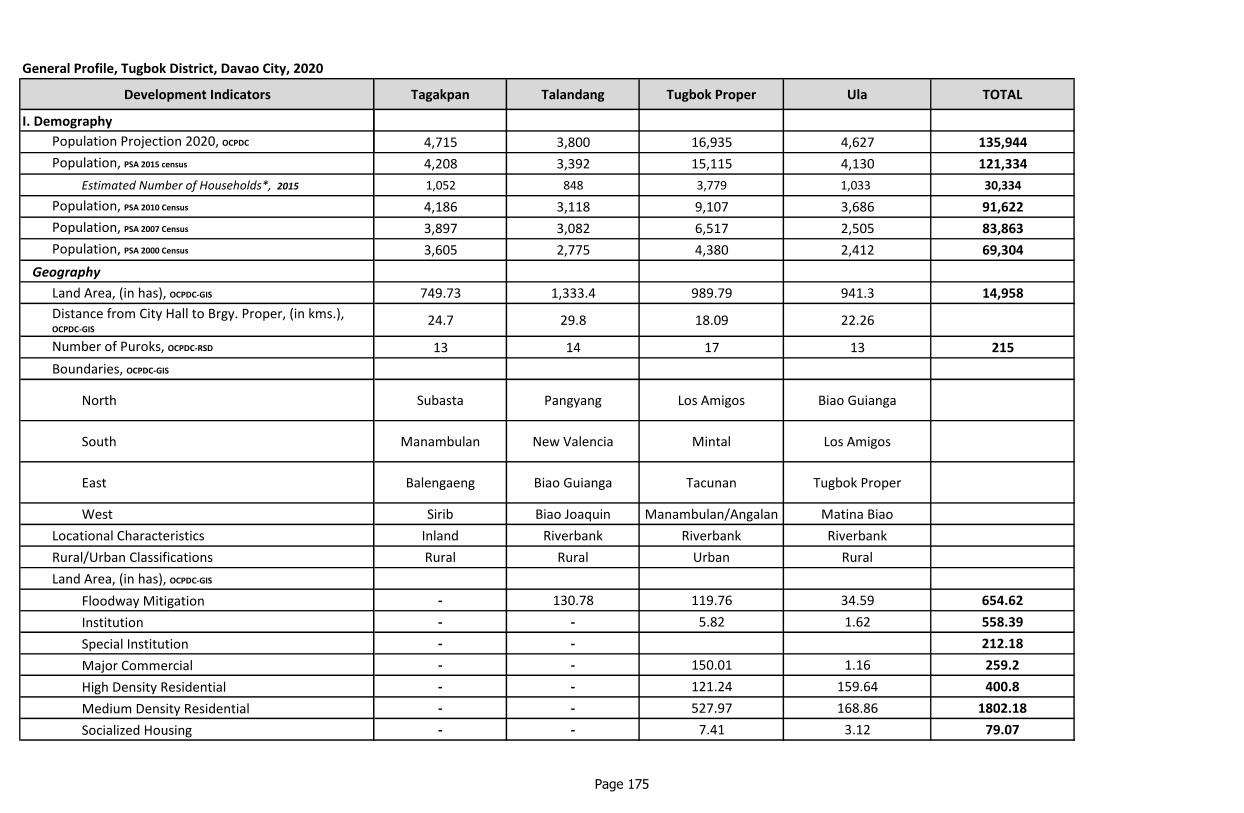
General Profile, Tugbok District, Davao City, 2020
Development Indicators
I. Demography
Population Projection 2020, OCPDC
Population, PSA 2015 census
Estimated Number of Households*, 2015
Population, PSA 2010 Census
Population, PSA 2007 Census
Population, PSA 2000 Census
Geography
Land Area, (in has), OCPDC-GIS
Distance from City Hall to Brgy. Proper, (in kms.), OCPDC-GIS
Number of Puroks, OCPDC-RSD
Boundaries, OCPDC-GIS
North
South
East
West
Locational Characteristics
Rural/Urban Classifications
Land Area, (in has), OCPDC-GIS
Floodway Mitigation
Institution
Special Institution
Major Commercial
High Density Residential
Medium Density Residential
Socialized Housing
Tagakpan Talandang Tugbok Proper Ula TOTAL
4,715 3,800 16,935 4,627 135,944
4,208 3,392 15,115 4,130 121,334
1,052 848 3,779 1,033 30,334
4,186 3,118 9,107 3,686 91,622
3,897 3,082 6,517 2,505 83,863
3,605 2,775 4,380 2,412 69,304
749.73 1,333.4 989.79 941.3 14,958
24.7 29.8 18.09 22.26
13 14 17 13 215
Subasta Pangyang Los Amigos Biao Guianga
Manambulan New Valencia Mintal Los Amigos
Balengaeng Biao Guianga Tacunan Tugbok Proper
Sirib Biao Joaquin Manambulan/Angalan Matina Biao
Inland Riverbank Riverbank Riverbank
Rural Rural Urban Rural
- 130.78 119.76 34.59 654.62
- - 5.82 1.62 558.39
- - 212.18
- - 150.01 1.16 259.2
- - 121.24 159.64 400.8
- - 527.97 168.86 1802.18
- - 7.41 3.12 79.07
Page 175

General Profile, Tugbok District, Davao City, 2020
Development Indicators
Rural Settlement Area
Heavy Industrial
Light Industrial
Infrastructure/Utilities
Prime Agricultural
Agricultural Non-Tillage
Parks and Recreation
Waste Management Treatment Utilization Disposal
Planned Unit Development
Conservation
Open Space
Special Use
Marginal
Total
Soil Classification, CAO
Elevation (in has.), OCPDC-GIS
>100 m
101 - 300 m
301-500m
501 - 1,000 m
Total
Slope (in has.), OCPDC-GIS
Level to Nearly Level (0-3%)
Gently Sloping to Undulating Range (3-8%)
Undulating to Unrolling Range (8-8%)
Rolling to Moderately Steep Range (18-30%)
Steep Range (30-50%)
Very Steep Range (>50%)
Total
Tagakpan Talandang Tugbok Proper Ula TOTAL
- 78.41 - - 628.86
- - - - 2.02
- - - 68.50 69.73
- - 13.30 - 79.21
702.64 654.89 37.80 503.73 7410.94
- 444.02 - - 2106.33
- - - - 20.02
- - - - 18.26
- - - - 14.12
41.44 - - - 145.83
- - 3.19 0.08 12.03
- - 3.29 - 3.29
5.65 25.26 - - 481.4
749.73 1,333.36 989.79 941.30 14,958.48
Tugbok Clay Tugbok Clay Tugbok Clay Tugbok Clay
- 433.92 - - 4,349.39
702.09 662.88 809.06 632.66 8,721.12
47.64 236.56 180.73 308.64 1,288.37
- - - - 599.61
749.73 1,333.36 989.79 941.30 14,958.48
- 33.77 - - 435.05
- 742.23 988.22 941.30 8,530.80
749.73 289.71 1.57 - 4,267.98
- - - - 1,198.24
- 267.65 - - 429.23
- - - - 97.18
749.73 1,333.36 989.79 941.30 14,958.48
Page 176

General Profile, Tugbok District, Davao City, 2020
Development Indicators
II. Economic Services
Commercial & Industrial Establishments, Bus. Bureau,
2019
Micro
Number
Total Capitalization (in million pesos)
Declared No. of Employees
Small
Number
Total Capitalization (in million pesos)
Declared No. of Employees
Medium
Number
Total Capitalization (in million pesos)
Declared No. of Employees
Large
Number
Total Capitalization (in million pesos)
Declared No. of Employees
III. Social Services
No. of Health Centers, CHO 2019
Barangay Health Human Resources
No. of Barangay Health Workers
No. of Barangay Nutrition Scholars
Health Services, CHO 2019
% of Fully Immunized Children aged 11 months old
and below
Prevalence Rate of Severely Underweight Children
aged 0-71 months
Tagakpan Talandang Tugbok Proper Ula TOTAL
24 14 151 23 1,303
1,953,000.00 1,765,000.00 15,471,315.60 2,010,000.00 124,510,417.40
43 37 211 18 2,022
4 4 32 5 251
2,702,500.00 4,500,001.00 24,339,336.92 3,500,000.00 207,801,942.88
15 29 167 34 1,375
3 2 16 1 95
8,612,038.84 7,000,000.00 53,010,258.40 2,320,688.00 330,841,502.65
14 10 83 46 564
0 0 6 5 38
0.00 0.00 350,127,076.00 92,973,950.00 1,116,451,044.75
0 0 366 125 1,466
1 1 1 1 18
7 5 12 6 122
2 2 4 1 42
90.22 55.96 82.65 76.95
0.37 0.28 0.05 0.00
Page 177
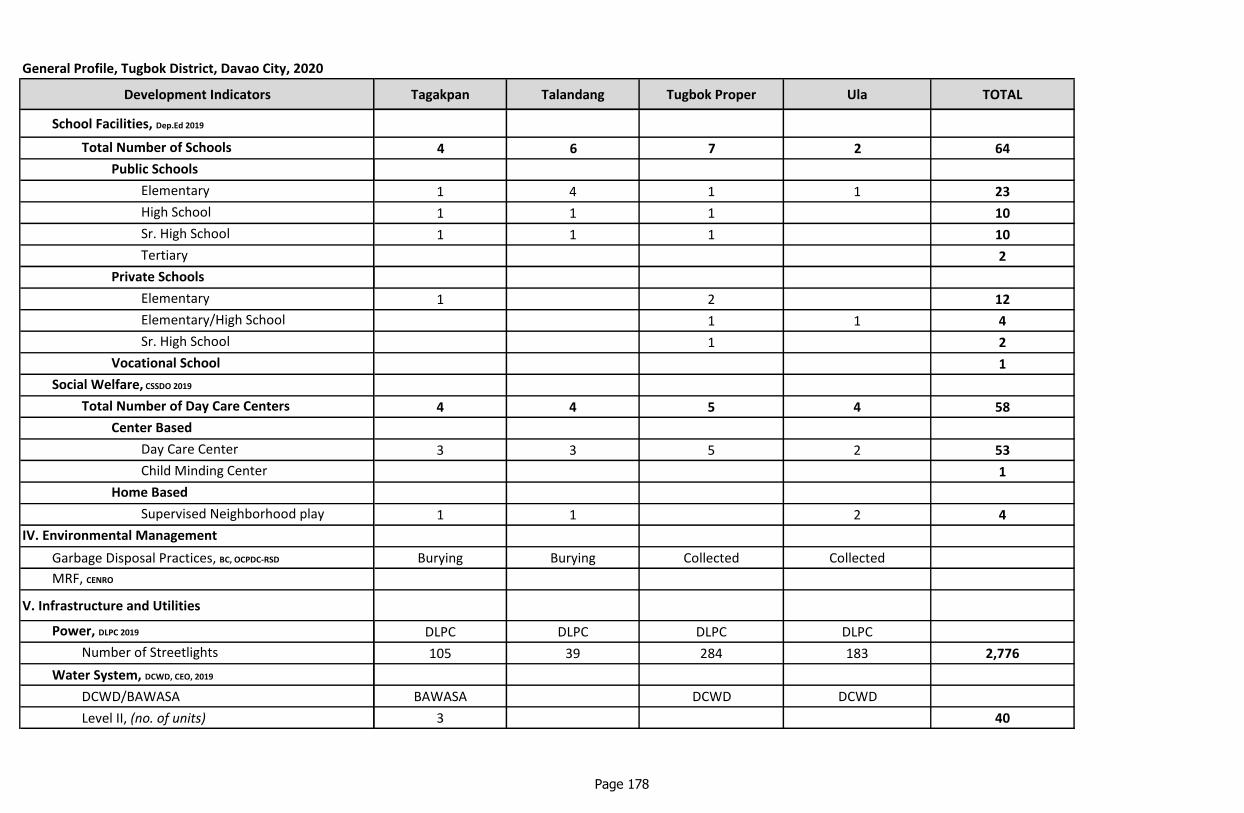
General Profile, Tugbok District, Davao City, 2020
Development Indicators
School Facilities, Dep.Ed 2019
Total Number of Schools
Public Schools
Elementary
High School
Sr. High School
Tertiary
Private Schools
Elementary
Elementary/High School
Sr. High School
Vocational School
Social Welfare, CSSDO 2019
Total Number of Day Care Centers
Center Based
Day Care Center
Child Minding Center
Home Based
Supervised Neighborhood play
IV. Environmental Management
Garbage Disposal Practices, BC, OCPDC-RSD
MRF, CENRO
V. Infrastructure and Utilities
Power, DLPC 2019
Number of Streetlights
Water System, DCWD, CEO, 2019
DCWD/BAWASA
Level II, (no. of units)
Tagakpan Talandang Tugbok Proper Ula TOTAL
4 6 7 2 64
1 4 1 1 23
1 1 1 10
1 1 1 10
2
1 2 12
1 1 4
1 2
1
4 4 5 4 58
3 3 5 2 53
1
1 1 2 4
Burying Burying Collected Collected
DLPC DLPC DLPC DLPC
105 39 284 183 2,776
BAWASA DCWD DCWD
3 40
Page 178

General Profile, Tugbok District, Davao City, 2020
Development Indicators
VI. Local Government Administration
Membership of Barangay Council, BCCAD, 207-2019
Barangay Captain
Barangay Kagawad (7)
Sanggunian Kabataan Representative
Tagakpan Talandang Tugbok Proper Ula TOTAL
Hon. Eusebio A.
Bangcas
Hon. Cinderela D.
HiyasHon. Wilfredo C. Anfone Hon. Esteban J. Togonon
Edelito M. Cañedo Sr. Maver C. Galit Nelson C. Santander Jefferson A. Idoy
Shirley M. Buenvenida Gil L. Lopez Imelda N. Flores Julian C. Cañete Sr.
Roy D. Bangcas Reynaldo T. Dumagan Reynaldo T. Amante Mario T. Amistad
Edgardo T. Mañacap Emy Grace P. Man-on Bernardino L. Baclaan Jr. Rodrigo C. Coca
Joel C. Juntong Fernando I. Candia Jr. Erlinda C. De Los Santos Lorna B. Talam
Dennis E. Maniego Joselito S. Lopez Graciano O. Garong Unice L. Andan
Arfel J. Goc-ong Rodolfo E. Ferolino Reynaldo M. Bagcat Naciancino L. Babarin
Karen Joy A. Añora Michael B. Tabay Cyrhod John T. Tirol Samantha Kaye Idoy
*Average of four (4) members/household
Sources of data: CSSDO - City Social Services & Development Office
PSA - Philippine Statistics Authority BC - Barangay Council
OCPDC-GIS - Office of the City Planning & Development Coordinator- Geographical Information System BCCAD - Barangay Cultural Communities Affairs Division
OCPDC-RSD- Office of the City Planning & Development Coordinator- Research & Statistics Division CEO - City Engineer's Office
CAO - City Agriculturist's Office DCWD - Davao City Water District
Bus. Bureau - Business Bureau DLPC - Davao Light & Power Corporation
CHO - City Health Office
DepEd - Department of Education
Page 179