2020 ACI Worldwide Annual Report And 10-K
101
2020 Annual Report
-
Upload
khangminh22 -
Category
Documents
-
view
0 -
download
0
Transcript of 2020 ACI Worldwide Annual Report And 10-K

2020 Annual Report
2020 FinancialHighlights
ACI Worldwide is a global software company that provides mission-critical real-time payment solutions to corporations. Customers use our proven, scalable and secure solutions to process and manage digital payments, enable omni-commerce payments, present and process bill payments, and manage fraud and risk. We combine our global footprint with local presence to drive the real-time digital transformation of payments and commerce.

Our Mission
To accelerate global commerce through real-time payments
Our Vision
To be a global leader in real-time payments
Our Purpose
To create global prosperity through real-time payments

I am exceptionally proud of what our team achieved in 2020 — a year like no other in our company’s 45+ years of driving digital payments.
Weeks after I joined ACI in March 2020, we pivoted in response to the emerging pandemic. This included transitioning our nearly 4,000 employees and contractors to work from home, focusing in on operational discipline to strengthen profitability in an uncertain macro-environment and evolving our solutions as global acceptance of digital payment systems accelerated. Against this backdrop, we also began taking initial steps toward a significant business transformation using a three-pillar strategy to position ACI for continuous profitable growth and value creation in the years ahead.
The ACI of early 2020 was a real-time payments leader in a large, dynamic and growing market with blue chip customers, mission-critical products, an R&D center of excellence and a successful track record of value creation through M&A. Alongside these strengths, we acknowledged the need to accelerate organic growth, improve our go-to-market execution, increase our predictability, and simplify our story and operating model. Today our strengths remain key to our success, and we have made significant progress addressing our areas of improvement through our three-pillar strategy.
Fit for Growth
The first pillar of our strategy is Fit for Growth. We developed a more efficient, nimble and agile functional operating model to unleash ACI’s growth potential. This model results in a flat, lean organization with fewer layers. It empowers ACIers by clarifying accountabilities and giving them broader responsibilities, and it brings our senior leaders closer to our customers so they can make faster, better-informed decisions. Our functional operating model also strengthens how we go to market through a new, centralized commercial function with sales teams organized by geography and segment to
improve local execution. We launched our Fit for Growth operating model in January 2021 and have already seen improved productivity and efficiency. We have also generated significant cost savings to reinvest into the business, including to fund expanded sales capacity.
Focused on Growth
The second pillar of our strategy is Focused on Growth. To drive increased organic growth, we committed to a greater focus on high-growth market opportunities. For ACI, these opportunities include real-time payments, global merchants and emerging markets — areas that will all yield double-digit growth in the years ahead. We are already well positioned to take advantage of increasing real-time payment volumes, particularly those volumes moving through global banks and central infrastructures. In the merchant space, sophisticated global merchants are our center of attention. We have the solutions to help them capitalize on the rapid digital transformation of commerce. Emerging markets are growing at two times the rate of mature markets, so we are strengthening how we go to market in Africa, Asia, Latin America and the Middle East. Through this heightened focus on high-growth opportunities, we are positioning ACI for solid organic revenue acceleration in 2021.
Step-Change Value Creation
The third pillar of our strategy is Step-Change Value Creation. We will continue ACI’s legacy of successful inorganic growth by identifying accretive investments and divestitures to drive significant value creation. We seek software-led payment assets with actionable, realistic synergies that will bolster organic revenue growth and/or enhance scale. Our areas of focus include bill payments, cloud capabilities, and value-added services in real-time, acquiring and omni-commerce. We are committed to valuation discipline and strive for superior execution as required to unlock true step-change value creation from our M&A activities.
Valued Shareholders

A Simpler Story
To support our three-pillar strategy, we also addressed ACI’s positioning in the market with three goals in mind: simplify our story, differentiate from competitors and modernize our brand. This work has introduced “Worldwide” to our logo for the first time, put the spotlight on our bold, blue corporate color, made customer needs the focus of our story and simplified our message to help all stakeholders more easily understand what we do. Our new message is built around real-time payments. ACI is the number one brand in terms of awareness and preference in real-time, and real-time is important to customers across all our segments. Today, if you ask us who ACI is, we will say, “ACI Worldwide is a global software company that delivers mission-critical real-time payment solutions to corporations.” It is a simple and powerful statement that carves out our place in the evolving digital payments landscape.
Looking Ahead
In a business environment transformed by the pandemic, ACI delivered strong financial results in 2020, generating $1.29 billion in revenue, $359 million in adjusted EBITDA and $336 million of cash flows from operations. We also expect to achieve our Rule of 40 metric for the first time ever in 2021. These results and the continued execution of our three-pillar strategy position us well for continuous profitable growth and value creation in the years ahead. We are Fit for Growth, Focused on Growth and ready for Step-Change Value Creation, and I am confident 2021 will be a milestone year for ACI.
I am also aware that stakeholder relationships are key to a successful business, and I want to thank our customers, suppliers, employees and shareholders for their support of ACI throughout 2020 and into the future. ACI is proud to be the payments provider of choice for the world’s leading banks, merchants and billers, and our entire team looks forward to continuing to deliver the mission-critical real-time payment solutions our customers and the world depend on to accelerate global commerce.
Thank you for being part of our growth story.
Odilon Almeida President and Chief Executive Officer
2020 FinancialHighlights$1.29B Total Revenue
$359M Adjusted EBITDA
$336M Cash Flows from Operations
$737M New Bookings
+3% vs. 2019
+17%vs. 2019
+144%vs. 2019
+36%vs. 2019

Notable AwardsFrost & SullivanInnovation Excellence Award for ACI® Fraud ManagementTM
Global Banking & Finance Awards Best Information Security and Fraud Management Technology Provider North America 2020
2020 Asia-Pacific Stevie Awards Gold Stevie Award for Innovation in Technology Development
Aite Group AIM Evaluation: The Leading Providers of U.S. Cash Management Technology, 2020 ACI Digital Business BankingTM receives “Best-in-Class” status
FStech Awards Best Use of IT in Retail Banking & Insurance
IDC MarketScape Worldwide Integrated Payment Platforms 2019-2020 Vendor Assessment names ACI a Leader
IDC Financial Insights 2020 FinTech Rankings ACI named among top 20 largest providers of financial technology

UNITED STATESSECURITIES AND EXCHANGE COMMISSION
Washington, D.C. 20549
FORM 10-KÈ ANNUAL REPORT PURSUANT TO SECTION 13 OR 15(d) OF THE SECURITIES EXCHANGE
ACT OF 1934For the fiscal year ended December 31, 2020
Or‘ TRANSITION REPORT PURSUANT TO SECTION 13 OR 15(d) OF THE SECURITIES
EXCHANGE ACT OF 1934For the transition period from to
Commission File Number 0-25346
ACI WORLDWIDE, INC.(Exact name of registrant as specified in its charter)
Delaware 47-0772104(State or other jurisdiction of
incorporation or organization)(I.R.S. Employer
Identification No.)
3520 Kraft Rd, Suite 300 Naples, Florida 34105(Address of principal executive offices) (Zip code)
(239) 403-4660(Registrant’s telephone number, including area code)
Securities registered pursuant to Section 12(b) of the Act:Title of each class Trading Symbol(s) Name of each exchange on which registered
Common Stock, $0.005 par value ACIW Nasdaq Global Select MarketSecurities registered pursuant to Section 12(g) of the Act: None
Indicate by check mark if the registrant is a well-known seasoned issuer, as defined in Rule 405 of the SecuritiesAct. Yes ‘ No È
Indicate by check mark if the registrant is not required to file reports pursuant to Section 13 or Section 15(d) of theAct. Yes ‘ No È
Indicate by check mark whether the registrant (1) has filed all reports required to be filed by Section 13 or 15(d) of the SecuritiesExchange Act of 1934 during the preceding 12 months (or for such shorter period that the registrant was required to file suchreports), and (2) has been subject to such filing requirements for the past 90 days. Yes È No ‘
Indicate by check mark whether the registrant has submitted electronically every Interactive Data File required to be submittedpursuant to Rule 405 of Regulation S-T during the preceding 12 months (or for such shorter period that the registrant was requiredto submit such files). Yes È No ‘
Indicate by check mark whether the registrant is a large accelerated filer, an accelerated filer, a non-accelerated filer, smallerreporting company, or an emerging growth company. See the definitions of “large accelerated filer,” “accelerated filer,” “smallerreporting company”, and “emerging growth company” in Rule 12b-2 of the Act. (Check one):Large accelerated filer È Accelerated filer ‘Non-accelerated filer ‘ Smaller reporting company ‘Emerging growth company ‘
If an emerging growth company, indicate by check mark if the registrant has elected not to use the extended transition period forcomplying with any new or revised financial accounting standards provided pursuant to Section 13(a) of the Exchange Act. ‘
Indicate by check mark whether the registrant has filed a report on and attestation to its management’s assessment of theeffectiveness of its internal control over financial reporting under Section 404(b) of the Sarbanes-Oxley Act (15 U.S.C. 7262(b)) bythe registered public accounting firm that prepared or issued its audit report. È
Indicate by check mark whether the registrant is a shell company (as defined in Rule 12b-2 of the Act). Yes ‘ No È
The aggregate market value of the Company’s voting common stock held by non-affiliates on June 30, 2020 (the last business dayof the registrant’s most recently completed second fiscal quarter), based upon the last sale price of the common stock on that date of$26.99 was $2,767,626,204. For purposes of this calculation, executive officers, directors, and holders of 10% or more of theoutstanding shares of the registrant’s common stock are deemed to be affiliates of the registrant and are excluded from thecalculation.As of February 22, 2021, there were 117,142,557 shares of the registrant’s common stock outstanding.Documents Incorporated by Reference – Portions of the registrant’s definitive Proxy Statement for the Annual Meeting ofShareholders to be held on June 2, 2021, are incorporated by reference in Part III of this report. This registrant’s Proxy Statementwill be filed with the Securities and Exchange Commission pursuant to Regulation 14A.

TABLE OF CONTENTS
PagePART I
Item 1. Business 3Item 1A. Risk Factors 15Item 1B. Unresolved Staff Comments 26Item 2. Properties 26Item 3. Legal Proceedings 26Item 4. Mine Safety Disclosures 26
PART IIItem 5. Market for Registrant’s Common Equity, Related Stockholder Matters, and Issuer Purchases of Equity
Securities 27Item 6. Selected Financial Data 28Item 7. Management’s Discussion and Analysis of Financial Condition and Results of Operations 29Item 7A. Quantitative and Qualitative Disclosures About Market Risk 45Item 8. Financial Statements and Supplementary Data 46Item 9. Changes in and Disagreements with Accountants on Accounting and Financial Disclosure 46Item 9A. Controls and Procedures 46Item 9B. Other Information 48
PART IIIItem 10. Directors, Executive Officers, and Corporate Governance 48Item 11. Executive Compensation 48Item 12. Security Ownership of Certain Beneficial Owners and Management and Related Stockholder Matters 48Item 13. Certain Relationships and Related Transactions, and Director Independence 48Item 14. Principal Accounting Fees and Services 48
PART IVItem 15. Exhibits, Financial Statement Schedules 49Signatures 91

Forward-Looking Statements
This report contains forward-looking statements based on current expectations that involve a number of risks and uncertainties.Generally, forward-looking statements do not relate strictly to historical or current facts and may include words or phrases suchas “believes,” “will,” “expects,” “anticipates,” “intends,” and words and phrases of similar impact. The forward-lookingstatements are made pursuant to safe harbor provisions of the Private Securities Litigation Reform Act of 1995, as amended.
Forward-looking statements in this report include, but are not limited to, statements regarding future operations, businessstrategy, business environment, key trends, and, in each case, statements related to expected financial and other benefits. Manyof these factors will be important in determining our actual future results. Any or all of the forward-looking statements in thisreport may turn out to be incorrect. They may be based on inaccurate assumptions or may not account for known or unknownrisks and uncertainties. Consequently, no forward-looking statement can be guaranteed. Actual future results may varymaterially from those expressed or implied in any forward-looking statements, and our business, financial condition and resultsof operations could be materially and adversely affected. In addition, we disclaim any obligation to update any forward-lookingstatements after the date of this report, except as required by law.
All forward-looking statements in this report are expressly qualified by the risk factors discussed in our filings with theSecurities and Exchange Commission (“SEC”). The cautionary statements in this report expressly qualify all of our forward-looking statements. Factors that could cause actual results to differ from those expressed or implied in the forward-lookingstatements include, but are not limited to, those discussed in our Risk Factors in Part I, Item 1A of this Form 10-K.
Trademarks and Service Marks
ACI, ACI Worldwide, ACI Payments, Inc., ACI Pay, Speedpay, and all ACI product/solution names are trademarks orregistered trademarks of ACI Worldwide, Inc., or one of its subsidiaries, in the United States, other countries or both. Otherparties' trademarks referenced are the property of their respective owners.
COVID-19 Pandemic
The COVID-19 pandemic resulted in authorities implementing numerous measures to try to contain the virus. These measuresmay remain in place for a significant period of time and adversely affect our business, operations and financialff condition as wellas the business, operations and financial conditions of our customers and business partners. The spread of the virus has alsocaused us to modify our business practices (including employee work locations and cancellation of physical participation inmeetings) in ways that may be detrimental to our business (including working remotely and its attendant cybersecurity risks).We may take further actions as may be required by government authorities or that we determine are in the best interests of ouremployees and customers. There is no certainty that such measures will be sufficient to mitigate the risks posed by the virus orotherwise be satisfactory to government authorities.
We created a dedicated Crisis Management Team to oversee and execute our business continuity plans and a variety ofmeasures designed to ensure the ongoing availability of our products, solutions and services for our customers, while takinghealth and safety measures for our employees, including telecommuting, travel restrictions, social distancing policies, andstepped-up facility cleaning practices.
We believe we have sufficient liquidity to continue business operations during this volatile and uncertain period. We have$608.9 million of available liquidity as of December 31, 2020, consisting of cash on hand and availability under our revolvingcredit facility. To address the potential long-term financial impacts of the virus, we have delayed non-essential capital spendingand operating expenses.
The pandemic presents potential new risks to our business. We began to see the impacts of COVID-19 on certain customertransaction volumes in late March and continued to see changes for the remainder of 2020, primarily within the Merchants andBillers customer base of our ACI On Demand segment. The effect of COVID-19 and related events, including those describedabove, could have an ongoing negative effect on our stock price, business prospects, financial condition, and results ofoperations. More specifically, for those customers under consumption-based contracts, continued declines in transactionvolumes could negatively impact our financial position, results of operations, and cash flows. We also experienced atypicalfluctuations in Biller volumes as a result of the change in timing of assessments and due dates for federal, state, and local taxes.
1

For the reasons discussed above, we cannot reasonably estimate with any degree of certainty the future impact COVID-19 mayhave on our results of operations, financial position, and liquidity. Notwithstanding any actions by national, state, and localNgovernments to mitigate the impact of COVID-19 or by us to address the adverse impacts of COVID-19, there can be noassurance that any of the foregoing activities will be successful in mitigating or preventing significant adverse effects on theCompany.
2

PART I
ITEM 1. BUSINESS
General
ACI Worldwide, Inc. (“ACI”, “ACI Worldwide”, the “Company,” “we,” “us,” or “our”) is a Delaware corporation incorporatedin November 1993 under the name ACI Holding, Inc. ACI is largely the successor to Applied Communications, Inc. andApplied Communications Inc. Limited, which we acquired from Tandem Computers Incorporated on December 31, 1993. OnJuly 24, 2007, we changed our corporate name from “Transaction Systems Architects, Inc.” to “ACI Worldwide, Inc.” We havebeen marketing our products and services under the ACI Worldwide brand since 1993 and have gained significant marketrecognition under this brand name.
dWe devellop, market, install, and support a broad line of software products and solutions primarily focused on facilitating real-p, market, install, and support a broad line of software products and solutions primarily focused on facilitating real-time digitime digi ltal payments. Our payment capabipayments. Our payment capabili i hlities, technologies, and solutions are marketed under the ACI Worldwide brandnologies, and solutions are marketed under the ACI Worldwide brandname. ACI’s enterprise payments capabiname. ACI’s enterprise payments capabili ilities target any channel, any network, and any payment type and our solutionsget any channel, any network, and any payment type and our solutionsempower customers to regain control, choice, and flexibility in today’s complex payments environment, get to market moreempower customers to regain control, choice, and flexibility in today’s complex payments environment, get to market morequickly,quickly, and d i ld reduce operational costs.
ACI's products and services are used globally by banks, intermediaries, merchants and billers, such as third-party digitalpayment processors, payment associations, switch interchanges and a wide range of transaction-generating endpoints, includingautomated teller machines (“ATM”), merchant point-of-sale (“POS”) terminals, bank branches, mobile phones, tablets,corporations, and internet commerce sites. The authentication, authorization, switching, settlement, fraud-checking, andreconciliation of digital payments is a complex activity due to the large number of locations and variety of sources from whichtransactions can be generated, the large number of participants in the market, high transaction volumes, geographicallydispersed networks, differing types of authorization, and varied reporting requirements. These activities are typically performedonline and are conducted 24 hours a day, seven days a week.
ACI combines a global perspective with local presence to tailor digital payment solutions for our customers. We believe that wehave one of the most diverse and robust digital payment product portfolios in the industry with application software spanningthe entire payments value chain. We also believe that our financial performance has been attributable to our ability to designand deliver quality products and solutions coupled with our ability to identify and successfully complete and integrate strategicacquisitions.
Fiscal 2019 Acquisition
Speedpay
On May 9, 2019, we acquired E Commerce Group Products, Inc. ("ECG"), a subsidiary of The Western Union Company(“Western Union”), along with ECG's subsidiary, Speedpay, Inc. (collectively referred to as "Speedpay"). The combination ofthe Company and Speedpay's bill pay solutions serve more than 4,000 customers across the United States, bringing expandedreach in existing and complementary market segments such as consumer finance, insurance, healthcare, higher education,utilities, government, and mortgage. The acquisition of Speedpay increases the scale of our ACI On Demand ("AOD") platformbusiness and allows the acceleration of platform innovation.
Target Markets
ACI’s comprehensive digital payment solutions serve three key markets:
Banks and Intermediaries
ACI provides payment solutions to large and mid-size banks globally for both retail banking, digital, and other paymentservices. Our solutions transform banks’ complex payment environments to speed time to market, reduce costs, and deliver aconsistent experience to customers across channels while enabling them to prevent and rapidly react to fraudulent activity. Inaddition, we enable banks to meet the requirements of different real-time payments schemes and to quickly create differentiatedproducts to meet consumer, business, and merchant demands.
3

ACI’s payment solutions support intermediaries, such as processors, networks, payment service providers (“PSPs”), and newfinancial technology entrants. We offer these customers scalable solutions that strategically position them to innovate andachieve growth and cost efficiency, while protecting them against fraud. Our solutions also allow new entrants in the digitalmarketplace to access innovative payment schemes, such as the U.K. Faster Payments New Access Model, Singapore FAST,India Unified Payments Interface ("UPI"), the Payments Network Malaysia ("PayNet"), Real-time Retail Payments Platformy("RPP"), and others.
Merchants
ACI’s support of merchants globally includes Tier 1 and Tier 2 merchants, online-only merchants and the PSPs, independentselling organizations (“ISOs”), value-added resellers (“VARs”), and acquirers who service them. These customers operate in avariety of verticals, including general merchandise, grocery, hospitality, dining, transportation, and others. Our solutionsprovide merchants with a secure, omni-channel payments platform that gives them independence from third-party paymentproviders. We also offer secure solutions to online-only merchants that provide consumers with a convenient and seamless wayto shop.
Billers
Within the biller segment, ACI provides electronic bill presentment and payment (“EBPP”) services to companies operating inthe consumer finance, insurance, healthcare, higher education, utility, government, and mortgage categories. Our solutionsenable these customers to support a wide range of payment options and provide a convenient consumer payments experiencethat drives consumer loyalty and increases revenue.
Solutions
ACI is a global software company that provides mission-critical real-time payment solutions to corporations. Customers use ourproven, scalable, and secure solutions to process and manage digital payments, enable omni-commerce payments, present andprocess bill payments, and manage fraud and risk. We combine our global footprint with local presence to drive the real-timedigital transformation of payments and commerce. Our strategic solution areas include the following:
Issuing & Acquiring
ACI offers comprehensive consumer payment solutions ranging from core payment engines to back-office support that enablebanks and intermediaries to compete effectively inff today’s real-time, open payments ecosystem.
ACI® Acquiring™ is a merchant management system that helps acquirers offer merchants capabilities to deliver digitalinnovation, improve fraud prevention, and reduce interchange fees.
ACI Issuing™ is a digital payments issuing solution that helps issuers accelerate innovation, give customers newpayment offerings and deliver cutting-edge security, with flexible cloud-based or on-premise deployments.
ACI Enterprise Payments Platform™ is a market-leading technology that provides payment players global paymentprocessing and orchestration capabilities for all digital payments, including high- and low-value payments, real-time andalternative payments, and cards.
Real-Time Payments
ACI supports both low- and high-value real-time payment processing for banks and intermediaries globally, ensuring multi-bank, multi-currency and 24x7 payment processing capabilities, as well as complete and ongoing regulatory compliance.
ACI Low Value Real-Time Payments™ is a platform with a complete range of capabilities for processing real-timepayments, including origination, processing, orchestration, clearing and settlement, fraud detection and connectivity.
ACI High Value Real-Time Payments™ is a global payments engine that offers multi-bank, multi-currency, and 24x7payment processing capabilities, as well as SWIFT messaging with seamless integrations to multiple clearing andsettlement mechanisms.
4

Omni-Commerce Payments
ACI provides real-time, any-to-any payment capabilities globally in both card-present anda card-not-present environments.
ACI Omni Commerce™ offers merchants a scalable, omni-channel payment processing platform with the flexibility tosupport in-store, online, and mobile payments, protected by advanced P2P encryption, tokenization, and fraudmanagement capabilities.a
ACI Secure eCommerce™ is a holistic platform that combines a powerful payments gateway, sophisticated real-timefraud prevention capabilities, advanced business intelligence tools, and access to an extensive global network ofacquirers and alternative payment methods.
Fraud and Risk Management
ACI’s big data engine uses powerful analytics to deliver robust fraud prevention and detection capabilities to bank,intermediary, and merchant customers.
ACI Fraud Management™ for financial institutions offers banks and intermediaries a comprehensive, real-timeapproach to fraud management that uses a superior combination of machine learning, fraud and payments data, andadvanced analytics to prevent fraud and reduce the burden of compliance. Our solution supports merchants with acomprehensive, real-time approach to fraud management that uses a superior combination of machine learning, fraud andpayments data, advanced analytics and unprecedented consortium data to prevent fraud and reduce the burden ofcompliance.
Digital Business Banking
ACI offers banks advanced cash management capabilities in a multi-tenant, cloud-based platform.
ACI Digital Business Banking™ is a cloud-based digital banking platform with a vast application programminginterface ("API") library and market-leading payments functionality that enables banks to reduce expenses and increasemarket share.
Bill Payments
ACI meets the bill payment needs of corporate customers across myriad industries through a range of electronic bill paymentsolutions that help companies raise consumer satisfaction while reducing costs.
ACI Speedpay® is an integrated suite of digital billing, payment, disbursement, and communication services that lowersthe cost of presenting and accepting bill payments while delivering industry-leading security.
On Premise or On Demand Software Delivery Options
Our software solutions are offered to our customers through either a traditional term software license arrangement where thesoftware is installed and operated on the customer premises or in a third-party public cloud environment (ACI On Premise™),through an on-demand arrangement where the solution is maintained and delivered through the cloud via our global data centers(ACI On Demand™d ), or a combination of the two. Solutions delivered through ACI’s on-demand cloud are available in either asingle-tenant environment, known as a software as a service (“SaaS”) offering, or in a multi-tenant environment, known as aplatform as a service (“PaaS”) offering. Pricing and payment terms depend on which solutions the customer requires and theirtransaction volumes. Generally, customers are required to commit to a minimum contract of five years, or three years in thecase of certain acquired SaaS and PaaS contracts.
Partnerships and Industry Participation
We have two major types of third-party product partners: 1) technology partners, or industry leaders with whom we workclosely that drive key industry trends and mandates, and 2) business partners, with whom we embed the partners’ technology inACI products, host the partners’ software in ACI’s cloud as a part of our AOD offering, or jointly market solutions that includethe products of the other company.
Technology partners help us add value to our solutions, stay abreast of current market conditions and industry developmentssuch as standards. Technology partner organizations include Diebold, Inc. (“Diebold”), NCR Corporation (“NCR”), Wincor-Nixdorf, VISA, Mastercard, and SWIFT. In addition, ACI has membership in or participates in the relevant committees ofseveral industry associations, such as the International Organization for Standardization (“ISO”), Accredited StandardsCommittee ("ASC") X9, ATM Industry Association, Financial Services, Interactive Financial eXchange Forum (“IFX”), NexoStandards, International Payments Framework Association (“IPFA”), U.K. Cards Association, Smart Card Alliance, and the
5

PCI Security Standards Council. These partnerships provide direction as it relates to the specifications that are used by the cardschemes, and in some cases, manufacturers. These organizations typically look to ACI as a source of knowledge and experienceto be shared in conjunction with creating and enhancing their standards. The benefit to ACI is in having the opportunity toinfluence these standards with concepts and ideas that will benefit the market, our customers, and ACI.
Business partner relationships extend our product portfolio, improve our ability to get our solutions to market, and enhance ourability to deliver market-leading solutions. We share revenues with these business partners based on several factors related tooverall value contribution in the delivery of the joint solution or payment type. The agreements with business partners includereferral, resale, traditional original equipment manufacturer (“OEM”) relationships, and transaction fee-based payment-enablement partnerships. These agreements generally grant ACI the right to create an integrated solution that we host ordistribute, or provide ACI access to established payment networks or capabilities. The agreements are generally worldwide inscope and have a term of several years.
We have alliances with our technology partners Amazon, HP, IBM, Microsoft Corporation, and Oracle USA, Inc. (“Oracle”),whose industry-leading hardware, software, and cloud-based infrastructure services are utilized by and in delivery of ACI’sproducts. These partnerships allow us to understand developments in the partners’ technology and to utilize their expertise intopics like sizing, scalability, and performance testing.
The following is a list of key product business partners:
• Amazon
• Apple Inc.
• Arvato Financial solutions
• Bank of America – CashPro Online
• Biocatch
• Black Knight Servicing Technologies, LLC
• Cardinal Commerce
• Chase Paymentech
• Clickatel
• Computershare Inc.
• DataOceans, LLC
• Diamond Communications Solutions
• Elavon Inc.
• Epic Systems Corporation
• FairCom Corporation
• Fifth Third Bank
• Guidewire
• Heirloom Computing
• Hewlett-Packard Company (HP)
• iData Incorporated
• Ingenico Group
• Integrated Research Limited
• International Business Machines Corporation (IBM)
• Intuit, Inc.
• Jack Henry & Associates, Inc.
• Kiosk
6

• Lean Software Services, Inc.
• Limonetik
• MAGTEK Inc.
• Mastercard
• Mi-Pay Limited
• Micro Focus, Inc.
• Microsoft Corporation
• Monex Financial Services Limited
• MTFX
• N2N
• Neustar, Inc.
• Noggintech
• Nordis Technologies
• Opentext
• Oracle USA, Inc. (Oracle)
• Paragon Application Systems, Inc.
• Pavreto
• Pax Technologies
• PayPal
• Payworks GmbH
• Perseuss - IATA
• Rambus Company
• Reliant Solutions
• RSA Security LLC, the Security Division of Dell EMC Corporation
• Safetrust pcProxPlusr BLE
• SAP America, Inc.
• Semafone—Cardff Protect
• ShopSite
• Solutions by Text, LLC
• Spectrum Message Services Pty Ltd
• Stiftung SIC
• SWIFT
• Symantec Corporation
• Transunion
• TSYS Acquiring Solutions
• VISA
• Vocalink Limited, a Mastercard company
• Worldpay Inc.
7

Services
We offer our customers a wide range of professional services, including analysis, design, development, implementation,integration, and training. Our service professionals generally perform the majority of the work associated with installing andintegrating our software products. In addition, we work with a limited number of systems integration and services partners suchas Accenture, LLC, Cognizant Technology Solutions Corporation, and Stanchion Payments Solution for staff augmentation andcoordinated co-prime delivery where appropriate.
We offer the following types of services for our customers:
• Implementation Services. We utilize a standard methodology to deliver customer project implementations acrossall product lines and delivery options. Within the process, we provide customers with a variety of services, includingsolution scoping reviews, project planning, training, site preparation, installation, product configuration, productcustomization, testing and go-live support, and project management throughout the project lifecycle. Implementationservices are typically priced according to the level of technical expertise required.
• Product Support Services. These product-support-funded services are available to customers after a solution hasbeen installed and are based on the relevant product support category. An extensive team of support analysts areavailable to assist customers.
• Technical Services. Our technical services are provided to customers who have licensed one or more of oursoftware products. Services offered include programming and programming support, day-to-day systems operations,network operations, help desk staffing, quality assurance testing, problem resolution, system design, andperformance planning and review. Technical services are typically priced according to the level of technicalexpertise required.
• Education Services. ACI courses include both theory and practical sessions to allow students to work though realbusiness scenarios and put their newly learned skills to use. This hands-on approach ensures that the knowledge isretained and the student is more productive upon their return to the workplace. ACI’s education courses providestudents with knowledge at all levels, to enhance and improve their understanding of ACI products. ACI alsoprovides further, more in-depth technical courses that allow students to use practical labs to enhance what they havelearned in the classroom. The ACI trainers’ ability to understand customers’ systems means ACI can also providetailored course materials for individual customers. Depending upon products purchased, training may be conductedat a dedicated education facility at one of ACI’s offices, online, on demand, ord at the customer site.
Customer Support
ACI provides our customers with product support that is available 24 hours a day, seven days a week. When requested by acustomer, the product support group can remotely access the customer’s systems on a real-time basis. This allows us to helpdiagnose issues, correct any problems, and enhance the continuous availability of a customer’s business-critical systems. Weoffer our customers three support options:
Standard Customer Support. After software installation and project completion, we provide maintenance services to customersfor a monthly product support fee. Maintenance services include:
• New product releases (major, minor and patches)
• 24-hour hotline for priority one (“P1”) problem resolutions
• Access to our online support portal (eSupport)
• Vendor-required mandates and updates
• Product documentation
• Hardware operating system compatibility
• User group membership
Enhanced Customer Support. This includes all features of Standard Customer Support plus the following:
• Named technical account manager
• Accelerated service levels
• Consulting support
8

Premium Customer Support.u Under the premium customer support option, referred to as the Premium Customer SupportProgram, each customer is assigned an experienced technician(s) to work with its system. The technician(s) typically performsfunctions such as:
• Configuration and testing software fixes
• Retrofitting custom software modifications (“CSMs”) into new software releases
• Answering questions and resolving problems related to the customer’s implementation
• Maintaining a detailed CSM history
• Monitoring customer problems on ACI’s HELP24™ hotline database on a priority basis
• Supplying onsite support, available upon demand
• Performing an annual system review/health check and capacity planning exercisea
We provide new releases of our products on a periodic basis. New releases of our products, which often contain minor productenhancements, are typically provided at no additional fee for customers under standard customer support agreements.Agreements with our customers permit us to charge for substantial product enhancements that are not provided as part of thestandard, enhanced, or premium customer support agreement.
Competition
The digital payments market is highly competitive and subject to rapid change. Competitive factors affecting the market for ourproducts and services include product features, price, availability of customer support, ease of implementation, product andcompany reputation, and a commitment to continued investment in research and development.
Our competitors vary by solution, geography, and market segment. Generally, our most significant competition comes from in-house information technology departments of existing and potential customers, as well as third-party digital payment processors(some of whom are our customers). Many of these companies are significantly larger than us and have significantly greaterfinancial, technical, and marketing resources.
Key competitors by solution area include the following:
Issuing, Acquiring, and Real-Time Payments
The third-party software competitors for ACI’s Issuing, Acquiring, and Real-Time Payments solution areas are ComputerSciences Corporation, Fidelity National Information Service, Inc. ("FIS"), Finastra, Fiserv, Inc. ("Fiserv"),NCR, OpenWay Group, and Total System Services, Inc. (Global Payments), as well as small, regionally-focused companiessuch as BPC Banking Technologies, CR2, Financial Software and Systems, Form3, HPS, Icon Solution, Lusis Payments Ltd.,Opus Software Solutions Private Limited, PayEx Solutions AS, Renovite, RS2, and TSYS. Primary digital payment processingcompetitors in this area include global entities such as Atos Origin S.A., Fiserv, Mastercard, SiNSYS, and VISA, as well asregional or country-specific processors.
Omni-Commerce Payments
Competitors in the Omni-Commerce Payments solution area come from both third-party software and service providers as wellas service organizations run by major banks. Third-party software and service competitors include Adyen, Cybersource (VISA),First Data (Fiserv), GlobalCollect, Ingenico Group, NCR, Square, Inc., Tender Retail Inc., VeriFone Systems, Inc., andWorldpay Inc. (FIS).
Fraud and Risk Management
Principal competitors for our Fraud and Risk Management solution area are Accertify (American Express), BAE Systems,ffCybersource (VISA), Fair Isaac Corporation, Featurespace, Feedzai, FIS, Fiserv, Forter, Kount, NCR, NICE LTD, and SASInstitute, Inc., as well as dozens of smaller companies focused on niches of this segment such as anti-money laundering.
Digital Business Banking
Principal competitors for our Digital Business Banking solution area are Bottomline Technologies, Finastra, FIS, Fiserv, JackHenry & Associates, Inc., NCR, and Q2 Software, Inc.
9

Bill Payments
The principal competitors for Bill Payment solutions are Aliaswire Inc., CSG Systems International, Inc., FIS, Fiserv, InvoiceCloud, Inc., Jack Henry & Associates, Inc., Kubra Customer Interaction Management, Nelnet, Inc. and Affiliates, NIC,Paymentus Corp., PayNearMe, Repay, TouchNet Information Systems, Inc., Transact and Worldpay Inc. (FIS), as well assmaller vertical-specific providers.
Research and Development
Our product development efforts focus on new products and improved versions of existing products. We facilitate user groupmeetings to help us determine our product strategy, development plans, and aspects of customer support. The user groups aregenerally organized geographically or by product lines. We believe that the timely development of new applications andenhancements is essential to maintain our competitive position in the market.
During the development of new products, we work closely with our customers and industry leaders to determine requirements.We work with device manufacturers, such as Diebold, NCR, and Wincor-Nixdorf, to ensure compatibility with the latest ATMtechnology. We work with network vendors, such as Mastercard, SWIFT, and VISA, to ensure compliance with newregulations or processing mandates. We work with computer hardware and software manufacturers, such as HPE, IBM,Microsoft Corporation, and Oracle, to ensure compatibility with new operating system releases and generations of hardware.Customers often provide additional information on requirements and serve as beta-test partners.
We have a continuous process to encourage and capture innovative product ideas. Such ideas include features, as well asentirely new products or service offerings. A proof of concept (“POC”) may be conducted to validate the idea. If determined tobe viable, the innovation is scheduled into a product roadmap for development and release.
Customers
We provide software products and solutions to customers in a range of industries worldwide with billers, banks andintermediaries, and merchants comprising our largest industry segments. As of December 31, 2020, we serve more than 6,000organizations, including 19 of the top 20 banks worldwide, as measured by asset size, and 80,000+ merchants directly andthrough payment service providers, as measured by revenue, in 95+ countries on six continents. No single customer accountedfor more than 10% of our consolidated revenues for the years ended December 31, 2020, 2019, and 2018. No customeraccounted for more than 10% of our consolidated receivables balance as of December 31, 2020 and 2019.
Selling and Implementation
Our primary method of distribution is direct sales by employees assigned to specific target segments. Headquartered in Naples,Florida, we have sales personnel in and outside the United States in numerous locations, including East Brunswick, Norcross,Omaha, and Waltham. In addition, we have sales offices located outside the United States in Auckland, Bahrain, Bangkok,Beijing, Bogota, Brussels, Buenos Aires, Cape Town, Dubai, Gouda, Johannesburg, Kuala Lumpur, Limerick, Madrid, Manila,uMelbourne, Mexico City, Milan, Montevideo, Mumbai, Munich, Naples (Italy), Paris, Quito, Santiago, Sao Paulo, Shanghai,Singapore, Sulzbach, Sydney, Tokyo, Toronto, and Watford.ff
We use distributors and referral partners to supplement our direct sau les force in countries where it is more efficient andeconomical to do so. We generate a majority of our sales leads through existing relationships with vendors, direct marketingprograms, customers and prospects, or through referrals. ACI’s distributors, resellers, and system integration partners areenabled to provide supplemental or complete product implementation and customization services directly to our customers or ina joint delivery model.
Current international distributors, resellers, referral partners, and implementation partners (collectively, “Channel Partners”) forus during the year ended December 31, 2020, included:
• AGS Technology Inc. (India)
• ADSI International (Colombia/Venezuela/Caribbean)
• Bayshore (China)
• CAPSYS Technologies, LLC (Russia/Eastern Europe)
• Channel Solutions Inc. (Philippines)
• DataOne Asia Co., Ltd. (Thailand)
10

• Deda Group Business Solutions (Italy)
• EFT Corporation (Sub-Saharan Africa)
• Interswitch Ltd. (Sub-Saharan Africa)
• JRI Inc. (Japan)
• Korea Computer Inc (Korea)
• Kuvasz (Chile)KK
• Pactera (China)
• P.T. Abhimata Persada (Indonesia)
• Stanchion (South Africa)
• STET (EU)
• Stream IT Consulting Ltd. (Thailand)
• Syscom Computer Co., Ltd. (Shenzhen) (China)
• Syscom Computer Engineering Co. (Taiwan)
• TIS Inc. (Japan)
• Transaction Payment Solutions - Liquid Telecom (Sub-Saharan Africa)
• Worldline (China)
Omni-Commerce channel partners during the year ended December 31, 2020, included:
• Altapay (Denmark)
• Amadeus (Spain)
• Barclaycard (United Kingdom)
• Computop (Germany)
• Easy Nolo S.P.A. (Italy)
• Evo Payments (United States)
• Ingenico Group (Netherlands)
• Mastercard/Datacash (United Kingdom.)
• Metrics Global (United States)
• MNP Media Ltd. (United Kingdom)
• Paysafe Group Plc (United States)
• PayU South Africa (South Africa)
• Planet Payments (United States)
• Secure Trading (United Kingdom)
• Simplepay (Australia)
• VeriFone Systems, Inc. (United States and European Union)
• Worldline Sweden AB (Sweden)
Biller channel partners during the year ended December 31, 2020, included:
• 3 Point Alliance
• ACH Payment Solutions
• Adirondack Solutions
• API Outsourcing
11

• Clearwater Payments
• County Information Resources Agency
• Discover
• Donald R. Frey & Co.
• ECHO Health
• Ellucian
• Epic
• Guidewire
• MoneyGram
• Nordis Technologies
• Nortridge Software Company
• Ontario Systems
• Radiant 44
• RR Donnelley
• Salepoint
• Semafoneff
• Shaw
• Solutions by Text
• SourceHOV
• Thompson Reuters
• Transactis (Mastercard)
• TriZetto (Cognizant)
• The Western Union Company
We distribute the products of other vendors where they complement our existing product lines. We are typically responsible forthe sales and marketing of the vendor’s products, and agreements with these vendors generally provide for revenue sharingbased on relative responsibilities.
Proprietary Rights and Licenses
We rely on a combination of trade secret and copyright laws, license agreements, contractual provisions, and confidentialityagreements to protect our proprietary rights. We distribute our software products under software license agreements thattypically grant customers nonexclusive licenses to use our products. Use of our software products is usually restricted todesignated computers, specified locations and/or specified capacity, and is subject to terms and conditions prohibitingunauthorized reproduction or transfer of our software products. We also seek to protect the source code of our software as atrade secret and as a copyrighted work. Despite these precautions, there can be no assurance that misappropriation of oursoftware products and technology will not occur.
In addition to our own products, we distribute, or act as a sales agent for, software developed by third parties. However, wetypically are not involved in the development process used by these third parties. Our rights to those third-party products andthe associated intellectual property rights are limited by the terms of the contractual agreement between us and the respectivethird party.
Although we believe that our owned and licensed intellectual property rights do not infringe upon the proprietary rights of thirdparties, there can be no assurance that third parties will not assert infringement claims against us. Further, there can be noassurance that intellectual property protection will be available for our products in all foreign countries.
12
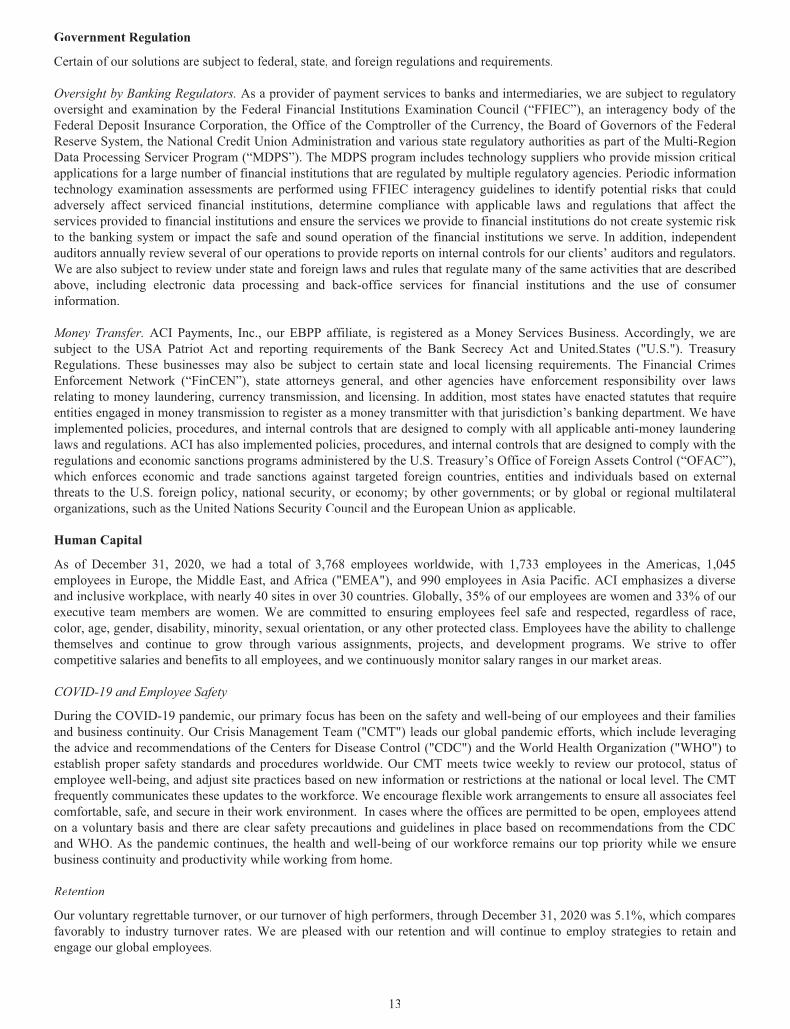
Government Regulation
Certain of our solutions are subject to federal, state, and foreign regulations and requirements.
Oversight by Banking Regulators. As a provider of payment services to banks and intermediaries, we are subject to regulatoryoversight and examination by the Federal Financial Institutions Examination Council (“FFIEC”), an interagency body of theFederal Deposit Insurance Corporation, the Office of the Comptroller of the Currency, the Board of Governors of the FederalReserve System, the National Credit Union Administration and various state regulatory authorities as part of the Multi-RegionData Processing Servicer Program (“MDPS”). The MDPS program includes technology suppliers who provide mission criticalapplications for a large number of financial institutions that are regulated by multiple regulatory agencies. Periodic informationtechnology examination assessments are performed using FFIEC interagency guidelines to identify potential risks that couldadversely affect serviced financial institutions, determine compliance with applicable laws and regulations that affect theservices provided to financial institutions and ensure the services we provide to financial institutions do not create systemic riskto the banking system or impact the safe and sound operation of the financial institutions we serve. In addition, independentauditors annually review several of our operations to provide reports on internal controls for our clients’ auditors and regulators.We are also subject to review under state and foreign laws and rules that regulate many of the same activities that are describedabove, including electronic data processing and back-office services for financial institutions and the use of consumerinformation.
Money Transfer. ACI Payments, Inc., our EBPP affiliate, is registered as a Money Services Business. Accordingly, we aresubject to the USA Patriot Act and reporting requirements of the Bank Secrecy Act and United.States ("U.S."). TreasuryRegulations. These businesses may also be subject to certain state and local licensing requirements. The Financial CrimesEnforcement Network (“FinCEN”), state attorneys general, and other agencies have enforcement responsibility over lawsrelating to money laundering, currency transmission, and licensing. In addition, most states have enacted statutes that requireentities engaged in money transmission to register as a money transmitter with that jurisdiction’s banking department. We haveimplemented policies, procedures, and internal controls that are designed to comply with all applicable anti-money launderinglaws and regulations. ACI has also implemented policies, procedures, and internal controls that are designed to comply with theregulations and economic sanctions programs administered by the U.S. Treasury’s Office of Foreign Assets Control (“OFAC”),which enforces economic and trade sanctions against targeted foreign countries, entities and individuals based on externalthreats to the U.S. foreign policy, national security, or economy; by other governments; or by global or regional multilateralorganizations, such as the United Nations Security Council and the European Union as applicable.
Human Capital
As of December 31, 2020, we had a total of 3,768 employees worldwide, with 1,733 employees in the Americas, 1,045employees in Europe, the Middle East, and Africa ("EMEA"), and 990 employees in Asia Pacific. ACI emphasizes a diverseand inclusive workplace, with nearly 40 sites in over 30 countries. Globally, 35% of our employees are women and 33% of ourexecutive team members are women. We are committed to ensuring employees feel safe and respected, regardless of race,color, age, gender, disability, minority, sexual orientation, or any other protected class. Employees have the ability to challengethemselves and continue to grow through various assignments, projects, and development programs. We strive to offercompetitive salaries and benefits to all employees, and we continuously monitor salary ranges in our market areas.
COVID-19 and Employee SafetyII
During the COVID-19 pandemic, our primary focus has been on the safety and well-being of our employees and their familiesand business continuity. Our Crisis Management Team ("CMT") leads our global pandemic efforts, which include leveragingthe advice and recommendations of the Centers for Disease Control ("CDC") and the World Health Organization ("WHO") toestablish proper safety standards and procedures worldwide. Our CMT meets twice weekly to review our protocol, status ofemployee well-being, and adjust site practices based on new information or restrictions at the national or local level. The CMTfrequently communicates these updates to the workforce. We encourage flexible work arrangements to ensure all associates feelcomfortable, safe, and secure in their work environment. In cases where the offices are permitted to be open, employees attendon a voluntary basis and there are clear safety precautions and guidelines in place based on recommendations from the CDCand WHO. As the pandemic continues, the health and well-being of our workforce remains our top priority while we ensurebusiness continuity and productivity while working from home.
Retention
Our voluntary regrettable turnover, or our turnover of high performers, through December 31, 2020 was 5.1%, which comparesfavorably to industry turnover rates. We are pleased with our retention and will continue to employ strategies to retain andengage our global employees.
13

Benefits
We provide our global employees with competitive and comprehensive benefits to meet their needs and the needs of theirdependents.
In the United States, nearly all of our employees participate in our employee benefits programs that include:
• Comprehensive health coverage for medical, vision, and dental care
• Short term, long term, accident and disability insurance coverage
• Flexible spending accounts for medicaff l and dependent care expenses
• Commuter expense reimbursement accounts
• Retirement savings plans including 401(K) and deferred compensation plans
• Access to 529 Plans for college savings
• Adoption assistance
• Employee discounts programs
Some of these benefits are available to our employees outside the United States where applicable and permissible by law inaddition to locally provided benefits.
Globally, all employees have access to an employee assistance program which offers support to employees and their immediatefamily to address a range of personal needs and concerns in support ofu their well-being and mental health.
To foster a stronger sense of ownership and align with the interests of our shareholders, participation in the employee stockpurchase plan is available forff eligible employees.
Available Information
Our annual reports on Form 10-K, quarterly reports on Form 10-Q, current reports on Form 8-K, and amendments to thosereports filed or furnished pursuant to Section 13(a) or 15(d) of the Securitieff s Exchange Act of 1934 (the “Exchange Act”), areavailable free of charge on our website atff www.aciworldwide.com as soon as reasonably practicable after we file suchffinformation electronically with the SEC. The information found on our website is not part of this or any other report we filewith or furnish to the SEC. The public may read and copy any materials that we file with thff e SEC at the SEC’s PublicReference Room at 100 F Street, Room 1580, NW, Washington DC 20549. The public may obtain information on the operationof the Public Reference Room by calling the SEC at 1-800-SEC-0330. The SEC maintains an Internet site thaff t contains reports,proxy and information statements, and other information regarding issuers that file electronically with the SEC at www.sec.govg .
Executive Officers of the Registrant
As of February 25, 2021, our executive officers, their ages, and their positions were as follows:ff
Name Age PositionOdilon Almeida 59 President and Chief Executive OfficerffScott W. Behrens 49 Executive Vice President, Chief Financial OfficerEvanthia (Eve) C. Aretakis 61 Executive Vice President, Chief Revenue OfficerffJeremy M. Wilmot 52 Executive Vice President, Chief Product OfficerffDennis P. Byrnes 57 Executive Vice President, Chief Legal Officer, General Counsel, and Secretary
Mr. Almeida was appointea d President and Chief Executive Officer on March 9, 2020. Mr. Almeida has senior leadershipexperience spanning multiple industries and countries and two decades of payments experience. Prior to joining ACI, Mr.Almeida served as an operating partner at Advent International, one of the world's largest private equity funds. Mr. Almeidaffalso spent 17 years at The Western Union Company, where he most recently served as the President of Global Money Transfer.Mr. Almeida is fluent in English, Spanish, and Portuguese, and he holds a bachelor’s degree in Civil Engineering from CentroUniversitário Instituto Mauá de Tecnologia in São Paulo and a Master of Business Administration from Fundação GetulioVargas in São Paulo. He extended his education at Harvard Business School, The Wharton School, and the InternationalInstitute of Management (IMD).
14

Mr. Behrens serves as Executive Vice President and Chief Financial Officer. Mr. Behrens joined ACI in June 2007 as ourCorporate Controller and was appointed as Chief Accounting Officer in October 2007. Mr. Behrens was appointed ChiefFinancial Officer in December 2009 and ceased serving as our Corporate Controller in December 2010. Mr. Behrens wasappointed Executive Vice President in March 2011. Prior to joining ACI, Mr. Behrens served as Senior Vice President,Corporate Controller and Chief Accounting Officer at SITEL Corporation from January 2005 to June 2007. He also served asVice President of Financial Reporting at SITEL Corporation from April 2003 to January 2005. From 1993 to 2003, Mr. Behrenswas with Deloitte & Touche, LLP, including two years as a Senior Audit Manager. Mr. Behrens holds a Bachelor of Sciencefrom the University of Nebraska – Lincoln.
Ms. Aretakis serves as Executive Vice President and Chief Revenue Officer. Previously, Ms. Aretakis led ACI's On Demandsegment and Product Development group. Prior to joining ACI in 2016, Ms. Aretakis was Executive Vice President at Unify/Siemens Enterprise Communications. Her responsibilities included P&L management and accountability for softwaredevelopment, product management and manufacturing of the global product portfolio. She previously served as President of IPNetwork Solutions at Siemens, Unit President of the company’s U.S. carrier division, and as Executive Vice President atUnisphere Networks. Ms. Aretakis began her career as a Software Engineer for Texas Instruments and Raytheon. Shetransitioned to Product Management as she progressed into management roles of various business units. Ms. Aretakis holds abachelor’s degree in Computer Science and Economics from Union College.
Mr. Wilmot serves as Executive Vice President and Chief Product Officer. Prior to his current role, Mr. Wilmot held a numberof senior leadership roles at ACI, including leading ACI's On Premise segment, Chief Marketing and Revenue Officer, SeniorVice President and Managing Director for the Americas, President for Asia Pacific and Regional Director for Western Europeand Africa. Prior to joining ACI in 1999, Mr. Wilmot worked for ICL (now Fujitsu) in several capacities, including asInternational Sales Manager for Financial Services. Mr. Wilmot holds a Bachelor of Arts in Business Studies from OxfordBrookes University in the United Kingdom and has completed the Advanced Management Program at INSEAD in France.
Mr. Byrnes serves as Executive Vice President, Chief Legal Officer, General Counsel, and Secretary. He has served in thatcapacity since March 2011 and as General Counsel and Secretary since joining the Company in June 2003. Prior to joiningACI, Mr. Byrnes served as an attorney with Bank One Corporation’s technology group from 2002 to 2003; with SterlingCommerce from 1996 to 2002; and with Baker Hostetler from 1991 to 1996. Mr. Byrnes holds a JD from The Ohio StateUniversity College of Law, a Master of Business Administration from Xavier University, and a Bachelor of Science inEngineering from Case Western Reserve University.
ITEM 1A. RISK FACTORS
We operate in a rapidly changing technological and economic environment that presents numerous risks. Many of these risksare beyond our control and are driven by factors that often cannot be predicted. The following discussion highlights some ofthese risks.
Risks Related to COVID-19
The effects of the COVID-19 pandemic have materially affected how we, our clients and business partners are operating,and the duration and extent to which this will impact our future results of operations and overall financial performanceffremains uncertain.
We remain subject to risk and uncertainties as resu ult of the COVID-19 pandemic though the extent of the impact on ourbusiness and operations remains highly uncertain and difficult to predict. The COVID-19 pandemic continues to have a global,evolving, and unpredictable impact on the economy, financial markets and business practices, and the overall impact of theCOVID-19 pandemic on our business and financial performance remains to be seen. Our future operational results, financialperformance and liquidity could be negatively impacted by delays in payments of outstanding receivable amounts beyondnormal payment terms and uncertain demand for our products and services.
As a result of the COVID-19 pandemic, we have temporarily closed our offices globally and a majority of our employeescontinue to work from home or remotely, which has caused strain for, and may adversely impact the productivity of, some ofour employees. Remote working conditions may persist, which could harm our business, including our future financialperformance, our potential exposure to cybersecurity risks and potential improper dissemination of personal or confidentialinformation. Additionally, the COVID-19 pandemic may have long-lasting effects on the viability of the office environmentand remote working, and this may result in challenging how we operate our business.
15

Due to the ongoing uncertainty surrounding the continued severity and duration of the COVID-19 pandemic, we cannot yetdetermine if our efforts thus far and efforts to come will be effective in mitigating the effects of the COVID-19 pandemic onour business, results of operations or financial performance. Accordingly, we are unable at this time to predict how theCOVID-19 pandemic will continue to affect our operations, liquidity, and financial results. Further, without more clarity on theultimate magnitude and duration of the COVID-19 pandemic, we are unable to determine whether the impact of COVID-19will be material.
Risks Related to Our Business and Operations
The markets in which we compete are rapidly changing and highly competitive, and we may not be able to competeeffectively.
The markets in which we compete are characterized by rapid change, evolving technologies and industry standards and intensecompetition. There is no assurance that we will be able to maintain our current market share or customer base. We face intensecompetition in our businesses and we expect competition to remain intense in the future. We have many competitors that aresignificantly larger than us and have significantly greater financial, technical and marketing resources, have well-establishedrelationships with our current or potential customers, advertise aggressively or beat us to the market with new products andservices. In addition, we expect that the markets in which we compete will continue to attract new competitors and newtechnologies. Increased competition in our markets could lead to price reductions, reduced profits, or loss of market share.
To compete successfully, we need to maintain a successful research and development effort. If we fail to enhance our currentproducts and develop new products in response to changes in technology and industry standards, bring product enhancements ornew product developments to market quickly enough, or accurately predict future changes in our customers’ needs and ourcompetitors develop new technologies or products, our products could become less competitive or obsolete.
If we experience business interruptions or failure of our information technology and communication systems, theavailability of our products and services could be interrupted which could adversely affect our reputation, business andfinancial condition.
Our ability to provide reliable service in a number of our businesses depends on the efficient and uninterrupted operation of ourdata centers, information technology and communication systems, and those of our external service providers. As we continueto grow our ACI On Demand business, our dependency on the continuing operation and availability of these systems increases.Our systems and data centers, and those of our external service providers, could be exposed to damage or interruption from fire,natural disasters, constraints within our workforce due to pandemics such as COVID-19, power loss, telecommunicationsfailure, unauthorized entry and computer viruses. Although we have taken steps to prevent system failures and we haveinstalled back-up systems and procedures to prevent or reduce disruption, such steps may not be sufficient to prevent aninterruption of services and our disaster recovery planning may not account for all eventualities. Further, our property andbusiness interruption insurance may not be adequate to compensate us for all losses or failures that may occur.
An operational failure or outage in any of these systems, or damage to or destruction of these systems, which causes disruptionsin our services, could result in loss of customers, damage to customer relationships, reduced revenues and profits, refunds ofcustomer charges and damage to our brand and reputation and may require us to incur substantial additional expense to repair orreplace damaged equipment and recover data loss caused by the interruption. Any one or more of the foregoing occurrencescould have a material adverse effect on our reputation, business, financial condition, cash flows and results of operations.
If our security measures are breached or become infected with a computer virus,ii or if our services are subject to attacks thatdegrade or deny the ability of users to access our products or services, our business will be harmed by disrupting delivery ofservices and damaging our reputation.
As part of our business, we electronically receive, process, store, and transmit sensitive business information of our customers.Unauthorized access to our computer systems or databases could result in the theft or publication of confidential information orthe deletion or modification of records or could otherwise cause interruptions in our operations. These concerns about securityuare increased when we transmit information over the Internet. Security breaches in connection with the delivery of our productsrrand services, including products and services utilizing the Internet, or well-publicized security breaches, and the trend towardbroad consumer and general public notification of such incidents, could significantly harm our business, financial condition,cash flows and/or results of operations. We cannot be certain that advances in criminal capabilities, discovery of newvulnerabilities, attempts to exploit vulnerabilities in our systems, data thefts, physical system or network break-ins orinappropriate access, or other developments will not compromise or breach the technology protecting our networks andconfidential information. Computer viruses have also been distributed and have rapidly spread over the Internet. Computerviruses could infiltrate our systems, disrupting our delivery of services and making our applications unavailable. Any inability
16

to prevent security breaches or computer viruses could also cause existing customers to lose confidence in our systems andterminate their agreements with us, and could inhibit our ability to attract new customers.
Failure to attract and retain senior management personnel and skilled technical employees could harm our ability to grow.
Our senior management team has significant experience in the financial services industry. The loss of this leadership could havean adverse effect on our business, operating results and financial condition. Further, the loss of this leadership may have anadverse impact on senior management’s ability to provide effective oversight and strategic direction for all key functions withinthe Company, which could impact our future business, operating results and financial condition.
Our future success also depends upon our ability to attract and retain highly-skilled technical personnel. Because thedevelopment of our solutions and services requires knowledge of computer hardware, operating system software, systemmanagement software, and application software, our technical personnel must be proficient in a number of disciplines.Competition for such technical personnel is intense, and our failure to hire and retain talented personnel could have a materialadverse effect on our business, operating results and financialff condition.
Our future growth will also require sales and marketing, financial and administrative personnel to develop and support newsolutions and services, to enhance and support current solutions and services and to expand operational and financial systems.There can be no assurance that we will be able to attract and retain the necessary personnel to accomplish our growth strategiesand we may experience constraints that could adversely affect our ability to satisfy client demand in a timely fashion.
Our ability to maintain compliance with applicable laws, rules and regulations and to manage and monitor the risks facing ourbusiness relies upon the ability to maintain skilled compliance, security, risk and audit professionals. Competition for suchskillsets is intense, and our failure to hire and retain talented personnel could have an adverse effect on our internal controlenvironment and impact our operating results.
As a result of the global COVID-19 pandemic, a significant portion of our workforce is working in a mostly remoteenvironment. This remote environment may continue after the pandemic due to potential resulting trends, and could impact thequality of our corporate culture. Failure to attract, hire, develop, motivate and retain highly qualified and diverse employeetalent, or to maintain a corporate culture that fosters innovation, creativity, and teamwork could harm our overall business andresults of operations.
We have a number of new members on our senior management team, which coupled with the announced plan to relocateour corporate headquarters, may pose challenges to our operations and business growth.
Odilon Almeida was appointed our President and Chief Executive Officer on February 18, 2020, and assumed the roleseffective March 9, 2020. Anthony Dinkins also joined our executive leadership team in 2020, as our Chief Human ResourcesOfficer. As remote working and the COVID-19 pandemic continues, there may be challenges with fully integrating these newofficers and their direct reports to the executive leadership team and the Company more broadly.
In addition, we may face further personnel and executive leadership changes and challenges in connection with the plannedrelocation of our corporate headquarters from Naples, Florida to Miami, Florida. For example, we may face difficulties inretaining, attracting and training employees during and after the relocation of our headquarters. These difficulties may beexacerbated by the remaining impact of the COVID-19 pandemic and especially many employees’ continued remote workingsituation. Failure to meet these challenges successfully may adversely impact our operations, business results or long-termgrowth prospects.
If we engage in acquisitions, strategic partnerships or significant investments in new business, we will be exposed to riskswhich could materially adversely affect our business.
As part of our business strategy, we anticipate that we may acquire new products and services or enhance existing products andservices through acquisitions of other companies, product lines, technologies and personnel, or through investments in, orstrategic partnerships with, other companies. Any acquisition, investment or partnership, is subject to a number of risks. Suchrisks include the diversion of management time and resources, disruption of our ongoing business, potential overpayment forthe acquired company or assets, dilution to existing stockholders if our common stock is issued in consideration for anacquisition or investment, incurring or assuming indebtedness or other liabilities in connection with an acquisition which mayincrease our interest expense and leverage significantly, lack of familiarity with new markets, and difficulties in supporting newproduct lines.
17

Further, even if we successfully complete acquisitions, we may encounter issues not discovered during our due diligenceprocess, including product or service quality issues, intellectual property issues and legal contingencies, the internal controlenvironment of the acquired entity may not be consistent with our standards and may require significant time and resources toimprove and we may impair relationships with employees and customers as a result of migrating a business or product line to anew owner. We will also face challenges in integrating any acquired business. These challenges include eliminating redundantoperations, facilities and systems, coordinating management and personnel, retaining key employees, customers and businesspartners, managing different corporate cultures, and achieving cost reductions and cross-selling opportunities. There can be noassurance that we will be able to fully integrate all aspects of acquired businesses successfully, realize synergies expected toresult from the acquisition, advance our business strategy or fully realize the potential benefits of bringing the businessestogether, and the process of integrating these acquisitions may further disrupt our business and divert our resources.
See Critical Accounting Policies and Estimates in Part II, Item 7 of this Form 10-K for additional information related toAccounting Standards Codification ("ASC") 805, Business Combinations.
Our failure to successfully manage acquisitions or investments, or successfully integrate acquisitions could have a materialadverse effect on our business, financial condition, cash flows and/or results of operations. Correspondingly, our expectationsrelated to the benefits related to our recent acquisitions, prior acquisitions or any other future acquisition or investment could beinaccurate.
We may experience difficulties integrating Speedpay, which could cause us to fail to realize the anticipated benefits of theacquisition.
Achieving the anticipated benefits of our acquisition of Speedpay will depend in part upon whether we are able to integrate thebusiness in an effective and efficient manner. There can be no assurance that we will be able to fully integrate all aspects ofSpeedpay successfully, advance our business strategy, or fully realize the potential benefits of bringing the businesses together,and the process of integrating Speedpay may disrupt our business and divert our resources. Any delay or inability ofmanagement to successfully integrate the operations of Speedpay could compromise our potential to achieve the anticipatedlong-term strategic benefits of the acquisitions and could have a material adverse effect on the business, financial condition,cash flows, and results of operations.
We may experience difficulties implementing our new Three Pillii ar strategy, and the Threell Pillar strategy could provellunsuccessful in growing our business.
Our Three Pillar strategy focuses on investments in real-time payments, large sophisticated global merchants, and fast-growingemerging markets. Successfully implementing our Three Pillar strategy may present organizational and infrastructurechallenges, and we may not be able to fully implement or realize the intended benefits of this new strategy. Moving to a newbusiness strategy may result in a loss of established efficiency, which may have a negative impact on our business. As weadjust, we also may need to bring on additional talent, which could prove difficult in a competitive job market, especially as theCOVID-19 pandemic and remote working continues. The increased focus on mergers and acquisitions opportunities andresearch and development could result in financial difficulties and may not always be fruitful. We may also face an increasedamount of competition as we attempt to expand and grow our business, which may negatively impact our financial results. Inorder for us to be successful as we enter and invest in emerging markets, these markets must continue to grow. However, thisgrowth depends on a variety of factors that we are not always able to predict.
While there are anticipated challenges associated with shifting to a new business strategy, the scope and extent of thesechallenges are difficult to predict. As such, we will not always be able to fully and successfully mitigate any of our anticipatedchallenges. Further, even if we realize all anticipated benefits associated with this change in our business strategy, there may beconsequences, internal control issues, or business impacts that were not expected.
To the extent that we convert some or all of our on-premise licenses from a fixed-term to a subscription model, our futurefinancial results will be affected by the frequency at which our customers adopt our subscription model, which carries with itcertain risks.
Our on-premise licenses currently have a five-year fixed term model. In the future, we may transition some or all of theselicenses to a subscription model. A transition to a subscription model would reflect a significant shift from a fixed-term license.In addition, a subscription model presents a number of risks to us including the following:
• arrangements entered into on a subscription basis generally delay the timing of revenue recognition and can require theincurrence of up-front costs, which may be significant;
18

• subscription models make it difficult to rapidly increase revenues through additional bookings in any period, asrevenues are recognized ratably over the subscription period;
• customers in a subscription arrangement may elect not to renew their contract upon expiration or they may attempt torenegotiate pricing or other contractual terms at the point of (or prior to) renewal on terms that are less favorable to us;and
• there is no assurance that our customers will broadly accept a subscription model for our on-premise licenses.
Certain anti-takeover provisions contained in our charter and under Delaware law could hinder a takeover attempt.ii
We are subject to the provisions of Section 203 of the General Corporation Law of the State of Delaware prohibiting, underrsome circumstances, publicly-held Delaware corporations from engaging in business combinations with some stockholders fora specified period of time without the approval of the holders of substantially all of our outstanding voting stock. Suchprovisions could delay or impede the removal of incumbent directors and could make more difficult a merger, tender offer, orproxy contest involving us, even if such events could be beneficial, in the short term, to the interests of our stockholders. Inaddition, such provisions could limit the price that some investors might be willing to pay in the future for shares of ourcommon stock. Our certificate of incorporation and bylaws contain provisions relating to the limitation of liability andindemnification of our directors and officers, dividing our board of directors into three classes of directors serving three-yearterms and providing that our stockholders can take action only at a duly called annual or special meeting of stockholders.
Risks Related to Our Customers
Certain payment funding methods expose usxx to the credit and/or operating risk of our clients.
When we process an automated clearing house or ATM network payment transaction for certain clients, we occasionallytransfer funds from our settlement account to the intended destination account before we receive funds from a client’s sourceaccount. The vast majority of these occurrences are resolved quickly through normal processes. However, if they are notresolved and we are then unable to reverse the transaction that sent funds to the intended destination, a shortfall in oursettlement account will be created. Although we have legal recourse against our clients for the amount of the shortfall, timing ofrecovery may be delayed by litigation or the amount of any recovery may be less than the shortfall. In either case, we wouldhave to fund the shortfall in our settlement account from our corporate funds.
Potential customers may be reluctant to switch to a new vett ndor, which may adversely affect our growth, both in the UnitedStates and internationally.tt
For banks, intermediaries, and other potential customers of our products, switching from one vendor of core financial servicessoftware (or from an internally-developed legacy system) to a new vendor is a significant endeavor. Many potential customersbelieve switching vendors involves too many potential disadvantages such as disruption of business operations, loss ofaccustomed functionality, and increased costs (including conversion and transition costs). As a result, potential customers mayresist change. We seek to overcome this resistance through value enhancing strategies such as a defined conversion/migrationprocess, continued investment in the enhanced functionality of our software and system integration expertise. However, therecan be no assurance that our strategies for overcoming potential customers’ reluctance to change vendors will be successful, andthis resistance may adversely affect our growth, both in the United States and internationally.
Risks Related to Our Intellectual Property
We may be unable to protect our intellectual property and technology.
To protect our proprietary rights in our intellectual property, we rely on a combination of contractual provisions, includingcustomer licenses that restrict use of our products, confidentiality agreements and procedures, and trade secret and copyrightlaws. Despite such efforts, we may not be able to adequately protect our proprietary rights, or our competitors mayindependently develop similar technology, duplicate products, or design around any rights we believe to be proprietary. Thismay be particularly true in countries other than the United States because some foreign laws do not protect proprietary rights tothe same extent as certain laws of the United States. Any failure or inability to protect our proprietary rights could materiallyadversely affect our business.ff
We also use a limited amount of software licensed by its authors or other third parties under so-called “open source” licensesand may continue to use such software in the future. Some of these licenses contain requirements that we make available sourcecode for modifications or derivative works we create based upon the open source software, and that we license suchmodifications or derivative works under the terms of a particular open source license or other license granting third partiescertain rights of further use. By the terms of certain open source licenses, we could be required to release the source code of ourproprietary software if we combine our proprietary software with open source software in a certain manner. Additionally, the
19

terms of many open source licenses have not been interpreted by United States or other courts, and there is a risk that theselicenses could be construed in a manner that could impose unanticipated conditions or restrictions on our ability tocommercialize our solutions. In addition to risks related to license requirements, usage of open source software can lead togreater risks than use of third-party commercial software, as open source licensors generally do not provide warranties orcontrols on origin of the software.
Our exposure to risks associated with the use of intellectual property may be increased for third-party products distributed by usor as a result of acquisitions since we have a lower level of visibility, if any, into the development process with respect to suchthird-party products and acquired technology or the care taken to safeguard against infringement risks.
We may be subject to increasing litigation over our intellectual propertytt rights.i
There has been a substantial amount of litigation in the software industry regarding intellectual property rights. Third partieshave in the past, and may in the future, assert claims or initiate litigation related to exclusive patent, copyright, trademark orother intellectual property rights to business processes, technologies and related standards that are relevant to us and ourcustomers. These assertions have increased over time as a result of the general increase in patent claims assertions, particularlyin the United States. Because of the existence of a large number of patents in the electronic commerce field, the secrecy of somepending patents and the rapid issuance of new patents, it is not economical or even possible to determine in advance whether aproduct or any of its components infringes or will infringe on the patent rights of others. Any claim against us, with or withoutmerit, could be time-consuming, result in costly litigation, cause product delivery delays, require us to enter into royalty orrrlicensing agreements or pay amounts in settlement, or require us to develop alternative non-infringing technology.
We anticipate that software product developers and providers of electronic commerce solutions could increasingly be subject toinfringement claims, and third parties may claim that our present and future products infringe upon their intellectual propertyrights. Third parties may also claim, and we are aware that at least two parties have claimed on several occasions, that ourcustomers’ use of a business process method which utilizes our products in conjunction with other products infringe on thethird-party’s intellectual property rights. These third-party claims could lead to indemnification claims against us by ourcustomers. Claims against our customers related to our products, whether or not meritorious, could harm our reputation andreduce demand for our products. Where indemnification claims are made by customers, resistance even to unmeritorious claimscould damage the customer relationship. A successful claim by a third-party of intellectual property infringement by us or oneof our customers could compel us to enter into costly royalty or license agreements, pay significant damages, or stop sellingcertain products and incur additional costs to develop alternative non-infringing technology. Royalty or licensing agreements, ifrequired, may not be available on terms acceptable to us or at all, which could adversely affect our business.ff
We are engaged in offshore software development activo ities, which may not be successful and which may put our intellectualproperty at risk.
As part of our globalization strategy and to optimize available research and development resources, we utilize our Irishsubsidiary to serve as the focal point for certain international product development and commercialization efforts. Thissubsidiary oversees remote software development operations in Romania and elsewhere, as well as manages certain of ourintellectual property rights. In addition, we manage certain offshore development activities in India. While our experience todate with our offshore development centers has been positive, there is no assurance that this will continue. Specifically, thereare a number of risks associated with this activity, including but not limited to the following:
• communications and information flow may be less efficient and accurate as a consequence of the time, distance andlanguage differences between our primary development organization and the foreign based activities, resulting indelays in development or errors in the software developed;
• in addition to the risk of misappropriation of intellectual property from departing personnel, there is a general risk ofthe potential for misappropriation of our intellectual property that might not be readily discoverable;
• the quality of the development efforts undertaken offshore may not meet our requirements because of language,cultural and experiential differences, resulting in potential product errors and/or delays;
• potential disruption from the involvement of the United States in political and military conflicts around the world; and
• currency exchange rates could fluctuate and adversely impact the cost advantages intended from maintaining thesefacilities.
20

Risks Related to Our International Operations
There are a number of risks associated with our international operations that could have a material impact on ouroperations and financial condition.
We derive a significant portion of our revenues from international operations and anticipate continuing to do so. As a result, weare subject to risks of conducting international operations. One of the principal risks associated with international operations ispotentially adverse movements of foreign currency exchange rates. Our exposures resulting from fluctuations in foreigncurrency exchange rates may change over time as our business evolves and could have an adverse impact on our financialcondition, cash flows and/or results of operations. We have not entered into any derivative instruments or hedging contracts toreduce exposure to adverse foreign currency changes.
Other potential risks include difficulties associated with staffing and management, reliance on independent distributors, longerpayment cycles, potentially unfavorable changes to foreign tax rules, unfavorable trade treaties or tariffs, compliance withforeign regulatory requirements, effects of a variety of foreign laws and regulations, including restrictions on access to personalinformation, reduced protection of intellectual property rights, variability of foreign economic conditions, governmentalcurrency controls, difficulties in enforcing our contracts in foreign jurisdictions, and general economic and political conditionsin the countries where we sell our products and services. Some of our products may contain encrypted technology, the export ofwhich is regulated by the United States government. Changes in U.S. and other applicable export laws and regulationsrestricting the export of software or encryption technology could result in delays or reductions in our shipments of productsinternationally. There can be no assurance that we will be able to successfully address these challenges.
In addition, the implementation of the United Kingdom’s withdrawal from the European Union (referred to as Brexit) could,among other outcomes, disrupt the free movement of goods, services, and people between the United Kingdom and theEuropean Union, undermine bilateral cooperation in key policy areas, and significantly disrupt trade between the UnitedKingdom and the European Union. The uncertainties related to Brexit have cross-border operational, financial and taximplications, among others, and any economic volatility that may arise in the United Kingdom, the European Union, orelsewhere may adversely affect our business.
Risks Related to Our Products and Services
Global economic conditions could reduce the demand for our products and services or otherwise adversely impact our cashflows, operating results and financial condition.
For the foreseeable future, we expect to derive most of our revenue from products and services we provide to the banking andfinancial services industries. The global electronic payments industry and the banking and financial services industries dependheavily upon the overall levels of consumer, business and government spending. Adverse economic conditions such as thosecaused by the COVID-19 pandemic and the potential for disruptions in these industries as well as the general software sectorcould result in a decrease in consumers’ use of banking services and financial service providers resulting in significantdecreases in the demand for our products and services which could adversely affect our business and operating results. Alessening demand in either the overall economy, the banking and financial services industry or the software sector could alsoresult in the implementation by banks and related financial service providers of cost reduction measures or reduced capitalspending resulting in longer sales cycles, deferral or delay of purchase commitments for our products and increased pricecompetition which could lead to a material decrease in our future revenues and earnings.
If our products and services fail to comply with legislation, government regulations, and industry standards to which ourllcustomers are subject, it could result in a loss of customers and decreased revenue.
Legislation, governmental regulation, and industry standards affect how our business is conducted, and in some cases, couldsubject us to the possibility of future lawsuits arising from our products and services. Globally, legislation, governmentalregulation and industry standards may directly or indirectly impact our current and prospective customers’ activities, as well astheir expectations and needs in relation to our products and services. For example, our products are affected by VISA,Mastercard and other major payment brand electronic payment standards that are generally updated twice annually. Beyondthis, our products are affected by PCI Security Standards. As a provider of electronic data processing to financial institutions,we must comply with FFIEC regulations and are subject to FFIEC examinations.
In addition, action by government and regulatory authorities such as the Dodd-Frank Wall Street Reform and the ConsumerffProtection Act relating to financial regulatory reform, the European Union-wide General Data Protection Regulation (“GDPR”)(which imposes strict data privacy requirements and regulatory fines of up to 4% of “worldwide turnover”) and the CaliforniaffConsumer Privacy Act ("CCPA"), as well as legislation and regulation related to credit availability, data usage, privacy, orother related regulatory developments could have an adverse effect on our customers and therefore could have a material
21

adverse effect on our business, financial condition, cash flows and results of operations. The regulatory focus on privacy issuesalso continues to increase and worldwide laws and regulations concerning the handling of personal information are expandingand becoming more complex. Our failure, or perceived failure, to comply with laws and regulations concerning the handling ofpersonal information could result in lost or restricted business, proceedings, actions or fines brought against us or levied bygovernmental entities or others, or could adversely affect our businessff and harm our reputation.
Our software products may contain undetected errors or other defects, which could damage our reputation with customers,decrease profitability, and expose us to liability.
Our software products are complex. Software may contain bugs or errors that can unexpectedly interfere with the operation ofthe software products. Our software products may contain undetected errors or flaws when first introduced or as new versionsare released. These undetected errors may result in loss of, or delay in, market acceptance of our products and a correspondingloss of sales or revenues. Customers depend upon our products for mission-critical applications, and these errors may hurt ourreputation with customers. In addition, software product errors or failures could subject us to product liability, as well asperformance and warranty claims, which could materially adversely affect our business, financial condition, cash flows and/orresults of operations.
Risks Related to Legal, Regulatory, and Tax Matters
If we fail to comply with the complex regulations applicable to our payments business, we could be subject to liability or ourrevenues may be reduced.
ACI Payments, Inc. is licensed as a money transmitter in those states where such licensure is required. These licenses require usto demonstrate and maintain certain levels of net worth and liquidity, require us to file periodic reports and subject us toinspections by state regulatory agencies. In addition, our payment business is generally subject to federal regulation in theUnited States, including anti-money laundering regulations and certain restrictions on transactions to or from certain individualsor entities. The complexity of these regulations will continue to increase our cost of doing business. Any violations of theselaws may also result in civil or criminal penalties against us and our officers or the prohibition against us providing moneytransmitter services in particular jurisdictions. We could also be forced to change our business practices or be required to obtainadditional licenses or regulatory approvals that could cause us to incur substantial costs.
In addition, our customers must ensure that our services comply with the government regulations, including the EU GDPR, andindustry standards that apply to their businesses. Federal, state, foreign or industry authorities could adopt laws, rules, orregulations affecting our customers’ businesses that could lead to increased operating costs that may lead to reduced marketacceptance. In addition, action by regulatory authorities relating to credit availability, data usage, privacy, or other relatedregulatory developments could have an adverse effect on our customers and, therefore, could have a material adverse effect onour business, financial condition, and results of operations.
If we fail to comply with privacy regulations imposed on providers of services to financial institutions, our business could beharmed.
As a provider of services to financial institutions, we may be bound by the same limitations on disclosure of the information wereceive from our customers as apply to the financial institutions themselves. If we are subject to these limitations and we fail tocomply with applicable regulations, including the EU GDPR and CCPA, we could be exposed to suits for breach of contract orto governmental proceedings, our customer relationships and reputation could be harmed, and we could be inhibited in ourability to obtain new customers. In addition, if more restrictive privacy laws or rules are adopted in the future on the federal orstate level, or, with respect to our international operations, by authorities in foreign jurisdictions on the national, provincial,state, or other level, that could have an adverse impact on our business.
Our risk management and information security programs are the subject of oversight and periodic reviews by the federalagencies that regulate our business. In the event an examination of our information security and risk management functionsresults in adverse findings, such findings could be made public or communicated to our regulated financial institutioncustomers, which could have a material adverse effect on our business.ff
We may become involved in litigation that could materially adversely affect our business financial condition, cash flows and/or results of operations.
From time to time, we are involved in litigation relating to claims arising out of our operations. Any claims, with or withoutmerit, could be time-consuming and result in costly litigation. Failure to successfully defend against these claims could result ina material adverse effect on our business, financial condition, results of operations and/or cash flows.
22

We may face exposure to unknown tax liabilities, which could adversely affect our financial condition, cash flows and/orresults of operations.
We are subject to income and non-income based taxes in the United States and in various foreign jurisdictions. Significantjudgment is required in determining our worldwide income tax liabilities and other tax liabilities. In addition, we expect tocontinue to benefit from implemented tax-saving strategies. We believe that these tax-saving strategies comply with applicabletax law. If the governing tax authorities have a different interpretation of the applicable law and successfully challenge any ofour tax positions, our financial condition, cash flows and/or results of operations could be adversely affected.ff
Our U.S. companies are the subject of an examination by several state tax departments. Some of our foreign subsidiaries arecurrently the subject of a tax examination by the local taxing authorities. Other foreign subsidiaries could face challenges fromvarious foreign tax authorities. It is not certain that the local authorities will accept our tax positions. We believe our taxpositions comply with applicable tax law and intend to vigorously defend our positions. However, differing positions on certainissues could be upheld by foreign tax authorities, which could adversely affect our financial condition and/or results ofoperations.
Risks Related to Our Industry
Consolidations and failures in the financiii al services industry may adversely impact the number of customers and ourrevenues in the future.
Mergers, acquisitions, and personnel changes at key financial services organizations have the potential to adversely affect ourbusiness, financial condition, cash flows, and results of operations. Our business is concentrated in the financial servicesindustry, making us susceptible to consolidation in, or contraction of, the number of participating institutions within thatindustry. Consolidation activity among financial institutions and intermediaries has increased in recent years. Changes infinancial conditions have also historically resulted in consolidation and contraction as financial institutions have failed or havebeen acquired by or merged with other financial institutions. There are several potential negative effects of increasedconsolidation activity. Continuing consolidation could cause us to lose existing and potential customers for our products andservices. For instance, consolidation of two of our customers could result in reduced revenues if the combined entity were tonegotiate greater volume discounts or discontinue use of certain of our products. Additionally, if a non-customer and a customercombine and the combined entity in turn decided to forego future use of our products, our revenues would decline.
Due to the industry we operate in, our stock price may be volatile.a
No assurance can be given that operating results will not vary from quarter to quarter, and past performance may not accuratelypredict future performance. Any fluctuations in quarterly operating results may result in volatility in our stock price. Our stockprice may also be volatile, in part, due to external factors such as announcements by third parties or competitors, inherentvolatility in the technology sector, variability in demand from our existing customers, failure to meet the expectations of marketanalysts, the level of our operating expenses and changing market conditions in the software industry. In addition, the financialmarkets have experienced significant price and volume fluctuations that have particularly affected the stock prices of manyfftechnology companies and financial services companies, and these fluctuations sometimes are unrelated to the operatingperformance of these companies. Broad market fluctuations, as well as industry-specific and general economic conditions mayadversely affect the market price of our common stock.
Risks Related to Our Financial Performance
Our future profitability depends on demand for our products.
Our revenue and profitability depend on the overall demand for our products and services. A significant portion of our totalrevenues result from licensing our Issuing and Acquiring solutions, including our BASE24 product line and providing relatedservices and maintenance. Any reduction in demand for, or increase in competition with respect to, our Issuing and Acquiringsolutions could have a material adverse effect on our financial condition, cash flows and/or results of operations.
Failure to obtain renewals of customer contracts or obtain such renewals on favorable terms could adversely affect ourllresults of operations and financial condition.
Failure to achieve favorable renewals of customer contracts could negatively impact our business. Our contracts with ourcustomers generally run for a period of five years, or three years in the case of certain acquired SaaS and PaaS contracts. At theend of the contract term, customers have the opportunity to renegotiate their contracts with us and to consider whether toengage one of our competitors to provide products and services. Failure to achieve high renewal rates on commerciallyfavorable terms could adversely affect our results of operations and financialff condition.
23

The delay or cancellation of a customer project or inaccurate project completion estimates may adversely affect ouroperating results and financial performance.
Any unanticipated delays in a customer project, changes in customer requirements or priorities during the projectimplementation period, or a customer’s decision to cancel a project, may adversely impact our operating results and financialperformance. In addition, during the project implementation period, we perforff m ongoing estimates of the progress being madeon complex and difficult projects and documenting this progress is subject to potential inaccuracies. Changes in projectcompletion estimates are heavily dependent on the accuracy of our initial project completion estimates and our ability toevaluate project profits and losses. Any inaccuracies or changes in estimates resulting from changes in customer requirements,delays or inaccurate initial project completion estimates may result in increased project costs and adversely impact ouroperating results and financial performance.
Our balance sheet includes signifii cant amounts of goodwill and intangible assets. The impairment of a significant portion ofthese assets could negatively affect our financial results.
Our balance sheet includes goodwill and intangible assets that represent a significant portion of our total assets at December 31,2020. On at least an annual basis, we assess whether there have been impairments in the carrying value of goodwill andintangible assets. If the carrying value of the asset is determined to be impaired, then it is written down to fair value by a chargeto operating earnings. An impairment of a significant portion of goodwill or intangible assets could materially negatively affectour results of operations.
Management’s backlog estimate may not be accurate and may not generate the predicted revenues.
Estimates of future financial results are inherently unreliable. Our backlog estimates require substantial judgment and are basedon a number of assumptions, including management’s current assessment of customer and third-party contracts that exist as ofthe date the estimates are made, as well as revenues from assumed contract renewals, to the extent that we believe thatrecognition of the related revenue will occur within the corresponding backlog period. A number of factors could result inactual revenues being less than the amounts reflected in backlog. Our customers or third-party partners may attempt torenegotiate or terminate their contracts for a number of reasons, including mergers, changes in their financial condition, orgeneral changes in economic conditions within their industries or geographic locations, or we may experience delays in thedevelopment or delivery of products or services specified in customer contracts. Actual renewal rates and amounts may differfrom historical experience used to estimate backlog amounts. Changes in foreign currency exchange rates may also impact theamount of revenue actually recognized in future periods. Accordingly, there can be no assurance that contracts included inbacklog will actually generate the specified revenues or that the actual revenues will be generated within a 12-month or 60-month period. Additionally, because backlog estimates are operating metrics, the estimates are not required to be subject to thesame level of internal review or controls as a U.S. generally accepted accounting principles (“GAAP”) financial measure.
Our revenue and earnings are highly cyclical,ll our quarterly results fluctuate significantly, and we have revenue-generatingtransactions concentrated in the final weeksii of a quarter which may prevent accurate forectt asting of our financial resultsand cause our stock price to decline.
Our revenue and earnings are highly cyclical causing significant quarterly fluctuations in our financial results. Revenue andoperating results are usually strongest during the third and fourth fiscal quarters ending September 30 and December 31,primarily due to the sales and budgetary cycles of our customers. We experience lower revenues, and possible operating losses,in the first and second quarters ending March 31 and June 30. Our financial results may also fluctuate from quarter to quarterand year to year due to a variety of factors, including changes in product sales mix that affect average selling prices, and thetiming of customer renewals (any of which may impact the pattern of revenue recognition).
In addition, large portions of our customer contracts are executed in the final weeks of each quarter. Before these contracts areexecuted, we create and rely on forecasted revenues for planning, modeling and earnings guidance. Forecasts, however, areonly estimates and actual results may vary for a particular quarter or longer periods of time. Consequently, significantdiscrepancies between actual and forecasted results could limit our ability to plan, budget or provide accurate guidance, whichcould adversely affect our stock price. Any publicly-stated revenue or earnings projections are subjectff to this risk.
Risks Related to Financing
Our outstanding debt contains restrictions and other financial covenants that limit our flexibility in operating our business.
Our credit facility and the indenture governing our 5.750% Senior Notes due 2026 (“2026 Notes”) contain customaryaffirmative and negative covenants for debt of these types that limit our ability to engage in specified types of transactions. If anevent of default occurs, the lenders, trustee, or holders of the 2026 Notes wir ll be entitled to take various actions, including, butnot limited to, demanding payment for all amounts outstanding. If adverse global economic conditions persist or worsen, we
24

could experience decreased revenues from our operations attributable to reduced demand for our products and services and as aresult, we could fail to satisfy the financial and other restrictive covenants to which we are subject under our existing debt,resulting in an event of default. If we are unable to cure the default or obtain a waiver, we will not be able to access our creditfacility and there can be no assurance that we would be able to obtain alternative financing. See Note 4, Debt, to our Notes toConsolidated Financial Statements in Part IV, Item 15 of this Form 10-K for additional information.
Our existing levels of debt and debt service requirements may adversely affect our financial condition or operationalflexibility and prevent us from fulfilling our obligations under our outstanding indebtedness.
Our level of debt could have adverse consequences for our business, financial condition, operating results and operationalflexibility, including the following: (i) the debt level may cause us to have difficultyff borrowing money in the future for workingcapital, capital expenditures, acquisitions or other purposes; (ii) our debt level may limit operational flexibility and our ability topursue business opportunities and implement certain business strategies; (iii) we use a large portion of our operating cash flowto pay principal and interest on our credit facility and the 2026 Notes, which reduces the amount of money available to financeoperations, acquisitions and other business activities; (iv) we have a higher level of debt than some of our competitors orpotential competitors, which may cause a competitive disadvantage and may reduce flexibility in responding to changingbusiness and economic conditions, including increased competition and vulnerability to general adverse economic and industryconditions; (v) some of our debt has a variable rate of interest, which exposes us to the risk of increased interest rates; (vi) thereare significant maturities on our debt that we may not be able to fulfill or that may be refinanced at higher rates; and (vii) if wefail to satisfy our obligations under our outstanding debt or fail to comply with the financial or other restrictive covenantsrequired under our credit facility and the 2026 Notes, an event of default could result that could cause all of our debt to becomedue and payable and could permit the lenders under our credit facility to foreclose on the assets securing such debt.
Replacement of the LIBOR benchmark interest rate could adversely affect our business, financial condition, and results ofeeoperations.
In July 2017, the United Kingdom’s Financial Conduct Authority, which regulates the London Interbank Offered Rate("LIBOR"), announced it will no longer compel banks to submit rates for the calculation of LIBOR after 2021. The AlternativeReference Rates Committee has proposed the Secured Overnight Financing Rate ("SOFR") as its recommended alternative toLIBOR.
Our Credit Agreement is currently indexed to LIBOR, and the maturity date of the Credit Agreement extends beyond 2021. TheCredit Agreement contemplates the discontinuation of LIBOR and provides options for us in such an event. It is uncertain atthis time, however, what the potential impact of the transition from LIBOR as an interest rate benchmark to other potentialalternative reference rates, including SOFR, may be on our business, financial condition, and/or results of operations.
General Risk Factors
Our business and operating results could be adversely affected by events outside of our control, including natural disasters,wars and outbreaks of disease or other adverse public health developments.
We may be impacted by natural disasters, wars, and outbreaks of disease or other adverse public health developments such asthe recent COVID-19 coronavirus outbreak. These events could cause disruptr ions or restrictions on us, our partners andcustomers, including restrictions on travel, temporary closure of facilities, and other restrictions. Such disruptions or restrictionsmay result in delays or losses of sales and delays in the development or implementation of our products. These events couldalso result in a decrease in consumers’ use of our customers’ services, further adversely affecting our business and operatingresults.
If our revenues or mix of revenues are below anticipated levels or if our operating results are below analyst or investorexpectations, the market price of our common stock could be adversely affected.
A significant percentage of our expenses, particularly personnel and facilities costs, are relatively fixed and based in part onanticipated revenue levels which can be difficult to predict. A decline in revenues without a corresponding and timelyslowdown in expense growth could adversely affect our business. Significant revenue shortfalls in any quarter may causesignificant declines in operating results since we may be unable to reduce spending in a timely manner.
Quarterly or annual operating results that are below the expectations of public market analysts could adversely affect the marketprice of our common stock. Factors that could cause fluctuations in our operating results include:
• a change in customer demand for our products, which is highly dependent on our ability to continue to offer innovativetechnology solutions in very competitive markets;
25

• the timing of customer orders;
• the timing of product implementations, which are highly dependent on customers’ resources and discretion;
• overall economic conditions, which may affect our customers’ and potential customers’ budgets for informationtechnology expenditures;
• foreign exchange raff te volatility, which can have a significant effect on our total revenues and costs when our foreignoperations are translated to U.S. dollars;
• the incurrence of costs relating to the integration of software products and operations in connection with acquisitionsof technologies or businesses; and
• the timing and market acceptance of new products or product enhancements by either us or our competitors.
ITEM 1B. UNRESOLVED STAFF COMMENTS
None.
ITEM 2. PROPERTIES
We lease office space in Naples, Florida, for our principal executive headquarters. As of the end of 2020, we owned and leaseda total of approximately 453,000 square feet of office and data center space in the United States and leased approximately412,000 square feet of office and data center space outside the United States, primarily in India, the United Kingdom, Ireland,South Africa, Romania, and Singapore.
We believe our current facilities are adequate for our present and short-term foreseeable needs and that additional suitable spacewill be available as required. We also believe we will be able to renew leases as they expire or secure alternate suitable space.See Note 12, Leases, to our Notes to Consolidated Financial Statements in Part IV, Item 15 of this Form 10-K for additionalinformation regarding our obligations under our facilities leases.
ITEM 3. LEGAL PROCEEDINGS
From time to time, we are involved in various litigation matters arising in the ordinary course of our business. We are notcurrently a party to any legal proceedings, the adverse outcome of which, individually or in the aggregate, we believe would belikely to have a material effect on our financialff condition or results of operations.
ITEM 4. MINE SAFETY DISCLOSURES
Not applicable.
26

PART II
ITEM 5. MARKET FOR REGISTRANT’S COMMON EQUITY, RELATED STOCKHOLDER MATTERS, ANDISSUER PURCHASES OF EQUITY SECURITIES
Our common stock trades on The NASDAQ Global Select Market under the symbol ACIW.
As of February 22, 2021, there were 262 holders of record of our common stock. A substantially greater number ofshareholders hold our common stock in “street name”, or as beneficial holders whose shares are held in the name of banks,brokers, or other financial institutions.ff
Dividends
We have never declared nor paid cash dividends on our common stock. We do not presently anticipate paying cash dividends.However, any future determination relating to our dividend policy will be made at the discretion of our board of directors (the"board") and will depend upon our financial condition, capital requirements, and earnings, as well as other factors the boardffmay deem relevant. The terms of our current Credit Facility may restrict the payment of dividends subject to us meeting certainfinancial metrics and being in compliance with the events of default provisions of the agreement.
Issuer Purchases of Equity Securities
The following table provides information regarding our repurchases of common stock during the three months endedDecember 31, 2020:
Period
Total Numberof
SharesPurchased
Average PricePaid per Share
Total Numberof Shares
Purchased asPart ofPubliclyAnnouncedProgram
ApproximateDollar Value ofShares thatMay Yet BePurchasedUnder theProgram
October 1, 2020 through October 31, 2020 — $ — — $ 112,088,000November 1, 2020 through November 30, 2020 — — — 112,088,000December 1, 2020 through December 31, 2020 (1) 10,875 38.43 — 112,088,000
Total 10,875 $ 38.43 —
(1) Pursuant to our 2016 Equity and Performance Incentive Plan (the “2016 Incentive Plan”), we granted RSUs. Underthe RSU arrangement, shares are issued without direct cost to the employee. During the three months endedDecember 31, 2020, 27,639 shares of RSUs vested. We withheld 10,875 of these RSUs to pay the employees’portion of the applicable minimum payroll withholding taxes.
In 2005, our board approved a stock repurchase program authorizing us, as market and business conditions warrant, to acquireour common stock and periodically authorize additional funds for the program, with the intention of using existing cash andcash equivalents to fund these repurchases. In February 2018, the board approveff d the repurchase of the Company's commonstock for up to $200.0 million, in place of the remaining purchase amounts previously authorized. As of December 31, 2020,the maximum remaining amount authorized for purchase under the stock repurchase program was approximatela y $112.1million.
There is no guarantee as to the exact number of shares we will repurchase. Repurchased shares are returned to the status ofauthorized but unissued shares of common stock. In March 2005, our board approved a plan under Rule 10b5-1 of theSecurities Exchange Act of 1934 to facilitate the repurchase of shares of common stock under the existing stock repurchaseprogram. Under our Rule 10b5-1 plan, we have delegated authority over the timing and amount of repurchases to anindependent broker who does not have access to inside information about the Company. Rule 10b5-1 allows us, through theindependent broker, to purchase shares at times when we ordinarily would not be in the market because of self-imposed tradingblackout periods, such as the time immediately preceding the end of the fiscal quarter through a period of three business daysfollowing our quarterly earnings release.
27

Stock Performance Graph and Cumulative Total Return
The following table shows a line-graph presentation comparing cumulative stockholder return on an indexed basis with a broadequity market index and either a nationally-recognized industry standard or an index of peer companies selected by us. Weselected the S&P 500 Index and the NASDAQ Electronic Components Index for comparison.
The graph above assumes a $100 investment was made in our common stock and each index on December 31, 2015, and alldividends were reinvested. Also included are respective investment returns based on the stock and index values as of the end ofeach year during the five-year period. This information was provided by Zacks Investment Research, Inc. of Chicago, Illinois.
The stock performance graph disclosure above is not considered “filed” with the SEC under the Securities and Exchange Act of1934, as amended, and is not incorporated by reference in any past or future filing by us under the Securities Exchange Act of1934, as amended, or the Securities Act of 1933, as amended, unless specifically referenced.
ITEM 6. SELECTED FINANCIAL DATA
The following selected financial data has been derived from our consolidated financial statements (in thousands, except pershare data). This data should be read together with Item 7, “Management’s Discussion and Analysis of Financial Condition andResults of Operations”, and the consolidated financial statements and related notes included elsewhere in this annual report. Thefinancial information below is not necessarily indicative of the results of future operations. Future results could differ materiallyfrom historical results due tod many factors, including those discussed in Item 1A, Risk FactorsFF .
Years Ended December 31,2020 2019 (1)(2) 2018 (3) 2017 (4) 2016 (5)
Income Statement Data:Total revenues $ 1,294,322 $ 1,258,294 $ 1,009,780 $ 1,024,191 $ 1,005,701Net income 72,660 67,062 68,921 5,135 129,535Earnings per share:Basic $ 0.62 $ 0.58 $ 0.59 $ 0.04 $ 1.10Diluted $ 0.62 $ 0.57 $ 0.59 $ 0.04 $ 1.09
Weighted average common shares outstanding:Basic 116,397 116,175 116,057 118,059 117,533Diluted 118,079 118,571 117,632 119,444 118,847
28
0.00
50.00
100.00
150.00
200.00
350.00
300.00
250.00
2015
Comparison of 5 Year Cumulative Total ReturnAssumes Initial Investment of $100
December 2020
ACI Worldwide, Inc. S&P 500 Index - Total Return NASDAQ Electronic Components Index20202019201820172016

December 31,2020 2019 (1)(2) 2018 (3) 2017 2016 (5)
Balance Sheet Data:Working capital $ 249,309 $ 308,426 $ 269,857 $ 100,039 $ 31,625Total assets 3,386,903 3,257,534 2,122,455 1,861,639 1,902,295Current portion of debt (6) 34,265 34,148 20,767 17,786 90,323Debt (long-term portion) (6) 1,128,806 1,350,592 658,602 668,356 656,063Stockholders’ equity 1,206,597 1,129,968 1,048,231 764,597 754,917
(1) The consolidated balance sheet and statement of operations for the year ended December 31, 2019, includes theacquisition of Speedpay, as discussed in Note 3, Acquisition, to our Notes to Consolidated Financial Statements inPart IV, Item 15 of this Form 10-K.
(2) The consolidated balance sheet and statement of operations for the year ended December 31, 2019, reflects theapplication of Accounting Standards Update (“ASU”) 2016-02, Leases (codified as “ASC 842”), as discussed inNote 12, Leases, to our Notes to Consolidated Financial Statements.
(3) The consolidated balance sheet and statement of operations for the year ended December 31, 2018, reflects theadoption of ASU 2014-09, Revenue from Contracts with Customers (codified as “ASC 606”), as discussed in Note2, Revenue, to our Notes to Consolidated Financial Statements, including a cumulative adjustment of $244.0 millionto retained earnings.
(4) The consolidated statement of operations for the year ended December 31, 2017, reflects the Baldwin Hackett &Meeks, Inc. (“BHMI”) judgment. We recorded $46.7 million in general and administrative expense and $1.4 millionin interest expense.
(5) The consolidated balance sheet and statement of operations for the year ended December 31, 2016, reflects the saleof Community Financial Services assets and liabilities.a
(6) During the year ended December 31, 2019, we borrowed $500.0 million in the form of a new senior secured termloan and drew $250.0 million on the available Revolving Credit Facility to fund the acquisition of Speedpay. Duringthe year ended December 31, 2018, we issued $400.0 million in senior notes due August 15, 2026. We used the netdproceeds of these senior notes to redeem our outstanding $300.0 million senior notes due 2020, which we originallydentered in to during the yead r ended December 31, 2013. See Note 4, Debt, to our Notes to Consolidated FinancialStatements for additionaff l information.
ITEM 7. MANAGEMENT’S DISCUSSION AND ANALYSIS OF FINANCIAL CONDITION AND RESULTS OFOPERATIONS
Overview
ACI Worldwide powers digital payments for more than 6,000 organizations around the world. More than 1,000 of the largestffbanks and intermediaries, as well as thousands of global merchants, rely on ACI to execute $14 trillion each day in paymentsand securities. In addition, myriad organizations utilize our electronic bill presentment and payment services. Through ourcomprehensive suite of software solutions delivered on customers’ premises, through the public cloud or through ACI’s privatecloud, we provide real-time, immediate payments capabilities and enable the industry’s most complete omni-channel paymentsexperience.
Our products are sold and supported directly and through distribution networks covering three geographic regions – theAmericas, EMEA, and Asia Pacific. Each region has its own globally coordinated sales forceff , supplemented with localindependent reseller and/or distributor networks. Our products and solutions are used globally by banks, intermediaries,merchants, and billers, such as third-party electronic payment processors, payment associations, switch interchanges and a widerange of transaction-generating endpoints, including ATMs, merchant POS terminals, bank branches, mobile phones, tablets,corporations, and internet commerce sites. Accordingly, our business and operating results are influenced by trends such asinformation technology spending levels, the growth rate of digital payments, mandated regulatory changes, and changes in thenumber and type of customers in the financial services industry, as well as economic growth and purchasing habits. Ourproducts are marketed under the ACI Worldwide brand.
We derive a majority of our revenues from domestic operations and believe we have large opportunities for growth ininternational markets, as well as continued expansion domestically in the United States. Refining our global infrastructure is a
29

critical component of driving our growth. We also continue to maintain centers of expertise in Timisoara, Romania and Puneand Bangalore in India, as well as key operational centers such as in Cape Town, South Africa and in multiple locations in theUnited States.
Key trends that currently impact our strategies and operations include:
Increasing digital payment transaction volumes. The adoption of digital payments continues to accelerate, propelled by thedigitization of cash, financial inclusion efforts of countries throughout the world, the Internet of Things, rapid growth ofeCommerce and the adoption of real-time payments. COVID-19 has further accelerated this growth as more people,governments, and businesses have embraced digital payments—a change likely to continue once the pandemic is over. Weleverage the growth in transaction volumes through the licensing of new systems to customers whose older systems cannothandle increased volume, through the sale of capacity upgrades to existing customers, and through the scalability of ourplatform-based solutions.
Adoption of real-time payments. Expectations from both consumers and businesses are continuing to drive the paymentsworld to more real-time delivery. This is bolstered by the new data-rich ISO 20022 messaging format, which promises todeliver greater value to banks and their customers. We are seeing global players with existing schemes working to expandcapacity in anticipation of volume growth (further driven by COVID-19) and new payment types. Mature markets, includingIndia, the United Kingdom, Australia, Malaysia, Singapore, Thailand, and the Nordics (P27), continue to accelerate innovation,especially in terms of overlay services and cross-border connectivity. The United States is driving real-time payments adoptionthrough Zelle, TCH Real-Time Payments, and the planned FedNow service, while Brazil's PIX was recently launched inNovember. ACI's broad software portfolio, experience, and strategic partnerships with Mastercard, Microsoft, and MindgateSolutions continue to position us as the leaders in real-time payments, helping to drive seamless connectivity, increasedsecurity, and end-to-end modernization for organizations throughout the world.
Adoption of cloud technology.yy To leverage lower-cost computing technologies, increase time to market, accelerate innovation,and ensure scalability and resiliency, banks, intermediaries, merchants, and billers are seeking to transition their systems tomake use of cloud technology. Our investments and partnerships, as demonstrated by our product enablement and initialoptimization onto Microsoft Azure, enable us to leverage the hybrid cloud technology benefits of automation and rapiddeployment and delivery, while preserving the ACI fundamentals of resiliency and scalability, to deliver cloud capabilities nowand in the future. Market sizing data from Ovum (now Omdia) indicates that spend on SaaS and PaaS payment systems isgrowing faster than spend on installed applications.
Digital payments fraud and compliance. The rise in digital payment transaction volumes and payment types has subsu equentlyled to an increase in online fraud in many guises and across all channels. Driven in part by COVID-19, we have seen anincrease in phishing and friendly fraud, as well as remote banking fraud and authorized push payment scams. Real-timepayments bring a new level of urgency, as money cannot easily be retrieved once it has been sent. Banks, intermediaries,merchants, and billers must find faster, smarter, more accurate and increasingly automated ways to secure customers and meetregulatory pressures. We continue to see opportunity to offer our fraud detection solutions with advanced machine learningcapabilities to help customers manage the growing levels of digital payments fraud and compliance activity.
Omni-commerce. Shoppers are increasingly browsing, buying, and returning items across channels, including in-store, online,and mobile. COVID-19 has accelerated this trend, leading to an increase in contactless payments, click and collect, andcurbside collection. Merchants from all industries, including grocers, fuel and convenience stores, are being tasked withdelivering seamless experiences that include pay-in-aisle, kiosks, mobile app payments, QR code payments, eCommerce,traditional and mobile POS, buy online pickup in-store (BOPIS) and buy online return in-store (BORIS). We believe there issignificant opportunity to provide merchants with the tools to deliver a seamless, secure, personalized experience that createsloyalty and satisfaction, and drives conversion rates while protecting consumer data and preventing fraud.
Request for Payment (RfP). Markets across the world are introducing an innovative payments service called Request forPayment (RfP). This technology is known by different names in different markets: Collect payments in India, Request 2 Pay inEurope, Request To Pay (RTP) in the United Kingdom, or Request for Payment (RfP) in the United States. RfP offers securemessaging between consumers and billers or merchants, wherein a biller or merchant can request a payment from a consumerthrough the use of a trusted app, most likely a banking app. RfP is primarily being implemented on top of real-time payments,which are continuing to grow and flourish as countries around the world develop and launch their real-time schemes as notedabove. ACI is in a unique position to deliver this overlay service given our real-time payments software, our relationships withbanks, merchants and billers, and global real-time connectivity.
30

Several other factors related to our business may have a significant impact on our operating results from year to year. Forexample, the accounting rules governing the timing of revenue recognition are complex, and it can be difficult to estimate whenwe will recognize revenue generated by a given transaction. Factors such as creditworthiness of the customer and timing oftransfer of control or acceptance of our products may cause revenues related to sales generated in one period to be deferred andrecognized in later periods. For arrangements in which services revenue is deferred, related direct and incremental costs mayalso be deferred. Additionally, while the majority of our contracts are denominated in the U.S. dollar, a substantial portion ofour sales are made, and some of our expenses are incurred, in the local currency of countries other than the United States.Fluctuations in currency exchange rates in a given period may result in the recognition of gains or losses for that period.
We continue to seek ways to grow through organic sources, partnerships, alliances, and acquisitions. We continually look forpotential acquisitions designed to improve our solutions’ breadth or provide access to new markets. As part of our acquisitionstrategy, we seek acquisition candidates that are strategic, capable of being integrated into our operating environment, andaccretive to our financial performance.
Acquisition
Speedpay
On May 9, 2019, we acquired Speedpay for $754.1 million in cash, including working capital adjustments, pursuant to a StockPurchase Agreement, among the Company, Western Union, and ACI Worldwide Corp., our wholly owned subsidiary.
To fund the acquisition, we amended our existing Credit Agreement, dated February 24, 2017, for an additional $500.0 millionsenior secured term loan, in addition to drawing $250.0 million on the available Revolving Credit Facility. See Note 4, Debt, toour Notes to Consolidated Financial Statements in Part IV, Item 15 of this Form 10-K for terms of the Credit Agreement. Theremaining acquisition consideration was funded with cash on hand.
Backlog
Backlog is comprised of:
• Committed Backlog, which includes (1) contracted revenue that will be recognized in future periods (contracted butnot recognized) from software license fees, maintenance fees, service fees, and SaaS and PaaS fees specified inexecuted contracts (including estimates of variable consideration if required under ASC 606) and included in thetransaction price for those contracts, which includes deferred revenue and amounts that will be invoiced andrecognized as revenue in future periods and (2) estimated future revenues from software license fees, maintenancefees, services fees, and SaaS and PaaS fees specified in executed contracts.
• Renewal Backlog, which includes estimated future revenues from assumed contract renewals to the extent webelieve recognition of the related revenue will occur within the corresponding backlog period.
We have historically included assumed renewals in backlog estimates based upon automatic renewal provisions in the executedcontract and our historic experience with customer renewal rates.
Our 60-month backlog estimates are derived using the following key assumptions:
• License arrangements are assumed to renew at the end of their committed term or under the renewal option stated inthe contract at a rate consistent with historical experience. If the license arrangement includes extended paymentterms, the renewal estimate is adjusted for the effects of a significant financing component.
• Maintenance fees are assumed to exist for the duration of the license term for those contracts in which thecommitted maintenance term is less than the committed license term.
• SaaS and PaaS arrangements are assumed to renew at the end of their committed term at a rate consistent with ourhistorical experiences.
• Foreign currency exchange rates are assumed to remain constant over the 60-month backlog period for thosecontracts stated in currencies other than the U.S. dollar.
• Our pricing policies and practices are assumed to remain constant over the 60-month backlog period.
31

In computing our 60-month backlog estimate, the following items are specifically not taken into account:
• Anticipated increases in transaction, account, or processing volumes by our customers.
• Optional annual upliftu s or inflationary increases in recurring fees.
• Services engagements, other than SaaS and PaaS arrangements, are not assumed to renew over the 60-monthbacklog period.
• The potential impact of consolidation activity within our markets and/or customers.
We review our customer renewal experience on an annual basis. The impact of this review and subsequent updates may resultin a revision to the renewal assumptions used in computing the 60-month backlog estimates. In the event a significant revisionto renewal assumptions is determined to be necessary, prior periods will be adjusted d for comparabilitff y purposes.
The following table sets forth our 60-montff h backlog estimate, by reportable segment, as of December 31, 2020; September 30,2020; June 30, 2020; March 31, 2020; and December 31, 2019 (in millions). Dollar amounts reflect foreiff gn currency exchangerates as of each period end. This is a non-GAAP financial measure being presented to provide comparability across accountingperiods. We believe this measure provides useful information to investors and others in understanding and evaluating ourfinancial performance.
December 31,2020
September 30,2020
June 30,2020
March 31,2020
December 31,2019
ACI On Demand $ 3,965 $ 3,868 $ 3,863 $ 3,781 $ 3,855ACI On Premise 2,074 2,041 1,976 1,933 1,977
Total $ 6,039 $ 5,909 $ 5,839 $ 5,714 $ 5,832
December 31,2020
September 30,2020
June 30,2020
March 31,2020
December 31,2019
Committed $ 2,447 $ 2,189 $ 2,140 $ 2,095 $ 2,168Renewal 3,592 3,720 3,699 3,619 3,664
Total $ 6,039 $ 5,909 $ 5,839 $ 5,714 $ 5,832
Estimates of future financialff results require substantial judgment and are based on several assumptions, as described above.These assumptions may turn out to be inaccuratt e or wrong for reasons outside of management’s control. For example, ourcustomers may attempt to renegotiate or terminate their contracts for many reasons, including mergers, changes in theirfinancial condition, or general changes in economic conditions (e.g. economic declines resulting from COVID-19ff ) in thecustomer’s industry or geographic location. We may also experience delays in the development or delivery of products orservices specified in customer contracts, which may cause the actual renewal rates and amounts to differ from historicalffexperiences. Changes in foreign currency exchange ratff es may also impact the amount of revenue recognized in future periods.Accordingly, there can be no assurance that amounts included in backlog estimates will generate the specified revenues or thatthe actual revenues will be generated within the corresponding 60-month period. Additionally, because certain components ofCommitted Backlog and all of Renewal Backlog estimates are operating metrics, the estimates are not required to be subject tothe same level of internal review or controls as contracted but not recognized Committed Backlog.
32

Results of Operations
The following tables present the consolidated statements of operations, as well as the percentage relationship to total revenuesof items included in our consolidated statements of operations (in thousands):
Year Ended December 31, 2020, Compared to Year Ended December 31, 2019
2020 2019
Amount% of TotalRevenue
$ Changevs 2019
% Changevs 2019 Amount
% of TotalRevenue
Revenues:Software as a service andplatform as a service $ 769,180 60 % $ 91,511 14 % $ 677,669 54 %License 246,896 19 % (41,365) (14)% 288,261 23 %Maintenance 211,697 16 % (1,712) (1)% 213,409 17 %Services 66,549 5 % (12,406) (16)% 78,955 6 %Total revenues 1,294,322 100 % 36,028 3 % 1,258,294 100 %
Operating expenses:Cost of revenue 622,459 48 % 5,006 1 % 617,453 49 %Research and development 139,293 11 % (7,280) (5)% 146,573 12 %Selling and marketing 103,567 8 % (20,117) (16)% 123,684 10 %General and administrative 152,468 12 % 17,172 13 % 135,296 11 %Depreciation andamortization 131,791 10 % 20,259 18 % 111,532 9 %Total operating expenses 1,149,578 89 % 15,040 1 % 1,134,538 91 %
Operating income 144,744 11 % 20,988 17 % 123,756 9 %Other income (expense):Interest expense (56,630) (4)% 7,403 (12)% (64,033) (5)%Interest income 11,628 1 % (339) (3)% 11,967 1 %Other, net (1,116) — % (1,636) (315)% 520 — %
Total other income(expense) (46,118) (3)% 5,428 (11)% (51,546) (4)%
Income beforeff income taxes 98,626 8 % 26,416 37 % 72,210 5 %Income tax expense 25,966 2 % 20,818 404 % 5,148 — %Net income $ 72,660 6 % $ 5,598 8 % $ 67,062 5 %
Revenues
Total revenue for the year ended December 31, 2020, increased $36.0 million, or 3%, as compared to the same period in 2019.
• Speedpay contributed an incremental $123.3 million in total revenue during the year ended December 31, 2020, ascompared to the same period in 2019.
• The impact of certain foreign currencies weakening against the U.S. dollar resulted in a $2.1 million decrease in totalrevenue during the year ended December 31, 2020, as compared to the same period in 2019.
• Adjusted for the impact of incremental Speedpay revenue and foreign currency, total revenue for the year endedDecember 31, 2020, decreased $85.2 million, or 7%, as compared to the same period in 2019.
33

Software as a Service (“SaaS”) and Platform as a Service (“PaaS”) Revenue
The Company’s SaaS arrangements allow customers to use certain software solutions (without taking possession of thesoftware) in a single-tenant cloud environment on a subscription basis. The Company’s PaaS arrangements allow customers touse certain software solutions (without taking possession of the software) in a multi-tenant cloud environment on a subscriptionor consumption basis. Included in SaaS and PaaS revenue are fees paid by our customers for use of our Biller solutions. Biller-related fees may be paid by our clients or directly by their customers and may be a percentage of the underlying transactionamount, a fixed fee per executed transaction or a monthly fee for each customer enrolled. SaaS and PaaS costs include paymentcard interchange fees, the amounts payable to banks and payment card processing fees, which are included in cost of revenue inthe accompanying consolidated statements of operations. All revenue from SaaS and PaaS arrangements that does not qualifyfor treatment as a distinct performance obligation, which includes set-up fees, implementation or customization services, andproduct support services, are included in SaaS and PaaS revenue.
SaaS and PaaS revenue increased $91.5 million, or 14%, during the year ended December 31, 2020, as compared to the sameperiod in 2019.
• Speedpay contributed an incremental $123.3 million in SaaS and PaaS revenue during the year ended December 31,2020, as compared to the same period in 2019.
• The impact of certain foreign currencies strengthening against the U.S. dollar resulted in a $0.6 million increase inSaaS and PaaS revenue during the year ended December 31, 2020, as compared to the same period in 2019.
• Adjusted for the impact of the incremental revenue from Speedpay and foreign currency, SaaS and PaaS revenue forthe year ended December 31, 2020, decreased $32.4 million, or 5%, as compared to the same period in 2019.
• The decrease was primarily due to declines in transaction volumes within our Biller customer base as a result of theeconomic impact of COVID-19.
License Revenue
Customers purchase the right to license ACI software under multi-year, time-based software license arrangements that vary inlength but are generally five years. Under these arrangements the software is installed at the customer’s location (i.e. on-premise). Within these agreements are specified capacity limits typically based on customer transaction volume. ACI employsmeasurement tools that monitor the number of transactions processed by customers and if contractually specified limits areexceeded, additional fees are charged for the overage. Capacity overages may occur at varying times throughout the term of theagreement depending on the product, the size of the customer, and the significance of customer transaction volume growth.Depending on specific circumstances, multiple overages or no overages may occur during the term of the agreement.
Included in license revenue are license and capacity fees that are payable at the inception of the agreement or annually (initiallicense fees). License revenue also includes license and capacity fees payable quarterly or monthly due to negotiated customerpayment terms (monthly license fees). The Company recognizes revenue in advance of billings for software licensearrangements with extended payment terms and adjusts for the effects of the financing component, if significant.ff
License revenue decreased $41.4 million, or 14%, during the year ended December 31, 2020, as compared to the same period in2019.
• The impact of foreign currencies was not significant for license revenue during the year ended December 31, 2020, ascompared to the same period in 2019.
• The decrease in license revenue was primarily driven by the timing and relative size of license and capacity eventsduring the year ended December 31, 2020, as compared to the same period in 2019.
Maintenance Revenue
Maintenance revenue includes standard, enhanced, and premium customer support and any post contract support fees receivedfrom customers for the provision of product support services.
Maintenance revenue decreased $1.7 million, or 1%, during the year ended December 31, 2020, as compared to the same periodin 2019.
• The impact of foreign currencies weakening against the U.S. dollar resulted in a $1.8 million decrease in maintenancerevenue during the year ended December 31, 2020, as compared to the same period in 2019.
• Adjusted for the impact of foreign currency, maintenance revenue for the year ended December 31, 2020, remainedflat as compared to the same period in 2019.
34

Services Revenue
Services revenue includes fees earned through implementation services and other professional services. Implementationservices include product installations, product configurations, and custom software modifications (“CSMs”). Other professionalservices include business consultancy, technical consultancy, on-site support services, product education, and testing services.These services include new customer implementations as well as existing customer migrations to new products or new releasesof existing products.
Services revenue decreased $12.4 million, or 16%, during the year ended December 31, 2020, as compared to the same periodin 2019.
• The impact of foreign currencies weakening against the U.S. dollar resulted in a $0.7 million decrease in servicesrevenue during the year ended December 31, 2020, as compared to the same period in 2019.
• Adjusted for the impact of foreign currency, services revenue for the year ended December 31, 2020, decreased $11.7million, or 15%, as compared to the same period in 2019.
• The decrease was primarily driven by the timing and magnitude of project-related work during the year endedDecember 31, 2020, as compared to the same period in 2019.
Operating Expensesxx
Total operating expenses for the year ended December 31, 2020, increased $15.0 million, or 1%, as compared to the sameperiod in 2019.
• Speedpay contributed an incremental $105.5 million to total operating expenses during the year ended December 31,2020, as compared to the same period in 2019.
• Total operating expenses for the year ended December 31, 2020, included $44.6 million of significant transaction-related expenses associated with cost reduction strategies implemented during the period and ongoing integration ofthe acquisition of Speedpay. Total operating expenses for the year ended December 31, 2019, included $24.9 millionof significant transaction-related expenses associated with the acquisition of Speedpay.
• The impact of foreign currencies weakening against the U.S. dollar resulted in a $5.5 million decrease in totaloperating expenses for the year ended December 31, 2020, as compared to the same period in 2019.
• Adjusted for the impact of incremental Speedpay operating expenses, significant transaction-related expenses, andforeign currency, total operating expenses for the year ended December 31, 2020, decreased $104.7 million, or 9%, ascompared to the same period in 2019.
Cost of Revenue
Cost of revenue includes costs to provide SaaS and PaaS, third-party royalties, amortization of purchased and developedsoftware for resale, the costs of maintaining our software products, as well as the costs required to deliver, install, and supportsoftware at customer sites. SaaS and PaaS service costs include payment card interchange fees, amounts payable to banks, andpayment card processing fees. Maintenance costs include the efforts associated with providing the customer with upgrades, 24-hour help desk, post go-live (remote) support, and production-type support for software that was previously installed at acustomer location. Service costs include human resource costs and other incidental costs such as travel and training required forboth pre go-live and post go-live support. Such efforts include project management, delivery, product customization andrrimplementation, installation support, consulting, configuration, and on-site support.
Cost of revenue increased $5.0 million, or 1%, during the year ended December 31, 2020, as compared to the same period in2019.
• Speedpay contributed an incremental $84.9 million to cost of revenue during the year ended December 31, 2020, ascompared to the same period in 2019.
• Cost of revenue for the year ended December 31, 2020 included $4.3 million of significant transaction-relatedexpenses associated with the acquisition of Speedpay and cost reduction strategies implemented during the period.
• The impact of foreign currencies weakening against the U.S. dollar resulted in a $2.2 million decrease in cost ofrevenue during the year ended December 31, 2020, as compared to the same period in 2019.
• Adjusted for the impact of incremental Speedpay expense, significant transaction-related expenses, and foreigncurrency, cost of revenue decreased $81.9 million, or 13%, for the year ended December 31, 2020, as compared to thesame period in 2019.
• The decrease was primarily due to lower payment card interchange and biller related expenses, personnel and relatedexpenses, travel and entertainment expenses, and amortization of acquired software of $57.2 million, $18.6 million,$3.7 million, and $2.4 million, respectively.
35

Research and Development
Research and development (“R&D”) expenses are primarily human resource costs related to the creation of new products,improvements made to existing products as well as compatibility with new operating system releases and generations ofhardware.
R&D expense decreased $7.3 million, or 5%, during the year ended December 31, 2020, as compared to the same period in2019.
• Speedpay contributed an incremental $4.1 million to R&D expense during the year ended December 31, 2020, asdcompared to hthe same i dperiod iin 2019.
• R&D expense for the year endedR&D expense for the year ended bDecember 31, 2020 i l d d, included $ illi$1.0 million of significant transaction-related expensesof significant transaction-related expensesassociated with cost reduction strategies implemented during the period. R&D expense for the year ended Decemberassociated with cost reduction strategies implemented during the period. R&D expense for the year ended December31, 2019 i l d d, included $ illi$0.4 million of significant transaction-related expensesof significant transaction-related expenses ass i d i hociated with hthe acquisition of Speedpay.quisition of Speedpay.
• The impact of foreign currencies weakening against the U.S. dollar resulted in a $1.5 million decrease in R&D expenseduring the year ended December 31, 2020, as compared to the same period in 2019.
• Adjusted for the impact of incremental Speedpay expense, significant transaction-related expenses, and foreigncurrency, R&D expense decreased $10.4 million, or 7%, during the year ended December 31, 2020, as compared to thesame period in 2019, primarily due to lower personnel and related expenses.
Selling and Marketing
Selling and marketing includes both the costs related to selling our products to current and prospective customers as well as thecosts related to promoting the Company, its products and the research efforts required to measure customers’ future needs andffsatisfaction levels. Selling costs are primarily the human resource and travel costs related to the effort expended to license ourproducts and services to current and potential clients within defined territories and/or industries as well as the management ofthe overall relationship with customer accounts. Selling costs also include the costs associated with assisting distributors in theirefforts to sell our products and services in their respective local markets. Marketing costs include costs incurred to promote theCompany and its products, perform or acquire market research to help the Company better understand impending changes incustomer demand for and of our products, and the costs associated with measuring customers’ opinions toward the Company,our products and personnel.
Selling and marketing expense decreased $20.1 million, or 16%, during the year ended December 31, 2020, as compared to thesame period in 2019.
• Speedpay contributed an incremental $3.9 million to selling and marketing expense during the year endedDecember 31, 2020, as compared to same period in 2019.
• The impact of foreign currencies weakening against the U.S. dollar resulted in a $1.0 million decrease in selling andmarketing expense during the year ended December 31, 2020, as compared to the same period in 2019.
• Adjusted for the impact of incremental Speedpay expense and foreign currency, selling and marketing expensedecreased $23.0 million, or 19%, for the year ended December 31, 2020, as compared to the same period in 2019.
• The decrease was primarily due to lower advertising costs, personnel and related expenses, travel and entertainment,and commissions of $8.7 million, $6.6 million, $3.9 million, and $3.8 million, respectively.
General and Administrativedd
General and administrative expenses are primarily human resource costs including executive salaries and benefits, personneladministration costs, and the costs of corporate support functions such as legal, administrative, human resources, and financeand accounting.
General and administrative expense increased $17.2 million, or 13%, during the year ended December 31, 2020, as compared tothe same period in 2019.
• Speedpay contributed an incremental $0.7 million to general and administrative expense during the year endedDecember 31, 2020, as compared to the same period in 2019.
• General and administrative expenses for the year ended December 31, 2020, included $39.3 million of significanttransaction-related expenses associated with cost reduction strategies implemented during the period. General andadministrative expense for the year ended December 31, 2019, included $24.4 million of significant transaction-relatedexpenses associated with the acquisition of Speedpay.
• The impact of foreign currencies weakening against the U.S. dollar resulted in a $0.7 million decrease in general andadministrative expenses during the year ended December 31, 2020, as compared to the same period in 2019.
36

• Adjusted for the impact of incremental Speedpay expense, significant transaction-related expenses, and foreigncurrency, general and administrative expense increased $2.2 million, or 2%, for the year ended December 31, 2020, ascompared to the same period in 2019.
• The increase was primarily due to higher professional and other fees of $5.6 million, partially offset by lower traveland entertainment expenses and personnel and related expenses of $2.0 million and $1.4 million, respectively.
Depreciation and Amortization
Depreciation and amortization increased $20.3 million, or 18%, during the year ended December 31, 2020, as compared to thesame period in 2019.
• Speedpay contributed an incremental $11.9 million of depreciation and amortization expense during the year endedDecember 31, 2020, as compared to the same period in 2019.
• The impact of foreign currencies was not significant for depreciation and amortization expense during the year endedDecember 31, 2020, as compared to the same period in 2019.
• Adjusted for the impact of incremental Speedpay expense, depreciation and amortization increased $8.4 million, or8%, for the year ended December 31, 2020, as compared to the same period in 2019, primarily due to additionalamortization of internal-use software in our On Demand business.
Other Income and Expense
Interest expense for the year ended December 31, 2020, decreased $7.4 million, or 12%, as compared to the same period in2019, primarily due to lower interest rates, partially offset by higher comparative debt balances.
Interest income includes the portion of software license fees paid by customers under extended payment terms that is attributedto the significant financing component. Interest income for the year ended December 31, 2020, decreased $0.3 million, or 3%,as compared to the same period in 2019.
Other, net is primarily comprised of foreign currency transaction gains and losses. Other, net was $1.1 million of expense forthe year ended December 31, 2020, and $0.5 million of income for the year ended December 31, 2019.
Income Taxes
The effective tax rates for the years ended December 31, 2020 and 2019, were approximately 26% and 7%, respectively. Oureffective tax rates vary from our federal statutory rates due to operating in multiple foreign countries where we apply foreigntax laws and rates which differ from those we apply to the income generated from our domestic operations. Of the foreignjurisdictions in which we operate, our December 31, 2020, effective rate was most impacted by our operations in Ireland,Mexico, Singapore, and the United Kingdom, and our December 31, 2019, effective tax rate was most impacted by ouroperations in Ireland, Luxembourg, and the United Kingdom.
Refer to Note 11, Income Taxes, to our Notes to Consolidated Financial Statements in Part IV, Item 15 of this Form 10-K foradditional information.
Prior Year Results
For discussion of the year ended December 31, 2019, compared to the year ended December 31, 2018, see Results ofOperations in Part II, Item 7 of our annual report on Form 10-K for the year ended December 31, 2019.
Segment Results
We report financial performance based on our segments, ACI On Demand and ACI On Premise, and analyze Segment AdjustedEBITDA as a measure of segment profitability.
Our Chief Executive Officer is also our chief operating decision maker ("CODM"). The CODM, together with other seniormanagement personnel, focus their review on consolidated financial information and the allocation of resources based onoperating results, including revenues and Segment Adjusted EBITDA, for each segment, separate from corporate operations.
ACI On Demand serves the needs of banks, merchants, and billers who use payments to facilitate their core business. These on-demand solutions are maintained and delivered through the cloud via our global data centers and are available in either a single-tenant environment for SaaS offerings, or in a multi-tenant environment for PaaS offerings.
37

ACI On Premise serves customers who manage their software on site or through a third-party public cloud environment. Theseon-premise customers use the Company’s software to develop sophisticated solutions, which are often part of a larger systemlocated and managed at the customer specified site. These customers require a level of control and flexibility that ACI OnPremise solutions can offer, and they have the resources and expertise to take a lead role in managing these solutions.
Revenue is attributed to the reportable segments based upon the product sold and mechanism for delivery to the customer.Expenses are attributed to the reportable segments in one of three methods, (1) direct costs of the segment, (2) labor costs thatcan be attributed based upon time tracking for individual products, or (3) costs that are allocated. Allocated costs are generallymarketing and sales related activities as well as information technology and facilities related expense for which multiplesegments benefit. We also allocate certain depreciation costs to the segments.
Segment Adjusted EBITDA is the measure reported to the CODM for purposes of making decisions on allocating resources andassessing the performance of our segments and, therefore, Segment Adjusted EBITDA is presented in conformity with ASC280, Segment Reporting. Segment Adjusted EBITDA is defined as earnings (loss) from operations before interest, income taxexpense (benefit), depreciation and amortization (“EBITDA”) adjusted to exclude stock-based compensation, and net otherincome (expense).
Corporate and unallocated expenses consist of the corporate overhead costs that are not allocated to reportable segments. Theseoverhead costs relate to human resources, financeff , legal, accounting, merger and acquisition activity, and other costs that are notconsidered when management evaluates segment performance.
The following is selected financial data for our reportablff e segments for the periods indicateff d (in thousands):
Years Ended December 31,2020 2019
RevenuesACI On Demand $ 769,180 $ 678,960ACI On Premise 525,142 579,334
Total revenue $ 1,294,322 $ 1,258,294Segment Adjusted EBITDAACI On Demand $ 149,610 $ 66,501ACI On Premise 290,310 321,305
Depreciation and amortization (140,316) (122,569)Stock-based compensation expense (29,602) (36,763)Corporate and unallocated expenses (125,258) (104,718)Interest, net (45,002) (52,066)Other, net (1,116) 520Income beforeff income taxes $ 98,626 $ 72,210Depreciation and amortizationACI On Demand $ 40,594 $ 34,395ACI On Premise 13,207 11,992Corporate 86,515 76,182
Total depreciation and amortization $ 140,316 $ 122,569Stock-based compensation expenseACI On Demand $ 8,852 $ 7,995ACI On Premise 8,872 7,651Corporate and other 11,878 21,117
Total stock-based compensation expense $ 29,602 $ 36,763
ACI On Demand Segment Adjusted EBITDA increased $83.1 million for the year ended December 31, 2020, compared to thesame period in 2019, of which $30.0 million was due to the acquisition of Speedpay. Excluding the impacd t of the acquisition ofSpeedpay, ACI On Demand Segment Adjusted EBITDA increased $53.1 million, primarily due to a $86.2 million decrease incash operating expense, partially offset by a $33.1 million decrease in revenue.
38

ACI On Premise Segment Adjusted EBITDA decreased $31.0 million for the year ended December 31, 2020, compared to thesame period in 2019, primarily due to a $54.2 million decrease in revenue, partially offset by $23.2 million decrease in cashoperating expense.
Prior Year Results
For discussion of 2019 compared to 2018, see Segment Results in Part II, Item 7 of our annual report on Form 10-K for the yearended December 31, 2019.
Liquidity and Capital Resources
General
Our primary liquidity needs are: (i) to fund normal operating expenses; (ii) to meet the interest and principal requirements ofour outstanding indebtedness; and (iii) to fund acquisitions, capital expenditures, and lease payments. We believe these needswill be satisfied using cash flow generated by our operations, cash and cash equivalents, and available borrowings under ourrevolving credit facilitff y.
Our cash requirements in the future may be financed through additional equitff y or debt financings. However, the disruption inthe capital markets caused by the COVID-19 pandemic could make any new financing more challenging, and there can be noassurance that such financings will be obtained on commercially reasonable terms, or at all. We believe our liquidity will allowus to manage the anticipated impact of COVID-19 on our business operations for the foreseeable futureff , which could includereductions in revenue and delays in payments from customers and partners. We are compliant witff h our debt covenants and donot anticipate an inability to service our debt. As the challenges posed by COVID-19 on our business and the economy as awhole evolve rapidly, we will continue to evaluate our liquidity and financial position in light of future developments,particularly those relating to COVID-19.
Available Liquidity
The following table sets forth our available liquidity for the periods indicated (in thousands):
December 31,2020 2019
Cash and cash equivalents $ 165,374 $ 121,398Availability under revolving credit facilitff y 443,500 261,000Total liquidity $ 608,874 $ 382,398
The increase in total liquidity is primarily attributable to positive operating cash flows of $336.3 million, partially offset by$46.6 million of payments to purchase property and equipment and software and distribution rights, $39.0 million ofrepayments on the Term Loans and $28.9 million of payments related to stock repurchases. We also repaid a net $184.0 millionon the Revolving Credit Facility.
The Company and ACI Payments, Inc., a wholly owned subsidiary, maintain a $100.0 million uncommitted overdraft facilitywith Bank of America, N.A. The overdraft facility acts as a secured loan under the terms of the Credit Agreement to provide anadditional funding mechanism for timing differences that can occur in the bill payment settlement process. As of December 31,2020, the full $100.0 million was available.
Cash and cash equivalents consist of highly liquid investments with original maturities of three months or less. As ofDecember 31, 2020, we had $165.4 million of cash and cash equivalents, of which $69.9 million was held by our foreignsubsidiaries. If these funds were needed for our operations in the United States, we may potentially be required to accrue andpay foreign and U.S. state income taxes to repatriate these funds. As of December 31, 2020, only the earnings in our Indianforeign subsidiaries are indefinitely reinvested. The earnings of all other foreign entitieff s are no longer indefinitely reinvested.We are also permanently reinvested for outside book/tax basis differenceff s related to foreign subsidiaries. These outside basisdifferences could reverse through sales of the foreign subsidiaries, as well as various other events, none of which are consideredprobable as of December 31, 2020.
39

Cash Flows
The folff lowing table sets forth summary cash flow data forff the periods indicated (in thousands).
Years Ended December 31,2020 2019
Net cash provided by (used in):Operating activities $ 336,302 $ 137,649Investing activities (30,699) (830,481)Financing activities (261,570) 667,223
Cash FloFF w from Operating Activitiesff
Net cash flowff s provided by operating activities for the yeaff r ended December 31, 2020, were $336.3 million as compared to$137.6 million during the same period in 2019. Net cash provided by operating activities primarily consists of net incomeadjusted to add back depreciation, amortization, and stock-based compensation. Cash flows provided by operating activitieswere $198.7 million higher for the yeaff r ended December 31, 2020, compared to the same period in 2019, due to higher netincome and the timing of working capital. Our current policy is to use our operating cash flow primarily for funding capitalexpenditures, lease payments, stock repurchases, and acquisitions.
Cash FloFF w from Investing Activitiesff
During the year ended December 31, 2020, we used $46.6 million to purchase software, property, and equipment, as comparedto $48.0 million during the same period in 2019. During the year ended December 31, 2019, we paid $753.9 million, net of $0.1million in cash acquired, to acquire Speedpay. We also used cash of $18.5 million to invest in a payment technology andservices company in India and $7.0 million to acquire the technology assets of RevChip, LLC and TranSend IntegratedTechnologies Inc in 2019.
Cash Flow fromFF Financing Activities
Net cash flows used by financing activities for the yeaff r ended December 31, 2020, were $261.6 million, as compared to netcash flows provided by financing activitieff s of $667.2 million during the same period in 2019. During 2020, we repaid a net$184.0 million on the Revolving Credit Facility and $39.0 million on the Term Loans. In addition, we used $28.9 million torepurchase common stock and we received proceeds of $15.7 million from the exercise of stock options and the issuance ofcommon stock under our 2017 Employee Stock Purchase Plan, as amended. We also used $11.6 million for the repurchase ofstock-based compensation awards for tax withholdings. During 2019, we received proceeds of $500.0 million from our DelayedDraw Term Loan and $280.0 million from our Revolving Credit Facility to fund our purchase of Speedpay and stockrepurchases, and we repaid $41.0 million on the Revolving Credit Facility and $28.9 million on the Initial Term Loan. Inaddition, we used $35.6 million to repurchase common stock, and we received proceeds of $16.6 million from the exercise ofstock options and the issuance of common stock under our 2017 Employee Stock Purchase Plan, as amended. We also used$4.0 million for the repurchase of stock-based compensation awards for tax withholdings.
Prior Year Results
For discussion of 2019 compared to 2018, see Liquidity and Capital Resources in Part II, Item 7 of our annual report on Form10-K for the year ended December 31, 2019.
Debt
On April 5, 2019, we entered into the Second Amended and Restated Credit Agreement (the "Credit Agreement") to amend andrestate our existing agreement, dated February 24, 2017. The Credit Agreement consists of (a) a five-yeaff r $500.0 million seniorsecured revolving credit facility (the “Revolving Credit Facility”), (b) a five-yeaff r $279.0 million senior secured term loanfacility (the “Initial Term Loan”) and (c) a five-yeaff r $500.0 million senior secured term loan facilitff y (the "Delayed Draw TermLoan", together with the Initial Term Loan, the "Term Loans", and together with the Initial Term Loan and the RevolvingCredit Facility, the “Credit Facility”).
On August 12, 2020, we entered a standby letter of credit agreement (the “Letter of Credit”), under the terms of the CreditAgreement, for $1.5 million. The Letter of Crediff t expires on July 31, 2021, with automatic renewal for twelve month periodsthereafter. The Letter of Credit reduces the maximum available borrowings under our Revolving Credit Facility to $498.5million. Upon expiration of the Letter of Credit, maximum borrowings will return to $500.0 million.
40

As of December 31, 2020, we had $55.0 million and $717.1 million outstanding under our Revolving Credit Facility and TermLoans, respectively, with up to $443.5 million of unused borrowings under the Revolving Credit Facility, as amended, and up to$1.5 million of unused borrowings under the Letter of Credit agreement. As of December 31, 2020, and at all times during theyear, we were in compliance with our debt covenants. The interest rate in effect for the Credit Facility was 2.15% as ofDecember 31, 2020.
We also had $400.0 million outstanding of the 2026 Notes as of December 31, 2020. See Note 4, Debt, to our Notes toConsolidated Financial Statements in Part IV, Item 15 of this Form 10-K for additional information.
Stock Repurchase Program
We repurchased 1,000,000 shares for $28.9 million under our stock repurchase program during the year ended December 31,2020. Under the program to date, we have repurchased 46,357,495 shares for approximately $612.3 million. As ofDecember 31, 2020, the maximum remaining amount authorized for purchase under the stock repurchase program wasapproximately $112.1 million. See Note 7, Common Stock and Treasury Stock, to our Notes to Consolidated FinancialStatements in Part IV, Item 15 of this Form 10-K for additional information.
Contractual Obligations and Commercial Commitments
We lease office space and equipment under operating leases that run through October 2028. Additionally, we have entererr d intoa Credit Agreement that matures in April 2024 and have issued Senior Notes that mature in August 2026.
Contractual obligations as of December 31, 2020, are as follows (in thousands):
Payments Due by Period
TotalLess than1 year 1-3 years 3-5 years
More than5 years
Operating lease obligations $ 59,677 $ 15,116 $ 23,427 $ 9,561 $ 11,573Term loans 717,110 38,950 120,337 557,823 —Term loans interest (1) 46,198 15,081 27,160 3,957 —Revolving credit facility 55,000 — — 55,000 —Revolving credit facility interest (2) 3,840 1,182 2,363 295 —Senior notes 400,000 — — — 400,000Senior notes interest (3) 138,000 23,000 46,000 46,000 23,000Financed internal-use software (4) 7,847 5,660 2,187 — —Total $ 1,427,672 $ 98,989 $ 221,474 $ 672,636 $ 434,573
(1) Based on the Term Loans debt outstanding and interest rate in effect at December 31, 2020, of 2.15%.
(2) Based on Revolving Credit Facility debt outstanding and interest rate in effect at December 31, 2020, of 2.15%.
(3) Based on 2026 Notes issued of $400.0 million with an annual interest rate of 5.750%.
(4) As of December 31, 2020, $7.8 million is outstanding under certain multi-year license agreements for internal-usesoftware, with $5.6 million and $2.2 million included in other current liabilities and other noncurrent liabilities,respectively, in our Consolidated Balance Sheet in Part IV, Item 15 of this Form 10-K as of December 31, 2020.
We are unable to reasonably estimate the ultimate amount or timing of settlement of our reserves for income taxes underffASC 740, Income Taxes. The liability for unrecognizedff tax benefits at December 31, 2020, is $24.3 million.
41

Off-Balance Sheet Arrangements
Settlement Accounts
We enter into agreements with certain Biller clients to process payment funds on their behalf. When an ACH or ATM networkpayment transaction is processed, a transaction is initiated to withdraw funds from the designated source account and depositthem into a settlement account. This settlement account is a trust account maintained for the benefit of our clients. Asimultaneous transaction is initiated to transfer funds from the settlement account to the intended destination account. These“back to back” transactions are designed to settle at the same time, usually overnight, so we receive the funds from the source atthe same time it sends the funds to their destination. However, due to the transactions being with various financial institutions,there may be timing differences that result in float balances. These funds are maintained in accounts for the benefit of ourclients, which are separate from our corporate assets. As we do not take ownership of the funds, the settlement accounts are notincluded in our balance sheet. We are entitled to interest earned on the fund balances. The collection of interest on thesesettlement accounts is considered in our determination of fee structures for clients and represents a portion of the payment forservices performed by us. The amount of settlement funds as of December 31, 2020 and 2019, were $246.8 million and $274.0million, respectively.
We do not have any other obligations that meet the definition of an off-balance sheet arrangement and that have or arereasonably likely to have a material effect on our consolidated financial statements.
Critical Accounting Policies and Estimates
The preparation of the consolidated financial statements requires that we make estimates and assumptions that affect thereported amounts of assets, liabilities, revenues and expenses, and related disclosure of contingent assets and liabilities. Webase our estimates on historical experience and other assumptions that we believe to be proper and reasonable under thecircumstances. We continually evaluate the appropriateness of estimates and assumptions used in the preparation of ourconsolidated financial statements. Actual results could differ from those estimates.
The following key accounting policies are impacted significantly by judgments, assumptions, and estimates used in thepreparation of the consolidated financial statements. See Note 1, Nature of Business and Summary of Significant AccountingPolicies, and Note 2, Revenue, to our Notes to Consolidated Financial Statements in Part IV, Item 15 of this Form 10-K for afurther discussion of significant accounting policies and revenue recognition.
Revenue Recognition
In accordance with ASC 606, Revenue From Contracts with Customers,CC revenue is recognized upon transfer of control ofpromised products and/or services to customers in an amount that reflects the consideration we expect to be entitled to receivein exchange for those products and services.
Our software license arrangements provide the customer with the right to use functional intellectual property for the duration ofthe contract term. Implementation, support, and other services are typically considered distinct performance obligations whensold with a software license. Significant judgment is required to determine the stand-alone selling price (“SSP”) for eachperformance obligation, the amount allocated to each performance obligation and whether it depicts the amount that we expectto be entitled to receive in exchange for the related product and/or service. As the selling prices of our software licenses arehighly variable, we estimate SSP of our software licenses using the residual approach when the software license is sold withother services and observable SSPs exist for the other services. We use a range of amounts to estimate SSP for maintenance andservices. These ranges are based on stand-alone sales and vary based on the type of service and geographic region. If the SSP ofa performance obligation is not directly observable, we will maximize observable inputs to determine its SSP.
When a software license arrangement contains payment terms that are extended beyond one year, a significant financingcomponent may exist. The significant financing component is calculated as the difference between the stated value and presentvalue of the software license fees and is recognized as interest income over the extended payment period. Judgment is used indetermining: (1) whether the financing component in a software license agreement is significant and, if so, (2) the discount rateused in calculating the significant financing component.
We assess the significance of the financing component based on the ratio of license fees paid over time to total license fees. Ifdetermined to be significant, the financing component is calculated using a rate that discounts the license fees to the cash sellingprice.
Our SaaS-based and PaaS-based arrangements represent a single promise to provide continuous access to its software solutionsand their processing capabilities in the form of a service through one of our data centers. These arrangements may include fixed
42

and/or variable consideration. Fixed consideration is recognized over the term of the arrangement and variable consideration,which is a function of transaction volume or another usage-based measure, generally meets the allocation objective and revenueis recognized as the usage occurs.
We apply judgment in determining the customer’s ability and intention to pay, which is based on a variety of factors includingthe creditworthiness of the customer, economic conditions in the customer’s industry and geographic location, and generaleconomic conditions.
Certain of our arrangements are through unrelated distributors or sales agents. For software license arrangements in which weact as a distributor of another company’s product, and in certain circumstances, modify or enhance the product, revenues arerecorded on a gross basis. These include arrangements in which we take control of the products and are responsible forproviding the product or service. For software license arrangements in which we act as a sales agent for another company’sproduct, revenues are recorded on a net basis. Judgment is required in evaluating the facts and circumstances of our relationshipwith the distributor or sales agent as well as our operating history and practices that can impact the timing of revenuerecognition related to these arrangements. For software license arrangements in which we utilize a third-party distributor orsales agent, we recognize revenue upon transfer of control of the software license(s) to the third-party distributor or sales agent.
We may execute more than one contract or agreement with a single customer at or near the same time. The separate contracts oragreements may be viewed as one combined arrangement or separate agreements for revenue recognition purposes. Weevaluate whether the agreements were negotiated as a package with a single commercial objective, whether the products orservices promised in the agreements represent a single performance obligation, or whether the amount of consideration to bepaid in one agreement depends on the price and/or performance of another agreement to reach appropriate conclusionsregarding whether such arrangements are related or separate. The conclusions reached can impact the allocation of thetransaction price to each performance obligation and the timing of revenue recognition related to those arrangements.
Intangible Assets and Goodwill
Our business acquisitions typically result in the recording of intangible assets. As of December 31, 2020 and 2019, ourintangible assets, excluding goodwill, net of accumulated amortization, were $322.0 million and $357.0 million, respectively.The determination of the value of such intangible assets requires management to make estimates and assumptions that affect theconsolidated financial statements. We assess potential impairments to intangible assets when there is evidence that events orchanges in circumstances indicate the carrying amount of an asset may not be recovered. Judgments regarding the existence ofimpairment indicators and future cash flows related to intangible assets are based on operational performance of our businesses,market conditions, and other factors. Although there are inherent uncertainties in this assessment process, the estimates andassumptions used, including estimates of future cash flows, volumes, market penetration and discount rates, are consistent withour internal planning. If these estimates or their related assumptions change in the future, we may be required to record animpairment charge on all or a portion of our intangible assets. Furthermore, we cannot predict the occurrence of futureimpairment-triggering events nor the impact such events might have on our reported asset values. Future events could cause usto conclude that impairment indicators exist and that intangible assets associated with acquired businesses are impaired. Anyresulting impairment loss could have an impact on our results of operations.
Other intangible assets are amortized using the straight-line method over periods ranging from four to 20 years.
As of December 31, 2020 and 2019, our goodwill was $1.3 billion. In accordance with ASC 350, Intangibles – Goodwill andOther, we assess goodwill for impairment annually during the fourth quarter of our fiscal year using October 1 balances, orwhen there is evidence that events or changes in circumstances indicate that the carrying amount of the asset may not berecovered. We evaluate goodwill at the reporting unit level and have identified our reportable segments, ACI On Demand andACI On Premise, as our reporting units. Recoverability of goodwill is measured using a discounted cash flow valuation modelincorporating discount rates commensurate with the risks involved. Use of a discounted cash flow valuation model is commonpractice in impairment testing in the absence of available transactional market evidence to determine the fair value.
The key assumptions used in the discounted cash flow valuation model include discount rates, growth rates, cash flowprojections, and terminal value rates. Discount rates, growth rates, and cash flow projections are the most sensitive andsusceptible to change, as they require significant management judgment. Discount rates are determined by using a weightedaverage cost of capital (“WACC”). The WACC considers market and industry data, as well as Company-specific risk factors.Operational management, considering industry and Company-specific historical and projected data, develops growth rates andcash flow projections for each reporting unit. Terminal value rate determination follows common methodology of capturing thepresent value of perpetual cash flow estimates beyond the last projected period assuming a constant WACC and low long-termgrowth rates. If the calculated fair value is less than the current carrying value, impairment of the reporting unit may exist. The
43

implied fair value of goodwill is determined in a manner similar to how goodwill is calculated in a business combination. If theimplied fair value of goodwill exceeds the carrying value of goodwill assigned to the reporting unit, there is no impairment. Ifthe carrying value of goodwill assigned to the reporting unit exceeds the implied fair value of the goodwill, an impairmentcharge is recorded to write down the carrying value. The calculated fair value substantially exceeds the current carrying valueufor all reporting units. No reporting units were deemed to be at risk of failing Step 1 of the goodwill impairment test under ASC350.
Business Combinations
We apply the provisions of ASC 805, Business Combinations, in the accounting for our acquisitions. It requires us to recognizethe assets acquired and the liabilities assumed at their acquisition date fair values, separately from goodwill. Goodwill as of theacquisition date is measured as the excess of consideration transferred and the net of the acquisition date fair values of the assetsacquired and the liabilities assumed. While we use our best estimates and assumptions to accurately value assets acquired andliabilities assumed at the acquisition date, estimates are inherently uncertain and subject to refinement. As a result, during themeasurement period, which may be up to one year from the acquisition date, we record adjustments to the assets acquired andliabilities assumed with the corresponding offset to goodwill. Upon the conclusion of the measurement period or finaldetermination of the values of assets acquired or liabilities assumed, whichever comes first, any subsequent adjustments arerecorded to our consolidated statements of operations.
Critical estimates in valuing certain intangible assets include but are not limited to future expected cash flows from customerrelationships, covenants not to compete, and acquired developed technologies; brand awareness and market position, as well asassumptions about the period of time the brand will continue to be used in our product portfolio; and discount rates.Management’s estimates of fair value are based upon assumptions believed to be reasonable, but which are inherently uncertainand unpredictable and, as a result, actual results may differ from estimates.
Other estimates associated with the accounting for acquisitions may change as additional information becomes availableregarding the assets acquired and liabilities assumed.
Stock-Based Compensation
On June 9, 2020, upon recommendation of our board, stockholders approved the ACI Worldwide, Inc. 2020 Equity andIncentive Compensation Plan (the “2020 Plan”). The 2020 Plan authorizes the board to provide for equity-based compensationin the form of stock options, stock appreciation rights, restricted stock, restricted stock units, performance shares, performanceunits, dividend equivalents, and certain other awards, including those denominated or payable in, or otherwise based on, ourcommon stock ("awards"). The purpose of the 2020 Plan is to provide incentives and rewards for service and/or performance byproviding awards to non-employee directors, officers, other employees, and certain consultants and other service providers ofus and our subsidiaries. Following the approval of the 2020 Plan, the 2016 Incentive Plan was terminated. Termination of the2016 Incentive Plan did not affect any equity awards outstanding under the 2016 Incentive Plan.
On March 23, 2016, our board approved the 2016 Incentive Plan. The 2016 Incentive Plan was intended to meet our objectiveof balancing stockholder concerns about dilution with the need to provide appropriate incentives to achieve Companyperformance objectives. The 2016 Incentive Plan was adopted by the stockholders on June 14, 2016. Following the adoption ofthe 2016 Incentive Plan, the 2005 Equity and Performance Incentive Plan, as amended (the “2005 Incentive Plan”) wasterminated. Termination of the 2005 Incentive Plan did not affect any equity awards outstanding under the 2005 Incentive Plan.
In accordance with ASC 718, Compensation – Stock Compensation, stock-based compensation expense for stock option awardsis estimated at the grant date based on the award’s fair value, as calculated by the Black-Scholes option-pricing model and isrecognized as expense ratably over the requisite service period. The Black-Scholes option-pricing model requires various highlyjudgmental assumptions, including volatility and expected option life. If any assumptions used in the Black-Scholes option-pricing model change significantly, stock-based compensation expense may differ materially for future awards from thatrecorded for existing awards.
Total shareholder return awards (“TSRs”) are performance shares that are earned, if at all, based upon our total shareholderreturn as compared to a group of peer companies over a three-year performance period. The award payout can range from 0% to200%. To determine the grant date fair value of TSRs, a Monte Carlo simulation model is used. We recognize compensationexpense for the TSRs over a three-year performance period based on the grant date fair value.
Restricted share unit awards (“RSUs”) generally have requisite service periods of three years and vest in increments of 33% onthe anniversary of the grant dates. Under each arrangement, RSUs are issued without direct cost to the employee on the vesting
44

date. We estimate the fair value of RSUs based upon the market price of our stock on the date of grant. We recognizecompensation expense for RSUs on a straight-line basis over the requisite service period.
The assumptions utilized in the Black-Scholes option-pricing and Monte Carlo simulation models, as well as the description ofthe plans the stock-based awards are granted under are described in further detail in Note 6, Stock-Based CompensationPlans, to our Notes to Consolidated Financial Statements in Part IV, Item 15 of this Form 10-K.
Accounting for Income Taxes
Accounting for income taxes requires significant judgments in the development of estimates used in income tax calculations.Such judgments include, but are not limited to, the likelihood we would realize the benefits of net operating loss carryforwardsand/or foreign tax credit carryforwards, the adequacy of valuation allowances, and the rates used to measure transactions withforeign subsidiaries. As part of the process of preparing our consolidated financial statements, we are required to estimate ourincome taxes in each of the jurisdictions in which we operate. The judgments and estimates used are subject to challenge bydomestic and foreign taxing authorities.
We account for income taxes in accordance with ASC 740, Income Taxes. As part of our process of determining current taxliability, we exercise judgment in evaluating positions we have taken in our tax returns. We periodically assess our taxexposures and establish, or adjust, estimated unrecognized benefits for probable assessments by taxing authorities, including theInternal Revenue Service, and various foreign and state authorities. Such unrecognized tax benefits represent the estimatedprovision for income taxes expected to ultimately be paid. It is possible that either domestic or foreign taxing authorities couldchallenge those judgments or positions and draw conclusions that would cause us to incur tax liabilities in excess of, or realizebenefits less than, those currently recorded. In addition, changes in the geographical mix or estimated amount of annual pretaxincome could impact our overall effectiveff tax rate.
To the extent recovery of deferred tax assets is not more likely than not, we record a valuation allowance to reduce our deferredtax assets to the amount that is more likely than not to be realized. Although we have considered future taxable income alongwith prudent and feasible tax planning strategies in assessing the need for a valuation allowance, if we should determine that wewould not be able to realize all or part of our deferred tax assets in the future, an adjustment to deferred tax assets would becharged to income in the period any such determination was made. Likewise, in the event we are able to realize our deferred taxassets in the future in excess of the net recorded amount, an adjustment to deferred tax assets would increase income in theperiod any such determination was made.
New Accounting Standards Recently Adopted
For information related to recent accounting pronouncements and the impact of these pronouncements on our consolidatedfinancial statements, see Note 1, Nature of Business and Summary of Significant Accounting Policies, to our Notes toConsolidated Financial Statements in Part IV, Item 15 of this Form 10-K.
ITEM 7A. QUANTITATIVE AND QUALITATIVE DISCLOSURES ABOUT MARKET RISK
Excluding the impact of changes in interest rates and the uncertainty in the global financial markets, there have been no materialchanges to our market risk for the year ended December 31, 2020. We conduct business in all parts of the world and are therebyexposed to market risks related to fluctuations in foreign currency exchange rates. The U.S. dollar is the single largest currencyin which our revenue contracts are denominated. Any decline in the value of local foreign currencies against the U.S. dollarresults in our products and services being more expensive to a potential foreign customer. In those instances where our goodsand services have already been sold, receivables may be more difficult to collect. Additionally, in jurisdictions where therevenue contracts are denominated in U.S. dollars and operating expenses are incurred in the local currency, any decline in thevalue of the U.S. dollar will have an unfavorable impact to operating margins. At times, we enter into revenue contracts that aredenominated in the country’s local currency, primarily in Australia, Canada, the United Kingdom, other European countries,Brazil, India, and Singapore. This practice serves as a natural hedge to finance the local currency expenses incurred in thoselocations. We have not entered into any foreign currency hedging transactions. We do not purchase or hold any derivativefinancial instruments for speculation or arbitrage.r
The primary objective of our cash investment policy is to preserve principal without significantly increasing risk. If wemaintained similar cash investments for a period of one year based on our cash investments and interest rates at December 31,2020, a hypothetical ten percent increase or decrease in effective interest rates would increase or decrease interest income byless than $0.1 million annually.
45

We had approximately $1.2 billion of debt outstanding at December 31, 2020, with $772.1 million outstanding under our CreditFacility and $400.0 million in 2026 Notes. Our Credit Facility has a floating rate, which was 2.15% at December 31, 2020. Our2026 Notes are fixed-rate long-term debt obligations with a 5.750% interest rate. A hypothetical ten percent increase ordecrease in effective interest rates would increase or decrease interest expense related to the Credit Facility by approximately$1.7 million.
ITEM 8. FINANCIAL STATEMENTS AND SUPPLEMENTARY DATA
The required consolidated financial statements and notes thereto are included in this annual report and are listed in Part IV,Item 15.
ITEM 9. CHANGES IN AND DISAGREEMENTS WITH ACCOUNTANTS ON ACCOUNTING AND FINANCIALDISCLOSURE
None.
ITEM 9A. CONTROLS AND PROCEDURES
Evaluation of Disclosure Controls and Procedures
Our management, under the supervision and with the participation of the Chief Executive Officer and Chief Financial Officer,performed an evaluation of the effectiveness of our disclosure controls and procedures (as defined in Rules 13a-15(e) and15d-15(e) under the Securities Exchange Act of 1934 (the “Exchange Act”)) as of the end of the period covered by this report,December 31, 2020.
In connection with our evaluation of disclosure controls and procedures, we have concluded that our disclosure controls andprocedures are effective as of December 31, 2020.
Management’s Report on Internal Control overee Financial Reporting
Our management is responsible for establishing and maintaining adequate internal control over financial reporting to providereasonable assurance regarding the reliability of our financial reporting and the preparation of our consolidated financialstatements for external purposes in accordance with U.S. GAAP. Under the supervision of, and with the participation of ourChief Executive Officer and Chief Financial Officer, management assessed the effectiveness of internal control over financialreporting as of December 31, 2020.
Management based its assessment on criteria established in “Internal Control Integrated Framework (2013)” issued by theCommittee of Sponsoring Organizations of the Treadway Commission. Based on this evaluation, management concluded thatour internal control over financial reporting was effectiveff as of December 31, 2020.
The effectiveness of our internal control over financial reporting as of December 31, 2020, has been audited by Deloitte &Touche, LLP, an independent registered public accounting firm, and Deloitte & Touche, LLP has issued an attestation report onour internal control over financial reporting.
Changes in Internal Control over Financial Reporting
There were no additional changes in our internal control over financial reporting (as defined in Rules 13a-15(f) under theExchange Act) during the quarter ended December 31, 2020, that have materially affected, or are reasonably likely to materiallyffaffect, our internal control over financial reporting.
46

REPORT OF INDEPENDENT REGISTERED PUBLIC ACCOUNTING FIRM
To the Board of Directors and Stockholders ofACI Worldwide, Inc.
Opinion on Internal Control over Financial Reporting
We have audited the internal control over financial reporting of ACI Worldwide, Inc. and subsidiaries (the “Company”) as ofDecember 31, 2020, based on criteria established in Internal Control – Integrated Framework (2013) issued by the Committeeof Sponsoring Organizations of the Treadway Commission (COSO). In our opinion, the Company maintained, in all materialrespects, effective internal control over financial reporting as of December 31, 2020, based on criteria established in InternalControl – Integrated Framework (2013) issued by COSO.
We have also audited, in accordance with the standards of the Public Company Accounting Oversight Board (United States)(PCAOB), the consolidated financial statements as of and for the year ended December 31, 2020, of the Company and ourreport dated February 25, 2021, expressed an unqualified opinion on those financial statements and included an explanatoryrrparagraph regarding the Company’s adoption of FASB Accounting Standards Update 2016-02, Leases, effective January 1,2019.
Basis for Opinion
The Company’s management is responsible for maintaining effective internal control over financial reporting and for itsassessment of the effectiveness of internal control over financial reporting, included in the accompanying Management’s Reporton Internal Control over Financial Reporting. Our responsibility is to express an opinion on the Company’s internal controlover financial reporting based on our audit. We are a public accounting firm registered with the PCAOB and are required to beindependent with respect to the Company in accordance with the U.S. federal securities laws and the applicable rules andregulations of the Securities and Exchange Commission and the PCAOB.
We conducted our audit in accordance with the standards of the PCAOB. Those standards require that we plan and perform theaudit to obtain reasonable assurance about whether effective internal control over financial reporting was maintained in allmaterial respects. Our audit included obtaining an understanding of internal control over financial reporting, assessing the riskthat a material weakness exists, testing and evaluating the design and operating effectiveness of internal control based on theassessed risk, and performing such other procedures as we considered necessary in the circumstances. We believe that our auditprovides a reasonable basis for our opinion.
Definition and Limitations of Internal Control over Financial Reporting
A company’s internal control over financial reporting is a process designed to provide reasonable assurance regarding thereliability of financial reporting and the preparation of financial statements for external purposes in accordance with generallyaccepted accounting principles. A company’s internal control over financial reporting includes those policies and proceduresthat (1) pertain to the maintenance of records that, in reasonable detail, accurately and fairly reflect the transactions anddispositions of the assets of the company; (2) provide reasonable assurance that transactions are recorded as necessary to permitpreparation of financial statements in accordance with generally accepted accounting principles, and that receipts andexpenditures of the company are being made only in accordance with authorizations of management and directors of thecompany; and (3) provide reasonable assurance regarding prevention or timely detection of unauthorized acquisition, use, ordisposition of the company’s assets that could have a material effect onff the financial statements.
Because of its inherent limitations, internal control over financial reporting may not prevent or detect misstatements. Also,projections of any evaluation of effectiveness to future periods are subject to the risk that controls may become inadequatebecause of changes in conditions, or that the degree of compliance with the policies or procedures may deteriorate.
/s/ DELOITTE & TOUCHE LLPEE
Omaha, NebraskaFebruary 25, 2021
47

ITEM 9B. OTHER INFORMATION
None.
PART III
ITEM 10. DIRECTORS, EXECUTIVE OFFICERS, AND CORPORATE GOVERNANCE
The information under the heading “Executive Officers of the Registrant” in Part 1, Item 1 of this Form 10-K is incorporatedherein by reference.
The other information required by this Item 10 is incorporated by reference from our Proxy Statement for the Annual Meetingof Stockholders to be held on June 2, 2021 (the “2021 Proxy Statement“), under the sections entitled “Proposal 1 – Election ofDirectors,” “Information Regarding Security Ownership – Section 16(a) Beneficial Ownership Reporting Compliance,”Corporate Governance – Code of Business Conduct and Ethics,” and “Corporate Governance – Board Committees.”
ITEM 11. EXECUTIVE COMPENSATION
Information included in the sections entitled “Director Compensation,” “Compensation Discussion and Analysis,”“Compensation Committee Report,” “Executive Compensation,” and “Compensation Committee Interlocks and InsiderParticipation” in our 2021 Proxy Statement is incorporated herein by reference.
ITEM 12. SECURITY OWNERSHIP OF CERTAIN BENEFICIAL OWNERS AND MANAGEMENT ANDRELATED STOCKHOLDER MATTERS
Information included in the sections entitled “Information Regarding Security Ownership” in our 2021 Proxy Statement isincorporated herein by reference.
Information included in the section entitled “Information Regarding Equity Compensation Plans” in our 2021 Proxy Statementis incorporated herein by reference.
ITEM 13. CERTAIN RELATIONSHIPS AND RELATED TRANSACTIONS AND DIRECTOR INDEPENDENCE
Information included in the section entitled “Certain Relationships and Related Transactions” in our 2021 Proxy Statement isincorporated herein by reference.
Information included in the sections entitled “Director Independence” and “Board Committees and Committee Meetings” in the“Corporate Governance” section of our 2021 Proxy Statement is incorporated by reference.
ITEM 14. PRINCIPAL ACCOUNTING FEES AND SERVICES
Information included in the sections entitled “Independent Registered Public Accounting Firm Fees” and “Pre-Approval ofAudit and Non-Audit Services” under “Proposal 2 – Ratification of Appointment of the Company’s Independent RegisteredPublic Accounting Firm” in our 2021 Proxy Statement is incorporated herein by reference.u
48

PART IV
ITEM 15. EXHIBITS, FINANCIAL STATEMENT SCHEDULES
Documents filed as part of this annual report on Form 10-K:
(1) Financial Statements. The following index lists consolidated financial statements and notes thereto filed as part of thisffannual report on Form 10-K:
PageReport of Independent Registered Public Accounting Firm – Deloitte & Touche LLP 50Consolidated Balance Sheets as of December 31, 2020 and 2019 52Consolidated Statements of Operations for each of the three years in the period ended December 31, 2020 53Consolidated Statements of Comprehensive Income for each of the three years in the period ended December 31,2020 54Consolidated Statements of Stockholders’ Equity for each of the three years in the period ended December 31, 2020 55Consolidated Statements of Cash Flows for each of the three years in the period ended December 31, 2020 56Notes to Consolidated Financial Statements 57
(2) Financial Statement Schedules. All scheduled s have been omitted because they are not applicable or the requiredinformation is included in the consolidated financial statements or notes thereto.
(3) Exhibits. A list of exhibits filed or furnished with thiff s report on Form 10-K (or incorporated by reference to exhibitspreviously filed by ACI) is provided in the accompanying Exhibit Index.
49

REPORT OF INDEPENDENT REGISTERED PUBLIC ACCOUNTING FIRM
To the Board of Directors and Stockholders ofACI Worldwide, Inc.
Opinion on the Financial Statements
We have audited the accompanying consolidated balance sheets of ACI Worldwide, Inc. and subsidiaries (the “Company”) asof December 31, 2020 and 2019, the related consolidated statements of operations, comprehensive income, stockholders’equity, and cash flows for each of the three years in the period ended December 31, 2020, and the related notes (collectivelyreferred to as the “financial statements”). In our opinion, the financial statements present fairly, in all material respects, thefinancial position of the Company as of December 31, 2020 and 2019, and the results of its operations and its cash flows foreach of the three years in the period ended December 31, 2020, in conformity with accounting principles generally accepted inthe United States of America.
We have also audited, in accordance with the standards of the Public Company Accounting Oversight Board (United States)(PCAOB), the Company’s internal control over financial reporting as of December 31, 2020, based on criteria established inInternal Control — Integrated Framework (2013) issued by the Committee of Sponsoring Organizations of the TreadwayCommission and our report dated February 25, 2021, expressed an unqualified opinion on the Company’s internal control overrrfinancial reporting.
Change in Accounting Principle
As discussed in Note 1 to the financial statements, effective January 1, 2019, the Company adopted FASB AccountingffStandards Update 2016-02, Leases, using the optional transition method.
Basis for Opinion
These financial statements are the responsibility of the Company’s management. Our responsibility is to express an opinion onthe Company’s financial statements based on our audits. We are a public accounting firm registered with the PCAOB and arerequired to be independent with respect to the Company in accordance with the U.S. federal securities laws and the applicablerules and regulations of the Securities and Exchange Commission and the PCAOB.
We conducted our audits in accordance with the standards of the PCAOB. Those standards require that we plan and perform theaudit to obtain reasonable assurance about whether the financial statements are free of material misstatement, whether due toerror or fraud. Our audits included performing procedures to assess the risks of material misstatement of the financialstatements, whether due to error or fraud, and performing procedures that respond to those risks. Such procedures includedexamining, on a test basis, evidence regarding the amounts and disclosures in the financial statements. Our audits also includedevaluating the accounting principles used and significant estimates made by management, as well as evaluating the overallpresentation of the financial statements. We believe that our audits provide a reasonable basis for our opinion.
Critical Audit Matter
The critical audit matter communicated below is a matter arising from the current-period audit of the financial statements thatwas communicated or required to be communicated to the audit committee and that (1) relates to accounts or disclosures thatare material to the financial statements and (2) involved our especially challenging, subjective, or complex judgments. Thecommunication of critical audit matters does not alter in any way our opinion on the financial statements, taken as a whole, andwe are not, by communicating the critical audit matter below, providing a separate opinion on the critical audit matter or on theaccounts or disclosures to which it relates.
Revenue Recognition - Referff to Note 2 to the financial statements
The Company recognizes revenue upon transfer of control of promised products and/or services to customers in an amount thatreflects the consideration the Company expects to be entitled to in exchange for those products or services. The Company’ssoftware license arrangements provide the customer with the right to use functional intellectual property for the duration of thecontract term and are typically bundled with implementation, support, and other services.
Significant judgment is exercised by the Company in determining revenue recognition for these customer arrangements, andincludes the following:
• Determination of the term of a software license arrangement when early termination rights are provided to the customer.
50

• Determination of whether products and/or services are considered distinct performance obligations that should beaccounted for separately.
• Determination of whether the financing component in a software licensing arrangement is significant and, if so, thediscount rate used in calculating the significant financing component.
• Assessment of whether the extension of payment terms in a software licensing arrangement results in variableconsideration and, if so, the amount to be included in the transaction price.
• Determination of the standalone selling price for each performance obligation and whether it depicts the amount that theCompany expects to be entitled to in exchange for the related product and/or service. As the selling prices of theCompany’s software licenses are highly variable, the Company estimates standalone selling price of its software licensesusing the residual approach when the software licensed is sold with other services and observable standalone selling pricesexist for the other services.
Given these factors, the related audit effort in evaluating management’s judgments in determining revenue recognition forsoftware license arrangements was extensive and required a high degree of auditor judgment.
How the Critical Audit Matter Was Addressed indd the Audit
Our audit procedures related to the Company’s accounting for software license arrangements included the following, amongothers:
• We tested the effectiveness of controls over the review of software license arrangements, including, among others, thedetermination of the contract term, identification of performance obligations, determination of significant financingcomponent, estimation of variable consideration, and determination of standalone selling prices, including those controlsover the determination that software license pricing is highly variable.
• We selected a sample of software license arrangements and performed the following, among others:
• Obtained contract source documents for each selection, including separate contracts or agreements that should becombined with the selected arrangement, and other documents that were part of the arrangement.
• Tested management’s determination of the contract term, identification of performance obligations, determinationof significant financing component, estimation of variable consideration, and determination of standalone sellingprices.
• Evaluated the reasonableness of the methodology and estimates used by management and the appropriateness of itsrevenue recognition conclusions for these key judgment areas.
• Tested the mathematical accuracy of management’s calculations of revenue and the associated timing of revenuerecognized in the financial statements.
• We evaluated management’s determination that software license pricing is highly variable by obtaining management’shighly variable analysis and performing the following:
• Testing the completeness of management’s analysis by tracing a selection of known data points from anindependent internal source into the highly variable analysis.
• Testing the accuracy of management’s analysis by selecting a sample of contracts from the highly variable analysis,obtaining the contract and price detail, and evaluating whether discounts were appropriately included in theanalysis.
• Testing the mathematical accuracy of management’s calculations.
/s/ DELOITTE & TOUCHE LLPEE
Omaha, NebraskaFebruary 25, 2021We have served as the Company’s auditor since 2009.
51

ACI WORLDWIDE, INC. AND SUBSIDIARIESCONSOLIDATED BALANCE SHEETS
(in thousands, except share and per share amounts)
December 31,2020 2019
ASSETSCurrent assetsCash and cash equivalents $ 165,374 $ 121,398Receivables, net of allowances of $3,912 and $5,149, respectively 342,879 359,197Settlement assets 605,008 391,039Prepaid expenses 24,288 24,542Other current assets 17,365 24,200Total current assets 1,154,914 920,376
Noncurrent assetsAccrued receivables, net 215,772 213,041Property and equipment, net 64,734 70,380Operating lease right-of-use assets 41,243 57,382Software, net 196,456 234,517Goodwill 1,280,226 1,280,525Intangible assets, net 321,983 356,969Deferred income taxes, net 57,476 51,611Other noncurrent assets 54,099 72,733TOTAL ASSETS $ 3,386,903 $ 3,257,534
LIABILITIES AND STOCKHOLDERS’ EQUITYCurrent liabilitiesAccounts payable $ 41,223 $ 37,010Settlement liabilities 604,096 368,719Employee compensation 48,560 29,318Current portion of long-term debt 34,265 34,148Deferred revenue 95,849 65,784Other current liabilities 81,612 76,971Total current liabilities 905,605 611,950
Noncurrent liabilitiesDeferred revenue 33,564 53,155Long-term debt 1,120,742 1,339,007Deferred income taxes, net 40,504 32,053Operating lease liabilities 39,958 46,766Other noncurrent liabilities 39,933 44,635Total liabilities 2,180,306 2,127,566
Commitments and contingencies (Note 13)Stockholders’ equityPreferred stock; $0.01 par value; 5,000,000 shares authorized; no shares issued atDecember 31, 2020 and 2019 — —Common stock; $0.005 par value; 280,000,000 shares authorized; 140,525,055 sharesissued at December 31, 2020 and 2019 702 702Additional paid-in capital 682,431 667,658Retained earnings 1,003,490 930,830Treasury stock, at cost, 23,412,870 and 24,538,703 shares at December 31, 2020 and2019, respectively (387,581) (377,639)Accumulated other comprehensive loss (92,445) (91,583)Total stockholders’ equity 1,206,597 1,129,968TOTAL LIABILITIES AND STOCKHOLDERS’ EQUITY $ 3,386,903 $ 3,257,534
The accompanying notes are an integral part of the consolidated financial statements.
52

ACI WORLDWIDE, INC. AND SUBSIDIARIESCONSOLIDATED STATEMENTS OF OPERATIONS
(in thousands, except per share amounts)
Years Ended December 31,2020 2019 2018
RevenuesSoftware as a service and platform as a service $ 769,180 $ 677,669 $ 433,025License 246,896 288,261 280,556Maintenance 211,697 213,409 219,145Services 66,549 78,955 77,054Total revenues 1,294,322 1,258,294 1,009,780
Operating expensesCost of revenue (1) 622,459 617,453 430,351Research and development 139,293 146,573 143,630Selling and marketing 103,567 123,684 117,881General and administrative 152,468 135,296 107,422Depreciation and amortization 131,791 111,532 84,585Total operating expenses 1,149,578 1,134,538 883,869
Operating income 144,744 123,756 125,911Other income (expense)Interest expense (56,630) (64,033) (41,530)Interest income 11,628 11,967 11,142Other, net (1,116) 520 (3,724)Total other income (expense) (46,118) (51,546) (34,112)
Income before income taxes 98,626 72,210 91,799Income tax expense 25,966 5,148 22,878
Net income $ 72,660 $ 67,062 $ 68,921Income per common shareBasic $ 0.62 $ 0.58 $ 0.59Diluted $ 0.62 $ 0.57 $ 0.59
Weighted average common shares outstandingBasic 116,397 116,175 116,057Diluted 118,079 118,571 117,632
(1) The cost of revenue excludes charges for depreciation but includes amortization of purchased and developed software forresale.
The accompanying notes are an integral part of the consolidated financial statements.
53

ACI WORLDWIDE, INC. AND SUBSIDIARIESCONSOLIDATED STATEMENTS OF COMPREHENSIVE INCOME
(in thousands)
Years Ended December 31,2020 2019 2018
Net income $ 72,660 $ 67,062 $ 68,921Other comprehensive income (loss):Foreign currency translation adjustments (862) 1,034 (15,261)Total other comprehensive income (loss) (862) 1,034 (15,261)
Comprehensive income $ 71,798 $ 68,096 $ 53,660
The accompanying notes are an integral part of the consolidated financial statements.
54
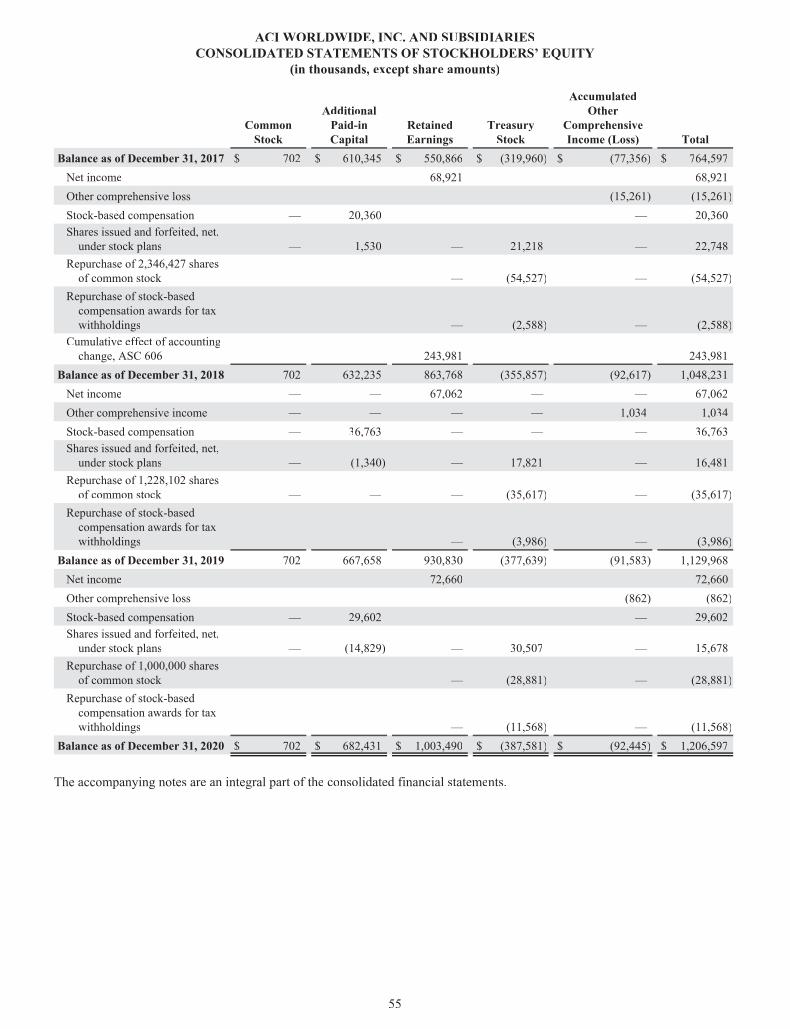
ACI WORLDWIDE, INC. AND SUBSIDIARIESCONSOLIDATED STATEMENTS OF STOCKHOLDERS’ EQUITY
(in thousands, except share amounts)
CommonStock
AdditionalPaid-inCapital
RetainedEarnings
TreasuryStock
AccumulatedOther
ComprehensiveIncome (Loss) Total
Balance as of December 31, 2017 $ 702 $ 610,345 $ 550,866 $ (319,960) $ (77,356) $ 764,597Net income — — 68,921 — — 68,921Other comprehensive loss — — — — (15,261) (15,261)Stock-based compensation — 20,360 — — — 20,360Shares issued and forfeited, net,under stock plans — 1,530 — 21,218 — 22,748
Repurchase of 2,346,427 sharesof common stock — — — (54,527) — (54,527)
Repurchase of stock-basedcompensation awards for taxwithholdings — — — (2,588) — (2,588)
Cumulative effectff of accountingchange, ASC 606 — — 243,981 — — 243,981
Balance as of December 31, 2018 702 632,235 863,768 (355,857) (92,617) 1,048,231Net income — — 67,062 — — 67,062Other comprehensive income — — — — 1,034 1,034Stock-based compensation — 36,763 — — — 36,763Shares issued and forfeited, net,under stock plans — (1,340) — 17,821 — 16,481
Repurchase of 1,228,102 sharesof common stock — — — (35,617) — (35,617)
Repurchase of stock-basedcompensation awards for taxwithholdings — — — (3,986) — (3,986)
Balance as of December 31, 2019 702 667,658 930,830 (377,639) (91,583) 1,129,968Net income — — 72,660 — — 72,660Other comprehensive loss — — — — (862) (862)Stock-based compensation — 29,602 — — — 29,602Shares issued and forfeited, net,under stock plans — (14,829) — 30,507 — 15,678
Repurchase of 1,000,000 sharesof common stock — — — (28,881) — (28,881)
Repurchase of stock-basedcompensation awards for taxwithholdings — — — (11,568) — (11,568)
Balance as of December 31, 2020 $ 702 $ 682,431 $ 1,003,490 $ (387,581) $ (92,445) $ 1,206,597
The accompanying notes are an integral part of the consolidated financial statements.
55

ACI WORLDWIDE, INC. AND SUBSIDIARIESCONSOLIDATED STATEMENTS OF CASH FLOWS
(in thousands)
Years Ended December 31,2020 2019 2018
Cash flows from operating activities:ffNet income $ 72,660 $ 67,062 $ 68,921Adjustments to reconcile net income to net cash flows from operatingffactivities:Depreciation 24,728 24,092 23,805Amortization 115,588 98,477 73,545Amortization of operating lease right-of-use assets 23,448 15,934 —Amortization of deferred debt issuance costs 4,802 4,128 4,637Deferred income taxes 3,349 (22,140) (5,734)Stock-based compensation expense 29,602 36,763 20,360Other 6,017 5,175 2,007Changes in operating assets and liabilities, net of impact of acquisitions:Receivables 8,793 (19,054) (14,760)Accounts payable 2,484 (7,703) 5,766Accrued employee compensation 18,491 (10,829) (9,684)Deferred revenue 9,421 (37,561) 14,219Other current and noncurrent assets and liabilitiesa 16,919 (16,695) 850Net cash flows from operatingff activities 336,302 137,649 183,932
Cash flows fromff investing activities:Purchases of property and equipment (17,804) (23,099) (18,265)Purchases of software and distribution rights (28,829) (24,915) (25,628)Acquisition of businesses, net of cash acquired — (757,268) —Other 15,934 (25,199) (1,467)
Net cash flows from investing activities (30,699) (830,481) (45,360)Cash flows from financing activities:Proceeds from issuance of common stock 3,759 3,591 3,098Proceeds from exercises of stock options 11,924 12,985 19,674Repurchase of stock-based compensation awards for tax withholdings (11,568) (3,986) (2,588)Repurchase of common stock (28,881) (35,617) (54,527)Proceeds from senior notes — — 400,000Redemption of senior notes — — (300,000)Proceeds from revolving credit facilityff 30,000 280,000 109,000Repayments of revolving credit facilityff (214,000) (41,000) (111,000)Proceeds from term portion of credit agreement — 500,000 —Repayments of term portion of credit agreement (38,950) (28,900) (109,289)Payment for debt issuance costs — (12,830) (7,319)Payments on or proceeds from other debt, net (13,854) (7,020) (4,753)
Net cash flows from financing activities (261,570) 667,223 (57,704)Effect of exchange rate fluff ctuations on cash (57) (1,495) (2,076)Net increase (decrease) in cash and cash equivalents 43,976 (27,104) 78,792Cash and cash equivalents, beginning of period 121,398 148,502 69,710Cash and cash equivalents, end of period $ 165,374 $ 121,398 $ 148,502Supplemental cash flow informationIncome taxes paid, net $ 27,760 $ 27,727 $ 32,205Interest paid $ 51,991 $ 58,980 $ 35,300
The accompanying notes are an integral part of the consolidated financial statements.
56

NOTES TO CONSOLIDATED FINANCIAL STATEMENTS
1. Nature of Business and Summary of Significant Accounting Policies
Nature of Business
ACI Worldwide, Inc., a Delaware corporation, and its subsidiaries (collectively referred to as “ACI” or the “Company”)develop, market, install, and support a broad line of software products and services primarily focused on facilitating electronicpayments. In addition to its own products, the Company distributes or acts as a sales agent for software developed by thirdparties. These products and services are used principally by banks, intermediaries, merchants, and billers, both in domestic andinternational markets.
Consolidated Financial Statements
The consolidated financial statements include the accounts of the Company and its wholly-owned subsidiaries. Allintercompany balances and transactions have been eliminated.
Capital Stock
The Company’s outstanding capital stock consists of a single class of common stock. Each share of common stock is entitled toone vote for each matter subject to a stockholder’s vote and to dividends, if and when declared by the board of directors (the“board”).
Use of Estimates
The preparation of consolidated financial statements in conformity with accounting principles generally accepted in the UnitedStates (“U.S. GAAP”) requires management to make estimates and assumptions that affect the reported amounts of assets andliabilities and disclosure of contingent assets and liabilities at the date of the consolidated financial statements and the reportedamounts of revenues and expenses during the reporting period. Actual results could differ from those estimates.
Cash and Cash Equivalents
The Company considers all highly liquid investments with original maturities of three months or less to be cash equivalents.The Company’s cash and cash equivalents includes holdings in checking, savings, money market, and overnight sweepaccounts, all of which have daily maturities, as well as time deposits with maturities of three months or less at the date ofpurchase. The carrying amounts of cash and cash equivalents on the consolidated balance sheets approximate fair value.
Risks and Uncertainties
The Company is subject to risks and uncertainties as a result of the COVID-19 pandemic. The extent of the impact of theCOVID-19 pandemic on the Company's business is highly uncertain and difficult to predict, as the response to the pandemicand available information continues to be evolving. The Company has experienced changes in volumes for certain Merchantand Biller customers and has received limited requests for extended payment terms under existing contracts. Furthermore,capital markets and economies worldwide have also been negatively impacted by the COVID-19 pandemic, and it is possiblethat it could cause a local and/or global economic recession. Such economic disruption could have a material adverse effect onour business as our customers curtail and reduce capital and overall spending. Policymakers around the globe have respondedwith fiscal policy actions to support the economy as a whole. The magnitude and overall effectiveness of these actions remainsuncertain.
The severity of the impact of the COVID-19 pandemic on the Company's business will depend on a number of factors,including, but not limited to, the duration and severity of the pandemic and the extent and severity of the impact on theCompany's customers, all of which are uncertain and cannot be predicted. The Company's future results of operations andliquidity could be adversely impacted by delays in payments of outstanding receivable amounts beyond normal payment terms,uncertain demand, and the impact of any initiatives or programs that the Company may undertake to address financial andoperational challenges faced by its customers. As of the date of issuance of these consolidated financial statements, the extent towhich the COVID-19 pandemic may materially impact the Company's financial condition, liquidity, or results of operations isuncertain.
57

Other Current Liabilities
The components of other current liabilities are included in the following tabla e (in thousands):
December 31,2020 2019
Operating lease liabilitiesa $ 13,438 $ 15,049Vendor financed licenses 12,901 9,667Accrued interest 8,745 9,212Royalties payable 3,959 6,107Other 42,569 36,936Total other current liabilities $ 81,612 $ 76,971
Settlement Assets att nd Liabilities
Individuals and businesses settle their obligations to the Company’s various Biller clients using credit or debit cards or viaautomated clearing house (“ACH”) payments. The Company creates a receivable for the amount due from the crediff t or debitcard processor and an offsetting payable to the client. Upon confirmation that the funds have been received, the Companysettles the obligation to the client. Due to timing, in some instances, the Company may (1) receive the funds into bank accountscontrolled by and in the Company’s name that are not disbursed to its clients by the end of the day, resulting in a settlementdeposit on the Company’s books and (2) disburse funds to its clients in advance of receiving funds from the credit or debit cardprocessor, resulting in a net settlement receivable position.
Off Balance Sheet Settlement AccountsSS
The Company also enters into agreements with certain Biller clients to process payment funds on their behalf. When an ACH orautomated teller machine network payment transaction is processed, a transaction is initiated to withdraw funds from theffdesignated source account and deposit them into a settlement account, which is a trust account maintained for the benefit of theCompany’s clients. A simultaneous transaction is initiated to transfer funds from the settlement account to the intendeddestination account. These “back to back” transactions are designed to settle at the same time, usually overnight, such that theCompany receives the funds from the source at the same time as it sends the funds to their destination. However, due to thetransactions being with various financial institutions there may be timing differences that result in floatff balances. These fundsare maintained in accounts for the benefit of the clieff nt which is separate from the Company’s corporate assets. As the Companydoes not take ownership of the funds, these settlement accounts are not included in the Company’s balance sheet. The Companyis entitled to interest earned on the fund balances. The collection of interest on these settlement accounts is considered in theCompany’s determination of its fee structure for clients and representsff a portion of the payment for services performff ed by theCompany. The amount of settlement funds as of December 31, 2020 and 2019, were $246.8 million and $274.0 million,respectively.
Property and Equipment
Property and equipment are stated at cost. Depreciation of these assets is generally computed using the straight-line methodover their estimated useful lives based on asset class. As of December 31, 2020 and 2019, net property and equipment consistedof the following (in thousands):
December 31,Useful Lives 2020 2019
Computer and office equipment 3 - 5 years $ 133,346 $ 143,942
Leasehold improvementsLesser of useful life of improvement or remaining life oflease 29,535 33,346
Building and improvements 7 - 30 years 14,588 14,553Furniture and fixturesff 7 years 8,539 12,980Land Non-depreciable 1,785 1,785Property and equipment, gross 187,793 206,606Less: accumulated depreciation (123,059) (136,226)Property and equipment, net $ 64,734 $ 70,380
58

Software
Software may be for internal use or for resale. Costs related to certain software, which is for resale, are capitalized inaccordance with Accounting Standards Codification (“ASC”) 985-20, Costs of Software to be Sold, Leased, or Marketed, whenthe resulting product reaches technological feasibility. The Company generally determines technological feasibility when it hasa detailed program design that takes product function, feature and technical requirements to their most detailed, logical formand is ready for coding. The Company does not typically capitalize costs related to software for resale as technologicalfeasibility generally coincides with general availability of the software. The Company capitalizes the costs of softwaredeveloped or obtained for internal use in accordance with ASC 350-40, Internal Use Software. The Company expenses all costsincurred during the preliminary project stage of its development and capitalizes the costs incurred during the applicationdevelopment stage. Costs incurred relating to upgrades and enhancements to the software are capitalized if it is determined thatthese upgrades or enhancements add additional functionality to the software. Costs incurred during the application developmentstage include purchased software licenses, implementation costs, consulting costs, and payroll-related costs for projects thatqualify for capitalization. All othera costs, primarily related to maintenance and minor software fixes, are expensed as incurred.
Amortization of software for resale is determined on a product-by-product basis and begins when the product is available forlicensing to customers. The annual amortization is computed using the greater of (a) the ratio of current gross revenues to thetotal of current and future gross revenues expected to be derived from the software or (b) the straight-line method over theremaining estimated useful life of generally five to ten years, including the period being reported on. Due to competitivepressures, it may be possible that the estimates of future gross revenue or remaining estimated useful life of the software will bereduced significantly. As a result, the carrying amount of the software may be reduced accordingly. Amortization of internal-use software is generally computed using the straight-line method over estimated useful lives of three to eight years.
Business Combinations
The Company applies the provisions of ASC 805, Business Combinations, in the accounting for its acquisitions. It requires theCompany to recognize separately from goodwill the assets acquired and the liabilities assumed at their acquisition date fairvalues. Goodwill as of the acquisition date is measured as the excess of consideration transferred and the net of the acquisitiondate fair values of the assets acquired and the liabilities assumed. While the Company uses its best estimates and assumptions toaccurately value assets acquired and liabilities assumed at the acquisition date, its estimates are inherently uncertain and subjectto refinement. As a result, during the measurement period, which may be up to one year from the acquisition date, it recordsadjustments to the assets acquired and liabilities assumed with the corresponding offset to goodwill. Upon the conclusion of themeasurement period or final determination of the values of assets acquired or liabilities assumed, whichever comes first, anysubsequent adjustments are recorded to our consolidated statements of operations.
Critical estimates in valuing certain intangible assets include but are not limited to future expected cash flows from customerrelationships, covenants not to compete and acquired developed technologies, brand awareness and market position, as well asassumptions about the period of time the brand will continue to be used in our product portfolio, and discount rates.Management’s estimates of fair value are based upon assumptions believed to be reasonable, but which are inherently uncertainand unpredictable and, as a result, actual results may differ from estimates.
Other estimates associated with the accounting for acquisitions may change as additional information becomes availableregarding the assets acquired and liabilities assumed.
Fair Value
ASC 820, Fair Value Measurements and Disclosures, (“ASC 820”) defines fair value as the price that would be received to sellan asset or paid to transfer a liability in an orderly transaction between market participants. ASC 820 establishes a fair valuehierarchy for valuation inputs that gives the highest priority to quoted prices in active markets for identical assets or liabilitiesand the lowest priority to unobservable inputs. The fair value hierarchy is as follows:
• Level 1 Inputs – Unadjusted quoted prices in active markets for identical assets or liabilities that the reporting entityhas the ability to access at the measurement date.
• Level 2 Inputs – Inputs other than quoted prices included in Level 1 that are observable for the asset or liability,either directly or indirectly. These might include quoted prices for similar assets or liabilities in active markets,quoted prices for identical or similar assets or liabilities in markets that are not active, inputs other than quotedprices that are observable for the asset or liability (such as interest rates, volatilities, prepayment speeds, credit risks,etc.) or inputs that are derived principally from or corroborated by market data by correlation or other means.
• Level 3 Inputs – Unobservable inputs for determining the fair values of assets or liabilities that reflect an entity’sown assumptions about the assumptions that market participants would use in pricing the assets or liabilities.
59

The fair value of the Company’s Crediff t Agreement approximates the carrying value due to the floating interest rate (Level 2 ofthe fair value hierarchy). The Company measures the fair value of its Senior Notes based on Level 2 inputs, which includequoted market prices and interest rate spreads of similar securities. The fair value of the Company’s 5.750% Senior Notes due2026 (“2026 Notes”) was $424.5 million and $432.0 million as of December 31, 2020 and 2019, respectively.
The fair values of cash and cash equivalents approximate the carrying values due to the short period of time to maturity (Levela2 of the fair value hierarchy).
Goodwill and Other IntangiblesII
In accordance with ASC 350, Intangibles – Goodwill and Other, the Company assesses goodwill for impairment annuallyduring the fourth quarter of its fiscaff l year using October 1 balances or when there is evidence that events or changes incircumstances indicate that the carrying amount of the asset may not be recovered. The Company evaluates goodwill at thereporting unit level using the discounted cash flow valuation modeff l and allocates goodwill to these reporting units using arelative fair value approach. During thia s assessment, management relies on a number of factors, including operating results,ffbusiness plans, and anticipated future caff sh flows. The Company has identified its reportable segments, ACI On Demand andACI On Premise, as the reporting units.
The key assumptions used in the discounted cash flow valuation modeff l include discount rates, growth rates, cash flowprojections and terminal value rates. Discount rates, growth rates, and cash flow projections are the most sensitive andsusceptible to change, as they require significant management judgment. Discount rates are determined by using a weightedaverage cost of capital (“WACC”). The WACC considers market and industry data as well as company-specific risk factors.ffOperational management, considering industry and company-specific historical and projected data, develops growth rates andcash flow projections for each reporting unit. Terminal value rate determination follows common methodology of capturing thepresent value of perpetual cash flow estimates beyond the laff st projected period, assuming a constant WACC and low, long-termgrowth rates. If the recoverability test indicates potential impairment, the Company calculates an implied fair value of goodwillfor the reporting unit. The implied fair value of goodwill is determined in a manner similar to how goodwill is calculated in abusiness combination. If the implied fair value of goodwill exceeds the carrying value of goodwill assigned to the reportingunit, there is no impairment. If the carrying value of goodwill assigned to the reporting unit exceeds the implied fair value of thegoodwill, an impairment charge is recorded to write down the carrying value. The calculated fair value substantiallu y exceededthe current carrying value for all reporting units for all periods.
Changes in the carrying amount of goodwill attributable to each reporting unit during the year ended December 31, 2020, wereas follows (in thousands):
ACI OnDemand
ACI OnPremise Total
Gross Balance, prior to December 31, 2018 $ 183,783 $ 773,340 $ 957,123Total impairment prior to December 31, 2018 — (47,432) (47,432)
Balance, December 31, 2018 183,783 909,691725,908Goodwill from acquisitions (1) 370,834 — 370,834
Balance, December 31, 2019 554,617 1,280,525725,908Goodwill from acquisitions (1) (299) — (299)
Balance, December 31, 2020 $ 554,318 $ 725,908 $ 1,280,226
(1) Goodwill from acquisitions relates to the goodwilff l recorded, as well as adjustments, for the acquisitions of E CommerceGroup Products, Inc. ("ECG"), along with ECG's subsidiary, Speedpay, Inc. (collectively referred to as "Speedpay"),and Walletron, Inc. ("Walletron"), as discussed in Note 3, Acquisition.
Other intangible assets, which include customer relationships and trademarks and trade names, are amortized using the straight-line method over periods ranging from four to 20 years. The Company reviews its other intangible assets for impairmentffwhenever events or changes in circumstances indicate that the carrying amount may not be recoverable.
60

Equity Method Investment
On July 23, 2019, the Company invested $18.3 million for a 30% non-controlling financial interest in a payment technologyand services company in India. The Company accounted for this investment using the equity method in accordance with ASC323, Investments - Equity Method and Joint Ventures. The Company records its share of earnings and losses in the investmenton a one-quarter lag basis. Accordingly, the Company recorded an investment of $19.3 million and $18.5 million, which isincluded in other noncurrent assets in the consolidated balance sheet as of December 31, 2020 and 2019, respectively.
Name Change
Effective January 1, 2020, Official Payments Corporation, a wholly owned subsidiary, changed its name to ACI Payments, Inc.An amended and restated certificate of incorporation was filed with the state of Delaware to reflect the change. The OfficialPayments Corporation name and corresponding trade name may continue to be used until all stationary and marketing materialsare transitioned to ACI Payments, Inc. equivalents.
Impairment of Long-Lived Assets
The Company reviews its long-lived assets for impairment whenever events or changes in circumstances indicate that thecarrying amount of a long-lived asset group may not be recoverable. An impairment loss is recorded if the sum of the futurecash flows expected to result from the use of the asset (undiscounted and without interest charges) is less than the carryingamount of the asset. The amount of the impairment charge is measured based upon the fair value of the asset group.
Treasury Stock
The Company accounts for shares of its common stock that are repurchased without intent to retire as treasury stock. Suchshares are recorded at cost and reflected separately on the consolidated balance sheets as a reduction of stockholders’ equity.The Company issues shares of treasury stock upon exercise of stock options, issuance of restricted share awards and restrictedshare units, payment of earned performance shares, and for issuances of common stock pursuant to the Company’s employeestock purchase plan. For purposes of determining the cost of the treasury shares re-issued, the Company uses the average costmethod.
Stock-Based Compensation Plans
In accordance with ASC 718, Compensation – Stock Compensation, ("ASC 718") the Company recognizes stock-basedcompensation expense for awards that are probable of vesting on a straight-line basis over the requisite service period of theaward, which is generally the vesting term. Stock-based compensation expense is recorded in operating expenses depending onwhere the respective individual’s compensation is recorded. The Company generally utilizes the Black-Scholes option-pricingmodel to determine the fair value of stock options on the date of grant. To determine the grant date fair value of thesupplemental stock options and total shareholder return awards (“TSRs”), a Monte Carlo simulation model was used. Theassumptions utilized in the Black-Scholes option-pricing and Monte Carlo simulation models, as well as the description of theplans the stock-based awards are granted under, are described in further detail in Note 6, Stock-Based Compensation Plans.
Translation of Foreign Currencies
The Company’s foreign subsidiaries typically use the local currency of the countries in which they are located as theirfunctional currency. Their assets and liabilities are translated into U.S. dollars at the exchange rates in effect at the balance sheetdate. Revenues and expenses are translated at the average exchange rates during the period. Translation gains and losses arereflected in the consolidated financial statements as a component of accumulated other comprehensive income (loss).Transaction gains and losses, including those related to intercompany accounts, that are not considered to be of a long-terminvestment nature are included in the determination of net income. Transaction gains and losses, including those related tointercompany accounts, that are considered to be of a long-term investment nature are reflected in the consolidated financialstatements as a component of accumulated other comprehensive income (loss).
Income Taxesaa
The provision for income taxes is computed using the asset and liability method, under which deferred tax assets and liabilitiesare recognized for the expected future tax consequences of temporary differences between the financial reporting and tax basesof assets and liabilities. Deferred tax assets are reduced by a valuation allowance when it is more likely than not that someportion or all of the deferred tax assets will not be realized.
61

The Company periodically assesses its tax exposures and establishes, or adjusts, estimated unrecognized tax benefits forprobable assessments by taxing authorities, including the Internal Revenue Service, and various foreign and state authorities.Such unrecognized tax benefits represent the estimated provision for income taxes expected to ultimately be paid.
New Accounting Standards Recently Adopted
In February 2016, the Financial Accounting Standards Board (“FASB”) issued Accounting Standards Update (“ASU”)2016-02, Leases (codified as “ASC 842”). ASC 842 requires lessees to recognize right-of-use (“ROU”) assets and leaseliabilities on the balance sheet for all leases unless, as a policy election, a lessee elects not to apply ASC 842 to short-termleases. In addition, this standard requires both lessees and lessors to disclose certain key information about lease transactions.The Company adopted ASC 842 on January 1, 2019 (the effective date) using the optional transition method to not apply thenew lease standard in the comparative periods presented and elected the "practical expedient package", which permits theCompany to not reassess prior conclusions about lease identification, lease classification, and initial direct costs. ASC 842 alsoprovides practical expedients for the Company’s ongoing accounting, including the combination of lease and non-leasecomponents into a single lease component, which the Company has elected to apply to its leases. As of January 1, 2019, theCompany recognized ROU assets and operating lease liabilities of $63.3 million and $68.6 million, respectively. Refer to Note12, Leases, for further details.
In June 2016, the FASB issued ASU 2016-13, Financial Instruments – Credit Losses: Measurement of Credit Losses onFinancial Instruments, codified as ASC 326. Subsequent amendments to the guidance were issued as follows: ASU 2018-19 inNovember 2018; ASU 2019-04 in April 2019; ASU 2019-05 in May 2019; ASU's 2019-10 and 2019-11 in November 2019;and ASU 2020-02 in February 2020. This ASU provides financial statement users with more decision-useful information aboutthe expected credit losses on financial instruments and other commitments to extend credit held by a reporting entity at eachreporting date. The amendments in ASU 2016-13 replace the incurred loss impairment methodology in current U.S. GAAP witha methodology that reflects expected credit losses and requires consideration of a broader range of reasonable and supportableinformation to inform credit loss estimates. The Company is required to use a forward-looking expected credit loss model forbilled and accrued receivables. The Company adopted ASU 2016-13 as of January 1, 2020. The adoption of ASU 2016-13 didnot have a material impact on the consolidated financial statements.
In February 2020, the FASB issued ASU 2020-03, Codification Improvements to Financial Instruments, which clarifies orimproves various financial instruments topics in the accounting standards codification to increase stakeholder awareness. ASU2020-03 was effective uponff issuance and did not have a material impact on the consolidated financial statements.
In March 2020, the FASB issued ASU 2020-04, Reference Rate Reform (Te opic 848): Facilitation of the EfTT fectsff of ReferenceeRate Reform on Financial Reporting. The update provides optional guidance for a limited period of time to ease potentialaccounting impacts associated with transitioning away from reference rates that are expected to be discontinued, such as theLondon Interbank Offered Rate (“LIBOR”). This guidance includes optional expedients and exceptions for applying U.S.GAAP to transactions affected by reference rate reform if certain criteria are met. ASU 2020-04 is effective for all entities as ofMarch 12, 2020, through December 31, 2022, when the reference rate replacement activity is expected to be completed. InJanuary 2021, the FASB issued ASU 2021-01, Reference Rate Reform -e Scopeo , which clarified the scope and application of theoriginal guidance. The adoption of ASU 2020-04 did not have an impact on the Company's consolidated financial statements.
Recently Issued Accounting Standards Not Yet Effective
In December 2019, the FASB issued ASU 2019-12, Income Taxes (Topic 740): Simplifying the Accounting for Income Taxes,as part of its initiative to reduce complexity in accounting standards. The amendments in this update simplify the accounting forffincome taxes by removing certain exceptions within ASC 740, as well as clarify and simplify other aspects of the accountingfor income taxes to promote consistency among reporting entities. ASU 2019-12 is effective for annual and interim periodsbeginning after December 15, 2020. The adoption of ASU 2019-12 will not have a material impact on the Company'sconsolidated financial statements.
In October 2020, the FASB issued ASU 2020-10, Codification Improvements, which improves the consistency of thecodification by including all disclosure related guidance in the appropriate disclosure sections and clarifies application ofvarious provisions in the codification by amending and adding new headings, cross referencing to other guidance, and refiningor correcting terminology. ASU 2020-10 is effective for annual periods after December 15, 2020, and early application ispermitted for any annual or interim period for which financial statements have not been issued. The adoption of ASU 2020-10will not have a material impact on the Company's consolidated financial statements.
62

2. Revenue
Revenue Recognition
In accordance with ASC 606, Revenue From Contracts With Customers, revenue is recognized upon transfer of control ofpromised products and/or services to customers in an amount that reflects the consideration the Company expects to be entitledto in exchange for those products and services. Revenue is recognized net of any taxes collected from customers andsubsequently remitted to governmental authorities.
Contract Combination. The Company may execute more than one contract or agreement with a single customer at or near thesame time. The separate contracts or agreements may be viewed as one combined arrangement or separate agreements forrevenue recognition purposes. In order to reach appropriate conclusions regarding whether such agreements should becombined, the Company evaluates whether the agreements were negotiated as a package with a single commercial objective,whether the amount of consideration to be paid in one agreement depends on the price and/or performance of anotheragreement, or whether the product(s) or services promised in the agreements represent a single performance obligation. Theconclusions reached can impact the allocation of the transaction price to each performance obligation and the timing of revenuerecognition related to those arrangements.
Software as a Service (“SaaS”) and Platform as a Service (“PaaS”) Arrangements. The Company’s SaaS-based and PaaS-based arrangements, including implementation, support and other services, represent a single promise to provide continuousaccess (i.e. a stand-ready performance obligation) to its software solutions and their processing capabilities in the form of aservice through one of the Company’s data centers. As each day of providing access to the software solution(s) is substantiallythe same and the customer simultaneously receives and consumes the benefits as access is provided, the Company’s singlepromise under its SaaS-based and PaaS-based arrangements is comprised of a series of distinct service periods. The Company’sSaaS-based and PaaS-based arrangements may include fixed consideration, variable consideration, or a combination of the two.Fixed consideration is recognized over the term of the arrangement or longer if the fixed consideration relates to a materialright. A material right would be a separate performance obligation. The Company estimates the stand-alone selling price for amaterial right by reference to the services expected to be provided and the corresponding expected consideration. Variableconsideration in these arrangements is typically a function of transaction volume or another usage-based measure. Dependingupon the structure of a particular arrangement, the Company: (1) allocates the variable amount to each distinct service periodwithin the series and recognizes revenue as each distinct service period is perforff med, (2) estimates total variable considerationat contract inception (giving consideration to any constraints that may apply and updating the estimates as new informationbecomes available) and recognizes the total transaction price over the period to which it relates, or (3) applies the ‘right toinvoice’ practical expedient and recognizes revenue based on the amount invoiced to the customer during the period.
License Arrangements. The Company’s software license arrangements provide the customer with the right to use functionalintellectual property (as it exists at the point in time at which the license is granted) for the duration of the contract term.Implementation, support, and other services are typically considered distinct performance obligations when sold with a softwarelicense.
Payment terms for the Company’s software license arrangements generally include fixed license and capacity fees that arepayable up front or over time. These arrangements may also include incremental usage-based fees that are payable when thecustomer exceeds its contracted license capacity limits. The Company accounts for capacity overages as a usage-based royaltythat is recognized when the usage occurs.
When a software license arrangement contains payment terms that are extended beyond one year, a significant financingcomponent may exist. The significant financing component is calculated as the diffeff rence between the stated value and presentvalue of the software license fees and is recognized as interest income over the extended payment period. The total fixedsoftware license fee net of the significant financing component is recognized as revenue at the point in time when the softwareis transferred toff the customer.
For those software license arrangements that include customer-specific acceptance provisions, such provisions are generallypresumed to be substantive and the Company does not recognize revenue until the earlier of the receipt of a written customeracceptance, objective demonstration that the delivered product meets the customer-specific acceptance criteria, or the expirationof the acceptance period. The Company recognizes revenues on such arrangements upon the earlier of receipt of writtenacceptance or the first production use of the software by the customer.
For software license arrangements in which the Company acts as a distributor of another company’s product, and in certaincircumstances, modifies or enhances the product, revenues are recorded on a gross basis. These include arrangements in whichthe Company takes control of the products and is responsible for providing the product or service. For software license
63

arrangements in which the Company acts as a sales agent for another company’s product, revenues are recorded on a net basis.These include arrangements in which the Company does not take control of products and is not responsible for providing theproduct or service.
For software license arrangements in which the Company utilizes a third-party distributor or sales agent, the Companyrecognizes revenue upon transfer of control of the software license(s) to the third-party distributor or sales agent.
The Company’s software license arrangements typically provide the customer with a standard 90-day assurance-type warranty.These warranties do not represent an additional performance obligation as services beyond assuring that the software licensecomplies with agreed-upon specifications are not provided.
Software license arrangements typically include an initial post contract customer support (maintenance or “PCS”) term of oneyear with subsequent renewals for additional years within the initial license period. The Company’s promise to those customerswho elect to purchase PCS represents a stand-ready performance obligation that is distinct from the license performanceobligation and recognized over the PCS term.
The Company also provides various professional services to customers with software licenses. These include projectmanagement, software implementation, and software modification services. Revenues from arrangements to provideprofessional services are generally distinct from the other promises in the contract(s) and are recognized as the related servicesare performed. Consideration received under these arrangements is either fixed fee or on a time-and-materials basis, whichrepresents variable consideration that must be estimated using the most likely amount based on the range of hours expected tobe incurred in providing the services.
The Company estimates the stand-alone selling price (“SSP”) for maintenance and professional services based on observablestand-alone sales. The Company applies the residual approach to estimate the SSP for software licenses.
Refer to Note 10, Segment Information, for further details, including disaggregation of revenue based on primary solutioncategory and geographic location.
Significant Judgments
The Company applies judgment in determining the customer’s ability and intention to pay, which is based on a variety offactors including the customer’s historical payment experience or, in the case of a new customer, published credit and financialinformation.
The Company also applies judgment in determining the term of an arrangement when early termination rights are provided tothe customer.
The Company’s software license arrangements with its customers often include multiple promises to transfer licensed softwareproducts and services. Determining whether the products and/or services are distinct performance obligations that should beaccounted for separately may require significant judgment.
The Company’s SaaS and PaaS arrangements may include variable consideration in the form of usage-based fees. If thearrangement that includes variable consideration in the form of usage-based fees does not meet the allocation exception forvariable consideration, the Company estimates the amount of variable consideration at the outset of the arrangement usingeither the expected value or most likely amount method, depending on the specifics of each arrangement. These estimates areconstrained to the extent that it is probable that a significant reversal of incremental revenue will not occur and are updated eachreporting period as additional information becomes available.
Judgment is used in determining: (1) whether the financing component in a software license agreement is significant and, if so,(2) the discount rate used in calculating the significant financing component. The Company assesses the significance of thefinancing component based on the ratio of license fees paid over time to total license fees. If determined to be significant, thefinancing component is calculated using a rate that discounts the license fees to the cash selling price.
Judgment is also used in assessing whether the extension of payment terms in a software license arrangement results in variableconsideration and, if so, the amount to be included in the transaction price. The Company applies the portfolio approach toestimate the amount of variable consideration in these arrangements using the most likely amount method that is based on theCompany’s historical collection experience under similar arrangements.
64

Significant judgment is required to determine the SSP for each performance obligation, the amount allocated to eachperformance obligation and whether it depicts the amount that the Company expects to be entitled to in exchange for the relatedproduct and/or service. As the selling prices of the Company’s software licenses are highly variable, the Company estimatesSSP of its software licenses using the residual approach when the software license is sold with other services and observableSSPs exist for the other services. The Company uses a range of amounts to estimate SSP for maintenance and services. Theseranges are based on stand-alone sales and vary based on the type of service and geographic region. If the SSP of a performanceobligation is not directly observable, the Company will maximize observable inputs to determine its SSP.
Contract Balances
Timing of revenue recognition may differ from the timiff ng of invoicing to customers. The Company records an accruedreceivable when revenue is recognized prior to invoicing and the Company’s right to consideration only requires the passage oftime, or deferred revenue when revenue is recognized subsequent to invoicing.
Total receivablea s represent amounts billed and amounts earned that are to be billed in the future (i.e., accrued receivables).rIncluded in accrued receivables are services and SaaS and PaaS revenues earned in the current period but billed in the followingperiod and amounts due under multi-year software license arrangements with extended payment terms for which the Companyhas an unconditional right to invoice and receive payment subsequent to invoicing.
Total receivables, net is comprised of the following (iff n thousands):
December 31,2020 2019
Billed receivables $ 179,177 $ 213,654Allowance for doubtful accounts (3,912) (5,149)Billed receivables, net 175,265 208,505
Current accrued receivables, netrr 167,614 150,692Long-term accrued receivables, net 215,772 213,041Total accrued receivables, net 383,386 363,733
Total receivables, net $ 558,651 $ 572,238
No customer accounted for more than 10% of the Company’s consolidated receivables balance as of December 31, 2020 and2019.
The Company maintains an allowance for doubtful accounts for expected future crediff t losses that is calculated based onhistorical experience, current economic trends, and expectations of near term economic trends. The Company regularlymonitors its credit risk exposures in consolidated receivables.
The following reflects activity in the Company’s allowance for doubtful accounts receivablff e forff the periods indicated (inthousands):
Years Ended December 31,2020 2019 2018
Balance, beginning of period $ (5,149) $ (3,912) $ (4,799)Provision (increase) decrease 374 (2,561) (1,505)Amounts written off, net of recoveries 941 1,368 2,269Foreign currency translation adjustments and other (78) (44) 123
Balance, end of period $ (3,912) $ (5,149) $ (3,912)
Provision (increases) decreases recorded in general and administrative expense during the years ended December 31, 2020,December 31, 2019, and 2018, reflect (increases) decreases in the allowance for doubtful accounts based upon collectionexperience, net of collection of customer-specific receivables that were previously reserved for as doubtful of collection.ff
Deferred revenue includes amounts due or received from customers for software licenses, maintenance, services, and/or SaaSand PaaS services in advance of recording the related revenue.
65

Changes in deferred revenue were as follows (in thousands):ff
Balance, December 31, 2018 $ 156,135Deferral of revenue 149,253Recognition of deferred revenue (187,069)Foreign currency translation 620
Balance, December 31, 2019 118,939Deferral of revenue 149,363Recognition of deferred revenue (141,313)Foreign currency translation 2,424
Balance, December 31, 2020 $ 129,413
Revenue allocated to remaining performance obligations represents contracted revenue that will be recognized in future periods,which is comprised of deferred revenue and amounts that will be invoiced and recognized as revenue in future periods. Thisdoes not include:
• Revenue that will be recognized in future periods from capacity overages that are accounted for as a usage-basedroyalty.
• SaaS and PaaS revenue from variable consideration that will be recognized in accordance with the ‘right to invoice’practical expedient or meets the allocation objective.
Revenue allocated to remaining performance obligations was $846.9 million as of December 31, 2020, of which the Companyexpects to recognize approximatela y 50% over the next 12 months and the remainder thereafter.
During the year ended December 31, 2020, the revenue recognized by the Company from performance obligations satisfied inprevious periods was $39.3 million.
Costs to Obtain and Fulfill a ContractCC
The Company accounts for costs to obtain and fulfill itff s contracts in accordance with ASC 340-40.
The Company capitalizes certain of its sales commissions that meet the definition of incremental costs of obtaining a contractand for which the amortization period is greater than one year. The costs associated with those sales commissions arecapitalized during the period in which the Company becomes obligated to pay the commissions and are amortized over theperiod in which the related products or services are transferred to the customer. As of December 31, 2020 and 2019, $1.3million and $0.5 million of these costs are included in other current assets, respectively, and $6.2 million and $6.9 million ofthese costs are included in other noncurrent assets, respectively, on the consolidated balance sheets. During the years endedDecember 31, 2020 and 2019, the Company recognized $4.7 million and $6.6 million of sales commission expense,respectively, related to the amortization of these costs, which is included in selling and marketing expense on the consolidatedstatements of operations.
The Company capitalizes costs incurred to fulfill its contracts that: (1) relate directly to the arrangement, (2) are expected togenerate resources that will be used to satisfy the Company’s performance obligation under the arrangement, and (3) areexpected to be recovered through revenue generated under the arrangement. Contract fulfillment costs are expensed as theCompany transfers the related services to the customer. As of December 31, 2020 and December 31, 2019, less than$0.1 million and $0.2 million of these costs are included in other current assets, and $9.5 million and $10.2 million of thesecosts are included in other noncurrent assets, respectively, on the consolidated balance sheets. The amounts capitalizedprimarily relate to direct costs that enhance resources under the Company’s SaaS and PaaS arrangements. During the yearsended December 31, 2020 and 2019, the Company recognized $4.4 million and $5.9 million of expense, respectively, related tothe amortization of these costs, which is included in cost of revenue on the consolidated statements of operations.
66

3. Acquisition
Speedpay
On May 9, 2019, the Company acquired Speedpay, a subsidiary of The Western Union Company (“Western Union”), for$754.1 million in cash, including working capital adjustments, pursuant to a Stock Purchase Agreement, among the Company,Western Union, and ACI Worldwide Corp., a wholly owned subsidiary of the Company. The Company has included thefinancial results of Speedpay in the consolidated financial statements from the date of acquisition. The combination of theCompany and Speedpay bill pay solutions serves more than 4,000 customers across the United States, bringing expanded reachin existing and complementary market segments such as consumer finance, insurance, healthcare, higher education, utilities,government, and mortgage. The acquisition of Speedpay increased the scale of the Company’s On Demand platform businessand allows the acceleration of platform innovation through increased research and development and investment in ACI's OnDemand platform infrastructure.
To fund the acquisition, the Company amended its existing Credit Agreement, dated February 24, 2017, for an additional$500.0 million senior secured term loan (“Delayed Draw Term Loan”), in addition to drawing $250.0 million on the availableRevolving Credit Facility. See Note 4, Debt, for terms of the Credit Agreement. The remaining acquisition consideration wasfunded with cash on hand.
The Company expensed approximately $22.2 million of costs related to the acquisition of Speedpay for the year endedDecember 31, 2019. These costs, which consist primarily of investment bank, consulting, and legal fees, are included in generaland administrative expenses in the accompanying consolidated statements of operations.
Speedpay contributed approximately $329.2 million in total revenue the year ended December 31, 2020. Due to integrationactivities, the Company is no longer able to separately identify the contribution to operating income generated from theacquisition of Speedpay for the year ended December 31, 2020.
Speedpay contributed approximately $227.7 million in total revenue and $24.9 million in total operating income for the yearended December 31, 2019.
67

In connection with the acquisition, the Company recorded the following amounts based upon its purchase price allocation as ofDecember 31, 2020 (in thousands, except weighted average useful lives):
Amount
WeightedAverage
Useful LivesCurrent assets:Cash and cash equivalents $ 135Receivables, net of allowances 17,658Settlement assets 239,604Prepaid expenses 317Other current assets 19,585Total current assets acquired 277,299
Noncurrent assets:Goodwill 366,508Software 113,600 7 yearsCustomer relationships 208,500 15 yearsTrade names 10,900 5 yearsOther noncurrent assets 3,745Total assets acquired 980,552
Current liabilities:Accounts payable 6,623Settlement liabilities 212,892Employee compensation 1,959Other current liabilities 3,802Total current liabilities acquired 225,276
Noncurrent liabilities:Other noncurrent liabilities 1,219Total liabilities acquired 226,495Net assets acquired $ 754,057
During the year ended December 31, 2020, the Company made adjustments to the preliminary purchase price allocation asadditional information became available for accountff s payable. These adjustments and any resulting adjustments to thestatements of operations were not material to the Company’s previously reported operating results or financial position. TheffCompany's review of the purchase price allocation has been completed.
Factors contributing to the purchase price that resulted in the goodwill (which is tax deductible) include the acquisition ofmanagement, sales, and technology personnel with the skills to market new and existing products of the Company, enhancedproduct capabilities, complementary products, and customers.
Unaudited Pro Forma Financial Information
The pro forma financial information in the table below presents the combined results of operations for ACI and Speedpay as ifthe acquisition had occurred January 1, 2018. The pro forma information is shown for illustrative purposes only and is notnecessarily indicative of future results of operations of the Company or results of operations of the Company that would haveactually occurred had the transaction been in effect for the periods presented. This pro forma information is not intended torepresent or be indicative of actual results had the acquisition occurred as of the beginning of each period, and does not reflectpotential synergies, integration costs, or other such costs or savings.
68

Certain pro forma adjustments have been made to net income for the years ended December 31, 2019 and 2018, to give effect toestimated adjustments that remove the amortization expense on eliminated Speedpay historical identifiable intangible assets,add amortization expense for the value of acquired identified intangible assets (primarily acquired software, customerrelationships, and trademarks), and add estimated interest expense on the Company’s additional Delayed Draw Term Loan andRevolving Credit Facility borrowings. Additionally, certain transaction expenses that are a direct result of the acquisition havebeen excluded. The year ended December 31, 2020, is not presented, as Speedpay is included in the Company's consolidatedresults for theff entire period.
The following is the unaudited summarized pro forma financial information for the periods presented (in thousandsff , except pershare data):
Years Ended December 31,2019 2018
Pro forma revenue $ 1,382,957 $ 1,361,729Pro forma net income $ 82,003 $ 88,428Pro forma income per share:Basic $ 0.71 $ 0.76Diluted $ 0.69 $ 0.75
Walletron
On May 9, 2019, the Company also completed the acquisition of Walletron, which delivers patented mobile wallet technology.The Company has included the financial results of Walletron in the consolidated financial statements froff m the date ofacquisition, which were not material.
RevChip and TranSend
On October 1, 2019, the Company acquired certain technology assets of RevChip, LLC ("RevChip") and TranSend IntegratedTechnologies Inc. ("TranSend") forff a combined $7.0 million. As substantially all of the value was in the developed technology,the purchase was recognized as an asset acquisition. The Company has included the financial results of RevChip and TranSendin the consolidated financial statementff s from the datff e of acquisition, which were not material.
4. Debt
As of December 31, 2020, the Company had $55.0 million, $717.1 million, and $400.0 million outstanding under its RevolvingCredit Facility, Term Loan, and Senior Notes, respectively, with up to $443.5 million of unused borrowings under theRevolving Credit Facility portion of the Credit Agreement, as amended, and up to $1.5 million of unused borrowings under theLetter of Credit agreement. The amount of unused borrowings actually available varies in accordance with the terms of theagreement.
Credit Agreement
On April 5, 2019, the Company (and its wholly-owned subsidiaries, ACI Worldwide Corp. and ACI Payments, Inc. entered intothe Second Amended and Restated Credit Agreement (the “Credit Agreement”), with the lenders, and Bank of America, N.A.,as administrative agent for the lenders, to amend and restate the Company's existing agreement, as amended, dated February 24,2017. The amended Credit Agreement permitted the Company to borrow up to $500.0 million in the form of an additionalsenior secured term loan; extended the revolver and the existing term loan maturity datt e from February 24, 2022, to April 5,ff2024; increased the maximum consolidated senior secured net leverage ratio covenant from 3.50:1.00 to 3.75:1.00; andincreased the maximum consolidated total net leverage ratio covenant from 4.25:1.00 to 5.00:1.00, with subsequent decreasesoccurring every three quarters thereafter for a specified period of time; among other things. In connection with amending theCredit Agreement, the Company incurred and paid debt issuance costs of $12.8 million during the year ended December 31,2019.
The Credit Agreement consists of (a) a five-yeaff r $500.0 million senior secured revolving credit facility (the “Revolving CreditFacility”), which includes sublimits for (1) the issuance of standby letters of credit and (2) swingline loans, (b)ff a five-yearff$279.0 million senior secured term loan facilitff y (the “Initial Term Loan”) and (c) a five-yeaff r $500.0 million Delayed DrawTerm Loan (together with the Initial Term Loan, the "Term Loans", and together with the Initial Term Loan and the RevolvingCredit Facility, the “Credit Facility”). The Credit Agreement also allows the Company to request optional incremental termloans and increases in the revolving commitment.
69

At the Company’s option, borrowings under the Credit Facility bear interest at an annual rate equal to either (a) a base ratedetermined by reference to the highest of (1) the annual interest rate publicly announced by the administrative agent as its PrimeRate, (2) the federal funds effective rate plus 1/2 of 1% or (3) a LIBOR rate determined by reference to the costs of funds forU.S. dollar deposits for a one-month interest period, adjusted for certain additional costs plus 1% or (b) a LIBOR ratedetermined by reference to the costs of funds for U.S. dollar deposits for the interest period relevant to such borrowings,adjusted for certain additional costs plus an applicable margin. Based on the calculation of the applicable consolidated totalleverage ratio, the applicable margin for borrowings under the Credit Facility is between 0.25% to 1.25% with respect to baserate borrowings and between 1.25% and 2.25% with respect to LIBOR rate borrowings. Interest is due and payable monthly.The interest rate in effect for the Credit Facility as of December 31, 2020, was 2.15%.
The Company is also required to pay (a) a commitment fee related to the unutilized commitments under the Revolving CreditFacility, payable quarterly in arrears, (b) letter of credit fees on the maximum amount available to be drawn under alloutstanding letters of credit in an amount equal to the applicable margin on LIBOR rate borrowings under the Revolving CreditFacility on an annual basis, payable quarterly in arrears, and (c) customary fronting fees for the issuance of letters of credit feesand agency fees.
The Company’s obligations under the Credit Facility and cash management arrangements entered into with lenders under theCredit Facility (or affiliates thereof) and the obligations of the subsidiary guarantors are secured by first-priority securityinterests in substantially all assets of the Company and any guarantor, including 100% of the capital stock of ACI WorldwideCorp. and each domestic subsidiary of the Company, each domestic subsidiary of any guarantor, and 65% of the voting capitalrstock of each foreign subsidiary of the Company that is directly owned by the Company or a guarantor, in each case subject tocertain exclusions set forth in the credit documentation governing the Credit Facility. The collateral agreement of the CreditAgreement, as amended, released the lien on certain assets of ACI Payments, Inc., our electronic bill presentment and paymentaffiliate, to allow ACI Payments, Inc. to comply with certain eligible securities and unencumbered asset requirements related tomoney transmitter or transfer license rules and regulations.
The Credit Agreement contains a number of covenants that, among other things and subject to certain exceptions, restrict theCompany’s and its subsidiaries' ability to: create, incur, assume or suffer to exist any additional indebtedness; create, incur,assume or suffer to exist any liens; enter into agreements and other arrangements that include negative pledge clauses; paydividends on capital stock or redeem, repurchase or retire capital stock or subordinated indebtedness; create restrictions on thepayment of dividends or other distributions by subsidiaries; make investments, loans, advances and acquisitions; merge,consolidate or enter into any similar combination or sell assets, including equity interests of the subsidiaries; enter into sale andleaseback transactions; directly or indirectly engage in transactions with affiliates; alff ter in any material respect the character orconduct of the business; enter into amendments of or waivers under subordinated indebtedness, organizational documents andcertain other material agreements; and hold certain assets and incur certain liabilities.
Letter of Credit
On August 12, 2020, the Company and ACI Payments, Inc. entered into a standby letter of credit (the “Letter of Credit”), underthe terms of the Credit Agreement, for $1.5 million. The Letter of Credit expires on July 31, 2021, with automatic renewals fortwelve month periods thereafter. The Letter of Credit reduces the maximum available borrowings under the Revolving CreditFacility to $498.5 million. Upon expiration of the Letter of Credit, maximum borrowings will return to $500.0 million.
Expected Discontinuation of LIBOR
In July 2017, the United Kingdom’s Financial Conduct Authority, which regulates LIBOR, announced it will no longer compelbanks to submit rates for the calculation of LIBOR after 2021. The Alternative Reference Rates Committee has proposed theSecured Overnight Financing Rate ("SOFR") as its recommended alternative to LIBOR, and the first publication of SOFR rateswas released in April 2018.
The Company is evaluating the potential impact of the transition from LIBOR as an interest rate benchmark to other potentialalternative reference rates, including SOFR. The Company's Credit Agreement is currently indexed to LIBOR and the maturitydate of the Credit Agreement extends beyond 2021. The Credit Agreement contemplates the discontinuation of LIBOR andprovides options for the Company in such an event. The Company will continue to actively assess the related opportunities andrisks involved in this transition.
70

Senior Notes
On August 21, 2018, the Company completed a $400.0 million offering of the 2026 Notes at an issue price of 100% of theprincipal amount in a private placement for resale to qualified institutional buyers. The 2026 Notes bear interest at an annualrate of 5.750%, payable semi-annually in arrears on February 15 and August 15 of each year, which commenced onFebruary 15, 2019. Interest accrued from August 21, 2018. The 2026 Noteff s will mature on August 15, 2026. In connection withtthe issuance of the 2026 Notes, the Company incurred and paid debt issuance costs of $7.3 million for the year endedDecember 31, 2018.
The Company used the net proceeds of the offering described above to redeema , in fullff , the Company’s outstanding 6.375%Senior Notes due 2020, including accrued d interest, and repaid a portion of the outstanding amount under the Term CreditFacility.
Maturities on debt outstanding at December 31, 2020, are as follows (in thousands):
Fiscal Year Ending December 31,2021 $ 38,9502022 50,4312023 69,9062024 612,8232025 —Thereafter 400,000Total $ 1,172,110
The Revolving Credit Facility and 2026 Notes do not amortize. The Term Loans do amortize, with principal payable inconsecutive quarterly installments.
The Credit Agreement and 2026 Notes contain certain customary affirmative covenants and negative covenants that limit orrestrict, subject to certain exceptions, the incurrence of liens, indebtedness of subsidiaries, mergers, advances, investments,acquisitions, transactions with affiliates, change in nature of business, and the sale of the assets. In addition, the CreditAgreement and 2026 Notes contain certain customary mandatory prepayment provisions. The Company is also required tomaintain a consolidated leverage ratio at or below a specified amount and an interest coverage ratio at or above a specifiedamount. As specified in the Credit Agreement and 2026 Notes agreement, if certain events occur and continue, the Companymay be required to repay all amounts outstanding under the Credit Facility and 2026 Notes. As of December 31, 2020, and atall times during the period, the Company was in compliance with its financial debt covenants.
Total debt is comprised of the following (iff n thousands):
December 31,2020 2019
Term loans $ 717,110 $ 756,060Revolving credit facility 55,000 239,0005.750% Senior Notes, due August 2026 400,000 400,000Debt issuance costs (17,103) (21,905)
Total debt 1,155,007 1,373,155Less: current portion of term loans 38,950 38,950Less: current portion of debt issuance costs (4,685) (4,802)
Total long-term debt $ 1,120,742 $ 1,339,007
71

Overdraft Facility
In 2019, the Company and ACI Payments, Inc. entered in to an uncommitted overdraft facility with Bank of America, N.A. Theoverdraft facility bears interest at LIBOR plus 2.25% based on the Company’s average outstanding balance and the frequencyin which overdrafts occur. The overdraft facility acts as a secured loan under the terms of the Credit Agreement to provide anadditional funding mechanism for timing differences that can occur in the bill payment settlement process. Amountsoutstanding on the overdraft facility are included in other current liabilities in the consolidated balance sheet. As ofDecember 31, 2020, there was $100.0 million available and no amount outstanding on the overdraft facility. As ofDecember 31, 2019, there was $1.5 million outstanding on the overdraft facility.
Other
The Company finances certain multi-year license agreements for internal-use software. Upon execution, these arrangements aretreated as a non-cash investing and financing activity for purposes of the consolidateff d statements of cash flows. During the yearffended December 31, 2019, the Company financed agreements for $10.4 million with annuaff l payments through April 2022. Asof December 31, 2020, $7.8 million was outstanding under these and other license agreements previously entered into, of which$5.6 million and $2.2 million is included in other current liabilities and other noncurrent liabilities, respectively, in theconsolidated balance sheet. As of December 31, 2019, $13.8 million was outstanding, of which $6.0 million and $7.8 millionwas included in other current liabilities and other noncurrent liabilities, respectively, in the consolidated balance sheet.
5. Software and Other Intangible Assets
The carrying amount and accumulated amortization of the Company's software assets subject to amortization at each balancesheet date are as follows (in thousands):
December 31, 2020 December 31, 2019GrossCarryingAmount
AccumulatedAmortization
NetBalance
GrossCarryingAmount
AccumulatedAmortization
NetBalance
Software for resale $ 130,261 $ (123,418) $ 6,843 $ 138,823 $ (122,061) $ 16,762Software for internal use 430,330 (240,717) 189,613 400,065 (182,310) 217,755Total software $ 560,591 $ (364,135) $ 196,456 $ 538,888 $ (304,371) $ 234,517
Software for resale amortization expense recorded during the years ended December 31, 2020, 2019, and 2018, totaled $8.5million, $11.0 million, and $12.8 million, respectively. These software amortization expense amounts are reflected in cost ofrevenue in the consolidated statements of operations.
Software for internal use amortization expense recorded during the years ended December 31, 2020, 2019, and 2018, totaled$70.0 million, $55.6 million, and $41.7 million, respectively. These software amortization expense amounts are reflected indepreciation and amortization in the consolidated statements of operations.
The carrying amount and accumulated amortization of the Company’s other intangible assets subject to amortization at eachbalance sheet date are as follows (in thousands):
December 31, 2020 December 31, 2019GrossCarryingAmount
AccumulatedAmortization
NetBalance
GrossCarryingAmount
AccumulatedAmortization
NetBalance
Customer relationships $ 512,389 $ (197,787) $ 314,602 $ 507,785 $ (160,775) $ 347,010Trademarks and trade names 24,115 (16,734) 7,381 27,312 (17,353) 9,959Total other intangible assets $ 536,504 $ (214,521) $ 321,983 $ 535,097 $ (178,128) $ 356,969
Other intangible assets amortization expense recorded during the years ended December 31, 2020, 2019, and 2018, totaled$37.1 million, $31.9 million, and $19.0 million, respectively.
72
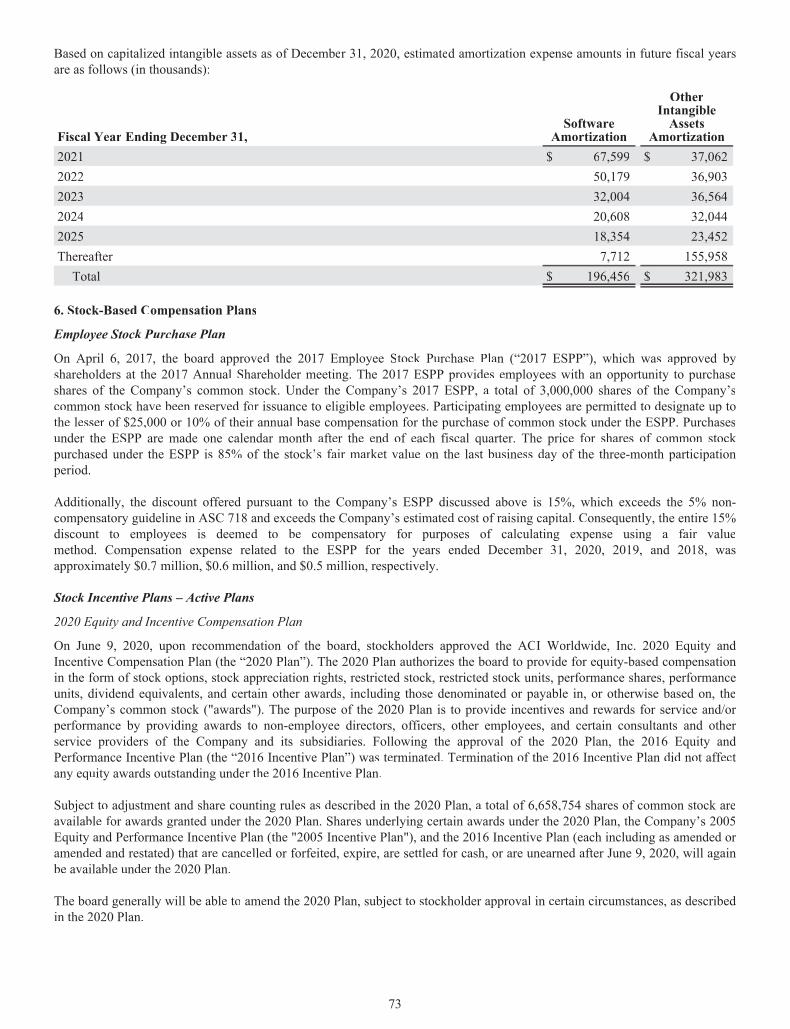
Based on capitalized intangible assets as of December 31, 2020, estimated amortization expense amounts in future fiscal yearsare as follows (in thousands):
Fiscal Year Ending December 31,Software
Amortization
OtherIntangibleAssets
Amortization2021 $ 67,599 $ 37,0622022 50,179 36,9032023 32,004 36,5642024 20,608 32,0442025 18,354 23,452Thereafter 7,712 155,958Total $ 196,456 $ 321,983
6. Stock-Based Compensation Plans
Employee Stock Purchase Plan
On April 6, 2017, the board approved the 2017 Employee Stock Purchase Plan (“2017 ESPP”), which was approvea d byshareholders at the 2017 Annual Shareholder meeting. The 2017 ESPP provides employees with an opportunity to purchaseshares of the Company’s common stock. Under the Company’s 2017 ESPP, a total of 3,000,000 shares of the Company’scommon stock have been reserved for issuance to eligible employees. Participating employees are permitted to designate up tothe lesser of $25,000 or 10% of their annual base compensation for the purchase of common stock under the ESPP. Purchasesunder the ESPP are made one calendar month after the end of each fiscal quarter. The price for shares of common stockffpurchased under the ESPP is 85% of the stock’s fair marff ket value on the last business day of the three-month participationperiod.
Additionally, the discount offered pursuant to the Company’s ESPP discussed above is 15%, which exceeds the 5% non-compensatory guideline in ASC 718 and exceeds the Company’s estimated cost of raising capital. Consequently, the entire 15%discount to employees is deemed to be compensatory for purposes of calculating expense using a faiff r valuemethod. Compensation expense related to the ESPP for the years ended Decembeff r 31, 2020, 2019, and 2018, wasapproximately $0.7 million, $0.6 million, and $0.5 million, respectively.
Stock Incentive Plans – Active PlansPP
2020 Equity and Incentive Compensation Plan
On June 9, 2020, upon recommendation of the board, stockholders approved the ACI Worldwide, Inc. 2020 Equity andIncentive Compensation Plan (the “2020 Plan”). The 2020 Plan authorizes the board to provide for equity-based compensationin the form of stock options, stock appreciation rights, restricted stock, restricted stock units, performance shares, performanceunits, dividend equivalents, and certain other awards, including those denominated or payable in, or otherwise based on, theCompany’s common stock ("awards"). The purpose of the 2020 Plan is to provide incentives and rewards for service and/orperformance by providing awards to non-employee directors, officers, other employees, and certain consultants and otherservice providers of the Company and its subsidiaries. Following the approval of the 2020 Plan, the 2016 Equity andPerformance Incentive Plan (the “2016 Incentive Plan”) was terminated. Termination of the 2016 Incentive Plan did not affectany equity awards outstanding under the 2016 Incentive Plan.
Subject to adjustment and share counting rules as described in the 2020 Plan, a total of 6,658,754 shares of common stock areavailable for awards granted under the 2020 Plan. Shares underlying certain awards under the 2020 Plan, the Company’s 2005ffEquity and Performance Incentive Plan (the "2005 Incentive Plan"), and the 2016 Incentive Plan (each including as amended oramended and restated) that are cancelled or forfeited, expire, are settled for cash, or are unearned after June 9, 2020, will againffbe available under the 2020 Plan.
The board generally will be able to amend the 2020 Plan, subject to stockholder approval in certain circumstances, as describedin the 2020 Plan.
73

2016 Equity and Performance IncentivII e Plan
On March 23, 2016, the board approved the 2016 Incentive Plan. The 2016 Incentive Plan is intended to meet the Company’sobjective of balancing stockholder concerns about dilution with the need to provide appropriate incentives to achieve Companyperformance objectives. The 2016 Incentive Plan was adopted by the stockholders on June 14, 2016. Following the adoption ofthe 2016 Incentive Plan, the 2005 Incentive Plan was terminated. Termination of the 2005 Incentive Plan did not affect anyequity awards outstanding under the 2005 Incentive Plan.
The 2016 Incentive Plan provides for the grant of incentive stocff k options, nonqualified stock options, stock appreciation rights,restricted share and restricted share units, performance shares and performance units, and other awards (“awards”). Subject toadjustment in certain circumstances, the maximum number of shares of common stock that may be issued or transferred inconnection with awards granted under the 2016 Incentive Plan will be the sum of (i) 8,000,000 shares of common stock and(ii) any shares of common stock that are represented by options previously granted under the 2005 Incentive Plan which areforfeited, expire, or are cancelled without delivery of common stock or which result in the forfeiture or relinquishment ofcommon stock back to the Company. To the extent awards granted under the 2016 Incentive Plan terminate, expire, arecancelled without being exercised, are forfeited or lapse for any reason, the shares of common stock subject to such award willagain become available for grants under the 2016 Incentive Plan.
The 2016 Incentive Plan expressly prohibits re-pricing stock options and appreciation rights. The 2016 Incentive Plan also,subject to certain limited exceptions, expressly requires a one-year vesting period for all stock options and appreciation rights.
No eligible person selected by the board to receive awards (“participant”) will receive stock options, stock appreciation rights,restricted share awards, restricted share units, and other awards under the 2016 Incentive Plan, during any calendar year, formore than 3,000,000 shares of common stock. In addition, no participant may receive performance shares or performance unitshaving an aggregate value on the date of grant in excess of $9,000,000 during any calendar year. Each of the limits describedabove may be adjusted equitably to accommodate a change in the capital structure of the Company.
2005 Equity and Performance IncentivII e Plan
The Company had a 2005 Incentive Plan, as amended, under which shares of the Company’s common stock were reserved forffissuance to eligible employees or non-employee directors of the Company. The 2005 Incentive Plan provided for the grant offfincentive stock options, nonqualified stock options, stock appreciation rights, restricted stock awards, performance awards, andother awards. The maximum number of shares of the Company’s common stock that was issued or transferred in connectionwith awards granted under the 2005 Incentive Plan was the sum of (i) 23,250,000 shares and (ii) any shares represented byoutstanding options that had been granted under designated terminated stock option plans that were subsequently forfeited,expired, or are cancelled without delivery of the Company’s common stock.
Stock OptionsO
Stock options granted pursuant to the Company's incentive plans were granted at an exercise price not less than the marketvalue per share of the Company’s common stock on the date of grant. The term of the outstanding options may not exceed tenyears nor be less than one year. Vesting of options is determined by the compensation committee of the board and theadministrator of the respective plan and can vary based upon the individual award agreements. In addition, outstanding optionsdo not have dividend equivalent rights associated with them.
A summary of stock option activity is as follows:
Number ofShares
WeightedAverage
Exercise Price($)
WeightedAverageRemainingContractualTerm (Years)
AggregateIntrinsic Valueof In-the-Money
Options ($)Outstanding, December 31, 2019 4,006,816 $ 18.18
Exercised (1,756,471) 18.53Forfeited (57,744) 19.08Expired (6,090) 18.44
Outstanding, December 31, 2020 2,186,511 $ 17.87 3.96 $ 44,944,958Exercisable, December 31, 2020 2,039,275 $ 17.72 4.16 $ 42,231,530
74

The weighted average grant date fair value of stocff k options granted during the year ended December 31, 2018, was $7.03. TheCompany did not grant stock options during the years ended December 31, 2020 and 2019. The total intrinsic value of stockoptions exercised during the years ended Decembed r 31, 2020, 2019, and 2018, was $19.5 million, $16.0 million, and $15.8million, respectively.
The fair value of options granted during the year ended December 31, 2018, were estimated on the date of grant using theBlack-Scholes option-pricing model, acceptable under ASC 718, with the following weighted average assumptions:
Year EndedDecember 31, 2018
Expected life (years) 5.6Risk-free interest rate 2.7 %Expected volatility 26.4 %Expected dividend yield —
Expected volatilities are based on the Company’s historical common stock volatility, derived from historical stock price data forffperiods commensurate with the options’ expected life. The expected life offf options granted represents the period of time optionsare expected to be outstanding, based primarily on historical employee option exercise behavior. The risk-free interest rate isbased on the implied yield currently available on U.S. Treasury zero coupon bonds issued with a term equal to the expected lifeat the date of grant of the options. The expected dividend yield is zero, as the Company has historically paid no dividends anddoes not anticipate dividends to be paid in the future.
Long-term Incentive Program Performance Share Awards
During the year ended December 31, 2017, pursuant to the Company’s 2016 Incentive Plan, the Company granted long-termincentive program performance share awards (“LTIP performance shares”). These LTIP performance shares were earned basedupon the achievement, over a specified period that must not be less than one year and is typically a three-year performanceperiod, of performance goals related to (i) the compound annual growth over the performaff nce period in the sales for theCompany as determined by the Company, and (ii) the cumulative operating income or EBITDA over the performaff nce period asdetermined by the Company. Up to 200% of the LTIP performance shares could be earned upon achievement of performancegoals equal to or exceeding the maximum target levels for the perfff ormaff nce goals over the performaff nce period. On a quarterlybasis, management evaluated the probability that the threshold performance goals would be achieved, if at all, and theanticipated level of attainment to determine the amount of compensation expense to record in the consolidated financialffstatements.
A summary of the nonvested LTIP performance shares is as follows:
Number ofShares atExpectedAttainment
WeightedAverageGrant DateFair Value
Nonvested at December 31, 2019 669,469 $ 20.12Vested (668,240) 20.12Forfeited (5,368) 20.12Change in expected attainment 4,139 20.12
Nonvested at December 31, 2020 — $ —
During the year ended December 31, 2020, a total of 668,240 LTIPs vested. The Company withheld 165,237 of those shares topay the employees' portion of the minimum payroll withholding taxes.
Restricted Share Awards
During the year ended December 31, 2017, pursuant to the Company’s 2016 Incentive Plan, the Company granted RSAs. Theawards had requisite service periods of three years and vested in increments of 33% on the anniversary of the grant dates. Undereach arrangement, shares were issued without direct cost to the employee. The Company estimated the fair value of the RSAsbased upon the market price of the Company’s stock on the date of grant. The RSA grants provided for the payment offfdividends on the Company’s common stock, if any, to the participant during the requisite servicd e period, and the participant had
75

voting rights for each share of common stock. The Company recognized compensation expense for RSAs onff a straight-linebasis over the requisite service period.
A summary of nonvested RSAs is as follows:
Number ofShares
WeightedAverageGrant DateFair Value
Nonvested at December 31, 2019 92,842 $ 20.13Vested (88,913) 20.12Forfeited (3,929) 20.35
Nonvested at December 31, 2020 — $ —
During the year ended December 31, 2020, a total of 88,913 RSAs vested. The Company withheld 28,233 of those shares to paythe employees’ portion of the minimum payroll withholding taxes.
Total Shareholder Return Awards
During the years ended December 31, 2020, 2019, and 2018, pursuant to the 2016 Incentive Plan, the Company granted totalshareholder return awards (“TSRs”). TSRs are performance shares that are earned, if at all, based upon the Company’s totalshareholder return as compared to a group of peer companies over a three-year performance period. The award payout canrange from 0% to 200%. To determine the grant date fair value of the TSRs,ff a Monte Carlo simulation model is used. TheCompany recognizes compensation expense for the TSRs over a three-year performance period based on the grant date fairffvalue.
A summary of nonvested TSRs is as follows:ff
Number ofShares
WeightedAverageGrant DateFair Value
Nonvested as of December 31, 2019 1,062,291 $ 35.77Granted 677,195 30.01Vested (199,413) 24.37Forfeited (158,086) 36.69Change in payout rate (14,259) 24.37
Nonvested as of December 31, 2020 1,367,728 $ 34.59
During the year ended December 31, 2020, a total of 199,413 TSRs awards granted in fiscal 2017 vested and achieved a payoutrate of 93% based on the Company's total shareholder return as compared to a group of peer companies over a three-yearperformance period. The Company withheld 53,033 of those shares to pay the employees’ portion of the minimum payrollwithholding taxes.
The fair value of TSRs granted duringd the years ended December 31, 2020, 2019, and 2018, were estimated on the date of grantusing the Monte Carlo simulation model, acceptable under ASC 718, using the following weighted-average assumptions:
Years Ended December 31,2020 2019 2018
Expected life (years) 2.8 2.8 2.9Risk-free interest rate 0.5 % 2.5 % 2.4 %Volatility 31.4 % 29.3 % 28.0 %Expected dividend yield — — —
76

Restricted Share Units
During the years ended December 31, 2020, 2019, and 2018, pursuant to the 2020 Plan and the 2016 Incentive Plan, theCompany granted restricted share unit awards (“RSUs”). RSUs generally have requisite service periods of three years and vestin increments of 33% on the anniversary of the grant dates. RSUs granted to the board vest one year from grant or as of the nextffannual shareholders meeting, whichever is earlier. Under each arrangement, RSUs are issued without direct cost to theemployee on the vesting date. The Company estimates the fair value of the RSUs based upon the market price of theCompany’s stock on the date of grant. The Company recognizes compensation expense for RSUs on a straight-line basis overthe requisite service period.
A summary of nonvested RSUs is as follows:
Number ofShares
WeightedAverageGrant DateFair Value
Nonvested as of December 31, 2019 1,009,404 $ 29.96Granted 816,543 25.72Vested (431,504) 29.60Forfeited (276,261) 28.57
Nonvested as of December 31, 2020 1,118,182 $ 27.34
During the year ended December 31, 2020, a total of 431,504 RSUs vested. The Company withheld 121,564 of those shares topay the employees’ portion of the minimum payroll withholding taxes.
As of December 31, 2020, there was unrecognized compensation expense of $18.9 million related to RSUs, $17.6 millionrelated to TSRs, and less than $0.1 million related to nonvested stock options, which the Company expects to recognize overweighted average periods of 1.8 years, 1.9 years, and 0.2 years, respectively.
The Company recorded stock-based compensation expense recognized under ASC 718 during the years ended December 31,2020, 2019, and 2018, of $29.6 million, $36.8 million, and $20.4 million, respectively, with corresponding tax benefits of $5.4million, $5.9 million, and $3.9 million, respectively. The Company recognizes compensation expense for stock option awardsthat vest with only service conditions on a straight-line basis over the requisite service period. The Company recognizescompensation expense for stock option awards that vest with service and market-based conditions on a straight-line basis overthe longer of the requisite service period or the estimated period to meet the defined market-based condition.
7. Common Stock and Treasury Stock
In 2005, the board approved a stock repurchase program authorizing the Company, as market and business conditions warrant,to acquire its common stock and periodically authorize additional funds for the program. In February 2018, the board approvedthe repurchase of the Company's common stock of up to $200.0 million, in place of the remaining purchase amounts previouslyauthorized.
The Company repurchased 1,000,000 shares for $28.9 million under the program for the year ended December 31, 2020. Underthe program to date, the Company has repurchased 46,357,495 shares for approximately $612.3 million. As of December 31,2020, the maximum remaining amount authorized for purchase underff the stock repurchase program was $112.1 million.
77

During the year ended September 30, 2006, the Company began to issue shares of treasury stock upon exercise of stock options,upayment of earned performance shares (LTIP performance shares and TSRs), vesting of RSUs, and for issuances of commonstock pursuant to the Company’s ESPP. Treasury shares issued by award type are as follows:
Years Ended December 31,2020 2019 2018
Stock options 1,756,471 854,524 1,379,704LTIP performance shares 668,240 — —TSRs 199,413 — —RSUs 431,504 259,634 10,000ESPP 151,542 126,983 148,520Total treasury shares issued 3,207,170 1,241,141 1,538,224
8. Earnings Per Share
Basic earnings per share is computed in accordance with ASC 260, Earnings per Share, based on weighted average outstandingcommon shares. Diluted earnings per share is computed based on basic weighted average outstanding common shares adjustedfor the dilutive effect of stock options, RSUs, and certain contingently issuable shares for which performance targets have beenachieved.
The following table reconciles the weighted average share amounts used to compute both basic and diluted earnings per share(in thousands):
Years Ended December 31,2020 2019 2018
Weighted average shares outstanding:Basic weighted average shares outstanding 116,397 116,175 116,057Add: Dilutive effect of stock options, RSUs, and contingently issuableshares 1,682 2,396 1,575Diluted weighted average shares outstanding 118,079 118,571 117,632
The diluted earnings per share computation excludes 1.5 million, 1.8 million, and 2.2 million options to purchase shares, RSUs,and contingently issuable shares during the years ended Decembed r 31, 2020, 2019, and 2018, respectively, as their effect wouldbe anti-dilutive.
Common stock outstanding as of December 31, 2020 and 2019, was 117,112,185 and 115,986,352, respectively.
9. Other, Net
Other, net is primarily comprised of foreign currency transaction gains and losses. Other, net was $1.1 million of expense, $0.5million of income, and $3.7 million of expense for the years ended December 31, 2020, 2019, and 2018, respectively.
10. Segment Information
The Company reports financial perfoff rmance based on its segments, ACI On Demand and ACI On Premise, and analyzesSegment Adjusted EBITDA as a measure of segment profitability.
The Company’s Chief Executive Officer is also the chief operating decision maker ("CODM"). The CODM, together with othersenior management personnel, focus theiff r review on consolidated financial information and the allocation of resources based onoperating results, including revenues and Segment Adjusted EBITDA, for each segment, separate from corporate operations.ff
ACI On Demand serves the needs of banks, merchants, and billers who use payments to facilitate their core business. These on-demand solutions are maintained and delivered through the cloud via our global data centers and are available in either a single-tenant environment for SaaS offerings, or in a multi-tenant environment for PaaS offerings.
ACI On Premise serves customers who manage their software on site or through a third-party public cloud environment. Theseon-premise customers use the Company’s software to develop sophisticated solutions, which are often part of a larger system
78

located and managed at the customer specified site. These customers require a level of control and flexibility that ACI OnPremise solutions can offer, and they have the resources and expertise to take a lead role in managing these solutions.
Revenue is attributed to the reportable segments based upon the product sold and mechanism for delivery to the customer.Expenses are attributed to the reportable segments in one of three methods, (1) direct costs of the segment, (2) labor costs thatcan be attributed based upon time tracking for individual products, or (3) costs that are allocated. Allocated costs are generallymarketing and sales related activities as well as information technology and facilities related expense for which multiplesegments benefit. The Company also allocates certain depreciation costs to the segments.
Segment Adjusted EBITDA is the measure reported to the CODM for purposes of making decisions on allocating resources andassessing the performance of the Company’s segments and, therefore, Segment Adjusted EBITDA is presented in conformitywith ASC 280, Segment Reporting. Segment Adjusted EBITDA is defined as earnings (loss) from operations before interest,income tax expense (benefit), depreciation and amortization (“EBITDA”) adjusted to exclude stock-based compensation, andnet other income (expense).
Corporate and unallocated expenses consist of the corporate overhead costs that are not allocated to reportable segments. Theseoverhead costs relate to human resources, financeff , legal, accounting, merger and acquisition activity, and other costs that are notconsidered when management evaluates segment performance.
The following is selected financial data for the Company’s reportable segments for the periods indicated (iff n thousands):
Years Ended December 31,2020 2019 2018
RevenuesACI On Demand $ 769,180 $ 678,960 $ 433,025ACI On Premise 525,142 579,334 576,755
Total revenue $ 1,294,322 $ 1,258,294 $ 1,009,780Segment Adjusted EBITDAACI On Demand $ 149,610 $ 66,501 $ 12,015ACI On Premise 290,310 321,305 323,902
Depreciation and amortization (140,316) (122,569) (97,350)Stock-based compensation expense (29,602) (36,763) (20,360)Corporate and unallocated expenses (125,258) (104,718) (92,296)Interest, net (45,002) (52,066) (30,388)Other, net (1,116) 520 (3,724)Income beforeff income taxes $ 98,626 $ 72,210 $ 91,799Depreciation and amortizationACI On Demand $ 40,594 $ 34,395 $ 31,541ACI On Premise 13,207 11,992 11,634Corporate 86,515 76,182 54,175
Total depreciation and amortization $ 140,316 $ 122,569 $ 97,350Stock-based compensation expenseACI On Demand $ 8,852 $ 7,995 $ 4,338ACI On Premise 8,872 7,651 4,348Corporate 11,878 21,117 11,674
Total stock-based compensation expense $ 29,602 $ 36,763 $ 20,360
Assets are not allocated to segments, and the Company’s CODM does not evaluate operating segments using discrete assetinformation.
79

The folff lowing is revenue by primary geographic market and primary solution category for the Company’s reportable segmentsfor the periods indicated (in thousands):
Year Ended December 31, 2020 Year Ended December 31, 2019ACI
On DemandACI
On Premise TotalACI
On DemandACI
On Premise TotalPrimary Geographic MarketsAmericas - United States $ 687,923 $ 142,588 $ 830,511 $ 609,160 $ 172,660 $ 781,820Americas - Other 11,561 61,533 73,094 9,350 68,020 77,370EMEA 58,857 234,369 293,226 50,629 251,035 301,664Asia Pacificff 10,839 86,652 97,491 9,821 87,619 97,440Total $ 769,180 $ 525,142 $ 1,294,322 $ 678,960 $ 579,334 $ 1,258,294
Primary Solution CategoriesBill Payments $ 586,047 $ — $ 586,047 $ 510,300 $ — $ 510,300Digital Channels 46,269 29,438 75,707 44,731 32,980 77,711Merchant Payments 84,997 23,730 108,727 77,204 25,693 102,897Payments Intelligence 40,495 21,570 62,065 36,019 33,790 69,809Real-Time Payments 3,902 77,158 81,060 3,456 97,153 100,609Issuing and Acquiring 7,470 373,246 380,716 7,250 389,718 396,968Total $ 769,180 $ 525,142 $ 1,294,322 $ 678,960 $ 579,334 $ 1,258,294
Year Ended December 31, 2018ACI
On DemandACI
On Premise TotalPrimary Geographic MarketsAmericas - United States $ 369,097 $ 131,382 $ 500,479Americas - Other 9,577 61,969 71,546EMEA 48,889 296,157 345,046Asia Pacificff 5,462 87,247 92,709Total $ 433,025 $ 576,755 $ 1,009,780
Primary Solution CategoriesBill Payments $ 275,526 $ — $ 275,526Digital Channels 40,342 35,231 75,573Merchant Payments 64,956 30,447 95,403Payments Intelligence 41,330 42,353 83,683Real-Time Payments 2,193 92,068 94,261Issuing and Acquiring 8,678 376,656 385,334Total $ 433,025 $ 576,755 $ 1,009,780
The following is the Company’s long-lived assets by geographic location for the periods indicated (in thousands):
December 31,2020 2019
Long-lived AssetsUnited States $ 1,423,862 $ 1,526,046Other 750,651 759,501Total $ 2,174,513 $ 2,285,547
No single customer accounted for more than 10% of the Company’s consolidated revenues during the years endedDecember 31, 2020, 2019, and 2018. No other country outside the United States accounted for more than 10% of theCompany’s consolidated revenues during the years ended December 31, 2020, 2019, and 2018.
80

11. Income Taxes
On December 22, 2017, the Tax Cuts and Jobs Act (“Tax Act”) was signed into U.S. Law. As of December 31, 2018, theCompany had completed its accounting for the tax effects related to the enactment of the Tax Act.
The Tax Act reduced the U.S. federal corporate income tax rate from 35% to 21%, effective January 1, 2018. During the yearended December 31, 2017, the Company remeasured certain deferred tax assets and liabilities and recorded a $15.0 millionprovisional tax charge. During the year ended December 31, 2018, the Company reduced the initial provisional tax charge byrecording a $4.9 million benefit related to accelerated tax deductions claimed on the 2018 U.S. Federal Income Tax Return.t
The Tax Act required U.S. companies to pay a one-time transition tax on certain unremitted foreign earnings. During the yearffended December 31, 2017, the Company recorded a $20.9 million provisional tax charge based on post-1986 earnings andprofits of foreign subsidiarieff s that were previously deferred from U.S. income taxes. Upon further analysis, the Companyreduced the initial provisional tax charge by recording an $8.1 million benefit during the yead r ended December 31, 2018.
During the year ended December 31, 2018, the Company recorded a $15.5 million valuation allowance on its deferred tax assetrelated to U.S. foreign tax credits based upon business conditions and tax laws in effect at that time.
During the year ended December 31, 2019, following the acquisition of Speedpay, the Company determined it will more likelythan not be able to utilize foreign tax credits in future years due to additional incomff e generated by Speedpay; therefore, theCompany released the $15.5 million valuation allowance that had been established on this deferred tax asset.
The Tax Act subjectb s a U.S. shareholder to tax on global intangible low-taxed income ("GILTI") earned by certain foreignsubsidiaries. The Company has elected to account for GILTI in the year the tax is incurred.
Prior to 2018, the Company considered all earnings in foreign subsidiaries to be indefinitely reinvested, and accordingly,recorded no deferred income taxes related to unremitted earnings. As of December 31, 2020, 2019, and 2018 the Companyconsidered only the earnings in its Indian subsidiaries to be indefinitely reinvested. The earnings of all other foreignffsubsidiaries are no longer considered indefinitely reinvested. The Company is also permanently reinvested for outside book/taxffbasis differences related to foreign subsidiaries.
For financial reporting purposes, income beforeff income taxes includes the following components (in thousands):
Years Ended December 31,2020 2019 2018
United State $s 19,405 $ (16,317) $ 16,312Foreign 79,221 88,527 75,487
Total $ 98,626 $ 72,210 $ 91,799
81

The expense (benefit) for income taxes consistff s of the following (in thousands):
d December 31,2020 2019 2018
FederalCurrent $ (2,683) $ 3,738 $ 6,545Deferred (3,477) (25,150) (6,587)Total (6,160) (21,412) (42)
StateCurrent 2,514 590 4,441Deferre (d 1,758) (2,649)342Total 756 932 1,792
ForeignCurrent 22,786 22,960 17,626Deferred 8,584 2,668 3,502Total 31,370 25,628 21,128
Total $ 25,966 $ 5,148 $ 22,878
Differences between the income tax expense computed at the statutory federal income tax rate and per the consolidatedstatements of operations are summarized as follows (in thousands):
Years Ended December 31,2020 2019 2018
Tax expense at federal rate of 21% $ 20,711 $ 15,164 $ 19,278State income taxes, net of federal benefit 321 1,227 5,246Change in valuation allowance 2,459 (12,760) 12,657Foreign tax rate differentialff (1,809) (2,535) (4,796)Unrecognized tax benefit increase (decrease) (4,405) 898 1,262Tax effect of foreign operations 11,373 6,698 8,546Tax benefit of research & development (2,557)(2,506)(2,173)Transition tax — — (8,112)Revaluation of deferred tax balances —— (4,937)Performance-based compensation (2,624) (560) (4,541)Other 2,113 (478) 832Income tax provision $ 25,966 $ 5,148 $ 22,878
The countries having the greatest impact on the tax rate adjustment line shown in the above table as “Foreign tax ratedifferential” are Ireland, Mexico, Singapore, and the United Kingdom for the year ended December 31, 2020; Ireland,Luxembourg, and the United Kingdom for the year ended December 31, 2019; and Ireland and Luxembourg for the year endedDecember 31, 2018.
82

The deferred tax assets and liabilities result from differences in the timing of the recognition of certain income and expenseitems for taff x and financial accounting purposes. The sources of these differences at each balance sheet date are as follows (inthousands):
December 31,2020 2019
Deferred income tax assets:Net operating loss carryforwards $ 20,347 $ 23,030Tax credits 40,188 47,411Compensation 18,731 18,791Deferred revenue 19,169 25,599Operating lease 10,162 12,956Othe 9r ,051 8,517Gross deferred income tax assets 117,648 136,304
Less: valuation allowance ( (7,653)10,112)Net deferreff d income tax assets $ 107,536 $ 128,651
Deferred income tax liabilities:aDepreciation and amortization $ (48,967) $ (52,978)Operating lease right-of-use asset (7,650) (11,917)Deferred revenue (33,947) (44,198)Total deferred income tax liabilities (90,564) (109,093)Net deferred income taxes $ 16,972 $ 19,558
Deferred income taxes / liabilities included in the balance sheet are:Deferred income tax asset – noncurrent $ 57,476 $ 51,611Deferred income tax liability – noncurrent (32,053)(40,504)Net deferred income taxes $ 16,972 $ 19,558
The Company has reclassified certain prior period amounts between deferred income tax line items to conform to the currentyear presentation of deferred income tax disclosures. The Company reclassified $13.0 million from other deferred tax assets tooperating lease deferred tax assets and $11.9 million from other deferred tax assets to operating lease right-of-use asset deferredtax liabilities as of Decembea r 31, 2019. The Company also reclassified $5.5 million from tax credit deferred tax assets to otherdeferred tax assets as of December 31, 2019.
In assessing the realizability of deferred tax assets, the Company considers whether it is more likely than not that some portionor all of the deferred tax assets will not be realized. The ultimate realization of deferred tax assets is dependent upon thegeneration of future taxable income during the periods in which those temporary differences become deductibled . The Companyconsiders projected future taxable income, carryback opportunities, and tax planning strategies in making this assessment.Based upon the level of historical taxable income and projections for future taxable income over the periods which the deferredtax assets are deductible, the Company believes it is more likely than not that it will realize the benefits of these deductibledifferences, net of the valuation allowances recorded. During the year ended December 31, 2019, the Company decreased itsvaluation allowance by $12.8 million which relates to a reduction in the valuation allowance on U.S. foreign tax credits offsetby an increase in valuation allowance on foreign net operating losses.
At December 31, 2020, the Company had domestic federal tax net operating losses (“NOLs”) of $59.9 million, which willbegin to expire in 2021. The Company had deferred tax assets equal to $1.5 million related to domestic state tax NOLs whichwill begin to expire in 2021. The Company does not have any valuation allowance against the federal tax NOLs but hasprovided a $1.2 million valuation allowance against the deferred tax asset associated with the state NOLs. The Company hadforeign tax NOLs of $25.0 million, of which $22.8 million may be utilized over an indefinite life, with the remainder expiringover the next 10 years. The Company has provided a $0.7 million valuation allowance against the deferred tax asset associatedwith the foreign NOLs.ff
83

The Company had U.S. foreign tax credit carryforwards at December 31, 2020, of $38.9 million, for which a $2.3 millionvaluation allowance has been provided. The U.S. foreign tax credits will begin to expire in 2025. The Company had foreign taxcredit carryforwards in other foreign jurisdictions at Decemff ber 31, 2020, of $2.3 million, of which $1.1 million may be utilizedover an indefinite life, with the remainder expiring over the next seven years. The Company has provided a $1.2 millionvaluation allowance against the tax benefit associated with these foreign credits. The Company also has domestic federal andstate general business tax credit carryforwards at December 31, 2020, of $17.1 million and $0.8 million, respectively, whichwill begin to expire in 2021 and 2022, respectively.
The unrecognized tax benefit at December 31, 2020 and 2019, was $24.3 million and $29.0 million, respectively, of which$17.7 million and $22.4 million, respectively, are included in other noncurrent liabilities in the consolidated balance sheets. Ofthe total unrecognized tax benefit amounts at December 31, 2020 and 2019, $23.2 million and $28.2 million, respectively,represent the net unrecognized tax benefits that, if recognized, would favorably impact the effective income tax rate in therespective years.
A reconciliation of the beginning and ending amount of unrecognized tax benefits for the years ended Decembeff r 31 is asfollows (in thousands):
2020 2019 2018Balance of unrecognized tax benefits at beginning of year $ 29,000 $ 28,406 $ 27,237Increases for tax positions of prior years 4,219 2,784 315Decreases for tax positions of prior years (— 96) (61)Increases for tax positions established for the current periodff 3,912 2,542 1,185Decreases for settlements with taxing authorities (285) (220) —Reductions resulting from lapse of applicable statute of limitation (12,630) (4,462) (115)Adjustment resulting from foreign currency translation 94 46 (155)
Balance of unrecognized tax benefits at end of year $ 24,310 $ 29,000 $ 28,406
The Company files income tax returns in the U.S. federal jurisdiction, various state and local jurisdictions, and many foreignjurisdictions. The United States, India, Ireland, Mexico, Singapore, and the United Kingdom are the main taxing jurisdictions inwhich the Company operates. The years open for audit vary depending on the tax jurisdiction. In the United States, theCompany’s tax returns for years following 2016 are open for audit. In the foreign jurisdictions, the tax returns open for auditgenerally vary by jurisdiction between 2003 and 2019.
The Company’s Indian income tax returns covering fiscal years 2005, 2010 through 2014, 2016, and 2017 are under audit bythe Indian tax authority. Other foreign subsidiaries could facff e challenges from various foreign taff x authorities. It is not certainthat the local authorities will accept the Company’s tax positions. The Company believes its tax positions comply withapplicable tax law and intends to vigorously defend its positions. However, differing positions on certain issues could be uphelduby tax authorities, which could adversely affect the Company’s financial condition and results of operations.
The Company believes it is reasonably possible that the total amount of unrecognized tax benefits will decrease within the next12 months by approximately $3.6 million due to the settlement of various audits and the expiration of statutes of limitations.The Company accrues interest related to uncertain tax positions in interest expense or interest income and recognizes penaltiesrelated to uncertain tax positions in other income or other expense. As of December 31, 2020 and 2019, $1.2 million is accruedfor the payment of interest and penalties related to income tax liabilities. The aggregate amount of interest and penaltiesexpense (benefit) recorded in the statements of operations for the years ended December 31, 2020, 2019, and 2018, was lessthan $0.1 million, $0.2 million, and less than $(0.1) million, respectively.
12. Leases
The Company has operating leases for corporate offices and data centers. Excluding office leases, leases with an initial term of12-months or less that do not include an option to purchase the underlying asset are not recorded on the consolidated balancesheet and are expensed on a straight-line basis over the lease term.
84

The Company’s leases typically include certain renewal options to extend the leases for up to 25 years, some of which includeoptions to terminate the leases within one year. The exercise of lease renewal options is at the Company’s sole discretion. TheCompany combines lease and non-lease components of its leases and currently has no leases with options to purchase the leasedproperty. Payments of maintenance and property tax costs paid by the Company are accounted for as variablff e lease cost, whichare expensed as incurred.
The components of lease cost are as follows (in thousands):
Years Ended December 31,2020 2019
Operating lease cost $ 25,148 $ 18,486Variable lease cost 3,588 3,756Sublease income (134) (528)Total lease cost $ 28,602 $ 21,714
Supplemental cash flow information relateff d to leases is as follows (in thousands):
Years Ended December 31,2020 2019
Cash paid for amounts included in the measurement of lease liabilities:Operating cash flows from operating leases $ 18,827 $ 19,578
Right-of-use assets obtained in exchange for new lease obligations:Operating leases $ 11,431 $ 10,478
Supplemental balance sheet information related to leases is as follows (in thousands, except lease term and discount rate):
December 31,2020 2019
Assets:Operating lease right-of-use assets $ 41,243 $ 57,382
Liabilities:Other current liabilities $ 13,438 $ 15,049Operating lease liabilitiesa 39,958 46,766Total operating lease liabilities $ 53,396 $ 61,815
Weighted average remaining operating lease term (years) 6.01 6.58Weighted average operating lease discount rate 3.67 % 4.00 %
The Company uses its incremental borrowing rate as the discount rate. As the Company enters into operating leases in multiplejurisdictions and denominated in currencies other than the U.S. dollar, judgment is used to determine the Company’sincremental borrowing rate including (1) conversion of its subordinated borrowing rate (using published yield curves) to anunsubordinated and collateralized rate, (2) adjusting the rate to align with the term of each lease, and (3) adjusting the rate toincorporate the effects of the currencyff in which the lease is denominated.
85

Maturities on lease liabilities as of December 31, 2020, are as follows (in thousands):
Fiscal Year Ending December 31,2021 $ 15,1162022 12,9912023 10,4362024 5,5452025 4,016Thereafter 11,573Total lease payments 59,677
Less: imputed interest 6,281Total lease liability $ 53,396
13. Commitments and Contingencies
In accordance with ASC 460, Guarantees, the Company recognizes the fair value for guarantee and indemnificationarrangements it issues or modifies if these arrangements are within the scope of the interpretation. In addition, the Companymust continue to monitor the conditions that are subject to the guarantees and indemnifications, as required under thepreviously existing generally accepted accounting principles, to identify if a loss has occurred. If the Company determines it isprobable a loss has occurred, then any estimable loss would be recognized under those guarantees and indemnifications. Underits customer agreements, the Company may agree to indemnify, defend, and hold harmless its customers from and againstcertain losses, damages, and costs arising from claims alleging that the use of its software infringes the intellectual property of athird-party. Historically, the Company has not been required to pay material amounts in connection with claims asserted underthese provisions, and accordingly, the Company has not recorded a liability relating to such provisions.
Under its customer agreements, the Company also may represent and warrant to customers that its software will operatesubstantially in conformance with its documentation, and that the services the Company performs will be performed in aworkmanlike manner by personnel reasonably qualified by experience and expertise to perform their assigned tasks.Historically, only minimal costs have been incurred relating to the satisfactff ion of warranty claims. In addition, from time totime, the Company may guarantee the performance of a contract on behalf of one or more of its subsidiaries, or a subsidiarymay guarantee the performance of a contract on behalf of another subsidiary.
Other guarantees include promises to indemnify, defend, and hold harmless the Company’s executive officers, directors, andcertain other key officers. The Company’s certificate of incorporation provides that it will indemnify and advance expenses toits directors and officers to the maximum extent permitted by Delaware law. The indemnification covers any expenses andliabilities reasonably incurred by a person, by reason of the fact that such person is, was, or has agreed to be a director orofficer, in connection with the investigation, defense, and settlement of any threatened, pending, or completed action, suit,proceeding, or claim. The Company’s certificate of incorporation authorizes the use of indemnification agreements, and theCompany enters into such agreements with its directors and certain officers from time to time. These indemnificationagreements typically provide for a broader scope of the Company’s obligation to indemnify the directors and officers than setforth in the certificate of incorporation. The Company’s contractual indemnification obligations under these agreements are inaddition to the respective directors’ and officers’ rights under the certificate of incorporation or under Delaware law.
14. Employee Benefit Plans
ACI 4CC 01(k) Plan
The ACI 401(k) Plan is a defined contribution plan covering all domestic employees of the Company. Participants maycontribute up to 75% of their annual eligible compensation up to a maximum of $19,500 (for employees who are under the ageof 50 on December 31, 2020) or a maximum of $26,000 (for employees aged 50 or older on December 31, 2020). After oneyear of service, the Company matches 100% of the first 4% of eligible participant contributions and 50% of the next 4% ofeligible participant contributions, not to exceed $5,000 per employee annually. Company contributions charged to expense were$6.3 million during the year ended December 31, 2020, and $6.4 million during both the years ended December 31, 2019 and2018.
86

ACI Worldwide EMEA Group PersonalMM Pension Scheme
The ACI Worldwide EMEA Group Personal Pension Scheme is a defined contribution plan covering substantially all ACIWorldwide (EMEA) Limited (“ACI-EMEA”) employees. For those ACI-EMEA employees who elect to participate in the plan,the Company contributes a minimum of 8.5% of eligible compensation to the plan for employees employed at Deceff mber 1,2000 (up to a maximum of 15.5% for employees aged over 55 years on December 1, 2000) or from 6% to 10% of eligiblecompensation for employees employed subsequent to December 1, 2000. ACI-EMEA contributions charged to expense were$1.5 million during both the years ended December 31, 2020 and 2019, and $1.6 million during the year ended December 31,2018.
15. Quarterly Financial Data (Unaudited)
The following consists of quarterly financial datff a (in thousands, except per share amounts):
Quarter Ended Year EndedMarch 31,2020
June 30,2020
September 30,2020
December 31,2020
December 31,2020
Revenues:Software as a service andplatform as a service $ 192,950 $ 180,573 $ 190,369 $ 205,288 $ 769,180License 28,129 50,136 56,773 111,858 246,896Maintenance 53,280 52,749 53,049 52,619 211,697Services 17,126 16,452 15,692 17,279 66,549Total revenues 291,485 299,910 315,883 387,044 1,294,322
Operating expenses:Cost of revenue (1) 165,837 147,346 158,579 150,697 622,459Research and development 39,024 35,578 33,573 31,118 139,293Selling and marketing 30,083 24,455 22,154 26,875 103,567General and administrative 35,926 29,758 37,000 49,784 152,468Depreciation and amortization 31,898 33,635 33,395 32,863 131,791Total operating expenses 302,768 270,772 284,701 291,337 1,149,578
Operating income (loss) (11,283) 29,138 31,182 95,707 144,744Other income (expense):Interest expense (17,171) (14,142) (12,925) (12,392) (56,630)Interest income 2,900 2,954 2,927 2,847 11,628Other, net (9,758) 2,041 1,356 5,245 (1,116)Total other income (expense) (24,029) (9,147) (8,642) (4,300) (46,118)
Income (loss) before income taxes (35,312) 19,991 22,540 91,407 98,626Income tax expense (benefit) (10,885) 5,916 6,674 24,261 25,966
Net income (loss) $ (24,427) $ 14,075 $ 15,866 $ 67,146 $ 72,660Earnings (loss) per shareBasic $ (0.21) $ 0.12 $ 0.14 $ 0.57 $ 0.62Diluted $ (0.21) $ 0.12 $ 0.13 $ 0.56 $ 0.62
(1) The cost of revenue excludes charges for depreciation but includes amortization of purchased and developed software forresale.
87

Quarter Ended Year EndedMarch 31,2019
June 30,2019
September 30,2019
December 31,2019
December 31,2019
Revenues:Software as a service andplatform as a service $ 108,557 $ 172,499 $ 192,952 $ 203,661 $ 677,669License 21,078 52,541 92,058 122,584 288,261Maintenance 55,111 51,922 52,638 53,738 213,409Services 21,109 20,656 17,253 19,937 78,955Total revenues 205,855 297,618 354,901 399,920 1,258,294
Operating expenses:Cost of revenue (1) 114,941 155,240 174,168 173,104 617,453Research and development 36,194 39,235 36,543 34,601 146,573Selling and marketing 29,430 32,962 30,417 30,875 123,684General and administrative 31,517 49,319 27,286 27,174 135,296Depreciation and amortization 21,866 26,744 31,169 31,753 111,532Total operating expenses 233,948 303,500 299,583 297,507 1,134,538
Operating income (loss) (28,093) (5,882) 55,318 102,413 123,756Other income (expense):Interest expense (11,614) (15,323) (18,987) (18,109) (64,033)Interest income 3,033 2,997 2,988 2,949 11,967Other, net (1,912) 1,402 (2,369) 3,399 520Total other income (expense) (10,493) (10,924) (18,368) (11,761) (51,546)
Income (loss) before income taxes (38,586) (16,806) 36,950 90,652 72,210Income tax expense (benefit) (12,623) (22,531) 5,136 35,166 5,148
Net income (loss) $ (25,963) $ 5,725 $ 31,814 $ 55,486 $ 67,062Earnings (loss) per shareBasic $ (0.22) $ 0.05 $ 0.27 $ 0.48 $ 0.58Diluted $ (0.22) $ 0.05 $ 0.27 $ 0.47 $ 0.57
(1) The cost of revenue excludes charges for depreciation but includes amortization of purchased and developed software forresale.
88

EXHIBIT INDEX
ExhibitNo. Description3.01 (1) 2013 Amended and Restated Certificate of Incorporation of the Company3.02 (2) Amended and Restated Bylaws of the Company4.01 (3) Form of Common Stock Certificate (P)4.02 (4) Indenture, dated as of August 21, 2018, among ACI Worldwide, Inc., the guarantors listed therein, and
Wilmington Trust, National Association, as trustee4.03 Form of 5.750% Senior Notes due 2026 (Includedd as Exhibit A to Exhibit 4.02)4.04 Description of Securities10.01 (5)* ACI Worldwide, Inc. 2017 Employee Stock Purchase Plan10.02 (6)* ACI Worldwide, Inc. 2005 Equity and Performance Incentive Plan, as amended10.03 (7)* Form of Indemnification Agreement between the Company and certain officers, including executive
officers10.04 (8)* ACI Worldwide, Inc. 2013 Executive Management Incentive Compensation Plan10.05 (9)* Amended and Restated Deferred Compensation Plan10.06 (10) Amended and Restated Credit Agreement, dated February 24, 2017, by and among ACI Worldwide, Inc.,
Bank of America, N.A. and the lenders that are party thereto10.07 (11)* Form of 2015 Supplemental LTIP Performance Shares Agreement for the Company’s 2005 Equity and
Performance Incentive Plan, as amended10.08 (12)* ACI Worldwide, Inc. 2016 Equity and Performance Incentive Plan10.09 (13)* Form of 2016 Restricted Share Unit Award Agreement for the Company’s 2016 Equity and Performance
Incentive Plan10.10 (14)* Form of Performance Share Award Agreement CEO (rTSR Performance Share Awards)10.11 (15)* Form of Restricted Share Unit Award Agreement (RSUs)10.12 (16)* Form of Performance Share Award Agreement (rTSR Performance Share Awards)10.13 (17) Amendment Agreement to the Amended and Restated Credit Agreement, dated April 5, 201910.14 (18) November 5, 2019 Retirement and General Release Agreement between the Company and Philip G.
Heasley10.15 (19)* Form of Severance Agreement between ACI Worldwide, Inc. and Odilon Almeida10.16 (20)* Form of Change in Control Employment Agreement between ACI Worldwide, Inc. and certain officers,
including executive officers10.17 (21)* Form of Nonqualified Stock Option Agreement – Employee forff the Company’s 2005 Equity and
Performance Incentive Plan, as amended10.18 (22)* Form of 2015 Supplemental Nonqualified Stock Option Agreement - Employee forff the Company’s 2005
Equity and Performance Incentive Plan, as amended10.19 (23)* Form of 2015 Nonqualified Stock Option Agreement - Employee forff the Company's 2005 Equity and
Performance Incentive Plan, as amended10.20 (24)* Form of 2016 Nonqualified Stock Option Agreement for the Company’s 2016 Equity and Performance
Incentive Plan, as amended10.21 (25)* ACI Worldwide, Inc. 2020 Equity and Incentive Compensation Plan10.22 (26)* Form of Restricted Share Unit Award Agreement for the Company's 2020 Equity and Incentive
Compensation Plan10.23 (27)* Form of Performance Share Award Agreement for the Company's 2020 Equity and Incentive
Compensation Plan21.01 Subsidiaries of the Registrant (filed herewith)23.01 Consent of Independent Registered Public Accounting Firm (filed herewith) – Deloitte & Touche LLP31.01 Certification of Chief Executive Officer pursuant to S.E.C. Rule 13a-14,RR as adopted pursuant to Section
302 of the Sarbanes-Oxley Act of 2002 (filed herewith)31.02 Certification of Chief Financial Officer pursuant to S.E.C. Rule 13a-14,RR as adopted pursuant to Section 302
of the Sarbanes-Oxley Act of 2002 (filed herewith)32.01 ** Certification of Chief Executive Officer pursuant to 18 U.S.C. Section 1350, as adopted pursuant to
Section 906 of the Sarbanes-Oxley Act of 2002 (furnished herewith)
89

32.02 ** Certification of Chief Financial Officer pursuant to 18 U.S.C. Section 1350, as adopted pursuant toSection 906 of the Sarbanes-Oxley Act of 2002 (furnished herewith)
101.INS XBRL Instance Document - the instance document does not appear in the Interactive Data File because itsXBRL tags are embedded within the Inline XBRL document.
101.SCH XBRL Taxonomy Extension Schema101.CAL XBRL Taxonomy Extension Calculation Linkbase101.LAB XBRL Taxonomy Extension Label Linkbase101.PRE XBRL Taxonomy Extension Presentation Linkbase101.DEF XBRL Taxonomy Extension Definition Linkbase104 Cover Page Interactive Data File (formatted as Inline XBRL and contained in Exhibit 101)
(1) Incorporated herein by reference to Exhibit 3.1 to the registrant’s current report on Form 8-K filed August 17, 2017.(2) Incorporated herein by reference to Exhibit 3.1 to the registrant’s current report on Form 8-K filed February 27, 2017.(3) Incorporated herein by reference to Exhibit 4.01 to the registrant’s Registration Statement No. 33-88292 on Form S-1.(4) Incorporated herein by reference to Exhibit 4.1 to the registrant’s current report on Form 8-K filed August 21, 2018.(5) Incorporated herein by reference to Annex A to the registrant’s Proxy Statement filed on April 27, 2017.(6) Incorporated herein by reference to Exhibit 10.07 to the registrant’s quarterly report on Form 10-Q for the period
ended June 30, 2014.(7) Incorporated herein by reference to Exhibit 10.10 to the registrant’s annual report on Form 10-K for the year ended
December 31, 2009.(8) Incorporated herein by reference to Annex A to the registrant’s Proxy Statement for its 2013 Annual Meeting (File
No. 000-25346) filed on April 29, 2013.(9) Incorporated herein by reference to Exhibit 4.3 to the registrant’s Registration Statement No. 333-169293 on Form S-8
filed September 9, 2010(10) Incorporated herein by reference to Exhibit 10.1 to the registrant’s current report on Form 8-K filed February 27, 2017.(11) Incorporated herein by reference to Exhibit 10.1 to the registrant’s current report on Form 8-K filed January 30, 2015.(12) Incorporated herein by reference to Exhibit 10.1 to the registrant’s current report on Form 8-K filed June 20, 2016.(13) Incorporated herein by reference to Exhibit 10.26 to the registrant’s annual report on Form 10-K for the year ended
December 31, 2017.(14) Incorporated herein by reference to Exhibit 10.2 to the registrant’s current report on Form 8-K filed March 8, 2019.(15) Incorporated herein by reference to Exhibit 10.3 to the registrant’s current report on Form 8-K filed March 8, 2019.(16) Incorporated herein by reference to Exhibit 10.4 to the registrant’s current report on Form 8-K filed March 8, 2019.(17) Incorporated herein by reference to Exhibit 10.1 to the registrant’s current report on Form 8-K filed April 11, 2019.(18) Incorporated herein by reference to Exhibit 10.1 to the registrant’s current report on Form 8-K filed November 7,
2019.(19) Incorporated herein by reference to Exhibit 10.1 to the registrant’s current report on Form 8-K filed February 20, 2020.(20) Incorporated herein by reference to Exhibit 10.2 to the registrant’s current report on Form 8-K filed February 20, 2020.(21) Incorporated herein by reference to Exhibit 10.01 to the registrant's quarterly report on Form 10-Q for the period ended
March 31, 2020.(22) Incorporated herein by reference to Exhibit 10.02 to the registrant's quarterly report on Form 10-Q for the period ended
March 31, 2020.(23) Incorporated herein by reference to Exhibit 10.03 to the registrant's quarterly report on Form 10-Q for the period ended
March 31, 2020.(24) Incorporated herein by reference to Exhibit 10.04 to the registrant's quarterly report on Form 10-Q for the period ended
March 31, 2020.(25) Incorporated herein by reference to Appendix A to the registrant's definitive proxy statement on Schedule 14A
(Commission File No. 000-25346) filed April 24, 2020.(26) Incorporated herein by reference to Exhibit 10.06 to the registrant's quarterly report on Form 10-Q for the period ended
June 30, 2020.(27) Incorporated herein by reference to Exhibit 10.07 to the registrant's quarterly report on Form 10-Q for the period ended
June 30, 2020.__________________* Denotes exhibit that constitutes a management contract, or compensatory plan or arrangement.** This certification is not deemed “filed” for purposes of Section 18 of the Securities Exchange Act of 1934, or
otherwise subject to the liability of that section. Such certification will not be deemed to be incorporated by referenceinto any filing under the Securities Act of 1933 or the Securities Exchange Act of 1934, except to the extent that theCompany specifically incorporates it by reference.
90

SIGNATURES
Pursuant to the requirements of Section 13 or 15(d) of the Securities Exchange Act of 1934, the registrant has duly caused thisreport to be signed on its behalf by the undersigned, thereunto dulyd authorized.
ACI WORLDWIDE, INC.(Registrant)
Date: February 25, 2021 By: /s/ ODILON ALMEIDAOdilon Almeida
President, Chief Ee xecutivEE e Officer, and Director (PrincipalOExecutive Officer)
Pursuant to the requirements of the Securities Exchange Act of 1934, this report has been signed by the following persons onbehalf of the registrant and in the capacities and on the dates indicated.
Name Title Date
/S/ ODILON ALMEIDA President, Chief Executive Officer, and Director (PrincipalExecutive Officer)
February 25, 2021
Odilon Almeida
/S/ SCOTT W. BEHRENS Executive Vice President, Chief Financial Officer, and ChiefAccounting Officer (Principal Financial Officer)
February 25, 2021
Scott W. Behrens
/S/ DAVID A. POE Chairman of the Board and Director February 25, 2021
David A. Poe
/S/ CHARLES K. BOBRINSKOY Director February 25, 2021
Charles K. Bobrinskoy
/S/ JANET O. ESTEP Director February 25, 2021Janet O. Estep
/S/ JAMES C. HALE Director February 25, 2021James C. Hale
/S/ DIDIER R. LAMOUCHE Director February 25, 2021
Didier R. Lamouche
/S/ PAMELA H. PATSLEY Director February 25, 2021Pamela H. Patsley
/S/ CHARLES E. PETERS, JR Director February 25, 2021Charles E. Peters, JR
/S/ ADALIO T. SANCHEZ Director February 25, 2021Adalio T. Sanchez
/S/ THOMAS W. WARSOP, III Director February 25, 2021Thomas W. Warsop, III
91

David A. PoeChairman of the Board, ACI Worldwide, Inc.Director Emeritus and Advisor, Edgar, Dunn & CompanyFormer Senior Director and CEO, Edgar, Dunn & Company
Odilon AlmeidaPresident and CEO, ACI Worldwide, Inc.Former Operating Partner, Advent InternationalFormer President, Western Union Global Money Transfer
Charles K. BobrinskoyVice Chairman, Head of Investment Group, Portfolio Manager and Board Member, Ariel InvestmentsFormer Managing Director and Head of North American Investment Banking Branch Offices, Salomon Brothers (now Citigroup)
Janet O. EstepFormer President and CEO, NACHAFormer Executive Vice President, Transaction Services Division and Merchant Payment Services Division, U.S. Bank
James C. Hale IIIFounder and Chairman, Columbus Strategic Advisors, LLCFounder, Managing Partner Emeritus and Advisor, FTV CapitalFormer Senior Managing Partner, BancAmerica Securities (formerly Montgomery Securities)
Didier R. LamoucheFormer President and CEO, Oberthur Technologies, then IDEMIA after its merger with Safran/MorphoFormer Chief Operating Officer, ST-Microelectronics and former CEO, ST-EricssonFormer Chairman and CEO, Bull Group
Pamela H. Patsley
Board of Directors Investor Information
AustraliaAustriaBahrainBrazilCanadaChinaColombiaFrance
Corporate Headquarters Miami, Florida, United States
Principal OfficesGermanyHong KongIndiaIndonesiaIrelandItalyJapanMalaysia
NetherlandsNew ZealandPhilippinesRomaniaRussiaSaudi ArabiaSingaporeSouth Africa
South KoreaSpainTaiwanThailandU.A.E.U.K.U.S.
Former Executive Chairman and CEO, MoneyGram International, Inc.Former President, First Data InternationalFormer President and CEO, Paymentech, Inc.Former CFO, First USA, Inc.
Charles E. Peters, Jr.Former Executive Vice President and CFO, Red Hat, Inc.Former Senior Vice President and CFO, Burlington IndustriesFormer Senior Vice President of Finance, Boston Edison Company
Adalio T. SanchezPresident, S Group Advisory, LLCFormer interim CEO, Quantum CorporationFormer Senior Vice President, Lenovo Group Limited
Copies of ACI Worldwide, Inc.’s Annual Report on Form 10-K for the year that ended December 31, 2020, as filed with the Securities and Exchange Commission, will be sent free of charge to stockholders upon written request to:Investor Relations Department ACI Worldwide, Inc. 6060 Coventry Drive Elkhorn, NE 68022
Transfer AgentCommunications regarding change of address, transfer of stock ownership or lost stock certificates should be sent directly to:EQ Shareowner Services 1110 Centre Pointe Curve Suite 101 Mendota Heights, MN 55120
Stock ListingThe company’s common stock trades on the NASDAQ Global Select Market under the symbol ACIW.
Independent Registered Public Accounting FirmDeloitte & Touche LLP First National Tower 1601 Dodge Street, Suite 3100 Omaha, NE 68102
Thomas W. Warsop IIICEO, One Call Care ManagementCEO, Hananui, LLCFormer Executive Chairman, York Risk Services GroupFormer President and CEO, The Warranty Group, Inc.Former Group President, Fiserv, Inc.

ACI Worldwide is a global software company that provides mission-critical real-time payment solutions to corporations. Customers use our proven, scalable and secure solutions to process and manage digital payments, enable omni-commerce payments, present and process bill payments, and manage fraud and risk. We combine our global footprint with local presence to drive the real-time digital transformation of payments and commerce.
Learn Morewww.aciworldwide.com
@ACI_Worldwide
Americas +1 402 390 7600Asia Pacific +65 6334 4843Europe, Middle East, Africa +44 (0) 1923 816393
©Copyright ACI Worldwide, Inc. 2021
ACI, ACI Worldwide, ACI Payments, Inc., ACI Pay, Speedpay and all ACI product/solution names are trademarks or registered trademarks of ACI Worldwide, Inc., or one of its subsidiaries, in the United States, other countries or both. Other parties’ trademarks referenced are the property of their respective owners.
AAR1100 04-21