2018_audit.pdf - City of Urbana, Ohio
99
CITY OF URBANA CHAMPAIGN COUNTY AUDIT REPORT FOR THE YEAR ENDED DECEMBER 31, 2018
-
Upload
khangminh22 -
Category
Documents
-
view
4 -
download
0
Transcript of 2018_audit.pdf - City of Urbana, Ohio

CITY OF URBANA
CHAMPAIGN COUNTY
AUDIT REPORT
FOR THE YEAR ENDED DECEMBER 31, 2018

Efficient Effective Transparent
City Council City of Urbana 205 S. Main Street P.O. Box 747 Urbana, OH 43078 We have reviewed the Independent Auditor's Report of the City of Urbana, Champaign County, prepared by Charles E. Harris & Associates, Inc., for the audit period January 1, 2018 to December 31, 2018. Based upon this review, we have accepted these reports in lieu of the audit required by Section 117.11, Revised Code. The Auditor of State did not audit the accompanying financial statements and, accordingly, we are unable to express, and do not express an opinion on them. Our review was made in reference to the applicable sections of legislative criteria, as reflected by the Ohio Constitution, and the Revised Code, policies, procedures and guidelines of the Auditor of State, regulations and grant requirements. The City of Urbana is responsible for compliance with these laws and regulations. Keith Faber Auditor of State Columbus, Ohio August 7, 2019
JRHelle
Keith Faber

This page intentionally left blank.
i
CITY OF URBANA CHAMPAIGN COUNTY
AUDIT REPORT For the Year Ended December 31, 2018
TABLE OF CONTENTS
Title Page
Independent Auditor’s Report 1
Management’s Discussion and Analysis 3
Basic Financial Statements:
Government-Wide Financial Statements:
Statement of Net Position – December 31, 2018 15
Statement of Activities – For the Year Ended December 31, 2018 16
Fund Financial Statements:
Balance Sheet – Governmental Funds – December 31, 2018 18
Reconciliation of Total Governmental Fund Balances to Net Position of Governmental Activities – December 31, 2018 21
Statement of Revenues, Expenditures and Changes In Fund Balances – Governmental Funds – For the Year Ended December 31, 2018 22
Reconciliation of the Statement of Revenues, Expenditures and Changes in Fund Balances of Governmental Fund to the Statement of Activities For the Year Ended December 31, 2018 25
Statement of Net Position – Proprietary Funds – December 31, 2018 26
Statement of Revenues, Expenditures and Changes in Fund Net Position – For the Year Ended December 31, 2018 27
Statement of Cash Flows – Proprietary Funds – For the Year Ended December 31, 2018 28
Statement of Fiduciary Assets and Liabilities - Fiduciary Funds - December 31, 2018 30
Notes to the Financial Statements 31
Required Supplementary Information:
Schedule of Revenues, Expenditures, and Changes in Fund Balances Budget (Non-GAAP Basis) and Actual – General Fund For the Year Ended December 31, 2018 76
Schedule of Revenues, Expenditures and Changes in Fund Balances Budget (Non-GAAP Basis) and Actual – Police and Fire Levy Fund For the Year Ended December 31, 2018 79
Notes to the Required Supplementary Information 80
Schedule of City’s Proportionate Share of Net Pension (Asset)/Liability 82
Schedule of City’s Contributions 84
Schedule of City’s Proportionate Share of Net OPEB Liability 86

ii
CITY OF URBANA CHAMPAIGN COUNTY
AUDIT REPORT For the Year Ended December 31, 2018
TABLE OF CONTENTS
Title Page
Schedule of City OPEB Contribution 88
Notes to the Required Supplementary Information 90
Independent Auditor’s Report on Internal Control Over Financial Reporting and on Compliance and Other Matters Required by Government Auditing Standards 91
1
Rockefeller Building 614 W Superior Ave Ste 1242 Cleveland OH 44113-1306
Charles E. Harris & Associates, Inc. Office phone - (216) 575-1630 Certified Public Accountants Fax - (216) 436-2411
INDEPENDENT AUDITOR’S REPORT City of Urbana Champaign County 205 S. Main Street Urbana, Ohio 43078 To the City Council: Report on the Financial Statements We have audited the accompanying financial statements of the governmental activities, the business-type activities, each major fund, and the aggregate remaining fund information of the City of Urbana, Champaign County, Ohio (the City), as of and for the year ended December 31, 2018, and the related notes to the financial statements, which collectively comprise the City’s basic financial statements as listed in the table of contents. Management’s Responsibility for the Financial Statements Management is responsible for the preparation and fair presentation of these financial statements in accordance with accounting principles generally accepted in the United States of America; this includes the design, implementation, and maintenance of internal control relevant to the preparation and fair presentation of financial statements that are free from material misstatement, whether due to fraud or error. Auditor's Responsibility Our responsibility is to express an opinion on these financial statements based on our audit. We conducted our audit in accordance with auditing standards generally accepted in the United States of America and the standards applicable to financial audits contained in Government Auditing Standards, issued by the Comptroller General of the United States. Those standards require that we plan and perform the audit to obtain reasonable assurance about whether the financial statements are free from material misstatement. An audit involves performing procedures to obtain audit evidence about the amounts and disclosures in the financial statements. The procedures selected depend on the auditor’s judgment, including the assessment of the risks of material misstatement of the financial statements, whether due to fraud or error. In making those risk assessments, the auditor considers internal control relevant to the City’s preparation and fair presentation of the financial statements in order to design audit procedures that are appropriate in the circumstances, but not for the purpose of expressing an opinion on the effectiveness of the City’s internal control. Accordingly, we express no such opinion. An audit also includes evaluating the appropriateness of accounting policies used and the reasonableness of significant accounting estimates made by management, as well as evaluating the overall presentation of the financial statements. We believe that the audit evidence we have obtained is sufficient and appropriate to provide a basis for our audit opinion.
2
City of Urbana Champaign County Independent Auditor’s Report Page 2 Opinion In our opinion, the financial statements referred to above present fairly, in all material respects, the respective financial position of the governmental activities, the business-type activities, each major fund, and the aggregate remaining fund information of the City of Urbana, Champaign County, Ohio, as of December 31, 2018, and the respective changes in financial position and, where applicable, cash flows thereof for the year then ended in accordance with the accounting principles generally accepted in the United States of America. Other Matters Required Supplementary Information Accounting principles generally accepted in the United States of America require that the Management’s discussion and analysis, required budgetary comparison schedules and schedules of net pension and OPEB liabilities and pension and OPEB contributions listed in the table of contents, be presented to supplement the basic financial statements. Such information, although not a part of the basic financial statements, is required by the Governmental Accounting Standards Board, who considers it to be an essential part of financial reporting for placing the basic financial statements in an appropriate operational, economic, or historical context. We applied certain limited procedures to the required supplementary information in accordance with auditing standards generally accepted in the United States of America, which consisted of inquiries of management about the methods of preparing the information and comparing the information for consistency with management’s responses to our inquiries, the basic financial statements, and other knowledge we obtained during our audit of the basic financial statements. We do not express an opinion or provide any assurance on the information because the limited procedures do not provide us with sufficient evidence to express an opinion or provide any other assurance. Other Reporting Required by Government Auditing Standards In accordance with Government Auditing Standards, we have also issued our report dated June 21, 2019, on our consideration of the City’s internal control over financial reporting and on our tests of its compliance with certain provisions of laws, regulations, contracts and grant agreements and other matters. The purpose of that report is solely to describe the scope of our testing of internal control over financial reporting and compliance, and the results of that testing, and not to provide an opinion on the effectiveness of the City’s internal control over financial reporting or on compliance. That report is an integral part of an audit performed in accordance with Government Auditing Standards in considering the City’s internal control over financial reporting and compliance.
Charles E. Harris & Associates, Inc. June 21, 2019
CITY OF URBANA, OHIO CHAMPAIGN COUNTY
MANAGEMENT’S DISCUSSION & ANALYSIS FOR THE YEAR ENDED DECEMBER 31, 2018
(UNAUDITED)
As management of the City of Urbana (City), we offer readers of the City’s financial statements this narrative overview and analysis of the financial activities of the City for the fiscal year ended December 31, 2018. FINANCIAL HIGHLIGHTS The assets and deferred outflows of resources of the City exceeded its liabilities and deferred inflows
of resources at the close of the most recent fiscal year by approximately $27.4 million (net position).
The City’s net position increased by approximately $1.8 million, or 7%, during the fiscal year. As of the close of the current fiscal year, the City’s governmental funds reported combined ending fund
balances of approximately $10.3 million, an increase of approximately $1.5 million in comparison with the prior year.
At the end of the current fiscal year, unassigned fund balance for the general fund was approximately
$3.5 million, or 58% of total general fund expenditures including transfers. OVERVIEW OF THE FINANCIAL STATEMENTS This discussion and analysis is intended to serve as an introduction to the City’s basic financial statements. The City’s basic financial statements consist of three components: 1) government-wide financial statements, 2) fund financial statements, and 3) notes to the basic financial statements. This report also contains required supplementary information in addition to the basic financial statements themselves. Government-wide financial statements. The government-wide financial statements are designed to provide readers with a broad overview of the City’s finances, in a manner similar to a private-sector business. The statement of net position presents information on all of the City’s assets, deferred outflows of resources, liabilities, and deferred inflows of resources with the difference reported as net position. Over time, increases or decreases in net position may serve as a useful indicator of whether the financial position of the City is improving or deteriorating. The statement of activities presents information showing how the City’s net position changed during the most recent fiscal year. All changes in net position are reported as soon as the underlying event giving rise to the change occurs, regardless of the timing of related cash flows. Thus, revenues and expenses are reported in this statement for some items that will only result in cash flows in future fiscal periods (e.g. uncollected taxes and earned but unused vacation leave).
3
CITY OF URBANA, OHIO CHAMPAIGN COUNTY
MANAGEMENT’S DISCUSSION & ANALYSIS FOR THE YEAR ENDED DECEMBER 31, 2018
(UNAUDITED)
Both of the government-wide financial statements distinguish functions of the City that are principally supported by taxes and intergovernmental revenues (governmental activities) from other functions that are intended to recover all or a significant portion of their costs through user fees and charges (business-type activities). The governmental activities of the City include public safety, health, leisure time activities, community development, transportation, and general government. The business-type activities of the City include water distribution, sewage collection, storm water distribution, and recycling. The government-wide financial statements can be found on pages 15-17 of this report. Fund Financial Statements. A fund is a grouping of related accounts that is used to maintain control over resources that have been segregated for specific activities or objectives. The City, like other state and local governments, uses fund accounting to ensure and demonstrate compliance with finance-related legal requirements. All of the funds of the City can be divided into three categories: governmental funds, proprietary funds, and fiduciary funds. Governmental Funds. Governmental funds are used to account for essentially the same functions reported as governmental activities in the government-wide financial statements. However, unlike the government-wide financial statements, governmental fund financial statements focus on near-term inflows and outflows of spendable resources, as well as on balances of spendable resources available at the end of the fiscal year. Such information may be useful in evaluating the City’s near-term financing requirements. Because the focus of governmental funds is narrower than that of the government-wide financial statements, it is useful to compare the information presented for governmental funds with similar information presented for governmental activities in the government-wide statements. By doing so, readers may better understand the long-term impact of the government’s near-term financing decisions. Both the governmental fund balance sheet and the governmental fund statement of revenues, expenditures, and changes in fund balances provide a reconciliation to facilitate this comparison between governmental funds and governmental activities. The City maintains 30 individual governmental funds. Information is presented separately in the governmental fund balance sheet and in the governmental fund statement of revenues, expenditures, and changes in fund balances for the General Fund, Police and Fire Levy Fund, Capital Improvements Fund and Perpetual Investment Fund, each of which are considered to be major funds. Data from the other 26 governmental funds are combined into a single, aggregated presentation. The basic governmental fund financial statements can be found on pages 18-25 of this report. Proprietary Funds. The City utilizes only one type of proprietary fund: enterprise funds. Enterprise funds are used to report the same functions presented as business-type activities in the government-wide financial statements. The City uses enterprise funds to account for its water distribution, sewage collection, storm water distribution, and recycling activities. Proprietary funds provide the same type of information as the government-wide financial statements, only in more detail. The proprietary fund financial statements provide separate information for each enterprise fund, each of which are considered to be major funds of the City.
4
CITY OF URBANA, OHIO CHAMPAIGN COUNTY
MANAGEMENT’S DISCUSSION & ANALYSIS FOR THE YEAR ENDED DECEMBER 31, 2018
(UNAUDITED)
The basic proprietary fund financial statements can be found on pages 26-29 of this report. Fiduciary Funds. Fiduciary funds are used to account for resources held for the benefit of parties outside the government. Fiduciary funds are not reflected in the government-wide financial statements because the resources of those funds are not available to support the City’s own programs. The accounting used for fiduciary funds is much like that used for proprietary funds. The basic fiduciary fund financial statement can be found on page 30 of this report. Notes to the basic financial statements. The notes provide additional information that is essential to a full understanding of the data provided in the government-wide and fund financial statements. The notes to the financial statements can be found on pages 31-74 of this report. Other information. In addition to the basic financial statements and accompanying notes, this report also presents certain required supplementary information concerning the City’s compliance with budgetary law, as well as the City’s progress in funding its obligations to provide pension benefits to its employees. Required supplementary information can be found on pages 75-89 of this report.
THIS SPACE INTENTIONALLY LEFT BLANK
5
CITY OF URBANA, OHIO CHAMPAIGN COUNTY
MANAGEMENT’S DISCUSSION & ANALYSIS FOR THE YEAR ENDED DECEMBER 31, 2018
(UNAUDITED)
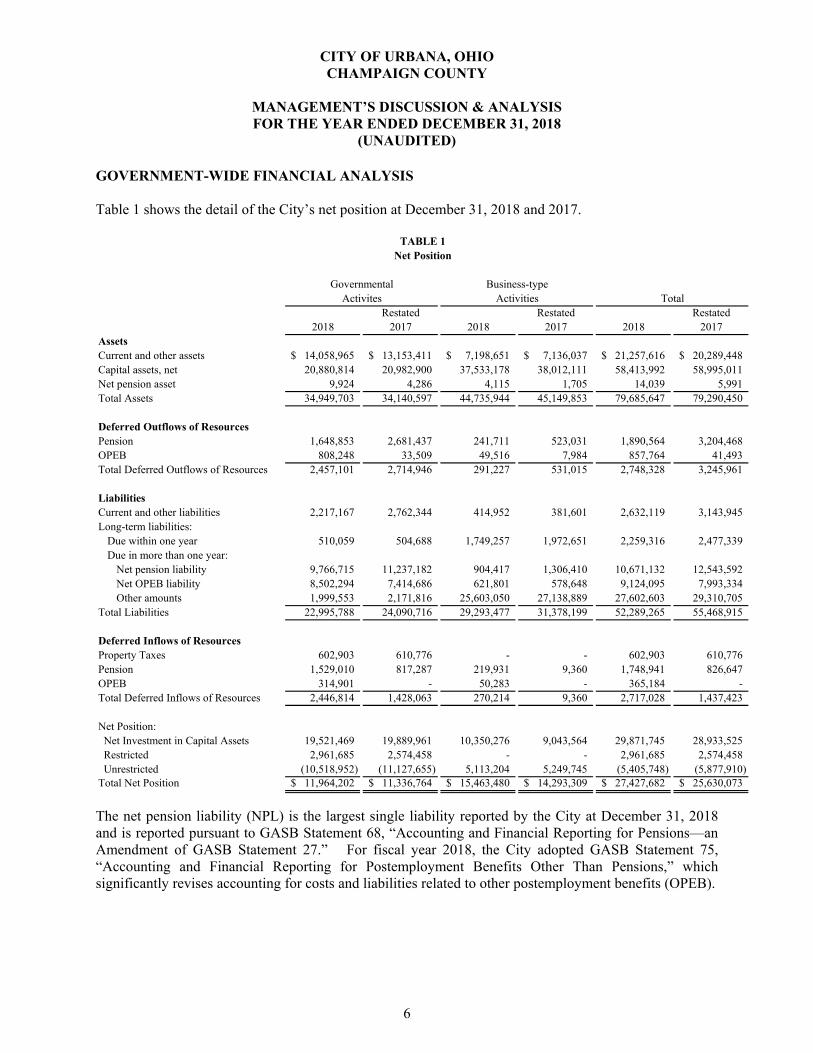
GOVERNMENT-WIDE FINANCIAL ANALYSIS Table 1 shows the detail of the City’s net position at December 31, 2018 and 2017.
TABLE 1Net Position
Governmental Business-typeActivites Activities Total
Restated Restated Restated2018 2017 2018 2017 2018 2017
AssetsCurrent and other assets 14,058,965$ 13,153,411$ 7,198,651$ 7,136,037$ 21,257,616$ 20,289,448$ Capital assets, net 20,880,814 20,982,900 37,533,178 38,012,111 58,413,992 58,995,011 Net pension asset 9,924 4,286 4,115 1,705 14,039 5,991 Total Assets 34,949,703 34,140,597 44,735,944 45,149,853 79,685,647 79,290,450
Deferred Outflows of ResourcesPension 1,648,853 2,681,437 241,711 523,031 1,890,564 3,204,468 OPEB 808,248 33,509 49,516 7,984 857,764 41,493 Total Deferred Outflows of Resources 2,457,101 2,714,946 291,227 531,015 2,748,328 3,245,961
LiabilitiesCurrent and other liabilities 2,217,167 2,762,344 414,952 381,601 2,632,119 3,143,945 Long-term liabilities:
Due within one year 510,059 504,688 1,749,257 1,972,651 2,259,316 2,477,339 Due in more than one year:
Net pension liability 9,766,715 11,237,182 904,417 1,306,410 10,671,132 12,543,592 Net OPEB liability 8,502,294 7,414,686 621,801 578,648 9,124,095 7,993,334 Other amounts 1,999,553 2,171,816 25,603,050 27,138,889 27,602,603 29,310,705
Total Liabilities 22,995,788 24,090,716 29,293,477 31,378,199 52,289,265 55,468,915
Deferred Inflows of ResourcesProperty Taxes 602,903 610,776 - - 602,903 610,776 Pension 1,529,010 817,287 219,931 9,360 1,748,941 826,647 OPEB 314,901 - 50,283 - 365,184 - Total Deferred Inflows of Resources 2,446,814 1,428,063 270,214 9,360 2,717,028 1,437,423
Net Position: Net Investment in Capital Assets 19,521,469 19,889,961 10,350,276 9,043,564 29,871,745 28,933,525 Restricted 2,961,685 2,574,458 - - 2,961,685 2,574,458 Unrestricted (10,518,952) (11,127,655) 5,113,204 5,249,745 (5,405,748) (5,877,910) Total Net Position 11,964,202$ 11,336,764$ 15,463,480$ 14,293,309$ 27,427,682$ 25,630,073$
The net pension liability (NPL) is the largest single liability reported by the City at December 31, 2018 and is reported pursuant to GASB Statement 68, “Accounting and Financial Reporting for Pensions—an Amendment of GASB Statement 27.” For fiscal year 2018, the City adopted GASB Statement 75, “Accounting and Financial Reporting for Postemployment Benefits Other Than Pensions,” which significantly revises accounting for costs and liabilities related to other postemployment benefits (OPEB).
6
CITY OF URBANA, OHIO CHAMPAIGN COUNTY
MANAGEMENT’S DISCUSSION & ANALYSIS FOR THE YEAR ENDED DECEMBER 31, 2018
(UNAUDITED)
For reasons discussed below, many end users of this financial statement will gain a clearer understanding of the City’s actual financial condition by adding deferred inflows related to pension and OPEB, the net pension liability and the net OPEB liability to the reported net position and subtracting deferred outflows related to pension and OPEB. Governmental Accounting Standards Board standards are national and apply to all government financial reports prepared in accordance with generally accepted accounting principles. Prior accounting for pensions (GASB 27) and postemployment benefits (GASB 45) focused on a funding approach. This approach limited pension and OPEB costs to contributions annually required by law, which may or may not be sufficient to fully fund each plan’s net pension liability or net OBEP liability. GASB 68 and GASB 75 take an earnings approach to pension and OPEB accounting; however, the nature of Ohio’s statewide pension/OPEB plans and state law governing those systems requires additional explanation in order to properly understand the information presented in these statements.
GASB 68 and GASB 75 require the net pension liability and the net OPEB liability to equal the City’s proportionate share of each plan’s collective:
1. Present value of estimated future pension/OPEB benefits attributable to active and inactive employees’ past service
2 Minus plan assets available to pay these benefits GASB notes that pension and OPEB obligations, whether funded or unfunded, are part of the “employment exchange” – that is, the employee is trading his or her labor in exchange for wages, benefits, and the promise of a future pension and other postemployment benefits. GASB noted that the unfunded portion of this promise is a present obligation of the government, part of a bargained-for benefit to the employee and should accordingly be reported by the government as a liability since they received the benefit of the exchange. However, the City is not responsible for certain key factors affecting the balance of these liabilities. In Ohio, the employee shares the obligation of funding pension benefits with the employer. Both employer and employee contribution rates are capped by State statute. A change in these caps requires action of both Houses of the General Assembly and approval of the Governor. Benefit provisions are also determined by State statute. The Ohio revised Code permits, but does not require, the retirement systems to provide healthcare to eligible benefit recipients. The retirement systems may allocate a portion of the employer contributions to provide for these OPEB benefits. The employee enters the employment exchange with the knowledge that the employer’s promise is limited not by contract but by law. The employer enters the exchange also knowing that there is a specific, legal limit to its contribution to the retirement system. In Ohio, there is no legal means to enforce the unfunded liability of the pension/OPEB plan as against the public employer. State law operates to mitigate/lessen the moral obligation of the public employer to the employee, because all parties enter the employment exchange with notice as to the law. The retirement system is responsible for the administration of the pension and OPEB plans. Most long-term liabilities have set repayment schedules or, in the case of compensated absences (i.e. sick and vacation leave), are satisfied through paid time-off or termination payments. There is no repayment schedule for the net pension liability or the net OPEB liability.
7
CITY OF URBANA, OHIO CHAMPAIGN COUNTY
MANAGEMENT’S DISCUSSION & ANALYSIS FOR THE YEAR ENDED DECEMBER 31, 2018
(UNAUDITED)
As explained above, changes in benefits, contribution rates, and return on investments affect the balance of these liabilities but are outside the control of the local government. In the event that contributions, investment returns, and other changes are insufficient to keep up with required payments, State statute does not assign/identify the responsible party for the unfunded portion. Due to the unique nature of how the net pension liability and the net OPEB liability are satisfied, these liabilities are separately identified within the long-term liability section of the statement of net position. In accordance with GASB 68 and GASB 75, the City’s statements prepared on an accrual basis of accounting include an annual pension expense and an annual OPEB expense for their proportionate share of each plan’s change in net pension liability and net OPEB liability, respectively, not accounted for as deferred inflows/outflows. As a result of implementing GASB 75, the City is reporting a net OPEB liability and deferred inflows/outflows of resources related to OPEB on the accrual basis of accounting. This implementation also had the effect of restating net position at December 31, 2017, from $18,717,941 to $11,336,764 for governmental activities and from $14,863,973 to $14,293,309 for business type activities. Governmental Activities Capital assets, net, decreased in comparison with the prior fiscal year-end. This increase represents the amount in which capital asset depreciation exceeded capital asset additions during the year. Current and other liabilities also decreased significantly. This decrease primarily represents prepaid income taxes earned by the City during the year. Other amounts due in more than one year decreased significantly. This decrease represents debt principal payments made during the year. Business-Type Activities Other amounts due in more than one year decreased significantly. This decrease represents debt principal payments made during the year. Capital assets, net, also decreased in comparison with the prior fiscal year-end. This decrease represents the amount in which capital asset depreciation exceeded capital asset additions during the year. Governmental and Business-Type Activities The net pension and net OPEB liabilities and related deferred outflows and inflows of resources all fluctuated significantly in comparison with the prior year. These fluctuations are primarily the result of the greater than expected returns on pension plan investments. This is also due to the City paying off their proportionate share of the Ohio Police & Fire unfunded liabilities. As noted earlier, net position may serve over time as a useful indicator of the City’s financial position. In the case of the City, assets and deferred outflows of resources exceeded liabilities and deferred inflows of resources by approximately $27.4 million at the close of the most recent fiscal year.
8
CITY OF URBANA, OHIO CHAMPAIGN COUNTY
MANAGEMENT’S DISCUSSION & ANALYSIS FOR THE YEAR ENDED DECEMBER 31, 2018
(UNAUDITED)
By far the largest portion of the City’s net position (approximately $29.9 million) reflects its investment in capital assets (e.g. land, buildings, machinery, equipment, and infrastructure), less any related debt used to acquire those assets that is still outstanding. The City uses these capital assets to provide services to citizens; consequently, these assets are not available for future spending. Although the City’s investment in its capital assets is reported net of related debt, it should be noted that the resources needed to repay this debt must be provided from other sources, since the capital assets themselves cannot be used to liquidate these liabilities. An additional portion of the City’s net position (approximately $3.0 million) represents resources that are subject to external restrictions on how they may be used. The remaining balance of unrestricted net position (approximately $5.4 million) may be used to meet the City’s ongoing obligations to citizens and creditors. At the end of the current fiscal year, the City is able to report positive balances in its investment in capital assets and restricted net position, both for the City as a whole, as well as for its separate governmental and business-type activities.
Remainder of this page intentionally left blank.
9
CITY OF URBANA, OHIO CHAMPAIGN COUNTY
MANAGEMENT’S DISCUSSION & ANALYSIS FOR THE YEAR ENDED DECEMBER 31, 2018
(UNAUDITED)
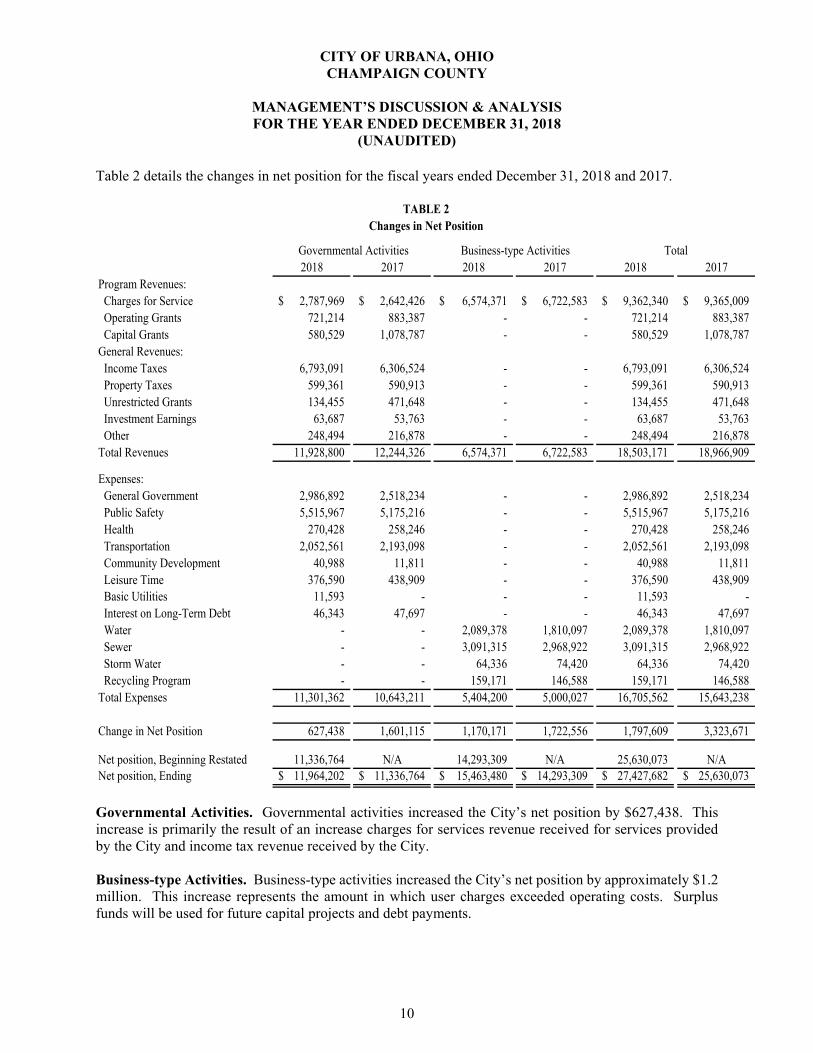
Table 2 details the changes in net position for the fiscal years ended December 31, 2018 and 2017.
TABLE 2Changes in Net Position
Governmental Activities Business-type Activities Total2018 2017 2018 2017 2018 2017
Program Revenues: Charges for Service 2,787,969$ 2,642,426$ 6,574,371$ 6,722,583$ 9,362,340$ 9,365,009$ Operating Grants 721,214 883,387 - - 721,214 883,387 Capital Grants 580,529 1,078,787 - - 580,529 1,078,787 General Revenues: Income Taxes 6,793,091 6,306,524 - - 6,793,091 6,306,524 Property Taxes 599,361 590,913 - - 599,361 590,913 Unrestricted Grants 134,455 471,648 - - 134,455 471,648 Investment Earnings 63,687 53,763 - - 63,687 53,763 Other 248,494 216,878 - - 248,494 216,878 Total Revenues 11,928,800 12,244,326 6,574,371 6,722,583 18,503,171 18,966,909
Expenses: General Government 2,986,892 2,518,234 - - 2,986,892 2,518,234 Public Safety 5,515,967 5,175,216 - - 5,515,967 5,175,216 Health 270,428 258,246 - - 270,428 258,246 Transportation 2,052,561 2,193,098 - - 2,052,561 2,193,098 Community Development 40,988 11,811 - - 40,988 11,811 Leisure Time 376,590 438,909 - - 376,590 438,909 Basic Utilities 11,593 - - - 11,593 - Interest on Long-Term Debt 46,343 47,697 - - 46,343 47,697 Water - - 2,089,378 1,810,097 2,089,378 1,810,097 Sewer - - 3,091,315 2,968,922 3,091,315 2,968,922 Storm Water - - 64,336 74,420 64,336 74,420 Recycling Program - - 159,171 146,588 159,171 146,588 Total Expenses 11,301,362 10,643,211 5,404,200 5,000,027 16,705,562 15,643,238
Change in Net Position 627,438 1,601,115 1,170,171 1,722,556 1,797,609 3,323,671
Net position, Ending 11,964,202$ 11,336,764$ 15,463,480$ 14,293,309$ 27,427,682$ 25,630,073$ 14,293,309 N/A25,630,073 Net position, Beginning Restated N/A11,336,764 N/A
Governmental Activities. Governmental activities increased the City’s net position by $627,438. This increase is primarily the result of an increase charges for services revenue received for services provided by the City and income tax revenue received by the City. Business-type Activities. Business-type activities increased the City’s net position by approximately $1.2 million. This increase represents the amount in which user charges exceeded operating costs. Surplus funds will be used for future capital projects and debt payments.
10
CITY OF URBANA, OHIO CHAMPAIGN COUNTY
MANAGEMENT’S DISCUSSION & ANALYSIS FOR THE YEAR ENDED DECEMBER 31, 2018
(UNAUDITED)
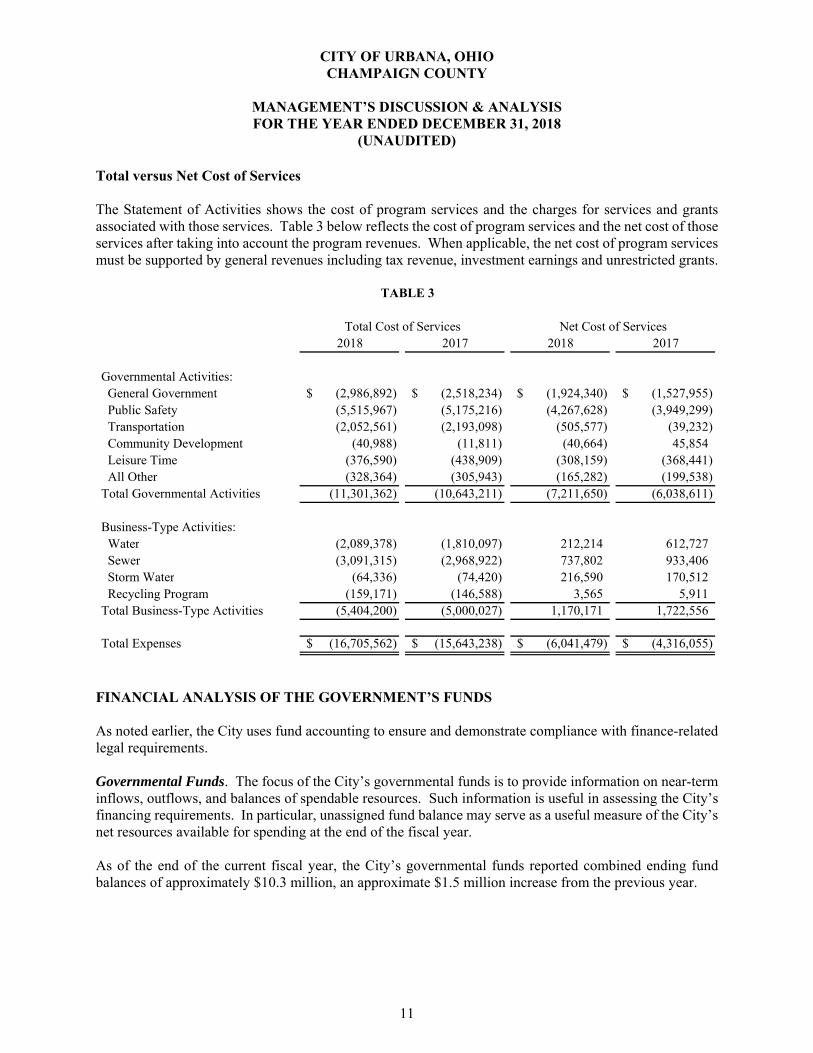
Total versus Net Cost of Services The Statement of Activities shows the cost of program services and the charges for services and grants associated with those services. Table 3 below reflects the cost of program services and the net cost of those services after taking into account the program revenues. When applicable, the net cost of program services must be supported by general revenues including tax revenue, investment earnings and unrestricted grants.
Total Cost of Services Net Cost of Services2018 2017 2018 2017
Governmental Activities: General Government (2,986,892)$ (2,518,234)$ (1,924,340)$ (1,527,955)$ Public Safety (5,515,967) (5,175,216) (4,267,628) (3,949,299) Transportation (2,052,561) (2,193,098) (505,577) (39,232) Community Development (40,988) (11,811) (40,664) 45,854 Leisure Time (376,590) (438,909) (308,159) (368,441) All Other (328,364) (305,943) (165,282) (199,538) Total Governmental Activities (11,301,362) (10,643,211) (7,211,650) (6,038,611)
Business-Type Activities: Water (2,089,378) (1,810,097) 212,214 612,727 Sewer (3,091,315) (2,968,922) 737,802 933,406 Storm Water (64,336) (74,420) 216,590 170,512 Recycling Program (159,171) (146,588) 3,565 5,911 Total Business-Type Activities (5,404,200) (5,000,027) 1,170,171 1,722,556
Total Expenses (16,705,562)$ (15,643,238)$ (6,041,479)$ (4,316,055)$
TABLE 3
FINANCIAL ANALYSIS OF THE GOVERNMENT’S FUNDS As noted earlier, the City uses fund accounting to ensure and demonstrate compliance with finance-related legal requirements. Governmental Funds. The focus of the City’s governmental funds is to provide information on near-term inflows, outflows, and balances of spendable resources. Such information is useful in assessing the City’s financing requirements. In particular, unassigned fund balance may serve as a useful measure of the City’s net resources available for spending at the end of the fiscal year. As of the end of the current fiscal year, the City’s governmental funds reported combined ending fund balances of approximately $10.3 million, an approximate $1.5 million increase from the previous year.
11
CITY OF URBANA, OHIO CHAMPAIGN COUNTY
MANAGEMENT’S DISCUSSION & ANALYSIS FOR THE YEAR ENDED DECEMBER 31, 2018
(UNAUDITED)
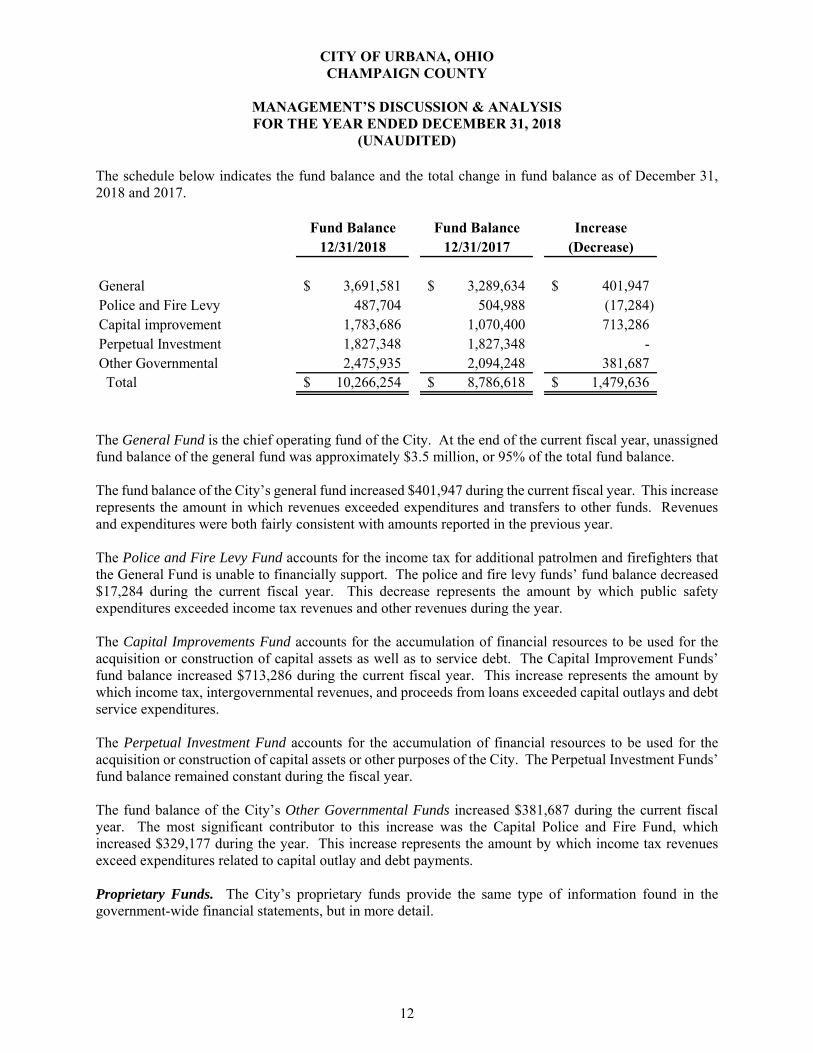
The schedule below indicates the fund balance and the total change in fund balance as of December 31, 2018 and 2017.
Fund Balance Fund Balance Increase12/31/2018 12/31/2017 (Decrease)
General 3,691,581$ 3,289,634$ 401,947$ Police and Fire Levy 487,704 504,988 (17,284) Capital improvement 1,783,686 1,070,400 713,286 Perpetual Investment 1,827,348 1,827,348 - Other Governmental 2,475,935 2,094,248 381,687 Total 10,266,254$ 8,786,618$ 1,479,636$
The General Fund is the chief operating fund of the City. At the end of the current fiscal year, unassigned fund balance of the general fund was approximately $3.5 million, or 95% of the total fund balance. The fund balance of the City’s general fund increased $401,947 during the current fiscal year. This increase represents the amount in which revenues exceeded expenditures and transfers to other funds. Revenues and expenditures were both fairly consistent with amounts reported in the previous year. The Police and Fire Levy Fund accounts for the income tax for additional patrolmen and firefighters that the General Fund is unable to financially support. The police and fire levy funds’ fund balance decreased $17,284 during the current fiscal year. This decrease represents the amount by which public safety expenditures exceeded income tax revenues and other revenues during the year. The Capital Improvements Fund accounts for the accumulation of financial resources to be used for the acquisition or construction of capital assets as well as to service debt. The Capital Improvement Funds’ fund balance increased $713,286 during the current fiscal year. This increase represents the amount by which income tax, intergovernmental revenues, and proceeds from loans exceeded capital outlays and debt service expenditures. The Perpetual Investment Fund accounts for the accumulation of financial resources to be used for the acquisition or construction of capital assets or other purposes of the City. The Perpetual Investment Funds’ fund balance remained constant during the fiscal year. The fund balance of the City’s Other Governmental Funds increased $381,687 during the current fiscal year. The most significant contributor to this increase was the Capital Police and Fire Fund, which increased $329,177 during the year. This increase represents the amount by which income tax revenues exceed expenditures related to capital outlay and debt payments. Proprietary Funds. The City’s proprietary funds provide the same type of information found in the government-wide financial statements, but in more detail.
12
CITY OF URBANA, OHIO CHAMPAIGN COUNTY
MANAGEMENT’S DISCUSSION & ANALYSIS FOR THE YEAR ENDED DECEMBER 31, 2018
(UNAUDITED)
Unrestricted net position in the Water Revenue Fund at the end of the year amounted to approximately $1.7 million. Total net position increased $212,214 from the previous year. This increase represents the amount in which operating income exceeded program expenses and interest expense during the year. Unrestricted net position in the Sewer Revenue Fund at the end of the year amounted to $3.0 million. Total net position increased $737,802 from the previous year. This increase represents the amount in which operating income exceeded program expenses and interest expense during the year. Unrestricted net position in the other proprietary funds at the end of the year amounted to $424,001. Total net position increased $220,155 from the previous year. This increase represents the amount in which operating income exceeded operating expenses during the year. Budget Information General Fund The City’s budget is prepared in accordance with Ohio law and is based on the budgetary basis of accounting, utilizing cash receipts, disbursements and encumbrances. The most significant budgeted fund is the General Fund. The variance between the original and final revenue estimates was $0. Actual revenue exceeded final revenue estimates by $553,387 as a result of greater than expected income taxes and receipts from fines, licenses, and permits provided by the City. Final appropriations exceeded the original resolution by $314,875, or 5%, and the final amended appropriations exceeded actual expenditures by $80,692, or 1%. Capital Assets The City’s investment in capital assets for its governmental and business-type activities as of December 31, 2018, amounts to approximately $58.4 million (net of accumulated depreciation). This investment in capital assets includes land, construction in progress, land improvements, buildings, equipment, furniture, vehicles, and infrastructure. Total acquisitions for the current fiscal year were approximately $1.8 million and depreciation was approximately $2.4 million. Detailed information regarding capital asset activity is included in the Note 9 to the basic financial statements. Debt At the end of the current fiscal year, the City had total debt outstanding of approximately $27.1 million. Of this amount, approximately $1.3 million represents bonds backed by the full faith and credit of the City. The remaining $25.8 million of the City’s debt represents loans in the City’s name. Detailed information regarding long-term debt is included in Note 10 to the basic financial statements.
13
CITY OF URBANA, OHIO CHAMPAIGN COUNTY
MANAGEMENT’S DISCUSSION & ANALYSIS FOR THE YEAR ENDED DECEMBER 31, 2018
(UNAUDITED)
Contacting the City Finance Department This financial report is designed to provide our citizens, taxpayers, investors, and creditors with a general overview of the City’s finances and to demonstrate the City’s accountability for the money it administers. If you have any questions about this report or need additional financial information, contact Chris Boettcher, Finance Director, 205 South Main Street, Urbana, Ohio 43078.
14
CITY OF URBANA, OHIOCHAMPAIGN COUNTY
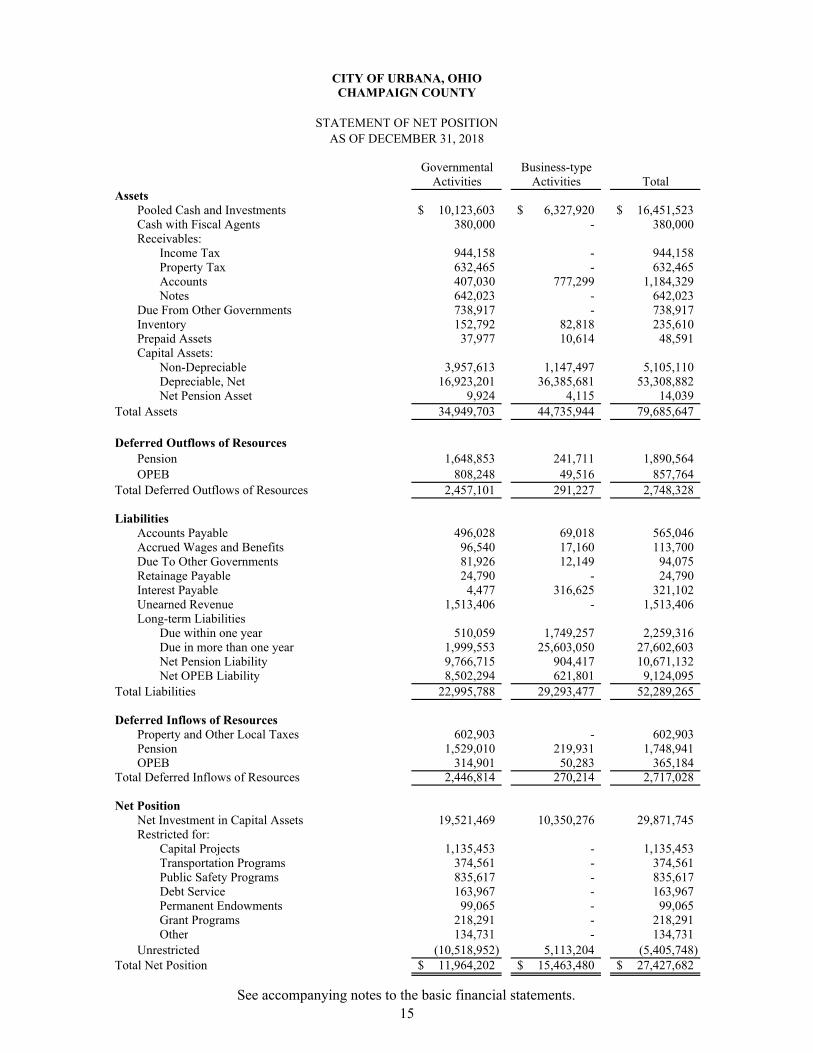
STATEMENT OF NET POSITIONAS OF DECEMBER 31, 2018
Governmental Business-typeActivities Activities Total
AssetsPooled Cash and Investments 10,123,603$ 6,327,920$ 16,451,523$ Cash with Fiscal Agents 380,000 - 380,000 Receivables:
Income Tax 944,158 - 944,158 Property Tax 632,465 - 632,465 Accounts 407,030 777,299 1,184,329 Notes 642,023 - 642,023
Due From Other Governments 738,917 - 738,917 Inventory 152,792 82,818 235,610 Prepaid Assets 37,977 10,614 48,591 Capital Assets:
Non-Depreciable 3,957,613 1,147,497 5,105,110 Depreciable, Net 16,923,201 36,385,681 53,308,882 Net Pension Asset 9,924 4,115 14,039
Total Assets 34,949,703 44,735,944 79,685,647
Deferred Outflows of ResourcesPension 1,648,853 241,711 1,890,564 OPEB 808,248 49,516 857,764
Total Deferred Outflows of Resources 2,457,101 291,227 2,748,328
LiabilitiesAccounts Payable 496,028 69,018 565,046 Accrued Wages and Benefits 96,540 17,160 113,700 Due To Other Governments 81,926 12,149 94,075 Retainage Payable 24,790 - 24,790 Interest Payable 4,477 316,625 321,102 Unearned Revenue 1,513,406 - 1,513,406 Long-term Liabilities
Due within one year 510,059 1,749,257 2,259,316 Due in more than one year 1,999,553 25,603,050 27,602,603 Net Pension Liability 9,766,715 904,417 10,671,132 Net OPEB Liability 8,502,294 621,801 9,124,095
Total Liabilities 22,995,788 29,293,477 52,289,265
Deferred Inflows of ResourcesProperty and Other Local Taxes 602,903 - 602,903 Pension 1,529,010 219,931 1,748,941 OPEB 314,901 50,283 365,184
Total Deferred Inflows of Resources 2,446,814 270,214 2,717,028
Net PositionNet Investment in Capital Assets 19,521,469 10,350,276 29,871,745 Restricted for:
Capital Projects 1,135,453 - 1,135,453 Transportation Programs 374,561 - 374,561 Public Safety Programs 835,617 - 835,617 Debt Service 163,967 - 163,967 Permanent Endowments 99,065 - 99,065 Grant Programs 218,291 - 218,291 Other 134,731 - 134,731
Unrestricted (10,518,952) 5,113,204 (5,405,748) Total Net Position 11,964,202$ 15,463,480$ 27,427,682$
See accompanying notes to the basic financial statements.15
CITY OF URBANA, OHIOCHAMPAIGN COUNTY
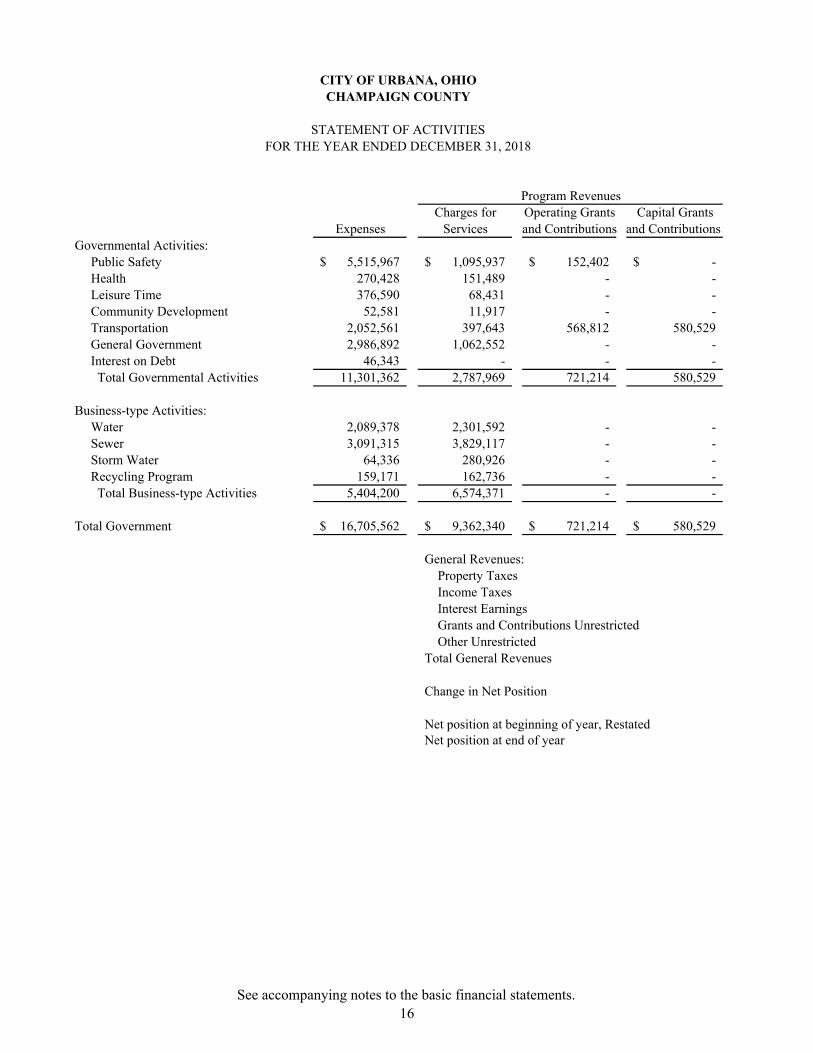
STATEMENT OF ACTIVITIESFOR THE YEAR ENDED DECEMBER 31, 2018
Program RevenuesCharges for Operating Grants Capital Grants
Expenses Services and Contributions and Contributions Governmental Activities:
Public Safety 5,515,967$ 1,095,937$ 152,402$ -$ Health 270,428 151,489 - - Leisure Time 376,590 68,431 - - Community Development 52,581 11,917 - - Transportation 2,052,561 397,643 568,812 580,529 General Government 2,986,892 1,062,552 - - Interest on Debt 46,343 - - - Total Governmental Activities 11,301,362 2,787,969 721,214 580,529
Business-type Activities:Water 2,089,378 2,301,592 - - Sewer 3,091,315 3,829,117 - - Storm Water 64,336 280,926 - - Recycling Program 159,171 162,736 - - Total Business-type Activities 5,404,200 6,574,371 - -
Total Government 16,705,562$ 9,362,340$ 721,214$ 580,529$
General Revenues: Property Taxes Income Taxes Interest Earnings Grants and Contributions Unrestricted Other UnrestrictedTotal General Revenues
Change in Net Position
Net position at beginning of year, RestatedNet position at end of year
See accompanying notes to the basic financial statements.16

Net (Expense) Revenue andChanges in Net Position
Governmental Business-typeActivities Activities Total
(4,267,628)$ -$ (4,267,628)$ (118,939) - (118,939) (308,159) - (308,159)
(40,664) - (40,664) (505,577) - (505,577)
(1,924,340) - (1,924,340) (46,343) - (46,343)
(7,211,650) - (7,211,650)
- 212,214 212,214 - 737,802 737,802 - 216,590 216,590 - 3,565 3,565 - 1,170,171 1,170,171
(7,211,650)$ 1,170,171$ (6,041,479)$
599,361 - 599,361 6,793,091 - 6,793,091
63,687 - 63,687 134,455 - 134,455 248,494 - 248,494
7,839,088 - 7,839,088
627,438 1,170,171 1,797,609
11,336,764 14,293,309 25,630,073 11,964,202$ 15,463,480$ 27,427,682$
See accompanying notes to the basic financial statements.17

Police and Capital Perpetual General Fire Levy Improvement Investment
Fund Fund Fund FundAssets: Pooled Cash and Investments 4,777,775$ 546,344$ 1,357,706$ 1,186,402$ Cash with Fiscal Agents - - 380,000 - Receivables: Income Tax 505,799 202,319 168,600 - Property Tax 485,226 - - - Accounts 340,421 - 1,350 - Notes - - - 640,946 Due From Other Governments 162,583 5,407 - - Due From Other Funds 4,106 - - - Inventory 25,089 - - - Prepaid Assets 31,207 - - - Advances To Other Funds 70,500 - - - Total Assets 6,402,706$ 754,070$ 1,907,656$ 1,827,348$
Liabilities: Accounts Payable 59,994$ 139,350$ 47,240$ -$ Accrued Wages and Benefits 67,440 18,511 - - Due To Other Governments 57,723 16,430 - - Retainage Payable - - - - Due To Other Funds - - - - Advances From Other Funds - - - - Unearned Revenue 1,513,406 - - - Total Liabilities 1,698,563 174,291 47,240 -
Deferred Inflows of Resources:Unavailable Revenue 551,523 92,075 76,730 - Property and Other Local Taxes 461,039 - - -
Total Deferred Inflows of Resources 1,012,562 92,075 76,730 -
Fund Balances: Nonspendable: Inventory 25,089 - - - Advances 70,500 - - - Prepaids 31,207 - - - Restricted: Capital Projects - - - - Transportation Programs - - - - Public Safety Programs - 487,704 - - Debt Service - - - - Permanent Endowments - - - - Grant Programs - - - - Other - - - - Committed: Transportation Programs - - - - Assigned: General Government 53,162 - - - Security of Person and Property 18,887 - - - Leisure Activity 296 - - - Capital Projects - - 1,783,686 1,827,348 Unassigned 3,492,440 - - - Total Fund Balances 3,691,581 487,704 1,783,686 1,827,348
Total Liabilities, Deferred Inflows of Resources, and Fund Balances 6,402,706$ 754,070$ 1,907,656$ 1,827,348$
CITY OF URBANA, OHIOCHAMPAIGN COUNTY
BALANCE SHEETGOVERNMENTAL FUNDSAS OF DECEMBER 31, 2018
See accompanying notes to the basic financial statements.18
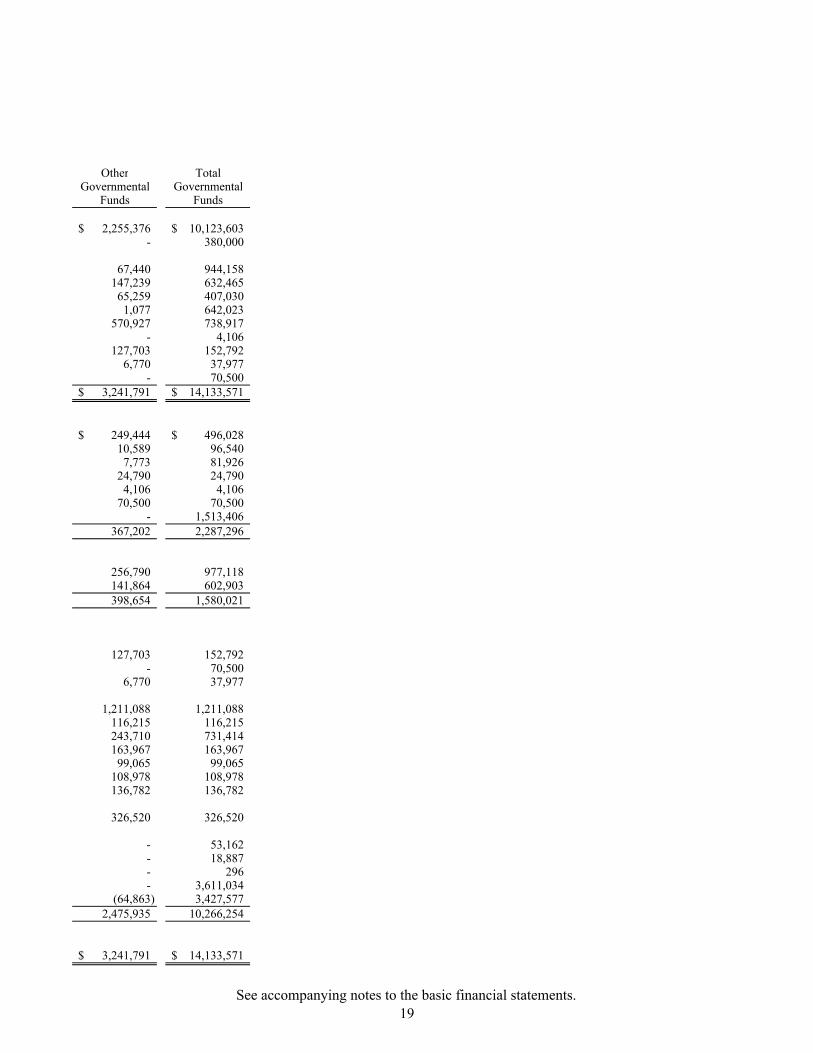
Other TotalGovernmental Governmental
Funds Funds
2,255,376$ 10,123,603$ - 380,000
67,440 944,158 147,239 632,465 65,259 407,030 1,077 642,023
570,927 738,917 - 4,106
127,703 152,792 6,770 37,977
- 70,500 3,241,791$ 14,133,571$
249,444$ 496,028$ 10,589 96,540 7,773 81,926
24,790 24,790 4,106 4,106
70,500 70,500 - 1,513,406
367,202 2,287,296
256,790 977,118 141,864 602,903 398,654 1,580,021
127,703 152,792 - 70,500
6,770 37,977
1,211,088 1,211,088 116,215 116,215 243,710 731,414 163,967 163,967 99,065 99,065
108,978 108,978 136,782 136,782
326,520 326,520
- 53,162 - 18,887 - 296 - 3,611,034
(64,863) 3,427,577 2,475,935 10,266,254
3,241,791$ 14,133,571$
See accompanying notes to the basic financial statements.19

THIS PAGE INTENTIONALLY LEFT BLANK
20
CITY OF URBANA, OHIOCHAMPAIGN COUNTY
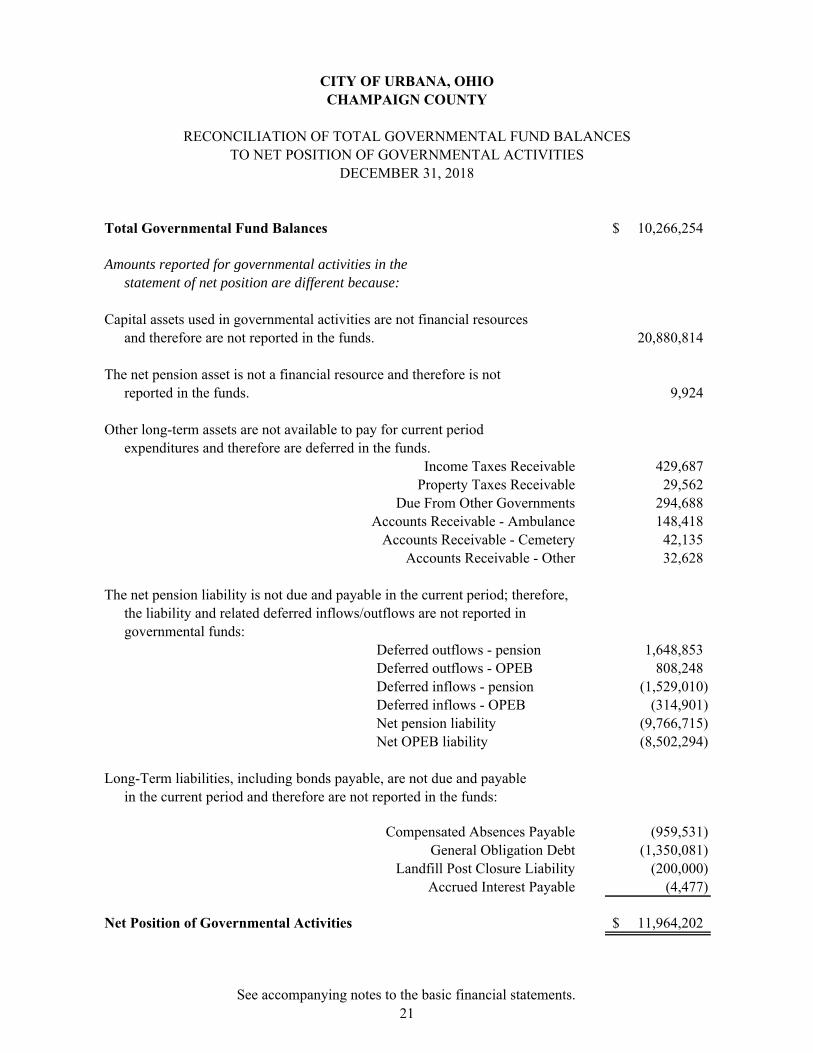
RECONCILIATION OF TOTAL GOVERNMENTAL FUND BALANCESTO NET POSITION OF GOVERNMENTAL ACTIVITIES
DECEMBER 31, 2018
Total Governmental Fund Balances 10,266,254$
Amounts reported for governmental activities in thestatement of net position are different because:
Capital assets used in governmental activities are not financial resourcesand therefore are not reported in the funds. 20,880,814
The net pension asset is not a financial resource and therefore is notreported in the funds. 9,924
Other long-term assets are not available to pay for current periodexpenditures and therefore are deferred in the funds.
Income Taxes Receivable 429,687 Property Taxes Receivable 29,562
Due From Other Governments 294,688 Accounts Receivable - Ambulance 148,418
Accounts Receivable - Cemetery 42,135 Accounts Receivable - Other 32,628
The net pension liability is not due and payable in the current period; therefore,the liability and related deferred inflows/outflows are not reported in governmental funds:
Deferred outflows - pension 1,648,853 Deferred outflows - OPEB 808,248 Deferred inflows - pension (1,529,010) Deferred inflows - OPEB (314,901) Net pension liability (9,766,715) Net OPEB liability (8,502,294)
Long-Term liabilities, including bonds payable, are not due and payablein the current period and therefore are not reported in the funds:
Compensated Absences Payable (959,531) General Obligation Debt (1,350,081)
Landfill Post Closure Liability (200,000) Accrued Interest Payable (4,477)
Net Position of Governmental Activities 11,964,202$
See accompanying notes to the basic financial statements.21
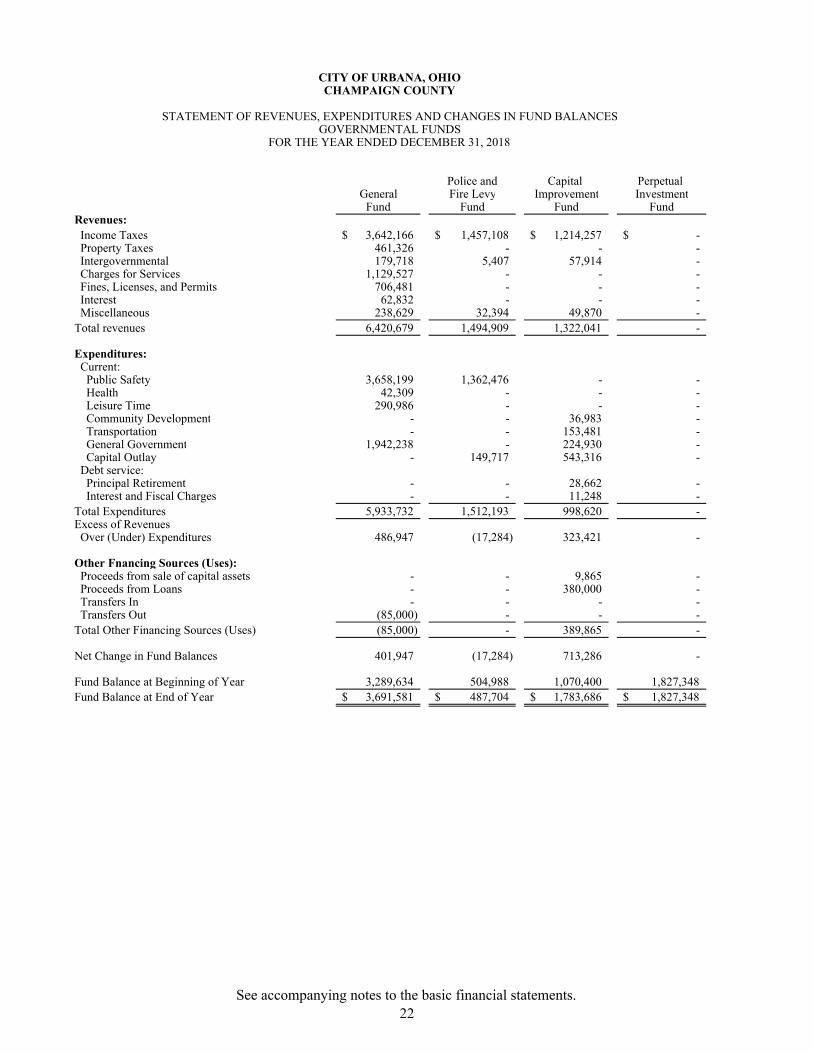
Police and Capital Perpetual General Fire Levy Improvement Investment
Fund Fund Fund FundRevenues: Income Taxes 3,642,166$ 1,457,108$ 1,214,257$ -$ Property Taxes 461,326 - - - Intergovernmental 179,718 5,407 57,914 - Charges for Services 1,129,527 - - - Fines, Licenses, and Permits 706,481 - - - Interest 62,832 - - - Miscellaneous 238,629 32,394 49,870 - Total revenues 6,420,679 1,494,909 1,322,041 -
Expenditures: Current: Public Safety 3,658,199 1,362,476 - - Health 42,309 - - - Leisure Time 290,986 - - - Community Development - - 36,983 - Transportation - - 153,481 - General Government 1,942,238 - 224,930 - Capital Outlay - 149,717 543,316 - Debt service: Principal Retirement - - 28,662 - Interest and Fiscal Charges - - 11,248 - Total Expenditures 5,933,732 1,512,193 998,620 - Excess of Revenues Over (Under) Expenditures 486,947 (17,284) 323,421 -
Other Fnancing Sources (Uses): Proceeds from sale of capital assets - - 9,865 - Proceeds from Loans - - 380,000 - Transfers In - - - - Transfers Out (85,000) - - - Total Other Financing Sources (Uses) (85,000) - 389,865 -
Net Change in Fund Balances 401,947 (17,284) 713,286 -
Fund Balance at Beginning of Year 3,289,634 504,988 1,070,400 1,827,348 Fund Balance at End of Year 3,691,581$ 487,704$ 1,783,686$ 1,827,348$
CITY OF URBANA, OHIOCHAMPAIGN COUNTY
STATEMENT OF REVENUES, EXPENDITURES AND CHANGES IN FUND BALANCESGOVERNMENTAL FUNDS
FOR THE YEAR ENDED DECEMBER 31, 2018
See accompanying notes to the basic financial statements.22

Other TotalGovernmental Governmental
Funds Funds
485,702$ 6,799,233$ 141,920 603,246
1,268,520 1,511,559 325,013 1,454,540 259,004 965,485
855 63,687 220,653 541,546
2,701,667 11,939,296
381,329 5,402,004 167,062 209,371
- 290,986 4,005 40,988
1,020,479 1,173,960 56,036 2,223,204
697,324 1,390,357
44,321 72,983 34,424 45,672
2,404,980 10,849,525
296,687 1,089,771
- 9,865 - 380,000
85,000 85,000 - (85,000)
85,000 389,865
381,687 1,479,636
2,094,248 8,786,618 2,475,935$ 10,266,254$
See accompanying notes to the basic financial statements.23

THIS PAGE INTENTIONALLY LEFT BLANK
24
CITY OF URBANA, OHIOCHAMPAIGN COUNTY
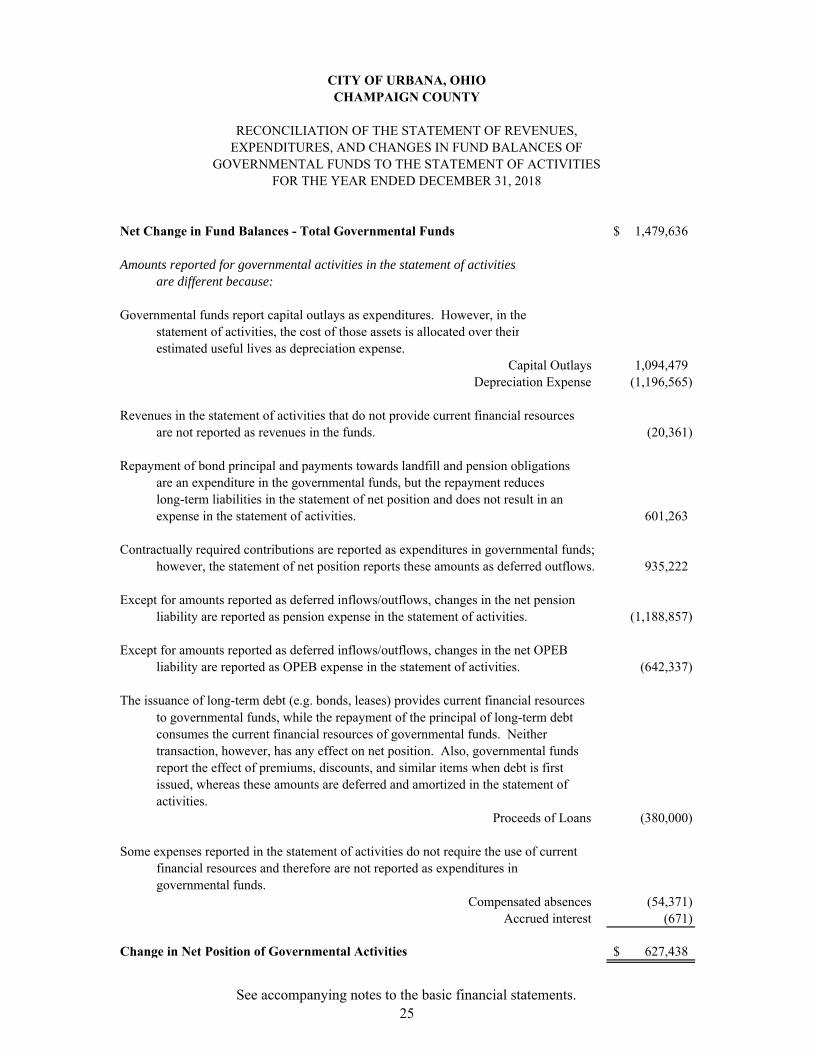
RECONCILIATION OF THE STATEMENT OF REVENUES,EXPENDITURES, AND CHANGES IN FUND BALANCES OF
GOVERNMENTAL FUNDS TO THE STATEMENT OF ACTIVITIESFOR THE YEAR ENDED DECEMBER 31, 2018
Net Change in Fund Balances - Total Governmental Funds 1,479,636$
Amounts reported for governmental activities in the statement of activitiesare different because:
Governmental funds report capital outlays as expenditures. However, in thestatement of activities, the cost of those assets is allocated over theirestimated useful lives as depreciation expense.
Capital Outlays 1,094,479 Depreciation Expense (1,196,565)
Revenues in the statement of activities that do not provide current financial resourcesare not reported as revenues in the funds. (20,361)
Repayment of bond principal and payments towards landfill and pension obligations are an expenditure in the governmental funds, but the repayment reduces long-term liabilities in the statement of net position and does not result in an expense in the statement of activities. 601,263
Contractually required contributions are reported as expenditures in governmental funds;however, the statement of net position reports these amounts as deferred outflows. 935,222
Except for amounts reported as deferred inflows/outflows, changes in the net pensionliability are reported as pension expense in the statement of activities. (1,188,857)
Except for amounts reported as deferred inflows/outflows, changes in the net OPEBliability are reported as OPEB expense in the statement of activities. (642,337)
The issuance of long-term debt (e.g. bonds, leases) provides current financial resources
Proceeds of Loans (380,000)
Some expenses reported in the statement of activities do not require the use of currentfinancial resources and therefore are not reported as expenditures ingovernmental funds.
Compensated absences (54,371) Accrued interest (671)
Change in Net Position of Governmental Activities 627,438$
to governmental funds, while the repayment of the principal of long-term debt consumes the current financial resources of governmental funds. Neither transaction, however, has any effect on net position. Also, governmental funds report the effect of premiums, discounts, and similar items when debt is first issued, whereas these amounts are deferred and amortized in the statement of activities.
See accompanying notes to the basic financial statements.25

CITY OF URBANA, OHIOCHAMPAIGN COUNTY
STATEMENT OF NET POSITIONPROPRIETARY FUNDS
AS OF DECEMBER 31, 2018
Other TotalWater Sewer Enterprise Enterprise
Assets Revenue Revenue Funds FundsCurrent Assets: Pooled Cash and Investments 2,202,108$ 3,732,071$ 393,741$ 6,327,920$ Receivables: Accounts 262,305 471,500 43,494 777,299 Inventory 46,119 36,699 - 82,818 Prepaid Assets 3,115 7,499 - 10,614 Total Current Assets 2,513,647 4,247,769 437,235 7,198,651
Noncurrent Assets: Depreciable Capital Assets, Net 11,934,139 24,415,216 36,326 36,385,681 Non-Depreciable Capital Assets 460,028 687,469 - 1,147,497
Net Pension Asset 1,734 2,381 - 4,115 Total Noncurrent Assets 12,395,901 25,105,066 36,326 37,537,293 Total Assets 14,909,548 29,352,835 473,561 44,735,944
Deferred Outflows of Resources Pension 101,786 139,925 - 241,711 OPEB 19,283 30,233 - 49,516 Total Deferred Outflows of Resources 121,069 170,158 - 291,227
LiabilitiesCurrent Liabilities: Accounts Payable 12,201 43,583 13,234 69,018 Accrued Wages and Benefits 7,581 9,579 - 17,160 Due to Other Governments 5,292 6,857 - 12,149 Accrued Interest payable 77,462 239,163 - 316,625 Accrued Vacation and Sick Leave 20,135 40,059 - 60,194 Bonds Payable 12,671 24,892 - 37,563 Loan Payable 756,654 894,846 - 1,651,500 Total Current Liabilities 891,996 1,258,979 13,234 2,164,209
Noncurrent Liabilities: Accrued Vacation and Sick Leave 29,964 91,147 - 121,111 Bonds Payable 162,622 322,117 - 484,739 Loan Payable 7,096,064 17,901,136 - 24,997,200 Net Pension Liability 381,063 523,354 - 904,417 Net OPEB Liability 262,034 359,767 - 621,801 Total Noncurrent Liabilities 7,931,747 19,197,521 - 27,129,268 Total Liabilities 8,823,743 20,456,500 13,234 29,293,477
Deferred Inflows of Resources Pension 95,821 124,110 - 219,931 OPEB 23,483 26,800 - 50,283 Total Deferred Inflows of Resources 119,304 150,910 - 270,214
Net Position Net Investment in Capital Assets 4,366,156 5,947,794 36,326 10,350,276 Unrestricted 1,721,414 2,967,789 424,001 5,113,204 Total Net Position 6,087,570$ 8,915,583$ 460,327$ 15,463,480$
Business-type Activities - Enterprise Funds
See accompanying notes to the basic financial statements.26

CITY OF URBANA, OHIOCHAMPAIGN COUNTY
STATEMENT OF REVENUES, EXPENSES AND CHANGES IN FUND NET POSITIONPROPRIETARY FUNDS
FOR THE YEAR ENDED DECEMBER 31, 2018
Other TotalWater Sewer Enterprise Enterprise
Revenue Revenue Funds FundsOperating RevenuesCharges for Services 2,301,592$ 3,829,117$ 443,662$ 6,574,371$ Total Operating Revenues 2,301,592 3,829,117 443,662 6,574,371
Operating ExpensesPersonal Services 615,572 891,577 - 1,507,149 Contractual Services 357,651 608,404 189,908 1,155,963 Supplies and Materials 163,693 49,289 - 212,982 Administrative Fees 313,031 301,654 33,567 648,252 Depreciation 474,933 756,523 32 1,231,488 Total Operating Expenses 1,924,880 2,607,447 223,507 4,755,834
Operating Income 376,712 1,221,670 220,155 1,818,537
Nonoperating ExpensesInterest Expense (164,498) (483,868) - (648,366) Total Non-Operating Expenses (164,498) (483,868) - (648,366)
Change in Net Position 212,214 737,802 220,155 1,170,171
Net Position at Beginning of Year, Restated 5,875,356 8,177,781 240,172 14,293,309 Net Position at End of Year 6,087,570$ 8,915,583$ 460,327$ 15,463,480$
Business-type Activities - Enterprise Funds
See accompanying notes to the basic financial statements.27
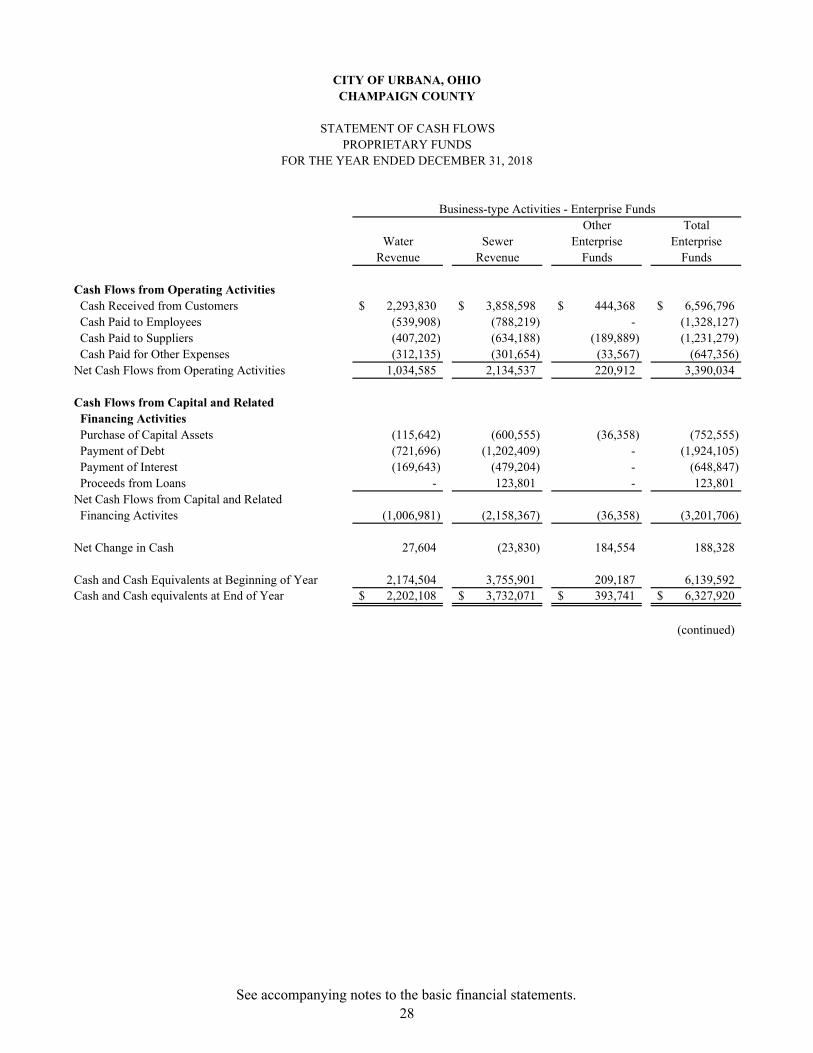
CITY OF URBANA, OHIOCHAMPAIGN COUNTY
STATEMENT OF CASH FLOWSPROPRIETARY FUNDS
FOR THE YEAR ENDED DECEMBER 31, 2018
Business-type Activities - Enterprise FundsOther Total
Water Sewer Enterprise EnterpriseRevenue Revenue Funds Funds
Cash Flows from Operating Activities Cash Received from Customers 2,293,830$ 3,858,598$ 444,368$ 6,596,796$ Cash Paid to Employees (539,908) (788,219) - (1,328,127) Cash Paid to Suppliers (407,202) (634,188) (189,889) (1,231,279) Cash Paid for Other Expenses (312,135) (301,654) (33,567) (647,356) Net Cash Flows from Operating Activities 1,034,585 2,134,537 220,912 3,390,034
Cash Flows from Capital and Related Financing Activities Purchase of Capital Assets (115,642) (600,555) (36,358) (752,555) Payment of Debt (721,696) (1,202,409) - (1,924,105) Payment of Interest (169,643) (479,204) - (648,847) Proceeds from Loans - 123,801 - 123,801 Net Cash Flows from Capital and Related Financing Activites (1,006,981) (2,158,367) (36,358) (3,201,706)
Net Change in Cash 27,604 (23,830) 184,554 188,328
Cash and Cash Equivalents at Beginning of Year 2,174,504 3,755,901 209,187 6,139,592 Cash and Cash equivalents at End of Year 2,202,108$ 3,732,071$ 393,741$ 6,327,920$
(continued)
See accompanying notes to the basic financial statements.28
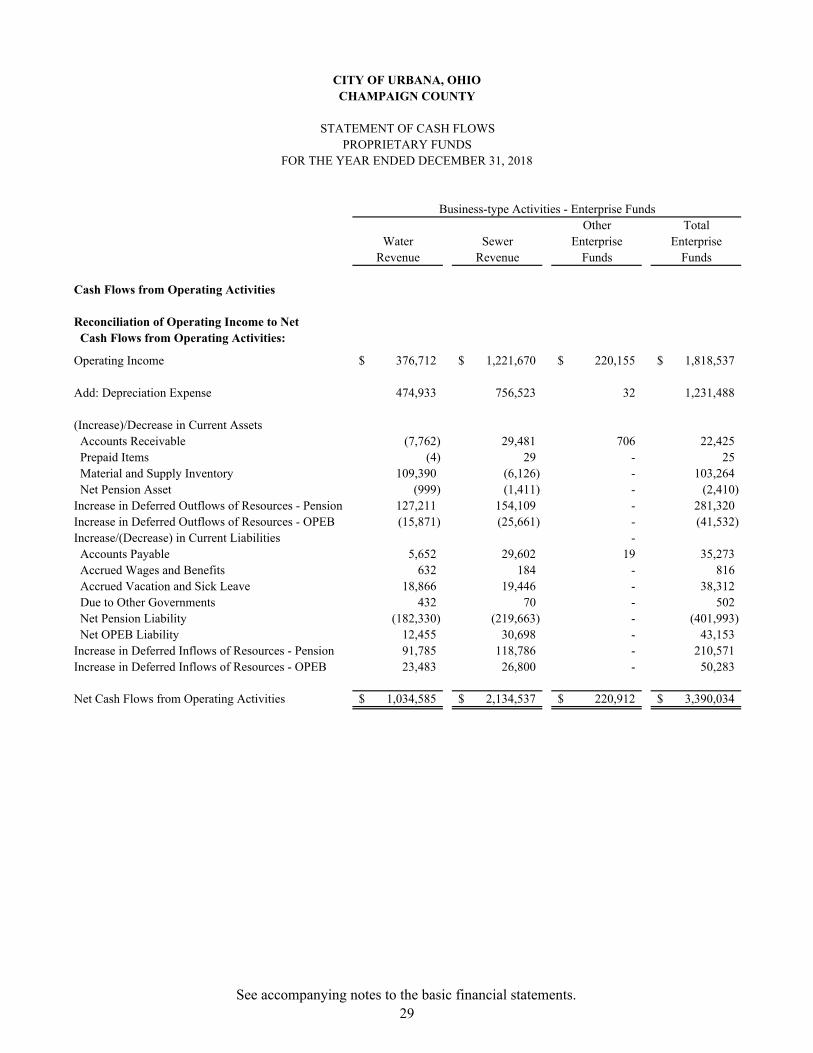
CITY OF URBANA, OHIOCHAMPAIGN COUNTY
STATEMENT OF CASH FLOWSPROPRIETARY FUNDS
FOR THE YEAR ENDED DECEMBER 31, 2018
Business-type Activities - Enterprise FundsOther Total
Water Sewer Enterprise EnterpriseRevenue Revenue Funds Funds
Cash Flows from Operating Activities
Reconciliation of Operating Income to Net Cash Flows from Operating Activities:
Operating Income 376,712$ 1,221,670$ 220,155$ 1,818,537$
Add: Depreciation Expense 474,933 756,523 32 1,231,488
(Increase)/Decrease in Current Assets Accounts Receivable (7,762) 29,481 706 22,425 Prepaid Items (4) 29 - 25 Material and Supply Inventory 109,390 (6,126) - 103,264 Net Pension Asset (999) (1,411) - (2,410) Increase in Deferred Outflows of Resources - Pension 127,211 154,109 - 281,320 Increase in Deferred Outflows of Resources - OPEB (15,871) (25,661) - (41,532) Increase/(Decrease) in Current Liabilities - Accounts Payable 5,652 29,602 19 35,273 Accrued Wages and Benefits 632 184 - 816 Accrued Vacation and Sick Leave 18,866 19,446 - 38,312 Due to Other Governments 432 70 - 502 Net Pension Liability (182,330) (219,663) - (401,993) Net OPEB Liability 12,455 30,698 - 43,153 Increase in Deferred Inflows of Resources - Pension 91,785 118,786 - 210,571 Increase in Deferred Inflows of Resources - OPEB 23,483 26,800 - 50,283
Net Cash Flows from Operating Activities 1,034,585$ 2,134,537$ 220,912$ 3,390,034$
See accompanying notes to the basic financial statements.29
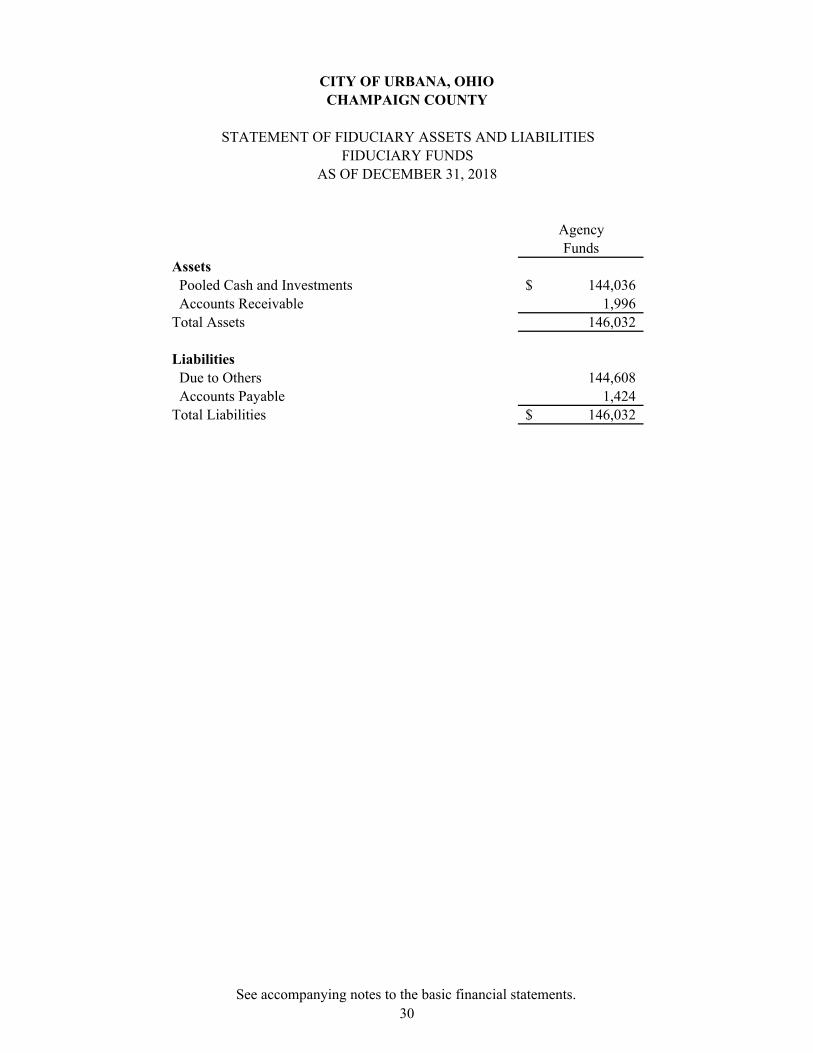
CITY OF URBANA, OHIOCHAMPAIGN COUNTY
STATEMENT OF FIDUCIARY ASSETS AND LIABILITIES FIDUCIARY FUNDS
AS OF DECEMBER 31, 2018
AgencyFunds
Assets Pooled Cash and Investments 144,036$ Accounts Receivable 1,996 Total Assets 146,032
Liabilities Due to Others 144,608 Accounts Payable 1,424 Total Liabilities 146,032$
See accompanying notes to the basic financial statements.30
CITY OF URBANA, OHIO NOTES TO BASIC FINANCIAL STATEMENTS
FOR THE FISCAL YEAR ENDED DECEMBER 31, 2018
NOTE 1 – REPORTING ENTITY The City of Urbana, Ohio (City) is a political unit incorporated and established for the purpose of exercising the rights and privileges conveyed to it by the constitution and laws of the State of Ohio. The City was incorporated in 1868, and has a Council-Mayor form of government. The City provides the following services: public safety (police and fire), highways and streets, water, sewer, storm water, recycling, recreation, planning and zoning and general administrative services. For financial reporting purposes, the City includes in this report all funds, agencies, boards, commissions, and departments in accordance with Governmental Accounting Standards Board (GASB) Statement No. 14 “The Financial Reporting Entity” as amended by GASB Statement No. 39, “Determining Whether Certain Organizations Are Component Units” and GASB Statement No. 61, “The Financial Reporting Entity: Omnibus”. Under the provisions of GASB Statement No. 14, the City of Urbana is the primary government, since it is a general purpose government that has a separate elected governing body; functions as a separate legal entity; and is fiscally independent of other state and local governments. As used in GASB Statement No. 14, fiscally independent means that the City may, without the approval or consent of another governmental entity, determine or modify its own budget, levy its own taxes or set rates or charges, and issue debt. As required by generally accepted accounting principles, these basic financial statements present the City and its component units, entities for which the City is considered to be financially accountable. Blended component units, although legally separate entities are, in substance, part of the City’s operations and so data is combined with data of the primary government. Each discretely presented component unit, on the other hand, is reported in a separate column in the financial statements to emphasize it is legally separate from the City. There are no blended or discretely presented component units at December 31, 2018. Jointly Governed Organizations Champaign Countywide Public Safety Communications System Council of Governments The City entered into an agreement in April 2005 with the Champaign Countywide Public Safety Communications System Council of Governments (COG) whereby Champaign County and the City created the COG for the purpose of operating an enhanced 911 system. The COG contracted with Champaign County to serve as its fiscal agent. Financial information may be obtained by writing to 1512 South Highway 68, Suite A100, Urbana, Ohio 43078. NOTE 2 – SUMMARY OF SIGNIFICANT ACCOUNTING POLICIES The financial statements of the City have been prepared in conformity with accounting principles generally accepted in the United States of America (GAAP) as applied to governmental units. The GASB is the accepted standard-setting body for establishing governmental accounting and financial reporting principles. The most significant of the City’s accounting policies are described below.
31
CITY OF URBANA, OHIO NOTES TO BASIC FINANCIAL STATEMENTS
FOR THE FISCAL YEAR ENDED DECEMBER 31, 2018
NOTE 2 – SUMMARY OF SIGNIFICANT ACCOUNTING POLICIES (Continued) (a) Basis of Presentation Government-Wide Financial Statements - The government-wide financial statements (i.e. the statement of net position and the statement of activities) report information on all of the nonfiduciary activities of the primary government and its component units. Interfund activity, and related interfund receivables and payables, have been eliminated in the government-wide statements. These eliminations remove the duplicating effect on assets, liabilities, revenues, expenses that would otherwise occur. Governmental activities, which normally are supported by taxes and intergovernmental revenues, are reported separately from business-type activities, which rely to a significant extent on fees and charges for support. Likewise, the primary government is reported separately from certain legally separate component units for which the primary government is financially accountable. The statement of activities demonstrates the degree to which the direct expenses of a given function, or segment, are offset by program revenues. Direct expenses are those that are clearly identifiable with a specific function or segment. Program revenues include 1) charges to customers or applicants who purchase, use, or directly benefit from goods, services, or privileges provided by a given function or segment and 2) grants and contributions that are restricted to meeting the operational or capital requirements of a particular function or segment. Taxes and other items not properly included among program revenues are reported instead as general revenues. Fund Financial Statements - Separate financial statements are provided for governmental funds, proprietary funds, and fiduciary funds, even though the latter are excluded from the government-wide financial statements. Major individual governmental funds and major individual enterprise funds are reported as separate columns in the fund financial statements. (b) Measurement focus, basis of accounting, and financial statement presentation The government-wide financial statements are reported using the economic resources measurement focus and the accrual basis of accounting, as are the proprietary fund and fiduciary fund financial statements. Revenues are recorded when earned and expenses are recorded when a liability is incurred, regardless of the timing of related cash flows. Property taxes are recognized as revenues in the year for which they are levied. Grants and similar items are recognized as revenue as soon as all eligibility requirements imposed by the provider have been met. Governmental fund financial statements are reported using the current financial resources measurement focus and the modified accrual basis of accounting. Revenues are recognized as soon as they are both measurable and available. Revenues are considered available when they are collectible within the current period or soon enough after to pay liabilities of the current period. For this purpose, the City considers revenues to be available if they are collected within 60 days of the end of the current fiscal period. Expenditures generally are recorded when a liability is incurred, as under accrual accounting. However, debt service expenditures, as well as expenditures related to compensated absences, are recorded only when payment is due. Taxes, intergovernmental revenues, charges for services, licenses, and interest associated with the current fiscal period are all considered to be susceptible to accrual and so have been recognized as revenues of the current fiscal period. All other revenue items are considered to be measurable and available only when cash is received by the City.
32

CITY OF URBANA, OHIO NOTES TO BASIC FINANCIAL STATEMENTS
FOR THE FISCAL YEAR ENDED DECEMBER 31, 2018
NOTE 2 – SUMMARY OF SIGNIFICANT ACCOUNTING POLICIES (Continued) The City reports the following major governmental funds: General Fund - The General Fund is the City’s primary operating fund. It accounts for all financial resources of the City, except those required to be accounted for in another fund. Police and Fire Tax Levy Fund - To account for the 3/10% income tax for additional patrolmen and firefighters that the General Fund is unable to financially support. Capital Improvement Fund – To account for the income tax resources earmarked for capital improvements used for general improvement of all City facilities and operations. Perpetual Investment Fund - To account for the proceeds from the sale of the City's Gas Lines in 1982. The Fund currently accounts for monies assigned for capital projects. The proprietary funds are used to account for the City's ongoing activities that are similar to those found in the private sector where the intent of the governing body is that the cost (expenses, including depreciation) of providing goods or services to the general public on a continuing basis be financed or recovered primarily through user charges. The City reports the following major proprietary funds: Water Fund – Accounts for the operation of the waterworks distribution system and related expenses, including capital improvement and debt service. The operation is exclusively financed by customer user charges. Sewer Fund – Accounts for the operation of the sanitary sewer collection and treatment system and related expenses, including capital improvement and debt service. The operation is exclusively financed by customer user charges. Proprietary funds distinguish operating revenues and expenses from non-operating items. Operating revenues and expenses generally result from providing services and producing and delivering goods in connection with a proprietary fund’s principal ongoing operations. The principal operating revenues of the enterprise funds are charges to customers for sales and services. Operating expenses for enterprise funds include the cost of sales and services, administrative expenses, and depreciation on capital assets. Fiduciary funds are used to account for assets held by the City in a trustee capacity or as an agent for individuals, private organizations, other governmental units and/or other funds. The City's fiduciary funds include agency funds. Agency funds are custodial in nature (assets equal liabilities) and do not involve measurement of results of operations. The City’s agency funds consist of the Champaign County Municipal Court fund and employee supplemental health insurance fund. All revenues and expenses not meeting this definition are reported as non-operating revenues and expenses. When both restricted and unrestricted resources are available for use, it is the City’s policy to use restricted resources first, then unrestricted resources as they are needed.
33
CITY OF URBANA, OHIO NOTES TO BASIC FINANCIAL STATEMENTS
FOR THE FISCAL YEAR ENDED DECEMBER 31, 2018
NOTE 2 – SUMMARY OF SIGNIFICANT ACCOUNTING POLICIES (Continued) (c) Cash and Cash Equivalents and Investments The City pools cash and investments of various funds to improve investment performance. Each fund’s position in the pool is reflected in the participating fund as Pooled Cash and Investments. Interest earnings from cash and investments are allocated to the General Fund, except for funds derived from contract, trust agreement or City ordinance which require crediting otherwise. For purposes of the statement of cash flows, the City’s proprietary funds consider cash equivalents to be pooled cash and investments, cash on hand, demand deposits, and investments. The City did not have any investments at year end. (d) Receivables and Payables Activity between funds that are representative of lending/borrowing arrangements and outstanding at the end of the fiscal year are referred to as either “due to/from other funds” (i.e. the current portion of interfund loans) or “advances to/from other funds” (i.e. the non-current portion of interfund loans). All other outstanding balances between funds are reported as “due to/from other funds.” Any residual balances outstanding between the governmental activities and business-type activities are reported in the government-wide financial statements as “internal balances.” Advances between funds, as reported in the fund financial statements, are offset by a nonspendable fund balance account to indicate that they do not constitute available financial resources and therefore are not available for appropriation. (e) Notes Receivable Notes receivable represent the right to receive repayment for a mortgage note made by the City. This note is based upon a written agreement between the City and the note recipient. (f) Inventory and Prepaid Assets Inventory is valued at cost (first-in, first-out). In both the governmental and proprietary funds, inventories are recorded as expenditures/expenses when consumed rather than when purchased. Certain payments to vendors reflect costs applicable to future accounting periods and are recorded as prepaid items in both government-wide and fund financial statements. In the governmental funds, inventories and prepaid items are offset by a nonspendable fund balance account to indicate that they do not constitute available financial resources and therefore are not available for appropriation.
34

CITY OF URBANA, OHIO NOTES TO BASIC FINANCIAL STATEMENTS
FOR THE FISCAL YEAR ENDED DECEMBER 31, 2018
NOTE 2 – SUMMARY OF SIGNIFICANT ACCOUNTING POLICIES (Continued) (g) Capital Assets and Depreciation
Capital assets, which include property, plant, equipment, and infrastructure assets (e.g. roads, bridges, sidewalks, and similar items), are reported in the applicable governmental or business-type activities columns in the government-wide financial statements. The City defines capital assets as assets with an initial, individual cost of more than $5,000 and an estimated useful life in excess of one year. In the case of the initial capitalization of general infrastructure assets (i.e. those reported in the governmental activities) the City chose to include all such items acquired from January 1, 1980 through the present. The City was able to estimate the historical cost for the initial reporting of these assets through back trending (i.e., estimating the current replacement cost of the infrastructure to be capitalized and using an appropriate price-level index to deflate the cost to the acquisition year). As the City constructs or acquires additional capital assets each period, including infrastructure assets, they are capitalized and recorded at historical cost. The reported value excludes normal maintenance and repairs which are essentially amounts spent in relation to capital assets that do not increase the capacity or efficiency of the item or extend its useful life beyond the original estimate. In the case of donations, the City values these capital assets at the acquisition value of the item at the date of its donation. Interest incurred during the construction phase of capital assets of business-type activities, if significant, is included as part of the capitalized value of the assets constructed. Property, plant, and equipment is depreciated using the straight-line method over the following estimated useful lives:
Description Estimated Useful Life (Years) Land improvements 25 Buildings and improvements 25 Vehicles 3-5 Machinery and equipment 5-20 Infrastructure 25-50
(h) Deferred Outflows/Inflows of Resources In addition to assets, the statements of financial position will sometimes report a separate section for deferred outflows of resources. Deferred outflows of resources represent a consumption of net position that applies to a future period and will not be recognized as an outflow of resources (expense/expenditure) until then. For the City, deferred outflows of resources are reported on the government-wide and proprietary statements of net position for pension and other postemployment benefits (OPEB). The deferred outflows of resources related to pension and OPEB are explained in Notes 12 and 13. In addition to liabilities, the statements of financial position will sometimes report a separate section for deferred inflows of resources. Deferred inflows of resources represent an acquisition of net position that applies to a future period and will not be recognized until that time. For the City, deferred inflows of resources include property taxes, payments in lieu of taxes, pension, other postemployment benefits (OPEB), and unavailable revenue. Property taxes and payments lieu of taxes represent amounts for which there is an enforceable legal claim as of December 31, 2018, but which were levied to finance 2019 operations. These amounts have been recorded as a deferred inflow on both the government-wide statement of Net Position and governmental fund financial statements.
35
CITY OF URBANA, OHIO NOTES TO BASIC FINANCIAL STATEMENTS
FOR THE FISCAL YEAR ENDED DECEMBER 31, 2018
NOTE 2 – SUMMARY OF SIGNIFICANT ACCOUNTING POLICIES (Continued) Unavailable revenue is reported only on the governmental funds balance sheet and represents receivables which will not be collected within the available period. For the City, unavailable revenue includes delinquent property taxes, income taxes, grants and entitlements, and other revenues. These amounts are deferred and recognized as an inflow of resources in the period the amounts become available. Deferred inflows of resources related to pension and OPEB are reported on both the government-wide and proprietary statements of net position (See Notes 12 and 13). (i) Pensions/Other Postemployment Benefits (OPEB) For purposes of measuring the net pension/OPEB liability, deferred outflows and deferred inflow of resources related pensions/OPEB, and pension/OPEB expense, information about the fiduciary net position of pension/OPEB plans and additions to/deductions from their fiduciary net position have been determined on the same basis as they are reported by the pension/OPEB plan. For this purpose, benefit payments (including refunds of employee contributions) are recognized when due and payable in accordance with the benefit terms. The pension/OPEB plans report investments at fair value. (j) Unearned Revenue Other revenues received in advance of the year for which they were intended to finance, have been recorded as unearned revenue on the statement of net position and governmental fund balance sheet. Income taxes not received within the available period due at December 31, 2018, are recorded as unavailable revenue in the governmental funds and as revenue on the statement of activities. (k) Compensated Absences Vested vacation and sick leave is recorded as an expense in the government-wide and proprietary fund financial statements in the period in which such leave was earned. In the governmental funds, an expenditure is recorded for only the portion of vested vacation and sick leave that is expected to be liquidated with expendable available resources. Payment of vacation and sick leave recorded in the government-wide financial statements is dependent upon many factors; therefore, timing of future payments is not readily determinable. Management believes that sufficient resources will be made available when payment is due. (l) Long Term Obligations In the government-wide financial statements, and proprietary fund types in the fund financial statements, long-term debt and other long-term obligations are reported as liabilities in the applicable governmental activities, business-type activities, or proprietary fund type statements of net position. Bond premiums and discounts are deferred and amortized over the life of the bonds. Bonds payable are reported net of the applicable bond premium or discount. In the fund financial statements, governmental fund types recognize bond premiums and discounts, as well as bond issuance costs, during the current period. The face amount of debt issued is reported as other financing sources. Premiums received on debt issuances are reported as other financing sources while discounts on debt issuances are reported as other financing uses. Issuance costs, whether or not withheld from the actual debt proceeds received, are reported as debt service expenditures.
36
CITY OF URBANA, OHIO NOTES TO BASIC FINANCIAL STATEMENTS
FOR THE FISCAL YEAR ENDED DECEMBER 31, 2018
NOTE 2 – SUMMARY OF SIGNIFICANT ACCOUNTING POLICIES (Continued) (m) Fund Balance GASB Statement No. 54, Fund Balance Reporting became effective for years beginning after June 15, 2010. The objective of this Statement is to enhance the usefulness of fund balance information by providing clearer fund balance classifications that can be more consistently applied and by clarifying the existing governmental fund type definitions. This Statement establishes fund balance classifications that comprise a hierarchy based primarily on the extent to which a government is bound to observe constraints imposed upon the use of the resources reported in governmental funds. In accordance with this guidance, the City classifies its fund balance based on the purpose for which the resources were received and the level of constraint placed on the resources. The City may use the following categories:
Nonspendable - resources that cannot be spent because they are not in a spendable form (inventory, prepaids, and advances) or have legal or contractual requirements to maintain the balance intact. Restricted - resources that have external purpose restraints imposed on them by providers, such as creditors (through debt covenants), grantors, contributors, or laws or regulations of other governments or is imposed by law through constitutional provisions or enabling legislation (City ordinances). Enabling legislation authorizes the City to assess, levy, charge, or otherwise mandate payment of resources (from external resource providers) and includes a legally enforceable requirement that those resources be used only for the specific purposes stipulated in the legislation. Legal enforceability means that the City can be compelled by an external party such as citizens, public interest groups, or the judiciary to use the resources created by enabling legislation only for the purposes specified by the legislation. Committed - resources that can be used only for specific purposes imposed by formal action (ordinance or resolution) of City Council. Those committed amounts cannot be used for any other purpose unless City Council removes or changes the specified use by taking the same type of action (ordinance or resolution) it employed to previously commit those amounts. In contrast to fund balance that is restricted by enabling legislation, committed fund balance may be redeployed for other purposes with appropriate due process. Constraints imposed on the use of committed amounts are imposed by City Council, separate from the authorization to raise the underlying revenue; therefore, compliance with these constraints are not considered to be legally enforceable. Committed fund balance also incorporates contractual obligations to the extent that existing resources in the fund have been specifically committed for use in satisfying those contractual requirements.
Assigned - resources that are intended to the used by the City for specific purposes, but do not meet the criteria to be classified as restricted or committed. In governmental funds other than the general fund, assigned fund balance represents the remaining amount that is not restricted or committed. In the General Fund, assigned amounts represent intended uses established by City Council or a City official delegated that authority by City Charter or ordinance, or by State Statute. The finance director is authorized to assign fund balance using encumbrances for planned purchases, provided such amounts have been lawfully appropriated. City Council may also assign fund balance as it does when appropriating fund balance to cover a gap between estimated revenue and appropriations in the subsequent year’s appropriated budget.
37

CITY OF URBANA, OHIO NOTES TO BASIC FINANCIAL STATEMENTS
FOR THE FISCAL YEAR ENDED DECEMBER 31, 2018
NOTE 2 – SUMMARY OF SIGNIFICANT ACCOUNTING POLICIES (Continued)
Unassigned - residual classification for the General Fund and includes all spendable amounts not contained in the other classifications. In other governmental funds, the unassigned classification is used only to report a deficit balance resulting from overspending for specific purposes for which amounts had been restricted, committed, or assigned.
The City applies restricted resources first when an expense is incurred for purposes which both restricted and unrestricted fund balance/net position are available. The City considers committed, assigned and unassigned fund balances, respectively, to be spent when expenditures are incurred for purposes for which any of the unrestricted fund balance classifications could be used. (n) Net Position Net position represents the difference between assets and deferred outflows of resources and liabilities and deferred inflows of resources. Net Investment in Capital Assets consists of capital assets, net of accumulated depreciation, reduced by the outstanding balances of any borrowing used for the acquisition, construction or improvement of those assets. Net position is reported as restricted when there are limitations imposed on their use either through the enabling legislation or through external restrictions imposed by creditors, grantors or laws or regulations of other governments. The City applies restricted resources first, when an expense is incurred for purposes for which both restricted and unrestricted net position is available. (o) Estimates The preparation of these financial statements in conformity with generally accepted accounting principles require management to make estimates and assumptions that affect the reported amounts of assets and liabilities and disclosure of contingent liabilities at the date of the financial statements and reported amounts of revenues and expenditure/expenses during the reporting period. Actual results could differ from those estimates. NOTE 3 – ACCOUNTABILITY Deficit Fund Balances – The following deficit fund balances are primarily the result of accrued liabilities recorded with the application of generally accepted accounting principles. The general fund is responsible for fund deficits; however, transfers are recorded when cash is needed rather than when the accruals occurs.
Fund Balance
Other Governmental Funds:Victim Assistance Grant (33)$ Probation Grant (6,474) Mausoleum Trust (58,356)
38

CITY OF URBANA, OHIO NOTES TO BASIC FINANCIAL STATEMENTS
FOR THE FISCAL YEAR ENDED DECEMBER 31, 2018
NOTE 4 – DEPOSITS AND INVESTMENTS State statutes classify monies held by the City into three categories. Active deposits are public deposits necessary to meet current demands on the treasury. Such monies must be maintained either as cash in the City treasury, in commercial accounts payable or can be withdrawn on demand, including negotiable order of withdrawal (NOW) accounts, or in money market deposit accounts. Inactive deposits are public deposits the City has identified as not required for use within the current two-year period of designation of depositories. Inactive deposits must either be evidenced by certificates of deposit maturing not later than the end of the current period of designation of depositories, or by savings or deposit accounts including, but not limited to, passbook accounts. Interim deposits are deposits of interim monies. Interim monies are those monies which are not needed for immediate use but which will be needed before the end of the current period of designation of depositories. Interim deposits must be evidenced by time certificates of deposit maturing not more than one year from the date of deposit, or by savings or deposit accounts, including passbook accounts. Interim monies may be deposited or invested in the following securities:
1. United States Treasury bills, bonds, notes, or any other obligation or security issued by the United
States Treasury, or any other obligation guaranteed as to principal and interest by the United States;
2. Bonds, notes, debentures, or any other obligation or security issued by any federal government agency or instrumentality, including but not limited to, the Federal National Mortgage Association, Federal Home Loan Bank, Federal Farm Credit Bank, Federal Home Loan Mortgage Corporation, and Government National Mortgage Association. All federal agency securities shall be direct issuances of federal government agencies or instrumentalities;
3. No-load money market mutual funds consisting exclusively of obligations described in division (1) or (2) and repurchase agreements secured by such obligations, provided that investments in securities described in this division are made only through eligible institutions;
4. Time certificates of deposit or savings or deposit accounts including, but not limited to, passbook accounts;
5. Bonds or other obligations of the State of Ohio, and, with certain limitations including a requirement for maturity within ten years from the date of settlement, bonds and other obligations of political subdivisions of the State of Ohio, if training requirements have been met;
6. The State Treasurer’s investment pool (STAR Ohio);
7. Certain bankers’ acceptances (for a period not to exceed one hundred and eighty days) and commercial paper notes (for a period not to exceed two hundred seventy days) in an amount not to exceed forty percent of the interim monies available for investment at any one time if training requirements have been met; and
8. Written repurchase agreements in the securities listed above provided that the market value of the securities subject to the repurchase agreement must exceed the principal value of the agreement by at least 2 percent and be marked to market daily, and that the term of the agreement must not exceed thirty days;
39

CITY OF URBANA, OHIO NOTES TO BASIC FINANCIAL STATEMENTS
FOR THE FISCAL YEAR ENDED DECEMBER 31, 2018
NOTE 4 – DEPOSITS AND INVESTMENTS (Continued) Investments in stripped principal or interest obligations, reverse repurchase agreements, and derivatives are prohibited. The issuance of taxable notes for the purpose of arbitrage, the use of leverage, and short selling are also prohibited. An investment must mature within five years from the date of purchase, unless matched to a specific obligation or debt of the City and must be purchased with the expectation that it will be held to maturity. Investments may only be made through specified dealers and institutions. Payment for investments may be made only upon delivery of the securities representing the investment to the Treasurer, or qualified trustee, unless the securities are not represented by a certificate, in which payment may be made upon receipt of confirmation of transfer from the custodian. (a) Cash on Hand At year end, the City had $1,109 in undeposited petty cash on hand which is included on the financial statements of the City as part of “pooled cash and investments”. (b) Deposits with Financial Institutions At year-end, the carrying amount of the City’s deposits was $16,974,450, which includes certificates of deposit totaling $2,481,711 and cash with fiscal agent totaling $380,000 and the bank balance was $16,723,162. Of the bank balance, $1,229,816 was covered by federal depository insurance, and the remaining amount was collateralized. Custodial Credit Risk - Custodial credit risk is the risk that, in the event of bank failure, the City’s deposits may not be returned. Public depositories must give security for all public funds on deposit. These institutions may either specifically collateralize individual accounts in addition to amounts insured by the FDIC or may pledge a single pool of collateral for the benefit of every depositor via the Ohio Pooled Collateral Program administered by the Treasurer of State. Specific collateral must equal or exceed 105% of the carrying value of assets, whereas pooled collateral must equal or exceed 102% or lesser amount as determined by the Treasurer of State. The City has no deposit policy for custodial credit risk beyond the requirements of State statute. Although the securities were held by the pledging institutions’ trust department and all statutory requirements for the deposit of money had been followed, noncompliance with federal requirements could potentially subject the City to a successful claim by the FDIC. The City does not have a policy for custodial credit risk. (c) Investments As of December 31, 2018, the City did not have any investments. Interest Rate Risk: As a means of limiting its exposure to fair value losses arising from rising interest rates and according to State law, the City’s investment policy limits investment portfolio maturities to five years or less. Credit Risk: The City has no investment policy that would further limit its investment choices. Custodial Credit Risk: For an investment, custodial credit risk is the risk that, in the event of the failure of the counterparty, the City will not be able to recover the value of its investment or collateral securities that are in the possession of an outside party. The City has no investment policy dealing with investment custodial risk beyond the requirement in State statute that prohibits payment for investments prior to the delivery of the securities representing such investments to the Finance Director or qualified trustee. The City was not exposed to custodial credit risk.
40
CITY OF URBANA, OHIO NOTES TO BASIC FINANCIAL STATEMENTS
FOR THE FISCAL YEAR ENDED DECEMBER 31, 2018
NOTE 4 – DEPOSITS AND INVESTMENTS (Continued) (d) Reconciliation of Cash and Investments to the Statement of Net Position The following is a reconciliation of cash and investments as reported in the note above to cash and investments as reported on the statement of net position as of December 31, 2018: Cash and Investments Per NoteCarrying Amount of Deposits 16,974,450$ Cash on Hand 1,109 Total 16,975,559$
Cash and Investments Per Statements of Net PositionGovernmental and Business-type Activities 16,831,523$ Agency Funds 144,036 Total 16,975,559$
NOTE 5 - NOTES RECEIVABLE During 2011, the City loaned Sarica/Hughley and Phillips LLC, $950,000, to assist in financing the cost to retain and expand their company within the City. In consideration of the repayment of the note, monthly payments of $4,806 began on July 1, 2011 and continue on the first day of each month until June 1, 2031 when the remaining principal at that time on the note shall become due and payable in full. Sarica/Hughley and Phillips LLC made twelve payments, totaling $43,147 during 2018. At December 31, 2018, the balance of the Sarica/Hughley and Phillips LLC note was $640,946. In addition, the City had Community Development Block Grant loans outstanding at year-end totaling $1,077, for a total notes receivable balance at December 31, 2018 of $642,023. NOTE 6 – INCOME TAXES Municipalities within the State of Ohio are permitted by state statute to levy an income tax up to a maximum rate of 1% subject to the approval of the local legislative body. Any rate in excess of 1% requires the approval of a majority of the eligible voters residing within the municipal corporation. The City of Urbana levies a tax on all wages, salaries, commissions and other compensation paid by employers and the net profits from a business or professional person earned within the City, excluding income from intangible personal property. In addition, City residents pay city income tax on income earned outside the City; net of a credit limited to 1% for income taxes paid to other municipalities. In 1992, the City Council ordered mandatory income tax filing. The tax rate applied in 2018 was 1.4% of which 1% was unvoted and 0.4% was voted. The additional 0.4% tax became effective January 1, 1992 and is designated to fund fire and police personnel and capital improvement costs. Twenty-five percent (25%) of all income tax revenues are required to be used for the purpose of financing capital improvements, including debt service charges on notes and bonds issued for capital improvements. This portion of income tax revenues is distributed to the Capital Improvement Fund from which capital improvements and related debt service charges are financed.
41
CITY OF URBANA, OHIO NOTES TO BASIC FINANCIAL STATEMENTS
FOR THE FISCAL YEAR ENDED DECEMBER 31, 2018
NOTE 7 – PROPERTY TAXES Property taxes are levied and assessed on a calendar year basis. Property taxes include amounts levied against all real, public utility, and tangible personal (used in business) property located in the City. All property is required to be revalued every six years with equalization adjustments in the third year following reappraisal. The last revaluation was completed in 2013. Real property taxes are levied after April 1 on the assessed value listed as of the prior January 1, the lien date. Assessed values for real property taxes are established by State law at 35 percent of appraised market value. Public utility property taxes are assessed on tangible personal property as well as land and improvements at 88% of true value (50% of cost) with certain exceptions. Public utility property taxes, attached as a lien on December 31 of the prior year, were levied April 1 and are collected with real property taxes. The Champaign County Treasurer collects property taxes on behalf of all taxing districts within the County, including the City of Urbana. The County Auditor periodically advances to the City its portion of the taxes collected. Property taxes may be paid on either an annual or semi-annual basis. The assessed valuations of the City for tax year 2017, which were used to collect taxes in calendar year 2018, are as follows: Amount Percent Real Estate (Other Than Public Utility) $180,846,690 95.9 % Public Utility 7,725,560 4.1 % Total Assessed Value $188,572,250 100.0% NOTE 8 – TAX ABATEMENTS Community Reinvestment Area Description – Under the authority of ORC 3735.65 – 3735.70, the City created a Community Reinvestment Area (CRA). Legislation established that the remodeling of existing and construction of new structures within this CRA constituted a public purpose for which real property tax exemptions may be granted. The specific tax being abated is the property tax. These taxes are abated through a reduction in assessed value. Recipient Commitment – The company is committed to purchasing, remodeling, and/or constructing properties within the CRA that will improve property value and potentially bring jobs to the City. The gross dollar amount for the total abated value of the CRA parcels for 2018 was as follows:
Company Term Percent Amount
Muzzy Properties, LLC (Marshall Plastics) 2003-2017 100 6,260$ Interstate Truckers Inc. 2005-2019 100 6,260 Phoenix Drive Properties, LLC 2009-2018 75 19,680
32,200$
42
CITY OF URBANA, OHIO NOTES TO BASIC FINANCIAL STATEMENTS
FOR THE FISCAL YEAR ENDED DECEMBER 31, 2018
NOTE 8 – TAX ABATEMENTS (Continued) Enterprise Zone Description – Under the authority of ORC 5709.61, the City created an Enterprise Zone (EZ) within city limits. Legislation established that the remodeling of existing and construction of new structures within this EZ constituted a public purpose for which real property tax exemptions may be granted. The specific tax being abated is the property tax. These taxes are abated through a reduction in assessed value. Recipient Commitment – The company is committed to purchasing, remodeling, and/or constructing properties within the EZ that will improve property value and bring jobs to the City. Provisions for recapturing abated taxes - If the owner or lessee materially fails to fulfill its obligation, reimbursement level will be 100 percent (less than year one), 80 percent (year one to year two), 60 percent (year two to year three), 40 percent (year three to year four), and 20 percent (year four to year ten). The gross dollar amount for the total abated value of the EZ parcel for 2018 was as follows:
Company Term Percent Amount
Ultra Met Company 2009-2018 75 4,070$ Willow Run Realty and American Pan Company 2013-2022 75 54,180
58,250$
43
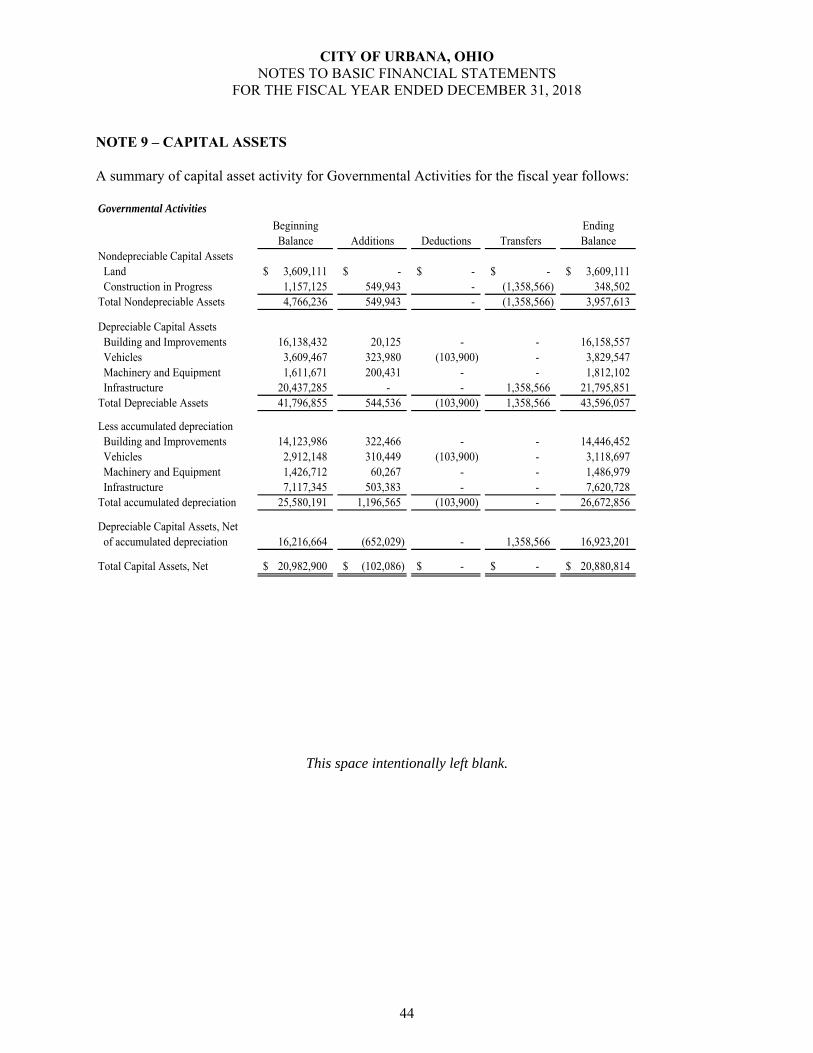
CITY OF URBANA, OHIO NOTES TO BASIC FINANCIAL STATEMENTS
FOR THE FISCAL YEAR ENDED DECEMBER 31, 2018
NOTE 9 – CAPITAL ASSETS A summary of capital asset activity for Governmental Activities for the fiscal year follows: Governmental Activities
Beginning EndingBalance Additions Deductions Transfers Balance
Nondepreciable Capital Assets Land 3,609,111$ -$ -$ -$ 3,609,111$ Construction in Progress 1,157,125 549,943 - (1,358,566) 348,502 Total Nondepreciable Assets 4,766,236 549,943 - (1,358,566) 3,957,613
Depreciable Capital Assets Building and Improvements 16,138,432 20,125 - - 16,158,557 Vehicles 3,609,467 323,980 (103,900) - 3,829,547 Machinery and Equipment 1,611,671 200,431 - - 1,812,102 Infrastructure 20,437,285 - - 1,358,566 21,795,851 Total Depreciable Assets 41,796,855 544,536 (103,900) 1,358,566 43,596,057
Less accumulated depreciation Building and Improvements 14,123,986 322,466 - - 14,446,452 Vehicles 2,912,148 310,449 (103,900) - 3,118,697 Machinery and Equipment 1,426,712 60,267 - - 1,486,979 Infrastructure 7,117,345 503,383 - - 7,620,728 Total accumulated depreciation 25,580,191 1,196,565 (103,900) - 26,672,856
Depreciable Capital Assets, Net of accumulated depreciation 16,216,664 (652,029) - 1,358,566 16,923,201
Total Capital Assets, Net 20,982,900$ (102,086)$ -$ -$ 20,880,814$
This space intentionally left blank.
44
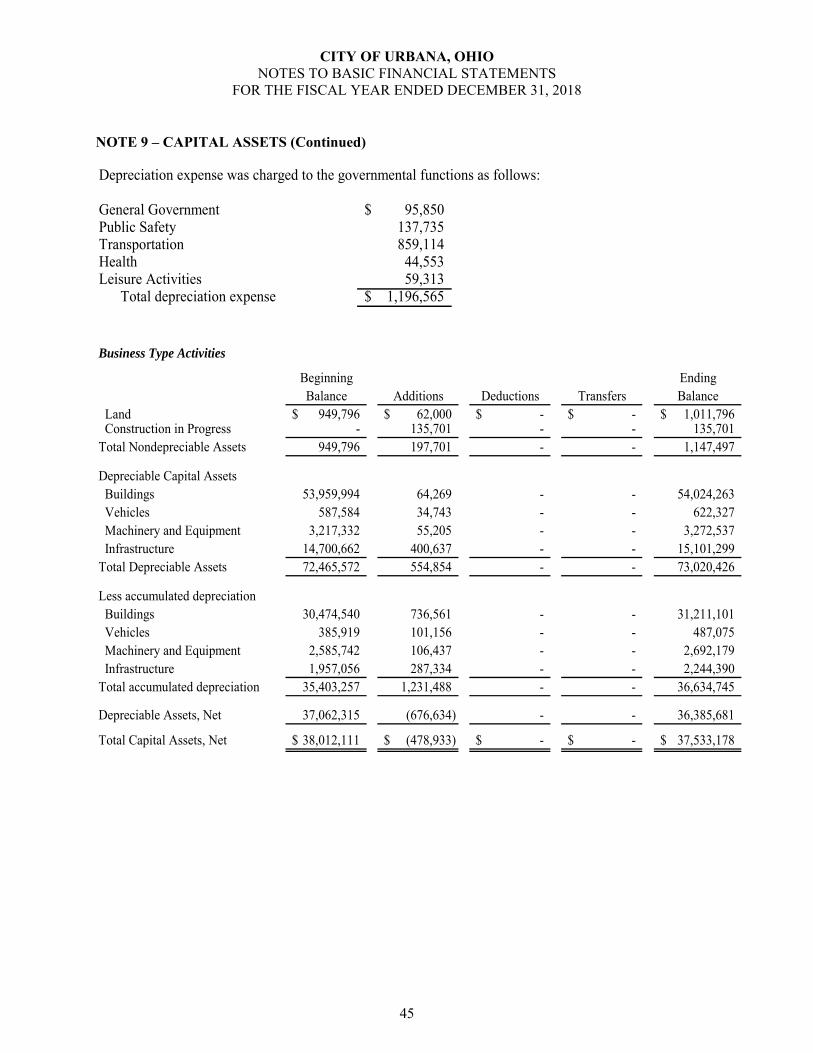
CITY OF URBANA, OHIO NOTES TO BASIC FINANCIAL STATEMENTS
FOR THE FISCAL YEAR ENDED DECEMBER 31, 2018
NOTE 9 – CAPITAL ASSETS (Continued) Depreciation expense was charged to the governmental functions as follows:
General Government 95,850$ Public Safety 137,735 Transportation 859,114 Health 44,553 Leisure Activities 59,313 Total depreciation expense 1,196,565$
Business Type Activities
Beginning EndingBalance Additions Deductions Transfers Balance
Land 949,796$ 62,000$ -$ -$ 1,011,796$ Construction in Progress - 135,701 - - 135,701 Total Nondepreciable Assets 949,796 197,701 - - 1,147,497
Depreciable Capital Assets Buildings 53,959,994 64,269 - - 54,024,263 Vehicles 587,584 34,743 - - 622,327 Machinery and Equipment 3,217,332 55,205 - - 3,272,537 Infrastructure 14,700,662 400,637 - - 15,101,299 Total Depreciable Assets 72,465,572 554,854 - - 73,020,426
Less accumulated depreciation Buildings 30,474,540 736,561 - - 31,211,101 Vehicles 385,919 101,156 - - 487,075 Machinery and Equipment 2,585,742 106,437 - - 2,692,179 Infrastructure 1,957,056 287,334 - - 2,244,390 Total accumulated depreciation 35,403,257 1,231,488 - - 36,634,745
Depreciable Assets, Net 37,062,315 (676,634) - - 36,385,681
Total Capital Assets, Net 38,012,111$ (478,933)$ -$ -$ 37,533,178$
45
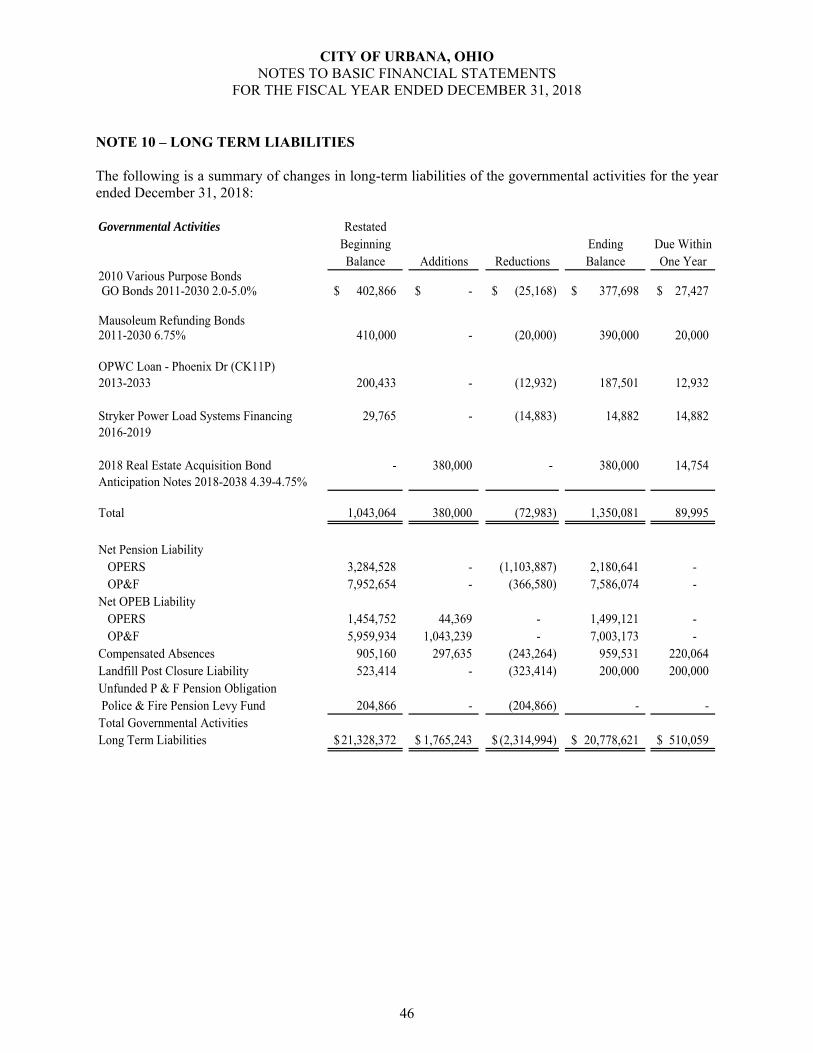
CITY OF URBANA, OHIO NOTES TO BASIC FINANCIAL STATEMENTS
FOR THE FISCAL YEAR ENDED DECEMBER 31, 2018
NOTE 10 – LONG TERM LIABILITIES The following is a summary of changes in long-term liabilities of the governmental activities for the year ended December 31, 2018: Governmental Activities Restated
Beginning Ending Due WithinBalance Additions Reductions Balance One Year
2010 Various Purpose Bonds GO Bonds 2011-2030 2.0-5.0% 402,866$ -$ (25,168)$ 377,698$ 27,427$
Mausoleum Refunding Bonds2011-2030 6.75% 410,000 - (20,000) 390,000 20,000
OPWC Loan - Phoenix Dr (CK11P)2013-2033 200,433 - (12,932) 187,501 12,932
Stryker Power Load Systems Financing 29,765 - (14,883) 14,882 14,882 2016-2019
2018 Real Estate Acquisition Bond - 380,000 - 380,000 14,754 Anticipation Notes 2018-2038 4.39-4.75%
Total 1,043,064 380,000 (72,983) 1,350,081 89,995
Net Pension LiabilityOPERS 3,284,528 - (1,103,887) 2,180,641 - OP&F 7,952,654 - (366,580) 7,586,074 -
Net OPEB LiabilityOPERS 1,454,752 44,369 - 1,499,121 - OP&F 5,959,934 1,043,239 - 7,003,173 -
Compensated Absences 905,160 297,635 (243,264) 959,531 220,064 Landfill Post Closure Liability 523,414 - (323,414) 200,000 200,000 Unfunded P & F Pension Obligation Police & Fire Pension Levy Fund 204,866 - (204,866) - - Total Governmental Activities Long Term Liabilities 21,328,372$ 1,765,243$ (2,314,994)$ 20,778,621$ 510,059$
46

CITY OF URBANA, OHIO NOTES TO BASIC FINANCIAL STATEMENTS
FOR THE FISCAL YEAR ENDED DECEMBER 31, 2018
NOTE 10 – LONG TERM LIABILITIES (Continued) The following is a summary of changes in long-term liabilities of the business-type activities for the year ended December 31, 2018: Business-Type Activities Restated
Beginning Ending Due WithinBalance Additions Reductions Balance One Year
Water Fund:OPWC 0% Interest Loan- CK26C 100,411$ -$ (22,314)$ 78,097$ 22,314$
OPWC 0% Interest Loan Well Field 47,338 - (4,734) 42,604 4,734
OWDA Loan 2008-2029 3.0%North 29 Water System Improvement 3,854,761 - (265,679) 3,589,082 274,680
OPWC 0% Interest Loan Well Field 575,000 - (50,000) 525,000 50,000
OPWC 0% Interest Loan- CT Communication Utility Extension 52,607 - (4,112) 48,495 4,112
OPWC - South Main Water Main (CK19O)2013-2033 289,679 - (19,312) 270,367 19,312
2010 Various Purpose Bonds2011-2030 2.0-5.0% 186,978 - (11,685) 175,293 12,671
ODWA Phase I Water Main Replacement (#6731)2016-2035 2,378,613 - (82,023) 2,296,590 114,665
OPWC 0% Interest Loan Wooddale Amherst2016-2036 527,250 - (28,500) 498,750 28,500
East Lawn Avenue Tank Loan2016-2019 211,278 - (105,639) 105,639 105,639
Gwynne Street Tank Loan2016-2021 530,792 - (132,698) 398,094 132,698
Net Pension LiabilityOPERS 563,393 - (182,330) 381,063 -
Net OPEB LiabilityOPERS 249,579 12,455 - 262,034 -
Accrued Vacation and Sick Leave 31,233 29,986 (11,120) 50,099 20,135
Total Water Fund 9,598,912$ 42,441$ (920,146)$ 8,721,207$ 789,460$
47
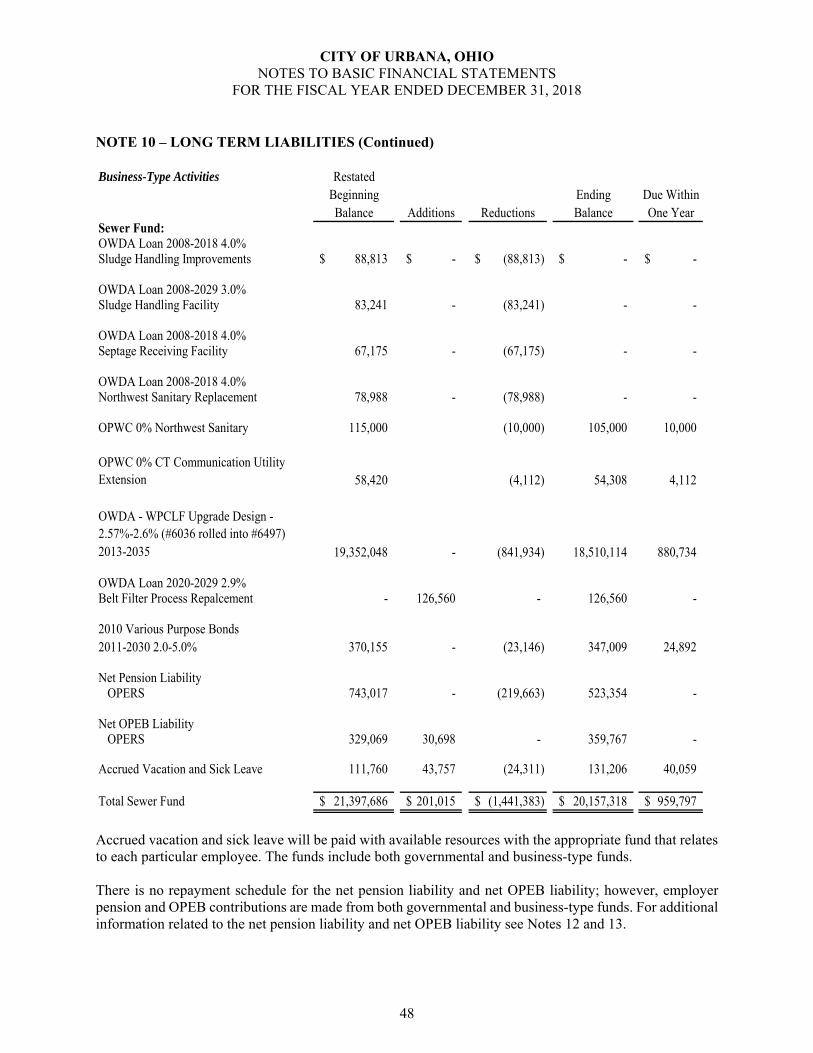
CITY OF URBANA, OHIO NOTES TO BASIC FINANCIAL STATEMENTS
FOR THE FISCAL YEAR ENDED DECEMBER 31, 2018
NOTE 10 – LONG TERM LIABILITIES (Continued) Business-Type Activities Restated
Beginning Ending Due WithinBalance Additions Reductions Balance One Year
Sewer Fund:OWDA Loan 2008-2018 4.0%Sludge Handling Improvements 88,813$ -$ (88,813)$ -$ -$
OWDA Loan 2008-2029 3.0%Sludge Handling Facility 83,241 - (83,241) - -
OWDA Loan 2008-2018 4.0%Septage Receiving Facility 67,175 - (67,175) - -
OWDA Loan 2008-2018 4.0%Northwest Sanitary Replacement 78,988 - (78,988) - -
OPWC 0% Northwest Sanitary 115,000 (10,000) 105,000 10,000
OPWC 0% CT Communication Utility Extension 58,420 (4,112) 54,308 4,112
OWDA - WPCLF Upgrade Design - 2.57%-2.6% (#6036 rolled into #6497)2013-2035 19,352,048 - (841,934) 18,510,114 880,734
OWDA Loan 2020-2029 2.9%Belt Filter Process Repalcement - 126,560 - 126,560 -
2010 Various Purpose Bonds2011-2030 2.0-5.0% 370,155 - (23,146) 347,009 24,892
Net Pension LiabilityOPERS 743,017 - (219,663) 523,354 -
Net OPEB LiabilityOPERS 329,069 30,698 - 359,767 -
Accrued Vacation and Sick Leave 111,760 43,757 (24,311) 131,206 40,059
Total Sewer Fund 21,397,686$ 201,015$ (1,441,383)$ 20,157,318$ 959,797$
Accrued vacation and sick leave will be paid with available resources with the appropriate fund that relates to each particular employee. The funds include both governmental and business-type funds. There is no repayment schedule for the net pension liability and net OPEB liability; however, employer pension and OPEB contributions are made from both governmental and business-type funds. For additional information related to the net pension liability and net OPEB liability see Notes 12 and 13.
48
CITY OF URBANA, OHIO NOTES TO BASIC FINANCIAL STATEMENTS
FOR THE FISCAL YEAR ENDED DECEMBER 31, 2018
NOTE 10 – LONG TERM LIABILITIES (Continued) In 2010, the City paid off Bond Anticipation Notes and issued Various Purpose Bonds in the amount of $1,335,000. The Bonds mature in 2030 and have interest rates ranging from 2.0 to 5.0 percent during the life of the Bonds. In 2010, the City also issued $525,000 in bonds for the re-finance of the Mausoleum Building. The bonds mature in 2031 and have an interest rate of 6.75 percent. During 2012, the City entered into two loan arrangements through the Ohio Public Works Commission (OPWC) and one loan with the Ohio Water Development Agency (OWDA). The two OPWC loans were to fund the Phoenix Drive ($258,623) and South Main Water Main ($386,239) projects. The OWDA loan was entered into to fund a Waste Water Plant Upgrade project. The OWDA approved a loan in the amount $20,697,045 for the project. An additional $453,388 in capitalized interest was added to the loan balance during construction. In 2014, the City entered into another loan with the Ohio Water Development Agency (OWDA) to fund a Water Main Replacement project. The OWDA approved a loan in the amount of $2,861,925 for the project and as of December 31, 2018, the City has drawn down $2,612,525. An additional $14,681 in capitalized interest was added to the loan balance during construction. During 2015, the City entered into a loan arrangement with the OPWC and a financing arrangement with Stryker Flex Financial. The OPWC loan was to fund the Wooddale Amherst Phase One Water Replacement Project for $570,000. The financing arrangement with Stryker Flex Financing was to finance the remaining balance for the equipment bought by the City, totaling $44,648, over a three-year period. During 2016, the City entered into financing agreements with the Utility Services Co., Inc. for renovations of the East Lawn Avenue Water Tank and Gwynne Street Water Tank, totaling $422,556 and $703,490, respectively. The East Lawn Avenue Water Tank financing matures in 2019 and the Gwynne Street Water Tank financing matures 2021. During 2018, the City entered into a loan agreement with the Ohio Water Development Agency (OWDA) to fund the purchase of a screw press and related construction at the Water Reclamation Facility. The OWDA approved a loan in the amount of $556,170 for the project and as of December 31, 2018, the City has drawn down $125,741. In 2018, the City also issued $380,000 in bond anticipation notes through Security National Bank for the purpose of purchasing the building and land located at 225 South Main Street. The notes mature in 2038 and have interest rates ranging from 4.39 to 4.75 percent.
49
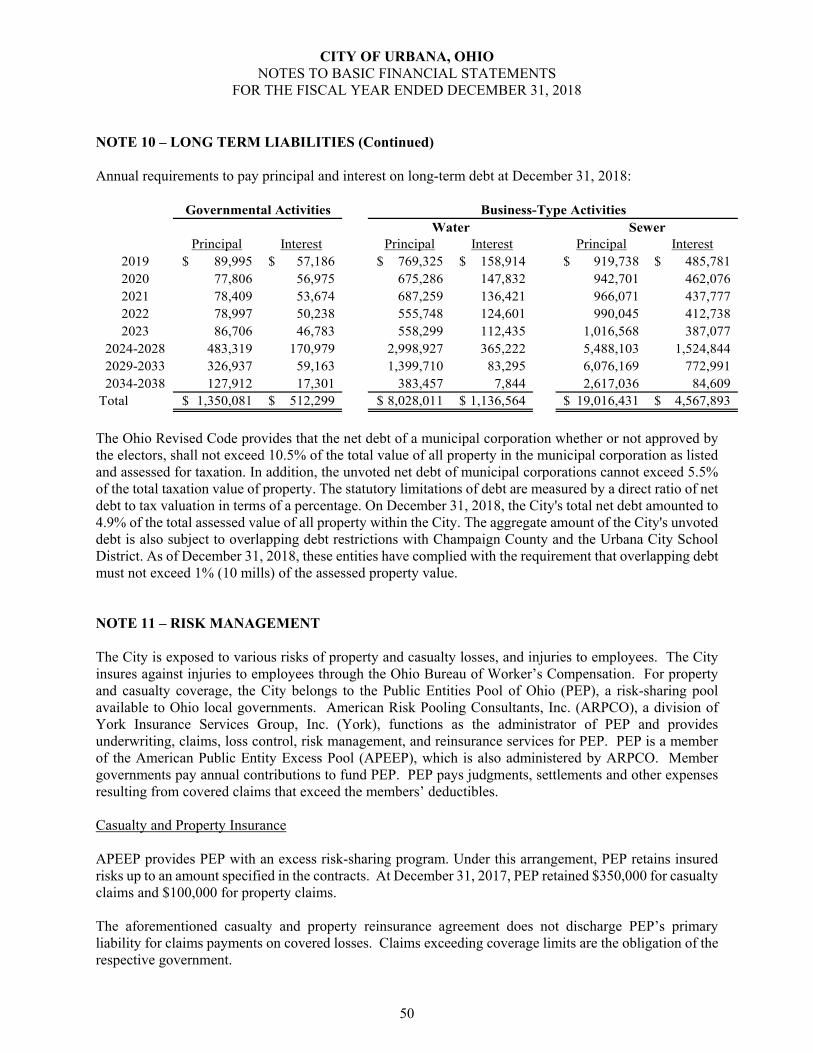
CITY OF URBANA, OHIO NOTES TO BASIC FINANCIAL STATEMENTS
FOR THE FISCAL YEAR ENDED DECEMBER 31, 2018
NOTE 10 – LONG TERM LIABILITIES (Continued) Annual requirements to pay principal and interest on long-term debt at December 31, 2018:
Principal Interest Principal Interest Principal Interest2019 89,995$ 57,186$ 769,325$ 158,914$ 919,738$ 485,781$ 2020 77,806 56,975 675,286 147,832 942,701 462,076 2021 78,409 53,674 687,259 136,421 966,071 437,777 2022 78,997 50,238 555,748 124,601 990,045 412,738 2023 86,706 46,783 558,299 112,435 1,016,568 387,077
2024-2028 483,319 170,979 2,998,927 365,222 5,488,103 1,524,844 2029-2033 326,937 59,163 1,399,710 83,295 6,076,169 772,991 2034-2038 127,912 17,301 383,457 7,844 2,617,036 84,609
Total 1,350,081$ 512,299$ 8,028,011$ 1,136,564$ 19,016,431$ 4,567,893$
Water SewerGovernmental Activities Business-Type Activities
The Ohio Revised Code provides that the net debt of a municipal corporation whether or not approved by the electors, shall not exceed 10.5% of the total value of all property in the municipal corporation as listed and assessed for taxation. In addition, the unvoted net debt of municipal corporations cannot exceed 5.5% of the total taxation value of property. The statutory limitations of debt are measured by a direct ratio of net debt to tax valuation in terms of a percentage. On December 31, 2018, the City's total net debt amounted to 4.9% of the total assessed value of all property within the City. The aggregate amount of the City's unvoted debt is also subject to overlapping debt restrictions with Champaign County and the Urbana City School District. As of December 31, 2018, these entities have complied with the requirement that overlapping debt must not exceed 1% (10 mills) of the assessed property value. NOTE 11 – RISK MANAGEMENT The City is exposed to various risks of property and casualty losses, and injuries to employees. The City insures against injuries to employees through the Ohio Bureau of Worker’s Compensation. For property and casualty coverage, the City belongs to the Public Entities Pool of Ohio (PEP), a risk-sharing pool available to Ohio local governments. American Risk Pooling Consultants, Inc. (ARPCO), a division of York Insurance Services Group, Inc. (York), functions as the administrator of PEP and provides underwriting, claims, loss control, risk management, and reinsurance services for PEP. PEP is a member of the American Public Entity Excess Pool (APEEP), which is also administered by ARPCO. Member governments pay annual contributions to fund PEP. PEP pays judgments, settlements and other expenses resulting from covered claims that exceed the members’ deductibles. Casualty and Property Insurance APEEP provides PEP with an excess risk-sharing program. Under this arrangement, PEP retains insured risks up to an amount specified in the contracts. At December 31, 2017, PEP retained $350,000 for casualty claims and $100,000 for property claims. The aforementioned casualty and property reinsurance agreement does not discharge PEP’s primary liability for claims payments on covered losses. Claims exceeding coverage limits are the obligation of the respective government.
50

CITY OF URBANA, OHIO NOTES TO BASIC FINANCIAL STATEMENTS
FOR THE FISCAL YEAR ENDED DECEMBER 31, 2018
NOTE 11 – RISK MANAGEMENT (Continued) Financial Position PEP’s financial statements (audited by other auditors) conform with generally accepted accounting principles, and reported the following assets, liabilities and net position at December 31, 2017 and 2016:
Casualty & Property Coverage 2017 2016 Assets $44,452,326 $42,182,281 Liabilities (13,004,011) (13,396,700) Net Position $31,448,315 $28,785,581
At December 31, 2016 and 2017, respectively, the liabilities above include approximately $12.0 million and $11.8 million of estimated incurred claims payable. The assets above also include approximately $11.0 million and $11.3 million of unpaid claims to be billed to approximately 520 and 527 member governments in the future, as of December 31, 2016 and 2017, respectively. These amounts will be included in future contributions from members when the related claims are due for payment. Based on discussions with PEP, the expected rates PEP charges to compute member contributions, which are used to pay claims as they become due, are not expected to change significantly from those used to determine the historical contributions detailed below. By contract, the annual liability of each member is limited to the amount of financial contributions required to be made to PEP for each year of membership.
2018 151,105$ 2017 151,229$
Contributions to PEP
After one year of membership, a member may withdraw on the anniversary of the date of joining PEP, if the member notifies PEP in writing 60 days prior to the anniversary date. Upon withdrawal, members are eligible for a full or partial refund of their capital contributions, minus the subsequent year’s contribution. Withdrawing members have no other future obligation to PEP. Upon withdrawal, payments for all casualty claims and claim expenses become the sole responsibility of the withdrawing member, regardless of whether a claim occurred or was reported prior to the withdrawal. There has been no reduction in coverage from the prior year. Settled claims did not exceed coverage in any of the last three years. NOTE 12 – DEFINED BENEFIT PENSION PLANS Net Pension (Asset)/Liability
The net pension (asset)/liability reported on the statement of net position represents a (asset)/liability to employees for pensions. Pensions are a component of exchange transactions-–between an employer and its employees—of salaries and benefits for employee services. Pensions are provided to an employee—on a deferred-payment basis—as part of the total compensation package offered by an employer for employee services each financial period. The obligation to sacrifice resources for pensions is a present obligation because it was created as a result of employment exchanges that already have occurred.
51
CITY OF URBANA, OHIO NOTES TO BASIC FINANCIAL STATEMENTS
FOR THE FISCAL YEAR ENDED DECEMBER 31, 2018
NOTE 12 – DEFINED BENEFIT PENSION PLANS (Continued) The net pension (asset)/liability represents the City’s proportionate share of each pension plan’s collective actuarial present value of projected benefit payments attributable to past periods of service, net of each pension plan’s fiduciary net position. The net pension (asset)/liability calculation is dependent on critical long-term variables, including estimated average life expectancies, earnings on investments, cost of living adjustments and others. While these estimates use the best information available, unknowable future events require adjusting this estimate annually. The Ohio Revised Code limits the City’s obligation for this (asset)/liability to annually required payments. The City cannot control benefit terms or the manner in which pensions are financed; however, the Authority does receive the benefit of employees’ services in exchange for compensation including pension. GASB 68 assumes the net pension (asset)/liability is solely the obligation of the employer, because (1) they benefit from employee services; and (2) State statute requires all funding to come from these employers. All contributions to date have come solely from these employers (which also includes costs paid in the form of withholdings from employees). State statute requires the pension plans to amortize unfunded liabilities within 30 years. If the amortization period exceeds 30 years, each pension plan’s board must propose corrective action to the State legislature. Any resulting legislative change to benefits or funding could significantly affect the net pension liability. Resulting adjustments to the net pension (asset)/liability would be effective when the changes are legally enforceable.
The proportionate share of each plan’s unfunded benefits is presented as a long-term net pension (asset)/liability on the accrual basis of accounting. Any liability for the contractually-required pension contribution outstanding at the end of the year is included in due to other governments on both the accrual and modified accrual basis of accounting. Plan Description – Ohio Public Employees Retirement System (OPERS) Plan Description - City employees, other than full-time police and firefighters, participate in the Ohio Public Employees Retirement System (OPERS). OPERS administers three separate pension plans. The traditional pension plan is a cost-sharing, multiple-employer defined benefit pension plan. The member-directed plan is a defined contribution plan and the combined plan is a cost-sharing, multiple-employer defined benefit pension plan with defined contribution features. OPERS provides retirement, disability, survivor and death benefits, and annual cost of living adjustments to members of the traditional plan. Authority to establish and amend benefits is provided by Chapter 145 of the Ohio Revised Code. OPERS issues a stand-alone financial report that includes financial statements, required supplementary information and detailed information about OPERS’ fiduciary net position that may be obtained by visiting https://www.opers.org/financial/reports.shtml, by writing to the Ohio Public Employees Retirement System, 277 East Town Street, Columbus, Ohio 43215-4642, or by calling 800-222-7377. Senate Bill (SB) 343 was enacted into law with an effective date of January 7, 2013. In the legislation, members were categorized into three groups with varying provisions of the law applicable to each group. The following table provides age and service requirements for retirement and the retirement formula applied to final average salary (FAS) for the three member groups under the traditional plan as per the reduced benefits adopted by SB 343 (see OPERS CAFR referenced above for additional information):
52
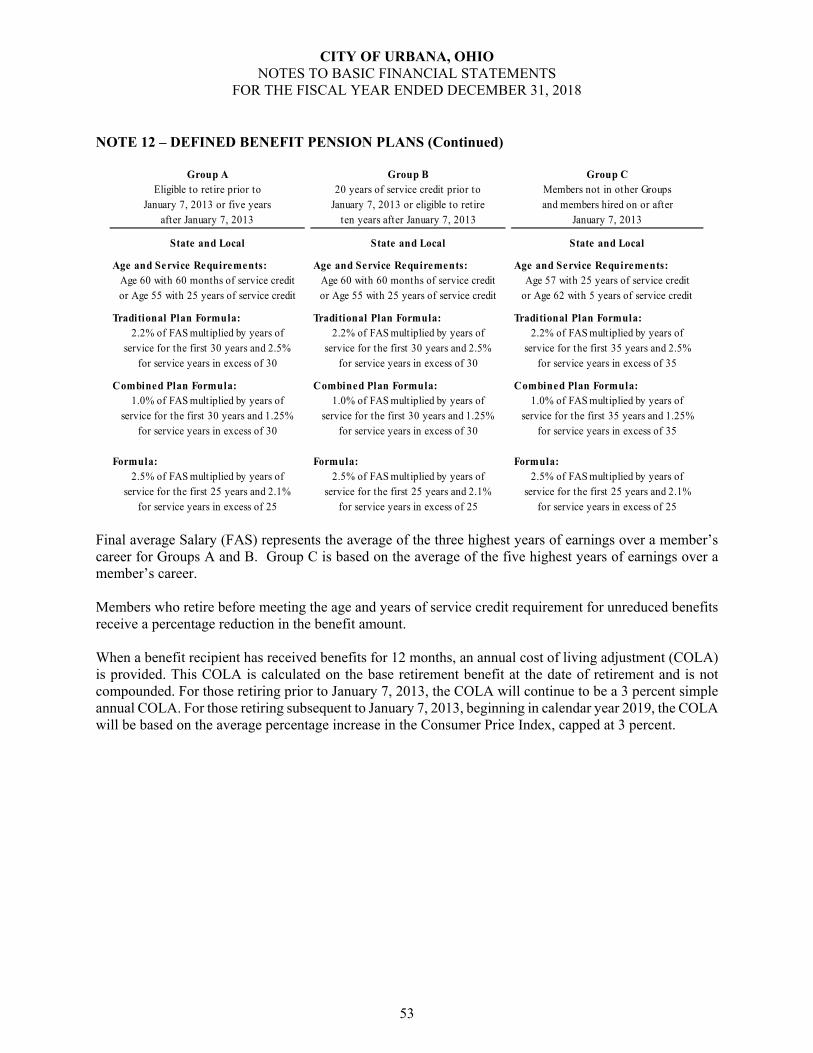
CITY OF URBANA, OHIO NOTES TO BASIC FINANCIAL STATEMENTS
FOR THE FISCAL YEAR ENDED DECEMBER 31, 2018
NOTE 12 – DEFINED BENEFIT PENSION PLANS (Continued)
Final average Salary (FAS) represents the average of the three highest years of earnings over a member’s career for Groups A and B. Group C is based on the average of the five highest years of earnings over a member’s career. Members who retire before meeting the age and years of service credit requirement for unreduced benefits receive a percentage reduction in the benefit amount. When a benefit recipient has received benefits for 12 months, an annual cost of living adjustment (COLA) is provided. This COLA is calculated on the base retirement benefit at the date of retirement and is not compounded. For those retiring prior to January 7, 2013, the COLA will continue to be a 3 percent simple annual COLA. For those retiring subsequent to January 7, 2013, beginning in calendar year 2019, the COLA will be based on the average percentage increase in the Consumer Price Index, capped at 3 percent.
Group A Group B Group CEligible to retire prior to 20 years of service credit prior to Members not in other Groups
January 7, 2013 or five years January 7, 2013 or eligible to retire and members hired on or afterafter January 7, 2013 ten years after January 7, 2013 January 7, 2013
State and Local State and Local State and Local
Age and Service Requirements: Age and Service Requirements: Age and Service Requirements:Age 60 with 60 months of service credit Age 60 with 60 months of service credit Age 57 with 25 years of service creditor Age 55 with 25 years of service credit or Age 55 with 25 years of service credit or Age 62 with 5 years of service credit
Traditional Plan Formula: Traditional Plan Formula: Traditional Plan Formula:2.2% of FAS multiplied by years of 2.2% of FAS multiplied by years of 2.2% of FAS multiplied by years of
service for the first 30 years and 2.5% service for the first 30 years and 2.5% service for the first 35 years and 2.5%for service years in excess of 30 for service years in excess of 30 for service years in excess of 35
Combined Plan Formula: Combined Plan Formula: Combined Plan Formula:1.0% of FAS multiplied by years of 1.0% of FAS multiplied by years of 1.0% of FAS multiplied by years of
service for the first 30 years and 1.25% service for the first 30 years and 1.25% service for the first 35 years and 1.25%for service years in excess of 30 for service years in excess of 30 for service years in excess of 35
Formula: Formula: Formula:2.5% of FAS multiplied by years of 2.5% of FAS multiplied by years of 2.5% of FAS multiplied by years of
service for the first 25 years and 2.1% service for the first 25 years and 2.1% service for the first 25 years and 2.1%for service years in excess of 25 for service years in excess of 25 for service years in excess of 25
53

CITY OF URBANA, OHIO NOTES TO BASIC FINANCIAL STATEMENTS
FOR THE FISCAL YEAR ENDED DECEMBER 31, 2018
NOTE 12 – DEFINED BENEFIT PENSION PLANS (Continued) Funding Policy - The Ohio Revised Code (ORC) provides statutory authority for member and employer contributions as follows:
2018 Statutory Maximum Contribution RatesEmployer 14.0 %Employee 10.0 %
2018 Actual Contribution RatesEmployer:
Pension 14.0 %Post-employment Health Care Benefits 0.0
Total Employer 14.0 %
Employee 10.0 %
Employer contribution rates are actuarially determined and are expressed as a percentage of covered payroll. The City’s contractually required contribution was $414,802 for 2018. Of this amount, $7,253 is reported as due to other governments. Plan Description – Ohio Police & Fire Pension Fund (OPF) Plan Description - City full-time police and firefighters participate in Ohio Police and Fire Pension Fund (OPF), a cost-sharing, multiple-employer defined benefit pension plan administered by OPF. OPF provides retirement and disability pension benefits, annual cost-of-living adjustments, and death benefits to plan members and beneficiaries. Benefit provisions are established by the Ohio State Legislature and are codified in Chapter 742 of the Ohio Revised Code. OPF issues a publicly available financial report that includes financial information and required supplementary information and detailed information about OPF fiduciary net position. The report that may be obtained by visiting the OPF website at www.op-f.org or by writing to the Ohio Police and Fire Pension Fund, 140 East Town Street, Columbus, Ohio 43215-5164. Upon attaining a qualifying age with sufficient years of service, a member of OPF may retire and receive a lifetime monthly pension. OPF offers four types of service retirement: normal, service commuted, age/service commuted and actuarially reduced. Each type has different eligibility guidelines and is calculated using the member’s average annual salary. The following discussion of the pension formula relates to normal service retirement. For members hired after July 1, 2013, the minimum retirement age is 52 for normal service retirement with at least 25 years of service credit. For members hired on or before July 1, 2013, the minimum retirement age is 48 for normal service retirement with at least 25 years of service credit.
54
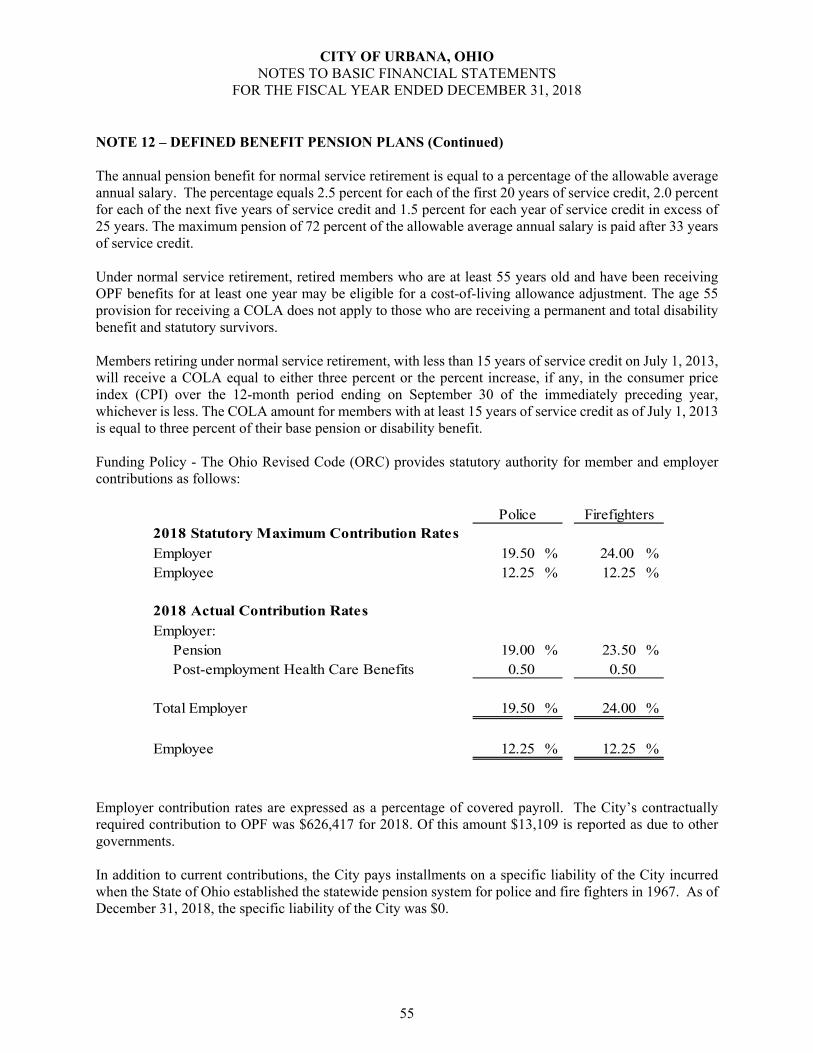
CITY OF URBANA, OHIO NOTES TO BASIC FINANCIAL STATEMENTS
FOR THE FISCAL YEAR ENDED DECEMBER 31, 2018
NOTE 12 – DEFINED BENEFIT PENSION PLANS (Continued) The annual pension benefit for normal service retirement is equal to a percentage of the allowable average annual salary. The percentage equals 2.5 percent for each of the first 20 years of service credit, 2.0 percent for each of the next five years of service credit and 1.5 percent for each year of service credit in excess of 25 years. The maximum pension of 72 percent of the allowable average annual salary is paid after 33 years of service credit. Under normal service retirement, retired members who are at least 55 years old and have been receiving OPF benefits for at least one year may be eligible for a cost-of-living allowance adjustment. The age 55 provision for receiving a COLA does not apply to those who are receiving a permanent and total disability benefit and statutory survivors. Members retiring under normal service retirement, with less than 15 years of service credit on July 1, 2013, will receive a COLA equal to either three percent or the percent increase, if any, in the consumer price index (CPI) over the 12-month period ending on September 30 of the immediately preceding year, whichever is less. The COLA amount for members with at least 15 years of service credit as of July 1, 2013 is equal to three percent of their base pension or disability benefit. Funding Policy - The Ohio Revised Code (ORC) provides statutory authority for member and employer contributions as follows:
Police Firefighters2018 Statutory Maximum Contribution RatesEmployer 19.50 % 24.00 %Employee 12.25 % 12.25 %
2018 Actual Contribution RatesEmployer:
Pension 19.00 % 23.50 %Post-employment Health Care Benefits 0.50 0.50
Total Employer 19.50 % 24.00 %
Employee 12.25 % 12.25 %
Employer contribution rates are expressed as a percentage of covered payroll. The City’s contractually required contribution to OPF was $626,417 for 2018. Of this amount $13,109 is reported as due to other governments. In addition to current contributions, the City pays installments on a specific liability of the City incurred when the State of Ohio established the statewide pension system for police and fire fighters in 1967. As of December 31, 2018, the specific liability of the City was $0.
55
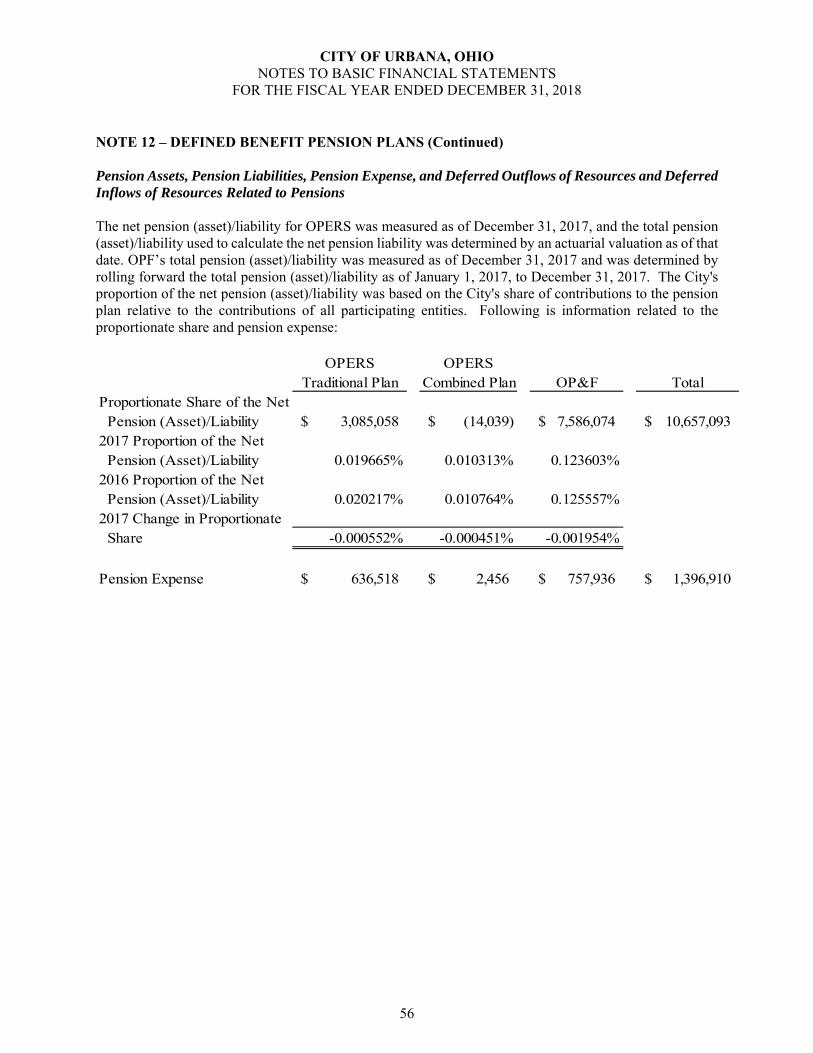
CITY OF URBANA, OHIO NOTES TO BASIC FINANCIAL STATEMENTS
FOR THE FISCAL YEAR ENDED DECEMBER 31, 2018
NOTE 12 – DEFINED BENEFIT PENSION PLANS (Continued) Pension Assets, Pension Liabilities, Pension Expense, and Deferred Outflows of Resources and Deferred Inflows of Resources Related to Pensions The net pension (asset)/liability for OPERS was measured as of December 31, 2017, and the total pension (asset)/liability used to calculate the net pension liability was determined by an actuarial valuation as of that date. OPF’s total pension (asset)/liability was measured as of December 31, 2017 and was determined by rolling forward the total pension (asset)/liability as of January 1, 2017, to December 31, 2017. The City's proportion of the net pension (asset)/liability was based on the City's share of contributions to the pension plan relative to the contributions of all participating entities. Following is information related to the proportionate share and pension expense:
OPERS OPERSTraditional Plan Combined Plan OP&F Total
Proportionate Share of the Net Pension (Asset)/Liability 3,085,058$ (14,039)$ 7,586,074$ 10,657,093$ 2017 Proportion of the Net Pension (Asset)/Liability 0.019665% 0.010313% 0.123603%2016 Proportion of the Net Pension (Asset)/Liability 0.020217% 0.010764% 0.125557%2017 Change in Proportionate Share -0.000552% -0.000451% -0.001954%
Pension Expense 636,518$ 2,456$ 757,936$ 1,396,910$
56
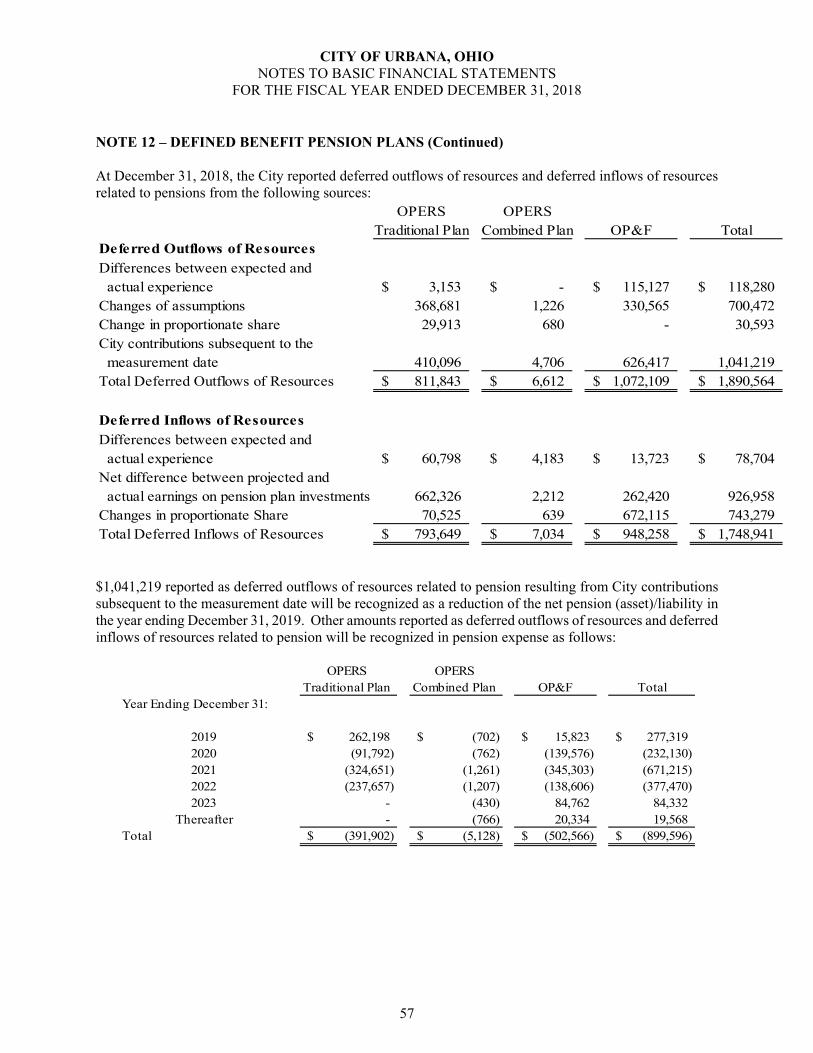
CITY OF URBANA, OHIO NOTES TO BASIC FINANCIAL STATEMENTS
FOR THE FISCAL YEAR ENDED DECEMBER 31, 2018
NOTE 12 – DEFINED BENEFIT PENSION PLANS (Continued) At December 31, 2018, the City reported deferred outflows of resources and deferred inflows of resources related to pensions from the following sources:
OPERS OPERSTraditional Plan Combined Plan OP&F Total
Deferred Outflows of ResourcesDifferences between expected and actual experience 3,153$ -$ 115,127$ 118,280$ Changes of assumptions 368,681 1,226 330,565 700,472 Change in proportionate share 29,913 680 - 30,593 City contributions subsequent to the measurement date 410,096 4,706 626,417 1,041,219 Total Deferred Outflows of Resources 811,843$ 6,612$ 1,072,109$ 1,890,564$
Deferred Inflows of ResourcesDifferences between expected and actual experience 60,798$ 4,183$ 13,723$ 78,704$ Net difference between projected and actual earnings on pension plan investments 662,326 2,212 262,420 926,958 Changes in proportionate Share 70,525 639 672,115 743,279 Total Deferred Inflows of Resources 793,649$ 7,034$ 948,258$ 1,748,941$
$1,041,219 reported as deferred outflows of resources related to pension resulting from City contributions subsequent to the measurement date will be recognized as a reduction of the net pension (asset)/liability in the year ending December 31, 2019. Other amounts reported as deferred outflows of resources and deferred inflows of resources related to pension will be recognized in pension expense as follows:
OPERS OPERS Traditional Plan Combined Plan OP&F Total
Year Ending December 31:
2019 262,198$ (702)$ 15,823$ 277,319$ 2020 (91,792) (762) (139,576) (232,130) 2021 (324,651) (1,261) (345,303) (671,215) 2022 (237,657) (1,207) (138,606) (377,470) 2023 - (430) 84,762 84,332
Thereafter - (766) 20,334 19,568 Total (391,902)$ (5,128)$ (502,566)$ (899,596)$
57
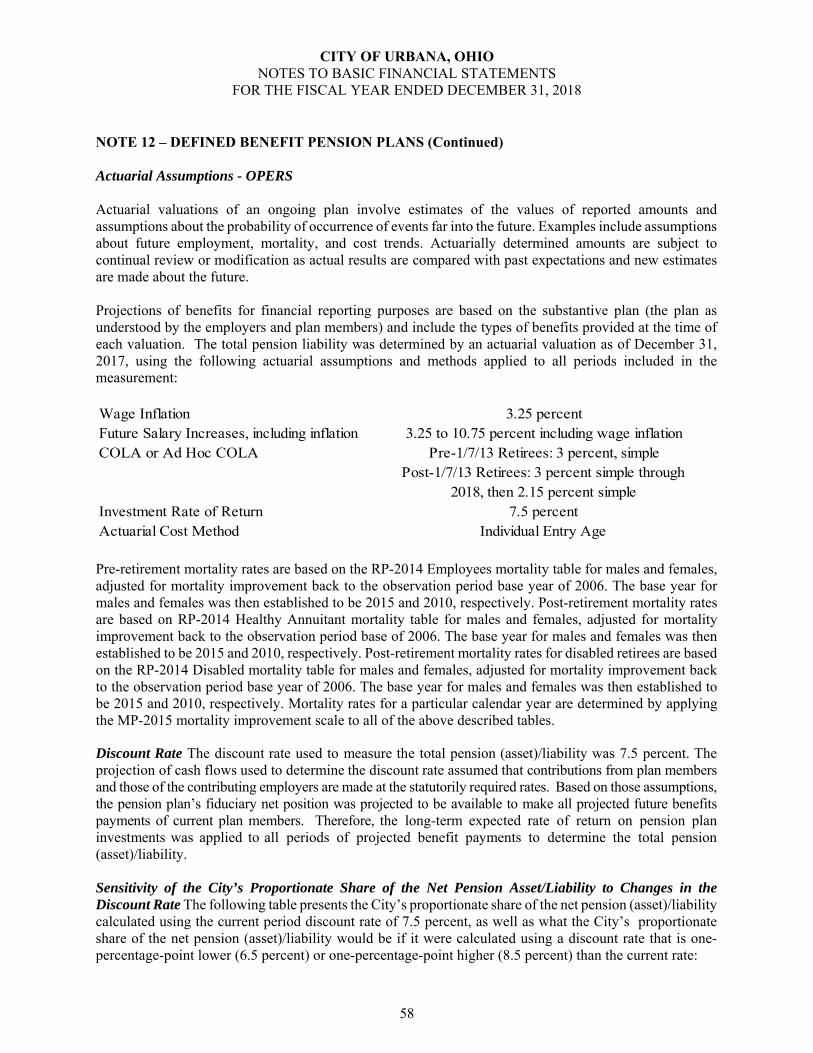
CITY OF URBANA, OHIO NOTES TO BASIC FINANCIAL STATEMENTS
FOR THE FISCAL YEAR ENDED DECEMBER 31, 2018
NOTE 12 – DEFINED BENEFIT PENSION PLANS (Continued) Actuarial Assumptions - OPERS Actuarial valuations of an ongoing plan involve estimates of the values of reported amounts and assumptions about the probability of occurrence of events far into the future. Examples include assumptions about future employment, mortality, and cost trends. Actuarially determined amounts are subject to continual review or modification as actual results are compared with past expectations and new estimates are made about the future. Projections of benefits for financial reporting purposes are based on the substantive plan (the plan as understood by the employers and plan members) and include the types of benefits provided at the time of each valuation. The total pension liability was determined by an actuarial valuation as of December 31, 2017, using the following actuarial assumptions and methods applied to all periods included in the measurement: Wage Inflation 3.25 percentFuture Salary Increases, including inflation 3.25 to 10.75 percent including wage inflationCOLA or Ad Hoc COLA Pre-1/7/13 Retirees: 3 percent, simple
Post-1/7/13 Retirees: 3 percent simple through 2018, then 2.15 percent simple
Investment Rate of Return 7.5 percentActuarial Cost Method Individual Entry Age
Pre-retirement mortality rates are based on the RP-2014 Employees mortality table for males and females, adjusted for mortality improvement back to the observation period base year of 2006. The base year for males and females was then established to be 2015 and 2010, respectively. Post-retirement mortality rates are based on RP-2014 Healthy Annuitant mortality table for males and females, adjusted for mortality improvement back to the observation period base of 2006. The base year for males and females was then established to be 2015 and 2010, respectively. Post-retirement mortality rates for disabled retirees are based on the RP-2014 Disabled mortality table for males and females, adjusted for mortality improvement back to the observation period base year of 2006. The base year for males and females was then established to be 2015 and 2010, respectively. Mortality rates for a particular calendar year are determined by applying the MP-2015 mortality improvement scale to all of the above described tables. Discount Rate The discount rate used to measure the total pension (asset)/liability was 7.5 percent. The projection of cash flows used to determine the discount rate assumed that contributions from plan members and those of the contributing employers are made at the statutorily required rates. Based on those assumptions, the pension plan’s fiduciary net position was projected to be available to make all projected future benefits payments of current plan members. Therefore, the long-term expected rate of return on pension plan investments was applied to all periods of projected benefit payments to determine the total pension (asset)/liability. Sensitivity of the City’s Proportionate Share of the Net Pension Asset/Liability to Changes in the Discount Rate The following table presents the City’s proportionate share of the net pension (asset)/liability calculated using the current period discount rate of 7.5 percent, as well as what the City’s proportionate share of the net pension (asset)/liability would be if it were calculated using a discount rate that is one-percentage-point lower (6.5 percent) or one-percentage-point higher (8.5 percent) than the current rate:
58

CITY OF URBANA, OHIO NOTES TO BASIC FINANCIAL STATEMENTS
FOR THE FISCAL YEAR ENDED DECEMBER 31, 2018
NOTE 12 – DEFINED BENEFIT PENSION PLANS (Continued)
1% Decrease Current Discount Rate 1% Increase(6.50%) (7.50%) (8.50%)
City's proportionate share of the net pension (asset)/liability
Traditional Plan 5,478,276$ 3,085,058$ 1,089,834$ Combined Plan (7,632) (14,039) (18,460)
The allocation of investment assets with the Defined Benefit portfolio is approved by the OPERS Board of Trustees as outlined in the annual investment plan. Plan assets are managed on a total return basis with a long-term objective of achieving and maintaining a fully funded status for the benefits provided through the defined benefit pension plans.
The following table displays the OPERS Board-approved asset allocation policy for 2017 and the long-term expected real rates of return:
TargetAsset Class Allocation
Fixed Income 23.00 % 2.20 %Domestic Equities 19.00 6.37Real Estate 10.00 5.26Private Equity 10.00 8.97International Equities 20.00 7.88Other investments 18.00 5.26
Total 100.00 % 5.66 %
(Arithmetic)
Weighted AverageLong-Term ExpectedReal Rate of Return
The long-term rate of return on defined benefit investment assets was determined using a building-block method in which best-estimate ranges of expected future real rates of return are developed for each major asset class. These ranges are combined to produce the long-term expected real rate of return by weighting the expected future real rates of return by the target asset allocation percentage, adjusted for inflation.
During 2017, OPERS managed investments in three investment portfolios: the Defined Benefit portfolio, the Health Care portfolio, and the Defined Contribution portfolio. The Defined Benefit portfolio contains the investment assets for the Traditional Pension Plan, the defined benefit component of the Combined Plan and the annuitized accounts of the Member-Directed Plan. Within the Defined Benefit portfolio, contributions into the plans are all recorded at the same time, and benefit payments all occur on the first of the month. Accordingly, the money-weighted rate of return is considered to be the same for all plans within the portfolio. The annual money-weighted rate of return expressing investment performance, net of investment expenses and adjusted for the changing amounts actually invested, for the Defined Benefit portfolio was 16.82% for 2017.
59
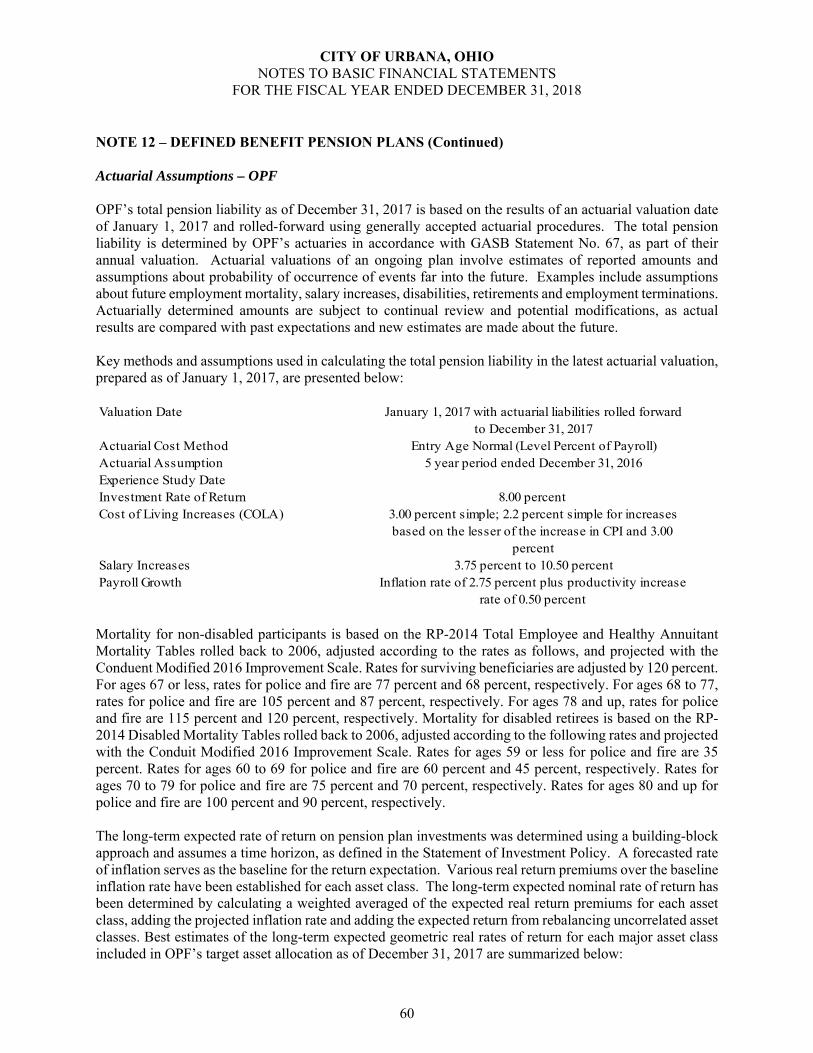
CITY OF URBANA, OHIO NOTES TO BASIC FINANCIAL STATEMENTS
FOR THE FISCAL YEAR ENDED DECEMBER 31, 2018
NOTE 12 – DEFINED BENEFIT PENSION PLANS (Continued) Actuarial Assumptions – OPF OPF’s total pension liability as of December 31, 2017 is based on the results of an actuarial valuation date of January 1, 2017 and rolled-forward using generally accepted actuarial procedures. The total pension liability is determined by OPF’s actuaries in accordance with GASB Statement No. 67, as part of their annual valuation. Actuarial valuations of an ongoing plan involve estimates of reported amounts and assumptions about probability of occurrence of events far into the future. Examples include assumptions about future employment mortality, salary increases, disabilities, retirements and employment terminations. Actuarially determined amounts are subject to continual review and potential modifications, as actual results are compared with past expectations and new estimates are made about the future. Key methods and assumptions used in calculating the total pension liability in the latest actuarial valuation, prepared as of January 1, 2017, are presented below: Valuation Date January 1, 2017 with actuarial liabilities rolled forward
to December 31, 2017Actuarial Cost Method Entry Age Normal (Level Percent of Payroll)Actuarial Assumption 5 year period ended December 31, 2016Experience Study DateInvestment Rate of Return 8.00 percent Cost of Living Increases (COLA) 3.00 percent simple; 2.2 percent simple for increases
based on the lesser of the increase in CPI and 3.00 percent
Salary Increases 3.75 percent to 10.50 percentPayroll Growth Inflation rate of 2.75 percent plus productivity increase
rate of 0.50 percent
Mortality for non-disabled participants is based on the RP-2014 Total Employee and Healthy Annuitant Mortality Tables rolled back to 2006, adjusted according to the rates as follows, and projected with the Conduent Modified 2016 Improvement Scale. Rates for surviving beneficiaries are adjusted by 120 percent. For ages 67 or less, rates for police and fire are 77 percent and 68 percent, respectively. For ages 68 to 77, rates for police and fire are 105 percent and 87 percent, respectively. For ages 78 and up, rates for police and fire are 115 percent and 120 percent, respectively. Mortality for disabled retirees is based on the RP-2014 Disabled Mortality Tables rolled back to 2006, adjusted according to the following rates and projected with the Conduit Modified 2016 Improvement Scale. Rates for ages 59 or less for police and fire are 35 percent. Rates for ages 60 to 69 for police and fire are 60 percent and 45 percent, respectively. Rates for ages 70 to 79 for police and fire are 75 percent and 70 percent, respectively. Rates for ages 80 and up for police and fire are 100 percent and 90 percent, respectively. The long-term expected rate of return on pension plan investments was determined using a building-block approach and assumes a time horizon, as defined in the Statement of Investment Policy. A forecasted rate of inflation serves as the baseline for the return expectation. Various real return premiums over the baseline inflation rate have been established for each asset class. The long-term expected nominal rate of return has been determined by calculating a weighted averaged of the expected real return premiums for each asset class, adding the projected inflation rate and adding the expected return from rebalancing uncorrelated asset classes. Best estimates of the long-term expected geometric real rates of return for each major asset class included in OPF’s target asset allocation as of December 31, 2017 are summarized below:
60

CITY OF URBANA, OHIO NOTES TO BASIC FINANCIAL STATEMENTS
FOR THE FISCAL YEAR ENDED DECEMBER 31, 2018
NOTE 12 – DEFINED BENEFIT PENSION PLANS (Continued)
TargetAsset Class Allocation
Cash and Cash Equivalents 0.00 % 0.00 %Domestic Equity 16.00 5.21Non-US Equity 16.00 5.40Core Fixed Income * 20.00 2.37Global Inflation Protected Securities * 20.00 2.33High Yield 15.00 4.48Real Estate 12.00 5.65Private Markets 8.00 7.99Timber 5.00 6.87Master Limited Partnerships 8.00 7.36
Total 120.00 %
* levered 2x
Long Term ExpectedReal Rate of Return*
OPF’s Board of Trustees has incorporated the “risk parity” concept into OPF’s asset liability valuation with the goal of reducing equity risk exposure, which reduces overall Total Portfolio risk without sacrificing return, and creating a more risk-balanced portfolio based on their relationship between asset classes and economic environments. From the notional portfolio perspective above, the Total Portfolio may be levered up to 1.20 times due to the application of leverage in certain fixed income asset classes. Discount Rate The total pension liability was calculated using the discount rate of 8.00 percent. The projection of cash flows used to determine the discount rate assumed the contributions from employers and from the members would be computed based on contribution requirements as stipulated by State statute. Projected inflows from investment earning were calculated using the longer-term assumed investment rate of return 8.00 percent. Based on those assumptions, the plan’s fiduciary net position was projected to be available to make all future benefit payments of current plan members. Therefore, a long-term expected rate of return on pension plan investments was applied to all periods of projected benefits to determine the total pension liability. Sensitivity of the City's Proportionate Share of the Net Pension Liability to Changes in the Discount Rate Net pension liability is sensitive to changes in the discount rate, and to illustrate the potential impact the following table presents the net pension liability calculated using the discount rate of 8.00 percent, as well as what the net pension liability would be if it were calculated using a discount rate that is one percentage point lower (7.00 percent), or one percentage point higher (9.00 percent) than the current rate.
1% Decrease Current Discount Rate 1% Increase(7.00%) (8.00%) (9.00%)
City's proportionate share of the net pension liability 10,516,288$ 7,586,074$ 5,196,217$
61

CITY OF URBANA, OHIO NOTES TO BASIC FINANCIAL STATEMENTS
FOR THE FISCAL YEAR ENDED DECEMBER 31, 2018
NOTE 13 – DEFINED BENEFIT OPEB PLANS Net OPEB Liability For 2018, Governmental Accounting Standards Board (GASB) Statement No. 75, “Accounting and Financial Reporting for Postemployment Benefits Other Than Pensions” was effective. The net OPEB liability has been disclosed below. OPEB is a component of exchange transactions-–between an employer and its employees—of salaries and benefits for employee services. OPEB are provided to an employee—on a deferred-payment basis—as part of the total compensation package offered by an employer for employee services each financial period. The net OPEB liability represents the City’s proportionate share of each OPEB plan’s collective actuarial present value of projected benefit payments attributable to past periods of service, net of each OPEB plan’s fiduciary net position. The net OPEB liability calculation is dependent on critical long-term variables, including estimated average life expectancies, earnings on investments, cost of living adjustments and others. While these estimates use the best information available, unknowable future events require adjusting these estimates annually. The Ohio Revised Code limits the City’s obligation for this liability to annually required payments. The City cannot control benefit terms or the manner in which OPEB are financed; however, the City does receive the benefit of employees’ services in exchange for compensation including OPEB. GASB 75 assumes the liability is solely the obligation of the employer, because they benefit from employee services. OPEB contributions come from these employers and health care plan enrollees which pay a portion of the health care costs in the form of a monthly premium. The Ohio revised Code permits, but does not require, the retirement systems to provide healthcare to eligible benefit recipients. Any change to benefits or funding could significantly affect the net OPEB liability. Resulting adjustments to the net OPEB liability would be effective when the changes are legally enforceable. The retirement systems may allocate a portion of the employer contributions to provide for these OPEB benefits. The proportionate share of each plan’s unfunded benefits is presented as a long-term net OPEB liability on the accrual basis of accounting. Any liability for the contractually-required OPEB contribution outstanding at the end of the year would be included in due to other governments on both the accrual and modified accrual bases of accounting. Plan Description – Ohio Public Employees Retirement System (OPERS)
Plan Description - The Ohio Public Employees Retirement System (OPERS) administers three separate pension plans: the traditional pension plan, a cost-sharing, multiple-employer defined benefit pension plan; the member-directed plan, a defined contribution plan; and the combined plan, a cost-sharing, multiple-employer defined benefit pension plan that has elements of both a defined benefit and defined contribution plan.
OPERS maintains a cost-sharing, multiple-employer defined benefit post-employment health care trust, which funds multiple health care plans including medical coverage, prescription drug coverage and deposits to a Health Reimbursement Arrangement to qualifying benefit recipients of both the traditional pension and the combined plans. This trust is also used to fund health care for member-directed plan participants, in the form of a Retiree Medical Account (RMA). At retirement or refund, member directed plan participants may be eligible for reimbursement of qualified medical expenses from their vested RMA balance.
62
CITY OF URBANA, OHIO NOTES TO BASIC FINANCIAL STATEMENTS
FOR THE FISCAL YEAR ENDED DECEMBER 31, 2018
NOTE 13 – DEFINED BENEFIT OPEB PLANS (Continued) In order to qualify for postemployment health care coverage, age and service retirees under the traditional pension and combined plans must have twenty or more years of qualifying Ohio service credit. Health care coverage for disability benefit recipients and qualified survivor benefit recipients is available. The health care coverage provided by OPERS meets the definition of an Other Post Employment Benefit (OPEB) as described in GASB Statement 75. See OPERS’ CAFR referenced below for additional information.
The Ohio Revised Code permits, but does not require OPERS to provide health care to its eligible benefit recipients. Authority to establish and amend health care coverage is provided to the Board in Chapter 145 of the Ohio Revised Code.
Disclosures for the health care plan are presented separately in the OPERS financial report. Interested parties may obtain a copy by visiting https://www.opers.org/financial/reports.shtml, by writing to OPERS, 277 East Town Street, Columbus, Ohio 43215-4642, or by calling (614) 222-5601 or 800-222-7377. Funding Policy - The Ohio Revised Code provides the statutory authority requiring public employers to fund postemployment health care through their contributions to OPERS. When funding is approved by OPERS’ Board of Trustees, a portion of each employer’s contribution to OPERS is set aside to fund OPERS health care plans. Beginning in 2018, health care is not being funded.
Employer contribution rates are expressed as a percentage of the earnable salary of active members. In 2018, state and local employers contributed at a rate of 14.0 percent of earnable salary and public safety and law enforcement employers contributed at 18.1 percent. These are the maximum employer contribution rates permitted by the Ohio Revised Code. Active member contributions do not fund health care.
Each year, the OPERS Board determines the portion of the employer contribution rate that will be set aside to fund health care plans. The portion of employer contributions allocated to health care for members in the Traditional Pension Plan and Combined Plan was 1.0 percent during calendar year 2017. As recommended by OPERS’ actuary, the portion of employer contributions allocated to health care beginning January 1, 2018 decreased to 0 percent for both plans. The OPERS Board is also authorized to establish rules for the retiree or their surviving beneficiaries to pay a portion of the health care provided. Payment amounts vary depending on the number of covered dependents and the coverage selected. The employer contribution as a percentage of covered payroll deposited into the RMA for participants in the Member-Directed Plan for 2017 was 4.0 percent. Employer contribution rates are actuarially determined and are expressed as a percentage of covered payroll. The City’s contractually required contribution was $0 for 2018. Plan Description – Ohio Police & Fire Pension Fund (OP&F) Plan Description – The City contributes to the Ohio Police and Fire Pension Fund (OP&F) sponsored healthcare program, a cost-sharing, multiple-employer defined post-employment healthcare plan administered by a third-party provider. This program is not guaranteed and is subject to change at any time upon action of the Board of Trustees. OP&F provides health care benefits including coverage for medical, prescription drug, dental, vision, and Medicare Part B Premium to retirees, qualifying benefit recipients and their eligible dependents.
63

CITY OF URBANA, OHIO NOTES TO BASIC FINANCIAL STATEMENTS
FOR THE FISCAL YEAR ENDED DECEMBER 31, 2018
NOTE 13 – DEFINED BENEFIT OPEB PLANS (Continued) OP&F provides access to postretirement health care coverage for any person who receives or is eligible to receive a monthly service, disability, or statutory survivor benefit, or is a spouse or eligible dependent child of such person. The health care coverage provided by OP&F meets the definition of an Other Post Employment Benefit (OPEB) as described in Government Accounting Standards Board (GASB) Statement No. 75. The Ohio Revised Code allows, but does not mandate, OP&F to provide OPEB benefits. Authority for the OP&F Board of Trustees to provide health care coverage to eligible participants and to establish and amend benefits is codified in Chapter 742 of the Ohio Revised Code. OP&F issues a publicly available financial report that includes financial information and required supplementary information for the plan. The report may be obtained by visiting the OP&F website at www.op-f.org or by writing to the Ohio Police and Fire Pension Fund, 140 East Town Street, Columbus, Ohio 43215-5164. Funding Policy – The Ohio Revised Code provides for contribution requirements of the participating employers and of plan members to the OP&F defined benefit pension plan. Participating employers are required to contribute to the pension plan at rates expressed as percentages of the payroll of active pension plan members, currently 19.5 percent and 24 percent of covered payroll for police and fire employer units, respectively. The Ohio Revised Code states that the employer contribution may not exceed 19.5 percent of covered payroll for police employer units and 24 percent of covered payroll for fire employer units. Active members do not make contributions to the OPEB Plan. OP&F maintains funds for health care in two separate accounts. There is one account for health care benefits and one account for Medicare Part B reimbursements. A separate health care trust accrual account is maintained for health care benefits under IRS Code Section 115 trust. An Internal Revenue Code 401(h) account is maintained for Medicare Part B reimbursements. The Board of Trustees is authorized to allocate a portion of the total employer contributions made into the pension plan to the Section 115 trust and the Section 401(h) account as the employer contribution for retiree health care benefits. For 2018, the portion of employer contributions allocated to health care was 0.5 percent of covered payroll. The amount of employer contributions allocated to the health care plan each year is subject to the Trustees’ primary responsibility to ensure that pension benefits are adequately funded and is limited by the provisions of Sections 115 and 401(h).
The OP&F Board of Trustees is also authorized to establish requirements for contributions to the health care plan by retirees and their eligible dependents or their surviving beneficiaries. Payment amounts vary depending on the number of covered dependents and the coverage selected. Beginning January 1, 2019, OP&F is changing its retiree health care model and the current self-insured health care plan will no longer be offered. In its place is a stipend-based health care model. A stipend funded by OP&F will be placed in individual Health Reimbursement Accounts that retirees will use to be reimbursed for health care expenses. The City’s contractually required contribution to OP&F was $14,567 for 2018.
64
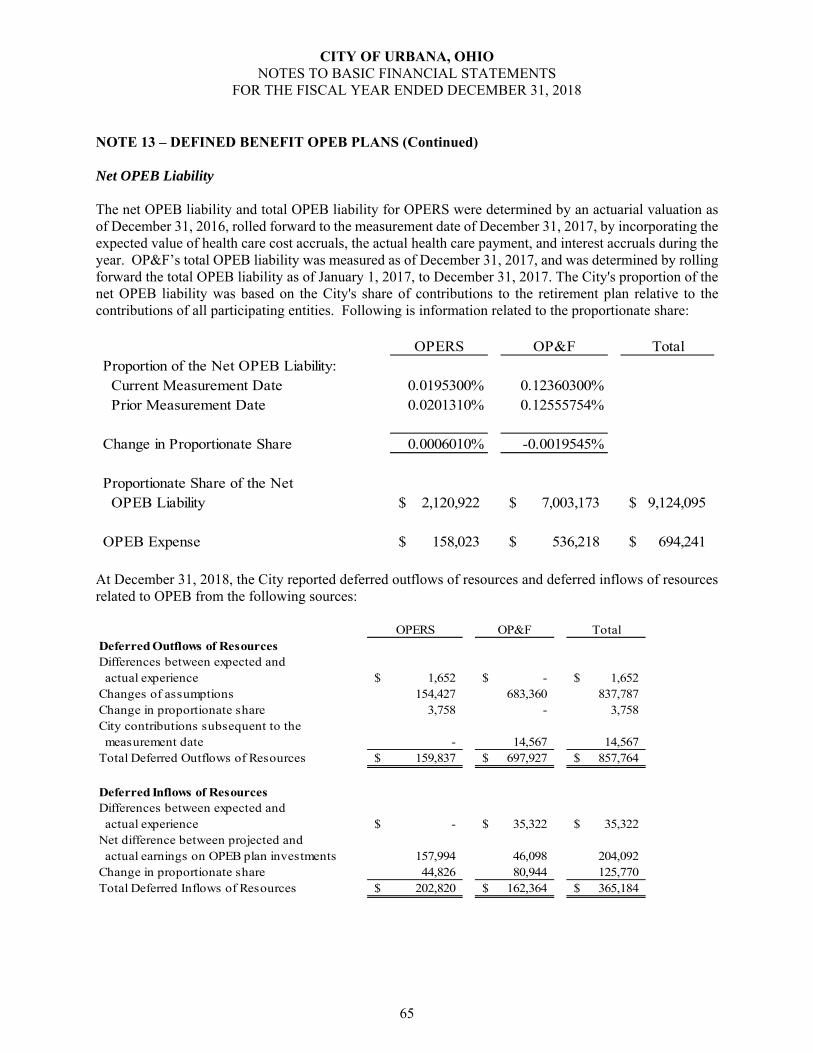
CITY OF URBANA, OHIO NOTES TO BASIC FINANCIAL STATEMENTS
FOR THE FISCAL YEAR ENDED DECEMBER 31, 2018
NOTE 13 – DEFINED BENEFIT OPEB PLANS (Continued) Net OPEB Liability
The net OPEB liability and total OPEB liability for OPERS were determined by an actuarial valuation as of December 31, 2016, rolled forward to the measurement date of December 31, 2017, by incorporating the expected value of health care cost accruals, the actual health care payment, and interest accruals during the year. OP&F’s total OPEB liability was measured as of December 31, 2017, and was determined by rolling forward the total OPEB liability as of January 1, 2017, to December 31, 2017. The City's proportion of the net OPEB liability was based on the City's share of contributions to the retirement plan relative to the contributions of all participating entities. Following is information related to the proportionate share:
OPERS OP&F TotalProportion of the Net OPEB Liability: Current Measurement Date 0.0195300% 0.12360300% Prior Measurement Date 0.0201310% 0.12555754%
Change in Proportionate Share 0.0006010% -0.0019545%
Proportionate Share of the Net OPEB Liability 2,120,922$ 7,003,173$ 9,124,095$
OPEB Expense 158,023$ 536,218$ 694,241$
At December 31, 2018, the City reported deferred outflows of resources and deferred inflows of resources related to OPEB from the following sources:
OPERS OP&F TotalDeferred Outflows of ResourcesDifferences between expected and actual experience 1,652$ -$ 1,652$ Changes of assumptions 154,427 683,360 837,787 Change in proportionate share 3,758 - 3,758 City contributions subsequent to the measurement date - 14,567 14,567 Total Deferred Outflows of Resources 159,837$ 697,927$ 857,764$
Deferred Inflows of ResourcesDifferences between expected and actual experience -$ 35,322$ 35,322$ Net difference between projected and actual earnings on OPEB plan investments 157,994 46,098 204,092 Change in proportionate share 44,826 80,944 125,770 Total Deferred Inflows of Resources 202,820$ 162,364$ 365,184$
65
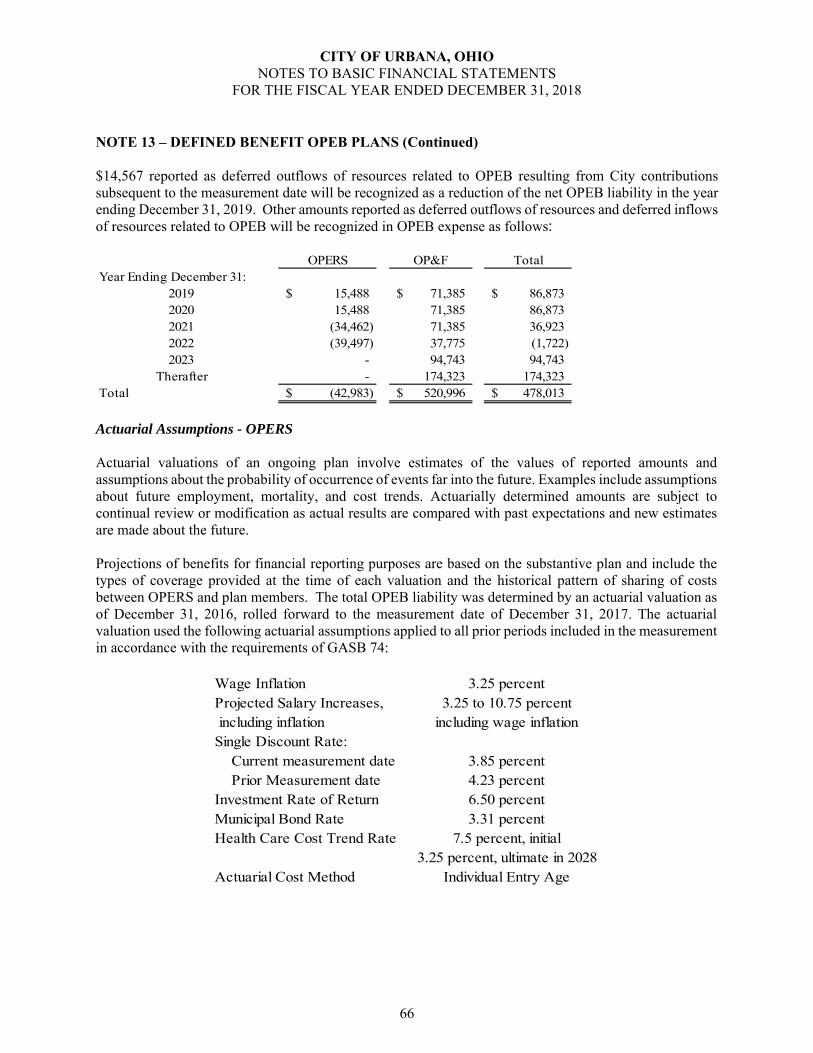
CITY OF URBANA, OHIO NOTES TO BASIC FINANCIAL STATEMENTS
FOR THE FISCAL YEAR ENDED DECEMBER 31, 2018
NOTE 13 – DEFINED BENEFIT OPEB PLANS (Continued) $14,567 reported as deferred outflows of resources related to OPEB resulting from City contributions subsequent to the measurement date will be recognized as a reduction of the net OPEB liability in the year ending December 31, 2019. Other amounts reported as deferred outflows of resources and deferred inflows of resources related to OPEB will be recognized in OPEB expense as follows:
OPERS OP&F TotalYear Ending December 31:
2019 15,488$ 71,385$ 86,873$ 2020 15,488 71,385 86,873 2021 (34,462) 71,385 36,923 2022 (39,497) 37,775 (1,722) 2023 - 94,743 94,743
Therafter - 174,323 174,323 Total (42,983)$ 520,996$ 478,013$
Actuarial Assumptions - OPERS Actuarial valuations of an ongoing plan involve estimates of the values of reported amounts and assumptions about the probability of occurrence of events far into the future. Examples include assumptions about future employment, mortality, and cost trends. Actuarially determined amounts are subject to continual review or modification as actual results are compared with past expectations and new estimates are made about the future. Projections of benefits for financial reporting purposes are based on the substantive plan and include the types of coverage provided at the time of each valuation and the historical pattern of sharing of costs between OPERS and plan members. The total OPEB liability was determined by an actuarial valuation as of December 31, 2016, rolled forward to the measurement date of December 31, 2017. The actuarial valuation used the following actuarial assumptions applied to all prior periods included in the measurement in accordance with the requirements of GASB 74:
Wage Inflation 3.25 percentProjected Salary Increases, 3.25 to 10.75 percent including inflation including wage inflationSingle Discount Rate: Current measurement date 3.85 percent Prior Measurement date 4.23 percentInvestment Rate of Return 6.50 percentMunicipal Bond Rate 3.31 percentHealth Care Cost Trend Rate 7.5 percent, initial
3.25 percent, ultimate in 2028Actuarial Cost Method Individual Entry Age
66
CITY OF URBANA, OHIO NOTES TO BASIC FINANCIAL STATEMENTS
FOR THE FISCAL YEAR ENDED DECEMBER 31, 2018
NOTE 13 – DEFINED BENEFIT OPEB PLANS (Continued) Pre-retirement mortality rates are based on the RP-2014 Employees mortality table for males and females, adjusted for mortality improvement back to the observation period base year of 2006. The base year for males and females was then established to be 2015 and 2010, respectively. Post-retirement mortality rates are based on the RP-2014 Healthy Annuitant mortality table for males and females, adjusted for mortality improvement back to the observation period base year of 2006. The base year for males and females was then established to be 2015 and 2010, respectively. Post-retirement mortality rates for disabled retirees are based on the RP-2014 Disabled mortality table for males and females, adjusted for mortality improvement back to the observation period base year of 2006. The base year for males and females was then established to be 2015 and 2010, respectively. Mortality rates for a particular calendar year are determined by applying the MP-2015 mortality improvement scale to all of the above described tables. The most recent experience study was completed for the five year period ended December 31, 2015. The long-term expected rate of return on health care investment assets was determined using a building-block method in which best-estimate ranges of expected future real rates of return are developed for each major asset class. These ranges are combined to produce the long-term expected real rate of return by weighting the expected future real rates of return by the target asset allocation percentage, adjusted for inflation. During 2017, OPERS managed investments in three investment portfolios: the Defined Benefit portfolio, the Health Care portfolio and the Defined Contribution portfolio. The Health Care portfolio includes the assets for health care expenses for the Traditional Pension Plan, Combined Plan and Member-Directed Plan eligible members. Within the Health Care portfolio, contributions into the plans are assumed to be received continuously throughout the year based on the actual payroll payable at the time contributions are made, and health care-related payments are assumed to occur mid-year. Accordingly, the money-weighted rate of return is considered to be the same for all plans within the portfolio. The annual money-weighted rate of return expressing investment performance, net of investment expenses and adjusted for the changing amounts actually invested, for the Health Care portfolio is 15.2 percent for 2017. The allocation of investment assets with the Health Care portfolio is approved by the Board of Trustees as outlined in the annual investment plan. Assets are managed on a total return basis with a long-term objective of continuing to offer a sustainable health care program for current and future retirees. OPERS’ primary goal is to achieve and maintain a fully funded status for the benefits provided through the defined pension plans. Health care is a discretionary benefit. The table below displays the Board-approved asset allocation policy for 2017 and the long-term expected real rates of return:
67
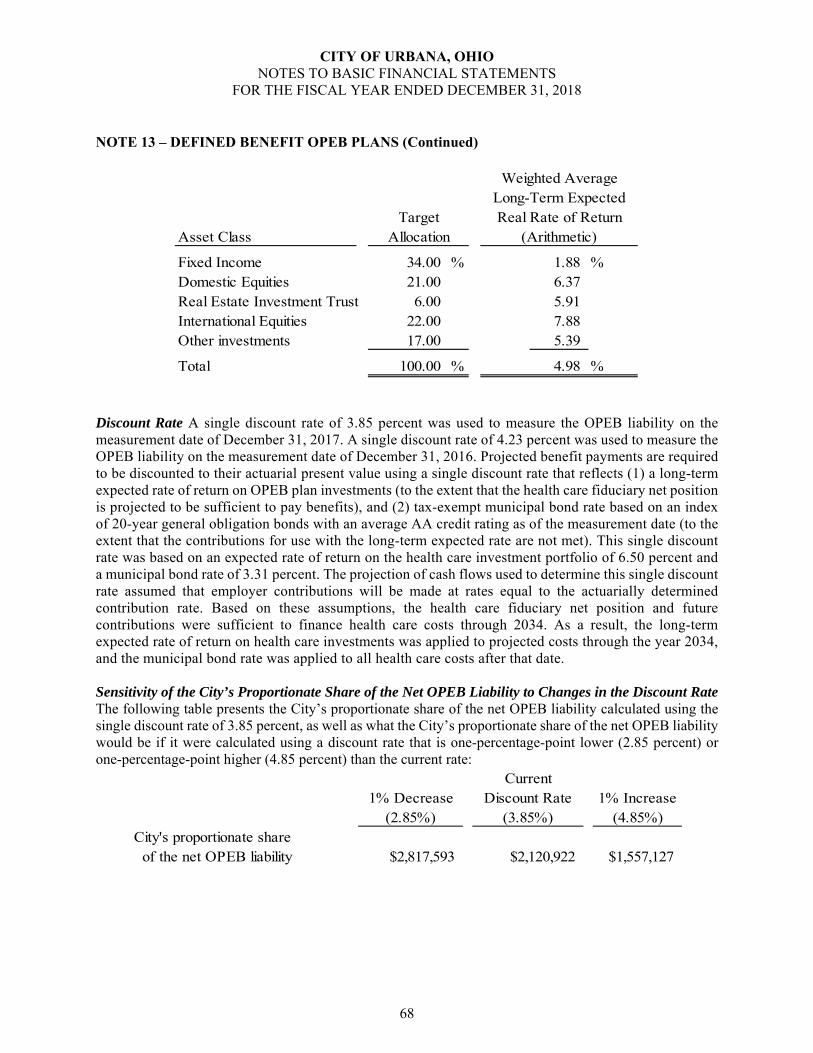
CITY OF URBANA, OHIO NOTES TO BASIC FINANCIAL STATEMENTS
FOR THE FISCAL YEAR ENDED DECEMBER 31, 2018
NOTE 13 – DEFINED BENEFIT OPEB PLANS (Continued)
TargetAsset Class Allocation
Fixed Income 34.00 % 1.88 %Domestic Equities 21.00 6.37Real Estate Investment Trust 6.00 5.91International Equities 22.00 7.88Other investments 17.00 5.39
Total 100.00 % 4.98 %
(Arithmetic)
Weighted AverageLong-Term ExpectedReal Rate of Return
Discount Rate A single discount rate of 3.85 percent was used to measure the OPEB liability on the measurement date of December 31, 2017. A single discount rate of 4.23 percent was used to measure the OPEB liability on the measurement date of December 31, 2016. Projected benefit payments are required to be discounted to their actuarial present value using a single discount rate that reflects (1) a long-term expected rate of return on OPEB plan investments (to the extent that the health care fiduciary net position is projected to be sufficient to pay benefits), and (2) tax-exempt municipal bond rate based on an index of 20-year general obligation bonds with an average AA credit rating as of the measurement date (to the extent that the contributions for use with the long-term expected rate are not met). This single discount rate was based on an expected rate of return on the health care investment portfolio of 6.50 percent and a municipal bond rate of 3.31 percent. The projection of cash flows used to determine this single discount rate assumed that employer contributions will be made at rates equal to the actuarially determined contribution rate. Based on these assumptions, the health care fiduciary net position and future contributions were sufficient to finance health care costs through 2034. As a result, the long-term expected rate of return on health care investments was applied to projected costs through the year 2034, and the municipal bond rate was applied to all health care costs after that date. Sensitivity of the City’s Proportionate Share of the Net OPEB Liability to Changes in the Discount Rate The following table presents the City’s proportionate share of the net OPEB liability calculated using the single discount rate of 3.85 percent, as well as what the City’s proportionate share of the net OPEB liability would be if it were calculated using a discount rate that is one-percentage-point lower (2.85 percent) or one-percentage-point higher (4.85 percent) than the current rate:
Current1% Decrease Discount Rate 1% Increase
(2.85%) (3.85%) (4.85%)City's proportionate share of the net OPEB liability $2,817,593 $2,120,922 $1,557,127
68
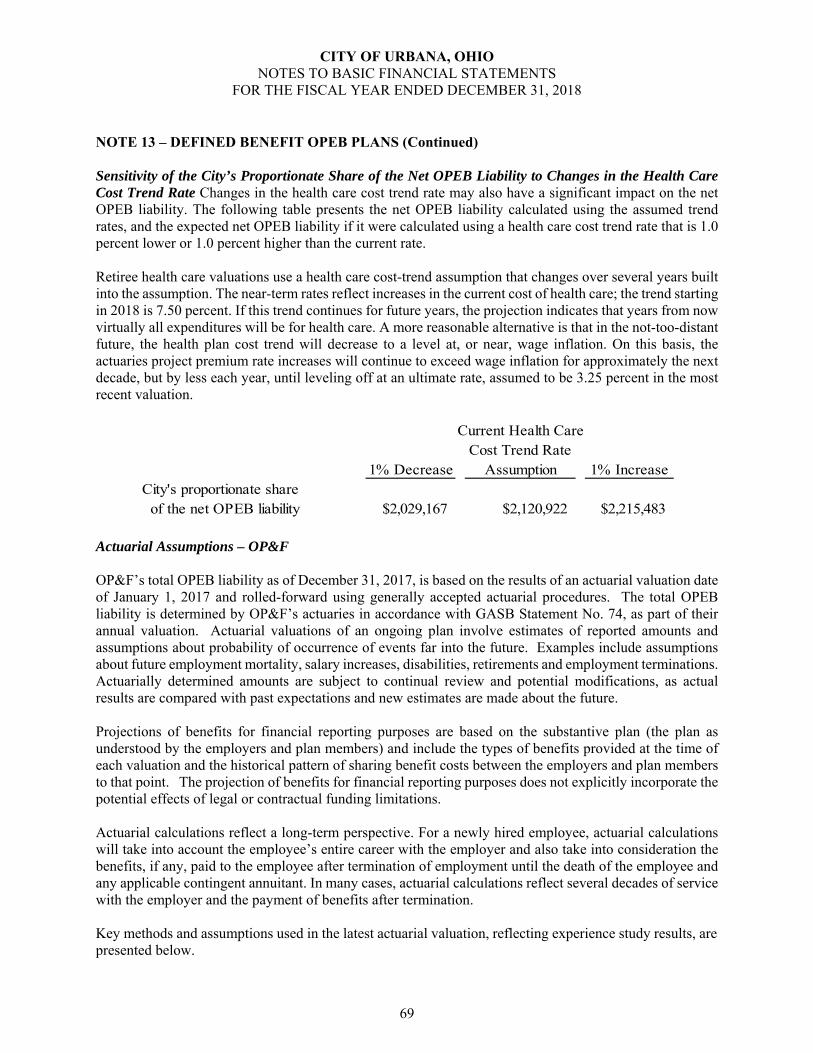
CITY OF URBANA, OHIO NOTES TO BASIC FINANCIAL STATEMENTS
FOR THE FISCAL YEAR ENDED DECEMBER 31, 2018
NOTE 13 – DEFINED BENEFIT OPEB PLANS (Continued) Sensitivity of the City’s Proportionate Share of the Net OPEB Liability to Changes in the Health Care Cost Trend Rate Changes in the health care cost trend rate may also have a significant impact on the net OPEB liability. The following table presents the net OPEB liability calculated using the assumed trend rates, and the expected net OPEB liability if it were calculated using a health care cost trend rate that is 1.0 percent lower or 1.0 percent higher than the current rate. Retiree health care valuations use a health care cost-trend assumption that changes over several years built into the assumption. The near-term rates reflect increases in the current cost of health care; the trend starting in 2018 is 7.50 percent. If this trend continues for future years, the projection indicates that years from now virtually all expenditures will be for health care. A more reasonable alternative is that in the not-too-distant future, the health plan cost trend will decrease to a level at, or near, wage inflation. On this basis, the actuaries project premium rate increases will continue to exceed wage inflation for approximately the next decade, but by less each year, until leveling off at an ultimate rate, assumed to be 3.25 percent in the most recent valuation.
Current Health CareCost Trend Rate
1% Decrease Assumption 1% IncreaseCity's proportionate share of the net OPEB liability $2,029,167 $2,120,922 $2,215,483
Actuarial Assumptions – OP&F
OP&F’s total OPEB liability as of December 31, 2017, is based on the results of an actuarial valuation date of January 1, 2017 and rolled-forward using generally accepted actuarial procedures. The total OPEB liability is determined by OP&F’s actuaries in accordance with GASB Statement No. 74, as part of their annual valuation. Actuarial valuations of an ongoing plan involve estimates of reported amounts and assumptions about probability of occurrence of events far into the future. Examples include assumptions about future employment mortality, salary increases, disabilities, retirements and employment terminations. Actuarially determined amounts are subject to continual review and potential modifications, as actual results are compared with past expectations and new estimates are made about the future. Projections of benefits for financial reporting purposes are based on the substantive plan (the plan as understood by the employers and plan members) and include the types of benefits provided at the time of each valuation and the historical pattern of sharing benefit costs between the employers and plan members to that point. The projection of benefits for financial reporting purposes does not explicitly incorporate the potential effects of legal or contractual funding limitations. Actuarial calculations reflect a long-term perspective. For a newly hired employee, actuarial calculations will take into account the employee’s entire career with the employer and also take into consideration the benefits, if any, paid to the employee after termination of employment until the death of the employee and any applicable contingent annuitant. In many cases, actuarial calculations reflect several decades of service with the employer and the payment of benefits after termination.
Key methods and assumptions used in the latest actuarial valuation, reflecting experience study results, are presented below.
69
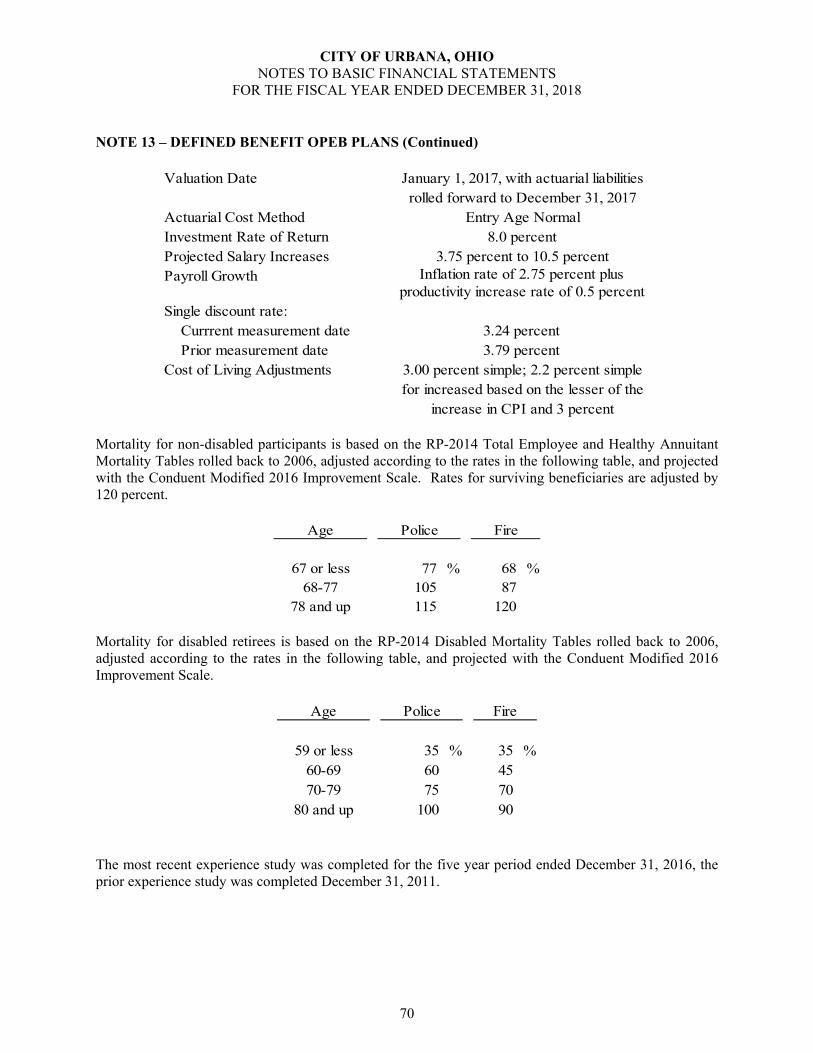
CITY OF URBANA, OHIO NOTES TO BASIC FINANCIAL STATEMENTS
FOR THE FISCAL YEAR ENDED DECEMBER 31, 2018
NOTE 13 – DEFINED BENEFIT OPEB PLANS (Continued)
Valuation Date January 1, 2017, with actuarial liabilitiesrolled forward to December 31, 2017
Actuarial Cost Method Entry Age NormalInvestment Rate of Return 8.0 percentProjected Salary Increases 3.75 percent to 10.5 percentPayroll Growth Inflation rate of 2.75 percent plus
productivity increase rate of 0.5 percentSingle discount rate: Currrent measurement date 3.24 percent Prior measurement date 3.79 percentCost of Living Adjustments 3.00 percent simple; 2.2 percent simple
for increased based on the lesser of theincrease in CPI and 3 percent
Mortality for non-disabled participants is based on the RP-2014 Total Employee and Healthy Annuitant Mortality Tables rolled back to 2006, adjusted according to the rates in the following table, and projected with the Conduent Modified 2016 Improvement Scale. Rates for surviving beneficiaries are adjusted by 120 percent.
Age Police Fire
67 or less 77 % 68 %68-77 105 87
78 and up 115 120 Mortality for disabled retirees is based on the RP-2014 Disabled Mortality Tables rolled back to 2006, adjusted according to the rates in the following table, and projected with the Conduent Modified 2016 Improvement Scale.
Age Police Fire
59 or less 35 % 35 %60-69 60 4570-79 75 70
80 and up 100 90
The most recent experience study was completed for the five year period ended December 31, 2016, the prior experience study was completed December 31, 2011.
70
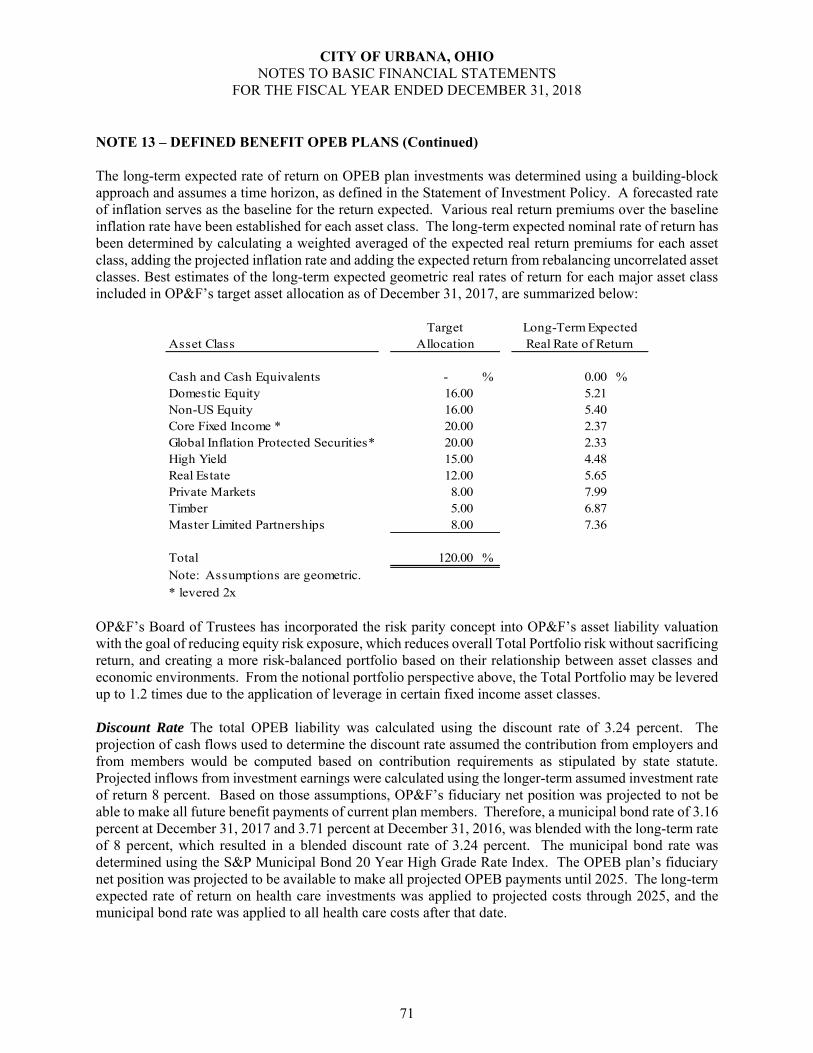
CITY OF URBANA, OHIO NOTES TO BASIC FINANCIAL STATEMENTS
FOR THE FISCAL YEAR ENDED DECEMBER 31, 2018
NOTE 13 – DEFINED BENEFIT OPEB PLANS (Continued) The long-term expected rate of return on OPEB plan investments was determined using a building-block approach and assumes a time horizon, as defined in the Statement of Investment Policy. A forecasted rate of inflation serves as the baseline for the return expected. Various real return premiums over the baseline inflation rate have been established for each asset class. The long-term expected nominal rate of return has been determined by calculating a weighted averaged of the expected real return premiums for each asset class, adding the projected inflation rate and adding the expected return from rebalancing uncorrelated asset classes. Best estimates of the long-term expected geometric real rates of return for each major asset class included in OP&F’s target asset allocation as of December 31, 2017, are summarized below:
OP&F’s Board of Trustees has incorporated the risk parity concept into OP&F’s asset liability valuation with the goal of reducing equity risk exposure, which reduces overall Total Portfolio risk without sacrificing return, and creating a more risk-balanced portfolio based on their relationship between asset classes and economic environments. From the notional portfolio perspective above, the Total Portfolio may be levered up to 1.2 times due to the application of leverage in certain fixed income asset classes.
Discount Rate The total OPEB liability was calculated using the discount rate of 3.24 percent. The projection of cash flows used to determine the discount rate assumed the contribution from employers and from members would be computed based on contribution requirements as stipulated by state statute. Projected inflows from investment earnings were calculated using the longer-term assumed investment rate of return 8 percent. Based on those assumptions, OP&F’s fiduciary net position was projected to not be able to make all future benefit payments of current plan members. Therefore, a municipal bond rate of 3.16 percent at December 31, 2017 and 3.71 percent at December 31, 2016, was blended with the long-term rate of 8 percent, which resulted in a blended discount rate of 3.24 percent. The municipal bond rate was determined using the S&P Municipal Bond 20 Year High Grade Rate Index. The OPEB plan’s fiduciary net position was projected to be available to make all projected OPEB payments until 2025. The long-term expected rate of return on health care investments was applied to projected costs through 2025, and the municipal bond rate was applied to all health care costs after that date.
TargetAsset Class Allocation
Cash and Cash Equivalents - % 0.00 %Domestic Equity 16.00 5.21Non-US Equity 16.00 5.40Core Fixed Income * 20.00 2.37Global Inflation Protected Securities* 20.00 2.33High Yield 15.00 4.48Real Estate 12.00 5.65Private Markets 8.00 7.99Timber 5.00 6.87Master Limited Partnerships 8.00 7.36
Total 120.00 %Note: Assumptions are geometric.* levered 2x
Long-Term ExpectedReal Rate of Return
71

CITY OF URBANA, OHIO NOTES TO BASIC FINANCIAL STATEMENTS
FOR THE FISCAL YEAR ENDED DECEMBER 31, 2018
NOTE 13 – DEFINED BENEFIT OPEB PLANS (Continued)
Sensitivity of the City's Proportionate Share of the Net OPEB Liability to Changes in the Discount Rate Net OPEB liability is sensitive to changes in the discount rate, and to illustrate the potential impact the following table presents the net OPEB liability calculated using the discount rate of 3.24 percent, as well as what the net OPEB liability would be if it were calculated using a discount rate that is one percentage point lower (2.24 percent), or one percentage point higher (4.24 percent) than the current rate.
Current
1% Decrease Discount Rate 1% Increase(2.24%) (3.24%) (4.24%)
City's proportionate share of the net OPEB liability $8,754,050 $7,003,173 $5,655,949
Sensitivity of the City’s Proportionate Share of the Net OPEB Liability to Changes in the Health Care Cost Trend Rate Net OPEB liability is sensitive to changes in the health care cost trend rate. The trend rate is the annual rate at which the cost of covered medical services is assumed to increase from the current year to the next year. Beginning in 2017, the per-capita costs are assumed to change by the following percentages each year:
MedicareNon-Medicare Non-AARP AARP Rx Drug Part B
Year
2017 -0.47% -2.50% 4.50% -0.47% 5.20%2018 7.00% 7.00% 4.50% 7.00% 5.10%2019 6.50% 6.50% 4.50% 6.50% 5.00%2020 6.00% 6.00% 4.50% 6.00% 5.00%2021 5.50% 5.50% 4.50% 5.50% 5.00%2022 5.00% 5.00% 4.50% 5.00% 5.00%
2023 and Later 4.50% 4.50% 4.50% 4.50% 5.00%
To illustrate the potential impact, the following table presents the net OPEB liability calculated using the current healthcare cost trend current rates as outlined in the table above, a one percent decrease in the trend rates and a one percent increase in the trend rates.
Current1% Decrease Rates 1% Increase
City's proportionate share of the net OPEB liability $5,440,191 $7,003,173 $9,109,544
72
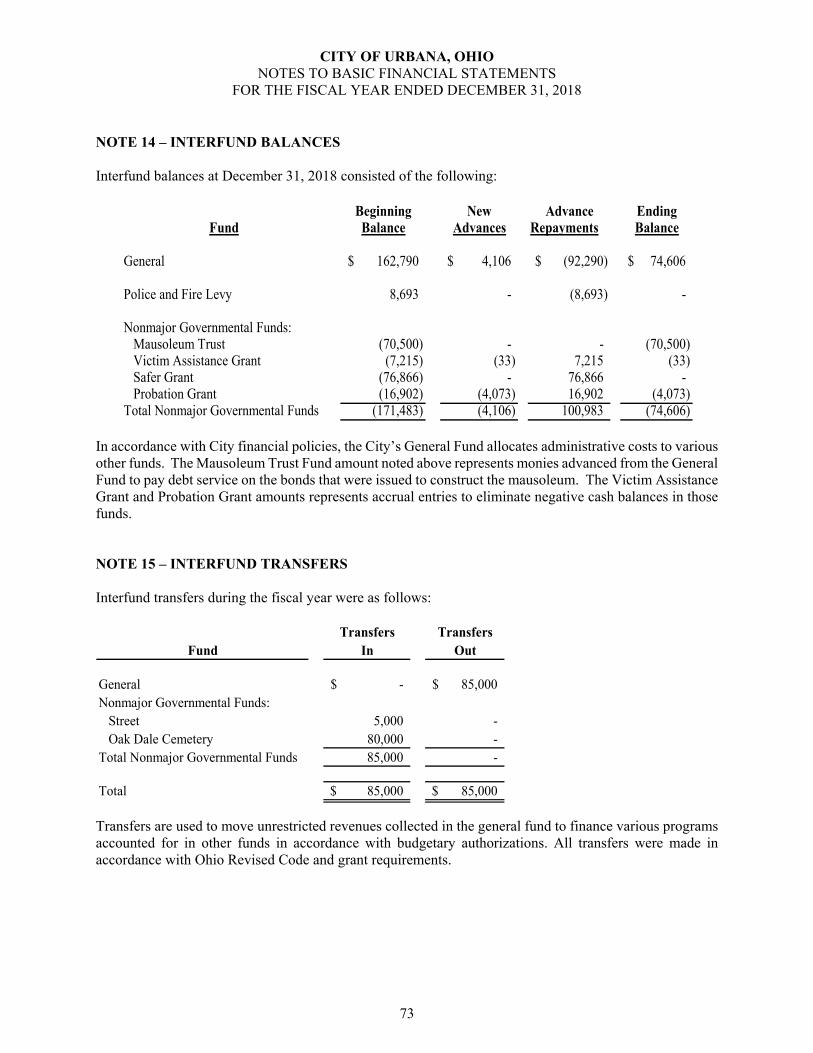
CITY OF URBANA, OHIO NOTES TO BASIC FINANCIAL STATEMENTS
FOR THE FISCAL YEAR ENDED DECEMBER 31, 2018
NOTE 14 – INTERFUND BALANCES Interfund balances at December 31, 2018 consisted of the following:
Beginning New Advance EndingFund Balance Advances Repayments Balance
General 162,790$ 4,106$ (92,290)$ 74,606$
Police and Fire Levy 8,693 - (8,693) -
Nonmajor Governmental Funds:Mausoleum Trust (70,500) - - (70,500) Victim Assistance Grant (7,215) (33) 7,215 (33) Safer Grant (76,866) - 76,866 - Probation Grant (16,902) (4,073) 16,902 (4,073)
Total Nonmajor Governmental Funds (171,483) (4,106) 100,983 (74,606)
In accordance with City financial policies, the City’s General Fund allocates administrative costs to various other funds. The Mausoleum Trust Fund amount noted above represents monies advanced from the General Fund to pay debt service on the bonds that were issued to construct the mausoleum. The Victim Assistance Grant and Probation Grant amounts represents accrual entries to eliminate negative cash balances in those funds. NOTE 15 – INTERFUND TRANSFERS Interfund transfers during the fiscal year were as follows:
Transfers TransfersFund In Out
General -$ 85,000$ Nonmajor Governmental Funds:
Street 5,000 - Oak Dale Cemetery 80,000 -
Total Nonmajor Governmental Funds 85,000 -
Total 85,000$ 85,000$
Transfers are used to move unrestricted revenues collected in the general fund to finance various programs accounted for in other funds in accordance with budgetary authorizations. All transfers were made in accordance with Ohio Revised Code and grant requirements.
73
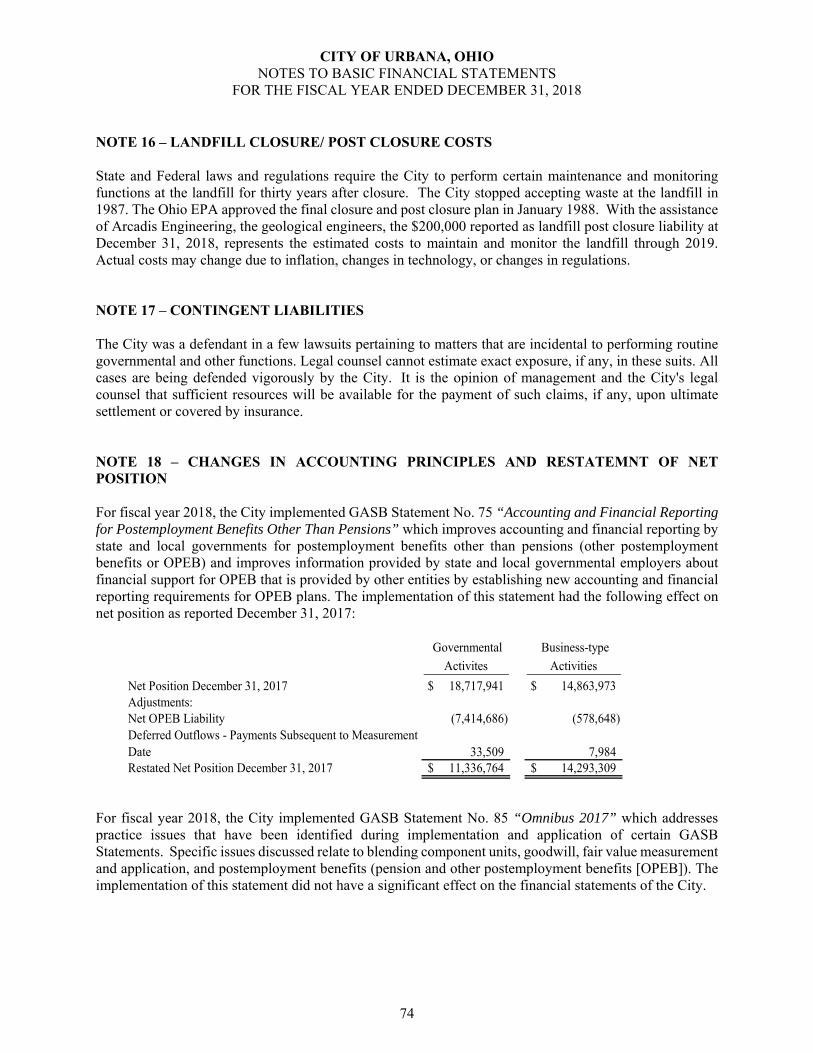
CITY OF URBANA, OHIO NOTES TO BASIC FINANCIAL STATEMENTS
FOR THE FISCAL YEAR ENDED DECEMBER 31, 2018
NOTE 16 – LANDFILL CLOSURE/ POST CLOSURE COSTS State and Federal laws and regulations require the City to perform certain maintenance and monitoring functions at the landfill for thirty years after closure. The City stopped accepting waste at the landfill in 1987. The Ohio EPA approved the final closure and post closure plan in January 1988. With the assistance of Arcadis Engineering, the geological engineers, the $200,000 reported as landfill post closure liability at December 31, 2018, represents the estimated costs to maintain and monitor the landfill through 2019. Actual costs may change due to inflation, changes in technology, or changes in regulations. NOTE 17 – CONTINGENT LIABILITIES The City was a defendant in a few lawsuits pertaining to matters that are incidental to performing routine governmental and other functions. Legal counsel cannot estimate exact exposure, if any, in these suits. All cases are being defended vigorously by the City. It is the opinion of management and the City's legal counsel that sufficient resources will be available for the payment of such claims, if any, upon ultimate settlement or covered by insurance. NOTE 18 – CHANGES IN ACCOUNTING PRINCIPLES AND RESTATEMNT OF NET POSITION For fiscal year 2018, the City implemented GASB Statement No. 75 “Accounting and Financial Reporting for Postemployment Benefits Other Than Pensions” which improves accounting and financial reporting by state and local governments for postemployment benefits other than pensions (other postemployment benefits or OPEB) and improves information provided by state and local governmental employers about financial support for OPEB that is provided by other entities by establishing new accounting and financial reporting requirements for OPEB plans. The implementation of this statement had the following effect on net position as reported December 31, 2017:
Governmental Activites
Business-type Activities
Net Position December 31, 2017 18,717,941$ 14,863,973$ Adjustments:Net OPEB Liability (7,414,686) (578,648) Deferred Outflows - Payments Subsequent to Measurement Date 33,509 7,984 Restated Net Position December 31, 2017 11,336,764$ 14,293,309$
For fiscal year 2018, the City implemented GASB Statement No. 85 “Omnibus 2017” which addresses practice issues that have been identified during implementation and application of certain GASB Statements. Specific issues discussed relate to blending component units, goodwill, fair value measurement and application, and postemployment benefits (pension and other postemployment benefits [OPEB]). The implementation of this statement did not have a significant effect on the financial statements of the City.
74

CITY OF URBANA, OHIO NOTES TO BASIC FINANCIAL STATEMENTS
FOR THE FISCAL YEAR ENDED DECEMBER 31, 2018
NOTE 18 – CHANGES IN ACCOUNTING PRINCIPLES AND RESTATEMNT OF NET POSITION (Continued) For fiscal year 2018, the City implemented GASB Statement No. 86 “Certain Debt Extinguishment Issues” which improves consistency in accounting and financial reporting for in-substance defeasance of debt by providing guidance for transactions in which cash and other monetary assets acquired with only existing resources – resources other than the proceeds of refunding debt – are placed in an irrevocable trust for the sole purpose of extinguishing debt. This statement also improves accounting and financial reporting for prepaid insurance on debt that is extinguished and notes to financial statements for debt that is defeased in substance. The implementation of this statement did not have an effect on the financial statements of the City’s. For fiscal year 2018, the City early implemented GASB Statement No. 89 “Accounting for Interest Cost Incurred before the End of a Construction Period” which addresses capitalizing interest. As a result of the early implementation of this statement, the City did not capitalize interest costs associated with construction projects during the year. NOTE 19 – SUBSEQUENT EVENT On February 8, 2019, the City purchased the building and land located at 225 South Main Street. In order to acquire the property, the City issued $380,000 in bond anticipation notes in 2018. The notes mature in 2038 and have interest rates ranging from 4.39 to 4.75 percent.
75
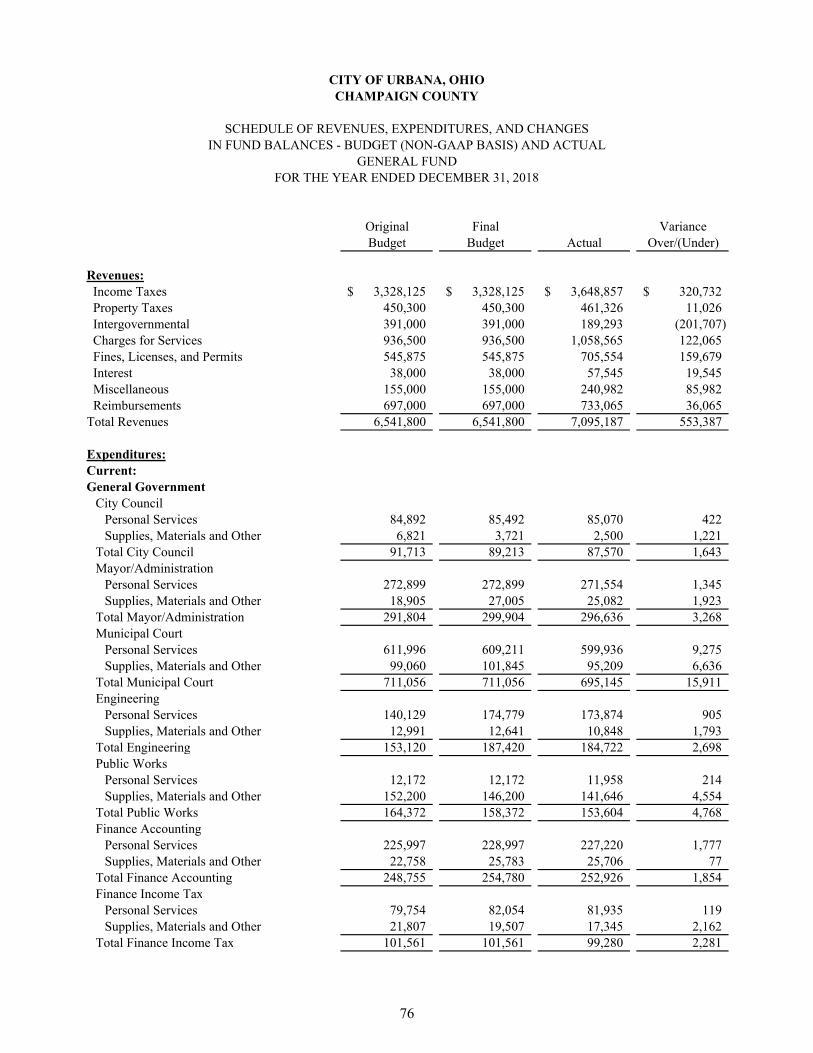
Original Final VarianceBudget Budget Actual Over/(Under)
Revenues: Income Taxes 3,328,125$ 3,328,125$ 3,648,857$ 320,732$ Property Taxes 450,300 450,300 461,326 11,026 Intergovernmental 391,000 391,000 189,293 (201,707) Charges for Services 936,500 936,500 1,058,565 122,065 Fines, Licenses, and Permits 545,875 545,875 705,554 159,679 Interest 38,000 38,000 57,545 19,545 Miscellaneous 155,000 155,000 240,982 85,982 Reimbursements 697,000 697,000 733,065 36,065 Total Revenues 6,541,800 6,541,800 7,095,187 553,387
Expenditures:Current:General Government
City CouncilPersonal Services 84,892 85,492 85,070 422 Supplies, Materials and Other 6,821 3,721 2,500 1,221
Total City Council 91,713 89,213 87,570 1,643 Mayor/Administration
Personal Services 272,899 272,899 271,554 1,345 Supplies, Materials and Other 18,905 27,005 25,082 1,923
Total Mayor/Administration 291,804 299,904 296,636 3,268 Municipal Court
Personal Services 611,996 609,211 599,936 9,275 Supplies, Materials and Other 99,060 101,845 95,209 6,636
Total Municipal Court 711,056 711,056 695,145 15,911 Engineering
Personal Services 140,129 174,779 173,874 905 Supplies, Materials and Other 12,991 12,641 10,848 1,793
Total Engineering 153,120 187,420 184,722 2,698 Public Works
Personal Services 12,172 12,172 11,958 214 Supplies, Materials and Other 152,200 146,200 141,646 4,554
Total Public Works 164,372 158,372 153,604 4,768 Finance Accounting
Personal Services 225,997 228,997 227,220 1,777 Supplies, Materials and Other 22,758 25,783 25,706 77
Total Finance Accounting 248,755 254,780 252,926 1,854 Finance Income Tax
Personal Services 79,754 82,054 81,935 119 Supplies, Materials and Other 21,807 19,507 17,345 2,162
Total Finance Income Tax 101,561 101,561 99,280 2,281
FOR THE YEAR ENDED DECEMBER 31, 2018
CITY OF URBANA, OHIOCHAMPAIGN COUNTY
SCHEDULE OF REVENUES, EXPENDITURES, AND CHANGESIN FUND BALANCES - BUDGET (NON-GAAP BASIS) AND ACTUAL
GENERAL FUND
76
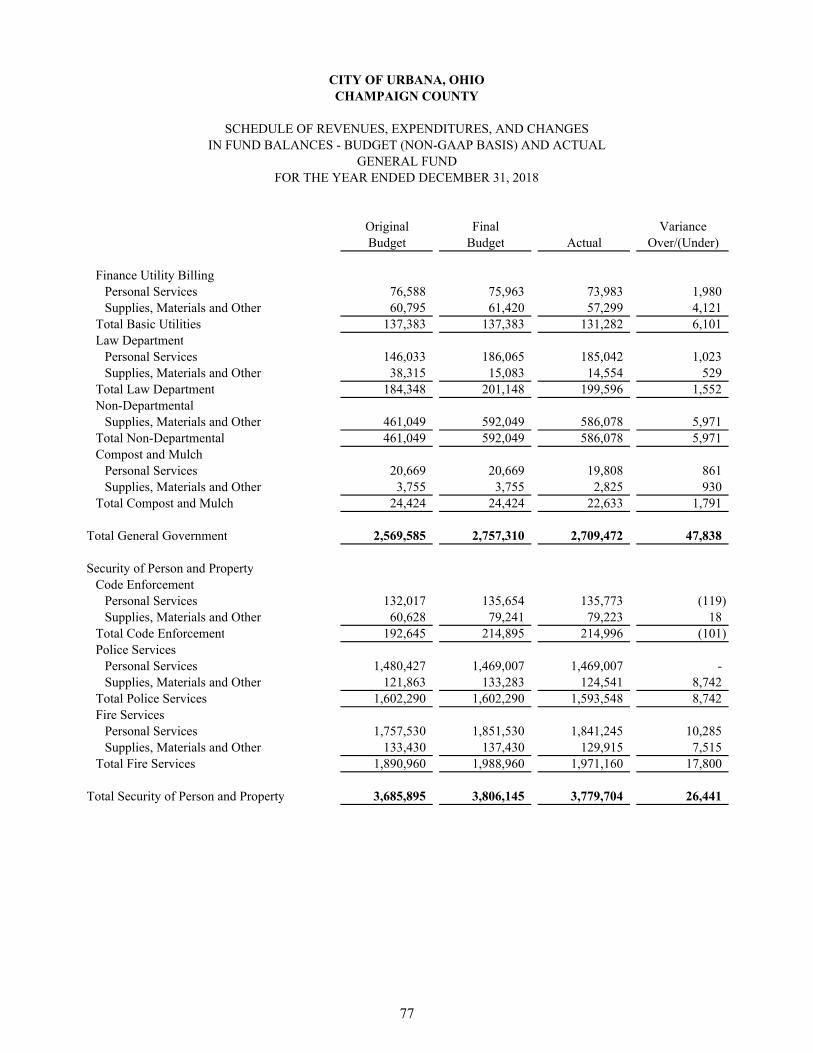
Original Final VarianceBudget Budget Actual Over/(Under)
FOR THE YEAR ENDED DECEMBER 31, 2018
CITY OF URBANA, OHIOCHAMPAIGN COUNTY
SCHEDULE OF REVENUES, EXPENDITURES, AND CHANGESIN FUND BALANCES - BUDGET (NON-GAAP BASIS) AND ACTUAL
GENERAL FUND
Finance Utility BillingPersonal Services 76,588 75,963 73,983 1,980 Supplies, Materials and Other 60,795 61,420 57,299 4,121
Total Basic Utilities 137,383 137,383 131,282 6,101 Law Department
Personal Services 146,033 186,065 185,042 1,023 Supplies, Materials and Other 38,315 15,083 14,554 529
Total Law Department 184,348 201,148 199,596 1,552 Non-Departmental
Supplies, Materials and Other 461,049 592,049 586,078 5,971 Total Non-Departmental 461,049 592,049 586,078 5,971 Compost and Mulch
Personal Services 20,669 20,669 19,808 861 Supplies, Materials and Other 3,755 3,755 2,825 930
Total Compost and Mulch 24,424 24,424 22,633 1,791
Total General Government 2,569,585 2,757,310 2,709,472 47,838
Security of Person and PropertyCode Enforcement
Personal Services 132,017 135,654 135,773 (119) Supplies, Materials and Other 60,628 79,241 79,223 18
Total Code Enforcement 192,645 214,895 214,996 (101) Police Services
Personal Services 1,480,427 1,469,007 1,469,007 - Supplies, Materials and Other 121,863 133,283 124,541 8,742
Total Police Services 1,602,290 1,602,290 1,593,548 8,742 Fire Services
Personal Services 1,757,530 1,851,530 1,841,245 10,285 Supplies, Materials and Other 133,430 137,430 129,915 7,515
Total Fire Services 1,890,960 1,988,960 1,971,160 17,800
Total Security of Person and Property 3,685,895 3,806,145 3,779,704 26,441
77
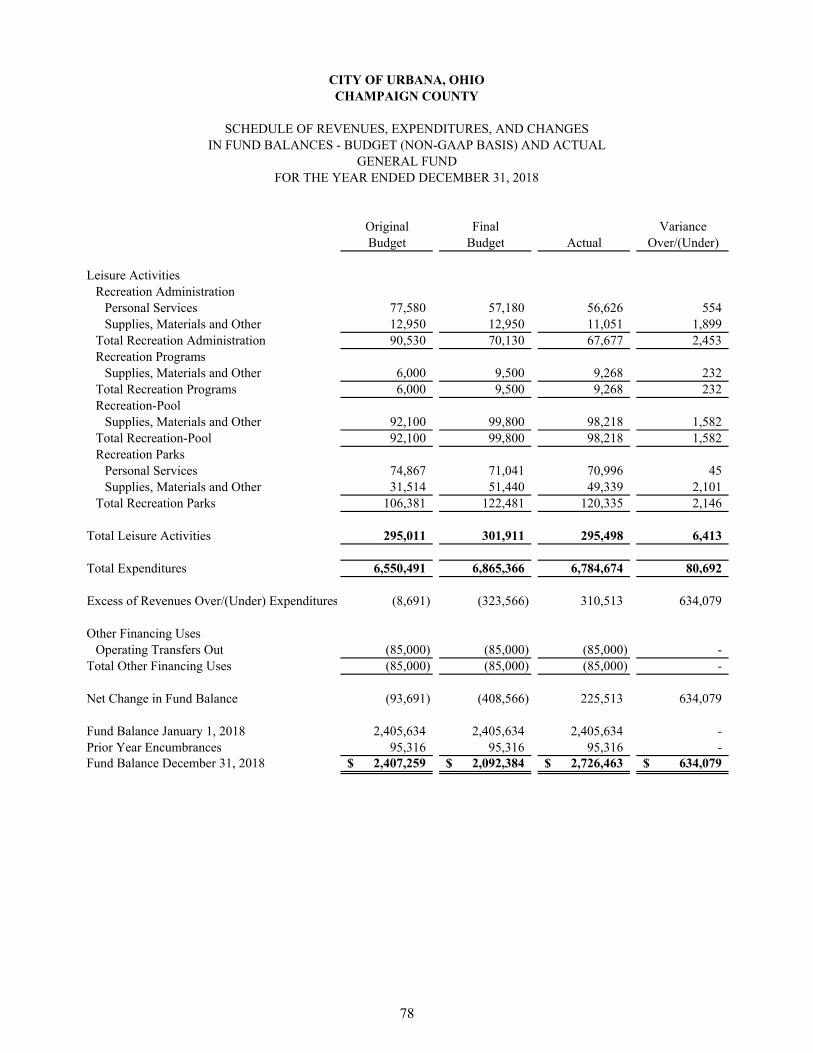
Original Final VarianceBudget Budget Actual Over/(Under)
FOR THE YEAR ENDED DECEMBER 31, 2018
CITY OF URBANA, OHIOCHAMPAIGN COUNTY
SCHEDULE OF REVENUES, EXPENDITURES, AND CHANGESIN FUND BALANCES - BUDGET (NON-GAAP BASIS) AND ACTUAL
GENERAL FUND
Leisure ActivitiesRecreation Administration
Personal Services 77,580 57,180 56,626 554 Supplies, Materials and Other 12,950 12,950 11,051 1,899
Total Recreation Administration 90,530 70,130 67,677 2,453 Recreation Programs
Supplies, Materials and Other 6,000 9,500 9,268 232 Total Recreation Programs 6,000 9,500 9,268 232 Recreation-Pool
Supplies, Materials and Other 92,100 99,800 98,218 1,582 Total Recreation-Pool 92,100 99,800 98,218 1,582 Recreation Parks
Personal Services 74,867 71,041 70,996 45 Supplies, Materials and Other 31,514 51,440 49,339 2,101
Total Recreation Parks 106,381 122,481 120,335 2,146
Total Leisure Activities 295,011 301,911 295,498 6,413
Total Expenditures 6,550,491 6,865,366 6,784,674 80,692
Excess of Revenues Over/(Under) Expenditures (8,691) (323,566) 310,513 634,079
Other Financing UsesOperating Transfers Out (85,000) (85,000) (85,000) -
Total Other Financing Uses (85,000) (85,000) (85,000) -
Net Change in Fund Balance (93,691) (408,566) 225,513 634,079
Fund Balance January 1, 2018 2,405,634 2,405,634 2,405,634 - Prior Year Encumbrances 95,316 95,316 95,316 - Fund Balance December 31, 2018 2,407,259$ 2,092,384$ 2,726,463$ 634,079$
78
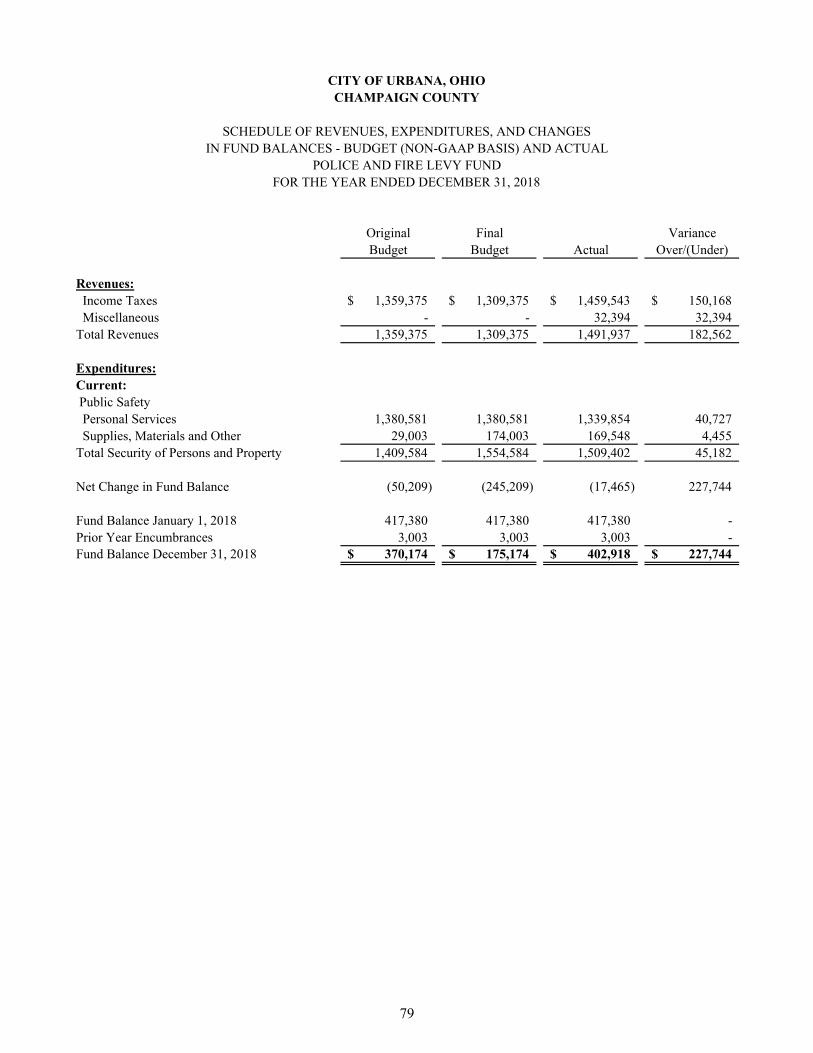
Original Final VarianceBudget Budget Actual Over/(Under)
Revenues: Income Taxes 1,359,375$ 1,309,375$ 1,459,543$ 150,168$ Miscellaneous - - 32,394 32,394 Total Revenues 1,359,375 1,309,375 1,491,937 182,562
Expenditures:Current: Public Safety Personal Services 1,380,581 1,380,581 1,339,854 40,727 Supplies, Materials and Other 29,003 174,003 169,548 4,455 Total Security of Persons and Property 1,409,584 1,554,584 1,509,402 45,182
Net Change in Fund Balance (50,209) (245,209) (17,465) 227,744
Fund Balance January 1, 2018 417,380 417,380 417,380 - Prior Year Encumbrances 3,003 3,003 3,003 - Fund Balance December 31, 2018 370,174$ 175,174$ 402,918$ 227,744$
FOR THE YEAR ENDED DECEMBER 31, 2018
CITY OF URBANA, OHIOCHAMPAIGN COUNTY
SCHEDULE OF REVENUES, EXPENDITURES, AND CHANGESIN FUND BALANCES - BUDGET (NON-GAAP BASIS) AND ACTUAL
POLICE AND FIRE LEVY FUND
79
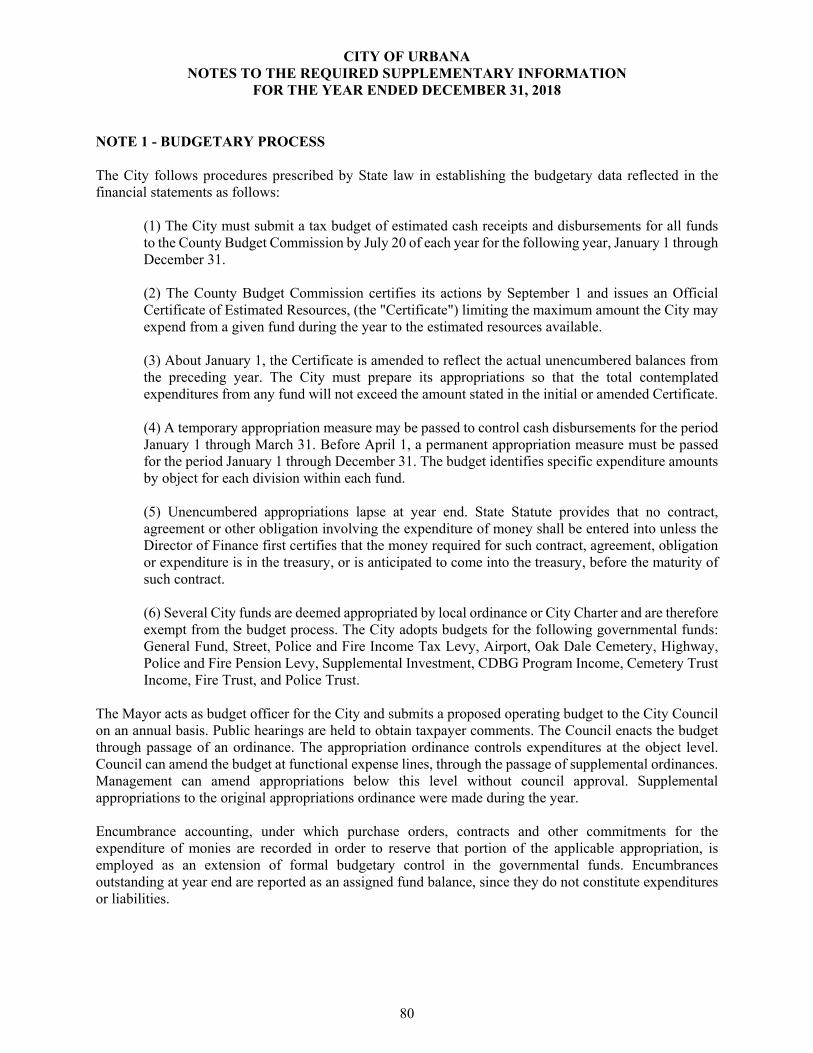
CITY OF URBANA NOTES TO THE REQUIRED SUPPLEMENTARY INFORMATION
FOR THE YEAR ENDED DECEMBER 31, 2018
NOTE 1 - BUDGETARY PROCESS The City follows procedures prescribed by State law in establishing the budgetary data reflected in the financial statements as follows:
(1) The City must submit a tax budget of estimated cash receipts and disbursements for all funds to the County Budget Commission by July 20 of each year for the following year, January 1 through December 31.
(2) The County Budget Commission certifies its actions by September 1 and issues an Official Certificate of Estimated Resources, (the "Certificate") limiting the maximum amount the City may expend from a given fund during the year to the estimated resources available.
(3) About January 1, the Certificate is amended to reflect the actual unencumbered balances from the preceding year. The City must prepare its appropriations so that the total contemplated expenditures from any fund will not exceed the amount stated in the initial or amended Certificate.
(4) A temporary appropriation measure may be passed to control cash disbursements for the period January 1 through March 31. Before April 1, a permanent appropriation measure must be passed for the period January 1 through December 31. The budget identifies specific expenditure amounts by object for each division within each fund.
(5) Unencumbered appropriations lapse at year end. State Statute provides that no contract, agreement or other obligation involving the expenditure of money shall be entered into unless the Director of Finance first certifies that the money required for such contract, agreement, obligation or expenditure is in the treasury, or is anticipated to come into the treasury, before the maturity of such contract.
(6) Several City funds are deemed appropriated by local ordinance or City Charter and are therefore exempt from the budget process. The City adopts budgets for the following governmental funds: General Fund, Street, Police and Fire Income Tax Levy, Airport, Oak Dale Cemetery, Highway, Police and Fire Pension Levy, Supplemental Investment, CDBG Program Income, Cemetery Trust Income, Fire Trust, and Police Trust.
The Mayor acts as budget officer for the City and submits a proposed operating budget to the City Council on an annual basis. Public hearings are held to obtain taxpayer comments. The Council enacts the budget through passage of an ordinance. The appropriation ordinance controls expenditures at the object level. Council can amend the budget at functional expense lines, through the passage of supplemental ordinances. Management can amend appropriations below this level without council approval. Supplemental appropriations to the original appropriations ordinance were made during the year. Encumbrance accounting, under which purchase orders, contracts and other commitments for the expenditure of monies are recorded in order to reserve that portion of the applicable appropriation, is employed as an extension of formal budgetary control in the governmental funds. Encumbrances outstanding at year end are reported as an assigned fund balance, since they do not constitute expenditures or liabilities.
80
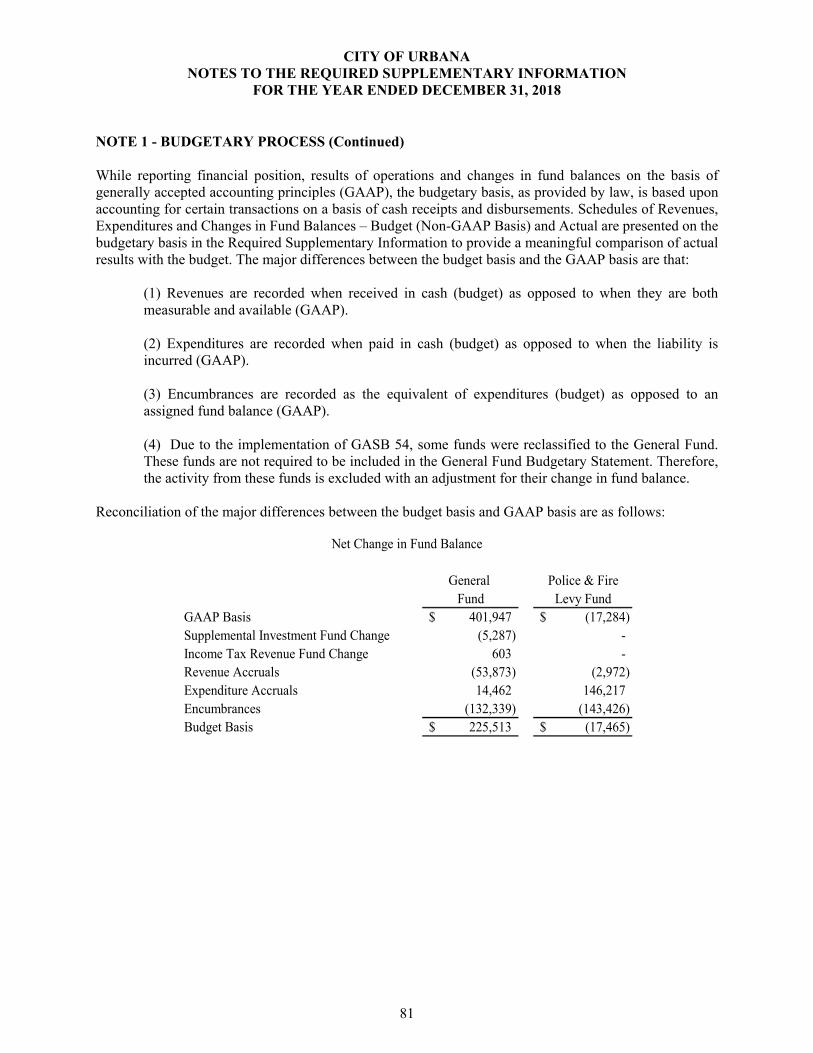
CITY OF URBANA NOTES TO THE REQUIRED SUPPLEMENTARY INFORMATION
FOR THE YEAR ENDED DECEMBER 31, 2018
NOTE 1 - BUDGETARY PROCESS (Continued) While reporting financial position, results of operations and changes in fund balances on the basis of generally accepted accounting principles (GAAP), the budgetary basis, as provided by law, is based upon accounting for certain transactions on a basis of cash receipts and disbursements. Schedules of Revenues, Expenditures and Changes in Fund Balances – Budget (Non-GAAP Basis) and Actual are presented on the budgetary basis in the Required Supplementary Information to provide a meaningful comparison of actual results with the budget. The major differences between the budget basis and the GAAP basis are that:
(1) Revenues are recorded when received in cash (budget) as opposed to when they are both measurable and available (GAAP).
(2) Expenditures are recorded when paid in cash (budget) as opposed to when the liability is incurred (GAAP). (3) Encumbrances are recorded as the equivalent of expenditures (budget) as opposed to an assigned fund balance (GAAP). (4) Due to the implementation of GASB 54, some funds were reclassified to the General Fund. These funds are not required to be included in the General Fund Budgetary Statement. Therefore, the activity from these funds is excluded with an adjustment for their change in fund balance.
Reconciliation of the major differences between the budget basis and GAAP basis are as follows:
General Police & FireFund Levy Fund
GAAP Basis 401,947$ (17,284)$ Supplemental Investment Fund Change (5,287) - Income Tax Revenue Fund Change 603 - Revenue Accruals (53,873) (2,972) Expenditure Accruals 14,462 146,217 Encumbrances (132,339) (143,426) Budget Basis 225,513$ (17,465)$
Net Change in Fund Balance
81

City of Urbana, OhioRequired Supplementary Information
Schedule of City's Proportionate Share of the Net Pension (Asset)/LiabilityOhio Public Employees Retirement System
Last Five Years
2018 2017 2016 2015 2014 (1)
City's Proportion of the Net Pension (Asset)/LiabilityTraditional Plan 0.019665% 0.020217% 0.019715% 0.020529% 0.020529%Combined Plan 0.010313% 0.010764% 0.010740% 0.009907% 0.009907%
City's Proportionate Share of the Net PensionTraditional Plan 3,085,058$ 4,590,938$ 3,414,888$ 2,476,029$ 2,420,102$ Combined Plan (14,039) (5,991) (5,226) (3,815) (1,040)
City's Covered Payroll 2,751,560$ 2,781,113$ 2,608,371$ 2,561,683$ 2,208,115$
City's Proportionate Share of the Net Pension (Asset)/Liability as a Percentage of its Covered Payroll 111.61% 164.86% 130.72% 96.51% 109.55%
Plan Fiduciary Net Position as a Percentage of the Total Pension Liability
Traditional Plan 84.66% 77.25% 81.08% 86.45% 86.36%Combined Plan 137.28% 116.55% 116.90% 114.83% 104.56%
(1) This schedule is intended to show information for ten years. Information prior to 2014 is not available.
Amounts presented as of the City's measurement date, which is the prior fiscal year-end.
See accompanying notes to the required supplementary information.
82

City of Urbana, OhioRequired Supplementary Information
Schedule of City's Proportionate Share of the Net Pension LiabilityOhio Police and Fire Pension Fund
Last Five Years
2018 2017 2016 2015 2014 (1)
City's Proportion of the Net Pension Liability 0.123603% 0.125557% 0.135095% 0.144162% 0.144162%
City's Proportionate Share of the Net Pension Liability 7,586,074$ 7,952,654$ 8,690,756$ 7,468,214$ 7,021,161$
City's Covered Payroll 2,795,416$ 2,616,381$ 2,721,320$ 2,784,088$ 2,828,327$
City's Proportionate Share of the Net Pension Liability as a Percentage of its Covered Payroll 271.38% 303.96% 319.36% 268.25% 248.24%
Plan Fiduciary Net Position as a Percentage of the Total Pension Liability 70.91% 68.36% 66.77% 72.20% 73.00%
(1) This schedule is intended to show information for ten years. Information prior to 2014 is not available.
Amounts presented as of the City's measurement date, which is the prior fiscal year-end.
See accompanying notes to the required supplementary information.
83
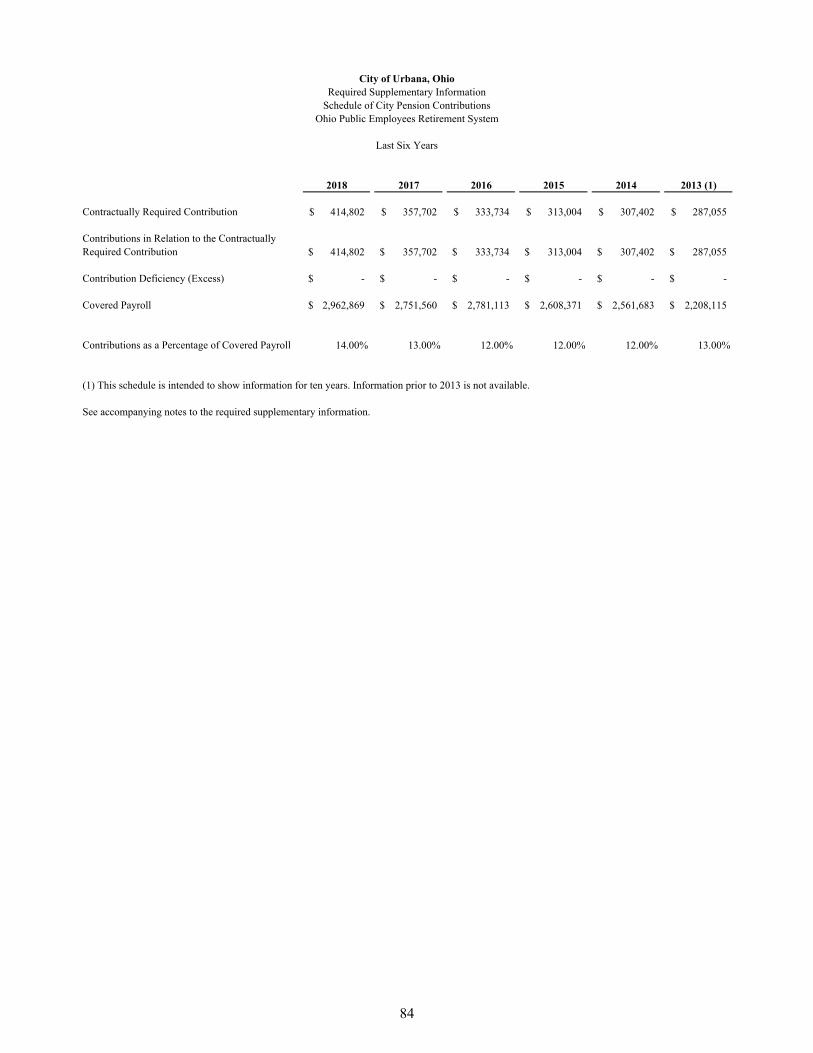
City of Urbana, OhioRequired Supplementary Information
Schedule of City Pension ContributionsOhio Public Employees Retirement System
Last Six Years
2018 2017 2016 2015 2014 2013 (1)
Contractually Required Contribution 414,802$ 357,702$ 333,734$ 313,004$ 307,402$ 287,055$
Contributions in Relation to the Contractually Required Contribution 414,802$ 357,702$ 333,734$ 313,004$ 307,402$ 287,055$
Contribution Deficiency (Excess) -$ -$ -$ -$ -$ -$
Covered Payroll 2,962,869$ 2,751,560$ 2,781,113$ 2,608,371$ 2,561,683$ 2,208,115$
Contributions as a Percentage of Covered Payroll 14.00% 13.00% 12.00% 12.00% 12.00% 13.00%
(1) This schedule is intended to show information for ten years. Information prior to 2013 is not available.
See accompanying notes to the required supplementary information.
84

City of Urbana, OhioRequired Supplementary Information
Schedule of City Pension ContributionsOhio Police and Fire Pension Fund
Last Eight Fiscal Years
2018 2017 2016 2015 2014 2013 2012 2011 (1)
Contractually Required Contribution 626,417$ 599,842$ 560,816$ 582,135$ 603,310$ 519,856$ 418,227$ 448,255$
Contributions in Relation to the Contractually Required Contribution 626,417$ 599,842$ 560,816$ 582,135$ 603,310$ 519,856$ 418,227$ 448,255$
Contribution Deficiency (Excess) -$ -$ -$ -$ -$ -$ -$ -$
Covered Payroll 2,913,388$ 2,795,416$ 2,616,381$ 2,721,320$ 2,784,088$ 2,828,327$ 2,672,123$ 2,861,247$
Contributions as a Percentage of Covered Payroll 21.50% 21.46% 21.43% 21.39% 21.67% 18.38% 15.65% 15.67%
(1) This schedule is intended to show information for ten years. Information prior to 2011 is not available.
See accompanying notes to the required supplementary information.
85
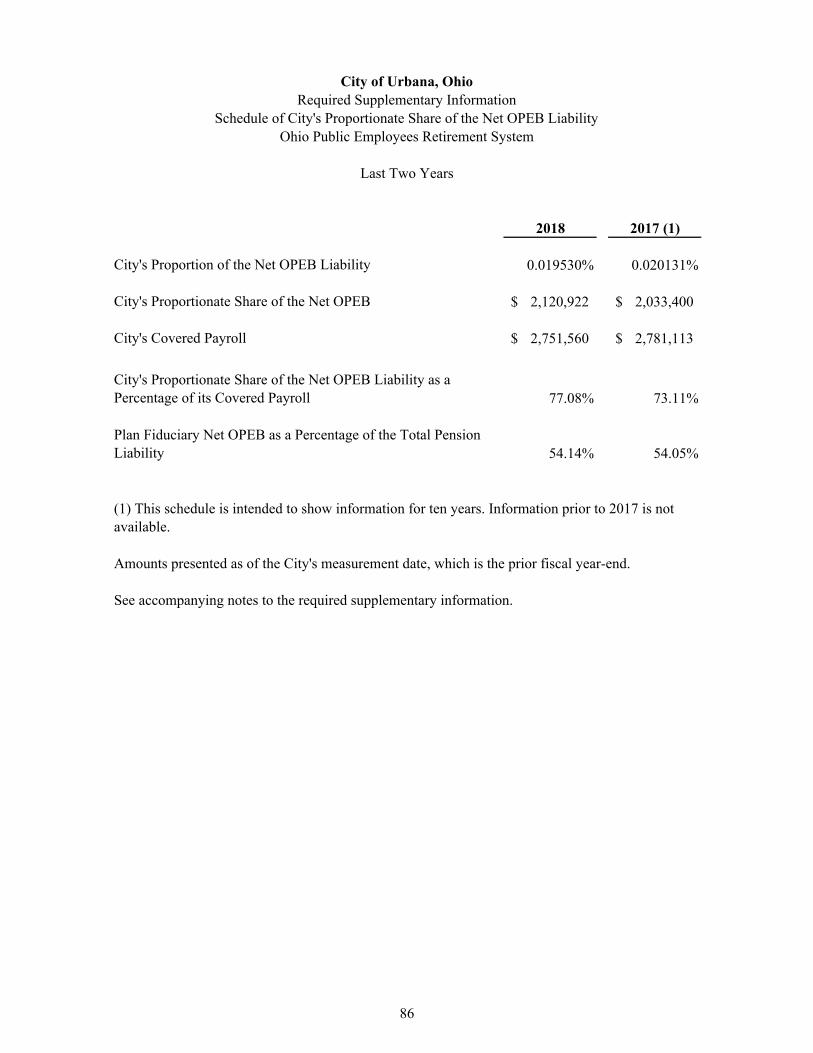
City of Urbana, OhioRequired Supplementary Information
Schedule of City's Proportionate Share of the Net OPEB LiabilityOhio Public Employees Retirement System
Last Two Years
2018 2017 (1)
City's Proportion of the Net OPEB Liability 0.019530% 0.020131%
City's Proportionate Share of the Net OPEB 2,120,922$ 2,033,400$
City's Covered Payroll 2,751,560$ 2,781,113$
City's Proportionate Share of the Net OPEB Liability as a Percentage of its Covered Payroll 77.08% 73.11%
Plan Fiduciary Net OPEB as a Percentage of the Total Pension Liability 54.14% 54.05%
Amounts presented as of the City's measurement date, which is the prior fiscal year-end.
See accompanying notes to the required supplementary information.
(1) This schedule is intended to show information for ten years. Information prior to 2017 is not available.
86

City of Urbana, OhioRequired Supplementary Information
Schedule of City's Proportionate Share of the Net OPEB LiabilityOhio Police and Fire Pension Fund
Last Two Years
2018 2017 (1)
City's Proportion of the Net OPEB Liability 0.12360300% 0.12555754%
City's Proportionate Share of the Net OPEB Liability 7,003,173$ 5,959,934$
City's Covered Payroll 2,795,416$ 2,616,381$
City's Proportionate Share of the Net OPEB Liability as a Percentage of its Covered Payroll 250.52% 227.79%
Plan Fiduciary Net Position as a Percentage of the Total OPEB Liability 14.13% 18.00%
Amounts presented as of the City's measurement date, which is the prior fiscal year-end.
See accompanying notes to the required supplementary information.
(1) This schedule is intended to show information for ten years. Information prior to 2017 is not available.
87

City of Urbana, OhioRequired Supplementary InformationSchedule of City OPEB Contributions
Ohio Public Employees Retirement System
Last Six Years
2018 2017 2016 2015 2014 2013 (1)
Contractually Required Contribution -$ 27,516$ 55,622$ 52,167$ 51,205$ 22,081$
Contributions in Relation to the Contractually Required Contribution -$ 27,516$ 55,622$ 52,167$ 51,205$ 22,081$
Contribution Deficiency (Excess) -$ -$ -$ -$ -$ -$
Covered Payroll 2,962,869$ 2,751,560$ 2,781,113$ 2,608,371$ 2,561,683$ 2,208,115$
Contributions as a Percentage of Covered Payroll 0.00% 1.00% 2.00% 2.00% 2.00% 1.00%
(1) This schedule is intended to show information for ten years. Information prior to 2013 is not available.
See accompanying notes to the required supplementary information.
88
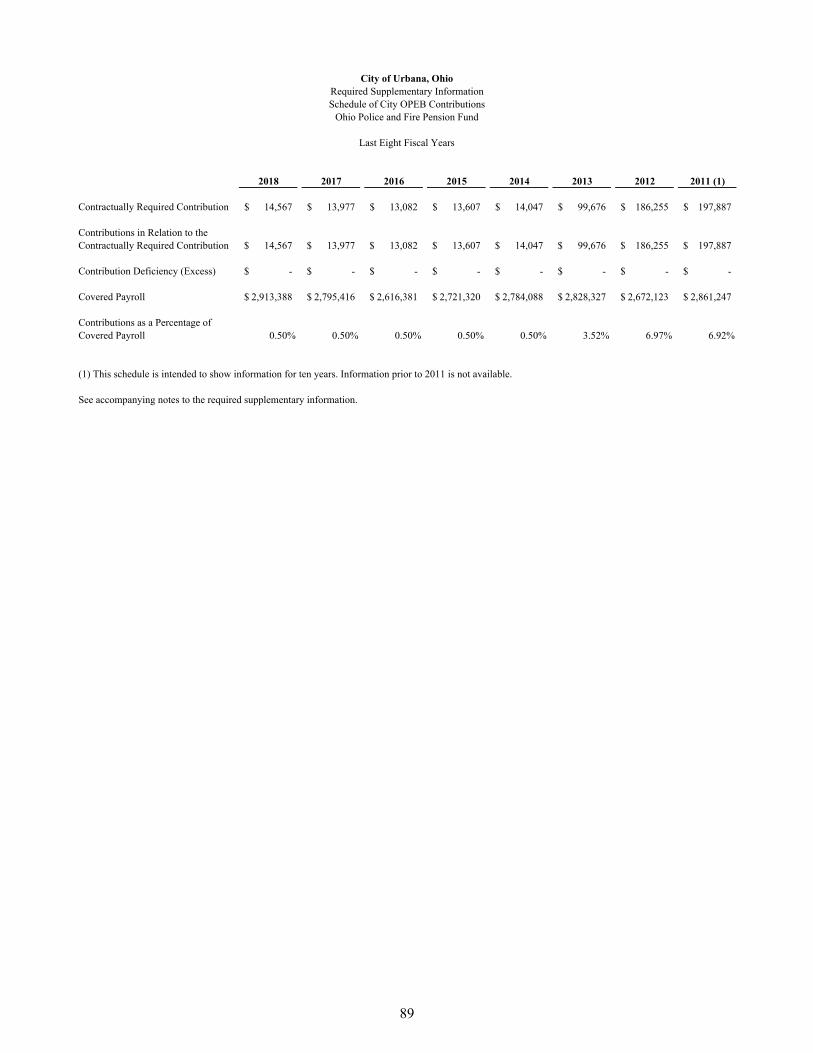
City of Urbana, OhioRequired Supplementary InformationSchedule of City OPEB Contributions
Ohio Police and Fire Pension Fund
Last Eight Fiscal Years
2018 2017 2016 2015 2014 2013 2012 2011 (1)
Contractually Required Contribution 14,567$ 13,977$ 13,082$ 13,607$ 14,047$ 99,676$ 186,255$ 197,887$
Contributions in Relation to the Contractually Required Contribution 14,567$ 13,977$ 13,082$ 13,607$ 14,047$ 99,676$ 186,255$ 197,887$
Contribution Deficiency (Excess) -$ -$ -$ -$ -$ -$ -$ -$
Covered Payroll 2,913,388$ 2,795,416$ 2,616,381$ 2,721,320$ 2,784,088$ 2,828,327$ 2,672,123$ 2,861,247$
Contributions as a Percentage of Covered Payroll 0.50% 0.50% 0.50% 0.50% 0.50% 3.52% 6.97% 6.92%
(1) This schedule is intended to show information for ten years. Information prior to 2011 is not available.
See accompanying notes to the required supplementary information.
89

CITY OF URBANA, OHIO NOTES TO REQUIRED SUPPLEMENTARY INFORMATION
FOR THE FISCAL YEAR ENDED DECEMBER 31, 2018
Ohio Public Employees Retirement System Changes of benefit terms. There were no significant changes of benefit terms in 2018.
Changes of assumptions. There were no significant changes in assumptions in 2018.
Ohio Police and Fire Pension System Changes of benefit terms. There were no significant changes of benefit terms in 2018.
Changes of assumptions. Amounts reported in 2018 reflect changes in both demographic and economic assumptions, with the most notable being a reduction in the actuarially assumed rate of return from 8.25% down to 8.00%, for the defined benefit investments.
90

91
Rockefeller Building 614 W Superior Ave Ste 1242 Cleveland OH 44113-1306
Charles E. Harris & Associates, Inc. Office phone - (216) 575-1630 Certified Public Accountants Fax - (216) 436-2411
INDEPENDENT AUDITOR’S REPORT ON INTERNAL CONTROL OVER FINANCIAL
REPORTING AND ON COMPLIANCE AND OTHER MATTERS REQUIRED BY GOVERNMENT AUDITING STANDARDS
City of Urbana Champaign County 205 S. Main Street Urbana, Ohio 43078 To the City Council: We have audited, in accordance with the auditing standards generally accepted in the United States of America and the standards applicable to financial audits contained in Government Auditing Standards, issued by the Comptroller General of the United States, the financial statements of the governmental activities, the business-type activities, each major fund, and the aggregate remaining fund information of the City of Urbana, Champaign County, as of and for the year ended December 31, 2018, and the related notes to the financial statements, which collectively comprise the City’s basic financial statements, and have issued our report thereon dated June 21, 2019. Internal Control Over Financial Reporting In planning and performing our audit of the financial statements, we considered the City’s internal control over financial reporting (internal control) to determine the audit procedures that are appropriate in the circumstances for the purpose of expressing our opinion on the financial statements, but not for the purpose of expressing an opinion on the effectiveness of the City’s internal control. Accordingly, we do not express an opinion on the effectiveness of the City’s internal control. A deficiency in internal control exists when the design or operation of a control does not allow management or employees, in the normal course of performing their assigned functions, to prevent, or detect and correct, misstatements on a timely basis. A material weakness is a deficiency, or a combination of deficiencies, in internal control, such that there is a reasonable possibility that a material misstatement of the City’s financial statements will not be prevented, or detected and corrected on a timely basis. A significant deficiency is a deficiency, or a combination of deficiencies, in internal control that is less severe than a material weakness, yet important enough to merit attention by those charged with governance. Our consideration of internal control was for the limited purpose described in the first paragraph of this section and was not designed to identify all deficiencies in internal control that might be material weaknesses or significant deficiencies. Given these limitations, during our audit we did not identify any deficiencies in internal control that we consider to be material weaknesses. However, material weaknesses may exist that have not been identified. Compliance and Other Matters As part of reasonably assuring whether the City’s financial statements are free of material misstatement, we tested its compliance with certain provisions of laws, regulations, contracts, and grant agreements, noncompliance with which could directly and materially affect the determination of financial statement amounts. However, opining on compliance with those provisions was not an objective of our audit and accordingly, we do not express an opinion. The results of our tests disclosed no instances of noncompliance or other matters we must report under Government Auditing Standards.

92
City of Urbana Champaign County Independent Auditor’s Report on Internal Control Over Financial Reporting and on Compliance and Other Matters Required by Government Auditing Standards Page 2 We did note certain matters not requiring inclusion in this report that we reported to the City’s management in a separate letter dated June 21, 2019. Purpose of this Report The purpose of this report is solely to describe the scope of our testing of internal control and compliance and the results of that testing, and not to provide an opinion on the effectiveness of the City’s internal control or on compliance. This report is an integral part of an audit performed in accordance with Government Auditing Standards in considering the City’s internal control and compliance. Accordingly, this communication is not suitable for any other purpose.
Charles E. Harris & Associates, Inc. June 21, 2019

88 East Broad Street, Columbus, Ohio 43215 Phone: 614-466-4514 or 800-282-0370
www.ohioauditor.gov
CITY OF URBANA
CHAMPAIGN COUNTY
CLERK’S CERTIFICATION
This is a true and correct copy of the report which is required to be filed in the Office of the Auditor of State pursuant to Section 117.26, Revised Code, and which is filed in Columbus, Ohio.
CLERK OF THE BUREAU CERTIFIED AUGUST 20, 2019